2013 amp sustainability report
TRANSCRIPT

TM
2013 REPORT ON SUSTAINABILITY
FOCUS on SUSTAINABILITY

2 A MP 2013 REPORT ON SUSTAINABILIT Y

Letter from the President & Chairman of the Board of TrusteesAMP’s Approach to Sustainability Overview of AMP’s 2013 Report on SustainabilityAMP’s Sustainability Principles Key Sustainability Accomplishments in 2013ECONOMYOrganizational OverviewFinancial StrengthFinancial Summary AMP Member Credit Scoring/Monitoring ProgramGeneration PortfolioHydroelectric Construction Progress Efficiency Smart™ ENVIRONMENTEmissions ProfileDecommissioning R.H. Gorsuch StationOther Environmental Mitigation MeasuresEcoSmart Choice®Green Team InitiativesForestry Carbon Offset ProjectsCOMMUNITY/SOCIETYWorker Health and Safety/Training APPA RP3® ProgramCommunications & OutreachAwards to Member Communities Member Sustainability Reporting InitiativeScholarshipsCharitable GivingAMP’s Sustainability Performance at a GlanceAMP Members & Geographic Footprint
4678
1012
16
21
2526
About the FSC label
The FSC Mixed Sources label on the back cover signifies that this report is printed on paper certified by the Forest-ry Steward ship Council. This paper product supports the development of responsible forest management world-wide. The wood for the paper comes from FSC-certified well-managed forests, company-controlled sources and/or recycled material (the paper used for this report has 10 percent post-consumer recycled content).
Company controlled sources are controlled, in accordance with FSC standards, to exclude illegally harvested timber, forests where high conservation values are threatened, genetically modified organisms and violation of people’s civil and traditional rights.
AMP also prints its quarterly Amplifier magazine, annual report, calendar and letterhead on FSC-certified paper. The publications are produced with sustainable soy- and vegetable-based inks.
On the cover: AMP provides a variety of services, including wetland delineation and assessments, to assist member communities in managing their environmental needs and compliance.
Table ofC O N T E N T S
3A MP 2013 REPORT ON SUSTAINABILIT Y

Bringing these efforts into “focus” by using sustainability as a core AMP principle is one way to
enhance our achievements toward growing and diversifying our generation portfolio, reducing
and offsetting emissions, helping our members save energy, fostering strong and stable member
communities, and being responsible stewards.
We note that our efforts to use sustainability as a focal point of our operations have been on
the leading edge of much of the public power community, and we are seeing a broader interest
in sustainability and performance metrics based on sustainability among various public power
stakeholders, including municipal bond markets, financial advisers, and their customers. With
conservative investors often looking to municipal bonds for stable returns, the fact that an entity
has a forward-looking business approach based on sustainability can be the factor that tilts the
balance toward one investment over an otherwise comparable one. AMP envisioned this pos-
sible result when we first adopted our Environmental Stewardship Principles back in 2005; the
Letter from theP R E S I D E N T & C H A I R M A N O F T H E B O A R D O F T R U S T E E S
The theme of AMP’s 2013 Report on Sustainability – “Focus on Sustainability” –
is very appropriate as we mark the completion of our third comprehensive annual
report. Since 2011, AMP has built on the foundation of previous years’ sustainability
efforts to refine our reporting capabilities and metrics in order to better reflect and
track progress along AMP’s sustainability journey.
+
4 A MP 2013 REPORT ON SUSTAINABILIT Y

continued fragility of the nation’s economic recovery and the search for lower-risk investments
have apparently helped this come to fruition.
Our 2013 Report on Sustainability compares progress made throughout the year and reports
other metrics that demonstrate the breadth of AMP’s commitment to sustainability through eco-
nomic, environmental, and societal measures and actions. As always, we welcome your feedback.
On behalf of the members,
Jon A. Bisher, Ph.D., AMP Board of Trustees Chairman and City Manager, Napoleon, Ohio (left), and Marc S. Gerken, PE, AMP President/CEO
Marc S. Gerken, PE AMP President/CEO
Jon A. Bisher, Ph.D., AMP Board of Trustees Chairman and City Manager, Napoleon, Ohio
5A MP 2013 REPORT ON SUSTAINABILIT Y

AMP’s Approach toSUSTAINABILIT Y
Owned and governed by its members, AMP is dedicated to providing value-added member services and cost-competitive power supply. AMP also serves as project manager for groups of municipal electric communities participating in joint ventures and other structures to share ownership of power generation and related facilities.
AMP and its members are committed to achieving sustainable bal-ance between being responsible corporate citizens, governmental entities, employers, and environmental stewards while simultane-ously maintaining a supply of cost-competitive, reliable electric power for our members’ retail customers.
AMP believes that the best way to achieve the desired balance between sometimes competing considerations is through the con-sistent application of the concept of sustainability as a focused busi-ness practice. AMP defines “corporate sustainability” as a business approach that creates long-term member value by maximizing opportunities and minimizing risks related to a host of economic, environmental, and community or societal considerations.
AMP employs the concept of a “three-legged stool” to explain how these considerations must be in balance for sustainability to be achieved. The three legs of the sustainability stool are “ECON-
OMY,” “ENVIRONMENT,” and “COMMUNITY or SOCIETY.” To properly support sustain-
ability as a business approach, all three legs have to be present
and given relatively equal con-sideration when business deci-
sions are made. Remove one leg of the stool and it topples over – there is no foundation for a strictly sustainable corporate decision. Give one leg of the stool greater emphasis than the others, and the unbalanced platform on which the decision is based will not allow it to be sustained over time – it, too, will lean and eventually fail.
The nature of AMP’s members as units of local municipal gov-ernment underscores the long-term sustainability vision that pre-vails at AMP. An organization cannot effectively practice sustain-ability while having its eye solely on the next quarterly report to shareholders. Conversely, public power utilities are governed and operated as public services for their citizens for the betterment of their communities. Through its members, AMP deploys pro-grams and projects to provide reliable, cost-competitive and environmentally responsible generation development, operations, and technical support; environmental management; business development; project financing; education and training; and energy efficiency and conservation as part of an overall corporate strategy of sustainability.
AMP and its members continue to make significant investments in the development, construction and management of a variety of sustainable generation projects including efficient coal, natural gas, wind, hydroelectric and solar projects which provide a bal-anced, yet diversified portfolio of power supply options for our members. In addition to developing its own generation assets, AMP also is able to secure other needed capacity – including re-newable wind and landfill gas – for its members through the use of power purchase agreements (PPAs). The latter approach helps to further diversify AMP’s power supply mix while reducing financial and project risk to members.
American Municipal Power, Inc. (AMP) is the
Columbus-based nonprofit wholesale power supply
and services provider for 129 members in seven
states, including 128 member communities that
operate municipal electric systems – 83 in Ohio,
29 in Pennsylvania, six in Michigan, five in Virginia,
three in Kentucky, and two in West Virginia – and the
Delaware Municipal Electric Corporation, Inc., which is
a joint action agency representing nine municipal electric
systems in the state of Delaware.
+
6 A MP 2013 REPORT ON SUSTAINABILIT Y

Overview of AMP’s 2103 REPORT ON SUSTAINABILIT Y
AMP’s 2013 Report on Sustainability is focused on
presenting information relating to its sustainability efforts
from the 2013 calendar year, and comparing that performance
to 2012 (and in some cases additional prior years) whenever
practicable. In addition to being addressed in the text, the
most pertinent data are presented in a summary “at a glance”
comparison table located at the end of this report.
+
This report is meant to be viewed as an accompany-ing document to other AMP and Efficiency Smart™-prepared annual reports that cover a much broader scope of activities within the organization. Howev-er, as a stand-alone document, AMP’s 2013 Report on Sustainability provides a good focus on AMP’s progress along its sustainability journey.
The 2013 report is organized with several intro-ductory sections, followed by three major chapters, representing the three legs of the “sustainability stool” – ECONOMY, ENVIRONMENT and COM-MUNITY / SOCIETY. Major accomplishments and data from various AMP programs and projects are provided in the most appropriate of these three chapters. Readers should note that, because the concept of sustainability requires a balancing of all three primary components, many of the reported results (from the identified projects and programs) could easily be discussed in different chapters.
7A MP 2013 REPORT ON SUSTAINABILIT Y

AMP’s SUSTAINABILIT YPRINCIPLES
In 2005, the AMP Board of Trustees first adopted
a set of Environmental Stewardship Principles to
help guide the organization. Modified in 2009, these
principles were again revised in 2011 to reflect the broader
nature of “sustainability” (i.e., vs. “stewardship”) for AMP’s
business model and were renamed “Sustainability Principles.”
+
In 2013, AMP’s Board of Trustees reviewed and revised AMP’s Sustainability Principles as part of the organization’s efforts to keep current with evolving environmental trends, issues, and technologies and to more accurately reflect the evolving nature of AMP’s mission, vision, priorities, and actions. One goal of this Report on Sustainability is to reflect the accomplishments and progress with regard to these principles and to report such
to member communities, other stakeholders, and the public. As appropriate and as approved by AMP’s Board of Trustees, these Sustainability Principles may be subsequently supported by the establishment of more specific goals, targets, and other performance standards that can be measured and reported. The Sustainability Principles approved by the Board in 2013 are listed on the facing page.
Behind-the-meter solar generation such as AMP’s 3.54-megawatt Napoleon Solar Facility helps produce transmission savings
and provide enhanced reli-ability to members. It also helps diversify power sup-
ply portfolios and reduce emissions profiles. AMP
plans to add more behind-the-meter
solar generation in its member communities.
8 A MP 2013 REPORT ON SUSTAINABILIT Y

Principle #1 – Providing a balanced and sustainable power supply portfolioAMP is committed to providing our members with a variety of options for meeting their power supply needs. This includes maintaining a balanced portfolio of generation projects, power purchase agreements, and a project development pipeline that in-cludes cost-effective fuel and generation technology options. This also means using energy efficiency and load control as meaningful tools in power supply planning to reduce the need for new genera-tion resources.
Principle #2 – Reducing our overall emissions profileAMP is committed to reducing its overall emissions profile. Reduc-tions of airborne emissions can be achieved through the use of efficient coal and natural gas and other lower- or zero-emission generation technologies (including hydroelectric and other renew-ables), supply-side or end-use efficiency improvements, and con-servation activities. Improvements in energy and operational effi-ciency and use of efficient coal and natural gas technologies at the generation level will also reduce water usage and need for landfill space. Mindful that emissions of greenhouse gases (GHGs) will be limited at some point in the future, AMP will prudently invest in projects to offset carbon dioxide and other GHG emissions from our fossil generation resources. AMP also encourages efforts to ac-count for and reduce GHG emissions by individual AMP member communities, which promotes balancing their system needs with other stewardship and customer values.
Principle #3 – Using lessAMP recognizes that electricity not generated – because it is not needed – yields the greatest environmental benefit and is essen-tial to a truly sustainable business approach. Reducing electricity demand through innovative conservation efforts and efficiency improvements offered to AMP member communities will help con-serve natural resources as well as reduce emissions. AMP will also promote the “reduce, reuse, recycle” principles of sustainability to its membership and employees and throughout its operations.
Principle #4 – Making smart investmentsAMP is faced with finding new power supply options to meet mem-ber needs. Volatile energy markets and aging generation resources have spurred AMP to make smart investments in efficient coal, nat-
ural gas, hydroelectric, landfill gas, and solar generation assets to mitigate overexposure to the wholesale market. AMP will continue to pursue incorporating other cost-effective renewable resources as an important part of our generation portfolio and will endeavor to use any available favorable local, state, or federal regulatory treat-ment when siting and financing these projects.
Principle #5 – Assisting member communitiesAMP member municipal electric systems are critical components in the success of the communities they serve. Investment of capi-tal – both financial and human – in AMP member communities is essential to ensuring a good quality of life and encouraging eco-nomic development and growth. AMP provides ongoing employee training, safety instruction, project engineering, and other techni-cal services to ensure that member communities have access to the most up-to-date services in these areas. Environmental enhance-ments (planting trees, creating green space, etc.) are also valuable assets to local communities, and AMP will provide technical sup-port and work with interested member communities to identify en-ergy efficiency, carbon management, and sustainable investment and development opportunities consistent with local needs.
Principle #6 – Reaching out to stakeholdersAMP will reach out to other stakeholder entities – including (but not limited to) government, business, academia, media, and other utility organizations – to ensure that they understand AMP’s mis-sion and vision and AMP’s approach to sustainability. This out-reach is intended to help AMP identify potential future collabora-tive opportunities beyond those traditionally associated with pro-viding electric power supply. AMP encourages member communi-ties to identify potential partnership opportunities as well.
Principle #7 – Leading by exampleAMP encourages its officers and employees to lead by example through increased efforts to reuse and recycle home and office products and conserve energy, both at home and in the work-place. To the extent practicable, AMP will strive to use its head-quarters building to demonstrate the use of green materials and energy efficient products, thus leading by example. AMP will re-port its sustainability and environmental stewardship actions on both a quarterly and an annual basis and, where possible, mea-sure its success in achieving the goals laid out by these Sustain-ability Principles.
9A MP 2013 REPORT ON SUSTAINABILIT Y

+ Hydroelectric projects
Construction progress continued throughout 2013 on four run-of-the-river hydroelectric projects located at the Cannelton, Smithland, Meldahl, and Willow Island locks and dams on the Ohio River. AMP owns, through a separate nonprofit wholly owned, limited-liability company, the Meldahl hydro project, which it is developing with the member community of Ham-ilton. Hamilton retains the rights for a 51 percent share of the output of that project and will operate the project. AMP’s work on these projects marks the nation’s largest run-of-the-river hydroelectric construction effort, which will provide 300 mega-watts (MW) of new capacity when completed. Because these resources are key to the long-term sustainability of our mem-bers’ power supply portfolios and thus their local economies, we are including a discussion of various construction milestone updates in the ECONOMY section of this year’s report.
Key Sustainability Accomplishments I N 2 0 1 3
Construction progresses at the Cannelton hydroelectric project. The 84-megawatt facility, located on the Cannelton Locks and Dam near Hawesville, Kentucky, is one of four projects comprising the nation’s largest run-of-the-river hydro construction effort.
10 A MP 2013 REPORT ON SUSTAINABILIT Y

+ Efficiency Smart™ surpasses another milestone
AMP’s Efficiency Smart™ program provided energy efficiency ser-vices to 49 subscribing AMP member communities in 2013. Initiat-ed in 2011, Efficiency Smart™ was originally designed to save partic-ipants 81,000 megawatt-hours (MWh) of energy by the end of 2013 – a goal which the program passed in March 2013. In addition, AMP and the Vermont Energy Investment Corporation (VEIC) inked a new contract in July to extend the operation of the Efficiency Smart™ program through 2016. More details on Efficiency Smart™ are included in the ECONOMY section of this year’s report.
+ Decommissioning completed
AMP completed decommissioning activities at the site of the former Richard H. Gorsuch Station near Marietta, Ohio, in 2013. Environ-mental restoration of the 45-acre site, which formerly hosted a 213-MW coal-fired generation facility that was closed in 2010, was com-pleted within budget and project timeframes. More details and pho-tos can be found in the ENVIRONMENT section of this year’s report.
+ Member sustainability reporting initiative
In 2013, AMP began developing a reporting template in Microsoft Ex-cel and Word format that members could use to develop their own sustainability reports. Refinements have been added in 2014. Details on this effort can be found in the COMMUNITY / SOCIETY section.
®
11A MP 2013 REPORT ON SUSTAINABILIT Y

The Delaware Municipal Electric Corporation (DEMEC) joined AMP in 2011, adding to AMP’s eastern U.S. presence. A map of AMP’s footprint states, communities, and key facilities is located on the inside back cover of this report.
This organizational growth has provided substantial benefits for AMP’s membership in the form of heightened economies of scale, enhanced services and a larger influence footprint. From a staffing standpoint, in 2013, AMP employed approximately 160 employees at the headquarters and at generating assets. The AMP employ-ment numbers do not include the hundreds currently employed through various contractors in conjunction with hydroelectric plant construction or other entities involved with most operation-al functions at the AMP Fremont Energy Center (AFEC), through our contract with Vermont Energy Investment Corp. (VEIC) for Efficiency Smart™ or at the Prairie State Energy Campus, of which AMP is a 23.26 percent owner.
+ FINANCIAL STRENGTH
In 2013, Moody’s Investor Service reaffirmed AMP’s A1 issuer rat-ing for the sixth straight year, which signifies AMP’s strong credit position and that of its members. This ultimately results in lower project financing costs – and thus more savings for customers.
ORGANIZATIONAL OVERVIEW
Strategic organizational growth is essential to AMP’s sustainability vision. Since 1996, AMP’s
membership has grown by more than 65 percent and expanded from Ohio to include six other
states: Delaware, Kentucky, Michigan, Pennsylvania, Virginia and West Virginia.
+
ECONOMY
AMP Membership Growth
0
20
40
60
80
100
120
140
1996 1998 2000 2002 2004 2006 2008 2010 2012
Number of AMP Members
12 A MP 2013 REPORT ON SUSTAINABILIT Y

+ AMP MEMBER CREDIT SCORING/ MONITORING PROGRAM
Realizing the organization was about to embark on a large cap-ital-intensive building program, AMP staff developed a credit scoring program for its members from criteria utilized by the three primary rating agencies (i.e., Moody’s, Fitch and Standard & Poors) in 2006. Subsequently, this credit scoring policy was approved by the AMP Board of Trustees and used by AMP staff in calculating credit scores upon the receipt of a member’s annual audit. Credit scores are reported to the AMP Board monthly as audits are received.
The credit scoring program has increased awareness with mem-bers as to critical areas relating to a municipality’s credit. The goal of the program is to enhance the financial soundness and creditworthiness of the entire AMP membership and is expected to enhance the credit of participating members in all current re-financings and future AMP project financings. The average AMP member credit score has increased an average of 17 percent from the inception of the program.
The credit scoring policy is reviewed regularly with scoring crite-ria updates made as dictated by changes in rating agency financial metrics and approved by the AMP Board. In addition, AMP staff conduct educational meetings for members on current topics in finance and accounting and other information throughout the year.
AMP Financial Summary
From Consolidated Statements of Revenues and ExpensesYears Ended Dec. 31, 2013 and 2012
2013 2012Revenues Electric revenue $953,077,162 $797,996,283 Service fees 9,648,054 6,697,162 Programs and other 19,769,641 19,042,794 Total revenues 982,494,857 823,736,239 Operating expenses Purchased electric power 610,212,025 555,589,498 Production 66,589,310 36,190,145 Fuel 113,312,952 118,934,119 Depreciation and amortization 57,578,445 38,748,939 Administrative and general 9,829,551 6,343,378 Property and real estate taxes 3,561,677 1,667,407 Programs and other 18,714,669 17,386,909 Total operating expenses 879,798,629 774,860,395 Operating margin 102,696,228 48,875,844
Nonoperating revenues (expenses) Interest expense (118,680,542) (60,467,853) Interest income, subsidy 13,550,548 6,226,152 Interest income, other 6,017,591 7,125,095 Other, net 1,694,974 151,381 Total nonoperating expenses (97,417,429) (46,965,225) Net margin $5,278,799 $1,910,619
Downtown Oberlin
13A MP 2013 REPORT ON SUSTAINABILIT Y

2016 AMP Member Projected Energy Resource Mix (16,600,000 MWh)
Purchased Power38%
Prairie State 17%
Wind & Solar 2.5%
Member Coal 9%
Natural Gas (combined cycle)
15%
Landfill2%
Hydro (including NYPA)
17%
As seen in a comparison of the 2013 and 2016 energy resource mix charts, the purchased power (market) portion is projected to decrease 15 percent by 2016. A major contributing factor is the addition of AMP’s new hydroelectric assets and solar development, which will also expand the amount of energy produced by renewable resources to slightly more than 21 percent.
2013 AMP Member Energy Resource Mix (16,400,000 MWh)
Purchased Power 53%
Wind 1.9%
Member Coal8%
Hydro (including NYPA) 6%
Landfill3%
Prairie State13%
Natural Gas (combined cycle)
15%
Notes to 2013 & 2016 charts– The Member Coal figure includes the participation of AMP members
Paducah and Princeton in PSEC through the Kentucky Municipal Power Association.
– The Wind & Solar percentage includes member-owned solar.
– The Hydro percentage includes member-owned hydro.
+ AMP’S GENERATION PORTFOLIO
One of AMP’s overarching goals is to provide cost-competitive pow-er supply options to its members, while remaining true to its sus-tainability approach. In the past, a large portion of AMP’s owned, operated or purchased supply included units fueled by older coal facilities, which on average supply more than 50 percent of the electricity capacity throughout AMP’s footprint states. Until 2011, AMP’s coal-fired portfolio was supplied by the recently decommis-
sioned 213-MW Richard H. Gorsuch Station (closed in December 2010), member-owned coal-fired units and market purchases.
With the addition of new generation resources in 2012, AMP’s power supply portfolio has changed considerably, providing members with the opportunity to replace a portion of their mar-ket purchases with new efficient coal, natural gas and solar proj-ects as additions to the portfolio of AMP-owned assets. The AMP Fremont Energy Center (AFEC), a nominal 700-MW natural gas combined cycle (NGCC) generating plant, began commercial operation in January 2012. The Prairie State Energy Campus in southern Illinois – of which AMP owns 23.26 percent on behalf of its participating members – is a two-unit, 1,600 MW state-of-the-art efficient mine-mouth coal plant that also became com-mercially available in 2012. Finally, the 3.54-MW Napoleon Solar facility came online in August 2012. Together, these three assets added more than 1,000 MW of capacity to AMP’s power supply portfolio in 2012. No new generation was added in 2013.
Also under AMP development at this time are more than 350 MW of new run-of-the-river hydroelectric generation (300 MW cur-rently under construction). Other generation secured through power purchase arrangements (PPAs - e.g., wind and landfill gas) further diversifies AMP’s power supply portfolio. As these units come online or are added to AMP’s portfolio, their contributions will be included in future sustainability reports.
At the end of 2013, AMP’s existing portfolio of owned and/or op-erated energy generation assets included the following:
2013 AMP Owned/Operated Assets (Capacity in MW)
PSEC368
AFEC700
Diesel units142
Natural gas units217
Belleville Hydro42
AMP Wind Farm7.2
Napoleon Solar3.54
14 A MP 2013 REPORT ON SUSTAINABILIT Y

• AMP Fremont Energy Center – nominal 700 MW
• Prairie State Energy Campus (AMP share) – 368 MW
• Belleville Hydroelectric Plant – 42 MW
• Various diesels units (distributed generation) – 142 MW
• Various natural gas units (distributed generation) – 217 MW
• AMP Wind Farm – 7.2 MW
• Napoleon Solar Facility – 3.54 MW
AMP and individual member-owned generation (e.g., coal, hy-droelectric, natural gas, diesel, landfill gas, and solar) contributed 7,767,484 MWh of generation towards total AMP system energy usage in 2013. Market purchases (including bilateral power pur-chases) provided 8,643,217 MWh of additional energy towards the total 2013 AMP system energy usage of 16,410,701 MWh. Please see the preceding charts for comparison of 2013 energy needs against 2016 projected energy needs for AMP. Note that the purchased power (market) portion changes dramatically with the addition of AMP’s new hydroelectric assets.
+ HYDROELECTRIC CONSTRUCTION PROGRESS
Construction progress continued throughout 2013 on four run-of-the-river hydroelectric projects located at the Cannelton, Smith-land, Meldahl, and Willow Island locks and dams on the Ohio River. AMP’s work on these projects marks the nation’s largest run-of-the-river hydroelectric construction effort, which will provide 300 MW of new capacity when completed. AMP continues its de-velopment work on one additional hydroelectric project currently in the Federal Energy Regulatory Commission (FERC) licensing and permitting stage of development (R.C. Byrd) in conjunction with its member community Wadsworth, Ohio, which would add approximately another 50 MW of hydro capacity in the future.
At AMP’s Cannelton site near Hawesville, Kentucky, structural pow-erhouse concrete construction was complete at the end of 2013, and other concrete work was 78 percent complete. The project will add 84 MW of clean energy capacity to AMP’s power supply portfolio.
At the other active hydro construction sites, 2013 also proved to be a year of a significant progress. Structural concrete placement at the Smithland site, near Smithland, Kentucky, was 63 percent complete, with nearly 60,000 cubic yards in place by the end of the year. Smithland is projected to add 76 MW of hydroelectric capacity when completed. Structural concrete placement at the Willow Island site (35 MW, near St. Marys, West Virginia) was 66 percent complete at the end of 2013, with over 48,000 cubic yards placed. Finally, the 105-MW Meldahl project near Maysville, Ken-tucky, had 98 percent of its structural concrete placed by the end of 2013.
+ EFFICIENCY SMART™
2013 marked the third year of AMP’s very successful Efficiency Smart™ program, which provided energy efficiency services to 49 subscrib-ing AMP member communities in 2013. Initiated in 2011, Efficiency
Smart™ was originally designed to save participants 81,000 MWh of energy by the end of 2013 – a goal which the program passed in March 2013. In addition, AMP and the Vermont Energy Investment Corpora-tion (VEIC) inked a new contract in July to extend the operation of the Efficiency Smart™ program through 2016; Efficiency Smart™ is a separate entity from AMP with its own staff and budget.
The 49 AMP members that were enrolled in the program in 2013 realized a three-year total of 121,339 MWh of energy savings (or 150 percent of the program’s three-year MWh savings target) across residential, commercial, and industrial service classes. Strong in-dustrial savings led the way, accounting for 46 percent, or 56,254 MWh, of the 121,339 MWh saved from 2011 through 2013, with commercial a close second at 43 percent, or 52,328 MWh. Residen-tial savings accounted for 11 percent, or 12,757 MWh.
Efficiency Smart™ also sponsored savings opportunities through residential initiatives that included efficient-product rebates, appli-ance-recycling incentives and efficient lighting. In 2013, residential customers redeemed rebates for 1,124 items that were among seven qualifying products (which included refrigerators, clothes washers and dehumidifiers). In addition, customers at 926 residences ac-cepted a $50 incentive to recycle old, inefficient refrigerators and freezers. Responding to discounts Efficiency Smart™ offered in 2013 through point-of-sale lighting campaigns and its online light-ing store, customers purchased 19,308 compact fluorescent light bulbs (CFL). Efficiency Smart™ also distributed nearly 94,000 CFLs through activities such as community outreach and incandescent trade-in events. By the end of 2013, the project pipeline for Effi-ciency Smart™ had identified 450 individual projects, potentially accounting for an additional 36,826 MWh of savings.
% ACHIEVED OF 3-YEAR GOAL:
150%PARTICIPATING AMP
COMMUNITIES:
49% OF COMMUNITIES MEETING
SAVINGS GOAL:
100%% OF COMMUNITIES EXCEEDING GOAL:
80%
AMP Efficiency Smart ProgramSavings achieved: 121,339 MWh
15A MP 2013 REPORT ON SUSTAINABILIT Y
ENVIRONMENT
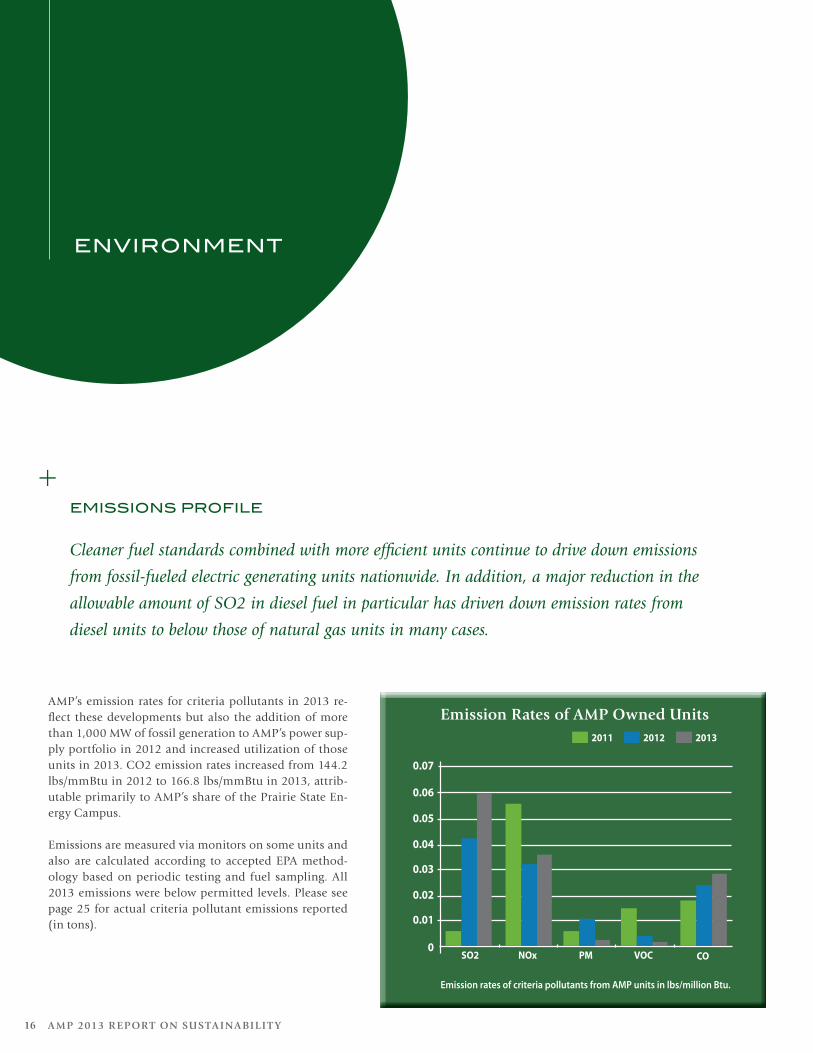
AMP’s emission rates for criteria pollutants in 2013 re-flect these developments but also the addition of more than 1,000 MW of fossil generation to AMP’s power sup-ply portfolio in 2012 and increased utilization of those units in 2013. CO2 emission rates increased from 144.2 lbs/mmBtu in 2012 to 166.8 lbs/mmBtu in 2013, attrib-utable primarily to AMP’s share of the Prairie State En-ergy Campus.
Emissions are measured via monitors on some units and also are calculated according to accepted EPA method-ology based on periodic testing and fuel sampling. All 2013 emissions were below permitted levels. Please see page 25 for actual criteria pollutant emissions reported (in tons).
EMISSIONS PROFILE
Cleaner fuel standards combined with more efficient units continue to drive down emissions
from fossil-fueled electric generating units nationwide. In addition, a major reduction in the
allowable amount of SO2 in diesel fuel in particular has driven down emission rates from
diesel units to below those of natural gas units in many cases.
+
0
0.02
0.05
0.01
0.04
0.03
0.06
SO2 NOx PM VOC CO
Emission rates of criteria pollutants from AMP units in lbs/million Btu.
20122011
Emission Rates of AMP Owned Units2013
0.07
16 A MP 2013 REPORT ON SUSTAINABILIT Y

+ DECOMMISSIONING R.H. GORSUCH STATION
AMP completed decommissioning activities at the site of the former Richard H. Gorsuch Sta-tion near Marietta, Ohio, in 2013. Environmen-tal restoration of the 45-acre site, which formerly hosted a 213-MW coal-fired generation facility that closed in 2010, was nearly completed by the end of 2013; the photos at right show progress to fill and reseed the area at the end of 2013, as compared to earlier in the year when considerable debris was still on site.
Decommissioning of the facility included re-moving asbestos and other hazardous materials from the site, demolishing existing structures, and closing the former coal ash disposal land-fill – all in accordance with applicable state and federal environmental statutes. As noted in last year’s Report on Sustainability, the landfill was closed and groundwater monitoring wells installed by the end of 2012, and other site re-mediation activities have now been completed, with over 20,500 gross tons of various metal waste recycled in total.
AMP continues to evaluate possible brownfield use of the Gorsuch site on the Ohio River for such activities as material handling or other uses, thus providing some additional economic development options for the area and value for project participants.
+ OTHER ENVIRONMENTAL MITIGATION MEASURES
As with the decommissioning of the Gorsuch Sta-tion site, AMP’s generation construction activi-ties bear the responsibility for mitigating possible environmental damages to local areas. AMP con-tinues to maintain three wetlands constructed in 2008 (totaling 12 combined acres of aquatic habi-tat) at the site of a planned and subsequently can-celled generation construction project in Meigs County, Ohio, which provide habitat protection for the Ohio-endangered Eastern spadefoot toad on nearly 70 acres of conservation easements. AMP continues to explore options for the site and maintains Ohio Power Siting Board certificates.
AMP also has performed environmental mitiga-tion activities as conditions of its FERC licenses and other regulatory requirements for the various hydroelectric projects currently under construc-tion. These include payment of financial compen-
17A MP 2013 REPORT ON SUSTAINABILIT Y

sation, consideration of conservation easements or other environ-mental protection for adjoining properties, purchasing additional acreage to compensate for land cleared for transmission lines, etc. AMP continues to work with regulatory agencies and local commu-nities to identify other possible site improvements, including future fishing and recreational areas and reforestation activities.
+ ECOSMART CHOICE®
EcoSmart Choice® is AMP’s green-pricing program, which of-fers to member communities the opportunity to support addi-tional renewable development without altering their power sup-ply. While many AMP communities currently support renewable energy projects through direct participation and/or contractual ownership, some end-use customers in these communities want to be sure they are supporting renewable energy development as much as they can on an individual basis. EcoSmart Choice® en-ables participating AMP member communities to extend the benefits of renewable generation to their end-use customers, re-gardless of their power supply mix. Green pricing programs such as this rely on the use of renewable energy certificates (RECs) to offset the customer’s electricity usage. Customers’ participa-tion in EcoSmart Choice® is supported by the purchase of wind, hydroelectric, landfill gas or other qualifying RECs, which helps stimulate new renewable project development. The program is open to both residential and commercial/industrial customers.
At the option of the participating AMP member community, residential customers who choose to join EcoSmart Choice® are able to offset varying levels of their month-ly electric usage (25 percent, 50 percent, 75 percent, or 100 percent) with renew-able energy for an additional base cost of $0.005 per kWh. For example, if a customer uses 750 kWh in a month and is participat-ing at the 100 percent level, the EcoSmart Choice® program will purchase an equal number of RECs to match that monthly us-age, and the customer would pay an addi-tional $3.75 ($0.005 X 750) as part of their utility bill that month to cover their partici-pation in the program. Customers in participating member com- munities are generally able to sign up for the program via the website
(www.ecosmartchoice.org), phone call or visit to the utility office, or response post card – depending on the options provided by the local utility. Customers can join or drop out at any time, with no penalty. In 2013, six AMP communities participated in this pro-gram, and nearly 5,600 MWh of traditional generation was offset with the purchase and retirement of qualifying RECs.
AMP’s forestry carbon offset project at Hellbender Bluff Park in Columbiana County, Ohio, features the planting of native hardwoods on 185 acres of abandoned strip-mined land. The project is a collaboration among AMP, the Columbiana County Park District and the Appalachian Regional Refores-tation Initiative/Green Forests Work.
18 A MP 2013 REPORT ON SUSTAINABILIT Y

+ GREEN TEAM INITIATIVES
In 2011, AMP reorganized its existing Green Team to add staff mem-bers that have the ability to drive initiatives within their respective departments and the organization as a whole. Based on discus-sions with fellow employees and amongst themselves, the Green Team developed a list of possible projects for the AMP headquarters building and then evaluated and prioritized those projects based on cost, energy savings, ease of implementation, and other factors.
In 2013, AMP continued to implement a number of the Green Team’s initiatives, including installation of efficient light-emitting-diode (LED) fixtures in the garage, to outside bollards and soffits, and, most notably, to the exterior parking lots. (The photos at right show “before and after” shots of AMP’s rear parking lot.) AMP also was able to convert toilets in the building to units that use less water per flush. Green Team staff will be evaluating energy and water sav-ings attributable to these initiatives over the coming years.
The Green Team continued to promote the concept of vehicle trip elimination or consolidation by pointing out monetary and energy/emissions savings that could be achieved through car-pooling for or packing lunch. For example, a solo trip by an AMP employee away from the office every day to get a sandwich can easily total more than 1,000 miles annually on a car’s odometer. Using the U.S. vehicle average of 21 MPG at $3.50 per gallon, that
means that employee can spend more than $166 annually just to go to lunch. At that rate, the environmental impact of those daily trips can add more than 900 pounds of carbon into the at-mosphere annually. Staff members were made aware that packing lunch or carpooling with others can both save money and reduce your carbon footprint.
Improving AMP’s recycling program at its headquarters has been a priority for the Green Team since its inception. In 2013, build-ing on the improvements made to the program in 2011:
• An estimated 77,300 pounds of paper and cardboard waste was recycled at AMP headquarters.
• An estimated 840 pounds of glass and plastic bottles and alu-
minum and steel cans was recycled at AMP headquarters, filling a 95-gallon container about every nine days (i.e., about 2,500 gallons of metal, glass, and plastic waste recycled in 2013).
+ FORESTRY CARBON OFFSET PROJECTS
The reduction of carbon dioxide (CO2) and other greenhouse gases (GHGs) remains a priority for many environmental orga-nizations and policy makers. AMP was a member of the Chicago Climate Exchange (CCX), a voluntary cap-and-trade effort estab-lished to reduce GHGs, from 2007 through the program’s end in
Before and after: High-efficiency LED lighting brightened the rear AMP head-quarters parking lot considerably after a 2013 installation project.
AMP Green Team members (from middle to right ) Mike Schilling, Alice Wolfe and Emily Park look on as Evolved Lighting Solutions workers install efficient lighting in the AMP headquarters lobby.
19A MP 2013 REPORT ON SUSTAINABILIT Y

2010. Through its CCX participation, AMP reduced its CO2 emis-sions in excess of its 6 percent requirement and gained invaluable knowledge and experience regarding carbon markets and emis-sions trading.
One approach that AMP is employing as the debate over the appro-priate level of atmospheric GHGs continues is to invest in projects that “offset” a portion of the CO2 emissions from its fossil-fueled generation facilities. Such “carbon offsets” can be created when spe-cific, measureable actions are undertaken that result in reduced emis-sions of CO2 into the atmosphere. The accumulation of CO2 and other GHGs in the atmosphere, whether naturally occurring or the result of burning fossil fuels, is viewed as contributing to global cli-mate change. By reducing – or “offsetting” – emissions of CO2 from AMP’s fossil-fueled electric generation operations, the organization is demonstrating its continuing commitment to sustainability.
AMP continues to work with states, communities, and private entities in its member footprint states to identify, evaluate, and develop appropriate car-bon offset projects that use the natu-ral growth process of trees to hold (or “sequester”) CO2 in the living wood, roots, and forest soils, thus preventing its escape to the atmosphere. It typical-ly takes six to ten years of tree growth before appreciable carbon offsets can be calculated. Specific scientific proto-cols have been established to measure
the accumulation of carbon in trees (based on species, age, climate and other criteria), and AMP will be using these protocols to certify any future carbon offsets that are expected to result from our for-estry carbon projects.
AMP’s forestry carbon offset project at Hellbender Bluff Park in Columbiana County, Ohio, was completed in 2012 on 185 acres of abandoned strip-mined land. The project is a collaboration among AMP, the Columbiana County Park District (which retains the actual ownership of the land and will be responsible for the sustainable management of the new forest), and the Appalachian Regional Reforestation Initiative/Green Forests Work (which also assisted with the acquisition and interspersed planting of a num-ber of hybrid American chestnuts among the other hardwoods planted on the site).
This project joins AMP’s first forestry carbon project, which was completed in 2010 at Shawnee State Forest in southern Ohio. The Shaw-nee project involved the planting of over 17,000 native seedlings on 25 acres in partnership with the Ohio Department of Natural Resources – Division of Forestry. AMP staff con-tinues to identify possible partners for additional forestry carbon offset projects in other AMP footprint states and began a process to solicit carbon offsets and carbon offset projects through an RFP at the end of 2013.
AMP’s John Mahaffey prepares recycled materials for pickup. In 2013, AMP recycled an estimated 77,300 pounds of paper and cardboard and an estimated 840 pounds of bottles and cans.
20 A MP 2013 REPORT ON SUSTAINABILIT Y

AMP took a step forward in 2013 by adding a “Safety Minute” dis-cussion to each month’s Board of Trustees meeting, led by AMP’s environmental health and safety manager, who also initiated the bolstering of internal safety policies and procedures for AMP. AMP staff also covered health and safety topics in several brown bag lun-cheon presentations to fellow staff in 2013.
+ APPA RP3® PROGRAM
APPA’s Reliable Public Power Provider (RP3®) program exemplifies all that is great about local public ownership of electric utilities. The purpose of the RP3® program is to encourage public power utilities to operate an efficient and reliable distribution system by
Community/S O C I E T Y
WORKER HEALTH AND SAFETY/TRAINING
Worker health and safety are critical to the
safe operation of AMP’s member electric sys-
tems. AMP staff conduct regular safety classes for
member communities and also provide lineworker
training sessions at AMP headquarters.
+
Lineworkers from AMP member communities ready a mannequin for poletop rescue techniques during an AMP training class in Columbus.
21A MP 2013 REPORT ON SUSTAINABILIT Y

demonstrating proficiency in four important disciplines: reliability, safety, work force development, and system improvement. Utilities sub-mit an application to the RP3® pro-gram for a peer-evaluation review. The RP3® award is not a lifetime designation – through 2013 it was valid for two years, but is increas-ing to three in 2014. Utilities want-ing to maintain reliability “bragging
rights” must apply for RP3® designation every three years. AMP member participation in the RP3® program continues to grow, as does their level of recognition.
+ COMMUNICATIONS & OUTREACH
With 129 members in seven states, AMP’s efforts to provide time-ly and effective communication are key. AMP regularly uses its weekly Update publication, the quarterly Amplifier magazine, the Public Power Connections newsletter for customers in mem-ber communities, AMP’s website (www.amppartners.org), Face-book, LinkedIn, online member directory and member extranet, email updates, and other essential avenues of communication to help get out the public power message and promote sustainability to AMP members, staff, and the public.
AMP developed several new tools for educating members in 2013, including a new brochure on AMP’s general safety and Occupa-tional Safety and Health Administration (OSHA) compliance programs, and a catalogue of various training programs offered throughout the year. These are updated as needed to keep current offerings available to interested members. AMP also initiated a new certification program in 2013 for local policymakers, offering a series of six program sessions (to be offered twice annually) cov-ering topics such as electric utility 101, electric utility governance, AMP organizational overview, power supply overview, financial issues, and legislative/regulatory issues. Individuals who complete the series are awarded certification and are recognized at AMP’s annual conference. The breadth of issues covered is consistent with AMP’s broad view of sustainability.
+ MEMBER SUSTAINABILITY REPORTING INITIATIVE
In 2013, AMP began developing a reporting template in Micro-soft Excel and Word format to assist members in creating their own reports describing local sustainability efforts and progress. The template uses the member’s power supply data and participa-tion in various AMP programs, plus member-owned generation if applicable, to numerically and graphically depict the member’s renewable generation, emissions, carbon footprint, etc. This tool can create appropriate graphics that can be included in a munici-pal electric system’s communications with local elected officials, customers, and other interested stakeholders.
In 2013, AMP members gaining RP3® recognition (awarded for the 2014-2015 period) included:
DIAMOND LEVEL: Piqua, OhioPLATINUM LEVEL: Bowling Green, Ohio Cleveland, Ohio Coldwater, MichiganGOLD LEVEL: Dover, Ohio Ephrata, Pennsylvania New Martinsville, West Virginia Wyandotte, Michigan
The above listed communities joined the following 15 AMP member communities who also held RP3® recognition in 2013 (awarded in 2012 for the 2013-2014 period):
PLATINUM LEVEL: Bryan, Ohio Danville, Virginia Hamilton, Ohio Hillsdale, Michigan Paducah, Kentucky Painesville, Ohio Princeton, Kentucky Shelby, Ohio Wapakoneta, Ohio Westerville, OhioGOLD LEVEL: Cuyahoga Falls, Ohio Marshall, Michigan Oberlin, Ohio Orrville, Ohio Versailles, Ohio
22 A MP 2013 REPORT ON SUSTAINABILIT Y

+ AWARDS TO MEMBER COMMUNITIES Each October, AMP holds an awards banquet in conjunction with its annual conference, where AMP member communities and individuals are recognized for their contributions to public power. A list of those communities honored at the 2013 banquet and their awards follows.
AMP FINANCE AWARDS • Highest Credit Score Population 5,000
and Over – City of Danville • Highest Credit Score Population Under
5,000 – Village of Clinton • Most Improved Credit Score – Borough
of Ephrata
AMP INNOVATION AWARDS • Hudson Public Power, for its automatic
vehicle location project • Oberlin Municipal Light and Power
System, for its Energy Advocacy and Assessment Service
• City of Wadsworth Electric & Communi-cations, for its Smart Grid Phase 2: Home Area Network & Customer Engagement
AMP SYSTEM IMPROVEMENT AWARDS • Bryan Municipal Utilities, for the 34.5 kV
Switch Project • Cuyahoga Falls Electric System, for LED
Streetlight Retrofits and 87L Protective Relay
• Dover Light & Power, for Coal Storage Facility and System Improvement Project
• City of Dover, for the Dover Chemical Isolation Project
• Village of Genoa, for Downtown Street Lighting Project
• Hudson Public Power, for AMR Metering Installation, LED Re-Lamping and Substation Security projects
• City of Napoleon, for Glenwood Feeder Project and Oil Containment
• Philippi Municipal Electric, for New Housing and Alderson Broaddus Univer-sity, Anglin Run Project and the Benedum Upgrade
• Village of Pioneer, for Pole Replacement Project
• St. Clair Borough Electric Light Depart-ment, for Entire Electric Distribution Conversion/Upgrade and AMI Meters Installation
• City of Shelby, for Main Street LED Lamp Post Lighting
• Village of Versailles, for Cremer Road Electric Upgrades Project and LED Street Lighting Pilot Program
• City of Westerville, for New Underground 69 kV Cable Project
PUBLIC POWER PROMOTION AWARDS • Division 2 – St. Clairsville Light &
Power for the Light Up the Holidays program
• Division 3 – Dover Light & Power Public Power Week Open House
• Division 4 – Painesville Electric System 125th Anniversary Celebration “Party At the Plant”
• Division 3 (Honorable Mention) – Hudson Public Power, for its Touch-A-Truck event
• Division 4 (Honorable Mention) – Cuyahoga Falls Electric System, for its Public Power Promotion & Consumer Awareness program
• Division 4 (Honorable Mention) – City of Wadsworth Electric & Communica-tions, for its CityLink Branding and Application
AMP ENVIRONMENTAL STEWARDSHIP AWARDS • City of Cuyahoga Falls Electric System,
for Public Involvement and Volunteerism Programming for Environmental Stewardship
• Hudson Public Power, for Green on the Green program
• Oberlin Municipal Light & Power System, for Super Rebate program
• St. Clairsville Light & Power, for Bad to Good then Green program
2013 AMP SAFETY AWARD –
GENERATION • Bryan Municipal Utilities • Dover Light & Power • Oberlin Municipal Light & Power System • Orrville Utilities – Power Plant
Operations
2013 AMP SAFETY AWARD –
TRANSMISSION & DISTRIBUTION
• Bryan Municipal Utilities
• Danville Utilities Department
• Dover Light & Power
• Borough of Ephrata Electric Division
• Genoa Municipal Utilities
• Hudson Public Power
• Kutztown Electric Department • Minster Electric Department
• Montpelier Municipal Utility
• New Martinsville Municipal Electric
Utility
• Newton Falls Electric Department
• Oak Harbor Public Power
• Oberlin Municipal Light & Power
System
• Orrville Utilities
• Philippi Municipal Electric
• Pioneer Light Department
• St. Clairsville Light & Power
• Shelby Division of Electric and
Telecommunications
• Village of Versailles Utilities
• City of Wadsworth Electric &
Communications
• Wapakoneta Electric Department
2013 AMP SAFETY COMMENDATION –
GENERATION • Orrville Utilities – Power Plant
Maintenance
2013 AMP SAFETY COMMENDATION –
TRANSMISSION & DISTRIBUTION
• City of Columbus Division of Power
• Cuyahoga Falls Electric System
• Village of Lodi Utilities
23A MP 2013 REPORT ON SUSTAINABILIT Y

+ SCHOLARSHIPS
AMP recognizes that the future depends on the capabilities of the next generations. Education is a staple of sustainability, and AMP’s learning focus has been to stress the importance of science and energy education throughout elementary, middle, and high school grades and more recently into the university setting. As AMP’s cur-rent employee base ages, its needs for engineers and other techni-cal- and scientific-degreed graduates increases, further increasing the importance of quality education to AMP’s future.
In 2013, AMP provided eight scholarships for a total of $16,000 to eligible high school seniors. The scholarships are awarded in mem-ory of Lyle B. Wright and Richard H. Gorsuch, distinguished leaders in Ohio’s public power history. Since the program’s beginning in 1988 through 2013, AMP has presented 147 scholarships for a total of $240,000.
+ CHARITABLE GIVING
AMP has facilitated the participation of its employees in support-ing a number of local charities through voluntary paycheck with-holding over the years. In 2013, the following charities were sup-ported, with staff donating a total of nearly $8,900 (an increase of more than 30 percent over 2012): Children’s Hunger Alliance, Faith Mission, Mid-Ohio Foodbank, Special Olympics, and Westerville Caring & Sharing.
In addition, AMP staff generously supported Faith Mission and Lu-theran Social Services, both located in AMP’s hometown of Colum-bus, Ohio, for the 2013 holidays. Staff donated about 300 pounds of items for both food pantries and the Faith Mission shelter, going a long way to helping those in need in the Columbus community.
AMP also sponsored a “day of giving” in 2013, with more than 20 AMP staff and their friends and family members helping to rehab a playground in Columbus, Ohio. The “day of giving” was adopted
by AMP based on prior successful efforts led by our national trade association, the American Public Power Association (APPA), during its annual convention.
+ CONCLUSION
The information presented in the 2013 AMP Report on Sustainabil-ity – Focus on Sustainability – is intended to provide readers with a snapshot of AMP’s overall approach to sustainability, covering all three major legs of the sustainability stool – economy, environment, and community/society. With this year’s Report on Sustainability, we continue to provide transparent measurements of our progress on our sustainability journey, comparing 2013 performance to the prior year. Future progress will be reported in future reports.
If you would like more information on AMP’s efforts, please con-tact Julia Blankenship, director of energy policy & sustainability, at [email protected] or 614.540.0840
AMP STAFF CHARITABLE GIVING - 2013
Westerville Caring & Sharing
Children’s Hunger Alliance
Mid-Ohio Foodbank
Faith Mission
Special Olympics
AMP staff, spouses, children and guests participate in AMP’s 2013 Day of Giving, which promotes AMP values and sustainability goals. They were spreading mulch at the City of Columbus’ Livingston Park.
24 A MP 2013 REPORT ON SUSTAINABILIT Y

2012 2013 AMP Organization and Financial Metrics Number of member communities 129 129 Load (in million MWh) 16.1 16.4 System peak (in MW) 3,494 3,503 Electric revenue (in $) $797,996,283 $953,077,162 Service fees (in $) $6,697,162 $9,648,054 Programs and other revenue (in $) $19,042,794 $19,769,641 Operating expenses (in $) $774,860,395 $879,798,629 Net margin (in $) $1,910,619 $5,278,799 Number of employees (as of 12/31) 140 147 Power Generation (in net MWh) Prairie State Energy Campus (AMP share) 1,121,878 2,076,643 AFEC 3,369,114 2,708,704 Belleville Hydro 219,497 284,731 Distributed generation 15,111 15,953 AMP Wind Farm 14,452 14,582 Napoleon Solar 1,554 5,270 Efficiency and Other Offsets to Traditional Generation Efficiency Smart - cumulative generation savings since 2011 (in MWh) 54,660 121,339 % of 2011-2013 targets 72.4% 149.8% EcoSmart Choice (green energy sales in MWh) 6,188 5,661 Health & Safety Employee work-related fatalities 0 0 Reportable incidents or accidents 31 0 Lost work-day incidents 22 0
Environment Permit violations 13 14
Fines or penalties 0 0 NPDES permit exceedences 0 0 Total heat input - all generating units combined (in mmBtu) 37,710,923 38,787,347 CO2 emissions (in short tons) 2,718,532 3,235,408 Annual CO2 emission rate (in lbs / mmBtu) 144.177 166.828 SO2 emission (in short tons) 784 1,159 Annual SO2 emission rate (in lbs / mmBtu) 0.042 0.060 NOx emissions (in short tons) 612 699 Annual NOx emission rate (in lbs / mmBtu) 0.032 0.036 PM emissions (in short tons) 201 64 Annual PM emission rate (in lbs / mmBtu) 0.011 0.003 CO emissions (in short tons) 458 560 Annual CO emission rate (in lbs / mmBtu) 0.024 0.029 VOC emissions (in tons) 67 32 Annual VOC emission rate (in lbs / mmBtu) 0.004 0.002 Hazardous waste disposed (manifested from RHGS demolition, in short tons) 768 1,217 Cooling water usage (net, in million gallons) 725 358 Recycled metals (RHGS demolition, in gross tons) 3,583 20,573 AMP HQ recycled paper and cardboard (estimate, in pounds) 77,100 77,300 AMP HQ recycled glass, metal, and plastic (estimate, in pounds) 790 840 Forestry carbon projects - cumulative acres of trees planted 210 210
Community Number of scholarships awarded 8 8 Value of scholarships awarded $16,000 $16,000 AMP employee charitable giving (payroll deduction in $) $6,781 $8,880
AMP’s Sustainability
Performance AT A G L A N C E
1 Employee-operated vehicle was struck by animal. Two incidents in Forestry Department.
2 On-the-job injury to Forestry Department employee - two separate incidents.3 Construction storm water minor violation at Napoleon Solar Facility.4 Minor reporting violation at R.H. Gorsuch Station. Financial metrics from AMP Consolidated Statements of Revenues and Expenses
25A MP 2013 REPORT ON SUSTAINABILIT Y

26 A MP 2013 REPORT ON SUSTAINABILIT Y
ColdwaterHillsdale
PioneerHoliday City
Montpelier
BryanNapoleon
Custar
Deshler
CygnetBloomdale
Arcadia
Wharton
Carey
Republic
Monroeville
Greenwich
Wellington
GraftonOberlin
SevillePlymouth
Shiloh
Shelby
Lucas
Lodi
Milan
Amherst
Cleveland
Hudson
Cuyahoga Falls
Wadsworth
Columbiana
Hubbard
Niles
NewtonFalls
Painesville
Marshallville
Orrville
Brewster
Beach City
ClydeAFEC
HuronOak Harbor
ElmoreGenoa
Toledo
Haskins
Bowling Green
Woodville
PembervilleBradner
Sycamore
Ohio CityMendon
WapakonetaWaynesfield
Lakeview
New KnoxvilleProspect
Galion
Jackson CenterNew BremenMinster
Versailles
Eldorado
ArcanumTipp City
South Vienna
ColumbusWesterville
Yellow Springs
Blanchester
Jackson
Woodsfield
St. Clairsvillle
Dover
NewMartinsville
Glouster Lebanon
Hamilton
Piqua
Celina
St. Marys
ohio
west virginia
kentucky
Edgerton
Princeton
WilliamstownGreenup
Hydroelectric Plant(Hamilton/AMP)
Richlands
Belleville HydroelectricPlant (OMEGA JV5)
Paducah
Clinton
Wyandotte Union City
Marshall
H
H
H
H
H
H
H
H
H
H
HJ
J
J
michigan
H+
Meldahl Hydroelectric Project (Hamilton/AMP)
Cannelton Hydroelectric Project (AMP)
Smithland Hydroelectric Project, Ky. (AMP)
Prairie State Energy Campus, Ill.
Willow IslandHydroelectricProject (AMP)
Georgetown

27A MP 2013 REPORT ON SUSTAINABILIT Y
Columbiana
Hubbard
Niles
virginia
Martinsville
Danville
Bedford
Front Royal
Weatherly
Blakely
Lehighton
Kutztown
Ephrata
Saint Clair
Catawissa
Watsontown
Smethport
Grove City
New Wilmington
Wampum
Ellwood City
Zelienople
Girard
Summerhill
Hooversville
Berlin
East Conemaugh
Mifflinburg
Duncannon
Royalton
Lewisberry
Schuylkill Haven
QuakertownPerkasie
Hatfield
Lansdale
Philippi
Goldsboro
DEMEC
delaware
pennsylvania
J
HH
Member Baseload Generation
AMP Owned Distributed Generation
JV1 Diesel Generation
JV2 Diesel Generation
JV2 Gas Turbine
Member Peaking or Back-Up Generation
JV5 Diesel Generation
Hydroelectric Generation
AMP Member Without Generation
JV6 Wind Farm
AMP Fremont Energy Center (AFEC)
Delaware Municipal Electric Corp. ( DEMEC members: Newark, New Castle,
Middletown, Clayton, Smyrna, Dover, Milford, Lewes and Seaford)
AMP Napoleon Solar Facility
Prairie State Energy Campus
AMP MEMBERS
+

TM
American Municipal Power, Inc. 1111 Schrock Road, Suite 100Columbus, Ohio 43229614.540.1111www.amppartners.org
For more information contact:Julia Blankenship, director of energy policy & [email protected]