20120315 impact of weather on driver behavior-yang
TRANSCRIPT

Impact of Weather on Driver Behavior & Travel Demand:
FHWA’s Activities
March 15, 2012
C. Y. David Yang, Ph.D.Office of Operations R&D
Roemer M. Alfelor, Ph.D.Office of Operations
,
Impacts of Weather on Transportation
o Safety• 1.5 million weather-related crashes/year resulting
in more than 7 000 fatalitiesin more than 7,000 fatalitieso Mobility
• 25% of non-recurring delays on freeways is weather-related
o Productivity• Weather affects 1/3 of the national GDP
o Environment• Chemical anti-icing & deicing account for roughly
1/3 of expenditures for snow & ice control
FHWA Peer Exchange Meeting on Transportation Systems Management during Inclement Weather
Presentation 05 1 Buffalo, NY | March 15, 2012
FHWA’s Road Weather Management Program
Goalso Better understand the impacts of weather
(e.g., snow, rain, fog, wind, etc.) on traffic flow and operations
o Develop, promote, and implement strategies & tools to mitigate those impacts Weather g pResponsive Traffic Management (WRTM)
WRTM Success Measures
o Agencies use current and forecast weather-traffic conditions to manage traffic flow and ghighway operations
o Motorists receive and respond to road weather and traffic information
o Weather impacts incorporated in traffic o eat e pacts co po ated t a canalysis models
FHWA Peer Exchange Meeting on Transportation Systems Management during Inclement Weather
Presentation 05 2 Buffalo, NY | March 15, 2012

Safety, Mobility and Performance
Evaluation
WRTM Framework
Behavioral/Human Factors Analysis
Traffic and Weather Data Collection and
Integration
WRTM STRATEGIES
AdvisoryControl
Treatment
Evaluation
Traffic Analysis and Modeling
Types of Traffic Analysis & Modeling
o Macroscopic• Analysis of flow, speed, and density on a
segment-by-segment basiso Mesoscopic
• Dynamic analysis of individual vehicles based on average segment speeds
o Microscopic • Individual movement of vehicles on the
transportation network
FHWA Peer Exchange Meeting on Transportation Systems Management during Inclement Weather
Presentation 05 3 Buffalo, NY | March 15, 2012

Macroscopic Analysis of Weather & Traffic (2004-2006)
o Traffic data• Speed, Volume, Density
o Weather data• Rain, Snow, Visibility
o Collection devices• Loop detectors • Weather Stations
o Analysis SitesASOS/AWOSRWIS
NEXRADLoop
Detector
o Analysis Sites• Minneapolis, Seattle, Baltimore
o Traffic Model• Free Flow Speed• Speed at Capacity• Capacity
0
20
40
60
80
100
120
0 500 1000 1500 2000 2500Flow (veh/h/lane)
Spee
d (k
m/h
)
Macroscopic Analysis of Weather & Traffic (cont.)
Traffic Parameter Weather Condition Range of Impact
Free-Flow Speed • Light Rain (<0.01 cm/h) - 2 % to - 3.6%• Rain (~1.6 cm/h)• Light snow (<0.01 cm/h)• Snow (~0.3 cm/h)
- 6% to - 9%- 5% to - 16%- 5% to - 19%
Speed at Capacity • Light Rain (<0.01 cm/h)• Rain (~1.6 cm/h)• Light snow (<0.01 cm/h)• Snow (~0 3 cm/h)
- 8% to - 10%- 8% to - 14%- 5% to - 16%- 5% to - 19%Snow ( 0.3 cm/h) - 5% to - 19%
Capacity • Light Rain (<0.01 cm/h) & Rain (~1.6 cm/h)
• Light snow (<0.01 cm/h)
- 10% to - 11%
- 12% to - 20%
FHWA Peer Exchange Meeting on Transportation Systems Management during Inclement Weather
Presentation 05 4 Buffalo, NY | March 15, 2012

Macroscopic Analysis of Weather & Traffic (cont.)
o Snow has more impact on free-flow speed and capacity than rain
o Low visibility with snow has higher impact on free-flow speed and capacity compared to low visibility with rain
o Snow causes more variable traffic flow than dry and rainy conditionsPrecipitation impacts in Minneapolis iso Precipitation impacts in Minneapolis is greater than Baltimore
Reference: Empirical Studies on Traffic Flow in Inclement Weather (October 2006), Publication No. FHWA-HOP-07-073.
o Car following • Acceleration, deceleration, headways,
Microscopic Analysis of Weather & Traffic (2007-2011)
Acceleration, deceleration, headways, perception reaction time
• Developed models, calibrated for arterialso Gap acceptance
• Intersections, ramps• Developed models for intersection
o Lane changing • Theoretical models exist, no data for
calibration
FHWA Peer Exchange Meeting on Transportation Systems Management during Inclement Weather
Presentation 05 5 Buffalo, NY | March 15, 2012

Car-Following Analysis
o Quantify impact of icy roadway surface conditions on car-following behavior gusing controlled field data (Japan)
o Factors affecting driver car-following behavior• Roadway surface condition
Pl t iti• Platoon positiono Studied typical variability in driver
behavior
Effect of Roadway Surface Conditions: Dry vs. Icy
0.2
0.25(a) Capacity
DryIcy 0.6
0.8(b) Jam Density
0.3
0.4(c) Speed at Capacity
0 1000 2000 30000
0.05
0.1
0.15
Capacity (veh/hr)
Pro
porti
on
170 180 190 2000
0.2
0.4
Jam Density (veh/km)
Pro
porti
on
20 30 40 50 600
0.1
0.2
Speed at Capacity (km/h)
Pro
porti
on
0 2
0.25(d) Freeflow Speed
0 2
0.25(e) Reaction Time
40 60 80 100 1200
0.05
0.1
0.15
0.2
Freeflow Speed (km/h)
Pro
porti
on
0 2 4 60
0.05
0.1
0.15
0.2
Perception-Reaction Time (s)
Pro
porti
on
FHWA Peer Exchange Meeting on Transportation Systems Management during Inclement Weather
Presentation 05 6 Buffalo, NY | March 15, 2012
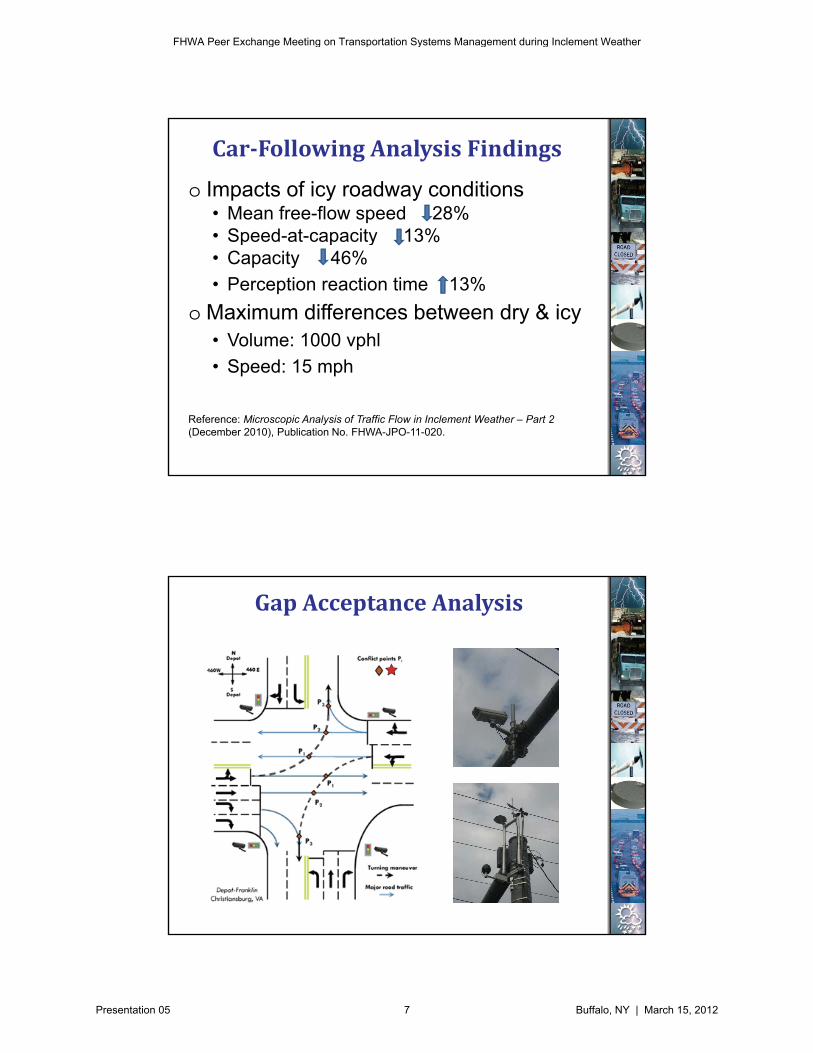
Car-Following Analysis Findings
o Impacts of icy roadway conditions • Mean free-flow speed 28%• Speed-at-capacity 13%• Speed-at-capacity 13%• Capacity 46%• Perception reaction time 13%
o Maximum differences between dry & icy• Volume: 1000 vphl• Speed: 15 mph
Reference: Microscopic Analysis of Traffic Flow in Inclement Weather – Part 2 (December 2010), Publication No. FHWA-JPO-11-020.
Gap Acceptance Analysis
FHWA Peer Exchange Meeting on Transportation Systems Management during Inclement Weather
Presentation 05 7 Buffalo, NY | March 15, 2012

Gap Acceptance – Data Collection Site
Quadrant 1 Quadrant 2
Quadrant 3 Quadrant 4
Traffic Simulation SoftwareWeather Parameters
VISSIM INTEGRATION CORSIM
Car Following Driving Behavior Parameter Sets
Link characteristics
Car following sensitivity factorsParameter Sets
• Wiedemann 74/99 parameters
characteristics • Free-flow speed, speed-at-capacity, and saturation flow
sensitivity factorsVariation of free flow speed
Acceleration “Base Data” • “Maximum acceleration”
“Max_acc.dat” file • Rolling/friction coefficients
Acceleration Lag
Deceleration “Base Data” “M i
“Max_acc.dat” file C ffi i t f
Deceleration Lag• “Maximum deceleration”
• Coefficient of friction
Gap Acceptance “Priority Rules” and “Conflict Areas”
Link characteristics • Critical gap
Acceptable gaps for turning vehicles
Reference: Zohdy, I., Rakha, H. A., Alfelor, R., Yang, C. Y. D., and Krechmer, D. (2011). Impact of Inclement Weather on Left-Turn Gap Acceptance Behavior of Drivers. Transportation Research Record: Journal of the Transportation Research Board, 2257, 51-61..
FHWA Peer Exchange Meeting on Transportation Systems Management during Inclement Weather
Presentation 05 8 Buffalo, NY | March 15, 2012

Findings
o Weather affects traffic flows at the microscopic & macroscopic levelsp
o Existing traffic simulation models and software can be modified to account for weather conditions
o Traffic & weather data exist to conduct analyses and develop weather-sensitive traffic a a yses a d de e op eat e se s t e t a cmodels
o Need more data, analyses, research to validate existing models
Traffic Estimation and Prediction System (TrEPS)
Reference: Incorporating Weather Impacts in Traffic Estimation and Prediction Systems (September 2009), Publication No. FHWA-JPO-09-065.
FHWA Peer Exchange Meeting on Transportation Systems Management during Inclement Weather
Presentation 05 9 Buffalo, NY | March 15, 2012

Incorporating Weather Impact in DYNASMART-X
o Objectives• Assessing the
impacts of adverseimpacts of adverse weather on networks
• Evaluating effectiveness of weather-related advisory/control strategies in alleviating traffic congestion due to adverse weather conditions
Snapshot of DYNASMART-X GUI
Current traffic conditions
Prediction (no intervention)
Prediction (with intervention)
FHWA Peer Exchange Meeting on Transportation Systems Management during Inclement Weather
Presentation 05 10 Buffalo, NY | March 15, 2012

Phase 2 of TrEPS Project
o Calibrate and validate weather sensiti e TrEPSsensitive TrEPS models using data (weather & traffic) from 3 Cities• Salt Lake City, UT• Long Island, NY• Chicago, IL
Phase 2 of TrEPS Project (cont.)o Implement and evaluate weather responsive
traffic management strategies using TrEPS Models
FHWA Peer Exchange Meeting on Transportation Systems Management during Inclement Weather
Presentation 05 11 Buffalo, NY | March 15, 2012

Phase 2 of TrEPS Project (cont.)
Implementation …
o Identify weather conditionsconditions
o Retrieve available WRTM strategies
o Simulate the effect of various scenarios using TrEPS
ho Integrate the knowledge from simulation outputs into deployment decision making
Phase 2 of TrEPS Project (cont.)Evaluation …
o Extract various performance pmeasures from resulting traffic states
o Evaluate benefits of WRTM strategies
o Update or modifyo Update or modify strategies
FHWA Peer Exchange Meeting on Transportation Systems Management during Inclement Weather
Presentation 05 12 Buffalo, NY | March 15, 2012

Contact Information
David [email protected](202) 93 328(202) 493-3284FHWA’s Office of Operations R&D (Turner-Fairbank Highway Research Center)
Roemer [email protected](202) 366-9242FHWA’s Office of Operations
FHWA Peer Exchange Meeting on Transportation Systems Management during Inclement Weather
Presentation 05 13 Buffalo, NY | March 15, 2012