2012 workforce retention metrics: company vs. market ...€¦ · market sample report 2012 edition...
TRANSCRIPT

WORKFORCE RETENTION METRICS:
COMPANY VS. MARKET SAMPLE REPORT
2012 EDITIONBELGIUM
Sam
ple

Workforce Retention Metrics:
Sample Pay Report - Belgium
© 2012 Mercer LLC.
Mercer is the global leader for trusted HR and related financial advice, products and services. In our work with clients, we make a positive impact on the world every day. We do this by enhancing the financial and retirement security, health, productivity and employment relationships of the global workforce.
Mercer has more than 19,000 employees serving clients in over 180 cities and 40 countries and territories worldwide.
As a wholly owned subsidiary of Marsh & McLennan Companies, Inc., we can also provide access to the complementary services of our sibling companies, Marsh, Guy Carpenter and Oliver Wyman.
about mercer
Sam
ple
Workforce Retention Metrics:
Sample Pay Report - Belgium
© 2012 Mercer LLC.
Editor’s NotE 1
iNtroductioN 2
surVEY ProFiLE 5
sEParatioNs bY carEEr LEVEL aNd bY FuNctioN 5
separations by career level 6
percent of voluntary separations by career level 6
percent of involuntary separations by career level 8
separations by function 10
percent of voluntary separations by function 10
percent of involuntary separations by function 13
turNoVEr ratEs 18
General information on turnover rate 18
global turnover rate 18
global voluntary turnover rate 20
global involuntary turnover rate 21
turnover rate by career level 23
voluntary turnover rate by career level 23
involuntary turnover rate by career level 25
turnover rate by function 27
voluntary turnover rate by function 27
involuntary turnover rate by function 30
table of contents
Sam
ple

Workforce Retention Metrics:
Sample Pay Report - Belgium
1© 2012 Mercer LLC.
We are pleased to present Mercer’s 2012 Workforce retention Metrics report-belgium. The report provides key indicators to analyse separations and turnover rates by career level and by function, giving management better insight into their human resources – and how best to allocate them.
The survey, which was conducted in the first half of 2012 via Mercer’s Total Remuneration Survey, captured data from companies located in Belgium.
We thank the participants who provided their information for this report. We remain at your disposal if you have questions regarding the data or methodology used. We welcome and value your feedback and comments.
eDitor’s note
Sam
ple
Workforce Retention Metrics:
Sample Pay Report - Belgium
2© 2012 Mercer LLC.
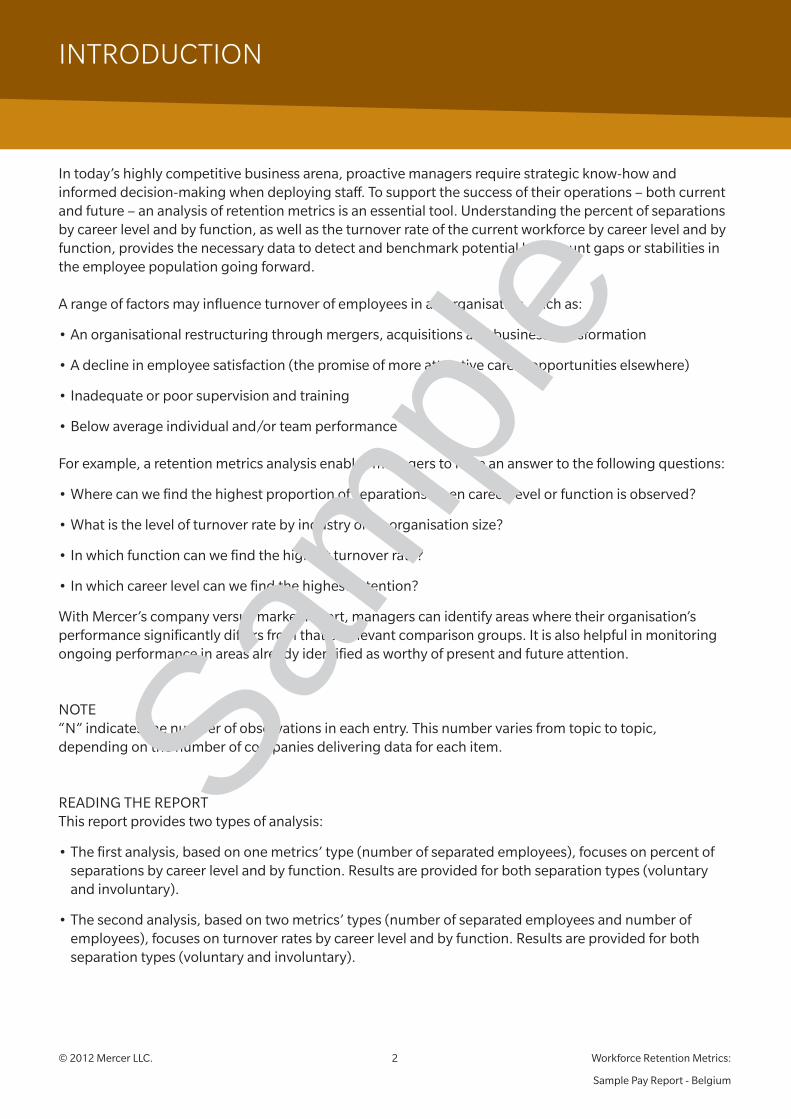
In today’s highly competitive business arena, proactive managers require strategic know-how and informed decision-making when deploying staff. To support the success of their operations – both current and future – an analysis of retention metrics is an essential tool. Understanding the percent of separations by career level and by function, as well as the turnover rate of the current workforce by career level and by function, provides the necessary data to detect and benchmark potential headcount gaps or stabilities in the employee population going forward.
A range of factors may influence turnover of employees in an organisation, such as:
•An organisational restructuring through mergers, acquisitions and business transformation
•A decline in employee satisfaction (the promise of more attractive career opportunities elsewhere)
•Inadequate or poor supervision and training
•Below average individual and/or team performance
For example, a retention metrics analysis enables managers to have an answer to the following questions:
•Where can we find the highest proportion of separations when career level or function is observed?
•What is the level of turnover rate by industry or by organisation size?
•In which function can we find the highest turnover rate?
•In which career level can we find the highest retention?
With Mercer’s company versus market report, managers can identify areas where their organisation’s performance significantly differs from that of relevant comparison groups. It is also helpful in monitoring ongoing performance in areas already identified as worthy of present and future attention.
NOTe“N” indicates the number of observations in each entry. This number varies from topic to topic, depending on the number of companies delivering data for each item.
ReAdING THe RepORTThis report provides two types of analysis:
•The first analysis, based on one metrics’ type (number of separated employees), focuses on percent of separations by career level and by function. Results are provided for both separation types (voluntary and involuntary).
•The second analysis, based on two metrics’ types (number of separated employees and number of employees), focuses on turnover rates by career level and by function. Results are provided for both separation types (voluntary and involuntary).
introDuction
Sam
ple

Workforce Retention Metrics:
Sample Pay Report - Belgium
3© 2012 Mercer LLC.
Your company results are indicated in each of the tables and can be systematically compared to the market. The notion of market can be considered at different levels: country, industry, revenue size and company size.
each section is always organised in the same way: The first table provides results for the entire country sample with a set of different measures (average, median, quartiles); other tables that follow allow a deeper analysis, on an average basis, by industry, by revenue size and by company size. The global turnover rate by industry, by revenue size and by company size, is given in more detail with all measures’ types (average, median, quartiles). The last table of each section provides a resume comparing your company with your country sample, as well as with your specific markets (your industry, your revenue size and your organisation size).
introDuction
Sam
ple

Workforce Retention Metrics:
Sample Pay Report - Belgium
4© 2012 Mercer LLC.
workforce retention metrics: company vs. market sample report - belgium
company vs. market sample report - belgium
Sam
ple

Workforce Retention Metrics:
Sample Pay Report - Belgium
5© 2012 Mercer LLC.
workforce retention metrics: company vs. market sample report - belgium
SURveY pROFILeA total of 28 organisations provided data in the Belgium Workforce Retention Metrics Survey. Companies are grouped by industry, by organisation size (according to average number of employees) and by revenue size. Your company has its primary business activity in the consumer goods industry, a revenue size between 45 and 300 million euros and a company size of 300 employees and more.
SepARATIONS BY CAReeR LeveL ANd BY FUNCTIONThis section analyses separations by career level and by function. It helps to identify the specific career levels and functions in which more employees are leaving the company. The calculation is based on two similar metrics: separations by career level or by function as a percentage of all separations. Ratios are available for both separation types (voluntary and involuntary).
Consumer goods, 24.1%
High-tech, 6.9%
Finance/banking/
insurance, 20.7%
Non-durable, 10.3%
Durable, 6.9%
Other, 31.0%
Country sample distribution by industry
Under 45 million euros,
32.1%
300 million euros and
more, 32.1%
Between 45 and 300 million
euros, 35.7%
Country sample distribution by revenue size
Under 100 employees,
32.1%
300 employees and more,
32.1%
Between 100 and 300
employees, 35.7%
Country sample distribution by company size
Sam
ple

Workforce Retention Metrics:
Sample Pay Report - Belgium
6© 2012 Mercer LLC.
workforce retention metrics: company vs. market sample report - belgium
SepARATIONS BY CAReeR LeveL
peRCeNT OF vOLUNTARY SepARATIONS BY CAReeR LeveLThe percent of voluntary separations by career level is calculated with the division of the number of voluntary separations per career level by the total number of voluntary separations (for example, voluntary executives’ separations as a percentage of all voluntary separations). This measure analyses the breakdown of employees per career level against the sample of all employees who voluntarily left the company.
At the entire country sample level, the highest proportions of employees who voluntarily left their company are found in the following career levels: professional non-sales (24.12%) and professional sales (21.89%).
percent of voluntary separations by career level for the entire country sample
Your average First third career level company (breakdown) Median quartile quartile N
executives 1.00% 2.39% 1.70% 0.10% 2.98% 28
Management 4.00% 15.95% 12.95% 5.00% 13.50% 28
professional sales 22.00% 21.89% 20.00% 10.00% 22.00% 28
professional non-sales 10.00% 24.12% 16.15% 5.00% 18.00% 28
White collar 25.00% 17.20% 15.00% 10.00% 18.00% 28
Blue collar 38.00% 18.46% 15.00% 10.00% 16.00% 28
Breakdown of voluntary separations by career level and by industry
Profes- Profes- Manage sional sional White blue industry/career level Executives ment sales non-sales collar collar total
Your company 1.00% 4.00% 22.00% 10.00% 25.00% 38.00% 100.00%
Consumer goods 1.50% 6.50% 11.50% 27.00% 25.50% 28.00% 100.00%
High-tech 2.00% 5.70% 6.30% 30.70% 24.00% 31.30% 100.00%
Finance/banking/insurance 4.50% 3.50% 13.50% 37.00% 41.50% 0.00% 100.00%
Non-durable 2.50% 5.50% 16.50% 23.50% 27.00% 25.00% 100.00%
durable 3.70% 4.20% 19.50% 13.50% 25.00% 34.10% 100.00%
Other 3.90% 5.80% 18.50% 25.00% 27.80% 19.00% 100.00%
N 28 28 28 28 28 28 168
Breakdown of voluntary separations by career level and by revenue size
Profes- Profes- Manage sional sional White blue revenue size/career level Executives ment sales non-sales collar collar total
Your company 1.00% 4.00% 22.00% 10.00% 25.00% 38.00% 100.00%
Under 45 million euros 5.00% 5.00% 14.00% 24.00% 25.00% 27.00% 100.00%
Between 45 and 300 million euros 3.00% 5.00% 16.00% 26.00% 25.00% 25.00% 100.00%
Sam
ple
Workforce Retention Metrics:
Sample Pay Report - Belgium
7© 2012 Mercer LLC.
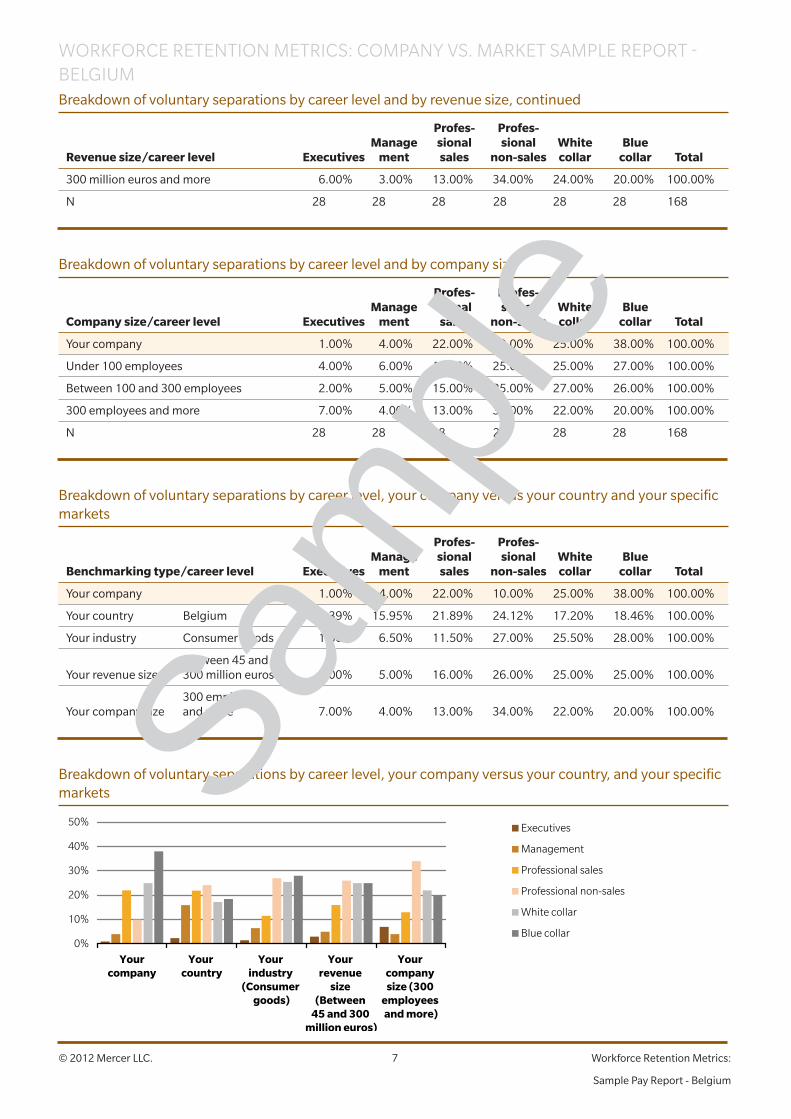
workforce retention metrics: company vs. market sample report - belgiumBreakdown of voluntary separations by career level and by revenue size, continued
Profes- Profes- Manage sional sional White blue revenue size/career level Executives ment sales non-sales collar collar total
300 million euros and more 6.00% 3.00% 13.00% 34.00% 24.00% 20.00% 100.00%
N 28 28 28 28 28 28 168
Breakdown of voluntary separations by career level and by company size
Profes- Profes- Manage sional sional White blue company size/career level Executives ment sales non-sales collar collar total
Your company 1.00% 4.00% 22.00% 10.00% 25.00% 38.00% 100.00%
Under 100 employees 4.00% 6.00% 13.00% 25.00% 25.00% 27.00% 100.00%
Between 100 and 300 employees 2.00% 5.00% 15.00% 25.00% 27.00% 26.00% 100.00%
300 employees and more 7.00% 4.00% 13.00% 34.00% 22.00% 20.00% 100.00%
N 28 28 28 28 28 28 168
Breakdown of voluntary separations by career level, your company versus your country and your specific markets
Profes- Profes- Manage sional sional White blue benchmarking type/career level Executives ment sales non-sales collar collar total
Your company 1.00% 4.00% 22.00% 10.00% 25.00% 38.00% 100.00%
Your country Belgium 2.39% 15.95% 21.89% 24.12% 17.20% 18.46% 100.00%
Your industry Consumer goods 1.50% 6.50% 11.50% 27.00% 25.50% 28.00% 100.00%
Between 45 and Your revenue size 300 million euros 3.00% 5.00% 16.00% 26.00% 25.00% 25.00% 100.00%
300 employees Your company size and more 7.00% 4.00% 13.00% 34.00% 22.00% 20.00% 100.00%
Breakdown of voluntary separations by career level, your company versus your country, and your specific markets
0%
10%
20%
30%
40%
50%
Yourcompany
Your country
Your industry
(Consumer goods)
Your revenue
size (Between
45 and 300 million euros)
Your company size (300
employees and more)
Executives
Management
Professional sales
Professional non-sales
White collar
Blue collar
Sam
ple

Argentina
Australia
Austria
Belgium
Brazil
Canada
Chile
China
Colombia
Czech Republic
Denmark
Finland
France
Germany
Hong Kong
India
Indonesia
Ireland
Italy
Japan
Malaysia
Mexico
Netherlands
New Zealand
Norway
Peru
Philippines
Poland
Portugal
Saudi Arabia
Singapore
South Korea
Spain
Sweden
Switzerland
Taiwan
Thailand
Turkey
United Arab Emirates
United Kingdom
United States
Venezuela
For further information, please contact your local Mercer office or visit our website at:www.mercer.com
12-WMRpM-pUCopyright 2012 Mercer LLC. All rights reserved.
Sam
ple