2012 small and medium businesses mobile solutions study · mobile devices, applications and...
TRANSCRIPT

Copyright SMB Group
2012 Small and Medium BusinessesMobile Solutions Study
April, 2012
Sanjeev AggarwalLaurie McCabe
Brent LearyArjun Aggarwal
4/10/2012 1

Why is Mobility Solutions Important?
• In the next 3-4 years the mobile internet traffic will surpass the desktopinternet traffic, driven by mobile internet/data enabled devices
• The Mobility focus is shifting away from wireless carriers and devicemanufacturers over to mobile operating systems, software and serviceproviders (cloud-based datacenters)
• Rapid growth for smartphones and tablet category. Number of devices inthis category far exceeds number of laptops
• Emergence of vertically integrated ecosystems driven by Apple and nowpossibly being adopted by Google
• In the longer-term - mobile application platform, innovative mobileapplication solutions and mobile service providers will be the marketdrivers and not the device or device OS/ middleware providers
24/10/2012

Business Issues
4/10/2012 3
Mobile devices, applications and services are dramatically reshaping SMBsrevenue models, business strategies and how employees interact with otheremployees, partners and customers. To gain share in this large and diversemarket, vendors need to develop product and marketing strategies based on asolid understanding of:
• Key drivers and inhibitors for mobile solutions and services adoption.
• The discovery, learning, evaluation and selection process for mobile solutionsand services.
• Top functions/workflows that SMBs use/plan to use mobile solutions for.
• Internal governance and purchase criteria for mobile solutions.• How SMB factors such as company size, industry, user role and age ofbusinesses impact attitudes, adoption, spending and plans for mobile solution.
solutions.
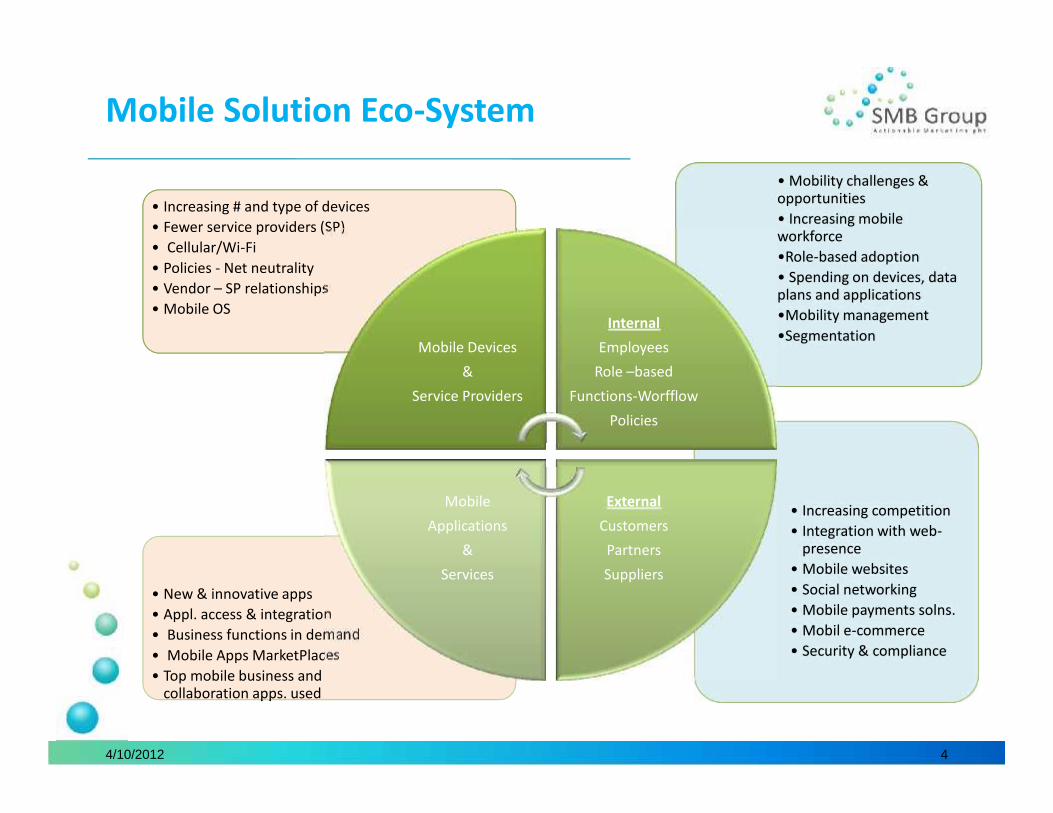
Mobile Solution Eco-System
4/10/2012 4
• Increasing competition• Integration with web-
presence• Mobile websites• Social networking• Mobile payments solns.• Mobil e-commerce• Security & compliance
• Increasing competition• Integration with web-
presence• Mobile websites• Social networking• Mobile payments solns.• Mobil e-commerce• Security & compliance
• New & innovative apps• Appl. access & integration• Business functions in demand• Mobile Apps MarketPlaces• Top mobile business and
collaboration apps. used
• New & innovative apps• Appl. access & integration• Business functions in demand• Mobile Apps MarketPlaces• Top mobile business and
collaboration apps. used
• Mobility challenges &opportunities• Increasing mobileworkforce•Role-based adoption• Spending on devices, dataplans and applications•Mobility management•Segmentation
• Mobility challenges &opportunities• Increasing mobileworkforce•Role-based adoption• Spending on devices, dataplans and applications•Mobility management•Segmentation
• Increasing # and type of devices• Fewer service providers (SP)• Cellular/Wi-Fi• Policies - Net neutrality• Vendor – SP relationships• Mobile OS
• Increasing # and type of devices• Fewer service providers (SP)• Cellular/Wi-Fi• Policies - Net neutrality• Vendor – SP relationships• Mobile OS
Mobile Devices&
Service Providers
InternalEmployees
Role –basedFunctions-Worfflow
Policies
ExternalCustomersPartnersSuppliers
MobileApplications
&Services

Mobility Study Focus
4/10/2012 5
Small &Medium
Businesses
Challenges &opportunities
Current andplanned usageof devices and
services
Spending –devices &services
(voice, data,apps), changes
in next 12months
Companymobility
dynamicsMobile apps
usage(current,planned)internally
Mobile apps.offered
externally –current &planned
Mobile Apps.Marketplace
Companydemographics
The study will alsoprovide trending
insights based onyear-over-year data
comparisons with theSMB Group’s 2010Small and MediumBusiness MobileSolutions Study.

Key Questions this Study Will Answer
How do SMBs think mobile solutions can help address their key business challenges and opportunities? How much are SMBs spending today on mobile solutions—and how much do they expect to spend? What percentage of the IT budget is for mobile solutions and devices? What are SMBs’ top information sources for mobile solutions trends and information? What are the top drivers and inhibitors for SMBs to adopt mobile business solutions? What business functions (and top applications) are SMBs using mobile solutions for now—and for what
are they planning to use them? What solutions do mobile solutions need to integrate with? What percentage of SMB employees use smart mobile devices and solutions for work? What kind of policies and governance do SMBs have about providing mobile devices, solutions and
services to employees? How does mobile solution adoption vary based on company size, user roles, industry, and company age? How does mobile solution adoption impact broader SMB business and technology strategy? What types of providers do SMBs purchase mobile (cellular and Wi-Fi) solutions from? How does mobile solution adoption affect the selection of cellular service providers? What’s the role of mobile application marketplaces in the consideration, evaluation and purchase process
for mobile business solutions? What are SMBs perceptions of the top benefits mobile solutions provide? What are their top issues/concerns about mobile solutions? What mobile solutions (and top applications) are the SMBs planning to offer to their customers,
prospects, partners, etc.? (e.g. Mobile e-commerce and mobile payment processing )
4/10/2012 6

Option A: Extended Package—Study Results, Presentation plus AdditionalCross Tabs and Inquiry time $17,500o Study presentation (Power Point format)o Web conference presentation of key findings and Q&Ao 3 hours of additional inquiry (including additional crosstabs)o PDF of study results with employee size crosstab banner for all questionso Analysis and crosstabs by industryo SMB Group will compare similar data points from the 2010 SMB Routes-to-Market
Survey to provide trend analysis in key areas
Option B: Basic Package—Study Results $16,000o Study presentation (Power Point format)o PDF of study results with employee size crosstab banner for all questions
Please contact us if you’d like to schedule time to learn [email protected] or call Sanjeev Aggarwal (508)410-3562
Deliverables and Pricing
4/10/2012 7

Copyright SMB Group
2010 Small and Medium BusinessesMobile Solutions Study
Example of Analysis and Presentation
December 2010
SMB Groupwww.smb-gr.com
Sanjeev AggarwalLaurie McCabeArjun Aggarwal
8
Source: SMB Group 2010 Small & Medium Business Mobile Solutions Study, December 2010
4/10/2012

Table of Contents
• About the 2010 Small and Medium BusinessMobile Solutions Study
• Executive Summary and Key Findings• Very Small Business: 1-19 Employee Analysis
o Core Respondent Demographicso Survey Highlightso Detailed Demographics
• Small Business: 1-99 Employees Analysiso Core Respondent Demographicso Survey Highlightso Detailed Demographics
• Medium Business: 100-1,000 Employees Analysiso Core Respondent Demographicso Survey Highlightso Detailed Demographics
4/10/2012 9

What this market research project covers?
4/10/2012 10
BusinessChallenges
Mobile solutionDrivers/Barriers
InformationSources
Mobile Devicesand ServiceProviders
MobileProductivity App.
UsageMobile Business
App. Usage
Mobile App.Marketplaces
MobileWebsites
MobileWebsite/App.Transactions
MobileSolutionsSpending

December 2010 Copyright 2010, SMB Group, Allrights reserved
11
13.) What do you view as the top 3 drivers for using/providing mobile devices, voice and general data servicesand mobile business applications to employees in your organization?
Small Business
24%
24%
26%
26%
2%
2%
3%
3%
43%
45%
33%
36%
2%
2%
2%
3%
3%
3%
3%
7%
15%
15%
19%
13%
4%
3%
8%
5%
8%
8%
5%
7%
Total
1-19 Empl.
20-49 Empl.
50-99 Empl.
Quicker access to people and information to make better/faster decisionsExtend the work dayWork more easily from the field, home, and in other locationsIncreasing employee demand for mobile devices and servicesCustomer/partner/supplier pressure to use mobile devices and servicesImprove customer service
Top Drivers for Mobile Solution AdoptionMore work flexibility, better information access and customer service drive mobileadoption across small businesses, regardless of size.
Sample Size = 143
4/10/2012 12
1%
1%
1%
2%
3%
4%
5%
7%
10%
12%
13%
40%
Employee resistance to usingmobile business applications
Lack of/inadequate support
Compliance with standards
Lack of a company policy orstrategy to deploy mobile…
Lack of applicationsavailability
Concerns that employees alsouse their devices and…
Difficult to manage mobiledevices and applications
Poor performance of mobileapplications
Concerns about storingsensitive data on devices
Concerns about data, networkor transaction security
Poor networkservice/reliability
Voice and data service costs
% Valid Cases
1%
2%
2%
2%
3%
4%
6%
7%
10%
13%
12%
37%
Lack of/inadequate support
Compliance with standards
Lack of a company policy orstrategy to deploy mobile…
Employee resistance to usingmobile business applications
Lack of applications availability
Difficult to manage mobiledevices and applications
Concerns that employees alsouse their devices and services…
Poor performance of mobileapplications
Concerns about storingsensitive data on devices
Poor network service/reliability
Concerns about data, networkor transaction security
Voice and data service costs
3%
4%
5%
5%
6%
6%
7%
8%
8%
8%
14%
27%
Employee resistance tousing mobile business…
Lack of a companypolicy or strategy to…
Compliance withstandards
Difficult to managemobile devices and…
Poor performance ofmobile applications
Lack of/inadequatesupport
Concerns thatemployees also use…
Concerns about storingsensitive data on…
Poor networkservice/reliability
Lack of applicationsavailability
Concerns about data,network or…
Voice and data servicecosts
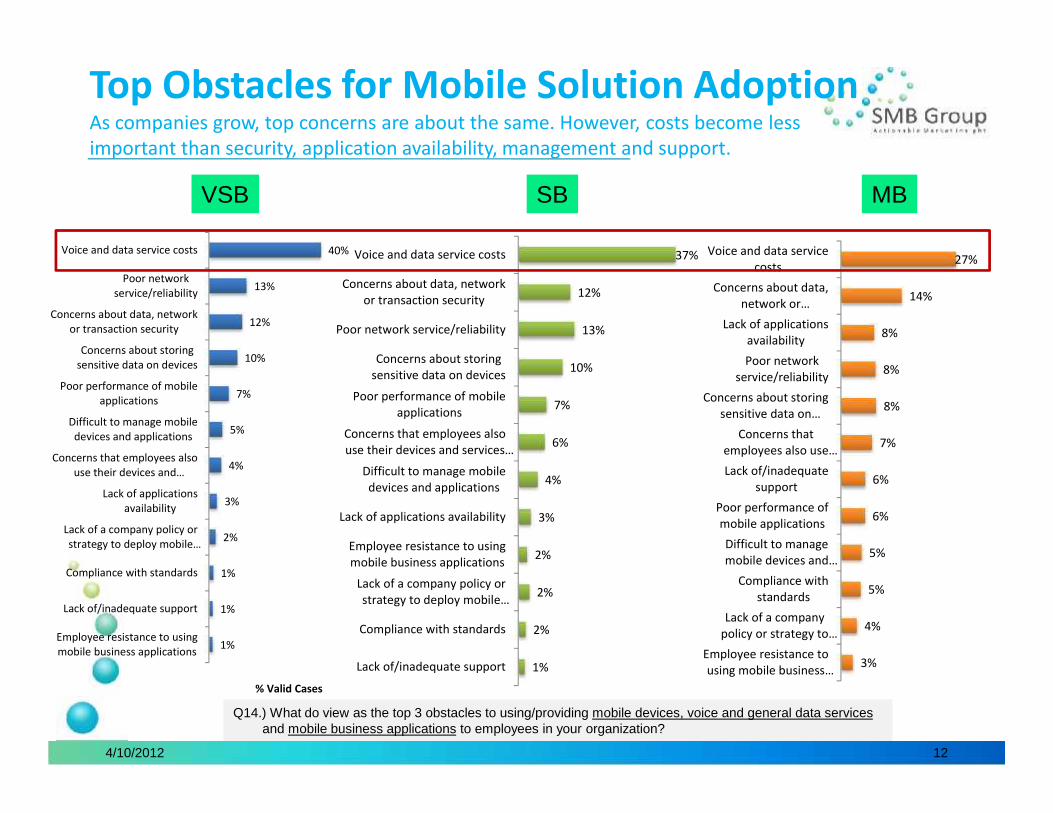
VSB SB MB
Top Obstacles for Mobile Solution AdoptionAs companies grow, top concerns are about the same. However, costs become lessimportant than security, application availability, management and support.
Q14.) What do view as the top 3 obstacles to using/providing mobile devices, voice and general data servicesand mobile business applications to employees in your organization?

December 2010 Copyright 2010, SMB Group, Allrights reserved
13
A) How does your company provide mobile devices to employees? B) How does your company provide mobile voice, text and data service plans to employees?
Small Business
52%
53%
47%
61%
19%
18%
23%
14%
8%
7%
10%
15%
20%
22%
20%
10%
Total
1-19Empl.
20-49Empl.
50-99Empl.
How does your company provide mobile devicesEmployees are responsible for procuring and paying for mobiledevices on their ownThe company provides employees with the option to purchasetheir own device or use a company-supplied deviceThe company provides allowances for individuals to purchasemobile devices
55%
55%
52%
66%
15%
12%
25%
17%
10%
12%
4%
9%
20%
21%
19%
8%
Total
1-19 Empl.
20-49Empl.
50-99Empl.
How does your company provide mobile service plansEmployees are responsible for procuring and paying for mobile serviceplans on their ownThe company provides allowances for individuals to purchase their ownservice plans from any carrier they chooseThe company provides allowances for individuals to purchase their ownservice plans from designated carrier(s)The company contracts for service plans from a carrier(s) and providesthem to employees
Mobile Device and Service Procurement PoliciesThe 50-99 employee size band represents a tipping point where businesses becomemuch more likely to determine, purchase and issues both devices and services to achieve morecontrol over expenses, productivity and collaboration.
Sample Size = 143

December 2010 Copyright 2010, SMB Group, Allrights reserved
14
10.) What type(s) of mobile device(s) do you use and authorize your company employees to use for business purposes?
Small Business
26%
25%
33%
41%
37%
34%
60%
54%
20%
19%
23%
30%
22%
21%
22%
39%
8%
7%
10%
18%
4%
3%
4%
9%
8%
7%
17%
24%
2%
2%
3%
7%
43%
44%
34%
46%
4%
3%
5%
13%
6%
6%
0%
2%
Total
1-19 Empl.
20-49 Empl.
50-99 Empl.
Apple iPhone deviceBlackberry (RIM) devicesGoogle Android-based devicesMicrosoft Windows Mobile-based devicesPalm OS-based devicesNokia Symbian-based devicesApple iPad tabletOther tablet devices (e.g. Dell Streak)
Mobile Devices Authorized for EmployeesBlackberry RIM plays a much larger role in companies with 20+ employees than inVSBs (1-19). Larger small businesses are also more likely to authorize and use Windows-basedpurpose-built devices than smaller counterparts.
Sample Size = 143
December 2010 Copyright 2010, SMB Group, Allrights reserved
15
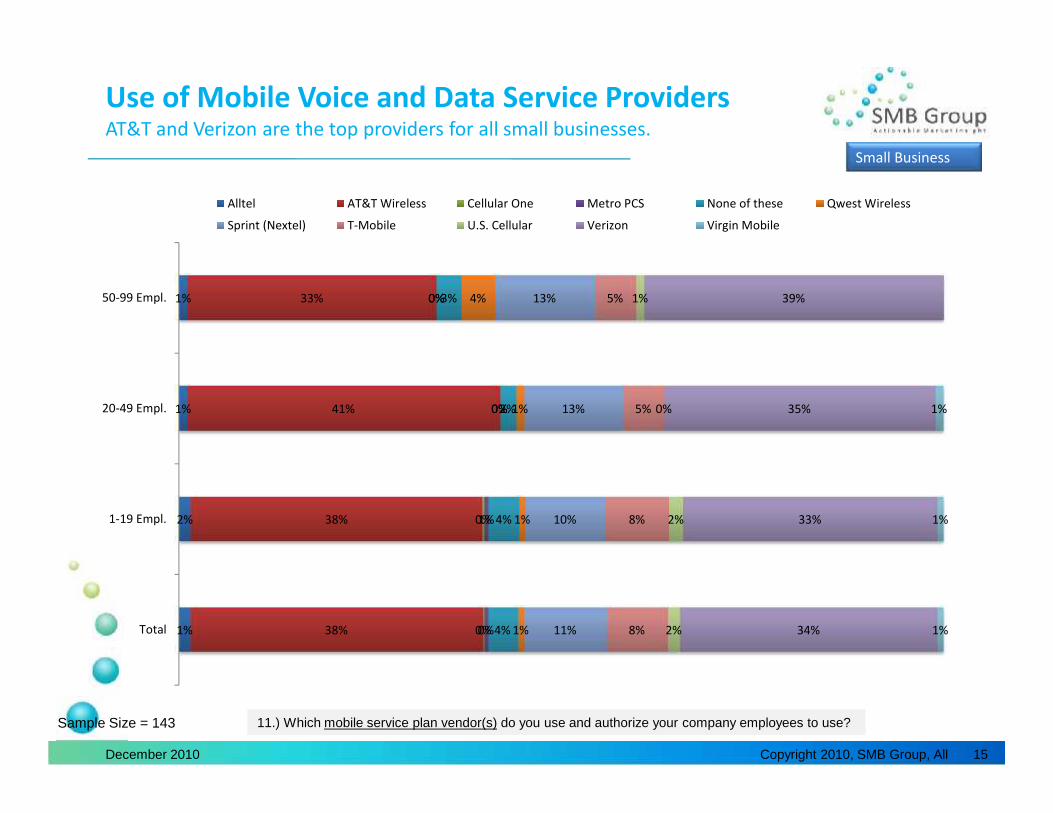
11.) Which mobile service plan vendor(s) do you use and authorize your company employees to use?
Small Business
1%
2%
1%
1%
38%
38%
41%
33%
0%
0%
0%
0%
0%
1%
0%
0%
4%
4%
2%
3%
1%
1%
1%
4%
11%
10%
13%
13%
8%
8%
5%
5%
2%
2%
0%
1%
34%
33%
35%
39%
1%
1%
1%
Total
1-19 Empl.
20-49 Empl.
50-99 Empl.
Alltel AT&T Wireless Cellular One Metro PCS None of these Qwest Wireless
Sprint (Nextel) T-Mobile U.S. Cellular Verizon Virgin Mobile
Use of Mobile Voice and Data Service ProvidersAT&T and Verizon are the top providers for all small businesses.
Sample Size = 143
December 2010 Copyright 2010, SMB Group, Allrights reserved
16
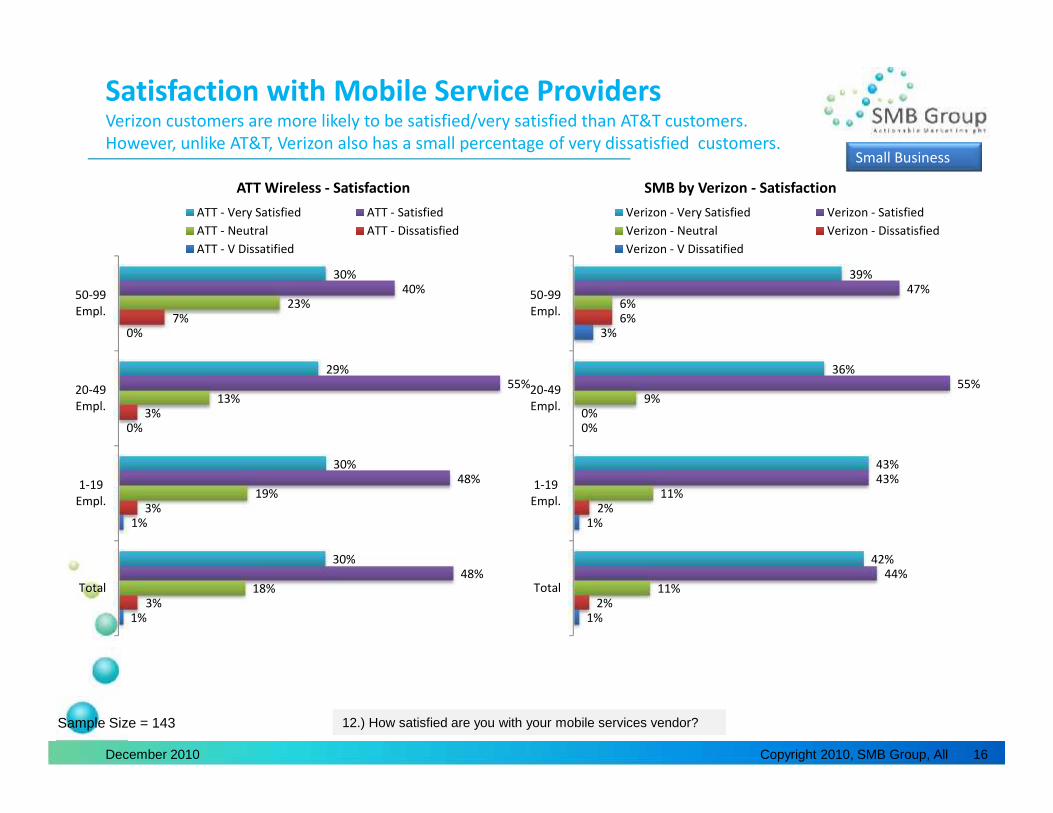
12.) How satisfied are you with your mobile services vendor?
Small Business
1%
1%
0%
0%
3%
3%
3%
7%
18%
19%
13%
23%
48%
48%
55%
40%
30%
30%
29%
30%
Total
1-19Empl.
20-49Empl.
50-99Empl.
ATT Wireless - SatisfactionATT - Very Satisfied ATT - SatisfiedATT - Neutral ATT - DissatisfiedATT - V Dissatified
1%
1%
0%
3%
2%
2%
0%
6%
11%
11%
9%
6%
44%
43%
55%
47%
42%
43%
36%
39%
Total
1-19Empl.
20-49Empl.
50-99Empl.
SMB by Verizon - SatisfactionVerizon - Very Satisfied Verizon - SatisfiedVerizon - Neutral Verizon - DissatisfiedVerizon - V Dissatified
Satisfaction with Mobile Service ProvidersVerizon customers are more likely to be satisfied/very satisfied than AT&T customers.However, unlike AT&T, Verizon also has a small percentage of very dissatisfied customers.
Sample Size = 143

9%
17%
18%
30%
32%
48%
49%
63%
67%
70%
71%
72%
79%
14%
26%
29%
27%
22%
16%
24%
11%
16%
15%
14%
15%
11%
Presence, find-mefollow-me
Travel & expensetracker
Conferencingapplications –…
Documentmanagement –…
Location-basedservices – travel,…
Instant messaging(IM)
GPS/navigation andmapping
SMS (Short MessageService), AKA texting
Web access andsearch
Company E-mail
Calendar
Contact Information
Voicemail & Voicenote recording
Current Planned
December 2010 Copyright 2010, SMB Group, Allrights reserved
17
15.) What specific mobile collaboration and productivity applications do you use/provide or plan to provide for employees in your company to use?
Small Business
Use and Planned Use of Mobile Collaboration andProductivity Solutions
Sample Size = 143

4/10/2012 18
16.) What specific line of business applications (to support financial, marketing, sales, services, inventory management,operations, etc.) do you use and/or plan to provide for your company employees to use?
Very Small Business
7%
11%
14%
15%
18%
20%
23%
25%
28%
29%
34%
51%
12%
23%
20%
42%
18%
28%
26%
31%
33%
30%
35%
36%
Fleet asset tracking
Supply chainintegration/inven…
Sales forceautomation…
Mobile marketingand advertising
Employee payroll
Business analytics
Paymentprocessing
Field serviceapplications
Time management& time capture
Delivery &shipment…
Social mediamarketing
Customermanagement
Currently Use Plan to Use
Sample Size = 394
Use and Planned Use of Mobile Business ApplicationsMobile business apps for VSBs are a huge, largely untapped opportunity for vendors.The biggest growth area is mobile marketing and advertising--poised to almost triple.
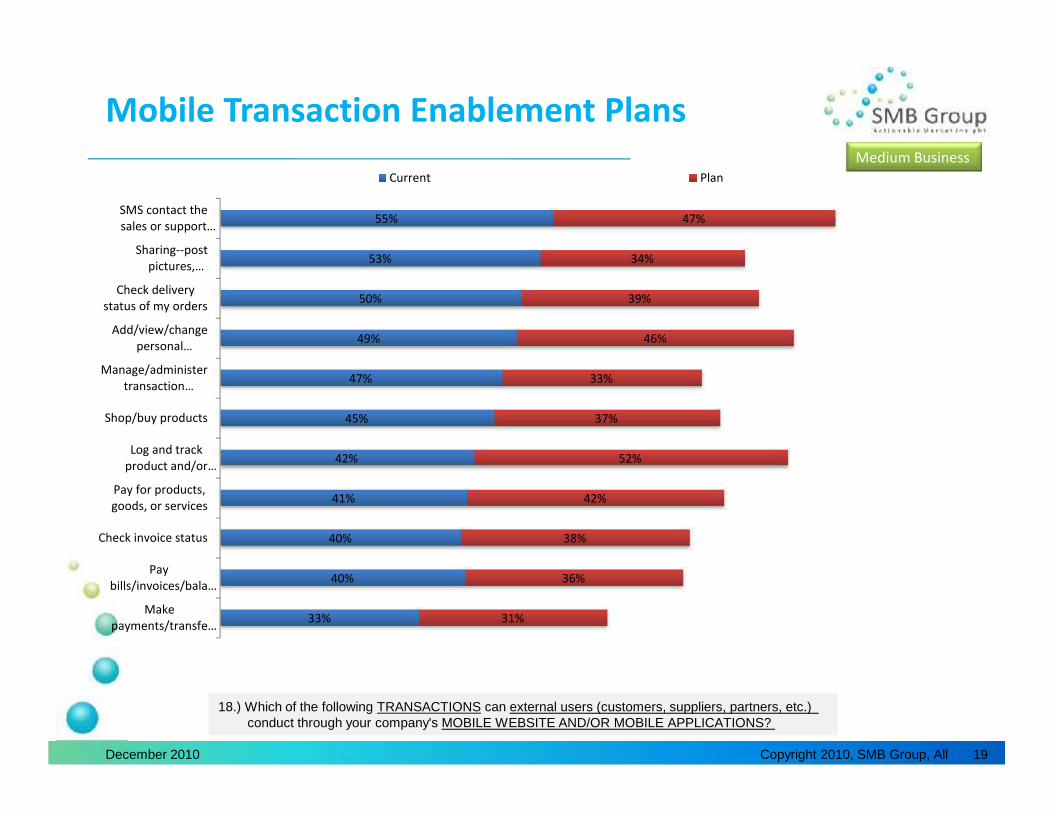
33%
40%
40%
41%
42%
45%
47%
49%
50%
53%
55%
31%
36%
38%
42%
52%
37%
33%
46%
39%
34%
47%
Makepayments/transfe…
Paybills/invoices/bala…
Check invoice status
Pay for products,goods, or services
Log and trackproduct and/or…
Shop/buy products
Manage/administertransaction…
Add/view/changepersonal…
Check deliverystatus of my orders
Sharing--postpictures,…
SMS contact thesales or support…
Current Plan
Mobile Transaction Enablement Plans
December 2010 Copyright 2010, SMB Group, Allrights reserved
19
18.) Which of the following TRANSACTIONS can external users (customers, suppliers, partners, etc.)conduct through your company's MOBILE WEBSITE AND/OR MOBILE APPLICATIONS?
Medium Business

Annual MobileDevice Spending,
$3.12B , 11%
Annual MobileManagement
Spending,$2.10B , 8%
Annual Voice andData Spending,$18.41B , 69%
Annual MobileApplicationSpending,
$3.14B , 12%
2010 SMB Mobile Market SizeLarge and growing SMB Opportunity
4/10/2012 20
2010Mobile SMB
Spending$26.1B
• Voice and data service is the biggest part of SMBs’ mobile budgets (69%), followed bymobile application spending(12%), mobile devices(11%) and mobile device/applicationmanagement(8%)• The highest growth segments are mobile applications followed by mobilemanagement

• Web-based survey• Data collected in late Oct./early Nov. 2011• Sample selection: Random sample of small and medium businesses• 30-35 questions• 500-750 respondents/completed interviews covering the four segments:
• Very small business (1-19 employees)• Small business (20-49 employees, 50-99 employees)• Medium business (100-249 employees, 250-499 employees)• Mid-market business (500 to 999 employees)
• SMB survey respondents are responsible for making Mobility Solutionsevaluating and purchasing decisions.
• The survey is intended to provide directional guidance to solution providersas they develop their go-to-market strategies and messaging
Methodology
214/10/2012

Survey Process
Target Quota:N=750
NationallyRepresentative Sampling
Technology SolutionsSelection and
Purchasing DecisionMakers in North America
Based Small andMedium Businesses
(businesses with 1-1,000employees)
CompletedInterviews: N=
All employee sizesrepresented
Representative ofmost vertical
industries
Representative ofmost regions
Home-based, non-profit included
Weighted byemployee size
22
SMB CompanyDatabases
Web based survey
4/10/2012

SMBs Defined
Small Businesses
• Fewer than 100 employees (full-time)across entire corporationo Education, government, non-profit
organizations are included
• Location:o Home-based businesses (Soho) are
includedo Non-profits are includedo Located in North America
• Franchises are not includedo Purchase decisions driven by
business/location being surveyed
Medium Businesses
• 100 – 1,000 employees (full-time)across entire corporationo Education, government, non-profit
organizations are included
• Location:o Commercial locationo Non-profits are includedo Located in North America
• Franchises are not includedo Purchase decisions driven by
business/location being surveyed
234/10/2012