2012 semiannual report
TRANSCRIPT

SEMIANNUALREPORT
2015ALL DATA AS OF 6/30/2015
RS VALUE FUNDSClass A, C, K, and Y Shares
RS PARTNERS FUND
RS VALUE FUND
RS LARGE CAP ALPHA FUND
RS INVESTORS FUND
RS GLOBAL NATURAL RESOURCES FUND
NOT FDIC INSURED
MAY LOSE VALUE
NOBANKGUARANTEE
T A B L E O F C O N T E N T S
RS Investments Overview
CEO’s Letter 1
Understanding Your Fund’s Expenses 3
Financial Information
Schedules of Investments 6
Statements of Assets and Liabilities 24
Statements of Operations 26
Statements of Changes in Net Assets 28
Financial Highlights 32
Notes to Financial Statements 42
Supplemental Information 59
RS Investments
Alternatives | Fixed Income | Growth | International | Natural Resources | Value
Alternatives Growth RS Emerging Markets Small Cap Fund
RS Focused Opportunity Fund RS Small Cap Growth Fund* RS China Fund
RS Focused Growth Opportunity Fund RS Select Growth Fund
RS Mid Cap Growth Fund Natural Resources
Fixed Income RS Growth Fund RS Global Natural Resources Fund
RS Investment Quality Bond Fund RS Technology Fund
RS Low Duration Bond Fund RS Small Cap Equity Fund* Value
RS High Yield Fund RS Partners Fund*
RS Tax-Exempt Fund International RS Value Fund
RS High Income Municipal Bond Fund RS International Fund RS Large Cap Alpha Fund
RS Floating Rate Fund RS Global Fund RS Investors Fund
RS Strategic Income Fund RS Emerging Markets Fund
* The Fund is currently offered only to certain investors. Please contact RS Investments for more information.
Except as otherwise specifically stated, all information, including portfolio security positions, is as ofJune 30, 2015.

C E O ’ S L E T T E R
Matthew H. ScanlanCEO, RS Investments
Dear RS Funds Shareholder,
The active versus passive debate seemsto be hotter than ever. Passive investinghas gained popularity over the past fewyears, and on the surface, the reason mayseem clear: In 2014, 78% of activemanagers lagged their relevantbenchmarks. So it’s no surprise thatactively managed domestic equity fundssaw $13 billion in net withdrawals lastyear, while their passively managedcounterparts (index funds and ETFs)received $244 billion in net subscriptions.
But as always, it would behoove investors todig a little deeper. When you “buy thebenchmark” with a passive approach, thatinvestment seeks to replicate theperformance of a particular index. Yetbenchmarks do not always represent theoptimal portfolio of assets within a givenopportunity set. In fact, like any portfolio, abenchmark can perform well or poorlydepending on design and market conditions.
Understanding benchmark constructionprovides a clearer picture of passiveinvesting — and what to expect in termsof performance through different marketenvironments. New research from RSInvestments explores the active decisionsthat go into benchmark design andconstruction. We found that thosedecisions can lead to biases inbenchmarks, so even passive strategiesinvolve active decisions, with thedecisions made by benchmark providersrather than by fund managers.
The question is, who do you want to trustto make those active decisions?Personally, I’d prefer that my chosenportfolio manager select my stocks.
While passive investing has gainedpopularity, we’ve noticed that theconcept of high-conviction activeinvesting is also attractive to investors,many of whom are exploring newapproaches to capture alpha (a measureof performance on a risk-adjusted basis).In fact, one key takeaway from ourresearch is that investors can blend thebest of index and active exposures tocreate an optimal portfolio. That blendincludes high-conviction active managers,in those cases where the investor hasconfidence that the manager has theability to exceed expectations.
We always aim to exceed expectations,and we appreciate the confidence you’veplaced in us. In the pages that follow,you’ll find an update on the RS Funds. Itincludes important information about yourinvestment with our firm.
Please visit www.rsinvestments.com foradditional insights and the latestcommentary from our investment teams.
Sincerely,
Matthew H. ScanlanChief Executive Officer
THIS PAGE NOT PART OF YOUR FUND REPORT www.rsinvestments.com 1

C E O ’ S L E T T E R
As with all mutual funds, the value of an investment in a Fund could decline, so youcould lose money.
RS Funds are sold by Prospectus only. Before investing in any RS Fund, you should carefully consider the Fund’s investment objectives, risks, and charges and expenses. To obtain a Fund’s Prospectus and Summary Prospectus, which contain this and other important information, please call 800-766-3863 or visit www.rsinvestments.com. The Prospectus and Summary Prospectus should be read carefully before investing or sending money.RS Funds are distributed by RS Funds Distributor LLC, member: FINRA, SIPC.
©2015 RS Investment Management Co. LLC
2 www.rsinvestments.com THIS PAGE NOT PART OF YOUR FUND REPORT

U N D E R S T A N D I N G Y O U R F U N D ’ S E X P E N S E S ( U N A U D I T E D )
As a shareholder of the Funds, you incur two types of costs: (1) transaction costs,including, as applicable, sales charges (loads) on purchase payments; redemption fees;and exchange fees; and (2) ongoing costs, including investment advisory fees;distribution (12b-1) fees; and other Fund expenses. The examples below are intendedto help you understand your ongoing costs (in dollars) of investing in the Funds and tocompare these costs with the ongoing costs of investing in other mutual funds.
The examples are based on an investment of $1,000 invested at the beginning of theperiod and held for the entire period from January 1, 2015, to June 30, 2015. Thefollowing table shows the Funds’ expenses in two ways:
Expenses based on actual return
This section of the table provides information about actual account values and actualexpenses. You may use the information in this section, together with the amount youinvested, to estimate the expenses that you paid over the period. Simply divide your accountvalue by $1,000 (for example, an $8,600 account value divided by $1,000 = 8.6), thenmultiply the result by the number in the section under the heading entitled “Expenses PaidDuring Period” for your Fund to estimate the expenses you paid on your account during thisperiod. A maintenance fee of $12.00 that is charged once a year may apply for IRAs. Thisfee is not included in the following table. If it were, the estimate of expenses you paid duringthe period would be higher, and your ending account value lower, by this amount.
Expenses based on hypothetical 5% return for comparison purposes
This section of the table provides information about hypothetical account values andhypothetical expenses based on the Fund’s actual expense ratio and an assumed rateof return of 5% per year before expenses, which is not the Fund’s actual return. Thehypothetical account values and expenses may not be used to estimate the actualending account balance or expenses you paid for the period. You may use thisinformation to compare the ongoing costs of investing in the Funds with the costs ofinvesting in other mutual funds. To do so, compare this 5% hypothetical example withthe 5% hypothetical examples that appear in the shareholder reports of the other funds.A maintenance fee of $12.00 that is charged once a year may apply for IRAs. This fee isnot included in the following table. If it were, the estimate of expenses you paid duringthe period would be higher, and your ending account value lower, by this amount.
Note that the expenses shown in the table are meant to highlight your ongoing costsonly and do not reflect any transactional costs, such as sales charges (loads) orexchange fees. Therefore the second section is useful in comparing ongoing costs only,and will not help you determine the relative total costs of owning different funds. If thesetransactional costs were included, your costs would have been higher.
www.rsinvestments.com 3

U N D E R S T A N D I N G Y O U R F U N D ’ S E X P E N S E S ( U N A U D I T E D )
Based on ActualReturn
BeginningAccount Value
1/1/15
EndingAccount Value
6/30/15
Expenses PaidDuring Period*
1/1/15-6/30/15
Expense RatioDuring Period
1/1/15-6/30/15
RS Partners Fund Class A $1,000.00 $996.50 $7.18 1.45%
Class K $1,000.00 $994.60 $8.95 1.81%
Class Y $1,000.00 $997.80 $5.55 1.12%RS Value Fund Class A $1,000.00 $1,026.00 $6.38 1.27%
Class C $1,000.00 $1,021.60 $10.38 2.07%
Class K $1,000.00 $1,023.80 $8.48 1.69%
Class Y $1,000.00 $1,026.80 $5.33 1.06%RS Large Cap Alpha
FundClass A $1,000.00 $1,009.50 $4.53 0.91%
Class C $1,000.00 $1,005.40 $8.60 1.73%
Class K $1,000.00 $1,007.60 $6.57 1.32%
Class Y $1,000.00 $1,010.50 $3.49 0.70%RS Investors Fund Class A $1,000.00 $1,000.00 $6.60 1.33%
Class C $1,000.00 $996.70 $10.25 2.07%
Class K $1,000.00 $997.60 $9.31 1.88%
Class Y $1,000.00 $1,001.50 $5.21 1.05%RS Global Natural
Resources FundClass A $1,000.00 $972.60 $7.19 1.47%
Class C $1,000.00 $968.50 $11.13 2.28%
Class K $1,000.00 $970.60 $9.04 1.85%
Class Y $1,000.00 $973.70 $5.63 1.15%Based on Hypothetical Return(5% Return Before Expenses)
RS Partners Fund Class A $1,000.00 $1,017.60 $7.25 1.45%
Class K $1,000.00 $1,015.82 $9.05 1.81%
Class Y $1,000.00 $1,019.24 $5.61 1.12%RS Value Fund Class A $1,000.00 $1,018.50 $6.36 1.27%
Class C $1,000.00 $1,014.53 $10.34 2.07%
Class K $1,000.00 $1,016.41 $8.45 1.69%
Class Y $1,000.00 $1,019.54 $5.31 1.06%RS Large Cap Alpha
FundClass A $1,000.00 $1,020.28 $4.56 0.91%
Class C $1,000.00 $1,016.22 $8.65 1.73%
Class K $1,000.00 $1,018.25 $6.61 1.32%
Class Y $1,000.00 $1,021.32 $3.51 0.70%RS Investors Fund Class A $1,000.00 $1,018.20 $6.66 1.33%
Class C $1,000.00 $1,014.53 $10.34 2.07%
Class K $1,000.00 $1,015.47 $9.39 1.88%
Class Y $1,000.00 $1,019.59 $5.26 1.05%RS Global Natural
Resources FundClass A $1,000.00 $1,017.51 $7.35 1.47%
Class C $1,000.00 $1,013.49 $11.38 2.28%
Class K $1,000.00 $1,015.62 $9.25 1.85%
Class Y $1,000.00 $1,019.09 $5.76 1.15%* Expenses are equal to the Fund’s annualized expense ratio as indicated, multiplied by the average account value
over the period, multiplied by 181/365 (to reflect the one-half year period).
4 www.rsinvestments.com

Financial InformationSix-Month Period Ended June 30, 2015

S C H E D U L E O F I N V E S T M E N T S — R S P A R T N E R S F U N D
June 30, 2015 (unaudited) Shares Value
Common Stocks – 97.1%Air Transport – 2.6%Bristow Group, Inc. 707,868 $ 37,729,364
37,729,364
Auto Parts – 4.6%American Axle & Manufacturing Holdings, Inc.(1) 947,087 19,803,589
Dana Holding Corp. 2,279,793 46,918,140
66,721,729
Back Office Support, HR and Consulting – 0.6%Performant Financial Corp.(1)(2) 2,651,545 8,591,006
8,591,006
Banks: Diversified – 11.5%Associated Banc-Corp. 2,583,249 52,362,457
First Horizon National Corp. 2,097,617 32,869,658
FirstMerit Corp. 635,024 13,227,550
Hancock Holding Co. 371,643 11,859,128
Renasant Corp. 134,620 4,388,612
Synovus Financial Corp. 1,105,453 34,070,062
UMB Financial Corp. 329,068 18,763,457
167,540,924
Building Materials – 2.1%Masonite International Corp.(1) 429,235 30,093,666
30,093,666
Chemicals: Diversified – 1.9%Olin Corp. 1,022,951 27,568,529
27,568,529
Commercial Vehicles & Parts – 1.6%Navistar International Corp.(1) 1,023,712 23,166,603
23,166,603
Communications Technology – 0.9%Plantronics, Inc. 235,799 13,277,842
13,277,842
Computer Services, Software & Systems – 8.9%Cadence Design Systems, Inc.(1) 954,140 18,758,393
CommVault Systems, Inc.(1) 1,244,107 52,762,578
DST Systems, Inc. 113,790 14,335,264
IAC/InterActiveCorp 212,630 16,938,106
MicroStrategy, Inc., Class A(1) 110,765 18,838,911
Pegasystems, Inc. 175,980 4,028,182
RealPage, Inc.(1) 185,860 3,544,350
129,205,784
6 www.rsinvestments.com The accompanying notes are an integral part of these financial statements.

R S P A R T N E R S F U N D
June 30, 2015 (unaudited) Shares Value
Containers & Packaging – 3.7%
Sealed Air Corp. 1,054,943 $ 54,202,971
54,202,971
Diversified Manufacturing Operations – 0.9%
TriMas Corp.(1) 434,527 12,861,999
12,861,999
Diversified Retail – 3.2%
Liberty Ventures, Series A(1) 1,196,720 46,995,194
46,995,194
Engineering & Contracting Services – 1.2%
MasTec, Inc.(1) 893,950 17,762,787
17,762,787
Health Care Management Services – 3.3%
Magellan Health, Inc.(1) 676,859 47,427,510
47,427,510
Health Care Services – 6.1%
Allscripts Healthcare Solutions, Inc.(1) 2,935,585 40,158,803
HMS Holdings Corp.(1) 2,807,287 48,201,118
88,359,921
Home Building – 1.3%
William Lyon Homes, Class A(1) 752,404 19,314,211
19,314,211
Household Equipment & Products – 1.7%
Tupperware Brands Corp. 391,321 25,255,857
25,255,857
Insurance: Life – 5.4%
StanCorp Financial Group, Inc. 477,478 36,102,111
Torchmark Corp. 737,904 42,960,771
79,062,882
Insurance: Property - Casualty – 8.9%
Endurance Specialty Holdings Ltd. 606,624 39,855,197
Essent Group Ltd.(1) 1,529,223 41,824,249
First American Financial Corp. 1,280,214 47,636,763
129,316,209
Metal Fabricating – 1.0%
MRC Global, Inc.(1) 973,159 15,025,575
15,025,575
The accompanying notes are an integral part of these financial statements. www.rsinvestments.com 7

S C H E D U L E O F I N V E S T M E N T S — R S P A R T N E R S F U N D
June 30, 2015 (unaudited)Foreign
Currency Shares Value
Metals & Minerals: Diversified – 0.7%Materion Corp. 299,525 $10,558,256
10,558,256
Office Supplies & Equipment – 0.6%Avery Dennison Corp. 147,637 8,996,999
8,996,999
Oil: Crude Producers – 3.8%Approach Resources, Inc.(1) 1,939,467 13,285,349
Laredo Petroleum, Inc.(1) 1,988,203 25,011,594
Peyto Exploration & Development Corp. CAD 137,824 3,368,908
Unit Corp.(1) 484,140 13,129,877
54,795,728
Pharmaceuticals – 0.4%The Medicines Co.(1) 182,877 5,232,111
5,232,111
Precious Metals & Minerals – 1.8%Horsehead Holding Corp.(1) 2,210,908 25,911,842
25,911,842
Real Estate Investment Trusts – 4.7%Ares Commercial Real Estate Corp. 867,640 9,882,420
CBL & Associates Properties, Inc. 392,317 6,355,535
Equity Commonwealth(1) 1,378,300 35,380,961
MFA Financial, Inc. 1,377,047 10,176,377
PennyMac Mortgage Investment Trust 327,672 5,711,323
67,506,616
Real Estate Services – 3.0%Jones Lang LaSalle, Inc. 258,378 44,182,638
44,182,638
Scientific Instruments: Pollution Control – 3.7%Clean Harbors, Inc.(1) 498,973 26,814,809
Waste Connections, Inc. 558,074 26,296,447
53,111,256
Specialty Retail – 1.7%FTD Cos., Inc.(1) 861,485 24,285,262
24,285,262
Textiles, Apparel & Shoes – 0.9%Tumi Holdings, Inc.(1) 619,233 12,706,661
12,706,661
8 www.rsinvestments.com The accompanying notes are an integral part of these financial statements.

R S P A R T N E R S F U N D
June 30, 2015 (unaudited) Shares Value
Utilities: Gas Distributors – 2.3%Questar Corp. 1,606,068 $ 33,582,882
33,582,882
Utilities: Miscellaneous – 2.1%Calpine Corp.(1) 1,706,136 30,693,387
30,693,387
Total Common Stocks(Cost $1,197,099,387) 1,411,044,201
PrincipalAmount Value
Repurchase Agreements – 3.1%
Fixed Income Clearing Corp. RepurchaseAgreement, 0.00%, dated 6/30/2015,maturity value of $44,559,000, due7/1/2015(3) $44,559,000 $ 44,559,000
Total Repurchase Agreements(Cost $44,559,000) 44,559,000
Total Investments - 100.2%(Cost $1,241,658,387) 1,455,603,201
Other Liabilities, Net - (0.2)% (3,381,840)
Total Net Assets - 100.0% $1,452,221,361
(1) Non-income-producing security.(2) Affiliated issuer. See 2d in Notes to Financial Statements.(3) The table below presents collateral for repurchase agreements.
Security Coupon Maturity Date Value
U.S. Treasury Bond 4.75% 2/15/2041 $37,069,038
U.S. Treasury Note 4.25% 11/15/2024 8,382,875
Legend:Foreign-Denominated Security
CAD – Canadian Dollar
The accompanying notes are an integral part of these financial statements. www.rsinvestments.com 9

S C H E D U L E O F I N V E S T M E N T S — R S P A R T N E R S F U N D
The following is a summary of the inputs used as of June 30, 2015, in valuing the Fund’s investments. For moreinformation on valuation inputs, please refer to Note 1a of the accompanying Notes to Financial Statements.
Valuation Inputs
Investments in Securities(unaudited) Level 1 Level 2 Level 3 Total
Common Stocks $1,411,044,201 $ — $ — $1,411,044,201
Repurchase Agreements — 44,559,000 — 44,559,000
Total $ 1,411,044,201 $ 44,559,000 $ — $ 1,455,603,201
10 www.rsinvestments.com The accompanying notes are an integral part of these financial statements.

S C H E D U L E O F I N V E S T M E N T S — R S V A L U E F U N D
June 30, 2015 (unaudited) Shares Value
Common Stocks – 96.7%Advertising Agencies – 2.1%Nielsen N.V. 632,855 $ 28,332,918
28,332,918
Auto Parts – 0.7%Dana Holding Corp. 451,340 9,288,577
9,288,577
Banks: Diversified – 6.5%Comerica, Inc. 400,800 20,569,056
KeyCorp 850,761 12,778,430
Zions Bancorporation 1,687,850 53,563,920
86,911,406
Building Materials – 1.8%Owens Corning 586,323 24,185,824
24,185,824
Chemicals: Diversified – 2.7%Axiall Corp. 569,265 20,522,003
Eastman Chemical Co. 191,770 15,690,622
36,212,625
Commercial Vehicles & Parts – 2.6%Allison Transmission Holdings, Inc. 458,940 13,428,584
Navistar International Corp.(1) 933,260 21,119,674
34,548,258
Computer Services, Software & Systems – 9.8%Cadence Design Systems, Inc.(1) 1,463,078 28,764,113
Check Point Software Technologies Ltd.(1) 210,100 16,713,455
DST Systems, Inc. 110,140 13,875,437
IAC/InterActiveCorp 351,680 28,014,829
Rackspace Hosting, Inc.(1) 254,825 9,476,942
Synopsys, Inc.(1) 538,470 27,273,506
TransUnion(1) 278,050 6,979,055
131,097,337
Containers & Packaging – 3.8%Crown Holdings, Inc.(1) 502,239 26,573,465
Sealed Air Corp. 476,781 24,497,008
51,070,473
Diversified Financial Services – 1.8%Raymond James Financial, Inc. 405,374 24,152,183
24,152,183
The accompanying notes are an integral part of these financial statements. www.rsinvestments.com 11
S C H E D U L E O F I N V E S T M E N T S — R S V A L U E F U N D
June 30, 2015 (unaudited) Shares Value
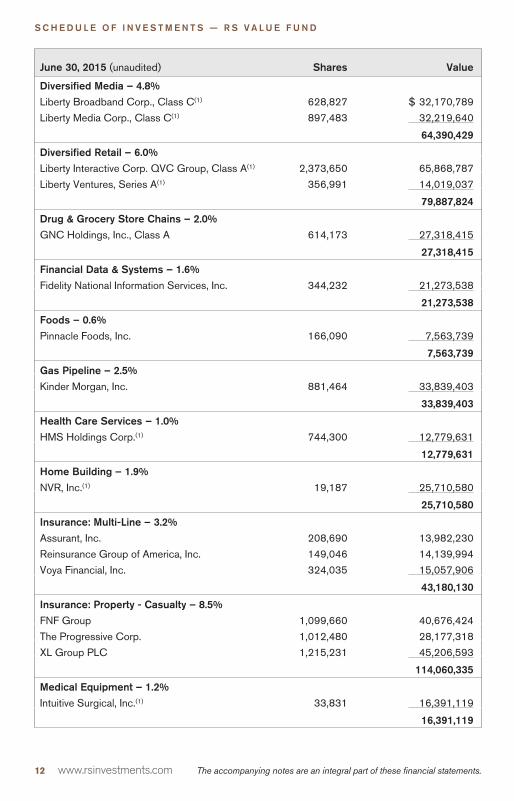
Diversified Media – 4.8%Liberty Broadband Corp., Class C(1) 628,827 $ 32,170,789
Liberty Media Corp., Class C(1) 897,483 32,219,640
64,390,429
Diversified Retail – 6.0%Liberty Interactive Corp. QVC Group, Class A(1) 2,373,650 65,868,787
Liberty Ventures, Series A(1) 356,991 14,019,037
79,887,824
Drug & Grocery Store Chains – 2.0%GNC Holdings, Inc., Class A 614,173 27,318,415
27,318,415
Financial Data & Systems – 1.6%Fidelity National Information Services, Inc. 344,232 21,273,538
21,273,538
Foods – 0.6%Pinnacle Foods, Inc. 166,090 7,563,739
7,563,739
Gas Pipeline – 2.5%Kinder Morgan, Inc. 881,464 33,839,403
33,839,403
Health Care Services – 1.0%HMS Holdings Corp.(1) 744,300 12,779,631
12,779,631
Home Building – 1.9%NVR, Inc.(1) 19,187 25,710,580
25,710,580
Insurance: Multi-Line – 3.2%Assurant, Inc. 208,690 13,982,230
Reinsurance Group of America, Inc. 149,046 14,139,994
Voya Financial, Inc. 324,035 15,057,906
43,180,130
Insurance: Property - Casualty – 8.5%FNF Group 1,099,660 40,676,424
The Progressive Corp. 1,012,480 28,177,318
XL Group PLC 1,215,231 45,206,593
114,060,335
Medical Equipment – 1.2%Intuitive Surgical, Inc.(1) 33,831 16,391,119
16,391,119
12 www.rsinvestments.com The accompanying notes are an integral part of these financial statements.

R S V A L U E F U N D
June 30, 2015 (unaudited) Shares Value
Oil: Crude Producers – 5.0%Concho Resources, Inc.(1) 124,677 $ 14,195,723
Laredo Petroleum, Inc.(1) 1,626,045 20,455,646
Rosetta Resources, Inc.(1) 842,737 19,500,934
Unit Corp.(1) 464,515 12,597,647
66,749,950
Oil Well Equipment & Services – 0.9%Rowan Companies PLC, Class A 584,728 12,343,608
12,343,608
Pharmaceuticals – 6.9%Allergan PLC(1) 133,432 40,491,275
Cardinal Health, Inc. 272,614 22,804,161
Endo International PLC(1) 358,037 28,517,647
91,813,083
Real Estate Investment Trusts – 6.3%American Campus Communities, Inc. 490,479 18,486,154
Equity Commonwealth(1) 1,120,050 28,751,683
Iron Mountain, Inc. 1,172,958 36,361,698
83,599,535
Real Estate Services – 1.5%CBRE Group, Inc., Class A(1) 549,119 20,317,403
20,317,403
Scientific Instruments: Pollution Control – 3.4%Clean Harbors, Inc.(1) 849,307 45,641,758
45,641,758
Semiconductors & Components – 0.7%Atmel Corp. 961,270 9,473,316
9,473,316
Utilities: Electrical – 3.4%NRG Energy, Inc. 1,990,920 45,552,250
45,552,250
Utilities: Gas Distributors – 1.7%Questar Corp. 1,051,192 21,980,425
21,980,425
Utilities: Miscellaneous – 1.8%Calpine Corp.(1) 1,303,812 23,455,578
23,455,578
Total Common Stocks(Cost $1,095,578,937) 1,293,121,650
The accompanying notes are an integral part of these financial statements. www.rsinvestments.com 13

S C H E D U L E O F I N V E S T M E N T S — R S V A L U E F U N D
June 30, 2015 (unaudited)PrincipalAmount Value
Repurchase Agreements – 3.3%
Fixed Income Clearing Corp. RepurchaseAgreement, 0.00%, dated 6/30/2015, maturityvalue of $44,908,000, due 7/1/2015(2) $44,908,000 $ 44,908,000
Total Repurchase Agreements(Cost $44,908,000) 44,908,000
Total Investments - 100.0%(Cost $1,140,486,937) 1,338,029,650
Other Liabilities, Net - 0.0% (306,182)
Total Net Assets - 100.0% $1,337,723,468
(1) Non-income-producing security.(2) The table below presents collateral for repurchase agreements.
Security Coupon Maturity Date Value
U.S. Treasury Bond 4.75% 2/15/2041 $21,320,925
U.S. Treasury Bond 3.75% 11/15/2043 24,489,300
The following is a summary of the inputs used as of June 30, 2015, in valuing the Fund’s investments. For moreinformation on valuation inputs, please refer to Note 1a of the accompanying Notes to Financial Statements.
Valuation Inputs
Investments in Securities(unaudited) Level 1 Level 2 Level 3 Total
Common Stocks $1,293,121,650 $ — $ — $1,293,121,650
Repurchase Agreements — 44,908,000 — 44,908,000
Total $ 1,293,121,650 $ 44,908,000 $ — $ 1,338,029,650
14 www.rsinvestments.com The accompanying notes are an integral part of these financial statements.
S C H E D U L E O F I N V E S T M E N T S — R S L A R G E C A P A L P H A F U N D
June 30, 2015 (unaudited) Shares Value
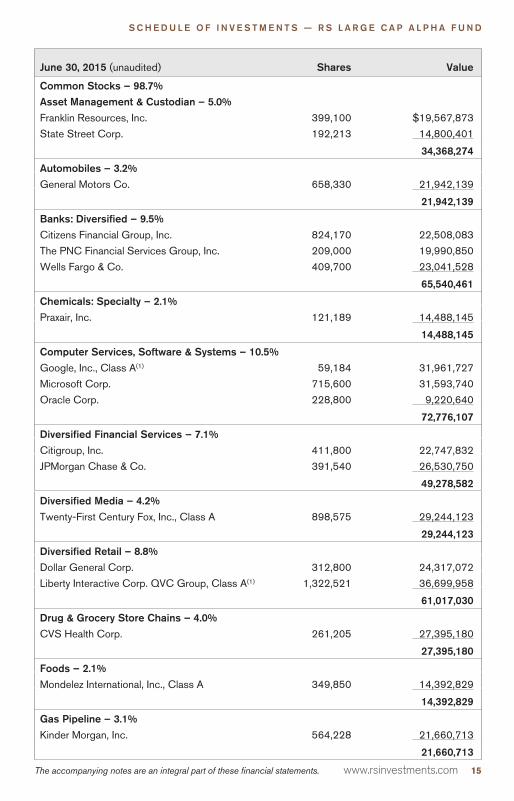
Common Stocks – 98.7%Asset Management & Custodian – 5.0%Franklin Resources, Inc. 399,100 $19,567,873
State Street Corp. 192,213 14,800,401
34,368,274
Automobiles – 3.2%General Motors Co. 658,330 21,942,139
21,942,139
Banks: Diversified – 9.5%Citizens Financial Group, Inc. 824,170 22,508,083
The PNC Financial Services Group, Inc. 209,000 19,990,850
Wells Fargo & Co. 409,700 23,041,528
65,540,461
Chemicals: Specialty – 2.1%Praxair, Inc. 121,189 14,488,145
14,488,145
Computer Services, Software & Systems – 10.5%Google, Inc., Class A(1) 59,184 31,961,727
Microsoft Corp. 715,600 31,593,740
Oracle Corp. 228,800 9,220,640
72,776,107
Diversified Financial Services – 7.1%Citigroup, Inc. 411,800 22,747,832
JPMorgan Chase & Co. 391,540 26,530,750
49,278,582
Diversified Media – 4.2%Twenty-First Century Fox, Inc., Class A 898,575 29,244,123
29,244,123
Diversified Retail – 8.8%Dollar General Corp. 312,800 24,317,072
Liberty Interactive Corp. QVC Group, Class A(1) 1,322,521 36,699,958
61,017,030
Drug & Grocery Store Chains – 4.0%CVS Health Corp. 261,205 27,395,180
27,395,180
Foods – 2.1%Mondelez International, Inc., Class A 349,850 14,392,829
14,392,829
Gas Pipeline – 3.1%Kinder Morgan, Inc. 564,228 21,660,713
21,660,713
The accompanying notes are an integral part of these financial statements. www.rsinvestments.com 15

S C H E D U L E O F I N V E S T M E N T S — R S L A R G E C A P A L P H A F U N D
June 30, 2015 (unaudited) Shares Value
Health Care Management Services – 2.8%UnitedHealth Group, Inc. 161,075 $19,651,150
19,651,150
Home Building – 2.1%D.R. Horton, Inc. 528,600 14,462,496
14,462,496
Insurance: Life – 1.8%Prudential Financial, Inc. 139,930 12,246,674
12,246,674
Insurance: Multi-Line – 0.6%American International Group, Inc. 71,000 4,389,220
4,389,220
Insurance: Property - Casualty – 4.1%FNF Group 337,980 12,501,880
The Progressive Corp. 555,390 15,456,504
27,958,384
Machinery: Engines – 2.1%Cummins, Inc. 110,170 14,453,202
14,453,202
Oil: Crude Producers – 1.8%Concho Resources, Inc.(1) 52,298 5,954,651
Noble Energy, Inc. 156,790 6,691,797
12,646,448
Oil: Integrated – 6.6%Chevron Corp. 319,785 30,849,659
Marathon Oil Corp. 556,600 14,772,164
45,621,823
Pharmaceuticals – 10.4%Allergan PLC(1) 84,681 25,697,296
Bristol-Myers Squibb Co. 134,970 8,980,904
Merck & Co., Inc. 287,354 16,359,063
Pfizer, Inc. 619,265 20,763,956
71,801,219
Radio & TV Broadcasters – 2.0%Sirius XM Holdings, Inc.(1) 3,751,900 13,994,587
13,994,587
Restaurants – 2.1%McDonald’s Corp. 151,600 14,412,612
14,412,612
16 www.rsinvestments.com The accompanying notes are an integral part of these financial statements.
R S L A R G E C A P A L P H A F U N D
June 30, 2015 (unaudited) Shares Value
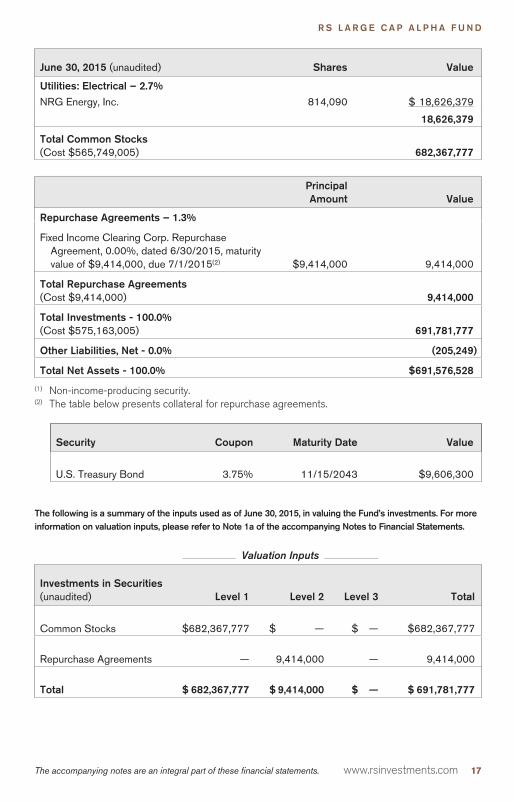
Utilities: Electrical – 2.7%NRG Energy, Inc. 814,090 $ 18,626,379
18,626,379
Total Common Stocks(Cost $565,749,005) 682,367,777
PrincipalAmount Value
Repurchase Agreements – 1.3%
Fixed Income Clearing Corp. RepurchaseAgreement, 0.00%, dated 6/30/2015, maturityvalue of $9,414,000, due 7/1/2015(2) $9,414,000 9,414,000
Total Repurchase Agreements(Cost $9,414,000) 9,414,000
Total Investments - 100.0%(Cost $575,163,005) 691,781,777
Other Liabilities, Net - 0.0% (205,249)
Total Net Assets - 100.0% $691,576,528
(1) Non-income-producing security.(2) The table below presents collateral for repurchase agreements.
Security Coupon Maturity Date Value
U.S. Treasury Bond 3.75% 11/15/2043 $9,606,300
The following is a summary of the inputs used as of June 30, 2015, in valuing the Fund’s investments. For moreinformation on valuation inputs, please refer to Note 1a of the accompanying Notes to Financial Statements.
Valuation Inputs
Investments in Securities(unaudited) Level 1 Level 2 Level 3 Total
Common Stocks $682,367,777 $ — $ — $682,367,777
Repurchase Agreements — 9,414,000 — 9,414,000
Total $ 682,367,777 $ 9,414,000 $ — $ 691,781,777
The accompanying notes are an integral part of these financial statements. www.rsinvestments.com 17

S C H E D U L E O F I N V E S T M E N T S — R S I N V E S T O R S F U N D
June 30, 2015 (unaudited) Shares Value
Common Stocks – 98.9%Auto Parts – 3.4%Dana Holding Corp. 313,553 $ 6,452,921
6,452,921
Banks: Diversified – 3.3%First Horizon National Corp. 407,400 6,383,958
6,383,958
Computer Services, Software & Systems – 15.2%Cadence Design Systems, Inc.(1) 274,768 5,401,939
CommVault Systems, Inc.(1) 199,340 8,454,009
Google, Inc., Class A(1) 15,622 8,436,505
Microsoft Corp. 152,070 6,713,890
29,006,343
Containers & Packaging – 3.2%Sealed Air Corp. 118,050 6,065,409
6,065,409
Diversified Financial Services – 3.5%JPMorgan Chase & Co. 99,890 6,768,546
6,768,546
Diversified Media – 4.8%Twenty-First Century Fox, Inc., Class A 278,960 9,078,753
9,078,753
Diversified Retail – 14.2%Dollar General Corp. 96,300 7,486,362
Liberty Interactive Corp. QVC Group, Class A(1) 425,670 11,812,343
Liberty Ventures, Series A(1) 198,709 7,803,302
27,102,007
Financial Data & Systems – 3.4%Fidelity National Information Services, Inc. 103,630 6,404,334
6,404,334
Health Care Management Services – 3.4%Magellan Health, Inc.(1) 92,110 6,454,148
6,454,148
Health Care Services – 6.6%Allscripts Healthcare Solutions, Inc.(1) 412,154 5,638,267
HMS Holdings Corp.(1) 401,612 6,895,678
12,533,945
Insurance: Property - Casualty – 10.5%FNF Group 269,820 9,980,642
XL Group PLC 267,890 9,965,508
19,946,150
18 www.rsinvestments.com The accompanying notes are an integral part of these financial statements.
R S I N V E S T O R S F U N D
June 30, 2015 (unaudited) Shares Value
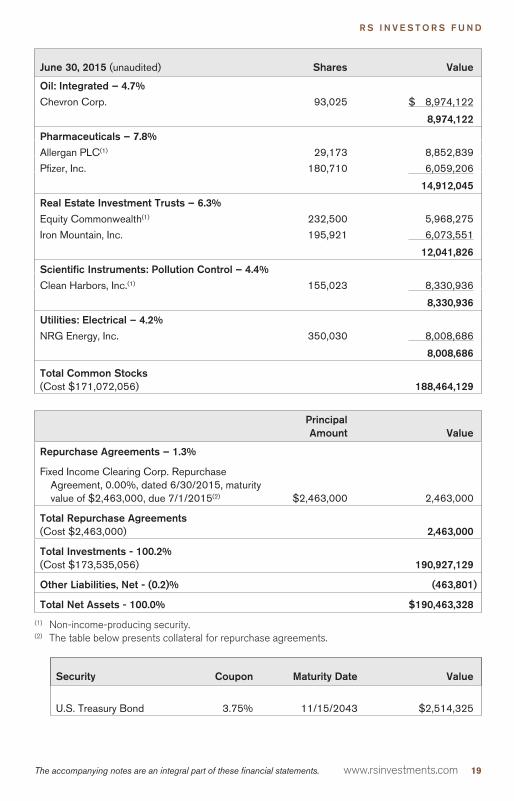
Oil: Integrated – 4.7%Chevron Corp. 93,025 $ 8,974,122
8,974,122
Pharmaceuticals – 7.8%Allergan PLC(1) 29,173 8,852,839
Pfizer, Inc. 180,710 6,059,206
14,912,045
Real Estate Investment Trusts – 6.3%Equity Commonwealth(1) 232,500 5,968,275
Iron Mountain, Inc. 195,921 6,073,551
12,041,826
Scientific Instruments: Pollution Control – 4.4%Clean Harbors, Inc.(1) 155,023 8,330,936
8,330,936
Utilities: Electrical – 4.2%NRG Energy, Inc. 350,030 8,008,686
8,008,686
Total Common Stocks(Cost $171,072,056) 188,464,129
PrincipalAmount Value
Repurchase Agreements – 1.3%
Fixed Income Clearing Corp. RepurchaseAgreement, 0.00%, dated 6/30/2015, maturityvalue of $2,463,000, due 7/1/2015(2) $2,463,000 2,463,000
Total Repurchase Agreements(Cost $2,463,000) 2,463,000
Total Investments - 100.2%(Cost $173,535,056) 190,927,129
Other Liabilities, Net - (0.2)% (463,801)
Total Net Assets - 100.0% $190,463,328
(1) Non-income-producing security.(2) The table below presents collateral for repurchase agreements.
Security Coupon Maturity Date Value
U.S. Treasury Bond 3.75% 11/15/2043 $2,514,325
The accompanying notes are an integral part of these financial statements. www.rsinvestments.com 19

S C H E D U L E O F I N V E S T M E N T S — R S I N V E S T O R S F U N D
The following is a summary of the inputs used as of June 30, 2015, in valuing the Fund’s investments. For moreinformation on valuation inputs, please refer to Note 1a of the accompanying Notes to Financial Statements.
Valuation Inputs
Investments in Securities(unaudited) Level 1 Level 2 Level 3 Total
Common Stocks $188,464,129 $ — $ — $188,464,129
Repurchase Agreements — 2,463,000 — 2,463,000
Total $ 188,464,129 $ 2,463,000 $ — $ 190,927,129
20 www.rsinvestments.com The accompanying notes are an integral part of these financial statements.

S C H E D U L E O F I N V E S T M E N T S — R S G L O B A L N A T U R A L R E S O U R C E S F U N D
June 30, 2015 (unaudited)Foreign
Currency Shares Value
Common Stocks – 95.0%Chemicals: Diversified – 4.8%Sociedad Quimica y Minera de Chile S.A.,
ADR 9,117,188 $ 146,057,352
146,057,352
Copper – 10.8%First Quantum Minerals Ltd. CAD 18,617,342 243,411,685
HudBay Minerals, Inc. 8,371,325 69,733,137
Taseko Mines Ltd. (1)(2) 22,691,678 12,541,691
325,686,513
Fertilizers – 3.6%The Mosaic Co. 2,330,851 109,200,369
109,200,369
Gold – 3.0%Goldcorp, Inc. 5,497,173 89,054,203
89,054,203
Metals & Minerals: Diversified – 18.5%Iluka Resources Ltd.(1) AUD 21,860,939 129,537,109
Mineral Resources Ltd.(1) AUD 13,326,434 67,861,282
Turquoise Hill Resources Ltd.(2) 94,974,601 359,953,738
557,352,129
Oil: Crude Producers – 54.3%Antero Resources Corp.(2) 4,201,163 144,267,937
Cabot Oil & Gas Corp. 4,678,264 147,552,447
Concho Resources, Inc.(2) 326,181 37,138,969
Denbury Resources, Inc. 9,895,536 62,935,609
EOG Resources, Inc. 1,205,060 105,503,003
Kosmos Energy Ltd.(2) 13,307,484 112,182,090
Laredo Petroleum, Inc.(1)(2) 12,198,882 153,461,936
Noble Energy, Inc. 3,012,965 128,593,346
Ophir Energy PLC(1)(2) GBP 37,863,431 67,345,976
Painted Pony Petroleum Ltd.(2) CAD 4,716,013 30,055,615
Peyto Exploration & Development Corp. CAD 5,178,979 126,592,657
Range Resources Corp. 2,984,954 147,397,029
Rosetta Resources, Inc.(1)(2) 5,729,295 132,575,886
Southwestern Energy Co.(2) 5,105,098 116,038,878
Tourmaline Oil Corp.(2) CAD 4,094,820 123,008,524
1,634,649,902
Total Common Stocks(Cost $3,726,452,118) 2,862,000,468
The accompanying notes are an integral part of these financial statements. www.rsinvestments.com 21

S C H E D U L E O F I N V E S T M E N T S — R S G L O B A L N A T U R A L R E S O U R C E S F U N D
June 30, 2015 (unaudited)PrincipalAmount Value
Repurchase Agreements – 4.7%
Fixed Income Clearing Corp. RepurchaseAgreement, 0.00%, dated 6/30/2015, maturityvalue of $141,418,000, due 7/1/2015(3) $141,418,000 $ 141,418,000
Total Repurchase Agreements(Cost $141,418,000) 141,418,000
Total Investments - 99.7%(Cost $3,867,870,118) 3,003,418,468
Other Assets, Net - 0.3% 9,715,254
Total Net Assets - 100.0% $3,013,133,722
(1) Affiliated issuer. See 2d in Notes to Financial Statements.(2) Non-income-producing security.(3) The table below presents collateral for repurchase agreements.
Security Coupon Maturity Date Value
U.S. Treasury Bond 3.75% 11/15/2043 $144,246,713
Legend:ADR – American Depositary Receipt.
Foreign-Denominated SecurityAUD – Australian DollarCAD – Canadian DollarGBP – Great British Pound
The following is a summary of the inputs used as of June 30, 2015, in valuing the Fund’s investments. For moreinformation on valuation inputs, please refer to Note 1a of the accompanying Notes to Financial Statements.
Valuation Inputs
Investments in Securities(unaudited) Level 1 Level 2 Level 3 Total
Common Stocks $2,862,000,468 $ — $ — $2,862,000,468
Repurchase Agreements — 141,418,000 — 141,418,000
Total $ 2,862,000,468 $ 141,418,000 $ — $ 3,003,418,468
22 www.rsinvestments.com The accompanying notes are an integral part of these financial statements.

This Page Intentionally Left Blank
www.rsinvestments.com 23

F I N A N C I A L I N F O R M A T I O N
Statements of Assets and LiabilitiesAs of June 30, 2015 (unaudited) RS Partners
AssetsInvestments in unaffiliated issuers, at value $1,447,012,195Investments in affiliated issuers, at value 8,591,006
Investments in securities, at value 1,455,603,201Cash —Foreign currency, at value —Receivable for investments sold 6,119,314Dividends receivable 1,352,223Receivable for fund shares subscribed 332,050Prepaid expenses 62,116Total Assets 1,463,468,904
LiabilitiesPayable for investments purchased 5,593,599Payable for fund shares redeemed 3,451,101Payable to adviser 1,223,022Payable to custodian 136,804Accrued trustees’ fees 25,431Payable to distributor 23,974Accrued expenses/other liabilities 793,612Total Liabilities 11,247,543Total Net Assets $ 1,452,221,361
Net Assets Consist of:Paid-in capital $1,215,598,738Accumulated net investment income/(loss) (1,229,614)Accumulated net realized gain/(loss) from investments, foreign currency
transactions and in-kind redemptions 23,907,532Net unrealized appreciation/(depreciation) on investments and translation of
assets and liabilities in foreign currencies 213,944,705Total Net Assets $ 1,452,221,361
Investments in Unaffiliated Issuers, at Cost $1,218,667,329
Investments in Affiliated Issuers, at Cost $ 22,991,058
Foreign Currency, at Cost $ —
Pricing of SharesNet Assets:
Class A $ 672,871,410Class C —Class K 3,874,139Class Y 775,475,812
Shares of Beneficial Interest Outstanding with No Par Value:Class A 21,727,962Class C —Class K 131,056Class Y 24,324,714
Net Asset Value Per Share:Class A $ 30.97Class C —Class K 29.56Class Y 31.88
Sales Charge Class A (Load) 4.75%Maximum Offering Price Per Class A Share $ 32.51
24 www.rsinvestments.com The accompanying notes are an integral part of these financial statements.

F I N A N C I A L I N F O R M A T I O N
RS ValueRS Large Cap
Alpha RS InvestorsRS Global Natural
Resources
$1,338,029,650 $691,781,777 $190,927,129 $2,440,094,588— — — 563,323,880
1,338,029,650 691,781,777 190,927,129 3,003,418,46848,379 — 31,484 —
— — — 9— — — 24,928,413
469,458 375,820 45,630 387,6971,800,575 587,064 195,534 7,400,513
83,469 46,488 35,871 106,2091,340,431,531 692,791,149 191,235,648 3,036,241,309
— — — 1,265,0721,373,230 606,723 541,233 17,713,723
937,683 290,701 130,631 2,694,580— 16,543 — 231,813
19,403 10,565 3,359 56,22819,231 27,327 6,213 29,412
358,516 262,762 90,884 1,116,7592,708,063 1,214,621 772,320 23,107,587
$ 1,337,723,468 $ 691,576,528 $ 190,463,328 $ 3,013,133,722
$1,041,630,701 $497,550,503 $186,583,628 $4,157,894,179372,512 3,367,299 (89,294) (6,414,167)
98,177,542 74,039,954 (13,423,079) (273,890,546)
197,542,713 116,618,772 17,392,073 (864,455,744)$ 1,337,723,468 $ 691,576,528 $ 190,463,328 $ 3,013,133,722
$1,140,486,937 $575,163,005 $173,535,056 $2,858,729,495
$ — $ — $ — $1,009,140,623
$ — $ — $ — $ 9
$ 421,370,242 $606,663,704 $ 54,562,213 $ 600,481,22229,911,444 35,494,559 29,285,534 55,617,605
4,167,369 13,958,518 1,960,121 5,672,611882,274,413 35,459,747 104,655,460 2,351,362,284
12,431,319 10,142,409 4,211,674 24,889,310928,315 654,239 2,396,735 2,478,768126,065 234,220 159,788 245,335
25,855,558 594,004 8,006,699 94,759,255
$ 33.90 $ 59.81 $ 12.95 $ 24.1332.22 54.25 12.22 22.4433.06 59.60 12.27 23.1234.12 59.70 13.07 24.81
4.75% 4.75% 4.75% 4.75%$ 35.59 $ 62.79 $ 13.60 $ 25.33
The accompanying notes are an integral part of these financial statements. www.rsinvestments.com 25

F I N A N C I A L I N F O R M A T I O N
Statements of OperationsFor the Six-Month Period Ended June 30, 2015 (unaudited) RS Partners
Investment IncomeDividends $ 8,776,513
Dividends from affiliated issuers —
Interest 142
Withholding taxes on foreign dividends (50,624)
Total Investment Income 8,726,031
ExpensesInvestment advisory fees 7,795,131
Transfer agent fees 1,119,955
Distribution fees 930,611
Professional fees 122,684
Shareholder reports 85,815
Administrative service fees 64,687
Trustees’ fees 51,126
Custodian fees 48,814
Registration fees 28,042
Insurance expense 26,755
Other expenses 22,951
Total Expenses 10,296,571
Less: Fee waiver by adviser (340,926)
Total Expenses, Net 9,955,645
Net Investment Income/(Loss) (1,229,614)
Realized Gain/(Loss) and Change inUnrealized Appreciation/Depreciation on Investments, Foreign CurrencyTransactions and In-kind RedemptionsNet realized gain/(loss) from investments 29,168,777
Net realized loss from investments in affiliated issuers (171,959)
Net realized loss from foreign currency transactions (37,278)
Net realized gain from in-kind redemptions —
Net change in unrealized appreciation/depreciation on investments (22,150,144)
Net change in unrealized appreciation/depreciation on investments in affiliatedissuers (12,427,158)
Net change in unrealized appreciation/depreciation on translation of assetsand liabilities in foreign currencies (265)
Net Gain/(Loss) on Investments, Foreign Currency Transactions andIn-kind Redemptions (5,618,027)
Net Increase/(Decrease) in Net Assets Resulting from Operations $ (6,847,641)
26 www.rsinvestments.com The accompanying notes are an integral part of these financial statements.
F I N A N C I A L I N F O R M A T I O N
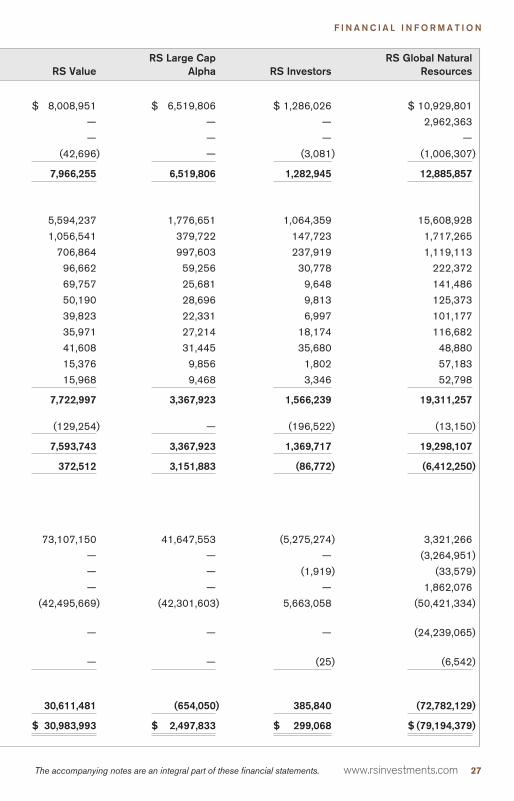
RS ValueRS Large Cap
Alpha RS InvestorsRS Global Natural
Resources
$ 8,008,951 $ 6,519,806 $ 1,286,026 $ 10,929,801
— — — 2,962,363
— — — —
(42,696) — (3,081) (1,006,307)
7,966,255 6,519,806 1,282,945 12,885,857
5,594,237 1,776,651 1,064,359 15,608,928
1,056,541 379,722 147,723 1,717,265
706,864 997,603 237,919 1,119,113
96,662 59,256 30,778 222,372
69,757 25,681 9,648 141,486
50,190 28,696 9,813 125,373
39,823 22,331 6,997 101,177
35,971 27,214 18,174 116,682
41,608 31,445 35,680 48,880
15,376 9,856 1,802 57,183
15,968 9,468 3,346 52,798
7,722,997 3,367,923 1,566,239 19,311,257
(129,254) — (196,522) (13,150)
7,593,743 3,367,923 1,369,717 19,298,107
372,512 3,151,883 (86,772) (6,412,250)
73,107,150 41,647,553 (5,275,274) 3,321,266
— — — (3,264,951)
— — (1,919) (33,579)
— — — 1,862,076
(42,495,669) (42,301,603) 5,663,058 (50,421,334)
— — — (24,239,065)
— — (25) (6,542)
30,611,481 (654,050) 385,840 (72,782,129)
$ 30,983,993 $ 2,497,833 $ 299,068 $ (79,194,379)
The accompanying notes are an integral part of these financial statements. www.rsinvestments.com 27

F I N A N C I A L I N F O R M A T I O N
Statements of Changes in Net AssetsSix-Months-Ended Numbers are unaudited RS Partners
For theSix Months
Ended6/30/15
For theYear Ended
12/31/14Operations
Net investment income/(loss) $ (1,229,614) $ (3,669,969)Net realized gain from investments and foreign
currency transactions 28,959,540 383,728,914Net change in unrealized appreciation/depreciation
on investments and translation of assets andliabilities in foreign currencies (34,577,567) (457,566,876)
Net Increase/(Decrease) in Net Assets Resultingfrom Operations (6,847,641) (77,507,931)
Distributions to ShareholdersNet investment income
Class A — —Class C — —Class K — —Class Y — —
Net realized gain on investmentsClass A — (161,856,174)Class C — —Class K — (846,972)Class Y — (176,090,672)
Total Distributions — (338,793,818)
Capital Share TransactionsProceeds from sales of shares 83,514,535 475,518,463Reinvestment of distributions — 329,290,295Cost of shares redeemed (359,707,464) (825,007,282)Cost of shares redeemed in-kind — (138,910,943)
Net Increase/(Decrease) in Net Assets Resultingfrom Capital Share Transactions (276,192,929) (159,109,467)
Net Increase/(Decrease) in Net Assets (283,040,570) (575,411,216)
Net AssetsBeginning of period 1,735,261,931 2,310,673,147
End of period $1,452,221,361 $1,735,261,931
Accumulated Undistributed Net InvestmentIncome/(Loss) Included in Net Assets $ (1,229,614) $ —
Other Information:SharesSold 2,675,086 11,921,028Reinvested — 10,617,584Redeemed (11,536,024) (21,234,629)Redeemed in-kind — (3,443,292)
Net Increase/(Decrease) (8,860,938) (2,139,309)
28 www.rsinvestments.com The accompanying notes are an integral part of these financial statements.

F I N A N C I A L I N F O R M A T I O N
RS Value RS Large Cap Alpha
For theSix Months
Ended6/30/15
For theYear Ended
12/31/14
For theSix Months
Ended6/30/15
For theYear Ended
12/31/14
$ 372,512 $ 11,359,059 $ 3,151,883 $ 7,623,591
73,107,150 216,210,571 41,647,553 125,206,498
(42,495,669) (83,405,281) (42,301,603) (27,604,155)
30,983,993 144,164,349 2,497,833 105,225,934
— (4,068,377) — (5,212,174)— (113,183) — (63,919)— (31,175) — (69,893)— (10,774,202) — (2,043,742)
— (60,777,666) — (66,219,711)— (4,492,092) — (4,256,029)— (612,247) — (1,743,700)— (112,929,517) — (19,906,901)
— (193,798,459) — (99,516,069)
198,824,464 329,646,664 21,590,208 72,459,987— 187,916,999 — 95,652,762
(180,626,006) (499,816,537) (206,341,105) (145,652,514)— — — —
18,198,458 17,747,126 (184,750,897) 22,460,23549,182,451 (31,886,984) (182,253,064) 28,170,100
1,288,541,017 1,320,428,001 873,829,592 845,659,492
$1,337,723,468 $1,288,541,017 $ 691,576,528 $ 873,829,592
$ 372,512 $ — $ 3,367,299 $ 215,416
5,746,732 8,930,299 366,482 1,183,311— 5,752,188 — 1,631,771
(5,307,039) (13,682,307) (3,560,098) (2,372,305)— — — —
439,693 1,000,180 (3,193,616) 442,777
The accompanying notes are an integral part of these financial statements. www.rsinvestments.com 29

F I N A N C I A L I N F O R M A T I O N
Statements of Changes in Net Assets (continued)Six-Months-Ended Numbers are unaudited RS Investors
For theSix Months
Ended6/30/15
For theYear Ended
12/31/14Operations
Net investment income/(loss) $ (86,772) $ 2,618,324Net realized gain/(loss) from investments, foreign
currency transactions and in-kind redemptions (5,277,193) 1,422,573Net change in unrealized appreciation/depreciation on
investments and translation of assets and liabilities inforeign currencies 5,663,033 2,423,868
Net Increase/(Decrease) in Net Assets Resultingfrom Operations 299,068 6,464,765
Distributions to ShareholdersNet investment income
Class A — (620,581)Class C — (181,578)Class K — (15,605)Class Y — (1,796,849)
Net realized gain on investmentsClass A — (2,567,017)Class C — (1,270,050)Class K — (81,496)Class Y — (5,372,611)
Total Distributions — (11,905,787)
Capital Share TransactionsProceeds from sales of shares 22,311,045 243,598,882Reinvestment of distributions — 7,560,089Cost of shares redeemed (76,030,089) (115,837,384)Cost of shares redeemed in-kind — —
Net Increase/(Decrease) in Net Assets Resultingfrom Capital Share Transactions (53,719,044) 135,321,587
Net Increase/(Decrease) in Net Assets (53,419,976) 129,880,565
Net AssetsBeginning of period 243,883,304 114,002,739
End of period $190,463,328 $ 243,883,304
Distributions in Excess of Net Investment IncomeIncluded in Net Assets $ — $ (2,522)
Accumulated Undistributed Net Investment LossIncluded in Net Assets $ (89,294) $ —
Other Information:SharesSold 1,729,888 18,230,327Reinvested — 595,492Redeemed (5,853,226) (8,667,673)Redeemed in-kind — —
Net Increase/(Decrease) (4,123,338) 10,158,146
30 www.rsinvestments.com The accompanying notes are an integral part of these financial statements.

F I N A N C I A L I N F O R M A T I O N
RS Global Natural Resources
For theSix Months
Ended6/30/15
For theYear Ended
12/31/14
$ (6,412,250) $ 6,148,862
1,884,812 (131,696,047)
(74,666,941) (894,257,964)
(79,194,379) (1,019,805,149)
— (321,500)— (34,998)— (2,471)— (1,070,690)
— (53,670,914)— (5,842,539)— (412,466)— (178,739,897)
— (240,095,475)
789,496,763 1,354,014,298— 221,041,107
(571,200,875) (2,106,598,978)(44,647,225) (77,376,760)
173,648,663 (608,920,333)94,454,284 (1,868,820,957)
2,918,679,438 4,787,500,395
$3,013,133,722 $ 2,918,679,438
$ — $ (1,917)
$ (6,414,167) $ —
31,251,103 39,224,159
— 8,800,146(22,465,814) (65,412,182)
(1,879,092) (2,054,233)
6,906,197 (19,442,110)
The accompanying notes are an integral part of these financial statements. www.rsinvestments.com 31

F I N A N C I A L I N F O R M A T I O N
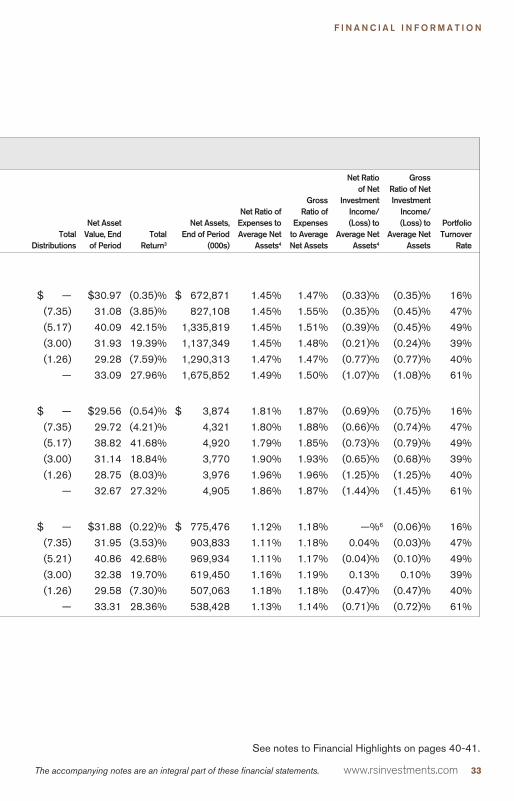
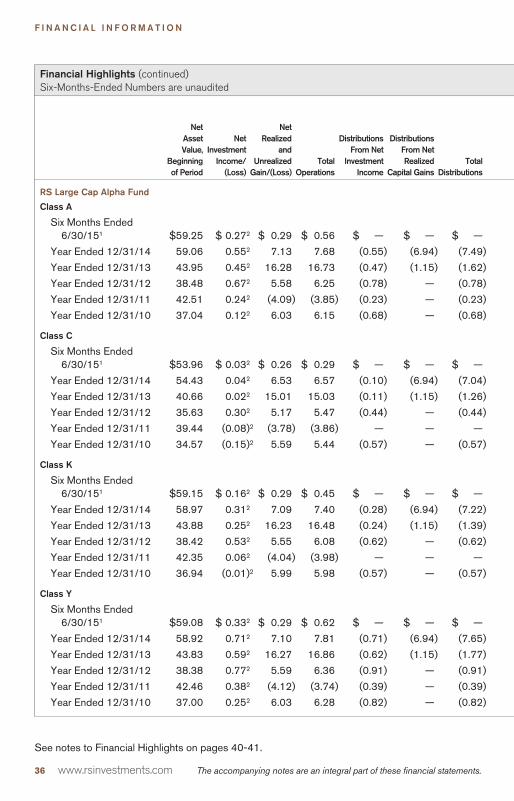
The Financial Highlights table is intended to help you understand each Fund’s financialperformance for the past six reporting periods. Certain information reflects financialresults for a single Fund share. The total returns in the table represent the rate that aninvestor would have earned (or lost) on an investment in each Fund (assumingreinvestment of all distributions).
Financial HighlightsSix-Months-Ended Numbers are unaudited
Net AssetValue,
Beginningof Period
NetInvestment
Income/(Loss)
Net Realizedand
UnrealizedGain/(Loss)
TotalOperations
DistributionsFrom Net
InvestmentIncome
DistributionsFrom NetRealized
Capital Gains
RS Partners Fund
Class A
Six Months Ended 6/30/151 $31.08 $(0.05)2 $ (0.06) $ (0.11) $ — $ —
Year Ended 12/31/14 40.09 (0.14)2 (1.52) (1.66) — (7.35)
Year Ended 12/31/13 31.93 (0.15) 13.48 13.33 — (5.17)
Year Ended 12/31/12 29.28 (0.09) 5.74 5.65 — (3.00)
Year Ended 12/31/11 33.09 (0.27) (2.28) (2.55) — (1.26)
Year Ended 12/31/10 25.86 (0.33) 7.56 7.23 — —
Class K
Six Months Ended 6/30/151 $29.72 $(0.10)2 $ (0.06) $ (0.16) $ — $ —
Year Ended 12/31/14 38.82 (0.25)2 (1.50) (1.75) — (7.35)
Year Ended 12/31/13 31.14 (0.18) 13.03 12.85 — (5.17)
Year Ended 12/31/12 28.75 (0.39) 5.78 5.39 — (3.00)
Year Ended 12/31/11 32.67 (0.51) (2.15) (2.66) — (1.26)
Year Ended 12/31/10 25.66 (1.21) 8.22 7.01 — —
Class Y
Six Months Ended 6/30/151 $31.95 $ —2,5 $ (0.07) $ (0.07) $ — $ —
Year Ended 12/31/14 40.86 0.012 (1.57) (1.56) — (7.35)
Year Ended 12/31/13 32.38 (0.06) 13.75 13.69 (0.04) (5.17)
Year Ended 12/31/12 29.58 0.02 5.78 5.80 — (3.00)
Year Ended 12/31/11 33.31 (0.16) (2.31) (2.47) — (1.26)
Year Ended 12/31/10 25.95 (0.21) 7.57 7.36 — —
See notes to Financial Highlights on pages 40-41.
32 www.rsinvestments.com The accompanying notes are an integral part of these financial statements.
F I N A N C I A L I N F O R M A T I O N
TotalDistributions
Net AssetValue, End
of PeriodTotal
Return3
Net Assets,End of Period
(000s)
Net Ratio ofExpenses toAverage Net
Assets4
GrossRatio of
Expensesto AverageNet Assets
Net Ratioof Net
InvestmentIncome/(Loss) to
Average NetAssets4
GrossRatio of NetInvestment
Income/(Loss) to
Average NetAssets
PortfolioTurnover
Rate
$ — $30.97 (0.35)% $ 672,871 1.45% 1.47% (0.33)% (0.35)% 16%
(7.35) 31.08 (3.85)% 827,108 1.45% 1.55% (0.35)% (0.45)% 47%
(5.17) 40.09 42.15% 1,335,819 1.45% 1.51% (0.39)% (0.45)% 49%
(3.00) 31.93 19.39% 1,137,349 1.45% 1.48% (0.21)% (0.24)% 39%
(1.26) 29.28 (7.59)% 1,290,313 1.47% 1.47% (0.77)% (0.77)% 40%
— 33.09 27.96% 1,675,852 1.49% 1.50% (1.07)% (1.08)% 61%
$ — $29.56 (0.54)% $ 3,874 1.81% 1.87% (0.69)% (0.75)% 16%
(7.35) 29.72 (4.21)% 4,321 1.80% 1.88% (0.66)% (0.74)% 47%
(5.17) 38.82 41.68% 4,920 1.79% 1.85% (0.73)% (0.79)% 49%
(3.00) 31.14 18.84% 3,770 1.90% 1.93% (0.65)% (0.68)% 39%
(1.26) 28.75 (8.03)% 3,976 1.96% 1.96% (1.25)% (1.25)% 40%
— 32.67 27.32% 4,905 1.86% 1.87% (1.44)% (1.45)% 61%
$ — $31.88 (0.22)% $ 775,476 1.12% 1.18% —%6 (0.06)% 16%
(7.35) 31.95 (3.53)% 903,833 1.11% 1.18% 0.04% (0.03)% 47%
(5.21) 40.86 42.68% 969,934 1.11% 1.17% (0.04)% (0.10)% 49%
(3.00) 32.38 19.70% 619,450 1.16% 1.19% 0.13% 0.10% 39%
(1.26) 29.58 (7.30)% 507,063 1.18% 1.18% (0.47)% (0.47)% 40%
— 33.31 28.36% 538,428 1.13% 1.14% (0.71)% (0.72)% 61%
See notes to Financial Highlights on pages 40-41.
The accompanying notes are an integral part of these financial statements. www.rsinvestments.com 33

F I N A N C I A L I N F O R M A T I O N
Financial Highlights (continued)Six-Months-Ended Numbers are unaudited
Net AssetValue,
Beginningof Period
NetInvestment
Income/(Loss)
Net Realizedand
UnrealizedGain/(Loss)
TotalOperations
DistributionsFrom Net
InvestmentIncome
DistributionsFrom NetRealized
Capital Gains
RS Value Fund
Class A
Six Months Ended 6/30/151 $33.04 $(0.01)2 $ 0.87 $ 0.86 $ — $ —
Year Ended 12/31/14 34.76 0.252 3.71 3.96 (0.36) (5.32)
Year Ended 12/31/13 25.93 (0.07) 9.82 9.75 (0.06) (0.86)
Year Ended 12/31/12 23.04 0.26 2.92 3.18 (0.29) —
Year Ended 12/31/11 25.91 (0.14) (2.73) (2.87) — —
Year Ended 12/31/10 20.65 (0.13) 5.39 5.26 — —
Class C
Six Months Ended 6/30/151 $31.54 $(0.14)2 $ 0.82 $ 0.68 $ — $ —
Year Ended 12/31/14 33.47 —2,5 3.52 3.52 (0.13) (5.32)
Year Ended 12/31/13 25.13 (0.35) 9.55 9.20 — (0.86)
Year Ended 12/31/12 22.35 (0.04) 2.94 2.90 (0.12) —
Year Ended 12/31/11 25.33 (0.27) (2.71) (2.98) — —
Year Ended 12/31/10 20.33 (0.21) 5.21 5.00 — —
Class K
Six Months Ended 6/30/151 $32.29 $(0.08)2 $ 0.85 $ 0.77 $ — $ —
Year Ended 12/31/14 34.15 0.132 3.60 3.73 (0.27) (5.32)
Year Ended 12/31/13 25.54 (0.31) 9.78 9.47 — (0.86)
Year Ended 12/31/12 22.73 0.21 2.83 3.04 (0.23) —
Year Ended 12/31/11 25.66 (0.16) (2.77) (2.93) — —
Year Ended 12/31/10 20.53 (0.13) 5.26 5.13 — —
Class Y
Six Months Ended 6/30/151 $33.23 $ 0.032 $ 0.86 $ 0.89 $ — $ —
Year Ended 12/31/14 34.99 0.382 3.69 4.07 (0.51) (5.32)
Year Ended 12/31/13 26.09 0.02 9.88 9.90 (0.14) (0.86)
Year Ended 12/31/12 23.19 0.43 2.84 3.27 (0.37) —
Year Ended 12/31/11 26.01 (0.02) (2.80) (2.82) — —
Year Ended 12/31/10 20.66 (0.05) 5.40 5.35 — —
See notes to Financial Highlights on pages 40-41.
34 www.rsinvestments.com The accompanying notes are an integral part of these financial statements.
F I N A N C I A L I N F O R M A T I O N
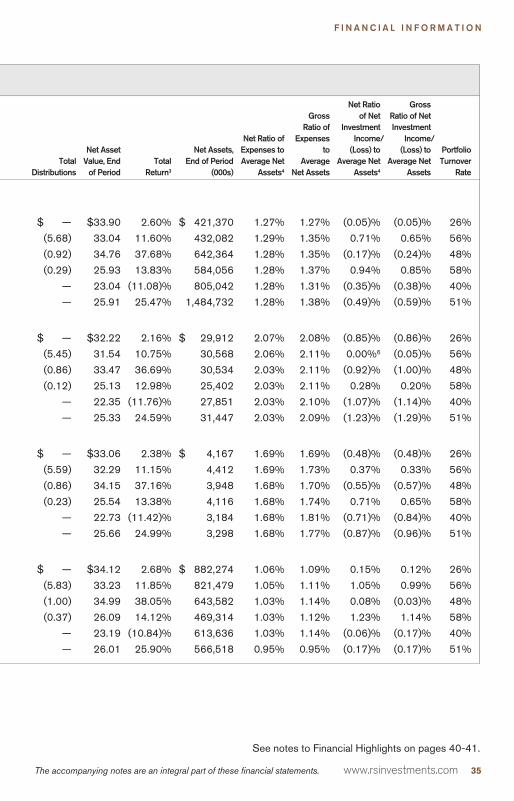
TotalDistributions
Net AssetValue, End
of PeriodTotal
Return3
Net Assets,End of Period
(000s)
Net Ratio ofExpenses toAverage Net
Assets4
GrossRatio of
Expensesto
AverageNet Assets
Net Ratioof Net
InvestmentIncome/
(Loss) toAverage Net
Assets4
GrossRatio of NetInvestment
Income/(Loss) to
Average NetAssets
PortfolioTurnover
Rate
$ — $33.90 2.60% $ 421,370 1.27% 1.27% (0.05)% (0.05)% 26%
(5.68) 33.04 11.60% 432,082 1.29% 1.35% 0.71% 0.65% 56%
(0.92) 34.76 37.68% 642,364 1.28% 1.35% (0.17)% (0.24)% 48%
(0.29) 25.93 13.83% 584,056 1.28% 1.37% 0.94% 0.85% 58%
— 23.04 (11.08)% 805,042 1.28% 1.31% (0.35)% (0.38)% 40%
— 25.91 25.47% 1,484,732 1.28% 1.38% (0.49)% (0.59)% 51%
$ — $32.22 2.16% $ 29,912 2.07% 2.08% (0.85)% (0.86)% 26%
(5.45) 31.54 10.75% 30,568 2.06% 2.11% 0.00%6 (0.05)% 56%
(0.86) 33.47 36.69% 30,534 2.03% 2.11% (0.92)% (1.00)% 48%
(0.12) 25.13 12.98% 25,402 2.03% 2.11% 0.28% 0.20% 58%
— 22.35 (11.76)% 27,851 2.03% 2.10% (1.07)% (1.14)% 40%
— 25.33 24.59% 31,447 2.03% 2.09% (1.23)% (1.29)% 51%
$ — $33.06 2.38% $ 4,167 1.69% 1.69% (0.48)% (0.48)% 26%
(5.59) 32.29 11.15% 4,412 1.69% 1.73% 0.37% 0.33% 56%
(0.86) 34.15 37.16% 3,948 1.68% 1.70% (0.55)% (0.57)% 48%
(0.23) 25.54 13.38% 4,116 1.68% 1.74% 0.71% 0.65% 58%
— 22.73 (11.42)% 3,184 1.68% 1.81% (0.71)% (0.84)% 40%
— 25.66 24.99% 3,298 1.68% 1.77% (0.87)% (0.96)% 51%
$ — $34.12 2.68% $ 882,274 1.06% 1.09% 0.15% 0.12% 26%
(5.83) 33.23 11.85% 821,479 1.05% 1.11% 1.05% 0.99% 56%
(1.00) 34.99 38.05% 643,582 1.03% 1.14% 0.08% (0.03)% 48%
(0.37) 26.09 14.12% 469,314 1.03% 1.12% 1.23% 1.14% 58%
— 23.19 (10.84)% 613,636 1.03% 1.14% (0.06)% (0.17)% 40%
— 26.01 25.90% 566,518 0.95% 0.95% (0.17)% (0.17)% 51%
See notes to Financial Highlights on pages 40-41.
The accompanying notes are an integral part of these financial statements. www.rsinvestments.com 35
F I N A N C I A L I N F O R M A T I O N
Financial Highlights (continued)Six-Months-Ended Numbers are unaudited
NetAssetValue,
Beginningof Period
NetInvestment
Income/(Loss)
NetRealized
andUnrealized
Gain/(Loss)Total
Operations
DistributionsFrom Net
InvestmentIncome
DistributionsFrom NetRealized
Capital GainsTotal
Distributions
RS Large Cap Alpha Fund
Class A
Six Months Ended6/30/151 $59.25 $ 0.272 $ 0.29 $ 0.56 $ — $ — $ —
Year Ended 12/31/14 59.06 0.552 7.13 7.68 (0.55) (6.94) (7.49)
Year Ended 12/31/13 43.95 0.452 16.28 16.73 (0.47) (1.15) (1.62)
Year Ended 12/31/12 38.48 0.672 5.58 6.25 (0.78) — (0.78)
Year Ended 12/31/11 42.51 0.242 (4.09) (3.85) (0.23) — (0.23)
Year Ended 12/31/10 37.04 0.122 6.03 6.15 (0.68) — (0.68)
Class C
Six Months Ended6/30/151 $53.96 $ 0.032 $ 0.26 $ 0.29 $ — $ — $ —
Year Ended 12/31/14 54.43 0.042 6.53 6.57 (0.10) (6.94) (7.04)
Year Ended 12/31/13 40.66 0.022 15.01 15.03 (0.11) (1.15) (1.26)
Year Ended 12/31/12 35.63 0.302 5.17 5.47 (0.44) — (0.44)
Year Ended 12/31/11 39.44 (0.08)2 (3.78) (3.86) — — —
Year Ended 12/31/10 34.57 (0.15)2 5.59 5.44 (0.57) — (0.57)
Class K
Six Months Ended6/30/151 $59.15 $ 0.162 $ 0.29 $ 0.45 $ — $ — $ —
Year Ended 12/31/14 58.97 0.312 7.09 7.40 (0.28) (6.94) (7.22)
Year Ended 12/31/13 43.88 0.252 16.23 16.48 (0.24) (1.15) (1.39)
Year Ended 12/31/12 38.42 0.532 5.55 6.08 (0.62) — (0.62)
Year Ended 12/31/11 42.35 0.062 (4.04) (3.98) — — —
Year Ended 12/31/10 36.94 (0.01)2 5.99 5.98 (0.57) — (0.57)
Class Y
Six Months Ended6/30/151 $59.08 $ 0.332 $ 0.29 $ 0.62 $ — $ — $ —
Year Ended 12/31/14 58.92 0.712 7.10 7.81 (0.71) (6.94) (7.65)
Year Ended 12/31/13 43.83 0.592 16.27 16.86 (0.62) (1.15) (1.77)
Year Ended 12/31/12 38.38 0.772 5.59 6.36 (0.91) — (0.91)
Year Ended 12/31/11 42.46 0.382 (4.12) (3.74) (0.39) — (0.39)
Year Ended 12/31/10 37.00 0.252 6.03 6.28 (0.82) — (0.82)
See notes to Financial Highlights on pages 40-41.
36 www.rsinvestments.com The accompanying notes are an integral part of these financial statements.
F I N A N C I A L I N F O R M A T I O N
IncreaseFrom
RegulatorySettlements
Net AssetValue,
Endof Period Total Return3
Net Assets,End of Period
(000s)
Net Ratio ofExpenses toAverage Net
Assets4
GrossRatio of
Expensesto AverageNet Assets
Net Ratioof Net
InvestmentIncome/
(Loss) toAverage Net
Assets4
GrossRatio of NetInvestment
Income/(Loss) to
Average NetAssets
PortfolioTurnover
Rate
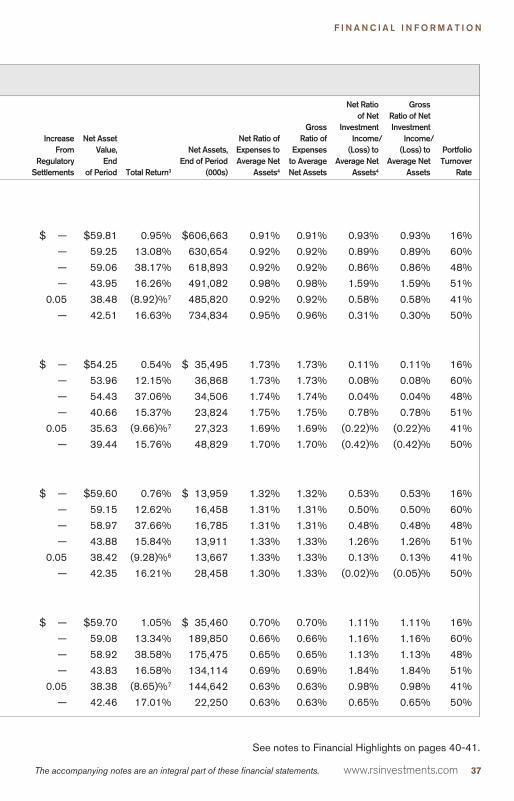
$ — $59.81 0.95% $606,663 0.91% 0.91% 0.93% 0.93% 16%
— 59.25 13.08% 630,654 0.92% 0.92% 0.89% 0.89% 60%
— 59.06 38.17% 618,893 0.92% 0.92% 0.86% 0.86% 48%
— 43.95 16.26% 491,082 0.98% 0.98% 1.59% 1.59% 51%
0.05 38.48 (8.92)%7 485,820 0.92% 0.92% 0.58% 0.58% 41%
— 42.51 16.63% 734,834 0.95% 0.96% 0.31% 0.30% 50%
$ — $54.25 0.54% $ 35,495 1.73% 1.73% 0.11% 0.11% 16%
— 53.96 12.15% 36,868 1.73% 1.73% 0.08% 0.08% 60%
— 54.43 37.06% 34,506 1.74% 1.74% 0.04% 0.04% 48%
— 40.66 15.37% 23,824 1.75% 1.75% 0.78% 0.78% 51%
0.05 35.63 (9.66)%7 27,323 1.69% 1.69% (0.22)% (0.22)% 41%
— 39.44 15.76% 48,829 1.70% 1.70% (0.42)% (0.42)% 50%
$ — $59.60 0.76% $ 13,959 1.32% 1.32% 0.53% 0.53% 16%
— 59.15 12.62% 16,458 1.31% 1.31% 0.50% 0.50% 60%
— 58.97 37.66% 16,785 1.31% 1.31% 0.48% 0.48% 48%
— 43.88 15.84% 13,911 1.33% 1.33% 1.26% 1.26% 51%
0.05 38.42 (9.28)%6 13,667 1.33% 1.33% 0.13% 0.13% 41%
— 42.35 16.21% 28,458 1.30% 1.33% (0.02)% (0.05)% 50%
$ — $59.70 1.05% $ 35,460 0.70% 0.70% 1.11% 1.11% 16%
— 59.08 13.34% 189,850 0.66% 0.66% 1.16% 1.16% 60%
— 58.92 38.58% 175,475 0.65% 0.65% 1.13% 1.13% 48%
— 43.83 16.58% 134,114 0.69% 0.69% 1.84% 1.84% 51%
0.05 38.38 (8.65)%7 144,642 0.63% 0.63% 0.98% 0.98% 41%
— 42.46 17.01% 22,250 0.63% 0.63% 0.65% 0.65% 50%
See notes to Financial Highlights on pages 40-41.
The accompanying notes are an integral part of these financial statements. www.rsinvestments.com 37

F I N A N C I A L I N F O R M A T I O N
Financial Highlights (continued)Six-Months-Ended Numbers are unaudited
Net AssetValue,
Beginningof Period
NetInvestment
Income/(Loss)
NetRealized and
UnrealizedGain/(Loss)
TotalOperations
DistributionsFrom Net
InvestmentIncome
DistributionsFrom NetRealized
Capital Gains
RS Investors Fund
Class A
Six Months Ended 6/30/151 $12.95 $(0.01)2 $ 0.01 $ — $ — $ —
Year Ended 12/31/14 13.02 0.142 0.42 0.56 (0.12) (0.51)
Year Ended 12/31/13 8.96 (0.02)2 4.14 4.12 —5 (0.06)
Year Ended 12/31/12 7.48 0.122 1.48 1.60 (0.12) —
Year Ended 12/31/11 7.88 (0.01)2 (0.39) (0.40) — —
Year Ended 12/31/10 6.31 (0.01)2 1.58 1.57 — —
Class C
Six Months Ended 6/30/151 $12.26 $(0.05)2 $ 0.01 $(0.04) $ — $ —
Year Ended 12/31/14 12.40 0.002 0.42 0.44 (0.07) (0.51)
Year Ended 12/31/13 8.60 (0.11)2 3.97 3.86 —5 (0.06)
Year Ended 12/31/12 7.16 0.052 1.42 1.47 (0.03) —
Year Ended 12/31/11 7.60 (0.06)2 (0.38) (0.44) — —
Year Ended 12/31/10 6.09 (0.03)2 1.54 1.51 — —
Class K
Six Months Ended 6/30/151 $12.30 $(0.04)2 $ 0.01 $(0.03) $ — $ —
Year Ended 12/31/14 12.43 0.062 0.42 0.48 (0.10) (0.51)
Year Ended 12/31/13 8.59 (0.07)2 3.97 3.90 —5 (0.06)
Year Ended 12/31/12 7.16 0.092 1.42 1.51 (0.08) —
Year Ended 12/31/11 7.57 (0.03)2 (0.38) (0.41) — —
Year Ended 12/31/10 6.07 (0.01)2 1.51 1.50 — —
Class Y
Six Months Ended 6/30/151 $13.05 $ 0.012 $ 0.01 $ 0.02 $ — $ —
Year Ended 12/31/14 13.12 0.202 0.41 0.61 (0.17) (0.51)
Year Ended 12/31/13 9.01 0.012 4.17 4.18 (0.01) (0.06)
Year Ended 12/31/12 7.52 0.112 1.53 1.64 (0.15) —
Year Ended 12/31/11 7.92 —2,5 (0.40) (0.40) — —
Year Ended 12/31/10 6.35 (0.01)2 1.58 1.57 — —
See notes to Financial Highlights on pages 40-41.
38 www.rsinvestments.com The accompanying notes are an integral part of these financial statements.

F I N A N C I A L I N F O R M A T I O N
TotalDistributions
Net AssetValue,
Endof Period
TotalReturn3
Net Assets,End of Period
(000s)
Net Ratio ofExpenses toAverage Net
Assets4
GrossRatio of
Expensesto AverageNet Assets
Net Ratioof Net
InvestmentIncome/
(Loss) toAverage Net
Assets4
GrossRatio of NetInvestment
Income/(Loss) to
Average NetAssets
PortfolioTurnover
Rate
$ — $12.95 0.00% $ 54,562 1.33% 1.55% (0.11)% (0.33)% 29%
(0.63) 12.95 4.39% 67,364 1.32% 1.52% 1.04% 0.84% 83%
(0.06) 13.02 46.04% 35,159 1.30% 1.89% (0.23)% (0.82)% 128%
(0.12) 8.96 21.46% 12,183 1.30% 2.28% 1.42% 0.44% 97%
— 7.48 (5.08)% 11,715 1.22% 2.07% (0.11)% (0.96)% 55%
— 7.88 24.88% 13,004 1.05% 2.18% (0.18)% (1.31)% 62%
$ — $12.22 (0.33)% $ 29,286 2.07% 2.31% (0.85)% (1.09)% 29%
(0.58) 12.26 3.63% 31,819 2.07% 2.29% 0.18% (0.04)% 83%
(0.06) 12.40 44.94% 6,473 2.05% 2.66% (0.99)% (1.59)% 128%
(0.03) 8.60 20.59% 588 2.05% 3.31% 0.62% (0.64)% 97%
— 7.16 (5.79)% 642 1.87% 2.99% (0.75)% (1.87)% 55%
— 7.60 24.79% 548 1.34% 3.57% (0.43)% (2.66)% 62%
$ — $12.27 (0.24)% $ 1,960 1.88% 1.94% (0.67)% (0.73)% 29%
(0.61) 12.30 3.90% 2,077 1.91% 1.97% 0.47% 0.41% 83%
(0.06) 12.43 45.46% 628 1.70% 2.56% (0.66)% (1.51)% 128%
(0.08) 8.59 21.04% 211 1.70% 3.22% 1.17% (0.35)% 97%
— 7.16 (5.42)% 151 1.52% 2.65% (0.40)% (1.53)% 55%
— 7.57 24.71% 133 1.05% 2.83% (0.16)% (1.94)% 62%
$ — $13.07 0.15% $104,655 1.05% 1.20% 0.14% (0.01)% 29%
(0.68) 13.05 4.72% 142,623 1.05% 1.17% 1.49% 1.37% 83%
(0.07) 13.12 46.45% 71,743 1.05% 1.44% 0.04% (0.34)% 128%
(0.15) 9.01 21.86% 2,382 1.05% 1.91% 1.38% 0.52% 97%
— 7.52 (5.05)% 2,954 1.05% 1.72% 0.05% (0.62)% 55%
— 7.92 24.72% 3,778 1.05% 1.80% (0.17)% (0.92)% 62%
See notes to Financial Highlights on pages 40-41.
The accompanying notes are an integral part of these financial statements. www.rsinvestments.com 39

F I N A N C I A L I N F O R M A T I O N
Financial Highlights (continued)Six-Months-Ended Numbers are unaudited
Net AssetValue,
Beginningof Period
NetInvestment
Income/(Loss)
Net Realizedand
UnrealizedGain/(Loss)
TotalOperations
DistributionsFrom Net
InvestmentIncome
DistributionsFrom NetRealized
Capital Gains
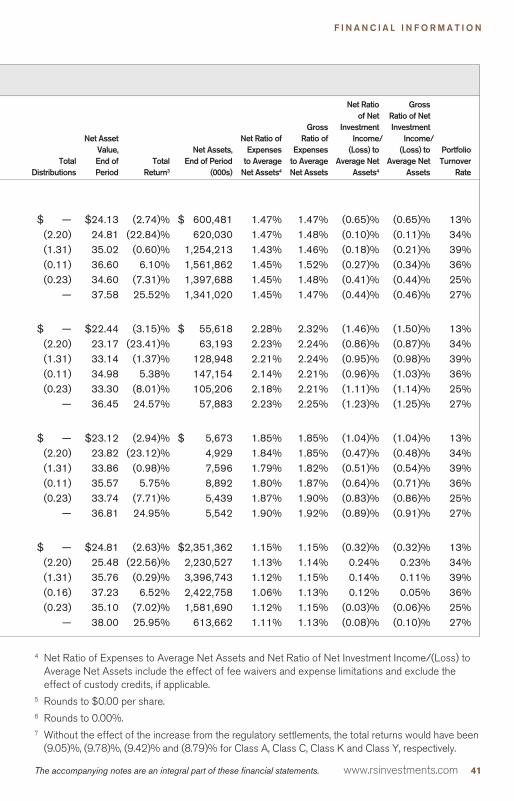
RS Global Natural Resources FundClass A
Six Months Ended 6/30/151 $24.81 $(0.08)2 $(0.60) $(0.68) $ — $ —Year Ended 12/31/14 35.02 (0.04)2 (7.97) (8.01) (0.01) (2.19)Year Ended 12/31/13 36.60 (0.07)2 (0.20) (0.27) — (1.31)Year Ended 12/31/12 34.60 (0.10)2 2.21 2.11 — (0.11)Year Ended 12/31/11 37.58 (0.15)2 (2.60) (2.75) — (0.23)Year Ended 12/31/10 29.94 (0.14)2 7.78 7.64 — —
Class C
Six Months Ended 6/30/151 $23.17 $(0.17)2 $(0.56) $(0.73) $ — $ —Year Ended 12/31/14 33.14 (0.29)2 (7.48) (7.77) (0.01) (2.19)Year Ended 12/31/13 34.98 (0.34)2 (0.19) (0.53) — (1.31)Year Ended 12/31/12 33.30 (0.33)2 2.12 1.79 — (0.11)Year Ended 12/31/11 36.45 (0.40)2 (2.52) (2.92) — (0.23)Year Ended 12/31/10 29.26 (0.38)2 7.57 7.19 — —
Class K
Six Months Ended 6/30/151 $23.82 $(0.13)2 $(0.57) $(0.70) $ — $ —Year Ended 12/31/14 33.86 (0.16)2 (7.68) (7.84) (0.01) (2.19)Year Ended 12/31/13 35.57 (0.18)2 (0.22) (0.40) — (1.31)Year Ended 12/31/12 33.74 (0.22)2 2.16 1.94 — (0.11)Year Ended 12/31/11 36.81 (0.30)2 (2.54) (2.84) — (0.23)Year Ended 12/31/10 29.46 (0.28)2 7.63 7.35 — —
Class Y
Six Months Ended 6/30/151 $25.48 $(0.04)2 $(0.63) $(0.67) $ — $ —Year Ended 12/31/14 35.76 0.092 (8.17) (8.08) (0.01) (2.19)Year Ended 12/31/13 37.23 0.062 (0.22) (0.16) — (1.31)Year Ended 12/31/12 35.10 0.042 2.25 2.29 (0.05) (0.11)Year Ended 12/31/11 38.00 (0.01)2 (2.66) (2.67) — (0.23)Year Ended 12/31/10 30.17 (0.02)2 7.85 7.83 — —
Distributions reflect actual per-share amounts distributed for the period.
1 Ratios for periods less than one year have been annualized, except for total return and portfolioturnover rate.
2 Calculated based on the average shares outstanding during the period.3 Initial sales charges or contingent deferred sales charges are not reflected in the calculation of
total return.
40 www.rsinvestments.com The accompanying notes are an integral part of these financial statements.
F I N A N C I A L I N F O R M A T I O N
TotalDistributions
Net AssetValue,End ofPeriod
TotalReturn3
Net Assets,End of Period
(000s)
Net Ratio ofExpenses
to AverageNet Assets4
GrossRatio of
Expensesto AverageNet Assets
Net Ratioof Net
InvestmentIncome/
(Loss) toAverage Net
Assets4
GrossRatio of NetInvestment
Income/(Loss) to
Average NetAssets
PortfolioTurnover
Rate
$ — $24.13 (2.74)% $ 600,481 1.47% 1.47% (0.65)% (0.65)% 13%(2.20) 24.81 (22.84)% 620,030 1.47% 1.48% (0.10)% (0.11)% 34%(1.31) 35.02 (0.60)% 1,254,213 1.43% 1.46% (0.18)% (0.21)% 39%(0.11) 36.60 6.10% 1,561,862 1.45% 1.52% (0.27)% (0.34)% 36%(0.23) 34.60 (7.31)% 1,397,688 1.45% 1.48% (0.41)% (0.44)% 25%
— 37.58 25.52% 1,341,020 1.45% 1.47% (0.44)% (0.46)% 27%
$ — $22.44 (3.15)% $ 55,618 2.28% 2.32% (1.46)% (1.50)% 13%(2.20) 23.17 (23.41)% 63,193 2.23% 2.24% (0.86)% (0.87)% 34%(1.31) 33.14 (1.37)% 128,948 2.21% 2.24% (0.95)% (0.98)% 39%(0.11) 34.98 5.38% 147,154 2.14% 2.21% (0.96)% (1.03)% 36%(0.23) 33.30 (8.01)% 105,206 2.18% 2.21% (1.11)% (1.14)% 25%
— 36.45 24.57% 57,883 2.23% 2.25% (1.23)% (1.25)% 27%
$ — $23.12 (2.94)% $ 5,673 1.85% 1.85% (1.04)% (1.04)% 13%(2.20) 23.82 (23.12)% 4,929 1.84% 1.85% (0.47)% (0.48)% 34%(1.31) 33.86 (0.98)% 7,596 1.79% 1.82% (0.51)% (0.54)% 39%(0.11) 35.57 5.75% 8,892 1.80% 1.87% (0.64)% (0.71)% 36%(0.23) 33.74 (7.71)% 5,439 1.87% 1.90% (0.83)% (0.86)% 25%
— 36.81 24.95% 5,542 1.90% 1.92% (0.89)% (0.91)% 27%
$ — $24.81 (2.63)% $2,351,362 1.15% 1.15% (0.32)% (0.32)% 13%(2.20) 25.48 (22.56)% 2,230,527 1.13% 1.14% 0.24% 0.23% 34%(1.31) 35.76 (0.29)% 3,396,743 1.12% 1.15% 0.14% 0.11% 39%(0.16) 37.23 6.52% 2,422,758 1.06% 1.13% 0.12% 0.05% 36%(0.23) 35.10 (7.02)% 1,581,690 1.12% 1.15% (0.03)% (0.06)% 25%
— 38.00 25.95% 613,662 1.11% 1.13% (0.08)% (0.10)% 27%
4 Net Ratio of Expenses to Average Net Assets and Net Ratio of Net Investment Income/(Loss) toAverage Net Assets include the effect of fee waivers and expense limitations and exclude theeffect of custody credits, if applicable.
5 Rounds to $0.00 per share.6 Rounds to 0.00%.7 Without the effect of the increase from the regulatory settlements, the total returns would have been
(9.05)%, (9.78)%, (9.42)% and (8.79)% for Class A, Class C, Class K and Class Y, respectively.
The accompanying notes are an integral part of these financial statements. www.rsinvestments.com 41

N O T E S T O F I N A N C I A L S T A T E M E N T S ( U N A U D I T E D )
Notes to Financial Statements
June 30, 2015 (unaudited)
RS Investment Trust (the “Trust”), a Massachusetts business trust organized onMay 11, 1987, is registered under the Investment Company Act of 1940, as amended(the “1940 Act”), as an open-end management investment company. These financialstatements relate to five series offered by the Trust: RS Partners Fund, RS Value Fund,RS Large Cap Alpha Fund, RS Investors Fund and RS Global Natural Resources Fund(each a “Fund,” collectively the “Funds”). All of the Funds are diversified funds, otherthan RS Investors Fund, which is a non-diversified fund. The financial statements for theother remaining series of the Trust are presented in separate reports.
RS Partners Fund offers Class A, K and Y shares. RS Value Fund, RS Large Cap AlphaFund, RS Investors Fund and RS Global Natural Resources Fund offer Class A, C, Kand Y shares. The various classes differ principally in their respective sales charges,transfer agent expenses, and other expenses. In general, all classes of shares haveidentical rights to earnings, assets and voting privileges, except for certain differences,including class-specific expenses and voting rights with respect to matters affectingfewer than all classes or in which the interests of one class differ from the interests ofany other class.
The Trust has an unlimited number of authorized shares of beneficial interest with no parvalue. Shares are bought and sold at closing net asset value (“NAV”) less anyapplicable sales charge.
Note 1 Significant Accounting Policies
The Funds follow the investment company accounting and reporting guidance of theFinancial Accounting Standards Board (“FASB”) Accounting Standards CodificationTopic 946 Financial Services — Investment Companies. The following policies are inconformity with accounting principles generally accepted in the United States ofAmerica (“GAAP”). The preparation of financial statements in accordance with generallyaccepted accounting principles requires management to make estimates andassumptions that affect the reported amounts and disclosures in the financialstatements. Actual results could differ from those estimates.
a. Investment Valuations Marketable securities are valued at the last reported saleprice on the principal exchange or market on which they are traded; or, if there were nosales that day, at the mean between the closing bid and ask prices . Securities tradedon the NASDAQ Stock Market, LLC (“NASDAQ”) are generally valued at the NASDAQofficial closing price, which may not be the last sale price. If the NASDAQ officialclosing price is not available for a security, that security is generally valued at the meanbetween the closing bid and ask prices . Repurchase agreements are carried at cost,which approximates market value (see Note 5d). Foreign securities are valued in thecurrencies of the markets in which they trade and then converted to U.S. dollars by theapplication of foreign exchange rates at the close of the New York Stock Exchange(“NYSE”).
42 www.rsinvestments.com

N O T E S T O F I N A N C I A L S T A T E M E N T S ( U N A U D I T E D )
Securities for which market quotations are not readily available or for which marketquotations may be considered unreliable are valued at their fair values as determined inaccordance with guidelines and procedures adopted by the Trust’s Board of Trustees.
Securities whose values have been materially affected by events occurring before theFunds’ valuation time but after the close of the securities’ principal exchange or marketmay be fair valued in accordance with guidelines and procedures adopted by the Boardof Trustees. In addition, if there has been a movement in the U.S. markets that exceedsa specified threshold, the values of a Fund’s investments in foreign securities aregenerally determined by a pricing service using pricing models designed to estimatelikely changes in the values of those securities.
In accordance with FASB Accounting Standards Codification Topic 820 (“ASC Topic820”), fair value is defined as the price that the Funds would receive upon selling aninvestment in an “arm’s length” transaction to a willing buyer in the principal or mostadvantageous market for the investment. ASC Topic 820 established a hierarchy forclassification of fair value measurements for disclosure purposes. Observable inputs areinputs that reflect the assumptions market participants would use in pricing the asset orliability based on market data obtained from sources independent of the reporting entity.Unobservable inputs are inputs that reflect the reporting entity’s own assumptionsabout the assumptions market participants would use in pricing the asset or liabilitybased on the best information available in the circumstances. The hierarchy of inputs issummarized in the three broad levels listed below.
‰ Level 1 — unadjusted quoted prices in active markets for identical investments
‰ Level 2 — inputs other than unadjusted quoted prices that are observable eitherdirectly or indirectly (including adjusted quoted prices for similar investments, interestrates, prepayment speeds, credit risks, etc.)
‰ Level 3 — significant unobservable inputs (including the Funds’ own assumptions indetermining the fair value of investments)
Inputs may include price information, volatility statistics, specific and broad credit data,liquidity statistics, and other factors. A security’s level within the fair value hierarchy isbased on the lowest level of any input that is significant to the fair value measurement.However, the determination of what constitutes “observable” requires significantjudgment by the Trust. The Trust considers observable data to be that market datawhich is readily available, regularly distributed or updated, reliable and verifiable, andprovided by independent sources that are actively involved in the relevant market. Theinputs or methodology used for valuing securities are not necessarily an indication ofthe risk associated with investing in those securities. Changes in valuation techniquesmay result in transfers into or out of an investment’s assigned level within the hierarchy.
The FASB requires reporting entities to make disclosures about purchases, sales,issuances and settlements of Level 3 securities on a gross basis. For the six monthsended June 30, 2015, the Funds had no securities classified as Level 3.
The Funds’ policy is to recognize transfers between Level 1, Level 2 and Level 3 at theend of the reporting period. Transfers between Levels 1 and 2 related to certain
www.rsinvestments.com 43

N O T E S T O F I N A N C I A L S T A T E M E N T S ( U N A U D I T E D )
exchange-traded foreign securities whose prices may have been affected by eventsoccurring after the close of trading on the exchange and, as a result, whose values weredetermined by a pricing service using pricing models in accordance with methodsapproved by the Funds’ Board of Trustees.
Transfers into and out of each level of the fair value hierarchy for the six months endedJune 30, 2015, were as follows:
Transfersinto
Level 1
Transfers(out) ofLevel 1
Transfersinto
Level 2
Transfers(out) ofLevel 2
Transfersinto
Level 3
Transfers(out) ofLevel 3
RS Global Natural Resources Fund
CommonStocks $67,345,976 $ — $ — $(67,345,976) $ — $ —
In determining a security’s placement within the hierarchy, the Trust separates theFunds’ investment portfolios into two categories: investments and derivatives (e.g.,futures).
Investments Investments whose values are based on quoted market prices in activemarkets, and are therefore classified within Level 1, include active listed equities.
Investments that trade in markets that are not considered to be active, but are valuedbased on quoted market prices, dealer quotations or alternative pricing sourcessupported by observable inputs are classified within Level 2. These include certain U.S.government and sovereign obligations, most government agency securities, investment-grade corporate bonds, certain mortgage products, state, municipal and provincialobligations, and certain foreign equity securities, including securities whose prices mayhave been affected by events occurring after the close of trading on their principalexchange or market and, as a result, whose values are determined by a pricing serviceas described above, or securities whose values are otherwise determined using fairvaluation methods approved by the Funds’ Board of Trustees.
Investments classified within Level 3 have significant unobservable inputs, as they tradeinfrequently or not at all. Level 3 investments include, among others, private placementsecurities. When observable prices are not available for these securities, the Trust usesone or more valuation techniques for which sufficient and reliable data is available. Theinputs used by the Trust in estimating the value of Level 3 investments include, forexample, the original transaction price, recent transactions in the same or similarinstruments, completed or pending third-party transactions in the underlying investmentor comparable issuers, subsequent rounds of financing, recapitalizations, and othertransactions across the capital structure. Level 3 investments may also be adjusted toreflect illiquidity and/or non-transferability, with the amount of such discount estimatedby the Trust in the absence of market information. Assumptions used by the Trust dueto the lack of observable inputs may significantly impact the resulting fair value andtherefore the Funds’ results of operations.
Derivatives Exchange-traded derivatives, such as futures contracts, exchange-tradedoption contracts and certain swaps, are typically classified within Level 1 or Level 2 of
44 www.rsinvestments.com

N O T E S T O F I N A N C I A L S T A T E M E N T S ( U N A U D I T E D )
the fair value hierarchy depending on whether or not they are deemed to be activelytraded. Certain non-exchange-traded derivatives, such as generic forwards, certainswaps and options, have inputs which can generally be corroborated by market dataand are therefore classified within Level 2.
b. Taxes The Funds intend to continue complying with the requirements of the InternalRevenue Code to qualify as regulated investment companies and to distributesubstantially all net investment income and realized net capital gains, if any, toshareholders. Therefore, the Funds do not expect to be subject to income tax, and noprovision for such tax has been made.
From time to time, however, a Fund may choose to pay an excise tax if the cost ofmaking the required distribution exceeds the amount of the excise tax.
As of June 30, 2015, the Trust has reviewed the tax positions for open periods, asapplicable to the Funds, and has determined that no provision for income tax is requiredin the Funds’ financial statements. The Trust is not aware of any tax positions for whichit is reasonably possible that the total amounts of unrecognized tax benefits will changematerially in the next twelve months. The Funds recognize interest and penalties, if any,related to unrecognized tax positions as income tax expense in the Statement ofOperations. For the six months ended June 30, 2015, the Funds did not incur any suchinterest or penalties. The Funds are not subject to examination by U.S. federal taxauthorities for tax years before 2011 and by state authorities for tax years before 2010.
c. Securities Transactions Securities transactions are accounted for on the datesecurities are purchased or sold (trade date). Realized gains or losses on securitiestransactions are determined on the basis of specific identification.
d. Foreign Currency Translation The accounting records of the Funds are maintainedin U.S. dollars. Investment securities and all other assets and liabilities of the Fundsdenominated in a foreign currency are generally translated into U.S. dollars at theexchange rates quoted at the close of the NYSE on each business day. Purchases andsales of securities, income receipts, and expense payments are translated into U.S.dollars at the exchange rates in effect on the dates of the respective transactions. TheFunds do not isolate the portion of the fluctuations on investments resulting fromchanges in foreign currency exchange rates from the fluctuations in market prices ofinvestments held. Such fluctuations are included with the net realized and unrealizedgain or loss from investments.
e. Investment Income Dividend income is generally recorded on the ex-dividend date.Interest income, which includes amortization/accretion of premium/discount, is accruedand recorded daily.
In calculating net asset value per share for each class, investment income, realized andunrealized gains and losses, and expenses other than class-specific expenses areallocated daily to each class of shares based upon the proportion of net assetsattributable to each class at the beginning of the day.
f. Expenses Many expenses of the Trust can be directly attributed to a specific Fund.Expenses that cannot be directly attributed to a specific Fund are generally apportionedamong all the series in the Trust, based on relative net assets.
www.rsinvestments.com 45
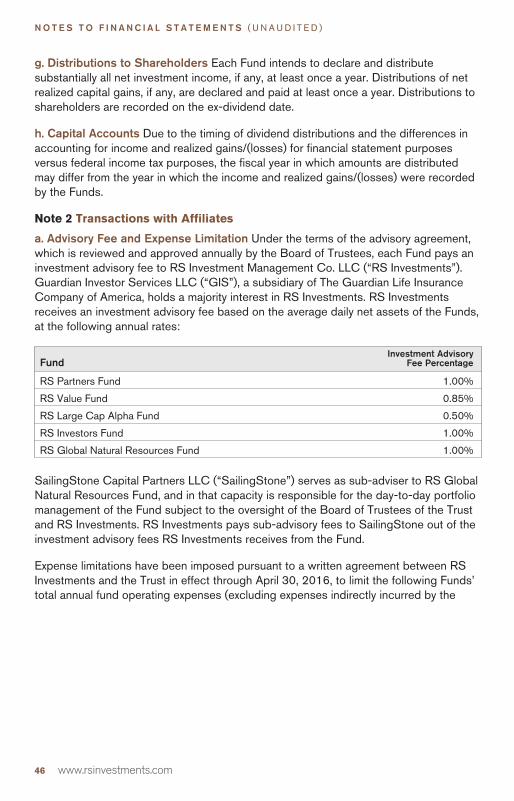
N O T E S T O F I N A N C I A L S T A T E M E N T S ( U N A U D I T E D )
g. Distributions to Shareholders Each Fund intends to declare and distributesubstantially all net investment income, if any, at least once a year. Distributions of netrealized capital gains, if any, are declared and paid at least once a year. Distributions toshareholders are recorded on the ex-dividend date.
h. Capital Accounts Due to the timing of dividend distributions and the differences inaccounting for income and realized gains/(losses) for financial statement purposesversus federal income tax purposes, the fiscal year in which amounts are distributedmay differ from the year in which the income and realized gains/(losses) were recordedby the Funds.
Note 2 Transactions with Affiliates
a. Advisory Fee and Expense Limitation Under the terms of the advisory agreement,which is reviewed and approved annually by the Board of Trustees, each Fund pays aninvestment advisory fee to RS Investment Management Co. LLC (“RS Investments”).Guardian Investor Services LLC (“GIS”), a subsidiary of The Guardian Life InsuranceCompany of America, holds a majority interest in RS Investments. RS Investmentsreceives an investment advisory fee based on the average daily net assets of the Funds,at the following annual rates:
FundInvestment Advisory
Fee Percentage
RS Partners Fund 1.00%
RS Value Fund 0.85%
RS Large Cap Alpha Fund 0.50%
RS Investors Fund 1.00%
RS Global Natural Resources Fund 1.00%
SailingStone Capital Partners LLC (“SailingStone”) serves as sub-adviser to RS GlobalNatural Resources Fund, and in that capacity is responsible for the day-to-day portfoliomanagement of the Fund subject to the oversight of the Board of Trustees of the Trustand RS Investments. RS Investments pays sub-advisory fees to SailingStone out of theinvestment advisory fees RS Investments receives from the Fund.
Expense limitations have been imposed pursuant to a written agreement between RSInvestments and the Trust in effect through April 30, 2016, to limit the following Funds’total annual fund operating expenses (excluding expenses indirectly incurred by the
46 www.rsinvestments.com

N O T E S T O F I N A N C I A L S T A T E M E N T S ( U N A U D I T E D )
Funds through investments in pooled investment vehicles, interest, taxes, investment-related expenses (e.g., brokerage commissions), and extraordinary expenses) to thefollowing rates:
Fund Expense Limitation
Class A Class C Class K Class Y
RS Partners Fund 1.45% N/A 1.81% 1.12%
RS Value Fund 1.30% 2.07% 1.69% 1.06%
RS Investors Fund 1.33% 2.07% 1.95% 1.05%
RS Global Natural Resources Fund 1.48% 2.28% 1.86% 1.15%
RS Investments does not intend to recoup any reimbursed expenses or waived advisoryfees from a prior year under expense limitations then in effect for a Fund.
b. Compensation of Trustees and Officers Trustees and officers of the Trust who areinterested persons, as defined in the 1940 Act, of RS Investments receive nocompensation from the Funds for acting as such. Trustees of the Trust who are notinterested persons of RS Investments receive compensation and reimbursement ofexpenses from the Trust.
c. Distribution Fees RS Funds Distributor LLC (“RSFD”), a wholly owned subsidiary ofRS Investments, serves as the principal underwriter for shares of the Funds. The Fundshave entered into an agreement with RSFD for distribution services with respect to theirshares and have adopted a distribution plan pursuant to Rule 12b-1 under the 1940Act, whose continuance is reviewed annually by the Trust’s Board of Trustees. Underthe plan, RSFD is compensated for services in such capacity, including its expenses inconnection with the promotion and distribution of shares of each Fund. For the sixmonths ended June 30, 2015, RSFD received distribution fees as follows:
Fund Annual Rate Distribution Fees
RS Partners Fund Class A 0.25% $917,812Class K 0.65% 12,799Class Y 0.00% —
RS Value Fund Class A 0.25% 540,023Class C 1.00% 152,852Class K 0.65% 13,989Class Y 0.00% —
RS Large Cap AlphaFund
Class A 0.25% 768,541Class C 1.00% 180,274Class K 0.65% 48,788Class Y 0.00% —
RS Investors Fund Class A 0.25% 75,729Class C 1.00% 155,760Class K 0.65% 6,430Class Y 0.00% —
www.rsinvestments.com 47

N O T E S T O F I N A N C I A L S T A T E M E N T S ( U N A U D I T E D )
Fund Annual Rate Distribution Fees
RS Global NaturalResources Fund
Class A 0.25% $795,283
Class C 1.00% 305,605
Class K 0.65% 18,225
Class Y 0.00% —
RS Investments may perform certain services and incur certain expenses with respectto the promotion of the Funds’ shares and the servicing of shareholder accounts, whichexpenses are allocable to RSFD. RS Investments compensates RSFD for its services inconnection with the promotion of Fund shares and reimburses RSFD for its expenses,including payments made by RSFD to third parties in respect of the promotion of Fundshares in excess of amounts received by RSFD under the distribution plan. In additionto payments under the distribution plan, the Funds reimburse RSFD for payments RSFDmakes to financial intermediaries that provide certain administrative, recordkeeping, andaccount maintenance services. The amount of the reimbursement is calculated in amanner reviewed by the Board of Trustees periodically. Such amounts are included inthe Statement of Operations as “Transfer agent fees.”
Park Avenue Securities LLC (“PAS”), a wholly owned subsidiary of The GuardianInsurance & Annuity Company, Inc. (“GIAC”) and an affiliate of GIS, distributes theFunds’ shares as a retail broker-dealer. For the six months ended June 30, 2015, PASinformed the Trust it received $947,626 directly or indirectly from RSFD as continuingcompensation for its services relating to its distribution of shares of all series in theTrust.
For the six months ended June 30, 2015, aggregate front-end sales charges for thesale of Class A shares paid to RSFD were as follows:
FundSales
Charges
RS Partners Fund $ 1,537
RS Value Fund 7,562
RS Large Cap Alpha Fund 17,175
RS Investors Fund 4,851
RS Global Natural Resources Fund 7,961
RSFD is entitled to retain any contingent deferred sales load (“CDSL”) imposed oncertain share redemptions. For the six months ended June 30, 2015, RSFD receivedCDSL charges as follows:
Fund CDSL
RS Partners Fund $ —
RS Value Fund 663
RS Large Cap Alpha Fund 11,676
RS Investors Fund 7,866
RS Global Natural Resources Fund 17,009
48 www.rsinvestments.com
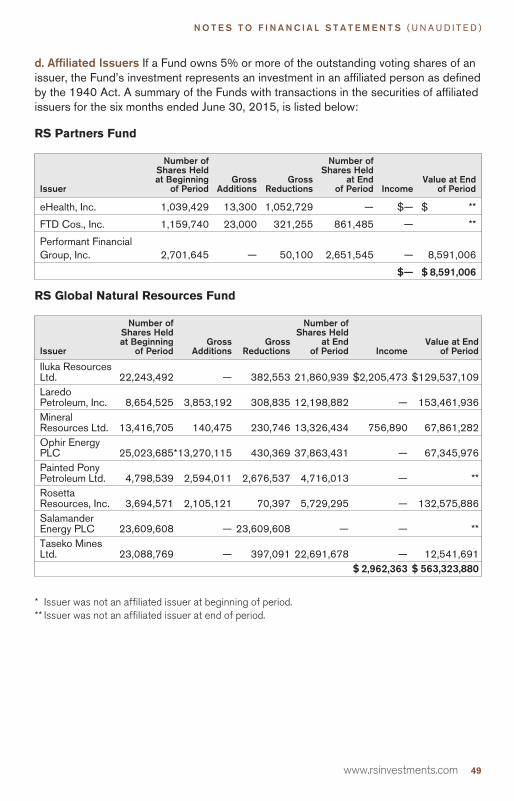
N O T E S T O F I N A N C I A L S T A T E M E N T S ( U N A U D I T E D )
d. Affiliated Issuers If a Fund owns 5% or more of the outstanding voting shares of anissuer, the Fund’s investment represents an investment in an affiliated person as definedby the 1940 Act. A summary of the Funds with transactions in the securities of affiliatedissuers for the six months ended June 30, 2015, is listed below:
RS Partners Fund
Issuer
Number ofShares Heldat Beginning
of PeriodGross
AdditionsGross
Reductions
Number ofShares Held
at Endof Period Income
Value at Endof Period
eHealth, Inc. 1,039,429 13,300 1,052,729 — $— $ **
FTD Cos., Inc. 1,159,740 23,000 321,255 861,485 — **
Performant FinancialGroup, Inc. 2,701,645 — 50,100 2,651,545 — 8,591,006
$— $ 8,591,006
RS Global Natural Resources Fund
Issuer
Number ofShares Heldat Beginning
of PeriodGross
AdditionsGross
Reductions
Number ofShares Held
at Endof Period Income
Value at Endof Period
Iluka ResourcesLtd. 22,243,492 — 382,553 21,860,939 $2,205,473 $129,537,109LaredoPetroleum, Inc. 8,654,525 3,853,192 308,835 12,198,882 — 153,461,936MineralResources Ltd. 13,416,705 140,475 230,746 13,326,434 756,890 67,861,282Ophir EnergyPLC 25,023,685*13,270,115 430,369 37,863,431 — 67,345,976Painted PonyPetroleum Ltd. 4,798,539 2,594,011 2,676,537 4,716,013 — **RosettaResources, Inc. 3,694,571 2,105,121 70,397 5,729,295 — 132,575,886SalamanderEnergy PLC 23,609,608 — 23,609,608 — — **Taseko MinesLtd. 23,088,769 — 397,091 22,691,678 — 12,541,691
$ 2,962,363 $ 563,323,880
* Issuer was not an affiliated issuer at beginning of period.** Issuer was not an affiliated issuer at end of period.
www.rsinvestments.com 49
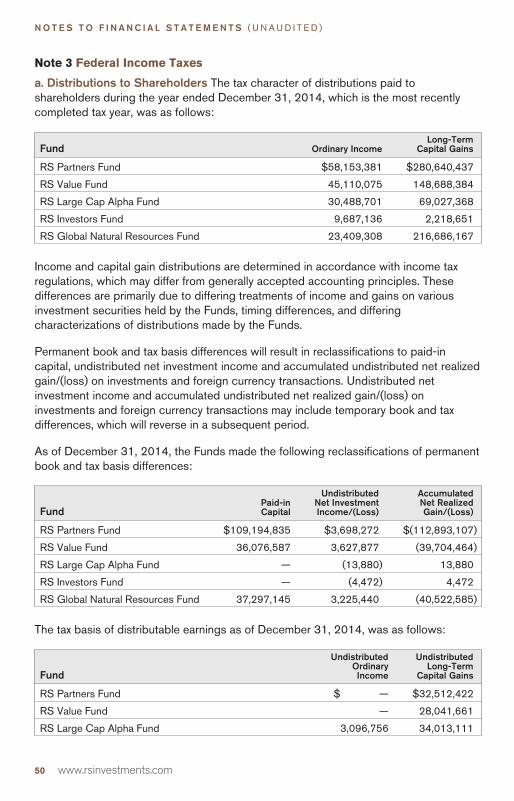
N O T E S T O F I N A N C I A L S T A T E M E N T S ( U N A U D I T E D )
Note 3 Federal Income Taxes
a. Distributions to Shareholders The tax character of distributions paid toshareholders during the year ended December 31, 2014, which is the most recentlycompleted tax year, was as follows:
Fund Ordinary IncomeLong-Term
Capital Gains
RS Partners Fund $58,153,381 $280,640,437
RS Value Fund 45,110,075 148,688,384
RS Large Cap Alpha Fund 30,488,701 69,027,368
RS Investors Fund 9,687,136 2,218,651
RS Global Natural Resources Fund 23,409,308 216,686,167
Income and capital gain distributions are determined in accordance with income taxregulations, which may differ from generally accepted accounting principles. Thesedifferences are primarily due to differing treatments of income and gains on variousinvestment securities held by the Funds, timing differences, and differingcharacterizations of distributions made by the Funds.
Permanent book and tax basis differences will result in reclassifications to paid-incapital, undistributed net investment income and accumulated undistributed net realizedgain/(loss) on investments and foreign currency transactions. Undistributed netinvestment income and accumulated undistributed net realized gain/(loss) oninvestments and foreign currency transactions may include temporary book and taxdifferences, which will reverse in a subsequent period.
As of December 31, 2014, the Funds made the following reclassifications of permanentbook and tax basis differences:
FundPaid-inCapital
UndistributedNet InvestmentIncome/(Loss)
AccumulatedNet RealizedGain/(Loss)
RS Partners Fund $109,194,835 $3,698,272 $(112,893,107)
RS Value Fund 36,076,587 3,627,877 (39,704,464)
RS Large Cap Alpha Fund — (13,880) 13,880
RS Investors Fund — (4,472) 4,472
RS Global Natural Resources Fund 37,297,145 3,225,440 (40,522,585)
The tax basis of distributable earnings as of December 31, 2014, was as follows:
Fund
UndistributedOrdinaryIncome
UndistributedLong-Term
Capital Gains
RS Partners Fund $ — $32,512,422
RS Value Fund — 28,041,661
RS Large Cap Alpha Fund 3,096,756 34,013,111
50 www.rsinvestments.com

N O T E S T O F I N A N C I A L S T A T E M E N T S ( U N A U D I T E D )
During any particular year, net realized gains from investment transactions, in excess ofavailable capital loss carryforwards, would be taxable to the Funds if not distributed and,therefore, are normally distributed to shareholders annually.
During the year ended December 31, 2014, the Funds utilized capital loss carryovers asfollows:
Fund Amount
RS Large Cap Alpha Fund $2,187,926
See the chart below for capital loss carryovers available to the Funds at December 31, 2014.
FundExpiring
2016
RS Large Cap Alpha Fund $4,375,852
In determining their taxable income, current tax law permits the Funds to elect to treat allor a portion of any net capital or currency loss realized after October 31 as occurring onthe first day of the following fiscal year. For the year ended December 31, 2014, theFunds elected to defer net capital and currency losses as follows:
FundDeferred Net
Capital Losses
RS Partners Fund $ 36,939,566
RS Value Fund 936,521
RS Investors Fund 7,055,031
RS Global Natural Resources Fund 213,509,239
b. Tax Basis of Investments The cost of investments (excluding foreign currencyrelated transactions) for federal income tax purposes at June 30, 2015, for each Fund islisted in the chart below. The net unrealized appreciation/(depreciation) on investments,which consists of gross unrealized appreciation and depreciation, is also disclosed inthe chart below:
FundCost of
Investments
Net UnrealizedAppreciation/(Depreciation)
on InvestmentsGross Unrealized
AppreciationGross Unrealized
Depreciation
RS PartnersFund $1,243,385,602 $ 212,217,599 $299,233,940 $ (87,016,341)
RS Value Fund 1,144,244,014 193,785,636 251,840,716 (58,055,080)
RS Large CapAlpha Fund 575,575,021 116,206,756 137,516,692 (21,309,936)
RS InvestorsFund 174,536,062 16,391,067 20,488,581 (4,097,514)
RS GlobalNaturalResourcesFund 3,931,805,447 (928,386,979) 137,509,171 (1,065,896,150)
www.rsinvestments.com 51

N O T E S T O F I N A N C I A L S T A T E M E N T S ( U N A U D I T E D )
Note 4 Capital Shares
a. Transactions The Funds have authorized an unlimited number of shares of beneficialinterest with no par value. Transactions, including conversions and exchanges, in capitalshares for the Funds were as follows:
Transactions in Capital Shares
RS Partners Fund
For the Six Months Ended 6/30/15 For the Year Ended 12/31/14
Shares Amount Shares Amount
Class AShares sold 1,005,974 $ 30,930,256 2,810,866 $ 110,768,152Shares
reinvested — — 5,187,902 158,698,511
Sharesredeemed (5,886,326) (181,013,073) (14,218,177) (555,849,763)
Sharesredeemedin-kind — — (488,995) (18,493,779)
Net decrease (4,880,352) $(150,082,817) (6,708,404) $(304,876,879)
Class KShares sold 14,225 $ 419,791 15,389 $ 574,218Shares
reinvested — — 28,956 846,972
Sharesredeemed (28,520) (833,917) (25,733) (970,485)
Net increase/(decrease) (14,295) $ (414,126) 18,612 $ 450,705
Class YShares sold 1,654,887 $ 52,164,488 9,094,773 $ 364,176,093Shares
reinvested — — 5,400,726 169,744,812
Sharesredeemed (5,621,178) (177,860,474) (6,990,719) (268,187,034)
Sharesredeemedin-kind — — (2,954,297) (120,417,164)
Net increase/(decrease) (3,966,291) $(125,695,986) 4,550,483 $ 145,316,707
52 www.rsinvestments.com

N O T E S T O F I N A N C I A L S T A T E M E N T S ( U N A U D I T E D )
RS Value Fund
For the Six Months Ended 6/30/15 For the Year Ended 12/31/14
Shares Amount Shares Amount
Class AShares sold 562,912 $ 19,356,191 1,103,767 $ 39,885,125Shares reinvested — — 1,887,416 61,510,889
Shares redeemed (1,207,850) (41,307,061) (8,392,792) (307,985,878)
Net decrease (644,938) $ (21,950,870) (5,401,609) $(206,589,864)
Class CShares sold 48,705 $ 1,590,750 123,018 $ 4,178,965Shares reinvested — — 134,867 4,195,715
Shares redeemed (89,644) (2,921,418) (201,030) (6,817,268)
Net increase/(decrease) (40,939) $ (1,330,668) 56,855 $ 1,557,412
Class KShares sold 9,312 $ 310,207 23,691 $ 816,004Shares reinvested — — 20,202 643,422
Shares redeemed (19,865) (664,539) (22,887) (804,016)
Net increase/(decrease) (10,553) $ (354,332) 21,006 $ 655,410
Class YShares sold 5,125,803 $ 177,567,316 7,679,823 $ 284,766,570Shares reinvested — — 3,709,703 121,566,973
Shares redeemed (3,989,680) (135,732,988) (5,065,598) (184,209,375)
Net increase 1,136,123 $ 41,834,328 6,323,928 $ 222,124,168
RS Large Cap Alpha Fund
For the Six Months Ended 6/30/15 For the Year Ended 12/31/14
Shares Amount Shares Amount
Class AShares sold 233,010 $ 13,853,622 537,060 $ 33,077,501Shares reinvested — — 1,174,774 69,158,886Shares redeemed (734,444) (43,709,198) (1,546,729) (95,478,304)
Net increase/(decrease) (501,434) $(29,855,576) 165,105 $ 6,758,083
Class CShares sold 33,720 $ 1,810,636 111,336 $ 6,302,404Shares reinvested — — 65,951 3,537,040Shares redeemed (62,719) (3,371,836) (127,979) (7,214,817)
Net increase/(decrease) (28,999) $ (1,561,200) 49,308 $ 2,624,627
www.rsinvestments.com 53
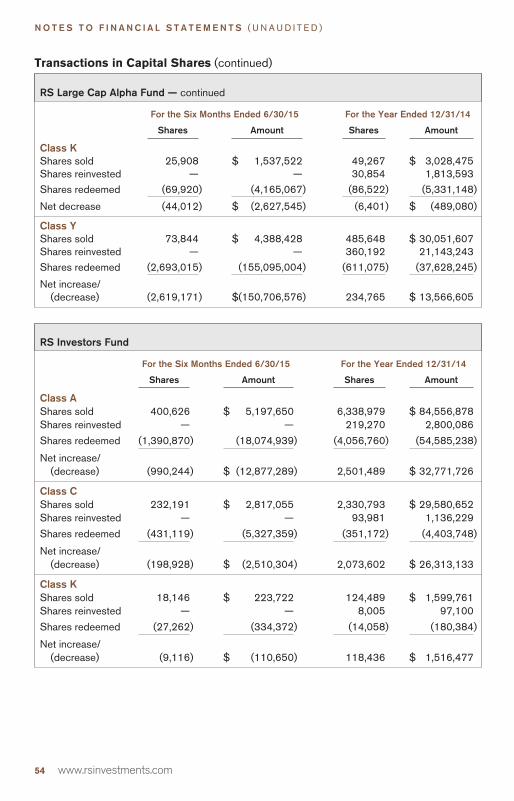
N O T E S T O F I N A N C I A L S T A T E M E N T S ( U N A U D I T E D )
Transactions in Capital Shares (continued)
RS Large Cap Alpha Fund — continued
For the Six Months Ended 6/30/15 For the Year Ended 12/31/14
Shares Amount Shares Amount
Class KShares sold 25,908 $ 1,537,522 49,267 $ 3,028,475Shares reinvested — — 30,854 1,813,593Shares redeemed (69,920) (4,165,067) (86,522) (5,331,148)
Net decrease (44,012) $ (2,627,545) (6,401) $ (489,080)
Class YShares sold 73,844 $ 4,388,428 485,648 $ 30,051,607Shares reinvested — — 360,192 21,143,243Shares redeemed (2,693,015) (155,095,004) (611,075) (37,628,245)
Net increase/(decrease) (2,619,171) $(150,706,576) 234,765 $ 13,566,605
RS Investors Fund
For the Six Months Ended 6/30/15 For the Year Ended 12/31/14
Shares Amount Shares Amount
Class AShares sold 400,626 $ 5,197,650 6,338,979 $ 84,556,878Shares reinvested — — 219,270 2,800,086
Shares redeemed (1,390,870) (18,074,939) (4,056,760) (54,585,238)
Net increase/(decrease) (990,244) $ (12,877,289) 2,501,489 $ 32,771,726
Class CShares sold 232,191 $ 2,817,055 2,330,793 $ 29,580,652Shares reinvested — — 93,981 1,136,229
Shares redeemed (431,119) (5,327,359) (351,172) (4,403,748)
Net increase/(decrease) (198,928) $ (2,510,304) 2,073,602 $ 26,313,133
Class KShares sold 18,146 $ 223,722 124,489 $ 1,599,761Shares reinvested — — 8,005 97,100
Shares redeemed (27,262) (334,372) (14,058) (180,384)
Net increase/(decrease) (9,116) $ (110,650) 118,436 $ 1,516,477
54 www.rsinvestments.com

N O T E S T O F I N A N C I A L S T A T E M E N T S ( U N A U D I T E D )
RS Investors Fund — continued
For the Six Months Ended 6/30/15 For the Year Ended 12/31/14
Shares Amount Shares Amount
Class YShares sold 1,078,925 $ 14,072,618 9,436,067 $ 127,861,592Shares
reinvested — — 274,236 3,526,672
Sharesredeemed (4,003,975) (52,293,419) (4,245,684) (56,668,013)
Net increase/(decrease) (2,925,050) $ (38,220,801) 5,464,619 $ 74,720,251
RS Global Natural Resources Fund
For the Six Months Ended 6/30/15 For the Year Ended 12/31/14
Shares Amount Shares Amount
Class AShares sold 5,753,838 $ 140,894,509 5,063,915 $ 171,776,634Shares
reinvested — — 2,062,250 50,875,700
Shares redeemed (5,852,656) (146,726,060) (17,950,489) (587,373,577)
Net decrease (98,818) $ (5,831,551) (10,824,324) $(364,721,243)
Class CShares sold 255,690 $ 5,974,460 329,855 $ 9,827,496Shares
reinvested — — 214,059 4,931,928
Shares redeemed (504,546) (11,777,926) (1,707,366) (51,835,094)
Net decrease (248,856) $ (5,803,466) (1,163,452) $ (37,075,670)
Class KShares sold 75,437 $ 1,775,043 48,012 $ 1,556,359Shares
reinvested — — 15,389 364,569
Shares redeemed (36,992) (886,412) (80,830) (2,622,201)
Net increase/(decrease) 38,445 $ 888,631 (17,429) $ (701,273)
www.rsinvestments.com 55
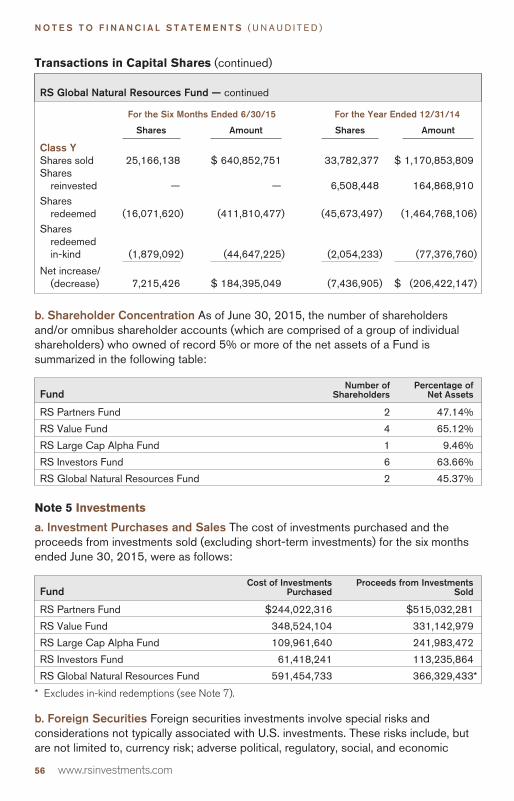
N O T E S T O F I N A N C I A L S T A T E M E N T S ( U N A U D I T E D )
Transactions in Capital Shares (continued)
RS Global Natural Resources Fund — continued
For the Six Months Ended 6/30/15 For the Year Ended 12/31/14
Shares Amount Shares Amount
Class YShares sold 25,166,138 $ 640,852,751 33,782,377 $ 1,170,853,809Shares
reinvested — — 6,508,448 164,868,910Shares
redeemed (16,071,620) (411,810,477) (45,673,497) (1,464,768,106)Shares
redeemedin-kind (1,879,092) (44,647,225) (2,054,233) (77,376,760)
Net increase/(decrease) 7,215,426 $ 184,395,049 (7,436,905) $ (206,422,147)
b. Shareholder Concentration As of June 30, 2015, the number of shareholdersand/or omnibus shareholder accounts (which are comprised of a group of individualshareholders) who owned of record 5% or more of the net assets of a Fund issummarized in the following table:
FundNumber of
ShareholdersPercentage of
Net Assets
RS Partners Fund 2 47.14%
RS Value Fund 4 65.12%
RS Large Cap Alpha Fund 1 9.46%
RS Investors Fund 6 63.66%
RS Global Natural Resources Fund 2 45.37%
Note 5 Investments
a. Investment Purchases and Sales The cost of investments purchased and theproceeds from investments sold (excluding short-term investments) for the six monthsended June 30, 2015, were as follows:
FundCost of Investments
PurchasedProceeds from Investments
Sold
RS Partners Fund $244,022,316 $515,032,281
RS Value Fund 348,524,104 331,142,979
RS Large Cap Alpha Fund 109,961,640 241,983,472
RS Investors Fund 61,418,241 113,235,864
RS Global Natural Resources Fund 591,454,733 366,329,433*
* Excludes in-kind redemptions (see Note 7).
b. Foreign Securities Foreign securities investments involve special risks andconsiderations not typically associated with U.S. investments. These risks include, butare not limited to, currency risk; adverse political, regulatory, social, and economic
56 www.rsinvestments.com

N O T E S T O F I N A N C I A L S T A T E M E N T S ( U N A U D I T E D )
developments; and less reliable information about issuers. Moreover, securities of someforeign companies may be less liquid and their prices more volatile than those ofcomparable U.S. companies.
c. Industry or Sector Concentration In their normal course of business, some of theFunds may invest a significant portion of their assets in companies within a limitednumber of industries or sectors. As a result, these Funds may be subject to a greaterrisk of loss than that of a fund invested in a wider spectrum of industries or sectorsbecause the stocks of many or all of the companies in the industry, group of industries,sector, or sectors may decline in value due to developments adversely affecting theindustry, group of industries, sector, or sectors.
d. Repurchase Agreements The collateral for repurchase agreements is either cash orfully negotiable U.S. government securities (including U.S. government agencysecurities). Repurchase agreements are fully collateralized (including the interestaccrued thereon) and such collateral is marked to market daily while the agreementsremain in force. If the value of the collateral falls below the repurchase price plusaccrued interest, the Fund will typically require the seller to deposit additional collateralby the next business day. If the request for additional collateral is not met, or the sellerdefaults, the Fund maintains the right to sell the collateral (although it may be preventedor delayed from doing so in certain circumstances) and may be required to claim anyresulting loss against the seller.
Note 6 Temporary Borrowings
The Funds, with other funds managed by RS Investments, are parties to a $400 millioncommitted revolving credit facility from State Street Bank and Trust Company, in effectthrough August 18, 2015, for temporary borrowing purposes, including the meeting ofredemption requests that otherwise might require the untimely disposition of securities.Interest is calculated based on market rates at the time of borrowing.
For the six months ended June 30, 2015, the Funds which borrowed under the facilitywere as follows:
FundAmount Outstanding
at 6/30/15Average
Borrowing*
DaysBorrowings
OutstandingAverage
Interest Rate*
RS Investors Fund $ — $426,547 4 1.39%
* For the six months ended June 30, 2015, based on the number of days borrowings wereoutstanding.
Note 7 In-Kind Redemptions
In certain circumstances, the Funds may distribute portfolio securities rather than cashas payment for a redemption of fund shares (in-kind redemption). For financial reportingpurposes, the Funds recognize a gain on an in-kind redemption to the extent the valuesof the distributed securities exceed their costs; the Funds recognize a loss if costexceeds value. Gains and losses realized on in-kind redemptions are not recognized fortax purposes, and are reclassified from accumulated realized gain (loss) to paid-incapital. During the six months ended June 30, 2015, RS Global Natural ResourcesFund realized $1,862,076 of net capital gain attributable to in-kind redemptions.
www.rsinvestments.com 57

N O T E S T O F I N A N C I A L S T A T E M E N T S ( U N A U D I T E D )
Note 8 Review for Subsequent Events
Management has evaluated subsequent events through the issuance of the Funds’financial statements and determined that no material events have occurred that requiredisclosure.
Note 9 Indemnifications
Under the Trust’s organizational documents, its officers and trustees are indemnifiedagainst certain liabilities arising out of the performance of their duties to the Funds. Inaddition, in the normal course of business, the Funds enter into contracts with theirvendors and others that provide general indemnifications. The Funds’ maximumexposure under these arrangements is unknown as this would involve future claims thatmay be made against the Funds. However, based on experience, the Funds expect therisk of loss to be remote.
58 www.rsinvestments.com

S U P P L E M E N T A L I N F O R M A T I O N ( U N A U D I T E D )
Supplemental Information (unaudited)
Portfolio Holdings and Proxy Voting Procedures
The Funds file their complete schedule of portfolio holdings with the Securities andExchange Commission for the first and third quarters of each fiscal year on Form N-Q.The Funds’ Form N-Q is available on the Securities and Exchange Commission’swebsite at http://www.sec.gov. The Funds’ Form N-Q may be reviewed and copied atthe Commission’s Public Reference Room in Washington, DC, and information on theoperation of the Public Reference Room may be obtained by calling 800-SEC-0330.This information is also available, without charge, upon request, by calling toll-free800-766-3863.
A description of the policies and procedures that the Funds use to determine how tovote proxies relating to portfolio securities, and information regarding how the Fundsvoted proxies relating to portfolio securities during the most recent 12-month periodended June 30 will be available (i) without charge, upon request, by calling toll-free800-766-3863; (ii) on RS Investments’ website at http://www.rsinvestments.com; and(iii) on the Securities and Exchange Commission’s website at http://www.sec.gov.
The Statement of Additional Information includes information about the Trust’sTrustees and Officers and is available, without charge, upon request by calling toll-free800-766-3863.
This report is transmitted to shareholders only. It is not authorized for use as anoffer of sale or a solicitation of an offer to buy shares of a Fund unlessaccompanied or preceded by that Fund’s current prospectus. Past performanceresults shown in this report should not be considered a representation of futureperformance. Investment returns and principal value of shares will fluctuate sothat shares, when redeemed, may be worth more or less than their original cost.Statements and other information herein are as dated and are subject to change.
www.rsinvestments.com 59

This Page Intentionally Left Blank

This Page Intentionally Left Blank
This Page Intentionally Left Blank

This Page Intentionally Left Blank

This Page Intentionally Left Blank


On
eB
ush
Str
eet,
Su
ite
90
0S
anFr
anci
sco,
CA
94
104
PR
SR
TS
TDU
.S.P
OS
TAG
EP
AID
RS
INV
ES
TME
NTS
WW
W.R
SIN
VE
ST
ME
NT
S.C
OM
//8
00
.76
6.3
86
3E
B0
150
96
(06
/15
)