2012 - performance models and metrics in higher...
TRANSCRIPT

Performance Models and Metrics in Higher Education
Presentation to the
Senate Education, Business, and Administration Subcommittee and the
House Education and Economic Development Subcommittee
Department of Legislative Services Office of Policy Analysis
Annapolis, Maryland
February 23, 2012
Contributing Staff
Writers
Sara J. Baker Garret T. Halbach Richard H. Harris
Reviewers
Rachel H. Hise Mary E. Clapsaddle
For further information concerning this document contact:
Library and Information Services Office of Policy Analysis
Department of Legislative Services 90 State Circle
Annapolis, Maryland 21401
Baltimore Area: 410-946-5400 ● Washington Area: 301-970-5400 Other Areas: 1-800-492-7122, Extension 5400
TTY: 410-946-5401 ● 301-970-5401 Maryland Relay Service: 1-800-735-2258
E-mail: [email protected] Home Page: http://mlis.state.md.us
The Department of Legislative Services does not discriminate on the basis of age, ancestry, color, creed, marital status, national origin, race, religion, gender, sexual orientation, or disability in the admission or access to its programs, services, or activities. The Department’s Information Officer has been designated to coordinate compliance with the nondiscrimination requirements contained in Section 35.107 of the Department of Justice Regulations. Requests for assistance should be directed to the Information Officer at the telephone numbers shown above.

1
Performance Models and Metrics in Higher Education The Rise in Performance-based Funding
Historically, funding for higher education has been based on inputs with states typically focusing on increasing access by linking appropriations to enrollment growth. This method proved to be successful as colleges and universities enrolled an increasing number of students, but there were few, if any, incentives to ensure student success. While access remains important, especially for first-time and low-income students, many are now leaving college without a degree or credentials. According to the Southern Regional Education Board (SREB) the 2003 cohort six-year graduation rate for SREB states was 55.8% and the four-year rate was 28.4%. Maryland compared favorably with overall rates of 60.7 and 39.5%, respectively.
Generally, states fund higher education through a variety of mechanisms including
incremental changes to the base appropriation, credit hours attempted, benchmarking of peer institutions, and vouchers, which has resulted in a growing disconnect between funding higher education and a state’s priorities. This, along with no or slow growth in state revenues, has led to policymakers demanding accountability and performance from higher education. In response, states are crafting various performance-based funding (PBF) models linking state appropriations to outcomes that align with the state’s goals and priorities.
Performance-based Funding Basically, PBF provides incentives or rewards institutions for meeting state goals such as
increasing the number of degrees awarded or credit hours completed. PBF is comprised of three main components – goals, measurements, and incentives. In order to be successful, these components need to be aligned and complementary with each other. Goals consist of the state priorities such as increasing the number of adults with a college degree; tracking progress toward the goals that reflect the priorities of the state and institution; and rewarding institutions for improvement in the measures through financial or regulatory incentives.
PBF for higher education institutions is not a new concept, and in fact, has been put into
practice with mixed results over the last 30 years. Between 1979 and 2007, of the 26 states that implemented PBF, 14 abandoned the practice, but 2 have since reestablished the program. During the economic boom of the 1990s, PBF proved to be popular when states could afford to provide extra funding to reward improvement on outcomes, but declining revenues in the 2000s led to the elimination of these funding mechanisms. Many states abandoned PBF because it was considered an “add-on” or a provision of the budget instead of placed in statute. Other reasons included lack of sustained support from political and campus leaders, overly complex formulas, and failure to align measures with the state’s goals or account for institutions’ missions.
Today, a number of states use performance metrics not only to allocate appropriations but
also, in the case of Indiana, to prioritize budget cuts.

2 Performance Models and Metrics in Higher Education
2
Pro
du
ctivity Fu
nd
ing
in M
aryla
nd
Appendix 1 and 2 summarize PBF programs currently being implemented or studied by fourteen other states. In general, performance funding models can be categorized as: Output-based: Paying for results in which a funding formula is linked to outcomes such
as number of students meeting credit milestones or graduating. The formula can be weighted to account for varying campus missions or give preference to low-income or at-risk students. States implementing this model include Indiana, Ohio, and Tennessee.
Performance-based: Encouraging improvement in campus performance through a
separate portion or “set aside” of state appropriations. Pennsylvania employs this model to partially fund the state’s four-year institutions, while Florida and Washington use it to fund community colleges.
Performance Agreements: Achieving results through negotiated agreement between
the state and institutions regarding benchmarks and goals. Louisiana uses this model.
Has PFB Produced Results?
While many states have implemented PBF over the years, results have varied due to a number of factors as previously mentioned. However, results have been positive in those states committed to using PBF as a mechanism to fund higher education while advancing the priorities of the state. In 2000, the Pennsylvania State System of Higher Education (PASSHE) implemented performance funding, allocating a portion of its funds each year to reward those institutions that demonstrated improvements in key areas including student achievement. Institutions received additional funds for meeting or exceeding targets and benchmarks for eight measures including the number and percentage of all students and African American and Hispanic students who returned for their second year and graduated within four years, and number of degrees awarded. According to PASSHE, performance funding from 2000 to 2008 resulted in “significant improvements” including: second-year retention rate for all students of 76.7%, “a rate above the national average of
peer institutions,” with the rate for African American and Hispanic students increasing 3.2 percentage points to 72.3%;
four-year graduation rate for all students rose from 25.0 to 32.2%, with the rate for
African Americans and Hispanic students increasing to 16.2%; six-year graduation rate for all students stands at 54.3%, and that same rate for African
Americans and Hispanic students is 38.6%; and the average number of bachelor’s degrees awarded from 2000 to 2007 increased 22.7%,
and the average number of Master’s degrees conferred rose 39.9%.

Department of Legislative Services 3
In the 1990s, Ohio implemented the Challenge Program in which all new funds were allocated based on the performance in four challenge initiatives: access, research, jobs, and success. Funds for the success challenge (totaling approximately $55 million per year) rewarded timely degree completion of all in-state undergraduate students and degree completion for any in-state at risk student which Ohio defined in economic terms as any student who in the previous 10 years was eligible to receive an Ohio Instruction Grant (need-based aid). The Ohio Board of Regents reported that due to the Challenge Program the time to degree declined from 4.7 to 4.3 years between 1999 and 2003, and from 1999 to 2006, the four-year graduation rate increased from 34 to 43% while the rate for at-risk students grew from 20 to 26%.
While states have had differing results in employing PBF, it has yielded a number of best
practices which states are taking into account when developing and implementing their own models. Many documents, including those published by the American Association of State College and Universities, the Lumina Foundation, Complete College America, and the New England Board of Higher Education, cite best practices that should be taken into consideration when crafting PBF program. Commonly identified best practices include:
Bipartisan political commitment. Stakeholder “buy-in” and involvement. Keep it simple – most PFB methods failed due to too many measures with too much state
funding at stake making funding unpredictable and complicated. Stable funding – incentives need to remain in place with stable funding, but if not
possible, consider embedding state funding into formulas to protect from budget reductions as in the case of Tennessee and Ohio.
Account for institutional differences. Allow time for implementation – institutions need time to understand measures and make
changes to programs, systems, and processes. Anticipate challenges – address attempts to manipulate or game the system, e.g., grade
inflation, changing the makeup of the student population, and reducing program rigor. Extensive and ongoing evaluation of outcomes.
Can PBF Work in Maryland?
In Maryland, higher education is generally funded through incremental changes to the
base appropriations. However, from fiscal 2007 to 2009, USM received additional State funds for its enrollment funding initiative in which additional funds were appropriated to subsidize
4 Performance Models and Metrics in Higher Education
4
Pro
du
ctivity Fu
nd
ing
in M
aryla
nd
enrollment growth. From fall 2005 (fiscal 2006) to fall 2008 (fiscal 2009) undergraduate enrollment increased 10.3%, or 9,533 students, with 51.4% of this increase occurring in fiscal 2007, the first year of funding. While student completion data is not currently available for these cohort groups, according to USM’s November 2011 Instructional Faculty Workload Report, the four-year graduation rate for those entering a USM institution in 2006 (fiscal 2007) declined 2 percentage points to 39.0%. While Maryland was not one of the states to implement a PFB program over the last few decades, it made a tentative step in that direction with 1988 legislation that included language that the Maryland Higher Education Commission (MHEC) may distribute strategic incentive funds to institutions to encourage attainment of the goals and priorities in the State Plan for Higher Education. The Larson Task Force reaffirmed this goal in 1999, recommending MHEC receive “strategic incentive funding” to distribute among institutions in support of statewide goals and priorities in the State Plan but funding was never provided. In addition, the 1999 legislation endorsed the funding guidelines approach based on institutions’ peers and the use of performance peers to measure progress. The funding guidelines adopted by MHEC included an aspirational component that would reward institutions that were outperforming their peers by allowing them to add an aspirational institution to their funding peers. In 2006, legislation established the Commission to Develop the Maryland Model for Funding Higher Education to develop a framework to fund higher education. The commission endorsed the continued use of the funding guidelines but recommended modifying the peer institutions used to benchmark funding to those states Maryland competes with to attract employers. Tracking institutions’ performance, especially graduation rates, was also recommended as a means to hold institutions accountable for their funding and performance.
In the 2011 legislative session, interest in PBF gained momentum, with language in the
Joint Chairmen’s Report requiring that MHEC, in conjunction with Maryland’s public four-year institutions, submit an interim report identifying models the State could use to determine an institution’s predictive performance such as graduation and retention rates based on student characteristics and if any states are using predictive modeling on a statewide level.
In developing the initial model, the MHEC workgroup decided to use six-year graduation rates since these rates vary among institutions more so then second-year retention rates. It was also decided to use data for the fall 2004 cohort of first-time full-time students, since this is the earliest group for which data were available on all indicators identified by the workgroup. The workgroup identified four limitations to the data that would affect any predictive model: (1) exclusions of students who enter college a year or more after graduating from high school; (2) data elements not included in the data collection likely affect graduation rates, such as the education level of the parents; (3) a model may only be effective in predicting the success of a student based on one outcome variable; and (4) limited data availability including data on cohort groups and a national data set with student level data. Additionally, the workgroup determined that some states use predictive modeling mainly to predict enrollment for capital planning and budgeting.

Department of Legislative Services 5
The workgroup will continue to test its preliminary model and attempt to adapt it for evaluating other variables affecting performance such as second-year retention. The report notes that applying a model to multiple institutions that may have differing and various missions will increase the complexity of the model. Overall, the task of developing a broadly applicable model is severely constrained by the limitations of the available data. The workgroup’s final report is due September 1, 2012.
How Might Maryland Institutions Perform? This section will examine common indicators that are used in PBF by other states for
public four-year institutions and two-year community colleges as examples for possible Maryland metrics. As previously discussed, among the best practices for PBF is using metrics that tie to State higher education goals. One obvious metric is the number of degrees awarded by institutions, particularly associate’s and bachelor’s degrees, as Maryland works to have 55% of adults have a college degree by 2025. This is a metric that can be used for both public four-year institutions and community colleges. Time to degree is another metric that could be used for both higher education segments, although community colleges have broader missions than four-year institutions and serve many students who are not seeking a degree.
Public Four-year Institutions Exhibit 1 shows the total change and percentage change in bachelor’s degrees awarded
by each Maryland public four-year institution from fiscal 2010 to 2011. This metric could be used to fund increases in annual degree output, and it could also be used to reward institutions that are performing at or above their peers. The data show 10 of 12 institutions increased the number of degrees awarded in fiscal 2011, while 2 declined. Of those 10, 8 grew by 5% or more. The University of Baltimore (UB), in particular, stands out with its 25% increase as the undergraduate program has ramped up and begins to graduate students. However, UB’s actual degree growth of 124 degrees is much smaller when compared to the University of Maryland, College Park’s (UMCP) growth of 418 degrees.

6 Performance Models and Metrics in Higher Education
6
Pro
du
ctivity Fu
nd
ing
in M
aryla
nd
Exhibit 1
Change in Bachelor’s Degrees Awarded by Campus Fiscal 2010-2011
BSU: Bowie State University UB: University of Baltimore CSU: Coppin State University UMB: University of Maryland, Baltimore FSU: Frostburg State University UMBC: University of Maryland Baltimore County MSU: Morgan State University UMCP: University of Maryland, College Park SMCM: St. Mary’s College of Maryland UMES: University of Maryland Eastern Shore SU: Salisbury University UMUC: University of Maryland University College TU: Towson University Source: Integrated Postsecondary Education Data System; University System of Maryland; Department of Legislative Services
Exhibits 2 and 3 show degrees awarded at Maryland public four-year institutions
compared to the average of their performance peers. In general, each institution selects performance peers from among their current funding peers, which are developed statistically based on characteristics similar to the institution including size of enrollment, student composition, and academic program mix. Exhibit 2 shows that bachelor’s degree output varies greatly across the nine comprehensive institutions in Maryland, in part due to size. Salisbury University (SU), Towson University, and the University of Maryland University College (UMUC) exceed the degree output of their peers. UMUC shows the greatest differential, surpassing its peers by 526 degrees, a difference of 17.1%. On the other end, UB falls 466 degrees below its peers, or 90.3%; however, it has a significantly smaller undergraduate
-10.0%
0.0%
10.0%
20.0%
30.0%
40.0%
50.0%
-100
0
100
200
300
400
500
2011 Change in Degrees Awarded Percent Change in Degrees

Department of Legislative Services 7
Exhibit 2
Bachelor’s Degrees Awarded Maryland Comprehensive Institutions and Peer Averages
Fiscal 2010
UB: University of Baltimore UMUC: University of Maryland University College UMES: University of Maryland Eastern Shore Source: Integrated Postsecondary Education Data System
752 519
1,121 1,638
507
3,253
982 723
2,544
606 378
768
1,661
441
3,625
516 463
3,070
0
500
1,000
1,500
2,000
2,500
3,000
3,500
4,000
Bowie Coppin Frostburg Salisbury St. Mary’s Towson UB UMES UMUC
Peer Average Degrees Institution Degrees
8 Performance Models and Metrics in Higher Education
8
Pro
du
ctivity Fu
nd
ing
in M
aryla
nd
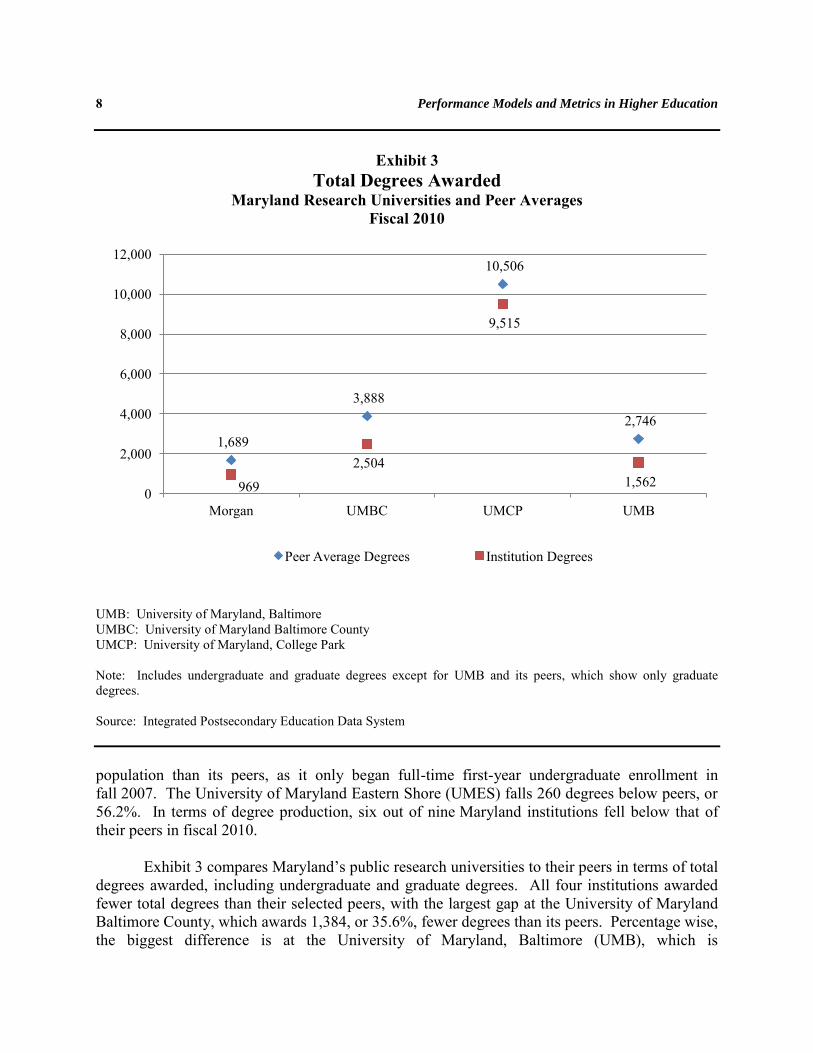
Exhibit 3
Total Degrees Awarded Maryland Research Universities and Peer Averages
Fiscal 2010
UMB: University of Maryland, Baltimore UMBC: University of Maryland Baltimore County UMCP: University of Maryland, College Park Note: Includes undergraduate and graduate degrees except for UMB and its peers, which show only graduate degrees. Source: Integrated Postsecondary Education Data System
population than its peers, as it only began full-time first-year undergraduate enrollment in fall 2007. The University of Maryland Eastern Shore (UMES) falls 260 degrees below peers, or 56.2%. In terms of degree production, six out of nine Maryland institutions fell below that of their peers in fiscal 2010.
Exhibit 3 compares Maryland’s public research universities to their peers in terms of total
degrees awarded, including undergraduate and graduate degrees. All four institutions awarded fewer total degrees than their selected peers, with the largest gap at the University of Maryland Baltimore County, which awards 1,384, or 35.6%, fewer degrees than its peers. Percentage wise, the biggest difference is at the University of Maryland, Baltimore (UMB), which is
1,689
3,888
10,506
2,746
969
2,504
9,515
1,562 0
2,000
4,000
6,000
8,000
10,000
12,000
Morgan UMBC UMCP UMB
Peer Average Degrees Institution Degrees

Department of Legislative Services 9 1,184 degrees below its peer average, or 43.1%. It should be noted that the peers for UMCP and UMB are aspirational, not current, peers.
Time to Degree at Public Four-year Institutions Another common metric used to measure performance is time to degree. Exhibit 4
compares the average time to complete a bachelor’s degree at Maryland’s public institutions for first-time, full-time students in fiscal 2008. This data is being collected for the first time by MHEC as part of the Complete College America grant and as such, it is hard to draw any conclusions. To the extent that there is any confusion among institutions about data definitions, comparisons between colleges may not be valid. Before a making policy or fiscal decisions based on any performance metrics, it is important to ensure that the data being reported is consistent and valid.
Exhibit 4 Average Time to Degree Public Four-year Institutions
First-time Full-time Students Fiscal 2008
SMCM: St. Mary’s College of Maryland UMBC: University of Maryland Baltimore County UMCP: University of Maryland, College Park UMES: University of Maryland Eastern Shore UMUC: University of Maryland University College Note: Data shows time to degree for first-time, full-time students and does not include the University of Baltimore or the University of Maryland, Baltimore Source: Maryland Higher Education Commission; St. Mary’s College of Maryland; Morgan State University
0
1
2
3
4
5
6
Years to Degree

10 Performance Models and Metrics in Higher Education
10
Pro
du
ctivity Fu
nd
ing
in M
aryla
nd
In general, it takes four years to complete a bachelor’s degree. St. Mary’s College of Maryland, SU, and UMCP are both very close to that rate for degree completion. For students at Morgan State University and Coppin State University, it takes a first-time, full-time students about five years complete their degree. UMB and UB had no first-time students among those who graduated in fiscal 2008 and are not reported in the data. UB has since started to enroll first-time students, and this metric will apply in future years.
UMUC shows an average time to degree of 3.1 years for full-time students. The
university typically has less than 100 students who enter as freshmen, and many of them begin with part-time status. If this data is accurate, UMUC is especially efficient at graduating first-time, full-time students. It may be the case that students self-selected to enroll at UMUC for its more flexible scheduling, and that these extra-motivated students took a more aggressive course schedule than those at a traditional four-year college, allowing them to graduate at an accelerated rate.
Community Colleges
Although community colleges have broader missions than four-year institutions, the number of associate’s degrees awarded is a valid measure, among others, that is used in other states’ PBF and is particularly relevant as Maryland aims for 55% of its adults to hold an associate’s or bachelor’s degree as a State goal. Exhibit 5 compares Maryland’s community colleges by how many associate’s degrees are awarded for every 100 full-time equivalent students (FTES) enrolled in credit courses. While this includes students who may not be seeking a degree, this method is a more understandable way to compare the colleges due to their wide variation in enrollments. Allegany and Frederick colleges awarded the highest number of associate’s degrees per 100 FTES in fiscal 2008.

Department of Legislative Services 11
Exhibit 5
Associate’s Degrees Per 100 FTES Maryland Community Colleges
Fiscal 2008
FTES: full-time equivalent student enrolled for credit Source: Maryland Higher Education Commission; Maryland Association of Community Colleges
0
2
4
6
8
10
12
14
16
18
20

12 Performance Models and Metrics in Higher Education
12
Pro
du
ctivity Fu
nd
ing
in M
aryla
nd
Percent of Credit Hours Attempted and Completed
Since community colleges serve a diverse student population, several states use the metric of credit hours attempted and/or completed rather than, or in addition to, degrees awarded. Exhibit 6 shows the percentage of credit hours attempted that were successfully completed at Maryland’s community colleges. There is wide variation among the colleges. While over 82% of attempted credits are successfully completed at Cecil College and Harford Community College, the credit completion rate at Baltimore City Community College and Anne Arundel Community College are both below 60%.
Exhibit 6 Percent of Attempted Credits Completed
Maryland Community Colleges Fiscal 2008
Source: Maryland Higher Education Commission; Complete College America
Issues and Recommendations
The Department of Legislative Services (DLS) has raised a number of policy issues that
should be considered with PBF. The performance metric examples illustrate how the metrics that are used can greatly affect the results of PBF and consequently institutional funding. Different measures will be needed for institutions with different enrollment sizes and missions, as evidenced by the mix in results for non-research four-year institutions. Some of these common metrics are required to be reported by institutions every year and are readily available
0% 10% 20% 30% 40% 50% 60% 70% 80% 90%

Department of Legislative Services 13 from institutional, state, and federal sources. Others, like time to degree, have only recently been reported to MHEC for the first time as part of the Complete College America grant.
To be effective, PBF needs reliable State support and buy-in from all higher education
stakeholders; therefore, the public higher education segment heads and presidents have been asked to be prepared to discuss PBF issues in Maryland.
The following issues should be discussed:
As the economy improves and additional funding may be available for Maryland higher education in the future, should a portion of the funds be allocated based on an incentive/ performance metric-driven model? Is PBF complementary or counter to the Enrollment Funding Initiative, which has been used recently in Maryland?
Should PBF be kept as simple as possible or should it be tailored to certain state goals,
such as production of Science, Technology, Engineering, and Mathematics (STEM) degrees? For example, incentive funding could be allocated to institutions that reach certain benchmarks in STEM degree awards toward the fiscal 2015 goal set by the Governor.
How are institutions being held accountable for their performance currently? Should additional data be reported to MHEC? As the State implements the Longitudinal Data System (LDS), the additional student- and transcript-level data now being collected for the Complete College America grant as well as institution-level data that has not been reported to MHEC in the past should be incorporated into the LDS.
How could transfer students between two- and four-year schools be considered in PBF? Is there a way to incentivize the transfer of students after receiving an associate’s degree using PBF, which is one of the State’s goals?
Could PBF metrics be useful in allocating budget cuts if (when) the State encounters difficult economic times in the future?
How would Regional Higher Education Centers fit into PBF?
Maryland is in the exploratory phase of PBF, with the Joint Chairmen’s Report (JCR) on a predictive performance model to be submitted in September 2012. Among the best practices cited by experts when developing a PBF model is to involve higher education stakeholders at all levels from the outset. To that end, DLS recommends that the September 2012 JCR be expanded to ask the workgroup to develop the framework for a Maryland PBF model that could be supported by higher education stakeholders. The precise metrics to be used should come from a discussion between all higher education segments, the Governor, and the General Assembly.

14 P
erform
an
ce Mo
dels a
nd
Metrics in
Hig
her E
du
catio
n o
du
ctivity Fu
nd
ing
in M
aryla
nd
Appendix 1
Performance Funding in Selected States
Output-based Funding
Indiana
Background Funding Metrics (Allocation %) Other 2003 2007 2011
Established research support incentive Shifted from funding enrollment growth to performance set asides with adoption three metrics Added four new metrics for total of seven metrics
2007-2010 2011 2014 2015
65% of new appropriation allocated according to formula (1.0-2.0% budget increase) No new money; formula funded with $61.4 million across-the-board reduction to base appropriation (5.0% reduction); budget further reduced by $13.7 million as part of State reductions1 6.0% of operating budget 7.0% of operating budget
Total Degree Attainment Change (60%) Low-income (15%) On-time (15%) Overall degree (30%)
Total Completion of Credit Hours (25%) Successful Completion (18.7%) Dual Credit Successful Completion (5.5%) Early College Successful Completion (0.8%)
Research Incentive (15%)
Institutions evaluated against the same benchmarks regardless of size or mission Funding based on year to year changes in numbers not percentage change
1Reductions made to three institutions with the amount incorporated into total base appropriations for all institutions which was reallocated across all institutions. Those with better performance and lower cost received smaller cuts than those with high costs and low completion rates. Note: In 2011, institutions were rewarded for increase performance with no penalty for negative performance, which for some institutions would have resulted in a double cut. Source: Indiana Commission for Higher Education: 2011-2013 Budget Recommendations presentation and Reaching Higher with Accountability Embracing Accountability for Results, 2008; Catalyst for Completion: Performance-based Funding in Higher Education, New England Board of Higher Education, 2011.

D
epa
rtmen
t of L
egisla
tive Service
s
15
Ohio
Background Funding Metrics Other 1985 1990s 2010 2011
Established research challenge Established State Share of Instruction (SSI) and Challenge Program1 to allocate new funds SSI shifts to outcome based formulas based on campus type2
Implemented Success Points for Community Colleges
1985 1990s 2010 2011 2012 2013
Research ~ $11million/year Challenge Program ~ $130 million/year3 $1.99 billion $2.00 billion with 5% of funding allocated for Success Points 2.7% increase in SSI 0.9% increase in SSI. Includes “stop loss” to maintain majority of funds as adjusts to SSI. FY 2010 maintains 99% of funds, and FY 2011 maintains 98%
University Main Campuses Course and degree completion
University Regional Campuses Course completion Degree completion will be added
Community Colleges/Success Points Progression from remedial to college level courses Students earning 15 and 30 college level credits Students earning an associate degree Completion of 15 hours and transfers to four-year institutions
Phased in with more weight shifting from course completions to degree completion Main campuses: at- risk students more heavily weighted in formula Funds allocated for graduate education will be based on success factors e.g., degree completion and research expenditures
1Funds allocated based on access (keeping tuition low); success (degree completion); and jobs (non-credit related training). 2Campus types – university main campus, university regional campuses, and community colleges. 3Funding for access ~ $65 million/year; success ~ 55 million/year (two-thirds for at-risk students); and jobs ~ $10million/year. Note: A portion of funding is reserved for mission-specific contributions to the state’s strategic plan. Source: Performance-based Funding for Higher Education, Ohio Board of Regents; Degrees of Success presentation by Ohio Board of Regents; Ohio Board of Regents, State Share of Instruction (SSI) Funding FY 2012-13; Catalyst for Completion: Performance-based Funding in Higher Education, New England Board of Higher Education, 2011; Outcomes Tied to Dollars: Performance Funding for Higher Education presentation at Missouri’s Governor’s summit on higher education, 2011; Four Steps to Finishing First, Lumina Foundation

16 P
erform
an
ce Mo
dels a
nd
Metrics in
Hig
her E
du
catio
n o
du
ctivity Fu
nd
ing
in M
aryla
nd
Tennessee
Background Funding Metrics Other 1979 2010
Implemented Performance-based funding but 60% of funds were tied to enrollment Passage of Complete College TN Act of 2010 – replaces enrollment based funding with outcomes-based formula
1979 2011
Institutions could earn an additional 5.45% in funds totaling $50 million annually Phase-in new formula over four years; all funds will be allocated through formula; state funds for fixed cost will account for 18 and 15% of universities and community college budgets
1979: program review and accreditation results; test results on general education; and major field tests and licensure rates Complete College TN Act of 2010 University1
Students accumulating: 24, 48, and 72 hours
Bachelor’s, Master’s, Doctoral, and law degrees
Research/grant funding Transfers out with 12 hours Degrees per 100 full-time equivalent
(FTE) Six-year graduation rate
Community College Student accumulating: 12, 24, and
36 hours Dual enrolled students Associated degrees Graduates placed in jobs Remedial and development success Transfers out with 12 credit hours Workforce training (contact hours) Award per 100 FTEs
Not based on goals or targets therefore are not penalized for not meeting pre-determined goals Outcomes Model Points awarded
Weight applied to each outcome; reflects priority and institutional mission
Monetize with average Southern Regional Education Board salary multiplier
Adjust for fixed costs (i.e., utilities and infrastructure size)
Add Quality Assurance program (accreditation, student satisfaction, and licensure exam pass rate)
1 Adults (over 25) and low-income students completing any of the metrics are more heavily weighted. Source: Tennessee’s Outcomes-based Funding Formula presentation by Tennessee Higher Education Commission; The Public Agenda for Tennessee Higher Education 2010-2015, Tennessee Higher Education Commission; Outcomes Tied to Dollars: Performance Funding for Higher Education presentation at Missouri’s Governor’s summit on higher education, 2011; Catalyst for Completion: Performance-based Funding in Higher Education, New England Board of Higher Education, 2011; Performance-based Funding: A Re-emerging Strategy in Public Higher Education Financing, American Association of State Colleges and Universities, 2011

D
epa
rtmen
t of L
egisla
tive Service
s
17
Performance-based or Set Asides
Pennsylvania
Background Funding Metrics Other 2000 2002 2011
Established System of Accountability (SAP) and Performance Funding Program (PFP) Revised formula; 8 of 17 measures in SAP used in PFP Revised formula to align with new strategic objectives
2000-01 2002 2003 2004 2005-10 2011
Program initiative line item in 2000 = $2.0 million; 2001= $4.5 million $8.8 million – jointly funded from Program Initiatives ($1.2 million) and education and general (E&G) appropriations ($7.6 million, or 2%, of E&G) $12.5 million, or 3%, from E&G $21.7 million, or 5%, from E&G $38.7 million; 6 and 2% from E&G and program initiatives $38.7 million, or 2.4%, funded from E&G appropriations
2011-2017 Revised Metrics Mandatory Student Success: degrees conferred and
closing achievement gap Access: close access gap and faculty
diversity Stewardship: private support dollars
raised Optional (chose 5) Success: deep learning scale results;
senior survey; student persistence; value added; and STEM degrees
Access: faculty career advancement; employment diversity; student experience with diversity; and student diversity
Stewardship: facilities investment; admin. expenditures as a % of educational costs; faculty productivity; and employee productivity
University-specific: may create no more than 2 indicators
Measures based on progress toward institution-specific goals and against external comparisons or expectations Measures are worth 1 point for total of 10 points which are weighted by the base appropriation Weighted points divided into total performance funding pool creating a dollar per point value
Source: Pennsylvania State System of Higher Education: Performance Funding Program Recommendations, and System Accountability Plan; Performance-based Funding: A Re-emerging Strategy in Public Higher Education Financing, American Association of State Colleges and Universities, 2011; Outcomes Tied to Dollars: Performance Funding for Higher Education presentation at Missouri’s Governor’s summit on higher education, 2011; Four Steps to Finishing First, Lumina Foundation

18 P
erform
an
ce Mo
dels a
nd
Metrics in
Hig
her E
du
catio
n o
du
ctivity Fu
nd
ing
in M
aryla
nd
Washington – Community College
Background Funding Metrics Other 2006
Adopted Student Achievement Initiative (also referred to as momentum points)
2007-08 2009-11
$1.75 million seed money; each institution received $52,000
Proposed budget included $3.5 million with $500,000 set aside for first year
Build College Level Skills: adult literacy/English language proficiency test score gains; GED or H.S. diploma; and passing pre-college writing or math First-year Retention: Earning 15 and 30 college level credits Completing College Level Math: passing courses required for technical or academic associate degrees Completions: certificates; Associate degrees; and apprenticeship training
2007-08 2006-07 2008-09
Learning year to understand measures, analyze data, and identify types of students and areas of curricula for focused attention Baseline year First performance year
Source: Outcomes Tied to Dollars: Performance Funding for Higher Education presentation at Missouri’s Governor’s Summit on Higher Education, 2011; Performance-based Funding: A Re-emerging Strategy in Public Higher Education Financing, American Association of State Colleges and Universities, 2011; Illinois Public Agenda for College and Career Success, Higher Education Finance Study Commission, 2010

D
epa
rtmen
t of L
egisla
tive Service
s
19
Performance-based Contracts
Louisiana
Background Funding Metrics Other 1997 2001 2010 2011
Legislation required PBF for agencies led to required reporting on four core objectives1
Established funding formula included performance component2 Revised formula to consist of cost model and performance GRAD Act requires institutions to enter into six-year performance agreements
2010 2011
25% of institution’s state funding based on performance Total funding comprised of 75% cost component; 15% performance funds and 10% tuition (if meet student success target may annually increase tuition up to 10%)
Cost component or end of course Based on number of credit hours completed Performance Access and Success: Graduates at all levels; 25 yrs or older; underserved minorities, and low-income Transfers with an associate’s degree and with 30 or more credit hours Competiveness and Workforce: completers in STEM/Health; research; and workforce training
Metric Categories Measures – institutions are benchmark against specific measures Tracked – lack baseline; will be converted to measures Descriptive – only reported 80% score required for passage Must pass student success to retain tuition authority and be eligible for autonomies
1Reported on total and minority enrollment, and retention and graduation rates. 2Formula consisted of core funding, quality improvement, and performance incentive; however, only core component provided equitable funding for institutions with similar missions and enrollment, received funding and was not fully funded. Source: Louisiana Board of Regents: Response to Act 899 of the 2010 Regular Session of the Louisiana Legislature; GRAD Act Annual Review – Year1; and Regent Recap: Regents Adopt Revamped Formula, 2011; Outcomes Tied to Dollars: Performance Funding for Higher Education presentation at Missouri’s Governor’s Summit on Higher Education, 2011

20 P
erform
an
ce Mo
dels a
nd
Metrics in
Hig
her E
du
catio
n o
du
ctivity Fu
nd
ing
in M
aryla
nd
Appendix 2
Other States Investigating Performance-based Funding
State Actions Arizona During the 2011 session, the legislature required the Arizona Board of
Regents to submit a report on a funding structure for performance and outcomes-based funding; proposed fiscal 2013 funding includes performance funding for completion and credit hour completion with each weighted by level and cost; and research/public service.
Colorado Passed legislation creating a new system of performance contracts to be negotiated between the Commission on Higher Education and individual institutions to be effective by 2016 through 2017 but only if a specified level of state base funding is reached.
Illinois Higher Education Finance Study Commission developed recommendations to align funding with state goals; proposed to be a small component of funding to be phased in over time beginning with fiscal 2013 budget submissions.
Kentucky Proposed funding based on five student success metrics with each institution able to earn up to one point for each metric; funds will be added to the base budget.
Massachusetts The Governor set aside $2.5 million of the 2012 budget that will be awarded to institutions based on their plans to increase academic performance which according to the Secretary of Education is a “change in the way we think about higher education funding and a harbinger of important changes to come.”
Missouri The Governor called for a higher education funding formula that allocates future increases to institutions based on quantitative measures on their performance.
Texas The Higher Education Outcomes-based Funding Act of 2011 directs the Higher Education Coordinating Board to propose an outcomes-based funding methodology.
Virginia The Virginia Higher Education Opportunity Act of 2011 includes a provision to create incentives for institutions to meet performance goals.