2012 local government financial information handbook
TRANSCRIPT

2012
Local Government Financial Information Handbook
October 2012
The Florida Legislature’s
Office of Economic and Demographic Research

2012 Local Government Financial Information Handbook October 2012
Prepared by the Florida Legislature’s Office of Economic and Demographic Research (EDR)
with assistance provided by the Florida Department of Revenue’s Office of Tax Research.
Acknowledgments The Florida Legislature’s Office of Economic and Demographic Research (EDR) is responsible for the publication and distribution of this annual report. This report includes county and municipal revenue estimates calculated by the Florida Department of Revenue’s Office of Tax Research. Questions pertaining to the estimated distributions of select state-shared revenues and local option taxes to individual county and municipal governments should be directed to the Department’s Office of Tax Research at (850) 617-8322. Alternatively, questions pertaining to estimated distributions can be directed to the EDR at the following address.
Melissa Hallaian, Economist Office of Economic and Demographic Research 111 West Madison Street, Suite 574 Tallahassee, FL 32399-6588 Phone: (850) 487-1402
General inquiries regarding this publication should be directed to the EDR. In addition, suggested improvements that will make future editions of this publication more informative and useful as a resource document are always welcome. Please direct your general comments or questions to the EDR at the following address.
Steven O’Cain, Senior Legislative Analyst Office of Economic and Demographic Research 111 West Madison Street, Suite 574 Tallahassee, FL 32399-6588 Phone: (850) 487-1402
Additional data of potential interest to state and local officials can be found on the EDR’s website: http://edr.state.fl.us/Content/index.cfm.

Office of Economic and Demographic Research
2012 Local Government Financial Information Handbook i
Introduction The Local Government Financial Information Handbook is a reference for most of the revenue sources available to local governments. It contains relevant information on several items useful for local government budgeting purposes, including descriptions of revenue sources, estimated revenue distributions, and adjusted population estimates used for revenue-sharing calculations. This publication was written as a guide to understanding constitutional and statutory laws regarding these revenue sources. However, questions of legal interpretation should be directed to appropriate legal counsel. The Florida Legislature’s Office of Economic and Demographic Research (EDR) prepared this publication with the assistance of the Florida Department of Revenue’s Office of Tax Research. The EDR staff updated the descriptions of local revenue sources, summarized relevant changes to general law provisions affecting those sources, and prepared a number of accompanying summary tables. The Office of Tax Research prepared the estimated distributions of numerous state-shared revenues and local option taxes to counties and municipalities for the 2012-13 fiscal year. It is important for the reader to note that the estimated distributions presented in this publication do not necessarily represent the actual disbursements that each local government will ultimately receive since economic conditions are subject to future change. The discussion of local government revenue sources in this report is organized as follows:
Part One: Revenue Source Authorized by the Constitution
Part Two: Revenue Sources Based on Home Rule Authority Part Three: Revenue Sources Authorized by the Legislature Adjusted 2011 county and municipal population estimates used for the 2012-13 fiscal year revenue-sharing calculations are provided in Appendix A. A comparison of the 2010 and 2011 adjusted population estimates used in the state revenue-sharing calculations for fiscal years 2011-12 and 2012-13 is provided in Appendix B. Finally, a listing of the 2012 federal, state, and county tax rates on motor fuel and diesel fuel by county is provided in Appendix C.

Office of Economic and Demographic Research
ii 2012 Local Government Financial Information Handbook
Table of Contents Page No. Part One: Revenue Source Authorized in the Constitution ................................................................. 1 Ad Valorem Tax ........................................................................................................................... 3 Part Two: Revenue Sources Based on Home Rule Authority .............................................................. 9 Proprietary Fees... ....................................................................................................................... 11 Regulatory Fees….. .................................................................................................................... 13 Special Assessments ................................................................................................................... 15 Part Three: Revenue Sources Authorized by the Legislature ............................................................ 17 State-Imposed Fees or Taxes Shared with Local Governments or School Districts Alcoholic Beverage License Tax ................................................................................................ 19 Cardroom Revenues .................................................................................................................... 21 Constitutional Fuel Tax .............................................................................................................. 23 Estimated Distributions ................................................................................................. 26 County Fuel Tax ......................................................................................................................... 29 Estimated Distributions ................................................................................................. 31 County Revenue Sharing Program ............................................................................................. 33 Estimated Distributions ................................................................................................. 36 Distribution of Sales and Use Taxes to Counties ........................................................................ 39 Emergency Management Assistance .......................................................................................... 41 Enhanced 911 Fee ....................................................................................................................... 43 Fuel Tax Refunds and Credits .................................................................................................... 47 Indian Gaming Revenues ............................................................................................................ 49 Insurance License Tax ................................................................................................................ 51 Intergovernmental Radio Communication Program ................................................................... 53 Local Government Half-Cent Sales Tax Program ...................................................................... 55 Estimated Distributions ................................................................................................. 62 Miami-Dade County Lake Belt Mitigation Fee .......................................................................... 73 Miami-Dade County Lake Belt Water Treatment Plant Fee ....................................................... 75 Mobile Home License Tax ......................................................................................................... 77 Municipal Revenue Sharing Program ......................................................................................... 79 Estimated Distributions ................................................................................................. 84 Oil, Gas, and Sulfur Production Tax ........................................................................................... 91 Phosphate Rock Severance Tax .................................................................................................. 93 State Housing Initiatives Partnership Program ........................................................................... 97 Support for School Capital Outlay Purposes .............................................................................. 99

Office of Economic and Demographic Research
2012 Local Government Financial Information Handbook iii
Vessel Registration Fee ............................................................................................................ 101 Other Local Revenue Sources Communications Services Tax ................................................................................................. 105 Estimated Distributions ............................................................................................... 109 Convention Development Taxes ............................................................................................... 119 Consolidated County Convention Development Tax .................................................. 121 Charter County Convention Development Tax ........................................................... 123 Special District, Special, and Subcounty Convention Development Taxes ................ 125 Discretionary Surtax on Documents ......................................................................................... 127 Green Utility Fee ...................................................................................................................... 131 Gross Receipts Tax on Commercial Hazardous Waste Facilities ............................................. 133 Highway Safety Fees – Red Light Cameras ............................................................................. 135 Insurance Premium Tax ............................................................................................................ 137 Local Business Tax (Including the Panama City and Panama City Beach Merchant License Tax) ................................................................................................................ 139 Local Discretionary Sales Surtaxes .......................................................................................... 143 History of Local Discretionary Sales Surtax Levies .................................................... 147 2012 Local Discretionary Sales Surtax Rates in Florida’s Counties ........................... 150 Estimated Distributions ............................................................................................... 152 Estimation of Realized and Unrealized Tax Revenues ................................................ 164 Charter County and Regional Transportation System Surtax ...................................... 167 Local Government Infrastructure Surtax ..................................................................... 171 Small County Surtax .................................................................................................... 175 Indigent Care and Trauma Center Surtax .................................................................... 177 County Public Hospital Surtax .................................................................................... 181 School Capital Outlay Surtax ...................................................................................... 183 Voter-Approved Indigent Care Surtax ......................................................................... 185 Emergency Fire Rescue Services and Facilities Surtax ............................................... 187 Local Option Food and Beverage Taxes ................................................................................... 191 Motor Fuel and Diesel Fuel Taxes (Ninth-Cent and Local Options) ........................................ 195 Ninth-Cent Fuel Tax: Estimated Distributions ............................................................ 199 Local Option Fuel Tax: Estimated Distributions ......................................................... 201 Estimation of Realized and Unrealized Tax Revenues ................................................ 211 Ninth-Cent Fuel Tax .................................................................................................... 213 1 to 6 Cents Local Option Fuel Tax............................................................................. 215 1 to 5 Cents Local Option Fuel Tax............................................................................. 219 Municipal Pari-Mutuel Tax ...................................................................................................... 223 Municipal Parking Facility Space Surcharges .......................................................................... 225 Municipal Resort Tax ............................................................................................................... 227 Public Service Tax .................................................................................................................... 229 Tourist Development Taxes ...................................................................................................... 233 History of Local Option Tourist Tax Levies ............................................................... 237 Taxable Sales Reported by Transient Rental Facilities ............................................... 242 2012 Local Option Tourist Tax Rates in Florida’s Counties ....................................... 244 Estimation of Realized and Unrealized Tax Revenues ................................................ 246

Office of Economic and Demographic Research
iv 2012 Local Government Financial Information Handbook
1 or 2 Percent Tax ........................................................................................................ 249 Additional 1 Percent Tax ............................................................................................. 251 Professional Sports Franchise Facility Tax ................................................................. 253 High Tourism Impact Tax ........................................................................................... 255 Additional Professional Sports Franchise Facility Tax ............................................... 257 Tourist Impact Tax .................................................................................................................... 259 Appendix A: Adjusted 2011 Population Estimates for Florida’s Counties and Municipalities Used in the FY 2012-13 State Revenue-Sharing Calculations ......................................................... 261 Appendix B: Comparison of 2010 and 2011 Adjusted Population Estimates Used for FY 2011-12 and FY 2012-13 State Revenue-Sharing Calculations ................................................. 271 Appendix C: 2012 Federal, State, and County Tax Rates on Motor Fuel and Diesel Fuel in Florida’s Counties ........................................................................................................................ 285

Office of Economic and Demographic Research
2012 Local Government Financial Information Handbook 1
Part One: Revenue Source Authorized in the State Constitution
The ability of local governments to raise revenue for their operations is narrowly constrained by the state constitution.
No tax shall be levied except in pursuance of law. No state ad valorem taxes shall be levied upon real estate or tangible personal property. All other forms of taxation shall be preempted to the state except as provided by general law.1
Counties, school districts, and municipalities shall, and special districts may, be authorized by law to levy ad valorem taxes and may be authorized by general law to levy other taxes, for their respective purposes, except ad valorem taxes on intangible personal property and taxes prohibited by this constitution.2
These constitutional provisions expressly authorize counties, municipalities, and school districts to levy ad valorem taxes. A discussion of the ad valorem tax is the subject of Part One of this report. These constitutional provisions also preserve legislative discretion for the levy of all other taxes by requiring general law authorization. However, all local government revenue sources are not taxes requiring general law authorization. When a county or municipal revenue source is imposed by ordinance, the judicial question is whether the charge meets the legal sufficiency test for a valid assessment or fee. As long as the charge is not deemed a tax, the imposition of the assessment or fee by ordinance is within the constitutional and statutory home rule powers of county and municipal governments. These home rule revenue sources are addressed in Part Two of this report. If the charge fails the legal sufficiency test for a valid assessment or fee, it is deemed a revenue source requiring general law authorization. Part Three of this report addresses local government revenue sources authorized by general law.
1. Section 1(a), Art. VII, State Constitution. 2. Section 9(a), Art. VII, State Constitution.

Office of Economic and Demographic Research
2 2012 Local Government Financial Information Handbook
This page was intentionally left blank.

Office of Economic and Demographic Research
2012 Local Government Financial Information Handbook 3
Ad Valorem Tax Section 9, Article VII, Florida Constitution Chapters 192-197 and 200, Florida Statutes
Summary: The ability of local governments to raise revenue for governmental operations is narrowly constrained by the state constitution.
Counties, school districts, and municipalities shall, and special districts may, be authorized by law to levy ad valorem taxes and may be authorized by general law to levy other taxes, for their respective purposes, except ad valorem taxes on intangible personal property and taxes prohibited by this constitution.1
Ad valorem taxes, exclusive of taxes levied for the payment of bonds and taxes levied for periods not longer than two years when authorized by vote of the electors who are the owners of freeholds therein not wholly exempt from taxation, shall not be levied in excess of the following millages upon the assessed value of real estate and tangible personal property: for all county purposes, ten mills; for all municipal purposes, ten mills; for all school purposes, ten mills; for water management purposes for the northwest portion of the state lying west of the line between ranges two and three east, 0.05 mill; for water management purposes for the remaining portions of the state, 1.0 mill; and for all other special districts a millage authorized by law approved by vote of the electors who are owners of freeholds therein not wholly exempt from taxation. A county furnishing municipal services may, to the extent authorized by law, levy additional taxes within the limits fixed for municipal purposes.2
With the exception of the ad valorem tax and constitutionally and statutorily authorized home-rule revenue sources, local governments are dependent on the Legislature for the authority to levy other forms of taxation. Therefore, the relative importance of the ad valorem tax as a revenue source for local governments is increased. To summarize, local governments may levy ad valorem taxes subject to the following limitations.
1. Ten mills for county purposes. 2. Ten mills for municipal purposes. 3. Ten mills for school purposes. 4. A millage fixed by law for a county furnishing municipal services. 5. A millage authorized by law and approved by voters for special districts.
As mentioned, the state constitution provides two exceptions to the ten-mill cap. The exceptions include a voted debt service millage and a voted millage not to exceed a period of two years. Additionally, no property may be subject to more than twenty mills of ad valorem tax for municipal and county purposes without elector approval, regardless of the property’s location, under the state constitution. Duval County-City of Jacksonville is a consolidated government; therefore, it has a twenty-mill cap since it operates as both a county and municipal government. 1. Section 9(a), Art. VII, State Constitution. 2. Section 9(b), Art. VII, State Constitution.

Office of Economic and Demographic Research
4 2012 Local Government Financial Information Handbook
County Millages: County government millages are composed of four categories of millage rates.3
1. County general millage is the nonvoted millage rate set by the county’s governing body. 2. County debt service millage is the rate necessary to raise taxes for debt service as authorized by a
vote of the electors pursuant to Section 12, Art. VII, State Constitution. 3. County voted millage is the rate set by the county’s governing body as authorized by a vote of the
electors pursuant to Section 9(b), Art. VII, State Constitution. 4. County dependent special district millage is set by the county’s governing body pursuant to s.
200.001(5), F.S., and added to the county’s millage to which the district is dependent. A dependent special district is defined as a special district meeting at least one of four criteria specified in law.4
County Furnishing Municipal Services: General law implements the constitutional provision authorizing a county furnishing municipal services to levy additional taxes within the limits fixed for municipal purposes via the establishment of municipal service taxing or benefit units.5 The distinction between a municipal service taxing unit (MSTU) and a municipal service benefit unit (MSBU) is that a MSTU is the correct terminology when the mechanism used to fund the county services is derived through taxes rather than service charges or special assessments (i.e., MSBU). The creation of a MSTU allows the county’s governing body to place the burden of ad valorem taxes upon property in a geographic area less than countywide to fund a particular municipal-type service or services. The MSTU is used in a county budget to separate those ad valorem taxes levied within the taxing unit itself to ensure that the funds derived from the tax levy are used within the boundaries of the taxing unit for the contemplated services. If ad valorem taxes are levied to provide these municipal services, counties are authorized to levy up to ten mills.6 The MSTU may encompass the entire unincorporated area, a portion of the unincorporated area, or all or part of the boundaries of a municipality. However, the inclusion of municipal boundaries within the MSTU is subject to the consent by ordinance of the governing body of the affected municipality given either annually or for a term of years. Municipal Millages: Municipal government millages are composed of four categories of millage rates.7
1. Municipal general millage is the nonvoted millage rate set by the municipality’s governing body. 2. Municipal debt service millage is the rate necessary to raise taxes for debt service as authorized by a
vote of the electors pursuant to Section 12, Art. VII, State Constitution. 3. Municipal voted millage is the rate set by the municipality’s governing body as authorized by a vote
of the electors pursuant to Section 9(b), Art. VII, State Constitution. 4. Municipal dependent special district millage is set by the municipality’s governing body pursuant to
s. 200.001(5), F.S., and added to the municipality’s millage to which the district is dependent and included as municipal millage for the purpose of the ten-mill cap.
3. Section 200.001(1), F.S. 4. Section 189.403(2), F.S. 5. Section 125.01(1)(q), F.S. 6. Section 200.071(3), F.S. 7. Section 200.001(2), F.S.

Office of Economic and Demographic Research
2012 Local Government Financial Information Handbook 5
School District Millages: As previously stated, the state constitution restricts the levy of nonvoted ad valorem tax levies for school purposes to ten mills. The voted levies, which are constitutionally available to counties and municipalities as well as school districts, do not count toward the ten-mill cap. School district millage rates are composed of five categories.8
1. Nonvoted required school operating millage (otherwise known as required local effort) is set by the school board for current operating purposes and imposed pursuant to s. 1011.60(6), F.S. It reflects the minimum financial effort required for support of the Florida Education Finance Program (FEFP) as prescribed in the current year’s General Appropriations Act.
2. Nonvoted discretionary school operating millage is the rate set by the school board for operating purposes other than the required local effort millage rate imposed pursuant to s. 1011.60(6), F.S., and the nonvoted capital improvement millage rate imposed pursuant to s. 1011.71(2), F.S. The Legislature shall prescribe annually in the appropriations act the maximum amount of millage a district may levy.9
3. Nonvoted district school capital improvement millage is the rate set by the school board for capital improvements as authorized in s. 1011.71(2), F.S. General law caps the maximum rate at 1.5 mills.10 However, a district school board is authorized to levy two additional millages of up to 0.25 mills each under certain circumstances.11
4. Voted district school operating millage is the rate set by the school board for current operating purposes as authorized by a vote of the electors pursuant to Section 9(b), Art. VII, State Constitution.
5. Voted district school debt service millage is the rate set by the school board as authorized by a vote of the electors pursuant to Section 12, Art. VII, State Constitution.
Independent Special District Millages: Independent special district millages are the rates set by the district’s governing body, and the following issues must be addressed.12
1. Whether the millage authorized by a special act is approved by the electors pursuant to Section 9(b), Art. VII, State Constitution; authorized pursuant to Section 15, Art. XII, State Constitution; or otherwise authorized.
2. Whether the tax is to be levied countywide, less than countywide, or on a multicounty basis. Adjustments to the Tax Base: The ad valorem taxable base is the fair market value of locally assessed real estate, tangible personal property, and state assessed railroad property, less certain exclusions, differentials, exemptions, credits and deferrals. Intangible personal property is excluded because it is separately assessed and taxed by the state. Exclusions are specific types of property constitutionally or statutorily removed from ad valorem taxation. Differentials are reductions in assessments that result from a valuation standard other than fair market value. Exemptions are deductions from the assessed value that are typically specified as a dollar amount (e.g., homestead exemption of $25,000). Credits are deductions from the tax liability of a particular taxpayer and 8. Section 200.001(3), F.S. 9. Section 1011.71(1), F.S. 10. Section 1011.71(2), F.S. 11. Section 1011.71(3), F.S. 12. Section 200.001(4), F.S.

Office of Economic and Demographic Research
6 2012 Local Government Financial Information Handbook
may take the form of allowances, discounts, and rebates. Deferrals allow for changes in the timing of payments but do not reduce the taxpayer’s overall tax liability.13 General Law Amendments: The following list highlights the legislation passed during the 2012 Regular Legislative Session that amended provisions related to the ad valorem tax and its administration. These chapter laws are available via the Department of State’s Division of Elections website.14
Chapter Law # Subject 2012-32 Economic Development 2012-54 Homestead Property Tax Exemptions 2012-57 Homestead Exemptions for Seniors 2012-83 Agriculture 2012-159 Military Support 2012-193 Administration of Property Taxes 2012-212 Legal Notices Joint Resolution Additional Homestead Tax Exemption for Seniors Joint Resolution Homestead Property Tax Exemption for Surviving Spouse of Military
Veteran or First Responder Joint Resolution Tangible Personal Property Tax Exemptions
Eligibility Requirements: Florida’s constitution authorizes counties, municipalities, and school districts to levy ad valorem taxes. At its discretion, the Legislature may authorize special districts to levy ad valorem taxes. Millage rates are fixed only by ordinance or resolution of the taxing authority’s governing body in the manner specifically provided by general law or special law.15 Millage rates vary among local governments subject to constitutional, statutory, and political limitations. Administrative Procedures: The DOR and units of local government administer the ad valorem tax. Two county constitutional officers, the property appraiser and tax collector, have primary responsibility for the administration and collection of ad valorem taxes at the local level. The property appraiser is charged with determining the fair market value, the assessed value, and the values of applicable exemptions to arrive at the taxable value of all property within the county, pursuant to constitutional and statutory requirements. The property appraiser is also tasked with maintaining appropriate records related to the valuation of such property. The tax collector is charged with the collection of ad valorem taxes levied by the county, school district, all municipalities within the county, and any special taxing districts within the county. The DOR has general supervision of the assessment and valuation of property so that all property is placed on the tax rolls and valued according to its just valuation. Additionally, the DOR prescribes and furnishes all forms as well as prescribes rules and regulations to be used by property appraisers, tax collectors, clerks of
13. See the Florida Revenue Estimating Conference’s 2012 Florida Tax Handbook Including Fiscal Impact of Potential Change, pp. 189-199 at http://edr.state.fl.us/Content/revenues/reports/tax-handbook/taxhandbook2012.pdf for additional detail. 14. http://laws.flrules.org/ 15. Section 200.001(7), F.S.

Office of Economic and Demographic Research
2012 Local Government Financial Information Handbook 7
circuit court, and value adjustment boards in administering and collecting ad valorem taxes. The following chapters of the Florida Statutes address the ad valorem tax, its administration, and other relevant issues: Chapter 192, general provisions of taxation; Chapter 193, assessments; Chapter 194, administrative and judicial review of property taxes; Chapter 195, administration of property assessments; Chapter 196, exemptions; Chapter 197, tax collections, sales, and liens; and Chapter 200, determination of millage. Distribution of Proceeds: The tax collector distributes taxes to each taxing authority.16 Authorized Uses: Ad valorem taxes are considered general revenue for general-purpose local governments (i.e., county, municipality, or consolidated city-county government) as well as for school districts. An independent special district may be restricted in the expenditure of the revenue for the purpose associated with the district’s creation. If ad valorem taxes are levied within a municipal service taxing unit (MSTU), the expenditure of those funds may be restricted to those services specified in s. 125.01(1)(q), F.S. Attorney General Opinions: Florida’s Attorney General has issued hundreds of legal opinions relevant to this revenue source. The full texts of those opinions are available via the searchable on-line database of legal opinions.17 Interested persons may view the opinions by accessing the website and performing a search using the keyword phrase ad valorem tax. Local government officials seeking more clarification should review the opinions in their entirety. The reader should keep the date of the opinion in mind when reviewing its relevance to current law or any interpretations that have been articulated in Florida case law. Prior Years’ Revenues: The DOR annually publishes online its Florida Property Valuations & Tax Data, which details property valuations and tax data by local jurisdiction. Data for 2012 as well as several prior years are available via the DOR’s website.18 Using data obtained from these annual reports, several summaries that profile historical millage rates and ad valorem taxes levied by counties, municipalities, and school districts have been compiled.19
16. Section 197.383, F.S. 17. http://myfloridalegal.com/ago.nsf/Opinions 18. http://dor.myflorida.com/dor/property/resources/data.html 19. http://edr.state.fl.us/Content/local-government/data/data-a-to-z/index.cfm

Office of Economic and Demographic Research
8 2012 Local Government Financial Information Handbook
This page was intentionally left blank.

Office of Economic and Demographic Research
2012 Local Government Financial Information Handbook 9
Part Two: Revenue Sources Based on Home Rule Authority
Under Florida’s Constitution, local governments possess expansive home rule powers. Given these powers, local governments may utilize proprietary and regulatory fees and special assessments to pay the cost of providing a facility or service or regulating an activity. Each fee imposed under a local government’s home rule powers must be analyzed in the context of requirements established in Florida case law that are applicable to its validity. Proprietary fees are based on the assertion that local governments have the exclusive legal right to impose such fees. Examples of proprietary fees include admissions fees, franchise fees, user fees, and utility fees. The guiding legal principle is that the imposed proprietary fee is reasonable in relation to the government-provided privilege or service or the fee payer receives a special benefit. Regulatory fees may be imposed pursuant to a local government’s police powers in the exercise of a sovereign function. Examples of regulatory fees include building permit fees, impact fees, inspection fees, and stormwater fees. A regulatory fee should not exceed the regulated activity’s cost and is generally required to be applied solely to the regulated activity’s cost for which the fee is imposed. Special assessments are used to construct and maintain capital facilities and to fund certain services. In order for a special assessment to be deemed valid, the assessed property must derive a special benefit from the improvement or service provided, and the assessment must be fairly and reasonably apportioned among the properties that receive the special benefit. In summary, all local government revenue sources are not taxes requiring general law authorization. When a county or municipal revenue source is imposed by ordinance, the question is whether or not the charge meets the legal sufficiency test for a valid assessment or fee. If the charge does not meet the test, it is considered a tax and requires general law authorization. If the charge is not deemed a tax, the imposition of the assessment or fee is within the constitutional and statutory home rule powers of county and municipal governments. Summaries of Select Court Rulings: One resource containing a discussion of local revenues based on home rule authority, including summaries of significant case law and recent legal developments, is a publication produced by the law firm of Nabors, Giblin, & Nickerson, P.A. This publication is entitled Primer on Home Rule & Local Government Revenue Sources, and persons interested in its availability should contact the firm’s Tallahassee office directly at (850) 224-4070.

Office of Economic and Demographic Research
10 2012 Local Government Financial Information Handbook
This page was intentionally left blank.

Office of Economic and Demographic Research
2012 Local Government Financial Information Handbook 11
Proprietary Fees Home Rule Authority
Sections 403.0893, Florida Statutes Summary: Proprietary fees are home rule revenue sources, which are based on the assertion that local governments have the exclusive legal right to impose such fees. Examples of proprietary fees include admissions fees, franchise fees, user fees, and utility fees. Each proprietary fee imposed under a local government’s home rule powers should be considered in context with rules applicable to its validity that are set forth in case law. The guiding legal principle is that the imposed fee is reasonable in relation to the government-provided privilege or service or the fee payer receives a special benefit. Local governments, for example, may exercise their home rule authority to impose a franchise fee upon a utility for the grant of a franchise and the privilege of using local government’s rights-of-way to conduct the utility business. The fee is considered fair rent for the use of such rights-of-way and consideration for the local government’s agreement not to provide competing utility services during the term of the franchise agreement. The imposition of the fee requires the adoption of a franchise agreement, which grants a special privilege that is not available to the general public. Typically, the franchise fee is calculated as a percentage of the utility’s gross revenues within a defined geographic area. A fee imposed by a municipality is based upon the gross revenues received from the incorporated areas while a fee imposed by a county is generally based upon the gross revenues received from the unincorporated areas. General Law Amendments: There were no general law amendments resulting from the 2012 Regular Legislative Session. Attorney General Opinions: Florida’s Attorney General has issued numerous legal opinions relevant to these revenue sources. The full texts of those opinions are available via the searchable on-line database of legal opinions.1 Interested persons may view the opinions by accessing the website and performing a search using the keyword phrases: franchise fees, user fees, or utility fees. Local government officials seeking more clarification should review the opinions in their entirety. The reader should keep the date of the opinion in mind when reviewing its relevance to current law or any interpretations that have been articulated in Florida case law. Prior Years’ Revenues: Summaries of prior years’ franchise fee revenues as reported by local governments are available.2
1. http://myfloridalegal.com/ago.nsf/Opinions 2. http://edr.state.fl.us/Content/local-government/data/data-a-to-z/index.cfm

Office of Economic and Demographic Research
12 2012 Local Government Financial Information Handbook
This page was intentionally left blank.

Office of Economic and Demographic Research
2012 Local Government Financial Information Handbook 13
Regulatory Fees Home Rule Authority
Section 163.31801, Florida Statutes Summary: Regulatory fees are home rule revenue sources that may be imposed pursuant to a local government’s police powers in the exercise of a sovereign function. Examples of regulatory fees include building permit fees, impact fees, inspection fees, and stormwater fees. Two principles guide the application and use of regulatory fees. The fee should not exceed the regulated activity’s cost and is generally required to be applied solely to the regulated activity’s cost for which the fee is imposed. As one type of regulatory fee, impact fees are charges imposed by local governments against new development to provide for capital facilities’ costs made necessary by population growth. Rather than imposing the costs of these additional capital facilities upon the general public, the purpose of impact fees is to shift the expense burden to newcomers. Until 2006, the characteristics and limitations of impact fees in Florida were found in case law rather than state statute. As developed under case law, an impact fee imposed by a local government must meet the dual rational nexus test in order to withstand legal challenge. First, there must be a reasonable connection, or rational nexus, between the anticipated need for additional capital facilities and the population growth generated by the new development. Second, the local government must show a rational nexus between the expenditure of impact fee proceeds and the benefits accruing to the new development from those proceeds. In response to local governments’ reliance on impact fees and the growth of impact fee collections, the Florida Legislature adopted the Florida Impact Fee Act in 2006, which requires local governing authorities to satisfy certain requirements when imposing impact fees.1 The Act was amended in 2009 to impose new restrictive rules on impact fees by requiring local governments to shoulder the burden of proof when an impact fee is challenged in court and prohibiting the judiciary from giving deference to local government impact fee determinations.2 General Law Amendments: Chapter 2012-83, L.O.F., (CS/HB 1197) includes municipalities within the types of governmental entities that are prohibited from charging an assessment or fee for stormwater management on a bona fide farm operation on land classified as agricultural, under certain circumstances. This change became effective July 1, 2012. The Revenue Estimating Conference estimates that this legislation will have a recurring negative fiscal impacts to municipalities of ($0.8) million in the 2012-13 fiscal year and ($0.9) million in each fiscal year thereafter. Attorney General Opinions: Florida’s Attorney General has issued numerous legal opinions relevant to these revenue sources. The full texts of those opinions are available via the searchable on-line database of legal opinions.3 Interested persons may view the opinions by accessing the website and performing a search using the keyword phrases: building permit fees, impact fees, inspection fees, or stormwater fees. Local government officials seeking more 1. Section 163.31801, F.S. 2. Chapter 2009-49, L.O.F. 3. http://myfloridalegal.com/ago.nsf/Opinions
Office of Economic and Demographic Research
14 2012 Local Government Financial Information Handbook
clarification should review the opinions in their entirety. The reader should keep the date of the opinion in mind when reviewing its relevance to current law or any interpretations that have been articulated in Florida case law. Prior Years’ Revenues: Summaries of prior years’ building permit fee and impact fee revenues as reported by local governments or school districts are available.4
4. http://edr.state.fl.us/Content/local-government/data/data-a-to-z/index.cfm
Office of Economic and Demographic Research
2012 Local Government Financial Information Handbook 15
Special Assessments Home Rule Authority
Sections 125.01, 125.271, and Chapter 170, Florida Statutes Summary: Special assessments are a home rule revenue source used to construct and maintain capital facilities and to fund certain services. Additionally, state law authorizes the levy of special assessments for county and municipal governments1 and for county emergency medical services.2 Special districts derive their authority to levy special assessments through general law or special act. As established by Florida case law, two requirements exist for the imposition of a valid special assessment. First, the assessed property must derive a special benefit from the improvement or service provided. Second, the assessment must be fairly and reasonably apportioned among the properties that receive the special benefit. In order for an assessed property to derive a special benefit from the service provided, there should be a logical relationship between the provided service and the benefit to real property. This logical relationship to property legal test defines those services that can be funded by special assessments versus those that cannot. General government services, such as general law enforcement and indigent health care, fail to satisfy the logical relationship to property test and cannot be funded by special assessments. Many improvements and services have been upheld by the courts as providing a special benefit to assessed properties. Examples of such improvements and services include downtown redevelopment, garbage disposal, fire and rescue services, fire protection, parking facilities, sewer improvements, stormwater management services, street improvements, and water and sewer line extensions. Once the service or capital facility satisfies the special benefit test, the assessment must be fairly apportioned among the benefited property in a manner consistent with the logical relationship embodied in the special benefit requirement. Whether imposed to fund capital projects or services, a special assessment is generally collected on the annual ad valorem tax bill. Under this collection procedure, the special assessment is characterized as a non-ad valorem assessment.3 General Law Amendments: Chapter 2012-83, L.O.F., (CS/HB 1197) includes municipalities within the types of governmental entities that are prohibited from charging an assessment or fee for stormwater management on a bona fide farm operation on land classified as agricultural, under certain circumstances. This change became effective July 1, 2012. The Revenue Estimating Conference estimates that this legislation will have a recurring negative fiscal impacts to municipalities of ($0.8) million in the 2012-13 fiscal year and ($0.9) million in each fiscal year thereafter. Attorney General Opinions: Florida’s Attorney General has issued numerous legal opinions relevant to this revenue source. The full texts of those opinions are available via the searchable on-line database of legal opinions.4 Interested persons may view the opinions by accessing the website and performing a search using the keyword phrase: special
1. For county governments, sections 125.01(1)(r), F.S.; for municipal governments, chapter 170, F.S. 2. Section 125.271, F.S. 3. Section 197.3632, F.S. 4. http://myfloridalegal.com/ago.nsf/Opinions
Office of Economic and Demographic Research
16 2012 Local Government Financial Information Handbook
assessments. Local government officials seeking clarification should review the opinions in their entirety. The reader should keep the date of the opinion in mind when reviewing its relevance to current law or any interpretations that have been articulated in Florida case law. Prior Years’ Revenues: A summary of prior years’ revenues as reported by local governments is available.5
5. http://edr.state.fl.us/Content/local-government/data/data-a-to-z/index.cfm

Office of Economic and Demographic Research
2012 Local Government Financial Information Handbook 17
Part Three: Revenue Sources Authorized by the Legislature
In addition to constitutionally authorized and home rule revenue sources, local governments have other available revenue sources that have been authorized by the Legislature. For purposes of discussion, these revenue sources are grouped into two categories: 1) state-imposed fees or taxes shared with local governments or school districts, or 2) other local revenue sources. Generally, state-shared revenue programs allocate all or some portion of a state-collected fee or tax to specified local governments based on eligibility requirements. In some cases, a formula is developed for the allocation of funds between units of local government. While general law restricts the use of several shared revenues, proceeds derived from other shared revenues may be used for the general revenue needs of local governments. A few revenue sharing programs require as a prerequisite that the county or municipality meet eligibility criteria.1 One such criterion requires that the local government have levied ad valorem taxes to produce the revenue equivalent to a millage rate of 3 mills on the dollar based on 1973 taxable values, or produce revenue equivalent to that which would be produced by a 3-mill ad valorem tax from any combination of the following four sources: receiving a remittance from the county pursuant to s. 125.01(6)(a), F.S., collecting an occupational license tax or a utility tax; or levying an ad valorem tax. The category of state-shared revenues includes the following sources, which are discussed in greater detail later in this document.
Alcoholic Beverage License Tax Cardroom Revenues Constitutional Fuel Tax County Fuel Tax County Revenue Sharing Program Distribution of Sales and Use Taxes to Counties Emergency Management Assistance Enhanced 911 Fee Fuel Tax Refunds and Credits Indian Gaming Revenues Insurance License Tax Intergovernmental Radio Communication Program Local Government Half-cent Sales Tax Program Miami-Dade County Lake Belt Mitigation Fee Miami-Dade County Lake Belt Water Treatment Plant Fee Mobile Home License Tax Municipal Revenue Sharing Program Oil, Gas, and Sulfur Production Tax Phosphate Rock Severance Tax State Housing Initiatives Partnership Program Support for School Capital Outlay Purposes Vessel Registration Fee
1. Section 218.23, F.S.

Office of Economic and Demographic Research
18 2012 Local Government Financial Information Handbook
A special case of state-shared revenues is funding for school districts.2 During the 2009-10 fiscal year, school districts received 32.84 percent of their financial support from state sources; 51.11 percent from local sources, including the Required Local Effort (RLE) portion of the Florida Education Finance Program (FEFP); and 16.06 percent from federal sources. Funds for state support to school districts are provided primarily by legislative appropriations. However, the Florida Constitution authorizes certain revenues to be used by the school districts for capital outlay purposes. Article XII, Section 9(d), of the State Constitution, guarantees a stated amount for each district annually from proceeds of licensing motor vehicles, referred to as Capital Outlay and Debt Service (CO&DS) funds. Additionally, Article XII, Section (a)(2), of the State Constitution, provides that school districts may share in the proceeds from gross receipts taxes, referred to as Public Education Capital Outlay (PECO) funds, as provided by legislative appropriation. Minor state funding sources include the “race track funds,” which are collected by the Florida Department of Business and Professional Regulation and divided equally among Florida’s counties, in accordance with s. 212.20(6)(d)6.a., F.S. The allocation of these funds is to the counties, which may share the funds with school districts, in lieu of funds distributed from the Pari-mutuel Wagering Trust Fund under s. 550.135, F.S., prior to July 1, 2000. Other funding sources are tax receipts from state forests, provided to certain school boards in accordance with s. 589.081, F.S., and proceeds from mobile home licenses, which are deposited into the License Tax Collection Trust Fund and distributed to local governments pursuant to s. 320.081, F.S. In addition to state-shared revenue sources, the Legislature has authorized a number of other local revenue sources. In many instances, the local government must enact an ordinance providing for the levy and collection of the fee, tax, or surcharge. However, in some cases, referendum approval is required. For a number of revenue sources included in this category, general law restricts the expenditure use of the generated funds. The following revenues are included in the category of other local revenue sources.
Communication Services Tax Convention Development Taxes Discretionary Surtax on Documents Green Utility Fee Gross Receipts Tax on Commercial Hazardous Waste Facilities Highway Safety Fees - Red Light Cameras Insurance Premium Tax Local Business Tax (Including the Panama City and Panama City Beach Merchant License Tax) Local Discretionary Sales Surtaxes Local Option Food and Beverage Taxes Motor Fuel and Diesel Fuel Taxes (Ninth-Cent and Local Options) Municipal Pari-mutuel Tax Municipal Parking Facility Space Surcharges Municipal Resort Tax Public Service Tax Tourist Development Taxes Tourist Impact Tax
2. Refer to the Florida Department of Education’s 2011-12 Funding for Florida School Districts (http://www.fldoe.org/fefp/pdf/fefpdist.pdf) for an overview of school district funding.

Office of Economic and Demographic Research
2012 Local Government Financial Information Handbook 19
Alcoholic Beverage License Tax Section 561.342, Florida Statutes
Summary: A portion of the annual state license tax levied on manufacturers, distributors, vendors, brokers, sales agents, and importers of alcoholic beverages and collected within a county or municipality is shared with those local governments. The statutes require that an annual license tax shall be imposed on the following: 1) any person operating a bottle club;1 2) vendors of malt beverages containing alcohol of 0.5 percent or more by volume, manufacturers engaged in the business of brewing only malt beverages, or distributors of alcoholic beverages containing less than 17.259 percent alcohol by volume;2 3) vendors authorized to sell brewed beverages containing malt, wines, and fortified wines; authorized wine manufacturers; or distributors authorized to sell brewed beverages containing malt, wines, and fortified wines in counties where the sale of intoxicating liquors, wines, and beers is permitted;3 4) vendors permitted to sell any alcoholic beverages regardless of alcoholic content, persons associated together as a chartered or incorporated club, and any caterer at a horse or dog racetrack or jai alai fronton;4 and 5) authorized liquor manufacturers and distributors as well as brokers, sales agents, and importers, as defined in s. 561.14(4)-(5), F.S.5 General Law Amendments: There were no general law amendments resulting from the 2012 Regular Legislative Session. Eligibility Requirements: A county or municipality where the license taxes are collected is eligible to receive a portion of the proceeds. Administrative Procedures: The tax is administered, collected, and enforced by the Division of Alcoholic Beverages and Tobacco within the Department of Business and Professional Regulation.6 Distribution of Proceeds: Twenty-four percent of the eligible taxes collected within each county shall be returned to that county’s tax collector.7 Thirty-eight percent of the eligible taxes collected within an incorporated municipality shall be returned to the appropriate municipal officer.8 Authorized Uses: The use of the revenue is at the discretion of the governing body. Attorney General Opinions: Florida’s Attorney General has issued the following legal opinions relevant to this revenue source.
1. Section 561.14(6), F.S. 2. Section 563.02, F.S. 3. Section 564.02, F.S. 4. Section 565.02(1),(4),(5), F.S. 5. Section 565.03, F.S. 6. Section 561.02, F.S. 7. Section 561.342(1), F.S. 8. Section 561.342(2), F.S.

Office of Economic and Demographic Research
20 2012 Local Government Financial Information Handbook
Opinion # Subject 74-131 Taxation and local sales, cigarette, or alcohol tax 79-36 Municipal taxation, alcoholic beverage distribution
The full texts of these opinions are available via a searchable on-line database.9 Local government officials seeking more clarification should review the opinions in their entirety. The statutory language pertaining to this revenue source has been amended since its authorization. The reader should keep the date of the opinion in mind when reviewing its relevance to current law or any interpretations that have been articulated in Florida case law. Prior Years’ Revenues: Summaries of prior years’ distributions are available.10
9. http://myfloridalegal.com/ago.nsf/Opinions 10. http://edr.state.fl.us/Content/local-government/data-a-to-z/index.cfm

Office of Economic and Demographic Research
2012 Local Government Financial Information Handbook 21
Cardroom Revenues Section 849.086, Florida Statutes
Summary: An eligible county or municipality shall receive a portion of taxes imposed on licensed cardroom operators. Located at licensed pari-mutuel facilities, cardrooms are “rooms” where authorized games are played for money or anything of value to which the public is invited to participate and charged a participation fee by the facility operator. An authorized game means a game or series of games of poker or dominoes, which are played in a nonbanking manner. These games are considered pari-mutuel style games rather than casino gaming because the participants play against each other instead of against the “house” (i.e., the cardroom operator and all employees of the cardroom operator). Several taxes and fees are authorized in law; however, only a portion of the tax proceeds are shared with eligible local governments. An annual cardroom license fee for each facility shall be $1,000 for each table to be operated at the cardroom.1 The cardroom employee occupational license fee shall not exceed $50 per employee for any 12-month period, and the cardroom business occupational license fee shall not exceed $250 for any 12-month period.2 The cardroom operator may charge a fee for the right to participate in cardroom games, and such fee may be either a flat fee or hourly rate for the use of a seat at a table or a rake (i.e., a set fee or percentage of the pot assessed by a cardroom operator for providing the services of a dealer, table, or location for playing the authorized game) subject to a posted maximum amount.3 Each cardroom operator shall pay a tax to the state of 10 percent of the cardroom operation’s monthly gross receipts.4 An admission tax equal to 15 percent of the admission charge, if any, for entrance to the licensee’s cardroom facility, or 10 cents, whichever is greater, is imposed on each person entering the cardroom.5 General Law Amendments: There were no general law amendments resulting from the 2012 Regular Legislative Session. Eligibility Requirements: A county or municipality, which has approved a cardroom, is eligible to receive a portion of the taxes deposited into the Pari-mutuel Wagering Trust Fund [hereinafter Trust Fund]. The Division of Pari-mutuel Wagering [hereinafter Division] of the Department of Business and Professional Regulation shall not issue any initial license for cardroom gaming until the local government, where such cardroom gaming activity is to be conducted, has approved such activity by a majority vote of the municipality’s governing body, or the county’s governing body if the facility is located in the unincorporated area.6 Administrative Procedures: The Division shall administer and regulate the operation of cardrooms and monitor and ensure the proper collection of imposed taxes and fees.7 The Division may deny a license or the renewal thereof, or may
1. Section 849.086(5)(d), F.S. 2. Section 849.086(6)(i), F.S. 3. Section 849.086(10), F.S. 4. Section 849.086(13)(a), F.S. 5. Section 849.086(13)(b), F.S. 6. Section 849.086(16), F.S. 7. Section 849.086(4), F.S.

Office of Economic and Demographic Research
22 2012 Local Government Financial Information Handbook
suspend or revoke any license when the applicant has violated or failed to comply with the provisions of the section or any adopted rules pertaining to the administration and operation of cardrooms.8 Distribution of Proceeds: By September 1st of each year, the Division shall determine the amount of taxes deposited into the Trust Fund from each cardroom licensee, the location by county of each cardroom, the location of each cardroom whether within an incorporated municipality or unincorporated area of the county, and the total amount to be distributed to each eligible county and municipality. By October 1st of each year, 25 percent of the taxes deposited into the Trust Fund shall be distributed to eligible local governments.9 Authorized Uses: The use of the revenue is at the discretion of the governing body. Attorney General Opinions: Florida’s Attorney General has issued the following legal opinions relevant to this revenue source.
Opinion # Subject 96-45 Gambling – ordinance necessary for cardroom gaming 2007-48 Gambling – telephone card sweepstakes
The full texts of these opinions are available via a searchable on-line database.10 Local government officials seeking more clarification should review the opinions in their entirety. The statutory language pertaining to this revenue source has been amended since its authorization. The reader should keep the date of the opinion in mind when reviewing its relevance to current law or any interpretations that have been articulated in Florida case law.
8. Section 849.086(14)(a), F.S. 9. Section 849.086(13)(h), F.S. 10. http://myfloridalegal.com/ago.nsf/Opinions

Office of Economic and Demographic Research
2012 Local Government Financial Information Handbook 23
Constitutional Fuel Tax (2 Cents) Section 9(c), Article XII, Florida Constitution
Sections 206.41(1)(a), 206.45, 206.47, 336.023, and 336.024, Florida Statutes Summary: Pursuant to constitutional authorization and statutory implementation, a state tax of 2 cents per gallon on motor fuel is levied.1 The first call on the tax proceeds is to meet the debt service requirements, if any, on local bond issues backed by the tax proceeds. The remaining balance, called the surplus funds, is also used, as necessary, to meet the debt service requirements on local bond issues backed by the surplus funds. Any remaining surplus funds are used for the acquisition, construction, and maintenance of roads. General Law Amendments: There were no general law amendments resulting from the 2012 Regular Legislative Session. Eligibility Requirements: All counties are eligible to receive proceeds. Administrative Procedures: The tax is paid into the state treasury by the Department of Revenue (DOR) for deposit in the Fuel Tax Collection Trust Fund.2 The DOR transmits the tax, as collected monthly, to the State Board of Administration (SBA).3 The SBA calculates a monthly allocation of the taxes received from the DOR based on the formula contained in Section 9(c)(4), Art. XII, State Constitution, and credits to each county’s account the amount of tax allocated by the formula.4 The allocation formula is comprised of three components: a geographic area component, a population component, and a collection component. A distribution factor, based on these three allocation components, is calculated annually for each county in the form of weighted county-to-state ratios. To determine each county’s monthly distribution, the monthly statewide tax receipts are multiplied by each county’s distribution factor. A county’s estimated distribution is determined via the following steps. First, a county’s distribution factor is calculated as the sum of the following three allocation components. 1/4 x County Area
Statewide Area 1/4 x County Population Based on the Latest Available Federal Census
Statewide Population Based on the Latest Available Federal Census 1/2 x County Constit. Fuel Tax Collected on Retail Sales or Use During the Previous FY
Statewide Constit. Fuel Tax Collected on Retail Sales or Use During the Previous FY 1. Section 9(c), Art. XII, State Constitution. 2. Section 206.45(1), F.S. 3. Section 206.47(2), F.S. 4. Section 206.47(6), F.S.
Office of Economic and Demographic Research
24 2012 Local Government Financial Information Handbook
The calculation of the collection component is based upon a DOR certificate of the taxable gallons attributable to each county as of June 30th for each fiscal year. On or before July 31st following the end of each fiscal year, the DOR shall furnish the certificate to the SBA. This certificate is conclusive as to the tax collected in each county for the prior fiscal year.5 Second, a county’s monthly distribution is calculated as follows. Monthly Statewide Constitutional Fuel Tax Receipts x County’s Distribution Factor Distribution of Proceeds: The taxes credited to each county are first distributed to meet the debt service requirements, if any, of the Section 16, Art. IX, State Constitution of 1885, debt assumed or refunded by the SBA payable from the tax. The remaining taxes credited to each county are surplus fuel tax funds.6 These surplus fuel tax funds are divided into 80 percent and 20 percent portions. In each fiscal year, the SBA distributes the 80 percent surplus fuel tax proceeds allocated to each county to the debt service requirements of each bond issue pledging the 80 percent surplus accruing to that county. The remaining 80 percent surplus fuel tax funds are advanced monthly, to the extent practicable, to the Board of County Commissioners (BOCC) for use in the county.7 In each fiscal year, the SBA distributes the 20 percent surplus fuel tax proceeds allocated to each county to the debt service requirements of each bond issue pledging the 20 percent surplus accruing to that county. The remaining 20 percent surplus fuel tax funds are advanced monthly, to the extent practicable, to the BOCC for use in the county.8 The SBA assumes responsibility for distribution of a county’s 80 percent share in the same manner as the 20 percent share is currently distributed pursuant to s. 206.47, F.S. However, the SBA ensures that county funds are made available to the Department of Transportation and held in escrow for any construction underway on behalf of the county pursuant to resolution of the county’s governing body.9 Authorized Uses: As previously mentioned, the taxes credited to each county are first distributed to meet the debt service requirements, if any, of the Section 16, Art. IX, State Constitution of 1885, debt assumed or refunded by the SBA payable from the tax. The remaining monies, or surplus fuel tax funds, are used for the acquisition, construction, and maintenance of roads. The term maintenance means periodic and routine maintenance, as defined in s. 334.03, F.S., and may include the construction and installation of traffic signals, sidewalks, bicycle paths, and landscaping. The funds may be used as matching funds for any federal, state, or private grant specifically related to these purposes.10 Periodic maintenance is defined as those activities that are large in scope and require a major work effort to restore deteriorated components of the transportation system to a safe and serviceable condition. Such efforts may include, but not be limited to, the repair of large bridge structures, major repairs to bridges and bridge
5. Section 206.47(5)(a), F.S. 6. Section 206.47(7), F.S. 7. Section 206.47(9), F.S. 8. Section 206.47(10), F.S. 9. Section 336.024, F.S. 10. Section 206.47(7), F.S.
Office of Economic and Demographic Research
2012 Local Government Financial Information Handbook 25
systems, and the mineral sealing of lengthy sections of roadway.11 Routine maintenance is defined as minor repairs and associated tasks necessary to maintain a safe and efficient transportation system and includes pavement patching; shoulder repair; cleaning and repair of drainage ditches, traffic signs, and structures; mowing; bridge inspection and maintenance; pavement striping; litter cleanup; and other similar activities.12 Any county that agreed prior to July 1, 1977, by resolution, to use the surplus proceeds to provide a connecting road to a planned interchange on the interstate system shall provide the connecting road. Any surplus, not otherwise used to provide the connecting road, shall be used on any road in the county at the discretion of the county’s governing body.13 Attorney General Opinions: Florida’s Attorney General has issued the following legal opinions relevant to this revenue source.
Opinion # Subject 79-41 County transportation trust funds, auditing 79-43 Surplus constitutional fuel tax, authorized use 79-104 Surplus constitutional fuel tax, authorized use 80-22 Surplus constitutional fuel tax, authorized use 82-55 Surplus constitutional fuel tax, authorized use 83-22 Surplus constitutional fuel tax, authorized use 83-26 Surplus constitutional fuel tax, authorized use 84-06 Surplus constitutional fuel tax, authorized use 85-53 Service charge charged by clerk from gas tax money 85-93 Constitutional fuel tax, payment of service charges and administrative fees 93-25 Surplus constitutional fuel tax, authorized use 2004-03 Surplus second gas tax funds used on roads in county
The full texts of these opinions are available via a searchable on-line database.14 Local government officials seeking more clarification should review the opinions in their entirety. The statutory language pertaining to this revenue source has been amended since its authorization. The reader should keep the date of the opinion in mind when reviewing its relevance to current law or any interpretations that have been articulated in Florida case law. Current Year’s Revenues: The table included in this section lists each county’s collection, population, and area components; distribution factor; and estimated distributions for the local fiscal year ending 2013. The estimates are based on a statewide estimate of total constitutional fuel tax collections, and are net of the SBA’s administrative deductions. A table listing the 2012 federal, state, and local fuel tax rates on both motor and diesel fuels by county is included in Appendix C.
11. Section 334.03(19), F.S. 12. Section 334.03(24), F.S. 13. Section 336.023, F.S. 14. http://myfloridalegal.com/ago.nsf/Opinions

Calculated by the Florida Department of Revenue's Office of Tax Research
Constitutional Fuel TaxRevenue Estimates for the Local Fiscal Year Ending September 30, 2013
Collection Population Area Distribution EstimatedCounty Component Component Component Factor DistributionAlachua 0.63482% 0.32708% 0.40960% 1.37150% 2,666,333$ Baker 0.10150% 0.03561% 0.24530% 0.38240% 743,424$ Bay 0.53138% 0.22385% 0.36710% 1.12230% 2,181,863$ Bradford 0.09069% 0.03790% 0.12260% 0.25120% 488,358$ Brevard 1.44074% 0.72095% 0.54030% 2.70200% 5,252,958$ Broward 4.51450% 2.31838% 0.51240% 7.34530% 14,279,998$ Calhoun 0.03403% 0.01942% 0.24060% 0.29400% 571,565$ Charlotte 0.46617% 0.21220% 0.33840% 1.01680% 1,976,761$ Citrus 0.29307% 0.18640% 0.27480% 0.75430% 1,466,435$ Clay 0.43504% 0.25277% 0.26040% 0.94820% 1,843,396$ Collier 0.73464% 0.42817% 0.86260% 2.02540% 3,937,580$ Columbia 0.31576% 0.08930% 0.33290% 0.73800% 1,434,746$ DeSoto 0.07050% 0.04590% 0.26590% 0.38230% 743,229$ Dixie 0.05069% 0.02167% 0.30930% 0.38170% 742,063$ Duval 2.78656% 1.14335% 0.35900% 4.28890% 8,338,050$ Escambia 0.82984% 0.39574% 0.31990% 1.54550% 3,004,607$ Flagler 0.20313% 0.12727% 0.21280% 0.54320% 1,056,035$ Franklin 0.03719% 0.01524% 0.32150% 0.37390% 726,899$ Gadsden 0.26867% 0.06374% 0.22460% 0.55700% 1,082,864$ Gilchrist 0.04067% 0.02246% 0.14920% 0.21230% 412,732$ Glades 0.02707% 0.01694% 0.41210% 0.45610% 886,704$ Gulf 0.03622% 0.02088% 0.27390% 0.33100% 643,497$ Hamilton 0.07942% 0.01950% 0.21750% 0.31640% 615,113$ Hardee 0.07512% 0.03657% 0.26760% 0.37930% 737,397$ Hendry 0.12802% 0.05145% 0.49600% 0.67550% 1,313,240$ Hernando 0.44603% 0.22888% 0.20730% 0.88220% 1,715,085$ Highlands 0.26744% 0.13054% 0.45980% 0.85780% 1,667,649$ Hillsborough 3.47581% 1.63839% 0.52040% 5.63460% 10,954,226$ Holmes 0.06285% 0.02632% 0.20860% 0.29780% 578,953$ Indian River 0.42093% 0.18341% 0.22120% 0.82550% 1,604,855$ Jackson 0.27790% 0.06607% 0.39660% 0.74060% 1,439,800$ Jefferson 0.06559% 0.01939% 0.25160% 0.33660% 654,384$ Lafayette 0.01709% 0.01157% 0.23090% 0.25960% 504,688$ Lake 0.77595% 0.39443% 0.48500% 1.65540% 3,218,263$ Lee 1.55684% 0.82691% 0.42980% 2.81350% 5,469,725$ Leon 0.72567% 0.36535% 0.29790% 1.38890% 2,700,160$ Levy 0.12698% 0.05391% 0.48590% 0.66680% 1,296,326$ Liberty 0.02366% 0.01107% 0.34770% 0.38240% 743,424$ Madison 0.16061% 0.02552% 0.30000% 0.48610% 945,027$ Manatee 0.82267% 0.43098% 0.35570% 1.60930% 3,128,640$ Marion 1.08625% 0.43870% 0.68440% 2.20940% 4,295,295$ Martin 0.41884% 0.19398% 0.28450% 0.89730% 1,744,441$ Miami-Dade 5.90388% 3.32783% 0.91700% 10.14870% 19,730,088$ Monroe 0.25811% 0.09610% 0.82010% 1.17430% 2,282,957$ Nassau 0.20745% 0.09744% 0.27480% 0.57970% 1,126,995$ Okaloosa 0.52352% 0.24025% 0.41760% 1.18140% 2,296,760$ Okeechobee 0.16712% 0.05272% 0.37080% 0.59060% 1,148,185$ Orange 3.44092% 1.53047% 0.41850% 5.38990% 10,478,505$
2012 Local Government Financial Information Handbook Page 26

Calculated by the Florida Department of Revenue's Office of Tax Research
Constitutional Fuel TaxRevenue Estimates for the Local Fiscal Year Ending September 30, 2013
Collection Population Area Distribution EstimatedCounty Component Component Component Factor DistributionOsceola 0.88771% 0.36216% 0.62880% 1.87870% 3,652,381$ Palm Beach 2.98387% 1.75318% 0.93300% 5.67010% 11,023,241$ Pasco 1.08544% 0.61694% 0.32410% 2.02650% 3,939,719$ Pinellas 1.99016% 1.21462% 0.18120% 3.38600% 6,582,723$ Polk 1.57382% 0.79978% 0.83950% 3.21310% 6,246,588$ Putnam 0.18391% 0.09793% 0.34560% 0.62740% 1,219,728$ St. Johns 0.63539% 0.25503% 0.29250% 1.18290% 2,299,676$ St. Lucie 0.70886% 0.36987% 0.25450% 1.33320% 2,591,874$ Santa Rosa 0.37491% 0.20484% 0.48500% 1.06470% 2,069,883$ Sarasota 0.85117% 0.50426% 0.24910% 1.60450% 3,119,308$ Seminole 1.07266% 0.56147% 0.14620% 1.78030% 3,461,081$ Sumter 0.39195% 0.12776% 0.24110% 0.76080% 1,479,071$ Suwannee 0.15118% 0.05715% 0.28870% 0.49700% 966,218$ Taylor 0.09087% 0.02975% 0.44040% 0.56100% 1,090,640$ Union 0.03540% 0.02046% 0.10450% 0.16040% 311,834$ Volusia 1.19963% 0.65512% 0.52300% 2.37770% 4,622,487$ Wakulla 0.05836% 0.04083% 0.26040% 0.35960% 699,098$ Walton 0.20289% 0.07333% 0.47960% 0.75580% 1,469,351$ Washington 0.06429% 0.03258% 0.26040% 0.35730% 694,627$ Totals 50.00000% 25.00000% 25.00000% 100.00000% 194,410,000$
Note: The dollar figures represent a 100 percent distribution of estimated monies.
2012 Local Government Financial Information Handbook Page 27
Office of Economic and Demographic Research
28 2012 Local Government Financial Information Handbook
This page was intentionally left blank.

Office of Economic and Demographic Research
2012 Local Government Financial Information Handbook 29
County Fuel Tax (1 Cent) Sections 206.41(1) and 206.60, Florida Statutes
Summary: The county fuel tax is levied on motor fuel at the rate of 1 cent per gallon.1 The proceeds are to be used by counties for transportation-related expenses, including the reduction of bonded indebtedness incurred for transportation purposes. It is the legislative intent that these proceeds be used for such purposes in order to reduce the burden of county ad valorem taxes.2 The proceeds are allocated to each county via the same distribution formula used for distributing the Constitutional Fuel Tax. General Law Amendments: There were no general law amendments resulting from the 2012 Regular Legislative Session. Eligibility Requirements: All counties are eligible to receive proceeds. Administrative Procedures: The tax is administered by the Department of Revenue (DOR). Prior to distributing the proceeds to county governments, the DOR deducts the General Revenue Service Charge pursuant to s. 215.20, F.S., and transfers the service charge proceeds to the state’s General Revenue Fund.3 Additionally, the DOR is authorized to deduct its administrative costs incurred in the collection, administration, enforcement, and distribution of the tax; however, the deduction shall not exceed 2 percent of collections. Distribution of Proceeds: The DOR shall distribute monthly the amount allocated to each county in the same manner as the Constitutional Fuel Tax. The allocation formula is comprised of three components: a geographic area component, a population component, and a collection component. A distribution factor, based on these three allocation components, is calculated annually for each county in the form of weighted county-to-state ratios. To determine each county’s monthly distribution, the monthly statewide tax receipts are multiplied by each county’s distribution factor. A county’s estimated distribution is determined via the following steps. First, a county’s distribution factor is calculated as the sum of the following three allocation components. 1/4 x County Area
Statewide Area 1/4 x County Population Based on the Latest Available Federal Census
Statewide Population Based on the Latest Available Federal Census 1/2 x County Constit. Fuel Tax Collected on Retail Sales or Use During the Previous FY
Statewide Constit. Fuel Tax Collected on Retail Sales or Use During the Previous FY 1. Section 206.41(1)(b), F.S. 2. Section 206.60(5), F.S. 3. Section 206.60(1)(a), F.S.

Office of Economic and Demographic Research
30 2012 Local Government Financial Information Handbook
The calculation of the collection component is based upon a DOR certificate of the taxable gallons attributable to each county as of June 30th for each fiscal year. Second, a county’s monthly distribution is calculated as follows. Monthly Statewide County Fuel Tax Receipts x County’s Distribution Factor Authorized Uses: The tax revenues are to be used solely for the acquisition of rights-of-way; the construction, reconstruction, operation, maintenance, and repair of transportation facilities, roads, bridges, bicycle paths, and pedestrian pathways; or the reduction of bonded indebtedness incurred for road and bridge or other transportation purposes. In the event that the powers and duties related to transportation facilities, roads, bridges, bicycle paths, and pedestrian pathways usually exercised by the county’s governing body are performed by some other county board, that board shall receive the proceeds.4 Attorney General Opinions: Florida’s Attorney General has issued the following legal opinion relevant to this revenue source.
Opinion # Subject 80-22 County fuel tax, use of proceeds for projects within incorporated municipality
The full text of this opinion is available via a searchable on-line database.5 Local government officials seeking more clarification should review the opinion in its entirety. The statutory language pertaining to this revenue source has been amended since its authorization. The reader should keep the date of the opinion in mind when reviewing its relevance to current law or any interpretations that have been articulated in Florida case law. Current and Prior Years’ Revenues: The table included in this section lists each county’s collection, population, and area components; distribution factor; and estimated distributions for local fiscal year ending 2013. The estimated distributions are based on an adjusted statewide estimate of total county fuel tax collections that reflect the deductions for the General Revenue Service Charge, administrative costs, motor fuel refunds, and dealer collection allowances. A summary of prior years’ distributions are available.6 A table listing the 2012 federal, state, and local fuel tax rates on both motor and diesel fuels by county is included in Appendix C.
4. Section 206.60(1)(b), F.S. 5. http://myfloridalegal.com/ago.nsf/Opinions 6. http://edr.state.fl.us/Content/local-government/data/data-a-to-z/index.cfm

Calculated by the Florida Department of Revenue's Office of Tax Research
County Fuel TaxRevenue Estimates for the Local Fiscal Year Ending September 30, 2013
Collection Population Area Distribution EstimatedCounty Component Component Component Factor DistributionAlachua 0.63482% 0.32708% 0.40960% 1.37150% 1,166,152$ Baker 0.10150% 0.03561% 0.24530% 0.38240% 325,145$ Bay 0.53138% 0.22385% 0.36710% 1.12230% 954,264$ Bradford 0.09069% 0.03790% 0.12260% 0.25120% 213,589$ Brevard 1.44074% 0.72095% 0.54030% 2.70200% 2,297,443$ Broward 4.51450% 2.31838% 0.51240% 7.34530% 6,245,525$ Calhoun 0.03403% 0.01942% 0.24060% 0.29400% 249,981$ Charlotte 0.46617% 0.21220% 0.33840% 1.01680% 864,560$ Citrus 0.29307% 0.18640% 0.27480% 0.75430% 641,362$ Clay 0.43504% 0.25277% 0.26040% 0.94820% 806,231$ Collier 0.73464% 0.42817% 0.86260% 2.02540% 1,722,147$ Columbia 0.31576% 0.08930% 0.33290% 0.73800% 627,503$ DeSoto 0.07050% 0.04590% 0.26590% 0.38230% 325,060$ Dixie 0.05069% 0.02167% 0.30930% 0.38170% 324,550$ Duval 2.78656% 1.14335% 0.35900% 4.28890% 3,646,744$ Escambia 0.82984% 0.39574% 0.31990% 1.54550% 1,314,100$ Flagler 0.20313% 0.12727% 0.21280% 0.54320% 461,869$ Franklin 0.03719% 0.01524% 0.32150% 0.37390% 317,918$ Gadsden 0.26867% 0.06374% 0.22460% 0.55700% 473,603$ Gilchrist 0.04067% 0.02246% 0.14920% 0.21230% 180,513$ Glades 0.02707% 0.01694% 0.41210% 0.45610% 387,810$ Gulf 0.03622% 0.02088% 0.27390% 0.33100% 281,441$ Hamilton 0.07942% 0.01950% 0.21750% 0.31640% 269,027$ Hardee 0.07512% 0.03657% 0.26760% 0.37930% 322,509$ Hendry 0.12802% 0.05145% 0.49600% 0.67550% 574,361$ Hernando 0.44603% 0.22888% 0.20730% 0.88220% 750,113$ Highlands 0.26744% 0.13054% 0.45980% 0.85780% 729,366$ Hillsborough 3.47581% 1.63839% 0.52040% 5.63460% 4,790,960$ Holmes 0.06285% 0.02632% 0.20860% 0.29780% 253,212$ Indian River 0.42093% 0.18341% 0.22120% 0.82550% 701,902$ Jackson 0.27790% 0.06607% 0.39660% 0.74060% 629,714$ Jefferson 0.06559% 0.01939% 0.25160% 0.33660% 286,203$ Lafayette 0.01709% 0.01157% 0.23090% 0.25960% 220,731$ Lake 0.77595% 0.39443% 0.48500% 1.65540% 1,407,545$ Lee 1.55684% 0.82691% 0.42980% 2.81350% 2,392,249$ Leon 0.72567% 0.36535% 0.29790% 1.38890% 1,180,947$ Levy 0.12698% 0.05391% 0.48590% 0.66680% 566,963$ Liberty 0.02366% 0.01107% 0.34770% 0.38240% 325,145$ Madison 0.16061% 0.02552% 0.30000% 0.48610% 413,319$ Manatee 0.82267% 0.43098% 0.35570% 1.60930% 1,368,348$ Marion 1.08625% 0.43870% 0.68440% 2.20940% 1,878,598$ Martin 0.41884% 0.19398% 0.28450% 0.89730% 762,952$ Miami-Dade 5.90388% 3.32783% 0.91700% 10.14870% 8,629,186$ Monroe 0.25811% 0.09610% 0.82010% 1.17430% 998,478$ Nassau 0.20745% 0.09744% 0.27480% 0.57970% 492,904$ Okaloosa 0.52352% 0.24025% 0.41760% 1.18140% 1,004,515$ Okeechobee 0.16712% 0.05272% 0.37080% 0.59060% 502,172$ Orange 3.44092% 1.53047% 0.41850% 5.38990% 4,582,897$
2012 Local Government Financial Information Handbook Page 31

Calculated by the Florida Department of Revenue's Office of Tax Research
County Fuel TaxRevenue Estimates for the Local Fiscal Year Ending September 30, 2013
Collection Population Area Distribution EstimatedCounty Component Component Component Factor DistributionOsceola 0.88771% 0.36216% 0.62880% 1.87870% 1,597,412$ Palm Beach 2.98387% 1.75318% 0.93300% 5.67010% 4,821,144$ Pasco 1.08544% 0.61694% 0.32410% 2.02650% 1,723,082$ Pinellas 1.99016% 1.21462% 0.18120% 3.38600% 2,879,031$ Polk 1.57382% 0.79978% 0.83950% 3.21310% 2,732,019$ Putnam 0.18391% 0.09793% 0.34560% 0.62740% 533,463$ St. Johns 0.63539% 0.25503% 0.29250% 1.18290% 1,005,790$ St. Lucie 0.70886% 0.36987% 0.25450% 1.33320% 1,133,587$ Santa Rosa 0.37491% 0.20484% 0.48500% 1.06470% 905,288$ Sarasota 0.85117% 0.50426% 0.24910% 1.60450% 1,364,266$ Seminole 1.07266% 0.56147% 0.14620% 1.78030% 1,513,745$ Sumter 0.39195% 0.12776% 0.24110% 0.76080% 646,889$ Suwannee 0.15118% 0.05715% 0.28870% 0.49700% 422,587$ Taylor 0.09087% 0.02975% 0.44040% 0.56100% 477,004$ Union 0.03540% 0.02046% 0.10450% 0.16040% 136,384$ Volusia 1.19963% 0.65512% 0.52300% 2.37770% 2,021,699$ Wakulla 0.05836% 0.04083% 0.26040% 0.35960% 305,759$ Walton 0.20289% 0.07333% 0.47960% 0.75580% 642,638$ Washington 0.06429% 0.03258% 0.26040% 0.35730% 303,803$ Totals 50.00000% 25.00000% 25.00000% 100.00000% 85,027,500$
Note: The dollar figures represent a 100 percent distribution of estimated monies.
2012 Local Government Financial Information Handbook Page 32

Office of Economic and Demographic Research
2012 Local Government Financial Information Handbook 33
County Revenue Sharing Program Sections 210.20(2), 212.20(6), and 218.20-.26, Florida Statutes
Summary: The Florida Revenue Sharing Act of 1972 was a major attempt by the Legislature to ensure a minimum level of revenue parity across units of local government.1 Provisions in the enacting legislation created the Revenue Sharing Trust Fund for Counties. Currently, the trust fund receives 2.9 percent of net cigarette tax collections and 2.044 percent of sales and use tax collections. An allocation formula serves as the basis for the distribution of these revenues to each county that meets the strict eligibility requirements. There are no use restrictions on these revenues other than some statutory limitations regarding funds that can be used as a pledge for indebtedness. General Law Amendments: Legislation passed during the 2012 Regular Legislative Session did not affect provisions related to this revenue source. It is not unusual for legislation to pass that results in changes to the state’s sales tax base in the form of enactments or repeals of sales tax exemptions. Such changes have the potential for fiscal impact, either positively or negatively, to the amount of sales tax revenues available for distribution to county governments via this revenue sharing program. However, a summary of such changes is not provided here. Eligibility Requirements: In order to be eligible to participate in revenue sharing beyond the minimum entitlement in any fiscal year, a county government must have satisfied a number of statutory requirements.2 As it relates to county revenue sharing, the term minimum entitlement is defined as the amount of revenue, as certified by the county government and determined by the Department of Revenue (DOR), which must be shared with the county so that the county will receive the amount of revenue necessary to meet its obligations as the result of pledges, assignments, or trusts entered into which obligated funds received from revenue sources or proceeds distributed out of the Revenue Sharing Trust Fund for Counties [hereinafter Trust Fund].3 Administrative Procedures: The county revenue sharing program is administered by the DOR, and monthly distributions shall be made to eligible county governments. The program is comprised of state cigarette and sales taxes that are collected and transferred to the Trust Fund. The percentage of each tax source transferred into the Trust Fund is listed below. The proportional contribution of each source during the state fiscal year ending 2013, as determined by the DOR, is also noted.
2.9 percent of net cigarette tax collections 4 = 2.1 percent of total program funding
2.044 percent of sales and use tax collections 5 = 97.9 percent of total program funding
1. Chapter 72-360, L.O.F. 2. Section 218.23(1), F.S. 3. Section 218.21(7), F.S. 4. Section 210.20(2)(a), F.S. 5. Section 212.20(6)(d)4., F.S.
Office of Economic and Demographic Research
34 2012 Local Government Financial Information Handbook
Distribution of Proceeds: An apportionment factor is calculated for each eligible county using a formula consisting of the following equally weighted factors: county population, unincorporated county population, and county sales tax collections.6 A county population factor is an eligible county’s population divided by total population of all eligible counties in the state. Inmates and residents residing in institutions operated by the federal government as well as the Florida Departments of Corrections, Children and Family Services, and Health are not considered to be residents of the county in which the institutions are located for the purpose of calculating the distribution proportions.7 An unincorporated county population factor is an eligible county’s unincorporated population divided by total unincorporated population of all eligible counties in the state. A county sales tax collections factor is an eligible county’s sales tax collections during the preceding year divided by total sales tax collections during the preceding year of all eligible counties in the state. Consequently, a county’s apportionment factor is determined by the following formula.
Unincorporated County County County Sales Tax Population + Population + Collection
Apportionment = Factor Factor Factor Factor 3
Additionally, any unit of local government that is consolidated pursuant to the provisions contained in Section 6(e), Art. VIII, State Constitution (i.e., City of Jacksonville-Duval County) shall receive an annual distribution from the Trust Fund equal to $6.24 multiplied by its population.8 The distribution to an eligible county is determined by the following procedure.9 First, a county government’s entitlement shall be computed on the basis of the apportionment factor applied to all Trust Fund receipts available for distribution. Second, the revenue to be shared via the formula in any fiscal year is adjusted so that no county receives fewer funds than its guaranteed entitlement, which is equal to the aggregate amount received from the state in fiscal year 1971-72 under then-existing statutory provisions. Third, the revenue to be shared via the formula in any fiscal year is adjusted so that no county receives fewer funds than its guaranteed entitlement plus the second guaranteed entitlement, which is equal to the aggregate amount received from the state in fiscal year 1981-82 under then-existing statutory provisions. Fourth, the revenue to be shared via the formula in any fiscal year is adjusted so that all counties receive at least their minimum entitlement, which means the amount of revenue necessary for a county to meet its obligations as the result of pledges, assignments, or trusts entered into that obligated Trust Fund monies. Finally, after making these adjustments, any remaining Trust Fund monies shall be distributed on the basis of additional money of each qualified county in proportion to the total additional money for all qualified counties.
6. Section 218.245(1), F.S. 7. Section 186.901, F.S. 8. Section 218.23(2), F.S. 9. Section 218.23(3), F.S.

Office of Economic and Demographic Research
2012 Local Government Financial Information Handbook 35
Authorized Uses: There are no use restrictions on these revenues; however, statutory provisions exist that restrict the amount of funds that can be pledged for bonded indebtedness. Counties are allowed to pledge the guaranteed entitlement proceeds.10 Additionally, the second guaranteed entitlement may also be assigned, pledged, or set aside as a trust for the payment of principal or interest on bonds, tax anticipation certificates, or any other form of indebtedness.11 However, in spite of these restrictions, a county may assign, pledge, or set aside as a trust for the payment of principal or interest on bonds, tax anticipation certificates, or any other form of indebtedness, an amount up to 50 percent of the funds received in the prior year.12 Consequently, it is possible that some portion of a county’s growth monies will become available as a pledge for bonded indebtedness. Attorney General Opinions: Florida’s Attorney General has issued the following legal opinions relevant to this revenue source.
Opinion # Subject 73-246 Revenue Sharing Act of 1972, applicability 74-367 Revenue Sharing Act of 1972, applicability to regional housing authorities 77-14 Authority to repay loan with state revenue sharing funds 79-18 Authority to borrow monies, use of state revenue sharing funds 86-44 Authority to donate state revenue sharing funds to nonprofit club 92-87 Distribution of trust fund monies in the event of revised population estimate 94-26 Nonpayment of incentive pay, eligibility to participate in revenue sharing 2002-36 Census correction, redistribution of sales tax
The full texts of these opinions are available via a searchable on-line database.13 Local government officials seeking more clarification should review the opinions in their entirety. The statutory language pertaining to this revenue source has been amended since its authorization. The reader should keep the date of the opinion in mind when reviewing its relevance to current law or any interpretations that have been articulated in Florida case law. Current and Prior Years’ Revenues: The table included in this section lists the estimated distributions to county governments for state fiscal year ending 2013, and these figures represent a 95 percent distribution of the estimated monies. Summaries of prior years’ distributions are available.14
10. Section 218.25(1), F.S. 11. Section 218.25(2), F.S. 12. Section 218.25(4), F.S. 13. http://myfloridalegal.com/ago.nsf/Opinions 14. http://edr.state.fl.us/Content/local-government/data/data-a-to-z/index.cfm

Calculated by the Florida Department of Revenue's Office of Tax Research
County Revenue Sharing ProgramRevenue Estimates for the State Fiscal Year Ending June 30, 2013
First Second Growth YearlyCounty Guaranteed Guaranteed Money TotalAlachua 254,168$ 1,007,247$ 2,697,543$ 3,958,958$ Baker 28,273$ 90,639$ 311,259$ 430,171$ Bay 154,793$ 684,481$ 2,322,750$ 3,162,024$ Bradford 28,713$ 129,364$ 278,537$ 436,614$ Brevard 464,254$ 1,807,775$ 6,082,417$ 8,354,446$ Broward 3,573,165$ 4,779,269$ 14,311,264$ 22,663,698$ Calhoun 14,713$ 68,369$ 138,200$ 221,282$ Charlotte 187,080$ 493,387$ 2,776,624$ 3,457,091$ Citrus 90,480$ 499,080$ 2,296,786$ 2,886,346$ Clay 102,028$ 599,690$ 3,158,878$ 3,860,596$ Collier 491,318$ 594,600$ 6,716,865$ 7,802,783$ Columbia 72,308$ 288,232$ 928,341$ 1,288,881$ DeSoto 30,961$ 132,516$ 411,353$ 574,830$ Dixie 15,487$ 54,021$ 203,376$ 272,884$ Duval 1,999,042$ 4,106,467$ 16,676,968$ 22,782,477$ Escambia 728,024$ 1,779,956$ 3,924,849$ 6,432,829$ Flagler 23,543$ 78,036$ 936,714$ 1,038,293$ Franklin 18,862$ 41,026$ 130,868$ 190,756$ Gadsden 80,864$ 239,311$ 394,352$ 714,527$ Gilchrist 5,883$ 45,494$ 222,922$ 274,299$ Glades 12,360$ 41,438$ 148,702$ 202,500$ Gulf 68,034$ 19,920$ 117,121$ 205,075$ Hamilton 23,270$ 109,630$ 73,962$ 206,862$ Hardee 36,082$ 144,439$ 222,326$ 402,847$ Hendry 28,673$ 148,507$ 471,727$ 648,907$ Hernando 79,474$ 409,209$ 3,061,601$ 3,550,284$ Highlands 104,948$ 349,039$ 1,404,872$ 1,858,859$ Hillsborough 1,835,627$ 4,916,849$ 18,725,261$ 25,477,737$ Holmes 20,087$ 112,718$ 175,147$ 307,952$ Indian River 205,850$ 425,545$ 2,041,124$ 2,672,519$ Jackson 67,470$ 259,685$ 423,760$ 750,915$ Jefferson 29,079$ 67,261$ 179,712$ 276,052$ Lafayette 6,472$ 29,717$ 81,363$ 117,552$ Lake 256,097$ 708,355$ 3,953,321$ 4,917,773$ Lee 578,772$ 1,764,708$ 9,616,571$ 11,960,051$ Leon 316,798$ 1,026,649$ 2,873,073$ 4,216,520$ Levy 34,157$ 137,533$ 556,779$ 728,469$ Liberty 8,441$ 28,423$ 84,618$ 121,482$ Madison 34,591$ 95,970$ 171,845$ 302,406$ Manatee 530,269$ 1,054,577$ 5,107,912$ 6,692,758$ Marion 251,941$ 1,024,873$ 5,245,773$ 6,522,587$ Martin 244,331$ 553,167$ 2,565,458$ 3,362,956$ Miami-Dade 5,895,217$ 10,571,522$ 27,853,831$ 44,320,570$ Monroe 246,464$ 455,801$ 1,219,128$ 1,921,393$ Nassau 65,716$ 252,268$ 1,111,530$ 1,429,514$ Okaloosa 147,680$ 859,331$ 2,660,101$ 3,667,112$ Okeechobee 41,041$ 173,472$ 543,100$ 757,613$ Orange 1,632,765$ 3,816,110$ 24,082,048$ 29,530,923$ Osceola 95,114$ 414,462$ 4,761,218$ 5,270,794$ Palm Beach 2,570,430$ 2,766,174$ 18,309,595$ 23,646,199$
2012 Local Government Financial Information Handbook Page 36

Calculated by the Florida Department of Revenue's Office of Tax Research
County Revenue Sharing ProgramRevenue Estimates for the State Fiscal Year Ending June 30, 2013
First Second Growth YearlyCounty Guaranteed Guaranteed Money TotalPasco 310,426$ 1,782,481$ 7,491,317$ 9,584,224$ Pinellas 2,452,694$ 3,368,283$ 8,131,881$ 13,952,858$ Polk 857,616$ 2,627,126$ 7,216,871$ 10,701,613$ Putnam 98,535$ 409,282$ 833,948$ 1,341,765$ St. Johns 152,548$ 403,262$ 3,633,664$ 4,189,474$ St. Lucie 187,010$ 618,973$ 2,696,035$ 3,502,018$ Santa Rosa 77,885$ 448,253$ 2,425,308$ 2,951,446$ Sarasota 1,119,924$ 1,148,225$ 5,323,319$ 7,591,468$ Seminole 339,130$ 1,316,016$ 5,732,698$ 7,387,844$ Sumter 35,653$ 182,301$ 1,569,685$ 1,787,639$ Suwannee 32,719$ 175,516$ 541,597$ 749,832$ Taylor 36,940$ 118,139$ 198,010$ 353,089$ Union 18,615$ 33,326$ 128,427$ 180,368$ Volusia 698,366$ 1,525,368$ 4,518,285$ 6,742,019$ Wakulla 24,054$ 90,110$ 431,939$ 546,103$ Walton 39,806$ 151,427$ 1,244,869$ 1,436,102$ Washington 16,827$ 101,973$ 281,956$ 400,756$ Statewide Totals 30,329,957$ 64,756,373$ 255,163,253$ 350,249,583$
Notes:1) These estimates represent a 95 percent distribution of trust fund monies.2) Duval County's total distribution includes $5,391,660 pursuant to s. 218.23(2), F.S., (Calculation = $6.24 times the 2011 countywide population of 864,048).
4) On September 10, 2012, the U.S. Census Bureau revised the 2010 census counts for the City of Panama City and unincorporated Bay County, which also caused their respective 2011 revenue-sharing populations to change as well. Panama City's population was decreased by 981; unincorporated Bay County's population was increased by 981. Consequently, Bay County's estimated distribution was increased by $11,375 and all other counties' estimated distributions were decreased by negligible amounts.
3) The proportional contribution of each revenue source comprising the County Revenue Sharing Program in state fiscal year 2013 has been estimated to be as follows: state sales tax, $360.8 million or 97.9%; cigarette tax, $7.6 million or 2.1%.
2012 Local Government Financial Information Handbook Page 37

Office of Economic and Demographic Research
38 2012 Local Government Financial Information Handbook
This page was intentionally left blank.

Office of Economic and Demographic Research
2012 Local Government Financial Information Handbook 39
Distribution of Sales and Use Taxes to Counties Section 212.20(6)(d)6.a., Florida Statutes
Summary: Each fiscal year, the sum of $29,915,500 shall be divided into as many equal parts as there are counties in the state. One part equaling $446,500 shall be distributed to each county. This distribution specifically is in lieu of funds distributed under the then-existing s. 550.135, F.S., prior to July 1, 2000. Any subsequent distribution to other governmental entities within the county shall be pursuant to local ordinance or special act. The use of the revenue is at the discretion of the governing body. General Law Amendments: There were no general law amendments resulting from the 2012 Regular Legislative Session. Eligibility Requirements: All counties are eligible to receive proceeds. Distribution of Proceeds: Each fiscal year, the sum of $29,915,500 is divided into 67 equal parts, and one part (i.e., $446,500) is distributed to each county government. The distribution to counties shall begin each fiscal year on or before January 5th and shall continue monthly for a total of four months. It is possible that all or some portion of the $446,500 received by a county government shall be subsequently distributed to one or more other governmental entities (i.e., district school board, municipal government, or special district) within the county pursuant to local ordinance or special act. If a local or special law required that any monies accruing to a county in fiscal year 1999-2000 under the then-existing provisions of s. 550.135, F.S., be paid directly to the district school board, special district, or a municipal government, such payment must continue until the local or special law is amended or repealed. Authorized Uses: The use of the revenue is at the discretion of the governing body. Attorney General Opinions: No opinions specifically relevant to this revenue source have been issued.

Office of Economic and Demographic Research
40 2012 Local Government Financial Information Handbook
This page was intentionally left blank.
Office of Economic and Demographic Research
2012 Local Government Financial Information Handbook 41
Emergency Management Assistance Sections 252.371-.373, Florida Statutes
Summary: In order to provide funds for emergency management, preparedness, and assistance, an annual surcharge of $2 shall be imposed on every homeowner’s, mobile home owner’s, tenant homeowner’s, and condominium unit owner’s insurance policy. In addition, an annual $4 surcharge shall be imposed on every new or renewed commercial fire, commercial multiple peril, and business owner’s property insurance policy. A portion of the proceeds shall be distributed to counties and municipalities for the purpose of funding local emergency management agencies and programs. General Law Amendments: There were no general law amendments resulting from the 2012 Regular Legislative Session. Eligibility Requirements: Any county or municipality that has created a local emergency management agency is eligible to receive funding. The term local emergency management agency is defined as an organization created in accordance with the provisions of ss. 252.31-252.90, F.S., to discharge the emergency management responsibilities and functions of a county or municipality.1 Administrative Procedures: The policyholder shall pay the surcharge to the insurer. The insurer shall collect the surcharge and remit it to the Department of Revenue which shall collect, administer, audit, and enforce the surcharge pursuant to s. 624.5092, F.S. The surcharge is not to be considered premiums of the insurer; however, nonpayment of the surcharge by the insured may be a valid reason for cancellation of the policy. All surcharge proceeds shall be deposited in the Emergency Management, Preparedness, and Assistance Trust Fund [hereinafter Trust Fund] and may not be used to supplant existing funding.2 The Trust Fund is administered by the Division of Emergency Management within the Executive Office of the Governor.3 The Division shall allocate funds from the Trust Fund to local emergency management agencies and programs pursuant to criteria specified in rule. Such rules shall include, but are not limited to, requirements regarding the employment of an emergency management program director or coordinator, formula to establish base allocation and distribute excess funds, local match of state funding, and preferential funding for participation in mutual aid agreements.4 If adequate funding is available, every county shall receive funds at least sufficient to fund a dedicated, full-time emergency preparedness officer position.5 Distribution of Proceeds: Funds appropriated from the Trust Fund shall be allocated by the Division.
1. Section 252.34(5), F.S. 2. Sections 252.372, F.S. 3. Sections 252.371, F.S. 4. Section 252.373(2), F.S. 5. Section 252.373(3), F.S.

Office of Economic and Demographic Research
42 2012 Local Government Financial Information Handbook
Authorized Uses: Proceeds shall be used to implement and administer state and local emergency management programs, including administration, training, and operations; fund grants and loans to state or regional agencies, local governments, and private organizations to implement projects that will further state and local emergency management objectives; and meet any matching requirements imposed as a condition of receiving federal disaster relief assistance.6 Attorney General Opinions: No opinions specifically relevant to this revenue source have been issued.
6. Section 252.373(1), F.S.

Office of Economic and Demographic Research
2012 Local Government Financial Information Handbook 43
Enhanced 911 Fee Sections 365.172-.173, Florida Statutes
Summary: Each voice communications service provider shall collect an enhanced 911 (E911) fee monthly from service subscribers. The fee rate shall be set, and may subsequently be adjusted, by the E911 Board, but may not exceed 50 cents per month per each service identifier. The fee is intended to provide funds to county governments to pay certain costs associated with their 911 or E911 systems and reimburse wireless telephone service providers for costs incurred to provide 911 or E911 systems. General Law Amendments: Chapter 2012-177, L.O.F., (CS/CS/HB 801) modifies the membership of the E911 Board and clarifies how the E911 fee will be billed by certain voice communications services providers. These changes became effective on July 1, 2012. Eligibility Requirements: All counties are eligible to receive two separate distributions, one based on the total number of wireless service identifiers in each county, and a second based on the total number of nonwireless service identifiers in each county. Additionally, counties having a total population of less than 75,000 are eligible to receive another separate distribution. Administrative Procedures: Each voice communications service provider, as part of its monthly billing process, shall collect an E911 fee. Specifically, the voice communications service provider other than a wireless provider shall bill the fee to a subscriber based on the number of access lines having access to the E911 system on a service-identifier basis, up to a maximum of 25 access lines per account bill rendered. Additionally, each voice communications service provider other than a wireless provider shall be the fee to a subscriber on a basis of five service-identified access lines for each digital transmission link, including primary rate interface service or equivalent Digital-Signal-1-level service, which can be channelized and split into 23 or 24 voice-grade or data-grade channels for communications, up to a maximum of 25 access lines per account bill rendered. Except in the case of prepaid wireless service, each wireless provider shall bill the fee to a subscriber on a per service-identifier basis for service identifiers whose primary place of use is within Florida. The voice communications service providers not previously addressed shall bill the fee on a per-service identifier basis for service identifiers whose primary place of use is within the state up to a maximum of 25 service identifiers for each account bill rendered.1 Each provider may retain 1 percent of the amount of fees collected as reimbursement for the administrative costs incurred by the provider to bill, collect, and remit the fee.2 State and local taxes do not apply to this fee, and local governments are prohibited from levying any additional fee on providers or subscribers for the provision of E911 service.3 All revenues derived from the fee levied on subscribers under s. 365.172, F.S., must be paid by the E911 Board [hereinafter, Board] into the State Treasury on or before the 15th day of each month. Such monies must 1. Section 365.172(8)(a), F.S. 2. Section 365.172(8)(d), F.S. 3. Section 365.172(8)(j)-(k), F.S.

Office of Economic and Demographic Research
44 2012 Local Government Financial Information Handbook
be accounted for in the designated Emergency Communications Number E911 System Fund, and, for accounting purposes, must be segregated into two separate categories: 1) the wireless category, and 2) the nonwireless category. All monies must be invested by the Chief Financial Officer, and the funds are not subject to the General Revenue Service Charges pursuant to s. 215.20, F.S.4 The Board is charged with administering the E911 fee, including receiving revenues derived from the fee; distributing portions of the revenues to wireless providers and counties; accounting for receipts, distributions, and income derived by the funds; and providing annual reports to the Governor and the Legislature on amounts collected and expended, the purposes for which expenditures have been made, and the status of E911 service in the state.5 Distribution of Proceeds: As determined by the Board pursuant to s. 365.172(8)(h), F.S., and subject to any Board-approved modifications pursuant to s. 365.172(6)(a)3. or (8)(i), F.S., the monies in the wireless and nonwireless categories of the fund shall be distributed as specified below.6 Monies in the wireless category of the fund:
1. Sixty seven percent shall be distributed monthly to counties, based on the total number of service identifiers in each county.
2. Thirty percent shall be distributed to wireless providers in response to sworn invoices submitted to the Board by wireless providers.
3. Two percent shall be distributed monthly to rural counties, which are defined as those counties having a total population of less than 75,000.
4. One percent shall be retained by the Board. Monies in the nonwireless category of the fund:
1. Ninety seven percent shall be distributed monthly to counties, based on the total number of service identifiers in each county.
2. Two percent shall be distributed monthly to rural counties, which are defined as those counties having a total population of less than 75,000.
3. One percent shall be retained by the Board. Authorized Uses: The monies in the wireless and nonwireless categories of the fund shall be used as specified below.7 Monies in the wireless category of the fund:
1. The proceeds of the 67 percent portion distributed monthly to counties shall be used for the payment of authorized expenditures, as specified in s. 365.172(9), F.S.; and the costs to comply with the requirements for E911 service contained in the order and any future rules related to the order as defined in s. 365.172(3)(u), F.S.
2. The proceeds of the 30 percent portion distributed to wireless providers shall be used to reimburse such providers for the actual costs incurred to provide 911 or E911 service and may include costs and
4. Section 365.173(1), F.S. 5. Section 365.172(5), F.S. 6. Section 365.173(2), F.S. 7. Section 365.173(2), F.S.

Office of Economic and Demographic Research
2012 Local Government Financial Information Handbook 45
expenses incurred to design, purchase, lease, program, install, test, upgrade, operate, and maintain all necessary data, hardware, and software required to provide E911 service.
3. The proceeds of the 2 percent portion distributed to rural counties shall be used to provide facilities and network and service enhancements and assistance for the 911 or E911 systems operated by rural counties and for the provision of grants to rural counties by the Technology Program within the Department of Management Services for upgrading and replacing E911 systems.
4. The proceeds of the 1 percent portion retained by the Board shall be applied to costs and expenses incurred for the purpose of managing, administering, and overseeing the receipts and disbursements from the fund and other activities as defined in s. 365.172(6), F.S.
Monies in the nonwireless category of the fund:
1. The proceeds of the 97 percent portion distributed monthly to counties shall be used exclusively for payment of authorized expenditures as specified in s. 365.172(9), F.S.
2. The proceeds of the 2 percent portion distributed to rural counties shall be used to provide facilities and network and service enhancements and assistance for the 911 or E911 systems operated by rural counties and for the provision of grants to rural counties by the Technology Program within the Department of Management Services for upgrading and replacing E911 systems.
3. The proceeds of the 1 percent portion retained by the Board shall be applied to costs and expenses incurred for the purpose of managing, administering, and overseeing the receipts and disbursements from the fund and other activities as defined in s. 365.172(6), F.S.
Attorney General Opinions: Florida’s Attorney General has issued the following legal opinions relevant to this revenue source.
Opinion # Subject 87-66 Payment of 911 fee by state 2005-66 Wireless 911 Board, authority to sue/collect fees
The full texts of these opinions are available via a searchable on-line database.8 Local government officials seeking more clarification should review the opinion in its entirety. The statutory language pertaining to this revenue source has been amended since its authorization. The reader should keep the date of the opinion in mind when reviewing its relevance to current law or any interpretations that have been articulated in Florida case law.
8. http://myfloridalegal.com/ago.nsf/Opinions

Office of Economic and Demographic Research
46 2012 Local Government Financial Information Handbook
This page was intentionally left blank.

Office of Economic and Demographic Research
2012 Local Government Financial Information Handbook 47
Fuel Tax Refunds and Credits Sections 206.41(4)(d)-(e), 206.625, and 206.874(4), Florida Statutes
Summary: Under separate authorizations, eligible counties, municipalities, and school districts may be entitled to refunds or credits on taxes paid on motor or diesel fuel. Generally, the refunded monies are to be used to fund the construction, reconstruction, and maintenance of roads. General Law Amendments: There were no general law amendments resulting from the 2012 Regular Legislative Session. Eligibility Requirements: The portion of the state’s fuel sales tax imposed by s. 206.41(1)(g), F.S., (i.e., the “fuel sales tax”) which results from the collection of such taxes paid by a county or municipality on motor or diesel fuel for use in a motor vehicle operated by the local government shall be refunded. When licensed as a local government user, a county or municipality shall be entitled to take a credit on the monthly diesel fuel tax return not to exceed the tax imposed under s. 206.41(1)(b) and (g), F.S., on those gallons that would otherwise be eligible for refund.1 The portion of the state’s fuel sales tax imposed by s. 206.41(1)(g), F.S., (i.e., the “fuel sales tax”) which results from the collection of such tax paid by a school district or a private contractor operating school buses for a school district or by a nonpublic school on motor fuel or diesel fuel for use in a motor vehicle operated by such district, private contractor, or nonpublic school shall be refunded to the school district or to the nonpublic school. When licensed as a local government user, a school district shall be entitled to take a credit on the monthly diesel fuel tax return not to exceed the tax imposed under s. 206.41(1)(b) and (g), F.S., on those gallons which would otherwise be eligible for refund.2 Those portions of the county fuel tax imposed by s. 206.41(1)(b), F.S., which result from the collection of the tax paid on motor fuel by a county, municipality, school district, or private contractor operating school buses for a school district for use in a motor vehicle operated by it shall be refunded to the governing body of the county, municipality, or school district.3 Each county, municipality, or school district may receive a credit for additional taxes paid under s. 206.87, F.S., for the highway use of diesel fuel, provided the purchases of diesel fuel meet the requirements relating to refunds for motor fuel purchases under s. 206.41, F.S.4 Administrative Procedures: The Department of Revenue (DOR) administers the refund or credit of fuel taxes. The DOR shall deduct a fee of $2 for each claim, which fee shall be deposited in the state’s General Revenue Fund.5
1. Section 206.41(4)(d), F.S. 2. Section 206.41(4)(e), F.S. 3. Section 206.625, F.S. 4. Section 206.874(4)(d), F.S. 5. Section 206.41(5), F.S.

Office of Economic and Demographic Research
48 2012 Local Government Financial Information Handbook
Distribution of Proceeds: The DOR shall pay claims on a quarterly basis. Authorized Uses: The refunds to the counties and municipalities shall be used for the construction, reconstruction, and maintenance of roads and streets within the respective jurisdiction.6 The refunds to school districts shall be used to fund construction, reconstruction, and maintenance of roads and streets within the school district required as the result of the construction of new schools or the renovation of existing schools.7 The school board shall select the projects to be funded; however, the first priority shall be given to projects required as the result of the construction of new schools, unless the affected county or municipal government grants a waiver. Refunds returned to nonpublic schools shall be used for transportation-related purposes. Attorney General Opinions: Florida’s Attorney General has issued the following legal opinions relevant to this revenue source.
Opinion # Subject 74-341 Return of gas taxes paid 74-342 Return of gas taxes paid 81-30 Refund provisions of ch. 206, F.S. 82-08 Authority of special district to refund tax 83-25 Eligibility for refund on motor fuel taxes
The full texts of these opinions are available via a searchable on-line database.8 Local government officials seeking more clarification should review the opinions in their entirety. The statutory language pertaining to this revenue source has been amended since its authorization. The reader should keep the date of the opinion in mind when reviewing its relevance to current law or any interpretations that have been articulated in Florida case law.
6. Sections 206.41(4)(d) and 206.625(1), F.S. 7. Sections 206.41(4)(e) and 206.625(2), F.S. 8. http://myfloridalegal.com/ago.nsf/Opinions

Office of Economic and Demographic Research
2012 Local Government Financial Information Handbook 49
Indian Gaming Revenues Section 285.710, Florida Statutes
Summary: On April 7, 2010, Florida’s Governor and the Seminole Tribe of Florida [hereinafter Tribe] executed a gaming compact, which was subsequently ratified by the Legislature and later approved by the U.S. Secretary of the Interior.1 The compact allows for select gaming activity in tribal facilities.2 The Tribe will make payments to the State for the privilege of conducting gaming activity in seven facilities located in Broward, Collier, Glades, Hendry, and Hillsborough counties. Three percent of the monies paid by the Tribe to the State shall be designated as the local government share and distributed to select county and municipal governments in those counties where the tribal gaming facilities are located. General Law Amendments: There were no general law amendments resulting from the 2012 Regular Legislative Session. Eligibility Requirements: Select county and municipal governments in those counties where the tribal gaming facilities are located are eligible to receive a portion of the proceeds. Administrative Procedures: The Division of Pari-mutuel Wagering [hereinafter Division] of the Department of Business and Professional Regulation is designated as the state compliance agency having the authority to carry out the state’s oversight responsibilities under the compact.3 Distribution of Proceeds: The monies paid by the Tribe to the state shall be deposited into the General Revenue Fund, and three percent of those monies shall be designated as the local government share.4 The calculations necessary to determine the local government share distributions shall be made by the Division based upon the net win per facility as provided by the Tribe. The local government share attributable to each casino shall be distributed in the following manner.
1. From the Seminole Indian Casino in Coconut Creek, Broward County shall receive 22.5 percent, the City of Coconut Creek shall receive 55 percent, the City of Coral Springs shall receive 12 percent, the City of Margate shall receive 8.5 percent, and the City of Parkland shall receive 2 percent.
2. From the Seminole Indian Casino in Hollywood, Broward County shall receive 25 percent, the City of Hollywood shall receive 55 percent, the Town of Davie shall receive 10 percent, and the City of Dania Beach shall receive 10 percent.
3. From the Seminole Hard Rock Hotel & Casino in Hollywood, Broward County shall receive 25 percent, the City of Hollywood shall receive 55 percent, the Town of Davie shall receive 10 percent, and the City of Dania Beach shall receive 10 percent.
4. From the Seminole Indian Casino in Immokalee, Collier County shall receive 100 percent. 5. From the Seminole Indian Casino in Brighton, Glades County shall receive 100 percent.
1. Chapter 2010-29, L.O.F. 2. Section 285.710(13), F.S. 3. Section 285.710(7), F.S. 4. Section 285.710(9), F.S.

Office of Economic and Demographic Research
50 2012 Local Government Financial Information Handbook
6. From the Seminole Indian Casino in Big Cypress, Hendry County shall receive 100 percent. 7. From the Seminole Hard Rock Hotel & Casino in Tampa, Hillsborough County shall receive 100
percent.5 Authorized Uses: The use of the revenue is at the discretion of the governing body. Attorney General Opinions: No opinions specifically relevant to this revenue source have been issued.
5. Section 285.710(10), F.S.

Office of Economic and Demographic Research
2012 Local Government Financial Information Handbook 51
Insurance License Tax Sections 624.501-.508, Florida Statutes
Summary: County governments receive proceeds from an annual license tax on the original appointment and renewal of insurance representatives and agents selling various types of insurance products.1 The county tax portion is either $6 or $12 per original appointment or renewal. The county tax shall be paid by each insurer for each agent only for the county where the agent resides. If the agent’s place of business is located in a county other than that of residence, then the county tax is paid based on where the place of business is located. If an agent maintains a place of business in more than one county, the county tax shall be paid by each insurer for each county where the agent represents the insurer and has a place of business.2 A county tax of $3 per year shall be paid by each insurer for each county in this state in which an agent who resides outside of this state represents and engages in person in the activities of an agent for the insurer.3 Municipal governments may also require a tax on insurance agents not to exceed 50 percent of the applicable state tax.4 This tax may apply only to those agents having business offices within the municipal jurisdiction. If no such office is required, the tax may be required by the municipal government where the agent’s place of residence is located. An authorized use of the proceeds of the county or municipal tax is not specified in current law. General Law Amendments: There were no general law amendments resulting from the 2012 Regular Legislative Session. Eligibility Requirements: A county government will receive proceeds if an agent does business within the county or has a business office located within the county. A municipal government may receive proceeds if an agent’s office is located within the municipal jurisdiction or the agent’s place of residence is located within the municipal jurisdiction if no office is required. Administrative Procedures: The Department of Financial Services administers this tax and shall deposit all county monies in the Agents County Tax Trust Fund.5 The Department shall maintain a separate account for all monies collected for each county and, after applying the General Revenue Service Charge deduction authorized pursuant to s. 215.20, F.S., remit the balance to the counties. The payment and collection of the county tax shall be in lieu of collection by the respective county tax collectors.6 Distribution of Proceeds: The Chief Financial Officer shall annually, as of January 1st following the date of collection, and thereafter at such other dates that the Officer may elect draw warrants on the State Treasury payable to the respective counties for the full net amount due to those counties.7 1. Section 624.501, F.S. 2. Section 624.505(1), F.S. 3. Section 624.505(2), F.S. 4. Section 624.507, F.S. 5. Section 624.506(1), F.S. 6. Section 624.506(2), F.S. 7. Section 624.506(3), F.S.
Office of Economic and Demographic Research
52 2012 Local Government Financial Information Handbook
Authorized Uses: The use of the revenue is at the discretion of the governing body. Attorney General Opinions: Florida’s Attorney General has issued the following legal opinions relevant to this revenue source.
Opinion # Subject 74-209 Occupational licensing of insurance companies 76-219 Power to levy regulatory fees on insurance agents
The full texts of these opinions are available via a searchable on-line database.8 Local government officials seeking more clarification should review the opinions in their entirety. The statutory language pertaining to this revenue source has been amended since its authorization. The reader should keep the date of the opinion in mind when reviewing its relevance to current law or any interpretations that have been articulated in Florida case law. Prior Years’ Revenues: A summary of prior years’ distributions is available.9
8. http://myfloridalegal.com/ago.nsf/Opinions 9. http://edr.state.fl.us/Content/local-government/data/data-a-to-z/index.cfm

Office of Economic and Demographic Research
2012 Local Government Financial Information Handbook 53
Intergovernmental Radio Communication Program Section 318.21(9), Florida Statutes
Summary: Civil penalties received by a county court that result from traffic infractions pursuant to the provisions of ch. 318, F.S., shall be distributed and paid monthly as directed by s. 318.21, F.S. From each moving traffic violation, the amount of $12.50 must be used by the county to fund its participation in an intergovernmental radio communication program. If the county is not participating in a program, the revenues collected must be used to fund local law enforcement automation. General Law Amendments: There were no general law amendments resulting from the 2012 Regular Legislative Session. Eligibility Requirements: All counties are eligible to participate in the program. Administrative Procedures: The clerk of circuit court shall remit $12.50 from each moving traffic violation to the county, municipality, or special improvement district depending on the county’s participation or lack of participation in an approved intergovernmental radio communication program. Distribution of Proceeds: If the county participates in an approved program, the funds must be distributed to the county. If the county is not participating in an approved program, the funds must be distributed to the municipality or special improvement district in which the violation occurred or to the county if the violation occurred in the county’s unincorporated area. Authorized Uses: The county must use the revenues to fund its participation in an intergovernmental radio communication program approved by the Department of Management Services. If the county is not participating, the revenues must be used to fund local law enforcement automation. Attorney General Opinions: Florida’s Attorney General has issued the following legal opinions relevant to this revenue source.
Opinion # Subject 94-38 Fees collected to upgrade the city’s communications system 97-38 Clerks, distribution of civil penalties 97-73 Civil penalty used for law enforcement automation 2005-25 Traffic control, use of civil penalty 2009-21 Traffic fines, used for automation associated costs
The full texts of these opinions are available via a searchable on-line database.1 Local government officials seeking more clarification should review the opinions in their entirety. The statutory language pertaining to
1. http://myfloridalegal.com/ago.nsf/Opinions

Office of Economic and Demographic Research
54 2012 Local Government Financial Information Handbook
this revenue source has been amended since its authorization. The reader should keep the date of the opinion in mind when reviewing its relevance to current law or any interpretations that have been articulated in Florida case law.
Office of Economic and Demographic Research
2012 Local Government Financial Information Handbook 55
Local Government Half-cent Sales Tax Program Sections 202.18(2)(c), 212.20(6), and 218.60-.67, Florida Statutes
Summary: Authorized in 1982, the program generates the largest amount of revenue for local governments among the state-shared revenue sources currently authorized by the Legislature.1 It distributes a portion of state sales tax revenue via three separate distributions to eligible county or municipal governments. Additionally, the program distributes a portion of communications services tax revenue to eligible local governments. Allocation formulas serve as the basis for these separate distributions. The program’s primary purpose is to provide relief from ad valorem and utility taxes in addition to providing counties and municipalities with revenues for local programs. The program includes three distributions of state sales tax revenues collected pursuant to ch. 212, F.S. The ordinary distribution to eligible county and municipal governments is possible due to the transfer of 8.814 percent of net sales tax proceeds to the Local Government Half-cent Sales Tax Clearing Trust Fund [hereinafter Trust Fund].2 The emergency and supplemental distributions are possible due to the transfer of 0.095 percent of net sales tax proceeds to the Trust Fund.3 The emergency and supplemental distributions are available to select counties that meet certain fiscal-related eligibility requirements or have an inmate population of greater than seven percent of the total county population, respectively. As of July 1, 2006, the program includes a separate distribution from the Trust Fund to select counties that meet statutory criteria to qualify as a fiscally constrained county.4 A fiscally constrained county is one that is entirely within a rural area of critical economic concern as designated by the Governor pursuant to s. 288.0656, F.S., or for which the value of one mill of property tax levy will raise no more than $5 million in revenue based on the taxable value certified pursuant to s. 1011.62(4)(a)1.a., F.S. This separate distribution is in addition to the qualifying county’s ordinary distribution and any emergency or supplemental distribution. General Law Amendments: There were no general law amendments resulting from the 2012 Regular Legislative Session. Typically, legislation is passed each year that results in changes to the state’s sales tax base or sales tax administration. Such changes have the potential for fiscal impact, either positively or negatively, to the amount of sales tax revenues available for distribution to county and municipal governments. However, a summary of such changes is not provided here. Eligibility Requirements: Only those county and municipal governments that meet the eligibility requirements for revenue sharing pursuant to s. 218.23, F.S., shall participate in the program.5 However, a municipality incorporated subsequent to the effective date of ch. 82-154, L.O.F. (i.e., April 19, 1982), which does not meet the applicable criteria for incorporation pursuant to s. 165.061, F.S., shall not participate in the program, and distributions to eligible units of local government in that county shall be made as though the nonparticipating municipality had not incorporated.
1. Chapter 82-154, L.O.F. 2. Section 212.20(6)(d)2., F.S. 3. Section 212.20(6)(d)3., F.S. 4. Section 218.67, F.S. 5. Section 218.63(1), F.S.

Office of Economic and Demographic Research
56 2012 Local Government Financial Information Handbook
The monies that otherwise would be distributed to a unit of local government failing to certify compliance as required by s. 218.23(1), F.S., or having otherwise failed to meet the requirements of s. 200.065, F.S., shall be deposited in the State General Revenue Fund for the twelve months following a determination of noncompliance by the Department of Revenue (DOR).6 A county government, meeting certain criteria, shall also participate in the monthly emergency and supplemental distributions, and such qualification shall be determined annually at the start of the fiscal year.7 Participation in the emergency distribution is dependent on the existence of a defined fiscal emergency. The Legislature has declared that a fiscal emergency exists in any county that meets both conditions listed below.
1. The county has a population of 65,000 or less; and 2. The monies distributed to the county government pursuant to s. 218.62, F.S., for the prior fiscal year
were less than the current per capita limitation, based on the county’s population. Any county having an inmate population greater than seven percent of its total population is eligible for a supplemental distribution for that year from funds expressly appropriated by the Legislature for that purpose. Inmate population means the latest official state estimate of the number of inmates and patients residing in institutions operated by the federal government, the Florida Department of Corrections, or the Florida Department of Children and Family Services. At the beginning of each fiscal year, the DOR shall calculate a supplemental allocation for each eligible county equal to the current per capita limitation pursuant to s. 218.65(4), F.S., multiplied by the county’s inmate population. If monies appropriated for the current year’s distribution are less than the sum of the supplemental allocations, each eligible county shall receive a share of the appropriated total that is proportional to its supplemental allocation. Otherwise, each eligible county shall receive an amount equal to its supplemental allocation. Administrative Procedures: Monies remitted by a sales tax dealer located within the county and transferred into the Trust Fund shall be earmarked for distribution to the governing body of that county and each municipality within that county.8 Such distributions shall be made after funding is provided pursuant to s. 218.64(3), F.S. Monies in the Trust Fund are appropriated to the DOR and shall be distributed monthly to participating units of local government. Distribution of Proceeds: Each participating county and municipal government shall receive a proportion of monies earmarked for distribution within that county.9 Except in the case of error of population figures certified pursuant to s. 186.901, F.S., the apportionment factors shall remain in effect for the fiscal year. Any adjustments to revenue distributions to correct for population error shall be made subsequent to receipt by the DOR of the corrected certified population figures.
6. Section 218.63(2), F.S. 7. Section 218.65, F.S. 8. Section 218.61, F.S. 9. Section 218.62, F.S.

Office of Economic and Demographic Research
2012 Local Government Financial Information Handbook 57
Calculation of the Ordinary Distribution to Eligible County and Municipal Governments: The allocation factor for each county government shall be computed by dividing the sum of the county’s unincorporated area population plus two-thirds of the county’s incorporated area population by the sum of the county’s total population plus two-thirds of the county’s incorporated area population. Each county’s distribution is then determined by multiplying the allocation factor by the sales tax monies earmarked for distribution within that county. The allocation factor for each municipal government shall be computed by dividing the municipality’s total population by the sum of the county’s total population plus two-thirds of the county’s incorporated population. Each municipality’s distribution is then determined by multiplying the allocation factor by the sales tax monies earmarked for distribution within its respective county. Calculation of the Emergency Distribution to Eligible County Governments: The monthly emergency distribution to each eligible county is made as follows.10
STEP #1. The 2012-13 state fiscal year per capita limitation of $52.15 is multiplied by the latest official estimate of total county population. The county's ordinary distribution for the prior fiscal year is subtracted from this product. This difference is referred to as the county’s base allocation. STEP #2. If the monies deposited into the Trust Fund, excluding monies appropriated for supplemental distributions pursuant to s. 218.65(8), F.S., for the current year are less than or equal to the sum of the base allocations, each eligible county shall receive a share of the appropriated amount proportional to its base allocation.
STEP #3. If the monies deposited into the Trust Fund for the current year exceed the sum of base allocations, each eligible county shall receive its base allocation. Any excess monies, less any amounts distributed pursuant to s. 218.65(6), F.S., shall be distributed equally among the eligible counties on a per capita basis.
Calculation of the Supplemental Distribution to Eligible County Governments: The monthly supplemental distribution to each eligible county is made as follows.11
STEP #1. The 2012-13 state fiscal year per capita limitation of $52.15 is multiplied by the county’s inmate population. STEP #2. If the monies available for supplemental distribution in the current year are less than the sum of supplemental allocations, each eligible county shall receive a share of the available revenue proportional to its supplemental allocation. Otherwise, each eligible county shall receive an amount equal to its supplemental allocation.
Calculation of the Distribution to Eligible Fiscally Constrained County Governments: The amount to be distributed to each fiscally constrained county shall be determined by the DOR at the beginning of the fiscal year, using the prior fiscal year’s July 1st taxable value certified pursuant to s.
10. Section 218.65(5), F.S. 11. Section 218.65(8), F.S.

Office of Economic and Demographic Research
58 2012 Local Government Financial Information Handbook
1011.62(4)(a)1.a., F.S.; tax data; population as defined in s. 218.21, F.S.; and the millage rate levied for the prior fiscal year. The amount distributed shall be allocated based upon the following factors.12
The relative revenue-raising capacity factor represents the ability of an eligible county to generate ad valorem revenues from 1 mill of taxation on a per capita basis. A county that raises no more than $25 per capita from 1 mill shall be assigned a value of 1. A county that raises more than $25 but no more than $30 per capita from 1 mill shall be assigned a value of 0.75. A county that raises more than $30 but no more than $50 per capita from 1 mill shall be assigned a value of 0.5. No value shall be assigned to counties that raise more than $50 per capita from 1 mill of ad valorem taxation.
The local effort factor shall be a measure of the eligible county’s relative level of local effort as indicated by the millage rate levied for the prior fiscal year. The local effort factor shall be the eligible county’s most recently adopted countywide operating millage rate multiplied by 0.1.
Each eligible county’s proportional allocation of the total amount available for distribution to all eligible counties shall be in the same proportion as the sum of the county’s two factors is to the sum of the two factors for all eligible counties. Transitional Provisions of the Emergency and Fiscally Constrained Counties Distributions: If monies deposited into the Trust Fund for the purpose of making the emergency distribution exceed the amount necessary to provide the base allocation to each eligible county, these monies may be used to provide a transitional distribution to certain counties whose population has exceeded the 65,000 limit.13 Beginning on July 1st of the year following the year in which the county no longer qualifies for an emergency distribution, the county shall receive two-thirds of the amount received in the prior year. Beginning on July 1st of the second year following the year in which the county no longer qualifies for an emergency distribution, the county shall receive one-third of the amount received in the last year that the county qualified for the emergency distribution. If insufficient monies are available in the Trust Fund to fully provide such a transitional distribution to each eligible county, then that county shall receive a share of the available monies proportional to the amount it would have received had monies been sufficient to fully fund the transitional distribution to all eligible counties. For those counties that will no longer qualify for the fiscally constrained county distribution after July 1, 2006, there shall be a two-year phase-out period.14 Beginning on July 1st of the year following the year in which the value of a mill for that county exceeds $5 million in revenue, the county shall receive two-thirds of the amount received in the prior year. Beginning on July 1st of the second year following the year in which the value of a mill for that county exceeds $5 million in revenue, the county shall receive one-third of the amount received in the last year that the county qualified as a fiscally constrained county. Following the two-year phase-out period, the county shall no longer be eligible to receive any such distributions unless the county subsequently qualifies as being fiscally constrained. Special Distribution for Contested Property Taxes: If an action contesting a tax assessment is brought by a taxpayer in a participating county or municipality and the difference between the good faith payment made by that taxpayer pursuant to s. 194.171(3), F.S., and the
12. Section 218.67(3), F.S. 13. Section 218.65(6), F.S. 14. Section 218.67(4), F.S.
Office of Economic and Demographic Research
2012 Local Government Financial Information Handbook 59
taxes that would have been paid on the property appraiser’s tax assessment is greater than 6 percent of the total assessed taxes for the county or municipality, the county or municipality qualifies for a special distribution of funds from the Trust Fund.15 Authorized Uses: The proportion of the total proceeds received by a county government based on two-thirds of the incorporated area population shall be deemed countywide revenues and shall be expended only for countywide tax relief or countywide programs. The remaining county government portion shall be deemed county revenues derived on behalf of the unincorporated area but may be expended on a countywide basis.16 Using Alachua County as an example, the following illustrates the calculation to determine the proportion of the county government’s ordinary distribution based on two-thirds of the incorporated area population and the remaining proportion derived on behalf of the unincorporated area population.
2011 Adjusted Population Figures Used for State Revenue-Sharing Purposes: Total county population: 245,550 Total unincorporated population: 98,537 Total incorporated population: 147,013
The county government’s distribution factor is calculated using the formula below.
County’s Unincorporated Population + (2/3 x County’s Incorporated Population) Total Countywide Population + (2/3 x County’s Incorporated Population)
98,537 + (2/3 x 147,013) 245,550 + (2/3 x 147,013) = 0.57208764
In this example, the amount of Alachua County Government’s ordinary distribution is determined by multiplying the total countywide estimated FY 2013 ordinary distribution amount by the county government’s distribution factor.
$17,725,529 x 0.57208764 = $10,140,556 In order to determine the county government’s portions derived on behalf of two-thirds of the incorporated area population and on behalf of the unincorporated area population, it is necessary to calculate two ratios. For purposes here, these ratios will be referred to as A and B.
A = (2/3 x County’s Incorporated Population) Total Countywide Population + (2/3 x County’s Incorporated Population)
A = (2/3 x 147,013) [245,550 + (2/3 x 147,013)] = 0.28527491
15. Section 218.66, F.S. 16. Section 218.64(1), F.S.

Office of Economic and Demographic Research
60 2012 Local Government Financial Information Handbook
B = County’s Unincorporated Population Total Countywide Population + (2/3 x County’s Incorporated Population)
B = 98,537 [245,550 + (2/3 x 147,013)] = 0.28681272 The formula listed below, based on the ratios illustrated above, is used to calculate the proportion of the county government’s ordinary distribution derived on behalf of two-thirds of the incorporated population.
Proportion = [A / (A + B)] = [0.28527491 / (0.28527491 + 0.28681272)] = 0.49865597 To determine Alachua County Government’s portion of the ordinary distribution based on two-thirds of the incorporated area population that shall be deemed countywide revenues and expended only for countywide tax relief or countywide programs, multiply the county government’s ordinary distribution amount by the proportion illustrated above.
$10,140,556 x 0.49865597 = $5,056,649 In order to calculate the proportion of the county government’s ordinary distribution derived on behalf of the unincorporated population, the following formula, based on the ratios illustrated above, is used.
Proportion = [B / (A + B)] = [0.28681272 / (0.28527491 + 0.28681272)] = 0.50134403 To determine Alachua County Government’s portion of the ordinary distribution based on the unincorporated area population that shall be deemed county revenues but may be expended on a countywide basis, multiply the county government’s ordinary distribution amount by the proportion illustrated above.
$10,140,556 x 0.50134403 = $5,083,907 Municipalities are directed to expend their portions only for municipal-wide programs or for municipal-wide property tax or municipal utility tax relief. All utility tax rate reductions afforded by participation in the program shall be applied uniformly across all types of taxed utility services.17 Subject to ordinances enacted by the majority of members of the county governing authority and the majority of members of the municipal governing authorities representing at least 50 percent of the municipal population of such county, counties may use up to $2 millon annually of the tax proceeds allocated to that county to fund any of the following certified applicants:
1. A certified applicant as a facility for a new or retained professional sports franchise under s. 288.1162, F.S., or a certified applicant as defined in s. 288.11621, F.S., for a facility for a spring training franchise.
2. A certified applicant as a motorsport entertainment complex as provided for in s. 288.1171, F.S. A county or municipality is also authorized to pledge the proceeds for the payment of principal and interest on any capital project.18 For any eligible county receiving a fiscally constrained distribution, the revenues may be 17. Section 218.64(2), F.S.
Office of Economic and Demographic Research
2012 Local Government Financial Information Handbook 61
used for any public purpose, except to pay debt service on bonds, notes, certificates of participation, or any other forms of indebtedness.19 Attorney General Opinions: Florida’s Attorney General has issued the following legal opinions relevant to this revenue source.
Opinion # Subject 82-41 Depositing sales tax money, procedures used by the Department of Revenue 92-87 Distribution of trust fund monies in the event of revised population estimate 94-67 City of Port LaBelle referendum, eligibility for half-cent sales tax monies 2002-36 Census correction, redistribution of sales tax
The full texts of these opinions are available via a searchable on-line database.20 Local government officials seeking more clarification should review the opinions in their entirety. The statutory language pertaining to this revenue source has been amended since its authorization. The reader should keep the date of the opinion in mind when reviewing its relevance to current law or any interpretations that have been articulated in Florida case law. Current and Prior Years’ Revenues: The table included in this section lists the estimated ordinary, emergency, supplemental, fiscally constrained, and total distributions to eligible county or municipal governments for local fiscal year ending 2013 as calculated by the DOR. The figures represent a 100 percent distribution of the estimated monies. Several summaries of prior years’ distributions are available.21
18. Section 218.64(4), F.S. 19. Section 218.67(5), F.S. 20. http://myfloridalegal.com/ago.nsf/Opinions 21. http://edr.state.fl.us/Content/local-government/data/data-a-to-z/index.cfm

Calculated by the Florida Department of Revenue's Office of Tax Research
Local Government Half-Cent Sales TaxRevenue Estimates for the Local Fiscal Year Ending September 30, 2013
FiscallyOrdinary Emergency Supplemental Constrained Total
Local Government Distribution Distribution Distribution Distribution DistributionALACHUA BOCC 10,140,556$ -$ -$ -$ 10,140,556$ Alachua 469,917$ -$ -$ -$ 469,917$ Archer 58,765$ -$ -$ -$ 58,765$ Gainesville 6,351,466$ -$ -$ -$ 6,351,466$ Hawthorne 72,696$ -$ -$ -$ 72,696$ High Springs 276,440$ -$ -$ -$ 276,440$ La Crosse 18,161$ -$ -$ -$ 18,161$ Micanopy 30,647$ -$ -$ -$ 30,647$ Newberry 255,132$ -$ -$ -$ 255,132$ Waldo 51,749$ -$ -$ -$ 51,749$ Countywide Total 17,725,529$ -$ -$ -$ 17,725,529$ BAKER BOCC 686,669$ 732,753$ 20,879$ 583,302$ 2,023,603$ Glen St. Mary 13,088$ -$ -$ -$ 13,088$ Macclenny 191,934$ -$ -$ -$ 191,934$ Countywide Total 891,691$ 732,753$ 20,879$ 583,302$ 2,228,625$ BAY BOCC 10,276,809$ -$ -$ -$ 10,276,809$ Callaway 1,088,726$ -$ -$ -$ 1,088,726$ Lynn Haven 1,399,500$ -$ -$ -$ 1,399,500$ Mexico Beach 81,478$ -$ -$ -$ 81,478$ Panama City 2,672,718$ -$ -$ -$ 2,672,718$ Panama City Beach 905,515$ -$ -$ -$ 905,515$ Parker 325,985$ -$ -$ -$ 325,985$ Springfield 672,829$ -$ -$ -$ 672,829$ Countywide Total 17,423,561$ -$ -$ -$ 17,423,561$ BRADFORD BOCC 882,717$ 531,489$ 46,056$ 684,673$ 2,144,935$ Brooker 13,096$ -$ -$ -$ 13,096$ Hampton 19,624$ -$ -$ -$ 19,624$ Lawtey 29,116$ -$ -$ -$ 29,116$ Starke 217,385$ -$ -$ -$ 217,385$ Countywide Total 1,161,938$ 531,489$ 46,056$ 684,673$ 2,424,156$ BREVARD BOCC 20,750,622$ -$ -$ -$ 20,750,622$ Cape Canaveral 478,424$ -$ -$ -$ 478,424$ Cocoa 830,020$ -$ -$ -$ 830,020$ Cocoa Beach 540,875$ -$ -$ -$ 540,875$ Grant-Valkaria 186,198$ -$ -$ -$ 186,198$ Indialantic 131,499$ -$ -$ -$ 131,499$ Indian Harbour Beach 398,302$ -$ -$ -$ 398,302$ Malabar 132,414$ -$ -$ -$ 132,414$ Melbourne 3,676,490$ -$ -$ -$ 3,676,490$ Melbourne Beach 149,508$ -$ -$ -$ 149,508$ Melbourne Village 31,876$ -$ -$ -$ 31,876$ Palm Bay 4,983,778$ -$ -$ -$ 4,983,778$ Palm Shores 42,180$ -$ -$ -$ 42,180$ Rockledge 1,203,765$ -$ -$ -$ 1,203,765$ Satellite Beach 489,499$ -$ -$ -$ 489,499$ Titusville 2,110,103$ -$ -$ -$ 2,110,103$ West Melbourne 901,620$ -$ -$ -$ 901,620$ Countywide Total 37,037,171$ -$ -$ -$ 37,037,171$ BROWARD BOCC 67,303,086$ -$ -$ -$ 67,303,086$ Coconut Creek 3,050,878$ -$ -$ -$ 3,050,878$ Cooper City 1,673,320$ -$ -$ -$ 1,673,320$ Coral Springs 6,982,267$ -$ -$ -$ 6,982,267$
2012 Local Government Financial Information Handbook Page 62

Calculated by the Florida Department of Revenue's Office of Tax Research
Local Government Half-Cent Sales TaxRevenue Estimates for the Local Fiscal Year Ending September 30, 2013
FiscallyOrdinary Emergency Supplemental Constrained Total
Local Government Distribution Distribution Distribution Distribution DistributionDania Beach 1,698,689$ -$ -$ -$ 1,698,689$ Davie 5,288,801$ -$ -$ -$ 5,288,801$ Deerfield Beach 4,311,866$ -$ -$ -$ 4,311,866$ Fort Lauderdale 9,522,666$ -$ -$ -$ 9,522,666$ Hallandale Beach 2,136,791$ -$ -$ -$ 2,136,791$ Hillsboro Beach 107,617$ -$ -$ -$ 107,617$ Hollywood 8,088,802$ -$ -$ -$ 8,088,802$ Lauderdale-By-The-Sea 348,623$ -$ -$ -$ 348,623$ Lauderdale Lakes 1,880,634$ -$ -$ -$ 1,880,634$ Lauderhill 3,828,822$ -$ -$ -$ 3,828,822$ Lazy Lake 1,378$ -$ -$ -$ 1,378$ Lighthouse Point 595,597$ -$ -$ -$ 595,597$ Margate 3,082,963$ -$ -$ -$ 3,082,963$ Miramar 7,058,661$ -$ -$ -$ 7,058,661$ North Lauderdale 2,367,466$ -$ -$ -$ 2,367,466$ Oakland Park 2,384,742$ -$ -$ -$ 2,384,742$ Parkland 1,399,943$ -$ -$ -$ 1,399,943$ Pembroke Park 350,058$ -$ -$ -$ 350,058$ Pembroke Pines 8,854,750$ -$ -$ -$ 8,854,750$ Plantation 4,860,685$ -$ -$ -$ 4,860,685$ Pompano Beach 5,743,779$ -$ -$ -$ 5,743,779$ Sea Ranch Lakes 38,742$ -$ -$ -$ 38,742$ Southwest Ranches 421,573$ -$ -$ -$ 421,573$ Sunrise 4,842,778$ -$ -$ -$ 4,842,778$ Tamarac 3,479,281$ -$ -$ -$ 3,479,281$ West Park 808,019$ -$ -$ -$ 808,019$ Weston 3,744,335$ -$ -$ -$ 3,744,335$ Wilton Manors 674,000$ -$ -$ -$ 674,000$ Countywide Total 166,931,611$ -$ -$ -$ 166,931,611$ CALHOUN BOCC 277,456$ 449,845$ 18,092$ 724,425$ 1,469,818$ Altha 12,366$ -$ -$ -$ 12,366$ Blountstown 58,170$ -$ -$ -$ 58,170$ Countywide Total 347,991$ 449,845$ 18,092$ 724,425$ 1,540,353$ CHARLOTTE BOCC 10,048,128$ -$ -$ -$ 10,048,128$ Punta Gorda 1,090,407$ -$ -$ -$ 1,090,407$ Countywide Total 11,138,535$ -$ -$ -$ 11,138,535$ CITRUS BOCC 6,323,372$ -$ -$ -$ 6,323,372$ Crystal River 143,193$ -$ -$ -$ 143,193$ Inverness 331,507$ -$ -$ -$ 331,507$ Countywide Total 6,798,072$ -$ -$ -$ 6,798,072$ CLAY BOCC 8,499,631$ -$ -$ -$ 8,499,631$ Green Cove Springs 316,329$ -$ -$ -$ 316,329$ Keystone Heights 61,358$ -$ -$ -$ 61,358$ Orange Park 385,758$ -$ -$ -$ 385,758$ Penney Farms 33,981$ -$ -$ -$ 33,981$ Countywide Total 9,297,056$ -$ -$ -$ 9,297,056$ COLLIER BOCC 31,329,637$ -$ -$ -$ 31,329,637$ Everglades 40,821$ -$ -$ -$ 40,821$ Marco Island 1,653,257$ -$ -$ -$ 1,653,257$ Naples 1,955,696$ -$ -$ -$ 1,955,696$ Countywide Total 34,979,411$ -$ -$ -$ 34,979,411$ COLUMBIA BOCC 3,525,999$ 383,038$ -$ 628,559$ 4,537,595$
2012 Local Government Financial Information Handbook Page 63

Calculated by the Florida Department of Revenue's Office of Tax Research
Local Government Half-Cent Sales TaxRevenue Estimates for the Local Fiscal Year Ending September 30, 2013
FiscallyOrdinary Emergency Supplemental Constrained Total
Local Government Distribution Distribution Distribution Distribution DistributionFort White 33,402$ -$ -$ -$ 33,402$ Lake City 692,462$ -$ -$ -$ 692,462$ Countywide Total 4,251,862$ 383,038$ -$ 628,559$ 5,263,459$ DESOTO BOCC 917,454$ 952,588$ -$ 574,648$ 2,444,690$ Arcadia 231,488$ -$ -$ -$ 231,488$ Countywide Total 1,148,942$ 952,588$ -$ 574,648$ 2,676,178$ DIXIE BOCC 326,162$ 547,885$ 13,558$ 724,425$ 1,612,031$ Cross City 38,902$ -$ -$ -$ 38,902$ Horseshoe Beach 3,782$ -$ -$ -$ 3,782$ Countywide Total 368,846$ 547,885$ 13,558$ 724,425$ 1,654,714$ JACKSONVILLE-DUVAL 74,584,857$ -$ -$ -$ 74,584,857$ Atlantic Beach 1,112,006$ -$ -$ -$ 1,112,006$ Baldwin 123,400$ -$ -$ -$ 123,400$ Jacksonville Beach 1,881,808$ -$ -$ -$ 1,881,808$ Neptune Beach 618,405$ -$ -$ -$ 618,405$ Countywide Total 78,320,476$ -$ -$ -$ 78,320,476$ ESCAMBIA BOCC 20,317,179$ -$ -$ -$ 20,317,179$ Century 123,217$ -$ -$ -$ 123,217$ Pensacola 3,782,540$ -$ -$ -$ 3,782,540$ Countywide Total 24,222,936$ -$ -$ -$ 24,222,936$ FLAGLER BOCC 1,941,150$ -$ -$ -$ 1,941,150$ Beverly Beach 9,545$ -$ -$ -$ 9,545$ Bunnell 76,472$ -$ -$ -$ 76,472$ Flagler Beach (part) 125,867$ -$ -$ -$ 125,867$ Marineland (part) 453$ -$ -$ -$ 453$ Palm Coast 2,141,695$ -$ -$ -$ 2,141,695$ Countywide Total 4,295,181$ -$ -$ -$ 4,295,181$ FRANKLIN BOCC 574,339$ -$ 18,199$ 240,509$ 833,048$ Apalachicola 148,963$ -$ -$ -$ 148,963$ Carrabelle 89,817$ -$ -$ -$ 89,817$ Countywide Total 813,119$ -$ 18,199$ 240,509$ 1,071,827$ GADSDEN BOCC 1,062,654$ 1,459,942$ -$ 671,609$ 3,194,205$ Chattahoochee 67,962$ -$ -$ -$ 67,962$ Greensboro 16,242$ -$ -$ -$ 16,242$ Gretna 39,390$ -$ -$ -$ 39,390$ Havana 47,619$ -$ -$ -$ 47,619$ Midway 82,989$ -$ -$ -$ 82,989$ Quincy 201,537$ -$ -$ -$ 201,537$ Countywide Total 1,518,393$ 1,459,942$ -$ 671,609$ 3,649,945$ GILCHRIST BOCC 242,303$ 647,945$ -$ 640,850$ 1,531,098$ Bell 7,038$ -$ -$ -$ 7,038$ Fanning Springs (part) 5,518$ -$ -$ -$ 5,518$ Trenton 31,750$ -$ -$ -$ 31,750$ Countywide Total 286,609$ 647,945$ -$ 640,850$ 1,575,405$ GLADES BOCC 136,060$ 525,361$ 10,504$ 682,732$ 1,354,656$ Moore Haven 19,734$ -$ -$ -$ 19,734$ Countywide Total 155,794$ 525,361$ 10,504$ 682,732$ 1,374,391$ GULF BOCC 418,639$ 304,157$ 34,126$ 277,305$ 1,034,228$ Port St. Joe 134,255$ -$ -$ -$ 134,255$ Wewahitchka 76,280$ -$ -$ -$ 76,280$ Countywide Total 629,174$ 304,157$ 34,126$ 277,305$ 1,244,763$ HAMILTON BOCC 395,948$ 361,649$ 29,839$ 482,950$ 1,270,386$
2012 Local Government Financial Information Handbook Page 64

Calculated by the Florida Department of Revenue's Office of Tax Research
Local Government Half-Cent Sales TaxRevenue Estimates for the Local Fiscal Year Ending September 30, 2013
FiscallyOrdinary Emergency Supplemental Constrained Total
Local Government Distribution Distribution Distribution Distribution DistributionJasper 60,153$ -$ -$ -$ 60,153$ Jennings 32,247$ -$ -$ -$ 32,247$ White Springs 28,599$ -$ -$ -$ 28,599$ Countywide Total 516,947$ 361,649$ 29,839$ 482,950$ 1,391,385$ HARDEE BOCC 564,399$ 903,950$ -$ 413,115$ 1,881,464$ Bowling Green 72,949$ -$ -$ -$ 72,949$ Wauchula 123,868$ -$ -$ -$ 123,868$ Zolfo Springs 45,737$ -$ -$ -$ 45,737$ Countywide Total 806,953$ 903,950$ -$ 413,115$ 2,124,018$ HENDRY BOCC 1,204,308$ 1,011,535$ -$ 593,516$ 2,809,359$ Clewiston 254,079$ -$ -$ -$ 254,079$ LaBelle 164,206$ -$ -$ -$ 164,206$ Countywide Total 1,622,594$ 1,011,535$ -$ 593,516$ 3,227,645$ HERNANDO BOCC 7,451,533$ -$ -$ -$ 7,451,533$ Brooksville 337,940$ -$ -$ -$ 337,940$ Weeki Wachee 526$ -$ -$ -$ 526$ Countywide Total 7,789,999$ -$ -$ -$ 7,789,999$ HIGHLANDS BOCC 3,947,299$ -$ -$ 342,894$ 4,290,193$ Avon Park 382,453$ -$ -$ -$ 382,453$ Lake Placid 93,834$ -$ -$ -$ 93,834$ Sebring 454,716$ -$ -$ -$ 454,716$ Countywide Total 4,878,301$ -$ -$ 342,894$ 5,221,196$ HILLSBOROUGH BOCC 84,107,564$ -$ -$ -$ 84,107,564$ Plant City 2,642,895$ -$ -$ -$ 2,642,895$ Tampa 25,612,259$ -$ -$ -$ 25,612,259$ Temple Terrace 1,859,139$ -$ -$ -$ 1,859,139$ Countywide Total 114,221,857$ -$ -$ -$ 114,221,857$ HOLMES BOCC 319,858$ 715,391$ 15,691$ 828,766$ 1,879,706$ Bonifay 51,862$ -$ -$ -$ 51,862$ Esto 6,835$ -$ -$ -$ 6,835$ Noma 3,718$ -$ -$ -$ 3,718$ Ponce de Leon 11,060$ -$ -$ -$ 11,060$ Westville 5,520$ -$ -$ -$ 5,520$ Countywide Total 398,852$ 715,391$ 15,691$ 828,766$ 1,958,700$ INDIAN RIVER BOCC 7,738,264$ -$ -$ -$ 7,738,264$ Fellsmere 329,455$ -$ -$ -$ 329,455$ Indian River Shores 246,650$ -$ -$ -$ 246,650$ Orchid 26,255$ -$ -$ -$ 26,255$ Sebastian 1,388,193$ -$ -$ -$ 1,388,193$ Vero Beach 962,868$ -$ -$ -$ 962,868$ Countywide Total 10,691,684$ -$ -$ -$ 10,691,684$ JACKSON BOCC 1,582,675$ 831,427$ 80,643$ 585,446$ 3,080,191$ Alford 20,565$ -$ -$ -$ 20,565$ Bascom 5,089$ -$ -$ -$ 5,089$ Campbellton 9,757$ -$ -$ -$ 9,757$ Cottondale 39,153$ -$ -$ -$ 39,153$ Graceville 95,800$ -$ -$ -$ 95,800$ Grand Ridge 39,994$ -$ -$ -$ 39,994$ Greenwood 28,765$ -$ -$ -$ 28,765$ Jacob City 11,229$ -$ -$ -$ 11,229$ Malone 27,083$ -$ -$ -$ 27,083$ Marianna 250,602$ -$ -$ -$ 250,602$
2012 Local Government Financial Information Handbook Page 65

Calculated by the Florida Department of Revenue's Office of Tax Research
Local Government Half-Cent Sales TaxRevenue Estimates for the Local Fiscal Year Ending September 30, 2013
FiscallyOrdinary Emergency Supplemental Constrained Total
Local Government Distribution Distribution Distribution Distribution DistributionSneads 78,305$ -$ -$ -$ 78,305$ Countywide Total 2,189,015$ 831,427$ 80,643$ 585,446$ 3,686,531$ JEFFERSON BOCC 784,650$ 108,069$ 11,940$ 643,415$ 1,548,073$ Monticello 151,343$ -$ -$ -$ 151,343$ Countywide Total 935,993$ 108,069$ 11,940$ 643,415$ 1,699,416$ LAFAYETTE BOCC 108,580$ 274,154$ 20,064$ 664,056$ 1,066,854$ Mayo 20,392$ -$ -$ -$ 20,392$ Countywide Total 128,972$ 274,154$ 20,064$ 664,056$ 1,087,247$ LAKE BOCC 11,676,327$ -$ -$ -$ 11,676,327$ Astatula 84,072$ -$ -$ -$ 84,072$ Clermont 1,375,026$ -$ -$ -$ 1,375,026$ Eustis 865,960$ -$ -$ -$ 865,960$ Fruitland Park 194,465$ -$ -$ -$ 194,465$ Groveland 412,161$ -$ -$ -$ 412,161$ Howey-in-the-Hills 51,520$ -$ -$ -$ 51,520$ Lady Lake 653,182$ -$ -$ -$ 653,182$ Leesburg 955,840$ -$ -$ -$ 955,840$ Mascotte 238,445$ -$ -$ -$ 238,445$ Minneola 444,244$ -$ -$ -$ 444,244$ Montverde 68,147$ -$ -$ -$ 68,147$ Mount Dora 588,126$ -$ -$ -$ 588,126$ Tavares 656,414$ -$ -$ -$ 656,414$ Umatilla 161,961$ -$ -$ -$ 161,961$ Countywide Total 18,425,890$ -$ -$ -$ 18,425,890$ LEE BOCC 37,770,747$ -$ -$ -$ 37,770,747$ Bonita Springs 3,141,132$ -$ -$ -$ 3,141,132$ Cape Coral 11,085,179$ -$ -$ -$ 11,085,179$ Fort Myers 4,508,521$ -$ -$ -$ 4,508,521$ Fort Myers Beach 444,003$ -$ -$ -$ 444,003$ Sanibel 458,751$ -$ -$ -$ 458,751$ Countywide Total 57,408,332$ -$ -$ -$ 57,408,332$ LEON BOCC 10,722,541$ -$ -$ -$ 10,722,541$ Tallahassee 9,051,364$ -$ -$ -$ 9,051,364$ Countywide Total 19,773,905$ -$ -$ -$ 19,773,905$ LEVY BOCC 1,251,175$ 1,081,283$ -$ 618,726$ 2,951,185$ Bronson 36,745$ -$ -$ -$ 36,745$ Cedar Key 23,617$ -$ -$ -$ 23,617$ Chiefland 75,360$ -$ -$ -$ 75,360$ Fanning Springs (part) 16,168$ -$ -$ -$ 16,168$ Inglis 44,361$ -$ -$ -$ 44,361$ Otter Creek 4,476$ -$ -$ -$ 4,476$ Williston 92,362$ -$ -$ -$ 92,362$ Yankeetown 16,502$ -$ -$ -$ 16,502$ Countywide Total 1,560,765$ 1,081,283$ -$ 618,726$ 3,260,774$ LIBERTY BOCC 131,035$ 249,203$ 16,667$ 724,425$ 1,121,330$ Bristol 19,199$ -$ -$ -$ 19,199$ Countywide Total 150,234$ 249,203$ 16,667$ 724,425$ 1,140,529$ MADISON BOCC 452,302$ 597,418$ 18,532$ 702,629$ 1,770,880$ Greenville 23,143$ -$ -$ -$ 23,143$ Lee 9,480$ -$ -$ -$ 9,480$ Madison 80,079$ -$ -$ -$ 80,079$ Countywide Total 565,003$ 597,418$ 18,532$ 702,629$ 1,883,582$
2012 Local Government Financial Information Handbook Page 66

Calculated by the Florida Department of Revenue's Office of Tax Research
Local Government Half-Cent Sales TaxRevenue Estimates for the Local Fiscal Year Ending September 30, 2013
FiscallyOrdinary Emergency Supplemental Constrained Total
Local Government Distribution Distribution Distribution Distribution DistributionMANATEE BOCC 19,317,060$ -$ -$ -$ 19,317,060$ Anna Maria 96,282$ -$ -$ -$ 96,282$ Bradenton 3,178,776$ -$ -$ -$ 3,178,776$ Bradenton Beach 75,298$ -$ -$ -$ 75,298$ Holmes Beach 245,663$ -$ -$ -$ 245,663$ Longboat Key (part) 153,219$ -$ -$ -$ 153,219$ Palmetto 810,048$ -$ -$ -$ 810,048$ Countywide Total 23,876,347$ -$ -$ -$ 23,876,347$ MARION BOCC 16,612,782$ -$ -$ -$ 16,612,782$ Belleview 247,551$ -$ -$ -$ 247,551$ Dunnellon 94,297$ -$ -$ -$ 94,297$ McIntosh 24,538$ -$ -$ -$ 24,538$ Ocala 3,059,591$ -$ -$ -$ 3,059,591$ Reddick 27,741$ -$ -$ -$ 27,741$ Countywide Total 20,066,500$ -$ -$ -$ 20,066,500$ MARTIN BOCC 12,220,344$ -$ -$ -$ 12,220,344$ Jupiter Island 71,799$ -$ -$ -$ 71,799$ Ocean Breeze Park 28,191$ -$ -$ -$ 28,191$ Sewall's Point 176,371$ -$ -$ -$ 176,371$ Stuart 1,375,465$ -$ -$ -$ 1,375,465$ Countywide Total 13,872,170$ -$ -$ -$ 13,872,170$ MIAMI-DADE BOCC 138,713,539$ -$ -$ -$ 138,713,539$ Aventura 2,430,433$ -$ -$ -$ 2,430,433$ Bal Harbour 170,225$ -$ -$ -$ 170,225$ Bay Harbor Islands 383,312$ -$ -$ -$ 383,312$ Biscayne Park 209,005$ -$ -$ -$ 209,005$ Coral Gables 3,199,779$ -$ -$ -$ 3,199,779$ Cutler Bay 2,765,236$ -$ -$ -$ 2,765,236$ Doral 3,164,740$ -$ -$ -$ 3,164,740$ El Portal 159,271$ -$ -$ -$ 159,271$ Florida City 796,288$ -$ -$ -$ 796,288$ Golden Beach 62,729$ -$ -$ -$ 62,729$ Hialeah 15,413,107$ -$ -$ -$ 15,413,107$ Hialeah Gardens 1,482,766$ -$ -$ -$ 1,482,766$ Homestead 4,183,164$ -$ -$ -$ 4,183,164$ Indian Creek 6,055$ -$ -$ -$ 6,055$ Key Biscayne 841,123$ -$ -$ -$ 841,123$ Medley 56,742$ -$ -$ -$ 56,742$ Miami 27,496,011$ -$ -$ -$ 27,496,011$ Miami Beach 6,010,870$ -$ -$ -$ 6,010,870$ Miami Gardens 7,285,992$ -$ -$ -$ 7,285,992$ Miami Lakes 1,997,319$ -$ -$ -$ 1,997,319$ Miami Shores 721,721$ -$ -$ -$ 721,721$ Miami Springs 941,884$ -$ -$ -$ 941,884$ North Bay 499,993$ -$ -$ -$ 499,993$ North Miami 4,000,897$ -$ -$ -$ 4,000,897$ North Miami Beach 2,835,720$ -$ -$ -$ 2,835,720$ Opa-locka 1,047,951$ -$ -$ -$ 1,047,951$ Palmetto Bay 1,597,270$ -$ -$ -$ 1,597,270$ Pinecrest 1,241,988$ -$ -$ -$ 1,241,988$ South Miami 841,123$ -$ -$ -$ 841,123$ Sunny Isles Beach 1,429,222$ -$ -$ -$ 1,429,222$
2012 Local Government Financial Information Handbook Page 67

Calculated by the Florida Department of Revenue's Office of Tax Research
Local Government Half-Cent Sales TaxRevenue Estimates for the Local Fiscal Year Ending September 30, 2013
FiscallyOrdinary Emergency Supplemental Constrained Total
Local Government Distribution Distribution Distribution Distribution DistributionSurfside 391,136$ -$ -$ -$ 391,136$ Sweetwater 1,358,193$ -$ -$ -$ 1,358,193$ Virginia Gardens 162,605$ -$ -$ -$ 162,605$ West Miami 407,397$ -$ -$ -$ 407,397$ Countywide Total 234,304,805$ -$ -$ -$ 234,304,805$ MONROE BOCC 9,316,677$ -$ -$ -$ 9,316,677$ Islamorada 966,608$ -$ -$ -$ 966,608$ Key Colony Beach 125,170$ -$ -$ -$ 125,170$ Key West 3,871,623$ -$ -$ -$ 3,871,623$ Layton 28,619$ -$ -$ -$ 28,619$ Marathon 1,307,681$ -$ -$ -$ 1,307,681$ Countywide Total 15,616,378$ -$ -$ -$ 15,616,378$ NASSAU BOCC 3,539,632$ -$ -$ -$ 3,539,632$ Callahan 58,259$ -$ -$ -$ 58,259$ Fernandina Beach 593,667$ -$ -$ -$ 593,667$ Hilliard 160,276$ -$ -$ -$ 160,276$ Countywide Total 4,351,833$ -$ -$ -$ 4,351,833$ OKALOOSA BOCC 12,574,707$ -$ -$ -$ 12,574,707$ Cinco Bayou 31,210$ -$ -$ -$ 31,210$ Crestview 1,745,341$ -$ -$ -$ 1,745,341$ Destin 1,001,251$ -$ -$ -$ 1,001,251$ Fort Walton Beach 1,587,664$ -$ -$ -$ 1,587,664$ Laurel Hill 42,833$ -$ -$ -$ 42,833$ Mary Esther 312,429$ -$ -$ -$ 312,429$ Niceville 1,043,108$ -$ -$ -$ 1,043,108$ Shalimar 58,519$ -$ -$ -$ 58,519$ Valparaiso 411,343$ -$ -$ -$ 411,343$ Countywide Total 18,808,404$ -$ -$ -$ 18,808,404$ OKEECHOBEE BOCC 1,762,588$ 491,264$ -$ 654,252$ 2,908,104$ Okeechobee 272,232$ -$ -$ -$ 272,232$ Countywide Total 2,034,820$ 491,264$ -$ 654,252$ 3,180,336$ ORANGE BOCC 136,002,595$ -$ -$ -$ 136,002,595$ Apopka 5,633,225$ -$ -$ -$ 5,633,225$ Belle Isle 805,052$ -$ -$ -$ 805,052$ Eatonville 285,741$ -$ -$ -$ 285,741$ Edgewood 334,836$ -$ -$ -$ 334,836$ Maitland 2,114,700$ -$ -$ -$ 2,114,700$ Oakland 341,926$ -$ -$ -$ 341,926$ Ocoee 4,818,541$ -$ -$ -$ 4,818,541$ Orlando 32,318,206$ -$ -$ -$ 32,318,206$ Windermere 384,868$ -$ -$ -$ 384,868$ Winter Garden 4,719,682$ -$ -$ -$ 4,719,682$ Winter Park 3,703,133$ -$ -$ -$ 3,703,133$ Countywide Total 191,462,508$ -$ -$ -$ 191,462,508$ OSCEOLA BOCC 15,448,474$ -$ -$ -$ 15,448,474$ Kissimmee 3,856,725$ -$ -$ -$ 3,856,725$ St. Cloud 2,369,839$ -$ -$ -$ 2,369,839$ Countywide Total 21,675,038$ -$ -$ -$ 21,675,038$ PALM BEACH BOCC 72,531,887$ -$ -$ -$ 72,531,887$ Atlantis 135,958$ -$ -$ -$ 135,958$ Belle Glade 1,173,451$ -$ -$ -$ 1,173,451$ Boca Raton 5,700,388$ -$ -$ -$ 5,700,388$
2012 Local Government Financial Information Handbook Page 68

Calculated by the Florida Department of Revenue's Office of Tax Research
Local Government Half-Cent Sales TaxRevenue Estimates for the Local Fiscal Year Ending September 30, 2013
FiscallyOrdinary Emergency Supplemental Constrained Total
Local Government Distribution Distribution Distribution Distribution DistributionBoynton Beach 4,606,599$ -$ -$ -$ 4,606,599$ Briny Breeze 40,471$ -$ -$ -$ 40,471$ Cloud Lake 9,225$ -$ -$ -$ 9,225$ Delray Beach 4,103,172$ -$ -$ -$ 4,103,172$ Glen Ridge 14,747$ -$ -$ -$ 14,747$ Golf 16,835$ -$ -$ -$ 16,835$ Greenacres 2,550,333$ -$ -$ -$ 2,550,333$ Gulf Stream 59,595$ -$ -$ -$ 59,595$ Haverhill 127,540$ -$ -$ -$ 127,540$ Highland Beach 238,515$ -$ -$ -$ 238,515$ Hypoluxo 177,506$ -$ -$ -$ 177,506$ Juno Beach 214,206$ -$ -$ -$ 214,206$ Jupiter 3,740,147$ -$ -$ -$ 3,740,147$ Jupiter Inlet Colony 26,936$ -$ -$ -$ 26,936$ Lake Clarke Shores 227,202$ -$ -$ -$ 227,202$ Lake Park 552,046$ -$ -$ -$ 552,046$ Lake Worth 2,350,201$ -$ -$ -$ 2,350,201$ Lantana 700,596$ -$ -$ -$ 700,596$ Loxahatchee Groves 212,926$ -$ -$ -$ 212,926$ Manalapan 27,340$ -$ -$ -$ 27,340$ Mangonia Park 122,018$ -$ -$ -$ 122,018$ North Palm Beach 810,291$ -$ -$ -$ 810,291$ Ocean Ridge 120,066$ -$ -$ -$ 120,066$ Pahokee 373,463$ -$ -$ -$ 373,463$ Palm Beach 562,281$ -$ -$ -$ 562,281$ Palm Beach Gardens 3,274,699$ -$ -$ -$ 3,274,699$ Palm Beach Shores 76,834$ -$ -$ -$ 76,834$ Palm Springs 1,333,246$ -$ -$ -$ 1,333,246$ Riviera Beach 2,190,877$ -$ -$ -$ 2,190,877$ Royal Palm Beach 2,305,286$ -$ -$ -$ 2,305,286$ South Bay 199,795$ -$ -$ -$ 199,795$ South Palm Beach 79,056$ -$ -$ -$ 79,056$ Tequesta 380,196$ -$ -$ -$ 380,196$ Wellington 3,821,627$ -$ -$ -$ 3,821,627$ West Palm Beach 6,766,365$ -$ -$ -$ 6,766,365$ Countywide Total 121,953,922$ -$ -$ -$ 121,953,922$ PASCO BOCC 23,110,178$ -$ -$ -$ 23,110,178$ Dade City 331,259$ -$ -$ -$ 331,259$ New Port Richey 764,119$ -$ -$ -$ 764,119$ Port Richey 135,466$ -$ -$ -$ 135,466$ St. Leo 70,389$ -$ -$ -$ 70,389$ San Antonio 58,130$ -$ -$ -$ 58,130$ Zephyrhills 680,244$ -$ -$ -$ 680,244$ Countywide Total 25,149,786$ -$ -$ -$ 25,149,786$ PINELLAS BOCC 37,973,883$ -$ -$ -$ 37,973,883$ Belleair 209,925$ -$ -$ -$ 209,925$ Belleair Beach 84,630$ -$ -$ -$ 84,630$ Belleair Bluffs 110,891$ -$ -$ -$ 110,891$ Belleair Shore 5,902$ -$ -$ -$ 5,902$ Clearwater 5,839,827$ -$ -$ -$ 5,839,827$ Dunedin 1,911,414$ -$ -$ -$ 1,911,414$ Gulfport 650,945$ -$ -$ -$ 650,945$
2012 Local Government Financial Information Handbook Page 69

Calculated by the Florida Department of Revenue's Office of Tax Research
Local Government Half-Cent Sales TaxRevenue Estimates for the Local Fiscal Year Ending September 30, 2013
FiscallyOrdinary Emergency Supplemental Constrained Total
Local Government Distribution Distribution Distribution Distribution DistributionIndian Rocks Beach 222,108$ -$ -$ -$ 222,108$ Indian Shores 76,942$ -$ -$ -$ 76,942$ Kenneth City 270,135$ -$ -$ -$ 270,135$ Largo 4,205,533$ -$ -$ -$ 4,205,533$ Madeira Beach 232,558$ -$ -$ -$ 232,558$ North Redington Beach 77,267$ -$ -$ -$ 77,267$ Oldsmar 736,659$ -$ -$ -$ 736,659$ Pinellas Park 2,669,027$ -$ -$ -$ 2,669,027$ Redington Beach 77,104$ -$ -$ -$ 77,104$ Redington Shores 115,223$ -$ -$ -$ 115,223$ Safety Harbor 913,879$ -$ -$ -$ 913,879$ St. Petersburg 13,312,973$ -$ -$ -$ 13,312,973$ St. Pete Beach 505,400$ -$ -$ -$ 505,400$ Seminole 932,505$ -$ -$ -$ 932,505$ South Pasadena 269,702$ -$ -$ -$ 269,702$ Tarpon Springs 1,270,540$ -$ -$ -$ 1,270,540$ Treasure Island 363,592$ -$ -$ -$ 363,592$ Countywide Total 73,038,564$ -$ -$ -$ 73,038,564$ POLK BOCC 26,656,947$ -$ -$ -$ 26,656,947$ Auburndale 689,483$ -$ -$ -$ 689,483$ Bartow 868,334$ -$ -$ -$ 868,334$ Davenport 150,293$ -$ -$ -$ 150,293$ Dundee 190,162$ -$ -$ -$ 190,162$ Eagle Lake 115,954$ -$ -$ -$ 115,954$ Fort Meade 284,406$ -$ -$ -$ 284,406$ Frostproof 152,576$ -$ -$ -$ 152,576$ Haines City 1,047,996$ -$ -$ -$ 1,047,996$ Highland Park 11,666$ -$ -$ -$ 11,666$ Hillcrest Heights 12,579$ -$ -$ -$ 12,579$ Lake Alfred 254,784$ -$ -$ -$ 254,784$ Lake Hamilton 63,049$ -$ -$ -$ 63,049$ Lake Wales 723,366$ -$ -$ -$ 723,366$ Lakeland 4,955,167$ -$ -$ -$ 4,955,167$ Mulberry 191,988$ -$ -$ -$ 191,988$ Polk City 79,230$ -$ -$ -$ 79,230$ Winter Haven 1,730,276$ -$ -$ -$ 1,730,276$ Countywide Total 38,178,256$ -$ -$ -$ 38,178,256$ PUTNAM BOCC 2,559,580$ -$ -$ 414,202$ 2,973,782$ Crescent City 56,912$ -$ -$ -$ 56,912$ Interlachen 52,842$ -$ -$ -$ 52,842$ Palatka 393,084$ -$ -$ -$ 393,084$ Pomona Park 34,357$ -$ -$ -$ 34,357$ Welaka 26,290$ -$ -$ -$ 26,290$ Countywide Total 3,123,066$ -$ -$ 414,202$ 3,537,267$ ST. JOHNS BOCC 12,619,959$ -$ -$ -$ 12,619,959$ Hastings 40,858$ -$ -$ -$ 40,858$ St. Augustine 885,920$ -$ -$ -$ 885,920$ St. Augustine Beach 423,108$ -$ -$ -$ 423,108$ Countywide Total 13,969,846$ -$ -$ -$ 13,969,846$ ST. LUCIE BOCC 6,786,687$ -$ -$ -$ 6,786,687$ Fort Pierce 1,349,453$ -$ -$ -$ 1,349,453$ Port St. Lucie 5,363,666$ -$ -$ -$ 5,363,666$
2012 Local Government Financial Information Handbook Page 70

Calculated by the Florida Department of Revenue's Office of Tax Research
Local Government Half-Cent Sales TaxRevenue Estimates for the Local Fiscal Year Ending September 30, 2013
FiscallyOrdinary Emergency Supplemental Constrained Total
Local Government Distribution Distribution Distribution Distribution DistributionSt. Lucie Village 19,706$ -$ -$ -$ 19,706$ Countywide Total 13,519,512$ -$ -$ -$ 13,519,512$ SANTA ROSA BOCC 5,850,141$ -$ -$ -$ 5,850,141$ Gulf Breeze 232,902$ -$ -$ -$ 232,902$ Jay 21,088$ -$ -$ -$ 21,088$ Milton 365,088$ -$ -$ -$ 365,088$ Countywide Total 6,469,220$ -$ -$ -$ 6,469,220$ SARASOTA BOCC 23,664,186$ -$ -$ -$ 23,664,186$ Longboat Key (part) 315,796$ -$ -$ -$ 315,796$ North Port 4,074,528$ -$ -$ -$ 4,074,528$ Sarasota 3,667,378$ -$ -$ -$ 3,667,378$ Venice 1,460,532$ -$ -$ -$ 1,460,532$ Countywide Total 33,182,420$ -$ -$ -$ 33,182,420$ SEMINOLE BOCC 20,944,237$ -$ -$ -$ 20,944,237$ Altamonte Springs 2,472,136$ -$ -$ -$ 2,472,136$ Casselberry 1,564,577$ -$ -$ -$ 1,564,577$ Lake Mary 824,124$ -$ -$ -$ 824,124$ Longwood 809,387$ -$ -$ -$ 809,387$ Oviedo 2,009,502$ -$ -$ -$ 2,009,502$ Sanford 3,173,366$ -$ -$ -$ 3,173,366$ Winter Springs 1,979,729$ -$ -$ -$ 1,979,729$ Countywide Total 33,777,057$ -$ -$ -$ 33,777,057$ SUMTER BOCC 4,693,728$ -$ 96,581$ -$ 4,790,309$ Bushnell 136,823$ -$ -$ -$ 136,823$ Center Hill 53,966$ -$ -$ -$ 53,966$ Coleman 39,549$ -$ -$ -$ 39,549$ Webster 43,083$ -$ -$ -$ 43,083$ Wildwood 388,648$ -$ -$ -$ 388,648$ Countywide Total 5,355,798$ -$ 96,581$ -$ 5,452,379$ SUWANNEE BOCC 1,278,477$ 1,092,190$ -$ 627,835$ 2,998,502$ Branford 23,519$ -$ -$ -$ 23,519$ Live Oak 228,787$ -$ -$ -$ 228,787$ Countywide Total 1,530,783$ 1,092,190$ -$ 627,835$ 3,250,808$ TAYLOR BOCC 811,537$ 257,727$ 32,433$ 338,611$ 1,440,308$ Perry 330,183$ -$ -$ -$ 330,183$ Countywide Total 1,141,720$ 257,727$ 32,433$ 338,611$ 1,770,491$ UNION BOCC 213,853$ 389,982$ 51,115$ 965,900$ 1,620,849$ Lake Butler 41,044$ -$ -$ -$ 41,044$ Raiford 5,532$ -$ -$ -$ 5,532$ Worthington Springs 8,482$ -$ -$ -$ 8,482$ Countywide Total 268,911$ 389,982$ 51,115$ 965,900$ 1,675,907$ VOLUSIA BOCC 16,556,622$ -$ -$ -$ 16,556,622$ Daytona Beach 2,750,546$ -$ -$ -$ 2,750,546$ Daytona Beach Shores 192,202$ -$ -$ -$ 192,202$ DeBary 871,245$ -$ -$ -$ 871,245$ DeLand 1,232,779$ -$ -$ -$ 1,232,779$ Deltona 3,844,621$ -$ -$ -$ 3,844,621$ Edgewater 935,252$ -$ -$ -$ 935,252$ Flagler Beach (part) 2,706$ -$ -$ -$ 2,706$ Holly Hill 525,589$ -$ -$ -$ 525,589$ Lake Helen 117,910$ -$ -$ -$ 117,910$ New Smyrna Beach 1,022,490$ -$ -$ -$ 1,022,490$
2012 Local Government Financial Information Handbook Page 71

Calculated by the Florida Department of Revenue's Office of Tax Research
Local Government Half-Cent Sales TaxRevenue Estimates for the Local Fiscal Year Ending September 30, 2013
FiscallyOrdinary Emergency Supplemental Constrained Total
Local Government Distribution Distribution Distribution Distribution DistributionOak Hill 80,922$ -$ -$ -$ 80,922$ Orange City 507,681$ -$ -$ -$ 507,681$ Ormond Beach 1,730,853$ -$ -$ -$ 1,730,853$ Pierson 77,765$ -$ -$ -$ 77,765$ Ponce Inlet 137,081$ -$ -$ -$ 137,081$ Port Orange 2,540,121$ -$ -$ -$ 2,540,121$ South Daytona 554,142$ -$ -$ -$ 554,142$ Countywide Total 33,680,526$ -$ -$ -$ 33,680,526$ WAKULLA BOCC 856,359$ 709,538$ 34,984$ 651,982$ 2,252,863$ St. Marks 9,044$ -$ -$ -$ 9,044$ Sopchoppy 14,302$ -$ -$ -$ 14,302$ Countywide Total 879,705$ 709,538$ 34,984$ 651,982$ 2,276,209$ WALTON BOCC 7,091,490$ -$ -$ -$ 7,091,490$ DeFuniak Springs 705,641$ -$ -$ -$ 705,641$ Freeport 256,898$ -$ -$ -$ 256,898$ Paxton 87,428$ -$ -$ -$ 87,428$ Countywide Total 8,141,457$ -$ -$ -$ 8,141,457$ WASHINGTON BOCC 633,502$ 600,216$ 23,055$ 672,242$ 1,929,015$ Caryville 8,796$ -$ -$ -$ 8,796$ Chipley 109,802$ -$ -$ -$ 109,802$ Ebro 7,941$ -$ -$ -$ 7,941$ Vernon 21,533$ -$ -$ -$ 21,533$ Wausau 11,881$ -$ -$ -$ 11,881$ Countywide Total 793,456$ 600,216$ 23,055$ 672,242$ 2,088,968$ STATEWIDE TOTALS 1,622,032,000$ 16,210,000$ 592,958$ 17,358,000$ 1,656,192,958$
2) On September 10, 2012, the U.S. Census Bureau revised the 2010 census counts for the City of Panama City and unincorporated Bay County, which also caused their respective 2011 revenue-sharing populations to change as well. Panama City's population was decreased by 981; unincorporated Bay County's population was increased by 981. Consequently, Panama City's estimated distribution was decreased by $66,131, and the estimated distributions for Bay County and all Bay County municipalities were increased by small amounts. The estimated distributions for all other counties and municipalities remained unchanged.
Notes:1) The dollar figures represent a 100 percent distribution of estimated monies.
2012 Local Government Financial Information Handbook Page 72

Office of Economic and Demographic Research
2012 Local Government Financial Information Handbook 73
Miami-Dade County Lake Belt Mitigation Fee Section 373.41492, Florida Statutes
Summary: A mitigation fee of 45 cents is imposed on each ton of limerock and sand, extracted in raw, processed, or manufactured form, by any person who engages in the business of extracting such material from within the Miami-Dade County Lake Belt Area and certain sections of two separate townships. The proceeds shall be used to provide for the mitigation of wetland resources lost to mining activities within the Miami-Dade County Lake Belt Plan. General Law Amendments: Chapter 2012-107, L.O.F., (CS/HB 377) changes the implementation of the mitigation fee to require approval by the Miami-Dade County Lake Belt Mitigation Committee rather than in a manner consistent with the recommendations submitted to the Legislature under s. 337.4149, F.S. The legislation also specifies that the fee proceeds may be used for the management of wetlands and uplands in the Everglades watershed and any modifications to the existing drainage system to enhance the hydrology of the Everglades watershed in addition to the Miami-Dade Lake Belt Area. These changes became effective on April 13, 2012. Eligibility Requirements: The fee is only imposed on each ton of limerock and sand extracted by any person who engages in the business of extracting these resources from within the Miami-Dade County Lake Belt Area and the east one-half of sections 24 and 25 and all of sections 35 and 36, Township 53 South, Range 39 East. The fee is imposed for each ton of limerock and sand from within the properties where the fee applies in raw, processed, or manufactured form, including, but not limited to, sized aggregate, asphalt, cement, concrete, and other limerock and concrete products. Administrative Procedures: The Department of Revenue shall administer, collect, and enforce the fee. The limerock or sand miner, or its subsidiary or affiliate, who sells the limerock or sand product shall collect the fee and forward the proceeds to the Department on or before the 20th day of the month following the calendar month in which the sale occurred. The Department is authorized to deduct for administrative costs that may not exceed 3 percent of the total revenues collected and may equal only those administrative costs reasonably attributable to the fees. Each January 1st, beginning January 1, 2010, through December 31, 2011, the fee shall be increased by 2.1 percent, plus a cost growth index. The cost growth index shall be the percentage change in the weighted average of the Employment Cost Index for All Civilian Workers (i.e., ecu 100011) and the percentage change in the Producer Price Index for All Commodities (i.e., WPU 00000000), both issued by the U.S. Department of Labor for the most recent 12 month period ending on September 30th compared to the weighted average of these indices for the previous year. The weighted average shall be calculated as 0.6 times the percentage change in the Employment Cost Index for All Civilian Workers plus 0.4 times the percentage change in the Producer Price Index for All Commodities. An interagency committee, consisting of representatives from the Miami-Dade County Department of Environmental Resource Management, the Florida Department of Environmental Protection, the South Florida Water Management District, and the Florida Fish and Wildlife Conservation Commission, shall be established. Additionally, the limerock mining industry shall select a representative to serve as a nonvoting

Office of Economic and Demographic Research
74 2012 Local Government Financial Information Handbook
member. At the discretion of the committee, additional members may be added to represent federal regulatory, environmental, and fish and wildlife agencies. This interagency committee shall annually prepare and submit to the South Florida Water Management District’s governing board a report evaluating the mitigation costs and revenues generated by the mitigation fee. No sooner than January 31, 2010, and no more frequently than every 2 years thereafter, the committee shall submit to the Legislature a report recommending any needed adjustments to the mitigation fee, including the annual cost escalator. Distribution of Proceeds: The fee proceeds, less administrative costs, must be transferred by the Department of Revenue to the South Florida Water Management District and deposited into the Lake Belt Mitigation Trust Fund. Authorized Uses: Expenditures of the mitigation fee must be approved by the interagency committee. The fee proceeds must be used to conduct mitigation activities that are appropriate to offset the loss of value and functions of wetlands as a result of mining activities and approved by the Miami-Dade County Lake Belt Mitigation Committee. Such mitigation may include the purchase, enhancement, restoration, and management of wetlands and uplands in the Everglades watershed, the purchase of mitigation credit from a permitted mitigation bank, and any structural modifications to the existing drainage system to enhance the hydrology of the Miami-Dade County Lake Belt Area or the Everglades watershed. Funds may also be used to reimburse other funding sources, including the Save Our Rivers Land Acquisition Program, the Internal Improvement Trust Fund, the South Florida Water Management District and Miami-Dade County, for the purchase of lands that were acquired in areas appropriate for mitigation due to rock mining and to reimburse governmental agencies that exchanged land under s. 373.4149, F.S., for mitigation due to rock mining. Attorney General Opinions: No opinions specifically relevant to this revenue source have been issued. Prior Years’ Revenues: A summary of prior years’ distributions is available.1
1. http://edr.state.fl.us/Content/local-government/data/data-a-to-z.index.cfm

Office of Economic and Demographic Research
2012 Local Government Financial Information Handbook 75
Miami-Dade County Lake Belt Water Treatment Plant Upgrade Fee Section 373.41492, Florida Statutes
Summary: A water treatment plant upgrade fee of 15 cents is imposed on each ton of limerock and sand, extracted in raw, processed, or manufactured form, by any person who engages in the business of extracting such material from within the Miami-Dade County Lake Belt Area and certain sections of two separate townships. The fee proceeds are transferred to the South Florida Water Management District and deposited into the Lake Belt Mitigation Trust Fund until either $20 million is placed in the trust fund or quarterly pathogen sampling demonstrates that the water in any quarry lake in the vicinity of the Northwest Wellfield would be classified as being in Bin 2 or higher as defined in the Environmental Protection Agency’s Long Term 2 Enhanced Surface Water Treatment Rule. The fee proceeds shall be used to pay for seepage mitigation projects. Upon the earliest occurrence of either of the two criteria, the fee proceeds will be redirected from the South Florida Water Management District to Miami-Dade County to be used to upgrade a water treatment plant that treats water coming from the Northwest Wellfield. General Law Amendments: Chapter 2012-107, L.O.F., (CS/HB 377) transfers the fee proceeds from Miami-Dade County to the South Florida Water Management District for deposit into the Lake Belt Mitigation Trust Fund until either $20 million is placed in the trust fund or quarterly pathogen sampling demonstrates that the water in any quarry lake in the vicinity of the Northwest Wellfield would be classified as being in Bin 2 or higher as defined in the Environmental Protection Agency’s Long Term 2 Enhanced Surface Water Treatment Rule. The fee proceeds received by the South Florida Water Management District shall be used solely to pay for seepage mitigation projects, including groundwater or surface water management structures designed to improve wetland habitat and approved by the Lake Belt Mitigation Committee. Upon the earliest occurrence of either of these criteria, the fee proceeds will be redirected from the South Florida Water Management District to Miami-Dade County to be used to upgrade a water treatment plant that treats water coming from the Northwest Wellfield. These changes became effective on April 13, 2012. Eligibility Requirements: The fee is only imposed on each ton of limerock and sand extracted by any person who engages in the business of extracting these resources from within the Miami-Dade County Lake Belt Area and the east one-half of sections 24 and 25 and all of sections 35 and 36, Township 53 South, Range 39 East. The fee is imposed for each ton of limerock and sand from within the properties where the fee applies in raw, processed, or manufactured form, including, but not limited to, sized aggregate, asphalt, cement, concrete, and other limerock and concrete products. Administrative Procedures: The Department of Revenue shall administer, collect, and enforce the fee. The limerock or sand miner, or its subsidiary or affiliate, who sells the limerock or sand product shall collect the fee and forward the proceeds to the Department on or before the 20th day of the month following the calendar month in which the sale occurred. The Department is authorized to deduct for administrative costs that may not exceed 3 percent of the total revenues collected and may equal only those administrative costs reasonably attributable to the fees.

Office of Economic and Demographic Research
76 2012 Local Government Financial Information Handbook
Distribution of Proceeds: The fee proceeds, less administrative costs, must be transferred to the South Florida Water Management District and deposited into the Lake Belt Mitigation Trust Fund until either: 1) a total of $20 million is deposited into the trust fund; or 2) the quarterly pathogen sampling conducted as a condition of the permits issued by the Department for rock mining activities in the Miami-Dade County Lake Belt Area demonstrates that the water in any quarry lake in the vicinity of the Northwest Wellfield would be classified as being in Bin 2 or higher as defined in the Environment Protection Agency’s Long Term 2 Enhanced Surface Water Treatment Rule. Upon the earliest occurrence of either of these criteria, the fee proceeds, less administrative costs, must be transferred by the Department to a trust fund established by Miami-Dade County. Authorized Uses: The fee proceeds deposited into the South Florida Water Management District’s Lake Belt Mitigation Trust Fund shall be used solely to pay for seepage mitigation projects, including groundwater or surface water management structures designed to improve wetland habitat and approved by the Lake Belt Mitigation Committee. The fee proceeds, which are transmitted to the trust fund established by Miami-Dade County, shall be used solely to upgrade a water treatment plant that treats water coming from the Northwest Wellfield in Miami-Dade County and includes those works necessary to treat or filter a surface water source or supply or both. Attorney General Opinions: No opinions specifically relevant to this revenue source have been issued. Prior Years’ Revenues: A summary of prior years’ distributions is available.1
1. http://edr.state.fl.us/Content/local-government/data/data-a-to-z/index.cfm
Office of Economic and Demographic Research
2012 Local Government Financial Information Handbook 77
Mobile Home License Tax Sections 320.08, 320.08015, and 320.081, Florida Statutes
Summary: Counties, municipalities, and school districts receive proceeds from an annual license tax levied on all mobile homes and park trailers, and on all travel trailers and fifth-wheel trailers exceeding 35 feet in body length. The license taxes, ranging from $20 to $80 depending on vehicle type and length, are collected in lieu of ad valorem taxes.1 A sticker is issued as evidence of payment. Half of the net proceeds are remitted to the respective district school board. The other half is distributed to the respective municipalities depending on the location of such units or the county if the units are located in the unincorporated area. The use of the revenue is at the discretion of the governing body. General Law Amendments: There were no general law amendments resulting from the 2012 Regular Legislative Session. Eligibility Requirements: A county government is eligible to receive proceeds if taxable units are located in its unincorporated area. If taxable units are located within a municipal jurisdiction, then the municipal government is eligible to receive proceeds. The district school board is eligible to receive proceeds if taxable units are located in the respective county. Administrative Procedures: The taxes are collected by the county tax collectors and remitted to the Department of Highway Safety and Motor Vehicles (DHSMV). Two deductions are made from the tax collections prior to the remaining balance being transferred into the License Tax Collection Trust Fund for distribution to governmental entities.2 The first is a deduction of $1.50 for each sticker issued with the proceeds deposited into the State General Revenue Fund. The second is a deduction of $1.00 for each sticker issued with the proceeds deposited into the Florida Mobile Home Relocation Trust Fund. The DHSMV shall keep records showing the total number of stickers issued to each type of unit, the total amount of license taxes collected, the county or municipality where each unit is located, and the amount derived from license taxes in each county and its respective municipalities. The tax collections, less the amounts corresponding to the two deductions previously discussed, shall be paid monthly to counties, municipalities, or school districts. Distribution of Proceeds: All proceeds, available for distribution within a county, are distributed in the following manner. Fifty percent is distributed to the district school board. The remaining fifty percent is distributed to the county government for taxable units located within its unincorporated area or to any municipal government within the county for taxable units located within its corporate limits. Authorized Uses: The use of the revenue is at the discretion of the governing body.
1. Section 320.08(10)-(11), F.S. 2. Section 320.081(4), F.S.

Office of Economic and Demographic Research
78 2012 Local Government Financial Information Handbook
Attorney General Opinions: Florida’s Attorney General has issued the following legal opinions relevant to this revenue source.
Opinion # Subject 74-282 Owner of mobile home eligible for tax credit 75-42 Mobile home taxable as personal property 88-20 Registration of mobile homes
The full texts of these opinions are available via a searchable on-line database.3 Local government officials seeking more clarification should review the opinions in their entirety. The statutory language pertaining to this revenue source has been amended since its authorization. The reader should keep the date of the opinion in mind when reviewing its relevance to current law or any interpretations that have been articulated in Florida case law. Prior Years’ Revenues: A summary of prior years’ distributions is available.4
3. http://myfloridalegal.com/ago.nsf/Opinions 4. http://edr.state.fl.us/Content/local-government/data/data-a-to-z/index.cfm

Office of Economic and Demographic Research
2012 Local Government Financial Information Handbook 79
Municipal Revenue Sharing Program Sections 206.605(1), 206.879(1), 212.20(6), and 218.20-.26, Florida Statutes
Summary: The Florida Revenue Sharing Act of 1972 was a major attempt by the Legislature to ensure a minimum level of revenue parity across units of local government.1 Provisions in the enacting legislation created the Revenue Sharing Trust Fund for Municipalities. Currently, the trust fund receives 1.3409 percent of sales and use tax collections, 12.5 percent of the state alternative fuel user decal fee collections, and the net collections from the one-cent municipal fuel tax. An allocation formula serves as the basis for the distribution of these revenues to each municipality that meets strict eligibility requirements. Municipalities must use the funds derived from the one-cent municipal fuel tax for transportation-related expenditures. Additionally, there are statutory limitations on the use of the funds as a pledge for bonded indebtedness. General Law Amendments: There were no general law amendments resulting from the 2012 Regular Legislative Session. Typically, legislation is passed each year that results in changes to the state’s sales tax base or sales tax administration. Such changes have the potential for fiscal impact, either positively or negatively, to the amount of sales tax revenues available for distribution to county and municipal governments. However, a summary of such changes is not provided here. Eligibility Requirements: In order to be eligible to participate in revenue sharing beyond the minimum entitlement in any fiscal year, a municipal government must have satisfied a number of statutory requirements.2 As it relates to municipal revenue sharing, the minimum entitlement is defined as the amount of revenue, as certified by the municipal government and determined by the Department of Revenue (DOR), which must be shared with the municipality so that the municipality will receive the amount of revenue necessary to meet its obligations as the result of pledges, assignments, or trusts entered into which obligated funds received from revenue sources or proceeds distributed out of the Revenue Sharing Trust Fund for Municipalities [hereinafter Trust Fund].3 Administrative Procedures: The municipal revenue sharing program is administered by the DOR, and monthly distributions shall be made to eligible municipal governments. The program is comprised of state sales taxes, municipal fuel taxes, and state alternative fuel user decal fees that are collected and transferred to the Trust Fund. The percentage of each revenue source transferred into the Trust Fund is listed below. The proportional contribution of each source during the state fiscal year ending 2013, as determined by the DOR, is also noted.
1.3409 percent of sales and use tax collections4 = 73.37 percent of total program funding
One-cent municipal fuel tax on motor fuel5 = 26.61 percent of total program funding
12.5 percent of state alternative fuel user decal fee collections6 = 0.02 percent of total program funding
1. Chapter 72-360, L.O.F. 2. Section 218.23(1), F.S. 3. Section 218.21(7), F.S. 4. Section 212.20(6)(d)5., F.S. 5. Section 206.605(1), F.S.

Office of Economic and Demographic Research
80 2012 Local Government Financial Information Handbook
Once each fiscal year, the DOR shall compute apportionment factors for use during the fiscal year.7 The computation shall be made prior to July 25th of each fiscal year and shall be based upon information submitted and certified to the DOR prior to June 1st of each year. Except in the case of error, the apportionment factors shall remain in effect for the fiscal year. It is the duty of the local government to submit the certified information required for the program’s administration to the DOR in a timely manner. A local government’s failure to provide timely information authorizes the DOR to utilize the best information available or, if no such information is available, to take any necessary action, including partial or entire disqualification. Additionally, the local government shall waive its right to challenge the DOR’s determination as to the jurisdiction’s share of program revenues. Distribution of Proceeds: An apportionment factor is calculated for each eligible municipality using a formula consisting of the following equally weighted factors: adjusted municipal population, derived municipal sales tax collections, and municipality’s relative ability to raise revenue.8 Adjusted Municipal Population: The adjusted municipal population factor is calculated by multiplying a given municipality’s population by the appropriate adjustment factor and dividing that product by the total adjusted statewide municipal population. Depending on the municipality’s population, one of the following adjustment factors is used. Population Class Adjustment Factor 0 - 2,000 1.0 2,001 - 5,000 1.135 5,001 - 20,000 1.425 20,001 - 50,000 1.709 Over 50,000 1.791 Inmates and residents residing in institutions operated by the federal government as well as the Florida Departments of Corrections, Health, and Children and Family Services are not considered to be residents of the county in which the institutions are located for the purpose of calculating the distribution proportions.9 Derived Municipal Sales Tax Collections: In order to calculate the municipal sales tax collection factor, it is first necessary to allocate a share of the sales tax collected within a county to each of its respective municipalities. This allocation is derived on the basis of population. First, the municipality’s population is divided by the total countywide population. Second, the resulting quotient is multiplied by the countywide sales tax collections to determine the sales tax collected within a given municipality. The municipal sales tax collection factor is then calculated by dividing the sales tax collected within a given municipality by the total sales tax collected within all eligible municipalities in the state.
6. Section 206.879(1), F.S. 7. Section 218.26, F.S. 8. Section 218.245(2), F.S. 9. Section 186.901, F.S.

Office of Economic and Demographic Research
2012 Local Government Financial Information Handbook 81
Municipality’s Relative Ability to Raise Revenue: The municipality’s relative ability to raise revenue factor is determined by a three-step process involving a series of calculations. First, the per capita taxable real and personal property valuation of all eligible municipalities in the state is divided by the per capita taxable real and personal property valuation of a given municipality. Second, a given municipality’s quotient, as calculated in the first step, is multiplied by the municipality’s population. For discussion purposes, this product is referred to as the recalculated population. Third, a given municipality’s recalculated population is divided by the total recalculated population of all eligible municipalities in the state. This quotient represents the municipality’s relative ability to raise revenue factor. Consequently, a municipality’s apportionment factor is determined by the following formula.
Proportion of Proportion of Proportion of Adjusted Derived Municipal Municipality’s Relative Municipal + Sales Tax + Ability to Raise
Apportionment Factor = Population Collections Revenue 3 Adjustment for a Metropolitan or Consolidated Government: For a metropolitan or consolidated government, as provided in Section 3, 6(e) or (f), Art. VIII, State Constitution (i.e., Miami-Dade County and City of Jacksonville-Duval County), the factors are further adjusted by multiplying the adjusted or recalculated population or sales tax collections, as the case may be, by a percentage that is derived by dividing the total amount of ad valorem taxes levied by the county government on real and personal property in the area of the county outside of municipal limits or urban service district limits by the total amount of ad valorem taxes levied on real and personal property by the county and municipal governments.10 Section 212.20(6)(d)5., F.S. Distribution: This distribution was authorized in ch. 2000-355, L.O.F. The law restructured the Municipal Revenue Sharing Program by transferring the portions of cigarette tax that previously funded the former Municipal Financial Assistance Trust Fund and Revenue Sharing Trust Fund for Municipalities to the state’s General Revenue Fund and provided for a separate distribution from state sales and use taxes to the Revenue Sharing Trust Fund for Municipalities. If the total revenue to be distributed is at least as great as the amount due from the Revenue Sharing Trust Fund for Municipalities and the former Municipal Financial Assistance Trust Fund in state fiscal year 1999-2000, no municipality shall receive less than the amount due from the Revenue Sharing Trust Fund for Municipalities and the former Municipal Financial Assistance Trust Fund in state fiscal year 1999-2000. If the total proceeds to be distributed are less than the amount received in combination from the Revenue Sharing Trust Fund for Municipalities and the former Municipal Financial Assistance Trust Fund in state fiscal year 1999-2000, each municipality shall receive an amount proportionate to the amount it was due in state fiscal year 1999-2000.
10. Section 218.245(2)(d), F.S.

Office of Economic and Demographic Research
82 2012 Local Government Financial Information Handbook
Section 218.245(3), F.S. Distribution: This distribution was authorized in ch. 2004-265, L.O.F. A prior year’s law, ch. 2003-402, L.O.F., which addressed state funding of the judicial system, included reductions in the proportion of state sales and use taxes transferred to the Local Government Half-cent Sales Tax Clearing Trust Fund and Revenue Sharing Trust Fund for Counties and an increase in the proportion of state sales and use taxes transferred to the Revenue Sharing Trust Fund for Municipalities to offset municipalities’ losses from the Local Government Half-cent Sales Tax reduction. Ch. 2004-265, L.O.F., included a hold harmless provision such that the revenue sharing dollar increases to individual municipalities resulting from the increased share of state sales and use taxes transferred to the Revenue Sharing Trust Fund for Municipalities are to be distributed in proportion to their respective loss from the Local Government Half-cent Sales Tax Program. Each eligible local government’s allocation shall be based on the amount it received from the Local Government Half-cent Sales Tax Program under s. 218.61, F.S., in the prior state fiscal year divided by the total receipts under the same authority in the prior state fiscal year for all eligible local governments provided, however, for the purpose of calculating this distribution, the amount received in the prior state fiscal year by a consolidated unit of local government (i.e., City of Jacksonville/Duval County) shall be reduced by 50 percent for such local government and for the total receipts. For eligible municipalities that began participating in this allocation in the previous state fiscal year, their annual receipts shall be calculated by dividing their actual receipts by the number of months they participated, and the results multiplied by 12. In summary, the distribution to an eligible municipality is determined by the following procedure.11 First, a municipal government’s entitlement shall be computed on the basis of the apportionment factor applied to all Trust Fund receipts available for distribution. Second, the revenue to be shared via the formula in any fiscal year is adjusted so that no municipality receives fewer funds than its guaranteed entitlement, which is equal to the aggregate amount received from the state in fiscal year 1971-72 under then-existing statutory provisions. Third, the revenue to be shared via the formula in any fiscal year is adjusted so that all municipalities receive at least their minimum entitlement, which means the amount of revenue necessary for a municipality to meet its obligations as the result of pledges, assignments, or trusts entered into that obligated Trust Fund monies. Finally, after making these adjustments, any remaining Trust Fund monies shall be distributed on the basis of the additional money of each qualified municipality in proportion to the total additional money for all qualified municipalities. Authorized Uses: Several statutory restrictions exist regarding the authorized use of municipal revenue sharing proceeds. Funds derived from the municipal fuel tax on motor fuel shall be used only for the purchase of transportation facilities and road and street rights-of-way; construction, reconstruction, and maintenance of roads, streets, bicycle paths, and pedestrian pathways; adjustment of city-owned utilities as required by road and street construction; and construction, reconstruction, transportation-related public safety activities, maintenance, and operation of transportation facilities. Municipalities are authorized to expend these funds in conjunction with other municipalities, counties, state government, or the federal government in joint projects. According to the DOR, municipalities may assume that 26.61 percent of their estimated 2012-13 fiscal year distribution is derived from the municipal fuel tax. Therefore, at least that proportion of each municipality’s revenue sharing distribution must be expended on those transportation-related purposes specifically mentioned in the preceding paragraph. 11. Section 218.23(3), F.S.

Office of Economic and Demographic Research
2012 Local Government Financial Information Handbook 83
Municipalities are restricted as to the amount of program funds that can be assigned, pledged, or set aside as a trust for the payment of principal or interest on bonds, tax anticipation certificates, or any other form of indebtedness, and there shall be no other use restriction on these shared revenues.12 Municipalities may assign, pledge, or set aside as trust for the payment of principal or interest on bonds, tax anticipation certificates, or any other form of indebtedness an amount up to 50 percent of the funds received in the prior year.13 Consequently, it is possible that some portion of a municipality’s growth monies will become available as a pledge for bonded indebtedness. Attorney General Opinions: Florida’s Attorney General has issued the following legal opinions relevant to this revenue source.
Opinion # Subject 73-246 Revenue Sharing Act of 1972, applicability 74-367 Revenue Sharing Act of 1972, applicability to regional housing authorities 77-21 State revenue sharing trust fund, charter counties 78-110 Municipalities, financing restrictions 82-94 Municipal fuel tax, use of proceeds for sewer system repairs 83-32 Municipal fuel tax, use of proceeds for channel maintenance dredging 85-15 Municipal revenue sharing, DOR’s authority to withhold funds 92-87 Distribution of trust fund monies in the event of revised population estimate 2000-37 Municipal fuel tax, use of proceeds 2007-09 Municipalities, minimum millage
The full texts of these opinions are available via a searchable on-line database.14 Local government officials seeking more clarification should review the opinions in their entirety. The statutory language pertaining to this revenue source has been amended since its authorization. The reader should keep the date of the opinion in mind when reviewing its relevance to current law or any interpretations that have been articulated in Florida case law. Current and Prior Years’ Revenues: The table included in this section lists the estimated distributions to municipal governments for state fiscal year ending 2013, and these figures represent a 100 percent distribution of the estimated monies. A summary of prior years’ distributions is available.15
12. Section 218.25(1), F.S. 13. Section 218.25(4), F.S. 14. http://myfloridalegal.com/ago.nsf/Opinions 15. http://edr.state.fl.us/Content/local-government/data/data-a-to-z/index.cfm

Calculated by the Florida Department of Revenue's Office of Tax Research
Municipal Revenue Sharing ProgramRevenue Estimates for the State Fiscal Year Ending June 30, 2013
Section Section212.20(6)(d)5.,F.S. Growth 218.245(3),F.S. Yearly
Municipality County Guaranteed Distribution Money Distribution TotalAlachua Alachua 49,626$ 88,764$ 25,357$ 39,542$ 203,289$ Archer Alachua 18,029$ 33,656$ -$ 4,880$ 56,565$ Gainesville Alachua 1,100,340$ 1,705,342$ 308,792$ 537,044$ 3,651,518$ Hawthorne Alachua 21,367$ 19,443$ -$ 6,185$ 46,995$ High Springs Alachua 55,311$ 50,973$ 15,525$ 23,353$ 145,162$ La Crosse Alachua 3,761$ 546$ 2,473$ 1,571$ 8,352$ Micanopy Alachua 9,869$ 9,238$ -$ 2,619$ 21,726$ Newberry Alachua 20,259$ 46,838$ 14,444$ 21,607$ 103,148$ Waldo Alachua 13,057$ 27,207$ -$ 4,430$ 44,695$ Glen St. Mary Baker 13,069$ 5,756$ -$ 1,096$ 19,921$ Macclenny Baker 53,341$ 79,062$ 13,382$ 15,981$ 161,765$ Callaway Bay 35,468$ 405,907$ 18,427$ 91,367$ 551,169$ Lynn Haven Bay 47,769$ 285,682$ 75,712$ 117,295$ 526,459$ Mexico Beach Bay 6,978$ 13,927$ -$ 6,799$ 27,705$ Panama City Bay 510,541$ 605,083$ -$ 230,792$ 1,346,416$ Panama City Beach Bay 90,906$ 18,273$ 55,706$ 76,226$ 241,111$ Parker Bay 32,217$ 121,916$ -$ 27,381$ 181,515$ Springfield Bay 65,328$ 385,113$ -$ 56,469$ 506,910$ Brooker Bradford 5,183$ 8,819$ -$ 1,126$ 15,128$ Hampton Bradford 7,757$ 6,907$ 2,515$ 1,666$ 18,846$ Lawtey Bradford 13,179$ 13,879$ -$ 2,433$ 29,490$ Starke Bradford 125,408$ 40,777$ -$ 18,123$ 184,308$ Cape Canaveral Brevard 62,081$ 119,049$ 11,772$ 39,074$ 231,976$ Cocoa Brevard 327,756$ 207,008$ -$ 67,465$ 602,230$ Cocoa Beach Brevard 239,157$ 36,241$ -$ 44,207$ 319,605$ Grant-Valkaria Brevard -$ 60,639$ -$ 15,154$ 75,793$ Indialantic Brevard 54,072$ 11,654$ -$ 10,706$ 76,432$ Indian Harbour Beach Brevard 41,142$ 114,964$ 9,739$ 32,375$ 198,219$ Malabar Brevard 4,704$ 38,548$ 5,970$ 10,852$ 60,074$ Melbourne Brevard 731,356$ 998,709$ 183,054$ 299,414$ 2,212,533$ Melbourne Beach Brevard 19,175$ 40,996$ -$ 12,206$ 72,377$ Melbourne Village Brevard 1,852$ 8,627$ 1,600$ 2,606$ 14,685$ Palm Bay Brevard 91,142$ 1,891,539$ 706,845$ 406,170$ 3,095,696$ Palm Shores Brevard 943$ 8,950$ 3,487$ 3,543$ 16,923$ Rockledge Brevard 155,640$ 299,063$ 103,031$ 97,994$ 655,728$ Satellite Beach Brevard 109,567$ 122,350$ 3,934$ 39,790$ 275,642$ Titusville Brevard 518,566$ 622,507$ 119,811$ 172,135$ 1,433,019$ West Melbourne Brevard 34,950$ 159,950$ 109,226$ 72,264$ 376,390$ Coconut Creek Broward 21,380$ 808,863$ 297,240$ 246,544$ 1,374,028$ Cooper City Broward 22,887$ 599,098$ 67,678$ 133,004$ 822,667$ Coral Springs Broward 49,420$ 2,248,352$ 442,394$ 564,280$ 3,304,446$ Dania Beach Broward 201,595$ 178,011$ 142,572$ 138,111$ 660,289$ Davie Broward 166,836$ 1,292,312$ 401,170$ 428,634$ 2,288,952$ Deerfield Beach Broward 306,407$ 940,271$ 324,719$ 349,567$ 1,920,964$ Fort Lauderdale Broward 3,196,503$ 393,819$ 138,130$ 769,968$ 4,498,419$ Hallandale Beach Broward 491,404$ 272,633$ 64,382$ 172,938$ 1,001,357$ Hillsboro Beach Broward 3,190$ 21,499$ 2,640$ 8,737$ 36,066$ Hollywood Broward 2,090,384$ 1,094,500$ 246,964$ 655,948$ 4,087,795$ Lauderdale-By-The-Sea Broward 58,784$ 12,584$ 19,074$ 28,220$ 118,662$ Lauderdale Lakes Broward 210,740$ 556,914$ 206,669$ 151,876$ 1,126,199$ Lauderhill Broward 183,519$ 1,116,853$ 493,312$ 311,679$ 2,105,362$ Lazy Lake Broward 3,320$ 43$ -$ 112$ 3,475$ Lighthouse Point Broward 176,544$ 45,186$ 130$ 48,201$ 270,061$ Margate Broward 247,098$ 1,014,019$ 207,092$ 248,292$ 1,716,500$ Miramar Broward 284,110$ 984,076$ 897,481$ 568,684$ 2,734,351$ North Lauderdale Broward 8,186$ 787,638$ 342,169$ 191,158$ 1,329,151$ Oakland Park Broward 398,752$ 282,181$ 207,017$ 192,742$ 1,080,692$ Parkland Broward 511$ 211,574$ 141,632$ 111,658$ 465,374$ Pembroke Park Broward 112,788$ 5,945$ 9,979$ 28,434$ 157,146$ Pembroke Pines Broward 320,564$ 2,182,935$ 766,956$ 718,095$ 3,988,550$ Plantation Broward 444,753$ 1,246,947$ 213,557$ 395,871$ 2,301,128$ Pompano Beach Broward 918,495$ 756,933$ 350,398$ 464,179$ 2,490,005$ Sea Ranch Lakes Broward 59,037$ 765$ -$ 3,122$ 62,924$ Southwest Ranches Broward -$ 121,343$ -$ 34,226$ 155,569$ Sunrise Broward 173,630$ 1,562,011$ 266,794$ 393,467$ 2,395,902$ Tamarac Broward 96,778$ 1,098,792$ 289,189$ 281,576$ 1,766,335$ West Park Broward -$ 397,876$ -$ 65,964$ 463,840$
2012 Local Government Financial Information Handbook Page 84

Calculated by the Florida Department of Revenue's Office of Tax Research
Municipal Revenue Sharing ProgramRevenue Estimates for the State Fiscal Year Ending June 30, 2013
Section Section212.20(6)(d)5.,F.S. Growth 218.245(3),F.S. Yearly
Municipality County Guaranteed Distribution Money Distribution TotalWeston Broward -$ 734,078$ 350,466$ 304,437$ 1,388,981$ Wilton Manors Broward 350,732$ 14,698$ -$ 54,203$ 419,632$ Altha Calhoun 7,411$ 25,570$ -$ 1,044$ 34,025$ Blountstown Calhoun 57,485$ 25,265$ -$ 4,897$ 87,648$ Punta Gorda Charlotte 146,243$ 290,244$ -$ 90,744$ 527,231$ Crystal River Citrus 95,471$ 82,517$ -$ 12,083$ 190,071$ Inverness Citrus 119,126$ 158,993$ -$ 28,030$ 306,149$ Green Cove Springs Clay 82,207$ 86,797$ -$ 25,901$ 194,905$ Keystone Heights Clay 26,696$ 20,290$ -$ 5,062$ 52,048$ Orange Park Clay 92,507$ 214,419$ -$ 31,540$ 338,466$ Penney Farms Clay 3,053$ 34,801$ -$ 2,808$ 40,662$ Everglades Collier 9,969$ 7,822$ -$ 3,276$ 21,066$ Marco Island Collier -$ 313,452$ 10,502$ 134,406$ 458,360$ Naples Collier 386,057$ 278,555$ -$ 159,989$ 824,600$ Fort White Columbia 8,215$ 13,628$ -$ 2,692$ 24,535$ Lake City Columbia 241,791$ 97,728$ -$ 55,722$ 395,241$ Arcadia DeSoto 157,477$ 58,085$ 10,169$ 19,218$ 244,949$ Cross City Dixie 60,079$ 44,964$ -$ 3,129$ 108,172$ Horseshoe Beach Dixie 1,856$ 2,884$ -$ 306$ 5,046$ Atlantic Beach Duval 65,115$ 223,961$ 911$ 91,643$ 381,629$ Baldwin Duval 21,646$ 18,965$ 1,467$ 10,319$ 52,398$ Jacksonville Duval -$ 9,147,024$ 774,590$ -$ 9,921,614$ Jacksonville (Duval) Duval 5,826,077$ 1,493,270$ 1,702,549$ 2,878,027$ 11,899,922$ Jacksonville Beach Duval 219,174$ 271,792$ 6,933$ 154,696$ 652,595$ Neptune Beach Duval 41,884$ 120,975$ 552$ 50,959$ 214,371$ Century Escambia 53,674$ 37,553$ -$ 10,497$ 101,724$ Pensacola Escambia 727,797$ 1,208,512$ -$ 320,556$ 2,256,865$ Beverly Beach Flagler 4,223$ 2,419$ -$ 761$ 7,403$ Bunnell Flagler 38,218$ 17,416$ -$ 6,026$ 61,660$ Palm Coast Flagler -$ 1,405,740$ -$ 169,300$ 1,575,040$ Marineland Flagler/St. Johns -$ -$ -$ -$ -$ Flagler Beach Flagler/Volusia 23,161$ 61,267$ 19$ 10,183$ 94,630$ Apalachicola Franklin 51,929$ 26,876$ -$ 12,114$ 90,919$ Carrabelle Franklin 25,647$ 13,071$ -$ 7,368$ 46,087$ Chattahoochee Gadsden 81,632$ 20,315$ 3,945$ 5,382$ 111,274$ Greensboro Gadsden 9,894$ 16,933$ -$ 1,408$ 28,235$ Gretna Gadsden 11,242$ 196,491$ -$ 3,415$ 211,148$ Havana Gadsden 28,337$ 19,857$ -$ 4,103$ 52,297$ Midway Gadsden -$ 44,305$ 8,550$ 7,027$ 59,882$ Quincy Gadsden 166,567$ 53,139$ -$ 17,663$ 237,368$ Bell Gilchrist 5,992$ 3,449$ -$ 602$ 10,043$ Trenton Gilchrist 22,161$ 16,661$ 4,503$ 2,640$ 45,965$ Fanning Springs Gilchrist/Levy 7,553$ 7,022$ 641$ 1,739$ 16,956$ Moore Haven Glades 32,012$ 12,379$ 389$ 1,627$ 46,407$ Port St. Joe Gulf 64,183$ 12,435$ -$ 10,780$ 87,398$ Wewahitchka Gulf 23,114$ 39,495$ -$ 6,199$ 68,808$ Jasper Hamilton 59,554$ 6,604$ -$ 7,887$ 74,046$ Jennings Hamilton 12,571$ 16,539$ 4,877$ 2,183$ 36,170$ White Springs Hamilton 13,231$ 17,299$ -$ 1,932$ 32,462$ Bowling Green Hardee 24,763$ 46,667$ 36,815$ 5,947$ 114,192$ Wauchula Hardee 81,340$ 30,308$ 21,326$ 10,150$ 143,125$ Zolfo Springs Hardee 23,025$ 24,473$ 15,750$ 3,708$ 66,957$ Clewiston Hendry 116,479$ 64,991$ 13,364$ 20,185$ 215,019$ LaBelle Hendry 56,826$ 24,144$ 11,065$ 13,090$ 105,125$ Brooksville Hernando 175,729$ 197,686$ -$ 28,367$ 401,782$ Weeki Wachee Hernando 2,118$ 168$ -$ 44$ 2,330$ Avon Park Highlands 119,637$ 159,617$ 2,542$ 31,762$ 313,558$ Lake Placid Highlands 53,574$ 10,289$ -$ 7,991$ 71,854$ Sebring Highlands 168,381$ 89,615$ -$ 37,712$ 295,708$ Plant City Hillsborough 332,397$ 466,961$ 105,497$ 215,842$ 1,120,698$ Tampa Hillsborough 4,897,504$ 3,693,425$ 289,925$ 2,083,061$ 10,963,915$ Temple Terrace Hillsborough 205,169$ 350,033$ 65,692$ 152,551$ 773,445$ Bonifay Holmes 46,920$ 39,056$ -$ 4,340$ 90,316$ Esto Holmes 4,617$ 11,583$ 154$ 566$ 16,920$ Noma Holmes -$ 15,105$ -$ 328$ 15,433$ Ponce de Leon Holmes 8,741$ 5,469$ 2,248$ 929$ 17,387$ Westville Holmes 2,077$ 10,741$ 1,031$ 449$ 14,298$
2012 Local Government Financial Information Handbook Page 85
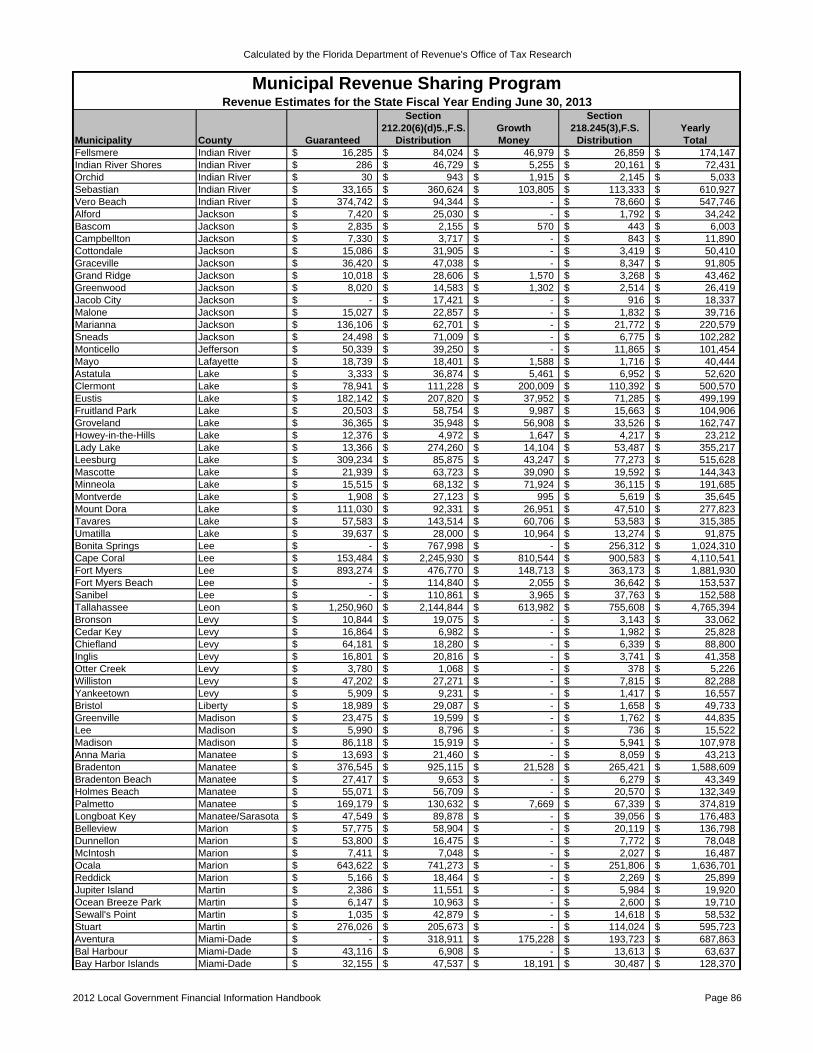
Calculated by the Florida Department of Revenue's Office of Tax Research
Municipal Revenue Sharing ProgramRevenue Estimates for the State Fiscal Year Ending June 30, 2013
Section Section212.20(6)(d)5.,F.S. Growth 218.245(3),F.S. Yearly
Municipality County Guaranteed Distribution Money Distribution TotalFellsmere Indian River 16,285$ 84,024$ 46,979$ 26,859$ 174,147$ Indian River Shores Indian River 286$ 46,729$ 5,255$ 20,161$ 72,431$ Orchid Indian River 30$ 943$ 1,915$ 2,145$ 5,033$ Sebastian Indian River 33,165$ 360,624$ 103,805$ 113,333$ 610,927$ Vero Beach Indian River 374,742$ 94,344$ -$ 78,660$ 547,746$ Alford Jackson 7,420$ 25,030$ -$ 1,792$ 34,242$ Bascom Jackson 2,835$ 2,155$ 570$ 443$ 6,003$ Campbellton Jackson 7,330$ 3,717$ -$ 843$ 11,890$ Cottondale Jackson 15,086$ 31,905$ -$ 3,419$ 50,410$ Graceville Jackson 36,420$ 47,038$ -$ 8,347$ 91,805$ Grand Ridge Jackson 10,018$ 28,606$ 1,570$ 3,268$ 43,462$ Greenwood Jackson 8,020$ 14,583$ 1,302$ 2,514$ 26,419$ Jacob City Jackson -$ 17,421$ -$ 916$ 18,337$ Malone Jackson 15,027$ 22,857$ -$ 1,832$ 39,716$ Marianna Jackson 136,106$ 62,701$ -$ 21,772$ 220,579$ Sneads Jackson 24,498$ 71,009$ -$ 6,775$ 102,282$ Monticello Jefferson 50,339$ 39,250$ -$ 11,865$ 101,454$ Mayo Lafayette 18,739$ 18,401$ 1,588$ 1,716$ 40,444$ Astatula Lake 3,333$ 36,874$ 5,461$ 6,952$ 52,620$ Clermont Lake 78,941$ 111,228$ 200,009$ 110,392$ 500,570$ Eustis Lake 182,142$ 207,820$ 37,952$ 71,285$ 499,199$ Fruitland Park Lake 20,503$ 58,754$ 9,987$ 15,663$ 104,906$ Groveland Lake 36,365$ 35,948$ 56,908$ 33,526$ 162,747$ Howey-in-the-Hills Lake 12,376$ 4,972$ 1,647$ 4,217$ 23,212$ Lady Lake Lake 13,366$ 274,260$ 14,104$ 53,487$ 355,217$ Leesburg Lake 309,234$ 85,875$ 43,247$ 77,273$ 515,628$ Mascotte Lake 21,939$ 63,723$ 39,090$ 19,592$ 144,343$ Minneola Lake 15,515$ 68,132$ 71,924$ 36,115$ 191,685$ Montverde Lake 1,908$ 27,123$ 995$ 5,619$ 35,645$ Mount Dora Lake 111,030$ 92,331$ 26,951$ 47,510$ 277,823$ Tavares Lake 57,583$ 143,514$ 60,706$ 53,583$ 315,385$ Umatilla Lake 39,637$ 28,000$ 10,964$ 13,274$ 91,875$ Bonita Springs Lee -$ 767,998$ -$ 256,312$ 1,024,310$ Cape Coral Lee 153,484$ 2,245,930$ 810,544$ 900,583$ 4,110,541$ Fort Myers Lee 893,274$ 476,770$ 148,713$ 363,173$ 1,881,930$ Fort Myers Beach Lee -$ 114,840$ 2,055$ 36,642$ 153,537$ Sanibel Lee -$ 110,861$ 3,965$ 37,763$ 152,588$ Tallahassee Leon 1,250,960$ 2,144,844$ 613,982$ 755,608$ 4,765,394$ Bronson Levy 10,844$ 19,075$ -$ 3,143$ 33,062$ Cedar Key Levy 16,864$ 6,982$ -$ 1,982$ 25,828$ Chiefland Levy 64,181$ 18,280$ -$ 6,339$ 88,800$ Inglis Levy 16,801$ 20,816$ -$ 3,741$ 41,358$ Otter Creek Levy 3,780$ 1,068$ -$ 378$ 5,226$ Williston Levy 47,202$ 27,271$ -$ 7,815$ 82,288$ Yankeetown Levy 5,909$ 9,231$ -$ 1,417$ 16,557$ Bristol Liberty 18,989$ 29,087$ -$ 1,658$ 49,733$ Greenville Madison 23,475$ 19,599$ -$ 1,762$ 44,835$ Lee Madison 5,990$ 8,796$ -$ 736$ 15,522$ Madison Madison 86,118$ 15,919$ -$ 5,941$ 107,978$ Anna Maria Manatee 13,693$ 21,460$ -$ 8,059$ 43,213$ Bradenton Manatee 376,545$ 925,115$ 21,528$ 265,421$ 1,588,609$ Bradenton Beach Manatee 27,417$ 9,653$ -$ 6,279$ 43,349$ Holmes Beach Manatee 55,071$ 56,709$ -$ 20,570$ 132,349$ Palmetto Manatee 169,179$ 130,632$ 7,669$ 67,339$ 374,819$ Longboat Key Manatee/Sarasota 47,549$ 89,878$ -$ 39,056$ 176,483$ Belleview Marion 57,775$ 58,904$ -$ 20,119$ 136,798$ Dunnellon Marion 53,800$ 16,475$ -$ 7,772$ 78,048$ McIntosh Marion 7,411$ 7,048$ -$ 2,027$ 16,487$ Ocala Marion 643,622$ 741,273$ -$ 251,806$ 1,636,701$ Reddick Marion 5,166$ 18,464$ -$ 2,269$ 25,899$ Jupiter Island Martin 2,386$ 11,551$ -$ 5,984$ 19,920$ Ocean Breeze Park Martin 6,147$ 10,963$ -$ 2,600$ 19,710$ Sewall's Point Martin 1,035$ 42,879$ -$ 14,618$ 58,532$ Stuart Martin 276,026$ 205,673$ -$ 114,024$ 595,723$ Aventura Miami-Dade -$ 318,911$ 175,228$ 193,723$ 687,863$ Bal Harbour Miami-Dade 43,116$ 6,908$ -$ 13,613$ 63,637$ Bay Harbor Islands Miami-Dade 32,155$ 47,537$ 18,191$ 30,487$ 128,370$
2012 Local Government Financial Information Handbook Page 86
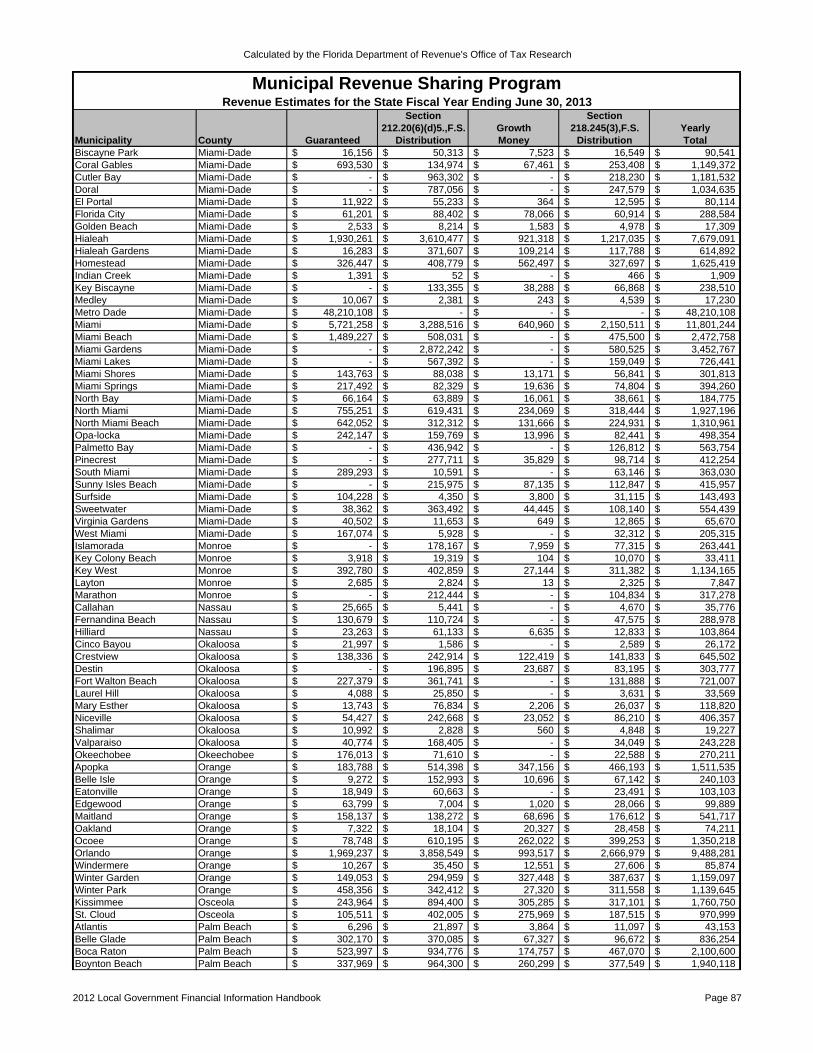
Calculated by the Florida Department of Revenue's Office of Tax Research
Municipal Revenue Sharing ProgramRevenue Estimates for the State Fiscal Year Ending June 30, 2013
Section Section212.20(6)(d)5.,F.S. Growth 218.245(3),F.S. Yearly
Municipality County Guaranteed Distribution Money Distribution TotalBiscayne Park Miami-Dade 16,156$ 50,313$ 7,523$ 16,549$ 90,541$ Coral Gables Miami-Dade 693,530$ 134,974$ 67,461$ 253,408$ 1,149,372$ Cutler Bay Miami-Dade -$ 963,302$ -$ 218,230$ 1,181,532$ Doral Miami-Dade -$ 787,056$ -$ 247,579$ 1,034,635$ El Portal Miami-Dade 11,922$ 55,233$ 364$ 12,595$ 80,114$ Florida City Miami-Dade 61,201$ 88,402$ 78,066$ 60,914$ 288,584$ Golden Beach Miami-Dade 2,533$ 8,214$ 1,583$ 4,978$ 17,309$ Hialeah Miami-Dade 1,930,261$ 3,610,477$ 921,318$ 1,217,035$ 7,679,091$ Hialeah Gardens Miami-Dade 16,283$ 371,607$ 109,214$ 117,788$ 614,892$ Homestead Miami-Dade 326,447$ 408,779$ 562,497$ 327,697$ 1,625,419$ Indian Creek Miami-Dade 1,391$ 52$ -$ 466$ 1,909$ Key Biscayne Miami-Dade -$ 133,355$ 38,288$ 66,868$ 238,510$ Medley Miami-Dade 10,067$ 2,381$ 243$ 4,539$ 17,230$ Metro Dade Miami-Dade 48,210,108$ -$ -$ -$ 48,210,108$ Miami Miami-Dade 5,721,258$ 3,288,516$ 640,960$ 2,150,511$ 11,801,244$ Miami Beach Miami-Dade 1,489,227$ 508,031$ -$ 475,500$ 2,472,758$ Miami Gardens Miami-Dade -$ 2,872,242$ -$ 580,525$ 3,452,767$ Miami Lakes Miami-Dade -$ 567,392$ -$ 159,049$ 726,441$ Miami Shores Miami-Dade 143,763$ 88,038$ 13,171$ 56,841$ 301,813$ Miami Springs Miami-Dade 217,492$ 82,329$ 19,636$ 74,804$ 394,260$ North Bay Miami-Dade 66,164$ 63,889$ 16,061$ 38,661$ 184,775$ North Miami Miami-Dade 755,251$ 619,431$ 234,069$ 318,444$ 1,927,196$ North Miami Beach Miami-Dade 642,052$ 312,312$ 131,666$ 224,931$ 1,310,961$ Opa-locka Miami-Dade 242,147$ 159,769$ 13,996$ 82,441$ 498,354$ Palmetto Bay Miami-Dade -$ 436,942$ -$ 126,812$ 563,754$ Pinecrest Miami-Dade -$ 277,711$ 35,829$ 98,714$ 412,254$ South Miami Miami-Dade 289,293$ 10,591$ -$ 63,146$ 363,030$ Sunny Isles Beach Miami-Dade -$ 215,975$ 87,135$ 112,847$ 415,957$ Surfside Miami-Dade 104,228$ 4,350$ 3,800$ 31,115$ 143,493$ Sweetwater Miami-Dade 38,362$ 363,492$ 44,445$ 108,140$ 554,439$ Virginia Gardens Miami-Dade 40,502$ 11,653$ 649$ 12,865$ 65,670$ West Miami Miami-Dade 167,074$ 5,928$ -$ 32,312$ 205,315$ Islamorada Monroe -$ 178,167$ 7,959$ 77,315$ 263,441$ Key Colony Beach Monroe 3,918$ 19,319$ 104$ 10,070$ 33,411$ Key West Monroe 392,780$ 402,859$ 27,144$ 311,382$ 1,134,165$ Layton Monroe 2,685$ 2,824$ 13$ 2,325$ 7,847$ Marathon Monroe -$ 212,444$ -$ 104,834$ 317,278$ Callahan Nassau 25,665$ 5,441$ -$ 4,670$ 35,776$ Fernandina Beach Nassau 130,679$ 110,724$ -$ 47,575$ 288,978$ Hilliard Nassau 23,263$ 61,133$ 6,635$ 12,833$ 103,864$ Cinco Bayou Okaloosa 21,997$ 1,586$ -$ 2,589$ 26,172$ Crestview Okaloosa 138,336$ 242,914$ 122,419$ 141,833$ 645,502$ Destin Okaloosa -$ 196,895$ 23,687$ 83,195$ 303,777$ Fort Walton Beach Okaloosa 227,379$ 361,741$ -$ 131,888$ 721,007$ Laurel Hill Okaloosa 4,088$ 25,850$ -$ 3,631$ 33,569$ Mary Esther Okaloosa 13,743$ 76,834$ 2,206$ 26,037$ 118,820$ Niceville Okaloosa 54,427$ 242,668$ 23,052$ 86,210$ 406,357$ Shalimar Okaloosa 10,992$ 2,828$ 560$ 4,848$ 19,227$ Valparaiso Okaloosa 40,774$ 168,405$ -$ 34,049$ 243,228$ Okeechobee Okeechobee 176,013$ 71,610$ -$ 22,588$ 270,211$ Apopka Orange 183,788$ 514,398$ 347,156$ 466,193$ 1,511,535$ Belle Isle Orange 9,272$ 152,993$ 10,696$ 67,142$ 240,103$ Eatonville Orange 18,949$ 60,663$ -$ 23,491$ 103,103$ Edgewood Orange 63,799$ 7,004$ 1,020$ 28,066$ 99,889$ Maitland Orange 158,137$ 138,272$ 68,696$ 176,612$ 541,717$ Oakland Orange 7,322$ 18,104$ 20,327$ 28,458$ 74,211$ Ocoee Orange 78,748$ 610,195$ 262,022$ 399,253$ 1,350,218$ Orlando Orange 1,969,237$ 3,858,549$ 993,517$ 2,666,979$ 9,488,281$ Windermere Orange 10,267$ 35,450$ 12,551$ 27,606$ 85,874$ Winter Garden Orange 149,053$ 294,959$ 327,448$ 387,637$ 1,159,097$ Winter Park Orange 458,356$ 342,412$ 27,320$ 311,558$ 1,139,645$ Kissimmee Osceola 243,964$ 894,400$ 305,285$ 317,101$ 1,760,750$ St. Cloud Osceola 105,511$ 402,005$ 275,969$ 187,515$ 970,999$ Atlantis Palm Beach 6,296$ 21,897$ 3,864$ 11,097$ 43,153$ Belle Glade Palm Beach 302,170$ 370,085$ 67,327$ 96,672$ 836,254$ Boca Raton Palm Beach 523,997$ 934,776$ 174,757$ 467,070$ 2,100,600$ Boynton Beach Palm Beach 337,969$ 964,300$ 260,299$ 377,549$ 1,940,118$
2012 Local Government Financial Information Handbook Page 87

Calculated by the Florida Department of Revenue's Office of Tax Research
Municipal Revenue Sharing ProgramRevenue Estimates for the State Fiscal Year Ending June 30, 2013
Section Section212.20(6)(d)5.,F.S. Growth 218.245(3),F.S. Yearly
Municipality County Guaranteed Distribution Money Distribution TotalBriny Breeze Palm Beach 4,322$ 4,722$ 1,942$ 3,326$ 14,312$ Cloud Lake Palm Beach 3,753$ 274$ 50$ 747$ 4,824$ Delray Beach Palm Beach 362,476$ 882,567$ 105,545$ 334,961$ 1,685,549$ Glen Ridge Palm Beach 1,438$ 3,283$ 107$ 1,212$ 6,040$ Golf Palm Beach 1,033$ 2,030$ 424$ 1,395$ 4,881$ Greenacres Palm Beach 14,848$ 633,993$ 260,889$ 207,949$ 1,117,679$ Gulf Stream Palm Beach 1,397$ 9,474$ 1,368$ 5,197$ 17,436$ Haverhill Palm Beach 8,402$ 19,445$ 11,511$ 10,366$ 49,724$ Highland Beach Palm Beach 2,928$ 51,775$ 2,708$ 19,587$ 76,998$ Hypoluxo Palm Beach 2,273$ 21,689$ 12,488$ 14,323$ 50,773$ Juno Beach Palm Beach 13,616$ 36,407$ 2,932$ 17,578$ 70,533$ Jupiter Palm Beach 67,918$ 570,474$ 262,548$ 305,263$ 1,206,203$ Jupiter Inlet Colony Palm Beach 1,225$ 5,397$ 6$ 2,214$ 8,842$ Lake Clarke Shores Palm Beach 7,218$ 70,108$ 3,295$ 18,685$ 99,305$ Lake Park Palm Beach 253,135$ 16,751$ -$ 45,134$ 315,020$ Lake Worth Palm Beach 364,734$ 555,345$ 116,348$ 193,211$ 1,229,638$ Lantana Palm Beach 209,533$ 29,683$ 9,462$ 57,432$ 306,110$ Loxahatchee Groves Palm Beach -$ 60,273$ -$ 17,600$ 77,873$ Manalapan Palm Beach 1,985$ 3,310$ 446$ 2,247$ 7,988$ Mangonia Park Palm Beach 15,044$ 11,874$ 5,101$ 10,449$ 42,469$ North Palm Beach Palm Beach 82,307$ 179,019$ 1,486$ 66,630$ 329,442$ Ocean Ridge Palm Beach 4,910$ 21,892$ 1,321$ 9,885$ 38,007$ Pahokee Palm Beach 96,481$ 233,596$ -$ 30,529$ 360,605$ Palm Beach Palm Beach 171,886$ 29,242$ -$ 46,202$ 247,330$ Palm Beach Gardens Palm Beach 126,411$ 564,740$ 157,433$ 268,159$ 1,116,744$ Palm Beach Shores Palm Beach 11,360$ 7,533$ 105$ 6,320$ 25,319$ Palm Springs Palm Beach 90,524$ 237,677$ 133,340$ 105,261$ 566,802$ Riviera Beach Palm Beach 369,915$ 342,877$ 37,806$ 179,806$ 930,404$ Royal Palm Beach Palm Beach 3,712$ 414,848$ 215,403$ 188,949$ 822,912$ South Bay Palm Beach 42,669$ 86,119$ 4,040$ 16,681$ 149,509$ South Palm Beach Palm Beach 745$ 24,235$ -$ 6,481$ 31,461$ Tequesta Palm Beach 129,246$ 12,301$ -$ 31,154$ 172,701$ Wellington Palm Beach -$ 596,246$ 319,351$ 312,745$ 1,228,343$ West Palm Beach Palm Beach 1,326,451$ 764,585$ 198,278$ 551,262$ 2,840,576$ Dade City Pasco 134,787$ 135,017$ -$ 26,527$ 296,331$ New Port Richey Pasco 290,251$ 309,776$ -$ 61,449$ 661,476$ Port Richey Pasco 15,410$ 72,453$ -$ 11,007$ 98,870$ St. Leo Pasco 9,442$ 29,624$ 1,058$ 5,522$ 45,646$ San Antonio Pasco 14,350$ 24,736$ -$ 4,690$ 43,776$ Zephyrhills Pasco 110,964$ 236,781$ -$ 54,761$ 402,505$ Belleair Pinellas 15,115$ 54,353$ 494$ 17,134$ 87,096$ Belleair Beach Pinellas 4,762$ 31,009$ -$ 6,908$ 42,679$ Belleair Bluffs Pinellas 66,417$ 5,775$ -$ 8,994$ 81,186$ Belleair Shore Pinellas 352$ 529$ 281$ 483$ 1,644$ Clearwater Pinellas 1,191,562$ 1,270,006$ 118,479$ 477,993$ 3,058,040$ Dunedin Pinellas 313,081$ 591,613$ 32,777$ 156,394$ 1,093,864$ Gulfport Pinellas 133,248$ 166,253$ 3,493$ 53,271$ 356,265$ Indian Rocks Beach Pinellas 54,431$ 27,332$ -$ 18,215$ 99,978$ Indian Shores Pinellas 10,610$ 12,732$ -$ 6,289$ 29,631$ Kenneth City Pinellas 145,147$ 11,413$ 9,844$ 22,134$ 188,538$ Largo Pinellas 652,934$ 1,160,997$ 204,295$ 344,531$ 2,362,757$ Madeira Beach Pinellas 174,090$ 10,826$ -$ 18,879$ 203,794$ North Redington Beach Pinellas 11,820$ 7,712$ 1,379$ 6,275$ 27,187$ Oldsmar Pinellas 19,857$ 204,898$ 34,425$ 60,268$ 319,447$ Pinellas Park Pinellas 387,226$ 701,404$ 106,711$ 217,481$ 1,412,821$ Redington Beach Pinellas 4,793$ 22,244$ -$ 6,320$ 33,356$ Redington Shores Pinellas 12,192$ 29,311$ -$ 9,393$ 50,896$ Safety Harbor Pinellas 57,772$ 314,728$ 20,944$ 74,785$ 468,229$ St. Petersburg Pinellas 3,125,822$ 3,324,207$ 223,771$ 1,082,085$ 7,755,885$ St. Pete Beach Pinellas 199,235$ 25,108$ -$ 41,389$ 265,733$ Seminole Pinellas 166,578$ 83,971$ 69,891$ 76,317$ 396,757$ South Pasadena Pinellas 89,458$ 44,021$ -$ 21,983$ 155,462$ Tarpon Springs Pinellas 199,105$ 289,344$ 54,697$ 104,008$ 647,154$ Treasure Island Pinellas 104,086$ 47,176$ -$ 29,693$ 180,956$ Auburndale Polk 95,208$ 159,178$ 18,163$ 54,882$ 327,431$ Bartow Polk 247,027$ 225,594$ 17,361$ 69,473$ 559,454$ Davenport Polk 22,371$ 44,204$ 6,499$ 11,783$ 84,858$
2012 Local Government Financial Information Handbook Page 88

Calculated by the Florida Department of Revenue's Office of Tax Research
Municipal Revenue Sharing ProgramRevenue Estimates for the State Fiscal Year Ending June 30, 2013
Section Section212.20(6)(d)5.,F.S. Growth 218.245(3),F.S. Yearly
Municipality County Guaranteed Distribution Money Distribution TotalDundee Polk 25,917$ 41,724$ 14,595$ 15,103$ 97,339$ Eagle Lake Polk 20,806$ 52,004$ 754$ 9,163$ 82,727$ Fort Meade Polk 76,018$ 139,315$ 12,355$ 22,860$ 250,547$ Frostproof Polk 59,573$ 16,744$ 254$ 12,157$ 88,728$ Haines City Polk 182,087$ 253,960$ 68,590$ 83,454$ 588,091$ Highland Park Polk -$ 2,740$ 962$ 935$ 4,636$ Hillcrest Heights Polk 498$ 4,933$ 347$ 1,032$ 6,810$ Lake Alfred Polk 36,465$ 67,725$ 23,065$ 20,377$ 147,632$ Lake Hamilton Polk 15,272$ 14,019$ -$ 5,002$ 34,293$ Lake Wales Polk 190,668$ 99,186$ 33,379$ 57,799$ 381,032$ Lakeland Polk 973,011$ 1,183,911$ 202,660$ 395,846$ 2,755,428$ Mulberry Polk 53,918$ 36,479$ 1,483$ 15,509$ 107,389$ Polk City Polk 15,070$ 51,140$ -$ 6,347$ 72,556$ Winter Haven Polk 439,141$ 303,030$ 73,694$ 137,637$ 953,502$ Crescent City Putnam 47,077$ 14,453$ -$ 4,491$ 66,021$ Interlachen Putnam 11,693$ 30,525$ -$ 3,995$ 46,213$ Palatka Putnam 276,527$ 92,156$ -$ 30,071$ 398,753$ Pomona Park Putnam 7,968$ 14,081$ 804$ 2,597$ 25,450$ Welaka Putnam 7,493$ 7,421$ -$ 1,996$ 16,911$ Hastings St. Johns 15,795$ 11,024$ -$ 3,262$ 30,081$ St. Augustine St. Johns 340,862$ 131,711$ -$ 72,973$ 545,545$ St. Augustine Beach St. Johns 7,099$ 95,665$ 7,221$ 34,734$ 144,719$ Fort Pierce St. Lucie 711,816$ 324,578$ 7,426$ 110,793$ 1,154,613$ Port St. Lucie St. Lucie 6,475$ 1,696,431$ 1,116,110$ 436,570$ 3,255,586$ St. Lucie Village St. Lucie 2,371$ 8,188$ -$ 1,565$ 12,124$ Gulf Breeze Santa Rosa 75,883$ 88,344$ -$ 19,304$ 183,531$ Jay Santa Rosa 20,822$ 7,321$ -$ 1,785$ 29,929$ Milton Santa Rosa 116,957$ 150,174$ -$ 29,303$ 296,434$ North Port Sarasota 24,372$ 435,594$ 531,179$ 334,656$ 1,325,802$ Sarasota Sarasota 937,613$ 519,388$ -$ 302,980$ 1,759,981$ Venice Sarasota 240,488$ 242,976$ -$ 121,057$ 604,521$ Altamonte Springs Seminole 57,567$ 824,280$ 89,708$ 198,242$ 1,169,797$ Casselberry Seminole 170,722$ 488,283$ 51,434$ 125,335$ 835,773$ Lake Mary Seminole -$ 175,333$ 41,128$ 66,033$ 282,494$ Longwood Seminole 80,818$ 231,114$ 7,098$ 65,245$ 384,274$ Oviedo Seminole 39,986$ 475,431$ 153,187$ 159,288$ 827,892$ Sanford Seminole 376,081$ 611,108$ 227,990$ 255,724$ 1,470,903$ Winter Springs Seminole 13,825$ 673,732$ 97,907$ 159,001$ 944,465$ Bushnell Sumter 36,546$ 37,825$ -$ 11,071$ 85,443$ Center Hill Sumter 8,283$ 27,199$ -$ 4,513$ 39,995$ Coleman Sumter 13,609$ 27,386$ -$ 3,211$ 44,206$ Webster Sumter 17,618$ 18,676$ -$ 3,585$ 39,880$ Wildwood Sumter 61,478$ 72,500$ 11,403$ 30,643$ 176,024$ Branford Suwannee 20,042$ 4,266$ -$ 1,986$ 26,295$ Live Oak Suwannee 153,904$ 117,320$ -$ 19,108$ 290,332$ Perry Taylor 180,555$ 57,391$ -$ 29,294$ 267,240$ Lake Butler Union 29,351$ 46,307$ -$ 3,458$ 79,117$ Raiford Union 1,694$ 8,057$ -$ 465$ 10,216$ Worthington Springs Union 4,563$ 2,353$ 3,767$ 330$ 11,013$ Daytona Beach Volusia 1,027,176$ 657,390$ -$ 224,477$ 1,909,044$ Daytona Beach Shores Volusia 91,781$ 7,979$ -$ 15,641$ 115,401$ DeBary Volusia -$ 241,559$ 70,253$ 71,152$ 382,963$ DeLand Volusia 318,746$ 142,072$ 119,716$ 99,550$ 680,084$ Deltona Volusia -$ 1,548,977$ 896,153$ 313,708$ 2,758,838$ Edgewater Volusia 68,458$ 392,955$ 97,327$ 76,418$ 635,158$ Holly Hill Volusia 155,248$ 143,841$ 8,011$ 42,938$ 350,038$ Lake Helen Volusia 8,885$ 58,031$ 5,849$ 9,664$ 82,429$ New Smyrna Beach Volusia 201,998$ 197,487$ 34,687$ 82,730$ 516,903$ Oak Hill Volusia 13,952$ 22,879$ 2,463$ 6,600$ 45,893$ Orange City Volusia 21,923$ 108,197$ 64,877$ 39,686$ 234,683$ Ormond Beach Volusia 294,368$ 472,729$ 67,921$ 140,429$ 975,447$ Pierson Volusia 18,098$ 13,177$ 9,540$ 6,393$ 47,209$ Ponce Inlet Volusia 4,946$ 32,790$ 4,264$ 11,166$ 53,167$ Port Orange Volusia 93,493$ 980,523$ 229,242$ 209,109$ 1,512,367$ South Daytona Volusia 132,655$ 192,449$ 11,133$ 45,122$ 381,359$ St. Marks Wakulla 9,455$ 15,580$ -$ 761$ 25,795$ Sopchoppy Wakulla 9,800$ 23,142$ -$ 1,186$ 34,128$
2012 Local Government Financial Information Handbook Page 89

Calculated by the Florida Department of Revenue's Office of Tax Research
Municipal Revenue Sharing ProgramRevenue Estimates for the State Fiscal Year Ending June 30, 2013
Section Section212.20(6)(d)5.,F.S. Growth 218.245(3),F.S. Yearly
Municipality County Guaranteed Distribution Money Distribution TotalDeFuniak Springs Walton 100,398$ 116,851$ -$ 57,084$ 274,332$ Freeport Walton 11,372$ 31,161$ 3,099$ 19,842$ 65,474$ Paxton Walton 13,228$ 7,606$ 4,653$ 7,151$ 32,638$ Caryville Washington 11,357$ 1,616$ 197$ 765$ 13,935$ Chipley Washington 67,615$ 46,974$ -$ 9,780$ 124,369$ Ebro Washington 4,447$ 4,418$ -$ 738$ 9,603$ Vernon Washington 12,365$ 26,926$ -$ 1,877$ 41,168$ Wausau Washington 4,597$ 16,650$ -$ 1,046$ 22,294$ Statewide Totals 124,683,365$ 122,417,058$ 27,919,603$ 47,600,000$ 322,620,025$
Notes:1) These estimates represent a 100 percent distribution of trust fund monies.2) The column labeled "Section 212.20(6)(d)5., F.S. Distribution" reflects the distribution authorized in Chapter 2000-355, L.O.F. This law restructured the Municipal Revenue Sharing Program by transferring the portions of cigarette tax that previously funded the former Municipal Financial Assistance Trust Fund and Revenue Sharing Trust Fund for Municipalities to the state's General Revenue Fund and providing a separate distribution from state sales and use taxes to the Revenue Sharing Trust Fund for Municipalities.
3) The column labeled "Section 218.245(3), F.S. Distribution" reflects the distribution authorized in Chapter 2004-265, L.O.F. Chapter 2003-402, L.O.F., which addressed state funding of the judicial system, including reductions in the proportion of state sales and use taxes transferred to the Local Government Half-cent Sales Tax Clearing Trust Fund and Revenue Sharing Trust Fund for Counties and an increase in the proportion of state sales and use taxes transferred to the Revenue Sharing Trust Fund for Municipalities to offset municipalities' losses from the Local Government Half-cent Sales Tax reduction. Chapter 2004-265, L.O.F., included a hold harmless provision such that the revenue sharing dollar increases to individual municipalities resulting from the increased share of state sales and use taxes transferred to the Revenue Sharing Trust Fund for Municipalities are to be distributed in proportion to their respective loss from the Local Government Half-cent Sales Tax Program.4) The proportional contribution of each revenue source comprising the Municipal Revenue Sharing Program in state fiscal year 2013 has been estimated to be as follows: state sales tax, $236.7 million or 73.37%; municipal fuel tax, $85.9 million or 26.6%; and the state alternative fuel user decal fee collections, 0.1 million or 0.02%.
2012 Local Government Financial Information Handbook Page 90

Office of Economic and Demographic Research
2012 Local Government Financial Information Handbook 91
Oil, Gas, and Sulfur Production Tax Section 211.06(2)(b), Florida Statutes
Summary: An excise tax is levied on every person who extracts gas, oil, or sulfur for sale, transport, storage, profit, or commercial use. The tax rate is calculated separately for oil, gas, or sulfur; however, the tax rates are all based on the volume of oil, gas, or sulfur produced in a particular month. A portion of the revenue is distributed to those counties where the oil, gas, or sulfur is severed. An authorized use of the proceeds is not specified in current law. General Law Amendments: Chapter 2012-32, L.O.F., (HB 7087) defines a new class of oil, mature field recovery oil, and applies the current tiered tax rate structure for tertiary oil to this new class. Additionally, the legislation modifies the distribution of tax proceeds. These changes became effective on July 1, 2012. The Revenue Estimating Conference estimates that these changes will have a negative fiscal impact of ($0.1) million to local governments in the 2012-13 fiscal year and a recurring negative impact of ($0.1) million to those county governments eligible to receive tax proceeds. Eligibility Requirements: Only those counties where the resources are extracted are eligible to receive proceeds. Administrative Procedures: The revenue generated from these types of excise taxes is deposited into the Oil and Gas Tax Trust Fund, which is administered by the Department of Revenue. Distribution of Proceeds: The tax proceeds, subject to the service charge imposed under ch. 215, F.S., shall be credited to the general revenue fund of the county government where the gas, oil, or sulfur is produced, according to the following percentages: 12.5 percent of the tax proceeds on oil production;1 20 percent of the tax proceeds on small well oil, tertiary oil, and mature field recovery oil;2 20 percent of the tax proceeds on gas;3 and 20 percent of the tax proceeds on sulfur.4 Authorized Uses: The use of the revenue is at the discretion of the governing body. Attorney General Opinions: Florida’s Attorney General has issued the following legal opinions relevant to this revenue source.
Opinion # Subject 74-310 Solid minerals severance tax 79-05 Levy on irreplaceable minerals
1. Imposed pursuant to Section 211.02(1)(c), F.S. 2. Imposed pursuant to Section 211.02(1)(a)-(b), F.S. 3. Imposed pursuant to Section 211.025, F.S. 4. Imposed pursuant to Section 211.026, F.S.

Office of Economic and Demographic Research
92 2012 Local Government Financial Information Handbook
The full texts of these opinions are available via a searchable on-line database.5 Local government officials seeking more clarification should review the opinions in their entirety. The statutory language pertaining to this revenue source has been amended since its authorization. The reader should keep the date of the opinion in mind when reviewing its relevance to current law or any interpretations that have been articulated in Florida case law. Prior Years’ Revenues: A summary of prior years’ distributions is available.6
5. http://myfloridalegal.com/ago.nsf/Opinions 6. http://edr.state.fl.us/Content/local-government/data/data-a-to-z/index.cfm

Office of Economic and Demographic Research
2012 Local Government Financial Information Handbook 93
Phosphate Rock Severance Tax Section 211.3103, Florida Statutes
Summary: A severance tax is levied upon every person engaging in the business of severing phosphate rock from the soils or waters in Florida for commercial use. A small portion of the total net tax proceeds are returned to those counties where phosphate rock is severed. Depending on eligibility, counties shall use the tax proceeds for phosphate-related expenses or purposes related to local economic development. General Law Amendments: Chapter 2012-32, L.O.F., (HB 7087) sets the tax rate at $1.61 per ton severed, except for the eight year period from January 1, 2015, until December 31, 2022, when the tax rate is set at $1.80 per ton severed. Additionally, the legislation eliminates the $1.38 per ton surcharge and the base rate adjustment mechanism. During the eight year period when the tax rate is set at $1.80, the distribution of tax proceeds is modified so that a higher proportion of total proceeds is directed to the Nonmandatory Land Reclamation Trust Fund and lower proportions of total proceeds are directed to the other uses. These changes became effective on July 1, 2012. The Revenue Estimating Conference estimates that these changes will have a recurring negative fiscal impact of ($3.6) million to those county governments eligible to receive tax proceeds. Eligibility Requirements: Only those counties where phosphate rock is severed are eligible to receive proceeds. Administrative Procedures: The tax is administered, collected, and enforced by the Department of Revenue.1 The tax applies to the total production of the producer during the taxable year as measured on the basis of bone-dry tons produced at the point of severance.2 The tax rate shall be $1.61 per ton severed, except for the time period beginning January 1, 2015, until December 31, 2022, when the tax rate shall be $1.80 per ton severed.3 This severance tax shall be in addition to any ad valorem taxes levied upon the separately assessed mineral interest in the real property upon which the site of severance is located, or any other tax, permit, or license fee imposed by the state or its political subdivisions.4 Distribution of Proceeds: Except during the period of January 1, 2015, until December 31, 2022, the proceeds from the severance taxes, interest, and penalties are exempt from the General Revenue Service Charge provided in s. 215.20, F.S., and shall be paid into the State Treasury as follows:
1. 25.5 percent to the Conservation and Recreation Lands Trust Fund; 2. 35.7 percent to the state’s General Revenue Fund; 3. 12.8 percent for payment to counties in proportion to the number of tons of phosphate rock produced
from a phosphate rock matrix located within such county boundary; 1. Section 211.3103(1), F.S. 2. Section 211.3103(3), F.S. 3. Section 211.3103(2), F.S. 4. Section 211.3103(4), F.S.
Office of Economic and Demographic Research
94 2012 Local Government Financial Information Handbook
4. 10.0 percent for payment to counties that have been designated a Rural Area of Critical Economic Concern pursuant to s. 288.0656, F.S., in proportion to the number of tons of phosphate rock produced from a phosphate rock matrix located within such county boundary. These particular payments shall be made to the counties unless the Legislature by special act creates a local authority to promote and direct the county’s economic development. If such an authority exists, payments shall be made to that authority;
5. 6.2 percent to the Nonmandatory Land Reclamation Trust Fund; 6. 6.2 percent to the Phosphate Research Trust Fund in the Department of Education’s Division of
Universities; and 7. 3.6 percent to the Minerals Trust Fund.5
During the period of January 1, 2015, until December 31, 2022, the proceeds from the severance taxes, interest, and penalties are exempt from the General Revenue Service Charge provided in s. 215.20, F.S., and shall be paid into the State Treasury as follows:
1. 22.8 percent to the Conservation and Recreation Lands Trust Fund; 2. 31.9 percent to the state’s General Revenue Fund; 3. 11.5 percent for payment to counties in proportion to the number of tons of phosphate rock produced
from a phosphate rock matrix located within such county boundary; 4. 8.9 percent for payment to counties that have been designated a Rural Area of Critical Economic
Concern pursuant to s. 288.0656, F.S., in proportion to the number of tons of phosphate rock produced from a phosphate rock matrix located within such county boundary. These particular payments shall be made to the counties unless the Legislature by special act creates a local authority to promote and direct the county’s economic development. If such an authority exists, payments shall be made to that authority;
5. 16.1 percent to the Nonmandatory Land Reclamation Trust Fund; 6. 5.6 percent to the Phosphate Research Trust Fund in the Department of Education’s Division of
Universities; and 7. 3.2 percent to the Minerals Trust Fund.6
Authorized Uses: The tax proceeds received by counties shall be used only for phosphate-related expenses. The term phosphate-related expenses means those expenses that provide for infrastructure or services in support of the phosphate industry, reclamation or restoration of phosphate lands, community infrastructure on such reclaimed lands, and similar expenses directly related to support of the industry.7 Attorney General Opinions: Florida’s Attorney General has issued the following legal opinions relevant to this revenue source.
Opinion # Subject 74-310 Solid minerals severance tax 79-05 Levy on irreplaceable minerals 79-99 Severance tax, solid minerals
5. Section 211.3103(6)(a), F.S. 6. Section 211.3103(6)(b), F.S. 7. Section 211.3103(7), F.S.

Office of Economic and Demographic Research
2012 Local Government Financial Information Handbook 95
The full texts of these opinions are available via a searchable on-line database.8 Local government officials seeking more clarification should review the opinions in their entirety. The statutory language pertaining to this revenue source has been amended since its authorization. The reader should keep the date of the opinion in mind when reviewing its relevance to current law or any interpretations that have been articulated in Florida case law. Prior Years’ Revenues: A summary of prior years’ distributions is available.9
8. http://myfloridalegal.com/ago.nsf/Opinions 9. http://edr.state.fl.us/Content/local-government/data/data-a-to-z/index.cfm

Office of Economic and Demographic Research
96 2012 Local Government Financial Information Handbook
This page was intentionally left blank.

Office of Economic and Demographic Research
2012 Local Government Financial Information Handbook 97
State Housing Initiatives Partnership Program Sections 420.907-.9079, Florida Statutes
Summary: The State Housing Initiatives Partnership (SHIP) Program was created for the purpose of providing funds to counties and eligible municipalities as an incentive for the creation of local housing partnerships, to expand production and preservation of affordable housing, to further the housing element of local government comprehensive plans specific to affordable housing, and to increase housing-related employment. Portions of the documentary stamp tax are transferred into the Local Government Housing Trust Fund for distribution to eligible county and municipal governments to fund the implementation of local housing assistance plans. General Law Amendments: There were no general law amendments resulting from the 2012 Regular Legislative Session. Eligibility Requirements: A county or eligible municipality, as defined in s. 420.9071(9), F.S., must satisfy a number of requirements in order to be eligible to receive funds under the program.1 Administrative Procedures: A portion of the documentary stamp tax revenues as provided in s. 201.15, F.S., monies received from any other source for the purposes of this program, and all proceeds derived from the investment of such monies are deposited into the Local Government Housing Trust Fund. The Florida Housing Finance Corporation (FHFC), on behalf of the Department of Economic Opportunity, shall administer this trust fund for the purpose of implementing this program.2 After the distributions specified in s. 201.15(1)-(8), F.S., 7.53 percent of remaining documentary stamp taxes in each fiscal year shall be paid into the State Treasury to the credit of the State Housing Trust Fund. Beginning in the 2012-13 fiscal year, the first $35 million of such funds shall be transferred annually, subject to any distribution required under s. 201.15(15), F.S., to the State Economic Enhancement and Development Trust Fund within the Department of Economic Opportunity. Half of the remaining funds shall be paid to the credit of the Local Government Housing Trust Fund.3 After the distributions specified in s. 201.15(1)-(9), F.S., 8.66 percent of remaining documentary stamp taxes in each fiscal year shall be paid into the State Treasury to the credit of the State Housing Trust Fund. Beginning in the 2012-13 fiscal year, the first $40 million of such funds shall be transferred annually, subject to any distribution required under s. 201.15(15), F.S., to the State Economic Enhancement and Development Trust Fund. From the remaining funds, 87.5 percent shall be paid to the credit of the Local Government Housing Trust Fund.4
1. Section 420.9072(2)(a), F.S. 2. Section 420.9079, F.S. 3. Section 201.15(9), F.S. 4. Section 201.15(10), F.S.
Office of Economic and Demographic Research
98 2012 Local Government Financial Information Handbook
A county or eligible municipality seeking approval to receive its share of the local housing distribution must adopt an ordinance containing specified provisions.5 Additional procedures exist regarding the local government’s submission of its local housing assistance plan.6 Distribution of Proceeds: Monies in the Local Government Housing Trust Fund shall be distributed by the FHFC to each approved county and eligible municipality within the county as provided in s. 420.9073, F.S. Distributions shall be allocated to the participating county and to each eligible municipality within the county according to an interlocal agreement between the county and eligible municipality. If no interlocal agreement exists, the allocation is made according to population. The portion for each eligible municipality is computed by multiplying the total monies earmarked for a county by a fraction; the numerator is the population of the eligible municipality, and the denominator is the county’s total population. The remaining proceeds shall be distributed to the county.7 Local housing distributions shall be disbursed on a quarterly or more frequent basis, subject to the availability of funds.8 Each county’s share of the funds to be distributed from the portion of funds received pursuant to s. 201.15(9), F.S., shall be calculated for each fiscal year pursuant to the procedure specified in s. 420.9073, F.S. Authorized Uses: A county or eligible municipality must expend its portion of the local housing distribution only to implement a local housing assistance plan or as provided in s. 420.9072(7)(b), F.S., until July 1, 2010. Proceeds may not be expended for the purpose of providing rent subsidies; however, this does not prohibit the use of the funds for security and utility deposit assistance.9 Additionally, funds may not be pledged to pay the debt service on any bonds.10 Attorney General Opinions: Florida’s Attorney General has issued the following legal opinion relevant to this revenue source.
Opinion # Subject 2008-66 Sunshine Law, community land trust
The full text of this opinion is available via a searchable on-line database.11 Local government officials seeking more clarification should review the opinions in their entirety. The statutory language pertaining to this revenue source has been amended since its authorization. The reader should keep the date of the opinion in mind when reviewing its relevance to current law or any interpretations that have been articulated in Florida case law.
5. Section 420.9072(2)(b), F.S. 6. Section 420.9072(3), F.S. 7. Section 420.9072(4), F.S. 8. Section 420.9073(1), F.S. 9. Section 420.9072(7), F.S. 10. Section 420.9072(8), F.S. 11. http://myfloridalegal.com/ago.nsf/Opinions

Office of Economic and Demographic Research
2012 Local Government Financial Information Handbook 99
Support for School Capital Outlay Purposes Gross Receipts Tax on Utilities
Section 9(a), Article XII, Florida Constitution Chapter 203, Florida Statutes
Motor Vehicle License Tax
Section 9(d), Article XII, Florida Constitution Chapter 320, Florida Statutes
Summary: Pursuant to constitutional authorization and statutory implementation, two state taxes are levied that support school capital outlay purposes. The first is a gross receipts tax on utilities.1 The tax consists of three separate rates. The rate of 2.5 percent is applied to utility services, the rate of 2.37 percent is applied to communications services, and an additional rate of 0.15 percent is applied to communications services subject to the tax levied pursuant to s. 202.12(1)(a),(c)-(d), F.S.2 The proceeds of the tax are placed in the Public Education Capital Outlay and Debt Service Trust Fund and used for capital outlay projects of the state system of public education that includes universities, community colleges, vocational technical schools, and public schools. The following lists the order of priority and purposes for which the monies in the trust fund shall be used in each fiscal year.
1) The servicing of any bonds due in the current fiscal year. 2) The deposit into any reserve funds established for the issuance of bonds. 3) The direct payment of any part of the cost of any capital project for the state system of education, as
authorized by the Legislature. The second source of revenue is a portion of the revenues derived from the licensing of motor vehicles and mobile homes.3 The state constitution provides that the first proceeds of revenues derived from such licensing are placed in the District Capital Outlay and Debt Service Trust Fund and used for capital outlay projects of school districts and community colleges. The revenue is distributed annually among school districts and community colleges based on the constitutional formula. The following lists the order of priority and purposes for which the distributed monies shall be used in each fiscal year.
1) The compliance with bond obligations based on motor vehicle tax anticipation certificates issued prior to the enactment of the 1968 Florida Constitution.
2) The debt service on bonds or motor vehicle license revenue anticipation certificates. 3) The debt service on bonds where the proceeds of such bonds were used for capital outlay needs. 4) The payment of the State Board of Education’s expenses in administering the distribution and use of
the motor vehicle license tax by school districts.
1. Section 9(a)(2), Art. XII, State Constitution. 2. Section 203.01(1)(b), F.S. 3. Section 9(d), Art. XII, State Constitution.
Office of Economic and Demographic Research
100 2012 Local Government Financial Information Handbook
5) The construction and maintenance of capital outlay projects, and those school purposes as determined by the school district or the Legislature, after all major capital outlay needs of the school district have been met.

Office of Economic and Demographic Research
2012 Local Government Financial Information Handbook 101
Vessel Registration Fees Sections 328.66 and 328.72, Florida Statutes
Summary: Vessel owners are required to pay annually a state registration fee, and the fee amount varies by vessel class. A portion of the state fee, derived from recreational vessels only, is distributed to county governments for expenditure on a variety of recreational boating-related purposes. In addition, any county government may impose an annual registration fee on vessels registered, operated, used, or stored on the water of this state within its jurisdiction. This optional registration fee shall be 50 percent of the applicable state registration fee. A municipality that was imposing a registration fee before April 1, 1984, may continue to levy such fee. Monies received from the fee shall be expended for the patrol, regulation, and maintenance of lakes, rivers, and waters as well as for other boating-related activities of such municipality or county. General Law Amendments: There were no general law amendments resulting from the 2012 Regular Legislative Session. Eligibility Requirements: All counties are eligible to impose the optional fee subject to an ordinance adopted by the governing body. Additionally, a municipality that was imposing a registration fee before April 1, 1984, is permitted to continue levying its fee. Administrative Procedures: County tax collectors collect both the state fees and county optional fees, if applicable.1 The amount of the state fee varies by vessel class for each 12 month period registered according to the following schedule.2 The county portion of the state fee, which is derived from recreational vessels only, is noted as well.
1. Class A-1 (less than 12 feet in length; and all canoes to which propulsion motors have been attached, regardless of length): The state fee is $5.50 with no distribution to the county.
2. Class A-2 (12 feet or more and less than 16 feet in length): The state fee is $16.25 of which $2.85 is distributed to the county.
3. Class 1 (16 feet or more and less than 26 feet in length): The state fee is $28.75 of which $8.85 is distributed to the county.
4. Class 2 (26 feet or more and less than 40 feet in length): The state fee is $78.25 of which $32.85 is distributed to the county.
5. Class 3 (40 feet or more and less than 65 feet in length): The state fee is $127.75 of which $56.85 is distributed to the county.
6. Class 4 (65 feet or more and less than 110 feet in length): The state fee is $152.75 of which $68.85 is distributed to the county.
7. Class 5 (110 feet or more in length): The state fee is $189.75 of which $86.85 is distributed to the county.
8. Dealer Registration Certificate: The state fee is $25.50 with no distribution to the county.
1. Section 328.73(1), F.S. 2. Section 328.72(1)(a), F.S.

Office of Economic and Demographic Research
102 2012 Local Government Financial Information Handbook
If a county government imposes the optional fee on vessels registered, operated, used, or stored on the waters of this state within its jurisdiction, the fee shall be 50 percent of the applicable state fee. Beginning in 2013 and every 5 years thereafter, the state registration fees shall be adjusted by the percentage change in the Consumer Price Index for All Urban Consumers since the fees were last adjusted, unless otherwise provided by general law. By February 1 of each year in which an adjustment is scheduled to occur, the Fish and Wildlife Conservation Commission shall submit a report to the President of the Senate and the Speaker of the House of Representatives detailing how the increase in vessel registration fees will be used within the agency. The state fee increases shall take effect July 1 of each adjustment year.3 Distribution of Proceeds: The county portion of the state fee shall be distributed by the tax collector to the board of county commissioners.4 The county shall retain the optional fee proceeds, less the first dollar of each registration fee, which shall be remitted to the State for deposit in the Save the Manatee Trust Fund.5 Any county that imposes the optional fee may establish, by interlocal agreement with one or more municipalities located in the county, a distribution formula for dividing the proceeds or for the use of the funds for boating-related projects located within the county and/or municipality or municipalities.6 Authorized Uses: The portion of the state fees returned to county governments are for the sole purposes of providing recreational channel marking and other uniform waterway markers, public boat ramps, lifts, and hoists, marine railways, and other public launching facilities, derelict vessel removal, and removal of vessels and floating structures deemed a hazard to public safety and health for failure to comply with s. 327.53, F.S.7 County governments shall demonstrate through an annual detailed accounting report that their portion of the state fees were spent as provided, and such report shall be provided to the Fish and Wildlife Conservation Commission no later than November 1st of each year. If a county’s report has not been provided to the Commission by January 1st of the year following the November 1st deadline, the tax collector shall not distribute the designated monies to the board of county commissioners for the next calendar year but shall remit the monies to the State for deposit into the Marine Resources Conservation Trust Fund. If the county complies with the reporting requirement within the calendar year, the monies shall be returned to the county. If not, the monies shall remain in the Trust Fund and may be appropriated for specified purposes. The optional fee proceeds shall be expended for the patrol, regulation, and maintenance of the lakes, rivers, and waters and for other boating-related activities of such county or municipality.8 Attorney General Opinions: Florida’s Attorney General has issued the following legal opinions relevant to this revenue source.
Opinion # Subject 90-60 Municipality’s regulation of resident vessels 92-88 Operation of commercial mullet vessels
3. Section 328.72(1)(b), F.S. 4. Section 328.72(15), F.S. 5. Section 328.66(1), F.S. 6. Section 328.66(2), F.S. 7. Section 328.72(15), F.S. 8. Section 328.66(1), F.S.
Office of Economic and Demographic Research
2012 Local Government Financial Information Handbook 103
2005-51 Boats, exemption for non-motored powered boats The full texts of these opinions are available via a searchable on-line database.9 Local government officials seeking more clarification should review the opinion in its entirety. The statutory language pertaining to this revenue source has been amended since its authorization. The reader should keep the date of the opinion in mind when reviewing its relevance to current law or any interpretations that have been articulated in Florida case law.
9. http://myfloridalegal.com/ago.nsf/Opinions

Office of Economic and Demographic Research
104 2012 Local Government Financial Information Handbook
This page was intentionally left blank.

Office of Economic and Demographic Research
2012 Local Government Financial Information Handbook 105
Communications Services Tax Chapter 202, Florida Statutes
Summary: The communications services tax applies to telecommunications, video, direct-to-home satellite, and related services. The definition of communications services encompasses voice, data, audio, video, or any other information or signals transmitted by any medium. Examples of services subject to the tax include, but are not limited to, local, long distance, and toll telephone; voice over Internet protocol telephone; video services; video streaming; direct-to-home satellite; mobile communications; private line services; pager and beeper; telephone charges made at a hotel or motel; facsimiles; and telex, telegram, and teletype. The tax is imposed on retail sales of communications services which originate and terminate in the state, or originate or terminate in the state and are billed to an address within the state. The tax is comprised of two parts: the Florida communications services tax and the local communications services tax. Tax proceeds are transferred to county and municipal governments, the Public Education Capital Outlay and Debt Service Trust Fund, and the state’s General Revenue Fund. Florida Communications Services Tax: The Florida communications services tax includes both a state tax and a gross receipts tax. Although the gross receipts tax on communications services is imposed under Chapter 203, F.S., it is administered under Chapter 202, F.S. Communications services, except direct-to-home satellite service, are subject to the state tax of 6.65 percent and the gross receipts tax of 2.52 percent.1 Direct-to-home satellite service is subject to the state tax of 10.8 percent and the gross receipts tax of 2.37 percent.2 Local Communications Services Tax: A county or municipality may authorize by ordinance the levy of a local communications services tax.3 The local tax rates vary depending on the type of local government entity. For municipalities and charter counties that have not chosen to levy permit fees, the tax may be levied at a rate of up to 5.1 percent. For municipalities and charter counties that have chosen to levy permit fees, the tax may be levied at a rate of up to 4.98 percent. Non-charter counties may levy the tax at a rate of up to 1.6 percent. These maximum rates do not include add-ons of up to 0.12 percent for municipalities and charter counties or up to 0.24 percent for non-charter counties that have elected not to require and collect permit fees authorized pursuant to s. 337.401, F.S., nor do they supersede conversion or emergency rates authorized by s. 202.20, F.S., which are in excess of these maximum rates.4 In addition to the local communications services taxes, any local option sales tax that a county or school board has levied pursuant to s. 212.055, F.S., is imposed as a local communications services tax, and the rate shall be determined in accordance with s. 202.20(3), F.S.5 General Law Amendments: Chapter 2012-70, L.O.F., (CS/HB 809) updates and modifies a number of provisions regarding the manner in which the communications services tax is levied. The legislation makes several definitional changes including the definition of sales price to expand the existing provisions relating to what charges a communications services dealer may exclude from the taxable sales price of communications services. In addition, the
1. Sections 202.12(1)(a), 203.01(b), F.S. 2. Sections 202.12(1)(b), 203.01(b), F.S. 3. Section 202.19(1), F.S. 4. Section 202.19(2), F.S. 5. Section 202.19(5), F.S.

Office of Economic and Demographic Research
106 2012 Local Government Financial Information Handbook
legislation modifies the requirements of s. 202.22, F.S., relating to a dealer that does not use one of the three approved local tax situsing methods. Also, it requires the Department of Revenue to make jurisdiction-by-jurisdiction gross taxable sales and net tax information by fiscal year available to the public. The legislation also makes the revised definitions and liability provisions retroactive and remedial and creates a nine-member working group to review various aspects of communications services tax law and provide recommendations to the Governor and Legislature by February 1, 2013. These changes became effective on July 1, 2012. The Revenue Estimating Conference estimates that the changes to dealer liability for incorrectly assigned service addresses will have a negative fiscal impact of ($4.3) million to local governments in the 2012-13 fiscal year and a recurring negative impact of ($4.7) million. Other changes in the legislation will have a negative indeterminate effect on local government revenues. Eligibility Requirements: County and municipal governments receive proceeds of the Florida communications services tax via the County Revenue Sharing Program, Local Government Half-cent Sales Tax Program, and Municipal Revenue Sharing Program. Counties, municipalities, and school boards may be eligible to receive proceeds of the local communications services tax. Administrative Procedures: The communications services taxes, as imposed pursuant to Chapters 202 and 203, F.S., (i.e., the gross receipts tax on communications services) shall be paid by the purchaser and shall be collected from the purchaser by the dealer of such services. Each dealer who makes retail sales of communications services shall add the amount of applicable taxes to the price of services sold and shall state the taxes separately from the price of services on all invoices.6 The Department of Revenue (DOR) administers the statewide collection of the state and local tax payments. Dealers who collect local communications services tax must notify the DOR of the method employed to accurately assign addresses to the appropriate taxing jurisdiction. The DOR maintains a database that provides the local taxing jurisdiction for all addresses in Florida. The database contains county and municipal names for every address and is based on information provided by the local taxing jurisdiction and updated at least once every six months.7 The amount of revenue collected is dependent on the jurisdiction’s local communications services tax rate. A county government’s local communications services tax is charged to those billable customers residing within the unincorporated area. A municipal government’s local communications services tax is charged to those billable customers residing within the incorporated area. The proceeds of each local communications services tax levied by a county or municipality, less the DOR’s costs of administration, shall be transferred to the Local Communications Services Tax Clearing Trust Fund for distribution to counties and municipalities. The amount deducted for administrative costs may not exceed 1 percent of the total revenue generated for all taxing jurisdictions, and the total administrative costs shall be prorated among those taxing jurisdictions on the basis of the amount collected for a particular jurisdiction relative to the amount collected for all such jurisdictions.8
6. Section 202.16, F.S. 7. Section 202.22, F.S. 8. Section 202.18(3), F.S.
Office of Economic and Demographic Research
2012 Local Government Financial Information Handbook 107
Any adoption, repeal, or change in the rate of a local communications services tax imposed under s. 202.19, F.S., is effective with respect to taxable services included on bills that are dated on or after the January 1st subsequent to such adoption, repeal, or change. The local government must notify the DOR of the adoption, repeal, or change by the September 1st that immediately precedes the January 1st effective date.9 Distribution of Proceeds: Florida Communications Services Tax: The proceeds derived from the gross receipts tax on communications services and direct-to-home satellite service are transferred to the Public Education Capital Outlay and Debt Service Trust Fund, which serves as a funding source for public school capital construction.10 The proceeds derived from the 6.65 percent state tax on communications services, except direct-to-home satellite service, are distributed by the same formula used for distribution of the state sales and use tax, as prescribed in s. 212.20(6), F.S., which directs portions of the available proceeds to the County Revenue Sharing Program, Local Government Half-cent Sales Tax Program, and Municipal Revenue Sharing Program via their separate trust funds.11 The proceeds derived from the 10.8 percent state tax on direct-to-home satellite service are distributed pursuant to s. 202.18(2), F.S.12 This provision specifies that 63 percent of the proceeds are distributed by the state sales and use tax distribution formula prescribed in s. 212.20(6), F.S., with an adjustment to s. 212.20(6)(d), F.S. The remaining 37 percent of the proceeds are transferred to the Local Government Half-cent Sales Tax Clearing Trust Fund with 70 percent allocated in the same proportion as the ordinary distribution under s. 218.61, F.S., and the emergency distribution under s. 218.65, F.S., in the prior state fiscal year, and 30 percent shall be allocated pursuant to the distribution for fiscally constrained counties under s. 218.67, F.S. Local Communications Services Tax: The amount of tax revenues available for distribution to local governments is dependent on each jurisdiction’s taxable sales and local tax rate. The tax revenues, less the DOR’s administrative cost deduction, are distributed monthly to the appropriate jurisdictions. The proceeds of taxes imposed pursuant to s. 202.19(5), F.S., shall be distributed in the same manner as the local option sales taxes.13 Authorized Uses: The tax revenues raised by or distributed to a county or municipal government tax may be used for any public purpose, including the pledge of such revenues for the repayment of current or future bonded indebtedness. However, any revenue raised by a tax imposed pursuant to s. 202.19(5), F.S., (i.e., a local option sales tax imposed on communications services) shall be used for the same purposes as the underlying local option sales tax imposed by the county or school board pursuant to s. 212.055, F.S.14 Attorney General Opinions: Florida’s Attorney General has issued the following legal opinion relevant to this revenue source. 9. Section 202.21, F.S. 10. Sections 202.18(1)(a), 202.18(2)(a), F.S. 11. Section 202.18(1)(b), F.S. 12. Section 202.12(1)(b), F.S. 13. Section 202.18(3), F.S. 14. Section 202.19(8), F.S.
Office of Economic and Demographic Research
108 2012 Local Government Financial Information Handbook
Opinion # Subject 2008-14 Records, lease payments as proprietary information
The full text of this opinion is available via a searchable on-line database.15 Local government officials seeking more clarification should review the opinion in its entirety. The statutory language pertaining to this revenue source has been amended since its authorization. The reader should keep the date of the opinion in mind when reviewing its relevance to current law or any interpretations that have been articulated in Florida case law. Local Tax Rates and Current Year’s Revenues: The DOR maintains a list of historical, current, and upcoming local tax rates.16 The table included in this section lists the estimated local communications services tax distributions for local fiscal year ending 2013 as calculated by the DOR. Additional Detail: Compilations of communications services taxable sales within county unincorporated areas and municipal jurisdictions as well as local communications services tax distributions to counties and municipalities by fiscal year, as compiled from DOR source data, can be found on the EDR’s website.17
15. http://myfloridalegal.com/ago.nsf/Opinions 16. http://dor.myflorida.com/dor/taxes/local_tax_rates.html 17. http://edr.state.fl.us/Content/local-government/data/data-a-to-z/index.cfm

Calculated by the Florida Department of Revenue's Office of Tax Research
Revenue2011 Estimate
Estimated Revenue Per Capita AfterCST Base Sharing Consumption Current Adjustments
Local Government LFY 2013 Population (See Note 4) Tax Rate (See Notes 1-3)ALACHUA BOCC 68,605,274$ 98,537 696$ 6.90% 4,940,127$ Alachua 7,224,895$ 9,108 793$ 5.22% 385,253$ Archer 659,292$ 1,139 579$ 5.22% 37,107$ Gainesville 89,564,683$ 123,105 728$ 5.57% 5,035,204$ Hawthorne 998,260$ 1,409 708$ 5.22% 54,279$ High Springs 3,234,248$ 5,358 604$ 5.22% 174,905$ La Crosse 160,564$ 352 456$ 3.42% 6,140$ Micanopy 359,802$ 594 606$ 5.10% 20,251$ Newberry 3,119,066$ 4,945 631$ 5.22% 167,571$ Waldo 435,342$ 1,003 434$ 5.22% 23,521$ BAKER BOCC 7,588,935$ 18,196 417$ 1.84% 139,597$ Glen St. Mary 342,080$ 433 790$ 5.30% 20,487$ Macclenny 3,958,494$ 6,350 623$ 6.02% 240,605$ BAY BOCC 50,329,906$ 72,221 697$ 1.84% 1,019,752$ Callaway 7,944,581$ 14,458 549$ 5.22% 449,415$ Lynn Haven 13,194,406$ 18,585 710$ 5.22% 748,322$ Mexico Beach 1,456,582$ 1,082 1,346$ 2.88% 35,373$ Panama City 34,195,554$ 36,474 938$ 5.22% 1,939,146$ Panama City Beach 18,683,703$ 12,025 1,554$ 5.22% 1,064,626$ Parker 2,723,937$ 4,329 629$ 5.22% 151,779$ Springfield 4,748,543$ 8,935 531$ 5.22% 260,524$ BRADFORD BOCC 6,517,000$ 17,393 375$ 0.64% 42,584$ Brooker 218,628$ 327 669$ 3.00% 7,848$ Hampton 101,581$ 490 207$ 2.20% 2,619$ Lawtey 336,830$ 727 463$ 1.10% 4,721$ Starke 4,906,482$ 5,428 904$ 5.22% 271,183$ BREVARD BOCC 155,053,996$ 205,458 755$ 5.22% 8,332,805$ Cape Canaveral 10,284,902$ 9,936 1,035$ 5.22% 548,946$ Cocoa 15,694,884$ 17,238 910$ 5.22% 853,997$ Cocoa Beach 13,594,478$ 11,233 1,210$ 5.22% 736,367$ Grant-Valkaria 2,643,287$ 3,867 684$ 5.22% 137,990$ Indialantic 3,253,835$ 2,731 1,191$ 6.20% 214,171$ Indian Harbour Beach 7,370,782$ 8,272 891$ 5.22% 402,235$ Malabar 2,108,207$ 2,750 767$ 5.22% 115,185$ Melbourne 76,892,142$ 76,354 1,007$ 5.93% 4,559,704$ Melbourne Beach 2,781,728$ 3,105 896$ 5.22% 155,641$ Melbourne Village 725,581$ 662 1,096$ 5.22% 41,005$ Palm Bay 66,054,385$ 103,504 638$ 5.22% 3,597,668$ Palm Shores 754,263$ 876 861$ 4.80% 38,305$ Rockledge 21,124,468$ 25,000 845$ 5.22% 1,148,901$ Satellite Beach 9,245,682$ 10,166 909$ 5.22% 508,526$ Titusville 32,667,020$ 43,823 745$ 5.42% 1,835,640$ West Melbourne 14,752,102$ 18,725 788$ 5.52% 838,998$ BROWARD BOCC 28,711,792$ 15,403 1,864$ 5.22% 1,385,594$ Coconut Creek 43,068,325$ 53,155 810$ 5.22% 2,323,835$ Cooper City 24,752,303$ 29,154 849$ 4.80% 1,235,977$ Coral Springs 102,356,306$ 121,651 841$ 5.22% 5,532,743$ Dania Beach 22,401,148$ 29,596 757$ 5.32% 1,255,298$ Davie 77,594,707$ 92,146 842$ 5.20% 4,158,570$ Deerfield Beach 70,234,406$ 75,125 935$ 5.22% 3,775,886$
Forecast of Taxable Communication Services and RevenuesLocal Fiscal Year Ending September 30, 2013
2012 Local Government Financial Information Handbook Page 109

Calculated by the Florida Department of Revenue's Office of Tax Research
Revenue2011 Estimate
Estimated Revenue Per Capita AfterCST Base Sharing Consumption Current Adjustments
Local Government LFY 2013 Population (See Note 4) Tax Rate (See Notes 1-3)
Forecast of Taxable Communication Services and RevenuesLocal Fiscal Year Ending September 30, 2013
Fort Lauderdale 251,457,321$ 165,912 1,516$ 5.22% 13,655,843$ Hallandale Beach 32,054,489$ 37,229 861$ 5.22% 1,778,130$ Hillsboro Beach 2,692,371$ 1,875 1,436$ 1.20% 35,536$ Hollywood 123,780,090$ 140,930 878$ 5.22% 6,815,876$ Lauderdale-By-The-Sea 6,734,960$ 6,074 1,109$ 5.22% 368,157$ Lauderdale Lakes 20,550,631$ 32,766 627$ 5.32% 1,128,472$ Lauderhill 40,731,590$ 66,709 611$ 5.22% 2,209,880$ Lazy Lake 25,531$ 24 1,064$ 0.60% 219$ Lighthouse Point 10,507,553$ 10,377 1,013$ 6.22% 698,293$ Margate 40,807,198$ 53,714 760$ 5.32% 2,274,395$ Miramar 98,532,583$ 122,982 801$ 5.22% 5,250,984$ North Lauderdale 24,190,941$ 41,248 586$ 5.22% 1,308,973$ Oakland Park 34,825,423$ 41,549 838$ 5.42% 1,978,565$ Parkland 20,718,503$ 24,391 849$ 5.22% 1,128,723$ Pembroke Park 4,952,262$ 6,099 812$ 5.22% 266,687$ Pembroke Pines 134,745,002$ 154,275 873$ 5.42% 7,518,508$ Plantation 94,465,440$ 84,687 1,115$ 5.22% 5,096,828$ Pompano Beach 104,178,871$ 100,073 1,041$ 5.22% 5,682,935$ Sea Ranch Lakes 750,919$ 675 1,112$ 5.22% 40,891$ Southwest Ranches 7,041,455$ 7,345 959$ 5.22% 388,401$ Sunrise 80,250,533$ 84,375 951$ 5.22% 4,350,160$ Tamarac 50,120,615$ 60,619 827$ 5.22% 2,741,713$ West Park 5,497,060$ 14,078 390$ 5.22% 286,988$ Weston 66,314,703$ 65,237 1,017$ 5.22% 3,595,510$ Wilton Manors 10,970,458$ 11,743 934$ 5.62% 643,492$ CALHOUN BOCC 3,583,653$ 9,951 360$ 1.84% 66,167$ Altha 299,613$ 534 561$ 5.22% 15,967$ Blountstown 2,065,058$ 2,512 822$ 5.22% 108,409$ CHARLOTTE BOCC 99,909,153$ 143,108 698$ 5.22% 5,331,268$ Punta Gorda 18,801,435$ 16,741 1,123$ 5.22% 996,185$ CITRUS BOCC 76,806,066$ 130,464 589$ 2.24% 1,815,146$ Crystal River 4,464,214$ 3,110 1,435$ 5.22% 243,693$ Inverness 6,431,251$ 7,200 893$ 5.32% 355,880$ CLAY BOCC 111,064,781$ 173,754 639$ 5.92% 6,858,845$ Green Cove Springs 6,323,758$ 6,898 917$ 5.22% 341,748$ Keystone Heights 1,296,561$ 1,338 969$ 5.22% 71,464$ Orange Park 12,493,729$ 8,412 1,485$ 5.22% 665,270$ Penney Farms 315,933$ 741 426$ 5.22% 17,749$ COLLIER BOCC 233,528,936$ 287,399 813$ 2.10% 5,079,452$ Everglades 533,799$ 406 1,315$ 3.90% 21,437$ Marco Island 19,047,853$ 16,443 1,158$ 5.22% 1,013,002$ Naples 50,103,542$ 19,451 2,576$ 5.22% 2,701,295$ COLUMBIA BOCC 22,296,926$ 51,457 433$ 1.30% 322,286$ Fort White 529,177$ 565 937$ 0.60% 3,882$ Lake City 14,012,661$ 11,713 1,196$ 5.22% 831,454$ DESOTO BOCC 8,022,203$ 25,028 321$ 2.34% 195,553$ Arcadia 4,885,122$ 7,592 643$ 5.22% 268,645$ DIXIE BOCC 4,489,517$ 13,224 339$ 1.84% 88,250$ Cross City 1,540,484$ 1,728 891$ 2.50% 41,657$ Horseshoe Beach 167,431$ 168 997$ 6.20% 10,708$
2012 Local Government Financial Information Handbook Page 110

Calculated by the Florida Department of Revenue's Office of Tax Research
Revenue2011 Estimate
Estimated Revenue Per Capita AfterCST Base Sharing Consumption Current Adjustments
Local Government LFY 2013 Population (See Note 4) Tax Rate (See Notes 1-3)
Forecast of Taxable Communication Services and RevenuesLocal Fiscal Year Ending September 30, 2013
DUVAL - Jacksonville 745,649,522$ 821,485 908$ 5.22% 39,853,539$ Atlantic Beach 11,027,426$ 12,670 870$ 5.22% 604,997$ Baldwin 1,061,519$ 1,406 755$ 6.22% 67,420$ Jacksonville Beach 24,245,680$ 21,441 1,131$ 5.22% 1,430,802$ Neptune Beach 6,287,251$ 7,046 892$ 5.22% 327,227$ ESCAMBIA BOCC 162,562,319$ 242,950 669$ 1.84% 3,153,717$ Century 1,085,920$ 1,690 643$ 2.10% 23,353$ Pensacola 66,802,591$ 51,880 1,288$ 5.22% 3,562,836$ FLAGLER BOCC 11,101,099$ 13,127 846$ 1.84% 228,045$ Beverly Beach 353,138$ 337 1,048$ 5.10% 19,238$ Bunnell 2,244,008$ 2,700 831$ 5.75% 133,505$ Flagler Beach (part) 4,391,563$ 4,444 988$ 5.10% 244,333$ Marineland (part) 427,312$ 16 26,707$ 0.40% 2,089$ Palm Coast 50,950,238$ 75,617 674$ 5.22% 2,731,941$ FRANKLIN BOCC 5,543,213$ 6,240 888$ 0.90% 50,266$ Apalachicola 1,987,294$ 2,239 888$ 3.60% 72,219$ Carrabelle 954,492$ 1,350 707$ 5.82% 52,996$ GADSDEN BOCC 12,287,329$ 28,126 437$ 1.84% 302,492$ Chattahoochee 1,255,095$ 2,519 498$ 5.22% 80,761$ Greensboro 300,430$ 602 499$ 5.12% 18,724$ Gretna 613,259$ 1,460 420$ 4.02% 26,234$ Havana 1,679,956$ 1,765 952$ 5.22% 92,388$ Midway 2,239,451$ 3,076 728$ 3.70% 85,169$ Quincy 5,847,354$ 7,470 783$ 5.22% 260,248$ GILCHRIST BOCC 5,235,295$ 13,302 394$ 1.84% 110,409$ Bell 239,198$ 440 544$ 4.50% 13,032$ Fanning Springs (part) 238,719$ 345 692$ 5.62% 13,966$ Trenton 1,365,328$ 1,985 688$ 5.22% 74,998$ GLADES BOCC 3,606,873$ 10,195 354$ 1.84% 68,241$ Moore Haven 614,175$ 1,637 375$ 1.20% 7,972$ GULF BOCC 4,778,486$ 7,176 666$ 1.84% 87,633$ Port St. Joe 3,286,960$ 3,462 949$ 5.22% 178,327$ Wewahitchka 1,647,157$ 1,967 837$ 5.22% 86,336$ HAMILTON BOCC 4,117,544$ 8,643 476$ 0.30% 15,584$ Jasper 1,030,053$ 1,649 625$ 4.80% 53,137$ Jennings 355,343$ 884 402$ 5.10% 19,746$ White Springs 301,339$ 784 384$ 5.00% 16,360$ HARDEE BOCC 6,944,274$ 16,086 432$ 1.34% 102,336$ Bowling Green 644,560$ 2,914 221$ 3.32% 22,506$ Wauchula 2,663,339$ 4,948 538$ 5.10% 145,068$ Zolfo Springs 416,936$ 1,827 228$ 2.32% 10,615$ HENDRY BOCC 12,526,439$ 26,083 480$ 1.84% 243,539$ Clewiston 3,998,527$ 7,161 558$ 5.22% 217,617$ LaBelle 3,591,465$ 4,628 776$ 4.22% 158,811$ HERNANDO BOCC 98,972,273$ 164,878 600$ 1.40% 1,499,174$ Brooksville 7,753,963$ 7,711 1,006$ 5.22% 433,213$ Weeki Wachee 422,372$ 12 35,198$ 0.10% 735$ HIGHLANDS BOCC 38,933,005$ 77,109 505$ 1.84% 758,131$ Avon Park 5,250,968$ 8,865 592$ 5.22% 285,180$ Lake Placid 2,345,102$ 2,175 1,078$ 5.22% 125,879$
2012 Local Government Financial Information Handbook Page 111

Calculated by the Florida Department of Revenue's Office of Tax Research
Revenue2011 Estimate
Estimated Revenue Per Capita AfterCST Base Sharing Consumption Current Adjustments
Local Government LFY 2013 Population (See Note 4) Tax Rate (See Notes 1-3)
Forecast of Taxable Communication Services and RevenuesLocal Fiscal Year Ending September 30, 2013
Sebring 9,017,116$ 10,540 856$ 5.22% 502,671$ HILLSBOROUGH BOCC 620,687,231$ 841,817 737$ 4.00% 25,246,299$ Plant City 25,203,815$ 34,746 725$ 5.72% 1,481,871$ Tampa 440,885,479$ 336,723 1,309$ 5.22% 23,019,316$ Temple Terrace 28,925,302$ 24,442 1,183$ 5.40% 1,589,335$ HOLMES BOCC 5,225,802$ 14,230 367$ 1.84% 97,007$ Bonifay 2,203,613$ 2,762 798$ 5.82% 139,647$ Esto 119,874$ 364 329$ 0.80% 962$ Noma 64,971$ 198 328$ 0.10% 73$ Ponce de Leon 256,093$ 589 435$ 2.70% 7,731$ Westville 154,005$ 294 524$ 0.90% 1,785$ INDIAN RIVER BOCC 70,182,247$ 91,411 768$ 1.84% 1,445,443$ Fellsmere 1,461,008$ 5,220 280$ 5.22% 81,055$ Indian River Shores 5,224,887$ 3,908 1,337$ 5.22% 279,066$ Orchid 1,049,085$ 416 2,522$ 2.10% 21,668$ Sebastian 16,184,731$ 21,995 736$ 5.22% 869,251$ Vero Beach 24,550,453$ 15,256 1,609$ 5.12% 1,356,012$ JACKSON BOCC 14,630,897$ 28,022 522$ 1.84% 290,488$ Alford 226,530$ 489 463$ 1.50% 3,671$ Bascom 64,360$ 121 532$ 1.32% 1,006$ Campbellton 146,961$ 232 633$ 5.22% 8,073$ Cottondale 390,151$ 931 419$ 5.22% 22,186$ Graceville 1,748,897$ 2,278 768$ 5.22% 94,994$ Grand Ridge 444,063$ 951 467$ 5.22% 24,081$ Greenwood 358,007$ 684 523$ 5.22% 19,681$ Jacob City 108,070$ 267 405$ 5.22% 5,641$ Malone 652,932$ 644 1,014$ 5.22% 34,695$ Marianna 4,778,893$ 5,959 802$ 5.22% 257,017$ Sneads 1,224,668$ 1,862 658$ 3.30% 41,425$ JEFFERSON BOCC 5,042,966$ 11,096 454$ 1.14% 59,441$ Monticello 2,369,646$ 2,456 965$ 4.50% 115,616$ LAFAYETTE BOCC 1,302,891$ 5,664 230$ 1.84% 25,538$ Mayo 1,324,892$ 1,216 1,090$ 2.00% 27,695$ LAKE BOCC 94,348,996$ 153,227 616$ 1.94% 1,918,166$ Astatula 756,586$ 1,795 421$ 4.40% 34,430$ Clermont 24,352,307$ 29,358 829$ 5.22% 1,324,022$ Eustis 12,186,872$ 18,489 659$ 5.22% 653,306$ Fruitland Park 3,289,279$ 4,152 792$ 5.22% 177,049$ Groveland 5,417,301$ 8,800 616$ 5.22% 287,582$ Howey-in-the-Hills 924,057$ 1,100 840$ 5.22% 49,934$ Lady Lake 20,946,818$ 13,946 1,502$ 5.22% 1,125,161$ Leesburg 20,410,495$ 20,408 1,000$ 5.22% 1,092,447$ Mascotte 1,901,785$ 5,091 374$ 5.22% 101,926$ Minneola 5,875,132$ 9,485 619$ 5.22% 313,560$ Montverde 972,380$ 1,455 668$ 5.10% 50,178$ Mount Dora 10,716,595$ 12,557 853$ 5.22% 571,985$ Tavares 9,981,900$ 14,015 712$ 5.32% 605,096$ Umatilla 2,149,364$ 3,458 622$ 5.22% 116,040$ LEE BOCC 259,083,070$ 348,061 744$ 3.61% 9,658,882$ Bonita Springs 37,901,050$ 44,301 856$ 1.82% 707,148$
2012 Local Government Financial Information Handbook Page 112

Calculated by the Florida Department of Revenue's Office of Tax Research
Revenue2011 Estimate
Estimated Revenue Per Capita AfterCST Base Sharing Consumption Current Adjustments
Local Government LFY 2013 Population (See Note 4) Tax Rate (See Notes 1-3)
Forecast of Taxable Communication Services and RevenuesLocal Fiscal Year Ending September 30, 2013
Cape Coral 111,316,379$ 156,340 712$ 5.22% 5,916,037$ Fort Myers 67,773,641$ 63,586 1,066$ 5.22% 3,646,092$ Fort Myers Beach 13,806,897$ 6,262 2,205$ 5.22% 736,366$ Sanibel 10,332,245$ 6,470 1,597$ 5.22% 550,831$ LEON BOCC 64,837,969$ 93,728 692$ 5.22% 3,460,797$ Tallahassee 147,064,317$ 180,954 813$ 6.10% 9,067,496$ LEVY BOCC 13,635,102$ 31,277 436$ 1.84% 254,885$ Bronson 590,879$ 1,100 537$ 2.50% 16,060$ Cedar Key 572,456$ 707 810$ 2.10% 12,906$ Chiefland 1,984,041$ 2,256 879$ 5.22% 107,939$ Fanning Springs (part) 142,639$ 484 295$ 5.62% 8,566$ Inglis 786,033$ 1,328 592$ 5.22% 43,703$ Otter Creek 50,198$ 134 375$ 0.70% 409$ Williston 1,889,529$ 2,765 683$ 5.22% 101,922$ Yankeetown 336,514$ 494 681$ 5.72% 20,631$ LIBERTY BOCC 2,873,261$ 5,863 490$ 0.60% 17,330$ Bristol 510,693$ 952 536$ 5.22% 26,647$ MADISON BOCC 5,203,881$ 13,527 385$ 1.84% 98,682$ Greenville 280,372$ 830 338$ 4.62% 14,523$ Lee 344,992$ 340 1,015$ 5.22% 19,082$ Madison 2,741,232$ 2,872 954$ 5.22% 149,706$ MANATEE BOCC 185,567,376$ 254,437 729$ 1.84% 3,562,586$ Anna Maria 1,821,171$ 1,505 1,210$ 5.22% 97,039$ Bradenton 41,778,922$ 49,688 841$ 5.72% 2,479,645$ Bradenton Beach 1,675,690$ 1,177 1,424$ 5.72% 98,787$ Holmes Beach 4,607,417$ 3,840 1,200$ 5.22% 247,484$ Longboat Key (part) 3,947,659$ 2,395 1,648$ 5.22% 233,740$ Palmetto 9,163,267$ 12,662 724$ 5.42% 512,952$ MARION BOCC 156,249,476$ 263,602 593$ 1.74% 2,870,614$ Belleview 4,122,662$ 4,560 904$ 5.12% 218,342$ Dunnellon 2,309,612$ 1,737 1,330$ 5.22% 131,795$ McIntosh 461,894$ 452 1,022$ 1.30% 6,512$ Ocala 60,925,941$ 56,359 1,081$ 5.22% 3,252,889$ Reddick 198,927$ 511 389$ 1.30% 3,454$ MARTIN BOCC 107,700,841$ 126,214 853$ 1.84% 2,148,239$ Jupiter Island 1,369,188$ 815 1,680$ 5.22% 75,490$ Ocean Breeze Park 338,565$ 320 1,058$ 2.20% 9,779$ Sewall's Point 2,125,281$ 2,002 1,062$ 3.12% 71,606$ Stuart 21,842,369$ 15,613 1,399$ 5.22% 1,192,491$ MIAMI-DADE BOCC 828,146,230$ 1,102,142 751$ 5.22% 44,906,690$ Aventura 46,682,487$ 35,723 1,307$ 5.20% 2,732,359$ Bal Harbour 5,653,945$ 2,502 2,260$ 5.22% 299,007$ Bay Harbor Islands 5,778,106$ 5,634 1,026$ 5.22% 299,080$ Biscayne Park 2,521,220$ 3,072 821$ 5.22% 136,062$ Coral Gables 79,216,757$ 47,031 1,684$ 5.22% 4,320,798$ Cutler Bay 24,895,066$ 40,644 613$ 5.22% 1,299,313$ Doral 94,417,317$ 46,516 2,030$ 5.22% 5,116,273$ El Portal 1,708,988$ 2,341 730$ 5.60% 102,109$ Florida City 5,015,879$ 11,704 429$ 5.42% 286,427$ Golden Beach 1,045,697$ 922 1,134$ 2.12% 24,534$
2012 Local Government Financial Information Handbook Page 113
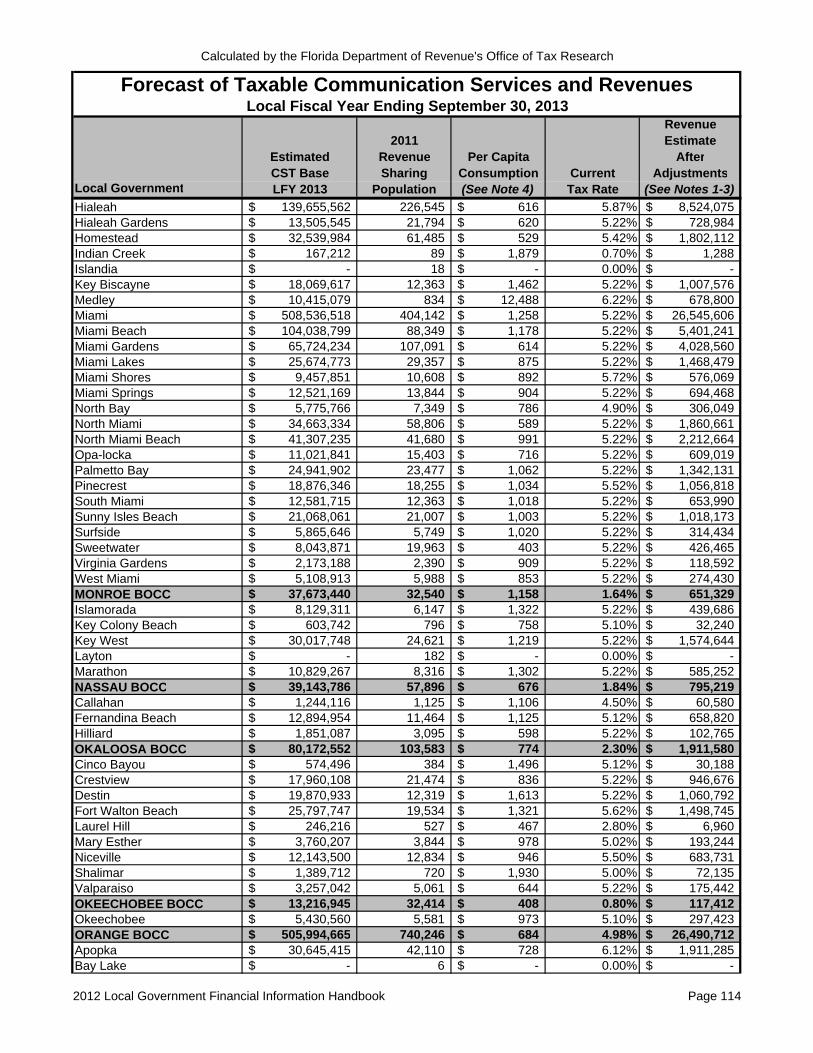
Calculated by the Florida Department of Revenue's Office of Tax Research
Revenue2011 Estimate
Estimated Revenue Per Capita AfterCST Base Sharing Consumption Current Adjustments
Local Government LFY 2013 Population (See Note 4) Tax Rate (See Notes 1-3)
Forecast of Taxable Communication Services and RevenuesLocal Fiscal Year Ending September 30, 2013
Hialeah 139,655,562$ 226,545 616$ 5.87% 8,524,075$ Hialeah Gardens 13,505,545$ 21,794 620$ 5.22% 728,984$ Homestead 32,539,984$ 61,485 529$ 5.42% 1,802,112$ Indian Creek 167,212$ 89 1,879$ 0.70% 1,288$ Islandia -$ 18 -$ 0.00% -$ Key Biscayne 18,069,617$ 12,363 1,462$ 5.22% 1,007,576$ Medley 10,415,079$ 834 12,488$ 6.22% 678,800$ Miami 508,536,518$ 404,142 1,258$ 5.22% 26,545,606$ Miami Beach 104,038,799$ 88,349 1,178$ 5.22% 5,401,241$ Miami Gardens 65,724,234$ 107,091 614$ 5.22% 4,028,560$ Miami Lakes 25,674,773$ 29,357 875$ 5.22% 1,468,479$ Miami Shores 9,457,851$ 10,608 892$ 5.72% 576,069$ Miami Springs 12,521,169$ 13,844 904$ 5.22% 694,468$ North Bay 5,775,766$ 7,349 786$ 4.90% 306,049$ North Miami 34,663,334$ 58,806 589$ 5.22% 1,860,661$ North Miami Beach 41,307,235$ 41,680 991$ 5.22% 2,212,664$ Opa-locka 11,021,841$ 15,403 716$ 5.22% 609,019$ Palmetto Bay 24,941,902$ 23,477 1,062$ 5.22% 1,342,131$ Pinecrest 18,876,346$ 18,255 1,034$ 5.52% 1,056,818$ South Miami 12,581,715$ 12,363 1,018$ 5.22% 653,990$ Sunny Isles Beach 21,068,061$ 21,007 1,003$ 5.22% 1,018,173$ Surfside 5,865,646$ 5,749 1,020$ 5.22% 314,434$ Sweetwater 8,043,871$ 19,963 403$ 5.22% 426,465$ Virginia Gardens 2,173,188$ 2,390 909$ 5.22% 118,592$ West Miami 5,108,913$ 5,988 853$ 5.22% 274,430$ MONROE BOCC 37,673,440$ 32,540 1,158$ 1.64% 651,329$ Islamorada 8,129,311$ 6,147 1,322$ 5.22% 439,686$ Key Colony Beach 603,742$ 796 758$ 5.10% 32,240$ Key West 30,017,748$ 24,621 1,219$ 5.22% 1,574,644$ Layton -$ 182 -$ 0.00% -$ Marathon 10,829,267$ 8,316 1,302$ 5.22% 585,252$ NASSAU BOCC 39,143,786$ 57,896 676$ 1.84% 795,219$ Callahan 1,244,116$ 1,125 1,106$ 4.50% 60,580$ Fernandina Beach 12,894,954$ 11,464 1,125$ 5.12% 658,820$ Hilliard 1,851,087$ 3,095 598$ 5.22% 102,765$ OKALOOSA BOCC 80,172,552$ 103,583 774$ 2.30% 1,911,580$ Cinco Bayou 574,496$ 384 1,496$ 5.12% 30,188$ Crestview 17,960,108$ 21,474 836$ 5.22% 946,676$ Destin 19,870,933$ 12,319 1,613$ 5.22% 1,060,792$ Fort Walton Beach 25,797,747$ 19,534 1,321$ 5.62% 1,498,745$ Laurel Hill 246,216$ 527 467$ 2.80% 6,960$ Mary Esther 3,760,207$ 3,844 978$ 5.02% 193,244$ Niceville 12,143,500$ 12,834 946$ 5.50% 683,731$ Shalimar 1,389,712$ 720 1,930$ 5.00% 72,135$ Valparaiso 3,257,042$ 5,061 644$ 5.22% 175,442$ OKEECHOBEE BOCC 13,216,945$ 32,414 408$ 0.80% 117,412$ Okeechobee 5,430,560$ 5,581 973$ 5.10% 297,423$ ORANGE BOCC 505,994,665$ 740,246 684$ 4.98% 26,490,712$ Apopka 30,645,415$ 42,110 728$ 6.12% 1,911,285$ Bay Lake -$ 6 -$ 0.00% -$
2012 Local Government Financial Information Handbook Page 114

Calculated by the Florida Department of Revenue's Office of Tax Research
Revenue2011 Estimate
Estimated Revenue Per Capita AfterCST Base Sharing Consumption Current Adjustments
Local Government LFY 2013 Population (See Note 4) Tax Rate (See Notes 1-3)
Forecast of Taxable Communication Services and RevenuesLocal Fiscal Year Ending September 30, 2013
Belle Isle 4,734,497$ 6,018 787$ 5.22% 258,582$ Eatonville 1,979,448$ 2,136 927$ 5.22% 107,328$ Edgewood 2,460,437$ 2,503 983$ 5.22% 134,146$ Lake Buena Vista -$ 21 -$ 0.00% -$ Maitland 26,493,798$ 15,808 1,676$ 5.22% 1,447,760$ Oakland 1,780,884$ 2,556 697$ 5.22% 94,374$ Ocoee 25,559,572$ 36,020 710$ 5.22% 1,375,878$ Orlando 306,079,310$ 241,588 1,267$ 5.22% 15,977,340$ Windermere 3,399,625$ 2,877 1,182$ 5.22% 189,911$ Winter Garden 25,831,745$ 35,281 732$ 5.22% 1,370,555$ Winter Park 42,548,500$ 27,682 1,537$ 5.72% 2,499,217$ OSCEOLA BOCC 115,488,542$ 176,290 655$ 5.22% 6,159,074$ Kissimmee 49,868,391$ 60,182 829$ 5.22% 2,653,806$ St. Cloud 23,221,835$ 36,980 628$ 5.10% 1,210,552$ PALM BEACH BOCC 455,005,837$ 587,829 774$ 5.72% 27,092,301$ Atlantis 2,566,933$ 2,019 1,271$ 5.10% 134,453$ Belle Glade 8,830,834$ 17,426 507$ 5.12% 475,006$ Boca Raton 145,488,701$ 84,652 1,719$ 5.42% 8,386,562$ Boynton Beach 47,888,032$ 68,409 700$ 5.22% 2,645,408$ Briny Breezes 181,802$ 601 302$ 5.22% 10,109$ Cloud Lake 71,167$ 137 519$ 2.32% 1,830$ Delray Beach 68,167,463$ 60,933 1,119$ 5.22% 3,697,560$ Glen Ridge 174,438$ 219 797$ 5.22% 9,417$ Golf 1,028,061$ 250 4,112$ 5.22% 54,541$ Greenacres 21,773,128$ 37,873 575$ 6.44% 1,455,464$ Gulf Stream 1,132,717$ 885 1,280$ 5.22% 60,015$ Haverhill 1,141,098$ 1,894 602$ 2.60% 33,774$ Highland Beach 5,161,982$ 3,542 1,457$ 5.22% 283,226$ Hypoluxo 1,698,089$ 2,636 644$ 5.92% 105,704$ Juno Beach 6,645,462$ 3,181 2,089$ 5.22% 353,986$ Jupiter 56,703,886$ 55,542 1,021$ 5.22% 3,074,345$ Jupiter Inlet Colony -$ 400 -$ 0.00% -$ Lake Clarke Shores 2,903,515$ 3,374 861$ 5.22% 156,777$ Lake Park 7,122,749$ 8,198 869$ 5.32% 398,887$ Lake Worth 22,747,767$ 34,901 652$ 5.22% 1,294,829$ Lantana 6,093,538$ 10,404 586$ 5.42% 352,530$ Loxahatchee Groves 2,619,273$ 3,162 828$ 5.22% 136,726$ Manalapan 930,755$ 406 2,293$ 1.60% 17,624$ Mangonia Park 1,889,008$ 1,812 1,042$ 5.62% 109,122$ North Palm Beach 13,924,360$ 12,033 1,157$ 5.22% 763,143$ Ocean Ridge 2,239,311$ 1,783 1,256$ 2.00% 48,792$ Pahokee 2,639,169$ 5,546 476$ 5.22% 149,052$ Palm Beach 21,861,399$ 8,350 2,618$ 5.22% 1,191,697$ Palm Beach Gardens 54,209,035$ 48,630 1,115$ 3.50% 1,973,397$ Palm Beach Shores 1,626,042$ 1,141 1,425$ 5.52% 91,975$ Palm Springs 11,898,809$ 19,799 601$ 5.32% 653,527$ Riviera Beach 27,197,830$ 32,535 836$ 5.22% 1,459,739$ Royal Palm Beach 26,585,986$ 34,234 777$ 5.22% 1,448,215$ South Bay 1,397,004$ 2,967 471$ 5.10% 74,389$ South Palm Beach 897,799$ 1,174 765$ 5.60% 54,437$
2012 Local Government Financial Information Handbook Page 115

Calculated by the Florida Department of Revenue's Office of Tax Research
Revenue2011 Estimate
Estimated Revenue Per Capita AfterCST Base Sharing Consumption Current Adjustments
Local Government LFY 2013 Population (See Note 4) Tax Rate (See Notes 1-3)
Forecast of Taxable Communication Services and RevenuesLocal Fiscal Year Ending September 30, 2013
Tequesta 6,506,110$ 5,646 1,152$ 5.22% 354,605$ Wellington 51,722,755$ 56,752 911$ 5.22% 2,773,976$ West Palm Beach 126,908,748$ 100,482 1,263$ 5.42% 7,134,178$ PASCO BOCC 281,215,099$ 425,804 660$ 1.84% 5,376,005$ Dade City 5,511,880$ 6,485 850$ 5.22% 306,273$ New Port Richey 15,003,384$ 14,959 1,003$ 5.62% 876,617$ Port Richey 3,421,568$ 2,652 1,290$ 5.10% 188,278$ St. Leo 392,399$ 1,378 285$ 5.22% 20,708$ San Antonio 1,069,055$ 1,138 939$ 0.80% 9,177$ Zephyrhills 10,678,955$ 13,317 802$ 5.52% 613,968$ PINELLAS BOCC 205,862,078$ 269,593 764$ 5.22% 11,007,857$ Belleair 3,707,621$ 3,877 956$ 5.22% 201,074$ Belleair Beach 1,548,376$ 1,563 991$ 6.00% 103,792$ Belleair Bluffs 2,033,285$ 2,048 993$ 5.22% 109,477$ Belleair Shore 107,940$ 109 990$ 2.40% 2,811$ Clearwater 111,005,799$ 107,853 1,029$ 5.12% 5,895,892$ Dunedin 26,662,656$ 35,301 755$ 5.32% 1,449,076$ Gulfport 8,229,356$ 12,022 685$ 6.12% 519,488$ Indian Rocks Beach 4,222,347$ 4,102 1,029$ 2.30% 100,036$ Indian Shores 2,273,032$ 1,421 1,600$ 5.22% 120,169$ Kenneth City 2,654,913$ 4,989 532$ 5.10% 138,000$ Largo 61,366,900$ 77,670 790$ 5.62% 3,517,417$ Madeira Beach 4,294,247$ 4,295 1,000$ 5.72% 252,939$ North Redington Beach 1,385,652$ 1,427 971$ 5.12% 72,453$ Oldsmar 21,688,341$ 13,605 1,594$ 5.82% 1,287,481$ Pinellas Park 40,322,226$ 49,293 818$ 5.40% 2,216,192$ Redington Beach 1,253,066$ 1,424 880$ 5.40% 69,954$ Redington Shores 2,124,510$ 2,128 998$ 5.22% 113,903$ Safety Harbor 14,381,818$ 16,878 852$ 6.52% 957,999$ St. Petersburg 214,341,664$ 245,871 872$ 5.62% 12,317,649$ St. Pete Beach 9,824,716$ 9,334 1,053$ 5.70% 574,940$ Seminole 15,134,499$ 17,222 879$ 5.22% 800,947$ South Pasadena 4,464,644$ 4,981 896$ 5.72% 261,747$ Tarpon Springs 18,867,801$ 23,465 804$ 5.72% 1,102,364$ Treasure Island 7,006,007$ 6,715 1,043$ 5.22% 372,212$ POLK BOCC 210,524,024$ 374,109 563$ 5.22% 11,199,299$ Auburndale 13,503,864$ 13,593 993$ 5.22% 690,448$ Bartow 10,975,640$ 17,119 641$ 6.12% 692,024$ Davenport 2,937,384$ 2,963 991$ 3.52% 112,632$ Dundee 2,194,170$ 3,749 585$ 5.72% 130,453$ Eagle Lake 1,598,237$ 2,286 699$ 5.42% 89,693$ Fort Meade 2,447,529$ 5,607 437$ 5.32% 137,196$ Frostproof 2,003,011$ 3,008 666$ 5.32% 112,960$ Haines City 11,963,330$ 20,661 579$ 5.22% 646,276$ Highland Park -$ 230 -$ 0.00% -$ Hillcrest Heights 101,882$ 248 411$ 1.10% 1,233$ Lake Alfred 2,956,923$ 5,023 589$ 5.22% 158,502$ Lake Hamilton 814,164$ 1,243 655$ 3.72% 32,067$ Lake Wales 9,944,106$ 14,261 697$ 5.22% 547,745$ Lakeland 85,566,153$ 97,690 876$ 6.43% 5,666,107$
2012 Local Government Financial Information Handbook Page 116
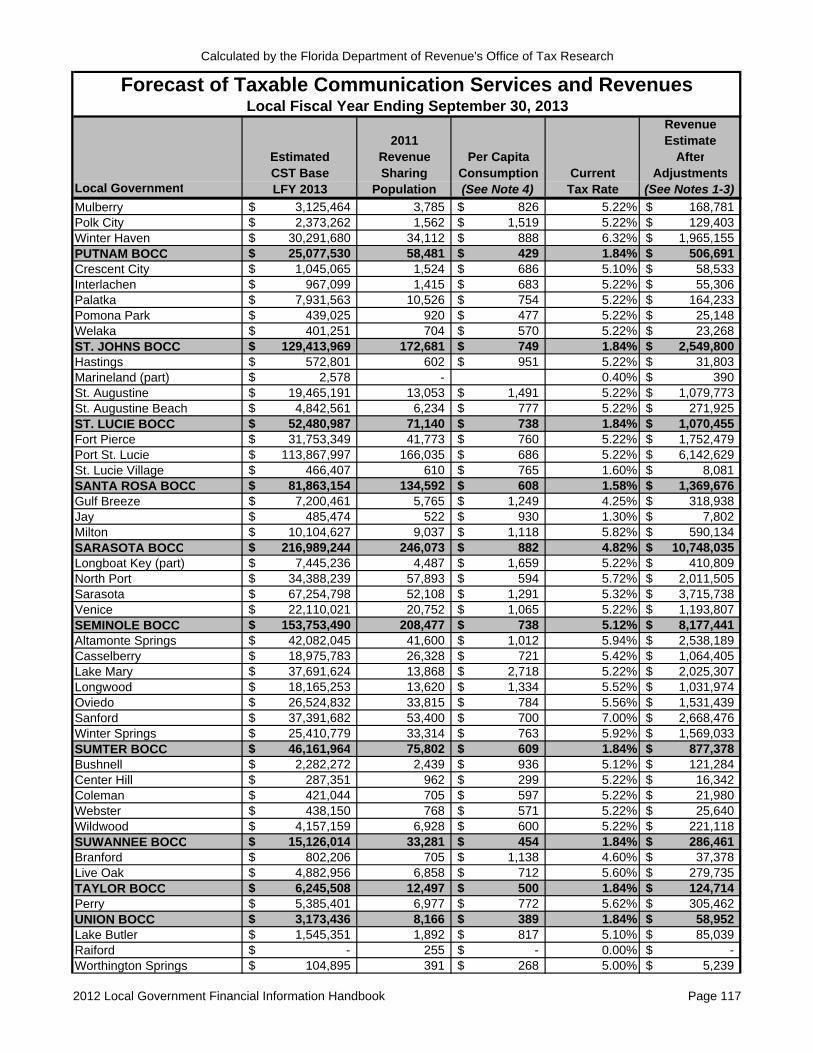
Calculated by the Florida Department of Revenue's Office of Tax Research
Revenue2011 Estimate
Estimated Revenue Per Capita AfterCST Base Sharing Consumption Current Adjustments
Local Government LFY 2013 Population (See Note 4) Tax Rate (See Notes 1-3)
Forecast of Taxable Communication Services and RevenuesLocal Fiscal Year Ending September 30, 2013
Mulberry 3,125,464$ 3,785 826$ 5.22% 168,781$ Polk City 2,373,262$ 1,562 1,519$ 5.22% 129,403$ Winter Haven 30,291,680$ 34,112 888$ 6.32% 1,965,155$ PUTNAM BOCC 25,077,530$ 58,481 429$ 1.84% 506,691$ Crescent City 1,045,065$ 1,524 686$ 5.10% 58,533$ Interlachen 967,099$ 1,415 683$ 5.22% 55,306$ Palatka 7,931,563$ 10,526 754$ 5.22% 164,233$ Pomona Park 439,025$ 920 477$ 5.22% 25,148$ Welaka 401,251$ 704 570$ 5.22% 23,268$ ST. JOHNS BOCC 129,413,969$ 172,681 749$ 1.84% 2,549,800$ Hastings 572,801$ 602 951$ 5.22% 31,803$ Marineland (part) 2,578$ - 0.40% 390$ St. Augustine 19,465,191$ 13,053 1,491$ 5.22% 1,079,773$ St. Augustine Beach 4,842,561$ 6,234 777$ 5.22% 271,925$ ST. LUCIE BOCC 52,480,987$ 71,140 738$ 1.84% 1,070,455$ Fort Pierce 31,753,349$ 41,773 760$ 5.22% 1,752,479$ Port St. Lucie 113,867,997$ 166,035 686$ 5.22% 6,142,629$ St. Lucie Village 466,407$ 610 765$ 1.60% 8,081$ SANTA ROSA BOCC 81,863,154$ 134,592 608$ 1.58% 1,369,676$ Gulf Breeze 7,200,461$ 5,765 1,249$ 4.25% 318,938$ Jay 485,474$ 522 930$ 1.30% 7,802$ Milton 10,104,627$ 9,037 1,118$ 5.82% 590,134$ SARASOTA BOCC 216,989,244$ 246,073 882$ 4.82% 10,748,035$ Longboat Key (part) 7,445,236$ 4,487 1,659$ 5.22% 410,809$ North Port 34,388,239$ 57,893 594$ 5.72% 2,011,505$ Sarasota 67,254,798$ 52,108 1,291$ 5.32% 3,715,738$ Venice 22,110,021$ 20,752 1,065$ 5.22% 1,193,807$ SEMINOLE BOCC 153,753,490$ 208,477 738$ 5.12% 8,177,441$ Altamonte Springs 42,082,045$ 41,600 1,012$ 5.94% 2,538,189$ Casselberry 18,975,783$ 26,328 721$ 5.42% 1,064,405$ Lake Mary 37,691,624$ 13,868 2,718$ 5.22% 2,025,307$ Longwood 18,165,253$ 13,620 1,334$ 5.52% 1,031,974$ Oviedo 26,524,832$ 33,815 784$ 5.56% 1,531,439$ Sanford 37,391,682$ 53,400 700$ 7.00% 2,668,476$ Winter Springs 25,410,779$ 33,314 763$ 5.92% 1,569,033$ SUMTER BOCC 46,161,964$ 75,802 609$ 1.84% 877,378$ Bushnell 2,282,272$ 2,439 936$ 5.12% 121,284$ Center Hill 287,351$ 962 299$ 5.22% 16,342$ Coleman 421,044$ 705 597$ 5.22% 21,980$ Webster 438,150$ 768 571$ 5.22% 25,640$ Wildwood 4,157,159$ 6,928 600$ 5.22% 221,118$ SUWANNEE BOCC 15,126,014$ 33,281 454$ 1.84% 286,461$ Branford 802,206$ 705 1,138$ 4.60% 37,378$ Live Oak 4,882,956$ 6,858 712$ 5.60% 279,735$ TAYLOR BOCC 6,245,508$ 12,497 500$ 1.84% 124,714$ Perry 5,385,401$ 6,977 772$ 5.62% 305,462$ UNION BOCC 3,173,436$ 8,166 389$ 1.84% 58,952$ Lake Butler 1,545,351$ 1,892 817$ 5.10% 85,039$ Raiford -$ 255 -$ 0.00% -$ Worthington Springs 104,895$ 391 268$ 5.00% 5,239$
2012 Local Government Financial Information Handbook Page 117

Calculated by the Florida Department of Revenue's Office of Tax Research
Revenue2011 Estimate
Estimated Revenue Per Capita AfterCST Base Sharing Consumption Current Adjustments
Local Government LFY 2013 Population (See Note 4) Tax Rate (See Notes 1-3)
Forecast of Taxable Communication Services and RevenuesLocal Fiscal Year Ending September 30, 2013
VOLUSIA BOCC 75,758,785$ 113,966 665$ 5.22% 4,180,122$ Daytona Beach 57,107,589$ 60,978 937$ 5.22% 3,010,570$ Daytona Beach Shores 5,588,270$ 4,261 1,311$ 5.22% 301,814$ DeBary 13,644,790$ 19,315 706$ 5.22% 734,409$ DeLand 19,742,526$ 27,330 722$ 5.22% 1,069,385$ Deltona 47,864,686$ 85,233 562$ 6.22% 3,080,956$ Edgewater 13,844,418$ 20,734 668$ 5.22% 753,576$ Flagler Beach (part) 24,936$ 60 416$ 5.10% 21,635$ Holly Hill 9,308,113$ 11,652 799$ 5.22% 503,888$ Lake Helen 1,796,915$ 2,614 687$ 5.22% 96,969$ New Smyrna Beach 21,571,880$ 22,668 952$ 5.22% 1,168,951$ Oak Hill 1,018,424$ 1,794 568$ 5.22% 54,540$ Orange City 9,878,556$ 11,255 878$ 5.22% 524,850$ Ormond Beach 36,689,574$ 38,372 956$ 5.22% 2,010,761$ Pierson 946,460$ 1,724 549$ 5.10% 50,187$ Ponce Inlet 3,302,889$ 3,039 1,087$ 5.42% 183,916$ Port Orange 41,351,451$ 56,313 734$ 5.22% 2,246,577$ South Daytona 9,138,624$ 12,285 744$ 5.72% 551,456$ WAKULLA BOCC 13,855,970$ 26,867 516$ 5.22% 731,228$ St. Marks 238,767$ 289 826$ 5.10% 12,521$ Sopchoppy 277,715$ 457 608$ 1.20% 3,478$ WALTON BOCC 46,494,747$ 46,276 1,005$ 0.70% 339,184$ DeFuniak Springs 4,402,240$ 5,109 862$ 4.82% 219,130$ Freeport 1,411,349$ 1,860 759$ 1.30% 19,027$ Paxton 312,912$ 633 494$ 2.60% 8,168$ WASHINGTON BOCC 6,991,659$ 17,250 405$ 1.84% 145,035$ Caryville 69,205$ 288 240$ 5.22% 3,990$ Chipley 2,767,172$ 3,595 770$ 5.42% 156,560$ Ebro 105,894$ 260 407$ 0.60% 850$ Vernon 328,965$ 705 467$ 5.40% 19,361$ Wausau 154,040$ 389 396$ 5.22% 8,818$ STATEWIDE TOTALS 15,454,154,536$ 18,777,429 823$ 749,589,741$
Notes:1. All adjustments made to payments issued to local governments are subject to s. 202.18(3), F.S. The estimates reflect the total after all relevant adjustments. Adjustments that started in 2009 will affect 5 months in LFY 2012-13. Adjustments that start in 2012 will affect 7 months in LFY 2012-13.2. The estimate does not include administrative fees or revenues generated from county surtax conversion factors.3. The local government Communications Services Tax (CST) estimate uses the growth rate from the January 3, 2012 Revenue Estimating Conference (REC) estimate. Local impacts of ($4.7) million under HB 809 as adopted by the REC were used to adjust the growth from the CST estimate.
4. The per capita consumption figures are calculated by dividing each jurisdiction's Estimated Communications Services Tax Base figure by its respective 2011 revenue sharing population figure. The revenue sharing population estimates reflect those certified to the Florida Department of Revenue by the Executive Office of the Governor in June 2012.
2012 Local Government Financial Information Handbook Page 118

Office of Economic and Demographic Research
2012 Local Government Financial Information Handbook 119
Convention Development Taxes Section 212.0305, Florida Statutes
Summary: Duval, Miami-Dade, and Volusia counties are authorized to levy convention development taxes on transient rental transactions. Three of the five available levies are applicable to separate taxing districts in Volusia County. The levies may be authorized pursuant to an ordinance enacted by the county’s governing body, and the tax rates are either 2 or 3 percent depending on the particular levy. Generally, the revenues may be used for capital construction of convention centers and other tourist-related facilities as well as tourist promotion; however, the authorized uses vary by levy. General Law Amendments: There were no general law amendments resulting from the 2012 Regular Legislative Session. Authorization to Levy: Each of the three counties is eligible to levy and impose a separate convention development tax on the exercise within its boundaries of the taxable privilege. These levies require the adoption of an authorizing ordinance by vote of the county’s governing body. The effective date of the levy shall be the first day of any month at least 60 days after enactment of the ordinance. One of the tax’s principal purposes is to promote tourism and use of hotel facilities by facilitating the improvement and construction of convention centers. Any municipality or county where the tax is levied is specifically authorized to adopt and implement a convention center booking policy to apply to convention centers owned or operated by a municipality or county. Such policy shall give priority to bookings in accordance with the minimum number of hotel rooms to be utilized in connection with such bookings or with the impact of such bookings on the amount of tax generated.1 Administrative Procedures: The convention development tax on transient rentals shall apply to the amount of any payment made by any person to rent, lease, or use for a period of six months or less any living quarters or accommodations in a hotel, apartment hotel, motel, resort motel, apartment, apartment motel, roominghouse, tourist or trailer camp, mobile home park, recreational vehicle park, condominium or timeshare resort. The tax shall be charged by the person receiving the consideration for the lease or rental at the time of payment for such lease or rental. Such person is responsible for receiving, accounting for, and remitting the tax to the Department of Revenue (DOR). The DOR shall keep records showing the amount of taxes collected, including records disclosing the amount of taxes collected from each county in which a tax is levied. The DOR shall promulgate such rules and publish such forms as necessary to enforce these taxes.2 A county may exempt itself from the requirements that the tax be administered by the DOR according to ch. 212, F.S., if the county adopts an ordinance providing for local collection and administration of the tax. A portion of the tax collections may be retained by the county for its administrative costs; however, that portion cannot exceed 2 percent of collections. A county electing to locally administer the tax shall also adopt an ordinance electing either to assume all responsibility for auditing the records and accounts of dealers and 1. Section 212.0305(2), F.S. 2. Section 212.0305(3), F.S.
Office of Economic and Demographic Research
120 2012 Local Government Financial Information Handbook
assessing, collecting, and enforcing payments of delinquent taxes, or delegate such authority to the DOR.3 Reporting Requirements: For each levy, the county is responsible for furnishing the DOR with a certified copy of the ordinance within 10 days after approval of such ordinance. Distribution of Proceeds: Tax collections received by the DOR, less the costs of administration, shall be paid monthly to the county, which imposed the particular tax or taxes. The funds shall be placed in a specific trust fund or funds created by the county.4 Attorney General Opinions: Florida’s Attorney General has issued the following legal opinions relevant to this revenue source.
Opinion # Subject 83-71 Authority of Department of Revenue to collect taxes 88-37 Local option tourist development tax 97-64 Tourist development tax/convention development tax 98-34 Convention development tax, rental proceeds 2002-34 Convention development tax, taxability of boat slips
The full texts of these opinions are available via a searchable on-line database.5 Local government officials seeking more clarification should review the opinions in their entirety. The statutory language pertaining to this revenue source has been amended since its authorization. The reader should keep the date of the opinion in mind when reviewing its relevance to current law or any interpretations that have been articulated in Florida case law. Tax Rates and Current Year’s Revenues: Please refer to the tables and the discussion of their use in the Tourist Development Taxes section. Additional Detail: Additional information regarding the five individual authorizations to levy can be found in the three sections immediately following this one.
3. Section 212.0305(5), F.S. 4. Section 212.0305(3)(e), F.S. 5. http://myfloridalegal.com/ago.nsf/Opinions

Office of Economic and Demographic Research
2012 Local Government Financial Information Handbook 121
Consolidated County Convention Development Tax Section 212.0305(4)(a), Florida Statutes
Summary: Each county operating under a government consolidated with one or more municipalities in the county may impose a 2 percent tax on the total consideration charged for transient rental transactions. The tax shall be levied pursuant to an ordinance enacted by the county’s governing body. The county may designate or appoint an authority to administer and disburse the tax proceeds and any other related source of revenue. However, the authority’s annual budget is subject to approval of the county’s governing body. Counties Eligible to Levy: Only a county operating under a government consolidated with one or more municipalities in the county (i.e., Duval County) is eligible to levy this tax. Authorized Uses of Proceeds: The tax proceeds and any accrued interest must be used in any of the following manners; however, the authorized use described in #1 below shall apply only to municipalities with a population of 10,000 or more.
1. To promote and advertise tourism. 2. To extend, enlarge, and improve existing publicly owned convention centers in the county. 3. To construct a multipurpose convention/coliseum/exhibition center or the maximum components
thereof as funds permit in the county. 4. To acquire, construct, extend, enlarge, remodel, repair, improve, or maintain one or more convention
centers, stadiums, exhibition halls, arenas, coliseums, or auditoriums. For the purposes of completion of such projects, the tax revenues and accrued interest may be used as collateral for authorized projects, including bonds issued for such projects. The revenues and accrued interest may also be used as a pledge or capital contribution in conjunction with a partnership, joint venture, or other business arrangement between the county and one or more business entities for authorized projects. In addition, one-half of the proceeds collected within a municipality the government of which is not consolidated with the county must be remitted to the municipality at the request of the municipality's governing body. The revenues may only be used by the municipality for the previously discussed authorized uses, but the municipality may enter into an interlocal agreement with the county or any other municipality in the county to use such revenue to jointly finance any authorized project. However, this provision does not apply to the distribution to the county of any convention development tax revenues necessary to repay the principal or interest on any bonds issued pursuant to s. 212.0305(4)(a)4.a., F.S. If the governing body adopts a resolution stating that the municipality is unable to use such revenue for any other authorized purpose, the municipality may use the revenue to acquire and develop municipal parks, lifeguard stations, or athletic fields.

Office of Economic and Demographic Research
122 2012 Local Government Financial Information Handbook
This page was intentionally left blank.

Office of Economic and Demographic Research
2012 Local Government Financial Information Handbook 123
Charter County Convention Development Tax Section 212.0305(4)(b), Florida Statutes
Summary: Each county, as defined in s. 125.011(1), F.S., (i.e., Miami-Dade County) may impose a 3 percent tax on the total consideration charged for transient rental transactions. The tax shall be levied pursuant to an ordinance enacted by the county’s governing body. Prior to the county enacting an ordinance imposing the levy, the county shall notify the governing body of each municipality in which projects are to be developed. As a precondition to the receipt of funding, the governing bodies of such municipalities shall designate or appoint an authority that shall have the power to approve the concept, location, program, and design of the facilities or improvements to be developed. In addition, such authority shall administer and disburse the tax proceeds and any other related source of revenue. However, the authority’s annual budget is subject to approval of the municipality’s governing body. The governing body of each municipality levying the Municipal Resort Tax may adopt a resolution prohibiting the imposition of this convention development tax within the municipality’s jurisdiction. If a municipality adopts such a resolution, the tax shall be imposed by the county in all other areas of the county except such municipality. No funds collected from this convention development tax may be expended in a municipality that has adopted such a resolution. Counties Eligible to Levy: Only a county, as defined in s. 125.011(1), F.S. (i.e., Miami-Dade County) is eligible to levy this tax. Authorized Uses of Proceeds: The tax proceeds, including any accrued interest, shall be used in the following manner.
1. Two-thirds of the proceeds shall be used to extend, enlarge, and improve the largest existing publicly owned convention center in the county.
2. One-third of the proceeds shall be used to construct a new multipurpose convention/coliseum/exhibition center/stadium or the maximum components thereof as funds permit in the most populous municipality in the county.
3. After completion of any project described in #1 above, the tax revenues and interest accrued pursuant to that authorized use, may be used to acquire, construct, extend, enlarge, remodel, repair, improve, plan for, operate, manage, or maintain one or more convention centers, stadiums, exhibition halls, arenas, coliseums, auditoriums, or golf courses, and may be used to acquire and construct an intercity light rail transportation system as described in the Light Rail Transit System Status Report to the Legislature dated April 1988. This system shall provide a means to transport persons to and from the largest existing publicly owned convention center in the county and the hotels north of the convention center and to and from the downtown area of the most populous municipality in the county as determined by the county.
4. After completion of any project described in #2 above, the tax revenues and interest accrued pursuant to that authorized use, may be used, as determined by the county to operate an authority created pursuant to s. 212.0305(4)(b)4., F.S., or to acquire, construct, extend, enlarge, remodel, repair, improve, operate, or maintain one or more convention centers, stadiums, exhibition halls, arenas,

Office of Economic and Demographic Research
124 2012 Local Government Financial Information Handbook
coliseums, auditoriums, golf courses, or related buildings and parking facilities in the most populous municipality in the county.
For the purposes of completion of such projects, the tax revenues and accrued interest may be used as collateral for authorized projects, including bonds issued for such projects. The revenues and accrued interest may also be used as a pledge or capital contribution in conjunction with a partnership, joint venture, or other business arrangement between a municipality and one or more business entities for authorized projects.

Office of Economic and Demographic Research
2012 Local Government Financial Information Handbook 125
Special District Convention Development Tax, Special Convention Development Tax, and Subcounty Convention Development Tax
Sections 212.0305(4)(c)-(e), and 212.03055, Florida Statutes Summary: Each county, chartered under Article VIII of the Florida Constitution, and levying a tourist advertising ad valorem tax within a special taxing district on January 1, 1984, (i.e., Volusia County) may impose a tax of up to 3 percent on the total consideration charged for transient rental transactions. Three separate taxes are authorized for levy in three separate taxing districts; however, the combined effect is to authorize a countywide tax. The taxes shall be levied pursuant to an ordinance enacted by the county’s governing body. Pursuant to s. 212.03055, F.S., any rate increase in excess of 2 percent must be approved by a supermajority (i.e., majority plus one) vote of the county’s governing body. The Special District Convention Development Tax shall be imposed within the boundaries of the special taxing district (i.e., Halifax Area Advertising Authority). The Special Convention Development Tax shall be imposed within the area outside the boundaries of the special taxing district and to the southeast of State Road 415 (i.e., Southeast Volusia Advertising Authority). The Subcounty Convention Development Tax shall be imposed within the area outside the boundaries of the special taxing district and to the northwest of State Road 415 (i.e., West Volusia Advertising Authority). For each levy, the county is authorized to designate or appoint an authority to administer and disburse the tax proceeds. The members of the authority shall be selected from persons involved in the tourism and lodging industries doing business within the special district. The majority of the members shall represent the lodging industry. The authority shall consist of 11 members and shall serve without compensation at the pleasure of the county’s governing body. The authority’s annual budget shall be subject to approval of the county’s governing body as well. Counties Eligible to Levy: Only a county, chartered under Article VIII of the Florida Constitution, and levying a tourist advertising ad valorem tax within a special taxing district on January 1, 1984, (i.e., Volusia County) is eligible to levy this tax. Authorized Uses of Proceeds: The tax proceeds, including any accrued interest, shall be used in the following manner.
1. To promote and advertise tourism. 2. To fund convention bureaus, tourist bureaus, tourist information centers, and news bureaus.

Office of Economic and Demographic Research
126 2012 Local Government Financial Information Handbook
This page was intentionally left blank.

Office of Economic and Demographic Research
2012 Local Government Financial Information Handbook 127
Discretionary Surtax on Documents Sections 125.0167 and 201.031, Florida Statutes
Summary: The governing body in each county, as defined by s. 125.011(1), F.S., (i.e., Miami-Dade County) is authorized to levy a discretionary surtax on deeds and other instruments relating to real property or interest in real property for the purpose of establishing and financing a Housing Assistance Loan Trust Fund [hereinafter Trust Fund] to assist in the financing of the construction, rehabilitation, or purchase of housing for low and moderate income families. The surtax levy shall be by ordinance approved by a majority vote of the total membership of the county’s governing body. General Law Amendments: There were no general law amendments resulting from the 2012 Regular Legislative Session. Eligibility Requirements: Each county, as defined by s. 125.011(1), F.S., (i.e., Miami-Dade County) is eligible to levy this surtax.1 This surtax is scheduled for repeal on October 1, 2031. Administrative Procedures: The surtax levy and creation of the Trust Fund shall be by ordinance, which shall set forth the policies and procedures of the assistance program. The ordinance shall be proposed at a regular meeting of the governing body at least two weeks prior to formal adoption. Formal adoption shall not be effective unless approved on final vote by a majority of the governing body’s total membership. The ordinance shall not take effect until 90 days after formal adoption.2 The surtax rate shall not exceed 45 cents for each $100 or fractional part thereof on deeds and other instruments relating to real property or interests in real property.3 The surtax shall be applicable to those documents taxable under the provisions of s. 201.02, F.S., except that there shall be no surtax on any document pursuant to which the interest granted, assigned, transferred, or conveyed involves only a single-family residence. Such single-family residence may be a condominium unit, a unit held through stock ownership or membership representing a proprietary interest in a corporation owning a fee or leasehold initially in excess or 98 years, or a detached dwelling.4 According to the Department of Revenue (DOR), Miami-Dade County currently levies the surtax at the maximum rate of 45 cents. Each county that levies the surtax shall comply with the following requirements.5
1. The county shall include in its financial report required pursuant to s. 218.32, F.S., information showing the revenues and expenditures of the Trust Fund for the fiscal year.
2. The county shall adopt a housing plan every three years that includes provisions substantially similar to the plans required in s. 420.9075(1), F.S.
1. Section 201.031(1), F.S. 2. Section 125.0167(2), F.S. 3. Section 125.0167(1), F.S. 4. Sections 125.0167(1); 201.031(1), F.S. 5. Section 201.031(3), F.S.

Office of Economic and Demographic Research
128 2012 Local Government Financial Information Handbook
3. The county shall have adopted an affordable housing element of its comprehensive land use plan that complies with s. 163.3177(6)(f), F.S.
4. The county shall require by resolution that the staff or entity, which has administrative authority for implementing the housing plan, prepare and submit to the county’s governing body an annual report substantially similar to the report required in s. 420.9075(10), F.S.
Distribution of Proceeds: The DOR shall pay to the county’s governing body that levies the surtax all taxes, penalties, and interest collected under this section less any costs of administration.6 The county shall deposit the revenues into the Trust Fund, except that a portion of such revenues may be deposited into the county’s Home Investment Trust Fund as defined by and created pursuant to federal law.7 Authorized Uses: No less than 50 percent of the funds used to provide such housing assistance shall be for the benefit of low-income families. The term low income family means a family whose income does not exceed 80 percent of the median income for the area. The term moderate income family means a family whose income is in excess of 80 percent but less than 140 percent of the median income for the area. The term housing is not limited to single-family, detached dwellings.8 The county shall use the revenues only to help finance the construction, rehabilitation, or purchase of housing for low and moderate-income families; pay the necessary costs of collection and enforcement of the surtax; and fund any local matching contributions required by federal law. Authorized uses of the surtax revenues shall include, but not be limited to, providing funds for first and second mortgages and acquiring property for the purpose of forming housing cooperatives. Special consideration shall be given toward utilizing the revenues in community development corporations’ neighborhood economic development programs. No more than 50 percent of the revenues collected each year may be used to help finance new construction, and the surtax proceeds shall not be used for rent subsidies or grants.9 No more than 10 percent of the surtax revenues collected by the DOR and remitted to the county in any fiscal year may be used for administrative costs.10 Notwithstanding the provisions of s. 125.0167(3), F.S., after the authorized administrative cost deduction, no less than 35 percent of the surtax revenues shall be used to provide homeownership assistance for low and moderate-income families, and no less than 35 percent shall be used for construction, rehabilitation, and purchase of rental housing units. At the county’s discretion, the remaining amount may be allocated to provide homeownership assistance or rental housing units. Any funds allocated for homeownership assistance or rental housing units that are not committed at the end of the fiscal year shall be reallocated in subsequent years consistent with these provisions. The term homeownership assistance means assisting low and moderate-income families in purchasing a home as their primary residence, which includes, but is not limited to, reducing: 1) the cost of the home with below-market construction financing, 2) the amount of down payment and closing costs paid by the borrower, and 3) the mortgage payment to an affordable amount for the purchaser or using any other financial assistance measure set forth in s. 420.5088, F.S.11 A local government receiving surtax funds can only use the funds to 6. Section 201.031(2), F.S. 7. Section 125.0167(3), F.S. 8. Section 125.0167(1), F.S. 9. Section 125.0167(3), F.S. 10. Section 125.0167(4), F.S. 11. Section 125.0167(5)(a), F.S.

Office of Economic and Demographic Research
2012 Local Government Financial Information Handbook 129
rehabilitate its own property after the majority of its governing body determines that no other funding sources are available.12 Housing Choice Assistance Voucher Program13: The governing body of each county, as defined in s. 125.011(1), F.S., (i.e., Miami-Dade County) may, by county ordinance and pursuant to procedures and requirements provided by such ordinance, create a housing choice assistance voucher program. This program provides a method that enables an employer who purchases property subject to the discretionary surtax to file for vouchers. Upon payment of the surtax, the purchasing employer may file for an allocation for the vouchers from the county in an amount not to exceed 50 percent of the discretionary surtax paid. The purchasing employer shall distribute the allocation to employers in the form of vouchers pursuant to the program’s established rules and procedures. The vouchers shall be used for down payment assistance by low or moderate-income persons within the county and within a 5-mile radius of the purchasing employer who are actively employed by the purchasing employer or by a business entity directly affiliated with the purchasing employer and prequalified for a mortgage loan by a certified lending institution. The term housing choice assistance voucher means the document used to access assistance paid by the county from the discretionary surtax balance in the Trust Fund to a prospective purchaser of a single-family residence, which must be the purchaser’s homestead. The term purchasing employer means a business or business entity that has acquired real property within the county and paid the surtax due as a result of the property’s acquisition. Any voucher not distributed to and redeemed by an employee within one year may not be used for housing choice assistance. Housing assistance paid pursuant to the program that is expended in a given year is included in the calculation for determining the percentage of discretionary surtax funds used for homeownership purposes for that year. Attorney General Opinions: No opinions specifically relevant to this surtax have been issued. Prior Years’ Revenues: A summary of prior years’ distributions is available.14
12. Section 125.0167(6), F.S. 13. Section 125.0167(7), F.S. 14. http://edr.state.fl.us/Content/local-government/data/data-a-to-z/index.cfm

Office of Economic and Demographic Research
130 2012 Local Government Financial Information Handbook
This page was intentionally left blank.

Office of Economic and Demographic Research
2012 Local Government Financial Information Handbook 131
Green Utility Fee Section 369.255, Florida Statutes
Summary: Counties with a population of 500,000 or more and municipalities with a population of 200,000 or more are authorized to create one or more green utilities or adopt fees sufficient to plan, restore, and manage urban forest resources, greenways, forest preserves, wetlands, and other aquatic zones and may create a stewardship grant program for private natural areas. General Law Amendments: There were no general law amendments resulting from the 2012 Regular Legislative Session. Eligibility Requirements: Counties with a population of 500,000 or more and municipalities with a population of 200,000 or more are eligible to impose the fee.1 Based on the 2011 population estimates, the ten counties of Brevard, Broward, Duval, Hillsborough, Lee, Miami-Dade, Orange, Palm Beach, Pinellas, and Polk have a total population of 500,000 or more. Likewise, the six municipalities of Hialeah, Jacksonville, Miami, Orlando, St. Petersburg, and Tampa have a population of 200,000 or more. Eligible local governments may create, alone or in cooperation with other counties or municipalities pursuant to s. 163.01, F.S., one or more greenspace management districts to fund the planning, management, operation, and administration of a greenspace management program. Administrative Procedures: The fee shall be collected on a voluntary basis as set forth by the county or municipality, and it shall be calculated to generate sufficient funds to plan, manage, operate, and administer a greenspace management program. Private natural areas assessed according to s. 193.501, F.S., would qualify for stewardship grants.2 Distribution of Proceeds: The law is silent to this issue; therefore, it is assumed that each eligible local government imposing the fee would retain all proceeds, unless an interlocal agreement provided otherwise. Authorized Uses: The fee proceeds shall be used to plan, restore, and manage urban forest resources, greenways, forest preserves, wetlands, and other aquatic zones. In addition, an eligible county or municipality may create a stewardship grant program for private natural areas.3 Attorney General Opinions: No opinions specifically relevant to this fee have been issued.
1. Section 369.255(3), F.S. 2. Section 369.255(2), F.S. 3. Section 369.255(2), F.S.

Office of Economic and Demographic Research
132 2012 Local Government Financial Information Handbook
This page was intentionally left blank.

Office of Economic and Demographic Research
2012 Local Government Financial Information Handbook 133
Gross Receipts Tax on Commercial Hazardous Waste Facilities Section 403.7215, Florida Statutes
Summary: A tax of 3 percent is levied on the annual gross receipts of a privately owned, permitted, commercial hazardous waste transfer, storage, treatment, or disposal facility. The owner of such facility is responsible for paying the annual tax to the primary host local government. The proceeds shall be used for a variety of purposes related to the facility’s inspection and security. General Law Amendments: There were no general law amendments resulting from the 2012 Regular Legislative Session. Eligibility Requirements: Any county or municipality having a privately owned, permitted, commercial hazardous waste transfer, storage, treatment, or disposal facility operating within its corporate limits, is entitled to receive the tax proceeds. Administrative Procedures: The owner or operator of each privately owned, permitted, commercial hazardous waste transfer, storage, treatment, or disposal facility shall, on or before January 25th of each year, file with the chief fiscal officer of the primary host local government a certified, notarized statement indicating the gross receipts from all charges imposed during the preceding calendar year for the storage, treatment, or disposal of hazardous waste at the facility.1 The owner of the facility is responsible for paying the tax annually on or before July 1st.2 The primary host local government is responsible for regulating, controlling, administering, and enforcing this tax.3 Distribution of Proceeds: The primary host local government retains all proceeds. It is not known how many local governments are currently receiving proceeds from this tax. Authorized Uses: Tax proceeds received by the local government shall be appropriated and used to pay for the following items.4
1. Costs of tax collection; 2. Any local inspection costs incurred by the local government to ensure that the facility is operating
pursuant to the provisions of part IV of ch. 403, F.S., and any rule adopted pursuant to this part; 3. Additional security costs incurred as a result of operating the facility, including monitoring, fire
protection, and police protection; 4. Hazardous waste contingency planning implementation; 5. Road construction or repair costs for public roads adjacent to and within 1,000 feet of the facility; 6. Any other cost incurred by the local government as the result of the operation of the facility, if all
other costs specified in #1-5 have been paid; and 1. Section 403.7215(1), F.S. 2. Section 403.7215(2), F.S. 3. Section 403.7215(4), F.S. 4. Section 403.7215(3), F.S.

Office of Economic and Demographic Research
134 2012 Local Government Financial Information Handbook
7. Any other purposes relating to environmental protection within the jurisdiction of the local government, if all other costs specified in #1-6 have been paid. Such purposes may include, but not be limited to, the establishment of a system for the collection and disposal of household, agricultural, and other types of hazardous waste; the protection or improvement of the quality of the air or water; or the acquisition of environmentally sensitive lands.
Attorney General Opinions: No opinions specifically relevant to this tax have been issued.
Office of Economic and Demographic Research
2012 Local Government Financial Information Handbook 135
Highway Safety Fees – Red Light Cameras Sections 316.0083 and 318.18, Florida Statutes
Summary: In 2010, the Legislature established the Mark Wandall Traffic Safety Program and authorized the use of traffic infraction detectors.1 A traffic infraction detector is defined as a vehicle sensor installed to work in conjunction with a traffic control signal and a camera or cameras synchronized to automatically record two or more sequenced photographic or electronic images or streaming video of only the rear of a motor vehicle at the time the vehicle fails to stop behind the stop bar or clearly marked stop line when facing a traffic control signal steady red light.2 A civil penalty of $158 is imposed on the motor vehicle’s owner when a traffic infraction detector has indicated that the driver failed to stop at a traffic signal and a traffic ticket has been issued by a state or local traffic enforcement officer. Eligible county or municipal governments receive or retain a local government share of the penalty. General Law Amendments: Chapter 2012-174, L.O.F., (CS/CS/CS/HB 599) provides for the dismissal of a uniform traffic citation for a red-light violation when the motor vehicle owner is deceased and an affidavit with specified supporting documents is filed with the issuing agency. This change became effective July 1, 2012. Chapter 2012-174, L.O.F., (CS/CS/CS/HB 599) provides for the dismissal of a uniform traffic citation for a red-light violation when the motor vehicle owner is deceased and an affidavit with specified supporting documents is filed with the issuing agency. In addition, the legislation corrects references to a trust fund that receives a portion of the civil penalty. These changes became effective July 1, 2012. Eligibility Requirements: A county or municipal government may use traffic infraction detectors to enforce obedience of traffic control devices when a driver fails to stop at a traffic signal on streets and highways under its jurisdiction.3 Only a county may install or authorize the installation of such detectors within the county’s unincorporated area. Only a municipality may install or authorize the installation of such detector within the municipality’s incorporated area. Those county or municipal governments having such installed detectors within their respective jurisdictions are eligible to receive a portion of the proceeds. Administrative Procedures: Penalties assessed and collected by the Department of Highway and Motor Vehicles (DHSMV), county, or municipality authorized to collect the funds, less any authorized amount retained by the county or municipality, shall be paid to the Department of Revenue (DOR) on a weekly basis by means of electronic funds transfer.4 Each county or municipality that operates a traffic infraction detector shall submit a report by October 1, 2012, and annually thereafter, to the DHSMV that details the results of using traffic infraction detectors and enforcement procedures for the preceding state fiscal year.5
1. Chapter 2010-80, L.O.F. 2. Section 316.003(87), F.S. 3. Section 316.008(8), F.S. 4. Section 316.0083(1)(b), F.S. 5. Section 316.0083(4)(a), F.S.

Office of Economic and Demographic Research
136 2012 Local Government Financial Information Handbook
Distribution of Proceeds: If enforcement is made by the DHSMV’s traffic infraction enforcement officer, the $158 penalty shall be remitted in the following manner.6
1. $100 shall be remitted to the DOR for deposit into the state’s General Revenue Fund. 2. $10 shall be remitted to the DOR for deposit into the Department of Health Emergency Medical
Services Trust Fund. 3. $3 shall be remitted to the DOR for deposit into the Brain and Spinal Cord Injury Trust Fund. 4. $45 shall be distributed to the municipality in which the violation occurred or to the county if the
violation occurred in the unincorporated area. If enforcement is made by a county or municipal traffic infraction enforcement officer, the $158 penalty shall be remitted in the following manner.7
1. $70 shall be remitted to the DOR for deposit into the state’s General Revenue Fund. 2. $10 shall be remitted to the DOR for deposit into the Department of Health Emergency Medical
Services Trust Fund. 3. $3 shall be remitted to the DOR for deposit into the Brain and Spinal Cord Injury Trust Fund. 4. $75 shall be retained by the county or municipality enforcing the enacted ordinance.
Authorized Uses: The use of the revenue is at the discretion of the governing body. Attorney General Opinions: Florida’s Attorney General has issued the following legal opinion relevant to this revenue source.
Opinion # Subject 2010-35 Traffic cameras, requirements for use
The full text of this opinion is available via a searchable on-line database.8 Local government officials seeking more clarification should review the opinions in their entirety. The reader should keep the date of the opinion in mind when reviewing its relevance to current law or any interpretations that have been articulated in Florida case law.
6. Section 316.0083(1)(b)3.a., F.S. 7. Section 316.0083(1)(b)3.b., F.S. 8. http://myfloridalegal.com/ago.nsf/Opinions

Office of Economic and Demographic Research
2012 Local Government Financial Information Handbook 137
Insurance Premium Tax Sections 175.101 and 185.08, Florida Statutes
Summary: Each qualified municipality or special fire control district, having a lawfully established fund providing pension benefits to firefighters, may impose an excise tax of 1.85 percent of the gross amount of receipts from policyholders on all premiums collected on property insurance policies covering property within the legally defined limits of the municipality or special fire control district.1 The tax revenues shall be distributed to the municipality or special fire control district according to the insured property’s location. The net proceeds of this excise tax shall be paid into the firefighters’ pension trust fund established by municipalities and special fire control districts.2 Each qualified municipality, having a lawfully established fund providing retirement benefits to police officers, may impose an excise tax amounting to 0.85 percent of the gross amount of receipts from policyholders on all premiums collected on casualty insurance policies covering property within the municipality’s legally defined limits.3 The net proceeds of this excise tax shall be paid into the municipal police officers’ retirement trust fund established by the municipalities.4 General Law Amendments: There were no general law amendments resulting from the 2012 Regular Legislative Session. Eligibility Requirements: Any municipality or special fire control district described and classified in s. 175.041, F.S., having a lawfully established firefighters’ pension trust fund, may impose the tax upon every insurance company, corporation, or other insurer engaged in the business of property insurance. Any municipality described and classified in s. 185.03, F.S., having a lawfully established municipal police officers’ retirement trust fund, may impose the tax upon every insurance company, corporation, or other insurer engaged in the business of casualty insurance. Administrative Procedures: Both excise taxes shall be payable annually on March 1st of each year after the passage of an ordinance, in the case of a municipal government; or resolution, in the case of a special fire control district, assessing and imposing the taxes.5 Installments of taxes shall be paid according to the provisions of s. 624.5092(2)(a)-(c), F.S. The DOR shall create, maintain, and update an electronic database that designates the local taxing jurisdiction for each street address and address range in the state, and insurance companies are required to exercise due diligence in employing the database to correctly assign parcels to local jurisdictions for tax purposes.6 The DOR shall also keep a separate account of all taxes collected for each tax on behalf of each municipality or special fire control district. All taxes collected must be transferred to the Police and Firefighters’ Premium Tax Trust Fund [hereinafter Trust Fund] and shall be separately accounted for by the Department of Management Services’ Division of Retirement, which administers the Trust Fund.7 1. Section 175.101(1), F.S. 2. Section 175.091, F.S. 3. Section 185.08(1), F.S. 4. Section 185.07, F.S. 5. Sections 175.101(3); 185.08(3), F.S. 6. Sections 175.1015; 185.085, F.S. 7. Sections 175.121(1); 185.10(1), F.S.
Office of Economic and Demographic Research
138 2012 Local Government Financial Information Handbook
Distribution of Proceeds: The Chief Financial Officer shall, on or before July 1st and at other times authorized by the Division of Retirement, disburse those monies collected from both taxes to eligible municipalities and special fire control districts.8 Separate from the issue of funding firefighters’ pension trust funds, every qualified firefighter shall be paid supplemental salary compensation by the employing agency if the firefighter has achieved the specified level of educational attainment. The employing agency may include any municipality, any county, or any special district employing firefighters. Authorized Uses: The net proceeds of the 1.85 percent tax are used to supplement firefighters’ pension trust funds. Net proceeds of the 0.85 percent tax are used to supplement police officers’ retirement trust funds. Attorney General Opinions: Florida’s Attorney General has issued the following legal opinions relevant to this revenue source.
Opinion # Subject 74-220 Consolidation of police forces of two cities 75-277 Fire protection outside boundaries 78-03 Trustee of pension plan, city officer 78-69 Funds intended for firefighters and policemen, pension 78-148 Municipal pension trust funds 84-100 Contract with private firm for fire protection 89-90 Police officers’ retirement trust fund, s. 185.15 91-15 Retirement plans 2001-67 Firefighters’ and Police Officers’ pension, premium tax 2003-54 City pension fund, amendment of investment authority
The full texts of these opinions are available via a searchable on-line database.9 Local government officials seeking more clarification should review the opinions in their entirety. The statutory language pertaining to this revenue source has been amended since its authorization. The reader should keep the date of the opinion in mind when reviewing its relevance to current law or any interpretations that have been articulated in Florida case law. Prior Years’ Revenues: Summaries of prior years’ distributions are available.10
8. Sections 175.121(2); 185.10(2), F.S. 9. http://myfloridalegal.com/ago.nsf/Opinions 10. http://edr.state.fl.us/Content/local-government/data/data-a-to-z/index.cfm

Office of Economic and Demographic Research
2012 Local Government Financial Information Handbook 139
Local Business Tax (Including the Panama City and Panama City Beach Merchant License Tax)
Chapter 205, Florida Statutes Summary: The local business tax represents the fees charged and the method by which a local government authority grants the privilege of engaging in or managing any business, profession, and occupation within its jurisdiction. Counties and municipalities may levy a business tax, and the tax proceeds are considered general revenue for the local government. This tax does not refer to any fees or licenses paid to any board, commission, or officer for permits, registration, examination, or inspection. General Law Amendments: Chapter 2012-102, L.O.F., (HB 7125) creates s. 205.067, F.S., to exempt any individual who is licensed and operating as a real estate sales or broker associate under ch. 475, F.S., from applying for an exemption from a local business tax, paying a local business tax, or obtaining a local business tax receipt when operating in the employ of another. Since Chapter 2011-78, L.O.F., created an exemption, which operates prospectively since October 13, 3010, from local business taxes imposed on individuals who are employees of another person, this legislation exempts from the tax those real estate sales and broker associates who are in a local governing authority that adopted a local business tax imposed upon employees prior to that date. This change becomes effective October 1, 2012. The Revenue Estimating Conference estimates that this legislation will have a recurring negative fiscal impact to local governments of ($3.8) million beginning in the 2012-13 fiscal year. Eligibility Requirements: County and municipal governments are eligible to levy, by appropriate resolution or ordinance, a business tax for the privilege of engaging in or managing any business, profession, or occupation within its jurisdiction.1 Prior to January 1, 1995, a county, as defined in s. 125.011(1), F.S., (i.e., Miami-Dade County) or any adjacent county (i.e., Broward, Collier, and Monroe counties) was authorized to levy and collect, by ordinance enacted by the county’s governing body, an additional business tax up to 50 percent of the appropriate business tax imposed under s. 205.033(1), F.S.2 Administrative Procedures: In order to levy a business tax, the governing body must first give at least 14 days of public notice between the first and last reading of the resolution or ordinance by publishing a notice in a newspaper of general circulation within its jurisdiction as defined by law. The public notice must contain the proposed classifications and rates applicable to the business tax.3 A number of other conditions for levy are imposed on counties and municipalities.4 The governing body of a municipality that levies the tax may request that the county in which the municipality is located issue the municipal receipt and collect the tax. The governing body of a county that levies the tax may request that municipalities within the county issue the county receipt and collect the tax. However, before any local government issues any business receipts on behalf of another local government,
1. Sections 205.032, .042, F.S. 2. Section 205.033(6), F.S. 3. Sections 205.032, .042, F.S. 4. Sections 205.033, .043, F.S.
Office of Economic and Demographic Research
140 2012 Local Government Financial Information Handbook
appropriate agreements must be entered into by the affected local governments.5 All business tax receipts shall be sold by the appropriate tax collector beginning July 1st of each year. The taxes are due and payable on or before September 30th of each year, and the receipts expire on September 30th of the succeeding year. In several situations, administrative penalties are also imposed.6 Beginning October 1, 1995, a county or municipality that has not adopted a business tax ordinance or resolution may adopt a business tax ordinance. The tax rate structure and classifications in the adopted ordinance must be reasonable and based upon the rate structure and classifications prescribed in ordinances adopted by adjacent local governments that have implemented s. 205.0535, F.S. If no adjacent local government has implemented s. 205.0535, F.S., or if the governing body of the county or municipality finds that the rate structures or classifications of adjacent local governments are unreasonable, then an alternative method is authorized. In such a case, the rate structure or classifications prescribed in the ordinance of the local government seeking to impose the tax may be based upon those prescribed in ordinances adopted by local governments that have implemented s. 205.0535, F.S., in counties or municipalities that have a comparable population.7 By October 1, 2008, any municipality that has adopted by ordinance a local business tax after October 1, 1995, may, by ordinance, reclassify businesses, professions, and occupations and may establish new rate structures, provided certain conditions have been met. If such conditions have been met, counties and municipalities may, every other year thereafter, increase or decrease by ordinance the rates of business taxes by up to 5 percent. However, an increase may not be enacted by less than a majority plus one vote of the governing body. A county or municipality is not prohibited from decreasing or repealing any authorized local business tax.8 State law exempts, or allows local governments to exempt, certain individuals from all or some portion of local business taxes.9 State law also regulates the issuance of local business tax receipts to certain individuals or businesses.10 Distribution of Proceeds: The revenues derived from the business tax imposed by county governments, exclusive of the costs of collection and credit given for municipal business taxes, shall be apportioned between the county’s unincorporated area and the incorporated municipalities located within the county by a ratio derived by dividing their respective populations by the county’s total population.11 Within 15 days following the month of receipt, the apportioned revenues shall be sent to each governing authority; however, this provision does not apply to counties that have established a new rate structure pursuant to s. 205.0535, F.S.12 Authorized Uses: The tax proceeds can be considered general revenue for the county or municipality. Additionally, the county business tax proceeds may be used for overseeing and implementing a comprehensive economic development strategy through advertising, promotional activities, and other sales and marketing techniques.13 The proceeds
5. Section 205.045, F.S. 6. Section 205.053, F.S. 7. Section 205.0315, F.S. 8. Section 205.0535, F.S. 9. Sections 205.054, .063, .064, .065, .162, .171, .191, .192, .193, F.S. 10. Sections 205.194, .196, .1965, .1967, .1969, .1971, .1973, .1975, F.S. 11. Section 205.033(4), F.S. 12. Section 205.033(5), F.S. 13. Section 205.033(7), F.S.

Office of Economic and Demographic Research
2012 Local Government Financial Information Handbook 141
of the additional county business tax imposed pursuant to s. 205.033(6), F.S., shall be distributed by the county’s governing body to a designated organization or agency for the purpose of implementing a comprehensive economic development strategy through advertising, promotional activities, and other sales and marketing techniques.14 Attorney General Opinions: Florida’s Attorney General has issued the following legal opinion relevant to this revenue source.
Opinion # Subject 2010-23 Local business taxes, amendment of ordinance 2010-41 Local business tax, reclassify/exempt businesses 2011-20 Guns dealers/gunsmiths, municipal business license tax
Interested persons can also access numerous opinions issued under the revenue source’s prior name occupational license tax. The full texts of these opinions are available via a searchable on-line database.15 Local government officials seeking more clarification should review the opinions in their entirety. The statutory language pertaining to this revenue source has been amended since its authorization. The reader should keep the date of the opinion in mind when reviewing its relevance to current law or any interpretations that have been articulated in Florida case law. Prior Years’ Revenues: A summary of prior years’ revenues reported by local governments is available.16 ________________________________________________________________________________________
Panama City and Panama City Beach Merchant License Tax Section 205.043 implemented by Part II, Chapter 7, Article II, Section 7-53, of the Panama City
Municipal Code, 2005 codified through Ordinance No. 2447 (enacted April 24, 2012);17 and Code of Ordinances, Chapter 14, Section 14-29 (136), of the Panama City Beach Code of Ordinances
codified through Ordinance No. 1216 (enacted January 12, 2012).18 Summary – Panama City Tax: The City of Panama City levies separate license taxes on the gross sales of all retail and wholesale merchants within the municipal jurisdiction. For retail merchants, the tax shall be $10 for each $1,000 (i.e., 1 percent) of gross sales with a minimum tax of $1.50 per month. For wholesale merchants, the tax shall be $0.50 for each $1,000 of gross sales, or major fraction thereof, (i.e., 0.05 percent) with a minimum tax of $1.50 per month. Additionally, the tax shall apply only to the first $10,000 collected by a merchant for any single item of merchandise. The merchant shall pay the license tax by the 30th day of each month, based on the merchant’s gross sales of the preceding month. If payment is made on or before the 20th day of the month such tax is payable, a 3 percent discount is allowed.
14. Section 205.033(6)(b), F.S. 15. http://myfloridalegal.com/ago.nsf/Opinions 16. http://edr.state.fl.us/Content/local-government/data/data-a-to-z/index.cfm 17. http://library.municode.com/index.aspx?clientId=13862&stateId=9&stateName=Florida 18. http://library.municode.com/index.aspx?clientId-14445

Office of Economic and Demographic Research
142 2012 Local Government Financial Information Handbook
Summary – Panama City Beach Tax: The City of Panama City Beach levies separate business taxes on the gross sales of all retail and wholesale merchants within the municipal jurisdiction. For retail merchants, the tax shall be $10 for each $1,000 of gross sales, or major portion thereof, (i.e., 1 percent) with a minimum tax of $50 per year. For wholesale merchants, the tax shall be $1.50 for each $1,000 of gross sales, or major fraction thereof, (i.e., 0.15 percent) with a minimum tax of $50 per year. On the first day of each month, the merchant shall submit a true and correct statement of gross sales for the preceding month at which time the tax shall be paid. The statement and payment shall be delinquent on the 10th day of each month following application for receipt. Upon becoming delinquent, the receipt shall be subject to revocation by the city council, and the city clerk shall report at each regular city council meeting any delinquent merchant’s business tax receipts. Once revoked, a merchant’s receipts may be reinstated if all accrued taxes plus a 10 percent penalty of the gross amount is paid. No merchant shall transact business while his or her business tax receipt stands revoked. If payment is made on or before the 10th day of the month such tax is payable, a 3 percent discount is allowed. The Cities of Panama City and Panama City Beach are the only known local governments in Florida that levy a license/business tax on the gross receipts of retail and wholesale merchants. Prior Years’ Revenues: The annual amounts of general fund revenue generated from merchant licenses are reported separately from other local business tax revenues in the City of Panama City’s annual budgets.19 However, such amounts are not separately reported in the City of Panama City Beach’s annual budgets.20 A summary of prior years’ revenues reported by local governments is available.21
19. http://www.pcgov.org/publications-3 20. http://www.pcbgov.com/financial_statements.htm 21. http://edr.state.fl.us/Content/local-government/data/data-a-to-z/index.cfm

Office of Economic and Demographic Research
2012 Local Government Financial Information Handbook 143
Local Discretionary Sales Surtaxes Sections 212.054-.055, Florida Statutes
Summary: Eight different types of local discretionary sales surtaxes (also known as local option sales taxes) are currently authorized in law and represent potential revenue sources for county and municipal governments and school districts.1 The local discretionary sales surtaxes apply to all transactions subject to the state tax imposed on sales, use, services, rentals, admissions, and other authorized transactions authorized pursuant to ch. 212, F.S., and communications services as defined for purposes of ch. 202, F.S.2 The local discretionary sales surtax rate varies from county to county, depending on the particular levies authorized in that jurisdiction. Discretionary sales surtax must be collected when the transaction occurs in, or delivery is into, a county that imposes the surtax, and the sale is subject to state’s sales and use tax. The following table summarizes when a transaction is subject to the surtax.
If a selling dealer located in any Florida county
with a discretionary
surtax sells and delivers
into the county where the selling vendor is located
surtax is collected at the county rate where the delivery
is made.
If a selling dealer located in any Florida county
with or without a discretionary surtax sells and delivers
into counties with different
discretionary surtax rates
surtax is collected at the county rate
where the delivery is made.
If a selling dealer located in any Florida county
with or without a discretionary
surtax sells and delivers
into counties without a
discretionary surtax
surtax is not collected.
If an out-of-state selling dealer sells and delivers into a Florida county with a
discretionary surtax
surtax is collected at the county rate
where delivery is made.
If an out-of-state selling dealer sells and delivers
into a Florida county without a
discretionary surtax
surtax is not collected.
Discretionary sales surtax applies to the first $5,000 of any single taxable item, when sold to the same purchaser at the same time. Single items include items normally sold in bulk and items assembled to comprise a working unit. The $5,000 limitation does not apply to the rental of commercial real property, transient rentals, or services. With regard to the sale of motor vehicles, mobile homes, boats, or aircraft, the surtax applies only to the first $5,000 of the total sales price. On the sale of a motor vehicle or mobile home, the tax rate is determined by the county where the purchaser resides as shown on the title or registration. On the sale of a boat or aircraft, the tax rate is determined by the county where the boat or aircraft is delivered.
1. Section 212.055, F.S. 2. Section 212.054(2), F.S.
Office of Economic and Demographic Research
144 2012 Local Government Financial Information Handbook
The local discretionary sales surtax applies to communications services as broadly defined in ch. 202, F.S. Because the new communications services tax base is much larger than the base under prior law, discretionary sales surtax conversion rates were specified in law. For any county or school board that levies the surtax, the tax rate on communications services as authorized by s. 202.19(5), F.S., is expressed in law.3 General Law Amendments: There were no general law amendments pertaining to the general administration of these taxes resulting from the 2012 Regular Legislative Session. Typically, legislation is enacted each year that results in changes to the state’s sales tax base or sales tax administration. Such changes have the potential for fiscal impact, either positively or negatively, to the amount of sales tax revenues available for distribution to local governments. However, a summary of such changes is not provided here. Administrative Procedures: The administrative procedures relevant to local discretionary sales surtaxes are outlined in s. 212.054, F.S. The Department of Revenue (DOR) is charged with administering, collecting, and enforcing those local discretionary sales surtaxes.4 The governing body of any county levying a local discretionary sales surtax shall enact an ordinance levying the surtax in accordance with the procedures described in s. 125.66(2), F.S.5 No initial levy or rate increase or decrease shall take effect on a date other than January 1st, and no levy shall terminate on a day other than December 31st.6 The proceeds of each county's discretionary sales surtax collections are transferred to the Discretionary Sales Surtax Clearing Trust Fund [hereinafter, the Trust Fund]. A separate account in the Trust Fund shall be established for each county imposing the surtax. The DOR is authorized to take an administrative cost deduction not to exceed 3 percent of the total surtax revenue generated by all levying counties. The administrative cost deduction shall be used only for those costs solely and directly attributable to the surtax, and the costs shall be prorated among those counties levying the surtax on the basis of the amount collected for a particular county to the total amount collected for all counties.7 Reporting Requirements: The governing body of any county or school board that levies the surtax shall notify the DOR within 10 days after the final adoption by ordinance or referendum of an imposition, termination, or rate change. The DOR must receive this notice no later than November 16th prior to the January 1st effective date. The notice must specify the rate as well as the time period during which the surtax will be in effect and must include a copy of the ordinance and such other information required by departmental rule. Failure to timely provide such notification to the DOR shall result in the delay of the effective date for a period of one year.8 Additionally, the governing body of any county or school board proposing to levy the surtax shall notify the DOR by October 1st if the referendum or consideration of the ordinance that would result in the imposition, termination, or rate change of a surtax is scheduled to occur on or after October 1st of that year. Failure to
3. Section 202.20(3), F.S. 4. Section 212.054(4)(a), F.S. 5. Section 212.054(6), F.S. 6. Section 212.054(5), F.S. 7. Section 212.054(4)(b), F.S. 8. Section 212.054(7)(a), F.S.

Office of Economic and Demographic Research
2012 Local Government Financial Information Handbook 145
timely provide such notification to the DOR shall result in the delay of the effective date for a period of one year.9 Distribution of Proceeds: The DOR shall distribute funds using a distribution factor determined for each levying county that is multiplied by the amount available for distribution. The county’s distribution factor shall equal the product of the county's latest official population, pursuant to s. 186.901, F.S.; the county's surtax rate; and the number of months the county has levied the surtax during the most recent distribution period divided by the sum of all such products of the counties levying the surtax during the most recent distribution period. The DOR shall compute distribution factors for eligible counties once each quarter and make appropriate quarterly distributions. A county that fails to timely provide information waives its rights to challenge the DOR’s determination of the county’s share of the revenues.10 Tax Rates and Current Year’s Revenues: The tables that follow are designed to aid counties in estimating how much revenue will be or could be generated from a surtax levy. The first table following this section provides a historical summary of surtax impositions, expirations, extensions, rate changes, and repeals based on information obtained from the DOR.11 The second table summarizes the counties eligible to levy the various local discretionary sales surtaxes and illustrates the 2012 tax rates. The third table provides estimates of the revenue amounts that counties, municipalities, and school districts may expect to receive under a 1 percent levy during the local fiscal year ending 2013. The fourth table provides countywide estimates of realized and unrealized revenues during the local fiscal year ending 2013. Additional Detail: Additional information regarding each of the eight individual authorizations to levy can be found in the sections immediately following the four tables previously discussed. Other information relevant to local discretionary sales surtaxes can be found via the Internet. A general description of the local discretionary sales surtax can be found on the DOR’s website.12 Historical local option sales tax distributions to counties and municipalities compiled from DOR source data can be found on the EDR’s website.13 Local option sales tax receipts and distributions data by fiscal year and by month can be found via this DOR webpage.14
9. Section 212.054(7)(b), F.S. 10. Section 212.054(4)(c), F.S. 11. Florida Department of Revenue, History of Local Sales Tax and Current Rates (Last Updated: June 1, 2012) https://revenuelaw.state.fl.us/LawLibraryDocuments/2012/06/OTH-110530_History%20of%20sales%20tax,%206-01-12.pdf 12. http://dor.myflorida.com/dor/taxes/discretionary.html 13. http://edr.state.fl.us/Content/local-government/data/data-a-to-z/index.cfm 14. http://dor.myflorida.com/dor/taxes/distributions.html

Office of Economic and Demographic Research
146 2012 Local Government Financial Information Handbook
This page was intentionally left blank.
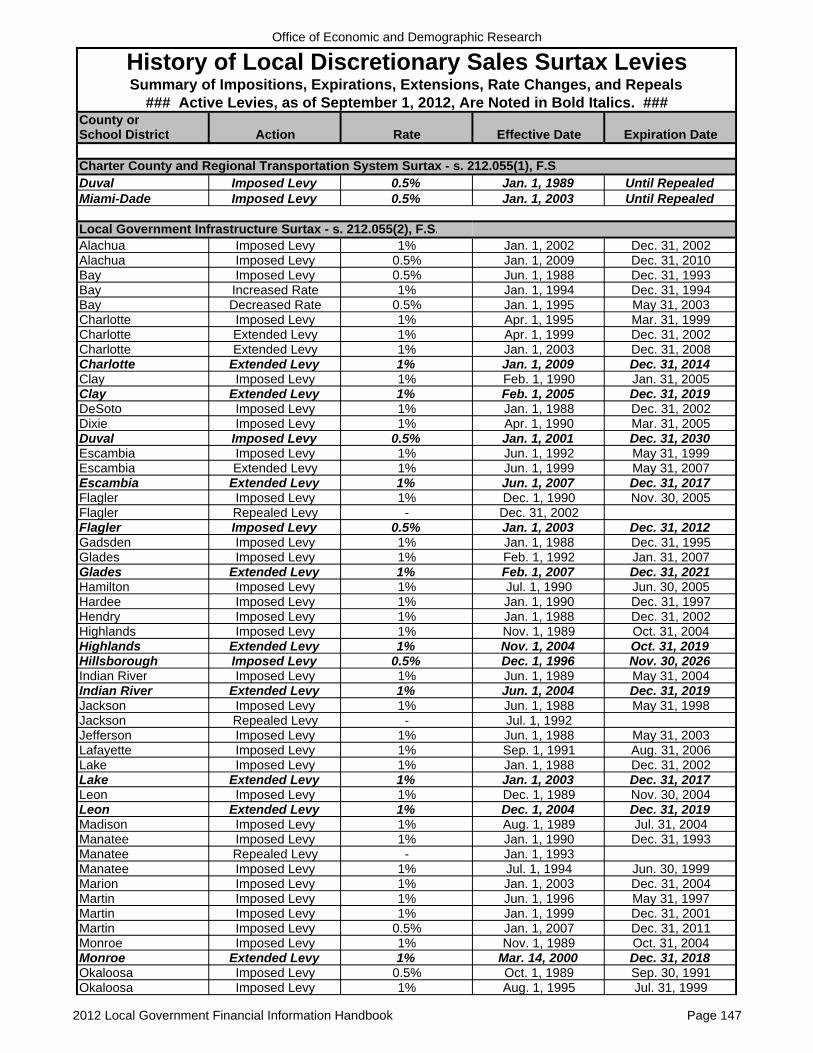
Office of Economic and Demographic Research
County orSchool District Action Rate Effective Date Expiration Date
Charter County and Regional Transportation System Surtax - s. 212.055(1), F.S.Duval Imposed Levy 0.5% Jan. 1, 1989 Until RepealedMiami-Dade Imposed Levy 0.5% Jan. 1, 2003 Until Repealed
Local Government Infrastructure Surtax - s. 212.055(2), F.S.Alachua Imposed Levy 1% Jan. 1, 2002 Dec. 31, 2002Alachua Imposed Levy 0.5% Jan. 1, 2009 Dec. 31, 2010Bay Imposed Levy 0.5% Jun. 1, 1988 Dec. 31, 1993Bay Increased Rate 1% Jan. 1, 1994 Dec. 31, 1994Bay Decreased Rate 0.5% Jan. 1, 1995 May 31, 2003Charlotte Imposed Levy 1% Apr. 1, 1995 Mar. 31, 1999Charlotte Extended Levy 1% Apr. 1, 1999 Dec. 31, 2002Charlotte Extended Levy 1% Jan. 1, 2003 Dec. 31, 2008Charlotte Extended Levy 1% Jan. 1, 2009 Dec. 31, 2014Clay Imposed Levy 1% Feb. 1, 1990 Jan. 31, 2005Clay Extended Levy 1% Feb. 1, 2005 Dec. 31, 2019DeSoto Imposed Levy 1% Jan. 1, 1988 Dec. 31, 2002Dixie Imposed Levy 1% Apr. 1, 1990 Mar. 31, 2005Duval Imposed Levy 0.5% Jan. 1, 2001 Dec. 31, 2030Escambia Imposed Levy 1% Jun. 1, 1992 May 31, 1999Escambia Extended Levy 1% Jun. 1, 1999 May 31, 2007Escambia Extended Levy 1% Jun. 1, 2007 Dec. 31, 2017Flagler Imposed Levy 1% Dec. 1, 1990 Nov. 30, 2005Flagler Repealed Levy - Dec. 31, 2002Flagler Imposed Levy 0.5% Jan. 1, 2003 Dec. 31, 2012Gadsden Imposed Levy 1% Jan. 1, 1988 Dec. 31, 1995Glades Imposed Levy 1% Feb. 1, 1992 Jan. 31, 2007Glades Extended Levy 1% Feb. 1, 2007 Dec. 31, 2021Hamilton Imposed Levy 1% Jul. 1, 1990 Jun. 30, 2005Hardee Imposed Levy 1% Jan. 1, 1990 Dec. 31, 1997Hendry Imposed Levy 1% Jan. 1, 1988 Dec. 31, 2002Highlands Imposed Levy 1% Nov. 1, 1989 Oct. 31, 2004Highlands Extended Levy 1% Nov. 1, 2004 Oct. 31, 2019Hillsborough Imposed Levy 0.5% Dec. 1, 1996 Nov. 30, 2026Indian River Imposed Levy 1% Jun. 1, 1989 May 31, 2004Indian River Extended Levy 1% Jun. 1, 2004 Dec. 31, 2019Jackson Imposed Levy 1% Jun. 1, 1988 May 31, 1998Jackson Repealed Levy - Jul. 1, 1992Jefferson Imposed Levy 1% Jun. 1, 1988 May 31, 2003Lafayette Imposed Levy 1% Sep. 1, 1991 Aug. 31, 2006Lake Imposed Levy 1% Jan. 1, 1988 Dec. 31, 2002Lake Extended Levy 1% Jan. 1, 2003 Dec. 31, 2017Leon Imposed Levy 1% Dec. 1, 1989 Nov. 30, 2004Leon Extended Levy 1% Dec. 1, 2004 Dec. 31, 2019Madison Imposed Levy 1% Aug. 1, 1989 Jul. 31, 2004Manatee Imposed Levy 1% Jan. 1, 1990 Dec. 31, 1993Manatee Repealed Levy - Jan. 1, 1993Manatee Imposed Levy 1% Jul. 1, 1994 Jun. 30, 1999Marion Imposed Levy 1% Jan. 1, 2003 Dec. 31, 2004Martin Imposed Levy 1% Jun. 1, 1996 May 31, 1997Martin Imposed Levy 1% Jan. 1, 1999 Dec. 31, 2001Martin Imposed Levy 0.5% Jan. 1, 2007 Dec. 31, 2011Monroe Imposed Levy 1% Nov. 1, 1989 Oct. 31, 2004Monroe Extended Levy 1% Mar. 14, 2000 Dec. 31, 2018Okaloosa Imposed Levy 0.5% Oct. 1, 1989 Sep. 30, 1991Okaloosa Imposed Levy 1% Aug. 1, 1995 Jul. 31, 1999
Summary of Impositions, Expirations, Extensions, Rate Changes, and RepealsHistory of Local Discretionary Sales Surtax Levies
### Active Levies, as of September 1, 2012, Are Noted in Bold Italics. ###
2012 Local Government Financial Information Handbook Page 147

Office of Economic and Demographic Research
County orSchool District Action Rate Effective Date Expiration Date
Summary of Impositions, Expirations, Extensions, Rate Changes, and RepealsHistory of Local Discretionary Sales Surtax Levies
### Active Levies, as of September 1, 2012, Are Noted in Bold Italics. ###
Osceola Imposed Levy 1% Sep. 1, 1990 Aug. 31, 2005Osceola Extended Levy 1% Sep. 1, 2005 Aug. 31, 2025Pasco Imposed Levy 1% Jan. 1, 2005 Dec. 31, 2014Pinellas Imposed Levy 1% Feb. 1, 1990 Dec. 31, 2019Putnam Imposed Levy 1% Jan. 1, 2003 Dec. 31, 2017Santa Rosa Imposed Levy 1% Sep. 1, 1993 Aug. 31, 1999Santa Rosa Repealed Levy - Sep. 1, 1998Sarasota Imposed Levy 1% Sep. 1, 1989 Aug. 31, 2004Sarasota Extended Levy 1% Jun. 1, 2003 Aug. 31, 2009Sarasota Extended Levy 1% Nov. 1, 2007 Dec. 31, 2024Seminole Imposed Levy 1% Oct. 1, 1991 Sep. 30, 2001Seminole Imposed Levy 1% Jan. 1, 2002 Dec. 31, 2011Suwannee Imposed Levy 1% Jan. 1, 1988 Dec. 31, 2002Taylor Imposed Levy 1% Aug. 1, 1989 Jul. 31, 2004Taylor Repealed Levy - Dec. 31, 1999Wakulla Imposed Levy 1% Jan. 1, 1988 Dec. 31, 2002Wakulla Extended Levy 1% Jan. 1, 2003 Dec. 31, 2017
Small County Surtax - s. 212.055(3), F.S.Baker Imposed Levy 1% Jan. 1, 1994 Until RepealedBradford Imposed Levy 1% Mar. 1, 1993 Until RepealedCalhoun Imposed Levy 1% Jan. 1, 1993 Dec. 31, 2000Calhoun Extended Levy 1% Jan. 1, 2001 Dec. 31, 2008Calhoun Extended Levy 1% Jan. 1, 2009 Until RepealedColumbia Imposed Levy 1% Aug. 1, 1994 Until RepealedDeSoto Imposed Levy 1% Jan. 1, 2003 Until RepealedDixie Imposed Levy 1% Apr. 1, 2005 Dec. 31, 2029Franklin Imposed Levy 1% Jan. 1, 2008 Until RepealedGadsden Imposed Levy 1% Jan. 1, 1996 Until RepealedGilchrist Imposed Levy 1% Oct. 1, 1992 Until RepealedGulf Imposed Levy 0.5% Jan. 1, 2006 Dec. 31, 2009Gulf Increased Rate 1% Jan. 1, 2010 Until RepealedHamilton Imposed Levy 1% Jul. 1, 2005 Dec. 31, 2019Hardee Imposed Levy 1% Jan. 1, 1998 Dec. 31, 2004Hardee Extended Levy 1% Jan. 1, 2005 Until RepealedHendry Imposed Levy 1% Jan. 1, 2003 Until RepealedHolmes Imposed Levy 1% Oct. 1, 1995 Sep. 30, 1999Holmes Extended Levy 1% Oct. 1, 1999 Sep. 30, 2006Holmes Extended Levy 1% Jan. 1, 2006 Dec. 31, 2013Jackson Imposed Levy 1% Jun. 1, 1995 May 31, 2010Jackson Extended Levy 1% Jun. 1, 2010 Dec. 31, 2025Jefferson Imposed Levy 1% Jun. 1, 2003 Until RepealedLafayette Imposed Levy 1% Sep. 1, 2006 Until RepealedLevy Imposed Levy 1% Oct. 1, 1992 Until RepealedLiberty Imposed Levy 1% Nov. 1, 1992 Until RepealedMadison Imposed Levy 1% Aug. 1, 2004 Until RepealedNassau Imposed Levy 0.5% Dec. 1, 1993 Nov. 30, 1994Nassau Imposed Levy 1% Mar. 1, 1996 Until RepealedOkeechobee Imposed Levy 1% Oct. 1, 1995 Sep. 30, 1999Okeechobee Extended Levy 1% Oct. 1, 1999 Until RepealedSumter Imposed Levy 1% Jan. 1, 1993 Until RepealedSuwannee Imposed Levy 1% Jan. 1, 2003 Until RepealedTaylor Imposed Levy 1% Jan. 1, 2000 Dec. 31, 2029Union Imposed Levy 1% Feb. 1, 1993 Jan. 31, 1996Union Extended Levy 1% Feb. 1, 1996 Jan. 31, 2001Union Extended Levy 1% Feb. 1, 2001 Dec. 31, 2005Union Extended Levy 1% Jan. 1, 2006 Until Repealed
2012 Local Government Financial Information Handbook Page 148

Office of Economic and Demographic Research
County orSchool District Action Rate Effective Date Expiration Date
Summary of Impositions, Expirations, Extensions, Rate Changes, and RepealsHistory of Local Discretionary Sales Surtax Levies
### Active Levies, as of September 1, 2012, Are Noted in Bold Italics. ###
Walton Imposed Levy 1% Feb. 1, 1995 Until RepealedWashington Imposed Levy 1% Nov. 1, 1993 Until Repealed
Indigent Care and Trauma Center Surtax - s. 212.055(4), F.S.Hillsborough Imposed Levy 0.5% Dec. 1, 1991 Sep. 30, 1997Hillsborough Decreased Rate 0.25% Oct. 1, 1997 Feb. 28, 2001Hillsborough Extended Levy 0.25% Mar. 1, 2001 Sep. 30, 2001Hillsborough Increased Rate 0.5% Oct. 1, 2001 Until Repealed
County Public Hospital Surtax - s. 212.055(5), F.S.Miami-Dade Imposed Levy 0.5% Jan. 1, 1992 Sep. 30, 1998Miami-Dade Extended Levy 0.5% Oct. 1, 1998 Until Repealed
School Capital Outlay Surtax - s. 212.055(6), F.S.Bay Imposed Levy 0.5% May 1, 1998 Apr. 30, 2008Bay Imposed Levy 0.5% Jan. 1, 2011 Dec. 31, 2020Calhoun Imposed Levy 0.5% Jan. 1, 2009 Dec. 31, 2018Escambia Imposed Levy 0.5% Jan. 1, 1998 Dec. 31, 2002Escambia Extended Levy 0.5% Jan. 1, 2003 Dec. 31, 2017Flagler Imposed Levy 0.5% Jan. 1, 2003 Dec. 31, 2012Flagler Extended Levy 0.5% Jan. 1, 2013 Dec. 31, 2022Gulf Imposed Levy 0.5% Jul. 1, 1997 Jun. 30, 2017Gulf Repealed Levy - Dec. 31, 2009Hernando Imposed Levy 0.5% Jan. 1, 1999 Dec. 31, 2003Hernando Imposed Levy 0.5% Jan. 1, 2005 Dec. 31, 2014Jackson Imposed Levy 0.5% Jul. 1, 1996 Jun. 30, 2006Jackson Extended Levy 0.5% Jul. 1, 2006 Dec. 31, 2015Leon Imposed Levy 0.5% Jan. 1, 2003 Dec. 31, 2012Liberty Imposed Levy 0.5% Jan. 1, 2012 Dec. 31, 2020Manatee Imposed Levy 0.5% Jan. 1, 2003 Dec. 31, 2017Marion Imposed Levy 0.5% Jan. 1, 2005 Dec. 31, 2009Monroe Imposed Levy 0.5% Jan. 1, 1996 Dec. 31, 2005Monroe Extended Levy 0.5% Jan. 1, 2006 Dec. 31, 2015Orange Imposed Levy 0.5% Jan. 1, 2003 Dec. 31, 2015Palm Beach Imposed Levy 0.5% Jan. 1, 2005 Dec. 31, 2010Polk Imposed Levy 0.5% Jan. 1, 2004 Dec. 31, 2018St. Lucie Imposed Levy 0.5% Jul. 1, 1996 Jun. 30, 2006St. Lucie Extended Levy 0.5% Jan. 1, 2006 Dec. 31, 2026Santa Rosa Imposed Levy 0.5% Oct. 1, 1998 Dec. 31, 2018Volusia Imposed Levy 0.5% Jan. 1, 2002 Dec. 16, 2016
Voter-Approved Indigent Care Surtax - s. 212.055(7), F.S.Alachua Imposed Levy 0.25% Jan. 1, 2005 Dec. 31, 2011Gadsden Imposed Levy 0.5% Jan. 1, 2009 Dec. 31, 2038Madison Imposed Levy 0.5% Jan. 1, 2007 Until RepealedPolk Imposed Levy 0.5% Jan. 1, 2005 Dec. 31, 2019
Emergency Fire Rescue Services and Facilities Surtax - s. 212.055(8), F.SNo county government has authorized the levy of this surtax.
Data Source: Florida Department of Revenue's "History of Local Sales Tax and Current Rates by County" (Last Updated: September 1, 2012) found at https://revenuelaw.state.fl.us/Pages/Home.aspx
2012 Local Government Financial Information Handbook Page 149
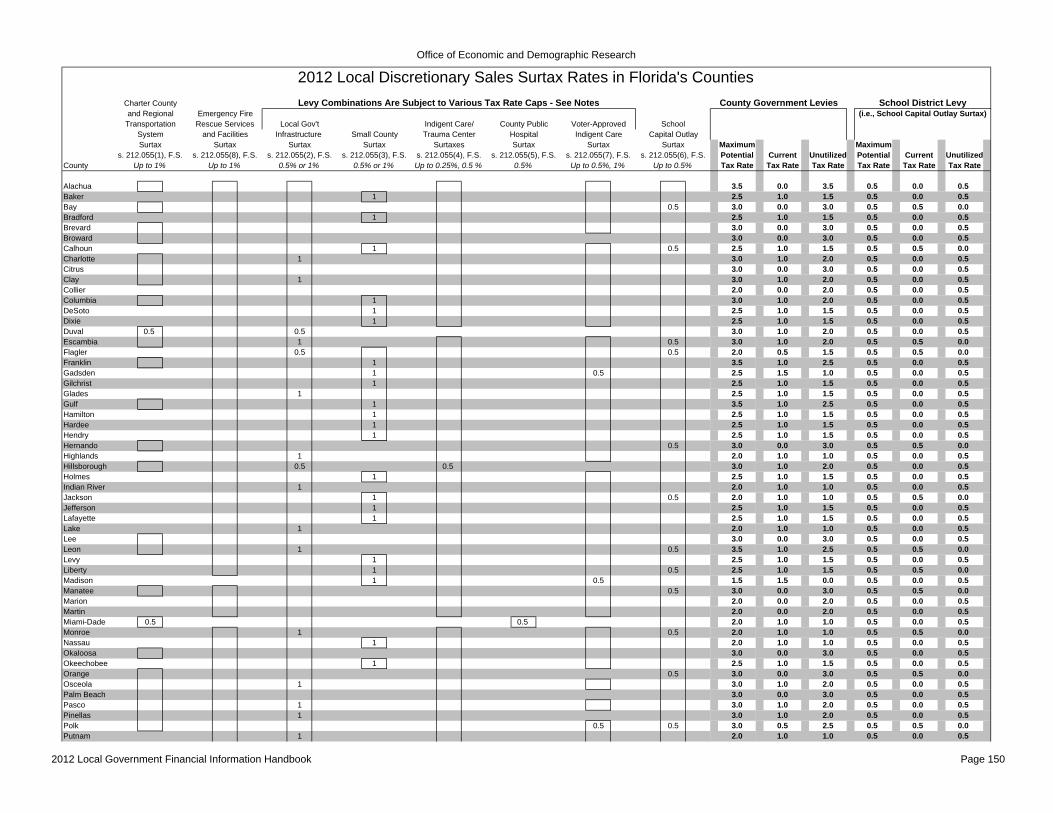
Office of Economic and Demographic Research
2012 Local Discretionary Sales Surtax Rates in Florida's CountiesCounty Government Levies School District Levy
Maximum MaximumPotential Current Unutilized Potential Current Unutilized
County Tax Rate Tax Rate Tax Rate Tax Rate Tax Rate Tax Rate
Alachua 3.5 0.0 3.5 0.5 0.0 0.5Baker 1 2.5 1.0 1.5 0.5 0.0 0.5Bay 0.5 3.0 0.0 3.0 0.5 0.5 0.0Bradford 1 2.5 1.0 1.5 0.5 0.0 0.5Brevard 3.0 0.0 3.0 0.5 0.0 0.5Broward 3.0 0.0 3.0 0.5 0.0 0.5Calhoun 1 0.5 2.5 1.0 1.5 0.5 0.5 0.0Charlotte 1 3.0 1.0 2.0 0.5 0.0 0.5Citrus 3.0 0.0 3.0 0.5 0.0 0.5Clay 1 3.0 1.0 2.0 0.5 0.0 0.5Collier 2.0 0.0 2.0 0.5 0.0 0.5Columbia 1 3.0 1.0 2.0 0.5 0.0 0.5DeSoto 1 2.5 1.0 1.5 0.5 0.0 0.5Dixie 1 2.5 1.0 1.5 0.5 0.0 0.5Duval 0.5 0.5 3.0 1.0 2.0 0.5 0.0 0.5Escambia 1 0.5 3.0 1.0 2.0 0.5 0.5 0.0Flagler 0.5 0.5 2.0 0.5 1.5 0.5 0.5 0.0Franklin 1 3.5 1.0 2.5 0.5 0.0 0.5Gadsden 1 0.5 2.5 1.5 1.0 0.5 0.0 0.5Gilchrist 1 2.5 1.0 1.5 0.5 0.0 0.5Glades 1 2.5 1.0 1.5 0.5 0.0 0.5Gulf 1 3.5 1.0 2.5 0.5 0.0 0.5Hamilton 1 2.5 1.0 1.5 0.5 0.0 0.5Hardee 1 2.5 1.0 1.5 0.5 0.0 0.5Hendry 1 2.5 1.0 1.5 0.5 0.0 0.5Hernando 0.5 3.0 0.0 3.0 0.5 0.5 0.0Highlands 1 2.0 1.0 1.0 0.5 0.0 0.5Hillsborough 0.5 0.5 3.0 1.0 2.0 0.5 0.0 0.5Holmes 1 2.5 1.0 1.5 0.5 0.0 0.5Indian River 1 2.0 1.0 1.0 0.5 0.0 0.5Jackson 1 0.5 2.0 1.0 1.0 0.5 0.5 0.0Jefferson 1 2.5 1.0 1.5 0.5 0.0 0.5Lafayette 1 2.5 1.0 1.5 0.5 0.0 0.5Lake 1 2.0 1.0 1.0 0.5 0.0 0.5Lee 3.0 0.0 3.0 0.5 0.0 0.5Leon 1 0.5 3.5 1.0 2.5 0.5 0.5 0.0Levy 1 2.5 1.0 1.5 0.5 0.0 0.5Liberty 1 0.5 2.5 1.0 1.5 0.5 0.5 0.0Madison 1 0.5 1.5 1.5 0.0 0.5 0.0 0.5Manatee 0.5 3.0 0.0 3.0 0.5 0.5 0.0Marion 2.0 0.0 2.0 0.5 0.0 0.5Martin 2.0 0.0 2.0 0.5 0.0 0.5Miami-Dade 0.5 0.5 2.0 1.0 1.0 0.5 0.0 0.5Monroe 1 0.5 2.0 1.0 1.0 0.5 0.5 0.0Nassau 1 2.0 1.0 1.0 0.5 0.0 0.5Okaloosa 3.0 0.0 3.0 0.5 0.0 0.5Okeechobee 1 2.5 1.0 1.5 0.5 0.0 0.5Orange 0.5 3.0 0.0 3.0 0.5 0.5 0.0Osceola 1 3.0 1.0 2.0 0.5 0.0 0.5Palm Beach 3.0 0.0 3.0 0.5 0.0 0.5Pasco 1 3.0 1.0 2.0 0.5 0.0 0.5Pinellas 1 3.0 1.0 2.0 0.5 0.0 0.5Polk 0.5 0.5 3.0 0.5 2.5 0.5 0.5 0.0Putnam 1 2.0 1.0 1.0 0.5 0.0 0.5
Charter County Levy Combinations Are Subject to Various Tax Rate Caps - See Notes
SchoolCounty Public Voter-ApprovedLocal Gov't Indigent Care/HospitalInfrastructure Surtax
0.5%
Small CountySurtax
0.5% or 1%
Surtax
0.5% or 1%
Capital OutlaySurtax
Up to 0.5%Up to 0.25%, 0.5 %s. 212.055(5), F.S.
Indigent CareSurtax
Up to 0.5%, 1%s. 212.055(7), F.S. s. 212.055(6), F.S.
Emergency FireRescue Services
and FacilitiesSurtax
Up to 1%
TransportationSystemSurtax
s. 212.055(1), F.S.Up to 1%
(i.e., School Capital Outlay Surtax)and Regional
s. 212.055(8), F.S. s. 212.055(2), F.S. s. 212.055(3), F.S.
Trauma CenterSurtaxes
s. 212.055(4), F.S.
2012 Local Government Financial Information Handbook Page 150

Office of Economic and Demographic Research
2012 Local Discretionary Sales Surtax Rates in Florida's CountiesCounty Government Levies School District Levy
Maximum MaximumPotential Current Unutilized Potential Current Unutilized
County Tax Rate Tax Rate Tax Rate Tax Rate Tax Rate Tax Rate
Charter County Levy Combinations Are Subject to Various Tax Rate Caps - See Notes
SchoolCounty Public Voter-ApprovedLocal Gov't Indigent Care/HospitalInfrastructure Surtax
0.5%
Small CountySurtax
0.5% or 1%
Surtax
0.5% or 1%
Capital OutlaySurtax
Up to 0.5%Up to 0.25%, 0.5 %s. 212.055(5), F.S.
Indigent CareSurtax
Up to 0.5%, 1%s. 212.055(7), F.S. s. 212.055(6), F.S.
Emergency FireRescue Services
and FacilitiesSurtax
Up to 1%
TransportationSystemSurtax
s. 212.055(1), F.S.Up to 1%
(i.e., School Capital Outlay Surtax)and Regional
s. 212.055(8), F.S. s. 212.055(2), F.S. s. 212.055(3), F.S.
Trauma CenterSurtaxes
s. 212.055(4), F.S.
St. Johns 2.0 0.0 2.0 0.5 0.0 0.5St. Lucie 0.5 2.0 0.0 2.0 0.5 0.5 0.0Santa Rosa 0.5 3.0 0.0 3.0 0.5 0.5 0.0Sarasota 1 3.0 1.0 2.0 0.5 0.0 0.5Seminole 3.0 0.0 3.0 0.5 0.0 0.5Sumter 1 2.0 1.0 1.0 0.5 0.0 0.5Suwannee 1 2.5 1.0 1.5 0.5 0.0 0.5Taylor 1 2.5 1.0 1.5 0.5 0.0 0.5Union 1 2.5 1.0 1.5 0.5 0.0 0.5Volusia 0.5 3.0 0.0 3.0 0.5 0.5 0.0Wakulla 1 3.5 1.0 2.5 0.5 0.0 0.5Walton 1 3.0 1.0 2.0 0.5 0.0 0.5Washington 1 2.5 1.0 1.5 0.5 0.0 0.5
# Eligible to Levy: 31 65 67 31 65 1 60 67 67 67
# Levying: 2 0 18 28 1 1 3 15 48 15
Notes:
12) The following local discretionary sales surtax levy is scheduled to expire on December 31, 2013: Holmes County's 1% levy of the Small County Surtax.
6) Subject to referendum approval, the Voter-Approved Indigent Care Surtax may be levied by counties with less than 800,000 residents at a rate not to exceed 0.5%. However, if a publicly supported medical school is located within the qualifying county, the rate shall not exceed 1%, pursuant to s. 212.055(7)(a), F.S. Currently, Florida has publicly supported medical schools at the following universities: Florida International University in Miami-Dade County; Florida State University in Leon County; University of Central Florida in Orange County; University of Florida in Alachua County; and the University of South Florida in Hillsborough County. The Florida International University, University of Central Florida, and University of South Florida medical schools are each located in counties having a resident population greater than 800,000; therefore, Hillsborough, Miami-Dade, and Orange counties are not eligible to levy the surtax. Only Alachua and Leon counties could levy the surtax at the maximum 1% rate. Additionally, the governing body of any county that has a population of less than 50,000 residents may levy the surtax, at a rate not to exceed 1%, subject to voter approval in countywide referendum pursuant to Chapter 2005-242, Laws of Florida. Consequently, if a publicly supported medical school is located in the county, or the county has a population of less than 50,000 residents, the combined tax rate of this levy and any Local Government Infrastructure Surtax and Small County Surtax levies shall not exceed 1.5% pursuant to s. 212.055(7)(f), F.S. For all other counties eligible to levy this surtax, the combined tax rate shall not exceed 1%.
8) Effective July 1, 2010, Chapter 2010-225, L.O.F., renames the Charter County Transportation System Surtax as the Charter County and Regional Transportation System Surtax and extends eligibility for surtax levy to each county that is within or under an interlocal agreement with a regional transportation or transit authority created under Chapters 343 or 349, Florida Statutes (i.e., South Florida Regional Transportation Authority, Central Florida Regional Transportation Authority, Northwest Florida Transportation Corridor Authority, Tampa Bay Area Regional Transportation Authority, and Jacksonville Transportation Authority). As a result of this legislation, seven counties within the Northwest Florida Transportation Corridor Authority (i.e., Bay, Escambia, Franklin, Gulf, Okaloosa, Santa Rosa, and Walton) and four counties of the Tampa Bay Area Regional Transportation Authority (i.e., Citrus, Hernando, Manatee, and Pasco) will be eligible to levy this surtax.9) Effective July 1, 2009, Chapter 2009-182, L.O.F., created the Emergency Fire Rescue Services and Facilities Surtax. A county's governing body, other than a county that has imposed two separate discretionary surtaxes without expiration, may levy this surtax at a rate of up to 1%, subject to voter approval in a countywide referendum. Madison and Miami-Dade counties are not eligible to levy this surtax since each county has imposed two separate discretionary surtaxes without expiration. The remaining 65 counties are eligible to levy this surtax. However, if Orange or Osceola impose the surtax, neither county shall levy the surtax within the boundaries of the Reedy Creek Improvement District pursuant to s. 212.055(8)(j), F.S.10) Since both the Charter County and Regional Transportation System Surtax and Emergency Fire Rescue Services and Facilities Surtax are not subject to any tax rate limitations, the maximum potential tax rates for nearly all county governments have increased sinceJuly 1, 2009. For Madison and Miami-Dade counties, the maximum potential tax rate has not changed. For 24 counties (i.e., Alachua, Bay, Brevard, Charlotte, Citrus, Clay, Columbia, Escambia, Franklin, Gulf, Hernando, Lee, Leon, Manatee, Okaloosa, Orange, Osceola, Palm Beach, Pasco, Polk, Santa Rosa, Seminole, Wakulla, and Walton), the maximum potential tax rate has increased by 2%. For all other counties, the maximum potential tax rate has increased by 1%. Currently, Alachua, Franklin, Gulf, Leon, and Wakulla counties have the highest maximum potential tax rate for county government levies at 3.5%.
Data Source: Florida Department of Revenue's "History of Local Sales Tax and Current Rates by County" (Last Updated: September 1, 2012) found at https://revenuelaw.state.fl.us/Pages/Home.aspx
11) The following local discretionary sales surtax levies are scheduled to expire on December 31, 2012: Flagler County's 0.5% levy of the Local Government Infrastructure Surtax and Leon County's 0.5% levy of the School Capital Outlay Surtax.
1) Boxed areas indicate those counties or school districts (for the School Capital Outlay Surtax only) eligible to impose the particular surtax.2) The Indigent Care and Trauma Center Surtax consists of two separate levies for different groups of eligible counties. Non-consolidated counties with a total population of 800,000 or more may impose, either by an extraordinary vote of the county's governing body or voter approval in a countywide referendum, a surtax not to exceed 0.5% for the purpose of funding health care services for qualified residents. Non-consolidated counties with a total population of less than 800,000 may impose, subject to voter approval in a countywide referendum, a surtax not to exceed 0.25% for the sole purpose of funding trauma services provided by a trauma center licensed pursuant to Chapter 395, Florida Statutes.3) Pursuant to ss. 212.055(2)(h) and 212.055(3)(f), F.S., a county shall not levy the Local Government Infrastructure, Small County, Indigent Care and Trauma Center, and County Public Hospital surtaxes in excess of a combined rate of 1%.4) Pursuant to s. 212.055(4)(b)5., F.S., a county shall not levy the Local Government Infrastructure, Small County, and Indigent Care and Trauma Center surtaxes in excess of a combined rate of 1%.5) Pursuant to s. 212.055(5)(f), F.S., a county shall not levy the Local Government Infrastructure, Small County, and County Public Hospital surtaxes in excess of a combined rate of 1%.
7) Effective July 1, 2009, Chapter 2009-146, L.O.F., renamed the Charter County Transit System Surtax as the Charter County Transportation System Surtax and extended eligibility for surtax levy to 13 additional charter counties.
2012 Local Government Financial Information Handbook Page 151

Calculated by the Florida Department of Revenue's Office of Tax Research
Local Discretionary Sales SurtaxRevenue Estimates for the Local Fiscal Year Ending September 30, 2013
Distribution Estimated Distribution EstimatedLocal Government Percentage Distribution Percentage DistributionALACHUA BOCC 57.208764 17,967,300$ Alachua 2.651076 832,611$ Archer 0.331530 104,122$ Gainesville 35.832308 11,253,692$ Hawthorne 0.410119 128,804$ High Springs 1.559559 489,804$ La Crosse 0.102457 32,178$ Micanopy 0.172896 54,301$ Newberry 1.439347 452,049$ Waldo 0.291944 91,690$ Countywide Total 100.000000 31,406,551$ BAKER BOCC 77.007559 1,380,292$ Glen St. Mary 1.467747 26,308$ Macclenny 21.524694 385,811$ Countywide Total 100.000000 1,792,411$ BAY BOCC 58.982253 18,921,621$ Callaway 6.248586 2,004,558$ Lynn Haven 8.032230 2,576,755$ Mexico Beach 0.467628 150,016$ Panama City 15.339679 4,920,999$ Panama City Beach 5.197071 1,667,230$ Parker 1.870946 600,203$ Springfield 3.861607 1,238,811$ Countywide Total 100.000000 32,080,193$ BRADFORD BOCC 75.969393 1,676,110$ 75.886834 1,674,289$ Brooker 1.127081 24,867$ 1.163324 25,666$ Hampton 1.688898 37,262$ 1.720894 37,968$ Lawtey 2.505773 55,285$ 2.512505 55,433$ Starke 18.708855 412,773$ 18.716443 412,940$ Countywide Total 100.000000 2,206,297$ 100.000000 2,206,297$ BREVARD BOCC 56.026476 34,917,954$ Cape Canaveral 1.291741 805,065$ Cocoa 2.241045 1,396,710$ Cocoa Beach 1.460359 910,154$ Grant-Valkaria 0.502734 313,324$ Indialantic 0.355047 221,279$ Indian Harbour Beach 1.075410 670,239$ Malabar 0.357517 222,819$ Melbourne 9.926486 6,186,585$ Melbourne Beach 0.403669 251,583$ Melbourne Village 0.086064 53,639$ Palm Bay 13.456152 8,386,415$ Palm Shores 0.113885 70,978$ Rockledge 3.250153 2,025,626$ Satellite Beach 1.321642 823,700$ Titusville 5.697257 3,550,760$ West Melbourne 2.434364 1,517,194$ Countywide Total 100.000000 62,324,023$ BROWARD BOCC 40.317760 113,253,766$ Coconut Creek 1.827622 5,133,843$ Cooper City 1.002398 2,815,766$
1% Tax Rate - Default Formula 1% Tax Rate - Interlocal Agreement
2012 Local Government Financial Information Handbook Page 152

Calculated by the Florida Department of Revenue's Office of Tax Research
Local Discretionary Sales SurtaxRevenue Estimates for the Local Fiscal Year Ending September 30, 2013
Distribution Estimated Distribution EstimatedLocal Government Percentage Distribution Percentage Distribution
1% Tax Rate - Default Formula 1% Tax Rate - Interlocal Agreement
Coral Springs 4.182711 11,749,358$ Dania Beach 1.017596 2,858,456$ Davie 3.168244 8,899,691$ Deerfield Beach 2.583013 7,255,760$ Fort Lauderdale 5.704531 16,024,196$ Hallandale Beach 1.280040 3,595,670$ Hillsboro Beach 0.064468 181,092$ Hollywood 4.845578 13,611,372$ Lauderdale-By-The-Sea 0.208842 586,642$ Lauderdale Lakes 1.126589 3,164,622$ Lauderhill 2.293647 6,442,922$ Lazy Lake 0.000825 2,318$ Lighthouse Point 0.356791 1,002,237$ Margate 1.846842 5,187,832$ Miramar 4.228475 11,877,909$ North Lauderdale 1.418225 3,983,835$ Oakland Park 1.428574 4,012,906$ Parkland 0.838633 2,355,744$ Pembroke Park 0.209701 589,057$ Pembroke Pines 5.304418 14,900,265$ Plantation 2.911782 8,179,282$ Pompano Beach 3.440797 9,665,300$ Sea Ranch Lakes 0.023208 65,193$ Southwest Ranches 0.252542 709,398$ Sunrise 2.901055 8,149,148$ Tamarac 2.084255 5,854,735$ West Park 0.484042 1,359,688$ Weston 2.243036 6,300,753$ Wilton Manors 0.403758 1,134,168$ Countywide Total 100.000000 280,902,924$ CALHOUN BOCC 79.730719 605,845$ Altha 3.553446 27,001$ Blountstown 16.715835 127,018$ Countywide Total 100.000000 759,864$ CHARLOTTE BOCC 90.210495 18,386,653$ Punta Gorda 9.789505 1,995,291$ Countywide Total 100.000000 20,381,944$ CITRUS BOCC 93.017144 11,285,850$ Crystal River 2.106371 255,568$ Inverness 4.876485 591,668$ Countywide Total 100.000000 12,133,086$ CLAY BOCC 91.422822 17,893,261$ 79.305486 14,190,338$ Green Cove Springs 3.402460 608,811$ 3.621916 648,079$ Keystone Heights 0.659973 118,091$ 0.968100 173,225$ Orange Park 4.149245 742,435$ 6.824202 1,221,072$ Penney Farms 0.365501 65,400$ 0.468575 83,843$ *** School Board *** 0.000000 -$ 8.811721 1,576,704$ Countywide Total 100.000000 17,893,261$ 100.000000 17,893,261$ COLLIER BOCC 89.565937 52,719,714$ Everglades 0.116701 68,692$ Marco Island 4.726372 2,782,006$
2012 Local Government Financial Information Handbook Page 153
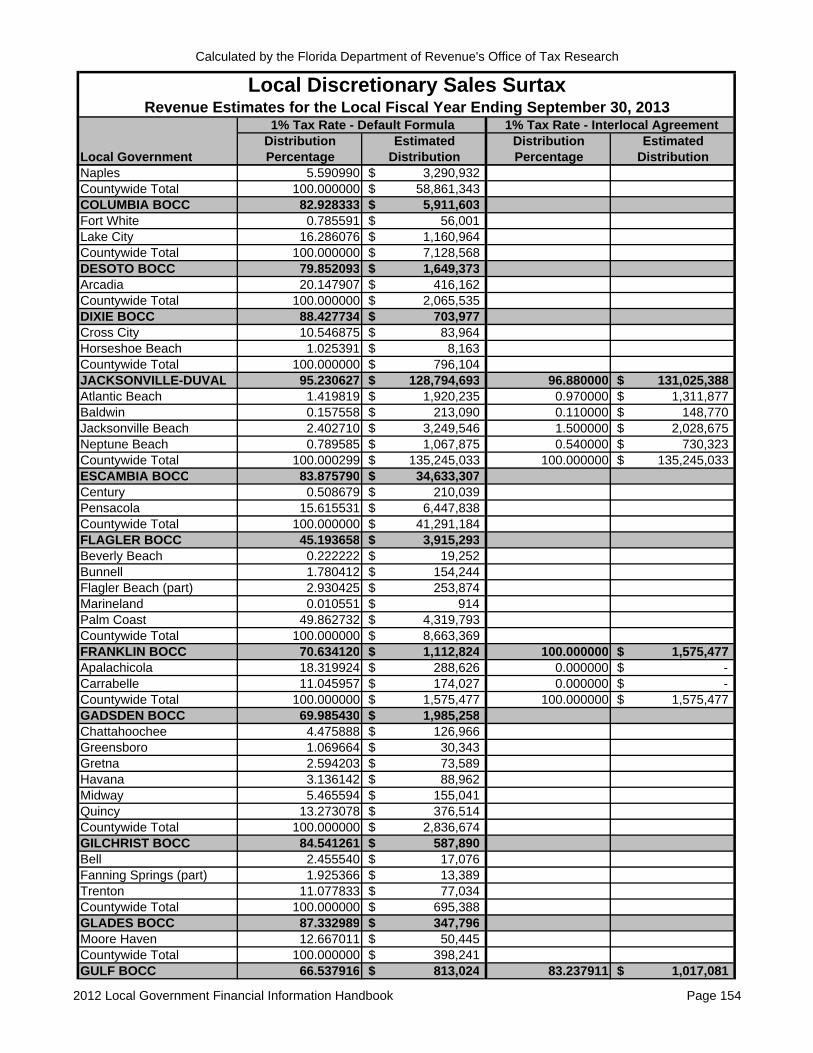
Calculated by the Florida Department of Revenue's Office of Tax Research
Local Discretionary Sales SurtaxRevenue Estimates for the Local Fiscal Year Ending September 30, 2013
Distribution Estimated Distribution EstimatedLocal Government Percentage Distribution Percentage Distribution
1% Tax Rate - Default Formula 1% Tax Rate - Interlocal Agreement
Naples 5.590990 3,290,932$ Countywide Total 100.000000 58,861,343$ COLUMBIA BOCC 82.928333 5,911,603$ Fort White 0.785591 56,001$ Lake City 16.286076 1,160,964$ Countywide Total 100.000000 7,128,568$ DESOTO BOCC 79.852093 1,649,373$ Arcadia 20.147907 416,162$ Countywide Total 100.000000 2,065,535$ DIXIE BOCC 88.427734 703,977$ Cross City 10.546875 83,964$ Horseshoe Beach 1.025391 8,163$ Countywide Total 100.000000 796,104$ JACKSONVILLE-DUVAL 95.230627 128,794,693$ 96.880000 131,025,388$ Atlantic Beach 1.419819 1,920,235$ 0.970000 1,311,877$ Baldwin 0.157558 213,090$ 0.110000 148,770$ Jacksonville Beach 2.402710 3,249,546$ 1.500000 2,028,675$ Neptune Beach 0.789585 1,067,875$ 0.540000 730,323$ Countywide Total 100.000299 135,245,033$ 100.000000 135,245,033$ ESCAMBIA BOCC 83.875790 34,633,307$ Century 0.508679 210,039$ Pensacola 15.615531 6,447,838$ Countywide Total 100.000000 41,291,184$ FLAGLER BOCC 45.193658 3,915,293$ Beverly Beach 0.222222 19,252$ Bunnell 1.780412 154,244$ Flagler Beach (part) 2.930425 253,874$ Marineland 0.010551 914$ Palm Coast 49.862732 4,319,793$ Countywide Total 100.000000 8,663,369$ FRANKLIN BOCC 70.634120 1,112,824$ 100.000000 1,575,477$ Apalachicola 18.319924 288,626$ 0.000000 -$ Carrabelle 11.045957 174,027$ 0.000000 -$ Countywide Total 100.000000 1,575,477$ 100.000000 1,575,477$ GADSDEN BOCC 69.985430 1,985,258$ Chattahoochee 4.475888 126,966$ Greensboro 1.069664 30,343$ Gretna 2.594203 73,589$ Havana 3.136142 88,962$ Midway 5.465594 155,041$ Quincy 13.273078 376,514$ Countywide Total 100.000000 2,836,674$ GILCHRIST BOCC 84.541261 587,890$ Bell 2.455540 17,076$ Fanning Springs (part) 1.925366 13,389$ Trenton 11.077833 77,034$ Countywide Total 100.000000 695,388$ GLADES BOCC 87.332989 347,796$ Moore Haven 12.667011 50,445$ Countywide Total 100.000000 398,241$ GULF BOCC 66.537916 813,024$ 83.237911 1,017,081$
2012 Local Government Financial Information Handbook Page 154
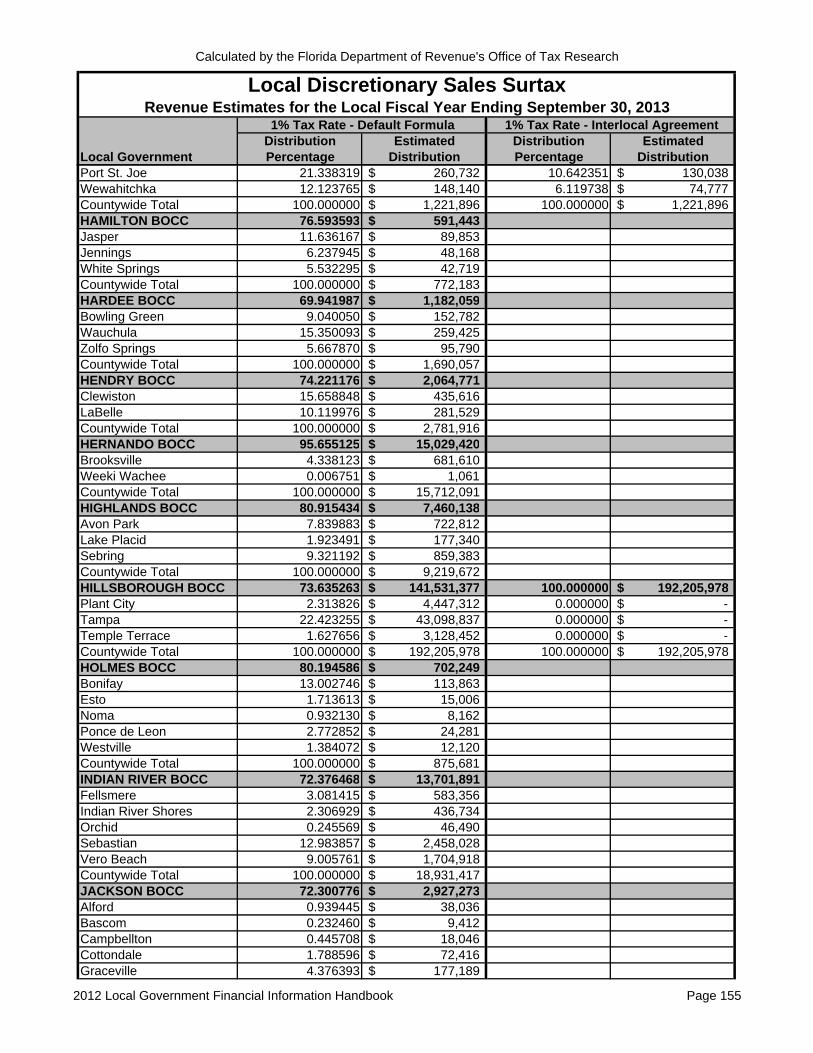
Calculated by the Florida Department of Revenue's Office of Tax Research
Local Discretionary Sales SurtaxRevenue Estimates for the Local Fiscal Year Ending September 30, 2013
Distribution Estimated Distribution EstimatedLocal Government Percentage Distribution Percentage Distribution
1% Tax Rate - Default Formula 1% Tax Rate - Interlocal Agreement
Port St. Joe 21.338319 260,732$ 10.642351 130,038$ Wewahitchka 12.123765 148,140$ 6.119738 74,777$ Countywide Total 100.000000 1,221,896$ 100.000000 1,221,896$ HAMILTON BOCC 76.593593 591,443$ Jasper 11.636167 89,853$ Jennings 6.237945 48,168$ White Springs 5.532295 42,719$ Countywide Total 100.000000 772,183$ HARDEE BOCC 69.941987 1,182,059$ Bowling Green 9.040050 152,782$ Wauchula 15.350093 259,425$ Zolfo Springs 5.667870 95,790$ Countywide Total 100.000000 1,690,057$ HENDRY BOCC 74.221176 2,064,771$ Clewiston 15.658848 435,616$ LaBelle 10.119976 281,529$ Countywide Total 100.000000 2,781,916$ HERNANDO BOCC 95.655125 15,029,420$ Brooksville 4.338123 681,610$ Weeki Wachee 0.006751 1,061$ Countywide Total 100.000000 15,712,091$ HIGHLANDS BOCC 80.915434 7,460,138$ Avon Park 7.839883 722,812$ Lake Placid 1.923491 177,340$ Sebring 9.321192 859,383$ Countywide Total 100.000000 9,219,672$ HILLSBOROUGH BOCC 73.635263 141,531,377$ 100.000000 192,205,978$ Plant City 2.313826 4,447,312$ 0.000000 -$ Tampa 22.423255 43,098,837$ 0.000000 -$ Temple Terrace 1.627656 3,128,452$ 0.000000 -$ Countywide Total 100.000000 192,205,978$ 100.000000 192,205,978$ HOLMES BOCC 80.194586 702,249$ Bonifay 13.002746 113,863$ Esto 1.713613 15,006$ Noma 0.932130 8,162$ Ponce de Leon 2.772852 24,281$ Westville 1.384072 12,120$ Countywide Total 100.000000 875,681$ INDIAN RIVER BOCC 72.376468 13,701,891$ Fellsmere 3.081415 583,356$ Indian River Shores 2.306929 436,734$ Orchid 0.245569 46,490$ Sebastian 12.983857 2,458,028$ Vero Beach 9.005761 1,704,918$ Countywide Total 100.000000 18,931,417$ JACKSON BOCC 72.300776 2,927,273$ Alford 0.939445 38,036$ Bascom 0.232460 9,412$ Campbellton 0.445708 18,046$ Cottondale 1.788596 72,416$ Graceville 4.376393 177,189$
2012 Local Government Financial Information Handbook Page 155
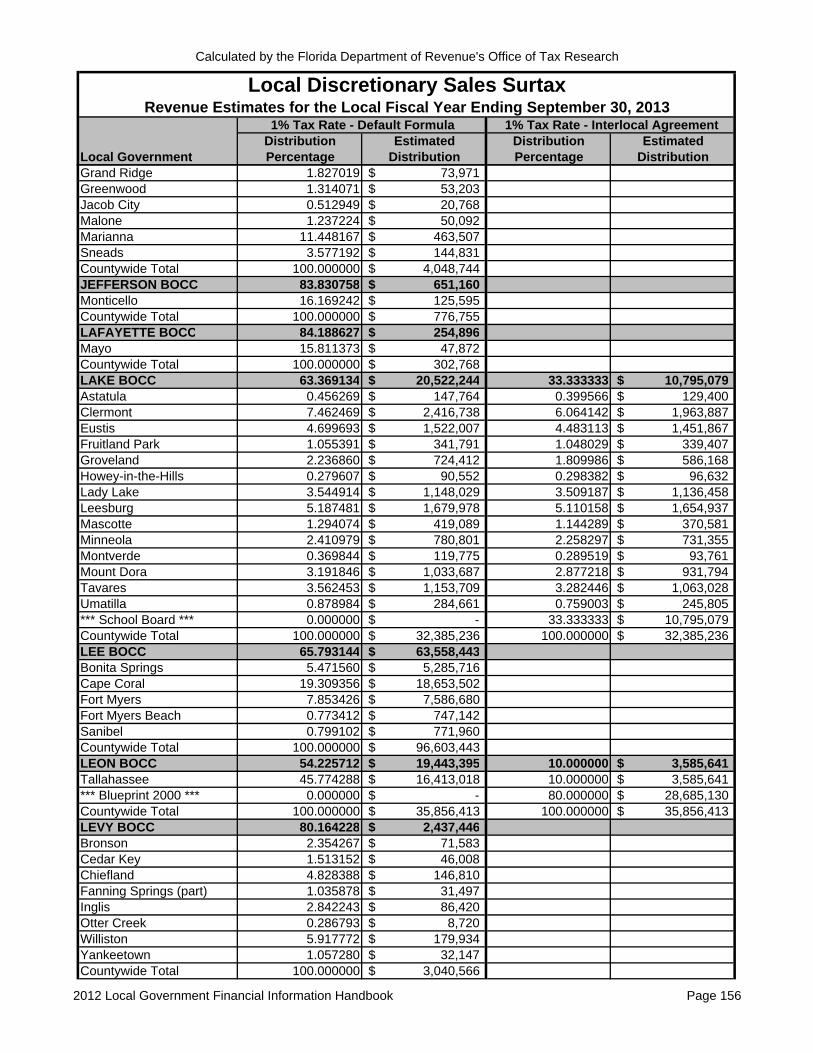
Calculated by the Florida Department of Revenue's Office of Tax Research
Local Discretionary Sales SurtaxRevenue Estimates for the Local Fiscal Year Ending September 30, 2013
Distribution Estimated Distribution EstimatedLocal Government Percentage Distribution Percentage Distribution
1% Tax Rate - Default Formula 1% Tax Rate - Interlocal Agreement
Grand Ridge 1.827019 73,971$ Greenwood 1.314071 53,203$ Jacob City 0.512949 20,768$ Malone 1.237224 50,092$ Marianna 11.448167 463,507$ Sneads 3.577192 144,831$ Countywide Total 100.000000 4,048,744$ JEFFERSON BOCC 83.830758 651,160$ Monticello 16.169242 125,595$ Countywide Total 100.000000 776,755$ LAFAYETTE BOCC 84.188627 254,896$ Mayo 15.811373 47,872$ Countywide Total 100.000000 302,768$ LAKE BOCC 63.369134 20,522,244$ 33.333333 10,795,079$ Astatula 0.456269 147,764$ 0.399566 129,400$ Clermont 7.462469 2,416,738$ 6.064142 1,963,887$ Eustis 4.699693 1,522,007$ 4.483113 1,451,867$ Fruitland Park 1.055391 341,791$ 1.048029 339,407$ Groveland 2.236860 724,412$ 1.809986 586,168$ Howey-in-the-Hills 0.279607 90,552$ 0.298382 96,632$ Lady Lake 3.544914 1,148,029$ 3.509187 1,136,458$ Leesburg 5.187481 1,679,978$ 5.110158 1,654,937$ Mascotte 1.294074 419,089$ 1.144289 370,581$ Minneola 2.410979 780,801$ 2.258297 731,355$ Montverde 0.369844 119,775$ 0.289519 93,761$ Mount Dora 3.191846 1,033,687$ 2.877218 931,794$ Tavares 3.562453 1,153,709$ 3.282446 1,063,028$ Umatilla 0.878984 284,661$ 0.759003 245,805$ *** School Board *** 0.000000 -$ 33.333333 10,795,079$ Countywide Total 100.000000 32,385,236$ 100.000000 32,385,236$ LEE BOCC 65.793144 63,558,443$ Bonita Springs 5.471560 5,285,716$ Cape Coral 19.309356 18,653,502$ Fort Myers 7.853426 7,586,680$ Fort Myers Beach 0.773412 747,142$ Sanibel 0.799102 771,960$ Countywide Total 100.000000 96,603,443$ LEON BOCC 54.225712 19,443,395$ 10.000000 3,585,641$ Tallahassee 45.774288 16,413,018$ 10.000000 3,585,641$ *** Blueprint 2000 *** 0.000000 -$ 80.000000 28,685,130$ Countywide Total 100.000000 35,856,413$ 100.000000 35,856,413$ LEVY BOCC 80.164228 2,437,446$ Bronson 2.354267 71,583$ Cedar Key 1.513152 46,008$ Chiefland 4.828388 146,810$ Fanning Springs (part) 1.035878 31,497$ Inglis 2.842243 86,420$ Otter Creek 0.286793 8,720$ Williston 5.917772 179,934$ Yankeetown 1.057280 32,147$ Countywide Total 100.000000 3,040,566$
2012 Local Government Financial Information Handbook Page 156

Calculated by the Florida Department of Revenue's Office of Tax Research
Local Discretionary Sales SurtaxRevenue Estimates for the Local Fiscal Year Ending September 30, 2013
Distribution Estimated Distribution EstimatedLocal Government Percentage Distribution Percentage Distribution
1% Tax Rate - Default Formula 1% Tax Rate - Interlocal Agreement
LIBERTY BOCC 87.220905 262,106$ Bristol 12.779095 38,402$ Countywide Total 100.000000 300,508$ MADISON BOCC 80.052968 833,838$ 100.000000 1,041,608$ Greenville 4.096001 42,664$ 0.000000 -$ Lee 1.677880 17,477$ 0.000000 -$ Madison 14.173151 147,629$ 0.000000 -$ Countywide Total 100.000000 1,041,608$ 100.000000 1,041,608$ MANATEE BOCC 80.904589 37,680,549$ Anna Maria 0.403252 187,811$ Bradenton 13.313494 6,200,634$ Bradenton Beach 0.315368 146,879$ Holmes Beach 1.028897 479,199$ Longboat Key (part) 0.641721 298,875$ Palmetto 3.392679 1,580,108$ Countywide Total 100.000000 46,574,056$ MARION BOCC 82.788635 27,955,034$ Belleview 1.233654 416,565$ Dunnellon 0.469925 158,678$ McIntosh 0.122283 41,291$ Ocala 15.247258 5,148,504$ Reddick 0.138245 46,681$ Countywide Total 100.000000 33,766,753$ MARTIN BOCC 88.092516 20,563,692$ Jupiter Island 0.517579 120,820$ Ocean Breeze Park 0.203221 47,438$ Sewall's Point 1.271402 296,787$ Stuart 9.915282 2,314,553$ Countywide Total 100.000000 23,343,291$ MIAMI-DADE BOCC 59.202174 239,509,161$ Aventura 1.037295 4,196,497$ Bal Harbour 0.072651 293,918$ Bay Harbor Islands 0.163596 661,844$ Biscayne Park 0.089202 360,878$ Coral Gables 1.365648 5,524,884$ Cutler Bay 1.180187 4,774,583$ Doral 1.350694 5,464,386$ El Portal 0.067976 275,005$ Florida City 0.339851 1,374,907$ Golden Beach 0.026772 108,310$ Hialeah 6.578229 26,612,977$ Hialeah Gardens 0.632836 2,560,212$ Homestead 1.785351 7,222,843$ Indian Creek 0.002584 10,455$ Key Biscayne 0.358987 1,452,322$ Medley 0.024217 97,973$ Miami 11.735146 47,475,874$ Miami Beach 2.565406 10,378,644$ Miami Gardens 3.109621 12,580,328$ Miami Lakes 0.852445 3,448,662$ Miami Shores 0.308026 1,246,156$
2012 Local Government Financial Information Handbook Page 157

Calculated by the Florida Department of Revenue's Office of Tax Research
Local Discretionary Sales SurtaxRevenue Estimates for the Local Fiscal Year Ending September 30, 2013
Distribution Estimated Distribution EstimatedLocal Government Percentage Distribution Percentage Distribution
1% Tax Rate - Default Formula 1% Tax Rate - Interlocal Agreement
Miami Springs 0.401991 1,626,300$ North Bay 0.213394 863,311$ North Miami 1.707561 6,908,132$ North Miami Beach 1.210270 4,896,285$ Opa-locka 0.447260 1,809,440$ Palmetto Bay 0.681706 2,757,919$ Pinecrest 0.530074 2,144,474$ South Miami 0.358987 1,452,322$ Sunny Isles Beach 0.609984 2,467,761$ Surfside 0.166935 675,354$ Sweetwater 0.579669 2,345,118$ Virginia Gardens 0.069399 280,761$ West Miami 0.173875 703,430$ Countywide Total 100.000000 404,561,426$ MONROE BOCC 59.659652 16,497,623$ Islamorada 6.189709 1,711,634$ Key Colony Beach 0.801531 221,646$ Key West 24.792065 6,855,725$ Layton 0.183265 50,678$ Marathon 8.373779 2,315,593$ Countywide Total 100.000000 27,652,899$ NASSAU BOCC 81.336570 6,686,071$ Callahan 1.338712 110,045$ Fernandina Beach 13.641773 1,121,388$ Hilliard 3.682945 302,747$ Countywide Total 100.000000 8,220,252$ OKALOOSA BOCC 66.856852 21,159,995$ Cinco Bayou 0.165938 52,519$ Crestview 9.279580 2,936,959$ Destin 5.323421 1,684,847$ Fort Walton Beach 8.441246 2,671,629$ Laurel Hill 0.227733 72,077$ Mary Esther 1.661111 525,737$ Niceville 5.545969 1,755,283$ Shalimar 0.311134 98,473$ Valparaiso 2.187015 692,184$ Countywide Total 100.000000 31,649,702$ OKEECHOBEE BOCC 86.621333 3,454,467$ Okeechobee 13.378667 533,542$ Countywide Total 100.000000 3,988,009$ ORANGE BOCC 71.033539 247,071,631$ Apopka 2.942208 10,233,703$ Belle Isle 0.420475 1,462,513$ Eatonville 0.149241 519,097$ Edgewood 0.174884 608,287$ Maitland 1.104498 3,841,709$ Oakland 0.178587 621,167$ Ocoee 2.516702 8,753,692$ Orlando 16.879652 58,711,467$ Windermere 0.201015 699,177$ Winter Garden 2.465069 8,574,098$
2012 Local Government Financial Information Handbook Page 158

Calculated by the Florida Department of Revenue's Office of Tax Research
Local Discretionary Sales SurtaxRevenue Estimates for the Local Fiscal Year Ending September 30, 2013
Distribution Estimated Distribution EstimatedLocal Government Percentage Distribution Percentage Distribution
1% Tax Rate - Default Formula 1% Tax Rate - Interlocal Agreement
Winter Park 1.934130 6,727,366$ Countywide Total 100.000000 347,823,909$ OSCEOLA BOCC 71.273111 28,655,808$ 53.572205 21,539,046$ Kissimmee 17.793393 7,153,947$ 13.465247 5,413,788$ St. Cloud 10.933496 4,395,882$ 7.962549 3,201,394$ *** School Board *** 0.000000 -$ 25.000000 10,051,409$ Countywide Total 100.000000 40,205,637$ 100.000000 40,205,637$ PALM BEACH BOCC 59.474829 122,052,491$ Atlantis 0.111483 228,782$ Belle Glade 0.962208 1,974,616$ Boca Raton 4.674214 9,592,285$ Boynton Beach 3.777327 7,751,720$ Briny Breeze 0.033185 68,102$ Cloud Lake 0.007565 15,524$ Delray Beach 3.364527 6,904,582$ Glen Ridge 0.012092 24,816$ Golf 0.013804 28,329$ Greenacres 2.091227 4,291,554$ Gulf Stream 0.048867 100,283$ Haverhill 0.104581 214,617$ Highland Beach 0.195578 401,359$ Hypoluxo 0.145552 298,697$ Juno Beach 0.175645 360,453$ Jupiter 3.066853 6,293,705$ Jupiter Inlet Colony 0.022087 45,326$ Lake Clarke Shores 0.186302 382,323$ Lake Park 0.452667 928,951$ Lake Worth 1.927122 3,954,783$ Lantana 0.574476 1,178,922$ Loxahatchee Groves 0.174596 358,300$ Manalapan 0.022418 46,006$ Mangonia Park 0.100053 205,326$ North Palm Beach 0.664424 1,363,511$ Ocean Ridge 0.098452 202,039$ Pahokee 0.306232 628,441$ Palm Beach 0.461060 946,175$ Palm Beach Gardens 2.685194 5,510,476$ Palm Beach Shores 0.063002 129,292$ Palm Springs 1.093238 2,243,510$ Riviera Beach 1.796479 3,686,682$ Royal Palm Beach 1.890293 3,879,203$ South Bay 0.163828 336,204$ South Palm Beach 0.064825 133,031$ Tequesta 0.311754 639,773$ Wellington 3.133665 6,430,815$ West Palm Beach 5.548297 11,386,051$ Countywide Total 100.000000 205,217,052$ PASCO BOCC 91.890157 40,699,819$ 45.000000 15,045,224$ Dade City 1.317146 583,388$ 1.680000 561,688$ New Port Richey 3.038271 1,345,706$ 4.240000 1,417,594$ Port Richey 0.538639 238,573$ 0.810000 270,814$
2012 Local Government Financial Information Handbook Page 159

Calculated by the Florida Department of Revenue's Office of Tax Research
Local Discretionary Sales SurtaxRevenue Estimates for the Local Fiscal Year Ending September 30, 2013
Distribution Estimated Distribution EstimatedLocal Government Percentage Distribution Percentage Distribution
1% Tax Rate - Default Formula 1% Tax Rate - Interlocal Agreement
St. Leo 0.279881 123,964$ 0.170000 56,838$ San Antonio 0.231135 102,374$ 0.190000 63,524$ Zephyrhills 2.704770 1,197,992$ 2.910000 972,925$ *** School Board *** 0.000000 -$ 45.000000 15,045,224$ *** School Board *** 0.000000 -$ lump sum 10,857,984$ Countywide Total 100.000000 44,291,816$ 100.000000 44,291,816$ PINELLAS BOCC 51.991552 67,668,906$ 100.000000 130,153,658$ Belleair 0.287416 374,083$ 0.000000 -$ Belleair Beach 0.115871 150,810$ 0.000000 -$ Belleair Bluffs 0.151826 197,607$ 0.000000 -$ Belleair Shore 0.008081 10,517$ 0.000000 -$ Clearwater 7.995539 10,406,487$ 0.000000 -$ Dunedin 2.616993 3,406,112$ 0.000000 -$ Gulfport 0.891235 1,159,975$ 0.000000 -$ Indian Rocks Beach 0.304096 395,792$ 0.000000 -$ Indian Shores 0.105344 137,109$ 0.000000 -$ Kenneth City 0.369853 481,377$ 0.000000 -$ Largo 5.757962 7,494,199$ 0.000000 -$ Madeira Beach 0.318404 414,415$ 0.000000 -$ North Redington Beach 0.105789 137,688$ 0.000000 -$ Oldsmar 1.008589 1,312,715$ 0.000000 -$ Pinellas Park 3.654271 4,756,168$ 0.000000 -$ Redington Beach 0.105566 137,398$ 0.000000 -$ Redington Shores 0.157756 205,326$ 0.000000 -$ Safety Harbor 1.251228 1,628,519$ 0.000000 -$ St. Petersburg 18.227321 23,723,524$ 0.000000 -$ St. Pete Beach 0.691964 900,616$ 0.000000 -$ Seminole 1.276730 1,661,711$ 0.000000 -$ South Pasadena 0.369260 480,605$ 0.000000 -$ Tarpon Springs 1.739547 2,264,084$ 0.000000 -$ Treasure Island 0.497808 647,915$ 0.000000 -$ Countywide Total 100.000000 130,153,658$ 100.000000 130,153,658$ POLK BOCC 69.822327 45,874,722$ Auburndale 1.805957 1,186,551$ Bartow 2.274419 1,494,341$ Davenport 0.393662 258,644$ Dundee 0.498090 327,255$ Eagle Lake 0.303716 199,548$ Fort Meade 0.744942 489,443$ Frostproof 0.399641 262,572$ Haines City 2.745007 1,803,527$ Highland Park 0.030558 20,077$ Hillcrest Heights 0.032949 21,648$ Lake Alfred 0.667353 438,464$ Lake Hamilton 0.165144 108,503$ Lake Wales 1.894707 1,244,862$ Lakeland 12.979030 8,527,493$ Mulberry 0.502873 330,398$ Polk City 0.207526 136,349$ Winter Haven 4.532098 2,977,683$ Countywide Total 100.000000 65,702,081$
2012 Local Government Financial Information Handbook Page 160

Calculated by the Florida Department of Revenue's Office of Tax Research
Local Discretionary Sales SurtaxRevenue Estimates for the Local Fiscal Year Ending September 30, 2013
Distribution Estimated Distribution EstimatedLocal Government Percentage Distribution Percentage Distribution
1% Tax Rate - Default Formula 1% Tax Rate - Interlocal Agreement
PUTNAM BOCC 81.957288 4,628,807$ Crescent City 1.822327 102,922$ Interlachen 1.691990 95,561$ Palatka 12.586493 710,864$ Pomona Park 1.100092 62,131$ Welaka 0.841810 47,544$ Countywide Total 100.000000 5,647,829$ ST. JOHNS BOCC 90.337140 22,523,895$ Hastings 0.292475 72,923$ St. Augustine 6.341662 1,581,176$ St. Augustine Beach 3.028723 755,156$ Countywide Total 100.000000 24,933,150$ ST. LUCIE BOCC 50.199202 13,061,711$ Fort Pierce 9.981521 2,597,168$ Port St. Lucie 39.673519 10,322,954$ St. Lucie Village 0.145758 37,926$ Countywide Total 100.000000 26,019,758$ SANTA ROSA BOCC 90.430395 11,932,277$ Gulf Breeze 3.600155 475,040$ Jay 0.325981 43,013$ Milton 5.643469 744,655$ Countywide Total 100.000000 13,194,985$ SARASOTA BOCC 71.315431 40,471,899$ 48.814092 27,702,266$ Longboat Key (part) 0.951698 540,094$ 0.970077 550,524$ North Port 12.279176 6,968,500$ 10.784046 6,120,005$ Sarasota 11.052171 6,272,168$ 10.211890 5,795,304$ Venice 4.401525 2,497,889$ 4.219895 2,394,814$ *** School Board *** 0.000000 -$ 25.000000 14,187,638$ Countywide Total 100.000000 56,750,550$ 100.000000 56,750,550$ SEMINOLE BOCC 62.007288 35,625,969$ 100.000000 57,454,486$ Altamonte Springs 7.318978 4,205,081$ 0.000000 -$ Casselberry 4.632069 2,661,331$ 0.000000 -$ Lake Mary 2.439894 1,401,829$ 0.000000 -$ Longwood 2.396262 1,376,760$ 0.000000 -$ Oviedo 5.949309 3,418,145$ 0.000000 -$ Sanford 9.395035 5,397,869$ 0.000000 -$ Winter Springs 5.861165 3,367,502$ 0.000000 -$ Countywide Total 100.000000 57,454,486$ 100.000000 57,454,486$ SUMTER BOCC 87.638260 8,293,365$ Bushnell 2.554676 241,754$ Center Hill 1.007625 95,353$ Coleman 0.738436 69,880$ Webster 0.804424 76,124$ Wildwood 7.256578 686,703$ Countywide Total 100.000000 9,463,179$ SUWANNEE BOCC 83.517849 2,592,648$ Branford 1.536416 47,695$ Live Oak 14.945735 463,961$ Countywide Total 100.000000 3,104,304$ TAYLOR BOCC 71.080192 1,443,910$ 100.000000 2,031,381$ Perry 28.919808 587,471$ 0.000000 -$
2012 Local Government Financial Information Handbook Page 161

Calculated by the Florida Department of Revenue's Office of Tax Research
Local Discretionary Sales SurtaxRevenue Estimates for the Local Fiscal Year Ending September 30, 2013
Distribution Estimated Distribution EstimatedLocal Government Percentage Distribution Percentage Distribution
1% Tax Rate - Default Formula 1% Tax Rate - Interlocal Agreement
Countywide Total 100.000000 2,031,381$ 100.000000 2,031,381$ UNION BOCC 79.525653 442,798$ Lake Butler 15.262988 84,984$ Raiford 2.057115 11,454$ Worthington Springs 3.154243 17,563$ Countywide Total 100.000000 556,799$ VOLUSIA BOCC 49.157847 31,092,796$ Daytona Beach 8.166576 5,165,435$ Daytona Beach Shores 0.570661 360,949$ DeBary 2.586792 1,636,170$ DeLand 3.660214 2,315,119$ Deltona 11.414966 7,220,072$ Edgewater 2.776834 1,756,373$ Flagler Beach (part) 0.008036 5,083$ Holly Hill 1.560513 987,039$ Lake Helen 0.350084 221,431$ New Smyrna Beach 3.035848 1,920,202$ Oak Hill 0.240264 151,969$ Orange City 1.507344 953,409$ Ormond Beach 5.139031 3,250,485$ Pierson 0.230889 146,040$ Ponce Inlet 0.407003 257,433$ Port Orange 7.541809 4,770,264$ South Daytona 1.645288 1,040,660$ Countywide Total 100.000000 63,250,930$ WAKULLA BOCC 97.346172 1,791,832$ 100.000000 1,840,680$ St. Marks 1.028092 18,924$ 0.000000 -$ Sopchoppy 1.625737 29,925$ 0.000000 -$ Countywide Total 100.000000 1,840,680$ 100.000000 1,840,680$ WALTON BOCC 87.103451 12,781,126$ DeFuniak Springs 8.667255 1,271,790$ Freeport 3.155430 463,012$ Paxton 1.073864 157,573$ Countywide Total 100.000000 14,673,501$ WASHINGTON BOCC 79.840893 1,253,504$ Caryville 1.108616 17,405$ Chipley 13.838455 217,264$ Ebro 1.000834 15,713$ Vernon 2.713800 42,607$ Wausau 1.497402 23,509$ Countywide Total 100.000000 1,570,003$ STATEWIDE TOTALS 2,832,846,478$
Notes:1) The dollar figures represent a 100 percent distribution of estimated monies.2) Revenue estimates are based on the $5,000 cap on transactions.3) Revenue estimates, based on the default formula methodology, are provided for every jurisdiction even though some counties do not impose a local discretionary sales surtax or an interlocal agreement specifies the distribution percentages in some jurisdictions. These estimates may assist local officials considering a future levy, rate change, or change in distribution methodology.
2012 Local Government Financial Information Handbook Page 162

Calculated by the Florida Department of Revenue's Office of Tax Research
Local Discretionary Sales SurtaxRevenue Estimates for the Local Fiscal Year Ending September 30, 2013
Distribution Estimated Distribution EstimatedLocal Government Percentage Distribution Percentage Distribution
1% Tax Rate - Default Formula 1% Tax Rate - Interlocal Agreement
6) On September 10, 2012, the U.S. Census Bureau revised the 2010 census counts for the City of Panama Cityand unincorporated Bay County, which also caused their respective 2011 revenue-sharing populations to change as well. Panama City's population was decreased by 981; unincorporated Bay County's population was increased by 981. Consequently, Panama City's estimated distribution was decreased by $121,759, and the estimated distributions for Bay County and all Bay County municipalities were increased by small amounts. The estimated distributions for all other counties and municipalities remained unchanged.
4) The distribution percentages and estimated distributions listed under the heading "1% Tax Rate - Default Formula" reflect the use of the default formula methodology (i.e., Local Government Half-cent Sales Tax Program distribution percentages).5) For those jurisdictions where the distribution of local discretionary sales surtax proceeds is governed by an interlocal agreement, the distribution percentages per the agreement as well as the estimated distributions are listed in the column labeled "1% Tax Rate - Interlocal Agreement".
2012 Local Government Financial Information Handbook Page 163

Office of Economic and Demographic Research
EstimatedCountywide Maximum Countywide Countywide Maximum Districtwide Districtwide
Distribution @ Potential 2012 Realized Unutilized Unrealized Potential 2012 Realized Unutilized UnrealizedCounty 1% Tax Rate Tax Rate Tax Rate Tax Revenues Tax Rate Tax Revenues Tax Rate Tax Rate Tax Revenues Tax Rate Tax RevenuesAlachua 31,406,551$ 3.5 0.0 -$ 3.5 109,922,929$ 0.5 0.0 -$ 0.5 15,703,276$ Baker 1,792,411$ 2.5 1.0 1,792,411$ 1.5 2,688,617$ 0.5 0.0 -$ 0.5 896,206$ Bay 32,080,193$ 3.0 0.0 -$ 3.0 96,240,579$ 0.5 0.5 16,040,097$ 0.0 -$ Bradford 2,206,297$ 2.5 1.0 2,206,297$ 1.5 3,309,446$ 0.5 0.0 -$ 0.5 1,103,149$ Brevard 62,324,023$ 3.0 0.0 -$ 3.0 186,972,069$ 0.5 0.0 -$ 0.5 31,162,012$ Broward 280,902,924$ 3.0 0.0 -$ 3.0 842,708,772$ 0.5 0.0 -$ 0.5 140,451,462$ Calhoun 759,864$ 2.5 1.0 759,864$ 1.5 1,139,796$ 0.5 0.5 379,932$ 0.0 -$ Charlotte 20,381,944$ 3.0 1.0 20,381,944$ 2.0 40,763,888$ 0.5 0.0 -$ 0.5 10,190,972$ Citrus 12,133,086$ 3.0 0.0 -$ 3.0 36,399,258$ 0.5 0.0 -$ 0.5 6,066,543$ Clay 17,893,261$ 3.0 1.0 17,893,261$ 2.0 35,786,522$ 0.5 0.0 -$ 0.5 8,946,631$ Collier 58,861,343$ 2.0 0.0 -$ 2.0 117,722,686$ 0.5 0.0 -$ 0.5 29,430,672$ Columbia 7,128,568$ 3.0 1.0 7,128,568$ 2.0 14,257,136$ 0.5 0.0 -$ 0.5 3,564,284$ DeSoto 2,065,535$ 2.5 1.0 2,065,535$ 1.5 3,098,303$ 0.5 0.0 -$ 0.5 1,032,768$ Dixie 796,104$ 2.5 1.0 796,104$ 1.5 1,194,156$ 0.5 0.0 -$ 0.5 398,052$ Duval 135,245,033$ 3.0 1.0 135,245,033$ 2.0 270,490,066$ 0.5 0.0 -$ 0.5 67,622,517$ Escambia 41,291,184$ 3.0 1.0 41,291,184$ 2.0 82,582,368$ 0.5 0.5 20,645,592$ 0.0 -$ Flagler 8,663,369$ 2.0 0.5 1,082,921$ 1.5 16,243,817$ 0.5 0.5 4,331,685$ 0.0 -$ Franklin 1,575,477$ 3.5 1.0 1,575,477$ 2.5 3,938,693$ 0.5 0.0 -$ 0.5 787,739$ Gadsden 2,836,674$ 2.5 1.5 4,255,011$ 1.0 2,836,674$ 0.5 0.0 -$ 0.5 1,418,337$ Gilchrist 695,388$ 2.5 1.0 695,388$ 1.5 1,043,082$ 0.5 0.0 -$ 0.5 347,694$ Glades 398,241$ 2.5 1.0 398,241$ 1.5 597,362$ 0.5 0.0 -$ 0.5 199,121$ Gulf 1,221,896$ 3.5 1.0 1,221,896$ 2.5 3,054,740$ 0.5 0.0 -$ 0.5 610,948$ Hamilton 772,183$ 2.5 1.0 772,183$ 1.5 1,158,275$ 0.5 0.0 -$ 0.5 386,092$ Hardee 1,690,057$ 2.5 1.0 1,690,057$ 1.5 2,535,086$ 0.5 0.0 -$ 0.5 845,029$ Hendry 2,781,916$ 2.5 1.0 2,781,916$ 1.5 4,172,874$ 0.5 0.0 -$ 0.5 1,390,958$ Hernando 15,712,091$ 3.0 0.0 -$ 3.0 47,136,273$ 0.5 0.5 7,856,046$ 0.0 -$ Highlands 9,219,672$ 2.0 1.0 9,219,672$ 1.0 9,219,672$ 0.5 0.0 -$ 0.5 4,609,836$ Hillsborough 192,205,978$ 3.0 1.0 192,205,978$ 2.0 384,411,956$ 0.5 0.0 -$ 0.5 96,102,989$ Holmes 875,681$ 2.5 1.0 875,681$ 1.5 1,313,522$ 0.5 0.0 -$ 0.5 437,841$ Indian River 18,931,417$ 2.0 1.0 18,931,417$ 1.0 18,931,417$ 0.5 0.0 -$ 0.5 9,465,709$ Jackson 4,048,744$ 2.0 1.0 4,048,744$ 1.0 4,048,744$ 0.5 0.5 2,024,372$ 0.0 -$ Jefferson 776,755$ 2.5 1.0 776,755$ 1.5 1,165,133$ 0.5 0.0 -$ 0.5 388,378$ Lafayette 302,768$ 2.5 1.0 302,768$ 1.5 454,152$ 0.5 0.0 -$ 0.5 151,384$ Lake 32,385,236$ 2.0 1.0 32,385,236$ 1.0 32,385,236$ 0.5 0.0 -$ 0.5 16,192,618$ Lee 96,603,443$ 3.0 0.0 -$ 3.0 289,810,329$ 0.5 0.0 -$ 0.5 48,301,722$ Leon 35,856,413$ 3.5 1.0 35,856,413$ 2.5 89,641,033$ 0.5 0.5 4,482,052$ 0.0 13,446,155$ Levy 3,040,566$ 2.5 1.0 3,040,566$ 1.5 4,560,849$ 0.5 0.0 -$ 0.5 1,520,283$ Liberty 300,508$ 2.5 1.0 300,508$ 1.5 450,762$ 0.5 0.5 150,254$ 0.0 -$ Madison 1,041,608$ 1.5 1.5 1,562,412$ 0.0 -$ 0.5 0.0 -$ 0.5 520,804$ Manatee 46,574,056$ 3.0 0.0 -$ 3.0 139,722,168$ 0.5 0.5 23,287,028$ 0.0 -$ Marion 33,766,753$ 2.0 0.0 -$ 2.0 67,533,506$ 0.5 0.0 -$ 0.5 16,883,377$ Martin 23,343,291$ 2.0 0.0 -$ 2.0 46,686,582$ 0.5 0.0 -$ 0.5 11,671,646$ Miami-Dade 404,561,426$ 2.0 1.0 404,561,426$ 1.0 404,561,426$ 0.5 0.0 -$ 0.5 202,280,713$ Monroe 27,652,899$ 2.0 1.0 27,652,899$ 1.0 27,652,899$ 0.5 0.5 13,826,450$ 0.0 -$ Nassau 8,220,252$ 2.0 1.0 8,220,252$ 1.0 8,220,252$ 0.5 0.0 -$ 0.5 4,110,126$
Local Fiscal Year Ending September 30, 2013
Local Discretionary Sales Surtax Levies in Florida's CountiesEstimation of Realized and Unrealized Tax Revenues
County Government Levies School District Levy - School Capital Outlay Surtax
2012 Local Government Financial Information Handbook Page 164

Office of Economic and Demographic Research
EstimatedCountywide Maximum Countywide Countywide Maximum Districtwide Districtwide
Distribution @ Potential 2012 Realized Unutilized Unrealized Potential 2012 Realized Unutilized UnrealizedCounty 1% Tax Rate Tax Rate Tax Rate Tax Revenues Tax Rate Tax Revenues Tax Rate Tax Rate Tax Revenues Tax Rate Tax Revenues
Local Fiscal Year Ending September 30, 2013
Local Discretionary Sales Surtax Levies in Florida's CountiesEstimation of Realized and Unrealized Tax Revenues
County Government Levies School District Levy - School Capital Outlay Surtax
Okaloosa 31,649,702$ 3.0 0.0 -$ 3.0 94,949,106$ 0.5 0.0 -$ 0.5 15,824,851$ Okeechobee 3,988,009$ 2.5 1.0 3,988,009$ 1.5 5,982,014$ 0.5 0.0 -$ 0.5 1,994,005$ Orange 347,823,909$ 3.0 0.0 -$ 3.0 1,043,471,727$ 0.5 0.5 173,911,955$ 0.0 -$ Osceola 40,205,637$ 3.0 1.0 40,205,637$ 2.0 80,411,274$ 0.5 0.0 -$ 0.5 20,102,819$ Palm Beach 205,217,052$ 3.0 0.0 -$ 3.0 615,651,156$ 0.5 0.0 -$ 0.5 102,608,526$ Pasco 44,291,816$ 3.0 1.0 44,291,816$ 2.0 88,583,632$ 0.5 0.0 -$ 0.5 22,145,908$ Pinellas 130,153,658$ 3.0 1.0 130,153,658$ 2.0 260,307,316$ 0.5 0.0 -$ 0.5 65,076,829$ Polk 65,702,081$ 3.0 0.5 32,851,041$ 2.5 164,255,203$ 0.5 0.5 32,851,041$ 0.0 -$ Putnam 5,647,829$ 2.0 1.0 5,647,829$ 1.0 5,647,829$ 0.5 0.0 -$ 0.5 2,823,915$ St. Johns 24,933,150$ 2.0 0.0 -$ 2.0 49,866,300$ 0.5 0.0 -$ 0.5 12,466,575$ St. Lucie 26,019,758$ 2.0 0.0 -$ 2.0 52,039,516$ 0.5 0.5 13,009,879$ 0.0 -$ Santa Rosa 13,194,985$ 3.0 0.0 -$ 3.0 39,584,955$ 0.5 0.5 6,597,493$ 0.0 -$ Sarasota 56,750,550$ 3.0 1.0 56,750,550$ 2.0 113,501,100$ 0.5 0.0 -$ 0.5 28,375,275$ Seminole 57,454,486$ 3.0 0.0 -$ 3.0 172,363,458$ 0.5 0.0 -$ 0.5 28,727,243$ Sumter 9,463,179$ 2.0 1.0 9,463,179$ 1.0 9,463,179$ 0.5 0.0 -$ 0.5 4,731,590$ Suwannee 3,104,304$ 2.5 1.0 3,104,304$ 1.5 4,656,456$ 0.5 0.0 -$ 0.5 1,552,152$ Taylor 2,031,381$ 2.5 1.0 2,031,381$ 1.5 3,047,072$ 0.5 0.0 -$ 0.5 1,015,691$ Union 556,799$ 2.5 1.0 556,799$ 1.5 835,199$ 0.5 0.0 -$ 0.5 278,400$ Volusia 63,250,930$ 3.0 0.0 -$ 3.0 189,752,790$ 0.5 0.5 31,625,465$ 0.0 -$ Wakulla 1,840,680$ 3.5 1.0 1,840,680$ 2.5 4,601,700$ 0.5 0.0 -$ 0.5 920,340$ Walton 14,673,501$ 3.0 1.0 14,673,501$ 2.0 29,347,002$ 0.5 0.0 -$ 0.5 7,336,751$ Washington 1,570,003$ 2.5 1.0 1,570,003$ 1.5 2,355,005$ 0.5 0.0 -$ 0.5 785,002$ Statewide 2,832,846,478$ 1,331,102,405$ 6,489,436,086$ 351,019,337$ 1,065,403,902$
Notes:
Data Sources:
2) A county's unutilized tax rate is determined by subtracting its 2012 tax rate from its maximum potential tax rate.
1) Pursuant to general law, no local discretionary sales surtax initial levy, rate increase, or rate decrease shall take effect on a date other than January 1st, and no levy shall terminate on a day other than December 31st. The governing body of any county or school board that levies a surtax shall notify the Florida Department of Revenue within 10 days after the final adoption by ordinance or referendum of an imposition, termination, or rate change. For the 2013 calendar year, the Department must have received notice no later than November 16, 2012, prior to the January 1, 2013 effective date.
3) The countywide unrealized tax revenues shown here represent estimates for the entire local fiscal year (i.e., October 1, 2012 through September 30, 2013) with two exceptions. Flagler County's levy of the Local Government Infrastructure Surtax and Leon County's levy of the School Capital Outlay Surtax are scheduled to expire on December 31, 2012. Consequently, the realized tax revenues for these levies correspond to the period of October 1 to December 31, 2012, and the unrealized tax revenues for these levies correspond to the period of January 1 to September 30, 2013.
1) Office of Economic and Demographic Research, "2012 Local Government Financial Information Handbook" Table: 2012 Local Discretionary Sales Surtax Rates in Florida's Counties.2) Office of Economic and Demographic Research, "2012 Local Government Financial Information Handbook" Table: Local Discretionary Sales Surtax - Revenue Estimates for the Local Fiscal Year EndingSeptember 30, 2013.
2012 Local Government Financial Information Handbook Page 165

Office of Economic and Demographic Research
166 2012 Local Government Financial Information Handbook
This page was intentionally left blank.

Office of Economic and Demographic Research
2012 Local Government Financial Information Handbook 167
Charter County and Regional Transportation System Surtax Section 212.055(1), Florida Statutes
Summary: Each charter county that has adopted a charter, each county the government of which is consolidated with that of one or more municipalities, and each county that is within or under an interlocal agreement with a regional transportation or transit authority created under ch. 343 or 349, F.S., may levy the Charter County and Regional Transportation System Surtax at a rate of up to 1 percent. The levy is subject to approval by a majority vote of the county’s electorate or by a charter amendment approved by a majority vote of the county’s electorate. Generally, the tax proceeds are for the development, construction, operation, and maintenance of fixed guideway rapid transit systems, bus systems, on-demand transportation services, and roads and bridges. General Law Amendments: There were no general law amendments resulting from the 2012 Regular Legislative Session. Authorization to Levy: Any county that has adopted a home rule charter, any county government that has consolidated with one or more municipalities, and any county that is within or under an interlocal agreement with a regional transportation or transit authority created under ch. 343 or 349, F.S., may levy this surtax at a rate of up to 1 percent, subject to approval by a majority vote of the county’s electorate or a charter amendment approved by a majority vote of the county’s electorate. In addition to the Emergency Fire Rescue Services and Facilities Surtax and the School Capital Outlay Surtax, this surtax is not subject to a combined rate limitation that impacts other discretionary sales surtaxes. Counties Eligible to Levy: Florida’s twenty charter counties (i.e., Alachua, Brevard, Broward, Charlotte, Clay, Columbia, Duval, Hillsborough, Lee, Leon, Miami-Dade, Orange, Osceola, Palm Beach, Pinellas, Polk, Sarasota, Seminole, Volusia and Wakulla) are eligible to levy this surtax. Additionally, each county that is within or under an interlocal agreement with a regional transportation authority created under to ch. 343, F.S., or a transit authority created under ch. 349, F.S., as summarized in the following table, is authorized to levy the surtax.
Regional Transportation or Transit Authority Authorizing Statute Counties Served South Florida Regional Transportation Authority Part I of Ch. 343, F.S.
(ss. 343.51 – 343.58) Broward, Miami-Dade, and
Palm Beach Central Florida Regional Transportation Authority Part II of Ch. 343, F.S.
(ss. 343.61 – 343.67) Orange, Osceola, and
Seminole Northwest Florida Transportation Corridor Authority Part III of Ch. 343, F.S.
(ss. 343.80 – 343.89) Bay, Escambia, Franklin,
Gulf, Okaloosa, Santa Rosa, Wakulla, and Walton
Tampa Bay Area Regional Transportation Authority Part IV of Ch. 343, F.S. (ss. 343.90 – 343.976)
Citrus, Hernando, Hillsborough, Manatee,
Pasco, Pinellas, and Sarasota Jacksonville Transportation Authority Ch. 349, F.S. Duval
Eleven of Florida’s twenty charter counties are also within one of the qualified regional transportation or transit authorities. Eleven non-charter counties that are within an authority are also eligible to levy this surtax.

Office of Economic and Demographic Research
168 2012 Local Government Financial Information Handbook
These counties include Bay, Escambia, Franklin, Gulf, Okaloosa, Santa Rosa, and Walton, which are counties served by the Northwest Florida Transportation Corridor Authority; and Citrus, Hernando, Manatee, and Pasco, which are counties served by the Tampa Bay Area Regional Transportation Authority. Distribution of Proceeds: The surtax proceeds shall be deposited into the county trust fund or remitted by the county’s governing body to an expressway, transit, or transportation authority created by law. Authorized Uses of Proceeds: The surtax proceeds shall be applied to as many or as few of the following uses as the county’s governing body deems appropriate.
1. Deposited into the county trust fund and used for the purposes of development, construction, equipment, maintenance, operation, supportive services, including a countywide bus system, on-demand transportation services, and related costs of a fixed guideway rapid transit system.
2. Remitted by the county’s governing body to an expressway or transportation authority created by law to be used at the authority’s discretion for the development, construction, operation, or maintenance of roads or bridges in the county, for the operation and maintenance of a bus system, for the operation and maintenance of on-demand transportation services, for the payment of principal and interest on existing bonds issued for the construction of such roads or bridges, and, upon approval of the county commission, such proceeds may be pledged for bonds issued to refinance existing bonds or new bonds issued for the construction of such roads or bridges.
3. Used by the county for the development, construction, operation, and maintenance of roads and bridges in the county; for the expansion, operation, and maintenance of bus and fixed guideway systems; for the expansion, operation, and maintenance of on-demand transportation services; and for the payment of principal and interest on bonds issued for the construction of fixed guideway rapid transit systems, bus systems, roads, or bridges; and such proceeds may be pledged by the county’s governing body for bonds issued to refinance existing bonds or new bonds issued for the construction of such fixed guideway rapid transit systems, bus systems, roads, or bridges and no more than 25 percent used for nontransit uses.
4. Used by the county for the planning, development, construction, operation, and maintenance of roads and bridges in the county; for the planning, development, expansion, operation, and maintenance of bus and fixed guideway systems; for the planning, development, construction, operation, and maintenance of on-demand transportation services; and for the payment of principal and interest on bonds issued for the construction of fixed guideway rapid transit systems, bus systems, roads, or bridges; and such proceeds may be pledged by the county’s governing body for bonds issued to refinance existing bonds or new bonds issued for the construction of such fixed guideway rapid transit systems, bus systems, roads, or bridges. Pursuant to an interlocal agreement entered into pursuant to ch. 163, F.S., the county’s governing body may distribute surtax proceeds to a municipality, or an expressway or transportation authority created by law to be expended for such purposes. Any county that has entered into interlocal agreements for the distribution of proceeds to one or more of its municipalities shall revise such agreements no less than every five years in order to include any municipalities created since the prior agreements were executed.
As it relates to the authorized uses of the surtax proceeds, the term on-demand transportation services means transportation provided between flexible points of origin and destination selected by individual users with

Office of Economic and Demographic Research
2012 Local Government Financial Information Handbook 169
such service being provided at a time that is agreed upon by the user and the provider of the service and that is not fixed-schedule or fixed-route in nature. Attorney General Opinions: No opinions specifically relevant to this surtax have been issued.
Office of Economic and Demographic Research
170 2012 Local Government Financial Information Handbook
This page was intentionally left blank.

Office of Economic and Demographic Research
2012 Local Government Financial Information Handbook 171
Local Government Infrastructure Surtax Section 212.055(2), Florida Statutes
Summary: The Local Government Infrastructure Surtax shall be levied at the rate of 0.5 or 1 percent pursuant to an ordinance enacted by a majority vote of the county’s governing body and approved by voters in a countywide referendum. Generally, the proceeds must be expended to finance, plan, and construct infrastructure; to acquire land for public recreation, conservation, or protection of natural resources; or to finance the closure of local government-owned solid waste landfills that have been closed or are required to be closed by order of the Department of Environmental Protection (DEP). Additional spending authority exists for select counties. General Law Amendments: Chapter 2012-117, L.O.F., (CS/CS/HB 7117) authorizes the surtax proceeds to be used for the additional purpose of providing loans, grants, or rebates to residential or commercial property owners who make energy efficiency improvements to their residential or commercial property, if a local government ordinance authorizing such use is approved by referendum. This change became effective on July 1, 2012. Authorization to Levy: Local governments may levy this surtax at a rate of 0.5 or 1 percent. This levy shall be pursuant to an ordinance enacted by a majority of the members of the county’s governing body and approved by the voters in a countywide referendum. In lieu of action by the county’s governing body, municipalities representing a majority of the county’s population may initiate the surtax through the adoption of uniform resolutions calling for a countywide referendum on the issue. If the proposal to levy the surtax is approved by a majority of the electors, the levy shall take effect. Additionally, the surtax may not be levied beyond the time established in the ordinance if the surtax was levied pursuant to a referendum held before July 1, 1993. If the pre-July 1, 1993 ordinance did not limit the period of the levy, the surtax may not be levied for more than 15 years. There is no state-mandated limit on the length of levy for those surtax ordinances enacted after July 1, 1993. The levy may only be extended by voter approval in a countywide referendum. This surtax is one of several surtaxes subject to a combined rate limitation. A county shall not levy this surtax and the Small County Surtax, Indigent Care and Trauma Center Surtax, and County Public Hospital Surtax in excess of a combined rate of 1 percent. Counties Eligible to Levy: All counties are eligible to levy the surtax. Distribution of Proceeds: The surtax proceeds shall be distributed to the county and its respective municipalities according to one of the following procedures.
1. An interlocal agreement between the county’s governing body and the governing bodies of the municipalities representing a majority of the county’s municipal population. This agreement may include a school district with the consent of all governing bodies previously mentioned.
2. If there is no interlocal agreement, then the distribution will be based on the Local Government Half-cent Sales Tax formulas provided in s. 218.62, F.S.

Office of Economic and Demographic Research
172 2012 Local Government Financial Information Handbook
Authorized Uses of Proceeds: The surtax proceeds and any accrued interest shall be expended by the school district, within the county and municipalities within the county, or, in the case of a negotiated joint county agreement, within another county, for any of the following purposes.
1. To finance, plan, and construct infrastructure. 2. To acquire land for public recreation, conservation, or protection of natural resources. 3. To provide loans, grants, or rebates to residential or commercial property owners who make energy
efficiency improvements to their residential or commercial property, if a local government ordinance authorizing such use is approved by referendum.
4. To finance the closure of county or municipal-owned solid waste landfills that have been closed or are required to be closed by order of the DEP. Any use of the proceeds or interest for purposes of landfill closures before July 1, 1993, is ratified.
The surtax proceeds and any interest may not be used to fund the operational expenses of infrastructure, except that a county that has a population of fewer than 75,000 that is required to close a landfill may use the proceeds or interest for long-term maintenance costs associated with landfill closure. Counties, as defined in s. 125.011, F.S., (i.e., Miami-Dade County) and charter counties may use the proceeds or interest to retire or service indebtedness incurred for bonds issued before July 1, 1987, for infrastructure purposes, and for bonds subsequently issued to refund such bonds. Any use of the proceeds or interest for purposes of retiring or servicing indebtedness incurred for refunding bonds before July 1, 1999, is ratified. As it relates to the authorized uses of the surtax proceeds and any accrued interest, the term infrastructure has the following meanings.
1. Any fixed capital expenditure or fixed capital outlay associated with the construction, reconstruction, or improvement of public facilities that have a life expectancy of 5 or more years and any related land acquisition, land improvement, design, and engineering costs.
2. A fire department vehicle, emergency medical services vehicle, sheriff’s office vehicle, police department vehicle, or any other vehicle, and the equipment necessary to outfit the vehicle for its official use or equipment that has a life expectancy of at least 5 years.
3. Any expenditure for the construction, lease, or maintenance of, or provision of utilities or security for, those court facilities as defined in s. 29.008, F.S.
4. Any fixed capital expenditure or fixed capital outlay associated with the improvement of private facilities that have a life expectancy of 5 or more years and that the owner agrees to make available for use on a temporary basis as needed by a local government as a public emergency shelter or staging area for emergency response equipment during an emergency officially declared by the state or by the local government under s. 252.38, F.S. These “private facility” improvements are limited to those necessary to comply with current standards for public emergency evacuation shelters, and the private facility’s owner must enter into a written contract with the local government providing the improvement funding to make the private facility available to the public for purposes of emergency shelter at no cost to the local government for a minimum of 10 years after the completion of the improvement, with the provision that the obligation will transfer to any subsequent owner until the end of the minimum period.
5. Any land-acquisition expenditure for a residential housing project in which at least 30 percent of the units are affordable to individuals or families whose total annual household income does not exceed 120 percent of the area median income adjusted for household size, if the land is owned by a local

Office of Economic and Demographic Research
2012 Local Government Financial Information Handbook 173
government or by a special district that enters into a written agreement with the local government to provide such housing. The local government or special district may enter into a ground lease with a public or private person or entity for nominal or other consideration for the construction of the residential housing project on land acquired pursuant to this provision.
Additionally, the term energy efficiency improvement means any energy conservation and efficiency improvement that reduces consumption through conservation or a more efficient use of electricity, natural gas, propane, or other forms of energy on the property, including, but not limited to, air sealing; installation of insulation; installation of energy-efficient heating, cooling, or ventilation systems; installation of solar panels; building modifications to increase the use of daylight or shade; replacement of windows; installation of energy controls or energy recovery systems; installation of electric vehicle charging equipment; and installation of efficient lighting equipment. Any local government infrastructure surtax imposed or extended after July 1, 1998, may allocate up to 15 percent of the surtax proceeds for deposit within a county trust fund created for the purpose of funding economic development projects having a general public purpose of improving local economies, including the funding of operational costs and incentives related to economic development. The referendum ballot statement must indicate the intention to make the allocation. School districts, counties, and municipalities may pledge the surtax proceeds for the purpose of servicing new bonded indebtedness. Local governments may use the services of the Division of Bond Finance of the State Board of Administration to issue bonds, and counties and municipalities may join together for the issuance of bonds. A county with a total population of 50,000 or less on April 1, 1992, or any county designated as an area of critical state concern that imposed the surtax before July 1, 1992, may use the proceeds and accrued interest of the surtax for any public purpose if the county satisfies all of the following criteria.
1. The debt service obligations for any year are met. 2. The county’s comprehensive plan has been determined to be in compliance with part II of ch. 163,
F.S. 3. The county has adopted an amendment to the surtax ordinance pursuant to the procedure provided in
s. 125.66, F.S., authorizing additional uses of the proceeds and accrued interest. Those counties designated as an area of critical state concern that qualify to use the surtax for any public purpose may use only up to 10 percent of the surtax proceeds for any public purpose other than for authorized infrastructure purposes. A county that was designated as an area of critical state concern for at least 20 consecutive years prior to removal of the designation, and that qualified to use the surtax for any public purpose at the time of the designation’s removal, may continue to use up to 10 percent of the surtax proceeds for any public purpose other than for infrastructure purposes for 20 years following the designation’s removal. After the 20 year period expires, a county may continue to use up to 10 percent of the surtax proceeds for any public purpose other than for infrastructure if the county adopts an ordinance providing for such continued use of the surtax proceeds. Likewise, a municipality located within such a county may not use the proceeds and accrued interest for any purpose other than an authorized infrastructure purpose unless the municipality’s comprehensive plan has been determined to be in compliance with part II of ch. 163, F.S., and the municipality has adopted an amendment to its surtax ordinance or resolution pursuant to the procedure provided in s. 166.041, F.S., authorizing additional uses of the proceeds and accrued interest. Such municipality may expend the proceeds
Office of Economic and Demographic Research
174 2012 Local Government Financial Information Handbook
and accrued interest for any public purpose authorized in the amendment. Despite any other use restrictions to the contrary, a county, having a population greater than 75,000 in which the taxable value of real property is less than 60 percent of the just value of real property for ad valorem tax purposes for the tax year in which the referendum is placed before voters, and the municipalities within such a county, may use the surtax proceeds and accrued interest for operation and maintenance of parks and recreation programs and facilities established with the proceeds throughout the duration of the levy or while accrued interest earnings are available for such use, whichever period is longer. Attorney General Opinions: Florida’s Attorney General has issued the following legal opinions relevant to this revenue source.
Opinion # Subject 88-59 Use of discretionary surtax for construction 90-96 Infrastructure surtax proceeds, payment of debt 92-08 Local government infrastructure surtax proceeds 92-81 Discretionary local option infrastructure sales surtax 93-92 Local government infrastructure surtax, purchase of vehicle 94-46 Vehicles purchased with proceeds of sales surtax 94-79 Uses of local government infrastructure surtax 95-71 Tourist development tax / infrastructure surtax 95-73 Counties, infrastructure surtax used to fund engineers 99-24 Capital improvements to property leased by county 2000-06 Expenditure of infrastructure surtax revenues 2001-45 Local government infrastructure surtax, health care 2003-17 Infrastructure surtax use to purchase computer system 2007-51 Municipalities, use of infrastructure surtax monies 2009-28 Counties, use of infrastructure surtax monies 2012-19 Infrastructure surtax, beach erosion projects/studies
The full texts of these opinions are available via a searchable on-line database.1 Local government officials seeking more clarification should review the opinions in their entirety. The statutory language pertaining to this revenue source has been amended since its authorization. The reader should keep the date of the opinion in mind when reviewing its relevance to current law or any interpretations that have been articulated in Florida case law.
1. http://myfloridalegal.com/ago.nsf/Opinions

Office of Economic and Demographic Research
2012 Local Government Financial Information Handbook 175
Small County Surtax Section 212.055(3), Florida Statutes
Summary: Any county having a total population of 50,000 or less on April 1, 1992, is authorized to levy the Small County Surtax at the rate of 0.5 or 1 percent. County governments may impose the levy by either an extraordinary vote of the governing body if the proceeds are to be expended for operating purposes or by voter approval in a countywide referendum if the proceeds are to be used to service bonded indebtedness. General Law Amendments: There were no general law amendments resulting from the 2012 Regular Legislative Session. Authorization to Levy: Only those counties, defined as having a total population of 50,000 or less on April 1, 1992, are eligible to levy the surtax. This surtax is one of several surtaxes subject to a combined rate limitation. A county shall not levy this surtax and the Local Government Infrastructure Surtax, Indigent Care and Trauma Center Surtax, and County Public Hospital Surtax in excess of a combined rate of 1 percent. Counties Eligible to Levy: According to the official 1992 population estimates, thirty-one counties had a total population of 50,000 or less on April 1, 1992, and are eligible to levy the surtax. These counties are Baker, Bradford, Calhoun, Columbia, DeSoto, Dixie, Flagler, Franklin, Gadsden, Gilchrist, Glades, Gulf, Hamilton, Hardee, Hendry, Holmes, Jackson, Jefferson, Lafayette, Levy, Liberty, Madison, Nassau, Okeechobee, Sumter, Suwannee, Taylor, Union, Wakulla, Walton and Washington. Some eligible counties currently levy the Local Government Infrastructure Surtax at the 0.5 or 1 percent rate. Therefore, these counties would only be able to levy the Small County Surtax at the 0.5 percent rate or not at all. Distribution of Proceeds: The surtax proceeds shall be distributed to the county and the municipalities within the county according to one of the following procedures.
1. An interlocal agreement between the county’s governing body and the governing bodies of the municipalities representing a majority of the county’s municipal population. This agreement may include a school district with the consent of all governing bodies previously mentioned.
2. If there is no interlocal agreement, then the distribution will be based on the Local Government Half-cent Sales Tax formulas provided in s. 218.62, F.S.
Authorized Uses of Proceeds: If the surtax is levied as a result of voter approval in a countywide referendum, the proceeds and any accrued interest may be used by the school district, county, or municipalities within the county, or municipalities within another county in the case of a negotiated joint county agreement, for the purpose of servicing bonded indebtedness to finance, plan, and construct infrastructure and to acquire land for public recreation, conservation, or protection of natural resources. In this case, infrastructure means any fixed capital expenditure or cost associated with the construction, reconstruction, or improvement of public facilities

Office of Economic and Demographic Research
176 2012 Local Government Financial Information Handbook
having a life expectancy of 5 or more years and any related land acquisition, land improvement, design, and engineering costs. If the surtax is levied pursuant to an ordinance approved by an extraordinary vote of the county’s governing body, the proceeds and accrued interest may be used for operational expenses of any infrastructure or for any public purpose authorized in the ordinance. School districts, counties, and municipalities may pledge the surtax proceeds for the purpose of servicing new bonded indebtedness. Local governments may use the services of the Division of Bond Finance of the State Board of Administration to issue bonds. In no case may a jurisdiction issue bonds more frequently than once per year, and counties and municipalities may join together for the issuance of bonds. Attorney General Opinions: Florida’s Attorney General has issued the following legal opinion relevant to this revenue source.
Opinion # Subject 2009-01 Referendum, surtax pledged to secure loan
The full text of this opinion is available via a searchable on-line database.1 Local government officials seeking more clarification should review the opinion in its entirety. The statutory language pertaining to this revenue source has been amended since its authorization. The reader should keep the date of the opinion in mind when reviewing its relevance to current law or any interpretations that have been articulated in Florida case law.
1. http://myfloridalegal.com/ago.nsf/Opinions

Office of Economic and Demographic Research
2012 Local Government Financial Information Handbook 177
Indigent Care and Trauma Center Surtax Section 212.055(4), Florida Statutes
Summary: This surtax consists of two separate levies for different groups of eligible counties. Non-consolidated counties having a total population of 800,000 or more (excluding Miami-Dade County) may impose, either by an extraordinary vote of the county’s governing body or voter approval in a countywide referendum, a surtax not to exceed 0.5 percent for the purpose of funding health care services for qualified residents. Non-consolidated counties with a total population of less than 800,000 may impose, subject to voter approval in a countywide referendum, a surtax not to exceed 0.25 percent for the sole purpose of funding trauma services provided by a trauma center licensed pursuant to ch. 395, F.S. General Law Amendments: There were no general law amendments resulting from the 2012 Regular Legislative Session. Authorization to Levy: Non-consolidated counties having a total population of 800,000 or more are eligible to levy the surtax at a rate not to exceed 0.5 percent. The surtax can be imposed by either an extraordinary vote of the county’s governing body or voter approval in a countywide referendum. However, Miami-Dade County is prohibited by law from levying this surtax because it already has statutory authority to levy the County Public Hospital Surtax. The ordinance adopted by the governing board providing for the imposition of this surtax shall include a plan for providing health care services to qualified residents. The term qualified residents means residents of the authorizing county who meet one of the following criteria.
1. Qualified as indigent persons as certified by the county. 2. Certified by the county as meeting the definition of medically poor. The term medically poor is
defined as those persons having insufficient income, resources, and assets to provide the needed medical care without using resources required to meet basic needs for shelter, food, clothing, and personal expenses; not being eligible for any other state or federal program, or having medical needs that are not covered by any such program; or having insufficient third-party insurance coverage. In all cases, the county serves as the payor of last resort.
3. Participating in innovative, cost-effective programs approved by the county. Non-consolidated counties having a total population of less than 800,000 are eligible to levy a surtax at a rate not to exceed 0.25 percent. The surtax can be imposed subject to voter approval in a countywide referendum. The ordinance adopted by the governing board providing for the imposition of this surtax shall include a plan for providing trauma services to trauma victims presenting in the trauma service area in which such county is located. Both of these surtaxes are subject to a combined rate limitation. A county eligible to levy either the 0.5 percent or 0.25 percent surtax shall not levy it along with the Local Government Infrastructure Surtax and Small County Surtax in excess of a combined rate of 1 percent.

Office of Economic and Demographic Research
178 2012 Local Government Financial Information Handbook
Counties Eligible to Levy: Based on the official 2011 population estimates, the five non-consolidated counties having a total population of 800,000 or more (i.e., Broward, Hillsborough, Orange, Palm Beach, and Pinellas counties) are eligible to levy the 0.5 percent surtax. Duval County is not eligible to levy because it is a consolidated county government. Although Miami-Dade County is a non-consolidated county having a total population greater than 800,000, the county is prohibited by law from levying this 0.5 percent surtax because it has been granted statutory authority to levy the County Public Hospital Surtax. All other counties (i.e., non-consolidated counties with a total population of less than 800,000) are eligible to levy the 0.25 percent surtax, and any such county levy shall expire four years after its effective date, unless reenacted by ordinance subject to voter approval in a countywide referendum. Distribution of Proceeds: The 0.5 percent surtax proceeds shall remain the property of the state and shall be distributed by the Department of Revenue on a regular and periodic basis to the Clerk of Circuit Court as the designated custodian of the proceeds. The clerk shall perform the following duties.
1. Maintain the monies in an indigent health care trust fund. 2. Invest any funds held on deposit in the trust fund pursuant to general law. 3. Disburse the funds, including any interest earned, to any provider of health care services upon
directive from the authorizing county. If a county has a population of at least 800,000 and has levied the 0.5 percent surtax, notwithstanding any directive of the authorizing county, the Clerk of Circuit Court is required to annually send $6.5 million to a hospital in the county with a Level I trauma center on October 1st. Alternatively, the clerk is required to annually send $3.5 million to a hospital within the county that has a Level I trauma center if the county enacts and implements a hospital lien law pursuant to ch. 98-499, L.O.F. Such funds are sent in recognition of the Level I trauma center status and shall be in addition to the base contract amount received during fiscal year 1999-2000 and any additional amount negotiated to the base contract. If the hospital receiving funds for its Level I trauma center requests the monies be used to generate federal matching funds under Medicaid, the clerk shall instead send the funds to the Agency for Health Care Administration to accomplish that purpose to the extent allowed through the General Appropriations Act.
4. Prepare on a biennial basis an audit of the indigent health care trust fund. Commencing February 1, 2004, the audit shall be delivered to the county’s governing body and to the chair of the legislative delegation of each authorizing county.
The 0.25 percent surtax proceeds shall remain the property of the state and shall be distributed by the Department of Revenue on a regular and periodic basis to the Clerk of Circuit Court as the designated custodian of the proceeds. The clerk shall perform the following duties.
1. Maintain the monies in a trauma services trust fund. 2. Invest any funds held on deposit in the trust fund pursuant to general law. 3. Disburse the funds, including any interest earned, to the trauma center in its trauma service area upon
directive from the authorizing county. If the trauma center receiving funds, requests the monies be used to generate federal matching funds under Medicaid, the clerk shall instead send the funds to the Agency for Health Care Administration to accomplish that purpose to the extent allowed through the General Appropriations Act.
Office of Economic and Demographic Research
2012 Local Government Financial Information Handbook 179
4. Prepare on a biennial basis an audit of the trauma services trust fund to be delivered to the authorizing county.
Authorized Uses of Proceeds: The 0.5 percent surtax proceeds shall be used to fund a broad range of health care services for both indigent persons and the medically poor, including, but not limited to, primary care and preventive care as well as hospital care. The 0.25 percent surtax proceeds shall be used for the sole purpose of funding trauma services provided by a trauma center licensed pursuant to ch. 395, F.S. Attorney General Opinions: Florida’s Attorney General has issued the following legal opinion relevant to this revenue source.
Opinion # Subject 2005-54 Indigent Care Surtax used for Medicaid contributions
The full text of this opinion is available via a searchable on-line database.1 Local government officials seeking more clarification should review the opinion in its entirety. The statutory language pertaining to this revenue source has been amended since its authorization. The reader should keep the date of the opinion in mind when reviewing its relevance to current law or any interpretations that have been articulated in Florida case law.
1. http://myfloridalegal.com/ago.nsf/Opinions

Office of Economic and Demographic Research
180 2012 Local Government Financial Information Handbook
This page was intentionally left blank.
Office of Economic and Demographic Research
2012 Local Government Financial Information Handbook 181
County Public Hospital Surtax Section 212.055(5), Florida Statutes
Summary: Any county, as defined in s. 125.011(1), F.S., [i.e., Miami-Dade County] is authorized to levy the County Public Hospital Surtax at a rate of 0.5 percent. The levy may be authorized either by an extraordinary vote of the county’s governing body or voter approval in a countywide referendum. Proceeds shall be used to supplement the operation, maintenance, and administration of the county public general hospital. General Law Amendments: There were no general law amendments resulting from the 2012 Regular Legislative Session. Authorization to Levy: Any county, as defined in s. 125.011(1), F.S., [i.e., Miami-Dade County] is authorized to levy this surtax at a rate of 0.5 percent. The surtax may be enacted either by an extraordinary vote of the county’s governing body or voter approval in a countywide referendum. The term county public general hospital means a general hospital, as defined in s. 395.002, F.S., which is owned, operated, maintained, or governed by the county or its agency, authority, or public health trust. This surtax is one of several surtaxes subject to a combined rate limitation. An eligible county shall not levy this surtax along with the Local Government Infrastructure Surtax and Small County Surtax in excess of a combined rate of 1 percent. Counties Eligible to Levy: Only Miami-Dade County is eligible to levy this surtax. Distribution of Proceeds: The proceeds from this surtax shall be deposited by the county in a special fund, set aside from other county funds, to be used only for the operation, maintenance, and administration of the county public general hospital. The funds shall be remitted promptly by the county to the agency, authority, or public health trust created by law that administers or operates the county public general hospital. The county must continue to contribute each year an amount equal to at least 80 percent of that percentage of the total county’s 1990-91 budget appropriated from general revenues for the operation, administration, and maintenance of the county public general hospital. Authorized Uses of Proceeds: The proceeds are designated to supplement the operation, maintenance, and administration of the county public general hospital. Of the 80 percent portion appropriated from the county budget’s general revenues, 25 percent of this amount must be remitted to a governing board, agency, or authority that is wholly independent from the public health trust, agency, or authority responsible for the county public general hospital, to be used solely for the purpose of funding the indigent health care services plan provided for in s. 212.055(5)(e), F.S. However, in the plan’s first and second years, a total of $10 million and $15 million, respectively, shall be remitted to such governing board, agency, or authority, to be used solely for the purpose of funding the indigent health care services plan.
Office of Economic and Demographic Research
182 2012 Local Government Financial Information Handbook
Attorney General Opinions: No opinions specifically relevant to this surtax have been issued.

Office of Economic and Demographic Research
2012 Local Government Financial Information Handbook 183
School Capital Outlay Surtax Section 212.055(6), Florida Statutes
Summary: Florida’s school districts may authorize the levy of the School Capital Outlay Surtax at a rate of up to 0.5 percent pursuant to a resolution conditioned to take effect only upon voter approval in a countywide referendum. The proceeds must be expended for school-related capital projects, technology implementation, and bond financing of such projects. General Law Amendments: There were no general law amendments resulting from the 2012 Regular Legislative Session. Authorization to Levy: District school boards may levy, pursuant to resolution conditioned to take effect only upon voter approval in a countywide referendum, this surtax at a rate of up to 0.5 percent. The resolution shall set forth a plan for use of the surtax proceeds in accordance with the authorized uses. In addition to the Charter County and Regional Transportation System Surtax and the Emergency Fire Rescue Services and Facilities Surtax, this surtax is not subject to a combined rate limitation that impacts the other discretionary sales surtaxes. School Districts Eligible to Levy: Any district school board is eligible to authorize the imposition of this surtax within the respective county, subject to voter approval in a countywide referendum. Distribution of Proceeds: The surtax revenues collected by the Department of Revenue shall be distributed to the school board imposing the surtax. Authorized Uses of Proceeds: The surtax proceeds shall be used to fund fixed capital expenditures or fixed capital costs associated with the construction, reconstruction, or improvement of school facilities and campuses which have a useful life expectancy of 5 or more years, as well as any related land acquisition, land improvement, design, and engineering costs. Additionally, the proceeds shall be used to fund the costs of retrofitting and providing for technology implementation, including hardware and software, for the various sites within the school district. The surtax proceeds may be used for the purpose of servicing of bonded indebtedness used to finance authorized projects, and any accrued interest may be held in trust to finance such projects. However, the surtax proceeds and any accrued interest shall not be used for operational expenses. Attorney General Opinions: Florida’s Attorney General has issued the following legal opinions relevant to this revenue source.
Opinion # Subject 98-29 School sale surtax referendum, authority to set date 2002-12 School capital outlay surtax, contingent on cap 2002-55 School capital outlay surtax, charter schools 2003-37 School capital outlay surtax

Office of Economic and Demographic Research
184 2012 Local Government Financial Information Handbook
2006-38 Schools, use of school capital outlay surtax 2008-08 School Capital Outlay Surtax, required uses
The full texts of these opinions are available via a searchable on-line database.1 Local government officials seeking more clarification should review the opinions in their entirety. The statutory language pertaining to this revenue source has been amended since its authorization. The reader should keep the date of the opinion in mind when reviewing its relevance to current law or any interpretations that have been articulated in Florida case law.
1. http://myfloridalegal.com/ago.nsf/Opinions

Office of Economic and Demographic Research
2012 Local Government Financial Information Handbook 185
Voter-Approved Indigent Care Surtax Section 212.055(7), Florida Statutes
Summary: Counties with a total population of less than 800,000 are eligible to levy the Voter-Approved Indigent Care Surtax subject to voter approval in a countywide referendum. If a publicly supported medical school is located within the county, the tax rate shall not exceed 1 percent. If no such medical school is located within the county, the tax rate is capped at 0.5 percent. In addition, any county with a total population of less than 50,000 may levy the surtax at a rate not to exceed 1 percent. The proceeds are to be used to fund health care services for the medically poor. General Law Amendments: There were no general law amendments resulting from the 2012 Regular Legislative Session. Authorization to Levy: Counties having a total population of less than 800,000 are eligible to levy this surtax subject to voter approval in a countywide referendum. If a publicly supported medical school is located within the county, the tax rate shall not exceed 1 percent. If no such medical school is located within the county, the tax rate is capped at 0.5 percent; however, any county that has a total population of less than 50,000 is eligible to levy this surtax, subject to referendum approval, at a rate not to exceed 1 percent. Florida has five publicly supported medical schools at the following universities: Florida International University (Miami-Dade County); Florida State University (Leon County); University of Central Florida (Orange County); University of Florida (Alachua County); and University of South Florida (Hillsborough County). However, only the University of Florida and Florida State University medical schools are each located in a county having a total population less than 800,000. The ordinance adopted by the governing board providing for the imposition of the surtax shall include a plan for providing health care services to qualified residents. The term qualified residents means residents of the authorizing county who meet one of the following criteria.
1. Qualified as indigent persons as certified by the county. 2. Certified by the county as meeting the definition of medically poor. The term medically poor is
defined as those persons having insufficient income, resources, and assets to provide the needed medical care without using resources required to meet basic needs for shelter, food, clothing, and personal expenses; not being eligible for any other state or federal program, or having medical needs that are not covered by any such program; or having insufficient third-party insurance coverage. In all cases, the county shall serve as the payor of last resort.
3. Participating in innovative, cost-effective programs approved by the county. This surtax is one of several surtaxes subject to a combined rate limitation. A county eligible to levy this surtax shall not levy it along with the Local Government Infrastructure Surtax and the Small County Surtax in excess of a combined rate of 1 percent with the following exceptions. If a publicly supported medical school is located within the county or the county has a total population of less than 50,000, the combined rate cannot exceed 1.5 percent.

Office of Economic and Demographic Research
186 2012 Local Government Financial Information Handbook
Counties Eligible to Levy: Only those counties having a total population of less than 800,000 are eligible to levy this surtax. Distribution of Proceeds: The surtax proceeds shall remain the property of the state and shall be distributed by the Department of Revenue on a regular and periodic basis to the Clerk of Circuit Court as the designated custodian of the proceeds. The clerk shall perform the following duties.
1. Maintain the monies in an indigent health care trust fund. 2. Invest any funds held on deposit in the trust fund pursuant to general law. 3. Disburse the funds, including any interest earned, to any provider of health care services subject to
the statutory provisions and upon directive from the authorizing county. 4. Disburse the funds, including any interest earned, to service the authorized bonded indebtedness upon
directive from the authorizing county, which directive may be irrevocably given at the time the bonded indebtedness is incurred.
Authorized Uses of Proceeds: The surtax proceeds shall be used to fund a broad range of health care services for both indigent persons and the medically poor, including, but not limited to, primary care and preventive care as well as hospital care. In addition to these specified uses, the ordinance adopted by a county that has a total population of less than 50,000 residents may pledge the surtax proceeds to service new or existing bonded indebtedness incurred to finance, plan, construct, or reconstruct a public or not-for-profit hospital in such county and any land acquisition, land improvement, design, or engineering costs related to such hospital, if the county’s governing body determines that a public or not-for-profit hospital existing at the time of bond issuance would, more likely than not, otherwise cease to operate. Any county, which has a total population of less than 50,000 residents at the time any authorized bonds are issued, retains the granted authority throughout the terms of such bonds, including the term of any refinancing bonds, regardless of any subsequent population increases that result in the county having 50,000 or more residents. Attorney General Opinions: Florida’s Attorney General has issued the following legal opinion relevant to this revenue source.
Opinion # Subject 2004-40 Indigent care surtax, Medicaid and inmate health payments
The full text of this opinion is available via a searchable on-line database.1 Local government officials seeking more clarification should review the opinion in its entirety. The statutory language pertaining to this revenue source has been amended since its authorization. The reader should keep the date of the opinion in mind when reviewing its relevance to current law or any interpretations that have been articulated in Florida case law.
1. http://myfloridalegal.com/ago.nsf/Opinions
Office of Economic and Demographic Research
2012 Local Government Financial Information Handbook 187
Emergency Fire Rescue Services and Facilities Surtax Section 212.055(8), Florida Statutes
Summary: The Emergency Fire Rescue Services and Facilities Surtax shall be levied at the rate of up to 1 percent pursuant to an ordinance enacted by a majority vote of the county’s governing body and approved by voters in a countywide referendum. However, any county that has imposed two separate discretionary surtaxes without expiration cannot levy this surtax. The proceeds must be expended for specified emergency fire rescue services and facilities. General Law Amendments: There were no general law amendments resulting from the 2012 Regular Legislative Session. Authorization to Levy: Eligible county governments may levy this surtax at a rate of up to 1 percent. This levy shall be pursuant to an ordinance enacted by the county’s governing body and approved by the voters in a countywide referendum. The referendum shall be placed on the ballot of a regularly scheduled election, and the referendum ballot must conform to the requirements of s. 101.161, F.S. A required interlocal agreement, as described below, is a precondition to holding the referendum. The county’s governing body must develop and execute an interlocal agreement with participating jurisdictions (i.e., the governing bodies of municipalities, dependent special districts, independent special districts, or municipal service taxing units) that provide emergency fire and rescue services within the county. The interlocal agreement must include a majority of the county’s service providers. Upon the surtax taking effect and initiation of collections, a county and any participating jurisdiction entering into the interlocal agreement shall reduce the ad valorem tax levy or any non-ad valorem assessment for fire control and emergency rescue services in its next and subsequent budgets by the estimated amount of revenue provided by the surtax. In addition to the Charter County and Regional Transportation System Surtax and the School Capital Outlay Surtax, this surtax is not subject to a combined rate limitation that impacts the other discretionary sales surtaxes. Counties Eligible to Levy: Any county, except Madison, Miami-Dade, and certain portions of Orange and Osceola, is eligible to levy the surtax. Any county that has imposed two separate discretionary surtaxes without expiration is not eligible to levy this surtax. According to a recent update, Madison and Miami-Dade counties currently levy two separate discretionary surtaxes without expiration.1 Madison County levies both the Small County Surtax and Voter-Approved Indigent Care Surtax without expiration dates, and Miami-Dade County levies both the Charter County Transportation System Surtax and County Public Hospital Surtax without expiration dates. Additionally, notwithstanding s. 212.054, F.S., if a multicounty independent special district created pursuant to ch. 67-764, L.O.F., levies ad valorem taxes on district property to fund emergency fire rescue service within the district and is required by s. 2, Art. VII of the State Constitution to maintain a uniform ad valorem tax rate throughout the district, the county may not levy the surtax within the district’s boundaries. This provision relates specifically to the Reedy Creek Improvement District, which is located within portions of 1. Florida Department of Revenue, History of Local Sales Tax and Current Rates (Last Updated: September 1, 2012) https://revenuelaw.state.fl.us/LawLibraryDocuments/2012/09/OTH-111031_History%20of%20sales%20tax,%209-01-12.pdf

Office of Economic and Demographic Research
188 2012 Local Government Financial Information Handbook
Orange and Osceola counties. The cities of Bay Lake and Lake Buena Vista as well as the Walt Disney World Resort Complex are located within the district.2 This provision prevents either county from levying the surtax within the district’s boundaries if an ad valorem tax is levied to fund emergency fire rescue services. Reedy Creek Improvement District levies such an ad valorem tax and maintains a uniform ad valorem tax rate throughout the district. Consequently, Orange and Osceola counties would be prohibited from levying the surtax within the district’s boundaries. Distribution of Proceeds: The surtax proceeds, less an administrative fee that may be retained by the Department of Revenue, shall be distributed by the Department to the county. The county shall distribute the surtax proceeds it receives from the Department to the participating jurisdictions that have entered into the required interlocal agreement. The county may charge an administrative fee for receiving and distributing the surtax proceeds based on the actual costs incurred, not to exceed 2 percent of surtax collections. The required interlocal agreement must specify that the surtax proceeds shall be distributed by one of the following methods.
1. The amount of surtax proceeds to be distributed by the county to each participating jurisdiction is based on the actual amounts collected within each participating jurisdiction as determined by the Department’s population allocations in accordance with s. 218.62, F.S.
2. If a county has special fire control districts and rescue districts within its boundary, the county shall distribute the surtax proceeds among the county and the participating municipalities or special fire control and rescue districts based on the proportion of each entity’s expenditures of ad valorem taxes and non-ad valorem assessments for fire control and emergency rescue services in each of the immediately preceding 5 fiscal years to the total of the expenditures for all participating entities.
Each participating jurisdiction shall also agree that if a participating jurisdiction is requested to provide personnel or equipment to any other service provider, on a long-term basis pursuant to an interlocal agreement, the jurisdiction providing the service is entitled to payment from the requesting service provider from that provider’s share of the surtax proceeds for all equipment and personnel costs. However, the provisions of #1 above and the preceding paragraph do not apply if either of the following has occurred.
1. There is an interlocal agreement with the county and one or more participating jurisdictions that prohibits one or more jurisdictions from providing the same level of service for prehospital emergency medical treatment within the prohibited participating jurisdictions’ boundaries.
2. The county has issued a certificate of public convenience and necessity, or its equivalent, to a county department or a county dependent special district.
Use of the surtax proceeds does not relieve a local government from complying with the provisions of ch. 200, F.S., and any related statutory provisions that establish millage caps or limits undesignated budget reserves and procedures for establishing rollback rates for ad valorem taxes and budget adoption. If the surtax collections exceed projected collections in any fiscal year, any surplus distribution shall be used to further reduce ad valorem taxes in the next fiscal year. These proceeds shall be applied as a rebate to the final 2. http://www.rcid.org/AboutUS_main.cfm

Office of Economic and Demographic Research
2012 Local Government Financial Information Handbook 189
millage, after the TRIM notice is completed. However, municipalities, special fire control and rescue districts, and contract service providers that do not enter into an interlocal agreement are not entitled to receive a portion of the surtax proceeds and are not required to reduce ad valorem taxes or non-ad valorem assessments. Authorized Uses of Proceeds: The surtax proceeds shall be expended for emergency fire rescue services and facilities. The term emergency fire rescue services includes, but is not limited to, the following meanings.
1. Preventing and extinguishing fires. 2. Protecting and saving life and property from fires, natural or intentional acts, or disasters. 3. Enforcing municipal, county, or state fire protection codes and laws pertaining to the prevention and
control of fires. 4. Providing pre-hospital emergency medical treatment.
Attorney General Opinions: No opinions specifically relevant to this revenue source have been issued.
Office of Economic and Demographic Research
190 2012 Local Government Financial Information Handbook
This page was intentionally left blank.
Office of Economic and Demographic Research
2012 Local Government Financial Information Handbook 191
Local Option Food and Beverage Taxes Section 212.0306, Florida Statutes
Summary: Any county, as defined in s. 125.011(1), F.S., [i.e., Miami-Dade County] may impose two separate taxes by ordinance adopted by a majority vote of the county’s governing body. A 2 percent tax may be imposed on the sale of food, beverages, and alcoholic beverages in hotels and motels. The proceeds shall be used for promoting the county and its constituent municipalities as a destination site for conventions, trade shows, and pleasure travel. With some exceptions, a 1 percent tax may be imposed on the sale of food, beverages, and alcoholic beverages in establishments that are licensed by the state to sell alcoholic beverages for consumption on the premises, except for hotels and motels. Not less than 15 percent of the proceeds shall be used for construction and operation of domestic violence centers. The remainder shall be used for programs to assist the homeless or those about to become homeless. General Law Amendments: There were no general law amendments resulting from the 2012 Regular Legislative Session. Authorization to Levy: Any county, as defined in s. 125.011(1), F.S., [i.e., Miami-Dade County] may impose two separate taxes by ordinance adopted by a majority vote of the county’s governing body. The first tax may be imposed on the sale of food, beverages, and alcoholic beverages in hotels and motels at the rate of 2 percent. A second tax of 1 percent may be imposed on the sale of food, beverages, and alcoholic beverages in establishments that are licensed by the state to sell alcoholic beverages for consumption on the premises, except for hotels and motels. However, this 1 percent tax shall not apply to any alcoholic beverage sold by the package for off-premises consumption. An authorized tax may take effect on the first day of any month, but may not take effect until at least 60 days after the adoption of the ordinance levying the tax. In addition, two exemptions exist for both taxes. All transactions that are exempt from the state sales tax are also exempt from these taxes. Sales in those municipalities presently imposing the Municipal Resort Tax, as authorized by ch. 67-930, L.O.F., are also exempt. Several additional exemptions also exist for the 1 percent tax. The sales in any establishment licensed by the state to sell alcoholic beverages for consumption on the premises, except for hotels and motels, which had gross annual revenues of $400,000 or less in the previous calendar year, are exempt. Sales in any veterans’ organization are also exempt. Prior to enactment of the ordinance levying and imposing the 1 percent tax, the county shall appoint a representative task force to prepare and submit a countywide plan to the county’s governing body for its approval. The task force shall include, but not be limited to, service providers, homeless persons’ advocates, and impacted jurisdictions. The plan shall address the needs of persons who have become, or are about to become, homeless. The county’s governing body shall adopt this plan as part of the ordinance levying the 1 percent tax.

Office of Economic and Demographic Research
192 2012 Local Government Financial Information Handbook
Counties Eligible to Levy: Only a county, as defined in s. 125.011(1), F.S., [i.e., Miami-Dade County] is eligible to levy these taxes. According to the Department of Revenue (DOR), the county began levying these taxes on October 1, 1993. Administrative Procedures: The county levying either tax must locally administer the tax using the powers and duties enumerated for local administration of the tourist development tax by s. 125.0104, F.S. (1992 Supp.). The county ordinance shall also provide for brackets applicable to taxable transactions. The county shall also appoint an oversight board including, but not limited to, service providers, domestic violence victim advocates, members of the judiciary, concerned citizens, a victim of domestic violence, and impacted jurisdictions to prepare and submit to the governing body for its approval a plan for disbursing the funds made available for the construction and operation of domestic violence centers. Each member of the county’s governing board shall appoint a member, and the county manager shall appoint two members to the oversight board. Reporting Requirements: The county shall furnish a certified copy of the ordinance that authorizes the imposition of either tax to the DOR within 10 days after the adoption of the ordinance. Distribution of Proceeds: The county shall distribute the 2 percent tax proceeds to a countywide convention and visitors’ bureau, which by interlocal agreement and contract with the county has been given the primary responsibility for tourist and convention promotion, to be used for those purposes authorized in s. 125.0104(5)(a)2. or 3., F.S. (1992 Supp.). If the county is not or is no longer a party to such an interlocal agreement and contract with a countywide convention and visitors’ bureau, the county shall allocate the proceeds for those purposes authorized in s. 125.0104(5)(a)2. or 3., F.S. (1992 Supp.). The 1 percent tax proceeds shall be distributed by the county pursuant to the guidelines provided in the approved plans for addressing homeless needs as well as the construction and operation of domestic violence centers. The county and its respective municipalities shall continue to contribute each year at least 85 percent of aggregate expenditures from the respective county or municipal general fund budget for county-operated or municipally-operated homeless shelter services at or above the average level of such expenditures in the two fiscal years preceding the levy date of this tax. Authorized Uses of Proceeds: As described in s. 125.0104(5)(a)2. or 3., F.S. (1992 Supp.), the 2 percent tax proceeds shall be used for the following purposes.
1. Promoting and advertising tourism in the State of Florida and nationally and internationally. 2. Funding convention bureaus, tourist bureaus, tourist information centers, and news bureaus as county
agencies or by contract with the chambers of commerce or similar associations in the county. For the first 12 months of the 1 percent tax levy, the proceeds shall be used by the county to assist persons who have become or are about to become homeless. These funds shall be made available for emergency homeless shelters, food, clothing, medical care, counseling, alcohol and drug abuse treatment, mental health treatment, employment and training, education, and housing. Thereafter, not less than 15 percent of the proceeds shall be made available for construction and operation of domestic violence centers. The remainder shall be used for programs to assist the homeless or those about to become homeless. In addition, the proceeds
Office of Economic and Demographic Research
2012 Local Government Financial Information Handbook 193
and accrued interest may be used as collateral, pledged, or hypothecated for authorized projects, including bonds issued in connection with such authorized projects. Attorney General Opinions: No opinions specifically relevant to these taxes have been issued.

Office of Economic and Demographic Research
194 2012 Local Government Financial Information Handbook
This page was intentionally left blank.

Office of Economic and Demographic Research
2012 Local Government Financial Information Handbook 195
Motor Fuel and Diesel Fuel Taxes (Ninth-Cent and Local Option Fuel Taxes)
Sections 206.41(1)(d)-(e), 206.87(1)(b)-(c), 336.021, and 336.025, Florida Statutes Summary: County governments are authorized to levy up to 12 cents of local option fuel taxes in the form of three separate levies. The first is a tax of 1 cent on every net gallon of motor and diesel fuel sold within a county.1 Known as the ninth-cent fuel tax, this tax may be authorized by an ordinance adopted by an extraordinary vote of the governing body or voter approval in a countywide referendum. Generally, the proceeds may be used to fund transportation expenditures. The second is a tax of 1 to 6 cents on every net gallon of motor and diesel fuel sold within a county.2 This tax may be authorized by an ordinance adopted by a majority vote of the governing body or voter approval in a countywide referendum. Generally, the proceeds may be used to fund transportation expenditures. The third tax is a 1 to 5 cents levy upon every net gallon of motor fuel sold within a county.3 Diesel fuel is not subject to this tax. This additional tax shall be levied by an ordinance adopted by a majority plus one vote of the membership of the governing body or voter approval in a countywide referendum. Proceeds received from this additional tax may be used for transportation expenditures needed to meet the requirements of the capital improvements element of an adopted local government comprehensive plan. The Legislature has authorized the statewide equalization of local option tax rates on diesel fuel by requiring that the full 6 cents of the 1 to 6 cents fuel tax as well as the 1 cent ninth-cent fuel tax be levied on diesel fuel in every county even though the county government may not have imposed either tax on motor fuel or may not be levying the tax on motor fuel at the maximum rate.4 Consequently, 7 cents worth of local option tax revenue on diesel fuel are distributed to local governments, regardless of whether or not the county government is levying these two taxes on motor fuel at any rate. General Law Amendments: Chapter 2012-174, L.O.F., (CS/CS/HB 599) revises the imposition date for the ninth-cent fuel tax and the imposition and rate change date for the 1 to 6 cents and 1 to 5 cents fuel taxes from July 1st of each year to October 1st. These changes became effective on July 1, 2012. Administrative Procedures: The Department of Revenue (DOR) administers these taxes and has the authority to deduct its administrative costs incurred in collecting, administering, enforcing, and distributing the proceeds to the counties.5 Such administrative costs may not exceed 2 percent of collections. Additionally, several deductions from one or more of the local option fuel tax collections are statutorily authorized. These include the General Revenue Service Charge, collection allowances, and refunds.
1. Section 336.021(1)(a), F.S. 2. Section 336.025(1)(a), F.S. 3. Section 336.025(1)(b), F.S. 4. See Sections 336.021(6), .025(9), F.S. 5. See Sections 336.021(2)(a), .025(2)(a), F.S.

Office of Economic and Demographic Research
196 2012 Local Government Financial Information Handbook
The total administrative costs shall be prorated among those counties levying the tax according to formula, which shall be revised on July 1st of each year. Two-thirds of the amount deducted shall be based on the county’s proportional share of the number of dealers who are registered for purposes of ch. 212, F.S., on June 30th of the preceding state fiscal year. One-third of the amount deducted shall be based on the county’s share of the total amount of tax collected during the preceding state fiscal year. The DOR has the authority to promulgate rules necessary to enforce these taxes, and these rules shall have the full force and effect of law. The ninth-cent fuel tax proceeds shall be transferred to the Ninth-Cent Fuel Tax Trust Fund. The 1 to 6 cents of optional fuel tax shall be collected and remitted in the same manner provided by ss. 206.41(1)(e) and 206.87(1)(c), F.S. The 1 to 5 cents of optional fuel tax shall be collected and remitted in the same manner provided by s. 206.41(1)(e), F.S. The proceeds from these taxes shall be transferred to the Local Option Fuel Tax Trust Fund, which was created for distribution of the proceeds to the eligible local governments. Reporting Requirements: All local option fuel tax impositions shall be levied before October 1st of each year to be effective January 1st of the following year.6 However, tax levies that were in effect on July 1, 2002, and expire on August 31st of any year may be reimposed at the current authorized rate effective September 1st of the year of expiration. Additionally, the imposition of the 1 to 6 cents tax shall not exceed 30 years. A certified copy of the ordinance proposing the levy of the ninth-cent fuel tax pursuant to referendum shall be furnished to the DOR by the county within 10 days after approval of such ordinance; however, the failure to furnish the certified copy will not invalidate the passage of the ordinance. Within 10 days after referendum passage, the county shall notify the DOR of the referendum’s passage and the time period during which the tax will be levied. A county levying this tax pursuant to ordinance shall notify the DOR within 10 days after the governing body adopts the ordinance, and the county shall also furnish the DOR with a certified copy of the ordinance.7 By October 1st of each year, the county must notify the DOR of the respective tax rates for both the 1 to 6 cents and 1 to 5 cents fuel taxes and of its decision to rescind or change the rate of either tax. In addition, the county must provide the DOR with a certified copy of the interlocal agreement listing the distribution proportions established by such agreement or pursuant to the transportation expenditures methodology, if applicable.8 A decision to rescind any of these local option fuel taxes may not take effect on any date other than December 31st. A county must provide a minimum of 60 days notice to the DOR of its decision to rescind a local option fuel tax levy.9 Any dispute as to the determination by the county of distribution proportions for these two taxes shall be resolved through an appeal to the Administration Commission in accordance with procedures developed by the Commission. The Administration Commission is made up of the Governor and the Cabinet and is housed within the Executive Office of the Governor. Pending final disposition of such proceedings, the tax shall be collected, and the Clerk of the Circuit Court shall hold such funds in escrow.10
6. See Sections 336.021(5), .025(1)(a)1. and (b)1., F.S. 7. Section 336.021(4), F.S. 8. Section 336.025(5)(a), F.S. 9. See Sections 336.021(5), .025(5)(a), F.S. 10. Section 336.025(5)(b), F.S.

Office of Economic and Demographic Research
2012 Local Government Financial Information Handbook 197
Distribution of Proceeds: The local option fuel taxes on motor fuel shall be distributed monthly by the DOR to the county reported by the terminal suppliers, wholesalers, and importers as the destination of the gallons distributed for retail sale or use. The taxes on diesel fuel shall be distributed monthly by the DOR to each county according to the procedure specified in law.11 With regard to the ninth-cent fuel tax, the governing body of the county may provide, by joint agreement with one or more municipalities located within the county, for the authorized transportation purposes and the distribution of the tax proceeds within both the incorporated and unincorporated areas of the county. However, the county is not required to share the proceeds of this tax with municipalities.12 A county’s proceeds from the 1 to 6 cents and 1 to 5 cents fuel taxes shall be distributed by the DOR according to the distribution factors determined at the local level by interlocal agreement between the county and municipalities within the county’s boundaries. If no interlocal agreement is established, then the distribution shall be based on the transportation expenditures of each local government for the immediately preceding 5 fiscal years as a proportion of the total of such expenditures for the county and all municipalities within the county. These proportions shall be recalculated every 10 years based on the transportation expenditures of the immediately preceding 5 years. This recalculation shall under no circumstances materially or adversely affect the rights of holders of bonds outstanding on July 1, 1986, which are backed by proceeds of the 1 to 6 cents fuel tax. The amounts distributed to the county government and each municipality shall not be reduced below the amount necessary for the payment of principal and interest and reserves for principal and interest as required under the covenants of any bond resolution outstanding on the date of the recalculation. In addition, any inland county with a population greater than 500,000 as of July 1, 1996, having an interlocal agreement with one or more of the incorporated areas within the county must utilize the population estimates of local government units as of April 1st of each year for dividing the proceeds of the 1 to 6 cents fuel tax.13 This provision applies only to Orange County. Any newly incorporated municipality, eligible for participation in the distribution of monies under the Local Government Half-cent Sales Tax and Municipal Revenue Sharing Programs and located in a county levying the 1 to 6 cents or 1 to 5 cents fuel tax, is entitled to receive a distribution of the tax revenues in the first full fiscal year following incorporation.14 The distribution shall be equal to the county’s per lane mile expenditure in the previous year times the number of lane miles within the municipality’s jurisdiction or scope of responsibility, in which case the county’s share would be reduced proportionately; or as determined by the local act incorporating the municipality. Such a distribution shall under no circumstances materially or adversely affect the rights of holders of outstanding bonds that are backed by these taxes. The amounts distributed to the county government and each municipality shall not be reduced below the amount necessary for the payment of principal and interest and reserves for principal and interest as required under the covenants of any bond resolution outstanding on the date of redistribution.
11. See Sections 336.021(1)(d), .025(2)(a), F.S. 12. Section 336.021(1)(b), F.S. 13. Section 336.025(3)(a)3., F.S. 14. Section 336.025(4)(b), F.S.

Office of Economic and Demographic Research
198 2012 Local Government Financial Information Handbook
Tax Rates and Current Year’s Revenues: A table listing the 2012 federal, state, and local fuel tax rates on both motor and diesel fuels by county is included in Appendix C. The first table immediately following this section lists the estimated motor fuel gallons sold in each county, the ninth-cent fuel tax rates on motor and diesel fuels, and estimated tax receipts for the local fiscal year ending 2013. The second table provides estimated distributions of the 1 to 6 cents and 1 to 5 cents local option fuel taxes for the local fiscal year ending 2013 based on countywide tax rates and distribution percentages specified by either locally-determined interlocal agreements or statutory default formula. The third table provides countywide estimates of realized and unrealized revenues during the local fiscal year ending 2013. Additional Detail: Additional information regarding each of the three individual authorizations to levy can be found in the three sections immediately following the two tables previously discussed. Other information relevant to local option fuel taxes can be found via the Internet. A primer detailing Florida’s transportation tax sources is available via the Department of Transportation’s website.15 Historical local option fuel tax distributions to counties compiled from DOR source data can be found can be found on the EDR’s website.16 Local option fuel tax receipts and distributions data by fiscal year and by month can be found via this DOR webpage.17
15. http://www.dot.state.fl.us/financialplanning/revenue/primer.shtm 16. http://edr.state.fl.us/Content/local-government/data/data-a-to-z/index.cfm 17. http://dor.myflorida.com/dor/taxes/distributions.html

Calculated by the Florida Department of Revenue's Office of Tax Research
Ninth-Cent Fuel TaxEstimated Gallons and Tax by Fuel Type
Revenue Estimates for the Local Fiscal Year Ending September 30, 2013Estimated Estimated Tax Estimated Tax TotalMotor Fuel Motor Fuel Receipts from Diesel Fuel Receipts from Estimated
County Gallons Tax Rate Motor Fuel Tax Rate Diesel Fuel Tax ReceiptsAlachua 107,226,758 0.01$ 1,047,069$ 0.01$ 124,805$ 1,171,874$ Baker 16,158,327 0.01$ 157,786$ 0.01$ 27,952$ 185,738$ Bay 89,829,166 0.01$ 877,182$ 0.01$ 111,104$ 988,286$ Bradford 13,570,185 -$ 132,513$ 0.01$ 22,896$ 22,896$ Brevard 209,206,365 -$ 2,042,900$ 0.01$ 768,233$ 768,233$ Broward 776,310,809 0.01$ 7,580,675$ 0.01$ 815,153$ 8,395,828$ Calhoun 3,837,624 -$ 37,474$ 0.01$ 23,535$ 23,535$ Charlotte 78,131,224 0.01$ 762,951$ 0.01$ 128,765$ 891,716$ Citrus 50,482,672 0.01$ 492,963$ 0.01$ 53,891$ 546,855$ Clay 76,247,736 0.01$ 744,559$ 0.01$ 72,524$ 817,084$ Collier 129,814,727 0.01$ 1,267,641$ 0.01$ 116,984$ 1,384,624$ Columbia 43,854,147 0.01$ 428,236$ 0.01$ 145,228$ 573,464$ DeSoto 10,229,810 0.01$ 99,894$ 0.01$ 31,365$ 131,259$ Dixie 6,363,286 -$ 62,137$ 0.01$ 26,858$ 26,858$ Duval 434,704,131 -$ 4,244,886$ 0.01$ 997,119$ 997,119$ Escambia 128,338,575 0.01$ 1,253,226$ 0.01$ 247,597$ 1,500,823$ Flagler 35,500,003 0.01$ 346,658$ 0.01$ 39,080$ 385,738$ Franklin 5,695,998 -$ 55,621$ 0.01$ 12,189$ 12,189$ Gadsden 24,544,704 -$ 239,679$ 0.01$ 207,941$ 207,941$ Gilchrist 6,133,318 0.01$ 59,892$ 0.01$ 9,430$ 69,321$ Glades 3,780,651 0.01$ 36,918$ 0.01$ 12,085$ 49,003$ Gulf 5,322,822 0.01$ 51,977$ 0.01$ 10,211$ 62,188$ Hamilton 7,188,113 -$ 70,192$ 0.01$ 73,427$ 73,427$ Hardee 10,076,462 0.01$ 98,397$ 0.01$ 36,461$ 134,858$ Hendry 14,908,806 0.01$ 145,584$ 0.01$ 85,881$ 231,465$ Hernando 71,299,071 0.01$ 696,235$ 0.01$ 120,352$ 816,588$ Highlands 40,835,381 0.01$ 398,757$ 0.01$ 110,173$ 508,930$ Hillsborough 573,159,423 0.01$ 5,596,902$ 0.01$ 993,339$ 6,590,241$ Holmes 8,039,197 0.01$ 78,503$ 0.01$ 33,949$ 112,452$ Indian River 63,023,832 -$ 615,428$ 0.01$ 167,178$ 167,178$ Jackson 28,451,623 0.01$ 277,830$ 0.01$ 218,756$ 496,587$ Jefferson 6,720,337 0.01$ 65,624$ 0.01$ 49,534$ 115,159$ Lafayette 2,226,678 -$ 21,744$ 0.01$ 8,724$ 8,724$ Lake 133,535,033 0.01$ 1,303,970$ 0.01$ 143,051$ 1,447,021$ Lee 266,818,311 0.01$ 2,605,481$ 0.01$ 325,035$ 2,930,515$ Leon 129,146,138 0.01$ 1,261,112$ 0.01$ 130,258$ 1,391,370$ Levy 20,299,211 -$ 198,222$ 0.01$ 43,689$ 43,689$ Liberty 2,182,354 0.01$ 21,311$ 0.01$ 21,106$ 42,417$ Madison 10,537,468 -$ 102,898$ 0.01$ 191,042$ 191,042$ Manatee 139,509,660 0.01$ 1,362,312$ 0.01$ 181,480$ 1,543,792$ Marion 158,495,086 0.01$ 1,547,705$ 0.01$ 434,355$ 1,982,059$ Martin 71,662,728 0.01$ 699,787$ 0.01$ 76,318$ 776,105$ Miami-Dade 986,996,171 0.01$ 9,638,018$ 0.01$ 1,250,744$ 10,888,762$ Monroe 47,972,372 0.01$ 468,450$ 0.01$ 39,335$ 507,785$ Nassau 29,871,550 0.01$ 291,696$ 0.01$ 78,074$ 369,770$ Okaloosa 99,898,020 0.01$ 975,504$ 0.01$ 78,916$ 1,054,421$ Okeechobee 23,666,034 0.01$ 231,099$ 0.01$ 71,811$ 302,909$ Orange 560,941,861 -$ 5,477,597$ 0.01$ 1,012,296$ 1,012,296$ Osceola 157,994,512 0.01$ 1,542,816$ 0.01$ 132,204$ 1,675,020$ Palm Beach 524,207,689 0.01$ 5,118,888$ 0.01$ 586,966$ 5,705,854$ Pasco 180,813,202 0.01$ 1,765,641$ 0.01$ 233,446$ 1,999,087$
2012 Local Government Financial Information Handbook Page 199
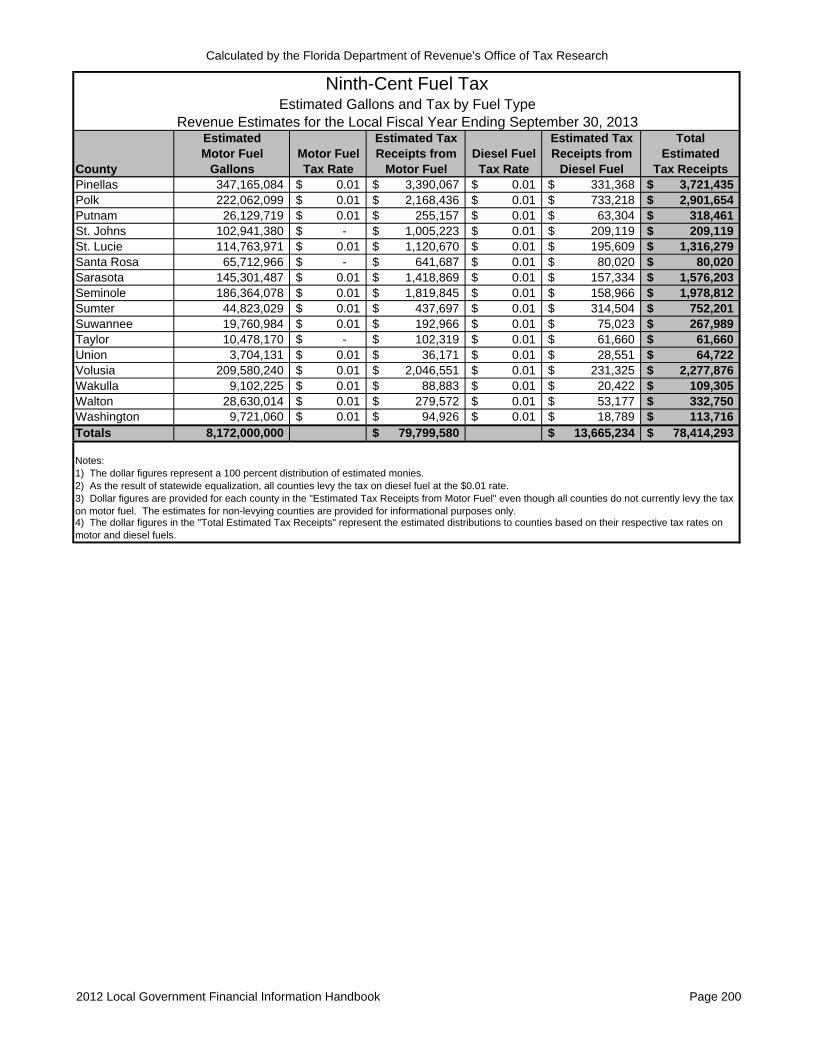
Calculated by the Florida Department of Revenue's Office of Tax Research
Ninth-Cent Fuel TaxEstimated Gallons and Tax by Fuel Type
Revenue Estimates for the Local Fiscal Year Ending September 30, 2013Estimated Estimated Tax Estimated Tax TotalMotor Fuel Motor Fuel Receipts from Diesel Fuel Receipts from Estimated
County Gallons Tax Rate Motor Fuel Tax Rate Diesel Fuel Tax ReceiptsPinellas 347,165,084 0.01$ 3,390,067$ 0.01$ 331,368$ 3,721,435$ Polk 222,062,099 0.01$ 2,168,436$ 0.01$ 733,218$ 2,901,654$ Putnam 26,129,719 0.01$ 255,157$ 0.01$ 63,304$ 318,461$ St. Johns 102,941,380 -$ 1,005,223$ 0.01$ 209,119$ 209,119$ St. Lucie 114,763,971 0.01$ 1,120,670$ 0.01$ 195,609$ 1,316,279$ Santa Rosa 65,712,966 -$ 641,687$ 0.01$ 80,020$ 80,020$ Sarasota 145,301,487 0.01$ 1,418,869$ 0.01$ 157,334$ 1,576,203$ Seminole 186,364,078 0.01$ 1,819,845$ 0.01$ 158,966$ 1,978,812$ Sumter 44,823,029 0.01$ 437,697$ 0.01$ 314,504$ 752,201$ Suwannee 19,760,984 0.01$ 192,966$ 0.01$ 75,023$ 267,989$ Taylor 10,478,170 -$ 102,319$ 0.01$ 61,660$ 61,660$ Union 3,704,131 0.01$ 36,171$ 0.01$ 28,551$ 64,722$ Volusia 209,580,240 0.01$ 2,046,551$ 0.01$ 231,325$ 2,277,876$ Wakulla 9,102,225 0.01$ 88,883$ 0.01$ 20,422$ 109,305$ Walton 28,630,014 0.01$ 279,572$ 0.01$ 53,177$ 332,750$ Washington 9,721,060 0.01$ 94,926$ 0.01$ 18,789$ 113,716$ Totals 8,172,000,000 79,799,580$ 13,665,234$ 78,414,293$
Notes:1) The dollar figures represent a 100 percent distribution of estimated monies.2) As the result of statewide equalization, all counties levy the tax on diesel fuel at the $0.01 rate.
4) The dollar figures in the "Total Estimated Tax Receipts" represent the estimated distributions to counties based on their respective tax rates on motor and diesel fuels.
3) Dollar figures are provided for each county in the "Estimated Tax Receipts from Motor Fuel" even though all counties do not currently levy the tax on motor fuel. The estimates for non-levying counties are provided for informational purposes only.
2012 Local Government Financial Information Handbook Page 200

Calculated by the Florida Department of Revenue's Office of Tax Research
Local Option Fuel TaxesRevenue Estimates for the Local Fiscal Year Ending September 30, 2013
Motor Fuel Distribution Estimated Motor Fuel Distribution EstimatedLocal Government Tax Rate Percentage Distribution Tax Rate Percentage DistributionALACHUA BOCC 0.06$ 52.1500000 3,443,095$ 0.05$ 52.1500000 2,559,401$ Alachua 1.8750000 123,793$ 1.8750000 92,021$ Archer 0.8550000 56,450$ 0.8550000 41,961$ Gainesville 38.6350000 2,550,795$ 38.6350000 1,896,116$ Hawthorne 1.0600000 69,984$ 1.0600000 52,022$ High Springs 2.1100000 139,308$ 2.1100000 103,554$ La Crosse 0.2950000 19,477$ 0.2950000 14,478$ Micanopy 0.9000000 59,421$ 0.9000000 44,170$ Newberry 1.2550000 82,859$ 1.2550000 61,592$ Waldo 0.8650000 57,110$ 0.8650000 42,452$ Countywide Total 100.0000000 6,602,292$ 100.0000000 4,907,769$ BAKER BOCC 0.06$ 86.0000000 898,737$ -$ Glen St. Mary 1.0000000 10,450$ Macclenny 13.0000000 135,856$ Countywide Total 100.0000000 1,045,043$ 147,467$ BAY BOCC 0.06$ 60.8100000 3,386,951$ -$ Callaway 3.6690000 204,353$ Lynn Haven 3.8390000 213,822$ Mexico Beach 0.8250000 45,950$ Panama City 22.7020000 1,264,439$ Panama City Beach 4.2950000 239,220$ Parker 1.8800000 104,711$ Springfield 1.9800000 110,281$ Countywide Total 100.0000000 5,569,726$ 819,817$ BRADFORD BOCC 0.06$ 70.0000000 614,980$ -$ Brooker 1.8000000 15,814$ Hampton 1.9000000 16,692$ Lawtey 2.9000000 25,478$ Starke 23.4000000 205,579$ Countywide Total 100.0000000 878,543$ 123,847$ BREVARD BOCC 0.06$ 47.1400427 7,660,275$ -$ Cape Canaveral 1.8093989 294,028$ Cocoa 1.8808877 305,645$ Cocoa Beach 2.4059384 390,966$ Grant-Valkaria 0.3808116 61,882$ Indialantic 0.5213589 84,721$ Indian Harbor Beach 1.7878376 290,524$ Malabar 0.5139053 83,510$ Melbourne 13.2470836 2,152,656$ Melbourne Beach 0.4076174 66,238$ Melbourne Village 0.0862882 14,022$ Palm Bay 16.1978969 2,632,164$ Palm Shores 0.0914209 14,856$ Rockledge 3.5542664 577,570$ Satellite Beach 2.0562326 334,139$ Titusville 5.5595393 903,427$ West Melbourne 2.3594736 383,415$ Countywide Total 100.0000000 16,250,038$ 1,909,301$ BROWARD BOCC 0.06$ 62.5000000 29,500,234$ 0.05$ 64.0380000 22,753,819$ Coconut Creek 1.1457400 540,794$ 1.0987488 390,405$ Cooper City 0.6181820 291,784$ 0.5928288 210,642$ Coral Springs 2.6223230 1,237,746$ 2.5147728 893,543$
1 to 6 Cents Local Option Fuel TaxImposed on Motor and Diesel Fuels
1 to 5 Cents Local Option Fuel TaxImposed on Motor Fuel Only
2012 Local Government Financial Information Handbook Page 201

Calculated by the Florida Department of Revenue's Office of Tax Research
Local Option Fuel TaxesRevenue Estimates for the Local Fiscal Year Ending September 30, 2013
Motor Fuel Distribution Estimated Motor Fuel Distribution EstimatedLocal Government Tax Rate Percentage Distribution Tax Rate Percentage Distribution
1 to 6 Cents Local Option Fuel TaxImposed on Motor and Diesel Fuels
1 to 5 Cents Local Option Fuel TaxImposed on Motor Fuel Only
Dania Beach 0.6418300 302,946$ 0.6155064 218,700$ Davie 1.9920780 940,268$ 1.9103768 678,790$ Deerfield Beach 1.6245080 766,774$ 1.5578812 553,542$ Fort Lauderdale 3.5843420 1,691,823$ 3.4373366 1,221,346$ Hallandale Beach 0.8036790 379,339$ 0.7707168 273,849$ Hillsboro Beach 0.0406030 19,165$ 0.0389374 13,835$ Hollywood 3.0483180 1,438,817$ 2.9232968 1,038,698$ Lauderdale-By-The-Sea 0.1311420 61,900$ 0.1257638 44,686$ Lauderdale Lakes 0.7057980 333,139$ 0.6768516 240,497$ Lauderhill 1.4484320 683,665$ 1.3890268 493,545$ Lazy Lake 0.0005210 246$ 0.0004984 177$ Lighthouse Point 0.2239980 105,728$ 0.2148118 76,326$ Margate 1.1538600 544,626$ 1.1065368 393,172$ Miramar 2.6427870 1,247,405$ 2.5343972 900,516$ North Lauderdale 0.8883490 419,304$ 0.8519150 302,700$ Oakland Park 0.8957120 422,779$ 0.8589756 305,209$ Parkland 0.5188950 244,920$ 0.4976138 176,811$ Pembroke Park 0.1321380 62,370$ 0.1267184 45,025$ Pembroke Pines 3.3510970 1,581,730$ 3.2136574 1,141,869$ Plantation 1.8396930 868,342$ 1.7642408 626,866$ Pompano Beach 2.1621340 1,020,535$ 2.0734580 736,736$ Sea Ranch Lakes 0.0145090 6,848$ 0.0139134 4,944$ Southwest Ranches 0.1590550 75,075$ 0.1525316 54,197$ Sunrise 1.8285190 863,068$ 1.7535252 623,058$ Tamarac 1.3085410 617,636$ 1.2548732 445,878$ Weston 1.4147800 667,781$ 1.3567552 482,079$ West Park 0.3065470 144,691$ 0.2939744 104,454$ Wilton Manors 0.2518900 118,893$ 0.2415592 85,830$ Countywide Total 100.0000000 47,200,374$ 100.0000000 35,531,746$ CALHOUN BOCC 0.06$ 79.8900000 275,061$ -$ Altha 1.2200000 4,200$ Blountstown 18.8900000 65,038$ Countywide Total 100.0000000 344,300$ 35,024$ CHARLOTTE BOCC 0.06$ 89.6600000 4,501,185$ 0.05$ 93.2600000 3,335,039$ Punta Gorda 10.3400000 519,097$ 6.7400000 241,027$ Countywide Total 100.0000000 5,020,283$ 100.0000000 3,576,066$ CITRUS BOCC 0.06$ 90.9500000 2,803,841$ 0.05$ 90.9500000 2,101,483$ Crystal River 3.5000000 107,899$ 3.5000000 80,871$ Inverness 5.5500000 171,097$ 5.5500000 128,238$ Countywide Total 100.0000000 3,082,838$ 100.0000000 2,310,592$ CLAY BOCC 0.06$ 85.9000000 3,952,256$ -$ Green Cove Springs 5.7000000 262,257$ Keystone Heights 1.7000000 78,217$ Orange Park 6.1000000 280,661$ Penney Farms 0.6000000 27,606$ Countywide Total 100.0000000 4,600,996$ 695,867$ COLLIER BOCC 0.06$ 84.6600000 6,593,061$ 0.05$ 84.6600000 5,030,176$ Everglades 0.1900000 14,797$ 0.1900000 11,289$ Marco Island 4.8700000 379,261$ 4.8700000 289,357$ Naples 10.2800000 800,575$ 10.2800000 610,799$ Countywide Total 100.0000000 7,787,693$ 100.0000000 5,941,620$ COLUMBIA BOCC 0.06$ 71.3900000 2,303,580$ -$
2012 Local Government Financial Information Handbook Page 202

Calculated by the Florida Department of Revenue's Office of Tax Research
Local Option Fuel TaxesRevenue Estimates for the Local Fiscal Year Ending September 30, 2013
Motor Fuel Distribution Estimated Motor Fuel Distribution EstimatedLocal Government Tax Rate Percentage Distribution Tax Rate Percentage Distribution
1 to 6 Cents Local Option Fuel TaxImposed on Motor and Diesel Fuels
1 to 5 Cents Local Option Fuel TaxImposed on Motor Fuel Only
Fort White 1.1000000 35,494$ Lake City 27.5100000 887,680$ Countywide Total 100.0000000 3,226,755$ 401,441$ DESOTO BOCC 0.06$ 78.0000000 578,290$ 0.05$ 82.0000000 383,939$ Arcadia 22.0000000 163,107$ 18.0000000 84,279$ Countywide Total 100.0000000 741,398$ 100.0000000 468,218$ DIXIE BOCC 0.06$ 81.2500000 412,753$ -$ Cross City 12.5000000 63,500$ Horseshoe Beach 6.2500000 31,750$ Countywide Total 100.0000000 508,003$ 58,074$ JACKSONVILLE-DUVAL 0.06$ 95.0817000 28,076,406$ -$ Atlantic Beach 1.4652000 432,655$ Baldwin 0.1650000 48,722$ Jacksonville Beach 2.4733000 730,334$ Neptune Beach 0.8148000 240,600$ Countywide Total 100.0000000 29,528,717$ 3,967,284$ ESCAMBIA BOCC 0.06$ 81.1500000 6,861,212$ -$ Century 0.6300000 53,266$ Pensacola 18.2200000 1,540,496$ Countywide Total 100.0000000 8,454,975$ 1,171,269$ FLAGLER BOCC 0.06$ 19.5300000 424,095$ -$ Beverly Beach 0.3000000 6,515$ Bunnell 2.6400000 57,328$ Flagler Beach 4.1100000 89,249$ Palm Coast 73.4200000 1,594,318$ Countywide Total 100.0000000 2,171,503$ 323,987$ FRANKLIN BOCC 0.05$ 75.0800000 247,922$ -$ Appalachicola 16.8500000 55,641$ Carrabelle 8.0700000 26,648$ Countywide Total 100.0000000 330,211$ 51,984$ GADSDEN BOCC 0.06$ 76.3000000 1,972,574$ -$ Chattahoochee 7.4600000 192,862$ Greensboro 0.3300000 8,531$ Gretna 1.2800000 33,092$ Havana 3.7700000 97,465$ Midway 0.2300000 5,946$ Quincy 10.6300000 274,816$ Countywide Total 100.0000000 2,585,287$ 224,005$ GILCHRIST BOCC 0.06$ 85.5700000 333,825$ -$ Bell 1.3000000 5,072$ Fanning Springs (part) 2.0600000 8,036$ Trenton 11.0700000 43,186$ Countywide Total 100.0000000 390,119$ 55,975$ GLADES BOCC 0.06$ 80.0000000 223,584$ -$ Moore Haven 20.0000000 55,896$ Countywide Total 100.0000000 279,479$ 34,504$ GULF BOCC 0.06$ 100.0000000 353,867$ -$ 48,578$ HAMILTON BOCC 0.06$ 82.0000000 663,643$ -$ Jasper 10.0000000 80,932$ Jennings 4.0000000 32,373$ White Springs 4.0000000 32,373$ Countywide Total 100.0000000 809,321$ 65,602$
2012 Local Government Financial Information Handbook Page 203
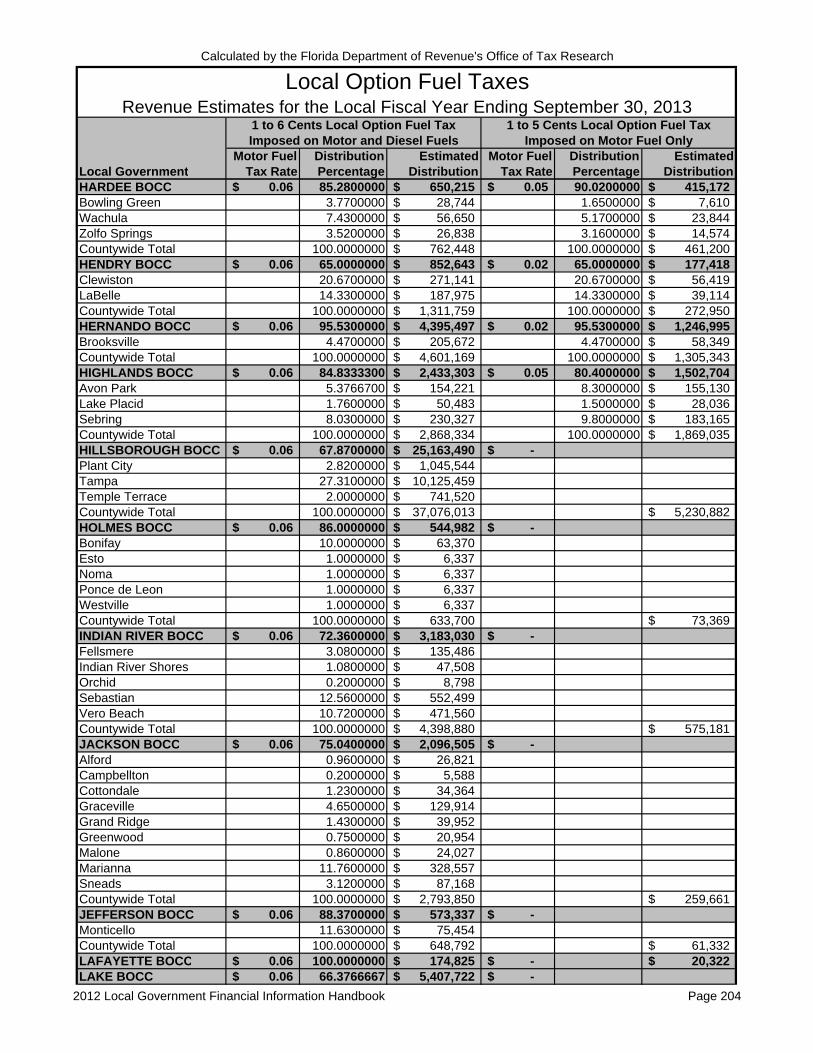
Calculated by the Florida Department of Revenue's Office of Tax Research
Local Option Fuel TaxesRevenue Estimates for the Local Fiscal Year Ending September 30, 2013
Motor Fuel Distribution Estimated Motor Fuel Distribution EstimatedLocal Government Tax Rate Percentage Distribution Tax Rate Percentage Distribution
1 to 6 Cents Local Option Fuel TaxImposed on Motor and Diesel Fuels
1 to 5 Cents Local Option Fuel TaxImposed on Motor Fuel Only
HARDEE BOCC 0.06$ 85.2800000 650,215$ 0.05$ 90.0200000 415,172$ Bowling Green 3.7700000 28,744$ 1.6500000 7,610$ Wachula 7.4300000 56,650$ 5.1700000 23,844$ Zolfo Springs 3.5200000 26,838$ 3.1600000 14,574$ Countywide Total 100.0000000 762,448$ 100.0000000 461,200$ HENDRY BOCC 0.06$ 65.0000000 852,643$ 0.02$ 65.0000000 177,418$ Clewiston 20.6700000 271,141$ 20.6700000 56,419$ LaBelle 14.3300000 187,975$ 14.3300000 39,114$ Countywide Total 100.0000000 1,311,759$ 100.0000000 272,950$ HERNANDO BOCC 0.06$ 95.5300000 4,395,497$ 0.02$ 95.5300000 1,246,995$ Brooksville 4.4700000 205,672$ 4.4700000 58,349$ Countywide Total 100.0000000 4,601,169$ 100.0000000 1,305,343$ HIGHLANDS BOCC 0.06$ 84.8333300 2,433,303$ 0.05$ 80.4000000 1,502,704$ Avon Park 5.3766700 154,221$ 8.3000000 155,130$ Lake Placid 1.7600000 50,483$ 1.5000000 28,036$ Sebring 8.0300000 230,327$ 9.8000000 183,165$ Countywide Total 100.0000000 2,868,334$ 100.0000000 1,869,035$ HILLSBOROUGH BOCC 0.06$ 67.8700000 25,163,490$ -$ Plant City 2.8200000 1,045,544$ Tampa 27.3100000 10,125,459$ Temple Terrace 2.0000000 741,520$ Countywide Total 100.0000000 37,076,013$ 5,230,882$ HOLMES BOCC 0.06$ 86.0000000 544,982$ -$ Bonifay 10.0000000 63,370$ Esto 1.0000000 6,337$ Noma 1.0000000 6,337$ Ponce de Leon 1.0000000 6,337$ Westville 1.0000000 6,337$ Countywide Total 100.0000000 633,700$ 73,369$ INDIAN RIVER BOCC 0.06$ 72.3600000 3,183,030$ -$ Fellsmere 3.0800000 135,486$ Indian River Shores 1.0800000 47,508$ Orchid 0.2000000 8,798$ Sebastian 12.5600000 552,499$ Vero Beach 10.7200000 471,560$ Countywide Total 100.0000000 4,398,880$ 575,181$ JACKSON BOCC 0.06$ 75.0400000 2,096,505$ -$ Alford 0.9600000 26,821$ Campbellton 0.2000000 5,588$ Cottondale 1.2300000 34,364$ Graceville 4.6500000 129,914$ Grand Ridge 1.4300000 39,952$ Greenwood 0.7500000 20,954$ Malone 0.8600000 24,027$ Marianna 11.7600000 328,557$ Sneads 3.1200000 87,168$ Countywide Total 100.0000000 2,793,850$ 259,661$ JEFFERSON BOCC 0.06$ 88.3700000 573,337$ -$ Monticello 11.6300000 75,454$ Countywide Total 100.0000000 648,792$ 61,332$ LAFAYETTE BOCC 0.06$ 100.0000000 174,825$ -$ 20,322$ LAKE BOCC 0.06$ 66.3766667 5,407,722$ -$
2012 Local Government Financial Information Handbook Page 204

Calculated by the Florida Department of Revenue's Office of Tax Research
Local Option Fuel TaxesRevenue Estimates for the Local Fiscal Year Ending September 30, 2013
Motor Fuel Distribution Estimated Motor Fuel Distribution EstimatedLocal Government Tax Rate Percentage Distribution Tax Rate Percentage Distribution
1 to 6 Cents Local Option Fuel TaxImposed on Motor and Diesel Fuels
1 to 5 Cents Local Option Fuel TaxImposed on Motor Fuel Only
Astatula 0.3751667 30,565$ Clermont 3.7691667 307,075$ Eustis 6.7879000 553,012$ Fruitland Park 0.9792333 79,778$ Groveland 1.2958667 105,575$ Howey-in-the-Hills 0.2582000 21,036$ Lady Lake 1.7440333 142,087$ Leesburg 7.8357333 638,379$ Mascotte 0.8613667 70,176$ Minneola 0.5556333 45,268$ Montverde 0.2879667 23,461$ Mount Dora 4.0516000 330,085$ Tavares 3.6762667 299,506$ Umatilla 1.1452000 93,300$ Countywide Total 100.0000000 8,147,022$ 1,218,694$ LEE BOCC 0.06$ 50.4900000 8,329,764$ 0.05$ 50.4900000 6,165,977$ Bonita Springs 4.5400000 749,002$ 4.5400000 554,437$ Cape Coral 24.9500000 4,116,213$ 24.9500000 3,046,962$ Fort Myers 14.0000000 2,309,699$ 14.0000000 1,709,718$ Fort Myers Beach 1.0200000 168,278$ 1.0200000 124,565$ Sanibel 5.0000000 824,892$ 5.0000000 610,614$ Countywide Total 100.0000000 16,497,849$ 100.0000000 12,212,274$ LEON BOCC 0.06$ 46.6700000 3,652,077$ -$ Tallahassee 53.3300000 4,173,243$ Countywide Total 100.0000000 7,825,320$ 1,178,639$ LEVY BOCC 0.06$ 89.2300000 1,217,277$ -$ Bronson 1.3000000 17,735$ Cedar Key 0.9300000 12,687$ Chiefland 3.0000000 40,926$ Fanning Springs (part) 0.2400000 3,274$ Inglis 2.2000000 30,012$ Otter Creek 0.1400000 1,910$ Williston 2.3500000 32,059$ Yankeetown 0.6100000 8,322$ Countywide Total 100.0000000 1,364,201$ 185,259$ LIBERTY BOCC 0.06$ 90.0000000 215,906$ -$ Bristol 10.0000000 23,990$ Countywide Total 100.0000000 239,896$ 19,917$ MADISON BOCC 0.06$ 70.1700000 1,157,897$ -$ Greenville 6.1600000 101,648$ Lee 1.9800000 32,673$ Madison 21.6900000 357,913$ Countywide Total 100.0000000 1,650,131$ 96,169$ MANATEE BOCC 0.06$ 100.0000000 8,685,658$ 0.05$ 100.0000000 6,385,357$ MARION BOCC 0.06$ 70.1000000 7,818,112$ 0.05$ 70.1000000 5,085,278$ Belleview 2.5600000 285,512$ 2.5600000 185,711$ Dunnellon 2.5600000 285,512$ 2.5600000 185,711$ McIntosh 0.6400000 71,378$ 0.6400000 46,428$ Ocala 23.5000000 2,620,908$ 23.5000000 1,704,765$ Reddick 0.6400000 71,378$ 0.6400000 46,428$ Countywide Total 100.0000000 11,152,799$ 100.0000000 7,254,320$ MARTIN BOCC 0.06$ 86.8300000 3,793,131$ 0.05$ 86.8300000 2,848,027$
2012 Local Government Financial Information Handbook Page 205

Calculated by the Florida Department of Revenue's Office of Tax Research
Local Option Fuel TaxesRevenue Estimates for the Local Fiscal Year Ending September 30, 2013
Motor Fuel Distribution Estimated Motor Fuel Distribution EstimatedLocal Government Tax Rate Percentage Distribution Tax Rate Percentage Distribution
1 to 6 Cents Local Option Fuel TaxImposed on Motor and Diesel Fuels
1 to 5 Cents Local Option Fuel TaxImposed on Motor Fuel Only
Jupiter Island 1.3500000 58,974$ 1.3500000 44,280$ Ocean Breeze 0.0900000 3,932$ 0.0900000 2,952$ Sewall's Point 2.3300000 101,785$ 2.3300000 76,424$ Stuart 9.4000000 410,635$ 9.4000000 308,320$ Countywide Total 100.0000000 4,368,456$ 100.0000000 3,280,003$ MIAMI-DADE BOCC 0.06$ 70.3980000 43,142,237$ 0.03$ 73.9980000 20,057,076$ Aventura 0.6060000 371,377$ 0.5320000 144,198$ Bal Harbour 0.0400000 24,513$ 0.0350000 9,487$ Bay Harbor Islands 0.1120000 68,637$ 0.0980000 26,563$ Biscayne Park 0.0900000 55,155$ 0.0790000 21,413$ Coral Gables 1.3350000 818,132$ 1.1720000 317,669$ Cutler Bay 0.8610000 527,649$ 0.7560000 204,913$ Doral 0.8750000 536,229$ 0.7690000 208,437$ El Portal 0.0660000 40,447$ 0.0580000 15,721$ Florida City 0.2670000 163,626$ 0.2350000 63,696$ Golden Beach 0.0420000 25,739$ 0.0370000 10,029$ Hialeah 4.4460000 2,724,657$ 3.9050000 1,058,446$ Hialeah Gardens 0.4390000 269,034$ 0.3850000 104,354$ Homestead 1.3060000 800,360$ 1.1470000 310,893$ Indian Creek 0.0070000 4,290$ 0.0060000 1,626$ Key Biscayne 0.2470000 151,370$ 0.2170000 58,818$ Medley 0.0950000 58,219$ 0.0840000 22,768$ Miami 7.9980000 4,901,441$ 7.0250000 1,904,118$ Miami Beach 1.6520000 1,012,401$ 1.4510000 393,292$ Miami Gardens 2.5640000 1,571,305$ 2.2520000 610,402$ Miami Lakes 0.6580000 403,244$ 0.5780000 156,666$ Miami Shores 0.3080000 188,753$ 0.2710000 73,454$ Miami Springs 0.4360000 267,195$ 0.3830000 103,812$ North Bay 0.1290000 79,055$ 0.1140000 30,900$ North Miami 1.2700000 778,298$ 1.1150000 302,220$ North Miami Beach 0.9540000 584,643$ 0.8380000 227,139$ Opa Locka 0.3310000 202,848$ 0.2910000 78,875$ Palmetto Bay 0.6640000 406,921$ 0.5840000 158,293$ Pinecrest 0.5530000 338,897$ 0.4860000 131,730$ South Miami 0.2970000 182,011$ 0.2610000 70,744$ Sunny Isles Beach 0.3530000 216,330$ 0.3100000 84,025$ Surfside 0.1210000 74,153$ 0.1060000 28,731$ Sweetwater 0.3010000 184,463$ 0.2650000 71,828$ Virginia Gardens 0.0530000 32,480$ 0.0470000 12,739$ West Miami 0.1260000 77,217$ 0.1100000 29,815$ Countywide Total 100.0000000 61,283,328$ 100.0000000 27,104,889$ MONROE BOCC 0.06$ 60.5000000 1,158,702$ 0.03$ 45.2100000 595,604$ Islamorada See note 294,500$ 9.0600000 119,358$ Key Colony Beach 2.0000000 57,089$ 1.0900000 14,360$ Key West 36.5000000 1,041,870$ 31.2100000 411,166$ Layton 1.0000000 28,544$ 0.2600000 3,425$ Marathon See note 273,733$ 13.1700000 173,504$ Countywide Total 100.0000000 2,854,439$ 100.0000000 1,317,417$ NASSAU BOCC 0.06$ 85.6065000 1,778,321$ -$ Callahan 0.7494000 15,567$ Fernandina Beach 9.0497000 187,991$ Hilliard 4.5944000 95,440$
2012 Local Government Financial Information Handbook Page 206

Calculated by the Florida Department of Revenue's Office of Tax Research
Local Option Fuel TaxesRevenue Estimates for the Local Fiscal Year Ending September 30, 2013
Motor Fuel Distribution Estimated Motor Fuel Distribution EstimatedLocal Government Tax Rate Percentage Distribution Tax Rate Percentage Distribution
1 to 6 Cents Local Option Fuel TaxImposed on Motor and Diesel Fuels
1 to 5 Cents Local Option Fuel TaxImposed on Motor Fuel Only
Countywide Total 100.0000000 2,077,321$ 272,620$ OKALOOSA BOCC 0.06$ 60.0000000 3,555,042$ -$ Cinco Bayou 0.4262000 25,253$ Crestview 8.6734000 513,905$ Destin 8.7925000 520,962$ Fort Walton Beach 10.8840000 644,885$ Laurel Hill 0.5102000 30,230$ Mary Esther 2.2109000 130,997$ Niceville 4.8463000 287,147$ Shalimar 0.6803000 40,308$ Valparaiso 2.9762000 176,342$ Countywide Total 100.0000000 5,925,069$ 911,709$ OKEECHOBEE BOCC 0.06$ 80.6600000 1,379,330$ 0.05$ 80.6600000 873,705$ Okeechobee 19.3400000 330,725$ 19.3400000 209,490$ Countywide Total 100.0000000 1,710,055$ 100.0000000 1,083,194$ ORANGE BOCC 0.06$ 63.9700000 23,378,813$ -$ Apopka 3.6700000 1,341,258$ Belle Isle 0.5400000 197,351$ Eatonville 0.2100000 76,748$ Edgewood 0.2100000 76,748$ Maitland 1.5100000 551,853$ Oakland 0.1700000 62,129$ Ocoee 3.0800000 1,125,633$ Orlando 21.0000000 7,674,771$ Windermere 0.2400000 87,712$ Winter Garden 2.8400000 1,037,921$ Winter Park 2.5600000 935,591$ Countywide Total 100.0000000 36,546,527$ 5,119,380$ OSCEOLA BOCC 0.06$ 62.5000000 5,883,836$ -$ Kissimmee 25.0000000 2,353,534$ St. Cloud 12.5000000 1,176,767$ Countywide Total 100.0000000 9,414,138$ 1,441,921$ PALM BEACH BOCC 0.06$ 66.5650000 21,380,158$ 0.05$ 78.9240000 18,936,224$ Atlantis 0.1950000 62,632$ 0.1230000 29,511$ Belle Glade 0.9210000 295,818$ 0.5800000 139,159$ Boca Raton 4.1870000 1,344,832$ 2.6390000 633,175$ Boynton Beach 2.4790000 796,235$ 1.5630000 375,010$ Briny Breezes 0.0130000 4,175$ 0.0090000 2,159$ Cloud Lake 0.0120000 3,854$ 0.0090000 2,159$ Delray Beach 2.7940000 897,411$ 1.7610000 422,516$ Glen Ridge 0.0250000 8,030$ 0.0160000 3,839$ Golf 0.0680000 21,841$ 0.0430000 10,317$ Greenacres 0.8250000 264,984$ 0.5200000 124,764$ Gulfstream 0.0660000 21,199$ 0.0410000 9,837$ Haverhill 0.0820000 26,338$ 0.0520000 12,476$ Highland Beach 0.0640000 20,556$ 0.0400000 9,597$ Hypoluxo 0.0350000 11,242$ 0.0220000 5,278$ Juno Beach 0.1100000 35,331$ 0.0690000 16,555$ Jupiter 2.4240000 778,570$ 1.5280000 366,613$ Jupiter Inlet Colony 0.0400000 12,848$ 0.0250000 5,998$ Lake Clarke Shores 0.2220000 71,305$ 0.1400000 33,590$ Lake Park 0.4910000 157,705$ 0.3100000 74,378$
2012 Local Government Financial Information Handbook Page 207

Calculated by the Florida Department of Revenue's Office of Tax Research
Local Option Fuel TaxesRevenue Estimates for the Local Fiscal Year Ending September 30, 2013
Motor Fuel Distribution Estimated Motor Fuel Distribution EstimatedLocal Government Tax Rate Percentage Distribution Tax Rate Percentage Distribution
1 to 6 Cents Local Option Fuel TaxImposed on Motor and Diesel Fuels
1 to 5 Cents Local Option Fuel TaxImposed on Motor Fuel Only
Lake Worth 1.7410000 559,196$ 1.0970000 263,203$ Lantana 0.5620000 180,510$ 0.3540000 84,935$ Loxahatchee Groves 0.7760000 249,245$ 0.4890000 117,326$ Manalapan 0.0370000 11,884$ 0.0230000 5,518$ Mangonia Park 0.1240000 39,828$ 0.0780000 18,715$ North Palm Beach 0.5630000 180,831$ 0.3550000 85,175$ Ocean Ridge 0.1070000 34,368$ 0.0670000 16,075$ Pahokee 0.3510000 112,738$ 0.2210000 53,024$ Palm Beach 0.6440000 206,848$ 0.4060000 97,412$ Palm Beach Gardens 1.4550000 467,335$ 0.9170000 220,016$ Palm Beach Shores 0.0770000 24,732$ 0.0490000 11,757$ Palm Springs 0.7030000 225,798$ 0.4430000 106,289$ Riviera Beach 1.4880000 477,934$ 0.9380000 225,054$ Royal Palm Beach 1.3890000 446,136$ 0.8760000 210,179$ South Bay 0.2540000 81,583$ 0.1600000 38,389$ South Palm Beach 0.0160000 5,139$ 0.0100000 2,399$ Tequesta 0.3640000 116,914$ 0.2290000 54,944$ Wellington 3.1470000 1,010,792$ 1.9840000 476,021$ West Palm Beach 4.5840000 1,472,345$ 2.8900000 693,397$ Countywide Total 100.0000000 32,119,219$ 100.0000000 23,992,986$ PASCO BOCC 0.06$ 87.9772000 9,893,987$ -$ Dade City 2.1618000 243,118$ New Port Richey 4.3827000 492,882$ Port Richey 1.0274000 115,542$ St. Leo 0.0934000 10,504$ San Antonio 0.7200000 80,972$ Zephyrhills 3.6375000 409,076$ Countywide Total 100.0000000 11,246,080$ 1,650,174$ PINELLAS BOCC 0.06$ 100.0000000 20,929,893$ -$ 3,168,367$ POLK BOCC 0.06$ 64.9830000 10,634,377$ 0.05$ 64.9830000 6,604,731$ Auburndale 2.0290000 332,043$ 2.0290000 206,223$ Bartow 2.8880000 472,617$ 2.8880000 293,530$ Davenport 0.4990000 81,661$ 0.4990000 50,717$ Dundee 0.6160000 100,808$ 0.6160000 62,609$ Eagle Lake 0.4710000 77,078$ 0.4710000 47,871$ Fort Meade 1.0450000 171,013$ 1.0450000 106,212$ Frostproof 0.8440000 138,119$ 0.8440000 85,782$ Haines City 2.5770000 421,722$ 2.5770000 261,921$ Highland Park 0.0460000 7,528$ 0.0460000 4,675$ Hillcrest Heights 0.0460000 7,528$ 0.0460000 4,675$ Lake Alfred 0.6750000 110,463$ 0.6750000 68,606$ Lake Hamilton 0.3640000 59,568$ 0.3640000 36,996$ Lake Wales 2.0500000 335,480$ 2.0500000 208,358$ Lakeland 14.1700000 2,318,901$ 14.1700000 1,440,208$ Mulberry 1.1250000 184,105$ 1.1250000 114,343$ Polk City 0.4200000 68,732$ 0.4200000 42,688$ Winter Haven 5.1520000 843,118$ 5.1520000 523,638$ Countywide Total 100.0000000 16,364,860$ 100.0000000 10,163,782$ PUTNAM BOCC 0.06$ 78.4450000 1,407,237$ 0.05$ 78.4450000 938,169$ Crescent City 2.3770000 42,641$ 2.3770000 28,428$ Interlachen 1.9278000 34,583$ 1.9278000 23,056$ Palatka 15.3344000 275,086$ 15.3344000 183,393$
2012 Local Government Financial Information Handbook Page 208
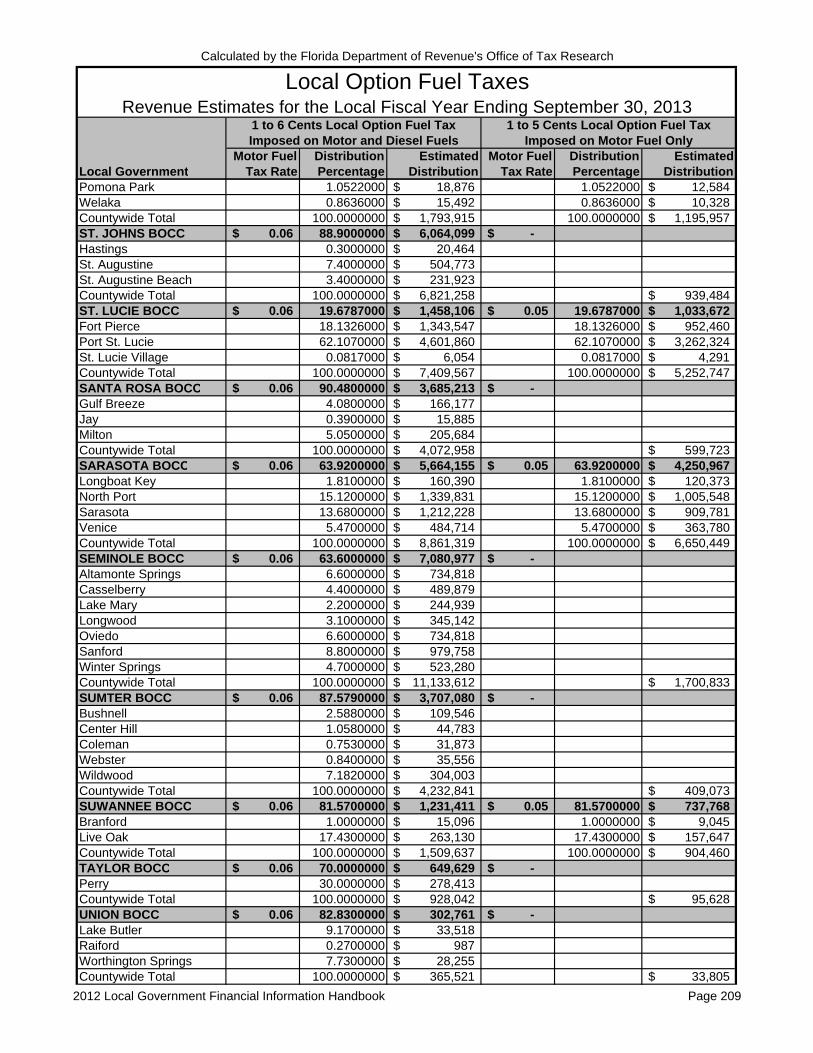
Calculated by the Florida Department of Revenue's Office of Tax Research
Local Option Fuel TaxesRevenue Estimates for the Local Fiscal Year Ending September 30, 2013
Motor Fuel Distribution Estimated Motor Fuel Distribution EstimatedLocal Government Tax Rate Percentage Distribution Tax Rate Percentage Distribution
1 to 6 Cents Local Option Fuel TaxImposed on Motor and Diesel Fuels
1 to 5 Cents Local Option Fuel TaxImposed on Motor Fuel Only
Pomona Park 1.0522000 18,876$ 1.0522000 12,584$ Welaka 0.8636000 15,492$ 0.8636000 10,328$ Countywide Total 100.0000000 1,793,915$ 100.0000000 1,195,957$ ST. JOHNS BOCC 0.06$ 88.9000000 6,064,099$ -$ Hastings 0.3000000 20,464$ St. Augustine 7.4000000 504,773$ St. Augustine Beach 3.4000000 231,923$ Countywide Total 100.0000000 6,821,258$ 939,484$ ST. LUCIE BOCC 0.06$ 19.6787000 1,458,106$ 0.05$ 19.6787000 1,033,672$ Fort Pierce 18.1326000 1,343,547$ 18.1326000 952,460$ Port St. Lucie 62.1070000 4,601,860$ 62.1070000 3,262,324$ St. Lucie Village 0.0817000 6,054$ 0.0817000 4,291$ Countywide Total 100.0000000 7,409,567$ 100.0000000 5,252,747$ SANTA ROSA BOCC 0.06$ 90.4800000 3,685,213$ -$ Gulf Breeze 4.0800000 166,177$ Jay 0.3900000 15,885$ Milton 5.0500000 205,684$ Countywide Total 100.0000000 4,072,958$ 599,723$ SARASOTA BOCC 0.06$ 63.9200000 5,664,155$ 0.05$ 63.9200000 4,250,967$ Longboat Key 1.8100000 160,390$ 1.8100000 120,373$ North Port 15.1200000 1,339,831$ 15.1200000 1,005,548$ Sarasota 13.6800000 1,212,228$ 13.6800000 909,781$ Venice 5.4700000 484,714$ 5.4700000 363,780$ Countywide Total 100.0000000 8,861,319$ 100.0000000 6,650,449$ SEMINOLE BOCC 0.06$ 63.6000000 7,080,977$ -$ Altamonte Springs 6.6000000 734,818$ Casselberry 4.4000000 489,879$ Lake Mary 2.2000000 244,939$ Longwood 3.1000000 345,142$ Oviedo 6.6000000 734,818$ Sanford 8.8000000 979,758$ Winter Springs 4.7000000 523,280$ Countywide Total 100.0000000 11,133,612$ 1,700,833$ SUMTER BOCC 0.06$ 87.5790000 3,707,080$ -$ Bushnell 2.5880000 109,546$ Center Hill 1.0580000 44,783$ Coleman 0.7530000 31,873$ Webster 0.8400000 35,556$ Wildwood 7.1820000 304,003$ Countywide Total 100.0000000 4,232,841$ 409,073$ SUWANNEE BOCC 0.06$ 81.5700000 1,231,411$ 0.05$ 81.5700000 737,768$ Branford 1.0000000 15,096$ 1.0000000 9,045$ Live Oak 17.4300000 263,130$ 17.4300000 157,647$ Countywide Total 100.0000000 1,509,637$ 100.0000000 904,460$ TAYLOR BOCC 0.06$ 70.0000000 649,629$ -$ Perry 30.0000000 278,413$ Countywide Total 100.0000000 928,042$ 95,628$ UNION BOCC 0.06$ 82.8300000 302,761$ -$ Lake Butler 9.1700000 33,518$ Raiford 0.2700000 987$ Worthington Springs 7.7300000 28,255$ Countywide Total 100.0000000 365,521$ 33,805$
2012 Local Government Financial Information Handbook Page 209

Calculated by the Florida Department of Revenue's Office of Tax Research
Local Option Fuel TaxesRevenue Estimates for the Local Fiscal Year Ending September 30, 2013
Motor Fuel Distribution Estimated Motor Fuel Distribution EstimatedLocal Government Tax Rate Percentage Distribution Tax Rate Percentage Distribution
1 to 6 Cents Local Option Fuel TaxImposed on Motor and Diesel Fuels
1 to 5 Cents Local Option Fuel TaxImposed on Motor Fuel Only
VOLUSIA BOCC 0.06$ 57.2390000 7,336,971$ 0.05$ 57.2390000 5,490,644$ Daytona Beach 7.7080000 988,022$ 7.7080000 739,389$ Daytona Beach Shores 1.2280000 157,407$ 1.2280000 117,796$ DeBary 2.0380000 261,234$ 2.0380000 195,495$ DeLand 2.3500000 301,226$ 2.3500000 225,423$ Deltona 9.4280000 1,208,494$ 9.4280000 904,380$ Edgewater 1.8470000 236,751$ 1.8470000 177,173$ Holly Hill 1.2470000 159,842$ 1.2470000 119,618$ Lake Helen 0.2530000 32,430$ 0.2530000 24,269$ New Smyrna Beach 3.3200000 425,562$ 3.3200000 318,471$ Oak Hill 0.1520000 19,484$ 0.1520000 14,581$ Orange City 0.8400000 107,672$ 0.8400000 80,577$ Ormond Beach 5.0870000 652,058$ 5.0870000 487,970$ Pierson 0.2100000 26,918$ 0.2100000 20,144$ Ponce Inlet 0.6530000 83,702$ 0.6530000 62,639$ Port Orange 5.0170000 643,086$ 5.0170000 481,255$ South Daytona 1.3830000 177,275$ 1.3830000 132,664$ Countywide Total 100.0000000 12,818,133$ 100.0000000 9,592,488$ WAKULLA BOCC 0.06$ 100.0000000 617,310$ -$ 83,071$ WALTON BOCC 0.06$ 85.7600000 1,608,918$ -$ DeFuniak Springs 13.4500000 252,331$ Freeport 0.7900000 14,821$ Countywide Total 100.0000000 1,876,070$ 261,289$ WASHINGTON BOCC 0.06$ 85.7600000 551,100$ -$ Caryville 0.1200000 771$ Chipley 12.3500000 79,362$ Vernon 1.4600000 9,382$ Wausau 0.3100000 1,992$ Countywide Total 100.0000000 642,607$ 88,718$ STATEWIDE TOTALS 526,516,584$ 173,034,864$
Notes:
5) The estimated distributions to the municipalities of Islamorada and Marathon in Monroe County reflect fixed dollar amounts deducted from the county government's share.
3) Revenue estimates are based on distribution percentages specified by either locally-determined interlocal agreements or statutory default formula.
4) The revenue estimates are based on the total number of cents imposed by the counties as reflected in the table with the following exception. For those counties that do not currently impose the 1 to 5 cents local option fuel tax, a separate revenue estimate is provided. This estimate represents a countywide distribution based on a hypothetical 1 cent per gallon levy and is provided for those officials that may be considering a future tax levy.
1) The dollar figures represent a 100 percent distribution of estimated monies.2) As a result of statewide equalization, all counties levy the 1 to 6 cents local option fuel tax on diesel fuel at the maximum rate of 6 cents. Consequently, the rates listed in that particular column are for motor fuel only.
2012 Local Government Financial Information Handbook Page 210

Office of Economic and Demographic Research
Countywide Countywide Countywide Countywide Countywide Countywide Countywide Countywide2012 Realized Unutilized Unrealized 2012 Realized Unutilized Unrealized 2012 Realized Unutilized Unrealized 2012 Realized Unutilized Unrealized
County Tax Rate Tax Revenues Tax Rate Tax Revenues Tax Rate Tax Revenues Tax Rate Tax Revenues Tax Rate Tax Revenues Tax Rate Tax Revenues Tax Rate Tax Revenues Tax Rate Tax RevenuesAlachua 1 1,171,874$ 0 -$ 6 6,602,292$ 0 -$ 5 4,907,769$ 0 -$ 12 12,681,934$ 0 -$ Baker 1 185,738$ 0 -$ 6 1,045,043$ 0 -$ 0 -$ 5 737,337$ 7 1,230,781$ 5 737,337$ Bay 1 988,286$ 0 -$ 6 5,569,726$ 0 -$ 0 -$ 5 4,099,085$ 7 6,558,012$ 5 4,099,085$ Bradford 0 22,896$ 1 132,513$ 6 878,543$ 0 -$ 0 -$ 5 619,235$ 6 901,439$ 6 751,748$ Brevard 0 768,233$ 1 2,042,900$ 6 16,250,038$ 0 -$ 0 -$ 5 9,546,505$ 6 17,018,272$ 6 11,589,405$ Broward 1 8,395,828$ 0 -$ 6 47,200,374$ 0 -$ 5 35,531,746$ 0 -$ 12 91,127,948$ 0 -$ Calhoun 0 23,535$ 1 37,474$ 6 344,300$ 0 -$ 0 -$ 5 175,118$ 6 367,835$ 6 212,593$ Charlotte 1 891,716$ 0 -$ 6 5,020,283$ 0 -$ 5 3,576,066$ 0 -$ 12 9,488,065$ 0 -$ Citrus 1 546,855$ 0 -$ 6 3,082,838$ 0 -$ 5 2,310,592$ 0 -$ 12 5,940,284$ 0 -$ Clay 1 817,084$ 0 -$ 6 4,600,996$ 0 -$ 0 -$ 5 3,479,337$ 7 5,418,079$ 5 3,479,337$ Collier 1 1,384,624$ 0 -$ 6 7,787,693$ 0 -$ 5 5,941,620$ 0 -$ 12 15,113,937$ 0 -$ Columbia 1 573,464$ 0 -$ 6 3,226,755$ 0 -$ 0 -$ 5 2,007,204$ 7 3,800,219$ 5 2,007,204$ DeSoto 1 131,259$ 0 -$ 6 741,398$ 0 -$ 5 468,218$ 0 -$ 12 1,340,875$ 0 -$ Dixie 0 26,858$ 1 62,137$ 6 508,003$ 0 -$ 0 -$ 5 290,369$ 6 534,861$ 6 352,507$ Duval 0 997,119$ 1 4,244,886$ 6 29,528,717$ 0 -$ 0 -$ 5 19,836,419$ 6 30,525,836$ 6 24,081,305$ Escambia 1 1,500,823$ 0 -$ 6 8,454,975$ 0 -$ 0 -$ 5 5,856,346$ 7 9,955,798$ 5 5,856,346$ Flagler 1 385,738$ 0 -$ 6 2,171,503$ 0 -$ 0 -$ 5 1,619,936$ 7 2,557,241$ 5 1,619,936$ Franklin 0 12,189$ 1 55,621$ 5 330,206$ 1 51,984$ 0 -$ 5 259,920$ 5 342,395$ 7 367,525$ Gadsden 0 207,941$ 1 239,679$ 6 2,585,287$ 0 -$ 0 -$ 5 1,120,024$ 6 2,793,228$ 6 1,359,703$ Gilchrist 1 69,321$ 0 -$ 6 390,119$ 0 -$ 0 -$ 5 279,876$ 7 459,441$ 5 279,876$ Glades 1 49,003$ 0 -$ 6 279,479$ 0 -$ 0 -$ 5 172,519$ 7 328,483$ 5 172,519$ Gulf 1 62,188$ 0 -$ 6 353,867$ 0 -$ 0 -$ 5 242,891$ 7 416,056$ 5 242,891$ Hamilton 0 73,427$ 1 70,192$ 6 809,321$ 0 -$ 0 -$ 5 328,008$ 6 882,748$ 6 398,200$ Hardee 1 134,858$ 0 -$ 6 762,448$ 0 -$ 5 461,200$ 0 -$ 12 1,358,505$ 0 -$ Hendry 1 231,465$ 0 -$ 6 1,311,759$ 0 -$ 2 272,950$ 3 409,426$ 9 1,816,175$ 3 409,426$ Hernando 1 816,588$ 0 -$ 6 4,601,169$ 0 -$ 2 1,305,343$ 3 1,958,015$ 9 6,723,100$ 3 1,958,015$ Highlands 1 508,930$ 0 -$ 6 2,868,334$ 0 -$ 5 1,869,035$ 0 -$ 12 5,246,300$ 0 -$ Hillsborough 1 6,590,241$ 0 -$ 6 37,076,013$ 0 -$ 0 -$ 5 26,154,411$ 7 43,666,254$ 5 26,154,411$ Holmes 1 112,452$ 0 -$ 6 633,700$ 0 -$ 0 -$ 5 366,845$ 7 746,152$ 5 366,845$ Indian River 0 167,178$ 1 615,428$ 6 4,398,880$ 0 -$ 0 -$ 5 2,875,904$ 6 4,566,058$ 6 3,491,331$ Jackson 1 496,587$ 0 -$ 6 2,793,850$ 0 -$ 0 -$ 5 1,298,304$ 7 3,290,436$ 5 1,298,304$ Jefferson 1 115,159$ 0 -$ 6 648,792$ 0 -$ 0 -$ 5 306,662$ 7 763,950$ 5 306,662$ Lafayette 0 8,724$ 1 21,744$ 6 174,825$ 0 -$ 0 -$ 5 101,608$ 6 183,549$ 6 123,351$ Lake 1 1,447,021$ 0 -$ 6 8,147,022$ 0 -$ 0 -$ 5 6,093,471$ 7 9,594,043$ 5 6,093,471$ Lee 1 2,930,515$ 0 -$ 6 16,497,849$ 0 -$ 5 12,212,274$ 0 -$ 12 31,640,638$ 0 -$ Leon 1 1,391,370$ 0 -$ 6 7,825,320$ 0 -$ 0 -$ 5 5,893,197$ 7 9,216,690$ 5 5,893,197$ Levy 0 43,689$ 1 198,222$ 6 1,364,201$ 0 -$ 0 -$ 5 926,294$ 6 1,407,890$ 6 1,124,515$ Liberty 1 42,417$ 0 -$ 6 239,896$ 0 -$ 0 -$ 5 99,585$ 7 282,312$ 5 99,585$ Madison 0 191,042$ 1 102,898$ 6 1,650,131$ 0 -$ 0 -$ 5 480,846$ 6 1,841,173$ 6 583,744$ Manatee 1 1,543,792$ 0 -$ 6 8,685,658$ 0 -$ 5 6,385,357$ 0 -$ 12 16,614,807$ 0 -$ Marion 1 1,982,059$ 0 -$ 6 11,152,799$ 0 -$ 5 7,254,320$ 0 -$ 12 20,389,179$ 0 -$ Martin 1 776,105$ 0 -$ 6 4,368,456$ 0 -$ 5 3,280,003$ 0 -$ 12 8,424,564$ 0 -$ Miami-Dade 1 10,888,762$ 0 -$ 6 61,283,328$ 0 -$ 3 27,104,889$ 2 18,069,926$ 10 99,276,979$ 2 18,069,926$ Monroe 1 507,785$ 0 -$ 6 2,854,439$ 0 -$ 3 1,317,417$ 2 878,278$ 10 4,679,641$ 2 878,278$ Nassau 1 369,770$ 0 -$ 6 2,077,321$ 0 -$ 0 -$ 5 1,363,099$ 7 2,447,090$ 5 1,363,099$ Okaloosa 1 1,054,421$ 0 -$ 6 5,925,069$ 0 -$ 0 -$ 5 4,558,546$ 7 6,979,490$ 5 4,558,546$ Okeechobee 1 302,909$ 0 -$ 6 1,710,055$ 0 -$ 5 1,083,194$ 0 -$ 12 3,096,159$ 0 -$ Orange 0 1,012,296$ 1 5,477,597$ 6 36,546,527$ 0 -$ 0 -$ 5 25,596,899$ 6 37,558,823$ 6 31,074,496$ Osceola 1 1,675,020$ 0 -$ 6 9,414,138$ 0 -$ 0 -$ 5 7,209,606$ 7 11,089,158$ 5 7,209,606$ Palm Beach 1 5,705,854$ 0 -$ 6 32,119,219$ 0 -$ 5 23,992,986$ 0 -$ 12 61,818,059$ 0 -$ Pasco 1 1,999,087$ 0 -$ 6 11,246,080$ 0 -$ 0 -$ 5 8,250,868$ 7 13,245,167$ 5 8,250,868$ Pinellas 1 3,721,435$ 0 -$ 6 20,929,893$ 0 -$ 0 -$ 5 15,841,837$ 7 24,651,328$ 5 15,841,837$ Polk 1 2,901,654$ 0 -$ 6 16,364,860$ 0 -$ 5 10,163,782$ 0 -$ 12 29,430,297$ 0 -$ Putnam 1 318,461$ 0 -$ 6 1,793,915$ 0 -$ 5 1,195,957$ 0 -$ 12 3,308,333$ 0 -$ St. Johns 0 209,119$ 1 1,005,223$ 6 6,821,258$ 0 -$ 0 -$ 5 4,697,421$ 6 7,030,378$ 6 5,702,644$ St. Lucie 1 1,316,279$ 0 -$ 6 7,409,567$ 0 -$ 5 5,252,747$ 0 -$ 12 13,978,593$ 0 -$ Santa Rosa 0 80,020$ 1 641,687$ 6 4,072,958$ 0 -$ 0 -$ 5 2,998,614$ 6 4,152,978$ 6 3,640,301$ Sarasota 1 1,576,203$ 0 -$ 6 8,861,319$ 0 -$ 5 6,650,449$ 0 -$ 12 17,087,971$ 0 -$ Seminole 1 1,978,812$ 0 -$ 6 11,133,612$ 0 -$ 0 -$ 5 8,504,166$ 7 13,112,424$ 5 8,504,166$
Local Option Fuel Tax Levies on Motor Fuel in Florida's Counties
Local Fiscal Year Ending September 30, 2013Estimation of Realized and Unrealized Tax Revenues
Combined Total: All Taxes1-5 Cents Local Option Fuel TaxNinth-Cent Fuel Tax 1-6 Cents Local Option Fuel Tax
2012 Local Government Financial Information Handbook Page 211

Office of Economic and Demographic Research
Countywide Countywide Countywide Countywide Countywide Countywide Countywide Countywide2012 Realized Unutilized Unrealized 2012 Realized Unutilized Unrealized 2012 Realized Unutilized Unrealized 2012 Realized Unutilized Unrealized
County Tax Rate Tax Revenues Tax Rate Tax Revenues Tax Rate Tax Revenues Tax Rate Tax Revenues Tax Rate Tax Revenues Tax Rate Tax Revenues Tax Rate Tax Revenues Tax Rate Tax Revenues
Local Option Fuel Tax Levies on Motor Fuel in Florida's Counties
Local Fiscal Year Ending September 30, 2013Estimation of Realized and Unrealized Tax Revenues
Combined Total: All Taxes1-5 Cents Local Option Fuel TaxNinth-Cent Fuel Tax 1-6 Cents Local Option Fuel Tax
Sumter 1 752,201$ 0 -$ 6 4,232,841$ 0 -$ 0 -$ 5 2,045,364$ 7 4,985,042$ 5 2,045,364$ Suwannee 1 267,989$ 0 -$ 6 1,509,637$ 0 -$ 5 904,460$ 0 -$ 12 2,682,086$ 0 -$ Taylor 0 61,660$ 1 102,319$ 6 928,042$ 0 -$ 0 -$ 5 478,140$ 6 989,701$ 6 580,459$ Union 1 64,722$ 0 -$ 6 365,521$ 0 -$ 0 -$ 5 169,027$ 7 430,243$ 5 169,027$ Volusia 1 2,277,876$ 0 -$ 6 12,818,133$ 0 -$ 5 9,592,488$ 0 -$ 12 24,688,497$ 0 -$ Wakulla 1 109,305$ 0 -$ 6 617,310$ 0 -$ 0 -$ 5 415,353$ 7 726,615$ 5 415,353$ Walton 1 332,750$ 0 -$ 6 1,876,070$ 0 -$ 0 -$ 5 1,306,445$ 7 2,208,820$ 5 1,306,445$ Washington 1 113,716$ 0 -$ 6 642,607$ 0 -$ 0 -$ 5 443,591$ 7 756,323$ 5 443,591$ Florida Total 78,414,293$ 15,050,521$ 526,516,579$ 51,984$ 173,034,864$ 200,461,873$ 777,965,736$ 215,564,378$
Notes:
3) Office of Economic and Demographic Research, "2012 Local Government Financial Information Handbook" Table: Local Option Fuel Taxes - Revenue Estimates for the Local Fiscal Year Ending September 30, 2013.
2) Office of Economic and Demographic Research, "2012 Local Government Financial Information Handbook" Table: Ninth-Cent Fuel Tax - Estimated Gallons and Tax by Fuel Type - Revenue Estimates for the Local Fiscal Year Ending September 30, 2013.
1) Office of Economic and Demographic Research, "2012 Local Government Financial Information Handbook" Table: 2012 Federal, State, and County Tax Rates on Motor Fuel and Diesel Fuel in Florida's Counties.
1) The estimation of realized and unrealized revenues reflects countywide totals and assumes those tax rates in effect beginning January 1, 2012. Tax rates for 2013 are not yet available.2) The estimation of unrealized revenues from the Ninth-Cent Fuel Tax levy on motor fuel assumes the maximum levy rate of $0.01 per gallon and reflects countywide totals.3) The estimation of unrealized revenues from the 1-6 Cents Local Option Fuel Tax levy on motor fuel assumes the maximum levy rate of $0.06 per gallon and reflects countywide totals.4) The estimation of unrealized revenues from the 1-5 Cents Local Option Fuel Tax levy on motor fuel assumes the maximum levy rate of $0.05 per gallon and reflects countywide totals.5) The Ninth-Cent Fuel Tax and 1-6 Cents Local Option Fuel Tax are imposed on diesel fuel in every county at the maximum rate of $0.01 and $0.06 per gallon, respectively, as the result of statewide equalization. Consequently, there are no unrealized tax revenues resulting from these levies on diesel fuel.6) Current law requires the countywide tax proceeds generated from the 1-6 Cents and 1-5 Cents Local Option Fuel Taxes to be distributed among the county government and municipalities within the county's boundaries pursuant to interlocal agreement or default formula (i.e., historical transportation expenditures) methodology. County governments are not required by law to share the Ninth-Cent Fuel Tax proceeds with municipalities within their respective boundaries.
Data Sources:
2012 Local Government Financial Information Handbook Page 212

Office of Economic and Demographic Research
2012 Local Government Financial Information Handbook 213
Ninth-Cent Fuel Tax Sections 206.41(1)(d), 206.87(1)(b), and 336.021, Florida Statutes
Summary: The Ninth-Cent Fuel Tax is a tax of 1 cent on every net gallon of motor and diesel fuel sold within a county. The tax may be authorized by an ordinance adopted by an extraordinary vote of the governing body or voter approval in a countywide referendum. The proceeds may be used to fund specified transportation expenditures. General Law Amendments: Chapter 2012-174, L.O.F., (CS/CS/HB 599) revises the imposition date for the ninth-cent fuel tax from July 1st of each year to October 1st. Additionally, the legislation incorporates the installation, operation, maintenance, and repair of street lighting, traffic signs, traffic engineering, signalization, and pavement markings as permitted uses of the tax proceeds. These changes became effective on July 1, 2012. Authorization to Levy: Pursuant to ss. 206.41(1)(d) and 206.87(1)(b), F.S., any county in the state may levy a 1 cent per gallon tax on motor and diesel fuels sold in the county by extraordinary vote of the membership of its governing body or voter approval in a countywide referendum. Since January 1, 1994, this tax has been imposed on diesel fuel in every county as the result of statewide equalization. All impositions of the tax shall be levied before October 1st to be effective January 1st of the following year. However, levies of the tax which were in effect on July 1, 2002, and which expire on August 31st of any year may be reimposed at the current authorized rate to be effective September 1st of the year of expiration. A decision to rescind the tax shall not take effect on any other date than December 31st and shall require a minimum of 60 days notice to the Department of Revenue of such decision. Counties Eligible to Levy: All counties are eligible to levy this tax on motor fuel. Distribution of Proceeds: The county’s governing body may provide by joint agreement with one or more of its respective municipalities for the authorized transportation purposes and the distribution of the tax proceeds within both the incorporated and unincorporated areas of the county. However, the county is not required to share the proceeds of the tax with municipalities. Even if the county does not levy the tax on motor fuel, it still receives proceeds from the levy on diesel fuel. Authorized Uses of Proceeds: County and municipal governments may use the tax proceeds for transportation expenditures as defined in s. 336.025(7), F.S. Transportation expenditures are defined to include those expenditures by the local government from local or state-shared revenue sources, excluding expenditures of bond proceeds, for the following programs.
1. Public transportation operations and maintenance. 2. Roadway and right-of-way maintenance and equipment and structures used primarily for the storage
and maintenance of such equipment.
Office of Economic and Demographic Research
214 2012 Local Government Financial Information Handbook
3. Roadway and right-of-way drainage. 4. Street lighting installation, operation, maintenance, and repair. 5. Traffic signs, traffic engineering, signalization, and pavement markings installation, operation,
maintenance, and repair. 6. Bridge maintenance and operation. 7. Debt service and current expenditures for transportation capital projects in the foregoing program
areas, including construction or reconstruction of roads and sidewalks. Counties are also authorized to expend the revenues received in conjunction with the state or federal government for joint transportation projects. Attorney General Opinions: Florida’s Attorney General has issued the following legal opinions relevant to this revenue source.
Opinion # Subject 79-98 Cattle gaps, construction and maintenance 81-30 Refund provisions of F.S. 206 82-54 Use of motor fuel tax for road construction, bond issue 83-25 Eligibility for refunds on motor fuel taxes 85-104 Use of excess funds from gas tax trust fund 86-39 Authority to use funds for sports complex 90-79 Local option fuel tax funding transportation disadvantaged
The full texts of these opinions are available via a searchable on-line database.1 Local government officials seeking more clarification should review the opinions in their entirety. The statutory language pertaining to this revenue source has been amended since its authorization. The reader should keep the date of the opinion in mind when reviewing its relevance to current law or any interpretations that have been articulated in Florida case law.
1. http://myfloridalegal.com/ago.nsf/Opinions

Office of Economic and Demographic Research
2012 Local Government Financial Information Handbook 215
1 to 6 Cents Local Option Fuel Tax Sections 206.41(1)(e), 206.87(1)(c), and 336.025, Florida Statutes
Summary: Local governments are authorized to levy a tax of 1 to 6 cents on every net gallon of motor fuel sold in a county. As the result of statewide equalization, this tax is imposed on diesel fuel in each county at the maximum rate of 6 cents per gallon. The tax on motor fuel may be authorized by an ordinance adopted by a majority vote of the governing body or voter approval in a countywide referendum. Generally, the proceeds may be used to fund transportation expenditures. General Law Amendments: Chapter 2012-174, L.O.F., (CS/CS/HB 599) revises the imposition and rate change date for the 1 to 6 cents fuel tax from July 1st of each year to October 1st. Additionally, the legislation incorporates the installation, operation, maintenance, and repair of street lighting, traffic signs, traffic engineering, signalization, and pavement markings as permitted uses of the tax proceeds. These changes became effective on July 1, 2012. Authorization to Levy: The tax shall be levied using either of the following procedures.
1. This tax may be levied by an ordinance adopted by a majority vote of the county’s governing body or upon approval by referendum. Such ordinance shall be adopted in accordance with the requirements imposed under one of the following two circumstances, whichever is applicable:
a. Prior to June 1st, the county may establish by interlocal agreement with one or more of the municipalities located within the county, representing a majority of the population of the incorporated area, a distribution formula for dividing the entire proceeds of this fuel tax among the county government and all eligible municipalities within the county. If no interlocal agreement exists, a new interlocal agreement may be established prior to June 1st. However, any interlocal agreement executed after the initial levy of the tax, extension of the tax, or change in the tax rate, shall under no circumstances materially or adversely affect the rights of holders of outstanding bonds, which are backed by these taxes. The amounts distributed to the county government and each municipality shall not be reduced below the amount necessary for the payment of principal and interest and reserves for principal and interest as required under the covenants of any bond resolution outstanding on the date of establishment of the new interlocal agreement.
b. If an interlocal agreement has not been executed, the county may, prior to June 10th, adopt a resolution of intent to levy this tax.
2. If no interlocal agreement or resolution is adopted pursuant to the procedures described in #1 above, then municipalities representing more than 50 percent of the county population may, prior to June 20th, adopt uniform resolutions approving the tax, establishing the duration of the levy and the rate, and setting the date for a county-wide referendum on whether or not to levy the tax. A referendum shall be held in accordance with the provisions of such resolution and applicable state law, provided that the county shall bear the costs of such referendum. The tax shall be levied and collected countywide on January 1st, following 30 days after voter approval.
All impositions and rate changes of this tax shall be levied before October 1st to be effective January 1st of the following year for a period not to exceed 30 years. However, levies of the tax that were in effect on July 1, 2002, and which expire on August 31st of any year may be reimposed at the current authorized rate to be
Office of Economic and Demographic Research
216 2012 Local Government Financial Information Handbook
effective September 1st of the year of expiration. Upon expiration, the tax may be re-levied provided that a redetermination of the method of distribution is made. Counties Eligible to Levy: All counties are eligible to levy this tax on motor fuel. However, counties and municipalities must meet the same eligibility requirements as specified for the Local Government Half-cent Sales Tax Program and the County and Municipal Revenue Sharing Programs in order to receive proceeds from this tax. Any funds otherwise undistributed because of ineligibility shall be distributed to eligible governments within the county in the same proportion as other local option fuel tax monies. Since the tax is imposed on diesel fuel at the maximum rate of 6 cents in all counties as the result of statewide equalization, each county receives the tax revenues associated with that levy regardless of whether or not the county is levying the tax on motor fuel. Distribution of Proceeds: The tax proceeds shall be distributed by the Department of Revenue (DOR) according to the distribution factors determined at the local level by interlocal agreement between the county and municipalities within the county’s boundaries. If no interlocal agreement has been established, then the distribution shall be based on the transportation expenditures of each local government for the immediately preceding 5 fiscal years, as a proportion of the total of such expenditures for the county and all municipalities within the county. These proportions shall be recalculated every 10 years based on the transportation expenditures of the immediately preceding 5 years. This recalculation shall under no circumstances materially or adversely affect the rights of holders of bonds outstanding on July 1, 1986, which are backed by the proceeds. The amounts distributed to the county government and each municipality shall not be reduced below the amount necessary for the payment of principal and interest and reserves for principal and interest as required under the covenants of any bond resolution outstanding on the date of the recalculation. If the interlocal agreement does not provide for automatic adjustments or periodic review of the distribution method by the local governmental entities, then the parties to the agreement shall review and hold public hearings on the terms of the agreement at least every two years. Additionally, any inland county with a population greater than 500,000 as of July 1, 1996, having an interlocal agreement with one or more of the incorporated areas within the county must utilize the population estimates of local government units as of April 1st of each year for dividing the proceeds. This provision applies only to Orange County. Authorized Uses of Proceeds: County and municipal governments may use the tax proceeds for transportation expenditures as defined in s. 336.025(7), F.S. Transportation expenditures are defined to include those expenditures by the local government from local or state-shared revenue sources, excluding expenditures of bond proceeds, for the following programs.
1. Public transportation operations and maintenance. 2. Roadway and right-of-way maintenance and equipment and structures used primarily for the storage
and maintenance of such equipment. 3. Roadway and right-of-way drainage. 4. Street lighting installation, operation, maintenance, and repair. 5. Traffic signs, traffic engineering, signalization, and pavement markings, installation, operation,
maintenance, and repair. 6. Bridge maintenance and operation.

Office of Economic and Demographic Research
2012 Local Government Financial Information Handbook 217
7. Debt service and current expenditures for transportation capital projects in the foregoing program areas, including construction or reconstruction of roads and sidewalks.
Small counties, which are defined as having a total population of 50,000 or less on April 1, 1992, and municipalities within such counties are authorized to use the proceeds to fund infrastructure projects, if such projects are consistent with the local government’s approved comprehensive plan. If the approval or denial of the plan has not become final, such projects should be consistent with the plan last submitted to the state land-planning agency. In addition, no more than an amount equal to the proceeds from 4 cents of this tax may be used by the county for the express purpose of paying for a court-ordered refund of special assessments. Except as provided for in s. 336.025(7), F.S., such funds shall not be used for the operational expenses of any infrastructure. Such funds may be used for infrastructure projects only after the local government, prior to the fiscal year in which the funds are proposed to be used, or if pledged for bonded indebtedness, prior to the fiscal year in which the bonds will be issued, has held a duly noticed public hearing on the proposed use of the funds and adopted a resolution certifying that the local government has met all of the transportation needs identified in its approved comprehensive plan. If the approval or denial of the plan has not become final, the resolution should certify that the local government has met all transportation needs consistent with the plan last submitted to the state land-planning agency. Additionally, the proceeds shall not be pledged for bonded indebtedness for a period exceeding 10 years, with one exception. For the express purpose of using such proceeds in any fiscal year to pay a court-ordered refund of special assessments, the proceeds may be pledged for bonded indebtedness not exceeding 15 years. For these purposes, the term infrastructure has the same meaning as provided in s. 212.055, F.S. Local governments may use the services of the Division of Bond Finance of the State Board of Administration to issue any bonds through these provisions and may pledge the revenues from these local option fuel taxes to secure the payment of bonds. Counties and municipalities may join together for the issuance of these bonds. Attorney General Opinions: Florida’s Attorney General has issued the following legal opinions relevant to this revenue source.
Opinion # Subject 90-79 Local option tax funding transportation disadvantaged 92-20 Use of local option gas tax funds 93-12 Distribution of local option gas tax 94-20 Local option gas tax revenues 94-67 Referendum vote creating the City of Port LaBelle 99-70 Municipalities, dredging canals as part of road program 2000-37 Interest on municipal fuel tax fund, uses 2002-02 Local option fuel tax, used for bicycle paths 2010-29 Local option fuel tax, use for electricity and water
The full texts of these opinions are available via a searchable on-line database.1 Local government officials seeking more clarification should review the opinions in their entirety. The statutory language pertaining to this revenue source has been amended since its authorization. The reader should keep the date of the opinion 1. http://myfloridalegal.com/ago.nsf/Opinions

Office of Economic and Demographic Research
218 2012 Local Government Financial Information Handbook
in mind when reviewing its relevance to current law or any interpretations that have been articulated in Florida case law.

Office of Economic and Demographic Research
2012 Local Government Financial Information Handbook 219
1 to 5 Cents Local Option Fuel Tax Sections 206.41(1)(e) and 336.025, Florida Statutes
Summary: County governments are authorized to levy a tax of 1 to 5 cents upon every net gallon of motor fuel sold within a county. Diesel fuel is not subject to this tax. This tax shall be levied by an ordinance adopted by a majority plus one vote of the membership of the governing body or voter approval in a countywide referendum. The tax proceeds may be used for transportation expenditures needed to meet the requirements of the capital improvements element of an adopted local government comprehensive plan or for expenditures needed to meet immediate local transportation problems and for other transportation-related expenditures that are critical for building comprehensive roadway networks by local governments. General Law Amendments: Chapter 2012-174, L.O.F., (CS/CS/HB 599) revises the imposition and rate change date for the 1 to 5 cents fuel tax from July 1st of each year to October 1st. Additionally, the legislation incorporates the installation, operation, maintenance, and repair of street lighting, traffic signs, traffic engineering, signalization, and pavement markings as permitted uses of the tax proceeds. These changes became effective on July 1, 2012. Authorization to Levy: The tax on motor fuel may be levied by an ordinance adopted by a majority plus one vote of the county’s governing body or upon approval by referendum. All impositions and rate changes of the tax shall be levied before October 1st, to be effective January 1st of the following year. However, levies of the tax which were in effect on July 1, 2002, and which expire on August 31st of any year may be reimposed at the current authorized rate to be effective September 1st of the year of expiration. A decision to rescind the tax may not take effect on any other date than December 31st and shall require a minimum of 60 days notice to the Department of Revenue (DOR) of such decision. The county may, prior to the tax levy, establish by interlocal agreement with one or more of its respective municipalities representing a majority of the county’s incorporated area population, a distribution formula for dividing the entire tax proceeds among the county government and all eligible municipalities. If no interlocal agreement is adopted before the tax’s effective date, the revenues shall be distributed according to the transportation expenditures methodology described in detail in the section, Distribution of Proceeds, discussed below. If no interlocal agreement exists, a new agreement may be established prior to June 1st of any year. However, any interlocal agreement established after the initial tax levy or rate change shall under no circumstances materially or adversely affect the rights of holders of outstanding bonds, which are backed by these taxes, and the amounts distributed to each local government shall not be reduced below the amount necessary for the payment of principal and interest and reserves for principal and interest as required under the covenants of any bond resolution outstanding on the date of establishment of the new interlocal agreement. Counties Eligible to Levy: All counties are eligible to levy this tax. However, counties and municipalities must meet the same eligibility requirements as specified for the Local Government Half-cent Sales Tax Program and the County and Municipal Revenue Sharing Programs in order to receive proceeds from this tax. Any funds otherwise undistributed because of ineligibility shall be distributed to eligible governments within the county in same proportion as other local option fuel tax monies.

Office of Economic and Demographic Research
220 2012 Local Government Financial Information Handbook
Distribution of Proceeds: The tax proceeds shall be distributed by the DOR according to the distribution factors determined at the local level by interlocal agreement between the county and municipalities within the county’s boundaries. If the interlocal agreement does not provide for automatic adjustments or periodic review of the distribution method by the local government entities, then the parties to the agreement shall review and hold public hearings on the terms of the agreement at least every two years. If no interlocal agreement is established, then the distribution shall be based on the transportation expenditures of each local government for the immediately preceding 5 fiscal years, as a proportion of the total of such expenditures for the county and all municipalities within the county. These proportions shall be recalculated every 10 years based on the transportation expenditures of the immediately preceding 5 years. This recalculation shall under no circumstances materially or adversely affect the rights of holders of bonds outstanding on July 1, 1986, which are backed by the proceeds. The amounts distributed to the county government and each municipality shall not be reduced below the amount necessary for the payment of principal and interest and reserves for principal and interest as required under the covenants of any bond resolution outstanding on the date of the recalculation. Authorized Uses of Proceeds: The tax proceeds shall be used for transportation expenditures needed to meet the requirements of the capital improvements element of an adopted comprehensive plan or for expenditures needed to meet immediate local transportation problems and for other transportation-related expenditures that are critical for building comprehensive roadway networks by local governments. Expenditures for the construction of new roads, the reconstruction or resurfacing of existing paved roads, or the paving of existing graded roads shall be deemed to increase capacity and such projects shall be included in the capital improvements element of an adopted comprehensive plan. Routine maintenance of roads is not considered an authorized expenditure. Local governments may use the services of the Division of Bond Finance of the State Board of Administration to issue any bonds through these provisions and may pledge the revenues from these local option fuel taxes to secure the payment of bonds. Counties and municipalities may join together for the issuance of these bonds. Attorney General Opinions: Florida’s Attorney General has issued the following legal opinions relevant to this revenue source.
Opinion # Subject 94-20 Local option gas tax revenues 94-67 Referendum vote creating the City of Port LaBelle 97-25 County local option fuel tax funding transit operations 2002-02 Local option fuel tax, used for bicycle paths 2010-29 Local option fuel tax, use for electricity and water
The full texts of these opinions are available via a searchable on-line database.1 Local government officials seeking more clarification should review the opinions in their entirety. The statutory language pertaining to this revenue source has been amended since its authorization. The reader should keep the date of the opinion
1. http://myfloridalegal.com/ago.nsf/Opinions
Office of Economic and Demographic Research
2012 Local Government Financial Information Handbook 221
in mind when reviewing its relevance to current law or any interpretations that have been articulated in Florida case law.

Office of Economic and Demographic Research
222 2012 Local Government Financial Information Handbook
This page was intentionally left blank.

Office of Economic and Demographic Research
2012 Local Government Financial Information Handbook 223
Municipal Pari-Mutuel Tax Section 550.105(9), Florida Statutes
Summary: If a live horse or dog race or jai alai game for any stake, purse, prize, or premium is held or conducted within a municipality’s corporate limits; such municipality may assess and collect an additional tax against any person conducting such live racing or games. The tax may not exceed $150 per day for horse racing or $50 per day for dog racing or jai alai. General Law Amendments: There were no general law amendments resulting from the 2012 Regular Legislative Session. Eligibility Requirements: Any municipality, in which a race or game is held or conducted within its corporate limits, is eligible to assess and collect this tax. The imposition of the tax is pursuant to an ordinance adopted by the governing body. The number of municipalities currently imposing this tax is not known. Administrative Procedures: The statutory language does not call for the administration of this tax by the Division of Pari-mutuel Wagering; therefore, it is assumed that each municipality levying the tax would be responsible for its administration. A municipality may not assess or collect any other additional excise or revenue tax against any person conducting races within the corporate limits of the municipality or against any patron of any such person, except as otherwise provided in ch. 550, F.S. Distribution of Proceeds: The statutory language is silent to this issue; therefore, it is assumed that each municipality levying the tax would retain all proceeds. Authorized Uses: The statutory language is silent to this issue; therefore, it is assumed that the use of the revenue is at the discretion of the governing body. Attorney General Opinions: Florida’s Attorney General has issued the following legal opinion relevant to this revenue source.
Opinion # Subject 94-01 Head tax on gate receipts
The full text of this opinion is available via a searchable on-line database.1 Local government officials seeking more clarification should review the opinion in its entirety. The statutory language pertaining to this revenue source has been amended since its authorization. The reader should keep the date of the opinion in mind when reviewing its relevance to current law or any interpretations that have been articulated in Florida case law.
1. http://myfloridalegal.com/ago.nsf/Opinions

Office of Economic and Demographic Research
224 2012 Local Government Financial Information Handbook
This page was intentionally left blank.
Office of Economic and Demographic Research
2012 Local Government Financial Information Handbook 225
Municipal Parking Facility Space Surcharges Sections 166.271, Florida Statutes
Summary: Certain municipalities are authorized to impose and collect parking facility space surcharges. These discretionary per-vehicle surcharges are calculated as a percentage of the amounts charged for the sale, lease, or rental of space at municipal parking facilities that are open to the public. The proceeds are used to reduce the municipality’s ad valorem tax millage rate or to eliminate non-ad valorem assessments and to improve transportation in downtown or urban core areas. General Law Amendments: There were no general law amendments resulting from the 2012 Regular Legislative Session. Eligibility Requirements: The governing body of any municipality with a resident population of 200,000 or more, which has more than 20 percent of its real property exempt from ad valorem taxation, and is located in a county with a population greater than 500,000, may impose and collect a discretionary per-vehicle surcharge. Subject to referendum approval by voters in the municipality, the surcharge shall be up to 15 percent of the amount charged for the sale, lease, or rental of space at municipal parking facilities that are open for use to the general public and are not airports, seaports, county administration buildings, or other projects as defined under ss. 125.011 and 125.015, F.S. This surcharge shall not take effect while any surcharge imposed pursuant to former s. 218.503(6)(a), F.S., is in effect.1 Based on April 1, 2011 population estimates, only six municipalities (i.e., Hialeah, Jacksonville, Miami, Orlando, St. Petersburg, and Tampa) were located in a county having a population greater than 500,000 and had a municipal population of 200,000 or more. Administrative Procedures: Any municipality imposing the surcharge shall administer it locally and should provide brackets applicable to transactions subject to the surcharge.2 Distribution of Proceeds: Since the surcharge is locally administered, each municipality levying the surcharge retains all proceeds. Authorized Uses: A municipality imposing the surcharge shall only use the proceeds for the following purposes.3
1. No less than 60 percent and no more than 80 percent shall be used to reduce the municipality’s ad valorem tax millage or to reduce or eliminate non-ad valorem assessments, unless the municipality has previously used the proceeds from the surcharge levied under former s. 218.503(6)(b), F.S., to reduce the municipality’s ad valorem tax millage or to reduce non-ad valorem assessments.
2. No less than 20 percent and no more than 40 percent shall be used to improve transportation, including, but not limited to, street, sidewalk, roadway, landscape, transit, and streetscape beautification improvements in downtown or urban core areas.
1. Section 166.271(1), F.S. 2. Section 166.271(3), F.S. 3. Section 166.271(2), F.S.
Office of Economic and Demographic Research
226 2012 Local Government Financial Information Handbook
Attorney General Opinions: No opinions specifically relevant to this revenue source have been issued.

Office of Economic and Demographic Research
2012 Local Government Financial Information Handbook 227
Municipal Resort Tax Chapter 67-930, Laws of Florida,
As amended by Chapters 82-142, 83-363, 93-286, and 94-344, Laws of Florida Summary: The Municipal Resort Tax may be levied at a rate of up to 4 percent on transient rental transactions, and up to 2 percent on the sale of food and beverages consumed in restaurants and bars in certain municipalities whose respective county population fell within specified limits based on the 1960 Census and whose municipal charter specifically provided for the levy of this tax prior to January 1, 1968. The tax levy must be adopted by an ordinance approved by the governing body. Revenues can be used for tourism promotion activities, capital construction and maintenance of convention and cultural facilities, and relief of ad valorem taxes used for those purposes. General Law Amendments: There were no general law amendments resulting from the 2012 Regular Legislative Session. Authorization to Levy: Municipalities in counties having a population of not less than 330,000 and not more than 340,000 (i.e., Broward County) and in counties having a population of more than 900,000 (i.e., Miami-Dade County), according to the 1960 decennial census, whose charter specifically provided or was so amended prior to January 1, 1968, for the levy of this tax, are eligible to impose it by ordinance adopted by the governing body. The tax shall be levied upon the rent of every occupancy of a room or rooms in any hotel, motel, apartment house, rooming house, tourist or trailer camp, as the same are defined in part I of ch. 212, F.S., and upon the retail sale price of all items of food or beverages sold at retail, and of alcoholic beverages sold at retail for consumption on the premises at any place of business required by law to be licensed by the state hotel and restaurant commission or by the state beverage department. However, the tax shall not apply to those sales the amount of which is less than 50 cents or sales of food or beverages delivered to a person’s home under a contract providing for deliveries on a regular schedule when the price of each meal is less than $10. Municipalities Eligible to Levy: Currently, only three municipalities in Miami-Dade County (i.e., Bal Harbour, Miami Beach, and Surfside) are eligible to impose the tax. According to the Department of Revenue (DOR), all three municipalities are imposing the tax at the following rates: 4 percent of transient rental transactions and 2 percent on the sale of food and beverages. Administrative Procedures: It is the duty of every person renting a room or rooms and every person selling at retail food or beverages or alcoholic beverages for consumption on the premises to act as the collection agent. Every such person must collect, report, and pay over to the municipality all such taxes imposed, levied, and collected, in accordance with the accounting and other provisions of the enacted ordinance. Any municipality collecting the tax shall have the same duties and privileges as the DOR under part I of ch. 212, F.S., and may use any power granted to the DOR under this part, including enforcement and collection procedures and penalties, which shall be binding upon all persons and entities that are subject to the tax. Additionally, municipalities responsible for administering the tax shall participate in the Registration Information Sharing and Exchange (RISE) Program

Office of Economic and Demographic Research
228 2012 Local Government Financial Information Handbook
and share tax administration information as prescribed by the DOR.1 Distribution of Proceeds: The governing body may authorize by ordinance the creation of an authority or commission empowered to contract and be contracted with its own name as an agency of the municipality to expend such portion of the proceeds of this tax as the body may determine appropriate. Authorized Uses of Proceeds: The tax proceeds shall only be used for the creation and maintenance of convention and publicity bureaus; development and maintenance of art and cultural centers; enhancement of tourism; publicity and advertising; construction, operation, and maintenance of auditoriums, community centers, and convention structures; or relief from ad valorem taxes being used for any of these other purposes. Attorney General Opinions: No opinions specifically relevant to this tax have been issued.
1. Section 213.0535, F.S.
Office of Economic and Demographic Research
2012 Local Government Financial Information Handbook 229
Public Service Tax Sections 166.231-.235, Florida Statutes
Summary: Municipalities and charter counties are authorized to levy by ordinance a public service tax on the purchase of electricity, metered natural gas, liquefied petroleum gas either metered or bottled, manufactured gas either metered or bottled, and water service.1 The tax shall be levied only upon purchases within the municipality or within the charter county’s unincorporated area and shall not exceed 10 percent of the payments received by the seller of the taxable item. Services competitive with those listed above, as defined by ordinance, shall be taxed on a comparable base at the same rates; however, fuel oil shall be taxed at a rate not to exceed 4 cents per gallon.2 The tax proceeds are considered general revenue for the municipality or charter county. General Law Amendments: There were no general law amendments resulting from the 2012 Regular Legislative Session. Eligibility Requirements: All municipalities are eligible to levy the tax within the area of its tax jurisdiction. In addition, municipalities imposing the tax on cable television service as of May 4, 1977, are authorized to continue the tax levy in order to satisfy debt obligations incurred prior to that date. A charter county, by virtue of numerous legal rulings in Florida case law, may levy the tax within the unincorporated area. For example, the Florida Supreme Court has ruled that charter counties, unless specifically precluded by general or special law, may impose by ordinance any tax in the area of its tax jurisdiction that a municipality may impose.3 More recently, the Court held that Orange County could levy a public service tax without specific statutory authority to do so.4 Administrative Procedures: The tax shall be collected by the seller of the taxable item from the purchaser at the time of payment for such service.5 At the discretion of the local taxing authority, the tax may be levied on a physical unit basis. Using this basis, the tax would be levied as follows: electricity, number of kilowatt hours purchased; metered or bottled gas, number of cubic feet purchased; fuel oil and kerosene, number of gallons purchased; and water service, number of gallons purchased.6 A number of tax exemptions are specified in law.7 A tax levy must be adopted by ordinance, and the effective date of every tax levy or repeal must be the beginning of a subsequent calendar quarter: January 1, April 1, July 1, or October 1. The taxing authority shall notify the Department of Revenue (DOR) of a tax levy adoption or repeal at least 120 days before its effective date. Such notification must be furnished on a form prescribed by the DOR and must specify the services taxed, the tax rate applied to each service, and the effective date of the levy or repeal as well as other additional information.8
1. Section 166.231(1), F.S. 2. Section 166.231(2), F.S. 3. Volusia County vs. Dickinson, 269 So.2d 9 (Fla. 1972). 4. McLeod vs. Orange County, 645 So.2d 411 (Fla. 1994). 5. Section 166.231(7), F.S. 6. Section 166.232, F.S. 7. Section 166.231(3)-(6) and (8), F.S. 8. Section 166.233(2), F.S.

Office of Economic and Demographic Research
230 2012 Local Government Financial Information Handbook
Distribution of Proceeds: The seller of the service shall remit the taxes collected to the governing body in the manner prescribed by ordinance.9 Authorized Uses: The tax proceeds can be considered general revenue for the municipality or charter county. Attorney General Opinions: Florida’s Attorney General has issued the following legal opinions relevant to this revenue source.
Opinion # Subject 74-379 Utility tax and sewer system 74-157 Municipal utility tax exemptions 75-05 Public service tax and exempt organizations 75-20 Services for users residing outside city limits 75-49 Fuel adjustment charge 75-209 Church property and taxation 76-42 Exemption from municipal public service tax 77-24 Fuel adjustment charge 78-44 Exemption from tax, church group 78-124 Municipalities, housing authorities, tax exemption 78-142 Municipalities, taxation, bonds, issuance 79-26 Public service tax, utility services 82-06 Fuel oil sale; taxable 82-96 Pledging use of service tax for sewer system 87-45 Authority to place cap on public service tax 89-11 Municipality, authority to impose utility tax cap 93-35 Past due public service tax 93-38 Municipality / not require state or county to pay tax 94-08 Municipality grant church exempt from public service tax 94-76 Imposition of monetary cap on items or services tax 95-02 Municipality tax certain services if taxing one utility 95-42 Part of audit w/info from its telecommunications audit exempt 97-83 Taxation, collection of past-due municipal utility tax 2003-61 Public Service Tax, exemptions
The full texts of these opinions are available via a searchable on-line database.10 Local government officials seeking more clarification should review the opinions in their entirety. The statutory language pertaining to this revenue source has been amended since its authorization. The reader should keep the date of the opinion in mind when reviewing its relevance to current law or any interpretations that have been articulated in Florida case law. Tax Rates Imposed by Taxing Authorities: As previously mentioned, taxing authorities are required to furnish information to the DOR. This information 9. Section 166.231(7), F.S. 10. http://myfloridalegal.com/ago.nsf/Opinions

Office of Economic and Demographic Research
2012 Local Government Financial Information Handbook 231
includes the services taxed, the tax rate applied to each service, and the effective date of the levy or repeal as well as other additional information. The DOR maintains an online database that can be searched or downloaded.11 Prior Years’ Revenues: Summaries of prior years’ revenues reported by county and municipal governments are available.12
11. http://dor.myflorida.com/dor/governments/mpst/ 12. http://edr.state.fl.us/Content/local-government/data/data-a-to-z/index.cfm

Office of Economic and Demographic Research
232 2012 Local Government Financial Information Handbook
This page was intentionally left blank.

Office of Economic and Demographic Research
2012 Local Government Financial Information Handbook 233
Tourist Development Taxes Section 125.0104, Florida Statutes
Summary: Section 125.0104, F.S., authorizes five separate tourist development taxes on transient rental transactions. Depending on a county’s eligibility to levy, the tax rate varies from a minimum of 3 percent to a maximum of 6 percent. The levies may be authorized by vote of the county’s governing body or referendum approval. Generally, the revenues may be used for capital construction of tourist-related facilities, tourist promotion, and beach and shoreline maintenance; however, the authorized uses vary according to the particular levy. General Law Amendments: Chapter 2012-180, L.O.F., (HB 1015) permits county governments to use tax revenues for purposes related to publicly owned and operated aquariums, including acquisition, construction, maintenance, or promotion. This change became effective on July 1, 2012. Authorization to Levy: Any county may levy and impose a tourist development tax on the exercise within its boundaries of the taxable privilege except there shall be no additional levy of a tourist development tax in any municipalities presently imposing the Municipal Resort Tax as authorized in ch. 67-930, L.O.F. Additionally, no county authorized to levy any of the convention development taxes shall be allowed to levy more than 2 percent of tourist development tax.1 However, this second limitation does not apply to a county’s levy of the Professional Sports Franchise Facility Tax2 and Duval County’s levy of the Additional Professional Sports Franchise Facility Tax.3 A county may elect to levy and impose the tourist development tax in a subcounty special district. However, if a county elects to levy and impose the tax on a subcounty special district basis, the district shall embrace all or a significant contiguous portion of the county. The county shall assist the Department of Revenue (DOR) in identifying the rental units in the district that are subject to the tax. These levies require the adoption of an authorizing ordinance by vote of the county’s governing body. Additionally, some levies require referendum approval or provide the option for the tax to be approved by referendum. Depending on the particular tax levy, the effective date of the levy and imposition of the tax shall be the first day on the second month following approval of the ordinance by referendum, as prescribed in s. 125.0104(6), F.S., or the first day of any subsequent month as may be specified in the ordinance. At least 60 days prior to the enactment of the ordinance levying the tax, the county’s governing body shall adopt a resolution establishing and appointing the members of the county tourist development council and indicating the intention of the county to consider the enactment of an ordinance levying and imposing the tax. The tourist development council, prior the enactment of the ordinance, shall prepare and submit to the county’s governing body for its approval a plan for tourist development.4 Please note that these provisions regarding the establishment of a county tourist development council and the submission of a tourist
1. Section 125.0104(3)(b), F.S. 2. Section 125.0104(3)(l)4., F.S. 3. Section 125.0104(3)(n)2., F.S. 4. Section 125.0104(4), F.S.
Office of Economic and Demographic Research
234 2012 Local Government Financial Information Handbook
development plan only applies to the 1 or 2 percent tax pursuant to s. 125.0104(3)(c), F.S., since the other levies are exempted from these requirements. The plan shall set forth the anticipated net tax revenue to be derived by the county for two years following the levy of the tax as well as indicate the tax district in which the tourist development tax is proposed. In addition, the plan shall provide a list, in order of priority, of the proposed uses of the tax revenue by specific project or special use as well as the approximate cost or expense allocation for each specific project or special use. The governing body shall adopt the county plan for tourist development as part of the ordinance levying the tax. Administrative Procedures: It is the Legislature’s intent that every person who rents, leases, or lets for consideration any living quarters or accommodations in any hotel, apartment hotel, motel, resort motel, apartment, apartment motel, roominghouse, mobile home park, recreational vehicle park, condominium or timeshare resort for a term of six months or less is exercising a taxable privilege, unless such person rents, leases, or lets for consideration any living quarters or accommodations which are exempt according to the provisions of ch. 212, F.S. The tax shall be charged by the person receiving the consideration for rent or lease at the time of payment for such lease or rental. Such person is responsible for receiving, accounting for, and remitting any applicable tax to the DOR. The DOR shall keep records showing the amount of taxes collected, including records disclosing the amount of taxes collected from each county in which a tax is levied. The DOR shall promulgate rules and publish forms as necessary to enforce these taxes.5 A county may exempt itself from the requirements that the tax be administered by the DOR according to ch. 212, F.S., if the county adopts an ordinance providing for local collection and administration of the tax. A portion of the tax collections may be retained by the county for its administrative costs; however, that portion cannot exceed 3 percent of collections. A county electing to locally administer the tax shall also adopt an ordinance electing either to assume all responsibility for auditing the records and accounts of dealers and assessing, collecting, and enforcing payments of delinquent taxes, or delegate such authority to the DOR.6 Reporting Requirements: For each levy, the county is responsible for furnishing the DOR with a certified copy of the ordinance within 10 days after its approval. If applicable, the county shall also notify the DOR within 10 days after the ordinance’s approval by referendum of the time period during which the tax will be levied.7 Distribution of Proceeds: Tax collections received by the DOR, less the costs of administration, shall be paid monthly to the county, which imposed the particular tax or taxes. The funds shall be placed in the county tourist development trust fund of the respective county, which shall be established by each county as a pre-condition to the receipt of such funds.8 Attorney General Opinions: Florida’s Attorney General has issued the following legal opinions relevant to this revenue source.
5. Section 125.0104(3), F.S. 6. Section 125.0104(10), F.S. 7. Section 125.0104(4)(a), F.S. 8. Section 125.0104(3)(i), F.S.

Office of Economic and Demographic Research
2012 Local Government Financial Information Handbook 235
Opinion # Subject 77-81 Counties, tourist development tax 79-30 Tourist development tax, usage 83-18 Use of tourist tax for convention center 86-68 Use of tourist development tax to maintain beaches 86-87 Funds used for advertising 86-96 Authority to increase tourist development tax 87-16 Use of tourist tax to improve shoreline 88-37 Local option tourist development tax 88-49 Use of tourist development tax 89-50 Tourist tax revenues used for travel expenses 90-14 Revenues derived from tourist development tax 90-55 Tourist development tax, beach facilities 90-59 Tourist development tax, hydrilla and weed control 90-83 Immunity from suit, county tourist development councils 91-62 Tourist development tax revenues 92-03 Clerk of Court’s authority regarding tourist development tax 92-16 Tourist development tax – Concert in the Park 92-34 Use of tourist development tax revenue 92-66 Tourist development tax revenues, purchase of all terrain vehicles 94-12 County use of tourist development tax revenues for rail trail 95-71 Tourist development tax, infrastructure surtax 96-26 Tourist development tax, creation of second district 96-54 Tourist development tax funds for raceway facility 97-13 Tourist development tax, foreign national’s residence 97-48 Tourist development tax revenues for artificial reef 97-64 Tourist development tax, convention development tax 98-74 Tourist development tax, construction of war memorial 2000-15 Tourist development tax, use of tax for museum parking lot 2000-25 Tourist development tax revenues 2000-29 Tourist development tax, transfer of revenues 2000-50 Tourist development tax, welcome signs 2000-56 Use of tourist development tax to pay debt service 2001-42 Tourist development tax, purchase of beach property 2002-34 Tourist development tax, taxability of boat slips 2008-26 Local option tourist development, convention centers 2010-09 Tourist development tax, used to stock lakes with fish 2010-26 Tourist development tax, subcounty special district
The full texts of these opinions are available via a searchable on-line database.9 Local government officials seeking more clarification should review the opinions in their entirety. The statutory language pertaining to this revenue source has been amended since its authorization. The reader should keep the date of the opinion in mind when reviewing its relevance to current law or any interpretations that have been articulated in Florida case law. 9. http://myfloridalegal.com/ago.nsf/Opinions

Office of Economic and Demographic Research
236 2012 Local Government Financial Information Handbook
Tax Rates, Taxable Sales, and Estimates of Realized and Unrealized Revenues: Optional tourist taxes can be a valuable source of revenue for tourist facilities development and promotion, and the tables that follow are designed to aid counties in estimating how much revenue will be or could be generated from a tourist tax levy. Although these tables are useful in estimating revenues, the user should recognize their limitations. Besides seasonal factors and normal variation due to general economic conditions, county tourist tax revenues can be influenced by a variety of factors such as the value of the dollar, temporary surpluses or shortages in the stock of hotel and motel rooms, and the availability of convention facilities. The first table following this section provides a historical summary of tourist and convention development tax impositions, expirations, rate changes, and repeals based on information obtained from the DOR.10 The second table reports the taxable sales by transient rental facilities on a county-by-county basis and may be useful in identifying the general trend of potential collections as well as estimating revenues from tourist development tax levies. In order to calculate a revenue estimate using this table, take the county’s estimate of taxable sales reported by transient rental facilities as listed in the table and multiply it by the county’s applicable or proposed tax rate (i.e., 0.01, 0.02, or 0.03, etc.). The third table summarizes the counties eligible to levy the various local option tourist taxes and illustrates the 2012 tax rates. The fourth table provides countywide estimates of realized and unrealized revenues during the local fiscal year ending 2013. Additional Detail: Additional information regarding each of the five individual authorizations to levy can be found in the sections immediately following the three tables previously discussed. Additional tourist development tax data can be found on the EDR’s website.11
10. Florida Department of Revenue, History of Local Sales Tax and Current Rates (Last Updated: September 1, 2012) https://revenuelaw.state.fl.us/LawLibraryDocuments/2012/09/OTH-111031_History%20of%20sales%20tax,%209-01-12.pdf 11. http://edr.state.fl.us/Content/local-government/data/data-a-to-z/index.cfm

Office of Economic and Demographic Research
County Action Rate Effective Date Expiration Date
1 or 2 Percent Tax - s. 125.0104(3)(c), F.S.Alachua Imposed Levy 2% Jun. 1, 1987 -Baker Imposed Levy 2% May 1, 2000 -Bay (select zip codes only) Imposed Levy 2% Mar. 1, 1986 -Bradford Imposed Levy 2% Nov. 1, 1990 -Brevard Imposed Levy 2% Dec. 1, 1986 -Broward Imposed Levy 2% Dec. 1, 1980 -Charlotte Imposed Levy 2% Apr. 1, 1984 -Citrus Imposed Levy 2% Dec. 1, 1986 -Clay Imposed Levy 2% Jan. 1, 1989 -Collier Imposed Levy 2% Nov. 1, 1990 -Collier Repealed Levy - Nov. 14, 1991 -Collier Imposed Levy 2% Jan. 1, 1993 -Columbia Imposed Levy 2% Dec. 1, 1984 -DeSoto Imposed Levy 2% Jan. 1, 2011 -Dixie Imposed Levy 2% Jan. 1, 2011 -Duval Imposed Levy 2% Jan. 1, 1979 -Escambia Imposed Levy 2% Dec. 1, 1980 -Flagler Imposed Levy 2% Dec. 1, 1986 -Franklin Imposed Levy 2% Jan. 1, 2005 -Gadsden Imposed Levy 2% Jan. 1, 2003 -Gilchrist Imposed Levy 2% Jan. 1, 2007 -Glades Imposed Levy 2% Jan. 1, 2009 -Gulf Imposed Levy 2% Jan. 1, 1999 -Hamilton Imposed Levy 2% Nov. 1, 1996 -Hendry Imposed Levy 2% Feb. 1, 2003 -Hernando Imposed Levy 2% Jan. 1, 1993 -Highlands Imposed Levy 2% Jan. 1, 2003 -Hillsborough Imposed Levy 2% Oct. 1, 1978 -Holmes Imposed Levy 2% Jan. 1, 2005 -Indian River Imposed Levy 2% Apr. 1, 1987 -Jackson Imposed Levy 2% Jan. 1, 1999 -Jefferson Imposed Levy 2% Feb. 1, 2007 -Lake Imposed Levy 2% Dec. 1, 1984 -Lee Imposed Levy 2% Nov. 1, 1982 -Leon Imposed Levy 2% May 1, 1988 -Levy Imposed Levy 2% Jan. 1, 2003 -Madison Imposed Levy 2% Jan. 1, 1999 -Manatee Imposed Levy 2% Jan. 1, 1981 -Marion Imposed Levy 2% Jan. 1, 2005 -Martin Imposed Levy 2% Nov. 1, 2002 -Miami-Dade (select cities exempt) Imposed Levy 2% Dec. 1, 1978 -Monroe (Key West only) Imposed Levy 2% Dec. 1, 1981 Mar. 31, 1984Monroe (countywide) Imposed Levy 2% Apr. 1, 1984 -Nassau (Amelia Island only) Imposed Levy 2% Jan. 1, 1989 -Okaloosa (select voting districts only) Imposed Levy 2% Nov. 1, 1989 -Okeechobee Imposed Levy 2% Jan. 1, 1993 -Orange Imposed Levy 2% May 1, 1978 -Osceola Imposed Levy 2% Dec. 1, 1977 -Palm Beach Imposed Levy 1% Oct. 1, 1982 Dec. 31, 1983Palm Beach Increased Rate 2% Jan. 1, 1984 -Pasco Imposed Levy 2% Jan. 1, 1991 -Pinellas Imposed Levy 2% Nov. 1, 1978 -Polk Imposed Levy 2% Dec. 1, 1986 -Putnam Imposed Levy 2% Jan. 1, 1993 -St. Johns Imposed Levy 2% Dec. 1, 1986 -St. Lucie Imposed Levy 2% Nov. 1, 1984 -Santa Rosa Imposed Levy 2% Jan. 1, 1992 -Sarasota Imposed Levy 2% Nov. 1, 1988 -Seminole Imposed Levy 2% Jan. 1, 1989 -Sumter Imposed Levy 2% Jan. 1, 2005 -
Summary of Impositions, Expirations, Rate Changes, and RepealsHistory of Local Option Tourist Tax Levies
### Active Levies, as of September 1, 2012, Are Noted in Bold Italics. ###
2012 Local Government Financial Information Handbook Page 237

Office of Economic and Demographic Research
County Action Rate Effective Date Expiration Date
Summary of Impositions, Expirations, Rate Changes, and RepealsHistory of Local Option Tourist Tax Levies
### Active Levies, as of September 1, 2012, Are Noted in Bold Italics. ###
Suwannee Imposed Levy 2% Jan. 1, 1991 -Taylor Imposed Levy 2% Dec. 1, 1998 -Volusia Imposed Levy 2% May 1, 1978 -Wakulla Imposed Levy 2% Apr. 1, 1995 -Walton (select zip codes only) Imposed Levy 2% Oct. 1, 1986 -Washington Imposed Levy 2% Jan. 1, 2001 -
Additional 1 Percent Tax - s. 125.0104(3)(d), F.S.Alachua Imposed Levy 1% Feb. 1, 1993 -Baker Imposed Levy 1% Jan. 1, 2012 -Bay (select zip codes only) Imposed Levy 1% Feb. 1, 1997 -Bradford Imposed Levy 1% Mar. 1, 2007 -Brevard Imposed Levy 1% Dec. 1, 1989 -Broward Imposed Levy 1% Aug. 1, 1987 -Charlotte Imposed Levy 1% Jan. 1, 1993 -Citrus Imposed Levy 1% Oct. 1, 2002 -Clay Imposed Levy 1% Jun. 1, 1999 -Collier Imposed Levy 1% Nov. 1, 1990 -Collier Repealed Levy - Nov. 14, 1991 -Collier Imposed Levy 1% Jan. 1, 1996 -Columbia Imposed Levy 1% May 1, 1991 Jul. 31, 1994Columbia Imposed Levy 1% Apr. 1, 2010 -Escambia Imposed Levy 1% Mar. 1, 1988 -Flagler Imposed Levy 1% Mar. 1, 2004 -Gulf Imposed Levy 1% Feb. 1, 2002 -Hamilton Imposed Levy 1% Jan. 1, 2002 -Hendry Imposed Levy 1% May 1, 2007 -Hernando Imposed Levy 1% Aug. 1, 1998 -Hillsborough Imposed Levy 1% Oct. 1, 1986 -Indian River Imposed Levy 1% Sep. 30, 1993 -Jackson Imposed Levy 1% Aug. 1, 2004 -Lake Imposed Levy 1% Apr. 1, 2003 -Lee Imposed Levy 1% Mar. 1, 1988 -Leon Imposed Levy 1% Jan. 1, 1994 -Madison Imposed Levy 1% Dec. 1, 2002 -Manatee Imposed Levy 1% Oct. 1, 1986 -Martin Imposed Levy 1% May 1, 2008 -Monroe (Key West only) Imposed Levy 1% Nov. 1, 1986 Jun. 30, 1987Monroe (countywide) Imposed Levy 1% Jul. 1, 1987 -Nassau (Amelia Island only) Imposed Levy 1% Dec. 1, 2008 -Okaloosa (select voting districts only) Imposed Levy 1% Jul. 1, 1999 -Okeechobee Imposed Levy 1% Dec. 1, 1996 -Orange Imposed Levy 1% Jun. 1, 1986 -Osceola Imposed Levy 1% Jul. 1, 1986 -Palm Beach Imposed Levy 1% Feb. 1, 1989 -Pinellas Imposed Levy 1% Jul. 1, 1988 -Polk Imposed Levy 1% Oct. 1, 1990 -Putnam Imposed Levy 1% Feb. 1, 2008 -St. Johns Imposed Levy 1% Jan. 1, 1992 -St. Lucie Imposed Levy 1% Feb. 1, 1988 -Santa Rosa Imposed Levy 1% Oct. 1, 1996 -Sarasota Imposed Levy 1% Apr. 1, 1997 -Seminole Imposed Levy 1% Jan. 1, 1993 -Taylor Imposed Levy 1% Jan. 1, 2006 -Wakulla Imposed Levy 1% Nov. 1, 2011 -Walton (select zip codes only) Imposed Levy 1% Feb. 1, 1999 -Washington Imposed Levy 1% Jul. 1, 2006 -
Professional Sports Franchise Facility Tax - s. 125.0104(3)(l), F.S.Alachua Imposed Levy 1% May 1, 2010 -Bay Imposed Levy 1% Mar. 1, 2009 -Bradford Imposed Levy 1% Mar. 1, 2007 -
2012 Local Government Financial Information Handbook Page 238

Office of Economic and Demographic Research
County Action Rate Effective Date Expiration Date
Summary of Impositions, Expirations, Rate Changes, and RepealsHistory of Local Option Tourist Tax Levies
### Active Levies, as of September 1, 2012, Are Noted in Bold Italics. ###
Brevard Imposed Levy 1% Mar. 1, 1994 -Broward Imposed Levy 1% Jul. 1, 1996 -Charlotte Imposed Levy 1% Oct. 1, 2005 -Collier Imposed Levy 1% Oct. 1, 2005 -Duval Imposed Levy 1% Feb. 1, 1994 -Escambia (Navarre Beach exempt) Imposed Levy 1% May 1, 1996 Apr. 30, 1999Escambia (Navarre Beach exempt) Imposed Levy 1% Aug. 1, 2000 -Flagler Imposed Levy 1% Dec. 1, 2010 -Gulf Imposed Levy 1% Jan. 1, 2007 -Hillsborough Imposed Levy 1% Mar. 1, 1990 -Indian River Imposed Levy 1% Feb. 1, 2001 -Jackson Imposed Levy 1% Aug. 1, 2004 -Lake Imposed Levy 1% Apr. 1, 2003 -Lee Imposed Levy 1% Jan. 1, 2006 -Leon Imposed Levy 1% Nov. 1, 2004 -Manatee Imposed Levy 1% Dec. 1, 2003 -Martin Imposed Levy 1% May 1, 2008 -Miami-Dade (select cities exempt) Imposed Levy 1% Jan. 1, 1991 -Nassau (Amelia Island only) Imposed Levy 1% Apr. 1, 2010 -Okaloosa (select voting districts only) Imposed Levy 1% Jul. 1, 1999 -Orange Imposed Levy 1% Feb. 1, 1995 -Osceola Imposed Levy 1% Sep. 1, 1997 -Palm Beach Imposed Levy 1% Jan. 1, 1994 -Pinellas Imposed Levy 1% Jan. 1, 1996 -Polk Imposed Levy 1% May 1, 1994 -Putnam Imposed Levy 1% Feb. 1, 2008 -St. Johns Imposed Levy 1% Apr. 1, 2010 -St. Lucie Imposed Levy 1% Aug. 1, 1997 Dec. 31, 2002St. Lucie Imposed Levy 1% Feb. 1, 2003 Jan. 31, 2018Santa Rosa Imposed Levy 1% Jun. 1, 2006 -Sarasota Imposed Levy 1% May 1, 2007 -Seminole Imposed Levy 1% Jan. 1, 2009 -Volusia Imposed Levy 1% Jul. 1, 2003 -Wakulla Imposed Levy 1% Mar. 1, 2012 -Walton (select zip codes only) Imposed Levy 1% May 1, 2004 -
High Tourism Impact Tax - s. 125.0104(3)(m), F.S.Monroe Imposed Levy 1% Jun. 1, 2009 -Orange Imposed Levy 1% Oct. 1, 1989 -Osceola Imposed Levy 1% Oct. 1, 1990 -
Additional Professional Sports Franchise Facility Tax - s. 125.0104(3)(n), F.S.Alachua Imposed Levy 1% May 1, 2010 -Bay Imposed Levy 1% Apr. 1, 2009 Mar. 31, 2014Brevard Imposed Levy 1% Jul. 1, 2005 -Broward Imposed Levy 1% Jul. 1, 1996 -Charlotte Imposed Levy 1% Apr. 1, 2007 -Duval Imposed Levy 1% Nov. 1, 1994 -Hillsborough Imposed Levy 1% Dec. 1, 1994 -Lee Imposed Levy 1% Jan. 1, 2006 -Leon Imposed Levy 1% May 1, 2009 -Manatee Imposed Levy 1% Jun. 1, 2009 -Okaloosa (select voting districts only) Imposed Levy 1% Jan. 1, 2008 -Orange Imposed Levy 1% Sep. 1, 2006 -Osceola Imposed Levy 1% Jul. 1, 2004 -Palm Beach Imposed Levy 1% Dec. 1, 2006 -Pinellas Imposed Levy 1% Dec. 1, 2005 -Polk Imposed Levy 1% Mar. 1, 2004 -St. Lucie Imposed Levy 1% Mar. 1, 2003 Jan. 31, 2018Sarasota Imposed Levy 0.5% May 1, 2010 Apr. 30, 2011Sarasota Increased Rate 1% May 1, 2011 -Seminole Imposed Levy 1% Feb. 1, 2009 -Walton (select zip codes only) Imposed Levy 0.5% Oct. 1, 2009 Sep. 30, 2014
2012 Local Government Financial Information Handbook Page 239

Office of Economic and Demographic Research
County Action Rate Effective Date Expiration Date
Summary of Impositions, Expirations, Rate Changes, and RepealsHistory of Local Option Tourist Tax Levies
### Active Levies, as of September 1, 2012, Are Noted in Bold Italics. ###
Tourist Impact Tax - s. 125.0108, F.S.Monroe Imposed Levy 1% May 1, 1988 -
Consolidated County Convention Development Tax - s. 212.0305(4)(a), F.S.Duval Imposed Levy 2% Nov. 1, 1984 -
Charter County Convention Development Tax - s. 212.0305(4)(b), F.S.Miami-Dade (select cities exempt) Imposed Levy 3% May 1, 1984 -
Special District Convention Development Tax - s. 212.0305(4)(c), F.S.Volusia (portion) Imposed Levy 1% Oct. 1, 1984 Aug. 31, 1991Volusia (portion) Increased Rate 2% Sep. 1, 1991 Sep. 30, 1995Volusia (portion) Increased Rate 3% Oct. 1, 1995 -Note: This levy is imposed within the jurisdiction of the Halifax Area Advertising Authority.
Special Convention Development Tax - s. 212.0305(4)(d), F.S.Volusia (portion) Imposed Levy 1% Oct. 1, 1987 Mar. 31, 1992Volusia (portion) Increased Rate 2% Apr. 1, 1992 Sep. 30, 2000Volusia (portion) Increased Rate 3% Oct. 1, 2000 -Note: This levy is imposed within the jurisdiction of the Southeast Volusia Advertising Authority.
Subcounty Convention Development Tax - s. 212.0305(4)(e), F.S.Volusia (portion) Imposed Levy 1% Oct. 1, 1984 Aug. 31, 1991Volusia (portion) Increased Rate 2% Sep. 1, 1991 Sep. 30, 1995Volusia (portion) Increased Rate 3% Oct. 1, 1995 -Note: This levy is imposed within the jurisdiction of the West Volusia Advertising Authority.
Local Administration of Tourist TaxesCounty Effective Date Termination DateAlachua Jul. 1, 2001Baker May 1, 2000Bay Jan. 1, 1994Brevard Oct. 1, 1992Broward Mar. 1, 1994Charlotte Sep. 1, 1990Citrus Sep. 1, 1991 Dec. 31, 2005Clay Jan. 1, 1989Collier Jan. 1, 1993Duval Dec. 1, 1990Escambia Jun. 1, 1989Gulf Jun. 1, 2001Hernando Jan. 1, 1993Hillsborough Jan. 1, 1992Indian River Oct. 1, 2000Lake Nov. 1, 1998Lee May 1, 1988Leon Oct. 1, 1994Manatee Oct. 1, 1989Marion Apr. 1, 2008Martin Nov. 1, 2002Miami-Dade Apr. 1, 1988Monroe (Tourist Development Taxes) Jan. 1, 1991Monroe (Tourist Impact Tax) Jan. 1, 1996Nassau May 1, 1989Okaloosa Jul. 1, 1992
2012 Local Government Financial Information Handbook Page 240
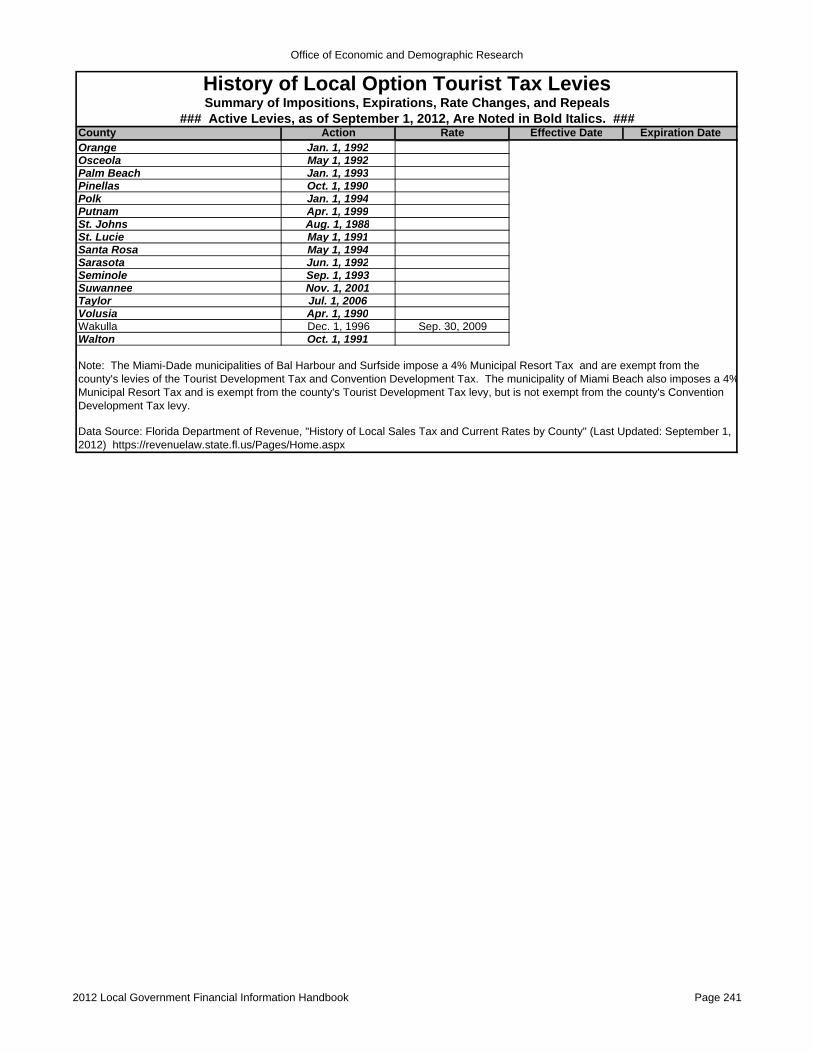
Office of Economic and Demographic Research
County Action Rate Effective Date Expiration Date
Summary of Impositions, Expirations, Rate Changes, and RepealsHistory of Local Option Tourist Tax Levies
### Active Levies, as of September 1, 2012, Are Noted in Bold Italics. ###
Orange Jan. 1, 1992Osceola May 1, 1992Palm Beach Jan. 1, 1993Pinellas Oct. 1, 1990Polk Jan. 1, 1994Putnam Apr. 1, 1999St. Johns Aug. 1, 1988St. Lucie May 1, 1991Santa Rosa May 1, 1994Sarasota Jun. 1, 1992Seminole Sep. 1, 1993Suwannee Nov. 1, 2001Taylor Jul. 1, 2006Volusia Apr. 1, 1990Wakulla Dec. 1, 1996 Sep. 30, 2009Walton Oct. 1, 1991
Data Source: Florida Department of Revenue, "History of Local Sales Tax and Current Rates by County" (Last Updated: September 1, 2012) https://revenuelaw.state.fl.us/Pages/Home.aspx
Note: The Miami-Dade municipalities of Bal Harbour and Surfside impose a 4% Municipal Resort Tax and are exempt from the county's levies of the Tourist Development Tax and Convention Development Tax. The municipality of Miami Beach also imposes a 4%Municipal Resort Tax and is exempt from the county's Tourist Development Tax levy, but is not exempt from the county's Convention Development Tax levy.
2012 Local Government Financial Information Handbook Page 241

Calculated by the Florida Department of Revenue's Office of Tax Research
Taxable Sales Reported by Transient Rental FacilitiesState Fiscal Years Ended June 30, 2004 - 2013
County 2004 2005 2006 2007 2008 2009 2010 2011 2012 (est.) 2013 (est.)Alachua 55,904,993$ 58,584,056$ 65,615,424$ 74,594,673$ 75,917,950$ 65,985,970$ 65,658,413$ 66,764,676$ 69,602,940$ 70,546,286$ Baker 1,504,500$ 1,699,572$ 1,603,440$ 1,741,451$ 1,351,770$ 1,218,154$ 978,419$ 840,385$ 846,386$ 869,807$ Bay 196,208,387$ 208,158,496$ 183,988,163$ 205,883,807$ 220,615,421$ 257,737,516$ 232,109,551$ 237,176,016$ 277,895,499$ 289,115,293$ Bradford 2,580,981$ 2,622,384$ 2,642,988$ 2,704,138$ 2,708,650$ 2,562,224$ 2,259,884$ 2,041,857$ 2,130,625$ 2,175,924$ Brevard 118,405,980$ 138,017,993$ 166,546,628$ 172,366,524$ 176,303,417$ 159,168,832$ 160,305,862$ 164,148,420$ 166,285,611$ 167,336,495$ Broward 654,875,401$ 705,221,067$ 777,095,108$ 802,185,494$ 840,297,004$ 717,890,868$ 699,454,719$ 764,820,163$ 842,144,851$ 870,650,309$ Calhoun 123,889$ 124,139$ 112,493$ 105,841$ 110,629$ 88,919$ 93,633$ 96,358$ 97,322$ 97,461$ Charlotte 45,588,167$ 44,867,990$ 48,404,996$ 44,563,667$ 44,150,162$ 41,037,361$ 42,168,318$ 41,613,104$ 46,822,755$ 47,536,091$ Citrus 16,915,167$ 17,942,932$ 18,476,567$ 19,545,020$ 20,971,656$ 20,168,718$ 21,516,465$ 18,858,689$ 19,896,831$ 19,619,287$ Clay 11,948,733$ 12,444,196$ 12,623,704$ 12,914,586$ 14,635,620$ 15,825,800$ 14,483,278$ 14,380,911$ 15,113,724$ 15,412,557$ Collier 313,330,067$ 353,421,354$ 392,064,458$ 353,863,988$ 368,128,308$ 317,620,585$ 319,328,433$ 306,160,212$ 341,479,701$ 347,483,706$ Columbia 16,271,833$ 18,768,712$ 21,071,923$ 20,029,588$ 19,580,587$ 19,147,110$ 17,050,484$ 19,545,225$ 20,700,892$ 21,384,022$ DeSoto 1,473,428$ 1,517,631$ 1,578,336$ 1,641,470$ 1,707,128$ 1,691,764$ 1,744,209$ 1,798,279$ 1,829,631$ 1,829,886$ Dixie 784,000$ 807,520$ 839,821$ 873,414$ 908,350$ 1,160,161$ 1,196,042$ 1,233,033$ 1,257,694$ 1,245,623$ Duval 212,759,328$ 253,346,688$ 246,503,395$ 258,543,775$ 278,887,590$ 245,315,509$ 228,738,469$ 239,032,912$ 251,825,329$ 259,113,709$ Escambia 126,929,725$ 128,311,967$ 113,095,231$ 119,002,462$ 136,216,083$ 132,542,672$ 136,432,615$ 139,713,211$ 169,291,904$ 174,360,215$ Flagler 16,931,340$ 20,380,075$ 26,051,942$ 29,314,259$ 30,298,172$ 26,924,544$ 27,127,008$ 32,647,008$ 36,952,821$ 38,481,719$ Franklin 28,909,511$ 29,499,501$ 33,492,460$ 35,818,210$ 38,940,899$ 37,386,261$ 37,048,249$ 37,385,979$ 43,136,770$ 44,313,212$ Gadsden 1,485,454$ 1,467,751$ 1,961,062$ 3,246,307$ 3,844,048$ 4,377,602$ 3,691,542$ 4,119,461$ 4,666,765$ 4,820,768$ Gilchrist 852,180$ 897,032$ 944,244$ 993,941$ 1,048,933$ 1,029,357$ 1,277,031$ 1,496,742$ 1,403,574$ 1,351,558$ Glades 777,870$ 801,207$ 825,243$ 850,000$ 775,543$ 702,378$ 821,850$ 818,518$ 830,525$ 808,917$ Gulf 10,173,967$ 11,669,207$ 10,142,467$ 16,589,656$ 16,869,490$ 16,977,036$ 18,808,357$ 19,253,269$ 21,985,374$ 22,067,016$ Hamilton 1,114,285$ 1,213,745$ 1,578,692$ 1,723,357$ 1,479,858$ 1,095,290$ 793,231$ 1,049,938$ 1,002,255$ 1,035,329$ Hardee 1,180,217$ 1,268,447$ 1,527,334$ 1,588,427$ 1,651,964$ 1,626,808$ 1,706,592$ 1,744,026$ 1,764,954$ 1,756,813$ Hendry 5,103,589$ 5,285,291$ 6,577,038$ 7,200,436$ 5,314,203$ 3,401,627$ 3,327,241$ 3,851,646$ 4,427,635$ 4,573,747$ Hernando 9,915,767$ 11,936,720$ 12,603,417$ 14,115,419$ 12,593,398$ 11,483,336$ 10,575,923$ 10,782,145$ 10,667,369$ 10,857,285$ Highlands 13,231,189$ 17,217,031$ 17,746,896$ 17,309,328$ 17,545,187$ 16,009,673$ 15,545,762$ 14,322,495$ 15,494,534$ 15,704,919$ Hillsborough 316,207,780$ 386,592,182$ 408,460,676$ 441,240,774$ 430,109,735$ 380,735,219$ 342,605,509$ 342,662,613$ 408,737,195$ 429,884,047$ Holmes 443,714$ 390,921$ 533,985$ 420,883$ 448,102$ 477,606$ 572,323$ 1,120,633$ 757,104$ 757,450$ Indian River 40,940,118$ 45,865,631$ 39,580,971$ 37,668,933$ 40,447,866$ 34,066,213$ 33,629,727$ 36,394,191$ 41,518,295$ 43,050,533$ Jackson 7,368,862$ 9,032,350$ 8,734,597$ 8,506,226$ 7,997,812$ 6,501,992$ 6,009,848$ 9,063,114$ 6,838,792$ 7,044,905$ Jefferson 1,344,611$ 1,720,657$ 1,808,855$ 1,432,150$ 1,615,564$ 1,409,084$ 1,286,043$ 1,219,663$ 1,189,147$ 1,203,396$ Lafayette 158,616$ 144,148$ 159,711$ 152,000$ 147,284$ 150,230$ 153,234$ 156,299$ 158,018$ 157,882$ Lake 45,006,100$ 51,389,328$ 57,139,686$ 58,661,492$ 58,514,303$ 49,197,218$ 47,547,280$ 48,787,502$ 49,599,432$ 50,429,021$ Lee 404,701,900$ 387,490,350$ 444,659,401$ 448,782,117$ 474,537,924$ 444,990,537$ 453,611,319$ 471,088,156$ 522,725,681$ 532,579,811$ Leon 75,231,400$ 81,079,561$ 84,209,240$ 86,967,922$ 85,372,427$ 76,790,239$ 71,710,039$ 77,169,801$ 81,429,516$ 83,962,662$ Levy 6,736,129$ 6,944,846$ 8,076,041$ 8,498,242$ 8,406,417$ 7,355,987$ 7,725,631$ 7,581,067$ 7,832,243$ 7,820,550$ Liberty 119,114$ 157,607$ 134,913$ 125,000$ 83,790$ 110,490$ 108,705$ 110,896$ 112,128$ 111,593$ Madison 2,268,187$ 2,584,372$ 2,895,695$ 3,150,150$ 2,875,674$ 2,655,758$ 2,344,814$ 2,790,466$ 2,836,432$ 2,930,035$ Manatee 105,276,914$ 109,532,158$ 119,010,865$ 125,222,264$ 128,560,133$ 114,705,715$ 126,965,315$ 135,280,670$ 154,935,339$ 156,842,963$ Marion 57,515,955$ 58,689,750$ 56,439,347$ 56,563,005$ 53,701,567$ 44,296,398$ 39,673,139$ 44,386,588$ 42,439,526$ 43,698,165$ Martin 31,373,908$ 32,662,770$ 34,324,146$ 31,194,758$ 26,300,948$ 25,479,264$ 26,054,314$ 27,731,796$ 29,250,341$ 29,578,630$ Miami-Dade 834,677,551$ 972,036,386$ 1,106,289,934$ 1,187,184,836$ 1,247,326,963$ 1,100,218,289$ 1,104,536,988$ 1,285,150,845$ 1,456,864,250$ 1,513,448,155$ Monroe 461,363,853$ 479,770,079$ 472,637,711$ 488,062,644$ 540,152,224$ 469,007,116$ 486,364,585$ 559,767,193$ 615,849,955$ 632,489,014$ Nassau 61,315,200$ 76,163,268$ 78,015,931$ 81,475,122$ 87,182,231$ 69,825,191$ 69,192,379$ 73,748,567$ 75,692,673$ 77,115,145$ Okaloosa 194,384,700$ 199,300,620$ 184,116,051$ 205,895,575$ 221,863,452$ 206,807,843$ 200,776,184$ 190,037,684$ 245,013,351$ 253,098,792$ Okeechobee 6,232,896$ 7,425,241$ 7,585,232$ 7,125,727$ 6,468,798$ 5,225,876$ 5,700,925$ 5,517,984$ 5,549,852$ 5,483,460$ Orange 2,110,929,980$ 2,399,217,846$ 2,521,706,550$ 2,710,670,357$ 2,826,399,571$ 2,427,416,667$ 2,371,408,333$ 2,735,741,667$ 3,002,993,333$ 3,117,851,661$ Osceola 465,696,020$ 620,126,216$ 551,083,486$ 549,271,440$ 607,570,774$ 551,729,145$ 496,245,954$ 538,492,671$ 553,385,759$ 572,070,536$ Palm Beach 484,045,875$ 556,600,117$ 588,503,498$ 580,142,798$ 555,139,359$ 455,870,564$ 459,071,848$ 506,011,995$ 543,106,098$ 557,016,563$ Pasco 34,022,518$ 35,852,212$ 40,609,728$ 37,758,722$ 41,728,456$ 33,202,199$ 31,589,671$ 33,253,837$ 36,513,876$ 37,824,550$ Pinellas 427,603,475$ 455,990,950$ 481,143,302$ 492,363,469$ 519,212,023$ 476,115,581$ 455,098,382$ 477,873,790$ 539,914,833$ 559,013,154$ Polk 105,443,529$ 136,314,664$ 137,310,953$ 146,666,851$ 150,698,292$ 135,340,143$ 120,812,842$ 132,251,359$ 136,587,350$ 141,644,121$
2012 Local Government Financial Information Handbook Page 242
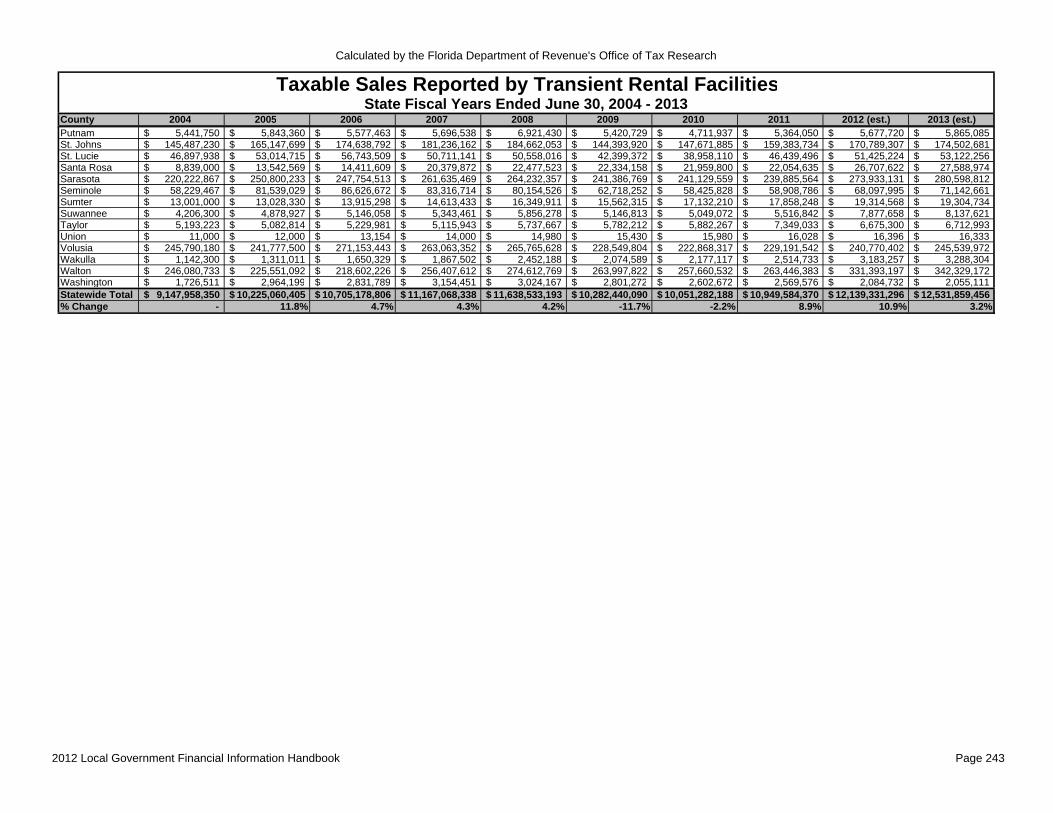
Calculated by the Florida Department of Revenue's Office of Tax Research
Taxable Sales Reported by Transient Rental FacilitiesState Fiscal Years Ended June 30, 2004 - 2013
County 2004 2005 2006 2007 2008 2009 2010 2011 2012 (est.) 2013 (est.)Putnam 5,441,750$ 5,843,360$ 5,577,463$ 5,696,538$ 6,921,430$ 5,420,729$ 4,711,937$ 5,364,050$ 5,677,720$ 5,865,085$ St. Johns 145,487,230$ 165,147,699$ 174,638,792$ 181,236,162$ 184,662,053$ 144,393,920$ 147,671,885$ 159,383,734$ 170,789,307$ 174,502,681$ St. Lucie 46,897,938$ 53,014,715$ 56,743,509$ 50,711,141$ 50,558,016$ 42,399,372$ 38,958,110$ 46,439,496$ 51,425,224$ 53,122,256$ Santa Rosa 8,839,000$ 13,542,569$ 14,411,609$ 20,379,872$ 22,477,523$ 22,334,158$ 21,959,800$ 22,054,635$ 26,707,622$ 27,588,974$ Sarasota 220,222,867$ 250,800,233$ 247,754,513$ 261,635,469$ 264,232,357$ 241,386,769$ 241,129,559$ 239,885,564$ 273,933,131$ 280,598,812$ Seminole 58,229,467$ 81,539,029$ 86,626,672$ 83,316,714$ 80,154,526$ 62,718,252$ 58,425,828$ 58,908,786$ 68,097,995$ 71,142,661$ Sumter 13,001,000$ 13,028,330$ 13,915,298$ 14,613,433$ 16,349,911$ 15,562,315$ 17,132,210$ 17,858,248$ 19,314,568$ 19,304,734$ Suwannee 4,206,300$ 4,878,927$ 5,146,058$ 5,343,461$ 5,856,278$ 5,146,813$ 5,049,072$ 5,516,842$ 7,877,658$ 8,137,621$ Taylor 5,193,223$ 5,082,814$ 5,229,981$ 5,115,943$ 5,737,667$ 5,782,212$ 5,882,267$ 7,349,033$ 6,675,300$ 6,712,993$ Union 11,000$ 12,000$ 13,154$ 14,000$ 14,980$ 15,430$ 15,980$ 16,028$ 16,396$ 16,333$ Volusia 245,790,180$ 241,777,500$ 271,153,443$ 263,063,352$ 265,765,628$ 228,549,804$ 222,868,317$ 229,191,542$ 240,770,402$ 245,539,972$ Wakulla 1,142,300$ 1,311,011$ 1,650,329$ 1,867,502$ 2,452,188$ 2,074,589$ 2,177,117$ 2,514,733$ 3,183,257$ 3,288,304$ Walton 246,080,733$ 225,551,092$ 218,602,226$ 256,407,612$ 274,612,769$ 263,997,822$ 257,660,532$ 263,446,383$ 331,393,197$ 342,329,172$ Washington 1,726,511$ 2,964,199$ 2,831,789$ 3,154,451$ 3,024,167$ 2,801,272$ 2,602,672$ 2,569,576$ 2,084,732$ 2,055,111$ Statewide Total 9,147,958,350$ 10,225,060,405$ 10,705,178,806$ 11,167,068,338$ 11,638,533,193$ 10,282,440,090$ 10,051,282,188$ 10,949,584,370$ 12,139,331,296$ 12,531,859,456$ % Change - 11.8% 4.7% 4.3% 4.2% -11.7% -2.2% 8.9% 10.9% 3.2%
2012 Local Government Financial Information Handbook Page 243

Office of Economic and Demographic Research
s. 125.0104(3), F.S. s. 212.0305(4), F.S.Special District,
Professional High Professional Special, &Sports Tourism Sports County Charter County Subcounty
Original Additional Franchise Impact Franchise Convention Convention Convention MaximumTax Tax Facility Tax Tax Facility Tax Tax Tax Tax Potential Current Unutilized
County (1 or 2%) (1%) (up to 1%) (1%) (up to 1%) (2%) (3%) (up to 3%) Tax Rate Tax Rate Tax Rate
Alachua * 2 1 1 1 5 5 0Baker * 2 1 5 3 2Bay * 2 1 1 1 5 5 0Bradford 2 1 1 5 4 1Brevard * 2 1 1 1 5 5 0Broward * 2 1 1 1 6 5 1Calhoun 4 0 4Charlotte * 2 1 1 1 5 5 0Citrus 2 1 5 3 2Clay * 2 1 5 3 2Collier * 2 1 1 5 4 1Columbia 2 1 5 3 2DeSoto 2 4 2 2Dixie 2 4 2 2Duval * 2 1 1 2 6 6 0Escambia * 2 1 1 5 4 1Flagler 2 1 1 5 4 1Franklin 2 5 2 3Gadsden 2 5 2 3Gilchrist 2 5 2 3Glades 2 5 2 3Gulf * 2 1 1 5 4 1Hamilton 2 1 5 3 2Hardee 4 0 4Hendry 2 1 5 3 2Hernando * 2 1 5 3 2Highlands 2 5 2 3Hillsborough * 2 1 1 1 5 5 0Holmes 2 5 2 3Indian River * 2 1 1 5 4 1Jackson 2 1 1 5 4 1Jefferson 2 5 2 3Lafayette 4 0 4Lake * 2 1 1 5 4 1Lee * 2 1 1 1 5 5 0Leon * 2 1 1 1 5 5 0Levy 2 5 2 3Liberty 4 0 4Madison 2 1 5 3 2Manatee * 2 1 1 1 5 5 0Marion * 2 5 2 3Martin * 2 1 1 5 4 1Miami-Dade * 2 1 3 6 6 0 2 1Monroe * 2 1 1 1 7 5 2Nassau * 2 1 1 5 4 1Okaloosa * 2 1 1 1 5 5 0Okeechobee 2 1 5 3 2Orange * 2 1 1 1 1 6 6 0Osceola * 2 1 1 1 1 6 6 0Palm Beach * 2 1 1 1 5 5 0
s. 125.0108, F.S. Establishments(1%)
Hotels and in OtherMotels(2%)(1%)
Beverages inConsolidated
ImpactTourist
s. 212.0306, F.S.
Tax
Convention Development TaxesTourist Development Taxes
Additional
2012 Local Option Tourist / Food and Beverage / Tax Rates in Florida's Counties
Food andBeverages
Local OptionLocal Option Taxes on Transient Rental Transactions
Food and Beverage Taxes
Food and
2012 Local Government Financial Information Handbook Page 244
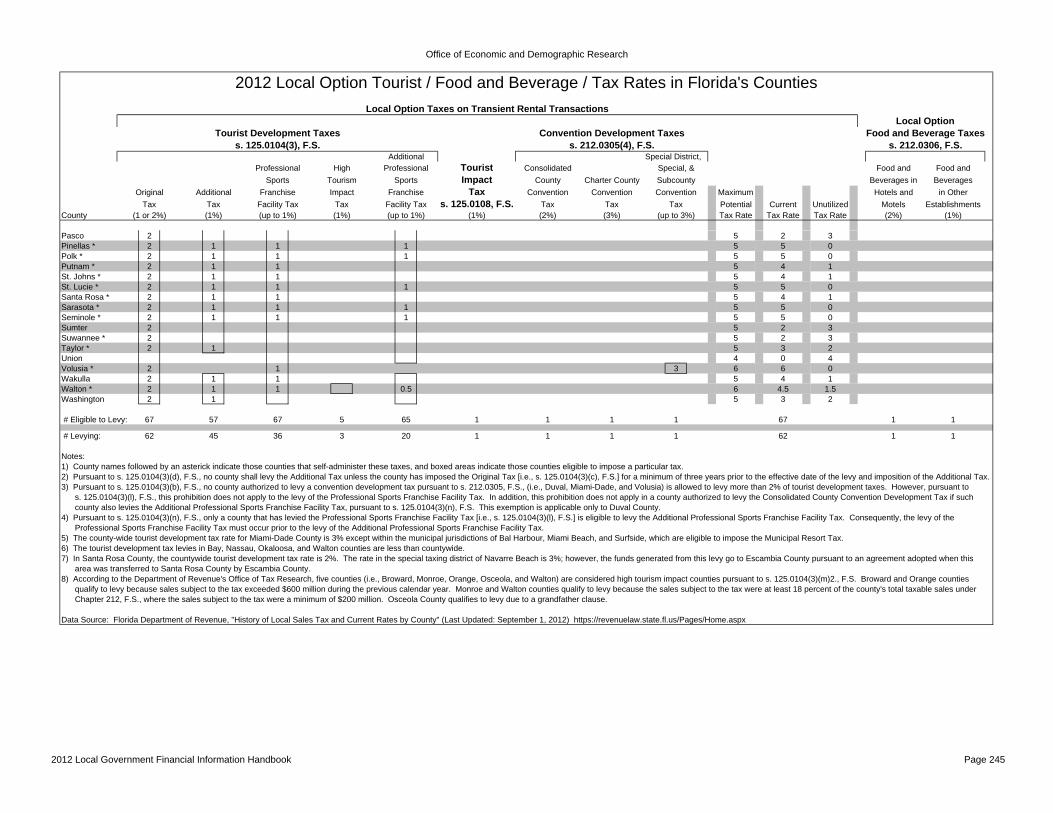
Office of Economic and Demographic Research
s. 125.0104(3), F.S. s. 212.0305(4), F.S.Special District,
Professional High Professional Special, &Sports Tourism Sports County Charter County Subcounty
Original Additional Franchise Impact Franchise Convention Convention Convention MaximumTax Tax Facility Tax Tax Facility Tax Tax Tax Tax Potential Current Unutilized
County (1 or 2%) (1%) (up to 1%) (1%) (up to 1%) (2%) (3%) (up to 3%) Tax Rate Tax Rate Tax Rates. 125.0108, F.S. Establishments
(1%)
Hotels and in OtherMotels(2%)(1%)
Beverages inConsolidated
ImpactTourist
s. 212.0306, F.S.
Tax
Convention Development TaxesTourist Development Taxes
Additional
2012 Local Option Tourist / Food and Beverage / Tax Rates in Florida's Counties
Food andBeverages
Local OptionLocal Option Taxes on Transient Rental Transactions
Food and Beverage Taxes
Food and
Pasco 2 5 2 3Pinellas * 2 1 1 1 5 5 0Polk * 2 1 1 1 5 5 0Putnam * 2 1 1 5 4 1St. Johns * 2 1 1 5 4 1St. Lucie * 2 1 1 1 5 5 0Santa Rosa * 2 1 1 5 4 1Sarasota * 2 1 1 1 5 5 0Seminole * 2 1 1 1 5 5 0Sumter 2 5 2 3Suwannee * 2 5 2 3Taylor * 2 1 5 3 2Union 4 0 4Volusia * 2 1 3 6 6 0Wakulla 2 1 1 5 4 1Walton * 2 1 1 0.5 6 4.5 1.5Washington 2 1 5 3 2
# Eligible to Levy: 67 57 67 5 65 1 1 1 1 67 1 1
# Levying: 62 45 36 3 20 1 1 1 1 62 1 1
Notes:1) County names followed by an asterick indicate those counties that self-administer these taxes, and boxed areas indicate those counties eligible to impose a particular tax.2) Pursuant to s. 125.0104(3)(d), F.S., no county shall levy the Additional Tax unless the county has imposed the Original Tax [i.e., s. 125.0104(3)(c), F.S.] for a minimum of three years prior to the effective date of the levy and imposition of the Additional Tax.3) Pursuant to s. 125.0104(3)(b), F.S., no county authorized to levy a convention development tax pursuant to s. 212.0305, F.S., (i.e., Duval, Miami-Dade, and Volusia) is allowed to levy more than 2% of tourist development taxes. However, pursuant to s. 125.0104(3)(l), F.S., this prohibition does not apply to the levy of the Professional Sports Franchise Facility Tax. In addition, this prohibition does not apply in a county authorized to levy the Consolidated County Convention Development Tax if such county also levies the Additional Professional Sports Franchise Facility Tax, pursuant to s. 125.0104(3)(n), F.S. This exemption is applicable only to Duval County.4) Pursuant to s. 125.0104(3)(n), F.S., only a county that has levied the Professional Sports Franchise Facility Tax [i.e., s. 125.0104(3)(l), F.S.] is eligible to levy the Additional Professional Sports Franchise Facility Tax. Consequently, the levy of the Professional Sports Franchise Facility Tax must occur prior to the levy of the Additional Professional Sports Franchise Facility Tax. 5) The county-wide tourist development tax rate for Miami-Dade County is 3% except within the municipal jurisdictions of Bal Harbour, Miami Beach, and Surfside, which are eligible to impose the Municipal Resort Tax.6) The tourist development tax levies in Bay, Nassau, Okaloosa, and Walton counties are less than countywide.7) In Santa Rosa County, the countywide tourist development tax rate is 2%. The rate in the special taxing district of Navarre Beach is 3%; however, the funds generated from this levy go to Escambia County pursuant to an agreement adopted when this area was transferred to Santa Rosa County by Escambia County.8) According to the Department of Revenue's Office of Tax Research, five counties (i.e., Broward, Monroe, Orange, Osceola, and Walton) are considered high tourism impact counties pursuant to s. 125.0104(3)(m)2., F.S. Broward and Orange counties qualify to levy because sales subject to the tax exceeded $600 million during the previous calendar year. Monroe and Walton counties qualify to levy because the sales subject to the tax were at least 18 percent of the county's total taxable sales under Chapter 212, F.S., where the sales subject to the tax were a minimum of $200 million. Osceola County qualifies to levy due to a grandfather clause.
Data Source: Florida Department of Revenue, "History of Local Sales Tax and Current Rates by County" (Last Updated: September 1, 2012) https://revenuelaw.state.fl.us/Pages/Home.aspx
2012 Local Government Financial Information Handbook Page 245

Office of Economic and Demographic Research
Estimated Tax Maximum Countywide Countywide Maximum Countywide CountywideRevenues @ Potential 2012 Realized Unutilized Unrealized Potential 2012 Realized Unutilized Unrealized
County 1% Tax Rate Tax Rate Tax Rate Tax Revenues Tax Rate Tax Revenues Tax Rate Tax Rate Tax Revenues Tax Rate Tax RevenuesAlachua 705,463$ 5 5 3,527,314$ 0 -$ -$ -$ Baker 8,698$ 5 3 26,094$ 2 17,396$ -$ -$ Bay 2,891,153$ 5 5 14,455,765$ 0 -$ -$ -$ Bradford 21,759$ 5 4 87,037$ 1 21,759$ -$ -$ Brevard 1,673,365$ 5 5 8,366,825$ 0 -$ -$ -$ Broward 8,706,503$ 6 5 43,532,515$ 1 8,706,503$ -$ -$ Calhoun 975$ 4 0 -$ 4 3,898$ -$ -$ Charlotte 475,361$ 5 5 2,376,805$ 0 -$ -$ -$ Citrus 196,193$ 5 3 588,579$ 2 392,386$ -$ -$ Clay 154,126$ 5 3 462,377$ 2 308,251$ -$ -$ Collier 3,474,837$ 5 4 13,899,348$ 1 3,474,837$ -$ -$ Columbia 213,840$ 5 3 641,521$ 2 427,680$ -$ -$ DeSoto 18,299$ 4 2 36,598$ 2 36,598$ -$ -$ Dixie 12,456$ 4 2 24,912$ 2 24,912$ -$ -$ Duval 2,591,137$ 4 4 10,364,548$ 0 -$ 2 2 5,182,274$ 0 -$ Escambia 1,743,602$ 5 4 6,974,409$ 1 1,743,602$ -$ -$ Flagler 384,817$ 5 4 1,539,269$ 1 384,817$ -$ -$ Franklin 443,132$ 5 2 886,264$ 3 1,329,396$ -$ -$ Gadsden 48,208$ 5 2 96,415$ 3 144,623$ -$ -$ Gilchrist 13,516$ 5 2 27,031$ 3 40,547$ -$ -$ Glades 8,089$ 5 2 16,178$ 3 24,268$ -$ -$ Gulf 220,670$ 5 4 882,681$ 1 220,670$ -$ -$ Hamilton 10,353$ 5 3 31,060$ 2 20,707$ -$ -$ Hardee 17,568$ 4 0 -$ 4 70,273$ -$ -$ Hendry 45,737$ 5 3 137,212$ 2 91,475$ -$ -$ Hernando 108,573$ 5 3 325,719$ 2 217,146$ -$ -$ Highlands 157,049$ 5 2 314,098$ 3 471,148$ -$ -$ Hillsborough 4,298,840$ 5 5 21,494,202$ 0 -$ -$ -$ Holmes 7,574$ 5 2 15,149$ 3 22,723$ -$ -$ Indian River 430,505$ 5 4 1,722,021$ 1 430,505$ -$ -$ Jackson 70,449$ 5 4 281,796$ 1 70,449$ -$ -$ Jefferson 12,034$ 5 2 24,068$ 3 36,102$ -$ -$ Lafayette 1,579$ 4 0 -$ 4 6,315$ -$ -$ Lake 504,290$ 5 4 2,017,161$ 1 504,290$ -$ -$ Lee 5,325,798$ 5 5 26,628,991$ 0 -$ -$ -$ Leon 839,627$ 5 5 4,198,133$ 0 -$ -$ -$ Levy 78,206$ 5 2 156,411$ 3 234,617$ -$ -$ Liberty 1,116$ 4 0 -$ 4 4,464$ -$ -$ Madison 29,300$ 5 3 87,901$ 2 58,601$ -$ -$ Manatee 1,568,430$ 5 5 7,842,148$ 0 -$ -$ -$ Marion 436,982$ 5 2 873,963$ 3 1,310,945$ -$ -$ Martin 295,786$ 5 4 1,183,145$ 1 295,786$ -$ -$ Miami-Dade 15,134,482$ 3 3 45,403,445$ 0 -$ 3 3 45,403,445$ 0 -$
Local Option Tourist Tax Levies in Florida's CountiesEstimation of Realized and Unrealized Tax Revenues
Tourist Development and Tourist Impact Tax Levies Convention Development Tax LeviesLocal Fiscal Year Ending September 30, 2013
2012 Local Government Financial Information Handbook Page 246

Office of Economic and Demographic Research
Estimated Tax Maximum Countywide Countywide Maximum Countywide CountywideRevenues @ Potential 2012 Realized Unutilized Unrealized Potential 2012 Realized Unutilized Unrealized
County 1% Tax Rate Tax Rate Tax Rate Tax Revenues Tax Rate Tax Revenues Tax Rate Tax Rate Tax Revenues Tax Rate Tax Revenues
Local Option Tourist Tax Levies in Florida's CountiesEstimation of Realized and Unrealized Tax Revenues
Tourist Development and Tourist Impact Tax Levies Convention Development Tax LeviesLocal Fiscal Year Ending September 30, 2013
Monroe 6,324,890$ 7 5 31,624,451$ 2 12,649,780$ -$ -$ Nassau 771,151$ 5 4 3,084,606$ 1 771,151$ -$ -$ Okaloosa 2,530,988$ 5 5 12,654,940$ 0 -$ -$ -$ Okeechobee 54,835$ 5 3 164,504$ 2 109,669$ -$ -$ Orange 31,178,517$ 6 6 187,071,100$ 0 -$ -$ -$ Osceola 5,720,705$ 6 6 34,324,232$ 0 -$ -$ -$ Palm Beach 5,570,166$ 5 5 27,850,828$ 0 -$ -$ -$ Pasco 378,245$ 5 2 756,491$ 3 1,134,736$ -$ -$ Pinellas 5,590,132$ 5 5 27,950,658$ 0 -$ -$ -$ Polk 1,416,441$ 5 5 7,082,206$ 0 -$ -$ -$ Putnam 58,651$ 5 4 234,603$ 1 58,651$ -$ -$ St. Johns 1,745,027$ 5 4 6,980,107$ 1 1,745,027$ -$ -$ St. Lucie 531,223$ 5 5 2,656,113$ 0 -$ -$ -$ Santa Rosa 275,890$ 5 4 1,103,559$ 1 275,890$ -$ -$ Sarasota 2,805,988$ 5 5 14,029,941$ 0 -$ -$ -$ Seminole 711,427$ 5 5 3,557,133$ 0 -$ -$ -$ Sumter 193,047$ 5 2 386,095$ 3 579,142$ -$ -$ Suwannee 81,376$ 5 2 162,752$ 3 244,129$ -$ -$ Taylor 67,130$ 5 3 201,390$ 2 134,260$ -$ -$ Union 163$ 4 0 -$ 4 653$ -$ -$ Volusia 2,455,400$ 3 3 7,366,199$ 0 -$ 3 3 7,366,199$ 0 -$ Wakulla 32,883$ 5 4 131,532$ 1 32,883$ -$ -$ Walton 3,423,292$ 6 4.5 15,404,813$ 1.5 5,134,938$ -$ -$ Washington 20,551$ 5 3 61,653$ 2 41,102$ -$ -$ Statewide 125,318,595$ 606,389,013$ 44,059,701$ 57,951,918$ -$
1) The shaded cells indicate those counties that are not eligible to levy convention development taxes.2) A county's unrealized tax rate is determined by subtracting its tax rate, as of September 1, 2012, from its maximum potential tax rate.3) The countywide realized and unrealized tax revenues reflect estimates for the entire local fiscal year (i.e., October 1, 2012 through September 30, 2013).
2) Office of Economic and Demographic Research, "2012 Local Government Financial Information Handbook" Table: Taxable Sales Reported by Transient Rental Facilities: State Fiscal Years Ended June 30, 2004-2013.
1) Office of Economic and Demographic Research, "2012 Local Government Financial Information Handbook" Table: 2012 Local Option Tourist / Food and Beverage / Tax Rates in Florida's Counties.
Notes:
Data Sources:
2012 Local Government Financial Information Handbook Page 247

Office of Economic and Demographic Research
248 2012 Local Government Financial Information Handbook
This page was intentionally left blank.
Office of Economic and Demographic Research
2012 Local Government Financial Information Handbook 249
1 or 2 Percent Tax Section 125.0104(3)(c), Florida Statutes
Summary: This tourist development tax may be levied by the county’s governing body at a rate of 1 or 2 percent on the total consideration charged for transient rental transactions. The tax shall be levied pursuant to an ordinance containing the enacted county tourist development plan. The ordinance must be approved in a countywide referendum election or by a majority of voters in the subcounty special tax district affected by the tax.1 Generally, the revenues may be used for capital construction of tourist-related facilities, tourist promotion, and beach and shoreline maintenance. Counties Eligible to Levy: All counties are eligible to levy the tax. Authorized Uses of Proceeds: The county shall only use the tax proceeds for the following purposes, and any use of the tax proceeds not expressly authorized is prohibited.2
1. To acquire, construct, extend, enlarge, remodel, repair, improve, maintain, operate, or promote one or more publicly owned and operated convention centers, sports stadiums, sports arenas, coliseums, auditoriums, aquariums, or museums that are publicly owned and operated or owned and operated by non-profit organizations and open to the public, within the boundaries of the county or subcounty special taxing district in which the tax is levied. The tax revenues may also be used for promotion of zoological parks that are publicly owned and operated or owned and operated by not-for-profit organizations and open to the public. However, these purposes may be implemented through service contracts and leases with lessees with sufficient expertise or financial capability to operate such facilities.
2. To promote and advertise tourism in Florida, nationally, and internationally. However, if the tax revenues are expended for an activity, service, venue, or event, the activity, service, venue, or event shall have as one of its main purposes the attraction of tourists as evidenced by the promotion of the activity, service, venue, or event to tourists.
3. To fund convention bureaus, tourist bureaus, tourist information centers, and news bureaus as county agencies or by contract with the chambers of commerce or similar associations in the county. This may include any indirect administrative costs for services performed by the county on behalf of the promotion agency.
4. To finance beach park facilities or beach improvement, maintenance, renourishment, restoration, and erosion control, including shoreline protection, enhancement, cleanup, or restoration of inland lakes and rivers to which there is public access as those uses relate to the physical preservation of the beach, shorelines, or inland lake or river. However, any funds identified by a county as the local matching source for beach renourishment, restoration, or erosion control projects included in the long-range budget plan of the state’s Beach Management Plan, pursuant to s. 161.091, F.S., or funds contractually obligated by a county in the financial plan for a federally authorized shore protection project may not be used or loaned for any other purpose. In counties having a total population less
1. Section 125.0104(6), F.S. 2. Section 125.0104(5), F.S.
Office of Economic and Demographic Research
250 2012 Local Government Financial Information Handbook
than 100,000, no more than 10 percent of tourist development tax revenues may be used for beach park facilities.
A county, having a total population less than 750,000, may also use the proceeds to acquire, construct, extend, enlarge, remodel, repair, improve, maintain, operate, or promote one or more zoological parks, fishing piers, or nature centers that are publicly owned and operated or owned and operated by not-for-profit organizations and open to the public. All population figures relating to this authority shall be based on the most recent official population estimates, pursuant to s. 186.901, F.S. These population estimates shall be those in effect on July 1st of each year. Finally, the proceeds may be pledged to secure and liquidate revenue bonds issued by the county for the purposes set forth in s. 125.0104(5)(a)1. and 4., F.S., or to refund bonds previously issued for such purposes or both. However, no more than 50 percent of the proceeds may be pledged to secure and liquidate revenue bonds or revenue refunding bonds previously issued for the purposes set forth in s. 125.0104(5)(a)4., F.S. Such revenue bonds and revenue refunding bonds may be authorized and issued in such principal amounts, with such interest rates and maturity dates, and subject to such other terms, conditions, and covenants as the county’s governing board shall provide.

Office of Economic and Demographic Research
2012 Local Government Financial Information Handbook 251
Additional 1 Percent Tax Section 125.0104(3)(d), Florida Statutes
Summary: In addition to the 1 or 2 percent tax authorized in s. 125.0104(3)(c), F.S., the county’s governing body may levy an additional 1 percent tax on the total consideration charged for transient rental transactions. The tax shall be levied pursuant to an ordinance adopted by an extraordinary vote of the governing body for the purposes set forth in s. 125.0104(5), F.S., or by referendum approval by the registered voters within the county or subcounty special district. The provisions in s. 125.0104(4)(a)-(d), F.S., regarding the preparation of the county tourist development plan shall not be applicable to this tax. No county shall levy this additional tax unless the county has imposed the 1 or 2 percent tax for a minimum of three years prior to the effective date of the levy and imposition of this additional tax. If the 1 or 2 percent tax is levied within a subcounty special district, then this additional tax shall only be levied within the district. Generally, the revenues may be used for capital construction of tourist-related facilities, tourist promotion, and beach and shoreline maintenance. Counties Eligible to Levy: To be eligible to levy, a county must have levied the 1 or 2 percent tax pursuant to s. 125.0104(3)(c), F.S., for a minimum of three years prior to the effective date of the levy and imposition of this additional 1 percent tax. Authorized Uses of Proceeds: The county shall only use the tax proceeds for the following purposes, and any use of the tax proceeds not expressly authorized is prohibited.1
1. To acquire, construct, extend, enlarge, remodel, repair, improve, maintain, operate, or promote one or more publicly owned and operated convention centers, sports stadiums, sports arenas, coliseums, auditoriums, aquariums, or museums that are publicly owned and operated or owned and operated by non-profit organizations and open to the public, within the boundaries of the county or subcounty special taxing district in which the tax is levied. The tax revenues may also be used for promotion of zoological parks that are publicly owned and operated or owned and operated by not-for-profit organizations and open to the public. However, these purposes may be implemented through service contracts and leases with lessees with sufficient expertise or financial capability to operate such facilities. Revenues raised from this tax shall not be used for debt service on or refinancing of existing facilities as specified here unless approved by a resolution adopted by an extraordinary majority of the total membership of the county’s governing board.2
2. To promote and advertise tourism in Florida, nationally and internationally. However, if the tax revenues are expended for an activity, service, venue, or event, the activity, service, venue, or event shall have as one of its main purposes the attraction of tourists as evidenced by the promotion of the activity, service, venue, or event to tourists.
3. To fund convention bureaus, tourist bureaus, tourist information centers, and news bureaus as county agencies or by contract with the chambers of commerce or similar associations in the county. This may include any indirect administrative costs for services performed by the county on behalf of the promotion agency.
1. Section 125.0104(5), F.S. 2. Section 125.0104(3)(d), F.S.

Office of Economic and Demographic Research
252 2012 Local Government Financial Information Handbook
4. To finance beach park facilities or beach improvement, maintenance, renourishment, restoration, and erosion control, including shoreline protection, enhancement, cleanup, or restoration of inland lakes and rivers to which there is public access as those uses relate to the physical preservation of the beach, shoreline, or inland lake or river. However, any funds identified by a county as the local matching source for beach renourishment, restoration, or erosion control projects included in the long-range budget plan of the state’s Beach Management Plan, pursuant to s. 161.091, F.S., or funds contractually obligated by a county in the financial plan for a federally authorized shore protection project may not be used or loaned for any other purpose. In counties having a total population less than 100,000, no more than 10 percent of tourist development tax revenues may be used for beach park facilities.
A county, having a total population less than 750,000, may also use the proceeds to acquire, construct, extend, enlarge, remodel, repair, improve, maintain, operate, or promote one or more zoological parks, fishing piers, or nature centers that are publicly owned and operated or owned and operated by not-for-profit organizations and open to the public. All population figures relating to this authority shall be based on the most recent official population estimates, pursuant to s. 186.901, F.S. These population estimates shall be those in effect on July 1st of each year. Finally, the proceeds may be pledged to secure and liquidate revenue bonds issued by the county for the purposes set forth in s. 125.0104(5)(a)1. and 4., F.S., or to refund bonds previously issued for such purposes or both. However, no more than 50 percent of the proceeds may be pledged to secure and liquidate revenue bonds or revenue refunding bonds previously issued for the purposes set forth in s. 125.0104(5)(a)4., F.S. Such revenue bonds and revenue refunding bonds may be authorized and issued in such principal amounts, with such interest rates and maturity dates, and subject to such other terms, conditions, and covenants as the county’s governing board shall provide.

Office of Economic and Demographic Research
2012 Local Government Financial Information Handbook 253
Professional Sports Franchise Facility Tax Section 125.0104(3)(l), Florida Statutes
Summary: In addition to any other tourist development tax imposed, a county may levy up to an additional 1 percent tax on the total consideration charged for transient rental transactions. The tax shall be levied pursuant to an ordinance adopted by a majority vote of the county’s governing body. The proceeds are to pay the debt service on bonds issued to finance professional sports franchise facilities, retained spring training franchise facilities, and convention centers. In addition, these proceeds can be used to promote tourism in the State of Florida, nationally and internationally. The provisions in s. 125.0104(4)(a)-(d), F.S., regarding the preparation of the county tourist development plan, shall not be applicable to this tax. In addition, the provision in s. 125.0104(3)(b), F.S., that prohibits any county authorized to levy a convention development tax from levying more than the 2 percent tourist development tax is not applicable to this tax. Counties Eligible to Levy: All counties are eligible to levy this tax. Authorized Uses of Proceeds: The county shall only use the tax proceeds for the following purposes, and any use of the tax proceeds not expressly authorized in s. 125.0104(3)(l), F.S., is prohibited.1
1. To pay the debt service on bonds issued to finance the construction, reconstruction, or renovation of a professional sports franchise facility, or the acquisition, construction, reconstruction, or renovation of a retained spring training franchise facility, either publicly owned and operated, or publicly owned and operated by the owner of a professional sports franchise or other lessee with sufficient expertise or financial capability to operate such facility. The proceeds may be used to pay the planning and design costs incurred prior to the issuance of such bonds.
2. To pay the debt service on bonds issued to finance the construction, reconstruction, or renovation of a convention center. The proceeds may be used to pay the planning and design costs incurred prior to the issuance of such bonds.
3. To pay the operation and maintenance costs of a convention center for a period of up to 10 years. Only counties that have elected to levy the tax for the purposes authorized in #2 above, may use the tax proceeds for the purposes described here. Any county that elects to levy the tax for the purposes authorized in #2 above after July 1, 2000, may use the tax proceeds to pay the operation and maintenance costs of a convention center for the life of the bonds.
4. To promote and advertise tourism in Florida, nationally and internationally. However, if the tax revenues are expended for an activity, service, venue, or event, the activity, service, venue, or event shall have as one of its main purposes the attraction of tourists as evidenced by the promotion of the activity, service, venue, or event to tourists.
1. Section 125.0104(5)(d), F.S.

Office of Economic and Demographic Research
254 2012 Local Government Financial Information Handbook
This page was intentionally left blank.

Office of Economic and Demographic Research
2012 Local Government Financial Information Handbook 255
High Tourism Impact Tax Section 125.0104(3)(m), Florida Statutes
Summary: In addition to any other tourist development tax imposed, a high tourism impact county may levy an additional 1 percent tax on the total consideration charged for transient rental transactions. The tax shall be levied pursuant to an ordinance adopted by an extraordinary vote of the county’s governing body. The proceeds are to be used for one or more of the authorized uses pursuant to s. 125.0104(5), F.S. The provisions in s. 125.0104(4)(a)-(d), F.S., regarding the preparation of the county tourist development plan shall not be applicable to this tax. A county is considered to be a high tourism impact county after the Department of Revenue has certified to the county that its sales subject to the tax exceeded $600 million during the previous calendar year or were at least 18 percent of the county’s total taxable sales under ch. 212, F.S., where the sales subject to the tax were a minimum of $200 million. No county authorized to levy a convention development tax shall be considered a high tourism impact county. Once a county receives this designation, it shall retain this designation for the period of time that the tax is levied. Counties Eligible to Levy: Broward, Monroe, Orange, Osceola, and Walton counties have been designated as high tourism impact counties. Authorized Uses of Proceeds: The county shall only use the tax proceeds for the following purposes, and any use of the tax proceeds not expressly authorized is prohibited.1
1. To acquire, construct, extend, enlarge, remodel, repair, improve, maintain, operate, or promote one or more publicly owned and operated convention centers, sports stadiums, sports arenas, coliseums, auditoriums, aquariums, or museums that are publicly owned and operated or owned and operated by non-profit organizations and open to the public, within the boundaries of the county or subcounty special taxing district in which the tax is levied. The tax revenues may also be used for promotion of zoological parks that are publicly owned and operated or owned and operated by not-for-profit organizations and open to the public. However, these purposes may be implemented through service contracts and leases with lessees with sufficient expertise or financial capability to operate such facilities.
2. To promote and advertise tourism in Florida, nationally and internationally. However, if the tax revenues are expended for an activity, service, venue, or event, the activity, service, venue, or event shall have as one of its main purposes the attraction of tourists as evidenced by the promotion of the activity, service, venue, or event to tourists.
3. To fund convention bureaus, tourist bureaus, tourist information centers, and news bureaus as county agencies or by contract with the chambers of commerce or similar associations in the county. This may include any indirect administrative costs for services performed by the county on behalf of the promotion agency.
4. To finance beach park facilities or beach improvement, maintenance, renourishment, restoration, and erosion control, including shoreline protection, enhancement, cleanup, or restoration of inland lakes
1. Section 125.0104(5)(d), F.S.
Office of Economic and Demographic Research
256 2012 Local Government Financial Information Handbook
and rivers to which there is public access as those uses relate to the physical preservation of the beach, shoreline, or inland lake or river. However, any funds identified by a county as the local matching source for beach renourishment, restoration, or erosion control projects included in the long-range budget plan of the state’s Beach Management Plan, pursuant to s. 161.091, F.S., or funds contractually obligated by a county in the financial plan for a federally authorized shore protection project may not be used or loaned for any other purpose. In counties having a total population less than 100,000, no more than 10 percent of tourist development tax revenues may be used for beach park facilities.
A county, having a total population less than 750,000, may also use the proceeds to acquire, construct, extend, enlarge, remodel, repair, improve, maintain, operate, or promote one or more zoological parks, fishing piers, or nature centers that are publicly owned and operated or owned and operated by not-for-profit organizations and open to the public. All population figures relating to this authority shall be based on the most recent official population estimates, pursuant to s. 186.901, F.S. These population estimates shall be those in effect on July 1st of each year. Finally, the proceeds may be pledged to secure and liquidate revenue bonds issued by the county for the purposes set forth in s. 125.0104(5)(a)1. and 4., F.S., or to refund bonds previously issued for such purposes or both. However, no more than 50 percent of the proceeds may be pledged to secure and liquidate revenue bonds or revenue refunding bonds previously issued for the purpose set forth in s. 125.0104(5)(a)4., F.S. Such revenue bonds and revenue refunding bonds may be authorized and issued in such principal amounts, with such interest rates and maturity dates, and subject to such other terms, conditions, and covenants as the county’s governing board shall provide.

Office of Economic and Demographic Research
2012 Local Government Financial Information Handbook 257
Additional Professional Sports Franchise Facility Tax Section 125.0104(3)(n), Florida Statutes
Summary: In addition to any other tourist development tax imposed, a county that has levied the Professional Sports Franchise Facility Tax pursuant to s. 125.0104(3)(l), F.S., may levy an additional tax that is no greater than 1 percent on the total consideration charged for transient rental transactions. The tax shall be levied pursuant to an ordinance adopted by a majority plus one vote of the county’s governing body. The proceeds are to pay the debt service on bonds issued to finance professional sports franchise facilities or retained spring training franchise facilities and promote tourism. The provisions in s. 125.0104(4), F.S., regarding the preparation of the county tourist development plan shall not be applicable to this tax. In addition, the provision in s. 125.0104(3)(b), F.S., that prohibits any county authorized to levy a convention development tax from levying this tax applies only to Miami-Dade and Volusia counties. Any county authorized to levy the Consolidated County Convention Development Tax (i.e., Duval County) pursuant to s. 212.0305(4)(a), F.S., is permitted to levy this tax. Counties Eligible to Levy: With the exception of Miami-Dade and Volusia counties, any county that has levied the Professional Sports Franchise Facility Tax pursuant to s. 125.0104(3)(l), F.S., is eligible to levy this tax. Authorized Uses of Proceeds: The county shall only use the tax proceeds for the following purposes, and any use of the tax proceeds not expressly authorized in s. 125.0104(3)(n), F.S., is prohibited.1
1. To pay the debt service on bonds issued to finance the construction, reconstruction, or renovation of a facility either publicly owned and operated, or publicly owned and operated by the owner of a professional sports franchise or other lessee with sufficient expertise or financial capability to operate such facility. In addition, the proceeds shall be used to pay the planning and design costs incurred prior to the issuance of such bonds for a new professional sports franchise as defined in s. 288.1162, F.S.
2. To pay the debt service on bonds issued to finance the acquisition, construction, reconstruction, or renovation of a facility either publicly owned and operated, or publicly owned and operated by the owner of a professional sports franchise or other lessee with sufficient expertise or financial capability to operate such facility. In addition, the proceeds shall be used to pay the planning and design costs incurred prior to the issuance of such bonds for a retained spring training franchise.
3. To promote and advertise tourism in Florida, nationally and internationally. However, if the tax revenues are expended for an activity, service, venue, or event, the activity, service, venue, or event shall have as one of its main purposes the attraction of tourists as evidenced by the promotion of the activity, service, venue, or event to tourists.
A county imposing this tax may not expend any ad valorem tax revenues for the acquisition, construction, reconstruction, or renovation of a facility for which tax revenues are used pursuant to purposes listed in #1 and #2 above.
1. Section 125.0104(5)(d), F.S.

Office of Economic and Demographic Research
258 2012 Local Government Financial Information Handbook
This page was intentionally left blank.

Office of Economic and Demographic Research
2012 Local Government Financial Information Handbook 259
Tourist Impact Tax Section 125.0108, Florida Statutes
Summary: Any county creating a land authority pursuant to s. 380.0663(1), F.S., is authorized to levy a 1 percent tax, subject to referendum approval, on transient rental facilities within the county area designated as an area of critical state concern pursuant to ch. 380, F.S. If the area(s) of critical state concern are greater than 50 percent of the county’s total land area, the tax may be levied countywide. The tax proceeds are used to purchase property in the area of critical state concern and offset the loss of ad valorem taxes due to those land purchases. General Law Amendments: There were no general law amendments resulting from the 2012 Regular Legislative Session. Authorization to Levy: Any county creating a land authority pursuant to s. 380.0663(1), F.S., is authorized to levy by ordinance the tax in the area or areas within the county designated as an area of critical state concern pursuant to ch. 380, F.S. If the area or areas of critical state concern are greater than 50 percent of the county’s total land area, the tax may be levied countywide. The tax shall not be effective until land development regulations and a local comprehensive plan that meet the requirements of ch. 380, F.S., have become effective.1 The tax shall be effective only upon approval by a majority vote of qualified voters in the area or areas of critical state concern in the county seeking the levy. If the area or areas of critical state concern are greater than 50 percent of the county’s land area and the tax is to be imposed countywide, then the tax must be approved in a countywide referendum.2 The effective date of the levy and the imposition of this tax shall be the first day of the second month following approval of the ordinance by referendum or the first day of any subsequent month as may be specified in the ordinance.3 The tax may be repealed by passage of a resolution by four-fifths vote of the county’s governing body.4 The tax shall be repealed 10 years after the date the area of critical state concern designation is removed, unless it is repealed before the end of the 10 year period by the county’s governing body.5 A county that has levied the tax in an area or areas designated as an area of critical state concern for at least 20 consecutive years prior to removal of the designation may continue to levy the tax for 20 years following the designation’s removal. After expiration of the 20-year period, a county may continue to levy the tax if the county adopts an ordinance reauthorizing the tax levy and the continued tax levy is approved by referendum as provided for in s. 125.0108(5), F.S.6 Areas Eligible to Levy: Areas that have been statutorily designated as areas of critical state concern include the Big Cypress Area, primarily in Collier County; the Green Swamp Area, in central Florida; the Florida Keys Area, in south Florida; and the Apalachicola Bay Area, in Franklin County.7 1. Section 125.0108(1)(a), F.S. 2. Section 125.0108(5), F.S. 3. Section 125.0108(6), F.S.. 4. Section 125.0108(1)(c), F.S. 5. Section 125.0108(6), F.S. 6. Section 125.0108(1)(g), F.S. 7. Sections 380.055, .0551, .0552, .0555, F.S.
Office of Economic and Demographic Research
260 2012 Local Government Financial Information Handbook
Administrative Procedures: The person receiving consideration for the taxable privilege and doing business within the area of critical state concern (or within the entire county, as applicable) shall receive, account for, and remit the tourist impact tax to the Department of Revenue (DOR). The DOR shall keep records showing the amount of taxes collected for and from each county in which the tax is applicable. The DOR shall promulgate such rules and shall publish such forms as necessary to enforce the tax and is authorized to establish audit procedures and to assess for delinquent taxes.8 A county may exempt itself from the requirements that the tax be administered by the DOR according to ch. 212, F.S., if the county adopts an ordinance providing for local collection and administration of the tax. A county electing to locally administer the tax shall also adopt an ordinance electing either to assume all responsibility for auditing the records and accounts of dealers and assessing, collecting, and enforcing payments of delinquent taxes, or delegate such authority to the DOR.9 Reporting Requirements: A certified copy of the ordinance, including the time period and the effective date of the levy, shall be furnished by the county to the DOR within 10 days after passage of the ordinance levying the tax and again within 10 days after approval by referendum. If applicable, the county levying the tax shall provide the DOR with a list of the businesses within the area of critical state concern where the tax is levied. The list should identify businesses by zip code or other means of identification, and the DOR shall assist the county in compiling such a list.10 Distribution of Proceeds: Tax collections received by the DOR, less its administrative costs, shall be paid and returned monthly to the county and the land authority imposing the tax.11 Authorized Uses of Proceeds: The proceeds shall be distributed for the following uses.12
1. Fifty percent shall be transferred to the land authority to be used to purchase property in the area of critical state concern for which the revenue is generated. No more than 5 percent may be used for administration and other costs related to such purchases.
2. Fifty percent shall be distributed to the county’s governing body where the revenue was generated. Such proceeds shall be used to offset the loss of ad valorem taxes due to property acquisitions.
Attorney General Opinions: No opinions specifically relevant to this tax have been issued.
8. Section 125.0108(2), F.S. 9. Section 125.0104(10), F.S. 10. Section 125.0108(6), F.S. 11. Section 125.0108(2)(c), F.S. 12. Section 125.0108(3), F.S.

Office of Economic and Demographic Research
2012 Local Government Financial Information Handbook 261
Appendix A:
Adjusted 2011 Population Estimates for Florida’s Counties and Municipalities
Used in the FY 2012-13 State Revenue-Sharing Calculations

As certified to the Florida Department of Revenue by the Executive Office of the Governor.
Municipal Adjusted TotalApril 1, 2011 April 1, 2011 April 1, 2011 Annexations, Municipal Population
Total Inmate Total Population De-annexations, Incorporations Used for StateCounty / Municipality Population Population Less Inmates or Corrections or Dissolutions Revenue SharingAlachua County 247,337 1,787 245,550 - - 245,550 Alachua 9,108 - 9,108 - - 9,108 Archer 1,139 - 1,139 - - 1,139 Gainesville 124,379 1,274 123,105 - - 123,105 Hawthorne 1,409 - 1,409 - - 1,409 High Springs 5,358 - 5,358 - - 5,358 La Crosse 352 - 352 - - 352 Micanopy 594 - 594 - - 594 Newberry 4,945 - 4,945 - - 4,945 Waldo 1,003 - 1,003 - - 1,003 Unincorporated County 99,050 513 98,537 - - 98,537 Baker County 26,927 1,948 24,979 - - 24,979 Glen St. Mary 433 - 433 - - 433 Macclenny 6,347 - 6,347 3 - 6,350 Unincorporated County 20,147 1,948 18,199 (3) - 18,196 Bay County 169,278 1,169 168,109 - - 168,109 Callaway 14,383 - 14,383 75 - 14,458 Lynn Haven 18,585 - 18,585 - - 18,585 Mexico Beach 1,082 - 1,082 - - 1,082 Panama City 35,609 121 35,488 5 - 35,493 Panama City Beach 12,025 - 12,025 - - 12,025 Parker 4,329 - 4,329 - - 4,329 Springfield 8,908 - 8,908 27 - 8,935 Unincorporated County 74,357 1,048 73,309 (107) - 73,202 Bradford County 28,662 4,297 24,365 - - 24,365 Brooker 327 - 327 - - 327 Hampton 490 - 490 - - 490 Lawtey 727 - 727 - - 727 Starke 5,441 13 5,428 - - 5,428 Unincorporated County 21,677 4,284 17,393 - - 17,393 Brevard County 545,184 1,484 543,700 - - 543,700 Cape Canaveral 9,936 - 9,936 - - 9,936 Cocoa 17,238 - 17,238 - - 17,238 Cocoa Beach 11,233 - 11,233 - - 11,233 Grant-Valkaria 3,867 - 3,867 - - 3,867 Indialantic 2,731 - 2,731 - - 2,731 Indian Harbour Beach 8,272 - 8,272 - - 8,272 Malabar 2,750 - 2,750 - - 2,750 Melbourne 76,354 - 76,354 - - 76,354 Melbourne Beach 3,105 - 3,105 - - 3,105 Melbourne Village 662 - 662 - - 662 Palm Bay 103,504 - 103,504 - - 103,504 Palm Shores 876 - 876 - - 876 Rockledge 25,026 26 25,000 - - 25,000 Satellite Beach 10,166 - 10,166 - - 10,166 Titusville 43,852 29 43,823 - - 43,823 West Melbourne 18,712 - 18,712 13 - 18,725 Unincorporated County 206,900 1,429 205,471 (13) - 205,458 Broward County 1,753,162 1,946 1,751,216 - - 1,751,216 Coconut Creek 53,155 - 53,155 - - 53,155 Cooper City 29,159 5 29,154 - - 29,154 Coral Springs 121,651 - 121,651 - - 121,651 Dania Beach 29,596 - 29,596 - - 29,596 Davie 92,151 5 92,146 - - 92,146 Deerfield Beach 75,125 - 75,125 - - 75,125 Fort Lauderdale 166,205 293 165,912 - - 165,912 Hallandale Beach 37,229 - 37,229 - - 37,229 Hillsboro Beach 1,875 - 1,875 - - 1,875 Hollywood 140,930 - 140,930 - - 140,930 Lauderdale-By-The-Sea 6,074 - 6,074 - - 6,074 Lauderdale Lakes 32,766 - 32,766 - - 32,766 Lauderhill 66,709 - 66,709 - - 66,709 Lazy Lake Village 24 - 24 - - 24 Lighthouse Point 10,377 - 10,377 - - 10,377 Margate 53,714 - 53,714 - - 53,714 Miramar 122,982 - 122,982 - - 122,982
Adjusted 2011 Population Estimates for Florida's Counties and MunicipalitiesUsed for the FY 2012-13 State Revenue-Sharing Calculations
Population Adjustments
2012 Local Government Financial Information Handbook Page 262

As certified to the Florida Department of Revenue by the Executive Office of the Governor.
Municipal Adjusted TotalApril 1, 2011 April 1, 2011 April 1, 2011 Annexations, Municipal Population
Total Inmate Total Population De-annexations, Incorporations Used for StateCounty / Municipality Population Population Less Inmates or Corrections or Dissolutions Revenue Sharing
Adjusted 2011 Population Estimates for Florida's Counties and MunicipalitiesUsed for the FY 2012-13 State Revenue-Sharing Calculations
Population Adjustments
North Lauderdale 41,248 - 41,248 - - 41,248 Oakland Park 41,549 - 41,549 - - 41,549 Parkland 24,391 - 24,391 - - 24,391 Pembroke Park 6,099 - 6,099 - - 6,099 Pembroke Pines 154,889 614 154,275 - - 154,275 Plantation 84,687 - 84,687 - - 84,687 Pompano Beach 100,319 246 100,073 - - 100,073 Sea Ranch Lakes 675 - 675 - - 675 Southwest Ranches 7,345 - 7,345 - - 7,345 Sunrise 84,375 - 84,375 - - 84,375 Tamarac 60,619 - 60,619 - - 60,619 Weston 65,237 - 65,237 - - 65,237 West Park 14,078 - 14,078 - - 14,078 Wilton Manors 11,743 - 11,743 - - 11,743 Unincorporated County 16,186 783 15,403 - - 15,403 Calhoun County 14,685 1,688 12,997 - - 12,997 Altha 534 - 534 - - 534 Blountstown 2,512 - 2,512 - - 2,512 Unincorporated County 11,639 1,688 9,951 - - 9,951 Charlotte County 160,463 614 159,849 - - 159,849 Punta Gorda 16,741 - 16,741 - - 16,741 Unincorporated County 143,722 614 143,108 - - 143,108 Citrus County 140,956 182 140,774 - - 140,774 Crystal River 3,110 - 3,110 - - 3,110 Inverness 7,200 - 7,200 - - 7,200 Unincorporated County 130,646 182 130,464 - - 130,464 Clay County 191,143 - 191,143 - - 191,143 Green Cove Springs 6,898 - 6,898 - - 6,898 Keystone Heights 1,338 - 1,338 - - 1,338 Orange Park 8,412 - 8,412 - - 8,412 Penney Farms 741 - 741 - - 741 Unincorporated County 173,754 - 173,754 - - 173,754 Collier County 323,785 86 323,699 - - 323,699 Everglades 406 - 406 - - 406 Marco Island 16,443 - 16,443 - - 16,443 Naples 19,451 - 19,451 - - 19,451 Unincorporated County 287,485 86 287,399 - - 287,399 Columbia County 67,528 3,793 63,735 - - 63,735 Fort White 565 - 565 - - 565 Lake City 12,052 339 11,713 - - 11,713 Unincorporated County 54,911 3,454 51,457 - - 51,457 DeSoto County 34,708 2,088 32,620 - - 32,620 Arcadia 7,592 - 7,592 - - 7,592 Unincorporated County 27,116 2,088 25,028 - - 25,028 Dixie County 16,385 1,265 15,120 - - 15,120 Cross City 1,728 - 1,728 - - 1,728 Horseshoe Beach 168 - 168 - - 168 Unincorporated County 14,489 1,265 13,224 - - 13,224 Duval County 864,601 553 864,048 - - 864,048 Atlantic Beach 12,670 - 12,670 - - 12,670 Baldwin 1,406 - 1,406 - - 1,406 Jacksonville 822,038 553 821,485 - - 821,485 Jacksonville Beach 21,441 - 21,441 - - 21,441 Neptune Beach 7,046 - 7,046 - - 7,046 Escambia County 299,261 2,741 296,520 - - 296,520 Century 1,690 - 1,690 - - 1,690 Pensacola 51,939 59 51,880 - - 51,880 Unincorporated County 245,632 2,682 242,950 - - 242,950 Flagler County 96,241 - 96,241 - - 96,241 Beverly Beach 337 - 337 - - 337 Bunnell 2,700 - 2,700 - - 2,700 Flagler Beach (part) 4,444 - 4,444 - - 4,444 Marineland (part) 16 - 16 - - 16 Palm Coast 75,617 - 75,617 - - 75,617 Unincorporated County 13,127 - 13,127 - - 13,127 Franklin County 11,527 1,698 9,829 - - 9,829
2012 Local Government Financial Information Handbook Page 263

As certified to the Florida Department of Revenue by the Executive Office of the Governor.
Municipal Adjusted TotalApril 1, 2011 April 1, 2011 April 1, 2011 Annexations, Municipal Population
Total Inmate Total Population De-annexations, Incorporations Used for StateCounty / Municipality Population Population Less Inmates or Corrections or Dissolutions Revenue Sharing
Adjusted 2011 Population Estimates for Florida's Counties and MunicipalitiesUsed for the FY 2012-13 State Revenue-Sharing Calculations
Population Adjustments
Apalachicola 2,239 - 2,239 - - 2,239 Carrabelle 2,737 1,387 1,350 - - 1,350 Unincorporated County 6,551 311 6,240 - - 6,240 Gadsden County 48,200 3,182 45,018 - - 45,018 Chattahoochee 3,784 1,265 2,519 - - 2,519 Greensboro 602 - 602 - - 602 Gretna 1,460 - 1,460 - - 1,460 Havana 1,765 - 1,765 - - 1,765 Midway 3,076 - 3,076 - - 3,076 Quincy 7,868 398 7,470 - - 7,470 Unincorporated County 29,645 1,519 28,126 - - 28,126 Gilchrist County 16,983 911 16,072 - - 16,072 Bell 440 - 440 - - 440 Fanning Springs (part) 270 - 270 75 - 345 Trenton 1,985 - 1,985 - - 1,985 Unincorporated County 14,288 911 13,377 (75) - 13,302 Glades County 12,812 980 11,832 - - 11,832 Moore Haven 1,637 - 1,637 - - 1,637 Unincorporated County 11,175 980 10,195 - - 10,195 Gulf County 15,789 3,184 12,605 - - 12,605 Port St. Joe 3,462 - 3,462 - - 3,462 Wewahitchka 1,967 - 1,967 - - 1,967 Unincorporated County 10,360 3,184 7,176 - - 7,176 Hamilton County 14,744 2,784 11,960 - - 11,960 Jasper 2,868 1,219 1,649 - - 1,649 Jennings 884 - 884 - - 884 White Springs 784 - 784 - - 784 Unincorporated County 10,208 1,565 8,643 - - 8,643 Hardee County 27,653 1,878 25,775 - - 25,775 Bowling Green 2,914 - 2,914 - - 2,914 Wauchula 4,948 - 4,948 - - 4,948 Zolfo Springs 1,827 - 1,827 - - 1,827 Unincorporated County 17,964 1,878 16,086 - - 16,086 Hendry County 38,908 1,036 37,872 - - 37,872 Clewiston 7,161 - 7,161 - - 7,161 LaBelle 4,628 - 4,628 - - 4,628 Unincorporated County 27,119 1,036 26,083 - - 26,083 Hernando County 173,078 477 172,601 - - 172,601 Brooksville 7,711 - 7,711 - - 7,711 Weeki Wachee 12 - 12 - - 12 Unincorporated County 165,355 477 164,878 - - 164,878 Highlands County 98,712 23 98,689 - - 98,689 Avon Park 8,865 - 8,865 - - 8,865 Lake Placid 2,175 - 2,175 - - 2,175 Sebring 10,540 - 10,540 - - 10,540 Unincorporated County 77,132 23 77,109 - - 77,109 Hillsborough County 1,238,951 1,223 1,237,728 - - 1,237,728 Plant City 34,746 - 34,746 - - 34,746 Tampa 337,368 645 336,723 - - 336,723 Temple Terrace 24,442 - 24,442 - - 24,442 Unincorporated County 842,395 578 841,817 - - 841,817 Holmes County 19,901 1,464 18,437 - - 18,437 Bonifay 2,762 - 2,762 - - 2,762 Esto 364 - 364 - - 364 Noma 198 - 198 - - 198 Ponce de Leon 589 - 589 - - 589 Westville 294 - 294 - - 294 Unincorporated County 15,694 1,464 14,230 - - 14,230 Indian River County 138,694 488 138,206 - - 138,206 Fellsmere 5,220 - 5,220 - - 5,220 Indian River Shores 3,908 - 3,908 - - 3,908 Orchid 416 - 416 - - 416 Sebastian 21,995 - 21,995 - - 21,995 Vero Beach 15,256 - 15,256 - - 15,256 Unincorporated County 91,899 488 91,411 - - 91,411 Jackson County 49,964 7,524 42,440 - - 42,440
2012 Local Government Financial Information Handbook Page 264

As certified to the Florida Department of Revenue by the Executive Office of the Governor.
Municipal Adjusted TotalApril 1, 2011 April 1, 2011 April 1, 2011 Annexations, Municipal Population
Total Inmate Total Population De-annexations, Incorporations Used for StateCounty / Municipality Population Population Less Inmates or Corrections or Dissolutions Revenue Sharing
Adjusted 2011 Population Estimates for Florida's Counties and MunicipalitiesUsed for the FY 2012-13 State Revenue-Sharing Calculations
Population Adjustments
Alford 489 - 489 - - 489 Bascom 121 - 121 - - 121 Campbellton 232 - 232 - - 232 Cottondale 931 - 931 - - 931 Graceville 2,278 - 2,278 - - 2,278 Grand Ridge 951 - 951 - - 951 Greenwood 684 - 684 - - 684 Jacob City 267 - 267 - - 267 Malone 2,167 1,523 644 - - 644 Marianna 6,008 79 5,929 30 - 5,959 Sneads 1,862 - 1,862 - - 1,862 Unincorporated County 33,974 5,922 28,052 (30) - 28,022 Jefferson County 14,666 1,114 13,552 - - 13,552 Monticello 2,456 - 2,456 - - 2,456 Unincorporated County 12,210 1,114 11,096 - - 11,096 Lafayette County 8,752 1,872 6,880 - - 6,880 Mayo 1,225 9 1,216 - - 1,216 Unincorporated County 7,527 1,863 5,664 - - 5,664 Lake County 298,265 929 297,336 - - 297,336 Astatula 1,795 - 1,795 - - 1,795 Clermont 29,358 - 29,358 - - 29,358 Eustis 18,483 - 18,483 6 - 18,489 Fruitland Park 4,086 - 4,086 66 - 4,152 Groveland 8,800 - 8,800 - - 8,800 Howey-in-the-Hills 1,100 - 1,100 - - 1,100 Lady Lake 13,946 - 13,946 - - 13,946 Leesburg 20,251 - 20,251 157 - 20,408 Mascotte 5,091 - 5,091 - - 5,091 Minneola 9,485 - 9,485 - - 9,485 Montverde 1,455 - 1,455 - - 1,455 Mount Dora 12,557 - 12,557 - - 12,557 Tavares 14,015 - 14,015 - - 14,015 Umatilla 3,456 - 3,456 2 - 3,458 Unincorporated County 154,387 929 153,458 (231) - 153,227 Lee County 625,310 290 625,020 - - 625,020 Bonita Springs 44,307 6 44,301 - - 44,301 Cape Coral 156,369 29 156,340 - - 156,340 Fort Myers 63,662 76 63,586 - - 63,586 Fort Myers Beach 6,262 - 6,262 - - 6,262 Sanibel 6,470 - 6,470 - - 6,470 Unincorporated County 348,240 179 348,061 - - 348,061 Leon County 276,278 1,596 274,682 - - 274,682 Tallahassee 182,482 1,528 180,954 - - 180,954 Unincorporated County 93,796 68 93,728 - - 93,728 Levy County 40,767 222 40,545 - - 40,545 Bronson 1,100 - 1,100 - - 1,100 Cedar Key 707 - 707 - - 707 Chiefland 2,256 - 2,256 - - 2,256 Fanning Springs (part) 484 - 484 - - 484 Inglis 1,328 - 1,328 - - 1,328 Otter Creek 134 - 134 - - 134 Williston 2,765 - 2,765 - - 2,765 Yankeetown 494 - 494 - - 494 Unincorporated County 31,499 222 31,277 - - 31,277 Liberty County 8,370 1,555 6,815 - - 6,815 Bristol 1,000 48 952 - - 952 Unincorporated County 7,370 1,507 5,863 - - 5,863 Madison County 19,298 1,729 17,569 - - 17,569 Greenville 830 - 830 - - 830 Lee 340 - 340 - - 340 Madison 2,872 - 2,872 - - 2,872 Unincorporated County 15,256 1,729 13,527 - - 13,527 Manatee County 325,905 201 325,704 - - 325,704 Anna Maria 1,505 - 1,505 - - 1,505 Bradenton 49,724 36 49,688 - - 49,688 Bradenton Beach 1,177 - 1,177 - - 1,177
2012 Local Government Financial Information Handbook Page 265

As certified to the Florida Department of Revenue by the Executive Office of the Governor.
Municipal Adjusted TotalApril 1, 2011 April 1, 2011 April 1, 2011 Annexations, Municipal Population
Total Inmate Total Population De-annexations, Incorporations Used for StateCounty / Municipality Population Population Less Inmates or Corrections or Dissolutions Revenue Sharing
Adjusted 2011 Population Estimates for Florida's Counties and MunicipalitiesUsed for the FY 2012-13 State Revenue-Sharing Calculations
Population Adjustments
Holmes Beach 3,840 - 3,840 - - 3,840 Longboat Key (part) 2,395 - 2,395 - - 2,395 Palmetto 12,708 48 12,660 2 - 12,662 Unincorporated County 254,556 117 254,439 (2) - 254,437 Marion County 331,745 4,524 327,221 - - 327,221 Belleview 4,561 5 4,556 4 - 4,560 Dunnellon 1,737 - 1,737 - - 1,737 McIntosh 452 - 452 - - 452 Ocala 56,545 186 56,359 - - 56,359 Reddick 511 - 511 - - 511 Unincorporated County 267,939 4,333 263,606 (4) - 263,602 Martin County 146,689 1,725 144,964 - - 144,964 Jupiter Island 815 - 815 - - 815 Ocean Breeze Park 320 - 320 - - 320 Sewall's Point 2,002 - 2,002 - - 2,002 Stuart 15,636 23 15,613 - - 15,613 Unincorporated County 127,916 1,702 126,214 - - 126,214 Miami-Dade County 2,516,515 9,335 2,507,180 - - 2,507,180 Aventura 35,723 - 35,723 - - 35,723 Bal Harbour 2,502 - 2,502 - - 2,502 Bay Harbor Islands 5,634 - 5,634 - - 5,634 Biscayne Park 3,072 - 3,072 - - 3,072 Coral Gables 47,031 - 47,031 - - 47,031 Cutler Bay 40,644 - 40,644 - - 40,644 Doral 46,516 - 46,516 - - 46,516 El Portal 2,341 - 2,341 - - 2,341 Florida City 11,704 - 11,704 - - 11,704 Golden Beach 922 - 922 - - 922 Hialeah 226,545 - 226,545 - - 226,545 Hialeah Gardens 21,794 - 21,794 - - 21,794 Homestead 61,503 18 61,485 - - 61,485 Indian Creek Village 89 - 89 - - 89 Islandia 18 - 18 - - 18 Key Biscayne 12,363 - 12,363 - - 12,363 Medley 834 - 834 - - 834 Miami 406,385 2,243 404,142 - - 404,142 Miami Beach 88,349 - 88,349 - - 88,349 Miami Gardens 107,091 - 107,091 - - 107,091 Miami Lakes 29,369 12 29,357 - - 29,357 Miami Shores 10,608 - 10,608 - - 10,608 Miami Springs 13,844 - 13,844 - - 13,844 North Bay 7,349 - 7,349 - - 7,349 North Miami 58,806 - 58,806 - - 58,806 North Miami Beach 41,680 - 41,680 - - 41,680 Opa-locka 15,403 - 15,403 - - 15,403 Palmetto Bay 23,477 - 23,477 - - 23,477 Pinecrest 18,255 - 18,255 - - 18,255 South Miami 12,363 - 12,363 - - 12,363 Sunny Isles Beach 21,007 - 21,007 - - 21,007 Surfside 5,749 - 5,749 - - 5,749 Sweetwater 19,963 - 19,963 - - 19,963 Virginia Gardens 2,390 - 2,390 - - 2,390 West Miami 5,988 - 5,988 - - 5,988 Unincorporated County 1,109,204 7,062 1,102,142 - - 1,102,142 Monroe County 72,670 68 72,602 - - 72,602 Islamorada 6,147 - 6,147 - - 6,147 Key Colony Beach 796 - 796 - - 796 Key West 24,626 5 24,621 - - 24,621 Layton 182 - 182 - - 182 Marathon 8,316 - 8,316 - - 8,316 Unincorporated County 32,603 63 32,540 - - 32,540 Nassau County 73,684 104 73,580 - - 73,580 Callahan 1,125 - 1,125 - - 1,125 Fernandina Beach 11,510 46 11,464 - - 11,464 Hilliard 3,095 - 3,095 - - 3,095 Unincorporated County 57,954 58 57,896 - - 57,896
2012 Local Government Financial Information Handbook Page 266

As certified to the Florida Department of Revenue by the Executive Office of the Governor.
Municipal Adjusted TotalApril 1, 2011 April 1, 2011 April 1, 2011 Annexations, Municipal Population
Total Inmate Total Population De-annexations, Incorporations Used for StateCounty / Municipality Population Population Less Inmates or Corrections or Dissolutions Revenue Sharing
Adjusted 2011 Population Estimates for Florida's Counties and MunicipalitiesUsed for the FY 2012-13 State Revenue-Sharing Calculations
Population Adjustments
Okaloosa County 181,679 1,399 180,280 - - 180,280 Cinco Bayou 384 - 384 - - 384 Crestview 21,474 - 21,474 - - 21,474 Destin 12,319 - 12,319 - - 12,319 Fort Walton Beach 19,534 - 19,534 - - 19,534 Laurel Hill 527 - 527 - - 527 Mary Esther 3,844 - 3,844 - - 3,844 Niceville 12,834 - 12,834 - - 12,834 Shalimar 720 - 720 - - 720 Valparaiso 5,061 - 5,061 - - 5,061 Unincorporated County 104,982 1,399 103,583 - - 103,583 Okeechobee County 39,870 1,875 37,995 - - 37,995 Okeechobee 5,581 - 5,581 - - 5,581 Unincorporated County 34,289 1,875 32,414 - - 32,414 Orange County 1,157,342 2,490 1,154,852 - - 1,154,852 Apopka 42,089 - 42,089 21 - 42,110 Bay Lake 6 - 6 - - 6 Belle Isle 6,018 - 6,018 - - 6,018 Eatonville 2,198 62 2,136 - - 2,136 Edgewood 2,503 - 2,503 - - 2,503 Lake Buena Vista 21 - 21 - - 21 Maitland 15,808 - 15,808 - - 15,808 Oakland 2,556 - 2,556 - - 2,556 Ocoee 36,005 - 36,005 15 - 36,020 Orlando 241,978 448 241,530 58 - 241,588 Windermere 2,481 - 2,481 396 - 2,877 Winter Garden 35,281 - 35,281 - - 35,281 Winter Park 27,727 45 27,682 - - 27,682 Unincorporated County 742,671 1,935 740,736 (490) - 740,246 Osceola County 273,867 415 273,452 - - 273,452 Kissimmee 60,375 193 60,182 - - 60,182 St. Cloud 35,844 - 35,844 1,136 - 36,980 Unincorporated County 177,648 222 177,426 (1,136) - 176,290 Palm Beach County 1,325,758 4,001 1,321,757 - - 1,321,757 Atlantis 2,019 - 2,019 - - 2,019 Belle Glade 17,426 - 17,426 - - 17,426 Boca Raton 84,652 - 84,652 - - 84,652 Boynton Beach 68,409 - 68,409 - - 68,409 Briny Breezes 601 - 601 - - 601 Cloud Lake 137 - 137 - - 137 Delray Beach 60,831 - 60,831 102 - 60,933 Glen Ridge 219 - 219 - - 219 Golf 250 - 250 - - 250 Greenacres 37,873 - 37,873 - - 37,873 Gulf Stream 885 - 885 - - 885 Haverhill 1,894 - 1,894 - - 1,894 Highland Beach 3,542 - 3,542 - - 3,542 Hypoluxo 2,636 - 2,636 - - 2,636 Juno Beach 3,181 - 3,181 - - 3,181 Jupiter 55,542 - 55,542 - - 55,542 Jupiter Inlet Colony 400 - 400 - - 400 Lake Clarke Shores 3,374 - 3,374 - - 3,374 Lake Park 8,198 - 8,198 - - 8,198 Lake Worth 34,901 - 34,901 - - 34,901 Lantana 10,466 62 10,404 - - 10,404 Loxahatchee Groves 3,162 - 3,162 - - 3,162 Manalapan 406 - 406 - - 406 Mangonia Park 1,812 - 1,812 - - 1,812 North Palm Beach 12,033 - 12,033 - - 12,033 Ocean Ridge 1,783 - 1,783 - - 1,783 Pahokee 5,920 374 5,546 - - 5,546 Palm Beach 8,350 - 8,350 - - 8,350 Palm Beach Gardens 48,630 - 48,630 - - 48,630 Palm Beach Shores 1,141 - 1,141 - - 1,141 Palm Springs 19,082 - 19,082 717 - 19,799 Riviera Beach 32,535 - 32,535 - - 32,535
2012 Local Government Financial Information Handbook Page 267

As certified to the Florida Department of Revenue by the Executive Office of the Governor.
Municipal Adjusted TotalApril 1, 2011 April 1, 2011 April 1, 2011 Annexations, Municipal Population
Total Inmate Total Population De-annexations, Incorporations Used for StateCounty / Municipality Population Population Less Inmates or Corrections or Dissolutions Revenue Sharing
Adjusted 2011 Population Estimates for Florida's Counties and MunicipalitiesUsed for the FY 2012-13 State Revenue-Sharing Calculations
Population Adjustments
Royal Palm Beach 34,234 - 34,234 - - 34,234 South Bay 4,827 1,860 2,967 - - 2,967 South Palm Beach 1,174 - 1,174 - - 1,174 Tequesta 5,646 - 5,646 - - 5,646 Wellington 56,752 - 56,752 - - 56,752 West Palm Beach 100,801 319 100,482 - - 100,482 Unincorporated County 590,034 1,386 588,648 (819) - 587,829 Pasco County 466,533 800 465,733 - - 465,733 Dade City 6,485 - 6,485 - - 6,485 New Port Richey 14,959 - 14,959 - - 14,959 Port Richey 2,652 - 2,652 - - 2,652 St. Leo 1,378 - 1,378 - - 1,378 San Antonio 1,138 - 1,138 - - 1,138 Zephyrhills 13,317 - 13,317 - - 13,317 Unincorporated County 426,604 800 425,804 - - 425,804 Pinellas County 918,496 1,310 917,186 - - 917,186 Belleair 3,877 - 3,877 - - 3,877 Belleair Beach 1,563 - 1,563 - - 1,563 Belleair Bluffs 2,048 - 2,048 - - 2,048 Belleair Shore 109 - 109 - - 109 Clearwater 107,805 - 107,805 48 - 107,853 Dunedin 35,307 6 35,301 - - 35,301 Gulfport 12,022 - 12,022 - - 12,022 Indian Rocks Beach 4,102 - 4,102 - - 4,102 Indian Shores 1,421 - 1,421 - - 1,421 Kenneth City 4,989 - 4,989 - - 4,989 Largo 77,653 - 77,653 17 - 77,670 Madeira Beach 4,295 - 4,295 - - 4,295 North Redington Beach 1,427 - 1,427 - - 1,427 Oldsmar 13,597 - 13,597 8 - 13,605 Pinellas Park 49,286 - 49,286 7 - 49,293 Redington Beach 1,424 - 1,424 - - 1,424 Redington Shores 2,128 - 2,128 - - 2,128 Safety Harbor 16,881 6 16,875 3 - 16,878 St. Petersburg 246,293 422 245,871 - - 245,871 St. Pete Beach 9,334 - 9,334 - - 9,334 Seminole 17,215 - 17,215 7 - 17,222 South Pasadena 4,981 - 4,981 - - 4,981 Tarpon Springs 23,465 - 23,465 - - 23,465 Treasure Island 6,715 - 6,715 - - 6,715 Unincorporated County 270,559 876 269,683 (90) - 269,593 Polk County 604,792 3,543 601,249 - - 601,249 Auburndale 13,593 - 13,593 - - 13,593 Bartow 17,323 204 17,119 - - 17,119 Davenport 2,961 - 2,961 2 - 2,963 Dundee 3,749 - 3,749 - - 3,749 Eagle Lake 2,286 - 2,286 - - 2,286 Fort Meade 5,607 - 5,607 - - 5,607 Frostproof 3,008 - 3,008 - - 3,008 Haines City 20,661 - 20,661 - - 20,661 Highland Park 230 - 230 - - 230 Hillcrest Heights 248 - 248 - - 248 Lake Alfred 5,023 - 5,023 - - 5,023 Lake Hamilton 1,243 - 1,243 - - 1,243 Lake Wales 14,261 - 14,261 - - 14,261 Lakeland 97,690 - 97,690 - - 97,690 Mulberry 3,785 - 3,785 - - 3,785 Polk City 1,562 - 1,562 - - 1,562 Winter Haven 34,112 - 34,112 - - 34,112 Unincorporated County 377,450 3,339 374,111 (2) - 374,109 Putnam County 74,052 482 73,570 - - 73,570 Crescent City 1,524 - 1,524 - - 1,524 Interlachen 1,415 - 1,415 - - 1,415 Palatka 10,522 - 10,522 4 - 10,526 Pomona Park 920 - 920 - - 920 Welaka 704 - 704 - - 704
2012 Local Government Financial Information Handbook Page 268

As certified to the Florida Department of Revenue by the Executive Office of the Governor.
Municipal Adjusted TotalApril 1, 2011 April 1, 2011 April 1, 2011 Annexations, Municipal Population
Total Inmate Total Population De-annexations, Incorporations Used for StateCounty / Municipality Population Population Less Inmates or Corrections or Dissolutions Revenue Sharing
Adjusted 2011 Population Estimates for Florida's Counties and MunicipalitiesUsed for the FY 2012-13 State Revenue-Sharing Calculations
Population Adjustments
Unincorporated County 58,967 482 58,485 (4) - 58,481 St. Johns County 192,852 282 192,570 - - 192,570 Hastings 602 - 602 - - 602 Marineland (part) - - - - - - St. Augustine 13,053 - 13,053 - - 13,053 St. Augustine Beach 6,234 - 6,234 - - 6,234 Unincorporated County 172,963 282 172,681 - - 172,681 St. Lucie County 279,696 138 279,558 - - 279,558 Fort Pierce 41,789 44 41,745 28 - 41,773 Port St. Lucie 166,041 6 166,035 - - 166,035 St. Lucie Village 610 - 610 - - 610 Unincorporated County 71,256 88 71,168 (28) - 71,140 Santa Rosa County 154,901 4,985 149,916 - - 149,916 Gulf Breeze 5,765 - 5,765 - - 5,765 Jay 522 - 522 - - 522 Milton 9,115 78 9,037 - - 9,037 Unincorporated County 139,499 4,907 134,592 - - 134,592 Sarasota County 381,319 6 381,313 - - 381,313 Longboat Key (part) 4,487 - 4,487 - - 4,487 North Port 57,893 - 57,893 - - 57,893 Sarasota 52,114 6 52,108 - - 52,108 Venice 20,752 - 20,752 - - 20,752 Unincorporated County 246,073 - 246,073 - - 246,073 Seminole County 424,587 165 424,422 - - 424,422 Altamonte Springs 41,600 - 41,600 - - 41,600 Casselberry 26,321 6 26,315 13 - 26,328 Lake Mary 13,868 - 13,868 - - 13,868 Longwood 13,620 - 13,620 - - 13,620 Oviedo 33,815 - 33,815 - - 33,815 Sanford 53,422 33 53,389 11 - 53,400 Winter Springs 33,314 - 33,314 - - 33,314 Unincorporated County 208,627 126 208,501 (24) - 208,477 Sumter County 96,615 9,011 87,604 - - 87,604 Bushnell 2,439 - 2,439 - - 2,439 Center Hill 962 - 962 - - 962 Coleman 705 - 705 - - 705 Webster 768 - 768 - - 768 Wildwood 6,926 - 6,926 2 - 6,928 Unincorporated County 84,815 9,011 75,804 (2) - 75,802 Suwannee County 43,215 2,371 40,844 - - 40,844 Branford 705 - 705 - - 705 Live Oak 6,858 - 6,858 - - 6,858 Unincorporated County 35,652 2,371 33,281 - - 33,281 Taylor County 22,500 3,026 19,474 - - 19,474 Perry 6,977 - 6,977 - - 6,977 Unincorporated County 15,523 3,026 12,497 - - 12,497 Union County 15,473 4,769 10,704 - - 10,704 Lake Butler 1,892 - 1,892 - - 1,892 Raiford 255 - 255 - - 255 Worthington Springs 391 - 391 - - 391 Unincorporated County 12,935 4,769 8,166 - - 8,166 Volusia County 495,400 1,807 493,593 - - 493,593 Daytona Beach 61,031 53 60,978 - - 60,978 Daytona Beach Shores 4,259 - 4,259 2 - 4,261 DeBary 19,315 - 19,315 - - 19,315 DeLand 27,330 - 27,330 - - 27,330 Deltona 85,233 - 85,233 - - 85,233 Edgewater 20,734 - 20,734 - - 20,734 Flagler Beach (part) 60 - 60 - - 60 Holly Hill 11,652 - 11,652 - - 11,652 Lake Helen 2,614 - 2,614 - - 2,614 New Smyrna Beach 22,668 - 22,668 - - 22,668 Oak Hill 1,794 - 1,794 - - 1,794 Orange City 11,143 - 11,143 112 - 11,255 Ormond Beach 38,376 4 38,372 - - 38,372 Pierson 1,724 - 1,724 - - 1,724
2012 Local Government Financial Information Handbook Page 269

As certified to the Florida Department of Revenue by the Executive Office of the Governor.
Municipal Adjusted TotalApril 1, 2011 April 1, 2011 April 1, 2011 Annexations, Municipal Population
Total Inmate Total Population De-annexations, Incorporations Used for StateCounty / Municipality Population Population Less Inmates or Corrections or Dissolutions Revenue Sharing
Adjusted 2011 Population Estimates for Florida's Counties and MunicipalitiesUsed for the FY 2012-13 State Revenue-Sharing Calculations
Population Adjustments
Ponce Inlet 3,039 - 3,039 - - 3,039 Port Orange 56,313 - 56,313 - - 56,313 South Daytona 12,285 - 12,285 - - 12,285 Unincorporated County 115,830 1,750 114,080 (114) - 113,966 Wakulla County 30,877 3,264 27,613 - - 27,613 St. Marks 289 - 289 - - 289 Sopchoppy 457 - 457 - - 457 Unincorporated County 30,131 3,264 26,867 - - 26,867 Walton County 55,450 1,572 53,878 - - 53,878 DeFuniak Springs 5,149 40 5,109 - - 5,109 Freeport 1,860 - 1,860 - - 1,860 Paxton 633 - 633 - - 633 Unincorporated County 47,808 1,532 46,276 - - 46,276 Washington County 24,638 2,151 22,487 - - 22,487 Caryville 409 121 288 - - 288 Chipley 3,620 25 3,595 - - 3,595 Ebro 260 - 260 - - 260 Vernon 705 - 705 - - 705 Wausau 389 - 389 - - 389 Unincorporated County 19,255 2,005 17,250 - - 17,250 Statewide Total 18,905,048 127,619 18,777,429 - - 18,777,429 Statewide Incorporated 9,506,423 18,828 9,487,595 3,174 - 9,490,769 Statewide Unincorporated 9,398,625 108,791 9,289,834 (3,174) - 9,286,660
Notes:
Data Sources: Bureau of Economic and Business Research, University of Florida, and the Executive Office of the Governor.
1) The adjusted population estimates exclude the estimated number of inmates and patients in institutions operated by the federal government, Florida Departments of Corrections, Health, and Children and Family Services as of April 1, 2011. Pursuant to s. 186.901(2)(b), F.S., for the purpose of revenue-sharing distribution formulas and distribution proportions for the Local Government Half-cent Sales Tax Program, inmates and patients shall not be considered residents of the governmental unit in which the institutions are located.
2) Pursuant to s. 186.901(1), F.S., the Office of Economic and Demographic Research shall provide the Executive Office of the Governor with population estimates for municipal annexations or consolidations occurring during the period of April 1st through February 28th, and the Executive Office of the Governor shall include these estimates in its certification to the Department of Revenue for the annual revenue-sharing calculation.
4) On September 10, 2012, the U.S. Census Bureau revised the 2010 census counts for the City of Panama City and unincorporated Bay County, which also caused their respective 2011 revenue-sharing populations to change as well. Panama City's population was decreased by 981; unincorporated Bay County's population was increased by 981.
3) The population estimates were adjusted to reflect the population effects of any population corrections, municipal incorporations and dissolutions, and municipal annexations and de-annexations that occurred during the period of April 1, 2011 through February 28, 2012. The column "Adjusted Total Population Used for State Revenue Sharing" reflects all these adjustments.
2012 Local Government Financial Information Handbook Page 270
Office of Economic and Demographic Research
2012 Local Government Financial Information Handbook 271
Appendix B:
Comparison of 2010 and 2011 Adjusted Population Estimates
Used for the FY 2011-12 and FY 2012-13 State Revenue-Sharing Calculations
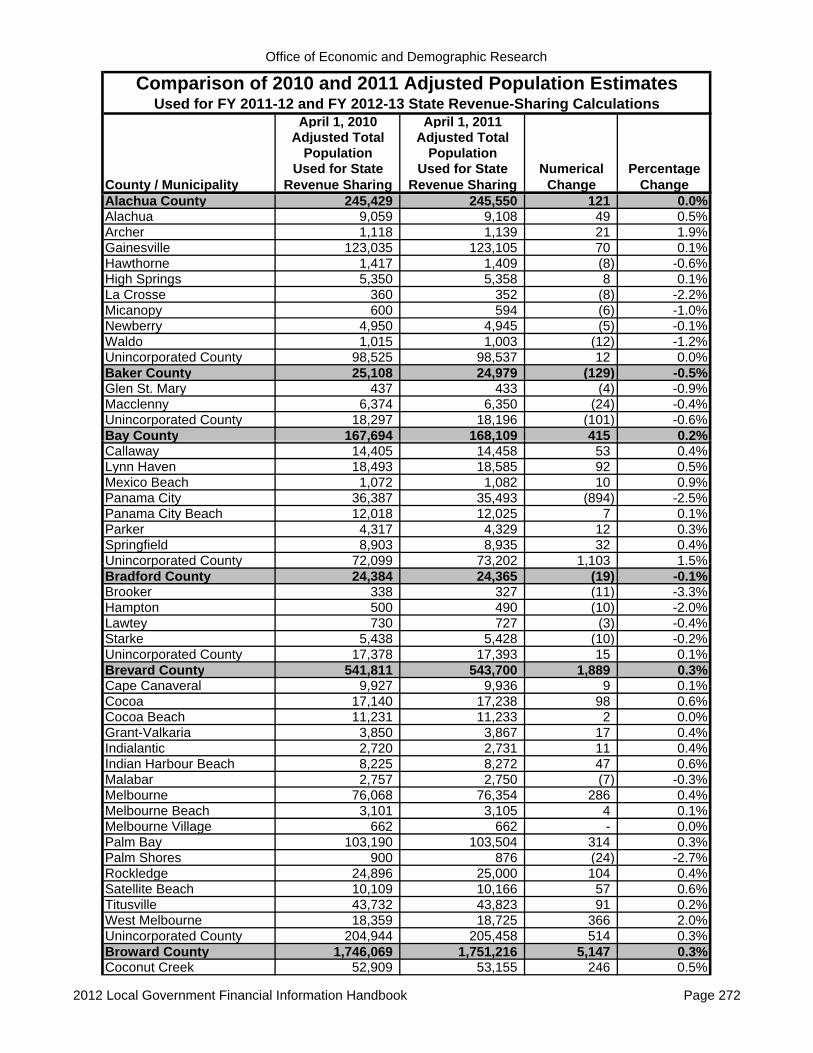
Office of Economic and Demographic Research
April 1, 2010 April 1, 2011Adjusted Total Adjusted Total
Population PopulationUsed for State Used for State Numerical Percentage
County / Municipality Revenue Sharing Revenue Sharing Change Change
Comparison of 2010 and 2011 Adjusted Population EstimatesUsed for FY 2011-12 and FY 2012-13 State Revenue-Sharing Calculations
Alachua County 245,429 245,550 121 0.0%Alachua 9,059 9,108 49 0.5%Archer 1,118 1,139 21 1.9%Gainesville 123,035 123,105 70 0.1%Hawthorne 1,417 1,409 (8) -0.6%High Springs 5,350 5,358 8 0.1%La Crosse 360 352 (8) -2.2%Micanopy 600 594 (6) -1.0%Newberry 4,950 4,945 (5) -0.1%Waldo 1,015 1,003 (12) -1.2%Unincorporated County 98,525 98,537 12 0.0%Baker County 25,108 24,979 (129) -0.5%Glen St. Mary 437 433 (4) -0.9%Macclenny 6,374 6,350 (24) -0.4%Unincorporated County 18,297 18,196 (101) -0.6%Bay County 167,694 168,109 415 0.2%y y , ,Callaway 14,405 14,458 53 0.4%Lynn Haven 18,493 18,585 92 0.5%Mexico Beach 1,072 1,082 10 0.9%Panama City 36,387 35,493 (894) -2.5%Panama City Beach 12,018 12,025 7 0.1%Parker 4,317 4,329 12 0.3%Springfield 8,903 8,935 32 0.4%Unincorporated County 72,099 73,202 1,103 1.5%Unincorporated County 72,099 73,202 1,103 1.5%Bradford County 24,384 24,365 (19) -0.1%Brooker 338 327 (11) -3.3%Hampton 500 490 (10) -2.0%Lawtey 730 727 (3) -0.4%Starke 5,438 5,428 (10) -0.2%Unincorporated County 17,378 17,393 15 0.1%Brevard County 541,811 543,700 1,889 0.3%Cape Canaveral 9 927 9 936 9 0 1%Cape Canaveral 9,927 9,936 9 0.1%Cocoa 17,140 17,238 98 0.6%Cocoa Beach 11,231 11,233 2 0.0%Grant-Valkaria 3,850 3,867 17 0.4%Indialantic 2,720 2,731 11 0.4%Indian Harbour Beach 8,225 8,272 47 0.6%Malabar 2,757 2,750 (7) -0.3%Melbourne 76,068 76,354 286 0.4%Melbourne Beach 3 101 3 105 4 0 1%Melbourne Beach 3,101 3,105 4 0.1%Melbourne Village 662 662 - 0.0%Palm Bay 103,190 103,504 314 0.3%Palm Shores 900 876 (24) -2.7%Rockledge 24,896 25,000 104 0.4%Satellite Beach 10,109 10,166 57 0.6%Titusville 43,732 43,823 91 0.2%West Melbourne 18,359 18,725 366 2.0%U i t d C t 204 944 205 458 514 0 3%Unincorporated County 204,944 205,458 514 0.3%Broward County 1,746,069 1,751,216 5,147 0.3%Coconut Creek 52,909 53,155 246 0.5%
2012 Local Government Financial Information Handbook Page 272
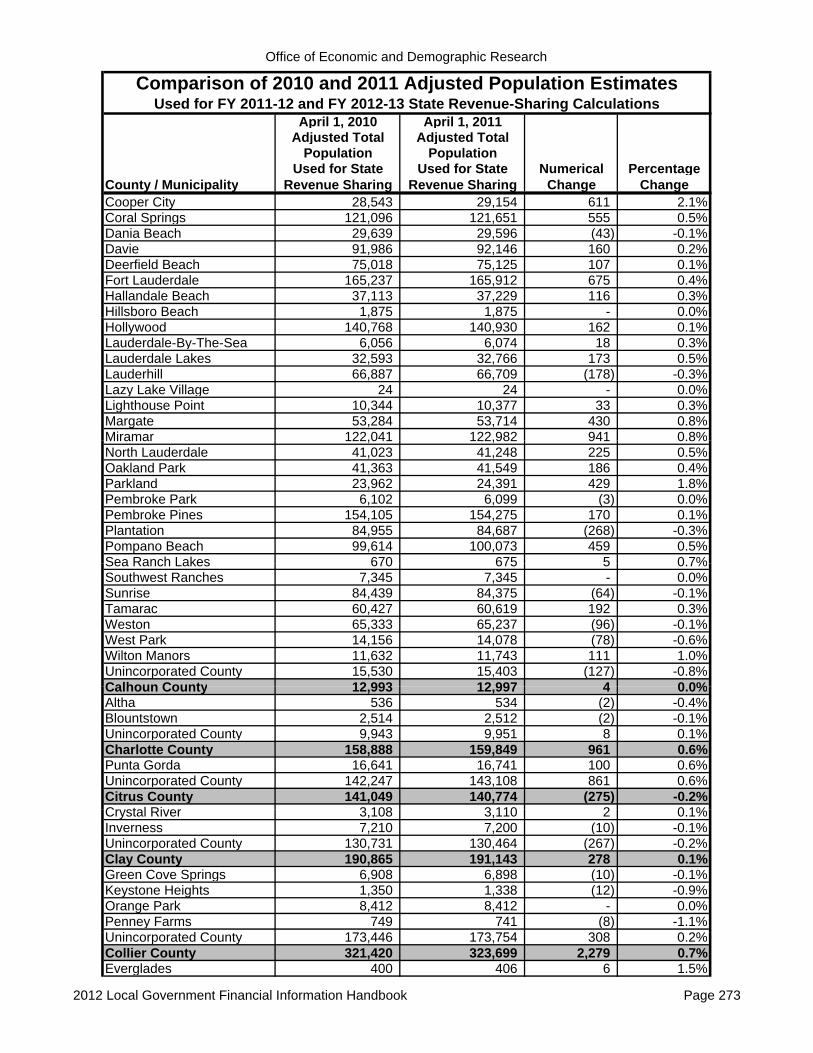
Office of Economic and Demographic Research
April 1, 2010 April 1, 2011Adjusted Total Adjusted Total
Population PopulationUsed for State Used for State Numerical Percentage
County / Municipality Revenue Sharing Revenue Sharing Change Change
Comparison of 2010 and 2011 Adjusted Population EstimatesUsed for FY 2011-12 and FY 2012-13 State Revenue-Sharing Calculations
Cooper City 28,543 29,154 611 2.1%Coral Springs 121,096 121,651 555 0.5%Dania Beach 29,639 29,596 (43) -0.1%Davie 91,986 92,146 160 0.2%Deerfield Beach 75,018 75,125 107 0.1%Fort Lauderdale 165,237 165,912 675 0.4%Hallandale Beach 37,113 37,229 116 0.3%Hillsboro Beach 1,875 1,875 - 0.0%, ,Hollywood 140,768 140,930 162 0.1%Lauderdale-By-The-Sea 6,056 6,074 18 0.3%Lauderdale Lakes 32,593 32,766 173 0.5%Lauderhill 66,887 66,709 (178) -0.3%Lazy Lake Village 24 24 - 0.0%Lighthouse Point 10,344 10,377 33 0.3%Margate 53,284 53,714 430 0.8%Miramar 122,041 122,982 941 0.8%Miramar 122,041 122,982 941 0.8%North Lauderdale 41,023 41,248 225 0.5%Oakland Park 41,363 41,549 186 0.4%Parkland 23,962 24,391 429 1.8%Pembroke Park 6,102 6,099 (3) 0.0%Pembroke Pines 154,105 154,275 170 0.1%Plantation 84,955 84,687 (268) -0.3%Pompano Beach 99,614 100,073 459 0.5%Sea Ranch Lakes 670 675 5 0 7%Sea Ranch Lakes 670 675 5 0.7%Southwest Ranches 7,345 7,345 - 0.0%Sunrise 84,439 84,375 (64) -0.1%Tamarac 60,427 60,619 192 0.3%Weston 65,333 65,237 (96) -0.1%West Park 14,156 14,078 (78) -0.6%Wilton Manors 11,632 11,743 111 1.0%Unincorporated County 15,530 15,403 (127) -0.8%Calhoun County 12 993 12 997 4 0 0%Calhoun County 12,993 12,997 4 0.0%Altha 536 534 (2) -0.4%Blountstown 2,514 2,512 (2) -0.1%Unincorporated County 9,943 9,951 8 0.1%Charlotte County 158,888 159,849 961 0.6%Punta Gorda 16,641 16,741 100 0.6%Unincorporated County 142,247 143,108 861 0.6%Citrus County 141,049 140,774 (275) -0.2%Crystal River 3 108 3 110 2 0 1%Crystal River 3,108 3,110 2 0.1%Inverness 7,210 7,200 (10) -0.1%Unincorporated County 130,731 130,464 (267) -0.2%Clay County 190,865 191,143 278 0.1%Green Cove Springs 6,908 6,898 (10) -0.1%Keystone Heights 1,350 1,338 (12) -0.9%Orange Park 8,412 8,412 - 0.0%Penney Farms 749 741 (8) -1.1%U i t d C t 173 446 173 754 308 0 2%Unincorporated County 173,446 173,754 308 0.2%Collier County 321,420 323,699 2,279 0.7%Everglades 400 406 6 1.5%
2012 Local Government Financial Information Handbook Page 273

Office of Economic and Demographic Research
April 1, 2010 April 1, 2011Adjusted Total Adjusted Total
Population PopulationUsed for State Used for State Numerical Percentage
County / Municipality Revenue Sharing Revenue Sharing Change Change
Comparison of 2010 and 2011 Adjusted Population EstimatesUsed for FY 2011-12 and FY 2012-13 State Revenue-Sharing Calculations
Marco Island 16,413 16,443 30 0.2%Naples 19,537 19,451 (86) -0.4%Unincorporated County 285,070 287,399 2,329 0.8%Columbia County 63,822 63,735 (87) -0.1%Fort White 567 565 (2) -0.4%Lake City 11,738 11,713 (25) -0.2%Unincorporated County 51,517 51,457 (60) -0.1%DeSoto County 32,702 32,620 (82) -0.3%y , , ( )Arcadia 7,637 7,592 (45) -0.6%Unincorporated County 25,065 25,028 (37) -0.1%Dixie County 15,140 15,120 (20) -0.1%Cross City 1,728 1,728 - 0.0%Horseshoe Beach 169 168 (1) -0.6%Unincorporated County 13,243 13,224 (19) -0.1%Duval County 863,686 864,048 362 0.0%Atlantic Beach 12,655 12,670 15 0.1%Atlantic Beach 12,655 12,670 15 0.1%Baldwin 1,425 1,406 (19) -1.3%Jacksonville 821,207 821,485 278 0.0%Jacksonville Beach 21,362 21,441 79 0.4%Neptune Beach 7,037 7,046 9 0.1%Escambia County 294,992 296,520 1,528 0.5%Century 1,698 1,690 (8) -0.5%Pensacola 51,851 51,880 29 0.1%Unincorporated County 241 443 242 950 1 507 0 6%Unincorporated County 241,443 242,950 1,507 0.6%Flagler County 95,696 96,241 545 0.6%Beverly Beach 338 337 (1) -0.3%Bunnell 2,676 2,700 24 0.9%Flagler Beach (part) 4,424 4,444 20 0.5%Marineland (part) 16 16 - 0.0%Palm Coast 75,180 75,617 437 0.6%Unincorporated County 13,062 13,127 65 0.5%Franklin County 9 814 9 829 15 0 2%Franklin County 9,814 9,829 15 0.2%Apalachicola 2,231 2,239 8 0.4%Carrabelle 1,357 1,350 (7) -0.5%Unincorporated County 6,226 6,240 14 0.2%Gadsden County 43,102 45,018 1,916 4.4%Chattahoochee 2,301 2,519 218 9.5%Greensboro 602 602 - 0.0%Gretna 1,460 1,460 - 0.0%Havana 1 754 1 765 11 0 6%Havana 1,754 1,765 11 0.6%Midway 3,004 3,076 72 2.4%Quincy 7,551 7,470 (81) -1.1%Unincorporated County 26,430 28,126 1,696 6.4%Gilchrist County 16,036 16,072 36 0.2%Bell 456 440 (16) -3.5%Fanning Springs (part) 278 345 67 24.1%Trenton 1,999 1,985 (14) -0.7%U i t d C t 13 303 13 302 (1) 0 0%Unincorporated County 13,303 13,302 (1) 0.0%Glades County 11,903 11,832 (71) -0.6%Moore Haven 1,680 1,637 (43) -2.6%
2012 Local Government Financial Information Handbook Page 274
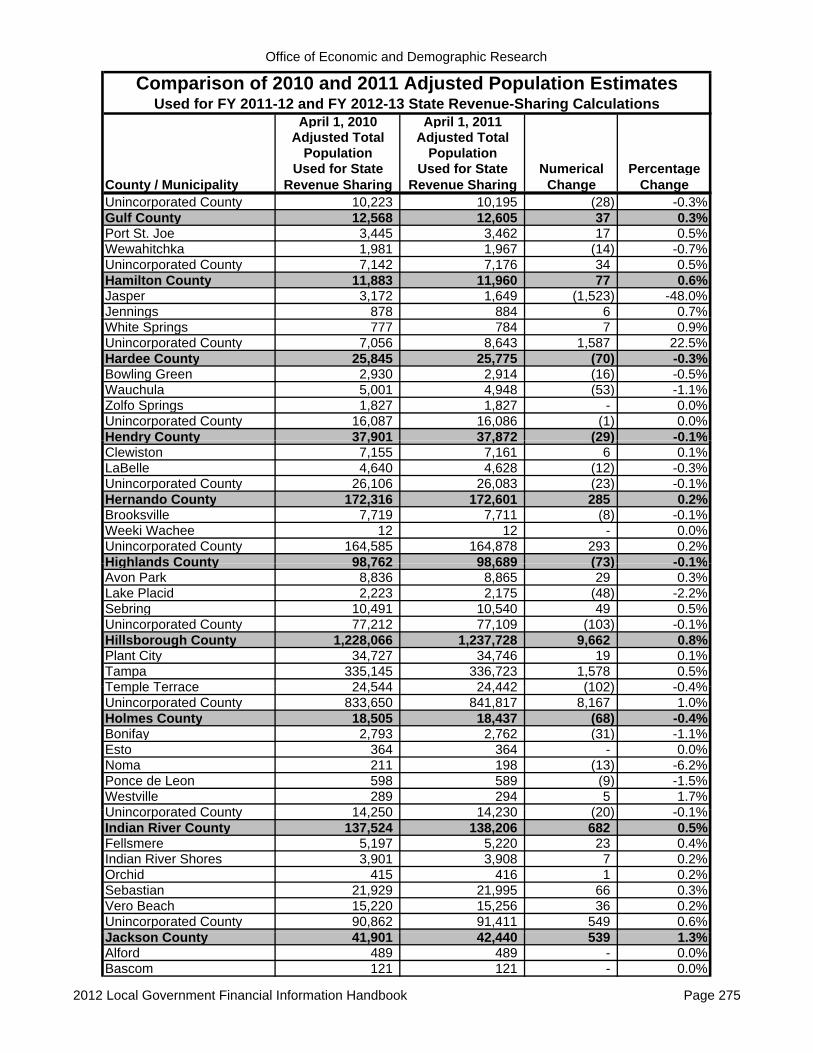
Office of Economic and Demographic Research
April 1, 2010 April 1, 2011Adjusted Total Adjusted Total
Population PopulationUsed for State Used for State Numerical Percentage
County / Municipality Revenue Sharing Revenue Sharing Change Change
Comparison of 2010 and 2011 Adjusted Population EstimatesUsed for FY 2011-12 and FY 2012-13 State Revenue-Sharing Calculations
Unincorporated County 10,223 10,195 (28) -0.3%Gulf County 12,568 12,605 37 0.3%Port St. Joe 3,445 3,462 17 0.5%Wewahitchka 1,981 1,967 (14) -0.7%Unincorporated County 7,142 7,176 34 0.5%Hamilton County 11,883 11,960 77 0.6%Jasper 3,172 1,649 (1,523) -48.0%Jennings 878 884 6 0.7%gWhite Springs 777 784 7 0.9%Unincorporated County 7,056 8,643 1,587 22.5%Hardee County 25,845 25,775 (70) -0.3%Bowling Green 2,930 2,914 (16) -0.5%Wauchula 5,001 4,948 (53) -1.1%Zolfo Springs 1,827 1,827 - 0.0%Unincorporated County 16,087 16,086 (1) 0.0%Hendry County 37,901 37,872 (29) -0.1%Hendry County 37,901 37,872 (29) 0.1%Clewiston 7,155 7,161 6 0.1%LaBelle 4,640 4,628 (12) -0.3%Unincorporated County 26,106 26,083 (23) -0.1%Hernando County 172,316 172,601 285 0.2%Brooksville 7,719 7,711 (8) -0.1%Weeki Wachee 12 12 - 0.0%Unincorporated County 164,585 164,878 293 0.2%Highlands County 98 762 98 689 (73) -0 1%Highlands County 98,762 98,689 (73) -0.1%Avon Park 8,836 8,865 29 0.3%Lake Placid 2,223 2,175 (48) -2.2%Sebring 10,491 10,540 49 0.5%Unincorporated County 77,212 77,109 (103) -0.1%Hillsborough County 1,228,066 1,237,728 9,662 0.8%Plant City 34,727 34,746 19 0.1%Tampa 335,145 336,723 1,578 0.5%Temple Terrace 24 544 24 442 (102) 0 4%Temple Terrace 24,544 24,442 (102) -0.4%Unincorporated County 833,650 841,817 8,167 1.0%Holmes County 18,505 18,437 (68) -0.4%Bonifay 2,793 2,762 (31) -1.1%Esto 364 364 - 0.0%Noma 211 198 (13) -6.2%Ponce de Leon 598 589 (9) -1.5%Westville 289 294 5 1.7%Unincorporated County 14 250 14 230 (20) 0 1%Unincorporated County 14,250 14,230 (20) -0.1%Indian River County 137,524 138,206 682 0.5%Fellsmere 5,197 5,220 23 0.4%Indian River Shores 3,901 3,908 7 0.2%Orchid 415 416 1 0.2%Sebastian 21,929 21,995 66 0.3%Vero Beach 15,220 15,256 36 0.2%Unincorporated County 90,862 91,411 549 0.6%J k C t 41 901 42 440 539 1 3%Jackson County 41,901 42,440 539 1.3%Alford 489 489 - 0.0%Bascom 121 121 - 0.0%
2012 Local Government Financial Information Handbook Page 275

Office of Economic and Demographic Research
April 1, 2010 April 1, 2011Adjusted Total Adjusted Total
Population PopulationUsed for State Used for State Numerical Percentage
County / Municipality Revenue Sharing Revenue Sharing Change Change
Comparison of 2010 and 2011 Adjusted Population EstimatesUsed for FY 2011-12 and FY 2012-13 State Revenue-Sharing Calculations
Campbellton 230 232 2 0.9%Cottondale 933 931 (2) -0.2%Graceville 2,278 2,278 - 0.0%Grand Ridge 892 951 59 6.6%Greenwood 686 684 (2) -0.3%Jacob City 250 267 17 6.8%Malone 500 644 144 28.8%Marianna 5,942 5,959 17 0.3%, ,Sneads 1,849 1,862 13 0.7%Unincorporated County 27,731 28,022 291 1.0%Jefferson County 13,566 13,552 (14) -0.1%Monticello 2,476 2,456 (20) -0.8%Unincorporated County 11,090 11,096 6 0.1%Lafayette County 6,854 6,880 26 0.4%Mayo 1,237 1,216 (21) -1.7%Unincorporated County 5,617 5,664 47 0.8%Unincorporated County 5,617 5,664 47 0.8%Lake County 295,913 297,336 1,423 0.5%Astatula 1,810 1,795 (15) -0.8%Clermont 28,742 29,358 616 2.1%Eustis 18,560 18,489 (71) -0.4%Fruitland Park 4,078 4,152 74 1.8%Groveland 8,729 8,800 71 0.8%Howey-in-the-Hills 1,098 1,100 2 0.2%Lady Lake 13 926 13 946 20 0 1%Lady Lake 13,926 13,946 20 0.1%Leesburg 20,119 20,408 289 1.4%Mascotte 5,101 5,091 (10) -0.2%Minneola 9,403 9,485 82 0.9%Montverde 1,463 1,455 (8) -0.5%Mount Dora 12,370 12,557 187 1.5%Tavares 13,951 14,015 64 0.5%Umatilla 3,456 3,458 2 0.1%Unincorporated County 153 107 153 227 120 0 1%Unincorporated County 153,107 153,227 120 0.1%Lee County 618,443 625,020 6,577 1.1%Bonita Springs 43,908 44,301 393 0.9%Cape Coral 154,276 156,340 2,064 1.3%Fort Myers 62,214 63,586 1,372 2.2%Fort Myers Beach 6,277 6,262 (15) -0.2%Sanibel 6,469 6,470 1 0.0%Unincorporated County 345,299 348,061 2,762 0.8%Leon County 273 914 274 682 768 0 3%Leon County 273,914 274,682 768 0.3%Tallahassee 179,887 180,954 1,067 0.6%Unincorporated County 94,027 93,728 (299) -0.3%Levy County 40,572 40,545 (27) -0.1%Bronson 1,113 1,100 (13) -1.2%Cedar Key 702 707 5 0.7%Chiefland 2,245 2,256 11 0.5%Fanning Springs (part) 486 484 (2) -0.4%I li 1 325 1 328 3 0 2%Inglis 1,325 1,328 3 0.2%Otter Creek 134 134 - 0.0%Williston 2,768 2,765 (3) -0.1%
2012 Local Government Financial Information Handbook Page 276

Office of Economic and Demographic Research
April 1, 2010 April 1, 2011Adjusted Total Adjusted Total
Population PopulationUsed for State Used for State Numerical Percentage
County / Municipality Revenue Sharing Revenue Sharing Change Change
Comparison of 2010 and 2011 Adjusted Population EstimatesUsed for FY 2011-12 and FY 2012-13 State Revenue-Sharing Calculations
Yankeetown 502 494 (8) -1.6%Unincorporated County 31,297 31,277 (20) -0.1%Liberty County 6,748 6,815 67 1.0%Bristol 944 952 8 0.8%Unincorporated County 5,804 5,863 59 1.0%Madison County 17,563 17,569 6 0.0%Greenville 843 830 (13) -1.5%Lee 352 340 (12) -3.4%( )Madison 2,843 2,872 29 1.0%Unincorporated County 13,525 13,527 2 0.0%Manatee County 322,617 325,704 3,087 1.0%Anna Maria 1,503 1,505 2 0.1%Bradenton 49,498 49,688 190 0.4%Bradenton Beach 1,171 1,177 6 0.5%Holmes Beach 3,836 3,840 4 0.1%Longboat Key (part) 2,398 2,395 (3) -0.1%Longboat Key (part) 2,398 2,395 (3) 0.1%Palmetto 12,558 12,662 104 0.8%Unincorporated County 251,653 254,437 2,784 1.1%Marion County 326,694 327,221 527 0.2%Belleview 4,486 4,560 74 1.6%Dunnellon 1,733 1,737 4 0.2%McIntosh 452 452 - 0.0%Ocala 56,145 56,359 214 0.4%Reddick 506 511 5 1 0%Reddick 506 511 5 1.0%Unincorporated County 263,372 263,602 230 0.1%Martin County 144,550 144,964 414 0.3%Jupiter Island 817 815 (2) -0.2%Ocean Breeze Park 355 320 (35) -9.9%Sewall's Point 1,996 2,002 6 0.3%Stuart 15,569 15,613 44 0.3%Unincorporated County 125,813 126,214 401 0.3%Miami Dade County 2 486 436 2 507 180 20 744 0 8%Miami-Dade County 2,486,436 2,507,180 20,744 0.8%Aventura 35,762 35,723 (39) -0.1%Bal Harbour 2,513 2,502 (11) -0.4%Bay Harbor Islands 5,628 5,634 6 0.1%Biscayne Park 3,055 3,072 17 0.6%Coral Gables 46,780 47,031 251 0.5%Cutler Bay 40,286 40,644 358 0.9%Doral 45,704 46,516 812 1.8%El Portal 2 325 2 341 16 0 7%El Portal 2,325 2,341 16 0.7%Florida City 11,245 11,704 459 4.1%Golden Beach 919 922 3 0.3%Hialeah 224,669 226,545 1,876 0.8%Hialeah Gardens 21,744 21,794 50 0.2%Homestead 60,494 61,485 991 1.6%Indian Creek Village 86 89 3 3.5%Islandia 18 18 - 0.0%K Bi 12 344 12 363 19 0 2%Key Biscayne 12,344 12,363 19 0.2%Medley 838 834 (4) -0.5%Miami 396,992 404,142 7,150 1.8%
2012 Local Government Financial Information Handbook Page 277

Office of Economic and Demographic Research
April 1, 2010 April 1, 2011Adjusted Total Adjusted Total
Population PopulationUsed for State Used for State Numerical Percentage
County / Municipality Revenue Sharing Revenue Sharing Change Change
Comparison of 2010 and 2011 Adjusted Population EstimatesUsed for FY 2011-12 and FY 2012-13 State Revenue-Sharing Calculations
Miami Beach 87,779 88,349 570 0.6%Miami Gardens 107,167 107,091 (76) -0.1%Miami Lakes 29,361 29,357 (4) 0.0%Miami Shores 10,493 10,608 115 1.1%Miami Springs 13,809 13,844 35 0.3%North Bay 7,137 7,349 212 3.0%North Miami 58,786 58,806 20 0.0%North Miami Beach 41,523 41,680 157 0.4%, ,Opa-locka 15,219 15,403 184 1.2%Palmetto Bay 23,410 23,477 67 0.3%Pinecrest 18,223 18,255 32 0.2%South Miami 11,657 12,363 706 6.1%Sunny Isles Beach 20,832 21,007 175 0.8%Surfside 5,744 5,749 5 0.1%Sweetwater 19,963 19,963 - 0.0%Virginia Gardens 2,375 2,390 15 0.6%Virginia Gardens 2,375 2,390 15 0.6%West Miami 5,965 5,988 23 0.4%Unincorporated County 1,095,591 1,102,142 6,551 0.6%Monroe County 73,023 72,602 (421) -0.6%Islamorada 6,119 6,147 28 0.5%Key Colony Beach 797 796 (1) -0.1%Key West 24,644 24,621 (23) -0.1%Layton 184 182 (2) -1.1%Marathon 8 297 8 316 19 0 2%Marathon 8,297 8,316 19 0.2%Unincorporated County 32,982 32,540 (442) -1.3%Nassau County 73,214 73,580 366 0.5%Callahan 1,123 1,125 2 0.2%Fernandina Beach 11,441 11,464 23 0.2%Hilliard 3,086 3,095 9 0.3%Unincorporated County 57,564 57,896 332 0.6%Okaloosa County 179,257 180,280 1,023 0.6%Cinco Bayou 383 384 1 0 3%Cinco Bayou 383 384 1 0.3%Crestview 20,978 21,474 496 2.4%Destin 12,305 12,319 14 0.1%Fort Walton Beach 19,507 19,534 27 0.1%Laurel Hill 537 527 (10) -1.9%Mary Esther 3,851 3,844 (7) -0.2%Niceville 12,751 12,834 83 0.7%Shalimar 717 720 3 0.4%Valparaiso 5 036 5 061 25 0 5%Valparaiso 5,036 5,061 25 0.5%Unincorporated County 103,192 103,583 391 0.4%Okeechobee County 38,100 37,995 (105) -0.3%Okeechobee 5,621 5,581 (40) -0.7%Unincorporated County 32,479 32,414 (65) -0.2%Orange County 1,142,720 1,154,852 12,132 1.1%Apopka 41,577 42,110 533 1.3%Bay Lake 47 6 (41) -87.2%B ll I l 5 988 6 018 30 0 5%Belle Isle 5,988 6,018 30 0.5%Eatonville 2,095 2,136 41 2.0%Edgewood 2,503 2,503 - 0.0%
2012 Local Government Financial Information Handbook Page 278

Office of Economic and Demographic Research
April 1, 2010 April 1, 2011Adjusted Total Adjusted Total
Population PopulationUsed for State Used for State Numerical Percentage
County / Municipality Revenue Sharing Revenue Sharing Change Change
Comparison of 2010 and 2011 Adjusted Population EstimatesUsed for FY 2011-12 and FY 2012-13 State Revenue-Sharing Calculations
Lake Buena Vista 10 21 11 110.0%Maitland 15,751 15,808 57 0.4%Oakland 2,538 2,556 18 0.7%Ocoee 35,607 36,020 413 1.2%Orlando 237,852 241,588 3,736 1.6%Windermere 2,462 2,877 415 16.9%Winter Garden 34,571 35,281 710 2.1%Winter Park 27,786 27,682 (104) -0.4%, , ( )Unincorporated County 733,933 740,246 6,313 0.9%Osceola County 268,272 273,452 5,180 1.9%Kissimmee 59,497 60,182 685 1.2%St. Cloud 35,183 36,980 1,797 5.1%Unincorporated County 173,592 176,290 2,698 1.6%Palm Beach County 1,316,481 1,321,757 5,276 0.4%Atlantis 2,005 2,019 14 0.7%Belle Glade 17,467 17,426 (41) -0.2%Belle Glade 17,467 17,426 (41) 0.2%Boca Raton 84,392 84,652 260 0.3%Boynton Beach 68,217 68,409 192 0.3%Briny Breezes 601 601 - 0.0%Cloud Lake 135 137 2 1.5%Delray Beach 60,522 60,933 411 0.7%Glen Ridge 219 219 - 0.0%Golf 252 250 (2) -0.8%Greenacres 37 573 37 873 300 0 8%Greenacres 37,573 37,873 300 0.8%Gulf Stream 939 885 (54) -5.8%Haverhill 1,873 1,894 21 1.1%Highland Beach 3,539 3,542 3 0.1%Hypoluxo 2,588 2,636 48 1.9%Juno Beach 3,176 3,181 5 0.2%Jupiter 55,156 55,542 386 0.7%Jupiter Inlet Colony 400 400 - 0.0%Lake Clarke Shores 3 376 3 374 (2) 0 1%Lake Clarke Shores 3,376 3,374 (2) -0.1%Lake Park 8,155 8,198 43 0.5%Lake Worth 34,910 34,901 (9) 0.0%Lantana 10,377 10,404 27 0.3%Loxahatchee Groves 3,180 3,162 (18) -0.6%Manalapan 406 406 - 0.0%Mangonia Park 1,888 1,812 (76) -4.0%North Palm Beach 12,039 12,033 (6) 0.0%Ocean Ridge 1 786 1 783 (3) 0 2%Ocean Ridge 1,786 1,783 (3) -0.2%Pahokee 5,516 5,546 30 0.5%Palm Beach 8,348 8,350 2 0.0%Palm Beach Gardens 48,452 48,630 178 0.4%Palm Beach Shores 1,142 1,141 (1) -0.1%Palm Springs 19,019 19,799 780 4.1%Riviera Beach 32,488 32,535 47 0.1%Royal Palm Beach 34,140 34,234 94 0.3%S th B 3 014 2 967 (47) 1 6%South Bay 3,014 2,967 (47) -1.6%South Palm Beach 1,171 1,174 3 0.3%Tequesta 5,629 5,646 17 0.3%
2012 Local Government Financial Information Handbook Page 279

Office of Economic and Demographic Research
April 1, 2010 April 1, 2011Adjusted Total Adjusted Total
Population PopulationUsed for State Used for State Numerical Percentage
County / Municipality Revenue Sharing Revenue Sharing Change Change
Comparison of 2010 and 2011 Adjusted Population EstimatesUsed for FY 2011-12 and FY 2012-13 State Revenue-Sharing Calculations
Wellington 56,508 56,752 244 0.4%West Palm Beach 99,604 100,482 878 0.9%Unincorporated County 586,279 587,829 1,550 0.3%Pasco County 463,893 465,733 1,840 0.4%Dade City 6,437 6,485 48 0.7%New Port Richey 14,911 14,959 48 0.3%Port Richey 2,671 2,652 (19) -0.7%St. Leo 1,340 1,378 38 2.8%, ,San Antonio 1,138 1,138 - 0.0%Zephyrhills 13,288 13,317 29 0.2%Unincorporated County 424,108 425,804 1,696 0.4%Pinellas County 915,218 917,186 1,968 0.2%Belleair 3,869 3,877 8 0.2%Belleair Beach 1,560 1,563 3 0.2%Belleair Bluffs 2,031 2,048 17 0.8%Belleair Shore 109 109 - 0.0%Belleair Shore 109 109 0.0%Clearwater 107,935 107,853 (82) -0.1%Dunedin 35,315 35,301 (14) 0.0%Gulfport 12,029 12,022 (7) -0.1%Indian Rocks Beach 4,113 4,102 (11) -0.3%Indian Shores 1,420 1,421 1 0.1%Kenneth City 4,998 4,989 (9) -0.2%Largo 77,798 77,670 (128) -0.2%Madeira Beach 4 263 4 295 32 0 8%Madeira Beach 4,263 4,295 32 0.8%North Redington Beach 1,417 1,427 10 0.7%Oldsmar 13,609 13,605 (4) 0.0%Pinellas Park 49,109 49,293 184 0.4%Redington Beach 1,427 1,424 (3) -0.2%Redington Shores 2,121 2,128 7 0.3%Safety Harbor 16,887 16,878 (9) -0.1%St. Petersburg 244,344 245,871 1,527 0.6%St Pete Beach 9 346 9 334 (12) 0 1%St. Pete Beach 9,346 9,334 (12) -0.1%Seminole 17,233 17,222 (11) -0.1%South Pasadena 4,964 4,981 17 0.3%Tarpon Springs 23,486 23,465 (21) -0.1%Treasure Island 6,705 6,715 10 0.1%Unincorporated County 269,130 269,593 463 0.2%Polk County 598,621 601,249 2,628 0.4%Auburndale 13,507 13,593 86 0.6%Bartow 17 098 17 119 21 0 1%Bartow 17,098 17,119 21 0.1%Davenport 2,900 2,963 63 2.2%Dundee 3,717 3,749 32 0.9%Eagle Lake 2,255 2,286 31 1.4%Fort Meade 5,626 5,607 (19) -0.3%Frostproof 2,992 3,008 16 0.5%Haines City 20,539 20,661 122 0.6%Highland Park 230 230 - 0.0%Hill t H i ht 254 248 (6) 2 4%Hillcrest Heights 254 248 (6) -2.4%Lake Alfred 5,015 5,023 8 0.2%Lake Hamilton 1,231 1,243 12 1.0%
2012 Local Government Financial Information Handbook Page 280

Office of Economic and Demographic Research
April 1, 2010 April 1, 2011Adjusted Total Adjusted Total
Population PopulationUsed for State Used for State Numerical Percentage
County / Municipality Revenue Sharing Revenue Sharing Change Change
Comparison of 2010 and 2011 Adjusted Population EstimatesUsed for FY 2011-12 and FY 2012-13 State Revenue-Sharing Calculations
Lake Wales 14,225 14,261 36 0.3%Lakeland 97,422 97,690 268 0.3%Mulberry 3,817 3,785 (32) -0.8%Polk City 1,562 1,562 - 0.0%Winter Haven 33,874 34,112 238 0.7%Unincorporated County 372,357 374,109 1,752 0.5%Putnam County 73,919 73,570 (349) -0.5%Crescent City 1,577 1,524 (53) -3.4%y , , ( )Interlachen 1,403 1,415 12 0.9%Palatka 10,560 10,526 (34) -0.3%Pomona Park 912 920 8 0.9%Welaka 701 704 3 0.4%Unincorporated County 58,766 58,481 (285) -0.5%St. Johns County 189,778 192,570 2,792 1.5%Hastings 580 602 22 3.8%Marineland (part) - - - -Marineland (part) St. Augustine 12,975 13,053 78 0.6%St. Augustine Beach 6,176 6,234 58 0.9%Unincorporated County 170,047 172,681 2,634 1.5%St. Lucie County 277,640 279,558 1,918 0.7%Fort Pierce 41,772 41,773 1 0.0%Port St. Lucie 164,599 166,035 1,436 0.9%St. Lucie Village 590 610 20 3.4%Unincorporated County 70 679 71 140 461 0 7%Unincorporated County 70,679 71,140 461 0.7%Santa Rosa County 148,252 149,916 1,664 1.1%Gulf Breeze 5,763 5,765 2 0.0%Jay 533 522 (11) -2.1%Milton 8,748 9,037 289 3.3%Unincorporated County 133,208 134,592 1,384 1.0%Sarasota County 379,442 381,313 1,871 0.5%Longboat Key (part) 4,490 4,487 (3) -0.1%North Port 57 357 57 893 536 0 9%North Port 57,357 57,893 536 0.9%Sarasota 51,928 52,108 180 0.3%Venice 20,748 20,752 4 0.0%Unincorporated County 244,919 246,073 1,154 0.5%Seminole County 422,541 424,422 1,881 0.4%Altamonte Springs 41,496 41,600 104 0.3%Casselberry 26,235 26,328 93 0.4%Lake Mary 13,822 13,868 46 0.3%Longwood 13 657 13 620 (37) 0 3%Longwood 13,657 13,620 (37) -0.3%Oviedo 33,342 33,815 473 1.4%Sanford 53,528 53,400 (128) -0.2%Winter Springs 33,282 33,314 32 0.1%Unincorporated County 207,179 208,477 1,298 0.6%Sumter County 84,291 87,604 3,313 3.9%Bushnell 2,424 2,439 15 0.6%Center Hill 988 962 (26) -2.6%C l 703 705 2 0 3%Coleman 703 705 2 0.3%Webster 785 768 (17) -2.2%Wildwood 6,709 6,928 219 3.3%
2012 Local Government Financial Information Handbook Page 281

Office of Economic and Demographic Research
April 1, 2010 April 1, 2011Adjusted Total Adjusted Total
Population PopulationUsed for State Used for State Numerical Percentage
County / Municipality Revenue Sharing Revenue Sharing Change Change
Comparison of 2010 and 2011 Adjusted Population EstimatesUsed for FY 2011-12 and FY 2012-13 State Revenue-Sharing Calculations
Unincorporated County 72,682 75,802 3,120 4.3%Suwannee County 40,688 40,844 156 0.4%Branford 712 705 (7) -1.0%Live Oak 6,850 6,858 8 0.1%Unincorporated County 33,126 33,281 155 0.5%Taylor County 19,508 19,474 (34) -0.2%Perry 7,017 6,977 (40) -0.6%Unincorporated County 12,491 12,497 6 0.0%p y , ,Union County 10,703 10,704 1 0.0%Lake Butler 1,897 1,892 (5) -0.3%Raiford 255 255 - 0.0%Worthington Springs 181 391 210 116.0%Unincorporated County 8,370 8,166 (204) -2.4%Volusia County 492,663 493,593 930 0.2%Daytona Beach 60,953 60,978 25 0.0%Daytona Beach Shores 4,247 4,261 14 0.3%Daytona Beach Shores 4,247 4,261 14 0.3%DeBary 19,320 19,315 (5) 0.0%DeLand 27,031 27,330 299 1.1%Deltona 85,182 85,233 51 0.1%Edgewater 20,750 20,734 (16) -0.1%Flagler Beach (part) 60 60 - 0.0%Holly Hill 11,659 11,652 (7) -0.1%Lake Helen 2,624 2,614 (10) -0.4%New Smyrna Beach 22 464 22 668 204 0 9%New Smyrna Beach 22,464 22,668 204 0.9%Oak Hill 1,792 1,794 2 0.1%Orange City 10,776 11,255 479 4.4%Ormond Beach 38,131 38,372 241 0.6%Pierson 1,736 1,724 (12) -0.7%Ponce Inlet 3,032 3,039 7 0.2%Port Orange 56,780 56,313 (467) -0.8%South Daytona 12,252 12,285 33 0.3%Unincorporated County 113 874 113 966 92 0 1%Unincorporated County 113,874 113,966 92 0.1%Wakulla County 27,486 27,613 127 0.5%St. Marks 293 289 (4) -1.4%Sopchoppy 457 457 - 0.0%Unincorporated County 26,736 26,867 131 0.5%Walton County 53,479 53,878 399 0.7%DeFuniak Springs 5,141 5,109 (32) -0.6%Freeport 1,787 1,860 73 4.1%Paxton 644 633 (11) 1 7%Paxton 644 633 (11) -1.7%Unincorporated County 45,907 46,276 369 0.8%Washington County 22,435 22,487 52 0.2%Caryville 280 288 8 2.9%Chipley 3,580 3,595 15 0.4%Ebro 270 260 (10) -3.7%Vernon 687 705 18 2.6%Wausau 383 389 6 1.6%U i t d C t 17 235 17 250 15 0 1%Unincorporated County 17,235 17,250 15 0.1%Statewide Total 18,673,368 18,777,429 104,061 0.6%Statewide Incorporated 9,442,935 9,491,750 48,815 0.5%
2012 Local Government Financial Information Handbook Page 282
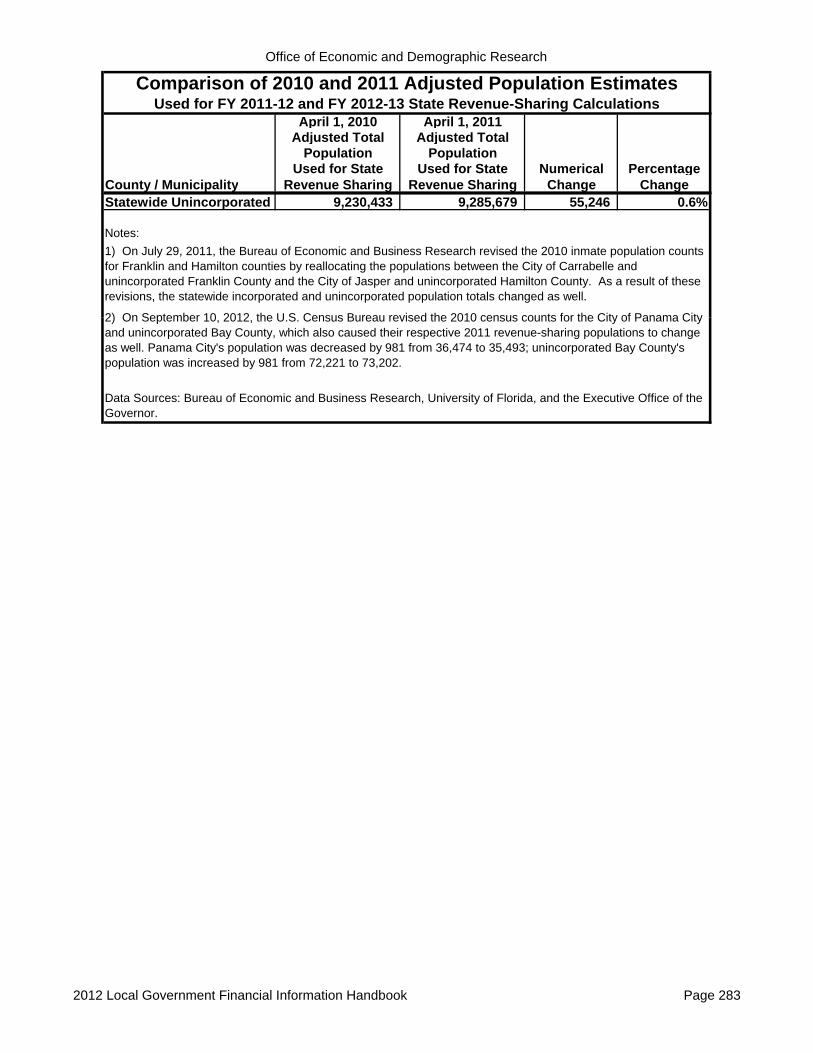
Office of Economic and Demographic Research
April 1, 2010 April 1, 2011Adjusted Total Adjusted Total
Population PopulationUsed for State Used for State Numerical Percentage
County / Municipality Revenue Sharing Revenue Sharing Change Change
Comparison of 2010 and 2011 Adjusted Population EstimatesUsed for FY 2011-12 and FY 2012-13 State Revenue-Sharing Calculations
Statewide Unincorporated 9,230,433 9,285,679 55,246 0.6%
2) On September 10 2012 the U S Census Bureau revised the 2010 census counts for the City of Panama City
Notes:1) On July 29, 2011, the Bureau of Economic and Business Research revised the 2010 inmate population counts for Franklin and Hamilton counties by reallocating the populations between the City of Carrabelle and unincorporated Franklin County and the City of Jasper and unincorporated Hamilton County. As a result of these revisions, the statewide incorporated and unincorporated population totals changed as well.
Data Sources: Bureau of Economic and Business Research, University of Florida, and the Executive Office of the Governor.
2) On September 10, 2012, the U.S. Census Bureau revised the 2010 census counts for the City of Panama City and unincorporated Bay County, which also caused their respective 2011 revenue-sharing populations to change as well. Panama City's population was decreased by 981 from 36,474 to 35,493; unincorporated Bay County's population was increased by 981 from 72,221 to 73,202.
2012 Local Government Financial Information Handbook Page 283

Office of Economic and Demographic Research
284 2012 Local Government Financial Information Handbook
This page was intentionally left blank.

Office of Economic and Demographic Research
2012 Local Government Financial Information Handbook 285
Appendix C:
2012 Federal, State, and County Tax Rates on Motor Fuel and Diesel Fuel in Florida’s
Counties

Office of Economic and Demographic Research
2012 Federal, State, and County Tax Rates on Motor Fuel and Diesel Fuel in Florida's CountiesMotor Fuel Tax Rates (# of Cents Per Gallon) Unutilized County-Imposed Diesel Fuel Tax Rates (# of Cents Per Gallon)
Federal State County (Local Option) Motor Fuel Taxes Federal State County (Local Option)Fuel Fuel Constit. County Municipal Ninth-cent 1-6 Cents 1-5 Cents Ninth-cent 1-6 Cents 1-5 Cents Total Fuel Fuel Fuel Ninth-cent 1-6 Cents 1-5 Cents
Excise Sales SCETS Fuel Fuel Fuel Fuel Fuel Fuel Total Fuel Fuel Fuel Unutilized Excise Sales SCETS Excise Fuel Fuel Fuel TotalCounty Tax Tax Tax Tax Tax Tax Tax Tax Tax Tax Tax Tax Tax Tax Tax Tax Tax Tax Tax Tax Tax TaxAlachua 18.4 12.6 6.9 2 1 1 1 6 5 53.9 0 0 0 0 24.4 12.6 6.9 4 1 6 n/a 54.9Baker 18.4 12.6 6.9 2 1 1 1 6 0 48.9 0 0 5 5 24.4 12.6 6.9 4 1 6 n/a 54.9Bay 18.4 12.6 6.9 2 1 1 1 6 0 48.9 0 0 5 5 24.4 12.6 6.9 4 1 6 n/a 54.9Bradford 18.4 12.6 6.9 2 1 1 0 6 0 47.9 1 0 5 6 24.4 12.6 6.9 4 1 6 n/a 54.9Brevard 18.4 12.6 6.9 2 1 1 0 6 0 47.9 1 0 5 6 24.4 12.6 6.9 4 1 6 n/a 54.9Broward 18.4 12.6 6.9 2 1 1 1 6 5 53.9 0 0 0 0 24.4 12.6 6.9 4 1 6 n/a 54.9Calhoun 18.4 12.6 6.9 2 1 1 0 6 0 47.9 1 0 5 6 24.4 12.6 6.9 4 1 6 n/a 54.9Charlotte 18.4 12.6 6.9 2 1 1 1 6 5 53.9 0 0 0 0 24.4 12.6 6.9 4 1 6 n/a 54.9Citrus 18.4 12.6 6.9 2 1 1 1 6 5 53.9 0 0 0 0 24.4 12.6 6.9 4 1 6 n/a 54.9Clay 18.4 12.6 6.9 2 1 1 1 6 0 48.9 0 0 5 5 24.4 12.6 6.9 4 1 6 n/a 54.9Collier 18.4 12.6 6.9 2 1 1 1 6 5 53.9 0 0 0 0 24.4 12.6 6.9 4 1 6 n/a 54.9Columbia 18.4 12.6 6.9 2 1 1 1 6 0 48.9 0 0 5 5 24.4 12.6 6.9 4 1 6 n/a 54.9DeSoto 18.4 12.6 6.9 2 1 1 1 6 5 53.9 0 0 0 0 24.4 12.6 6.9 4 1 6 n/a 54.9Dixie 18.4 12.6 6.9 2 1 1 0 6 0 47.9 1 0 5 6 24.4 12.6 6.9 4 1 6 n/a 54.9Duval 18.4 12.6 6.9 2 1 1 0 6 0 47.9 1 0 5 6 24.4 12.6 6.9 4 1 6 n/a 54.9Escambia 18.4 12.6 6.9 2 1 1 1 6 0 48.9 0 0 5 5 24.4 12.6 6.9 4 1 6 n/a 54.9Flagler 18.4 12.6 6.9 2 1 1 1 6 0 48.9 0 0 5 5 24.4 12.6 6.9 4 1 6 n/a 54.9Franklin 18.4 12.6 5.8 2 1 1 0 5 0 45.8 1 1 5 7 24.4 12.6 6.9 4 1 6 n/a 54.9Gadsden 18.4 12.6 6.9 2 1 1 0 6 0 47.9 1 0 5 6 24.4 12.6 6.9 4 1 6 n/a 54.9Gilchrist 18.4 12.6 6.9 2 1 1 1 6 0 48.9 0 0 5 5 24.4 12.6 6.9 4 1 6 n/a 54.9Glades 18.4 12.6 6.9 2 1 1 1 6 0 48.9 0 0 5 5 24.4 12.6 6.9 4 1 6 n/a 54.9Gulf 18.4 12.6 6.9 2 1 1 1 6 0 48.9 0 0 5 5 24.4 12.6 6.9 4 1 6 n/a 54.9Hamilton 18.4 12.6 6.9 2 1 1 0 6 0 47.9 1 0 5 6 24.4 12.6 6.9 4 1 6 n/a 54.9Hardee 18.4 12.6 6.9 2 1 1 1 6 5 53.9 0 0 0 0 24.4 12.6 6.9 4 1 6 n/a 54.9Hendry 18.4 12.6 6.9 2 1 1 1 6 2 50.9 0 0 3 3 24.4 12.6 6.9 4 1 6 n/a 54.9Hernando 18.4 12.6 6.9 2 1 1 1 6 2 50.9 0 0 3 3 24.4 12.6 6.9 4 1 6 n/a 54.9Highlands 18.4 12.6 6.9 2 1 1 1 6 5 53.9 0 0 0 0 24.4 12.6 6.9 4 1 6 n/a 54.9Hillsborough 18.4 12.6 6.9 2 1 1 1 6 0 48.9 0 0 5 5 24.4 12.6 6.9 4 1 6 n/a 54.9Holmes 18.4 12.6 6.9 2 1 1 1 6 0 48.9 0 0 5 5 24.4 12.6 6.9 4 1 6 n/a 54.9Indian River 18.4 12.6 6.9 2 1 1 0 6 0 47.9 1 0 5 6 24.4 12.6 6.9 4 1 6 n/a 54.9Jackson 18.4 12.6 6.9 2 1 1 1 6 0 48.9 0 0 5 5 24.4 12.6 6.9 4 1 6 n/a 54.9Jefferson 18.4 12.6 6.9 2 1 1 1 6 0 48.9 0 0 5 5 24.4 12.6 6.9 4 1 6 n/a 54.9Lafayette 18.4 12.6 6.9 2 1 1 0 6 0 47.9 1 0 5 6 24.4 12.6 6.9 4 1 6 n/a 54.9Lake 18.4 12.6 6.9 2 1 1 1 6 0 48.9 0 0 5 5 24.4 12.6 6.9 4 1 6 n/a 54.9Lee 18.4 12.6 6.9 2 1 1 1 6 5 53.9 0 0 0 0 24.4 12.6 6.9 4 1 6 n/a 54.9Leon 18.4 12.6 6.9 2 1 1 1 6 0 48.9 0 0 5 5 24.4 12.6 6.9 4 1 6 n/a 54.9Levy 18.4 12.6 6.9 2 1 1 0 6 0 47.9 1 0 5 6 24.4 12.6 6.9 4 1 6 n/a 54.9Liberty 18.4 12.6 6.9 2 1 1 1 6 0 48.9 0 0 5 5 24.4 12.6 6.9 4 1 6 n/a 54.9Madison 18.4 12.6 6.9 2 1 1 0 6 0 47.9 1 0 5 6 24.4 12.6 6.9 4 1 6 n/a 54.9Manatee 18.4 12.6 6.9 2 1 1 1 6 5 53.9 0 0 0 0 24.4 12.6 6.9 4 1 6 n/a 54.9Marion 18.4 12.6 6.9 2 1 1 1 6 5 53.9 0 0 0 0 24.4 12.6 6.9 4 1 6 n/a 54.9Martin 18.4 12.6 6.9 2 1 1 1 6 5 53.9 0 0 0 0 24.4 12.6 6.9 4 1 6 n/a 54.9Miami-Dade 18.4 12.6 6.9 2 1 1 1 6 3 51.9 0 0 2 2 24.4 12.6 6.9 4 1 6 n/a 54.9Monroe 18.4 12.6 6.9 2 1 1 1 6 3 51.9 0 0 2 2 24.4 12.6 6.9 4 1 6 n/a 54.9Nassau 18.4 12.6 6.9 2 1 1 1 6 0 48.9 0 0 5 5 24.4 12.6 6.9 4 1 6 n/a 54.9Okaloosa 18.4 12.6 6.9 2 1 1 1 6 0 48.9 0 0 5 5 24.4 12.6 6.9 4 1 6 n/a 54.9Okeechobee 18.4 12.6 6.9 2 1 1 1 6 5 53.9 0 0 0 0 24.4 12.6 6.9 4 1 6 n/a 54.9Orange 18.4 12.6 6.9 2 1 1 0 6 0 47.9 1 0 5 6 24.4 12.6 6.9 4 1 6 n/a 54.9Osceola 18.4 12.6 6.9 2 1 1 1 6 0 48.9 0 0 5 5 24.4 12.6 6.9 4 1 6 n/a 54.9Palm Beach 18.4 12.6 6.9 2 1 1 1 6 5 53.9 0 0 0 0 24.4 12.6 6.9 4 1 6 n/a 54.9Pasco 18.4 12.6 6.9 2 1 1 1 6 0 48.9 0 0 5 5 24.4 12.6 6.9 4 1 6 n/a 54.9Pinellas 18.4 12.6 6.9 2 1 1 1 6 0 48.9 0 0 5 5 24.4 12.6 6.9 4 1 6 n/a 54.9Polk 18.4 12.6 6.9 2 1 1 1 6 5 53.9 0 0 0 0 24.4 12.6 6.9 4 1 6 n/a 54.9Putnam 18.4 12.6 6.9 2 1 1 1 6 5 53.9 0 0 0 0 24.4 12.6 6.9 4 1 6 n/a 54.9St. Johns 18.4 12.6 6.9 2 1 1 0 6 0 47.9 1 0 5 6 24.4 12.6 6.9 4 1 6 n/a 54.9St. Lucie 18.4 12.6 6.9 2 1 1 1 6 5 53.9 0 0 0 0 24.4 12.6 6.9 4 1 6 n/a 54.9Santa Rosa 18.4 12.6 6.9 2 1 1 0 6 0 47.9 1 0 5 6 24.4 12.6 6.9 4 1 6 n/a 54.9Sarasota 18.4 12.6 6.9 2 1 1 1 6 5 53.9 0 0 0 0 24.4 12.6 6.9 4 1 6 n/a 54.9Seminole 18.4 12.6 6.9 2 1 1 1 6 0 48.9 0 0 5 5 24.4 12.6 6.9 4 1 6 n/a 54.9Sumter 18.4 12.6 6.9 2 1 1 1 6 0 48.9 0 0 5 5 24.4 12.6 6.9 4 1 6 n/a 54.9Suwannee 18.4 12.6 6.9 2 1 1 1 6 5 53.9 0 0 0 0 24.4 12.6 6.9 4 1 6 n/a 54.9Taylor 18.4 12.6 6.9 2 1 1 0 6 0 47.9 1 0 5 6 24.4 12.6 6.9 4 1 6 n/a 54.9Union 18.4 12.6 6.9 2 1 1 1 6 0 48.9 0 0 5 5 24.4 12.6 6.9 4 1 6 n/a 54.9Volusia 18.4 12.6 6.9 2 1 1 1 6 5 53.9 0 0 0 0 24.4 12.6 6.9 4 1 6 n/a 54.9Wakulla 18.4 12.6 6.9 2 1 1 1 6 0 48.9 0 0 5 5 24.4 12.6 6.9 4 1 6 n/a 54.9Walton 18.4 12.6 6.9 2 1 1 1 6 0 48.9 0 0 5 5 24.4 12.6 6.9 4 1 6 n/a 54.9Washington 18.4 12.6 6.9 2 1 1 1 6 0 48.9 0 0 5 5 24.4 12.6 6.9 4 1 6 n/a 54.9
2012 Local Government Financial Information Handbook Page 286

Office of Economic and Demographic Research
2012 Federal, State, and County Tax Rates on Motor Fuel and Diesel Fuel in Florida's CountiesMotor Fuel Tax Rates (# of Cents Per Gallon) Unutilized County-Imposed Diesel Fuel Tax Rates (# of Cents Per Gallon)
Federal State County (Local Option) Motor Fuel Taxes Federal State County (Local Option)Fuel Fuel Constit. County Municipal Ninth-cent 1-6 Cents 1-5 Cents Ninth-cent 1-6 Cents 1-5 Cents Total Fuel Fuel Fuel Ninth-cent 1-6 Cents 1-5 Cents
Excise Sales SCETS Fuel Fuel Fuel Fuel Fuel Fuel Total Fuel Fuel Fuel Unutilized Excise Sales SCETS Excise Fuel Fuel Fuel TotalCounty Tax Tax Tax Tax Tax Tax Tax Tax Tax Tax Tax Tax Tax Tax Tax Tax Tax Tax Tax Tax Tax Tax
2) Florida Department of Transportation, Office of Financial Development.1) Florida Department of Revenue, Tax Information Publication "Fuel Taxes Adjusted Beginning January 1, 2012" (https://taxlaw.state.fl.us/wordfiles/MSF%20TIP%2011B05-01.pdf).Data Sources:
7) For a complete list of transportation funding sources, please refer to the Florida Department of Transportation's annual report entitled Florida's Transportation Tax Sources: A Primer (www.dot.state.fl.us/financialplanning/revenue/primer.shtm).6) County local option tax rate changes for 2012: None.5) County taxes on diesel fuel for local use consist of the 1 cent Ninth-cent Fuel Tax, pursuant to s. 206.87(1)(b), F.S.; and the 1 to 6 cents of Local Option Fuel Tax, pursuant to s. 206.87(1)(c), F.S. The 1 to 5 cents Local Option Fuel Tax is not authorized for levy on diesel fuel.4) State taxes on diesel fuel consist of the Fuel Sales Tax, pursuant to s. 206.87(1)(e), F.S.; the State Comprehensive Enhanced Transportation System (SCETS) Tax, pursuant to s. 206.87(1)(d), F.S.; and the Fuel Excise Tax, pursuant to s. 206.41(1)(a), F.S.3) County local option taxes on motor fuel consist of the 1 cent Ninth-cent Fuel Tax, pursuant to s. 206.41(1)(d), F.S.; the 1 to 6 cents of Local Option Fuel Tax and the 1 to 5 cents of Local Option Fuel Tax, pursuant to s. 206.41(1)(e), F.S.
2) State taxes on motor fuel consist of the Fuel Sales Tax, pursuant to s. 206.41(1)(g), F.S.; the State Comprehensive Enhanced Transportation System (SCETS) Tax, pursuant to s. 206.41(1)(f), F.S.; the Constitutional Fuel Tax, pursuant to s. 206.41(1)(a), F.S.; the County Fuel Tax, pursuant to s. 206.41(1)(b), F.S.; and the Municipal Fuel Tax, pursuant to s. 206.41(1)(c), F.S.
1) Federal taxes on motor and diesel fuels are authorized pursuant to Title 26, United States Code.Notes:
2012 Local Government Financial Information Handbook Page 287

Office of Economic and Demographic Research
288 2012 Local Government Financial Information Handbook
This page was intentionally left blank.