2012 - jcr evaluation form - wyoming game · habitat issues in this herd unit include continued gas...
TRANSCRIPT
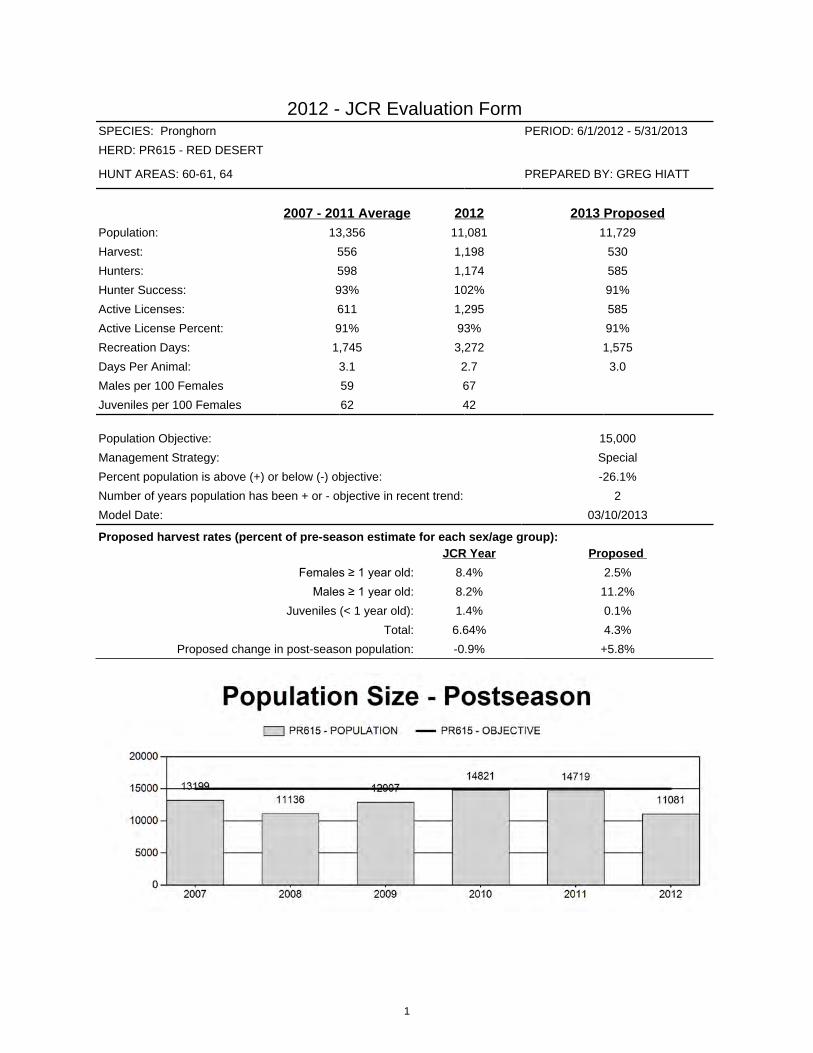
2012 - JCR Evaluation FormSPECIES: Pronghorn PERIOD: 6/1/2012 - 5/31/2013
HERD: PR615 - RED DESERT
HUNT AREAS: 60-61, 64 PREPARED BY: GREG HIATT
2007 - 2011 Average 2012 2013 ProposedPopulation: 13,356 11,081 11,729
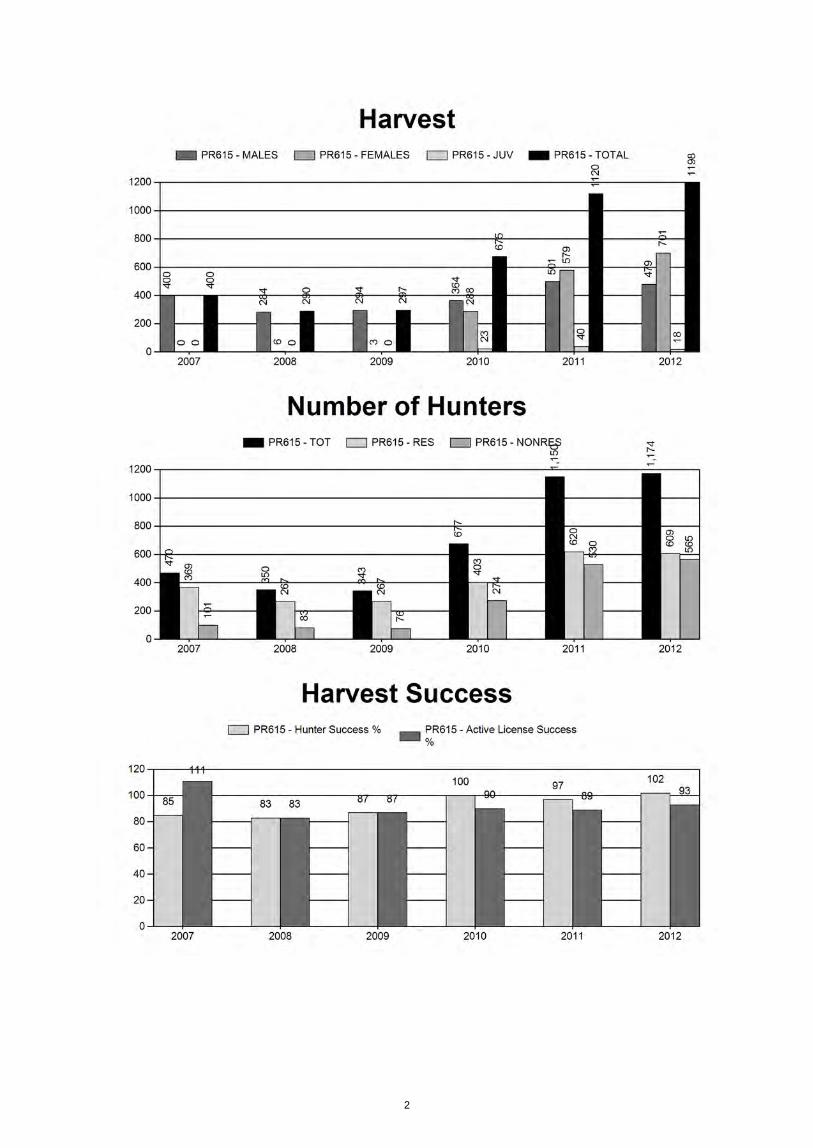
Harvest: 556 1,198 530
Hunters: 598 1,174 585
Hunter Success: 93% 102% 91%
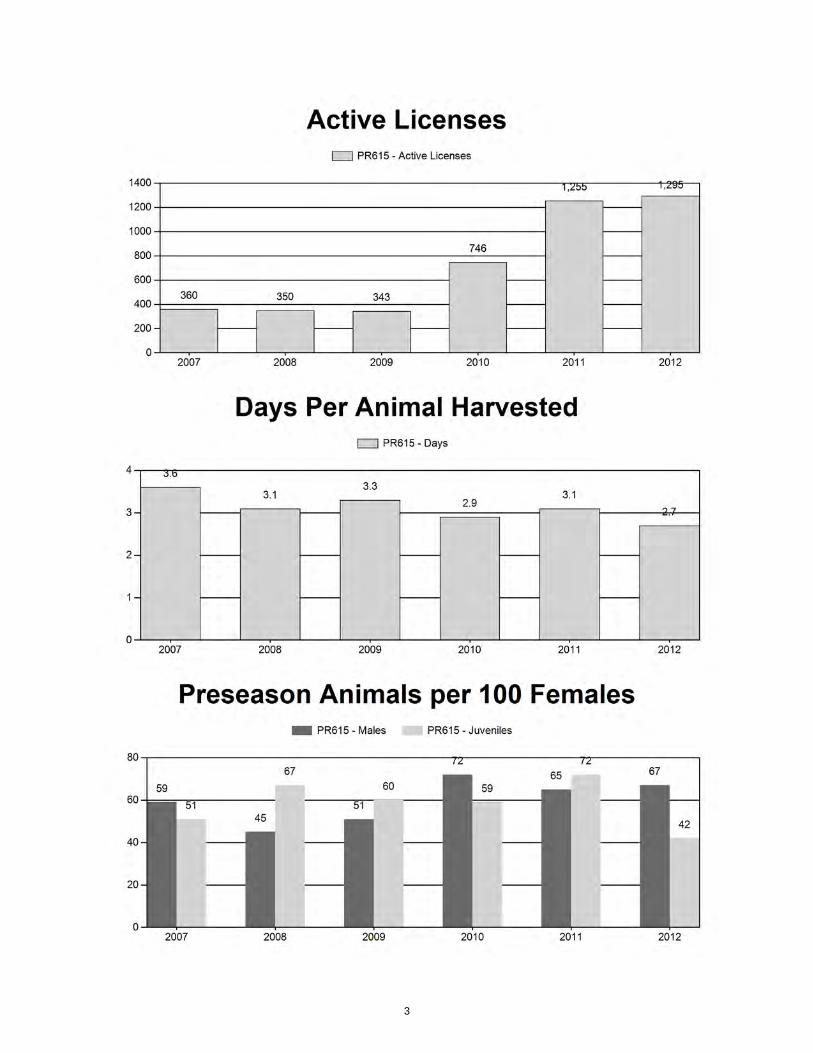
Active Licenses: 611 1,295 585
Active License Percent: 91% 93% 91%
Recreation Days: 1,745 3,272 1,575
Days Per Animal: 3.1 2.7 3.0
Males per 100 Females 59 67
Juveniles per 100 Females 62 42
Population Objective: 15,000
Management Strategy: Special
Percent population is above (+) or below (-) objective: -26.1%
Number of years population has been + or - objective in recent trend: 2
Model Date: 03/10/2013
Proposed harvest rates (percent of pre-season estimate for each sex/age group):JCR Year Proposed
Females ≥ 1 year old: 8.4% 2.5%
Males ≥ 1 year old: 8.2% 11.2%
Juveniles (< 1 year old): 1.4% 0.1%
Total: 6.64% 4.3%
Proposed change in post-season population: -0.9% +5.8%
1
2
3

2007 - 2012 Preseason Classification Summary
for Pronghorn Herd PR615 - RED DESERT
MALES FEMALES JUVENILES Males to 100 Females Young to
Year Pre Pop Ylg Adult Total % Total % Total %TotCls
ClsObj Ylng Adult Total
Conf Int
100Fem
ConfInt
100Adult
2007 13,639 154 617 771 28% 1,298 48% 657 24% 2,726 2,077 12 48 59 ± 4 51 ± 4 32
2008 11,455 136 428 564 21% 1,255 47% 842 32% 2,661 2,167 11 34 45 ± 3 67 ± 4 46
2009 13,234 268 749 1,017 24% 1,987 47% 1,190 28% 4,194 1,907 13 38 51 ± 3 60 ± 3 40
2010 15,563 361 951 1,312 31% 1,823 43% 1,077 26% 4,212 2,595 20 52 72 ± 4 59 ± 3 34
2011 15,951 263 736 999 27% 1,540 42% 1,115 31% 3,654 0 17 48 65 ± 4 72 ± 4 44
2012 12,390 177 888 1,065 32% 1,600 48% 667 20% 3,332 0 11 56 67 ± 4 42 ± 3 25
4
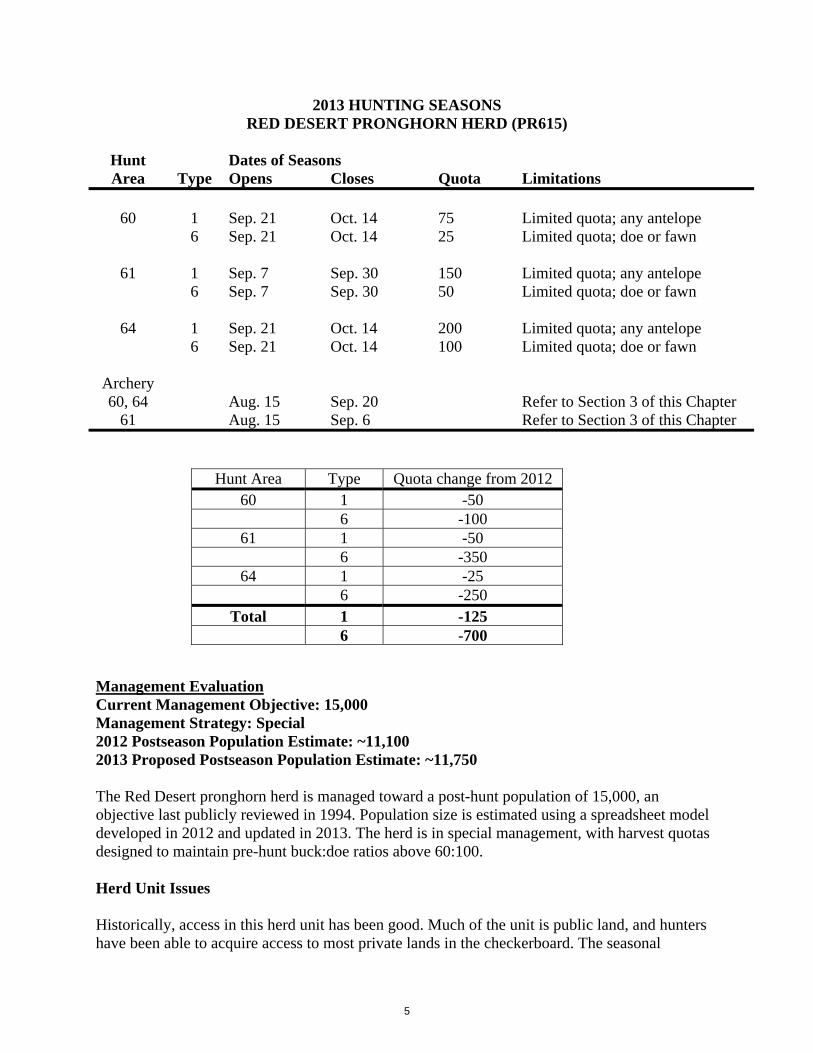
2013 HUNTING SEASONS RED DESERT PRONGHORN HERD (PR615)
Hunt Dates of Seasons Area Type Opens Closes Quota Limitations
60 1 Sep. 21 Oct. 14 75 Limited quota; any antelope 6 Sep. 21 Oct. 14 25 Limited quota; doe or fawn
61 1 Sep. 7 Sep. 30 150 Limited quota; any antelope 6 Sep. 7 Sep. 30 50 Limited quota; doe or fawn
64 1 Sep. 21 Oct. 14 200 Limited quota; any antelope 6 Sep. 21 Oct. 14 100 Limited quota; doe or fawn
Archery 60, 64 Aug. 15 Sep. 20 Refer to Section 3 of this Chapter
61 Aug. 15 Sep. 6 Refer to Section 3 of this Chapter
Hunt Area Type Quota change from 2012
60 1 -50 6 -100
61 1 -50 6 -350
64 1 -25 6 -250
Total 1 -125 6 -700
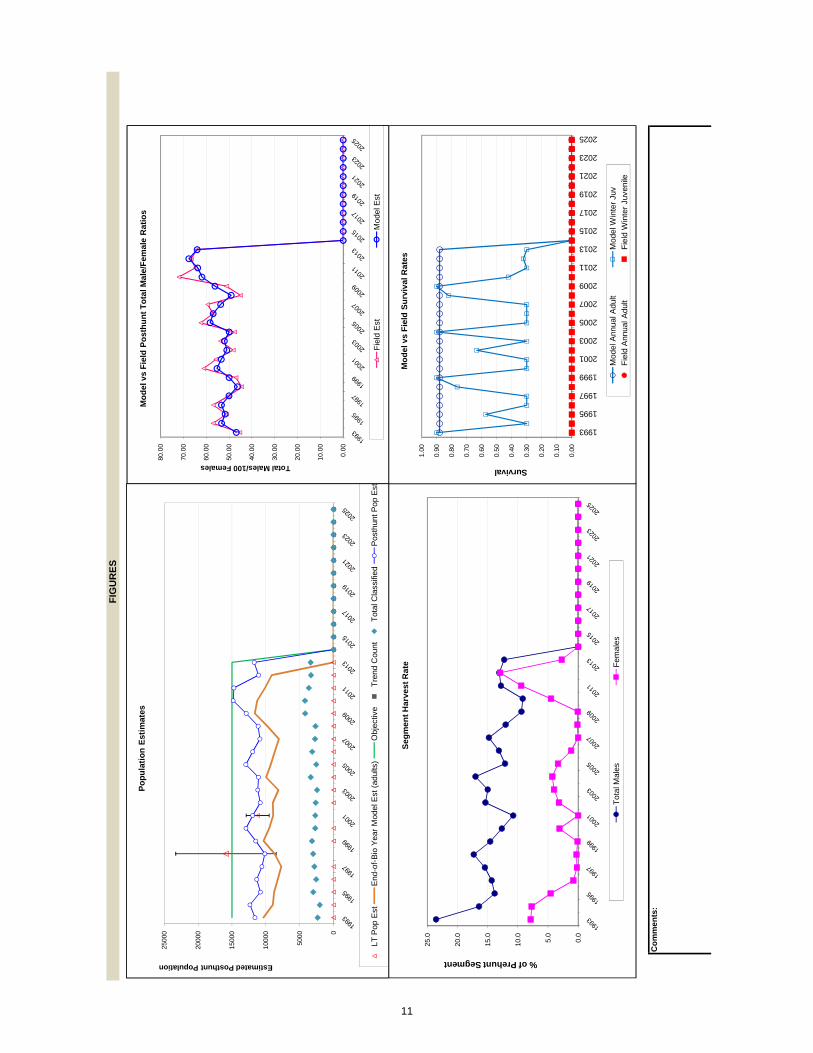
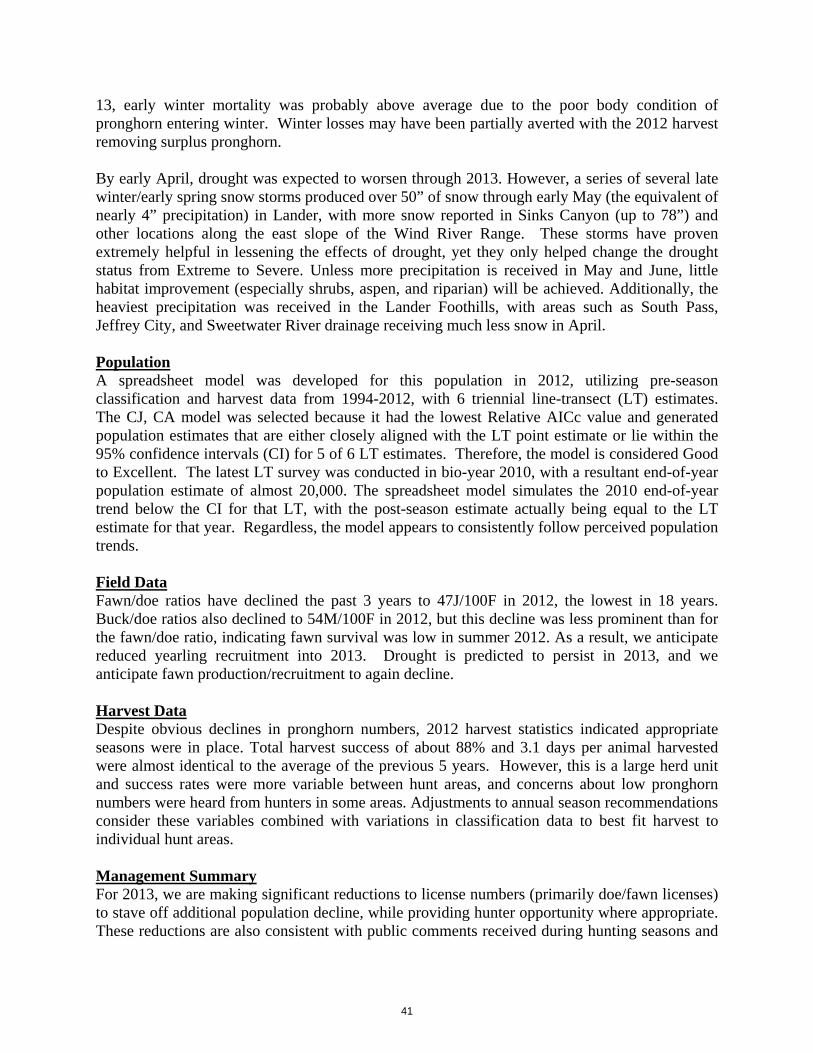
Management Evaluation Current Management Objective: 15,000 Management Strategy: Special 2012 Postseason Population Estimate: ~11,100 2013 Proposed Postseason Population Estimate: ~11,750 The Red Desert pronghorn herd is managed toward a post-hunt population of 15,000, an objective last publicly reviewed in 1994. Population size is estimated using a spreadsheet model developed in 2012 and updated in 2013. The herd is in special management, with harvest quotas designed to maintain pre-hunt buck:doe ratios above 60:100. Herd Unit Issues Historically, access in this herd unit has been good. Much of the unit is public land, and hunters have been able to acquire access to most private lands in the checkerboard. The seasonal
5
distribution map for the herd has not been updated for many years, and it is likely there are crucial winter habitats, particularly in Area 60, that have not yet been delineated. Habitat issues in this herd unit include continued gas field development, coalbed natural gas development, opening of an in situ uranium mine with other mines proposed and possible development of shale oil. Many miles of sheep-tight fences exist in the herd unit, impeding pronghorn movements and migrations, and increasing losses during severe winters. Weather Drought conditions were extreme in 2012, with minimal snowfall during the 2011-12 winter and almost no precipitation throughout the spring and summer. Drought was classified as moderate in April, severe in May and then extreme for all subsequent months through February 2013. As a consequence, fawn production was exceptionally low at 42:100, the lowest ever recorded for this herd. Body condition of most pronghorn harvested from these three areas in 2012 was poor, especially for lactating does. Given the poor condition of animals at the end of fall, mortality is expected to be above average during the 2012-13 winter, despite moderate winter conditions. Habitat While no herbaceous habitat transects are established within this herd unit, herbaceous forage production is expected to have been minimal due to record drought. Only one shrub transect has been established near this herd unit, on the Chain Lakes WHMA, but was not read in 2012. BP America transferred ownership of two solar water wells on Chain Lakes WHMA to WGFD. WWNRT allocated $8,000 to WGFD for development of these two wells. Once developed, these wells will provide additional water sources for wildlife and help disperse domestic livestock that graze Chain Lakes WHMA. Field Data Because of the extreme drought, fawn production in 2012 was only 42:100, the lowest ever recorded for this herd and at least 30 percent less than the previous 5-year average. Production was low in all three areas, ranging from an 11-year low of 31:100 in Area 60 to an all-time low of 48:100 in Area 64. Buck:doe ratios met the special management criterion in all three areas in 2012, but are expected to decline with the 2013 harvest quotas due to the reduced number of bucks in the population, reduced doe harvest, and expected poor recruitment of yearlings from the 2012 fawn crop. Harvest Data Hunter success in Areas 60 and 61 was similar to that seen in 2011, but improved for both license types in Area 64. Similarly, the average days of effort required to harvest an animal declined for hunters with both license types in Area 64. While these data suggest the number of pronghorn in the herd has increased, particularly in Area 64, herd data and the model estimates
6
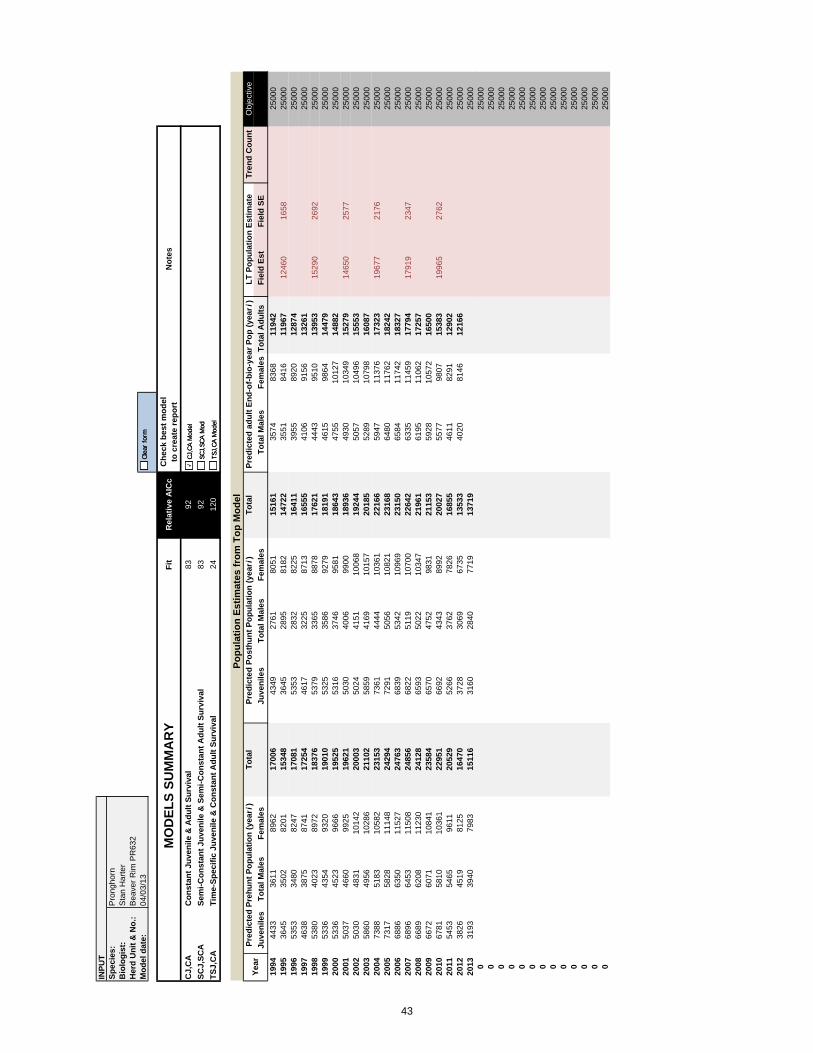
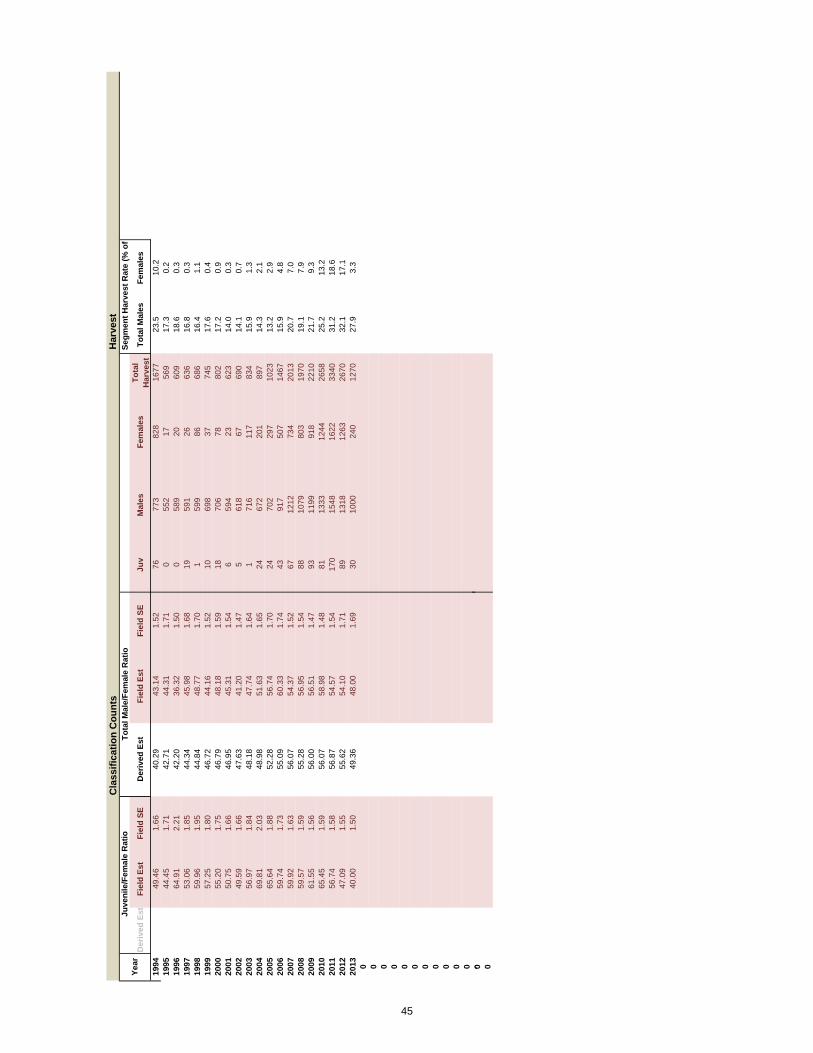
do not support that conclusion. It appears more likely the extreme drought conditions caused a significant number of pronghorn to move out of Area 60 and Area 61 into the more mesic habitats in Area 64, as was seen with telemetered pronghorn in this herd during the 1980s. Population The Time-Specific Juvenile & Constant Adult Survival (TSJ,CAS) spreadsheet model provided the best fit with observed buck:doe ratios for this herd, behaved predictably when 2012 classification and harvest data were added and is considered a “Fair” model of the herd. Annual adult survival was predicted at 88 percent, a reasonable level. Juvenile survival rates fluctuated within the allowed range and did not hover at maximum or minimum values for most years. The CJ,CA and SCJ,SCA models each had slightly lower AIC values, but both models predicted herd sizes well below line transect estimates and generated roughly stable buck:doe estimates that did not track the dips and rises of observed values. Due to the poor condition of animals going into this winter and projections of continued drought in 2013, fawn production in 2013 was projected to be similar to that seen in 2012. Similarly, the model was run with low juvenile survival in 2013. Management Summary This herd was well below objective size following a record harvest and severe winter losses in 1992. Conservative harvests after that winter combined with improved fawn production and survival beginning in 2007 allowed the herd to reach and be maintained at objective size in 2010 and 2011. Prior to the development of a reasonable spreadsheet model in mid-2012, population estimates suggested this herd was slightly above objective size and harvest, particularly for does and fawns, was increased in 2012 to its highest level since 1992. According to the spreadsheet model, the combination of heavy harvest and extremely poor fawn production in 2012 significantly reduced herd size, estimated at just over 11,000. With the population estimated to be 26% below objective, harvests need to be reduced to allow the herd to recover. Quotas for Type 6 doe/fawn licenses are reduced in all three hunt areas, and to minimal numbers in Areas 60 and 61. Quotas for Type 1 licenses are also reduced in all three areas, by 11 percent in Area 64 to 25 percent in Area 61. With the projected harvest of roughly 390 bucks and 140 does and fawns, the model predicts the herd will increase by ~5 percent in 2013. If precipitation improves, improving both fawn production and survival, the increase in herd size will be greater, but would be unlikely allow the herd to reach objective in just one or two years.
7

INPU
T Sp
ecie
s:P
rong
horn
Bio
logi
st:
Gre
g H
iatt
Her
d U
nit &
No.
:R
ed D
eser
tM
odel
dat
e:03
/10/
13
CJ,
CA
Con
stan
t Juv
enile
& A
dult
Surv
ival
118
127
SCJ,
SCA
Sem
i-Con
stan
t Juv
enile
& S
emi-C
onst
ant A
dult
Surv
ival
118
132
TSJ,
CA
Tim
e-Sp
ecifi
c Ju
veni
le &
Con
stan
t Adu
lt Su
rviv
al49
160
Tota
lTo
tal
Tren
d C
oun t
Obj
ectiv
e
Juve
nile
sTo
tal M
ales
Fem
ales
Juve
nile
sTo
tal M
ales
Fem
ales
Tota
l Mal
esFe
mal
esTo
tal A
dults
Fiel
d Es
tFi
eld
SE19
9337
5429
0161
8812
842
3689
2218
5702
1160
836
0167
5710
359
1500
019
9433
5535
2966
2213
507
3286
2950
6113
1234
930
6059
1289
7215
000
1995
2715
2999
5794
1150
726
9225
8455
3010
806
3055
5722
8777
1500
019
9632
1729
9456
0811
819
3217
2565
5563
1134
527
4654
8882
3415
000
1997
2936
2691
5378
1100
529
3622
7653
6710
579
2445
5273
7718
1500
019
9830
1023
9651
6810
574
3010
1981
5153
1014
529
0358
0487
0715
906
7414
1500
019
9933
7228
4556
8811
905
3372
2431
5682
1148
536
8366
5610
339
1500
020
0034
8136
1065
2313
613
3465
3153
6322
1294
033
0461
8494
8815
000
2001
3002
3238
6060
1230
130
0228
8960
6011
952
3015
5908
8923
1122
217
0015
000
2002
2740
2955
5790
1148
427
2725
0056
0610
833
3071
5896
8967
1500
020
0330
9830
1057
7811
886
3082
2559
5547
1118
827
1154
2581
3615
000
Pred
icte
d Pr
ehun
t Pop
ulat
ion
(yea
r i)
LT P
opul
atio
n Es
timat
e
Not
esM
OD
ELS
SUM
MA
RY
Fit
Rel
ativ
e A
ICc
Che
ck b
est m
odel
to
cre
ate
repo
rt
Popu
latio
n Es
timat
es fr
om T
op M
odel
Year
Pred
icte
d ad
ult E
nd-o
f-bio
-yea
r Pop
(yea
r i)
Pred
icte
d Po
sthu
nt P
opul
atio
n (y
ear i
)
SCJ,
SCA
Mod
TSJ,
CA M
odel
CJ,C
A M
odel
Clea
r fo
rm
003
3098
300
58
886
308
559
5588
55
836
1500
020
0438
4026
5753
1611
813
3798
2205
5089
1109
136
6962
8999
5815
000
2005
3850
3596
6163
1360
938
2931
6059
5712
947
3367
5909
9276
1500
020
0633
6133
0057
9112
451
3355
2866
5724
1194
530
3656
5086
8515
000
2007
2802
2975
5537
1131
428
0225
3555
3710
874
2655
5406
8061
1500
020
0835
5526
0152
9811
455
3555
2289
5292
1113
635
1262
4997
6115
000
2009
3668
3442
6124
1323
436
6831
1961
2112
907
4449
7186
1163
515
000
2010
4161
4360
7043
1556
341
3539
5967
2614
821
4395
6892
1128
715
000
2011
4890
4307
6754
1595
148
4637
5661
1714
719
4086
6039
1012
615
000
2012
2467
4004
5919
1239
024
4834
8151
5311
081
3568
5576
9144
1500
020
1333
5134
9754
6412
312
3346
3068
5316
1172
915
000
2014
2015
2016
2017
2018
2019
2020
2021
2022
2023
2024
2025
SCJ,
SCA
Mod
TSJ,
CA M
odel
CJ,C
A M
odel
Clea
r fo
rm
8

Mod
el E
stFi
eld
Est
SEM
odel
Est
Fiel
d Es
tSE
1993
0.90
0.88
Para
met
ers:
Opt
im c
ells
1994
0.30
0.88
1995
0.57
0.88
Adu
lt S
urvi
val =
0.88
119
960.
300.
88In
itial
Tot
al M
ale
Pop
/10,
000
=
0.29
019
970.
300.
88In
itial
Fem
ale
Pop
/10,
000
=0.
619
1998
0.76
0.88
1999
0.90
0.88
2000
0.30
0.88
2001
0.30
0.88
Sex
Rat
io (
% M
ales
) =
50%
2002
0.63
0.88
Wou
ndin
g Lo
ss (
tota
l mal
es)
=10
%
2003
0.30
0.88
Wou
ndin
g Lo
ss (
fem
ales
) =
10%
2004
0.90
0.88
Wou
ndin
g Lo
ss (
juve
nile
s) =
10%
2005
0.30
0.88
Ove
r-su
mm
er a
dult
surv
iva
98%
2006
0.30
0.88
2007
0.30
0.88
2008
0.82
0.88
2009
0.90
0.88
2010
0.42
0.88
2011
0.30
0.88
2012
0.32
0.88
2013
0.30
0.88
2014
2015
MO
DEL
ASS
UM
PTIO
NS
Year
Ann
ual A
dult
Surv
ival
Rat
esA
nnua
l Juv
enile
Sur
viva
l Rat
esSu
rviv
al a
nd In
itial
Pop
ulat
ion
Estim
ates
2015
2016
2017
2018
2019
2020
2021
2022
2023
2024
2025
9

Der
ived
Est
Fiel
d Es
tFi
eld
SED
eriv
ed E
stFi
eld
Est
Fiel
d SE
Juv
Mal
esFe
mal
esTo
tal
Har
vest
Tota
l Mal
esFe
mal
es
1993
60.6
72.
9346
.88
45.3
02.
4062
144
259
1122
23.5
7.9
1994
50.6
62.
7953
.30
57.0
03.
0252
746
363
1053
16.4
7.7
1995
46.8
62.
1351
.75
51.2
22.
2637
724
021
638
13.8
4.6
1996
57.3
72.
7553
.39
56.9
52.
7439
041
043
114
.30.
819
9754
.59
2.47
50.0
550
.25
2.34
378
100
388
15.4
0.2
1998
58.2
52.
4946
.36
44.4
42.
0837
713
039
017
.30.
319
9959
.29
2.47
50.0
246
.99
2.11
377
50
382
14.6
0.1
2000
53.3
62.
5455
.33
61.1
12.
7941
518
314
612
12.6
3.1
2001
49.5
42.
3753
.43
55.7
82.
5731
70
031
710
.80.
020
0247
.33
2.28
51.0
348
.14
2.30
413
167
1259
215
.43.
220
0353
.62
2.65
52.0
953
.88
2.66
410
210
1563
515
.04.
020
0472
.22
2.85
49.9
847
.58
2.14
411
207
3865
617
.04.
320
0562
.47
2.99
58.3
562
.38
2.99
396
187
1960
212
.13.
320
0658
.03
2.50
56.9
757
.01
2.47
394
615
460
13.1
1.2
2007
50.6
22.
4253
.73
59.4
02.
7040
00
040
014
.80.
020
0867
.09
2.99
49.1
044
.94
2.28
284
60
290
12.0
0.1
2009
59.8
92.
2056
.21
51.1
81.
9729
43
029
79.
40.
120
1059
.08
2.27
61.9
071
.97
2.61
364
288
2367
59.
24.
520
1172
.40
2.85
63.7
664
.87
2.64
501
579
4011
2012
.89.
420
1241
.69
1.92
67.6
666
.56
2.63
696
1190
13.1
12.9
2013
61.3
32.
5764
.00
64.0
02.
6513
553
012
.32.
720
1420
15
Year
Segm
ent H
arve
st R
ate
(% o
f To
tal M
ale/
Fem
ale
Rat
ioC
lass
ifica
tion
Cou
nts
Har
vest
Juve
nile
/Fem
ale
Rat
io
2015
2016
2017
2018
2019
2020
2021
2022
2023
2024
2025
10
FIG
UR
ES
0.00
10.0
0
20.0
0
30.0
0
40.0
0
50.0
0
60.0
0
70.0
0
80.0
0
Total Males/100 Females
Mod
el v
s Fi
eld
Post
hunt
Tot
al M
ale/
Fem
ale
Rat
ios
Fie
ld E
stM
odel
Est
0
5000
1000
0
1500
0
2000
0
2500
0
Estimated Posthunt Population
Popu
latio
n Es
timat
es
LT P
op E
stE
nd-o
f-B
io Y
ear
Mod
el E
st (
adul
ts)
Obj
ectiv
eT
rend
Cou
ntT
otal
Cla
ssifi
edP
osth
unt P
op E
st
Com
men
ts:
0.00
10.0
0
20.0
0
30.0
0
40.0
0
50.0
0
60.0
0
70.0
0
80.0
0
Total Males/100 Females
Mod
el v
s Fi
eld
Post
hunt
Tot
al M
ale/
Fem
ale
Rat
ios
Fie
ld E
stM
odel
Est
0
5000
1000
0
1500
0
2000
0
2500
0
Estimated Posthunt Population
Popu
latio
n Es
timat
es
LT P
op E
stE
nd-o
f-B
io Y
ear
Mod
el E
st (
adul
ts)
Obj
ectiv
eT
rend
Cou
ntT
otal
Cla
ssifi
edP
osth
unt P
op E
st
0.0
5.0
10.0
15.0
20.0
25.0
% of Prehunt Segment
Segm
ent H
arve
st R
ate
Tot
al M
ales
Fem
ales
0.00
0.10
0.20
0.30
0.40
0.50
0.60
0.70
0.80
0.90
1.00
1993
1995
1997
1999
2001
2003
2005
2007
2009
2011
2013
2015
2017
2019
2021
2023
2025
Survival
Mod
el v
s Fi
eld
Surv
ival
Rat
es
Mod
el A
nnua
l Adu
ltM
odel
Win
ter
Juv
Fie
ld A
nnua
l Adu
ltF
ield
Win
ter
Juve
nile
11

12
2012 - JCR Evaluation FormSPECIES: Pronghorn PERIOD: 6/1/2012 - 5/31/2013
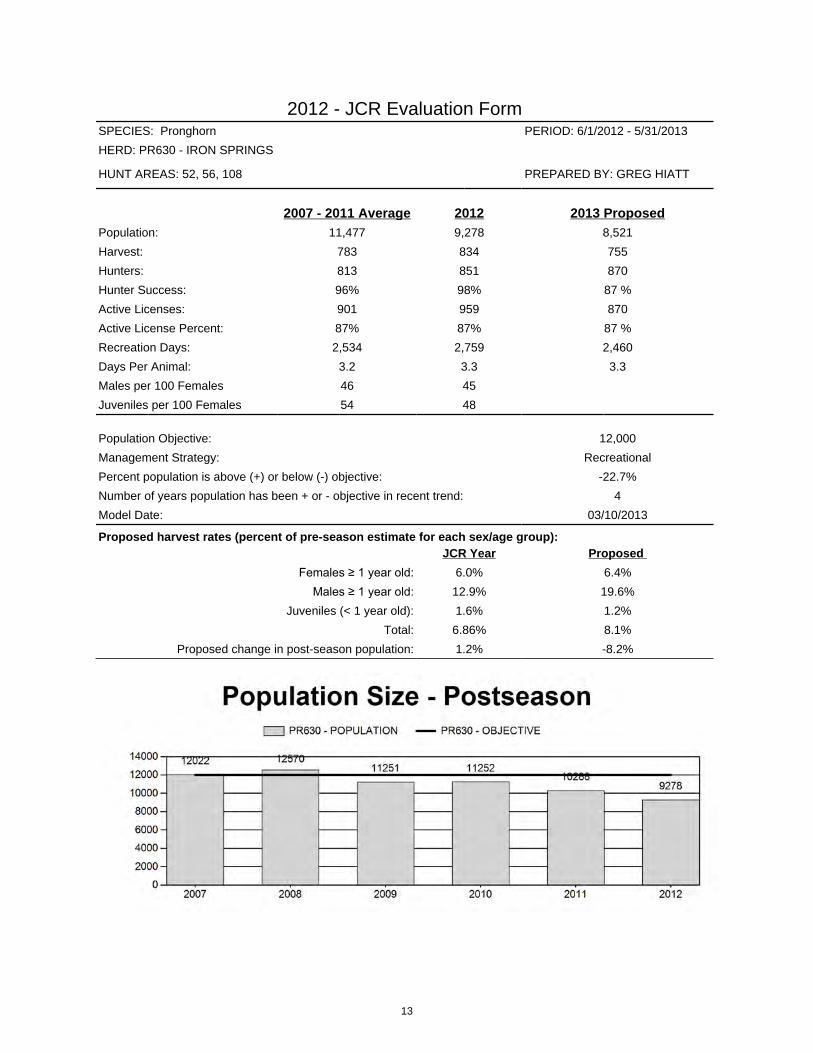
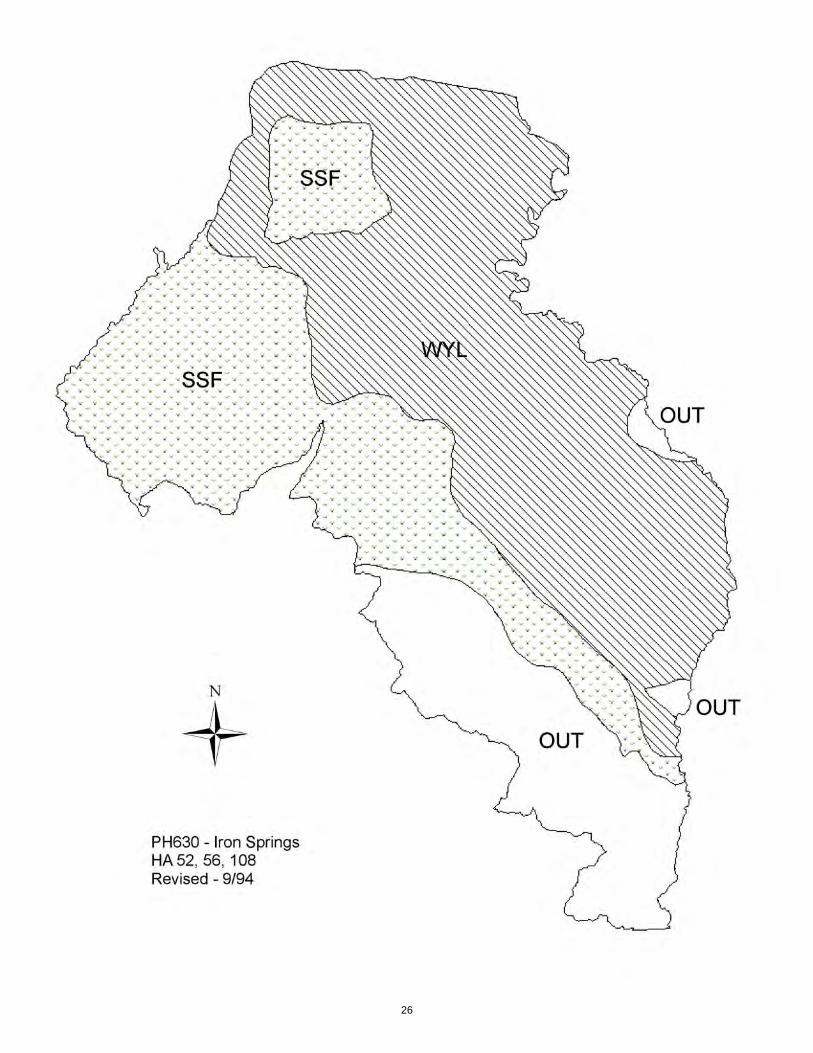
HERD: PR630 - IRON SPRINGS
HUNT AREAS: 52, 56, 108 PREPARED BY: GREG HIATT
2007 - 2011 Average 2012 2013 ProposedPopulation: 11,477 9,278 8,521
Harvest: 783 834 755
Hunters: 813 851 870
Hunter Success: 96% 98% 87 %
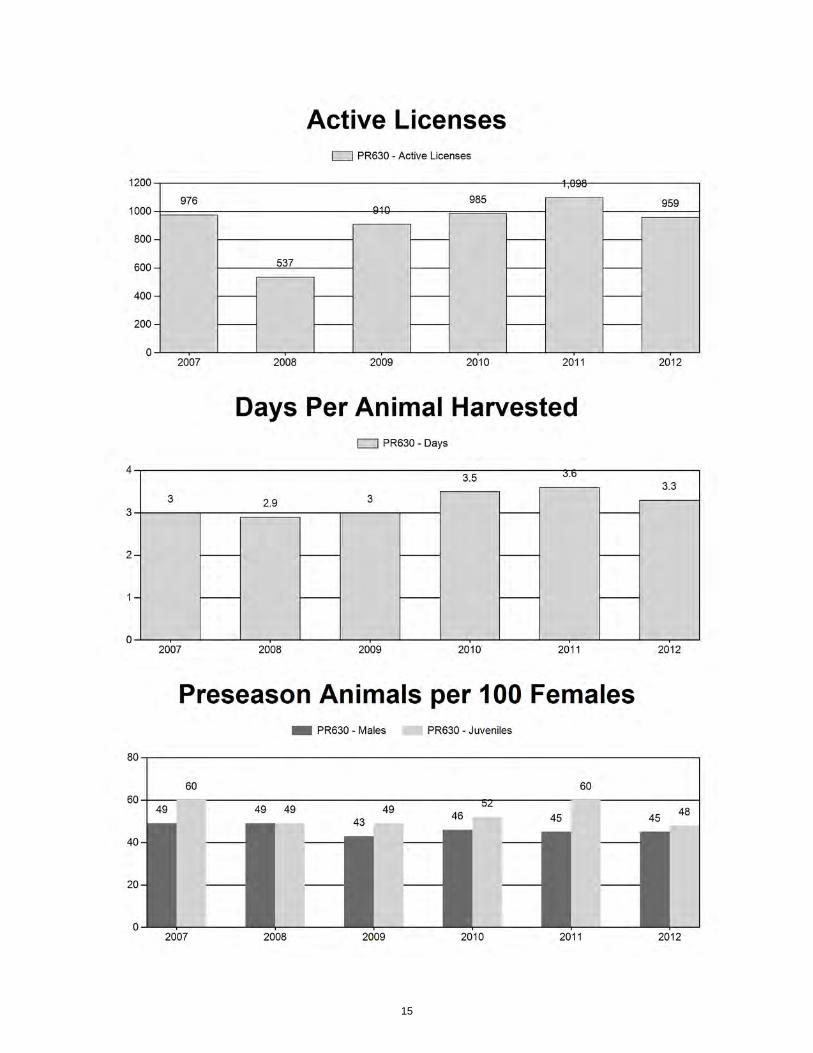
Active Licenses: 901 959 870
Active License Percent: 87% 87% 87 %
Recreation Days: 2,534 2,759 2,460
Days Per Animal: 3.2 3.3 3.3
Males per 100 Females 46 45
Juveniles per 100 Females 54 48
Population Objective: 12,000
Management Strategy: Recreational
Percent population is above (+) or below (-) objective: -22.7%
Number of years population has been + or - objective in recent trend: 4
Model Date: 03/10/2013
Proposed harvest rates (percent of pre-season estimate for each sex/age group):JCR Year Proposed
Females ≥ 1 year old: 6.0% 6.4%
Males ≥ 1 year old: 12.9% 19.6%
Juveniles (< 1 year old): 1.6% 1.2%
Total: 6.86% 8.1%
Proposed change in post-season population: 1.2% -8.2%
13
14
15
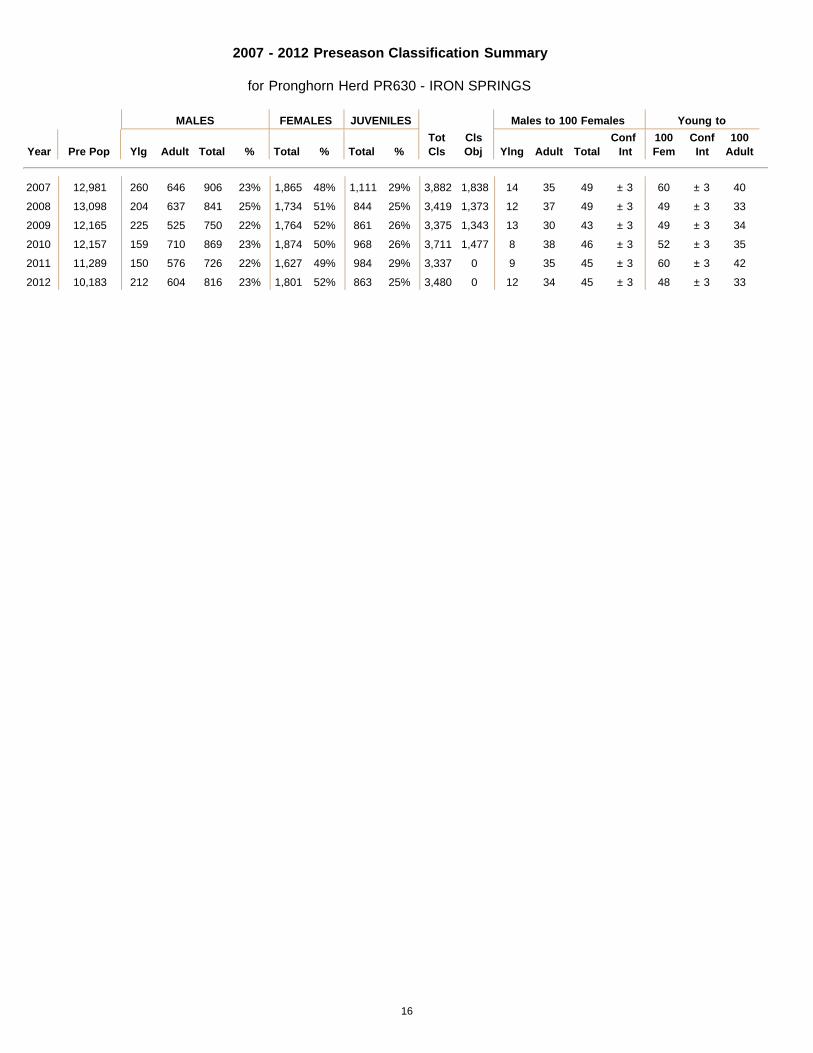
2007 - 2012 Preseason Classification Summary
for Pronghorn Herd PR630 - IRON SPRINGS
MALES FEMALES JUVENILES Males to 100 Females Young to
Year Pre Pop Ylg Adult Total % Total % Total %TotCls
ClsObj Ylng Adult Total
Conf Int
100Fem
ConfInt
100Adult
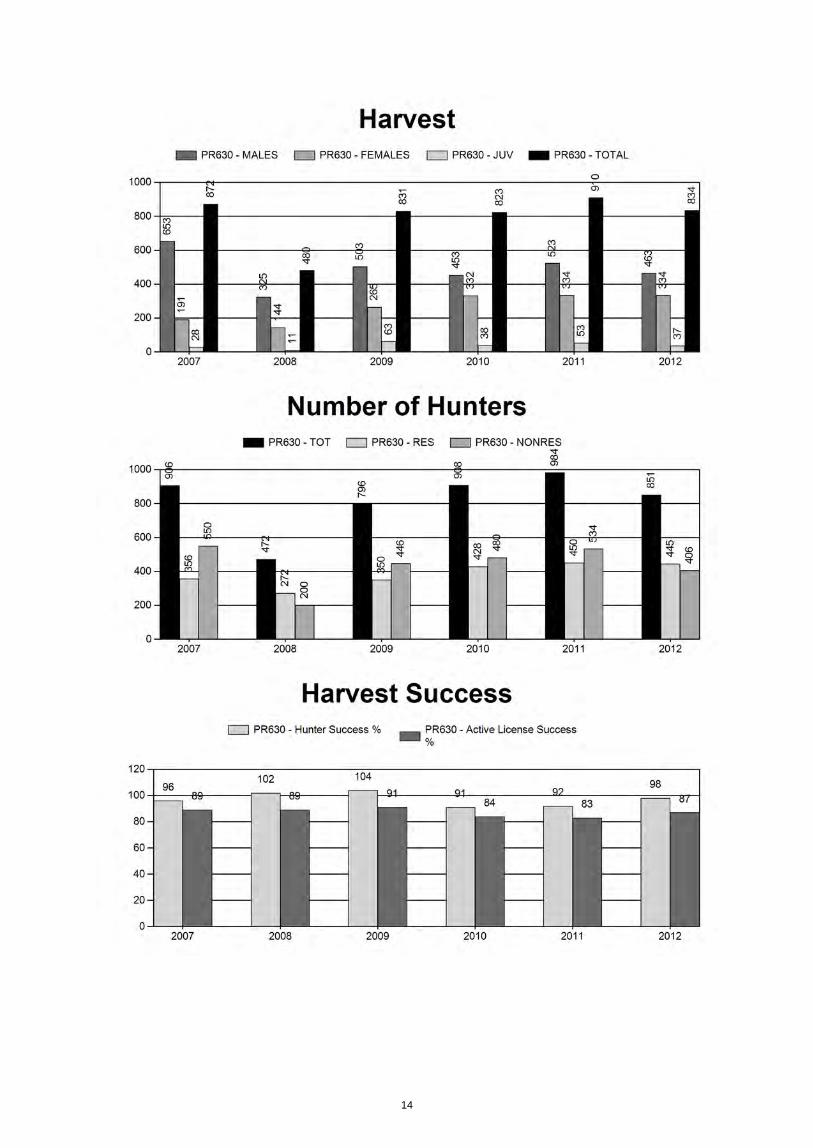
2007 12,981 260 646 906 23% 1,865 48% 1,111 29% 3,882 1,838 14 35 49 ± 3 60 ± 3 40
2008 13,098 204 637 841 25% 1,734 51% 844 25% 3,419 1,373 12 37 49 ± 3 49 ± 3 33
2009 12,165 225 525 750 22% 1,764 52% 861 26% 3,375 1,343 13 30 43 ± 3 49 ± 3 34
2010 12,157 159 710 869 23% 1,874 50% 968 26% 3,711 1,477 8 38 46 ± 3 52 ± 3 35
2011 11,289 150 576 726 22% 1,627 49% 984 29% 3,337 0 9 35 45 ± 3 60 ± 3 42
2012 10,183 212 604 816 23% 1,801 52% 863 25% 3,480 0 12 34 45 ± 3 48 ± 3 33
16

2013 HUNTING SEASONS IRON SPRINGS PRONGHORN HERD (PR630)
Hunt Dates of Seasons Area Type Opens Closes Quota Limitations
52 1 Sep. 16 Oct. 31 150 Limited quota; any antelope 2 Sep. 16 Nov. 14 200 Limited quota; any antelope valid
in that portion of Area 52 south of North Spring Creek
6 Sep. 16 Oct. 31 150 Limited quota; doe or fawn 7 Sep. 16 Nov. 14 250 Limited quota; doe or fawn valid
in that portion of Area 52 south of North Spring Creek
56 1 Sep. 20 Oct. 14 75 Limited quota; any antelope
108 1 Sep. 20 Oct. 14 100 Limited quota; any antelope 6 Sep. 20 Oct. 14 75 Limited quota; doe or fawn
Archery 52 Aug. 15 Sep. 15 Refer to Section 3 of this Chapter
56, 108 Aug. 15 Sep. 19 Refer to Section 3 of this Chapter
Hunt Area Type Quota change from 2012
52 1 -50 2 0 6 -50 7 0
56 1 0 108 1 0
6 0 Total 1&2 -50
6&7 -50
Management Evaluation Current Management Objective: 12,000 Management Strategy: Recreation 2012 Postseason Population Estimate: ~9,300 2013 Proposed Postseason Population Estimate: ~8,500 The Iron Springs pronghorn herd is managed toward a post-hunt population of 12,000, an objective last publicly reviewed in 1994. Population size is estimated using a spreadsheet model
17
developed in 2012 and updated in 2013. The herd is in recreational management, with harvest quotas designed to maintain pre-hunt buck:doe ratios below 60:100. Herd Unit Issues Construction of the proposed Chokecherry and Sierra Madre wind farms, consisting of roughly 1,000 turbines and the associated road network, could have significant impacts on important habitats in large portions of Areas 56 and 108, as well as the north portion of Area 52. Construction of several large, trans-continental powerlines would cross important winter habitats at the north edge of Area 56. Access remains an issue in this herd unit, particularly in the checkerboard in association with the proposed Chokecherry and Sierra Madre wind farms. The Walk-In program has opened access to large blocks of private land, primarily in Area 52, which has helped address concerns over large numbers of pronghorn residing on irrigated croplands during summer and fall. The seasonal distribution map was last revised in March 1994 and no changes were made during the past 3 years. Observations made during winters since 1994 indicate consideration should be given to delineating crucial winter ranges south of Saratoga, southeast of Chokecherry Knob and near Fort Steele. The southern boundary between Area 108 and Area 53 of the Baggs herd was moved further south onto more easily recognized county roads in 2011 and the herd unit boundary should be expanded to align with the new hunt area boundary. Fences continue to pose barriers to pronghorn movements throughout much of the herd unit, increasing mortality during tough winters. Sheep-tight fences may also contribute to low fawn survival in pastures with limited water sources during dry summers. Small acreages of crucial winter range have been lost to subdivision of deeded lands, primarily in the southern portion of the herd, and along Interstate Highway 80 in Area 56. Increased subdivision of these habitats, especially if these tracts are fenced, could seriously degrade the quality and utility of some winter ranges and migration routes. Development, partitioning, and fencing of these lands could have more deleterious effects on pronghorn migrations and habitat than some energy developments. Segregating land ownership among dozens of owners also deters recreational use of those divided lands and inter-mixed public lands. Weather Drought conditions were extreme across the herd unit in 2012, with minimal snowfall during the 2011-12 winter and almost no precipitation during the spring and summer. Drought was classified as moderate in April, severe in May and then extreme for all subsequent months through February 2013. Three late winter blizzards in April 2013 probably increased mortality from this herd. Habitat This herd unit overlaps most of the western half of the Platte Valley Mule Deer herd, and habitats for pronghorn suffer the same low productivity due to overuse, decadent shrubs and
18
drought. Treatments designed to improve habitat for mule deer through the Platte Valley Habitat Partnership are likely to improve habitats for pronghorn as well. Recent tebuthiuron treatments on top of Miller Hill in Area 108 and prescribed burns in Area 52 should improve summer ranges for pronghorn, at least in the short term. Oil and gas drilling activity has tapered off in the herd unit, as most drilling rigs are active in more productive fields elsewhere in the country, but a successful shale oil well a few miles east of the herd unit may lead to increased interest here. Proposed strip mining of coal in Kindt Basin in Area 56 could damage winter habitats, but is unlikely to occur in the near future because of more competitive coal reserves elsewhere in the state and conflict with the Chokecherry wind farm. Increased interest in developing coalbed methane resources in southern Wyoming may lead to proposals to develop well fields to extract the methane from these coal seams. Field Data As a consequence of extreme drought, fawn production dropped to 48:100, the lowest recorded in 15 years. Almost all the decline occurred in Area 52, with fawn production in Areas 56 and 108 remaining near low levels already seen in recent years. Classification sample size declined again in Area 56 for the third year, and was the smallest sample in over 20 years. The buck:doe ratio for that area exceeded the 60:100 criterion for the third year, a consequence of both the small samples and the lack of hunting access to over 80 percent of Area 56 because of the impending Chokecherry wind farm. If access continues to be denied after the wind project is constructed, buck:doe ratios will be expected to continue to rise in that area. The buck:doe ratio improved in Area 108, but at 39:100 was still well below what would be desired in an area with significant blocks of public land. The buck:doe ratio for Area 52 was not much better, at 46:100, and was unchanged from the 2012 ratio. The supply of adult bucks declined in Area 52, from 36:100 in 2011 to 32:100 in 2012, a result of poor yearling recruitment the previous year.
Harvest Data Hunter success improved in 2012, for almost all license types in each of the three areas. Success was lowest in Area 52. Similarly, the average number of days of effort required to harvest an animal declined for most license types, but was highest in Area 52. Population This herd was more than 10 percent below objective size following severe losses during the 1992-93 winter and remained below objective size for the rest of that decade due to poor fawn production. Fawn production began to improve in 1999, particularly in Area 52, allowing the herd to quickly reach objective size and then exceed it by ~35 percent by 2002. Most of the population growth was associated with irrigated croplands in the southern portion of Area 52. Harvests were increased, especially with the addition of Type 2 and 7 licenses limited to the southern portion of Area 52.
19

Losses in the northern portion of the herd unit were high again during the 2007-08 winter and pronghorn densities in that portion of the herd have not recovered due to repeated poor fawn production in low desert habitats in Areas 56 and 108. Losses were not exceptional in Area 52 during that winter and fawn production remained adequate in that portion of the herd until 2012. Prior to the development of a reasonable spreadsheet model in mid-2012, population estimates suggested this herd was roughly at objective size up until 2011. According to the spreadsheet model and a line transect survey flown in spring of 2012, the herd was actually 15 percent below objective as early as 2010. The combination of continued doe/fawn harvest and extremely poor fawn production in 2012 significantly reduced herd size this year, estimated at just over 9,300. The Time-Specific Juvenile & Constant Adult Survival (TSJ/CAS) spreadsheet model provided the best fit with observed buck:doe ratios for this herd, behaved predictably when 2012 classification and harvest data were added and is considered a “Fair” model of the herd. Annual adult survival was predicted at 88 percent, a reasonable level. Juvenile survival rates fluctuated within the allowed range and did not hover at maximum or minimum values for most years. The CJ,CA and SCJ,SCA models each had slightly lower AIC values, but both models predicted herd sizes well below the confidence interval of the most recent line transect estimate and generated roughly stable buck:doe estimates that did not track major dips and rises of observed values. The SCJ,SCA model also overestimated observed buck:doe ratios for each of the past three years. Due to the poor condition of animals going into this winter and projections of continued drought in 2013, fawn production in 2013 was projected to be similar to that seen in 2012. Similarly, the model was run using low juvenile survival in 2013. Management Evaluation With the population estimated to be 22% below objective, harvests should be reduced to allow the herd to recover. Quotas were reduced for the Type 1 and Type 6 licenses in Area 52, most of which are presumably filled on public lands in the northern portion of that area. However, the increased harvest from Type 2 and Type 7 licenses in Area 52 has successfully alleviated most landowner complaints about high pronghorn numbers on irrigated fields in the southern portion of that area. No increase in pronghorn numbers is desired in that portion of the herd unit and quotas for those license types are unchanged from 2012 levels. License quotas for Area 56 have been low in recent years since hunters are denied access to more than 80 percent of the hunt area by landowners and proponents of the Chokecherry wind project. There would be little benefit to the pronghorn population from a further reduction in that area and the quota is unchanged from 2012. License quotas in Area 108 have also been low since 2008, but include doe/fawn licenses intended primarily to address landowner concerns over high pronghorn numbers on one ranch that allows public hunting. License quotas Area 108 are also the same as available in 2012. The expected harvest of roughly 420 bucks and 335 does and fawns from the 2013 season quotas should continue to reduce herd size further below objective, projected to be ~8,500 at post-hunt 2013. This assumes reduced survival through the 2012-13 winter and fawn production similar to the low level seen in 2012. If either winter survival or fawn production exceeds expectations in 2013, herd reduction would be lessened. When weather and range conditions allow for growth of this population towards objective size, the most desired areas for that growth would be in the
20
northern portion of Area 52 and southern portion of Area 108 where access is available and numbers of pronghorn on private lands has been less of an issue. Opening dates for all areas and types are consistent with the application booklets. Opening dates for licenses in Area 52 are the same as in 2012 and coincide with seasons in neighboring Areas 50 and 51. As in 2012, the Type 2 and 7 licenses in the southern portion of this area are valid for an additional two weeks into November. The season in area 52 entirely overlaps local deer and elk general license seasons. Opening dates for areas 56 and 108 are the same as in the previous 14 years and coincide with neighboring areas 53 and 55 of the Baggs herd. Closing dates for areas 56 and 108 overlap local deer seasons and the first four days of the season in elk area 108. Archery seasons use standardized opening dates and close the day before the regular season opens for each area.
If significant portions of the herd unit remain closed to hunting, buck:doe ratios for the herd may have to exceed 60:100 in order to maintain reasonable levels of buck quality on the portions where harvest occurs.
21

INPU
T Sp
ecie
s:P
rong
horn
Bio
logi
st:
Gre
g H
iatt
Her
d U
nit &
No.
:63
0 =
Iron
Spr
ings
Mod
el d
ate:
03/1
0/13
CJ,
CA
Con
stan
t Juv
enile
& A
dult
Surv
ival
7887
SCJ,
SCA
Sem
i-Con
stan
t Juv
enile
& S
emi-C
onst
ant A
dult
Surv
ival
9411
4
TSJ,
CA
Tim
e-Sp
ecifi
c Ju
veni
le &
Con
stan
t Adu
lt Su
rviv
al20
135
Tota
lTo
tal
Tren
d C
oun t
Obj
ectiv
e
Juve
nile
sTo
tal M
ales
Fem
ales
Juve
nile
sTo
tal M
ales
Fem
ales
Tota
l Mal
esFe
mal
esTo
tal A
dults
Fiel
d Es
tFi
eld
SE19
9328
1630
3560
0011
851
2738
2251
5535
1052
331
8161
7293
5312
000
1994
3523
3117
6049
1269
034
2124
2755
9411
441
2852
5727
8579
1200
019
9522
9727
9556
1310
705
2219
2132
5210
9562
2401
5199
7600
1200
019
9629
1223
5350
9510
360
2858
1817
4910
9586
2668
5491
8160
1200
019
9722
6726
1553
8210
263
2234
2151
5286
9670
2207
5070
7277
1200
019
9828
4721
6349
6999
7828
2217
0549
0794
3526
7456
0082
7412
000
1999
3576
2620
5488
1168
535
6321
7354
0211
138
3333
6280
9613
1200
020
0037
2832
6761
5413
149
3718
2820
6070
1260
937
5667
2210
477
1200
020
0140
6236
8065
8714
330
4046
3246
6511
1380
347
2277
0112
423
1200
020
0246
2646
2875
4716
801
4610
4168
7421
1619
843
9173
5511
746
1200
020
0339
4743
0372
0815
458
3924
3609
7014
1454
737
5268
7410
627
1200
0
MO
DEL
S SU
MM
AR
YFi
tR
elat
ive
AIC
cC
heck
bes
t mod
el
to c
reat
e re
port
Popu
latio
n Es
timat
es fr
om T
op M
odel
Year
Pred
icte
d ad
ult E
nd-o
f-bio
-yea
r Pop
(yea
r i)
Pred
icte
d Po
sthu
nt P
opul
atio
n (y
ear i
)Pr
edic
ted
Preh
unt P
opul
atio
n (y
ear i
)LT
Pop
ulat
ion
Estim
ate
Not
es
SCJ,
SCA
Mod
TSJ,
CA M
odel
CJ,C
A M
odel
Clea
r fo
rm
003
3930
308
558
3936
090
53
568
0612
000
2004
4385
3677
6737
1479
943
6429
6365
6613
894
3238
6543
9780
1200
020
0541
8431
7364
1213
769
4166
2423
6216
1280
439
9974
7611
475
1200
020
0641
8339
1973
2715
428
4150
3092
7109
1435
134
8171
6510
646
1200
020
0741
8334
1170
2214
616
4152
2693
6812
1365
731
2468
8810
012
1200
020
0832
8630
6267
5113
098
3274
2704
6592
1257
028
8464
0492
8812
000
2009
3063
2826
6276
1216
529
9422
7359
8411
251
2900
6268
9168
1200
020
1031
7328
4261
4212
157
3131
2344
5777
1125
225
1156
1381
2412
000
2011
3327
2460
5501
1128
932
6918
8551
3410
288
2471
5354
7825
8736
884
1200
020
1225
1424
2252
4710
183
2472
1917
4888
9278
2183
4852
7036
1200
020
1324
5721
4047
5593
5224
2416
7844
2085
2112
000
2014
2015
2016
2017
2018
2019
2020
2021
2022
2023
2024
2025
SCJ,
SCA
Mod
TSJ,
CA M
odel
CJ,C
A M
odel
Clea
r fo
rm
22

Mod
el E
stFi
eld
Est
SEM
odel
Est
Fiel
d Es
tSE
1993
0.90
0.88
Para
met
ers:
Opt
im c
ells
1994
0.45
0.88
1995
0.52
0.88
Adu
lt S
urvi
val =
0.88
119
960.
760.
88In
itial
Tot
al M
ale
Pop
/10,
000
=
0.30
319
970.
300.
88In
itial
Fem
ale
Pop
/10,
000
=0.
600
1998
0.83
0.88
1999
0.79
0.88
2000
0.67
0.88
2001
0.90
0.88
Sex
Rat
io (
% M
ales
) =
50%
2002
0.30
0.88
Wou
ndin
g Lo
ss (
tota
l mal
es)
=10
%
2003
0.30
0.88
Wou
ndin
g Lo
ss (
fem
ales
) =
10%
2004
0.30
0.88
Wou
ndin
g Lo
ss (
juve
nile
s) =
10%
2005
0.90
0.88
Ove
r-su
mm
er a
dult
surv
iva
98%
2006
0.38
0.88
2007
0.38
0.88
2008
0.30
0.88
2009
0.61
0.88
2010
0.30
0.88
2011
0.46
0.88
2012
0.37
0.88
2013
0.30
0.88
2014
2015
Ann
ual A
dult
Surv
ival
Rat
esA
nnua
l Juv
enile
Sur
viva
l Rat
esSu
rviv
al a
nd In
itial
Pop
ulat
ion
Estim
ates
Year
MO
DEL
ASS
UM
PTIO
NS
2015
2016
2017
2018
2019
2020
2021
2022
2023
2024
2025
23
Der
ived
Est
Fiel
d Es
tFi
eld
SED
eriv
ed E
stFi
eld
Est
Fiel
d SE
Juv
Mal
esFe
mal
esTo
tal
Har
vest
Tota
l Mal
esFe
mal
es
1993
46.9
32.
1150
.58
48.8
72.
1771
342
371
1207
25.8
7.8
1994
58.2
52.
9051
.54
54.1
52.
7662
841
493
1135
22.2
7.5
1995
40.9
32.
0149
.79
49.7
92.
2860
236
671
1039
23.7
7.2
1996
57.1
52.
5046
.18
46.1
82.
1748
716
849
704
22.8
3.6
1997
42.1
22.
0648
.59
50.7
82.
3342
287
3053
917
.81.
819
9857
.29
2.68
43.5
341
.83
2.17
416
5622
494
21.2
1.2
1999
65.1
62.
8947
.75
47.7
42.
3440
779
1249
817
.11.
620
0060
.58
2.76
53.0
853
.08
2.52
406
769
491
13.7
1.4
2001
61.6
72.
9555
.87
52.9
62.
6639
569
1547
911
.81.
220
0261
.30
2.78
61.3
270
.60
3.07
418
115
1554
89.
91.
720
0354
.75
2.55
59.6
960
.58
2.73
631
176
2182
816
.12.
720
0465
.09
2.53
54.5
853
.56
2.22
649
155
1982
319
.42.
520
0565
.26
2.57
49.4
847
.49
2.07
682
178
1787
723
.63.
120
0657
.10
2.22
53.4
854
.40
2.15
751
198
3097
921
.13.
020
0759
.57
2.26
48.5
848
.58
1.97
653
191
2887
221
.13.
020
0848
.67
2.04
45.3
548
.50
2.04
325
144
1148
011
.72.
320
0948
.81
2.03
45.0
442
.52
1.85
503
265
6383
119
.64.
620
1051
.65
2.04
46.2
746
.37
1.90
453
332
3882
317
.55.
920
1160
.48
2.44
44.7
344
.62
1.99
523
334
5391
023
.46.
720
1247
.92
1.98
46.1
645
.31
1.91
326
823
20.8
6.8
2013
51.6
72.
0945
.00
45.0
01.
9030
575
521
.67.
120
1420
15
Juve
nile
/Fem
ale
Rat
ioYe
arSe
gmen
t Har
vest
Rat
e (%
of
Tota
l Mal
e/Fe
mal
e R
atio
Cla
ssifi
catio
n C
ount
sH
arve
st
2015
2016
2017
2018
2019
2020
2021
2022
2023
2024
2025
24
FIG
UR
ES
0.00
10.0
0
20.0
0
30.0
0
40.0
0
50.0
0
60.0
0
70.0
0
80.0
0
Total Males/100 Females
Mod
el v
s Fi
eld
Post
hunt
Tot
al M
ale/
Fem
ale
Rat
ios
Fie
ld E
stM
odel
Est
0
2000
4000
6000
8000
1000
0
1200
0
1400
0
1600
0
1800
0
Estimated Posthunt Population
Popu
latio
n Es
timat
es
LT P
op E
stE
nd-o
f-B
io Y
ear
Mod
el E
st (
adul
ts)
Obj
ectiv
eT
rend
Cou
ntT
otal
Cla
ssifi
edP
osth
unt P
op E
st
Com
men
ts:
0.00
10.0
0
20.0
0
30.0
0
40.0
0
50.0
0
60.0
0
70.0
0
80.0
0
Total Males/100 Females
Mod
el v
s Fi
eld
Post
hunt
Tot
al M
ale/
Fem
ale
Rat
ios
Fie
ld E
stM
odel
Est
0
2000
4000
6000
8000
1000
0
1200
0
1400
0
1600
0
1800
0
Estimated Posthunt Population
Popu
latio
n Es
timat
es
LT P
op E
stE
nd-o
f-B
io Y
ear
Mod
el E
st (
adul
ts)
Obj
ectiv
eT
rend
Cou
ntT
otal
Cla
ssifi
edP
osth
unt P
op E
st
0.0
5.0
10.0
15.0
20.0
25.0
30.0
% of Prehunt Segment
Segm
ent H
arve
st R
ate
Tot
al M
ales
Fem
ales
0.00
0.10
0.20
0.30
0.40
0.50
0.60
0.70
0.80
0.90
1.00
1993
1995
1997
1999
2001
2003
2005
2007
2009
2011
2013
2015
2017
2019
2021
2023
2025
Survival
Mod
el v
s Fi
eld
Surv
ival
Rat
es
Mod
el A
nnua
l Adu
ltM
odel
Win
ter
Juv
Fie
ld A
nnua
l Adu
ltF
ield
Win
ter
Juve
nile
25
26
2012 - JCR Evaluation FormSPECIES: Pronghorn PERIOD: 6/1/2012 - 5/31/2013
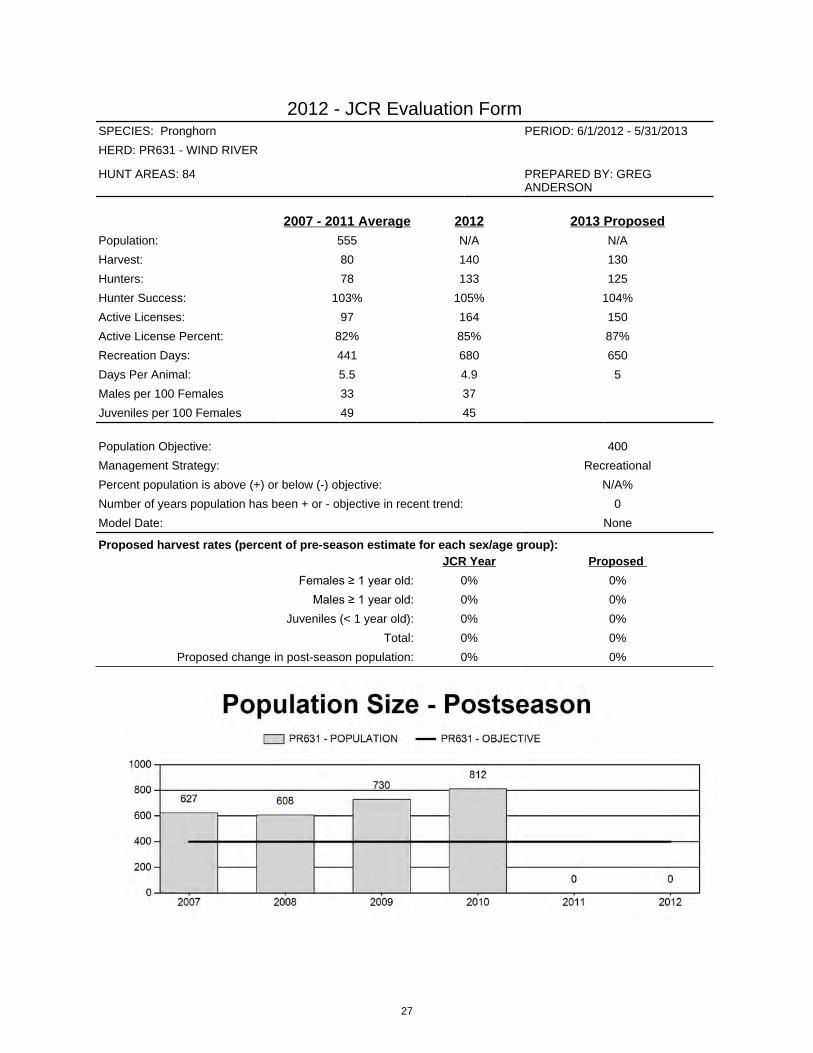
HERD: PR631 - WIND RIVER
HUNT AREAS: 84 PREPARED BY: GREG ANDERSON
2007 - 2011 Average 2012 2013 ProposedPopulation: 555 N/A N/A
Harvest: 80 140 130
Hunters: 78 133 125
Hunter Success: 103% 105% 104%
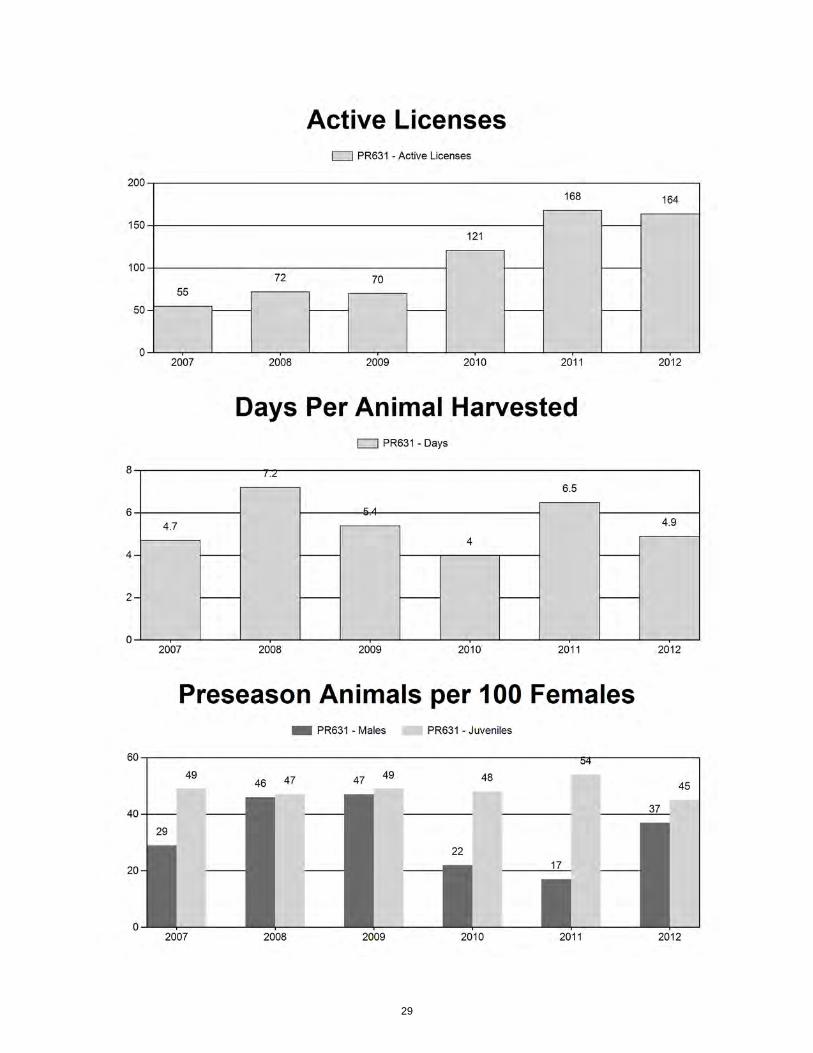
Active Licenses: 97 164 150
Active License Percent: 82% 85% 87%
Recreation Days: 441 680 650
Days Per Animal: 5.5 4.9 5
Males per 100 Females 33 37
Juveniles per 100 Females 49 45
Population Objective: 400
Management Strategy: Recreational
Percent population is above (+) or below (-) objective: N/A%
Number of years population has been + or - objective in recent trend: 0
Model Date: None
Proposed harvest rates (percent of pre-season estimate for each sex/age group):JCR Year Proposed
Females ≥ 1 year old: 0% 0%
Males ≥ 1 year old: 0% 0%
Juveniles (< 1 year old): 0% 0%
Total: 0% 0%
Proposed change in post-season population: 0% 0%
27
28
29
2007 - 2012 Preseason Classification Summary
for Pronghorn Herd PR631 - WIND RIVER
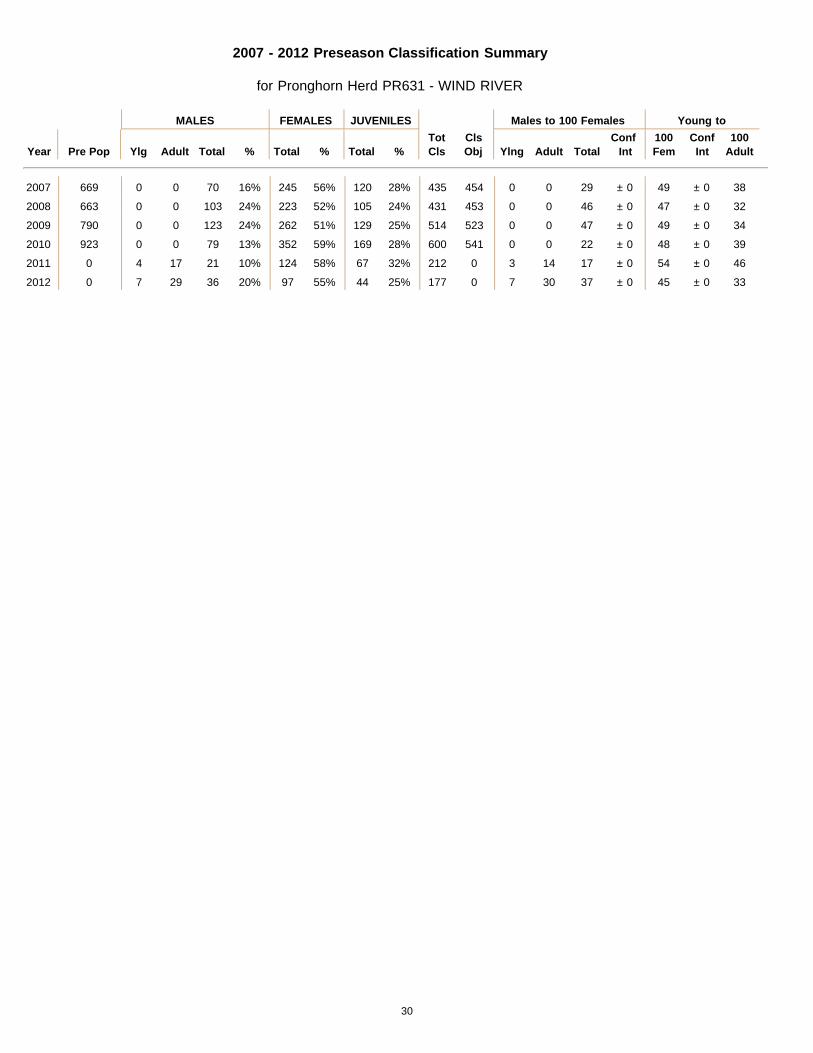
MALES FEMALES JUVENILES Males to 100 Females Young to
Year Pre Pop Ylg Adult Total % Total % Total %TotCls
ClsObj Ylng Adult Total
Conf Int
100Fem
ConfInt
100Adult
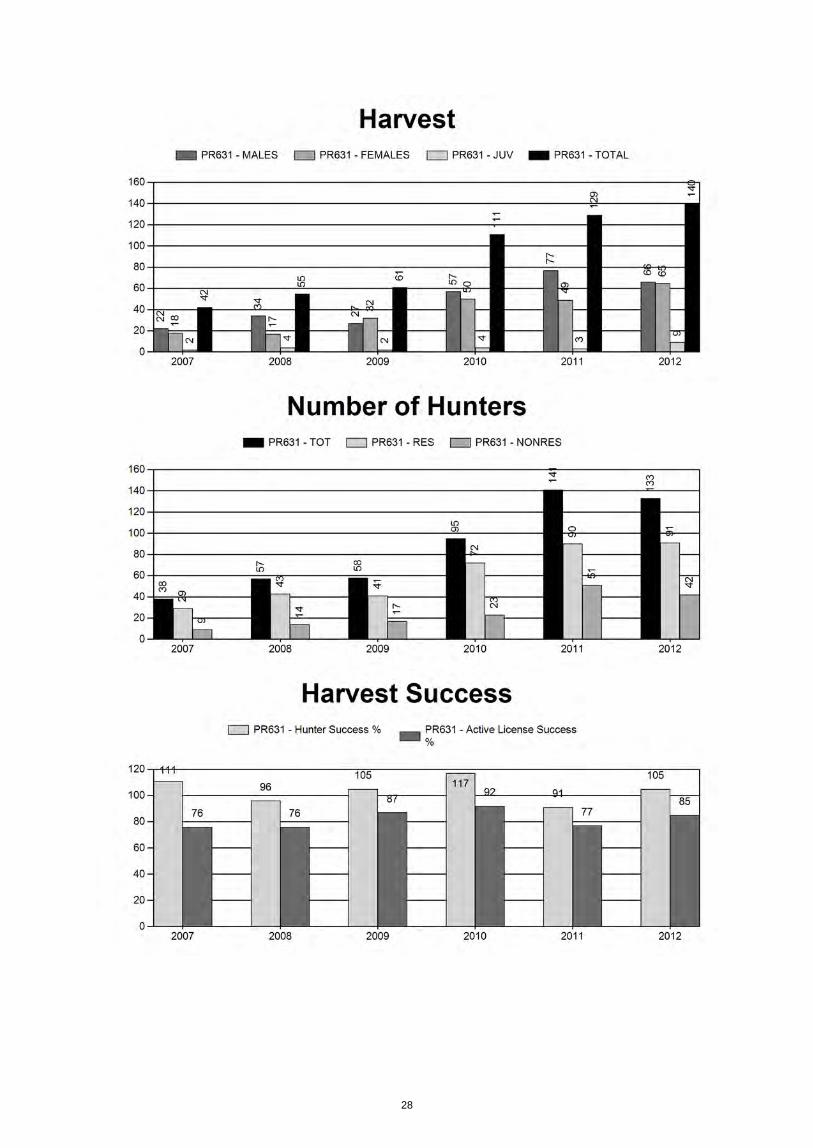
2007 669 0 0 70 16% 245 56% 120 28% 435 454 0 0 29 ± 0 49 ± 0 38
2008 663 0 0 103 24% 223 52% 105 24% 431 453 0 0 46 ± 0 47 ± 0 32
2009 790 0 0 123 24% 262 51% 129 25% 514 523 0 0 47 ± 0 49 ± 0 34
2010 923 0 0 79 13% 352 59% 169 28% 600 541 0 0 22 ± 0 48 ± 0 39
2011 0 4 17 21 10% 124 58% 67 32% 212 0 3 14 17 ± 0 54 ± 0 46
2012 0 7 29 36 20% 97 55% 44 25% 177 0 7 30 37 ± 0 45 ± 0 33
30
2013 HUNTING SEASONS WIND RIVER PRONGHORN (PR 631)
Hunt Season Dates Area Type Opens Closes Quota Limitations
84 1 Sep. 21 Oct. 22 75 Limited quota licenses; any
antelope 6 Sep. 21 Oct. 22 75 Limited quota licenses; doe or
fawn
Archery Aug. 15 Sep. 20 Refer to Section 3 of this Chapter
Hunt Area Type Quota change from 2012 84 6 -25
Total 6 -25
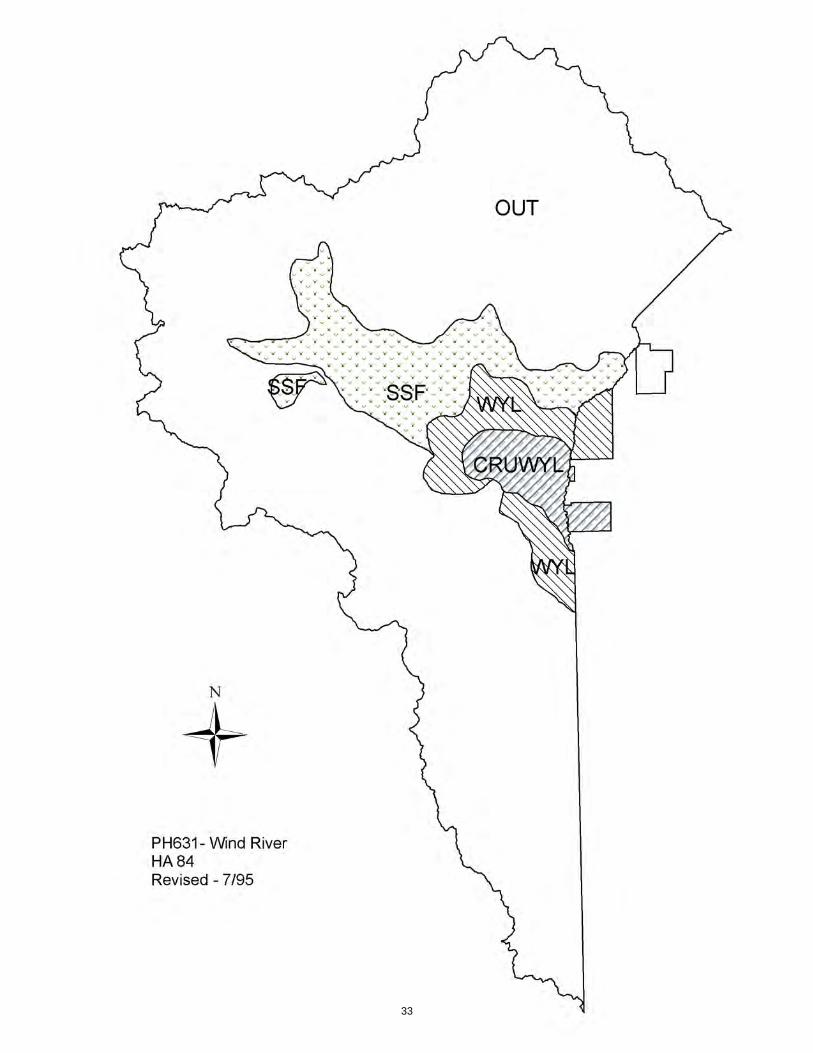
Management Evaluation Current Management Objective: 400 Management Strategy: Recreational 2012 Postseason Population Estimate: unknown 2013 Proposed Postseason Population Estimate: unknown Management Issues The Wind River pronghorn herd has a management objective of 400 with a recreational management strategy. This objective has been in place since 1994. Despite the length of time the numerical objective has been on record, personnel have never been able to effectively estimate the population based on interchange with the Wind River Reservation (WRR) and difficulty collecting adequate demographic data in the mountainous terrain throughout the herd unit. Over the next several years, the Lander Region plans to adopt a suitable alternative objective. Habitat/Weather This pronghorn population occupies the upper Wind River basin west of the WRR. Much of the habitat throughout the herd unit is marginal or unsuitable. Pronghorn densities are highest on the east end of the herd unit where they occupy deer and elk winter range throughout the summer months. Some pronghorn winter on bare slopes in the mountain foothills, but many migrate east down the Wind River onto the WRR. Available habitat and climatic conditions seem to be the biggest factors limiting this population.
31
Much of the pronghorn range in the herd unit was subject to extreme drought during the 2012 spring and summer. Very little new forage or browse grew throughout the area. Some pronghorn spending summer in higher mountain basins would have had access to better feed resources. Field/Harvest Data/Population Poor feed conditions were not immediately manifested in classification data. The 2012 fawn/doe ratio was 45/100. This is low for most pronghorn herds, but not atypical in this herd unit with the doe/fawn ratio averaging 49/100 over the past 5 years. The 2012 buck/doe ratio was 37/100. Again this is not atypically low for this population. It should be noted; the classification ratios are based on very small sample sizes and not considered reliable. The unreliable classification data combined with significant interchange with the WRR precludes the construction of a population model. The 2012 classification sample was the lowest of the past five years. Personnel discontinued aerial classifications in 2011which resulted in significantly smaller classification samples than in previous years. That said, it did appear there were fewer pronghorn at traditionally occupied areas. It is likely this population was impacted by a particularly harsh winter in 2010 similar to neighboring herds. Harvest statistics for 2012 are unremarkable. The Type 1 license success was 90%. Over the past decade, Type 1 license success has fluctuated from a low of 56% to a high of 97% with no directional trend apparent. Similarly, Type 6 license success has shown dramatic year-to-year changes with no consistent trend. The days/animal statistic is likewise uninformative due to fluctuations, but no trend. Management Summary Given ambiguous harvest statistics and scarce demographic data it is difficult to make strong statements regarding population trend in this herd unit. Anecdotally, based on public and personnel observations, it appears this population grew substantially from the middle to end of the past decade. Following a harsh winter in 2010 and extreme drought in 2012 it seems the population declined. This follows demographic trends in several neighboring herd units. Scarce classification data indicate the buck/doe ratio increased the past year. The 2013 hunt season will slightly reduce pressure on the population in response to the perceived population decline. Given good harvest success on Type 1 licenses, numbers will not be reduced in order to provide the same amount of recreational opportunity as in 2012.
32
33

34

2012 - JCR Evaluation FormSPECIES: Pronghorn PERIOD: 6/1/2012 - 5/31/2013
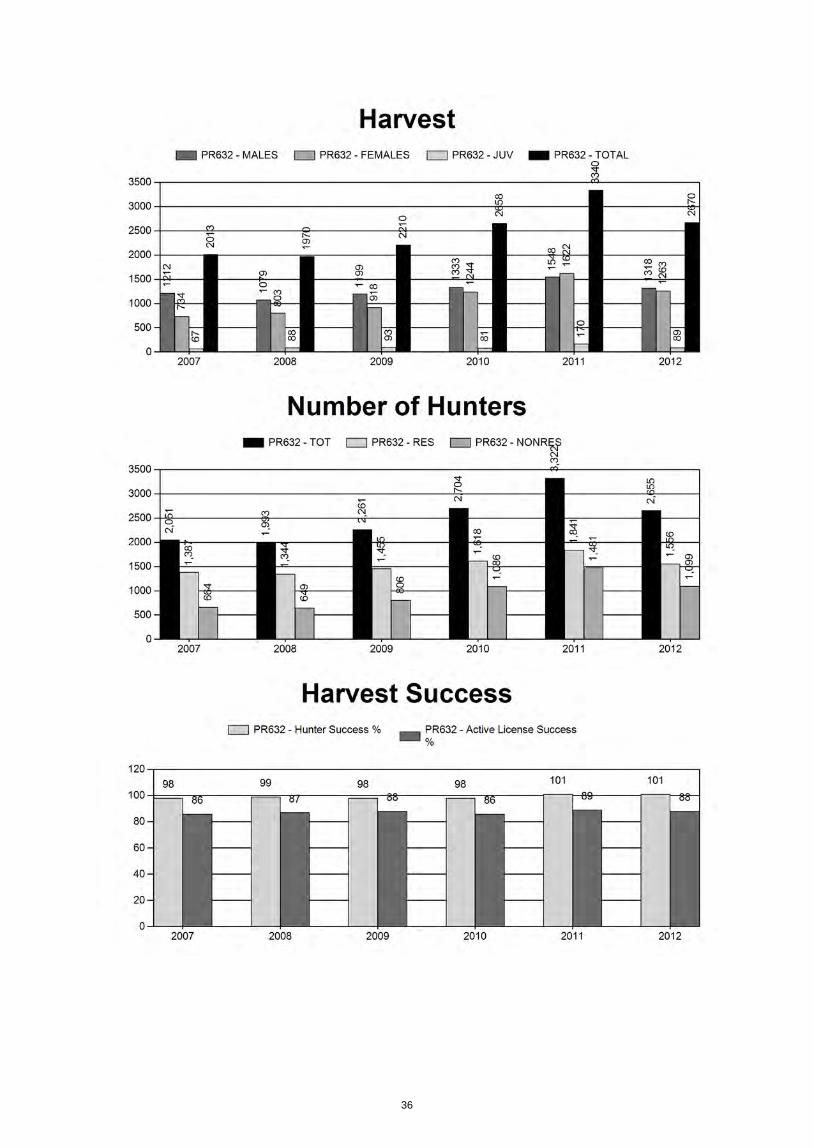
HERD: PR632 - BEAVER RIM
HUNT AREAS: 65-69, 74, 106 PREPARED BY: STAN HARTER
2007 - 2011 Average 2012 2013 ProposedPopulation: 20,528 13,533 13,719
Harvest: 2,438 2,670 1,270
Hunters: 2,466 2,655 1,450
Hunter Success: 99% 101% 88 %
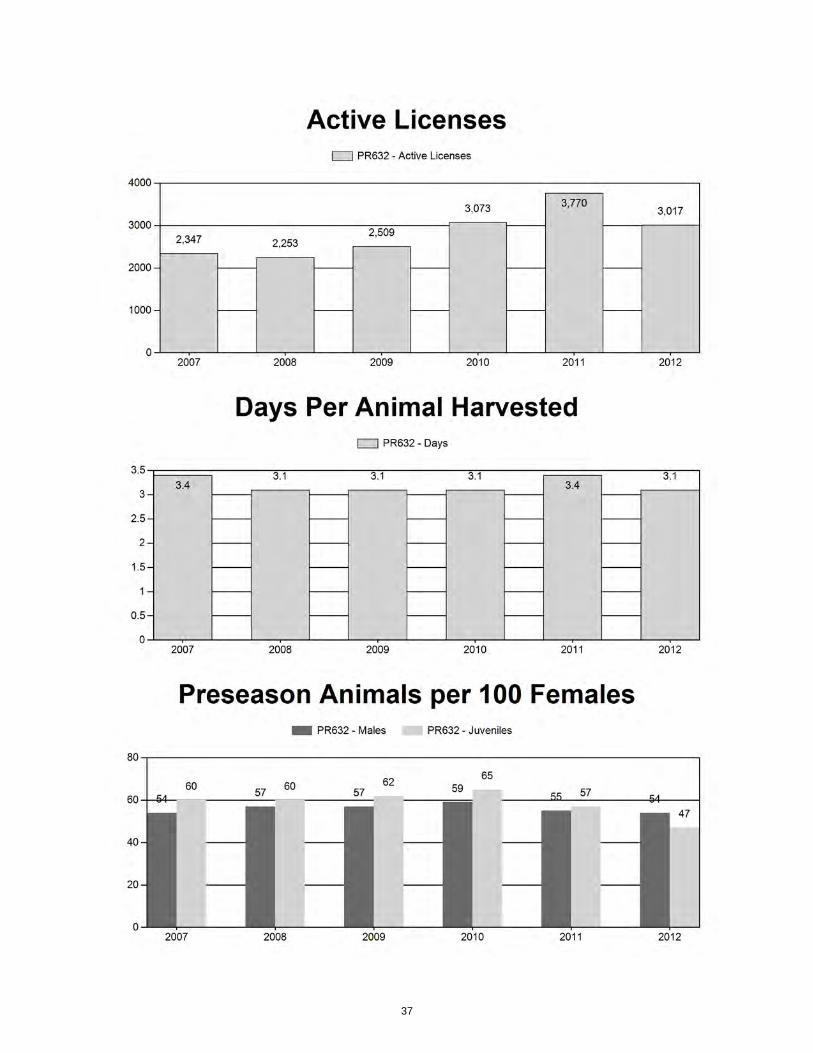
Active Licenses: 2,790 3,017 1,460
Active License Percent: 87% 88% 87 %
Recreation Days: 7,909 8,189 4,300
Days Per Animal: 3.2 3.1 3.4
Males per 100 Females 56 54
Juveniles per 100 Females 61 47
Population Objective: 25,000
Management Strategy: Special
Percent population is above (+) or below (-) objective: -45.9%
Number of years population has been + or - objective in recent trend: 6
Model Date: 4/3/2013
Proposed harvest rates (percent of pre-season estimate for each sex/age group):JCR Year Proposed
Females ≥ 1 year old: 17.1% 3.3%
Males ≥ 1 year old: 32.1% 27.9%
Juveniles (< 1 year old): 0.2% 0.1%
Total: 16.2% 8.4%
Proposed change in post-season population: -19.7% +1.4%
35
36
37

2007 - 2012 Preseason Classification Summary
for Pronghorn Herd PR632 - BEAVER RIM
MALES FEMALES JUVENILES Males to 100 Females Young to
Year Pre Pop Ylg Adult Total % Total % Total %TotCls
ClsObj Ylng Adult Total
Conf Int
100 Fem
Conf Int
100 Adult
2007 24,856 514 1,456 1,970 25% 3,623 47% 2,171 28% 7,764 2,057 14 40 54 ± 2 60 ± 2 392008 24,128 687 1,447 2,134 26% 3,747 46% 2,232 28% 8,113 2,064 18 39 57 ± 2 60 ± 2 382009 23,584 649 1,673 2,322 26% 4,109 46% 2,529 28% 8,960 2,190 16 41 57 ± 2 62 ± 2 392010 22,951 778 1,745 2,523 26% 4,278 45% 2,800 29% 9,601 2,381 18 41 59 ± 2 65 ± 2 412011 20,529 521 1,413 1,934 26% 3,544 47% 2,011 27% 7,489 1,893 15 40 55 ± 2 57 ± 2 372012 16,470 317 1,234 1,551 27% 2,867 50% 1,350 23% 5,768 1,766 11 43 54 ± 2 47 ± 2 31
38
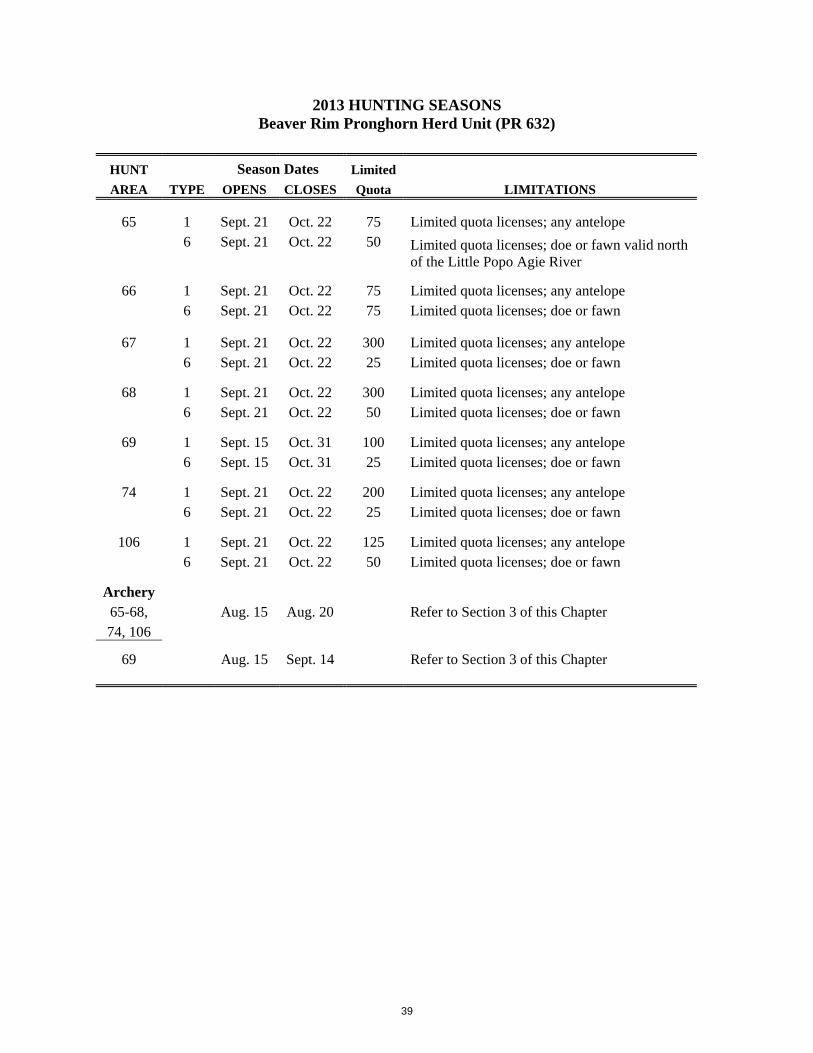
2013 HUNTING SEASONS Beaver Rim Pronghorn Herd Unit (PR 632)
HUNT Season Dates Limited AREA TYPE OPENS CLOSES Quota LIMITATIONS
65 1 Sept. 21 Oct. 22 75 Limited quota licenses; any antelope 6 Sept. 21 Oct. 22 50 Limited quota licenses; doe or fawn valid north
of the Little Popo Agie River
66 1 Sept. 21 Oct. 22 75 Limited quota licenses; any antelope 6 Sept. 21 Oct. 22 75 Limited quota licenses; doe or fawn
67 1 Sept. 21 Oct. 22 300 Limited quota licenses; any antelope 6 Sept. 21 Oct. 22 25 Limited quota licenses; doe or fawn
68 1 Sept. 21 Oct. 22 300 Limited quota licenses; any antelope 6 Sept. 21 Oct. 22 50 Limited quota licenses; doe or fawn
69 1 Sept. 15 Oct. 31 100 Limited quota licenses; any antelope 6 Sept. 15 Oct. 31 25 Limited quota licenses; doe or fawn
74 1 Sept. 21 Oct. 22 200 Limited quota licenses; any antelope 6 Sept. 21 Oct. 22 25 Limited quota licenses; doe or fawn
106 1 Sept. 21 Oct. 22 125 Limited quota licenses; any antelope 6 Sept. 21 Oct. 22 50 Limited quota licenses; doe or fawn
Archery 65-68, Aug. 15 Aug. 20 Refer to Section 3 of this Chapter 74, 106
69 Aug. 15 Sept. 14 Refer to Section 3 of this Chapter
39
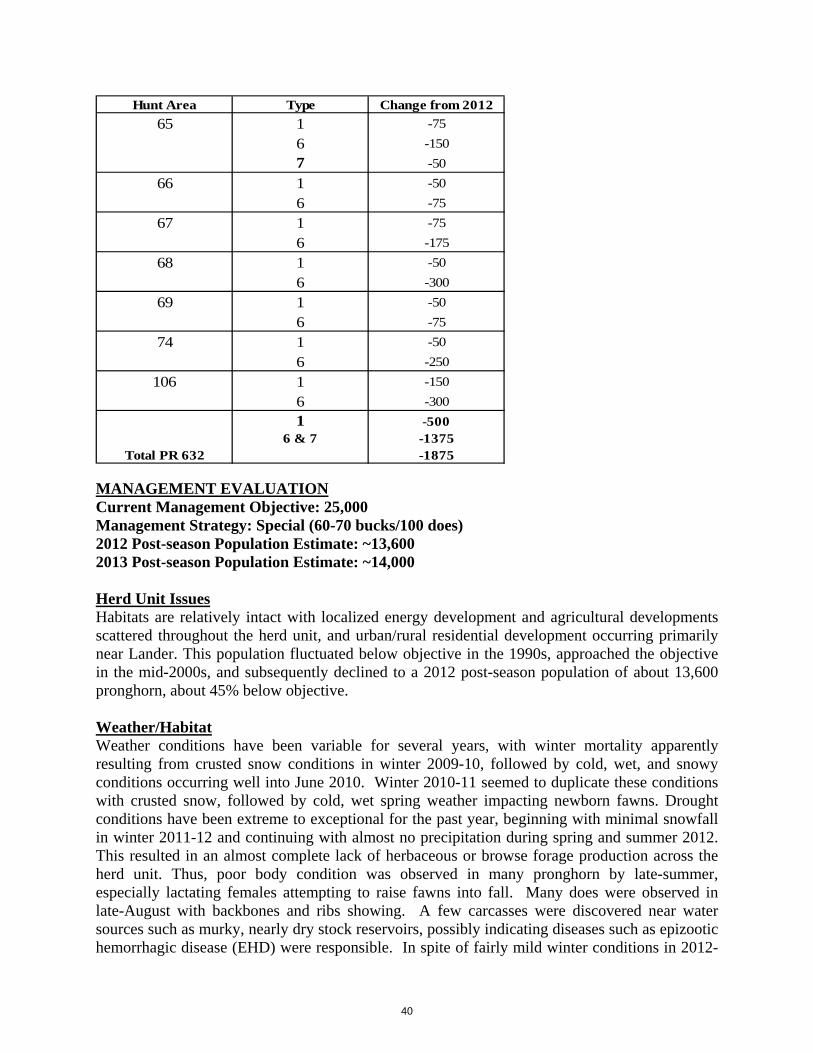
Hunt Area Type Change from 201265 1 -75
6 -1507 -50
66 1 -506 -75
67 1 -756 -175
68 1 -506 -300
69 1 -506 -75
74 1 -506 -250
106 1 -1506 -3001 -500
6 & 7 -1375Total PR 632 -1875
MANAGEMENT EVALUATION Current Management Objective: 25,000 Management Strategy: Special (60-70 bucks/100 does) 2012 Post-season Population Estimate: ~13,600 2013 Post-season Population Estimate: ~14,000 Herd Unit Issues Habitats are relatively intact with localized energy development and agricultural developments scattered throughout the herd unit, and urban/rural residential development occurring primarily near Lander. This population fluctuated below objective in the 1990s, approached the objective in the mid-2000s, and subsequently declined to a 2012 post-season population of about 13,600 pronghorn, about 45% below objective. Weather/Habitat Weather conditions have been variable for several years, with winter mortality apparently resulting from crusted snow conditions in winter 2009-10, followed by cold, wet, and snowy conditions occurring well into June 2010. Winter 2010-11 seemed to duplicate these conditions with crusted snow, followed by cold, wet spring weather impacting newborn fawns. Drought conditions have been extreme to exceptional for the past year, beginning with minimal snowfall in winter 2011-12 and continuing with almost no precipitation during spring and summer 2012. This resulted in an almost complete lack of herbaceous or browse forage production across the herd unit. Thus, poor body condition was observed in many pronghorn by late-summer, especially lactating females attempting to raise fawns into fall. Many does were observed in late-August with backbones and ribs showing. A few carcasses were discovered near water sources such as murky, nearly dry stock reservoirs, possibly indicating diseases such as epizootic hemorrhagic disease (EHD) were responsible. In spite of fairly mild winter conditions in 2012-
40
13, early winter mortality was probably above average due to the poor body condition of pronghorn entering winter. Winter losses may have been partially averted with the 2012 harvest removing surplus pronghorn. By early April, drought was expected to worsen through 2013. However, a series of several late winter/early spring snow storms produced over 50” of snow through early May (the equivalent of nearly 4” precipitation) in Lander, with more snow reported in Sinks Canyon (up to 78”) and other locations along the east slope of the Wind River Range. These storms have proven extremely helpful in lessening the effects of drought, yet they only helped change the drought status from Extreme to Severe. Unless more precipitation is received in May and June, little habitat improvement (especially shrubs, aspen, and riparian) will be achieved. Additionally, the heaviest precipitation was received in the Lander Foothills, with areas such as South Pass, Jeffrey City, and Sweetwater River drainage receiving much less snow in April. Population A spreadsheet model was developed for this population in 2012, utilizing pre-season classification and harvest data from 1994-2012, with 6 triennial line-transect (LT) estimates. The CJ, CA model was selected because it had the lowest Relative AICc value and generated population estimates that are either closely aligned with the LT point estimate or lie within the 95% confidence intervals (CI) for 5 of 6 LT estimates. Therefore, the model is considered Good to Excellent. The latest LT survey was conducted in bio-year 2010, with a resultant end-of-year population estimate of almost 20,000. The spreadsheet model simulates the 2010 end-of-year trend below the CI for that LT, with the post-season estimate actually being equal to the LT estimate for that year. Regardless, the model appears to consistently follow perceived population trends. Field Data Fawn/doe ratios have declined the past 3 years to 47J/100F in 2012, the lowest in 18 years. Buck/doe ratios also declined to 54M/100F in 2012, but this decline was less prominent than for the fawn/doe ratio, indicating fawn survival was low in summer 2012. As a result, we anticipate reduced yearling recruitment into 2013. Drought is predicted to persist in 2013, and we anticipate fawn production/recruitment to again decline. Harvest Data Despite obvious declines in pronghorn numbers, 2012 harvest statistics indicated appropriate seasons were in place. Total harvest success of about 88% and 3.1 days per animal harvested were almost identical to the average of the previous 5 years. However, this is a large herd unit and success rates were more variable between hunt areas, and concerns about low pronghorn numbers were heard from hunters in some areas. Adjustments to annual season recommendations consider these variables combined with variations in classification data to best fit harvest to individual hunt areas. Management Summary For 2013, we are making significant reductions to license numbers (primarily doe/fawn licenses) to stave off additional population decline, while providing hunter opportunity where appropriate. These reductions are also consistent with public comments received during hunting seasons and
41

at public meetings. With declining population trend and concern about drought and potential for increased winter mortality, we removed all Type 6 and 7 licenses from the 2013 application information. However, we have reinstated minimal numbers of doe/fawn licenses in most areas to focus hunters into specific hayfield damage prone areas and to show our concern about population growth in during this period of poor habitat quality. We believe the seasons outlined above will be acceptable to the public and should curb population decline if drought lessens and fawn production levels improve. A total of 1,175 any antelope and 300 doe/fawn licenses are available for 2013, and should result in a harvest of approximately 1,200 animals. With average survival in combination with our harvest, we anticipate the population to remain stable at just under 14,000 pronghorn.
42
INPU
T Sp
ecie
s:P
rong
horn
Bio
logi
st:
Sta
n H
arte
rH
erd
Uni
t & N
o.:
Bea
ver
Rim
PR
632
Mod
el d
ate:
04/0
3/13
CJ,
CA
Con
stan
t Juv
enile
& A
dult
Surv
ival
8392
SCJ,
SCA
Sem
i-Con
stan
t Juv
enile
& S
emi-C
onst
ant A
dult
Surv
ival
8392
TSJ,
CA
Tim
e-Sp
ecifi
c Ju
veni
le &
Con
stan
t Adu
lt Su
rviv
al24
120
Tota
lTo
tal
Tren
d C
oun t
Obj
ectiv
e
Juve
nile
sTo
tal M
ales
Fem
ales
Juve
nile
sTo
tal M
ales
Fem
ales
Tota
l Mal
esFe
mal
esTo
tal A
dults
Fiel
d Es
tFi
eld
SE19
9444
3336
1189
6217
006
4349
2761
8051
1516
135
7483
6811
942
2500
019
9536
4535
0282
0115
348
3645
2895
8182
1472
235
5184
1611
967
1246
016
5825
000
1996
5353
3480
8247
1708
153
5328
3282
2516
411
3955
8920
1287
425
000
1997
4638
3875
8741
1725
446
1732
2587
1316
555
4106
9156
1326
125
000
1998
5380
4023
8972
1837
653
7933
6588
7817
621
4443
9510
1395
315
290
2692
2500
019
9953
3643
5493
2019
010
5325
3586
9279
1819
146
1598
6414
479
2500
020
0053
3645
2396
6619
525
5316
3746
9581
1864
347
5510
127
1488
225
000
2001
5037
4660
9925
1962
150
3040
0699
0018
936
4930
1034
915
279
1465
025
7725
000
2002
5030
4831
1014
220
003
5024
4151
1006
819
244
5057
1049
615
553
2500
020
0358
6049
5610
286
2110
258
5941
6910
157
2018
552
8910
798
1608
725
000
2004
7388
5183
1058
223
153
7361
4444
1036
122
166
5947
1137
617
323
1967
721
7625
000
2005
7317
5828
1114
824
294
7291
5056
1082
123
168
6480
1176
218
242
2500
020
0668
8663
5011
527
2476
368
3953
4210
969
2315
065
8411
742
1832
725
000
2007
6896
6453
1150
824
856
6822
5119
1070
022
642
6335
1145
917
794
1791
923
4725
000
2008
6689
6208
1123
024
128
6593
5022
1034
721
961
6195
1106
217
257
2500
020
0966
7260
7110
841
2358
465
7047
5298
3121
153
5928
1057
216
500
2500
020
1067
8158
1010
361
2295
166
9243
4389
9220
027
5577
9807
1538
319
965
2762
2500
020
1154
5354
6596
1120
529
5266
3762
7826
1685
546
1182
9112
902
2500
020
1238
2645
1981
2516
470
3728
3069
6735
1353
340
2081
4612
166
2500
020
1331
9339
4079
8315
116
3160
2840
7719
1371
925
000
MO
DEL
S SU
MM
AR
YFi
tR
elat
ive
AIC
cC
heck
bes
t mod
el
to c
reat
e re
port
Popu
latio
n Es
timat
es fr
om T
op M
odel
Year
Pred
icte
d ad
ult E
nd-o
f-bio
-yea
r Pop
(yea
r i)
Pred
icte
d Po
sthu
nt P
opul
atio
n (y
ear i
)Pr
edic
ted
Preh
unt P
opul
atio
n (y
ear i
)LT
Pop
ulat
ion
Estim
ate
Not
es
SCJ,
SCA
Mod
TSJ,
CA M
odel
CJ,C
A M
odel
Clea
r fo
rm
025
000
025
000
025
000
025
000
025
000
025
000
025
000
025
000
025
000
025
000
025
000
025
000
025
000
SCJ,
SCA
Mod
TSJ,
CA M
odel
CJ,C
A M
odel
Clea
r fo
rm
43

Mod
el E
stFi
eld
Est
SEM
odel
Est
Fiel
d Es
tSE
1994
0.53
0.89
Para
met
ers:
Opt
im c
ells
1995
0.53
0.89
Juve
nile
Sur
viva
l =0.
534
1996
0.53
0.89
Adu
lt S
urvi
val =
0.88
919
970.
530.
89In
itial
Tot
al M
ale
Pop
/10,
000
=
0.36
119
980.
530.
89In
itial
Fem
ale
Pop
/10,
000
=0.
896
1999
0.53
0.89
2000
0.53
0.89
2001
0.53
0.89
2002
0.53
0.89
Sex
Rat
io (
% M
ales
) =
50%
2003
0.53
0.89
Wou
ndin
g Lo
ss (
tota
l mal
es)
=10
%
2004
0.53
0.89
Wou
ndin
g Lo
ss (
fem
ales
) =
10%
2005
0.53
0.89
Wou
ndin
g Lo
ss (
juve
nile
s) =
10%
2006
0.53
0.89
Ove
r-su
mm
er a
dult
surv
iva
98%
2007
0.53
0.89
2008
0.53
0.89
2009
0.53
0.89
2010
0.53
0.89
2011
0.53
0.89
2012
0.53
0.89
2013
0.53
0.89
0 0 0 0 0 0 0 0 0 0 0 0
Ann
ual A
dult
Surv
ival
Rat
esA
nnua
l Juv
enile
Sur
viva
l Rat
esSu
rviv
al a
nd In
itial
Pop
ulat
ion
Estim
ates
Year
MO
DEL
ASS
UM
PTIO
NS
0
44
Der
ived
Est
Fiel
d Es
tFi
eld
SED
eriv
ed E
stFi
eld
Est
Fiel
d SE
Juv
Mal
esFe
mal
esTo
tal
Har
vest
Tota
l Mal
esFe
mal
es
1994
49.4
61.
6640
.29
43.1
41.
5276
773
828
1677
23.5
10.2
1995
44.4
51.
7142
.71
44.3
11.
710
552
1756
917
.30.
219
9664
.91
2.21
42.2
036
.32
1.50
058
920
609
18.6
0.3
1997
53.0
61.
8544
.34
45.9
81.
6819
591
2663
616
.80.
319
9859
.96
1.95
44.8
448
.77
1.70
159
986
686
16.4
1.1
1999
57.2
51.
8046
.72
44.1
61.
5210
698
3774
517
.60.
420
0055
.20
1.75
46.7
948
.18
1.59
1870
678
802
17.2
0.9
2001
50.7
51.
6646
.95
45.3
11.
546
594
2362
314
.00.
320
0249
.59
1.66
47.6
341
.20
1.47
561
867
690
14.1
0.7
2003
56.9
71.
8448
.18
47.7
41.
641
716
117
834
15.9
1.3
2004
69.8
12.
0348
.98
51.6
31.
6524
672
201
897
14.3
2.1
2005
65.6
41.
8852
.28
56.7
41.
7024
702
297
1023
13.2
2.9
2006
59.7
41.
7355
.09
60.3
31.
7443
917
507
1467
15.9
4.8
2007
59.9
21.
6356
.07
54.3
71.
5267
1212
734
2013
20.7
7.0
2008
59.5
71.
5955
.28
56.9
51.
5488
1079
803
1970
19.1
7.9
2009
61.5
51.
5656
.00
56.5
11.
4793
1199
918
2210
21.7
9.3
2010
65.4
51.
5956
.07
58.9
81.
4881
1333
1244
2658
25.2
13.2
2011
56.7
41.
5856
.87
54.5
71.
5417
015
4816
2233
4031
.218
.620
1247
.09
1.55
55.6
254
.10
1.71
8913
1812
6326
7032
.117
.120
1340
.00
1.50
49.3
648
.00
1.69
3010
0024
012
7027
.93.
30 0 0 0 0 0 0 0 0 0 0 0
Juve
nile
/Fem
ale
Rat
ioYe
arSe
gmen
t Har
vest
Rat
e (%
of
Tota
l Mal
e/Fe
mal
e R
atio
Cla
ssifi
catio
n C
ount
sH
arve
st
0 0
45
FIG
UR
ES
0.00
10.0
0
20.0
0
30.0
0
40.0
0
50.0
0
60.0
0
70.0
0
Total Males/100 Females
Mod
el v
s Fi
eld
Post
hunt
Tot
al M
ale/
Fem
ale
Rat
ios
Fie
ld E
stM
odel
Est
0
5000
1000
0
1500
0
2000
0
2500
0
3000
0
Estimated Posthunt Population
Popu
latio
n Es
timat
es
LT P
op E
stE
nd-o
f-B
io Y
ear
Mod
el E
st (
adul
ts)
Obj
ectiv
eT
rend
Cou
ntT
otal
Cla
ssifi
edP
osth
unt P
op E
st
25.0
30.0
35.0
Segment
Segm
ent H
arve
st R
ate
060
0.70
0.80
0.90
1.00
Mod
el v
s Fi
eld
Surv
ival
Rat
es
Com
men
ts:
0.0
5.0
10.0
15.0
20.0
25.0
% of Prehunt Segm
Tot
al M
ales
Fem
ales
0.00
0.10
0.20
0.30
0.40
0.50
0.60
0.70
1994
1996
1998
2000
2002
2004
2006
2008
2010
2012
0
0
0
0
0
0
0
Survival
Mod
el A
nnua
l Adu
ltM
odel
Win
ter
Juv
Fie
ld A
nnua
l Adu
ltF
ield
Win
ter
Juve
nile
46

47

48
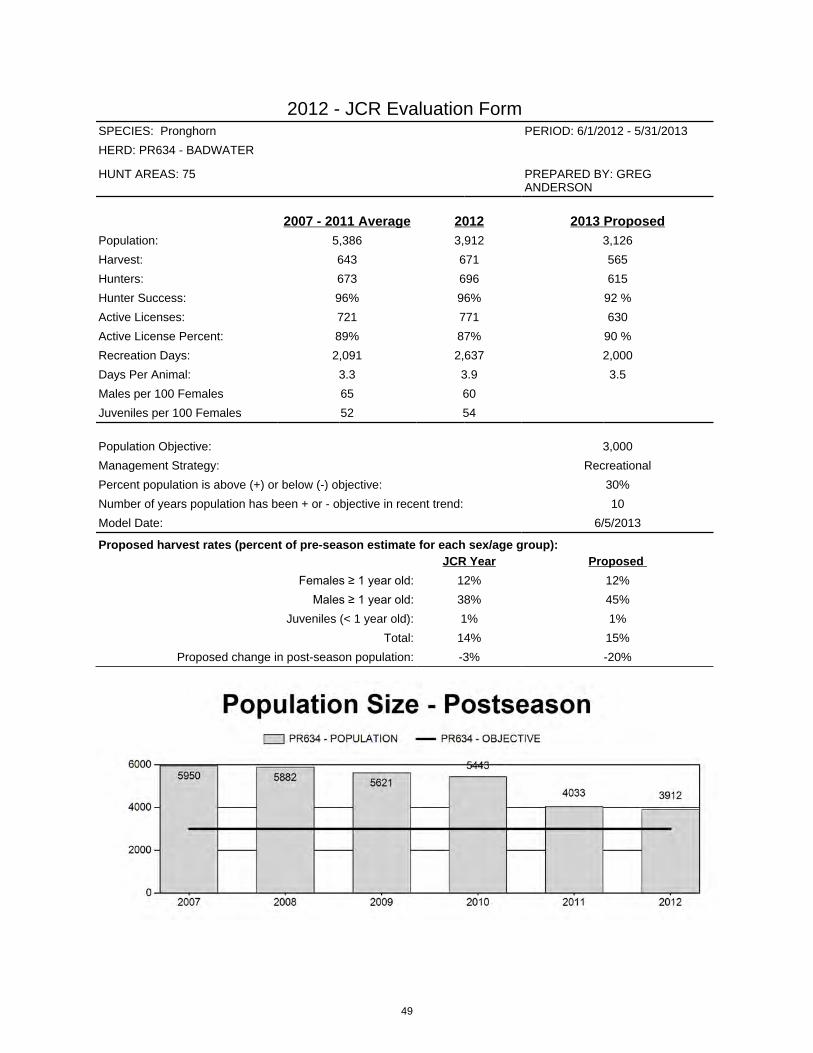
2012 - JCR Evaluation FormSPECIES: Pronghorn PERIOD: 6/1/2012 - 5/31/2013
HERD: PR634 - BADWATER
HUNT AREAS: 75 PREPARED BY: GREG ANDERSON
2007 - 2011 Average 2012 2013 ProposedPopulation: 5,386 3,912 3,126
Harvest: 643 671 565
Hunters: 673 696 615
Hunter Success: 96% 96% 92 %
Active Licenses: 721 771 630
Active License Percent: 89% 87% 90 %
Recreation Days: 2,091 2,637 2,000
Days Per Animal: 3.3 3.9 3.5
Males per 100 Females 65 60
Juveniles per 100 Females 52 54
Population Objective: 3,000
Management Strategy: Recreational
Percent population is above (+) or below (-) objective: 30%
Number of years population has been + or - objective in recent trend: 10
Model Date: 6/5/2013
Proposed harvest rates (percent of pre-season estimate for each sex/age group):JCR Year Proposed
Females ≥ 1 year old: 12% 12%
Males ≥ 1 year old: 38% 45%
Juveniles (< 1 year old): 1% 1%
Total: 14% 15%
Proposed change in post-season population: -3% -20%
49
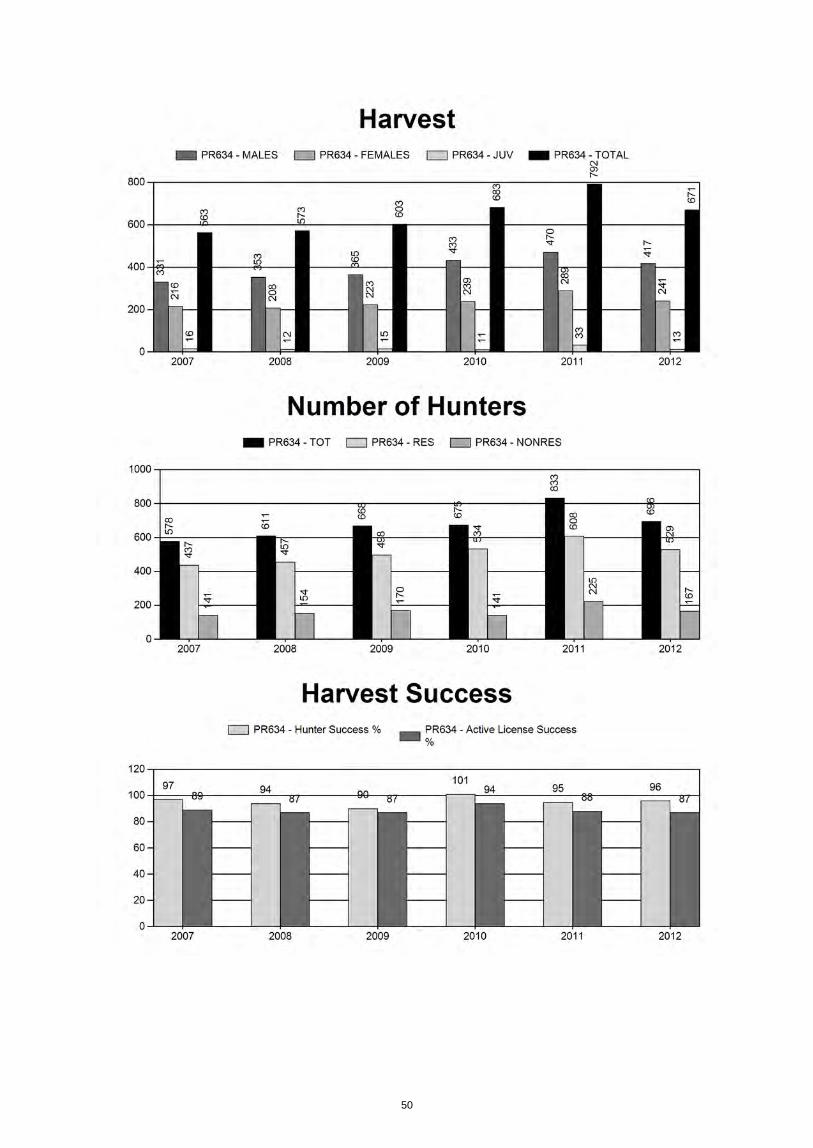
50

51
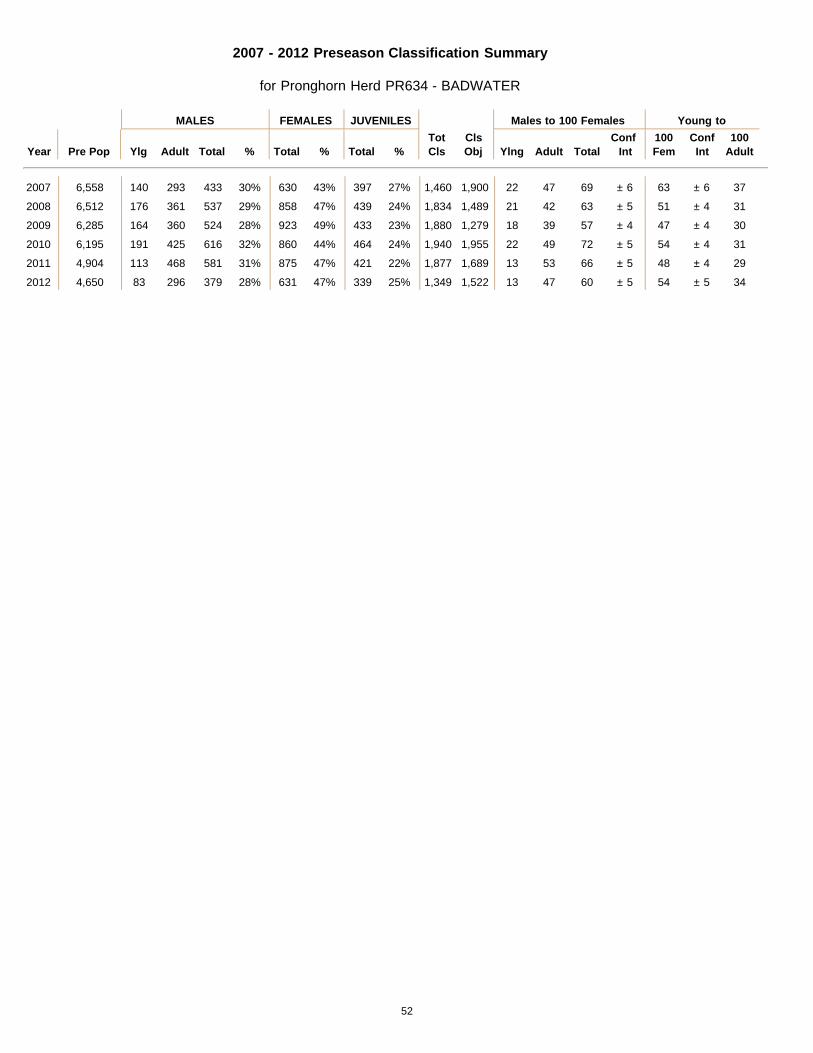
2007 - 2012 Preseason Classification Summary
for Pronghorn Herd PR634 - BADWATER
MALES FEMALES JUVENILES Males to 100 Females Young to
Year Pre Pop Ylg Adult Total % Total % Total %TotCls
ClsObj Ylng Adult Total
Conf Int
100Fem
ConfInt
100Adult
2007 6,558 140 293 433 30% 630 43% 397 27% 1,460 1,900 22 47 69 ± 6 63 ± 6 37
2008 6,512 176 361 537 29% 858 47% 439 24% 1,834 1,489 21 42 63 ± 5 51 ± 4 31
2009 6,285 164 360 524 28% 923 49% 433 23% 1,880 1,279 18 39 57 ± 4 47 ± 4 30
2010 6,195 191 425 616 32% 860 44% 464 24% 1,940 1,955 22 49 72 ± 5 54 ± 4 31
2011 4,904 113 468 581 31% 875 47% 421 22% 1,877 1,689 13 53 66 ± 5 48 ± 4 29
2012 4,650 83 296 379 28% 631 47% 339 25% 1,349 1,522 13 47 60 ± 5 54 ± 5 34
52
2013 HUNTING SEASONS BADWATER PRONGHORN (PR 634)
Hunt Season Dates Area Type Opens Closes Quota Limitations
75 1 Sep. 21 Oct. 22 400 Limited quota licenses; any
antelope 6 Sep. 21 Oct. 22 250 Limited quota licenses; doe or
fawn
Archery Aug. 15 Sep. 20 Refer to Section 3 of this Chapter
Hunt Area Type Quota change from 2012 75 1 -150 6 -50
Total 1 -150 6 -50
Management Evaluation Current Management Objective: 3,000 Management Strategy: Recreational 2012 Postseason Population Estimate: ~3,900 2013 Proposed Postseason Population Estimate: ~3,100 Management Issues The Badwater pronghorn herd is managed toward a numerical objective of 3,000. The population is estimated using a spreadsheet model developed in 2012 and updated in 2013. The herd is managed for recreational opportunity. The objective was last reviewed in 1994. This pronghorn population inhabits a heavily industrialized area in central Wyoming. Much of the herd unit has or will soon be designated as a special management area emphasizing oil and gas production in both the Casper and Lander BLM RMPs. The Lander BLM is currently beginning to analyze a proposal by EnCana to develop approximately 4,200 oil/gas wells in the central part of the herd unit. Given the commodities production emphasis in the area, it is likely a significant amount of pronghorn habitat will we lost or degraded over the next 20 years. Habitat/Weather Over the past year, drought conditions were extreme in this herd unit. There was minimal snowfall during the 2011/12 winter and almost no precipitation throughout the spring and summer. The end result was essentially no forage/browse production throughout the herd unit. Given the poor feed resource, pronghorn body condition in the herd unit was generally quite poor
53
entering the 2012/13 winter. This was particularly true for reproductively successful does that succeeded in raising fawns through early fall. Despite relatively mild winter conditions in 2012/13 it is likely early winter mortality was above average due to the poor body condition of many animals in the fall. Population The population estimate for 2012 is approximately 3,900 pronghorn. The population is 30% above objective. This population increased steadily in the late 1990’s through the mid 2000’s. The population peaked around 2007 at approximately 5,900 animals according the most recent population model. Over the past 6 years the population has declined dramatically and is expected to be at objective in 2013. The 2013 post-season population estimate is 3,100 antelope. The long-term population decline is a result of extended, poor environmental conditions combined with increased harvest designed to reduce the population to objective. In 2012, a spreadsheet model was developed for this population. The model behaved predictably with the addition of 2012 data and appears to track population trends reliably. In addition to 2012 field data, the model was updated with a line transect estimate from a survey flown on 5/21/13. For 2012, the SCJ, SCA version of the model was selected to simulate the population. Annual juvenile survival in the model is 0.9 and considered reasonable for the area. The SCJ, SCA model has two years with modified juvenile survival to account for extreme winter conditions in 2010 and extreme drought conditions in 2012. Juvenile survival for both these years is fixed at 0.4. This model version produces population estimates mirroring field personnel impressions and supported by harvest statistics. The model attempts to track 6 line transect estimates over the past 20 years. The estimates from 2007 and 2010 were vastly different and the model is unable to track through the CIs of the estimates effectively. Nevertheless, the model produces a peak estimate in 2007 and shows a significant population decline over the past 6 years with a marked reduction over the past 2 years. The model appears to track population trends in the herd unit well and estimates from the past several years are supported by trends in classification data as well as harvest statistics. Due to the lack of survival estimates, the model is considered a fair simulation. Data from the 2013 line transect survey is detailed in Appendix I. The survey produced a population estimate of 2303 antelope with a CV of 22.9. The high CV is a bit of a concern, but much of the variation was due to the low encounter rate (only 75 antelope groups were observed). Transect lines were 1.5 degrees apart so it would be difficult to boost the number of groups observed by adding lines. It is likely high variation will always be associated with population estimates from this herd unit due to the low number of group observations. That said, 6 detection functions were analyzed using the survey data with estimates varying from 1977 to 2420 antelope. All but one model produced estimates within 10% of each other. The negative exponential detection function was selected for use in estimation because it had a similar CV to other models but required no additional adjustment terms to track the data. The negative exponential curve also appeared to track a histogram of the data more closely than other detection curves.
54
Field Data The decline projected in the population model is also notable in classification data where personnel observed significantly fewer pronghorn along classification routes in 2012. Additionally, the buck/doe ratio in the area has steadily declined over the past 3 years from 72/100 to 60/100 in 2012. Fawn recruitment was fairly low in 2012 with a fawn/doe ratio of 54/100. Although low, this recruitment is not atypical for the herd unit over the past five years. It is likely fawn survival will be lower than average over the 2012/13 winter due to lack of feed resources. Harvest Data Harvest statistics also indicate a noticeable population decline over the past couple of years. Type 1 license success declined from 91% in 2010 to 89% in 2011 to 86% in 2012. Also in 2012, 4% of Type 1 license holders harvested does. This was a significantly higher percentage than any time over the past five years. While the days/animal of 3.7 was the same in 2012 as in 2011, it was a significant increase from the 2010 figure of 2.7. Management Summary Given the population decline over the past several years, expected low survival over the 2012/13 winter, and the fact the population is predicted to be at objective post-season 2013, Type 6 licenses will be reduced slightly in 2013. Type 1 licenses will be reduced a bit more given the declining buck/doe ratio over the past several years and an expected future decline given low fawn survival. That said it is expected the buck/doe ratio will decline in 2013 despite the license reduction due to the fact overall buck numbers have declined over the past several years and yearling buck recruitment will be low. Given average survival over the next year combined with the proposed hunting season, the population is expected to decline 20% to 3,100 and be at objective. Although this population has been managed toward the objective of 3,000 over the past several years, public comments indicate the Department may need to review the population objective for the herd. Field personnel have received numerous complaints over the past several years from the public concerned about the decline in antelope numbers and buck quality in the herd unit.
55
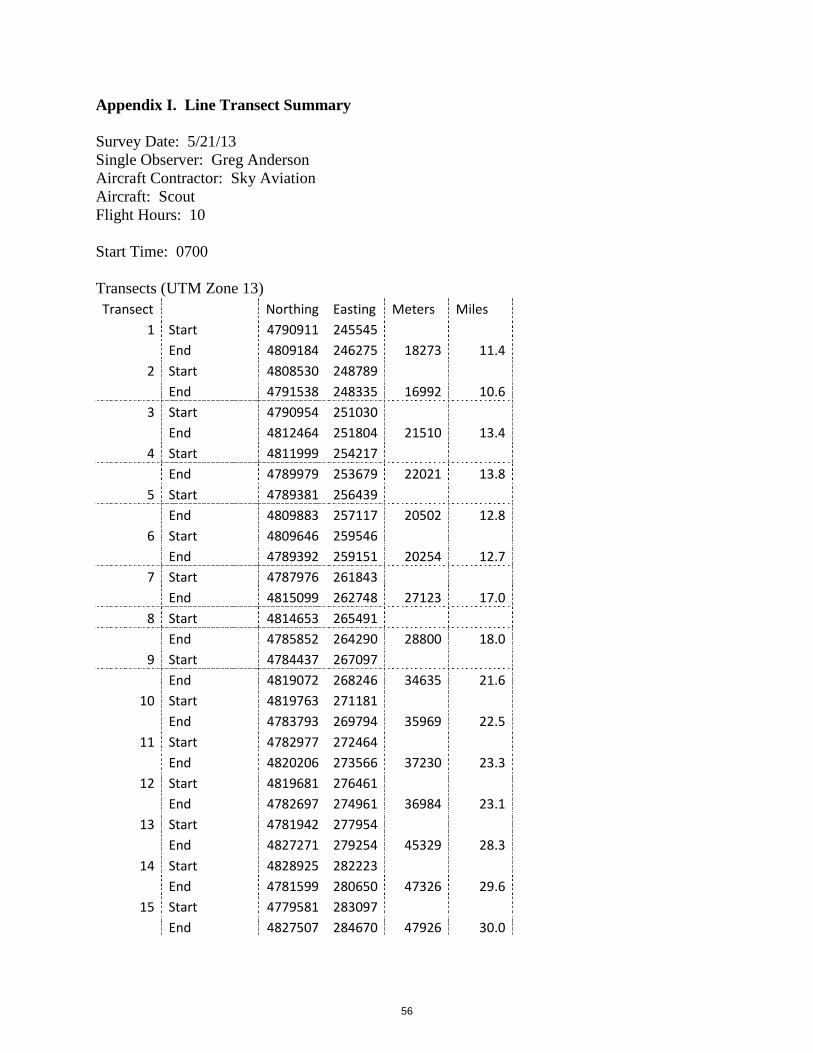
Appendix I. Line Transect Summary Survey Date: 5/21/13 Single Observer: Greg Anderson Aircraft Contractor: Sky Aviation Aircraft: Scout Flight Hours: 10 Start Time: 0700 Transects (UTM Zone 13) Transect
Northing Easting Meters Miles
1 Start 4790911 245545
End 4809184 246275 18273 11.4
2 Start 4808530 248789
End 4791538 248335 16992 10.6
3 Start 4790954 251030
End 4812464 251804 21510 13.4
4 Start 4811999 254217
End 4789979 253679 22021 13.8
5 Start 4789381 256439
End 4809883 257117 20502 12.8
6 Start 4809646 259546
End 4789392 259151 20254 12.7
7 Start 4787976 261843
End 4815099 262748 27123 17.0
8 Start 4814653 265491
End 4785852 264290 28800 18.0
9 Start 4784437 267097
End 4819072 268246 34635 21.6
10 Start 4819763 271181
End 4783793 269794 35969 22.5
11 Start 4782977 272464
End 4820206 273566 37230 23.3
12 Start 4819681 276461
End 4782697 274961 36984 23.1
13 Start 4781942 277954
End 4827271 279254 45329 28.3
14 Start 4828925 282223
End 4781599 280650 47326 29.6
15 Start 4779581 283097
End 4827507 284670 47926 30.0
56
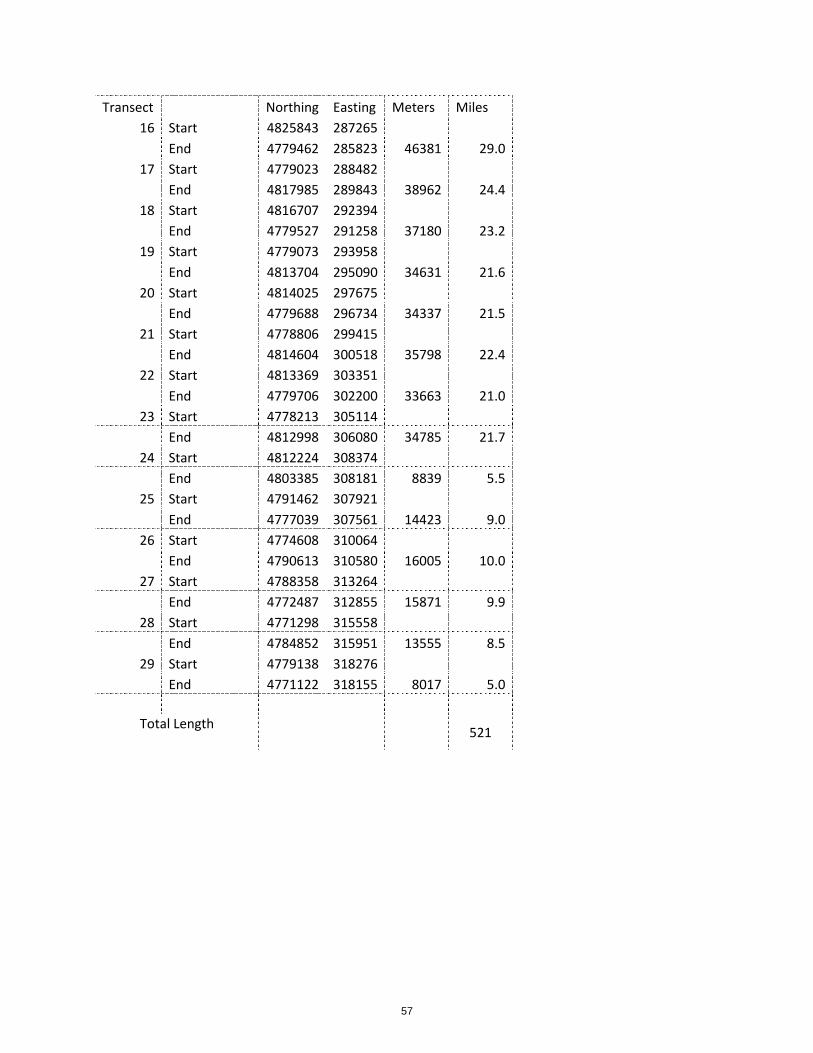
Transect
Northing Easting Meters Miles 16 Start 4825843 287265
End 4779462 285823 46381 29.0 17 Start 4779023 288482
End 4817985 289843 38962 24.4 18 Start 4816707 292394
End 4779527 291258 37180 23.2 19 Start 4779073 293958
End 4813704 295090 34631 21.6 20 Start 4814025 297675
End 4779688 296734 34337 21.5 21 Start 4778806 299415
End 4814604 300518 35798 22.4 22 Start 4813369 303351
End 4779706 302200 33663 21.0 23 Start 4778213 305114
End 4812998 306080 34785 21.7 24 Start 4812224 308374
End 4803385 308181 8839 5.5 25 Start 4791462 307921
End 4777039 307561 14423 9.0 26 Start 4774608 310064
End 4790613 310580 16005 10.0 27 Start 4788358 313264
End 4772487 312855 15871 9.9 28 Start 4771298 315558
End 4784852 315951 13555 8.5 29 Start 4779138 318276
End 4771122 318155 8017 5.0
Total Length 521
57
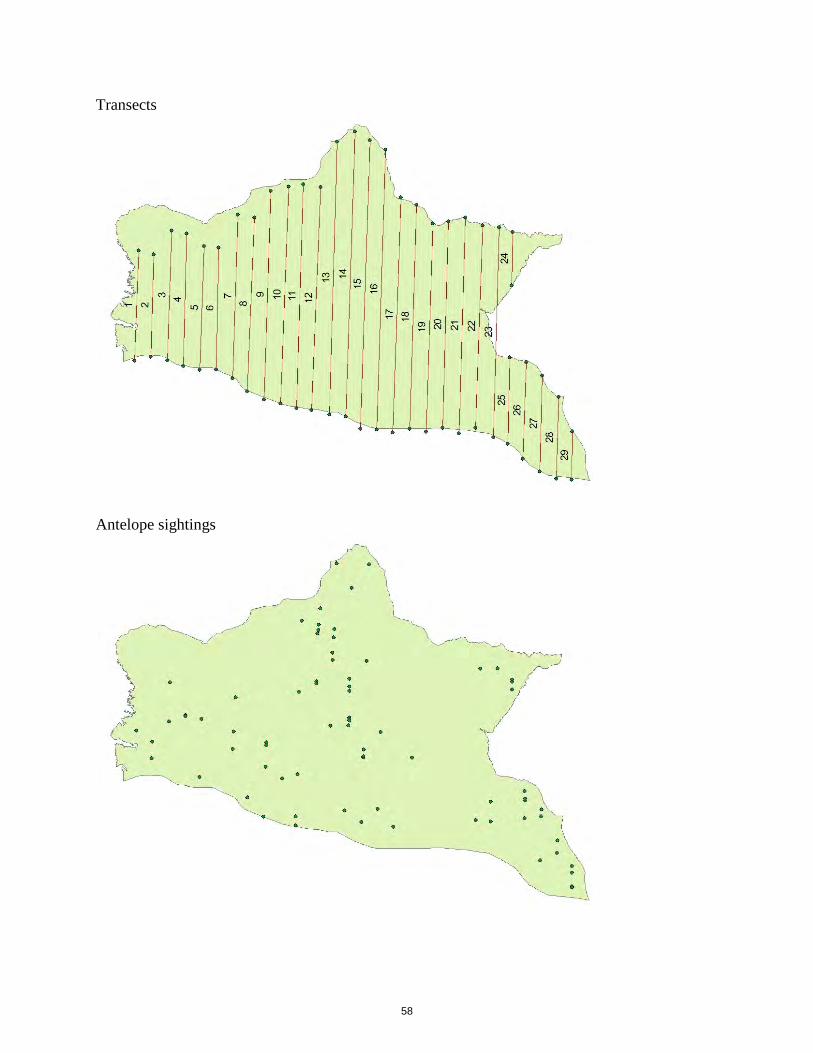
Transects
Antelope sightings
58

Survey Results Lines: 29 Miles: 521 Occupied Habitat: 866 mi2
Antelope Groups: Band Groups A 17 B 18 C 14 D 15 E 11
Total 75 Average Group Size: 2.0 Detection Function: negative exponential curve (no polynomial adjustment terms)
0
0.2
0.4
0.6
0.8
1
1.2
0 50 100 150 200 250
59
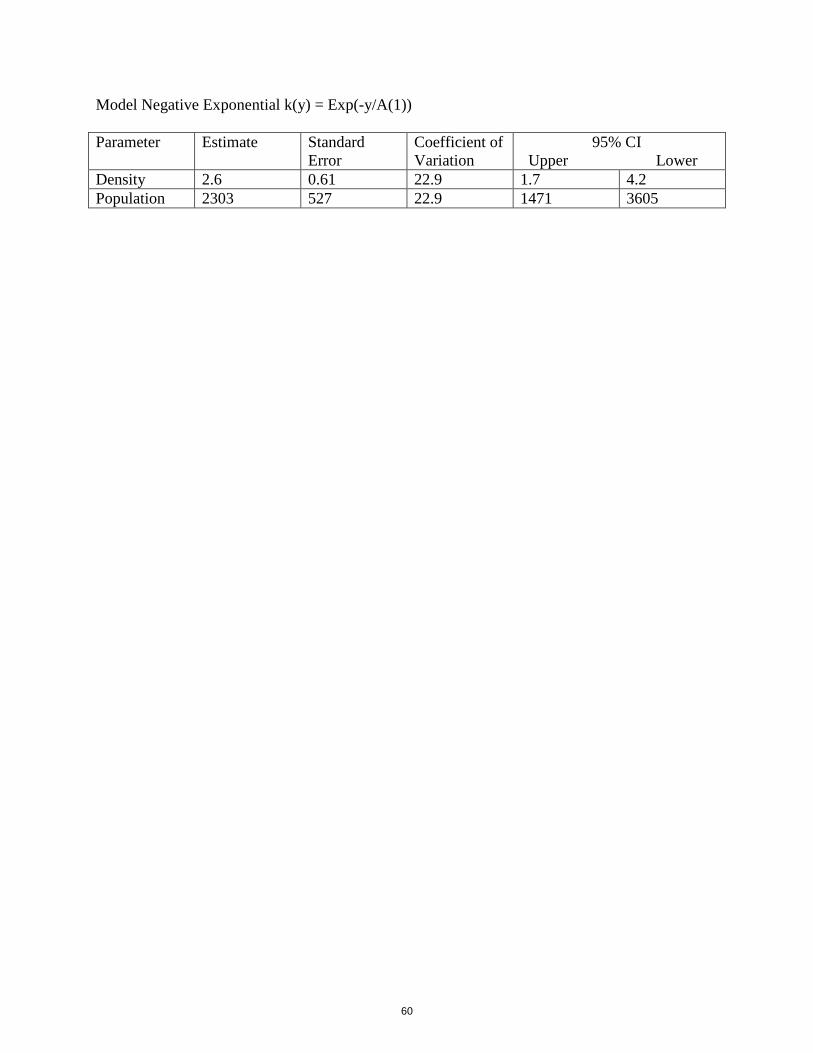
Model Negative Exponential k(y) = Exp(-y/A(1)) Parameter Estimate Standard
Error Coefficient of Variation
95% CI Upper Lower
Density 2.6 0.61 22.9 1.7 4.2 Population 2303 527 22.9 1471 3605
60

INPU
T Sp
ecie
s:P
rong
horn
Bio
logi
st:
Gre
g A
nder
son
Her
d U
nit &
No.
:B
adw
ater
Mod
el d
ate:
06/0
5/13
CJ,
CA
Con
stan
t Juv
enile
& A
dult
Surv
ival
7887
SCJ,
SCA
Sem
i-Con
stan
t Juv
enile
& S
emi-C
onst
ant A
dult
Surv
ival
8810
0
TSJ,
CA
Tim
e-Sp
ecifi
c Ju
veni
le &
Con
stan
t Adu
lt Su
rviv
al61
162
Tota
lTo
tal
Tren
d C
ount
Obj
ectiv
e
Juve
nile
sTo
tal M
ales
Fem
ales
Juve
nile
sTo
tal M
ales
Fem
ales
Tota
l Mal
esFe
mal
esTo
tal A
dults
Fiel
d Es
tFi
eld
SE19
9381
710
1814
5532
9076
956
211
2424
5475
112
5020
0130
0019
9465
073
612
2526
1163
338
498
920
0655
710
9116
4830
0019
9568
054
610
7022
9665
729
994
319
0051
410
8215
9530
0019
9696
950
310
6025
3296
931
210
5223
3367
813
3920
1730
0019
9773
066
413
1227
0673
044
212
9724
6867
314
3621
0930
0019
9892
866
014
0729
9592
446
714
0727
9978
916
2124
1130
0019
9911
0377
415
8934
6511
0360
415
8032
8799
218
4928
4130
0020
0096
997
218
1237
5396
979
018
0935
6810
8619
8330
7030
9075
130
0020
0185
010
6519
4438
5985
088
219
4036
7311
1020
4131
5127
6658
630
0020
0292
410
8820
0040
1292
490
719
9038
2111
6621
1632
8130
0020
0311
1611
4220
7343
3211
1693
720
7341
2712
7522
7735
5230
0020
0415
7112
4922
3150
5115
7110
5322
2748
5115
8426
1542
0037
6079
630
0020
0517
9915
5325
6359
1517
9712
7324
9455
6418
6129
3547
9630
0020
0614
9218
2428
7661
9214
8714
8126
9956
6718
8429
4948
3430
0020
0718
2118
4728
9065
5818
0614
8326
6259
5020
2830
5450
8227
6450
730
0020
0815
3119
8829
9365
1215
1815
9927
6458
8219
9130
1050
0130
0020
0913
8419
5229
5062
8513
6715
5027
0456
2118
7828
8647
6430
0020
1015
2618
4028
2861
9515
1413
6425
6654
4313
8524
4438
2952
5693
130
0020
1111
5213
5723
9549
0411
1684
020
7740
3312
1622
9635
1230
0020
1212
0911
9122
5046
5011
9573
319
8539
1286
819
3728
0423
0352
730
0020
1399
985
018
9837
4798
246
516
7831
2630
0020
1420
1520
1620
1720
1820
1920
2020
2120
2220
2320
2420
25
MO
DEL
S SU
MM
ARY
Fit
Rel
ativ
e AI
Cc
Che
ck b
est m
odel
to
cre
ate
repo
rt
Popu
latio
n Es
timat
es fr
om T
op M
odel
Year
Pred
icte
d ad
ult E
nd-o
f-bio
-yea
r Pop
(yea
r i)
Pred
icte
d Po
sthu
nt P
opul
atio
n (y
ear i
)Pr
edic
ted
Preh
unt P
opul
atio
n (y
ear i
)LT
Pop
ulat
ion
Estim
ate
Not
es
SCJ,
SCA
Mod
TSJ,
CA M
odel
CJ,C
A M
odel
Clea
r fo
rm
61
Mod
el E
stFi
eld
Est
SEM
odel
Est
Fiel
d Es
tSE
1993
0.90
0.83
Para
met
ers:
Opt
im c
ells
1994
0.90
0.83
Juve
nile
Sur
viva
l =0.
900
1995
0.90
0.83
Adu
lt S
urvi
val =
0.83
419
960.
900.
83In
itial
Tot
al M
ale
Pop
/10,
000
=
0.10
219
970.
900.
83In
itial
Fem
ale
Pop
/10,
000
=0.
145
1998
0.90
0.83
1999
0.90
0.83
2000
0.90
0.83
2001
0.90
0.83
Sex
Rat
io (
% M
ales
) =
50%
2002
0.90
0.83
Wou
ndin
g Lo
ss (
tota
l mal
es)
=10
%
2003
0.90
0.83
Wou
ndin
g Lo
ss (
fem
ales
) =
10%
2004
0.90
0.83
Wou
ndin
g Lo
ss (
juve
nile
s) =
10%
2005
0.90
0.83
Ove
r-su
mm
er a
dult
surv
ival
98%
2006
0.90
0.83
2007
0.90
0.83
2008
0.90
0.83
2009
0.90
0.83
2010
0.40
0.83
2011
0.90
0.83
2012
0.40
0.83
2013
0.90
0.83
2014
2015
2016
2017
2018
2019
2020
2021
2022
2023
2024
2025
Annu
al A
dult
Surv
ival
Rat
esAn
nual
Juv
enile
Sur
viva
l Rat
esSu
rviv
al a
nd In
itial
Pop
ulat
ion
Estim
ates
Year
MO
DEL
ASS
UM
PTIO
NS
62
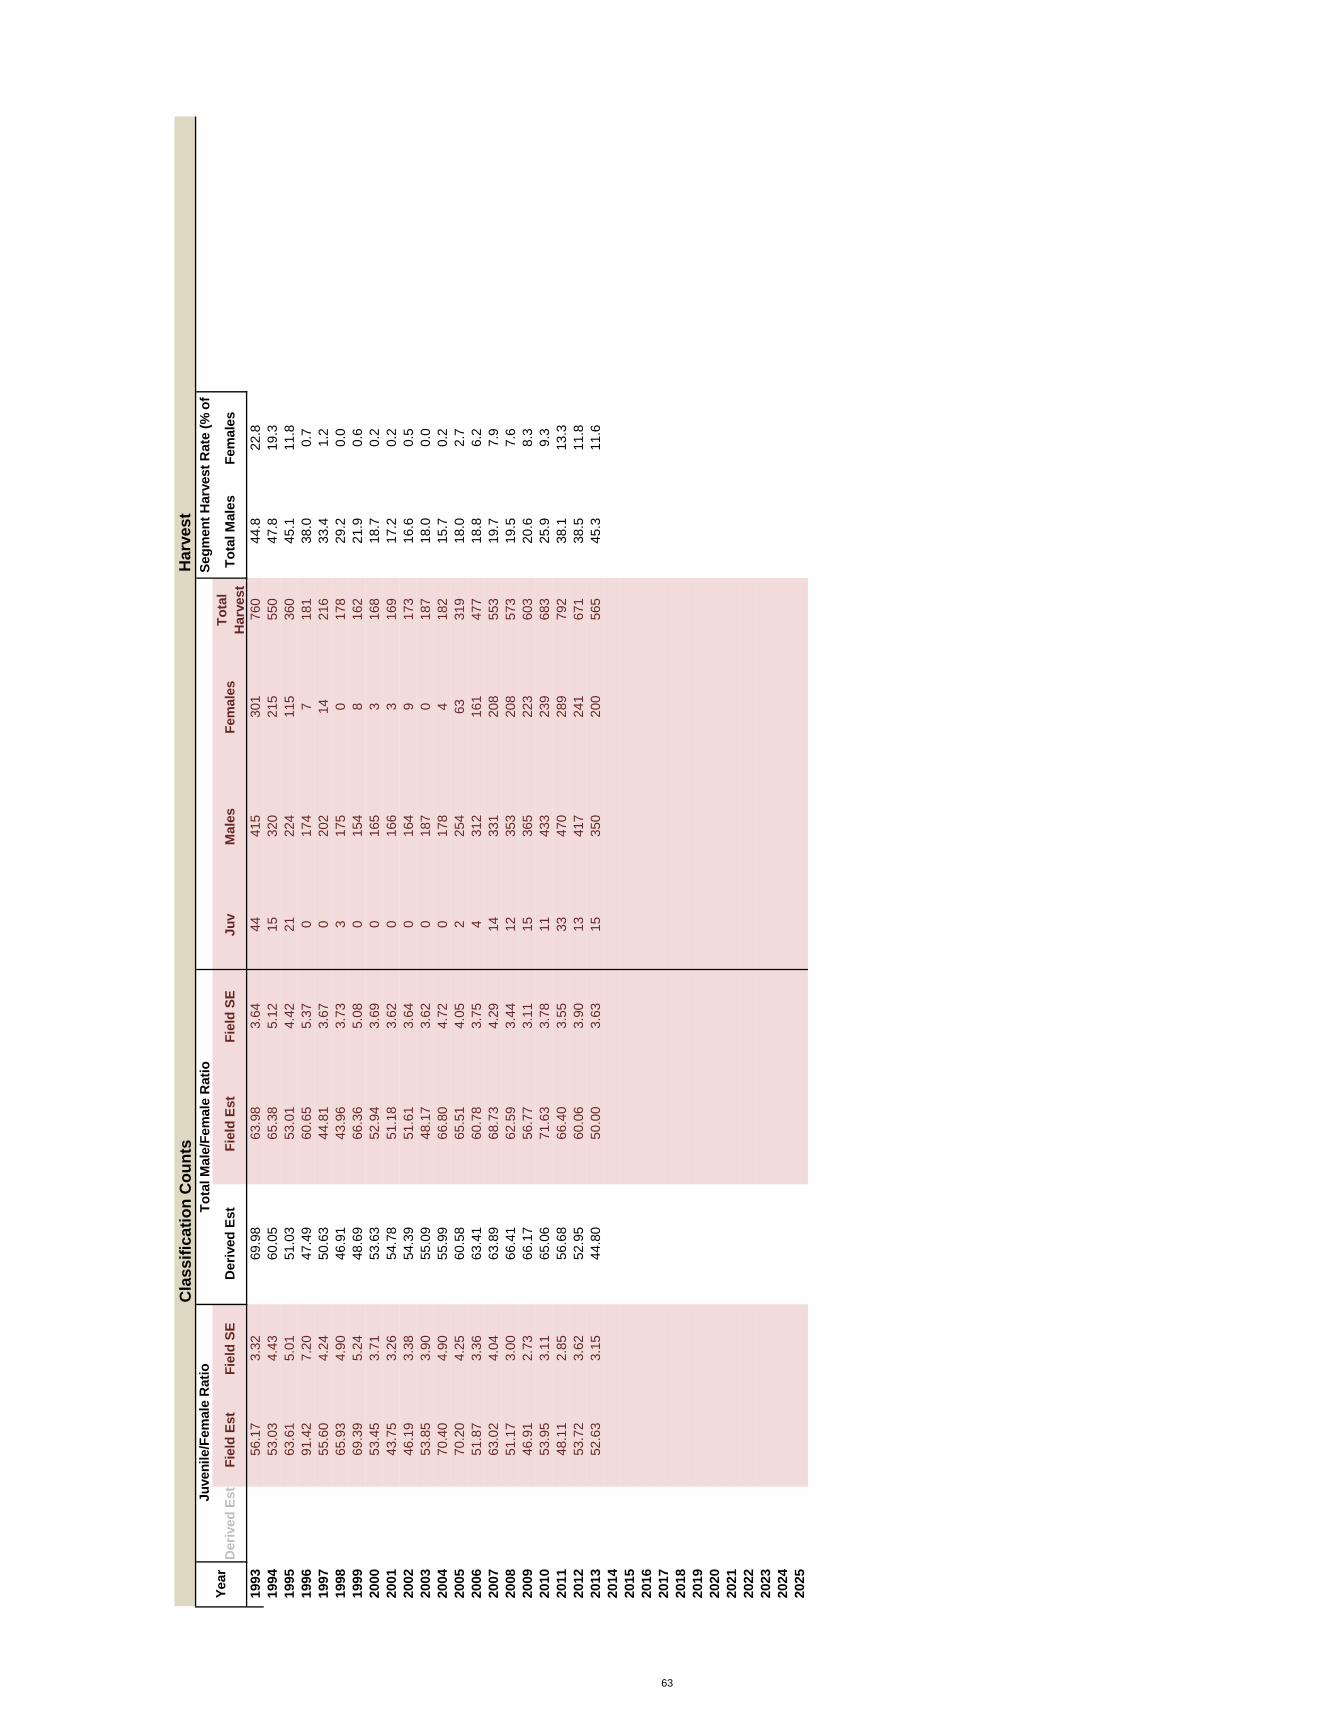
Der
ived
Est
Fiel
d Es
tFi
eld
SED
eriv
ed E
stFi
eld
Est
Fiel
d SE
Juv
Mal
esFe
mal
esTo
tal
Har
vest
Tota
l Mal
esFe
mal
es
1993
56.1
73.
3269
.98
63.9
83.
6444
415
301
760
44.8
22.8
1994
53.0
34.
4360
.05
65.3
85.
1215
320
215
550
47.8
19.3
1995
63.6
15.
0151
.03
53.0
14.
4221
224
115
360
45.1
11.8
1996
91.4
27.
2047
.49
60.6
55.
370
174
718
138
.00.
719
9755
.60
4.24
50.6
344
.81
3.67
020
214
216
33.4
1.2
1998
65.9
34.
9046
.91
43.9
63.
733
175
017
829
.20.
019
9969
.39
5.24
48.6
966
.36
5.08
015
48
162
21.9
0.6
2000
53.4
53.
7153
.63
52.9
43.
690
165
316
818
.70.
220
0143
.75
3.26
54.7
851
.18
3.62
016
63
169
17.2
0.2
2002
46.1
93.
3854
.39
51.6
13.
640
164
917
316
.60.
520
0353
.85
3.90
55.0
948
.17
3.62
018
70
187
18.0
0.0
2004
70.4
04.
9055
.99
66.8
04.
720
178
418
215
.70.
220
0570
.20
4.25
60.5
865
.51
4.05
225
463
319
18.0
2.7
2006
51.8
73.
3663
.41
60.7
83.
754
312
161
477
18.8
6.2
2007
63.0
24.
0463
.89
68.7
34.
2914
331
208
553
19.7
7.9
2008
51.1
73.
0066
.41
62.5
93.
4412
353
208
573
19.5
7.6
2009
46.9
12.
7366
.17
56.7
73.
1115
365
223
603
20.6
8.3
2010
53.9
53.
1165
.06
71.6
33.
7811
433
239
683
25.9
9.3
2011
48.1
12.
8556
.68
66.4
03.
5533
470
289
792
38.1
13.3
2012
53.7
23.
6252
.95
60.0
63.
9013
417
241
671
38.5
11.8
2013
52.6
33.
1544
.80
50.0
03.
6315
350
200
565
45.3
11.6
2014
2015
2016
2017
2018
2019
2020
2021
2022
2023
2024
2025
Juve
nile
/Fem
ale
Rat
ioYe
arSe
gmen
t Har
vest
Rat
e (%
of
Tota
l Mal
e/Fe
mal
e R
atio
Cla
ssifi
catio
n C
ount
sH
arve
st
63
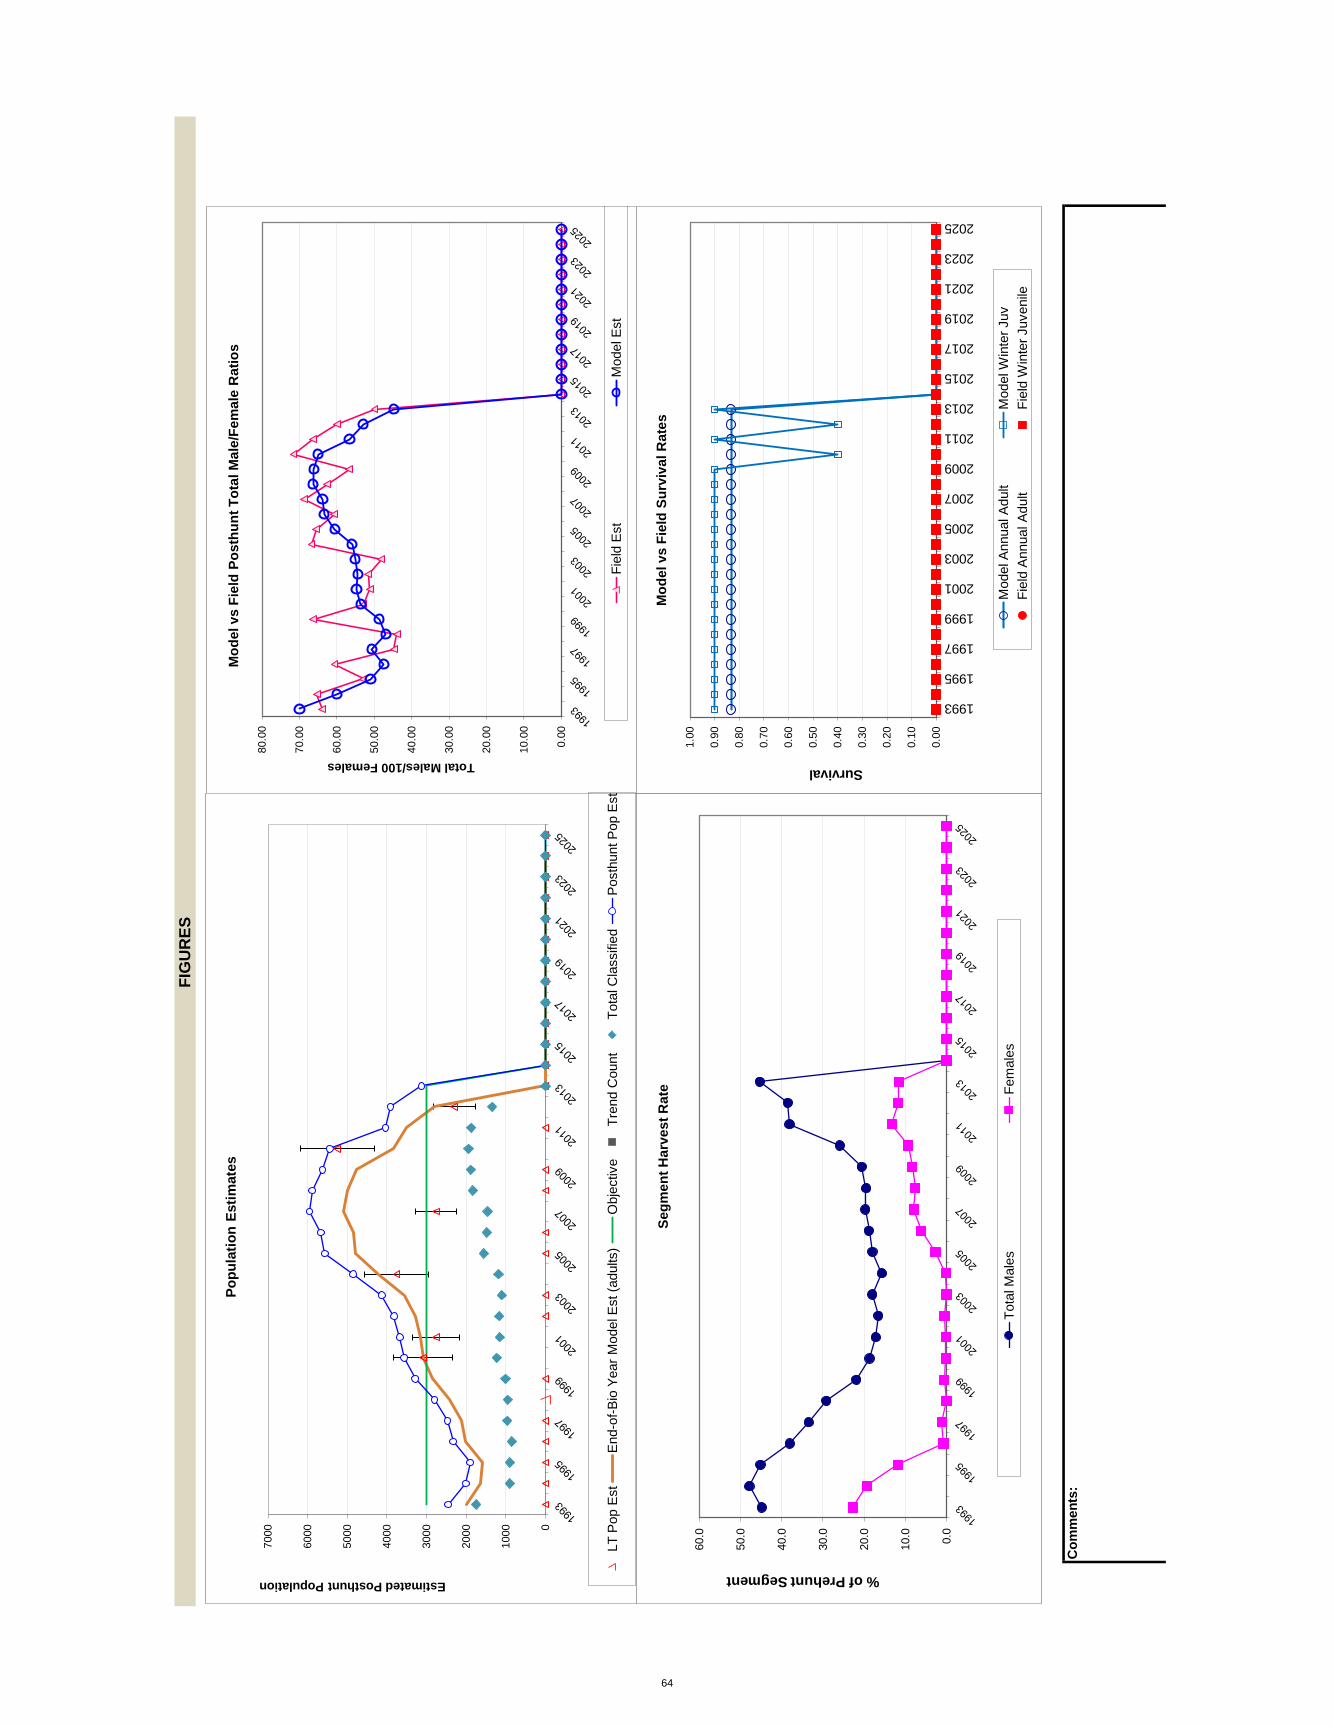
Com
men
ts:
FIG
UR
ES
0.00
10.0
0
20.0
0
30.0
0
40.0
0
50.0
0
60.0
0
70.0
0
80.0
0
Total Males/100 Females
Mod
el v
s Fi
eld
Post
hunt
Tot
al M
ale/
Fem
ale
Rat
ios
Fie
ld E
st
Mod
el E
st
0
1000
2000
3000
4000
5000
6000
7000
Estimated Posthunt Population
Popu
latio
n Es
timat
es
LT P
op E
st
End
-of-
Bio
Yea
r M
odel
Est
(ad
ults
) O
bjec
tive
Tre
nd C
ount
T
otal
Cla
ssifi
ed
Pos
thun
t Pop
Est
0.0
10.0
20.0
30.0
40.0
50.0
60.0
% of Prehunt Segment
Segm
ent H
arve
st R
ate
Tot
al M
ales
F
emal
es
0.00
0.10
0.20
0.30
0.40
0.50
0.60
0.70
0.80
0.90
1.00
1993
1995
1997
1999
2001
2003
2005
2007
2009
2011
2013
2015
2017
2019
2021
2023
2025
Survival
Mod
el v
s Fi
eld
Surv
ival
Rat
es
Mod
el A
nnua
l Adu
lt M
odel
Win
ter
Juv
Fie
ld A
nnua
l Adu
lt F
ield
Win
ter
Juve
nile
64

65

66
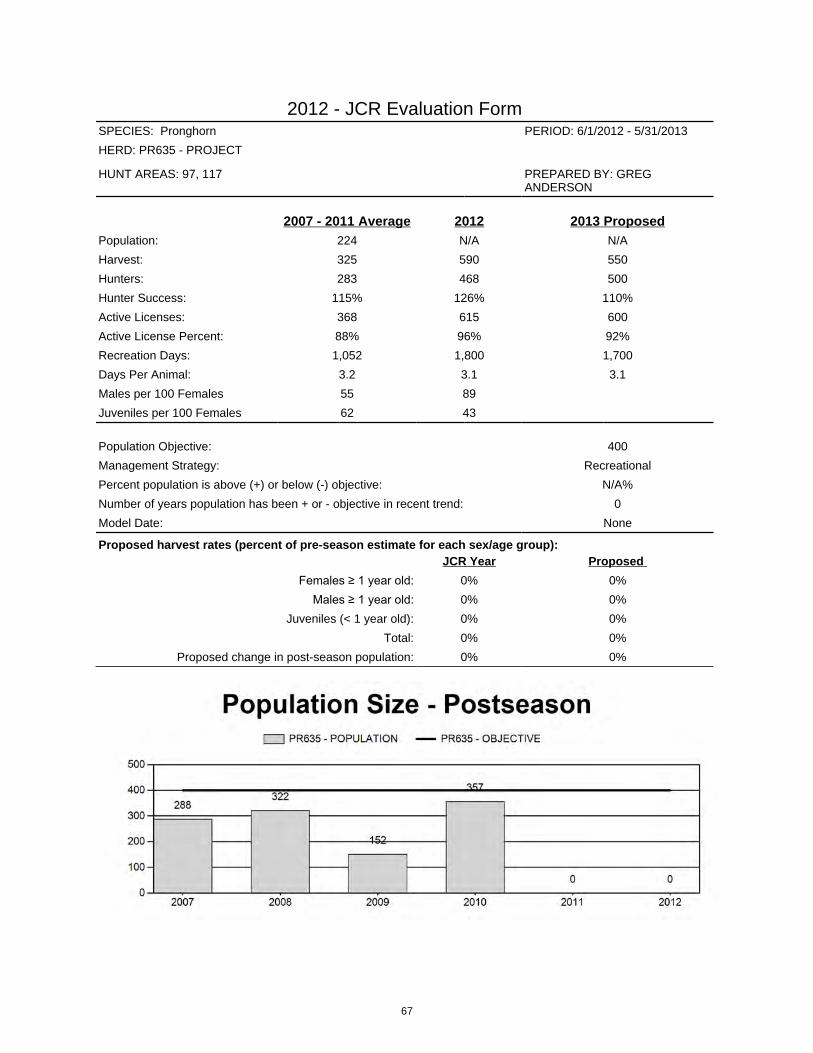
2012 - JCR Evaluation FormSPECIES: Pronghorn PERIOD: 6/1/2012 - 5/31/2013
HERD: PR635 - PROJECT
HUNT AREAS: 97, 117 PREPARED BY: GREG ANDERSON
2007 - 2011 Average 2012 2013 ProposedPopulation: 224 N/A N/A
Harvest: 325 590 550
Hunters: 283 468 500
Hunter Success: 115% 126% 110%
Active Licenses: 368 615 600
Active License Percent: 88% 96% 92%
Recreation Days: 1,052 1,800 1,700
Days Per Animal: 3.2 3.1 3.1
Males per 100 Females 55 89
Juveniles per 100 Females 62 43
Population Objective: 400
Management Strategy: Recreational
Percent population is above (+) or below (-) objective: N/A%
Number of years population has been + or - objective in recent trend: 0
Model Date: None
Proposed harvest rates (percent of pre-season estimate for each sex/age group):JCR Year Proposed
Females ≥ 1 year old: 0% 0%
Males ≥ 1 year old: 0% 0%
Juveniles (< 1 year old): 0% 0%
Total: 0% 0%
Proposed change in post-season population: 0% 0%
67
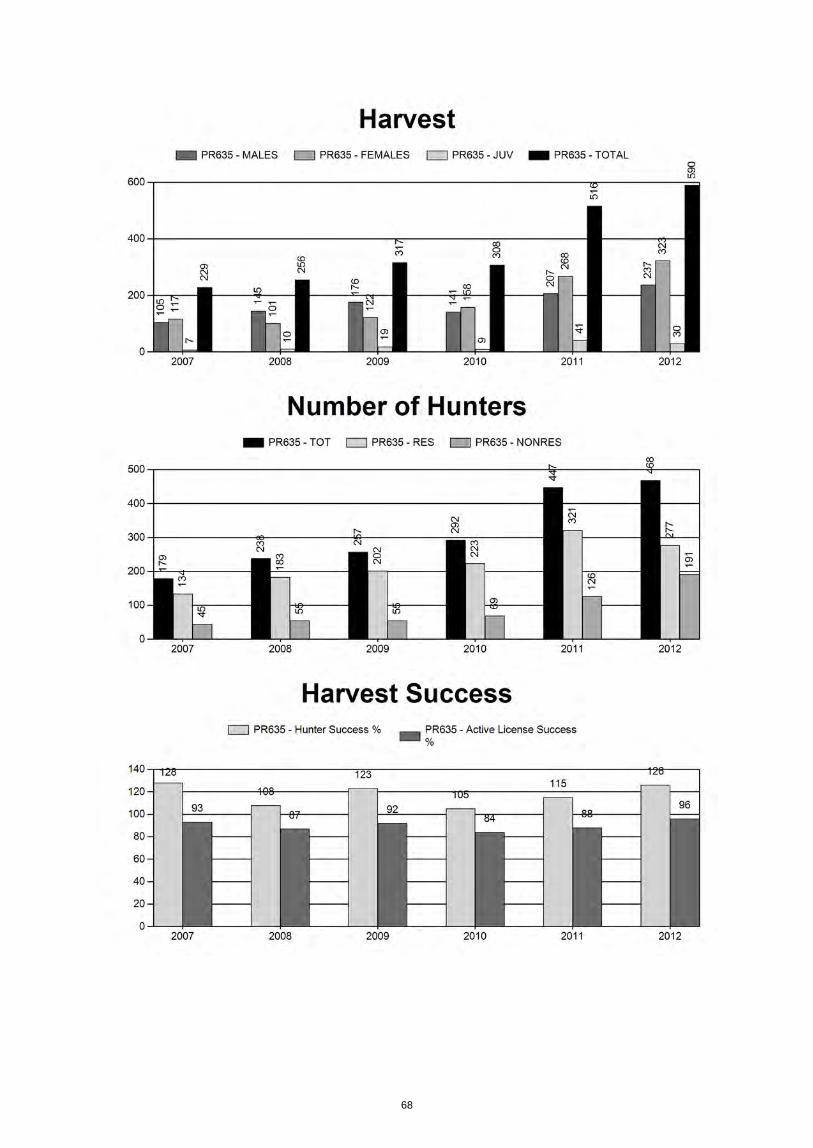
68
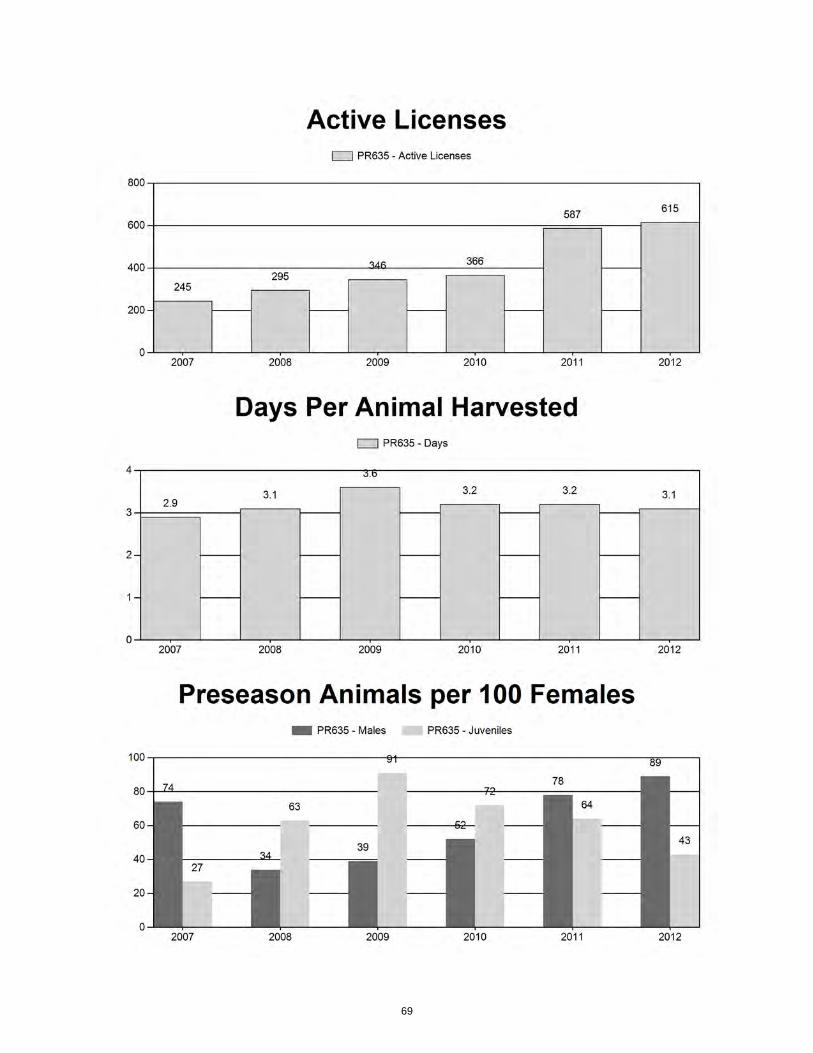
69

2007 - 2012 Preseason Classification Summary
for Pronghorn Herd PR635 - PROJECT
MALES FEMALES JUVENILES Males to 100 Females Young to
Year Pre Pop Ylg Adult Total % Total % Total %TotCls
ClsObj Ylng Adult Total
Conf Int
100Fem
ConfInt
100Adult
2007 502 0 0 148 37% 200 50% 54 13% 402 426 0 0 74 ± 0 27 ± 0 16
2008 563 0 0 78 17% 229 51% 144 32% 451 450 0 0 34 ± 0 63 ± 0 47
2009 429 0 0 58 17% 149 43% 136 40% 343 391 0 0 39 ± 0 91 ± 0 66
2010 634 0 0 118 23% 226 45% 163 32% 507 524 0 0 52 ± 0 72 ± 0 47
2011 0 45 89 134 32% 171 41% 109 26% 414 0 26 52 78 ± 0 64 ± 0 36
2012 0 67 112 179 38% 202 43% 86 18% 467 0 33 55 89 ± 0 43 ± 0 23
70
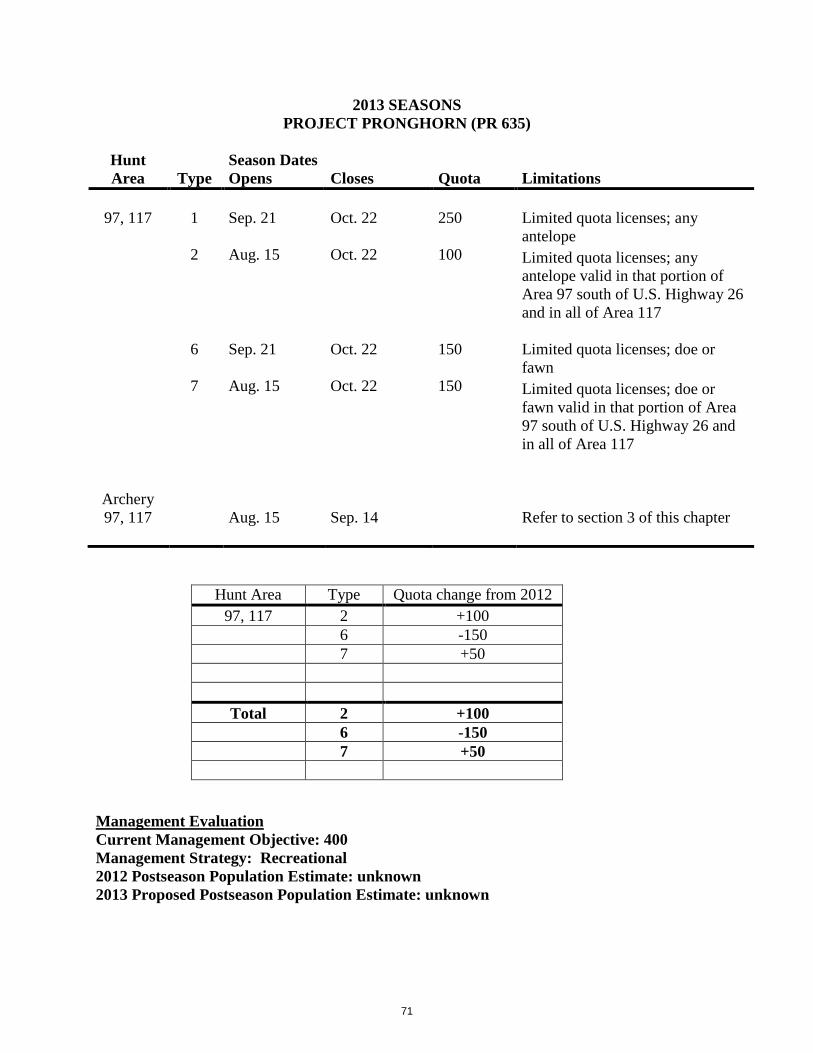
2013 SEASONS PROJECT PRONGHORN (PR 635)
Hunt Season Dates Area Type Opens Closes Quota Limitations
97, 117 1 Sep. 21 Oct. 22 250 Limited quota licenses; any
antelope 2 Aug. 15 Oct. 22 100 Limited quota licenses; any
antelope valid in that portion of Area 97 south of U.S. Highway 26 and in all of Area 117
6 Sep. 21 Oct. 22 150 Limited quota licenses; doe or fawn
7 Aug. 15 Oct. 22 150 Limited quota licenses; doe or fawn valid in that portion of Area 97 south of U.S. Highway 26 and in all of Area 117
Archery 97, 117 Aug. 15 Sep. 14 Refer to section 3 of this chapter
Hunt Area Type Quota change from 2012 97, 117 2 +100
6 -150 7 +50
Total 2 +100 6 -150 7 +50
Management Evaluation Current Management Objective: 400 Management Strategy: Recreational 2012 Postseason Population Estimate: unknown 2013 Proposed Postseason Population Estimate: unknown
71
Management Issues The Project pronghorn herd has a population objective of 400 with a recreational management strategy. The objective has been in place since 1994. Despite having a numerical objective for decades, it has never been possible to effectively estimate this population due to significant interchange with the Wind River Reservation (WRR) along the northern border of hunt area 97 and the inability to effectively collect demographic data throughout hunt area 117. Over the years, personnel have managed the population in response to damage claims by landowners and to provide quality recreational opportunities in the publicly accessible portions of hunt area 97. The Lander Region is in the process of developing an alternative objective for this herd in an attempt to provide more consistent management year-to-year. Habitat/Weather This herd occupies a heavily agricultural area in central Wyoming as well as lands interspersed with the WRR. Land ownership patterns and extensive border with the WRR make it cost prohibitive to collect adequate demographic data in the herd unit. The highest densities of pronghorn are found along the northern portion of hunt area 97 and commonly move between the herd unit and the WRR. Extensive agriculture in the area results in a more stable feed resource for pronghorn in this herd unit compared to neighboring populations. Drought conditions were extreme throughout the region in 2012 but adult pronghorn in this population were not severely impacted due to feed availability. That said, the population does appear to have declined over the past couple years in conjunction with liberal seasons aimed at reducing pronghorn numbers. Field/Harvest Data/Population Due to extensive interchange with the WRR it has not been possible to construct a reliable population model for this herd unit. Fawn recruitment was quite low in 2012 with a fawn/doe ratio of 43/100. Despite the belief this population is somewhat buffered from drought conditions with the presence of irrigated, agricultural feed resources the extreme drought of 2012 may be manifested in the low fawn/doe ratio. It is likely pronghorn from the WRR moved into the herd unit toward the end of summer as drought conditions worsened. These pronghorn would have had extremely poor feed in early summer and their immigration may account for the low fawn/doe ratio in the herd. Given the low recruitment, the population is expected to decline over the coming year. Conversely, the buck/doe ratio was quite high at 89/100. The buck/doe ratio has been very high over the past 2 years. The high ratios coincide with a change in survey methodology in the area. Prior to 2011, personnel conducted an aerial survey encompassing primarily dry, uplands managed by the Bureau of Reclamation with unrestricted hunting access. The buck/doe ratio in this area was 34/100, 39/100, and 52/100 in 2008, 2009, and 2010 respectively. In 2011, personnel began conducting ground classifications along routes that included a number of agricultural fields to the west of the previously surveyed area. The immediate, large increase in the buck/doe ratio associated with the survey change is indicative of variable buck distribution throughout the herd unit. Much of the newly surveyed area has far more restricted hunting access and a high buck/doe ratio for the overall herd unit but a low buck/doe ratio in areas easily accessible to hunters could present future management challenges. Harvest success on Type 1 licenses in area 97 where the bulk of harvest occurs within the herd unit was 98% in 2012. This was higher than each of the last several years and indicates hunters
72
currently have access to areas with bucks regardless of animal distribution. The days/animal statistic was 3.0 in 2012 and is unremarkable compared to past years with no trend evident. Management Summary For several consecutive years, seasons in this herd unit included increasing numbers of doe/fawn licenses with the intent of curbing growth. Based on landowner comments and personnel perceptions it appears the population has stabilized or declined slightly over the past year. Given the low fawn recruitment in 2012, it is expected the population may decline further in 2013. The 2013 hunting season is designed to decrease harvest pressure on does while maintaining recreational opportunity given the high buck/doe ratio in the herd. While reducing harvest pressure on does throughout most of the herd unit with decreased Type 6 licenses, localized damage problems necessitate the addition of 50 Type 7 licenses. Personnel have also noticed increased buck numbers at sites with damage problems. To address unreasonably high buck numbers at sites targeted with Type 7 licenses, a new Type 2 license will be issued in 2013 to afford hunters the opportunity to harvest bucks.
73
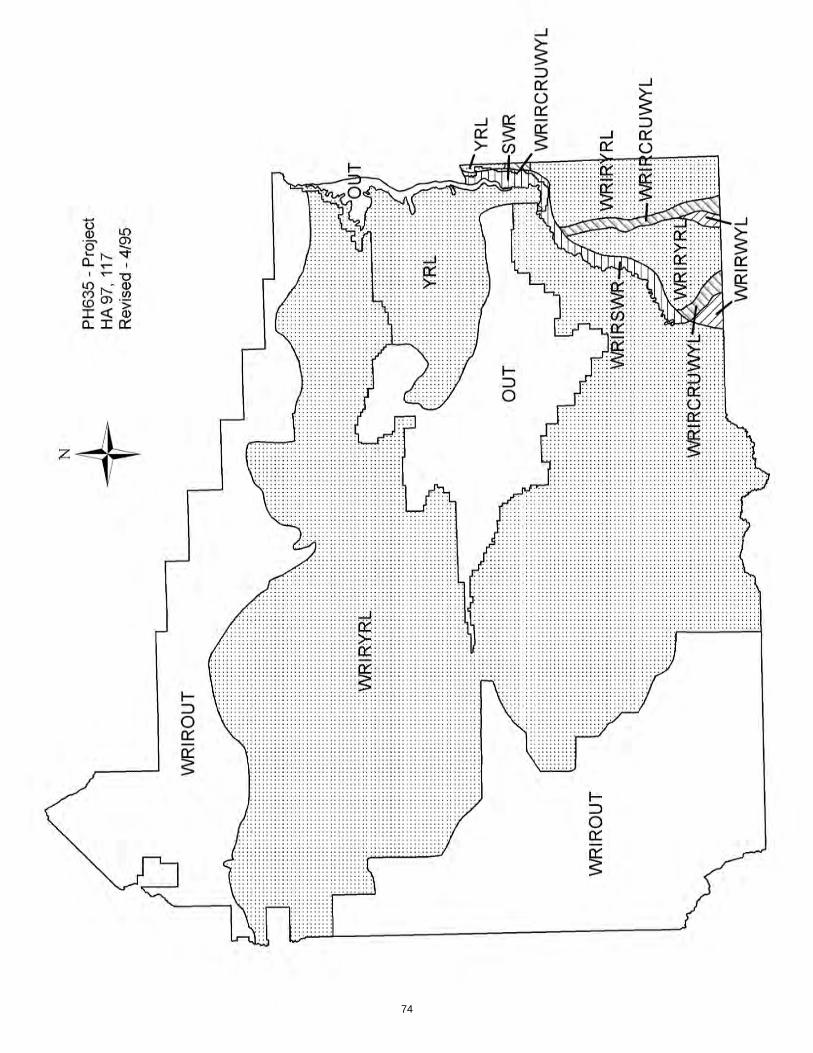
74

2012 - JCR Evaluation FormSPECIES: Pronghorn PERIOD: 6/1/2012 - 5/31/2013
HERD: PR636 - NORTH FERRIS
HUNT AREAS: 63 PREPARED BY: GREG HIATT
2007 - 2011 Average 2012 2013 ProposedPopulation: 6,121 3,330 3,388
Harvest: 649 760 285
Hunters: 689 788 320
Hunter Success: 94% 96% 89 %
Active Licenses: 735 885 320
Active License Percent: 88% 86% 89 %
Recreation Days: 1,986 2,415 850
Days Per Animal: 3.1 3.2 3.0
Males per 100 Females 71 58
Juveniles per 100 Females 59 39
Population Objective: 5,000
Management Strategy: Recreational
Percent population is above (+) or below (-) objective: -33.4%
Number of years population has been + or - objective in recent trend: 2
Model Date: 03/10/2013
Proposed harvest rates (percent of pre-season estimate for each sex/age group):JCR Year Proposed
Females ≥ 1 year old: 9.1% 2.2%
Males ≥ 1 year old: 21.3% 26.1%
Juveniles (< 1 year old): 1.3% 0.5%
Total: 10.66% 7.7%
Proposed change in post-season population: -2.0% +1.7%
75

76
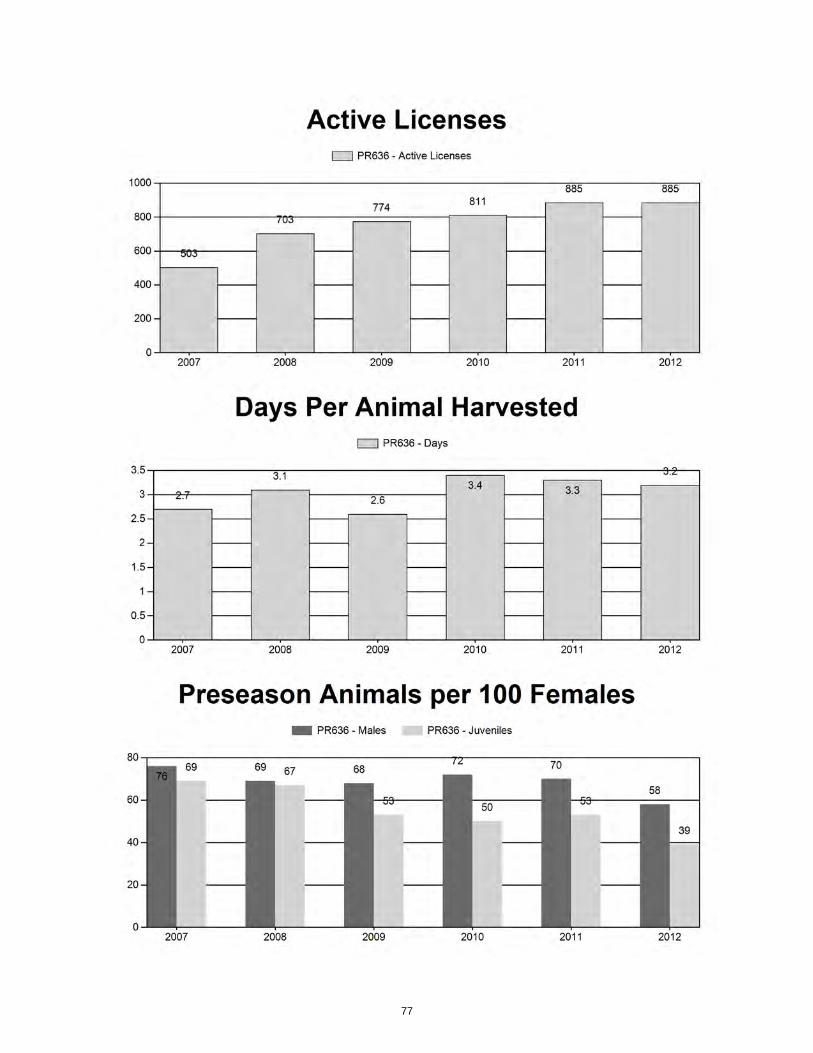
77

2007 - 2012 Preseason Classification Summary
for Pronghorn Herd PR636 - NORTH FERRIS
MALES FEMALES JUVENILES Males to 100 Females Young to
Year Pre Pop Ylg Adult Total % Total % Total %TotCls
ClsObj Ylng Adult Total
Conf Int
100Fem
ConfInt
100Adult
2007 7,962 200 371 571 31% 751 41% 520 28% 1,842 2,455 27 49 76 ± 6 69 ± 5 39
2008 7,224 166 370 536 29% 775 42% 522 28% 1,833 2,190 21 48 69 ± 6 67 ± 5 40
2009 6,935 240 573 813 31% 1,192 45% 627 24% 2,632 2,040 20 48 68 ± 4 53 ± 3 31
2010 6,318 99 274 373 32% 519 45% 257 22% 1,149 2,145 19 53 72 ± 7 50 ± 6 29
2011 5,733 72 288 360 31% 516 45% 275 24% 1,151 0 14 56 70 ± 7 53 ± 6 31
2012 4,158 55 253 308 29% 534 51% 208 20% 1,050 0 10 47 58 ± 6 39 ± 5 25
78
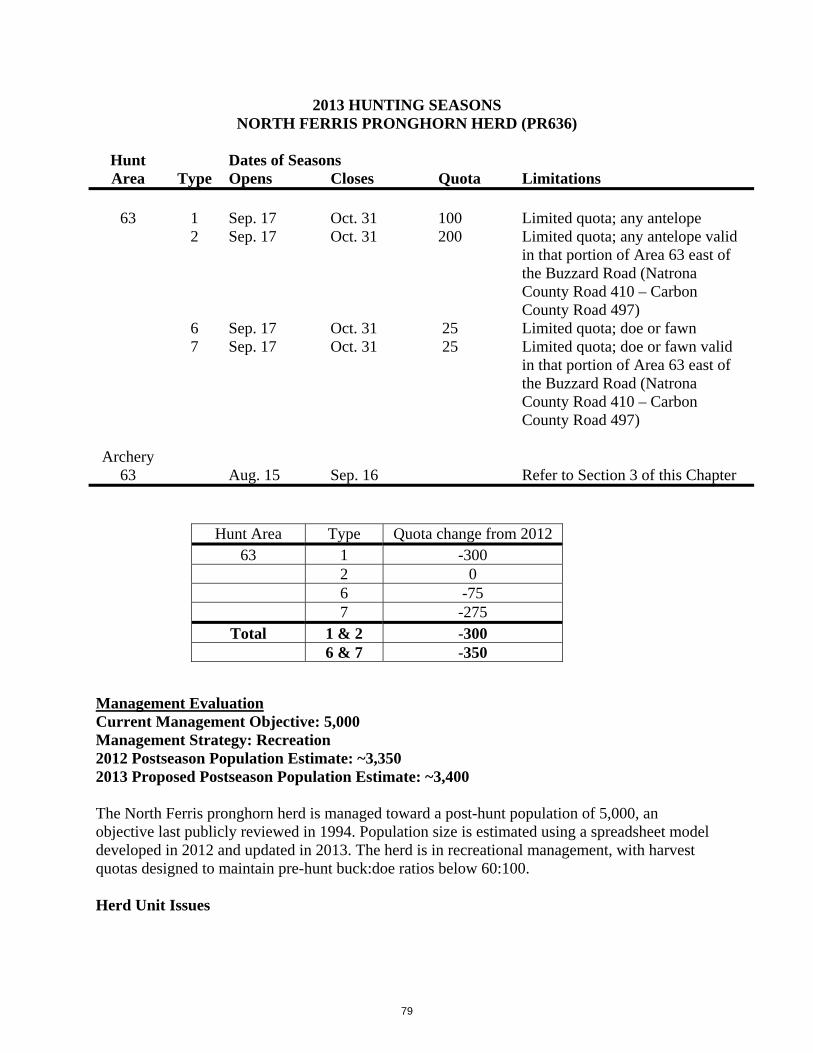
2013 HUNTING SEASONS NORTH FERRIS PRONGHORN HERD (PR636)
Hunt Dates of Seasons Area Type Opens Closes Quota Limitations
63 1 Sep. 17 Oct. 31 100 Limited quota; any antelope 2 Sep. 17 Oct. 31 200 Limited quota; any antelope valid
in that portion of Area 63 east of the Buzzard Road (Natrona County Road 410 – Carbon County Road 497)
6 Sep. 17 Oct. 31 25 Limited quota; doe or fawn 7 Sep. 17 Oct. 31 25 Limited quota; doe or fawn valid
in that portion of Area 63 east of the Buzzard Road (Natrona County Road 410 – Carbon County Road 497)
Archery
63 Aug. 15 Sep. 16 Refer to Section 3 of this Chapter
Hunt Area Type Quota change from 2012
63 1 -300 2 0 6 -75 7 -275
Total 1 & 2 -300 6 & 7 -350
Management Evaluation Current Management Objective: 5,000 Management Strategy: Recreation 2012 Postseason Population Estimate: ~3,350 2013 Proposed Postseason Population Estimate: ~3,400 The North Ferris pronghorn herd is managed toward a post-hunt population of 5,000, an objective last publicly reviewed in 1994. Population size is estimated using a spreadsheet model developed in 2012 and updated in 2013. The herd is in recreational management, with harvest quotas designed to maintain pre-hunt buck:doe ratios below 60:100. Herd Unit Issues
79

Historically, access has not been an issue in this herd unit which is mostly public lands, but access to some blocks of private land has become more difficult in recent years and may affect management ability to attain adequate harvests in the future. Potential for economic wind power exists within the herd unit, but appears unlikely when other resource issues such as T&E species and sage-grouse Core are considered. Many miles of sheep-tight fences still stand in the herd unit, impeding pronghorn movements. Weather Drought conditions were extreme in 2012, with minimal snowfall during the 2011-12 winter and almost no precipitation throughout the spring and summer. Drought was classified as moderate in April, severe in May and then extreme for all subsequent months through February 2013. As a consequence, fawn production was quite low, at 39:100, the lowest ratio in 19 years. The combination of continued heavy doe/fawn harvest and extremely poor fawn production in 2012 significantly reduced herd size this year, estimated at just over 3,300. This is the lowest this herd has been in at least 20 years. Habitat While no herbaceous habitat transects are established within this herd unit, herbaceous forage production is expected to have been minimal due to record drought. Two shrub transect have been established within this herd unit, primarily to monitor mule deer winter forage. One of these, on the Morgan Creek WHMA, was burned in the 2012 fires and the second was not read in 2012. New owners of the Pathfinder Ranch, which encompasses the north-central portion of this herd, have expressed interest in looking for opportunities for improving habitat conditions for wildlife, possibly as mitigation for wind power projects in other parts of the state. Habitat issues that would benefit pronghorn include treatment of winter ranges, adjustments of grazing use, and modification of sheep-tight fences. Field Data Classification sample size declined again for the third year, was the smallest sample in over 18 years, and was less than half the sample of 2009. These data are collected from the ground along routes that have had only minor changes over the past two decades, and again found significantly higher densities of pronghorn in the eastern half of the area near Pathfinder Reservoir and along irrigated hayfields on the Buzzard and Sand Creek Ranches. Fawn production declined to its lowest level in 19 years, a direct result of the exceptionally dry spring and summer.
Following unusually high recruitment of yearlings in 2005, buck:doe ratios exceeded the 60:100 maximum criterion for recreational management in this herd. Buck harvests were increased for the following seven years, often double or triple historic levels, and surplus bucks were successfully harvested prior to 2012 when the buck:doe ratio returned to an acceptable 58:100. Much of this decline was in the supply of adult bucks, with that ratio dropping to its lowest level in seven years. Quotas for “any antelope” licenses were still 3 times historic levels in 2012 after the excess bucks had been removed from the herd and total pronghorn numbers were below objective. As expected, hunter complaints about poor quality of bucks were common and the buck:doe ratio is expected to continue to decline in 2013.
80
Harvest Data Success for hunters with Type 1 licenses dropped to its lowest level in 10 years, at just 81 percent, a consequence of both reduced numbers of pronghorn and the lowered buck:doe ratio. Hunters with Type 2 licenses fared better, at 92 percent, presumably because they were forced to hunt where pronghorn densities were higher, but also because 73 percent of these licenses went to nonresidents, who typically have higher success. Doe/fawn hunters had the second poorest success since doe/fawn licenses were reintroduced in this herd in 2006, again a result of fewer pronghorn in the herd, but success was similar between the Type 6 and Type 7 licenses. Field contacts suggest a fair proportion of hunters with the Type 6 tags also used them in the eastern portion of the area.
Population This herd was below objective size for most of the decade following the 1992-93 winter, occasionally by as much as 20 percent or more, a consequence of low fawn production and poor recruitment. High fawn production followed by an unusually mild winter in 2004 provided the first significant growth in herd size. Prior to the development of a reasonable spreadsheet model in mid-2012, population estimates suggested this herd was well above objective size from 2006 up until 2012, and harvests were increased accordingly. The 2012 spreadsheet model showed a similar growth above objective in 2006, but predicts the increased harvests successfully reduced the herd to within 10 percent of objective by 2010 and slightly below objective following the 2011 hunt. The Time-Specific Juvenile & Constant Adult Survival (TSJ,CAS) spreadsheet model provided the best fit with observed buck:doe ratios for this herd, particularly for the most recent six years. The model behaved well when 2012 classification and harvest data were added and is considered a “Fair” model of the herd. Annual adult survival was predicted at 79 percent, a level slightly lower than models for some nearby pronghorn herds. Juvenile survival rates fluctuated within the allowed range but frequently hovered at maximum or minimum allowed values. The CJ,CA and SCJ,SCA models each had lower AIC values, but both models predicted herd sizes greatly exceeding past trend counts, without following count trends, and generated roughly stable buck:doe estimates that did not follow dips and rises in observed values. Estimated buck:doe ratios of these two models approximated observed values in only four or five of the past 20 years. Due to the poor condition of animals going into this winter and projections of continued drought in 2013, fawn production in 2013 was projected to be similar to that seen in 2012. Similarly, the model was run using low juvenile survival in 2013. A line transect survey scheduled for spring of 2013 should provide an independent estimate to evaluate the spreadsheet model predictions and winter survival. Management Summary With the population estimated to be 33% below objective, harvests need to be reduced to allow the herd to recover. The 2013 quota for Type 1 licenses, most of which are expected to be filled
81

on public lands in the western portion of the area, is reduced by 75 percent. A similar reduction is not recommended for the Type 2 licenses. These are limited to the eastern portion of the herd where most private lands are found, where pronghorn densities have been highest close to Pathfinder Reservoir and on irrigated hayfields, and which only represented 1/3rd of the “any antelope” quota in 2012. Quotas for both the Type 6 and Type 7 doe/fawn licenses are reduced to minimal numbers, intended to maximize herd recovery while providing reasonable chance of success for hunters applying for such tags.
The expected harvest of roughly 240 bucks and 45 does and fawns from the 2013 license quotas should provide only a minimal increase (~2 percent) in herd size, projected to be ~3,400 at post-hunt 2013. This assumes reduced survival through the 2012-13 winter and fawn production similar to the low level seen in 2012. If either winter survival or fawn production exceeds expectations in 2013, the increase would be improved, but this herd is unlikely to reach objective size for several years without significant improvement in fawn production and survival. Opening date falls on the traditional day of the week, is compatible with the application booklet and, as intended when first selected years ago, reduces crowding on opening day and the following weekend. The closing date is the same as in 2012 and extends to the closing of the local deer season. Archery season uses a standardized opening date and closes the day before the opening of the regular season.
A review of the management objectives for this herd is scheduled for late 2013, following results of the line transect survey planned for spring 2013.
82
INPU
T Sp
ecie
s:P
rong
horn
Bio
logi
st:
Gre
g H
iatt
Her
d U
nit &
No.
:N
orth
Fer
ris 6
36M
odel
dat
e:03
/10/
13
CJ,
CA
Con
stan
t Juv
enile
& A
dult
Surv
ival
9810
7
SCJ,
SCA
Sem
i-Con
stan
t Juv
enile
& S
emi-C
onst
ant A
dult
Surv
ival
7589
TSJ,
CA
Tim
e-Sp
ecifi
c Ju
veni
le &
Con
stan
t Adu
lt Su
rviv
al32
151
Tota
lTo
tal
Tren
d C
oun t
Obj
ectiv
e
Juve
nile
sTo
tal M
ales
Fem
ales
Juve
nile
sTo
tal M
ales
Fem
ales
Tota
l Mal
esFe
mal
esTo
tal A
dults
Fiel
d Es
tFi
eld
SE19
9375
413
1528
1448
8375
411
1528
1146
8012
0626
2138
2750
0019
9411
7311
8225
6949
2411
7399
825
6447
3613
0826
1339
2150
0019
9511
7112
8225
6150
1311
7110
9025
5348
1413
8026
0239
8250
0019
9617
0913
5225
5056
1117
0911
7225
5054
3013
7325
2739
0050
0019
9712
0413
4624
7650
2612
0411
5924
7348
3612
0523
0835
1350
0019
9815
3811
8122
6249
8215
3890
922
5747
0410
7022
1932
8950
0019
9913
8010
4921
7446
0313
8086
121
7244
1310
0921
1031
1950
0020
0010
7298
920
6741
2810
6981
720
6739
5389
719
4528
4250
0020
0114
0087
919
0641
8514
0071
519
0440
1990
118
9827
9950
0020
0213
1688
318
6040
5913
1671
318
6038
8811
3420
9832
3250
0020
0314
0411
1120
5645
7114
0492
620
5343
8313
5623
0536
6150
00
MO
DEL
S SU
MM
AR
YFi
tR
elat
ive
AIC
cC
heck
bes
t mod
el
to c
reat
e re
port
Popu
latio
n Es
timat
es fr
om T
op M
odel
Year
Pred
icte
d ad
ult E
nd-o
f-bio
-yea
r Pop
(yea
r i)
Pred
icte
d Po
sthu
nt P
opul
atio
n (y
ear i
)Pr
edic
ted
Preh
unt P
opul
atio
n (y
ear i
)LT
Pop
ulat
ion
Estim
ate
Not
es
SCJ,
SCA
Mod
TSJ,
CA M
odel
CJ,C
A M
odel
Clea
r fo
rm
003
005
65
09
605
338
335
630
536
650
0020
0416
0113
2822
5951
8916
0111
6122
5950
2216
4025
6442
0450
0020
0517
5416
0725
1358
7417
5414
3825
0556
9719
3328
3147
6450
0020
0616
6718
9527
7563
3616
6716
4427
3260
4220
4329
6750
1050
0020
0720
1320
0229
0869
2320
0816
6127
8964
5821
5631
1652
7250
0020
0820
5721
1330
5472
2420
2417
1528
3465
7322
3231
7554
0650
0020
0916
3721
8731
1169
3516
1117
0628
2361
4020
1829
6249
8050
0020
1014
3819
7829
0363
1814
1115
1525
7254
9817
7526
5944
3350
0020
1113
8917
3926
0557
3313
6912
8822
3948
9612
5921
4734
0650
0020
1282
012
3421
0441
5879
374
117
9533
3093
818
6728
0650
0020
1395
291
918
3037
0194
665
517
8633
8850
0020
1420
1520
1620
1720
1820
1920
2020
2120
2220
2320
2420
25
SCJ,
SCA
Mod
TSJ,
CA M
odel
CJ,C
A M
odel
Clea
r fo
rm
83

Mod
el E
stFi
eld
Est
SEM
odel
Est
Fiel
d Es
tSE
1993
0.90
0.79
Para
met
ers:
Opt
im c
ells
1994
0.90
0.79
1995
0.90
0.79
Adu
lt S
urvi
val =
0.79
319
960.
530.
79In
itial
Tot
al M
ale
Pop
/10,
000
=
0.13
219
970.
500.
79In
itial
Fem
ale
Pop
/10,
000
=0.
281
1998
0.50
0.79
1999
0.50
0.79
2000
0.50
0.79
2001
0.50
0.79
Sex
Rat
io (
% M
ales
) =
50%
2002
0.88
0.79
Wou
ndin
g Lo
ss (
tota
l mal
es)
=10
%
2003
0.90
0.79
Wou
ndin
g Lo
ss (
fem
ales
) =
10%
2004
0.90
0.79
Wou
ndin
g Lo
ss (
juve
nile
s) =
10%
2005
0.90
0.79
Ove
r-su
mm
er a
dult
surv
iva
98%
2006
0.90
0.79
2007
0.86
0.79
2008
0.90
0.79
2009
0.90
0.79
2010
0.90
0.79
2011
0.50
0.79
2012
0.50
0.79
2013
0.50
0.79
2014
2015
Ann
ual A
dult
Surv
ival
Rat
esA
nnua
l Juv
enile
Sur
viva
l Rat
esSu
rviv
al a
nd In
itial
Pop
ulat
ion
Estim
ates
Year
MO
DEL
ASS
UM
PTIO
NS
2015
2016
2017
2018
2019
2020
2021
2022
2023
2024
2025
84
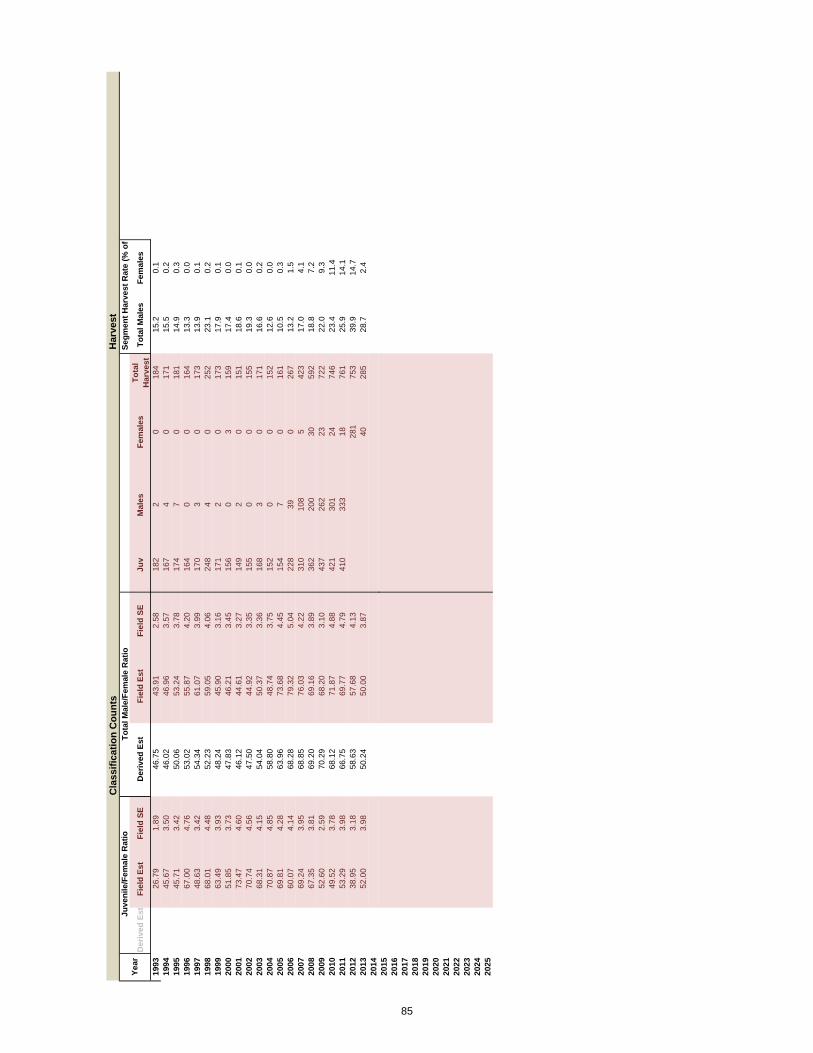
Der
ived
Est
Fiel
d Es
tFi
eld
SED
eriv
ed E
stFi
eld
Est
Fiel
d SE
Juv
Mal
esFe
mal
esTo
tal
Har
vest
Tota
l Mal
esFe
mal
es
1993
26.7
91.
8946
.75
43.9
12.
5818
22
018
415
.20.
119
9445
.67
3.50
46.0
246
.96
3.57
167
40
171
15.5
0.2
1995
45.7
13.
4250
.06
53.2
43.
7817
47
018
114
.90.
319
9667
.00
4.76
53.0
255
.87
4.20
164
00
164
13.3
0.0
1997
48.6
33.
4254
.34
61.0
73.
9917
03
017
313
.90.
119
9868
.01
4.48
52.2
359
.05
4.06
248
40
252
23.1
0.2
1999
63.4
93.
9348
.24
45.9
03.
1617
12
017
317
.90.
120
0051
.85
3.73
47.8
346
.21
3.45
156
03
159
17.4
0.0
2001
73.4
74.
6046
.12
44.6
13.
2714
92
015
118
.60.
120
0270
.74
4.56
47.5
044
.92
3.35
155
00
155
19.3
0.0
2003
68.3
14.
1554
.04
50.3
73.
3616
83
017
116
.60.
220
0470
.87
4.85
58.8
048
.74
3.75
152
00
152
12.6
0.0
2005
69.8
14.
2863
.96
73.6
84.
4515
47
016
110
.50.
320
0660
.07
4.14
68.2
879
.32
5.04
228
390
267
13.2
1.5
2007
69.2
43.
9568
.85
76.0
34.
2231
010
85
423
17.0
4.1
2008
67.3
53.
8169
.20
69.1
63.
8936
220
030
592
18.8
7.2
2009
52.6
02.
5970
.29
68.2
03.
1043
726
223
722
22.0
9.3
2010
49.5
23.
7868
.12
71.8
74.
8842
130
124
746
23.4
11.4
2011
53.2
93.
9866
.75
69.7
74.
7941
033
318
761
25.9
14.1
2012
38.9
53.
1858
.63
57.6
84.
1328
175
339
.914
.720
1352
.00
3.98
50.2
450
.00
3.87
4028
528
.72.
420
1420
15
Juve
nile
/Fem
ale
Rat
ioYe
arSe
gmen
t Har
vest
Rat
e (%
of
Tota
l Mal
e/Fe
mal
e R
atio
Cla
ssifi
catio
n C
ount
sH
arve
st
2015
2016
2017
2018
2019
2020
2021
2022
2023
2024
2025
85
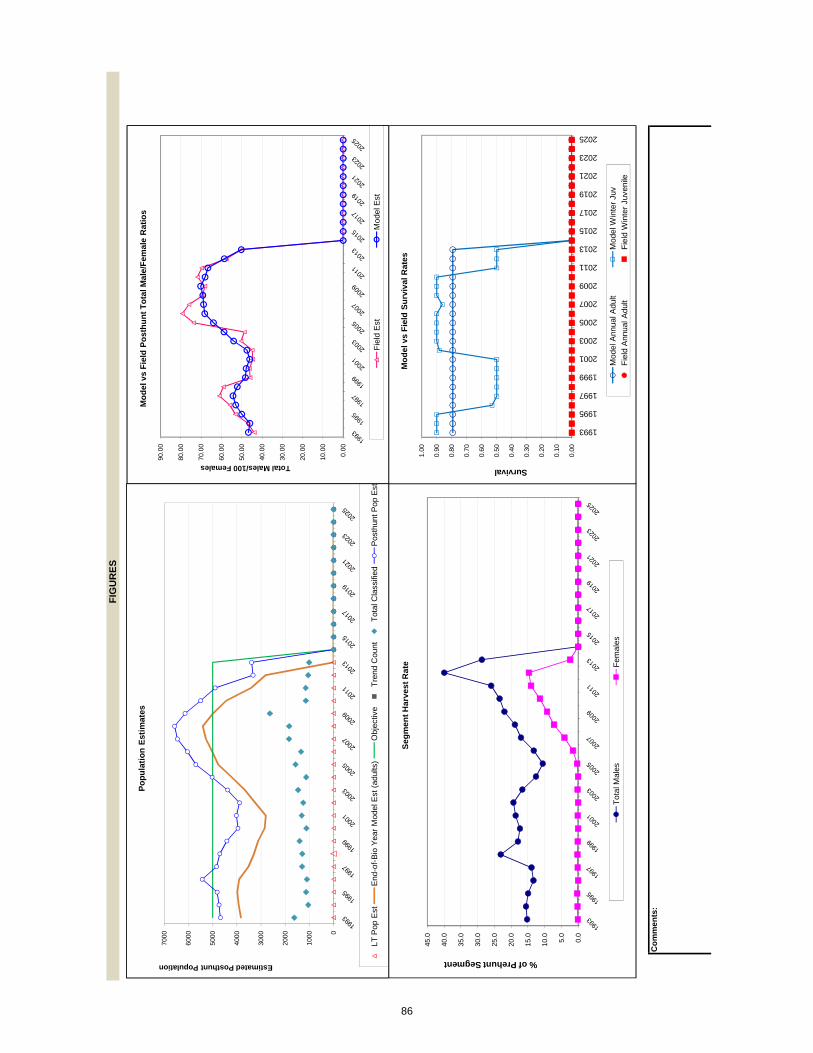
FIG
UR
ES
0.00
10.0
0
20.0
0
30.0
0
40.0
0
50.0
0
60.0
0
70.0
0
80.0
0
90.0
0
Total Males/100 Females
Mod
el v
s Fi
eld
Post
hunt
Tot
al M
ale/
Fem
ale
Rat
ios
Fie
ld E
stM
odel
Est
0
1000
2000
3000
4000
5000
6000
7000
Estimated Posthunt Population
Popu
latio
n Es
timat
es
LT P
op E
stE
nd-o
f-B
io Y
ear
Mod
el E
st (
adul
ts)
Obj
ectiv
eT
rend
Cou
ntT
otal
Cla
ssifi
edP
osth
unt P
op E
st
Com
men
ts:
0.00
10.0
0
20.0
0
30.0
0
40.0
0
50.0
0
60.0
0
70.0
0
80.0
0
90.0
0
Total Males/100 Females
Mod
el v
s Fi
eld
Post
hunt
Tot
al M
ale/
Fem
ale
Rat
ios
Fie
ld E
stM
odel
Est
0
1000
2000
3000
4000
5000
6000
7000
Estimated Posthunt Population
Popu
latio
n Es
timat
es
LT P
op E
stE
nd-o
f-B
io Y
ear
Mod
el E
st (
adul
ts)
Obj
ectiv
eT
rend
Cou
ntT
otal
Cla
ssifi
edP
osth
unt P
op E
st
0.0
5.0
10.0
15.0
20.0
25.0
30.0
35.0
40.0
45.0
% of Prehunt Segment
Segm
ent H
arve
st R
ate
Tot
al M
ales
Fem
ales
0.00
0.10
0.20
0.30
0.40
0.50
0.60
0.70
0.80
0.90
1.00
1993
1995
1997
1999
2001
2003
2005
2007
2009
2011
2013
2015
2017
2019
2021
2023
2025
Survival
Mod
el v
s Fi
eld
Surv
ival
Rat
es
Mod
el A
nnua
l Adu
ltM
odel
Win
ter
Juv
Fie
ld A
nnua
l Adu
ltF
ield
Win
ter
Juve
nile
86

87

88
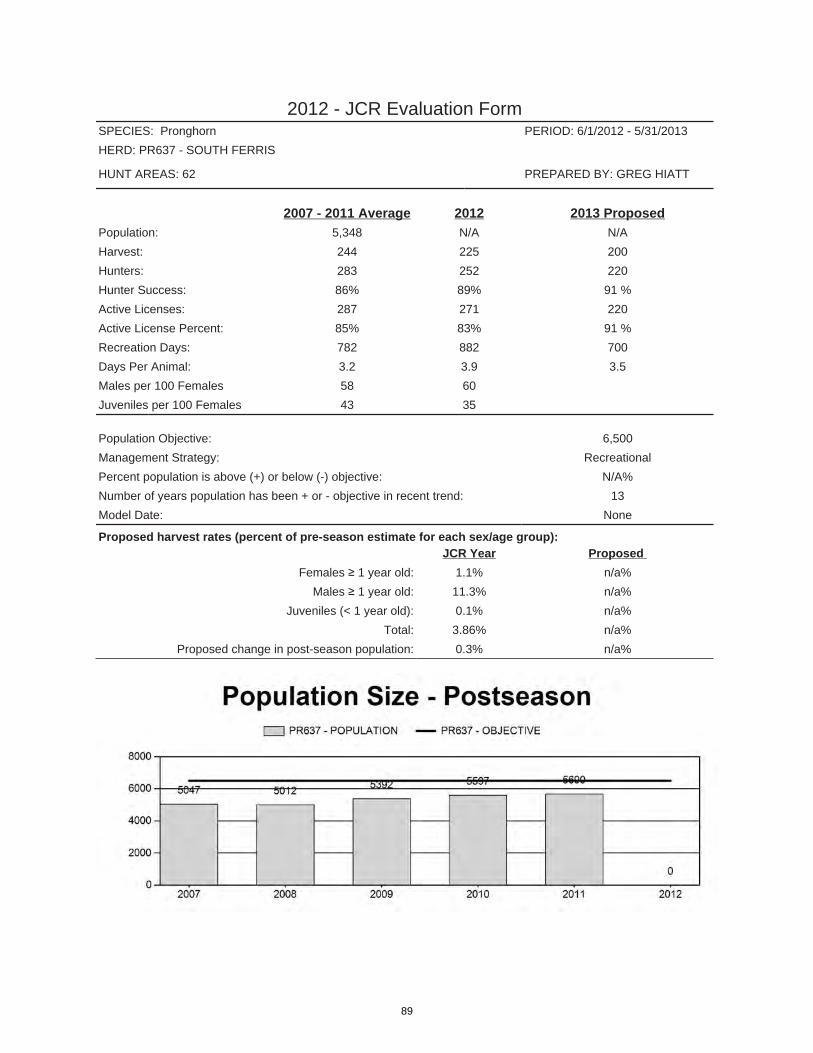
2012 - JCR Evaluation FormSPECIES: Pronghorn PERIOD: 6/1/2012 - 5/31/2013
HERD: PR637 - SOUTH FERRIS
HUNT AREAS: 62 PREPARED BY: GREG HIATT
2007 - 2011 Average 2012 2013 ProposedPopulation: 5,348 N/A N/A
Harvest: 244 225 200
Hunters: 283 252 220
Hunter Success: 86% 89% 91 %
Active Licenses: 287 271 220
Active License Percent: 85% 83% 91 %
Recreation Days: 782 882 700
Days Per Animal: 3.2 3.9 3.5
Males per 100 Females 58 60
Juveniles per 100 Females 43 35
Population Objective: 6,500
Management Strategy: Recreational
Percent population is above (+) or below (-) objective: N/A%
Number of years population has been + or - objective in recent trend: 13
Model Date: None
Proposed harvest rates (percent of pre-season estimate for each sex/age group):JCR Year Proposed
Females ≥ 1 year old: 1.1% n/a%
Males ≥ 1 year old: 11.3% n/a%
Juveniles (< 1 year old): 0.1% n/a%
Total: 3.86% n/a%
Proposed change in post-season population: 0.3% n/a%
89
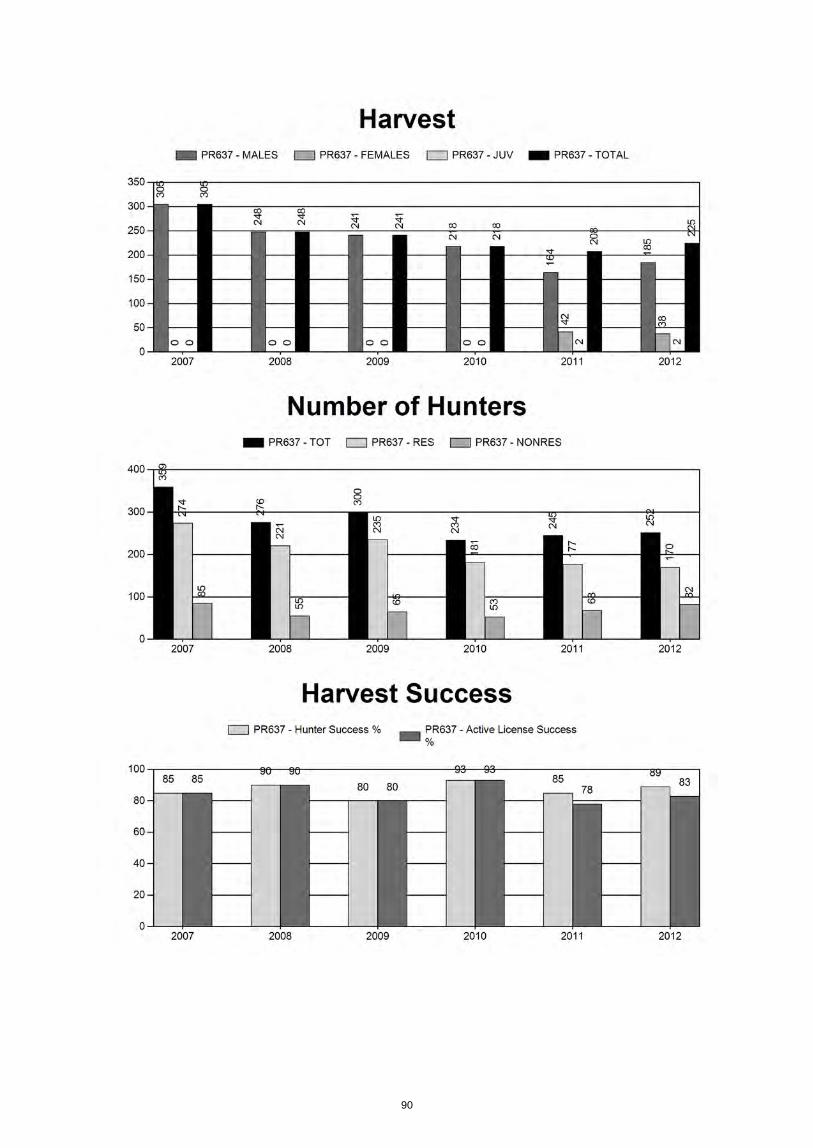
90

91
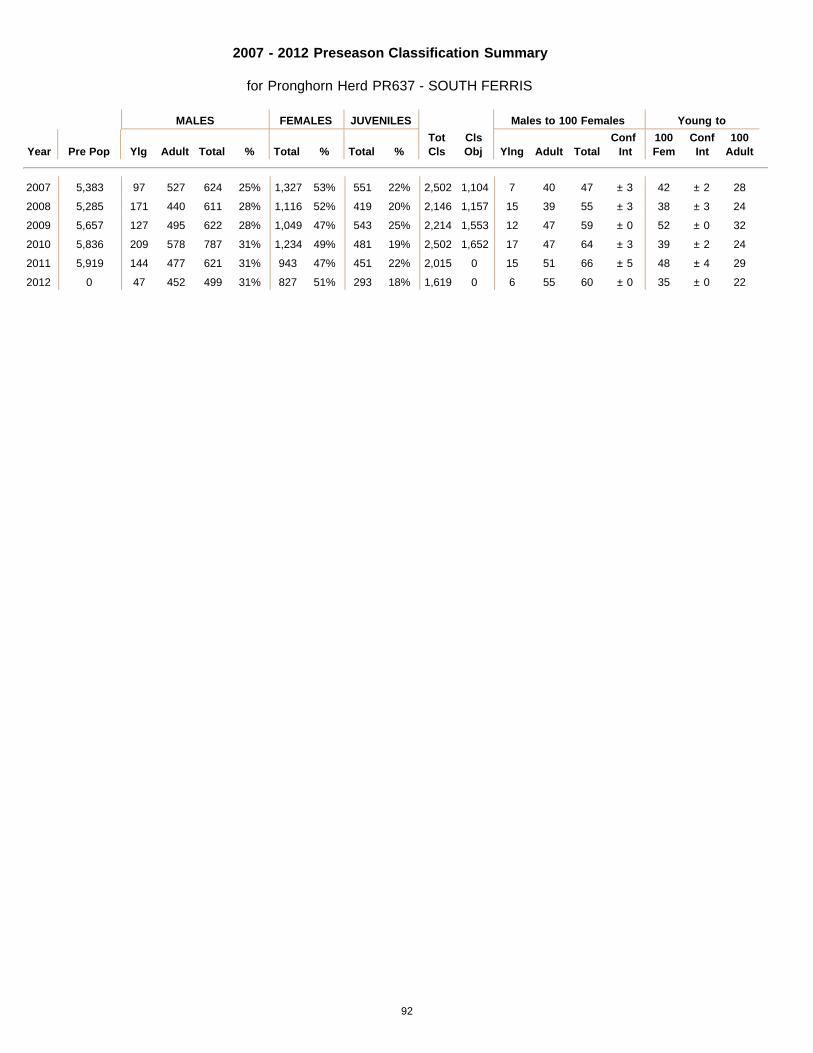
2007 - 2012 Preseason Classification Summary
for Pronghorn Herd PR637 - SOUTH FERRIS
MALES FEMALES JUVENILES Males to 100 Females Young to
Year Pre Pop Ylg Adult Total % Total % Total %TotCls
ClsObj Ylng Adult Total
Conf Int
100Fem
ConfInt
100Adult
2007 5,383 97 527 624 25% 1,327 53% 551 22% 2,502 1,104 7 40 47 ± 3 42 ± 2 28
2008 5,285 171 440 611 28% 1,116 52% 419 20% 2,146 1,157 15 39 55 ± 3 38 ± 3 24
2009 5,657 127 495 622 28% 1,049 47% 543 25% 2,214 1,553 12 47 59 ± 0 52 ± 0 32
2010 5,836 209 578 787 31% 1,234 49% 481 19% 2,502 1,652 17 47 64 ± 3 39 ± 2 24
2011 5,919 144 477 621 31% 943 47% 451 22% 2,015 0 15 51 66 ± 5 48 ± 4 29
2012 0 47 452 499 31% 827 51% 293 18% 1,619 0 6 55 60 ± 0 35 ± 0 22
92
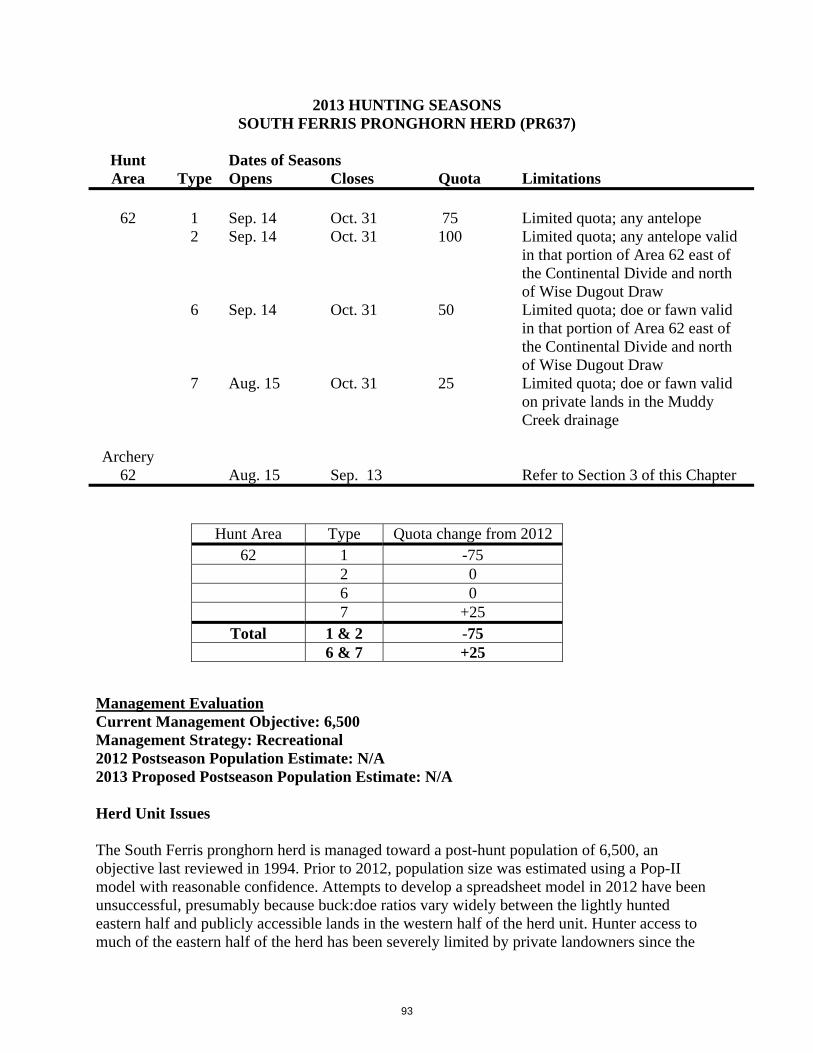
2013 HUNTING SEASONS SOUTH FERRIS PRONGHORN HERD (PR637)
Hunt Dates of Seasons Area Type Opens Closes Quota Limitations
62 1 Sep. 14 Oct. 31 75 Limited quota; any antelope 2 Sep. 14 Oct. 31 100 Limited quota; any antelope valid
in that portion of Area 62 east of the Continental Divide and north of Wise Dugout Draw
6 Sep. 14 Oct. 31 50 Limited quota; doe or fawn valid in that portion of Area 62 east of the Continental Divide and north of Wise Dugout Draw
7 Aug. 15 Oct. 31 25 Limited quota; doe or fawn valid on private lands in the Muddy Creek drainage
Archery
62 Aug. 15 Sep. 13 Refer to Section 3 of this Chapter
Hunt Area Type Quota change from 2012
62 1 -75 2 0 6 0 7 +25
Total 1 & 2 -75 6 & 7 +25
Management Evaluation Current Management Objective: 6,500 Management Strategy: Recreational 2012 Postseason Population Estimate: N/A 2013 Proposed Postseason Population Estimate: N/A Herd Unit Issues The South Ferris pronghorn herd is managed toward a post-hunt population of 6,500, an objective last reviewed in 1994. Prior to 2012, population size was estimated using a Pop-II model with reasonable confidence. Attempts to develop a spreadsheet model in 2012 have been unsuccessful, presumably because buck:doe ratios vary widely between the lightly hunted eastern half and publicly accessible lands in the western half of the herd unit. Hunter access to much of the eastern half of the herd has been severely limited by private landowners since the
93
mid-1990s and has resulted in buck:doe ratios and pronghorn densities that are greatly skewed between the western and eastern portions. This herd was at objective size at the end of the 1990s but declined in 2001 and has remained roughly 15-20 percent below objective ever since, largely a result of poor fawn production. Fawn crops only ranged from 28 to 55:100 over the past 12 years, averaging 40:100. Poor production and recruitment has prevented the herd from recovering towards objective. Weather Drought conditions were extreme in 2012, with minimal snowfall during the 2011-12 winter and almost no precipitation throughout the spring and summer. Drought was classified as moderate in April, severe in May and then extreme for all subsequent months through February 2013. As a consequence, fawn production was again exceptionally low at 35:100. Body condition of most pronghorn harvested from this area in 2012 was poor, especially for lactating does. Given the poor condition of animals at the end of fall, mortality is expected to be above average during the 2012-13 winter, despite moderate winter conditions. Three late winter blizzards in April 2013 likely increased winter losses. Habitat While no herbaceous habitat transects are established within this herd unit, herbaceous forage production is expected to have been minimal due to record drought. Only one shrub transect has been established near this herd unit, on the Morgan Creek WHMA. This transect monitored bitterbrush growth and utilization in the Seminoe Mountains but was burned in the 2012 fires. New owners of the Pathfinder Ranch, which encompasses the north-central portion of this herd, have expressed interest in looking for opportunities for improving habitat conditions for wildlife, possibly as mitigation for wind power projects in other parts of the state. Habitat issues that would benefit pronghorn include treatment of winter ranges, adjustments of grazing use, and modification of sheep-tight fences. Field Data Classification sample size declined again for the third year, to the smallest sample since 1979. Part of the decline the past two years was due to loss of data that used to be collected by aerial flights over a small portion of the herd, but most ground classification routes also showed drops in the number of pronghorn seen. Fawn production declined to its lowest level in 6 years, a direct result of the exceptionally dry spring and summer.
Buck:doe ratios exceeded the 60:100 maximum criterion for recreational management in three of the past five years, but always due to high ratios in the half of the herd unavailable to most hunters. Buck:doe ratios in the western portion only averaged 43:100 over the past five years, a poor supply of bucks for an area with large acreages of public land, which generated complaints of poor buck numbers and quality by hunters. Buck:doe ratios in the eastern portion, however, averaged 78:100. The Type 2 licenses introduced in 2012 are intended to address the disparity between buck supplies between the two portions of the area by forcing much of the hunting pressure into the eastern portion.
94

Harvest Data The difference in supply of bucks between the two halves of the herd unit is also apparent when looking at hunter success for the Type 2 licenses, first introduced in 2012. Hunters with these tags, restricted to the eastern third of the area with limited public access, enjoyed 94 percent success, compared to only 73 percent for hunters with Type 1 tags that were valid for the entire area. Roughly half of these Type 2 hunters paid for access to private lands in that part of the checkerboard, the other half hunting the limited public lands. Type 2 hunters also spent 20 percent less time, on average, in the field in order to harvest their animal than hunters with Type 1 licenses. The 73 percent success for hunters with Type 1 licenses was the lowest success ever recorded for this herd and the average of 4.7 days hunted for each animal harvested was the highest ever recorded, indicating exceptionally low pronghorn numbers in the western half of the herd.
Population Efforts to develop a reasonable spreadsheet model for this herd have failed, presumably due to the highly skewed buck:doe ratios between the eastern and western portions of the herd unit. In 2012, the buck:doe ratio in the publicly available portion of the herd was only 36:100, whereas the portion with limited access had 89:100. Half the herd unit is essentially unhunted. As a result, when classification samples for the two halves are combined to determine herd ratios, changes in harvests do not necessarily result in predictable changes in buck:doe ratios, the key parameter used for running spreadsheet models. It may be possible to develop a useful spreadsheet model of this herd by weighting buck:doe ratios between the two portions of the herd unit, rather than simply combining data as has been done in the past. A line transect survey scheduled for spring of 2013 should provide an independent estimate of herd size and also a means to evaluate any spreadsheet model using weighted ratios. Management Summary With the population apparently well below objective, harvests need to be reduced to allow the herd to recover, particularly in the western half. The 2013 quota for Type 1 licenses, most of which are expected to be filled on public lands or Walk-In areas in the western portion of the area, is reduced by 50 percent. No reduction is recommended for the Type 2 licenses, nor the Type 6 quota which are also restricted to the eastern third where pronghorn densities are higher. High numbers of pronghorn on irrigated croplands in the northwestern corner of the herd have been a perpetual complaint, which was aggravated by drought conditions in 2012. Anticipating similar drought in 2013 and subsequent concentration of pronghorn on these irrigated fields, a Type 7 license was created to open earlier than usual and allow for harvest of does and fawns off those private lands. Most of these lands are enrolled in the Department’s Walk-In program, so access to these private lands should not be a concern.
The expected harvest of roughly 135 bucks and 65 does and fawns from the proposed license quotas should allow some increase in herd size, particularly in the western half, while simultaneously reducing pronghorn numbers on irrigated fields along Muddy Creek and
95

providing some control on pronghorn numbers in the eastern third of the area. This assumes reduced survival through the 2012-13 winter due to drought-stressed animals and forage, and fawn production similar to the low level seen in 2012. If either winter survival or fawn production exceeds expectations in 2013, the increase would be improved, but this herd is unlikely to reach objective size for several years without significant improvement in fawn production and survival. Opening date falls on the traditional day of the week and is compatible with the application booklet. The closing date is the same as in 2012 and extends to the closing of the local deer season. A standardized opening date is used for the archery season, which closes the day before the opening of the regular season.
A review of the management objectives for this herd is scheduled for late 2013, following the line transect survey planned for spring 2013.
96
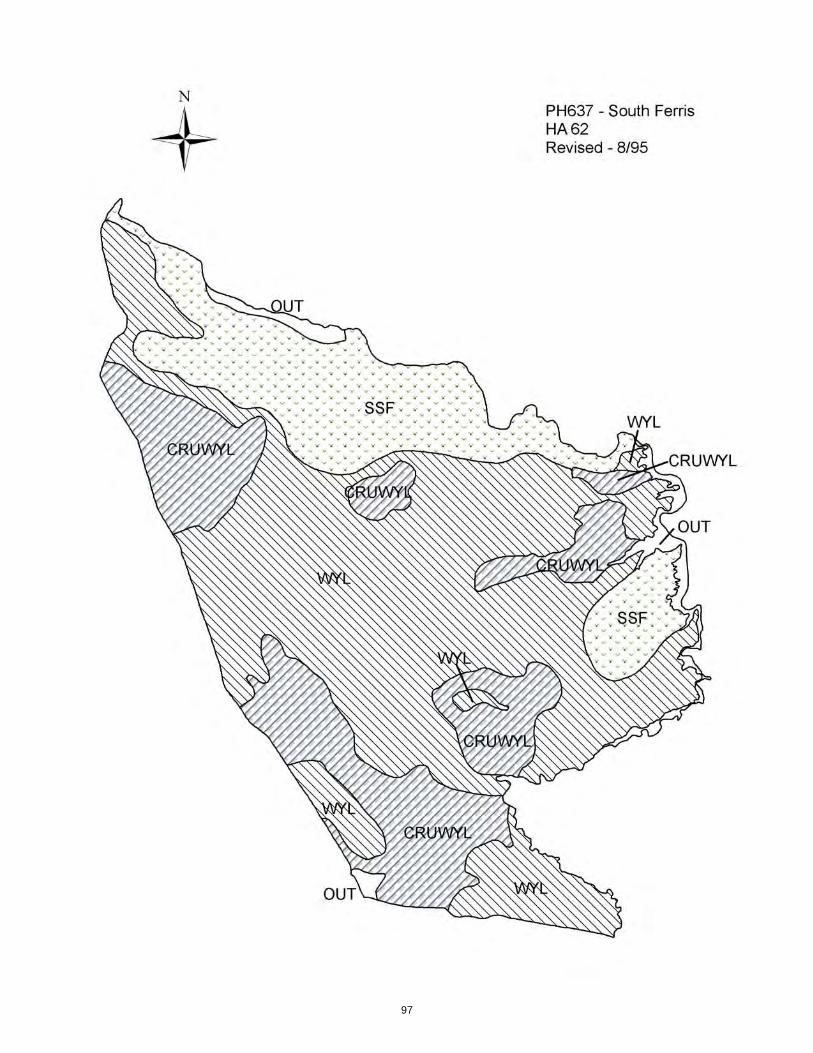
97

98