2012 it trends it trends economy globalization sourcing models (+ aging workforce, millennials)...
TRANSCRIPT

Jerry Luftman Ph.D.
SIM VP Chapter Relations & Academic Affairs, & NJ Chapter President Emeritus
Professor & Executive Director
Global Institute for IT Management
www.globaliim.com
201-787-9509
2012 IT TRENDS
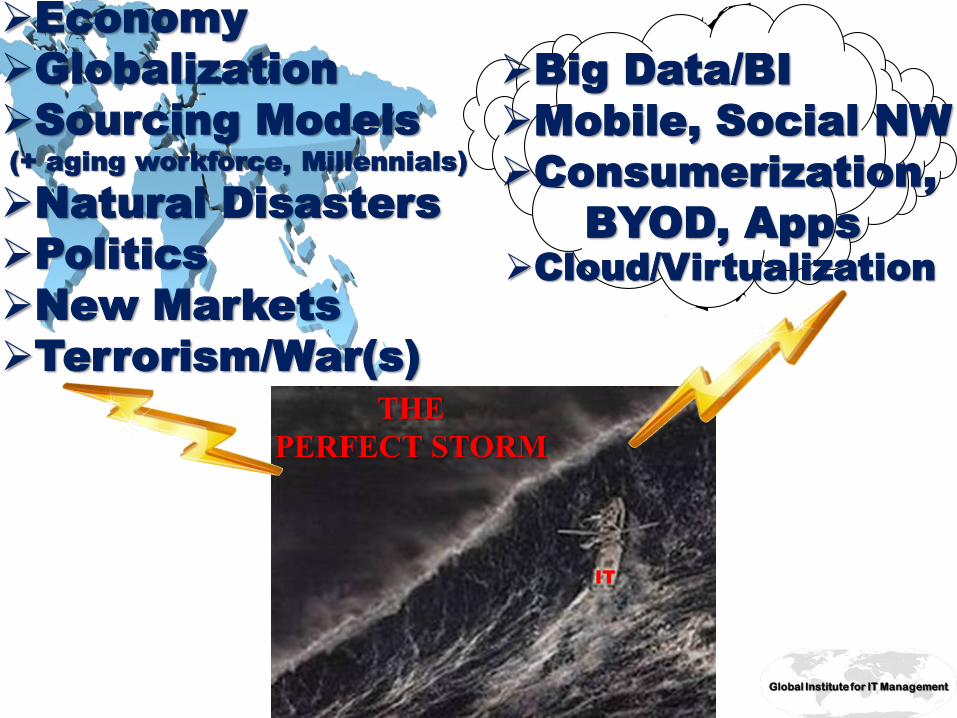
Economy
Globalization
Sourcing Models
(+ aging workforce, Millennials)
Natural Disasters
Politics
New Markets
Terrorism/War(s)
Big Data/BI
Mobile, Social NW
Consumerization,
BYOD, Apps
Cloud/Virtualization
THE
PERFECT STORM
IT
Global Institute for IT Management
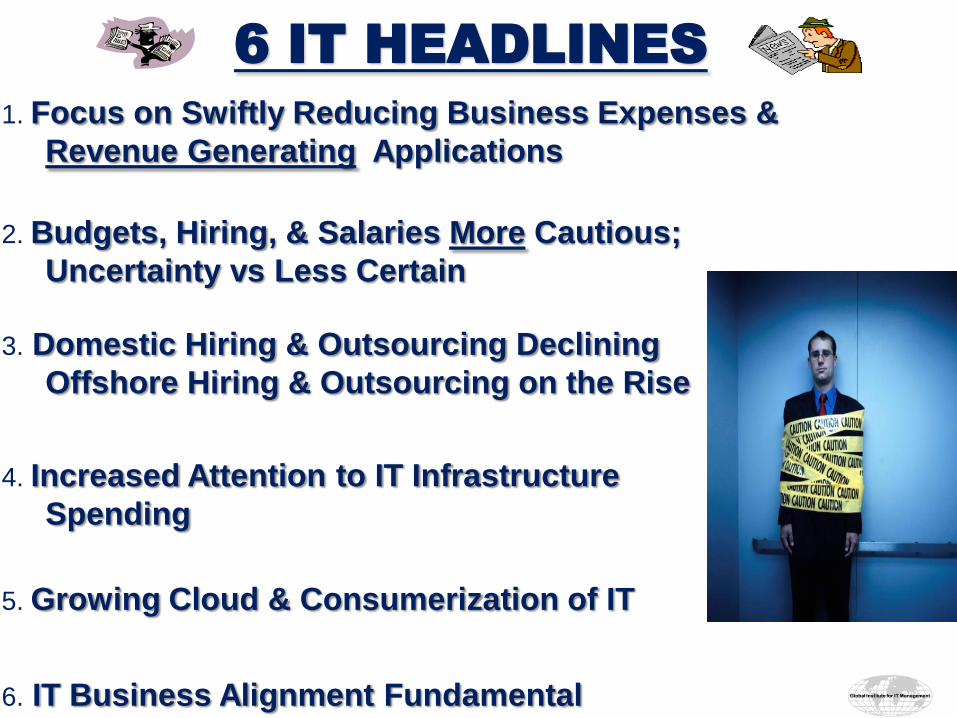
6 IT HEADLINES
1. Focus on Swiftly Reducing Business Expenses &
Revenue Generating Applications
4. Increased Attention to IT Infrastructure
Spending
5. Growing Cloud & Consumerization of IT
2. Budgets, Hiring, & Salaries More Cautious;
Uncertainty vs Less Certain
3. Domestic Hiring & Outsourcing Declining
Offshore Hiring & Outsourcing on the Rise
6. IT Business Alignment Fundamental
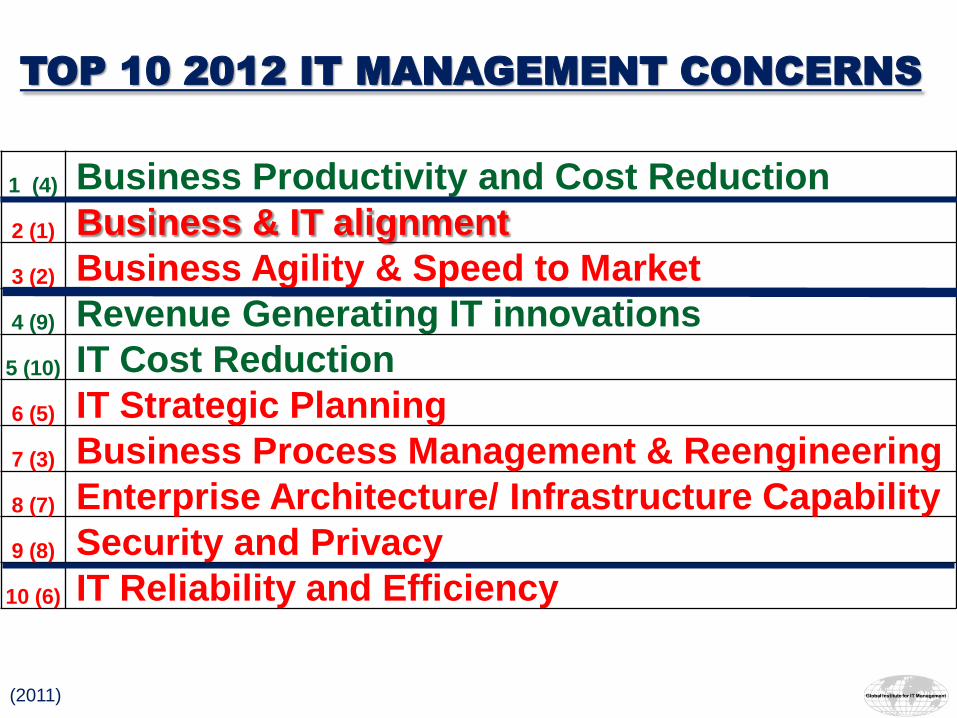
TOP 10 2012 IT MANAGEMENT CONCERNS
1 (4) Business Productivity and Cost Reduction
2 (1) Business & IT alignment
3 (2) Business Agility & Speed to Market
4 (9) Revenue Generating IT innovations
5 (10) IT Cost Reduction
6 (5) IT Strategic Planning
7 (3) Business Process Management & Reengineering
8 (7) Enterprise Architecture/ Infrastructure Capability
9 (8) Security and Privacy
10 (6) IT Reliability and Efficiency
(2011)

1 (1) Big Data, Business Intelligence
2 (2) Cloud Computing (SaaS, PaaS, IaaS)
3 (3) Enterprise Resource Planning (ERP) systems
4 (8) Collaborative and Workflow tools
5 (5) Customer Relationship Management (CRM)
6 (4) Mobile and Wireless Applications
7 * BYOD (Bring Your Own Device)
8 (9) (EAI/EAM) Enterprise Application Integration/Management
9
(16) Business Process Management Systems
10 * Apps Development
TOP 5 APPLICATIONS &
TECHNOLOGIES 2012
(2011) New* OFF: Virtualization, Continuity Planning

2012 IT BUDGET (ACTUAL)
2012
52%
2012 = 2011
2012 < 2011
2012 > 2011
47.9%

2012 IT BUDGET (ACTUAL)
2012 (2011) (2010) (2009) (2008)
(2007)
52% (44%)
(39%)
2012 = 2011 17.6% (27%) (31%) (23%) (28%) (17%)
2012 < 2011 34.5% (17%) (35%) (52%) (26%) (22%)
2012 > 2011
47.9% (56%) (34%) (25)% (46%)
(61%)

2013 IT BUDGET(PROJECTED)
(2011) 54.2% (52.1%)
2013 = 2012; 32.4%
(17.6%)
2013 < 2012; 21.8%
(34.5%)
2013 > 2012; 45.8%
(47.9%)
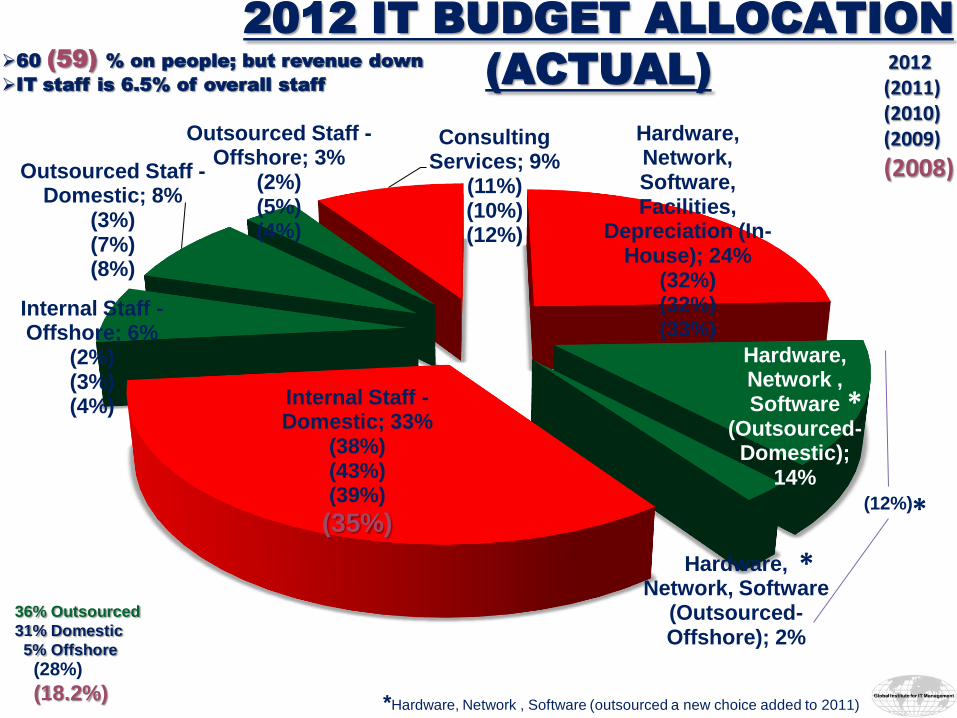
2012 IT BUDGET ALLOCATION
(ACTUAL) 2012 (2011) (2010) (2009)
(2008)
*Hardware, Network , Software (outsourced a new choice added to 2011)
60 (59) % on people; but revenue down
IT staff is 6.5% of overall staff
Hardware, Network, Software, Facilities,
Depreciation (In-House); 24%
(32%) (32%) (33%)
Hardware, Network , Software
(Outsourced-Domestic);
14%
Hardware, Network, Software
(Outsourced-Offshore); 2%
Internal Staff - Domestic; 33%
(38%) (43%) (39%)
(35%)
Internal Staff - Offshore; 6%
(2%) (3%) (4%)
Outsourced Staff - Domestic; 8%
(3%) (7%) (8%)
Outsourced Staff - Offshore; 3%
(2%) (5%) (4%)
Consulting Services; 9%
(11%) (10%) (12%)
*
*
(12%)
36% Outsourced
31% Domestic
5% Offshore
(28%)
(18.2%)
*

2013 IT Budget ALLOCATION
(Projected)
(2012)
62% on people (60%)
Hardware, Network, Software, Facilities,
Depreciation ( In House); 22%
(24%) (32%)
Hardware, Network, Software
(Outsourced-Domestic); 13%
(14%)
Hardware, Network, Software
(Outsourced-Offshore), 3%
(2%)
Internal Staff - Domestic; 31%
(33%) (38%)
Internal Staff - Offshore; 11%
(6%) (2%)
Outsourced Staff - Domestic; 8%
(8%) (3%)
Outsourced Staff - Offshore; 4%
(3%) (2%)
Consulting Services; 8%
(9%) (11%)
36% Outsourced
29% Domestic
7% Offshore

IT Budget allocation for Offshore Outsourcing
0
1
2
3
4
5
6
7
1.7
4.2 4.0
3.3
4.0
5.0 5.0%
2% 1% 5%
2.0%
2005 2006 2007 2008 2009 2010 2011 2013 (project)
2012
7.0%

2012 OFFSHORE OUTSOURCING
BUDGET ALLOCATED BY GEOGRAPHY
(2011)
India; 43% (58%)
China; 2% (10%)
Brazil; 2% (2%)
Caribbean; 0% (4%)
Mexico; 5% (5%)
Western EU; 13% (6%)
Eastern EU; 6% (4%)
Phillipines; 12% (4%)
Russia; 1% (3%)
Other, 16%

PERCENTAGE OF 2012 BUDGET ALLOCATED
TO INTERNAL CLOUD
> 10%
12%
(20%)
1 - 5%
40%
(21%)
Average: 5% (6% )
(2011)
0-1%; 37% (43%)
1-2; 20% (6%)
2-3; 7% (5%)
3-4; 2% (5%)
4-5; 11% (5%)
6-10; 11% (17%)
11-15; 4% (6%)
16-20; 1% (4%)
21-25; 3% (4%)
>25%; 4% (6%)
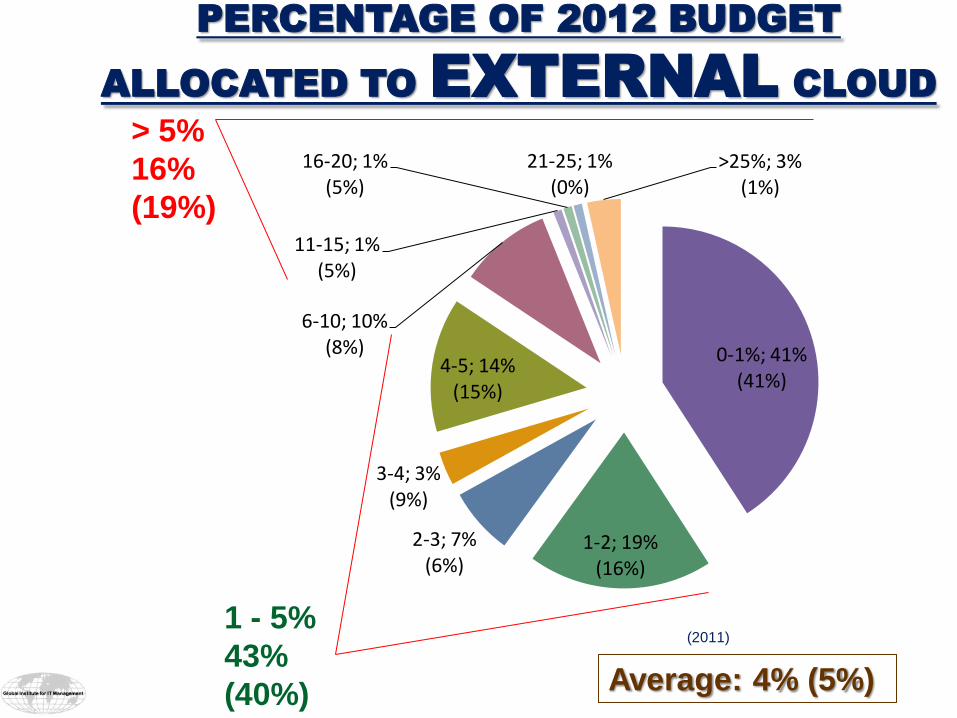
PERCENTAGE OF 2012 BUDGET
ALLOCATED TO EXTERNAL CLOUD
> 5%
16%
(19%)
Average: 4% (5%)
1 - 5%
43%
(40%)
(2011)
0-1%; 41% (41%)
1-2; 19% (16%)
2-3; 7% (6%)
3-4; 3% (9%)
4-5; 14% (15%)
6-10; 10% (8%)
11-15; 1% (5%)
16-20; 1% (5%)
21-25; 1% (0%)
>25%; 3% (1%)

0.00
2.00
4.00
6.003.60 3.60 3.50 3.82 3.83 3.87 3.55
4.94
3.84 Avg.
2005 2006 2008 2007 2009 2012 2010 2011
PERCENTAGE OF CORPORATE
REVENUE ALLOCATED TO IT BUDGET

IT BUDGET AS PERCENT OF REVENUE BY
INDUSTRY CLASSIFICATION
Information Technology 13.67% 10.19%
Finance/Banking 8.12% 6.67%
Transportation 6.1% 4.00%
Manufacturing 2.0% 1.70%
Government-State/Local 2.75% 9.45%
Business Services 12.12% 4.37%
Education 4.78% 4.04%
Aerospace 9.37% 2.50%
Data Processing Services 11.5% 10.19%
Insurance 8.16% 6.67%
3.55 Average
2011 2012
4.94

0.00
2.50
5.00
7.50 5.80 6.41 7.11 5.20 5.50 5.51 5.23
2012 IT STAFF TURNOVER RATE
5.82% Avg.
2006 2007 2008 2009 2012 2010 2011

2012 = 2011 29%
2012 > 2011
60%
2012 < 2011 11%
2012 IT STAFF SALARIES
(ACTUAL)
(2011: 67%)
(2010: 42%)
(2009: 34%)
(2008: 78%)
(2011: 26%)
(2010: 41%)
(2009: 47%)
(2008: 18%)
(2011: 8%)
(2010: 17%)
(2009: 19%)
(2008: 4%)
89%
(93%)
(96%)

2013 = 2012 27%
2013 > 2012 60%
2013 < 2012 13%
2013 IT STAFF SALARIES PROJECTED)
(2012: 60%)
(2011: 67%)
(2010: 42%)
(2009: 34%)
(2008: 78%)
(2012: 29%)
(2011: 26%)
(2010: 41%)
(2009: 47%)
(2008: 18%)
(2012: 11%)
(2011: 8%)
(2010: 17%)
(2009: 19%)
(2008: 4%)
87%
(89%)
(96%)

2012 IT BUDGET ALLOCATION PERCENTAGE FOR
EDUCATION/TRAINING
0
0.5
1
1.5
2
2.5
3
3.53.09
3.48 3.23 2.87 2.99
2009 2010 2011 2013
(Projected)
3.13 Avg.
2012

0%
5%
10%
15%
20%
25%
30%
35%
40%
45%
50%
CEO CFO COO BUE Other
27%
19% 10%
2%
CIO OR SENIOR IT EXECUTIVE
REPORTS TO
43% 27% 16% 7% 7% Avg.
20
05
20
06
20
07
20
08
20
09
20
10
20
11
20
12
200
5
20
06
20
07
20
08
20
09
20
10
20
11
20
12
200
5
20
06
20
07
20
08
20
09
20
10
20
11
20
12
20
05
20
06
20
07
20
08
20
09
20
10
20
11
20
12
20
05
20
06
20
07
20
08
20
09
20
10
20
11
20
12
43%

0.00
1.00
2.00
3.00
4.00
5.00
6.00
3.60 4.10 4.30
4.60 5.10
4.45
5.96
HOW LONG (YEARS) HAS YOUR CIO (OR
SENIOR IT EXECUTIVE) HELD THEIR
POSITION?
4.59 Avg.
2006 2008 2007 2009 2012 2010 2011
> NFL Quarterback CEO: 8 years (Booz)
0%
5%
10%
15%
20%
25%
30%
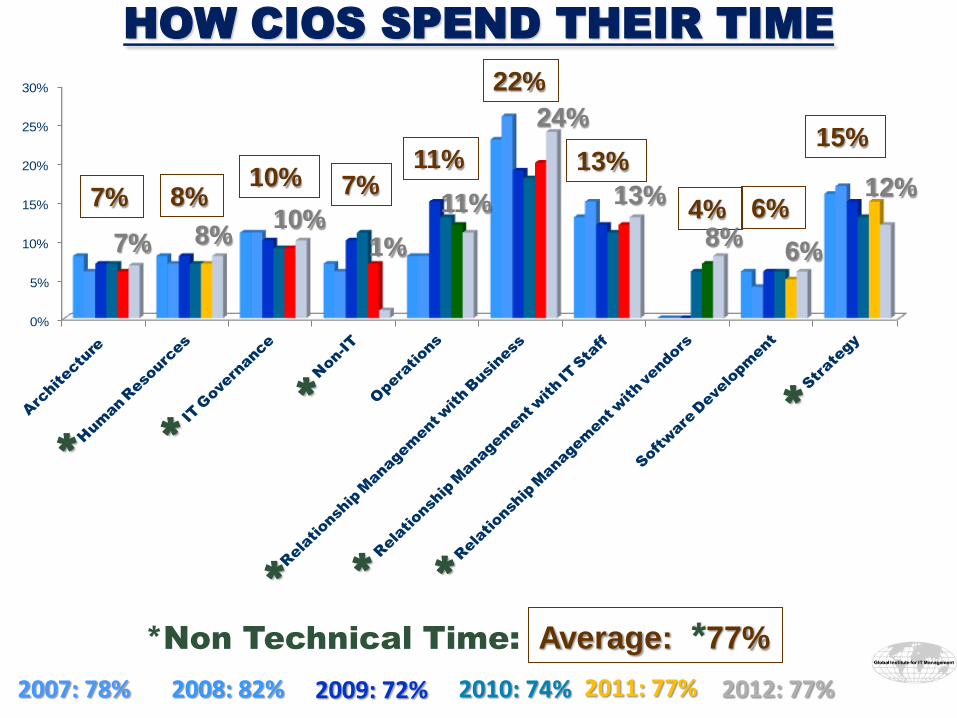
HOW CIOS SPEND THEIR TIME
2007: 78% 2008: 82% 2009: 72% 2012: 77% 2010: 74%
7% 8% 7% 10% 11%
22%
13%
4% 6%
15%
Average: *77%
7% 8% 10%
1%
11%
24%
13%
8% 6%
12%
*Non Technical Time:
*
* *
*
* * *
2011: 77%

0%
10%
20%
30%
40%
50%
60%
70%
Within yourcompany's ITorganization
Outside yourcompany from an
external ITorganization
Within yourcompany butoutside of IT
Outside yourcompany from an
organizationoutside of IT
38%
54%
4% 4%
31%
61%
4% 3%
37%
54%
5% 5%
YOUR CURRENT CIO WAS HIRED FROM
2010 2011 2010 2011 2010 2011 2010 2011 2012 2012 2012 2012
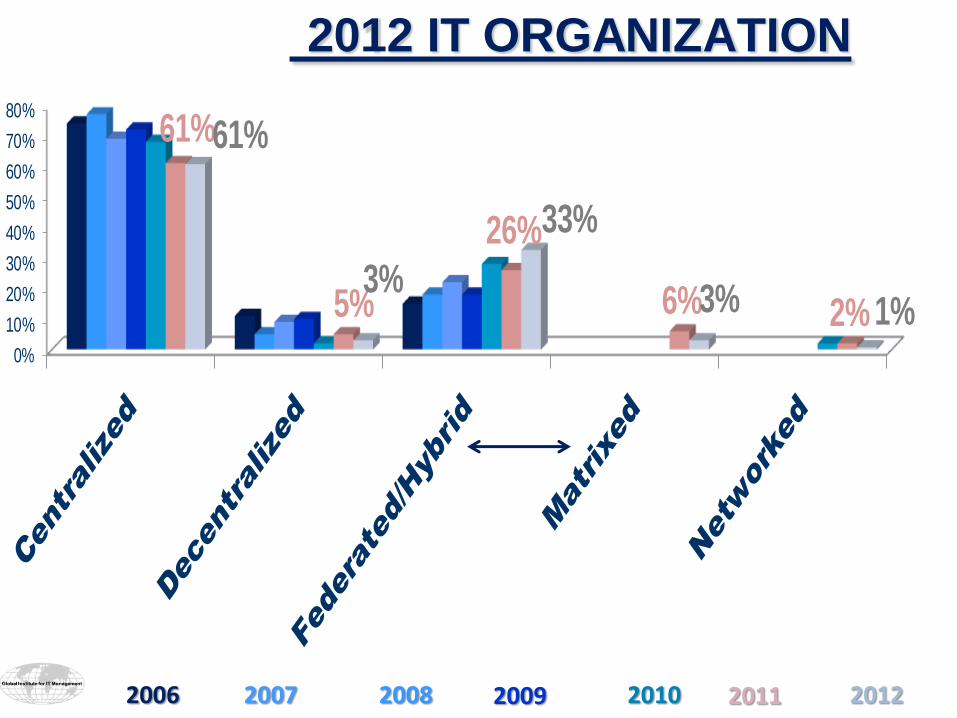
2012 IT ORGANIZATION
0%
10%
20%
30%
40%
50%
60%
70%
80%
61%
5%
26%
6% 2%
61%
3%
33%
3% 1%
2006 2007 2008 2009 2012 2010 2011

Never Sometimes Always
CIO 2% 8% 90%
CEO 21% 57% 22%
CFO 9% 61% 30%
COO 34% 43% 23%
Bus. Unit Exec 19% 69% 12%
Other IT Exec 15% 49% 36%
ENGAGED IN ALLOCATION OF IT INFRASTRUCTURE RESOURCES
ENGAGED IN ALLOCATION OF IT APPLICATION RESOURCES
Never Sometimes Always
CIO 2% 12% 86%
CEO 22% 53% 25%
CFO 8% 61% 31%
COO 31% 47% 22%
Bus. Unit Exec 16% 85% 19%
Other IT Exec 13% 56% 31%
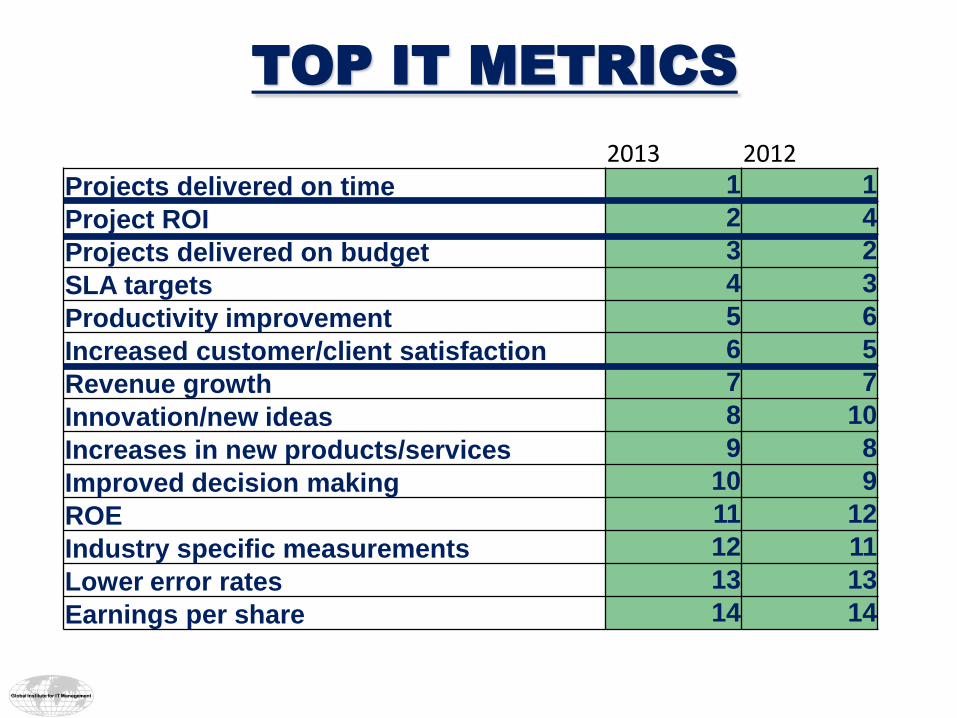
TOP IT METRICS
2013 2012
Projects delivered on time 1 1
Project ROI 2 4
Projects delivered on budget 3 2
SLA targets 4 3
Productivity improvement 5 6
Increased customer/client satisfaction 6 5
Revenue growth 7 7
Innovation/new ideas 8 10
Increases in new products/services 9 8
Improved decision making 10 9
ROE 11 12
Industry specific measurements 12 11
Lower error rates 13 13
Earnings per share 14 14

WHY DISCUSS IT-BUSINESS
ALIGNMENT? STILL
6. How do you know if your alignment is “appropriate”?
7. Can we move from a descriptive vehicle to a prescriptive
vehicle?
4. In search of mythical silver bullet
2. Too often considered just IT aligned with the business
3. Semantics: alignment vs fused, linked, integrated, fit,
harmony, converged, matched, melded, interwoven…
5. Focusing on infrastructure/architecture
1. Consider their organizations are not misaligned
Global Institute for IT Management
·
·
·
·
·
·
-
·
-
-
- Inter -
-
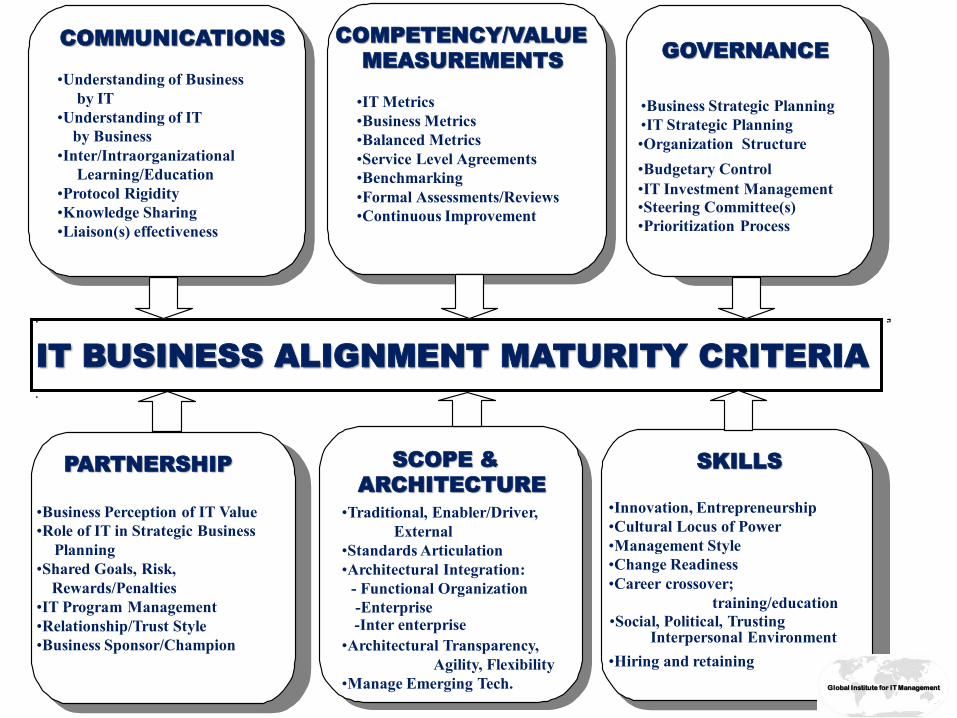
IT BUSINESS ALIGNMENT MATURITY CRITERIA
PARTNERSHIP
•Business Perception of IT Value
•Role of IT in Strategic Business
Planning
•Shared Goals, Risk,
Rewards/Penalties
•IT Program Management
•Relationship/Trust Style
•Business Sponsor/Champion
SCOPE &
ARCHITECTURE
•Traditional, Enabler/Driver,
External
•Standards Articulation
•Architectural Integration:
- Functional Organization
-Enterprise -Inter enterprise
•Architectural Transparency,
Agility, Flexibility
•Manage Emerging Tech.
SKILLS
by Business
•Liaison(s) effectiveness
COMMUNICATIONS
•Understanding of Business
by IT
•Understanding of IT
•Inter/Intra organizational
Learning/Education
•Protocol Rigidity
•Knowledge Sharing
COMPETENCY/VALUE
MEASUREMENTS
•IT Metrics
•Business Metrics
•Balanced Metrics
•Service Level Agreements
•Benchmarking
•Formal Assessments/Reviews
•Continuous Improvement
GOVERNANCE
•Organization Structure
•IT Investment Management
•Prioritization Process
•Business Strategic Planning
•IT Strategic Planning
•Budgetary Control
•Steering Committee(s)
•Cultural Locus of Power
•Change Readiness
•Innovation, Entrepreneurship
•Management Style
•Career crossover;
training/education
•Hiring and retaining
Interpersonal Environment •Social, Political, Trusting
Global Institute for IT Management

HIGHEST ELEMENTS Averages
LOWEST ELEMENTS Averages
1. Career Crossover 2.79
2. Change Readiness 2.84
3. Knowledge Sharing 2.86
4. Balanced Metrics 2.88
5. Understanding of IT by business 2.89
3.09 3.09
1. Demonstrated Contribution of IT to Business 3.48
2. Protocol Rigidity 3.36
3. Prioritization Process 3.32
4. Business Sponsor/Champion 3.23
Global Institute for IT Management

SAM Performance Framework
Communic.
Competency
Governance
Partnership
Tech Scope
Skills/HR
Strategic
Alignment
Maturity
Performance
Global Institute for IT Management
Outsourcing

22%
Decentralized
5%
Matrixed
25%
Centralized
Networked
30%
17%
Federated/Hybrid
2.98
3.60
2.69
2.87
Alignment Maturity 3.09
3.67
Global Institute for IT Management
Organization Structure
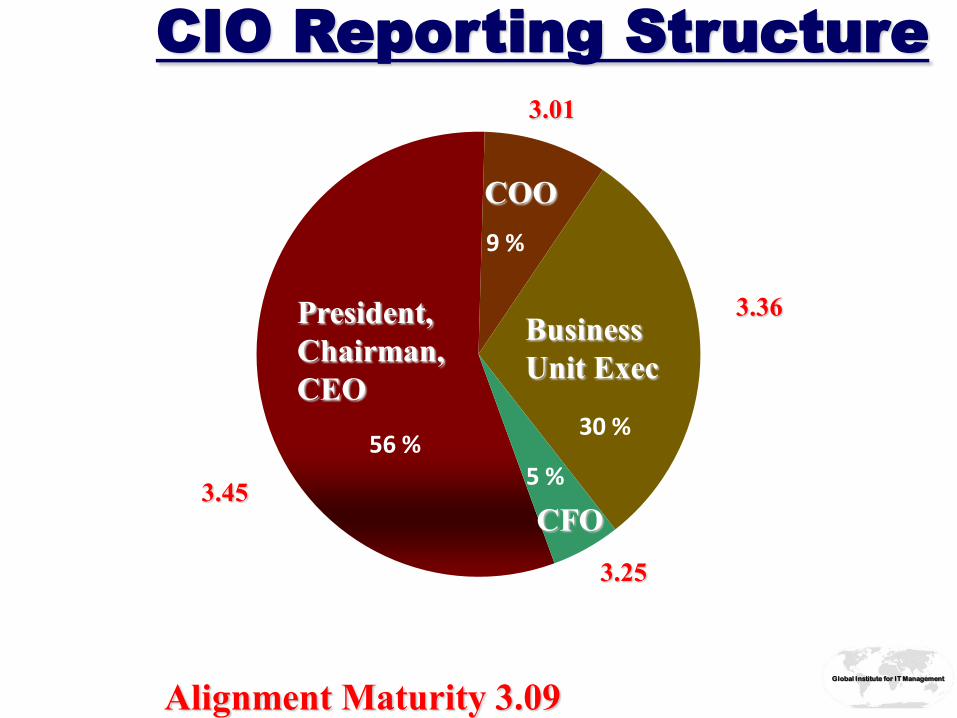
CIO Reporting Structure
President,
Chairman,
CEO
56 % 30 %
9 %
5 %
COO
CFO
Business
Unit Exec
3.45
3.36
3.25
3.01
Alignment Maturity 3.09 Global Institute for IT Management


• Technical Leadership Certificates
17. Big Data/Business Intelligence/Knowledge Mgt
18. Managing Cloud Computing
19. IT Infrastructure Integration
20. IT Security Management
21. Managing Social Networking/Mobile Computing
22. Project Management
23. Software Engineering
24. Technology Enabled Learning
• General Management Certificates 25. Effective English Business Communications
26. IT Business/Management Considerations (e.g.,
finance, organizational behavior, accounting,
statistics, economics, leadership)
Foundation
& IT Management
Certificates
26
• See our web: www.globaliim.com
1. 4 course IT Foundation Certificate (Mini MBA)
• Leadership
• Managing IT Trends & Emerging Technologies
• IT Resource Management
• IT Strategy
• Executive Certificates
2-9. IT in Industry (e.g., Finance, Pharmaceutical,
Healthcare, Manufacturing, Telecom,
Government, Transportation, Petro)
10. IT for the Business Executive
11. IT Human Resource Considerations
12. IT Management Consulting
13. Business Process Management
14. Supply Chain Management
15. Managing IT Legal Issues
16. Managing IT Vendors & Outsourcing (also for
non-IT)
Global Institute for IT Management