2012 energy sustainability index - world energy … · liu tie’nan vice chair, asia arup roy...
TRANSCRIPT

World Energy Trilemma
2012 Energy Sustainability Index
World Energy Council Project Partner OLIVER WYMAN

Officers of the World Energy Council
Pierre Gadonneix Chair
Abubakar Sambo Vice Chair, Africa
Liu Tie’nan Vice Chair, Asia
Arup Roy Choudhury Vice Chair, Asia Pacific & South Asia
Leonhard Birnbaum Vice Chair, Europe
José Antonio Vargas Lleras Vice Chair, Latin America/Caribbean
Taha Mohammed Zatari Vice Chair, Special Responsibility for Middle East & Gulf States
Kevin Meyers Vice Chair, North America
Joong-Kyum Kim Vice Chair, Daegu Congress 2013
Marie-José Nadeau Chair, Communications & Outreach Committee
Graham Ward, CBE Chair, Finance Committee
Michael Morris Chair, Programme Committee
Brian Statham Chair, Studies Committee
Christoph Frei Secretary General
World Energy Trilemma 2012 Energy Sustainability Index Project Partner OLIVER WYMAN
Copyright © 2012 World Energy Council
All rights reserved. All or part of this publication may be used or reproduced as long as the following citation is included on each copy or transmission: ‘Used by permission of the World Energy Council, London, www.worldenergy.org’
Published 2012 by:
World Energy Council Regency House 1-4 Warwick Street London W1B 5LT United Kingdom
ISBN: 978 0 946121 19 9
2012 Energy Sustainability Index

World Energy Council World Energy Trilemma: 2012 Energy Sustainability Index
1
Contents 1
Introduction 2
Executive Summary 3
2012 Energy Sustainability Index 8
Regional profiles 12
Country profiles 20
Appendix A. Index rationale, structure and methodology 116
Contents

World Energy Trilemma: 2012 Energy Sustainability Index World Energy Council
2
This report provides country-level details on the results of the 2012 Energy Sustainability Index prepared by the World Energy Council (WEC) in partnership with the global management consulting firm Oliver Wyman. For each WEC member country, a country profile has been prepared to highlight its relative energy performances and contextual attributes. These profiles and the Index provide a comparative ranking of countries’ ability to provide a stable, affordable, and environmentally-sensitive energy system and highlight current challenges.
Included in this report are:
Executive Summary, World Energy Trilemma: Time to get real – the case for sustainable energy policy
2012 Energy Sustainability Index rankings
Regional overviews
Country profiles for each of the WEC member countries
Index rationale, structure and methodology
This volume is a companion document to the report World Energy Trilemma: Time to get real – the case for sustainable energy policy which contains a detailed discussion of the findings of the 2012 Energy Sustainability Index. In addition, the report captures energy executives’ views on what the industry needs from policies and policymakers to succeed in providing environmentally sensitive, affordable, accessible, and secure energy. The 2012 report will be followed in 2013 with the views of policymakers on what they need from industry to
be assured the policies will have the intended effects of providing sustainable energy.
The 2012 and 2013 reports’ methodology is based on the guiding premise that energy sustainability involves both the efforts of industry and policymakers. Together the publications will support an evolving dialogue aimed at furthering knowledge and understanding effective strategies and policies to deliver the necessary transformation of the energy system to support sustainable economic and social development.
Iconography
Graphics displaying results of the Energy Sustainability Index analysis make use of the following iconography.
Energy performance dimensions:
Energy security
Social equity
Environmental impact mitigation
Contextual performance dimensions:
Political strength
Societal strength
Economic strength
Energy Sustainability Index results and country profiles can be found on the WEC website at www.worldenergy.org/data/sustainability-index.
Introduction

World Energy Council World Energy Trilemma: 2012 Energy Sustainability Index
3
You can see it in the faces of the 670 million people who recently suffered through blackouts in India, or sense it from the frustrations expressed by three million Americans forced to live without power in the middle of a record heat wave. After decades of work to advance sustainable energy solutions, an energy gap is growing as energy systems around the world buckle under significant strain.
Policymakers and the energy industry urgently need to work together to correct this mismatch by making the hard decisions necessary to realise sustainable energy systems on a much broader scale. If the supply of sustainable energy continues to lag behind rapidly rising demand globally, billions of people could be forced to live without reliable electricity and economic growth could be put in jeopardy. Already, 1.3 billion people live without access to electricity. This number could rise if demand continues to jump by as much as 30% over the next two decades.1
Goals supported at The United Nations Conference on Sustainable Development (Rio+20) in June 2012 could also remain out of reach. Unless action is taken now, it will be difficult to double the rate of energy-efficiency improvement, ensure universal access to modern energy, or to double the share of renewable energy in the global energy mix by 2030.
To assist policymakers and the energy industry with pressing forward sustainable energy systems, the World Energy Council, in collaboration with global management consulting firm Oliver Wyman,
1 International Energy Agency (IEA), 2011: World Energy Outlook 2011
has prepared the report World Energy Trilemma: Time to get real – the case for sustainable energy policy. This first of a two-part series of reports examines the drivers and risks preventing the development of sustainable energy systems. It then recommends actions to address these risks and to accelerate a global transition to a low-carbon future which will present new opportunities for economic growth.
The 2012 report describes what senior energy industry executives believe they need from policymakers to advance sustainable energy systems. It is based on interviews with more than 40 energy industry CEOs and senior executives and the 2012 Energy Sustainability Index built on an analysis of 22 indicators across 93 World Energy Council member countries. The 2013 World Energy Trilemma report will focus on what policymakers need from the energy industry.
Three dimensions of energy sustainability
The World Energy Council’s definition of energy sustainability is based on three core dimensions - energy security, social equity, and environmental impact mitigation. The development of stable, affordable, and environmentally-sensitive energy systems defies simple solutions. These three goals constitute a ‘trilemma’, entailing complex interwoven links between public and private actors, governments and regulators, economic and social factors, national resources, environmental concerns, and individual behaviours.
Executive Summary “We must accept that we have to make hard choices in this generation to bring about real changes for future generations and the planet. Politicians and the industry must get real.”
World Energy Trilemma: 2012 Energy Sustainability Index World Energy Council
4
Energy sustainability dimensions
Energy security: For both net energy importers and exporters, this refers to the effective management of primary energy supply from domestic and external sources, the reliability of energy infrastructure, and the ability of participating energy companies to meet current and future demand. For countries that are net energy exporters, this also relates to an ability to maintain revenues from external sales markets.
Social equity: This concerns the accessibility and affordability of energy supply across the population.
Environmental impact mitigation: This encompasses the achievement of supply and demand-side energy efficiencies and the development of energy supply from renewable and other low-carbon sources.
Energy industry recommendations
CEOs and senior executives from leading energy companies have three main recommendations for how policymakers must expedite the development of sustainable energy systems: 1) Design coherent and predictable energy policies, 2) Support market conditions that attract long-term investments, and 3) Encourage initiatives that foster research and development in all areas of energy technology.
Recommendation 1: Design coherent and predictable energy policies
Policymakers must establish coherent, long-term, accessible, predictable, and transparent policies that rise above narrow interests to respond to energy needs holistically. Contradictory and ad hoc policies developed in isolated ‘silos’ hinder energy investments. Sound and coherent policies that are oriented toward results rather than around the types of energy or technology used to achieve them can - and should - enable the world to achieve energy sustainability.
A master plan must be developed that connects energy policies on two fronts. First, national energy policies must complement and link together national industrial, financial, environmental, transportation, and agricultural goals and policies. Second, policies concerning energy resources, infrastructure, environmental issues, and regulations must be regionally coordinated. Sharing resources across borders enables countries to increase regional energy security, reduce power costs, and attract investments by creating greater market scale to interest investors, optimise natural resources, and develop common infrastructure.
To make sure that these policies are predictable for industry, governments must develop regulations that are consistent, clear, and simple, in spite of the complexities that they address. Equally important, policymakers should separate energy policies from short-term politics to guarantee that they reflect a well-defined, long-term view. A significant hurdle to policy longevity, as perceived by industry, is the

World Energy Council World Energy Trilemma: 2012 Energy Sustainability Index
5
conflict between the long-term nature of energy investments and the comparatively short-term nature of politics.
Consumer education and awareness is also crucial. To encourage energy efficiency, for example, governments must not only establish environmentally responsible construction and manufacturing standards, but can also set a regulatory framework for progressive energy tariffs to make consumers more aware of energy efficiency as a means to reduce overall national energy costs, introduce tax reductions on energy-efficient equipment (on VAT or on import duties), or on energy-efficiency investments (reduction in VAT rate).
Recommendation 2: Support market conditions that attract long-term investments
With consistent and committed regulatory approaches, policymakers must encourage the development of attractive markets to stimulate long-term private investments in energy infrastructure and technologies. Simultaneously, they must support the development of new investment mechanisms that can reduce risks and stimulate greater private sector investment in the energy sectors. Such mechanisms can include green banks, a green bond market, and public-private partnerships. These efforts must be underpinned by a stable and predictable carbon price necessary to drive the transition to a low-carbon energy system.
Huge investments are required to improve access to energy worldwide, develop new energy
technologies, and to build new and replace ageing infrastructure. Cash-strapped governments have limited funds to support a shift to a low-carbon future. Unfortunately, capital from the private sector and from investment funds remains largely on the side lines. Less than 1% of pension investment funds worldwide, for example, are invested in infrastructure projects designed to improve the supply of electricity.2
The use of subsidies should be minimised, since they increase political and regulatory uncertainty. This distorts competition and erodes investor confidence. If used, subsidies must be focused on achieving a specific outcome, and have a clear sunset built-in from the start.
Recommendation 3: Encourage initiatives to foster research and development in all areas of energy technology
To drive innovation further in all areas of energy technology, policymakers should implement goal-driven policies rather than prescriptive policies. New renewable energy and fossil fuel technologies can bring the world much closer to attaining sustainable energy systems and potentially spur economic growth. For this to happen, however, policymakers need to leave it to the market to decide which types of technology should survive so that they can remain competitive in the long term.
2 Organisation for Economic Co-operation and Development (OECD), 2011: Pension Funds Investment in infrastructure: A Survey

World Energy Trilemma: 2012 Energy Sustainability Index World Energy Council
6
‘Technology-neutral’ research and innovation policies should be supported with economic incentives and appropriate accountabilities.
Intellectual property rights must also be strongly enforced for the private sector to invest in environmentally responsible and energy-efficient technologies.
Finally, governments must support the research, development, and demonstration of new technologies to boost investor confidence. Policymakers will encourage companies to invest in developing new technologies if they establish a strong research-oriented environment that promotes national and international collaborative research and funds large-scale demonstration projects that support companies' efforts to bring their technologies to market.
Energy Sustainability Index
The 2012 Energy Sustainability Index shows that developed countries such as Sweden, Switzerland, and Canada are closest to achieving sustainable energy systems. This is in large part because a higher share of their energy mix comes from low-carbon energy sources, such as hydro power and from nuclear power. These countries are leaders in terms of energy security largely because of their diversified energy mixes.
The top three performers also have a significant advantage when it comes to mitigating their energy systems' environmental impact because they have long-term programs in place. Sweden, for example, has significantly reduced its greenhouse emissions even though its GDP is rising mainly because it has set long-term sustainable energy and climate policies and goals for 2020.
Figure 1 Similarities and differences for the top 10 performing countries in 2012 Index
Key Similarities
Common GDP grouping (GDP per capitagreater than USD33,500)
OECD members
Post-industrial economy
High (>10%) renewables in electricity mix
Key Differences
Nuclear and non-nuclear power producers
Low and high fossil fuel reserves
Net energy exporters and importers
Various geographic locations
2012 Rank Country
1 Sweden
2 Switzerland
3 Canada
4 Norway
5 Finland
6 New Zealand
7 Denmark
8 Japan
9 France
10 Austria

World Energy Council World Energy Trilemma: 2012 Energy Sustainability Index
7
Nevertheless, developing sustainable energy systems overall remains a challenge. Countries at all stages of development still have trouble balancing the trade-offs involved in providing secure, affordable, and environmentally-sensitive energy. Developing countries, for example, struggle to use cleaner forms of energy as they industrialise.
Sound policy making determines to what extent a country will be able to develop a sustainable energy system. The energy industry and policymakers should assist in helping nations to forge an alternative path of energy development. As Figure 1 shows, the top ten performers all have high GDPs per capita. They are OECD member countries with predictable and strong political, societal, and economic frameworks. However, there are also key differences between them, underscoring that there is not one single solution. France is a significant user of nuclear power. Canada is a net energy exporter. By contrast, Japan is a net importer.
Conclusion
Energy systems around the world remain at vastly different stages of development. But all countries share a common problem: They are far away from achieving sustainable energy systems.
To make affordable, secure, and environmentally-sensitive energy systems a reality, policymakers urgently need to develop interconnected, lasting, and coherent energy policies. Policymakers and energy industry executives must develop a common understanding of what energy
sustainability is, its importance for economic growth, and the steps necessary to achieve it. Only then can they work together to build on clearly defined sustainability goals that will encourage all forms of energy in every nation’s energy mix by taking a technology-neutral approach.
With clearly defined, coherent, and predictable energy policies, the energy industry will be able to mobilise the natural and human resources, finances, and technologies necessary to realise sustainable energy systems. Without them, billions of people will continue to live without secure, affordable, and environmentally-sensitive energy. Global prosperity could also be threatened. There is no time to waste.

World Energy Trilemma: 2012 Energy Sustainability Index World Energy Council
8
The Energy Sustainability Index (”Index”) ranks WEC member countries in terms of their likely ability to provide a secure, affordable, and environmentally-sensitive energy system. The rankings are based on a range of data and databases that capture both energy performance and the context of that energy performance.
Energy performance indicators consider supply and demand, the affordability and access of energy, and the environmental impact of the country’s energy use. The contextual indicators consider the broader circumstances of energy performance including societal, political, and economic strength and stability. Indicators were selected based on the high degree of relevance to the research goals; each is distinct, could be derived from reputable sources, and is captured for most WEC countries.
Overall, the Index displays the aggregate effect of energy policies applied over time in the context of each country. It is important to see the Index as a starting point for understanding the sustainability of countries’ policy approaches. More details on the methodology can be found in Appendix A. The methodology has been improved since the 2011 report with a particular focus on the assessment of the social equity and environmental impact mitigation dimensions. Index rankings for 2010 and 2011 were calculated retrospectively with the improved methodology to allow a year-to-year comparison. The complete 2010 and 2011 Index ranking can also be found in Appendix A.
The 2012 Energy Sustainability Index confirms that developed countries are in a better position to provide secure, affordable, and environmentally
sensitive energy and to balance the ‘trilemma of energy sustainability’. This is driven by their increased reliance on low- and zero-carbon emission forms of energy such as renewables, including hydro, and nuclear.
However, a deeper analysis shows that even top performing countries face challenges. Energy sustainability remains a far-off objective as trade-offs within the energy trilemma persist for countries at various stages of development. Moreover, the Index shows that countries face specific challenges as they pass through the stages of economic and social development.
For the deeper Index analysis countries were organised in four economic groups3:
Group A: GDP per capita greater than USD33,500
Group B: GDP per capita between USD14,300 and USD33,500
Group C: GDP per capita between USD6,000 and USD14,300
Group D: GDP per capita lower than USD6,000
Results of the 2012 Index are shown in Figures 2 and 3. For more discussion of the Index results, refer to World Energy Trilemma: Time to get real – the case for sustainable energy policy.
3 GDP per capita on a purchasing power parity (PPP) basis; International Monetary Fund (IMF), 2010
2012 Energy Sustainability Index

World Energy Council World Energy Trilemma: 2012 Energy Sustainability Index
9
Figure 2 2012 Energy Sustainability Index rankings
2012 Rank Country Importer / Exporter GDP Group 2011 Rank 2010 Rank
1 Sweden I A 4 72 Switzerland I A 3 13 Canada E A 1 24 Norway E A 5 35 Finland I A 2 46 New Zealand I B 6 57 Denmark E A 8 88 Japan I A 11 119 France I A 7 6
10 Austria I A 9 1011 Germany I A 10 1812 United States I A 12 913 Belgium I A 18 1214 Netherlands I A 16 1315 United Kingdom I A 28 2116 Spain I B 15 2617 Slovakia I B 20 1718 Luxembourg I A 13 1619 Hungary I B 21 2520 Australia E A 24 2021 Italy I B 31 3322 Slovenia I B 25 1423 Iceland I A 14 1524 Croatia I B 17 4025 Portugal I B 29 1926 Russia E B 27 2927 Korea (Republic) I A 37 3428 Argentina E B 19 2429 Czech Republic I B 26 2230 Ireland I A 39 2831 Lithuania I B 22 2732 Taiwan, China I A 33 3533 Colombia E C 32 3734 Hong Kong, China I A 35 3235 Estonia I B 38 2336 Uruguay I C 34 3037 Latvia I B 23 3138 Bulgaria I C 40 5139 Ukraine I C 36 4540 Albania I C 41 5841 Qatar E A 48 3842 Greece I B 52 4443 Kazakhstan E C 30 4944 United Arab Emirates E A 49 5045 Bolivia E D - -46 Saudi Arabia E B 47 4247 Poland I B 53 4748 Iran (Islamic Republic) E C 63 3949 Cyprus I B 51 4850 Mexico E C 46 5351 Trinidad & Tobago E B 62 5552 Paraguay E D 56 5953 Brazil I C 45 5654 Kuwait E A 60 5455 Egypt (Arab Republic) E C 50 3656 Romania I C 42 4157 South Africa E C 55 4658 Peru I C 59 6359 Gabon E B 73 -60 Tunisia I C 66 5261 Israel I B 61 7362 Macedonia (Republic) I C 58 4363 Thailand I C 67 7264 Turkey I C 75 6165 Cameroon E D 65 6666 Serbia I C 44 8267 Kenya I D 69 6568 Jordan I C 70 6069 Congo (Dem. Republic) E D 77 8370 Côte d'Ivoire E D 74 8171 China I C 71 7872 Zimbabwe I D - -73 Sri Lanka I D 68 7074 Nepal I D 78 7475 Philippines I D 57 6476 Syria (Arab Republic) E D 64 6977 Lebanon I B 72 6778 Algeria E C 84 7979 Namibia I C 81 6880 Swaziland I D 43 5781 Ghana I D 80 7682 Tanzania I D 79 8083 Indonesia E D 76 7184 Nigeria E D 83 7785 Mongolia E D 85 8886 Chad E D - -87 Morocco I D 82 8588 Libya E C 86 7589 Ethiopia I D 92 9190 Niger I D 90 9091 Botswana I B 87 8692 Pakistan I D 88 8793 India I D 89 8494 Senegal I D 91 89

World Energy Trilemma: 2012 Energy Sustainability Index World Energy Council
10
Figure 3 2012 Country rankings for energy performance dimensions
2012 Rank Energy security (2011 rank) Social equity (2011 rank) Environmental impact mitigation (2011 rank)
1 Canada (1) United States (1) Paraguay (8)2 Sweden (9) Canada (2) Sweden (1)3 Denmark (5) Australia (3) Iceland (2)4 Zimbabwe (-) Switzerland (4) France (3)5 Colombia (6) Luxembourg (5) Norway (4)6 Slovakia (28) United Kingdom (8) Finland (6)7 Japan (16) Austria (7) Albania (15)8 Russia (2) France (10) New Zealand (7)9 Norway (21) Japan (6) Lithuania (5)10 Hungary (20) Norway (11) Switzerland (14)11 Germany (13) Germany (12) Austria (18)12 Switzerland (15) Belgium (9) Canada (12)13 Finland (7) New Zealand (13) Latvia (9)14 Croatia (11) Finland (14) Slovakia (17)15 Czech Republic (38) Qatar (15) Belgium (24)16 New Zealand (33) Sweden (33) Russia (11)17 Spain (27) Argentina (20) Slovenia (20)18 Ukraine (8) Saudi Arabia (18) Luxembourg (13)19 Italy (49) Spain (17) Hungary (22)20 Kenya (23) Netherlands (22) Netherlands (31)21 Gabon (10) Iceland (19) Brazil (16)22 Bolivia (-) Taiwan, China (21) Uruguay (19)23 Portugal (39) Greece (16) Ukraine (23)24 Nigeria (18) Ireland (24) Japan (37)25 Australia (42) Korea (Republic) (25) Denmark (28)26 Congo (Dem. Republic) (30) Italy (23) Croatia (26)27 United States (32) Kuwait (31) Taiwan, China (47)28 Slovenia (41) Denmark (26) Bulgaria (43)29 France (29) Cyprus (28) Nepal (25)30 Côte d'Ivoire (3) Hong Kong, China (29) Argentina (27)31 Belgium (61) Iran (Islamic Republic) (30) United States (39)32 Cameroon (17) Czech Republic (27) Korea (Republic) (35)33 Egypt (Arab Republic) (14) Croatia (32) Italy (48)34 Netherlands (53) Mexico (34) Colombia (33)35 Argentina (12) Slovakia (35) United Kingdom (53)36 Romania (46) Hungary (39) Trinidad & Tobago (34)37 United Kingdom (58) Portugal (36) Ethiopia (66)38 Kazakhstan (34) Poland (38) Portugal (40)39 Austria (37) United Arab Emirates (40) Ghana (38)40 Bulgaria (25) Kazakhstan (37) Spain (46)41 Turkey (68) Slovenia (41) Germany (44)42 Estonia (69) Romania (43) Ireland (41)43 Greece (63) Israel (42) Tanzania (49)44 Albania (26) Uruguay (44) Kazakhstan (21)45 Mexico (51) Lithuania (45) Bolivia (-)46 Peru (48) Estonia (46) United Arab Emirates (55)47 Iran (Islamic Republic) (71) Russia (48) Congo (Dem. Republic) (51)48 Chad (-) Trinidad & Tobago (49) Niger (81)49 Sri Lanka (40) Egypt (Arab Republic) (47) Hong Kong, China (60)50 Poland (57) Latvia (50) Estonia (29)51 Tunisia (60) Tunisia (51) Iran (Islamic Republic) (50)52 Philippines (31) South Africa (52) Gabon (79)53 Lithuania (36) Turkey (53) South Africa (57)54 Syria (Arab Republic) (19) Macedonia (Republic) (58) Cameroon (62)55 Libya (70) Jordan (54) Swaziland (42)56 Macedonia (Republic) (43) Colombia (59) Côte d'Ivoire (77)57 Ireland (88) Serbia (57) Namibia (73)58 Thailand (67) Ukraine (56) Chad (-)59 China (45) Bulgaria (60) Saudi Arabia (56)60 Indonesia (47) Algeria (55) Peru (45)61 Korea (Republic) (83) Albania (67) Czech Republic (32)62 Paraguay (54) Thailand (63) Serbia (30)63 Uruguay (50) Lebanon (62) Cyprus (59)64 Latvia (22) Bolivia (-) Qatar (75)65 Lebanon (44) Brazil (65) Poland (63)66 Israel (52) Morocco (66) Egypt (Arab Republic) (74)67 Serbia (35) Peru (68) Jordan (67)68 Tanzania (56) Syria (Arab Republic) (71) Macedonia (Republic) (58)69 Trinidad & Tobago (86) China (72) Kenya (54)70 Swaziland (4) Paraguay (69) Algeria (84)71 Iceland (55) Sri Lanka (74) Zimbabwe (-)72 Luxembourg (81) Indonesia (61) Syria (Arab Republic) (70)73 Pakistan (64) Libya (64) Australia (72)74 Mongolia (72) Botswana (73) Kuwait (68)75 Algeria (65) Swaziland (70) Mongolia (78)76 Hong Kong, China (66) Namibia (75) Greece (83)77 Brazil (62) Philippines (76) Pakistan (71)78 South Africa (59) Gabon (77) Philippines (52)79 United Arab Emirates (80) Mongolia (78) Thailand (65)80 Morocco (77) Pakistan (79) Romania (36)81 Qatar (91) Ghana (80) Nigeria (88)82 Nepal (76) India (84) Sri Lanka (61)83 Taiwan, China (73) Cameroon (81) Mexico (64)84 Kuwait (92) Nigeria (82) Turkey (69)85 Saudi Arabia (85) Côte d'Ivoire (85) Lebanon (82)86 Senegal (78) Kenya (86) Senegal (85)87 India (84) Niger (88) Morocco (76)88 Ghana (79) Chad (-) Libya (92)89 Botswana (87) Senegal (87) Tunisia (80)90 Namibia (75) Ethiopia (92) Indonesia (90)91 Cyprus (90) Congo (Dem. Republic) (89) China (87)92 Niger (74) Nepal (90) Israel (89)93 Jordan (82) Tanzania (91) India (86)94 Ethiopia (89) Zimbabwe (-) Botswana (91)

World Energy Council World Energy Trilemma: 2012 Energy Sustainability Index
11

World Energy Trilemma: 2012 Energy Sustainability Index World Energy Council
12
The variability seen in performance across the three dimensions of the Energy Sustainability Index shows the degree to which the energy challenges faced by each country are unique. However, the transnational nature of both energy markets and environmental impacts necessitates a view that extends past the country level as highlighted in the recommendations of the report World Energy Trilemma: Time to get real - the case for sustainable energy policy. Energy executives emphasised the need to examine opportunities to adopt regionally coordinated approaches to energy resources, infrastructure and regulation.
This section shows the average scores for countries in each geographic region represented in the 2012 Index, as well as an overview of regional challenges
Regional profiles

World Energy Council World Energy Trilemma: 2012 Energy Sustainability Index
13
Asia
Asia is the world's largest and most populous continent, with a population of 3.9 billion that includes some of the world’s least developed countries, two major emerging economies (China and India) as well as highly developed nations. Economic growth in the region is high, averaging from around 6% in South Asia to around 8% in East Asia and the Pacific.
In the 2012 Index, the group of Asian countries with higher GDP per capita levels performs better in all dimensions, particularly in social equity. Performance in energy security is supported by well-diversified electricity generation. However, due to mostly low energy resource endowments, these countries struggle with a low ratio of production to total energy supply. Countries face a high energy consumption growth, which is necessary to expand energy services and to increase the countries' economic and social development. Environmental impact performance is only mediocre due to high energy and emissions intensity per capita and high CO2 emissions from electricity and heat generation.
The countries with lowest GDP per capita struggle across all dimensions of the energy trilemma. Social equity overall is low due to incomplete electricity access, and reliability of electricity supply remains a huge challenge. Low average energy
and emissions intensity per GDP per capita lead to a low environmental impact; however, emissions from electricity and heat generation as well as pollution of air and water are high. With continuous economic and social development it will become increasingly important to respond to rising energy demands with ‘clean’ electricity generation to be able to sustain or improve environmental sensitivity.
List of countries in GDP Group C and D (see Figure 4):
China, India, Indonesia, Kazakhstan, Mongolia, Nepal, Pakistan, Philippines, Sri Lanka, Thailand
List of countries in GDP Group A and B (see Figure 4):
Australia, Hong Kong (China), Japan, Korea (Republic), New Zealand, Taiwan (China)
Figure 4 Energy sustainability balance Asia
Asia GDP Group A and BAsia GDP Group C and DAsia all

World Energy Trilemma: 2012 Energy Sustainability Index World Energy Council
14
Europe
Europe has a population of around 740 million, while the European Union has around 500 million with an average GDP per capita of approximately USD35,000. Most economies are mature: the IMF predicts that GDP in the European Union will remain constant, while it expects that GDP in Central and Eastern Europe will grow by 1.9% in 2012.
European WEC member countries perform well and are rather balanced in the 2012 Index. Energy security is driven by well-diversified electricity production, with high shares of renewable energy, including hydro, and moderate consumption growth on average. As natural resources are scarce in some countries, the low ratio of production to total energy supply will remain a challenge as economies and energy-intensive lifestyles need to be fuelled. This furthermore leads to high energy and emissions intensity per capita and thus increases Europe's environmental footprint. However, due to relatively ‘clean’ electricity and heat generation, and measures to reduce pollution of air and water, Western Europe scores well in environmental impact mitigation for the most part.
Like most developed regions, European countries are able to provide affordable and high quality electricity access, but need to set incentives for
reductions in energy consumption. However, significant differences between regions exist. Nordic countries, for example, outperform other EU 27 countries in all dimensions of the energy trilemma. Further comparisons show that Western Europe performs better in all dimensions than Eastern Europe, most significantly in social equity.
List of countries Eastern Europe (see Figure 5):
Albania, Bulgaria, Croatia, Czech Republic, Estonia, Hungary, Latvia, Lithuania, Macedonia (Republic), Poland, Romania, Russia, Serbia, Slovakia, Slovenia, Ukraine
List of countries Western Europe (see Figure 5):
Austria, Belgium, Cyprus, Demark, Finland, France, Germany, Greece, Iceland, Ireland, Italy, Luxembourg, Netherlands, Norway, Portugal, Spain, Sweden, Switzerland, Turkey, United Kingdom
Figure 5 Energy sustainability balance Europe
Western EuropeEastern EuropeAll Europe

World Energy Council World Energy Trilemma: 2012 Energy Sustainability Index
15
Latin America and the Caribbean
Latin America and the Caribbean (LAC) have a population of around 590 million with an average GDP per capita of approximately USD9,600 in 2011. Most countries are experiencing high economic growth, resulting in an expected average economic growth rate of around 3.7% in 2012.
Latin America is a fossil fuel rich region with strong oil and gas endowments and great potential for the exploitation of renewable energy sources; however it may be difficult to sustain oil and gas production due to the current political climate of nationalisation and populist policies that may deter private investments. With economies expanding, energy consumption growth rates are also high, creating energy security challenges for countries in the region. Electricity production and exports are fairly well diversified, with an average share of about 30% of renewable energy, including hydro, in the electricity generation mix.
This has an additional positive impact on LAC’s environmental footprint, which remains relatively low compared to other high growth regions. Active mitigation policies will be needed to sustain this during future social and economic development. Performance in social equity is only mediocre, as the quality of electricity supply has to be improved and full electricity access is not yet achieved. This
is further challenged by very strong social inequality, which emphasises the need for social spending and policies that should be clearly targeted to benefit the poorest part of the population.
List of countries (see Figure 6):
Argentina, Bolivia, Brazil, Colombia, Paraguay, Peru, Trinidad & Tobago, Uruguay
Figure 6 Energy sustainability balance Latin America and the Caribbean

World Energy Trilemma: 2012 Energy Sustainability Index World Energy Council
16
Middle East and North Africa
The Middle East and North Africa (MENA) region has a population of around 355 million, with 84% living in middle-income countries and 8% each in high- and low-income countries. The region is experiencing sustained economic growth and social development, as demonstrated by a steady rise in average life expectancy to 70 years and a reduction of poverty. Predicted GDP growth is 4.2% for 2012.
The MENA region has vast reserves of petroleum and natural gas and includes most of the OPEC nations. It is estimated that it has about 57% of the world's proven oil reserves and 41% of the world's natural gas reserves. With high economic and population growth, the region faces increasing challenges in energy security and environmental impact mitigation, as pointed out in the 2012 Index. Water scarcity and underinvestment in infrastructure are other chronic risks, which can only be overcome if regulatory and contextual barriers are removed and private sector participation is encouraged.
The MENA region performs rather poorly in the overall 2012 Index despite its energy richness. For example, energy security is rather low, with insufficiently diversified electricity production and a strong 5-year energy consumption growth rate. The best relative performance is achieved in social equity, which is supported by very affordable gasoline as well as relatively high quality electricity
access. With high fossil fuel resource endowments and affordability of energy, the region needs to engage more actively in mitigating its environmental impact and in setting incentives to reduce energy consumption. The MENA region has a low environmental impact mitigation score due to its high energy and emissions intensity, high CO2 emissions from electricity and heat generation and strong pollution of air and water.
List of countries (see Figure 7):
Algeria, Egypt, Iran (Islamic Republic), Israel, Jordan, Kuwait, Lebanon, Libya, Morocco, Qatar, Saudi Arabia, Syria (Arab Republic), Tunisia, United Arab Emirates
Figure 7 Energy sustainability balance Middle East and North Africa

World Energy Council World Energy Trilemma: 2012 Energy Sustainability Index
17
North America
North America has a population of around 450 million and an average GDP per capita of USD38,203. All three countries have significant resource endowments including oil, natural gas, and hydro.
In the 2012 Index, North America performs very well in energy security and social equity; however, it lags behind in mitigating its environmental impact. Energy security is supported by a good ratio of production to total energy supply, well-diversified electricity generation portfolio and energy exports as well as flat energy consumption. Environmental sensitivity however is low due to strong energy and emissions intensity per capita, particularly in Canada and the USA. Average emissions from electricity and heat generation and pollution of air and water vary greatly, with Canada performing significantly better in these indicators. High affordability of gasoline and electricity support high social equity scores; however, it does not provide incentives to actively engage in energy efficiency or to reduce energy consumption.
List of countries (see Figure 8):
Canada, Mexico, United States
Figure 8 Energy sustainability balance North America

World Energy Trilemma: 2012 Energy Sustainability Index World Energy Council
18
Sub-Saharan Africa
The population of Sub-Saharan Africa is approximately 840 million with an average GDP per capita of USD1,127. Overall the region is still developing economically, and the IMF predicts a GDP growth rate of 5.4% for 2012.
This region is well endowed both with fossil fuels such as oil, gas and coal and renewable resources including hydro-power and geothermal. However, most of this potential remains untapped as countries face institutional and infrastructural barriers to make efficient use of it. In the 2012 Index, countries in Sub-Saharan Africa score low in environmental impact mitigation, exhibiting high pollution of air and water. The region has very low energy and emissions intensity per capita, as only 31% of the population currently has access to electricity. Social equity is therefore Sub-Saharan Africa's weakest dimension. Overall, reliability of electricity supply remains a huge challenge and power outages are frequent.
The region’s limited ability to improve its energy system and related services has significant repercussions on its social and economic development, including poor quality of life and low standards in health, education and economic competitiveness. While environmental and social equity performance varies across countries, it is notable that no country scores very well in either dimension. Some countries, mostly the oil
exporting ones, have strong energy security; however the average performance remains mediocre. This is primarily due to a positive 5 year energy consumption growth trend, which is necessary for expanding energy services. The region achieves a relatively good ratio of production to total energy supply; however with increasing economic and industrial development and rising demands, generation capacity and infrastructure will have to expand.
List of countries (see Figure 9):
Botswana, Cameroon, Chad, Congo (Democratic Republic), Côte d'Ivoire, Ethiopia, Gabon, Ghana, Kenya, Namibia, Niger, Nigeria, Senegal, South Africa, Swaziland, Tanzania, Zimbabwe
Figure 9 Energy sustainability balance Sub-Saharan Africa

World Energy Council World Energy Trilemma: 2012 Energy Sustainability Index
19

World Energy Trilemma: 2012 Energy Sustainability Index World Energy Council
20
This section shows the scores for each country represented in the 2012 Index, provides comments around the performance and gives the reader an indication of trends and future developments.
The trilemma graph on each country profile (upper left corner) visualises the Index scores for energy security, social equity, and environmental impact mitigation highlighting the degree of balance between the three dimensions.
Furthermore the country profile displays an overview of the country’s energy endowment, and contributions of energy sources to total electricity generation as well as relevant key metrics to provide more context.
Iconography
Graphics displaying results of the Energy Sustainability Index analysis make use of the following iconography.
Energy performance dimensions:
Energy security
Social equity
Environmental impact mitigation
Contextual performance dimensions:
Political strength
Societal strength
Economic strength
Energy Sustainability Index results and country profiles can be found on the WEC website at www.worldenergy.org/data/sustainability-index.
Country profiles

COUNTRY PROFILE GUIDE
ENERGY SUSTAINABILITY BALANCE ENERGY SUSTAINABILITY INDEX RANKINGS
2010 2011 2012 Trend
Energy performance 77 81 79 + Energy security 75 65 56 - Social equity 60 55 62 -- Environmental impact mitigation 70 84 82 + Contextual performance 73 84 69 + Political strength 86 84 83 - Societal strength 75 77 75 + Economic strength 45 77 37 + Overall rank
78 84 79 +
DIVERSITY OF ELECTRICITY GENERATION FOSSIL FUEL RESOURCES (IN MTOE)
KEY METRICS
Industrial sector (% of total GDP) 56.5 GDP per capita (PPP, USD); GDP Group 7,112 (C)
Percent of total GDP that is in the industrial sector (CIA World Factbook, 2012)
GDP (IMF, 2010) and GDP group assignment as defined in Volume I of this report
TPEP / TPEC (net energy exporter) 3.84 Energy intensity (million BTU per USD) 0.02
Ratio of total primary energy production to total primary energy consumption, showing the extent to which a country imports or experts energy (EIA, 2009)
Measure of how much energy (EIA, 2009) is required to produce one dollar of industrial sector GDP (IMF, 2010)
Emission intensity (kg of CO2 per USD) 1.15 CO2 emissions (metric tons) per capita 3.24
Measure of emissions (EIA) created by the production of one dollar of industrial sector GDP (IMF, 2010)
Emissions (EIA, 2009) per person (IMF, 2010)
Energy affordability (USD per kWh) n.a. Population with access to electricity (%) 99.3
Average cost of electricity (IEA, 2011) Access to electricity (IEA, 2009)
INDEX COMMENTARY
emissions (EIA) created by the production of one dollar of industrial sector GDP (IMF)
TRENDS AND OUTLOOK
INDEX RANK
78
Index scores for energy security, social equity and
environmental impact mitigation highlighting the
degree of balance
between three dimensions
Rank for each Index component as well as
overall rank
Contributions of energy sources to total electricity
generation indicating current reliance on fossil fuels or other
energy sources (EIA, 2010)
Overall rank
Resource endowment (WEC 2010 Survey of
Energy Resources)
Overview of current Index ranking and country’s energy trilemma, highlighting indicator changes from 2011 to 2012
Commentary explaining recent energy policy developments, future trends for country’s sustainability balance and issues of
importance for future policy making as provided by the country’s WEC member committee
2011-2012 Trend for each Index
component

ALBANIA
ENERGY SUSTAINABILITY BALANCE ENERGY SUSTAINABILITY INDEX RANKINGS
2010 2011 2012 Trend
Energy performance 47 30 32 - Energy security 54 26 44 - Social equity 76 67 61 + Environmental impact mitigation 16 15 7 + Contextual performance 77 70 70 Political strength 56 58 57 + Societal strength 65 55 55 Economic strength 88 85 86 -
Overall rank 58 41 40 +
DIVERSITY OF ELECTRICITY GENERATION FOSSIL FUEL RESOURCES (IN MTOE)
KEY METRICS
Industrial sector (% of total GDP) 19.7 GDP per capita (PPP, USD); GDP Group 7,468 (C)
TPEP / TPEC (net energy importer) 0.51 Energy intensity (million BTU per USD) 0.04
Emission intensity (kg of CO2 per USD) 1.65 CO2 emissions (metric tons) per capita 1.44
Energy affordability (USD per kWh) n.a. Population with access to electricity (%) 100.0
INDEX COMMENTARY
Albania increases by one place in the Index, mostly due to an increase in social equity and environmental impact mitigation. However, a decrease in energy security was driven by a large increase in the energy consumption growth rate. This negative trend could partly be offset by an increased diversity of electricity production which remains nonetheless Albania's weakest indicator. Social equity improves as Albania provided better quality and more affordable electricity to its population. Environmental performance is strong and further increases due to lower emissions intensity per GDP per capita and lower emissions from electricity and heat generation. Given its increase in energy intensity per capita, Albania outperforms peer countries with similar energy intensity levels in mitigating its environmental impact. Performance across contextual dimensions is relatively constant. The weak economic position is mostly caused by high costs of living as proportion of household consumption expenditure, while credit availability and macroeconomic stability receive slightly better scores.
556
30
04
0
500
1,000
1,500
2,000
2,500
Coal Oil Shale Oil Gas
INDEX RANK
40
1%
99%
Conventional thermal
Hydro
Other Renewables
Nuclear
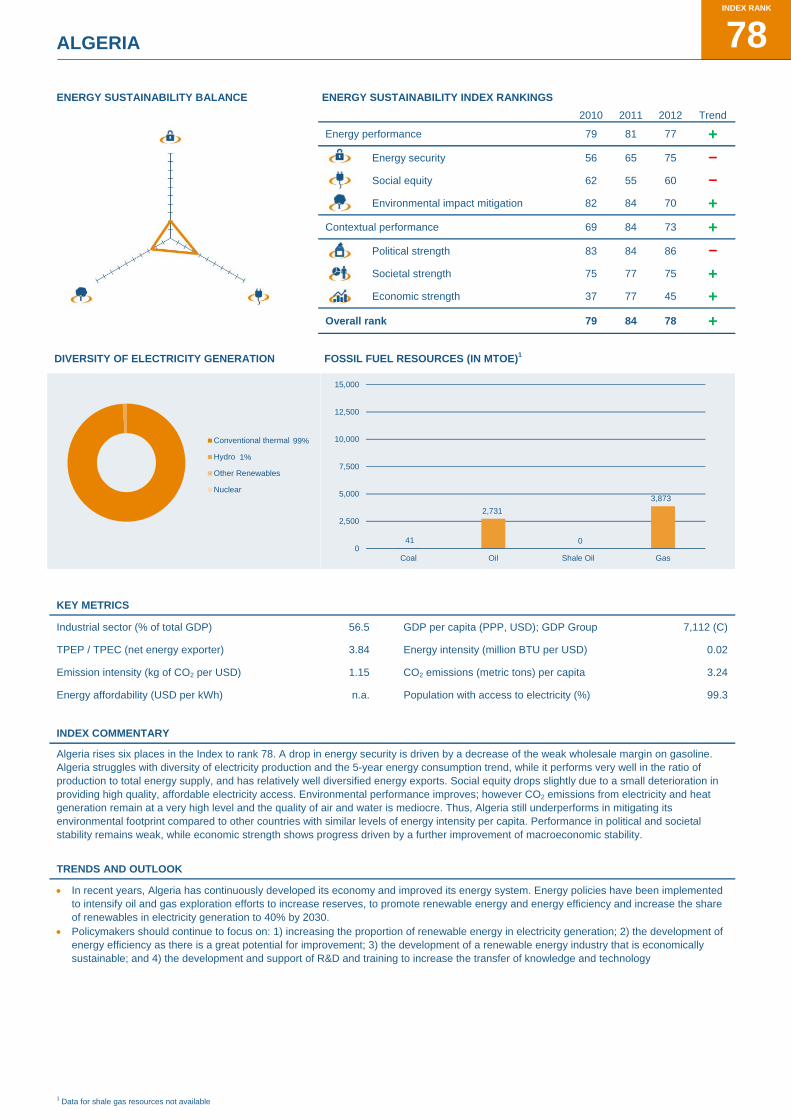
ALGERIA
ENERGY SUSTAINABILITY BALANCE ENERGY SUSTAINABILITY INDEX RANKINGS
2010 2011 2012 Trend
Energy performance 79 81 77 + Energy security 56 65 75 - Social equity 62 55 60 - Environmental impact mitigation 82 84 70 + Contextual performance 69 84 73 + Political strength 83 84 86 - Societal strength 75 77 75 + Economic strength 37 77 45 +
Overall rank 79 84 78 +
DIVERSITY OF ELECTRICITY GENERATION FOSSIL FUEL RESOURCES (IN MTOE)1
KEY METRICS
Industrial sector (% of total GDP) 56.5 GDP per capita (PPP, USD); GDP Group 7,112 (C)
TPEP / TPEC (net energy exporter) 3.84 Energy intensity (million BTU per USD) 0.02
Emission intensity (kg of CO2 per USD) 1.15 CO2 emissions (metric tons) per capita 3.24
Energy affordability (USD per kWh) n.a. Population with access to electricity (%) 99.3
INDEX COMMENTARY
Algeria rises six places in the Index to rank 78. A drop in energy security is driven by a decrease of the weak wholesale margin on gasoline. Algeria struggles with diversity of electricity production and the 5-year energy consumption trend, while it performs very well in the ratio of production to total energy supply, and has relatively well diversified energy exports. Social equity drops slightly due to a small deterioration in providing high quality, affordable electricity access. Environmental performance improves; however CO2 emissions from electricity and heat generation remain at a very high level and the quality of air and water is mediocre. Thus, Algeria still underperforms in mitigating its environmental footprint compared to other countries with similar levels of energy intensity per capita. Performance in political and societal stability remains weak, while economic strength shows progress driven by a further improvement of macroeconomic stability.
TRENDS AND OUTLOOK
In recent years, Algeria has continuously developed its economy and improved its energy system. Energy policies have been implemented to intensify oil and gas exploration efforts to increase reserves, to promote renewable energy and energy efficiency and increase the share of renewables in electricity generation to 40% by 2030.
Policymakers should continue to focus on: 1) increasing the proportion of renewable energy in electricity generation; 2) the development of energy efficiency as there is a great potential for improvement; 3) the development of a renewable energy industry that is economically sustainable; and 4) the development and support of R&D and training to increase the transfer of knowledge and technology
1 Data for shale gas resources not available
99%
1%
Conventional thermal
Hydro
Other Renewables
Nuclear
41
2,731
0
3,873
0
2,500
5,000
7,500
10,000
12,500
15,000
Coal Oil Shale Oil Gas
INDEX RANK
78

ARGENTINA A
ENERGY SUSTAINABILITY BALANCE ENERGY SUSTAINABILITY INDEX RANKINGS
2010 2011 2012 Trend
Energy performance 15 8 22 - Energy security 22 12 35 - Social equity 19 20 17 + Environmental impact mitigation 27 27 30 -
Contextual performance 64 64 63 + Political strength 69 74 66 + Societal strength 54 54 53 + Economic strength 58 54 60 -
Overall rank 24 19 28 -
DIVERSITY OF ELECTRICITY GENERATION FOSSIL FUEL RESOURCES (IN MTOE)1
KEY METRICS
Industrial sector (% of total GDP) 30.7 GDP per capita (PPP, USD); GDP Group 15,901 (B)
TPEP / TPEC (net energy exporter 2) 1.06 Energy intensity (million BTU per USD) 0.03
Emission intensity (kg of CO2 per USD) 1.43 CO2 emissions (metric tons) per capita 4.24
Energy affordability (USD per kWh) 0.02 Population with access to electricity (%) 97.2
INDEX COMMENTARY
Argentina overall drops by nine places to rank 28. This was triggered by a weaker energy security score driven by a substantial decrease of the wholesale margin on gasoline and a slightly weaker ratio of total primary energy production to consumption. Better performance in social equity is driven by small improvements across all indicators. Argentina experiences a small drop in environmental impact mitigation, despite reductions in energy intensity per capita. Overall, Argentina struggles most with its contextual dimensions. The 75/25 Index weighting regime however means that rather low contextual scores, both absolute and relative, have limited impact if the energy performance dimensions are stronger compared to peer countries.
TRENDS AND OUTLOOK
Argentina, although positioned relatively high in the Index, still faces major challenges and is expected to further drop in the rankings. With the current energy policy of low prices for producers and high subsidies to consumers continues, there is little chance to revert the
decline production. Oil production declined by 30% since 1998, while natural gas production declined by 8% since 2006. As a consequence, Argentina, previously a net energy exporter in 2006 with a surplus of USD6 billion, turned to be a net energy importer in 2011 with a deficit of USD3 billion.
The lack of investment in all energy sectors has become a major challenge, further intensified by the nationalisation of YPF (expropriation of Repsol shares in Argentina’s biggest oil company), where the new management is struggling to attract new investors which are necessary to exploit the large reserves of unconventional oil and natural gas in Argentina.
Policymakers urgently need to focus on restoring the energy markets and attracting a great deal of investment by implementing clear and stable rules and regulations.
1 Data for shale gas resources not available 2 Indicator is based on 2009 data; as of 2011 Argentina is a net importer
65%
28%
1%
6%
Conventional thermal
Hydro
Other Renewables
Nuclear
350 348
57
343
0
500
1,000
1,500
2,000
2,500
Coal Oil Shale Oil Gas
INDEX RANK
28

AUSTRALIA
ENERGY SUSTAINABILITY BALANCE ENERGY SUSTAINABILITY INDEX RANKINGS
2010 2011 2012 Trend
Energy performance 29 34 29 + Energy security 36 42 25 + Social equity 3 3 3
Environmental impact mitigation 66 72 73 -
Contextual performance 5 9 9
Political strength 7 12 12
Societal strength 8 10 8 + Economic strength 15 15 15
Overall rank 20 24 20 +
DIVERSITY OF ELECTRICITY GENERATION FOSSIL FUEL RESOURCES (IN MTOE)
KEY METRICS
Industrial sector (% of total GDP) 24.6 GDP per capita (PPP, USD); GDP Group 39,090 (A)
TPEP / TPEC (net energy exporter) 2.19 Energy intensity (million BTU per USD) 0.02
Emission intensity (kg of CO2 per USD) 1.35 CO2 emissions (metric tons) per capita 18.61
Energy affordability (USD per kWh) 0.10 Population with access to electricity (%) 100.0
INDEX COMMENTARY
Australia moves up four places in the Index. Most significant improvements were achieved in energy security driven by an increased wholesale margin on gasoline and a reduction in the energy consumption growth rate. Highly reliant on fossil fuels, Australia's weakest performance is environmental impact mitigation (rank 73). As Australia improves slower than peer countries, a small drop is noted from last year despite small improvements across all indicators: better quality of air and water, a decrease in energy and emission intensity on a per capita basis and from electricity and heat generation. Australia keeps up a strong and stable performance in social equity (rank three) and in all contextual dimensions. Economic strength ranks a little lower than political and societal strength due to higher costs of living.
TRENDS AND OUTLOOK
93%
5%
2%
Conventional thermal
Hydro
Other Renewables
Nuclear
53,480
255
4,531
7040
10,000
20,000
30,000
40,000
50,000
60,000
Coal Oil Shale Oil Gas
INDEX RANK
20

AUSTRIA
ENERGY SUSTAINABILITY BALANCE ENERGY SUSTAINABILITY INDEX RANKINGS
2010 2011 2012 Trend
Energy performance 10 11 11 Energy security 30 37 39 - Social equity 9 7 7 Environmental impact mitigation 18 18 11 + Contextual performance 13 10 11 - Political strength 11 9 7 + Societal strength 11 11 15 - Economic strength 27 22 22
Overall rank 10 9 10 -
DIVERSITY OF ELECTRICITY GENERATION FOSSIL FUEL RESOURCES (IN MTOE)
KEY METRICS
Industrial sector (% of total GDP) 29.4 GDP per capita (PPP, USD); GDP Group 39,849 (A)
TPEP / TPEC (net energy importer) 0.39 Energy intensity (million BTU per USD) 0.01
Emission intensity (kg of CO2 per USD) 0.62 CO2 emissions (metric tons) per capita 8.25
Energy affordability (USD per kWh) 0.26 Population with access to electricity (%) 100.0
INDEX COMMENTARY
Austria exhibits little change in the vast majority of indicators, experiencing a drop of one place to rank ten in the Index. The weakest dimension remains energy security with a relatively low ratio of production to total energy supply, a low wholesale margin on gasoline and low oil reserve stocks when compared to other countries. Higher environmental scores are driven by a continued decline in CO2 emissions from electricity and heat generation and maintenance of its good air and water quality compared to peer countries. Austria also tracked a slight drop in societal strength due to small declines in control of corruption and health.
TRENDS AND OUTLOOK
The Energy Sustainability Index reflects Austria’s situation very well. Energy security, however, does not yet reflect the countries achieved accomplishments. For example, Austria’s increasing energy self-sufficiency, which is also one of the country’s main long goals; or the progress since 1980 in the renewable energy sector, with Austria more than doubling the production of renewable energy.
Policy developments in Austria and targets for 2020 are compatible and in line with EU policy, including an increase of the share of energy consumption produced from renewable resources to 34% by 2020, reducing greenhouse gas emissions by 16% from 2005 levels for sectors not included in EU-ETS and 21% from 2005 levels for sectors included in EU-ETS, and a 20% improvement in energy efficiency. In addition, Austria set the goal of achieving 100% energy self-sufficiency with renewables by 2050. Lastly, Austria’s Sustainability Strategy lists 20 goals to increase quality of life overall, to strengthen economic growth, to support sustainable goods and services, and to optimise the transport system.
Key issues policymakers should continue developing measures to 1) reduce dependence on energy imports; 2) increase efforts around energy efficiency and energy savings; 3) decrease energy intensity; and 4) increase the use of renewable energy.
32%
53%
15%
Conventional thermal
Hydro
Other Renewables
Nuclear
0 71
14
0
500
1,000
1,500
2,000
2,500
Coal Oil Shale Oil Gas
INDEX RANK
10
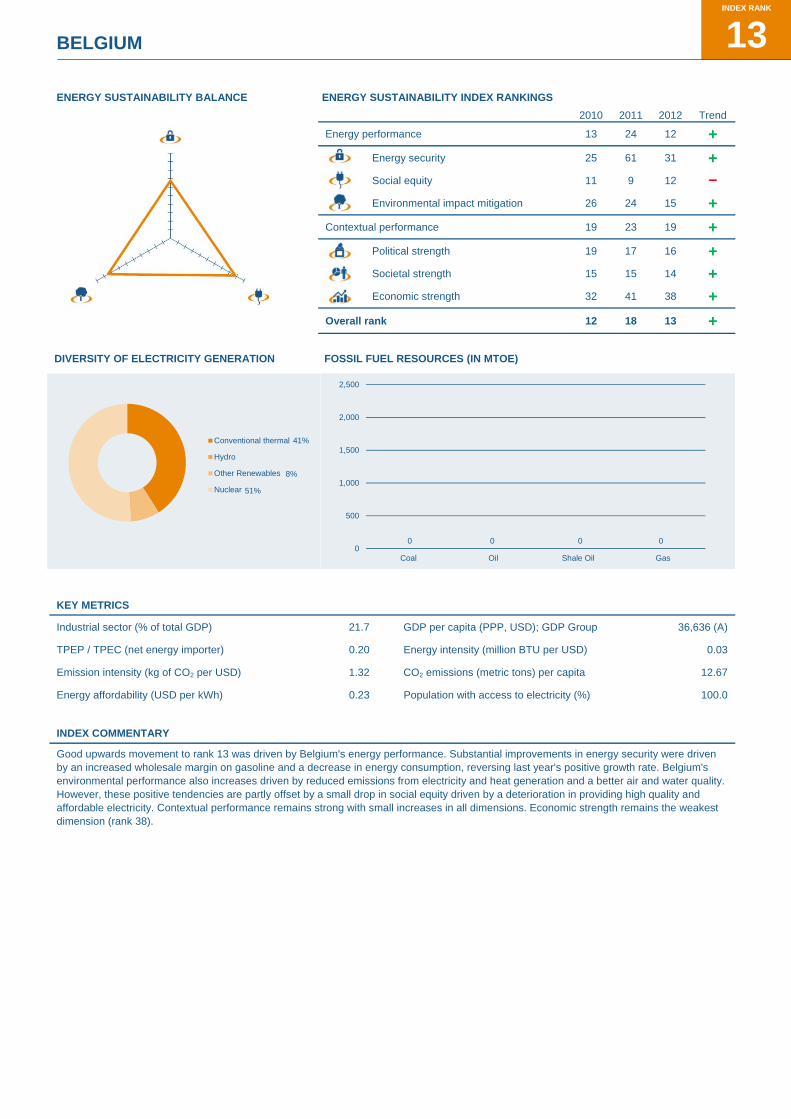
BELGIUM
ENERGY SUSTAINABILITY BALANCE ENERGY SUSTAINABILITY INDEX RANKINGS
2010 2011 2012 Trend
Energy performance 13 24 12 + Energy security 25 61 31 + Social equity 11 9 12 - Environmental impact mitigation 26 24 15 + Contextual performance 19 23 19 + Political strength 19 17 16 + Societal strength 15 15 14 + Economic strength 32 41 38 +
Overall rank 12 18 13 +
DIVERSITY OF ELECTRICITY GENERATION FOSSIL FUEL RESOURCES (IN MTOE)
KEY METRICS
Industrial sector (% of total GDP) 21.7 GDP per capita (PPP, USD); GDP Group 36,636 (A)
TPEP / TPEC (net energy importer) 0.20 Energy intensity (million BTU per USD) 0.03
Emission intensity (kg of CO2 per USD) 1.32 CO2 emissions (metric tons) per capita 12.67
Energy affordability (USD per kWh) 0.23 Population with access to electricity (%) 100.0
INDEX COMMENTARY
Good upwards movement to rank 13 was driven by Belgium's energy performance. Substantial improvements in energy security were driven by an increased wholesale margin on gasoline and a decrease in energy consumption, reversing last year's positive growth rate. Belgium's environmental performance also increases driven by reduced emissions from electricity and heat generation and a better air and water quality. However, these positive tendencies are partly offset by a small drop in social equity driven by a deterioration in providing high quality and affordable electricity. Contextual performance remains strong with small increases in all dimensions. Economic strength remains the weakest dimension (rank 38).
41%
8%
51%
Conventional thermal
Hydro
Other Renewables
Nuclear
0 0 0 00
500
1,000
1,500
2,000
2,500
Coal Oil Shale Oil Gas
INDEX RANK
13

BOLIVIA A
ENERGY SUSTAINABILITY BALANCE ENERGY SUSTAINABILITY INDEX RANKINGS
2010 2011 2012 Trend
Energy performance - - 40 Energy security - - 22 Social equity - - 64 Environmental impact mitigation - - 45 Contextual performance - - 69 Political strength - - 79 Societal strength - - 81 Economic strength - - 36
Overall rank - - 45
DIVERSITY OF ELECTRICITY GENERATION FOSSIL FUEL RESOURCES (IN MTOE)1
KEY METRICS
Industrial sector (% of total GDP) 40.0 GDP per capita (PPP, USD); GDP Group 4,549 (D)
TPEP / TPEC (net energy exporter) 2.25 Energy intensity (million BTU per USD) 0.03
Emission intensity (kg of CO2 per USD) 1.84 CO2 emissions (metric tons) per capita 1.72
Energy affordability (USD per kWh) n.a. Population with access to electricity (%) 77.5
INDEX COMMENTARY
Bolivia enters the Index this year for the first time and performs well in energy security with a strong ratio of production to total energy supply, good diversification of electricity production and a high wholesale margin on gasoline. However the positive 5-year energy consumption growth rate is a weak indicator for energy security; even though it is necessary for Bolivia's social and economic development. As only 78% of the population has access to electricity and due to high gasoline prices, Bolivia performs poorly in social equity. Environmental impact mitigation achieves medium scores across all indicators. Bolivia struggles with political and societal strength, particularly with regulatory quality and rule of law. Economic strength is better due to good macroeconomic stability.
1 Data for shale gas resources not available
60%
39%
1%
Conventional thermal
Hydro
Other Renewables
Nuclear
1 54
0
611
0
500
1,000
1,500
2,000
2,500
Coal Oil Shale Oil Gas
INDEX RANK
45
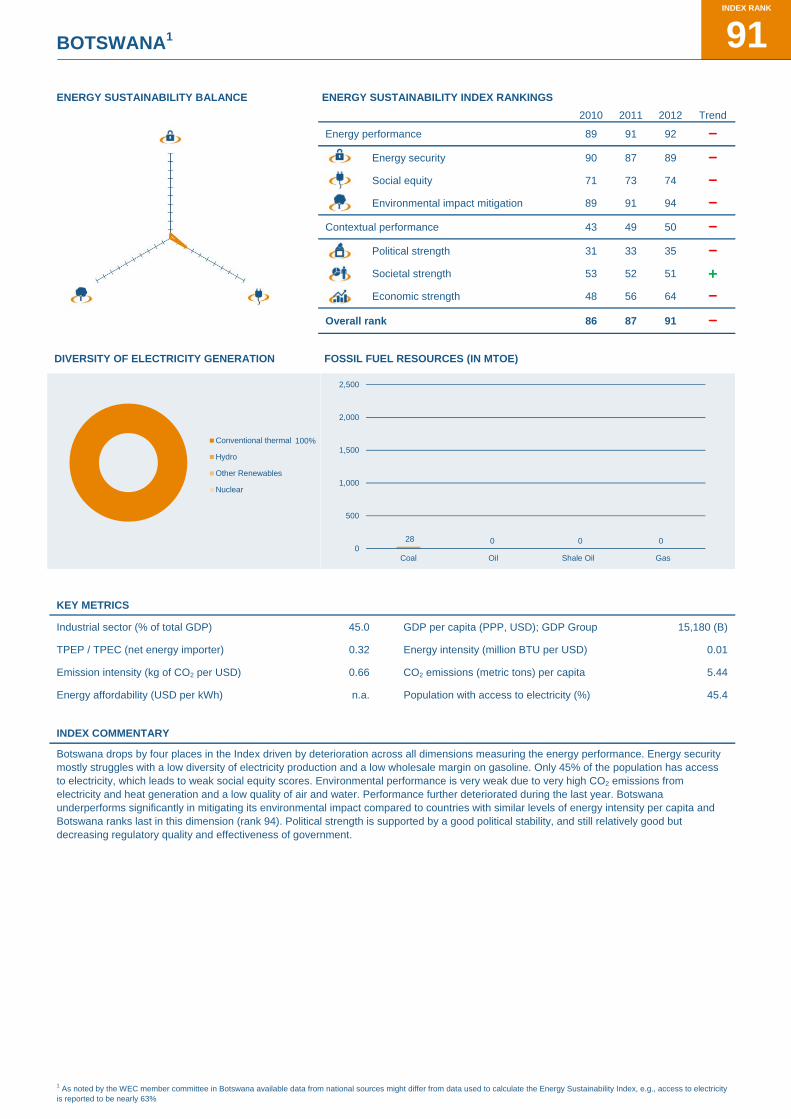
BOTSWANA1
ENERGY SUSTAINABILITY BALANCE ENERGY SUSTAINABILITY INDEX RANKINGS
2010 2011 2012 Trend
Energy performance 89 91 92 - Energy security 90 87 89 -
Social equity 71 73 74 -
Environmental impact mitigation 89 91 94 -
Contextual performance 43 49 50 -
Political strength 31 33 35 -
Societal strength 53 52 51 + Economic strength 48 56 64 -
Overall rank 86 87 91 -
DIVERSITY OF ELECTRICITY GENERATION FOSSIL FUEL RESOURCES (IN MTOE)
KEY METRICS
Industrial sector (% of total GDP) 45.0 GDP per capita (PPP, USD); GDP Group 15,180 (B)
TPEP / TPEC (net energy importer) 0.32 Energy intensity (million BTU per USD) 0.01
Emission intensity (kg of CO2 per USD) 0.66 CO2 emissions (metric tons) per capita 5.44
Energy affordability (USD per kWh) n.a. Population with access to electricity (%) 45.4
INDEX COMMENTARY
Botswana drops by four places in the Index driven by deterioration across all dimensions measuring the energy performance. Energy security mostly struggles with a low diversity of electricity production and a low wholesale margin on gasoline. Only 45% of the population has access to electricity, which leads to weak social equity scores. Environmental performance is very weak due to very high CO2 emissions from electricity and heat generation and a low quality of air and water. Performance further deteriorated during the last year. Botswana underperforms significantly in mitigating its environmental impact compared to countries with similar levels of energy intensity per capita and Botswana ranks last in this dimension (rank 94). Political strength is supported by a good political stability, and still relatively good but decreasing regulatory quality and effectiveness of government.
1 As noted by the WEC member committee in Botswana available data from national sources might differ from data used to calculate the Energy Sustainability Index, e.g., access to electricity is reported to be nearly 63%
100%Conventional thermal
Hydro
Other Renewables
Nuclear
28 0 0 00
500
1,000
1,500
2,000
2,500
Coal Oil Shale Oil Gas
INDEX RANK
91

BRAZIL L
ENERGY SUSTAINABILITY BALANCE ENERGY SUSTAINABILITY INDEX RANKINGS
2010 2011 2012 Trend
Energy performance 56 44 54 -
Energy security 79 62 77 -
Social equity 64 65 65
Environmental impact mitigation 17 16 21 -
Contextual performance 53 52 48 + Political strength 51 50 49 + Societal strength 48 49 46 + Economic strength 60 52 50 +
Overall rank 56 45 53 -
DIVERSITY OF ELECTRICITY GENERATION FOSSIL FUEL RESOURCES (IN MTOE)1
KEY METRICS
Industrial sector (% of total GDP) 27.5 GDP per capita (PPP, USD); GDP Group 11,314 (C)
TPEP / TPEC (net energy importer) 0.87 Energy intensity (million BTU per USD) 0.02
Emission intensity (kg of CO2 per USD) 0.74 CO2 emissions (metric tons) per capita 2.21
Energy affordability (USD per kWh) 0.19 Population with access to electricity (%) 98.3
INDEX COMMENTARY
Brazil's decrease by eight places to rank 53 in the Index is driven by a weaker performance in energy security and environmental impact mitigation. Energy security drops due to a decrease of the wholesale margin on gasoline, which makes energy security Brazil's weakest dimension (rank 77). Generally, Brazil exhibits especially weak oil reserve stocks, a weak wholesale margin on gasoline and sustained energy consumption growth. Not reliant on fossil fuels Brazil has a strong environmental performance (rank 21) and outperforms other countries with similar energy intensity in mitigating the environmental footprint. Brazil exhibits slight improvements in all contextual dimensions. Economic strength, Brazil's weakest contextual dimension increases slightly due to improved macroeconomic stability.
TRENDS AND OUTLOOK
The country’s most recent energy policy developments were directed to: 1) the development of large offshore oil and gas reserves found under a layer of salt in 2007 (“pre-salt”); 2) the development of renewable energy sources including wind and solar power, and biomass derived energies, including ethanol, bagasse, biodiesel ; and 3) implementation of energy prices that encourage energy efficiency and saving. The transportation sector is expected to contribute to energy efficiency measures, including electrical vehicles, roads improvement, as well as increased railroads and waterways transportation. These developments are expected to have a strong impact on, and lead to improvements in, all three dimensions of the energy policy trilemma.
Policymakers should focus on 1) the possibilities presented by biomass, including sugar cane, planted wood and other crops; and 2) the opportunities arising from the successful exploitation of the “pre-salt” oil and gas deposits. Both will impact the country’s energy security positively and change Brazil’s role in the global energy market, but the effects on the environment need to be considered. Lastly, the development, financing and implementation of energy efficiency programs, involving thousands of processes and appliances and millions of consumers on which the success of such measures depend, should advance more quickly.
1 Data for shale gas resources not available
9%
82%
6%
3%
Conventional thermal
Hydro
Other Renewables
Nuclear
3,191
1,088
11,734
2110
2,500
5,000
7,500
10,000
12,500
15,000
Coal Oil Shale Oil Gas
INDEX RANK
53

BULGARIA
ENERGY SUSTAINABILITY BALANCE ENERGY SUSTAINABILITY INDEX RANKINGS
2010 2011 2012 Trend
Energy performance 49 40 36 + Energy security 53 25 40 -
Social equity 63 60 59 + Environmental impact mitigation 37 43 28 + Contextual performance 52 45 48 -
Political strength 44 40 42 -
Societal strength 46 46 47 -
Economic strength 63 49 56 -
Overall rank 51 40 38 +
DIVERSITY OF ELECTRICITY GENERATION FOSSIL FUEL RESOURCES (IN MTOE)
KEY METRICS
Industrial sector (% of total GDP) 30.6 GDP per capita (PPP, USD); GDP Group 12,965 (C)
TPEP / TPEC (net energy importer) 0.52 Energy intensity (million BTU per USD) 0.05
Emission intensity (kg of CO2 per USD) 3.07 CO2 emissions (metric tons) per capita 5.92
Energy affordability (USD per kWh) n.a. Population with access to electricity (%) 100.0
INDEX COMMENTARY
Bulgaria improves its position in the Index by two spots to rank 38. This positive development is mostly due to a stronger environmental performance driven by improvements across almost all indicators; despite an absolute decrease in quality of air and water Bulgaria still performs better than its peer countries in this indicator. Energy security overall deteriorates due to a decrease in the wholesale margin on gasoline, which could not be offset by a decrease in the countries energy consumption growth. Performance in all contextual dimensions deteriorates. Economic strength decreases mostly due to less credit availability and slower improvements in macroeconomic stability compared to peer countries.
TRENDS AND OUTLOOK
In July 2012 the Bulgarian Parliament amended the existing Energy Act, now guaranteeing equal access to electricity and gas grids, strengthening the power of national energy regulators and improving market transparency, promoting trans-border trade and enhancing end-user rights. The new legal framework is expected to improve the sustainable use of renewable energy sources, market liberalisation and social equity.
Key issues policymakers need to focus on are: 1) improve energy security by building a reliable energy infrastructure, further diversifying sources and routes of energy supply, and optimising the use of indigenous energy resources; 2) increase energy efficiency; 3) promote clean development mechanisms; 4) social protection; and 5) pursue the ambitious targets of giving 30% of households access to natural gas by 2020 as set out in the national energy strategy.
55%
8%
2%
35%
Conventional thermal
Hydro
Other Renewables
Nuclear
1,656
218
1
0
500
1,000
1,500
2,000
2,500
Coal Oil Shale Oil Gas
INDEX RANK
38

CAMEROON N
ENERGY SUSTAINABILITY BALANCE ENERGY SUSTAINABILITY INDEX RANKINGS
2010 2011 2012 Trend
Energy performance 61 55 57 - Energy security 9 17 32 - Social equity 83 81 83 - Environmental impact mitigation 78 62 54 + Contextual performance 79 78 83 - Political strength 80 80 82 - Societal strength 88 89 88 + Economic strength 46 48 63 -
Overall rank 66 65 65
DIVERSITY OF ELECTRICITY GENERATION FOSSIL FUEL RESOURCES (IN MTOE)
KEY METRICS
Industrial sector (% of total GDP) 31.0 GDP per capita (PPP, USD); GDP Group 2,176 (D)
TPEP / TPEC (net energy exporter) 2.14 Energy intensity (million BTU per USD) 0.01
Emission intensity (kg of CO2 per USD) 1.08 CO2 emissions (metric tons) per capita 0.75
Energy affordability (USD per kWh) n.a. Population with access to electricity (%) 48.7
INDEX COMMENTARY
Cameroon maintains its position on rank 65 in the Index. It experiences decreases across most dimensions except societal strength and environmental impact mitigation. A drop in energy security is driven by a decrease in the wholesale margin on gasoline. A good ratio of production to total energy supply supports the performance in this dimension, while the country faces continued growths in energy consumption which is necessary for its economic and social development. Only 49% of the population has access to electricity. Cameroon therefore scores very poorly in social equity and a further increase in gasoline prices led to a small further decrease in social equity. Environmental performance slightly improves due to lower CO2 emissions from electricity and heat generation and a slightly better quality of air and water relative to peer countries. Overall Cameroon still underperforms in mitigating its environmental footprint compared to peer countries. Performance in political and societal strength remains relatively constant but with a small downward trend and weak performance across all indicators. The economic situation decreases substantially due to a decrease in macroeconomic stability.
29%
71%
Conventional thermal
Hydro
Other Renewables
Nuclear
0168
0
129
0
500
1,000
1,500
2,000
2,500
Coal Oil Shale Oil Gas
INDEX RANK
65

CANADA
ENERGY SUSTAINABILITY BALANCE ENERGY SUSTAINABILITY INDEX RANKINGS
2010 2011 2012 Trend
Energy performance 1 1 1
Energy security 1 1 1
Social equity 2 2 2
Environmental impact mitigation 13 12 12
Contextual performance 12 11 14 -
Political strength 12 8 10 -
Societal strength 9 7 10 -
Economic strength 24 33 40 -
Overall rank 2 1 3 -
DIVERSITY OF ELECTRICITY GENERATION FOSSIL FUEL RESOURCES (IN MTOE)1
KEY METRICS
Industrial sector (% of total GDP) 27.1 GDP per capita (PPP, USD); GDP Group 39,154 (A)
TPEP / TPEC (net energy exporter) 1.40 Energy intensity (million BTU per USD) 0.04
Emission intensity (kg of CO2 per USD) 1.72 CO2 emissions (metric tons) per capita 15.88
Energy affordability (USD per kWh) 0.09 Population with access to electricity (%) 100.0
INDEX COMMENTARY
Canada overall maintains its position in the top three balancing the energy trilemma very well. Canada's scores are very strong across all indicators that drive energy security and social equity. Good environmental performance is achieved despite high levels of energy and emissions intensity per GDP per capita, as Canada exhibits a lower environmental footprint than its peers. Canada experiences slight drops in political, societal and economic performance. Contextual performance overall remains strong.
TRENDS AND OUTLOOK
Canada’s high and improving position in the Index reflects the country’s extensive and diverse energy resource base and public and private commitment to develop those resources. The two main challenges Canada faces are: 1) balancing resource development with environmental protection; and 2) developing diverse markets for Canada’s energy resources.
The most recent energy policy developments include: 1) strong focus on developing markets for oil and gas beyond North America; 2) expediting energy infrastructure approvals processes; and 3) more stringent environmental standards for fossil-fuelled power generation, both federally and provincially. These three developments should support continuing improvement in Canada’s energy balance.
The three key future trends/issues that policymakers must focus on are: 1) managing the environmental/climate impacts of energy resource development; 2) market diversification; and 3) ensuring an appropriate sharing of the benefits from resource development, most notably with Canada’s aboriginal population in whose traditional territory most resource development and delivery projects are being developed.
1 Data for shale gas resources not available
23%
60%
2%
15%
Conventional thermal
Hydro
Other Renewables
Nuclear 4,607
3,126 2,192
1,508
0
2,500
5,000
7,500
10,000
12,500
15,000
Coal Oil Shale Oil Gas
INDEX RANK
3

CHAD D
ENERGY SUSTAINABILITY BALANCE ENERGY SUSTAINABILITY INDEX RANKINGS
2010 2011 2012 Trend
Energy performance - - 70
Energy security - - 48
Social equity - - 88
Environmental impact mitigation - - 58
Contextual performance - - 91
Political strength - - 93
Societal strength - - 93
Economic strength - - 80
Overall rank - - 86
DIVERSITY OF ELECTRICITY GENERATION FOSSIL FUEL RESOURCES (IN MTOE)
KEY METRICS
Industrial sector (% of total GDP) 6.7 GDP per capita (PPP, USD); GDP Group 1,842 (D)
TPEP / TPEC (net energy exporter) 61.92 Energy intensity (million BTU per USD) 0.01
Emission intensity (kg of CO2 per USD) 0.48 CO2 emissions (metric tons) per capita 0.03
Energy affordability (USD per kWh) n.a. Population with access to electricity (%) n.a.
INDEX COMMENTARY
Chad’s energy security performance is supported by a very high ratio of production to total energy supply and a good wholesale margin on gasoline; however low performing indicators are low diversity of electricity production and the positive 5-year energy consumption growth trend. The latter is however necessary for Chad's economic and social development as electricity access is still incomplete, leading to Chad's poor ranking in social equity (rank 88). Performance in environmental impact mitigation is driven by very low energy and emission intensity per capita, but a low quality of air and water. Chad slightly underperforms in mitigating its environmental impact when compared to other countries with similar level of energy intensity per capita. Contextual performance is overall rather weak. Economic strength is slightly better due to low costs of living as proportion of household consumption expenditure.
100%Conventional thermal
Hydro
Other Renewables
Nuclear
0
222
00
0
500
1,000
1,500
2,000
2,500
Coal Oil Shale Oil Gas
INDEX RANK
86

CHINA
ENERGY SUSTAINABILITY BALANCE ENERGY SUSTAINABILITY INDEX RANKINGS
2010 2011 2012 Trend
Energy performance 84 82 84 - Energy security 71 45 59 - Social equity 72 72 69 + Environmental impact mitigation 80 87 91 -
Contextual performance 40 39 40 - Political strength 57 59 60 - Societal strength 59 59 57 + Economic strength 7 5 8 -
Overall rank 78 71 71
DIVERSITY OF ELECTRICITY GENERATION FOSSIL FUEL RESOURCES (IN MTOE)1
KEY METRICS
Industrial sector (% of total GDP) 46.8 GDP per capita (PPP, USD); GDP Group 7,551 (C)
TPEP / TPEC (net energy importer) 0.91 Energy intensity (million BTU per USD) 0.03
Emission intensity (kg of CO2 per USD) 2.78 CO2 emissions (metric tons) per capita 5.78
Energy affordability (USD per kWh) 0.05 Population with access to electricity (%) 99.4
INDEX COMMENTARY
China maintains its position in the Index on rank 71. Energy security decreases due to a lower wholesale margin on gasoline and a slower reduction in energy consumption growth when compared to other countries due to China's continuing development and high economic growth; these trends are only partly offset by higher diversity of electricity production. China most struggles with environmental impact mitigation (rank 91) due to a very weak performance across all indicators, particularly in the quality of air and water. Improvements can also be seen in social equity driven by an increase in the quality and affordability of electricity supply. China experiences small drops in all three contextual dimensions, but remains in a strong economic position (rank 8).
1 Data for shale gas resources not available
79%
18%
1%
2%
Conventional thermal
Hydro
Other Renewables
Nuclear
80,150
2,466
47,600
2,657
0
10,000
20,000
30,000
40,000
50,000
60,000
70,000
80,000
90,000
Coal Oil Shale Oil Gas
INDEX RANK
71

COLOMBIA J
ENERGY SUSTAINABILITY BALANCE ENERGY SUSTAINABILITY INDEX RANKINGS
2010 2011 2012 Trend
Energy performance 32 26 24 + Energy security 18 6 5 + Social equity 61 59 56 + Environmental impact mitigation 33 33 34 -
Contextual performance 62 62 55 + Political strength 59 64 59 + Societal strength 55 57 54 + Economic strength 65 58 51 +
Overall rank 37 32 33 -
DIVERSITY OF ELECTRICITY GENERATION FOSSIL FUEL RESOURCES (IN MTOE)1
KEY METRICS
Industrial sector (% of total GDP) 37.6 GDP per capita (PPP, USD); GDP Group 9,585 (C)
TPEP / TPEC (net energy exporter) 3.13 Energy intensity (million BTU per USD) 0.01
Emission intensity (kg of CO2 per USD) 0.64 CO2 emissions (metric tons) per capita 1.65
Energy affordability (USD per kWh) 0.11 Population with access to electricity (%) 93.6
INDEX COMMENTARY
Colombia experiences a decline in the Index by one place. This is mostly due to a slightly weaker environmental performance driven by an increase in CO2 emission from electricity and heat generation as well as a slower decrease in emissions intensity per capita compared to peer countries. This could not be entirely offset by a better relative performance in the quality of air and water. Slight improvements were made in social equity (rank 56), but Colombia still struggles to provide full access to electricity for its entire population (7% without access). Performance in energy security remained very strong with well diversified electricity production and exports as well as a strong, increasing wholesale margin on gasoline. Colombia also achieved slight improvements in all contextual dimensions.
TRENDS AND OUTLOOK
Colombia, although relatively high positioned in the Index, still faces major challenges, such as expanding coverage of energy services, and finding solutions based on non-conventional energies, improving quality and reliability of energy services, diversification of the energy mix, and sustaining the positive economic development without increasing CO2 emissions.
Main areas policymakers are focusing on are: 1) ensuring the continued development of the mining and energy sector as one of the main drivers of economic growth and social development; 2) the promotion of energy efficiency on energy demand and supply side, and consolidate a culture for sustainable use of natural resources; 3) strengthening the participation of different stakeholders in the development phases of the industry; 4) increasing exploration of natural gas; 5) developing and implementing efficient mass transportation systems; 6) ensuring the expansion of electricity generation capacity; and 7) strengthening guarantees and investment opportunities in the country, and boosting investment in science and technology applied to energy sector.
Furthermore, Colombia was an active participant at the Rio+20 summit, and is committed to continue this effort in setting the objectives of sustainable development, seeking food security, protection of water sources, promoting the use of renewable energy, sustainable city development, protection of the oceans, and increasing employment to reduce poverty.
1 Data for shale gas resources not available
28%
71%
1%
Conventional thermal
Hydro
Other Renewables
Nuclear4,722
226 0 1070
2,500
5,000
7,500
10,000
12,500
15,000
Coal Oil Shale Oil Gas
INDEX RANK
33

CONGO (DEMOCRATIC REPUBLIC)
ENERGY SUSTAINABILITY BALANCE ENERGY SUSTAINABILITY INDEX RANKINGS
2010 2011 2012 Trend
Energy performance 74 64 55 + Energy security 51 30 26 + Social equity 88 89 91 - Environmental impact mitigation 52 51 47 + Contextual performance 91 92 94 - Political strength 91 92 94 - Societal strength 91 92 94 - Economic strength 85 81 88 -
Overall rank 83 77 69 +
DIVERSITY OF ELECTRICITY GENERATION FOSSIL FUEL RESOURCES (IN MTOE)
KEY METRICS
Industrial sector (% of total GDP) 70.7 GDP per capita (PPP, USD); GDP Group 328 (D)
TPEP / TPEC (net energy exporter) 1.18 Energy intensity (million BTU per USD) 0.01
Emission intensity (kg of CO2 per USD) 0.32 CO2 emissions (metric tons) per capita 0.13
Energy affordability (USD per kWh) n.a. Population with access to electricity (%) 30.0
INDEX COMMENTARY
The Congo (Democratic Republic) improves by eight places in the Index to rank 69. Environmental performance slightly increases due to the maintaining of low CO2 emissions in electricity and heat generation relative to peer countries. The weak performance in social equity further deteriorates (rank 91) with changes for the worse across all indicators and still only 30% of the population having access to electricity. A rise in energy security is driven by more diversified electricity production which outweighs the decrease in the wholesale margin on gasoline. The positive energy consumption growth, necessary for the economic and social development of the Congo (Democratic Republic), presents a challenge for the energy security dimension. The country scores very poorly across all indicators in the contextual dimensions. It now occupies the last rank in the political and social dimension and ranks only slightly better in economic strength (rank 88).
35%
65%
Conventional thermal
Hydro
Other Renewables
Nuclear
62 25
14,310
10
2,500
5,000
7,500
10,000
12,500
15,000
Coal Oil Shale Oil Gas
INDEX RANK
69

CÔTE D'IVOIRE J
ENERGY SUSTAINABILITY BALANCE ENERGY SUSTAINABILITY INDEX RANKINGS
2010 2011 2012 Trend
Energy performance 70 60 59 + Energy security 42 3 30 - Social equity 77 85 85 Environmental impact mitigation 65 77 56 + Contextual performance 89 87 89 - Political strength 90 90 90 Societal strength 90 91 90 + Economic strength 78 78 83 -
Overall rank 81 74 70 +
DIVERSITY OF ELECTRICITY GENERATION FOSSIL FUEL RESOURCES (IN MTOE)
KEY METRICS
Industrial sector (% of total GDP) 21.0 GDP per capita (PPP, USD); GDP Group 1,683 (D)
TPEP / TPEC (net energy exporter) 1.55 Energy intensity (million BTU per USD) 0.03
Emission intensity (kg of CO2 per USD) 1.36 CO2 emissions (metric tons) per capita 0.64
Energy affordability (USD per kWh) n.a. Population with access to electricity (%) 47.3
INDEX COMMENTARY
The Côte d’Ivoire increases by four places in the Index to rank 70. Energy security performance overall is good due a very strong ratio of production to total energy supply and well diversified energy exports. The recent drop in this dimension is driven by a decrease of the wholesale margin on gasoline, less diversified electricity production and a further increase in the positive 5-year energy consumption growth rate. The consumption increase is however necessary for the country's economic and social development and to increase the weak performance in social equity (rank 85) with only 47% of the population having access to electricity. An increase in environmental performance was driven by less CO2 emissions from electricity and heat generation and improvements in the air and water quality when compared to peer countries. Performance across all indicators measuring political and societal strength is very weak and showed little improvement over the last year. Economic performance is slightly better due to a relatively low cost of living as proportion of household consumption expenditure, but credit availability and macroeconomic stability remain low.
62%
38%
Conventional thermal
Hydro
Other Renewables
Nuclear
0 64
0
36
0
500
1,000
1,500
2,000
2,500
Coal Oil Shale Oil Gas
INDEX RANK
70

CROATIA
ENERGY SUSTAINABILITY BALANCE ENERGY SUSTAINABILITY INDEX RANKINGS
2010 2011 2012 Trend
Energy performance 40 13 17 -
Energy security 76 11 14 -
Social equity 29 32 33 -
Environmental impact mitigation 25 26 26
Contextual performance 48 50 54 -
Political strength 39 39 39
Societal strength 43 41 40 + Economic strength 61 66 77 -
Overall rank 40 17 24 -
DIVERSITY OF ELECTRICITY GENERATION FOSSIL FUEL RESOURCES (IN MTOE)
KEY METRICS
Industrial sector (% of total GDP) 25.5 GDP per capita (PPP, USD); GDP Group 17,819 (B)
TPEP / TPEC (net energy importer) 0.45 Energy intensity (million BTU per USD) 0.02
Emission intensity (kg of CO2 per USD) 1.30 CO2 emissions (metric tons) per capita 4.88
Energy affordability (USD per kWh) 0.10 Population with access to electricity (%) 100.0
INDEX COMMENTARY
Croatia overall drops seven places in the Index to rank 24. Slight deteriorations can be observed in all energy dimensions. Decreases in energy consumption are slower than in peer countries, leading to a drop in energy security, which is partly offset by stronger oil reserve stocks. Environmental impact mitigation remains constant as higher energy and emissions intensity per GDP per capita and a lower quality of air and water are offset by reductions in emissions from electricity and heat generation. Croatia's weak economic situation further deteriorates by eleven places (rank 77) due to less macroeconomic stability. Performance in social equity, political and societal strength remains relatively constant.
44%
55%
1%
Conventional thermal
Hydro
Other Renewables
Nuclear
0 100
31
0
500
1,000
1,500
2,000
2,500
Coal Oil Shale Oil Gas
INDEX RANK
24

CYPRUS J
ENERGY SUSTAINABILITY BALANCE ENERGY SUSTAINABILITY INDEX RANKINGS
2010 2011 2012 Trend
Energy performance 62 67 64 + Energy security 89 90 91 - Social equity 28 28 29 - Environmental impact mitigation 54 59 63 -
Contextual performance 27 25 23 + Political strength 26 26 23 + Societal strength 21 23 25 - Economic strength 41 28 28
Overall rank 48 51 49 +
DIVERSITY OF ELECTRICITY GENERATION FOSSIL FUEL RESOURCES (IN MTOE)
KEY METRICS
Industrial sector (% of total GDP) 16.5 GDP per capita (PPP, USD); GDP Group 28,782 (B)
TPEP / TPEC (net energy importer) 0.00 Energy intensity (million BTU per USD) 0.03
Emission intensity (kg of CO2 per USD) 2.20 CO2 emissions (metric tons) per capita 11.73
Energy affordability (USD per kWh) n.a. Population with access to electricity (%) 100.0
INDEX COMMENTARY
Cyprus increases by two places in the Index. Energy security is overall very weak (rank 91) due to a weak ratio of production to total energy supply, low diversity of electricity production and a low wholesale margin on gasoline. A decrease of the latter caused the small drop in energy security during the last year. Environmental performance struggles with high emissions per capita and from electricity and heat generation as well as a poor quality of air and water. Performance in social equity and the contextual dimensions remains mostly constant. Political strength increases with improvements across all indicators. A better credit availability supports economic strength overall, however costs of living as proportion of total household consumption expenditure are fairly high and macroeconomic stability is low.
98%
2%
Conventional thermal
Hydro
Other Renewables
Nuclear
0 0 0 00
500
1,000
1,500
2,000
2,500
Coal Oil Shale Oil Gas
INDEX RANK
49

CZECH REPUBLIC
ENERGY SUSTAINABILITY BALANCE ENERGY SUSTAINABILITY INDEX RANKINGS
2010 2011 2012 Trend
Energy performance 19 25 31 -
Energy security 14 38 15 + Social equity 26 27 32 -
Environmental impact mitigation 46 32 61 -
Contextual performance 35 31 32 -
Political strength 24 18 18
Societal strength 30 29 29
Economic strength 64 60 59 +
Overall rank 22 26 29 -
DIVERSITY OF ELECTRICITY GENERATION FOSSIL FUEL RESOURCES (IN MTOE)
KEY METRICS
Industrial sector (% of total GDP) 38.1 GDP per capita (PPP, USD); GDP Group 26,122 (B)
TPEP / TPEC (net energy importer) 0.66 Energy intensity (million BTU per USD) 0.02
Emission intensity (kg of CO2 per USD) 1.26 CO2 emissions (metric tons) per capita 9.07
Energy affordability (USD per kWh) 0.19 Population with access to electricity (%) 100.0
INDEX COMMENTARY
The Czech Republic drops by three places in the Index ranking with up and down movements in different dimensions. It shows close to no changes in its contextual dimensions, among which economic strength is weakest (rank 59). Substantial improvements in energy security are driven by an increase of the wholesale margin on gasoline and a decrease of energy consumption, reversing last year's positive growth rate. Environmental performance decreases substantially despite a decrease in energy intensity per capita, as the Czech Republic underperforms in mitigating its environmental footprint when compared to peer countries with a similar level of energy intensity.
TRENDS AND OUTLOOK
The most recent policy development is the completion of the update of the national energy policy “State Energy Concept of the Czech Republic – SEK”, which is expected to undergo public review by technical experts and professionals and subsequently considered by the Government by the end of 2012. The policy is based on the following pillars: 1) construction of new electricity generation units in the existing sites of nuclear power plants; 2) gradual transition from largely extracted lignite deposits towards natural gas and renewable energy sources as the main sources for electricity and heat production; however, domestic coal remains a stable segment of the country´s energy mix (decrease from today´s 45% to a perspective of less than 20% in the coming decades); 3) medium-term stabilizing of combined heat and power (CHP), provision of coal / fuels for central heating; 4) significant efficiency increase in energy production sector and reaching considerable economies in use of all kinds of energy; and 5) reconstruction and development of network infrastructure (electricity, gas) to ensure system integration of decentralised production, operational reliability, as well as ancillary and transit services.
Key issues to be considered by policymakers are 1) diversification of imported fuels (oil, gas) and enlargement of transport routes and capacities; 2) acceleration and simplification of project administrative approval and permitting procedures for modernising and new constructions of energy infrastructure; and 3) strengthening international cooperation in the process implementing EU Internal Energy Markets and, creating common regional markets, especially for electricity and gas.
60%
3%
4%
33%
Conventional thermal
Hydro
Other Renewables
Nuclear770
20
3
0
500
1,000
1,500
2,000
2,500
Coal Oil Shale Oil Gas
INDEX RANK
29
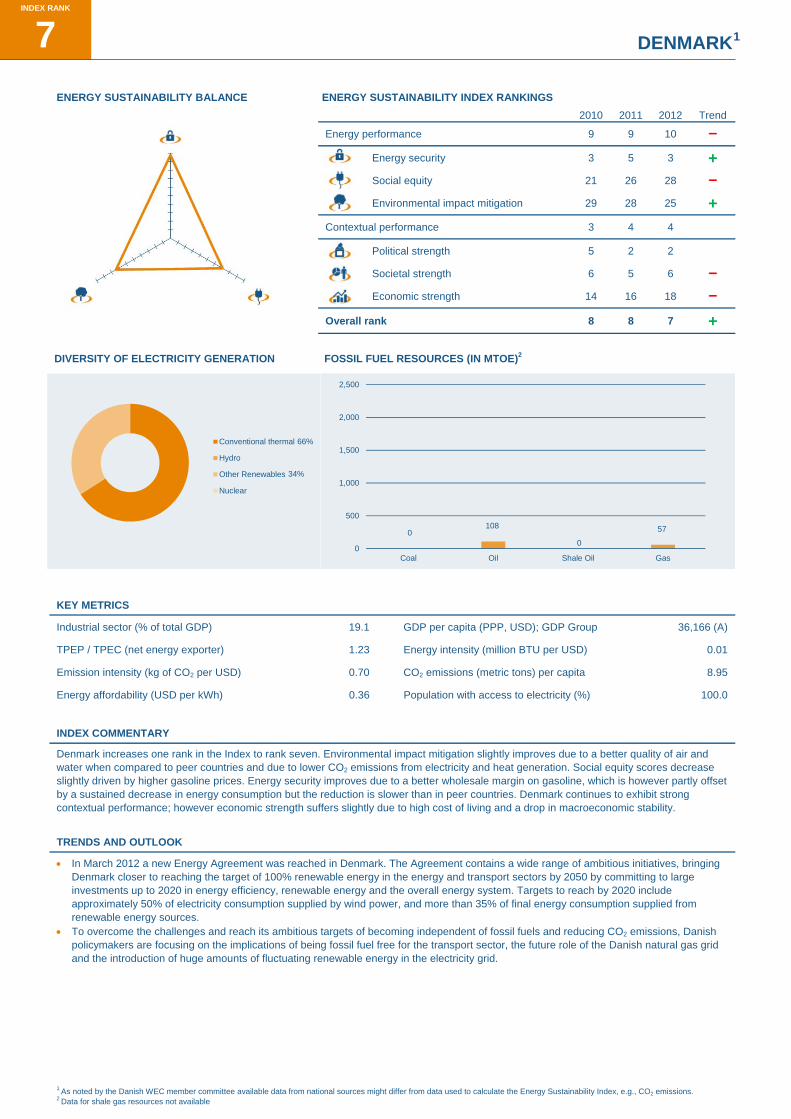
DENMARK 1 J
ENERGY SUSTAINABILITY BALANCE ENERGY SUSTAINABILITY INDEX RANKINGS
2010 2011 2012 Trend
Energy performance 9 9 10 -
Energy security 3 5 3 + Social equity 21 26 28 -
Environmental impact mitigation 29 28 25 + Contextual performance 3 4 4
Political strength 5 2 2
Societal strength 6 5 6 -
Economic strength 14 16 18 -
Overall rank 8 8 7 +
DIVERSITY OF ELECTRICITY GENERATION FOSSIL FUEL RESOURCES (IN MTOE)2
KEY METRICS
Industrial sector (% of total GDP) 19.1 GDP per capita (PPP, USD); GDP Group 36,166 (A)
TPEP / TPEC (net energy exporter) 1.23 Energy intensity (million BTU per USD) 0.01
Emission intensity (kg of CO2 per USD) 0.70 CO2 emissions (metric tons) per capita 8.95
Energy affordability (USD per kWh) 0.36 Population with access to electricity (%) 100.0
INDEX COMMENTARY
Denmark increases one rank in the Index to rank seven. Environmental impact mitigation slightly improves due to a better quality of air and water when compared to peer countries and due to lower CO2 emissions from electricity and heat generation. Social equity scores decrease slightly driven by higher gasoline prices. Energy security improves due to a better wholesale margin on gasoline, which is however partly offset by a sustained decrease in energy consumption but the reduction is slower than in peer countries. Denmark continues to exhibit strong contextual performance; however economic strength suffers slightly due to high cost of living and a drop in macroeconomic stability.
TRENDS AND OUTLOOK
In March 2012 a new Energy Agreement was reached in Denmark. The Agreement contains a wide range of ambitious initiatives, bringing Denmark closer to reaching the target of 100% renewable energy in the energy and transport sectors by 2050 by committing to large investments up to 2020 in energy efficiency, renewable energy and the overall energy system. Targets to reach by 2020 include approximately 50% of electricity consumption supplied by wind power, and more than 35% of final energy consumption supplied from renewable energy sources.
To overcome the challenges and reach its ambitious targets of becoming independent of fossil fuels and reducing CO2 emissions, Danish policymakers are focusing on the implications of being fossil fuel free for the transport sector, the future role of the Danish natural gas grid and the introduction of huge amounts of fluctuating renewable energy in the electricity grid.
1 As noted by the Danish WEC member committee available data from national sources might differ from data used to calculate the Energy Sustainability Index, e.g., CO2 emissions. 2 Data for shale gas resources not available
66%
34%
Conventional thermal
Hydro
Other Renewables
Nuclear
0108
0
57
0
500
1,000
1,500
2,000
2,500
Coal Oil Shale Oil Gas
INDEX RANK
7
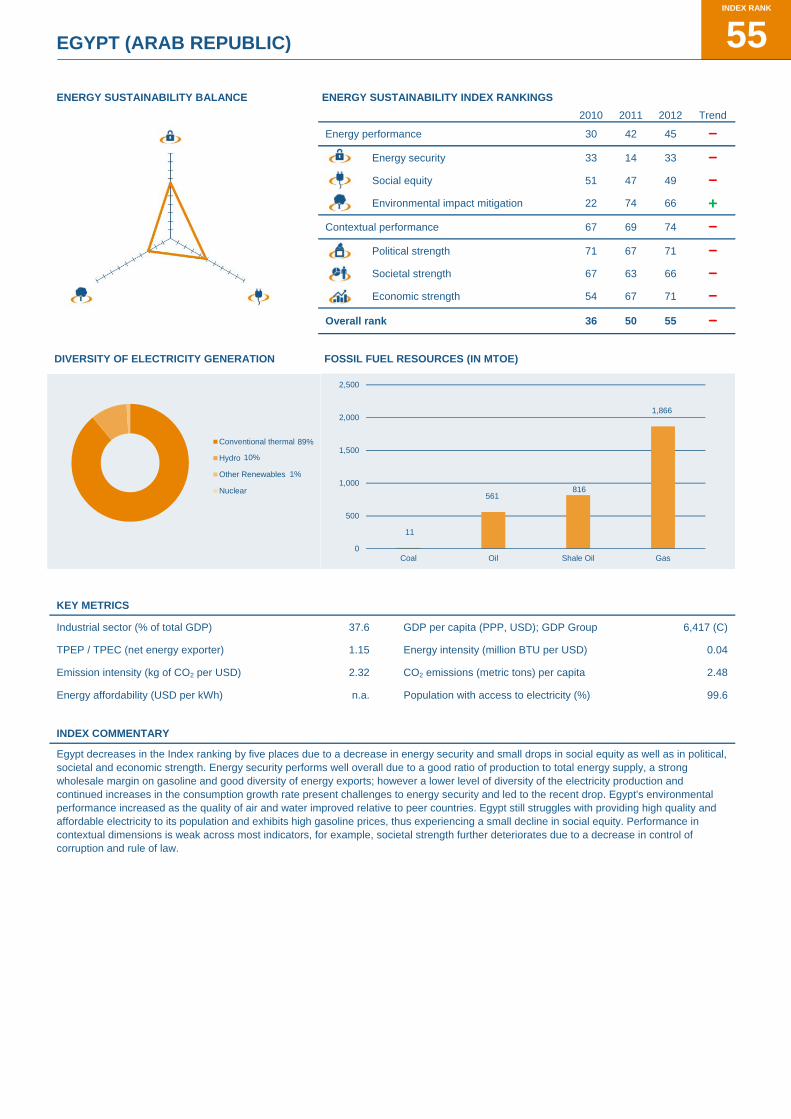
EGYPT (ARAB REPUBLIC)
ENERGY SUSTAINABILITY BALANCE ENERGY SUSTAINABILITY INDEX RANKINGS
2010 2011 2012 Trend
Energy performance 30 42 45 -
Energy security 33 14 33 -
Social equity 51 47 49 -
Environmental impact mitigation 22 74 66 + Contextual performance 67 69 74 -
Political strength 71 67 71 -
Societal strength 67 63 66 -
Economic strength 54 67 71 -
Overall rank 36 50 55 -
DIVERSITY OF ELECTRICITY GENERATION FOSSIL FUEL RESOURCES (IN MTOE)
KEY METRICS
Industrial sector (% of total GDP) 37.6 GDP per capita (PPP, USD); GDP Group 6,417 (C)
TPEP / TPEC (net energy exporter) 1.15 Energy intensity (million BTU per USD) 0.04
Emission intensity (kg of CO2 per USD) 2.32 CO2 emissions (metric tons) per capita 2.48
Energy affordability (USD per kWh) n.a. Population with access to electricity (%) 99.6
INDEX COMMENTARY
Egypt decreases in the Index ranking by five places due to a decrease in energy security and small drops in social equity as well as in political, societal and economic strength. Energy security performs well overall due to a good ratio of production to total energy supply, a strong wholesale margin on gasoline and good diversity of energy exports; however a lower level of diversity of the electricity production and continued increases in the consumption growth rate present challenges to energy security and led to the recent drop. Egypt's environmental performance increased as the quality of air and water improved relative to peer countries. Egypt still struggles with providing high quality and affordable electricity to its population and exhibits high gasoline prices, thus experiencing a small decline in social equity. Performance in contextual dimensions is weak across most indicators, for example, societal strength further deteriorates due to a decrease in control of corruption and rule of law.
89%
10%
1%
Conventional thermal
Hydro
Other Renewables
Nuclear
11
561816
1,866
0
500
1,000
1,500
2,000
2,500
Coal Oil Shale Oil Gas
INDEX RANK
55

ESTONIA J
ENERGY SUSTAINABILITY BALANCE ENERGY SUSTAINABILITY INDEX RANKINGS
2010 2011 2012 Trend
Energy performance 26 46 43 + Energy security 46 69 42 + Social equity 47 46 46
Environmental impact mitigation 5 29 50 -
Contextual performance 28 24 24
Political strength 23 21 22 -
Societal strength 29 30 28 + Economic strength 38 26 27 -
Overall rank 23 38 35 +
DIVERSITY OF ELECTRICITY GENERATION FOSSIL FUEL RESOURCES (IN MTOE)
KEY METRICS
Industrial sector (% of total GDP) 28.5 GDP per capita (PPP, USD); GDP Group 18,539 (B)
TPEP / TPEC (net energy importer) 0.63 Energy intensity (million BTU per USD) 0.04
Emission intensity (kg of CO2 per USD) 3.22 CO2 emissions (metric tons) per capita 13.05
Energy affordability (USD per kWh) n.a. Population with access to electricity (%) 100.0
INDEX COMMENTARY
Estonia rises in the Index by three places to rank 35. This was mainly triggered by significant improvements in energy security driven by a decrease in energy consumption, as well as a more diversified electricity production and an increased wholesale margin on gasoline. Environmental impact mitigation decreases due to a significant drop in the quality of air and water, which is partly offset by small improvements in CO2 emissions from electricity and heat generation. Estonia exhibits a constant performance in social equity and the contextual dimensions. Overall, Estonia performs better in all contextual dimensions; however, the 75/25 Index weighting regime means better contextual scores, both absolute and relative, have only limited impact while the country struggles with improving its energy performance.
TRENDS AND OUTLOOK
Estonia has over the last couple of years successfully worked on improving its security of energy supply by diversifying its energy imports, increasing the domestic electricity production capacity to exceed domestic demand and increasing the share of domestically produced liquid fuels and thereby its export capability. Estonia still struggles with environmental impact mitigation, mainly due to CO2 emissions from electricity production.
Recently, Estonia has had several excellent developments: 1) due to the increase of production of renewable energy, the government is now in a position to negotiate decreasing subsidies for renewable energy with the energy industry. In the first half of 2012 the share of renewable electricity production reached 20.4% of consumption; 2) new shale oil production units are being built, leading to less dependence on imports of petroleum products; and 3) regulated electricity prices will be completely abolished starting January 1, 2013 which is expected to lead a slight increase of electricity prices.
Key trends, which are expected to support Estonia’s moving up in the Index rankings are: 1) the continued increase of the share of renewable energy in the electricity production mix; 2) the building of new interconnections with neighbouring countries; and 3) the ability to satisfy most of its need for diesel fuel from refining shale oil. However, Estonian policymakers need to also focus on the other two aspects of the energy trilemma, environmental impact mitigation and social equity, while keeping energy security levels high.
93%
7%
Conventional thermal
Hydro
Other Renewables
Nuclear
0 0
2,494
0
0
500
1,000
1,500
2,000
2,500
Coal Oil Shale Oil Gas
INDEX RANK
35

ETHIOPIA
ENERGY SUSTAINABILITY BALANCE ENERGY SUSTAINABILITY INDEX RANKINGS
2010 2011 2012 Trend
Energy performance 91 89 85 + Energy security 87 89 94 -
Social equity 89 92 90 + Environmental impact mitigation 85 66 37 + Contextual performance 88 88 88
Political strength 84 85 85
Societal strength 80 85 86 -
Economic strength 87 90 79 +
Overall rank 91 92 89 +
DIVERSITY OF ELECTRICITY GENERATION FOSSIL FUEL RESOURCES (IN MTOE)
KEY METRICS
Industrial sector (% of total GDP) 13.0 GDP per capita (PPP, USD); GDP Group 1,019 (D)
TPEP / TPEC (net energy importer) 0.27 Energy intensity (million BTU per USD) 0.03
Emission intensity (kg of CO2 per USD) 1.69 CO2 emissions (metric tons) per capita 0.48
Energy affordability (USD per kWh) n.a. Population with access to electricity (%) 17.0
INDEX COMMENTARY
Ethiopia increases its position in the Index by three places to rank 89 due to improvements in environmental impact mitigation and economic strength. Environmental performance, Ethiopia's strongest performance, further increases due to a better quality of air and water and lower CO2 emissions from electricity and heat generation; however this is partly offset by higher energy and emissions intensity per GDP per capita. Low performance in social equity remains (rank 90) as only 17% of the population has access to electricity. Ethiopia now ranks last in energy security with a poor performance across all indicators. The recent downward trend was driven by a decrease in the wholesale margin on gasoline and by the increased, positive energy consumption growth rate, which is however necessary for Ethiopia's economic and social development. Poor performance across all indicators drives the rankings in the three contextual dimensions; however economic strength was improved by eleven positions due to stronger macroeconomic stability.
12%
87%
1%
Conventional thermal
Hydro
Other Renewables
Nuclear
0 0 0 220
500
1,000
1,500
2,000
2,500
Coal Oil Shale Oil Gas
INDEX RANK
89

FINLAND J
ENERGY SUSTAINABILITY BALANCE ENERGY SUSTAINABILITY INDEX RANKINGS
2010 2011 2012 Trend
Energy performance 5 2 5 -
Energy security 6 7 13 -
Social equity 15 14 14
Environmental impact mitigation 15 6 6
Contextual performance 7 5 8 -
Political strength 2 1 1
Societal strength 5 2 3 -
Economic strength 25 23 29 -
Overall rank 4 2 5 -
DIVERSITY OF ELECTRICITY GENERATION FOSSIL FUEL RESOURCES (IN MTOE)
KEY METRICS
Industrial sector (% of total GDP) 29.2 GDP per capita (PPP, USD); GDP Group 34,661 (A)
TPEP / TPEC (net energy importer) 0.37 Energy intensity (million BTU per USD) 0.02
Emission intensity (kg of CO2 per USD) 0.75 CO2 emissions (metric tons) per capita 9.70
Energy affordability (USD per kWh) 0.18 Population with access to electricity (%) 100.0
INDEX COMMENTARY
Finland's slight drop from rank two to five in the Index is caused by slight drops across most energy and contextual dimensions. While social equity and environmental impact mitigation scores remain constant, Finland's energy security score suffers from a slower decrease in the energy consumption growth compared to other countries and a deterioration in the ratio of production to total energy supply; these negative trends are however tempered by an increase in the wholesale margin on gasoline. Finland continues to perform strongly across all political and social indicators. Due to high cost of living, economic strength is Finland's weakest dimension and it experiences a further decrease of six spots in this dimension because improvements in cost of living, macroeconomic stability and credit availability are slower than its peer countries.
TRENDS AND OUTLOOK
Even though Finland’s electricity fuel mix still shows a large share of conventional thermal power generation, it has to be noted that three-quarters of that figure is combined heat and power production. This should not be viewed as conventional as it reaches efficiency ratios up to two times compared to conventional thermal generation.
Recent energy policy developments in Finland include: 1) a proposal to introduce a windfall tax which will make hydro and nuclear energy less competitive; 2) streamlining the approval of wind farms; and 3) tax hikes on fossil fuels in heat generation (mainly affects light fuel oil in domestic heating and other fossil fuels in District heating and industrial cogeneration) which will increase costs but also ‘clean’ the fuel mix.
A number of policies are under discussion including: 1) an ambition to completely phase out coal by 2025; 2) limiting the use of peat, a domestic biofuel which is not categorised as a renewable; and 3) limitation of oil consumption and support for electric mobility.
41%
17%
14%
28%
Conventional thermal
Hydro
Other Renewables
Nuclear
0 0 0 00
500
1,000
1,500
2,000
2,500
Coal Oil Shale Oil Gas
INDEX RANK
5

FRANCE
ENERGY SUSTAINABILITY BALANCE ENERGY SUSTAINABILITY INDEX RANKINGS
2010 2011 2012 Trend
Energy performance 4 5 8 -
Energy security 21 29 29
Social equity 6 10 8 + Environmental impact mitigation 3 3 4 -
Contextual performance 23 20 27 -
Political strength 21 22 20 + Societal strength 14 13 16 -
Economic strength 36 34 49 -
Overall rank 6 7 9 -
DIVERSITY OF ELECTRICITY GENERATION FOSSIL FUEL RESOURCES (IN MTOE)1
KEY METRICS
Industrial sector (% of total GDP) 18.8 GDP per capita (PPP, USD); GDP Group 33,997 (A)
TPEP / TPEC (net energy importer) 0.45 Energy intensity (million BTU per USD) 0.02
Emission intensity (kg of CO2 per USD) 0.81 CO2 emissions (metric tons) per capita 6.32
Energy affordability (USD per kWh) 0.16 Population with access to electricity (%) 100.0
INDEX COMMENTARY
France drops by two places in the Index with a very high performance in social equity, environmental impact mitigation and a steady, although slightly less strong position in energy security. Environmental performance is driven by good quality of air and water and low emissions intensity on a per capita basis and in electricity and heat generation. Energy intensity per capita remains on a relatively high level. While France performs well in all social equity indicators, its energy security score is mainly supported by highly diversified electricity production and a continuous decrease in energy consumption. France's slight drop from rank seven to nine in the Index is driven by a substantial decrease in its economic performance due to less macroeconomic stability as well as a small decrease in political strength.
1 Data for shale gas resources not available
10%
11%
3%
76%
Conventional thermal
Hydro
Other Renewables
Nuclear
0 14
1,002
6
0
500
1,000
1,500
2,000
2,500
Coal Oil Shale Oil Gas
INDEX RANK
9

GABON J
ENERGY SUSTAINABILITY BALANCE ENERGY SUSTAINABILITY INDEX RANKINGS
2010 2011 2012 Trend
Energy performance - 61 46 + Energy security - 10 21 -
Social equity - 77 78 -
Environmental impact mitigation - 79 52 + Contextual performance - 86 87 -
Political strength - 73 70 + Societal strength - 80 77 + Economic strength - 91 94 -
Overall rank - 73 59 +
DIVERSITY OF ELECTRICITY GENERATION FOSSIL FUEL RESOURCES (IN MTOE)
KEY METRICS
Industrial sector (% of total GDP) 54.4 GDP per capita (PPP, USD); GDP Group 15,197 (B)
TPEP / TPEC (net energy exporter) 11.72 Energy intensity (million BTU per USD) 0.01
Emission intensity (kg of CO2 per USD) 0.55 CO2 emissions (metric tons) per capita 8.32
Energy affordability (USD per kWh) n.a. Population with access to electricity (%) 36.7
INDEX COMMENTARY
Gabon rises fourteen ranks in the Index overall. Performance in energy security is strong due to a good ratio of energy production to total energy supply and a relatively strong diversity of electricity production. The 5-year energy consumption growth rate is a challenge for energy security, but necessary for Gabon's economic and social development as only 37% of Gabon's population has access to electricity. This also explains the weak performance in social equity. Due to low energy intensity, Gabon has a low environmental impact. An increase in this dimension was driven by lower emissions intensity per capita, lower CO2 emission from electricity and heat generation and an improvement in the quality of air and water when compared to peer countries. Gabon's contextual performance is rather weak across all indicators. Political strength increased slightly due to small improvements in political stability and an increase in control of corruption led to improvements in societal strength. However, a further decrease in credit availability and relatively high costs of living as proportion of household consumption expenditure led to the poor performance in economic strength. Data to measure the macroeconomic stability indicator is missing for Gabon.
45%
55%
Conventional thermal
Hydro
Other Renewables
Nuclear
0
504
025
0
500
1,000
1,500
2,000
2,500
Coal Oil Shale Oil Gas
INDEX RANK
59

GERMANY
ENERGY SUSTAINABILITY BALANCE ENERGY SUSTAINABILITY INDEX RANKINGS
2010 2011 2012 Trend
Energy performance 21 14 14
Energy security 10 13 11 + Social equity 14 12 11 + Environmental impact mitigation 63 44 41 + Contextual performance 15 12 12
Political strength 14 15 14 + Societal strength 17 17 13 + Economic strength 21 19 19
Overall rank 18 10 11 -
DIVERSITY OF ELECTRICITY GENERATION FOSSIL FUEL RESOURCES (IN MTOE)1
KEY METRICS
Industrial sector (% of total GDP) 28.6 GDP per capita (PPP, USD); GDP Group 36,013 (A)
TPEP / TPEC (net energy importer) 0.35 Energy intensity (million BTU per USD) 0.01
Emission intensity (kg of CO2 per USD) 0.83 CO2 emissions (metric tons) per capita 9.36
Energy affordability (USD per kWh) 0.32 Population with access to electricity (%) 100.0
INDEX COMMENTARY
Germany showed a very stable and overall strong performance across all dimensions and drops by one place in the Index. Despite small improvements since last year, environmental performance remains weak (rank 41) with relatively high energy and emissions intensity per GDP per capita and high CO2 emissions from electricity and heat generation. Slight improvements can be noted in energy security due to an increased wholesale margin on gasoline and increase of its oil reserve stocks. Better results in social equity are driven by an improvement in the quality and affordability of electricity supply. An improvement in societal strength is supported by a rise in the education indicator.
TRENDS AND OUTLOOK
The most recent policy development in Germany, initiated before 2010, is the German Energy Transition. The goal of the German Energy Transition of 2011 is a strong increase in power generation from renewable sources, a reduction of primary energy usage and CO2 emissions. Furthermore, following the accidient in Fukushima (Japan) in March 2011, the government made the decision to completely abandon the use of nuclear power by 2022. Eight out of 17 facilities were closed immediately, while the remaining nine nuclear power plants will be phased out gradually to ensure system stability. However, the decision to phase-out nuclear by 2022 constitutes a challenge to Germany’s energy mix.
To achieve the increase in power generation from renewable sources, the Renewable Energy Law (EEG) guarantees a fixed price independent of demand and supply for renewable power plants. The law first came into effect in 2000 with revisions in 2006, 2008, and 2012. Even though there are visible successes, the law is disabling free market mechanisms as it allows the sector to rely on subsidies rather than encouraging competition for innovative, efficient and inexpensive technologies. Investors are reluctant to invest in new conventional power plants, which still will be needed to secure future energy demand.
Subsidies for renewable energy and investments in grid infrastructure to integrate the increasing amounts of volatile renewable energy into the system have led and will continue to lead to higher electricity prices. Policymakers must set the right framework towards a free and efficient European electricity market to limit the burden.
Furthermore, the European emission trading systems is an important tool to tackle climate goals. With a European effort in energy politics, particularly when it comes to future market designs, investments in conventional power plants could be enabled to ensure security of energy supply.
1 Data for shale gas resources not available
59%
3%
15%
23%
Conventional thermal
Hydro
Other Renewables
Nuclear
28,489
16286
1080
10,000
20,000
30,000
40,000
50,000
Coal Oil Shale Oil Gas
INDEX RANK
11

GHANA J
ENERGY SUSTAINABILITY BALANCE ENERGY SUSTAINABILITY INDEX RANKINGS
2010 2011 2012 Trend
Energy performance 75 78 80 -
Energy security 60 79 88 -
Social equity 79 80 81 -
Environmental impact mitigation 53 38 39 -
Contextual performance 76 72 75 -
Political strength 52 51 50 + Societal strength 68 66 65 + Economic strength 89 88 93 -
Overall rank 76 80 81 -
DIVERSITY OF ELECTRICITY GENERATION FOSSIL FUEL RESOURCES (IN MTOE)
KEY METRICS
Industrial sector (% of total GDP) 21.0 GDP per capita (PPP, USD); GDP Group 2,725 (D)
TPEP / TPEC (net energy importer) 0.43 Energy intensity (million BTU per USD) 0.02
Emission intensity (kg of CO2 per USD) 1.02 CO2 emissions (metric tons) per capita 0.57
Energy affordability (USD per kWh) n.a. Population with access to electricity (%) 60.5
INDEX COMMENTARY
Ghana decreases by one position to rank 81 in the Index. The energy security rank overall is supported by a relatively good ratio of production to total electricity supply and a good diversity of electricity production. The decrease in energy security during the last year was driven by further decreases in the weakest indicators: the low wholesale margin on gasoline further decreased and the positive 5-year energy consumption growth rate increased. The latter is however necessary for Ghana's economic and social development, as only 61% of the population have access to electricity, leading to low social equity scores. Environmental performance overall is strong due to a very low emissions intensity per capita and low CO2 emissions from heat and electricity generation. Ghana outperforms countries with similar levels of energy intensity per capita in mitigating its environmental impact, but it does so less than a year ago. Political and societal performance remains relatively stable. Economic strength is Ghana's weakest dimension due to very low credit availability and low macroeconomic stability.
22%
78%
Conventional thermal
Hydro
Other Renewables
Nuclear
0 20
21
0
500
1,000
1,500
2,000
2,500
Coal Oil Shale Oil Gas
INDEX RANK
81

GREECE
ENERGY SUSTAINABILITY BALANCE ENERGY SUSTAINABILITY INDEX RANKINGS
2010 2011 2012 Trend
Energy performance 46 58 44 + Energy security 50 63 43 + Social equity 10 16 23 -
Environmental impact mitigation 86 83 76 + Contextual performance 34 40 39 + Political strength 38 41 41
Societal strength 34 36 36
Economic strength 45 47 47
Overall rank 44 52 42 +
DIVERSITY OF ELECTRICITY GENERATION FOSSIL FUEL RESOURCES (IN MTOE)
KEY METRICS
Industrial sector (% of total GDP) 17.9 GDP per capita (PPP, USD); GDP Group 27,668 (B)
TPEP / TPEC (net energy importer) 0.29 Energy intensity (million BTU per USD) 0.03
Emission intensity (kg of CO2 per USD) 1.87 CO2 emissions (metric tons) per capita 8.98
Energy affordability (USD per kWh) 0.16 Population with access to electricity (%) 100.0
INDEX COMMENTARY
Greece increases its Index ranking by ten places to rank 42, mostly due to stronger energy security. This was driven by an improvement across all indicators except the oil stock reserves which decreased slightly. Generally, the ratio of production to total energy supply remains the weakest indicator in this dimension. Greece continues to perform well in social equity but experiences a small decline in the quality and affordability of its electricity supply. An improvement in the environmental ranking is driven by a lower CO2 emission from electricity and heat generation, while performance in other indicators. However, in spite of substantial increases in energy intensity per capita, Greece seems to perform slightly better than last year in mitigating its environmental impact when compared to countries with similar levels of energy intensity. Contextual performance is overall constant.
85%
11%
4%
Conventional thermal
Hydro
Other Renewables
Nuclear
2,114
1 0 20
500
1,000
1,500
2,000
2,500
Coal Oil Shale Oil Gas
INDEX RANK
42

HONG KONG, CHINA J
ENERGY SUSTAINABILITY BALANCE ENERGY SUSTAINABILITY INDEX RANKINGS
2010 2011 2012 Trend
Energy performance 55 50 49 + Energy security 77 66 76 -
Social equity 32 29 30 -
Environmental impact mitigation 49 60 49 + Contextual performance 2 3 2 + Political strength 3 7 9 -
Societal strength 12 14 11 + Economic strength 3 1 1
Overall rank 32 35 34 +
DIVERSITY OF ELECTRICITY GENERATION FOSSIL FUEL RESOURCES (IN MTOE)
KEY METRICS
Industrial sector (% of total GDP) 6.8 GDP per capita (PPP, USD); GDP Group 46,128 (A)
TPEP / TPEC (net energy importer) 0.00 Energy intensity (million BTU per USD) 0.06
Emission intensity (kg of CO2 per USD) 5.05 CO2 emissions (metric tons) per capita 12.11
Energy affordability (USD per kWh) n.a. Population with access to electricity (%) 100.0
INDEX COMMENTARY
Hong Kong's Index ranking increases by one place which is mostly due to a better environmental performance. Hong Kong has a very high and increasing level of energy intensity per capita but is able to outperform peer countries in mitigating its environmental impact. Hong Kong's weak energy security is due to a very low ratio of production to total energy supply and low diversity of electricity production. However, the ranking drop was driven by a decrease in the wholesale margin on gasoline and a decrease in the 5-year energy consumption growth rate which was reduced, but slower than in other countries. Performance in social equity is mostly constant and Hong Kong maintained its strong performance across all contextual indicators and dimensions.
100%Conventional thermal
Hydro
Other Renewables
Nuclear
0 0 0 00
500
1,000
1,500
2,000
2,500
Coal Oil Shale Oil Gas
INDEX RANK
34
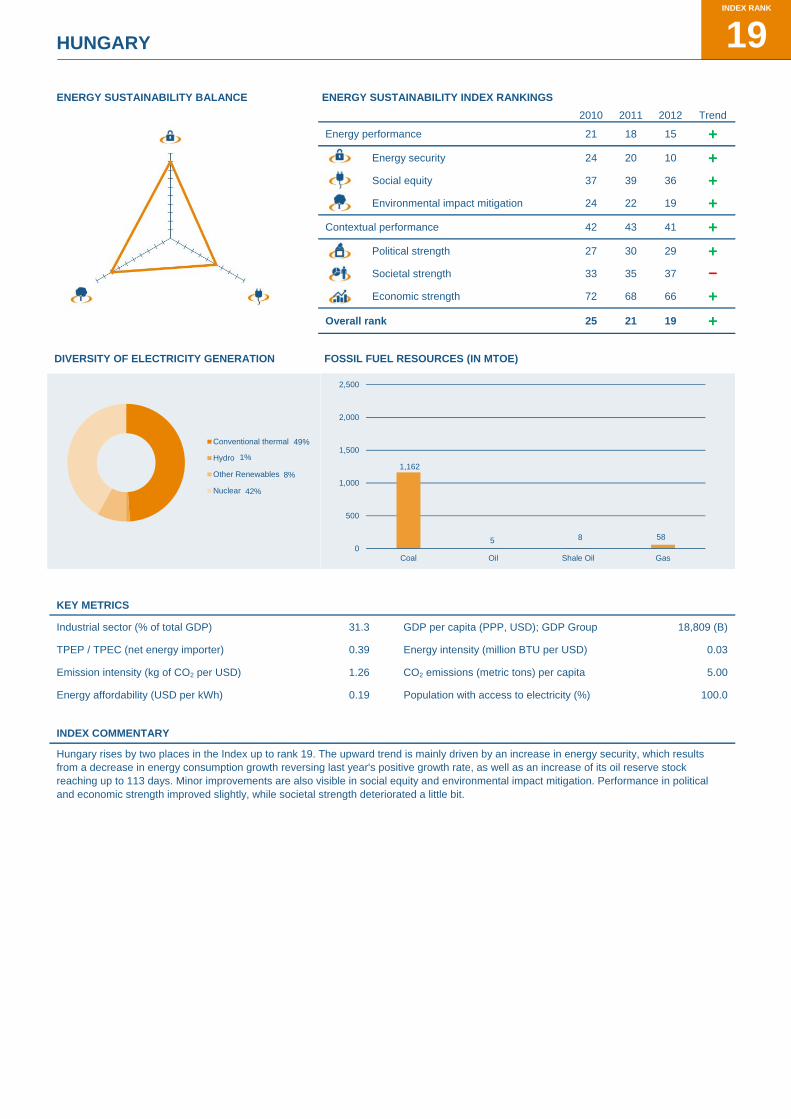
HUNGARY
ENERGY SUSTAINABILITY BALANCE ENERGY SUSTAINABILITY INDEX RANKINGS
2010 2011 2012 Trend
Energy performance 21 18 15 + Energy security 24 20 10 + Social equity 37 39 36 + Environmental impact mitigation 24 22 19 + Contextual performance 42 43 41 + Political strength 27 30 29 + Societal strength 33 35 37 - Economic strength 72 68 66 +
Overall rank 25 21 19 +
DIVERSITY OF ELECTRICITY GENERATION FOSSIL FUEL RESOURCES (IN MTOE)
KEY METRICS
Industrial sector (% of total GDP) 31.3 GDP per capita (PPP, USD); GDP Group 18,809 (B)
TPEP / TPEC (net energy importer) 0.39 Energy intensity (million BTU per USD) 0.03
Emission intensity (kg of CO2 per USD) 1.26 CO2 emissions (metric tons) per capita 5.00
Energy affordability (USD per kWh) 0.19 Population with access to electricity (%) 100.0
INDEX COMMENTARY
Hungary rises by two places in the Index up to rank 19. The upward trend is mainly driven by an increase in energy security, which results from a decrease in energy consumption growth reversing last year's positive growth rate, as well as an increase of its oil reserve stock reaching up to 113 days. Minor improvements are also visible in social equity and environmental impact mitigation. Performance in political and economic strength improved slightly, while societal strength deteriorated a little bit.
49%
1%
8%
42%
Conventional thermal
Hydro
Other Renewables
Nuclear
1,162
5 8 58
0
500
1,000
1,500
2,000
2,500
Coal Oil Shale Oil Gas
INDEX RANK
19

ICELAND J
ENERGY SUSTAINABILITY BALANCE ENERGY SUSTAINABILITY INDEX RANKINGS
2010 2011 2012 Trend
Energy performance 14 16 25 -
Energy security 49 55 71 -
Social equity 16 19 21 -
Environmental impact mitigation 1 2 3 -
Contextual performance 30 30 25 + Political strength 16 14 15 -
Societal strength 1 4 7 -
Economic strength 79 83 57 +
Overall rank 15 14 23 -
DIVERSITY OF ELECTRICITY GENERATION FOSSIL FUEL RESOURCES (IN MTOE)
KEY METRICS
Industrial sector (% of total GDP) 24.7 GDP per capita (PPP, USD); GDP Group 36,535 (A)
TPEP / TPEC (net energy importer) 0.78 Energy intensity (million BTU per USD) 0.07
Emission intensity (kg of CO2 per USD) 1.10 CO2 emissions (metric tons) per capita 10.56
Energy affordability (USD per kWh) n.a. Population with access to electricity (%) 100.0
INDEX COMMENTARY
Iceland drops nine places down to rank 23 in the Index due to a weaker performance in energy security which was driven by a decrease in the wholesale margin on gasoline and a slightly lower ratio of production to total energy supply. Not reliant on fossil fuels Iceland has a strong environmental performance. A small drop in social equity is visible as Iceland made slower progress than its peer countries in improving the quality and affordability of electricity. Iceland's weak economic position improved by 22 places, mainly due to stronger macroeconomic stability.
74%
26%
Conventional thermal
Hydro
Other Renewables
Nuclear
0 0 0 00
500
1,000
1,500
2,000
2,500
Coal Oil Shale Oil Gas
INDEX RANK
23

INDIA
ENERGY SUSTAINABILITY BALANCE ENERGY SUSTAINABILITY INDEX RANKINGS
2010 2011 2012 Trend
Energy performance 86 92 94 -
Energy security 57 84 87 -
Social equity 80 84 82 + Environmental impact mitigation 87 86 93 -
Contextual performance 55 56 64 -
Political strength 67 68 73 -
Societal strength 60 64 67 -
Economic strength 42 39 42 -
Overall rank 84 89 93 -
DIVERSITY OF ELECTRICITY GENERATION FOSSIL FUEL RESOURCES (IN MTOE)1
KEY METRICS
Industrial sector (% of total GDP) 26.4 GDP per capita (PPP, USD); GDP Group 3,419 (D)
TPEP / TPEC (net energy importer) 0.67 Energy intensity (million BTU per USD) 0.05
Emission intensity (kg of CO2 per USD) 3.51 CO2 emissions (metric tons) per capita 2.03
Energy affordability (USD per kWh) 0.05 Population with access to electricity (%) 66.3
INDEX COMMENTARY
India decreases by four places to rank 93 in the Index with small downward movements across all dimensions. In energy security, India struggles most with a low wholesale margin on gasoline, weak oil reserve stocks and a positive and increasing 5-year energy consumption growth rate, which is however necessary for India's economic and social development. Social equity performance is weak as only 67% of the population has access to electricity. India's weak environmental performance (rank 93) is overall driven by a very low quality of air and water, very high emissions from electricity and heat generation and high emissions on a per capita level. With a medium level of energy intensity per capita, India thus underperforms in mitigating its environmental footprint compared to other countries with similar levels of energy intensity per capita. India performs relatively better in the contextual dimensions. India's strongest dimension, economic strength, experiences a small drop due to a decrease in macroeconomic stability.
1 Data for shale gas resources not available
82%
13%
3%
2%
Conventional thermal
Hydro
Other Renewables
Nuclear
42,420
740 0 9240
10,000
20,000
30,000
40,000
50,000
Coal Oil Shale Oil Gas
INDEX RANK
93

INDONESIA J
ENERGY SUSTAINABILITY BALANCE ENERGY SUSTAINABILITY INDEX RANKINGS
2010 2011 2012 Trend
Energy performance 69 79 86 -
Energy security 29 47 60 -
Social equity 66 61 72 -
Environmental impact mitigation 88 90 90
Contextual performance 68 62 59 + Political strength 73 70 69 + Societal strength 71 69 72 - Economic strength 51 40 32 +
Overall rank 71 76 83 -
DIVERSITY OF ELECTRICITY GENERATION FOSSIL FUEL RESOURCES (IN MTOE)
KEY METRICS
Industrial sector (% of total GDP) 47.2 GDP per capita (PPP, USD); GDP Group 4,353 (D)
TPEP / TPEC (net energy exporter) 2.10 Energy intensity (million BTU per USD) 0.02
Emission intensity (kg of CO2 per USD) 1.26 CO2 emissions (metric tons) per capita 2.70
Energy affordability (USD per kWh) 0.06 Population with access to electricity (%) 64.5
INDEX COMMENTARY
Indonesia falls seven places in the Index. A drop in energy security is driven by a decrease in the weakest indicator, the wholesale margin on gasoline; this was offset by a slight reduction in the 5-year energy consumption trend. However, the energy consumption growth rate remains positive which is necessary for Indonesia's social and economic development as only 65% of the population have access to electricity, leading to low social equity scores. Environmental performance remains constant but is overall very weak due to high emissions from heat and electricity generation and a low quality of air and water. Indonesia underperforms in mitigating its environmental footprint compared to other countries with similar levels of energy intensity per capita. Political and societal strength remains mostly stable, although a small deterioration of control of corruption and rule of law lead to a small drop of societal strength. The strong economic performance is supported by low costs of living as proportion of household consumption expenditure and a good macroeconomic stability, slightly offset by low credit availability.
TRENDS AND OUTLOOK
Fossil fuels remain the main energy source, and levels of development and deployment of efficient and low-carbon and carbon-free energy technologies is slower than expected to fulfill sustained energy demand growth which remains positive under significant energy subsidies to support social and economic development.
Recent energy policy developments include: 1) energy policy targets of the Presidential Decree No. 5, 2006 on National Energy Policy and its Blueprint of National Energy Management 2005-2025. The targets include reduce energy elasticity to less than 1 which is aligned with the target of economic growth, enhance the national energy mix with oil below 20%, natural gas more than 30%, coal to more than 33%, and the remaining 17% from new and renewable energy; 2) the Ministerial Decree on feed-in-tariffs for renewable energy which gives more opportunity for development of small renewable energy with private participations. This will give remote islands the opportunity to accelerate access to electricity; and 3) preparations to issue a new national energy policy as the implementation of Energy Law No. 30, 2007.
Key issues policymakers need to continue focusing on include: 1) removing energy subsidies; 2) intensifying the efforts to increase the use of new and renewable energy through research and development, pilot projects, providing incentives, capacity building, etc.; 3) imbed low-carbon and carbon-free technologies in the long-term energy plan; 4) increase energy efficiency on supply and demand sides; and 5) attract more investments to the energy sector.
88%
7%
5%
Conventional thermal
Hydro
Other Renewables
Nuclear3,870
497 0
2,740
0
2,500
5,000
7,500
10,000
12,500
15,000
Coal Oil Shale Oil Gas
INDEX RANK
83

IRAN (ISLAMIC REPUBLIC)
ENERGY SUSTAINABILITY BALANCE ENERGY SUSTAINABILITY INDEX RANKINGS
2010 2011 2012 Trend
Energy performance 27 48 38 + Energy security 34 71 47 + Social equity 25 30 31 - Environmental impact mitigation 40 50 51 -
Contextual performance 82 82 79 + Political strength 88 88 89 - Societal strength 79 79 78 + Economic strength 70 65 58 +
Overall rank 39 63 48 +
DIVERSITY OF ELECTRICITY GENERATION FOSSIL FUEL RESOURCES (IN MTOE)
KEY METRICS
Industrial sector (% of total GDP) 37.7 GDP per capita (PPP, USD); GDP Group 12,722 (C)
TPEP / TPEC (net energy exporter) 1.58 Energy intensity (million BTU per USD) 0.05
Emission intensity (kg of CO2 per USD) 2.74 CO2 emissions (metric tons) per capita 7.17
Energy affordability (USD per kWh) n.a. Population with access to electricity (%) 98.4
INDEX COMMENTARY
Iran increases its Index ranking by 15 places due to significant improvements in energy security. These were driven by a reduction in the 5-year energy consumption growth rate and a slower decrease in the wholesale margin on gasoline as noted in peer countries. Iran performs slightly worse than last year in mitigating its environmental impact when compared to countries with similar levels of energy intensity. Iran's weakest dimension remains political strength (rank 89) with poor performance in regulatory quality and political stability. Performance in societal strength (rank 78) mostly struggles with control of corruption and rule of law. Economic strength improves by seven places (rank 58) due to an increase in macroeconomic stability; however costs of living as proportion of total household consumption expenditure remain very high and credit availability is low.
96%
4%
Conventional thermal
Hydro
Other Renewables
Nuclear
842
17,329
0
25,460
0
10,000
20,000
30,000
40,000
50,000
Coal Oil Shale Oil Gas
INDEX RANK
48

IRELAND J
ENERGY SUSTAINABILITY BALANCE ENERGY SUSTAINABILITY INDEX RANKINGS
2010 2011 2012 Trend
Energy performance 36 49 35 + Energy security 64 88 57 + Social equity 27 24 24 Environmental impact mitigation 32 41 42 -
Contextual performance 11 17 16 + Political strength 9 13 13 Societal strength 18 18 19 - Economic strength 18 29 33 -
Overall rank 28 39 30 +
DIVERSITY OF ELECTRICITY GENERATION FOSSIL FUEL RESOURCES (IN MTOE)
KEY METRICS
Industrial sector (% of total GDP) 29.0 GDP per capita (PPP, USD); GDP Group 39,492 (A)
TPEP / TPEC (net energy importer) 0.08 Energy intensity (million BTU per USD) 0.01
Emission intensity (kg of CO2 per USD) 0.67 CO2 emissions (metric tons) per capita 9.01
Energy affordability (USD per kWh) 0.23 Population with access to electricity (%) 100.0
INDEX COMMENTARY
Ireland increases by nine places in the Index, due to an increase in energy security. The improvements were driven by a substantial increase in the wholesale margin on gasoline and a reduction in energy consumption, which reverses last year's positive growth rate. Ireland now scores comparatively well in these two indicators, but still lags behind in oil stock reserves and in diversity of electricity production. Moreover, it has a very low ratio of production to total energy supply. Performance in social equity remains stable. A small decrease in environmental impact mitigation is driven by higher energy intensity per GDP per capita and by a decrease in the quality of air and water. Ireland's performance in the contextual dimensions is fairly constant; however a drop in economic strength is driven by further decreases in macroeconomic stability, the countries weakest contextual indicator.
87%
2%
11%
Conventional thermal
Hydro
Other Renewables
Nuclear
10 0 0 90
500
1,000
1,500
2,000
2,500
Coal Oil Shale Oil Gas
INDEX RANK
30

ISRAEL
ENERGY SUSTAINABILITY BALANCE ENERGY SUSTAINABILITY INDEX RANKINGS
2010 2011 2012 Trend
Energy performance 81 69 74 -
Energy security 81 52 66 -
Social equity 40 42 43 -
Environmental impact mitigation 91 89 92 -
Contextual performance 39 37 33 + Political strength 42 43 40 + Societal strength 24 26 22 + Economic strength 56 53 48 +
Overall rank 73 61 61
DIVERSITY OF ELECTRICITY GENERATION FOSSIL FUEL RESOURCES (IN MTOE)
KEY METRICS
Industrial sector (% of total GDP) 31.1 GDP per capita (PPP, USD); GDP Group 29,602 (B)
TPEP / TPEC (net energy importer) 0.05 Energy intensity (million BTU per USD) 0.01
Emission intensity (kg of CO2 per USD) 0.99 CO2 emissions (metric tons) per capita 9.51
Energy affordability (USD per kWh) n.a. Population with access to electricity (%) 99.7
INDEX COMMENTARY
Israel maintains its ranking in the Index as an improvement in all contextual dimensions is offset by a weaker performance in all energy dimensions. The decrease in energy security is mostly driven by a continuous increase in energy consumption growth compared to peers. Generally a weak ratio of production to total energy supply and low diversity of electricity production affects energy security, even though Israel has a strong wholesale margin on gasoline. Israel performs particularly weak in environmental impact mitigation (rank 92) due to high emissions per capita and from electricity and heat generation as well as a low quality of air and water. Israel thus underperforms in mitigating its environmental footprint compared to other countries with similar levels of energy intensity per capita. Social equity remains mostly unchanged since last year. Improvements across most contextual indicators drive increases in the three dimensions. However, the weakest indicators remain political stability and the cost of living as proportion of total household consumption expenditure.
100%Conventional thermal
Hydro
Other Renewables
Nuclear
0 0
550
21
0
500
1,000
1,500
2,000
2,500
Coal Oil Shale Oil Gas
INDEX RANK
61

ITALY J
ENERGY SUSTAINABILITY BALANCE ENERGY SUSTAINABILITY INDEX RANKINGS
2010 2011 2012 Trend
Energy performance 38 37 20 + Energy security 44 49 19 + Social equity 23 23 26 - Environmental impact mitigation 57 48 33 + Contextual performance 38 32 34 -
Political strength 37 38 38
Societal strength 32 33 34 -
Economic strength 53 42 43 -
Overall rank 33 31 21 +
DIVERSITY OF ELECTRICITY GENERATION FOSSIL FUEL RESOURCES (IN MTOE)
KEY METRICS
Industrial sector (% of total GDP) 24.7 GDP per capita (PPP, USD); GDP Group 29,841 (B)
TPEP / TPEC (net energy importer) 0.16 Energy intensity (million BTU per USD) 0.01
Emission intensity (kg of CO2 per USD) 0.79 CO2 emissions (metric tons) per capita 6.76
Energy affordability (USD per kWh) 0.26 Population with access to electricity (%) 100.0
INDEX COMMENTARY
As a result of improved energy performance, Italy improves its Index position by ten places to rank 21. A better wholesale margin on gasoline, more diversified electricity production and relatively high oil reserve stocks all lead to a substantial jump in the energy security dimension, even though Italy reduces its energy consumption slower than peer countries. Although energy intensity per GDP per capita increases, Italy reduced emissions intensity per capita and the quality of air and water improved relative to peer countries, allowing the country to win ground in the environmental impact mitigation. Italy shows a stable performance across all contextual dimensions.
TRENDS AND OUTLOOK
Italy has reached important mitigation policy objectives by transforming its thermoelectric fleet into one of the most efficient in Europe and by changing the energy mix for power generation from oil to cleaner natural gas and renewable energy. Furthermore, several measures were adopted for improving energy efficiency in the residential-commercial and transport sectors, however, additional efforts are necessary to upgrade the existing infrastructure, buildings and car-truck fleets.
Recent policy developments include: 1) two ministerial decrees, approved in July 2012, with reshaped incentives for electricity production from renewable energy and tariffs increasingly in line with those applied in other EU countries; 2) the decree “Dl Sviluppo” came into force in July 2012 and confirmed tax breaks for restructuring activities and the improvement of energy performances in buildings; and 3) the government’s commitment to support the development of natural gas infrastructures to improve diversification and support the expansion of renewable energy. Measures are expected to have a positive impact on both energy security and environmental impact mitigation by lowering the environmental impact of electricity production, reducing Italy’s dependence on imported fossil fuels and improving the Italian balance of payment.
However, concerns remain around the social equity dimension: the challenge of increasing costs of energy for families and businesses, mainly due to the surge in oil and gas import prices, but also due to incentives to drive the development of renewable energy, needs to be addressed, e.g., a further integration and convergence towards EU spot liquid markets and price formulas.
73%
18%
9%
Conventional thermal
Hydro
Other Renewables
Nuclear
7 62
10,446
600
2,500
5,000
7,500
10,000
12,500
15,000
Coal Oil Shale Oil Gas
INDEX RANK
21

JAPAN
ENERGY SUSTAINABILITY BALANCE ENERGY SUSTAINABILITY INDEX RANKINGS
2010 2011 2012 Trend
Energy performance 11 10 7 + Energy security 5 16 7 + Social equity 12 6 9 - Environmental impact mitigation 39 37 24 + Contextual performance 24 27 28 - Political strength 18 16 20 - Societal strength 13 12 12 Economic strength 47 51 54 -
Overall rank 11 11 8 +
DIVERSITY OF ELECTRICITY GENERATION FOSSIL FUEL RESOURCES (IN MTOE)
KEY METRICS
Industrial sector (% of total GDP) 27.3 GDP per capita (PPP, USD); GDP Group 34,330 (A)
TPEP / TPEC (net energy importer) 0.19 Energy intensity (million BTU per USD) 0.02
Emission intensity (kg of CO2 per USD) 0.87 CO2 emissions (metric tons) per capita 8.61
Energy affordability (USD per kWh) 0.23 Population with access to electricity (%) 100.0
INDEX COMMENTARY
Japan's rise by three ranks in the Index was driven by an improved energy performance, while contextual scores remained mostly constant with a small negative trend. Improvement in energy security was triggered by an increased wholesale margin on gasoline. Stronger environmental performance was driven by lower emissions intensity and a better quality of air and water. It has to be noted however, that the data currently available does not cover any repercussions from the Fukushima accident. Japan's weakest dimension is economic strength due to high cost of living and relatively low macroeconomic stability.
TRENDS AND OUTLOOK
Most recent energy policy developments include the implementation of a feed-in tariff (FIT) system as of July 1, 2012 which is expected to increase the penetration of renewable energies, such as solar PV and wind. However, the FIT system is viewed with some criticism, as purchasing prices are set high based on the estimated cost of individual renewable energies and a heavy burden on household’s (including households on welfare) electricity bill is expected. Also there are concerns that the domestic PV will not be able to compete against lower-cost imports in the national market.
After the devastating earthquake and tsunami which caused the accident at the Fukushima Daiichi nuclear power plant, Japan’s Strategic Energy Plan is under revision. Policymakers have to focus on defining the future energy mix after scientifically evaluating and comparing all available energy technologies. A subcommittee under the advisory committee on energy and natural resources has completed the review based on analysis and assessment of the impact on the trade balance, employment and electricity rates in connection with the adoption of either one of the three energy mix options for 2030: abandon nuclear power, reduce nuclear power (15%) or keep nuclear power (20-25%). Other sources for power generation include 25-35% renewable energy, 35-50% conventional thermal and 15% non-utility generation. A conclusion is to be expected in the second half of 2012 after completing the public debate.
63%
7%
3%
27%
Conventional thermal
Hydro
Other Renewables
Nuclear
2459
044
0
500
1,000
1,500
2,000
2,500
Coal Oil Shale Oil Gas
INDEX RANK
8
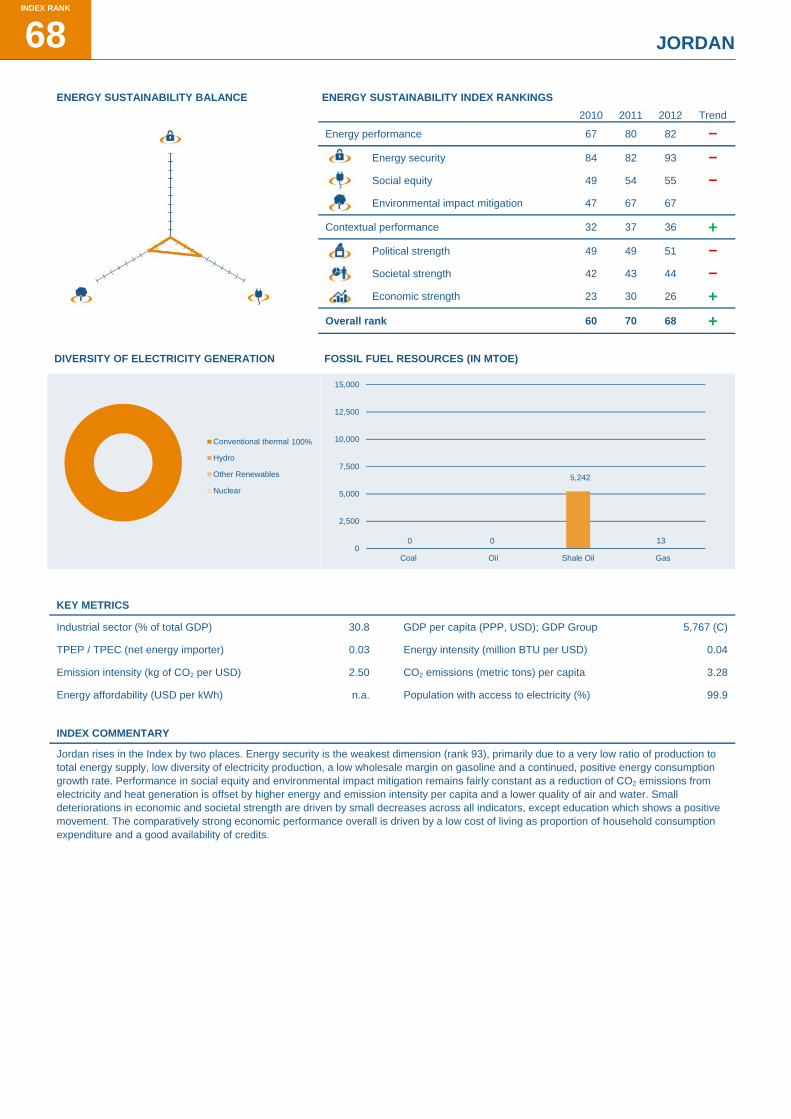
JORDAN J
ENERGY SUSTAINABILITY BALANCE ENERGY SUSTAINABILITY INDEX RANKINGS
2010 2011 2012 Trend
Energy performance 67 80 82 -
Energy security 84 82 93 -
Social equity 49 54 55 -
Environmental impact mitigation 47 67 67
Contextual performance 32 37 36 + Political strength 49 49 51 - Societal strength 42 43 44 - Economic strength 23 30 26 +
Overall rank 60 70 68 +
DIVERSITY OF ELECTRICITY GENERATION FOSSIL FUEL RESOURCES (IN MTOE)
KEY METRICS
Industrial sector (% of total GDP) 30.8 GDP per capita (PPP, USD); GDP Group 5,767 (C)
TPEP / TPEC (net energy importer) 0.03 Energy intensity (million BTU per USD) 0.04
Emission intensity (kg of CO2 per USD) 2.50 CO2 emissions (metric tons) per capita 3.28
Energy affordability (USD per kWh) n.a. Population with access to electricity (%) 99.9
INDEX COMMENTARY
Jordan rises in the Index by two places. Energy security is the weakest dimension (rank 93), primarily due to a very low ratio of production to total energy supply, low diversity of electricity production, a low wholesale margin on gasoline and a continued, positive energy consumption growth rate. Performance in social equity and environmental impact mitigation remains fairly constant as a reduction of CO2 emissions from electricity and heat generation is offset by higher energy and emission intensity per capita and a lower quality of air and water. Small deteriorations in economic and societal strength are driven by small decreases across all indicators, except education which shows a positive movement. The comparatively strong economic performance overall is driven by a low cost of living as proportion of household consumption expenditure and a good availability of credits.
100%Conventional thermal
Hydro
Other Renewables
Nuclear
0 0
5,242
130
2,500
5,000
7,500
10,000
12,500
15,000
Coal Oil Shale Oil Gas
INDEX RANK
68
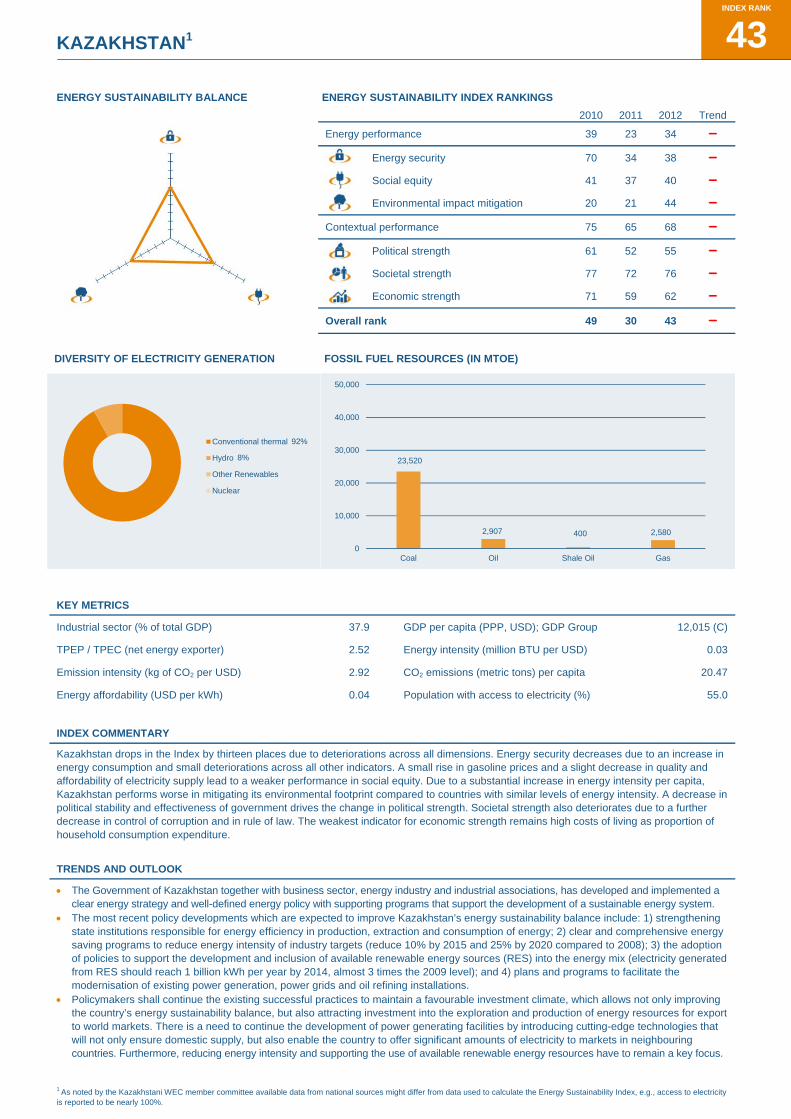
KAZAKHSTAN1
ENERGY SUSTAINABILITY BALANCE ENERGY SUSTAINABILITY INDEX RANKINGS
2010 2011 2012 Trend
Energy performance 39 23 34 -
Energy security 70 34 38 -
Social equity 41 37 40 -
Environmental impact mitigation 20 21 44 -
Contextual performance 75 65 68 -
Political strength 61 52 55 -
Societal strength 77 72 76 -
Economic strength 71 59 62 -
Overall rank 49 30 43 -
DIVERSITY OF ELECTRICITY GENERATION FOSSIL FUEL RESOURCES (IN MTOE)
KEY METRICS
Industrial sector (% of total GDP) 37.9 GDP per capita (PPP, USD); GDP Group 12,015 (C)
TPEP / TPEC (net energy exporter) 2.52 Energy intensity (million BTU per USD) 0.03
Emission intensity (kg of CO2 per USD) 2.92 CO2 emissions (metric tons) per capita 20.47
Energy affordability (USD per kWh) 0.04 Population with access to electricity (%) 55.0
INDEX COMMENTARY
Kazakhstan drops in the Index by thirteen places due to deteriorations across all dimensions. Energy security decreases due to an increase in energy consumption and small deteriorations across all other indicators. A small rise in gasoline prices and a slight decrease in quality and affordability of electricity supply lead to a weaker performance in social equity. Due to a substantial increase in energy intensity per capita, Kazakhstan performs worse in mitigating its environmental footprint compared to countries with similar levels of energy intensity. A decrease in political stability and effectiveness of government drives the change in political strength. Societal strength also deteriorates due to a further decrease in control of corruption and in rule of law. The weakest indicator for economic strength remains high costs of living as proportion of household consumption expenditure.
TRENDS AND OUTLOOK
The Government of Kazakhstan together with business sector, energy industry and industrial associations, has developed and implemented a clear energy strategy and well-defined energy policy with supporting programs that support the development of a sustainable energy system.
The most recent policy developments which are expected to improve Kazakhstan’s energy sustainability balance include: 1) strengthening state institutions responsible for energy efficiency in production, extraction and consumption of energy; 2) clear and comprehensive energy saving programs to reduce energy intensity of industry targets (reduce 10% by 2015 and 25% by 2020 compared to 2008); 3) the adoption of policies to support the development and inclusion of available renewable energy sources (RES) into the energy mix (electricity generated from RES should reach 1 billion kWh per year by 2014, almost 3 times the 2009 level); and 4) plans and programs to facilitate the modernisation of existing power generation, power grids and oil refining installations.
Policymakers shall continue the existing successful practices to maintain a favourable investment climate, which allows not only improving the country’s energy sustainability balance, but also attracting investment into the exploration and production of energy resources for export to world markets. There is a need to continue the development of power generating facilities by introducing cutting-edge technologies that will not only ensure domestic supply, but also enable the country to offer significant amounts of electricity to markets in neighbouring countries. Furthermore, reducing energy intensity and supporting the use of available renewable energy resources have to remain a key focus.
1 As noted by the Kazakhstani WEC member committee available data from national sources might differ from data used to calculate the Energy Sustainability Index, e.g., access to electricity is reported to be nearly 100%.
92%
8%
Conventional thermal
Hydro
Other Renewables
Nuclear
23,520
2,907 400 2,580
0
10,000
20,000
30,000
40,000
50,000
Coal Oil Shale Oil Gas
INDEX RANK
43

KENYA J
ENERGY SUSTAINABILITY BALANCE ENERGY SUSTAINABILITY INDEX RANKINGS
2010 2011 2012 Trend
Energy performance 51 59 61 -
Energy security 35 23 20 + Social equity 87 86 86
Environmental impact mitigation 34 54 69 -
Contextual performance 83 85 86 -
Political strength 76 77 78 -
Societal strength 86 88 85 + Economic strength 75 76 75 +
Overall rank 65 69 67 +
DIVERSITY OF ELECTRICITY GENERATION FOSSIL FUEL RESOURCES (IN MTOE)
KEY METRICS
Industrial sector (% of total GDP) 16.4 GDP per capita (PPP, USD); GDP Group 1,676 (D)
TPEP / TPEC (net energy importer) 0.19 Energy intensity (million BTU per USD) 0.04
Emission intensity (kg of CO2 per USD) 2.24 CO2 emissions (metric tons) per capita 1.80
Energy affordability (USD per kWh) n.a. Population with access to electricity (%) 16.1
INDEX COMMENTARY
Kenya rises two places in the Index. Energy security is the strongest dimension due to a good wholesale margin on gasoline and high diversity of electricity production, however the ratio of production to total energy supply is very weak and Kenya struggles with a continued positive energy consumption growth rate. This expansion of energy consumption is however necessary for Kenya's economic and social development as only 16% of the population has access to electricity. This also leads to low social equity scores (rank 86). Environmental performance decreased substantially due to an increase in CO2 emissions from electricity and heat generation and a small decrease in the quality of air and water. Kenya performs poorly across all contextual indicators. The economic performance is primarily supported by a good cost of living as proportion of household consumption expenditure.
41%
32%
27%
Conventional thermal
Hydro
Other Renewables
Nuclear
0 0 0 00
500
1,000
1,500
2,000
2,500
Coal Oil Shale Oil Gas
INDEX RANK
67

KOREA (REPUBLIC)
ENERGY SUSTAINABILITY BALANCE ENERGY SUSTAINABILITY INDEX RANKINGS
2010 2011 2012 Trend
Energy performance 43 44 33 + Energy security 63 83 61 + Social equity 31 25 25 Environmental impact mitigation 48 35 32 + Contextual performance 21 19 20 -
Political strength 33 36 36
Societal strength 27 24 26 -
Economic strength 9 8 9 -
Overall rank 34 37 27 +
DIVERSITY OF ELECTRICITY GENERATION FOSSIL FUEL RESOURCES (IN MTOE)
KEY METRICS
Industrial sector (% of total GDP) 39.2 GDP per capita (PPP, USD); GDP Group 30,042 (A)
TPEP / TPEC (net energy importer) 0.15 Energy intensity (million BTU per USD) 0.02
Emission intensity (kg of CO2 per USD) 1.32 CO2 emissions (metric tons) per capita 10.81
Energy affordability (USD per kWh) 0.10 Population with access to electricity (%) 100.0
INDEX COMMENTARY
Korea experienced a significant jump of ten spots in the Index to rank 27. An increase in the wholesale margin on gasoline, slightly more diversified electricity production and stronger oil reserve stocks led to a substantial rise in energy security. However, at rank 61, this dimension is still the weakest. Due to a better quality of air and water and overall lower environmental impact, Korea was able to outperform other countries in mitigating its environmental footprint given its increasing level of energy intensity per capita, leading to an improvement in its environmental performance. The contextual performance as well as the social equity score remains mostly unchanged.
TRENDS AND OUTLOOK
Energy Security remains a major challenge with a very low stability of resource supplies and an energy import dependency of around 97%. As a counter measure Korea (Republic) has invested in overseas resource development but this brings new challenges such as low production capacity, lack of human resources, technical skills, etc. Environmental impact mitigation calls for action given high energy intensity levels, growing energy consumption and increasing GHG emissions.
Recent policy measures to enhance energy security include: 1) expanding cooperation with resource-rich countries; 2) strengthening the competitiveness of energy developing companies; and 3) establishing the Overseas Resource Development Fund to fund energy development projects in addition to giving government loans and guarantees. In terms of environmental impact mitigation policy measures include: 1) the expansion of renewable energy with targets until 2030; 2) the shift from government-financed feed-in-tariffs to a renewable portfolio standard in 2012 to create new demand for renewable energy; and 3) the strong support of R&DD. Nuclear energy plays an essential role in the countries energy system in terms of energy security, economics, climate change and load demand.
Policymakers need to continue focusing on: 1) the enhancement of overseas energy development; 2) the development of renewable energy; and 3) the expansion of the nuclear power sector considering safety issues, waste disposal, and increasing public acceptance by providing objective information and being transparent.
67%
1%
1%
31%
Conventional thermal
Hydro
Other Renewables
Nuclear
88 00
3
0
500
1,000
1,500
2,000
2,500
Coal Oil Shale Oil Gas
INDEX RANK
27
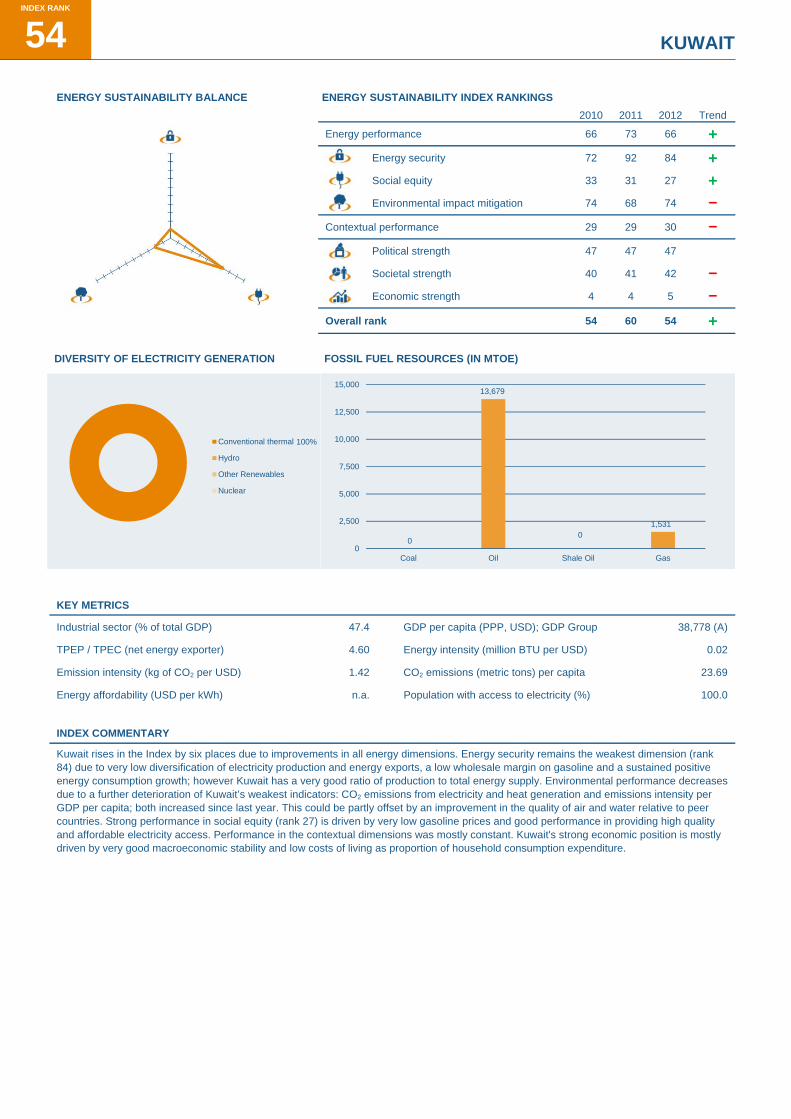
KUWAIT J
ENERGY SUSTAINABILITY BALANCE ENERGY SUSTAINABILITY INDEX RANKINGS
2010 2011 2012 Trend
Energy performance 66 73 66 + Energy security 72 92 84 + Social equity 33 31 27 + Environmental impact mitigation 74 68 74 -
Contextual performance 29 29 30 - Political strength 47 47 47 Societal strength 40 41 42 - Economic strength 4 4 5 -
Overall rank 54 60 54 +
DIVERSITY OF ELECTRICITY GENERATION FOSSIL FUEL RESOURCES (IN MTOE)
KEY METRICS
Industrial sector (% of total GDP) 47.4 GDP per capita (PPP, USD); GDP Group 38,778 (A)
TPEP / TPEC (net energy exporter) 4.60 Energy intensity (million BTU per USD) 0.02
Emission intensity (kg of CO2 per USD) 1.42 CO2 emissions (metric tons) per capita 23.69
Energy affordability (USD per kWh) n.a. Population with access to electricity (%) 100.0
INDEX COMMENTARY
Kuwait rises in the Index by six places due to improvements in all energy dimensions. Energy security remains the weakest dimension (rank 84) due to very low diversification of electricity production and energy exports, a low wholesale margin on gasoline and a sustained positive energy consumption growth; however Kuwait has a very good ratio of production to total energy supply. Environmental performance decreases due to a further deterioration of Kuwait’s weakest indicators: CO2 emissions from electricity and heat generation and emissions intensity per GDP per capita; both increased since last year. This could be partly offset by an improvement in the quality of air and water relative to peer countries. Strong performance in social equity (rank 27) is driven by very low gasoline prices and good performance in providing high quality and affordable electricity access. Performance in the contextual dimensions was mostly constant. Kuwait's strong economic position is mostly driven by very good macroeconomic stability and low costs of living as proportion of household consumption expenditure.
100%Conventional thermal
Hydro
Other Renewables
Nuclear
0
13,679
01,531
0
2,500
5,000
7,500
10,000
12,500
15,000
Coal Oil Shale Oil Gas
INDEX RANK
54

LATVIA
ENERGY SUSTAINABILITY BALANCE ENERGY SUSTAINABILITY INDEX RANKINGS
2010 2011 2012 Trend
Energy performance 32 18 36 -
Energy security 55 22 64 -
Social equity 50 50 50
Environmental impact mitigation 7 9 13 -
Contextual performance 49 46 47 -
Political strength 36 35 32 + Societal strength 39 39 38 + Economic strength 68 63 72 -
Overall rank 31 23 37 -
DIVERSITY OF ELECTRICITY GENERATION FOSSIL FUEL RESOURCES (IN MTOE)
KEY METRICS
Industrial sector (% of total GDP) 21.7 GDP per capita (PPP, USD); GDP Group 14,419 (B)
TPEP / TPEC (net energy importer) 0.19 Energy intensity (million BTU per USD) 0.04
Emission intensity (kg of CO2 per USD) 1.72 CO2 emissions (metric tons) per capita 3.79
Energy affordability (USD per kWh) n.a. Population with access to electricity (%) 100.0
INDEX COMMENTARY
Latvia drops in the Index by 14 places to rank 37. A substantial decrease in energy security makes this dimension the weakest one (rank 64). This was driven by a decrease in the wholesale margin on gasoline and a slowing down of the reductions in energy consumption. Latvia's strong environmental performance also experiences a drop driven by higher energy and emissions intensity per capita as well as by a declined quality of air and water; this is only partly offset by a reduction of CO2 emissions from electricity and heat generation. In addition, Latvia's very weak economic situation further deteriorates due to a decline in macroeconomic stability and credit availability.
45%
53%
2%
Conventional thermal
Hydro
Other Renewables
Nuclear
0 0 0 00
500
1,000
1,500
2,000
2,500
Coal Oil Shale Oil Gas
INDEX RANK
37

LEBANON J
ENERGY SUSTAINABILITY BALANCE ENERGY SUSTAINABILITY INDEX RANKINGS
2010 2011 2012 Trend
Energy performance 73 70 81 - Energy security 68 44 65 - Social equity 43 62 63 - Environmental impact mitigation 77 82 85 -
Contextual performance 54 61 58 + Political strength 78 79 74 + Societal strength 81 60 62 - Economic strength 8 38 35 +
Overall rank 67 72 77 -
DIVERSITY OF ELECTRICITY GENERATION FOSSIL FUEL RESOURCES (IN MTOE)
KEY METRICS
Industrial sector (% of total GDP) 19.7 GDP per capita (PPP, USD); GDP Group 15,168 (B)
TPEP / TPEC (net energy importer) 0.03 Energy intensity (million BTU per USD) 0.03
Emission intensity (kg of CO2 per USD) 2.51 CO2 emissions (metric tons) per capita 3.80
Energy affordability (USD per kWh) n.a. Population with access to electricity (%) 99.9
INDEX COMMENTARY
The Lebanon drops five places in the Index due to a decrease in energy security. Energy security struggles with a very low ratio of production to total energy supply and low diversification of electricity production; the recent drop was driven by a deterioration of the stronger indicators: a decrease in the wholesale margin on gasoline and an increase in the 5-year energy consumption growth trend. Social equity remains fairly constant with good gasoline prices but with a low performance in providing high quality, affordable electricity access. Lebanon’s weakest dimension is environmental impact mitigation with very high CO2 emissions from electricity and heat generation and high emissions intensity per capita. Lebanon thus underperforms in mitigating its environmental footprint compared to other countries with similar levels of energy intensity per capita. In the contextual dimension the Lebanon struggles with political stability, while small improvements are noted for regulatory quality and effectiveness of government as well as control of corruption and rule of law. A low macroeconomic stability, mediocre scores in credit availability, but very low costs of living as proportion of household consumption expenditure drive the relatively strong economic performance (rank 35).
TRENDS AND OUTLOOK
Lebanon has a chronic electricity supply problem. However, in 2010, the Government has approved a promising strategy for the rehabilitation of the power sector, including the development of energy efficiency and renewable energy. The national target is to reach 12% of renewable energy out of the total electricity production in 2020. Energy efficiency target is to minimise demand by 5% in 2015. Challenges include mainly updating the legislative framework of the power sector.
In addition to the policy paper, Lebanon is the first country in the Arab World to develop its National Energy Efficiency Action Plan (NEEAP) in 2011. Currently, the Renewable Energy Strategy is under preparation. Furthermore, Lebanon is embarking on a quite promising oil and gas exploration program.
Policymakers should focus on creating an enabling legislative framework for the development of renewable energy and energy efficiency, in addition to setting clear environmental regulations for the upcoming oil and gas industry.
95%
5%
Conventional thermal
Hydro
Other Renewables
Nuclear
0 0 0 00
500
1,000
1,500
2,000
2,500
Coal Oil Shale Oil Gas
INDEX RANK
77

LIBYA
ENERGY SUSTAINABILITY BALANCE ENERGY SUSTAINABILITY INDEX RANKINGS
2010 2011 2012 Trend
Energy performance 76 86 83 + Energy security 52 70 55 + Social equity 56 64 73 - Environmental impact mitigation 90 92 88 + Contextual performance 60 68 81 -
Political strength 74 72 84 -
Societal strength 70 75 91 -
Economic strength 34 43 52 -
Overall rank 75 86 88 -
DIVERSITY OF ELECTRICITY GENERATION FOSSIL FUEL RESOURCES (IN MTOE)
KEY METRICS
Industrial sector (% of total GDP) 49.5 GDP per capita (PPP, USD); GDP Group 14,384 (C)
TPEP / TPEC (net energy exporter) 5.49 Energy intensity (million BTU per USD) 0.02
Emission intensity (kg of CO2 per USD) 1.07 CO2 emissions (metric tons) per capita 8.66
Energy affordability (USD per kWh) n.a. Population with access to electricity (%) 97.0
INDEX COMMENTARY
Libya decreases in the Index by two places to rank 88 which is mostly driven by a decrease in social equity and all contextual dimensions. Overall, performance in energy security is supported by a very good ratio of production to total energy supply, but it struggles with diversity of electricity production and achieves mediocre scores in the wholesale margin on gasoline and the 5-year energy consumption growth trend which is positive. A further drop in providing high quality and affordable electricity led to a decrease in the social equity dimension ranking during the last year and only 97% of the population has access to electricity. Environmental performance overall is weak due to high emissions intensity per capita, a poor quality of air and water and very high CO2 emissions from electricity and heat generation. Libya significantly underperforms in mitigating its environmental impact when compared to countries with similar energy intensity levels. A small positive trend can be noted since last year. Political and societal stability remain weak, with a still mediocre performance in economic strength. A deterioration across all political and societal strength indicators led to significant drops in both dimensions.
1 Data for shale gas resources not available
100%Conventional thermal
Hydro
Other Renewables
Nuclear
0
5,712
01,324
0
2,500
5,000
7,500
10,000
12,500
15,000
Coal Oil Shale Oil Gas
INDEX RANK
88

LITHUANIA J
ENERGY SUSTAINABILITY BALANCE ENERGY SUSTAINABILITY INDEX RANKINGS
2010 2011 2012 Trend
Energy performance 24 20 30 -
Energy security 43 36 53 -
Social equity 46 45 45
Environmental impact mitigation 6 5 9 -
Contextual performance 37 34 36 -
Political strength 30 32 31 + Societal strength 38 37 35 + Economic strength 50 50 55 -
Overall rank 27 22 31 -
DIVERSITY OF ELECTRICITY GENERATION FOSSIL FUEL RESOURCES (IN MTOE)1
KEY METRICS
Industrial sector (% of total GDP) 28.2 GDP per capita (PPP, USD); GDP Group 17,333 (B)
TPEP / TPEC (net energy importer) 0.33 Energy intensity (million BTU per USD) 0.04
Emission intensity (kg of CO2 per USD) 1.56 CO2 emissions (metric tons) per capita 4.79
Energy affordability (USD per kWh) n.a. Population with access to electricity (%) 100.0
INDEX COMMENTARY
Lithuania moves down nine places to rank 31. There is a significant drop in energy security by 17 places driven by less diversified electricity production and a decrease of the wholesale margin on gasoline; negative trends that can only be partly offset by a decrease in energy consumption growth. Lithuania experiences a small drop in environmental performance; however it continues to perform very well despite a high level of energy intensity per capita as it outperforms other countries with similar levels of energy intensity. Lithuania did not manage to improve its performance in social equity and contextual performance remains mostly constant. However, Lithuania's weak economic position further deteriorates to rank 55 due to less credit availability.
1 Data for shale gas resources not available
88%
4%
8%
Conventional thermal
Hydro
Other Renewables
Nuclear
02
00
0
500
1,000
1,500
2,000
2,500
Coal Oil Shale Oil Gas
INDEX RANK
31

LUXEMBOURG
ENERGY SUSTAINABILITY BALANCE ENERGY SUSTAINABILITY INDEX RANKINGS
2010 2011 2012 Trend
Energy performance 23 27 25 + Energy security 74 81 72 + Social equity 5 5 5
Environmental impact mitigation 12 13 18 -
Contextual performance 4 2 3 -
Political strength 6 3 6 -
Societal strength 19 16 17 -
Economic strength 2 2 2
Overall rank 16 13 18 -
DIVERSITY OF ELECTRICITY GENERATION FOSSIL FUEL RESOURCES (IN MTOE)
KEY METRICS
Industrial sector (% of total GDP) 13.6 GDP per capita (PPP, USD); GDP Group 78,906 (A)
TPEP / TPEC (net energy importer) 0.02 Energy intensity (million BTU per USD) 0.02
Emission intensity (kg of CO2 per USD) 1.46 CO2 emissions (metric tons) per capita 20.91
Energy affordability (USD per kWh) 0.22 Population with access to electricity (%) 100.0
INDEX COMMENTARY
Luxembourg drops five places down to rank 18; however it continues to show a strong and relatively constant performance in the contextual and most energy dimensions. Luxembourg improved its performance in energy security driven by a further decrease in energy consumption and an increased wholesale margin on gasoline; however electricity production became less diversified.
00 97 0
0
500
1,000
1,500
2,000
2,500
Coal Oil Shale Oil Gas
INDEX RANK
18

MACEDONIA (REPUBLIC) J
ENERGY SUSTAINABILITY BALANCE ENERGY SUSTAINABILITY INDEX RANKINGS
2010 2011 2012 Trend
Energy performance 37 51 63 -
Energy security 23 43 56 -
Social equity 57 58 54 + Environmental impact mitigation 43 58 68 -
Contextual performance 63 60 60
Political strength 55 55 56 -
Societal strength 49 47 49 -
Economic strength 75 72 69 +
Overall rank 43 58 62 -
DIVERSITY OF ELECTRICITY GENERATION FOSSIL FUEL RESOURCES (IN MTOE)
KEY METRICS
Industrial sector (% of total GDP) 27.1 GDP per capita (PPP, USD); GDP Group 9,868 (C)
TPEP / TPEC (net energy importer) 0.55 Energy intensity (million BTU per USD) 0.06
Emission intensity (kg of CO2 per USD) 3.62 CO2 emissions (metric tons) per capita 3.57
Energy affordability (USD per kWh) n.a. Population with access to electricity (%) 100.0
INDEX COMMENTARY
Macedonia decreases four places in the Index. The drop in energy security is primarily driven by a decrease in the wholesale margin on gasoline, which is Macedonia's weakest indicator in this dimension; however this is partly offset by a reduction in energy consumption. Small improvements in the quality and affordability of electricity access as well as a small decrease in the gasoline prices improve social equity. Environmental performance drops due to a decrease in the quality of air and water, higher energy intensity and increased emissions per capita; which is partly offset by lower CO2 emissions from electricity and heat generation. Contextual performance overall remains stable. Political strength slightly decreases due to a small drop in political stability and effectiveness of government. Economic performance remains the weakest dimension due to very high cost of living as proportion of household consumption expenditure. Minor improvements are driven by improved macroeconomic stability and slightly better credit availability.
81%
19%
Conventional thermal
Hydro
Other Renewables
Nuclear
232
0 0 00
500
1,000
1,500
2,000
2,500
Coal Oil Shale Oil Gas
INDEX RANK
62

MEXICO1
ENERGY SUSTAINABILITY BALANCE ENERGY SUSTAINABILITY INDEX RANKINGS
2010 2011 2012 Trend
Energy performance 57 47 52 -
Energy security 48 51 45 + Social equity 42 34 34
Environmental impact mitigation 73 64 83 -
Contextual performance 46 46 46
Political strength 50 53 52 + Societal strength 61 58 57 + Economic strength 28 27 30 -
Overall rank 53 46 50 -
DIVERSITY OF ELECTRICITY GENERATION FOSSIL FUEL RESOURCES (IN MTOE)2
KEY METRICS
Industrial sector (% of total GDP) 34.2 GDP per capita (PPP, USD); GDP Group 13,932 (C)
TPEP / TPEC (net energy exporter) 1.23 Energy intensity (million BTU per USD) 0.02
Emission intensity (kg of CO2 per USD) 1.29 CO2 emissions (metric tons) per capita 3.95
Energy affordability (USD per kWh) 0.09 Population with access to electricity (%) 100.0
INDEX COMMENTARY
Mexico's overall drop by four places in the Index to rank 50 is mainly driven by a weaker environmental performance. This is caused by increased emissions in the electricity and heat generation and a lower quality of air and water, and could not be offset by improvements achieved in emissions and energy intensity per capita. Environmental impact mitigation is Mexico's weakest dimension (rank 83) of the energy trilemma. Energy security increases due to a substantial decrease in the energy consumption growth rate. Mexico's performance in social equity and in the contextual dimensions remains stable. Political stability, rule of law and availability of credits to the private sector are particularly weak indicators.
TRENDS AND OUTLOOK
The most important policy development is the enactment of the General Law on Climate Change in June 2012. México is the second country, after the UK, that has enacted a law that frames the actions to be taken as far as climate change is concerned, both from an emission mitigation point of view as well as measures of adaptation. The three explicit goals are: 1) by 2020, there should be a 30% reduction in emissions with respect to a business as usual (BAU) projection; 2) by 2024, 35% of the electricity generation has to be from clean energies (non-GHG emitting technologies); and 3) by 2050, an aspirational goal of a 50% reduction in emissions with respect to a BAU projection.
Furthermore, the first issue of the National Energy Strategy (NEA) was submitted and approved by the Congress in 2009, with the provision to be revisited on an annual basis. Among other provisions, NEA establishes the production from ‘clean energy sources’ in line with the General Law on Climate Change and although no concrete projects have been decided, nuclear power is being considered as part of the 35% goal for clean energy technologies.
The greatest challenges policymakers ought to focus on in order to meet the above mentioned targets are: 1) the continuation of a renewable energy program and the re-initiation of a nuclear program; 2) continued increase of production of both oil and natural gas on and off-shore as well as the development of shale gas resources; and 3) improved energy efficiency and energy conservation including decreasing energy intensity.
2 As noted by the Mexican WEC member committee available data from national sources might differ from data used to calculate the Energy Sustainability Index and shown under key metrics 1 Data for shale gas resources not available
80%
14%
4%
2%
Conventional thermal
Hydro
Other Renewables
Nuclear
848
1,611
0
310
0
500
1,000
1,500
2,000
2,500
Coal Oil Shale Oil Gas
INDEX RANK
50

MONGOLIA J
ENERGY SUSTAINABILITY BALANCE ENERGY SUSTAINABILITY INDEX RANKINGS
2010 2011 2012 Trend
Energy performance 87 87 89 -
Energy security 83 72 74 -
Social equity 81 78 79 -
Environmental impact mitigation 72 78 75 + Contextual performance 70 56 53 + Political strength 65 66 62 + Societal strength 76 74 71 + Economic strength 59 31 23 +
Overall rank 88 85 85
DIVERSITY OF ELECTRICITY GENERATION FOSSIL FUEL RESOURCES (IN MTOE)
KEY METRICS
Industrial sector (% of total GDP) 32.6 GDP per capita (PPP, USD); GDP Group 4,020 (D)
TPEP / TPEC (net energy exporter) 2.71 Energy intensity (million BTU per USD) 0.05
Emission intensity (kg of CO2 per USD) 4.00 CO2 emissions (metric tons) per capita 3.99
Energy affordability (USD per kWh) n.a. Population with access to electricity (%) 67.0
INDEX COMMENTARY
Mongolia remains constant on rank 85 of the Index. Performance in energy security is weak due to low diversity in electricity production and a positive and increasing 5-year energy consumption growth trend. The recent drop in energy security was driven by a decrease in the wholesale margin on gasoline. As only 67% of the population have access to electricity, social equity performance is low (rank 79). A small improvement in environmental performance is driven by a better quality of air and water when compared to peer countries but Mongolia still underperforms in mitigating its environmental impact compared to countries with a similar level of energy intensity per capita. While the country continues to struggle with its performance in political and societal strength it further improves its already strong economic performance, which is driven by low costs of living as proportion of household consumption expenditure and good macroeconomic stability, even though credit availability only achieves mediocre scores.
100%Conventional thermal
Hydro
Other Renewables
Nuclear
1,764
2 420
0
500
1,000
1,500
2,000
2,500
Coal Oil Shale Oil Gas
INDEX RANK
85

MOROCCO
ENERGY SUSTAINABILITY BALANCE ENERGY SUSTAINABILITY INDEX RANKINGS
2010 2011 2012 Trend
Energy performance 85 84 91 -
Energy security 88 77 80 -
Social equity 65 66 66
Environmental impact mitigation 70 76 87 -
Contextual performance 57 58 56 + Political strength 60 60 64 -
Societal strength 64 65 63 + Economic strength 49 46 41 +
Overall rank 85 82 87 -
DIVERSITY OF ELECTRICITY GENERATION FOSSIL FUEL RESOURCES (IN MTOE)1
KEY METRICS
Industrial sector (% of total GDP) 32.2 GDP per capita (PPP, USD); GDP Group 4,794 (D)
TPEP / TPEC (net energy importer) 0.05 Energy intensity (million BTU per USD) 0.02
Emission intensity (kg of CO2 per USD) 1.27 CO2 emissions (metric tons) per capita 1.18
Energy affordability (USD per kWh) n.a. Population with access to electricity (%) 97.0
INDEX COMMENTARY
Morocco drops by five places in the Index. Energy security overall is supported by a good wholesale margin on gasoline, but struggles with a low ratio of production to total energy supply and a positive 5-year energy consumption trend which further increased during the last year. However improvements were visible in diversity of electricity production. Social equity struggles most with high gasoline prices, but also with providing high quality and affordable access to electricity. Overall, Morocco has high CO2 emissions from electricity and heat generation and a low quality of air and water, and thus underperforms in mitigating its environmental impact compared to other countries with similar levels of energy intensity per capita. Morocco shows a mediocre performance across most of the indicators measuring the contextual performance. Overall an increase by five places in economic strength is driven by small improvements in macroeconomic stability and credit availability.
1 Data for shale gas resources not available
81%
16%
3%
Conventional thermal
Hydro
Other Renewables
Nuclear
0 0
8,167
20
2,500
5,000
7,500
10,000
12,500
15,000
Coal Oil Shale Oil Gas
INDEX RANK
87
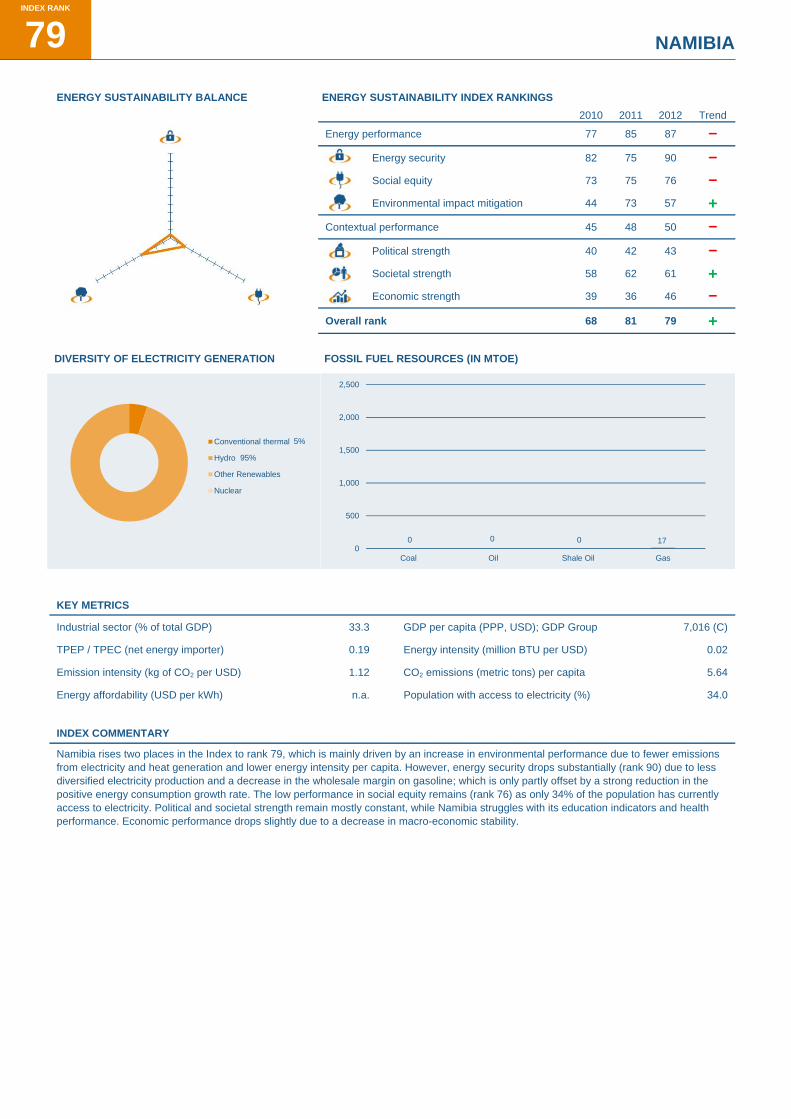
NAMIBIA J
ENERGY SUSTAINABILITY BALANCE ENERGY SUSTAINABILITY INDEX RANKINGS
2010 2011 2012 Trend
Energy performance 77 85 87 -
Energy security 82 75 90 -
Social equity 73 75 76 -
Environmental impact mitigation 44 73 57 + Contextual performance 45 48 50 -
Political strength 40 42 43 -
Societal strength 58 62 61 + Economic strength 39 36 46 -
Overall rank 68 81 79 +
DIVERSITY OF ELECTRICITY GENERATION FOSSIL FUEL RESOURCES (IN MTOE)
KEY METRICS
Industrial sector (% of total GDP) 33.3 GDP per capita (PPP, USD); GDP Group 7,016 (C)
TPEP / TPEC (net energy importer) 0.19 Energy intensity (million BTU per USD) 0.02
Emission intensity (kg of CO2 per USD) 1.12 CO2 emissions (metric tons) per capita 5.64
Energy affordability (USD per kWh) n.a. Population with access to electricity (%) 34.0
INDEX COMMENTARY
Namibia rises two places in the Index to rank 79, which is mainly driven by an increase in environmental performance due to fewer emissions from electricity and heat generation and lower energy intensity per capita. However, energy security drops substantially (rank 90) due to less diversified electricity production and a decrease in the wholesale margin on gasoline; which is only partly offset by a strong reduction in the positive energy consumption growth rate. The low performance in social equity remains (rank 76) as only 34% of the population has currently access to electricity. Political and societal strength remain mostly constant, while Namibia struggles with its education indicators and health performance. Economic performance drops slightly due to a decrease in macro-economic stability.
5%
95%
Conventional thermal
Hydro
Other Renewables
Nuclear
0 0 0 170
500
1,000
1,500
2,000
2,500
Coal Oil Shale Oil Gas
INDEX RANK
79

NEPAL
ENERGY SUSTAINABILITY BALANCE ENERGY SUSTAINABILITY INDEX RANKINGS
2010 2011 2012 Trend
Energy performance 72 74 76 -
Energy security 75 76 82 -
Social equity 90 90 92 -
Environmental impact mitigation 21 25 29 -
Contextual performance 74 72 67 + Political strength 87 89 88 + Societal strength 83 84 84 Economic strength 35 32 17 +
Overall rank 74 78 74 +
DIVERSITY OF ELECTRICITY GENERATION FOSSIL FUEL RESOURCES (IN MTOE)
KEY METRICS
Industrial sector (% of total GDP) 15.0 GDP per capita (PPP, USD); GDP Group 1,269 (D)
TPEP / TPEC (net energy importer) 0.39 Energy intensity (million BTU per USD) 0.03
Emission intensity (kg of CO2 per USD) 1.46 CO2 emissions (metric tons) per capita 0.28
Energy affordability (USD per kWh) n.a. Population with access to electricity (%) 43.6
INDEX COMMENTARY
Nepal rises four ranks in the Index. In the energy security dimension, Nepal most struggles with diversity of electricity production; however, the recent drop was driven by a decrease in the wholesale margin on gasoline and a decreased ratio of energy production to total energy supply. Energy consumption growth was reduced during the last year but remains positive. This will remain a challenge for Nepal's economic and social development as only 44% of the population has access to electricity. Low electricity access lead to Nepal's weak performance in social equity. The decrease in environmental performance is driven by a lower quality of air and water, which is Nepal's weakest indicator in this dimension and by an increase in CO2 emissions from electricity and heat generation. However, these negative trends are offset by a small decrease in energy intensity per GDP per capita. Nepal's strong economic position is supported by low costs of living as proportion of household consumption expenditure. The recent increase however was driven by an increase in macroeconomic stability. Performance in political and societal strength remains weak.
100%
Conventional thermal
Hydro
Other Renewables
Nuclear
1 0 0 00
500
1,000
1,500
2,000
2,500
Coal Oil Shale Oil Gas
INDEX RANK
74
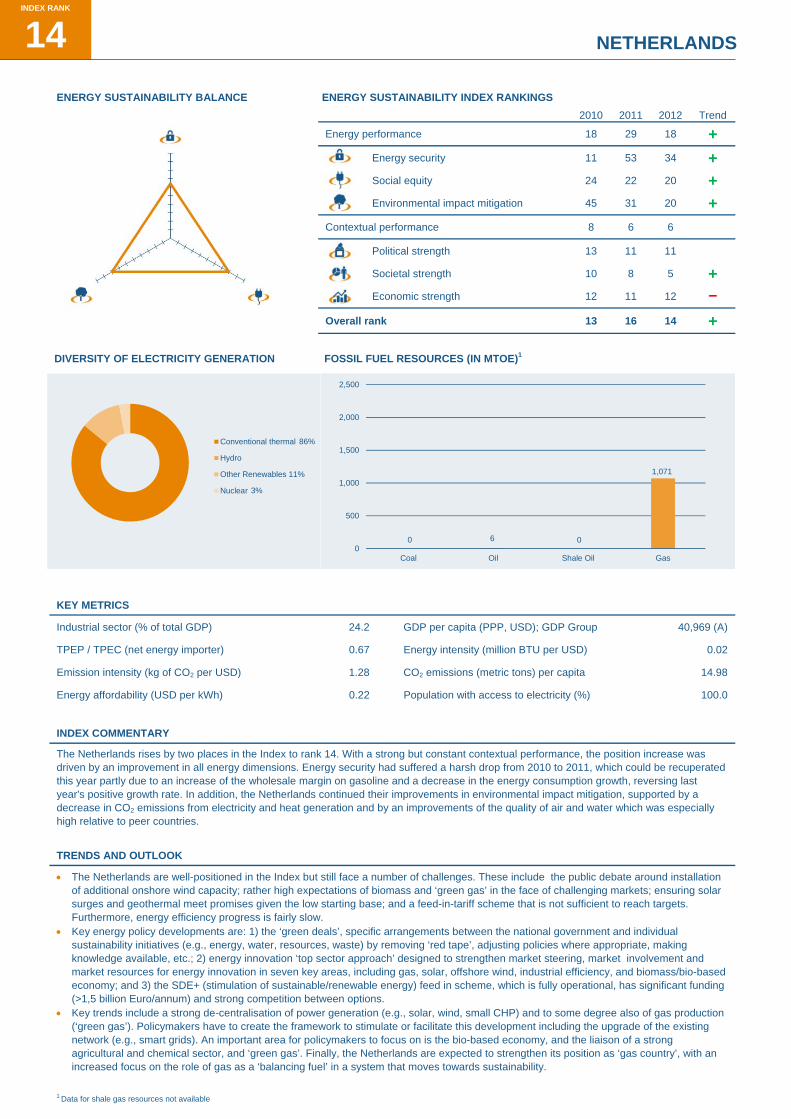
NETHERLANDS J
ENERGY SUSTAINABILITY BALANCE ENERGY SUSTAINABILITY INDEX RANKINGS
2010 2011 2012 Trend
Energy performance 18 29 18 + Energy security 11 53 34 + Social equity 24 22 20 + Environmental impact mitigation 45 31 20 + Contextual performance 8 6 6 Political strength 13 11 11 Societal strength 10 8 5 + Economic strength 12 11 12 -
Overall rank 13 16 14 +
DIVERSITY OF ELECTRICITY GENERATION FOSSIL FUEL RESOURCES (IN MTOE)1
KEY METRICS
Industrial sector (% of total GDP) 24.2 GDP per capita (PPP, USD); GDP Group 40,969 (A)
TPEP / TPEC (net energy importer) 0.67 Energy intensity (million BTU per USD) 0.02
Emission intensity (kg of CO2 per USD) 1.28 CO2 emissions (metric tons) per capita 14.98
Energy affordability (USD per kWh) 0.22 Population with access to electricity (%) 100.0
INDEX COMMENTARY
The Netherlands rises by two places in the Index to rank 14. With a strong but constant contextual performance, the position increase was driven by an improvement in all energy dimensions. Energy security had suffered a harsh drop from 2010 to 2011, which could be recuperated this year partly due to an increase of the wholesale margin on gasoline and a decrease in the energy consumption growth, reversing last year's positive growth rate. In addition, the Netherlands continued their improvements in environmental impact mitigation, supported by a decrease in CO2 emissions from electricity and heat generation and by an improvements of the quality of air and water which was especially high relative to peer countries.
TRENDS AND OUTLOOK
The Netherlands are well-positioned in the Index but still face a number of challenges. These include the public debate around installation of additional onshore wind capacity; rather high expectations of biomass and ‘green gas’ in the face of challenging markets; ensuring solar surges and geothermal meet promises given the low starting base; and a feed-in-tariff scheme that is not sufficient to reach targets. Furthermore, energy efficiency progress is fairly slow.
Key energy policy developments are: 1) the ‘green deals’, specific arrangements between the national government and individual sustainability initiatives (e.g., energy, water, resources, waste) by removing ‘red tape’, adjusting policies where appropriate, making knowledge available, etc.; 2) energy innovation ‘top sector approach’ designed to strengthen market steering, market involvement and market resources for energy innovation in seven key areas, including gas, solar, offshore wind, industrial efficiency, and biomass/bio-based economy; and 3) the SDE+ (stimulation of sustainable/renewable energy) feed in scheme, which is fully operational, has significant funding (>1,5 billion Euro/annum) and strong competition between options.
Key trends include a strong de-centralisation of power generation (e.g., solar, wind, small CHP) and to some degree also of gas production (‘green gas’). Policymakers have to create the framework to stimulate or facilitate this development including the upgrade of the existing network (e.g., smart grids). An important area for policymakers to focus on is the bio-based economy, and the liaison of a strong agricultural and chemical sector, and ‘green gas’. Finally, the Netherlands are expected to strengthen its position as ‘gas country’, with an increased focus on the role of gas as a ‘balancing fuel’ in a system that moves towards sustainability.
1 Data for shale gas resources not available
86%
11%
3%
Conventional thermal
Hydro
Other Renewables
Nuclear
0 6 0
1,071
0
500
1,000
1,500
2,000
2,500
Coal Oil Shale Oil Gas
INDEX RANK
14

NEW ZEALAND
ENERGY SUSTAINABILITY BALANCE ENERGY SUSTAINABILITY INDEX RANKINGS
2010 2011 2012 Trend
Energy performance 6 7 6 + Energy security 17 33 16 + Social equity 13 13 13 Environmental impact mitigation 11 7 8 -
Contextual performance 8 8 7 + Political strength 7 6 3 + Societal strength 7 9 9
Economic strength 20 17 20 -
Overall rank 5 6 6
DIVERSITY OF ELECTRICITY GENERATION FOSSIL FUEL RESOURCES (IN MTOE)
KEY METRICS
Industrial sector (% of total GDP) 24.5 GDP per capita (PPP, USD); GDP Group 26,997 (B)
TPEP / TPEC (net energy importer) 0.82 Energy intensity (million BTU per USD) 0.03
Emission intensity (kg of CO2 per USD) 1.16 CO2 emissions (metric tons) per capita 8.94
Energy affordability (USD per kWh) 0.18 Population with access to electricity (%) 100.0
INDEX COMMENTARY
New Zealand remains constant on rank six in the Index. Improvements in energy security are driven by an increased wholesale margin on gasoline and oil reserve. Performance in other dimensions remains solid, except a small drop in its economic performance which is driven by a decrease in macroeconomic stability.
TRENDS AND OUTLOOK
New Zealand is well-positioned in the Index and could see further improvements due to the increased use renewable energy sources and gas in electricity and heat generation which will lower CO2 emissions and improve environmental impact mitigation performance.
NZ Energy Strategy and NZEECS provide an overarching policy framework, its four priorities of diverse resource development, environmental responsibility, efficient use of energy, secure and affordable energy should improve New Zealand’s performance in all three energy dimensions. Key initiatives are: 1) a national ETS, which allows the protection of the competitiveness of export industries by allocations; and 2) the New Zealand Energy Strategy which has an aspirational aim to increase the amount of renewable electricity from 70% to 90% by 2025, facilitated by ETS, market mechanisms and grid investment, and without compromising security of supply or competitiveness. The two major parties both support the ETS and have similar renewable energy goals, which should help to increase investment certainty in the sector.
Trends to be watched are: 1) The extensions of the ETS to cover all sectors including agricultural emissions, and be fully internationally tradable; 2) An increasing proportion of electricity from renewable energy sources with gas likely make up most of the rest; 3) accommodating increasing intermittent wind generation; 4) Promotion of demand side measures including energy efficiency, and the use of renewables in the industrial and domestic sectors; and 5) Capitalising on opportunities to improve transport energy efficiency and the use of alternative transport fuels, which could contribute to greater energy security and have a positive environmental impact. New Zealand’s vehicles are generally older and less efficient than those in other countries such as Japan and Europe. Two-thirds of New Zealand’s liquid fuel comes from its one refinery and this will increase with the recent announcement of a CCR project.
26%
56%
18%
Conventional thermal
Hydro
Other Renewables
Nuclear
400
20 3 400
500
1,000
1,500
2,000
2,500
Coal Oil Shale Oil Gas
INDEX RANK
6

NIGER J
ENERGY SUSTAINABILITY BALANCE ENERGY SUSTAINABILITY INDEX RANKINGS
2010 2011 2012 Trend
Energy performance 88 88 88
Energy security 80 74 92 -
Social equity 86 88 87 + Environmental impact mitigation 81 81 48 + Contextual performance 84 81 83 -
Political strength 81 82 81 + Societal strength 84 76 74 + Economic strength 77 73 78 -
Overall rank 90 90 90
DIVERSITY OF ELECTRICITY GENERATION FOSSIL FUEL RESOURCES (IN MTOE)
KEY METRICS
Industrial sector (% of total GDP) 16.0 GDP per capita (PPP, USD); GDP Group 761 (D)
TPEP / TPEC (net energy importer) 0.24 Energy intensity (million BTU per USD) 0.00
Emission intensity (kg of CO2 per USD) 0.25 CO2 emissions (metric tons) per capita 0.26
Energy affordability (USD per kWh) n.a. Population with access to electricity (%) 35.0
INDEX COMMENTARY
Niger remains constant on rank 90 in the Index. The country is in the early stages of developing a well-functioning energy system and performs rather poor across most indicators in the energy security dimension. The continuously increasing energy consumption is necessary for Niger's economic and social development as only 35% of the population has access to electricity. In combination with high gasoline prices this leads to a poor performance in social equity. Environmental performance is stronger due to a still very low energy and emissions intensity per capita and a mediocre quality of air and water. Improvements across all indicators led to a substantial rise in the environmental score. Performance in contextual dimensions is weak and Niger struggles across all indicators.
100%Conventional thermal
Hydro
Other Renewables
Nuclear
490 0 0
0
500
1,000
1,500
2,000
2,500
Coal Oil Shale Oil Gas
INDEX RANK
90

NIGERIA
ENERGY SUSTAINABILITY BALANCE ENERGY SUSTAINABILITY INDEX RANKINGS
2010 2011 2012 Trend
Energy performance 68 71 68 + Energy security 16 18 24 - Social equity 82 82 84 - Environmental impact mitigation 83 88 81 + Contextual performance 85 90 92 - Political strength 89 91 90 + Societal strength 89 90 89 + Economic strength 66 82 92 -
Overall rank 77 83 84 -
DIVERSITY OF ELECTRICITY GENERATION FOSSIL FUEL RESOURCES (IN MTOE)
KEY METRICS
Industrial sector (% of total GDP) 33.6 GDP per capita (PPP, USD); GDP Group 2,420 (D)
TPEP / TPEC (net energy exporter) 7.42 Energy intensity (million BTU per USD) 0.01
Emission intensity (kg of CO2 per USD) 1.20 CO2 emissions (metric tons) per capita 0.98
Energy affordability (USD per kWh) n.a. Population with access to electricity (%) 50.6
INDEX COMMENTARY
Nigeria drops one place to rank 84 in the Index with energy security being the only high performing dimension. However, a slight drop in energy security is driven by a decrease in the wholesale margin on gasoline and less diversity in electricity production and energy exports; these trends are only partly offset by a reduction in the energy consumption, which reverses last years' positive growth rate. The performance in social equity sees no positive change (rank 84), with only 50% of the population having access to electricity. Nigeria's weak environmental performance improved slightly (rank 81) but remains low due to a bad quality of air and water and high emissions from electricity and heat generation. Nigeria overall underperforms in mitigating its environmental footprint compared to peer countries with similar levels of energy intensity per capita. Performance across all indicators in the three contextual dimensions is very poor and economic strength experiences a further drop due to a decrease in credit availability and macroeconomic stability.
76%
24%
Conventional thermal
Hydro
Other Renewables
Nuclear
133
4,953
0
4,550
0
2,500
5,000
7,500
10,000
12,500
15,000
Coal Oil Shale Oil Gas
INDEX RANK
84

NORWAY J
ENERGY SUSTAINABILITY BALANCE ENERGY SUSTAINABILITY INDEX RANKINGS
2010 2011 2012 Trend
Energy performance 3 4 3 + Energy security 7 21 9 + Social equity 8 11 10 + Environmental impact mitigation 4 4 5 -
Contextual performance 10 13 10 + Political strength 10 10 8 + Societal strength 4 6 4 + Economic strength 29 37 24 +
Overall rank 3 5 4 +
DIVERSITY OF ELECTRICITY GENERATION FOSSIL FUEL RESOURCES (IN MTOE)1
KEY METRICS
Industrial sector (% of total GDP) 39.7 GDP per capita (PPP, USD); GDP Group 52,165 (A)
TPEP / TPEC (net energy exporter) 5.20 Energy intensity (million BTU per USD) 0.01
Emission intensity (kg of CO2 per USD) 0.24 CO2 emissions (metric tons) per capita 8.06
Energy affordability (USD per kWh) 0.18 Population with access to electricity (%) 100.0
INDEX COMMENTARY
Norway increases by one place to rank four in the Index with improvements in most energy and all contextual dimensions. A substantial improvement in energy security was driven by an increased wholesale margin on gasoline. Driven by small deteriorations across all indicators, the environmental impact mitigation score decreases slightly. Norway exhibits substantially improved macroeconomic stability, which increases Norway's economic strength ranking by thirteen places to rank 24.
1 Data for shale gas resources not available
4%
95%
1%
Conventional thermal
Hydro
Other Renewables
Nuclear
4
920
0
1,905
0
500
1,000
1,500
2,000
2,500
Coal Oil Shale Oil Gas
INDEX RANK
4

PAKISTAN
ENERGY SUSTAINABILITY BALANCE ENERGY SUSTAINABILITY INDEX RANKINGS
2010 2011 2012 Trend
Energy performance 83 83 90 -
Energy security 67 64 73 -
Social equity 78 79 80 -
Environmental impact mitigation 68 71 77 -
Contextual performance 87 88 90 -
Political strength 85 87 87
Societal strength 85 87 87
Economic strength 81 86 91 -
Overall rank 87 88 92 -
DIVERSITY OF ELECTRICITY GENERATION FOSSIL FUEL RESOURCES (IN MTOE)1
KEY METRICS
Industrial sector (% of total GDP) 25.8 GDP per capita (PPP, USD); GDP Group 2,721 (D)
TPEP / TPEC (net energy importer) 0.66 Energy intensity (million BTU per USD) 0.06
Emission intensity (kg of CO2 per USD) 3.36 CO2 emissions (metric tons) per capita 1.31
Energy affordability (USD per kWh) n.a. Population with access to electricity (%) 62.4
INDEX COMMENTARY
Pakistan decreases four ranks in the overall Index. Energy security is overall supported by strong diversity of electricity production and a relatively good ratio of production to energy supply. However, the wholesale margin on gasoline and the continuously positive 5-year energy consumption growth rate are weaker indicators. A sustained consumption growth is however necessary as only 62% of the population currently has access to electricity. Low electricity access rates lead to low performance in social equity. A decrease in environmental performance is driven by a very low quality of air and water and mediocre performance in the other indicators. Pakistan underperforms in mitigating its environmental footprint compared to countries with similar levels of energy intensity per capita. Performance in the contextual dimension is poor with a weak performance across all indicators.
TRENDS AND OUTLOOK
Key trends, which are expected to support Pakistan’s moving up in the Index rankings are: 1) The continued increase of the share of renewable energy in the electricity production mix; 2) Stringent energy conservation rules and regulations; and 3) Synergy in all energy related departments / ministries through development of single ministry of energy.
1 Data for shale gas resources not available
65%
32%
3%
Conventional thermal
Hydro
Other Renewables
Nuclear
1,449
42 0
722
0
500
1,000
1,500
2,000
2,500
Coal Oil Shale Oil Gas
INDEX RANK
92

PARAGUAY J
ENERGY SUSTAINABILITY BALANCE ENERGY SUSTAINABILITY INDEX RANKINGS
2010 2011 2012 Trend
Energy performance 41 41 41
Energy security 38 54 62 -
Social equity 67 69 70 -
Environmental impact mitigation 31 8 1 + Contextual performance 86 83 85 -
Political strength 79 81 80 + Societal strength 82 83 82 + Economic strength 83 71 73 -
Overall rank 59 56 52 +
DIVERSITY OF ELECTRICITY GENERATION FOSSIL FUEL RESOURCES (IN MTOE)1
KEY METRICS
Industrial sector (% of total GDP) 18.6 GDP per capita (PPP, USD); GDP Group 5,208 (D)
TPEP / TPEC (net energy exporter) 1.22 Energy intensity (million BTU per USD) 0.13
Emission intensity (kg of CO2 per USD) 1.15 CO2 emissions (metric tons) per capita 0.64
Energy affordability (USD per kWh) 0.06 Population with access to electricity (%) 96.7
INDEX COMMENTARY
Paraguay rises four places in the Index to rank 52 due to an increase in environmental performance. This is driven by a reduction in emissions per capita and a better quality of air and water when compared to peer countries. Paraguay’s top ranking in the environmental dimension is based on good scores in all indicators, despite high levels of energy intensity per capita. A deterioration of energy security was driven by a decrease in the wholesale margin on gasoline and by an increase in the 5-year energy consumption growth rate. Overall the weakest indicators for energy security remain the diversity of electricity production and of energy exports. Low scores in social equity are driven by high gasoline prices and low scores in providing high quality and affordable electricity access. Overall 3% of Paraguay's population doesn’t have access to electricity. The weak contextual performance doesn’t improve. Weakest indicators remain effectiveness of government for political strength, rule of law and education for societal strength and macroeconomic stability and low credit availability for economic strength.
1 Data for shale gas resources not available
100%
Conventional thermal
Hydro
Other Renewables
Nuclear
0 0 0 00
500
1,000
1,500
2,000
2,500
Coal Oil Shale Oil Gas
INDEX RANK
52

PERU
ENERGY SUSTAINABILITY BALANCE ENERGY SUSTAINABILITY INDEX RANKINGS
2010 2011 2012 Trend
Energy performance 63 56 60 - Energy security 69 48 46 + Social equity 68 68 67 + Environmental impact mitigation 36 45 60 -
Contextual performance 56 59 52 + Political strength 62 61 58 + Societal strength 66 67 64 + Economic strength 43 45 34 +
Overall rank 63 59 58 +
DIVERSITY OF ELECTRICITY GENERATION FOSSIL FUEL RESOURCES (IN MTOE)
KEY METRICS
Industrial sector (% of total GDP) 38.0 GDP per capita (PPP, USD); GDP Group 9,358 (C)
TPEP / TPEC (net energy importer) 0.81 Energy intensity (million BTU per USD) 0.02
Emission intensity (kg of CO2 per USD) 0.75 CO2 emissions (metric tons) per capita 1.51
Energy affordability (USD per kWh) 0.13 Population with access to electricity (%) 85.7
INDEX COMMENTARY
Peru rises by one place in the Index to rank 58. It exhibits a substantial drop in environmental performance driven by higher emissions from electricity and heat generation and a decreased quality of air and water, which is only partly offset by lower energy and emissions intensity per GDP per capita. Overall, Peru thus underperforms in mitigating its environmental impact compared to other countries with similar energy intensity per capita. Small improvements are noted for energy security, but sustained and increasing energy consumption growth and weak oil reserve stocks remain challenges. Social equity remains the weakest dimension (rank 67) and only 85% of the population has access to electricity. Contextual performance increases with small improvements across all indicators. However, political stability, rule of law and credit availability remain very weak indicators overall.
39%
59%
2%
Conventional thermal
Hydro
Other Renewables
Nuclear
31 1240
288
0
500
1,000
1,500
2,000
2,500
Coal Oil Shale Oil Gas
INDEX RANK
58

PHILIPPINES J
ENERGY SUSTAINABILITY BALANCE ENERGY SUSTAINABILITY INDEX RANKINGS
2010 2011 2012 Trend
Energy performance 64 52 79 -
Energy security 59 31 52 -
Social equity 74 76 77 -
Environmental impact mitigation 41 52 78 -
Contextual performance 61 53 64 -
Political strength 66 69 74 -
Societal strength 69 70 70
Economic strength 44 20 37 -
Overall rank 64 57 75 -
DIVERSITY OF ELECTRICITY GENERATION FOSSIL FUEL RESOURCES (IN MTOE)
KEY METRICS
Industrial sector (% of total GDP) 31.5 GDP per capita (PPP, USD); GDP Group 3,920 (D)
TPEP / TPEC (net energy importer) 0.38 Energy intensity (million BTU per USD) 0.02
Emission intensity (kg of CO2 per USD) 1.16 CO2 emissions (metric tons) per capita 0.86
Energy affordability (USD per kWh) n.a. Population with access to electricity (%) 89.7
INDEX COMMENTARY
The Philippines experience a significant drop by 18 places in the Index due to deteriorations across all dimensions. Energy security drops due to a decrease across all indicators. As only 90% of the population has access to electricity, the Philippines still struggle in social equity. Weak environmental performance is driven by high emissions from electricity and heat generation and poor quality of air and water. Overall, given its energy intensity per capita, the Philippines underperform in mitigating its environmental footprint compared to countries with similar levels of energy intensity. Political and societal strength remain weak, mostly due to low political stability and low control of corruption. The 17 place drop in economic strength is caused by low credit availability.
73%
12%
15%
Conventional thermal
Hydro
Other Renewables
Nuclear
221
15 080
0
500
1,000
1,500
2,000
2,500
Coal Oil Shale Oil Gas
INDEX RANK
75
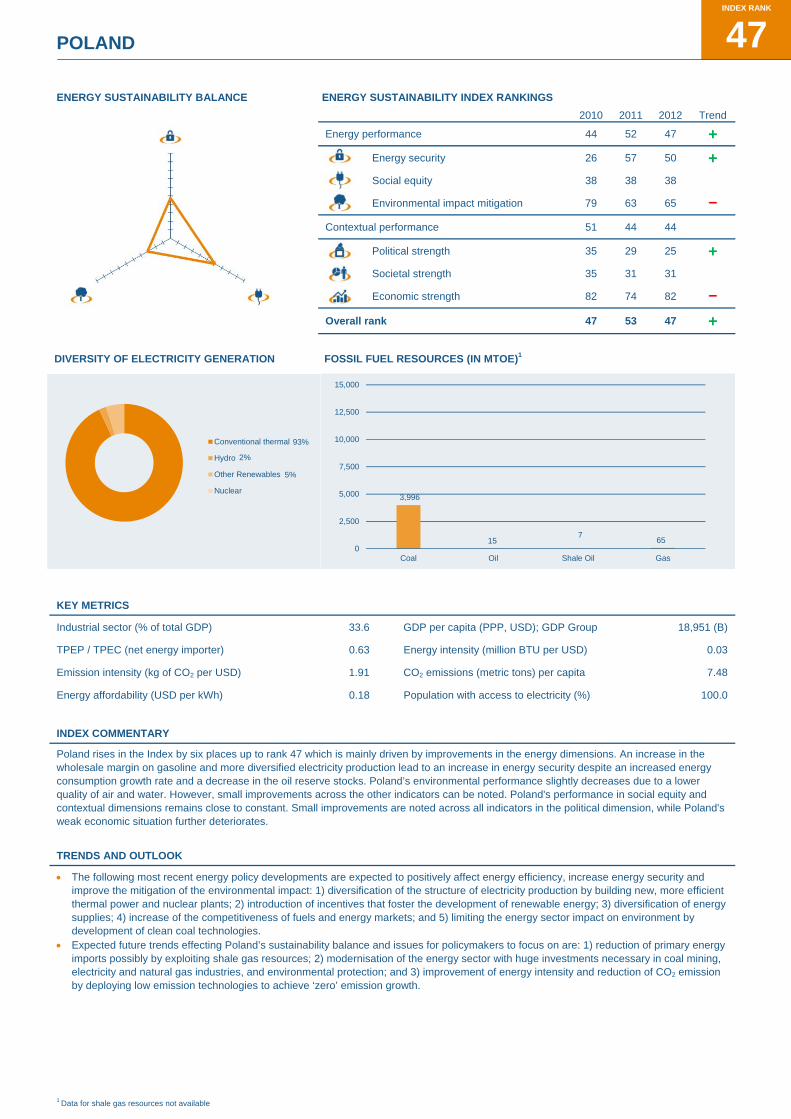
POLAND
ENERGY SUSTAINABILITY BALANCE ENERGY SUSTAINABILITY INDEX RANKINGS
2010 2011 2012 Trend
Energy performance 44 52 47 + Energy security 26 57 50 + Social equity 38 38 38 Environmental impact mitigation 79 63 65 -
Contextual performance 51 44 44 Political strength 35 29 25 + Societal strength 35 31 31 Economic strength 82 74 82 -
Overall rank 47 53 47 +
DIVERSITY OF ELECTRICITY GENERATION FOSSIL FUEL RESOURCES (IN MTOE)1
KEY METRICS
Industrial sector (% of total GDP) 33.6 GDP per capita (PPP, USD); GDP Group 18,951 (B)
TPEP / TPEC (net energy importer) 0.63 Energy intensity (million BTU per USD) 0.03
Emission intensity (kg of CO2 per USD) 1.91 CO2 emissions (metric tons) per capita 7.48
Energy affordability (USD per kWh) 0.18 Population with access to electricity (%) 100.0
INDEX COMMENTARY
Poland rises in the Index by six places up to rank 47 which is mainly driven by improvements in the energy dimensions. An increase in the wholesale margin on gasoline and more diversified electricity production lead to an increase in energy security despite an increased energy consumption growth rate and a decrease in the oil reserve stocks. Poland’s environmental performance slightly decreases due to a lower quality of air and water. However, small improvements across the other indicators can be noted. Poland's performance in social equity and contextual dimensions remains close to constant. Small improvements are noted across all indicators in the political dimension, while Poland's weak economic situation further deteriorates.
TRENDS AND OUTLOOK
The following most recent energy policy developments are expected to positively affect energy efficiency, increase energy security and improve the mitigation of the environmental impact: 1) diversification of the structure of electricity production by building new, more efficient thermal power and nuclear plants; 2) introduction of incentives that foster the development of renewable energy; 3) diversification of energy supplies; 4) increase of the competitiveness of fuels and energy markets; and 5) limiting the energy sector impact on environment by development of clean coal technologies.
Expected future trends effecting Poland’s sustainability balance and issues for policymakers to focus on are: 1) reduction of primary energy imports possibly by exploiting shale gas resources; 2) modernisation of the energy sector with huge investments necessary in coal mining, electricity and natural gas industries, and environmental protection; and 3) improvement of energy intensity and reduction of CO2 emission by deploying low emission technologies to achieve ‘zero’ emission growth.
1 Data for shale gas resources not available
93%
2%
5%
Conventional thermal
Hydro
Other Renewables
Nuclear3,996
157
650
2,500
5,000
7,500
10,000
12,500
15,000
Coal Oil Shale Oil Gas
INDEX RANK
47
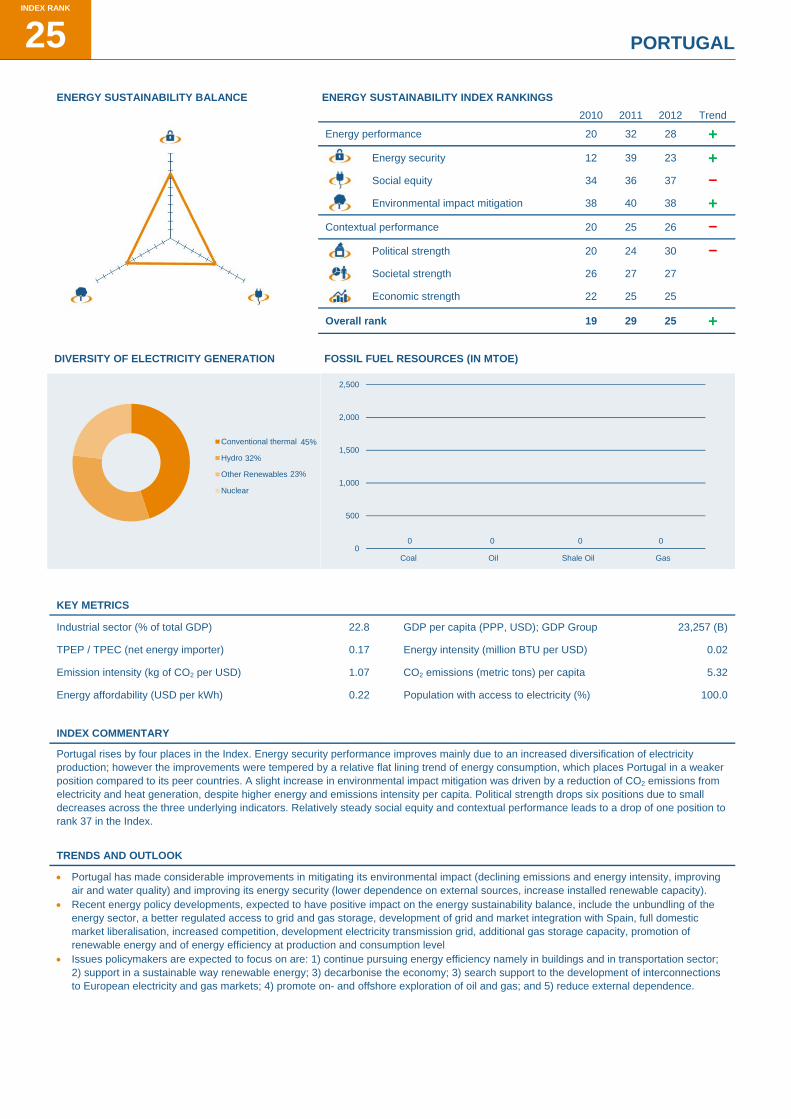
PORTUGAL J
ENERGY SUSTAINABILITY BALANCE ENERGY SUSTAINABILITY INDEX RANKINGS
2010 2011 2012 Trend
Energy performance 20 32 28 + Energy security 12 39 23 + Social equity 34 36 37 - Environmental impact mitigation 38 40 38 + Contextual performance 20 25 26 - Political strength 20 24 30 - Societal strength 26 27 27 Economic strength 22 25 25
Overall rank 19 29 25 +
DIVERSITY OF ELECTRICITY GENERATION FOSSIL FUEL RESOURCES (IN MTOE)
KEY METRICS
Industrial sector (% of total GDP) 22.8 GDP per capita (PPP, USD); GDP Group 23,257 (B)
TPEP / TPEC (net energy importer) 0.17 Energy intensity (million BTU per USD) 0.02
Emission intensity (kg of CO2 per USD) 1.07 CO2 emissions (metric tons) per capita 5.32
Energy affordability (USD per kWh) 0.22 Population with access to electricity (%) 100.0
INDEX COMMENTARY
Portugal rises by four places in the Index. Energy security performance improves mainly due to an increased diversification of electricity production; however the improvements were tempered by a relative flat lining trend of energy consumption, which places Portugal in a weaker position compared to its peer countries. A slight increase in environmental impact mitigation was driven by a reduction of CO2 emissions from electricity and heat generation, despite higher energy and emissions intensity per capita. Political strength drops six positions due to small decreases across the three underlying indicators. Relatively steady social equity and contextual performance leads to a drop of one position to rank 37 in the Index.
TRENDS AND OUTLOOK
Portugal has made considerable improvements in mitigating its environmental impact (declining emissions and energy intensity, improving air and water quality) and improving its energy security (lower dependence on external sources, increase installed renewable capacity).
Recent energy policy developments, expected to have positive impact on the energy sustainability balance, include the unbundling of the energy sector, a better regulated access to grid and gas storage, development of grid and market integration with Spain, full domestic market liberalisation, increased competition, development electricity transmission grid, additional gas storage capacity, promotion of renewable energy and of energy efficiency at production and consumption level
Issues policymakers are expected to focus on are: 1) continue pursuing energy efficiency namely in buildings and in transportation sector; 2) support in a sustainable way renewable energy; 3) decarbonise the economy; 3) search support to the development of interconnections to European electricity and gas markets; 4) promote on- and offshore exploration of oil and gas; and 5) reduce external dependence.
45%
32%
23%
Conventional thermal
Hydro
Other Renewables
Nuclear
0 0 0 00
500
1,000
1,500
2,000
2,500
Coal Oil Shale Oil Gas
INDEX RANK
25
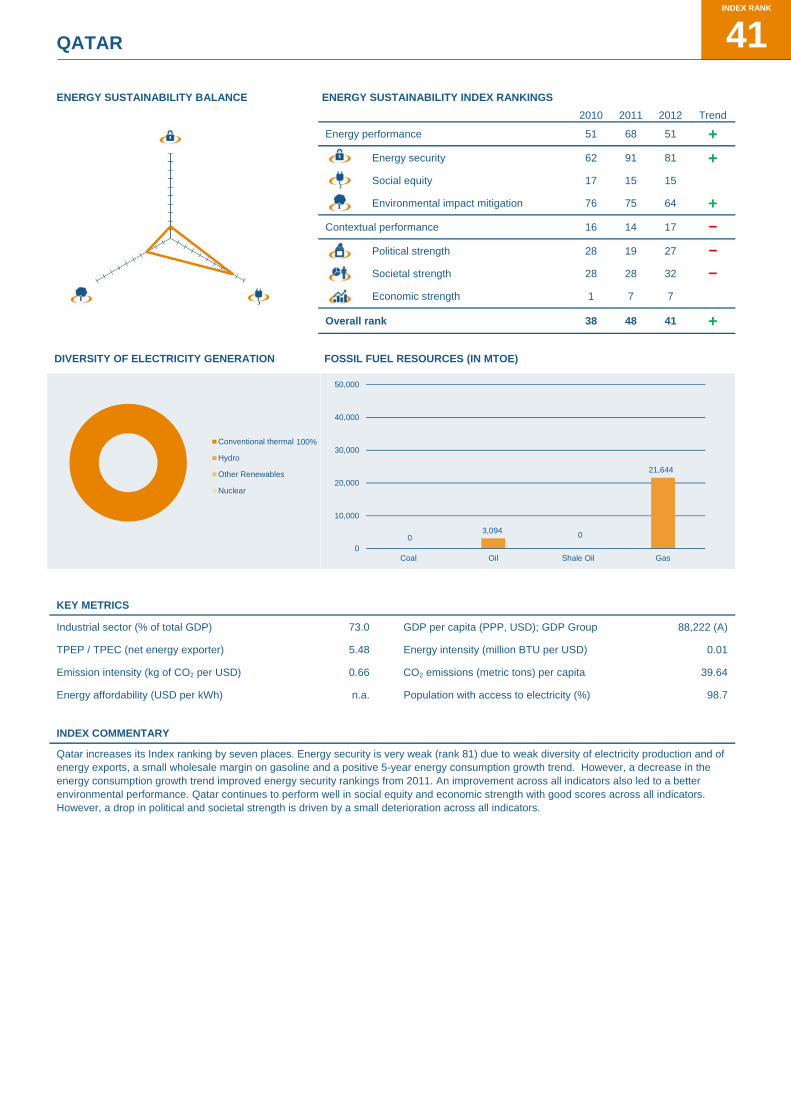
QATAR
ENERGY SUSTAINABILITY BALANCE ENERGY SUSTAINABILITY INDEX RANKINGS
2010 2011 2012 Trend
Energy performance 51 68 51 + Energy security 62 91 81 + Social equity 17 15 15 Environmental impact mitigation 76 75 64 + Contextual performance 16 14 17 - Political strength 28 19 27 - Societal strength 28 28 32 - Economic strength 1 7 7
Overall rank 38 48 41 +
DIVERSITY OF ELECTRICITY GENERATION FOSSIL FUEL RESOURCES (IN MTOE)
KEY METRICS
Industrial sector (% of total GDP) 73.0 GDP per capita (PPP, USD); GDP Group 88,222 (A)
TPEP / TPEC (net energy exporter) 5.48 Energy intensity (million BTU per USD) 0.01
Emission intensity (kg of CO2 per USD) 0.66 CO2 emissions (metric tons) per capita 39.64
Energy affordability (USD per kWh) n.a. Population with access to electricity (%) 98.7
INDEX COMMENTARY
Qatar increases its Index ranking by seven places. Energy security is very weak (rank 81) due to weak diversity of electricity production and of energy exports, a small wholesale margin on gasoline and a positive 5-year energy consumption growth trend. However, a decrease in the energy consumption growth trend improved energy security rankings from 2011. An improvement across all indicators also led to a better environmental performance. Qatar continues to perform well in social equity and economic strength with good scores across all indicators. However, a drop in political and societal strength is driven by a small deterioration across all indicators.
100%Conventional thermal
Hydro
Other Renewables
Nuclear
03,094 0
21,644
0
10,000
20,000
30,000
40,000
50,000
Coal Oil Shale Oil Gas
INDEX RANK
41

ROMANIA J
ENERGY SUSTAINABILITY BALANCE ENERGY SUSTAINABILITY INDEX RANKINGS
2010 2011 2012 Trend
Energy performance 35 39 50 -
Energy security 28 46 36 + Social equity 44 43 42 + Environmental impact mitigation 50 36 80 -
Contextual performance 59 55 61 - Political strength 48 46 45 + Societal strength 45 45 45
Economic strength 84 79 84 -
Overall rank 41 42 56 -
DIVERSITY OF ELECTRICITY GENERATION FOSSIL FUEL RESOURCES (IN MTOE)
KEY METRICS
Industrial sector (% of total GDP) 32.9 GDP per capita (PPP, USD); GDP Group 11,904 (C)
TPEP / TPEC (net energy importer) 0.78 Energy intensity (million BTU per USD) 0.02
Emission intensity (kg of CO2 per USD) 1.36 CO2 emissions (metric tons) per capita 3.75
Energy affordability (USD per kWh) n.a. Population with access to electricity (%) 100.0
INDEX COMMENTARY
Romania declines in the Index by 14 places to rank 56. Energy security improved due to reductions in energy consumption; those improvements were only partly offset by the decrease in the wholesale margin on gasoline and in the oil reserve stocks. Due to a weak and further decreasing quality of air and water, Romania underperforms in mitigating its environmental footprint compared to other countries with similar levels of energy intensity per capita. The substantial drop during the last year makes this dimension Romania’s weakest one (rank 80). Romania's weak economic situation further deteriorates (rank 84) due to lower credit availability and a slower improvement in macroeconomic stability when compared to other countries. Weakest indicator in this dimension is the high cost of living as proportion of household consumption expenditure. Romania shows a stable performance in social equity, political and social strength.
TRENDS AND OUTLOOK
The most recent energy policy development which is expected to positively influence the country’s energy sustainability balance is the revision of Romania’s renewable energy law which will offer differentiated, and potentially lucrative, green certificate (GC) packages across all renewable technologies. However, the implementation of the law has been postponed since 2008 and the delay has resulted in uncertainty of returns for investors already implementing projects and has discouraged potential new investors from entering the market.
Key issues for policymakers to focus on include: 1) integration of renewable energy sources; 2) energy infrastructure development, especially in the electricity transmission and distribution grid; 3) market integration at regional and European level; and 4) increasing environmental impact mitigation efforts.
46%
35%
19%
Conventional thermal
Hydro
Other Renewables
Nuclear
204
550
88
0
500
1,000
1,500
2,000
2,500
Coal Oil Shale Oil Gas
INDEX RANK
56

RUSSIA
ENERGY SUSTAINABILITY BALANCE ENERGY SUSTAINABILITY INDEX RANKINGS
2010 2011 2012 Trend
Energy performance 17 11 16 -
Energy security 8 2 8 -
Social equity 53 48 47 + Environmental impact mitigation 14 11 16 -
Contextual performance 71 79 71 + Political strength 75 76 77 - Societal strength 72 73 69 + Economic strength 55 70 53 +
Overall rank 29 27 26 +
DIVERSITY OF ELECTRICITY GENERATION FOSSIL FUEL RESOURCES (IN MTOE)
KEY METRICS
Industrial sector (% of total GDP) 36.9 GDP per capita (PPP, USD); GDP Group 15,657 (B)
TPEP / TPEC (net energy exporter) 1.85 Energy intensity (million BTU per USD) 0.05
Emission intensity (kg of CO2 per USD) 3.13 CO2 emissions (metric tons) per capita 11.00
Energy affordability (USD per kWh) n.a. Population with access to electricity (%) 100.0
INDEX COMMENTARY
Russia increased its Index ranking by one place to rank 26. Russia struggles the most with contextual performance, but improved this somewhat during the last year, increasing its societal strength by four places (to rank 69) and its economic strength by seventeen spots due to increased macroeconomic stability (to rank 53). Russia's environmental performance dropped slightly due to a substantial decrease in the quality of air and water and slower reduction of CO2 emission from electricity and heat generation compared to its peer countries. This is partly offset by lower energy and emissions intensity per GDP per capita. A decrease in energy security was driven by a decrease of the wholesale margin on gasoline, which outweighs the strong reduction in energy consumption reversing last year's positive growth rate.
67%
17%
16%
Conventional thermal
Hydro
Other Renewables
Nuclear
109,907
10,647
35,470 38,607
0
20,000
40,000
60,000
80,000
100,000
120,000
Coal Oil Shale Oil Gas
INDEX RANK
26
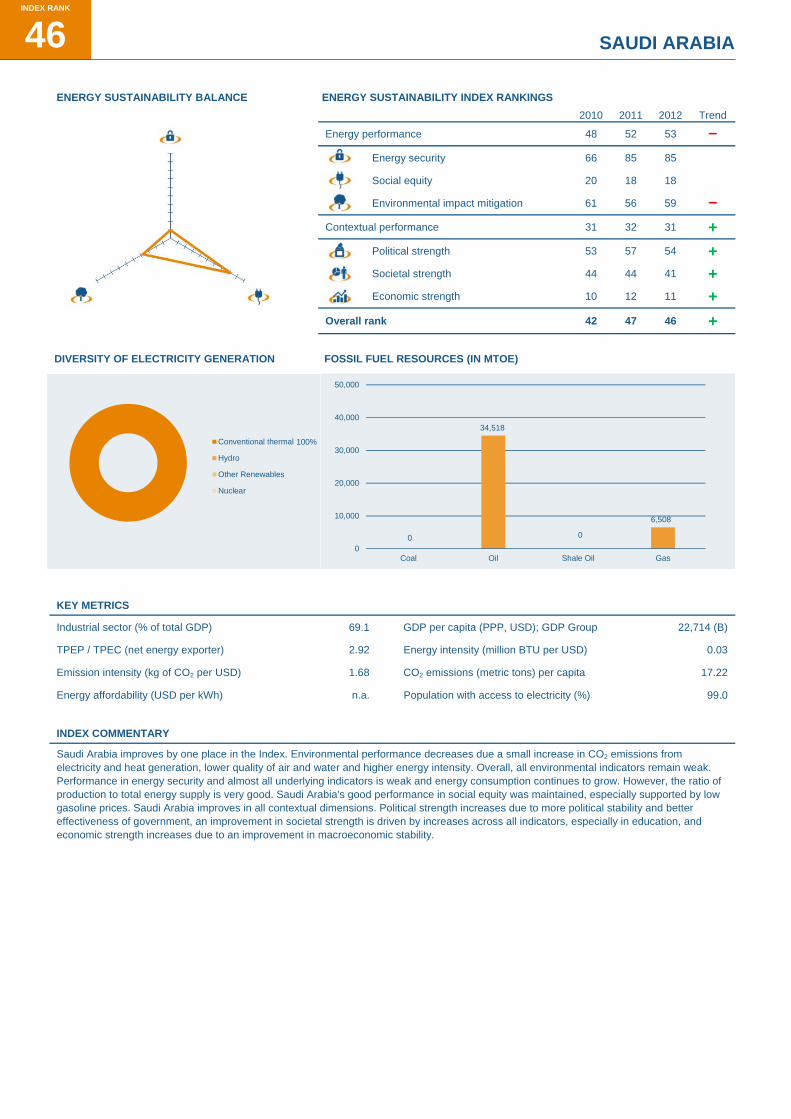
SAUDI ARABIA J
ENERGY SUSTAINABILITY BALANCE ENERGY SUSTAINABILITY INDEX RANKINGS
2010 2011 2012 Trend
Energy performance 48 52 53 -
Energy security 66 85 85
Social equity 20 18 18
Environmental impact mitigation 61 56 59 -
Contextual performance 31 32 31 + Political strength 53 57 54 + Societal strength 44 44 41 + Economic strength 10 12 11 +
Overall rank 42 47 46 +
DIVERSITY OF ELECTRICITY GENERATION FOSSIL FUEL RESOURCES (IN MTOE)
KEY METRICS
Industrial sector (% of total GDP) 69.1 GDP per capita (PPP, USD); GDP Group 22,714 (B)
TPEP / TPEC (net energy exporter) 2.92 Energy intensity (million BTU per USD) 0.03
Emission intensity (kg of CO2 per USD) 1.68 CO2 emissions (metric tons) per capita 17.22
Energy affordability (USD per kWh) n.a. Population with access to electricity (%) 99.0
INDEX COMMENTARY
Saudi Arabia improves by one place in the Index. Environmental performance decreases due a small increase in CO2 emissions from electricity and heat generation, lower quality of air and water and higher energy intensity. Overall, all environmental indicators remain weak. Performance in energy security and almost all underlying indicators is weak and energy consumption continues to grow. However, the ratio of production to total energy supply is very good. Saudi Arabia's good performance in social equity was maintained, especially supported by low gasoline prices. Saudi Arabia improves in all contextual dimensions. Political strength increases due to more political stability and better effectiveness of government, an improvement in societal strength is driven by increases across all indicators, especially in education, and economic strength increases due to an improvement in macroeconomic stability.
100%Conventional thermal
Hydro
Other Renewables
Nuclear
0
34,518
0
6,508
0
10,000
20,000
30,000
40,000
50,000
Coal Oil Shale Oil Gas
INDEX RANK
46

SENEGAL
ENERGY SUSTAINABILITY BALANCE ENERGY SUSTAINABILITY INDEX RANKINGS
2010 2011 2012 Trend
Energy performance 90 90 93 -
Energy security 86 78 86 -
Social equity 84 87 89 -
Environmental impact mitigation 84 85 86 -
Contextual performance 78 77 77
Political strength 63 63 68 -
Societal strength 74 78 78
Economic strength 73 75 76 -
Overall rank 89 91 94 -
DIVERSITY OF ELECTRICITY GENERATION FOSSIL FUEL RESOURCES (IN MTOE)
KEY METRICS
Industrial sector (% of total GDP) 22.8 GDP per capita (PPP, USD); GDP Group 1,828 (D)
TPEP / TPEC (net energy importer) 0.04 Energy intensity (million BTU per USD) 0.03
Emission intensity (kg of CO2 per USD) 2.27 CO2 emissions (metric tons) per capita 1.13
Energy affordability (USD per kWh) n.a. Population with access to electricity (%) 42.0
INDEX COMMENTARY
Senegal drops by three places. Energy security most struggles with a low ratio of production to total energy supply; however the recent decrease was driven by a decrease in the wholesale margin on gasoline, while the 5-year energy consumption growth rate decreased, but still remains positive. Growth in energy consumption is important for Senegal's economic and social development as only 42% of the population has access to electricity. In combination with high gasoline prices this leads to low performance in social equity. Environmental performance is very weak due to high CO2 emissions from electricity and heat generation and a low quality of air and water. Overall the Senegal underperforms in mitigating its environmental impact when compared to countries with similar levels of energy intensity per capita. Contextual performance remains low, but fairly constant as the country continues to struggle with most indicators, including political stability, effectiveness of government, health, education, control of corruption, rule of law as well as credit availability and macroeconomic stability.
91%
9%
Conventional thermal
Hydro
Other Renewables
Nuclear
0 0 0 90
500
1,000
1,500
2,000
2,500
Coal Oil Shale Oil Gas
INDEX RANK
94

SERBIA J
ENERGY SUSTAINABILITY BALANCE ENERGY SUSTAINABILITY INDEX RANKINGS
2010 2011 2012 Trend
Energy performance 80 38 67 -
Energy security 91 35 67 -
Social equity 59 57 57
Environmental impact mitigation 56 30 62 -
Contextual performance 73 71 72 -
Political strength 64 62 61 + Societal strength 51 51 52 -
Economic strength 90 89 89
Overall rank 82 44 66 -
DIVERSITY OF ELECTRICITY GENERATION FOSSIL FUEL RESOURCES (IN MTOE)
KEY METRICS
Industrial sector (% of total GDP) 18.7 GDP per capita (PPP, USD); GDP Group 10,258 (C)
TPEP / TPEC (net energy importer) 0.66 Energy intensity (million BTU per USD) 0.08
Emission intensity (kg of CO2 per USD) 6.28 CO2 emissions (metric tons) per capita 7.08
Energy affordability (USD per kWh) n.a. Population with access to electricity (%) 100.0
INDEX COMMENTARY
Serbia drops 22 places to rank 66 in the Index due to a weaker energy security and environmental performance. Energy security drops due to a decrease in the already low wholesale margin on gasoline. As the indicators of energy consumption growth and oil stock reserves are missing due to data constraints, a deterioration of one indicator has a very strong impact on the performance. It is therefore possible that the real effective decrease in energy security is smaller but cannot be evaluated due to data constraints. The substantial drop in environmental performance is driven by deteriorations across all indicators, particularly a decrease of the quality of air and water. Serbia's performance in social equity and all contextual dimensions remains constant. Performance in economic strength most struggles with very high costs of living as proportion of household consumption expenditure, while credit availability and macroeconomic stability is stronger and improved since last year’s Index
TRENDS AND OUTLOOK
In the last few years considerable investments have been made in the energy sector (e.g., electrostatic precipitators, new slug and ash removal systems, etc.), transportation system, and waste management, etc.
The recent energy policy developments include: 1) implementation of new energy policy, which further opens the energy market and meets the requirements of the South Eastern Europe Energy Treaty; 2) new standards for energy efficiency, including the building sector, are in force meeting EU regulation; and 3) implementation of a feed-in-tariff scheme two years ago. These developments are expected to have a positive impact especially on the energy security and environmental impact mitigation dimension.
The key future issues policymakers should focus on are: 1) by the end of 2012, adopt the new energy sector development strategy until 2030 with a clear vision how the sector incl. the energy mix should develop until 2050; 2) meet the obligation from the South Eastern Europe Energy Treaty to fully open the energy market by 2015; 3) implement flue gas de-sulfurisation in all power plants by 2017; 4) meet EU biofuel targets for transportation sector; and 5) establish a fund under the new law on rational use of energy, which will support energy efficiency and renewable energy projects, complementing the existing fund under the environmental policy.
72%
28%
Conventional thermal
Hydro
Other Renewables
Nuclear
9,639
100
410
2,500
5,000
7,500
10,000
12,500
15,000
Coal Oil Shale Oil Gas
INDEX RANK
66

SLOVAKIA
ENERGY SUSTAINABILITY BALANCE ENERGY SUSTAINABILITY INDEX RANKINGS
2010 2011 2012 Trend
Energy performance 12 17 9 + Energy security 15 28 6 + Social equity 35 35 35 Environmental impact mitigation 10 17 14 + Contextual performance 41 41 45 - Political strength 25 24 19 + Societal strength 37 38 39 - Economic strength 67 62 81 -
Overall rank 17 20 17 +
DIVERSITY OF ELECTRICITY GENERATION FOSSIL FUEL RESOURCES (IN MTOE)
KEY METRICS
Industrial sector (% of total GDP) 35.5 GDP per capita (PPP, USD); GDP Group 22,122 (B)
TPEP / TPEC (net energy importer) 0.33 Energy intensity (million BTU per USD) 0.02
Emission intensity (kg of CO2 per USD) 1.15 CO2 emissions (metric tons) per capita 6.58
Energy affordability (USD per kWh) 0.19 Population with access to electricity (%) 100.0
INDEX COMMENTARY
Slovakia rises by three places to rank 17 in the Index. A substantial improvement in energy security is driven by an increased wholesale margin on gasoline and a decrease in energy consumption growth. Political strength slightly improves due to better political stability. Slovakia's weak economic stability further deteriorated this year (rank 81) due to decreased macroeconomic stability.
TRENDS AND OUTLOOK
Improvements made to the Slovak energy sector over the past years are driven by energy saving efforts in all sectors of the economy, replacing existing by more efficient and clear heat and power technologies. The dependence on energy imports remains high and not diversified, however, the use of domestic renewable energy sources and processing of waste is increasing.
Recent policy developments are mainly driven by EU energy and climate targets and implementation of EU policy and regulation continues including market liberalization and promotion of environmentally friendly energy technologies. The removal of cross subsidies is challenging as it conflicts with the support of the availability of cheap energy for low-income households and for the manufacturing sector.
Policymakers need to focus on dealing with the challenge for the distribution system arising from the development of decentralized production and electric mobility. Increasing energy efficiency in all sectors of the economy remains a challenge as it requires a number of activities, including, structural changes in the economy to diverge from heavy industry to a sophisticated production with high added value, measure to reduce energy consumption of buildings, etc. The role of nuclear energy needs to be discussed as the technology allows an increase of electricity generation without increasing carbon emissions. Furthermore, policymakers need to focus on decreasing the dependence on natural gas and oil imports.
24%
21%
2%
53%
Conventional thermal
Hydro
Other Renewables
Nuclear
183
1 0 130
500
1,000
1,500
2,000
2,500
Coal Oil Shale Oil Gas
INDEX RANK
17

SLOVENIA J
ENERGY SUSTAINABILITY BALANCE ENERGY SUSTAINABILITY INDEX RANKINGS
2010 2011 2012 Trend
Energy performance 15 28 23 + Energy security 4 41 28 + Social equity 36 41 41 Environmental impact mitigation 28 20 17 + Contextual performance 24 28 29 -
Political strength 22 27 28 -
Societal strength 23 22 24 -
Economic strength 33 35 39 -
Overall rank 14 25 22 +
DIVERSITY OF ELECTRICITY GENERATION FOSSIL FUEL RESOURCES (IN MTOE)
KEY METRICS
Industrial sector (% of total GDP) 6.9 GDP per capita (PPP, USD); GDP Group 28,131 (B)
TPEP / TPEC (net energy importer) 0.47 Energy intensity (million BTU per USD) 0.02
Emission intensity (kg of CO2 per USD) 1.19 CO2 emissions (metric tons) per capita 8.61
Energy affordability (USD per kWh) n.a. Population with access to electricity (%) 100.0
INDEX COMMENTARY
Slovenia's rise by three places to rank 22 was driven by better performance in energy security and environmental impact mitigation. Improved energy security was triggered by an increased wholesale margin on gasoline; however the decrease in energy consumption growth is slower than in peer countries. An increase in environmental performance is driven by a reduction in CO2 emissions from electricity and heat generation; Slovenia overall outperforms other countries with a similar level of energy intensity per capita in mitigating its environmental footprint.. Weakest dimensions remain social equity (rank 41) and economic strength (rank 39) due to high costs of living as proportion to total household consumption.
TRENDS AND OUTLOOK
Recent energy policy developments include the amendments to the Energy Act in the year 2012 to implement the provisions of the European Third Energy legislative package. Changes made are expected to increase competition in the electricity and gas market, and also increase investments in use of renewable energy sources in final energy consumption. Furthermore, intense preparations are going on for the construction of a series of hydroelectric power plants on the Sava River, which will improve long-term reliability and environmental performance of electricity production.
Due to increased competition in the market, electricity prices for both industry and households dropped significantly at the beginning of the year 2012, and similarly, in the second half of the year 2012, natural gas prices dropped by approximately 20%. This is expected to have a positive impact on Slovenia’s performance in social equity.
South Stream, a gas pipeline which will pass through Slovenian territory and supply the southern and eastern countries of the European Union with natural gas from Russia, is expected to have a positive impact on the country’s energy security. Construction is planned between the years 2013 and 2015.
To improve Slovenia’s environmental performance additional financial investments into energy efficiency measures, particularly in the energy consumption of buildings (thermal insulation, window replacement and replacement of obsolete heating systems) and into supporting schemes for the use of renewable energy sources for energy supply of buildings are necessary.
35%
30%
1%
34%
Conventional thermal
Hydro
Other Renewables
Nuclear
156
0 0 00
500
1,000
1,500
2,000
2,500
Coal Oil Shale Oil Gas
INDEX RANK
22

SOUTH AFRICA
ENERGY SUSTAINABILITY BALANCE ENERGY SUSTAINABILITY INDEX RANKINGS
2010 2011 2012 Trend
Energy performance 50 62 64 -
Energy security 45 59 78 -
Social equity 48 52 52
Environmental impact mitigation 60 57 53 + Contextual performance 35 34 35 -
Political strength 43 45 45
Societal strength 56 61 59 + Economic strength 19 13 13
Overall rank 46 55 57 -
DIVERSITY OF ELECTRICITY GENERATION FOSSIL FUEL RESOURCES (IN MTOE)1
KEY METRICS
Industrial sector (% of total GDP) 31.6 GDP per capita (PPP, USD); GDP Group 10,541 (C)
TPEP / TPEC (net energy exporter) 1.11 Energy intensity (million BTU per USD) 0.05
Emission intensity (kg of CO2 per USD) 3.97 CO2 emissions (metric tons) per capita 12.01
Energy affordability (USD per kWh) 0.06 Population with access to electricity (%) 75.0
INDEX COMMENTARY
South Africa’s drop by two places in the Index to rank 57 is mostly driven by a drop in energy security due to a decrease in the wholesale margin on gasoline, and a particular weak performance in diversification of electricity production. Even though a small upward trend was visible during the last year, South Africa still struggles with all environmental indicators and has very high levels of energy intensity per capita. Performance in social equity remains constant with only 75% of the population having access to electricity. Performance remains fairly constant in all contextual dimensions, among which societal strength remains the weakest one (rank 59).
TRENDS AND OUTLOOK
South Africa's energy security dimension and Index ranking does not yet reflect the positive developments since 2008 which include no incidents of electricity load shedding or liquid fuel rationing.
Most recently, independent power producers (IPPs) are being allowed into the electricity sector using renewable technologies. Once these are operational, the energy security and environmental performance dimensions will show an improvement.
Issues policymakers should focus on are: 1) there is still much to be done on the social equity dimension, especially in terms of providing energy to rural communities; and 2) South Africa has abundant coal reserves but no natural gas or oil. The choice of technology for replacement and new electricity generation plant will be a very difficult one, especially since the issues of access and affordability are so critical to the social and economic development of the country.
1 Data for shale gas resources not available
94%
6%
Conventional thermal
Hydro
Other Renewables
Nuclear
21,109
219
90
10,000
20,000
30,000
40,000
50,000
Coal Oil Shale Oil Gas
INDEX RANK
57
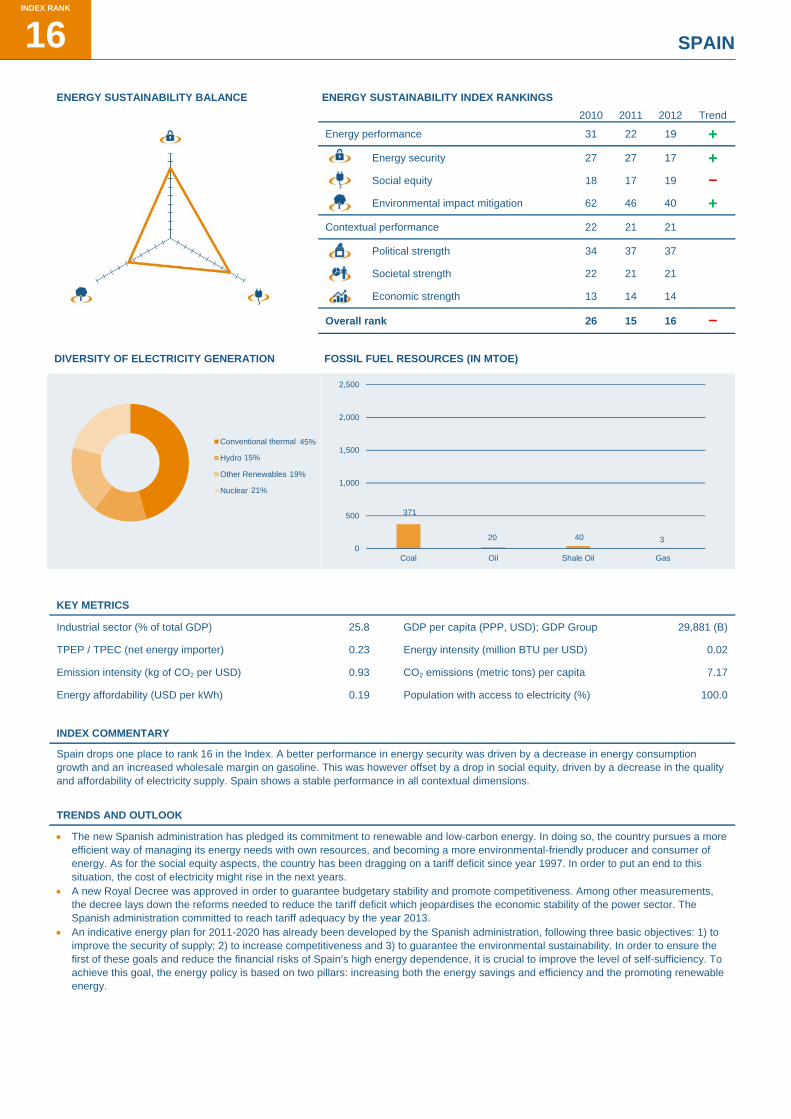
SPAIN J
ENERGY SUSTAINABILITY BALANCE ENERGY SUSTAINABILITY INDEX RANKINGS
2010 2011 2012 Trend
Energy performance 31 22 19 + Energy security 27 27 17 + Social equity 18 17 19 - Environmental impact mitigation 62 46 40 + Contextual performance 22 21 21 Political strength 34 37 37 Societal strength 22 21 21 Economic strength 13 14 14
Overall rank 26 15 16 -
DIVERSITY OF ELECTRICITY GENERATION FOSSIL FUEL RESOURCES (IN MTOE)
KEY METRICS
Industrial sector (% of total GDP) 25.8 GDP per capita (PPP, USD); GDP Group 29,881 (B)
TPEP / TPEC (net energy importer) 0.23 Energy intensity (million BTU per USD) 0.02
Emission intensity (kg of CO2 per USD) 0.93 CO2 emissions (metric tons) per capita 7.17
Energy affordability (USD per kWh) 0.19 Population with access to electricity (%) 100.0
INDEX COMMENTARY
Spain drops one place to rank 16 in the Index. A better performance in energy security was driven by a decrease in energy consumption growth and an increased wholesale margin on gasoline. This was however offset by a drop in social equity, driven by a decrease in the quality and affordability of electricity supply. Spain shows a stable performance in all contextual dimensions.
TRENDS AND OUTLOOK
The new Spanish administration has pledged its commitment to renewable and low-carbon energy. In doing so, the country pursues a more efficient way of managing its energy needs with own resources, and becoming a more environmental-friendly producer and consumer of energy. As for the social equity aspects, the country has been dragging on a tariff deficit since year 1997. In order to put an end to this situation, the cost of electricity might rise in the next years.
A new Royal Decree was approved in order to guarantee budgetary stability and promote competitiveness. Among other measurements, the decree lays down the reforms needed to reduce the tariff deficit which jeopardises the economic stability of the power sector. The Spanish administration committed to reach tariff adequacy by the year 2013.
An indicative energy plan for 2011-2020 has already been developed by the Spanish administration, following three basic objectives: 1) to improve the security of supply; 2) to increase competitiveness and 3) to guarantee the environmental sustainability. In order to ensure the first of these goals and reduce the financial risks of Spain’s high energy dependence, it is crucial to improve the level of self-sufficiency. To achieve this goal, the energy policy is based on two pillars: increasing both the energy savings and efficiency and the promoting renewable energy.
45%
15%
19%
21%
Conventional thermal
Hydro
Other Renewables
Nuclear
371
20 40 30
500
1,000
1,500
2,000
2,500
Coal Oil Shale Oil Gas
INDEX RANK
16
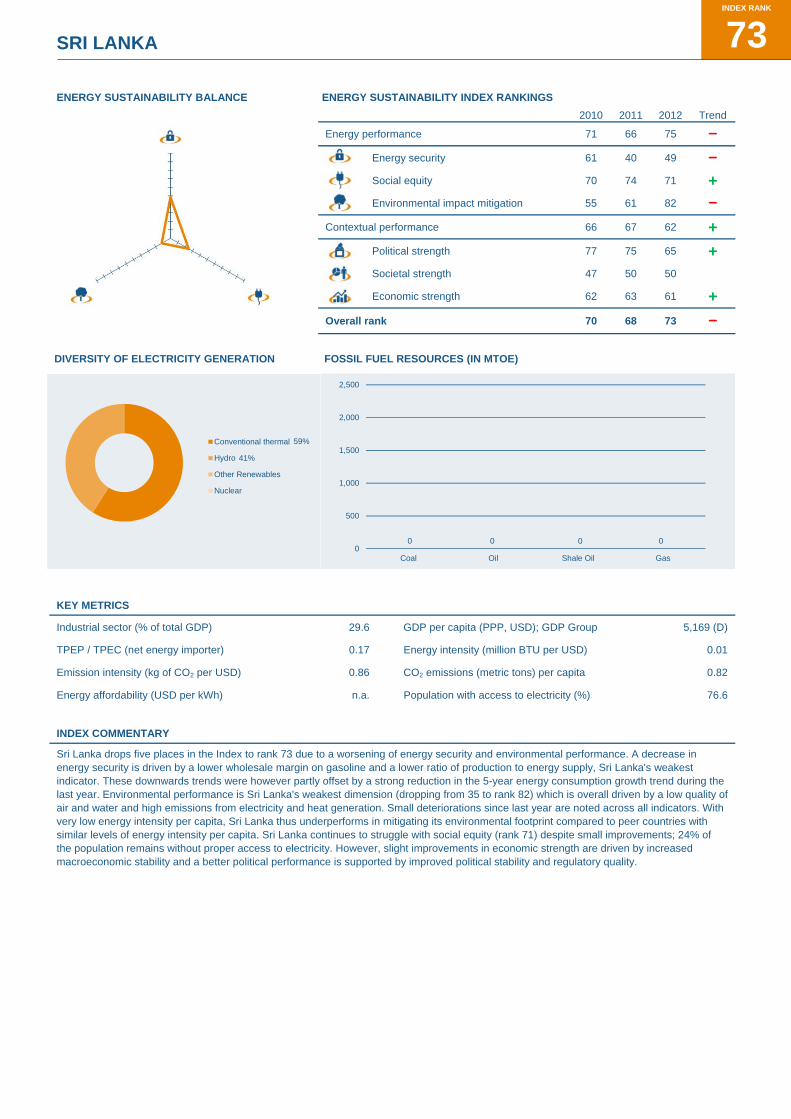
SRI LANKA
ENERGY SUSTAINABILITY BALANCE ENERGY SUSTAINABILITY INDEX RANKINGS
2010 2011 2012 Trend
Energy performance 71 66 75 -
Energy security 61 40 49 -
Social equity 70 74 71 + Environmental impact mitigation 55 61 82 -
Contextual performance 66 67 62 + Political strength 77 75 65 + Societal strength 47 50 50 Economic strength 62 63 61 +
Overall rank 70 68 73 -
DIVERSITY OF ELECTRICITY GENERATION FOSSIL FUEL RESOURCES (IN MTOE)
KEY METRICS
Industrial sector (% of total GDP) 29.6 GDP per capita (PPP, USD); GDP Group 5,169 (D)
TPEP / TPEC (net energy importer) 0.17 Energy intensity (million BTU per USD) 0.01
Emission intensity (kg of CO2 per USD) 0.86 CO2 emissions (metric tons) per capita 0.82
Energy affordability (USD per kWh) n.a. Population with access to electricity (%) 76.6
INDEX COMMENTARY
Sri Lanka drops five places in the Index to rank 73 due to a worsening of energy security and environmental performance. A decrease in energy security is driven by a lower wholesale margin on gasoline and a lower ratio of production to energy supply, Sri Lanka's weakest indicator. These downwards trends were however partly offset by a strong reduction in the 5-year energy consumption growth trend during the last year. Environmental performance is Sri Lanka's weakest dimension (dropping from 35 to rank 82) which is overall driven by a low quality of air and water and high emissions from electricity and heat generation. Small deteriorations since last year are noted across all indicators. With very low energy intensity per capita, Sri Lanka thus underperforms in mitigating its environmental footprint compared to peer countries with similar levels of energy intensity per capita. Sri Lanka continues to struggle with social equity (rank 71) despite small improvements; 24% of the population remains without proper access to electricity. However, slight improvements in economic strength are driven by increased macroeconomic stability and a better political performance is supported by improved political stability and regulatory quality.
59%
41%
Conventional thermal
Hydro
Other Renewables
Nuclear
0 0 0 00
500
1,000
1,500
2,000
2,500
Coal Oil Shale Oil Gas
INDEX RANK
73

SWAZILAND J
ENERGY SUSTAINABILITY BALANCE ENERGY SUSTAINABILITY INDEX RANKINGS
2010 2011 2012 Trend
Energy performance 53 33 73 -
Energy security 39 4 70 -
Social equity 75 70 75 -
Environmental impact mitigation 42 42 55 -
Contextual performance 58 75 80 -
Political strength 72 71 72 -
Societal strength 62 82 80 + Economic strength 40 55 74 -
Overall rank 57 43 80 -
DIVERSITY OF ELECTRICITY GENERATION FOSSIL FUEL RESOURCES (IN MTOE)
KEY METRICS
Industrial sector (% of total GDP) 46.9 GDP per capita (PPP, USD); GDP Group 5,156 (D)
TPEP / TPEC (net energy importer) 0.51 Energy intensity (million BTU per USD) 0.01
Emission intensity (kg of CO2 per USD) 0.89 CO2 emissions (metric tons) per capita 2.33
Energy affordability (USD per kWh) n.a. Population with access to electricity (%) 50.0
INDEX COMMENTARY
Swaziland experiences a substantial drop by 37 ranks in the Index to rank 80 due to a decrease across the majority of the dimensions. Energy security drops most significantly driven especially by a decrease in the wholesale margin on gasoline and an increase in the 5-year energy consumption trend, which reversed last year's negative growth rate to a positive one. This is however necessary as only 50% of the population have access to electricity, which also leads to Swaziland's weak performance in social equity that further drops by five places. Swaziland underperforms in mitigating its environmental footprint compared to other countries with similar levels of energy intensity per capita, which leads to low scores in this dimension. Small deteriorations since last year are noted across all indicators. Political and societal strength remain constant. Swaziland still struggles with regulatory quality and effectiveness of government. The substantial drop in economic strength is driven by a decrease in macroeconomic strength and very low credit availability.
TRENDS AND OUTLOOK
A trend towards an increased share of renewable energy is both power (off and on-grid) and fuel (biofuels) sector is apparent and the development of a renewable energy strategy, independent power producer policy, and feed-in-tariffs are underway.
Coal will continue to play an important role in the energy mix of Swaziland. The country has vast coal reserves and is considering a 300MW coal fired thermal power station utilising clean coal technologies which is expected to supply the country and allows export into the Southern African Power Pool.
These efforts are expected to improve the country’s energy independence by reducing the heavy reliance on imported energy from South Africa as well as increasing access to energy access for all citizens while ensuring a good quality of supply. In addition, the country is looking to increase its strategic fuel reserves, enhance bulk purchasing (better prices), explore the possibility of setting up a petroleum products refinery as well as tap into the natural gas market in Mozambique.
Policymakers need to: 1) support the adoption of renewable energy technologies and the development of incentives to enable market penetration; and 2) increase the budget for the energy sector to allow economic development and poverty reduction, for example, increased rural electrification and energy access, research and development, development of skills, and capacity building.
56%
44%
Conventional thermal
Hydro
Other Renewables
Nuclear
1010 0 0
0
500
1,000
1,500
2,000
2,500
Coal Oil Shale Oil Gas
INDEX RANK
80

SWEDEN
ENERGY SUSTAINABILITY BALANCE ENERGY SUSTAINABILITY INDEX RANKINGS
2010 2011 2012 Trend
Energy performance 7 6 2 + Energy security 13 9 2 + Social equity 30 33 16 + Environmental impact mitigation 2 1 2 -
Contextual performance 6 6 5 + Political strength 4 4 4 Societal strength 2 1 1 Economic strength 26 24 21 + Overall rank 7 4 1 +
DIVERSITY OF ELECTRICITY GENERATION FOSSIL FUEL RESOURCES (IN MTOE)1
KEY METRICS
Industrial sector (% of total GDP) 27.3 GDP per capita (PPP, USD); GDP Group 38,171 (A)
TPEP / TPEC (net energy importer) 0.61 Energy intensity (million BTU per USD) 0.02
Emission intensity (kg of CO2 per USD) 0.42 CO2 emissions (metric tons) per capita 5.37
Energy affordability (USD per kWh) 0.22 Population with access to electricity (%) 100.0
INDEX COMMENTARY
Sweden climbs to the top of the Index from number four in 2011. The jump is due to a substantial increase in energy security, which was driven by an increased wholesale margin on gasoline. Social equity improves markedly due to a relative increase in quality and affordability of electricity supply. Sweden continues to perform very strongly in environmental impact mitigation, which is driven by a very good quality of air and water and low emissions intensity on a per capita level and in electricity and heat generation, however energy intensity is still relatively high. Sweden is among the top performers in all political and societal strength indicators. Its economic strength ranking is a little lower due to high cost of living.
TRENDS AND OUTLOOK
In order to maintain a high Index ranking, a key issue for Sweden is to make the transportation sector sustainable. Currently, the transportation sector (except trains, metro and trams) relies on fossil fuels. Special policies and financial support to incentivize the purchase of electric cars are in place, but results are not yet satisfying. Improvements have however been made in terms of increasing the share of biofuels, where the EU target to increase the share of biofuels used in transport to 10% by 2020 will be achieved several years in advance (close to 10% already). This is mostly due to blending of ethanol and other biofuels in gasoline and diesel and an increased share of cars running on biogas.
Sweden has a successful market-based green certificate system for promoting renewable energy sources (RES) in place since 2003 and since 2012 this is a joint system with Norway. The joint system is a major step forward. However, it is important to review and improve targets and policies for the transportation sector.
Policymakers need to focus on finding a solution to replace the existing ten nuclear reactors which are expected to close around 2025 to meet the future electricity demand. Permit application for building new reactors to replace existing ones have been filed, in line with the governmental decision to allow the replacement of existing reactors at existing sites.
In addition to finding measures to meet the EU CO2 reduction and RES targets, energy efficiency needs to be a top priority as targets will be difficult to achieve.
1 Data for shale gas resources not available
7%
47%
9%
37%
Conventional thermal
Hydro
Other Renewables
Nuclear
0 0
875
00
500
1,000
1,500
2,000
2,500
Coal Oil Shale Oil Gas
INDEX RANK
1

SWITZERLAND J
ENERGY SUSTAINABILITY BALANCE ENERGY SUSTAINABILITY INDEX RANKINGS
2010 2011 2012 Trend
Energy performance 1 3 4 -
Energy security 2 15 12 + Social equity 4 4 4 Environmental impact mitigation 9 14 10 + Contextual performance 1 1 1 Political strength 1 4 5 - Societal strength 3 3 2 + Economic strength 11 6 6
Overall rank 1 3 2 +
DIVERSITY OF ELECTRICITY GENERATION FOSSIL FUEL RESOURCES (IN MTOE)
KEY METRICS
Industrial sector (% of total GDP) 27.5 GDP per capita (PPP, USD); GDP Group 41,942 (A)
TPEP / TPEC (net energy importer) 0.49 Energy intensity (million BTU per USD) 0.01
Emission intensity (kg of CO2 per USD) 0.32 CO2 emissions (metric tons) per capita 5.88
Energy affordability (USD per kWh) 0.18 Population with access to electricity (%) 100.0
INDEX COMMENTARY
Switzerland rises one place in the Index to second. A slight improvement in energy security is driven by an increased wholesale margin on gasoline, which is tempered through a continued growth in energy consumption that had started to manifest itself in last year's Index. Higher energy and emissions intensity per capita lead to a slight decrease in environmental performance, despite an increase in the air and water quality. Switzerland continues to perform very strongly across all contextual dimensions.
TRENDS AND OUTLOOK
Switzerland’s leading position in the Index reflects the country’s past energy and energy-related policy decisions. However, the recent developments and expected changes are expected to have a strong impact on the country’s energy sustainability balance.
Most recent energy policy developments include the decision to refrain from building new nuclear power plants which will be included in the new energy strategy that is under development and expected to be fully implemented by 2050. The necessary measures and next steps to phase-out nuclear are not yet known and will be matter of political discussions in the next few months (a public referendum is probable). To achieve the transition to a low-carbon energy system in the long term, in the short term Switzerland is likely to become more dependent on gas-fired electricity generation.
Policymakers need to focus on: 1) construction of new electricity grids; 2) completing the liberalisation of the electricity market; and 3) come to a bilateral agreement with the European Union regarding electricity and renewable energy. Furthermore, there is the need to be ambitious and increase the renovation rate of buildings as part of the transition to a low-carbon energy system.
1%
55%
4%
40%
Conventional thermal
Hydro
Other Renewables
Nuclear
0 0 0 00
500
1,000
1,500
2,000
2,500
Coal Oil Shale Oil Gas
INDEX RANK
2

SYRIA (ARAB REPUBLIC)
ENERGY SUSTAINABILITY BALANCE ENERGY SUSTAINABILITY INDEX RANKINGS
2010 2011 2012 Trend
Energy performance 60 56 70 -
Energy security 41 19 54 -
Social equity 69 71 68 + Environmental impact mitigation 59 70 72 -
Contextual performance 81 76 77 -
Political strength 82 83 83
Societal strength 73 71 73 -
Economic strength 74 57 67 -
Overall rank 69 64 76 -
DIVERSITY OF ELECTRICITY GENERATION FOSSIL FUEL RESOURCES (IN MTOE)
KEY METRICS
Industrial sector (% of total GDP) 27.4 GDP per capita (PPP, USD); GDP Group 5,041 (D)
TPEP / TPEC (net energy exporter) 1.33 Energy intensity (million BTU per USD) 0.05
Emission intensity (kg of CO2 per USD) 3.54 CO2 emissions (metric tons) per capita 2.95
Energy affordability (USD per kWh) n.a. Population with access to electricity (%) 90.0
INDEX COMMENTARY
Syria drops in the Index by 12 places mainly driven by a substantial deterioration of energy security. Energy security overall is supported by a good ratio of energy production to total energy supply and a strong diversity of energy exports. However, the recent substantial drop was driven by a deterioration of several, already weak indicators: low diversity of electricity production, a decrease in the wholesale margin on gasoline and an increase in the 5-year energy consumption growth trend, which turned from a negative into a positive growth rate. Small increases are visible in social equity, but further improvements are still necessary with electricity only provided to 90% of the population. Syria underperforms overall in mitigating its environmental footprint when compared to other countries with a similar level of energy intensity. Performance in contextual dimensions remains low.
0
335
0
258
0
500
1,000
1,500
2,000
2,500
Coal Oil Shale Oil Gas
INDEX RANK
76

TAIWAN, CHINA J
ENERGY SUSTAINABILITY BALANCE ENERGY SUSTAINABILITY INDEX RANKINGS
2010 2011 2012 Trend
Energy performance 45 43 42 + Energy security 65 73 83 -
Social equity 21 21 22 -
Environmental impact mitigation 58 47 27 + Contextual performance 17 15 13 + Political strength 29 28 24 + Societal strength 25 25 23 + Economic strength 6 3 3
Overall rank 35 33 32 +
DIVERSITY OF ELECTRICITY GENERATION FOSSIL FUEL RESOURCES (IN MTOE)
KEY METRICS
Industrial sector (% of total GDP) n.a. GDP per capita (PPP, USD); GDP Group 35,595 (A)
TPEP / TPEC (net energy importer) 0.11 Energy intensity (million BTU per USD) 0.03
Emission intensity (kg of CO2 per USD) 2.17 CO2 emissions (metric tons) per capita 12.69
Energy affordability (USD per kWh) n.a. Population with access to electricity (%) 99.0
INDEX COMMENTARY
Taiwan rises in the Index by one place to rank 32. A big improvement in environmental performance is driven by Taiwan's high quality of air and water. Despite high emissions intensity per GDP per capita and high CO2 emissions from electricity and heat generation, Taiwan outperforms other countries with similar energy intensity per capita in mitigating its environmental footprint. Energy security is Taiwan's weakest dimension due to a low ratio of production to total energy supply and a low wholesale margin on gasoline which further decreased over the last year; this was only partly offset by a small increase in Taiwan's weak oil reserve stocks. Performance in social equity and all contextual dimensions remains mostly constant. Taiwan maintains its strong economic position with macroeconomic stability and low cost of living as proportion of household consumption expenditure.
10 0 60
0
500
1,000
1,500
2,000
2,500
Coal Oil Shale Oil Gas
INDEX RANK
32

TANZANIA
ENERGY SUSTAINABILITY BALANCE ENERGY SUSTAINABILITY INDEX RANKINGS
2010 2011 2012 Trend
Energy performance 78 76 78 -
Energy security 58 56 68 -
Social equity 91 91 93 -
Environmental impact mitigation 51 49 43 + Contextual performance 72 74 76 -
Political strength 68 65 66 -
Societal strength 78 81 83 -
Economic strength 57 61 70 -
Overall rank 80 79 82 -
DIVERSITY OF ELECTRICITY GENERATION FOSSIL FUEL RESOURCES (IN MTOE)
KEY METRICS
Industrial sector (% of total GDP) 24.2 GDP per capita (PPP, USD); GDP Group 1,418 (D)
TPEP / TPEC (net energy importer) 0.43 Energy intensity (million BTU per USD) 0.03
Emission intensity (kg of CO2 per USD) 1.63 CO2 emissions (metric tons) per capita 1.41
Energy affordability (USD per kWh) n.a. Population with access to electricity (%) 11.5
INDEX COMMENTARY
Tanzania drops three places in the Index due to deteriorations across all dimensions. In the energy security dimension, the country struggles with the ratio of production to total energy supply and with its strong, positive energy consumption growth rate which is however necessary for Tanzania's economic and social development. With only 12% of the population having access to electricity, social equity is Tanzania's weakest dimension (rank 93). An improvement in environmental performance is driven by improvements in the quality of air and water when compared to peer countries, despite higher CO2 emissions from electricity and heat generation and higher emissions and energy intensity per GDP per capita. Performance in political and societal strength remains at the same level, while economic strength deteriorates mostly due to low credit availability and low macroeconomic stability.
39%
61%
Conventional thermal
Hydro
Other Renewables
Nuclear
140 0 0 210
500
1,000
1,500
2,000
2,500
Coal Oil Shale Oil Gas
INDEX RANK
82

THAILAND I
ENERGY SUSTAINABILITY BALANCE ENERGY SUSTAINABILITY INDEX RANKINGS
2010 2011 2012 Trend
Energy performance 82 76 72 + Energy security 85 67 58 + Social equity 60 63 62 + Environmental impact mitigation 67 65 79 -
Contextual performance 33 34 38 -
Political strength 58 56 63 -
Societal strength 52 53 56 -
Economic strength 5 10 4 +
Overall rank 72 67 63 +
DIVERSITY OF ELECTRICITY GENERATION FOSSIL FUEL RESOURCES (IN MTOE)
KEY METRICS
Industrial sector (% of total GDP) 34.0 GDP per capita (PPP, USD); GDP Group 9,222 (C)
TPEP / TPEC (net energy importer) 0.55 Energy intensity (million BTU per USD) 0.03
Emission intensity (kg of CO2 per USD) 1.74 CO2 emissions (metric tons) per capita 3.99
Energy affordability (USD per kWh) 0.09 Population with access to electricity (%) 99.3
INDEX COMMENTARY
Thailand rises in the Index by four places to rank 63. An improvement in energy security is driven by a decrease in the energy consumption growth rate and even though absolute oil reserve stocks decrease slightly, they do so less than in other countries. A slight increase in emissions intensity per capita combined with a decreased quality of air and water results in Thailand underperforming in mitigating its environmental footprint compared to peer countries with similar levels of energy intensity per capita. Performance in social equity remains stable. Concerning the contextual performance, a decrease is noted in political and societal strength with the weakest indicators being political stability and health. Thailand's strong economic position which relies on very low costs of living as proportion of household consumption expenditure, further increased due to improved macroeconomic stability.
92%
4%
4%
Conventional thermal
Hydro
Other Renewables
Nuclear867
50
916
292
0
500
1,000
1,500
2,000
2,500
Coal Oil Shale Oil Gas
INDEX RANK
63

TRINIDAD & TOBAGO
ENERGY SUSTAINABILITY BALANCE ENERGY SUSTAINABILITY INDEX RANKINGS
2010 2011 2012 Trend
Energy performance 59 62 48 + Energy security 78 86 69 + Social equity 55 49 48 + Environmental impact mitigation 35 34 36 -
Contextual performance 44 54 57 -
Political strength 45 44 44
Societal strength 57 56 60 -
Economic strength 31 69 65 +
Overall rank 55 62 51 +
DIVERSITY OF ELECTRICITY GENERATION FOSSIL FUEL RESOURCES (IN MTOE)
KEY METRICS
Industrial sector (% of total GDP) 58.4 GDP per capita (PPP, USD); GDP Group 19,981 (B)
TPEP / TPEC (net energy exporter) 2.10 Energy intensity (million BTU per USD) 0.07
Emission intensity (kg of CO2 per USD) 3.86 CO2 emissions (metric tons) per capita 36.65
Energy affordability (USD per kWh) 0.04 Population with access to electricity (%) 99.0
INDEX COMMENTARY
Trinidad & Tobago increases in the Index by 11 ranks due to increased energy security. The rise in energy security was driven by a reduction in the 5-year energy consumption growth rate and an increase in the diversity of electricity production, and is supported by a good ratio of production to total energy supply and a good diversity of energy exports. Weak performance and further deteriorations across all environmental indicators led to a small drop in environmental performance overall. Performance in social equity and the contextual dimensions remains overall stable. Societal strength overall struggles most with its performance in health.
K
100%Conventional thermal
Hydro
Other Renewables
Nuclear
080
0
414
0
500
1,000
1,500
2,000
2,500
Coal Oil Shale Oil Gas
INDEX RANK
51

TUNISIA1 J
ENERGY SUSTAINABILITY BALANCE ENERGY SUSTAINABILITY INDEX RANKINGS
2010 2011 2012 Trend
Energy performance 54 74 69 + Energy security 32 60 51 + Social equity 54 51 51
Environmental impact mitigation 71 80 89 -
Contextual performance 46 42 42
Political strength 46 48 48
Societal strength 41 40 43 -
Economic strength 52 44 44
Overall rank 52 66 60 +
DIVERSITY OF ELECTRICITY GENERATION FOSSIL FUEL RESOURCES (IN MTOE)2
KEY METRICS
Industrial sector (% of total GDP) 34.6 GDP per capita (PPP, USD); GDP Group 9,454 (C)
TPEP / TPEC (net energy importer) 0.86 Energy intensity (million BTU per USD) 0.02
Emission intensity (kg of CO2 per USD) 1.49 CO2 emissions (metric tons) per capita 2.18
Energy affordability (USD per kWh) n.a. Population with access to electricity (%) 99.5
INDEX COMMENTARY
Tunisia rises six places to rank 60 in the Index. This is caused by a substantial decrease in the environmental performance, now Tunisia's weakest dimension (rank 89), which is driven by higher emissions from electricity and heat generation, higher emissions per capita and a decreased quality of air and water. With very low and further decreasing energy intensity per capita, Tunisia thus underperforms in mitigating its environmental footprint compared to other countries with similar levels of energy intensity per capita. Energy security improves due to stronger oil stocks and a substantial decrease in energy consumption growth, reversing the previously positive growth rate; this is however offset by a decrease in the wholesale margin on gasoline. Tunisia's performance in social equity and all contextual dimensions is fairly steady when compared to last year.
TRENDS AND OUTLOOK
Over the past few years, Tunisia has made continued efforts to sustain its economic development and improvement the energy sustainability balance. To achieve the latter, policies have been implemented to manage the exploration and production of hydrocarbons which will allow Tunisia to accelerate its economic development and to establish its position on the world market. Furthermore, programmes for the promotion of energy efficiency, renewable energy and energy substitution have been instigated.
Going forward policymakers need to focus on: 1) increasing the share of renewable energy in electricity generation (including wind, solar and a new CSP scheme) and households (solar water heat, micro generation); and 2) extending the natural gas network in the South and central part of the country.
1 As noted by the Tunisian WEC member committee available data from national sources might differ from data used to calculate the Energy Sustainability Index. 2 Data for shale gas resources not available
98%
1%
1%
Conventional thermal
Hydro
Other Renewables
Nuclear
069
0 79
0
500
1,000
1,500
2,000
2,500
Coal Oil Shale Oil Gas
INDEX RANK
60
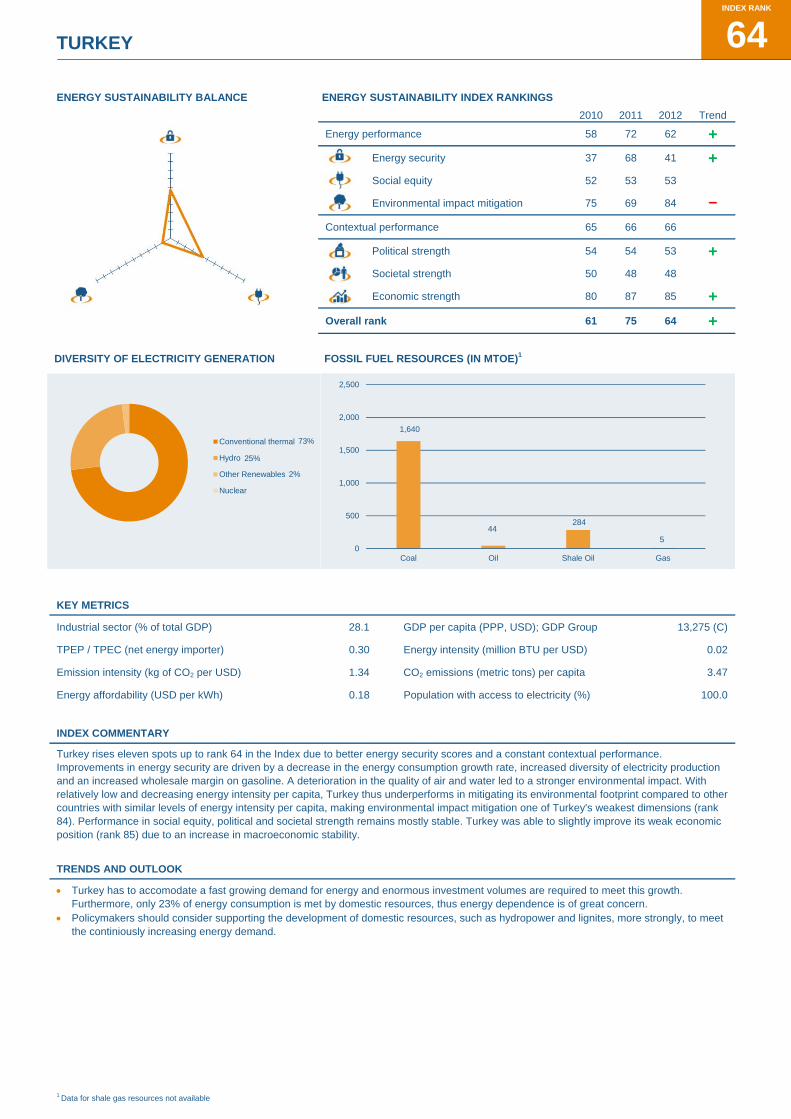
TURKEY
ENERGY SUSTAINABILITY BALANCE ENERGY SUSTAINABILITY INDEX RANKINGS
2010 2011 2012 Trend
Energy performance 58 72 62 + Energy security 37 68 41 + Social equity 52 53 53 Environmental impact mitigation 75 69 84 -
Contextual performance 65 66 66 Political strength 54 54 53 + Societal strength 50 48 48 Economic strength 80 87 85 +
Overall rank 61 75 64 +
DIVERSITY OF ELECTRICITY GENERATION FOSSIL FUEL RESOURCES (IN MTOE)1
KEY METRICS
Industrial sector (% of total GDP) 28.1 GDP per capita (PPP, USD); GDP Group 13,275 (C)
TPEP / TPEC (net energy importer) 0.30 Energy intensity (million BTU per USD) 0.02
Emission intensity (kg of CO2 per USD) 1.34 CO2 emissions (metric tons) per capita 3.47
Energy affordability (USD per kWh) 0.18 Population with access to electricity (%) 100.0
INDEX COMMENTARY
Turkey rises eleven spots up to rank 64 in the Index due to better energy security scores and a constant contextual performance. Improvements in energy security are driven by a decrease in the energy consumption growth rate, increased diversity of electricity production and an increased wholesale margin on gasoline. A deterioration in the quality of air and water led to a stronger environmental impact. With relatively low and decreasing energy intensity per capita, Turkey thus underperforms in mitigating its environmental footprint compared to other countries with similar levels of energy intensity per capita, making environmental impact mitigation one of Turkey's weakest dimensions (rank 84). Performance in social equity, political and societal strength remains mostly stable. Turkey was able to slightly improve its weak economic position (rank 85) due to an increase in macroeconomic stability.
TRENDS AND OUTLOOK
Turkey has to accomodate a fast growing demand for energy and enormous investment volumes are required to meet this growth. Furthermore, only 23% of energy consumption is met by domestic resources, thus energy dependence is of great concern.
Policymakers should consider supporting the development of domestic resources, such as hydropower and lignites, more strongly, to meet the continiously increasing energy demand.
1 Data for shale gas resources not available
73%
25%
2%
Conventional thermal
Hydro
Other Renewables
Nuclear
1,640
44284
50
500
1,000
1,500
2,000
2,500
Coal Oil Shale Oil Gas
INDEX RANK
64
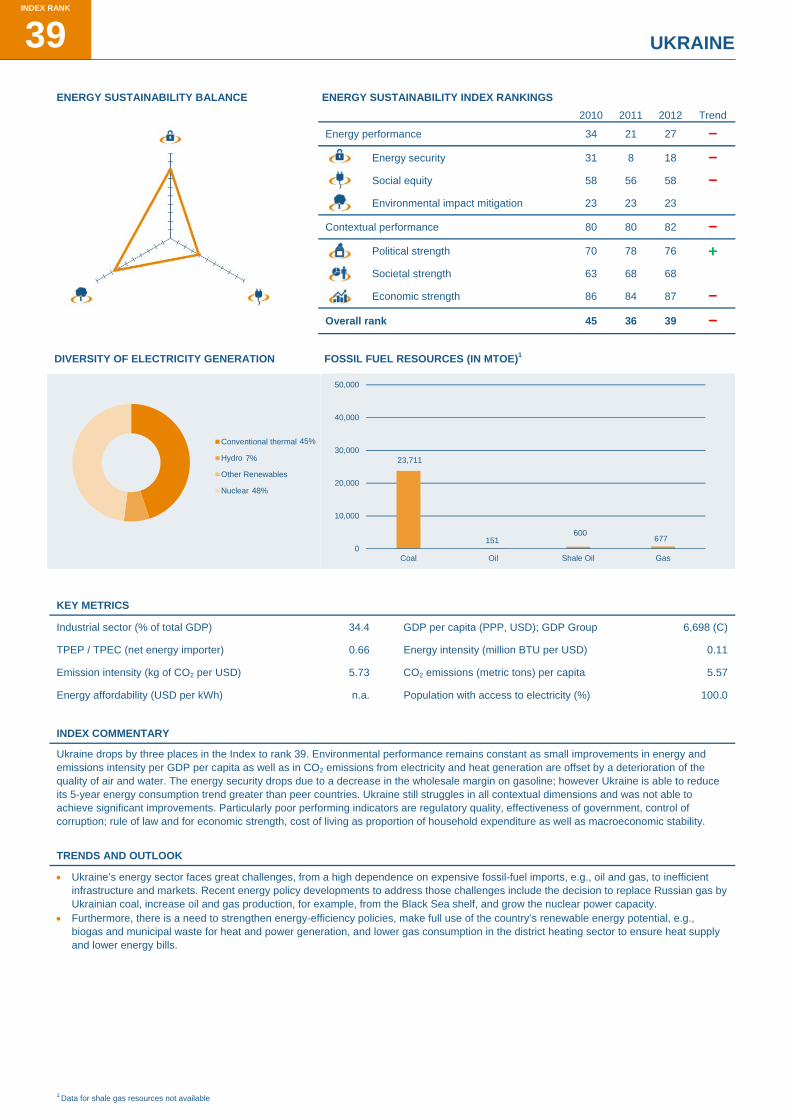
UKRAINE J
ENERGY SUSTAINABILITY BALANCE ENERGY SUSTAINABILITY INDEX RANKINGS
2010 2011 2012 Trend
Energy performance 34 21 27 -
Energy security 31 8 18 -
Social equity 58 56 58 -
Environmental impact mitigation 23 23 23
Contextual performance 80 80 82 -
Political strength 70 78 76 + Societal strength 63 68 68
Economic strength 86 84 87 -
Overall rank 45 36 39 -
DIVERSITY OF ELECTRICITY GENERATION FOSSIL FUEL RESOURCES (IN MTOE)1
KEY METRICS
Industrial sector (% of total GDP) 34.4 GDP per capita (PPP, USD); GDP Group 6,698 (C)
TPEP / TPEC (net energy importer) 0.66 Energy intensity (million BTU per USD) 0.11
Emission intensity (kg of CO2 per USD) 5.73 CO2 emissions (metric tons) per capita 5.57
Energy affordability (USD per kWh) n.a. Population with access to electricity (%) 100.0
INDEX COMMENTARY
Ukraine drops by three places in the Index to rank 39. Environmental performance remains constant as small improvements in energy and emissions intensity per GDP per capita as well as in CO2 emissions from electricity and heat generation are offset by a deterioration of the quality of air and water. The energy security drops due to a decrease in the wholesale margin on gasoline; however Ukraine is able to reduce its 5-year energy consumption trend greater than peer countries. Ukraine still struggles in all contextual dimensions and was not able to achieve significant improvements. Particularly poor performing indicators are regulatory quality, effectiveness of government, control of corruption; rule of law and for economic strength, cost of living as proportion of household expenditure as well as macroeconomic stability.
TRENDS AND OUTLOOK
Ukraine’s energy sector faces great challenges, from a high dependence on expensive fossil-fuel imports, e.g., oil and gas, to inefficient infrastructure and markets. Recent energy policy developments to address those challenges include the decision to replace Russian gas by Ukrainian coal, increase oil and gas production, for example, from the Black Sea shelf, and grow the nuclear power capacity.
Furthermore, there is a need to strengthen energy-efficiency policies, make full use of the country’s renewable energy potential, e.g., biogas and municipal waste for heat and power generation, and lower gas consumption in the district heating sector to ensure heat supply and lower energy bills.
1 Data for shale gas resources not available
45%
7%
48%
Conventional thermal
Hydro
Other Renewables
Nuclear
23,711
151600
6770
10,000
20,000
30,000
40,000
50,000
Coal Oil Shale Oil Gas
INDEX RANK
39
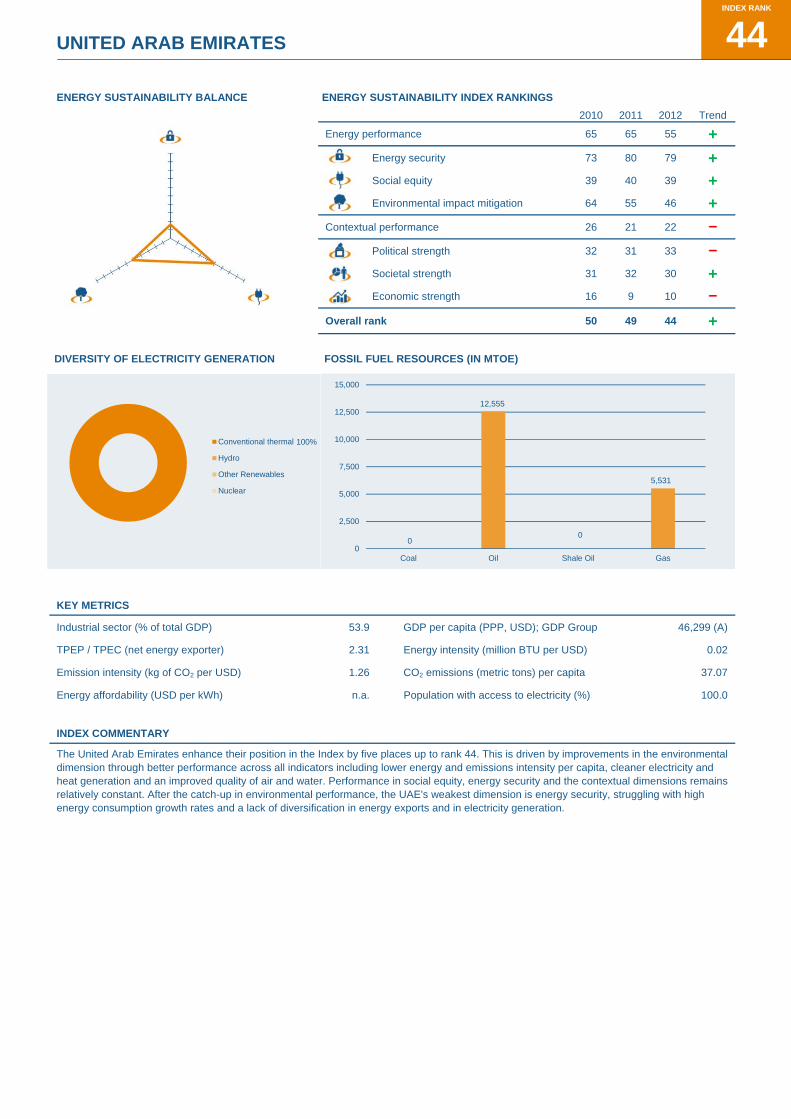
UNITED ARAB EMIRATES
ENERGY SUSTAINABILITY BALANCE ENERGY SUSTAINABILITY INDEX RANKINGS
2010 2011 2012 Trend
Energy performance 65 65 55 + Energy security 73 80 79 + Social equity 39 40 39 + Environmental impact mitigation 64 55 46 + Contextual performance 26 21 22 -
Political strength 32 31 33 -
Societal strength 31 32 30 + Economic strength 16 9 10 -
Overall rank 50 49 44 +
DIVERSITY OF ELECTRICITY GENERATION FOSSIL FUEL RESOURCES (IN MTOE)
KEY METRICS
Industrial sector (% of total GDP) 53.9 GDP per capita (PPP, USD); GDP Group 46,299 (A)
TPEP / TPEC (net energy exporter) 2.31 Energy intensity (million BTU per USD) 0.02
Emission intensity (kg of CO2 per USD) 1.26 CO2 emissions (metric tons) per capita 37.07
Energy affordability (USD per kWh) n.a. Population with access to electricity (%) 100.0
INDEX COMMENTARY
The United Arab Emirates enhance their position in the Index by five places up to rank 44. This is driven by improvements in the environmental dimension through better performance across all indicators including lower energy and emissions intensity per capita, cleaner electricity and heat generation and an improved quality of air and water. Performance in social equity, energy security and the contextual dimensions remains relatively constant. After the catch-up in environmental performance, the UAE's weakest dimension is energy security, struggling with high energy consumption growth rates and a lack of diversification in energy exports and in electricity generation.
100%Conventional thermal
Hydro
Other Renewables
Nuclear
0
12,555
0
5,531
0
2,500
5,000
7,500
10,000
12,500
15,000
Coal Oil Shale Oil Gas
INDEX RANK
44

UNITED KINGDOM J
ENERGY SUSTAINABILITY BALANCE ENERGY SUSTAINABILITY INDEX RANKINGS
2010 2011 2012 Trend
Energy performance 25 36 21 + Energy security 20 58 37 + Social equity 7 8 6 + Environmental impact mitigation 69 53 35 + Contextual performance 18 16 17 - Political strength 15 20 17 + Societal strength 20 19 18 + Economic strength 30 21 31 -
Overall rank 21 28 15 +
DIVERSITY OF ELECTRICITY GENERATION FOSSIL FUEL RESOURCES (IN MTOE)1
KEY METRICS
Industrial sector (% of total GDP) 21.4 GDP per capita (PPP, USD); GDP Group 35,344 (A)
TPEP / TPEC (net energy importer) 0.75 Energy intensity (million BTU per USD) 0.02
Emission intensity (kg of CO2 per USD) 1.04 CO2 emissions (metric tons) per capita 8.36
Energy affordability (USD per kWh) 0.20 Population with access to electricity (%) 100.0
INDEX COMMENTARY
The United Kingdom rises 13 places in the Index up to rank 15 due to an improved energy performance across all dimensions. Energy security scores increase substantially, driven by an increase of the wholesale margin on gasoline and enhanced diversity of electricity production. Improvements in environmental impact mitigation are driven by lower emissions from electricity and heat generation and an improved air and water quality relative to peer countries. Contextual performance remains mostly stable, however economic strength decreases substantially due to less credit availability and lower macroeconomic stability.
1 Data for shale gas resources not available
77%
1%
6%
16%
Conventional thermal
Hydro
Other Renewables
Nuclear
160
408 501
251
0
500
1,000
1,500
2,000
2,500
Coal Oil Shale Oil Gas
INDEX RANK
15

UNITED STATES
ENERGY SUSTAINABILITY BALANCE ENERGY SUSTAINABILITY INDEX RANKINGS
2010 2011 2012 Trend
Energy performance 8 15 13 + Energy security 19 32 27 + Social equity 1 1 1 Environmental impact mitigation 30 39 31 + Contextual performance 14 18 15 + Political strength 17 23 26 - Societal strength 16 20 20 Economic strength 17 18 16 +
Overall rank 9 12 12
DIVERSITY OF ELECTRICITY GENERATION FOSSIL FUEL RESOURCES (IN MTOE)1
KEY METRICS
Industrial sector (% of total GDP) 19.2 GDP per capita (PPP, USD); GDP Group 46,900 (A)
TPEP / TPEC (net energy importer) 0.77 Energy intensity (million BTU per USD) 0.03
Emission intensity (kg of CO2 per USD) 1.68 CO2 emissions (metric tons) per capita 17.51
Energy affordability (USD per kWh) 0.12 Population with access to electricity (%) 100.0
INDEX COMMENTARY
The United States maintains its position in the Index on rank twelve. The country shows relatively constant performance in the contextual dimensions and remains the leader in the social equity dimension. An improvement in energy security is driven by an increased wholesale margin on gasoline and a decrease in energy consumption growth, which may be partly driven by the economic recession. Environmental performance improves due to lower CO2 emissions from electricity and heat generation; however energy and emissions intensity per capita is very high compared to other countries and slightly increased during the last year.
TRENDS AND OUTLOOK
Due to advances in horizontal drilling and in hydraulic fracturing shale gas production has become economically viable in recent years. The Energy Information Administration (EIA) estimates that the country has more than 1,744 trillion cubic feet of technically recoverable natural gas, including 211 tcf of proved reserves (the discovered, economically recoverable fraction of the original gas-in-place); production of shale gas is expected to increase from a 2007 US total of 1.4 tcf to 4.8 tcf in 2020. The significant increases in domestic oil and gas production will greatly reduce oil imports over the next ten years, and lead to increased exports of refined products and possibly natural gas.
Important energy policy developments in the United States which will impact the countries balance in the three dimensions of energy sustainability include: 1) the Environmental Protection Agency (EPA) regulations on coal leading to the projected closure of more than 200 coal plants in the next few years accounting for more than 10% of the USA’s current energy production; 2) possible regulations on unconventional gas production; and 3) the extension (or not) of the wind production tax credit, which can cut the cost of developing a wind project by nearly a third.
1 Data for shale gas resources not available
70%
6%
4%
20%
Conventional thermal
Hydro
Other Renewables
Nuclear 166,107
3,429
536,931
6,0380
100,000
200,000
300,000
400,000
500,000
600,000
Coal Oil Shale Oil Gas
INDEX RANK
12

URUGUAY 1 J
ENERGY SUSTAINABILITY BALANCE ENERGY SUSTAINABILITY INDEX RANKINGS
2010 2011 2012 Trend
Energy performance 28 31 39 -
Energy security 40 50 63 -
Social equity 45 44 44
Environmental impact mitigation 19 19 22 -
Contextual performance 50 51 42 + Political strength 41 34 34 Societal strength 36 34 33 + Economic strength 69 80 68 +
Overall rank 30 34 36 -
DIVERSITY OF ELECTRICITY GENERATION FOSSIL FUEL RESOURCES (IN MTOE)
KEY METRICS
Industrial sector (% of total GDP) 21.7 GDP per capita (PPP, USD); GDP Group 14,049 (C)
TPEP / TPEC (net energy importer) 0.33 Energy intensity (million BTU per USD) 0.02
Emission intensity (kg of CO2 per USD) 0.81 CO2 emissions (metric tons) per capita 2.19
Energy affordability (USD per kWh) 0.16 Population with access to electricity (%) 98.3
INDEX COMMENTARY
Uruguay drops by two places in the Index due to a deterioration of energy security and environmental performance. Weak performance in energy security (rank 63) is driven by a low ratio of production to total energy supply and a low wholesale margin on gasoline. A less diversified electricity production added to the drop in energy security. This development is only partly offset by a decrease of the 5-year energy consumption growth rate, which for the first time reverses the positive growth rates of previous years. Uruguay remains very strong in all environmental indicators; however the quality of air and water decreases slightly and Uruguay experiences a small drop in environmental impact mitigation. Performance in social equity, political and societal strength remains stable. An improvement of Uruguay's weak economic position is driven by an increase in macroeconomic stability; however, the country still struggles with credit availability.
TRENDS AND OUTLOOK
Uruguay has defined a long term (2030) National Energy Policy, approved by all political parties. The country has no proven oil, natural gas or coal reservoirs but a high availability of renewable energy sources. By carefully choosing renewable energy sources and technologies (including hydro, wind energy, biomass cogeneration, and biofuels) it was possible, without subsidies, to reach a 46% share of renewable energy in the 2011 energy mix (up from 30% in 2005). This has enhanced the energy sovereignty, sustainability and security.
Under the National Energy Policy, an additional 1,000 MW of wind energy and 200 MW of biomass power plants are to be installed by 2015 to meet growing demand (currently, the average national power demand is 1,100 MW). By 2015, the share of renewable energy is to reach 50% of the energy mix and energy costs are expected to decrease. Furthermore, a re-gasification LNG plant is in the bidding process and 70% of the Uruguayan off-shore area is being exploration for natural gas and oil. Between 2010 and 2015 USD7 billion are being invested in the energy sector (15% of the annual GDP).
1 As noted by the Uruguayan WEC member committee available data from national sources might differ from data used to calculate the Energy Sustainability Index. According to national sources the Uruguayan electricity mix includes 30% conventional thermal, 58% hydro, almost 12% other renewables. Similar discrepancies exist for other indicators as well.
33%
66%
1%
Conventional thermal
Hydro
Other Renewables
Nuclear
0 0 0 00
500
1,000
1,500
2,000
2,500
Coal Oil Shale Oil Gas
INDEX RANK
36

ZIMBABWE
ENERGY SUSTAINABILITY BALANCE ENERGY SUSTAINABILITY INDEX RANKINGS
2010 2011 2012 Trend
Energy performance - - 58
Energy security - - 4
Social equity - - 94
Environmental impact mitigation - - 71
Contextual performance - - 93
Political strength - - 92
Societal strength - - 92
Economic strength - - 90
Overall rank - - 72
DIVERSITY OF ELECTRICITY GENERATION FOSSIL FUEL RESOURCES (IN MTOE)
KEY METRICS
Industrial sector (% of total GDP) 24.6 GDP per capita (PPP, USD); GDP Group 436 (D)
TPEP / TPEC (net energy importer) 0.74 Energy intensity (million BTU per USD) 0.09
Emission intensity (kg of CO2 per USD) 5.94 CO2 emissions (metric tons) per capita 2.03
Energy affordability (USD per kWh) n.a. Population with access to electricity (%) 41.5
INDEX COMMENTARY
Zimbabwe’s environmental performance is weak due to a low quality of air and water, high emissions intensity per capita and high CO2 emissions from heat and electricity generation. Zimbabwe thus underperforms in mitigating its environmental footprint for countries with a similar level of energy intensity per capita. Zimbabwe’s ranking in energy security is driven by a good ratio of production to total energy supply, a well-diversified electricity production and a very high wholesale margin on gasoline. However, the expansion of energy consumption necessary for Zimbabwe's economic and social development remains a challenge as we observe a negative 5-year energy consumption growth trend, even though only 49% of its population has access to electricity. Performance across all indicators in the contextual dimensions and social equity is very weak.
TRENDS AND OUTLOOK
Over the past few years Zimbabwe has made continued efforts to improve its energy security, energy access and environmental footprint. Policy developments include: 1) establishment of an independent energy regulator who regulates and supervises the entire energy sector; 2) amendment of the Electricity Act to promote energy efficiency within the public utility; 3) adoption of biofuels and incentives to promote uptake with a minimum target of 20% by 2015; 4) promotion of public private partnerships to spur development in the petroleum and power sector; 5) adoption of a long-term, government-driven renewable energy technologies programme, which encourages independent power producers and public private partnerships to develop renewable energy technologies in Zimbabwe; 6) establishment of comprehensive household energy plan addressing issues related to shortages, inefficient use of biomass and affordability of modern energy services; and 7) establishment and adoption of energy efficiency programmes.
Going forward policymakers should focus to include: 1) increase the use of renewable energy, including, biofuels and the use of solar power, by developing appropriate incentives; 2) improve energy efficiency and decrease the high electricity losses (currently more than 30% of our power is lost through inefficiency and obsolete equipment); and 3) develop mechanisms to increase power generation capacity.
45%
55%
Conventional thermal
Hydro
Other Renewables
Nuclear
351
00 0
0
500
1,000
1,500
2,000
2,500
Coal Oil Shale Oil Gas
INDEX RANK
72

World Energy Trilemma: 2012 Energy Sustainability Index World Energy Council
116
Figure A1 Index structure and weighting
Indicator type DimensionTotal score Indicators
Enhanced methodology for 2012
Energy security
Social equity
Societal strength
Economic strength
Political strength
Energy performance
Contextual performance
Environmentalimpact
mitigationCountry position
25%
8.3%
75%
25%
100%
1
2
1
2
1
2
3
3
1.2.1 Affordability of retail gasoline1.2.2 Affordability & quality of electricity relative
to access
2.1.1 Political stability2.1.2 Regulatory quality2.1.3 Effectiveness of government
2.2.1 Control of corruption2.2.2 Rule of law2.2.3 Quality of education2.2.4 Quality of health
2.3.1 Cost of living expenditure2.3.2 Macro-economic stability2.3.3 Availability of credit to the private sector
1/2each
1/3each
1/4each
1/3each
1.3.1 Energy intensity per capita per GDP1.3.2 Emissions intensity per capita per GD1.3.3 CO2 emissions from electricity & heat generation1.3.4 Effect of air and water pollution
1/4each
25%
25%
8.3%
8.3%
1.1.1 Ratio of energy production to consumption1.1.2 Diversity of electricity generation1.1.3 Wholesale margin on gasoline1.1.4 Five year energy consumption growth1.1.5a Exporters – Diversity of energy exports1.1.5b Importers – Oil stock reserves
1/5each
The Energy Sustainability Index (‘Index’) ranks WEC member countries in terms of their likely ability to provide a stable, affordable, and environmentally-sensitive energy system. The rankings are based on a range of country level data and databases that capture both energy performance and the contextual framework. Energy performance considers supply and demand, the affordability and access of energy, and the environmental impact of the country’s energy use. The contextual indicators consider the broader circumstances of energy performance including societal, political and economic strength and stability.
Indicators were selected based on the high degree of relevance to the research goals, exhibited low correlation, and could be derived from reputable sources to cover a high proportion of member countries. These sources include the International Energy Agency, the U.S. Energy Information Administration, the World Bank, the International Monetary Fund, the World Economic Forum and others.
The structure of the Index and the coverage of its 22 indicators are set out in Figure A-1. The Index is weighted in favour of the energy performance axis by a factor of 3:1, with the scores for each dimension carrying equal weight within their axis.
Appendix A. Index rationale, structureand methodology

World Energy Council World Energy Trilemma: 2012 Energy Sustainability Index
117
Overall, the Index displays the aggregate effect of energy policies applied over time in the context of each country and provides a snapshot of current energy sustainability performance. It is very difficult to compare the effectiveness of particular policies across countries, since each policy interacts with a unique set of policies specific to that country. But it is possible to broadly measure the aggregate outcome of policies, for example, how countries with similar levels of energy intensity per capita perform in mitigating their environmental impact or the overall use of electricity per capita.
Where possible, data has been updated, however, due to constraints on the collection, processing, and dissemination of data the current Index generally reflects data from 2009-2011. Recent world events that could affect the Index’s outcomes are not completely captured (for example, turbulence in global nuclear power industry due to Fukushima, or the political unrest in the Middle East). Further, policies generally take two to three years to become fully implemented and it may take longer for their effects to become evident. That noted, repercussions from the financial and economic crisis in 2008 are increasingly becoming visible as we see strong fluctuations in economic performance for several countries. It is possible that the financial crisis had further impacts on countries’ energy policies, such as cuts of subsidies due to financial and economic pressures. However, it is difficult to disentangle the origins as well as the effects from individual policy changes.
Full details of country scores in the three dimensions, further key metrics and analytical
commentaries for each country can be found in the country profiles online at www.worldenergy.org.
Index results by GDP group
To understand how each dimension of the Energy Sustainability Index is affected by wealth, countries were organized in four economic groups:
Group A: GDP (PPP) per capita greater than USD33,500
Group B: GDP (PPP) per capita between USD14,300 and USD33,500
Group C: GDP (PPP) per capita between USD6,000 and USD14,300
Group D: GDP (PPP) per capita lower than USD6,000
Figures A-2 through A-5 show the rankings of each country within these GDP groups.

World Energy Trilemma: 2012 Energy Sustainability Index World Energy Council
118
Figure A2 Country Ranking for GDP Group A
Figure A3 Country Ranking for GDP Group B
Figure A4
Country Ranking for GDP Group C
Rank Country Importer / Exporter Energy security rank Social equity rank Environmental impact mitigation rank 2012 Index rank
1 Sweden I 2 16 2 12 Switzerland I 12 4 10 23 Canada E 1 2 12 34 Norway E 9 10 5 45 Finland I 13 14 6 56 Denmark E 3 28 25 77 Japan I 7 9 24 88 France I 29 8 4 99 Austria I 39 7 11 10
10 Germany I 11 11 41 1111 United States I 27 1 31 1212 Belgium I 31 12 15 1313 Netherlands I 34 20 20 1414 United Kingdom I 37 6 35 1515 Luxembourg I 72 5 18 1816 Australia E 25 3 73 2017 Iceland I 71 21 3 2318 Korea (Republic) I 61 25 32 2719 Ireland I 57 24 42 3020 Taiwan, China I 83 22 27 3221 Hong Kong, China I 76 30 49 3422 Qatar E 81 15 64 4123 United Arab Emirates E 79 39 46 4424 Kuwait E 84 27 74 54
Rank Country Importer / Exporter Energy security rank Social equity rank Environmental impact mitigation rank 2012 Index rank
1 New Zealand I 16 13 8 62 Spain I 17 19 40 163 Slovakia I 6 35 14 174 Hungary I 10 36 19 195 Italy I 19 26 33 216 Slovenia I 28 41 17 227 Croatia I 14 33 26 248 Portugal I 23 37 38 259 Russia E 8 47 16 26
10 Argentina E 35 17 30 2811 Czech Republic I 15 32 61 2912 Lithuania I 53 45 9 3113 Estonia I 42 46 50 3514 Latvia I 64 50 13 3715 Greece I 43 23 76 4216 Saudi Arabia E 85 18 59 4617 Poland I 50 38 65 4718 Cyprus I 91 29 63 4919 Trinidad & Tobago E 69 48 36 5120 Gabon E 21 78 52 5921 Israel I 66 43 92 6122 Lebanon I 65 63 85 7723 Botswana I 89 74 94 91
Rank Country Importer / Exporter Energy security rank Social equity rank Environmental impact mitigation rank 2012 Index rank
1 Colombia E 5 56 34 332 Uruguay I 63 44 22 363 Bulgaria I 40 59 28 384 Ukraine I 18 58 23 395 Albania I 44 61 7 406 Kazakhstan E 38 40 44 437 Iran (Islamic Republic) E 47 31 51 488 Mexico E 45 34 83 509 Brazil I 77 65 21 53
10 Egypt (Arab Republic) E 33 49 66 5511 Romania I 36 42 80 5612 South Africa E 78 52 53 5713 Peru I 46 67 60 5814 Tunisia I 51 51 89 6015 Macedonia (Republic) I 56 54 68 6216 Thailand I 58 62 79 6317 Turkey I 41 53 84 6418 Serbia I 67 57 62 6619 Jordan I 93 55 67 6820 China I 59 69 91 7121 Algeria E 75 60 70 7822 Namibia I 90 76 57 7923 Libya E 55 73 88 88

World Energy Council World Energy Trilemma: 2012 Energy Sustainability Index
119
2012 Methodology enhancements
The Index methodology was enhanced in the 2012 Index to better assess the countries’ ability to mitigate their environmental impact and to provide social equity.
Changes to Social Equity dimension
The social equity dimension (affordability of energy access) was modified to minimise the effects of scale. In previous versions of the Index, large countries were privileged due to a scale effect (for example, very large populations) as both indicators, the gasoline prices and household electricity expenditure were normalised respectively by aggregate household consumption expenditure and by aggregate expenditure on housing, water, electricity, gas and other fuels. Furthermore, countries that emphasised affordability, but faced challenges with the quality of electricity supply were privileged as the latter was not formally included in the index.
To remove scale effects, the aggregate, individual consumption as well as the electricity expenditure indicator are now scaled by population, thus measuring the indicators on a per capita level. The ‘per capita’ amendment to Social Equity is in line with the rest of the Index and negates inadvertently privileging larger populations.
In addition, an indicator for “Quality of Electricity supply” is now included in the indicator 1.2.2 which
measures affordability and quality of electricity supply. The indicator is applied after we normalise cost of electricity by access. The new data is available for almost all countries, with the exception of four African countries for which the African average is used as a proxy. This change reduces the instances of countries with poor grid infrastructure capturing anomalously high rankings. Best scores are now obtained for complete, high quality, and affordable access.
Changes to Environmental Impact Mitigation (EIM) dimension
In the 2010 and 2011 Index, countries with very low energy consumption, due to poor energy access and low levels of industrialisation, were privileged in EIM for their comparatively low environmental footprint as measured by carbon emissions and energy intensity per capita. Two main changes were conducted to privilege countries that are able to combine economic and social development with environmental sensitivity.
First, the indicators of energy and emission intensity per capita per GDP PPP (1.3.1. and 1.3.2) were normalised by the percentage of energy access and the industrial sector percentage of total GDP. This provides a better ‘apples-to-apples’ country comparison as environmental impact mitigation accounts for the ‘per capita’ consuming energy and the burden of an industrialised nations.
In addition, the calculation of the EIM dimension was modified to identify those countries that out-perform peers for their given level of energy
Figure A5 Country Ranking for GDP Group D
Rank Country Importer / Exporter Energy security rank Social equity rank Environmental impact mitigation rank 2012 Index rank
1 Bolivia E 22 64 45 452 Paraguay E 62 70 1 523 Cameroon E 32 83 54 654 Kenya I 20 86 69 675 Congo (Dem. Republic) E 26 91 47 696 Côte d'Ivoire E 30 85 56 707 Zimbabwe I 4 94 71 728 Sri Lanka I 49 71 82 739 Nepal I 82 92 29 74
10 Philippines I 52 77 78 7511 Syria (Arab Republic) E 54 68 72 7612 Swaziland I 70 75 55 8013 Ghana I 88 81 39 8114 Tanzania I 68 93 43 8215 Indonesia E 60 72 90 8316 Nigeria E 24 84 81 8417 Mongolia E 74 79 75 8518 Chad E 48 88 58 8619 Morocco I 80 66 87 8720 Ethiopia I 94 90 37 8921 Niger I 92 87 48 9022 Pakistan I 73 80 77 9223 India I 87 82 93 9324 Senegal I 86 89 86 94

World Energy Trilemma: 2012 Energy Sustainability Index World Energy Council
120
consumption. After the environmental impact was assessed with the regular weighting system, this preliminary score is now regressed against the total primary energy consumption per capita per GDP. This regression allows estimating a projected environmental impact value for the sample of countries based on their energy consumption per capita per GDP. The final EIM score is then refined as the deviation from the expected and the actual environmental impact value. Countries that outperform against their estimate on EIM given their energy consumption are likely to be making concentrated efforts to mitigate their environmental impact, and vice-versa for underperformers. Figure A-6 presents the ‘column of expectation’ based on the 2012 regression trend as well as the out- and underperformers for the 2012 Index.
Rankings for previous years were calculated with the new methodology to allow for a comparison in performance between the years (see Figures A-7 and A-8).
Figure A6 Regression-based projections of environmental impact mitigation (EIM) scores identify under- and outperformers
En
viro
nm
en
tal I
mpa
ct M
itiga
tion
Total primary energy consumption / GDP (PPP)
Austria
Colombia
DenmarkNepal
Brazil Sweden
Canada
Iceland
Albania
LatviaLithuania
FranceFinland
New Zealand
Slovakia
Paraguay
ChinaCyprus
Greece
South Africa
India
Indonesia
Israel
Kuwait
Lebanon
Libya
Macedonia
Mongolia
Morocco
Pakistan
Romania
Tunisia
Turkey
Senegal
Thailand
Zimbabwe
Syria
SerbiaSaudi Arabia
Uruguay Switzerland
Norway
“Column of expectation”
Low High
Low
Hig
h Outperformers: Countries thatexhibit significantly better thanexpected EIM scores given theirenergy consumption
Underperformers: Countries thatexhibit significantly worse thanexpected EIM scores given theirenergy consumption

World Energy Council World Energy Trilemma: 2012 Energy Sustainability Index
121
Figure A-7 2011 Country ranking for the overall Index and energy dimensions
Rank 2011 Overall index ranking 2011 Energy security ranking 2011 Social equity ranking 2011 Environmental impact mitigation ranking
1 Canada Canada United States Sweden2 Finland Russia Canada Iceland3 Switzerland Côte d'Ivoire Australia France4 Sweden Swaziland Switzerland Norway5 Norway Denmark Luxembourg Lithuania6 New Zealand Colombia Japan Finland7 France Finland Austria New Zealand8 Denmark Ukraine United Kingdom Paraguay9 Austria Sweden Belgium Latvia10 Germany Gabon France Tajikistan11 Japan Croatia Norway Russia12 United States Argentina Germany Canada13 Luxembourg Germany New Zealand Luxembourg14 Iceland Egypt (Arab Republic) Finland Switzerland15 Spain Switzerland Qatar Albania16 Netherlands Japan Greece Brazil17 Croatia Cameroon Spain Slovakia18 Belgium Nigeria Saudi Arabia Austria19 Argentina Syria (Arab Republic) Iceland Uruguay20 Slovakia Hungary Argentina Slovenia21 Hungary Norway Taiwan, China Kazakhstan22 Lithuania Latvia Netherlands Hungary23 Latvia Kenya Italy Ukraine24 Australia Tajikistan Ireland Belgium25 Slovenia Bulgaria Korea (Republic) Nepal26 Czech Republic Albania Denmark Croatia27 Russia Spain Czech Republic Argentina28 United Kingdom Slovakia Cyprus Denmark29 Portugal France Hong Kong, China Estonia30 Kazakhstan Congo (Dem. Republic) Iran (Islamic Republic) Serbia31 Italy Philippines Kuwait Netherlands32 Colombia United States Croatia Czech Republic33 Taiwan, China New Zealand Sweden Colombia34 Uruguay Kazakhstan Mexico Trinidad & Tobago35 Hong Kong, China Serbia Slovakia Korea (Republic)36 Ukraine Lithuania Portugal Romania37 Korea (Republic) Austria Kazakhstan Japan38 Estonia Czech Republic Poland Ghana39 Ireland Portugal Hungary United States40 Bulgaria Sri Lanka United Arab Emirates Portugal41 Albania Slovenia Slovenia Ireland42 Romania Australia Israel Swaziland43 Swaziland Macedonia (Republic) Romania Bulgaria44 Serbia Lebanon Uruguay Germany45 Brazil China Lithuania Peru46 Mexico Romania Estonia Spain47 Saudi Arabia Indonesia Egypt (Arab Republic) Taiwan, China48 Qatar Peru Russia Italy49 UAE Italy Trinidad & Tobago Tanzania50 Egypt (Arab Republic) Uruguay Latvia Iran (Islamic Republic)51 Cyprus Mexico Tunisia Congo (Dem. Republic)52 Greece Israel South Africa Philippines53 Poland Netherlands Turkey United Kingdom54 Tajikistan Paraguay Jordan Kenya55 South Africa Iceland Algeria United Arab Emirates56 Paraguay Tanzania Ukraine Saudi Arabia57 Philippines Poland Serbia South Africa58 Macedonia Rep. United Kingdom Macedonia (Republic) Macedonia (Republic)59 Peru South Africa Colombia Cyprus60 Kuwait Tunisia Bulgaria Hong Kong, China61 Israel Belgium Indonesia Sri Lanka62 Trinidad & Tobago Brazil Lebanon Cameroon63 Iran (Islamic Republic) Greece Thailand Poland64 Syria (Arab Republic) Pakistan Libya Mexico65 Cameroon Algeria Brazil Thailand66 Tunisia Hong Kong, China Morocco Ethiopia67 Thailand Thailand Albania Jordan68 Sri Lanka Turkey Peru Kuwait69 Kenya Estonia Paraguay Turkey70 Jordan Libya Swaziland Syria (Arab Republic)71 China Iran (Islamic Republic) Syria (Arab Republic) Pakistan72 Lebanon Mongolia China Australia73 Gabon Taiwan, China Botswana Namibia74 Côte d'Ivoire Niger Sri Lanka Egypt (Arab Republic)75 Turkey Namibia Namibia Qatar76 Indonesia Nepal Philippines Morocco77 Congo (Dem. Republic) Morocco Gabon Côte d'Ivoire78 Nepal Senegal Mongolia Mongolia79 Tanzania Ghana Pakistan Gabon80 Ghana United Arab Emirates Ghana Tunisia81 Namibia Luxembourg Cameroon Niger82 Morocco Jordan Nigeria Lebanon83 Nigeria Korea (Republic) Tajikistan Greece84 Algeria India India Algeria85 Mongolia Saudi Arabia Côte d'Ivoire Senegal86 Libya Trinidad & Tobago Kenya India87 Botswana Botswana Senegal China88 Pakistan Ireland Niger Nigeria89 India Ethiopia Congo (Dem. Republic) Israel90 Niger Cyprus Nepal Indonesia91 Senegal Qatar Tanzania Botswana92 Ethiopia Kuwait Ethiopia Libya

World Energy Trilemma: 2012 Energy Sustainability Index World Energy Council
122
Figure A-8 2010 Country ranking for the overall Index and energy dimensions
Rank 2010 Overall index ranking 2010 Energy security ranking 2010 Social equity ranking 2010 Environmental impact mitigation ranking
1 Switzerland Canada United States Iceland2 Canada Switzerland Canada Sweden3 Norway Denmark Australia France4 Finland Slovenia Switzerland Norway5 New Zealand Japan Luxembourg Estonia6 France Finland France Lithuania7 Sweden Norway United Kingdom Latvia8 Denmark Russia Norway Tajikistan9 United States Cameroon Austria Switzerland
10 Austria Germany Greece Slovakia11 Japan Netherlands Belgium New Zealand12 Belgium Portugal Japan Luxembourg13 Netherlands Sweden New Zealand Canada14 Slovenia Czech Republic Germany Russia15 Iceland Slovakia Finland Finland16 Luxembourg Nigeria Iceland Albania17 Slovakia New Zealand Qatar Brazil18 Germany Colombia Spain Austria19 Portugal United States Argentina Uruguay20 Australia United Kingdom Saudi Arabia Kazakhstan21 United Kingdom France Denmark Nepal22 Czech Republic Argentina Taiwan, China Egypt (Arab Republic)23 Estonia Macedonia (Republic) Italy Ukraine24 Argentina Hungary Netherlands Hungary25 Hungary Belgium Iran (Islamic Republic) Croatia26 Spain Poland Czech Republic Belgium27 Lithuania Spain Ireland Argentina28 Ireland Romania Cyprus Slovenia29 Russia Indonesia Croatia Denmark30 Uruguay Austria Sweden United States31 Latvia Ukraine Korea (Republic) Paraguay32 Hong Kong, China Tunisia Hong Kong, China Ireland33 Italy Egypt (Arab Republic) Kuwait Colombia34 Korea (Republic) Iran (Islamic Republic) Portugal Kenya35 Taiwan, China Kenya Slovakia Trinidad & Tobago36 Egypt (Arab Republic) Australia Slovenia Peru37 Colombia Turkey Hungary Bulgaria38 Qatar Paraguay Poland Portugal39 Iran (Islamic Republic) Swaziland United Arab Emirates Japan40 Croatia Uruguay Israel Iran (Islamic Republic)41 Romania Syria (Arab Republic) Kazakhstan Philippines42 Saudi Arabia Côte d'Ivoire Mexico Swaziland43 Macedonia (Republic) Lithuania Lebanon Macedonia (Republic)44 Greece Italy Romania Namibia45 Ukraine South Africa Uruguay Netherlands46 South Africa Estonia Lithuania Czech Republic47 Poland Tajikistan Estonia Jordan48 Cyprus Mexico South Africa Korea (Republic)49 Kazakhstan Iceland Jordan Hong Kong, China50 UAE Greece Latvia Romania51 Bulgaria Congo (Dem. Republic) Egypt (Arab Republic) Tanzania52 Tunisia Libya Turkey Congo (Dem. Rep.)53 Mexico Bulgaria Russia Ghana54 Kuwait Albania Tunisia Cyprus55 Trinidad & Tobago Latvia Trinidad & Tobago Sri Lanka56 Brazil Algeria Libya Serbia57 Swaziland India Macedonia (Republic) Italy58 Albania Tanzania Ukraine Taiwan, China59 Paraguay Philippines Serbia Syria (Arab Republic)60 Jordan Ghana Thailand South Africa61 Turkey Sri Lanka Colombia Saudi Arabia62 Tajikistan Qatar Algeria Spain63 Peru Korea (Republic) Bulgaria Germany64 Philippines Ireland Brazil United Arab Emirates65 Kenya Taiwan, China Morocco Côte d'Ivoire66 Cameroon Saudi Arabia Indonesia Australia67 Lebanon Pakistan Paraguay Thailand68 Namibia Lebanon Peru Pakistan69 Syria (Arab Republic) Peru Syria (Arab Republic) United Kingdom70 Sri Lanka Kazakhstan Sri Lanka Morocco71 Indonesia China Botswana Tunisia72 Thailand Kuwait China Mongolia73 Israel United Arab Emirates Namibia Mexico74 Nepal Luxembourg Philippines Kuwait75 Libya Nepal Swaziland Turkey76 Ghana Croatia Albania Qatar77 Nigeria Hong Kong, China Côte d'Ivoire Lebanon78 China Trinidad & Tobago Pakistan Cameroon79 Algeria Brazil Ghana Poland80 Tanzania Niger India China81 Côte d'Ivoire Israel Mongolia Niger82 Serbia Namibia Nigeria Algeria83 Congo (Dem. Republic) Mongolia Cameroon Nigeria84 India Jordan Senegal Senegal85 Morocco Thailand Tajikistan Ethiopia86 Botswana Senegal Niger Greece87 Pakistan Ethiopia Kenya India88 Mongolia Morocco Congo (Dem. Republic) Indonesia89 Senegal Cyprus Ethiopia Botswana90 Niger Botswana Nepal Libya91 Ethiopia Serbia Tanzania Israel

World Energy Council World Energy Trilemma: 2012 Energy Sustainability Index
123

World Energy Trilemma: 2012 Energy Sustainability Index World Energy Council
124

Albania Algeria Argentina Austria Belgium Bolivia Botswana Brazil Bulgaria Cameroon Canada Chad China Colombia Congo (Democratic Republic) Côte d'Ivoire Croatia Cyprus Czech Republic Denmark Egypt (Arab Republic) Estonia Ethiopia Finland France Gabon Germany Ghana Greece Hong Kong, China Hungary
Iceland India Indonesia Iran (Islamic Republic) Ireland Israel Italy Japan Jordan Kazakhstan Kenya Korea (Republic) Kuwait Latvia Lebanon Libya Lithuania Luxembourg Macedonia (Republic) Mexico Monaco Mongolia Morocco Namibia Nepal Netherlands New Zealand Niger Nigeria Pakistan Paraguay Peru
Philippines Poland Portugal Qatar Romania Russian Federation Saudi Arabia Senegal Serbia Slovakia Slovenia South Africa Spain Sri Lanka Swaziland Sweden Switzerland Syria (Arab Republic) Taiwan, China Tanzania Thailand Trinidad & Tobago Tunisia Turkey Ukraine United Arab Emirates United Kingdom United States Uruguay Zimbabwe
Member committees of the World Energy Council
World Energy Council Regency House 1-4 Warwick Street London W1B 5LT United Kingdom T (+44) 20 7734 5996 F (+44) 20 7734 5926 E [email protected] www.worldenergy.org
For sustainable energy.
ISBN: 978 0 946121 19 9
The World Energy Council (WEC) is the principal impartial network of leaders and practitioners promoting an affordable, stable and environmentally sensitive energy system for the greatest benefit of all. Formed in 1923, WEC is the UN-accredited global energy body, representing the entire energy spectrum, with more than 3000 member organisations located in over 90 countries and drawn from governments, private and state corporations, academia, NGOs and energy related stakeholders. WEC informs global, regional and national energy strategies by hosting high-level events, publishing authoritative studies, and working through its extensive member network to facilitate the world’s energy policy dialogue. Further details at www.worldenergy.org and @WECouncil