2012 discard estimation, precision, and sample size ... · 2012 discard estimation, precision, and...
TRANSCRIPT

Northeast Fisheries Science Center Reference Document 12-17
2012 Discard Estimation, Precision, andSample Size Analyses for
14 Federally Managed Species Groups in the Northeast Region
by SE Wigley, J Blaylock, PJ Rago, and G Shield

Northeast Fisheries Science Center Reference Document 12-17
US DEPARTMENT OF COMMERCENational Oceanic and Atmospheric Administration
National Marine Fisheries ServiceNortheast Fisheries Science Center
Woods Hole, MA
August 2012
2012 Discard Estimation, Precision, and Sample Size Analyses for
14 Federally Managed Species Groups in the Northeast Region
by SE Wigley1, J Blaylock2, PJ Rago1, and G Shield1
1National Oceanic Atmospheric Administration, National Marine Fisheries Service,Northeast Fisheries Science Center, 166 Water Street, Woods Hole, MA, 02543 USA
2Integrated Statistics, 16 Sumner St., Woods Hole, MA 02543 USA

Northeast Fisheries Science Center Reference Documents
This series is a secondary scientific series designed to assure the long-term documentation and to enable the timely transmission of research results by Center and/or non-Center researchers, where such results bear upon the research mission of the Center (see the outside back cover for the mission statement). These documents receive internal scientific review, and most receive copy editing. The National Marine Fisheries Service does not endorse any proprietary material, process, or product mentioned in these documents. All documents issued in this series since April 2001, and several documents issued prior to that date, have been copublished in both paper and electronic versions. To access the electronic version of a document in this series, go to http://www.nefsc.noaa.gov/nefsc/publications/. The electronic version is available in PDF format to permit printing of a paper copy directly from the Internet. If you do not have Internet access, or if a desired document is one of the pre-April 2001 documents available only in the paper version, you can obtain a paper copy by contacting the senior Center author of the desired document. Refer to the title page of the document for the senior Center author’s name and mailing address. If there is no Center author, or if there is corporate (i.e., non-individualized) authorship, then contact the Center’s Woods Hole Labora-tory Library (166 Water St., Woods Hole, MA 02543-1026). Editorial Treatment: To distribute this report quickly, it has not undergone the normal tech-nical and copy editing by the Northeast Fisheries Science Center’s (NEFSC’s) Editorial Office as have most other issues in the NOAA Technical Memorandum NMFS-NE series. Other than the four covers and first two preliminary pages, all writing and editing have been performed by the authors listed within. This report was reviewed by the Stock Assessment Review Commit-tee, a panel of assessment experts from the Center for Independent Experts (CIE), University of Miami. Information Quality Act Compliance: In accordance with section 515 of Public Law 106-554, the Northeast Fisheries Science Center completed both technical and policy reviews for this report. These predissemination reviews are on file at the NEFSC Editorial Office. This document may be cited as:
Wigley SE, Blaylock J, Rago PJ, Shield G. 2012. 2012 Discard estimation, precision, and sample size analyses for 14 federally managed species groups in the northeast region. US Dept Commer, Northeast Fish Sci Cent Ref Doc. 12-17; 146 p. Available from: National Marine Fisheries Service, 166 Water Street, Woods Hole, MA 02543-1026, or online at http://www.nefsc.noaa.gov/nefsc/publications/
i
TABLE OF CONTENTS Table of Contents ........................................................................................................................................... i List of Tables ................................................................................................................................................ ii List of Figures ............................................................................................................................................... ii List of Appendix Tables ............................................................................................................................... iii List of Acronyms ......................................................................................................................................... iv Executive Summary ...................................................................................................................................... v Background ................................................................................................................................................... 1 Methods ........................................................................................................................................................ 1
Data Sources ............................................................................................................................................. 1 Discard Estimation .................................................................................................................................... 3 Discard Reasons ........................................................................................................................................ 3 Sample Size Analysis ................................................................................................................................ 4
Results ........................................................................................................................................................... 5 Discussion ..................................................................................................................................................... 8 Acknowledgements ....................................................................................................................................... 9 References Cited ......................................................................................................................................... 10 Appendix ................................................................................................................................................... 131
ii
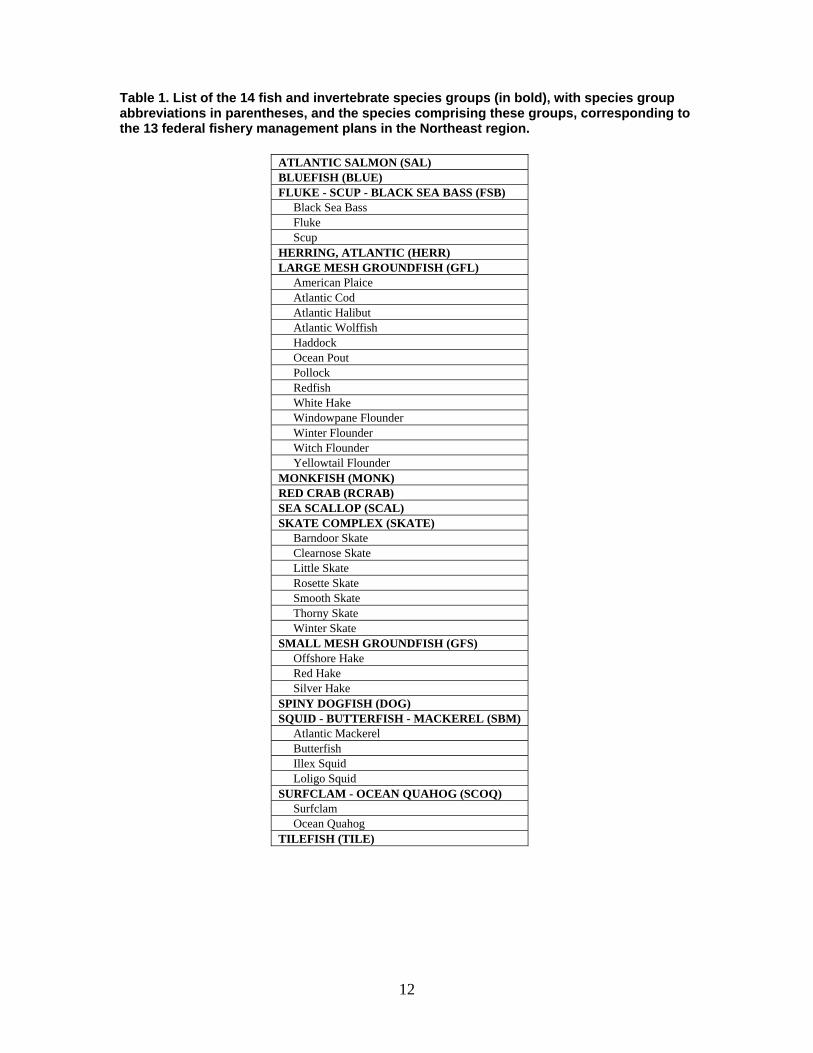
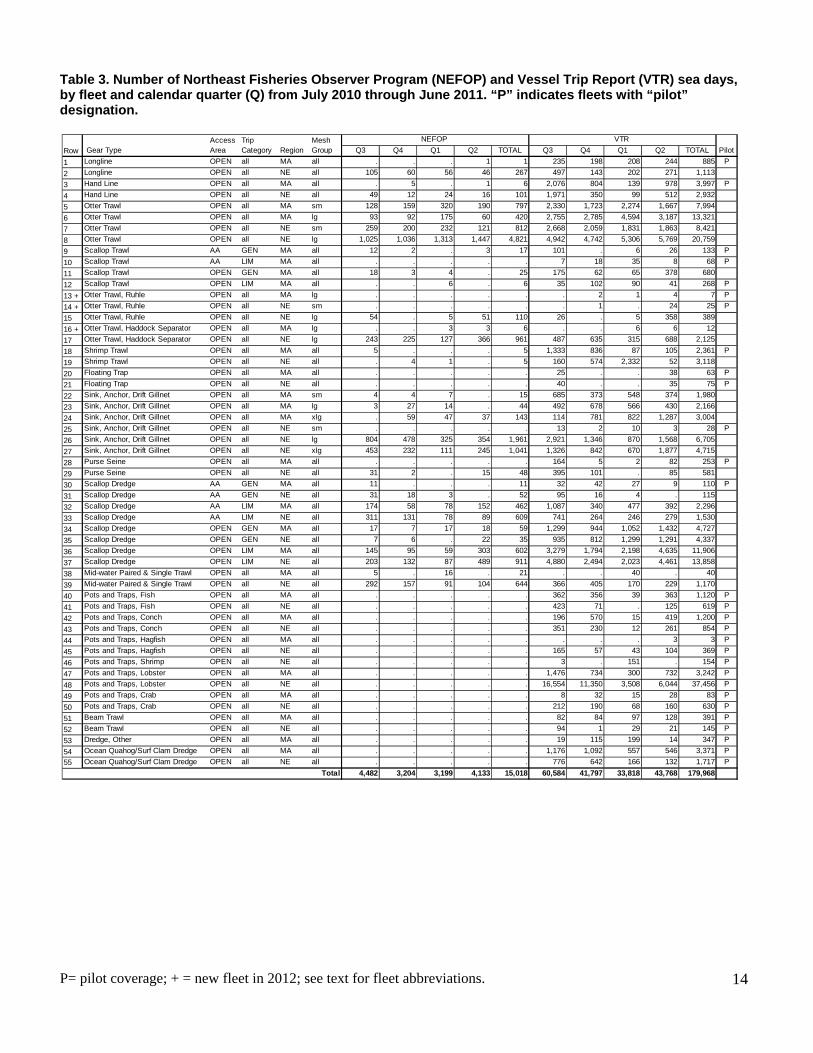
LIST OF TABLES Table 1. List of the 14 fish and invertebrate species groups, with species group abbreviations in parentheses, and the species comprising these groups, corresponding to the 13 federal fishery management plans in the Northeast region………………………………………………………12 Table 2. Number of Northeast Fisheries Observer Program and Vessel Trip Report trips, by fleet and calendar quarter from July 2010 through June 2011………………………………………...13 Table 3. Number of Northeast Fisheries Observer Program and Vessel Trip Report sea days, by fleet and calendar quarter from July 2010 through June 2011…………………………………..14 Table 4A. Total catch, Vessel Trip Report landings, estimated discards and associated coefficient of variation for 14 fish and invertebrate species groups, by fleet for July 2010 through June 2011…….………………………………………………………………………………………...15 Table 4B. Total catch, Vessel Trip Report landings, estimated discards and associated coefficient of variation for the 23 individual species that comprise the 14 species groups, by fleet for July 2010 through June 2011..……….………………..………………………………………………43 Table 5. The number of sea days needed to achieve a 30% CV of the discard estimate for each the 14 fish and invertebrate species groups, the number of pilot sea days, and the maximum number of sea days needed for each fleet for fish and invertebrate species groups based on July 2010 through June 2011 data…………………………………………………………………….89 Table 6. Number of sea days, trips, and percentage of trips needed to achieve a 30% CV of the discard estimate, by fleet and species group, based on July 2010 through June 2011 data……...90
LIST OF FIGURES Figure 1A. Percentage of Vessel Trip Report landings and estimated discards and the percentage of estimated discards by fleet for each of the 14 species groups for July 2010 through June 2011………………………………………………………………………………………...91 Figure 1B. Percentage of Vessel Trip Report landings and estimated discards and the percentage of estimated discards by fleet for the 23 individual species that comprise the 14 species groups for July 2010 through June 2011……………………………………………………………….. 98 Figure 2. Percentage of Vessel Trip Report landings and estimated discards and the percentage of estimated discards by FMP and non-FMP species groups for 26 selected fleets for July 2010 through June 2011………………………………………………………………………………110 Figure 3. Results from the 2012 sample size analysis conducted for 16 selected fleets………123

iii
LIST OF APPENDIX TABLES Appendix Table 1. Discard reason categories used in Appendix Tables 2A and 2B…………..134 Appendix Table 2A. Estimated discards and percentage by discard reason category for the 14 species groups for July 2010 through June 2011……………………………………………….135 Appendix Table 2B. Estimated discards and percentage by discard reason category for the 23 individual species that comprise the 14 species groups for July 2010 through June 2011……..139 Appendix Table 3. Fleet abbreviations used in Table 6 and Figures 1A, 1B, and 3…………...146
iv
LIST OF ACRONYMS CV = coefficient of variation d/k = discard/kept FMP = fishery management plan MRIP = Marine Recreational Information Program MRFSS = Marine Recreational Fisheries Statistical Survey NEFOP = Northeast Fisheries Observer Program NEFSC = Northeast Fisheries Science Center NERO = Northeast Regional Office NMFS = National Marine Fisheries Service SBRM = Standardized Bycatch Reporting Methodology VTR = Vessel Trip Report
v
EXECUTIVE SUMMARY
This report describes the analysis of the expected coverage needed by at-sea observers for Northeast fisheries for the April 2012 through March 2013 period using the Standardized Bycatch Reporting Methodology. Refinements to the procedure for filtering the needed sea days have been made based on analyses conducted for the 2011 3-year Review Report. The sea days needed to achieve the precision-based performance standard (30% coefficient of variation of the discard estimate) were updated using July 2010 through June 2011 data. To monitor 14 federally managed fish and invertebrate species groups across 55 fleets, a total of 18,822 sea days are needed. The discards reported in this document may not necessarily correspond directly with the discard estimates derived for individual stock assessments due to differences in stratification and data. Hence, the discard estimates are not definitive, but indicative of where discarding is occurring among commercial fleets and for which species groups. Based upon this analysis, the predominant species groups discarded are skates and dogfish. Across all species groups examined, “No Market” is the reason reported for the majority of discards.
1
BACKGROUND The Standardized Bycatch Reporting Methodology (SBRM) Omnibus Amendment
(NEFMC 2007; NMFS 2008) was vacated by the US District Court of the District of Columbia on September 15, 2011 and the regulations implementing the SBRM were removed by the National Marine Fisheries Service (NMFS) on December 29, 2011 (NMFS 2011). While an SBRM is not currently required, the need to allocate observer sea days to monitor fisheries prosecuted off the northeast coast of the US remains and thus an analysis to estimate the number of sea days needed by each fleet is needed.
The SBRM discard estimation methods described in Wigley et al. 2007 are still applicable. Refinements to the procedure for filtering the needed sea days have been made based on analyses conducted for the 2011 SBRM 3-year Review Report Part 2 (Wigley et al. forthcoming 2012).
This document presents the estimated discards and associated precision, and the number of sea days needed to obtain a 30% coefficient of variation (CV) on the discard estimates for the 14 species groups associated with federal fishery management plans (FMPs) in northeast fleets1. Additionally, discard reasons associated with the discarded species are summarized. This document differs from previous SBRM documents in that it does not include a sea day prioritization2 and focuses on fish and invertebrate species groups; it does not include sea turtles.
METHODS Data Sources
The data sets used include July 2010 through June 2011 data from the Northeast Fisheries Observer Program3 (NEFOP) database, the Vessel Trip Report (VTR; including logbooks from the surfclam and ocean quahog fishery) database, the Northeast Fisheries Science Center (NEFSC) commercial landings database, and the NOAA Fisheries Marine Recreational Fisheries Statistics Survey4 (MRFSS) database.
The NEFOP is a comprehensive, multi-purpose program that collects a broad range of data on all species that are encountered during a fishing trip as well as gear characteristics data, economic information, and biological samples (NEFOP, 2010). The NEFOP employs trained sea-going observers and monitors to collect these data that also include weight, by species and disposition (retained and discarded), of the entire catch. Fish and invertebrate species are recorded in weight. Conversion factors were applied to convert any dressed weight data to live weight equivalents.
For this analysis, only observed hauls from NEFOP trips with a “complete” sampling protocol were used. A “complete” sampling protocol includes obtaining species weights for both kept and discarded portions of all species in the catch. NEFOP training trips have been included
1 “fleet” is synonymous with “fishing mode.” 2 The Proposed 2012 Observer Sea Day Allocation (March 23, 2012) document is available on-line at: http://www.nefsc.noaa.gov/fsb/SBRM/2012/Proposed_2012_Observer_Sea_Day_Allocation_3-23-2012_v3.pdf 3 A comparison of discard rates derived from observer and at-sea monitor data revealed there were generally no statistical differences in discard rates between the two data collection programs for the 14 fish species groups for four gear types (longline, large mesh otter trawl, large mesh gillnet and extra large mesh gillnet) where at-sea monitor data exist. See Northeast Fisheries Observer Program (2011) for more information on at-sea monitoring. 4 Marine Recreational Fisheries Statistics Survey (MRFSS) was replaced with Marine Recreational Information Program (MRIP) in 2012.
2
in the analysis. Aborted trips, “set only” trips, and trips associated with a groundfish sentinel fishery (program code = 127) were excluded from this analysis. Additionally, hauls with no catch report and species hail weight with discard reason “039” (“previously discarded”) were excluded.
The same broad stratification scheme used in SBRM analyses was employed in this analysis, where trips were partitioned into fleets using six classification variables: calendar quarter, geographic region, gear type, mesh, access area, and trip category. Calendar quarter was based on landed date and used to capture seasonal variations in fishing activity and discard rates. Two broad geographical regions were defined: New England (NE) and Mid-Atlantic (MA) based on port of departure5; ports from Maine to Rhode Island constituted the NE region, and ports in states from Connecticut southward constituted the MA region. Gear type was based on Northeast gear codes (negear). Some gear codes were combined: sink, anchored, and drift gillnets, and single and paired mid-water trawls. Trips for which gear was unknown were excluded. Mesh size groups were formed for otter trawl and gillnet gear types. For otter trawls, two mesh groups were formed: small (mesh less than 5.5 inches) and large (5.5 inch mesh and greater). For gillnets, three mesh groups were formed: small (mesh less than 5.5 inches), large (mesh between 5.5 and 7.99 inches), and extra large (mesh 8 inches and greater). Two access area categories were formed: access area (AA) and open (OPEN). The sea scallop fishery was divided into General (GEN) and Limited (LIM) category trips. All other fisheries were combined into a category called “all.”
Stratification abbreviations used are given below.
Abbreviation Definition
MA Mid-Atlantic ports (CT and southward)
NE New England ports (RI and northward)
sm Small mesh (less than 5.5 inches)
lg Large mesh (5.5 to 7.99 inches)
xlg Extra large mesh (8 inches and greater)
LIM Limited access category
GEN General category
OPEN Non-access area
AA Access area
The VTR data are used as a basis for defining the sampling frame, since all federally permitted vessels are required to file a VTR for each fishing trip (See NMFS-Northeast Regional Office http://www.nero.noaa.gov/ro/fso/vtr_inst.pdf ). These self-reported data6 constitute the basis of the fishing activity of the commercial fleets. Because Dealer data do not contain mesh size and area fished information, the Dealer data7 could not be used to expand discard ratios by
5 Wigley et al. (2007) found that the majority (over 93%) of 2004 observed trips both originated and fished in the same region and exhibited the same general pattern as in the VTR data. An updated analysis using data collected during July 2007 through June 2011 found similar results. 6 See Wigley et al. 2007 for more details on self-reported VTR data. 7 The trip-based allocation of Dealer (CFDETT/SyyyyAA) data are conducted annually and were not available when the annual discard estimation and sample size analyses were conducted.

3
fleet for the annual analyses. The VTR data were used as a surrogate for Dealer data and were used to expand the NEFOP discard ratios to total discards. For this analysis, the commercial VTR trips [excluding NY state (non-federal) vessels] were used. Conversion factors were applied to convert various units of measure to pounds and all weight to live weight. VTR trip data were collapsed into fleets as defined above. Trips participating in the US/Canada access area, B-day category programs and other special access programs could not be identified in the VTR data. These trips have been grouped by the other stratification variables and have not been partitioned separately.
The clam fishery has a separate logbook system from the VTR logbook. The commercial clam logbook data were used to augment the VTR data for the clam dredge fishery. The commercial and recreational landings (in live weight) for the federally managed species were used only in sample size analysis. A list of the 14 federally managed fish and invertebrate species groups analyzed, and the individual species comprising each species group, is given in Table 1. This analysis does not include sea turtles. Summaries of the data used, in terms of number of trips and number of sea days, by fleet, calendar quarter, and data source (NEFOP and VTR), are given in Tables 2 and 3, respectively.
Discard Estimation
Total discards of each of the 14 federally managed species groups were estimated for the July 2010 through June 2011 time period using a combined discard/kept (d/k) ratio estimator (Cochran 1963), where d = discarded pounds of a given species group, and k = the kept pounds of all species. Total discards (in weight for fish) were derived by multiplying the estimated discard rate of each fleet by the corresponding fleet landings in the VTR database, and then summing over fleets.
Simple imputation methods were used to fill quarterly cells for which there were one or no observed trips. Data from adjoining strata were pooled to impute estimates for cells with zero or one trip. In this imputation only the temporal stratification, calendar quarter, was relaxed to half year (or annual) recognizing that seasonal variation can occur for some species. This simple imputation could not be applied to fleets where observer coverage was low or missing throughout the year (i.e., too few data to support the simple imputation approach). In these cases, imputed values were not used, and the fleet was designated as a fleet in need of pilot coverage. If some data were available, then discard estimates were derived, but these results were not used in sample size analyses.
The variances of the discard estimates were also derived. In this document, CV is defined as the ratio of the standard error of the total discards divided by the total discards. The appendix presents the equations used in the analysis.
For each species/species group and fleet, the landings from the VTR and clam logbook are presented to provide perspective for the discard estimates.
Discard Reasons
For each species group and fleet, the fish dispositions associated with discarding (as reported by the at-sea observer) have been grouped into the following six discard reason categories: no market, regulation (size), regulation (quota), regulation (other), poor quality, and
4
other. The discard reason categories and the associated fish dispositions are summarized in Appendix Table 1. The discard reasons “No Market” and “Poor Quality” would be considered economic discards and not regulatory discards.
The observed (non-extrapolated) discards associated with each of the six discard reason categories were summed for each species group/species for the fleets where discards could be estimated. For individual fleets, the percentage of observed discards by discard reason category was derived by dividing the sum of the observed discards for each discard reason category by the sum of the total observed discards for each species group/species and fleet. The discard reason category percentages were taken from the observed discard reason category percentages. For the “Other fleets filtered out” (an aggregated fleet that represents fleets where the variance of the discard estimate was not used in the annual sample size analysis), the observed discard reason category percentages were then multiplied by the total estimated (extrapolated) discards for each species group/species and fleet to derive the estimated discards by discard reason category for each species group/species and fleet for each of the fleets associated with the aggregated fleet. For each “Other fleets filtered out,” the total estimated discards by discard reason category were summed over the fleets that comprise the fleet aggregation for each species group/species. The estimated discard reason category percentage was derived by dividing the estimated discards for each discard reason category by the sum of the total estimated discards for each species group/species and fleet.
Sample Size Analysis
The sample size analysis (also referred to as sea day analysis) was conducted to estimate the number of baseline trips and sea days needed to monitor the 14 federally managed species groups in each fleet. As described in Wigley et al. 2007 (and given in the appendix), the number of trips and sea days needed to achieve a given precision level was based on the variance of the total discard estimate for a species group. Sample size (trips and sea days) associated with the precision standard for discard estimates (30% CV) were derived. The sample size analysis was performed using trips as the sampling unit, and then converting the number of trips to sea days by multiplying by the weighted mean trip length, where the weighting factor was the quarterly number of VTR trips. The percentage of trips was derived by dividing the number of trips needed by the number of VTR trips that occurred in the fleet.
When total discards could not be estimated due to little or no observer coverage (no data), or when total discards were zero (no variance), the sample size (number of trips) was determined using a pilot coverage level set to 2% of the quarterly VTR trips for a fleet, with a minimum of 3 trips per quarter (12 trips per year) and a maximum of 100 trips per quarter (400 trips per year). The 2% pilot coverage level8 was the same as was used in SBRM analyses (Wigley et al. 2007; Wigley et al. 2011). The quarterly trips were then multiplied by the quarterly mean VTR trip length to derive quarterly sea days. The quarterly trips and quarterly sea days were then summed for annual number of trips and sea days. It is recognized that pilot coverage may result in too much coverage in cases where little or no observer coverage may actually be needed.
Some fleet/species combinations contribute very little to the total mortality or discard of the species, but may require significant resources to characterize the precision of the estimate. 8 Pilot coverage is defined as a minimum level of observer coverage necessary to acquire bycatch information with which to calculate variance estimates that in turn can be used to further define the level of sampling needed (NMFS 2004).

5
For example, a high variance estimate for a rare event within a fleet would require high levels of sampling, even though the total discard in that fleet was unimportant with respect to either the total discard or total mortality on the resource. To address this, a modification of the filtering approach developed for SBRM was employed. Similar to the SBRM analyses (Wigley et al. 2007), importance filters were used to provide a standardized protocol to further refine the number of baseline sea days based on: (a) the importance of the discarded species relative to the total amount of discards by a fleet, and (b) the total fishing mortality due to the discards. In the SBRM analyses, the importance filter was comprised of three filters (i.e., unlikely cell filter, fraction of discard filter, and fraction of total mortality due to discards filter) that were applied simultaneously. However, based on an evaluation of the use of the unlikely filter over a three-year period, it was found that no substantive changes in the determination of sea days would have resulted had the unlikely filter been removed from the importance filter (Wigley et al. forthcoming 2012). Thus, in this analysis, all cells in the unlikely filter were set to 1 (all cells are likely).
The 2012 baseline sea days were filtered using a 95% cut-point in the discard filter, and a 98% cut-point for the total mortality filter due to discards. In other words, estimates of sea day coverage for a given species or species group were derived for those fleets where discards constituted 95% of the discard mortality and 98% of the total mortality.
To determine the number of sea days (referred to as the “2012 sea days needed”) and trips needed to achieve a 30% CV on the estimates of discards for each of the 14 species groups within a fleet, the maximum number of sea days for the 14 species groups (i.e., the maximum number of sea days in a row) was used. This ensures that all species groups will have a 30% CV or less. In the event that sea days for each species group within a fleet are filtered out, then the number of sea days for the fleet will be based on pilot coverage to maintain monitoring coverage for that fleet. If the fleet was designated as a pilot fleet, then pilot sea days were used. These fleets are indicated with a “P.” The fleets with sufficient data to estimate sample size are referred to as non-pilot fleets.
RESULTS There were 55 fleets identified during the July 2010 through June 2011 period (Tables 2
and 3). There were three new fleets compared to the 2011 sea day analysis (NEFSC 2011b, NEFSC and NERO 2011): MA large mesh Ruhle trawl (Row 13), NE small mesh Ruhle trawl (Row 14), and MA large mesh haddock separator trawl (Row 16). New fleets, those that have not been identified in previous analyses, have been identified with a plus (+).
Of the 55 fleets examined, 29 fleets had little or no observer data: 6 fleets had sparse observer data across all quarters, while 23 fleets were missing observer data in all quarterly cells. The fleets with no observer coverage were primarily pot and trap fisheries targeting particular species (e.g., lobster, crab, conch, shrimp, and hagfish). No discard estimation was performed for the 23 fleets with no observer coverage and they were designated as fleets in need of pilot coverage (Tables 2 and 3). The 6 fleets with sparse observer coverage were also designated as fleets in need of pilot coverage for the sample size analysis; however, discard estimation was performed using the sparse observer data. For the 26 remaining fleets (non-pilot fleets), estimates of discards and their associated variance were derived and used to determine the sample sizes needed for a 30% CV. Of the 26 fleets, there were 9 fleets (Rows 11, 15, 19, 22, 23, 24, 29, 31, and 35) where the simple imputation was applied.

6
Thus, for discard estimation and precision analysis, 23 fleets had no discard estimation and 32 fleets had discards estimated. For the sample size analysis, 26 fleets had sample sizes derived from the discard variances and 29 fleets had sample sizes based upon pilot coverage. A total of 5,444 trips (14,174 days) was observed during July 2010 through July 2011. When these trips were stratified, some trips were partitioned between strata resulting in 5,558 trips (15,018 days; Tables 2 and 3) in the VTR. There appears to be minor misreporting of gear type associated with trips in the NE Ruhle trawl fleet (Row 15) and MA Mid-water trawl (Row 38; Tables 2 and 3; Quarter 3). For Ruhle trawl, the incidence of misreporting gear (bottom otter trawl versus Ruhle trawl) is less than in previous years. The percentages of observed trips varied by fleet and calendar quarter. On an annual basis, the percentage of observed trips by fleet ranged between 0.1% (MA handline fleet, Row 3) to 72% (MA Mid-water trawl fleet, Row 38; Table 2). Over all fleets, the percentage of observed trips was 5.5%. Annual VTR landings and estimated discards (live pounds) with associated precision are summarized for 53 fleets (Rows 1-19, 21-43, 45-55 and “Other fleets” with landings only) for each of the 14 species groups and the individual species that comprise those species groups (Tables 4A and 4B; Figures 1A and 1B). The landings associated with the “minor” fleets not uniquely identified in this analysis have been aggregated into a single fleet labeled “Other fleets.” Due to confidentially rules, the landings associated with MA Floating Trap (Row 20) and MA Hagfish Pots and Traps (Row 44) have been combined with the landings of other minor fleets (labeled as “Other fleets”) that have not been not uniquely identified within this analysis. As a consequence, the fleet row numbers within Tables 4A and 4B are sequential but there are gaps in the row numbers. The landings associated with the various minor fleets aggregated into “Other fleets” generally contribute less than 0.5% of the total landings across all fleets for each of the 14 species groups (Table 4A). As mentioned above, there are 23 fleets (Rows 10, 13, 14, 20, 21, 25, 28, 40-55) that have no discard estimation due to no NEFOP coverage (dark shaded fleets in Tables 4A and 4B, with Rows 20 and 44 included in “Other fleets”). In Table 4A, the CVs associated with the cells (species group and fleet) that were not used in the sample size analysis (i.e. cells filtered out via the importance filter) are indicated in light shading. Precision of discards of individual species (Table 4B) were not used in the sample size analysis. Based upon this analysis, over 71,000 mt (live wt) of discards of the 14 species groups occurred during the July 2010 through June 2011 period. The majority (77%) of the discards were comprised of three species groups: skates (49%), scallops (16%), and dogfish (12%); the remaining species groups comprised less than or equal to 5% (Table 4A). The percentage of discards to total catch varied among the 14 species groups (Table 4A; Figure 1A) and individual species (Table 4B; Figure 1B). There was one species group (SAL) with zero discards (this species group is not presented in Figure 1A); two species groups (HERR and SCOQ) where discards were less than 1% total catch; three species groups (SCAL, SBM, and TILE) where percentages of discards ranged between 1% and 10% of total catch; three species groups (BLUE, FSB, and GFL) where discards ranged between 11% and 25% of total catch; and five species groups (MONK, RCRAB, SKATE, GFS, and DOG) where discards were greater than 26% of total catch. The species groups with the highest percentage of total discards relative to total catch were: skates (75%), dogfish (62%), and red crab (62%; Figure 1A). For individual species, most notable are the high percentages of discards to total catch of wolffish (99%) and ocean pout (99%) due to the no possession regulations for these two species.
7
The reasons for discarding varied among the 14 species groups (Appendix Table 2A) and individual species (Appendix Table 2B). Overall, for the 14 species groups, the majority (74%) of discards occurred due to “No Market,” “Regulation” (due to size, quota, and other), “Poor Quality,” and “Other” contributed 21%, 3%, and 1%, respectively (Appendix Table 2A). The percentages of discard to total catch were also summarized by fleet for 26 fleets (Figure 2). Discards of one or more of the 14 species groups that were filtered out via the importance filter have been aggregated into a species group labeled “Other FMP.” Discards of non-federally managed species have been aggregated into a species group labeled “Non-FMP.” The percentages of discard to total catch varied by fleet (Figure 2). There was one fleet (Row 29) where discards were less than 1% of the total catch in the fleet; four fleets (Rows 4, 23, 38, and 39) where the percentages of discards ranged between 1% and 10%; 13 fleets (Rows 2, 7, 15, 19, 22, 24, 26, 27, 32, 33, 35, 36, and 37) where the percentages of discards ranged between 11% and 25% of total catch; five fleets (Rows 5, 8, 17, 31, and 34) where the percentages of discards ranged between 26% and 50% of the total catch; and three fleets where discards were greater than 50% of the total catch (Row 6, 11, and 16). The number of species groups discarded within a fleet also varied among fleets. The majority of fleets (17 of the 26 fleets) were comprised of two or three discarded species groups. Eight of these fleets (Rows 2, 4, 15, 16, 31, 33, 35, and 38) had the “Other FMP” species group comprised the majority of the discards. This indicates that the majority of discards were filtered out via the importance filter. There were another five fleets (Rows 22, 29, 32, 34, and 39) where the “Non-FMP” species group comprised the majority of the discards. There was one fleet (Row 23) where discards were evenly split between with “Other FMP” and “Non-FMP” species groups. There were three fleets where two of the three discarded species groups were “Other FMP” and “Non-FMP” and the other was the dominant species group of skate, small mesh groundfish, and dogfish (Rows 11, 19, and 26 respectively). The remaining fleets (9 of the 26 fleets) had between four and nine discarded species groups. The skate species group dominated the discards in five of these fleets (Rows 6, 8, 17, 24, and 27) while “Non-FMP” species group dominated the discards in two fleets (Rows 36 and 37). Two fleets (Rows 5 and 7) had a mix of discarded species groups. The dominant “Non-FMP” species in the scallop dredge fleets (Rows 32, 33, 34, 35, and 36) were: sand dollar, sponge, and starfish. Menhaden and jellyfish were the dominant “Non-FMP” species in the MA small mesh gillnet fleet (Row 22). “Fish, not known” was the dominant species in the NE purse seine fleet (Row 29). The precision of the discard estimates varied by species group and fleet (Tables 4A and 4B). Of the 14 species groups, 11 species groups had an overall CV that was less than 30%, two species groups (BLUE and SCOQ) had an overall CV that was greater than 30% CV, and one species group (SAL) had zero discards and consequently no CV. The discards of four species groups (BLUE, HERR, SCOQ, and TILE) were filtered out in all fleets indicating the discards of these species groups were a minor component of the total catch of these species (Table 4A; Figure 1A). The numbers of sea days needed for each species group and fleet, as well of the number of sea days needed for the fleet (referred to as “2012 Sea Days Needed”), are summarized in Table 5. A total of 18,822 days are needed for all fleets. As mentioned previously, 29 fleets had insufficient observer information to estimate discards and the sea days for these fleets have sea days based on pilot coverage. The number of sea days needed associated with fleets with the pilot coverage designation was 1,638 days (9% of 18,822; Table 5). There are 10 fleets where the

8
sea days for all species groups were filtered out via the importance filter and pilot days was used to maintain some coverage (Rows 2, 4, 15, 16, 22, 23, 29, 31, 35, and 38; Table 5). The sea days needed associated with these fleets was 377 days (2% of 18,822; Table 5). The sea days needed for the remaining 16 fleets (16,807 days representing 89% of the total sea days needed) were derived using the variance of the discard estimate (Tables 5). Of the 16,807 days, 12,661 days (75%) were associated with three fleets (Rows 5, 6, and 8). The sample size (in terms of number of sea days, number of trips, and percentage of trips based upon the VTR trips in July 2010 through June 201) needed to achieve a 30% CV of the discard estimate in these 16 fleets is given in Table 6. The relationship between sample size and precision, over a range of sample sizes, is shown in Figure 3 for species groups and fleets. If the precision standard (30% CV) was relaxed for the red crab species group in three fleets (Rows 5, 6, and 8) and the penultimate (next largest) value was used in each of the three fleets, then the total number of sea days needed across all fleets would be 7,827 days (a 42% decrease from the 18,822 days). Using the penultimate value, the expected achieved precision of red crab discards in Rows 5, 6, and 8 would be 92% CV, 140% CV, and 72% CV respectively.
DISCUSSION A broad stratification was used to support the deployment of observers on commercial
fishing trips among various fleets using attributes known prior to the trip departure. As discussed in previous discard estimation analyses (Wigley et al. 2011), species-specific stock assessment discard estimation may differ from this report due to differences in stratification and data used [calendar year versus 12-month (July to June) time period; area fished versus region (port of departure); and VTR landings versus Dealer landings]. Region, based on port of departure, was used for the deployment of observers. It is recognized that area fished would provide a better stratification for discard estimation. It is expected, however, that estimates would be in the same order of magnitude. The discard estimates presented here are not definitive estimates, but rather are indicative of where discarding occurred among the commercial fleets for the 14 federally managed species groups.
We have assumed 100% discard mortality, i.e. we do not account for potential survival of organisms returned to the water. When comparing discard estimates from this study with those from stock assessments, it is usefully to note that survival ratios are applied in stock assessments for spiny dogfish, summer flounder, southern New England and Gulf of Maine stocks of winter flounder, and southern New England yellowtail flounder.
These analyses have used VTR data. Dealer (CFDERSyyyy) data do not contain mesh or area fished information until the trip-based allocation is performed. The trip-based allocation of Dealer (CFDETT/SyyyyAA) data is conducted annually and was not available when this analysis was initiated. Given that the VTR landings estimates are usually less (VTR reports the good faith hails) than the dealer records for a given fleet, the corresponding estimates of discards will also be underestimated. The magnitude of the underestimation will vary by fleet and year.
New fleets were added in response to VTR activity in the time period examined. The Ruhle Trawl (negear code 054) and Haddock Separator Trawl (negear code 057) were used by vessels departing from the MA region. These gear types are required in the US/Canada resource sharing area and their use is expected in both access and non-access areas to reduce discards of New England groundfish under sector management. Due to the low number of VTR trips reported for these fleets in the July 2010 through June 2011 period, the number of sea days
9
needed is lower than what may be realized. Additional outreach and education via permit holder letters to industry members have emphasized the proper use of these two gear codes.
There are several fleets with high sea day requirements (> 3,000 sea days). The Northeast Fisheries Observer Program data associated with the trips within these fleets were reviewed to rule out any data “irregularities.” The high coverage for New England and Mid-Atlantic otter trawl fleets (Rows 5, 6, and 8; Table 5) was due to high variability associated with red crab discards. In this analysis, as well as in the 2011 SBRM analysis (NEFSC 2011a; NEFSC 2011b; NEFSC and NERO 2011; Wigley et al. 2011), the high variability arises from observing some trips that are fishing in deep-water portions of statistical areas as well as observing other trips that are fishing in shallower portions of the same statistical areas. Red crabs were encountered during trips fishing in deep water. Although the discard reason reported for three fleets was “No Market” (Appendix Table 2A), these vessels do not generally have permits to land red crab, thus the red crabs must be discarded. Currently, the analysis does not stratify these fleets further to account for depth because statistical area is the finest spatial resolution that defines a subtrip within the Vessel Trip Report (a subtrip within the VTR is a unique gear, mesh, and statistical area). While depth is a data element in the VTR, depth is not always reported and there are few QA/QC checks on this data element.
Fish may be discarded for economic reasons (e.g., “No Market” or “Poor Quality”) or for regulatory reasons (size, quota, or other). When considering mechanisms to reduce discards, it may be useful to know why discarding is occurring. It is important to note that large discard percentages may be associated with a small quantity of discards. Additionally, it is important to note that for many species, the discards are associated with fleets that have been filtered out by the importance filter. Observers classify the discards by fish disposition based upon the NEFOP protocol (NEFOP 2010; NEFOP 2011) where the observer asks the captain/crew why species are being discarded. Thus, these data should be considered a form of self-reported data and as such these data are difficult to verify and should be interpreted cautiously. This analysis does not address the coverage needed for individual sectors or multiple stock components of a species. The analytical basis for the allocation of future sea day coverage in this analysis is a specified level of precision (i.e., 30% CV) and an expectation that the pattern of fishing activity observed in the prior year will be similar to that in the upcoming year.
ACKNOWLEDGEMENTS We thank all the NEFOP observers for their diligent efforts to collect the data used in this
report. We thank Jiachen Tang for her assistance with the figures. We thank our reviewers for their helpful comments on this report.
10
REFERENCES CITED Cochran WL. 1963. Sampling techniques. J. Wiley and Sons. New York. National Marine Fisheries Service (NMFS). 2004. Evaluating bycatch: a national approach to
standardized bycatch monitoring programs. U. S. Dep. Comm., NOAA Tech. Memo. NMFS-F/SPO-66, 108 p. On-line version, http://www.nmfs.noaa.gov/by_catch/SPO_final_rev_12204.pdf
National Marine Fisheries Service (NMFS). 2008. Magnuson-Stevens Fishery Conservation and
Management Act Provisions; Fisheries of the Northeastern United States; Northeast Region Standardized Bycatch Reporting Methodology Omnibus Amendment. Federal Register, Vol. 73, No. 18, Monday, January 28, 2008. p. 4736-4758. Available on-line at: http://www.gpoaccess.gov/fr/retrieve.html
National Marine Fisheries Service (NMFS). 2011. Fisheries of the northeastern United States;
Removal of standardized bycatch reporting methodology regulations. Federal Register, Vol. 76, No. 250, Thursday, December 29, 2011. p. 81844 – 81850. http://www.gpo.gov/fdsys/pkg/FR-2011-12-29/pdf/2011-33302.pdf
New England Fishery Management Council (NEFMC), Mid-Atlantic Fishery Management
Council and National Marine Fisheries Service. 2007. Northeast region standardized bycatch reporting methodology: An omnibus amendment to the fishery management plans of the New England and Mid-Atlantic Fishery Management Councils. June 2007. 642 p. Available on-line at: http://www.nefmc.org/issues/sbrm/index.html
Northeast Fisheries Science Center (NEFSC). 2011a. Standardized bycatch report methodology annual discard report 2011 (Section 1 and 2). Internal document presented to the NEFMC and MAFMC. 1135 p. Available on-line at: http://www.nefsc.noaa.gov/fsb/SBRM/
Northeast Fisheries Science Center (NEFSC). 2011b. Standardized bycatch report methodology
sea day analysis and prioritization 2011. Internal document presented to the NEFMC and MAFMC on January 25, 2011. 25 p. Available on-line at: http://www.nefsc.noaa.gov/fsb/SBRM/2011/2011-SBRM-Sea-Day-Analysis-Prioritization.pdf
Northeast Fisheries Science Center (NEFSC) and Northeast Regional Office (NERO). 2011. Standardized bycatch reporting methodology proposed 2011 observer sea day allocation consultation and prioritization process response to comments. April 1, 2011. Internal document presented to the Northeast Regional Coordinating Committee. 16p. Available on-line at: http://www.nefsc.noaa.gov/femad/fsb/SBRM/2011/2011_Re-Prioritization_and_Response_to_Comments_04012011.pdf

11
Northeast Fisheries Observer Program (NEFOP). 2010. Fisheries observer program manual 2010. Northeast Fisheries Science Center, Woods Hole, MA 02543. 442 p. Available on-line at: http://www.nefsc.noaa.gov/fsb/manuals/2010/NEFOPM_010110_Bookmarks_Compressed.pdf
Northeast Fisheries Observer Program (NEFOP). 2011. At-sea monitoring program manual.
Northeast Fisheries Science Center, Woods Hole, MA 02543. 502 p. Available on-line at: http://www.nefsc.noaa.gov/fsb/manuals/2011/ASM_program_manual_0611.pdf
Wigley SE, Blaylock J, Rago PJ, Murray KT, Nies TA, Seagraves RJ, Potts D, Drew K.
Forthcoming 2012. Standardized bycatch reporting methodology 3-year review report 2011- part 2. US Dept Commer, Northeast Fish Sci Cent Ref Doc. 238 p. Available from: National Marine Fisheries Service, 166 Water Street, Woods Hole, MA 02543-1026 or online at http://nefsc.noaa.gov/publications/.
Wigley SE, Blaylock J, Rago PJ, Tang J, Haas HL, Shield G. 2011. Standardized bycatch
reporting methodology 3-year review report 2011- part 1. US Dept Commer, Northeast Fish Sci Cent Ref Doc. 11-09; 285 p. Available from: National Marine Fisheries Service, 166 Water Street, Woods Hole, MA 02543-1026, or online at http://www.nefsc.noaa.gov/publications/crd/crd1109/
Wigley SE, Rago PJ, Sosebee KA, Palka DL. 2007. The analytic component to the standardized
bycatch reporting methodology omnibus amendment: sampling design and estimation of precision and accuracy (2nd edition). U.S. Dep. Commer., Northeast Fish. Sci. Cent. Ref. Doc. 07-09; 156 p. Available on-line:
http://www.nefsc.noaa.gov/publications/crd/crd0709/index.htm
12
Table 1. List of the 14 fish and invertebrate species groups (in bold), with species group abbreviations in parentheses, and the species comprising these groups, corresponding to the 13 federal fishery management plans in the Northeast region.
ATLANTIC SALMON (SAL) BLUEFISH (BLUE) FLUKE - SCUP - BLACK SEA BASS (FSB) Black Sea Bass Fluke Scup HERRING, ATLANTIC (HERR) LARGE MESH GROUNDFISH (GFL) American Plaice Atlantic Cod Atlantic Halibut Atlantic Wolffish Haddock Ocean Pout Pollock Redfish White Hake Windowpane Flounder Winter Flounder Witch Flounder Yellowtail Flounder MONKFISH (MONK) RED CRAB (RCRAB) SEA SCALLOP (SCAL) SKATE COMPLEX (SKATE) Barndoor Skate Clearnose Skate Little Skate Rosette Skate Smooth Skate Thorny Skate Winter Skate SMALL MESH GROUNDFISH (GFS) Offshore Hake Red Hake Silver Hake SPINY DOGFISH (DOG) SQUID - BUTTERFISH - MACKEREL (SBM) Atlantic Mackerel Butterfish Illex Squid Loligo Squid SURFCLAM - OCEAN QUAHOG (SCOQ) Surfclam Ocean Quahog TILEFISH (TILE)

P= pilot coverage; + = new fleet in 2012; see text for fleet abbreviations. 13
Table 2. Number of Northeast Fisheries Observer Program (NEFOP) and Vessel Trip Report (VTR) trips, by fleet and calendar quarter (Q) from July 2010 through June 2011. “P” indicates fleets with “pilot” designation.
Access Trip MeshRow Gear Type Area Category Region Group Q3 Q4 Q1 Q2 TOTAL Q3 Q4 Q1 Q2 TOTAL Pilot
1 Longline OPEN all MA all . . . 1 1 50 32 43 37 162 P
2 Longline OPEN all NE all 83 29 46 30 188 429 86 166 186 867
3 Hand Line OPEN all MA all . 1 . 1 2 1,885 786 123 963 3,757 P
4 Hand Line OPEN all NE all 46 10 24 7 87 1,763 241 57 491 2,552
5 Otter Trawl OPEN all MA sm 56 48 53 57 214 1,156 799 582 831 3,368
6 Otter Trawl OPEN all MA lg 63 24 41 28 156 1,799 1,335 1,234 1,901 6,269
7 Otter Trawl OPEN all NE sm 86 72 40 60 258 1,208 825 544 1,063 3,640
8 Otter Trawl OPEN all NE lg 341 319 402 376 1,438 2,217 1,560 1,559 1,962 7,298
9 Scallop Trawl AA GEN MA all 6 1 . 1 8 53 . 2 13 68 P
10 Scallop Trawl AA LIM MA all . . . . . 1 2 4 1 8 P
11 Scallop Trawl OPEN GEN MA all 10 3 2 . 15 94 32 35 213 374
12 Scallop Trawl OPEN LIM MA all . . 1 . 1 4 6 11 2 23 P
13 + Otter Trawl, Ruhle OPEN all MA lg . . . . . . 2 1 4 7 P
14 + Otter Trawl, Ruhle OPEN all NE sm . . . . . . 1 . 3 4 P
15 Otter Trawl, Ruhle OPEN all NE lg 7 . 1 6 14 4 . 1 44 49
16 + Otter Trawl, Haddock Separator OPEN all MA lg . . 3 3 6 . . 4 6 10
17 Otter Trawl, Haddock Separator OPEN all NE lg 31 26 14 50 121 61 77 35 84 257
18 Shrimp Trawl OPEN all MA all 1 . . . 1 251 122 5 10 388 P
19 Shrimp Trawl OPEN all NE all . 4 1 . 5 158 559 2,307 41 3,065
20 Floating Trap OPEN all MA all . . . . . 25 . . 38 63 P
21 Floating Trap OPEN all NE all . . . . . 40 . . 35 75 P
22 Sink, Anchor, Drift Gillnet OPEN all MA sm 4 4 7 . 15 615 359 543 301 1,818
23 Sink, Anchor, Drift Gillnet OPEN all MA lg 3 26 14 . 43 455 644 521 372 1,992
24 Sink, Anchor, Drift Gillnet OPEN all MA xlg . 49 28 27 104 109 606 580 1,132 2,427
25 Sink, Anchor, Drift Gillnet OPEN all NE sm . . . . . 13 2 1 2 18 P
26 Sink, Anchor, Drift Gillnet OPEN all NE lg 655 384 250 269 1,558 2,579 1,075 706 1,293 5,653
27 Sink, Anchor, Drift Gillnet OPEN all NE xlg 372 206 52 145 775 1,113 718 275 1,119 3,225
28 Purse Seine OPEN all MA all . . . . . 160 5 1 82 248 P
29 Purse Seine OPEN all NE all 13 1 . 5 19 166 41 . 35 242
30 Scallop Dredge AA GEN MA all 6 . . . 6 14 17 10 3 44 P
31 Scallop Dredge AA GEN NE all 18 7 1 . 26 62 13 2 . 77
32 Scallop Dredge AA LIM MA all 20 7 12 18 57 116 43 60 44 263
33 Scallop Dredge AA LIM NE all 34 13 8 8 63 86 27 23 25 161
34 Scallop Dredge OPEN GEN MA all 12 5 11 15 43 945 657 732 1,094 3,428
35 Scallop Dredge OPEN GEN NE all 6 4 . 18 28 617 520 1,026 994 3,157
36 Scallop Dredge OPEN LIM MA all 17 11 6 27 61 357 208 259 468 1,292
37 Scallop Dredge OPEN LIM NE all 18 14 8 40 80 495 245 201 394 1,335
38 Mid-water Paired & Single Trawl OPEN all MA all 1 . 4 . 5 . . 7 . 7
39 Mid-water Paired & Single Trawl OPEN all NE all 65 42 27 26 160 96 122 51 59 328
40 Pots and Traps, Fish OPEN all MA all . . . . . 350 342 33 346 1,071 P
41 Pots and Traps, Fish OPEN all NE all . . . . . 423 71 . 124 618 P
42 Pots and Traps, Conch OPEN all MA all . . . . . 195 569 14 418 1,196 P
43 Pots and Traps, Conch OPEN all NE all . . . . . 351 222 4 261 838 P
44 Pots and Traps, Hagfish OPEN all MA all . . . . . . . . 3 3 P
45 Pots and Traps, Hagfish OPEN all NE all . . . . . 43 6 8 18 75 P
46 Pots and Traps, Shrimp OPEN all NE all . . . . . 3 . 151 . 154 P
47 Pots and Traps, Lobster OPEN all MA all . . . . . 1,196 539 196 569 2,500 P
48 Pots and Traps, Lobster OPEN all NE all . . . . . 14,215 9,340 1,968 4,369 29,892 P
49 Pots and Traps, Crab OPEN all MA all . . . . . 8 32 15 28 83 P
50 Pots and Traps, Crab OPEN all NE all . . . . . 120 63 5 41 229 P
51 Beam Trawl OPEN all MA all . . . . . 31 27 34 71 163 P
52 Beam Trawl OPEN all NE all . . . . . 87 1 29 10 127 P
53 Dredge, Other OPEN all MA all . . . . . 2 97 199 8 306 P
54 Ocean Quahog/Surf Clam Dredge OPEN all MA all . . . . . 785 641 258 213 1,897 P
55 Ocean Quahog/Surf Clam Dredge OPEN all NE all . . . . . 736 535 101 83 1,455 P
Total 1,974 1,310 1,056 1,218 5,558 37,741 24,252 14,726 21,907 98,626
NEFOP VTR
P= pilot coverage; + = new fleet in 2012; see text for fleet abbreviations. 14
Table 3. Number of Northeast Fisheries Observer Program (NEFOP) and Vessel Trip Report (VTR) sea days, by fleet and calendar quarter (Q) from July 2010 through June 2011. “P” indicates fleets with “pilot” designation.
Access Trip MeshRow Gear Type Area Category Region Group Q3 Q4 Q1 Q2 TOTAL Q3 Q4 Q1 Q2 TOTAL Pilot
1 Longline OPEN all MA all . . . 1 1 235 198 208 244 885 P
2 Longline OPEN all NE all 105 60 56 46 267 497 143 202 271 1,113
3 Hand Line OPEN all MA all . 5 . 1 6 2,076 804 139 978 3,997 P
4 Hand Line OPEN all NE all 49 12 24 16 101 1,971 350 99 512 2,932
5 Otter Trawl OPEN all MA sm 128 159 320 190 797 2,330 1,723 2,274 1,667 7,994
6 Otter Trawl OPEN all MA lg 93 92 175 60 420 2,755 2,785 4,594 3,187 13,321
7 Otter Trawl OPEN all NE sm 259 200 232 121 812 2,668 2,059 1,831 1,863 8,421
8 Otter Trawl OPEN all NE lg 1,025 1,036 1,313 1,447 4,821 4,942 4,742 5,306 5,769 20,759
9 Scallop Trawl AA GEN MA all 12 2 . 3 17 101 . 6 26 133 P
10 Scallop Trawl AA LIM MA all . . . . . 7 18 35 8 68 P
11 Scallop Trawl OPEN GEN MA all 18 3 4 . 25 175 62 65 378 680
12 Scallop Trawl OPEN LIM MA all . . 6 . 6 35 102 90 41 268 P
13 + Otter Trawl, Ruhle OPEN all MA lg . . . . . . 2 1 4 7 P
14 + Otter Trawl, Ruhle OPEN all NE sm . . . . . . 1 . 24 25 P
15 Otter Trawl, Ruhle OPEN all NE lg 54 . 5 51 110 26 . 5 358 389
16 + Otter Trawl, Haddock Separator OPEN all MA lg . . 3 3 6 . . 6 6 12
17 Otter Trawl, Haddock Separator OPEN all NE lg 243 225 127 366 961 487 635 315 688 2,125
18 Shrimp Trawl OPEN all MA all 5 . . . 5 1,333 836 87 105 2,361 P
19 Shrimp Trawl OPEN all NE all . 4 1 . 5 160 574 2,332 52 3,118
20 Floating Trap OPEN all MA all . . . . . 25 . . 38 63 P
21 Floating Trap OPEN all NE all . . . . . 40 . . 35 75 P
22 Sink, Anchor, Drift Gillnet OPEN all MA sm 4 4 7 . 15 685 373 548 374 1,980
23 Sink, Anchor, Drift Gillnet OPEN all MA lg 3 27 14 . 44 492 678 566 430 2,166
24 Sink, Anchor, Drift Gillnet OPEN all MA xlg . 59 47 37 143 114 781 822 1,287 3,004
25 Sink, Anchor, Drift Gillnet OPEN all NE sm . . . . . 13 2 10 3 28 P
26 Sink, Anchor, Drift Gillnet OPEN all NE lg 804 478 325 354 1,961 2,921 1,346 870 1,568 6,705
27 Sink, Anchor, Drift Gillnet OPEN all NE xlg 453 232 111 245 1,041 1,326 842 670 1,877 4,715
28 Purse Seine OPEN all MA all . . . . . 164 5 2 82 253 P
29 Purse Seine OPEN all NE all 31 2 . 15 48 395 101 . 85 581
30 Scallop Dredge AA GEN MA all 11 . . . 11 32 42 27 9 110 P
31 Scallop Dredge AA GEN NE all 31 18 3 . 52 95 16 4 . 115
32 Scallop Dredge AA LIM MA all 174 58 78 152 462 1,087 340 477 392 2,296
33 Scallop Dredge AA LIM NE all 311 131 78 89 609 741 264 246 279 1,530
34 Scallop Dredge OPEN GEN MA all 17 7 17 18 59 1,299 944 1,052 1,432 4,727
35 Scallop Dredge OPEN GEN NE all 7 6 . 22 35 935 812 1,299 1,291 4,337
36 Scallop Dredge OPEN LIM MA all 145 95 59 303 602 3,279 1,794 2,198 4,635 11,906
37 Scallop Dredge OPEN LIM NE all 203 132 87 489 911 4,880 2,494 2,023 4,461 13,858
38 Mid-water Paired & Single Trawl OPEN all MA all 5 . 16 . 21 . . 40 . 40
39 Mid-water Paired & Single Trawl OPEN all NE all 292 157 91 104 644 366 405 170 229 1,170
40 Pots and Traps, Fish OPEN all MA all . . . . . 362 356 39 363 1,120 P
41 Pots and Traps, Fish OPEN all NE all . . . . . 423 71 . 125 619 P
42 Pots and Traps, Conch OPEN all MA all . . . . . 196 570 15 419 1,200 P
43 Pots and Traps, Conch OPEN all NE all . . . . . 351 230 12 261 854 P
44 Pots and Traps, Hagfish OPEN all MA all . . . . . . . . 3 3 P
45 Pots and Traps, Hagfish OPEN all NE all . . . . . 165 57 43 104 369 P
46 Pots and Traps, Shrimp OPEN all NE all . . . . . 3 . 151 . 154 P
47 Pots and Traps, Lobster OPEN all MA all . . . . . 1,476 734 300 732 3,242 P
48 Pots and Traps, Lobster OPEN all NE all . . . . . 16,554 11,350 3,508 6,044 37,456 P
49 Pots and Traps, Crab OPEN all MA all . . . . . 8 32 15 28 83 P
50 Pots and Traps, Crab OPEN all NE all . . . . . 212 190 68 160 630 P
51 Beam Trawl OPEN all MA all . . . . . 82 84 97 128 391 P
52 Beam Trawl OPEN all NE all . . . . . 94 1 29 21 145 P
53 Dredge, Other OPEN all MA all . . . . . 19 115 199 14 347 P
54 Ocean Quahog/Surf Clam Dredge OPEN all MA all . . . . . 1,176 1,092 557 546 3,371 P
55 Ocean Quahog/Surf Clam Dredge OPEN all NE all . . . . . 776 642 166 132 1,717 P
Total 4,482 3,204 3,199 4,133 15,018 60,584 41,797 33,818 43,768 179,968
NEFOP VTR
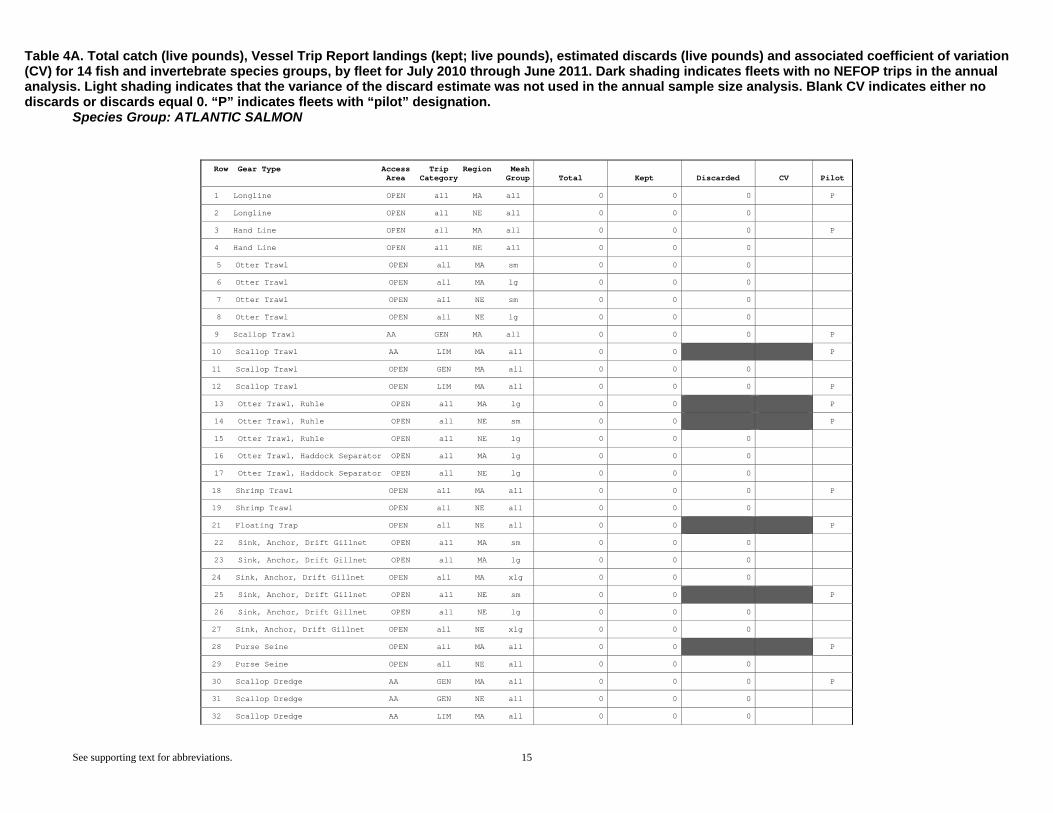
Table 4A. Total catch (live pounds), Vessel Trip Report landings (kept; live pounds), estimated discards (live pounds) and associated coefficient of variation (CV) for 14 fish and invertebrate species groups, by fleet for July 2010 through June 2011. Dark shading indicates fleets with no NEFOP trips in the annual analysis. Light shading indicates that the variance of the discard estimate was not used in the annual sample size analysis. Blank CV indicates either no discards or discards equal 0. “P” indicates fleets with “pilot” designation. Species Group: ATLANTIC SALMON
See supporting text for abbreviations. 15
Row Gear Type Access Trip Region Mesh
Area Category Group Total Kept Discarded CV Pilot
1 Longline OPEN all MA all 0 0 0 P
2 Longline OPEN all NE all 0 0 0
3 Hand Line OPEN all MA all 0 0 0 P
4 Hand Line OPEN all NE all 0 0 0
5 Otter Trawl OPEN all MA sm 0 0 0
6 Otter Trawl OPEN all MA lg 0 0 0
7 Otter Trawl OPEN all NE sm 0 0 0
8 Otter Trawl OPEN all NE lg 0 0 0
9 Scallop Trawl AA GEN MA all 0 0 0 P
10 Scallop Trawl AA LIM MA all 0 0 P
11 Scallop Trawl OPEN GEN MA all 0 0 0
12 Scallop Trawl OPEN LIM MA all 0 0 0 P
13 Otter Trawl, Ruhle OPEN all MA lg 0 0 P
14 Otter Trawl, Ruhle OPEN all NE sm 0 0 P
15 Otter Trawl, Ruhle OPEN all NE lg 0 0 0
16 Otter Trawl, Haddock Separator OPEN all MA lg 0 0 0
17 Otter Trawl, Haddock Separator OPEN all NE lg 0 0 0
18 Shrimp Trawl OPEN all MA all 0 0 0 P
19 Shrimp Trawl OPEN all NE all 0 0 0
21 Floating Trap OPEN all NE all 0 0 P
22 Sink, Anchor, Drift Gillnet OPEN all MA sm 0 0 0
23 Sink, Anchor, Drift Gillnet OPEN all MA lg 0 0 0
24 Sink, Anchor, Drift Gillnet OPEN all MA xlg 0 0 0
25 Sink, Anchor, Drift Gillnet OPEN all NE sm 0 0 P
26 Sink, Anchor, Drift Gillnet OPEN all NE lg 0 0 0
27 Sink, Anchor, Drift Gillnet OPEN all NE xlg 0 0 0
28 Purse Seine OPEN all MA all 0 0 P
29 Purse Seine OPEN all NE all 0 0 0
30 Scallop Dredge AA GEN MA all 0 0 0 P
31 Scallop Dredge AA GEN NE all 0 0 0
32 Scallop Dredge AA LIM MA all 0 0 0

Table 4A, continued. Total catch (live pounds), Vessel Trip Report landings (kept; live pounds), estimated discards (live pounds) and associated coefficient of variation (CV) for 14 fish and invertebrate species groups, by fleet for July 2010 through June 2011. Dark shading indicates fleets with no NEFOP trips in the annual analysis. Light shading indicates that the variance of the discard estimate was not used in the annual sample size analysis. Blank CV indicates either no discards or discards equal 0. “P” indicates fleets with “pilot” designation. Species Group: ATLANTIC SALMON
See supporting text for abbreviations. 16
33 Scallop Dredge AA LIM NE all 0 0 0
34 Scallop Dredge OPEN GEN MA all 0 0 0
35 Scallop Dredge OPEN GEN NE all 0 0 0
36 Scallop Dredge OPEN LIM MA all 0 0 0
37 Scallop Dredge OPEN LIM NE all 0 0 0
38 Mid-water Paired & Single Trawl OPEN all MA all 0 0 0
39 Mid-water Paired & Single Trawl OPEN all NE all 0 0 0
40 Pots and Traps, Fish OPEN all MA all 0 0 P
41 Pots and Traps, Fish OPEN all NE all 0 0 P
42 Pots and Traps, Conch OPEN all MA all 0 0 P
43 Pots and Traps, Conch OPEN all NE all 0 0 P
45 Pots and Traps, Hagfish OPEN all NE all 0 0 P
46 Pots and Traps, Shrimp OPEN all NE all 0 0 P
47 Pots and Traps, Lobster OPEN all MA all 0 0 P
48 Pots and Traps, Lobster OPEN all NE all 0 0 P
49 Pots and Traps, Crab OPEN all MA all 0 0 P
50 Pots and Traps, Crab OPEN all NE all 0 0 P
51 Beam Trawl OPEN all MA all 0 0 P
52 Beam Trawl OPEN all NE all 0 0 P
53 Dredge, Other OPEN all MA all 0 0 P
54 Ocean Quahog/Surf Clam Dredge OPEN all MA all 0 0 P
55 Ocean Quahog/Surf Clam Dredge OPEN all NE all 0 0 P
Other fleets 0 0
TOTAL 0 0 0
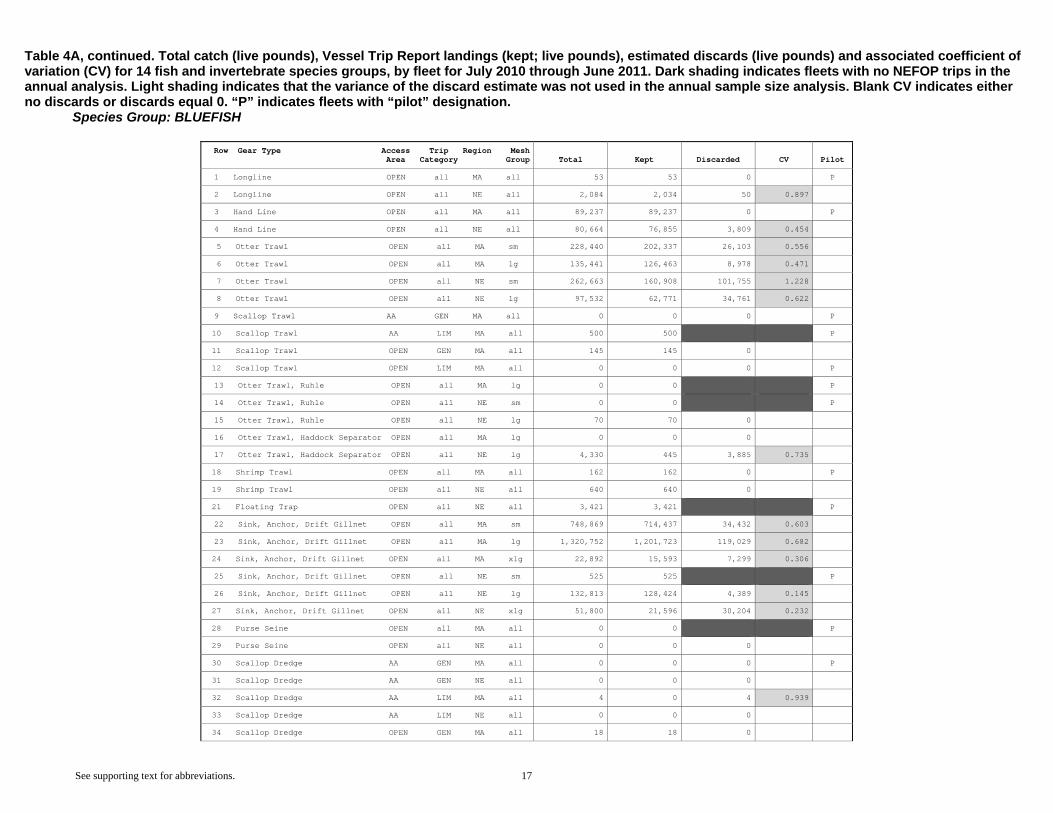
Table 4A, continued. Total catch (live pounds), Vessel Trip Report landings (kept; live pounds), estimated discards (live pounds) and associated coefficient of variation (CV) for 14 fish and invertebrate species groups, by fleet for July 2010 through June 2011. Dark shading indicates fleets with no NEFOP trips in the annual analysis. Light shading indicates that the variance of the discard estimate was not used in the annual sample size analysis. Blank CV indicates either no discards or discards equal 0. “P” indicates fleets with “pilot” designation. Species Group: BLUEFISH
See supporting text for abbreviations. 17
Row Gear Type Access Trip Region MeshArea Category Group Total Kept Discarded CV Pilot
1 Longline OPEN all MA all 53 53 0 P
2 Longline OPEN all NE all 2,084 2,034 50 0.897
3 Hand Line OPEN all MA all 89,237 89,237 0 P
4 Hand Line OPEN all NE all 80,664 76,855 3,809 0.454
5 Otter Trawl OPEN all MA sm 228,440 202,337 26,103 0.556
6 Otter Trawl OPEN all MA lg 135,441 126,463 8,978 0.471
7 Otter Trawl OPEN all NE sm 262,663 160,908 101,755 1.228
8 Otter Trawl OPEN all NE lg 97,532 62,771 34,761 0.622
9 Scallop Trawl AA GEN MA all 0 0 0 P
10 Scallop Trawl AA LIM MA all 500 500 P
11 Scallop Trawl OPEN GEN MA all 145 145 0
12 Scallop Trawl OPEN LIM MA all 0 0 0 P
13 Otter Trawl, Ruhle OPEN all MA lg 0 0 P
14 Otter Trawl, Ruhle OPEN all NE sm 0 0 P
15 Otter Trawl, Ruhle OPEN all NE lg 70 70 0
16 Otter Trawl, Haddock Separator OPEN all MA lg 0 0 0
17 Otter Trawl, Haddock Separator OPEN all NE lg 4,330 445 3,885 0.735
18 Shrimp Trawl OPEN all MA all 162 162 0 P
19 Shrimp Trawl OPEN all NE all 640 640 0
21 Floating Trap OPEN all NE all 3,421 3,421 P
22 Sink, Anchor, Drift Gillnet OPEN all MA sm 748,869 714,437 34,432 0.603
23 Sink, Anchor, Drift Gillnet OPEN all MA lg 1,320,752 1,201,723 119,029 0.682
24 Sink, Anchor, Drift Gillnet OPEN all MA xlg 22,892 15,593 7,299 0.306
25 Sink, Anchor, Drift Gillnet OPEN all NE sm 525 525 P
26 Sink, Anchor, Drift Gillnet OPEN all NE lg 132,813 128,424 4,389 0.145
27 Sink, Anchor, Drift Gillnet OPEN all NE xlg 51,800 21,596 30,204 0.232
28 Purse Seine OPEN all MA all 0 0 P
29 Purse Seine OPEN all NE all 0 0 0
30 Scallop Dredge AA GEN MA all 0 0 0 P
31 Scallop Dredge AA GEN NE all 0 0 0
32 Scallop Dredge AA LIM MA all 4 0 4 0.939
33 Scallop Dredge AA LIM NE all 0 0 0
34 Scallop Dredge OPEN GEN MA all 18 18 0
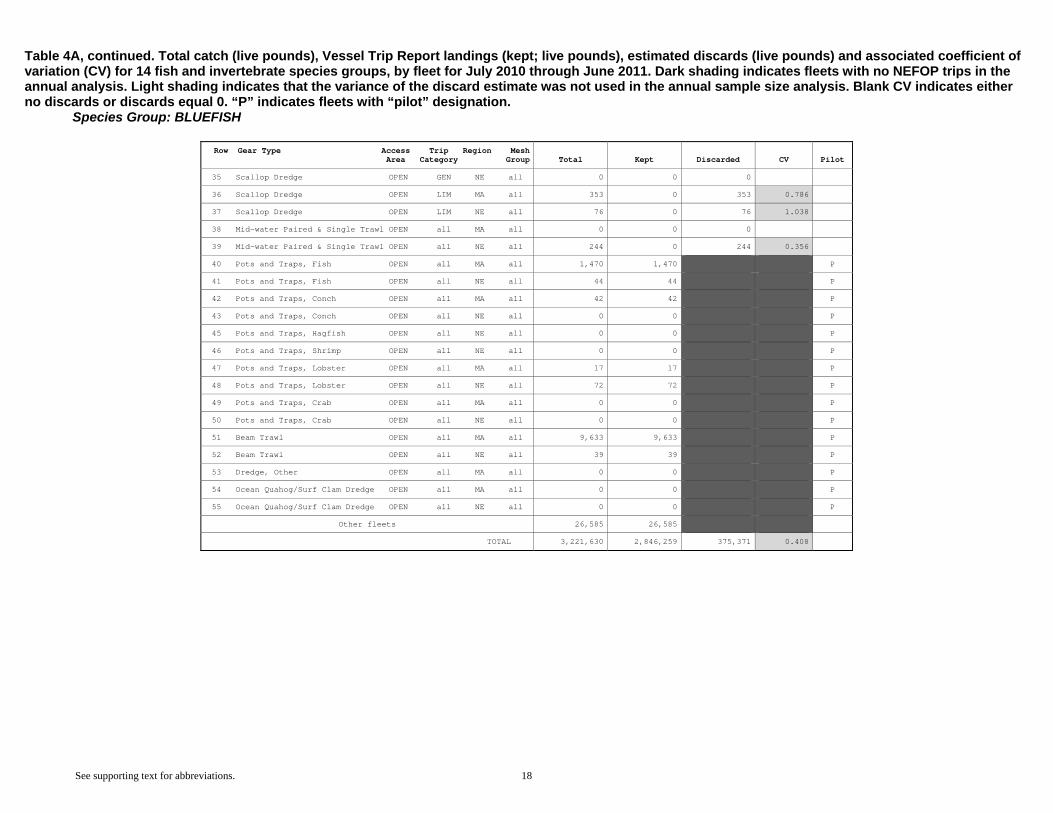
Table 4A, continued. Total catch (live pounds), Vessel Trip Report landings (kept; live pounds), estimated discards (live pounds) and associated coefficient of variation (CV) for 14 fish and invertebrate species groups, by fleet for July 2010 through June 2011. Dark shading indicates fleets with no NEFOP trips in the annual analysis. Light shading indicates that the variance of the discard estimate was not used in the annual sample size analysis. Blank CV indicates either no discards or discards equal 0. “P” indicates fleets with “pilot” designation. Species Group: BLUEFISH
See supporting text for abbreviations. 18
Row Gear Type Access Trip Region MeshArea Category Group Total Kept Discarded CV Pilot
35 Scallop Dredge OPEN GEN NE all 0 0 0
36 Scallop Dredge OPEN LIM MA all 353 0 353 0.786
37 Scallop Dredge OPEN LIM NE all 76 0 76 1.038
38 Mid-water Paired & Single Trawl OPEN all MA all 0 0 0
39 Mid-water Paired & Single Trawl OPEN all NE all 244 0 244 0.356
40 Pots and Traps, Fish OPEN all MA all 1,470 1,470 P
41 Pots and Traps, Fish OPEN all NE all 44 44 P
42 Pots and Traps, Conch OPEN all MA all 42 42 P
43 Pots and Traps, Conch OPEN all NE all 0 0 P
45 Pots and Traps, Hagfish OPEN all NE all 0 0 P
46 Pots and Traps, Shrimp OPEN all NE all 0 0 P
47 Pots and Traps, Lobster OPEN all MA all 17 17 P
48 Pots and Traps, Lobster OPEN all NE all 72 72 P
49 Pots and Traps, Crab OPEN all MA all 0 0 P
50 Pots and Traps, Crab OPEN all NE all 0 0 P
51 Beam Trawl OPEN all MA all 9,633 9,633 P
52 Beam Trawl OPEN all NE all 39 39 P
53 Dredge, Other OPEN all MA all 0 0 P
54 Ocean Quahog/Surf Clam Dredge OPEN all MA all 0 0 P
55 Ocean Quahog/Surf Clam Dredge OPEN all NE all 0 0 P
Other fleets 26,585 26,585
TOTAL 3,221,630 2,846,259 375,371 0.408

Table 4A, continued. Total catch (live pounds), Vessel Trip Report landings (kept; live pounds), estimated discards (live pounds) and associated coefficient of variation (CV) for 14 fish and invertebrate species groups, by fleet for July 2010 through June 2011. Dark shading indicates fleets with no NEFOP trips in the annual analysis. Light shading indicates that the variance of the discard estimate was not used in the annual sample size analysis. Blank CV indicates either no discards or discards equal 0. “P” indicates fleets with “pilot” designation. Species Group: FLUKE - SCUP - BLACK SEA BASS
See supporting text for abbreviations. 19
Row Gear Type Access Trip Region MeshArea Category Group Total Kept Discarded CV Pilot
1 Longline OPEN all MA all 9,586 9,586 0 P
2 Longline OPEN all NE all 0 0 0
3 Hand Line OPEN all MA all 274,188 274,188 0 P
4 Hand Line OPEN all NE all 40,891 40,891 0
5 Otter Trawl OPEN all MA sm 4,870,770 3,781,875 1,088,895 0.302
6 Otter Trawl OPEN all MA lg 14,143,686 13,102,065 1,041,621 0.216
7 Otter Trawl OPEN all NE sm 3,292,244 2,460,146 832,098 0.270
8 Otter Trawl OPEN all NE lg 4,084,969 3,459,194 625,775 0.122
9 Scallop Trawl AA GEN MA all 2,165 1,000 1,165 0.338 P
10 Scallop Trawl AA LIM MA all 19,583 19,583 P
11 Scallop Trawl OPEN GEN MA all 78,058 54,333 23,725 0.522
12 Scallop Trawl OPEN LIM MA all 47,525 46,221 1,304 0.000 P
13 Otter Trawl, Ruhle OPEN all MA lg 1,865 1,865 P
14 Otter Trawl, Ruhle OPEN all NE sm 1 1 P
15 Otter Trawl, Ruhle OPEN all NE lg 669 318 351 0.470
16 Otter Trawl, Haddock Separator OPEN all MA lg 445 429 16 0.537
17 Otter Trawl, Haddock Separator OPEN all NE lg 17,572 730 16,842 0.302
18 Shrimp Trawl OPEN all MA all 2,455 2,455 0 P
19 Shrimp Trawl OPEN all NE all 10,125 9,735 390 0.185
21 Floating Trap OPEN all NE all 147,815 147,815 P
22 Sink, Anchor, Drift Gillnet OPEN all MA sm 2,765 1,998 767 0.581
23 Sink, Anchor, Drift Gillnet OPEN all MA lg 16,931 16,247 684 0.729
24 Sink, Anchor, Drift Gillnet OPEN all MA xlg 36,104 25,767 10,337 0.345
25 Sink, Anchor, Drift Gillnet OPEN all NE sm 625 625 P
26 Sink, Anchor, Drift Gillnet OPEN all NE lg 70,406 68,041 2,365 0.364
27 Sink, Anchor, Drift Gillnet OPEN all NE xlg 137,799 37,792 100,007 0.140
28 Purse Seine OPEN all MA all 0 0 P
29 Purse Seine OPEN all NE all 0 0 0
30 Scallop Dredge AA GEN MA all 334 334 0 P
31 Scallop Dredge AA GEN NE all 69 0 69 0.396
32 Scallop Dredge AA LIM MA all 104,493 8,667 95,826 0.226
33 Scallop Dredge AA LIM NE all 93,086 0 93,086 0.158
34 Scallop Dredge OPEN GEN MA all 124,425 30,294 94,131 0.748
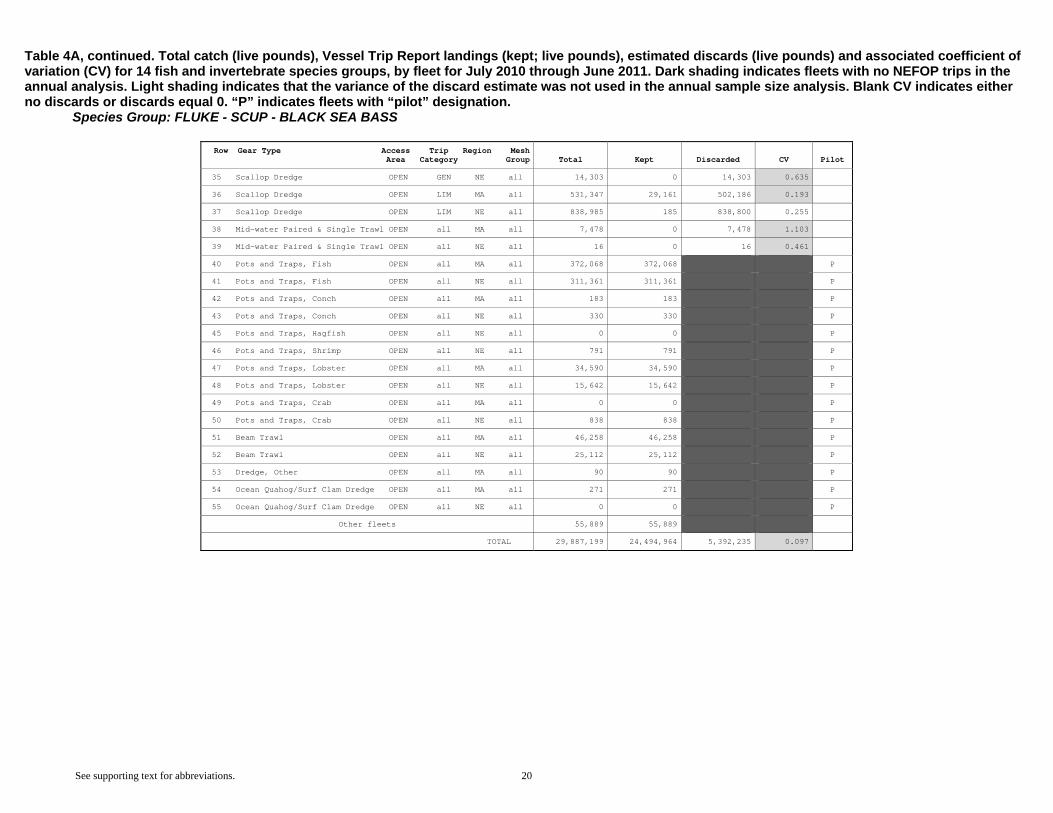
Table 4A, continued. Total catch (live pounds), Vessel Trip Report landings (kept; live pounds), estimated discards (live pounds) and associated coefficient of variation (CV) for 14 fish and invertebrate species groups, by fleet for July 2010 through June 2011. Dark shading indicates fleets with no NEFOP trips in the annual analysis. Light shading indicates that the variance of the discard estimate was not used in the annual sample size analysis. Blank CV indicates either no discards or discards equal 0. “P” indicates fleets with “pilot” designation. Species Group: FLUKE - SCUP - BLACK SEA BASS
See supporting text for abbreviations. 20
Row Gear Type Access Trip Region MeshArea Category Group Total Kept Discarded CV Pilot
35 Scallop Dredge OPEN GEN NE all 14,303 0 14,303 0.635
36 Scallop Dredge OPEN LIM MA all 531,347 29,161 502,186 0.193
37 Scallop Dredge OPEN LIM NE all 838,985 185 838,800 0.255
38 Mid-water Paired & Single Trawl OPEN all MA all 7,478 0 7,478 1.103
39 Mid-water Paired & Single Trawl OPEN all NE all 16 0 16 0.461
40 Pots and Traps, Fish OPEN all MA all 372,068 372,068 P
41 Pots and Traps, Fish OPEN all NE all 311,361 311,361 P
42 Pots and Traps, Conch OPEN all MA all 183 183 P
43 Pots and Traps, Conch OPEN all NE all 330 330 P
45 Pots and Traps, Hagfish OPEN all NE all 0 0 P
46 Pots and Traps, Shrimp OPEN all NE all 791 791 P
47 Pots and Traps, Lobster OPEN all MA all 34,590 34,590 P
48 Pots and Traps, Lobster OPEN all NE all 15,642 15,642 P
49 Pots and Traps, Crab OPEN all MA all 0 0 P
50 Pots and Traps, Crab OPEN all NE all 838 838 P
51 Beam Trawl OPEN all MA all 46,258 46,258 P
52 Beam Trawl OPEN all NE all 25,112 25,112 P
53 Dredge, Other OPEN all MA all 90 90 P
54 Ocean Quahog/Surf Clam Dredge OPEN all MA all 271 271 P
55 Ocean Quahog/Surf Clam Dredge OPEN all NE all 0 0 P
Other fleets 55,889 55,889
TOTAL 29,887,199 24,494,964 5,392,235 0.097

Table 4A, continued. Total catch (live pounds), Vessel Trip Report landings (kept; live pounds), estimated discards (live pounds) and associated coefficient of variation (CV) for 14 fish and invertebrate species groups, by fleet for July 2010 through June 2011. Dark shading indicates fleets with no NEFOP trips in the annual analysis. Light shading indicates that the variance of the discard estimate was not used in the annual sample size analysis. Blank CV indicates either no discards or discards equal 0. “P” indicates fleets with “pilot” designation. Species Group: HERRING, ATLANTIC
See supporting text for abbreviations. 21
Row Gear Type Access Trip Region MeshArea Category Group Total Kept Discarded CV Pilot
1 Longline OPEN all MA all 0 0 0 P
2 Longline OPEN all NE all 28 28 0
3 Hand Line OPEN all MA all 58 58 0 P
4 Hand Line OPEN all NE all 49 49 0
5 Otter Trawl OPEN all MA sm 587,539 525,168 62,371 0.444
6 Otter Trawl OPEN all MA lg 11,928 4,652 7,276 1.212
7 Otter Trawl OPEN all NE sm 10,047,331 9,890,924 156,407 0.337
8 Otter Trawl OPEN all NE lg 22,662 3,415 19,247 0.213
9 Scallop Trawl AA GEN MA all 0 0 0 P
10 Scallop Trawl AA LIM MA all 0 0 P
11 Scallop Trawl OPEN GEN MA all 33 0 33 1.890
12 Scallop Trawl OPEN LIM MA all 0 0 0 P
13 Otter Trawl, Ruhle OPEN all MA lg 0 0 P
14 Otter Trawl, Ruhle OPEN all NE sm 400 400 P
15 Otter Trawl, Ruhle OPEN all NE lg 559 0 559 0.756
16 Otter Trawl, Haddock Separator OPEN all MA lg 2 0 2 0.787
17 Otter Trawl, Haddock Separator OPEN all NE lg 1,129 0 1,129 0.209
18 Shrimp Trawl OPEN all MA all 0 0 0 P
19 Shrimp Trawl OPEN all NE all 641,550 614,020 27,530 0.988
21 Floating Trap OPEN all NE all 412 412 P
22 Sink, Anchor, Drift Gillnet OPEN all MA sm 5,170 5,170 0
23 Sink, Anchor, Drift Gillnet OPEN all MA lg 192 192 0
24 Sink, Anchor, Drift Gillnet OPEN all MA xlg 76 76 0
25 Sink, Anchor, Drift Gillnet OPEN all NE sm 380 380 P
26 Sink, Anchor, Drift Gillnet OPEN all NE lg 4,954 373 4,581 0.305
27 Sink, Anchor, Drift Gillnet OPEN all NE xlg 612 300 312 0.255
28 Purse Seine OPEN all MA all 0 0 P
29 Purse Seine OPEN all NE all 21,542,761 21,514,860 27,901 1.094
30 Scallop Dredge AA GEN MA all 0 0 0 P
31 Scallop Dredge AA GEN NE all 0 0 0
32 Scallop Dredge AA LIM MA all 0 0 0
33 Scallop Dredge AA LIM NE all 0 0 0
34 Scallop Dredge OPEN GEN MA all 8 8 0

Table 4A, continued. Total catch (live pounds), Vessel Trip Report landings (kept; live pounds), estimated discards (live pounds) and associated coefficient of variation (CV) for 14 fish and invertebrate species groups, by fleet for July 2010 through June 2011. Dark shading indicates fleets with no NEFOP trips in the annual analysis. Light shading indicates that the variance of the discard estimate was not used in the annual sample size analysis. Blank CV indicates either no discards or discards equal 0. “P” indicates fleets with “pilot” designation. Species Group: HERRING, ATLANTIC
See supporting text for abbreviations. 22
Row Gear Type Access Trip Region MeshArea Category Group Total Kept Discarded CV Pilot
35 Scallop Dredge OPEN GEN NE all 0 0 0
36 Scallop Dredge OPEN LIM MA all 99 0 99 0.742
37 Scallop Dredge OPEN LIM NE all 35 0 35 0.780
38 Mid-water Paired & Single Trawl OPEN all MA all 2,004,114 2,004,000 114 0.574
39 Mid-water Paired & Single Trawl OPEN all NE all 117,086,289 117,006,373 79,916 0.513
40 Pots and Traps, Fish OPEN all MA all 1,800 1,800 P
41 Pots and Traps, Fish OPEN all NE all 0 0 P
42 Pots and Traps, Conch OPEN all MA all 0 0 P
43 Pots and Traps, Conch OPEN all NE all 1,495,914 1,495,914 P
45 Pots and Traps, Hagfish OPEN all NE all 0 0 P
46 Pots and Traps, Shrimp OPEN all NE all 0 0 P
47 Pots and Traps, Lobster OPEN all MA all 0 0 P
48 Pots and Traps, Lobster OPEN all NE all 630 630 P
49 Pots and Traps, Crab OPEN all MA all 0 0 P
50 Pots and Traps, Crab OPEN all NE all 0 0 P
51 Beam Trawl OPEN all MA all 0 0 P
52 Beam Trawl OPEN all NE all 0 0 P
53 Dredge, Other OPEN all MA all 0 0 P
54 Ocean Quahog/Surf Clam Dredge OPEN all MA all 0 0 P
55 Ocean Quahog/Surf Clam Dredge OPEN all NE all 0 0 P
Other fleets 138 138
TOTAL 153,456,851 153,069,340 387,511 0.216
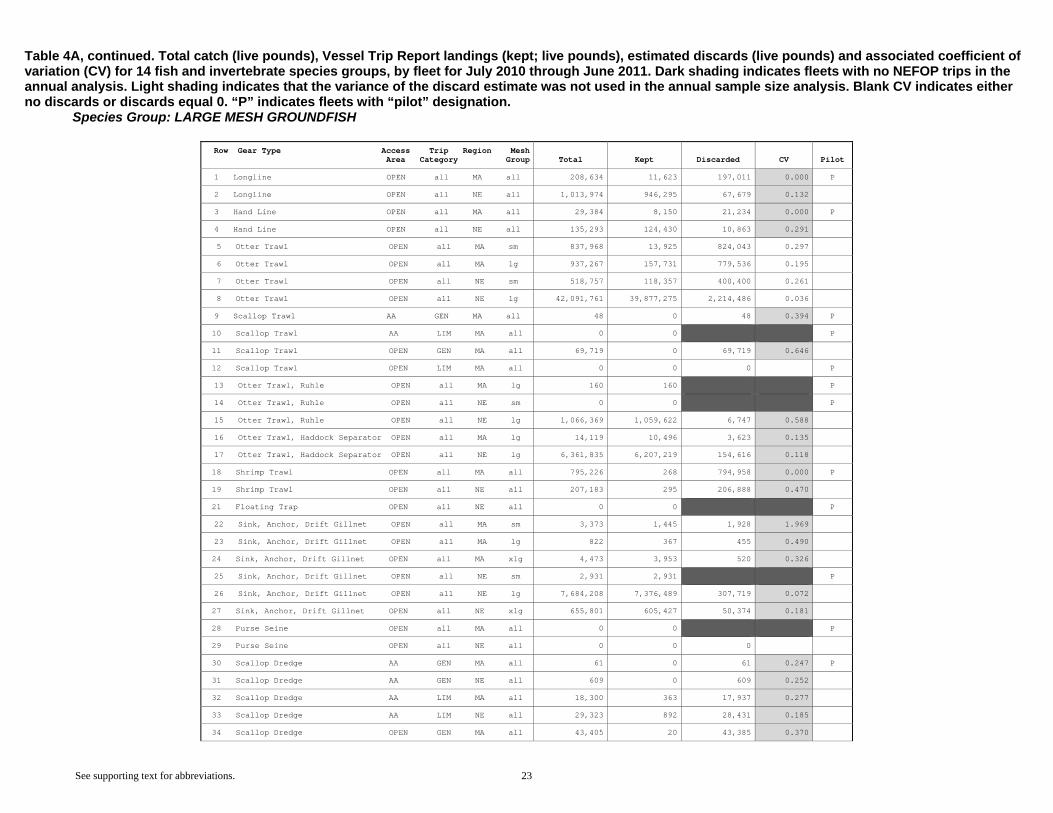
Table 4A, continued. Total catch (live pounds), Vessel Trip Report landings (kept; live pounds), estimated discards (live pounds) and associated coefficient of variation (CV) for 14 fish and invertebrate species groups, by fleet for July 2010 through June 2011. Dark shading indicates fleets with no NEFOP trips in the annual analysis. Light shading indicates that the variance of the discard estimate was not used in the annual sample size analysis. Blank CV indicates either no discards or discards equal 0. “P” indicates fleets with “pilot” designation. Species Group: LARGE MESH GROUNDFISH
See supporting text for abbreviations. 23
Row Gear Type Access Trip Region MeshArea Category Group Total Kept Discarded CV Pilot
1 Longline OPEN all MA all 208,634 11,623 197,011 0.000 P
2 Longline OPEN all NE all 1,013,974 946,295 67,679 0.132
3 Hand Line OPEN all MA all 29,384 8,150 21,234 0.000 P
4 Hand Line OPEN all NE all 135,293 124,430 10,863 0.291
5 Otter Trawl OPEN all MA sm 837,968 13,925 824,043 0.297
6 Otter Trawl OPEN all MA lg 937,267 157,731 779,536 0.195
7 Otter Trawl OPEN all NE sm 518,757 118,357 400,400 0.261
8 Otter Trawl OPEN all NE lg 42,091,761 39,877,275 2,214,486 0.036
9 Scallop Trawl AA GEN MA all 48 0 48 0.394 P
10 Scallop Trawl AA LIM MA all 0 0 P
11 Scallop Trawl OPEN GEN MA all 69,719 0 69,719 0.646
12 Scallop Trawl OPEN LIM MA all 0 0 0 P
13 Otter Trawl, Ruhle OPEN all MA lg 160 160 P
14 Otter Trawl, Ruhle OPEN all NE sm 0 0 P
15 Otter Trawl, Ruhle OPEN all NE lg 1,066,369 1,059,622 6,747 0.588
16 Otter Trawl, Haddock Separator OPEN all MA lg 14,119 10,496 3,623 0.135
17 Otter Trawl, Haddock Separator OPEN all NE lg 6,361,835 6,207,219 154,616 0.118
18 Shrimp Trawl OPEN all MA all 795,226 268 794,958 0.000 P
19 Shrimp Trawl OPEN all NE all 207,183 295 206,888 0.470
21 Floating Trap OPEN all NE all 0 0 P
22 Sink, Anchor, Drift Gillnet OPEN all MA sm 3,373 1,445 1,928 1.969
23 Sink, Anchor, Drift Gillnet OPEN all MA lg 822 367 455 0.490
24 Sink, Anchor, Drift Gillnet OPEN all MA xlg 4,473 3,953 520 0.326
25 Sink, Anchor, Drift Gillnet OPEN all NE sm 2,931 2,931 P
26 Sink, Anchor, Drift Gillnet OPEN all NE lg 7,684,208 7,376,489 307,719 0.072
27 Sink, Anchor, Drift Gillnet OPEN all NE xlg 655,801 605,427 50,374 0.181
28 Purse Seine OPEN all MA all 0 0 P
29 Purse Seine OPEN all NE all 0 0 0
30 Scallop Dredge AA GEN MA all 61 0 61 0.247 P
31 Scallop Dredge AA GEN NE all 609 0 609 0.252
32 Scallop Dredge AA LIM MA all 18,300 363 17,937 0.277
33 Scallop Dredge AA LIM NE all 29,323 892 28,431 0.185
34 Scallop Dredge OPEN GEN MA all 43,405 20 43,385 0.370
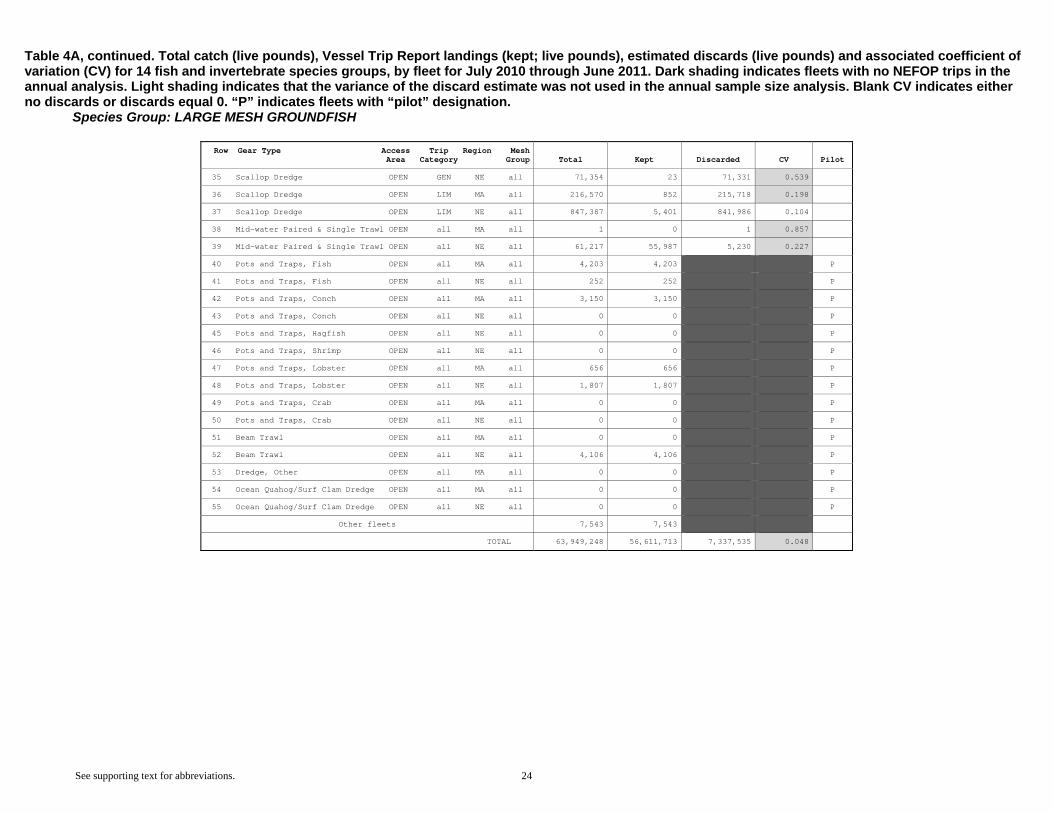
Table 4A, continued. Total catch (live pounds), Vessel Trip Report landings (kept; live pounds), estimated discards (live pounds) and associated coefficient of variation (CV) for 14 fish and invertebrate species groups, by fleet for July 2010 through June 2011. Dark shading indicates fleets with no NEFOP trips in the annual analysis. Light shading indicates that the variance of the discard estimate was not used in the annual sample size analysis. Blank CV indicates either no discards or discards equal 0. “P” indicates fleets with “pilot” designation. Species Group: LARGE MESH GROUNDFISH
See supporting text for abbreviations. 24
Row Gear Type Access Trip Region MeshArea Category Group Total Kept Discarded CV Pilot
35 Scallop Dredge OPEN GEN NE all 71,354 23 71,331 0.539
36 Scallop Dredge OPEN LIM MA all 216,570 852 215,718 0.198
37 Scallop Dredge OPEN LIM NE all 847,387 5,401 841,986 0.104
38 Mid-water Paired & Single Trawl OPEN all MA all 1 0 1 0.857
39 Mid-water Paired & Single Trawl OPEN all NE all 61,217 55,987 5,230 0.227
40 Pots and Traps, Fish OPEN all MA all 4,203 4,203 P
41 Pots and Traps, Fish OPEN all NE all 252 252 P
42 Pots and Traps, Conch OPEN all MA all 3,150 3,150 P
43 Pots and Traps, Conch OPEN all NE all 0 0 P
45 Pots and Traps, Hagfish OPEN all NE all 0 0 P
46 Pots and Traps, Shrimp OPEN all NE all 0 0 P
47 Pots and Traps, Lobster OPEN all MA all 656 656 P
48 Pots and Traps, Lobster OPEN all NE all 1,807 1,807 P
49 Pots and Traps, Crab OPEN all MA all 0 0 P
50 Pots and Traps, Crab OPEN all NE all 0 0 P
51 Beam Trawl OPEN all MA all 0 0 P
52 Beam Trawl OPEN all NE all 4,106 4,106 P
53 Dredge, Other OPEN all MA all 0 0 P
54 Ocean Quahog/Surf Clam Dredge OPEN all MA all 0 0 P
55 Ocean Quahog/Surf Clam Dredge OPEN all NE all 0 0 P
Other fleets 7,543 7,543
TOTAL 63,949,248 56,611,713 7,337,535 0.048

Table 4A, continued. Total catch (live pounds), Vessel Trip Report landings (kept; live pounds), estimated discards (live pounds) and associated coefficient of variation (CV) for 14 fish and invertebrate species groups, by fleet for July 2010 through June 2011. Dark shading indicates fleets with no NEFOP trips in the annual analysis. Light shading indicates that the variance of the discard estimate was not used in the annual sample size analysis. Blank CV indicates either no discards or discards equal 0. “P” indicates fleets with “pilot” designation. Species Group: MONKFISH
See supporting text for abbreviations. 25
Row Gear Type Access Trip Region MeshArea Category Group Total Kept Discarded CV Pilot
1 Longline OPEN all MA all 0 0 0 P
2 Longline OPEN all NE all 949 943 7 0.888
3 Hand Line OPEN all MA all 3,463 3,463 0 P
4 Hand Line OPEN all NE all 25 25 0
5 Otter Trawl OPEN all MA sm 262,396 96,970 165,426 0.281
6 Otter Trawl OPEN all MA lg 447,227 246,200 201,027 0.210
7 Otter Trawl OPEN all NE sm 145,738 108,535 37,203 0.287
8 Otter Trawl OPEN all NE lg 5,345,394 4,711,328 634,066 0.101
9 Scallop Trawl AA GEN MA all 1,285 157 1,128 0.250 P
10 Scallop Trawl AA LIM MA all 1,013 1,013 P
11 Scallop Trawl OPEN GEN MA all 4,589 676 3,914 0.413
12 Scallop Trawl OPEN LIM MA all 506 506 0 P
13 Otter Trawl, Ruhle OPEN all MA lg 27 27 P
14 Otter Trawl, Ruhle OPEN all NE sm 25 25 P
15 Otter Trawl, Ruhle OPEN all NE lg 652 469 183 0.266
16 Otter Trawl, Haddock Separator OPEN all MA lg 66 66 0
17 Otter Trawl, Haddock Separator OPEN all NE lg 46,196 41,879 4,317 0.168
18 Shrimp Trawl OPEN all MA all 115,273 269 115,004 0.000 P
19 Shrimp Trawl OPEN all NE all 182 125 57 1.053
21 Floating Trap OPEN all NE all 0 0 P
22 Sink, Anchor, Drift Gillnet OPEN all MA sm 4,067 4,067 0
23 Sink, Anchor, Drift Gillnet OPEN all MA lg 19,042 19,042 0
24 Sink, Anchor, Drift Gillnet OPEN all MA xlg 3,168,068 2,968,306 199,762 0.203
25 Sink, Anchor, Drift Gillnet OPEN all NE sm 4,476 4,476 P
26 Sink, Anchor, Drift Gillnet OPEN all NE lg 190,281 180,952 9,330 0.071
27 Sink, Anchor, Drift Gillnet OPEN all NE xlg 3,877,307 3,593,705 283,601 0.094
28 Purse Seine OPEN all MA all 0 0 P
29 Purse Seine OPEN all NE all 0 0 0
30 Scallop Dredge AA GEN MA all 2,300 493 1,807 0.203 P
31 Scallop Dredge AA GEN NE all 1,017 0 1,017 0.219
32 Scallop Dredge AA LIM MA all 209,599 21,401 188,197 0.216
33 Scallop Dredge AA LIM NE all 196,868 18,319 178,549 0.144
34 Scallop Dredge OPEN GEN MA all 90,424 47,983 42,442 0.348

Table 4A, continued. Total catch (live pounds), Vessel Trip Report landings (kept; live pounds), estimated discards (live pounds) and associated coefficient of variation (CV) for 14 fish and invertebrate species groups, by fleet for July 2010 through June 2011. Dark shading indicates fleets with no NEFOP trips in the annual analysis. Light shading indicates that the variance of the discard estimate was not used in the annual sample size analysis. Blank CV indicates either no discards or discards equal 0. “P” indicates fleets with “pilot” designation. Species Group: MONKFISH
See supporting text for abbreviations. 26
Row Gear Type Access Trip Region MeshArea Category Group Total Kept Discarded CV Pilot
35 Scallop Dredge OPEN GEN NE all 29,471 8,186 21,285 0.544
36 Scallop Dredge OPEN LIM MA all 1,865,862 168,313 1,697,549 0.221
37 Scallop Dredge OPEN LIM NE all 1,919,990 312,774 1,607,216 0.155
38 Mid-water Paired & Single Trawl OPEN all MA all 0 0 0
39 Mid-water Paired & Single Trawl OPEN all NE all 272 0 272 0.282
40 Pots and Traps, Fish OPEN all MA all 564 564 P
41 Pots and Traps, Fish OPEN all NE all 17 17 P
42 Pots and Traps, Conch OPEN all MA all 0 0 P
43 Pots and Traps, Conch OPEN all NE all 0 0 P
45 Pots and Traps, Hagfish OPEN all NE all 0 0 P
46 Pots and Traps, Shrimp OPEN all NE all 0 0 P
47 Pots and Traps, Lobster OPEN all MA all 227 227 P
48 Pots and Traps, Lobster OPEN all NE all 110 110 P
49 Pots and Traps, Crab OPEN all MA all 0 0 P
50 Pots and Traps, Crab OPEN all NE all 0 0 P
51 Beam Trawl OPEN all MA all 2,079 2,079 P
52 Beam Trawl OPEN all NE all 10 10 P
53 Dredge, Other OPEN all MA all 0 0 P
54 Ocean Quahog/Surf Clam Dredge OPEN all MA all 20,605 20,605 P
55 Ocean Quahog/Surf Clam Dredge OPEN all NE all 3,195 3,195 P
Other fleets 330 330
TOTAL 17,981,186 12,587,830 5,393,356 0.086
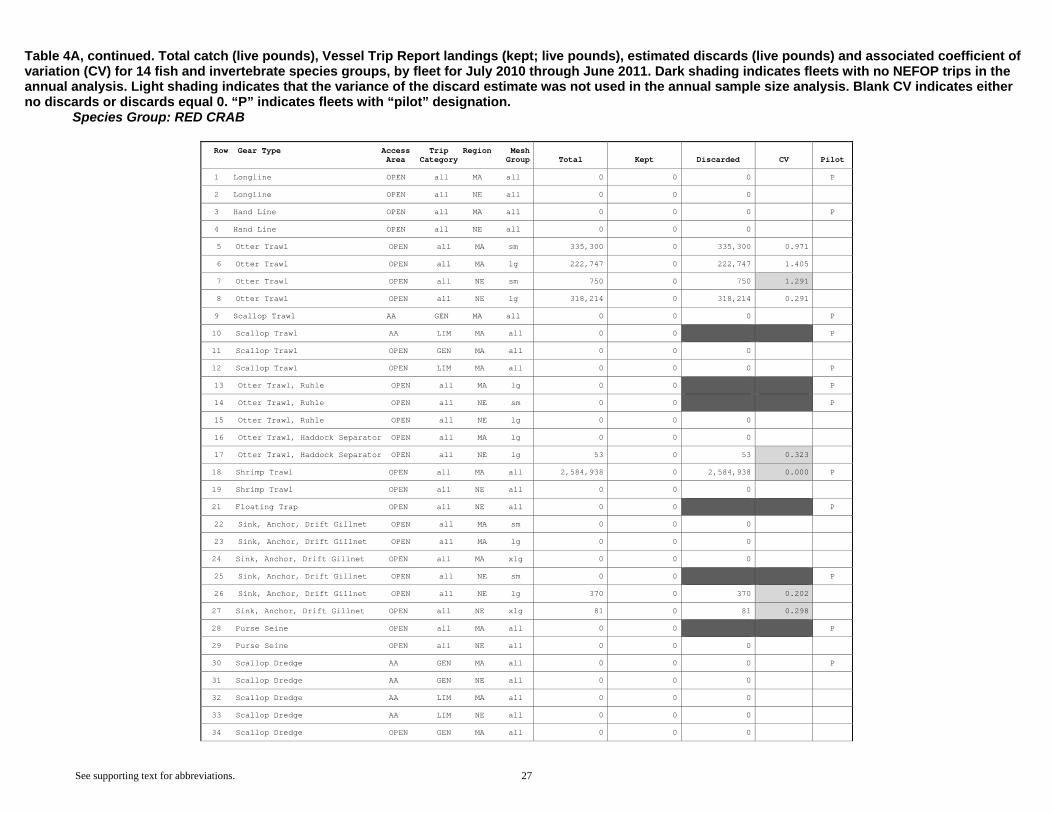
Table 4A, continued. Total catch (live pounds), Vessel Trip Report landings (kept; live pounds), estimated discards (live pounds) and associated coefficient of variation (CV) for 14 fish and invertebrate species groups, by fleet for July 2010 through June 2011. Dark shading indicates fleets with no NEFOP trips in the annual analysis. Light shading indicates that the variance of the discard estimate was not used in the annual sample size analysis. Blank CV indicates either no discards or discards equal 0. “P” indicates fleets with “pilot” designation. Species Group: RED CRAB
See supporting text for abbreviations. 27
Row Gear Type Access Trip Region MeshArea Category Group Total Kept Discarded CV Pilot
1 Longline OPEN all MA all 0 0 0 P
2 Longline OPEN all NE all 0 0 0
3 Hand Line OPEN all MA all 0 0 0 P
4 Hand Line OPEN all NE all 0 0 0
5 Otter Trawl OPEN all MA sm 335,300 0 335,300 0.971
6 Otter Trawl OPEN all MA lg 222,747 0 222,747 1.405
7 Otter Trawl OPEN all NE sm 750 0 750 1.291
8 Otter Trawl OPEN all NE lg 318,214 0 318,214 0.291
9 Scallop Trawl AA GEN MA all 0 0 0 P
10 Scallop Trawl AA LIM MA all 0 0 P
11 Scallop Trawl OPEN GEN MA all 0 0 0
12 Scallop Trawl OPEN LIM MA all 0 0 0 P
13 Otter Trawl, Ruhle OPEN all MA lg 0 0 P
14 Otter Trawl, Ruhle OPEN all NE sm 0 0 P
15 Otter Trawl, Ruhle OPEN all NE lg 0 0 0
16 Otter Trawl, Haddock Separator OPEN all MA lg 0 0 0
17 Otter Trawl, Haddock Separator OPEN all NE lg 53 0 53 0.323
18 Shrimp Trawl OPEN all MA all 2,584,938 0 2,584,938 0.000 P
19 Shrimp Trawl OPEN all NE all 0 0 0
21 Floating Trap OPEN all NE all 0 0 P
22 Sink, Anchor, Drift Gillnet OPEN all MA sm 0 0 0
23 Sink, Anchor, Drift Gillnet OPEN all MA lg 0 0 0
24 Sink, Anchor, Drift Gillnet OPEN all MA xlg 0 0 0
25 Sink, Anchor, Drift Gillnet OPEN all NE sm 0 0 P
26 Sink, Anchor, Drift Gillnet OPEN all NE lg 370 0 370 0.202
27 Sink, Anchor, Drift Gillnet OPEN all NE xlg 81 0 81 0.298
28 Purse Seine OPEN all MA all 0 0 P
29 Purse Seine OPEN all NE all 0 0 0
30 Scallop Dredge AA GEN MA all 0 0 0 P
31 Scallop Dredge AA GEN NE all 0 0 0
32 Scallop Dredge AA LIM MA all 0 0 0
33 Scallop Dredge AA LIM NE all 0 0 0
34 Scallop Dredge OPEN GEN MA all 0 0 0

Table 4A, continued. Total catch (live pounds), Vessel Trip Report landings (kept; live pounds), estimated discards (live pounds) and associated coefficient of variation (CV) for 14 fish and invertebrate species groups, by fleet for July 2010 through June 2011. Dark shading indicates fleets with no NEFOP trips in the annual analysis. Light shading indicates that the variance of the discard estimate was not used in the annual sample size analysis. Blank CV indicates either no discards or discards equal 0. “P” indicates fleets with “pilot” designation. Species Group: RED CRAB
See supporting text for abbreviations. 28
Row Gear Type Access Trip Region MeshArea Category Group Total Kept Discarded CV Pilot
35 Scallop Dredge OPEN GEN NE all 0 0 0
36 Scallop Dredge OPEN LIM MA all 0 0 0
37 Scallop Dredge OPEN LIM NE all 0 0 0
38 Mid-water Paired & Single Trawl OPEN all MA all 0 0 0
39 Mid-water Paired & Single Trawl OPEN all NE all 0 0 0
40 Pots and Traps, Fish OPEN all MA all 1,400 1,400 P
41 Pots and Traps, Fish OPEN all NE all 0 0 P
42 Pots and Traps, Conch OPEN all MA all 0 0 P
43 Pots and Traps, Conch OPEN all NE all 0 0 P
45 Pots and Traps, Hagfish OPEN all NE all 0 0 P
46 Pots and Traps, Shrimp OPEN all NE all 0 0 P
47 Pots and Traps, Lobster OPEN all MA all 2,285 2,285 P
48 Pots and Traps, Lobster OPEN all NE all 0 0 P
49 Pots and Traps, Crab OPEN all MA all 0 0 P
50 Pots and Traps, Crab OPEN all NE all 2,138,429 2,138,429 P
51 Beam Trawl OPEN all MA all 0 0 P
52 Beam Trawl OPEN all NE all 0 0 P
53 Dredge, Other OPEN all MA all 0 0 P
54 Ocean Quahog/Surf Clam Dredge OPEN all MA all 0 0 P
55 Ocean Quahog/Surf Clam Dredge OPEN all NE all 0 0 P
Other fleets 0 0
TOTAL 5,604,567 2,142,114 3,462,453 0.133

Table 4A, continued. Total catch (live pounds), Vessel Trip Report landings (kept; live pounds), estimated discards (live pounds) and associated coefficient of variation (CV) for 14 fish and invertebrate species groups, by fleet for July 2010 through June 2011. Dark shading indicates fleets with no NEFOP trips in the annual analysis. Light shading indicates that the variance of the discard estimate was not used in the annual sample size analysis. Blank CV indicates either no discards or discards equal 0. “P” indicates fleets with “pilot” designation. Species Group: SEA SCALLOP
See supporting text for abbreviations. 29
Row Gear Type Access Trip Region MeshArea Category Group Total Kept Discarded CV Pilot
1 Longline OPEN all MA all 0 0 0 P
2 Longline OPEN all NE all 463 0 463 0.792
3 Hand Line OPEN all MA all 0 0 0 P
4 Hand Line OPEN all NE all 0 0 0
5 Otter Trawl OPEN all MA sm 636,337 103,750 532,587 0.512
6 Otter Trawl OPEN all MA lg 2,644,970 2,352,490 292,480 0.626
7 Otter Trawl OPEN all NE sm 38,121 13,336 24,785 0.583
8 Otter Trawl OPEN all NE lg 89,331 44,516 44,816 0.185
9 Scallop Trawl AA GEN MA all 234,372 228,875 5,497 0.397 P
10 Scallop Trawl AA LIM MA all 232,574 232,574 P
11 Scallop Trawl OPEN GEN MA all 1,143,528 986,233 157,295 0.416
12 Scallop Trawl OPEN LIM MA all 81,226 30,946 50,280 0.000 P
13 Otter Trawl, Ruhle OPEN all MA lg 25 25 P
14 Otter Trawl, Ruhle OPEN all NE sm 0 0 P
15 Otter Trawl, Ruhle OPEN all NE lg 20 0 20 0.916
16 Otter Trawl, Haddock Separator OPEN all MA lg 7 0 7 0.512
17 Otter Trawl, Haddock Separator OPEN all NE lg 5,078 392 4,686 0.280
18 Shrimp Trawl OPEN all MA all 0 0 0 P
19 Shrimp Trawl OPEN all NE all 106 0 106 0.674
21 Floating Trap OPEN all NE all 0 0 P
22 Sink, Anchor, Drift Gillnet OPEN all MA sm 0 0 0
23 Sink, Anchor, Drift Gillnet OPEN all MA lg 0 0 0
24 Sink, Anchor, Drift Gillnet OPEN all MA xlg 489 8 480 0.638
25 Sink, Anchor, Drift Gillnet OPEN all NE sm 149,940 149,940 P
26 Sink, Anchor, Drift Gillnet OPEN all NE lg 1,732 0 1,732 0.754
27 Sink, Anchor, Drift Gillnet OPEN all NE xlg 1,235 0 1,235 0.700
28 Purse Seine OPEN all MA all 0 0 P
29 Purse Seine OPEN all NE all 0 0 0
30 Scallop Dredge AA GEN MA all 476,763 466,205 10,558 0.260 P
31 Scallop Dredge AA GEN NE all 365,090 256,445 108,645 0.185
32 Scallop Dredge AA LIM MA all 24,051,111 23,381,156 669,956 0.244
33 Scallop Dredge AA LIM NE all 22,503,246 20,841,843 1,661,403 0.182
34 Scallop Dredge OPEN GEN MA all 13,619,011 12,333,798 1,285,213 0.507

Table 4A, continued. Total catch (live pounds), Vessel Trip Report landings (kept; live pounds), estimated discards (live pounds) and associated coefficient of variation (CV) for 14 fish and invertebrate species groups, by fleet for July 2010 through June 2011. Dark shading indicates fleets with no NEFOP trips in the annual analysis. Light shading indicates that the variance of the discard estimate was not used in the annual sample size analysis. Blank CV indicates either no discards or discards equal 0. “P” indicates fleets with “pilot” designation. Species Group: SEA SCALLOP
See supporting text for abbreviations. 30
Row Gear Type Access Trip Region MeshArea Category Group Total Kept Discarded CV Pilot
35 Scallop Dredge OPEN GEN NE all 9,997,595 9,592,338 405,257 0.289
36 Scallop Dredge OPEN LIM MA all 167,812,239 164,954,002 2,858,237 0.225
37 Scallop Dredge OPEN LIM NE all 249,854,484 232,526,675 17,327,809 0.231
38 Mid-water Paired & Single Trawl OPEN all MA all 0 0 0
39 Mid-water Paired & Single Trawl OPEN all NE all 0 0 0
40 Pots and Traps, Fish OPEN all MA all 0 0 P
41 Pots and Traps, Fish OPEN all NE all 0 0 P
42 Pots and Traps, Conch OPEN all MA all 0 0 P
43 Pots and Traps, Conch OPEN all NE all 0 0 P
45 Pots and Traps, Hagfish OPEN all NE all 0 0 P
46 Pots and Traps, Shrimp OPEN all NE all 0 0 P
47 Pots and Traps, Lobster OPEN all MA all 0 0 P
48 Pots and Traps, Lobster OPEN all NE all 8 8 P
49 Pots and Traps, Crab OPEN all MA all 0 0 P
50 Pots and Traps, Crab OPEN all NE all 0 0 P
51 Beam Trawl OPEN all MA all 48,037 48,037 P
52 Beam Trawl OPEN all NE all 15,785 15,785 P
53 Dredge, Other OPEN all MA all 360,689 360,689 P
54 Ocean Quahog/Surf Clam Dredge OPEN all MA all 1,034,378 1,034,378 P
55 Ocean Quahog/Surf Clam Dredge OPEN all NE all 538,518 538,518 P
Other fleets 1,101,543 1,101,543
TOTAL 497,038,051 471,594,505 25,443,546 0.162
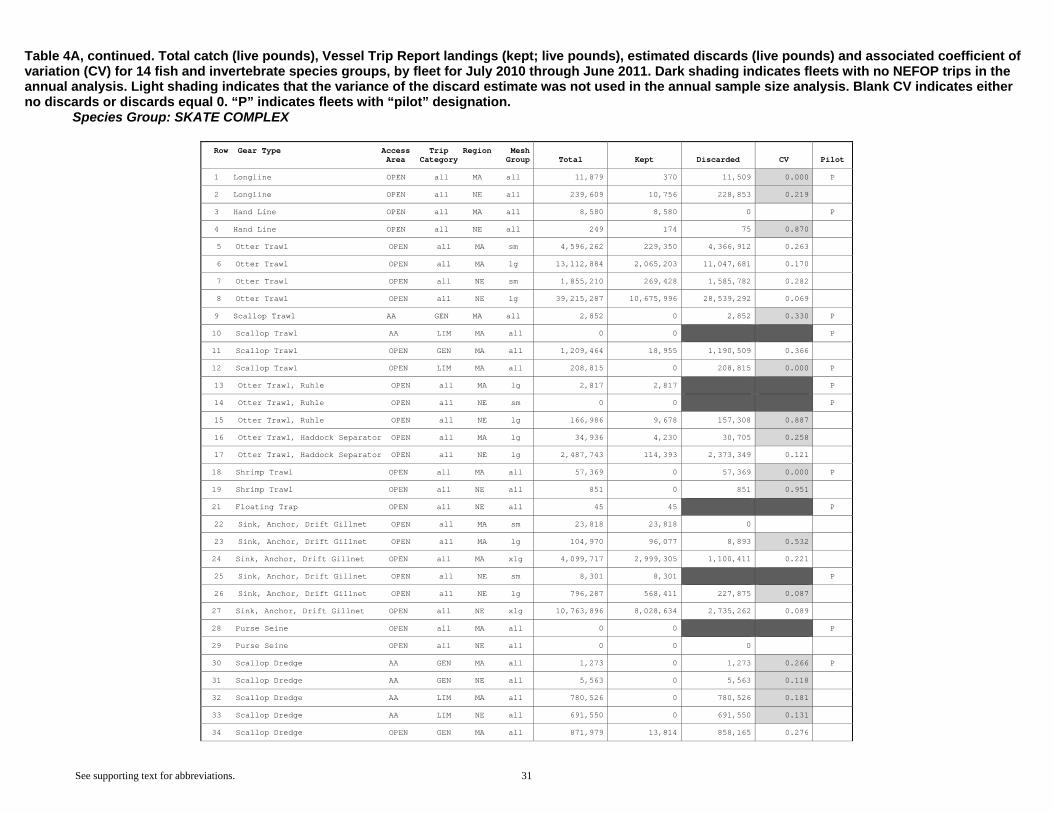
Table 4A, continued. Total catch (live pounds), Vessel Trip Report landings (kept; live pounds), estimated discards (live pounds) and associated coefficient of variation (CV) for 14 fish and invertebrate species groups, by fleet for July 2010 through June 2011. Dark shading indicates fleets with no NEFOP trips in the annual analysis. Light shading indicates that the variance of the discard estimate was not used in the annual sample size analysis. Blank CV indicates either no discards or discards equal 0. “P” indicates fleets with “pilot” designation. Species Group: SKATE COMPLEX
See supporting text for abbreviations. 31
Row Gear Type Access Trip Region MeshArea Category Group Total Kept Discarded CV Pilot
1 Longline OPEN all MA all 11,879 370 11,509 0.000 P
2 Longline OPEN all NE all 239,609 10,756 228,853 0.219
3 Hand Line OPEN all MA all 8,580 8,580 0 P
4 Hand Line OPEN all NE all 249 174 75 0.870
5 Otter Trawl OPEN all MA sm 4,596,262 229,350 4,366,912 0.263
6 Otter Trawl OPEN all MA lg 13,112,884 2,065,203 11,047,681 0.170
7 Otter Trawl OPEN all NE sm 1,855,210 269,428 1,585,782 0.282
8 Otter Trawl OPEN all NE lg 39,215,287 10,675,996 28,539,292 0.069
9 Scallop Trawl AA GEN MA all 2,852 0 2,852 0.330 P
10 Scallop Trawl AA LIM MA all 0 0 P
11 Scallop Trawl OPEN GEN MA all 1,209,464 18,955 1,190,509 0.366
12 Scallop Trawl OPEN LIM MA all 208,815 0 208,815 0.000 P
13 Otter Trawl, Ruhle OPEN all MA lg 2,817 2,817 P
14 Otter Trawl, Ruhle OPEN all NE sm 0 0 P
15 Otter Trawl, Ruhle OPEN all NE lg 166,986 9,678 157,308 0.887
16 Otter Trawl, Haddock Separator OPEN all MA lg 34,936 4,230 30,705 0.258
17 Otter Trawl, Haddock Separator OPEN all NE lg 2,487,743 114,393 2,373,349 0.121
18 Shrimp Trawl OPEN all MA all 57,369 0 57,369 0.000 P
19 Shrimp Trawl OPEN all NE all 851 0 851 0.951
21 Floating Trap OPEN all NE all 45 45 P
22 Sink, Anchor, Drift Gillnet OPEN all MA sm 23,818 23,818 0
23 Sink, Anchor, Drift Gillnet OPEN all MA lg 104,970 96,077 8,893 0.532
24 Sink, Anchor, Drift Gillnet OPEN all MA xlg 4,099,717 2,999,305 1,100,411 0.221
25 Sink, Anchor, Drift Gillnet OPEN all NE sm 8,301 8,301 P
26 Sink, Anchor, Drift Gillnet OPEN all NE lg 796,287 568,411 227,875 0.087
27 Sink, Anchor, Drift Gillnet OPEN all NE xlg 10,763,896 8,028,634 2,735,262 0.089
28 Purse Seine OPEN all MA all 0 0 P
29 Purse Seine OPEN all NE all 0 0 0
30 Scallop Dredge AA GEN MA all 1,273 0 1,273 0.266 P
31 Scallop Dredge AA GEN NE all 5,563 0 5,563 0.118
32 Scallop Dredge AA LIM MA all 780,526 0 780,526 0.181
33 Scallop Dredge AA LIM NE all 691,550 0 691,550 0.131
34 Scallop Dredge OPEN GEN MA all 871,979 13,814 858,165 0.276

Table 4A, continued. Total catch (live pounds), Vessel Trip Report landings (kept; live pounds), estimated discards (live pounds) and associated coefficient of variation (CV) for 14 fish and invertebrate species groups, by fleet for July 2010 through June 2011. Dark shading indicates fleets with no NEFOP trips in the annual analysis. Light shading indicates that the variance of the discard estimate was not used in the annual sample size analysis. Blank CV indicates either no discards or discards equal 0. “P” indicates fleets with “pilot” designation. Species Group: SKATE COMPLEX
See supporting text for abbreviations. 32
Row Gear Type Access Trip Region MeshArea Category Group Total Kept Discarded CV Pilot
35 Scallop Dredge OPEN GEN NE all 837,889 15 837,874 0.312
36 Scallop Dredge OPEN LIM MA all 7,701,133 0 7,701,133 0.159
37 Scallop Dredge OPEN LIM NE all 11,746,489 0 11,746,489 0.130
38 Mid-water Paired & Single Trawl OPEN all MA all 0 0 0
39 Mid-water Paired & Single Trawl OPEN all NE all 766 0 766 0.239
40 Pots and Traps, Fish OPEN all MA all 16 16 P
41 Pots and Traps, Fish OPEN all NE all 5,559 5,559 P
42 Pots and Traps, Conch OPEN all MA all 0 0 P
43 Pots and Traps, Conch OPEN all NE all 0 0 P
45 Pots and Traps, Hagfish OPEN all NE all 0 0 P
46 Pots and Traps, Shrimp OPEN all NE all 0 0 P
47 Pots and Traps, Lobster OPEN all MA all 0 0 P
48 Pots and Traps, Lobster OPEN all NE all 0 0 P
49 Pots and Traps, Crab OPEN all MA all 0 0 P
50 Pots and Traps, Crab OPEN all NE all 0 0 P
51 Beam Trawl OPEN all MA all 29,308 29,308 P
52 Beam Trawl OPEN all NE all 57 57 P
53 Dredge, Other OPEN all MA all 0 0 P
54 Ocean Quahog/Surf Clam Dredge OPEN all MA all 105 105 P
55 Ocean Quahog/Surf Clam Dredge OPEN all NE all 0 0 P
Other fleets 1,000 1,000
TOTAL 101,682,039 25,184,395 76,497,644 0.048
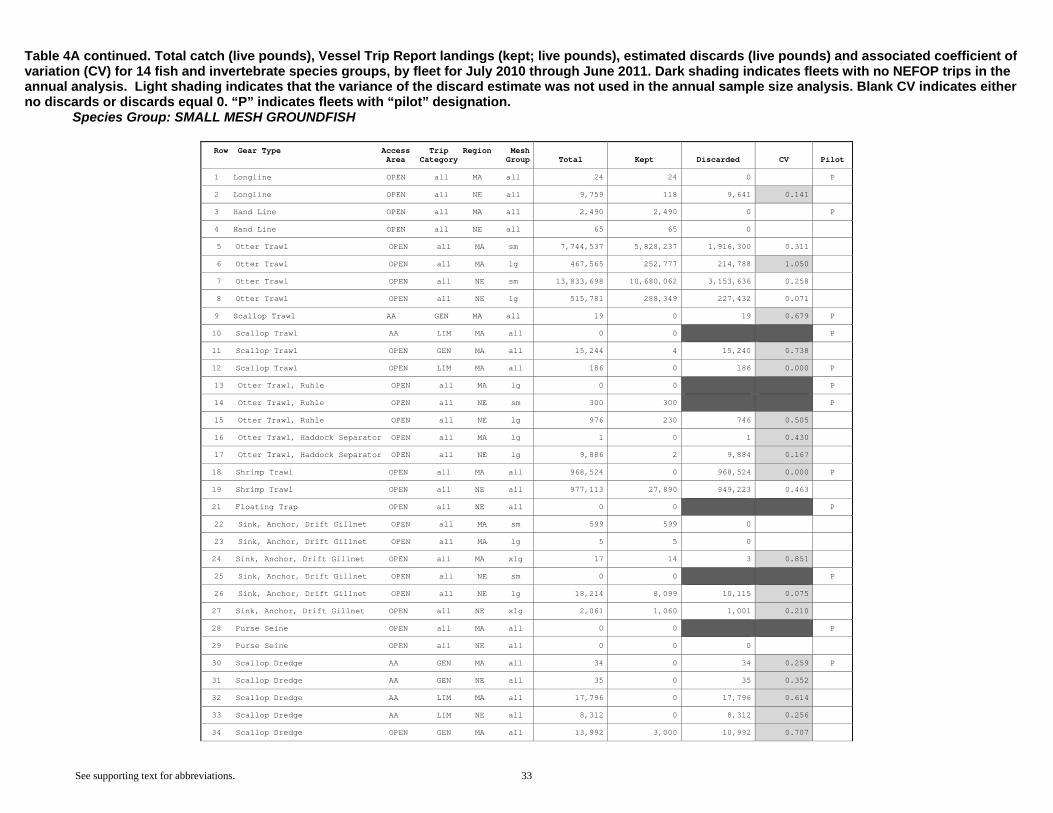
Table 4A continued. Total catch (live pounds), Vessel Trip Report landings (kept; live pounds), estimated discards (live pounds) and associated coefficient of variation (CV) for 14 fish and invertebrate species groups, by fleet for July 2010 through June 2011. Dark shading indicates fleets with no NEFOP trips in the annual analysis. Light shading indicates that the variance of the discard estimate was not used in the annual sample size analysis. Blank CV indicates either no discards or discards equal 0. “P” indicates fleets with “pilot” designation. Species Group: SMALL MESH GROUNDFISH
See supporting text for abbreviations. 33
Row Gear Type Access Trip Region MeshArea Category Group Total Kept Discarded CV Pilot
1 Longline OPEN all MA all 24 24 0 P
2 Longline OPEN all NE all 9,759 118 9,641 0.141
3 Hand Line OPEN all MA all 2,490 2,490 0 P
4 Hand Line OPEN all NE all 65 65 0
5 Otter Trawl OPEN all MA sm 7,744,537 5,828,237 1,916,300 0.311
6 Otter Trawl OPEN all MA lg 467,565 252,777 214,788 1.050
7 Otter Trawl OPEN all NE sm 13,833,698 10,680,062 3,153,636 0.258
8 Otter Trawl OPEN all NE lg 515,781 288,349 227,432 0.071
9 Scallop Trawl AA GEN MA all 19 0 19 0.679 P
10 Scallop Trawl AA LIM MA all 0 0 P
11 Scallop Trawl OPEN GEN MA all 15,244 4 15,240 0.738
12 Scallop Trawl OPEN LIM MA all 186 0 186 0.000 P
13 Otter Trawl, Ruhle OPEN all MA lg 0 0 P
14 Otter Trawl, Ruhle OPEN all NE sm 300 300 P
15 Otter Trawl, Ruhle OPEN all NE lg 976 230 746 0.505
16 Otter Trawl, Haddock Separator OPEN all MA lg 1 0 1 0.430
17 Otter Trawl, Haddock Separator OPEN all NE lg 9,886 2 9,884 0.167
18 Shrimp Trawl OPEN all MA all 968,524 0 968,524 0.000 P
19 Shrimp Trawl OPEN all NE all 977,113 27,890 949,223 0.463
21 Floating Trap OPEN all NE all 0 0 P
22 Sink, Anchor, Drift Gillnet OPEN all MA sm 599 599 0
23 Sink, Anchor, Drift Gillnet OPEN all MA lg 5 5 0
24 Sink, Anchor, Drift Gillnet OPEN all MA xlg 17 14 3 0.851
25 Sink, Anchor, Drift Gillnet OPEN all NE sm 0 0 P
26 Sink, Anchor, Drift Gillnet OPEN all NE lg 18,214 8,099 10,115 0.075
27 Sink, Anchor, Drift Gillnet OPEN all NE xlg 2,061 1,060 1,001 0.210
28 Purse Seine OPEN all MA all 0 0 P
29 Purse Seine OPEN all NE all 0 0 0
30 Scallop Dredge AA GEN MA all 34 0 34 0.259 P
31 Scallop Dredge AA GEN NE all 35 0 35 0.352
32 Scallop Dredge AA LIM MA all 17,796 0 17,796 0.614
33 Scallop Dredge AA LIM NE all 8,312 0 8,312 0.256
34 Scallop Dredge OPEN GEN MA all 13,992 3,000 10,992 0.707

Table 4A continued. Total catch (live pounds), Vessel Trip Report landings (kept; live pounds), estimated discards (live pounds) and associated coefficient of variation (CV) for 14 fish and invertebrate species groups, by fleet for July 2010 through June 2011. Dark shading indicates fleets with no NEFOP trips in the annual analysis. Light shading indicates that the variance of the discard estimate was not used in the annual sample size analysis. Blank CV indicates either no discards or discards equal 0. “P” indicates fleets with “pilot” designation. Species Group: SMALL MESH GROUNDFISH
See supporting text for abbreviations. 34
Row Gear Type Access Trip Region MeshArea Category Group Total Kept Discarded CV Pilot
35 Scallop Dredge OPEN GEN NE all 4,482 0 4,482 1.460
36 Scallop Dredge OPEN LIM MA all 46,981 0 46,981 0.188
37 Scallop Dredge OPEN LIM NE all 105,094 0 105,094 0.257
38 Mid-water Paired & Single Trawl OPEN all MA all 0 0 0
39 Mid-water Paired & Single Trawl OPEN all NE all 10,560 10,373 187 0.383
40 Pots and Traps, Fish OPEN all MA all 2,075 2,075 P
41 Pots and Traps, Fish OPEN all NE all 10,072 10,072 P
42 Pots and Traps, Conch OPEN all MA all 10 10 P
43 Pots and Traps, Conch OPEN all NE all 0 0 P
45 Pots and Traps, Hagfish OPEN all NE all 0 0 P
46 Pots and Traps, Shrimp OPEN all NE all 0 0 P
47 Pots and Traps, Lobster OPEN all MA all 18,927 18,927 P
48 Pots and Traps, Lobster OPEN all NE all 5,371 5,371 P
49 Pots and Traps, Crab OPEN all MA all 0 0 P
50 Pots and Traps, Crab OPEN all NE all 0 0 P
51 Beam Trawl OPEN all MA all 0 0 P
52 Beam Trawl OPEN all NE all 0 0 P
53 Dredge, Other OPEN all MA all 0 0 P
54 Ocean Quahog/Surf Clam Dredge OPEN all MA all 0 0 P
55 Ocean Quahog/Surf Clam Dredge OPEN all NE all 0 0 P
Other fleets 40 40
TOTAL 24,810,844 17,140,193 7,670,651 0.147
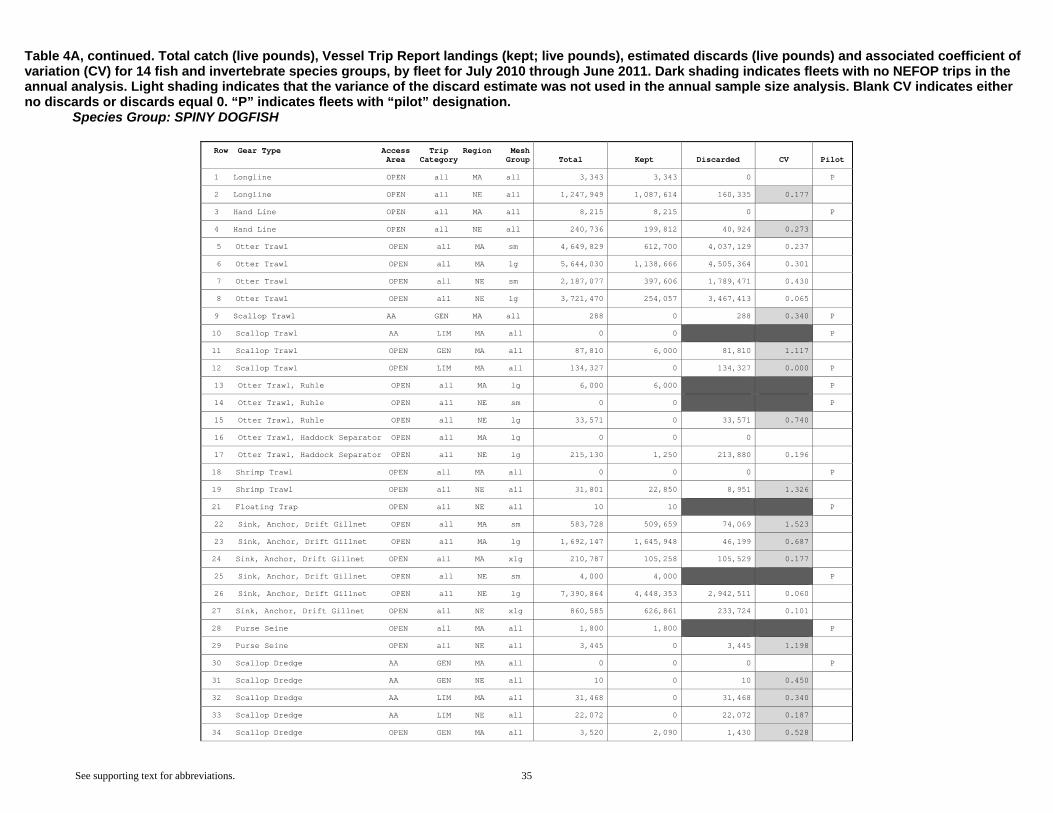
Table 4A, continued. Total catch (live pounds), Vessel Trip Report landings (kept; live pounds), estimated discards (live pounds) and associated coefficient of variation (CV) for 14 fish and invertebrate species groups, by fleet for July 2010 through June 2011. Dark shading indicates fleets with no NEFOP trips in the annual analysis. Light shading indicates that the variance of the discard estimate was not used in the annual sample size analysis. Blank CV indicates either no discards or discards equal 0. “P” indicates fleets with “pilot” designation. Species Group: SPINY DOGFISH
See supporting text for abbreviations. 35
Row Gear Type Access Trip Region MeshArea Category Group Total Kept Discarded CV Pilot
1 Longline OPEN all MA all 3,343 3,343 0 P
2 Longline OPEN all NE all 1,247,949 1,087,614 160,335 0.177
3 Hand Line OPEN all MA all 8,215 8,215 0 P
4 Hand Line OPEN all NE all 240,736 199,812 40,924 0.273
5 Otter Trawl OPEN all MA sm 4,649,829 612,700 4,037,129 0.237
6 Otter Trawl OPEN all MA lg 5,644,030 1,138,666 4,505,364 0.301
7 Otter Trawl OPEN all NE sm 2,187,077 397,606 1,789,471 0.430
8 Otter Trawl OPEN all NE lg 3,721,470 254,057 3,467,413 0.065
9 Scallop Trawl AA GEN MA all 288 0 288 0.340 P
10 Scallop Trawl AA LIM MA all 0 0 P
11 Scallop Trawl OPEN GEN MA all 87,810 6,000 81,810 1.117
12 Scallop Trawl OPEN LIM MA all 134,327 0 134,327 0.000 P
13 Otter Trawl, Ruhle OPEN all MA lg 6,000 6,000 P
14 Otter Trawl, Ruhle OPEN all NE sm 0 0 P
15 Otter Trawl, Ruhle OPEN all NE lg 33,571 0 33,571 0.740
16 Otter Trawl, Haddock Separator OPEN all MA lg 0 0 0
17 Otter Trawl, Haddock Separator OPEN all NE lg 215,130 1,250 213,880 0.196
18 Shrimp Trawl OPEN all MA all 0 0 0 P
19 Shrimp Trawl OPEN all NE all 31,801 22,850 8,951 1.326
21 Floating Trap OPEN all NE all 10 10 P
22 Sink, Anchor, Drift Gillnet OPEN all MA sm 583,728 509,659 74,069 1.523
23 Sink, Anchor, Drift Gillnet OPEN all MA lg 1,692,147 1,645,948 46,199 0.687
24 Sink, Anchor, Drift Gillnet OPEN all MA xlg 210,787 105,258 105,529 0.177
25 Sink, Anchor, Drift Gillnet OPEN all NE sm 4,000 4,000 P
26 Sink, Anchor, Drift Gillnet OPEN all NE lg 7,390,864 4,448,353 2,942,511 0.060
27 Sink, Anchor, Drift Gillnet OPEN all NE xlg 860,585 626,861 233,724 0.101
28 Purse Seine OPEN all MA all 1,800 1,800 P
29 Purse Seine OPEN all NE all 3,445 0 3,445 1.198
30 Scallop Dredge AA GEN MA all 0 0 0 P
31 Scallop Dredge AA GEN NE all 10 0 10 0.450
32 Scallop Dredge AA LIM MA all 31,468 0 31,468 0.340
33 Scallop Dredge AA LIM NE all 22,072 0 22,072 0.187
34 Scallop Dredge OPEN GEN MA all 3,520 2,090 1,430 0.528

Table 4A, continued. Total catch (live pounds), Vessel Trip Report landings (kept; live pounds), estimated discards (live pounds) and associated coefficient of variation (CV) for 14 fish and invertebrate species groups, by fleet for July 2010 through June 2011. Dark shading indicates fleets with no NEFOP trips in the annual analysis. Light shading indicates that the variance of the discard estimate was not used in the annual sample size analysis. Blank CV indicates either no discards or discards equal 0. “P” indicates fleets with “pilot” designation. Species Group: SPINY DOGFISH
See supporting text for abbreviations. 36
Row Gear Type Access Trip Region MeshArea Category Group Total Kept Discarded CV Pilot
35 Scallop Dredge OPEN GEN NE all 468 0 468 1.538
36 Scallop Dredge OPEN LIM MA all 137,627 0 137,627 0.317
37 Scallop Dredge OPEN LIM NE all 211,272 0 211,272 0.232
38 Mid-water Paired & Single Trawl OPEN all MA all 2,511 0 2,511 0.190
39 Mid-water Paired & Single Trawl OPEN all NE all 219,300 7,326 211,974 0.300
40 Pots and Traps, Fish OPEN all MA all 0 0 P
41 Pots and Traps, Fish OPEN all NE all 0 0 P
42 Pots and Traps, Conch OPEN all MA all 0 0 P
43 Pots and Traps, Conch OPEN all NE all 0 0 P
45 Pots and Traps, Hagfish OPEN all NE all 0 0 P
46 Pots and Traps, Shrimp OPEN all NE all 0 0 P
47 Pots and Traps, Lobster OPEN all MA all 0 0 P
48 Pots and Traps, Lobster OPEN all NE all 3,045 3,045 P
49 Pots and Traps, Crab OPEN all MA all 0 0 P
50 Pots and Traps, Crab OPEN all NE all 0 0 P
51 Beam Trawl OPEN all MA all 28,000 28,000 P
52 Beam Trawl OPEN all NE all 0 0 P
53 Dredge, Other OPEN all MA all 0 0 P
54 Ocean Quahog/Surf Clam Dredge OPEN all MA all 0 0 P
55 Ocean Quahog/Surf Clam Dredge OPEN all NE all 0 0 P
Other fleets 54,704 54,704
TOTAL 29,672,939 11,175,167 18,497,772 0.101
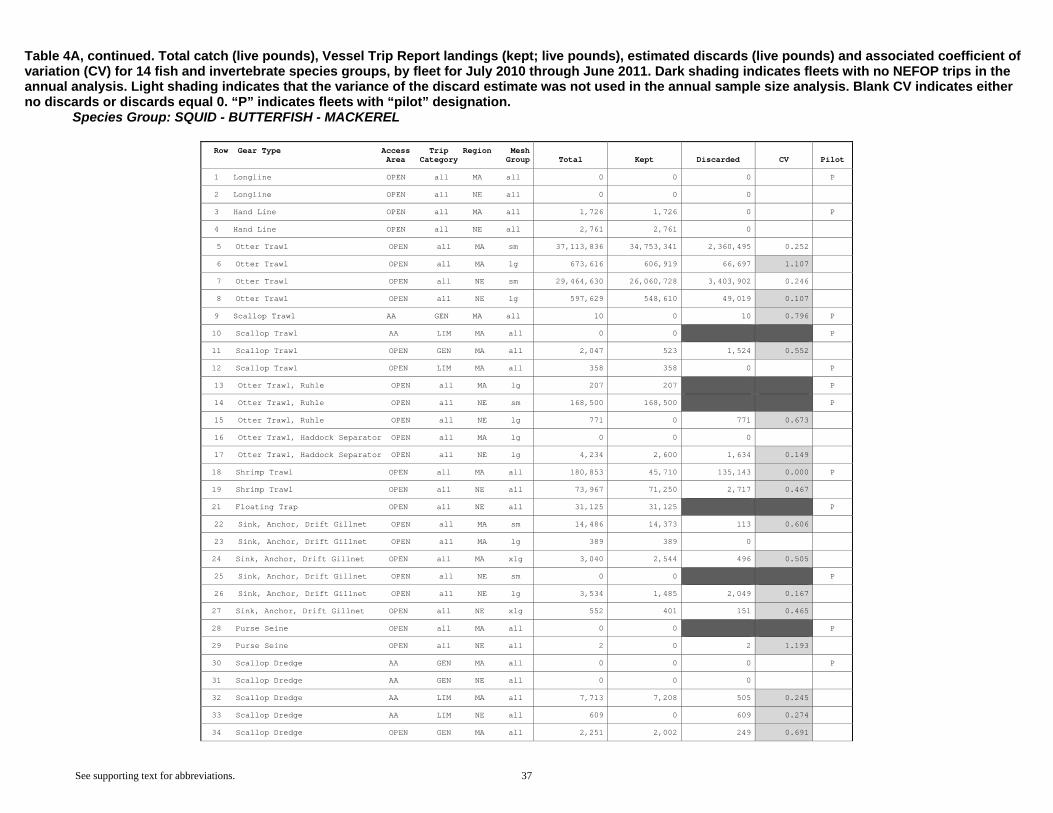
Table 4A, continued. Total catch (live pounds), Vessel Trip Report landings (kept; live pounds), estimated discards (live pounds) and associated coefficient of variation (CV) for 14 fish and invertebrate species groups, by fleet for July 2010 through June 2011. Dark shading indicates fleets with no NEFOP trips in the annual analysis. Light shading indicates that the variance of the discard estimate was not used in the annual sample size analysis. Blank CV indicates either no discards or discards equal 0. “P” indicates fleets with “pilot” designation. Species Group: SQUID - BUTTERFISH - MACKEREL
See supporting text for abbreviations. 37
Row Gear Type Access Trip Region MeshArea Category Group Total Kept Discarded CV Pilot
1 Longline OPEN all MA all 0 0 0 P
2 Longline OPEN all NE all 0 0 0
3 Hand Line OPEN all MA all 1,726 1,726 0 P
4 Hand Line OPEN all NE all 2,761 2,761 0
5 Otter Trawl OPEN all MA sm 37,113,836 34,753,341 2,360,495 0.252
6 Otter Trawl OPEN all MA lg 673,616 606,919 66,697 1.107
7 Otter Trawl OPEN all NE sm 29,464,630 26,060,728 3,403,902 0.246
8 Otter Trawl OPEN all NE lg 597,629 548,610 49,019 0.107
9 Scallop Trawl AA GEN MA all 10 0 10 0.796 P
10 Scallop Trawl AA LIM MA all 0 0 P
11 Scallop Trawl OPEN GEN MA all 2,047 523 1,524 0.552
12 Scallop Trawl OPEN LIM MA all 358 358 0 P
13 Otter Trawl, Ruhle OPEN all MA lg 207 207 P
14 Otter Trawl, Ruhle OPEN all NE sm 168,500 168,500 P
15 Otter Trawl, Ruhle OPEN all NE lg 771 0 771 0.673
16 Otter Trawl, Haddock Separator OPEN all MA lg 0 0 0
17 Otter Trawl, Haddock Separator OPEN all NE lg 4,234 2,600 1,634 0.149
18 Shrimp Trawl OPEN all MA all 180,853 45,710 135,143 0.000 P
19 Shrimp Trawl OPEN all NE all 73,967 71,250 2,717 0.467
21 Floating Trap OPEN all NE all 31,125 31,125 P
22 Sink, Anchor, Drift Gillnet OPEN all MA sm 14,486 14,373 113 0.606
23 Sink, Anchor, Drift Gillnet OPEN all MA lg 389 389 0
24 Sink, Anchor, Drift Gillnet OPEN all MA xlg 3,040 2,544 496 0.505
25 Sink, Anchor, Drift Gillnet OPEN all NE sm 0 0 P
26 Sink, Anchor, Drift Gillnet OPEN all NE lg 3,534 1,485 2,049 0.167
27 Sink, Anchor, Drift Gillnet OPEN all NE xlg 552 401 151 0.465
28 Purse Seine OPEN all MA all 0 0 P
29 Purse Seine OPEN all NE all 2 0 2 1.193
30 Scallop Dredge AA GEN MA all 0 0 0 P
31 Scallop Dredge AA GEN NE all 0 0 0
32 Scallop Dredge AA LIM MA all 7,713 7,208 505 0.245
33 Scallop Dredge AA LIM NE all 609 0 609 0.274
34 Scallop Dredge OPEN GEN MA all 2,251 2,002 249 0.691

Table 4A, continued. Total catch (live pounds), Vessel Trip Report landings (kept; live pounds), estimated discards (live pounds) and associated coefficient of variation (CV) for 14 fish and invertebrate species groups, by fleet for July 2010 through June 2011. Dark shading indicates fleets with no NEFOP trips in the annual analysis. Light shading indicates that the variance of the discard estimate was not used in the annual sample size analysis. Blank CV indicates either no discards or discards equal 0. “P” indicates fleets with “pilot” designation. Species Group: SQUID - BUTTERFISH - MACKEREL
See supporting text for abbreviations. 38
Row Gear Type Access Trip Region MeshArea Category Group Total Kept Discarded CV Pilot
35 Scallop Dredge OPEN GEN NE all 831 0 831 0.929
36 Scallop Dredge OPEN LIM MA all 27,450 21,152 6,298 0.277
37 Scallop Dredge OPEN LIM NE all 2,118 0 2,118 0.452
38 Mid-water Paired & Single Trawl OPEN all MA all 47,147 47,132 15 1.086
39 Mid-water Paired & Single Trawl OPEN all NE all 412,600 402,323 10,277 0.615
40 Pots and Traps, Fish OPEN all MA all 0 0 P
41 Pots and Traps, Fish OPEN all NE all 457 457 P
42 Pots and Traps, Conch OPEN all MA all 0 0 P
43 Pots and Traps, Conch OPEN all NE all 0 0 P
45 Pots and Traps, Hagfish OPEN all NE all 0 0 P
46 Pots and Traps, Shrimp OPEN all NE all 0 0 P
47 Pots and Traps, Lobster OPEN all MA all 0 0 P
48 Pots and Traps, Lobster OPEN all NE all 0 0 P
49 Pots and Traps, Crab OPEN all MA all 0 0 P
50 Pots and Traps, Crab OPEN all NE all 0 0 P
51 Beam Trawl OPEN all MA all 79,500 79,500 P
52 Beam Trawl OPEN all NE all 0 0 P
53 Dredge, Other OPEN all MA all 0 0 P
54 Ocean Quahog/Surf Clam Dredge OPEN all MA all 0 0 P
55 Ocean Quahog/Surf Clam Dredge OPEN all NE all 0 0 P
Other fleets 4,512 4,512
TOTAL 68,923,460 62,877,836 6,045,624 0.170
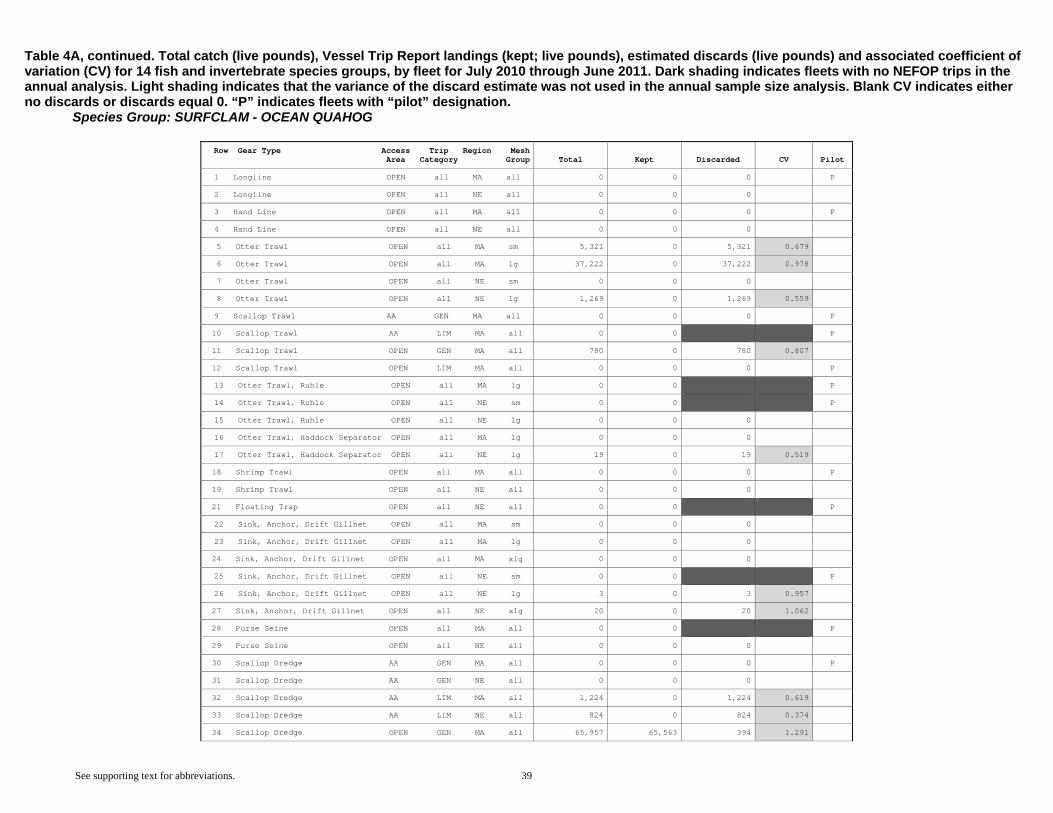
Table 4A, continued. Total catch (live pounds), Vessel Trip Report landings (kept; live pounds), estimated discards (live pounds) and associated coefficient of variation (CV) for 14 fish and invertebrate species groups, by fleet for July 2010 through June 2011. Dark shading indicates fleets with no NEFOP trips in the annual analysis. Light shading indicates that the variance of the discard estimate was not used in the annual sample size analysis. Blank CV indicates either no discards or discards equal 0. “P” indicates fleets with “pilot” designation. Species Group: SURFCLAM - OCEAN QUAHOG
See supporting text for abbreviations. 39
Row Gear Type Access Trip Region MeshArea Category Group Total Kept Discarded CV Pilot
1 Longline OPEN all MA all 0 0 0 P
2 Longline OPEN all NE all 0 0 0
3 Hand Line OPEN all MA all 0 0 0 P
4 Hand Line OPEN all NE all 0 0 0
5 Otter Trawl OPEN all MA sm 5,321 0 5,321 0.679
6 Otter Trawl OPEN all MA lg 37,222 0 37,222 0.978
7 Otter Trawl OPEN all NE sm 0 0 0
8 Otter Trawl OPEN all NE lg 1,269 0 1,269 0.559
9 Scallop Trawl AA GEN MA all 0 0 0 P
10 Scallop Trawl AA LIM MA all 0 0 P
11 Scallop Trawl OPEN GEN MA all 780 0 780 0.807
12 Scallop Trawl OPEN LIM MA all 0 0 0 P
13 Otter Trawl, Ruhle OPEN all MA lg 0 0 P
14 Otter Trawl, Ruhle OPEN all NE sm 0 0 P
15 Otter Trawl, Ruhle OPEN all NE lg 0 0 0
16 Otter Trawl, Haddock Separator OPEN all MA lg 0 0 0
17 Otter Trawl, Haddock Separator OPEN all NE lg 19 0 19 0.519
18 Shrimp Trawl OPEN all MA all 0 0 0 P
19 Shrimp Trawl OPEN all NE all 0 0 0
21 Floating Trap OPEN all NE all 0 0 P
22 Sink, Anchor, Drift Gillnet OPEN all MA sm 0 0 0
23 Sink, Anchor, Drift Gillnet OPEN all MA lg 0 0 0
24 Sink, Anchor, Drift Gillnet OPEN all MA xlg 0 0 0
25 Sink, Anchor, Drift Gillnet OPEN all NE sm 0 0 P
26 Sink, Anchor, Drift Gillnet OPEN all NE lg 3 0 3 0.957
27 Sink, Anchor, Drift Gillnet OPEN all NE xlg 20 0 20 1.062
28 Purse Seine OPEN all MA all 0 0 P
29 Purse Seine OPEN all NE all 0 0 0
30 Scallop Dredge AA GEN MA all 0 0 0 P
31 Scallop Dredge AA GEN NE all 0 0 0
32 Scallop Dredge AA LIM MA all 1,224 0 1,224 0.619
33 Scallop Dredge AA LIM NE all 824 0 824 0.374
34 Scallop Dredge OPEN GEN MA all 65,957 65,563 394 1.291

Table 4A, continued. Total catch (live pounds), Vessel Trip Report landings (kept; live pounds), estimated discards (live pounds) and associated coefficient of variation (CV) for 14 fish and invertebrate species groups, by fleet for July 2010 through June 2011. Dark shading indicates fleets with no NEFOP trips in the annual analysis. Light shading indicates that the variance of the discard estimate was not used in the annual sample size analysis. Blank CV indicates either no discards or discards equal 0. “P” indicates fleets with “pilot” designation. Species Group: SURFCLAM - OCEAN QUAHOG
See supporting text for abbreviations. 40
Row Gear Type Access Trip Region MeshArea Category Group Total Kept Discarded CV Pilot
35 Scallop Dredge OPEN GEN NE all 179,802 179,802 0
36 Scallop Dredge OPEN LIM MA all 7,490 0 7,490 0.785
37 Scallop Dredge OPEN LIM NE all 1,585 0 1,585 0.666
38 Mid-water Paired & Single Trawl OPEN all MA all 0 0 0
39 Mid-water Paired & Single Trawl OPEN all NE all 0 0 0
40 Pots and Traps, Fish OPEN all MA all 0 0 P
41 Pots and Traps, Fish OPEN all NE all 0 0 P
42 Pots and Traps, Conch OPEN all MA all 0 0 P
43 Pots and Traps, Conch OPEN all NE all 0 0 P
45 Pots and Traps, Hagfish OPEN all NE all 0 0 P
46 Pots and Traps, Shrimp OPEN all NE all 0 0 P
47 Pots and Traps, Lobster OPEN all MA all 0 0 P
48 Pots and Traps, Lobster OPEN all NE all 0 0 P
49 Pots and Traps, Crab OPEN all MA all 0 0 P
50 Pots and Traps, Crab OPEN all NE all 0 0 P
51 Beam Trawl OPEN all MA all 0 0 P
52 Beam Trawl OPEN all NE all 0 0 P
53 Dredge, Other OPEN all MA all 39,908 39,908 P
54 Ocean Quahog/Surf Clam Dredge OPEN all MA all 148,223,092 148,223,092 P
55 Ocean Quahog/Surf Clam Dredge OPEN all NE all 96,871,763 96,871,763 P
Other fleets 0 0
TOTAL 245,436,279 245,380,128 56,151 0.661
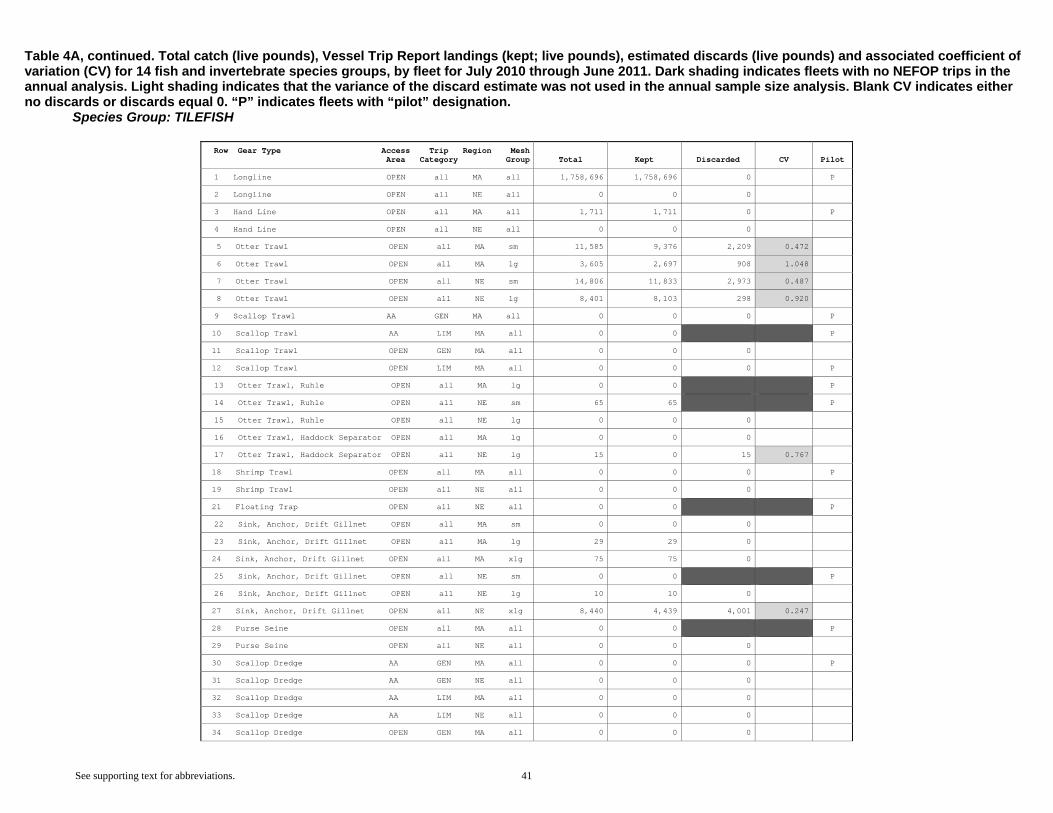
Table 4A, continued. Total catch (live pounds), Vessel Trip Report landings (kept; live pounds), estimated discards (live pounds) and associated coefficient of variation (CV) for 14 fish and invertebrate species groups, by fleet for July 2010 through June 2011. Dark shading indicates fleets with no NEFOP trips in the annual analysis. Light shading indicates that the variance of the discard estimate was not used in the annual sample size analysis. Blank CV indicates either no discards or discards equal 0. “P” indicates fleets with “pilot” designation. Species Group: TILEFISH
See supporting text for abbreviations. 41
Row Gear Type Access Trip Region MeshArea Category Group Total Kept Discarded CV Pilot
1 Longline OPEN all MA all 1,758,696 1,758,696 0 P
2 Longline OPEN all NE all 0 0 0
3 Hand Line OPEN all MA all 1,711 1,711 0 P
4 Hand Line OPEN all NE all 0 0 0
5 Otter Trawl OPEN all MA sm 11,585 9,376 2,209 0.472
6 Otter Trawl OPEN all MA lg 3,605 2,697 908 1.048
7 Otter Trawl OPEN all NE sm 14,806 11,833 2,973 0.487
8 Otter Trawl OPEN all NE lg 8,401 8,103 298 0.920
9 Scallop Trawl AA GEN MA all 0 0 0 P
10 Scallop Trawl AA LIM MA all 0 0 P
11 Scallop Trawl OPEN GEN MA all 0 0 0
12 Scallop Trawl OPEN LIM MA all 0 0 0 P
13 Otter Trawl, Ruhle OPEN all MA lg 0 0 P
14 Otter Trawl, Ruhle OPEN all NE sm 65 65 P
15 Otter Trawl, Ruhle OPEN all NE lg 0 0 0
16 Otter Trawl, Haddock Separator OPEN all MA lg 0 0 0
17 Otter Trawl, Haddock Separator OPEN all NE lg 15 0 15 0.767
18 Shrimp Trawl OPEN all MA all 0 0 0 P
19 Shrimp Trawl OPEN all NE all 0 0 0
21 Floating Trap OPEN all NE all 0 0 P
22 Sink, Anchor, Drift Gillnet OPEN all MA sm 0 0 0
23 Sink, Anchor, Drift Gillnet OPEN all MA lg 29 29 0
24 Sink, Anchor, Drift Gillnet OPEN all MA xlg 75 75 0
25 Sink, Anchor, Drift Gillnet OPEN all NE sm 0 0 P
26 Sink, Anchor, Drift Gillnet OPEN all NE lg 10 10 0
27 Sink, Anchor, Drift Gillnet OPEN all NE xlg 8,440 4,439 4,001 0.247
28 Purse Seine OPEN all MA all 0 0 P
29 Purse Seine OPEN all NE all 0 0 0
30 Scallop Dredge AA GEN MA all 0 0 0 P
31 Scallop Dredge AA GEN NE all 0 0 0
32 Scallop Dredge AA LIM MA all 0 0 0
33 Scallop Dredge AA LIM NE all 0 0 0
34 Scallop Dredge OPEN GEN MA all 0 0 0
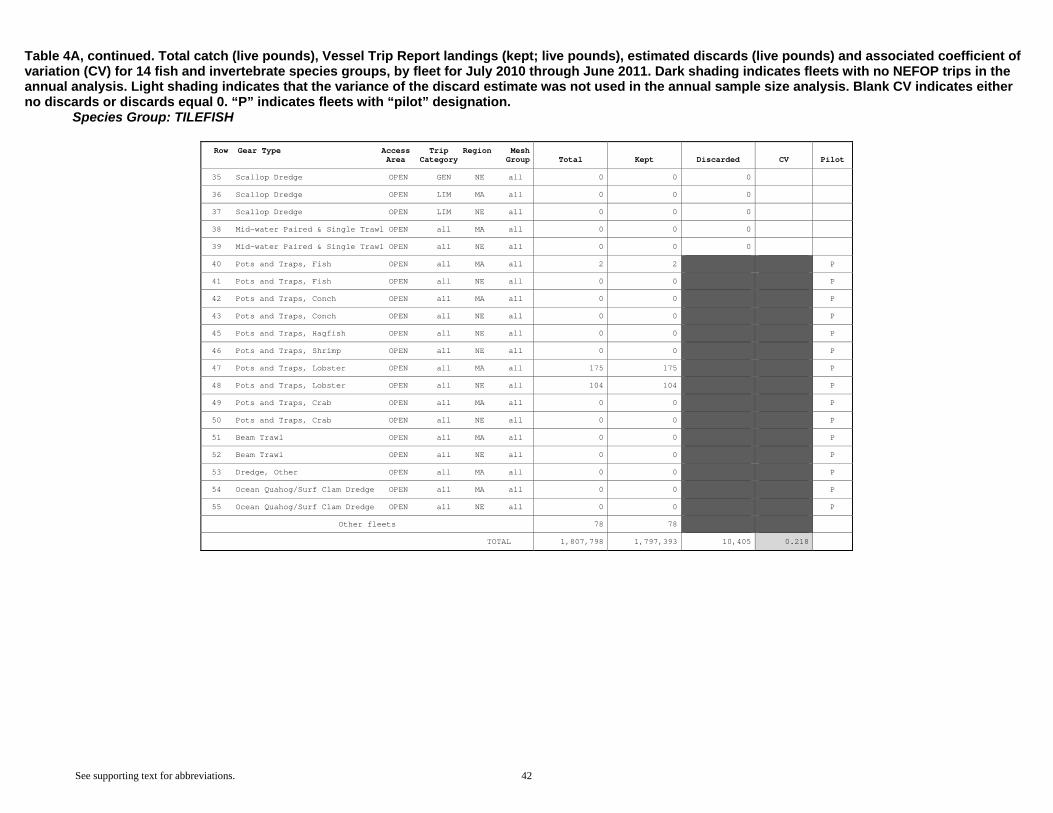
Table 4A, continued. Total catch (live pounds), Vessel Trip Report landings (kept; live pounds), estimated discards (live pounds) and associated coefficient of variation (CV) for 14 fish and invertebrate species groups, by fleet for July 2010 through June 2011. Dark shading indicates fleets with no NEFOP trips in the annual analysis. Light shading indicates that the variance of the discard estimate was not used in the annual sample size analysis. Blank CV indicates either no discards or discards equal 0. “P” indicates fleets with “pilot” designation. Species Group: TILEFISH
See supporting text for abbreviations. 42
Row Gear Type Access Trip Region MeshArea Category Group Total Kept Discarded CV Pilot
35 Scallop Dredge OPEN GEN NE all 0 0 0
36 Scallop Dredge OPEN LIM MA all 0 0 0
37 Scallop Dredge OPEN LIM NE all 0 0 0
38 Mid-water Paired & Single Trawl OPEN all MA all 0 0 0
39 Mid-water Paired & Single Trawl OPEN all NE all 0 0 0
40 Pots and Traps, Fish OPEN all MA all 2 2 P
41 Pots and Traps, Fish OPEN all NE all 0 0 P
42 Pots and Traps, Conch OPEN all MA all 0 0 P
43 Pots and Traps, Conch OPEN all NE all 0 0 P
45 Pots and Traps, Hagfish OPEN all NE all 0 0 P
46 Pots and Traps, Shrimp OPEN all NE all 0 0 P
47 Pots and Traps, Lobster OPEN all MA all 175 175 P
48 Pots and Traps, Lobster OPEN all NE all 104 104 P
49 Pots and Traps, Crab OPEN all MA all 0 0 P
50 Pots and Traps, Crab OPEN all NE all 0 0 P
51 Beam Trawl OPEN all MA all 0 0 P
52 Beam Trawl OPEN all NE all 0 0 P
53 Dredge, Other OPEN all MA all 0 0 P
54 Ocean Quahog/Surf Clam Dredge OPEN all MA all 0 0 P
55 Ocean Quahog/Surf Clam Dredge OPEN all NE all 0 0 P
Other fleets 78 78
TOTAL 1,807,798 1,797,393 10,405 0.218

Table 4B. Total catch (live pounds), Vessel Trip Report landings (kept; live pounds), estimated discards (live pounds) and associated coefficient of variation (CV) for the 23 individual species that comprise the 14 species groups, by fleet for July 2010 through June 2011. Dark shading indicates fleets with no NEFOP trips in the annual analysis. Light shading indicates that the variance of the discard estimate was not used in the annual sample size analysis. Blank CV indicates either no discards or discards equal 0. “P” indicates fleets with “pilot” designation. Species: BLACK SEA BASS
See supporting text for abbreviations. 43
Row Gear Type Access Trip Region MeshArea Category Group Total Kept Discarded CV Pilot
1 Longline OPEN all MA all 191 191 0 P
2 Longline OPEN all NE all 0 0 0
3 Hand Line OPEN all MA all 61,809 61,809 0 P
4 Hand Line OPEN all NE all 5,648 5,648 0
5 Otter Trawl OPEN all MA sm 380,791 235,020 145,771 0.339
6 Otter Trawl OPEN all MA lg 505,296 323,019 182,277 0.851
7 Otter Trawl OPEN all NE sm 118,824 48,673 70,151 0.612
8 Otter Trawl OPEN all NE lg 40,329 33,310 7,019 0.255
9 Scallop Trawl AA GEN MA all 941 0 941 0.340 P
10 Scallop Trawl AA LIM MA all 333 333 P
11 Scallop Trawl OPEN GEN MA all 781 17 764 1.191
12 Scallop Trawl OPEN LIM MA all 1,750 1,750 0 P
13 Otter Trawl, Ruhle OPEN all MA lg 5 5 P
14 Otter Trawl, Ruhle OPEN all NE sm 0 0 P
15 Otter Trawl, Ruhle OPEN all NE lg 0 0 0
16 Otter Trawl, Haddock Separator OPEN all MA lg 0 0 0
17 Otter Trawl, Haddock Separator OPEN all NE lg 13 0 13 0.576
18 Shrimp Trawl OPEN all MA all 0 0 0 P
19 Shrimp Trawl OPEN all NE all 640 640 0
21 Floating Trap OPEN all NE all 815 815 P
22 Sink, Anchor, Drift Gillnet OPEN all MA sm 26 26 0
23 Sink, Anchor, Drift Gillnet OPEN all MA lg 813 813 0
24 Sink, Anchor, Drift Gillnet OPEN all MA xlg 661 661 0
25 Sink, Anchor, Drift Gillnet OPEN all NE sm 140 140 P
26 Sink, Anchor, Drift Gillnet OPEN all NE lg 5,001 4,990 11 0.502
27 Sink, Anchor, Drift Gillnet OPEN all NE xlg 853 850 3 0.798
28 Purse Seine OPEN all MA all 0 0 P
29 Purse Seine OPEN all NE all 0 0 0
30 Scallop Dredge AA GEN MA all 0 0 0 P
31 Scallop Dredge AA GEN NE all 0 0 0
32 Scallop Dredge AA LIM MA all 859 0 859 0.391
33 Scallop Dredge AA LIM NE all 1,052 0 1,052 0.294

Table 4B, continued. Total catch (live pounds), Vessel Trip Report landings (kept; live pounds), estimated discards (live pounds) and associated coefficient of variation (CV) for the 23 individual species that comprise the 14 species groups, by fleet for July 2010 through June 2011. Dark shading indicates fleets with no NEFOP trips in the annual analysis. Light shading indicates that the variance of the discard estimate was not used in the annual sample size analysis. Blank CV indicates either no discards or discards equal 0. “P” indicates fleets with “pilot” designation. Species: BLACK SEA BASS
See supporting text for abbreviations. 44
Row Gear Type Access Trip Region MeshArea Category Group Total Kept Discarded CV Pilot
34 Scallop Dredge OPEN GEN MA all 1,418 123 1,295 0.585
35 Scallop Dredge OPEN GEN NE all 142 0 142 0.693
36 Scallop Dredge OPEN LIM MA all 8,249 53 8,196 0.337
37 Scallop Dredge OPEN LIM NE all 12,752 15 12,737 0.346
38 Mid-water Paired & Single Trawl OPEN all MA all 572 0 572 1.103
39 Mid-water Paired & Single Trawl OPEN all NE all 6 0 6 0.543
40 Pots and Traps, Fish OPEN all MA all 355,259 355,259 P
41 Pots and Traps, Fish OPEN all NE all 50,413 50,413 P
42 Pots and Traps, Conch OPEN all MA all 145 145 P
43 Pots and Traps, Conch OPEN all NE all 310 310 P
45 Pots and Traps, Hagfish OPEN all NE all 0 0 P
46 Pots and Traps, Shrimp OPEN all NE all 53 53 P
47 Pots and Traps, Lobster OPEN all MA all 27,871 27,871 P
48 Pots and Traps, Lobster OPEN all NE all 8,543 8,543 P
49 Pots and Traps, Crab OPEN all MA all 0 0 P
50 Pots and Traps, Crab OPEN all NE all 575 575 P
51 Beam Trawl OPEN all MA all 1,538 1,538 P
52 Beam Trawl OPEN all NE all 37 37 P
53 Dredge, Other OPEN all MA all 0 0 P
54 Ocean Quahog/Surf Clam Dredge OPEN all MA all 0 0 P
55 Ocean Quahog/Surf Clam Dredge OPEN all NE all 0 0 P
Other fleets 1,896 1,896
TOTAL 1,597,349 1,165,541 431,808 0.390

Table 4B, continued. Total catch (live pounds), Vessel Trip Report landings (kept; live pounds), estimated discards (live pounds) and associated coefficient of variation (CV) for the 23 individual species that comprise the 14 species groups, by fleet for July 2010 through June 2011. Dark shading indicates fleets with no NEFOP trips in the annual analysis. Light shading indicates that the variance of the discard estimate was not used in the annual sample size analysis. Blank CV indicates either no discards or discards equal 0. “P” indicates fleets with “pilot” designation. Species: FLUKE
See supporting text for abbreviations. 45
Row Gear Type Access Trip Region MeshArea Category Group Total Kept Discarded CV Pilot
1 Longline OPEN all MA all 9,395 9,395 0 P
2 Longline OPEN all NE all 0 0 0
3 Hand Line OPEN all MA all 111,878 111,878 0 P
4 Hand Line OPEN all NE all 19,590 19,590 0
5 Otter Trawl OPEN all MA sm 1,075,637 614,546 461,091 0.248
6 Otter Trawl OPEN all MA lg 11,221,557 10,607,722 613,835 0.215
7 Otter Trawl OPEN all NE sm 808,359 687,410 120,949 0.261
8 Otter Trawl OPEN all NE lg 2,619,318 2,044,953 574,365 0.128
9 Scallop Trawl AA GEN MA all 1,224 1,000 224 0.329 P
10 Scallop Trawl AA LIM MA all 19,150 19,150 P
11 Scallop Trawl OPEN GEN MA all 75,621 52,954 22,667 0.550
12 Scallop Trawl OPEN LIM MA all 45,725 44,421 1,304 0.000 P
13 Otter Trawl, Ruhle OPEN all MA lg 1,860 1,860 P
14 Otter Trawl, Ruhle OPEN all NE sm 0 0 P
15 Otter Trawl, Ruhle OPEN all NE lg 669 318 351 0.470
16 Otter Trawl, Haddock Separator OPEN all MA lg 445 429 16 0.537
17 Otter Trawl, Haddock Separator OPEN all NE lg 17,559 730 16,829 0.302
18 Shrimp Trawl OPEN all MA all 2,455 2,455 0 P
19 Shrimp Trawl OPEN all NE all 1,000 1,000 0
21 Floating Trap OPEN all NE all 1,566 1,566 P
22 Sink, Anchor, Drift Gillnet OPEN all MA sm 1,048 281 767 0.581
23 Sink, Anchor, Drift Gillnet OPEN all MA lg 14,992 14,308 684 0.729
24 Sink, Anchor, Drift Gillnet OPEN all MA xlg 35,252 24,940 10,312 0.346
25 Sink, Anchor, Drift Gillnet OPEN all NE sm 0 0 P
26 Sink, Anchor, Drift Gillnet OPEN all NE lg 31,469 29,119 2,350 0.365
27 Sink, Anchor, Drift Gillnet OPEN all NE xlg 134,367 34,364 100,003 0.140
28 Purse Seine OPEN all MA all 0 0 P
29 Purse Seine OPEN all NE all 0 0 0
30 Scallop Dredge AA GEN MA all 334 334 0 P
31 Scallop Dredge AA GEN NE all 69 0 69 0.396
32 Scallop Dredge AA LIM MA all 103,527 8,667 94,860 0.228
33 Scallop Dredge AA LIM NE all 91,922 0 91,922 0.159
34 Scallop Dredge OPEN GEN MA all 102,937 10,171 92,766 0.758

Table 4B, continued. Total catch (live pounds), Vessel Trip Report landings (kept; live pounds), estimated discards (live pounds) and associated coefficient of variation (CV) for the 23 individual species that comprise the 14 species groups, by fleet for July 2010 through June 2011. Dark shading indicates fleets with no NEFOP trips in the annual analysis. Light shading indicates that the variance of the discard estimate was not used in the annual sample size analysis. Blank CV indicates either no discards or discards equal 0. “P” indicates fleets with “pilot” designation. Species: FLUKE
See supporting text for abbreviations. 46
Row Gear Type Access Trip Region MeshArea Category Group Total Kept Discarded CV Pilot
35 Scallop Dredge OPEN GEN NE all 14,161 0 14,161 0.636
36 Scallop Dredge OPEN LIM MA all 522,589 29,106 493,483 0.197
37 Scallop Dredge OPEN LIM NE all 825,075 170 824,905 0.259
38 Mid-water Paired & Single Trawl OPEN all MA all 0 0 0
39 Mid-water Paired & Single Trawl OPEN all NE all 3 0 3 0.788
40 Pots and Traps, Fish OPEN all MA all 410 410 P
41 Pots and Traps, Fish OPEN all NE all 1,680 1,680 P
42 Pots and Traps, Conch OPEN all MA all 0 0 P
43 Pots and Traps, Conch OPEN all NE all 0 0 P
45 Pots and Traps, Hagfish OPEN all NE all 0 0 P
46 Pots and Traps, Shrimp OPEN all NE all 0 0 P
47 Pots and Traps, Lobster OPEN all MA all 41 41 P
48 Pots and Traps, Lobster OPEN all NE all 87 87 P
49 Pots and Traps, Crab OPEN all MA all 0 0 P
50 Pots and Traps, Crab OPEN all NE all 0 0 P
51 Beam Trawl OPEN all MA all 44,035 44,035 P
52 Beam Trawl OPEN all NE all 21,254 21,254 P
53 Dredge, Other OPEN all MA all 90 90 P
54 Ocean Quahog/Surf Clam Dredge OPEN all MA all 271 271 P
55 Ocean Quahog/Surf Clam Dredge OPEN all NE all 0 0 P
Other fleets 5,658 5,658
TOTAL 17,984,280 14,446,363 3,537,917 0.088

Table 4B, continued. Total catch (live pounds), Vessel Trip Report landings (kept; live pounds), estimated discards (live pounds) and associated coefficient of variation (CV) for the 23 individual species that comprise the 14 species groups, by fleet for July 2010 through June 2011. Dark shading indicates fleets with no NEFOP trips in the annual analysis. Light shading indicates that the variance of the discard estimate was not used in the annual sample size analysis. Blank CV indicates either no discards or discards equal 0. “P” indicates fleets with “pilot” designation. Species: SCUP
See supporting text for abbreviations. 47
Row Gear Type Access Trip Region MeshArea Category Group Total Kept Discarded CV Pilot
1 Longline OPEN all MA all 0 0 0 P
2 Longline OPEN all NE all 0 0 0
3 Hand Line OPEN all MA all 100,501 100,501 0 P
4 Hand Line OPEN all NE all 15,653 15,653 0
5 Otter Trawl OPEN all MA sm 3,414,343 2,932,309 482,034 0.461
6 Otter Trawl OPEN all MA lg 2,416,833 2,171,324 245,509 0.466
7 Otter Trawl OPEN all NE sm 2,365,062 1,724,063 640,999 0.282
8 Otter Trawl OPEN all NE lg 1,425,322 1,380,931 44,391 0.430
9 Scallop Trawl AA GEN MA all 0 0 0 0.340 P
10 Scallop Trawl AA LIM MA all 100 100 P
11 Scallop Trawl OPEN GEN MA all 1,655 1,362 293 1.091
12 Scallop Trawl OPEN LIM MA all 50 50 0 P
13 Otter Trawl, Ruhle OPEN all MA lg 0 0 P
14 Otter Trawl, Ruhle OPEN all NE sm 1 1 P
15 Otter Trawl, Ruhle OPEN all NE lg 0 0 0
16 Otter Trawl, Haddock Separator OPEN all MA lg 0 0 0
17 Otter Trawl, Haddock Separator OPEN all NE lg 0 0 0
18 Shrimp Trawl OPEN all MA all 0 0 0 P
19 Shrimp Trawl OPEN all NE all 8,485 8,095 390 0.185
21 Floating Trap OPEN all NE all 145,434 145,434 P
22 Sink, Anchor, Drift Gillnet OPEN all MA sm 1,691 1,691 0
23 Sink, Anchor, Drift Gillnet OPEN all MA lg 1,126 1,126 0
24 Sink, Anchor, Drift Gillnet OPEN all MA xlg 191 166 25 0.851
25 Sink, Anchor, Drift Gillnet OPEN all NE sm 485 485 P
26 Sink, Anchor, Drift Gillnet OPEN all NE lg 33,937 33,932 5 0.736
27 Sink, Anchor, Drift Gillnet OPEN all NE xlg 2,578 2,578 0
28 Purse Seine OPEN all MA all 0 0 P
29 Purse Seine OPEN all NE all 0 0 0
30 Scallop Dredge AA GEN MA all 0 0 0 P
31 Scallop Dredge AA GEN NE all 0 0 0
32 Scallop Dredge AA LIM MA all 107 0 107 0.710
33 Scallop Dredge AA LIM NE all 112 0 112 0.681
34 Scallop Dredge OPEN GEN MA all 20,070 20,000 70 0.593

Table 4B, continued. Total catch (live pounds), Vessel Trip Report landings (kept; live pounds), estimated discards (live pounds) and associated coefficient of variation (CV) for the 23 individual species that comprise the 14 species groups, by fleet for July 2010 through June 2011. Dark shading indicates fleets with no NEFOP trips in the annual analysis. Light shading indicates that the variance of the discard estimate was not used in the annual sample size analysis. Blank CV indicates either no discards or discards equal 0. “P” indicates fleets with “pilot” designation. Species: SCUP
See supporting text for abbreviations. 48
Row Gear Type Access Trip Region MeshArea Category Group Total Kept Discarded CV Pilot
35 Scallop Dredge OPEN GEN NE all 0 0 0
36 Scallop Dredge OPEN LIM MA all 509 2 507 0.521
37 Scallop Dredge OPEN LIM NE all 1,157 0 1,157 0.478
38 Mid-water Paired & Single Trawl OPEN all MA all 6,905 0 6,905 1.103
39 Mid-water Paired & Single Trawl OPEN all NE all 7 0 7 0.543
40 Pots and Traps, Fish OPEN all MA all 16,399 16,399 P
41 Pots and Traps, Fish OPEN all NE all 259,268 259,268 P
42 Pots and Traps, Conch OPEN all MA all 38 38 P
43 Pots and Traps, Conch OPEN all NE all 20 20 P
45 Pots and Traps, Hagfish OPEN all NE all 0 0 P
46 Pots and Traps, Shrimp OPEN all NE all 738 738 P
47 Pots and Traps, Lobster OPEN all MA all 6,678 6,678 P
48 Pots and Traps, Lobster OPEN all NE all 7,012 7,012 P
49 Pots and Traps, Crab OPEN all MA all 0 0 P
50 Pots and Traps, Crab OPEN all NE all 263 263 P
51 Beam Trawl OPEN all MA all 685 685 P
52 Beam Trawl OPEN all NE all 3,821 3,821 P
53 Dredge, Other OPEN all MA all 0 0 P
54 Ocean Quahog/Surf Clam Dredge OPEN all MA all 0 0 P
55 Ocean Quahog/Surf Clam Dredge OPEN all NE all 0 0 P
Other fleets 48,335 48,335
TOTAL 10,305,570 8,883,060 1,422,510 0.217
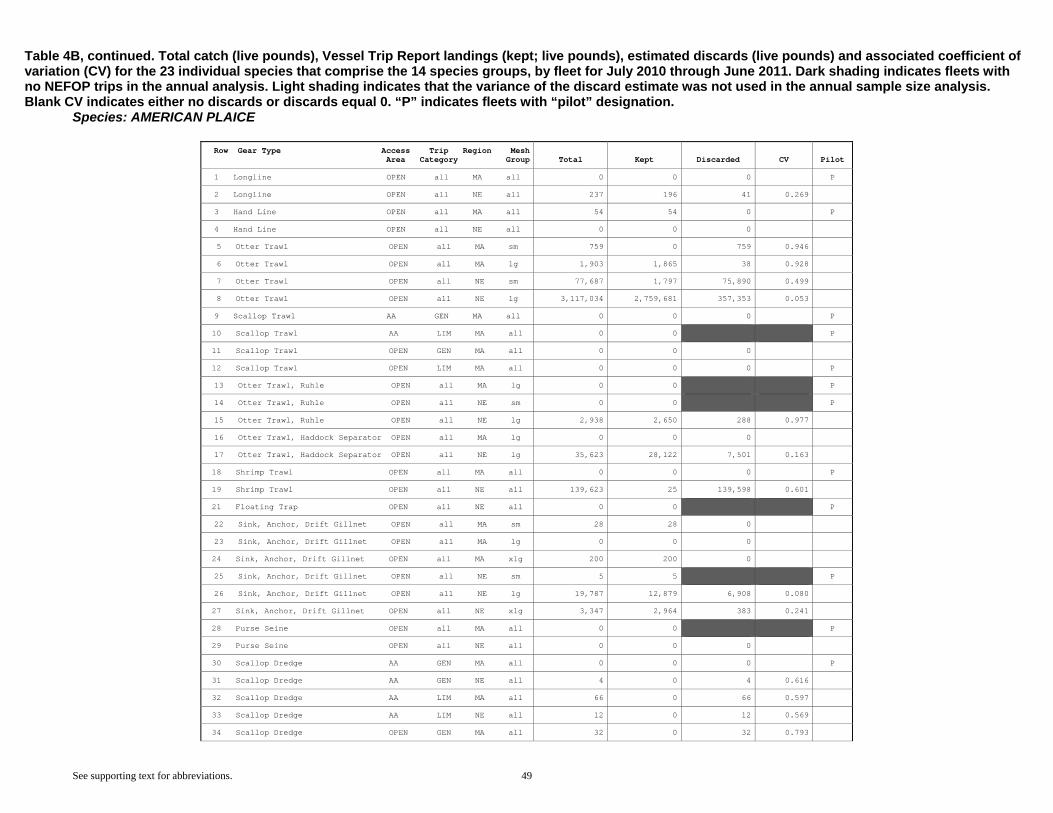
Table 4B, continued. Total catch (live pounds), Vessel Trip Report landings (kept; live pounds), estimated discards (live pounds) and associated coefficient of variation (CV) for the 23 individual species that comprise the 14 species groups, by fleet for July 2010 through June 2011. Dark shading indicates fleets with no NEFOP trips in the annual analysis. Light shading indicates that the variance of the discard estimate was not used in the annual sample size analysis. Blank CV indicates either no discards or discards equal 0. “P” indicates fleets with “pilot” designation. Species: AMERICAN PLAICE
See supporting text for abbreviations. 49
Row Gear Type Access Trip Region MeshArea Category Group Total Kept Discarded CV Pilot
1 Longline OPEN all MA all 0 0 0 P
2 Longline OPEN all NE all 237 196 41 0.269
3 Hand Line OPEN all MA all 54 54 0 P
4 Hand Line OPEN all NE all 0 0 0
5 Otter Trawl OPEN all MA sm 759 0 759 0.946
6 Otter Trawl OPEN all MA lg 1,903 1,865 38 0.928
7 Otter Trawl OPEN all NE sm 77,687 1,797 75,890 0.499
8 Otter Trawl OPEN all NE lg 3,117,034 2,759,681 357,353 0.053
9 Scallop Trawl AA GEN MA all 0 0 0 P
10 Scallop Trawl AA LIM MA all 0 0 P
11 Scallop Trawl OPEN GEN MA all 0 0 0
12 Scallop Trawl OPEN LIM MA all 0 0 0 P
13 Otter Trawl, Ruhle OPEN all MA lg 0 0 P
14 Otter Trawl, Ruhle OPEN all NE sm 0 0 P
15 Otter Trawl, Ruhle OPEN all NE lg 2,938 2,650 288 0.977
16 Otter Trawl, Haddock Separator OPEN all MA lg 0 0 0
17 Otter Trawl, Haddock Separator OPEN all NE lg 35,623 28,122 7,501 0.163
18 Shrimp Trawl OPEN all MA all 0 0 0 P
19 Shrimp Trawl OPEN all NE all 139,623 25 139,598 0.601
21 Floating Trap OPEN all NE all 0 0 P
22 Sink, Anchor, Drift Gillnet OPEN all MA sm 28 28 0
23 Sink, Anchor, Drift Gillnet OPEN all MA lg 0 0 0
24 Sink, Anchor, Drift Gillnet OPEN all MA xlg 200 200 0
25 Sink, Anchor, Drift Gillnet OPEN all NE sm 5 5 P
26 Sink, Anchor, Drift Gillnet OPEN all NE lg 19,787 12,879 6,908 0.080
27 Sink, Anchor, Drift Gillnet OPEN all NE xlg 3,347 2,964 383 0.241
28 Purse Seine OPEN all MA all 0 0 P
29 Purse Seine OPEN all NE all 0 0 0
30 Scallop Dredge AA GEN MA all 0 0 0 P
31 Scallop Dredge AA GEN NE all 4 0 4 0.616
32 Scallop Dredge AA LIM MA all 66 0 66 0.597
33 Scallop Dredge AA LIM NE all 12 0 12 0.569
34 Scallop Dredge OPEN GEN MA all 32 0 32 0.793

Table 4B, continued. Total catch (live pounds), Vessel Trip Report landings (kept; live pounds), estimated discards (live pounds) and associated coefficient of variation (CV) for the 23 individual species that comprise the 14 species groups, by fleet for July 2010 through June 2011. Dark shading indicates fleets with no NEFOP trips in the annual analysis. Light shading indicates that the variance of the discard estimate was not used in the annual sample size analysis. Blank CV indicates either no discards or discards equal 0. “P” indicates fleets with “pilot” designation. Species: AMERICAN PLAICE
See supporting text for abbreviations. 50
Row Gear Type Access Trip Region MeshArea Category Group Total Kept Discarded CV Pilot
35 Scallop Dredge OPEN GEN NE all 769 0 769 0.740
36 Scallop Dredge OPEN LIM MA all 614 0 614 0.894
37 Scallop Dredge OPEN LIM NE all 1,115 0 1,115 0.613
38 Mid-water Paired & Single Trawl OPEN all MA all 0 0 0
39 Mid-water Paired & Single Trawl OPEN all NE all 12 0 12 0.398
40 Pots and Traps, Fish OPEN all MA all 0 0 P
41 Pots and Traps, Fish OPEN all NE all 0 0 P
42 Pots and Traps, Conch OPEN all MA all 0 0 P
43 Pots and Traps, Conch OPEN all NE all 0 0 P
45 Pots and Traps, Hagfish OPEN all NE all 0 0 P
46 Pots and Traps, Shrimp OPEN all NE all 0 0 P
47 Pots and Traps, Lobster OPEN all MA all 0 0 P
48 Pots and Traps, Lobster OPEN all NE all 0 0 P
49 Pots and Traps, Crab OPEN all MA all 0 0 P
50 Pots and Traps, Crab OPEN all NE all 0 0 P
51 Beam Trawl OPEN all MA all 0 0 P
52 Beam Trawl OPEN all NE all 38 38 P
53 Dredge, Other OPEN all MA all 0 0 P
54 Ocean Quahog/Surf Clam Dredge OPEN all MA all 0 0 P
55 Ocean Quahog/Surf Clam Dredge OPEN all NE all 0 0 P
Other fleets 0 0
TOTAL 3,401,888 2,810,504 591,384 0.159

Table 4B, continued. Total catch (live pounds), Vessel Trip Report landings (kept; live pounds), estimated discards (live pounds) and associated coefficient of variation (CV) for the 23 individual species that comprise the 14 species groups, by fleet for July 2010 through June 2011. Dark shading indicates fleets with no NEFOP trips in the annual analysis. Light shading indicates that the variance of the discard estimate was not used in the annual sample size analysis. Blank CV indicates either no discards or discards equal 0. “P” indicates fleets with “pilot” designation. Species: ATLANTIC COD
See supporting text for abbreviations. 51
Row Gear Type Access Trip Region MeshArea Category Group Total Kept Discarded CV Pilot
1 Longline OPEN all MA all 196,737 11,574 185,163 0.000 P
2 Longline OPEN all NE all 437,927 391,663 46,264 0.165
3 Hand Line OPEN all MA all 28,704 7,470 21,234 0.000 P
4 Hand Line OPEN all NE all 102,810 92,254 10,556 0.286
5 Otter Trawl OPEN all MA sm 1,776 851 925 0.511
6 Otter Trawl OPEN all MA lg 60,433 46,610 13,823 0.766
7 Otter Trawl OPEN all NE sm 14,449 6,656 7,793 0.428
8 Otter Trawl OPEN all NE lg 8,465,309 8,143,083 322,226 0.078
9 Scallop Trawl AA GEN MA all 0 0 0 P
10 Scallop Trawl AA LIM MA all 0 0 P
11 Scallop Trawl OPEN GEN MA all 785 0 785 1.663
12 Scallop Trawl OPEN LIM MA all 0 0 0 P
13 Otter Trawl, Ruhle OPEN all MA lg 35 35 P
14 Otter Trawl, Ruhle OPEN all NE sm 0 0 P
15 Otter Trawl, Ruhle OPEN all NE lg 23,028 22,007 1,021 0.835
16 Otter Trawl, Haddock Separator OPEN all MA lg 8,323 7,927 396 0.562
17 Otter Trawl, Haddock Separator OPEN all NE lg 345,605 327,015 18,590 0.145
18 Shrimp Trawl OPEN all MA all 0 0 0 P
19 Shrimp Trawl OPEN all NE all 130 130 0
21 Floating Trap OPEN all NE all 0 0 P
22 Sink, Anchor, Drift Gillnet OPEN all MA sm 3,047 1,213 1,834 2.070
23 Sink, Anchor, Drift Gillnet OPEN all MA lg 21 21 0
24 Sink, Anchor, Drift Gillnet OPEN all MA xlg 558 122 436 0.371
25 Sink, Anchor, Drift Gillnet OPEN all NE sm 2,911 2,911 P
26 Sink, Anchor, Drift Gillnet OPEN all NE lg 3,052,849 2,958,863 93,986 0.115
27 Sink, Anchor, Drift Gillnet OPEN all NE xlg 298,276 279,153 19,123 0.127
28 Purse Seine OPEN all MA all 0 0 P
29 Purse Seine OPEN all NE all 0 0 0
30 Scallop Dredge AA GEN MA all 0 0 0 P
31 Scallop Dredge AA GEN NE all 0 0 0
32 Scallop Dredge AA LIM MA all 105 0 105 0.873
33 Scallop Dredge AA LIM NE all 335 0 335 0.359
34 Scallop Dredge OPEN GEN MA all 741 0 741 0.588

Table 4B, continued. Total catch (live pounds), Vessel Trip Report landings (kept; live pounds), estimated discards (live pounds) and associated coefficient of variation (CV) for the 23 individual species that comprise the 14 species groups, by fleet for July 2010 through June 2011. Dark shading indicates fleets with no NEFOP trips in the annual analysis. Light shading indicates that the variance of the discard estimate was not used in the annual sample size analysis. Blank CV indicates either no discards or discards equal 0. “P” indicates fleets with “pilot” designation. Species: ATLANTIC COD
See supporting text for abbreviations. 52
Row Gear Type Access Trip Region MeshArea Category Group Total Kept Discarded CV Pilot
35 Scallop Dredge OPEN GEN NE all 0 0 0
36 Scallop Dredge OPEN LIM MA all 444 25 419 0.924
37 Scallop Dredge OPEN LIM NE all 6,771 70 6,701 0.197
38 Mid-water Paired & Single Trawl OPEN all MA all 0 0 0
39 Mid-water Paired & Single Trawl OPEN all NE all 2,788 651 2,137 0.339
40 Pots and Traps, Fish OPEN all MA all 3,905 3,905 P
41 Pots and Traps, Fish OPEN all NE all 0 0 P
42 Pots and Traps, Conch OPEN all MA all 0 0 P
43 Pots and Traps, Conch OPEN all NE all 0 0 P
45 Pots and Traps, Hagfish OPEN all NE all 0 0 P
46 Pots and Traps, Shrimp OPEN all NE all 0 0 P
47 Pots and Traps, Lobster OPEN all MA all 255 255 P
48 Pots and Traps, Lobster OPEN all NE all 1,525 1,525 P
49 Pots and Traps, Crab OPEN all MA all 0 0 P
50 Pots and Traps, Crab OPEN all NE all 0 0 P
51 Beam Trawl OPEN all MA all 0 0 P
52 Beam Trawl OPEN all NE all 17 17 P
53 Dredge, Other OPEN all MA all 0 0 P
54 Ocean Quahog/Surf Clam Dredge OPEN all MA all 0 0 P
55 Ocean Quahog/Surf Clam Dredge OPEN all NE all 0 0 P
Other fleets 80 80
TOTAL 13,060,680 12,306,086 754,594 0.041

Table 4B, continued. Total catch (live pounds), Vessel Trip Report landings (kept; live pounds), estimated discards (live pounds) and associated coefficient of variation (CV) for the 23 individual species that comprise the 14 species groups, by fleet for July 2010 through June 2011. Dark shading indicates fleets with no NEFOP trips in the annual analysis. Light shading indicates that the variance of the discard estimate was not used in the annual sample size analysis. Blank CV indicates either no discards or discards equal 0. “P” indicates fleets with “pilot” designation. Species: ATLANTIC HALIBUT
See supporting text for abbreviations. 53
Row Gear Type Access Trip Region MeshArea Category Group Total Kept Discarded CV Pilot
1 Longline OPEN all MA all 0 0 0 P
2 Longline OPEN all NE all 1,872 808 1,064 0.521
3 Hand Line OPEN all MA all 0 0 0 P
4 Hand Line OPEN all NE all 488 488 0
5 Otter Trawl OPEN all MA sm 0 0 0
6 Otter Trawl OPEN all MA lg 30 30 0
7 Otter Trawl OPEN all NE sm 100 0 100 0.793
8 Otter Trawl OPEN all NE lg 37,614 7,103 30,511 0.073
9 Scallop Trawl AA GEN MA all 0 0 0 P
10 Scallop Trawl AA LIM MA all 0 0 P
11 Scallop Trawl OPEN GEN MA all 0 0 0
12 Scallop Trawl OPEN LIM MA all 0 0 0 P
13 Otter Trawl, Ruhle OPEN all MA lg 0 0 P
14 Otter Trawl, Ruhle OPEN all NE sm 0 0 P
15 Otter Trawl, Ruhle OPEN all NE lg 109 0 109 0.640
16 Otter Trawl, Haddock Separator OPEN all MA lg 0 0 0
17 Otter Trawl, Haddock Separator OPEN all NE lg 2,395 659 1,736 0.194
18 Shrimp Trawl OPEN all MA all 0 0 0 P
19 Shrimp Trawl OPEN all NE all 57 0 57 1.053
21 Floating Trap OPEN all NE all 0 0 P
22 Sink, Anchor, Drift Gillnet OPEN all MA sm 0 0 0
23 Sink, Anchor, Drift Gillnet OPEN all MA lg 0 0 0
24 Sink, Anchor, Drift Gillnet OPEN all MA xlg 97 97 0
25 Sink, Anchor, Drift Gillnet OPEN all NE sm 0 0 P
26 Sink, Anchor, Drift Gillnet OPEN all NE lg 5,263 982 4,281 0.152
27 Sink, Anchor, Drift Gillnet OPEN all NE xlg 15,488 1,106 14,382 0.568
28 Purse Seine OPEN all MA all 0 0 P
29 Purse Seine OPEN all NE all 0 0 0
30 Scallop Dredge AA GEN MA all 0 0 0 P
31 Scallop Dredge AA GEN NE all 0 0 0
32 Scallop Dredge AA LIM MA all 0 0 0
33 Scallop Dredge AA LIM NE all 0 0 0
34 Scallop Dredge OPEN GEN MA all 0 0 0

Table 4B, continued. Total catch (live pounds), Vessel Trip Report landings (kept; live pounds), estimated discards (live pounds) and associated coefficient of variation (CV) for the 23 individual species that comprise the 14 species groups, by fleet for July 2010 through June 2011. Dark shading indicates fleets with no NEFOP trips in the annual analysis. Light shading indicates that the variance of the discard estimate was not used in the annual sample size analysis. Blank CV indicates either no discards or discards equal 0. “P” indicates fleets with “pilot” designation. Species: ATLANTIC HALIBUT
See supporting text for abbreviations. 54
Row Gear Type Access Trip Region MeshArea Category Group Total Kept Discarded CV Pilot
35 Scallop Dredge OPEN GEN NE all 0 0 0
36 Scallop Dredge OPEN LIM MA all 49 0 49 0.914
37 Scallop Dredge OPEN LIM NE all 308 0 308 0.772
38 Mid-water Paired & Single Trawl OPEN all MA all 0 0 0
39 Mid-water Paired & Single Trawl OPEN all NE all 0 0 0
40 Pots and Traps, Fish OPEN all MA all 0 0 P
41 Pots and Traps, Fish OPEN all NE all 0 0 P
42 Pots and Traps, Conch OPEN all MA all 0 0 P
43 Pots and Traps, Conch OPEN all NE all 0 0 P
45 Pots and Traps, Hagfish OPEN all NE all 0 0 P
46 Pots and Traps, Shrimp OPEN all NE all 0 0 P
47 Pots and Traps, Lobster OPEN all MA all 0 0 P
48 Pots and Traps, Lobster OPEN all NE all 57 57 P
49 Pots and Traps, Crab OPEN all MA all 0 0 P
50 Pots and Traps, Crab OPEN all NE all 0 0 P
51 Beam Trawl OPEN all MA all 0 0 P
52 Beam Trawl OPEN all NE all 0 0 P
53 Dredge, Other OPEN all MA all 0 0 P
54 Ocean Quahog/Surf Clam Dredge OPEN all MA all 0 0 P
55 Ocean Quahog/Surf Clam Dredge OPEN all NE all 0 0 P
Other fleets 0 0
TOTAL 63,927 11,330 52,597 0.162

Table 4B, continued. Total catch (live pounds), Vessel Trip Report landings (kept; live pounds), estimated discards (live pounds) and associated coefficient of variation (CV) for the 23 individual species that comprise the 14 species groups, by fleet for July 2010 through June 2011. Dark shading indicates fleets with no NEFOP trips in the annual analysis. Light shading indicates that the variance of the discard estimate was not used in the annual sample size analysis. Blank CV indicates either no discards or discards equal 0. “P” indicates fleets with “pilot” designation. Species: ATLANTIC WOLFFISH
See supporting text for abbreviations. 55
Row Gear Type Access Trip Region MeshArea Category Group Total Kept Discarded CV Pilot
1 Longline OPEN all MA all 0 0 0 P
2 Longline OPEN all NE all 1,777 4 1,773 0.202
3 Hand Line OPEN all MA all 0 0 0 P
4 Hand Line OPEN all NE all 204 0 204 1.031
5 Otter Trawl OPEN all MA sm 0 0 0
6 Otter Trawl OPEN all MA lg 0 0 0
7 Otter Trawl OPEN all NE sm 0 0 0
8 Otter Trawl OPEN all NE lg 52,322 409 51,913 0.092
9 Scallop Trawl AA GEN MA all 0 0 0 P
10 Scallop Trawl AA LIM MA all 0 0 P
11 Scallop Trawl OPEN GEN MA all 0 0 0
12 Scallop Trawl OPEN LIM MA all 0 0 0 P
13 Otter Trawl, Ruhle OPEN all MA lg 0 0 P
14 Otter Trawl, Ruhle OPEN all NE sm 0 0 P
15 Otter Trawl, Ruhle OPEN all NE lg 0 0 0
16 Otter Trawl, Haddock Separator OPEN all MA lg 0 0 0
17 Otter Trawl, Haddock Separator OPEN all NE lg 1,154 0 1,154 0.407
18 Shrimp Trawl OPEN all MA all 0 0 0 P
19 Shrimp Trawl OPEN all NE all 0 0 0
21 Floating Trap OPEN all NE all 0 0 P
22 Sink, Anchor, Drift Gillnet OPEN all MA sm 0 0 0
23 Sink, Anchor, Drift Gillnet OPEN all MA lg 0 0 0
24 Sink, Anchor, Drift Gillnet OPEN all MA xlg 0 0 0
25 Sink, Anchor, Drift Gillnet OPEN all NE sm 0 0 P
26 Sink, Anchor, Drift Gillnet OPEN all NE lg 7,243 8 7,235 0.118
27 Sink, Anchor, Drift Gillnet OPEN all NE xlg 1,749 0 1,749 0.236
28 Purse Seine OPEN all MA all 0 0 P
29 Purse Seine OPEN all NE all 0 0 0
30 Scallop Dredge AA GEN MA all 0 0 0 P
31 Scallop Dredge AA GEN NE all 0 0 0
32 Scallop Dredge AA LIM MA all 0 0 0
33 Scallop Dredge AA LIM NE all 0 0 0
34 Scallop Dredge OPEN GEN MA all 0 0 0

Table 4B, continued. Total catch (live pounds), Vessel Trip Report landings (kept; live pounds), estimated discards (live pounds) and associated coefficient of variation (CV) for the 23 individual species that comprise the 14 species groups, by fleet for July 2010 through June 2011. Dark shading indicates fleets with no NEFOP trips in the annual analysis. Light shading indicates that the variance of the discard estimate was not used in the annual sample size analysis. Blank CV indicates either no discards or discards equal 0. “P” indicates fleets with “pilot” designation. Species: ATLANTIC WOLFFISH
See supporting text for abbreviations. 56
Row Gear Type Access Trip Region MeshArea Category Group Total Kept Discarded CV Pilot
35 Scallop Dredge OPEN GEN NE all 0 0 0
36 Scallop Dredge OPEN LIM MA all 0 0 0
37 Scallop Dredge OPEN LIM NE all 0 0 0
38 Mid-water Paired & Single Trawl OPEN all MA all 0 0 0
39 Mid-water Paired & Single Trawl OPEN all NE all 0 0 0
40 Pots and Traps, Fish OPEN all MA all 0 0 P
41 Pots and Traps, Fish OPEN all NE all 0 0 P
42 Pots and Traps, Conch OPEN all MA all 0 0 P
43 Pots and Traps, Conch OPEN all NE all 0 0 P
45 Pots and Traps, Hagfish OPEN all NE all 0 0 P
46 Pots and Traps, Shrimp OPEN all NE all 0 0 P
47 Pots and Traps, Lobster OPEN all MA all 0 0 P
48 Pots and Traps, Lobster OPEN all NE all 0 0 P
49 Pots and Traps, Crab OPEN all MA all 0 0 P
50 Pots and Traps, Crab OPEN all NE all 0 0 P
51 Beam Trawl OPEN all MA all 0 0 P
52 Beam Trawl OPEN all NE all 0 0 P
53 Dredge, Other OPEN all MA all 0 0 P
54 Ocean Quahog/Surf Clam Dredge OPEN all MA all 0 0 P
55 Ocean Quahog/Surf Clam Dredge OPEN all NE all 0 0 P
Other fleets 0 0
TOTAL 64,449 421 64,028 0.077

Table 4B, continued. Total catch (live pounds), Vessel Trip Report landings (kept; live pounds), estimated discards (live pounds) and associated coefficient of variation (CV) for the 23 individual species that comprise the 14 species groups, by fleet for July 2010 through June 2011. Dark shading indicates fleets with no NEFOP trips in the annual analysis. Light shading indicates that the variance of the discard estimate was not used in the annual sample size analysis. Blank CV indicates either no discards or discards equal 0. “P” indicates fleets with “pilot” designation. Species: HADDOCK
See supporting text for abbreviations. 57
Row Gear Type Access Trip Region MeshArea Category Group Total Kept Discarded CV Pilot
1 Longline OPEN all MA all 0 0 0 P
2 Longline OPEN all NE all 544,171 531,968 12,203 0.308
3 Hand Line OPEN all MA all 0 0 0 P
4 Hand Line OPEN all NE all 1,308 1,308 0
5 Otter Trawl OPEN all MA sm 44,636 0 44,636 0.448
6 Otter Trawl OPEN all MA lg 13 0 13 1.217
7 Otter Trawl OPEN all NE sm 41,388 2,861 38,527 0.358
8 Otter Trawl OPEN all NE lg 8,212,882 8,169,761 43,121 0.131
9 Scallop Trawl AA GEN MA all 0 0 0 P
10 Scallop Trawl AA LIM MA all 0 0 P
11 Scallop Trawl OPEN GEN MA all 0 0 0
12 Scallop Trawl OPEN LIM MA all 0 0 0 P
13 Otter Trawl, Ruhle OPEN all MA lg 0 0 P
14 Otter Trawl, Ruhle OPEN all NE sm 0 0 P
15 Otter Trawl, Ruhle OPEN all NE lg 926,280 923,883 2,397 0.358
16 Otter Trawl, Haddock Separator OPEN all MA lg 0 0 0
17 Otter Trawl, Haddock Separator OPEN all NE lg 4,951,997 4,927,034 24,963 0.137
18 Shrimp Trawl OPEN all MA all 0 0 0 P
19 Shrimp Trawl OPEN all NE all 3,794 0 3,794 0.403
21 Floating Trap OPEN all NE all 0 0 P
22 Sink, Anchor, Drift Gillnet OPEN all MA sm 0 0 0
23 Sink, Anchor, Drift Gillnet OPEN all MA lg 0 0 0
24 Sink, Anchor, Drift Gillnet OPEN all MA xlg 2,724 2,724 0
25 Sink, Anchor, Drift Gillnet OPEN all NE sm 0 0 P
26 Sink, Anchor, Drift Gillnet OPEN all NE lg 128,876 124,405 4,471 0.126
27 Sink, Anchor, Drift Gillnet OPEN all NE xlg 3,983 3,440 543 0.250
28 Purse Seine OPEN all MA all 0 0 P
29 Purse Seine OPEN all NE all 0 0 0
30 Scallop Dredge AA GEN MA all 0 0 0 P
31 Scallop Dredge AA GEN NE all 0 0 0
32 Scallop Dredge AA LIM MA all 10 0 10 0.941
33 Scallop Dredge AA LIM NE all 923 0 923 0.777
34 Scallop Dredge OPEN GEN MA all 0 0 0

Table 4B, continued. Total catch (live pounds), Vessel Trip Report landings (kept; live pounds), estimated discards (live pounds) and associated coefficient of variation (CV) for the 23 individual species that comprise the 14 species groups, by fleet for July 2010 through June 2011. Dark shading indicates fleets with no NEFOP trips in the annual analysis. Light shading indicates that the variance of the discard estimate was not used in the annual sample size analysis. Blank CV indicates either no discards or discards equal 0. “P” indicates fleets with “pilot” designation. Species: HADDOCK
See supporting text for abbreviations. 58
Row Gear Type Access Trip Region MeshArea Category Group Total Kept Discarded CV Pilot
35 Scallop Dredge OPEN GEN NE all 0 0 0
36 Scallop Dredge OPEN LIM MA all 122 0 122 0.889
37 Scallop Dredge OPEN LIM NE all 1,564 0 1,564 0.582
38 Mid-water Paired & Single Trawl OPEN all MA all 0 0 0
39 Mid-water Paired & Single Trawl OPEN all NE all 56,231 54,916 1,315 0.313
40 Pots and Traps, Fish OPEN all MA all 0 0 P
41 Pots and Traps, Fish OPEN all NE all 0 0 P
42 Pots and Traps, Conch OPEN all MA all 0 0 P
43 Pots and Traps, Conch OPEN all NE all 0 0 P
45 Pots and Traps, Hagfish OPEN all NE all 0 0 P
46 Pots and Traps, Shrimp OPEN all NE all 0 0 P
47 Pots and Traps, Lobster OPEN all MA all 0 0 P
48 Pots and Traps, Lobster OPEN all NE all 0 0 P
49 Pots and Traps, Crab OPEN all MA all 0 0 P
50 Pots and Traps, Crab OPEN all NE all 0 0 P
51 Beam Trawl OPEN all MA all 0 0 P
52 Beam Trawl OPEN all NE all 459 459 P
53 Dredge, Other OPEN all MA all 0 0 P
54 Ocean Quahog/Surf Clam Dredge OPEN all MA all 0 0 P
55 Ocean Quahog/Surf Clam Dredge OPEN all NE all 0 0 P
Other fleets 7,089 7,089
TOTAL 14,928,450 14,749,848 178,602 0.143

Table 4B, continued. Total catch (live pounds), Vessel Trip Report landings (kept; live pounds), estimated discards (live pounds) and associated coefficient of variation (CV) for the 23 individual species that comprise the 14 species groups, by fleet for July 2010 through June 2011. Dark shading indicates fleets with no NEFOP trips in the annual analysis. Light shading indicates that the variance of the discard estimate was not used in the annual sample size analysis. Blank CV indicates either no discards or discards equal 0. “P” indicates fleets with “pilot” designation. Species: OCEAN POUT
See supporting text for abbreviations. 59
Row Gear Type Access Trip Region MeshArea Category Group Total Kept Discarded CV Pilot
1 Longline OPEN all MA all 11,848 0 11,848 0.000 P
2 Longline OPEN all NE all 3,735 10 3,725 0.264
3 Hand Line OPEN all MA all 166 166 0 P
4 Hand Line OPEN all NE all 0 0 0
5 Otter Trawl OPEN all MA sm 30,880 0 30,880 0.705
6 Otter Trawl OPEN all MA lg 44,303 0 44,303 0.514
7 Otter Trawl OPEN all NE sm 20,426 150 20,276 0.389
8 Otter Trawl OPEN all NE lg 87,384 60 87,324 0.087
9 Scallop Trawl AA GEN MA all 0 0 0 P
10 Scallop Trawl AA LIM MA all 0 0 P
11 Scallop Trawl OPEN GEN MA all 8,671 0 8,671 1.524
12 Scallop Trawl OPEN LIM MA all 0 0 0 P
13 Otter Trawl, Ruhle OPEN all MA lg 0 0 P
14 Otter Trawl, Ruhle OPEN all NE sm 0 0 P
15 Otter Trawl, Ruhle OPEN all NE lg 121 0 121 0.810
16 Otter Trawl, Haddock Separator OPEN all MA lg 70 0 70 0.385
17 Otter Trawl, Haddock Separator OPEN all NE lg 5,106 0 5,106 0.307
18 Shrimp Trawl OPEN all MA all 0 0 0 P
19 Shrimp Trawl OPEN all NE all 0 0 0
21 Floating Trap OPEN all NE all 0 0 P
22 Sink, Anchor, Drift Gillnet OPEN all MA sm 6 6 0
23 Sink, Anchor, Drift Gillnet OPEN all MA lg 0 0 0
24 Sink, Anchor, Drift Gillnet OPEN all MA xlg 0 0 0
25 Sink, Anchor, Drift Gillnet OPEN all NE sm 0 0 P
26 Sink, Anchor, Drift Gillnet OPEN all NE lg 406 0 406 0.189
27 Sink, Anchor, Drift Gillnet OPEN all NE xlg 204 0 204 0.501
28 Purse Seine OPEN all MA all 0 0 P
29 Purse Seine OPEN all NE all 0 0 0
30 Scallop Dredge AA GEN MA all 0 0 0 P
31 Scallop Dredge AA GEN NE all 14 0 14 0.343
32 Scallop Dredge AA LIM MA all 220 0 220 0.590
33 Scallop Dredge AA LIM NE all 536 0 536 0.251
34 Scallop Dredge OPEN GEN MA all 406 0 406 0.588

Table 4B, continued. Total catch (live pounds), Vessel Trip Report landings (kept; live pounds), estimated discards (live pounds) and associated coefficient of variation (CV) for the 23 individual species that comprise the 14 species groups, by fleet for July 2010 through June 2011. Dark shading indicates fleets with no NEFOP trips in the annual analysis. Light shading indicates that the variance of the discard estimate was not used in the annual sample size analysis. Blank CV indicates either no discards or discards equal 0. “P” indicates fleets with “pilot” designation. Species: OCEAN POUT
See supporting text for abbreviations. 60
Row Gear Type Access Trip Region MeshArea Category Group Total Kept Discarded CV Pilot
35 Scallop Dredge OPEN GEN NE all 0 0 0
36 Scallop Dredge OPEN LIM MA all 1,508 0 1,508 0.406
37 Scallop Dredge OPEN LIM NE all 7,771 0 7,771 0.263
38 Mid-water Paired & Single Trawl OPEN all MA all 0 0 0
39 Mid-water Paired & Single Trawl OPEN all NE all 11 0 11 0.790
40 Pots and Traps, Fish OPEN all MA all 249 249 P
41 Pots and Traps, Fish OPEN all NE all 0 0 P
42 Pots and Traps, Conch OPEN all MA all 0 0 P
43 Pots and Traps, Conch OPEN all NE all 0 0 P
45 Pots and Traps, Hagfish OPEN all NE all 0 0 P
46 Pots and Traps, Shrimp OPEN all NE all 0 0 P
47 Pots and Traps, Lobster OPEN all MA all 400 400 P
48 Pots and Traps, Lobster OPEN all NE all 0 0 P
49 Pots and Traps, Crab OPEN all MA all 0 0 P
50 Pots and Traps, Crab OPEN all NE all 0 0 P
51 Beam Trawl OPEN all MA all 0 0 P
52 Beam Trawl OPEN all NE all 0 0 P
53 Dredge, Other OPEN all MA all 0 0 P
54 Ocean Quahog/Surf Clam Dredge OPEN all MA all 0 0 P
55 Ocean Quahog/Surf Clam Dredge OPEN all NE all 0 0 P
Other fleets 0 0
TOTAL 224,443 1,041 223,402 0.161

Table 4B, continued. Total catch (live pounds), Vessel Trip Report landings (kept; live pounds), estimated discards (live pounds) and associated coefficient of variation (CV) for the 23 individual species that comprise the 14 species groups, by fleet for July 2010 through June 2011. Dark shading indicates fleets with no NEFOP trips in the annual analysis. Light shading indicates that the variance of the discard estimate was not used in the annual sample size analysis. Blank CV indicates either no discards or discards equal 0. “P” indicates fleets with “pilot” designation. Species: POLLOCK
See supporting text for abbreviations. 61
Row Gear Type Access Trip Region MeshArea Category Group Total Kept Discarded CV Pilot
1 Longline OPEN all MA all 0 0 0 P
2 Longline OPEN all NE all 4,832 4,723 109 0.345
3 Hand Line OPEN all MA all 400 400 0 P
4 Hand Line OPEN all NE all 30,273 30,208 65 0.728
5 Otter Trawl OPEN all MA sm 20 0 20 0.736
6 Otter Trawl OPEN all MA lg 0 0 0
7 Otter Trawl OPEN all NE sm 4,085 3,841 244 0.478
8 Otter Trawl OPEN all NE lg 7,312,322 7,253,773 58,549 0.151
9 Scallop Trawl AA GEN MA all 0 0 0 P
10 Scallop Trawl AA LIM MA all 0 0 P
11 Scallop Trawl OPEN GEN MA all 0 0 0
12 Scallop Trawl OPEN LIM MA all 0 0 0 P
13 Otter Trawl, Ruhle OPEN all MA lg 0 0 P
14 Otter Trawl, Ruhle OPEN all NE sm 0 0 P
15 Otter Trawl, Ruhle OPEN all NE lg 11,936 11,878 58 0.641
16 Otter Trawl, Haddock Separator OPEN all MA lg 0 0 0
17 Otter Trawl, Haddock Separator OPEN all NE lg 437,126 430,624 6,502 0.329
18 Shrimp Trawl OPEN all MA all 0 0 0 P
19 Shrimp Trawl OPEN all NE all 1,134 0 1,134 0.417
21 Floating Trap OPEN all NE all 0 0 P
22 Sink, Anchor, Drift Gillnet OPEN all MA sm 20 20 0
23 Sink, Anchor, Drift Gillnet OPEN all MA lg 24 24 0
24 Sink, Anchor, Drift Gillnet OPEN all MA xlg 0 0 0
25 Sink, Anchor, Drift Gillnet OPEN all NE sm 15 15 P
26 Sink, Anchor, Drift Gillnet OPEN all NE lg 3,570,387 3,441,229 129,158 0.125
27 Sink, Anchor, Drift Gillnet OPEN all NE xlg 234,819 226,030 8,789 0.216
28 Purse Seine OPEN all MA all 0 0 P
29 Purse Seine OPEN all NE all 0 0 0
30 Scallop Dredge AA GEN MA all 0 0 0 P
31 Scallop Dredge AA GEN NE all 0 0 0
32 Scallop Dredge AA LIM MA all 0 0 0
33 Scallop Dredge AA LIM NE all 0 0 0
34 Scallop Dredge OPEN GEN MA all 0 0 0

Table 4B, continued. Total catch (live pounds), Vessel Trip Report landings (kept; live pounds), estimated discards (live pounds) and associated coefficient of variation (CV) for the 23 individual species that comprise the 14 species groups, by fleet for July 2010 through June 2011. Dark shading indicates fleets with no NEFOP trips in the annual analysis. Light shading indicates that the variance of the discard estimate was not used in the annual sample size analysis. Blank CV indicates either no discards or discards equal 0. “P” indicates fleets with “pilot” designation. Species: POLLOCK
See supporting text for abbreviations. 62
Row Gear Type Access Trip Region MeshArea Category Group Total Kept Discarded CV Pilot
35 Scallop Dredge OPEN GEN NE all 0 0 0
36 Scallop Dredge OPEN LIM MA all 0 0 0
37 Scallop Dredge OPEN LIM NE all 0 0 0
38 Mid-water Paired & Single Trawl OPEN all MA all 0 0 0
39 Mid-water Paired & Single Trawl OPEN all NE all 1,573 370 1,203 0.391
40 Pots and Traps, Fish OPEN all MA all 39 39 P
41 Pots and Traps, Fish OPEN all NE all 0 0 P
42 Pots and Traps, Conch OPEN all MA all 0 0 P
43 Pots and Traps, Conch OPEN all NE all 0 0 P
45 Pots and Traps, Hagfish OPEN all NE all 0 0 P
46 Pots and Traps, Shrimp OPEN all NE all 0 0 P
47 Pots and Traps, Lobster OPEN all MA all 0 0 P
48 Pots and Traps, Lobster OPEN all NE all 0 0 P
49 Pots and Traps, Crab OPEN all MA all 0 0 P
50 Pots and Traps, Crab OPEN all NE all 0 0 P
51 Beam Trawl OPEN all MA all 0 0 P
52 Beam Trawl OPEN all NE all 0 0 P
53 Dredge, Other OPEN all MA all 0 0 P
54 Ocean Quahog/Surf Clam Dredge OPEN all MA all 0 0 P
55 Ocean Quahog/Surf Clam Dredge OPEN all NE all 0 0 P
Other fleets 0 0
TOTAL 11,609,006 11,403,174 205,832 0.091
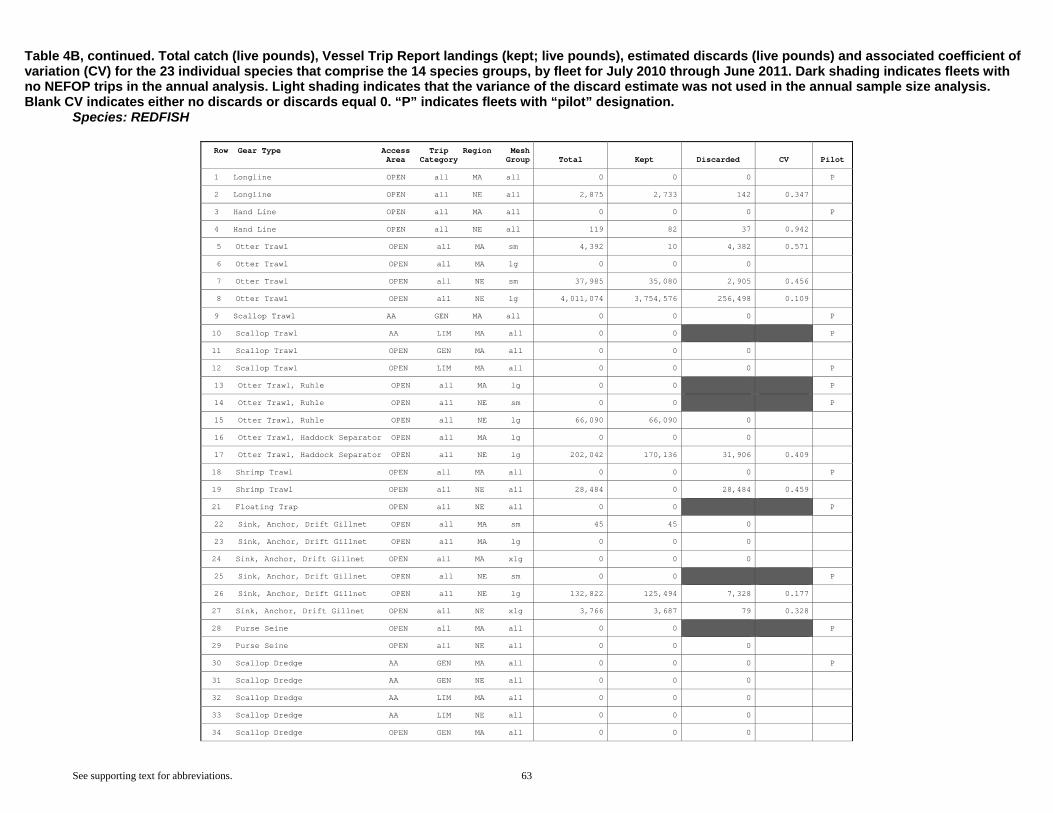
Table 4B, continued. Total catch (live pounds), Vessel Trip Report landings (kept; live pounds), estimated discards (live pounds) and associated coefficient of variation (CV) for the 23 individual species that comprise the 14 species groups, by fleet for July 2010 through June 2011. Dark shading indicates fleets with no NEFOP trips in the annual analysis. Light shading indicates that the variance of the discard estimate was not used in the annual sample size analysis. Blank CV indicates either no discards or discards equal 0. “P” indicates fleets with “pilot” designation. Species: REDFISH
See supporting text for abbreviations. 63
Row Gear Type Access Trip Region MeshArea Category Group Total Kept Discarded CV Pilot
1 Longline OPEN all MA all 0 0 0 P
2 Longline OPEN all NE all 2,875 2,733 142 0.347
3 Hand Line OPEN all MA all 0 0 0 P
4 Hand Line OPEN all NE all 119 82 37 0.942
5 Otter Trawl OPEN all MA sm 4,392 10 4,382 0.571
6 Otter Trawl OPEN all MA lg 0 0 0
7 Otter Trawl OPEN all NE sm 37,985 35,080 2,905 0.456
8 Otter Trawl OPEN all NE lg 4,011,074 3,754,576 256,498 0.109
9 Scallop Trawl AA GEN MA all 0 0 0 P
10 Scallop Trawl AA LIM MA all 0 0 P
11 Scallop Trawl OPEN GEN MA all 0 0 0
12 Scallop Trawl OPEN LIM MA all 0 0 0 P
13 Otter Trawl, Ruhle OPEN all MA lg 0 0 P
14 Otter Trawl, Ruhle OPEN all NE sm 0 0 P
15 Otter Trawl, Ruhle OPEN all NE lg 66,090 66,090 0
16 Otter Trawl, Haddock Separator OPEN all MA lg 0 0 0
17 Otter Trawl, Haddock Separator OPEN all NE lg 202,042 170,136 31,906 0.409
18 Shrimp Trawl OPEN all MA all 0 0 0 P
19 Shrimp Trawl OPEN all NE all 28,484 0 28,484 0.459
21 Floating Trap OPEN all NE all 0 0 P
22 Sink, Anchor, Drift Gillnet OPEN all MA sm 45 45 0
23 Sink, Anchor, Drift Gillnet OPEN all MA lg 0 0 0
24 Sink, Anchor, Drift Gillnet OPEN all MA xlg 0 0 0
25 Sink, Anchor, Drift Gillnet OPEN all NE sm 0 0 P
26 Sink, Anchor, Drift Gillnet OPEN all NE lg 132,822 125,494 7,328 0.177
27 Sink, Anchor, Drift Gillnet OPEN all NE xlg 3,766 3,687 79 0.328
28 Purse Seine OPEN all MA all 0 0 P
29 Purse Seine OPEN all NE all 0 0 0
30 Scallop Dredge AA GEN MA all 0 0 0 P
31 Scallop Dredge AA GEN NE all 0 0 0
32 Scallop Dredge AA LIM MA all 0 0 0
33 Scallop Dredge AA LIM NE all 0 0 0
34 Scallop Dredge OPEN GEN MA all 0 0 0
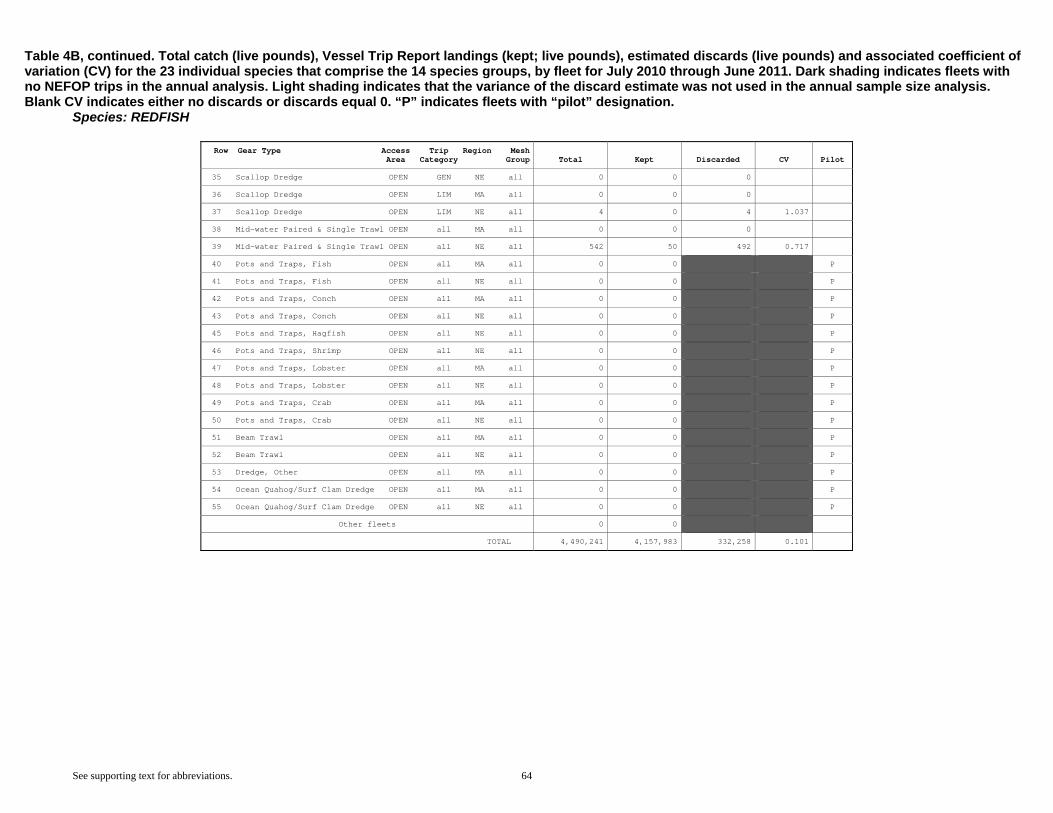
Table 4B, continued. Total catch (live pounds), Vessel Trip Report landings (kept; live pounds), estimated discards (live pounds) and associated coefficient of variation (CV) for the 23 individual species that comprise the 14 species groups, by fleet for July 2010 through June 2011. Dark shading indicates fleets with no NEFOP trips in the annual analysis. Light shading indicates that the variance of the discard estimate was not used in the annual sample size analysis. Blank CV indicates either no discards or discards equal 0. “P” indicates fleets with “pilot” designation. Species: REDFISH
See supporting text for abbreviations. 64
Row Gear Type Access Trip Region MeshArea Category Group Total Kept Discarded CV Pilot
35 Scallop Dredge OPEN GEN NE all 0 0 0
36 Scallop Dredge OPEN LIM MA all 0 0 0
37 Scallop Dredge OPEN LIM NE all 4 0 4 1.037
38 Mid-water Paired & Single Trawl OPEN all MA all 0 0 0
39 Mid-water Paired & Single Trawl OPEN all NE all 542 50 492 0.717
40 Pots and Traps, Fish OPEN all MA all 0 0 P
41 Pots and Traps, Fish OPEN all NE all 0 0 P
42 Pots and Traps, Conch OPEN all MA all 0 0 P
43 Pots and Traps, Conch OPEN all NE all 0 0 P
45 Pots and Traps, Hagfish OPEN all NE all 0 0 P
46 Pots and Traps, Shrimp OPEN all NE all 0 0 P
47 Pots and Traps, Lobster OPEN all MA all 0 0 P
48 Pots and Traps, Lobster OPEN all NE all 0 0 P
49 Pots and Traps, Crab OPEN all MA all 0 0 P
50 Pots and Traps, Crab OPEN all NE all 0 0 P
51 Beam Trawl OPEN all MA all 0 0 P
52 Beam Trawl OPEN all NE all 0 0 P
53 Dredge, Other OPEN all MA all 0 0 P
54 Ocean Quahog/Surf Clam Dredge OPEN all MA all 0 0 P
55 Ocean Quahog/Surf Clam Dredge OPEN all NE all 0 0 P
Other fleets 0 0
TOTAL 4,490,241 4,157,983 332,258 0.101

Table 4B, continued. Total catch (live pounds), Vessel Trip Report landings (kept; live pounds), estimated discards (live pounds) and associated coefficient of variation (CV) for the 23 individual species that comprise the 14 species groups, by fleet for July 2010 through June 2011. Dark shading indicates fleets with no NEFOP trips in the annual analysis. Light shading indicates that the variance of the discard estimate was not used in the annual sample size analysis. Blank CV indicates either no discards or discards equal 0. “P” indicates fleets with “pilot” designation. Species: WHITE HAKE
See supporting text for abbreviations. 65
Row Gear Type Access Trip Region MeshArea Category Group Total Kept Discarded CV Pilot
1 Longline OPEN all MA all 0 0 0 P
2 Longline OPEN all NE all 12,082 9,890 2,192 0.232
3 Hand Line OPEN all MA all 0 0 0 P
4 Hand Line OPEN all NE all 82 82 0
5 Otter Trawl OPEN all MA sm 2,394 1,040 1,354 0.938
6 Otter Trawl OPEN all MA lg 1,736 1,187 549 0.707
7 Otter Trawl OPEN all NE sm 64,314 55,925 8,389 1.105
8 Otter Trawl OPEN all NE lg 2,582,062 2,538,816 43,246 0.149
9 Scallop Trawl AA GEN MA all 0 0 0 P
10 Scallop Trawl AA LIM MA all 0 0 P
11 Scallop Trawl OPEN GEN MA all 0 0 0
12 Scallop Trawl OPEN LIM MA all 0 0 0 P
13 Otter Trawl, Ruhle OPEN all MA lg 0 0 P
14 Otter Trawl, Ruhle OPEN all NE sm 0 0 P
15 Otter Trawl, Ruhle OPEN all NE lg 3,437 3,433 4 0.690
16 Otter Trawl, Haddock Separator OPEN all MA lg 0 0 0
17 Otter Trawl, Haddock Separator OPEN all NE lg 61,251 59,845 1,406 0.200
18 Shrimp Trawl OPEN all MA all 268 268 0 P
19 Shrimp Trawl OPEN all NE all 90 90 0
21 Floating Trap OPEN all NE all 0 0 P
22 Sink, Anchor, Drift Gillnet OPEN all MA sm 0 0 0
23 Sink, Anchor, Drift Gillnet OPEN all MA lg 0 0 0
24 Sink, Anchor, Drift Gillnet OPEN all MA xlg 0 0 0
25 Sink, Anchor, Drift Gillnet OPEN all NE sm 0 0 P
26 Sink, Anchor, Drift Gillnet OPEN all NE lg 454,197 430,826 23,371 0.175
27 Sink, Anchor, Drift Gillnet OPEN all NE xlg 45,319 43,389 1,930 0.254
28 Purse Seine OPEN all MA all 0 0 P
29 Purse Seine OPEN all NE all 0 0 0
30 Scallop Dredge AA GEN MA all 44 0 44 0.364 P
31 Scallop Dredge AA GEN NE all 0 0 0
32 Scallop Dredge AA LIM MA all 100 0 100 0.585
33 Scallop Dredge AA LIM NE all 175 0 175 0.442
34 Scallop Dredge OPEN GEN MA all 0 0 0

Table 4B, continued. Total catch (live pounds), Vessel Trip Report landings (kept; live pounds), estimated discards (live pounds) and associated coefficient of variation (CV) for the 23 individual species that comprise the 14 species groups, by fleet for July 2010 through June 2011. Dark shading indicates fleets with no NEFOP trips in the annual analysis. Light shading indicates that the variance of the discard estimate was not used in the annual sample size analysis. Blank CV indicates either no discards or discards equal 0. “P” indicates fleets with “pilot” designation. Species: WHITE HAKE
See supporting text for abbreviations. 66
Row Gear Type Access Trip Region MeshArea Category Group Total Kept Discarded CV Pilot
35 Scallop Dredge OPEN GEN NE all 0 0 0
36 Scallop Dredge OPEN LIM MA all 3,212 0 3,212 1.448
37 Scallop Dredge OPEN LIM NE all 2,771 10 2,761 0.495
38 Mid-water Paired & Single Trawl OPEN all MA all 0 0 0
39 Mid-water Paired & Single Trawl OPEN all NE all 0 0 0
40 Pots and Traps, Fish OPEN all MA all 0 0 P
41 Pots and Traps, Fish OPEN all NE all 0 0 P
42 Pots and Traps, Conch OPEN all MA all 3,150 3,150 P
43 Pots and Traps, Conch OPEN all NE all 0 0 P
45 Pots and Traps, Hagfish OPEN all NE all 0 0 P
46 Pots and Traps, Shrimp OPEN all NE all 0 0 P
47 Pots and Traps, Lobster OPEN all MA all 0 0 P
48 Pots and Traps, Lobster OPEN all NE all 196 196 P
49 Pots and Traps, Crab OPEN all MA all 0 0 P
50 Pots and Traps, Crab OPEN all NE all 0 0 P
51 Beam Trawl OPEN all MA all 0 0 P
52 Beam Trawl OPEN all NE all 0 0 P
53 Dredge, Other OPEN all MA all 0 0 P
54 Ocean Quahog/Surf Clam Dredge OPEN all MA all 0 0 P
55 Ocean Quahog/Surf Clam Dredge OPEN all NE all 0 0 P
Other fleets 0 0
TOTAL 3,236,880 3,148,147 88,733 0.147
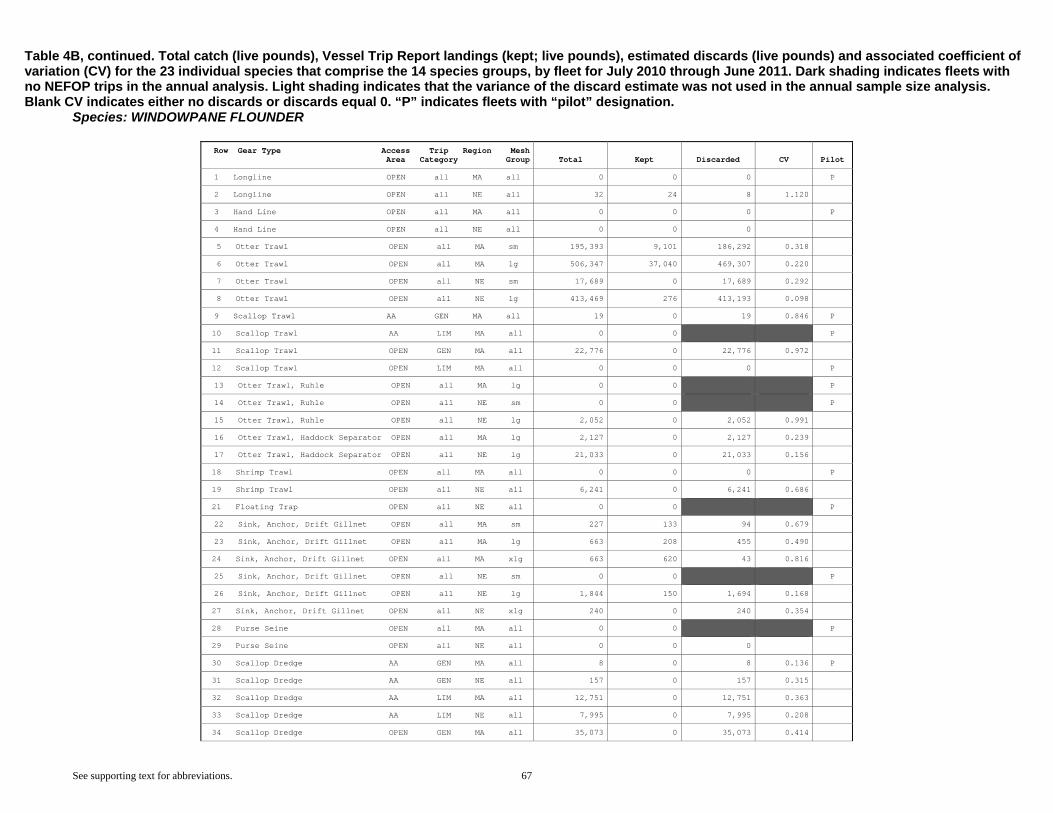
Table 4B, continued. Total catch (live pounds), Vessel Trip Report landings (kept; live pounds), estimated discards (live pounds) and associated coefficient of variation (CV) for the 23 individual species that comprise the 14 species groups, by fleet for July 2010 through June 2011. Dark shading indicates fleets with no NEFOP trips in the annual analysis. Light shading indicates that the variance of the discard estimate was not used in the annual sample size analysis. Blank CV indicates either no discards or discards equal 0. “P” indicates fleets with “pilot” designation. Species: WINDOWPANE FLOUNDER
See supporting text for abbreviations. 67
Row Gear Type Access Trip Region MeshArea Category Group Total Kept Discarded CV Pilot
1 Longline OPEN all MA all 0 0 0 P
2 Longline OPEN all NE all 32 24 8 1.120
3 Hand Line OPEN all MA all 0 0 0 P
4 Hand Line OPEN all NE all 0 0 0
5 Otter Trawl OPEN all MA sm 195,393 9,101 186,292 0.318
6 Otter Trawl OPEN all MA lg 506,347 37,040 469,307 0.220
7 Otter Trawl OPEN all NE sm 17,689 0 17,689 0.292
8 Otter Trawl OPEN all NE lg 413,469 276 413,193 0.098
9 Scallop Trawl AA GEN MA all 19 0 19 0.846 P
10 Scallop Trawl AA LIM MA all 0 0 P
11 Scallop Trawl OPEN GEN MA all 22,776 0 22,776 0.972
12 Scallop Trawl OPEN LIM MA all 0 0 0 P
13 Otter Trawl, Ruhle OPEN all MA lg 0 0 P
14 Otter Trawl, Ruhle OPEN all NE sm 0 0 P
15 Otter Trawl, Ruhle OPEN all NE lg 2,052 0 2,052 0.991
16 Otter Trawl, Haddock Separator OPEN all MA lg 2,127 0 2,127 0.239
17 Otter Trawl, Haddock Separator OPEN all NE lg 21,033 0 21,033 0.156
18 Shrimp Trawl OPEN all MA all 0 0 0 P
19 Shrimp Trawl OPEN all NE all 6,241 0 6,241 0.686
21 Floating Trap OPEN all NE all 0 0 P
22 Sink, Anchor, Drift Gillnet OPEN all MA sm 227 133 94 0.679
23 Sink, Anchor, Drift Gillnet OPEN all MA lg 663 208 455 0.490
24 Sink, Anchor, Drift Gillnet OPEN all MA xlg 663 620 43 0.816
25 Sink, Anchor, Drift Gillnet OPEN all NE sm 0 0 P
26 Sink, Anchor, Drift Gillnet OPEN all NE lg 1,844 150 1,694 0.168
27 Sink, Anchor, Drift Gillnet OPEN all NE xlg 240 0 240 0.354
28 Purse Seine OPEN all MA all 0 0 P
29 Purse Seine OPEN all NE all 0 0 0
30 Scallop Dredge AA GEN MA all 8 0 8 0.136 P
31 Scallop Dredge AA GEN NE all 157 0 157 0.315
32 Scallop Dredge AA LIM MA all 12,751 0 12,751 0.363
33 Scallop Dredge AA LIM NE all 7,995 0 7,995 0.208
34 Scallop Dredge OPEN GEN MA all 35,073 0 35,073 0.414

Table 4B, continued. Total catch (live pounds), Vessel Trip Report landings (kept; live pounds), estimated discards (live pounds) and associated coefficient of variation (CV) for the 23 individual species that comprise the 14 species groups, by fleet for July 2010 through June 2011. Dark shading indicates fleets with no NEFOP trips in the annual analysis. Light shading indicates that the variance of the discard estimate was not used in the annual sample size analysis. Blank CV indicates either no discards or discards equal 0. “P” indicates fleets with “pilot” designation. Species: WINDOWPANE FLOUNDER
See supporting text for abbreviations. 68
Row Gear Type Access Trip Region MeshArea Category Group Total Kept Discarded CV Pilot
35 Scallop Dredge OPEN GEN NE all 24,210 0 24,210 0.761
36 Scallop Dredge OPEN LIM MA all 124,924 0 124,924 0.239
37 Scallop Dredge OPEN LIM NE all 279,310 0 279,310 0.199
38 Mid-water Paired & Single Trawl OPEN all MA all 1 0 1 0.857
39 Mid-water Paired & Single Trawl OPEN all NE all 13 0 13 0.429
40 Pots and Traps, Fish OPEN all MA all 0 0 P
41 Pots and Traps, Fish OPEN all NE all 7 7 P
42 Pots and Traps, Conch OPEN all MA all 0 0 P
43 Pots and Traps, Conch OPEN all NE all 0 0 P
45 Pots and Traps, Hagfish OPEN all NE all 0 0 P
46 Pots and Traps, Shrimp OPEN all NE all 0 0 P
47 Pots and Traps, Lobster OPEN all MA all 0 0 P
48 Pots and Traps, Lobster OPEN all NE all 0 0 P
49 Pots and Traps, Crab OPEN all MA all 0 0 P
50 Pots and Traps, Crab OPEN all NE all 0 0 P
51 Beam Trawl OPEN all MA all 0 0 P
52 Beam Trawl OPEN all NE all 0 0 P
53 Dredge, Other OPEN all MA all 0 0 P
54 Ocean Quahog/Surf Clam Dredge OPEN all MA all 0 0 P
55 Ocean Quahog/Surf Clam Dredge OPEN all NE all 0 0 P
Other fleets 0 0
TOTAL 1,675,265 47,559 1,627,706 0.089

Table 4B, continued. Total catch (live pounds), Vessel Trip Report landings (kept; live pounds), estimated discards (live pounds) and associated coefficient of variation (CV) for the 23 individual species that comprise the 14 species groups, by fleet for July 2010 through June 2011. Dark shading indicates fleets with no NEFOP trips in the annual analysis. Light shading indicates that the variance of the discard estimate was not used in the annual sample size analysis. Blank CV indicates either no discards or discards equal 0. “P” indicates fleets with “pilot” designation. Species: WINTER FLOUNDER
See supporting text for abbreviations. 69
Row Gear Type Access Trip Region MeshArea Category Group Total Kept Discarded CV Pilot
1 Longline OPEN all MA all 0 0 0 P
2 Longline OPEN all NE all 3,242 3,119 123 0.444
3 Hand Line OPEN all MA all 60 60 0 P
4 Hand Line OPEN all NE all 8 8 0
5 Otter Trawl OPEN all MA sm 297,988 2,898 295,090 0.492
6 Otter Trawl OPEN all MA lg 196,769 12,313 184,456 0.304
7 Otter Trawl OPEN all NE sm 157,589 7,615 149,974 0.318
8 Otter Trawl OPEN all NE lg 3,581,933 3,382,764 199,169 0.081
9 Scallop Trawl AA GEN MA all 0 0 0 P
10 Scallop Trawl AA LIM MA all 0 0 P
11 Scallop Trawl OPEN GEN MA all 16,887 0 16,887 0.667
12 Scallop Trawl OPEN LIM MA all 0 0 0 P
13 Otter Trawl, Ruhle OPEN all MA lg 0 0 P
14 Otter Trawl, Ruhle OPEN all NE sm 0 0 P
15 Otter Trawl, Ruhle OPEN all NE lg 6,145 6,126 19 0.871
16 Otter Trawl, Haddock Separator OPEN all MA lg 471 0 471 0.204
17 Otter Trawl, Haddock Separator OPEN all NE lg 151,325 144,179 7,146 0.450
18 Shrimp Trawl OPEN all MA all 0 0 0 P
19 Shrimp Trawl OPEN all NE all 11,337 0 11,337 0.557
21 Floating Trap OPEN all NE all 0 0 P
22 Sink, Anchor, Drift Gillnet OPEN all MA sm 0 0 0
23 Sink, Anchor, Drift Gillnet OPEN all MA lg 50 50 0
24 Sink, Anchor, Drift Gillnet OPEN all MA xlg 168 168 0
25 Sink, Anchor, Drift Gillnet OPEN all NE sm 0 0 P
26 Sink, Anchor, Drift Gillnet OPEN all NE lg 59,219 50,336 8,883 0.111
27 Sink, Anchor, Drift Gillnet OPEN all NE xlg 4,914 3,062 1,852 0.660
28 Purse Seine OPEN all MA all 0 0 P
29 Purse Seine OPEN all NE all 0 0 0
30 Scallop Dredge AA GEN MA all 0 0 0 P
31 Scallop Dredge AA GEN NE all 257 0 257 0.437
32 Scallop Dredge AA LIM MA all 1,558 20 1,538 0.337
33 Scallop Dredge AA LIM NE all 12,323 0 12,323 0.224
34 Scallop Dredge OPEN GEN MA all 2,768 0 2,768 0.642
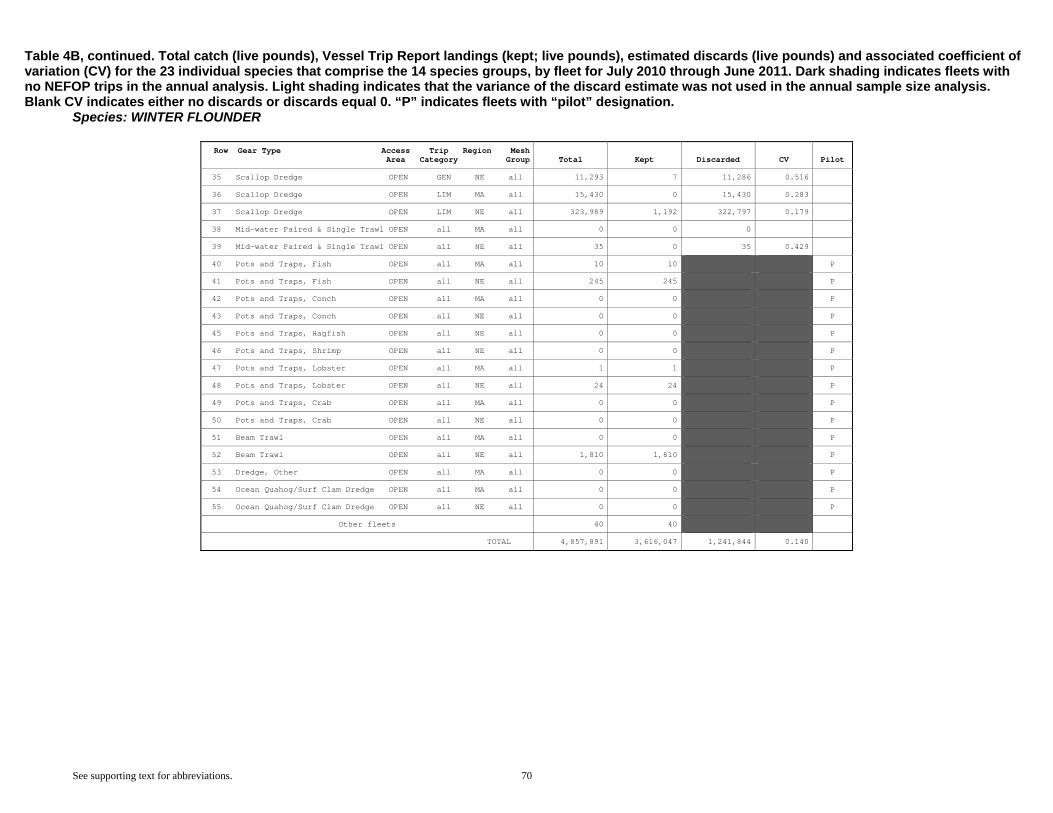
Table 4B, continued. Total catch (live pounds), Vessel Trip Report landings (kept; live pounds), estimated discards (live pounds) and associated coefficient of variation (CV) for the 23 individual species that comprise the 14 species groups, by fleet for July 2010 through June 2011. Dark shading indicates fleets with no NEFOP trips in the annual analysis. Light shading indicates that the variance of the discard estimate was not used in the annual sample size analysis. Blank CV indicates either no discards or discards equal 0. “P” indicates fleets with “pilot” designation. Species: WINTER FLOUNDER
See supporting text for abbreviations. 70
Row Gear Type Access Trip Region MeshArea Category Group Total Kept Discarded CV Pilot
35 Scallop Dredge OPEN GEN NE all 11,293 7 11,286 0.516
36 Scallop Dredge OPEN LIM MA all 15,430 0 15,430 0.283
37 Scallop Dredge OPEN LIM NE all 323,989 1,192 322,797 0.179
38 Mid-water Paired & Single Trawl OPEN all MA all 0 0 0
39 Mid-water Paired & Single Trawl OPEN all NE all 35 0 35 0.429
40 Pots and Traps, Fish OPEN all MA all 10 10 P
41 Pots and Traps, Fish OPEN all NE all 245 245 P
42 Pots and Traps, Conch OPEN all MA all 0 0 P
43 Pots and Traps, Conch OPEN all NE all 0 0 P
45 Pots and Traps, Hagfish OPEN all NE all 0 0 P
46 Pots and Traps, Shrimp OPEN all NE all 0 0 P
47 Pots and Traps, Lobster OPEN all MA all 1 1 P
48 Pots and Traps, Lobster OPEN all NE all 24 24 P
49 Pots and Traps, Crab OPEN all MA all 0 0 P
50 Pots and Traps, Crab OPEN all NE all 0 0 P
51 Beam Trawl OPEN all MA all 0 0 P
52 Beam Trawl OPEN all NE all 1,810 1,810 P
53 Dredge, Other OPEN all MA all 0 0 P
54 Ocean Quahog/Surf Clam Dredge OPEN all MA all 0 0 P
55 Ocean Quahog/Surf Clam Dredge OPEN all NE all 0 0 P
Other fleets 40 40
TOTAL 4,857,891 3,616,047 1,241,844 0.140

Table 4B, continued. Total catch (live pounds), Vessel Trip Report landings (kept; live pounds), estimated discards (live pounds) and associated coefficient of variation (CV) for the 23 individual species that comprise the 14 species groups, by fleet for July 2010 through June 2011. Dark shading indicates fleets with no NEFOP trips in the annual analysis. Light shading indicates that the variance of the discard estimate was not used in the annual sample size analysis. Blank CV indicates either no discards or discards equal 0. “P” indicates fleets with “pilot” designation. Species: WITCH FLOUNDER
See supporting text for abbreviations. 71
Row Gear Type Access Trip Region MeshArea Category Group Total Kept Discarded CV Pilot
1 Longline OPEN all MA all 0 0 0 P
2 Longline OPEN all NE all 0 0 0
3 Hand Line OPEN all MA all 0 0 0 P
4 Hand Line OPEN all NE all 0 0 0
5 Otter Trawl OPEN all MA sm 212,170 25 212,145 0.426
6 Otter Trawl OPEN all MA lg 31,671 908 30,763 1.047
7 Otter Trawl OPEN all NE sm 27,589 4,034 23,555 0.416
8 Otter Trawl OPEN all NE lg 1,559,952 1,436,420 123,532 0.062
9 Scallop Trawl AA GEN MA all 29 0 29 0.340 P
10 Scallop Trawl AA LIM MA all 0 0 P
11 Scallop Trawl OPEN GEN MA all 50 0 50 1.890
12 Scallop Trawl OPEN LIM MA all 0 0 0 P
13 Otter Trawl, Ruhle OPEN all MA lg 0 0 P
14 Otter Trawl, Ruhle OPEN all NE sm 0 0 P
15 Otter Trawl, Ruhle OPEN all NE lg 652 606 46 0.618
16 Otter Trawl, Haddock Separator OPEN all MA lg 0 0 0
17 Otter Trawl, Haddock Separator OPEN all NE lg 26,710 23,325 3,385 0.267
18 Shrimp Trawl OPEN all MA all 794,958 0 794,958 0.000 P
19 Shrimp Trawl OPEN all NE all 15,297 50 15,247 0.508
21 Floating Trap OPEN all NE all 0 0 P
22 Sink, Anchor, Drift Gillnet OPEN all MA sm 0 0 0
23 Sink, Anchor, Drift Gillnet OPEN all MA lg 0 0 0
24 Sink, Anchor, Drift Gillnet OPEN all MA xlg 3 3 0
25 Sink, Anchor, Drift Gillnet OPEN all NE sm 0 0 P
26 Sink, Anchor, Drift Gillnet OPEN all NE lg 9,059 8,294 765 0.103
27 Sink, Anchor, Drift Gillnet OPEN all NE xlg 26,122 25,963 159 0.270
28 Purse Seine OPEN all MA all 0 0 P
29 Purse Seine OPEN all NE all 0 0 0
30 Scallop Dredge AA GEN MA all 8 0 8 0.136 P
31 Scallop Dredge AA GEN NE all 4 0 4 0.917
32 Scallop Dredge AA LIM MA all 1,108 0 1,108 0.494
33 Scallop Dredge AA LIM NE all 974 0 974 0.407
34 Scallop Dredge OPEN GEN MA all 376 0 376 0.674

Table 4B, continued. Total catch (live pounds), Vessel Trip Report landings (kept; live pounds), estimated discards (live pounds) and associated coefficient of variation (CV) for the 23 individual species that comprise the 14 species groups, by fleet for July 2010 through June 2011. Dark shading indicates fleets with no NEFOP trips in the annual analysis. Light shading indicates that the variance of the discard estimate was not used in the annual sample size analysis. Blank CV indicates either no discards or discards equal 0. “P” indicates fleets with “pilot” designation. Species: WITCH FLOUNDER
See supporting text for abbreviations. 72
Row Gear Type Access Trip Region MeshArea Category Group Total Kept Discarded CV Pilot
35 Scallop Dredge OPEN GEN NE all 321 0 321 0.736
36 Scallop Dredge OPEN LIM MA all 7,933 0 7,933 0.313
37 Scallop Dredge OPEN LIM NE all 11,895 0 11,895 0.306
38 Mid-water Paired & Single Trawl OPEN all MA all 0 0 0
39 Mid-water Paired & Single Trawl OPEN all NE all 7 0 7 0.386
40 Pots and Traps, Fish OPEN all MA all 0 0 P
41 Pots and Traps, Fish OPEN all NE all 0 0 P
42 Pots and Traps, Conch OPEN all MA all 0 0 P
43 Pots and Traps, Conch OPEN all NE all 0 0 P
45 Pots and Traps, Hagfish OPEN all NE all 0 0 P
46 Pots and Traps, Shrimp OPEN all NE all 0 0 P
47 Pots and Traps, Lobster OPEN all MA all 0 0 P
48 Pots and Traps, Lobster OPEN all NE all 0 0 P
49 Pots and Traps, Crab OPEN all MA all 0 0 P
50 Pots and Traps, Crab OPEN all NE all 0 0 P
51 Beam Trawl OPEN all MA all 0 0 P
52 Beam Trawl OPEN all NE all 15 15 P
53 Dredge, Other OPEN all MA all 0 0 P
54 Ocean Quahog/Surf Clam Dredge OPEN all MA all 0 0 P
55 Ocean Quahog/Surf Clam Dredge OPEN all NE all 0 0 P
Other fleets 4 4
TOTAL 2,726,908 1,499,647 1,227,261 0.079
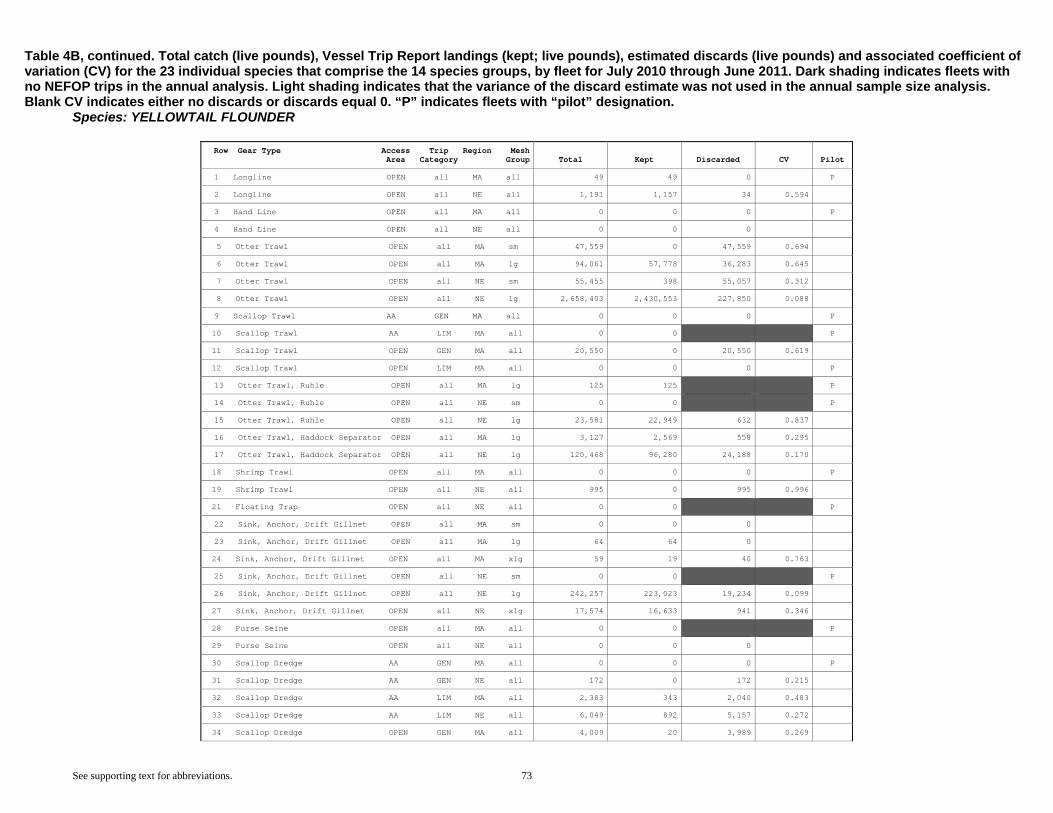
Table 4B, continued. Total catch (live pounds), Vessel Trip Report landings (kept; live pounds), estimated discards (live pounds) and associated coefficient of variation (CV) for the 23 individual species that comprise the 14 species groups, by fleet for July 2010 through June 2011. Dark shading indicates fleets with no NEFOP trips in the annual analysis. Light shading indicates that the variance of the discard estimate was not used in the annual sample size analysis. Blank CV indicates either no discards or discards equal 0. “P” indicates fleets with “pilot” designation. Species: YELLOWTAIL FLOUNDER
See supporting text for abbreviations. 73
Row Gear Type Access Trip Region MeshArea Category Group Total Kept Discarded CV Pilot
1 Longline OPEN all MA all 49 49 0 P
2 Longline OPEN all NE all 1,191 1,157 34 0.594
3 Hand Line OPEN all MA all 0 0 0 P
4 Hand Line OPEN all NE all 0 0 0
5 Otter Trawl OPEN all MA sm 47,559 0 47,559 0.694
6 Otter Trawl OPEN all MA lg 94,061 57,778 36,283 0.645
7 Otter Trawl OPEN all NE sm 55,455 398 55,057 0.312
8 Otter Trawl OPEN all NE lg 2,658,403 2,430,553 227,850 0.088
9 Scallop Trawl AA GEN MA all 0 0 0 P
10 Scallop Trawl AA LIM MA all 0 0 P
11 Scallop Trawl OPEN GEN MA all 20,550 0 20,550 0.619
12 Scallop Trawl OPEN LIM MA all 0 0 0 P
13 Otter Trawl, Ruhle OPEN all MA lg 125 125 P
14 Otter Trawl, Ruhle OPEN all NE sm 0 0 P
15 Otter Trawl, Ruhle OPEN all NE lg 23,581 22,949 632 0.837
16 Otter Trawl, Haddock Separator OPEN all MA lg 3,127 2,569 558 0.295
17 Otter Trawl, Haddock Separator OPEN all NE lg 120,468 96,280 24,188 0.170
18 Shrimp Trawl OPEN all MA all 0 0 0 P
19 Shrimp Trawl OPEN all NE all 995 0 995 0.996
21 Floating Trap OPEN all NE all 0 0 P
22 Sink, Anchor, Drift Gillnet OPEN all MA sm 0 0 0
23 Sink, Anchor, Drift Gillnet OPEN all MA lg 64 64 0
24 Sink, Anchor, Drift Gillnet OPEN all MA xlg 59 19 40 0.763
25 Sink, Anchor, Drift Gillnet OPEN all NE sm 0 0 P
26 Sink, Anchor, Drift Gillnet OPEN all NE lg 242,257 223,023 19,234 0.099
27 Sink, Anchor, Drift Gillnet OPEN all NE xlg 17,574 16,633 941 0.346
28 Purse Seine OPEN all MA all 0 0 P
29 Purse Seine OPEN all NE all 0 0 0
30 Scallop Dredge AA GEN MA all 0 0 0 P
31 Scallop Dredge AA GEN NE all 172 0 172 0.215
32 Scallop Dredge AA LIM MA all 2,383 343 2,040 0.483
33 Scallop Dredge AA LIM NE all 6,049 892 5,157 0.272
34 Scallop Dredge OPEN GEN MA all 4,009 20 3,989 0.269

Table 4B, continued. Total catch (live pounds), Vessel Trip Report landings (kept; live pounds), estimated discards (live pounds) and associated coefficient of variation (CV) for the 23 individual species that comprise the 14 species groups, by fleet for July 2010 through June 2011. Dark shading indicates fleets with no NEFOP trips in the annual analysis. Light shading indicates that the variance of the discard estimate was not used in the annual sample size analysis. Blank CV indicates either no discards or discards equal 0. “P” indicates fleets with “pilot” designation. Species: YELLOWTAIL FLOUNDER
See supporting text for abbreviations. 74
Row Gear Type Access Trip Region MeshArea Category Group Total Kept Discarded CV Pilot
35 Scallop Dredge OPEN GEN NE all 34,761 16 34,745 0.824
36 Scallop Dredge OPEN LIM MA all 62,334 827 61,507 0.332
37 Scallop Dredge OPEN LIM NE all 211,889 4,129 207,760 0.207
38 Mid-water Paired & Single Trawl OPEN all MA all 0 0 0
39 Mid-water Paired & Single Trawl OPEN all NE all 4 0 4 0.559
40 Pots and Traps, Fish OPEN all MA all 0 0 P
41 Pots and Traps, Fish OPEN all NE all 0 0 P
42 Pots and Traps, Conch OPEN all MA all 0 0 P
43 Pots and Traps, Conch OPEN all NE all 0 0 P
45 Pots and Traps, Hagfish OPEN all NE all 0 0 P
46 Pots and Traps, Shrimp OPEN all NE all 0 0 P
47 Pots and Traps, Lobster OPEN all MA all 0 0 P
48 Pots and Traps, Lobster OPEN all NE all 5 5 P
49 Pots and Traps, Crab OPEN all MA all 0 0 P
50 Pots and Traps, Crab OPEN all NE all 0 0 P
51 Beam Trawl OPEN all MA all 0 0 P
52 Beam Trawl OPEN all NE all 1,767 1,767 P
53 Dredge, Other OPEN all MA all 0 0 P
54 Ocean Quahog/Surf Clam Dredge OPEN all MA all 0 0 P
55 Ocean Quahog/Surf Clam Dredge OPEN all NE all 0 0 P
Other fleets 330 330
TOTAL 3,609,221 2,859,926 749,295 0.100

Table 4B, continued. Total catch (live pounds), Vessel Trip Report landings (kept; live pounds), estimated discards (live pounds) and associated coefficient of variation (CV) for the 23 individual species that comprise the 14 species groups, by fleet for July 2010 through June 2011. Dark shading indicates fleets with no NEFOP trips in the annual analysis. Light shading indicates that the variance of the discard estimate was not used in the annual sample size analysis. Blank CV indicates either no discards or discards equal 0. “P” indicates fleets with “pilot” designation. Species: OFFSHORE HAKE
See supporting text for abbreviations. 75
Row Gear Type Access Trip Region MeshArea Category Group Total Kept Discarded CV Pilot
1 Longline OPEN all MA all 24 24 0 P
2 Longline OPEN all NE all 5 0 5 0.894
3 Hand Line OPEN all MA all 0 0 0 P
4 Hand Line OPEN all NE all 45 45 0
5 Otter Trawl OPEN all MA sm 32,878 31,816 1,062 0.483
6 Otter Trawl OPEN all MA lg 11,256 1,243 10,013 1.405
7 Otter Trawl OPEN all NE sm 157,526 151,547 5,979 0.467
8 Otter Trawl OPEN all NE lg 3,756 1,367 2,389 0.372
9 Scallop Trawl AA GEN MA all 0 0 0 P
10 Scallop Trawl AA LIM MA all 0 0 P
11 Scallop Trawl OPEN GEN MA all 0 0 0
12 Scallop Trawl OPEN LIM MA all 0 0 0 P
13 Otter Trawl, Ruhle OPEN all MA lg 0 0 P
14 Otter Trawl, Ruhle OPEN all NE sm 0 0 P
15 Otter Trawl, Ruhle OPEN all NE lg 0 0 0
16 Otter Trawl, Haddock Separator OPEN all MA lg 0 0 0
17 Otter Trawl, Haddock Separator OPEN all NE lg 16 0 16 0.639
18 Shrimp Trawl OPEN all MA all 0 0 0 P
19 Shrimp Trawl OPEN all NE all 0 0 0
21 Floating Trap OPEN all NE all 0 0 P
22 Sink, Anchor, Drift Gillnet OPEN all MA sm 6 6 0
23 Sink, Anchor, Drift Gillnet OPEN all MA lg 0 0 0
24 Sink, Anchor, Drift Gillnet OPEN all MA xlg 0 0 0
25 Sink, Anchor, Drift Gillnet OPEN all NE sm 0 0 P
26 Sink, Anchor, Drift Gillnet OPEN all NE lg 39 5 34 0.413
27 Sink, Anchor, Drift Gillnet OPEN all NE xlg 0 0 0
28 Purse Seine OPEN all MA all 0 0 P
29 Purse Seine OPEN all NE all 0 0 0
30 Scallop Dredge AA GEN MA all 0 0 0 P
31 Scallop Dredge AA GEN NE all 0 0 0
32 Scallop Dredge AA LIM MA all 26 0 26 0.703
33 Scallop Dredge AA LIM NE all 59 0 59 0.581
34 Scallop Dredge OPEN GEN MA all 64 0 64 0.841

Table 4B, continued. Total catch (live pounds), Vessel Trip Report landings (kept; live pounds), estimated discards (live pounds) and associated coefficient of variation (CV) for the 23 individual species that comprise the 14 species groups, by fleet for July 2010 through June 2011. Dark shading indicates fleets with no NEFOP trips in the annual analysis. Light shading indicates that the variance of the discard estimate was not used in the annual sample size analysis. Blank CV indicates either no discards or discards equal 0. “P” indicates fleets with “pilot” designation. Species: OFFSHORE HAKE
See supporting text for abbreviations. 76
Row Gear Type Access Trip Region MeshArea Category Group Total Kept Discarded CV Pilot
35 Scallop Dredge OPEN GEN NE all 0 0 0
36 Scallop Dredge OPEN LIM MA all 3,925 0 3,925 0.909
37 Scallop Dredge OPEN LIM NE all 777 0 777 0.926
38 Mid-water Paired & Single Trawl OPEN all MA all 0 0 0
39 Mid-water Paired & Single Trawl OPEN all NE all 0 0 0
40 Pots and Traps, Fish OPEN all MA all 0 0 P
41 Pots and Traps, Fish OPEN all NE all 0 0 P
42 Pots and Traps, Conch OPEN all MA all 0 0 P
43 Pots and Traps, Conch OPEN all NE all 0 0 P
45 Pots and Traps, Hagfish OPEN all NE all 0 0 P
46 Pots and Traps, Shrimp OPEN all NE all 0 0 P
47 Pots and Traps, Lobster OPEN all MA all 0 0 P
48 Pots and Traps, Lobster OPEN all NE all 0 0 P
49 Pots and Traps, Crab OPEN all MA all 0 0 P
50 Pots and Traps, Crab OPEN all NE all 0 0 P
51 Beam Trawl OPEN all MA all 0 0 P
52 Beam Trawl OPEN all NE all 0 0 P
53 Dredge, Other OPEN all MA all 0 0 P
54 Ocean Quahog/Surf Clam Dredge OPEN all MA all 0 0 P
55 Ocean Quahog/Surf Clam Dredge OPEN all NE all 0 0 P
Other fleets 0 0
TOTAL 210,403 186,053 24,350 0.609

Table 4B, continued. Total catch (live pounds), Vessel Trip Report landings (kept; live pounds), estimated discards (live pounds) and associated coefficient of variation (CV) for the 23 individual species that comprise the 14 species groups, by fleet for July 2010 through June 2011. Dark shading indicates fleets with no NEFOP trips in the annual analysis. Light shading indicates that the variance of the discard estimate was not used in the annual sample size analysis. Blank CV indicates either no discards or discards equal 0. “P” indicates fleets with “pilot” designation. Species: RED HAKE
See supporting text for abbreviations. 77
Row Gear Type Access Trip Region MeshArea Category Group Total Kept Discarded CV Pilot
1 Longline OPEN all MA all 0 0 0 P
2 Longline OPEN all NE all 9,615 12 9,603 0.140
3 Hand Line OPEN all MA all 2,485 2,485 0 P
4 Hand Line OPEN all NE all 13 13 0
5 Otter Trawl OPEN all MA sm 1,417,845 571,479 846,366 0.342
6 Otter Trawl OPEN all MA lg 48,114 31,927 16,187 0.946
7 Otter Trawl OPEN all NE sm 1,820,131 684,643 1,135,488 0.278
8 Otter Trawl OPEN all NE lg 119,777 32,815 86,962 0.084
9 Scallop Trawl AA GEN MA all 0 0 0 0.340 P
10 Scallop Trawl AA LIM MA all 0 0 P
11 Scallop Trawl OPEN GEN MA all 2,195 0 2,195 0.600
12 Scallop Trawl OPEN LIM MA all 0 0 0 P
13 Otter Trawl, Ruhle OPEN all MA lg 0 0 P
14 Otter Trawl, Ruhle OPEN all NE sm 0 0 P
15 Otter Trawl, Ruhle OPEN all NE lg 142 0 142 0.244
16 Otter Trawl, Haddock Separator OPEN all MA lg 0 0 0
17 Otter Trawl, Haddock Separator OPEN all NE lg 5,112 0 5,112 0.215
18 Shrimp Trawl OPEN all MA all 0 0 0 P
19 Shrimp Trawl OPEN all NE all 36,715 1,300 35,415 0.333
21 Floating Trap OPEN all NE all 0 0 P
22 Sink, Anchor, Drift Gillnet OPEN all MA sm 350 350 0
23 Sink, Anchor, Drift Gillnet OPEN all MA lg 0 0 0
24 Sink, Anchor, Drift Gillnet OPEN all MA xlg 5 2 3 0.851
25 Sink, Anchor, Drift Gillnet OPEN all NE sm 0 0 P
26 Sink, Anchor, Drift Gillnet OPEN all NE lg 3,152 988 2,164 0.079
27 Sink, Anchor, Drift Gillnet OPEN all NE xlg 386 245 141 0.328
28 Purse Seine OPEN all MA all 0 0 P
29 Purse Seine OPEN all NE all 0 0 0
30 Scallop Dredge AA GEN MA all 0 0 0 P
31 Scallop Dredge AA GEN NE all 8 0 8 0.381
32 Scallop Dredge AA LIM MA all 16,871 0 16,871 0.643
33 Scallop Dredge AA LIM NE all 6,212 0 6,212 0.331
34 Scallop Dredge OPEN GEN MA all 3,361 0 3,361 0.610

Table 4B, continued. Total catch (live pounds), Vessel Trip Report landings (kept; live pounds), estimated discards (live pounds) and associated coefficient of variation (CV) for the 23 individual species that comprise the 14 species groups, by fleet for July 2010 through June 2011. Dark shading indicates fleets with no NEFOP trips in the annual analysis. Light shading indicates that the variance of the discard estimate was not used in the annual sample size analysis. Blank CV indicates either no discards or discards equal 0. “P” indicates fleets with “pilot” designation. Species: RED HAKE
See supporting text for abbreviations. 78
Row Gear Type Access Trip Region MeshArea Category Group Total Kept Discarded CV Pilot
35 Scallop Dredge OPEN GEN NE all 4,262 0 4,262 1.538
36 Scallop Dredge OPEN LIM MA all 25,392 0 25,392 0.232
37 Scallop Dredge OPEN LIM NE all 59,591 0 59,591 0.376
38 Mid-water Paired & Single Trawl OPEN all MA all 0 0 0
39 Mid-water Paired & Single Trawl OPEN all NE all 13 0 13 0.539
40 Pots and Traps, Fish OPEN all MA all 2,018 2,018 P
41 Pots and Traps, Fish OPEN all NE all 72 72 P
42 Pots and Traps, Conch OPEN all MA all 10 10 P
43 Pots and Traps, Conch OPEN all NE all 0 0 P
45 Pots and Traps, Hagfish OPEN all NE all 0 0 P
46 Pots and Traps, Shrimp OPEN all NE all 0 0 P
47 Pots and Traps, Lobster OPEN all MA all 18,927 18,927 P
48 Pots and Traps, Lobster OPEN all NE all 5,371 5,371 P
49 Pots and Traps, Crab OPEN all MA all 0 0 P
50 Pots and Traps, Crab OPEN all NE all 0 0 P
51 Beam Trawl OPEN all MA all 0 0 P
52 Beam Trawl OPEN all NE all 0 0 P
53 Dredge, Other OPEN all MA all 0 0 P
54 Ocean Quahog/Surf Clam Dredge OPEN all MA all 0 0 P
55 Ocean Quahog/Surf Clam Dredge OPEN all NE all 0 0 P
Other fleets 0 0
TOTAL 3,608,145 1,352,657 2,255,488 0.191
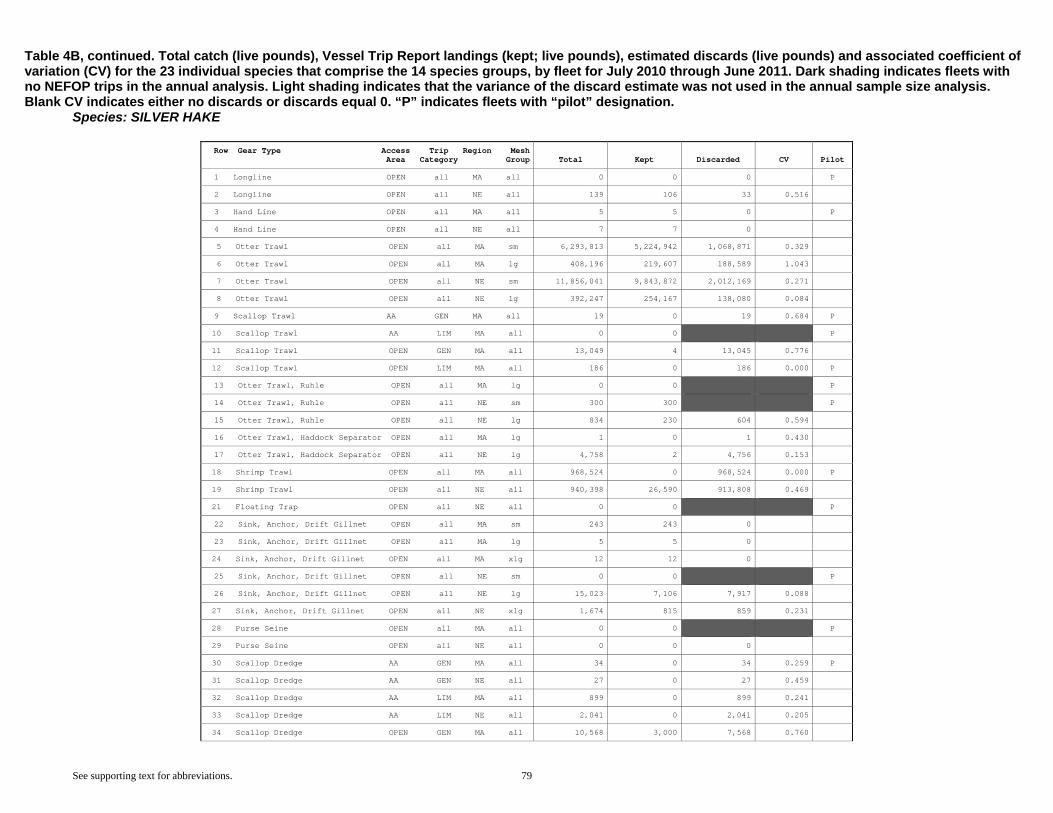
Table 4B, continued. Total catch (live pounds), Vessel Trip Report landings (kept; live pounds), estimated discards (live pounds) and associated coefficient of variation (CV) for the 23 individual species that comprise the 14 species groups, by fleet for July 2010 through June 2011. Dark shading indicates fleets with no NEFOP trips in the annual analysis. Light shading indicates that the variance of the discard estimate was not used in the annual sample size analysis. Blank CV indicates either no discards or discards equal 0. “P” indicates fleets with “pilot” designation. Species: SILVER HAKE
See supporting text for abbreviations. 79
Row Gear Type Access Trip Region MeshArea Category Group Total Kept Discarded CV Pilot
1 Longline OPEN all MA all 0 0 0 P
2 Longline OPEN all NE all 139 106 33 0.516
3 Hand Line OPEN all MA all 5 5 0 P
4 Hand Line OPEN all NE all 7 7 0
5 Otter Trawl OPEN all MA sm 6,293,813 5,224,942 1,068,871 0.329
6 Otter Trawl OPEN all MA lg 408,196 219,607 188,589 1.043
7 Otter Trawl OPEN all NE sm 11,856,041 9,843,872 2,012,169 0.271
8 Otter Trawl OPEN all NE lg 392,247 254,167 138,080 0.084
9 Scallop Trawl AA GEN MA all 19 0 19 0.684 P
10 Scallop Trawl AA LIM MA all 0 0 P
11 Scallop Trawl OPEN GEN MA all 13,049 4 13,045 0.776
12 Scallop Trawl OPEN LIM MA all 186 0 186 0.000 P
13 Otter Trawl, Ruhle OPEN all MA lg 0 0 P
14 Otter Trawl, Ruhle OPEN all NE sm 300 300 P
15 Otter Trawl, Ruhle OPEN all NE lg 834 230 604 0.594
16 Otter Trawl, Haddock Separator OPEN all MA lg 1 0 1 0.430
17 Otter Trawl, Haddock Separator OPEN all NE lg 4,758 2 4,756 0.153
18 Shrimp Trawl OPEN all MA all 968,524 0 968,524 0.000 P
19 Shrimp Trawl OPEN all NE all 940,398 26,590 913,808 0.469
21 Floating Trap OPEN all NE all 0 0 P
22 Sink, Anchor, Drift Gillnet OPEN all MA sm 243 243 0
23 Sink, Anchor, Drift Gillnet OPEN all MA lg 5 5 0
24 Sink, Anchor, Drift Gillnet OPEN all MA xlg 12 12 0
25 Sink, Anchor, Drift Gillnet OPEN all NE sm 0 0 P
26 Sink, Anchor, Drift Gillnet OPEN all NE lg 15,023 7,106 7,917 0.088
27 Sink, Anchor, Drift Gillnet OPEN all NE xlg 1,674 815 859 0.231
28 Purse Seine OPEN all MA all 0 0 P
29 Purse Seine OPEN all NE all 0 0 0
30 Scallop Dredge AA GEN MA all 34 0 34 0.259 P
31 Scallop Dredge AA GEN NE all 27 0 27 0.459
32 Scallop Dredge AA LIM MA all 899 0 899 0.241
33 Scallop Dredge AA LIM NE all 2,041 0 2,041 0.205
34 Scallop Dredge OPEN GEN MA all 10,568 3,000 7,568 0.760

Table 4B, continued. Total catch (live pounds), Vessel Trip Report landings (kept; live pounds), estimated discards (live pounds) and associated coefficient of variation (CV) for the 23 individual species that comprise the 14 species groups, by fleet for July 2010 through June 2011. Dark shading indicates fleets with no NEFOP trips in the annual analysis. Light shading indicates that the variance of the discard estimate was not used in the annual sample size analysis. Blank CV indicates either no discards or discards equal 0. “P” indicates fleets with “pilot” designation. Species: SILVER HAKE
See supporting text for abbreviations. 80
Row Gear Type Access Trip Region MeshArea Category Group Total Kept Discarded CV Pilot
35 Scallop Dredge OPEN GEN NE all 220 0 220 0.563
36 Scallop Dredge OPEN LIM MA all 17,664 0 17,664 0.271
37 Scallop Dredge OPEN LIM NE all 44,725 0 44,725 0.217
38 Mid-water Paired & Single Trawl OPEN all MA all 0 0 0
39 Mid-water Paired & Single Trawl OPEN all NE all 10,548 10,373 175 0.409
40 Pots and Traps, Fish OPEN all MA all 57 57 P
41 Pots and Traps, Fish OPEN all NE all 10,000 10,000 P
42 Pots and Traps, Conch OPEN all MA all 0 0 P
43 Pots and Traps, Conch OPEN all NE all 0 0 P
45 Pots and Traps, Hagfish OPEN all NE all 0 0 P
46 Pots and Traps, Shrimp OPEN all NE all 0 0 P
47 Pots and Traps, Lobster OPEN all MA all 0 0 P
48 Pots and Traps, Lobster OPEN all NE all 0 0 P
49 Pots and Traps, Crab OPEN all MA all 0 0 P
50 Pots and Traps, Crab OPEN all NE all 0 0 P
51 Beam Trawl OPEN all MA all 0 0 P
52 Beam Trawl OPEN all NE all 0 0 P
53 Dredge, Other OPEN all MA all 0 0 P
54 Ocean Quahog/Surf Clam Dredge OPEN all MA all 0 0 P
55 Ocean Quahog/Surf Clam Dredge OPEN all NE all 0 0 P
Other fleets 40 40
TOTAL 20,992,296 15,601,483 5,390,813 0.149

Table 4B, continued. Total catch (live pounds), Vessel Trip Report landings (kept; live pounds), estimated discards (live pounds) and associated coefficient of variation (CV) for the 23 individual species that comprise the 14 species groups, by fleet for July 2010 through June 2011 Dark shading indicates fleets with no NEFOP trips in the annual analysis. Light shading indicates that the variance of the discard estimate was not used in the annual sample size analysis. Blank CV indicates either no discards or discards equal 0. “P” indicates fleets with “pilot” designation. Species: ATLANTIC MACKEREL
See supporting text for abbreviations. 81
Row Gear Type Access Trip Region MeshArea Category Group Total Kept Discarded CV Pilot
1 Longline OPEN all MA all 0 0 0 P
2 Longline OPEN all NE all 0 0 0
3 Hand Line OPEN all MA all 1,462 1,462 0 P
4 Hand Line OPEN all NE all 1,822 1,822 0
5 Otter Trawl OPEN all MA sm 410,346 382,736 27,610 0.448
6 Otter Trawl OPEN all MA lg 11,447 7,996 3,451 1.159
7 Otter Trawl OPEN all NE sm 308,257 228,221 80,036 0.415
8 Otter Trawl OPEN all NE lg 3,049 1,893 1,156 0.234
9 Scallop Trawl AA GEN MA all 0 0 0 P
10 Scallop Trawl AA LIM MA all 0 0 P
11 Scallop Trawl OPEN GEN MA all 0 0 0
12 Scallop Trawl OPEN LIM MA all 0 0 0 P
13 Otter Trawl, Ruhle OPEN all MA lg 0 0 P
14 Otter Trawl, Ruhle OPEN all NE sm 0 0 P
15 Otter Trawl, Ruhle OPEN all NE lg 337 0 337 0.647
16 Otter Trawl, Haddock Separator OPEN all MA lg 0 0 0
17 Otter Trawl, Haddock Separator OPEN all NE lg 37 0 37 0.461
18 Shrimp Trawl OPEN all MA all 0 0 0 P
19 Shrimp Trawl OPEN all NE all 638 25 613 0.646
21 Floating Trap OPEN all NE all 29,357 29,357 P
22 Sink, Anchor, Drift Gillnet OPEN all MA sm 5,241 5,241 0
23 Sink, Anchor, Drift Gillnet OPEN all MA lg 279 279 0
24 Sink, Anchor, Drift Gillnet OPEN all MA xlg 2,913 2,432 481 0.520
25 Sink, Anchor, Drift Gillnet OPEN all NE sm 0 0 P
26 Sink, Anchor, Drift Gillnet OPEN all NE lg 3,418 1,438 1,980 0.172
27 Sink, Anchor, Drift Gillnet OPEN all NE xlg 476 401 75 0.331
28 Purse Seine OPEN all MA all 0 0 P
29 Purse Seine OPEN all NE all 0 0 0
30 Scallop Dredge AA GEN MA all 0 0 0 P
31 Scallop Dredge AA GEN NE all 0 0 0
32 Scallop Dredge AA LIM MA all 2 0 2 0.933
33 Scallop Dredge AA LIM NE all 22 0 22 0.497
34 Scallop Dredge OPEN GEN MA all 0 0 0

Table 4B, continued. Total catch (live pounds), Vessel Trip Report landings (kept; live pounds), estimated discards (live pounds) and associated coefficient of variation (CV) for the 23 individual species that comprise the 14 species groups, by fleet for July 2010 through June 2011 Dark shading indicates fleets with no NEFOP trips in the annual analysis. Light shading indicates that the variance of the discard estimate was not used in the annual sample size analysis. Blank CV indicates either no discards or discards equal 0. “P” indicates fleets with “pilot” designation. Species: ATLANTIC MACKEREL
See supporting text for abbreviations. 82
Row Gear Type Access Trip Region MeshArea Category Group Total Kept Discarded CV Pilot
35 Scallop Dredge OPEN GEN NE all 0 0 0
36 Scallop Dredge OPEN LIM MA all 26 0 26 0.703
37 Scallop Dredge OPEN LIM NE all 1 0 1 1.030
38 Mid-water Paired & Single Trawl OPEN all MA all 47,132 47,132 0 1.103
39 Mid-water Paired & Single Trawl OPEN all NE all 412,191 402,103 10,088 0.626
40 Pots and Traps, Fish OPEN all MA all 0 0 P
41 Pots and Traps, Fish OPEN all NE all 0 0 P
42 Pots and Traps, Conch OPEN all MA all 0 0 P
43 Pots and Traps, Conch OPEN all NE all 0 0 P
45 Pots and Traps, Hagfish OPEN all NE all 0 0 P
46 Pots and Traps, Shrimp OPEN all NE all 0 0 P
47 Pots and Traps, Lobster OPEN all MA all 0 0 P
48 Pots and Traps, Lobster OPEN all NE all 0 0 P
49 Pots and Traps, Crab OPEN all MA all 0 0 P
50 Pots and Traps, Crab OPEN all NE all 0 0 P
51 Beam Trawl OPEN all MA all 0 0 P
52 Beam Trawl OPEN all NE all 0 0 P
53 Dredge, Other OPEN all MA all 0 0 P
54 Ocean Quahog/Surf Clam Dredge OPEN all MA all 0 0 P
55 Ocean Quahog/Surf Clam Dredge OPEN all NE all 0 0 P
Other fleets 0 0
TOTAL 1,238,454 1,112,538 125,916 0.288

Table 4B, continued. Total catch (live pounds), Vessel Trip Report landings (kept; live pounds), estimated discards (live pounds) and associated coefficient of variation (CV) for the 23 individual species that comprise the 14 species groups, by fleet for July 2010 through June 2011 Dark shading indicates fleets with no NEFOP trips in the annual analysis. Light shading indicates that the variance of the discard estimate was not used in the annual sample size analysis. Blank CV indicates either no discards or discards equal 0. “P” indicates fleets with “pilot” designation. Species: BUTTERFISH
See supporting text for abbreviations. 83
Row Gear Type Access Trip Region MeshArea Category Group Total Kept Discarded CV Pilot
1 Longline OPEN all MA all 0 0 0 P
2 Longline OPEN all NE all 0 0 0
3 Hand Line OPEN all MA all 251 251 0 P
4 Hand Line OPEN all NE all 2 2 0
5 Otter Trawl OPEN all MA sm 1,495,697 482,965 1,012,732 0.289
6 Otter Trawl OPEN all MA lg 107,474 59,016 48,458 1.277
7 Otter Trawl OPEN all NE sm 2,566,142 630,111 1,936,031 0.246
8 Otter Trawl OPEN all NE lg 104,096 100,830 3,266 0.142
9 Scallop Trawl AA GEN MA all 0 0 0 P
10 Scallop Trawl AA LIM MA all 0 0 P
11 Scallop Trawl OPEN GEN MA all 1,451 3 1,448 0.581
12 Scallop Trawl OPEN LIM MA all 19 19 0 P
13 Otter Trawl, Ruhle OPEN all MA lg 0 0 P
14 Otter Trawl, Ruhle OPEN all NE sm 0 0 P
15 Otter Trawl, Ruhle OPEN all NE lg 4 0 4 0.651
16 Otter Trawl, Haddock Separator OPEN all MA lg 0 0 0
17 Otter Trawl, Haddock Separator OPEN all NE lg 126 0 126 0.315
18 Shrimp Trawl OPEN all MA all 1,074 1,074 0 P
19 Shrimp Trawl OPEN all NE all 2,492 1,050 1,442 0.513
21 Floating Trap OPEN all NE all 1,208 1,208 P
22 Sink, Anchor, Drift Gillnet OPEN all MA sm 9,245 9,132 113 0.606
23 Sink, Anchor, Drift Gillnet OPEN all MA lg 110 110 0
24 Sink, Anchor, Drift Gillnet OPEN all MA xlg 127 112 15 0.855
25 Sink, Anchor, Drift Gillnet OPEN all NE sm 0 0 P
26 Sink, Anchor, Drift Gillnet OPEN all NE lg 109 47 62 0.631
27 Sink, Anchor, Drift Gillnet OPEN all NE xlg 76 0 76 0.865
28 Purse Seine OPEN all MA all 0 0 P
29 Purse Seine OPEN all NE all 2 0 2 1.193
30 Scallop Dredge AA GEN MA all 0 0 0 P
31 Scallop Dredge AA GEN NE all 0 0 0
32 Scallop Dredge AA LIM MA all 53 8 45 0.737
33 Scallop Dredge AA LIM NE all 153 0 153 0.771
34 Scallop Dredge OPEN GEN MA all 0 0 0
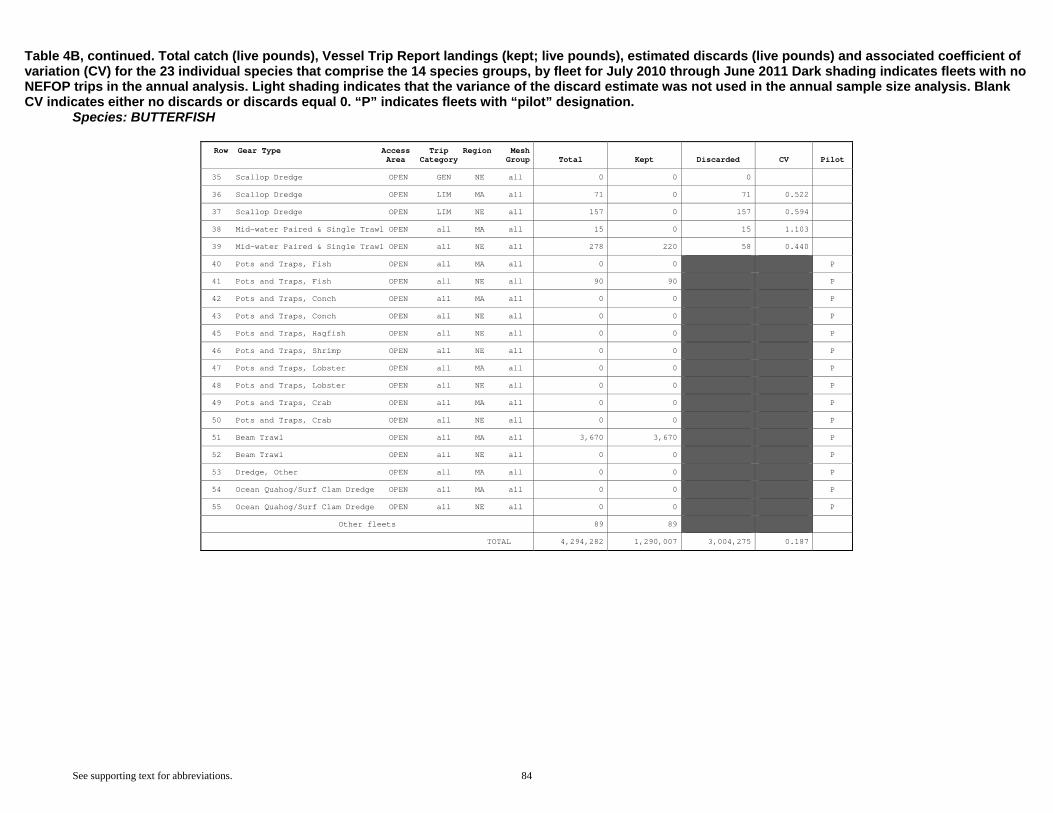
Table 4B, continued. Total catch (live pounds), Vessel Trip Report landings (kept; live pounds), estimated discards (live pounds) and associated coefficient of variation (CV) for the 23 individual species that comprise the 14 species groups, by fleet for July 2010 through June 2011 Dark shading indicates fleets with no NEFOP trips in the annual analysis. Light shading indicates that the variance of the discard estimate was not used in the annual sample size analysis. Blank CV indicates either no discards or discards equal 0. “P” indicates fleets with “pilot” designation. Species: BUTTERFISH
See supporting text for abbreviations. 84
Row Gear Type Access Trip Region MeshArea Category Group Total Kept Discarded CV Pilot
35 Scallop Dredge OPEN GEN NE all 0 0 0
36 Scallop Dredge OPEN LIM MA all 71 0 71 0.522
37 Scallop Dredge OPEN LIM NE all 157 0 157 0.594
38 Mid-water Paired & Single Trawl OPEN all MA all 15 0 15 1.103
39 Mid-water Paired & Single Trawl OPEN all NE all 278 220 58 0.440
40 Pots and Traps, Fish OPEN all MA all 0 0 P
41 Pots and Traps, Fish OPEN all NE all 90 90 P
42 Pots and Traps, Conch OPEN all MA all 0 0 P
43 Pots and Traps, Conch OPEN all NE all 0 0 P
45 Pots and Traps, Hagfish OPEN all NE all 0 0 P
46 Pots and Traps, Shrimp OPEN all NE all 0 0 P
47 Pots and Traps, Lobster OPEN all MA all 0 0 P
48 Pots and Traps, Lobster OPEN all NE all 0 0 P
49 Pots and Traps, Crab OPEN all MA all 0 0 P
50 Pots and Traps, Crab OPEN all NE all 0 0 P
51 Beam Trawl OPEN all MA all 3,670 3,670 P
52 Beam Trawl OPEN all NE all 0 0 P
53 Dredge, Other OPEN all MA all 0 0 P
54 Ocean Quahog/Surf Clam Dredge OPEN all MA all 0 0 P
55 Ocean Quahog/Surf Clam Dredge OPEN all NE all 0 0 P
Other fleets 89 89
TOTAL 4,294,282 1,290,007 3,004,275 0.187

Table 4B, continued. Total catch (live pounds), Vessel Trip Report landings (kept; live pounds), estimated discards (live pounds) and associated coefficient of variation (CV) for the 23 individual species that comprise the 14 species groups, by fleet for July 2010 through June 2011. Dark shading indicates fleets with no NEFOP trips in the annual analysis. Light shading indicates that the variance of the discard estimate was not used in the annual sample size analysis. Blank CV indicates either no discards or discards equal 0. “P” indicates fleets with “pilot” designation. Species: ILLEX SQUID
See supporting text for abbreviations. 85
Row Gear Type Access Trip Region MeshArea Category Group Total Kept Discarded CV Pilot
1 Longline OPEN all MA all 0 0 0 P
2 Longline OPEN all NE all 0 0 0
3 Hand Line OPEN all MA all 0 0 0 P
4 Hand Line OPEN all NE all 1 1 0
5 Otter Trawl OPEN all MA sm 26,362,878 25,134,844 1,228,034 0.296
6 Otter Trawl OPEN all MA lg 4,270 748 3,522 1.405
7 Otter Trawl OPEN all NE sm 14,578,134 13,487,820 1,090,314 0.331
8 Otter Trawl OPEN all NE lg 265,418 225,381 40,037 0.126
9 Scallop Trawl AA GEN MA all 7 0 7 0.809 P
10 Scallop Trawl AA LIM MA all 0 0 P
11 Scallop Trawl OPEN GEN MA all 9 0 9 0.756
12 Scallop Trawl OPEN LIM MA all 0 0 0 P
13 Otter Trawl, Ruhle OPEN all MA lg 0 0 P
14 Otter Trawl, Ruhle OPEN all NE sm 166,500 166,500 P
15 Otter Trawl, Ruhle OPEN all NE lg 406 0 406 0.712
16 Otter Trawl, Haddock Separator OPEN all MA lg 0 0 0
17 Otter Trawl, Haddock Separator OPEN all NE lg 1,220 0 1,220 0.184
18 Shrimp Trawl OPEN all MA all 160,143 25,000 135,143 0.000 P
19 Shrimp Trawl OPEN all NE all 0 0 0
21 Floating Trap OPEN all NE all 0 0 P
22 Sink, Anchor, Drift Gillnet OPEN all MA sm 0 0 0
23 Sink, Anchor, Drift Gillnet OPEN all MA lg 0 0 0
24 Sink, Anchor, Drift Gillnet OPEN all MA xlg 0 0 0
25 Sink, Anchor, Drift Gillnet OPEN all NE sm 0 0 P
26 Sink, Anchor, Drift Gillnet OPEN all NE lg 6 0 6 0.635
27 Sink, Anchor, Drift Gillnet OPEN all NE xlg 0 0 0
28 Purse Seine OPEN all MA all 0 0 P
29 Purse Seine OPEN all NE all 0 0 0
30 Scallop Dredge AA GEN MA all 0 0 0 P
31 Scallop Dredge AA GEN NE all 0 0 0
32 Scallop Dredge AA LIM MA all 37 0 37 0.407
33 Scallop Dredge AA LIM NE all 24 0 24 0.477
34 Scallop Dredge OPEN GEN MA all 0 0 0

Table 4B, continued. Total catch (live pounds), Vessel Trip Report landings (kept; live pounds), estimated discards (live pounds) and associated coefficient of variation (CV) for the 23 individual species that comprise the 14 species groups, by fleet for July 2010 through June 2011. Dark shading indicates fleets with no NEFOP trips in the annual analysis. Light shading indicates that the variance of the discard estimate was not used in the annual sample size analysis. Blank CV indicates either no discards or discards equal 0. “P” indicates fleets with “pilot” designation. Species: ILLEX SQUID
See supporting text for abbreviations. 86
Row Gear Type Access Trip Region MeshArea Category Group Total Kept Discarded CV Pilot
35 Scallop Dredge OPEN GEN NE all 831 0 831 0.929
36 Scallop Dredge OPEN LIM MA all 1,114 0 1,114 0.562
37 Scallop Dredge OPEN LIM NE all 1,000 0 1,000 0.903
38 Mid-water Paired & Single Trawl OPEN all MA all 0 0 0
39 Mid-water Paired & Single Trawl OPEN all NE all 122 0 122 0.340
40 Pots and Traps, Fish OPEN all MA all 0 0 P
41 Pots and Traps, Fish OPEN all NE all 0 0 P
42 Pots and Traps, Conch OPEN all MA all 0 0 P
43 Pots and Traps, Conch OPEN all NE all 0 0 P
45 Pots and Traps, Hagfish OPEN all NE all 0 0 P
46 Pots and Traps, Shrimp OPEN all NE all 0 0 P
47 Pots and Traps, Lobster OPEN all MA all 0 0 P
48 Pots and Traps, Lobster OPEN all NE all 0 0 P
49 Pots and Traps, Crab OPEN all MA all 0 0 P
50 Pots and Traps, Crab OPEN all NE all 0 0 P
51 Beam Trawl OPEN all MA all 0 0 P
52 Beam Trawl OPEN all NE all 0 0 P
53 Dredge, Other OPEN all MA all 0 0 P
54 Ocean Quahog/Surf Clam Dredge OPEN all MA all 0 0 P
55 Ocean Quahog/Surf Clam Dredge OPEN all NE all 0 0 P
Other fleets 0 0
TOTAL 41,542,119 39,040,294 2,501,825 0.205
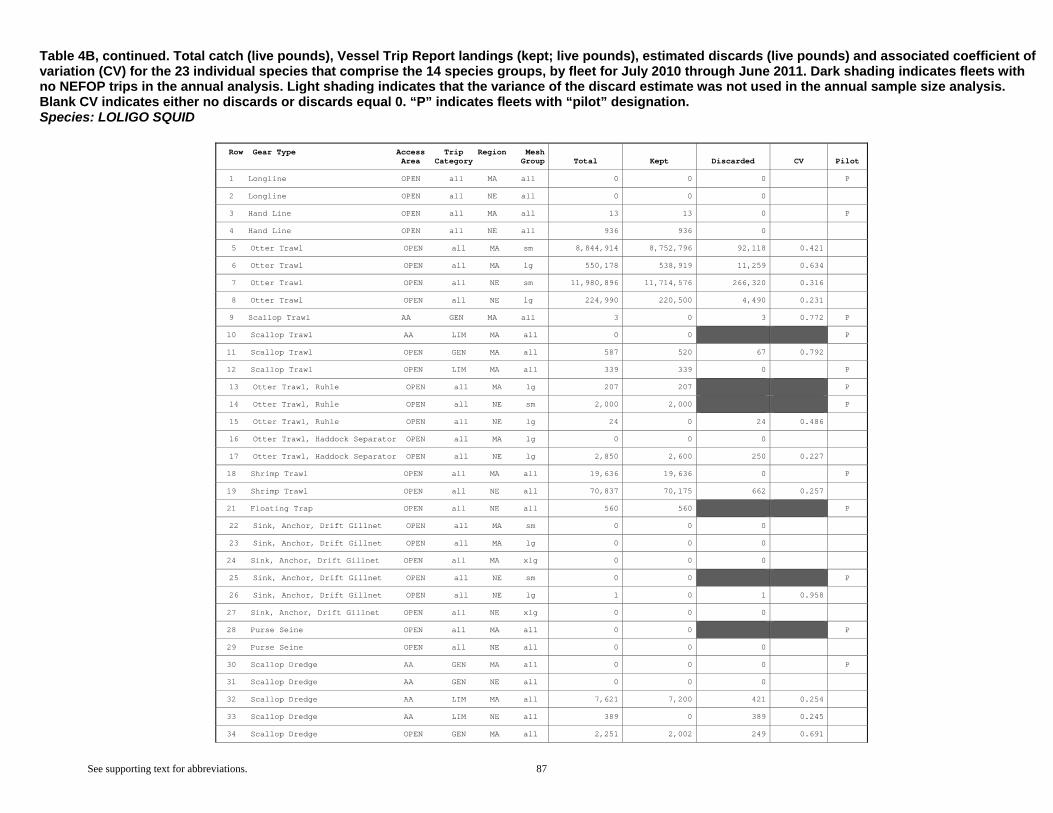
Table 4B, continued. Total catch (live pounds), Vessel Trip Report landings (kept; live pounds), estimated discards (live pounds) and associated coefficient of variation (CV) for the 23 individual species that comprise the 14 species groups, by fleet for July 2010 through June 2011. Dark shading indicates fleets with no NEFOP trips in the annual analysis. Light shading indicates that the variance of the discard estimate was not used in the annual sample size analysis. Blank CV indicates either no discards or discards equal 0. “P” indicates fleets with “pilot” designation. Species: LOLIGO SQUID
See supporting text for abbreviations. 87
Row Gear Type Access Trip Region MeshArea Category Group Total Kept Discarded CV Pilot
1 Longline OPEN all MA all 0 0 0 P
2 Longline OPEN all NE all 0 0 0
3 Hand Line OPEN all MA all 13 13 0 P
4 Hand Line OPEN all NE all 936 936 0
5 Otter Trawl OPEN all MA sm 8,844,914 8,752,796 92,118 0.421
6 Otter Trawl OPEN all MA lg 550,178 538,919 11,259 0.634
7 Otter Trawl OPEN all NE sm 11,980,896 11,714,576 266,320 0.316
8 Otter Trawl OPEN all NE lg 224,990 220,500 4,490 0.231
9 Scallop Trawl AA GEN MA all 3 0 3 0.772 P
10 Scallop Trawl AA LIM MA all 0 0 P
11 Scallop Trawl OPEN GEN MA all 587 520 67 0.792
12 Scallop Trawl OPEN LIM MA all 339 339 0 P
13 Otter Trawl, Ruhle OPEN all MA lg 207 207 P
14 Otter Trawl, Ruhle OPEN all NE sm 2,000 2,000 P
15 Otter Trawl, Ruhle OPEN all NE lg 24 0 24 0.486
16 Otter Trawl, Haddock Separator OPEN all MA lg 0 0 0
17 Otter Trawl, Haddock Separator OPEN all NE lg 2,850 2,600 250 0.227
18 Shrimp Trawl OPEN all MA all 19,636 19,636 0 P
19 Shrimp Trawl OPEN all NE all 70,837 70,175 662 0.257
21 Floating Trap OPEN all NE all 560 560 P
22 Sink, Anchor, Drift Gillnet OPEN all MA sm 0 0 0
23 Sink, Anchor, Drift Gillnet OPEN all MA lg 0 0 0
24 Sink, Anchor, Drift Gillnet OPEN all MA xlg 0 0 0
25 Sink, Anchor, Drift Gillnet OPEN all NE sm 0 0 P
26 Sink, Anchor, Drift Gillnet OPEN all NE lg 1 0 1 0.958
27 Sink, Anchor, Drift Gillnet OPEN all NE xlg 0 0 0
28 Purse Seine OPEN all MA all 0 0 P
29 Purse Seine OPEN all NE all 0 0 0
30 Scallop Dredge AA GEN MA all 0 0 0 P
31 Scallop Dredge AA GEN NE all 0 0 0
32 Scallop Dredge AA LIM MA all 7,621 7,200 421 0.254
33 Scallop Dredge AA LIM NE all 389 0 389 0.245
34 Scallop Dredge OPEN GEN MA all 2,251 2,002 249 0.691

Table 4B, continued. Total catch (live pounds), Vessel Trip Report landings (kept; live pounds), estimated discards (live pounds) and associated coefficient of variation (CV) for the 23 individual species that comprise the 14 species groups, by fleet for July 2010 through June 2011. Dark shading indicates fleets with no NEFOP trips in the annual analysis. Light shading indicates that the variance of the discard estimate was not used in the annual sample size analysis. Blank CV indicates either no discards or discards equal 0. “P” indicates fleets with “pilot” designation. Species: LOLIGO SQUID
See supporting text for abbreviations. 88
Row Gear Type Access Trip Region MeshArea Category Group Total Kept Discarded CV Pilot
35 Scallop Dredge OPEN GEN NE all 0 0 0
36 Scallop Dredge OPEN LIM MA all 26,240 21,152 5,088 0.325
37 Scallop Dredge OPEN LIM NE all 945 0 945 0.324
38 Mid-water Paired & Single Trawl OPEN all MA all 0 0 0
39 Mid-water Paired & Single Trawl OPEN all NE all 9 0 9 0.732
40 Pots and Traps, Fish OPEN all MA all 0 0 P
41 Pots and Traps, Fish OPEN all NE all 367 367 P
42 Pots and Traps, Conch OPEN all MA all 0 0 P
43 Pots and Traps, Conch OPEN all NE all 0 0 P
45 Pots and Traps, Hagfish OPEN all NE all 0 0 P
46 Pots and Traps, Shrimp OPEN all NE all 0 0 P
47 Pots and Traps, Lobster OPEN all MA all 0 0 P
48 Pots and Traps, Lobster OPEN all NE all 0 0 P
49 Pots and Traps, Crab OPEN all MA all 0 0 P
50 Pots and Traps, Crab OPEN all NE all 0 0 P
51 Beam Trawl OPEN all MA all 75,830 75,830 P
52 Beam Trawl OPEN all NE all 0 0 P
53 Dredge, Other OPEN all MA all 0 0 P
54 Ocean Quahog/Surf Clam Dredge OPEN all MA all 0 0 P
55 Ocean Quahog/Surf Clam Dredge OPEN all NE all 0 0 P
Other fleets 4,423 4,423
TOTAL 21,817,046 21,434,751 382,295 0.243
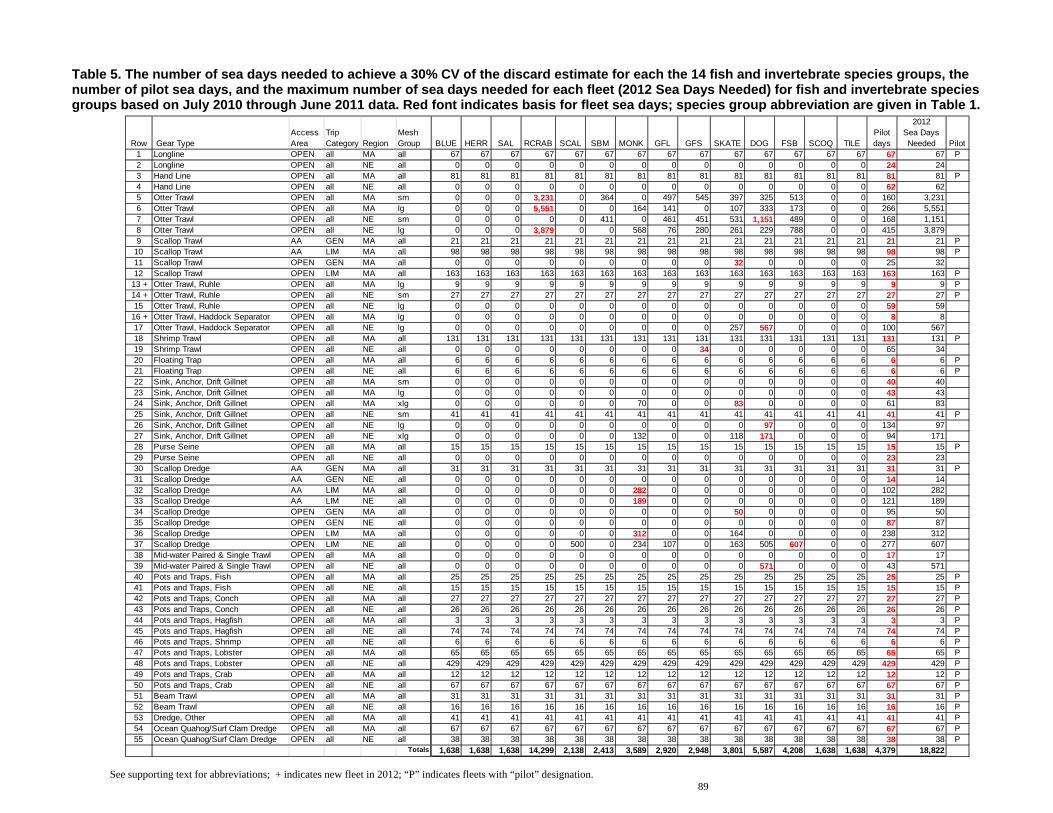
See supporting text for abbreviations; + indicates new fleet in 2012; “P” indicates fleets with “pilot” designation.
89
Row Gear TypeAccess Area
Trip Category Region
Mesh Group BLUE HERR SAL RCRAB SCAL SBM MONK GFL GFS SKATE DOG FSB SCOQ TILE
Pilot days
2012 Sea Days Needed Pilot
1 Longline OPEN all MA all 67 67 67 67 67 67 67 67 67 67 67 67 67 67 67 67 P2 Longline OPEN all NE all 0 0 0 0 0 0 0 0 0 0 0 0 0 0 24 243 Hand Line OPEN all MA all 81 81 81 81 81 81 81 81 81 81 81 81 81 81 81 81 P4 Hand Line OPEN all NE all 0 0 0 0 0 0 0 0 0 0 0 0 0 0 62 625 Otter Trawl OPEN all MA sm 0 0 0 3,231 0 364 0 497 545 397 325 513 0 0 160 3,2316 Otter Trawl OPEN all MA lg 0 0 0 5,551 0 0 164 141 0 107 333 173 0 0 266 5,5517 Otter Trawl OPEN all NE sm 0 0 0 0 0 411 0 461 451 531 1,151 489 0 0 168 1,1518 Otter Trawl OPEN all NE lg 0 0 0 3,879 0 0 568 76 280 261 229 788 0 0 415 3,8799 Scallop Trawl AA GEN MA all 21 21 21 21 21 21 21 21 21 21 21 21 21 21 21 21 P
10 Scallop Trawl AA LIM MA all 98 98 98 98 98 98 98 98 98 98 98 98 98 98 98 98 P11 Scallop Trawl OPEN GEN MA all 0 0 0 0 0 0 0 0 0 32 0 0 0 0 25 3212 Scallop Trawl OPEN LIM MA all 163 163 163 163 163 163 163 163 163 163 163 163 163 163 163 163 P
13 + Otter Trawl, Ruhle OPEN all MA lg 9 9 9 9 9 9 9 9 9 9 9 9 9 9 9 9 P 14 + Otter Trawl, Ruhle OPEN all NE sm 27 27 27 27 27 27 27 27 27 27 27 27 27 27 27 27 P
15 Otter Trawl, Ruhle OPEN all NE lg 0 0 0 0 0 0 0 0 0 0 0 0 0 0 59 59 16 + Otter Trawl, Haddock Separator OPEN all MA lg 0 0 0 0 0 0 0 0 0 0 0 0 0 0 8 8
17 Otter Trawl, Haddock Separator OPEN all NE lg 0 0 0 0 0 0 0 0 0 257 567 0 0 0 100 56718 Shrimp Trawl OPEN all MA all 131 131 131 131 131 131 131 131 131 131 131 131 131 131 131 131 P19 Shrimp Trawl OPEN all NE all 0 0 0 0 0 0 0 0 34 0 0 0 0 0 65 3420 Floating Trap OPEN all MA all 6 6 6 6 6 6 6 6 6 6 6 6 6 6 6 6 P21 Floating Trap OPEN all NE all 6 6 6 6 6 6 6 6 6 6 6 6 6 6 6 6 P22 Sink, Anchor, Drift Gillnet OPEN all MA sm 0 0 0 0 0 0 0 0 0 0 0 0 0 0 40 4023 Sink, Anchor, Drift Gillnet OPEN all MA lg 0 0 0 0 0 0 0 0 0 0 0 0 0 0 43 4324 Sink, Anchor, Drift Gillnet OPEN all MA xlg 0 0 0 0 0 0 70 0 0 83 0 0 0 0 61 8325 Sink, Anchor, Drift Gillnet OPEN all NE sm 41 41 41 41 41 41 41 41 41 41 41 41 41 41 41 41 P26 Sink, Anchor, Drift Gillnet OPEN all NE lg 0 0 0 0 0 0 0 0 0 0 97 0 0 0 134 9727 Sink, Anchor, Drift Gillnet OPEN all NE xlg 0 0 0 0 0 0 132 0 0 118 171 0 0 0 94 17128 Purse Seine OPEN all MA all 15 15 15 15 15 15 15 15 15 15 15 15 15 15 15 15 P29 Purse Seine OPEN all NE all 0 0 0 0 0 0 0 0 0 0 0 0 0 0 23 2330 Scallop Dredge AA GEN MA all 31 31 31 31 31 31 31 31 31 31 31 31 31 31 31 31 P31 Scallop Dredge AA GEN NE all 0 0 0 0 0 0 0 0 0 0 0 0 0 0 14 1432 Scallop Dredge AA LIM MA all 0 0 0 0 0 0 282 0 0 0 0 0 0 0 102 28233 Scallop Dredge AA LIM NE all 0 0 0 0 0 0 189 0 0 0 0 0 0 0 121 18934 Scallop Dredge OPEN GEN MA all 0 0 0 0 0 0 0 0 0 50 0 0 0 0 95 5035 Scallop Dredge OPEN GEN NE all 0 0 0 0 0 0 0 0 0 0 0 0 0 0 87 8736 Scallop Dredge OPEN LIM MA all 0 0 0 0 0 0 312 0 0 164 0 0 0 0 238 31237 Scallop Dredge OPEN LIM NE all 0 0 0 0 500 0 234 107 0 163 505 607 0 0 277 60738 Mid-water Paired & Single Trawl OPEN all MA all 0 0 0 0 0 0 0 0 0 0 0 0 0 0 17 1739 Mid-water Paired & Single Trawl OPEN all NE all 0 0 0 0 0 0 0 0 0 0 571 0 0 0 43 57140 Pots and Traps, Fish OPEN all MA all 25 25 25 25 25 25 25 25 25 25 25 25 25 25 25 25 P41 Pots and Traps, Fish OPEN all NE all 15 15 15 15 15 15 15 15 15 15 15 15 15 15 15 15 P42 Pots and Traps, Conch OPEN all MA all 27 27 27 27 27 27 27 27 27 27 27 27 27 27 27 27 P43 Pots and Traps, Conch OPEN all NE all 26 26 26 26 26 26 26 26 26 26 26 26 26 26 26 26 P44 Pots and Traps, Hagfish OPEN all MA all 3 3 3 3 3 3 3 3 3 3 3 3 3 3 3 3 P45 Pots and Traps, Hagfish OPEN all NE all 74 74 74 74 74 74 74 74 74 74 74 74 74 74 74 74 P46 Pots and Traps, Shrimp OPEN all NE all 6 6 6 6 6 6 6 6 6 6 6 6 6 6 6 6 P47 Pots and Traps, Lobster OPEN all MA all 65 65 65 65 65 65 65 65 65 65 65 65 65 65 65 65 P48 Pots and Traps, Lobster OPEN all NE all 429 429 429 429 429 429 429 429 429 429 429 429 429 429 429 429 P49 Pots and Traps, Crab OPEN all MA all 12 12 12 12 12 12 12 12 12 12 12 12 12 12 12 12 P50 Pots and Traps, Crab OPEN all NE all 67 67 67 67 67 67 67 67 67 67 67 67 67 67 67 67 P51 Beam Trawl OPEN all MA all 31 31 31 31 31 31 31 31 31 31 31 31 31 31 31 31 P52 Beam Trawl OPEN all NE all 16 16 16 16 16 16 16 16 16 16 16 16 16 16 16 16 P53 Dredge, Other OPEN all MA all 41 41 41 41 41 41 41 41 41 41 41 41 41 41 41 41 P54 Ocean Quahog/Surf Clam Dredge OPEN all MA all 67 67 67 67 67 67 67 67 67 67 67 67 67 67 67 67 P55 Ocean Quahog/Surf Clam Dredge OPEN all NE all 38 38 38 38 38 38 38 38 38 38 38 38 38 38 38 38 P
Totals 1,638 1,638 1,638 14,299 2,138 2,413 3,589 2,920 2,948 3,801 5,587 4,208 1,638 1,638 4,379 18,822
Table 5. The number of sea days needed to achieve a 30% CV of the discard estimate for each the 14 fish and invertebrate species groups, the number of pilot sea days, and the maximum number of sea days needed for each fleet (2012 Sea Days Needed) for fish and invertebrate species groups based on July 2010 through June 2011 data. Red font indicates basis for fleet sea days; species group abbreviation are given in Table 1.
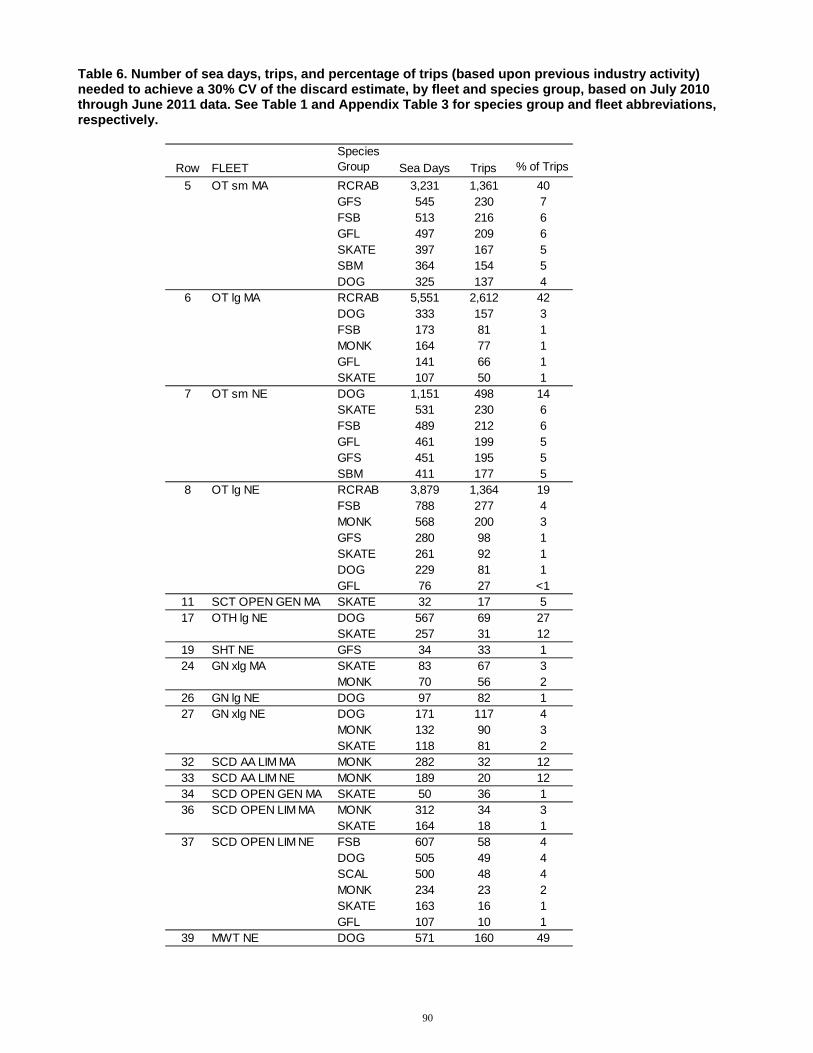
90
Row FLEET
Species Group Sea Days Trips % of Trips
5 OT sm MA RCRAB 3,231 1,361 40GFS 545 230 7FSB 513 216 6GFL 497 209 6SKATE 397 167 5SBM 364 154 5DOG 325 137 4
6 OT lg MA RCRAB 5,551 2,612 42DOG 333 157 3FSB 173 81 1MONK 164 77 1GFL 141 66 1SKATE 107 50 1
7 OT sm NE DOG 1,151 498 14SKATE 531 230 6FSB 489 212 6GFL 461 199 5GFS 451 195 5SBM 411 177 5
8 OT lg NE RCRAB 3,879 1,364 19FSB 788 277 4MONK 568 200 3GFS 280 98 1SKATE 261 92 1DOG 229 81 1GFL 76 27 <1
11 SCT OPEN GEN MA SKATE 32 17 517 OTH lg NE DOG 567 69 27
SKATE 257 31 1219 SHT NE GFS 34 33 124 GN xlg MA SKATE 83 67 3
MONK 70 56 226 GN lg NE DOG 97 82 127 GN xlg NE DOG 171 117 4
MONK 132 90 3SKATE 118 81 2
32 SCD AA LIM MA MONK 282 32 1233 SCD AA LIM NE MONK 189 20 1234 SCD OPEN GEN MA SKATE 50 36 136 SCD OPEN LIM MA MONK 312 34 3
SKATE 164 18 137 SCD OPEN LIM NE FSB 607 58 4
DOG 505 49 4SCAL 500 48 4MONK 234 23 2SKATE 163 16 1GFL 107 10 1
39 MWT NE DOG 571 160 49
Table 6. Number of sea days, trips, and percentage of trips (based upon previous industry activity) needed to achieve a 30% CV of the discard estimate, by fleet and species group, based on July 2010 through June 2011 data. See Table 1 and Appendix Table 3 for species group and fleet abbreviations, respectively.
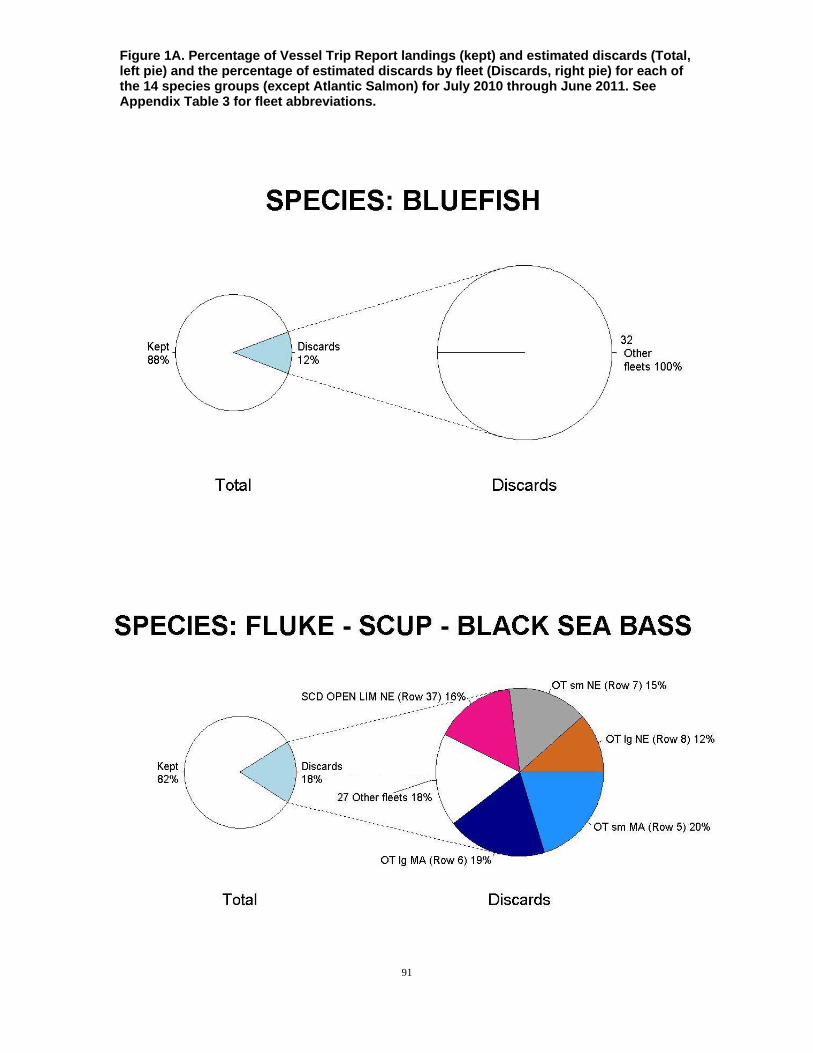
Figure 1A. Percentage of Vessel Trip Report landings (kept) and estimated discards (Total, left pie) and the percentage of estimated discards by fleet (Discards, right pie) for each of the 14 species groups (except Atlantic Salmon) for July 2010 through June 2011. See Appendix Table 3 for fleet abbreviations.
91

Figure 1A continued. Percentage of Vessel Trip Report landings (kept) and estimated discards (Total, left pie) and the percentage of estimated discards by fleet (Discards, right pie) for each of the 14 species groups (except Atlantic Salmon) for July 2010 through June 2011. See Appendix Table 3 for fleet abbreviations.
92
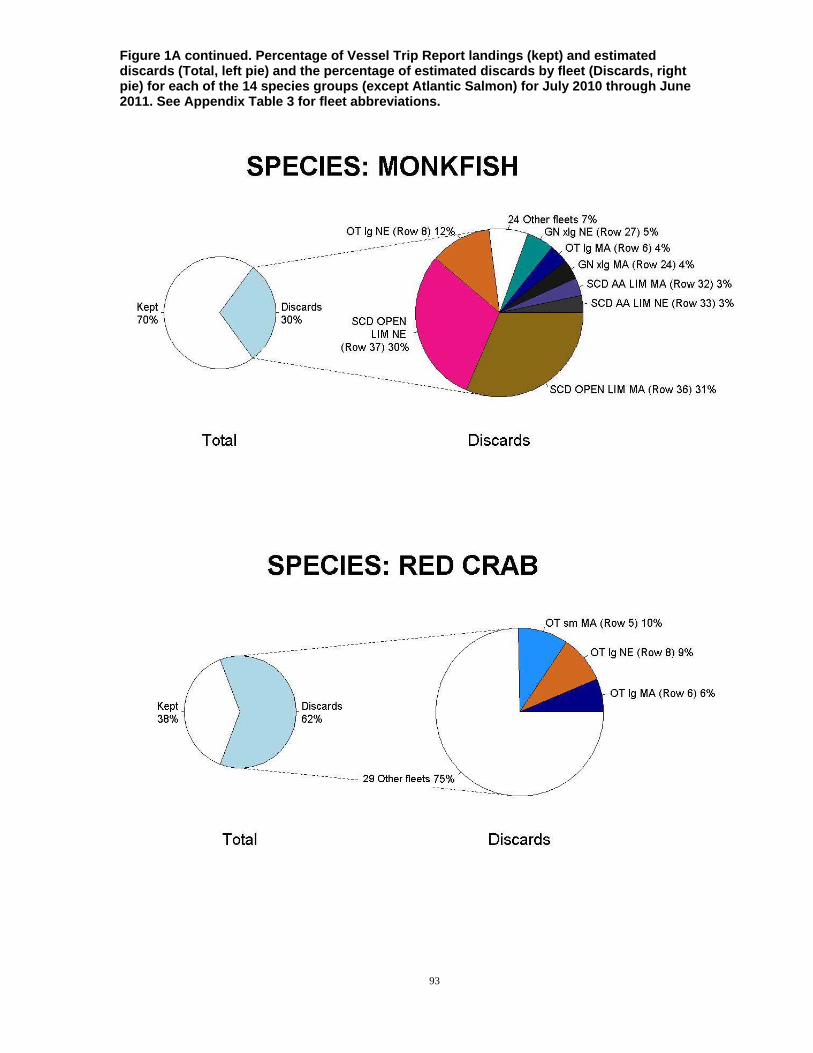
Figure 1A continued. Percentage of Vessel Trip Report landings (kept) and estimated discards (Total, left pie) and the percentage of estimated discards by fleet (Discards, right pie) for each of the 14 species groups (except Atlantic Salmon) for July 2010 through June 2011. See Appendix Table 3 for fleet abbreviations.
93
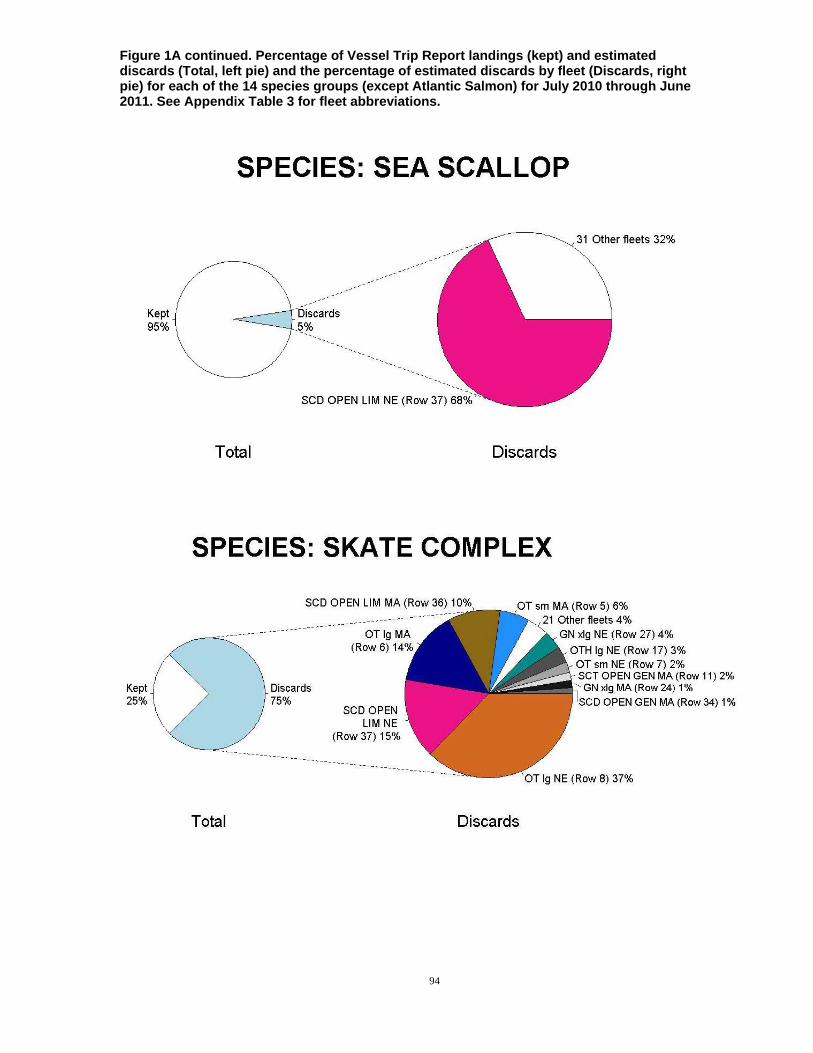
Figure 1A continued. Percentage of Vessel Trip Report landings (kept) and estimated discards (Total, left pie) and the percentage of estimated discards by fleet (Discards, right pie) for each of the 14 species groups (except Atlantic Salmon) for July 2010 through June 2011. See Appendix Table 3 for fleet abbreviations.
94
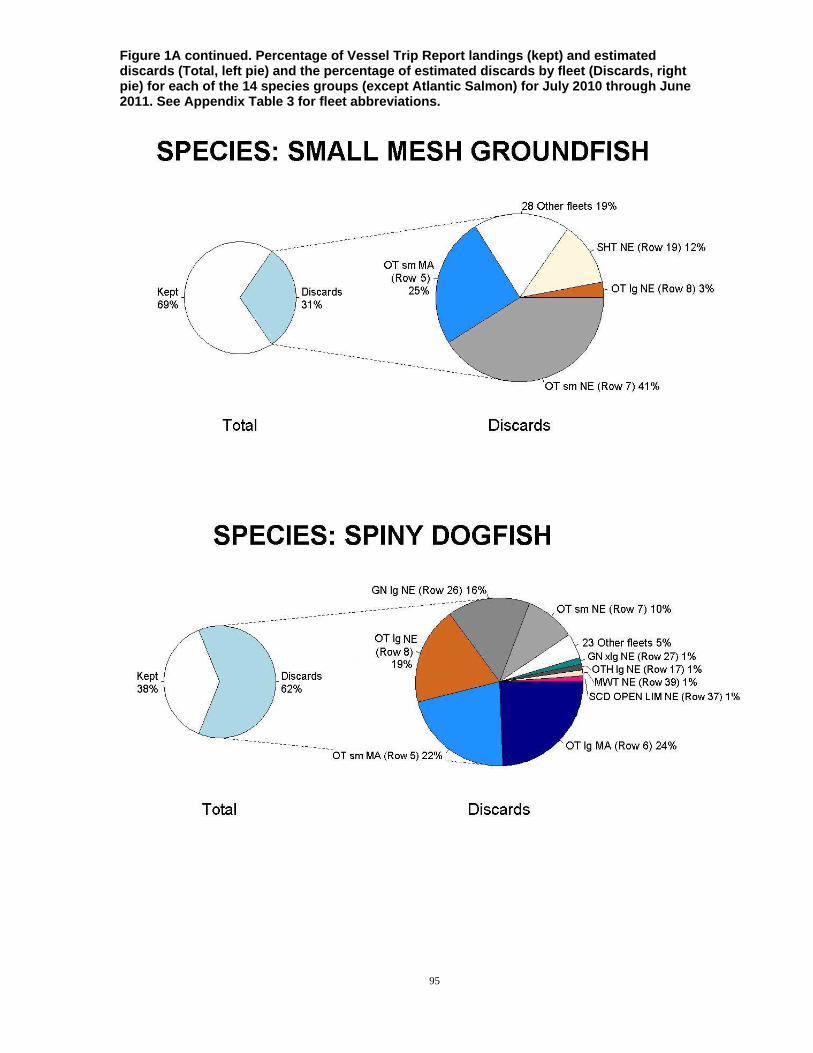
Figure 1A continued. Percentage of Vessel Trip Report landings (kept) and estimated discards (Total, left pie) and the percentage of estimated discards by fleet (Discards, right pie) for each of the 14 species groups (except Atlantic Salmon) for July 2010 through June 2011. See Appendix Table 3 for fleet abbreviations.
95

Figure 1A continued. Percentage of Vessel Trip Report landings (kept) and estimated discards (Total, left pie) and the percentage of estimated discards by fleet (Discards, right pie) for each of the 14 species groups (except Atlantic Salmon) for July 2010 through June 2011. See Appendix Table 3 for fleet abbreviations.
96
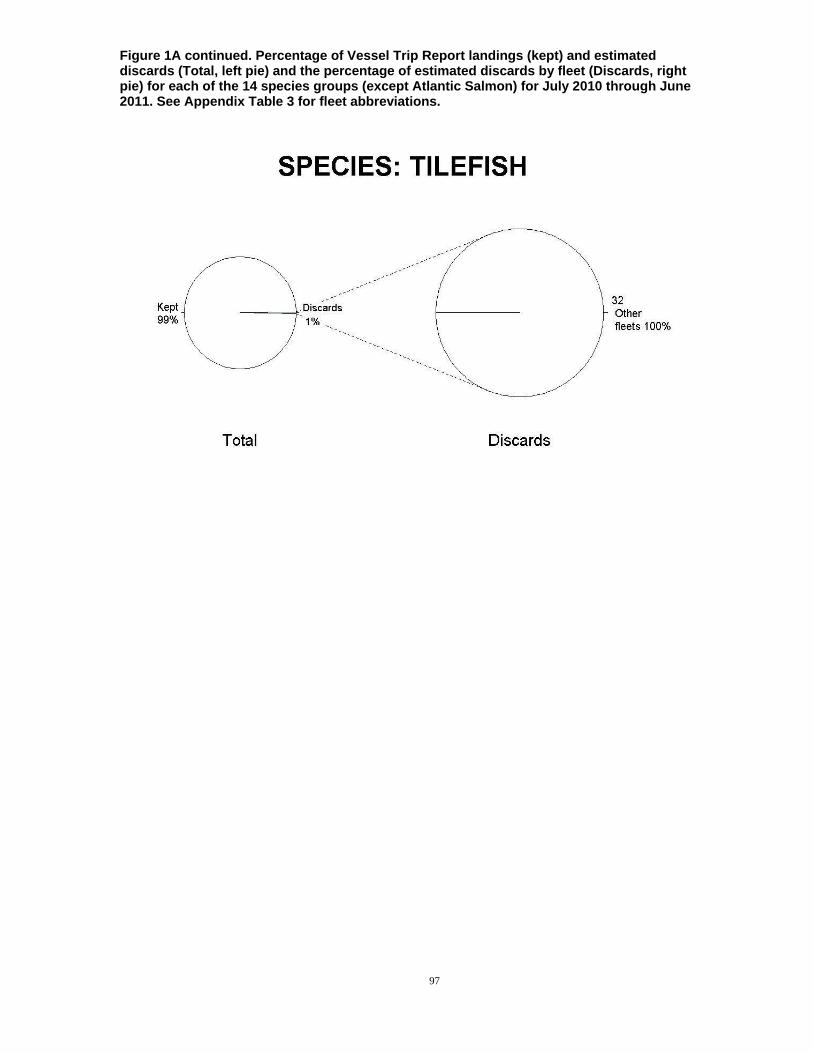
Figure 1A continued. Percentage of Vessel Trip Report landings (kept) and estimated discards (Total, left pie) and the percentage of estimated discards by fleet (Discards, right pie) for each of the 14 species groups (except Atlantic Salmon) for July 2010 through June 2011. See Appendix Table 3 for fleet abbreviations.
97

Figure 1B. Percentage of Vessel Trip Report landings (kept) and estimated discards (Total, left pie) and the percentage of estimated discards by fleet (Discards, right pie) for the 23 individual species that comprise the 14 species groups for July 2010 through June 2011. See Appendix Table 3 for fleet abbreviations.
98
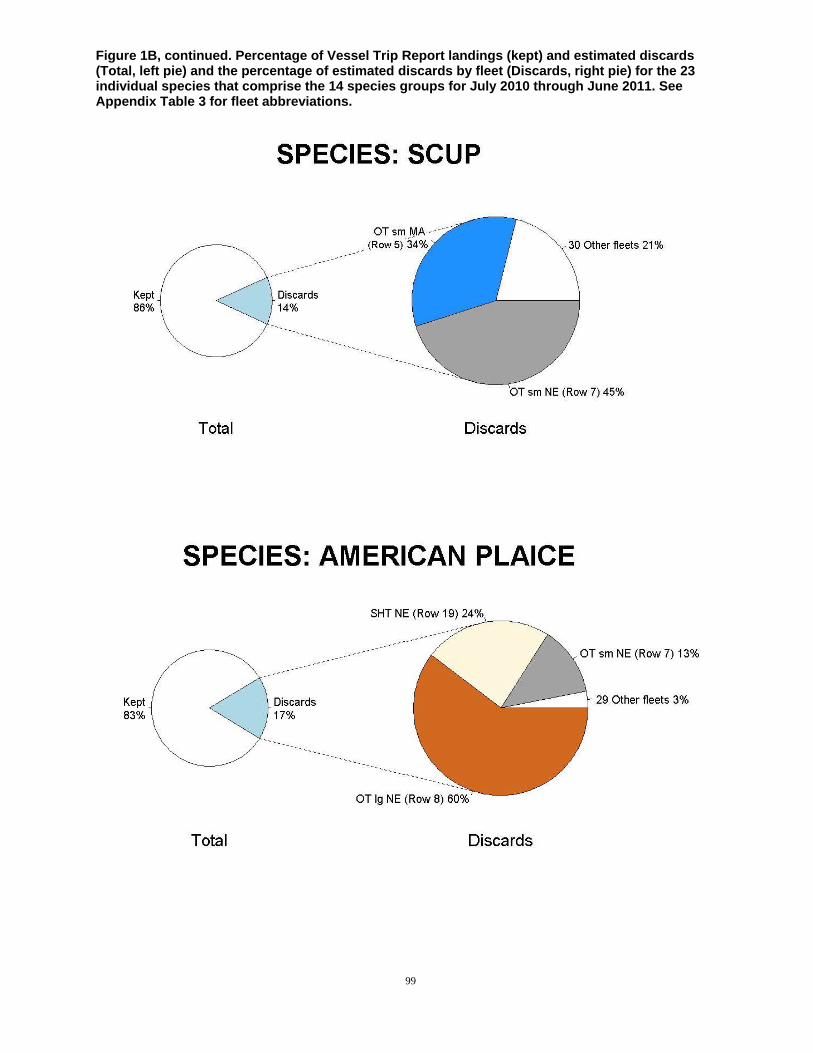
Figure 1B, continued. Percentage of Vessel Trip Report landings (kept) and estimated discards (Total, left pie) and the percentage of estimated discards by fleet (Discards, right pie) for the 23 individual species that comprise the 14 species groups for July 2010 through June 2011. See Appendix Table 3 for fleet abbreviations.
99
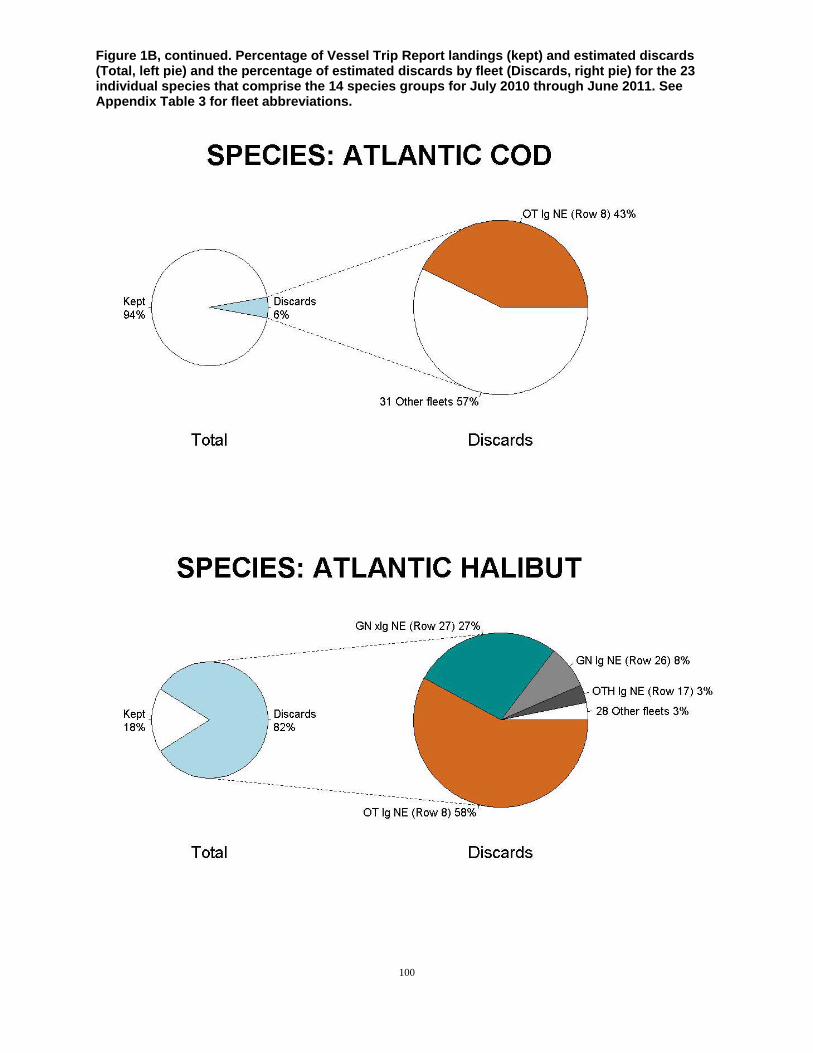
Figure 1B, continued. Percentage of Vessel Trip Report landings (kept) and estimated discards (Total, left pie) and the percentage of estimated discards by fleet (Discards, right pie) for the 23 individual species that comprise the 14 species groups for July 2010 through June 2011. See Appendix Table 3 for fleet abbreviations.
100
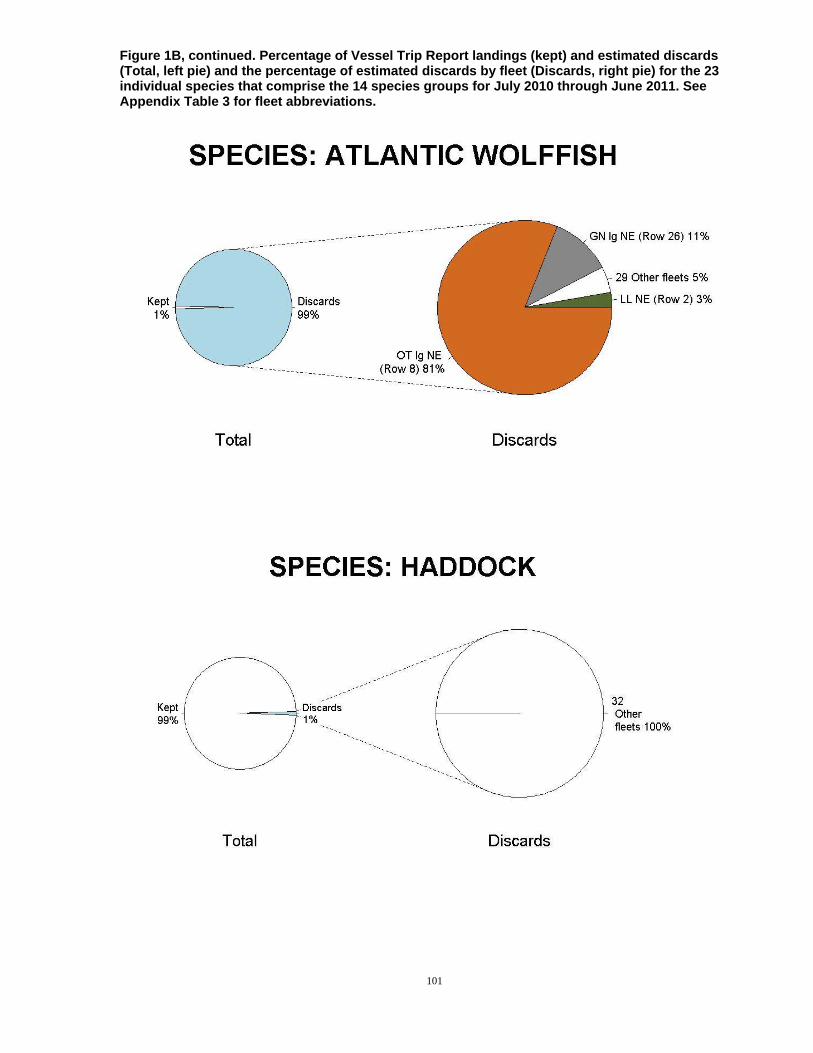
Figure 1B, continued. Percentage of Vessel Trip Report landings (kept) and estimated discards (Total, left pie) and the percentage of estimated discards by fleet (Discards, right pie) for the 23 individual species that comprise the 14 species groups for July 2010 through June 2011. See Appendix Table 3 for fleet abbreviations.
101

Figure 1B, continued. Percentage of Vessel Trip Report landings (kept) and estimated discards (Total, left pie) and the percentage of estimated discards by fleet (Discards, right pie) for the 23 individual species that comprise the 14 species groups for July 2010 through June 2011. See Appendix Table 3 for fleet abbreviations.
102

Figure 1B, continued. Percentage of Vessel Trip Report landings (kept) and estimated discards (Total, left pie) and the percentage of estimated discards by fleet (Discards, right pie) for the 23 individual species that comprise the 14 species groups for July 2010 through June 2011. See Appendix Table 3 for fleet abbreviations.
103

Figure 1B, continued. Percentage of Vessel Trip Report landings (kept) and estimated discards (Total, left pie) and the percentage of estimated discards by fleet (Discards, right pie) for the 23 individual species that comprise the 14 species groups for July 2010 through June 2011. See Appendix Table 3 for fleet abbreviations.
104
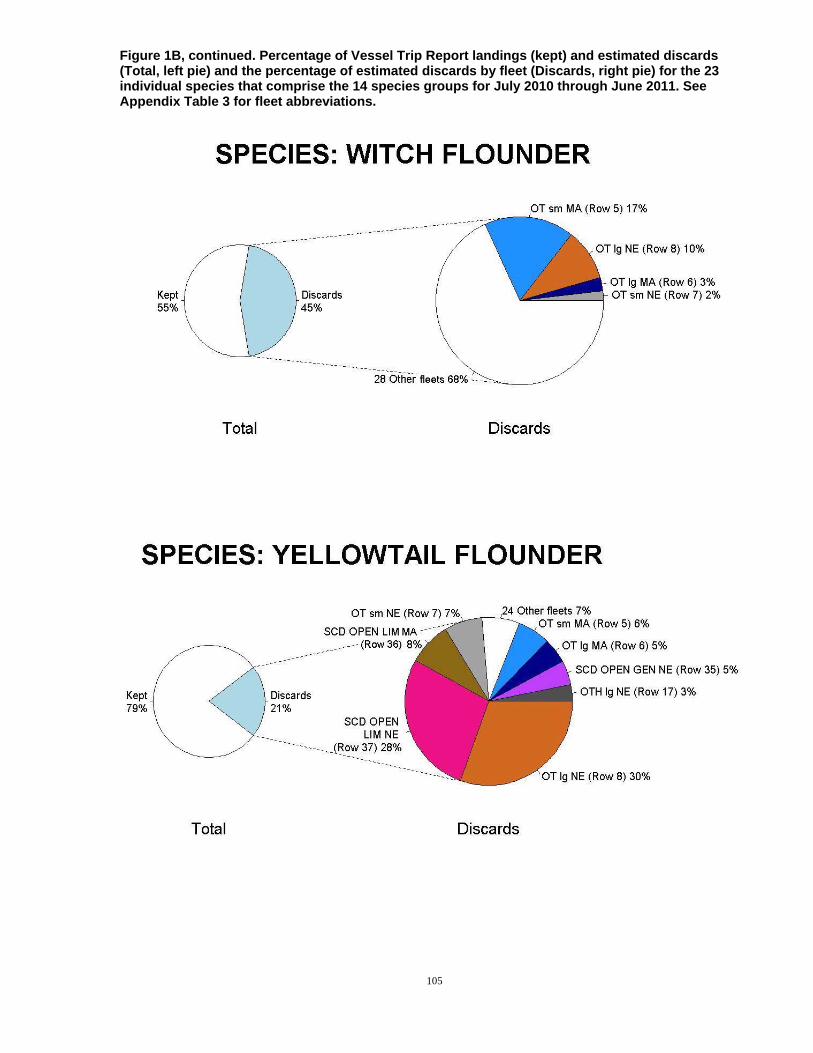
Figure 1B, continued. Percentage of Vessel Trip Report landings (kept) and estimated discards (Total, left pie) and the percentage of estimated discards by fleet (Discards, right pie) for the 23 individual species that comprise the 14 species groups for July 2010 through June 2011. See Appendix Table 3 for fleet abbreviations.
105
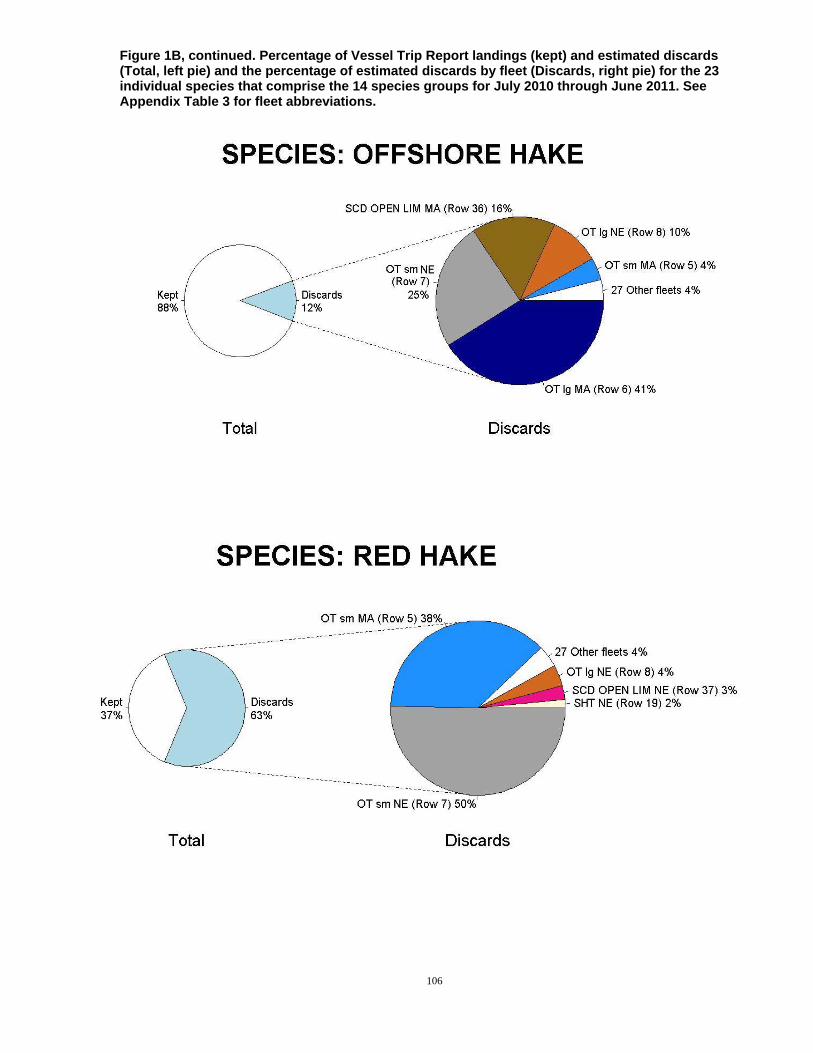
Figure 1B, continued. Percentage of Vessel Trip Report landings (kept) and estimated discards (Total, left pie) and the percentage of estimated discards by fleet (Discards, right pie) for the 23 individual species that comprise the 14 species groups for July 2010 through June 2011. See Appendix Table 3 for fleet abbreviations.
106
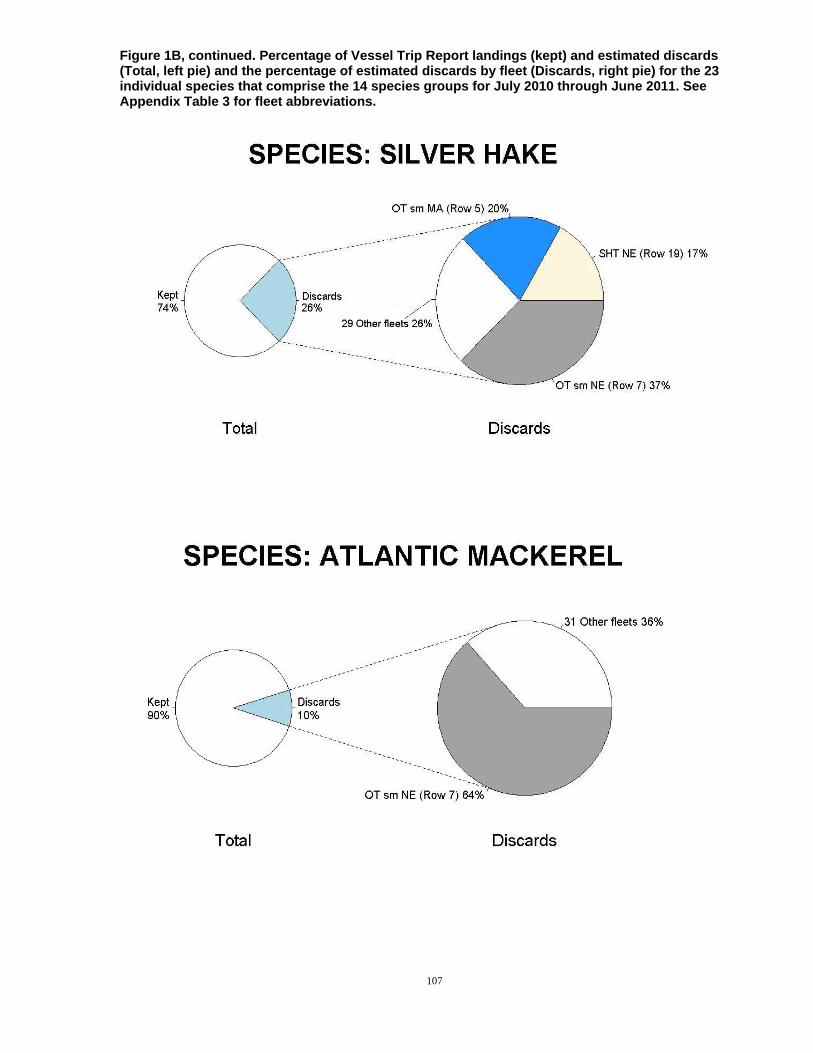
Figure 1B, continued. Percentage of Vessel Trip Report landings (kept) and estimated discards (Total, left pie) and the percentage of estimated discards by fleet (Discards, right pie) for the 23 individual species that comprise the 14 species groups for July 2010 through June 2011. See Appendix Table 3 for fleet abbreviations.
107

Figure 1B, continued. Percentage of Vessel Trip Report landings (kept) and estimated discards (Total, left pie) and the percentage of estimated discards by fleet (Discards, right pie) for the 23 individual species that comprise the 14 species groups for July 2010 through June 2011. See Appendix Table 3 for fleet abbreviations.
108

Figure 1B, continued. Percentage of Vessel Trip Report landings (kept) and estimated discards (Total, left pie) and the percentage of estimated discards by fleet (Discards, right pie) for the 23 individual species that comprise the 14 species groups for July 2010 through June 2011. See Appendix Table 3 for fleet abbreviations.
109

Figure 2. Percentage of Vessel Trip Report landings (kept) and estimated discards (Total, left pie) and the percentage of estimated discards by FMP and non-FMP species groups (Discards, right pie) for 26 selected fleets for July 2010 through June 2011. See Table 1 for species group abbreviations; FMP species groups that were filtered out through the importance filter have been aggregated and labeled “Other FMP” species groups; non-FMP species have been grouped and labeled “Non-FMP.” Note: Selected fleets include Rows 2, 4-8, 11, 15-17, 19, 22-24, 26-27, 29, and 31-39; these represent fleets where discards were estimated in 2012.
See supporting text for abbreviations. 110

Figure 2, continued. Percentage of Vessel Trip Report landings (kept) and estimated discards (Total, left pie) and the percentage of estimated discards by FMP and non-FMP species groups (Discards, right pie) for 26 selected fleets for July 2010 through June 2011. See Table 1 for species group abbreviations; FMP species groups that were filtered out through the importance filter have been aggregated and labeled “Other FMP” species groups; non-FMP species have been grouped and labeled “Non-FMP.” Note: Selected fleets include Rows 2, 4-8, 11, 15-17, 19, 22-24, 26-27, 29, and 31-39; these represent fleets where discards were estimated in 2012.
111 See supporting text for abbreviations.

Figure 2, continued. Percentage of Vessel Trip Report landings (kept) and estimated discards (Total, left pie) and the percentage of estimated discards by FMP and non-FMP species groups (Discards, right pie) for 26 selected fleets for July 2010 through June 2011. See Table 1 for species group abbreviations; FMP species groups that were filtered out through the importance filter have been aggregated and labeled “Other FMP” species groups; non-FMP species have been grouped and labeled “Non-FMP.” Note: Selected fleets include Rows 2, 4-8, 11, 15-17, 19, 22-24, 26-27, 29, and 31-39; these represent fleets where discards were estimated in 2012.
112 See supporting text for abbreviations.

Figure 2, continued. Percentage of Vessel Trip Report landings (kept) and estimated discards (Total, left pie) and the percentage of estimated discards by FMP and non-FMP species groups (Discards, right pie) for 26 selected fleets for July 2010 through June 2011. See Table 1 for species group abbreviations; FMP species groups that were filtered out through the importance filter have been aggregated and labeled “Other FMP” species groups; non-FMP species have been grouped and labeled “Non-FMP.” Note: Selected fleets include Rows 2, 4-8, 11, 15-17, 19, 22-24, 26-27, 29, and 31-39; these represent fleets where discards were estimated in 2012.
113 See supporting text for abbreviations.

Figure 2, continued. Percentage of Vessel Trip Report landings (kept) and estimated discards (Total, left pie) and the percentage of estimated discards by FMP and non-FMP species groups (Discards, right pie) for 26 selected fleets for July 2010 through June 2011. See Table 1 for species group abbreviations; FMP species groups that were filtered out through the importance filter have been aggregated and labeled “Other FMP” species groups; non-FMP species have been grouped and labeled “Non-FMP.” Note: Selected fleets include Rows 2, 4-8, 11, 15-17, 19, 22-24, 26-27, 29, and 31-39; these represent fleets where discards were estimated in 2012.
114 See supporting text for abbreviations.
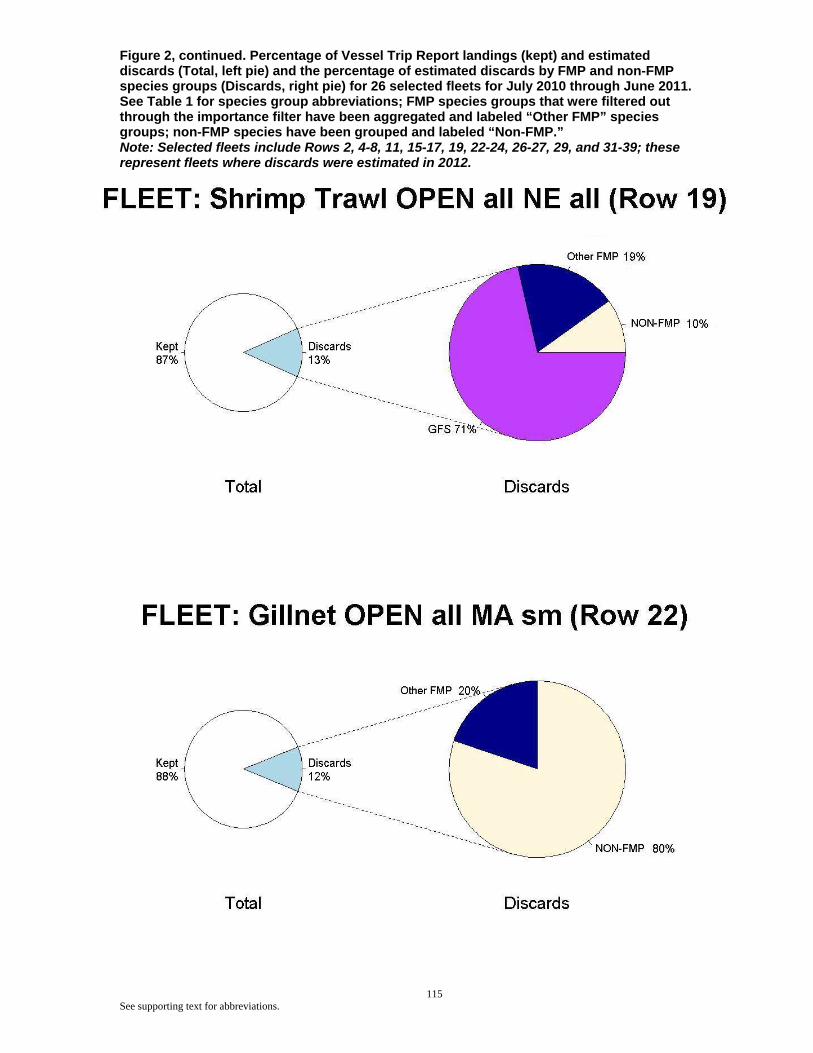
Figure 2, continued. Percentage of Vessel Trip Report landings (kept) and estimated discards (Total, left pie) and the percentage of estimated discards by FMP and non-FMP species groups (Discards, right pie) for 26 selected fleets for July 2010 through June 2011. See Table 1 for species group abbreviations; FMP species groups that were filtered out through the importance filter have been aggregated and labeled “Other FMP” species groups; non-FMP species have been grouped and labeled “Non-FMP.” Note: Selected fleets include Rows 2, 4-8, 11, 15-17, 19, 22-24, 26-27, 29, and 31-39; these represent fleets where discards were estimated in 2012.
115 See supporting text for abbreviations.
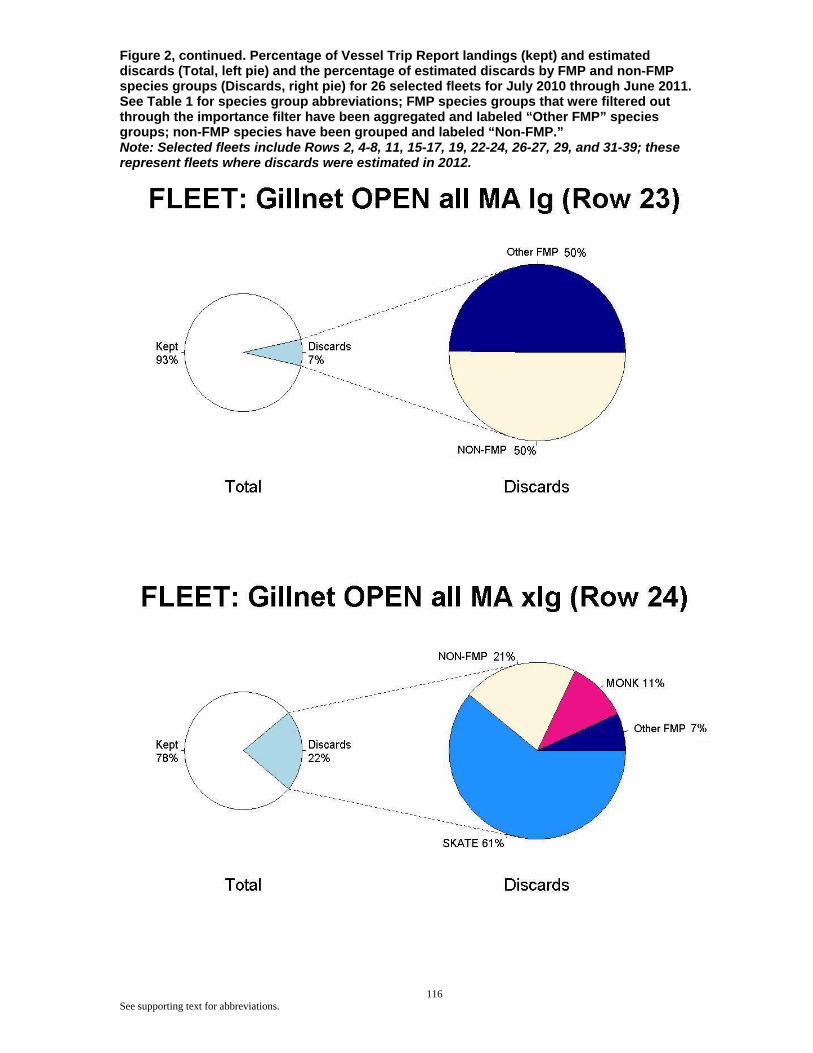
Figure 2, continued. Percentage of Vessel Trip Report landings (kept) and estimated discards (Total, left pie) and the percentage of estimated discards by FMP and non-FMP species groups (Discards, right pie) for 26 selected fleets for July 2010 through June 2011. See Table 1 for species group abbreviations; FMP species groups that were filtered out through the importance filter have been aggregated and labeled “Other FMP” species groups; non-FMP species have been grouped and labeled “Non-FMP.” Note: Selected fleets include Rows 2, 4-8, 11, 15-17, 19, 22-24, 26-27, 29, and 31-39; these represent fleets where discards were estimated in 2012.
116 See supporting text for abbreviations.
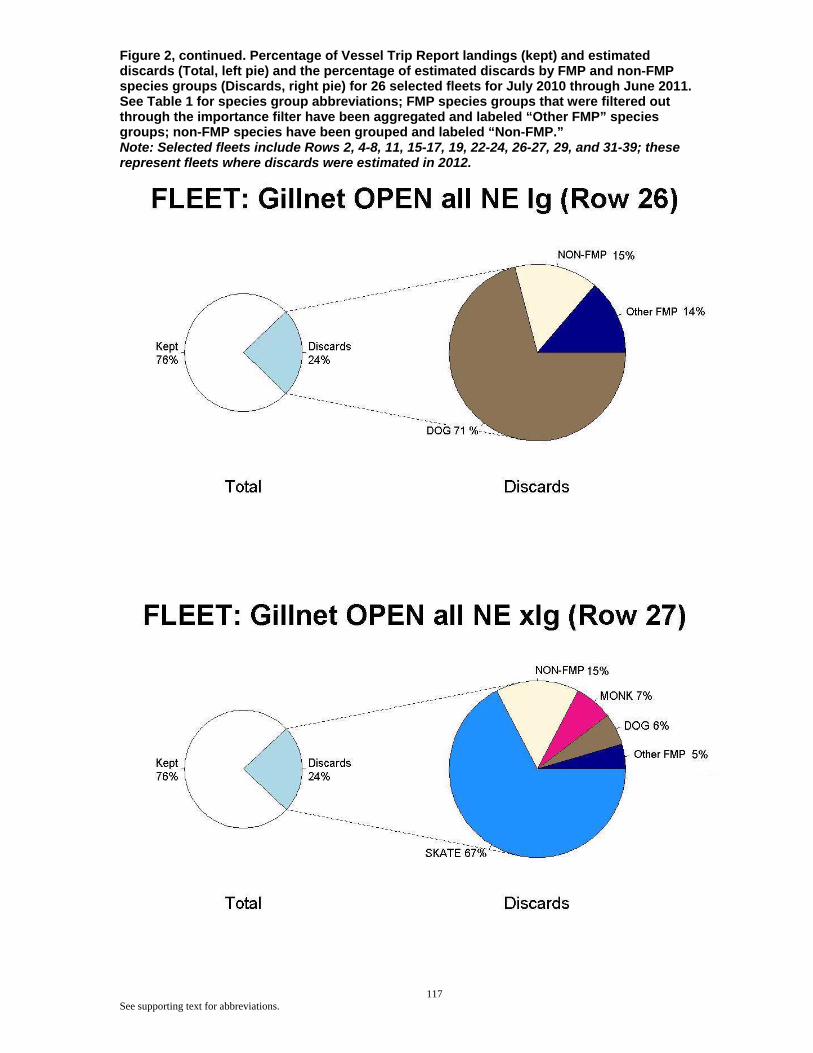
Figure 2, continued. Percentage of Vessel Trip Report landings (kept) and estimated discards (Total, left pie) and the percentage of estimated discards by FMP and non-FMP species groups (Discards, right pie) for 26 selected fleets for July 2010 through June 2011. See Table 1 for species group abbreviations; FMP species groups that were filtered out through the importance filter have been aggregated and labeled “Other FMP” species groups; non-FMP species have been grouped and labeled “Non-FMP.” Note: Selected fleets include Rows 2, 4-8, 11, 15-17, 19, 22-24, 26-27, 29, and 31-39; these represent fleets where discards were estimated in 2012.
117 See supporting text for abbreviations.

Figure 2, continued. Percentage of Vessel Trip Report landings (kept) and estimated discards (Total, left pie) and the percentage of estimated discards by FMP and non-FMP species groups (Discards, right pie) for 26 selected fleets for July 2010 through June 2011. See Table 1 for species group abbreviations; FMP species groups that were filtered out through the importance filter have been aggregated and labeled “Other FMP” species groups; non-FMP species have been grouped and labeled “Non-FMP.” Note: Selected fleets include Rows 2, 4-8, 11, 15-17, 19, 22-24, 26-27, 29, and 31-39; these represent fleets where discards were estimated in 2012.
118 See supporting text for abbreviations.

Figure 2, continued. Percentage of Vessel Trip Report landings (kept) and estimated discards (Total, left pie) and the percentage of estimated discards by FMP and non-FMP species groups (Discards, right pie) for 26 selected fleets for July 2010 through June 2011. See Table 1 for species group abbreviations; FMP species groups that were filtered out through the importance filter have been aggregated and labeled “Other FMP” species groups; non-FMP species have been grouped and labeled “Non-FMP.” Note: Selected fleets include Rows 2, 4-8, 11, 15-17, 19, 22-24, 26-27, 29, and 31-39; these represent fleets where discards were estimated in 2012.
119 See supporting text for abbreviations.
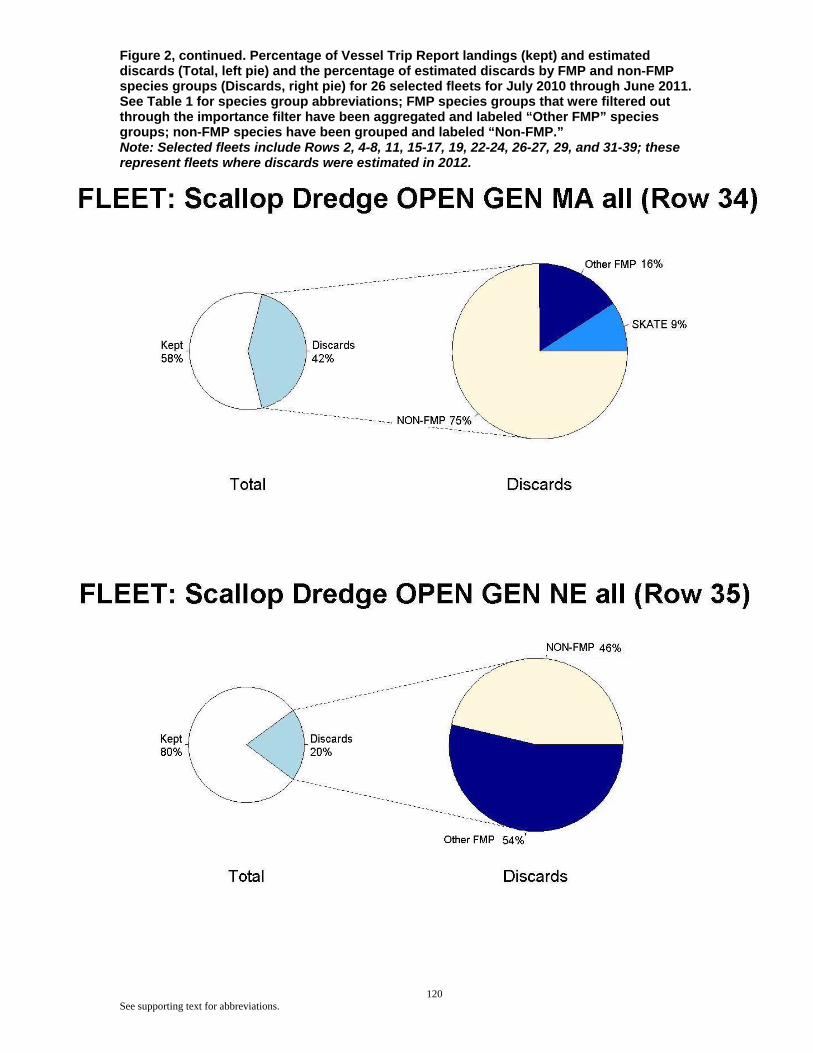
Figure 2, continued. Percentage of Vessel Trip Report landings (kept) and estimated discards (Total, left pie) and the percentage of estimated discards by FMP and non-FMP species groups (Discards, right pie) for 26 selected fleets for July 2010 through June 2011. See Table 1 for species group abbreviations; FMP species groups that were filtered out through the importance filter have been aggregated and labeled “Other FMP” species groups; non-FMP species have been grouped and labeled “Non-FMP.” Note: Selected fleets include Rows 2, 4-8, 11, 15-17, 19, 22-24, 26-27, 29, and 31-39; these represent fleets where discards were estimated in 2012.
120 See supporting text for abbreviations.

Figure 2, continued. Percentage of Vessel Trip Report landings (kept) and estimated discards (Total, left pie) and the percentage of estimated discards by FMP and non-FMP species groups (Discards, right pie) for 26 selected fleets for July 2010 through June 2011. See Table 1 for species group abbreviations; FMP species groups that were filtered out through the importance filter have been aggregated and labeled “Other FMP” species groups; non-FMP species have been grouped and labeled “Non-FMP.” Note: Selected fleets include Rows 2, 4-8, 11, 15-17, 19, 22-24, 26-27, 29, and 31-39; these represent fleets where discards were estimated in 2012.
121 See supporting text for abbreviations.
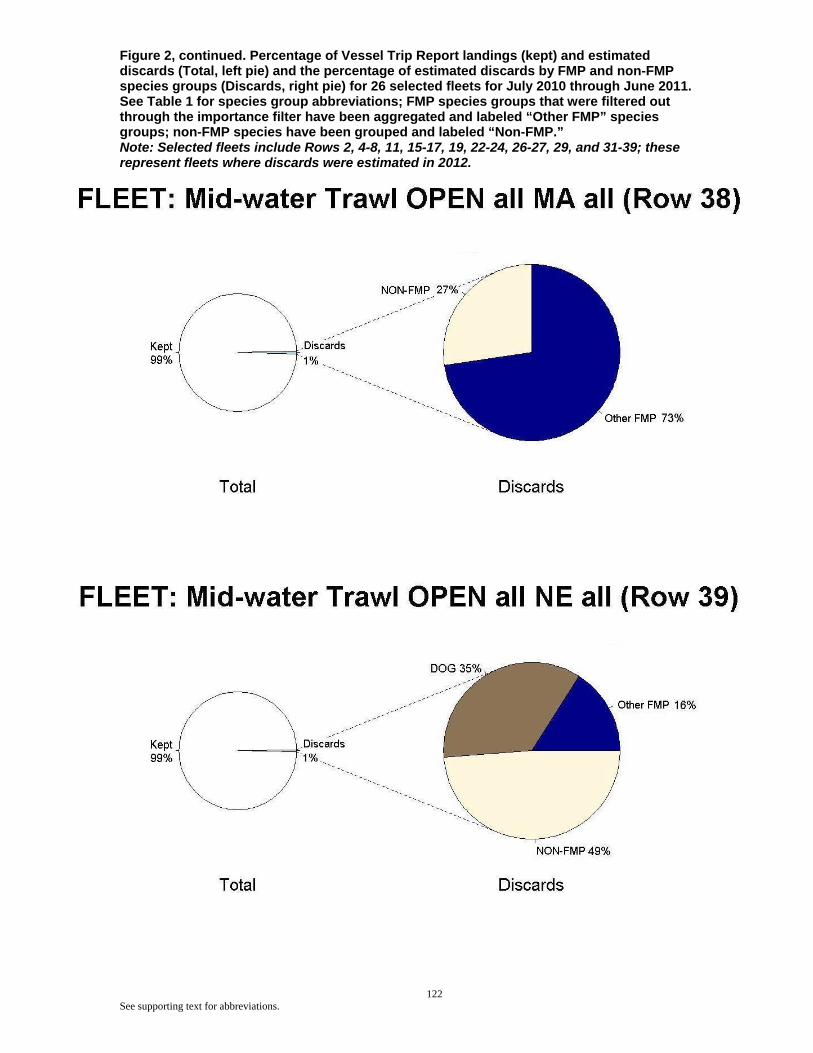
Figure 2, continued. Percentage of Vessel Trip Report landings (kept) and estimated discards (Total, left pie) and the percentage of estimated discards by FMP and non-FMP species groups (Discards, right pie) for 26 selected fleets for July 2010 through June 2011. See Table 1 for species group abbreviations; FMP species groups that were filtered out through the importance filter have been aggregated and labeled “Other FMP” species groups; non-FMP species have been grouped and labeled “Non-FMP.” Note: Selected fleets include Rows 2, 4-8, 11, 15-17, 19, 22-24, 26-27, 29, and 31-39; these represent fleets where discards were estimated in 2012.
122 See supporting text for abbreviations.
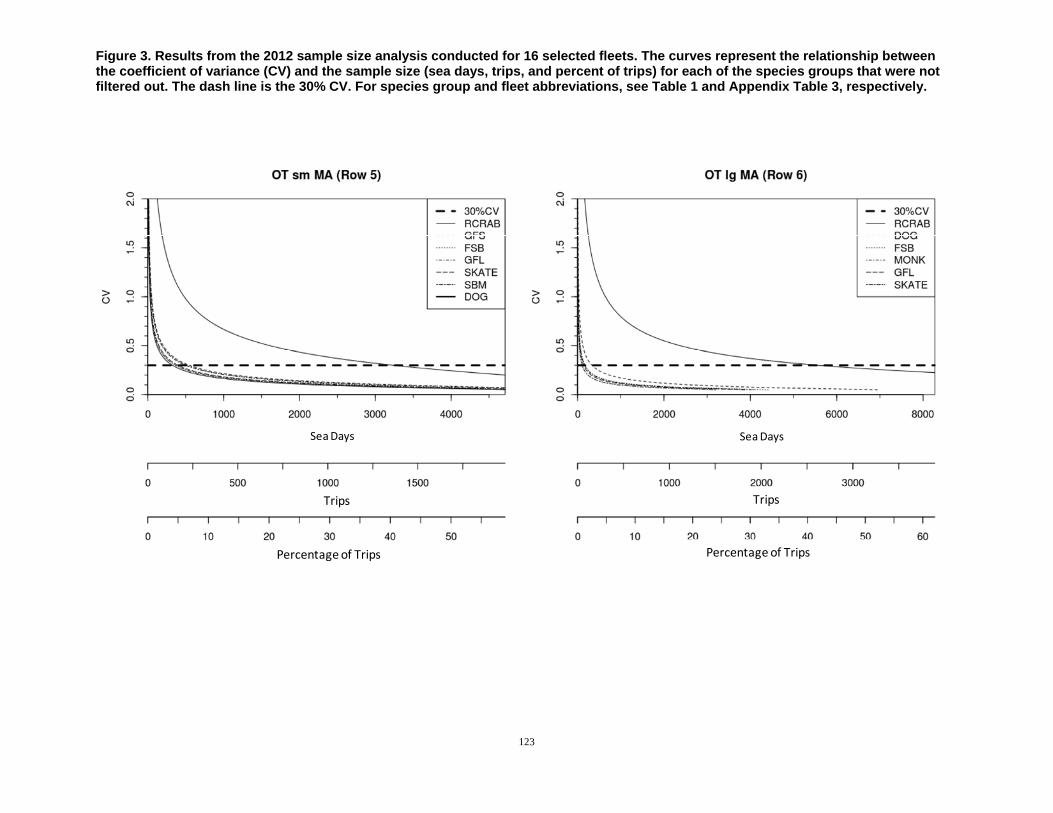
Figure 3. Results from the 2012 sample size analysis conducted for 16 selected fleets. The curves represent the relationship between the coefficient of variance (CV) and the sample size (sea days, trips, and percent of trips) for each of the species groups that were not filtered out. The dash line is the 30% CV. For species group and fleet abbreviations, see Table 1 and Appendix Table 3, respectively.
123
Sea Days
Percentage of Trips
Trips
Sea Days
Percentage of Trips
Trips
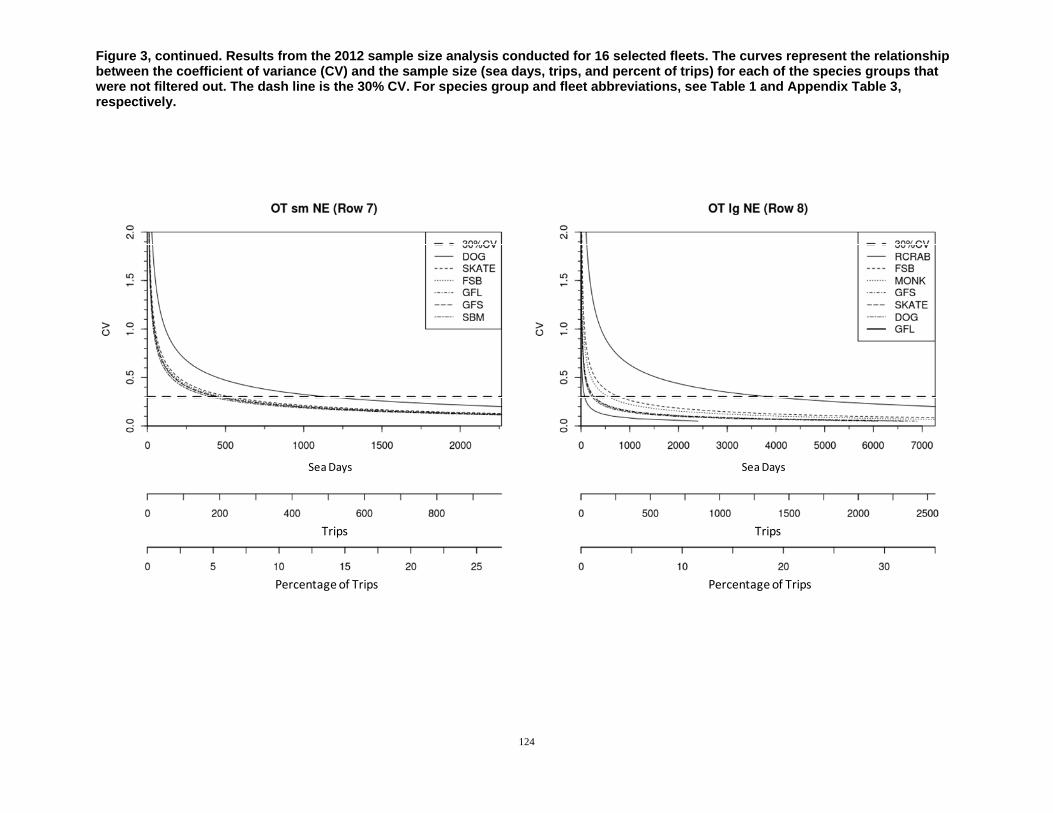
Figure 3, continued. Results from the 2012 sample size analysis conducted for 16 selected fleets. The curves represent the relationship between the coefficient of variance (CV) and the sample size (sea days, trips, and percent of trips) for each of the species groups that were not filtered out. The dash line is the 30% CV. For species group and fleet abbreviations, see Table 1 and Appendix Table 3, respectively.
124
Sea Days
Percentage of Trips
Trips
Sea Days
Percentage of Trips
Trips

Figure 3, continued. Results from the 2012 sample size analysis conducted for 16 selected fleets. The curves represent the relationship between the coefficient of variance (CV) and the sample size (sea days, trips, and percent of trips) for each of the species groups that were not filtered out. The dash line is the 30% CV. For species group and fleet abbreviations, see Table 1 and Appendix Table 3, respectively.
125
Sea Days
Percentage of Trips
Trips
Sea Days
Percentage of Trips
Trips
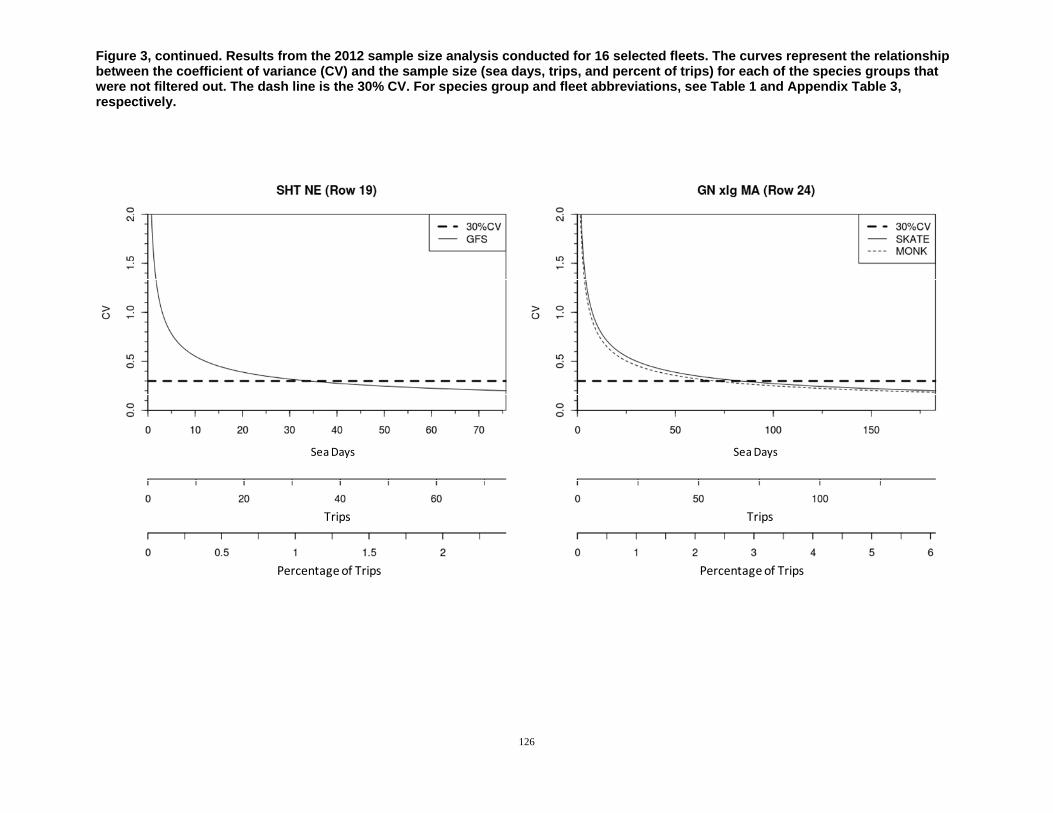
Figure 3, continued. Results from the 2012 sample size analysis conducted for 16 selected fleets. The curves represent the relationship between the coefficient of variance (CV) and the sample size (sea days, trips, and percent of trips) for each of the species groups that were not filtered out. The dash line is the 30% CV. For species group and fleet abbreviations, see Table 1 and Appendix Table 3, respectively.
126
Sea Days
Percentage of Trips
Trips
Sea Days
Percentage of Trips
Trips
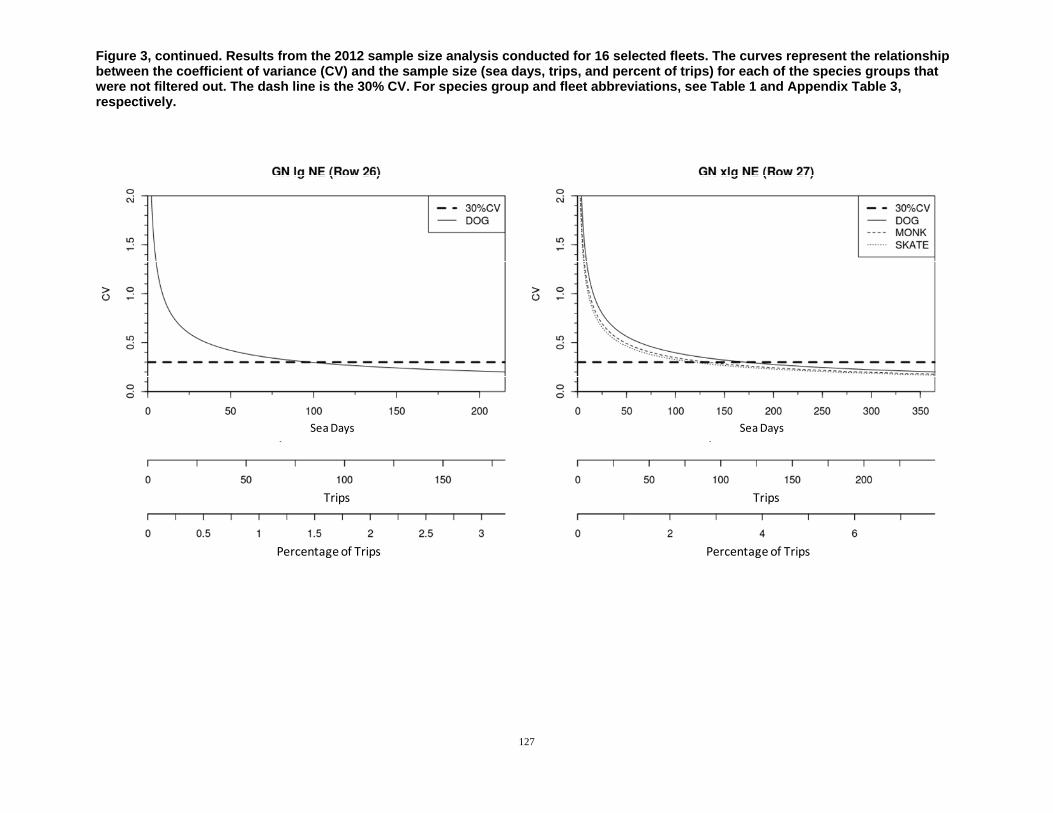
Figure 3, continued. Results from the 2012 sample size analysis conducted for 16 selected fleets. The curves represent the relationship between the coefficient of variance (CV) and the sample size (sea days, trips, and percent of trips) for each of the species groups that were not filtered out. The dash line is the 30% CV. For species group and fleet abbreviations, see Table 1 and Appendix Table 3, respectively.
127
Sea Days
Percentage of Trips
Trips
Sea Days
Percentage of Trips
Trips
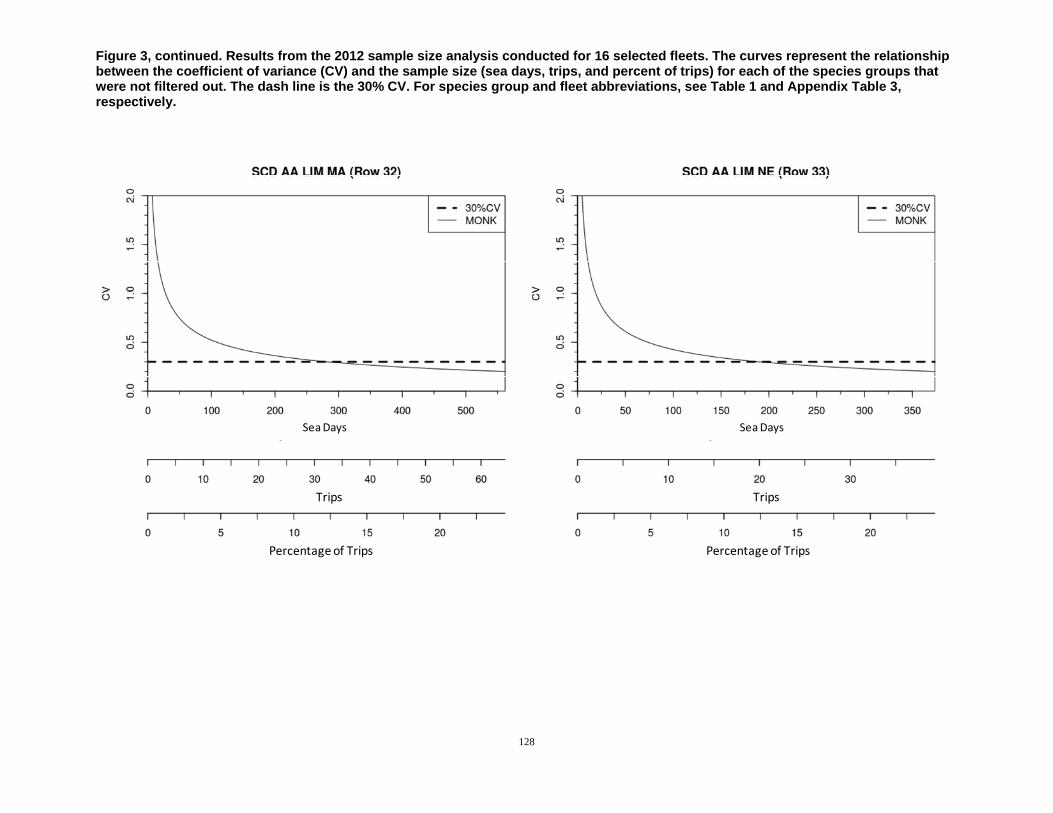
Figure 3, continued. Results from the 2012 sample size analysis conducted for 16 selected fleets. The curves represent the relationship between the coefficient of variance (CV) and the sample size (sea days, trips, and percent of trips) for each of the species groups that were not filtered out. The dash line is the 30% CV. For species group and fleet abbreviations, see Table 1 and Appendix Table 3, respectively.
128
Sea Days
Percentage of Trips
Trips
Sea Days
Percentage of Trips
Trips

Figure 3, continued. Results from the 2012 sample size analysis conducted for 16 selected fleets. The curves represent the relationship between the coefficient of variance (CV) and the sample size (sea days, trips, and percent of trips) for each of the species groups that were not filtered out. The dash line is the 30% CV. For species group and fleet abbreviations, see Table 1 and Appendix Table 3, respectively.
129
Sea Days
Percentage of Trips
Trips
Sea Days
Percentage of Trips
Trips
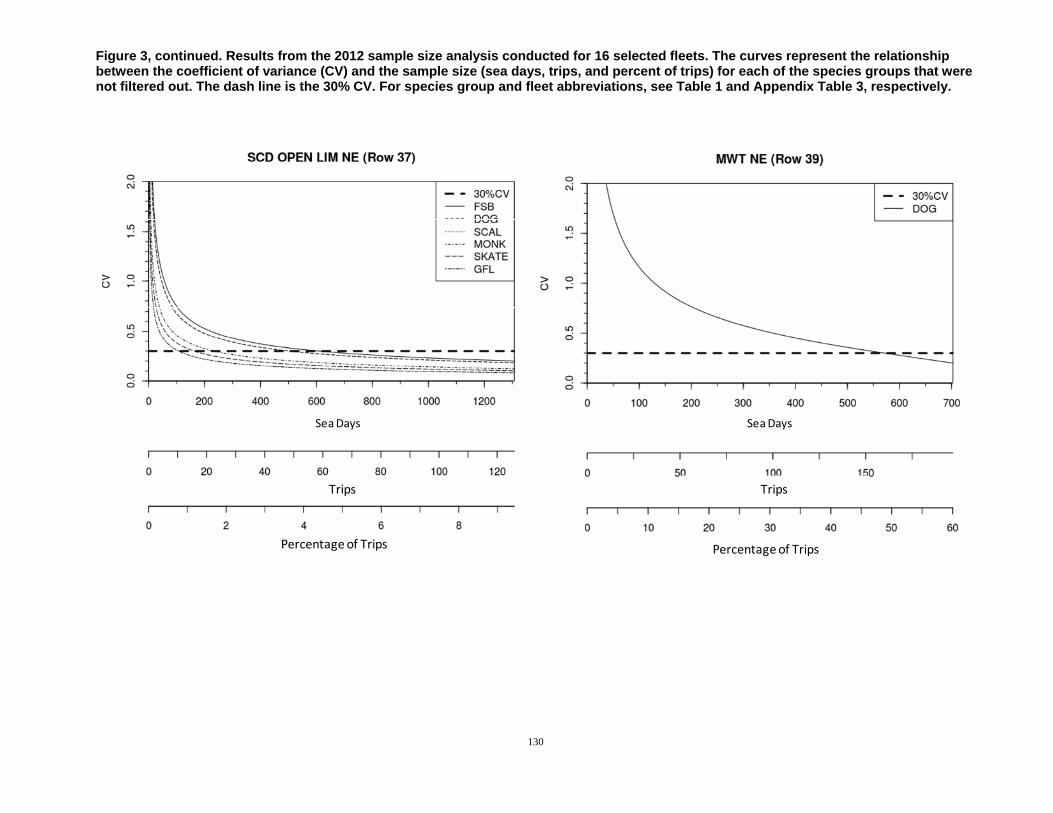
Figure 3, continued. Results from the 2012 sample size analysis conducted for 16 selected fleets. The curves represent the relationship between the coefficient of variance (CV) and the sample size (sea days, trips, and percent of trips) for each of the species groups that were not filtered out. The dash line is the 30% CV. For species group and fleet abbreviations, see Table 1 and Appendix Table 3, respectively.
130
Sea Days
Percentage of Trips
Trips
Sea Days
Percentage of Trips
Trips
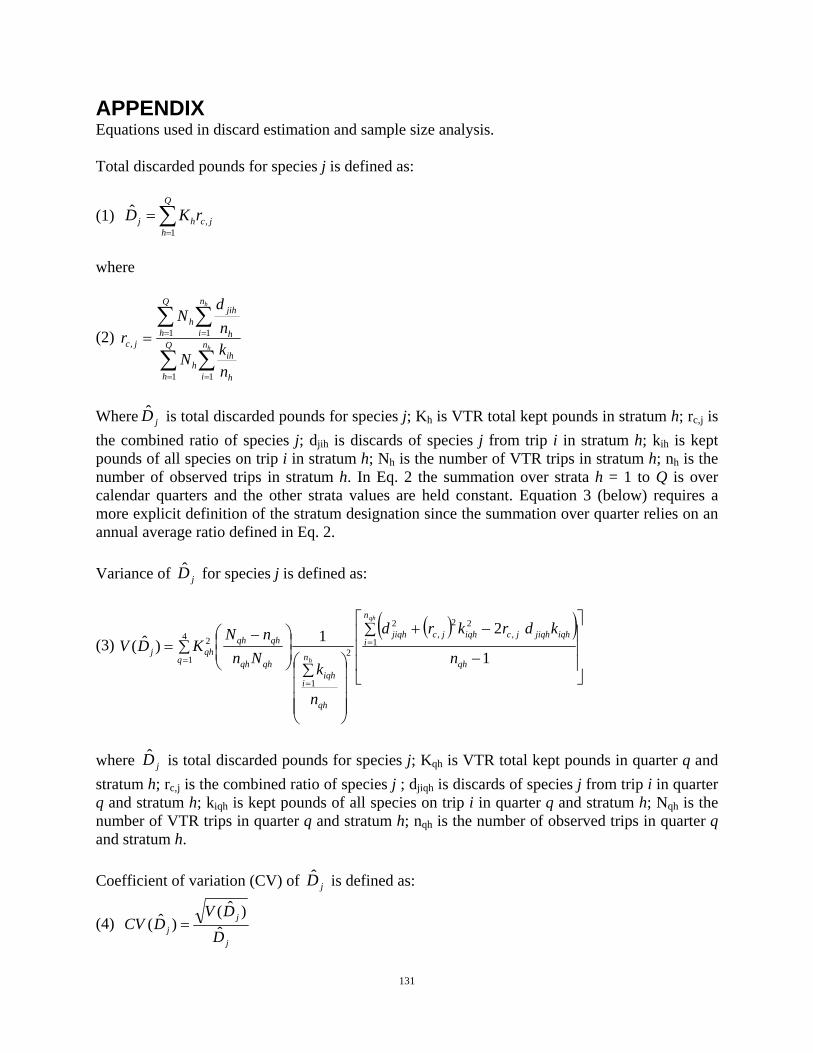
131
APPENDIX Equations used in discard estimation and sample size analysis. Total discarded pounds for species j is defined as:
(1) jc
Q
hhj rKD ,
1
ˆ
where
(2)
h
h
n
i h
ihQ
hh
n
i h
jihQ
hh
jc
n
kN
n
dN
r
11
11,
Where jD is total discarded pounds for species j; Kh is VTR total kept pounds in stratum h; rc,j is
the combined ratio of species j; djih is discards of species j from trip i in stratum h; kih is kept pounds of all species on trip i in stratum h; Nh is the number of VTR trips in stratum h; nh is the number of observed trips in stratum h. In Eq. 2 the summation over strata h = 1 to Q is over calendar quarters and the other strata values are held constant. Equation 3 (below) requires a more explicit definition of the stratum designation since the summation over quarter relies on an annual average ratio defined in Eq. 2.
Variance of jD for species j is defined as:
(3)
1
21)ˆ( 1
,22
,2
2
1
4
1
2
qh
n
iiqhjiqhjciqhjcjiqh
qh
n
iiqh
qhqh
qhqh
qqhj n
kdrkrd
n
kNn
nNKDV
qh
h
where jD is total discarded pounds for species j; Kqh is VTR total kept pounds in quarter q and
stratum h; rc,j is the combined ratio of species j ; djiqh is discards of species j from trip i in quarter q and stratum h; kiqh is kept pounds of all species on trip i in quarter q and stratum h; Nqh is the number of VTR trips in quarter q and stratum h; nqh is the number of observed trips in quarter q and stratum h.
Coefficient of variation (CV) of jD is defined as:
(4) j
j
jD
DVDCV ˆ
)ˆ()ˆ(

132
The number of sea days and trips needed to achieve a 30% CV are derived based on the variance of the total discards using the combined ratio method and the d/k discard ratio (Eq. 3). From Eq. 3, let
(5)
1
2ˆ 1
,22
,2
2
qh
n
iiqhjiqhjciqhjhcjiqh
jqh n
kdrkrdS
qh
and
(6)
4
1qqh
qhqh
n
n
where qh is the fraction of the trips in quarter q in stratum h; rc,jh is the combined annual ratio of species j in stratum h; djiqh is discards of species j from trip i in stratum h in quarter q; kiqh is kept pounds of all species on trip i in stratum h in quarter q; and nqh is the number of observed trips in stratum h in quarter q. The rc,jh in Eq. 5 is defined in Eq. 2 where the summation is over quarters within a given strata defined by gear, region, access area, trip type and so forth. The number of trips necessary to achieve a 30% CV based on the variance of the composite annual total discards for species group j in stratum h is defined as
(7)
h
jqhq qh
qh
jh
q qhjqh
qh
qh
jh
N
Sk
K
D
Sk
K
DT2
4
12
2
2
4
1
22
2
30
ˆ
ˆ)09.0(
1ˆ
ˆ
where 0.09 = 0.302, the square of the 30%CV, the given target precision level. The number of sea days necessary to achieve a 30% CV based on the variance of the composite annual total discards for species group j in stratum h is defined as
(8) hjhjh DADTDS *ˆˆ3030
where hAD is the weighted average trip length of VTR trips in stratum h (weighted by the
number of VTR trips in each quarter) . When total discards could not be estimated due to little or no observer coverage (no data) or when total discards are zero (no variance), sample size was determined by pilot cover, where 2% of the quarterly VTR trips for a fleet were multiplied by the quarterly mean VTR trip length.

133
(9) hqhqjhq DATS *ˆˆ,30
where hqT is 2% of the VTR trips in stratum h and quarter q, and 3 <= hqT <= 100 trips; hqAD is
the average trip length of VTR trips in stratum h and quarter q. The quarterly trips and sea days were then summed for annual number of trips and sea days. The achieved precision resulting from the number of funded sea days can be derived by
converting funded sea days into funded trips. The number of funded trips, hFT for stratum h is
defined as:
(10) hhh DAFSFT /ˆˆ
where hFS is the number of funded sea days in stratum h and hAD is the weighted average trip
length of VTR trips in stratum h (weighted by the number of VTR trips in each quarter).
The achieved coefficient of variation (CV) of jD is based on the variance of the composite
annual total discards for species group j in stratum h and the number of funded trips in stratum h and re-writing Eq. 7. From Eq. 7, let
(11) 2
4
1
4
1
22
2
22
2
ˆˆ
ˆ
ˆ1ˆ
)ˆ(jhh
q h
qjqh
qh
qh
hqh
jqhqh
qh
jhDFT
N
Sk
K
FTSk
K
DCV

134
Appendix Table 1. Discard reason categories used in Appendix Tables 2A and 2B.
Discard Reason Category
FISH DISPOSITION
Code9 FISH DISPOSITION Description
No Market
001 NO MARKET, REASON NOT SPECIFIED.
002 NO MARKET, TOO SMALL
003 NO MARKET, TOO LARGE
005 NO MARKET, WONT KEEP UNTIL TRIP END.
006 NO MARKET, BUT RETAINED BY VESSEL FOR ALTERNATE PROGRAM.
007 NO MARKET, BUT RETAINED FOR OBSERVER FOR SCIENTIFIC PURPOSES
Poor Quality
031 POOR QUALITY, REASON NOT SPECIFIED
032 POOR QUALITY, SANDFLEA DAMAGE
033 POOR QUALITY, SEAL DAMAGE
034 POOR QUALITY, SHARK DAMAGE
035 POOR QUALITY, CETACEAN DAMAGE
036 POOR QUALITY, HAGFISH DAMAGE
037 POOR QUALITY, SHALL DISEASE
038 POOR QUALITY, GEAR DAMAGE
Regulation (Size) 012 REGULATIONS PROHIBIT RETENTION, TOO SMALL
013 REGULATIONS PROHIBIT RETENTION, TOO LARGE
Regulation (Quota)
004 NO MARKET, QUOTA FILLED
014 REGULATIONS PROHIBIT RETENTION, QUOTA FILLED.
015 REGULATIONS PROHIBIT RETENTION, NO QUOTA IN AREA.
025 REGULATIONS PROHIBIT ANY RETENTION.
Regulation (Other)
011 REGULATIONS PROHIBIT RETENTION, REASON NOT SPECIFIED.
022 REGULATIONS PROHIBIT RETENTION, V-NOTCHED
023 REGULATIONS PROHIBIT RETENTION, SOFT-SHELL
024 REGULATIONS PROHIBIT RETENTION, WITH EGGS.
Other
000 DISCARDED GENERAL, UNKNOWN DISCARD REASON
041 NOT BROUGHT ON BOARD, REASON NOT SPECIFIED
042 NOT BROUGHT ON BOARD, GEAR DAMAGE PREVENTED CAPTURE
043 NOT BROUGHT ON BOARD, FELL OUT/OFF OF GEAR
044 NOT BROUGHT ON BOARD, CONSIDERED TO HAVE NO MARKET VALUE.
048 NOT BROUGHT ON BOARD, VESSEL CAPACITY FILLED
049 NOT BROUGHT ON BOARD, NOT ENOUGH FISH TO PUMP ABOARD
052 INCIDENTAL TAKE (MAMMAL, SEA TURTLE, SEA BIRD)
053 DEBRIS
054 EMPTY SHELLS
062 UPGRADED
063 RETAINING ONLY CERTAIN SIZE BETTER PRICE TRIP QUOTA IN EFFECT.
099 OTHER, DISCARDED
9 Fish disposition code “039” = POOR QUALITY, PREVIOUSLY DISCARDED has been excluded from this report.
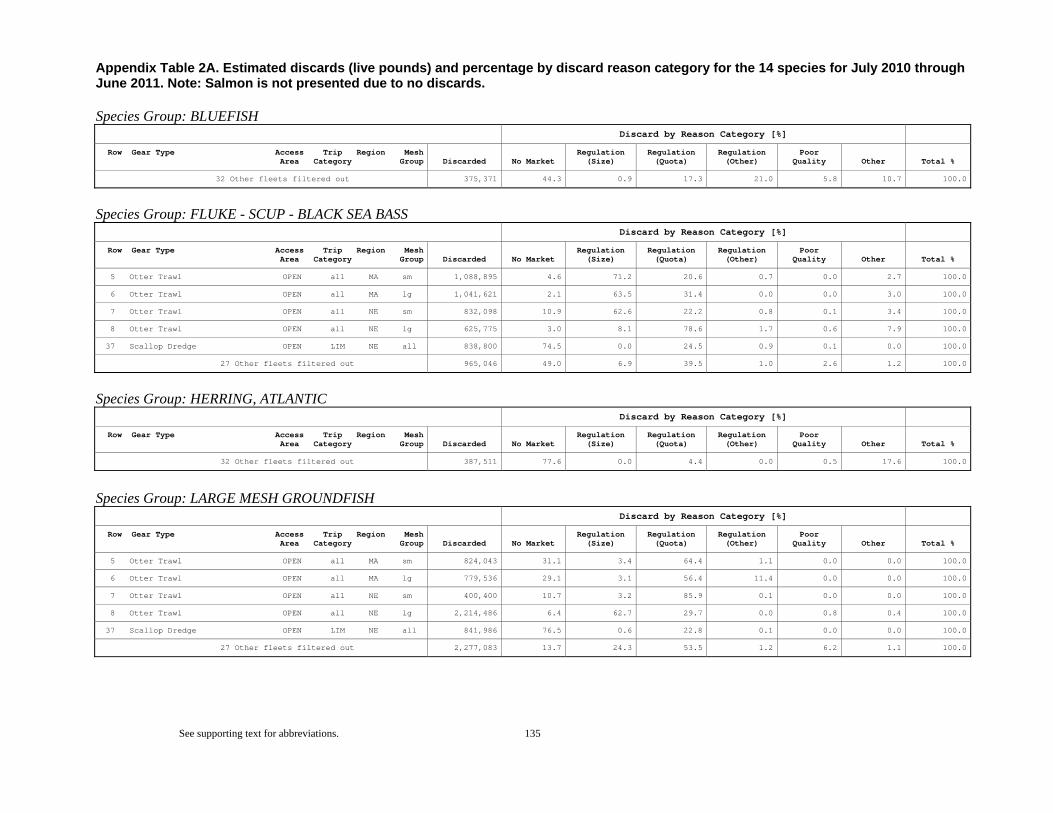
Appendix Table 2A. Estimated discards (live pounds) and percentage by discard reason category for the 14 species for July 2010 through June 2011. Note: Salmon is not presented due to no discards.
See supporting text for abbreviations. 135
Species Group: BLUEFISH
Discard by Reason Category [%]
Row Gear Type Access Trip Region MeshArea Category Group Discarded No Market
Regulation (Size)
Regulation (Quota)
Regulation (Other)
Poor Quality Other Total %
32 Other fleets filtered out 375,371 44.3 0.9 17.3 21.0 5.8 10.7 100.0
Species Group: FLUKE - SCUP - BLACK SEA BASS
Discard by Reason Category [%]
Row Gear Type Access Trip Region MeshArea Category Group Discarded No Market
Regulation (Size)
Regulation (Quota)
Regulation (Other)
Poor Quality Other Total %
5 Otter Trawl OPEN all MA sm 1,088,895 4.6 71.2 20.6 0.7 0.0 2.7 100.0
6 Otter Trawl OPEN all MA lg 1,041,621 2.1 63.5 31.4 0.0 0.0 3.0 100.0
7 Otter Trawl OPEN all NE sm 832,098 10.9 62.6 22.2 0.8 0.1 3.4 100.0
8 Otter Trawl OPEN all NE lg 625,775 3.0 8.1 78.6 1.7 0.6 7.9 100.0
37 Scallop Dredge OPEN LIM NE all 838,800 74.5 0.0 24.5 0.9 0.1 0.0 100.0
27 Other fleets filtered out 965,046 49.0 6.9 39.5 1.0 2.6 1.2 100.0
Species Group: HERRING, ATLANTIC
Discard by Reason Category [%]
Row Gear Type Access Trip Region MeshArea Category Group Discarded No Market
Regulation (Size)
Regulation (Quota)
Regulation (Other)
Poor Quality Other Total %
32 Other fleets filtered out 387,511 77.6 0.0 4.4 0.0 0.5 17.6 100.0
Species Group: LARGE MESH GROUNDFISH
Discard by Reason Category [%]
Row Gear Type Access Trip Region MeshArea Category Group Discarded No Market
Regulation (Size)
Regulation (Quota)
Regulation (Other)
Poor Quality Other Total %
5 Otter Trawl OPEN all MA sm 824,043 31.1 3.4 64.4 1.1 0.0 0.0 100.0
6 Otter Trawl OPEN all MA lg 779,536 29.1 3.1 56.4 11.4 0.0 0.0 100.0
7 Otter Trawl OPEN all NE sm 400,400 10.7 3.2 85.9 0.1 0.0 0.0 100.0
8 Otter Trawl OPEN all NE lg 2,214,486 6.4 62.7 29.7 0.0 0.8 0.4 100.0
37 Scallop Dredge OPEN LIM NE all 841,986 76.5 0.6 22.8 0.1 0.0 0.0 100.0
27 Other fleets filtered out 2,277,083 13.7 24.3 53.5 1.2 6.2 1.1 100.0
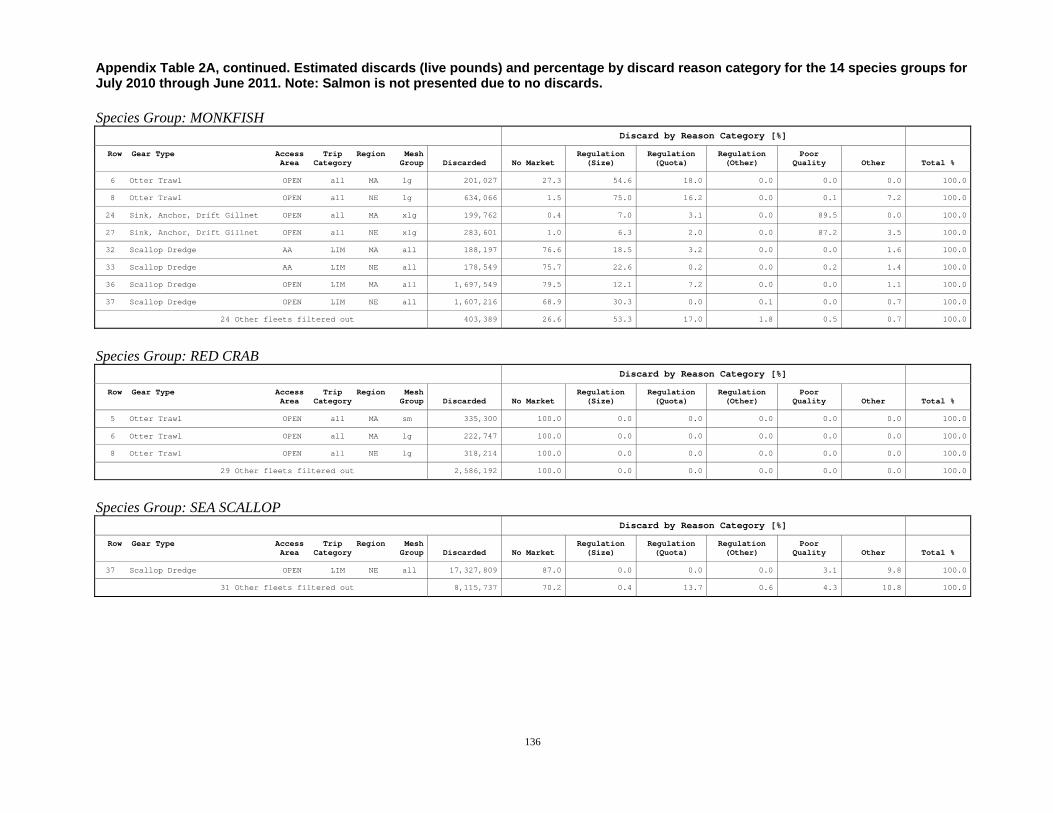
Appendix Table 2A, continued. Estimated discards (live pounds) and percentage by discard reason category for the 14 species groups for July 2010 through June 2011. Note: Salmon is not presented due to no discards.
136
Species Group: MONKFISH Discard by Reason Category [%]
Row Gear Type Access Trip Region MeshArea Category Group Discarded No Market
Regulation (Size)
Regulation (Quota)
Regulation (Other)
Poor Quality Other Total %
6 Otter Trawl OPEN all MA lg 201,027 27.3 54.6 18.0 0.0 0.0 0.0 100.0
8 Otter Trawl OPEN all NE lg 634,066 1.5 75.0 16.2 0.0 0.1 7.2 100.0
24 Sink, Anchor, Drift Gillnet OPEN all MA xlg 199,762 0.4 7.0 3.1 0.0 89.5 0.0 100.0
27 Sink, Anchor, Drift Gillnet OPEN all NE xlg 283,601 1.0 6.3 2.0 0.0 87.2 3.5 100.0
32 Scallop Dredge AA LIM MA all 188,197 76.6 18.5 3.2 0.0 0.0 1.6 100.0
33 Scallop Dredge AA LIM NE all 178,549 75.7 22.6 0.2 0.0 0.2 1.4 100.0
36 Scallop Dredge OPEN LIM MA all 1,697,549 79.5 12.1 7.2 0.0 0.0 1.1 100.0
37 Scallop Dredge OPEN LIM NE all 1,607,216 68.9 30.3 0.0 0.1 0.0 0.7 100.0
24 Other fleets filtered out 403,389 26.6 53.3 17.0 1.8 0.5 0.7 100.0
Species Group: RED CRAB
Discard by Reason Category [%]
Row Gear Type Access Trip Region MeshArea Category Group Discarded No Market
Regulation (Size)
Regulation (Quota)
Regulation (Other)
Poor Quality Other Total %
5 Otter Trawl OPEN all MA sm 335,300 100.0 0.0 0.0 0.0 0.0 0.0 100.0
6 Otter Trawl OPEN all MA lg 222,747 100.0 0.0 0.0 0.0 0.0 0.0 100.0
8 Otter Trawl OPEN all NE lg 318,214 100.0 0.0 0.0 0.0 0.0 0.0 100.0
29 Other fleets filtered out 2,586,192 100.0 0.0 0.0 0.0 0.0 0.0 100.0
Species Group: SEA SCALLOP
Discard by Reason Category [%]
Row Gear Type Access Trip Region MeshArea Category Group Discarded No Market
Regulation (Size)
Regulation (Quota)
Regulation (Other)
Poor Quality Other Total %
37 Scallop Dredge OPEN LIM NE all 17,327,809 87.0 0.0 0.0 0.0 3.1 9.8 100.0
31 Other fleets filtered out 8,115,737 70.2 0.4 13.7 0.6 4.3 10.8 100.0
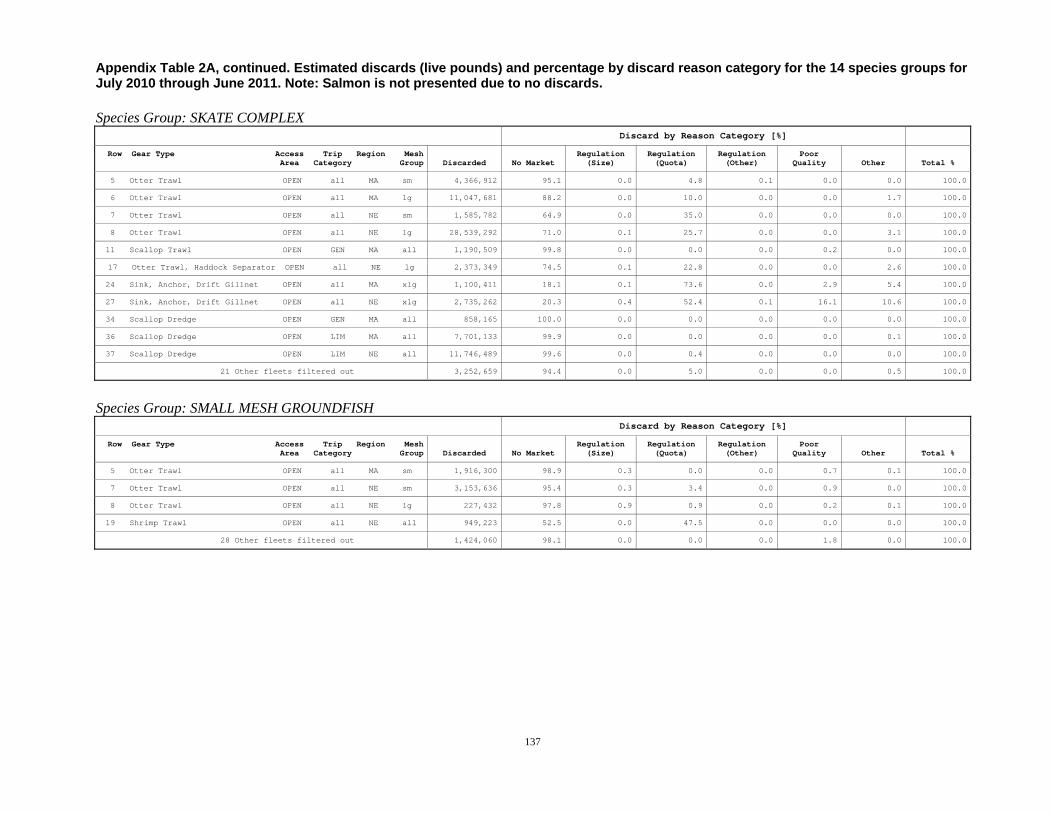
Appendix Table 2A, continued. Estimated discards (live pounds) and percentage by discard reason category for the 14 species groups for July 2010 through June 2011. Note: Salmon is not presented due to no discards.
137
Species Group: SKATE COMPLEX Discard by Reason Category [%]
Row Gear Type Access Trip Region MeshArea Category Group Discarded No Market
Regulation (Size)
Regulation (Quota)
Regulation (Other)
Poor Quality Other Total %
5 Otter Trawl OPEN all MA sm 4,366,912 95.1 0.0 4.8 0.1 0.0 0.0 100.0
6 Otter Trawl OPEN all MA lg 11,047,681 88.2 0.0 10.0 0.0 0.0 1.7 100.0
7 Otter Trawl OPEN all NE sm 1,585,782 64.9 0.0 35.0 0.0 0.0 0.0 100.0
8 Otter Trawl OPEN all NE lg 28,539,292 71.0 0.1 25.7 0.0 0.0 3.1 100.0
11 Scallop Trawl OPEN GEN MA all 1,190,509 99.8 0.0 0.0 0.0 0.2 0.0 100.0
17 Otter Trawl, Haddock Separator OPEN all NE lg 2,373,349 74.5 0.1 22.8 0.0 0.0 2.6 100.0
24 Sink, Anchor, Drift Gillnet OPEN all MA xlg 1,100,411 18.1 0.1 73.6 0.0 2.9 5.4 100.0
27 Sink, Anchor, Drift Gillnet OPEN all NE xlg 2,735,262 20.3 0.4 52.4 0.1 16.1 10.6 100.0
34 Scallop Dredge OPEN GEN MA all 858,165 100.0 0.0 0.0 0.0 0.0 0.0 100.0
36 Scallop Dredge OPEN LIM MA all 7,701,133 99.9 0.0 0.0 0.0 0.0 0.1 100.0
37 Scallop Dredge OPEN LIM NE all 11,746,489 99.6 0.0 0.4 0.0 0.0 0.0 100.0
21 Other fleets filtered out 3,252,659 94.4 0.0 5.0 0.0 0.0 0.5 100.0
Species Group: SMALL MESH GROUNDFISH
Discard by Reason Category [%]
Row Gear Type Access Trip Region MeshArea Category Group Discarded No Market
Regulation (Size)
Regulation (Quota)
Regulation (Other)
Poor Quality Other Total %
5 Otter Trawl OPEN all MA sm 1,916,300 98.9 0.3 0.0 0.0 0.7 0.1 100.0
7 Otter Trawl OPEN all NE sm 3,153,636 95.4 0.3 3.4 0.0 0.9 0.0 100.0
8 Otter Trawl OPEN all NE lg 227,432 97.8 0.9 0.9 0.0 0.2 0.1 100.0
19 Shrimp Trawl OPEN all NE all 949,223 52.5 0.0 47.5 0.0 0.0 0.0 100.0
28 Other fleets filtered out 1,424,060 98.1 0.0 0.0 0.0 1.8 0.0 100.0

Appendix Table 2A, continued. Estimated discards (live pounds) and percentage by discard reason category for the 14 species groups for July 2010 through June 2011. Note: Salmon is not presented due to no discards.
138
Species Group: SPINY DOGFISH Discard by Reason Category [%]
Row Gear Type Access Trip Region MeshArea Category Group Discarded No Market
Regulation (Size)
Regulation (Quota)
Regulation (Other)
Poor Quality Other Total %
5 Otter Trawl OPEN all MA sm 4,037,129 79.6 0.0 19.7 0.6 0.0 0.0 100.0
6 Otter Trawl OPEN all MA lg 4,505,364 55.2 0.2 40.1 1.6 0.0 2.9 100.0
7 Otter Trawl OPEN all NE sm 1,789,471 43.7 0.0 56.1 0.2 0.0 0.0 100.0
8 Otter Trawl OPEN all NE lg 3,467,413 60.8 0.0 38.5 0.5 0.0 0.1 100.0
17 Otter Trawl, Haddock Separator OPEN all NE lg 213,880 91.9 0.0 8.1 0.0 0.0 0.0 100.0
26 Sink, Anchor, Drift Gillnet OPEN all NE lg 2,942,511 56.7 0.5 40.3 0.0 1.6 0.9 100.0
27 Sink, Anchor, Drift Gillnet OPEN all NE xlg 233,724 45.9 0.1 46.1 0.0 7.6 0.3 100.0
37 Scallop Dredge OPEN LIM NE all 211,272 93.1 0.0 6.9 0.0 0.0 0.0 100.0
39 Mid-water paired & single Trawl OPEN all NE all 211,974 94.2 0.0 5.8 0.0 0.0 0.0 100.0
23 Other fleets filtered out 885,034 63.1 0.2 25.9 0.4 5.4 5.1 100.0
Species Group: SQUID - BUTTERFISH – MACKEREL
Discard by Reason Category [%]
Row Gear Type Access Trip Region MeshArea Category Group Discarded No Market
Regulation (Size)
Regulation (Quota)
Regulation (Other)
Poor Quality Other Total %
5 Otter Trawl OPEN all MA sm 2,360,495 90.2 0.4 5.0 0.0 1.2 3.2 100.0
7 Otter Trawl OPEN all NE sm 3,403,902 76.9 0.2 9.4 0.4 2.1 11.1 100.0
30 Other fleets filtered out 281,226 99.1 0.3 0.4 0.0 0.1 0.1 100.0
Species Group: SURFCLAM - OCEAN QUAHOG
Discard by Reason Category [%]
Row Gear Type Access Trip Region MeshArea Category Group Discarded No Market
Regulation (Size)
Regulation (Quota)
Regulation (Other)
Poor Quality Other Total %
32 Other fleets filtered out 56,151 99.4 0.0 0.6 0.0 0.0 0.0 100.0
Species Group: TILEFISH
Discard by Reason Category [%]
Row Gear Type Access Trip Region MeshArea Category Group Discarded No Market
Regulation (Size)
Regulation (Quota)
Regulation (Other)
Poor Quality Other Total %
32 Other fleets filtered out 10,405 58.9 9.6 7.8 0.0 23.7 0.0 100.0
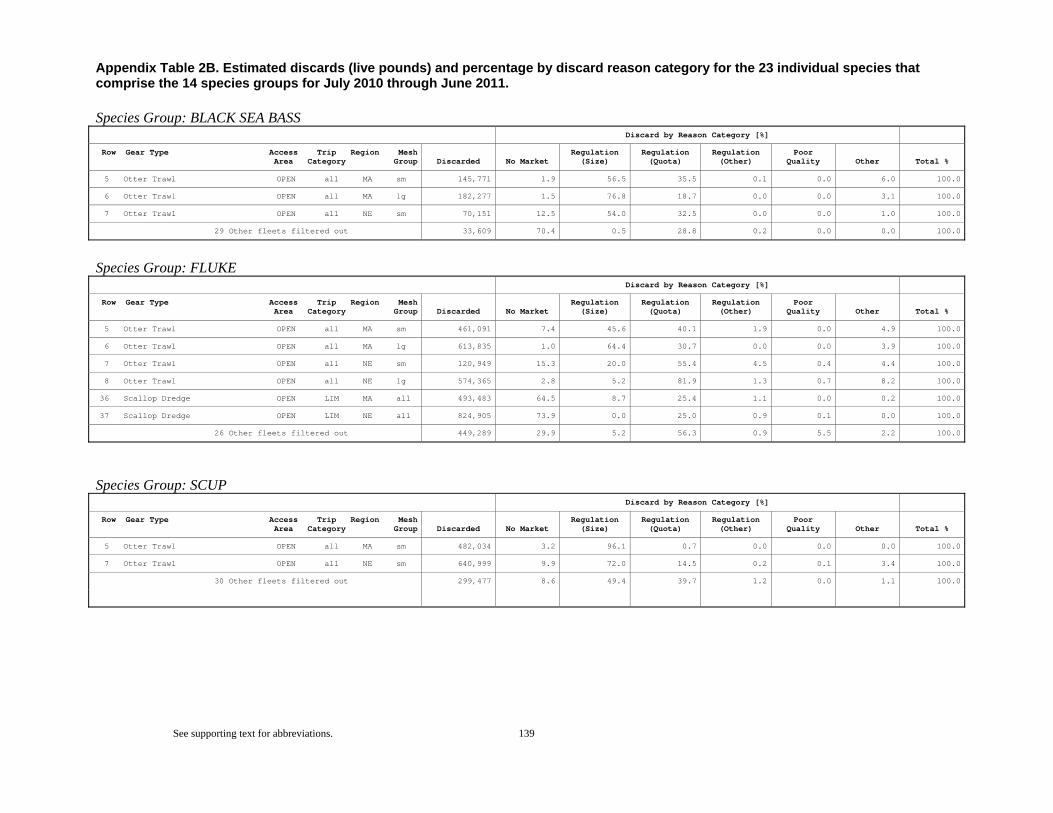
Appendix Table 2B. Estimated discards (live pounds) and percentage by discard reason category for the 23 individual species that comprise the 14 species groups for July 2010 through June 2011.
See supporting text for abbreviations. 139
Species Group: BLACK SEA BASS
Discard by Reason Category [%]
Row Gear Type Access Trip Region MeshArea Category Group Discarded No Market
Regulation (Size)
Regulation (Quota)
Regulation (Other)
Poor Quality Other Total %
5 Otter Trawl OPEN all MA sm 145,771 1.9 56.5 35.5 0.1 0.0 6.0 100.0
6 Otter Trawl OPEN all MA lg 182,277 1.5 76.8 18.7 0.0 0.0 3.1 100.0
7 Otter Trawl OPEN all NE sm 70,151 12.5 54.0 32.5 0.0 0.0 1.0 100.0
29 Other fleets filtered out 33,609 70.4 0.5 28.8 0.2 0.0 0.0 100.0
Species Group: FLUKE
Discard by Reason Category [%]
Row Gear Type Access Trip Region MeshArea Category Group Discarded No Market
Regulation (Size)
Regulation (Quota)
Regulation (Other)
Poor Quality Other Total %
5 Otter Trawl OPEN all MA sm 461,091 7.4 45.6 40.1 1.9 0.0 4.9 100.0
6 Otter Trawl OPEN all MA lg 613,835 1.0 64.4 30.7 0.0 0.0 3.9 100.0
7 Otter Trawl OPEN all NE sm 120,949 15.3 20.0 55.4 4.5 0.4 4.4 100.0
8 Otter Trawl OPEN all NE lg 574,365 2.8 5.2 81.9 1.3 0.7 8.2 100.0
36 Scallop Dredge OPEN LIM MA all 493,483 64.5 8.7 25.4 1.1 0.0 0.2 100.0
37 Scallop Dredge OPEN LIM NE all 824,905 73.9 0.0 25.0 0.9 0.1 0.0 100.0
26 Other fleets filtered out 449,289 29.9 5.2 56.3 0.9 5.5 2.2 100.0
Species Group: SCUP
Discard by Reason Category [%]
Row Gear Type Access Trip Region MeshArea Category Group Discarded No Market
Regulation (Size)
Regulation (Quota)
Regulation (Other)
Poor Quality Other Total %
5 Otter Trawl OPEN all MA sm 482,034 3.2 96.1 0.7 0.0 0.0 0.0 100.0
7 Otter Trawl OPEN all NE sm 640,999 9.9 72.0 14.5 0.2 0.1 3.4 100.0
30 Other fleets filtered out 299,477 8.6 49.4 39.7 1.2 0.0 1.1 100.0
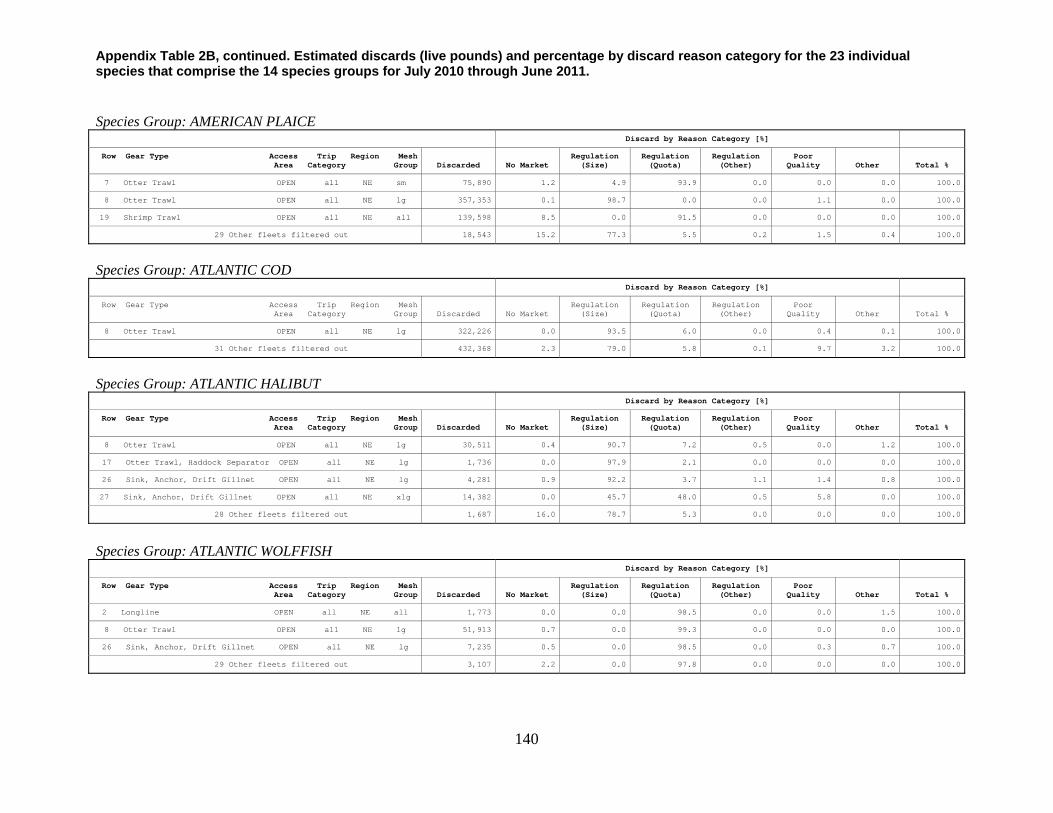
Appendix Table 2B, continued. Estimated discards (live pounds) and percentage by discard reason category for the 23 individual species that comprise the 14 species groups for July 2010 through June 2011.
140
Species Group: AMERICAN PLAICE
Discard by Reason Category [%]
Row Gear Type Access Trip Region MeshArea Category Group Discarded No Market
Regulation (Size)
Regulation (Quota)
Regulation (Other)
Poor Quality Other Total %
7 Otter Trawl OPEN all NE sm 75,890 1.2 4.9 93.9 0.0 0.0 0.0 100.0
8 Otter Trawl OPEN all NE lg 357,353 0.1 98.7 0.0 0.0 1.1 0.0 100.0
19 Shrimp Trawl OPEN all NE all 139,598 8.5 0.0 91.5 0.0 0.0 0.0 100.0
29 Other fleets filtered out 18,543 15.2 77.3 5.5 0.2 1.5 0.4 100.0
Species Group: ATLANTIC COD
Discard by Reason Category [%]
Row Gear Type Access Trip Region MeshArea Category Group Discarded No Market
Regulation (Size)
Regulation (Quota)
Regulation (Other)
Poor Quality Other Total %
8 Otter Trawl OPEN all NE lg 322,226 0.0 93.5 6.0 0.0 0.4 0.1 100.0
31 Other fleets filtered out 432,368 2.3 79.0 5.8 0.1 9.7 3.2 100.0
Species Group: ATLANTIC HALIBUT
Discard by Reason Category [%]
Row Gear Type Access Trip Region MeshArea Category Group Discarded No Market
Regulation (Size)
Regulation (Quota)
Regulation (Other)
Poor Quality Other Total %
8 Otter Trawl OPEN all NE lg 30,511 0.4 90.7 7.2 0.5 0.0 1.2 100.0
17 Otter Trawl, Haddock Separator OPEN all NE lg 1,736 0.0 97.9 2.1 0.0 0.0 0.0 100.0
26 Sink, Anchor, Drift Gillnet OPEN all NE lg 4,281 0.9 92.2 3.7 1.1 1.4 0.8 100.0
27 Sink, Anchor, Drift Gillnet OPEN all NE xlg 14,382 0.0 45.7 48.0 0.5 5.8 0.0 100.0
28 Other fleets filtered out 1,687 16.0 78.7 5.3 0.0 0.0 0.0 100.0
Species Group: ATLANTIC WOLFFISH
Discard by Reason Category [%]
Row Gear Type Access Trip Region MeshArea Category Group Discarded No Market
Regulation (Size)
Regulation (Quota)
Regulation (Other)
Poor Quality Other Total %
2 Longline OPEN all NE all 1,773 0.0 0.0 98.5 0.0 0.0 1.5 100.0
8 Otter Trawl OPEN all NE lg 51,913 0.7 0.0 99.3 0.0 0.0 0.0 100.0
26 Sink, Anchor, Drift Gillnet OPEN all NE lg 7,235 0.5 0.0 98.5 0.0 0.3 0.7 100.0
29 Other fleets filtered out 3,107 2.2 0.0 97.8 0.0 0.0 0.0 100.0

Appendix Table 2B, continued. Estimated discards (live pounds) and percentage by discard reason category for the 23 individual species that comprise the 14 species groups for July 2010 through June 2011.
141
Species Group: HADDOCK
Discard by Reason Category [%]
Row Gear Type Access Trip Region MeshArea Category Group Discarded No Market
Regulation (Size)
Regulation (Quota)
Regulation (Other)
Poor Quality Other Total %
32 Other fleets filtered out 178,602 2.7 52.7 33.5 0.0 8.9 2.2 100.0
Species Group: OCEAN POUT
Discard by Reason Category [%]
Row Gear Type Access Trip Region MeshArea Category Group Discarded No Market
Regulation (Size)
Regulation (Quota)
Regulation (Other)
Poor Quality Other Total %
5 Otter Trawl OPEN all MA sm 30,880 97.1 0.0 2.9 0.0 0.0 0.0 100.0
6 Otter Trawl OPEN all MA lg 44,303 33.6 0.0 66.4 0.0 0.0 0.0 100.0
7 Otter Trawl OPEN all NE sm 20,276 48.5 0.0 51.5 0.0 0.0 0.0 100.0
8 Otter Trawl OPEN all NE lg 87,324 40.2 0.0 59.7 0.0 0.0 0.1 100.0
11 Scallop Trawl OPEN GEN MA all 8,671 41.9 0.0 58.1 0.0 0.0 0.0 100.0
17 Otter Trawl, Haddock Separator OPEN all NE lg 5,106 29.9 0.0 70.1 0.0 0.0 0.0 100.0
37 Scallop Dredge OPEN LIM NE all 7,771 58.7 0.0 41.3 0.0 0.0 0.0 100.0
25 Other fleets filtered out 19,069 14.2 0.0 85.6 0.0 0.0 0.2 100.0
Species Group: POLLOCK
Discard by Reason Category [%]
Row Gear Type Access Trip Region MeshArea Category Group Discarded No Market
Regulation (Size)
Regulation (Quota)
Regulation (Other)
Poor Quality Other Total %
32 Other fleets filtered out 205,832 0.6 66.8 0.8 0.0 30.8 1.0 100.0
Species Group: REDFISH
Discard by Reason Category [%]
Row Gear Type Access Trip Region MeshArea Category Group Discarded No Market
Regulation (Size)
Regulation (Quota)
Regulation (Other)
Poor Quality Other Total %
8 Otter Trawl OPEN all NE lg 256,498 3.7 95.4 0.0 0.0 0.5 0.4 100.0
31 Other fleets filtered out 75,759 30.1 48.1 21.1 0.0 0.4 0.3 100.0
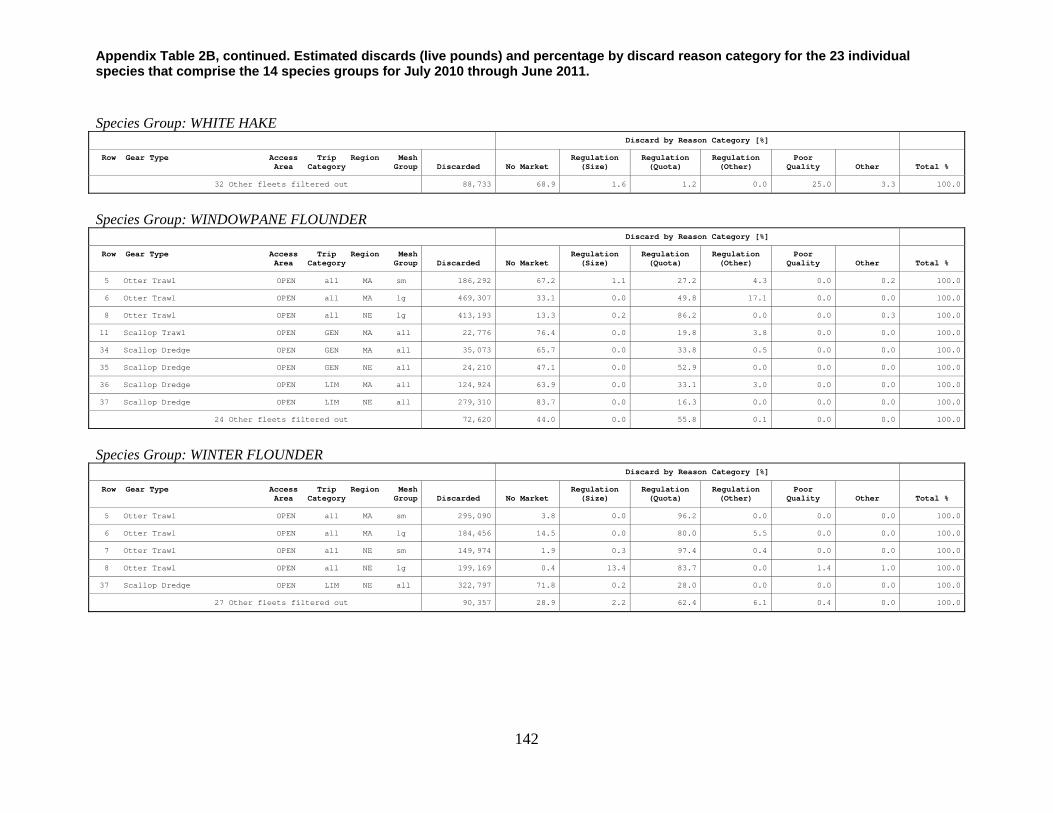
Appendix Table 2B, continued. Estimated discards (live pounds) and percentage by discard reason category for the 23 individual species that comprise the 14 species groups for July 2010 through June 2011.
142
Species Group: WHITE HAKE
Discard by Reason Category [%]
Row Gear Type Access Trip Region MeshArea Category Group Discarded No Market
Regulation (Size)
Regulation (Quota)
Regulation (Other)
Poor Quality Other Total %
32 Other fleets filtered out 88,733 68.9 1.6 1.2 0.0 25.0 3.3 100.0
Species Group: WINDOWPANE FLOUNDER
Discard by Reason Category [%]
Row Gear Type Access Trip Region MeshArea Category Group Discarded No Market
Regulation (Size)
Regulation (Quota)
Regulation (Other)
Poor Quality Other Total %
5 Otter Trawl OPEN all MA sm 186,292 67.2 1.1 27.2 4.3 0.0 0.2 100.0
6 Otter Trawl OPEN all MA lg 469,307 33.1 0.0 49.8 17.1 0.0 0.0 100.0
8 Otter Trawl OPEN all NE lg 413,193 13.3 0.2 86.2 0.0 0.0 0.3 100.0
11 Scallop Trawl OPEN GEN MA all 22,776 76.4 0.0 19.8 3.8 0.0 0.0 100.0
34 Scallop Dredge OPEN GEN MA all 35,073 65.7 0.0 33.8 0.5 0.0 0.0 100.0
35 Scallop Dredge OPEN GEN NE all 24,210 47.1 0.0 52.9 0.0 0.0 0.0 100.0
36 Scallop Dredge OPEN LIM MA all 124,924 63.9 0.0 33.1 3.0 0.0 0.0 100.0
37 Scallop Dredge OPEN LIM NE all 279,310 83.7 0.0 16.3 0.0 0.0 0.0 100.0
24 Other fleets filtered out 72,620 44.0 0.0 55.8 0.1 0.0 0.0 100.0
Species Group: WINTER FLOUNDER
Discard by Reason Category [%]
Row Gear Type Access Trip Region MeshArea Category Group Discarded No Market
Regulation (Size)
Regulation (Quota)
Regulation (Other)
Poor Quality Other Total %
5 Otter Trawl OPEN all MA sm 295,090 3.8 0.0 96.2 0.0 0.0 0.0 100.0
6 Otter Trawl OPEN all MA lg 184,456 14.5 0.0 80.0 5.5 0.0 0.0 100.0
7 Otter Trawl OPEN all NE sm 149,974 1.9 0.3 97.4 0.4 0.0 0.0 100.0
8 Otter Trawl OPEN all NE lg 199,169 0.4 13.4 83.7 0.0 1.4 1.0 100.0
37 Scallop Dredge OPEN LIM NE all 322,797 71.8 0.2 28.0 0.0 0.0 0.0 100.0
27 Other fleets filtered out 90,357 28.9 2.2 62.4 6.1 0.4 0.0 100.0
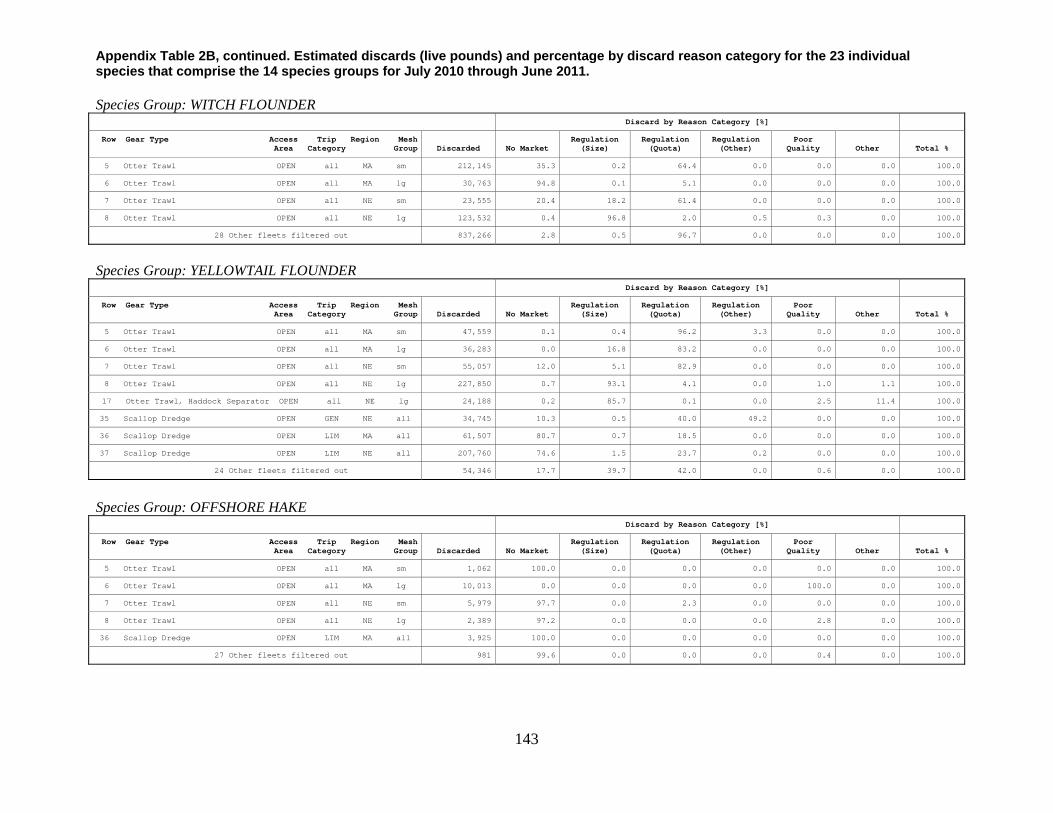
Appendix Table 2B, continued. Estimated discards (live pounds) and percentage by discard reason category for the 23 individual species that comprise the 14 species groups for July 2010 through June 2011.
143
Species Group: WITCH FLOUNDER Discard by Reason Category [%]
Row Gear Type Access Trip Region MeshArea Category Group Discarded No Market
Regulation (Size)
Regulation (Quota)
Regulation (Other)
Poor Quality Other Total %
5 Otter Trawl OPEN all MA sm 212,145 35.3 0.2 64.4 0.0 0.0 0.0 100.0
6 Otter Trawl OPEN all MA lg 30,763 94.8 0.1 5.1 0.0 0.0 0.0 100.0
7 Otter Trawl OPEN all NE sm 23,555 20.4 18.2 61.4 0.0 0.0 0.0 100.0
8 Otter Trawl OPEN all NE lg 123,532 0.4 96.8 2.0 0.5 0.3 0.0 100.0
28 Other fleets filtered out 837,266 2.8 0.5 96.7 0.0 0.0 0.0 100.0
Species Group: YELLOWTAIL FLOUNDER
Discard by Reason Category [%]
Row Gear Type Access Trip Region MeshArea Category Group Discarded No Market
Regulation (Size)
Regulation (Quota)
Regulation (Other)
Poor Quality Other Total %
5 Otter Trawl OPEN all MA sm 47,559 0.1 0.4 96.2 3.3 0.0 0.0 100.0
6 Otter Trawl OPEN all MA lg 36,283 0.0 16.8 83.2 0.0 0.0 0.0 100.0
7 Otter Trawl OPEN all NE sm 55,057 12.0 5.1 82.9 0.0 0.0 0.0 100.0
8 Otter Trawl OPEN all NE lg 227,850 0.7 93.1 4.1 0.0 1.0 1.1 100.0
17 Otter Trawl, Haddock Separator OPEN all NE lg 24,188 0.2 85.7 0.1 0.0 2.5 11.4 100.0
35 Scallop Dredge OPEN GEN NE all 34,745 10.3 0.5 40.0 49.2 0.0 0.0 100.0
36 Scallop Dredge OPEN LIM MA all 61,507 80.7 0.7 18.5 0.0 0.0 0.0 100.0
37 Scallop Dredge OPEN LIM NE all 207,760 74.6 1.5 23.7 0.2 0.0 0.0 100.0
24 Other fleets filtered out 54,346 17.7 39.7 42.0 0.0 0.6 0.0 100.0
Species Group: OFFSHORE HAKE
Discard by Reason Category [%]
Row Gear Type Access Trip Region MeshArea Category Group Discarded No Market
Regulation (Size)
Regulation (Quota)
Regulation (Other)
Poor Quality Other Total %
5 Otter Trawl OPEN all MA sm 1,062 100.0 0.0 0.0 0.0 0.0 0.0 100.0
6 Otter Trawl OPEN all MA lg 10,013 0.0 0.0 0.0 0.0 100.0 0.0 100.0
7 Otter Trawl OPEN all NE sm 5,979 97.7 0.0 2.3 0.0 0.0 0.0 100.0
8 Otter Trawl OPEN all NE lg 2,389 97.2 0.0 0.0 0.0 2.8 0.0 100.0
36 Scallop Dredge OPEN LIM MA all 3,925 100.0 0.0 0.0 0.0 0.0 0.0 100.0
27 Other fleets filtered out 981 99.6 0.0 0.0 0.0 0.4 0.0 100.0

Appendix Table 2B, continued. Estimated discards (live pounds) and percentage by discard reason category for the 23 individual species that comprise the 14 species groups for July 2010 through June 2011.
144
Species Group: RED HAKE Discard by Reason Category [%]
Row Gear Type Access Trip Region MeshArea Category Group Discarded No Market
Regulation (Size)
Regulation (Quota)
Regulation (Other)
Poor Quality Other Total %
5 Otter Trawl OPEN all MA sm 846,366 100.0 0.0 0.0 0.0 0.0 0.0 100.0
7 Otter Trawl OPEN all NE sm 1,135,488 99.5 0.0 0.5 0.0 0.0 0.0 100.0
8 Otter Trawl OPEN all NE lg 86,962 97.0 1.7 1.2 0.0 0.0 0.1 100.0
19 Shrimp Trawl OPEN all NE all 35,415 100.0 0.0 0.0 0.0 0.0 0.0 100.0
37 Scallop Dredge OPEN LIM NE all 59,591 99.0 0.0 1.0 0.0 0.0 0.0 100.0
27 Other fleets filtered out 91,666 99.4 0.1 0.0 0.0 0.1 0.4 100.0
Species Group: SILVER HAKE
Discard by Reason Category [%]
Row Gear Type Access Trip Region MeshArea Category Group Discarded No Market
Regulation (Size)
Regulation (Quota)
Regulation (Other)
Poor Quality Other Total %
5 Otter Trawl OPEN all MA sm 1,068,871 98.0 0.5 0.0 0.0 1.3 0.2 100.0
7 Otter Trawl OPEN all NE sm 2,012,169 93.0 0.4 5.1 0.0 1.5 0.0 100.0
19 Shrimp Trawl OPEN all NE all 913,808 50.7 0.0 49.3 0.0 0.0 0.0 100.0
29 Other fleets filtered out 1,395,964 98.6 0.1 0.1 0.0 1.3 0.0 100.0
Species Group: ATLANTIC MACKEREL
Discard by Reason Category [%]
Row Gear Type Access Trip Region MeshArea Category Group Discarded No Market
Regulation (Size)
Regulation (Quota)
Regulation (Other)
Poor Quality Other Total %
7 Otter Trawl OPEN all NE sm 80,036 99.9 0.0 0.0 0.0 0.1 0.0 100.0
31 Other fleets filtered out 45,880 97.3 0.0 0.1 0.0 2.0 0.6 100.0
Species Group: BUTTERFISH
Discard by Reason Category [%]
Row Gear Type Access Trip Region MeshArea Category Group Discarded No Market
Regulation (Size)
Regulation (Quota)
Regulation (Other)
Poor Quality Other Total %
5 Otter Trawl OPEN all MA sm 1,012,732 83.5 1.1 12.9 0.0 2.2 0.3 100.0
7 Otter Trawl OPEN all NE sm 1,936,031 76.8 0.3 16.4 0.7 0.0 5.9 100.0
30 Other fleets filtered out 55,511 98.2 1.5 0.0 0.0 0.2 0.1 100.0
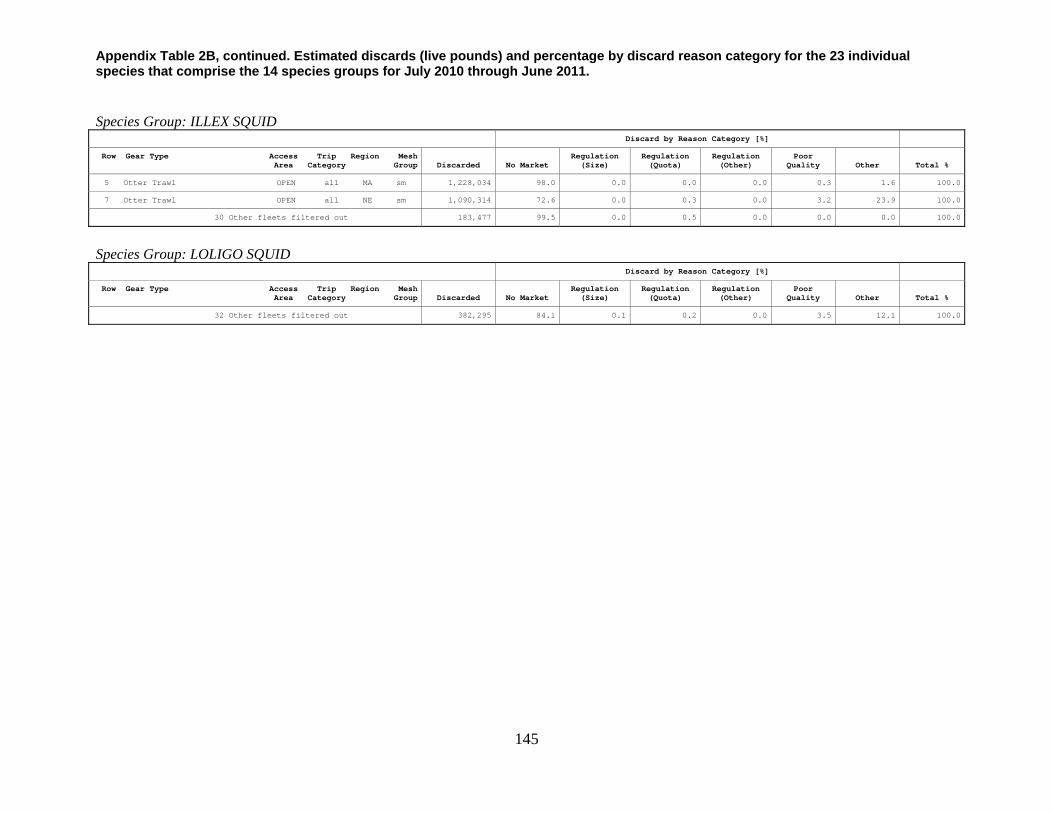
Appendix Table 2B, continued. Estimated discards (live pounds) and percentage by discard reason category for the 23 individual species that comprise the 14 species groups for July 2010 through June 2011.
145
Species Group: ILLEX SQUID
Discard by Reason Category [%]
Row Gear Type Access Trip Region MeshArea Category Group Discarded No Market
Regulation (Size)
Regulation (Quota)
Regulation (Other)
Poor Quality Other Total %
5 Otter Trawl OPEN all MA sm 1,228,034 98.0 0.0 0.0 0.0 0.3 1.6 100.0
7 Otter Trawl OPEN all NE sm 1,090,314 72.6 0.0 0.3 0.0 3.2 23.9 100.0
30 Other fleets filtered out 183,477 99.5 0.0 0.5 0.0 0.0 0.0 100.0
Species Group: LOLIGO SQUID
Discard by Reason Category [%]
Row Gear Type Access Trip Region MeshArea Category Group Discarded No Market
Regulation (Size)
Regulation (Quota)
Regulation (Other)
Poor Quality Other Total %
32 Other fleets filtered out 382,295 84.1 0.1 0.2 0.0 3.5 12.1 100.0

146
Appendix Table 3. Fleet abbreviations used in Table 6 and Figures 1A, 1B, and 3. Fleets that were filtered out through the importance filter and fleets designated as in need of pilot coverage have been aggregated into “Other fleets.”
Row Gear Type Access AreaTrip
Category Region Mesh Group Fleet Abbreviation
1 Longline OPEN all MA all LL MA
2 Longline OPEN all NE all LL NE
3 Hand Line OPEN all MA all HND MA
4 Hand Line OPEN all NE all HND NE
5 Otter T rawl OPEN all MA sm OT sm MA
6 Otter T rawl OPEN all MA lg OT lg MA
7 Otter T rawl OPEN all NE sm OT sm NE
8 Otter T rawl OPEN all NE lg OT lg NE
9 Scallop Trawl AA GEN MA all SCT AA GEN MA
10 Scallop Trawl AA LIM MA all SCT AA LIM MA
11 Scallop Trawl OPEN GEN MA all SCT OPEN GEN MA
12 Scallop Trawl OPEN LIM MA all SCT OPEN LIM MA
13 Otter T rawl, Ruhle OPEN all MA lg OTR lg MA
14 Otter T rawl, Ruhle OPEN all NE sm OTR sm NE
15 Otter T rawl, Ruhle OPEN all NE lg OTR lg NE
16 Otter T rawl, Haddock Separator OPEN all MA lg OTH lg MA
17 Otter T rawl, Haddock Separator OPEN all NE lg OTH lg NE
18 Shrimp Trawl OPEN all MA all SHT MA
19 Shrimp Trawl OPEN all NE all SHT NE
20 Floating Trap OPEN all MA all FT MA
21 Floating Trap OPEN all NE all FT NE
22 Sink, Anchor, Drift Gillnet OPEN all MA sm GN sm MA
23 Sink, Anchor, Drift Gillnet OPEN all MA lg GN lg MA
24 Sink, Anchor, Drift Gillnet OPEN all MA xlg GN xlg MA
25 Sink, Anchor, Drift Gillnet OPEN all NE sm GN sm NE
26 Sink, Anchor, Drift Gillnet OPEN all NE lg GN lg NE
27 Sink, Anchor, Drift Gillnet OPEN all NE xlg GN xlg NE
28 Purse Seine OPEN all MA all PS MA
29 Purse Seine OPEN all NE all PS NE
30 Scallop Dredge AA GEN MA all SCD AA GEN MA
31 Scallop Dredge AA GEN NE all SCD AA GEN NE
32 Scallop Dredge AA LIM MA all SCD AA LIM MA
33 Scallop Dredge AA LIM NE all SCD AA LIM NE
34 Scallop Dredge OPEN GEN MA all SCD OPEN GEN MA
35 Scallop Dredge OPEN GEN NE all SCD OPEN GEN NE
36 Scallop Dredge OPEN LIM MA all SCD OPEN LIM MA
37 Scallop Dredge OPEN LIM NE all SCD OPEN LIM NE
38 Mid-water Paired & Single Trawl OPEN all MA all MWT MA
39 Mid-water Paired & Single Trawl OPEN all NE all MWT NE
40 Pots and Traps, Fish OPEN all MA all FPT MA
41 Pots and Traps, Fish OPEN all NE all FPT NE
42 Pots and Traps, Conch OPEN all MA all CPT MA
43 Pots and Traps, Conch OPEN all NE all CPT NE
44 Pots and Traps, Hagfish OPEN all MA all HPT MA
45 Pots and Traps, Hagfish OPEN all NE all HPT NE
46 Pots and Traps, Shrimp OPEN all NE all SPT NE
47 Pots and Traps, Lobster OPEN all MA all LPT MA
48 Pots and Traps, Lobster OPEN all NE all LPT NE
49 Pots and Traps, Crab OPEN all MA all CRPT MA
50 Pots and Traps, Crab OPEN all NE all CRPT NE
51 Beam Trawl OPEN all MA all BT MA
52 Beam Trawl OPEN all NE all BT NE
53 Dredge, Other OPEN all MA all DRO MA
54 Ocean Quahog/Surf Clam Dredge OPEN all MA all CD MA
55 Ocean Quahog/Surf Clam Dredge OPEN all NE all CD NE
Other FleetsOther fleets aggregated together
Procedures for Issuing Manuscriptsin the
Northeast Fisheries Science Center Reference Document (CRD) Series
Clearance All manuscripts submitted for issuance as CRDs must have cleared the NEFSC’s manuscript/abstract/webpage review process. If any author is not a federal employee, he/she will be required to sign an “NEFSC Release-of-Copyright Form.” If your manuscript includes material from another work which has been copyrighted, then you will need to work with the NEFSC’s Editorial Office to arrange for permission to use that material by securing release signatures on the “NEFSC Use-of-Copyrighted-Work Permission Form.” For more information, NEFSC authors should see the NEFSC’s online publication policy manual, “Manu-script/abstract/webpage preparation, review, and dis-semination: NEFSC author’s guide to policy, process, and procedure,” located in the Publications/Manuscript Review section of the NEFSC intranet page.
Organization Manuscripts must have an abstract and table of contents, and (if applicable) lists of figures and tables. As much as possible, use traditional scientific manu-script organization for sections: “Introduction,” “Study Area” and/or ”Experimental Apparatus,” “Methods,” “Results,” “Discussion,” “Conclusions,” “Acknowl-edgments,” and “Literature/References Cited.”
Style The CRD series is obligated to conform with the style contained in the current edition of the United States Government Printing Office Style Manual. That style manual is silent on many aspects of scientific manuscripts. The CRD series relies more on the CSE Style Manual. Manuscripts should be prepared to conform with these style manuals. The CRD series uses the American Fisheries Soci-ety’s guides to names of fishes, mollusks, and decapod
crustaceans, the Society for Marine Mammalogy’s guide to names of marine mammals, the Biosciences Information Service’s guide to serial title abbreviations, and the ISO’s (International Standardization Organiza-tion) guide to statistical terms. For in-text citation, use the name-date system. A special effort should be made to ensure that all neces-sary bibliographic information is included in the list of cited works. Personal communications must include date, full name, and full mailing address of the con-tact.
Preparation Once your document has cleared the review pro-cess, the Editorial Office will contact you with publica-tion needs – for example, revised text (if necessary) and separate digital figures and tables if they are embedded in the document. Materials may be submitted to the Editorial Office as files on zip disks or CDs, email attachments, or intranet downloads. Text files should be in Microsoft Word, tables may be in Word or Excel, and graphics files may be in a variety of formats (JPG, GIF, Excel, PowerPoint, etc.).
Production and Distribution The Editorial Office will perform a copy-edit of the document and may request further revisions. The Editorial Office will develop the inside and outside front covers, the inside and outside back covers, and the title and bibliographic control pages of the docu-ment. Once both the PDF (print) and Web versions of the CRD are ready, the Editorial Office will contact you to review both versions and submit corrections or changes before the document is posted online. A number of organizations and individuals in the Northeast Region will be notified by e-mail of the availability of the document online.
Research Communications BranchNortheast Fisheries Science Center
National Marine Fisheries Service, NOAA166 Water St.
Woods Hole, MA 02543-1026
Publications and Reportsof the
Northeast Fisheries Science CenterThe mission of NOAA’s National Marine Fisheries Service (NMFS) is “stewardship of living marine resources for the benefit of the nation through their science-based conservation and management and promotion of the health of their environment.” As the research arm of the NMFS’s Northeast Region, the Northeast Fisheries Science Center (NEFSC) supports the NMFS mission by “conducting ecosystem-based research and assess-ments of living marine resources, with a focus on the Northeast Shelf, to promote the recovery and long-term sustainability of these resources and to generate social and economic opportunities and benefits from their use.” Results of NEFSC research are largely reported in primary scientific media (e.g., anonymously-peer-reviewed scientific journals). However, to assist itself in providing data, information, and advice to its constituents, the NEFSC occasionally releases its results in its own media. Currently, there are three such media:
NOAA Technical Memorandum NMFS-NE -- This series is issued irregularly. The series typically includes: data reports of long-term field or lab studies of important species or habitats; synthesis reports for important species or habitats; annual reports of overall assessment or monitoring programs; manuals describing program-wide surveying or experimental techniques; literature surveys of important species or habitat topics; proceedings and collected papers of scientific meetings; and indexed and/or annotated bibliographies. All issues receive internal scientific review and most issues receive technical and copy editing.
Northeast Fisheries Science Center Reference Document -- This series is issued irregularly. The series typically includes: data reports on field and lab studies; progress reports on experiments, monitoring, and assessments; background papers for, collected abstracts of, and/or summary reports of scientific meetings; and simple bibliographies. Issues receive internal scientific review and most issues receive copy editing.
Resource Survey Report (formerly Fishermen’s Report) -- This information report is a regularly-issued, quick-turnaround report on the distribution and relative abundance of selected living marine resources as derived from each of the NEFSC’s periodic research ves-sel surveys of the Northeast’s continental shelf. This report undergoes internal review, but receives no technical or copy editing.
TO OBTAIN A COPY of a NOAA Technical Memorandum NMFS-NE or a Northeast Fisheries Science Center Reference Document, either contact the NEFSC Editorial Office (166 Water St., Woods Hole, MA 02543-1026; 508-495-2350) or consult the NEFSC webpage on “Reports and Publications” (http://www.nefsc.noaa.gov/nefsc/publications/). To access Resource Survey Report, consult the Ecosystem Surveys Branch webpage (http://www.nefsc.noaa.gov/femad/ecosurvey/mainpage/).
ANY USE OF TRADE OR BRAND NAMES IN ANY NEFSC PUBLICATION OR REPORT DOES NOT IMPLY ENDORSE-MENT.
MEDIA MAIL