2012-3-33- p effect of descriptive parameters of slub yarn on strength and elongation properties p
DESCRIPTION
journalTRANSCRIPT

İlhan İ, Babaarslan O, Vuruşkan D. Effect of Descriptive Parameters of Slub Yarn on Strength and Elongation Properties.FIBRES & TEXTILES in Eastern Europe 2012; 20, 3(92): 33-38.
33
Effect of Descriptive Parameters of Slub Yarn on Strength and Elongation Properties
İlhami İlhan, *Osman Babaarslan,
**Deniz Vuruşkan
Çukurova University, Vocational School of Adana,
Textile Department, 01160, Beyazevler-Adana, Turkey
E-mail: [email protected]
*Çukurova University, Department of Textile Engineering,
01130, Balcalı-Adana, Turkey
*Gaziantep University, Department of Textile Engineering,
27310, Gaziantep, Turkey
AbstractStrength and elongation have a great effect on slub yarn performance in production and usage. The main aim of this study is to determine the statistically significant descriptive parameters that have an effect on the breaking force and elongation of slub yarn using the full factorial design method. In addition, the effects of the significant parameters on the breaking force and elongation were investigated. Slub yarn samples were produced by using a ring spinning frame on which an original slub attachment was designed and mounted. After the samples were produced, dimensional measurements and image analysis were made. Then quality tests were applied to all samples and the results analysed. As a re-sult, the parameters that have an effect on the breaking force of the slub yarn samples were obtained as the slub length, slub distance and base yarn count. The parameters affecting the breaking elongation of the slub yarn samples were obtained as the slub multiplier, base yarn count and twist coefficient. The relationship between the breaking force and elonga-tion and the parameters selected have been explained by statistically significant regression equations. It is concluded that slub pattern parameters should also be considered for slub yarn performance.
Key words: slub yarn, breaking force, breaking elongation, full factorial design, effective parameters.
erties. Besides this, a regression model of the relationship between the slub yarn pa-rameters selected and the breaking force and elongation was found. In addition, the flat and slub yarns were compared to each other in terms of the breaking force and elongation. For this purpose, an experimental design was formed in ac-cordance with the 2k full factorial design method. The slub yarn samples required were produced, B-force and elongation tests were performed, and then the results were statistically analysed and evaluated. Consequently, the statistically significant effective parameters were defined and re-gression models explain the relationship between the breaking force and elonga-tion properties. Later the main effect and interaction plots were interpreted.
n Material and methodExperimental designFirstly the six descriptive parameters of slub yarn that may have an effect on yarn strength and elongation were selected to use in the experimental design as inde-pendent variables. The dependent vari-ables are the breaking force and breaking elongation (Table 1, see page 34).
The 2k full factorial design method was used to screen the yarn parameters select-ed for their effect on yarn performance and to see whether or not a mathematical model could be found [7]. All statistical analysis was performed using Design Expert 6.0.1 software. The full factorial design was formed as 26 so that each fac-tor had 2 levels and 64 different combi-
is always more than the theoretical twist of slub yarn, which is mainly influenced by the ratio of the slub length to the slub distance, and anincrease in the ratio will increase the twist in base yarn sections. Generally, the strength of the yarn is influenced more by the increased fibre quantity in the yarn than by the decrease in slub twist. Therefore, the strength of the slub is higher than that of the basic yarn. The strength of the whole slub yarn is very close to that of common yarn with the same twist as base yarn [8].
The higher strength of slub yarns is re-quired in terms of both the performance in weaving and the strength of fabric. Therefore, the weak points in slub yarn are not desired; they especially occur at the beginning and end of the slubs, aris-ing from changing the draft level as a function of time during all production. These weak points can be determined us-ing B-force-elongation charts plotted us-ing tensile test results as much as possi-ble. In literature, it is recomended to use the breaking force (B-force, cN) instead of the relative breaking force (Tenacity, cN/tex) for analysing the tensile test re-sults of slub yarns [2]. The reason is that the two slub yarn samples, with differ-ent counts, have got extremely different breaking force levels but similar relative tenacity levels for all experiments.
The main aim of this study is to define the descriptive parameters that have a significant effect on the breaking force and elongation of slub yarns and to inves-tigate how the parameters effect the prop-
n IntroductionSlub fancy yarn is widely used in the tex-tile industry in order to produce prima-rily denim fabric, clothing and upholstery fabric. It is known that the main descrip-tive parameters of slub yarn (slub length, slub distance, slub multiplier, base yarn count, twist level etc.) have an effect on the strength and elongation performance of the yarn [3, 9, 10]. The importance of slub yarns for the textile industry is bet-ter understood with every passing day. In literature there have been a few stud-ies investigating the effect of the earlier mentioned properties on yarn perform-ance. Mahmood et al. [1] stated that the slub length, slub distance and twist cof-ficient have a statistically significant ef-fect, whereas the slub multiplier has no statistically significant effect on the yarn strength. Nevertheless, it has been em-phasised that slub yarn samples produced using the compact ring spinning system are stronger than those produced by the conventional ring spinning system. In ad-dition, it is stated that some parameters of slub yarn used as the weft in woven fabric have a statistically significant ef-fect on the weft-way strength of the fabric [1]. Lu et al. [8] analysed the in-fluence of four dimensional parameters of slub yarns (base yarn diameter, slub diameter, slub distance and slub length) on the distribution of twist using a de-veloped model. They stated that the twist of slub measured is always less than the theoretical twist. Here, the main effective factor is the slub multiplier. The increase in the slub multiplier decreases the twist in slub sections. The twist of base yarn

FIBRES & TEXTILES in Eastern Europe 2012, Vol. 20, No. 3 (92)34
nations in the design matrix. We have considered only two-factor interactions in ANOVA.
In accordance with the experimental de-sign matrix, 64 different samples of slub yarn were produced. Besides this, flat yarn samples of 19.7 tex (αm = 106.0 and 130.3) and 29.5 tex (αm = 106.0 and 130.3) were also produced to compare with the slub yarn samples.
Raw material and production conditionsThe raw material was 100% combed cot-ton blend. The means of fibre fineness, length and strength are 4.3 Mic, 28.4 mm and 29.2 cN/tex, respectively. The theo-retical roving linear density and twist are 738.33 tex and 40 t.p.m, respectively. The uneveness CVm of the roving was obtained as 4.52 %.
The climate conditions were 25 - 27 °C and 55 - 60% Rh. throughout the pro-duction of yarn samples. The travel-lers were number 2 at the lower level of
ratory. The rear and middle draft cylin-ders are directly driven by servo motors in the modernised ring spinning frame. The frame is flexible to produce different yarn types on the right and left sides of the machine at the same time. The pro-duction and slub dimensional data are entered into the system by means of a PC (Personel Computer) and the motors are controlled with the assistance of a PLC (Programming Logic Controller).
Measurements and quality testsAll the measurements and quality tests were performed under standard atmos-feric conditions (temperature 20 ± 2 °C, 65 ± 2% Rh). Before the quality tests, the dimensional parameters of the slub yarn samples were measured i.e. lengths (slub lengths, slub distance) and slub multipli-ers. A schematic represantation of slub yarn is given with dimensional param-eters in Figure 1.
After dimensional measurements, other quality tests were applied to all samples, given in Table 2.
In the length measurements, a yarn sam-ple was laid on a black surface without tension, then the beginning and end points of the slubs were marked by a colour pen, and finally the lengths were measured by means of a steel ruler. A total of 20 measurements were taken in duplicate from 10 cops for each com-bination.
The slub multipliers were measured by both manual and image analysis meth-ods. For manual measurement, many parts were cut from the slub and base yarn sections excluding ramp sections for the 8 different samples selected. We en-sured that the total length of parts for any sample is over 1 m. The yarn parts were weighted and the sectional yarn counts calculated for the slubs and base yarns. Then we obtained the slub multipliers by calculating the proportion of slub counts (texs) to base yarn counts (texti) for each sample. In the image analysis method, the diameters of the same yarn samples for base yarn and slub sections were also measured using an SDL Microscope Sys-tem with Digital Camera. The average of total 20 measurements were obtained and the slub multipliers calculated as the pro-portion of the slub diameters to the base yarn diameters for each sample.
slub lengths and number 4 at the higher level as type El 2f LB of Reinerfürst. The breaking draft was 1.15 for all the samples. The total draft was 9.1 - 25.0 for samples with 29.5 tex of base yarn count and 13.6 - 37.5 for samples with 19.7 tex of base yarn count. The spindle speed was 6000 r.p.m throughout all the production. Hence the delivery speed was 6.43 - 7.95 - 9.87 mpm depending on twist levels and yarn counts. In more de-tail, the speed was 6.43 mpm at 19.7 tex and αm=130.3, 7.95 mpm at 19.7 tex and αm = 106.0, 29.5 tex and αm = 130.3, 9.87 mpm at 29.5 tex and αm = 106.0 [3].
The raw material was transformed into roving with required properties by pass-ing it through the conventional opening, blending it and preparing it in the form of a combed cotton line. The slub yarn sam-ples were produced by using a ring spin-ning frame with 56 spindels which had been mecatronically modernised with an original electronically controllable slub attachment at Çukurova University Textile Engineering Department Labo-
Table 1. Selected independent and dependent variables with level values [3].
Variable Qualification Symbol Variables Unit Levels (low – high)
Dependent- Breaking force cN -- Breaking elongation % -
Independent
A Slub length mm 50 – 100B Slub distance mm 80 – 150C Slub multiplier - 1.75 – 2.75D Ramp time ms 60 – 120E Base yarn count tex 19.7 – 29.5F Twist coefficient (αm) - 106.0 – 130.3
Figure 1. Schematic representation of a slub yarn sample; i - a yarn section or step number, n - the total number of steps in a pattern unit, ki - slub multiplier, texs - slub count, and texti - base yarn count. The ramp time means the delivery time of the ramp section.
Table 2. Quality tests applied to slub yarn samples [3].
Experiments Instrument name Yarn properties StandardCount test Count Measurement Wheel Average count, tex TS 244 EN ISO 2060
Twist test MesdanLab Twist Measurement Device Twist level, t.p.m. TS 247 EN ISO 2061
Tensile test Titan Universal Strength DeviceBreaking force, cN
TS 245 EN ISO 2062Breaking elongation, %

35FIBRES & TEXTILES in Eastern Europe 2012, Vol. 20, No. 3 (92)
n Results and discussionResults of dimensional measurements The dimensional descriptive param-eters of the slub yarn, such as the slub length, slub distance and slub multiplier were measured in order to determine the deviations from theoretical values. In the measurements, the average devia-tion of the slub length was obtained as 8% (4 mm) at the lower level and 2.5% (2.5 mm) at the higher level of the slub length. The average deviation of the slub distance was obtained as 4% (3.2 mm) at the lower level and 6.1% (9.15 mm) at the higher level of the slub distance. In literature, it has been mentioned that a deviation in length of about 10 mm is normal for the slub length and slub dis-tance [4]. Thus we concluded that there is not any problem with the deviation lev-els. Results of the measurements for slub multipliers are given in Figure 2. From the plot, it seems that there are accept-able differences between the measured and theoretical slub multipliers. For all the measurements, the highest CV% was obtained as 14.11%.
Results of quality tests Linear density measurementTo define the deviation of linear density, the theoretical count of slub yarn should be calculated. Because there have not been any suggestion in literature, a math-ematical equation was developed to cal-culate the theoretical average counts of the slub yarn samples. Then we calculat-ed the differences between the measured and theoretical counts [5]. The average count deviation was obtained as 5.9% for 64 the slub yarn samples and 0.9% for the flat yarn samples.
Twist measurementWhen the base yarn count of the slub yarn samples and the count of the flat yarn samples were theoretically 29.5 tex, the theoretical twist levels were estab-lished as 608 t.p.m. for αm = 106.0 and 755 t.p.m. for αm = 130.3. When the base yarn count of the slub yarn samples and count of the flat yarn samples were theo-retically 19.7 tex, the theoretical twist levels were found to be 755 t.p.m. for αm = 106.0 and 933 t.p.m. for αm = 130.3. The means of the twist deviations are 7.5 t.p.m. for slub yarns and 21.2 t.p.m. for flat yarns. The mean CVm of the twists are 1.74% for the slub yarn sam-ples and 4.7% for the flat yarn samples.
For measuring of the yarn count, 10 skeins (100 m per cop) from 10 cops of each sample were wrapped by a wrap-ping reel. The skeins were weighed by a precision balance with a 1/10000 g sensitivity, and then the average counts (tex) of all samples were obtained. Twist measurements were performed by means of a conventional twist tester designed to determine yarn twist by the untwist/retwist method. Besides this, the helix angles in the base yarn and slub sections arising from the twist were measured us-ing the SDL Microscope System with Digital Camera.
For measuring the B-force and elonga-tion, a total of 100 measurements of each combination of samples (10 tests from 10 cops) were taken and the means ob-tained. All the tensile tests were manu-ally performed using a Titan Universal Strength Device. For all the tests, the jaw seperation was 500 mm, the test speed - 500 mm/min, and the pretension was 0.5 cN/tex.
Statistical analysisAll the statistical analysis was performed using Design Expert 6.0.1 packet soft-ware. Firstly, ANOVA was applied to the data obtained from the tests in order to define the statistically significant pa-rameters affecting slub yarn properties. Regression models that explain the rela-tionship between the parameters and the breaking force and elongation properties were established, and adequacy checking was made for validation. Then the 2D main factor and interaction plots were obtained. Finally all the results of the sta-tistical and image analysis and plots were discussed and evaluated.
Figure 2. Comparison plot of slub multi-plier measurements.
Table 3. Results of image analysis for selected slub yarn samples.
Sample No
Yarn properties Base yarn section Slub yarn sectionBase yarn count,
tex αm Slub multiplier (k)
Diameter, mm %CV Helix angle,
degree %CV Diameter, mm %CV Helix angle,
degree %CV
1
29.5
106.0 1.75 0.22 9.18 32.53 10.65 0.36 10.09 25.04 11.112 106.0 2.75 0.21 7.00 33.10 5.60 0.50 6.18 24.73 9.173 130.3 1.75 0.2 14.11 36.56 9.67 0.31 9.35 25.90 12.484 130.3 2.75 0.2 6.43 39.07 11.06 0.43 7.34 25.78 9.605
19.7
106.0 1.75 0.18 10.33 33.92 7.96 0.33 12.36 27.70 14.326 106.0 2.75 0.17 6.43 33.96 12.09 0.42 7.02 25.02 8.607 130.3 1.75 0.18 13.83 35.60 13.63 0.30 10.16 26.15 11.478 130.3 2.75 0.16 9.76 38.27 12.23 0.38 11.69 27.51 9.829
29.5130.3 1.0 0.22 12.45 31.26 12.99
10 106.0 1.0 0.21 14.11 28.64 11.73 11
19.7130.3 1.0 0.16 14.11 29.24 12.59
12 106.0 1.0 0.19 9.56 25.68 12.82
Figure 3. Scatter plot of the breaking force versus elongation for slub yarn samples.
Elongation at break, %
average count

FIBRES & TEXTILES in Eastern Europe 2012, Vol. 20, No. 3 (92)36
In the image analysis, the diameters and twist angles were measured for 8 select-ed samples. Therefore the slub multipli-ers were calculated as mentioned above, and the twist distribution over the whole slub yarn was examined. Lu et al. men-tioned that there is a considerable dif-ference between the twist levels of base yarn and slub sections [6]. This finding is supported by the results of image analy-sis obtained in this study. The results of diameter and twist helix measurements are given in Table 3 (see page 35). As is well known, the helix angle (the angle between the helix line and yarn axis) is directly proportional to the twist level. The table shows that the sectional twist level of the base yarn is higher than the original twist level and that the sectional twist level of the slub is lower than the original twist level.
Breaking force measurement In slub yarns, some weak points may oc-cur at the beginning or end of slubs. The
Figure 4. Comparison plots of flat and slub yarns for the breaking force (a) and elonga-tion (b).
Table 4. Results of ANOVA for the breaking force.
Source of variance
Sum of squares
Degrees of freedom
Mean squares F Ratio P Ratio Comment
Model 6.895×10⁵ 8 86130.85 403.66 0.0001SignificantA 12084.88 1 12084.88 56.64 0.0001
B 2453.59 1 2453.59 11.50 0.0013C 650.57 1 650.57 3.05 0.0864 InsignificantE 6.617×10⁵ 1 6.617×10⁵ 3101.28 0.0001 SignificantF 565.55 1 565.55 2.65 0.1092 Insignificant
AF 2019.94 1 2019.94 9.47 0.0033SignificantBE 2124.4 1 2124.40 9.96 0.0026
CF 7416.44 1 7416.44 34.76 0.0001Residual 11735.53 55 213.37Cor Total 7.008.105 63
weak points have an effect on slub yarn strength, therefore we investigated the existance of weak points in all the sam-ples to avoid any weak point effect on the results of the study. Hence we obtained a scatter plot of the breaking force versus the breaking elongation for the slub yarn samples in Figure 3 (see page 35) [2]. The scatter plot indicates that there is not any weak point in all the slub yarn sam-ples owing to there being no point close to the origin. The two clusters of points may occured due to the strong effect of the count on the breaking force.
The slub yarn samples were compared to the flat yarn samples in terms of the breaking force and elongation means. The comparison plots are given in Fig-ure 4. Figure 4.a shows that the slub yarn samples are generally stronger than the flat yarn samples. It seems that the differ-ences in the breaking force between the slub and flat yarn samples increases with a decrease in the twist coefficient. This finding indicates that the breaking force of slub yarn has a tendency to decrease at higher levels of the twist coefficient. Fig-ure 4.b does not indicate any significant differences in elongation between the flat and slub yarn samples.
Statistical AnalysisBreaking forceThe results of ANOVA and the regression models were obtained by using factorial analysis. Variance analysis results for the breaking force are given in Table 4. The table shows that the effects of the main factors A, B & E are statistically signifi-cant, whereas the effects of main factors C, D & F are statistically insignificant at α = 0.01. Besides this, the interaction terms of AF, BE and CF have a statisti-cally significant effect on the breaking force at α = 0.01. The model that was es-tablished with all the terms in Table 4 is
statistically significant at α = 0.01. How-ever, the adequacy checking of the model indicated a need for transformation. After the Natural Log transformation was ap-plied to the first model, the final log mod-el equation with actual factors was found in Equation 1.
Ln (Breaking force) = 3.6865 + + 5.709×10⁻³×A - 1.032×10⁻³×B +
+ 0.4137×C - 0.04677×E + (1)+ 0.1111×F - 3.934×10⁻⁵×A×F +
- 5.3591×10⁻⁵×B×E - 3.3976×10⁻³×C×F
Factor D was not placed in Equation 1 because it has not got any significant main or interaction effects. Thus we con-cluded that the ramp time (D) has not got any statistically significant effect on the breaking force of the slub yarn samples. Factors C (slub multiplier) and F (twist coefficient) have not got an individually significant effect on the breaking force of slub yarn, but their interaction effects are statistically significant at α = 0.01. There-fore they are in the model to preserve the hierarchy.
The results of the ANOVA for the final log model shows that the model is sig-nificant at α = 0.01. The coefficient of determination R2prediction is obtained as 0.985 and R2adj as 0.9829. The inconsid-erable difference between R2 and R2adj indicates that no unnessesary terms have been included in the model. The model explains about 98% of the variability in the breaking force for all observations in this study. The adequacy checking does not indicate any problem for the regres-sion model in Equation 1.
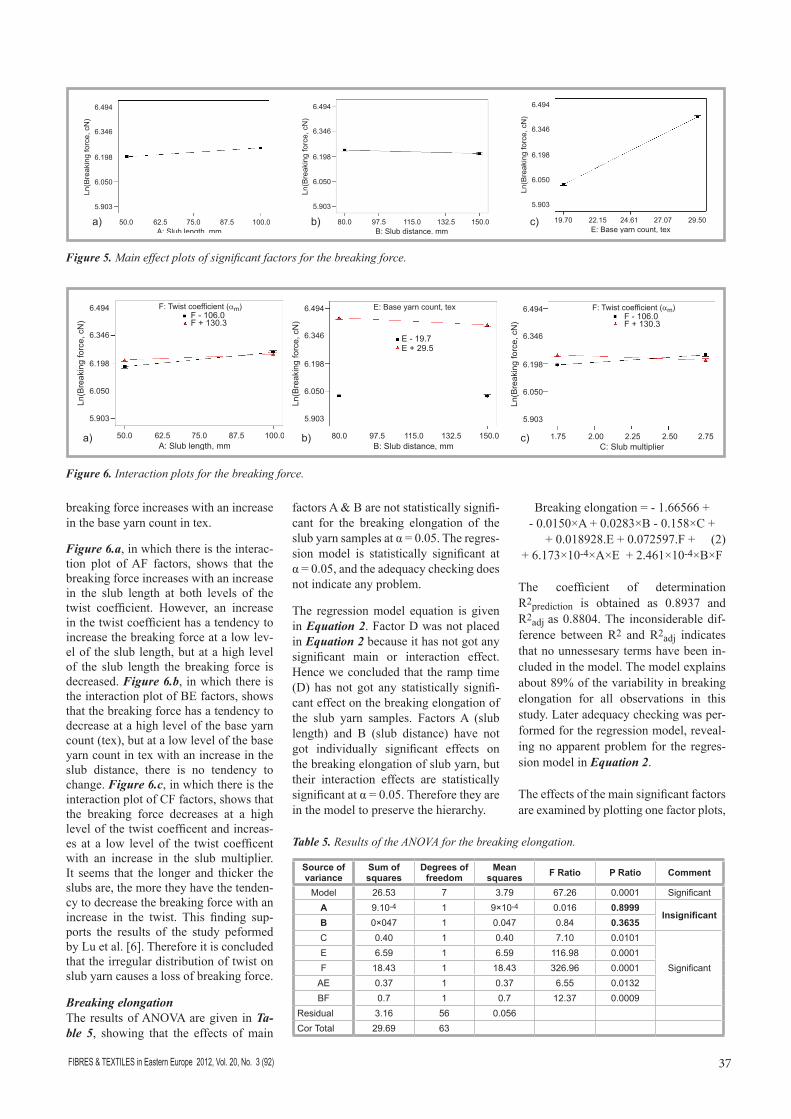
The effects of the main significant factors are examined by plotting one factor plots, shown in Figure 5. Figure 5.a shows that the breaking force increases signifi-cantly with an increase in the slub length. The reason may have been the increase in the fibre mass of slub portions in the yarn. Figure 5.b shows that the breaking force decreases slightly with an increase in the slub distance, indicating the impor-tance of slub distance for yarn breakages. In fact, it is observed that all breakages in the tensile tests mostly occurred out of the slub sections. As is generally known, finer yarns have lower strength and an in-crease in the slub distance decreases the average count of slub yarn in tex. Fig-ure 5.c indicates that there is a strong ef-fect of the base yarn count on the break-ing force of slub yarn. Unsurprisingly the
a)
b )
Elo
ngat
ion
at b
reak
, %
37FIBRES & TEXTILES in Eastern Europe 2012, Vol. 20, No. 3 (92)
breaking force increases with an increase in the base yarn count in tex.
Figure 6.a, in which there is the interac-tion plot of AF factors, shows that the breaking force increases with an increase in the slub length at both levels of the twist coefficient. However, an increase in the twist coefficient has a tendency to increase the breaking force at a low lev-el of the slub length, but at a high level of the slub length the breaking force is decreased. Figure 6.b, in which there is the interaction plot of BE factors, shows that the breaking force has a tendency to decrease at a high level of the base yarn count (tex), but at a low level of the base yarn count in tex with an increase in the slub distance, there is no tendency to change. Figure 6.c, in which there is the interaction plot of CF factors, shows that the breaking force decreases at a high level of the twist coefficent and increas-es at a low level of the twist coefficent with an increase in the slub multiplier. It seems that the longer and thicker the slubs are, the more they have the tenden-cy to decrease the breaking force with an increase in the twist. This finding sup-ports the results of the study peformed by Lu et al. [6]. Therefore it is concluded that the irregular distribution of twist on slub yarn causes a loss of breaking force.
Breaking elongation The results of ANOVA are given in Ta-ble 5, showing that the effects of main
Figure 5. Main effect plots of significant factors for the breaking force.
Table 5. Results of the ANOVA for the breaking elongation.
Source of variance
Sum of squares
Degrees of freedom
Mean squares F Ratio P Ratio Comment
Model 26.53 7 3.79 67.26 0.0001 SignificantA 9.10-4 1 9×10⁻⁴ 0.016 0.8999
InsignificantB 0×047 1 0.047 0.84 0.3635C 0.40 1 0.40 7.10 0.0101
SignificantE 6.59 1 6.59 116.98 0.0001F 18.43 1 18.43 326.96 0.0001
AE 0.37 1 0.37 6.55 0.0132BF 0.7 1 0.7 12.37 0.0009
Residual 3.16 56 0.056Cor Total 29.69 63
factors A & B are not statistically signifi-cant for the breaking elongation of the slub yarn samples at α = 0.05. The regres-sion model is statistically significant at α = 0.05, and the adequacy checking does not indicate any problem.
The regression model equation is given in Equation 2. Factor D was not placed in Equation 2 because it has not got any significant main or interaction effect. Hence we concluded that the ramp time (D) has not got any statistically signifi-cant effect on the breaking elongation of the slub yarn samples. Factors A (slub length) and B (slub distance) have not got individually significant effects on the breaking elongation of slub yarn, but their interaction effects are statistically significant at α = 0.05. Therefore they are in the model to preserve the hierarchy.
Figure 6. Interaction plots for the breaking force.
Breaking elongation = - 1.66566 + - 0.0150×A + 0.0283×B - 0.158×C +
+ 0.018928.E + 0.072597.F + (2)+ 6.173×10⁻⁴×A×E + 2.461×10⁻⁴×B×F
The coefficient of determination R2prediction is obtained as 0.8937 and R2adj as 0.8804. The inconsiderable dif-ference between R2 and R2adj indicates that no unnessesary terms have been in-cluded in the model. The model explains about 89% of the variability in breaking elongation for all observations in this study. Later adequacy checking was per-formed for the regression model, reveal-ing no apparent problem for the regres-sion model in Equation 2.
The effects of the main significant factors are examined by plotting one factor plots,
a) c)b)
a) c)b)

FIBRES & TEXTILES in Eastern Europe 2012, Vol. 20, No. 3 (92)38
shown in Figure 7. Figure 7.a shows that the breaking elongation decreases slightly with an increase in the slub mul-tiplier. Figure 7.b shows that the break-ing elongation increases significantly with an increase in the base yarn count in tex. Figure 7.c indicates the strong ef-fect of the twist coefficient on the break-ing elongation of slub yarn. It seems that the breaking elongation increases signifi-cantly with an increase in the twist coef-ficient.
Figure 8.a, in which there is the interac-tion plot of AE factors, shows that the breaking elongation increases at a high level of the base yarn count and decreas-es at a low level of the base yarn count with an increase in the slub length. Fig-ure 8.b, in which there is the interaction plot of BF factors, shows that the break-ing elongation has a tendency to decrease at a high level of the twist coefficient, but at a low level of the twist coefficient with an increase in the slub distance, it has a tendency to increase.
n SummaryIn this study, the descriptive parameters of slub yarn that have an effect on the breaking force and elongation were prac-tically investigated using the full facto-rial design method. The slub length (A), slub distance (B) and base yarn count (E)
are statistically significant for the break-ing force of slub yarn. The significant two-factor interactions are obtained as the slub length (A) - twist coefficient (F), the slub distance (B)-t base yarn count (E) and the slub multiplier (C) - twist coefficient (F). The relationship between the breaking force and descriptive pa-rameters was explained by a significant regression model at α = 0.01.
The significant parameters that have an effect on the breaking elongation were obtained as the slub multiplier (C), base yarn count (E) and twist coefficient (F). For the breaking elongation, the signifi-cant two-factor interactions are the slub length (A) - base yarn count (E) and the slub distance (B) - twist coefficient (F). The relationship between the breaking elongation and descriptive parameters was explained by a significant regression model at α = 0.05.
It is concluded that the dimensional pa-rameters of slub yarn should also be con-sidered for slub yarn performance. The longer and thicker the slubs, the more the tendency for the breaking force to de-crease with an increase in the twist level. Therefore the irregular twist distribution over the whole slub yarn arising from its dimensional parameter causes a loss of breaking force.
Figure 8. Interaction plots for the breaking elongation.
AcknowledgmentsThe authors would like to thank the Scien-tific and Technological Research Council of Türkiye (TÜBİTAK, Project No.107M134) for supporting this project.
References 1. Mahmood N, Arshad M, Iftikhar M, Mah-
mood T. Technological Study of Ring and Compact Spinning Systems for the Manufacturing of Slub Fancy Yarn under Multiple Slub Variations and Its Effect on Woven Fabric, Pak. J. Agri. Sci., 2009; 46(2).
2. Pour SE. USTER TESTER 5-S800 Ap-plication Report, Measurement of Slub Yarns, Part 2, Experience in Mills, Uster Technologies AG, 2007.
3. İlhan İ. Developing an Electronically Controlled Slub Attachment For Ring Spinning Frame and Investigating on the Slub Yarn Properties, Ph.D. Thesis, De-partment of Textile Engineering, Institute of Natural and Applied Sciences, Univer-sity of Çukurova, 2010
4. Liu J, Li Z, Lu Y, Jiang H. Visualisa-tion and Determination of the Geo-metrical Parameters of Slub Yarn, Fibers&Textiles in Eastern Europe, 2010; 18, 1(78): 31-35
5. İlhan İ, Babaarslan O, Vuruşkan D. A Theoretical Model and Practical Ob-servation for Prediction of Slub Yarn Counts, Journal of Textile and Apparel, 2010; 20: 4.
6. Lu YZ, Gao WD, Wang H. A Model for the Twist Distribution in the Slub-Yarn, International Journal of Clothing Sci-ence and Technology, 2007; 19: 36-42.
7. Myers RH, Montgomery DC. Response Surface Methodology, Second Edition, John Wiley&Sons, Inc., USA, 2002.
8. Lu YZ,Gao WD, Xie CP. Twist Distribu-tion of Ring Spun Slub Yarn and Its In-fluence on The Yarn Strength, Journal of Textile Research, 2006; 27. (http://en.cnki.com.cn/Article_en/CJFDTOTAL-FZXB200607004.htm)
9. Grabowska K. Characteristics of Slub Fancy Yarn, Fibres & Textiles in Eastern Europe, 2001; 9, 1(32): 28-30.
10. Kumpikaite E, Ragaisiene A, Barburski M. Comparable Analysis of the End-use Properties of Woven fabrics with Fancy Yarns. Part I:Abrasion Resistance and Air Permeability, Fibres & Textiles in Eastern Europe, 2010; 18, 3(80): 56-59.
Received 21.02.2011 Reviewed 30.09.2011
Figure 7. Main effect plots of significant factors for the breaking elongation.
a) c)b)
a) b)
Elo
ngat
ion
at b
reak
, %
Elo
ngat
ion
at b
reak
, %
Elo
ngat
ion
at b
reak
, %