2011 results presentation. 2 content highlights results 2011 operational overview markets strategy...
TRANSCRIPT

2011 RESULTS PRESENTATION

2
Content
• Highlights
• Results 2011
• Operational overview
• Markets
• Strategy
• Outlook
3
Financial highlights
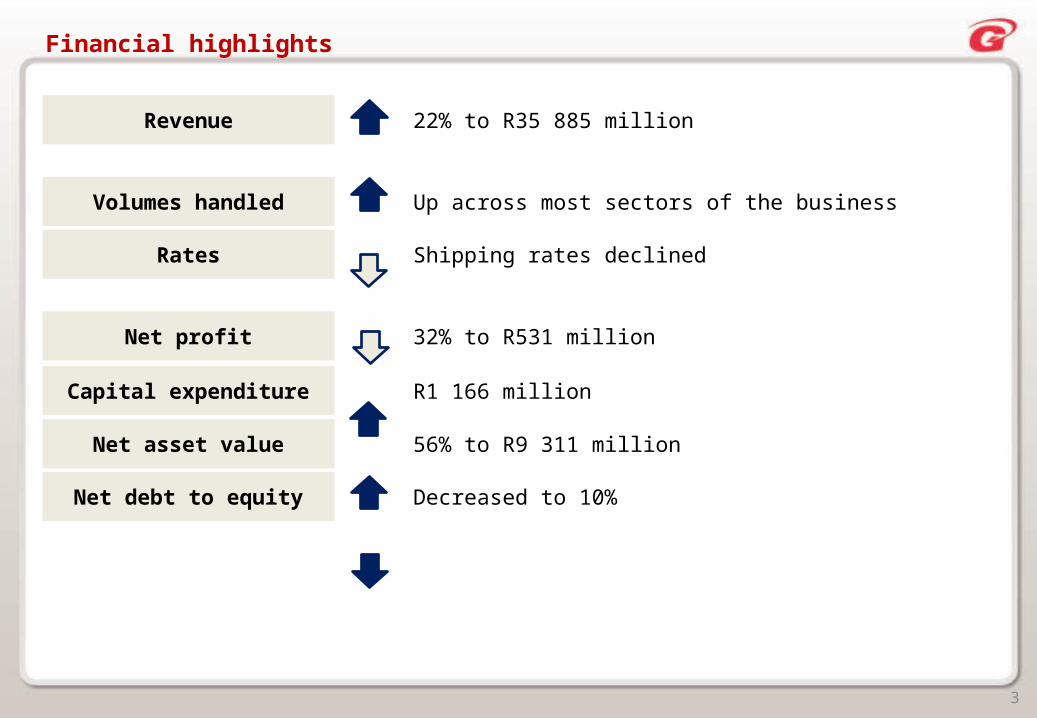
Revenue 22% to R35 885 million
Volumes handled Up across most sectors of the business
Rates Shipping rates declined
Net profit 32% to R531 million
Capital expenditure R1 166 million
Net asset value 56% to R9 311 million
Net debt to equity Decreased to 10%
4
Strategic highlights
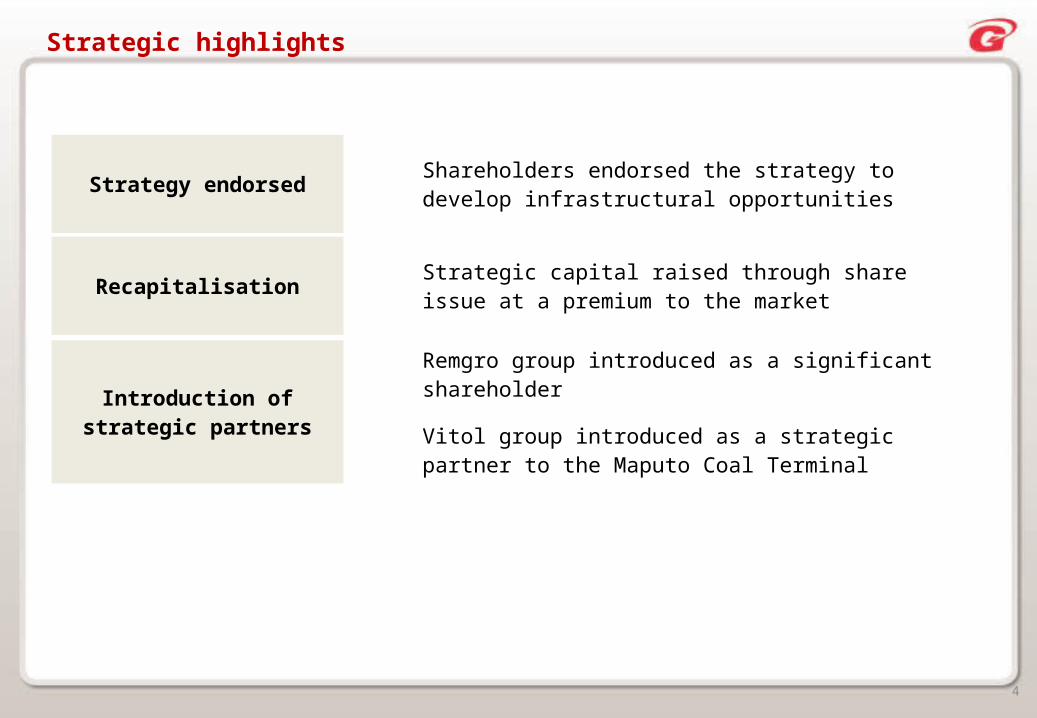
Strategy endorsed Shareholders endorsed the strategy to develop infrastructural opportunities
Recapitalisation Strategic capital raised through share issue at a premium to the market
Introduction of strategic partners
Remgro group introduced as a significant shareholder
Vitol group introduced as a strategic partner to the Maputo Coal Terminal

5
Business environment
• Continued growth in demand for general bulk products (iron ore and coal)
• Limited growth and oil demand
• European impact on global economy
• Over supply of dry cargo shipping capacity
• Growing demand for Africa’s resources
• Lack of infrastructure to support demand for African commodities
• Risk of slowdown in China

6
Income statement
R million 2011 2010 % Comments
Revenue 35 885 29 391 22 Increased commodity prices and higher volumes in marine fuel trading and terminals
Trading profit 1 006 1 183 (15) Reduced shipping rates
Depreciation and amortisation (363) (295) 23 Additions to vehicles, equipment and ships
Operating profit before interest and taxation 643 888
Non-trading items 60 13 362 Profit on disposal of investments and property
Net interest paid (49) (51) (4) Specific share issue offset by debt raised on ships
Profit before share of associate and joint venture companies’ profit
654 850
Share of associate and joint venture companies’ profit before taxation 118 109 8 Improved operating results
Profit before taxation 772 959
Taxation (175) (114) 54 Improved results in higher tax paying countries
Profit for the year 597 845
Non-controlling interests (13) (6) 117 Improved operating results
584 839
Preference dividends (53) (59)
Profit attributable to ordinary shareholders 531 780 (32)
Average rate of exchange ZAR/USD 7.27 7.34 (1)

7
Attributable income by division
Freight Trading Shipping Financial Group Total 0
200
400
600
800
262
120
36245 (9) 780
Freight Trading Shipping Financial Group Total 0
200
400
600
800
318
144 758 4 531
2011 2010
R million R million

8
Balance sheet
R million 2011 2010 % Comments
Ships 3 823 2 814 36 Exchange rate and delivery of ships
Terminal infrastructure, vehicles and equipment
914 1 008 (9) Capital expenditure offset by depreciation, net of Maputo Coal Terminal assets of R444 million included in current assets (held for sale)
Other non-current assets and investments 2 086 2 438 (14) Transfer to current assets held for sale
Other assets (including bank advances) 2 864 2 093 37 Increased advances to bank customers
Current assets 10 743 5 538 94 Increased cash balances due to specific share issue and held for sale assets
Total assets 20 430 13 891
Shareholders’ equity 9 311 5 971 56 Specific share issue and weaker closing exchange rate
Interest-bearing borrowings 4 374 3 328 31 Long-term funding raised on ships
Deposits from bank customers 2 911 2 016 44 Increased deposits in correlation with increased advances to customers
Other liabilities 3 834 2 576 49 Inclusion of non-current liabilities held for sale
Total equity and liabilities 20 430 13 891
Net debt:equity (%) 10 31
Closing rate of exchange ZAR/USD 8.11 6.62 23

9
Cash flow
2010 Cash gener-ated from
operations
Working cap-ital move-
ments
Short-term receivables advanced
Interest/ di-vidend/ taxa-
tion/forex/ other
Capital expendit-
ure
Share issue 2011(3 000)
(2 500)
(2 000)
(1 500)
(1 000)
( 500)
0
(1 835)
1 069 (1 264)
633(311)
(1 166)1 984
(890)
Net debt analysisR million

10
Capital commitments and expenditure
In addition to the capital committed above, a number of major projects including the significant additional coal
expansion at Maputo are being developed
The table above includes R365 million relating to Grindrod’s share of joint ventures’ capital commitments
(R million)
Capital expenditure Capital expenditure approved Split as follows
2011 2012 2013 2014
Total approved
commitmentsApproved not
contractedApproved and
contracted
Freight 287 384 129 - 513 468 45
Logistics 159 12 - - 12 - 12
Ports and Terminals 128 372 129 - 501 468 33
Trading 11 1 1 1 3 - 3
Shipping 866 251 42 - 293 4 289
Financial Services 1 23 2 3 28 - 28
Group 1 - - - - - -
1 166 659 174 4 837 472 365

11
Operational overview

12
8%
92%
Freight Services Group
60%
40%
Freight Services Group
Freight Services
Contribution to group revenue
Contribution to attributable income
• Earnings increased by 21% to R318 million (2010: R262 million)
• Maputo Coal Terminal volumes up 101% at 3.9 million tonnes (2010: 1.9 million tonnes)
• Richards Bay volumes up 8% at 3.8 million tonnes (2010: 3.5 million tonnes)
• Strong growth in rail operations (locomotive manufacturingand leasing)
• Reduced seafreight volumes
• Improved logistics volumes resulting from strong market demand
• Intermodal operations benefiting from improved mining volumes
Freight Services R millionChange from
2010 %
Revenue 2 905 22
EBITDA 572 36
Operating income 382 58
Share of associate and joint venture companies’ profit 71 (33)
Operating margin 13% 30

13
Operational highlights – Ports and Terminals
Maputo
• Concluded Maputo Coal Terminal expansion to 6 million tonnes
• Significant improvement in coal rail service
• Pre-feasibility to expand Maputo Coal Terminal capacity by 20 million tonnes completed
• Introduced Vitol as a strategic partner acquiring 35% interest in Maputo Coal Terminal for
USD$67.7 million subsequent to year end
• Port of Maputo volumes up to 11.8 million tonnes
Rail
• Locomotive manufacturing and leasing contracts secured for Sierra Leone and Mozambique
• Operational fleet of 31 locomotives at year end with the manufacture of a further 24 contracted for 2012
Liquid Bulk
• Conclusion of bulk liquid terminal joint venture with Oiltanking and Calulo (“OTGC”)
• OTGC awarded preferred bidder status to build and operate a tank terminal in Coega

14
Operational highlights – Terminal capacity
Terminals Utilisation % change 2010 - 2011
Annualcapacity
20112011 2010
Drybulk (tonnes) 9 462 164 6 917 577 37 14 250 000
Maputo Coal Terminal 3 901 000 1 941 165 101 6 000 000
Richards Bay 3 800 555 3 518 112 8 6 100 000
Maydon Wharf (Durban) 566 846 678 667 (16) 700 000
Walvis Bay (Namibia) 313 444 304 005 3 550 000
Maputo Sized Coal 880 319 475 628 85 900 000
Liquid Bulk (m3) 168 333 171 340 (2) 340 000
Durban 69 583 114 675 (39) 260 000
Cape Town 98 750 56 665 74 80 000
Maputo automotive (number of vehicles)
35 147 18 298 92 52 000

15
Operational highlights – Logistics
• Growth in volumes benefited road transport, intermodal and clearing and forwarding businesses
• Turnaround of the road transport businesses achieved during the fourth quarter of 2011
• Exit of the non–core furniture and perishable air cargo businesses
• Establishment of Intermodal container development in Port of Maputo in partnership with Dubai
Ports World
• Completed the development of the Bluff Road freight facility

16
Trading
Contribution to attributable income
Contribution to group revenue• Earnings increased by 20% to R144 million (2010: R120 million)
• Operating margin per tonne of US$2.75 (2010: US$3.04)
• Satisfactory performance by agricultural business in a
competitive market
• Marine fuels business performed well with good growth in
volumes, operating margins and profitability
• Good results by industrial commodities business
• Increases in commodity prices, in particular oil, increased
working capital requirements
81%
19%
Trading Group
27%
73%
Trading Group
Trading R millionChange from
2010 %
Revenue 29 189 28
EBITDA 166 (4)
Operating income 155 (6)
Share of associate and joint venture companies’ profit 33
Operating margin 0.53%

17
Operational highlights – Trading
• Concluded joint venture transaction for constructing grain silos in Beira, Mozambique
• Acquisition of milling operations in South Africa and Zimbabwe
• Successful crop finance programme to originate agricultural commodity supplyin South Africa
• Commissioning of an additional chrome ore recovery plant
• Construction of a further chrome ore recovery plant almost complete
• A partnership with Vitol to grow the sub-Saharan coal trading business concluded subsequent to year end
• Marine fuels improvement in volume and profit per metric tonne
• Contracted tank storage to support physical supply of marine fuel

18
Shipping
Contribution to group revenue
Contribution to attributable income
• Attributable earnings decreased to R7 million
• Earnings remained positive despite the Baltic Index annual
average falling by 44% to 1 549 (2010: 2 758)
• Average earnings per day outperformed average spot market
rates for the year
10%
90%
Shipping Group
1%
99%
Shipping Group
Shipping R millionChange from
2010 %
Revenue 3 597 (10)
EBITDA 188 (62)
Operating income 30 (92)
Share of associate and joint venture companies’ profit 14
Operating margin 1%

19
Operational highlights – Shipping
• Contractual performance by all counterparties both in wet and dry during one of the most
volatile and challenging markets of the last 20 years
• Relocation of Unicorn from the United Kingdom to Singapore to consolidate the drybulk and
tanker operations
• Realignment and expansion of the Far East Parcel Service
• Continued development of the Handymax operating division into an established and
recognised industry player
• Good performance of the South African tanker and bunker barge businesses
• Cancellation of two small products tankers had a negative impact on second half earnings
20
Financial Services
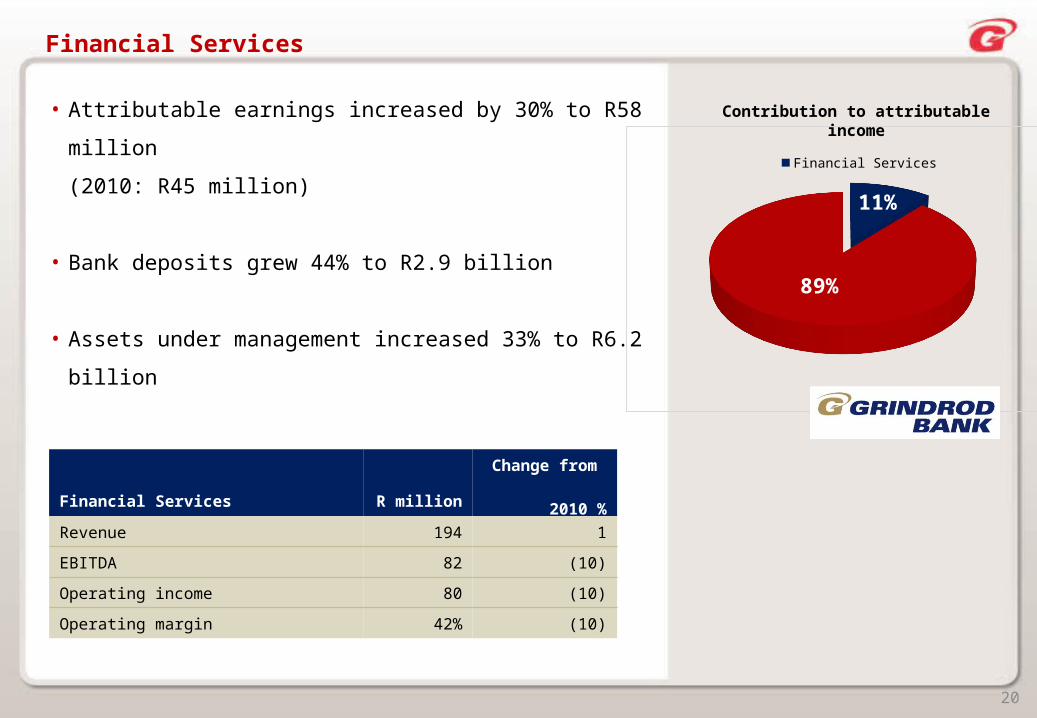
• Attributable earnings increased by 30% to R58 million
(2010: R45 million)
• Bank deposits grew 44% to R2.9 billion
• Assets under management increased 33% to R6.2 billion
Contribution to attributable income
11%
89%
Financial Services Group
Financial Services R millionChange from
2010 %
Revenue 194 1
EBITDA 82 (10)
Operating income 80 (10)
Operating margin 42% (10)

21
Operational highlights – Financial Services
• Continued diversification of Bank’s earning streams and product offerings
• Good balance of fees generated by Corporate Banking, Property Solutions, Asset
Management and Corporate Finance
• Credit advances and liquidity conservatively managed
• Strong liquidity position
• Well managed capital adequacy ratio

Markets

23
Seaborne drybulk demand forecasts
Graph source: Standard Chartered Bank/Macquarie/Clarksons Research Services Limited
2002 2003 2004 2005 2006 2007 2008 2009 2010 2011E* 2012E* 2013E* 2014E* 0
200
400
600
800
1 000
1 200
1 400
1 600
7.3%8.1%
7.3%6.5%
10.0%
7.7%
5.9%
4.2%
10.6%
5.5%
8.0% 7.9% 7.6%
Iron ore (mt) Coking coal (mt) Grains (mt) Minor bulks (mt) Demand growth (%)* Estimate

24
Forecast daily spot rates Baltic Dry Index
Graph source: Standard Chartered Bank/Macquarie/Clarksons Research Services Limited
2012 1QE* 2012 2QE* 2012 3QE* 2012 4QE* 2013 1QE* 2013 2QE* 2013 3QE* 2013 4QE* 2014 1QE* 2014 2QE* 2014 3QE* 2014 4QE* 0
5 000
10 000
15 000
20 000
25 000
30 000
35 000
40 000
1 2401 330
1 425
1 600
1 425
1 700 1 725
1 975
1 800 1 820
1 975
2 160
Capesize Panamax Supramax Handysize BDI* Quarter estimate

25
Handysize bulk carrier and products tanker time charter rates (US$/day)
Q1-
06
Q2-
06
Q3-
06
Q4-
06
Q1-
07
Q2-
07
Q3-
07
Q4-
07
Q1-
08
Q2-
08
Q3-
08
Q4-
08
Q1-
09
Q2-
09
Q3-
09
Q4-
09
Q1-
10
Q2-
10
Q3-
10
Q4-
10
Q1-
11
Q2-
11
Q3-
11
Q4-
11
Q1-
12
0
5 000
10 000
15 000
20 000
25 000
30 000
35 000
40 000
45 000
50 000
Baltic Handysize Index time charter average One year time charter rate 47 - 48 000 dwt modern products tanker
Graph source: Clarksons Research Services Limited

26
Shipping markets
<=
19
87
19
88
19
89
19
90
19
91
19
92
19
93
19
94
19
95
19
96
19
97
19
98
19
99
20
00
20
01
20
02
20
03
20
04
20
05
20
06
20
07
20
08
20
09
20
10
20
11
20
12
20
13
20
14
20
15
0
50
100
150
200
250
300
Capesize bulk carriers
Existing fleet capesize Capesize on order
No. of ships mDwt
Fleet (Feb 2012) 1 379 250.61
Orderbook (Feb 2012) 401 81.12
Orderbook percentage of fleet 38% 41%
Percentage of fleet over 25 years 4% 4%
% Non-delivery in 2010* 34% 33%
% Non-delivery in 2011** 25% 27%
Fleet growth 2010 - 2012*** 44% 47%
Graph source: Clarksons Research Services Limited
* Non-deliveries are vessels that were scheduled to be delivered according to the January 2010 orderbook, but due to delays, cancellations, re-negotiations of contracts and new market information, have not yet entered the fleet
** According to January 2011 orderbook.*** Fleet growth is from January 2010 until 1 February 2012

27
Shipping markets
<=
19
87
19
88
19
89
19
90
19
91
19
92
19
93
19
94
19
95
19
96
19
97
19
98
19
99
20
00
20
01
20
02
20
03
20
04
20
05
20
06
20
07
20
08
20
09
20
10
20
11
20
12
20
13
20
14
20
15
0
200
400
600
800
1 000
1 200
1 400
Handysize bulk carriers
Existing fleet handysize Handysize on order
No. of ships mDwt
Fleet (Feb 2012) 3 058 84.96
Orderbook (Feb 2012) 506 16.45
Orderbook percentage of fleet 17% 19%
Percentage of fleet over 25 years 36% 35%
% Non-delivery in 2010* 45% 47%
% Non-delivery in 2011** 56% 56%
Fleet growth 2010 - 2012*** 7% 11%
Graph source: Clarksons Research Services Limited
* Non-deliveries are vessels that were scheduled to be delivered according to the January 2010 orderbook, but due to delays, cancellations, re-negotiations of contracts and new market information, have not yet entered the fleet
** According to January 2011 orderbook*** Fleet growth is from January 2010 until 1 February 2012

28
Shipping markets
<=
19
87
19
88
19
89
19
90
19
91
19
92
19
93
19
94
19
95
19
96
19
97
19
98
19
99
20
00
20
01
20
02
20
03
20
04
20
05
20
06
20
07
20
08
20
09
20
10
20
11
20
12
20
13
20
14
20
15
0
50
100
150
200
250
Medium-range tankers
Existing fleet medium-range tankers Medium-range tankers on order
No. of ships mDwt
Fleet (Feb 2012) 2 001 84.16
Orderbook (Feb 2012) 209 9.32
Orderbook percentage of fleet 10% 11%
Percentage over 25 years 6% 5%
% Non-delivery in 2010* 51% 50%
% Non-delivery in 2011** 56% 56%
Fleet growth 2010 - 2012*** 6% 8%
Graph source: Clarksons Research Services Limited
* Non-deliveries are vessels that were scheduled to be delivered according to the January 2010 orderbook, but due to delays, cancellations, re-negotiations of contracts and new market information, have not yet entered the fleet
** According to January 2011 orderbook.*** Fleet growth is from January 2010 until 1 February 2012

29
Shipping markets
<=
19
87
19
88
19
89
19
90
19
91
19
92
19
93
19
94
19
95
19
96
19
97
19
98
19
99
20
00
20
01
20
02
20
03
20
04
20
05
20
06
20
07
20
08
20
09
20
10
20
11
20
12
20
13
20
14
0
10
20
30
40
50
60
70
80
Small chemical and products tankers
Existing fleet chemical and products tankers 15k - 20k dwt Chemical and product tankers 15k - 20k dwt on order
No. of ships mDwt
Fleet (Feb 2012) 558 10.09
Orderbook (Feb 2012) 59 1.07
Orderbook percentage of fleet 11% 11%
Percentage of fleet over 25 years 11% 11%
% Non-delivery in 2010* 50% 55%
% Non-delivery in 2011** 28% 46%
Fleet growth 2010 - 2012*** 10% 10%
Graph source: Clarksons Research Services Limited
* Non-deliveries are vessels that were scheduled to be delivered according to the January 2010 orderbook, but due to delays, cancellations, re-negotiations of contracts and new market information, have not yet entered the fleet
** According to January 2011 orderbook.*** Fleet growth is from January 2010 until 1 February 2012

Strategy

31
Strategy
Freight Services
• Fully develop existing businesses and pursue new strategic opportunities in line with strategy
– Drybulk terminal capacity in Maputo and Richards Bay
– Oil tank terminal in Coega
– Port of Maputo facilities
– Rail expansion
• Rationalise and full capacity utilisation for logistics businesses

32
Strategy
Trading
• Investment in supply chain participation projects
– Agricultural product financing
– Beira grain storage facility
– London tank storage facility
• Focus on utilisation of group assets, services and resources
• Fully develop existing businesses in line with market demand and target opportunities for growth

33
Strategy
Shipping
• Carefully timed expansion through:
– Purchase of well priced fuel efficient newbuildings
– Long-term charter of ships
– Strategic distressed opportunities
• Continue to develop and strengthen the global ship operating capability

34
Strategy
Financial Services
• Increase deposits, advances and assets under management
• Expand the direct transact card technology offering
• Create new collective investment scheme funds

35
Supply chain participation
Grindrod seeks to provide services throughout the complete commodity supply chain
• Increasing capacity
– Ongoing investment in strategic infrastructure – specifically Ports and Terminals
– Investment in shipping acquisitions at the appropriate time
• Maximising utilisation
– Retain suitable levels of contracted commitments for ships and terminals
– Continued capacity utilisation improvements through continued effective engagement with Transnet
• Improving margins
– Integration of businesses to further enhance margins
Producer
Procuremen
t
Rail/Ports
Shipping
Terminals/
Storage
Logistics
Customer

Outlook

37
Outlook
• Outlook for commodity demand remains positive for the long-term
• Growing demand for African commodity and infrastructure
Freight Services
• Execution on strategic projects driving growth and sustainability
• Performance of Logistics business expected to improve in 2012 as benefits extracted from
optimisation of the operations combined with further expected improvement in volumes
• Expect growth in earnings in 2012

38
Outlook
Trading
• Increased trade flows due to geographical supply and demand mismatch
• Demand for commodities and tight credit will continue to offer opportunities
• Expect growth in earnings in 2012
Shipping
• Dry cargo outlook is poor as newbuilding tonnage continues to deliver
• Tanker market continues to show signs that some improvement will be seen in the current year
• Distressed opportunities will become available
• Downward pressure on newbuilding prices will present opportunities
• Lack of bank financing will be positive in the longer-term

39
Outlook
Financial Services
• Global financial crisis and increased regulations are expected to continue to impact on banks’
tight liquidity and credit position
• Growth is expected in the niche markets in which the Bank operates
Conclusion
• Increased earnings in 2012
• Strong balance sheet
• Strategic infrastructure projects

40
Research disclaimer:
The information supplied herewith is believed to be correct but the accuracy thereof is not guaranteed and the company and its employees cannot accept liability for loss suffered in consequence of reliance on the information provided. Provision of this data does not obviate the need to make further appropriate enquiries and inspections. The information is for the use of the recipient only and is not to be used in any document for the purposes of raising finance without the written permission of Clarkson Research Services Limited (“CRSL”) and/or Standard Chartered Bank and/or Macquarie.
The statistical and graphical information contained under the heading is drawn from the CRSL and/or Standard Chartered Bank (“SCB”) and/or Macquarie database and other sources. CRSL, SCB and Macquarie have advised that:
(i) some information on CRSL’s, SCB’s and Macquarie’s databases are derived from estimates or subjective judgments; and
(ii) the information in the databases of other maritime data collection agencies may differ from the information in CRSL’s, SCB’s and Macquarie’s databases; and
(iii) whilst CRSL, SCB and Macquarie have taken reasonable care in the compilation of the statistical and graphical information and believe it to be accurate and correct, data compilation is subject to limited audit and validation procedures and may accordingly contain errors; and
(iv) CRSL, SCB and Macquarie, their agents, officers and employees do not accept liability for any loss suffered in consequence of reliance on such information or in any other manner; and
(v) the provision of such information does not obviate any need to make appropriate further enquiries; and
(vi) the provision of such information is not an endorsement of any commercial policies and/or any conclusions by CRSL, SCB and Macquarie; and
(viii) shipping is a variable and cyclical business and any forecasting concerning it cannot be very accurate

Annexures

42
Fleet overview (owned and long-term chartered ships)
Contracted in at 31.12.2011 Bulk carriers Tankers Total
Handysize Handymax Panamax CapesizeMedium
rangeSmall Chemical
2012Number (average) 17.5 1.0 2.0 3.0 6.5 4.5 4.0 38.5
Cost (US$/day) 9 400 15 800 9 800 23 200 14 900 12 100 14 600 12 500
2013Number (average) 19.5 1.0 2.0 3.0 8.0 4.5 4.0 42.0
Cost (US$/day) 9 400 15 800 10 100 23 600 15 200 12 500 14 100 12 500
2014Number (average) 19.5 1.0 2.0 2.6 8.5 4.5 4.0 42.1
Cost (US$/day) 9 500 15 800 10 300 22 800 15 400 13 300 14 600 12 600
2015Number (average) 19.5 1.0 2.0 2.0 8.5 4.5 4.0 41.5
Cost (US$/day) 9 500 15 800 10 400 21 800 15 600 13 400 14 600 12 500
Current fleet 17 1 2 3 7 4.5 4 38.5*
Net number of ships to deliver
2012 1.5 - - - (0.5) - - 1
2013 1 - - - 2 - - 3
2014 - - - (1) - - - (1)
2015 - - - - - - - -
Fleet at end of 2015 19.5 1 2 2 8.5 4.5 4 41.5**
*(Owned fleet 18.5; chartered fleet 20.0); **(Owned fleet 28.5; chartered fleet 13)
Included in the above figures are charter extension options and purchase options on 7.5 handysize bulk carriers and 2 panamax bulk carriers. The charter extension option rates and purchase option prices are currently close to where the market is at present. If these options are all not exercised the fleet at the end of 2015 reduces to 32 .

43
Contract cover
Contracted out at 31.12.2011 Bulk carriers Tankers Total
Handysize Handymax Panamax CapesizeMedium-
rangeSmall Chemical
2012Number (average) 4.6 0.5 2.0 2.6 2.2 0.7 3.0 15.6
Revenue (US$/day) 12 300 12 100 24 000 26 500 16 100 9 800 15 400 17 200
2013Number (average) 0.5 - 1.1 1.3 - - 1.5 4.4
Revenue (US$/day) 20 100 - 26 500 39 300 - - 16 700 26 200
2014Number (average) 0.4 - 1.0 1.2 - - - 2.6
Revenue (US$/day) 20 100 - 27 200 38 500 - - - 31 700
2015Number (average) - - 0.3 0.7 - - - 1.0
Revenue (US$/day) - - 27 200 35 600 - - - 33 400
Contract profits % of fleet fixed*Charters
(US$ million)Ship sales
(US$ million)Total
(US$ million)
2012 45 20 - 20
2013 13 17 - 17
2014 9 14 - 14
2015 4 4 - 4
Note: Variable volume contracts have been included at forecast volumes
* Does not include charter extension and purchase options

44
Analysis of 2011 earnings: Shipping
EBITDA from owned and long-term chartered ships
Bulk carriers Tankers 2011 2010
Growth%
Handysize Handymax Panamax CapesizeMedium range
Small Chemical Total Total
Average number of owned/ long-term chartered ships 15.8 1.1 2.0 3.2 6.9 2.7 4.0 35.7 34.1 5
Average daily revenue (US$)
13 000 13 400 24 000 27 900 14 600 9 600 13 300 15 100 17 500 (14)
Average daily cost (US$)
9 700 13 000 9 200 26 400 16 000 12 300 14 300 13 200 12 800 3
Profit (US$ million) 19 - 11 2 (4) (3) (1) 24 60 (60)
(US$ million)
Profit from ship operating activities 15 28 (46)
Profit from ship sales - 3 (100)
Ship building costs - (1) 100
Impairments (15) - -
Overheads (24) (27) 11
Funding costs/preference dividends/taxation 2 (8) 125
Foreign exchange (1) (6) 83
1 49 (98)