2011 results – key messages james white improvement and partnerships
TRANSCRIPT

2011 Results – Key Messages
James White
Improvement and Partnerships
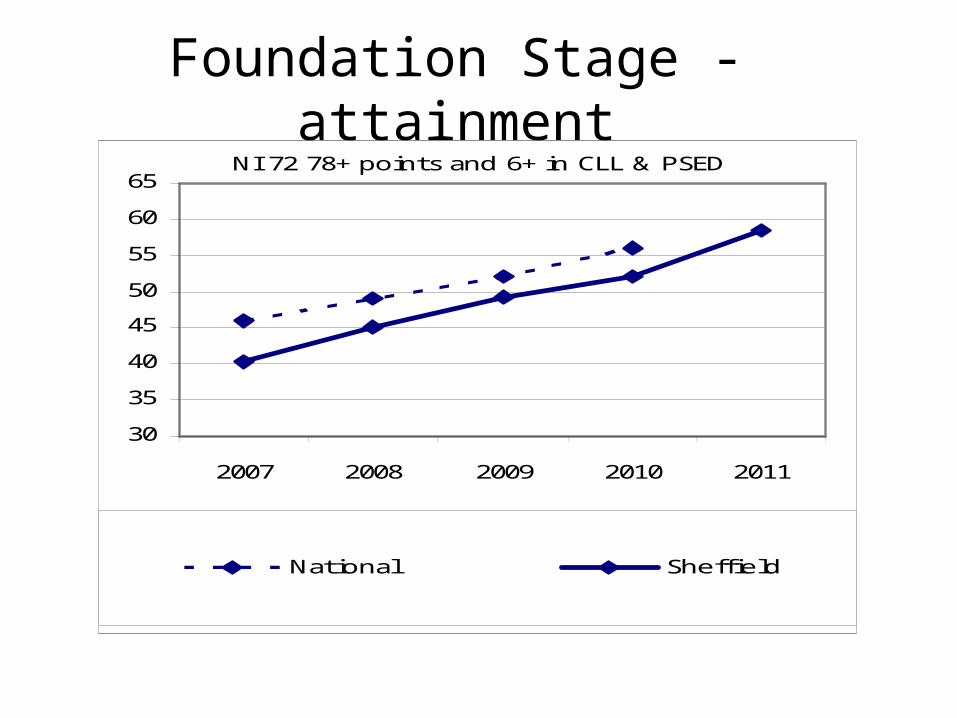
Foundation Stage - attainmentNI 72 78+ points and 6+ in CLL & PSED
30
35
40
45
50
55
60
65
2007 2008 2009 2010 2011
National Sheffield

Foundation Stage – attainment gap
% gap between the median score and the mean score of the lowest attaining 20%
NI 92, FS attainment gap
30
32
34
36
38
40
2007 2008 2009 2010 2011
Sheffield National
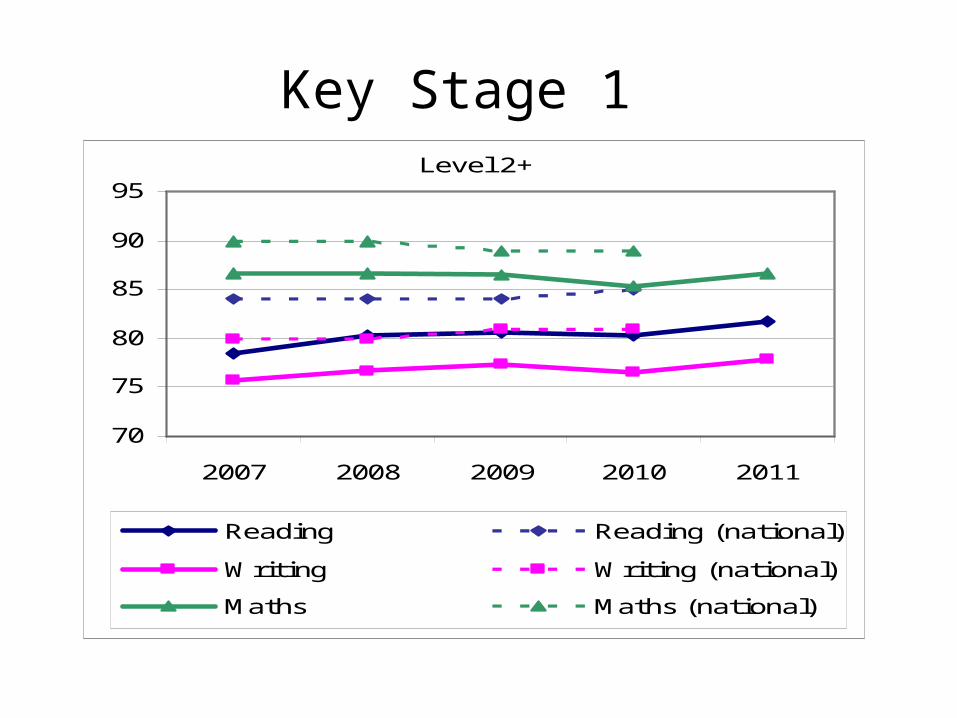
Key Stage 1Level 2+
70
75
80
85
90
95
2007 2008 2009 2010 2011
Reading Reading (national)
Writing Writing (national)
Maths Maths (national)
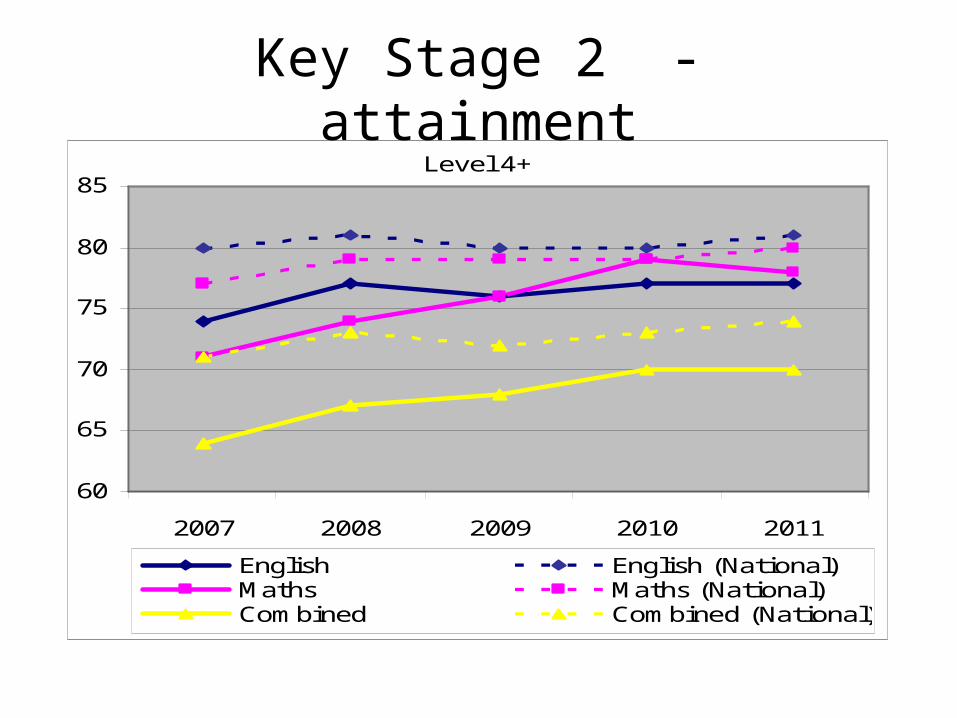
Key Stage 2 - attainmentLevel 4+
60
65
70
75
80
85
2007 2008 2009 2010 2011
English English (National)Maths Maths (National)Combined Combined (National)

Key Stage 2 - progress2+ levels Progress
65
70
75
80
85
90
2007 2008 2009 2010 2011
English English (National)
Maths Maths (National)

Key Stage 2 – floor standards
0
10
20
30
40
50
60
70
Combined belowfloor
English progressbelow floor
Maths progressbelow floor
Below all 3 floorstandards
Above all 3 floorstandards
2010
2011
Current floor standards are: 60% (L4+ in E&M), 87% (2+ levels progress English), 86% (2+ levels progress maths)

Key Stage 4 - attainment% 5+A*-C inc E&M
30
35
40
45
50
55
60
2007 2008 2009 2010 2011
Sheffield National
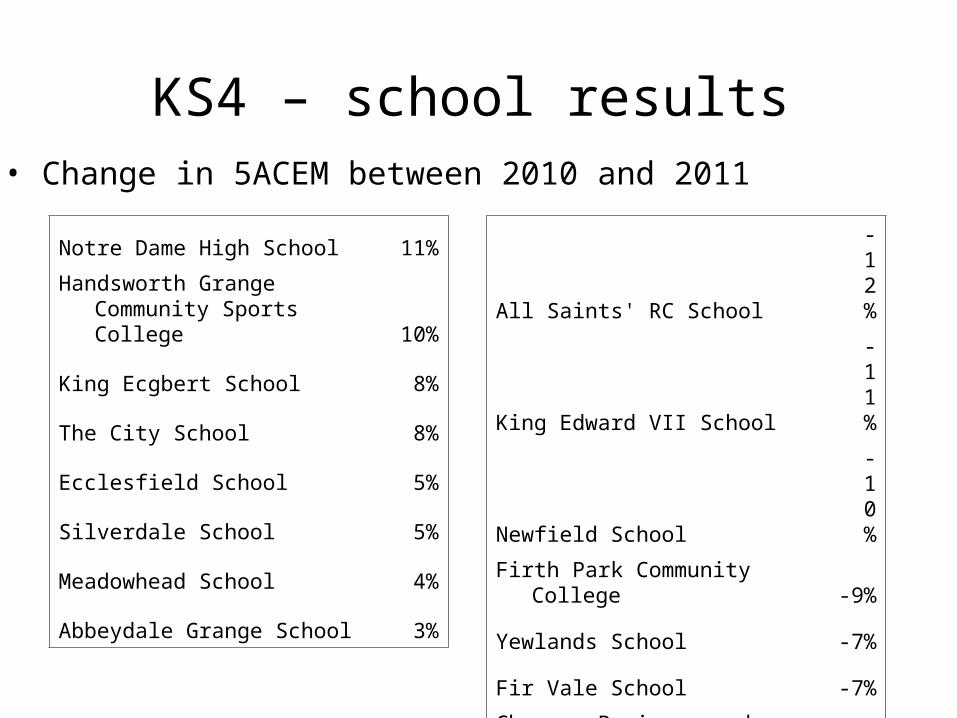
KS4 – school results
Notre Dame High School11%
Handsworth Grange Community Sports College
10%
King Ecgbert School 8%
The City School 8%
Ecclesfield School 5%
Silverdale School 5%
Meadowhead School 4%
Abbeydale Grange School 3%
All Saints' RC School
-12%
King Edward VII School
-11%
Newfield School
-10%
Firth Park Community College -9%
Yewlands School -7%
Fir Vale School -7%
Chaucer Business and Enterprise College -5%
Bradfield School -5%
Tapton School -3%
• Change in 5ACEM between 2010 and 2011

City
Wisewood
Hinde House
Silverdale
King Ecgbert
Chaucer
Tapton
Westfield
Yewlands
Firth Park
High StorrsKing Edward VII
Newfield
Ecclesfield
Stocksbridge
Bradfield
Birley
Handsworth Grange
MeadowheadFir Vale
Notre Dame
All SaintsSheffield Park
Sheffield Springs
Parkwood Academy
0
20
40
60
80
%5+
A*-
C in
c E
&M
, F
SM
(2
011)
30 40 50 60 70 80%5+ A*-C inc E&M, non FSM (2011)
Note: size of marker represents the number of FSM pupils in the school
Attainment of FSM vs non FSM pupils, 2011
KS4 – attainment of FSM pupils

Children’s Profile website

School summary information