2011 q1 earnings release - s1.q4cdn.com · first quarter 2011 earnings summary ... 242 rooms), and...
TRANSCRIPT

-1-
CONTACT: Jason Koval (914) 640-4429 FOR IMMEDIATE RELEASE April 28, 2011
STARWOOD REPORTS FIRST QUARTER 2011 RESULTS
WHITE PLAINS, NY, April 28, 2011 – Starwood Hotels & Resorts Worldwide, Inc. (NYSE: HOT) today reported first quarter 2011 financial results.
First Quarter 2011 Highlights
Excluding special items, EPS from continuing operations was $0.30. Including special items, EPS from continuing operations was $0.15.
Adjusted EBITDA was $208 million. Excluding special items, income from continuing operations was $58 million.
Including special items, income from continuing operations was $29 million. Worldwide System-wide REVPAR for Same-Store Hotels increased 10.4% (9.1% in
constant dollars) compared to 2010. System-wide REVPAR for Same-Store Hotels in North America increased 11.1% (10.4% in constant dollars).
Management fees, franchise fees and other income increased 15.7% compared to 2010.
Worldwide Same-Store company-operated gross operating profit margins increased approximately 90 basis points compared to 2010. Gross operating profits were negatively impacted by events in the Middle East, North Africa and Japan.
Worldwide REVPAR for Starwood branded Same-Store Owned Hotels increased 11.9% (10.2% in constant dollars) compared to 2010. REVPAR for Starwood branded Same-Store Owned Hotels in North America increased 9.6% (7.9% in constant dollars).
Margins at Starwood branded Same-Store Owned Hotels Worldwide increased approximately 90 basis points compared to 2010. Excluding Latin America, which was impacted by the increasing gap between inflation and currency devaluation, margins increased over 210 basis points.
Earnings from our vacation ownership and residential business increased $10 million compared to 2010.
During the quarter, the Company signed 29 hotel management and franchise contracts representing approximately 8,700 rooms and opened 21 hotels and resorts with approximately 5,200 rooms.
-2-
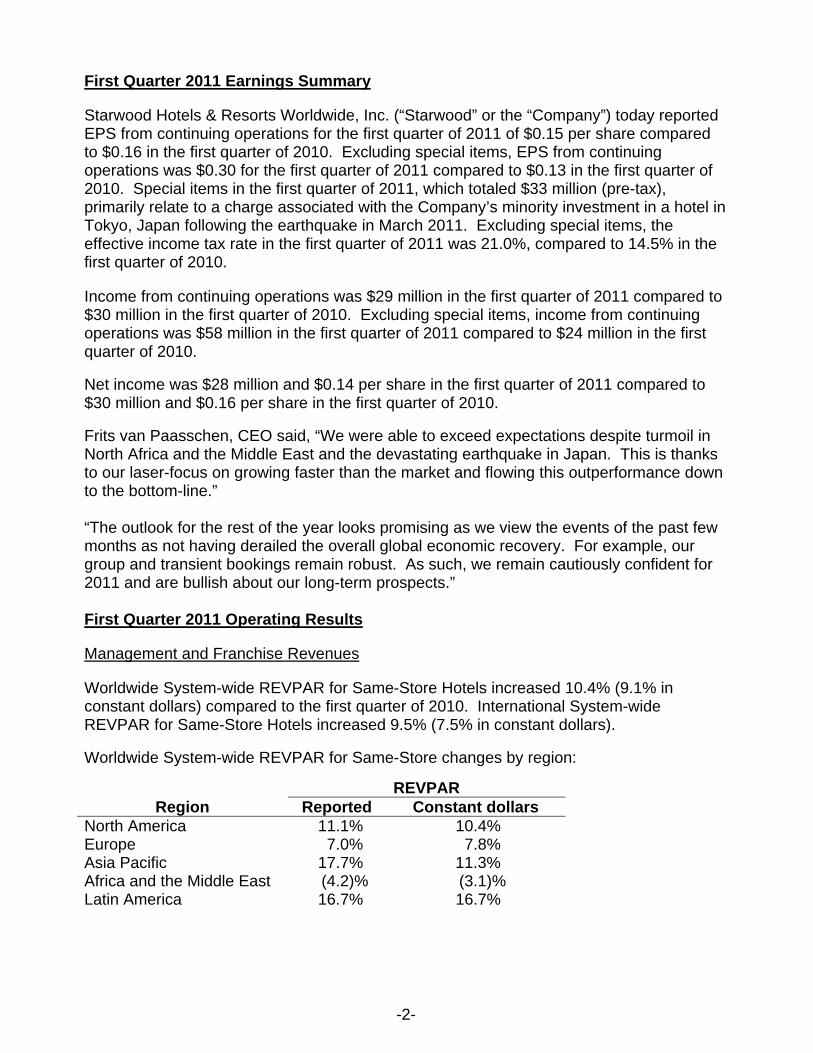
First Quarter 2011 Earnings Summary
Starwood Hotels & Resorts Worldwide, Inc. (“Starwood” or the “Company”) today reported EPS from continuing operations for the first quarter of 2011 of $0.15 per share compared to $0.16 in the first quarter of 2010. Excluding special items, EPS from continuing operations was $0.30 for the first quarter of 2011 compared to $0.13 in the first quarter of 2010. Special items in the first quarter of 2011, which totaled $33 million (pre-tax), primarily relate to a charge associated with the Company’s minority investment in a hotel in Tokyo, Japan following the earthquake in March 2011. Excluding special items, the effective income tax rate in the first quarter of 2011 was 21.0%, compared to 14.5% in the first quarter of 2010.
Income from continuing operations was $29 million in the first quarter of 2011 compared to $30 million in the first quarter of 2010. Excluding special items, income from continuing operations was $58 million in the first quarter of 2011 compared to $24 million in the first quarter of 2010.
Net income was $28 million and $0.14 per share in the first quarter of 2011 compared to $30 million and $0.16 per share in the first quarter of 2010.
Frits van Paasschen, CEO said, “We were able to exceed expectations despite turmoil in North Africa and the Middle East and the devastating earthquake in Japan. This is thanks to our laser-focus on growing faster than the market and flowing this outperformance down to the bottom-line.” “The outlook for the rest of the year looks promising as we view the events of the past few months as not having derailed the overall global economic recovery. For example, our group and transient bookings remain robust. As such, we remain cautiously confident for 2011 and are bullish about our long-term prospects.” First Quarter 2011 Operating Results
Management and Franchise Revenues
Worldwide System-wide REVPAR for Same-Store Hotels increased 10.4% (9.1% in constant dollars) compared to the first quarter of 2010. International System-wide REVPAR for Same-Store Hotels increased 9.5% (7.5% in constant dollars).
Worldwide System-wide REVPAR for Same-Store changes by region:
REVPAR Region Reported Constant dollars
North America 11.1% 10.4% Europe 7.0% 7.8% Asia Pacific 17.7% 11.3% Africa and the Middle East (4.2)% (3.1)% Latin America 16.7% 16.7%

-3-
Increases in REVPAR for Worldwide System-wide Same-Store hotels by brand: REVPAR
Brand Reported Constant dollars St. Regis/Luxury Collection 13.5% 12.6% W Hotels 16.7% 16.7% Westin 10.8% 9.3% Sheraton 8.5% 7.1% Le Méridien 8.0% 7.2% Four Points by Sheraton 12.3% 9.7% Aloft 24.9% 24.6%
Worldwide Same-Store company-operated gross operating profit margins increased approximately 90 basis points in the first quarter. International gross operating profit margins for Same-Store company-operated properties were flat, negatively impacted by the political unrest in the Middle East and North Africa, as well as the earthquake in Japan. North American Same-Store company-operated gross operating profit margins increased approximately 200 basis points, driven by REVPAR increases and cost controls.
Management fees, franchise fees and other income were $177 million, up $24 million, or 15.7% from the first quarter of 2010. Management fees increased 11.5% to $97 million and franchise fees increased 22.9% to $43 million.
During the first quarter of 2011, the Company signed 29 hotel management and franchise contracts, representing approximately 8,700 rooms, of which 19 are new builds and 10 are conversions from other brands. At March 31, 2011, the Company had approximately 350 hotels in the active pipeline representing approximately 85,000 rooms.
During the first quarter of 2011, 21 new hotels and resorts (representing approximately 5,200 rooms) entered the system, including the W London Leicester Square (England, 192 rooms), Sheraton Shanghai Hotel, Hongkou (China, 471 rooms), W Bali (Indonesia, 237 rooms), The Westin Phoenix Downtown (Arizona, 242 rooms), and The Liberty Hotel, a Luxury Collection Hotel (Boston, Massachusetts, 298 rooms). Eleven properties (representing approximately 3,400 rooms) were removed from the system during the quarter.
Owned, Leased and Consolidated Joint Venture Hotels
Worldwide REVPAR for Starwood branded Same-Store Owned Hotels increased 11.9% (10.2% in constant dollars) in the first quarter of 2011 when compared to 2010. REVPAR at Starwood branded Same-Store Owned Hotels in North America increased 9.6% (7.9% in constant dollars). Internationally, Starwood branded Same-Store Owned Hotel REVPAR increased 14.9% (13.3% in constant dollars).
Revenues at Starwood branded Same-Store Owned Hotels in North America increased 6.5% while costs and expenses increased 4.6% when compared to 2010. Margins at these hotels increased approximately 150 basis points.

-4-
Revenues at Starwood branded Same-Store Owned Hotels Worldwide increased 8.5% (6.9% in constant dollars) while costs and expenses increased 7.4% (6.3% in constant dollars) when compared to 2010. Margins at these hotels increased approximately 90 basis points and were negatively impacted by approximately 120 basis points due to continued increase in the gap between inflation and currency devaluation at the Company’s Latin America hotels.
Revenues at owned, leased and consolidated joint venture hotels were $410 million, compared to $381 million in 2010. Expenses at owned, leased and consolidated joint venture hotels were $361 million compared to $329 million in 2010. First quarter results were negatively impacted by pre-opening costs at the new leased W London Leicester Square, the effect of the earthquake at the new leased St. Regis Osaka, one renovation and one asset sale.
Vacation Ownership
Total vacation ownership revenues increased 12.2% to $147 million compared to 2010. Originated contract sales of vacation ownership intervals increased 6.5% primarily due to improved sales performance on existing owner channels and increased tour flow from new buyer preview packages. The number of contracts signed increased 7.8% when compared to 2010 and the average price per vacation ownership unit sold decreased 1.4% to approximately $16,500, driven by inventory mix.
Selling, General, Administrative and Other
Selling, general, administrative and other expenses increased 5.3% to $80 million compared to $76 million in 2010.
Capital
Gross capital spending during the quarter included approximately $40 million of maintenance capital and $33 million of development capital. Net investment spending on vacation ownership interest (“VOI”) and residential inventory was $16 million, primarily related to the St. Regis Bal Harbour project.
Balance Sheet
At March 31, 2011, the Company had gross debt of $2.853 billion, excluding $459 million of debt associated with securitized vacation ownership notes receivable. Additionally, the Company had cash and cash equivalents of $732 million (including $57 million of restricted cash), and net debt of $2.121 billion, compared to net debt of $2.060 billion as of December 31, 2010. Net debt at March 31, 2011 including debt and restricted cash ($21 million) associated with securitized vacation ownership notes receivables was $2.559 billion.
At March 31, 2011, debt was approximately 78% fixed rate and 22% floating rate and its weighted average maturity was 4.0 years with a weighted average interest rate of 6.80% excluding the securitized debt. The Company had cash (including current restricted cash) and availability under the domestic and international revolving credit facility of approximately $2.091 billion.

-5-
On April 6, 2011, the Company completed the sale of one wholly-owned hotel for cash proceeds of approximately $110 million. This hotel was sold subject to a long-term management contract.
Outlook For the three months ended June 30, 2011:
Adjusted EBITDA is expected to be approximately $245 million to $255 million, assuming:
REVPAR increases at Same-Store Company Operated Hotels Worldwide of 7% to 9% in constant dollars (approximately 200 basis points higher in dollars at current exchange rates).
REVPAR increases at Branded Same-Store Owned Hotels Worldwide of 8% to 10% in constant dollars (approximately 400 basis points higher in dollars at current exchange rates).
Management fees, franchise fees and other income increase approximately
10% to 12%, negatively impacted by approximately 200 basis points by Japan and North Africa.
Earnings from our vacation ownership and residential business are flat.
Depreciation and amortization is expected to be approximately $79 million. Interest expense is expected to be approximately $58 million. Income from continuing operations is expected to be approximately $82 million to
$90 million, reflecting an effective tax rate of approximately 24%. Assuming all of the above, EPS is expected to be approximately $0.42 to $0.46.
For the Full Year 2011: Macro-economic and geo-political environments remain uncertain. We believe that several scenarios are possible. With low supply growth in developed markets and high demand growth in emerging markets, rate improvement will be the key driver of 2011 results. Based on trends to date, our outlook assumes a normal lodging recovery in 2011, negatively impacted by Japan, North Africa and Mexico:
Adjusted EBITDA is expected to be approximately $975 million to $1 billion, assuming:
REVPAR increases at Same-Store Company Operated Hotels Worldwide of 7% to 9% in constant dollars (approximately 100 basis points higher in dollars at current exchange rates).

-6-
REVPAR increases at Branded Same-Store Owned Hotels Worldwide of 8% to 10% in constant dollars (approximately 200 basis points higher in dollars at current exchange rates).
Margin increases at Branded Same-Store Owned Hotels Worldwide of 150 to
200 basis points.
Management fees, franchise fees and other income increase approximately 10% to 12%, negatively impacted by approximately 200 basis points by Japan and North Africa.
Earnings from our vacation ownership and residential business of
approximately $130 million to $140 million.
Selling, general and administrative expenses increase 4% to 5%. Depreciation and amortization is expected to be approximately $320 million. Interest expense is expected to be approximately $240 million and cash taxes will
be approximately $80 million. Full year effective tax rate is expected to be approximately 25%. Assuming all of the above, EPS is expected to be approximately $1.60 to $1.70. Full year capital expenditure (excluding vacation ownership and residential
inventory) is expected to be approximately $300 million for maintenance, renovation and technology. In addition, in-flight investment projects and prior commitments for joint ventures and other investments are expected to total approximately $150 million. Vacation ownership (excluding Bal Harbour) is expected to generate approximately $165 million in positive cash flow.
The Company currently expects closings on Bal Harbour residential units to
commence in late Q4 2011. The Company’s current outlook does not include any revenue recognition or cash flows associated with these potential closings. The Company does, however, expect there to be revenue recognition and cash flows from closings in Q4 2011 and the Company will provide updates as the year progresses. Bal Harbour capital expenditure for 2011 is expected to be approximately $150 million.

-7-
Special Items
The Company’s special items netted to a charge of $33 million ($29 million after-tax) in the first quarter of 2011 compared to a benefit of $1 million ($6 million after-tax) in the same period of 2010.
The following represents a reconciliation of income from continuing operations before special items to income from continuing operations including special items (in millions, except per share data):
Three Months Ended March 31,
2011 2010 Income from continuing operations before special items .................. $ 58 $ 24 EPS before special items ................................................................ $ 0.30 $ 0.13 Special Items (Loss) gain on asset dispositions and impairments, net (a) ................ (33) 1 Total special items – pre-tax ............................................................. (33) 1 Income tax benefit for special items (b) ............................................. — 5 Income tax benefit associated with dispositions (c) ........................... 4 — Total special items – after-tax ............................................................ (29) 6 Income from continuing operations ................................................... $ 29 $ 30 EPS including special items ............................................................. $ 0.15 $ 0.16
(a) During the three months ended March 31, 2011, the net loss primarily relates to an impairment of a minority investment in a joint venture hotel located in Japan. During the three months ended March 31, 2010, the net gain relates to sales of two non-core assets partially offset by losses on the termination of two management contracts.
(b) During three months ended March 31, 2010, the benefit primarily relates to the adjustment of deferred tax assets associated with prior year impairment charges, due to a change in a foreign tax rate.
(c) During the three months ended March 31, 2011, the benefit relates to the reversal of income tax reserves associated with dispositions in prior years.
The Company has included the above supplemental information concerning special items to assist investors in analyzing Starwood’s financial position and results of operations. The Company has chosen to provide this information to investors to enable them to perform meaningful comparisons of past, present and future operating results and as a means to emphasize the results of core on-going operations.

-8-
Starwood will be conducting a conference call to discuss the first quarter financial results at 10:30 a.m. (EDT) today at (706) 758-8744. The conference call will be available through a simultaneous web cast in the Investor Relations/Press Releases section of the Company’s website at http://www.starwoodhotels.com. A replay of the conference call will also be available from 1:30 p.m. (EDT) today through May 5, 2011 at 12:00 midnight (EDT) on both the Company’s website and via telephone replay at (706) 645-9291 (pass code #23166357).
Definitions
All references to EPS, unless otherwise noted, reflect earnings per diluted share from continuing operations attributable to Starwood’s common shareholders. All references to continuing operations, discontinued operations and net income reflect amounts attributable to Starwood’s common shareholders (i.e. excluding amounts attributable to noncontrolling interests). All references to “net capital expenditures” mean gross capital expenditures for timeshare and fractional inventory net of cost of sales. EBITDA represents net income before interest expense, taxes, depreciation and amortization. The Company believes that EBITDA is a useful measure of the Company’s operating performance due to the significance of the Company’s long-lived assets and level of indebtedness. EBITDA is a commonly used measure of performance in its industry which, when considered with GAAP measures, the Company believes gives a more complete understanding of the Company’s operating performance. It also facilitates comparisons between the Company and its competitors. The Company’s management has historically adjusted EBITDA (i.e., “Adjusted EBITDA”) when evaluating operating performance for the total Company, as well as for individual properties or groups of properties, because the Company believes that the inclusion or exclusion of certain recurring and non-recurring items, such as restructuring, goodwill impairment and other special charges and gains and losses on asset dispositions and impairments, is necessary to provide the most accurate measure of core operating results and as a means to evaluate comparative results. The Company’s management also uses Adjusted EBITDA as a measure in determining the value of acquisitions and dispositions and it is used in the annual budget process. The Company has historically reported this measure to its investors and believes that the continued inclusion of Adjusted EBITDA provides consistency in its financial reporting and enables investors to perform more meaningful comparisons of past, present and future operating results and provides a means to evaluate the results of its core on-going operations. EBITDA and Adjusted EBITDA are not intended to represent cash flow from operations as defined by GAAP and such metrics should not be considered as an alternative to net income, cash flow from operations or any other performance measure prescribed by GAAP. The Company’s calculation of EBITDA and Adjusted EBITDA may be different from the calculations used by other companies and, therefore, comparability may be limited.
All references to Same-Store Owned Hotels reflect the Company’s owned, leased and consolidated joint venture hotels, excluding condo hotels, hotels sold to date and hotels undergoing significant repositionings or for which comparable results are not available (i.e., hotels not owned during the entire periods presented or closed due to seasonality or natural disasters). References to Company Operated Hotel metrics (e.g. REVPAR) reflect metrics for the Company’s owned and managed hotels. References to System-Wide metrics (e.g. REVPAR) reflect metrics for the Company’s owned, managed and franchised hotels. REVPAR is defined as revenue per available room. ADR is defined as average daily rate.

-9-
All references to revenues in constant dollars represent revenues, excluding the impact of the movement of foreign exchange rates. The Company calculates revenues in constant dollars by calculating revenues for the current year using the prior year’s exchange rates. The Company uses this revenue measure to better understand the underlying results and trends of the business, excluding the impact of movements in foreign exchange rates.
All references to contract sales or originated sales reflect vacation ownership sales before revenue adjustments for percentage of completion accounting methodology. All references to earnings from vacation ownership and residential represents operating income before depreciation expense.
All references to management and franchise revenues represent base and incentive fees, franchise fees, amortization of deferred gains resulting from the sales of hotels subject to long-term management contracts and termination fees.
Starwood Hotels & Resorts Worldwide, Inc. is one of the leading hotel and leisure companies in the world with 1,051 properties in nearly 100 countries and 145,000 employees at its owned and managed properties. Starwood Hotels is a fully integrated owner, operator and franchisor of hotels and resorts with the following internationally renowned brands: St. Regis®, The Luxury Collection®, W®, Westin®, Le Méridien®, Sheraton®, Four Points® by Sheraton, aloft(SM), and element(SM). Starwood Hotels also owns Starwood Vacation Ownership, Inc., one of the premier developers and operators of high quality vacation interval ownership resorts. For more information, including reconciliations of non-GAAP financial measures to GAAP financial measures, please visit www.starwoodhotels.com or contact Investor Relations at (914) 640-8165.
** Please contact Starwood’s new, toll-free media hotline at (866) 4-STAR-PR (866-478-2777) for photography or additional information.**
Note: This press release contains forward-looking statements within the meaning of federal securities regulations. Forward-looking statements are not guarantees of future performance and involve risks and uncertainties and other factors that may cause actual results to differ materially from those anticipated at the time the forward-looking statements are made. Further results, performance and achievements may be affected by general economic conditions including the impact of war and terrorist activity, natural disasters, business and financing conditions, foreign exchange fluctuations, cyclicality of the real estate (including residential) and the hotel and vacation ownership businesses, operating risks associated with the hotel, vacation ownership and residential businesses, relationships with associates and labor unions, customers and property owners, the impact of the internet reservation channels, our reliance on technology, domestic and international political and geopolitical conditions, competition, governmental and regulatory actions (including the impact of changes in U.S. and foreign tax laws and their interpretation), travelers’ fears of exposure to contagious diseases, risk associated with the level of our indebtedness, risk associated with potential acquisitions and dispositions and the introduction of new brand concepts and other risks and uncertainties. These risks and uncertainties are presented in detail in our filings with the Securities and Exchange Commission. Future vacation ownership units indicated in this press release include planned units on land owned by the Company or by joint ventures in which the Company has an interest that have received all major governmental land use approvals for the development of vacation ownership resorts. There can also be no assurance that such units will in fact be developed and, if developed, the time period of such development (which may be more than several years in the future). Some of the projects may require additional third-party approvals or permits for development and build out and may also be subject to legal challenges as well as a commitment of capital by the Company. The actual number of units to be constructed may be significantly lower than the number of future units indicated. There can also be no assurance that agreements will be entered into for the hotels in the Company’s pipeline and, if entered into, the timing of any agreement and the opening of the related hotel. Although we believe the expectations reflected in forward-looking statements are based upon reasonable assumptions, we can give no assurance that our expectations will be attained or that results will not materially differ. We undertake no obligation to publicly update or revise any forward-looking statement, whether as a result of new information, future events or otherwise.

-10-
STARWOOD HOTELS & RESORTS WORLDWIDE, INC. UNAUDITED CONSOLIDATED STATEMENTS OF INCOME
(In millions, except per share data)
Three Months Ended March 31,
2011 2010 %
Variance Revenues
Owned, leased and consolidated joint venture hotels ....... $ 410 $ 381 7.6 Vacation ownership and residential sales and services ..... 153 133 15.0 Management fees, franchise fees and other income ......... 177 153 15.7
Other revenues from managed and franchised
properties (a) ................................................................. 555 520 6.7 1,295 1,187 9.1 Costs and Expenses Owned, leased and consolidated joint venture hotels ....... 361 329 (9.7) Vacation ownership and residential .................................... 111 101 (9.9) Selling, general, administrative and other .......................... 80 76 (5.3) Depreciation ....................................................................... 60 66 9.1 Amortization ....................................................................... 8 10 20.0
Other expenses from managed and franchised
properties (a) ................................................................. 555 520 (6.7) 1,175 1,102 (6.6) Operating income .............................................................. 120 85 41.2
Equity earnings and gains and (losses) from
unconsolidated ventures, net ....................................... 4 3 33.3 Interest expense, net of interest income of $1 and $1 ........ (54) (62) 12.9 (Loss) gain on asset dispositions and impairments, net .... (33) 1 n/m Income from continuing operations before taxes ................ 37 27 37.0 Income tax (expense) benefit ............................................ (10) 1 n/m Income from continuing operations .................................... 27 28 (3.6) Discontinued Operations: Net loss on dispositions, net of tax ................................ (1) — n/m
Net income ........................................................................ 26 28 (7.1) Net loss attributable to noncontrolling interests .................. 2 2 —
Net income attributable to Starwood ................................... $ 28 $ 30 (6.7) Earnings (Loss) Per Share – Basic
Continuing operations ........................................................ $ 0.16 $ 0.16 — Discontinued operations ..................................................... (0.01) — n/m
Net income ........................................................................ $ 0.15 $ 0.16 (6.3) Earnings (Loss) Per Share – Diluted
Continuing operations ........................................................ $ 0.15 $ 0.16 (6.3) Discontinued operations ..................................................... (0.01) — n/m
Net income ......................................................................... $ 0.14 $ 0.16 (12.5) Amounts attributable to Starwood’s Common
Shareholders ............................................................... Continuing operations ......................................................... $ 29 $ 30 (3.3) Discontinued operations ..................................................... (1) — n/m Net income ......................................................................... $ 28 $ 30 (6.7) Weighted average number of shares ................................. 187 181 Weighted average number of shares assuming dilution .... 194 187
(a) The Company includes in revenues the reimbursement of costs incurred on behalf of managed hotel property owners and franchisees with no added margin and includes in costs and expenses these reimbursed costs. These costs relate primarily to payroll costs at managed properties where the Company is the employer.
n/m = not meaningful

-11-
STARWOOD HOTELS & RESORTS WORLDWIDE, INC. CONSOLIDATED BALANCE SHEETS
(In millions, except share data)
March 31, 2011
December 31,2010
(unaudited) Assets Current assets: Cash and cash equivalents ............................................................................... $ 675 $ 753 Restricted cash .................................................................................................. 73 53 Accounts receivable, net of allowance for doubtful accounts of $41 and $45 ...... 558 513 Securitized vacation ownership notes receivable, net of allowance for doubtful . accounts of $9 and $10 .......................................................................................
58
59
Inventories .......................................................................................................... 819 802 Prepaid expenses and other ............................................................................... 176 126 Total current assets ............................................................................................. 2,359 2,306 Investments ............................................................................................................ 291 312 Plant, property and equipment, net ........................................................................ 3,273 3,323 Assets held for sale ................................................................................................. 100 — Goodwill and intangible assets, net ........................................................................ 2,068 2,067 Deferred tax assets ................................................................................................. 988 979 Other assets (a) ....................................................................................................... 399 381 Securitized vacation ownership notes receivable ................................................... 381 408 $ 9,859 $ 9,776 Liabilities and Stockholders’ Equity Current liabilities: Short-term borrowings and current maturities of long-term debt (b) ..................... $ 8 $ 9 Current maturities of long-term securitized vacation ownership debt ................. 126 127 Accounts payable ............................................................................................... 140 138 Accrued expenses .............................................................................................. 1,185 1,104 Accrued salaries, wages and benefits ................................................................ 314 410 Accrued taxes and other ..................................................................................... 354 373 Total current liabilities ..................................................................................... 2,127 2,161 Long-term debt (b) ................................................................................................... 2,845 2,848 Long-term securitized vacation ownership debt ..................................................... 333 367 Deferred income taxes ........................................................................................... 29 28 Other liabilities ........................................................................................................ 1,905 1,886 7,239 7,290 Commitments and contingencies Stockholders’ equity: Common stock; $0.01 par value; authorized 1,000,000,000 shares;
outstanding 195,091,721 and 192,970,437 shares at March 31, 2011 and December 31, 2010, respectively .................................................................... 2 2
Additional paid-in capital ........................................................................................ 861 805 Accumulated other comprehensive loss ................................................................. (232) (283) Retained earnings ................................................................................................... 1,975 1,947 Total Starwood stockholders’ equity ............................................................... 2,606 2,471 Noncontrolling interest ............................................................................................ 14 15 Total equity ...................................................................................................... 2,620 2,486 $ 9,859 $ 9,776 (a) Includes restricted cash of $5 million and $10 million at March 31, 2011 and December 31, 2010, respectively. (b) Excludes Starwood’s share of unconsolidated joint venture debt aggregating approximately $430 million and $434 million at
March 31, 2011 and December 31, 2010, respectively.
-12-
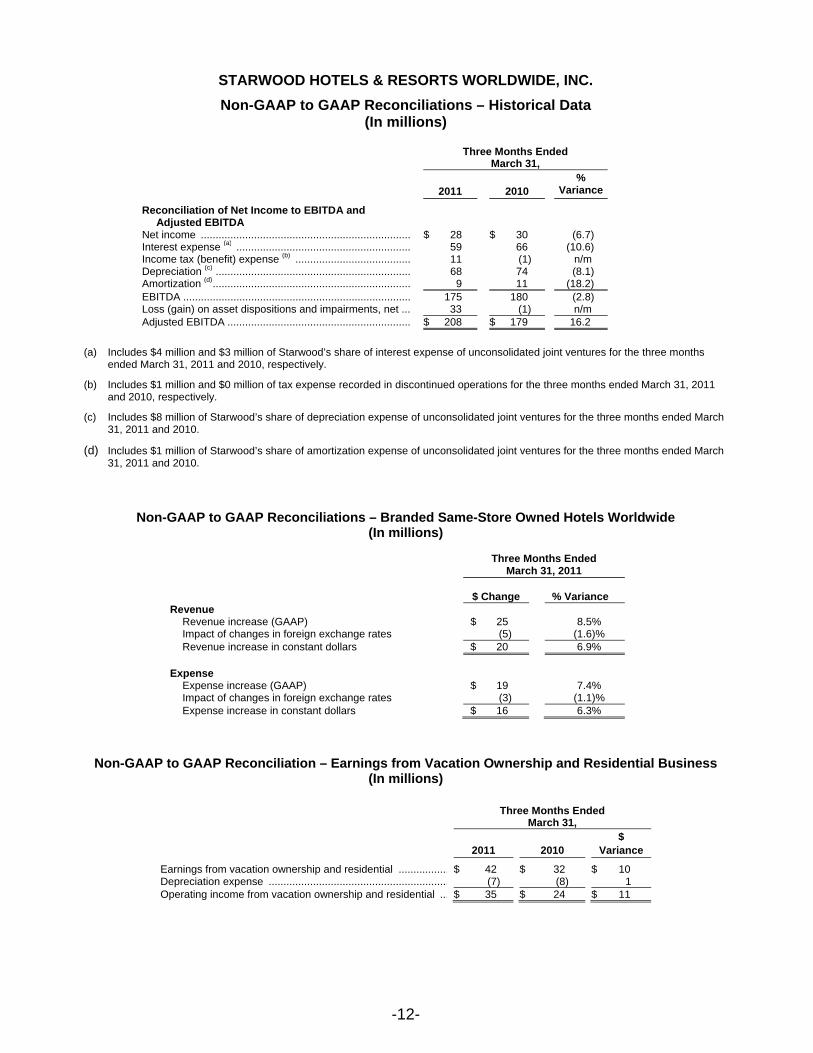
STARWOOD HOTELS & RESORTS WORLDWIDE, INC. Non-GAAP to GAAP Reconciliations – Historical Data
(In millions)
Three Months Ended March 31,
2011
2010 %
Variance
Reconciliation of Net Income to EBITDA and Adjusted EBITDA
Net income ....................................................................... $ 28 $ 30 (6.7) Interest expense (a) ........................................................... 59 66 (10.6) Income tax (benefit) expense (b) ....................................... 11 (1) n/m Depreciation (c) .................................................................. 68 74 (8.1) Amortization (d) ................................................................... 9 11 (18.2) EBITDA ............................................................................. 175 180 (2.8) Loss (gain) on asset dispositions and impairments, net ... 33 (1) n/m Adjusted EBITDA .............................................................. $ 208 $ 179 16.2
(a) Includes $4 million and $3 million of Starwood’s share of interest expense of unconsolidated joint ventures for the three months
ended March 31, 2011 and 2010, respectively.
(b) Includes $1 million and $0 million of tax expense recorded in discontinued operations for the three months ended March 31, 2011 and 2010, respectively.
(c) Includes $8 million of Starwood’s share of depreciation expense of unconsolidated joint ventures for the three months ended March 31, 2011 and 2010.
(d) Includes $1 million of Starwood’s share of amortization expense of unconsolidated joint ventures for the three months ended March 31, 2011 and 2010.
Non-GAAP to GAAP Reconciliations – Branded Same-Store Owned Hotels Worldwide
(In millions)
Three Months Ended March 31, 2011
$ Change
% Variance
Revenue Revenue increase (GAAP) $ 25 8.5% Impact of changes in foreign exchange rates (5) (1.6)% Revenue increase in constant dollars $ 20 6.9% Expense Expense increase (GAAP) $ 19 7.4% Impact of changes in foreign exchange rates (3) (1.1)% Expense increase in constant dollars $ 16 6.3%
Non-GAAP to GAAP Reconciliation – Earnings from Vacation Ownership and Residential Business
(In millions)
Three Months Ended March 31,
2011
2010 $
Variance
Earnings from vacation ownership and residential ................. $ 42 $ 32 $ 10 Depreciation expense ............................................................. (7) (8) 1 Operating income from vacation ownership and residential ... $ 35 $ 24 $ 11

-13-
STARWOOD HOTELS & RESORTS WORLDWIDE, INC.
Non-GAAP to GAAP Reconciliations – Future Performance (In millions, except per share data)
Low Case
Three Months Ended
June 30, 2011 Year Ended
December 31, 2011 $ 82 Net income ........................................................................................... $ 282 58 Interest expense ................................................................................. 240 26 Income tax expense ............................................................................ 100 79 Depreciation and amortization ............................................................ 320 245 EBITDA ............................................................................................... 942 — Loss (gain) on asset dispositions and impairments, net ...................... 33 $ 245 Adjusted EBITDA ................................................................................. $ 975
Three Months Ended
June 30, 2011 Year Ended
December 31, 2011 $ 82 Income from continuing operations before special items .................... $ 312 $ 0.42 EPS before special items ................................................................... $ 1.60 Special Items — (Loss) gain on asset dispositions and impairments, net ................... (33) — Total special items – pre-tax ................................................................ (33) — Income tax benefit associated with dispositions .................................. 4 — Total special items – after-tax ............................................................. (29) $ 82 Income from continuing operations ..................................................... $ 283 $ 0.42 EPS including special items ................................................................ $ 1.45
High Case
Three Months Ended
June 30, 2011 Year Ended
December 31, 2011 $ 90 Net income ........................................................................................... $ 301 58 Interest expense ................................................................................. 240 28 Income tax expense ............................................................................ 106 79 Depreciation and amortization ............................................................ 320 255 EBITDA ............................................................................................... 967 — Loss (gain) on asset dispositions and impairments, net ...................... 33 $ 255 Adjusted EBITDA ................................................................................. $ 1,000
Three Months Ended
June 30, 2011 Year Ended
December 31, 2011 $ 90 Income from continuing operations before special items .................... $ 331 $ 0.46 EPS before special items ................................................................... $ 1.70 Special Items — (Loss) gain on asset dispositions and impairments, net ................... (33) — Total special items – pre-tax ................................................................ (33) — Income tax benefit associated with dispositions .................................. 4 — Total special items – after-tax ............................................................. (29) $ 90 Income from continuing operations ..................................................... $ 302 $ 0.46 EPS including special items ................................................................ $ 1.55

-14-
STARWOOD HOTELS & RESORTS WORLDWIDE, INC.
Non-GAAP to GAAP Reconciliations –
Future Earnings from Vacation Ownership and Residential Business (In millions)
Three Months Ended
June 30,
2011
2010 $
Variance
Earnings from vacation ownership and residential ................. $ 34 $ 34 $ — Depreciation expense ............................................................. (6) (7) 1 Operating income from vacation ownership and residential ... $ 28 $ 27 $ 1
Non-GAAP to GAAP Reconciliations – Future Earnings from Vacation Ownership and Residential Business
(In millions)
Low Case
Three Months Ended June 30, 2011
Year Ended December 31, 2011
$ 34 Earnings from vacation ownership and residential ............................. $ 130 (6) Depreciation expense ......................................................................... (24) $ 28 Operating income from vacation ownership and residential ............... $ 106
High Case
Three Months Ended
June 30, 2011 Year Ended
December 31, 2011 $ 34 Earnings from vacation ownership and residential ............................. $ 140 (6) Depreciation expense ......................................................................... (24) $ 28 Operating income from vacation ownership and residential ............... $ 116

-15-
STARWOOD HOTELS & RESORTS WORLDWIDE, INC.
Non-GAAP to GAAP Reconciliations – Same Store Owned Hotel Revenue and Expenses (In millions)
Three Months Ended
March 31,
Same-Store Owned Hotels
Worldwide
2011 2010 %
Variance Revenue Same-Store Owned Hotels (a) .................................................... $ 351 $ 326 7.7 Hotels Sold or Closed in 2011 and 2010 ................................... — 8 (100.0) Hotels Without Comparable Results .......................................... 53 47 12.8 Other ancillary hotel operations ................................................. 6 — n/m
Total Owned, Leased and Consolidated Joint Venture Hotels
Revenue ................................................................................... $ 410 $ 381 7.6 Costs and Expenses Same-Store Owned Hotels (a) .................................................... $ 306 $ 287 (6.6) Hotels Sold or Closed in 2011 and 2010 .................................... — 6 100.0 Hotels Without Comparable Results .......................................... 49 36 (36.1) Other ancillary hotel operations ................................................. 6 — n/m
Total Owned, Leased and Consolidated Joint Venture Hotels
Costs and Expenses .................................................................. $ 361 $ 329 (9.7)
Three Months Ended
March 31,
Same-Store Owned Hotels
North America 2011 2010 %
Variance Revenue Same-Store Owned Hotels (a) ................................................... $ 210 $ 199 5.5 Hotels Sold or Closed in 2011 and 2010 .................................... — 8 (100.0) Hotels Without Comparable Results .......................................... 44 45 (2.2) Other ancillary hotel operations ................................................. 6 — n/m
Total Owned, Leased and Consolidated Joint Venture Hotels
Revenue ................................................................................... $ 260 $ 252 3.2 Costs and Expenses Same-Store Owned Hotels (a) .................................................... $ 186 $ 179 (3.9) Hotels Sold or Closed in 2011 and 2010 .................................... — 6 100.0 Hotels Without Comparable Results .......................................... 35 34 (2.9) Other ancillary hotel operations ................................................. 6 — n/m
Total Owned, Leased and Consolidated Joint Venture Hotels
Costs and Expenses ................................................................. $ 227 $ 219 (3.7)
Three Months Ended
March 31,
Same-Store Owned Hotels
International
2011
2010 %
Variance Revenue Same-Store Owned Hotels (a) .................................................... $ 141 $ 127 11.0 Hotels Sold or Closed in 2011 and 2010 .................................... — — — Hotels Without Comparable Results .......................................... 9 2 n/m Other ancillary hotel operations ................................................. — — —
Total Owned, Leased and Consolidated Joint Venture Hotels
Revenue ................................................................................... $ 150 $ 129 16.3 Costs and Expenses Same-Store Owned Hotels (a) .................................................... $ 120 $ 108 (11.1) Hotels Sold or Closed in 2011 and 2010 ................................... — — — Hotels Without Comparable Results .......................................... 14 2 n/m Other ancillary hotel operations ................................................. — — —
Total Owned, Leased and Consolidated Joint Venture Hotels
Costs and Expenses ................................................................. $ 134 $ 110 (21.8)
(a) Same-Store Owned Hotel Results exclude two hotels sold and nine hotels without comparable results.
n/m = not meaningful
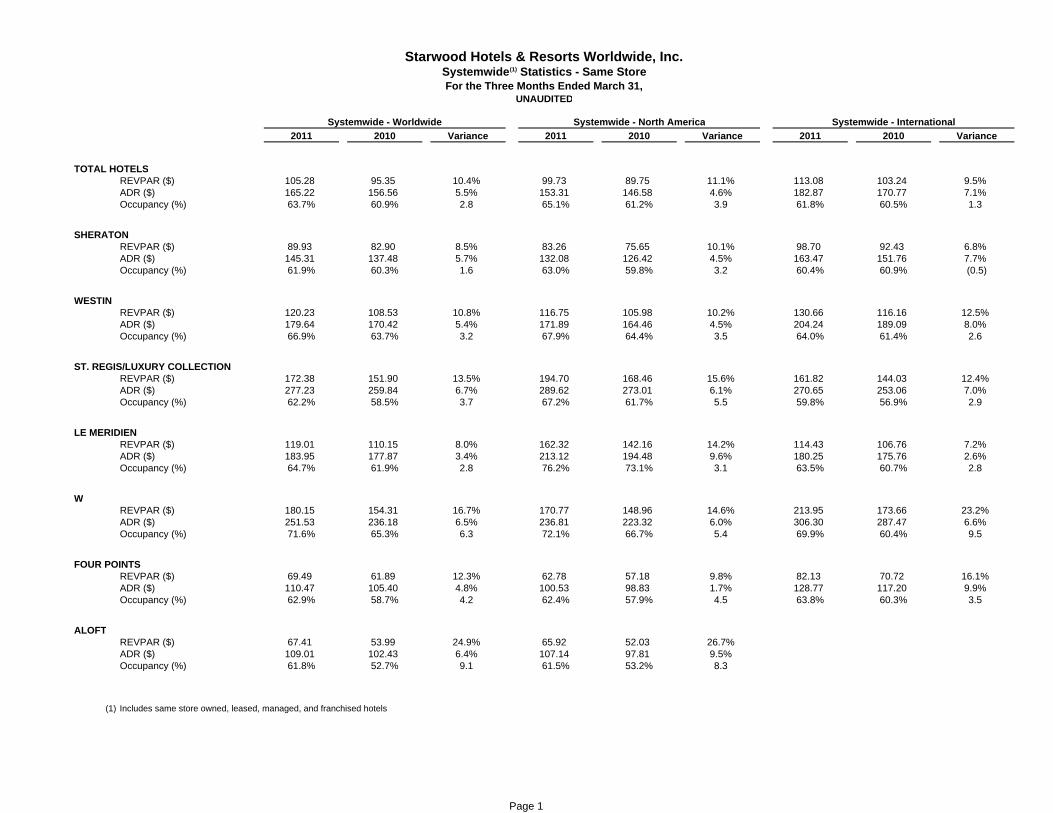
2011 2010 Variance 2011 2010 Variance 2011 2010 Variance
TOTAL HOTELSREVPAR ($) 105.28 95.35 10.4% 99.73 89.75 11.1% 113.08 103.24 9.5%ADR ($) 165.22 156.56 5.5% 153.31 146.58 4.6% 182.87 170.77 7.1%Occupancy (%) 63.7% 60.9% 2.8 65.1% 61.2% 3.9 61.8% 60.5% 1.3
SHERATONREVPAR ($) 89.93 82.90 8.5% 83.26 75.65 10.1% 98.70 92.43 6.8%ADR ($) 145.31 137.48 5.7% 132.08 126.42 4.5% 163.47 151.76 7.7%Occupancy (%) 61.9% 60.3% 1.6 63.0% 59.8% 3.2 60.4% 60.9% (0.5)
WESTINREVPAR ($) 120.23 108.53 10.8% 116.75 105.98 10.2% 130.66 116.16 12.5%ADR ($) 179.64 170.42 5.4% 171.89 164.46 4.5% 204.24 189.09 8.0%Occupancy (%) 66.9% 63.7% 3.2 67.9% 64.4% 3.5 64.0% 61.4% 2.6
ST. REGIS/LUXURY COLLECTIONREVPAR ($) 172.38 151.90 13.5% 194.70 168.46 15.6% 161.82 144.03 12.4%ADR ($) 277.23 259.84 6.7% 289.62 273.01 6.1% 270.65 253.06 7.0%Occupancy (%) 62.2% 58.5% 3.7 67.2% 61.7% 5.5 59.8% 56.9% 2.9
LE MERIDIENREVPAR ($) 119.01 110.15 8.0% 162.32 142.16 14.2% 114.43 106.76 7.2%ADR ($) 183.95 177.87 3.4% 213.12 194.48 9.6% 180.25 175.76 2.6%Occupancy (%) 64.7% 61.9% 2.8 76.2% 73.1% 3.1 63.5% 60.7% 2.8
WREVPAR ($) 180.15 154.31 16.7% 170.77 148.96 14.6% 213.95 173.66 23.2%ADR ($) 251.53 236.18 6.5% 236.81 223.32 6.0% 306.30 287.47 6.6%Occupancy (%) 71.6% 65.3% 6.3 72.1% 66.7% 5.4 69.9% 60.4% 9.5
FOUR POINTSREVPAR ($) 69.49 61.89 12.3% 62.78 57.18 9.8% 82.13 70.72 16.1%ADR ($) 110.47 105.40 4.8% 100.53 98.83 1.7% 128.77 117.20 9.9%Occupancy (%) 62.9% 58.7% 4.2 62.4% 57.9% 4.5 63.8% 60.3% 3.5
ALOFTREVPAR ($) 67.41 53.99 24.9% 65.92 52.03 26.7%ADR ($) 109.01 102.43 6.4% 107.14 97.81 9.5%Occupancy (%) 61.8% 52.7% 9.1 61.5% 53.2% 8.3
(1) Includes same store owned, leased, managed, and franchised hotels
Starwood Hotels & Resorts Worldwide, Inc.Systemwide(1) Statistics - Same StoreFor the Three Months Ended March 31,
UNAUDITED
Systemwide - Worldwide Systemwide - North America Systemwide - International
Page 1

2011 2010 Variance 2011 2010 Variance
TOTAL WORLDWIDEREVPAR ($) 105.28 95.35 10.4% 119.69 108.19 10.6%ADR ($) 165.22 156.56 5.5% 184.08 173.95 5.8%Occupancy (%) 63.7% 60.9% 2.8 65.0% 62.2% 2.8
NORTH AMERICAREVPAR ($) 99.73 89.75 11.1% 123.11 110.09 11.8%ADR ($) 153.31 146.58 4.6% 180.36 171.61 5.1%Occupancy (%) 65.1% 61.2% 3.9 68.3% 64.2% 4.1
EUROPEREVPAR ($) 113.44 106.02 7.0% 125.04 117.77 6.2%ADR ($) 199.04 190.97 4.2% 212.91 207.63 2.5%Occupancy (%) 57.0% 55.5% 1.5 58.7% 56.7% 2.0
AFRICA & MIDDLE EASTREVPAR ($) 127.95 133.62 (4.2%) 128.84 134.69 (4.3%)ADR ($) 199.77 190.09 5.1% 202.10 191.94 5.3%Occupancy (%) 64.0% 70.3% (6.3) 63.8% 70.2% (6.4)
ASIA PACIFICREVPAR ($) 111.23 94.53 17.7% 109.75 91.33 20.2%ADR ($) 173.09 155.49 11.3% 172.63 154.11 12.0%Occupancy (%) 64.3% 60.8% 3.5 63.6% 59.3% 4.3
LATIN AMERICAREVPAR ($) 95.75 82.05 16.7% 101.08 85.43 18.3%ADR ($) 154.16 143.40 7.5% 161.89 154.57 4.7%Occupancy (%) 62.1% 57.2% 4.9 62.4% 55.3% 7.1
(1) Includes same store owned, leased, managed, and franchised hotels(2) Includes same store owned, leased, and managed hotels
Starwood Hotels & Resorts Worldwide, Inc.Worldwide Hotel Results - Same Store
For the Three Months Ended March 31,UNAUDITED
Systemwide (1) Company Operated (2)
Page 2

2011 2010 Variance 2011 2010 Variance 2011 2010 Variance
TOTAL HOTELSREVPAR ($) 132.37 119.37 10.9% 134.14 123.81 8.3% 129.82 112.98 14.9%ADR ($) 197.33 191.11 3.3% 192.81 186.55 3.4% 204.46 198.77 2.9%Occupancy (%) 67.1% 62.5% 4.6 69.6% 66.4% 3.2 63.5% 56.8% 6.7
Total Revenue 351,275 326,078 7.7% 210,074 198,986 5.6% 141,201 127,092 11.1%Total Expenses 305,803 287,229 (6.5%) 186,150 179,470 (3.7%) 119,653 107,759 (11.0%)
BRANDED HOTELSREVPAR ($) 140.61 125.68 11.9% 150.49 137.28 9.6% 129.82 112.98 14.9%ADR ($) 203.70 195.49 4.2% 203.10 193.10 5.2% 204.46 198.77 2.9%Occupancy (%) 69.0% 64.3% 4.7 74.1% 71.1% 3.0 63.5% 56.8% 6.7
Total Revenue 320,535 295,526 8.5% 179,333 168,434 6.5% 141,201 127,092 11.1%Total Expenses 271,765 253,151 (7.4%) 152,112 145,392 (4.6%) 119,653 107,759 (11.0%)
(1) Hotel Results exclude 2 hotels sold and 9 hotels without comparable results during 2011 & 2010
*
Starwood Hotels & Resorts Worldwide, Inc.Owned Hotel Results - Same Store (1)
For the Three Months Ended March 31,UNAUDITED
WORLDWIDE NORTH AMERICA INTERNATIONAL
Revenues & Expenses above are represented in '000's
54 Hotels 27 Hotels 27 Hotels
47 Hotels 20 Hotels 27 Hotels
Page 3

2011 2010 $ Variance % Variance
Management Fees:Base Fees 67 60 7 11.7%Incentive Fees 30 27 3 11.1%
Total Management Fees 97 87 10 11.5%
Franchise Fees 43 35 8 22.9%
Total Management & Franchise Fees 140 122 18 14.8%
Other Management & Franchise Revenues (1) 32 29 3 10.3%
Total Management & Franchise Revenues 172 151 21 13.9%
Other 5 2 3 n/m
Management Fees, Franchise Fees & Other Income 177 153 24 15.7%
n/m = not meaningful
STARWOOD HOTELS & RESORTS WORLDWIDE, INC.Management Fees, Franchise Fees and Other Income
For the Three Months Ended March 31,UNAUDITED ($ millions)
Worldwide
(1) Other Management and Franchise Revenues includes the amortization of deferred gains of approximately $21 million in 2011 and $20 million in 2010 resulting from the sales of hotels subject to long-term management contracts and termination fees.
Page 4

STARWOOD HOTELS & RESORTS WORLDWIDE, INC.Vacation Ownership & Residential Revenues and Expenses
For the Three Months Ended March 31, UNAUDITED ($ millions)
2011 2010 $ Variance % Variance
Originated Sales Revenues (1) -- Vacation Ownership Sales 82 77 5 6.5%Other Sales and Services Revenues (2) 66 62 4 6.5%Deferred Revenues -- Percentage of Completion - - - 0.0%Deferred Revenues -- Other (3) (1) (8) 7 87.5%Vacation Ownership Sales and Services Revenues 147 131 16 12.2%Residential Sales and Services Revenues 6 2 4 n/mTotal Vacation Ownership & Residential Sales and Services Revenues 153 133 20 15.0%
Originated Sales Expenses (4) -- Vacation Ownership Sales 58 49 (9) (18.4%)Other Expenses (5) 48 45 (3) (6.7%)Deferred Expenses -- Percentage of Completion - - - 0.0%Deferred Expenses -- Other 3 6 3 50.0%Vacation Ownership Expenses 109 100 (9) (9 0%)
Page 5
Vacation Ownership Expenses 109 100 (9) (9.0%)Residential Expenses 2 1 (1) (100.0%)Total Vacation Ownership & Residential Expenses 111 101 (10) (9.9%)
(1) Timeshare sales revenue originated at each sales location before deferrals of revenue for U.S. GAAP reporting purposes(2) Includes resort income, interest income, gain on sale of notes receivable, and miscellaneous other revenues(3) Includes deferral of revenue for contracts still in rescission period, contracts that do not yet meet the requirements of ASC 978-605-25 and provision for loan loss(4) Timeshare cost of sales and sales & marketing expenses before deferrals of sales expenses for U.S. GAAP reporting purposes(5) Includes resort, general and administrative, and other miscellaneous expenses
Note: Deferred revenue is calculated based on the Percentage of Completion ("POC") of the project. Deferred expenses, also based on POC, include product costs and direct sales and marketing costs only. Indirect sales and marketing costs are not deferred per ASC 978-720-25 and ASC 978-340-25.
n/m = not meaningful
Page 5

Properties without comparable results in 2011 and 2010: Revenues and Expenses Associated with Assets Sold in 2011 and 2010: (1)
Property LocationSheraton Steamboat Resort Steamboat Springs, CO Q1 Q2 Q3 Q4 Full YearWestin Peachtree Plaza Atlanta, GA Hotels Sold in 2010:W New Orleans - French Quarter New Orleans, LA 2010The Westin St. John Resort St. John, Virgin Islands Revenues 8$ 3$ 7$ -$ 18$ St. Regis Osaka Osaka, Japan Expenses (excluding depreciation) 6$ 4$ 5$ -$ 15$ W London Leicester Square London, EnglandGrand Hotel, Florence Florence, Italy Hotels Sold in 2011:Sheraton Kauai Koloa, HI 2011The Westin Gaslamp Quarter San Diego, CA Revenues -$ -$ -$ -$ -$
Expenses (excluding depreciation) -$ -$ -$ -$ -$ Properties sold in 2011 and 2010: 2010Property Location Revenues -$ -$ -$ -$ -$ W New York - The Court & Tuscany New York, NY Expenses (excluding depreciation) -$ -$ -$ -$ -$ St. Regis Aspen Aspen, CO
(1) Results consist of 1 hotel sold in 2010. These amounts are included in the revenues and expenses from owned, leased and consolidated joint venture hotels in 2010. These amounts do not include revenues and expenses from the W New York - The Court & Tuscany, which were reclassified to discontinued operations.
STARWOOD HOTELS & RESORTS WORLDWIDE, INC.Hotels Without Comparable Results & Other Selected Items
As of March 31, 2011UNAUDITED ($ millions)
Page 6

Maintenance Capital Expenditures: (1)
Owned, Leased and Consolidated Joint Venture Hotels 22Corporate/IT 18
Subtotal 40
Vacation Ownership Capital Expenditures: (2)
Net capital expenditures for inventory (excluding St.Regis Bal Harbour) (16) Net capital expenditures for inventory - St.Regis Bal Harbour 32
Subtotal 16
Development Capital 33
Total Capital Expenditures 89
STARWOOD HOTELS & RESORTS WORLDWIDE, INC.Capital Expenditures
For the Three Months Ended March 31, 2011UNAUDITED ($ millions)
(1) Maintenance capital expenditures include improvements, renewals and extraordinary repairs that extend the useful life of the asset.
(2) Represents gross inventory capital expenditures of $37 in the three months ended March 31, 2011, less cost of sales of $21 in the three months ended March 31, 2011.
Page 7

Hotels Rooms Hotels Rooms Hotels Rooms Hotels Rooms Hotels RoomsOwnedSheraton 6 3,528 4 705 5 2,713 2 821 17 7,767 Westin 5 2,849 3 650 3 902 1 273 12 4,674 Four Points 2 327 - - - - - - 2 327 W 7 2,427 2 665 - - - - 9 3,092 Luxury Collection 1 643 7 828 1 180 - - 9 1,651 St. Regis 2 489 1 161 - - 1 160 4 810 Aloft 2 272 - - - - - - 2 272 Element 1 123 - - - - - - 1 123 Other 7 2,594 - - - - - - 7 2,594 Total Owned 33 13,252 17 3,009 9 3,795 4 1,254 63 21,310
Managed & UJVSheraton 39 26,743 62 18,875 15 2,942 59 21,335 175 69,895 Westin 54 28,259 12 3,569 1 259 26 8,860 93 40,947 Four Points 1 171 10 1,971 4 517 13 4,274 28 6,933 W 22 6,537 2 577 2 433 6 1,438 32 8,985 Luxury Collection 4 1,648 20 3,924 7 290 5 1,464 36 7,326 St. Regis 9 1,811 1 93 2 309 5 1,171 17 3,384 Le Meridien 4 607 53 13,604 - - 24 6,846 81 21,057 Aloft - - 2 555 - - 2 431 4 986 Other 1 773 1 - - - - - 2 773 Total Managed & UJV 134 66,549 163 43,168 31 4,750 140 45,819 468 160,286
FranchisedSheraton 151 45,243 29 6,814 8 2,040 15 6,421 203 60,518 Westin 58 18,628 6 2,657 2 396 8 2,231 74 23,912 Four Points 103 16,355 11 1,542 8 1,276 7 1,227 129 20,400 Luxury Collection 7 1,553 15 2,029 2 248 8 2,260 32 6,090 St. Regis - - 1 133 - - - - 1 133 Le Meridien 7 2,007 5 1,455 2 324 3 714 17 4,500 Aloft 40 5,644 - - - - 2 301 42 5,945 Element 8 1,309 - - - - - - 8 1,309 Total Franchised 374 90,739 67 14,630 22 4,284 43 13,154 506 122,807
SystemwideSheraton 196 75,514 95 26,394 28 7,695 76 28,577 395 138,180 Westin 117 49,736 21 6,876 6 1,557 35 11,364 179 69,533 Four Points 106 16,853 21 3,513 12 1,793 20 5,501 159 27,660 W 29 8,964 4 1,242 2 433 6 1,438 41 12,077 Luxury Collection 12 3,844 42 6,781 10 718 13 3,724 77 15,067 St. Regis 11 2,300 3 387 2 309 6 1,331 22 4,327 Le Meridien 11 2,614 58 15,059 2 324 27 7,560 98 25,557 Aloft 42 5,916 2 555 - - 4 732 48 7,203 Element 9 1,432 - - - - - - 9 1,432 Other 8 3,367 1 - - - - - 9 3,367 Vacation Ownership 13 6,618 - - 1 382 - - 14 7,000 Total Systemwide 554 177,158 247 60,807 63 13,211 187 60,227 1,051 311,403
*Includes Vacation Ownership properties
Starwood Hotels & Resorts Worldwide, Inc. 2011 Divisional Hotel Inventory Summary by Ownership by Brand*
As of March 31, 2011
NAD EAME LAD ASIA Total
Page 8

# ResortsIn In Active Pre-sales/ Future Total at
Brand Total (2) Operations Sales Completed (3) Development (4) Capacity (5),(6) Buildout
Sheraton 7 7 6 3,079 - 712 3,791 Westin 9 9 9 1,463 99 43 1,605 St. Regis 2 2 - 63 - - 63 The Luxury Collection 1 1 - 6 - - 6 Unbranded 3 3 1 124 - 1 125 Total SVO, Inc. 22 22 16 4,735 99 756 5,590
Unconsolidated Joint Ventures (UJV's) 1 1 1 198 - - 198 Total including UJV's 23 23 17 4,933 99 756 5,788
Total Intervals Including UJV's (7) 256,516 5,148 39,312 300,976
(1) Lockoff units are considered as one unit for this analysis.(2) Includes resorts in operation, active sales or future development. (3) Completed units include those units that have a certificate of occupancy.(4) Units in Pre-sales/Development are in various stages of development (including the permitting stage), most of which are currently being offered for sale to customers.(5) Based on owned land and average density in existing marketplaces(6) Future units indicated above include planned timeshare units on land owned by the Company or applicable UJV that have received all major governmental land use approvals for the development of timeshare. There can be no assurance that such units will in fact be developed and, if developed, the time period of such development (which may be more than several years in the future). Some of the projects may require additional third-party approvals or permits for development and build out and may also be subject to legal challenges as well as a commitment of capital by the Company. The actual number of units to be constructed may be significantly lower than the number of future units indicated.(7) Assumes 52 intervals per unit.
STARWOOD HOTELS & RESORTS WORLDWIDE, INC.Vacation Ownership Inventory Pipeline
As of March 31, 2011UNAUDITED
# of Units (1)
Page 9