2011 p&sp annual report - grain inspection, packers ... · pdf file2011 packers and...
TRANSCRIPT
2011 P&SP Annual Report
Packers & Stockyards Program
United States Department of Agriculture Grain Inspection, Packers and Stockyards Administration
Our Mission: “To protect fair trade practices, financial integrity, and competitive markets for livestock, meat, and poultry.”
March 2012


2011 Packers and Stockyards Annual Report
i
EXECUTIVE SUMMARY
Overview—The Packers and Stockyards Program (P&SP) operates under the authority of the Packers and Stockyards Act (P&S Act). P&SP is administered by a Deputy Administrator, who reports to the Administrator of the Grain Inspection, Packers and Stockyards Administration (GIPSA) of the U.S. Department of Agriculture (USDA). The Deputy Administrator provides leadership to five program directors—two in the Washington, D.C., headquarters and three in regional offices located in Atlanta, Georgia; Aurora, Colorado; and Des Moines, Iowa.
Each regional office director manages a Business Practices Unit, a Financial Unit, and two Resident Agent Units, which enforce the P&S Act through regulatory actions and investigations. The director also oversees the administrative Program Support Unit, and the Western Regional Office director oversees the Central Reporting Unit, which processes industry entities’ annual reports filed with P&SP.
Unit Level Activities—To ensure compliance with the P&S Act, P&SP agents conduct two broad types of activities: investigative and regulatory. Investigations are carried out when a violation of the Act appears to be occurring. Regulatory activities are monitoring activities to determine if a regulated entity is complying with the P&S Act and result in correction of identified deficiencies.
Program Management—P&SP measures its overall performance by annually measuring the regulated entities’ compliance with the P&S Act. The performance measure encompasses activities P&SP conducts that directly or indirectly influence industry compliance. In 2011, P&SP maintained industry compliance at 76 percent. P&SP measures its efficiency at achieving industry compliance by the number of days it takes to complete the investigative phase (the time from complaint until a decision is made whether to refer the case to the Office of General Counsel (OGC) or the Department of Justice (DOJ) for possible enforcement action) of investigations. The time increased from 98 days in 2010 to 104 days for investigations closed in 2011, including investigative time spent on cases eventually referred to USDA’s OGC and DOJ.
Industry Assessment—P&SP completed the annual assessment of the industries regulated under the P&S Act, which is based on data from the annual reports filed by regulated firms covering the firms’ 2010 fiscal year.


2011 Packers and Stockyards Annual Report
1
CONTENTS
EXECUTIVE SUMMARY i CONTENTS 1 1. OVERVIEW OF THE PACKERS AND STOCKYARDS PROGRAM 2
1.1 Authorities and Responsibilities 2 1.2 Packers and Stockyards Program’s Business Organization 3
2. PACKERS AND STOCKYARDS PROGRAM UNIT-LEVEL ACTIVITIES 7 2.1 Enforcing Business Practice Provisions 9 2.1.1 Competition ............................................................................................... …………..9 2.1.2 Trade Practices ....................................................................................................... 12 2.2 Enforcing Financial Provisions 13
3. PACKERS AND STOCKYARDS PROGRAM MANAGEMENT 18 3.1 Performance and Efficiency Measurement 18 3.1.2 Performance ............................................................................................................ 18 3.1.3 Efficiency ................................................................................................................. 20 3.2 Management Initiatives 24 3.2.1 Custodial Account Special Report .......................................................................... 24 3.2.2 Scale Test Standard Operating Procedures ............................................................ 24 3.2.3 P&SP’s Change Control Working Group (CCWG) ............................................... 25
4. ASSESSMENT OF THE INDUSTRIES 26 4.1 General Economic State of the Industry 28 4.1.1 Cattle—General Economic State of the Industry .................................................... 32 4.1.2 Hogs—General Economic State of the Industry ..................................................... 34 4.1.3 Sheep—General Economic State of the Industry .................................................... 36 4.1.4 Poultry—General Economic State of the Industry .................................................. 38 4.2 Changing Business Practices. 39 4.2.1 Cattle—Changing Business Practices .................................................................... 40 4.2.2 Hogs—Changing Business Practices ...................................................................... 45 4.2.3 Sheep—Changing Business Practices ..................................................................... 48 4.2.4 Poultry—Changing Business Practices .................................................................. 51 4.3 Industry Concerns 53
5. STATUTORY TEXT COMMISSIONING REPORT 55

2
1. OVERVIEW OF THE PACKERS AND STOCKYARDS PROGRAM
This section provides a brief overview of the Packers and Stockyards Program’s (P&SP) authority and responsibilities under the Packers and Stockyards Act of 1921 (P&S Act), P&SP’s position within the organizational structure of the USDA, and P&SP’s own internal organization.
1.1 Authorities and Responsibilities
Under the P&S Act, the Secretary of Agriculture (Secretary) has authority over businesses engaged in the marketing of livestock, wholesale meat, and poultry. The Secretary has delegated this authority to the Packers and Stockyards Program for regulation and enforcement. Regulated business entities include livestock market agencies (which include auction markets), livestock dealers, stockyards, packers, swine contractors, and live poultry dealers (this includes most poultry slaughterers or “poultry integrators”). These businesses assemble and process livestock and poultry, and move their products through the first manufacturing, or meatpacking, phases of the livestock and poultry marketing channel. Livestock producers, feedlots, and poultry growers at the originating or upstream ends of the market channels and most retailers at the opposite downstream end of the market channel are not under P&SP’s jurisdiction.
The P&S Act prohibits unfair, unjustly discriminatory, and deceptive practices. It also prohibits regulated businesses from engaging in specific anti-competitive practices.
In addition to describing unlawful behavior, the P&S Act mandates certain business practices by regulated industries. For example, market agencies and dealers must be registered; market agencies, packers (except those whose average annual livestock purchases do not exceed $500,000), and dealers must be bonded to protect livestock sellers; and buyers must make prompt payment for livestock. To protect unpaid cash sellers of livestock, packers are also subject to trust provisions that require that livestock inventories and receivables or proceeds from meat, meat food products, or livestock products be held in trust for unpaid cash sellers until payment is made in full. A similar provision applies to live poultry dealers.
P&SP uses its statutory authority to investigate alleged violations of the P&S Act and regulations, and prosecutes violations identified through those investigations in administrative actions prosecuted by USDA’s Office of the General Counsel or through referrals to the Department of Justice (DOJ).
Under the Food Security Act of 1985, States may establish central filing systems to pre-notify buyers, commission merchants, and selling agents about security interests against farm products. P&SP administers the section of the statute commonly referred to as the “Clear Title” provision by certifying the filing systems of States that apply to P&SP for certification. P&SP does not have authority to de-certify States unless a State requests such decertification, and it does not have the authority to determine if States are maintaining certification standards.

2011 Packers and Stockyards Annual Report
3
1.2 Packers and Stockyards Program’s Business Organization
The Packers and Stockyards Program is administered by a Deputy Administrator, who reports to the Administrator of the Grain Inspection, Packers and Stockyards Administration (GIPSA). In addition to the P&SP, the GIPSA Administrator oversees the Federal Grain Inspection Service (FGIS). Within the USDA, the GIPSA Administrator reports to the Under Secretary for Marketing and Regulatory Programs (Figure 1). P&SP’s appropriated budget for 2011 was $22.4 million compared to $23.7 million in 2010.
Figure 1. GIPSA Administration Organizational Structure
The Deputy Administrator of the P&SP provides strategic leadership to five program directors— two at headquarters in Washington D.C., and three in regional offices: the Eastern Regional Office in Atlanta, Georgia; the Western Regional Office in Aurora, Colorado; and the Midwestern Regional Office in Des Moines, Iowa (Figure 2). As of October 2011, P&SP had 162 full-time staff.
Each regional director manages an administrative Program Support Unit and four program units: a Business Practices Unit, a Financial Unit, and two Resident Agent Units. The units are organized based on responsibilities under the P&S Act and are designed to capitalize on the tactical advantages of placing staff in the field. Each unit is comprised of 5 to 10 staff members. Each unit has a supervisor who reports to the Regional Director. Staff members supervised in the regional offices are responsible for conducting investigations and regulatory activities such as business audits, weighing verifications, and day-to-day industry monitoring. These activities are described in greater detail in the next section.

4
Each regional office maintains expertise in one or more species of livestock or in poultry. The Eastern Regional Office focuses on poultry, the Midwestern Office on hogs, and the Western Regional Office on cattle and sheep. Fifty resident agents, who report to the regional offices, are located throughout the country to provide core services nationwide (Figure 2). The geographically dispersed resident agents enable P&SP to maintain close contact with the entities that it regulates, which are similarly dispersed throughout the United States (Figures 3 through 5).
Figure 2. P&SP Regional Offices and Resident Agent and Auditor Locations

2011 Packers and Stockyards Annual Report
5
Figure 3. Headquarters Location of Livestock Packers Subject to the P&S Act
Figure 4. Location of Livestock Markets and Firms Selling on Commission Subject to the P&S Act

6
Figure 5. Location of Livestock Dealers Subject to the P&S Act
Figure 6. Headquarters Location of Live Poultry Dealers Subject to the P&S Act

2011 Packers and Stockyards Annual Report
7
2. PACKERS AND STOCKYARDS PROGRAM UNIT-LEVEL ACTIVITIES
P&SP conducts two broad types of activities at the unit level to enforce the P&S Act: investigative and regulatory. Investigations are conducted when there is reason to believe a violation of the P&S Act is occurring or has occurred. Regulatory activities are monitoring activities carried out to determine if a regulated entity is complying with the Act. Agency resident agents, staffed with marketing specialists located in the field, are the agency’s frontline staff who work daily with regulated entities as well as livestock producers and poultry growers. They are typically the first responders for complaints and because of their daily contact with the industry a source of primary market intelligence.
Besides conducting routine regulatory activities, because of their situational awareness the resident agents often are the initiators of more complex investigations and regulatory activities. Support to the resident agents is provided by the regional offices’ Business Practices or Financial units. The Business Practices units include legal specialists, economists, and marketing specialists who focus on competition and trade practice issues. The Financial units are staffed with auditors who investigate and undertake regulatory activities related to enforcing the financial requirements of the Act. Investigations at a firm level may be a follow-up to previously identified violations of the P&S Act. In other instances, investigations may be initiated in response to complaints from industry participants, possible violations found while conducting regulatory activities on a business’s premises, or possible violations found through other monitoring. Investigations may be conducted as rapid response actions to prevent irreparable harm to the regulated industries.
Members of the livestock and poultry industries and the public may report complaints at 1-800-998-3447 or by e-mail at [email protected]. Individuals or firms with complaints about the livestock and poultry industries also are encouraged to call the appropriate regional office to discuss their concerns, anonymously if desired. P&SP responds to all of these external contacts. P&SP also initiates investigations independently, for example, as a result of information obtained from monitoring industry behavior.
Regulatory activities include, but are not limited to, check-weighing; custodial account and prompt payment audits; procurement and marketing business practice reviews; registering market agencies, dealers, and packer buyers who operate subject to the P&S Act; assisting producers in filing bond and trust claims; analyzing trust and bond claims; and conducting orientations for new markets and new packers.
Regulatory activities also include market-level monitoring, which is generally conducted using data that are available in the public domain. Examples include, but are not limited to, monitoring fed cattle and hog prices and analyzing structural changes in the livestock, meat, and poultry industries. Monitoring activities have led to firm-level investigations. Regulatory activity may occur entirely or partially at an entity’s place of business or at a Regional Office.

8
P&SP regulatory and investigative activities are categorized as generally addressing areas of competition, trade practice, or financial concerns. Program expenditures on investigations activities were greatest within the trade practice area of enforcement in 2011, whereas expenditures within the financial area were the largest part of expenditures on regulatory activities (Table 1).
Table 1. Total Regulatory and Investigation Expenditures, 2002-2011
Fiscal Year
Regulatory ($000) Investigation ($000)
Competition Trade
Practice Financial Competition Trade
Practice Financial 2002 N/A N/A N/A 3,575 4,290 5,5412003 N/A N/A N/A 3,755 4,506 5,8202004 N/A N/A N/A 3,905 4,686 6,0532005 N/A N/A N/A 4,050 4,860 6,2772006 N/A 6,705 N/A 1,775 2,640 3,8692007 N/A 7,142 N/A 1,488 4,259 3,4192008 N/A 3,664 N/A 330 6,220 6,2382009 205 2,047 3,281 245 3,330 9,2442010 81 1,342 4,463 388 4,928 8,6212011 183 924 2,141 414 8,909 6,464Table notes: “N/A” indicates data not available. Prior to fiscal year 2006, regulatory activities and investigations were not differentiated; from 2006-2008, competition, trade practice, and financial regulatory activities were not differentiated.
P&SP’s regulatory and investigative actions frequently find that entities are in compliance with the P&S Act. When violations are discovered, P&SP levies agency-established fines (stipulations) for admitted violations or pursues litigation through USDA’s Office of the General Counsel (OGC) before a USDA Administrative Law Judge or through the Department of Justice (DOJ). Litigation may result in a fine against the offending entity, or in suspension of the entity’s P&S registration. Not all cases result in monetary penalties. In 2011, P&SP levied $364,800 in stipulations and an additional $662,470 in penalties through administrative law judges for a total of $1,027,270, an average of $9,500 per case (Table 2). Penalties obtained through DOJ actions, including penalties assessed by default, averaged about $11,750 for a total of an additional $70,480.
Table 2. Penalties Levied for P&S Act Violations, 2007-2011
Type Judgment 2007 2008 2009 2010 2011 Stipulations ($) 9,750 23,275 30,775 127,787 364,800Administrative Penalties ($) 404,150 657,770 364,700 341,027 662,470DOJ Civil Penalties ($) 36,500 51,240 59,580 346,705 70,480Complaints Issued 50 46 40 50 38Suspensions 0 0 19 6 9

2011 Packers and Stockyards Annual Report
9
2.1 Enforcing Business Practice Provisions
The regional business practices units have responsibility for inspections and investigations of trade practice and competition provisions of the P&S Act. Supported by resident agents, the units conduct investigations of alleged anti-competitive practices and unfair and deceptive trade practices by market agencies, livestock dealers and order buyers, slaughtering packers, live poultry dealers, and meat dealers and brokers.
Economists and legal specialists in the units conduct competition investigations and regulatory activities. For example, an economist might monitor market and firm prices for indications of anti-competitive firm behavior. Marketing specialists conduct trade practice investigations and regulatory actions related to inaccurate weighing practices or carcass evaluation instruments and compliance with contracts. The competition and trade practice work conducted by these units is discussed in more detail below.
2.1.1 Competition
Investigations are a central activity of our competition program. P&SP investigates complaints alleging anti-competitive behavior such as attempted restriction of competition, failure to compete, buyers acting in concert to purchase livestock, apportionment of territory, price discrimination, price manipulation, and predatory pricing. P&SP’s economists, legal specialists, and investigative attorneys collaborate with USDA’s OGC on all competition investigations. When the results of an investigation indicate that the evidence and circumstances support legal action, P&SP formally refers the case file to OGC for action.
P&SP conducts many activities that monitor changes in industry behavior in order to understand the nature of and reasons for changes, and to anticipate potential competitive issues that may result from those changes. Details of specific, ongoing individual monitoring efforts are described in the next three sections.
2.1.1.1 Fed Cattle and Hog Market Price Monitoring
The current fed cattle and hog market price monitoring program was first implemented in 2004, but has since evolved into an enhanced program that includes a weekly internal reporting regime based on statistical models, one for the fed cattle markets and the other for hog markets. The statistical models rely on USDA’s Agricultural Marketing Service (AMS) publicly reported price data to assess regional price differences. If a statistically significant price difference is detected, P&SP initiates a regulatory review work plan to determine whether those price differences are caused by an undue or unreasonable preference or disadvantage in violation of section 202 (b) of the Act or by uncontrollable external factors, such as weather or other external macroeconomic conditions.
If the initial regulatory reviews of price differences do not clarify whether they were caused by external market factors, a field investigation is opened into the incident. The fed cattle price

10
monitoring program initiated 11 regulatory activities in 2011, none of which indicated cause for investigation (Table 3). P&SP continues to actively monitor market prices on a weekly basis and initiate timely regulatory reviews and investigations, if necessary, of observed market price anomalies.
Table 3. Regulatory Activities and Investigations Resulting From Statistical Monitoring of Fed Cattle Market Prices Weekly 2007 – 2011 and Hog Market
Prices Daily 2010 – 2011.
Fiscal Regulatory Activities Initiated Investigations Initiated Year Fed Cattle Hogs Fed Cattle Hogs 2007 13 - 0 - 2008 19 - 4 - 2009 25 - 3 - 2010 16 18 0 9 2011 11 19 0 17
The statistical model similar for daily monitoring of hog market prices includes the three AMS barrow and gilt price reporting areas. These AMS market areas include Iowa-Minnesota, the eastern Corn Belt, and the modified western Corn Belt. AMS includes Iowa and Minnesota in its market reports for the western Corn Belt region, but to ensure non-overlapping markets, P&SP modified the territory to remove the Iowa and Minnesota hog transactions and prices from this region. Live and carcass prices are monitored, except in the modified western Corn Belt market, which only reports carcass prices. 19 daily price outliers were detected by the model for these five market areas prices during fiscal year 2011, 17 of these outliers resulted in investigations being opened.
Whether P&SP is monitoring fed cattle or hog prices, when the statistical model reports an outlier, an economist from the Business and Economic Analysis Division in headquarters reviews the suspect price and makes a recommendation report, which is reviewed by an economist in the regional office. Based on the report and reviewer comments, the supervisor either closes the review or opens an investigation and requests individual firm transactions data from AMS.
2.1.1.2 Committed Procurement Review and Audit
P&SP monitors the use of “committed procurement” arrangements, which commit cattle and hogs to a packer more than 14 days prior to delivery. Each year, P&SP economists obtain fed-cattle and hog procurement data for the previous calendar year from the four largest beef packers and four largest hog packers. If the packers change their procurement arrangements with suppliers from previous years, P&SP also collects any new or modified written marketing agreements or contracts. P&SP economists review the contracts and, if necessary, discuss them with the packers to determine how the terms of the agreements relate to committed procurement categories of interest. Economists then classify, review, and tabulate the individual transactions
2011 Packers and Stockyards Annual Report
11
data and calculate the reliance of the top packers on committed procurement methods. Finally, P&SP economists reconcile the calculations based on the detailed transaction data on committed procurement as reported by the packers in their Packer Annual Reports.
If there are significant differences between the transaction data and the Packer Annual Report submissions on committed procurement, the economists contact the packers to identify the cause of the discrepancy. If necessary, P&SP meets with the packers in person to discuss the packers’ procurement methods and explain how they should be reported on the Packer Annual Report. These meetings foster a mutual understanding of the reporting requirements for committed procurement and more reliable reporting and calculation of the packers’ reliance on committed procurement methods.
Relying on written contracts and other information collected during the committed procurement reviews, P&SP agents analyze the various procurement and pricing methods used by hog and fed-cattle packers. Agents obtain and review contracts and agreements as necessary to determine if there have been any competition violations of the Act. The contracts are also used in procurement reviews of the packers to help determine if proper payment practices are being followed.
2.1.1.3 Poultry Contract Compliance Review Process
In FY 2011 P&SP conducted 49 poultry reviews, 31 of these reviews were based on a random sample. These reviews are based on standard operating procedures established in 2009 and are now included as a component of P&SP’s performance measure (see Performance and Efficiency Measurement section). Poultry contract reviews may be initiated based on industry intelligence or complaints in addition to those conducted based on random samples.
The standard operating procedure for conducting poultry contract reviews is electronically documented with links to Packers and Stockyards Automated System (PAS), the P&SP’s automated workflow software. P&SP agents follow these procedures when conducting poultry contract reviews. In general, the agent will collect relevant background information on the firm that is under review prior to conducting a site visit. Once on-site, the agent will conduct an interview and obtain copies of the grower contract being used at the plant location and 3 months of weekly ranking sheets for the contract. These documents are reviewed for consistency and adherence to P&S Act regulations. One week of payment data from the settlement sheet is selected as a random sample for a detailed review for accuracy and completeness. The results are compared to the firm’s ranking sheets, settlement sheets, and payments to the growers to ensure consistency with the contract. If discrepancies are found, an investigation is opened. If the firm’s practices are determined to be free of violation, the agent provides an exit interview indicating this to the firm’s management.

12
2.1.2 Trade Practices
Firms that furnish stockyard services in commerce are required to post a notice that informs the public that the stockyard meets the definition of a stockyard under the P&S Act. Once posted, the stockyard remains posted until it is de-posted through public notice. P&SP meets with new auction market owners and managers as the market begins operations to ensure that market operators understand their fiduciary responsibilities under the P&S Act.
These visits in the early stages of a market’s operation also provide important protection to livestock producers who rely on the market to provide a nondiscriminatory and competitive marketplace. Similarly, P&SP conducts orientations for hog and poultry growout contractors who operate feed mills to ensure they understand the regulatory requirements for feed weights used to calculate producer/grower payments.
P&SP reviews procurement practices to determine if unfair or deceptive trade activities are occurring in the procurement of livestock, meat, and poultry. The reviews assess pricing methods; payment practices; weighing of livestock, carcasses, and poultry; carcass grades used for payment; and accounting issued to sellers.
The P&S Act and regulations require markets, dealers, and packers to test scales at least semi-annually and file scale-test reports as evidence of scale maintenance. State or local government entities and private companies test scales. In addition, P&SP conducts several types of regulatory and investigative inspections to ensure scale operators and firms subject to the P&S Act are properly using their scales and properly recording weights in the purchase and sale of livestock and poultry (Table 4).
Table 4. Weighing Inspections and Violations, 2009-2011
Type 2009 2010 2011 Inspections Market 245 215 223 Dealer 41 61 132 Packer 18 5 35 Carcass 148 242 104 Poultry 74 74 70 Feed 63 74 62
Total 589 671 626 Violations Markets 15 23 33 Dealers 3 6 23 Packers 1 2 15 Carcass 25 30 17 Poultry 11 7 7 Feed 14 9 9
Total 69 77 104
2011 Packers and Stockyards Annual Report
13
These inspections include check weighing plus all other activities conducted by P&SP to ensure accurate weights of livestock, poultry, and poultry feed. Market, dealer, and packer inspections are conducted for scales weighing live animals. Carcass and poultry inspections are conducted on scales that weigh carcasses in slaughter plants, and feed inspections are conducted on scales at feed mills.
A transaction made on false or inaccurate weights, including instances in which a dealer modifies the actual weight of the livestock or fails to pass on a shrink allowance, is an unfair and deceptive practice. Anyone who believes that an action of a stockyard, market agency, or dealer caused personal loss or damage in violation of the P&S Act may file a complaint seeking reparation (damages) with P&SP within 90 days of learning of the action that caused damages. The Act does not provide for reparation complaints to be filed against packers, live poultry dealers, or swine contractors.
2.2 Enforcing Financial Provisions
P&SP’s financial units enforce the financial provisions of the P&S Act and regulations. These enforcement actions support the financial integrity and stability of the livestock, poultry, and meatpacking industries. Enforcement is carried out through reviews of annual and special reports, and onsite financial compliance reviews and investigations. Financial compliance reviews and investigations address solvency issues, payment to livestock sellers and poultry growers, bond claims, trust claims, and maintenance of custodial accounts. When P&SP identifies a potentially serious financial situation that may cause imminent and irreparable harm to livestock producers, rapid response teams are deployed immediately to conduct an investigation.
Under the P&S Act, most regulated entities must be solvent (current assets must exceed current liabilities). P&SP monitors the solvency of regulated entities by reviewing financial data in annual and special reports, and by onsite financial compliance reviews and investigations. P&SP notifies entities of their insolvencies and the immediate need to correct them. P&SP requires special reports from firms whose annual reports disclose insolvencies. In addition, P&SP conducts onsite financial investigations to ensure correction of reported insolvencies or other financial issues. Formal disciplinary action is initiated against firms when appropriate.
Market agencies selling livestock on commission (auction markets) must establish and maintain a bank account designated as a “custodial account for shipper’s proceeds” to hold proceeds from the sale of consigned livestock. The commission firm or auction market acts as a fiduciary depositor to the account, and the funds in the account are trust funds held for the benefit of livestock sellers. P&SP monitors custodial accounts by reviewing annual reports from market agencies, analyzing special custodial account reports, and conducting onsite custodial account audits. When the monitoring reveals shortages in the account, P&SP acts to have the account balance corrected (Table 5).

14
Table 5. Number of Market Reviews and Shortages Corrected Through On-Site Investigations, Fiscal Years 2002-2011
Year Reviews Under Funded
Accounts Corrections ($)
2002 206 97 2,814,439
2003 262 92 2,055,203
2004 272 94 2,144,986
2005 252 102 5,269,525
2006 347 140 7,256,052
2007 296 99 2,037,080
2008 176 62 5,022,966
2009 383 181 2,581,725
2010 297 79 3,402,608
2011 318 96 2,861,471
The P&S Act also establishes a statutory trust on certain assets of packers and live poultry dealers for the benefit of unpaid cash sellers of livestock and unpaid cash sellers or contract growers of live poultry grown for slaughter. Packer trust assets include all livestock purchased in cash sales, inventories, receivables, and proceeds from meat, meat food products, and livestock products derived from the purchase of livestock in cash sales. Poultry trust assets include all poultry obtained by live poultry dealers in cash poultry purchases or by poultry growing arrangements, inventories, receivables, or proceeds from such poultry or poultry products. Valid trust claims come before secured creditor claims in bankruptcy.
To be eligible for payment under the trust, a seller must file a claim with the packer or live poultry dealer and the Secretary within 30 days of the unpaid transaction. When a trust claim is filed, P&SP and OGC analyze the claim to assess whether it is timely and supported by adequate documentation. P&SP then makes the analysis available to the packer or live poultry dealer (the statutory trustee) and to trust claimants so that they can take any necessary action.
Additionally, all market agencies, dealers, and slaughtering packers purchasing over $500,000 of livestock annually are required to file and maintain bonds or bond equivalents for the protection of livestock sellers. To be eligible to receive payment under the bond, a seller (cash or credit) who does not receive payment for a transaction must file a bond claim within 60 days of the transaction. P&SP analyzes the claim to ensure it was filed within the timeline and supported by adequate documentation. P&SP provides its analysis to the principal and to the bond surety or trustee on a bond equivalent. In some instances the analysis is made available to all claimants to

2011 Packers and Stockyards Annual Report
15
facilitate joint legal action. In some cases, claims may be made against and paid by both bond and trust assets.
Bonding requirements usually do not cover the entire loss sustained when a firm fails financially. Further, livestock sellers do not always determine the current bond status of smaller packers, dealers, and market agencies before selling livestock to them, making those sellers vulnerable to insufficient bond protection if the smaller firms fail. A large packer’s failure may impact auction markets and dealers from whom it purchased livestock and failed to pay.
Since 2002, an average of 13 dealers failed each year, with a range of 1 to 31 failures per year. During that same time period, producers received an average 19 percent payment of amounts owed to them, with recovery ranging from 0 to 56 percent (Table 6).
Table 6. Total Dealer Financial Failures and Restitution, 2002-2011
Open Closed Restitution on Closed Cases
Year No. Owed ($) No. Owed ($) Bonds ($) Other ($) Return (%)
2002 NA NA 11 3,271,962 618,764 60,000 21
2003 NA NA 5 1,805,600 112,281 28,923 8
2004 NA NA 3 770,860 95,000 0 12
2005 NA NA 1 2,993,990 0 0 0
2006 NA NA 13 3,018,131 134,936 26,856 5
2007 NA NA 31 6,941,930 257,634 549,303 12
2008 NA NA 20 2,054,647 843,682 301,916 56
2009 NA NA 25 3,134,145 348,018 411,133 24
2010 2 NA 7 213,332 20,000 0 9
2011 6 23,632,101 14 878,620 407,105 4,479 47
Starting in 2010 entries show the number of firms that have claims open at year-end and those cases that have closed at year-end; for past years, only total number of failures is shown. Dollar amounts for all years are for failures with claims closed as of most recent year-end, so historical data may have been updated to reflect any settlements after the year the failure occurred. Although bond claims processing by P&SP is generally complete in the 2011 Eastern Livestock Market failure, it is being classified as open pending final outcome of proceedings in bankruptcy court.
Auction markets may be especially vulnerable to a domino effect from dealer failures since many dealers purchase livestock from auction markets. The failure of a large dealer may impact every auction market that it failed to pay. Since 2002, an average of 6 auction markets failed per year. Consignors received average restitution of 47 percent payment of amounts owed to them, with a range of 22 to 98 percent (Table 7). Starting in 2010 table entries show the number of firms that

16
have claims open at year-end and those cases that have closed at year-end; for past years, only total number of failures is shown. Dollar amounts for all years are for failures with claims closed as of most recent year-end, so historical data may have been updated to reflect any settlements after the year the failure occurred.
Table 7. Total Auction Market Financial Failures and Restitution, 2002-2011
Open Closed Restitution on Closed Cases
Year No. Owed ($) No. Owed ($) Bonds ($) Other ($) Return (%)
2002 NA NA 6 1,082,034 378,610 0 35
2003 NA NA 6 1,187,979 211,464 138,848 29
2004 NA NA 2 145,772 60,000 16,649 53
2005 NA NA 3 336,006 85,000 201,840 85
2006 NA NA 9 979,543 267,174 19,380 29
2007 NA NA 11 511,704 37,252 155,890 38
2008 NA NA 6 602,100 237,734 352,111 98
2009 NA NA 7 981,189 261,498 1,365 27
2010 1 NA 4 20,901 4,547 0 22
2011 0 0 4 158,279 0 89,586 57
To maximize recovery, bond claims filed against packers are normally paid after claims made against the packer trust are dispensed. On average, in any one year, 5 packers will suffer financial failures owing livestock sellers an average of $5,726,261 (Table 8).
Table 8. Total Packer Financial Failures, Bond Payout, and Payout From Other Sources, 2002-2011
Open Closed Restitution on Closed Cases Year No. Owed ($) No. Owed ($) Bonds ($) Other ($) Return (%)
2002 NA NA 3 17,007,170 6,394,489 5,838,750 72 2003 NA NA 3 2,508,633 225,952 1,238,772 58 2004 NA NA 3 2,056,869 142,752 369,507 25 2005 NA NA 1 5,032,018 55,000 1,977,761 40 2006 NA NA 13 755,550 35,267 683,834 95 2007 NA NA 31 4,118,456 40,000 4,083,946 100 2008 NA NA 20 3,498,895 0 1,588,620 45 2009 NA NA 25 15,676,349 196,208 9,999,228 65 2010 5 NA 7 5,960,684 748,435 3,825,518 77 2011 1 80,000 10 647,986 0 62,195 10

2011 Packers and Stockyards Annual Report
17
The bond payout for packers was, on average, $783,810 or 14 percent of the valid bond claims. Additional restitution from packer trust assets and other sources bring the average recovery to 59 percent of total amounts owed, with a standard deviation range of 30 to 89 percent.
As the livestock and meat industries evolve, P&SP continues to examine alternate ways to effectively regulate and monitor the industries and to effectively allocate its resources for planning and conducting regulatory compliance reviews. Most recently, P&SP adopted a statistical model to identify characteristics that place a livestock dealer, market, or packer at risk of financial failure. The characteristics identified are used, along with other firm information and market intelligence, to assess the need for financial audits.

18
3. PACKERS AND STOCKYARDS PROGRAM MANAGEMENT
The P&SP executes its management function through strategic, broad, multi-year goals and shorter term tactical annual objectives and activities. The next section addresses how P&SP improves its performance and efficiency, and the results P&SP is demonstrating.
3.1 Performance and Efficiency Measurement
P&SP measures its overall performance by annually measuring the regulated entities’ compliance with the P&S Act. The performance measure encompasses activities P&SP conducts that directly or indirectly influence industry compliance. P&SP calculates the percent of industry entities in compliance using random samples designed to provide an estimate of compliance with a 90-percent confidence level. In 2011, P&SP maintained industry compliance at 76 percent.
P&SP measures its efficiency at achieving industry compliance by the number of days it takes to complete the investigative phase (the time from complaint until the investigation is closed by P&SP or a decision is made whether to refer the case to OGC or DOJ for possible enforcement action) of investigations. The time increased from 98 days in 2010 to 104 days for investigations closed in 2011. The time to conduct the investigative phase is only one measurement in the complex process of conducting an investigation. Additional information about efficiency measures follows the performance section.
3.1.2 Performance
P&SP’s overall performance rate is a composite index of five program wide audit and inspection activities based on a scientifically-drawn random sample of subject entities. Note that this sampling approach provides estimates of industry-wide compliance among all subject entities, which will generally differ from simple ratios of number of violations found to number of entities investigated or inspected as illustrated in some previous tables in this report.
In 2011 the index included: 1) the financial components of the poultry contract compliance; 2) financial reviews of custodial accounts; 3) financial reviews of prompt payments of a random sample of firms; 4) inspection of scales and weighing practices at markets, dealers, and poultry integrators, and 5) inspection of all carcass evaluation devices and carcass evaluation practices for packing plants purchasing more than 1,000 head per year.
The sampling process is designed to yield 90-percent confidence for the estimated population compliance. The compliance rate declined to 76 percent last year after remaining steady for the last 3 prior reporting years at 80 percent (Figure 7).

2011 Packers and Stockyards Annual Report
19
Figure 7. Aggregated Industry Compliance 2008-2011
Financial reviews are conducted and overseen by P&SP staff auditors and supervisors, many of whom are licensed Certified Public Accountants. The reviews are carried out in accordance with general accounting standards. Business practice inspections of scales and weighing practices are conducted based on standards established by the National Institute of Standards and Technology and supervised by staff trained in inspection procedures.
P&SP validates reviews and inspections through internal compliance reviews, which were designed in conjunction with a private consultant, and adhere to the P&SP Standard Operating Procedures manual published on an internal GIPSA Web page.
While additional focus on activities to achieve industry compliance has been made, general economic conditions within the industry also affect year-to-year compliance. Weak economic conditions may increase the incentive for industry non-compliance in the financial components to a larger degree than in the business practice enforcement areas. The full effect of these external conditions on the compliance rate are not known, and to the degree that this measure only has a 4-year history, understanding the interaction of these variables on the overall compliance rate will be a challenge GIPSA confronts in future years. Additionally, GIPSA is just beginning to be able to use the data to make internal adjustments to ensure resources are effectively deployed to meet changing industry conditions due to external factors such as liquidity concerns.
The results of the individual component inspections and audits that comprise the aggregate index showed a year-to-year decline in compliance rates in 2011 for four of the five areas reviewed. The poultry payment review continues to show improvement, increasing from the initial rate of 60 percent in 2009 and 67 percent in 2010 to 69 percent in 2011. (Figure 8).
80 80 80 7650556065707580859095
100
2008 2009 2010 2011
Percent in Compliance
Year

20
Figure 8. Performance Measure Component Compliance 2008 – 2011.
3.1.3 Efficiency
P&SP measures its efficiency as the time from initiating an investigation to closing it in P&SP, or until the investigation case file is referred to OGC. After referral, P&SP and OGC typically work together to develop adequacy and quality of evidence, determine witness availability, and complete final case preparation. The average days to conduct an investigation and close the case increased in 2011, after decreasing in 2010 (Figure 9).
Figure 9. Average Days to Conduct Investigation from Opening to Closing or Referral to OGC, 2009 – 2011
0
20
40
60
80
100
Prompt Pay Custodial Account
Weighing Practices
Carcass Eval. Accuracy
Poultry Payment
2008 2009 2010 2011
114 98 1040
20
40
60
80
100
120
140
2009 2010 2011
Days

2011 Packers and Stockyards Annual Report
21
The data in Table 9 show total days to completion of investigative activity in regional offices, averaged across investigations completed by P&SP in the regional offices. Data in Table 9 do not include additional time spent on case development and processing for any investigative files forwarded to Headquarters. The total number of both types of actions that P&SP worked on during the year increased about 37 percent, from 5,525 in 2010 to 7,384 in 2011. Field activities are conducted at the location of the regulated business entity. Office activities are conducted in GIPSA offices and are typically filing violations, e.g., failure to submit required documentation. Data do not include time spent at Headquarters.
Table 9. Field and Office Investigations and Regulatory Activities Closed and Activities Open at End of the Fiscal Year, Fiscal Year 2011
Field Activities Office Activities
Type No. Avg. Days
Open No. Avg. Days
Open
Closed during year 715 147 1429 66 Open end of year 26 206 681 136 Regulatory Activities Closed during year 1129 18 1061 20 Open end of year 10 47 103 95
Investigations address a broad range of potential violations under the P&S Act and are grouped into three categories of competition, trade practice, or financial violations.
Competition violations often involve preferential treatment or restriction of competition, such as through apportionment of territory. Examples of trade practice violations include offenses such as unfair or deceptive practices, failure to register properly, tariff misrepresentation, and misuse of scales and improper weighing practices, including at any location where scales are used to weigh feed when feed is a factor affecting payment to livestock producers or poultry growers. Examples of financial violations include misuse of custodial accounts, failure to pay, and failure to pay when due (Table 10).

22
Table 10. Number of Investigations Closed at Regional Level in 2011 by Investigative Category
Investigative Category Number
Competition Restriction of Competition 14 Preferential Treatment 6 Concentration/Industry Structure 1 Financial
Bond Activities 609 Failure to Pay/Pay When Due 194 Custodial Accounts 128 Solvency 121 Annual Report 15 Packer/Poultry Trust 9
Trade Practice Registration/Jurisdiction 645 Weighing Practices and Scales 189 Unfair/Deceptive Practices 121 Contract Poultry Arrangements 44 Inadequate or False Records 17 Grower Termination 15 Procurement or Sales Review 10 Reparations 4 Merchandising 1 Tariff 1
Total 2,144 Table Note: Includes investigations for which regional-level work was completed in 2011and the cases were referred to headquarters, but may have remained open at headquarters at year-end. Thus the total differs from the total in Table 11.
P&SP’s regulatory and investigative actions often find that entities are in compliance with the P&S Act. When non-compliance is identified, P&SP either assesses fines or stipulations for admitted violations or pursues enforcement litigation with OGC. After referral but before filing, OGC works with P&SP to prepare the referred cases for filing and litigation before a USDA Administrative Law Judge or for referral to DOJ.
In fiscal year 2011, P&SP opened 2,780 cases, of which 2,678 were alleged violations for financial or trade practice behaviors. During the fiscal year, P&SP closed 2,053 cases without referring them to OGC (Table 11). An additional 78 cases were closed after referral to OGC, including 16 that OGC referred to DOJ.

2011 Packers and Stockyards Annual Report
23
Table 11. Number of Investigations Opened and Closed by Category and Enforcement Action, with Average Days to Complete Stages for Closed Cases, Fiscal Year 2011
Average Days
Status & Type
In P&SP
Referral to Filing
Filing to Resolution
Start to Resolution
Number
A. Total Investigations Opened Livestock Competition 10 Financial 1,411 Trade Practice 1,219Poultry Competition 2 Financial 16 Trade Practice 122Total Opened 2,780B. Total Investigations Resolved and Closed by P&SP Livestock Competition 238 238 20 Financial 81 81 1,014 Trade Practices 97 97 884Poultry Competition 175 175 3 Financial 153 153 8 Trade Practices 226 226 124Weighted Averages & Sub Total 98 98 2,053C. Total Referred to OGC and Closed Livestock Competition w/o Admin Action 298 492 5 Financial w Enforcement Action 190 882 29 Financial w/o Admin Action 248 254 438 674 11 Trade Practice w/ Enforcement Action 352 960 7 Trade Practice w/o Admin Action 326 276 333 613 7Poultry Trade Practice w/o Admin Action 370 535 3Weighted Averages & Sub Total 252 262 397 775 62D. Total Referred to DOJ and Closed Livestock Financial w/o Civil Action 211 519 1,014 4 Financial w/ Enforcement Action 149 704 1,061 7Poultry Trade Practice w/o Admin Action 379 122 658 5Weighted Averages & Sub Total 236 476 923 16
Overall Weighted Averages and Total 104 262 622 124 2,131
Table Note: Investigations opened during the fiscal year are not necessarily closed by year end. The number of days per stage applies only to cases closed during the fiscal year. Typically some closed cases were opened in prior years. Cases closed by P&SP after referral to OGC without a formal administrative action are indicated by “w/o Admin Action.” The “Referral to Filing” column in section C is the time that the case is in OGC prior to filing. The “Filing to Resolution” is the time from when a complaint is formally filed with the court clerk until a judicial decision. All cases closed after referral to DOJ in FY 2011 were settled without filing a complaint.

24
Investigations resolved by P&SP are closed either through a finding of no violation, a Notice of Violation letter issued to the entity, or a stipulation settlement in which the respondent admits the violation and voluntarily agrees to a penalty. P&SP closed these cases within an average of 98 days.
Another 62 cases were resolved that had been referred to OGC. Cases are referred to OGC when P&SP determines that the investigation requires cooperation with OGC. Frequently in competition and cases involving large financial failures, OGC and P&SP continue to develop evidence with the goal of filing a complaint. The average number of days for cases referred to OGC is calculated based on whether the cases were referred to DOJ for prosecution. Cases not referred to DOJ required an average of 252 days in P&SP; cases referred to DOJ required an average of 236 days in P&SP.
Table 11 represents only cases that were closed in 2011, and includes some cases that were initiated in years prior to 2011. As a result of referrals from P&SP, 36 administrative actions that had been filed by OGC were closed in 2011, and OGC closed an additional 26 cases after determining that evidence did not support formal administrative action. DOJ closed, without formal civil action, 9 cases that OGC had referred to DOJ, and closed 7 cases with formal action.
3.2 Management Initiatives
P&SP’s management team supports achieving higher performance and efficiency through various management initiatives. Central to the management initiatives has been the core recognition that the people in P&SP are its primary resource and strength in achieving its mission. In 2011, there were three special initiatives.
3.2.1 Custodial Account Special Report
P&SP management team selected six employees from the region to establish a standard operating procedure for handling custodial account special report requests. The team included some auditors, program support staff, and a Financial Unit supervisor. The team met by teleconferences over a couple of weeks and developed general instructions to follow when the agency requests these special reports from the industry. The standard operating procedures were reviewed and approved by the management team. A copy of the document has been published in the Employee Library and will be used to create a workflow in the Packers and Stockyard’s Automated System (PAS).
3.2.2 Scale Test Standard Operating Procedures
P&SP implemented the Packers and Stockyards Automated System (PAS) roughly 2 years ago. PAS is an automated management information system to manage workflows and capture data including data for case file management. PAS was implemented in two phases with phase 1

2011 Packers and Stockyards Annual Report
25
including higher priority standard procedures and phase 2 incorporating remaining standard procedures such as scale tests. The P&SP management team solicited several subject matter experts from each region to focus on updating the standard operating procedure for scale test and work with PAS developers to design a workflow to automate the process. A new Standard Operating Procedure workflow was developed and implemented. The new workflow has been implemented.
3.2.3 P&SP’s Change Control Working Group (CCWG)
In an effort to promote efficiency and adjustments for current industry changes, the P&SP management team established a team to focus on vetting change requests submitted from agency staff. The team is made up of voting members and non-voting members with representation from the regional and headquarter staff. The team is responsible for vetting change requests regarding agency activities, standard procedures, and PAS. The team forwards all change requests to the management team for final decision. This enables the management team to have an idea of issues of concern to staff. The CCWG is into its third year and has reviewed close to 200 change requests with 43 being approved by management.

26
4. ASSESSMENT OF THE INDUSTRIES
This section contains an assessment of the industries that P&SP regulates as requested by Congress. The first subsection provides an assessment of the general economic state of the regulated industries, including trends in the number of firms, financial conditions, and the percentage of the market held by the four largest firms of a particular sector (market concentration). The second subsection examines changing business practices of firms in the regulated industries, including pricing methods, and particularly pricing on live weight versus carcass weight; procurement methods, with a focus on commitments to procure more than 14 days before slaughter versus transactions conducted on a cash-carry or spot basis; and trends related to the volume marketed through market agencies via commissions versus direct purchases. Finally, this section outlines specific concerns about the behavior or conduct of the entities regulated under the P&S Act and P&SP’s actions to address those concerns.
Data in this section are generally from regulated industry annual reports to P&SP, and those reports for the 2011 reporting year are not due until April 15, 2012. Hence most statistics in this section are for 2010. Exceptions are statistics on firms currently bonded and/or registered as recorded in P&SP databases and market share (concentration) statistics.
The number of entities subject to the P&S Act shows some sign of stabilizing, with a small increase in number of entities of each type.
The four largest slaughter firms’ share of the total value of livestock purchases (i.e., aggregate industry concentration) declined nearly three percentage points in 2010 after increasing for the previous three years. Patterns of concentration in the purchase of different types of livestock, however, have exhibited varying trends.
Concentration in poultry slaughter has trended upward since 2000. The four-firm concentration ratio by volume of steer and heifer slaughter has been relatively stable in recent years, but increased by four percentage points in 2010. Cow and bull slaughter concentration increased from 1999 to 2007 then declined slightly for the last three years.
Concentration in hog slaughter increased sharply in 2003, declined in 2006, increased in 2007 and remained essentially steady since. Concentration in sheep slaughter declined in the first half of the decade then increased in 2005 and remained steady through 2009, but declined by five percentage points in 2010.
In general, increases in industry concentration from declining firm numbers reflect efforts by firms to increase net incomes. Agriculture firms in particular have tended to focus on cost minimization to increase net incomes. To achieve this objective, firms have adopted cost-saving technologies (frequently replacing labor with machines) that fostered larger capacities. Low interest rates throughout 2011 provided additional incentives for firms to replace labor with

2011 Packers and Stockyards Annual Report
27
capital assets. At the processor level increased worker productivity appears to be responsible in part for better income margins.
Some business practice trends are stabilizing. For example, carcass-basis purchases of cattle were 19.5 million head in 2010, near the average for the previous 10 years of 19 million. Carcass based purchases of hogs were 85 million in 2010 with the previous 10 years averaging 79 million. Carcass-based purchases reflect a trend by packers to pay livestock sellers for quality or grade characteristics tied to product values using contractual arrangements.
Carcass-basis pricing tends to correlate with trends in increased contracting for procurement and reductions in the volume of transactions through market agencies. These trends started over 10 years ago in the livestock/meat sector and will be resistant to change, even in the face of economically stressful conditions since they are related to cost-saving motives for increased coordination of livestock, poultry, and meat production and marketing.
The use of formula pricing methods and forward contracting for fed cattle increased in 2010, as the use of negotiated pricing declined. Packer feeding remained relatively constant. Packer feeding and forward contracting represent about 5 percent and 12 percent, respectively, of total fed cattle procurement. Patterns of use of alternative procurement and pricing methods for hogs were relatively unchanged in 2010, with about 68 percent purchased through various types of marketing arrangements, about 28 percent fed by packers, and the balance of just under five percent purchased on the negotiated spot market.
Unlike the livestock industry, which relies on contract procurement to coordinate the market supply channel, the poultry industry has been almost completely vertically integrated for several decades. As a result, the use of spot markets for poultry is virtually nonexistent.

28
4.1 General Economic State of the Industry
At the end of fiscal year 2011, there were 258 bonded livestock slaughter firms, 136 live poultry dealers, 4,572 registered dealers, and 1,220 market agencies were subject to the P&S Act (Table 12). There were also 1,218 posted stockyards. Entities subject to the Act are:
Bonded slaughter firms include firms operating Federally inspected plants as well as some firms operating plants that are not Federally inspected. Some firms with smaller volume purchases voluntarily bond but do not file annual reports. All packers operating in interstate commerce are subject to the P&S Act, which requires firms that purchase $500,000 or more of livestock for slaughter to be bonded and to file annual reports.
Livestock dealers purchase livestock for resale on their own accounts and take title to the animals. They may also purchase or sell as the agent or vendor of another entity.
Market agencies are entities engaged in the business of buying or selling livestock in commerce on a commission basis, furnishing stockyard services, or, in rare cases, an entity providing State brand inspection services.
Live poultry dealers, commonly called poultry integrators, contract with producers for grower services to raise chicks to slaughter size and weight. The integrator slaughters and further processes the poultry.
Table 12. Number of Slaughterers, Live Poultry Dealers, Bonded Dealers, Bonded Market Agencies, and Posted Stockyards Subject to the P&S Act, 2000-2011
Year
Bonded slaughter
firms
Live poultry dealers
Bonded dealers
Bonded market
agencies Posted
stockyards
2000 359 NA 4,772 1,608 1,519
2001 338 NA 4,675 1,575 1,525
2002 335 NA 4,480 1,544 1,510
2003 338 NA 4,675 1,575 1,429
2004 314 NA 4,152 1,457 1,443
2005 312 NA 4,100 1,447 1,426
2006 304 NA 3,984 1,433 1,400
2007 296 NA 3,883 1,410 1,413
2008 281 126 4,685 1,326 1,392
2009 284 125 4,529 1,225 1,170
2010 233 117 4,468 1,205 1,209
2011 258 136 4,572 1,220 1,218

2011 Packers and Stockyards Annual Report
29
Posted stockyards are physical facilities and are not necessarily separate businesses. For example, a county fairground may be registered as a posted stockyard. Terminal market agencies and auction market agencies are located at posted stockyards, but may or may not be the same entities that own and operate the stockyards.
In 2008, P&SP began transitioning from multiple older databases to a new single database. In the process, data was manually re-entered into the new system after field verification, except for information about posted stockyards, which do not report annually. In 2008, P&SP re-posted 864 known stockyards and in 2009 began de-posting any stockyards that do not respond to a request seeking applicants for re-posting. P&SP did not maintain statistics on live poultry dealers prior to 2008.
The volume of business of packers trended upward from 2006 through 2008, dropped in 2009, then returned to slightly more that the 2008 level at just over $50 billion in 2010. Similarly, dollar volume for firms selling on commission and for firms operating as dealers or purchasing on commission basis was relatively constant from 2004 through 2007, dropped in 2009, then increased in 2010. The decline in these measures in 2009 may reflect a changeover in GIPSA’s data tracking system (Figure 10).
Figure 10. Dollar Volume of Slaughter Firms, Dealers, and Market Agencies Selling and Buying on Commission Subject to P&S Act,
2000-2011.
The value of bonds held by subject firms has been relatively constant, although packing firms have shown some increase (Figure 10). The total value of bonds held by subject firms should continue to follow the same trend as the total dollar business volume of these firms.
15
20
25
30
35
40
45
50
55
60
65
2000 2002 2004 2006 2008 2010
Billion Dollars
Year
Packer Purchases
Commision Sales Value of livestock
Dealer and Commission Purchase Total Value

30
Figure 11 Value of Bonds Held in Accordance With P&S Act by Slaughter Firms, Market Agencies Selling on Commission, and Dealers and Market Agencies Purchasing on Commission,
2000-2010
The four largest slaughter firms’ share of total industry expenditures on livestock for slaughter dropped to 67 percent, about the same as the 2008 level after an increase in 2009 to about 70 percent (Figure 12).
Figure 12. Share of Total Industry Livestock Procurement Expenditures for the Four Largest Slaughter Firms, Ranked by Total Livestock Procurement Expenditure, 2000-2010
0
100
200
300
400
500
600
2000 2002 2004 2006 2008 2010
Million Dollars
Year
Reporting Packers
Firms Selling on Commission
Firms Purchasing on Commission and Dealers
50
55
60
65
70
75
80
85
2000 2002 2004 2006 2008 2010
Percentage
Year
2011 Packers and Stockyards Annual Report
31
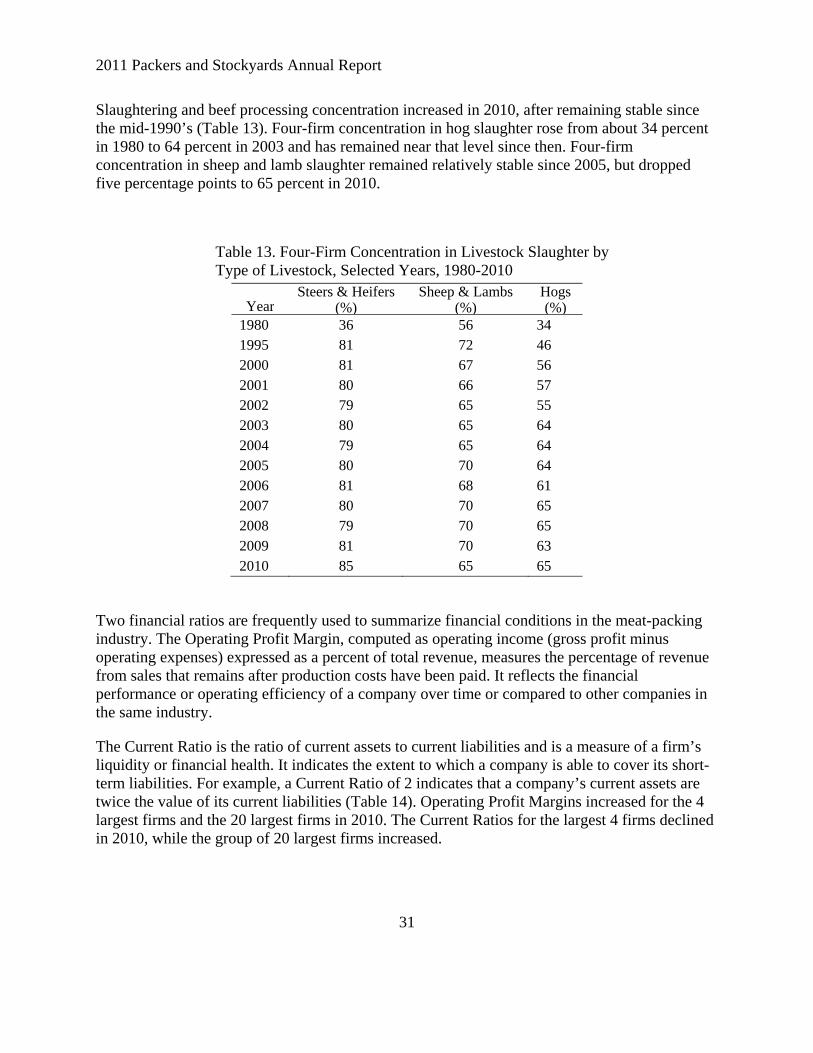
Slaughtering and beef processing concentration increased in 2010, after remaining stable since the mid-1990’s (Table 13). Four-firm concentration in hog slaughter rose from about 34 percent in 1980 to 64 percent in 2003 and has remained near that level since then. Four-firm concentration in sheep and lamb slaughter remained relatively stable since 2005, but dropped five percentage points to 65 percent in 2010.
Table 13. Four-Firm Concentration in Livestock Slaughter by Type of Livestock, Selected Years, 1980-2010
Year Steers & Heifers
(%)Sheep & Lambs
(%)Hogs (%)
1980 36 56 34 1995 81 72 46 2000 81 67 56 2001 80 66 57 2002 79 65 55 2003 80 65 64 2004 79 65 64 2005 80 70 64 2006 81 68 61 2007 80 70 65 2008 79 70 65 2009 81 70 63 2010 85 65 65
Two financial ratios are frequently used to summarize financial conditions in the meat-packing industry. The Operating Profit Margin, computed as operating income (gross profit minus operating expenses) expressed as a percent of total revenue, measures the percentage of revenue from sales that remains after production costs have been paid. It reflects the financial performance or operating efficiency of a company over time or compared to other companies in the same industry.
The Current Ratio is the ratio of current assets to current liabilities and is a measure of a firm’s liquidity or financial health. It indicates the extent to which a company is able to cover its short-term liabilities. For example, a Current Ratio of 2 indicates that a company’s current assets are twice the value of its current liabilities (Table 14). Operating Profit Margins increased for the 4 largest firms and the 20 largest firms in 2010. The Current Ratios for the largest 4 firms declined in 2010, while the group of 20 largest firms increased.

32
Table 14. Average Operating Profit Margin and Current Ratios for the Top 4 and the Top 20 Firms, 2006 - 2010
Operating Profit
Margin (%) Current RatioYear Top 4 Top 20 Top 4 Top 20
2006 -0.2 0.8 1.9 1.32007 1.0 1.7 1.9 1.62008 1.0 2.0 2.9 1.92009 2.0 2.0 3.5 2.32010 4.5 5.0 3.4 3.1
These financial data are averaged across a wide variety of types of firms. The size rankings are based on total livestock procurement expenditures. There are differences both across and within size groups in combinations of species slaughtered (beef, pork, sheep, and poultry) by the included firms. Within beef slaughter firms, the larger packers all slaughter a large proportion of steers and heifers in their total slaughter mix. Many smaller packers specialize in cow and bull slaughter and almost no steers and heifers.
Financial data reported to P&SP by some firms may include information on operations other than meat packing and processing. Variation in other types of non-meat activities included in the data from some firms occasionally leads to large swings in some of the ratios, especially for the group of smaller firms.
4.1.1 Cattle -- General Economic State of the Industry
The volume of cattle slaughtered by firms reporting to P&SP (firms with livestock purchases equal to or exceeding $500,000 per year) fluctuates with the cattle cycle. Total cattle slaughter by firms reporting to P&SP trended downward from 2000 through 2005 then increased in 2006, but has remained within a 1 million head band since (Figure 13). Total cattle includes steers and heifers (often collectively called “fed cattle”), cows, and bulls, but excludes calves. In most but not all cases, individual plants operated by firms that report to P&SP tend to slaughter either fed cattle or cows and bulls.

2011 Packers and Stockyards Annual Report
33
Figure 13. Total Slaughter Cattle Purchases for Firms Reporting to P&SP, 2000-2010
The number of cattle slaughter plants reporting to P&SP declined by approximately 60, or 27 percent, from 1998 through 2003, as plant sizes increased and smaller plants closed (Figure 14). The number of slaughter plants then remained stable until 2008, when there was a decline of 30 plants. The number of plants has remained relatively stable through 2010, but a gradual reduction in total numbers is expected as financial conditions make larger firms look for ways to reduce costs and operate more efficiently.
Figure 14. Number of Cattle Slaughter Plants for Firms Reporting to P&SP, 2000-2010
28,000
29,000
30,000
31,000
32,000
33,000
34,000
35,000
36,000
37,000
38,000
2000 2002 2004 2006 2008 2010
Head
(000)
Year
80
100
120
140
160
180
200
220
240
260
2000 2002 2004 2006 2008 2010
Number
Year
34
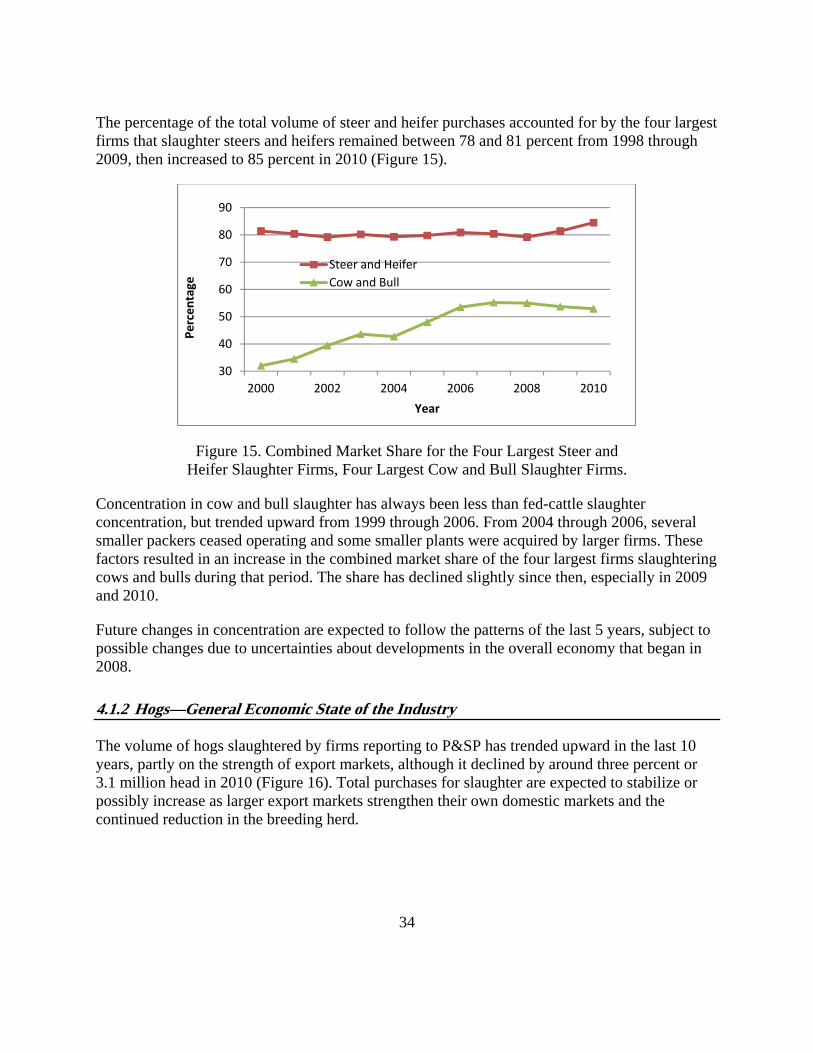
The percentage of the total volume of steer and heifer purchases accounted for by the four largest firms that slaughter steers and heifers remained between 78 and 81 percent from 1998 through 2009, then increased to 85 percent in 2010 (Figure 15).
Figure 15. Combined Market Share for the Four Largest Steer and Heifer Slaughter Firms, Four Largest Cow and Bull Slaughter Firms.
Concentration in cow and bull slaughter has always been less than fed-cattle slaughter concentration, but trended upward from 1999 through 2006. From 2004 through 2006, several smaller packers ceased operating and some smaller plants were acquired by larger firms. These factors resulted in an increase in the combined market share of the four largest firms slaughtering cows and bulls during that period. The share has declined slightly since then, especially in 2009 and 2010.
Future changes in concentration are expected to follow the patterns of the last 5 years, subject to possible changes due to uncertainties about developments in the overall economy that began in 2008.
4.1.2 Hogs—General Economic State of the Industry
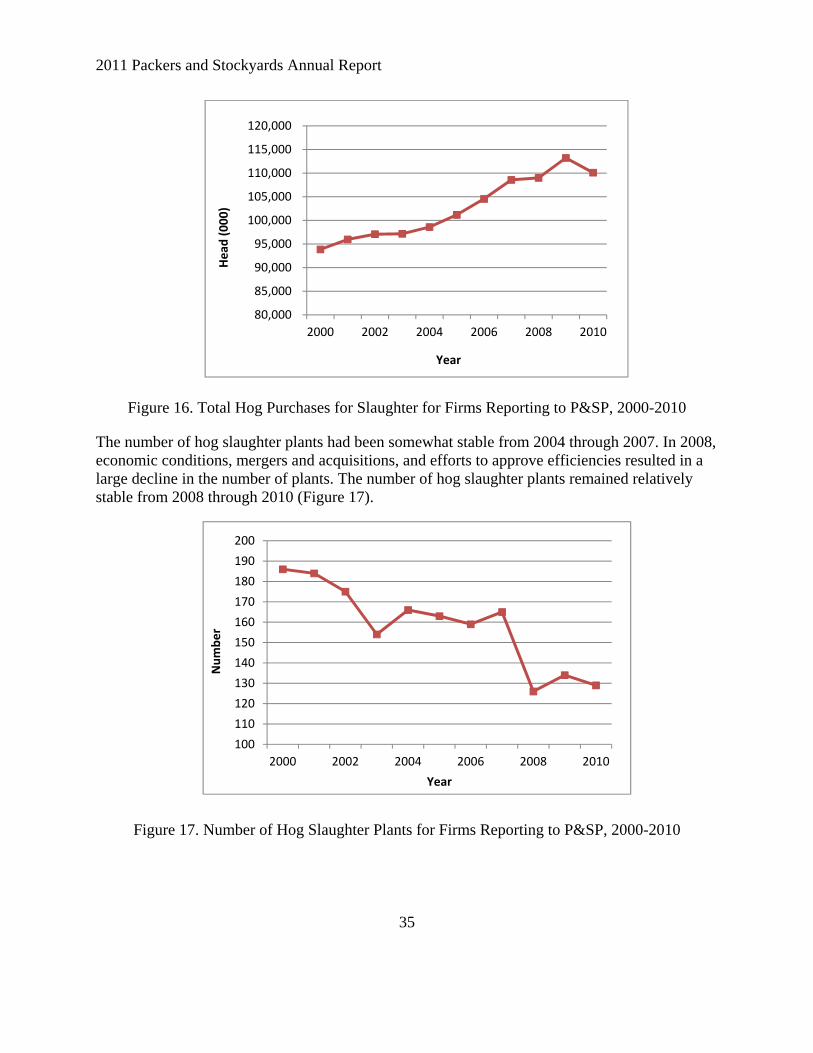
The volume of hogs slaughtered by firms reporting to P&SP has trended upward in the last 10 years, partly on the strength of export markets, although it declined by around three percent or 3.1 million head in 2010 (Figure 16). Total purchases for slaughter are expected to stabilize or possibly increase as larger export markets strengthen their own domestic markets and the continued reduction in the breeding herd.
30
40
50
60
70
80
90
2000 2002 2004 2006 2008 2010
Percentage
Year
Steer and Heifer
Cow and Bull
2011 Packers and Stockyards Annual Report
35
Figure 16. Total Hog Purchases for Slaughter for Firms Reporting to P&SP, 2000-2010
The number of hog slaughter plants had been somewhat stable from 2004 through 2007. In 2008, economic conditions, mergers and acquisitions, and efforts to approve efficiencies resulted in a large decline in the number of plants. The number of hog slaughter plants remained relatively stable from 2008 through 2010 (Figure 17).
Figure 17. Number of Hog Slaughter Plants for Firms Reporting to P&SP, 2000-2010
80,000
85,000
90,000
95,000
100,000
105,000
110,000
115,000
120,000
2000 2002 2004 2006 2008 2010
Head
(000)
Year
100
110
120
130
140
150
160
170
180
190
200
2000 2002 2004 2006 2008 2010
Number
Year

36
The four-firm concentration ratio for hog slaughterers was roughly 56 percent in the late 1990s and then increased to near 65 percent in 2003, where it remained in the mid 60’s range through 2010 (Figure 18).
Figure 18. Combined Market Share for the Four Largest Hog Slaughter Firms, 2000-2010
4.1.3 Sheep—General Economic State of the Industry
The volume of sheep and lambs slaughtered by packers reporting to P&SP declined in every year but three between 1998 and 2007, with the sharpest single year decline between 2007 and 2008. The volume has remained relatively constant since, with total slaughter of just over 1.9 million head in 2010 (Figure 19).
Figure 19. Total Slaughter Sheep and Lamb Purchases for Firms Reporting to P&SP, 2000-2010
50
55
60
65
70
75
2000 2002 2004 2006 2008 2010
Percentage
Year
600
1,000
1,400
1,800
2,200
2,600
3,000
3,400
2000 2002 2004 2006 2008 2010
Head
(000)
Year

2011 Packers and Stockyards Annual Report
37
The number of plants slaughtering sheep and lambs has been relatively constant since 2002, with a small decline from 2005 through 2008 offset by an equal increase since then (Figure 20). Many of these are small multispecies plants that slaughter only a few sheep and lambs, with fewer than two dozen plants averaging over 100 head per week in 2010.
Figure 20. Number of Sheep and Lamb Slaughter Plants for Firms Reporting to P&SP, 2000-2010
The combined market share of the four largest sheep and lamb slaughter firms trended steadily downward from 1998 through 2004, as the largest plants in the industry decreased slaughter faster than total industry slaughter declined (Figure 21).
Due to the small total slaughter volume of the industry, relatively moderate volume adjustments by any of the largest four firms result in relatively large changes in the percent of total industry slaughter accounted for by those firms. The long-term decline in share reversed in 2005, when one of the four largest firms exited and the remaining three large firms increased their combined volume by an amount equal to the output of the exiting firm. An additional firm then entered the group of four largest, causing a net increase in total slaughter of the four largest firms and in their share of total industry slaughter.
20
30
40
50
60
70
80
2000 2002 2004 2006 2008 2010
Number
Year

38
Figure 21. Combined Market Share for the Four Largest Sheep and Lamb Slaughter Firms, 2000-2010
The share of the four largest lamb packers then declined in 2006, returned to 2005 levels in 2007 through 2009, but decreased by five percentage points in 2010. But, as in previous years, these changes in shares represented only a few thousand head of slaughter lambs. Future changes in sheep slaughter concentration will continue to be variable due to adjustments among the four largest firms, but will likely remain in the 65-70 percent range.
4.1.4 Poultry—General Economic State of the Industry
This section addresses slaughter volume, industry concentration, and two measures of live poultry dealer financial health (the Operating Profit Margin and Current Ratio) obtained from annual reports filed by the industry with P&SP.
In 2010, poultry processors reporting to P&SP slaughtered an estimated 48.4 billion pounds of chickens. By comparison, in 2010, the federally inspected (FI) volume was 50.1 billion pounds. This continues to reflect an upward trend in poultry slaughter since 1996, when FI volume was approximately 26 billion pounds. Turkey slaughter increased to an estimated 7.2 billion pounds by firms reporting to P&SP for 2010. This was actually slightly more than the reported FI volume of 7.1 billion pounds for 2010, in part due to the fact that the reporting years for some P&SP firms are not the same as the calendar year represented by the FI statistics.
Concentration in broiler and turkey slaughter trended upwards from 2000 through 2008, but in 2009, the four largest broiler slaughterers posted a 4 percent decline to 53 percent of the market share compared to 57 percent in 2008, and their share decreased another 2 points to 51 percent in 2010. The four largest turkey slaughterers also posted a decrease of 2 percentage points to a 58 percent market share. Concentration in poultry slaughter is expected to remain relatively stable when data for 2011 are available.
50
55
60
65
70
75
2000 2002 2004 2006 2008 2010
Percentage
Year

2011 Packers and Stockyards Annual Report
39
In 2010, the Operating Profit Margin (the percentage of revenue from sales that remains after production costs have been paid) of the 20 largest broiler companies averaged 2.3 percent, an improvement over the 1.3 percent in 2009 (Table 15). Profits for the four largest broiler firms averaged considerably higher than profits for the entire group of 20 largest broiler firms, increasing to an average of 5.2 percent. The average profit margin for the four largest turkey processing companies was also higher than that of the 20 largest, at 5.4 percent versus 1.7 percent, respectively. The largest four firms for both types of poultry had a higher average Current Ratio than the group of the 20 largest firms.
Table 15. Poultry Industry Market Share, Operating Profit Margin, and Current Ratio, 2008 - 2010
Market Operating Profit
Margin (%) Current Ratio Type and Year Share (%) Top 4 Top 20 Top 4 Top 20
Broiler 2008 57 -5.4 -1.2 1.9 2.1 Broiler 2009 53 0.0 1.3 2.4 2.2 Broiler 2010 51 5.2 2.3 2.3 2.1 Turkey 2008 51 1.8 2.4 1.8 2.4 Turkey 2009 58 1.8 -1.6 2.0 2.5 Turkey 2010 56 5.4 1.7 2.9 2.4
4.2 Changing Business Practices.
The long-term decline in the number of livestock slaughter firms reporting to P&SP reported in the previous section has been accompanied by a trend toward increased specialization in slaughter. This has been illustrated by a greater decline from 1997 through 2006 in the number of firms slaughtering two or more classes of livestock than in the number of firms slaughtering a single class (Figure 22). For purposes of this comparison, the separate classes of livestock are steers and heifers; cows and bulls; calves; sheep and lambs; and hogs. While the number slaughtering two or more classes increased in 2007, it has declined since 2008 as the number slaughtering only one class stayed about the same.

40
Figure 22. Number of Firms Slaughtering One Class and Number of Firms Slaughtering Two or More Classes of Livestock, 2000-2010.
4.2.1 Cattle—Changing Business Practices
The pricing method that sellers and purchasers agree to use for a transaction is a fundamental characteristic of any market transaction. For livestock and for cattle transactions in particular, pricing methods are most often divided into two categories: live-weight and carcass pricing methods.
In live-weight purchasing of livestock, the price is quoted and the final payment is determined based on the weight of the live animal. Transactions that use some variation of live-weight purchasing are usually on an “as-is” basis with a single price per pound for all animals in the entire transaction.
The price may be fixed by negotiation in advance, or established from prices reported by a market price reporting service after the animals are delivered or slaughtered. In some instances, provisions may be made for paying different prices for animals that differ significantly from other animals in the transaction (e.g., animals that are much smaller than the average for the transaction may receive a lower price).
In a “carcass-based” purchase, the price is quoted and the final payment is determined based on each animal’s hot weight, which is the weight of the carcass after it has been slaughtered and eviscerated.
Carcass-based purchase methods often involve schedules of premiums or discounts based on animal quality and other features, such as time of delivery and number of animals in the transaction. The price before premiums or discounts is referred to as the “target” or “base” price. Carcass-based pricing typically rewards sellers with livestock that meet or exceed the target
8090100110120130140150160170180
2000 2002 2004 2006 2008 2010
Number
Year
Firm Slaughter One Class
Firms Slaughter Two or More Classes

2011 Packers and Stockyards Annual Report
41
standard. Livestock carcasses graded below the target result in the seller receiving significant discounts.
After declining annually through the 1990s, the proportion of cattle purchased on a live-weight basis by packers reporting to P&SP had been uneven but has increased slightly since 2008 (Table 16).
Table 16. Table Number and Percentage of Cattle Purchased Live-Weight and Carcass-Weight by Packers Reporting to P&SP, 2000-2010
Live-weight Carcass-weight
Year Head (000) Percent Head (000) Percent
2000 17,102 48.4 18,207 51.6 2001 15,044 44.3 18,877 55.7 2002 12,555 37.2 21,158 62.8 2003 14,116 40.2 21,008 59.8 2004 15,112 46.6 17,348 53.4 2005 13,663 43.7 17,591 56.3 2006 15,004 46.7 17,012 53.3 2007 14,135 42.8 18,887 57.2 2008 12,043 37.7 19,916 62.3 2009 12,282 38.2 19,863 61.8 2010 13,503 40.9 19,485 59.1
The total volume of cattle purchased on a carcass basis trended upward from 1998 through 2002 (Figure 23). Following a sharp decline in 2004, the volume stabilized in 2005 and 2006, and then increased through 2008 remaining close to constant in 2009and 2010. The proportion of cattle purchased on a carcass basis is expected to remain in the 60-percent range with modest fluctuation year over year.

42
Figure 23. Cattle Purchases on a Carcass Basis, 2000-2010
The proportion of calves purchased on a carcass-weight basis was considerably less, but has exhibited a mixed pattern in recent years. After declining from 2000 through 2003, the proportion of calves purchased on a carcass basis increased almost 10 percentage points in 2004, reversed and decreased sharply in 2005, trended up in 2007 and 2008, decreased very sharply once again in 2009, then increased in 2010 (Table 17).
Table 17. Number and Percentage of Calves Purchased Live-Weight and Carcass-Weight by Packers Reporting to P&SP, 2000-2010
Live-weight Carcass-weight Year Head (000) Percent Head (000) Percent 2000 495 51.3 470 48.7 2001 479 54.7 397 45.3 2002 492 57.3 367 42.7 2003 553 59.4 377 40.6 2004 351 49.6 357 50.4 2005 415 63.7 236 36.3 2006 397 66.3 201 33.7 2007 387 61.1 247 38.9 2008 338 53.9 289 46.1 2009 454 72.5 172 27.5 2010 448 63.8 254 36.2
Another business practice affecting transactions involves the location in the market channel of the transaction. P&SP monitors two major transaction location points in livestock marketing.
14,000
15,000
16,000
17,000
18,000
19,000
20,000
21,000
22,000
2000 2002 2004 2006 2008 2010
Head
(000)
Year

2011 Packers and Stockyards Annual Report
43
One major transaction point is exchange between the livestock producer and an assembly point, usually a market that accepts the livestock on a commission basis. The buyer procures the livestock through the market, generally with no direct contact between seller and buyer.
Although the volume of cattle handled by commission firms declined through 2008, these firms continue to play an important role in the cattle industry, particularly for cull cows (Figure 24). The number marketed through commission firms increased since 2008 to near 2006 level in 2010.
Figure 24. Volume of Cattle (Slaughter and Non-Slaughter) Marketed Through Firms Selling on Commission, 2000-2010
The second transaction location point monitored by P&SP is direct exchange between the livestock seller and the packer. Packers use multiple direct exchange procurement methods to obtain live cattle for slaughter. The methods commonly fall into two categories: (1) cash or “spot” sales for immediate delivery or normally delivery within at most 14 days, and (2) “committed procurement” arrangements that create an assured exchange and commit the cattle to a particular packer more than 14 days prior to delivery. Cash sales generally are priced on a negotiated basis, although various formulas may exist to establish premiums and discounts after the transfer. Committed procurement usually uses some form of formula pricing.
P&SP defines “packer fed” livestock as all livestock obtained for slaughter that a packer, a subsidiary of the packer, the packer’s parent firm, or a subsidiary of the packer’s parent firm owns, in whole or part, for more than 14 days before the packer slaughters the livestock. Marketing arrangements termed “forward contracts” are agreements between packers and sellers for deliveries more than 14 days in the future of specific lots or quantities of livestock. The price
30,000
32,000
34,000
36,000
38,000
40,000
42,000
2000 2002 2004 2006 2008 2010
Head
(000)
Year

44
of the cattle in a forward contract can be set at the time of the contract or determined upon delivery based upon an agreed pricing arrangement.
The term “marketing agreements” includes a variety of arrangements that establish an ongoing relationship for trading multiple lots of cattle rather than negotiating single lots of cattle. In these arrangements, the seller agrees to deliver cattle to the packer at a future date, with the price generally being determined by some type of formula pricing mechanism. The price is often based on the current cash market at the time of delivery, with premiums or discounts determined by evaluation of carcass characteristics.
USDA’s Agricultural Marketing Service (AMS) publishes prices and volumes of livestock purchased under alternative pricing methods (http://mpr.datamart.ams.usda.gov). The use of formula pricing methods and forward contracting for fed cattle increased in 2010 and continued to increase in 2011, as the use of negotiated pricing declined. Packer feeding remained relatively constant. Packer feeding and forward contracting represent slightly over 5 percent and 12 percent, respectively, of total cattle procurement (Figure 25).
Figure 25. Types of Procurement Arrangements Used by Fed Cattle Slaughter Firms, 2008- 2011
Information about business practices at the plant level, namely level of operations (e.g., one or two shifts per day), number of plants in business at any given time, and ownership of them, is also significant in describing industry trends.
Plant closures or re-openings can have direct competitive effects by shifting supply and demand patterns. The P&S Act does not provide authority to the Secretary for pre-merger review. Rather,
0.0
10.0
20.0
30.0
40.0
50.0
60.0
70.0
80.0
90.0
2008 2009 2010 2011
Percent
Year
Packer Owned Forward Contract
Formula Negotiated

2011 Packers and Stockyards Annual Report
45
that is the responsibility of either the DOJ or Federal Trade Commission under the Hart-Scott-Rodino Antitrust Improvements Act of 1976 (Public Law 94-435, known commonly as the HSR Act). Mergers and acquisitions, however, cause changes in business practices that may impact competition. P&SP monitors these industry events for any competitive effects.
The beef packing industry saw light activity in 2011 in terms of consolidation and plant closings. In June 2011, XL Four Star Beef, Inc. closed its plant in Caldwell, Idaho. It also closed a slaughter plant in Calgary, Alberta. Each plant had capacity to process more than 1,000 head per day. In December 2010, Meyer Natural Angus, LLC purchased Dakota Beef, LLC, which was a small packer in Howard, South Dakota. Dakota Beef, LLC had been an early entrant in the market for organic beef.
4.2.2 Hogs—Changing Business Practices
The proportion of hogs purchased on a live-weight basis steadily declined over the past several years; carcass-based purchases have become the predominant method used for hogs purchased for slaughter. The substantial decline in 2009 appears to have been a realignment with the normal carcass-based purchase average, as there was little change in 2010 (Table 18; Figure 26). The volume of hogs purchased on a carcass basis will likely continue to increase as total hog slaughter increases.
Figure 26. Hog Purchases on a Carcass Basis, 2000-2010
Some carcass-based purchases, often known as “carcass-merit” purchases, include a base price that applies to all carcasses in the transaction, with premiums or discounts for individual carcasses based on quality or other attributes of each carcass, such as quality grade, yield grade, yield, or percentage of lean meat in the carcass. Some carcass merit transactions use USDA grades to determine carcass quality. A growing number of transactions include price adjustments
35,000
45,000
55,000
65,000
75,000
85,000
95,000
105,000
2000 2002 2004 2006 2008 2010
Head
(000)
Year

46
for quality characteristics that are not covered by USDA grades, such as percent of lean meat in the carcass and depth of the loin.
Table 18. Number and Percentage of Hogs Purchased by Live-Weight and Carcass-Weight for Packers Reporting to P&SP, 2000-2010
Live-weight Carcass-weight
Year Head (000) Percent Head (000) Percent 2000 24,711 26.3 69,145 73.7
2001 26,883 28.0 69,070 72.0
2002 25,077 25.8 72,003 74.2 2003 22,413 23.1 74,748 76.9 2004 23,092 23.4 75,496 76.6 2005 21,453 21.2 79,730 78.8
2006 24,474 33.4 80,075 76.6
2007 23,238 21.4 85,344 78.6
2008 13,295 12.2 95,708 87.8
2009 26,653 23.5 86,569 76.5
2010 24,731 22.5 85,375 77.5
The volume of hogs marketed by firms selling hogs on commission declined between 1999 through 2002. Since 2002, the number has trended steadily upward from 2002 through 2007 (Figure 27). The pattern has shown extreme variability in the last three years, and it remains to be seen whether this component of the industry will attain a stable level of activity.
Figure 27. Volume of Hogs Marketed Through Firms Selling on Commission, 2000-2010
6,000
6,500
7,000
7,500
8,000
8,500
9,000
9,500
10,000
2000 2002 2004 2006 2008 2010
Head
(000)
Year

2011 Packers and Stockyards Annual Report
47
Like beef packers, pork packers use multiple procurement methods (Figure 28). For all pork slaughter firms reporting to USDA’s Agricultural Marketing Services under the provisions of the Mandatory Price Reporting Act, just over 5 percent of hogs were obtained on the negotiated spot market in 2010 compared to nearly 7 percent in 2009. Available data suggest the proportion fell slightly in 2011. About 27 percent, 1 percentage point more than in 2009, were packer-owned hogs in 2010 that were supplied from a packer-owned farrowing operation and were often fed under contract for the packer. The rest were purchased using various types of other marketing arrangements, usually either some variation of marketing agreement or forward contract. The relative importance of packer-owned hogs and other arrangements appears to be increasing slightly through 2011. Marketing agreements for hogs generally are based on multi-year contracts under which the producer agrees to deliver a set number of pigs per year to a packer. Some of these arrangements are verbal agreements. “Forward contracts” for hogs are typically simple one-time contracts for a given number of hogs to be delivered within a certain time window, with price based on a futures contract. Other modes of procurement for hogs are largely verbal contracts.
Procurement methods used by individual packers vary significantly among packers, ranging from the packers that are fully integrated to packers that rely primarily on the open market. Most hog packers use some combination of packer-fed hogs, marketing agreements, forward contracts, and negotiated spot market procurement. These combinations typically vary by plant for multi-plant packers.
Figure 28. Percentage of Hogs Procured Through Alternative Types of Procurement Arrangements, 2008-2011
0
20
40
60
80
100
120
2008 2009 2010 2011
Percent
Year
Negotiated Spot Market
Packer Owned
Other Marketing Arrangements

48
Among the top 25 largest hog producers, Maschhoffs LLC may be the only firm that has aggressively expanded. In February 2011 it agreed to buy substantially all of the assets of Nebraska Pork Producers, LLC, a firm with 50,000 sows and 80 production sites in Nebraska, South Dakota, and Iowa.
In 2011 the week to week slaughter of barrow and gilts has tracked that of 2010 with total head slaughtered expected to be with 1 percent of that of 2010, but nearly 4 percent lower than that of 2009. During the first 7 months of 2011, U.S. pork exports by volume were up 15.6 percent and pork imports were down 4.1 percent compared to a year ago. This has helped to set record high hog carcass prices. In 2011 carcass prices have been above 2010 levels every day up to mid-September. From late April to late August, carcass prices were above $90/cwt. and broke through the $100/cwt. ceiling on several days. While barrow and gilt slaughter numbers began their traditional fall increase earlier than in 2010, reaching 2 million head in late August, prices were still above 2010’s level. This increase in slaughter numbers resulted in carcass prices which dropped from $100 to $80/cwt. in late August.
Because of higher pork export volumes and lower imports, there will be less pork left for U.S. consumers and supplies per person will be down about three percent for 2011. Because of this and higher feed costs, consumers have had to pay record high prices for U.S. pork this year. In addition, per capita beef supplies dropped by about two percent resulting in less red meat competition.
In spite of reasonable profit levels for producers in 2010, little change should be expected in the hog herd until the feed supply situation is better known in the fall because corn price volatility is a major component of the pork production uncertainty. For this reason, there will be almost no movement to expand herds until hog producers are assured that corn prices will be $6 or less a bushel for some time.
In 2011 corn prices steadily increased in the first part of the year, hitting $7/bu where they have largely remained. It was thought that a good 2011 harvest would get corn prices back to around $6 per bushel. With a dryer summer in the Midwest and early September frosts, however, the 2011 corn harvest is thought to be down about 3% from 2010 and futures markets are indicating $7 corn for the 2011-2012 marketing year.
4.2.3 Sheep—Changing Business Practices
The volume of sheep and lambs purchased on a carcass basis peaked at over 1.9 million head in 2001. The trend before 2009 was a decline year over year starting in 2002 and continuing to a sharp decline in 2009 to around 600 thousand head aside from the small gain in 2007 (Figure 29).

2011 Packers and Stockyards Annual Report
49
Figure 29. Sheep and Lambs Purchased on a Carcass Basis, 2000 -2010
The volume of carcass purchases has declined with total slaughter over time, and purchases of sheep and lambs on a carcass basis declined sharply by 20 percent in 2009. Live-weight purchases in 2009 increased substantially to 69 percent of the sheep and lamb purchases for slaughter by packers reporting to P&SP (Table 19). However, the volume and proportion purchased on a carcass basis appear to have plateaued at least temporarily in 2010.
Table 19. Number and Percentage of Sheep and Lambs Purchased by Live-Weight and Carcass-Weight for Packers Reporting to P&SP, 2000-2010
Live-weight Carcass-weight Year Head (000) Percent Head (000) Percent
2000 1,323 44.1 1,674 55.9 2001 840 30.1 1,951 69.9
2002 1,062 39.6 1,615 60.4
2003 1,023 47.0 1,156 53.0
2004 1,329 53.9 1,135 46.1
2005 948 47.7 1,040 52.3
2006 1,056 51.9 977 48.1
2007 1,338 53.4 1,166 46.6
2008 828 44.8 1,019 55.2
2009 1,357 69.4 598 30.6
2010 1,317 68.4 610 31.6
‐
300
600
900
1,200
1,500
1,800
2,100
2000 2002 2004 2006 2008 2010
Head
(000)
Year

50
Procurement methods used to purchase sheep and lambs for slaughter are similar to those used for other species and include purchase in spot markets, use of marketing agreements, use of various other forms of advance sales contracts, and packer feeding.
Some producers who feed their own lambs market their lambs through a lamb feeding operation or feedlot that has a supply contract agreement with a packer. There also are business arrangements in which individuals who have financial interests in large lamb packing companies also have lamb feeding operations and supply lambs to the packing company. Some producers participate in cooperatives, associations, or pools of lamb producers to collectively market their lambs and lamb products.
As with other species, the various procurement methods used for lambs continue to evolve, but P&SP has not observed major changes in the methods in recent years and expects this stability to continue.
Use of commission firms for the sale of sheep and lambs has declined similarly to the decline in use of commission firms for cattle. The number of sheep and lambs marketed through commission firms has remained steady since 2007 and will likely continue to remain steady in the near term (Figure 30).
Figure 30. Volume of Sheep Marketed Through Firms Selling on Commission, 2000-2010
With respect to structural changes in the lamb industry, Superior Farms entered an agreement to acquire Iowa Lamb Corp. in Hawarden, Iowa in October 2010. Superior Farms then closed the plant in May 2011. The plant in Hawarden, Iowa had capacity to process about 240,000 head of sheep and lambs annually.
2,000
2,500
3,000
3,500
4,000
4,500
5,000
5,500
2000 2002 2004 2006 2008 2010
Head
(000)
Year

2011 Packers and Stockyards Annual Report
51
4.2.4 Poultry—Changing Business Practices
In general, the poultry industry in 2009 rebounded from 2008 and companies gradually increased production through 2010, but recent forecasts for prices of corn and other feed ingredient lowered 2011 growth and profit expectations, with several companies announcing reductions in production. Poultry companies are experiencing a cost squeeze, compounded by a decline in demand resulting in low margins.
Exemplifying this situation, in October 2011 Pilgrim's Pride Corp (PPC) reported a deeper quarterly loss than had been expected, due to high feed costs and low prices for chicken parts. The company had a net loss of $162.5 million in the third quarter, compared with year-earlier net earnings of $57.9 million. Due to higher market prices for corn and soybeans, Pilgrim's Pride said its feed ingredient purchases were higher than in the year-earlier period
As a result of its 2008 bankruptcy, Pilgrim’s Pride had closed several plants and reduced production at others, terminating grower contracts at these plants. Poultry growers who were harmed by Pilgrim’s Pride plant closures receive USDA compensation, with $17.7 million awarded to 154 Arkansas growers and $11.2 million awarded to 175 Louisiana growers. Pilgrim’s is now primarily owned by JBS USA (Brazil), but continues to operate as Pilgrim’s Pride. It reopened the Douglas, Georgia, complex in 2011, which had closed during bankruptcy proceedings. In July 2011 Pilgrim’s announced plans to close a chicken processing plant in Dallas, TX and consolidate its operations into other facilities in the region. Live production operations in the area were expected to continue.
Sanderson Farms, Inc. opened a poultry processing plant, feed mill, and hatchery in Kinston, NC in Janauary 2011. The company expects the plant to be operating at full capacity in 2012. Sanderson plans to open a second processing plant in Nash County, NC, but due to the current economic conditions, the expansion plans for this second plant are on hold.
Townsend Foods filed for voluntary Chapter 11 bankruptcy in December 2010. The company cited the impact of high feed ingredient costs and low chicken pricing as factors influencing the company’s financial state. Townsend operated facilities in Arkansas and North Carolina. The company sold the Arkansas operations to Peco Foods in February 2011, and the North Carolina division to Omtron USA, LLC (Ukraine). After only five months of operations, Omtron announced in July that they would close their operations in October 2011.
Lady Forest Farms, Inc. a small poultry company out of Forest, Mississippi, filed Chapter 11 bankruptcy in April 2011. The plant remains closed and no buyer has emerged for the facilities.
George’s Inc. bought the Tyson complex in Harrisonburg, VA in April 2011. The Department of Justice filed suit against George’s in May, based upon limiting of competition in the area, but the suit was settled and as a term of settlement, George’s plans to make capital improvements to the plant to increase its production.

52
Allen Family Foods, a Seaford, DE based poultry firm, filed for bankruptcy in June 2011. Harim USA, a South Korean firm, was the winning bidder through the bankruptcy court. Harim acquired two poultry processing plants, a feedmill and hatcheries.
In December 2010, the purchase of Butterball, LLC by Seaboard Corp. and Maxwell Farms, LLC was completed. Seaboard agreed to purchase the 50% ownership of Butterball from Smithfield Foods. In September 2011, Butterball announced the completion of the purchase of Powell Feed and Milling Co., located in Green Forest, Arkansas. Powell Feed & Milling Co, operations include two feed mills, contract farmers and 80 associates. In September 2011, Butterball announced the December 2011 closure of its Longmont, CO turkey operations.
Simmons Foods, based in Siloam Springs, AR, reported in June 2011 that it will close its Siloam Springs plant but will switch all the growers to their nearby Decatur, AR plant.
Cagles, Inc., headquartered in Atlanta, Georgia, filed for Chapter 11 bankruptcy protection on October 19, 2011. Cagles operates two poultry processing plants, a feed mill, and a hatchery.

2011 Packers and Stockyards Annual Report
53
4.3 Industry Concerns
Industry participants have expressed a concern over GIPSA's lack of administrative authority within certain poultry areas. Administrative authority regarding poultry as provided by the P&S Act is significantly different than the livestock provisions. In particular, the Secretary's administrative authority applies to only two financial payment provisions "Section 207, Statutory trust established; poultry'' and "Section 410, Final date for making payment to cash seller or poultry grower" of the P&S Act. If the Secretary seeks to bring enforcement action against an entity for an alleged violation of provisions outside of his administrative authority, then the investigative case would be referred to the Department of Justice.
Analysis of industry data indicates that those areas in which P&SP has administrative authority have higher compliance rates compared to areas without administrative authority. For example, in 2009 the industry compliance rate for areas under administrative authority was 79.6 percent. This compares to a 60.0 percent compliance rate for the poultry industry for a measure made over four provisions with only one being under the Secretary's administrative authority. Examining the poultry industry compliance data more closely in 2010, the areas under administrative authority had a compliance rate of 84.7 percent versus 65.3 percent for those areas not under administrative authority. Using the same areas in 2011 to measure poultry industry compliance, a difference was observed with those areas under administrative authority being 72.3 percent compliant versus a rate of 55.3 percent compliant for those areas not under administrative authority.
The lack of compliance imposes costs on poultry growers and potentially the poultry industry. Poultry, beef, and pork compete against each other for a share of the consumer's purchasing dollar. This competition is waged over product attributes offered to the consumer such as taste preferences, convenience, and price per pound. The poultry industry has made enormous gains in production efficiencies spanning more that 20 years to establish poultry as the low cost meat protein. In order to maintain that growth, the industry relies on a steady introduction of production technologies at the grower level. Frequently, these infusions of new technology require expensive capital investments in the form of new poultry growing house designs or environmental control features within existing houses. (See testimony provided at the joint Department of Justice and USDA competition workshop held in Normal, AL in May 2010 at: http://www.justice.gov/atr/public/workshops/ag2010/. P&SP collected similar public comments at a town hall meeting held in Gainesville, FL in October 2008 for the poultry industry. Individual grower complaints are also made to P&SP agents on a periodic basis.)
The nature of poultry production, where growers contract to integrators their production services, makes poultry growers susceptible to extraction of income by integrators after the contract is executed, referred to as ex-post opportunism. This is in part caused by the poultry grower making a relatively large investment in poultry growing facilities often prior to entering into a poultry growing contract or as terms of entering into a growing contract. The investment makes it difficult financially for growers to exit the industry once they enter into the contract and contract compensation rates may be below the grower's initial expectations. Frequently related to

54
the lower rates of compensation are credible threats of contract termination if the grower does not invest in new production technologies. Consistent reports to GIPSA over time suggest that this may be a systemic feature of poultry production potentially related to a lack of administrative authority. To determine the extent of harm related to the lack of authority, an estimate was made on the cost that poultry growers are being exposed to as a result of ex-post opportunism and whether it results in an over investment in technology that distorts cattle and hog prices.
The method to quantify potential ex-post opportunity costs uses return on equity defined as net farm income, minus the opportunity cost of operator labor, divided by net worth (gross assets minus debt). The presumption is that growers should be able to earn a rate of return on equity that maintains itself relative to the erosion created by inflation. The median return on equity from ERS data for growers that were earning 90 percent or more of their gross income from production contracts was -0.509 when averaged over the 7 years from 2003 to 2009.
Using an average rate of inflation of 2.18, the inflation-return on equity gap is 2.71. This implies poultry growers are losing equity at a rate exceeding the loss due to inflation. Based on a per farm asset value for 2009 of $624,047; the gap on earnings to inflation represents an annual loss on equity of $16,903 per farm. Assuming that 50 percent of the low return on equity is due to over investment in farm level technology induced on the grower by the processor from ex-post opportunism, the $16,903 when multiplied by the 20,637 poultry grower farms, implies an ex- post opportunism cost potentially due to lack of administrative authority of $174.4 million. This behavior also represents a significant comparative advantage for the poultry processing industry relative to the beef and pork industries.
In summary, administrative authority regarding poultry as provided by the P&S Act is significantly different than the livestock provisions. In particular, the Secretary's administrative authority applies to only two financial payment provisions "Section 207, Statutory trust established; poultry" and "Section 410, Final date for making payment to cash seller or poultry grower" of the P&S Act. Analysis of industry data indicates that those areas in which P&SP has administrative authority have higher compliance rates compared to areas without administrative authority. For example, in 2009 the industry compliance rate for areas under administrative authority was 79.6 percent. The lack of compliance imposes costs on poultry growers and potentially the poultry industry. Poultry, beef, and pork compete against each other for a share of the consumer's purchasing dollar. To determine the extent of harm related to the lack of authority, an estimate was made of the cost to poultry growers. The estimate suggests a cost potentially due to lack of administrative authority of $174.4 million.

2011 Packers and Stockyards Annual Report
55
5. STATUTORY TEXT COMMISSIONING REPORT
Congress specified specific content of this P&SP Annual Report with amendments to the P&S Act. Specifically the information on the disposition of cases was mandated by the Food, Conservation, and Energy Act of 2008 (Farm Bill). The relevant amendment in the Farm Bill to the Act states:
SEC. 416. ANNUAL REPORT.
(a) In General.--Not later than March 1 of each year, the Secretary shall submit to Congress and make publicly available a report that:
(1) States, for the preceding year, separately for livestock and poultry and separately by enforcement area category (financial, trade practice, or competitive acts and practices), with respect to Investigations into possible violations of this Act--
(A) the number of investigations opened;
(B) the number of investigations that were closed or settled without a referral to the General Counsel of the Department Agriculture;
(C) for investigations described in subparagraph (B), the length of time from initiation of the investigation to when the investigation was closed or settled without the filing of an enforcement complaint;
(D) the number of investigations that resulted in referral to the General Counsel of the Department of Agriculture for further action, the number of such referrals resolved without administrative enforcement action, and the number of enforcement actions filed by the General Counsel;
(E) for referrals to the General Counsel that resulted in an administrative enforcement action being filed, the length of time from the referral to the filing of the administrative action;
(F) for referrals to the General Counsel that resulted in an administrative enforcement action being filed, the length of time from filing to resolution of the administrative enforcement action;
(G) the number of investigations that resulted in referral to the Department of Justice for further action, and the number of civil enforcement actions filed by the Department of Justice on behalf of the Secretary pursuant to such a referral;

56
(H) for referrals that resulted in a civil enforcement action being filed by the Department of Justice, the length of time from the referral to the filing of the enforcement action;
(I) for referrals that resulted in a civil enforcement action being filed by the Department of Justice, the length of time from the filing of the enforcement action to resolution; and
(J) the average civil penalty imposed in administrative or civil enforcement actions for violations of this Act, and the total amount of civil penalties imposed in all such enforcement actions; and
(2) includes any other additional information the Secretary considers important to include in the annual report.
(b) Format of Information Provided- For subparagraphs (C), (E), (F), and (H) of subsection (a)(1), the Secretary may, if appropriate due to the number of complaints for a given category, provide summary statistics (including range, maximum, minimum, mean, and average times) and graphical representations.
Through an earlier amendment to the Grain Standards and Warehouse Improvement Act of 2000 (PL 106-472, Nov. 2000), the P&S Act was amended to include the following language:
Section 415. Annual Assessment of Cattle and Hog Industries.
Not later than March 1 of each year, the Secretary shall submit to Congress and make publicly available a report that—
(1) assesses the general economic state of the cattle and hog industries;
(2) describes changing business practices in those industries; and
(3) identifies market operations or activities in those industries that appear to raise concerns under this Act. (7 U.S.C. 228d)

2011 Packers and Stockyards Annual Report
57
The U.S. Department of Agriculture (USDA) prohibits discrimination in all its programs and activities on the basis of race, color, national origin, age, disability, and where applicable, sex, marital status, familial status, parental status, religion, sexual orientation, genetic information, political beliefs, reprisal, or because all or a part of an individual's income is derived from any public assistance program. (Not all prohibited bases apply to all programs.) Persons with disabilities who require alternative means for communication of program information (Braille, large print, audiotape, etc.) should contact USDA's TARGET Center at (202) 720-2600 (voice and TDD). To file a complaint of discrimination write to USDA, Director, Office of Civil Rights, 1400 Independence Avenue, S.W., Washington, D.C. 20250-9410 or call (800) 795-3272 (voice) or (202) 720-6382 (TDD). USDA is an equal opportunity provider and employer.