2011 - pacific basin shipping limited · feedback questionnaire available at the back of this...
TRANSCRIPT

Paci�c Basin
2011A N N U A LR E P O R T

Our 2011 Annual Report is different. The changes represent our first evolutionary steps towards more “Integrated Reporting”
That should result in a more concise, better flowing and holistic review of our business
We hope this is a clearer, more useful and informative report that appeals to a broad group of stakeholders
We welcome your comments and invite you to complete a feedback questionnaire available at the back of this report and on our website at www.pacificbasin.com
Key to navigation symbols
linkage to related details within the Annual Report
linkage to related details on our website or other external sites
A glossary covering many of the terms in this document is available on our website
page
website
Our cover photo was taken by Captain Jaene S. Felipe on board our Handysize ship “Santiago Basin”, and the inside cover photo was taken by regular contributor Chris Howell of South Island, New Zealand. We wish to acknowledge them and our other staff and supporters who send in photos from time to time, for which we are very grateful

2 Who We Are
3 What We Do
4 How We Create Value
14 Pacific Basin Dry Bulk
20 PB Energy & Infrastructure Services
23 PB RoRo
6 How We Run Our Business
8 2011 Performance Highlights
10 Chairman’s Statement
27 Monitoring the Health of our Group
28 Consolidated Group Performance
32 Funding and Commitments
58 Risk
64 Corporate Governance
70 Directors & Senior Management
73 Remuneration Report
77 Report of the Directors
84 Information for Shareholders
88 News and Achievements
153 Corporate Information
38 Corporate Social Responsibility
40 Green – The Business Case
42 How We Performed in CSR
44 Environment
48 Workplace
54 Community
92 Consolidated Balance Sheet
93 Balance Sheet of the Company
94 Consolidated Income Statement
95 Consolidated Statement of Comprehensive Income
95 Consolidated Statement of Changes in Equity
96 Consolidated Cash Flow Statement
97 Notes to the Financial Statements
151 Independent Auditor’s Report
152 Group Financial Summary
01Contents
Group O
verviewBusiness Review
Financial ReviewC
SR Report
Governance
Financial Statem
ents
PACIFIC BASIN SHIPPING LIMITED • ANNUAL REPORT 2011

02
PACIFIC BASIN SHIPPING LIMITED • ANNUAL REPORT 2011
Who We are
PB RoRoPB Towage
Our VisionTo be a shipping industry leader and the partner of choice for customers, staff, shareholders and other stakeholders
Our MissionTo achieve our vision by continuously improving our standards of service and conduct
Our StrategyTo achieve sustainable growth through optimisation of our fleet and through a continuous drive for efficiency, responsibility professionalism in the way we run our business
To direct new investment towards our core dry bulk activity – patiently awaiting the right opportunities at the right price – thereby further strengthening our leading market position in the Handysize and Handymax segments
To invest further in our towage business and fleet as specific projects materialise
2011 accomplishments taking us closer to our vision
p.11& 88 Business Principleswebsite
What We Stand forWe are committed to our business, our people and our brand, so what matters to us most is:
• findingtherightsolutionstochallengesfacedbyour customers
• honouringourcommitmentsandoperatingtothe highest standards of diligence, care, safety and reliability
• thevalueoflongtermrelationshipsovershort term gain
• animbleanddynamicorganisationcapableofquick decision making
• ourhard-earned,preeminentreputation
Pacific Basin Dry Bulk
Pacific Basin is a leading owner and operator of modern Handysize and Handymax dry bulk ships. We also own and operate offshore and harbour tugs and Roll-on Roll-off freight ferries

PACIFIC BASIN SHIPPING LIMITED • ANNUAL REPORT 2011
03
Group O
verviewBusiness Review
Financial ReviewC
SR Report
Governance
Financial Statem
ents
What We Do
OUR GROUPPacific Basin is headquartered and listed in Hong Kong, we have 2,000 seafarers and 300* shore-based staff in 21 offices, and we operate globally in our three maritime segments under the banners of:
Pacific Basin Dry Bulk PB Towage#
PB RoRo
2011 Segment Net Profit Segment Net Assets (at year end)
* following our sale of PacMarine Services # previously “PB Energy & Infrastructure Services” (“PB EIS”)
Our core dry bulk business is customer focused, providing industrial users and producers
of raw materials and other dry bulk commodities with a professional, high-quality, reliable and competitive freight service, predominantly under long term cargo contracts and on a spot basis. Our service is enhanced by round-the-clock support from experienced freight and operations professionals in ten chartering offices around the world.
PB Towage# operates a fleet of modern, high-quality tugs which provide harbour towage services and offshore project
towage support for energy and construction projects, operating mainly in Australasia under the banners of PB Towage and PB Sea-Tow.
PB RoRo owns a new fleet of advanced Roll-on Roll-off ships of efficient, high-capacity design suited to the longer
coastal freight ferry routes of Europe, the Mediterranean and an increasing number of other regions around the world. PB RoRo specialises in tonnage supply through chartering its ships to specialist RoRo operators.
Handysize
Handymax
Post Panamax
Tugs & Barges
Roll on Roll off
12215107
4537
2
43*
6
0 20 40 60
Number of vessels: 218
80 100 120
OUR FLEETas at 23 February 2012
Number of newbuildings: 23
* Including 35 tugs, 7 barges and 1 bunker tanker
Full fleet description website
8
PacificBasin
Dry Bulk 700
PB Towage
232
PB RoRo323
US$ millionUS$ million
-20
0
20
40
60
80
100
81.4
10.8
-10.6
Pacific BasinDry Bulk
PBTowage#
PBRoRo

PACIFIC BASIN SHIPPING LIMITED • ANNUAL REPORT 2011
How We Create Value04
OUR DRY BULK BUSINESS MODEL
• LargestindependentownerandoperatorofmodernHandysizeshipswith9%shareoftheglobalfleetofmodern(max15years)25,000-40,000dwtbulkcarriers
• Scaleanduniformityoffleetenablecompetitiveandreliableservicetocustomersinahighlyfragmentedmarket
• Homogeneousfleetofinterchangeableshipsallowsustooptimiseourscheduling–maximisingutilisationandearningsbyreducingballastlegs
• Comprehensivein-housetechnicaloperationsfunctionenhancesourabilityasshipownersandoperatorstodeliverhigh-quality,reliableservice
• Strongreputationbasedongood,transparentperformancetrackrecordandsizeablemarketshare
• Abilitytoengagecloselywithqualitypartnersandstakeholders
• Ourbalancesheetenhancesourprofile:setsusapartasapreferredcounterpartyforcargocustomersandtonnageproviders,affordingusaccesstoexcellentbusinessopportunities
• CSRandenvironmentalprogrammes
Description of uniformity and versatility of our dry bulk fleet
p.13

PACIFIC BASIN SHIPPING LIMITED • ANNUAL REPORT 2011
05
Group O
verviewBusiness Review
Financial ReviewG
overnance Financial S
tatements
CS
R Report
Our offices, areas of activity and examples of our most frequent dry bulk trades
OUR WORLDWIDE OFFICE NETWORK
• 21officesglobally
• 14drybulkoffices–including10charteringoffices–across6continentspositionusclosetocustomers
• Enablesclearunderstandingofcustomers’needsandfirst-rate,localisedcustomerservice
• Facilitatescomprehensive,accuratemarketintelligence
OUR DRY BULK CARGO VOLUMES IN 2011
Petcoke4%Grains&AgricultureProducts16%
Logs&ForestProducts16%
OtherBulks7%
Ore6%
Salt6%
Steel&Scrap5%
Concentrates5%
Sugar4%
Alumina7%
Fertilisers8%
Cement&CementClinker8%Coal/Coke8%
Hong Kong
Auckland
Towage
Towage
Sydney
Gladstone
Melbourne
Fremantle
Manila
Shanghai
Tokyo
DalianStamford
Beijing
Santiago
Vancouver
Dubai
Nanjing
Bad EssenLiverpool
London
OUR CUSTOMER FOCUS• Customer-focusedbusinessmodelfacilitatesstrong
relationshipswithover300industrialcommodityproducersandend-users
• Enhancesaccesstospotcargoesandlongtermcargocontractopportunities
• Substantialcargocontractportfolioaffordsourcustomersaccesstoreliable,competitivelongtermfreightcoverandreducesourexposuretospotmarketvolatility
• Committedservicedeliverytocustomers
Copenhagen
PacificBasinglobaloffices Drybulkoffices Towageoffices RoRoofficeDrybulktraderouteexamples Towageoperationsarea RoRooperationsarea
Durban
33.4 Million Tonnes(2010:31.7)
PACIFIC BASIN SHIPPING LIMITED • ANNUAL REPORT 2011
How We Run Our Business06
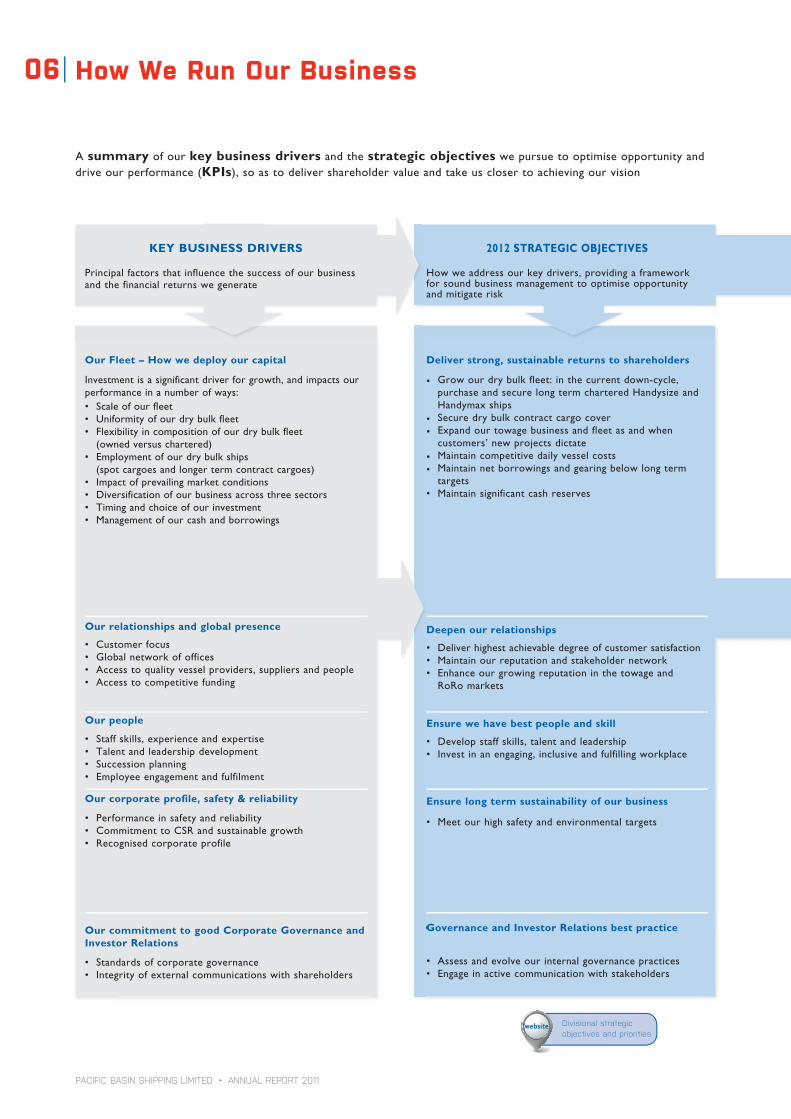
2012 STRATEGIC OBJECTIVES
How we address our key drivers, providing a frameworkfor sound business management to optimise opportunityand mitigate risk
Deliver strong, sustainable returns to shareholders
• Grow our dry bulk fleet: in the current down-cycle, purchase and secure long term chartered Handysize and Handymax ships
• Secure dry bulk contract cargo cover• Expand our towage business and fleet as and when
customers’ new projects dictate• Maintain competitive daily vessel costs• Maintain net borrowings and gearing below long term
targets• Maintainsignificantcashreserves
Deepen our relationships
• Deliver highest achievable degree of customer satisfaction• Maintain our reputation and stakeholder network• Enhance our growing reputation in the towage and
RoRo markets
Ensure we have best people and skill
• Develop staff skills, talent and leadership• Invest in an engaging, inclusive and fulfilling workplace
Ensure long term sustainability of our business
• Meetourhighsafetyandenvironmentaltargets
Governance and Investor Relations best practice
• Assess and evolve our internal governance practices• Engage in active communication with stakeholders
Governance and Investor Relations best practice
KEY BUSINESS DRIVERS
Principal factors that influence the success of our business and the financial returns we generate
Our Fleet – How we deploy our capital
Investment is a significant driver for growth, and impacts our performance in a number of ways:• Scaleofourfleet• Uniformityofourdrybulkfleet• Flexibilityincompositionofourdrybulkfleet (owned versus chartered)• Employmentofourdrybulkships (spot cargoes and longer term contract cargoes)• Impactofprevailingmarketconditions• Diversificationofourbusinessacrossthreesectors• Timingandchoiceofourinvestment• Managementofourcashandborrowings
Our relationships and global presence
• Customerfocus• Globalnetworkofoffices• Accesstoqualityvesselproviders,suppliersandpeople• Accesstocompetitivefunding
Our people
• Staffskills,experienceandexpertise• Talentandleadershipdevelopment• Successionplanning• Employeeengagementandfulfilment
Our corporate profile, safety & reliability
• Performanceinsafetyandreliability• CommitmenttoCSRandsustainablegrowth• Recognisedcorporateprofile
Our commitment to good Corporate Governance and Investor Relations
• Standardsofcorporategovernance• Integrityofexternalcommunicationswithshareholders
A summary of our key business drivers and the strategic objectives we pursue to optimise opportunity and drive our performance (KPIs), so as to deliver shareholder value and take us closer to achieving our vision
Divisional strategic objectives and priorities
website

PACIFIC BASIN SHIPPING LIMITED • ANNUAL REPORT 2011
07
Group O
verviewBusiness Review
Financial ReviewG
overnance Financial S
tatements
CS
R Report
• Underlyingprofit• Dividend per share• Operating cash to
EBITDAratio• Gearing on NBV• Revenuedays• Vesselrevenue• Fleetutilisation• Vesselcosts• Returnonnet
assets
• Earnings cover
• Staff turnover• External training
• CO2 Index• Pollution incidents• External safety
inspection record• Injury incidents &
frequency• Off-hire
• Investor meetings
KPIs
Headline measures we use to monitor progress against our strategic objectives
Financial performance
• Market Risks – Volatility in:
– freight or charter markets
– operating costs, interest rates and fuel prices
– foreign currency exchange rates
• Investment & Deployment Risk – Poor timing and
choices of ship investment, fleet composition and vessel
deployment
• Credit & Counterparty Risk – Default or breach of
obligations by our counterparties
• Insurance Risk–Inadequateinsurancecovering
maritime risks
• Liquidity Risk – Maintaining sufficient cash resources
and ability to service debt and comply with key loan-to-value covenants
• Capital Management Risk–Adequacyofprofit,operatingcashandmanagementofcapital
structure
Relationships & Customer satisfaction
• Customer Satisfaction & Reputation Risk – Damage
to the trust and support of customers and suppliers
• Banking Relationships Risk – Deterioration of our
relationships with banks and other debt providers
People and skills
• Employee Engagement Risk–Failuretoattract,
engage,developandretaintalented,qualifiedandreliable
shipping executives, seafarers and specialist staff
Safety, environment and reliability
• Safety Risk–Inadequatesafety,operationalandtrainingstandardsonourvesselsandpiracythreat
• Environmental Risk–Inadequatesystemsandinitiativestoreduceourenvironmentalimpacts
• Vessels & Systems Risk–Failuretooperateandutilisereliable,high-qualityvessels,equipmentand
systems resulting in periods of vessel off-hire
Maintaining investor & stakeholder confidence
• Corporate Governance Risk–Inadequatecorporategovernancestructureresultingin
unprofessionaldecisionmakingandreducedstakeholdersconfidenceintheCompany
• Investor Relations Risk–Poorqualityorinaccurateexternalcommunicationofourbusiness
PBTowage–Atightandregulatedlabourmarketandsubstantial resource shortages in Australia make it difficulttoattractskilledtugcrewandqualityshorestaff
PacificBasinDryBulk–Failuretomaintaincloserelations with shipyards and ship owners may severely limit access to the best Handysize and Handymax vessels
PBRoRo–TheRoRochartermarketisseverelydepressed making profitable employment difficult until we see a sustained revival in existing RoRo trades or the establishment of new trades. Delayed market recovery will lead to further losses for our RoRo division
Pacific Basin Dry Bulk – An inability to grow our long term cargo book in tandem with our fleet would result in increased exposure to the more volatile spot freight market
PBTowage–Marketshifts,competitivethreatsandcost escalation prevalent in the Australasian towage segment could adversely impact financial performance
RISKS
Principal risks that might derail our progress towards achieving our vision and impact shareholder value
Risk managementp.58
Examples of current risks faced by our divisions

PACIFIC BASIN SHIPPING LIMITED • ANNUAL REPORT 2011
2011 Performance Highlights08KPIs – monitoring thehealth of our group
p.27
Revenue and Net Profit
Revenue Net profit
$32 69.3%MILLIONNET PROFIT
US$ Million
2009200820072006 20100
200
400
600
800
1,000
1,200
1,400
1,600
1,800
104.3
1,268.5
32.0
1,342.5
2011
Cash Position
$618 12.1%
US$ Million
20102009200820072006
0
200
400
600
800
1,000
1,200
703.4
618.2
2011
MILLION
19.7%
Operating Cash Flow
$159US$ Million
0
100
200
300
400
500
198.6
159.4
2009 2010200820072006 2011
MILLION
131 14.9% 7%
Our Dry Bulk Fleet Size Average number of ships on the water
2009 2010200820072006
0
20
40
60
80
100
120
140131
2011
114
SHIPS
Group
53.5%
Dividend per Share
HK¢10HK Cents
2009 2010200820072006 2011
0
20
40
60
80
100
120
140
21.5
10
55
Proposed final dividend
Segment Net Profit
MILLIONDRY BULK$81 43.8%
-20%
0%
20%
40%
60%
80%
100%
0
50
100
150
200
250
Earnings per Share & Return on average Equity
HK¢13 69.0%
EPS Return on average Equity
2009 2010200820072006 2011
HK Cents
EPS
PB Dry Bulk PB EIS PB RoRo
US$ Million
Note: Segment reporting was adopted in 2009
0
20
-20
40
60
80
100
120
140
160
2009 2010
-1.1
4.9
144.9
-10.6
10.8
81.4
2011
7%
13
2%42
Handysize Revenue Days & Daily Rates
$13,530
Revenue Days Daily TCE (US$) Cost (US$)
2009200820072006 2010 2011
0
5,000
10,000
15,000
20,000
25,000
30,000
35,000
$11,970
29,070 days
32,710 days
$16,750
$10,680
$13,530
Revenue days & US$/day
19.2%
Handysize Contract Cover as at annual results announcement date
54%Revenue days & US$/day
Unfixed days TCEFixed days
2009200820072006 2010
59%
47%
2011 2012
0
5,000
10,000
15,000
20,000
25,000
30,000
$11,
480
54%
$13,
340
47%
PER DAY
Dry Bulk
PACIFIC BASIN SHIPPING LIMITED • ANNUAL REPORT 2011
09
Group O
verviewBusiness Review
Financial ReviewC
SR Report
Governance
Financial Statem
ents
BUSINESS HIGHLIGHTS
RESPECTABLE PERFORMANCE IN DIFFICULT MARKET CONDITIONS
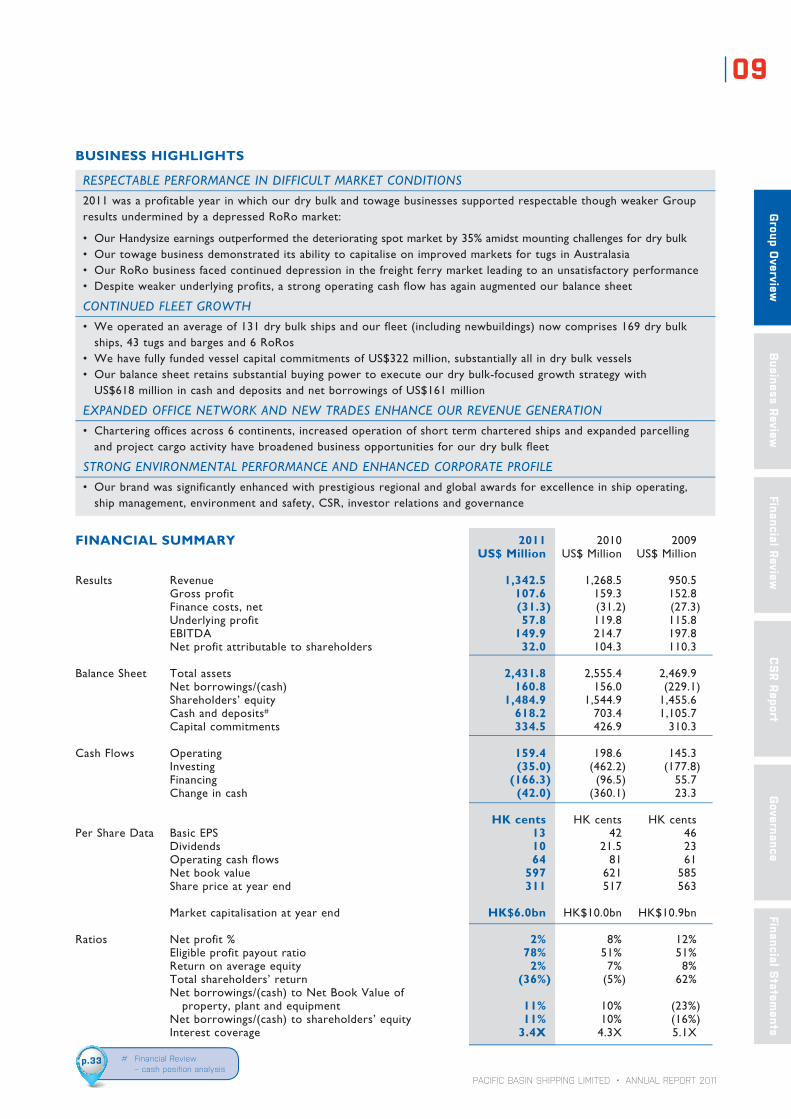
2011 was a profitable year in which our dry bulk and towage businesses supported respectable though weaker Group results undermined by a depressed RoRo market:
• OurHandysizeearningsoutperformedthedeterioratingspotmarketby35%amidstmountingchallengesfordrybulk• OurtowagebusinessdemonstrateditsabilitytocapitaliseonimprovedmarketsfortugsinAustralasia• OurRoRobusinessfacedcontinueddepressioninthefreightferrymarketleadingtoanunsatisfactoryperformance• Despiteweakerunderlyingprofits,astrongoperatingcashflowhasagainaugmentedourbalancesheet
CONTINUED FLEET GROWTH
• Weoperatedanaverageof131drybulkshipsandourfleet(includingnewbuildings)nowcomprises169drybulkships, 43 tugs and barges and 6 RoRos
• WehavefullyfundedvesselcapitalcommitmentsofUS$322million,substantiallyallindrybulkvessels• Ourbalancesheetretainssubstantialbuyingpowertoexecuteourdrybulk-focusedgrowthstrategywith
US$618 million in cash and deposits and net borrowings of US$161 million
EXPANDED OFFICE NETWORK AND NEW TRADES ENHANCE OUR REVENUE GENERATION
• Charteringofficesacross6continents,increasedoperationofshorttermcharteredshipsandexpandedparcellingand project cargo activity have broadened business opportunities for our dry bulk fleet
STRONG ENVIRONMENTAL PERFORMANCE AND ENHANCED CORPORATE PROFILE
• Ourbrandwassignificantlyenhancedwithprestigiousregionalandglobalawardsforexcellenceinshipoperating,ship management, environment and safety, CSR, investor relations and governance
FINANCIAL SUMMARY 2011 2010 2009 US$ Million US$ Million US$ Million
Results Revenue 1,342.5 1,268.5 950.5 Gross profit 107.6 159.3 152.8 Finance costs, net (31.3) (31.2) (27.3) Underlying profit 57.8 119.8 115.8 EBITDA 149.9 214.7 197.8 Net profit attributable to shareholders 32.0 104.3 110.3
Balance Sheet Total assets 2,431.8 2,555.4 2,469.9 Net borrowings/(cash) 160.8 156.0 (229.1) Shareholders’ equity 1,484.9 1,544.9 1,455.6 Cash and deposits# 618.2 703.4 1,105.7 Capital commitments 334.5 426.9 310.3
CashFlows Operating 159.4 198.6 145.3 Investing (35.0) (462.2) (177.8) Financing (166.3) (96.5) 55.7 Change in cash (42.0) (360.1) 23.3
HK cents HK cents HK centsPer Share Data Basic EPS 13 42 46 Dividends 10 21.5 23 Operatingcashflows 64 81 61 Net book value 597 621 585 Share price at year end 311 517 563
Market capitalisation at year end HK$6.0bn HK$10.0bn HK$10.9bn
Ratios Net profit % 2% 8% 12% Eligible profit payout ratio 78% 51% 51% Return on average equity 2% 7% 8% Total shareholders’ return (36%) (5%) 62% Net borrowings/(cash) to Net Book Value of property, plant and equipment 11% 10% (23%) Net borrowings/(cash) to shareholders’ equity 11% 10% (16%) Interest coverage 3.4X 4.3X 5.1X
# Financial Review – cash position analysis
p.33

PACIFIC BASIN SHIPPING LIMITED • ANNUAL REPORT 2011
Chairman’s Statement10
FINANCIAL RESULTS & DIVIDEND
The Group produced a net profit of US$32 million (2010: US$104 million) from an underlying profit of US$58 million. Basic EPS was HK$0.13 and return on shareholders’ equity was 2%. Our Operating cash flow remained strong at US$159 million (2010: US$199 million).
Our results for the year were impacted by:
1. weaker Handysize spot rates which drove a 19% decrease in our Handysize daily earnings and a 23% decrease in operating cash flow;
2. improved towage markets and a strong US$15 million contribution from PB Towage;
3. a significant US$80 million non-cash impairment of our RoRo investment as reported in our interim results; and
4. a partially offsetting net profit of US$56 million on the sale of a non-core asset (Green Dragon Gas) in the first half of the year.
The Board has recommended a final dividend of HK 5 cents per share bringing the total for 2011 to HK 10 cents per share (2010: HK 21.5 cents), representing a payout ratio of 78% of profits.
PERFORMANCE OVERVIEW
Our core dry bulk shipping business delivered a respectable performance in 2011 against the backdrop of a significantly weaker market.
Our average Handysize daily earnings outperformed the market, falling only 19% year on year to US$13,530 per day, as compared to spot freight rates which fell 36% to US$10,025 per day. Our performance was enhanced by the value of our cargo book throughout the period and by our business model which continues to ensure a world-class service for customers while delivering value for our shareholders and other stakeholders.
While our Handymax earnings outperformed the market by 10%, our Handymax results were disappointing due mainly to our reliance on relatively expensive short term chartered ships and the cost of repositioning ships into more favourable areas in response to the Queensland floods in early 2011.
A SOUND PLATFORM FOR DELIVERING A WORLD-CLASS SERVICE, SUSTAINABLE LONG TERM GROWTH AND SHAREHOLDER VALUE
See Business Review and Financial Review for more on our three divisions
p.13& 26

PACIFIC BASIN SHIPPING LIMITED • ANNUAL REPORT 2011
11
Group O
verviewBusiness Review
Financial ReviewG
overnance Financial S
tatements
CS
R Report
In the drive towards our vision, we have made progress on a number of other strategic business areas focusing on...
...WHAT WE BELIEVE MATTERS MOST TO PACIFIC BASIN: OUR BUSINESS , OUR PEOPLE AND OUR BRAND
CORPORATE PROFILE
For almost 25 years, Pacific Basin has built a strong name as a specialist Handysize bulk carrier owner and, since 1998, has evolved into an industrial provider of freight services directly to producers and end-users of raw materials and commodities.
Our performance and market share in our minor bulks focus area have earned us a strong reputation, allowing us to engage closely with excellent partners and stakeholders, including customers, ship owners, shipyards, suppliers and some of the best people in our industry. Our reputation and track record, supported by our strong balance sheet, set us apart as a preferred counterparty for cargo customers and tonnage providers, affording us access to long term business opportunities.
GOVERNANCE, ENVIRONMENT AND CSR
We believe good corporate governance and the rigour it brings to our decision-making process is central to a professionally managed company. Since our listing on the Hong Kong Stock Exchange in 2004, we have developed a solid corporate governance structure to underpin all other core components of our business and to enhance stakeholder confidence in Pacific Basin as a place to invest.
We target high standards of corporate social responsibility in the areas of Environment, Workplace and Community. While we have touched on these in our past annual reports, we now incorporate a CSR Report with a more detailed account of our environmental performance and other initiatives for a sustainable future.
Our standards of corporate governance and commercial, technical, safety, investor relations and CSR management have been increasingly recognised in recent years, with Pacific Basin winning prominent awards in all these areas.
I am happy to report that our efforts in the field of environmental responsibility were rewarded with the Environment Award at Lloyd’s List Global 2011.
PB Energy & Infrastructure Services (now renamed “PB Towage”) had a much improved year led by our towage activity despite losses on the closure of our Fujairah infrastructure business. Our towage team demonstrated its ability to capitalise on improved markets for offshore and harbour tugs in Australasia to generate a strong contribution to Group results.
However, continued depression in the Euro-centric RoRo market and suspension of the Nafta Gulf Bridge service have led to another disappointing year for our RoRo division, which has significantly impacted our results following the impairment in the middle of the year.
INVESTMENT AND BALANCE SHEET
As at 31 December 2011, we had cash and deposits of US$618 million and net borrowings of US$161 million. During the year, six new dry bulk purchase commitments were made. Our vessel capital expenditure obligations currently amount to US$322 million payable in the next three years in respect of 16 ships, leaving substantial buying power on our balance sheet for further fleet expansion.
VISION AND STRATEGY
In 2011, we formalised our Company’s vision, mission and a collection of business principles which have defined Pacific Basin for many years. Those business principles speak of commitment, motivation, diligence, respectfulness and other traits that make Pacific Basin what it is today.
Strategically, we seek to achieve sustainable growth through optimisation of our fleet of ships, and through a continuous drive for efficiency, responsibility and professionalism in the way we run our business. We are confident that we have positioned ourselves appropriately to grow and weather these challenging times.
We continue to direct new investment predominantly towards our core dry bulk activity – patiently growing our owned fleet and equipping ourselves with improved tools to support our increased scale – thereby further strengthening our leading market position in our segments.
We took a significant step forward last year in equipping ourselves with an upgraded maritime operating system and new processes to match. These are already generating meaningful efficiencies, enabling our existing team to manage more ships and optimise our service to customers.
Awards in 2011p.88Vision & Missionp.2 CSR Reportp.38

PACIFIC BASIN SHIPPING LIMITED • ANNUAL REPORT 2011
Chairman’s Statement12
OUR PEOPLE
Our Captain Zhu Qianchun’s receipt of Lloyd’s List’s “Seafarer of the Year” award perhaps says most about our Company: we are only as good as our staff at sea and ashore, and we believe our team comprises some of the best people in shipping. That team does not come together overnight, but is the result of considered investment in our staff and their workplace. Our diverse staff represent over 30 nationalities and it is they – combined with the quality of our management and governance standards – who make our vision possible.
Captain Zhu’s Tsunami battle
OUTLOOK
Notwithstanding – and in part because of – the prevailing challenging markets, the Board continues to be confident in our current strategy, objectives and business model and our ability to deliver a world-class service, sustainable long term growth and shareholder value.
We expect dry bulk freight rates will be weaker overall in 2012. The dry bulk shipping market is in crisis, facing excess ship supply and a significant contraction in funding for secondhand and newbuilding purchases. For banks, this is in part due to tighter regulatory requirements and to covenant defaults by some clients requiring loans to be restructured or repaid. This crisis may generate fleet expansion opportunities at attractive prices for cash rich owners like ourselves.
With upgraded systems and processes in place to complement our business model and strong balance sheet, we have a unique framework on which to build our dry bulk fleet organically through the acquisition of ships or fleets at the right time and price.
The outlook for the towage market and our PB Towage business in Australasia is promising for the year ahead, but demand and supply side challenges are expected to drive continued severe weakness in the RoRo charter market.
Therefore, our key strategic objectives for the Group in 2012 are to:
Direct new investment predominantly towards expansion of our owned fleet of dry bulk ships, patiently awaiting and capitalising on acquisition opportunities we expect to arise
Grow our dry bulk customers and cargo contract portfolio in tandem with expansion of our core fleet in order to manage our market exposure
Invest further in our towage business and fleet as specific projects materialise in the increasingly active offshore projects market
Enhance our towage organisation with the aim of improving the execution efficiency of our project towage business
Secure best possible charters and utilisation for our RoRo fleet in what will be another very challenging year, with no plans to invest in expansion of our RoRo fleet
Consider opportunities for further divestment of non-core businesses
IN CLOSING
We bid a sad farewell to our outgoing CEO Klaus Nyborg whom we thank for managing our business so capably during his tenure and for inspiring so many of us here at Pacific Basin. We wish him well for the future back home in Denmark. Klaus will be leaving us on 15 March and we expect to announce his successor by the end of March.
On a final note, the Board joins me in thanking our conscientious staff and loyal customers and other stakeholders for their commitment to the Company over the past year and their continued support in the future.
David M. TurnbullChairmanHong Kong, 1 March 2012
p.38
PACIFIC BASIN SHIPPING LIMITED • ANNUAL REPORT 2011
13
Group O
verviewBusiness Review
Financial ReviewG
overnance Financial S
tatements
CS
R Report
Business Review14 Pacific Basin Dry Bulk
20 PB Energy & Infrastructure Services
23 PB RoRo
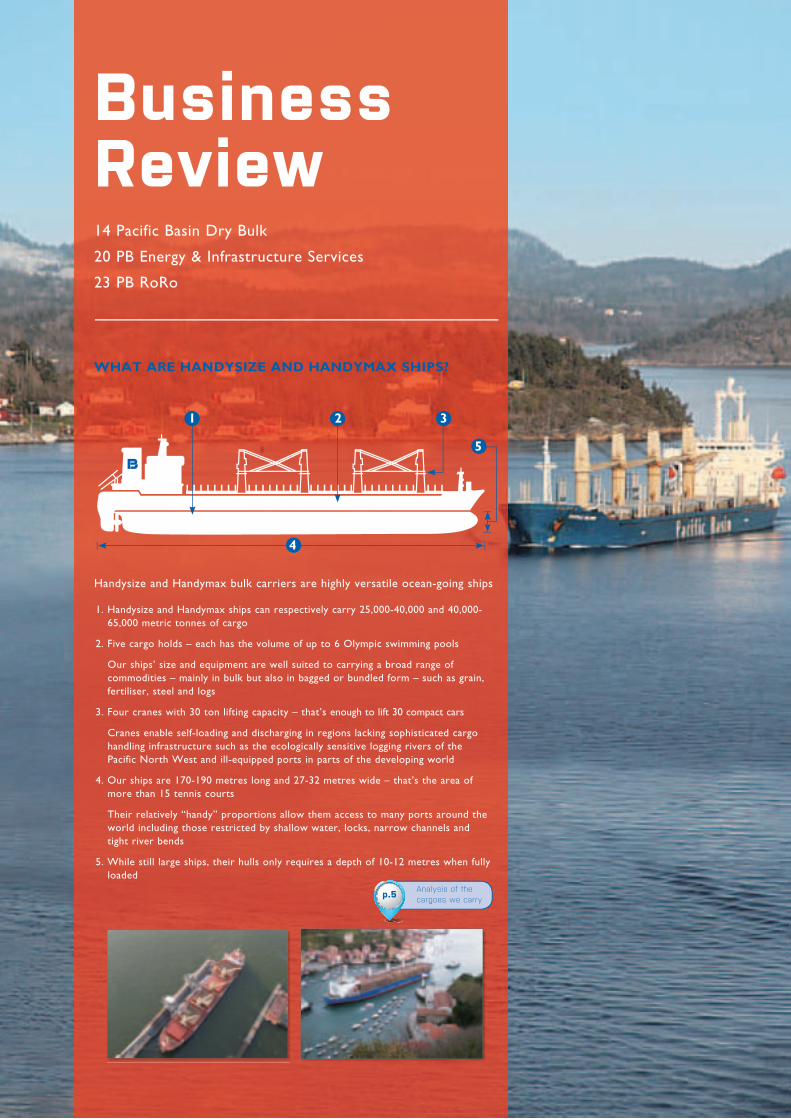
1. Handysize and Handymax ships can respectively carry 25,000-40,000 and 40,000-65,000 metric tonnes of cargo
2. Five cargo holds – each has the volume of up to 6 Olympic swimming pools
Our ships’ size and equipment are well suited to carrying a broad range of commodities – mainly in bulk but also in bagged or bundled form – such as grain, fertiliser, steel and logs
3. Four cranes with 30 ton lifting capacity – that’s enough to lift 30 compact cars
Cranes enable self-loading and discharging in regions lacking sophisticated cargo handling infrastructure such as the ecologically sensitive logging rivers of the Pacific North West and ill-equipped ports in parts of the developing world
4. Our ships are 170-190 metres long and 27-32 metres wide – that’s the area of more than 15 tennis courts
Their relatively “handy” proportions allow them access to many ports around the world including those restricted by shallow water, locks, narrow channels and tight river bends
5. While still large ships, their hulls only requires a depth of 10-12 metres when fully loaded
WHAT ARE HANDYSIZE AND HANDYMAX SHIPS?
Handysize and Handymax bulk carriers are highly versatile ocean-going ships
Analysis of the cargoes we carryp.5
1 2 3
4
5

14
PACIFIC BASIN SHIPPING LIMITED • ANNUAL REPORT 2011
Pacific Basin Dry Bulk
2011 DRY BULK MARKET REVIEW
FREIGHT MARKET SUMMARYThe dry bulk freight market was weaker and less volatile in 2011.
The market for Handysize and Handymax bulk carriers got off to a poor start and, despite some recovery in the second quarter, remained largely flat over the remainder of the year. Handysize spot rates traded in a narrow band and averaged US$10,025 per day in 2011 – down 36% year on year. Average Supramax rates also decreased 36% to US$13,680.
By contrast, average earnings for larger Capesize ships fell 53% and were more volatile, once again reflecting their greater sensitivity to market influences and a diminished correlation with earnings of other dry bulk segments since 2008.
2012 has again started poorly with a sharp decline in freight rates to 26-year lows attributable to the traditional rush of newbuilding deliveries in the new year, and the magnified impact on the dry bulk market of seasonal disruptions in increasingly influential dry bulk trade areas: monsoons in India and Southeast Asia, heavy rainfall in Brazil, cyclones in Australia, and winter and the Lunar New Year in China.
KEY DEMAND DEVELOPMENTSDry bulk transportation demand in 2011 is estimated by R.S. Platou to have increased by 10% reflecting the relatively healthy state of dry bulk activity last year, albeit offset by excessive expansion of supply.Seasonal disruptions affected demand and rates for bulk carriers early in the year, though the market then benefited from a resurgence in imports to China which continued to dominate dry bulk developments:• Chineseminorbulkimportsincreasedsignificantly
– 37% more logs and forestry products imported and proportionally more sourced from further afield compounding demand for our logs-fitted ships
– 92% more nickel and 49% more bauxite driving a five-fold increase in the bauxite volumes we carried
– 12% more manganese and 11% more fertilisers
DEMANDDRIVERS
IMP
AC
TIN
G S
HIP
VA
LU
ES
• Seaborneironoreandcoalimportsexperiencedaslowfirst half and record-breaking second half to grow 11% and 10% respectively in the year overall; increased ore imports from less traditional sources benefitted demand for smaller vessel types
• Domesticdrybulkactivitycontinuedtogrowstronglyat around 20% absorbing capacity otherwise competing in international trades
India also played a more prominent role in 2011:• ReducedIndianoreexportscausedFarEasternbuyers
to source from non-traditional exporters further afield, thereby increasing tonne-mile demand and benefiting smaller vessels not normally engaged in ore trades
• Indiancoalimportsincreased11%andwenotedover 30% growth in Indian imports of logs from New Zealand
The relatively stable freight market (BDI) ended the year 3% higher than it began – evidencing the strength of dry bulk demand when the global fleet expanded at a record pace.
China Seaborne Imports of Forestry Products
Source: Clarksons
2006 2007 2008 2009 2010 2011
Million Tonnes
0
5
10
15
20
25
30
35
40
+37%
Logs & forestry products comprised 16% of PB volumes in 2011 (+33% volume increase YoY) 28.9
39.6
China Imports of Manganese Ore
Source: Bloomberg
2006 2007 2008 2009 2010 2011
Million Tonnes
0
2
4
6
8
10
12
14
+12%
11.6
13.0
Source: RS Platou Markets
International cargo volumes Congestion effectTonne-mile effect
Dry Bulk Fleet Demand
-6
-3
0
3
6
9
12
15
2011E
% Change YOY
2005 2006 2007 201020092008
13.8
9.6
China coastal cargo effect Net demand growth
Baltic Dry Index (BDI) VersusBaltic Handysize Index (BHSI) & Baltic Capesize Index (BCI)
Source:TheBalticExchange,dataasat27February2012
Apr-11 Jul-11 Oct-11 Jan-12Jan-11
BCI –US$5,625
BDI – 730
BHSI – US$5,740
0
500
1,000
1,500
2,000
2,500
3,000
$0
$5,000
$10,000
$15,000
$20,000
$25,000
$30,000
$35,000
Manganese ore & concentrates comprised 2% of PB volumes in 2011 (-21% volume decrease YoY)
BDI US$/day (net rate)

15
PACIFIC BASIN SHIPPING LIMITED • ANNUAL REPORT 2011
Group O
verviewBusiness Review
Financial ReviewG
overnance Financial S
tatements
CS
R Report
0
2
4
6
8
10
12
SHIP VALUESClarksons estimates the current value of their benchmark five year old Handysize (now defined as 32,000 dwt) to have fallen 22% year on year to US$19.5 million, which is now down to the levels seen in early 2009. Newbuilding prices fell to a similar degree and, at current prices, shipyards are struggling to remain profitable – especially as their costs increase – hence we expect to see more shipyard closures.
ORDERBOOKChallenging market conditions led to a more than 80% reduction in new ship ordering activity in 2011 which, combined with the heavy influx of new ship deliveries, has resulted in a significant reduction in the overhang of dry bulk ships on order.Asat1February2012, the orderbook for Handysize vessels stood at 23% – down by over one third year on year – as compared with 30.5% for dry bulk overall.
Handysize(25,000-39,999 dwt)
Total Dry Bulk > 10,000 dwt
Orderbook as % of existing fleet
23%
27%
40%
31%
30.5%
Average age
14
10
9
8
14%
5%
4%
Handymax(40,000-64,999 dwt)
Panamax & Post-Panamax(65,000-119,000 dwt)
Capesize(120,000+ dwt)
Orderbook by Year Handysize Orderbook Handysize Age ProfileMillion Dwt Million Dwt
2014+
1.2%
16.6%
2014+2012 20122013 2013
0-15 years30+ years
25-29 years
16-24 years
Source:Clarksons,dataasat1February2012
Over 25 years old
33%
Source: Clarksons
US$ Million
Secondhand Handysize Vessel Values(5 Year Old 32,000 Dwt)
2003 2004 2005 2006 2007 2008 2009 2010 2011 2012
Handysize Orderbook Handysize Age Profile
5.2%
0
20
40
60
80
100
120
140
2.1%
8.7%
19.7%
57%
10%
23%
10%
10152025303540455055
Feb 2012:US$19.5 million
2,091 Vessels (66.8 million dwt)
Source: ClarksonsSource: Clarksons
SU
PP
LY
D
RIV
ER
S
KEY SUPPLY DEVELOPMENTSThe global fleet of 25,000-40,000 dwt Handysize ships in which we specialise expanded by 7% net during 2011.
Overall dry bulk capacity expanded by 14% net during the year. This was driven by the delivery of 96 million deadweight tonnes of new capacity – 30% below the scheduled orderbook at the start of 2011, but still 20% more than the previous record deliveries of 2010.
The heavy influx of newbuildings was moderated by record-high scrapping with 22 million tonnes of dry bulk capacity sold for demolition (largely during the weaker freight market in the first half of the year) of which 15% (3.4 million tonnes) was attributable to the Handysize segment.
The freight market was in part also supported by increased inefficienciesinthetradingofthedrybulkfleetastheEast-Westtradeimbalance resulted in ships spending more time in ballast. High fuel prices exacerbated the uneven availability of ships by increasing the cost of ballasting to Atlantic load ports from the dominant discharge regions in the Pacific, and combined with lower earnings to stimulate slower steaming of the fleet.
Global Dry Bulk Fleet DevelopmentMillion Dwt
Dry Bulk Scrapping Versus BDIMillion Dwt BDI
0123456789 0
500
1,000
1,500
2,000
2,500
3,000
3,500
4,000Q109 Q209 Q309 Q409 Q110 Q210 Q310 Q410 Q111 Q311 Q411Q211
2011:22 million
-6
14%
-22-40-20
020406080
100120
9680
-6%-3%0%3%6%9%12%15%18%17%
2005 2007 2008 20102009 20112006
Source: Clarksons
Conversions ScrappingYard deliveries
Net fleet growth YOY
Source: Clarksons, Bloomberg
Handysize scrapping(25,000-39,999 dwt)
Other dry bulk scrapping BDI

16
PACIFIC BASIN SHIPPING LIMITED • ANNUAL REPORT 2011
Pacific Basin Dry Bulk
KPI Revenue Days and TCE (vs Market Indices) Daily Opex Costs
Handysize Handymax Handysize Handymax
Aim
To grow our Handysize and Handymax fleets to increase the revenue generation, flexibility and reliability of our core dry bulk business
To maximise our daily earnings by leveraging:• theflexibilityofourlargeuniformfleet• ourschedulingandtraderoutes• thestrengthofourcargobook
To maintain competitive average daily ship operating expenses (opex)
Per
form
ance
Our Handysize average daily charter rates earned in 2011 outperformed the market index by 35%
Weoperatedanaverageof90Handysizeand39Handymax ships in 2011, resulting in a 13% and 16% increase in our Handysize and Handymax ship revenue days respectively
Our owned vessel daily operating expenses increased in 2011 mainly due to higher crew wages and, for Handymax, also due to higher maintenance costs
Tar
get
To grow our revenue days by expanding our owned and chartered fleet subject to cost, market developments and opportunities. One secondhand ship and 24 newbuildings are currently scheduled to join our fleet in 2012-2014
To be profitable in all market conditions, leveraging our competitive tonnage portfolio and solid cargo book so our daily earnings outperform market indices through the market cycle
To minimise escalation of our operating expenses at a time of significant wage inflation
HOW DID PACIFIC BASIN DRY BULK PERFORM IN 2011?
Our core Pacific Basin Dry Bulk division generated a significantly reduced but still respectable net profit of US$81 million, an 11% return on net assets and a relatively strong operating cash flow of US$138 million.
This weaker performance year on year mainly reflected a 19% decrease in our average Handysize daily earnings, but represented a good performance in the context of a significantly weaker market in which average Handysize spot rates fell 36%.
Once again, our ability to outperform the market was shaped by an increase in the number of ships we operated, the value of our cargo book throughout the period, and our strong, global organisation.
$3,900 per day 2%
2,700
2,900
3,100
3,300
3,500
3,700
3,900
4,100
4,300
3,830
3,900
201120102009200820072006
US$/day
$4,810 per day 20%
3,000
3,500
4,000
4,500
5,000
5,500
4,020
4,810
201120102009200820072006
US$/dayRevenue days &US$/day
0
5,000
10,000
15,000
20,000
25,000
30,000
35,000
5,000
10,000US$10,024
US$13,530
32,7
10 d
ays
29,0
70 d
ays
20112010200920082006 2007Revenue days TCE BHSI (net rate)
35% Outperformance compared to market
20112010200920082006 2007
Revenue days US$/day
0
2,000
4,000
6,000
8,000
10,000
12,000
14,000
10,000
20,000
30,000
40,000
50,000
US$13,679US$15,090
13,3
10 d
ays
11,4
50 d
ays
Revenue days TCE BSI (net rate)
10% Outperformance compared to market
Further analysis of PB Dry Bulk performance
p.30
Dry Bulk net profit US$81.4m
Handysize
Handymax
US$89.8m
US$(8.4)m
Operating cash flow US$138m
Return on net assets 11%

17
PACIFIC BASIN SHIPPING LIMITED • ANNUAL REPORT 2011
Group O
verviewBusiness Review
Financial ReviewG
overnance Financial S
tatements
CS
R Report
KPI Cargo Cover and Rates Return on Net Assets Off-hire
Handysize Handymax
Aim
To grow our cargo book at profitable rates thereby locking in sustainable future earnings
(This KPI is measured as at the time of our annual results announcement)
To deliver sustainable growth and a healthy return on our dry bulk division’s assets
(Segment reporting was adopted in 2009 and so Group return on net assets is shown for prior years for indication only)
To minimise our vessel down-time to support revenue maximisation and reliability of service to customers
Per
form
ance
Wehavecovered54%ofourHandysizerevenuedaysand 75% of our Handymax revenue days currently contracted for 2012
This 2012 cover has been secured at average rates of US$11,480 and US$11,850 respectively
A lacklustre dry bulkmarket impacted the division’s net profits resulting in a still respectable 11% return on net assets
Weachievedacompetitive off-hire rate of 1.2 days per ship in 2011
Tar
get
Weseektocover50-55%ofourHandysizerevenuedays for the year by the time of our annual results announcement
Wetargettodeliverreturns on net assets of at least 10% through the market cycle
Wesetourselvesanambitious off-hire target of no more than 0.7 days per ship per year (excluding dry docking)
1.2 days
20112008 2009 2010200720060.0
0.2
0.4
0.6
0.8
1.0
1.2
1.4
1.6
1.81.6
1.2
Days/ship
25%
KPI Cargo Cover and Rates Return on Net Assets Off-hire
Strategic Objectives
• AstuteinvestmentofcapitalthroughwellconsideredHandysizeandHandymaxfleetexpansionanddeployment
• Outperformourmarketandimprovecost-competitivenesstomaximiseresults,targeting>10%returnonnet assets
• Builddeeper,broadercustomerrelationships
• Enhanceourindustry-leadingorganisationandreputation,andthequalityandreliabilityofshipoperations
• Strivetohavebestpeoplethroughinvestmentinstaffdevelopmentandstaffengagement
Dry Bulk KPIsOur performance and progress against certain key divisional strategic objectives are measured by Key Performance Indicators as follows:
11% 10%
2011201020090%
10%
20%
30%
40%
50%
60%
70%
80%
21%
11%
20082007
85%
2009 2010 2011 2012200820070
1,000
2,000
3,000
4,000
5,000
6,000
7,000
8,000
0
10,000
20,000
30,000
40,000
50,000
Revenue days
Fixeddays Unfixed days TCE
US$
15,8
20
Asat27February2012
Revenue days & US$/day
Fixeddays
Asat27February2012
Unfixed days TCE
CSR Section – disclosure of our carbon emissions and other CSR KPIs
p.42
US
$11,
850
85%
75%
US$/days
2009 2010 201220112008200720060
5,000
10,000
15,000
20,000
25,000
30,000
US$
13,3
40
US
$11,
480
47%
54%

18
PACIFIC BASIN SHIPPING LIMITED • ANNUAL REPORT 2011
Pacific Basin Dry Bulk
BUSINESS HIGHLIGHTS
Wetookseveralsuccessfulstepsinourcoredrybulkbusiness in 2011 to move us closer to our vision for the Group. They relate mainly to the expansion of our dry bulk fleet and global presence, growing our customer base and relationships, and enhancing our efficiency both on shore and at sea.
• Scale of our fleet–Weoperatedanaverageof131dry bulk ships (up from 114 in 2010), operating more short term chartered-in Handysize ships to profitably supplement our core fleet activity and to service our growing customer base. Since this time last year, we committed to purchase or long term charter in another 11 dry bulk ships, and we now await the delivery of one secondhand bulk carrier and 14 owned and nine chartered newbuildings in 2012 to 2014.
Reflecting well on our strategic priority to grow our dry bulk fleet, the benefits of increasing scale continue to be apparent in our business and now enable us to providecustomerswithatrulyglobalservice.Wedonot see a limitation to what constitutes the optimum fleet size.
• Strong global presence and customer relationships–Wenowhave14drybulkoffices(including ten chartering offices) across six continents, having opened new offices in Stamford and Durban to boost our growing Atlantic platform and a new presence in Beijing to enhance our Pacific network. This expansion of office network positions our chartering staff even closer to our North American, African and Chinese customers as we expand our fleet and activity globally, and generated an almost immediate effect on our long term cargo book. Approximately 40% of our business is now in the Atlantic, where the spot market generally has been stronger due to tighter availability of ships.
Weincreasedouractivityintheparcellingandprojectcargo trades generating access to new customers and business opportunities for our ships, differentiating us from many of our bulk-focused competitors.
• Efficiency initiatives – Our new maritime operating system was implemented on time and within budget, and is already proving its value as an appropriately advanced IT platform to support our continued future fleetgrowth.Wehaveachievedsignificantfuelsavingsthrough the in-house development and implementation of our Right Speed Programme to determine optimal operating speeds based on prevailing freight rates and fuel prices. Other such initiatives included cylinder lubrication optimisation, negotiation of block agreements with dry docks and the more economic bulk purchase of stores.
• Other projects – Our 115,000 dwt Post-Panamax newbuilding delivered in July and promptly commenced her 15-year charter to one of China’s largest power producers. A 95,000 dwt Post-Panamax bulk carrier delivered into our long term chartered fleet in May and is relet on a back-to-back profit-share basis for the full 10-year charter period.
• Handymax–WhileourHandymaxbusinessisbuildinga strong long term forward book and our earnings outperformed the market by 10%, our Handymax results were disappointing due to our reliance on relatively expensive short term chartered ships to perform lower priced long term cargo contracts. Results, particularly in the first half of the year, were also negatively impacted by the cost of repositioning a number of our vessels into more favourable locations, partlyinresponsetothefloodsinAustralia.Wehave started the process of growing our core fleet of low cost Handymax ships and expect to improve our Handymax margins as we become less reliant on short term chartered ships.

19
PACIFIC BASIN SHIPPING LIMITED • ANNUAL REPORT 2011
Group O
verviewBusiness Review
Financial ReviewG
overnance Financial S
tatements
CS
R Report
OUTLOOK FOR OUR DRY BULK BUSINESS
Weanticipatethedrybulkmarkettoremainweakduring the first half of the year until a revival in activity provides scope for buoyancy in the second half.Weexpectfreightrateswillbeweakeroverallin2012 as the market will likely struggle to absorb the continued influx of newbuilding deliveries at a time of uncertaintyintheWorldeconomy.
Our exposure to a potentially weaker freight market ispartlylimitedbyourcargobook.Wehavecontractcover in place for 54% and 25% of our Handysize revenue days in 2012 and 2013 respectively and we currently expect the majority of our uncovered 2012 revenue days will generate revenue from the spot market.Wecontinuetobuildourforwardcargobook for 2012 and beyond.
Weremaincommittedtoourstrategyofdirectingnew investment towards the further expansion of our dry bulk fleet – patiently awaiting the right opportunities at the right price – and we have the platform on which to grow organically through the acquisition of individual ships or fleets.
2012 MARKET OUTLOOK – DRY BULK
OPPORTUNITIES
• China’ssignificantalbeitslowingeconomicandindustrial growth to support continued dependence on imported minor bulks
• GrowthinChina’sdominantshareofglobalbulkimports, driving further trade imbalance and fleet utilisation inefficiencies
• Continuedhighfuelpricesandweakmarkettoleadto increased adoption of slower steaming
• Increasedlevelsofscrappingofolderdrybulkcapacity
• Severebanklendingconstraintslimitfundingforshipacquisitions, raising barriers to entry and increasing opportunities for cash rich owners
THREATS
• Continuedexcessivenewbuildingdeliveriesforathird year in succession, despite expectations of a 35% delivery shortfall attributable to non-deliveries of expensive ships ordered in 2007/08 and shipyards slowing production to save costs
• HesitantglobaleconomicrecoveryimpactedbycontinuedcrisisinEurope
• PotentiallyweakergrowthinChineseeconomyandindustrial production
That platform draws its strength from:• ourgrowingglobalcustomerbase• ournewlyenhancedoperatingsystemandprocesses• variouson-goingefficiencyinitiatives• ourexpandednetworkofoffices• ourstrongbalancesheet• thevalueofourcargobook• theleverageofourfleet’sscaleandflexibility
Wearethereforewellpositionedtomaximiseourperformance in the challenging period ahead whilst also well equipped to capitalise on opportunities that we expect to arise and eventual improvements in market conditions ahead.
Our market outlook for the longer term is positive, as we believe expanding wealth in emerging economies will generally strengthen demand for dry bulk commodities for some years while the newbuilding orderbook becomes less onerous from 2013 onwards. This combination should provide the dry bulk market with a more favourable supply/demand balance in the future.
Pacific Basin Cargo VolumesMillion Tonnes
20072006 2008 2009 2010 201120
22
24
26
28
30
32
34 33.4
31.7
Handysize Contract Cover and Daily TCERevenue days
2009 2010 2011 20132012
Fixed UnfixedAsat27February2012
0
5,000
10,000
15,000
20,000
25,000
30,000
35,000
26,100 days
29,070 days
24,010 days
28,240 days
100% 100% 54% US$12,92025%
Asat27February2012
Handymax Contract Cover and Daily TCERevenue days
2009 2010 2011 20132012Fixed Unfixed
0
2,000
4,000
6,000
8,000
10,000
12,000
14,000
10,640 days
11,450 days
4,240 days
6,910 days
100% 100% 100% 75%
32,710 days
100%
13,310 days
US$
14,5
00U
S$19
,490
US$
22,5
70
US
$11,
850
US$
16,7
50
US
$11,
480
US
$13,
530
US
$15,
090
US$14,43031%

PACIFIC BASIN SHIPPING LIMITED • ANNUAL REPORT 2011
PB Energy & Infrastructure Services20(now renamed “PB Towage”)
OFFSHORE AND INFRASTRUCTURE SUPPORT
The growth in Australian energy and resources development increased demand for offshore tug and barge activity during 2011. New coastal gas infrastructure projects commenced and existing projects such as the Gorgon offshore gas project were expanded, buoying requirements for marine logistics resources.
The Middle East markets remained difficult due to an excess supply of vessels and the impact of regional economic conditions and political instability on infrastructure development.
HARBOUR TOWAGE
Improved container line activity impacted positively on demand for harbour towage services at Australian container ports. Generally strong Chinese demand for resources sustained dry bulk port calls, although throughput at Townsville where we have an exclusive license was impacted by disruptions due to Cyclone Yasi and related floods early in the year.
SUPPLY
The global fleet of tugs grew 3.6% in 2011, down from 4.3% in 2010 due to an 18% decline in newbuilding deliveries.
2011 TOWAGE MARKET REVIEW
The challenging market for both offshore and harbour towage services in 2010 gave way to significantly improved conditions in 2011.
Tug Fleet Development
-0.05
0.00
0.05
0.10
0.15
0.20
0.25
0.30
0%
-1%
1%
2%
3%
4%
5%
6%
0.17
-0.01
0.14
3.6%
4.3%
GT Million
2005 2007 2008 2009 2010 2011
Scrapping Net fleet growth YoYYard deliveries
Source: Clarksons, data as at February 2012
2006

PACIFIC BASIN SHIPPING LIMITED • ANNUAL REPORT 2011
21
Group O
verviewBusiness Review
Financial ReviewG
overnance Financial S
tatements
CS
R Report
HOW DID PB EIS PERFORM IN 2011?
Our PB Energy & Infrastructure Services (PB EIS) division (now renamed “PB Towage”) generated a net profit of US$10.8 million and an operating cash flow of US$29.0 million, reflecting a turnaround year for our towage business which contributed a net profit of US$15.2 million – more than offsetting the operating loss generated early in the year by our FBSL joint venture in the Middle East.
KPIVessel number
operatedReturn on Net Assets
Percentage of Fleet Deployed Vessel Revenue Vessel Costs
Aim
To grow our tug and barge fleet in line with market opportunities, enhancing revenue generation and economies of scale
To provide sustainable, acceptable returns to shareholders
To minimise our vessels’ idle downtime and maximise deployment and revenue
To maximise average annual revenue generated by each of our deployed vessels (tug or barge)
To maintain a competitive, low average annual cost per vessel
Per
form
ance
In 2011, we purchased two tugs and sold one. Our towage fleet comprised on average 33 tugs and 7 barges – sufficient to cover PB Towage’s immediate requirements
Improved net profits of US$10.8 million generated a return on net assets of 5% in 2011 (10% in the second half), up from 2% in 2010
Deployment of PB Towage’s tugs increased from 88% in 2010 to 91% in 2011 while barge deployment increased from 38% to 68%
Our fleet of deployed tugs and barges generated average revenue of US$3.1 million per vessel in 2011 – up 41% year on year
Our vessel costs increased 22% to US$2.2 million due to a 27% increase in operating expenses (mainly crewing and maintenance)
Tar
get
Further investment will depend on future project awards and business expansion, with assets sourced to fit specific business opportunities
To generate returns on net assets of at least 10%
To achieve over 95% deployment of our tugs in 2012
To improve our revenue performance further in 2012
To limit annual escalation of our daily vessel costs to less than CPI, and to limit operating expense inflation to 5% maximum
0
0.5
1.0
1.5
2.0
2.5
201120102009
US$ million
2.2
1.8
$2.2 per vessel 22%40 vessels 11%
0
10
20
30
40
201120102009
30
6
40
33
736
Tugs Barges
201120102009
5% 3%
0%
1%
2%
3%
4%
5%
6%
7%
8%
9%
5%
2%
91% tug fleet 3%
0
20
40
60
80
100
201120102009BargesTugs
38%
68%
88% 91%
$3.1 per vessel 41%
0
0.5
1.0
1.5
2.0
2.5
3.0
201120102009
US$ million 3.1
2.2
Strategic Objectives
• Astuteinvestmentofcapitalthroughwellconsideredbusinessgrowth and fleet expansion and deployment
• Improvecostcompetitivenesstomaximiseresultsanddeliverstrong,sustainablereturnstoshareholders• Builddeeper,broadercustomerrelationships• Enhanceourorganisation,systems,processesandreliability• Strivetohavethebestpeople
EIS KPIsOur performance and progress against certain key divisional strategic objectives are measured by Key Performance Indicators as follows:
Further analysis of PB EIS Performance
p.31
PB EIS net profit US$10.8m
PB Towage PacMarine Service FBSL
US$15.2mUS$0.7m
US$(5.1)m
Operating cash flow US$29m
Return on net assets 5%
PACIFIC BASIN SHIPPING LIMITED • ANNUAL REPORT 2011
PB Energy & Infrastructure Services22
BUSINESS HIGHLIGHTS
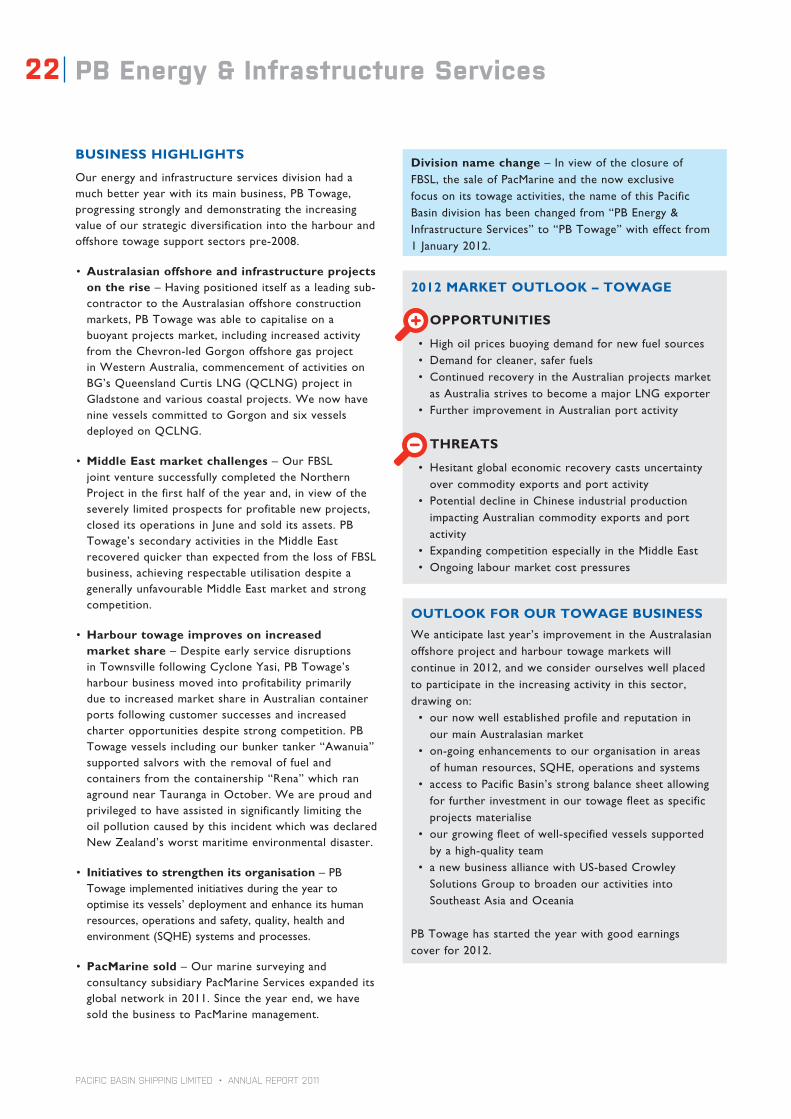
Our energy and infrastructure services division had a much better year with its main business, PB Towage, progressing strongly and demonstrating the increasing value of our strategic diversification into the harbour and offshore towage support sectors pre-2008.
• Australasian offshore and infrastructure projects on the rise – Having positioned itself as a leading sub-contractor to the Australasian offshore construction markets, PB Towage was able to capitalise on a buoyant projects market, including increased activity from the Chevron-led Gorgon offshore gas project in Western Australia, commencement of activities on BG’s Queensland Curtis LNG (QCLNG) project in Gladstone and various coastal projects. We now have nine vessels committed to Gorgon and six vessels deployed on QCLNG.
• Middle East market challenges – Our FBSL joint venture successfully completed the Northern Project in the first half of the year and, in view of the severely limited prospects for profitable new projects, closed its operations in June and sold its assets. PB Towage’s secondary activities in the Middle East recovered quicker than expected from the loss of FBSL business, achieving respectable utilisation despite a generally unfavourable Middle East market and strong competition.
• Harbour towage improves on increased market share – Despite early service disruptions in Townsville following Cyclone Yasi, PB Towage’s harbour business moved into profitability primarily due to increased market share in Australian container ports following customer successes and increased charter opportunities despite strong competition. PB Towage vessels including our bunker tanker “Awanuia” supported salvors with the removal of fuel and containers from the containership “Rena” which ran aground near Tauranga in October. We are proud and privileged to have assisted in significantly limiting the oil pollution caused by this incident which was declared New Zealand’s worst maritime environmental disaster.
• Initiatives to strengthen its organisation – PB Towage implemented initiatives during the year to optimise its vessels’ deployment and enhance its human resources, operations and safety, quality, health and environment (SQHE) systems and processes.
• PacMarine sold – Our marine surveying and consultancy subsidiary PacMarine Services expanded its global network in 2011. Since the year end, we have sold the business to PacMarine management.
Division name change – In view of the closure of FBSL, the sale of PacMarine and the now exclusive focus on its towage activities, the name of this Pacific Basin division has been changed from “PB Energy & Infrastructure Services” to “PB Towage” with effect from 1 January 2012.
2012 MARKET OUTLOOK – TOWAGE
OPPORTUNITIES
• Highoilpricesbuoyingdemandfornewfuelsources• Demandforcleaner,saferfuels• ContinuedrecoveryintheAustralianprojectsmarket
as Australia strives to become a major LNG exporter• FurtherimprovementinAustralianportactivity
THREATS
• Hesitantglobaleconomicrecoverycastsuncertaintyover commodity exports and port activity
• PotentialdeclineinChineseindustrialproductionimpacting Australian commodity exports and port activity
• ExpandingcompetitionespeciallyintheMiddleEast• Ongoinglabourmarketcostpressures
OUTLOOK FOR OUR TOWAGE BUSINESS
We anticipate last year’s improvement in the Australasian offshore project and harbour towage markets will continue in 2012, and we consider ourselves well placed to participate in the increasing activity in this sector, drawing on:• ournowwellestablishedprofileandreputationin
our main Australasian market• on-goingenhancementstoourorganisationinareas
of human resources, SQHE, operations and systems• accesstoPacificBasin’sstrongbalancesheetallowing
for further investment in our towage fleet as specific projects materialise
• ourgrowingfleetofwell-specifiedvesselssupportedby a high-quality team
• anewbusinessalliancewithUS-basedCrowleySolutions Group to broaden our activities into Southeast Asia and Oceania
PB Towage has started the year with good earnings cover for 2012.
PACIFIC BASIN SHIPPING LIMITED • ANNUAL REPORT 2011
23
Group O
verviewBusiness Review
Financial ReviewG
overnance Financial S
tatements
CS
R Report
PB RoRo
2011 RORO MARKET REVIEW
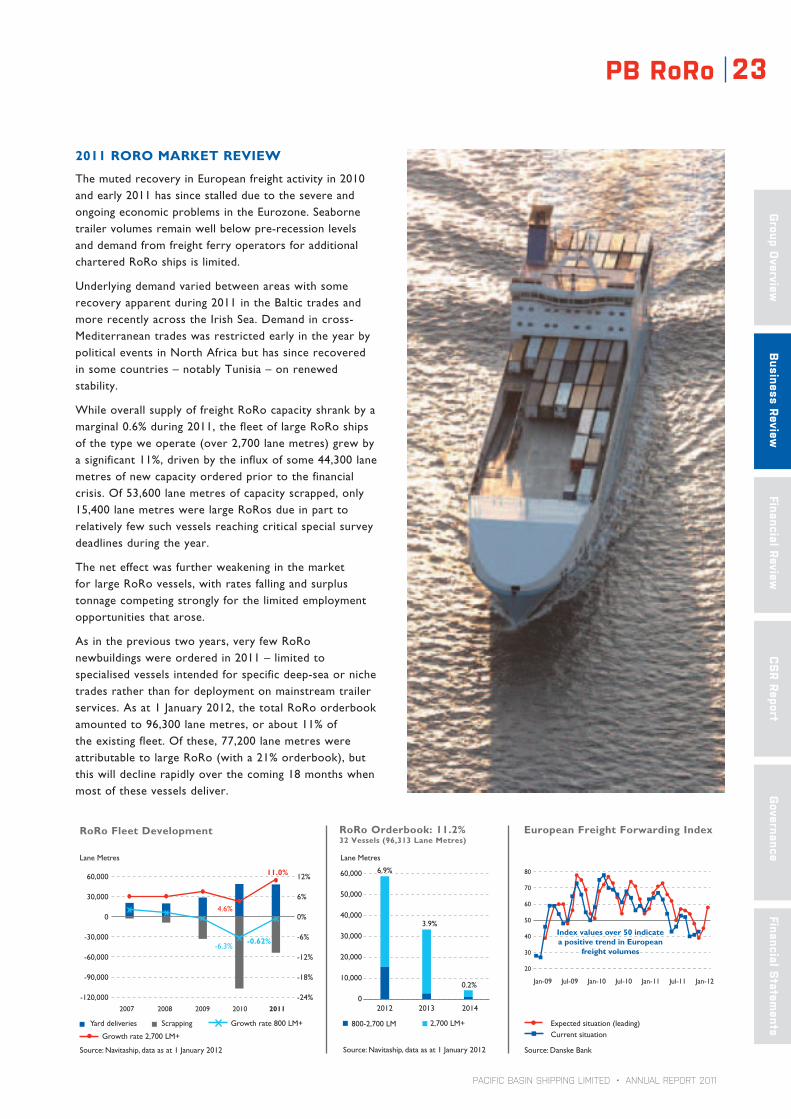
The muted recovery in European freight activity in 2010 and early 2011 has since stalled due to the severe and ongoing economic problems in the Eurozone. Seaborne trailer volumes remain well below pre-recession levels and demand from freight ferry operators for additional chartered RoRo ships is limited.
Underlying demand varied between areas with some recovery apparent during 2011 in the Baltic trades and more recently across the Irish Sea. Demand in cross-Mediterranean trades was restricted early in the year by political events in North Africa but has since recovered in some countries – notably Tunisia – on renewed stability.
While overall supply of freight RoRo capacity shrank by a marginal 0.6% during 2011, the fleet of large RoRo ships of the type we operate (over 2,700 lane metres) grew by a significant 11%, driven by the influx of some 44,300 lane metres of new capacity ordered prior to the financial crisis. Of 53,600 lane metres of capacity scrapped, only 15,400 lane metres were large RoRos due in part to relatively few such vessels reaching critical special survey deadlines during the year.
The net effect was further weakening in the market for large RoRo vessels, with rates falling and surplus tonnage competing strongly for the limited employment opportunities that arose.
As in the previous two years, very few RoRo newbuildings were ordered in 2011 – limited to specialised vessels intended for specific deep-sea or niche trades rather than for deployment on mainstream trailer services. As at 1 January 2012, the total RoRo orderbook amounted to 96,300 lane metres, or about 11% of the existing fleet. Of these, 77,200 lane metres were attributable to large RoRo (with a 21% orderbook), but this will decline rapidly over the coming 18 months when most of these vessels deliver.
European Freight Forwarding Index
Jan-09 Jul-09 Jan-10 Jul-10 Jan-11 Jan-12Jul-11
Expected situation (leading)Current situation
Source: Danske Bank
20
30
40
50
60
70
80
Index values over 50 indicate a positive trend in European
freight volumes
RoRo Orderbook: 11.2%32 Vessels (96,313 Lane Metres)
0
10,000
20,000
30,000
40,000
50,000
60,000
Source: Navitaship, data as at 1 January 2012
800-2,700 LM 2,700 LM+
Lane Metres
2012
6.9%
3.9%
0.2%
2013 2014
RoRo Fleet Development
-120,000
-90,000
-60,000
-30,000
0
30,000
60,000
-24%
-18%
-12%
-6%
0%
6%
12%
-6.3%-0.62%
11.0%
4.6%
2007 2008 2009 2010 2011
Source: Navitaship, data as at 1 January 2012
Lane Metres
ScrappingYard deliveries
Growth rate 2,700 LM+
Growth rate 800 LM+

PACIFIC BASIN SHIPPING LIMITED • ANNUAL REPORT 2011
PB RoRo24
KPI Return on Net Assets Fleet Utilisation Earnings Cover
Aim
To deliver stable and acceptable returns on investment to our shareholders
To maximise periods of employment (high utilisation) generating stable medium to long term earning streams by being the tonnage provider of choice to RoRo operators
To secure an acceptable level of forward earnings cover through long term time charters to quality RoRo ferry operators
Perf
orm
ance
Weak RoRo charter market and suspension of the NGB service resulted in operating losses of US$10.6 million and return on net assets of -3%
Declining vessel values and the challenging employment outlook necessitated an US$80 million impairment of our RoRo investment
Our RoRo fleet recorded 84% utilisation in 2011 with its ships on charter for 1,270 out of a total 1,520 ship revenue days and generating average daily charter rates of US$21,190 despite a very weak charter market
Earnings cover is currently in place for 34% of our RoRo capacity in 2012 at an average rate of US$19,200 per day
If all optional charter periods are exercised, earnings cover would increase to 45% at an average rate of US$17,980 per day
Tar
get
To secure the best possible employment to minimise losses and improve returns through higher fleet utilisation and cost control measures
Priority to improve fleet utilisation, pursuing opportunities in the established European markets and new trades worldwide
To accept shorter term earnings cover in the current depressed market, and secure longer term employment at higher rates when market conditions improve
KPI Return on Net Assets Fleet Utilisation Earnings Cover
HOW DID PB RORO PERFORM IN 2011?Our PB RoRo division generated a net loss of US$10.6 million (2010: US$1.1 million loss) and an operating cash flow of US$7.5 million in a very difficult year due to continued depression in the Euro-centric RoRo market and the suspension of the NGB service.
Strategic Objectives• Improvedreturnsfromdeployedcapital,securingthebestpossibleemploymentandminimisinglosses• Builddeeper,broadercustomerrelationships• EnhanceourreputationforsafeandreliableRoRotonnageprovision• Strivetohavethebestpeople
RoRo KPIs Our performance and progress against certain key divisional strategic objectives are measured by Key Performance Indicators as follows:
-3%
201120102009-3%
-2%
-1%
0%
1%
2%
3%
0% 0%
-3%
Charter rates earned in Euros are translated to US Dollars at an indicative rate of EUR1.00 to US$1.295
0
500
1,000
1,500
2,000
2,500
2011 201220102009
UnfixedFixed Hypothetical cover if all optional periods are exercised
Revenue days
1,520 days
2,180 days
84%US$21,190
34%US$19,200
45%US$17,980
Note: As at 27 February 2012
84% 34%
Further analysis of PB RoRo performance
p.31
PB RoRo net profit US$(10.6)m
Operating cash flow US$7.5m
Return on net assets -3%
utilisation 2012 cover
PACIFIC BASIN SHIPPING LIMITED • ANNUAL REPORT 2011
25
Group O
verviewBusiness Review
Financial ReviewG
overnance Financial S
tatements
CS
R Report
2012 MARKET OUTLOOK – RORO
OPPORTUNITIES
• Increasedlevelsofscrappingofoldershipstoreduce over-capacity
• Highfuelpricestomakeourmodernfuel-efficientvessels more attractive
• ContinuedalbeitlimiteddevelopmentofnewRoRotrades both in Europe and elsewhere
THREATS
• Continuingeconomiccrisisandincreasedausterityin Europe, albeit moderated by positive steps to repair economy later in the year
• Weakintra-Europeantrade• Limitedgrowthintrailervolumes• SignificantdeliveriesoflargefreightRoRo
newbuildings scheduled in 2012• ExcesscapacityamongmostEuropeanRoRo
operators leading to only limited requirement for chartering third-party vessels
• Hesitantglobaleconomicrecovery
OUTLOOK FOR OUR RORO BUSINESS
We expect the charter market for RoRo ships to remain weak throughout 2012 due to the further influx of newbuilding deliveries, overall muted growth in freight volumes and an anaemic European economy.
We therefore anticipate another very challenging loss-making year for our RoRo business. Our priority for 2012 is to secure best possible charters, improve utilisation and implement stringent cost control to minimise losses until the market recovers, with no plans to invest in expansion of our RoRo fleet.
Looking further ahead, an end to the current wave of newbuilding deliveries in 2013, coupled with eventual European economic recovery and the development of new RoRo trades support a much more positive outlook for our RoRo business in the longer term.
BUSINESS HIGHLIGHTS
Our RoRo division faced challenging circumstances, with the last three of our RoRo newbuildings delivering into a very weak charter market.
• Completion of RoRo newbuilding programme – Our final two RoRo ships delivered from Odense Steel Shipyard in Denmark in August 2011 and January 2012 respectively, bringing the fleet to six large, modern, fuel-efficient vessels.
• Employment of our earlier ships – Our first RoRo is still operating in the North Sea on charter to DFDS at a strong rate negotiated prior to the recession, and will continue to do so until the third quarter 2012. Her sistership which delivered in March 2011 traded satisfactorily in the Mediterranean on a one year time charter which has since been renewed, albeit at a low rate reflecting the weak market.
• Nafta Gulf Bridge suspended – Despite its potential, the Nafta Gulf Bridge service between Mexico and the US Gulf failed to generate sufficient cargo support, resulting in the suspension of the service in early October. We were able to redeploy our two US Gulf-based RoRo’s on short term business in the region, but longer term employment for these remains a challenge.
• Full focus given to chartering effort – Our RoRo team was engaged in a major drive to secure satisfactory employment for our fleet in 2011, but underlying trailer freight demand remained insufficient to revive the weak RoRo charter market. With our final two ships seeking employment and charters for three of our other RoRo’s expiring this year, our priority for 2012 is to secure the best possible employment for our ships.
• Reassessment of RoRo prospects led to impairment in mid-2011 – In the second quarter, the much weaker outlook for the RoRo charter market gave us concern about the ability to deploy our RoRo vessels profitably, which reduced their value-in-use to below their carrying values on our balance sheet. Consequently, an impairment of US$80 million for all six vessels was charged to our Group results. In calculating the value-in-use, we conservatively assumed that the RoRo charter market will continue to be weak for the coming two to three years before improving to and stabilising at rates approaching pre-financial crisis levels. After the impairment charge in mid-2011, carrying values of our RoRo’s were adjusted with reference to brokers’ indicative market value estimates. This impairment is not allocated to PB RoRo segment results as it does not relate to the division’s underlying operations. However, the impairment does reduce the carrying value of the Group’s assets.
PACIFIC BASIN SHIPPING LIMITED • ANNUAL REPORT 2011
26 Financial Review27 Monitoring the Health of Our Group
28 Consolidated Group Performance
32 Funding and Commitments

PACIFIC BASIN SHIPPING LIMITED • ANNUAL REPORT 2011
27
Group O
verviewBusiness Review
Financial ReviewG
overnance Financial S
tatements
CS
R Report
Monitoring the Health of Our Group
KPI Underlying Profit Dividend per ShareOperating Cash to
EBITDA Gearing on NBV
Aim
To maximise our financial results in the form of Underlying Profit, being the Group’s net profit excluding mark-to-market of derivatives and other exceptional items
To pay out in dividends at least 50% of annual attributable profit excluding disposal gains
Operating cash flow should be 0.9 times our EBITDA so as to fund a significant proportion of the capital expenditure required to grow our owned fleet
To maintain group net borrowings to Net Book Value (“NBV”) of property, plant and equipment under 50%, and considerably less in a weak shipping market
2011 P
erfo
rman
ce
Underlying profit decreased 52% mainly due to a 24% decrease in daily charter earnings of our dry bulk ships, balanced only in part by 17% lower blended daily vessel operating costs
Dividend per share was down 53% due to the decrease in profit eligible for dividends, but our strong operating cash flow allowed us to increase the pay-out level to 78%
Our ratio reflected the benefit of chartered-in vessel rates that are market appropriate and have not resulted in onerous charter contract provisions which have the effect of reducing this ratio when such provisions are released to EBITDA
10.5% is well below our peak level mainly due to our substantial cash resources
GROUP KPIs
We measure our Group’s progress in part through four financial Key Performance Indicators aligned to our strategy.
$57.8 MILLION 52%
0
50
100
150
200
250
300
350
2010 201120092008
US$ Million
119.8
57.8
HK¢10 53%
0
20
40
60
80
100
120
140
1021.5
2010 20112009200820072006
HK Cents
1.1 x 22%
0.5
0.6
0.7
0.8
0.9
1.0
1.1
0.9
1.1
201120102009200820072006
10.5% 0.3%
-30
-20
-10
0
10
20
30
40
50
10.2% 10.5%
Net cash
201120102009200820072006
Proposed final dividend
Net debt
55
CSR Report – non-financial KPIs
We consider our environmental and workplace initiatives to be closely aligned with delivering our Group strategy
P.42
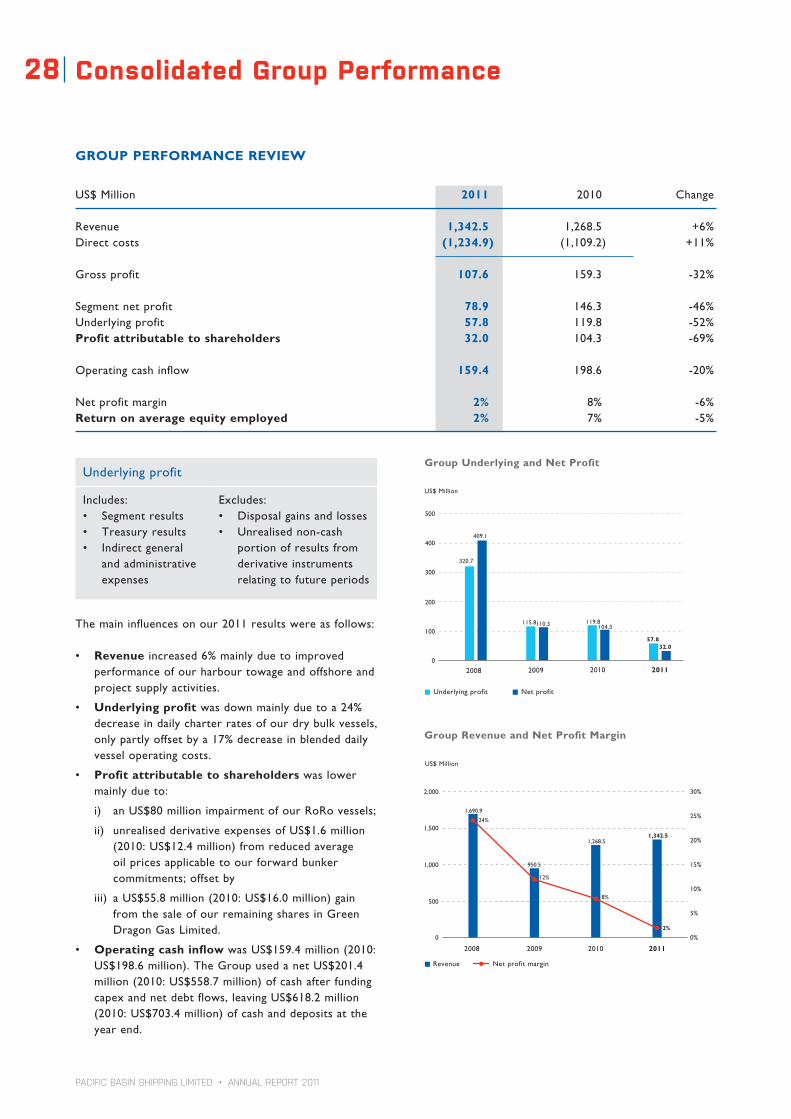
PACIFIC BASIN SHIPPING LIMITED • ANNUAL REPORT 2011
Consolidated Group Performance28
GROUP PERFORMANCE REVIEW
US$ Million 2011 2010 Change
Revenue 1,342.5 1,268.5 +6%Direct costs (1,234.9) (1,109.2) +11%
Gross profit 107.6 159.3 -32%
Segment net profit 78.9 146.3 -46%Underlying profit 57.8 119.8 -52%Profit attributable to shareholders 32.0 104.3 -69%
Operating cash inflow 159.4 198.6 -20%
Net profit margin 2% 8% -6%Return on average equity employed 2% 7% -5%
The main influences on our 2011 results were as follows:
• Revenue increased 6% mainly due to improved performance of our harbour towage and offshore and project supply activities.
• Underlying profit was down mainly due to a 24% decrease in daily charter rates of our dry bulk vessels, only partly offset by a 17% decrease in blended daily vessel operating costs.
• Profit attributable to shareholders was lower mainly due to:
i) an US$80 million impairment of our RoRo vessels;
ii) unrealised derivative expenses of US$1.6 million (2010: US$12.4 million) from reduced average oil prices applicable to our forward bunker commitments; offset by
iii) a US$55.8 million (2010: US$16.0 million) gain from the sale of our remaining shares in Green Dragon Gas Limited.
• Operating cash inflow was US$159.4 million (2010: US$198.6 million). The Group used a net US$201.4 million (2010: US$558.7 million) of cash after funding capex and net debt flows, leaving US$618.2 million (2010: US$703.4 million) of cash and deposits at the year end.
Underlying profit
Includes:• Segmentresults• Treasuryresults• Indirectgeneral
and administrative expenses
Excludes:• Disposalgainsandlosses• Unrealisednon-cash
portion of results from derivative instruments relating to future periods
Group Underlying and Net Profit
Underlying profit Net profit
0
100
200
300
400
500
US$ Million
2008
32.0
2009 2010
409.1
110.3
2011
104.3
320.7
115.8 119.8
57.8
2008 2009 2010 2011
Group Revenue and Net Profit Margin
US$ Million
Revenue Net profit margin
0
500
1,000
1,500
2,000
1,268.5
0%
5%
10%
15%
20%
25%
30%
950.5
1,690.9
1,342.5
2%
8%
12%
24%

PACIFIC BASIN SHIPPING LIMITED • ANNUAL REPORT 2011
29
Group O
verviewBusiness Review
Financial ReviewG
overnance Financial S
tatements
CS
R Report
SEGMENTS REVIEW
Reconciliation of segment net profit to profit attributable to shareholders
US$ Million 2011 2010
Segment net profit 78.9 146.3Treasury (12.8) (18.5)Indirect general and administrative expenses (8.3) (8.0)
Underlying profit 57.8 119.8Unrealised derivative expenses (1.6) (12.4)Fujairah Bulk Shipping impairment charge – (19.1)RoRo vessels impairment charge (80.0) –Gain from sale of shares in Green Dragon Gas 55.8 16.0
Profit attributable to shareholders 32.0 104.3
Management analyses the Group’s performance in three shipping-related reporting segments:
• PacificBasinDryBulk• PBEnergy&InfrastructureServices• PBRoRo
Non-segment activities mainly comprise Treasury.
PacificBasinDryBulkcontinuestodominatetheGroup’sactivities. The following sections provide further analysis of the Group’s results and net assets.
PacificBasin
Dry Bulk 700.1PB
Energy&Infrastructure
Services 232.1
PBRoRo322.9
US$ million
-20
0
20
40
60
80
100
US$ million
81.4
10.8
-10.6
PacificBasinDry Bulk
PBEnergy&Infrastructure
Services
PBRoRo
2011 Segment Net Profit Segment Net Assets (at year end)
Return onNet Assets 11% 5% -3%
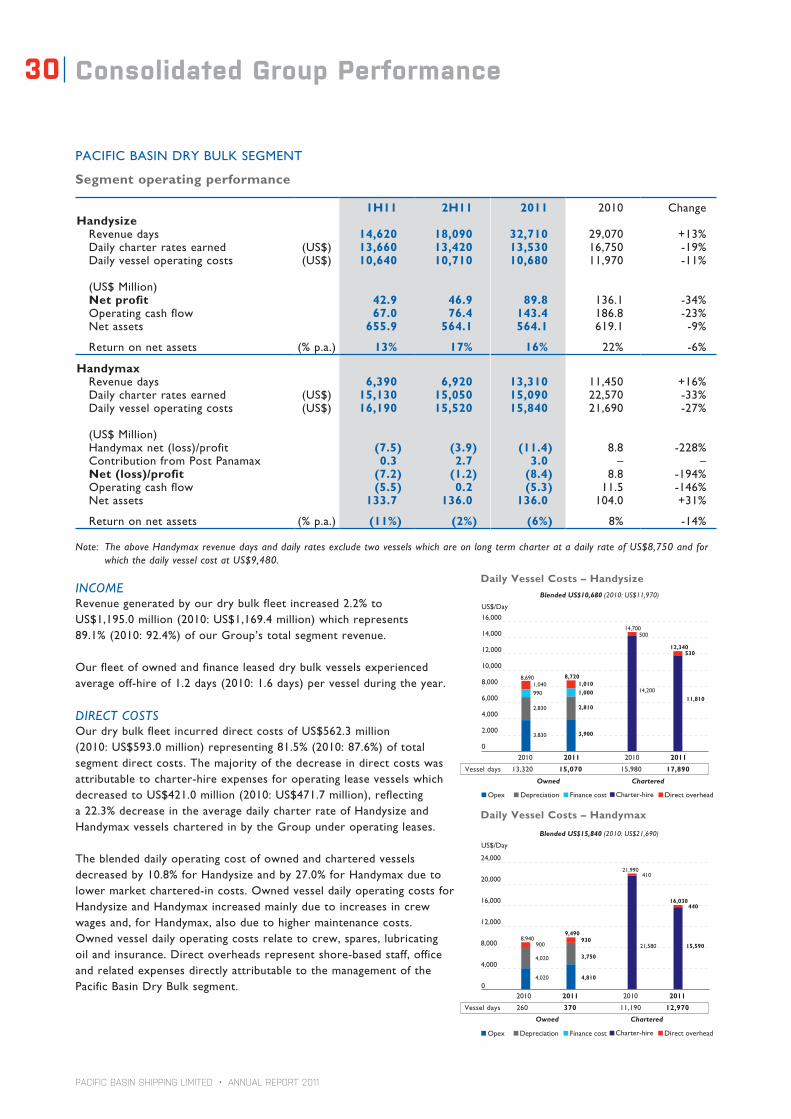
PACIFIC BASIN SHIPPING LIMITED • ANNUAL REPORT 2011
30 Consolidated Group Performance
PACIFICBASINDRYBULKSEGMENT
Segment operating performance
1H11 2H11 2011 2010 ChangeHandysize Revenue days 14,620 18,090 32,710 29,070 +13% Daily charter rates earned (US$) 13,660 13,420 13,530 16,750 -19% Daily vessel operating costs (US$) 10,640 10,710 10,680 11,970 -11%
(US$ Million) Net profit 42.9 46.9 89.8 136.1 -34% Operating cash flow 67.0 76.4 143.4 186.8 -23% Net assets 655.9 564.1 564.1 619.1 -9%
Return on net assets (% p.a.) 13% 17% 16% 22% -6%
Handymax Revenue days 6,390 6,920 13,310 11,450 +16% Daily charter rates earned (US$) 15,130 15,050 15,090 22,570 -33% Daily vessel operating costs (US$) 16,190 15,520 15,840 21,690 -27%
(US$ Million) Handymax net (loss)/profit (7.5) (3.9) (11.4) 8.8 -228% ContributionfromPostPanamax 0.3 2.7 3.0 – – Net (loss)/profit (7.2) (1.2) (8.4) 8.8 -194% Operating cash flow (5.5) 0.2 (5.3) 11.5 -146% Net assets 133.7 136.0 136.0 104.0 +31%
Return on net assets (% p.a.) (11%) (2%) (6%) 8% -14%
Note: The above Handymax revenue days and daily rates exclude two vessels which are on long term charter at a daily rate of US$8,750 and for which the daily vessel cost at US$9,480.
INCOMERevenue generated by our dry bulk fleet increased 2.2% to US$1,195.0 million (2010: US$1,169.4 million) which represents 89.1% (2010: 92.4%) of our Group’s total segment revenue.
Our fleet of owned and finance leased dry bulk vessels experienced average off-hire of 1.2 days (2010: 1.6 days) per vessel during the year.
DIRECT COSTSOur dry bulk fleet incurred direct costs of US$562.3 million (2010: US$593.0 million) representing 81.5% (2010: 87.6%) of total segment direct costs. The majority of the decrease in direct costs was attributable to charter-hire expenses for operating lease vessels which decreased to US$421.0 million (2010: US$471.7 million), reflecting a 22.3% decrease in the average daily charter rate of Handysize and Handymax vessels chartered in by the Group under operating leases.
The blended daily operating cost of owned and chartered vessels decreased by 10.8% for Handysize and by 27.0% for Handymax due to lower market chartered-in costs. Owned vessel daily operating costs for Handysize and Handymax increased mainly due to increases in crew wages and, for Handymax, also due to higher maintenance costs. Owned vessel daily operating costs relate to crew, spares, lubricating oil and insurance. Direct overheads represent shore-based staff, office and related expenses directly attributable to the management of the PacificBasinDryBulksegment.
0
2,000
4,000
6,000
8,000
10,000
12,000
14,000
16,000
2010 2011 2010 2011
3,900
2,810
1,00011,810
530
1,0108,720
3,830
2,830
9901,040
8,690
12,340
14,200
50014,700
Owned Chartered
Blended US$10,680 (2010: US$11,970)
US$/Day
Vessel days 13,320 15,070 15,980 17,890
Opex Depreciation Finance cost Charter-hire Direct overhead
0
4,000
8,000
12,000
16,000
20,000
24,000
2010 2011 2010 2011
US$/Day
Owned Chartered
Blended US$15,840 (2010: US$21,690)
4,810
15,590
3,750
930
440
9,490
4,020
4,020
9008,940
16,030
21,580
41021,990
Vessel days 260 370 11,190 12,970
Opex Depreciation Finance cost Charter-hire Direct overhead
Daily Vessel Costs – Handysize
Daily Vessel Costs – Handymax

PACIFIC BASIN SHIPPING LIMITED • ANNUAL REPORT 2011
31
Group O
verviewBusiness Review
Financial ReviewG
overnance Financial S
tatements
CS
R Report
PBENERGY&INFRASTRUCTURESERVICESSEGMENT
TheGroup’sPBEnergy&InfrastructureServicessegmentwasprimarilyengagedthroughPBTowageinoffshoreandproject supply and harbour towage.
1H11 2H11 2011 2010 Change
PBTowage Vesselsoperated (Number) 39.2 41.0 40.1 35.9 +12% Revenue per vessel (US$ Million) 1.4 1.7 3.1 2.2 +40% Cost per vessel (US$ Million) 1.1 1.1 2.2 1.8 +23%
(US$ Million)PBTowage 3.5 11.7 15.2 1.0 +1,420%PacMarineService 0.5 0.2 0.7 1.0 -30%Fujairah Bulk Shipping (5.2) 0.1 (5.1) 2.9 -276%Segment net (loss)/profit (1.2) 12.0 10.8 4.9 +120%Segment operating cash flow 10.9 18.1 29.0 16.8 +73%Segment net assets 234.0 232.1 232.1 229.4 +1%
Return on net assets -1% +10% +5% +2% +3%
PBTowage’sresultsimprovedsignificantlyduetoincreasedlinerportcallsintheharbourtowagesectorandgrowthinoffshore and project supply activities.
PacMarineServicesengagesinthebusinessofshipsurveyandinspectionserviceandit’sresultsreflectedadecreaseinthe number of ship inspections.
Fujairah Bulk Shipping is a joint venture with the Government of Fujairah in the Middle East. Due to continuing difficult market conditions, the board of Fujairah Bulk Shipping decided in 2011 to close its operations, and all its assets have now been sold.
PBROROSEGMENT
The Group’s first RoRo vessel began generating revenue in September 2009. The second vessel trades in the Mediterranean, while the third and fourth RoRo vessels are operating in the US Gulf albeit at disappointing rates reflecting the weak market. We are still seeking employment for our final two RoRo vessels which delivered in August 2011 and January 2012.
The US$80 million vessel impairment is estimated to reduce daily depreciation by approximately EUR850 or US$1,200 in 2012 for each of the six RoRo vessels.
1H11 2H11 2011 2010 Change
Revenue days 620 650 1,270 430 +195%Vesseldays 660 860 1,520 480 +217%
Daily charter rates earned (US$) 21,240 21,140 21,190 29,350 -28%Daily vessel operating costs (US$) 22,080 18,210 19,890 27,810 -28%
(US$ Million)Vesseloperatingloss (1.4) (2.0) (3.4) (0.8) +325%Share of loss of associate (4.1) (3.4) (7.5) (0.3) –Share of profit of jointly controlled entity
0.2 0.1 0.3 – –
Segment net loss (5.3) (5.3) (10.6) (1.1) +864%Segment operating cash flow 4.5 3.0 7.5 2.8 +168%Segment net assets 347.6 322.9 322.9 384.4 -16%
Return on net assets -3% -3% -3% 0% -3%

PACIFIC BASIN SHIPPING LIMITED • ANNUAL REPORT 2011
Funding and Commitments32
CASH FLOW AND CASH
The Group actively manages its cash, borrowings and commitments closely to ensure sufficient funds are available and an appropriate level of liquidity is maintained during different stages of the shipping cycle to meet all its obligations.
The Group’s four main sources of capital are equity, convertible bonds, bank loans and operating cash flows.
As at 31 December 2011, the Group had a strong cash position of US$618.2 million resulting in a 10.5% gearing ratio of net borrowings to Net Book Value of property, plant and equipment. Based on existing capital commitments of US$322.4 million, the Group has sufficient cash resources on hand to fund these commitments.
Over the long term, the Group aims to maintain group net gearing at no greater than 50%, which represents a conservative balance of borrowings and equity that is sustainable over different stages of the shipping cycle.
CASH FLOW
Liquidity US$618.2 million of cash and deposits (principally denominated in US$)US$116.6 million of unutilised bank borrowing facilities
Net working capital US$582.3 million
2011 Sources and uses of Group Cash Flow
Purchase and sale of vessels, and drawdown and repayment of borrowings shall continue to be the major factors influencing future cash flows.
Included vessel purchases US$172.0m: Delivered: 3 Handysize, 1 Post Panamax, 2 Tugs, 2 RoRo Instalments: 7 dry bulk vessels
Convertible bonds due in 2013 repurchased and redeemed using proceeds of the new convertible bonds issued in 2010.
500
550
600
650
700
750
800
850
900
950
1,000
US$ Million
+703.4
At 1 Jan 2011 Operating cash inflow
Sale of Green Dragon Gas investment
Increase in borrowings
Capex Convertible bonds repurchase
Dividend paid
Interest paid
Others At 31 Dec 2011
+159.4
+80.0+29.7
-174.5
-105.2
-53.4
-35.9
+14.7 +618.2
Cash inflow Cash outflow
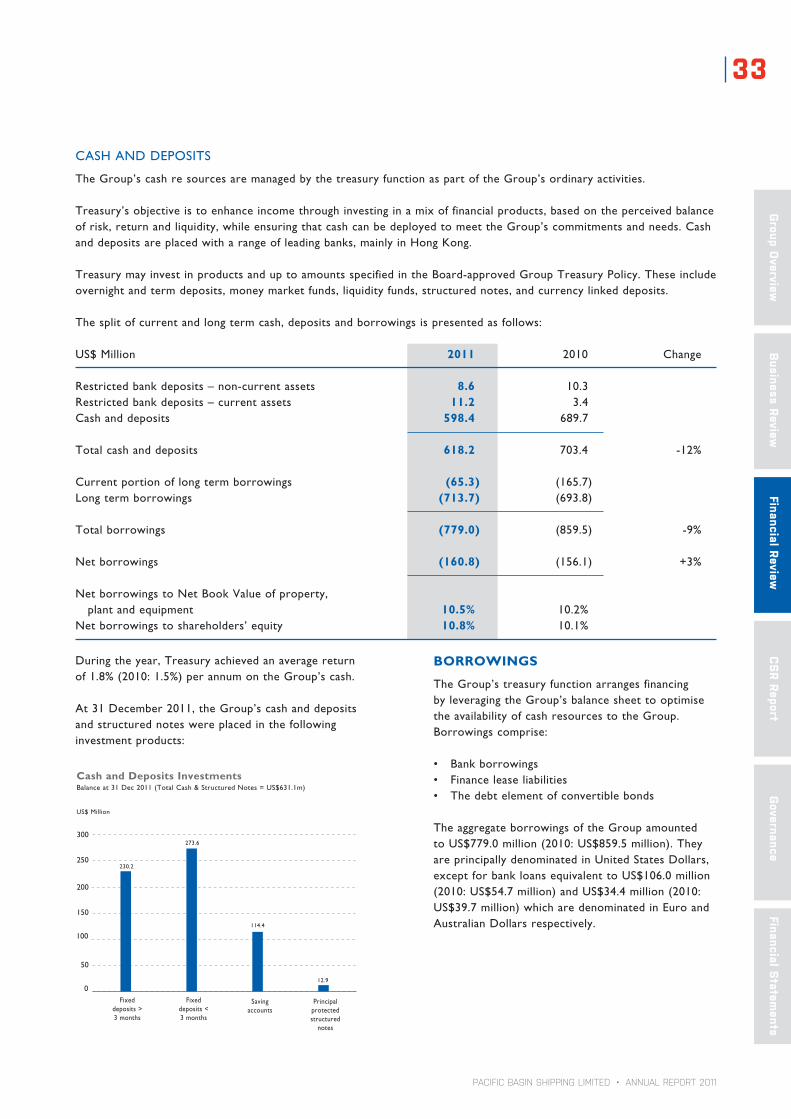
PACIFIC BASIN SHIPPING LIMITED • ANNUAL REPORT 2011
33
Group O
verviewBusiness Review
Financial ReviewG
overnance Financial S
tatements
CS
R Report
During the year, Treasury achieved an average return of 1.8% (2010: 1.5%) per annum on the Group’s cash.
At 31 December 2011, the Group’s cash and deposits and structured notes were placed in the following investment products:
Cash and Deposits InvestmentsBalance at 31 Dec 2011 (Total Cash & Structured Notes = US$631.1m)
US$ Million
Fixed deposits < 3 months
Fixed deposits > 3 months
Savingaccounts
Principal protected structured
notes
0
50
100
150
200
250
300
230.2
273.6
114.4
12.9
CASH AND DEPOSITS
The Group’s cash re sources are managed by the treasury function as part of the Group’s ordinary activities.
Treasury’s objective is to enhance income through investing in a mix of financial products, based on the perceived balance of risk, return and liquidity, while ensuring that cash can be deployed to meet the Group’s commitments and needs. Cash and deposits are placed with a range of leading banks, mainly in Hong Kong.
Treasury may invest in products and up to amounts specified in the Board-approved Group Treasury Policy. These include overnight and term deposits, money market funds, liquidity funds, structured notes, and currency linked deposits.
The split of current and long term cash, deposits and borrowings is presented as follows:
US$ Million 2011 2010 Change
Restricted bank deposits – non-current assets 8.6 10.3Restricted bank deposits – current assets 11.2 3.4Cash and deposits 598.4 689.7
Total cash and deposits 618.2 703.4 -12%
Current portion of long term borrowings (65.3) (165.7)Long term borrowings (713.7) (693.8)
Total borrowings (779.0) (859.5) -9%
Net borrowings (160.8) (156.1) +3%
Net borrowings to Net Book Value of property, plant and equipment 10.5% 10.2%Net borrowings to shareholders’ equity 10.8% 10.1%
BORROWINGS
The Group’s treasury function arranges financing by leveraging the Group’s balance sheet to optimise the availability of cash resources to the Group. Borrowings comprise:
• Bankborrowings• Financeleaseliabilities• Thedebtelementofconvertiblebonds
The aggregate borrowings of the Group amounted to US$779.0 million (2010: US$859.5 million). They are principally denominated in United States Dollars, except for bank loans equivalent to US$106.0 million (2010: US$54.7 million) and US$34.4 million (2010: US$39.7 million) which are denominated in Euro and Australian Dollars respectively.
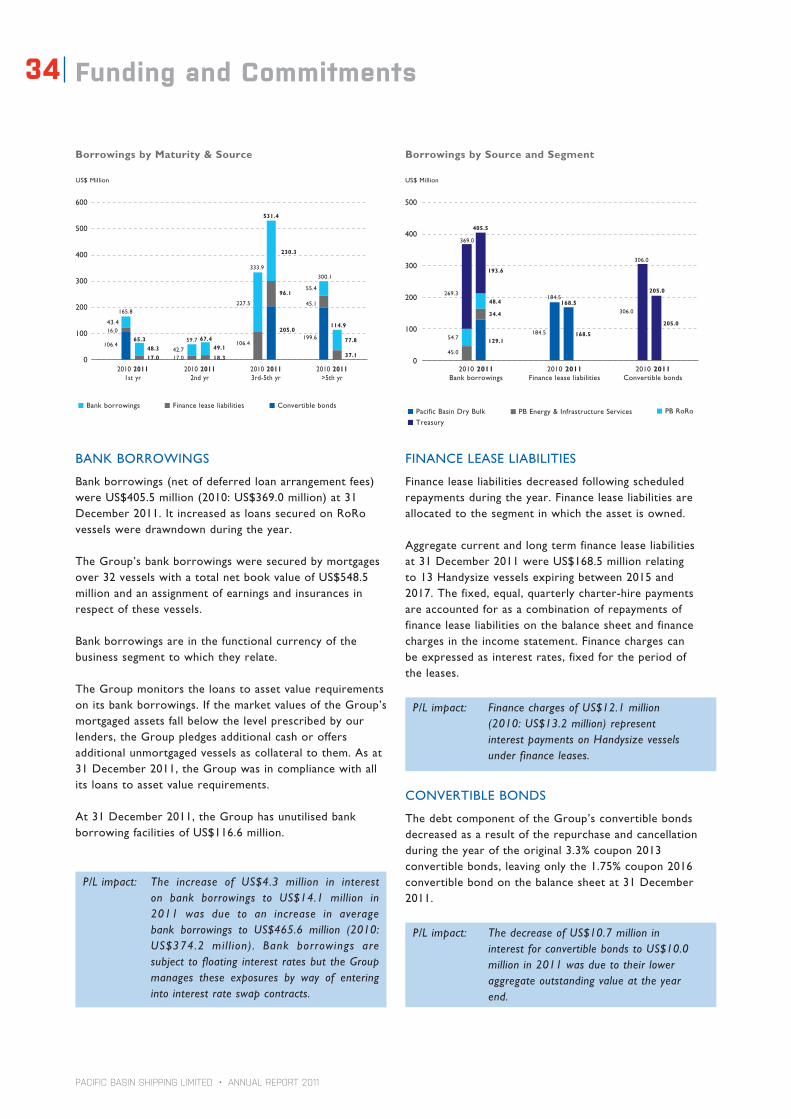
PACIFIC BASIN SHIPPING LIMITED • ANNUAL REPORT 2011
34 Funding and Commitments
BANK BORROWINGS
Bank borrowings (net of deferred loan arrangement fees) were US$405.5 million (2010: US$369.0 million) at 31 December 2011. It increased as loans secured on RoRo vessels were drawndown during the year.
The Group’s bank borrowings were secured by mortgages over 32 vessels with a total net book value of US$548.5 million and an assignment of earnings and insurances in respect of these vessels.
Bank borrowings are in the functional currency of the business segment to which they relate.
The Group monitors the loans to asset value requirements on its bank borrowings. If the market values of the Group’s mortgaged assets fall below the level prescribed by our lenders, the Group pledges additional cash or offers additional unmortgaged vessels as collateral to them. As at 31 December 2011, the Group was in compliance with all its loans to asset value requirements.
At 31 December 2011, the Group has unutilised bank borrowing facilities of US$116.6 million.
P/L impact: The increase of US$4.3 million in interest on bank borrowings to US$14.1 million in 2011 was due to an increase in average bank borrowings to US$465.6 million (2010: US$374.2 mil l ion). Bank borrowings are subject to floating interest rates but the Group manages these exposures by way of entering into interest rate swap contracts.
FINANCE LEASE LIABILITIES
Finance lease liabilities decreased following scheduled repayments during the year. Finance lease liabilities are allocated to the segment in which the asset is owned.
Aggregate current and long term finance lease liabilities at 31 December 2011 were US$168.5 million relating to 13 Handysize vessels expiring between 2015 and 2017. The fixed, equal, quarterly charter-hire payments are accounted for as a combination of repayments of finance lease liabilities on the balance sheet and finance charges in the income statement. Finance charges can be expressed as interest rates, fixed for the period of the leases.
P/L impact: Finance charges of US$12.1 million (2010: US$13.2 million) represent interest payments on Handysize vessels under finance leases.
CONVERTIBLE BONDS
The debt component of the Group’s convertible bonds decreased as a result of the repurchase and cancellation during the year of the original 3.3% coupon 2013 convertible bonds, leaving only the 1.75% coupon 2016 convertible bond on the balance sheet at 31 December 2011.
P/L impact: The decrease of US$10.7 million in interest for convertible bonds to US$10.0 million in 2011 was due to their lower aggregate outstanding value at the year end.
Borrowings by Maturity & Source
US$ Million
2010 20111st yr
2010 20112nd yr
2010 20113rd-5th yr
2010 2011>5th yr
0
100
300
400
200
500
600
Bank borrowings Convertible bondsFinance lease liabilities
165.8
43.4
106.465.3
48.3
17.0
59.7
17.0
67.449.1
227.5
106.4
18.3
333.9
531.4
96.1
205.0
300.1
45.1
199.6
114.9
77.8
37.142.7
16.0
230.3
55.4
US$ Million
Borrowings by Source and Segment
2010 2011Convertible bonds
2010 2011Finance lease liabilities
2010 2011Bank borrowings
0
100
200
300
500
400
PB Energy & Infrastructure Services
Treasury
Pacific Basin Dry Bulk PB RoRo
45.0
54.7
269.3
184.5
306.0
306.0
184.5
369.0
34.4
48.4
193.6
168.5
205.0
205.0
168.5
405.5
129.1

PACIFIC BASIN SHIPPING LIMITED • ANNUAL REPORT 2011
35
Group O
verviewBusiness Review
Financial ReviewG
overnance Financial S
tatements
CS
R Report
FINANCE COSTS
The key indicators on which Management focuses to assess the cost of borrowings are: i) group interest coverage and ii) average interest rates on borrowing sources.
0x
1x
2x
3x
4x
5x
2010 2011
4.3x
3.4x
Group Interest Coverage
Convertible bonds
Effective interest rateFinance leases
Bank borrowings(before hedging)
0%
2%
4%
6%
8%
Average Interest Rates on Borrowings
2.4%
2010 2011
2.7%
6.8% 6.8%
5.3%4.8%
The Group aims to achieve a balance between floating and fixed interest rates on its long term borrowings. As at 31 December 2011, 15% of the Group’s long term borrowings were in floating rates. The Group monitors this to maintain an appropriate floating to fixed interest rate ratio which is adjusted from time to time depending on the shipping and interest rate cycles.
Borrowings resulted in finance costs of US$44.2 million (2010: US$50.3 million) which are analysed as follows:
US$ Million
201120100
10
20
30
40
50
PB RoRo
Pacific Basin Dry Bulk
Treasury
Unrealised interest rate swap contract results
PB Energy & Infrastructure Services
50.3
44.2
21.9
2.6
3.3
15.0
1.4
Finance Costs by Segment
0.8
2.6
3.0
13.2
30.7
0
10
20
30
40
50
Interest on bank borrowings
Interest on finance leases
Interest on convertible bonds
Net losses on interest rate swap contracts
Other finance charges
US$ Million
50.30.3
6.3
20.7
13.2
9.8
14.1
12.1
10.0
6.9
1.144.2
20112010
Finance Costs by Source
0
200
400
600
800
1,000
1,200
1,400
US$ Million
Tugs and bargesRoRoDry bulk
Future instalments amount US$322 million
Vessel carrying values US$1,355 million
Progress payments made US$165 million
Total US$1,842 million
A Combined View of Vessel Carrying Values and Commitments
321 214
214820
116
306
1,242
4916
386
DELIVERED VESSELS
At 31 December 2011, the Group had property, plant and equipment with net book value (after RoRo impairment) of US$1,525.2 million, of which mostly related to:
• 42deliveredHandysizevessels;• 2Handymaxvessels;• 1PostPanamaxvessel;• 38tugsandbarges;and• 5RoRovessels.
Handysize vessels continued to dominate the Group’s assets with an average net book value of US$17.3 million and an average age of 7.6 years for those delivered. Tugs, barges and RoRo vessels are denominated in their functional currencies of Australian Dollar and Euro. As such, their United States Dollar carrying values and commitments are subject to exchange rate fluctuations.
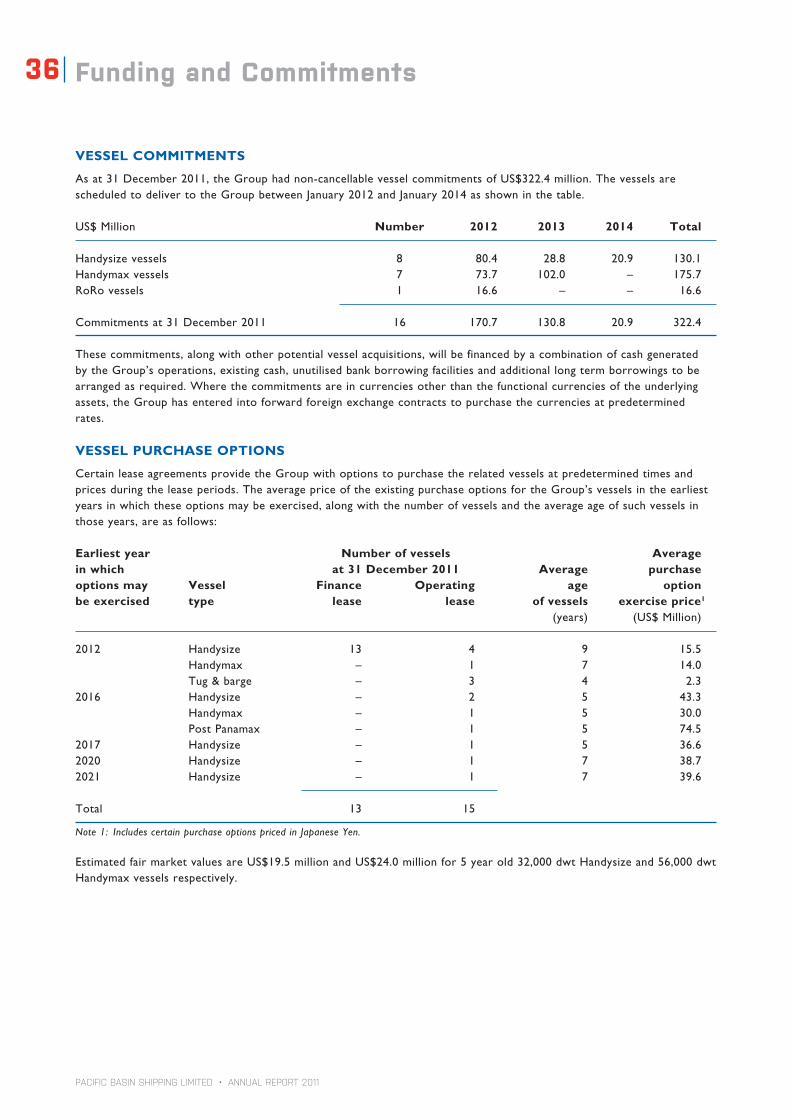
PACIFIC BASIN SHIPPING LIMITED • ANNUAL REPORT 2011
36 Funding and Commitments
VESSEL COMMITMENTS
As at 31 December 2011, the Group had non-cancellable vessel commitments of US$322.4 million. The vessels are scheduled to deliver to the Group between January 2012 and January 2014 as shown in the table.
US$ Million Number 2012 2013 2014 Total Handysize vessels 8 80.4 28.8 20.9 130.1Handymax vessels 7 73.7 102.0 – 175.7RoRo vessels 1 16.6 – – 16.6 Commitments at 31 December 2011 16 170.7 130.8 20.9 322.4 These commitments, along with other potential vessel acquisitions, will be financed by a combination of cash generated by the Group’s operations, existing cash, unutilised bank borrowing facilities and additional long term borrowings to be arranged as required. Where the commitments are in currencies other than the functional currencies of the underlying assets, the Group has entered into forward foreign exchange contracts to purchase the currencies at predetermined rates.
VESSEL PURCHASE OPTIONS
Certain lease agreements provide the Group with options to purchase the related vessels at predetermined times and prices during the lease periods. The average price of the existing purchase options for the Group’s vessels in the earliest years in which these options may be exercised, along with the number of vessels and the average age of such vessels in those years, are as follows:
Earliest year Number of vessels Averagein which at 31 December 2011 Average purchaseoptions may Vessel Finance Operating age optionbe exercised type lease lease of vessels exercise price1
(years) (US$ Million)
2012 Handysize 13 4 9 15.5 Handymax – 1 7 14.0 Tug & barge – 3 4 2.32016 Handysize – 2 5 43.3 Handymax – 1 5 30.0 Post Panamax – 1 5 74.52017 Handysize – 1 5 36.62020 Handysize – 1 7 38.72021 Handysize – 1 7 39.6
Total 13 15
Note 1: Includes certain purchase options priced in Japanese Yen.
Estimated fair market values are US$19.5 million and US$24.0 million for 5 year old 32,000 dwt Handysize and 56,000 dwt Handymax vessels respectively.

PACIFIC BASIN SHIPPING LIMITED • ANNUAL REPORT 2011
37
Group O
verviewBusiness Review
Financial ReviewG
overnance Financial S
tatements
CS
R Report
Bank borrowings (US$406 million): 2012-2023
Convertible bonds (face value US$230 million): Apr 2016, redeemable in Apr 2014
Finance lease liabilities (US$168 million): 2015-2017
Vessel capital commitments (US$322 million)
US$ Million
201420132012 2015 2016 2017 2018 2019-2023
0
100
200
300
48.3
17.0
170.7
49.170.3
19.6 20.9
129.8
68.6
30.2
230.0
7.924.2
37.116.7
36.9
18.3
130.8
Redeemable in April 2014
VESSEL LEASE COMMITMENTS
The following table shows the average contracted daily charter rates and total number of vessel days of our Handysize and Handymax vessels under operating leases and finance leases in each year of the lease term, assuming the purchase options will not be exercised until the expiry of the charter-hire agreements.
Handysize and Handymax vessel lease commitments
Handysize Handysize Handymax Operating leases Finance leases Operating leases
Average Vessel Average Vessel Average VesselYear daily rate days daily rate days daily rate days (US$) (US$) (US$)
2012 11,150 10,440 5,960 4,750 13,070 5,0302013 11,630 4,700 5,950 4,750 13,200 1,4702014 11,820 4,060 5,940 4,750 13,150 1,0002015 12,000 3,660 5,910 2,590 13,720 4402016 11,860 2,810 5,970 1,830 14,000 3702017 11,960 2,560 5,840 610 14,000 3702018 11,900 2,200 – – 14,000 3702019 12,830 1,460 – – 14,000 102020 13,020 1,100 – – – –2021 14,000 310 – – – –
Total 33,300 19,280 9,060
Aggregate operating lease commitments: US$390.2 m US$119.7 m
Vessel operating lease commitments stood at US$540.0 million (2010: US$362.0 million), comprising: US$390.2 million for Handysize;US$119.7millionforHandymax;US$1.0millionfortugs;andUS$29.1millionforPostPanamaxvessels.Theincrease in operating lease commitments was mainly due to the higher number of medium term (1-3 years) Handysize and Handymax contracted days.
Vessel finance lease commitments are included as part of property, plant and equipment.
SCHEDULE OF REPAYMENTS AND VESSEL CAPITAL COMMITMENTS
The repayments of borrowings and vessel capital commitments by year are shown below:
Repayments and Vessel Capital Commitments

Corporate Social Responsibility40 Green – The Business Case
42 How We Performed in CSR
44 Environment
48 Workplace
54 Community
CAPTAIN ZHU QIANCHUN — “SEAFARER OF THE YEAR”
Our Captain Zhu Qianchun was named “Seafarer of the Year” at the Lloyd’s List Awards Global 2011 event in London last September. He also received the same award at Lloyd’s List’s Asia awards event in October and has received commendations from the Hong Kong Marine Department and other shipping industry bodies for his actions.
The prestigious “Seafarer of the Year” award was welcomed acknowledgement of the exemplary seamanship and leadership that Captain Zhu demonstrated in the face of adversity.
On 11 March 2011, our “Port Pegasus” was berthed at Onahama when the devastating 9.0 magnitude earthquake and Tsunami struck. The ship experienced waves of up to 8 metres, submerging the dock and severing all but one of the ship’s mooring lines. For 18 hours, Captain Zhu and his crew operated the vessel’s propulsion and steering to manoeuvre the ship, often at full power, to battle the extraordinary currents and keep the ship at berth. And all that with a shore-side unloader still stuck deep in the ship’s hold and with no possible assistance from tugs, pilots, port control or linesmen.
Throughout, Captain Zhu focused on keeping his crew safe, calm, confident and organised, with constant communication within the team ensuring that the crew’s often very physical and speedy work was coordinated to cope with the continually changing situation. For their admirable and successful efforts, Captain Zhu and his crew saved the ship and re-secured her once the Tsunami subsided, all along avoiding any injury, pollution and damage affecting the ship’s seaworthiness. Captain Zhu showed great leadership and skill on that devastating day, as well as tremendous maturity for a young man who had been promoted to Master only one month earlier.
Captain Zhu started his career with Pacific Basin ten years ago, and we are immensely proud of him and thankful for his exemplary service under pressure. He fully deserves the accolade of “Seafarer of the Year”.
Ranking Captain Zhu among 100 most influential people in shipping, Lloyds’ List were right to highlight “the daily heroics that go unrewarded and largely unnoticed across the world and the influence that seafarers have on our industry” and the need to repeat the key message that seafarers deserve respect and recognition. That is something we at Pacific Basin recognise deeply.
we are immensely proud of him and thankful for his exemplary service


PACIFIC BASIN SHIPPING LIMITED • ANNUAL REPORT 2011
Green – The Business Case40
INTRODUCTION
We are pleased to introduce this first Pacific Basin CSR Report for 2011 which serves to communicate our environmental, workplace and community philosophies, initiatives and performance in greater detail than we have described in our previous annual and interim reports.
Pacific Basin is already a substantial business which operates a large fleet of ships and we plan to grow further with a focus on our core dry bulk activity and an ambitious vision for the future.
We recognise that such ambition comes with responsibility in a number of areas. The most fundamental of these is the environment and, as a leader in our field, we challenge ourselves to do the best we can to reduce our environmental footprint, not only because of the moral obligation to do so, but also because of the strong business case for taking action –
In the context of oil and fuel price inflation and increasing climate change and emissions-related legislation, the environmental decisions and actions we take now will make us competitively stronger and have a bearing on the long term sustainability and shareholder value of our business in the future.
OUR ACTIONS
We therefore operate our vessels in strict adherence to applicable environmental legislation and exceed regulatory requirements and industry standards where practically possible.
We give priority to our in-house efforts to minimise our emissions and are confident that we will be at the head of the pack in terms of environmental performance within our sector when emissions legislation becomes globally enforced. We can be proud of what we have achieved so far, and are glad to report that we have won high-profile recognition of our efforts in the form of the Environment Award at the Lloyd’s List Awards Global 2011.
CONCLUSION
The environment is one of several areas in which we feel we have a duty to act responsibly in a broader effort to improve our corporate citizenship and sustainable business practice. This report serves to share with our stakeholders a record of our environmental initiatives and performance.
We trust you will find we have made a good start in what is an ongoing programme to develop our CSR reporting and a continuous effort to reduce our impact on the environment. It is a comprehensive account of our actions which we intend to follow up with shorter updates of our progress and new initiatives in future annual reports.
IMO and tackling carbon emissions
International legislation – mandated and regulated by the UN’s International Maritime Organisation (IMO) – has addressed substantially all environmental impacts from shipping with the notable exception until now of greenhouse gas (GHG) emissions which are inextricably linked to climate change.
GHG emissions and climate change have quite correctly been a high priority on the global agenda in recent years, and we can expect to see new emissions legislation in the future that will directly impact the shipping industry.
The IMO proposes to tackle emissions reduction with:
• apackageoftechnicalandoperationalmeasuressetto come into force in 2013 comprising:
• theEnergyEfficiencyDesignIndex;and
• theShipEnergyEfficiencyManagementPlan;and
• market-basedemissions-cuttingincentives.
Failure of the IMO’s climate initiative proposal to be sufficiently credible may result in unilateral local or regional initiatives and consequently an expanded patchwork of regulation and a fragmented and difficult trading environment for what would become a much more segmented industry.
Pacific Basin is supportive of the creation of sensible but effective industry-wide measures to reduce emissions – a global effort which we believe should be the sole jurisdiction of the IMO – including the adoption of carbon taxation in the form of a levy on bunker fuel.
So, the global nature of our business creates unique challenges for us when considering the environment. Pacific Basin is fully prepared to meet these challenges and work with policy makers, researchers and customers to ensure we make the right choices to help combat pollution and anthropogenically induced climate change while providing a bright future for the Company.

PACIFIC BASIN SHIPPING LIMITED • ANNUAL REPORT 2011
41
Group O
verviewBusiness Review
Financial ReviewG
overnance Financial S
tatements
CS
R Report
CSR Milestones
Key Issues
We prioritise in this materiality matrix the CSR issues we deem most important to our business and to our stakeholders, and we have given them and their KPIs prominence in this report. We will seek to invite further feedback as part of an on-going stakeholder engagement programme to inform and develop our future CSR management and reporting.
Board-level Responsibility for CSR
Executive responsibility for Pacific Basin’s CSR and environmental sustainability – including climate change matters – is delegated to the CEO who oversees environmental, workplace and community initiatives managed largely by our Technical, Human Resources and Administration teams respectively. In view of the broad, complex and potentially very expensive nature of environmental concerns, regulations, technologies and initiatives, an Environmental Committee of senior executives has been established to assist in studying and giving direction to our environmental efforts. Reporting to the CEO and Environmental Committee is our Fleet Directorandhistechnicalandnewbuildingteamwhomanage and report on our main emissions tracking and minimisation and other ship-board environmental initiatives.
Pacific Basin trials and adopts various technologies and practices including Propeller Boss Cap Fins, increased antifouling paint area, garbage compactors, improved adaptive autopilot, slow steaming, etc.
Pacific Basin tracks head office emissions through WWF Loop Programme
“Nobody is perfect, but a team can be” is published in Alert
Pacific Basin wins Environment Award at Lloyd’s List Awards – Global 2011
Pacific Basin continues to assess viability of new technologies and practices
Pacific Basin signs for 10 dry bulk ships of enhanced, fuel-efficient eco-design
Introduction of “22 crew, 22 owners” concept
Pacific Basin wins gold award for Environmental Responsibility at The Asset Corporate Awards 2011
2010 2011 2012
Jan April June Sept
OUR SUSTAINABILITY STRATEGY
We firmly believe in the relationship between the adoption of responsible practices and risk and the financial performance of our business. Sustainability is therefore closely linked to our strategy in the short and medium terms and our vision for Pacific Basin in the long term. Our broad strategic CSR objectives that guide our sustainability initiatives relate to the environment, our workplace and our community as follows:
Environment
Understanding and minimising our impact on the environment through adoption of energy-efficient and environmentally-friendly ship designs, technologies and practices at sea and ashore
Workplace
Looking after our people by ensuring their safety, fostering a happy and fulfilling workplace, and nurturing our talent and harnessing their performance potential
Community
Ensuring our responsible behaviour in the communities in which we are present, from our engagement in the shipping industry, to anti-corruption in the business world, to positive contributions to worthy causes closest to our business
Nov
Impa
ct o
n ou
r St
akeh
olde
rs Hig
h
Areas identified as relevant for discussion:
Other emissionsMarine dischargeShore dischargeWaste managementWorking conditionsDiversity&equalopportunityResponsible business practicesCommunity interaction
Areas identified as critical for disclosure:
GHG emissionsMarine pollutionHealth&safetyEmployee engagement
Low
-Med
ium
Areas identified as not material for disclosure:
Other outputs
Shore-based enviro initiatives
CSR performance of PB Towage and PB RoRo (we plan to report on these in the future)
Areas identified as relevant for discussion:
Future green technologiesFuel consumption (energy efficiency)Development&TrainingAnti-Piracy
Low-Medium High
Impact on our Business

PACIFIC BASIN SHIPPING LIMITED • ANNUAL REPORT 2011
How We Performed in CSR42
0
1
2
3
4
5
1
Environment Workplace
KPI CO2 Index(Ships’ Emissions)
Environmental Pollution Incidents
Zero Deficiencies in External Inspections
Deficiency Rate in External Inspections
Aim
In the absence of an alternative primary fuel for dry bulk shipping, to do what we reasonably can to reduce our consumption of marine fuel oil and our emissions of greenhouse gases – particularly CO2 (2011 target: 9.43)
To achieve zero pollution incidents across our fleet
To maintain our ships to a very high standard, a good measure of which is our performance in external Port State Control (PSC) inspections, including:
• the frequency with which such inspections find zero regulatory deficiencies (2011 target: 77%)
• the average number of deficiencies in each external inspection (2011 target: 0.52)
Perf
orm
ance
Our emissions reduction initiatives contributed to a 7.5% decrease in our CO2 emissions to 8.66 grams of CO2 per tonne-mile
Regretfully, inadequate risk management resulted in the overflow of fuel during internal fuel transfer operations in Inchon, Korea. Corrective and preventive measures have been implemented across the fleet to avoid recurrence
Our zero deficiency rate reduced slightly to 72% and our average deficiencies per inspection increased to 1.12 which we attribute to increased PSC inspections in the Far East where defects are typically raised in larger numbers and logged even if subsequently proven to be in order. These results are nevertheless among the best in the industry and, excluding Far East inspections, we achieved a zero deficiency rate of 79% and an average deficiency rate of 0.75.
Tar
get
To improve our emissions performance in 2012, though this will partly be driven by the market’s adversity towards speed optimisation
We always target to achieve zero pollution incidents
To significantly improve our external inspections performance in 2012 through our policy of “zero defects in external checks through good self-checking by 22 crew, 22 owners”.
2007 2008 2009 2010 2011
8.66 7.5%
0
2
4
6
8
10
12
9.37
8.66
2011Target:
9.43
72%
2007 2008 2009 2010 2011
5%
0
20
40
60
80
100
72%
77%
2011Target:
77%
2007 2008 2009 2010 2011
1 INCIDENT
2011Target:
0
1.12
2007 2008 2009 20112010
115%
0
0.5
1.0
1.5
0.52
1.12
2011Target:
0.52
CSR KPIs
We measure our Group’s CSR progress through eight Key Performance Indicators aligned with delivering our strategy on environmental and workplace responsibility.
PREPARATION & SCOPE OF THIS REPORT
This CSR report focuses on the initiatives we pursue to reduce our business’ main impacts on the environment and enhance workplace health, safety and fulfilment. We disclose key indicators we use to assess our performance in these areas in 2011.
We have prepared this report to communicate our progress drawing on the voluntary ESG (environmental, social and governance) Reporting Guide of the Hong
Kong Stock exchange, the voluntary sustainability reporting guidelines of the Global Reporting Initiative and the guiding principles of the United Nations’ Global Compact.
Environmental and Safety KPI data in this report has been measured or calculated in accordance with industry standards, and measurements have been audited by Lloyd’s Register QA.
Grams of CO2
per tonne-mileDeficienciesper inspection

PACIFIC BASIN SHIPPING LIMITED • ANNUAL REPORT 2011
43
Group O
verviewBusiness Review
Financial ReviewG
overnance Financial S
tatements
CS
R Report
Workplace
KPI Lost Time Injury Incidents
Lost Time Injury Frequency (LTIF)
Employee Engagement
Shore-staff Turnover External Training
Aim
To minimise the risk of injury and to reduce lost time due to injury
The LTIF rate is a principal measure of safety performance, defined by the number of lost-time injuries multiplied by 1 million, divided by total man-hours worked in the reporting period
Lost Time Injuries are those in which the injured party misses at least one working day (8 hours) at work
To be the employer of choice in our industry so that we attract and retain the best people. To maximise the degree of our employees’ attachment to their job, colleagues and organisation, impacting their commitment to their work and our company
Our key indicators of shore-based employee engagement are our staff turnover rate and the percentage of staff receiving external training
Perf
orm
ance
Our LTIF improved by 11% although we failed to meet our target and the overall number of injuries remained unchanged due mainly to slips, trips and falls
15% of staff left the Group due in part to some rationalisation of our business during the year and 248 employees (64%) received external training
We achieved an engagement score of 71% in Hewitt “Best Employers in Hong Kong” survey results published in 2011 (one of the highest scores in Hong Kong, and up from 51% in 2006)
Our seafarer retention rate was 74% in 2011
Tar
get
To substantially eliminate our lost-time injury incidents in 2012 and to improve on our best LTIF achievement of 0.85 in 2007
To limit staff turnover to approximately 10% and maintain our current high levels of external training in 2012
We aim to participate in another Hewitt staff engagement survey in 2012 - this time involving all our staff globally
64% 10%
0%
20%
40%
60%
80%
64%
54%
0.0
0.5
1.0
1.5
2.0
1.54
1.37
2007 2008 2009 20112010
1.37 11%
2011Target:
0.85
0
5
10
15
1212
2007 2008 2009 20112010
12 INCIDENTS
0%
10%
20%
30%
15%
15%
15%
Our most significant safety, quality, health and environmental (SQHE) issues are generated by our core dry bulk fleet and so this report concentrates on our dry bulk, ship-based SQHE considerations and initiatives. In particular, it reviews how we manage our ships’ atmospheric emissions, risk of pollution incidents and safety performance. We also report on our group-wide staff engagement initiatives and performance.
We report on the environmental impacts of assets over which we have long term operational control which, according to the Greenhouse Gas Protocol, refers to
areas of our business “where the Group has authority to introduce and implement its operating policies”. Therefore, we focus on the SQHE performance of our fleet of owned and finance-leased dry bulk ships which we controlled both commercially and technically (average 43 vessels in 2011).
In due course, we will look to incorporate KPIs for our growing towage and RoRo shipping activities for which environmental programmes and reporting systems are currently under development.
We will again disclose our greenhouse gas emissions to the Carbon Disclosure Project in 2012
CDP
2007 2008 2009 20112010 2007 2008 2009 20112010
PACIFIC BASIN SHIPPING LIMITED • ANNUAL REPORT 2011
Environment44
ENVIRONMENTAL POLICY & MANAGEMENT SYSTEM
Recognising as we do that emissions and other environmental impacts from our industry need to be significantly reduced, and keen to be at the forefront of efforts within our sector to tackle this challenge, we have adopted an environmental philosophy which is encompassed in the following straightforward Environmental Policy:
Pacific Basin is committed to being an environmentally responsible company at the forefront of efforts within the shipping industry to minimise our impact on the environment, in particular through initiatives to reduce atmospheric emissions, marine discharges and resource consumption. We seek to achieve this by:
✓ adopting environmentally-friendly technologies and practices across our business;
✓ pursuing environmental initiatives at sea and on land that go beyond what is required of us under law; and
✓ promoting more modest practices even if they only bring relatively small benefits to the environment, because we believe that even small group-wide and individual contributions make a difference.

PACIFIC BASIN SHIPPING LIMITED • ANNUAL REPORT 2011
45
Group & S
trategyBusiness Review
Financial ReviewG
overnance Financial S
tatements
CS
R Report
AtmosphericEmissions
MarineDischarge
ShoreDischarge
OtherOutputs
INPUTS
Fuel Oil
Paints
Ballast Water
Food & Packaging
Dunnage(cargo packing material)
Lubricants
Chemicals
•CarbonDioxide(CO2) & other greenhouse gases
•SulphurOxides(SOx)
•NitrogenOxides(NOx)
•ParticulateMatter(PM)
•VolatileOrganicCompounds(VOCs)
•Bilgewater
•Ballastwater
•Sewage&graywater
•Garbage/foodwaste
•Toxicleachingfrompaint
•Cargoresidue
•Accidentaldischarges
•Garbage
•Wastedunnage
•Cargoresidue
•Sludge
•Hazardouswaste
•Expendedparts
•Noise
•Odour
•Visualimpact
OURIMPACTONTHEENVIRONMENT
Propelling a vessel across oceans requires a number of resources or inputs, the consumption of which results in outputs that impact negatively on the environment. The diagram below summarises the main inputs and resulting outputs related to dry bulk shipping.
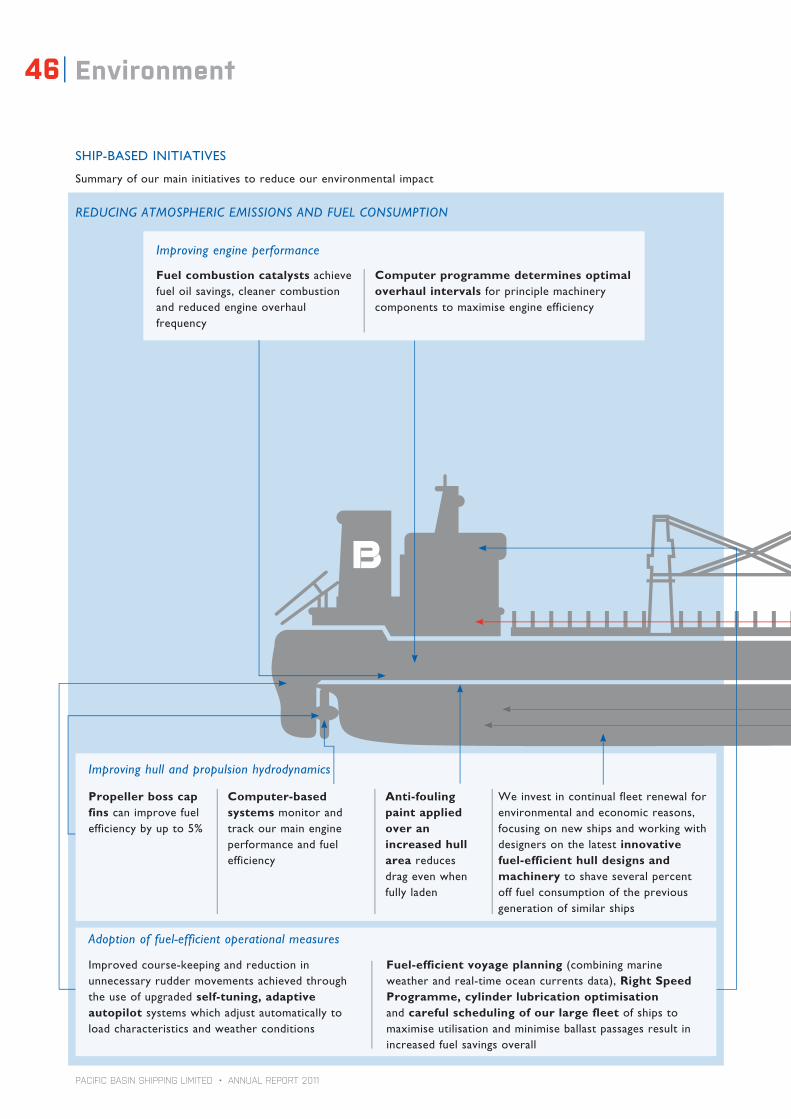
PACIFIC BASIN SHIPPING LIMITED • ANNUAL REPORT 2011
Environment46
SHIP-BASEDINITIATIVES
Summary of our main initiatives to reduce our environmental impact
Reducing AtmospheRic emissions And Fuel consumption
Fuel combustion catalysts achieve fuel oil savings, cleaner combustion and reduced engine overhaul frequency
Computer programme determines optimal overhaul intervals for principle machinery componentstomaximiseengineefficiency
improving engine performance
Propeller boss cap fins can improve fuel efficiency by up to 5%
improving hull and propulsion hydrodynamics
Computer-based systems monitor and track our main engine performance and fuel efficiency
Anti-fouling paint applied over an increased hull area reduces drag even when fully laden
Weinvestincontinualfleetrenewalforenvironmental and economic reasons, focusing on new ships and working with designers on the latest innovative fuel-efficient hull designs and machinery to shave several percent off fuel consumption of the previous generation of similar ships
Improvedcourse-keepingandreductioninunnecessary rudder movements achieved through the use of upgraded self-tuning, adaptive autopilot systems which adjust automatically to load characteristics and weather conditions
Fuel-efficient voyage planning(combiningmarineweatherandreal-timeoceancurrentsdata),Right Speed Programme, cylinder lubrication optimisation and careful scheduling of our large fleet of ships to maximiseutilisationandminimiseballastpassagesresultinincreased fuel savings overall
Adoption of fuel-efficient operational measures

PACIFIC BASIN SHIPPING LIMITED • ANNUAL REPORT 2011
47
Group O
verviewBusiness Review
Financial ReviewG
overnance Financial S
tatements
CS
R Report
Reducing mARine dischARges
Oil spill prevention – OurISM-compliantsafety management system prescribes strict system controls and procedural safeguards to prevent fuel oil spillage and our crew are trained in oil spill response in the event that accidental spillage should occur
Bilge water management – Oily water separators minimise the risk of inadvertently pumping out contaminated bilge water
Ballast water management – Our ballast water management plans set out strict ballast operations practices in compliance with the IMO’s ballast water management convention and equivalent local port state regulations
Hull Paint Considerations–Wephased out our use oftoxicTBT-basedantifouling paints well in advance of 2008 regulatory deadlines and nowusebiocide-basedpaints while monitoring advancesinmoreeco-friendly paints
monitoRing the deVelopment oF FutuRe gReen technologies
Exhaust filtration–Wearecloselytrackingthedevelopmentofexhaust gas scrubbing technology to reduce greenhouse gasemissionsinexhaustfumesalthough,fornow,scrubbingequipmentisnotsufficientlyviableforuseonourships
New, clean propulsion technologies–Wehopeandexpectnew, clean technologies to eventually replace the fossil fuel burning internal combustion engine to propel commercial vessels in the longer term. Meanwhile we are encouraged bydevelopmentsincleantechnologybeingtrialledasauxiliarysourcesofpropulsion(suchaslargetowingkites)butdonotyetconsideranyofthesetechnologiestobesufficientlyadvanced,practicalorcost-effectiveforadoptiononourships
Combustion of cleaner fuelTheshippingindustryhaslongbeendependentondirty,high-sulphurfueloil,butnewrequirementsfortheuse(andsupply)ofincreasinglycleaner,low-sulphurfuelinanumberofEmissionControlAreas(ECAs)andgloballyshouldmarkthebeginningofalonger-termefforttoimprovethequalityoffossilfuelsmadeavailabletothemaritimeindustry
impRoVing wAste mAnAgement
Garbage compactors on our ships facilitate easy storageofoperationalgarbage(excludingfoodwaste and cargo residues) until it can be disposed of responsibly ashore

PACIFIC BASIN SHIPPING LIMITED • ANNUAL REPORT 2011
Workplace48
Reflecting the sentiment in our vision, we strive to be the employer of choice for our existing staff and for talented potential employees in our industry.
Our people are central to our business and so we do what we can to provide our multi-national colleagues with an attractive, enjoyable, fulfilling, safe and supportive working environment. We believe that the right investment in our colleagues at all levels of the organisation – both at sea and ashore – does much to increase knowledge and productivity, contribution and engagement, loyalty and retention, and a deeper sense of belonging to the Company.
That investment in our employees and their engagement broadly takes the following forms:
• WorkingConditions
• Health&Safety(includingAnti-Piracy)
• Development&Training
• Diversity&EqualOpportunity
• ResponsibleBusinessPractices,including:
– Legal Trading
– Anti-Corruption
– Anti-CollusiveBehaviour
– ResponsibleProcurement
– LabourStandards,LabourRelations&HumanRights
WORKINGCONDITIONS
We work in well-located, high-qualityofficeswhichofferourstaffasafe, comfortable and engaging working environment. We pay particular attention to good air conditioning and lighting – mindful of the environmental impact of such technologies – as well as ergonomic workstations in open plan areas to facilitate staff interaction and efficient working practices.
Our staff work very hard and so we encourage them to pursue a healthy balance between family life and work.Agoodworkingenvironment is one that minimises stress and “burn out”, absenteeism and high levels of staff turnover which compromise team performance. First and foremost, we want our staff to be happy at work and thus able to perform effectively.
We believe that employee engagement – the degree of employees’ emotional attachment to their job, colleagues and organisation which profoundly influences their willingness to learn and perform at work – is significantly enhanced by offering them an environment in which they can better understand and influence the company’s goals, governance and culture. We seek to provide such a forum through quarterlytownhallmeetings,monthly informal gatherings and a relaxed open-door policy that gives all employees ready access to the group’s senior management team.
Staff engagement KPIsp.43
SHORE-BASEDENVIRONMENTALANDHEALTH&SAFETYINITIATIVES
We have introduced policies and practices in our offices to reduce our environmental impact, such as through reduced consumption of electricity, water and materials, and the recycling of much of our office waste, reflecting a similar commitment to protecting the environment ashore as we demonstrate at sea.
Internally, our environmental message is distributed through guidelines and notices posted on our intranet and on notice boards as well as through our company newsletter and occasional environmental and community events – externally, it has been conveyed to stakeholders through our annual reports.
Remuneration Reportp.73
Remuneration of key staff is partly aligned with the Company’s delivery of shareholder value through their participation in our share-based Long Term Incentive Scheme.
OurimplementationofthePacificBasinManagementSystemashoreandatseaconformstothemandatoryInternationalSafetyManagement(ISM)CodeandanumberofvoluntarysafetyandenvironmentalmanagementstandardsascertifiedbyLloyd’sRegisterQualityAssurance(LRQA),including:
• ISO9001:2008forourqualitymanagementsystem• ISO14001:2004forourenvironmentalmanagementsystem• OHSAS18001:2007forouroccupationalhealth&safetymanagementsystem
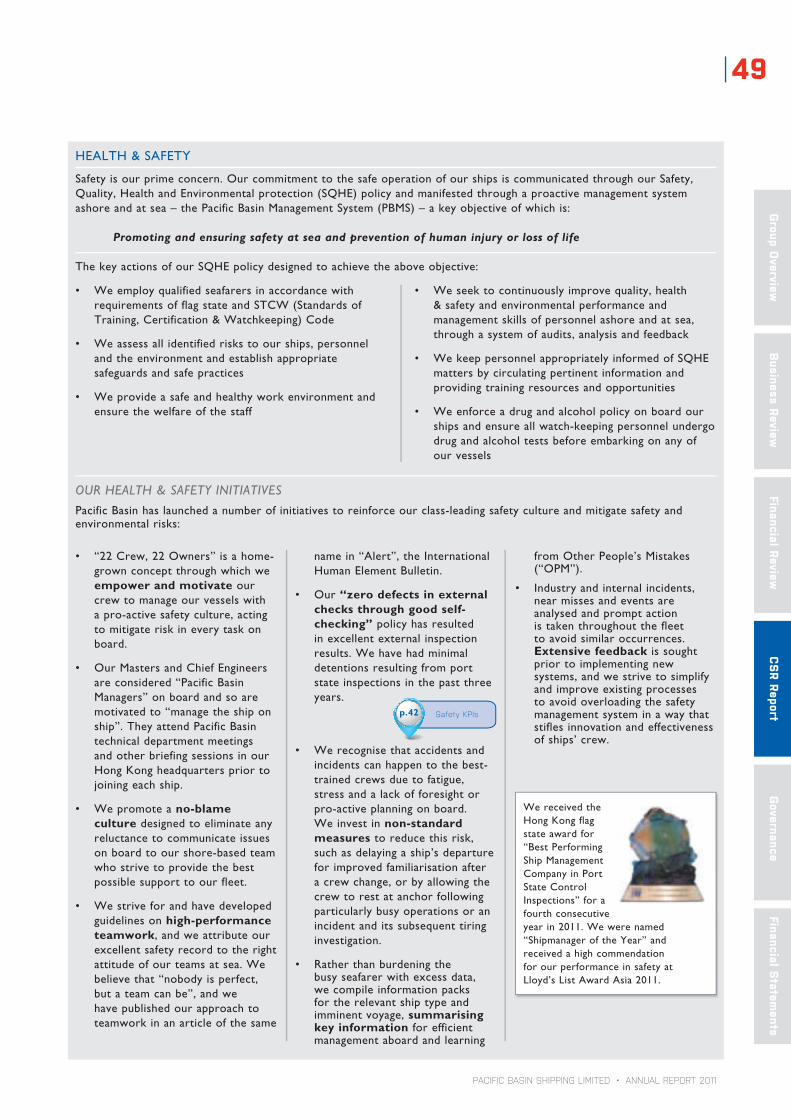
PACIFIC BASIN SHIPPING LIMITED • ANNUAL REPORT 2011
49
Group O
verviewBusiness Review
Financial ReviewG
overnance Financial S
tatements
CS
R Report
• “22Crew,22Owners”isahome-grown concept through which we empower and motivate our crew to manage our vessels with a pro-active safety culture, acting to mitigate risk in every task on board.
• OurMastersandChiefEngineersareconsidered“PacificBasinManagers”onboardandsoaremotivated to “manage the ship on ship”.TheyattendPacificBasintechnical department meetings and other briefing sessions in our HongKongheadquarterspriortojoining each ship.
• Wepromoteano-blame culture designed to eliminate any reluctance to communicate issues on board to our shore-based team who strive to provide the best possible support to our fleet.
• Westriveforandhavedevelopedguidelines on high-performance teamwork, and we attribute our excellent safety record to the right attitude of our teams at sea. We believe that “nobody is perfect, but a team can be”, and we have published our approach to teamwork in an article of the same
namein“Alert”,theInternationalHumanElementBulletin.
• Our“zero defects in external checks through good self-checking” policy has resulted in excellent external inspection results. We have had minimal detentions resulting from port state inspections in the past three years.
• Werecognisethataccidentsandincidents can happen to the best-trained crews due to fatigue, stress and a lack of foresight or pro-active planning on board. We invest in non-standard measures to reduce this risk, such as delaying a ship’s departure for improved familiarisation after a crew change, or by allowing the crew to rest at anchor following particularly busy operations or an incidentanditssubsequenttiringinvestigation.
• Ratherthanburdeningthebusy seafarer with excess data, we compile information packs for the relevant ship type and imminent voyage, summarising key information for efficient management aboard and learning
fromOtherPeople’sMistakes(“OPM”).
• Industryandinternalincidents,near misses and events are analysed and prompt action is taken throughout the fleet to avoid similar occurrences. Extensive feedback is sought prior to implementing new systems, and we strive to simplify and improve existing processes to avoid overloading the safety management system in a way that stifles innovation and effectiveness of ships’ crew.
OUR HEALTH & SAFETY INITIATIVES
PacificBasinhaslaunchedanumberofinitiativestoreinforceourclass-leadingsafetycultureandmitigatesafetyandenvironmental risks:
HEALTH&SAFETY
Safetyisourprimeconcern.OurcommitmenttothesafeoperationofourshipsiscommunicatedthroughourSafety,Quality,HealthandEnvironmentalprotection(SQHE)policyandmanifestedthroughaproactivemanagementsystemashoreandatsea–thePacificBasinManagementSystem(PBMS)–akeyobjectiveofwhichis:
Promoting and ensuring safety at sea and prevention of human injury or loss of life
ThekeyactionsofourSQHEpolicydesignedtoachievetheaboveobjective:
• WeemployqualifiedseafarersinaccordancewithrequirementsofflagstateandSTCW(StandardsofTraining,Certification&Watchkeeping)Code
• Weassessallidentifiedriskstoourships,personneland the environment and establish appropriate safeguards and safe practices
• Weprovideasafeandhealthyworkenvironmentandensure the welfare of the staff
• Weseektocontinuouslyimprovequality,health&safetyandenvironmentalperformanceandmanagement skills of personnel ashore and at sea, through a system of audits, analysis and feedback
• WekeeppersonnelappropriatelyinformedofSQHEmatters by circulating pertinent information and providing training resources and opportunities
• Weenforceadrugandalcoholpolicyonboardourships and ensure all watch-keeping personnel undergo drug and alcohol tests before embarking on any of our vessels
Safety KPIsp.42
We received the HongKongflagstate award for “BestPerformingShipManagementCompanyinPortStateControlInspections” for a fourth consecutive yearin2011.Wewerenamed“ShipmanageroftheYear”andreceived a high commendation for our performance in safety at Lloyd’sListAwardAsia2011.

PACIFIC BASIN SHIPPING LIMITED • ANNUAL REPORT 2011
Workplace50
EMPLOYEES AT SEA
• WetrainourseafarerstostandardsexceedingthoserequiredbySTCW.SomeoftheextrainvestmentswemakeareMaritimeResourceManagement(MRM),BridgeResourceManagement(BRM)andEngineResourceManagement(ERM)training,simulatorand computer-based training, enhanced pre-joining briefings for all staff, and the deployment of fleet training managers on our vessels.
• Weconducthalf-yearlyin-housetrainingseminarsatourcrewingcentresinDalianandManila.Incidents within the fleet and elsewhere in the industry are discussed and, with participant involvement, preventive measures are developed and communicated.Participantsarekeptfullyabreastofregulatoryrequirements,experiencefeedbackandother developments affecting our industry and their areas of focus.
• In2011,weintroducedtrainingseminarsrunonavoluntarybasisbyourexperiencedMastersandChiefEngineersforthebenefitofourratings.
• WehaveoperatedanofficercadetrecruitmentandtrainingschemeinChinasince2005,andthiswasextendedtothePhilippinesin2010.Wedoubledourintakeofofficercadetsonourvesselsin2011.
• WepartnerwiththeSwedishP&IClubtotrainourofficersinMaritimeResourceManagement.AnumberofmanagersfromourofficesinHongKong,DalianandManilahaveundergoneMRMLeadershipTrainingandnowrunregularMRMtrainingatourcrewingcentresinDalianandManila.
• WeemployfourFleetTrainingManagers(upfromthreelastyear)tosailperiodicallyonvesselsandoffer our crew on-the-job training in safety and key operational areas. Our in-house technical department provides advice and shore-based support for safe operationsandtheconsistentdeliveryofqualityservice.
• Ourcrewretentionratein2011exceeded74%andour officers have a clear career path from bridge or engine room to management positions ashore. ApproximatelyhalfthemanagersinourtechnicaldivisionareformerPacificBasinseafarers.
EMPLOYEES ASHORE
• Socialandteam-buildingevents–Wegathertocelebrate seasonal festivals and the delivery of new ships into our ownership, and we organise team-building off-site events which reinforce the personal bond and understanding each of us has with our colleagues and Company.
• Group-wideintranetconnectivity&informationsharing – We employ a group-wide intranet called “PBConnect”asanonlineplatformforsharingindustry data and news as well as company news from our teams around the world so that each of us is connectedtothe“PB”family.
• Onthejobtraining&companyvisits–Ourtraineesreceive exposure to a number of areas within our business and that of our various stakeholders. For example, our young executives understudy the heads of functional units within the Company, such as insurance, bunkering and technical, and they attend voyages on board our ships and visits to shipyards, shipping agents, shipbrokers and customers. They also receive preparatory support and sponsorship forInstituteofCharteredShipbrokerscoursesandexaminations.
• Independently-runclassroomandseminar-basedtraining–Staffatalllevelsoftheorganisationare encouraged to attend training conducted by professional academic bodies and training institutions. In2011,64%ofourshore-basedcolleaguesunderwent some form of classroom or seminar-based training, which we believe motivates staff whilst enhancing their skill sets to do their job efficiently and effectively.
• Leadershipandmanagementtraining–Weinvestin executive education for senior management and colleagues identified as future leaders of the Company, which we consider an important part of our succession planning. We send them to leadership consultants and business schools around the world to hone their leadership skills.
• Traininginotherspecialisedmanagementtools–TheCompanyequipsitsmanagersandleaderswithsufficient knowledge of specialised management tools such as psychometric evaluation systems that help in the process of recruitment, team-building, conflict management and promotion strategies.
DEVELOPMENT&TRAINING
Investment in the development and training of our staff at sea and ashore is key to maximising our crew and ships’ safety and productivity, while also a major factor in the successful motivation engagement and retention of our people.
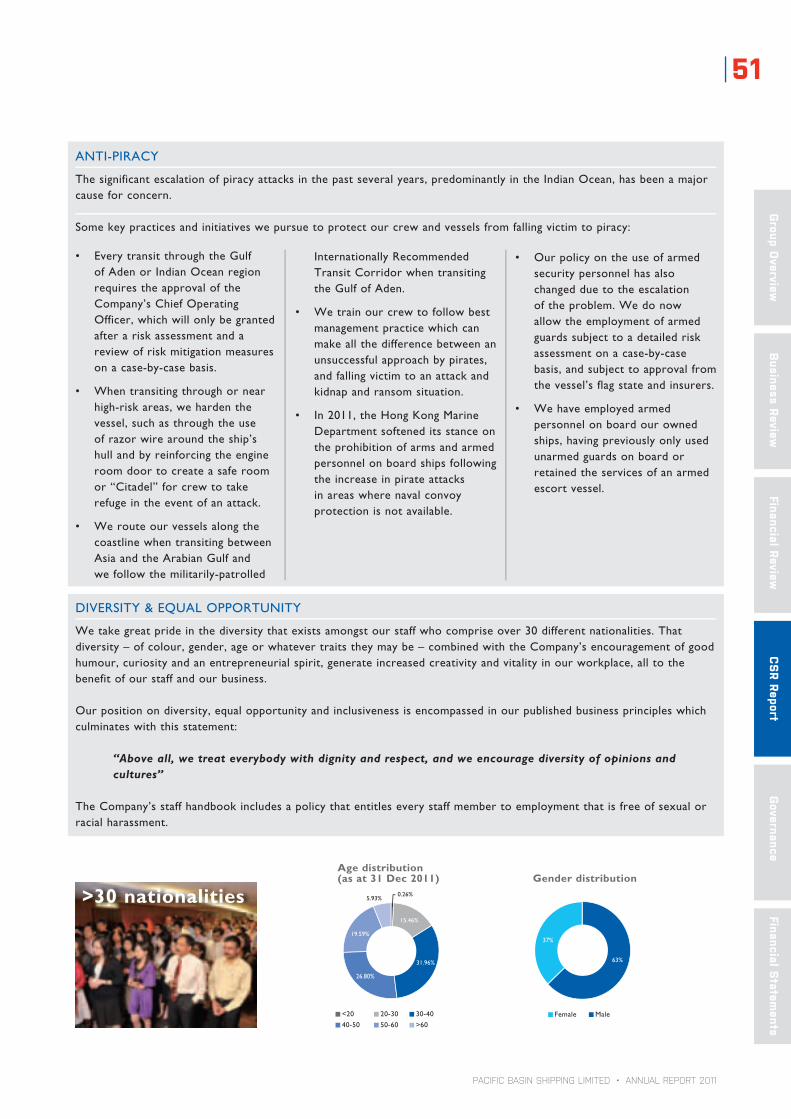
PACIFIC BASIN SHIPPING LIMITED • ANNUAL REPORT 2011
51
Group O
verviewBusiness Review
Financial ReviewG
overnance Financial S
tatements
CS
R Report
DIVERSITY&EQuALOPPORTuNITY
Wetakegreatprideinthediversitythatexistsamongstourstaffwhocompriseover30differentnationalities.Thatdiversity – of colour, gender, age or whatever traits they may be – combined with the Company’s encouragement of good humour, curiosity and an entrepreneurial spirit, generate increased creativity and vitality in our workplace, all to the benefit of our staff and our business.
Ourpositionondiversity,equalopportunityandinclusivenessisencompassedinourpublishedbusinessprincipleswhichculminates with this statement:
“Above all, we treat everybody with dignity and respect, and we encourage diversity of opinions and cultures”
The Company’s staff handbook includes a policy that entitles every staff member to employment that is free of sexual or racial harassment.
• EverytransitthroughtheGulfofAdenorIndianOceanregionrequirestheapprovaloftheCompany’s Chief Operating Officer, which will only be granted after a risk assessment and a review of risk mitigation measures on a case-by-case basis.
• Whentransitingthroughornearhigh-risk areas, we harden the vessel, such as through the use of razor wire around the ship’s hull and by reinforcing the engine room door to create a safe room or “Citadel” for crew to take refuge in the event of an attack.
• Werouteourvesselsalongthecoastline when transiting between AsiaandtheArabianGulfandwe follow the militarily-patrolled
Internationally Recommended Transit Corridor when transiting theGulfofAden.
• Wetrainourcrewtofollowbestmanagement practice which can make all the difference between an unsuccessful approach by pirates, and falling victim to an attack and kidnap and ransom situation.
• In2011,theHongKongMarineDepartmentsofteneditsstanceonthe prohibition of arms and armed personnel on board ships following the increase in pirate attacks in areas where naval convoy protection is not available.
ANTI-PIRACY
The significant escalation of piracy attacks in the past several years, predominantly in the Indian Ocean, has been a major cause for concern.
Somekeypracticesandinitiativeswepursuetoprotectourcrewandvesselsfromfallingvictimtopiracy:
37%
63%
Gender distribution
15.46%
31.96%
19.59%
5.93%0.26%
26.80%
Age distribution(as at 31 Dec 2011)
<20 20-30 30-40
40-50 50-60 >60
>30 nationalities
• Ourpolicyontheuseofarmedsecurity personnel has also changed due to the escalation of the problem. We do now allow the employment of armed guards subject to a detailed risk assessment on a case-by-case basis, and subject to approval from the vessel’s flag state and insurers.
• Wehaveemployedarmedpersonnel on board our owned ships, having previously only used unarmed guards on board or retained the services of an armed escort vessel.
MaleFemale
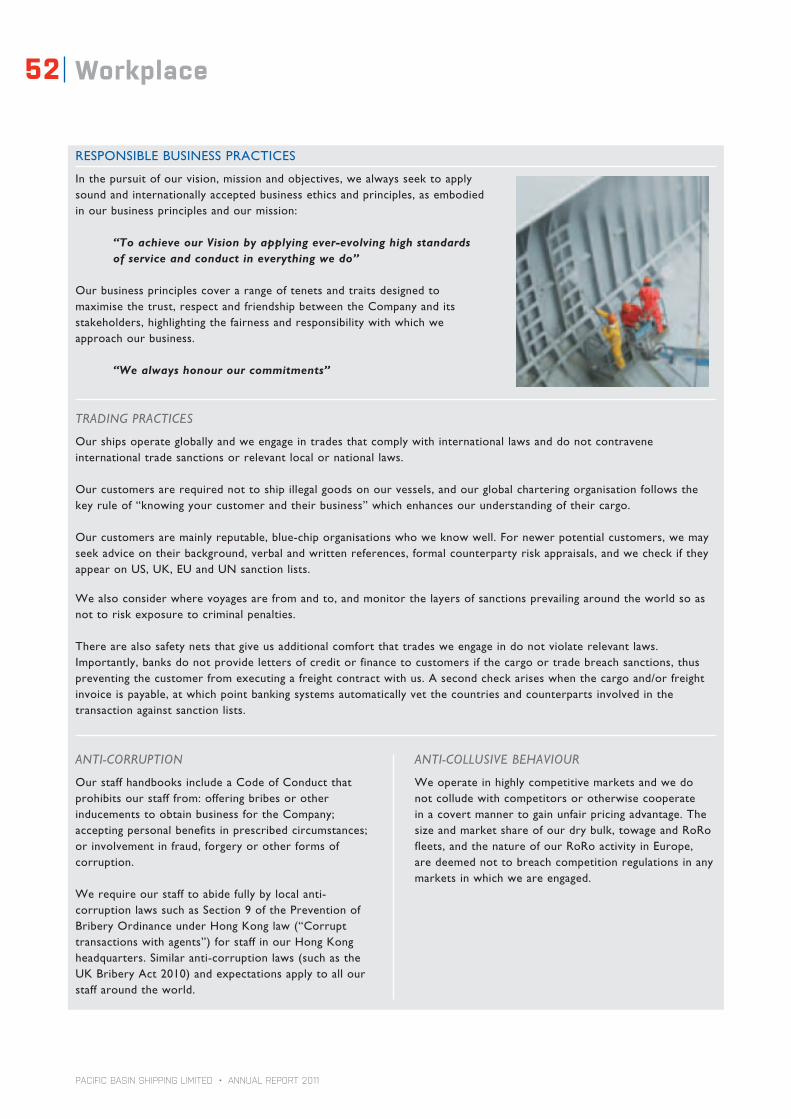
PACIFIC BASIN SHIPPING LIMITED • ANNUAL REPORT 2011
Workplace52
ANTI-CORRUPTION
Our staff handbooks include a Code of Conduct that prohibits our staff from: offering bribes or other inducements to obtain business for the Company; accepting personal benefits in prescribed circumstances; or involvement in fraud, forgery or other forms of corruption.
Werequireourstafftoabidefullybylocalanti-corruptionlawssuchasSection9ofthePreventionofBriberyOrdinanceunderHongKonglaw(“Corrupttransactionswithagents”)forstaffinourHongKongheadquarters.Similaranti-corruptionlaws(suchastheuKBriberyAct2010)andexpectationsapplytoallourstaff around the world.
ANTI-COLLUSIVE BEHAVIOUR
We operate in highly competitive markets and we do not collude with competitors or otherwise cooperate in a covert manner to gain unfair pricing advantage. The size and market share of our dry bulk, towage and RoRo fleets,andthenatureofourRoRoactivityinEurope,are deemed not to breach competition regulations in any markets in which we are engaged.
RESPONSIBLEBuSINESSPRACTICES
In the pursuit of our vision, mission and objectives, we always seek to apply sound and internationally accepted business ethics and principles, as embodied in our business principles and our mission:
“To achieve our Vision by applying ever-evolving high standards of service and conduct in everything we do”
Our business principles cover a range of tenets and traits designed to maximise the trust, respect and friendship between the Company and its stakeholders, highlighting the fairness and responsibility with which we approach our business.
“We always honour our commitments”
TRADING PRACTICES
Our ships operate globally and we engage in trades that comply with international laws and do not contravene international trade sanctions or relevant local or national laws.
Ourcustomersarerequirednottoshipillegalgoodsonourvessels,andourglobalcharteringorganisationfollowsthekey rule of “knowing your customer and their business” which enhances our understanding of their cargo.
Our customers are mainly reputable, blue-chip organisations who we know well. For newer potential customers, we may seek advice on their background, verbal and written references, formal counterparty risk appraisals, and we check if they appearonuS,uK,EuanduNsanctionlists.
We also consider where voyages are from and to, and monitor the layers of sanctions prevailing around the world so as not to risk exposure to criminal penalties.
There are also safety nets that give us additional comfort that trades we engage in do not violate relevant laws. Importantly, banks do not provide letters of credit or finance to customers if the cargo or trade breach sanctions, thus preventingthecustomerfromexecutingafreightcontractwithus.Asecondcheckariseswhenthecargoand/orfreightinvoice is payable, at which point banking systems automatically vet the countries and counterparts involved in the transaction against sanction lists.

PACIFIC BASIN SHIPPING LIMITED • ANNUAL REPORT 2011
53
Group O
verviewBusiness Review
Financial ReviewG
overnance Financial S
tatements
CS
R Report
Examplesofvettingcriteriawerequireofoursuppliersand sub-contractors include:
• certificationtoarecognisedinternationalstandard;
• approvalbyregulatoryauthorities;
• authorisedagentsororiginalequipmentmanufacturers;and/or
• membershipofareputableorganisation,suchasInternationalShipSuppliersAssociation(ISSA)ortheInternationalMarinePurchasingAssociation(IMPA)
Our labour policies and minimum standards are determined with reference to the conventions of the InternationalLabourOrganization(ILO)–theunitedNations agency that shapes policies to promote decent working conditions for seafarers and other workers.
MostoftheseILOconventionsrelatingtoseafarershavebeenratifiedbyChinaandHongKongandhavebeenincorporatedinHongKongflagstatelegislationunderHongKongCAP478MerchantShipping(Seafarers)andotherordinances.Assuch,theyaremandatoryforustofollowinrespectofourHongKong-flaggeddrybulkships.
Where ILO conventions have not been ratified by our flag state, we voluntarily comply with or exceed the requirementsofsuchconventionsbywayofaCollectiveBargainingAgreement(“CBA”)withtheInternationalTransportFederation(“ITF”)-affiliatedseafarerunions.PacificBasinwasactivelyinvolvedindraftingthecurrentHongKongflagstateCBAwhichappliestoallHongKong employers of seafarers under the ITF.
LABOUR STANDARDS, LABOUR RELATIONS & HUMAN RIGHTS
The many ILO conventions and recommendations relating to the employment of seafarers have been consolidated intoasingle,coherentinstrument–theMaritimeLabourConvention2006.WhilethisisexpectedtocomeintoforceinChinaandHongKongin2013,wehavealreadyamended our policies to comply.
SomeofthemainlabourissuescoveredbytheMaritimeLabourConvention2006are:
• preventingforcedlabour
• minimumage&preventingchildlabour
• hoursofwork
• wages&equalremuneration
• therighttoorganise&collectivebargaining
• seafarers’welfare
• accommodation,foodandcatering
• discrimination
• socialsecurity
• preventionofaccidents
• healthprotectionandmedicalCare
RESPONSIBLE PROCUREMENT
OurPacificBasinManagementSystemmanualrequiresthat, in all but some exceptional circumstances, stores and spares for our fleet are purchased from approved suppliers who are vetted before approval and reviewed at regular intervals thereafter.
Our selection and continued support of suppliers is heavily influenced by the outcome of our reviews of their and their products’ performance affecting occupational health,safety,qualityandtheenvironment.

PACIFIC BASIN SHIPPING LIMITED • ANNUAL REPORT 2011
Community54
We recognise our obligations as a responsible member of the communities in which we operate, in particular:
• theseafarercommunity
• HongKong–ourheadquartersandflagstate
• theportswhereourshipstrade
• theshippingindustry
• themarineandoceanicenvironment
Ourengagementinandcontributionstothesecommunitiestakesanumberofforms,inanefforttosupporttheirlongertermsustainabilityandthatofourinvolvementinthem.
THeseafarercOmmuniTy
aseafaringlifeisnotaneasyone,andourbusinessisnothingwithoutthededicationofofficersandratingswhokeeptheglobalmerchantfleetmovingsafely.Theyandtheirfamiliesfaceemotionalandpracticalchallengesthroughseparationformanymonthsatatime,andlifefortheseafarermovingbackashoreisnotalwaysanyeasier.
Weconsiderourcommitmenttoseafarerwelfaretobethemainfocusofourcommunityinvestment,andso:
• Wedonatedoverus$40,000tothesailors’societyandtheHongKongmissiontoseafarers;
• Wesponsoraminibusinmanilafortheuseofthesailors’societytoprovidefreetransporttoallseafarersinmanilaandtofacilitatedshipvisitsbythemanilaportchaplain;
• Wedonatedus$4,400toc.i.r.m.(theinternationalradiomedicalcentre)whichprovidesradio-medicalassistancetoshipsintheeventofmedicalemergenciesatsea;
• OurceOandHrDirectorservedasasianambassadorsforthesailors’societyin2011withabrieftoencourageasianshipownerstosupportseafarerwelfarecauses,especiallyinpartsoftheregionwheretherearefewornoseamen’schurchesandwelfaregroups.
asoneofthelargestforeignemployersofchinesecrewandasignificantemployeroffilipinocrew,wecontinuetosupportthechineseandfilipinoseafaringcommunitieswithinvestmentinourrecruitmentcentresandtrainingprogrammes(suchasourrecentlylaunchedofficercadettrainingprogrammeaffiliatedwiththePhilippinemerchantmarineacademy)inDalianandmanila.inreturn,webenefitfromaccesstocrewresourcepoolsenablingustomanourfleetwithexperiencedcrewdespitetheeverpresentshortageofmaritimepersonnelintheindustry.
THePOrTsWHereOursHiPsTraDe
OurdiverseandcitiescustomerbasetakesourshipstomanyportsandcitiesaroundtheworldandourcrewandshipsareconsideredambassadorsforPacificBasinwherevertheysail.assuch:
• Wedowhatwecantoexceedrequirementsunderapplicableenvironmentallawsoastominimiseourimpactonthecities,towns,portsandshorelineswevisit;
• Ourcrewarerequiredtoshowskilfulseamanshipandactprofessionallyinthewaytheyconducttheirships’business;
• Ourcrewarerequiredtoberespectfullaw-abidingvisitors,toshowwarmhospitalitytowardsvisitorsonboard,andtobeineverywaybecomingofPacificBasinpersonnel;and
• Wedowhatwecantoestablishandmaintaingoodrelationswithportauthorities,agentsandotherstakeholdersintheplaceswevisit.
HOngKOng
WeareheadquarteredandlistedinHongKongandourowneddrybulkfleetfliestheHongKongflag.WeareproudofourconnectionwithHongKongandwetakeanactiveroleinthelocalshippingcommunitytowhichwecontributethroughourmembershipof:
• theHongKongshipownersassociation(HKsOa)
• theexecutivecommitteeofHKsOa
• theshippingconsultativecommitteeoftheHongKongadministration
• theHongKongdelegationtotheimO’ssTcWconventionmanilaamendmentsconference
• theHongKongmarineDepartment’sseafareradvisoryboard
HongKong’smaritimeheritagehasimpactedhugelyonshippingandtradeinthewholeregion.in2011wemadeadonationtotheHongKongmaritimemuseumTrusttohelpfundtherelocationandexpansionofthemuseumtoanewandmuchlargerpremisesinHongKong’snewcentralHarbourfrontexpectedtobecompleteinearly2013.
in2010,wecommencedsponsorshipofonestudentperyeartopursueathreeyearbachelor’sdegreeininternationalshippingandTransportLogisticsattheHongKongPolytechnicuniversity.

PACIFIC BASIN SHIPPING LIMITED • ANNUAL REPORT 2011
55
Group O
verviewBusiness Review
Financial ReviewG
overnance Financial S
tatements
CS
R Report
THesHiPPinginDusTry
Weareactivecontributorswithintheshippingcommunitythroughourmembershipofmaritimeorganisationsandbodiessuchas:
• TheinternationalassociationofDrycargoshipowners(“intercargo”–theinternationalshipowners’associationwhollydedicatedtotheneedsofthedrybulkcargoindustry)
• TheBalticandinternationalmaritimecouncil(“BimcO”–thelargestinternationalshippingassociation representing ship owners, managers, brokersandagents)
• TheBalticexchange(amembershiporganisationthathashistoricallyprovidedamarketplacefordrybulktransportationandisnowalsothesourceofdailyshippingmarketinformation,shipbrokingstandardsanddisputeresolution)
• TechnicalcommitteesofLloyd’sregisterandclassnK(theseclassificationsocietiessetstandardsofqualityandreliabilityduringships’design,constructionandoperation)
• ThesafetyandLossadvisoryboardofstandard(asia)P&iclub(theP&iclubisamutualinsuranceassociationthatinsuresshipownersandoperatorsfortheirliabilitiestothirdpartiesarisingoutofshipoperations)
• TheHongKongshipownersassociation(“HKsOa”–theassociationthatpromotesandprotectstheinterestsofHongKongshipownersandshipmanagers)
HKsOaisparticularlyvocalinitsengagementwithinternationalindustrybodiessuchastheinternationalchamberofshippingandtheimO.OuractiveroleinHKsOaandotherindustrybodiesaffordsusavoiceininternationaldialoguewithlegislatorsandotherpartiesontopicalissues(suchasemissionsabatement)andfuturelegislation.
THemarineenvirOnmenT
Howwereduceourimpactontheenvironmentisdescribedintheenvironmentsectionofthiscsrreport.However,wealsocontinuetosupportmarine-relatedenvironmentalcausessuchasOceanrecoveryallianceandProjectKaisei,non-profitorganisationsthattogetherseektoincreaseunderstandingofthescaleandimpactofdebrisinouroceansandhowwecanintroducesolutionsforbothpreventionandclean-up.
OTHersTaKeHOLDers
inviewofourstrongbusinessconnectionwithJapan,wedonatedus$100,000totheTsunamireliefandreconstructioneffortsofThenipponfoundationin2011.
Weencourageourstafftotaketheirowninitiativetohelpcommunitiesorcauseswhichtheyfeelpassionateabout.in2011,anumberofourstaffraisedsignificantdonationstotallingus$100,000forcausessuchas:
• OxfamTrailwalker(JayK.Pillaiandteamraisedoverus$5,000)
• Theindochinastarfishfoundation(andrewBroomheadraisedus$72,000)
• Thechristinanoblechildren’sfoundationandtheHongKongcancerfund(markHardyandfriendsraisedoverus$3,000)
• climbingmountKinabaluforthesailors’society(yoyochu,alexBollhornandP.subbiahraisedoverus$3,000)
• WorldcancerresearchfundHongKong’s“fruityfriday”campaign(126HongKongofficestaffraisedus$1,000)
• ThesantosgreatBikerideforcharity(10PBTowagestaffraisedoverus$900)

56
PACIFIC BASIN SHIPPING LIMITED • ANNUAL REPORT 2011
Governance58 Risk
64 Corporate Governance
70 Directors & Senior Management
73 Remuneration Report
77 Report of the Directors
84 Information for Shareholders
88 News and Achievements

57
PACIFIC BASIN SHIPPING LIMITED • ANNUAL REPORT 2011
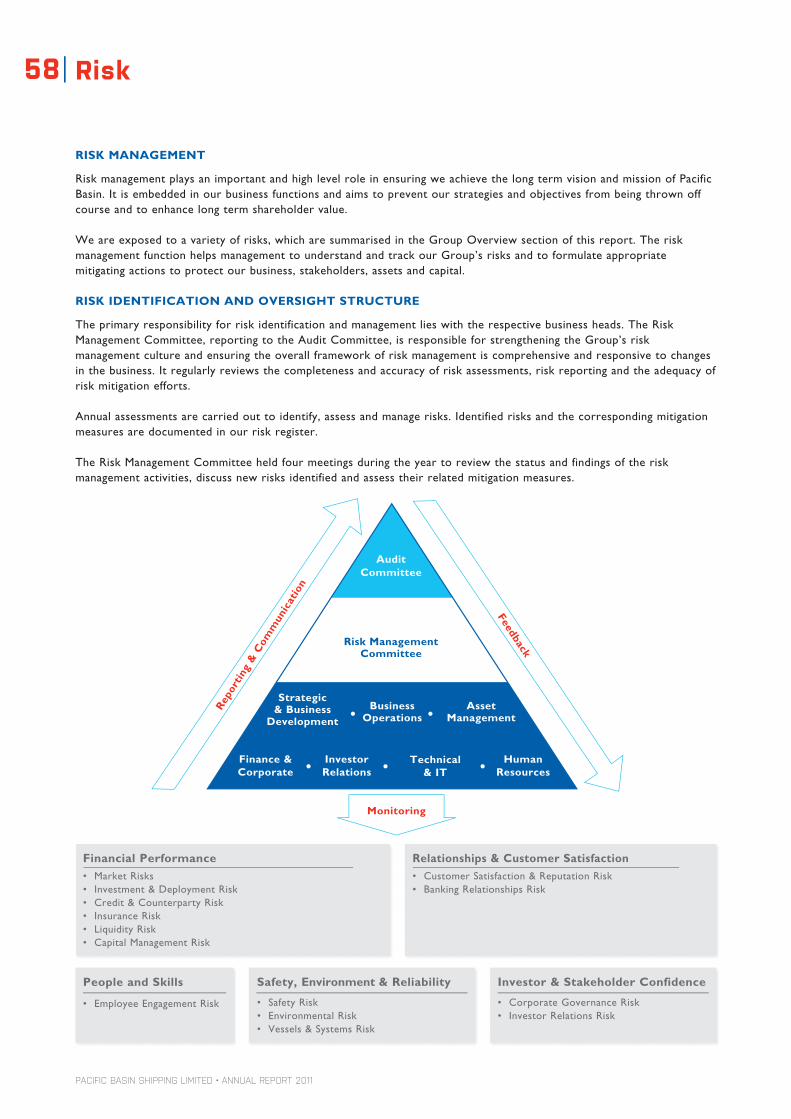
PACIFIC BASIN SHIPPING LIMITED • ANNUAL REPORT 2011
Risk58
RISK MANAGEMENT
Risk management plays an important and high level role in ensuring we achieve the long term vision and mission of Pacific Basin. It is embedded in our business functions and aims to prevent our strategies and objectives from being thrown off course and to enhance long term shareholder value.
We are exposed to a variety of risks, which are summarised in the Group Overview section of this report. The risk management function helps management to understand and track our Group’s risks and to formulate appropriate mitigating actions to protect our business, stakeholders, assets and capital.
RISK IDENTIFICATION AND OVERSIGHT STRUCTURE
The primary responsibility for risk identification and management lies with the respective business heads. The Risk Management Committee, reporting to the Audit Committee, is responsible for strengthening the Group’s risk management culture and ensuring the overall framework of risk management is comprehensive and responsive to changes in the business. It regularly reviews the completeness and accuracy of risk assessments, risk reporting and the adequacy of risk mitigation efforts.
Annual assessments are carried out to identify, assess and manage risks. Identified risks and the corresponding mitigation measures are documented in our risk register.
The Risk Management Committee held four meetings during the year to review the status and findings of the risk management activities, discuss new risks identified and assess their related mitigation measures.
Relationships & Customer Satisfaction• CustomerSatisfaction&ReputationRisk• BankingRelationshipsRisk
Financial Performance• MarketRisks• Investment&DeploymentRisk• Credit&CounterpartyRisk• InsuranceRisk• LiquidityRisk• CapitalManagementRisk
Safety, Environment & Reliability
• SafetyRisk• EnvironmentalRisk• Vessels&SystemsRisk
People and Skills
• EmployeeEngagementRisk
Investor & Stakeholder Confidence
• CorporateGovernanceRisk• InvestorRelationsRisk
Monitoring
AuditCommittee
Risk ManagementCommittee
Strategic & Business
DevelopmentAsset
Management
Finance & Corporate
InvestorRelations
Technical& IT
Business Operations
HumanResources
Feedback
Repo
rtin
g &
Com
mun
icat
ion
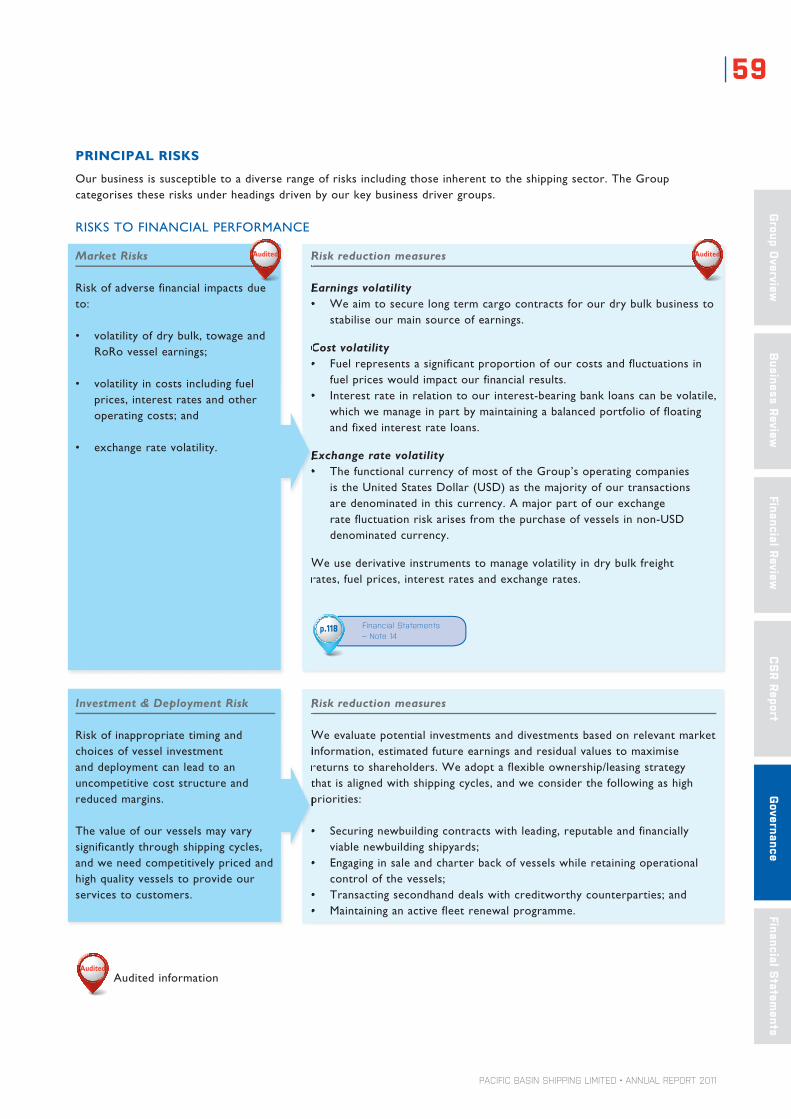
PACIFIC BASIN SHIPPING LIMITED • ANNUAL REPORT 2011
59
Group O
verviewBusiness Review
Financial ReviewG
overnanceFinancial S
tatements
CS
R Report
PRINCIPAL RISKS
Our business is susceptible to a diverse range of risks including those inherent to the shipping sector. The Group categorises these risks under headings driven by our key business driver groups.
RISKSTOFINANCIALPERFORMANCE
Risk reduction measures
Earnings volatility• Weaimtosecurelongtermcargocontractsforourdrybulkbusinessto
stabilise our main source of earnings.
Cost volatility• Fuelrepresentsasignificantproportionofourcostsandfluctuationsin
fuel prices would impact our financial results.• Interestrateinrelationtoourinterest-bearingbankloanscanbevolatile,
which we manage in part by maintaining a balanced portfolio of floating and fixed interest rate loans.
Exchange rate volatility• ThefunctionalcurrencyofmostoftheGroup’soperatingcompanies
is the United States Dollar (USD) as the majority of our transactions are denominated in this currency. A major part of our exchange ratefluctuationriskarisesfromthepurchaseofvesselsinnon-USDdenominated currency.
We use derivative instruments to manage volatility in dry bulk freight rates, fuel prices, interest rates and exchange rates.
Risk reduction measures
We evaluate potential investments and divestments based on relevant market information, estimated future earnings and residual values to maximise returns to shareholders. We adopt a flexible ownership/leasing strategy that is aligned with shipping cycles, and we consider the following as high priorities:
• Securingnewbuildingcontractswithleading,reputableandfinanciallyviable newbuilding shipyards;
• Engaginginsaleandcharterbackofvesselswhileretainingoperationalcontrol of the vessels;
• Transactingsecondhanddealswithcreditworthycounterparties;and• Maintaininganactivefleetrenewalprogramme.
Risk reduction measures
Earnings volatility• We
Cost volatility•
•
Exchange rate volatility•
We use derivative instruments to manage volatility in dry bulk freight rates, fuel prices, interest rates and exchange rates.
Risk reduction measures
We evaluate potential investments and divestments based on relevant market information, estimated future earnings and residual values to maximise returns to shareholders. We adopt a flexible ownership/leasing strategy that is aligned with shipping cycles, and we consider the following as high priorities:
• Securing
•
• Transacting•
Market Risks
Risk of adverse financial impacts due to:
• volatilityofdrybulk,towageandRoRo vessel earnings;
• volatilityincostsincludingfuelprices, interest rates and other operating costs; and
• exchangeratevolatility.
Investment & Deployment Risk
Risk of inappropriate timing and choices of vessel investment and deployment can lead to an uncompetitive cost structure and reduced margins.
The value of our vessels may vary significantly through shipping cycles, and we need competitively priced and high quality vessels to provide our services to customers.
Financial Statements– Note 14
p.118
Audited information
Audited Audited
Audited

PACIFIC BASIN SHIPPING LIMITED • ANNUAL REPORT 2011
Risk60
Insurance Risk
Any vessel accident could endanger our crew, adversely affect the strength of our brand and our reputation with stakeholders and result in service disruption and significant costs.
Risk reduction measures
We implemented measures to ensure safe operations across our companies and fleets which have positively impacted our performance in safety.
However, accidents do happen, and so we place insurance covers at competitive rates in marine insurance products, including hull and machinery, war risk, protection and indemnity, freight demurrage and defense cover, etc. Sufficiency of insurance cover is regularly evaluated and adjusted in line with prevailing asset values and in compliance with loan covenants and internal policies.
CSR – Health & SafetyWe implemented measures to ensure safe operations We implemented measures to ensure safe operations We implemented measures to ensure safe operations We implemented measures to ensure safe operations We implemented measures to ensure safe operations
p.49
Credit & Counterparty Risk
Risk of financial loss resulting from the default or failure of counterparties to meet their contractual obligations. These counterparties include:
• drybulk,towageandRoRochartering counterparties;
• newbuildingshipyards;
• derivativecounterparties;and
• banksandfinancialinstitutions.
Risk reduction measures
Our global network of offices positions us close to our customers allowing us to better know them, thus minimising the risk of counterparty failure. In addition, we take measures to limit our credit exposure including:
• securingadiversifiedprofileofcounterpartieswithsuccessfultrackrecords and sound credit ratings;
• activelyassessingthecreditworthinessofcounterparties;and
• obtainingrefundguaranteesfromtheshipyards.
The management of trade receivables and credit policy are set out in the Financial Statement section.
Financial Statements – Note 15(c)p.125-126
Liquidity Risk
Risk of not maintaining sufficient financial resources (such as bank borrowing facilities) to meet the Group’s payment obligations as they fall due.
Risk reduction measures
We regularly review our Group’s treasury policy to ensure:
• sufficientfundsareavailabletomeetourexistingandfuturecommitments; and
• compliancewithcovenantsofbankloans,financeleaseagreementsandconvertible bonds.
Financial Statements – Note 33
p.145
Audited
Our global network of offices positions us close to our customers allowing Our global network of offices positions us close to our customers allowing Our global network of offices positions us close to our customers allowing Our global network of offices positions us close to our customers allowing Our global network of offices positions us close to our customers allowing Our global network of offices positions us close to our customers allowing
Audited
Audited Audited
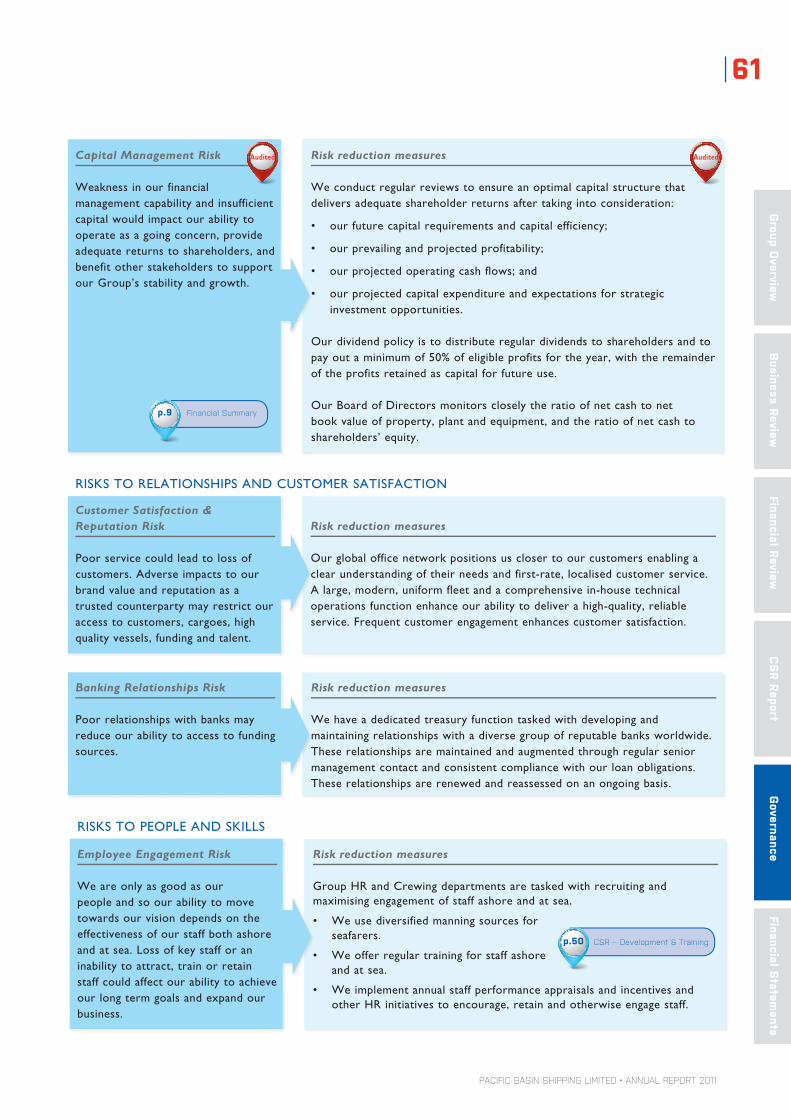
PACIFIC BASIN SHIPPING LIMITED • ANNUAL REPORT 2011
61
Group O
verviewBusiness Review
Financial ReviewG
overnanceFinancial S
tatements
CS
R Report
Capital Management Risk
Weakness in our financial management capability and insufficient capital would impact our ability to operate as a going concern, provide adequate returns to shareholders, and benefit other stakeholders to support our Group’s stability and growth.
Risk reduction measures
We conduct regular reviews to ensure an optimal capital structure that delivers adequate shareholder returns after taking into consideration:
• ourfuturecapitalrequirementsandcapitalefficiency;
• ourprevailingandprojectedprofitability;
• ourprojectedoperatingcashflows;and
• ourprojectedcapitalexpenditureandexpectationsforstrategicinvestment opportunities.
Our dividend policy is to distribute regular dividends to shareholders and to pay out a minimum of 50% of eligible profits for the year, with the remainder of the profits retained as capital for future use.
Our Board of Directors monitors closely the ratio of net cash to net book value of property, plant and equipment, and the ratio of net cash to shareholders’ equity.
Financial Summaryp.9
RISKSTORELATIONSHIPSANDCUSTOMERSATISFACTION
Customer Satisfaction & Reputation Risk
Poor service could lead to loss of customers. Adverse impacts to our brand value and reputation as a trusted counterparty may restrict our access to customers, cargoes, high quality vessels, funding and talent.
Risk reduction measures
Our global office network positions us closer to our customers enabling a clearunderstandingoftheirneedsandfirst-rate,localisedcustomerservice.Alarge,modern,uniformfleetandacomprehensivein-housetechnicaloperationsfunctionenhanceourabilitytodeliverahigh-quality,reliableservice. Frequent customer engagement enhances customer satisfaction.
Banking Relationships Risk
Poor relationships with banks may reduce our ability to access to funding sources.
Risk reduction measures
We have a dedicated treasury function tasked with developing and maintaining relationships with a diverse group of reputable banks worldwide. These relationships are maintained and augmented through regular senior management contact and consistent compliance with our loan obligations. These relationships are renewed and reassessed on an ongoing basis.
RISKSTOPEOPLEANDSKILLS
Employee Engagement Risk
We are only as good as our people and so our ability to move towards our vision depends on the effectiveness of our staff both ashore andatsea.Lossofkeystafforaninability to attract, train or retain staff could affect our ability to achieve our long term goals and expand our business.
Risk reduction measures
Group HR and Crewing departments are tasked with recruiting and maximising engagement of staff ashore and at sea.
• Weusediversifiedmanningsourcesforseafarers.
• Weofferregulartrainingforstaffashoreand at sea.
• Weimplementannualstaffperformanceappraisalsandincentivesandother HR initiatives to encourage, retain and otherwise engage staff.
CSR – Development & Trainingp.50
Audited Audited

PACIFIC BASIN SHIPPING LIMITED • ANNUAL REPORT 2011
Risk62
RISKSTOSAFETY,ENVIRONMENTANDRELIABILITY
Environmental Risk
Riskofnon-compliancewithenvironmental emissions and standards may result in financial loss and significant damage to our brand and the longer term sustainability of our business.
Risk reduction measures
Emissions riskWe are at the forefront of efforts in our sector to reduce emissions. Such emissions reduction efforts include initiatives to improve engine performance andhullandpropulsionhydrodynamics,andtoadoptfuel-efficientoperational measures.
Pollution liability riskWe promote a proactive safety culture across our fleet involving safety risk assessments to mitigate risk in critical tasks on board. Through our safety training, we seek to eradicate the risk of accidents that lead to pollution and related penalties, costs and adverse publicity. In addition, we cover our risk of liability for pollution through membership of reputed Protection & Indemnity (P&I) clubs.
Vessels & Systems Risk
The reliability of our operational performance depends on the effective deployment of our vessels and the dependability of our systems and technology.
Failure to operate and utilise reliable vessels, equipment and systems couldresultinvesseldown-time,service disruption and disruption to communications.
Risk reduction measures
Vessels operational riskWeoperatehigh-qualityvesselsbuiltbyreputableshipyardswhichwemaintain to a high standard under our ISM Code compliant “Pacific Basin Management System” to assure safety and reliability of service.
Systems riskRegular meetings of our IT Governance Committee to oversee the Group’s IT policies and procedures ensure that our IT strategies are met. Preventive or contingency measures are in place to minimise the risk of system failures and to promptly address system breakdowns. Our IT team receives regular technical training and our general staff are regularly updated of IT policies and system upgrades.
Safety Risk
Piracy, inadequate safety and operational standards and other causes of accidents may lead to loss of life, severe damage to property and our vessels, and impact the Group’s reputation among seafarers, customers and other stakeholders.
Risk reduction measures
Our commitment to the safe operation of our ships is manifested through a proactive management system ashore and at sea – the Pacific Basin ManagementSystem–enhancedbywell-conceivedtrainingandmaintenanceprogrammes and innovative initiatives to ensure our vessels are in good condition and in all respects safe to trade.
The high quality of our attention to safety is evidenced by an excellent safety recordandourseveralsafety-relatedawardsinrecentyears.
CSR – Health & Safetyp.49
CSR – Ship-based environmental initiatives
p.46
PACIFIC BASIN SHIPPING LIMITED • ANNUAL REPORT 2011
63
Group O
verviewBusiness Review
Financial ReviewG
overnanceFinancial S
tatements
CS
R Report
RISKSTOINVESTOR&STAKEHOLDERCONFIDENCE
Corporate Governance Risk
Inadequate corporate governance measures may adversely impact the diligence, integrity and transparency ofourriskassessment,decision-making and reporting processes and undermine stakeholder confidence.
Risk reduction measures
The Group commits to achieve and maintain high standards of corporate governance consistent with the needs and requirements of the business and its stakeholders, and consistent with the Code on Corporate Governance PracticesoftheStockExchangeofHongKongLimited.
Risk reduction measures
The Group has a dedicated investor relations function as well as policies and guidelines on communication and disclosure of information to the public. Latestcompanynewsandfinancialinformationaredisclosedonourwebsitewhich is updated regularly. Our strong performance in this area has won us several investor relations awards in recent years.
Investor Relationswebsite
Corporate Governancep.64
Risk reduction measures
The Group has a dedicated investor relations function as well as policies and guidelines on communication and disclosure of information to the public. Latestwhich is updated regularly. Our strong performance in this area has won us several investor relations awards in recent years.
Investor Relations Risk
An ineffective investor relations function or inadequate transparency in our external communications would undermine stakeholder confidence in our Group.
PACIFIC BASIN SHIPPING LIMITED • ANNUAL REPORT 2011
Corporate Governance64
Pacific Basin is committed to achieving and maintaining high standards of corporate governance consistent with the needs and requirements of the business and its stakeholders, and consistent with the Code on Corporate Governance Practices (the “Code”) of The Stock Exchange of Hong Kong Limited (the “Stock Exchange”).
Throughout the year the Group has complied with all code provisions of the Code, as contained in Appendix 14 of the Listing Rules. The Group continues to adopt the recommended best practices under the Code; however there are areas where full implementation is not considered appropriate, including the following:
• TheGroupprovidesaquarterlytradingupdatetoenable its shareholders to assess its performance, financial position and prospects. This is instead of publishing quarterly results, as the Group believes a trading update gives its shareholders the key quarterly information to assess the development of its business; and
• TheGroupseekscontinuousimprovementintheeffectiveness of its internal control procedures. Responsibility lies with the Risk Management Committee (“RMC”) headed by the Chief Executive Officer. The RMC’s activities are reviewed at least twice a year by the Audit Committee. The Audit Committee is satisfied that the internal audit of the controls environment is adequately covered by the system of internal reviews, where the Risk Manager and appropriate staff from various departments carry out formal internal control reviews in functions other than their own. The Audit Committee continuously assesses the need for any changes in the internal audit function as the Group develops.
Following publication of the Consultation Conclusions on Review of the Corporate Governance Code and Associated Listing Rules by the Stock Exchange in October 2011, the Group has taken necessary steps to implement and procure compliance with all those Listing Rules amendments which have become effective since 1 January 2012 and has commenced the assessment and implementation of the new Code which will come into effect on 1 April 2012.
THE BOARD OF DIRECTORS
BOARD COMPOSITION AND RESPONSIBILITIES
As at the date of this Annual Report, the Board comprises five Executive Directors, one Non-executive Director and four Independent Non-executive Directors. Mr. Klaus Nyborg, the Chief Executive Officer has tendered his resignation with effect on 15 March 2012.
The roles and responsibilities of each Board member are clearly set out and are available on the Company’s website. The biographical details of the Directors are set out in the “Directors and Senior Management” section of this Annual Report.
The four Independent Non-executive Directors and one Non-executive Director together play a key role in protecting shareholders’ interests. They bring a broad range of financial, regulatory and commercial experience and skills to the Board, which contribute to the effective strategic management of the Group.
The Executive Directors are required to devote all of their active or contracted business time to the business and affairs of the Group and are not permitted to engage in any other business which is in competition with that of the Group.
In accordance with the Company’s Bye-laws, at each annual general meeting one-third of the Directors (rounded up if the number is not a multiple of three) shall retire from office by rotation. Please refer to the Report of the Directors for the composition of the Board and Board Committees and the terms of appointment of each Director.
CHAIRMAN AND CHIEF EXECUTIVE OFFICER
The posts of Chairman and Chief Executive Officer (CEO) are held by Messrs. David M. Turnbull and Klaus Nyborg respectively and their roles and responsibilities are separate and are set out in writing. As mentioned above, Mr. Nyborg’s resignation will take effect on 15 March 2012. The Board expects to have announced the appointment of the new CEO by the end of March 2012.
INDEPENDENCE OF INDEPENDENT NON-EXECUTIVE DIRECTORS
Pursuant to the requirement of the Listing Rules, the Company has received written confirmation from all four Independent Non-executive Directors of their independence from the Company and considers them to be independent.

PACIFIC BASIN SHIPPING LIMITED • ANNUAL REPORT 2011
65
Group O
verviewBusiness Review
Financial ReviewG
overnance Financial S
tatements
CS
R Report
THE BOARD
Accountable to • TheShareholdersoftheCompanyPrimary Responsibilities • approvePacificBasin’slongtermcorporatestrategies
• makebroadpolicydecisions• overseethemanagementoftheGroup• approveannualbudgetsandbusinessplans• financialstatementsoftheGroup• evaluatetheperformanceoftheGroup• periodicallyassesstheachievementoftargetssetbytheBoard
Approves • acquisitionsordisposalsorothertransactionsthatrequireshareholdersnotificationorrequiring shareholders approval under the Listing Rules
• developmentsinthestrategicdirectionoftheGroup• mattersinvolvingaconflictofinterestforasubstantialshareholderorDirector
Delegates to • BoardCommittees:detailedevaluationofcertainresponsibilities(outlinedlaterinthissection)
• ExecutiveDirectors:oversightoftheGroup’sbusinessoperations;implementationofstrategies laid down by the Board; and the making of day-to-day operating decisions
Chairman Mr. David M. Turnbull
Responsible for:• consideringandapprovingGroupstrategiesandpoliciesinconjunctionwiththeBoard
and overseeing their subsequent execution by management• settingGroupmanagementprinciples,particularlyregardingthecontrolofrisksand
overall governance• ensuringthatheandhisdelegatesshall,inthecapacityofChairman,complywiththe
responsibilities under the CodeChief Executive Officer Mr. Klaus Nyborg
Responsible for:• generaldaytodaymanagementandexecutionoftheGroup’sactivitiesandstrategic
initiatives• formulatingandproposingGroupstrategyandpolicytotheBoard• ensuringthatappropriateinformationiscirculatedregularlysothatBoardmemberscan
actively contribute to the Group’s development
BOARD COMMITTEES
The Board has established Audit, Remuneration and Nomination Committees in accordance with the Code and all members of these 3 Committees are Independent Non-executive Directors. The Board has also established an Executive Committee to streamline the decision making process of the Company in certain circumstances. Decisions made by the Board and the Board Committees are based on detailed analysis prepared by management. The terms of reference of these Board Committees are available on the Company’s website.
Board, Board Committee Meetings and Annual General Meeting in 2011
The Board met on 4 occasions during 2011. The attendance of each Director at the Board, its Committees’ meetings and the AGM are set out below.
Meetings Attended
BoardAudit
CommitteeRemuneration
CommitteeNomination Committee AGM
Executive Directors David M. Turnbull 4 1Klaus Nyborg 4 1Jan Rindbo 4 1Andrew T. Broomhead 4 1Wang Chunlin 4 1
Non-executive Director Richard M. Hext 4 –Independent Non-executive Directors Patrick B. Paul 4 4 1 1 –
Robert C. Nicholson 4 4 1 1 1Alasdair G. Morrison 2 3 1 1 1Daniel R. Bradshaw 4 4 1 1 –
No. of Meetings held during the year 4 4 1 1 1
PACIFIC BASIN SHIPPING LIMITED • ANNUAL REPORT 2011
Corporate Governance66
THE AUDIT COMMITTEE
MEMBERSHIPThe Audit Committee consists of all four Independent Non-executive Directors.Chairman: Patrick B. Paul
MAIN RESPONSIBILITIES• reviews financial statements and auditors’ reports and monitors integrity of financial statements;• reviews effectiveness of the financial reporting system and internal control procedures; and• formulates policies on auditors engagement, approval of auditors’ remuneration, audit procedures and any other
matters arising from the above.
WORK DONE IN 2011
The Audit Committee held four meetings during the year and its work included the review of the following:
• continuing connected transactions for the year ended 31 December 2010 and for the six months ended 30 June 2011;
• independence of all Independent Non-executive Directors;
• Risk Management Committee Reports and Internal Control updates;
• external auditors’ Internal Control Memorandum;• accounting treatment for the issuance and
repurchase of convertible bonds;• proposed impairment for RoRo vessels in the 2011
interim report;• treasury position and proposed amendments to
the Group’s treasury manual;• external auditors’ Audit Strategy Memorandum;
• presentation of the implementation of a new operational system;
• external auditors’ Audit Committee Report in respect of the 2010 full year audit and 2011 interim review;
• 2010 draft annual report and annual results announcement with a recommendation to the Board for approval;
• 2011 interim report;• proposed dividend for 2010 final dividend and 2011
interim dividend;• proposed Risk Management work plan for 2012;• internal audit function in regard to the Group’s
business development; and• Group’s insurance strategies and policies.
During the year, the Audit Committee met the external auditors once without the presence of management.
THE REMUNERATION COMMITTEE
MEMBERSHIP
The Remuneration Committee consists of all four Independent Non-executive Directors.Chairman: Robert C. Nicholson
MAIN RESPONSIBILITIES
• makes recommendations to the Board on policy and structure of remuneration for all Directors, Senior Management and the establishment of a formal and transparent procedure for developing this policy;
• determines the specific remuneration packages for (i) Executive Directors, (ii) Senior Management and (iii) Employees earning the equivalent of US$20,000 per month or above, taking into consideration factors such as salaries paid by comparable companies and responsibilities of the individuals;
• reviews and approves the compensation payable to Executive Directors and Senior Management in connection with any appointment or termination of their offices to ensure that such compensation is determined in accordance with relevant contractual terms and is fair and not excessive for the Company;
• makes recommendations to the Board for the remuneration of Non-executive Directors;• reviews and approves performance-based remuneration and administers and oversees the Group’s Long Term
Incentive Scheme; and• ensures that no Director is involved in deciding his own remuneration.
WORK DONE IN 2011
The Remuneration Committee met once during the year and its work included the following:
• approval of 2010 year end bonuses and 2011 salaryadjustmentsforExecutiveDirectors,SeniorManagement and higher paid employees;
• approval of the grant of restricted share awards under the Long Term Incentive Scheme to Executive Directors and staff members;
• approval of the contract arrangement of an Executive Director; and
• approval of the increment of remuneration of an Executive Director during the year.
PACIFIC BASIN SHIPPING LIMITED • ANNUAL REPORT 2011
67
Group O
verviewBusiness Review
Financial ReviewG
overnance Financial S
tatements
CS
R Report
THE NOMINATION COMMITTEE
MEMBERSHIPThe Nomination Committee consists of all four Independent Non-executive Directors.Chairman: Robert C. Nicholson
MAIN RESPONSIBILITIES
• selects and nominates directors for approval by the Board based on, among other things, appropriate industry experience and professional knowledge, integrity, interpersonal skills, and the candidates’ commitment to the Company and Board;
• oversees the nomination of Directors to the Board ensuring that all such nominations are fair and transparent and that the Board benefits from the right balance of skills, experience and knowledge to govern effectively; and
• reviews the structure, size and composition of the Board, paying regard to the Stock Exchange board composition rules.
WORK DONE IN 2011
The Nomination Committee met once during the year and reviewed and considered the following:
• composition of the Board taking into consideration the expertise and experience of the existing Board members;
• process of appointing a new CEO;• adequacy of the number of independent directors
by reference to the requirement of the Company and the Stock Exchange regulations;
• independence of each Independent Non-Executive Director;
• certain imminent changes to the Listing Rules;• requirement that directors should have adequate
training and maintain training records;• requirement that directors should maintain a
proper records of their outside interests and other matters relevant to the role as directors; and
• resolved to implement required changes and adopt appropriate procedures following the recent amendments to the Listing Rules.
THE EXECUTIVE COMMITTEE
MEMBERSHIP
The Executive Committee consists of all five Executive Directors.Chairman: Klaus Nyborg
MAIN RESPONSIBILITIES
• identifies and executes transactions for vessel acquisitions or disposals that do not require shareholders notification or approval under the Listing Rules;
• identifies and executes the sale and charter back of vessels;• identifies and executes transactions for long term inward charters;• sets cover position targets which are within the normal course of the business of the Group;• makes decisions over commencement or cessation of employment and ongoing remuneration of key staff; and• exercises the Company’s general mandate to repurchase shares in accordance with the parameters set by the
Board and the limits approved by the shareholders.
WORK DONE IN 2011
The Executive Committee considered a range of business matters based on detailed analysis submitted by management including the following:
• disposaloftheentireinvestmentinGreenDragonGas;
• approvalofanannouncementontheconversionpriceadjustmentofthe3.3%coupon2016Convertible Bonds;
• approvalofanannouncementrelatingtotheintention of Mr. Klaus Nyborg to resign;
• approvalofthesecondsupplementalagreementfor a loan facility made to the Group;
• acquisitionofanumberofvesselsthatdidnotrequire announcement under the Listing Rules; and
• approvaloflongtermcargocontractsforthedrybulk division and charter out of a RoRo vessel.

PACIFIC BASIN SHIPPING LIMITED • ANNUAL REPORT 2011
Corporate Governance68
INTERNAL CONTROLS
FRAMEWORK
The Board has overall responsibility for the Group’s system of internal control and the assessment and management of risks.
The Group’s Risk Management Committee (“RMC”) which is headed by the Company’s Chief Executive Officer, actively identifies and reviews significant risks of theGroup.ItsobjectiveistostrengthentheGroup’sriskmanagement culture and to minimise the sensitivity of the Group’s earnings to the risks it faces.
The system of internal controls is designed to provide reasonable, but not absolute, assurance against human error, material misstatement, losses, damages or fraud. Please also refer to the “Risk” section of this Annual Report.
The Group has in place a framework that is consistent with the COSO (the Committee of Sponsoring Organisations of the Treadway Commission) framework which has the following five components:
CONTROL ENVIRONMENT
Defined organisational structures are established. Authority to operate various business functions is delegated to respective management within limits set by head office management or the Executive Directors. The Board meets on a regular basis to discuss and agree business strategies, plans and budgets prepared by individual business units. The performance of the Group is reported to the Board on a monthly basis.
RISK ASSESSMENT
The Group identifies, assesses and ranks the risks that are most relevant to the Group’s success according to their likelihood, financial consequence and reputational impact on the Group.
CONTROL ACTIVITIES
Policies and procedures are set for each business function which includes approvals, authorisation, verification, recommendations, performance reviews, asset security and segregation of duties.
INFORMATION AND COMMUNICATION
The Group documents operational procedures of all business units. The risks identified and their respective control procedures are documented in risk registers by the Risk Management Committee and reviewed by the Audit Committee at least annually.
MONITORING
The Group adopts a control and risk self-assessment methodology, continuously assessing and managing its business risks by way of internal audits, and communication of key control procedures to employees. The Risk Management Committee is tasked with the responsibility to assess the performance and effectiveness of the controls on a systematic basis. Findings of the assessments are submitted to the Audit Committee.
ANNUAL ASSESSMENT
Activities, procedures, existing controls and new controls to be implemented are documented in the risk registers. The existence and effectiveness of the existing control procedures are tested with a frequency determined by reference to the risk ranking of each individual risk area. All control procedures of significant risks are tested annually and others are reviewed annually.
The criteria for assessing the effectiveness of internal controls are based on whether the documented control processes have operated throughout the period being reviewed, and identifying whether there are any control weaknesses. The Risk Manager, on behalf of the RMC, co-ordinates the annual testing of control procedures in respect of all significant Group risks with findings reported to the RMC and the Audit Committee. This work is carried out by the Risk Manager and appropriate
staff from various departments who test the controls of functions other than their own.
INTERNAL CONTROL SYSTEM EFFECTIVENESS
The Board is responsible for the Group’s system of internal controls and for reviewing its effectiveness. The internal controls’ system is designed for the identification and management of risks that are significant to the fulfillmentoftheGroup’sbusinessobjectives.TheAuditCommittee reviews the findings and the opinion of the RMC on the effectiveness of the Group’s system of internal control and reports to the Board annually.
In respect of the year ended 31 December 2011, the Board has reviewed the internal control systems of the Group and no significant areas of concern were identified.

PACIFIC BASIN SHIPPING LIMITED • ANNUAL REPORT 2011
69
Group O
verviewBusiness Review
Financial ReviewG
overnance Financial S
tatements
CS
R Report
CONTROLS ON PRICE-SENSITIVE INFORMATION
With respect to the procedures and internal controls for the handling of and dissemination of price sensitive information:
• the Group is fully aware of its obligations under the Listing Rules;
• the Group conducts its affairs with close regard to the “Guide on Disclosure of Price-sensitive Information” issued by the Stock Exchange in 2002;
• through channels such as financial reporting, public announcements and websites, the Group has implemented and disclosed its policy on fair disclosure by pursuing broad, non-exclusive distribution of information to the public;
• the Group has included in its Code of Conduct a strict prohibition on the unauthorised use of confidential or insider information; and
• the Group has established and implemented procedures for responding to external enquiries about the Group’s affairs, so that only the Chief Executive Officer, Chief Operating Officer, Chief Financial Officer and Corporate Communication & Investor Relations Manager are authorised to communicate with parties outside the Group.
DIRECTORS’ SECURITIES TRANSACTIONS
The Board of Directors has adopted the Model Code for Securities Transactions by Directors of Listed Issuers, as set out in Appendix 10 of the Listing Rules (the “Model Code”).
The Board confirms that, having made specific enquiry, the Directors have complied in full with the required standards set out in the Model Code and its code of conduct during the year.
SENIOR MANAGEMENT AND STAFF SECURITIES TRANSACTIONS
The Company has adopted rules for senior managers and those staff who are more likely to be in possession of unpublished price-sensitive information or other relevant information in relation to the Group based on the Model Code for Securities Transactions by Directors (the “Dealing Rules”). These senior managers and staff have been individually notified and provided with a copy of the Dealing Rules.
No incident of non-compliance by these senior managers and staff was noted by or reported to the Company during the year.
DIRECTORS AND SENIOR MANAGEMENT – REMUNERATION AND SHARE OWNERSHIP
Details of the remuneration and share ownership of the Directors and senior management are contained in the Remuneration Report and Report of the Directors of this Annual Report.
AUDITORS’ REMUNERATION
Remuneration paid to the Group’s external auditors for services provided for the year ended 31 December 2011 is as follows:
US$’000
Audit Non-audit Total
1,439 247 1,686
SHAREHOLDERS’ RIGHTS
Shareholders are encouraged to maintain direct communication with the Company. Shareholders who have any questions for the Board may send an e-mail or letter to:
Company Secretary
Address: Pacific Basin Shipping (HK) Ltd. 7th Floor, Hutchison House 10 Harcourt Road Central, Hong KongE-mail: [email protected]
Should shareholders wish to call a special general meeting, it must be convened according to the Company’s Bye-laws, which state in summary:
• Shareholdersholdingnotlessthanone-tenthofthe paid up capital of the Company can, in writing to the Board or the Secretary of the Company, request a special general meeting to be called by the Board so as to carry out any business specified in such request.
• Thesignedwrittenrequest,whichshouldspecifythe purpose of the meeting, should be delivered to the Company’s registered office in Hong Kong. The meeting will be held within two months after receiving the request. If the Board fails to start convening such meeting within twenty-one days of receiving the request, the shareholders themselves may do so in accordance with the provisions ofSection74(3)oftheCompaniesAct1981ofBermuda.
2011 Shareholders Meetingp.87

PACIFIC BASIN SHIPPING LIMITED • ANNUAL REPORT 2011
Directors & Senior Management70
Executive Directors
David M. TurnbullChairmanage 56
Klaus NyborgChief Executive Officerage 48
Jan RindboChief Operating Officerage 37
Andrew T. BroomheadChief Financial Officer & Company Secretaryage 50
Wang ChunlinExecutive Director,age 48
Biography David spent 30 years with the Swire Group where he held various senior management positions. He was chairman of Swire’s Hong Kong-listed companies Swire Pacific, Cathay Pacific Airways and Hong Kong Aircraft Engineering Company. He has also served as a non-executive director of the Hongkong and Shanghai Banking Corporation, Hysan Development and Air China.
Klaus joined Pacific Basinas an Executive Director and Deputy Chief Executive Officer in 2006, and was appointed Chief Executive Officer in January 2010. Klaus spent 12 years with A.P. Moller-Maersk where he held a number of senior management posts including general manager corporate secretariat, general manager and regional CFO of Maersk Sealand for Europe/Africa, VP/regional CFO and head of corporate affairs for Asia, Oceania and the Middle East, and CFO and director of Maersk Logistics International. He joined Danish ship owning and operating group TORM (listed in Copenhagen and on NASDAQ) where he was CFO and an executive director until joining Pacific Basin.
Jan joined Pacific Basin in 2001 under secondment from TORM to head Pacific Basin’s chartering and commercial operations. He became fully employed by the Group in 2004 and was appointed Chief Operating Officer in January 2010 with responsibility for the Company’s dry bulk activities including asset management (sale and purchase) and the technical and commercial operations of the Group’s dry bulk fleet. Jan spent seven years with Danish ship owning and operating group TORM (listed in Copenhagen and on NASDAQ) for whom he served in Denmark, Hong Kong and the United States.
Andrew joined Pacific Basin in 2003 as the Group’s Chief Financial Officer and Company Secretary. He was appointed as an Executive Director in September 2010 with responsibility for Group finance and accounting, investor relations, corporate governance and compliance and IT. Andrew has previously worked with Deloitte, Haskins & Sells, Samuel Montagu, International Finance Corporation, Bakrie Investindo and Sanwa International Finance. He has been based in the UK, USA, Singapore, Indonesia and Hong Kong, and has worked in Asia for over 18 years.
CL Wang joined Pacific Basin in March 2006 and was shortly after appointed as an Executive Director with responsibility for group business development with a focus on China. CL has been in shipping since joining the Sinotrans Group in Beijing in 1986. From 1993 to 1995, he served as managing director of Sinotrans’ joint venture International Container Leasing Company. In 2002, he was promoted to assistant president of Sinotrans Group and managing director of Sinotrans Shipping. In 2005, he joined IMC Group where he was managing director of IMC Marine Holdings (HK) Ltd and vice chairman of IMC-Yongyue Shipyard & Engineering.
Education & qualifications
Cambridge University: honours degree in Economics
Copenhagen Business School: Diploma (Econ) and Bachelor of Arts and MSc degrees in Business and Business Law
Executive programmes at London Business School and IMD Business School
Naestved Business College, Denmark
International Executive Development programme at INSEAD
Cambridge University: Master of Arts degree in Natural Sciences
Fellow of the Hong Kong Institute of Certified Public Accountants and the Institute of Chartered Accountants in England and Wales
Breakthrough Programme for Senior Executives at IMD Business School
University of International Business and Economics, Beijing
Murdoch University, Australia: MBA degree
Hong Kong Polytechnic University: MSc degree in International Shipping and Transport Logistics
Breakthrough Programme for Senior Executives at IMD Business School
Term of office Appointed INED in May 2006
Appointed Chairman in January 2008 and Executive Director in July 2008
Current term expires by May 2014
Klaus has tendered his resignation from the Company effective 15 March 2012
Appointed Executive Director in April 2007
Current term expires at the AGM in 2012
Appointed Executive Director in September 2010
Current term expires by September 2013
Appointed Executive Director in September 2006
Current term expires by September 2013
External appointments
INED of Green Dragon Gas and Greka Drilling Limited (both London AIM listed)
INED of Hong Kong-listed Sands China
Chairman of Seabury Aviation and Aerospace Asia (Hong Kong), a subsidiary of Seabury Group LLC
None None None None
Committee membership
Executive Committee Chairman of Executive Committee
Executive Committee Executive Committee Executive Committee

PACIFIC BASIN SHIPPING LIMITED • ANNUAL REPORT 2011
71
Group O
verviewBusiness Review
Financial ReviewG
overnance Financial S
tatements
CS
R Report
Non-executive Director Independent Non-executive Directors (“INEDs”)
Richard M. HextNon-executive Directorage 54
Robert C. NicholsonIndependent Non-executive Directorage 56
Patrick B. PaulIndependent Non-executive Directorage 64
Alasdair G. MorrisonIndependent Non-executive Directorage 63
Daniel R. BradshawIndependent Non-executive Directorage 65
Biography Richard is chairman of the Vanderperre family shipping interests and has been with Vanderperre since January 2010. Prior to that he was Executive Deputy Chairman (2005 to 2006) and CEO (2006 to 2009) of Pacific Basin Shipping. From 2003 to 2004, he was CEO of the Marine Services Division of V Ships and, from 2001 to 2002, he was CEO of Levelseas. From 1978 to 2000, he worked for various subsidiaries and associates of John Swire & Sons, including The China Navigation Company where he was managing director from 1996 to 2000. During 1999 to 2000 he was a director of John Swire & Sons (HK).
Robin was a senior partner of Richards Butler where he established the corporate and commercial department. He then served as a senior advisor to the board of directors of PCCW Limited. He joined First Pacific Company Limited’s (First Pacific) board in June 2003 and was appointed as an executive director of First Pacific in November 2003.
Patrick served with PricewaterhouseCoopers for 33 years, during which time he held a number of senior management positions in Hong Kong, including chairman and senior partner of the firm for seven years.
Alasdair served with the Jardine Matheson Group where he held various senior positions including that of group managing director. He then moved to Morgan Stanley where he was a managing director and then chairman of Morgan Stanley Dean Witter Asia, and chairman and chief executive officer of Morgan Stanley Asia.
Dan has served for 33 years with Johnson, Stokes and Master (now Mayer Brown JSM) as a solicitor, partner, head of the firm’s shipping practice and now as a consultant. He was vice chairman of the Hong Kong Shipowners Association, a member of the Hong Kong Port and Maritime Board and the Hong Kong Maritime Industry Council.
Education & qualifications
Oxford University: Master of Arts degree
Executive programmes at INSEAD, Oxford University, Tsinghua University and Stanford University
University of Kent
Qualified as a solicitor in England and Wales and in Hong Kong
Oxford University
Qualified accountant
Cambridge University: Master of Arts degree
Program for Management Development at Harvard Business School
Victoria University of Wellington (New Zealand): Bachelor of Laws and a Master of Laws
Admitted as a solicitor in New Zealand, England and Hong Kong
Term of office Appointed Executive Director in April 2005
Became a Non-executive Director after stepping down as CEO on 31 December 2009
Current term expires at the AGM in 2013
Appointed INED in March 2004
Current term expires at the AGM in 2014
Appointed INED in March 2004
Current term expires at the AGM in 2013
Appointed INED in January 2008
Current term expires at the AGM in 2013
Appointed Non-executive Director and Deputy Chairman in April 2006
Stood down as Deputy Chairman in January 2008 and was re-designated as INED in September 2010
Current term expires at the AGM in 2014
External appointments
Non-executive director of The China Navigation Company, a wholly owned subsidiary of John Swire & Sons
Executive director of First Pacific
Director of Metro Pacific Investments Corporation, Philex Mining Corporation, and Philex Petroleum Corporation
Executive chairman of Forum Energy plc
Commissioner of PT Indofood Sukses Makmur Tbk.
INED of QPL International Holdings Limited
INED of Johnson Electric Holdings
INED of The Hongkong and Shanghai Hotels
Senior advisor to Citigroup Asia Pacific and a member of the firm’s Business Development Committee
Non-executive director of MTR Corporation, Hong Kong Mercantile Exchange and Grosvenor Group
Director on the boards of Euronav, IRC, Kadoorie Farm and Botanic Garden Corporation, and WWF Hong Kong
Committee membership
None Chairman of Remuneration and Nomination Committees
Member of Audit Committee
Chairman of Audit Committee
Member of Remuneration and Nomination Committees
Audit, Remuneration and Nomination Committees
Audit, Remuneration and Nomination Committees
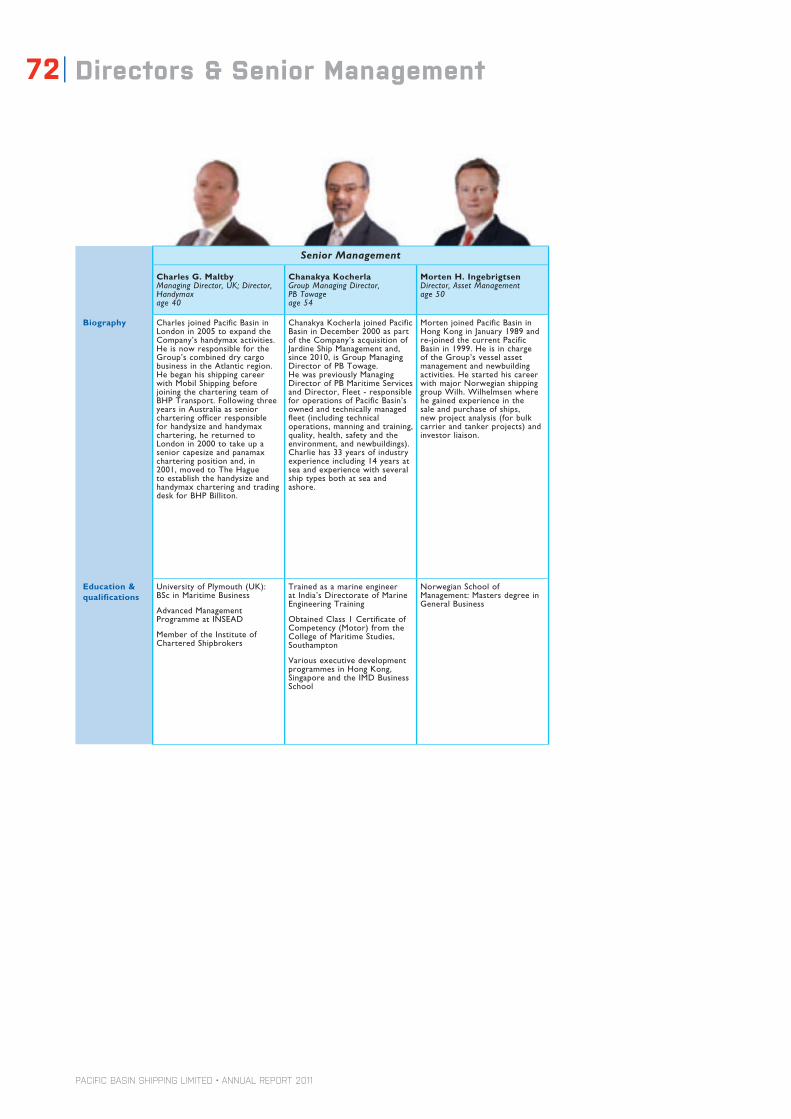
PACIFIC BASIN SHIPPING LIMITED • ANNUAL REPORT 2011
Directors & Senior Management72
Senior Management
Charles G. MaltbyManaging Director, UK; Director, Handymaxage 40
Chanakya KocherlaGroup Managing Director,PB Towageage 54
Morten H. IngebrigtsenDirector, Asset Managementage 50
Biography Charles joined Pacific Basin in London in 2005 to expand the Company’s handymax activities. He is now responsible for the Group’s combined dry cargo business in the Atlantic region. He began his shipping career with Mobil Shipping before joining the chartering team of BHP Transport. Following three years in Australia as senior chartering officer responsible for handysize and handymax chartering, he returned to London in 2000 to take up a senior capesize and panamax chartering position and, in 2001, moved to The Hague to establish the handysize and handymax chartering and trading desk for BHP Billiton.
Chanakya Kocherla joined Pacific Basin in December 2000 as part of the Company’s acquisition of Jardine Ship Management and, since 2010, is Group Managing Director of PB Towage.He was previously Managing Director of PB Maritime Services and Director, Fleet - responsible for operations of Pacific Basin’s owned and technically managed fleet (including technical operations, manning and training, quality, health, safety and the environment, and newbuildings). Charlie has 33 years of industry experience including 14 years at sea and experience with several ship types both at sea and ashore.
Morten joined Pacific Basin in Hong Kong in January 1989 and re-joined the current Pacific Basin in 1999. He is in charge of the Group’s vessel asset management and newbuilding activities. He started his career with major Norwegian shipping group Wilh. Wilhelmsen where he gained experience in the sale and purchase of ships, new project analysis (for bulk carrier and tanker projects) and investor liaison.
Education & qualifications
University of Plymouth (UK): BSc in Maritime Business
Advanced Management Programme at INSEAD
Member of the Institute of Chartered Shipbrokers
Trained as a marine engineer at India’s Directorate of Marine Engineering Training
Obtained Class 1 Certificate of Competency (Motor) from the College of Maritime Studies, Southampton
Various executive development programmes in Hong Kong, Singapore and the IMD Business School
Norwegian School of Management: Masters degree in General Business
PACIFIC BASIN SHIPPING LIMITED • ANNUAL REPORT 2011
Remuneration Report 73
Group O
verviewBusiness Review
Financial ReviewG
overnance Financial S
tatements
CS
R Report
This Remuneration Report sets out the Group’s remuneration policies and amounts for all staff including Executive Directors, Non-executive Directors and senior management. Sections 2, 3 and 4 comprise the auditable part of the Remuneration Report and form an integral part of the Group’s financial statements.
At 31 December 2011, the Group employed a total of 389 full time, shore based staff (2010: 375).
i. GROUP’S REMUNERATiON POLiCY
The Board, through the Remuneration Committee, seeks to attract and retain staff with the skills, experience and qualifications needed to manage and grow the business successfully by providing remuneration packages that are competitive, accord with market practice, reward short-term as well as long-term performance and align interests with those of shareholders.
Below sets out the key components of remuneration:
Key componentsAll staff and senior
management Executive DirectorsNon-executive
Directors
Fixed base salary Yes. Takes into consideration prevailing market conditions and local market practice as well as the individual’s role, duties, experience and responsibilities.
No
Annual discretionary cash bonus Yes. Bonuses are determined based on the overall performance of the individual and the Group. Bonuses for Executive Directors and senior management are assessed by the Remuneration Committee and those of all other staff are assessed by the Chief Executive Officer.
No
Long term equity incentives Yes. Awards typically vest annually over a three to five year period. New Awards are considered each year by the Remuneration Committee to maintain the incentive period.
No
Retirement benefit Yes Yes No
Fixed annual director’s fee No No Yes
Equity awards are provided through the Company’s Long Term Incentive Scheme which is designed to provide Executive Directors, senior management and other employees with long term financial benefits that are aligned to and consistent with increasing shareholder value.
The Group’s principal retirement benefit scheme is the Mandatory Provident Fund Scheme, a defined contribution scheme provided under the Hong Kong Mandatory Provident Fund Schemes Ordinance for those staff employed under the jurisdiction of the Hong Kong Employment Ordinance. Other locations provide pension contributions in line with the local regulations.
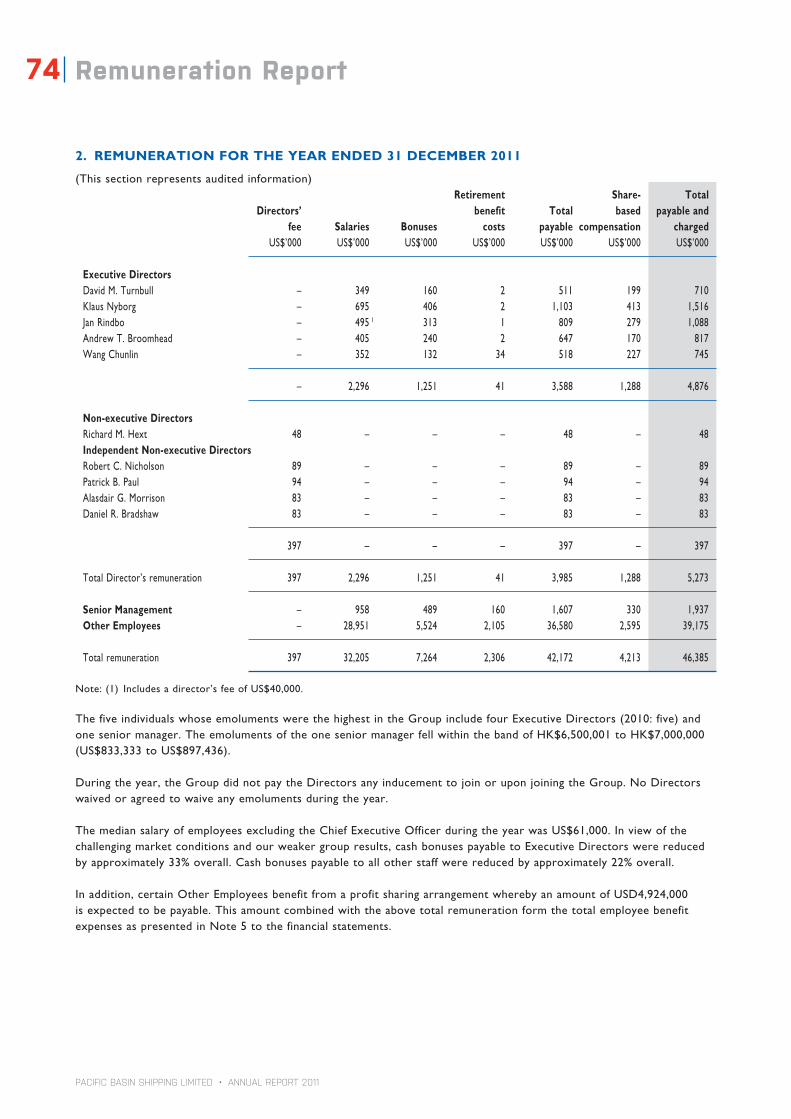
PACIFIC BASIN SHIPPING LIMITED • ANNUAL REPORT 2011
74 Remuneration Report
2. REMUNERATiON FOR THE YEAR ENDED 31 DECEMBER 2011
(This section represents audited information) Retirement Share- Total Directors’ benefit Total based payable and fee Salaries Bonuses costs payable compensation charged US$’000 US$’000 US$’000 US$’000 US$’000 US$’000 US$’000
Executive DirectorsDavid M. Turnbull – 349 160 2 511 199 710Klaus Nyborg – 695 406 2 1,103 413 1,516Jan Rindbo – 495 1 313 1 809 279 1,088Andrew T. Broomhead – 405 240 2 647 170 817Wang Chunlin – 352 132 34 518 227 745
– 2,296 1,251 41 3,588 1,288 4,876
Non-executive DirectorsRichard M. Hext 48 – – – 48 – 48independent Non-executive DirectorsRobert C. Nicholson 89 – – – 89 – 89Patrick B. Paul 94 – – – 94 – 94Alasdair G. Morrison 83 – – – 83 – 83Daniel R. Bradshaw 83 – – – 83 – 83
397 – – – 397 – 397
Total Director’s remuneration 397 2,296 1,251 41 3,985 1,288 5,273
Senior Management – 958 489 160 1,607 330 1,937Other Employees – 28,951 5,524 2,105 36,580 2,595 39,175
Total remuneration 397 32,205 7,264 2,306 42,172 4,213 46,385
Note: (1) Includes a director’s fee of US$40,000.
The five individuals whose emoluments were the highest in the Group include four Executive Directors (2010: five) and one senior manager. The emoluments of the one senior manager fell within the band of HK$6,500,001 to HK$7,000,000 (US$833,333 to US$897,436).
During the year, the Group did not pay the Directors any inducement to join or upon joining the Group. No Directors waived or agreed to waive any emoluments during the year.
The median salary of employees excluding the Chief Executive Officer during the year was US$61,000. In view of the challenging market conditions and our weaker group results, cash bonuses payable to Executive Directors were reduced by approximately 33% overall. Cash bonuses payable to all other staff were reduced by approximately 22% overall.
In addition, certain Other Employees benefit from a profit sharing arrangement whereby an amount of USD4,924,000 is expected to be payable. This amount combined with the above total remuneration form the total employee benefit expenses as presented in Note 5 to the financial statements.
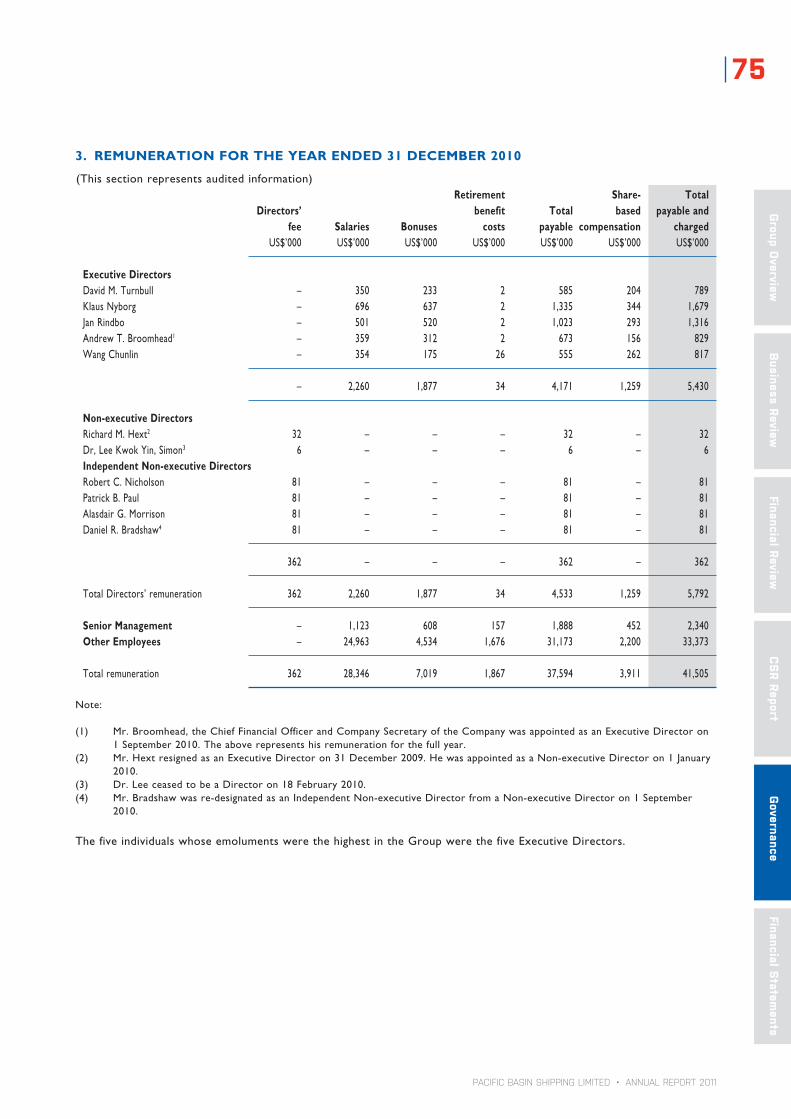
PACIFIC BASIN SHIPPING LIMITED • ANNUAL REPORT 2011
75
Group O
verviewBusiness Review
Financial ReviewG
overnance Financial S
tatements
CS
R Report
3. REMUNERATiON FOR THE YEAR ENDED 31 DECEMBER 2010
(This section represents audited information) Retirement Share- Total Directors’ benefit Total based payable and fee Salaries Bonuses costs payable compensation charged US$’000 US$’000 US$’000 US$’000 US$’000 US$’000 US$’000
Executive DirectorsDavid M. Turnbull – 350 233 2 585 204 789Klaus Nyborg – 696 637 2 1,335 344 1,679Jan Rindbo – 501 520 2 1,023 293 1,316Andrew T. Broomhead1 – 359 312 2 673 156 829Wang Chunlin – 354 175 26 555 262 817
– 2,260 1,877 34 4,171 1,259 5,430
Non-executive DirectorsRichard M. Hext2 32 – – – 32 – 32Dr, Lee Kwok Yin, Simon3 6 – – – 6 – 6independent Non-executive DirectorsRobert C. Nicholson 81 – – – 81 – 81Patrick B. Paul 81 – – – 81 – 81Alasdair G. Morrison 81 – – – 81 – 81Daniel R. Bradshaw4 81 – – – 81 – 81
362 – – – 362 – 362
Total Directors’ remuneration 362 2,260 1,877 34 4,533 1,259 5,792
Senior Management – 1,123 608 157 1,888 452 2,340Other Employees – 24,963 4,534 1,676 31,173 2,200 33,373
Total remuneration 362 28,346 7,019 1,867 37,594 3,911 41,505
Note:
(1) Mr. Broomhead, the Chief Financial Officer and Company Secretary of the Company was appointed as an Executive Director on 1 September 2010. The above represents his remuneration for the full year.
(2) Mr. Hext resigned as an Executive Director on 31 December 2009. He was appointed as a Non-executive Director on 1 January 2010.
(3) Dr. Lee ceased to be a Director on 18 February 2010.(4) Mr. Bradshaw was re-designated as an Independent Non-executive Director from a Non-executive Director on 1 September
2010.
The five individuals whose emoluments were the highest in the Group were the five Executive Directors.
PACIFIC BASIN SHIPPING LIMITED • ANNUAL REPORT 2011
76 Remuneration Report
4. ACCOUNTiNG POLiCiES ON EMPLOYEE BENEFiTS
(This section represents audited information)
BONUSES
The Group recognises a liability and expense for bonuses when there is a contractual or constructive obligation or where there is a past practice that created a constructive obligation.
RETIREMENT BENEFIT OBLIGATIONS
Mandatory Provident Fund ScheMe
The Group operates the Mandatory Provident Fund Scheme (the “MPF Scheme’’) under the Hong Kong Mandatory Provident Fund Schemes Ordinance for those employees employed under the jurisdiction of the Hong Kong Employment Ordinance. The MPF Scheme is a defined contribution scheme, the assets of which are held in separate trustee-administered funds.
Under the MPF scheme, the employer and its employees are each required to make contributions to the scheme at 5% of the employees’ relevant income, subject to a cap of monthly relevant income of HK$20,000. The Group also makes voluntary contribution in addition. The Group’s contributions to the scheme are expensed as incurred. When employees leave the scheme prior to the full vesting of the employer’s voluntary contributions, the amount of forfeited contributions is used to reduce the contributions payable by the Group.
other deFined contribution ScheMeS
The Group also operates a number of defined contribution retirement schemes outside Hong Kong in accordance to local statutory requirements. The assets of these schemes are generally held in separate administered funds and are generally funded by payments from employees and by the relevant group companies.
The Group’s contributions to the defined contribution retirement schemes are expensed as incurred and are reduced by contributions forfeited by those employees who leave the schemes prior to contributions being fully vested.
SHARE-BASED COMPENSATION
The Group operates an equity-settled, share-based compensation scheme. Restricted share awards and share options are recognised as an expense in the income statement with a corresponding credit to reserves, based on the fair value of employee services.
The total amount to be expensed is calculated by reference to the fair value of the equity instruments granted, excluding the impact of any non-market vesting conditions (for example, requirement of an employee to remain in employment for a specified time period). The number of equity instruments that are expected to vest takes into account non-market assumptions, including expectations of an employee remaining in the Group during the vesting period. The total amount expensed is charged through the vesting period. At each balance sheet date, the Company revises its estimates of the number of equity instruments that are expected to vest based on the non-market vesting conditions. It recognises the impact of the revision of the original estimates, if any, in the consolidated income statement with a corresponding adjustment to equity.
In respect of share options, the proceeds received, net of any directly attributable transaction costs, are credited to share capital and share premium accounts when the share options are exercised.
The grant by the Company of share-based compensation to the employees of subsidiary undertakings in the Group is treated as a capital contribution. The fair value of employee services received, measured by reference to the grant date fair value, is recognised over the vesting period as an increase in investment in subsidiary undertakings, with a corresponding credit to equity in the Company’s account. In the accounts of the subsidiaries, such fair value is recognised as an expense in the income statement with corresponding credit to reserve.

PACIFIC BASIN SHIPPING LIMITED • ANNUAL REPORT 2011
Report of the Directors 77
Group O
verviewBusiness Review
Financial ReviewG
overnance Financial S
tatements
CS
R Report
The Directors have pleasure in submitting their report together with the audited financial statements of the Company and its subsidiaries (collectively the “Group”) for the year ended 31 December 2011.
PRINCIPAL ACTIVITIES, ANALYSIS OF OPERATIONS AND FINANCIAL SUMMARY
The principal activity of the Company is investment holding. The Company’s principal subsidiaries (set out in Note 38 to the financial statements) are principally engaged in the provision of dry bulk shipping services, services to the energy and infrastructure sectors, and RoRo shipping services which are carried out internationally. In addition, the Group is engaged in the management and investment of the Group’s cash and deposits through its treasury activities.
A summary of the results and of the assets and liabilities of the Group for the last five financial years is set out in the “Group Financial Summary” section of this Annual Report.
RESULTS AND APPROPRIATIONS
The results of the Group for the year are set out in the consolidated income statement on page 94.
As set out in the interim report, the Board remains committed to the existing dividend policy of paying out a minimum of 50% of annual profits attributable to shareholders excluding vessel disposal gains.
Taking into consideration of the Group’s performance and current financial position, the Directors have recommended the payment of a final dividend of HK 5 cents per share for the year ended 31 December 2011. When this proposed dividend is aggregated with the interim dividend of HK 5 cents per share declared on 3 August 2011, the total payout of HK 10 cents per Share represents 78% of the Group’s profits for the year ended 31 December 2011.
The proposed final dividend for 2011 of HK 5 cents per share will be considered at the 2012 Annual General Meeting scheduled on 19 April 2012.
RESERVES AND DISTRIBUTABLE RESERVES
Distributable reserves of the Company at 31 December 2011, calculated in accordance with the Companies Act 1981 of Bermuda, amounted to US$696.0 million.
Movements in the reserves of the Group and of the Company are set out in Note 24 to the financial statements.
DONATIONS
Charitable and other donations made by the Group during the year amounted to US$156,000.
PROPERTY, PLANT AND EQUIPMENT
Movements in the property, plant and equipment of the Group are set out in Note 6 to the financial statements.
SHARE CAPITAL AND PRE-EMPTIVE RIGHTS
Movements in the share capital of the Company are set out in Note 23 to the financial statements.
There is no provision for pre-emptive rights under the Company’s bye-laws and there is no restriction against such rights under Bermuda Law.
CONVERTIBLE BONDS
Movements in the convertible bonds are disclosed below as well as in the “Financial Review” section of this Annual Report and under Note 21 to the financial statements.
PURCHASE, SALE OR REDEMPTION
On 1 February 2011, an aggregate of 8,092 units of the Group’s convertible bonds due 2013 at face value of US$10,000 each and with total principal value of US$80.92 million were redeemed and cancelled, following the relevant bondholders who had exercised put option for redemption of their convertible bonds on 31 December 2010. On the same day, the
PACIFIC BASIN SHIPPING LIMITED • ANNUAL REPORT 2011
78 Report of the Directors
Group exercised the option to redeem all the Group’s remaining 2,428 units of convertible bonds due 2013 at face value of US$10,000 each, together with accrued but unpaid interest to 4 March 2011. Redemption and cancellation of these 2,428 units was completed on 4 March 2011.
Saved as disclosed above and other than for satisfying restricted share awards granted under the LTIS as disclosed below, neither the Company nor any of its subsidiaries has, during the year, purchased, sold or redeemed any of the share capital or convertible bonds of the Company.
LONG TERM INCENTIVE SCHEME
Share awards and share options are granted to Executive Directors, senior management and other employees under the Company’s Long Term Incentive Scheme (“LTIS”).
(A) PURPOSE AND ELIGIBLE PARTICIPANTS OF THE LTIS
The LTIS enables the Company to grant share options and share awards to eligible participants (and their related trusts and companies), being principally directors and employees, as an incentive and recognition for their contribution to the Group. The LTIS incentivises performance of participants by linking part of their remuneration to the achievement of the Group. The value offered is related to job grade and contribution to the management of the business.
(B) MAXIMUM NUMBER OF SHARES
The total number of shares which may be or have been issued by the Company or transferred to (i) the trustee of the LTIS in satisfaction of share awards and (ii) in respect of options that have been granted or to be granted, under the LTIS or any other schemes must not, in aggregate, exceed 126,701,060 shares (representing 6.54% of the Shares in issue at 1 March 2012). There were 400,000 outstanding share options and 18,607,000 restricted shares not vested under the LTIS which represents 0.98% of the issued share capital of the Company as at 1 March 2012.
(C)LIMIT FOR EACH ELIGIBLE PARTICIPANT
The aggregate number of shares issued and to be issued upon exercise of share options or vesting of share awards granted in any 12 month period to an eligible participant (including vesting of outstanding share awards and both exercised and outstanding options) shall not exceed 1% of the shares in issue as at the date of grant.
(D)PROCEDURE OF GRANTING RESTRICTED SHARE AWARDS
The Board entered into a trust deed to appoint a trustee to administer share awards under the LTIS and to constitute a trust to hold property transferred by the Company to the trustee (which shall include cash or Shares) in order to satisfy grants of share awards. At the direction of the Board, the trustee shall either subscribe for new shares at par from the Company or acquire existing shares in the market in accordance with the LTIS.
(E) BASIS OF DETERMINING THE EXERCISE PRICE OF OPTIONS
The exercise price payable on exercise of the share options under the LTIS shall be determined by the Board and notified to each grantee. The exercise price shall not be less than the higher of: (i) the closing price of the shares as stated in the Stock Exchange’s daily quotations sheet on the date of grant of that share option, which must be a business day; (ii) the average of the closing prices per share as stated in the Stock Exchange’s daily quotations sheets for the five business days immediately preceding the date of grant of that share option; and (iii) the nominal value of the shares.
All notices to exercise share options shall be accompanied by a remittance for the full amount of the subscription price for the shares in respect of which the notice is given.
(F) REMAINING LIFE OF THE SCHEME
The LTIS will remain in force unless terminated by resolution in a general meeting or by the Board. No further share awards or share options can be offered under the LTIS after 14 July 2014, being the 10th anniversary of the adoption of the LTIS.

PACIFIC BASIN SHIPPING LIMITED • ANNUAL REPORT 2011
79
Group O
verviewBusiness Review
Financial ReviewG
overnance Financial S
tatements
CS
R Report
(G) AWARDS GRANTED
Details of the grant of long term incentives and a summary of the movements of the outstanding incentives during the year ended 31 December 2011 under the LTIS are as follows:
(i) History and movement of restricted sHare awards Granted
At At Granted Date of Total Vested 31 December 1 January during Vested Vesting in first award awarded to date 2011 2011 the year or lapsed 1 2012 2013 2014
’000 ’000 ’000 ’000 ’000 ’000 ’000 ’000 ’000
DirectorsDavid M. Turnbull 5 Aug 2008 1,315 (351) 964 729 352 (117) 299 313 352Klaus Nyborg 19 Sept 2006 4,624 (2,500) 2,124 2 1,924 700 (500) 802 622 700Jan Rindbo 11 May 2007 2,615 (1,179) 1,436 1,082 503 (149) 485 448 503Andrew T. Broomhead 11 May 2007 1,540 (630) 910 603 377 (70) 229 304 377Wang Chunlin 9 Mar 2006 2,561 (1,425) 1,136 1,037 354 (255) 467 315 354
12,655 (6,085) 6,570 5,375 2,286 (1,091) 2,282 2,002 2,286
Senior Management 3,155 1,541 1,614 1,456 449 (291) 638 527 449
Other Employees 12,334 9,999 5,131 (2,796) 4,821 3,552 3,961
20,518 16,830 7,866 (4,178) 7,741 6,081 6,696
Movement in 2010 16,831 17,286 6,446 (6,901)
Note : (1) 370,000 (2010: 963,000) Shares lapsed due to resignation of four Employees during 2011. (2) 2,124,000 Shares shall lapse following Mr. Nyborg’s resignation which will take effect from 15 March 2012.
The closing price of the shares of the Company immediately before the grant of:– 7,456,000 restricted share awards on 20 May 2011 was HK$4.77;– 206,000 restricted share awards on 4 November 2011 was HK$3.50; and– 204,000 restricted share awards on 30 December 2011 was HK$3.04.
(ii) sHare options and sHare valuation
Share options were granted on 14 July 2004 under the LTIS at an exercise price of HK$2.5 per share. There were 400,000 share options of Other Employees not exercised during the year ended 31 December 2011. They were fully vested and will expire on 14 July 2014.
Based on a report prepared by Watson Wyatt Hong Kong Limited, the fair market values of the share options granted on 14 July 2004 based on the binomial option pricing model for the exercise period from 14 July 2005 to 13 July 2014 is HK$0.834 per share option.
note: Key assumptions included an expected dividend yield of 8% per annum, volatility of the company’s share price of 50% per annum, a risk-free rate of interest of 4% and 4.1% per annum on the respective grant dates, that the employees will exercise their share options if the share price is 100% above the exercise price, and an expected rate of leaving service of eligible employees after the vesting date of 0.4% per annum.
Save as disclosed above, no right to subscribe for the securities of the Company nor its associated corporations within the meaning of the Securities and Futures Ordinance (the ‘’SFO’’), has been granted by the Company to, nor have any rights been exercised by, any person during the year.
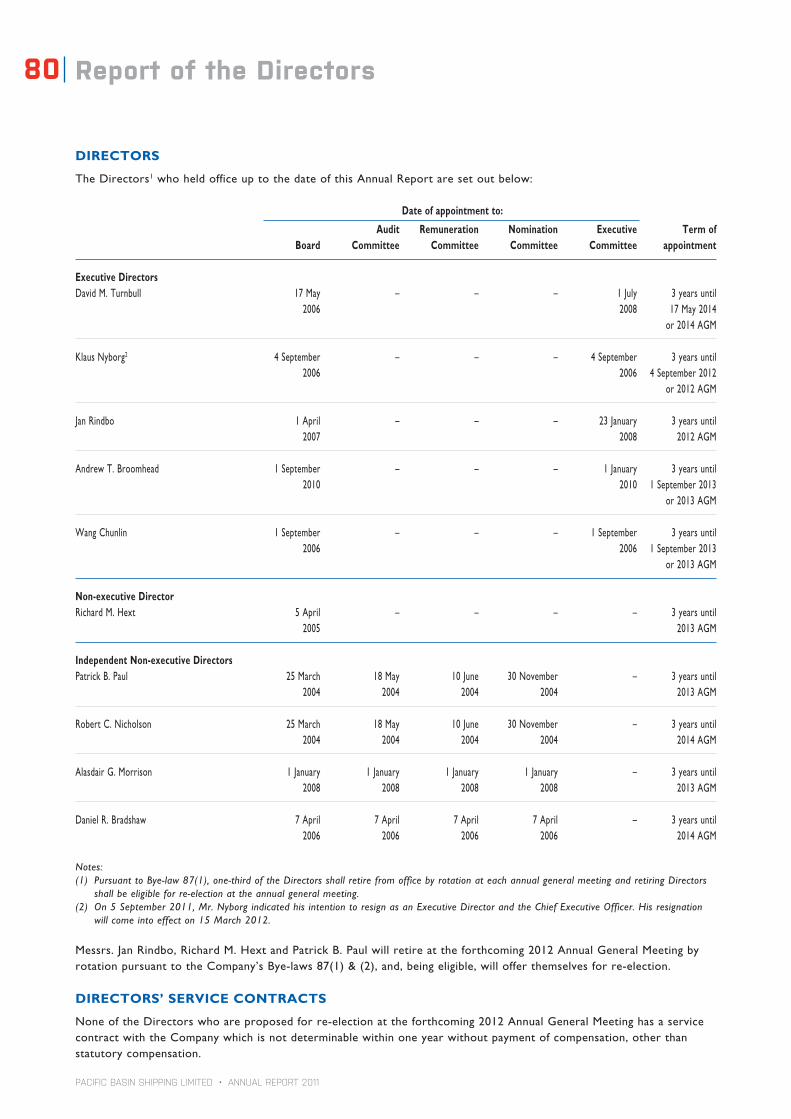
PACIFIC BASIN SHIPPING LIMITED • ANNUAL REPORT 2011
80 Report of the Directors
DIRECTORS
The Directors1 who held office up to the date of this Annual Report are set out below:
Date of appointment to:
Audit Remuneration Nomination Executive Term of Board Committee Committee Committee Committee appointment
Executive DirectorsDavid M. Turnbull 17 May – – – 1 July 3 years until 2006 2008 17 May 2014 or 2014 AGM
Klaus Nyborg2 4 September – – – 4 September 3 years until 2006 2006 4 September 2012 or 2012 AGM
Jan Rindbo 1 April – – – 23 January 3 years until 2007 2008 2012 AGM
Andrew T. Broomhead 1 September – – – 1 January 3 years until 2010 2010 1 September 2013 or 2013 AGM
Wang Chunlin 1 September – – – 1 September 3 years until 2006 2006 1 September 2013 or 2013 AGM
Non-executive DirectorRichard M. Hext 5 April – – – – 3 years until 2005 2013 AGM
Independent Non-executive DirectorsPatrick B. Paul 25 March 18 May 10 June 30 November – 3 years until 2004 2004 2004 2004 2013 AGM
Robert C. Nicholson 25 March 18 May 10 June 30 November – 3 years until 2004 2004 2004 2004 2014 AGM
Alasdair G. Morrison 1 January 1 January 1 January 1 January – 3 years until 2008 2008 2008 2008 2013 AGM
Daniel R. Bradshaw 7 April 7 April 7 April 7 April – 3 years until 2006 2006 2006 2006 2014 AGM
notes:(1) pursuant to Bye-law 87(1), one-third of the directors shall retire from office by rotation at each annual general meeting and retiring directors
shall be eligible for re-election at the annual general meeting.(2) on 5 september 2011, mr. nyborg indicated his intention to resign as an executive director and the chief executive officer. His resignation
will come into effect on 15 march 2012.
Messrs. Jan Rindbo, Richard M. Hext and Patrick B. Paul will retire at the forthcoming 2012 Annual General Meeting by rotation pursuant to the Company’s Bye-laws 87(1) & (2), and, being eligible, will offer themselves for re-election.
DIRECTORS’ SERVICE CONTRACTS
None of the Directors who are proposed for re-election at the forthcoming 2012 Annual General Meeting has a service contract with the Company which is not determinable within one year without payment of compensation, other than statutory compensation.

PACIFIC BASIN SHIPPING LIMITED • ANNUAL REPORT 2011
81
Group O
verviewBusiness Review
Financial ReviewG
overnance Financial S
tatements
CS
R Report
DIRECTORS’ INTERESTS IN CONTRACTS OF SIGNIFICANCE
No contracts of significance in relation to the Group’s business to which the Company was a party and in which a Director of the Company had a material interest, whether directly or indirectly, subsisted at the end of the year or at any time during the year.
BIOGRAPHICAL DETAILS OF DIRECTORS AND SENIOR MANAGEMENT
Brief biographical details of Directors and senior management are set out in the “Directors and Senior Management” section of this Annual Report.
DIRECTORS’ AND CHIEF EXECUTIVE’S INTERESTS AND SHORT POSITIONS IN THE SHARES, UNDERLYING SHARES AND DEBENTURES OF THE COMPANY OR ANY ASSOCIATED CORPORATION
At 31 December 2011, the discloseable interests and short positions of each Director and the Chief Executive in Shares, underlying Shares and debentures of the Company and its associated corporations within the meaning of Part XV of the SFO, which: (a) were required to be notified to the Company and the Stock Exchange pursuant to Divisions 7 and 8 of Part XV of the SFO (including interests and short positions which they are taken or deemed to have under such provisions of the SFO, or (b) were required to be entered in the register maintained by the Company under Section 352 of the SFO, or (c) were required pursuant to the Model Code for Securities Transactions by Directors of Listed Issuers (the “Model Code”) were as follows:
Number of Approximate underlying percentage Trust & Long/ Shares of issued Corporate Personal Family similar Short under equity Total Share share capitalName of Director interests interests interests interests Position derivatives interests of the Company
David M. Turnbull1 – 964,000 – 528,074 2 Long Position – 1,492,074 0.08%Klaus Nyborg1 – 2,124,000 – – Long Position – 2,124,000 0.11%Jan Rindbo1 – 3,556,370 – – Long Position – 3,556,370 0.18%Andrew T. Broomhead1 – 1,376,704 1,056,148 3 – Long Position – 2,432,852 0.13%Wang Chunlin1 – 1,136,000 – – Long Position – 1,136,000 0.06%Richard M. Hext 105,614 4 2,871,501 – – Long Position – 2,977,115 0.15%Patrick B. Paul – 50,000 – – Long Position – 50,000 less than 0.01%Daniel R. Bradshaw 386,417 5 – – – Long Position – 386,417 0.02%
notes:
(1) restricted share awards were granted under the ltis and have been disclosed on page 79 under the long term incentive scheme of this report of the directors.
(2) 528,074 shares are in the form of 50 units of convertible bonds due 2016 at face value of us$10,000 each, held by a trust namely Bentley trust (malta) limited, of which mr. turnbull is the founder.
(3) 1,056,148 shares are in the form of 100 units of convertible bonds due 2016 at face value of us$10,000 each, held jointly by mr. Broomhead and his wife.
(4) 105,614 shares are in the form of 10 units of convertible bonds due 2016 at a face value of us$10,000 each, held by lady margaret Hall limited, a company wholly owned by mr. Hext.
(5) mr. Bradshaw is a shareholder holding 100% and 50% of the issued share capital, respectively, in cormorant shipping limited and Goldeneye shipping limited. He beneficially owns 353,241 shares via cormorant shipping limited and is taken to be interested in the 33,176 shares held by Goldeneye shipping limited.
All the interests stated above represent long positions. No short positions were recorded in the register maintained by the Company under section 352 of the SFO as at 31 December 2011.
Saved as disclosed, at no time during the year was the Company, its subsidiaries, or its associated companies a party to any arrangement to enable the Directors and Chief Executive of the Company to hold any interests or short positions in the share or underlying shares in, or debentures of, the Company or its associated corporations.

PACIFIC BASIN SHIPPING LIMITED • ANNUAL REPORT 2011
82 Report of the Directors
SUBSTANTIAL SHAREHOLDERS’ INTERESTS AND SHORT POSITIONS IN THE SHARES AND UNDERLYING SHARES OF THE COMPANY
The register of substantial shareholders maintained under Section 336 of the SFO shows that as at 31 December 2011, the Company had been notified of the following substantial shareholders’ interests and short positions, being 5% or more of the Company’s issued share capital.
Approximate percentage of the Capacity/ Long/Short Number of issued share capitalName Nature of interest position shares of the Company
Canadian Forest Navigation Co. Ltd./ Beneficial owner Long 252,703,500 13.05% Compagnie De Navigation and Interest in Canadian Forest Ltee.1 corporation controlled
Michael HAGN Interest in Long 252,703,500 13.05% corporation controlled
MIHAG Holding Ltd. Interest in Long 252,703,500 13.05% corporation controlled
Total Investments Inc. Interest in Long 103,256,654 5.33% corporation controlled
Total Banking Corporation Beneficial owner Long 103,256,654 5.33%
Aberdeen Asset Management Plc Investment manager Long 176,735,536 9.13% and its Associates (together the “Group”) on behalf of accounts managed by the Group
Mondrian Investment Partners Limited Investment manager Long 162,045,000 8.37%
Prudential Plc Interest in Long 97,894,000 5.06% corporation controlled
JP Morgan Chase & Co. 2 Beneficial owner, Long 97,726,177 5.05% Investment manager Short 5,989,167 0.31% and Custodian Lending Pool 79,649,120 4.11% corporation/approved lending agent
notes:
(1) the shares held by canadian forest navigation co. ltd. / compagnie de navigation canadian forest ltee are held in the capacities of Beneficial owner (relating to 149,446,846 shares) and interest in corporation controlled (relating to 103,256,654 shares).
(2) the long position in shares held by Jp morgan chase & co. are held in the capacities of Beneficial owner (relating to 8,523,057 shares), investment manager (relating to 9,554,000 shares) and custodian corporation/approved lending agent (relating to 79,649,120 shares).
Save as disclosed above, to the best of the Directors’ knowledge, information and belief, having made all reasonable enquiry, as at 31 December 2011, no other person (other than a Director or Chief Executive of the Company) had an interest or short position in the shares or underlying shares of the Company which would fall to be disclosed to the Company and the Stock Exchange under the provisions of Divisions 2 and 3 of Part XV of the SFO, or which was recorded in the register required to be kept by the Company under section 336 of the SFO.

PACIFIC BASIN SHIPPING LIMITED • ANNUAL REPORT 2011
83
Group O
verviewBusiness Review
Financial ReviewG
overnance Financial S
tatements
CS
R Report
MANAGEMENT CONTRACTS
No contracts concerning the management and administration of the whole or any substantial part of the business of the Company were entered into or existed during the year.
MAJOR CUSTOMERS AND SUPPLIERS
During the year, the Group sold less than 30% of its goods and services to its five largest customers and purchased less than 30% of its goods and services from its five largest suppliers.
CONNECTED TRANSACTION
During the year, the Group had no connected transaction that was subject to the Listing Rules’ reporting requirements for disclosure in this Annual Report.
COMPLIANCE WITH THE CODE ON CORPORATE GOVERNANCE PRACTICES
Throughout the year, the Company has been fully compliant with all code provisions of the Code on Corporate Governance Practices as contained in Appendix 14 of the Listing Rules. Please also refer to the Corporate Governance Report of this Annual Report.
AUDIT AND REMUNERATION COMMITTEES
Details of the audit and remuneration committees are set out in the Corporate Governance Report of this Annual Report.
AUDITORS
The financial statements have been audited by PricewaterhouseCoopers who retire and, being eligible, offer themselves for re-appointment.
PUBLIC FLOAT
On the basis of information that is publicly available to the Company and within the knowledge of the Directors as at the date of this Annual Report, the Company has complied with the Listing Rules requirement to have at least 25% of the Company’s total issued share capital held by the public.
By Order of the Board
Andrew T. Broomheadexecutive director and company secretaryHong Kong, 1 March 2012
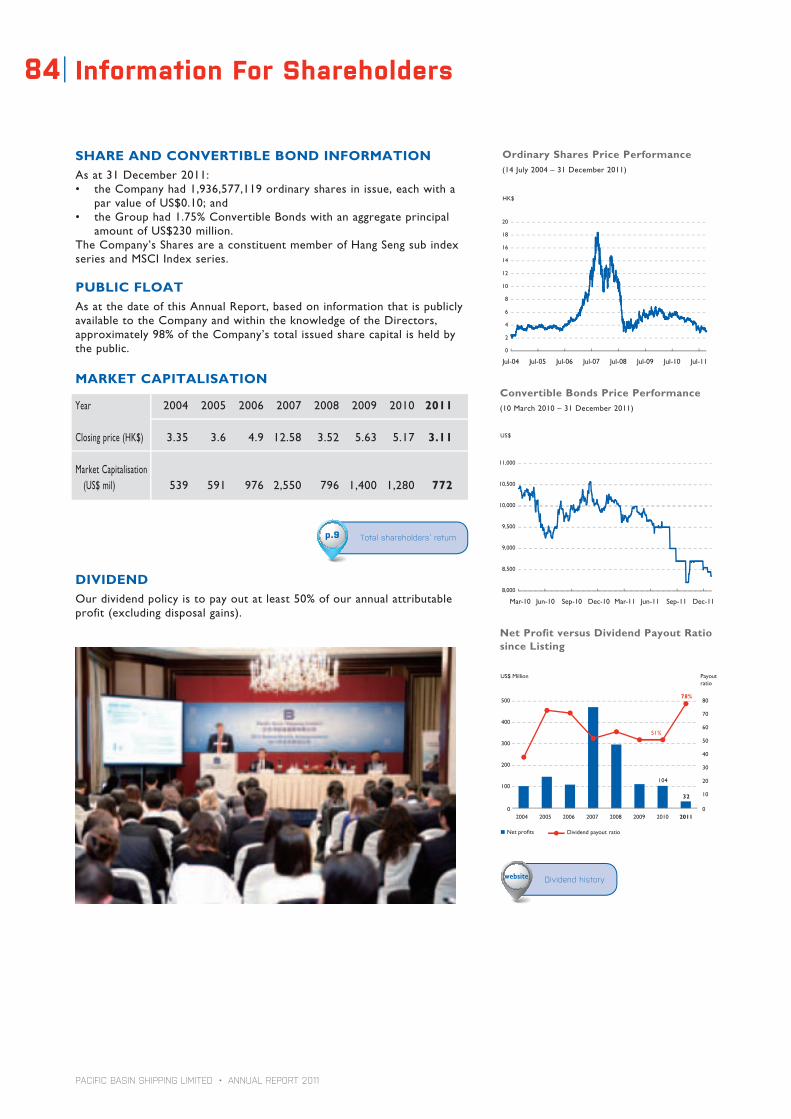
PACIFIC BASIN SHIPPING LIMITED • ANNUAL REPORT 2011
Information For Shareholders84
SHARE AND CONVERTIBLE BOND INFORMATIONAs at 31 December 2011: • theCompanyhad1,936,577,119ordinarysharesinissue,eachwitha
parvalueofUS$0.10;and• theGrouphad1.75%ConvertibleBondswithanaggregateprincipal
amountofUS$230million.TheCompany’sSharesareaconstituentmemberofHangSengsubindexseriesandMSCIIndexseries.
PUBLIC FLOATAsatthedateofthisAnnualReport,basedoninformationthatispubliclyavailabletotheCompanyandwithintheknowledgeoftheDirectors,approximately98%oftheCompany’stotalissuedsharecapitalisheldbythepublic.
MARKET CAPITALISATION
Year 2004 2005 2006 2007 2008 2009 2010 2011
Closingprice(HK$) 3.35 3.6 4.9 12.58 3.52 5.63 5.17 3.11
MarketCapitalisation (US$mil) 539 591 976 2,550 796 1,400 1,280 772
DIVIDENDOurdividendpolicyistopayoutatleast50%ofourannualattributableprofit(excludingdisposalgains).
HK$
US$
Convertible Bonds Price Performance(10March2010–31December2011)
Mar-10 Jun-10 Sep-10 Dec-10 Mar-11 Jun-11 Sep-11 Dec-11
8,000
8,500
9,000
9,500
10,000
10,500
11,000
Ordinary Shares Price Performance(14July2004–31December2011)
0
2
4
6
8
10
12
14
16
18
20
Jul-04 Jul-05 Jul-06 Jul-07 Jul-08 Jul-09 Jul-10 Jul-11
Total shareholders’ returnp.9
Net Profit versus Dividend Payout Ratio since Listing
Net pro�ts Dividend payout ratio
US$ Million Payoutratio
0
100
200
300
400
500
0
10
20
30
40
50
60
70
80
2004 2005 2006 2007 2008 2009 2010 2011
51%
78%
104
32
Dividend historywebsite
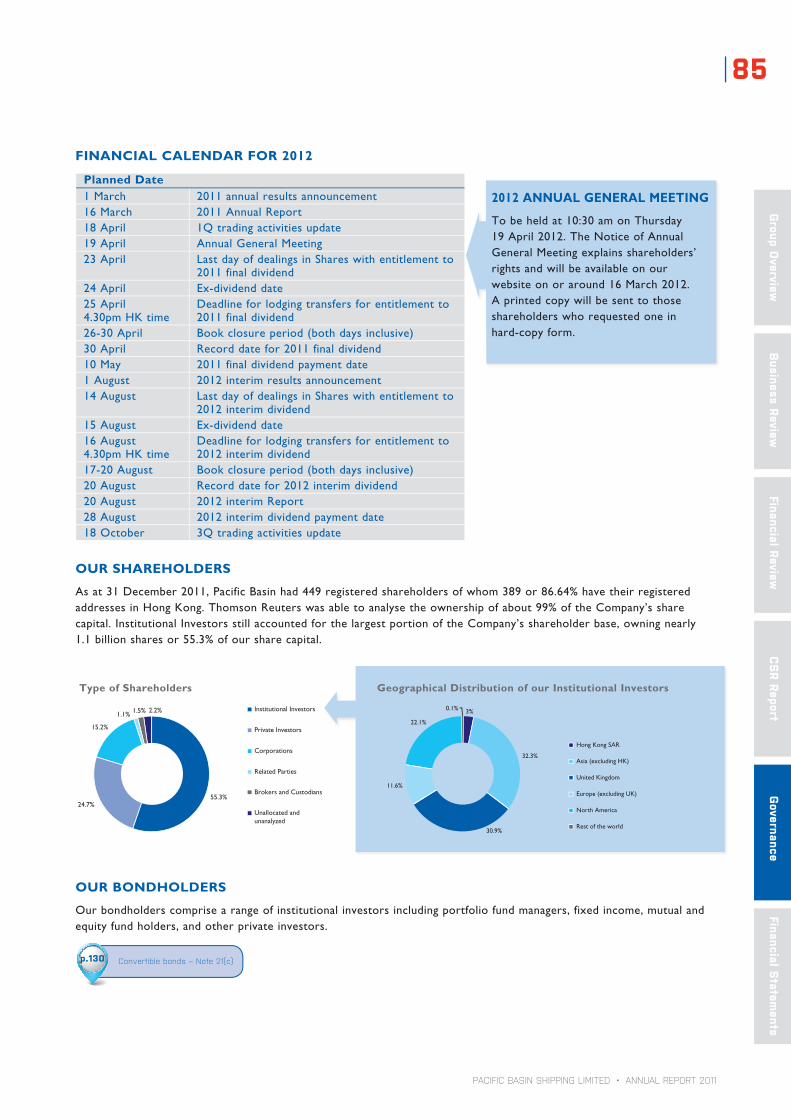
PACIFIC BASIN SHIPPING LIMITED • ANNUAL REPORT 2011
85
Group O
verviewBusiness Review
Financial ReviewG
overnance Financial S
tatements
CS
R Report
Planned Date1March 2011annualresultsannouncement16March 2011AnnualReport18April 1Qtradingactivitiesupdate19April AnnualGeneralMeeting23April LastdayofdealingsinShareswithentitlementto
2011finaldividend24April Ex-dividenddate25April4.30pmHKtime
Deadlineforlodgingtransfersforentitlementto2011finaldividend
26-30April Bookclosureperiod(bothdaysinclusive)30April Recorddatefor2011finaldividend10May 2011finaldividendpaymentdate1August 2012interimresultsannouncement14August LastdayofdealingsinShareswithentitlementto
2012interimdividend15August Ex-dividenddate16August4.30pmHKtime
Deadlineforlodgingtransfersforentitlementto2012interimdividend
17-20August Bookclosureperiod(bothdaysinclusive)20August Recorddatefor2012interimdividend20August 2012interimReport28August 2012interimdividendpaymentdate18October 3Qtradingactivitiesupdate
FINANCIAL CALENDAR FOR 2012
OUR SHAREHOLDERS
Asat31December2011,PacificBasinhad449registeredshareholdersofwhom389or86.64%havetheirregisteredaddressesinHongKong.ThomsonReuterswasabletoanalysetheownershipofabout99%oftheCompany’ssharecapital.InstitutionalInvestorsstillaccountedforthelargestportionoftheCompany’sshareholderbase,owningnearly 1.1billionsharesor55.3%ofoursharecapital.
OUR BONDHOLDERS
Ourbondholderscomprisearangeofinstitutionalinvestorsincludingportfoliofundmanagers,fixedincome,mutualandequityfundholders,andotherprivateinvestors.
2012 ANNUAL GENERAL MEETING
Tobeheldat10:30amonThursday19April2012.TheNoticeofAnnualGeneralMeetingexplainsshareholders’rightsandwillbeavailableonourwebsiteonoraround16March2012.Aprintedcopywillbesenttothoseshareholderswhorequestedonein hard-copyform.
Geographical Distribution of our Institutional InvestorsType of Shareholders
1.1% 2.2%1.5%
15.2%
24.7%55.3%
Institutional Investors
Private Investors
Corporations
Related Parties
Unallocated andunanalyzed
Brokers and Custodians
30.9%
32.3%
11.6%
22.1%
3%0.1%
United Kingdom
Asia (excluding HK)
North America
Europe (excluding UK)
Hong Kong SAR
Rest of the world
Convertible bonds – Note 21(c)p.130

PACIFIC BASIN SHIPPING LIMITED • ANNUAL REPORT 2011
Information For Shareholders86
• Roadshow–Wevisitedinvestorsintheselocations:
Boston
Washington DC
Amsterdam
Rotterdam
Glasgow
Dublin
New York
Copenhagen
Beijing
Hong Kong
Singapore
Sydney
Shanghai
Tokyo
Frankfurt
ZurichGeneva
London
Edinburgh
San FranciscoDes Moines
Boston
Washington DC
Amsterdam
Rotterdam
Glasgow
Dublin
New York
Copenhagen
Beijing
Hong Kong
Singapore
Sydney
Shanghai
Tokyo
Frankfurt
ZurichGeneva
London
Edinburgh
San FranciscoDes Moines
Boston
Washington DC
Amsterdam
Rotterdam
Glasgow
Dublin
New York
Copenhagen
Beijing
Hong Kong
Singapore
Sydney
Shanghai
Tokyo
Frankfurt
ZurichGeneva
London
Edinburgh
San FranciscoDes Moines
NorthAmerica Europe Asia–Pacific
INVESTOR RELATIONS AND CORPORATE COMMUNICATIONS
Weseektobetransparentaboutouroperationsandperformancethroughourreportingandinvestorrelationsactivities.WearecommittedtoensuringthemarketisinformedofrelevantinformationabouttheCompanyonaregularbasis,allowingbothexistingandpotentialshareholderstoevaluatetheCompany,itsperformanceanditsprospects.Wevaluethecommunicationwehavewithexistingandpotentialshareholdersandbelievethatinvestorrelationseffortscanhelptoaugmentthepublic’sunderstandingoftheCompany,increaserecognitionofourdevelopmentandultimatelyenhanceshareholdervalue.
STAKEHOLDER ENGAGEMENT
• Communicationchannels–ActivestakeholderengagementisimportantasawaytoincreaseunderstandingofPacificBasinandouractivitiesandperformance.Webelievethatthetransparencyencouragedbysuchengagementbuildsrecognitionofourbrandandultimatelyenhancesshareholdervalue.Weachieveengagementthroughthefollowingchannels:
Financial Reporting
• AnnualandInterimReports• Voluntaryquarterlytradingupdates• Pressreleasesonbusinessactivities
Shareholder Meetings and Hotlines
Groupandone-on-onemeetings,ashareholderhotlineande-mailchannelsencouragefeedback,commentsandqueriesfromthemarket
Investor RelationsE-mail:[email protected]:852-22337000
Vessel Tours
Shipvisitsforanalysts,investors,pressandguestsareorganisedduringvesselportcallsoratshipnamingceremonies
Social Media Communications
Companynews,videoclips,photosandeventsarepublishedthroughsocialmediasites:
Company Website www.pacificbasin.com
Informationavailableonthewebsite:
• Boardandmanagementteambiographicaldata• BoardCommittees’TermsofReference• Fleetprofile• CorporateGovernance,RiskManagementandCSR• FinancialinformationincludingExceldownloads,news
andpresskits• LinkedwebsitesoftheGroup’smainbusinesses
Boston
Washington DC
Amsterdam
Rotterdam
Glasgow
Dublin
New York
Copenhagen
Beijing
Hong Kong
Singapore
Sydney
Shanghai
Tokyo
Frankfurt
ZurichGeneva
London
Edinburgh
San FranciscoDes Moines
website
2011 • 2010
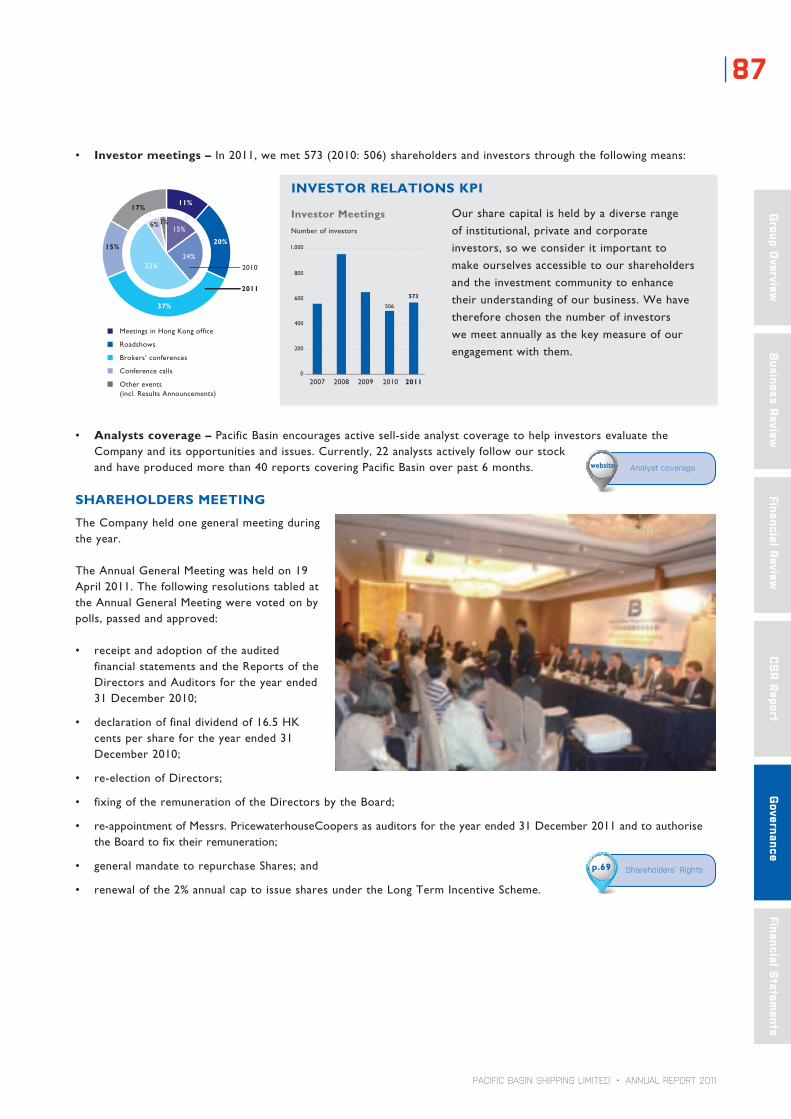
PACIFIC BASIN SHIPPING LIMITED • ANNUAL REPORT 2011
87
Group O
verviewBusiness Review
Financial ReviewG
overnance Financial S
tatements
CS
R Report
• Analystscoverage–PacificBasinencouragesactivesell-sideanalystcoveragetohelpinvestorsevaluatetheCompanyanditsopportunitiesandissues.Currently,22analystsactivelyfollowourstockandhaveproducedmorethan40reportscoveringPacificBasinoverpast6months.
SHAREHOLDERS MEETING
TheCompanyheldonegeneralmeetingduringtheyear.
TheAnnualGeneralMeetingwasheldon19April2011.ThefollowingresolutionstabledattheAnnualGeneralMeetingwerevotedonbypolls,passedandapproved:
• receiptandadoptionoftheauditedfinancialstatementsandtheReportsoftheDirectorsandAuditorsfortheyearended31December2010;
• declarationoffinaldividendof16.5HKcentspersharefortheyearended31December2010;
• re-electionofDirectors;
• fixingoftheremunerationoftheDirectorsbytheBoard;
• re-appointmentofMessrs.PricewaterhouseCoopersasauditorsfortheyearended31December2011andtoauthorisetheBoardtofixtheirremuneration;
• generalmandatetorepurchaseShares;and
• renewalofthe2%annualcaptoissuesharesundertheLongTermIncentiveScheme.
Analyst coverage website
• Investormeetings–In2011,wemet573(2010:506)shareholdersandinvestorsthroughthefollowingmeans:
Meetings in Hong Kong of�ce
Roadshows
Brokers’ conferences
Conference calls
Other events(incl. Results Announcements)
17%11%
20%
37%
15%
2011
2010
3%6%
24%
15%
52%
INVESTOR RELATIONS KPI
Oursharecapitalisheldbyadiverserangeofinstitutional,privateandcorporateinvestors,soweconsideritimportanttomakeourselvesaccessibletoourshareholdersandtheinvestmentcommunitytoenhancetheirunderstandingofourbusiness.Wehavethereforechosenthenumberofinvestorswemeetannuallyasthekeymeasureofourengagementwiththem.
Investor Meetings
0
200
400
600
800
1,000
573
506
2007 2008 2009 2010 2011
Numberofinvestors
sShareholders’ Rightsp.69
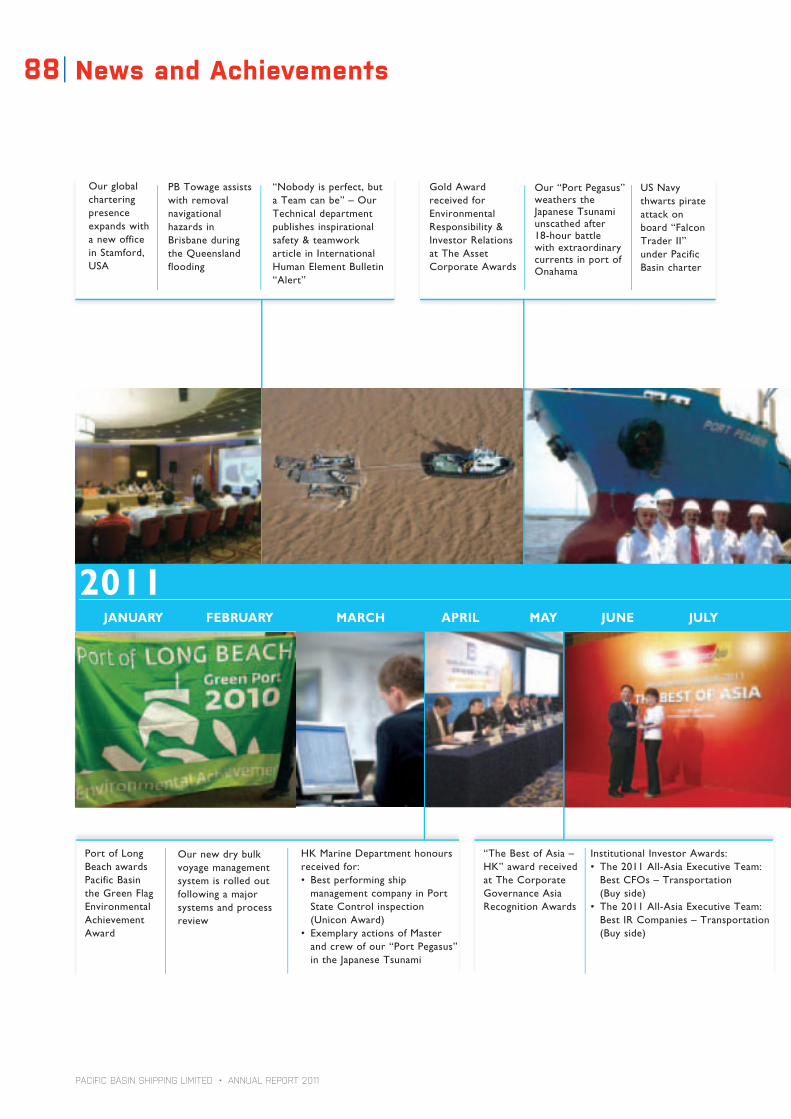
PACIFIC BASIN SHIPPING LIMITED • ANNUAL REPORT 2011
News and Achievements88
2011
PB Towage assists with removal navigational hazards in Brisbane during the Queensland flooding
“Nobody is perfect, but a Team can be” – Our Technical department publishes inspirational safety & teamwork article in International Human Element Bulletin “Alert”
Our global chartering presence expands with a new office in Stamford, USA
“The Best of Asia – HK” award received at The Corporate Governance Asia Recognition Awards
JANUARY FEBRUARY MARCH APRIL MAY JUNE JULY AUGUST SEPTEMBER OCTOBER NOVEMBER DECEMBER JANUARY
Our new dry bulk voyage management system is rolled out following a major systems and process review
Institutional Investor Awards:• The2011All-AsiaExecutiveTeam:
Best CFOs – Transportation (Buy side)
• The2011All-AsiaExecutiveTeam:Best IR Companies – Transportation (Buy side)
HK Marine Department honours received for:• Bestperformingship
management company in Port State Control inspection
(Unicon Award)• ExemplaryactionsofMaster
and crew of our “Port Pegasus” in the Japanese Tsunami
Port of Long Beach awards Pacific Basin the Green Flag Environmental Achievement Award
Our “Port Pegasus” weathers the Japanese Tsunami unscathed after 18-hourbattlewith extraordinary currents in port of Onahama
US Navy thwarts pirate attack on board “Falcon Trader II” under Pacific Basin charter
Gold Award received for Environmental Responsibility & Investor Relations at The Asset Corporate Awards
2011

PACIFIC BASIN SHIPPING LIMITED • ANNUAL REPORT 2011
89
Group O
verviewBusiness Review
Financial ReviewG
overnance Financial S
tatements
CS
R Report
JANUARY FEBRUARY MARCH APRIL MAY JUNE JULY AUGUST SEPTEMBER OCTOBER NOVEMBER DECEMBER JANUARY
Pacific Basin’s Handysize fleet expands beyond 100shipsinoperation
Lloyd’sListAwardsAsia2011:• SeafareroftheYear• EnvironmentAward• ShipmanageroftheYear• Highcommendationfor
performance in Safety
Captain Zhu Qianchun is nominated amongLloyd’sList100mostinfluentialpeopleinshippingin2011
Certificate of Excellence received for Investor Relations at the IR Awards2011–GreaterChina
“Bering Strait” delivers in January 2012markingthecompletion of our RoRo newbuilding programme
Pacific Basin wins Seatrade Asia Bulk Operator Award – and shortlisted in environmental protection, safety and ship management categories
“2010GlobalDealoftheYearAward – Equity Linked” at the Marine Money Awards
Honours received at IR Global Rankings:• BronzeAwardforInvestorRelations
Website in China• OutstandingCorporateGovernanceinAsia-PacificandGreaterChina
• OutstandingFinancialDisclosureinAsia-PacificandGreaterChina
“Awanuia” and other PB Towage vessels assist salvors in significantly limiting oil pollution caused by grounded containership “Rena” in New Zealand
PB Towage’s involvement in Chevron’s US$37 billion Gorgon project is extended for further2yearstoApril2014
Our global network of chartering offices is further expanded across six continents with opening of our Durban office
2012
Lloyd’sListAwardsGlobal2011:• CaptainZhuQianchunisnamed“SeafareroftheYear”forhisactionson board “Port Pegasus” during the Japanese Tsunami
• PacificBasinwinsEnvironmentAwardfor gold standard environmental policy and initiatives promising real results
Financial Statements92 Consolidated Balance Sheet
93 Balance Sheet of the Company
94 Consolidated Income Statement
95 Consolidated Statement of Comprehensive Income
95 Consolidated Statement of Changes in Equity
96 Consolidated Cash Flow Statement
97 Notes to the Financial Statements
151 Independent Auditor’s Report
152 Group Financial Summary

PACIFIC BASIN SHIPPING LIMITED • ANNUAL REPORT 2011
As at 31 December 2011
Consolidated Balance Sheet92
2011 2010 Note US$’000 US$’000
Non-current assets Property, plant and equipment 6 1,525,185 1,518,632 Investment properties 7 2,734 2,664 Land use rights 8 3,874 3,815 Goodwill 9 25,256 25,256 Interests in jointly controlled entities 11(a) 44,403 56,125 Investments in associates 12 4,411 4,098 Available-for-sale financial assets 13 11,533 74,476 Derivative assets 14 361 1,672 Trade and other receivables 15 5,175 6,792 Restricted bank deposits 16 8,566 10,280 Other non-current assets 17 4,400 –
1,635,898 1,703,810
Current assets Inventories 18 66,873 39,911 Derivative assets 14 5,303 7,066 Structured notes 19 12,913 – Trade and other receivables 15 101,110 111,444 Restricted bank deposits 16 11,154 3,421 Cash and deposits 16 598,501 689,736
795,854 851,578
Current liabilities Derivative liabilities 14 1,298 3,972 Trade and other payables 20 144,798 127,248 Current portion of long term borrowings 21 65,323 165,696 Taxation payable 2,139 3,059 Provision for onerous contracts 22 – 2,031
213,558 302,006
Net current assets 582,296 549,572
Total assets less current liabilities 2,218,194 2,253,382
Non-current liabilities Derivative liabilities 14 19,563 14,721 Long term borrowings 21 713,716 693,770
733,279 708,491
Net assets 1,484,915 1,544,891
Equity Capital and reserves attributable to shareholders Share capital 23 193,658 193,164 Retained profits 24 708,463 720,809 Other reserves 24 582,794 630,918
Total equity 1,484,915 1,544,891
Approved by the Board of Directors on 1 March 2012
Klaus Nyborg Andrew T. Broomhead Director Director
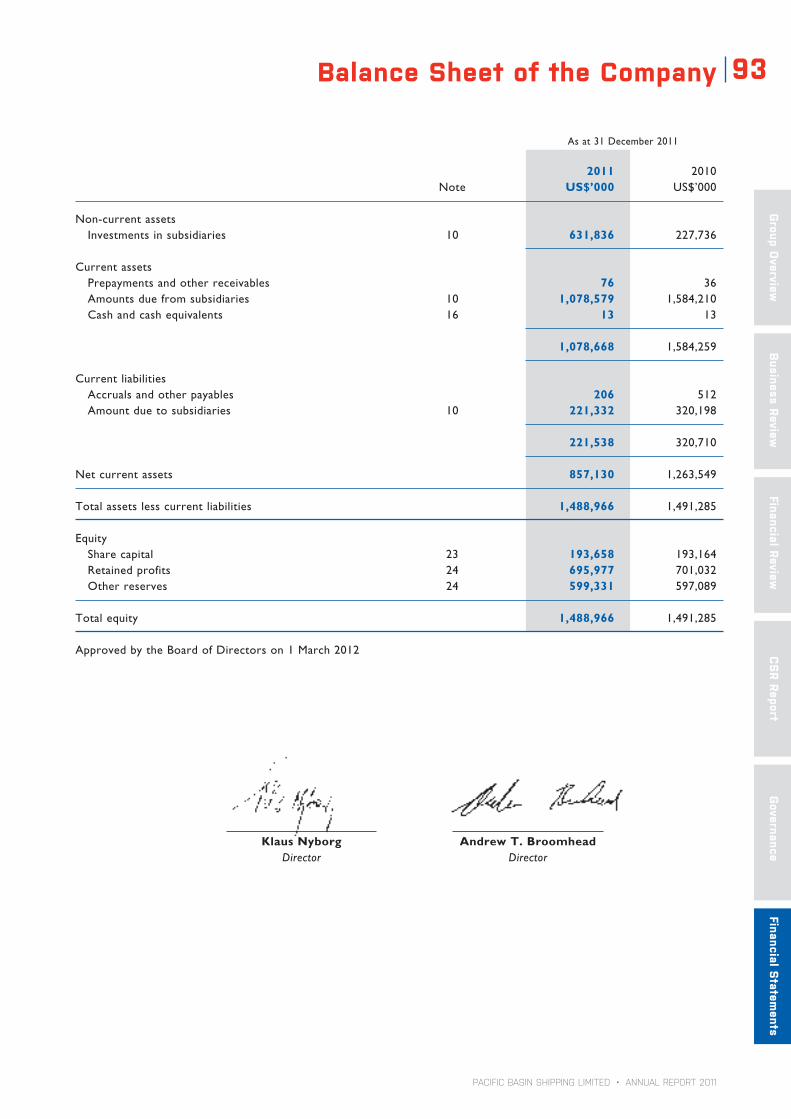
PACIFIC BASIN SHIPPING LIMITED • ANNUAL REPORT 2011
As at 31 December 2011
Balance Sheet of the Company 93
Group O
verviewBusiness Review
Financial ReviewG
overnance Financial S
tatements
CS
R Report
2011 2010 Note US$’000 US$’000
Non-current assets Investments in subsidiaries 10 631,836 227,736
Current assets Prepayments and other receivables 76 36 Amounts due from subsidiaries 10 1,078,579 1,584,210 Cash and cash equivalents 16 13 13
1,078,668 1,584,259
Current liabilities Accruals and other payables 206 512 Amount due to subsidiaries 10 221,332 320,198
221,538 320,710
Net current assets 857,130 1,263,549
Total assets less current liabilities 1,488,966 1,491,285
Equity Share capital 23 193,658 193,164 Retained profits 24 695,977 701,032 Other reserves 24 599,331 597,089
Total equity 1,488,966 1,491,285
Approved by the Board of Directors on 1 March 2012
Klaus Nyborg Andrew T. Broomhead Director Director

PACIFIC BASIN SHIPPING LIMITED • ANNUAL REPORT 2011
For the year ended 31 December 2011
Consolidated Income Statement94
2011 2010 Note US$’000 US$’000
Revenue 4(a) 1,342,535 1,268,542Direct costs 4(a), 5 (1,234,889) (1,109,213)
Gross profit 107,646 159,329General and administrative expenses 4(a), 5 (10,754) (12,945)Other income and gains 25 67,173 47,176Other expenses 5 (91,070) (59,189)Finance costs, net 26 (31,332) (31,193)Share of profits less losses of jointly controlled entities 11 508 1,805Share of profits less losses of associates 12 (9,992) (192)
Profit before taxation 32,179 104,791Taxation 27 (197) (453)
Profit attributable to shareholders 31,982 104,338
Dividends 29 24,896 53,441
Earnings per share for profit attributable to shareholders
Basic 30(a) US 1.65 cents US 5.41 cents
Diluted 30(b) US 1.65 cents US 5.41 cents
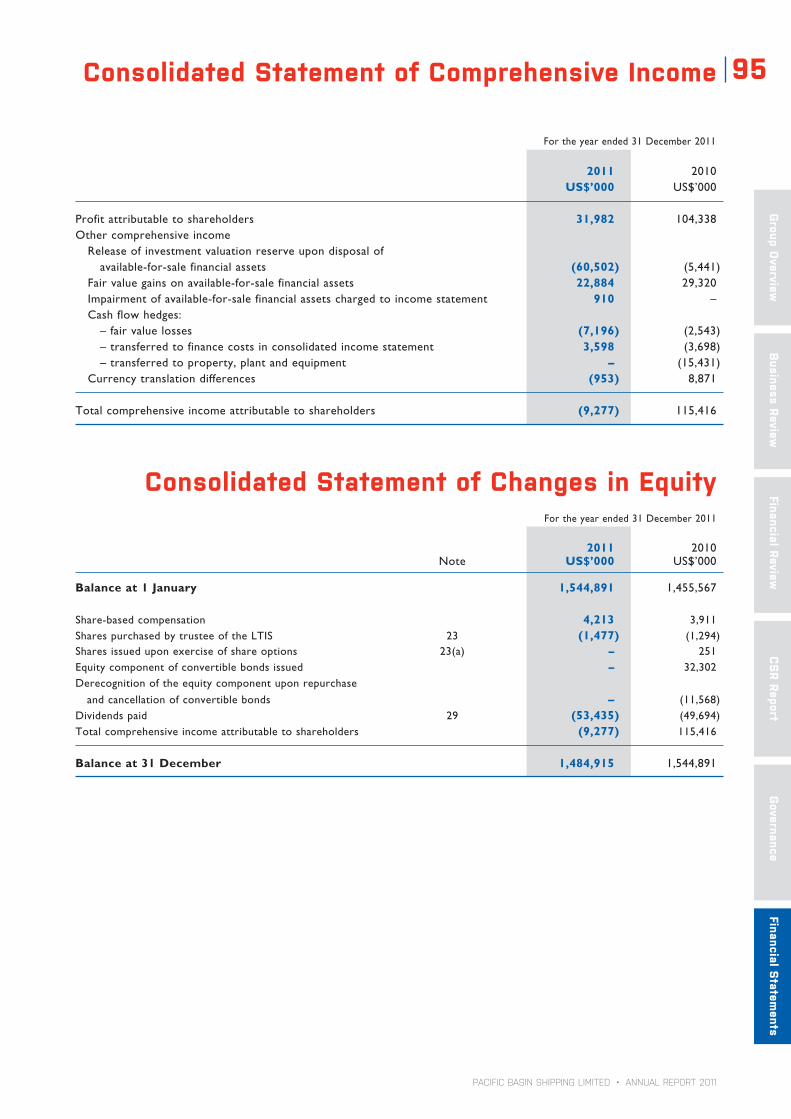
PACIFIC BASIN SHIPPING LIMITED • ANNUAL REPORT 2011
Consolidated Statement of Comprehensive Income
For the year ended 31 December 2011
95
Group O
verviewBusiness Review
Financial ReviewG
overnance Financial S
tatements
CS
R Report
2011 2010 US$’000 US$’000
Profit attributable to shareholders 31,982 104,338Other comprehensive income Release of investment valuation reserve upon disposal of available-for-sale financial assets (60,502) (5,441) Fair value gains on available-for-sale financial assets 22,884 29,320 Impairment of available-for-sale financial assets charged to income statement 910 – Cash flow hedges: – fair value losses (7,196) (2,543) – transferred to finance costs in consolidated income statement 3,598 (3,698) – transferred to property, plant and equipment – (15,431) Currency translation differences (953) 8,871
Total comprehensive income attributable to shareholders (9,277) 115,416
Consolidated Statement of Changes in EquityFor the year ended 31 December 2011
2011 2010 Note US$’000 US$’000
Balance at 1 January 1,544,891 1,455,567
Share-based compensation 4,213 3,911Shares purchased by trustee of the LTIS 23 (1,477) (1,294)Shares issued upon exercise of share options 23(a) – 251Equity component of convertible bonds issued – 32,302Derecognition of the equity component upon repurchase
and cancellation of convertible bonds – (11,568)Dividends paid 29 (53,435) (49,694)Total comprehensive income attributable to shareholders (9,277) 115,416
Balance at 31 December 1,484,915 1,544,891
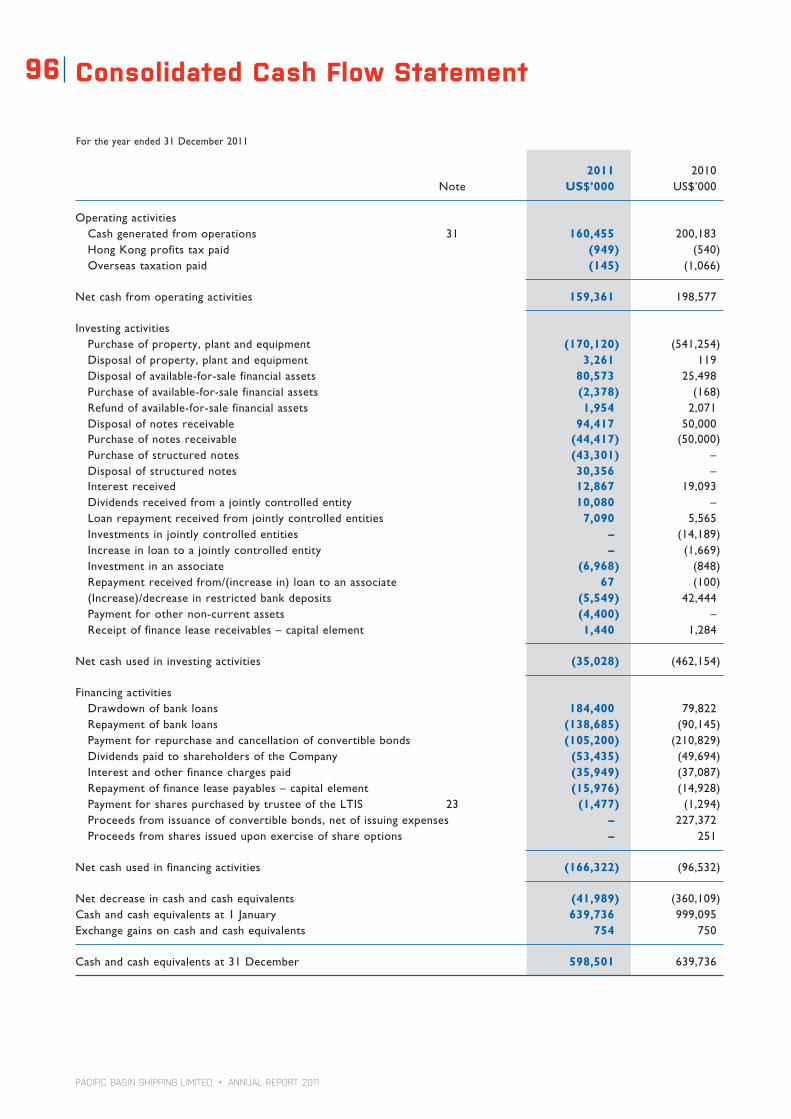
PACIFIC BASIN SHIPPING LIMITED • ANNUAL REPORT 2011
For the year ended 31 December 2011
Consolidated Cash Flow Statement96
2011 2010 Note US$’000 US$’000
Operating activities Cash generated from operations 31 160,455 200,183 Hong Kong profits tax paid (949) (540) Overseas taxation paid (145) (1,066)
Net cash from operating activities 159,361 198,577
Investing activities Purchase of property, plant and equipment (170,120) (541,254) Disposal of property, plant and equipment 3,261 119 Disposal of available-for-sale financial assets 80,573 25,498 Purchase of available-for-sale financial assets (2,378) (168) Refund of available-for-sale financial assets 1,954 2,071 Disposal of notes receivable 94,417 50,000 Purchase of notes receivable (44,417) (50,000) Purchase of structured notes (43,301) – Disposal of structured notes 30,356 – Interest received 12,867 19,093 Dividends received from a jointly controlled entity 10,080 – Loan repayment received from jointly controlled entities 7,090 5,565 Investments in jointly controlled entities – (14,189) Increase in loan to a jointly controlled entity – (1,669) Investment in an associate (6,968) (848) Repayment received from/(increase in) loan to an associate 67 (100) (Increase)/decrease in restricted bank deposits (5,549) 42,444 Payment for other non-current assets (4,400) – Receipt of finance lease receivables – capital element 1,440 1,284
Net cash used in investing activities (35,028) (462,154)
Financing activities Drawdown of bank loans 184,400 79,822 Repayment of bank loans (138,685) (90,145) Payment for repurchase and cancellation of convertible bonds (105,200) (210,829) Dividends paid to shareholders of the Company (53,435) (49,694) Interest and other finance charges paid (35,949) (37,087) Repayment of finance lease payables – capital element (15,976) (14,928) Payment for shares purchased by trustee of the LTIS 23 (1,477) (1,294) Proceeds from issuance of convertible bonds, net of issuing expenses – 227,372 Proceeds from shares issued upon exercise of share options – 251
Net cash used in financing activities (166,322) (96,532)
Net decrease in cash and cash equivalents (41,989) (360,109)Cash and cash equivalents at 1 January 639,736 999,095Exchange gains on cash and cash equivalents 754 750
Cash and cash equivalents at 31 December 598,501 639,736

PACIFIC BASIN SHIPPING LIMITED • ANNUAL REPORT 2011
Notes to the Financial Statements 97
Group O
verviewBusiness Review
Financial ReviewG
overnance Financial S
tatements
CS
R Report
1 INTRODUCTION
1.1 General information
Pacific Basin Shipping Limited (the “Company”) and its subsidiaries (together the “Group”) are principally engaged in the provision of dry bulk shipping services, services to the energy and infrastructure sectors, and RoRo shipping services, which are carried out internationally. In addition, the Group is engaged in the management and investment of the Group’s cash and deposits through its treasury activities.
The Company was incorporated in Bermuda on 10 March 2004 as an exempted company with limited liability under the Companies Act 1981 of Bermuda.
The Company is listed on The Stock Exchange of Hong Kong Limited (the “Stock Exchange”).
These financial statements have been approved for issue by the Board of Directors on 1 March 2012.
1.2 New presentation of the notes to the financial statements
The notes to the financial statements in this report have been changed to place them in order of significance to aid an understanding of the key drivers of the financial position of the Group, whilst maintaining the grouping of notes between income statement and balance sheet where appropriate.
Information relating to a specific financial statement line item has been brought together in one note.
Hence:-
Principal Accounting Policies are not shown separately but are included in the note or sections of this Annual Report for that item. They have been highlighted with this blue background shading. A navigation table is presented in Note 2.2.
Critical Accounting Estimates and Judgements are not shown separately but are included in the note or sections of this Annual Report for that item. They have been highlighted with this carnation red background shading. A navigation table is presented in Note 3.
Financial risk management has been integrated into the Risk section. The auditable parts have been clearly marked and are listed below:• MarketRisks(P.59)• Credit&CounterpartyRisks(P.60)• LiquidityRisk(P.60)• CapitalManagementRisk(P.61)
2 BASIS OF PREPARATION
2.1 Objective and accounting standards
The objective of these consolidated financial statements is to explain the results of the year ended 31 December 2011 and the financial position of the Group on that date, together with comparative information.
The financial statements have been prepared in accordance with Hong Kong Financial Reporting Standards (“HKFRS”) issued by the Hong Kong Institute of Certified Public Accountants (“HKICPA”). The financial statements have been prepared under the historical cost convention, as modified by the revaluation of available-for-sale financial assets and financial assets and financial liabilities (including derivative instruments) at fair value through profit or loss, which are carried at fair value.
ThepreparationoffinancialstatementsinconformitywithHKFRSrequirestheuseofcertaincriticalaccountingestimates.ItalsorequiresmanagementtoexerciseitsjudgementintheprocessofapplyingtheGroup’saccountingpolicies. The areas involving a higher degree of judgement or complexity, or areas where assumptions and estimates are significant to these financial statements are listed under Note 3.

PACIFIC BASIN SHIPPING LIMITED • ANNUAL REPORT 2011
98 Notes to the Financial Statements
2 BASIS OF PREPARATION (continued)
2.2 Accounting policies navigator
Accounting policies LocationAvailable-for-sale financial assets Note 13Borrowing costs Note6Borrowings (including convertible bonds) Note 21Cashandcashequivalents Note16Consolidation Associates Note 12 Jointly controlled entities Note 11(a) Jointly controlled operation Note 11(b) Subsidiaries Note 10Contingent liabilities and contingent assets Note36Current and deferred income tax Note 27Derivative financial instruments and hedging activities Cash flow hedge Note 14 Derivativesthatdonotqualifyforhedgeaccounting Note 14Dividends Note 29Employee Benefits Remuneration Report
(P.76)Finance leases Where the Group is the lessor Note15(b) Where the Group is the lessee Note 21 (a)Financial assets at fair value through profit or loss Note 14Financial guarantee contracts Note35Foreign currency translation Note 2.4Goodwill Note 9Impairment of investments in subsidiaries, jointly controlled entities and Note5 associates, non-financial assets, available-for-sale financial assets and trade and other receivablesInventories Note 18Investment properties Note 7Land use rights Note 8Loans and receivables Note15Operating leases Where the Group is the lessor Note 32 (b) Where the Group is the lessee Note 32 (b)Property,plantandequipment(“PP&E”) Gains or losses on disposal Note6 Vessels and vessel component costs Note6 Vessels under construction Note6Provisions Note2.5Revenue recognition Freight and charter-hire Note 4 Ship management Note 4 Others Note 4Segment reporting Note 4Share capital Note 23Trade and other receivables Note15
Trade payables Note 20
Except as described in Note 2.3, the Group’s principal accounting policies have been consistently applied to each of the years presented in these financial statements. Certain comparative figures have been reclassified to conform to the current year’s presentation.
PACIFIC BASIN SHIPPING LIMITED • ANNUAL REPORT 2011
99
Group O
verviewBusiness Review
Financial ReviewG
overnance Financial S
tatements
CS
R Report
2 BASIS OF PREPARATION (continued)
2.3 Impact of new accounting policies
The following revised standards, amendments and improvements to standard are mandatory for the accounting period beginning 1 January 2011 and are relevant to the Group’s operation.
HKAS 1 (Amendment) Presentation of financial statementsHKAS 24 (Revised) Related party disclosuresHKAS 27 (Amendment) Consolidated and separate financial statementsHKAS 34 (Amendment) Interim financial reportingHKFRS 3 (Amendment) Business combinationsHKFRS 7 (Amendment) Financial instruments: Disclosures
The adoption of the above do not have a significant effect on the financial statements or result in any significant changes to the Group’s principal accounting policies.
Certain new and amended standards, interpretations to the published standards and improvements to HKFRS are mandatory for accounting period beginning on or after 1 January 2012 or later periods. The Group was not requiredtoadoptthesenewandamendedstandards,interpretationsandimprovementsinthefinancialstatementsfor the year ended 31 December 2011. Such new and amended standards, interpretations and improvements that are relevant to the Group’s operation are as follows:
HKAS 1 (Amendments) Presentation of financial statementsHKAS 27 (Amendments) Separate financial statementsHKAS 28 (Revised 2011) Associates and joint venturesHKFRS 9 Financial instrumentsHKFRS 10 Consolidated financial statementsHKFRS 11 Joint arrangementsHKFRS 12 Disclosure of interests in other entitiesHKFRS 13 Fair value measurements
The Group has already commenced an assessment of the impact of these new and amended standards, interpretations and improvements but is not yet in a position to state whether they would have a significant impact on its results of operations and financial position.
2.4 Foreign currency translation
(a) Functional and presentation currency
The financial statements are presented in United States Dollars, which is the Company’s functional and the Group’s presentation currency. Items included in the financial statements of each of the Group’s entities are measured using the currency of the primary economic environment in which the entity operates (the “functional currency”). Major business segments with non-US Dollar functional currencies include:
(i) RoRo Segment: principally Euro
(ii) Energy and Infrastructure Services Segment: Australian Dollars, New Zealand Dollars and United States Dollars
(b) Transactions and balances
Foreign currency transactions are translated into the functional currency at the exchange rates prevailing at the dates of the transactions. Foreign exchange gains and losses resulting from the settlement of such transactions and from the translation at year end exchange rates of monetary assets and liabilities denominated in foreign currencies are recognised in “general and administrative expenses” of the income statement, except when deferredinequityasqualifyingcashflowhedges.
Translationdifferenceonnon-monetaryfinancialassetsandliabilitiessuchasequitiesheldatfairvaluethrough profit or loss are recognised in the income statement as part of the fair value gain or loss. Translation differencesonnon-monetaryfinancialassetsandliabilitiessuchasequitiesclassifiedasavailable-for-saleareincluded in the investment valuation reserve.

PACIFIC BASIN SHIPPING LIMITED • ANNUAL REPORT 2011
100 Notes to the Financial Statements
2 BASIS OF PREPARATION (continued)
2.4 Foreign currency translation (continued)
(c) Group companies
The results and financial position of each of the Group entities (none of which has the currency of a hyperinflationary economy) whose functional currency is different from the presentation currency is translated into the presentation currency as follows:
a) assets and liabilities are translated at the closing rate on the balance sheet date;
b) income and expenses are translated at the average exchange rates (unless this average is not a reasonable approximation of the cumulative effect of the rates prevailing on the transaction dates, in which case income and expenses are translated at the dates of the transactions); and
c) all resulting exchange differences are recognised as a separate component of other comprehensive income.
On consolidation, exchange differences arising from the translation of the net investment in foreign operations, and of borrowings and other currency instruments designated as hedges of such investments, are taken to other comprehensive income. When a foreign operation is partially or totally disposed of, exchange differences thatwererecordedinequityarerecognisedintheconsolidatedincomestatementaspartofthegainorlosson disposal.
Goodwillandfairvalueadjustmentsarisingfromtheacquisitionofaforeignentityaretreatedasassetsandliabilities of the foreign entity and translated at the closing rate on the balance sheet date.
2.5Provisions
Provisions are recognised when the Group has a present legal or constructive obligation as a result of past events; itisprobablethatanoutflowofresourceswillberequiredtosettletheobligation;andareliableestimateoftheamount can be made. Provisions are not recognised for future operating losses.
Wherethereareanumberofsimilarobligations,thelikelihoodthatanoutflowwillberequiredinsettlementisdetermined by considering the class of obligations as a whole. A provision is recognised even if the likelihood of an outflow with respect to any one item included in the same class of obligations may be small.
Provisionsaremeasuredatthepresentvalueoftheexpendituresexpectedtoberequiredtosettletheobligationusing a pre-tax rate that reflects current market assessments of the time value of money and the risks specific to the obligation. The increase in the provision due to passage of time is recognised as interest expense.
3 CRITICAL ACCOUNTING ESTIMATES AND JUDGEMENTS
Estimates and judgements are continually evaluated and are based on historical experience and other factors, including expectations of future events that are believed to be reasonable under the circumstances.
The Group makes estimates and assumptions concerning the future. The resulting accounting estimates will, by definition,seldomequaltherelatedactualresults.Theestimatesandassumptionsthatcarryasignificantriskofcausing a material adjustment to the carrying amounts of assets and liabilities within the next year are listed below with references to the locations of these items in the notes to the financial statements.
Critical Accounting Estimates and Judgements Locationa) Residualvaluesofproperty,plantandequipment Note6b) Useful lives of vessels and vessel component costs Note6c) Impairment of vessels and vessels under construction Note6d) Classification of leases Note15(b)&32(b)e) Provision for onerous contracts Note 22f) Income taxes Note 27
PACIFIC BASIN SHIPPING LIMITED • ANNUAL REPORT 2011
101
Group O
verviewBusiness Review
Financial ReviewG
overnance Financial S
tatements
CS
R Report
4 SEGMENT INFORMATION
The Group manages its businesses by divisions. Reports are presented to the heads of divisions as well as the Board for the purpose of making strategic decisions, allocation of resources and assessing performance. The reportable operating segments in this note are consistent with how information is presented to the heads of divisions and the Board.
The Group’s revenue is primarily derived from the provision of dry bulk shipping services, services to the energy and infrastructure sectors and RoRo shipping services.
The results of the port projects and maritime services activities are included in the “All Other Segments” column as theydonotmeetthequantitativethresholdssuggestedbyHKFRS.
“Treasury” manages the Group’s cash and borrowings. As such, related finance income and expenses are allocated under “Treasury”.
Geographical segment information is not presented as the Directors consider that the nature of the provision of shipping services, which are carried out internationally, preclude a meaningful allocation of operating profit to specific geographical segments.
Accounting policy – Segment reporting
Management’s approach to internal review and reporting to the heads of divisions and the Board is used as the basis for preparing segment information of the Group’s material operating segments.
Accounting policy – Revenue recognition
Revenue comprises the fair value of the consideration for the sale of goods and services in the ordinary course of the Group’s activities. Revenue is shown net of returns, rebates and discounts and after eliminating sales within the Group.
(i) Freight and charter-hire
The Group generates revenue from shipping activities, the principal sources of which are derived from the pools of handysize and handymax vessels.
Revenues from the pools of handysize and handymax vessels are derived from a combination of time charters and voyage charters. Revenue from a time charter is recognised on a straight-line basis over the period of the lease. Revenue from a voyage charter is recognised on a percentage-of-completion basis, which is determined on a time proportion method of the voyage.
(ii) Ship management
Ship management income is recognised when the services are rendered.
(iii) Others
Interest income is recognised on a time-proportion basis using the effective interest method.
Finance lease interest income is recognised over the term of the lease using the net investment method, based on a constant periodic rate of return.
Dividend income is recognised when the right to receive payment is established.

PACIFIC BASIN SHIPPING LIMITED • ANNUAL REPORT 2011
102 Notes to the Financial Statements4
SE
GM
EN
T I
NF
OR
MA
TIO
N (
con
tin
ued
)
(a)
Inco
me
stat
emen
t se
gmen
t in
form
atio
n
For t
he y
ear e
nded
Pa
cific
PB E
nerg
y &
U
nallo
cate
d
Per
31 D
ecem
ber 2
011
Basin
In
frastr
uctu
re
PB
All O
ther
To
tal
Re
class
- Fi
nanc
ial
US$
’000
Dr
y Bu
lk
Serv
ices
RoRo
Se
gmen
ts
Segm
ents
Tr
easu
ry
Oth
ers
Tota
l ifi
catio
n St
atem
ents
Rev
enue
1,
194,
971
116,
263
29,7
46
915
1,34
1,89
5 –
900
1,34
2,79
5 (2
60)
1,34
2,53
5
Freig
ht an
d ch
arte
r-hire
1,
194,
971 1
93,8
37
29,5
99
– 1,
318,
407
– 90
0 1 1,
319,
307
(260
)1 1,
319,
047
Ma
ritim
e ma
nage
ment
serv
ices
– 22
,426
14
7 91
5 23
,488
–
– 23
,488
–
23,4
88
Bunk
ers&
por
tdisb
urseme
nts
(536
,180
)2 (2
,843
) (2
,817
) –
(541
,840
) –
(1,1
59)2
(542
,999
) 54
2,99
9 2 –
Time
chartere
quiva
lente
arnin
gs
658,
791
Dire
ct co
sts
(562
,300
) (9
7,53
1)
(27,
720)
(2
,308
) (6
89,8
59)
– –
(689
,859
) (5
45,0
30)
(1,2
34,8
89)
Bu
nkers&
por
tdisb
urseme
nts
– –
– –
– –
– –
(542
,999
)2 (5
42,9
99)
Ch
arte
r-hire
exp
ense
s for
vesse
ls (4
20,9
51)
(3,5
08)
– –
(424
,459
) –
– (4
24,4
59)
(2,0
31)
(426
,490
)
Vesse
l ope
ratin
g cos
ts (6
3,39
5)
(48,
684)
(1
4,92
7)
– (1
27,0
06)
– –
(127
,006
) –
(127
,006
)
Depr
eciat
ion o
f ves
sels
(45,
808)
(1
5,06
1)
(11,
042)
–
(71,
911)
–
– (7
1,91
1)
– (7
1,91
1)
Dire
ct ov
erhe
ads
(32,
146)
(3
0,27
8)
(1,7
51)
(2,3
08)
(66,
483)
–
– (6
6,48
3)
– (6
6,48
3)
Gros
s pro
fit
96,4
91
15,8
89
(791
) (1
,393
) 11
0,19
6 –
(259
) 10
9,93
7 (2
,291
) 10
7,64
6
Gene
ral a
nd ad
minis
trativ
e ex
pens
es
– –
– –
– (2
,479
) (8
,275
) (1
0,75
4)
– (1
0,75
4)O
ther
inco
me an
d ex
pens
es
– (8
5)
– (1
,885
) (1
,970
) (2
1)
(24,
197)
3 (2
6,18
8)
2,29
1 1 (2
3,89
7)Fin
ance
costs
, net
(1
5,07
1)
(2,8
82)
(2,5
47)
873
(19,
627)
(1
0,32
0)
(1,3
85)4
(31,
332)
–
(31,
332)
Shar
e of
pro
fits l
ess l
osse
s of
joi
ntly
cont
rolle
d en
tities
–
758
283
(533
) 50
8 –
– 50
8 –
508
Shar
e of
losse
s of a
ssocia
tes
– (2
,468
) (7
,524
) –
(9,9
92)
– –
(9,9
92)
– (9
,992
)
Prof
it be
fore
taxa
tion
81,4
20
11,2
12
(10,
579)
(2
,938
) 79
,115
(1
2,82
0)
(34,
116)
32
,179
–
32,1
79Ta
xatio
n –
(434
) (1
9)
256
(197
) –
– (1
97)
– (1
97)
Prof
it att
ribut
able
to sh
areh
older
s 81
,420
10
,778
(1
0,59
8)
(2,6
82)
78,9
18
(12,
820)
(3
4,11
6)
31,9
82
– 31
,982
Not
e 1.
N
et u
nrea
lised
for
war
d fr
eigh
t ag
reem
ents
ben
efit
s an
d ex
pens
es a
re u
nder
“U
nallo
cate
d O
ther
s”.
Net
rea
lised
ben
efit
s an
d ex
pens
es a
re u
nder
“Pa
cific
Bas
in
Dry
Bul
k”.
For
the
pres
enta
tion
of
the
finan
cial
sta
tem
ents
, re
alis
ed a
nd u
nrea
lised
for
war
d fr
eigh
t ag
reem
ent
bene
fits
and
expe
nses
are
rec
lass
ified
to
othe
r in
com
e an
d ot
her
expe
nses
. T
he r
elat
ed d
eriv
ativ
e as
sets
and
lia
bilit
ies
are
also
und
er “
Una
lloca
ted
Oth
ers”
.
Not
e 2.
N
et u
nrea
lised
bun
ker
swap
con
trac
t be
nefit
s an
d ex
pens
es a
re u
nder
“U
nallo
cate
d O
ther
s”.
Net
rea
lised
ben
efit
s an
d ex
pens
es a
re u
nder
“Pa
cific
Bas
in D
ry
Bulk”.F
orthe
presentationofthe
financialstatemen
ts,b
unke
rs&por
tdisbursemen
tsarereclassified
todirectcosts.T
herelated
derivativeassetsand
liabilities
are
also
und
er “
Una
lloca
ted
Oth
ers”
.
Note3.“O
thers”rep
resentstheim
pairmen
tchargeofUS$
80m
illionofthe
RoR
ovessels,netofgainson
dispo
salo
finvestmen
tofU
S$55
.8m
illioninG
reen
Drago
nG
as L
imit
ed.
Not
e 4.
“O
ther
s” r
epre
sent
s ne
t un
real
ised
int
eres
t ra
te s
wap
con
trac
t be
nefit
s an
d ex
pens
es.

PACIFIC BASIN SHIPPING LIMITED • ANNUAL REPORT 2011
103
Group O
verviewBusiness Review
Financial ReviewG
overnance Financial S
tatements
CS
R Report
4 S
EG
ME
NT
IN
FO
RM
AT
ION
(co
nti
nu
ed)
(a)
Inco
me
stat
emen
t se
gmen
t in
form
atio
n (c
onti
nued
)
For t
he y
ear e
nded
Pacific
PBEne
rgy&
Unalloc
ated
Pe
r31
Dec
embe
r 201
0 Ba
sin
Infra
struc
ture
PB
Al
l Oth
er
Total
Recla
ss-
Finan
cial
US$’0
00
Dry B
ulk
Serv
ices
RoRo
Se
gmen
ts Se
gmen
ts Tr
easu
ry
Oth
ers
Total
ific
ation
St
ateme
nts
Revenu
e1,1
69,40
578
,744
14,57
22,4
73
1,265
,194
–(3,38
0)
1,261
,814
6,728
1,2
68,54
2
Freig
htan
dcharter-h
ire
1,169
,4051
50,95
614
,408
–1,2
34,76
9–
(3,38
0)1
1,231
,389
6,728
1 1,2
38,11
7
Marit
imema
nageme
ntse
rvice
s–
27,78
816
42,4
73
30,42
5–
–30
,425
–30
,425
Bunk
ers&
por
tdisb
urseme
nts
(418
,308)
2 (4,05
1)
(2,08
5)
–(424
,444)
–(8,19
5)2
(432
,639)
432,6
392
–
Time
chartere
quiva
lente
arnin
gs
751,0
97
Direct
costs
(592
,969)
(69,5
59)
(10,6
65)
(3,38
1)
(676
,574)
––
(676
,574)
(432
,639)
(1,10
9,213
)
Bunk
ers&
por
tdisb
urseme
nts
––
––
––
––
(432
,639)
2 (432
,639)
Ch
arte
r-hire
exp
ense
s for
vesse
ls (4
71,71
1)
(1,17
0)
(320
) –
(473
,201)
–
– (4
73,20
1)
– (4
73,20
1)
Vesse
lope
ratin
gcosts
(53,9
73)
(32,9
94)
(4,53
2)
–(91,4
99)
––
(91,4
99)
–(91,4
99)
De
preciat
ionofv
essels
(39,9
35)
(12,8
64)
(3,75
8)
–(56,5
57)
––
(56,5
57)
–(56,5
57)
Di
rect
overhe
ads
(27,3
50)
(22,5
31)
(2,05
5)
(3,38
1)
(55,3
17)
––
(55,3
17)
–(55,3
17)
Grossp
rofit
158,1
28
5,134
1,8
22
(908
)16
4,176
–
(11,5
75)
152,6
01
6,728
15
9,329
Gene
ral a
ndad
minis
trativ
eex
penses
––
––
–(4,93
6)
(8,00
9)
(12,9
45)
–(12,9
45)
Otherin
come
andex
penses
–(521
)(96)
(888
)(1,50
5)
(651
)(3,12
9)
(5,28
5)
(6,72
8)1
(12,0
13)
Financeco
sts,n
et
(13,1
86)
(2,72
7)
(2,62
8)
1,029
(17,5
12)
(12,8
80)
(801
)4 (3
1,193
) –
(31,1
93)
Shar
e of
pro
fits l
ess l
osse
s of
joi
ntly
contro
lleden
tities
–
2,181
79
(455
)1,8
05
––
1,805
–
1,805
Shar
e of
pro
fits l
ess l
osse
s
of as
socia
tes
– 10
0 (2
92)
– (1
92)
– –
(192
) –
(192
)
Profitbe
foreta
xatio
n14
4,942
4,1
67
(1,11
5)
(1,22
2)
146,7
72
(18,4
67)
(23,5
14)
104,7
91
–10
4,791
Taxatio
n–
726
(6)
(1,17
3)
(453
)–
–(453
)–
(453
)
Profitatt
ributable
tosh
areh
olders
144,9
42
4,893
(1,12
1)
(2,39
5)
146,3
19
(18,4
67)
(23,5
14)
104,3
38
–10
4,338

PACIFIC BASIN SHIPPING LIMITED • ANNUAL REPORT 2011
104 Notes to the Financial Statements
4 SEGMENT INFORMATION (continued)
(b) Balance sheet segment information
Total liabilities 406,436 59,393 52,299 2,822 520,950 400,876 25,011 946,837Total liabilities include: Long term borrowings 297,682 34,362 48,392 – 380,436 398,603 – 779,039
At 31 December 2011 Pacific PB Energy & Per Basin Infrastructure PB All Other Total Unallocated FinancialUS$’000 Dry Bulk Services RoRo Segments Segments Treasury Others Statements
Total assets 1,106,582 291,464 375,226 53,714 1,826,986 595,774 8,992 2,431,752Total assets include: Property, plant and equipment 936,136 213,678 369,989 5,382 1,525,185 – – 1,525,185 – Include additions to property, plant and equipment 120,244 8,982 38,366 2,528 170,120 – – 170,120 Interests in jointly controlled entities – 13,974 594 26,507 41,075 – 3,328 44,403 Investments in associates – 4,411 – – 4,411 – – 4,411 – Include additions to investment in an associate – – 6,968 – 6,968 – – 6,968
• Vessels delivered & under construction
• Goodwill
• Vessels delivered & under construction
• Group unallocated cash
• Derivative assets
1, 2
• Gold River Marine Terminal, Canada
• OMSA
• Bunker tanker, N.Z. • Longtan Tianyu Terminal
• Bank loans• Finance
lease liabilities
• Bank loans• Bank loans Group general facilities includes:
• Convertible bonds
• Loans secured on vessels for future expansion
• Derivative
liabilities
1, 2
At 31 December 2010 Pacific PBEnergy& Per Basin Infrastructure PB All Other Total Unallocated FinancialUS$’000 Dry Bulk Services RoRo Segments Segments Treasury Others Statements
Total assets 978,462 291,421 443,669 153,634 1,867,186 679,940 8,2621, 2
2,555,388Total assets include: Property,plantandequipment 828,667 223,633 429,148 37,184 1,518,632 – – 1,518,632 – Include additions to property, plantandequipment 250,998 55,308 195,339 21,851 523,496 – 642 524,138 Interestsinjointlycontrolledentities – 26,360 641 29,600 56,601 – (476) 56,125 – Include additions to interests in jointly controlled entities – – 1,000 13,189 14,189 – – 14,189 Investmentsinassociates – 3,442 656 – 4,098 – – 4,098
Total liabilities 288,372 62,009 59,237 6,360 415,978 575,826 18,6931, 2
1,010,497Total liabilities include: Longtermborrowings 184,458 44,975 54,718 – 284,151 575,315 – 859,466

PACIFIC BASIN SHIPPING LIMITED • ANNUAL REPORT 2011
105
Group O
verviewBusiness Review
Financial ReviewG
overnance Financial S
tatements
CS
R Report
5 EXPENSES BY NATURE
US$’000 2011 2010
Operating lease expenses – vessels 426,490 473,201 – land and buildings 3,753 3,332Bunkers consumed 368,123 263,380Port disbursements and other voyage costs 191,972 166,437Provision for/(write-back of) impairment losses –Property,plantandequipment 80,000 – – Available-for-sale financial assets 1,887 – – Trade receivables (620) 1,659 – Other non-current assets – 11,775 – Goodwill included as interest in jointly controlled entities – 7,233Depreciation – owned vessels 60,478 45,082 – leased vessels 11,433 11,475 –otherownedproperty,plantandequipment 1,503 1,386 – investment properties 64 61Amortisation of land use rights 113 108Employee benefit expenses including Directors’ emoluments (see Remuneration Report) 51,309 41,505Losses on forward freight agreements 9,067 36,559Net (gains)/losses on bunker swap contracts (14,906) 2,200Lubricating oil consumed 5,900 4,920Net exchange losses 2,526 5,540Auditors’ remuneration – audit 1,439 1,491 – non-audit 247 718Fair value losses on structured notes 32 –Losses on repurchase and cancellation of convertible bonds – 651Vessel and other expenses 135,903 102,634
Total of (i) “direct costs”, (ii) “general and administrative expenses” and (iii) “other expenses” 1,336,713 1,181,347
General and administrative expenses
TheGroupincurredtotaladministrativeexpensesofUS$77.2million(2010:US$68.3million).TotaladministrativeexpensescompriseddirectoverheadsofUS$66.5million(2010:US$55.3million)andgeneralandadministrativeexpenses of US$10.7 million (2010: US$13.0 million). The increase of US$11.2 million in direct overheads was primarily due to a profit share with management in a subsidiary and additional employees employed in our towage services. The decrease of US$2.3 million in general and administrative expenses was primarily due to an additional US$2.4 million expense arising from the revaluation of Euros held by Treasury last year.
Other expenses
An impairment of US$80.0 million for the Group’s RoRo vessels has been provided for in other expenses. The much weaker outlook for the RoRo charter market has given us concern about the ability to deploy our RoRo vessels profitably. This has reduced the value-in-use of our RoRo vessels to below their carrying values. This impairment is not allocated to the PB RoRo segment results as this does not relate to the underlying operations of the segment. However, the impairment reduces the carrying value of the PB RoRo segment assets.
MovementsinthefairvalueandpaymentsforforwardfreightagreementsamountedtoUS$9.0million(2010:US$36.6million). Taking into account the movements in fair value and receipts of US$9.3 million included in other income, the net movement in the fair value and payments for forward freight agreements resulted in an income of US$0.3 million (2010:expenseofUS$6.8million).
PACIFIC BASIN SHIPPING LIMITED • ANNUAL REPORT 2011
106 Notes to the Financial Statements
5 EXPENSES BY NATURE (continued)
Accounting policy – Impairment
Impairment of investments and non-financial assets
Assets that have an indefinite useful life, such as goodwill, are not subject to amortisation and are tested annually for impairment. Assets are reviewed for impairment whenever events or changes in circumstances indicate that the carrying amount may not be recoverable. In assessing whether there is any indication that an asset may be impaired, internal and external sources of information are considered. If any such indication exists, the entity estimates the recoverable amount of the asset. An impairment loss is recognised for the amount by which the asset’s carrying amount exceeds its recoverable amount, being the higher of (i) an asset’s fair value less costs to sell and (ii) the value-in-use.
The fair value of vessels and vessels under construction is either determined by the market valuation or by independent valuers.
The value-in-use of the vessels represents estimated future cash flows from the continuous use of the vessels.
For the purposes of assessing impairment, assets are grouped in the lowest levels at which there are separately identifiable cash flows. This level is described as a cash-generating unit (“CGU”). The way in which assets are grouped to form a CGU and the related cash flows associated with the CGU may in certain circumstances affect whether an impairment loss is recorded. Generally, the larger the grouping of assets and the broader the grouping of independent cash flows, the less likely it is that an impairment loss will be recorded as reductions in one cash inflow are more likely to be compensated by increases in other cash inflows within the same CGU.
Assets other than goodwill that suffered impairment are reviewed for possible reversal of the impairment at each balance sheet date.
Impairment of available-for-sale financial assets
The Group assesses at each balance sheet date whether there is objective evidence that a financial asset or a group offinancialassetsisimpaired.Inthecaseofequitysecuritiesclassifiedasavailable-for-sale,asignificantorprolongeddecline in the fair value of the security below its cost is considered as an indicator that the securities are impaired. Ifanysuchevidenceexists,thecumulativeloss–measuredasthedifferencebetweentheacquisitioncostandthecurrent fair value, less any impairment loss on that financial asset previously recognised in the income statement – isremovedfromequityandrecognisedintheconsolidatedincomestatement.Impairmentlossesrecognisedintheconsolidatedincomestatementonequitysecuritiesarenotreversedthroughtheconsolidatedincomestatement.
Impairment of trade and other receivables
A provision for impairment of trade and other receivables is established when there is objective evidence that the Group will not be able to collect the amount due according to the original terms of that receivable. Significant financial difficulties of the debtor, probability that the debtor will enter bankruptcy or financial reorganisation, and default or delinquencyinpaymentsareconsideredindicatorsthatthetradereceivableisimpaired.Theamountoftheprovisionis the difference between the asset’s carrying amount and the present value of estimated future cash flows, discounted at the original effective interest rate. The carrying amount of the assets is reduced through the use of an allowance account, and the amount of the loss is recognised in the income statement within “direct costs”. When a trade receivable is uncollectable, it is written off against the provision for impairment.

PACIFIC BASIN SHIPPING LIMITED • ANNUAL REPORT 2011
107
Group O
verviewBusiness Review
Financial ReviewG
overnance Financial S
tatements
CS
R Report
6 PROPERTY, PLANT AND EQUIPMENT
Group
Vessels and Furniture, vessel Vessels Leasehold fixtures component under improve- and Motor
US$’000 costs construction Buildings ments equipment vehicles Total
Cost At 1 January 2011 1,380,865 335,939 3,148 3,515 4,942 212 1,728,621 Additions 81,447 86,145 – 141 2,387 – 170,120 Write off (8,844) – – – – – (8,844) Disposals (3,867) – – – (106) – (3,973) Exchange differences (22,992) 5,552 89 (6) 3 4 (17,350) Reclassification 242,748 (242,748) – – – – –
At 31 December 2011 1,669,357 184,888 3,237 3,650 7,226 216 1,868,574
Accumulated depreciation and impairment At 1 January 2011 180,691 22,500 205 2,683 3,789 121 209,989 Charge for the year 71,911 – 89 325 1,042 47 73,414 Write off (8,844) – – – – – (8,844) Disposals (607) – – – (105) – (712) Impairment charge 50,665 29,335 – – – – 80,000 Exchange differences (8,497) (1,981) 20 (7) 5 2 (10,458) Reclassification 29,893 (29,893) – – – – –
At 31 December 2011 315,212 19,961 314 3,001 4,731 170 343,389
Net book value At 31 December 2011 1,354,145 164,927 2,923 649 2,495 46 1,525,185
Estimatedusefullives Drybulkvessels:25years N/A 50years 4to5years 3to 4to Towagevessels:30years orthe 5years 5years RoRo vessels: 30 years remaining Vessel components costs: period of estimated period to the lease, the next drydocking whichever is shorter
Estimatedusefullivesfortowagevesselschangedfrom25yearsto30yearswitheffectivefrom1July2011.Thechangeinusefullivesdecreasedthedepreciationchargefor2011byUS$1,336,000andwilldecreasethechargefor2012 by US$2,478,000.

PACIFIC BASIN SHIPPING LIMITED • ANNUAL REPORT 2011
108 Notes to the Financial Statements
6 PROPERTY, PLANT AND EQUIPMENT (continued)
Group
Vessels and Furniture, vessel Vessels Leasehold fixtures component under improve- and Motor
US$’000 costs construction Buildings ments equipment vehicles Total
Cost At1January2010 930,888 213,654 3,134 2,942 4,358 278 1,155,254 Additions 170,022 353,473 – 191 452 – 524,138 Write off (7,249) – – – – – (7,249) Disposals – – – (19) (332) (70) (421) Exchangedifferences 14,074 (5,203) 14 401 464 4 9,754 Reclassification 266,020 (266,020) – – – – – Transferfromothernon-currentasset 7,110 40,035 – – – – 47,145
At 31 December 2010 1,380,865 335,939 3,148 3,515 4,942 212 1,728,621
Accumulated depreciation and impairment At1January2010 129,694 22,500 115 2,115 2,732 137 157,293 Chargefortheyear 56,557 – 88 403 852 43 57,943 Write off (7,249) – – – – – (7,249) Disposals – – – (16) (223) (63) (302) Exchangedifferences 1,689 – 2 181 428 4 2,304
At 31 December 2010 180,691 22,500 205 2,683 3,789 121 209,989
Net book value At 31 December 2010 1,200,174 313,439 2,943 832 1,153 91 1,518,632
Estimatedusefullives Drybulkvessels:25years N/A 50years 5to6years 3to 4to Towagevessels:25years orthe 10years 5years RoRo vessels: 30 years remaining Vessel components costs: period of estimated period to the lease, the next drydocking whichever is shorter
As at 31 December 2011,(a)
2011 2010 Aggregate Accumulated Aggregate Accumulated US$’000 cost depreciation cost depreciation
Vessel component costs 41,844 (21,734) 39,721 (16,637)
Vessels and vessel component costs under finance leases 240,870 (78,105) 240,847 (68,218)
(b)CertainownedvesselsofnetbookvalueofUS$548,532,000(2010:US$493,624,000)werepledgedtobanksassecurities for bank loans granted to certain subsidiaries of the Group (Note 21(b)(i)).
(c) Vessels under construction includes an amount of US$73,778,000 (2010: US$88,701,000) paid by the Group in relation to vessels whose construction work had not yet commenced.
(d)Duringtheyear,theGrouphascapitalisedborrowingcostsamountingtoUS$1,280,000(2010:nil)onqualifyingassets. Borrowing costs were capitalised at the weighted average rate of the Group’s general borrowings of 3.2%.
PACIFIC BASIN SHIPPING LIMITED • ANNUAL REPORT 2011
109
Group O
verviewBusiness Review
Financial ReviewG
overnance Financial S
tatements
CS
R Report
6 PROPERTY, PLANT AND EQUIPMENT (continued)
Accounting policies – Property plant and equipment
PleaserefertoNote5fortheaccountingpolicyonimpairmentandNote21(a)forthatonfixedassetsheldunderfinance leases.
Vessels and vessel component costs
Vessels are stated at cost less accumulated depreciation and accumulated impairment losses. The cost of an asset comprises its purchase price and any directly attributable cost of bringing the asset to its working condition for its intendeduse.Costmayalsoincludetransfersfromequityofanygains/lossesonqualifyingcashflowhedgesofforeigncurrency purchases of vessels.
Vessel component costs include the cost of major components which are usually replaced or renewed at drydockings. The assets are stated at cost less accumulated depreciation and accumulated impairment losses. The Group subsequentlycapitalisesdrydockingcostsastheyareincurred.
Vessels under construction
Vessels under construction are stated at cost and are not subject to depreciation. All direct costs relating to the construction of vessels, including borrowing costs (see below) during the construction period, are capitalised as cost of vessels. When the assets concerned are brought into use, the costs are transferred to vessels and vessel component costs and depreciated in accordance with the policy on depreciation.
Borrowing costs
Borrowingcostsincurredfortheconstructionofanyqualifyingassetarecapitalisedduringtheperiodoftimethatisrequiredtocompleteandpreparetheassetforitsintendeduse.Otherborrowingcostsareexpensed.
Otherproperty,plantandequipment
Otherproperty,plantandequipment,comprisingbuildings,leaseholdimprovements,furniture,fixturesandequipmentand motor vehicles, are stated at cost less accumulated depreciation and accumulated impairment losses.
Depreciation
Depreciationofproperty,plantandequipmentiscalculatedusingstraight-linemethodtoallocatetheircosttotheirresidual values over their remaining estimated useful lives.
Gains or losses on disposal
Gains or losses on disposal are determined by comparing the proceeds with the carrying amounts and are recognised in the income statement.
Subsequentexpenditure
Subsequentexpenditureiseitherincludedinthecarryingamountoftheassetsorrecognisedasaseparateasset,asappropriate, only when it is probable that future economic benefits associated with the expenditure will accrue to the Group and such expenditure can be measured reliably. The carrying amount of a replaced part is written off. All other repairs and maintenance are expensed in the income statement during the financial period in which they are incurred.
Residual values and useful lives
The residual values of the Group’s assets are defined as the estimated amounts that the Group would currently obtain from disposal of the assets, after deducting the estimated costs of disposals, as if the assets were already of the age and in the conditions expected at the end of their useful lives.
Useful lives of the Group’s vessels and vessel component costs are defined as the period over which they are expected to be available for use by the Group.
The assets’ residual values and useful lives are reviewed, and adjusted if appropriate, at each balance sheet date.
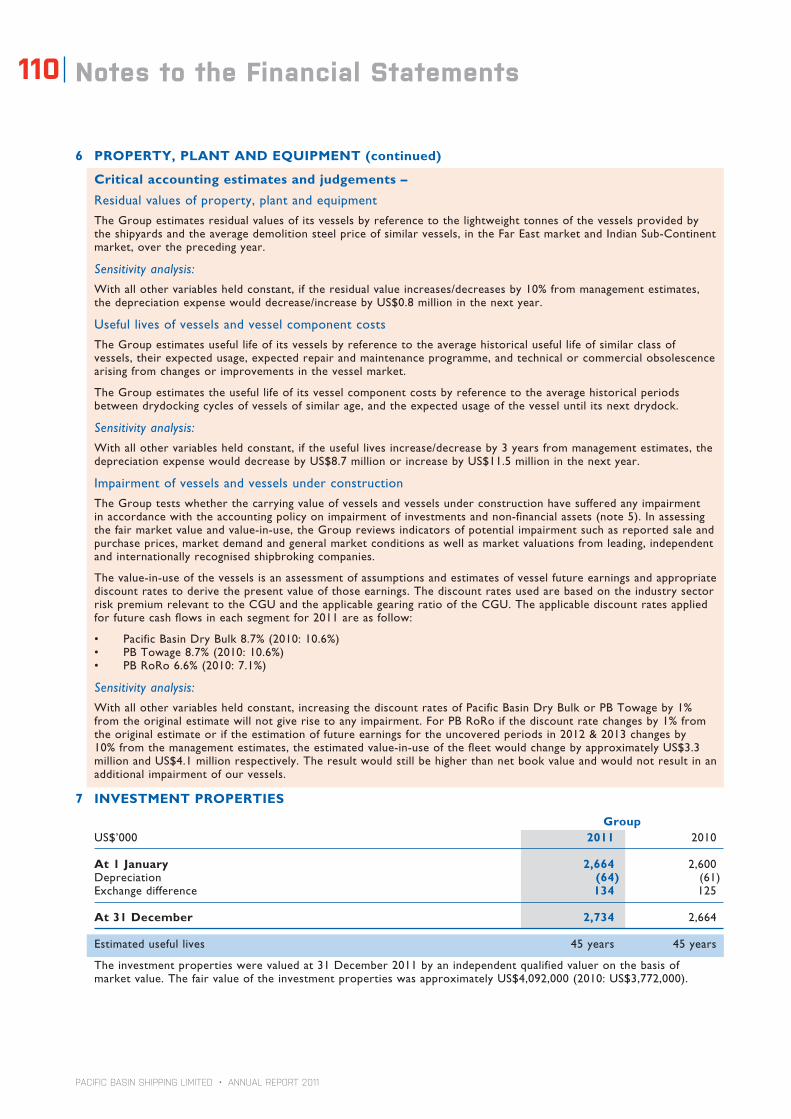
PACIFIC BASIN SHIPPING LIMITED • ANNUAL REPORT 2011
110 Notes to the Financial Statements
6 PROPERTY, PLANT AND EQUIPMENT (continued)
Critical accounting estimates and judgements –
Residualvaluesofproperty,plantandequipment
The Group estimates residual values of its vessels by reference to the lightweight tonnes of the vessels provided by the shipyards and the average demolition steel price of similar vessels, in the Far East market and Indian Sub-Continent market, over the preceding year.
Sensitivity analysis:
With all other variables held constant, if the residual value increases/decreases by 10% from management estimates, the depreciation expense would decrease/increase by US$0.8 million in the next year.
Useful lives of vessels and vessel component costs
The Group estimates useful life of its vessels by reference to the average historical useful life of similar class of vessels, their expected usage, expected repair and maintenance programme, and technical or commercial obsolescence arising from changes or improvements in the vessel market.
The Group estimates the useful life of its vessel component costs by reference to the average historical periods between drydocking cycles of vessels of similar age, and the expected usage of the vessel until its next drydock.
Sensitivity analysis:
With all other variables held constant, if the useful lives increase/decrease by 3 years from management estimates, the depreciationexpensewoulddecreasebyUS$8.7millionorincreasebyUS$11.5millioninthenextyear.
Impairment of vessels and vessels under construction
The Group tests whether the carrying value of vessels and vessels under construction have suffered any impairment inaccordancewiththeaccountingpolicyonimpairmentofinvestmentsandnon-financialassets(note5).Inassessingthe fair market value and value-in-use, the Group reviews indicators of potential impairment such as reported sale and purchase prices, market demand and general market conditions as well as market valuations from leading, independent and internationally recognised shipbroking companies.
The value-in-use of the vessels is an assessment of assumptions and estimates of vessel future earnings and appropriate discount rates to derive the present value of those earnings. The discount rates used are based on the industry sector risk premium relevant to the CGU and the applicable gearing ratio of the CGU. The applicable discount rates applied for future cash flows in each segment for 2011 are as follow:
• PacificBasinDryBulk8.7%(2010:10.6%)• PBTowage8.7%(2010:10.6%)• PBRoRo6.6%(2010:7.1%)
Sensitivity analysis:
With all other variables held constant, increasing the discount rates of Pacific Basin Dry Bulk or PB Towage by 1% from the original estimate will not give rise to any impairment. For PB RoRo if the discount rate changes by 1% from theoriginalestimateoriftheestimationoffutureearningsfortheuncoveredperiodsin2012&2013changesby10% from the management estimates, the estimated value-in-use of the fleet would change by approximately US$3.3 million and US$4.1 million respectively. The result would still be higher than net book value and would not result in an additional impairment of our vessels.
7 INVESTMENT PROPERTIES
Group US$’000 2011 2010
At 1 January 2,664 2,600Depreciation (64) (61)Exchange difference 134 125
At 31 December 2,734 2,664
Estimatedusefullives 45years 45years
Theinvestmentpropertieswerevaluedat31December2011byanindependentqualifiedvalueronthebasisofmarket value. The fair value of the investment properties was approximately US$4,092,000 (2010: US$3,772,000).
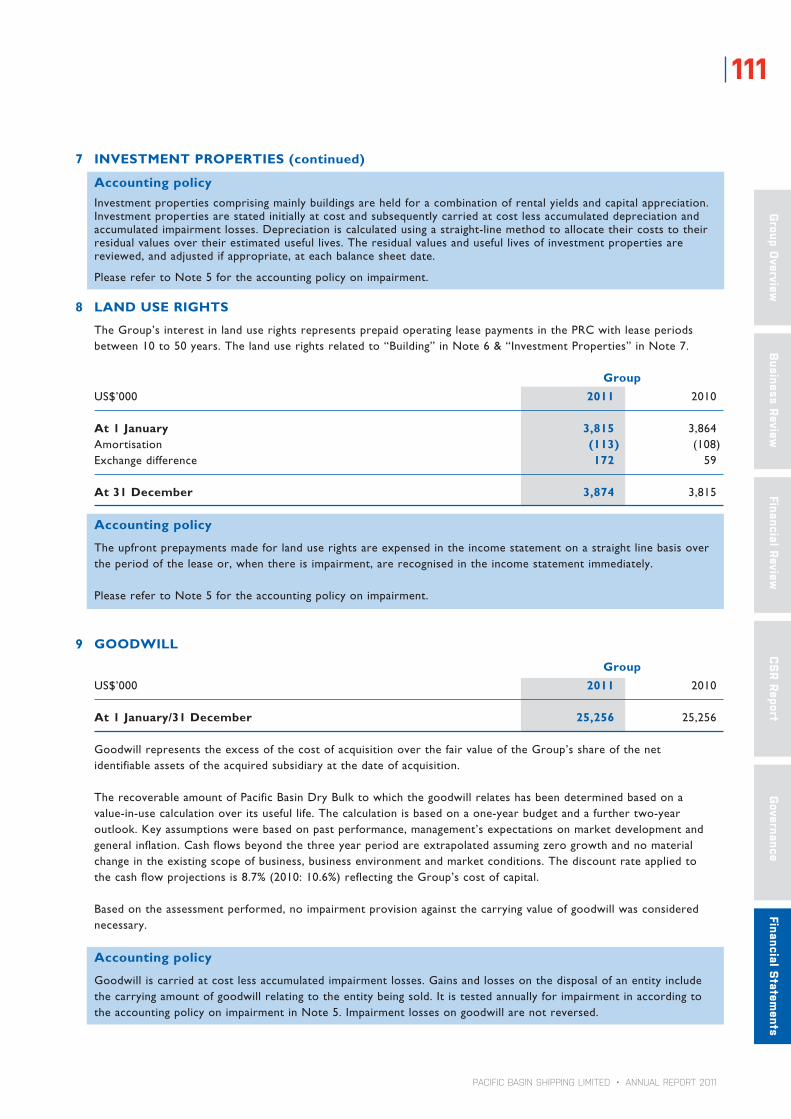
PACIFIC BASIN SHIPPING LIMITED • ANNUAL REPORT 2011
111
Group O
verviewBusiness Review
Financial ReviewG
overnance Financial S
tatements
CS
R Report
7 INVESTMENT PROPERTIES (continued)
Accounting policy
Investment properties comprising mainly buildings are held for a combination of rental yields and capital appreciation. Investmentpropertiesarestatedinitiallyatcostandsubsequentlycarriedatcostlessaccumulateddepreciationandaccumulated impairment losses. Depreciation is calculated using a straight-line method to allocate their costs to their residual values over their estimated useful lives. The residual values and useful lives of investment properties are reviewed, and adjusted if appropriate, at each balance sheet date.
PleaserefertoNote5fortheaccountingpolicyonimpairment.
8 LAND USE RIGHTS
The Group’s interest in land use rights represents prepaid operating lease payments in the PRC with lease periods between10to50years.Thelanduserightsrelatedto“Building”inNote6&“InvestmentProperties”inNote7.
Group US$’000 2011 2010
At 1 January 3,815 3,864Amortisation (113) (108)Exchange difference 172 59
At 31 December 3,874 3,815
Accounting policy
The upfront prepayments made for land use rights are expensed in the income statement on a straight line basis over the period of the lease or, when there is impairment, are recognised in the income statement immediately.
PleaserefertoNote5fortheaccountingpolicyonimpairment.
9 GOODWILL
Group US$’000 2011 2010
At 1 January/31 December 25,256 25,256
GoodwillrepresentstheexcessofthecostofacquisitionoverthefairvalueoftheGroup’sshareofthenetidentifiableassetsoftheacquiredsubsidiaryatthedateofacquisition.
The recoverable amount of Pacific Basin Dry Bulk to which the goodwill relates has been determined based on a value-in-use calculation over its useful life. The calculation is based on a one-year budget and a further two-year outlook. Key assumptions were based on past performance, management’s expectations on market development and general inflation. Cash flows beyond the three year period are extrapolated assuming zero growth and no material change in the existing scope of business, business environment and market conditions. The discount rate applied to thecashflowprojectionsis8.7%(2010:10.6%)reflectingtheGroup’scostofcapital.
Based on the assessment performed, no impairment provision against the carrying value of goodwill was considered necessary.
Accounting policy
Goodwill is carried at cost less accumulated impairment losses. Gains and losses on the disposal of an entity include the carrying amount of goodwill relating to the entity being sold. It is tested annually for impairment in according to theaccountingpolicyonimpairmentinNote5.Impairmentlossesongoodwillarenotreversed.

PACIFIC BASIN SHIPPING LIMITED • ANNUAL REPORT 2011
112 Notes to the Financial Statements
10 SUBSIDIARIES
Company US$’000 2011 2010
Non-current assets Unlisted investments, at cost 631,836 227,736
Current assets Amounts due from subsidiaries 1,078,579 1,584,210
Current liabilities Amount due to subsidiaries (221,332) (320,198)
The amounts due from and to subsidiaries are unsecured, non-interest bearing and repayable on demand.
The carrying values of amounts due from and to subsidiaries approximate their fair values due to the short term maturities of these assets and liabilities.
Details of principal subsidiaries of the Group as at 31 December 2011 are set out in Note 38.
Accounting policy – Consolidation
Subsidiaries are all entities (including special purpose entities) over which the Group has the power to govern the financial and operating policies generally accompanying a shareholding of more than one half of the voting rights. The existence and effect of potential voting rights that are currently exercisable or convertible are considered when assessing whether the Group controls another entity.
Subsidiaries are fully consolidated from the date on which control is transferred to the Group. They are deconsolidated from the date that control ceases.
TheGroupusestheacquisitionmethodofaccountingtoaccountforbusinesscombinations.Theconsiderationtransferredfortheacquisitionofasubsidiaryisthefairvaluesoftheassetstransferred,theliabilitiesincurredandtheequityinterestsissuedbytheGroup.Theconsiderationtransferredincludesthefairvalueofanyassetorliabilityresultingfromacontingentconsiderationarrangement.Acquisition-relatedcostsareexpensedasincurred.Identifiableassetsacquiredandliabilitiesandcontingentliabilitiesassumedinabusinesscombinationaremeasuredinitiallyattheirfairvaluesattheacquisitiondate.
Theexcessoftheconsiderationtransferred,theamountofanynon-controllinginterestintheacquireeandtheacquisition-datefairvalueofanypreviousequityinterestintheacquireeoverthefairvalueoftheidentifiablenetassetsacquiredisrecordedasgoodwill.Ifthisislessthanthefairvalueofthenetassetsofthesubsidiaryacquiredinthecaseofabargainpurchase,thedifferenceisrecogniseddirectlyintheincomestatement.Onanacquisition-by-acquisitionbasis,theGrouprecognisesanynon-controllinginterestintheacquireeeitheratfairvalueoratthenon-controllinginterest’sproportionateshareoftheacquiree’snetassets.
Intercompany transactions, balances and unrealised gains on transactions between group companies are eliminated. Unrealised losses are also eliminated unless the transaction provides evidence of an impairment of the asset transferred. The financial information of subsidiaries has been changed where necessary to ensure consistency with the policies adopted by the Group.
In the Company’s balance sheet, the investments in subsidiaries are stated at cost less provision for impairment losses. Cost is adjusted to reflect changes in consideration arising from contingent consideration amendments. Cost also includes direct attributable costs of investments. The results of subsidiaries are accounted for by the Company on the basis of dividends received and receivable.
PleaserefertoNote5fortheaccountingpolicyonimpairment.
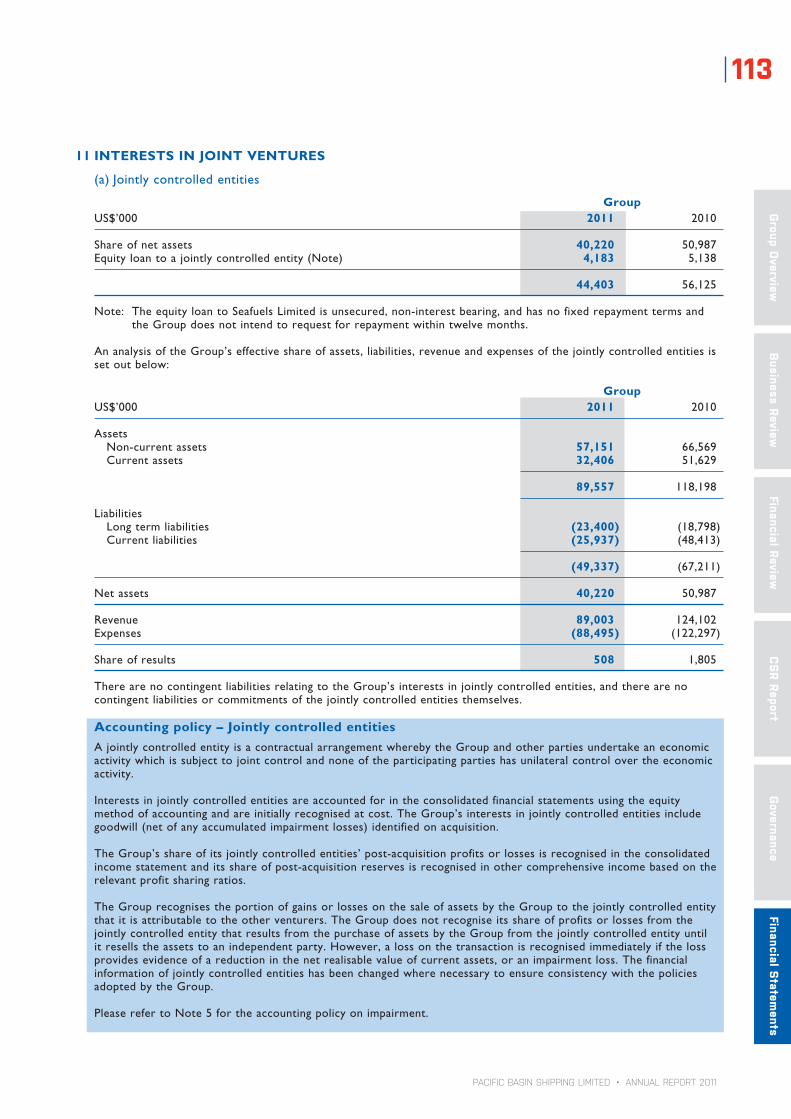
PACIFIC BASIN SHIPPING LIMITED • ANNUAL REPORT 2011
113
Group O
verviewBusiness Review
Financial ReviewG
overnance Financial S
tatements
CS
R Report
11 INTERESTS IN JOINT VENTURES
(a) Jointly controlled entities
Group US$’000 2011 2010
Share of net assets 40,220 50,987Equityloantoajointlycontrolledentity(Note) 4,183 5,138
44,403 56,125
Note: TheequityloantoSeafuelsLimitedisunsecured,non-interestbearing,andhasnofixedrepaymenttermsandtheGroupdoesnotintendtorequestforrepaymentwithintwelvemonths.
An analysis of the Group’s effective share of assets, liabilities, revenue and expenses of the jointly controlled entities is set out below:
Group US$’000 2011 2010
Assets Non-current assets 57,151 66,569 Current assets 32,406 51,629
89,557 118,198
Liabilities Long term liabilities (23,400) (18,798) Current liabilities (25,937) (48,413)
(49,337) (67,211)
Net assets 40,220 50,987
Revenue 89,003 124,102Expenses (88,495) (122,297)
Share of results 508 1,805
There are no contingent liabilities relating to the Group’s interests in jointly controlled entities, and there are no contingent liabilities or commitments of the jointly controlled entities themselves.
Accounting policy – Jointly controlled entities
A jointly controlled entity is a contractual arrangement whereby the Group and other parties undertake an economic activity which is subject to joint control and none of the participating parties has unilateral control over the economic activity.
Interestsinjointlycontrolledentitiesareaccountedforintheconsolidatedfinancialstatementsusingtheequitymethod of accounting and are initially recognised at cost. The Group’s interests in jointly controlled entities include goodwill(netofanyaccumulatedimpairmentlosses)identifiedonacquisition.
TheGroup’sshareofitsjointlycontrolledentities’post-acquisitionprofitsorlossesisrecognisedintheconsolidatedincomestatementanditsshareofpost-acquisitionreservesisrecognisedinothercomprehensiveincomebasedontherelevant profit sharing ratios.
The Group recognises the portion of gains or losses on the sale of assets by the Group to the jointly controlled entity that it is attributable to the other venturers. The Group does not recognise its share of profits or losses from the jointly controlled entity that results from the purchase of assets by the Group from the jointly controlled entity until it resells the assets to an independent party. However, a loss on the transaction is recognised immediately if the loss provides evidence of a reduction in the net realisable value of current assets, or an impairment loss. The financial information of jointly controlled entities has been changed where necessary to ensure consistency with the policies adopted by the Group.
PleaserefertoNote5fortheaccountingpolicyonimpairment.

PACIFIC BASIN SHIPPING LIMITED • ANNUAL REPORT 2011
114 Notes to the Financial Statements
11 INTERESTS IN JOINT VENTURES (continued)
(a) Jointly controlled entities (continued)
Details of the principal jointly controlled entities of the Group held indirectly by the Company at 31 December 2011 are as follows: Interest in Place of Issued and ownership/ incorporation/ fully paid up voting power/ PrincipalName operation share capital profit sharing activities
PB Energy & Infrastructure Services:
Offshore Marine Services Alliance Australia 300 shares of AUD1 each 331/3%/331/3%/331/3% Towage logistic services Pty Ltd (“OMSA”)
SeafuelsLimited NewZealand 100sharesofNZD1each 50%/50%/50% Bunkertankerowningandchartering
FujairahBulkShippingL.L.C.(“FBSL”) UnitedArabEmirates 5,500sharesof 50%/50%/50% Aggregatetradingandprovision AED1,000 each of material supply and marine transportation activities
PB RoRo:
Meridian Shipping Holdings Limited (formerly“IsisShippingLimited”) EnglandandWales 150sharesofGBP1each 50%/50%/50% Provisionofshipmanagement services
Meridian Shipping Limited (formerly“IsisRoRoManagementLimited”) EnglandandWales 1shareofGBP1each 50%/50%/50% Provisionofshipmanagement (“Meridian Shipping”) services
MeridianMarineManagement EnglandandWales 1,002sharesofGBP1 50%/50%/50% Provisionofshipmanagement Limited (“Meridian Marine”) each services
Others:
Longtan Tianyu Terminal Co., Ltd. 1 PRC RMB472,727,273 45%/50%/45% Terminaloperation 南京港龍潭天宇碼頭有限公司 (registered capital)
1 This jointly controlled entity is a sino-foreign cooperative joint venture established in the PRC.

PACIFIC BASIN SHIPPING LIMITED • ANNUAL REPORT 2011
115
Group O
verviewBusiness Review
Financial ReviewG
overnance Financial S
tatements
CS
R Report
11 INTERESTS IN JOINT VENTURES (continued)
(b) Jointly controlled operation
In2011,theGrouphadacontractualarrangementwithathirdpartytoshareequallytheoperatingresultassociatedwith the ship chartering of a vessel (jointly controlled operation). The amounts of income and expenses recognised in respect of the Group’s interest in the jointly controlled operation is as follow:
Group US$’000 2011 2010
Charter-hire income included in revenue 2,933 –Charter-hire expenses included in direct costs (2,155) –
778 –
Accounting policy – Jointly controlled operation
A jointly controlled operation is a contractual arrangement whereby the Group and other parties combine their operations, resources and expertise to undertake an economic activity in which each party takes a share of the revenue and costs in the economic activity, such a share being determined in accordance with the contractual arrangement.
The assets that the Group controls and liabilities that the Group incurs in relation to the jointly controlled operation are recognised in the consolidated balance sheet on an accrual basis and classified according to the nature of the item. The expenses that the Group incurs and its share of income that it earns from the jointly controlled operations are included in the consolidated income statement
12 INVESTMENTS IN ASSOCIATES
Group US$’000 2011 2010
Share of net assets 2,955 2,575Equityloantoanassociate(Note) 1,456 1,523
4,411 4,098
Note: Theequityloantoanassociate,MuchalatIndustriesLimited,isunsecured,non-interestbearing,andhasnofixedrepaymentterms,andtheGroupdoesnotintendtorequestforrepaymentwithintwelvemonths.
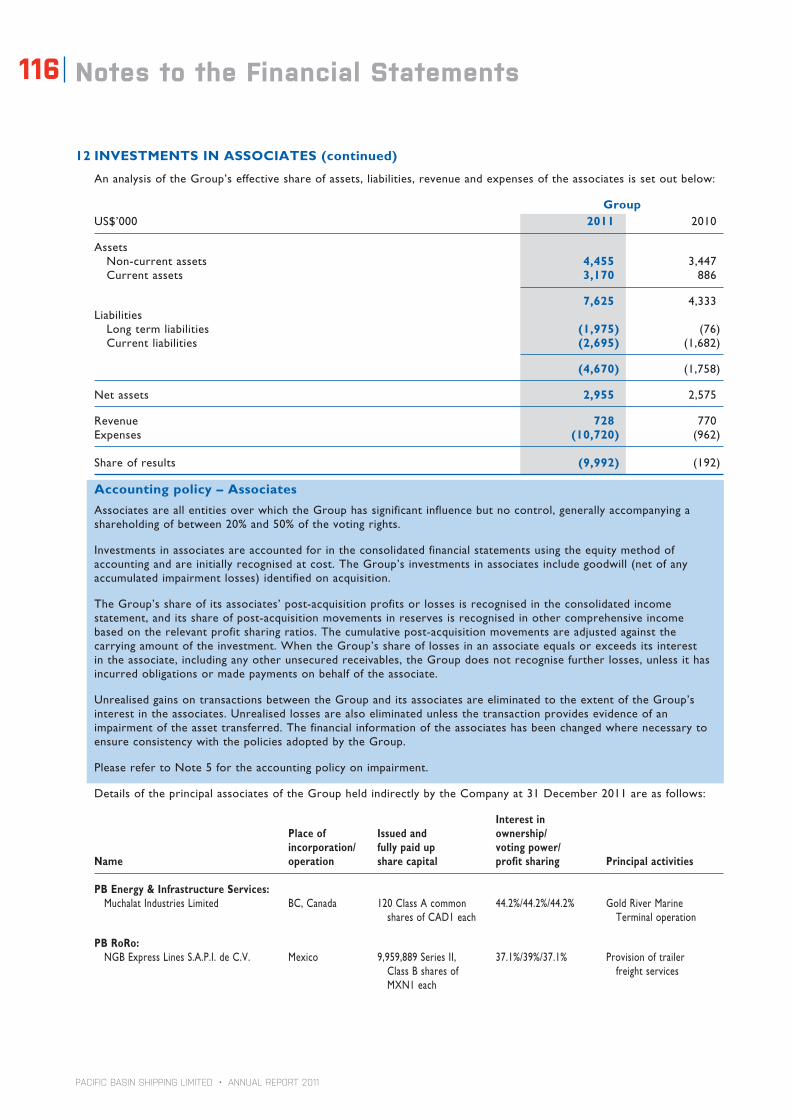
PACIFIC BASIN SHIPPING LIMITED • ANNUAL REPORT 2011
116 Notes to the Financial Statements
12 INVESTMENTS IN ASSOCIATES (continued)
An analysis of the Group’s effective share of assets, liabilities, revenue and expenses of the associates is set out below:
Group US$’000 2011 2010
Assets Non-current assets 4,455 3,447 Current assets 3,170 886
7,625 4,333Liabilities Long term liabilities (1,975) (76) Current liabilities (2,695) (1,682)
(4,670) (1,758)
Net assets 2,955 2,575
Revenue 728 770Expenses (10,720) (962)
Share of results (9,992) (192)
Accounting policy – Associates
Associates are all entities over which the Group has significant influence but no control, generally accompanying a shareholdingofbetween20%and50%ofthevotingrights.
Investmentsinassociatesareaccountedforintheconsolidatedfinancialstatementsusingtheequitymethodofaccounting and are initially recognised at cost. The Group’s investments in associates include goodwill (net of any accumulatedimpairmentlosses)identifiedonacquisition.
TheGroup’sshareofitsassociates’post-acquisitionprofitsorlossesisrecognisedintheconsolidatedincomestatement,anditsshareofpost-acquisitionmovementsinreservesisrecognisedinothercomprehensiveincomebasedontherelevantprofitsharingratios.Thecumulativepost-acquisitionmovementsareadjustedagainstthecarryingamountoftheinvestment.WhentheGroup’sshareoflossesinanassociateequalsorexceedsitsinterestin the associate, including any other unsecured receivables, the Group does not recognise further losses, unless it has incurred obligations or made payments on behalf of the associate.
Unrealised gains on transactions between the Group and its associates are eliminated to the extent of the Group’s interest in the associates. Unrealised losses are also eliminated unless the transaction provides evidence of an impairment of the asset transferred. The financial information of the associates has been changed where necessary to ensure consistency with the policies adopted by the Group.
PleaserefertoNote5fortheaccountingpolicyonimpairment.
Details of the principal associates of the Group held indirectly by the Company at 31 December 2011 are as follows:
Interest in Place of Issued and ownership/ incorporation/ fully paid up voting power/ Name operation share capital profit sharing Principal activities
PB Energy & Infrastructure Services: Muchalat Industries Limited BC, Canada 120 Class A common 44.2%/44.2%/44.2% Gold River Marine shares of CAD1 each Terminal operation
PB RoRo: NGBExpressLinesS.A.P.I.deC.V. Mexico 9,959,889SeriesII, 37.1%/39%/37.1% Provisionoftrailer Class B shares of freight services MXN1 each

PACIFIC BASIN SHIPPING LIMITED • ANNUAL REPORT 2011
117
Group O
verviewBusiness Review
Financial ReviewG
overnance Financial S
tatements
CS
R Report
13 AVAILABLE-FOR-SALE FINANCIAL ASSETS
Group 2011 2010
US$’000 Level 1 Level 3 Total Level 1 Level 3 Total
Listedequitysecurities(Notea) 9,786 – 9,786 72,176 – 72,176Unlistedequitysecurities(Noteb) – 1,747 1,747 – 2,300 2,300
9,786 1,747 11,533 72,176 2,300 74,476
Available-for-sale financial assets are denominated in United States Dollars.
(a) This represents the Group’s investment in Greka Drilling Limited (2010: Green Dragon Gas Limited), company listed on the London AIM market.
(b)ThisrepresentstheGroup’sinvestmentinanunlistedrenewableenergyequityfund.
Available-for-sale financial assets have been analysed by valuation method as above. The levels are defined as follows:
Fair value levels
• Level1:Quotedprices(unadjusted)inactivemarketsforidenticalassetsorliabilities.
• Level2:Inputsotherthanquotedpricesincludedwithinlevel1thatareobservablefortheassetorliability,eitherdirectly (that is, as prices) or indirectly (that is, derived from prices).
• Level3:Inputsfortheassetorliabilitythatarenotbasedonobservablemarketdata(thatis,unobservableinputs).
ChangesinLevel3financialinstruments,unlistedequitysecurities,fortheyearended31December2011areasfollows:
US$’000 2011 2010
At 1 January 2,300 4,203Additions 2,378 168Return of capital (1,954) (2,071)Impairment charge (977) –
At 31 December 1,747 2,300
Accounting policy – Available-for-sale financial assets
Available-for-sale financial assets are non-derivatives that are either designated in this category or not classified in any other categories under financial assets. They are included in non-current assets unless management intends to dispose of them within twelve months from the balance sheet date.
Assetsinthiscategoryareinitiallyrecognisedatfairvalueplustransactioncostsandaresubsequentlycarriedatfairvalue. Gains and losses arising from changes in the fair value are recognised in other comprehensive income.
When securities classified as available-for-sale are sold or impaired, the accumulated fair value adjustments recognised inequityarereleasedtotheincomestatement.
Interest on available-for-sale securities calculated using the effective interest method is recognised in the income statementaspartoffinanceincome.Dividendsonavailable-for-saleequityinstrumentsarerecognisedintheincomestatement as part of other income when the Group’s right to receive payments is established.
Thefairvaluesofquotedinvestmentsarebasedoncurrentbidprices.Ifthemarketforafinancialassetisnotactive(andforunlistedsecurities),theGroupestablishesfairvaluebyusingappropriatevaluationtechniques.Theseincludethe use of recent arm’s length transactions, reference to other substantially similar instruments, and discounted cash flow analysis.
PleaserefertoNote5fortheaccountingpolicyonimpairment.
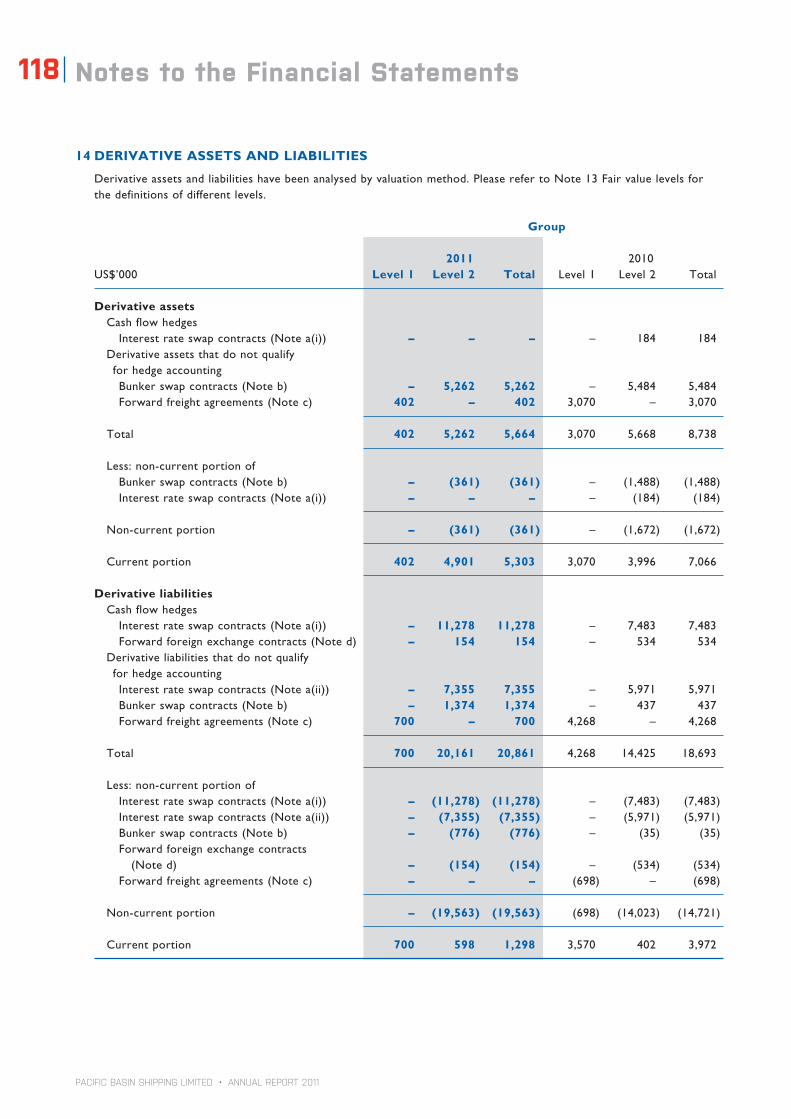
PACIFIC BASIN SHIPPING LIMITED • ANNUAL REPORT 2011
118 Notes to the Financial Statements
14 DERIVATIVE ASSETS AND LIABILITIES
Derivative assets and liabilities have been analysed by valuation method. Please refer to Note 13 Fair value levels for the definitions of different levels.
Group
2011 2010US$’000 Level 1 Level 2 Total Level 1 Level 2 Total
Derivative assets Cash flow hedges Interest rate swap contracts (Note a(i)) – – – – 184 184 Derivativeassetsthatdonotqualify for hedge accounting Bunker swap contracts (Note b) – 5,262 5,262 – 5,484 5,484 Forward freight agreements (Note c) 402 – 402 3,070 – 3,070
Total 402 5,262 5,664 3,070 5,668 8,738
Less: non-current portion of Bunker swap contracts (Note b) – (361) (361) – (1,488) (1,488) Interest rate swap contracts (Note a(i)) – – – – (184) (184)
Non-current portion – (361) (361) – (1,672) (1,672)
Current portion 402 4,901 5,303 3,070 3,996 7,066
Derivative liabilities Cash flow hedges Interest rate swap contracts (Note a(i)) – 11,278 11,278 – 7,483 7,483 Forward foreign exchange contracts (Note d) – 154 154 – 534 534 Derivativeliabilitiesthatdonotqualify for hedge accounting Interest rate swap contracts (Note a(ii)) – 7,355 7,355 – 5,971 5,971 Bunker swap contracts (Note b) – 1,374 1,374 – 437 437 Forward freight agreements (Note c) 700 – 700 4,268 – 4,268
Total 700 20,161 20,861 4,268 14,425 18,693
Less: non-current portion of Interest rate swap contracts (Note a(i)) – (11,278) (11,278) – (7,483) (7,483) Interest rate swap contracts (Note a(ii)) – (7,355) (7,355) – (5,971) (5,971) Bunker swap contracts (Note b) – (776) (776) – (35) (35) Forward foreign exchange contracts (Note d) – (154) (154) – (534) (534) Forward freight agreements (Note c) – – – (698) – (698)
Non-current portion – (19,563) (19,563) (698) (14,023) (14,721)
Current portion 700 598 1,298 3,570 402 3,972
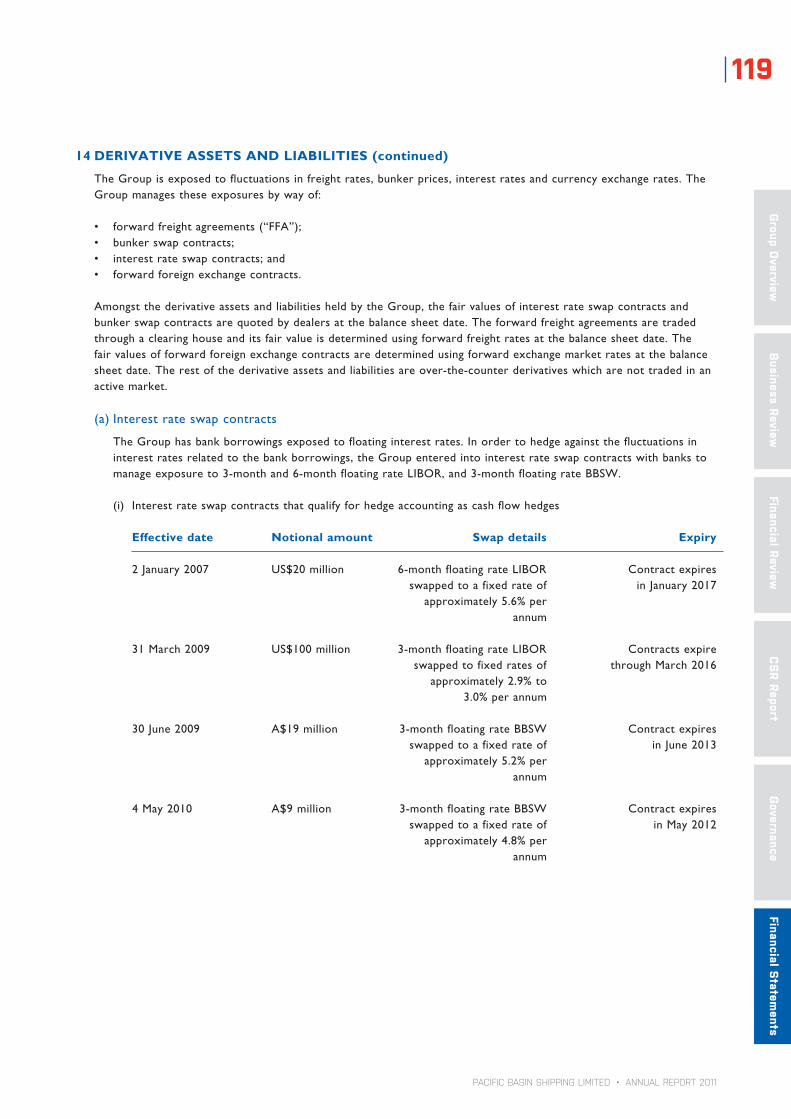
PACIFIC BASIN SHIPPING LIMITED • ANNUAL REPORT 2011
119
Group O
verviewBusiness Review
Financial ReviewG
overnance Financial S
tatements
CS
R Report
14 DERIVATIVE ASSETS AND LIABILITIES (continued)
The Group is exposed to fluctuations in freight rates, bunker prices, interest rates and currency exchange rates. The Group manages these exposures by way of:
• forwardfreightagreements(“FFA”);• bunkerswapcontracts;• interestrateswapcontracts;and• forwardforeignexchangecontracts.
Amongst the derivative assets and liabilities held by the Group, the fair values of interest rate swap contracts and bunkerswapcontractsarequotedbydealersatthebalancesheetdate.Theforwardfreightagreementsaretradedthrough a clearing house and its fair value is determined using forward freight rates at the balance sheet date. The fair values of forward foreign exchange contracts are determined using forward exchange market rates at the balance sheet date. The rest of the derivative assets and liabilities are over-the-counter derivatives which are not traded in an active market.
(a) Interest rate swap contracts
The Group has bank borrowings exposed to floating interest rates. In order to hedge against the fluctuations in interest rates related to the bank borrowings, the Group entered into interest rate swap contracts with banks to manageexposureto3-monthand6-monthfloatingrateLIBOR,and3-monthfloatingrateBBSW.
(i) Interestrateswapcontractsthatqualifyforhedgeaccountingascashflowhedges
Effective date Notional amount Swap details Expiry
2January2007 US$20million 6-monthfloatingrateLIBOR Contractexpires swapped to a fixed rate of in January 2017 approximately5.6%per annum
31 March 2009 US$100 million 3-month floating rate LIBOR Contracts expire swappedtofixedratesof throughMarch2016 approximately 2.9% to 3.0% per annum
30 June 2009 A$19 million 3-month floating rate BBSW Contract expires swapped to a fixed rate of in June 2013 approximately5.2%per annum
4 May 2010 A$9 million 3-month floating rate BBSW Contract expires swapped to a fixed rate of in May 2012 approximately 4.8% per annum
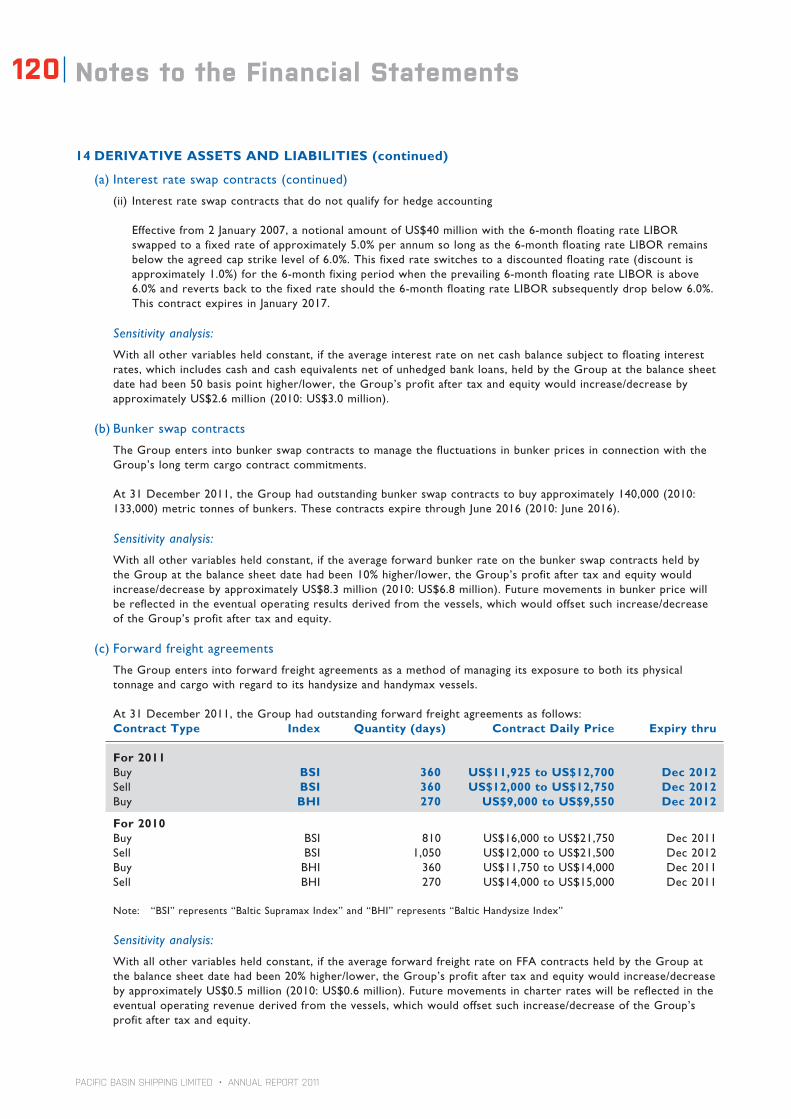
PACIFIC BASIN SHIPPING LIMITED • ANNUAL REPORT 2011
120 Notes to the Financial Statements
14 DERIVATIVE ASSETS AND LIABILITIES (continued)
(a) Interest rate swap contracts (continued)
(ii) Interestrateswapcontractsthatdonotqualifyforhedgeaccounting
Effectivefrom2January2007,anotionalamountofUS$40millionwiththe6-monthfloatingrateLIBORswappedtoafixedrateofapproximately5.0%perannumsolongasthe6-monthfloatingrateLIBORremainsbelowtheagreedcapstrikelevelof6.0%.Thisfixedrateswitchestoadiscountedfloatingrate(discountisapproximately1.0%)forthe6-monthfixingperiodwhentheprevailing6-monthfloatingrateLIBORisabove6.0%andrevertsbacktothefixedrateshouldthe6-monthfloatingrateLIBORsubsequentlydropbelow6.0%.This contract expires in January 2017.
Sensitivity analysis:
With all other variables held constant, if the average interest rate on net cash balance subject to floating interest rates,whichincludescashandcashequivalentsnetofunhedgedbankloans,heldbytheGroupatthebalancesheetdatehadbeen50basispointhigher/lower,theGroup’sprofitaftertaxandequitywouldincrease/decreasebyapproximatelyUS$2.6million(2010:US$3.0million).
(b) Bunker swap contracts
The Group enters into bunker swap contracts to manage the fluctuations in bunker prices in connection with the Group’s long term cargo contract commitments.
At 31 December 2011, the Group had outstanding bunker swap contracts to buy approximately 140,000 (2010: 133,000)metrictonnesofbunkers.ThesecontractsexpirethroughJune2016(2010:June2016).
Sensitivity analysis:
With all other variables held constant, if the average forward bunker rate on the bunker swap contracts held by theGroupatthebalancesheetdatehadbeen10%higher/lower,theGroup’sprofitaftertaxandequitywouldincrease/decreasebyapproximatelyUS$8.3million(2010:US$6.8million).Futuremovementsinbunkerpricewillbe reflected in the eventual operating results derived from the vessels, which would offset such increase/decrease oftheGroup’sprofitaftertaxandequity.
(c) Forward freight agreements
The Group enters into forward freight agreements as a method of managing its exposure to both its physical tonnage and cargo with regard to its handysize and handymax vessels.
At 31 December 2011, the Group had outstanding forward freight agreements as follows:Contract Type Index Quantity (days) Contract Daily Price Expiry thru
For 2011Buy BSI 360 US$11,925 to US$12,700 Dec 2012Sell BSI 360 US$12,000 to US$12,750 Dec 2012Buy BHI 270 US$9,000 to US$9,550 Dec 2012
For 2010Buy BSI 810 US$16,000toUS$21,750 Dec2011Sell BSI 1,050 US$12,000toUS$21,500 Dec2012Buy BHI 360 US$11,750toUS$14,000 Dec2011Sell BHI 270 US$14,000toUS$15,000 Dec2011
Note: “BSI” represents “Baltic Supramax Index” and “BHI” represents “Baltic Handysize Index”
Sensitivity analysis:
With all other variables held constant, if the average forward freight rate on FFA contracts held by the Group at thebalancesheetdatehadbeen20%higher/lower,theGroup’sprofitaftertaxandequitywouldincrease/decreasebyapproximatelyUS$0.5million(2010:US$0.6million).Futuremovementsincharterrateswillbereflectedintheeventual operating revenue derived from the vessels, which would offset such increase/decrease of the Group’s profitaftertaxandequity.

PACIFIC BASIN SHIPPING LIMITED • ANNUAL REPORT 2011
121
Group O
verviewBusiness Review
Financial ReviewG
overnance Financial S
tatements
CS
R Report
14 DERIVATIVE ASSETS AND LIABILITIES (continued)
(d) Forward foreign exchange contracts
The Group has long term bank borrowings denominated in Danish Kroner (“DKK”) with maturity in February 2023. To hedge against the potential fluctuations in foreign exchange, the Group entered into forward foreign exchange contracts with terms that match the repayment schedules of the long term bank borrowings. These forwardforeignexchangecontractsqualifyforhedgeaccountingascashflowhedges.
At 31 December 2011, the Group had outstanding forward foreign exchange contracts with banks to buy approximatelyDKK615.8million(2010:DKK307.9million)andsimultaneouslysellapproximatelyEUR82.7million (2010: EUR 41.4 million), which expire through February 2023.
Sensitivity analysis:
With all other variables held constant, if the currencies of Non-Functional Currency Items had weakened/strengthenedby3%againstUnitedStatesDollars,theGroup’sprofitaftertaxandequitywouldhavebeendecreased/increased by US$2.7 million (2010: US$0.8 million) mainly as a result of translation of cash and deposits denominated in Australian Dollars and Euro.
During the year ended 31 December 2011, the Group recognised net derivative income of US$8.3 million, as follows:
US$ Million Realised Unrealised 2011 2010
Income Forwardfreightagreements 4.7 4.6 9.3 29.8 Bunker swap contracts 17.8 3.3 21.1 12.9 Interest rate swap contracts – – – –
22.5 7.9 30.4 42.7
Expenses Forwardfreightagreements (5.3) (3.7) (9.0) (36.6) Bunkerswapcontracts (1.8) (4.4) (6.2) (15.1) Interestrateswapcontracts (5.5) (1.4) (6.9) (6.3)
(12.6) (9.5) (22.1) (58.0)
Net Forwardfreightagreements (0.6) 0.9 0.3 (6.8) Bunkerswapcontracts 16.0 (1.1) 14.9 (2.2) Interestrateswapcontracts (5.5) (1.4) (6.9) (6.3)
9.9 (1.6) 8.3 (15.3)
Presentation in the Financial Statements:
Revenue
Bunkers & port disbursements
Direct costs
Other income
Other expanses
Finance costs
Profit for the year
Presentation in the Segment Information:
Revenue
Bunkers & port disbursements
Direct costs
Other income
Other expanses
Finance costs
Profit for the year
• Contracts to be settled in future years
• Accounting reversal of earlier year contracts now completed
• Not part of segment results
• Cash settlement of contracts completed in the year
• Included in segment results
The application of HKAS 39 “Financial Instruments: Recognition and Measurement” has the effect of shifting to this year the estimated results of these derivative contracts that expire in future periods. In 2011 this created a net unrealisednon-cashexpenseofUS$1.6million(2010:expenseofUS$12.4million).Thecashflowsofthesecontractswill occur in future reporting years.

PACIFIC BASIN SHIPPING LIMITED • ANNUAL REPORT 2011
122 Notes to the Financial Statements
14 DERIVATIVE ASSETS AND LIABILITIES (continued)
Accounting policy –
Financial assets at fair value through profit or loss
Financial assets at fair value through profit or loss are financial assets held for trading. A financial asset is classified in thiscategoryifacquiredprincipallyforthepurposeofsellingintheshortterm.Derivativesareclassifiedasheldfortrading unless they are designated as hedges. Derivatives are classified as current and non-current assets according to their respective settlement dates.
Financial assets at fair value through profit or loss are initially recognised at fair value, and transaction costs are expensedintheincomestatement,andaresubsequentlyremeasuredattheirfairvalues.Gainsandlossesarisingfrom changes in the fair values are included in the other income or other expenses in the period in which they arise. Dividend income from financial assets at fair value through profit or loss is recognised in the income statement as part of other income when the Group’s right to receive payments is established.
In the cash flow statement, financial assets held for trading are presented within “operating activities” as part of changes in working capital.
Derivative financial instruments and hedging activities
The method of recognising the resulting gain or loss arising from changes in fair value for derivative financial instruments depends on whether the derivative is designated as a hedging instrument, and if so, the nature of the item being hedged. The Group designates certain derivatives as cash flow hedges.
The Group documents at the inception of the transaction the relationship between the hedging instruments and the hedged items, as well as its risk management objectives and strategy for undertaking various hedge transactions. The Group also documents its assessment, both at the hedge inception and on an ongoing basis, of whether the derivatives that are used in the hedging transactions are highly effective in offsetting the changes in fair values or cash flows of the hedged items.
The full fair value of a hedging derivative is classified as a non-current asset or liability when the remaining maturity of the hedged item is more than twelve months after the balance sheet date. A trading derivative is classified as a current asset or liability.
(i) Cash flow hedge
Theeffectiveportionofchangesinthefairvalueofderivativesthataredesignatedandqualifyascashflowhedgesare recognised in other comprehensive income. The gain or loss relating to the ineffective portion is recognised immediately in the income statement within other income and expenses.
Amountsaccumulatedinequityarerecycledintheincomestatementintheperiodswhenthehedgeditemaffectsprofit or loss. However, when the forecast transaction that is hedged results in the recognition of a non-financial assetoraliability,thegainsandlossespreviouslydeferredinequityaretransferredfromequityandincludedinthe initial measurement of the cost of the asset or liability. The deferred amounts are ultimately recognised in depreciationinthecaseofproperty,plantandequipment.
When a hedging instrument expires or is sold, or when a hedge no longer meets the criteria for hedge accounting, anycumulativegainorlossexistinginequityatthattimeremainsinequityandisrecycledwhentheforecasttransaction is ultimately recognised in the income statement. When a forecast transaction is no longer expected to occur,thecumulativegainorlossthatwasrecordedinequityisimmediatelytransferredtotheincomestatement.
At 31 December 2011, the forward foreign exchange contracts and all except one of the interest rate swap contractsqualifiedascashflowhedges.The change in the fair value of these instruments during the year was recognised directly in the hedging reserve.

PACIFIC BASIN SHIPPING LIMITED • ANNUAL REPORT 2011
123
Group O
verviewBusiness Review
Financial ReviewG
overnance Financial S
tatements
CS
R Report
14 DERIVATIVE ASSETS AND LIABILITIES (continued)
Derivative financial instruments and hedging activities (continued)
(ii) Derivatives that do not qualify for hedge accounting
Derivativeinstrumentsthatdonotqualifyforhedgeaccountingareaccountedforasfinancialassetsandliabilitiesat fair value through profit or loss. Changes in the fair value of these derivative instruments are recognised immediately in the income statement.
Bunkerswapcontractsandforwardfreightagreementsdonotqualifyforhedgeaccountingmainlybecausethecontract periods, which are in calendar months, do not coincide with the periods of the physical contracts. The termsofoneoftheinterestrateswapcontractsalsodidnotqualifyforhedgeaccounting.
15 TRADE AND OTHER RECEIVABLES
Group
US$’000 2011 2010
Non-current receivables Finance lease receivables – gross 5,392 7,706 Less: unearned finance lease income (217) (914)
Finance lease receivables – net (Note b) 5,175 6,792
Current receivables Finance lease receivables – gross 2,315 2,309 Less: unearned finance lease income (697) (869)
Finance lease receivables – net (Note b) 1,618 1,440
Trade receivables – gross 45,628 31,052 Less: provision for impairment (615) (3,003)
Trade receivables – net (Note c) 45,013 28,049
Other receivables 34,302 46,487 Prepayments 17,837 16,548 Amounts due from jointly controlled entities (Note a) 2,340 12,785 Loan to a jointly controlled entity (Note a) – 6,135
101,110 111,444
The carrying values of trade and other receivables approximate their fair values due to the short term maturities of these assets.
Trade and other receivables are mainly denominated in United States Dollars.

PACIFIC BASIN SHIPPING LIMITED • ANNUAL REPORT 2011
124 Notes to the Financial Statements
15 TRADE AND OTHER RECEIVABLES (continued)
Accounting policy – Loan receivables, trade and other receivables
Loansandreceivablesarenon-derivativefinancialassetswithfixedordeterminablepaymentsthatarenotquotedin an active market. They are included in current assets, except for maturities greater than twelve months after the balance sheet date. These are classified as non-current assets. Trade and other receivables in the balance sheet are classified as loans and receivables.
Loans and receivables are recognised initially at fair value, plus transaction costs incurred. Loans and receivables are subsequentlycarriedatamortisedcostusingtheeffectiveinterestmethod.
Trade receivables mainly represent freight and charter-hire receivables which are recognised initially at fair value and subsequentlymeasuredatamortisedcostusingeffectiveinterestmethod,lessprovisionforimpairment
PleaserefertoNote5fortheaccountingpolicyonimpairment.
(a) Amounts due from jointly controlled entities, OMSA and Seafuels Limited, are unsecured, non-interest bearing and repayable on demand.
(b) Finance leases receivables
At 31 December 2011 and 2010, the Group leased out a vessel under a finance lease. Under the terms of the lease, the charterer has the obligation to purchase the vessel at the end of the lease period.
The gross receivables, unearned finance lease income and the net receivables from a finance lease as at 31 December 2011 are as follows:
Group
US$’000 2011 2010
Gross receivables from finance lease Within one year 2,315 2,308 In the second year 5,392 2,315 In the third to fifth year – 5,392
7,707 10,015Less: unearned future finance lease income (914) (1,783)
6,793 8,232
Net receivables from finance lease Within one year 1,618 1,440 In the second year 5,175 1,618 In the third to fifth year – 5,174
6,793 8,232
Effective interest rate on finance lease receivables 11.3% 11.3%

PACIFIC BASIN SHIPPING LIMITED • ANNUAL REPORT 2011
125
Group O
verviewBusiness Review
Financial ReviewG
overnance Financial S
tatements
CS
R Report
15 TRADE AND OTHER RECEIVABLES (continued)
Accounting policy – Finance leases: where the Group is the lessor
Finance leases occur where the lessee has substantially all the risks and rewards of ownership of an asset.
When assets are leased out under finance leases, the present value of the lease payments is recognised as receivables. The difference between the gross receivables and the present value of the receivables is recognised as unearned finance lease interest income. Lease interest income is recognised over the term of the lease using the net investment method, which reflects a constant periodic rate of return.
Critical accounting estimates and judgements – Classification of leases
The Group classifies its leases into either finance leases or operating leases taking into account of the spirit, intention, and application of HKAS 17 “Leases”.
Management assesses the classification of leases by taking into account the market conditions at the inception of the lease, the period of the lease and the probability of exercising purchase options, if any, attached to the lease. For those leases that would transfer ownership of the assets to the Group at the end of the lease term, or the purchase options, if any, attached to the arrangements are sufficiently attractive as to make it reasonably certain that they would be exercised, they are being treated as finance leases.
(c) Trade receivables
At 31 December 2011, the ageing of net trade receivables is as follows:
Group
US$’000 2011 2010
Less than 30 days 31,371 19,53631-60days 8,212 4,28061-90days 2,069 1,164Over 90 days 3,361 3,069
45,013 28,049
Movements in the provision for impairment of trade receivables are as follows:
Group
US$’000 2011 2010
At 1 January 3,003 1,548Provision for receivable impairment 1,135 1,659Receivable written off during the year as uncollectible (1,768) (204)Unused amounts reversed (1,755) –
At 31 December 615 3,003

PACIFIC BASIN SHIPPING LIMITED • ANNUAL REPORT 2011
126 Notes to the Financial Statements
15 TRADE AND OTHER RECEIVABLES (continued)
Credit policy
Tradereceivablesconsistprincipallyofvoyage-relatedtradereceivables.Itisindustrypracticethat95%to100%offreight is paid upon completion of loading, with any balance paid after completion of discharge and the finalisation of port disbursements, demurrage claims or other voyage-related charges. The Group normally will not grant any credit terms to its customers.
There is no concentration of credit risk with respect to trade receivables, as the Group has a large number of international customers.
As at 31 December 2011 and 2010, net trade receivables are all past due but not impaired as no customer is expected to have significant financial difficulty. All other items within trade and other receivables do not contain past due or impaired assets.
16 CASH AND DEPOSITS
Group Company
US$’000 2011 2010 2011 2010
Cash at bank and on hand 114,458 226,191 13 13Short term bank deposits 503,763 427,246 – –Notes receivable – 50,000 – –
Cash and deposits – gross 618,221 703,437 13 13
Restricted bank deposits included in non-current assets (8,566) (10,280) – –Restricted bank deposits included in current assets (11,154) (3,421) – –
Restricted cash and deposits (Note) (19,720) (13,701) – –
Cash and deposits – net 598,501 689,736 13 13Notes receivable – (50,000) – –
Cashandcashequivalents 598,501 639,736 13 13
Effective interest rate on year end deposits 1.96% 1.55% – – Average remaining maturity of bank deposits 95 days 100 days – –
Note: The balances were held as securities with banks in relation to certain performance guarantees and bank loans.
Cash and deposits are mainly denominated in United States Dollars and the carrying values approximate their fair values due to the short term maturities of these assets.
Accounting policy – Cash and cash equivalents
Cashandcashequivalentscomprisecashonhandanddepositsheldwithbanksandothershorttermhighlyliquidinvestments with original maturities of three months or less.
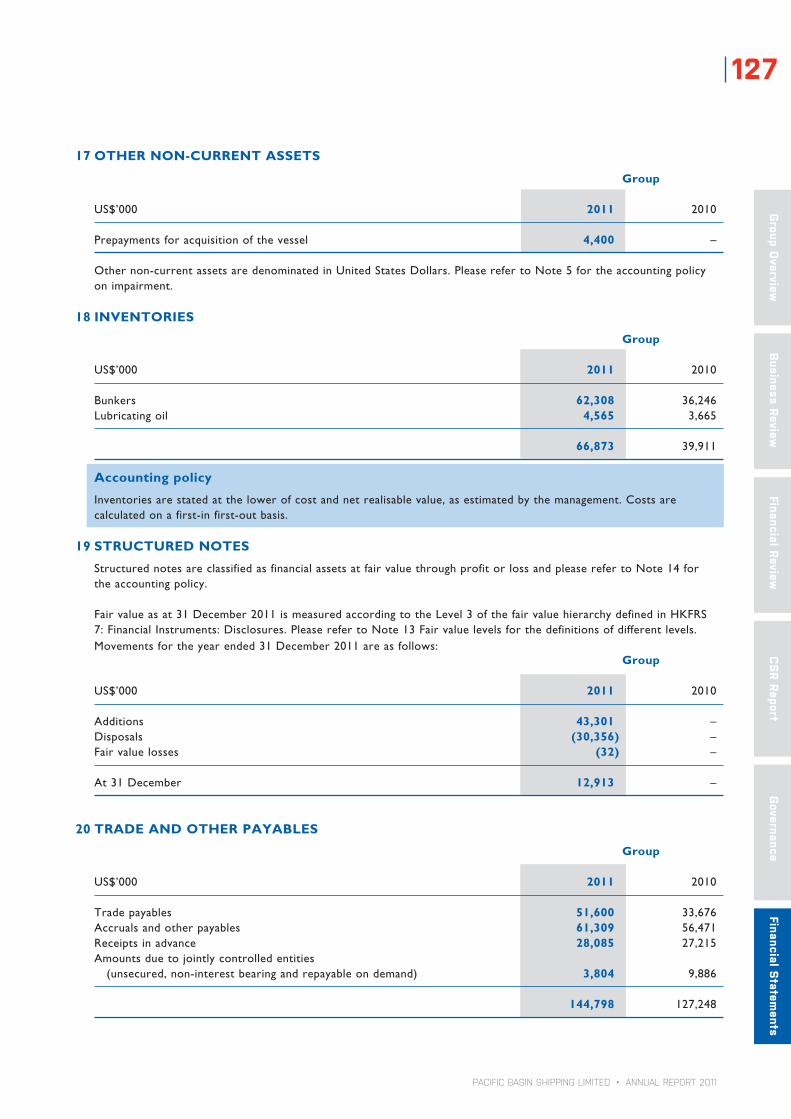
PACIFIC BASIN SHIPPING LIMITED • ANNUAL REPORT 2011
127
Group O
verviewBusiness Review
Financial ReviewG
overnance Financial S
tatements
CS
R Report
17 OTHER NON-CURRENT ASSETS
Group
US$’000 2011 2010
Prepaymentsforacquisitionofthevessel 4,400 –
Other non-current assets are denominated in United States Dollars. PleaserefertoNote5fortheaccountingpolicyon impairment.
18 INVENTORIES
Group
US$’000 2011 2010
Bunkers 62,308 36,246Lubricating oil 4,565 3,665
66,873 39,911
Accounting policy
Inventories are stated at the lower of cost and net realisable value, as estimated by the management. Costs are calculated on a first-in first-out basis.
19 STRUCTURED NOTES
Structured notes are classified as financial assets at fair value through profit or loss and please refer to Note 14 for the accounting policy.
Fair value as at 31 December 2011 is measured according to the Level 3 of the fair value hierarchy defined in HKFRS 7: Financial Instruments: Disclosures. Please refer to Note 13 Fair value levels for the definitions of different levels. Movements for the year ended 31 December 2011 are as follows:
Group
US$’000 2011 2010
Additions 43,301 –Disposals (30,356) –Fair value losses (32) –
At 31 December 12,913 –
20 TRADE AND OTHER PAYABLES
Group
US$’000 2011 2010
Trade payables 51,600 33,676Accruals and other payables 61,309 56,471Receipts in advance 28,085 27,215Amounts due to jointly controlled entities (unsecured, non-interest bearing and repayable on demand) 3,804 9,886
144,798 127,248

PACIFIC BASIN SHIPPING LIMITED • ANNUAL REPORT 2011
128 Notes to the Financial Statements
20 TRADE AND OTHER PAYABLES (continued)
At 31 December 2011, the ageing of trade payables is as follows:
Group
US$’000 2011 2010
Less than 30 days 45,314 27,41431-60days 201 85961-90days 75 272Over 90 days 6,010 5,131
51,600 33,676
The carrying values of trade and other payables approximate their fair values due to the short term maturities of these liabilities.
Trade and other payables are mainly denominated in United States Dollars.
Accounting policy – Trade payables
Trade payables mainly represent freight and charter-hire payables which are recognised initially at fair value and subsequentlymeasuredatamortisedcostusingtheeffectiveinterestmethod.
21 LONG TERM BORROWINGS
Group
US$’000 2011 2010
Non-current Finance lease liabilities (Note a) 151,432 168,482 Secured bank loans (Note b) 357,297 325,646 Convertible bonds (Note c) 204,987 199,642
713,716 693,770
Current Finance lease liabilities (Note a) 17,050 15,976 Secured bank loans (Note b) 48,273 43,350 Convertible bonds (Note d) – 106,370
65,323 165,696
Total long term borrowings 779,039 859,466
The fair value of long term borrowings is estimated by discounting the future contractual cash flows at the current market interest rate that is available to the Group for similar financial instruments.
Long term borrowings are mainly denominated in United States Dollars.

PACIFIC BASIN SHIPPING LIMITED • ANNUAL REPORT 2011
129
Group O
verviewBusiness Review
Financial ReviewG
overnance Financial S
tatements
CS
R Report
21 LONG TERM BORROWINGS (continued)
Accounting policy – Borrowings
Borrowingsarerecognisedinitiallyatfairvalue,netoftransactioncostsincurred.Borrowingsaresubsequentlystated at amortised cost; any difference between the proceeds (net of transaction costs) and the redemption value is recognised in the income statement over the period of the borrowings using the effective interest method.
Borrowings are classified as current liabilities unless the Group has an unconditional right to defer settlement of the liabilities for at least twelve months after the balance sheet date.
(a) Finance leases liabilities
At 31 December 2011, the Group leased certain vessels under finance leases. Under the terms of the leases, the Group has options to purchase these vessels at any time throughout the charter periods. Lease liabilities are effectively secured as the rights to the leased vessels revert to the lessors in the event of default.
The gross liabilities, future finance charges and net liabilities under finance leases as at 31 December 2011 are as follows:
Group
US$’000 2011 2010
Gross liabilities under finance leases Within one year 28,096 28,105 In the second year 28,086 28,096 In the third of fifth year 113,617 130,899 After the fifth year 39,036 49,839
208,835 236,939Less: future finance charges on finance leases (40,353) (52,481)
168,482 184,458
Average effective interest rates on finance lease payables 6.8% 6.8%
Group
US$’000 2011 2010
Net liabilities under finance leases Within one year 17,050 15,976 In the second year 18,286 17,049 In the third of fifth year 96,057 106,425 After the fifth year 37,089 45,008
168,482 184,458
Fair value of the finance lease liabilities 172,952 191,667

PACIFIC BASIN SHIPPING LIMITED • ANNUAL REPORT 2011
130 Notes to the Financial Statements
21 LONG TERM BORROWINGS (continued)
Accounting policy – Finance lease: where the Group is the lessee
Leases of assets where the lessee has substantially all the risks and rewards of ownership of such assets are classified as finance leases.
Where the Group is the lessee, finance leased assets are capitalised at the commencement of the lease at the lower of the fair value of the leased assets and the present value of the minimum lease payments. Each lease payment is allocated between liability and finance charges so as to achieve a constant rate of interest on the remaining balance of the liability. The finance lease liabilities are included in current and non-current borrowings. The finance charges are expensed in the income statement over the lease periods so as to produce a constant periodic rate of interest on the remaining balance of the liability for each period. The assets accounted for as finance leases are depreciated over the shorter of their estimated useful lives or the lease periods.
(b) Secured bank loans
The bank loans as at 31 December 2011 are secured, inter alia, by the following:i) MortgagesovercertainownedvesselswithnetbookvaluesofUS$548,532,000(2010:US$493,624,000)(Note
6);ii) Assignment of earnings and insurances compensation in respect of the vessels;iii) Fixed and floating charges over all of the assets of certain subsidiaries of the Group’s towage business; andiv) Nocashanddeposits(2010:US$5,323,000).
The maturities of the Group’s bank loans are as follows:
Group
US$’000 2011 2010
Within one year 48,273 43,350In the second year 49,065 42,650In the third to fifth year 230,330 227,531After the fifth year 77,902 55,465
405,570 368,996
Average effective interest rate of bank loans (before hedging) 2.6% 2.5%
(c)Convertiblebonds–1.75%couponconvertiblebondsdue2016
Issue size US$230 millionIssue date 12 April 2010Maturitydate 12April2016(6yearsfromissue)Coupon–cashcost 1.75%p.a.payablesemi-annuallyinarrearson12Apriland12OctoberEffective interest rate charged 4.70% to income statementRedemption Price 100%ConversionPriceintoshares HK$7.35(witheffectfrom16August2011)(Note)Conversion at bondholders’ options i) until 11 January 2014, conversion can only take place if the closing price
of the Company’s shares is at least at a 20% premium to the conversion price then in effect for five consecutive trading days.
ii) After 11 January 2014 conversion can take place at no premium.Bondholder put date and price On 12 April 2014 (4 years from issue), each bondholder will have the right
torequiretheGrouptoredeemallorsomeofthebondsat100%oftheprincipal amount.
Issuer call date and price On or after 12 April 2014, the Group may redeem the bonds in whole ataredemptionpriceequalto100%oftheirprincipalamountiftheclosing price of the Company’s shares is at least at a 30% premium to the conversion price then in effect for thirty consecutive trading days.
Note: The conversion price is subject to an adjustment arising from the cash dividends paid by the Company according to a pre-determined adjustment factor. Such adjustment becomes effective on the first date on which the Shares are traded ex-dividend.

PACIFIC BASIN SHIPPING LIMITED • ANNUAL REPORT 2011
131
Group O
verviewBusiness Review
Financial ReviewG
overnance Financial S
tatements
CS
R Report
21 LONG TERM BORROWINGS (continued)
(d) Convertible bonds – 3.3% coupon convertible bonds due 2013
3.3% coupon convertible bonds with an aggregate nominal value of US$80.9 million were redeemed and cancelled on 1 February 2011 at 100% of their principal amount. The Group exercised its call option on 1 February 2011 to redeem the remaining outstanding bonds with nominal value of US$24.3 million. These remaining outstanding bonds were redeemed and cancelled on 4 March 2011, thereby cancelling the 3.3% coupon convertible bonds in full.
Accounting policy – Convertible bonds
Convertiblebondsareaccountedforastheaggregateofi)aliabilitycomponentandii)anequitycomponent.
At initial recognition, the fair value of the liability component of the convertible bonds is determined using a market interestrateforanequivalentnon-convertiblebond.Theremainderoftheproceedsisallocatedtotheconversionoptionasanequitycomponent,recognisedinothercomprehensiveincome.
Transactioncostsassociatedwithissuingtheconvertiblebondsareallocatedtotheliabilityandequitycomponentsinproportiontotheallocationofproceeds.Theliabilitycomponentissubsequentlycarriedatamortisedcost,calculatedusing the effective interest method, until extinguished on conversion or maturity.
22 PROVISION FOR ONEROUS CONTRACTS
Group
US$’000 2011 2010
At 1 January 2,031 2,031Charge for the year – –Write-back for the year – –Utilised during the year (2,031) –
At 31 December – 2,031
Analysis of provisionCurrent – 2,031Non-current – –
– 2,031
Critical accounting estimates and judgements – Provision for onerous contracts
A provision for onerous contracts is recognised where the unavoidable costs of meeting the obligations under the contracts exceed the economic benefits expected to be received under them. The Group estimates the provision for its non-cancellable operating lease contracts in relation to the Group’s chartered-in vessels on a fleet basis for each type of vessel by calculating the difference between the total charter revenue and freight expected to be earned and the total value of future charter payments the Group is obligated to make for the remaining term of the chartered-in contracts.
The expected charter revenue and freight is derived from the aggregate of (a) the amount of revenue cover provided by existing contracts of affreightment, and (b) management estimates on the uncovered period by reference to current physical market rates, current trades of forward freight agreements and other relevant market information at the reporting date.
Withallothervariablesheldconstant,iftheexpectedfreightratesdecreaseby15%frommanagementestimatesover the next 3 years, the provision for onerous contracts would increase by US$1.4 million in the next year. If the expectedfreightratesincreaseby15%,theprovisionwouldremainunchanged.
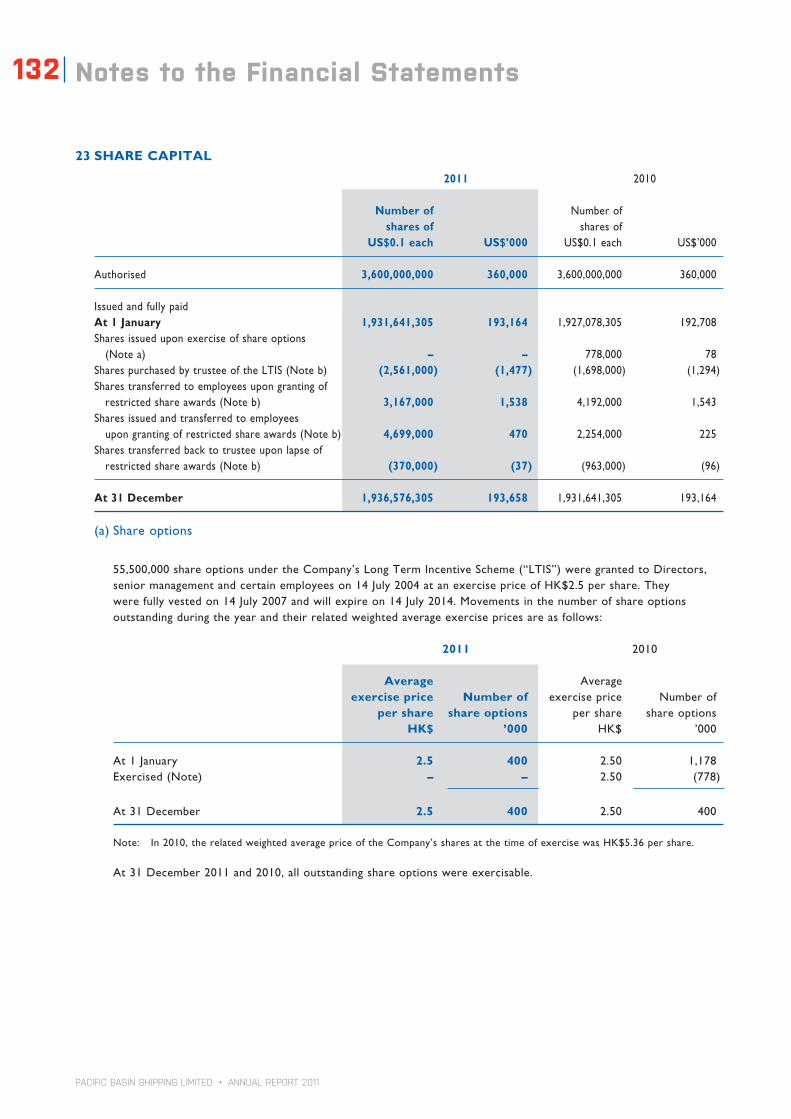
PACIFIC BASIN SHIPPING LIMITED • ANNUAL REPORT 2011
132 Notes to the Financial Statements
23 SHARE CAPITAL
2011 2010
Number of Number of shares of shares of US$0.1 each US$’000 US$0.1 each US$’000
Authorised 3,600,000,000 360,000 3,600,000,000 360,000
Issued and fully paidAt 1 January 1,931,641,305 193,164 1,927,078,305 192,708Shares issued upon exercise of share options (Note a) – – 778,000 78Shares purchased by trustee of the LTIS (Note b) (2,561,000) (1,477) (1,698,000) (1,294)Shares transferred to employees upon granting of restricted share awards (Note b) 3,167,000 1,538 4,192,000 1,543Shares issued and transferred to employees upon granting of restricted share awards (Note b) 4,699,000 470 2,254,000 225Shares transferred back to trustee upon lapse of restricted share awards (Note b) (370,000) (37) (963,000) (96)
At 31 December 1,936,576,305 193,658 1,931,641,305 193,164
(a) Share options
55,500,000shareoptionsundertheCompany’sLongTermIncentiveScheme(“LTIS”)weregrantedtoDirectors,seniormanagementandcertainemployeeson14July2004atanexercisepriceofHK$2.5pershare.Theywere fully vested on 14 July 2007 and will expire on 14 July 2014. Movements in the number of share options outstanding during the year and their related weighted average exercise prices are as follows:
2011 2010
Average Average exercise price Number of exercise price Number of per share share options per share share options HK$ ’000 HK$ ’000
At 1 January 2.5 400 2.50 1,178Exercised (Note) – – 2.50 (778)
At 31 December 2.5 400 2.50 400
Note: In2010,therelatedweightedaveragepriceoftheCompany’ssharesatthetimeofexercisewasHK$5.36pershare.
At 31 December 2011 and 2010, all outstanding share options were exercisable.
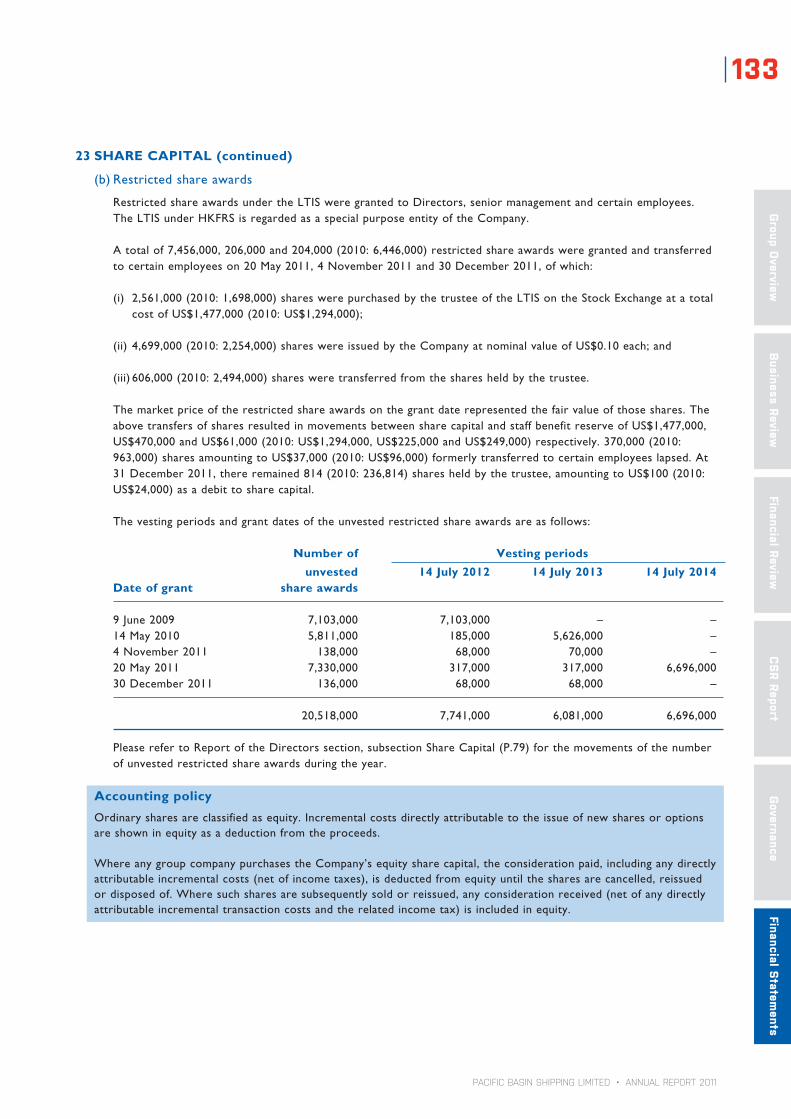
PACIFIC BASIN SHIPPING LIMITED • ANNUAL REPORT 2011
133
Group O
verviewBusiness Review
Financial ReviewG
overnance Financial S
tatements
CS
R Report
23 SHARE CAPITAL (continued)
(b) Restricted share awards
Restricted share awards under the LTIS were granted to Directors, senior management and certain employees. The LTIS under HKFRS is regarded as a special purpose entity of the Company.
Atotalof7,456,000,206,000and204,000(2010:6,446,000)restrictedshareawardsweregrantedandtransferredto certain employees on 20 May 2011, 4 November 2011 and 30 December 2011, of which:
(i) 2,561,000(2010:1,698,000)shareswerepurchasedbythetrusteeoftheLTISontheStockExchangeatatotalcost of US$1,477,000 (2010: US$1,294,000);
(ii)4,699,000(2010:2,254,000)shareswereissuedbytheCompanyatnominalvalueofUS$0.10each;and
(iii)606,000(2010:2,494,000)sharesweretransferredfromthesharesheldbythetrustee.
The market price of the restricted share awards on the grant date represented the fair value of those shares. The above transfers of shares resulted in movements between share capital and staff benefit reserve of US$1,477,000, US$470,000andUS$61,000(2010:US$1,294,000,US$225,000andUS$249,000)respectively.370,000(2010:963,000)sharesamountingtoUS$37,000(2010:US$96,000)formerlytransferredtocertainemployeeslapsed.At31December2011,thereremained814(2010:236,814)sharesheldbythetrustee,amountingtoUS$100(2010:US$24,000) as a debit to share capital.
The vesting periods and grant dates of the unvested restricted share awards are as follows:
Number of Vesting periods
unvested 14 July 2012 14 July 2013 14 July 2014Date of grant share awards
9 June 2009 7,103,000 7,103,000 – –14May2010 5,811,000 185,000 5,626,000 –4November2011 138,000 68,000 70,000 –20May2011 7,330,000 317,000 317,000 6,696,00030December2011 136,000 68,000 68,000 –
20,518,000 7,741,000 6,081,000 6,696,000
Please refer to Report of the Directors section, subsection Share Capital (P.79) for the movements of the number of unvested restricted share awards during the year.
Accounting policy
Ordinarysharesareclassifiedasequity.Incrementalcostsdirectlyattributabletotheissueofnewsharesoroptionsareshowninequityasadeductionfromtheproceeds.
WhereanygroupcompanypurchasestheCompany’sequitysharecapital,theconsiderationpaid,includinganydirectlyattributableincrementalcosts(netofincometaxes),isdeductedfromequityuntilthesharesarecancelled,reissuedordisposedof.Wheresuchsharesaresubsequentlysoldorreissued,anyconsiderationreceived(netofanydirectlyattributableincrementaltransactioncostsandtherelatedincometax)isincludedinequity.

PACIFIC BASIN SHIPPING LIMITED • ANNUAL REPORT 2011
134 Notes to the Financial Statements
24 RESERVES
Group
Other reserves
Convertible Staff Investment Share(a) Merger(b) bonds benefits Hedging valuation Exchange Retained
US$’000 premium reserve reserve reserve reserve reserve reserve Subtotal profits Total
At 1 January 2011 594,727 (56,606) 41,409 2,362 (7,834) 44,000 12,860 630,918 720,809 1,351,727Release of investment valuation reserve upon disposal of available-for-sale financial assets – – – – – (60,502) – (60,502) – (60,502)Fair value gains on available-for-sale financial assets – – – – – 22,884 – 22,884 – 22,884Impairment of available-for-sale financial assets charged to income statement – – – – – 910 – 910 – 910Cash flow hedges – fair value gains – – – – (7,196) – – (7,196) – (7,196) – transferred to finance costs in consolidated income statement – – – – 3,598 – – 3,598 – 3,598Currency translation differences – – – – – – (953) (953) – (953)Profit attributable to shareholders – – – – – – – – 31,982 31,982Share-based compensation (see Remuneration Report) – – – 4,213 – – – 4,213 – 4,213Derecognitionoftheequity component upon repurchase and cancellation of convertible bonds (Note 21(d)) – – (9,107) – – – – (9,107) 9,107 –Shares fully vested 2,397 – – (2,397) – – – – – –Shares transferred upon granting and lapse of restricted share awards (Note 23(b)) – – – (1,971) – – – (1,971) – (1,971)Dividends paid (Note 29) – – – – – – – – (53,435) (53,435)
At 31 December 2011 597,124 (56,606) 32,302 2,207 (11,432) 7,292 11,907 582,794 708,463 1,291,257
Representing: 2011 Proposed final dividend 12,480 Others 695,983
Retained profit at 31 December 2011 708,463
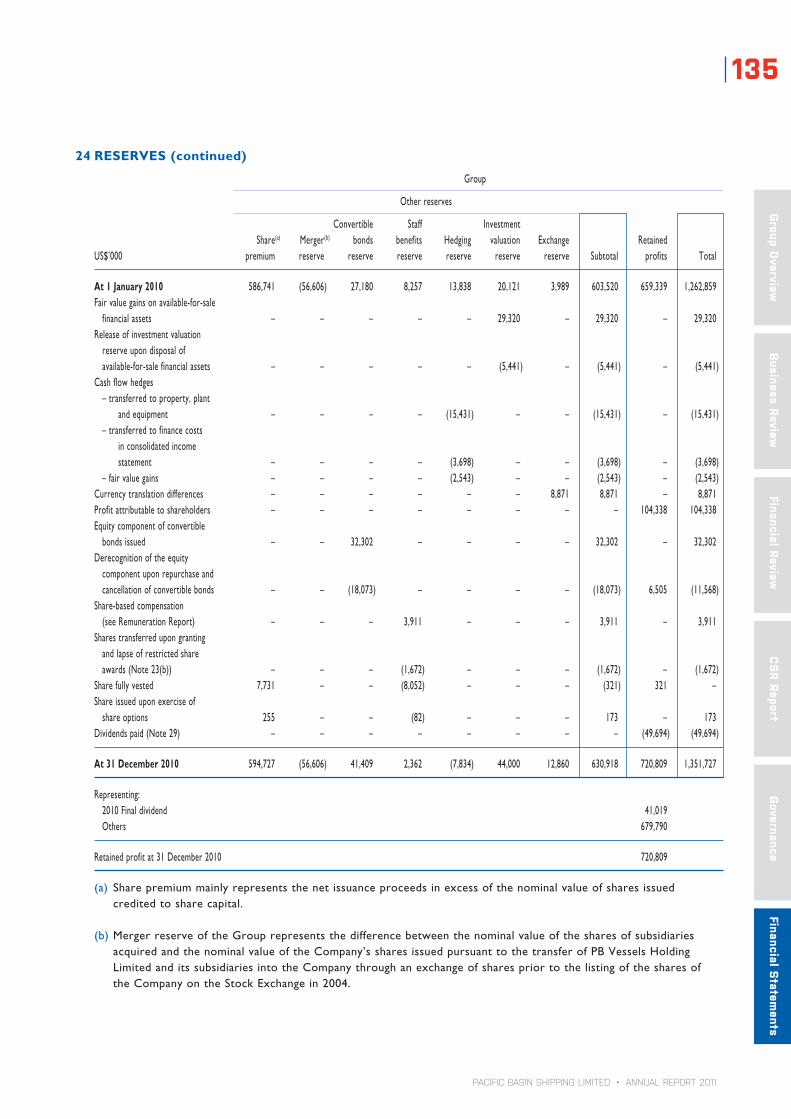
PACIFIC BASIN SHIPPING LIMITED • ANNUAL REPORT 2011
135
Group O
verviewBusiness Review
Financial ReviewG
overnance Financial S
tatements
CS
R Report
24 RESERVES (continued)
Group
Other reserves
Convertible Staff Investment Share(a) Merger(b) bonds benefits Hedging valuation Exchange Retained
US$’000 premium reserve reserve reserve reserve reserve reserve Subtotal profits Total
At 1 January 2010 586,741 (56,606) 27,180 8,257 13,838 20,121 3,989 603,520 659,339 1,262,859Fair value gains on available-for-sale financial assets – – – – – 29,320 – 29,320 – 29,320Release of investment valuation reserve upon disposal of available-for-salefinancialassets – – – – – (5,441) – (5,441) – (5,441)Cash flow hedges – transferred to property, plant andequipment – – – – (15,431) – – (15,431) – (15,431) – transferred to finance costs in consolidated income statement – – – – (3,698) – – (3,698) – (3,698) –fairvaluegains – – – – (2,543) – – (2,543) – (2,543)Currency translation differences – – – – – – 8,871 8,871 – 8,871Profit attributable to shareholders – – – – – – – – 104,338 104,338Equitycomponentofconvertible bonds issued – – 32,302 – – – – 32,302 – 32,302Derecognitionoftheequity component upon repurchase and cancellationofconvertiblebonds – – (18,073) – – – – (18,073) 6,505 (11,568)Share-based compensation (see Remuneration Report) – – – 3,911 – – – 3,911 – 3,911Shares transferred upon granting and lapse of restricted share awards(Note23(b)) – – – (1,672) – – – (1,672) – (1,672)Sharefullyvested 7,731 – – (8,052) – – – (321) 321 –Share issued upon exercise of shareoptions 255 – – (82) – – – 173 – 173Dividendspaid(Note29) – – – – – – – – (49,694) (49,694)
At 31 December 2010 594,727 (56,606) 41,409 2,362 (7,834) 44,000 12,860 630,918 720,809 1,351,727
Representing: 2010 Final dividend 41,019 Others 679,790
Retained profit at 31 December 2010 720,809
(a) Share premium mainly represents the net issuance proceeds in excess of the nominal value of shares issued credited to share capital.
(b) Merger reserve of the Group represents the difference between the nominal value of the shares of subsidiaries acquiredandthenominalvalueoftheCompany’ssharesissuedpursuanttothetransferofPBVesselsHoldingLimited and its subsidiaries into the Company through an exchange of shares prior to the listing of the shares of the Company on the Stock Exchange in 2004.

PACIFIC BASIN SHIPPING LIMITED • ANNUAL REPORT 2011
136 Notes to the Financial Statements
24 RESERVES (continued)
Company
Other reserves
Staff Share benefits Retained
US$’000 Premium reserve Subtotal profits Total
At 1 January 2011 594,727 2,362 597,089 701,032 1,298,121Profit attributable to shareholders (Note 28) – – – 48,380 48,380Share-based compensation (see Remuneration Report) – 4,213 4,213 – 4,213Shares transferred upon granting and lapse of restricted share awards (Note 23(b)) – (1,971) (1,971) – (1,971) Share fully vested 2,397 (2,397) – – –Dividends paid (Note 29) – – – (53,435) (53,435)
At 31 December 2011 597,124 2,207 599,331 695,977 1,295,308
Representing: 2011 Proposed final dividend 12,480 Others 683,497
Retained profits as at 31 December 2011 695,977
At 1 January 2010 586,741 8,257 594,998 626,510 1,221,508Profitattributabletoshareholders(Note28) – – – 123,895 123,895Share-based compensation (see Remuneration Report) – 3,911 3,911 – 3,911Shares transferred upon granting and lapse of restricted share awards (Note23(b)) – (1,672) (1,672) – (1,672)Sharefullyvested 7,731 (8,052) (321) 321 –Sharesissueduponexerciseofshareoptions 255 (82) 173 – 173Dividendspaid(Note29) – – – (49,694) (49,694)
At 31 December 2010 594,727 2,362 597,089 701,032 1,298,121
Representing: 2010 Final dividend 41,019 Others 660,013
Retained profits as at 31 December 2010 701,032

PACIFIC BASIN SHIPPING LIMITED • ANNUAL REPORT 2011
137
Group O
verviewBusiness Review
Financial ReviewG
overnance Financial S
tatements
CS
R Report
25 OTHER INCOME AND GAINS
US$’000 2011 2010
Gains Gains on disposal of available-for-sale financial assets 55,816 15,984 Gains on forward freight agreements 9,326 29,831Utilisation of provision for onerous contracts 2,031 –Write-back of provision for impairment of other receivables – 1,361
67,173 47,176
Duringtheyear,theGroupsolditsremainingshareholdingsinGreenDragonGasLimitedrealisingagainofUS$55.8million.
26 FINANCE INCOME AND COSTS
US$’000 2011 2010
Finance income Bank interest income (11,998) (18,069) Finance lease interest income (869) (1,024)
(12,867) (19,093)
Finance costs Borrowings wholly repayable within five years Interest on bank loans 5,198 4,797 Interest on finance leases 6,882 7,557 Interest on convertible bonds 10,009 14,131 Borrowings not wholly repayable within five years Interest on bank loans 10,150 4,990 Interest on finance leases 5,247 5,629 Interest on convertible bonds – 6,585 Other finance charges 1,062 323 Net losses on interest rate swap contracts 6,931 6,274
45,479 50,286 Less:amountscapitalisedonqualifyingassets(Note6) (1,280) –
Total finance costs 44,199 50,286
Finance costs, net 31,332 31,193
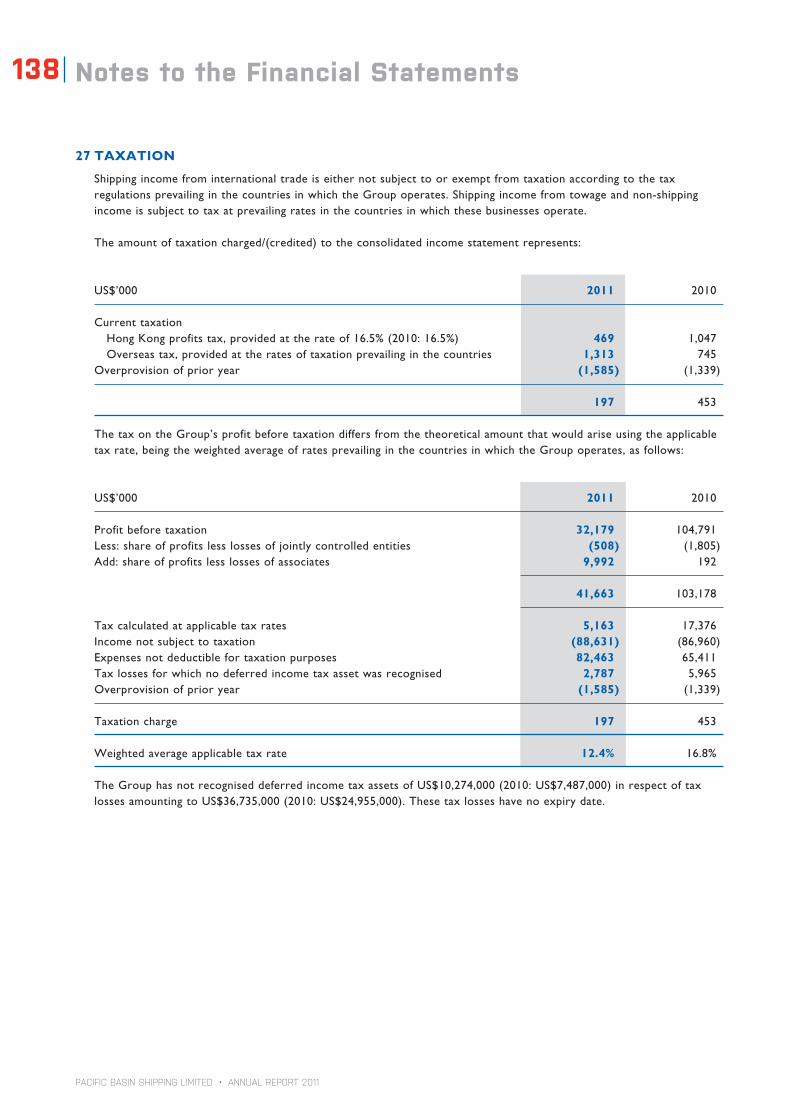
PACIFIC BASIN SHIPPING LIMITED • ANNUAL REPORT 2011
138 Notes to the Financial Statements
27 TAXATION
Shipping income from international trade is either not subject to or exempt from taxation according to the tax regulations prevailing in the countries in which the Group operates. Shipping income from towage and non-shipping income is subject to tax at prevailing rates in the countries in which these businesses operate.
The amount of taxation charged/(credited) to the consolidated income statement represents:
US$’000 2011 2010
Current taxation HongKongprofitstax,providedattherateof16.5%(2010:16.5%) 469 1,047 Overseas tax, provided at the rates of taxation prevailing in the countries 1,313 745Overprovision of prior year (1,585) (1,339)
197 453
The tax on the Group’s profit before taxation differs from the theoretical amount that would arise using the applicable tax rate, being the weighted average of rates prevailing in the countries in which the Group operates, as follows:
US$’000 2011 2010
Profit before taxation 32,179 104,791Less: share of profits less losses of jointly controlled entities (508) (1,805)Add: share of profits less losses of associates 9,992 192
41,663 103,178
Tax calculated at applicable tax rates 5,163 17,376Income not subject to taxation (88,631) (86,960)Expenses not deductible for taxation purposes 82,463 65,411Tax losses for which no deferred income tax asset was recognised 2,787 5,965Overprovision of prior year (1,585) (1,339)
Taxation charge 197 453
Weighted average applicable tax rate 12.4% 16.8%
The Group has not recognised deferred income tax assets of US$10,274,000 (2010: US$7,487,000) in respect of tax lossesamountingtoUS$36,735,000(2010:US$24,955,000).Thesetaxlosseshavenoexpirydate.
PACIFIC BASIN SHIPPING LIMITED • ANNUAL REPORT 2011
139
Group O
verviewBusiness Review
Financial ReviewG
overnance Financial S
tatements
CS
R Report
27 TAXATION (continued)
Critical accounting estimates and judgements – Income taxes
The Group is subject to income taxes in certain jurisdictions. There are transactions entered into where the ultimate taxdeterminationandtaxclassificationmaybeuncertain.Significantjudgementisrequiredindeterminingtheprovision for income taxes. The current provision for income tax of US$2,139,000 represents management’s estimates of the most likely amount of tax expected to be paid to the taxation authorities. Where the final tax outcome of these matters is different from the amounts that were initially recorded, such differences will impact the provision for income tax in the period in which such determination is made.
Accounting policy – Current income tax
The current income tax charge is calculated on the basis of the tax laws enacted or substantively enacted at the balance sheet date in the countries where the Company and its subsidiaries, jointly controlled entities and associates operate and generate taxable income. Management periodically evaluates positions taken in tax returns with respect to situations in which applicable tax regulations is subject to interpretation and establishes provisions where appropriate on the basis of amounts expected to be paid to the tax authorities.
Accounting policy – Deferred income tax
Deferred income tax is provided in full, using the liability method, on temporary differences arising between the tax bases of assets and liabilities and their carrying amounts in the financial statements. However, the deferred income tax is not accounted for if it arises from initial recognition of an asset or liability in a transaction other than a business combination that at the time of the transaction affects neither accounting nor taxable profit or loss. Deferred income tax is determined using tax rates (and laws) that have been enacted or substantially enacted by the balance sheet date and are expected to apply when the related deferred income tax asset is realised or the deferred income tax liability is settled.
Deferred income tax assets are recognised to the extent that it is probable that future taxable profit will be available against which the temporary differences can be utilised.
Deferred income tax is provided on temporary differences arising on investments in subsidiaries, jointly controlled entities and associates, except where the timing of the reversal of the temporary difference is controlled by the Group and it is probable that the temporary difference will not reverse in the foreseeable future.
28 PROFIT ATTRIBUTABLE TO SHAREHOLDERS
US$48,380,000(2010:US$123,895,000)oftheprofitattributabletoshareholdersisdealtwithinthefinancialstatements of the Company.

PACIFIC BASIN SHIPPING LIMITED • ANNUAL REPORT 2011
140 Notes to the Financial Statements
29 DIVIDENDS
2011 2010 HK cents US cents US$’000 HK cents US cents US$’000 per share per share per share per share
Interim dividend 5.0 0.6 12,416 5.0 0.6 12,422Proposed final dividend 5.0 0.6 12,480 16.5 2.1 41,019
10.0 1.2 24,896 21.5 2.7 53,441
Dividend paid during the year 21.5 2.7 53,435 20.0 2.5 49,694
The proposed final dividend is subject to approval by the shareholders at the Annual General Meeting on 19 April 2012.
Accounting policy
Dividend distributions to the Company’s shareholders are recognised as liabilities in the Group’s financial statements in the period in which the dividends are approved by the Company’s shareholders or Directors, where appropriate.
The dividend declared after the year end is not reflected as a dividend payable in the financial statements of that year, but will be reflected as an appropriation of retained profits for the following year.
30 EARNINGS PER SHARE
(a) Basic earnings per share
Basic earnings per share are calculated by dividing the Group’s profit attributable to shareholders by the weighted average number of ordinary shares in issue during the year, excluding the shares held by the trustee of the Company’s LTIS (Note 23(b)).
2011 2010
Profit attributable to shareholders (US$’000) 31,982 104,338Weighted average number of ordinary shares in issue (’000) 1,934,084 1,929,463Basic earnings per share (US cents) 1.65 5.41Equivalentto (HKcents) 12.88 42.01
(b) Diluted earnings per share
Diluted earnings per share are calculated by dividing the Group’s profit attributable to shareholders by the weighted average number of ordinary shares in issue during the year after adjusting for the number of potential dilutive ordinary shares granted under the Company’s LTIS but excluding the shares held by the trustee of the Company’s LTIS (Note 23(b)).
2011 2010
Profit attributable to shareholders (US$’000) 31,982 104,338
Weighted average number of ordinary shares in issue (’000) 1,934,084 1,929,463Adjustments for share options (’000) 161 224Weighted average number of ordinary shares for diluted earnings per share (’000) 1,934,245 1,929,687
Diluted earnings per share (US cents) 1.65 5.41Equivalentto (HKcents) 12.88 42.00
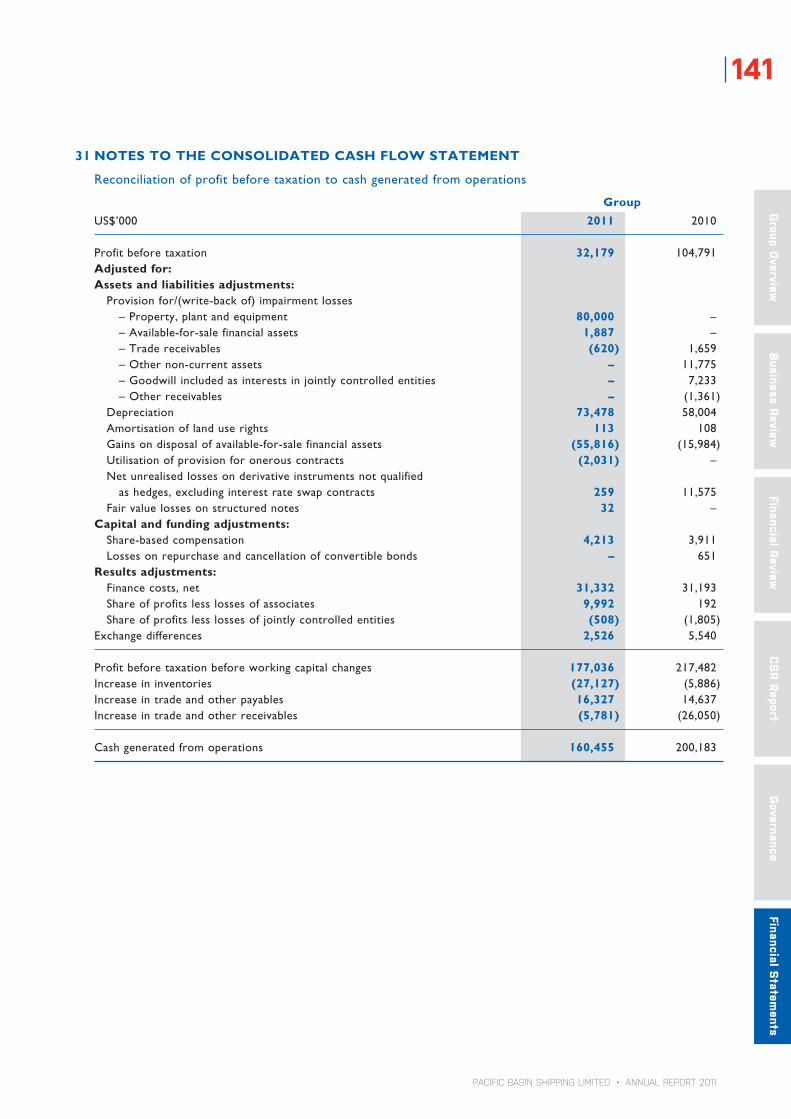
PACIFIC BASIN SHIPPING LIMITED • ANNUAL REPORT 2011
141
Group O
verviewBusiness Review
Financial ReviewG
overnance Financial S
tatements
CS
R Report
31 NOTES TO THE CONSOLIDATED CASH FLOW STATEMENT
Reconciliation of profit before taxation to cash generated from operations
Group US$’000 2011 2010
Profit before taxation 32,179 104,791Adjusted for:Assets and liabilities adjustments: Provision for/(write-back of) impairment losses –Property,plantandequipment 80,000 – – Available-for-sale financial assets 1,887 – – Trade receivables (620) 1,659 – Other non-current assets – 11,775 – Goodwill included as interests in jointly controlled entities – 7,233 – Other receivables – (1,361) Depreciation 73,478 58,004 Amortisation of land use rights 113 108 Gains on disposal of available-for-sale financial assets (55,816) (15,984) Utilisation of provision for onerous contracts (2,031) – Netunrealisedlossesonderivativeinstrumentsnotqualified as hedges, excluding interest rate swap contracts 259 11,575 Fair value losses on structured notes 32 –Capital and funding adjustments: Share-based compensation 4,213 3,911 Losses on repurchase and cancellation of convertible bonds – 651Results adjustments: Finance costs, net 31,332 31,193 Share of profits less losses of associates 9,992 192 Share of profits less losses of jointly controlled entities (508) (1,805)Exchange differences 2,526 5,540
Profit before taxation before working capital changes 177,036 217,482Increase in inventories (27,127) (5,886)Increase in trade and other payables 16,327 14,637Increase in trade and other receivables (5,781) (26,050)
Cash generated from operations 160,455 200,183
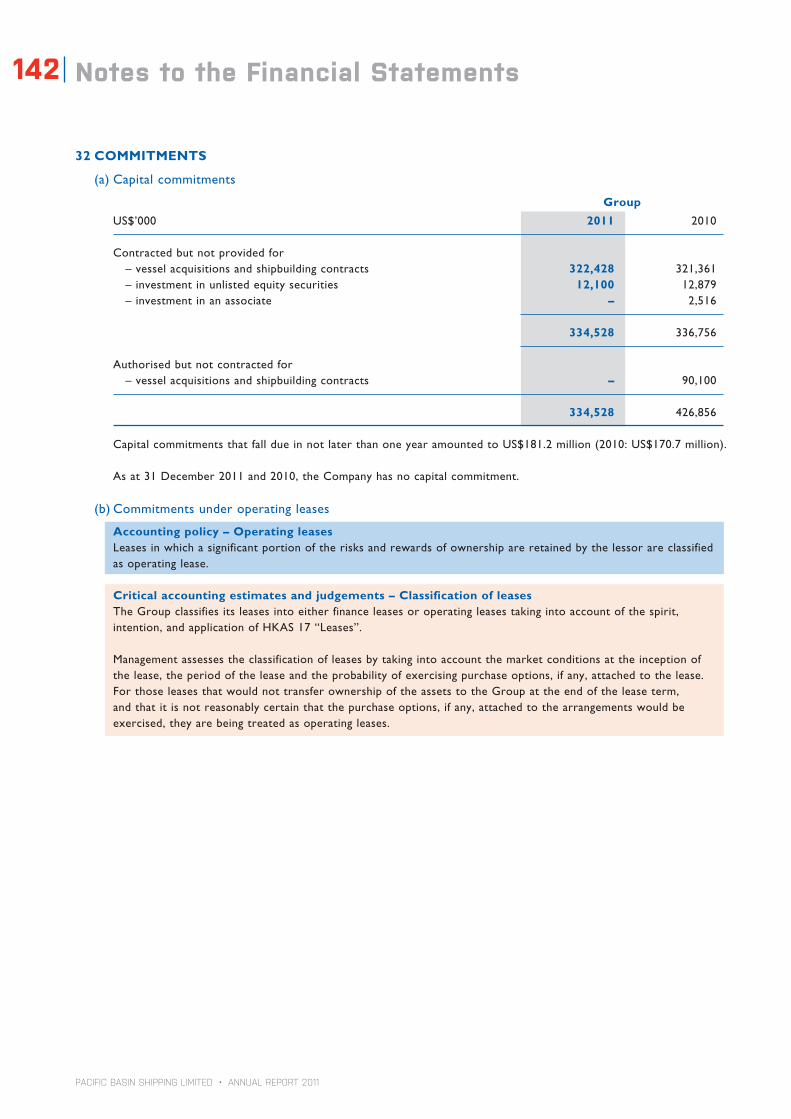
PACIFIC BASIN SHIPPING LIMITED • ANNUAL REPORT 2011
142 Notes to the Financial Statements
32 COMMITMENTS
(a) Capital commitments
Group US$’000 2011 2010
Contracted but not provided for –vesselacquisitionsandshipbuildingcontracts 322,428 321,361 –investmentinunlistedequitysecurities 12,100 12,879 – investment in an associate – 2,516
334,528 336,756
Authorised but not contracted for –vesselacquisitionsandshipbuildingcontracts – 90,100
334,528 426,856
Capital commitments that fall due in not later than one year amounted to US$181.2 million (2010: US$170.7 million).
As at 31 December 2011 and 2010, the Company has no capital commitment.
(b) Commitments under operating leases
Accounting policy – Operating leasesLeases in which a significant portion of the risks and rewards of ownership are retained by the lessor are classified as operating lease.
Critical accounting estimates and judgements – Classification of leasesThe Group classifies its leases into either finance leases or operating leases taking into account of the spirit, intention, and application of HKAS 17 “Leases”.
Management assesses the classification of leases by taking into account the market conditions at the inception of the lease, the period of the lease and the probability of exercising purchase options, if any, attached to the lease. For those leases that would not transfer ownership of the assets to the Group at the end of the lease term, and that it is not reasonably certain that the purchase options, if any, attached to the arrangements would be exercised, they are being treated as operating leases.

PACIFIC BASIN SHIPPING LIMITED • ANNUAL REPORT 2011
143
Group O
verviewBusiness Review
Financial ReviewG
overnance Financial S
tatements
CS
R Report
32 COMMITMENTS (continued)
(b) Commitments under operating leases (continued)
(i) The Group as the lessee – payments
The Group had future aggregate minimum lease payments under non-cancellable operating leases as follows:
Dry bulk Vessels Land andUS$’000 vessels Tug total buildings Total
At 31 December 2011
Within one year 188,665 973 189,638 3,615 193,253In the second to fifth year 246,003 – 246,003 5,404 251,407After the fifth year 104,405 – 104,405 822 105,227
539,073 973 540,046 9,841 549,887
At 31 December 2010
Withinoneyear 118,535 935 119,470 3,233 122,703Inthesecondtofifthyear 175,956 505 176,461 7,160 183,621Afterthefifthyear 66,041 – 66,041 1,341 67,382
360,532 1,440 361,972 11,734 373,706
ContingentleasepaymentsmadeamountedtoUS$44,150,000(2010:US$10,926,000).Theserelatetochartered-in dry bulk vessels on an index linked basis.
The leases have varying terms ranging from less than 1 year to 11 years. Certain of these leases have escalation clauses, renewal rights and purchase options.
Accounting policy – Operating leases: where the Group is the lesseePayments made under operating leases (net of any incentives received from the lessor) are charged to the income statement on a straight-line basis over the lease periods.

PACIFIC BASIN SHIPPING LIMITED • ANNUAL REPORT 2011
144 Notes to the Financial Statements
32 COMMITMENTS (continued)
(b) Commitments under operating leases (continued)
(ii) The Group as the lessor – receipts
The Group had future aggregate minimum lease receipts under non-cancellable operating leases as follows:
Dry bulk(a) Vessels Land andUS$’000 vessels RoRo Tug total buildings Total
At 31 December 2011
Within one year 24,626 10,226 7,266 42,118 117 42,235In the second to fifth year 57,667 – – 57,667 – 57,667After the fifth year 62,496 – – 62,496 – 62,496
144,789 10,226 7,266 162,281 117 162,398
At 31 December 2010
Withinoneyear 24,145 23,437 14,068 61,650 232 61,882Inthesecondtofifthyear 63,584 60,481 5,649 129,714 88 129,802Afterthefifthyear 50,616 – – 50,616 – 50,616
138,345 83,918 19,717 241,980 320 242,300
(a) Operating lease commitment with the Group as the lessor for dry bulk vessels mainly included the commitmentsfromtwopostpanamaxvesselsofUS$136.1million.
TheGroup’soperatingleasesarefortermsrangingfromlessthan1yearto16years.
Accounting policy – Operating leases: where the Group is the lessorWhen the Group leases out assets under operating leases, the assets are included in the balance sheet and, whereapplicable,aredepreciatedinaccordancewiththeGroup’sdepreciationpoliciesassetoutinNote6Property,plantandequipment.Revenuearisingfromassetsleasedoutunderoperatingleasesisrecognisedona straight-line basis over the lease periods.
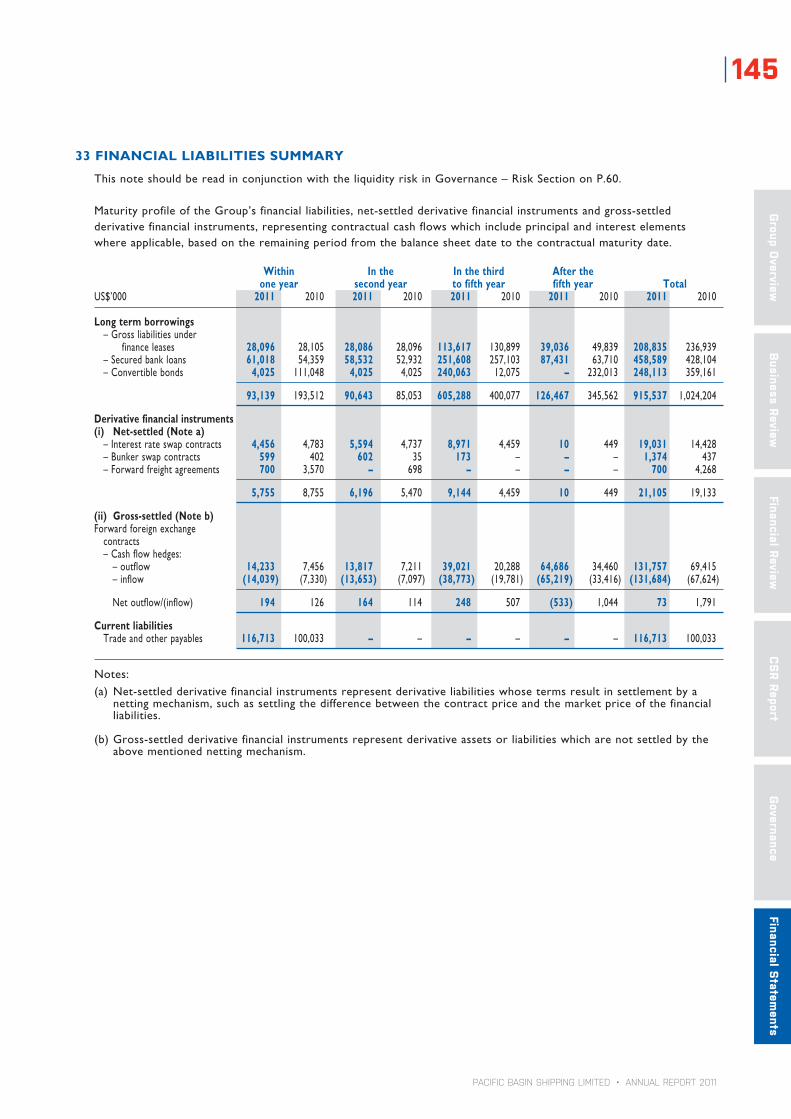
PACIFIC BASIN SHIPPING LIMITED • ANNUAL REPORT 2011
145
Group O
verviewBusiness Review
Financial ReviewG
overnance Financial S
tatements
CS
R Report
33 FINANCIAL LIABILITIES SUMMARY
ThisnoteshouldbereadinconjunctionwiththeliquidityriskinGovernance–RiskSectiononP.60.
Maturity profile of the Group’s financial liabilities, net-settled derivative financial instruments and gross-settled derivative financial instruments, representing contractual cash flows which include principal and interest elements where applicable, based on the remaining period from the balance sheet date to the contractual maturity date.
Within In the In the third After the one year second year to fifth year fifth year TotalUS$’000 2011 2010 2011 2010 2011 2010 2011 2010 2011 2010
Long term borrowings – Gross liabilities under finance leases 28,096 28,105 28,086 28,096 113,617 130,899 39,036 49,839 208,835 236,939 – Secured bank loans 61,018 54,359 58,532 52,932 251,608 257,103 87,431 63,710 458,589 428,104 – Convertible bonds 4,025 111,048 4,025 4,025 240,063 12,075 – 232,013 248,113 359,161
93,139 193,512 90,643 85,053 605,288 400,077 126,467 345,562 915,537 1,024,204
Derivative financial instruments(i) Net-settled (Note a) – Interest rate swap contracts 4,456 4,783 5,594 4,737 8,971 4,459 10 449 19,031 14,428 – Bunker swap contracts 599 402 602 35 173 – – – 1,374 437 – Forward freight agreements 700 3,570 – 698 – – – – 700 4,268
5,755 8,755 6,196 5,470 9,144 4,459 10 449 21,105 19,133
(ii) Gross-settled (Note b)Forward foreign exchange contracts – Cash flow hedges: – outflow 14,233 7,456 13,817 7,211 39,021 20,288 64,686 34,460 131,757 69,415 – inflow (14,039) (7,330) (13,653) (7,097) (38,773) (19,781) (65,219) (33,416) (131,684) (67,624)
Net outflow/(inflow) 194 126 164 114 248 507 (533) 1,044 73 1,791
Current liabilities Trade and other payables 116,713 100,033 – – – – – – 116,713 100,033
Notes:(a) Net-settled derivative financial instruments represent derivative liabilities whose terms result in settlement by a
netting mechanism, such as settling the difference between the contract price and the market price of the financial liabilities.
(b) Gross-settled derivative financial instruments represent derivative assets or liabilities which are not settled by the above mentioned netting mechanism.

PACIFIC BASIN SHIPPING LIMITED • ANNUAL REPORT 2011
146 Notes to the Financial Statements
34 SIGNIFICANT RELATED PARTY TRANSACTIONS
Significant related party transactions carried out in the normal course of the Group’s business and on an arm’s length basis were as follows:
(a) Purchases of services
US$’000 2011 2010
Management fee and commission paid to Meridian Shipping (Note i) 1,098 241Management fee and commission paid to Meridian Marine (Note ii) 1,063 305
Note:
(i) The Group paid to Meridian Shipping, a jointly controlled entity, management fees and commissions in relation to commercial management services.
(ii) The Group paid to Meridian Marine, a jointly controlled entity, management fees and commissions in relation to technical management services.
(b) Sales of services
US$’000 2011 2010
Charter-hire income received from OMSA (Note i) 19,366 13,297Service fee received from OMSA 7,415 8,276Charter-hire income received from NGB (Note ii) 8,452 8,276Charter-hire income received from FBSL – 2,112Management fee income received from FBSL – 2,973Termination fee received from FBSL – 3,300
Note:
(i) The Group leased out certain vessels to OMSA, a jointly controlled entity.
(ii) The Group leased out certain vessels to NGB, an associate.
(c) For the key management compensation (including Directors’ emoluments), please refer to Note 2 and Note 3 of theRemunerationReportonP.74andP.75.

PACIFIC BASIN SHIPPING LIMITED • ANNUAL REPORT 2011
147
Group O
verviewBusiness Review
Financial ReviewG
overnance Financial S
tatements
CS
R Report
35 FINANCIAL GUARANTEES
At31December2011,theCompanyhasgivencorporateguaranteeswithmaximumexposuresofUS$368.8million(2010:US$351.2million)forcertainsubsidiariesofPacificBasinDryBulk,PBTowageandPBRoRosegmentsinrespect of loan facilities granted to the subsidiaries.
Accounting policy
Financialguaranteecontractsarecontractsthatrequiretheissuer(i.e.theguarantor)tomakespecifiedpaymentsto reimburse the beneficiary holder of the guarantee (i.e. the holder) for a loss the holder incurs because a specified debtor fails to make payment when due in accordance with the terms of a debt instrument.
Financialguaranteecontractsareinitiallyrecognisedattheirfairvalues,andsubsequentlymeasuredatthehigherof(i)theamountinitiallyrecognisedlessaccumulatedamortisation;and(ii)theamountrequiredtobesettledbytheguarantor in respect of the financial guarantee contracts at the balance sheet date.
36 CONTINGENT LIABILITIES AND CONTINGENT ASSETS
The Company has no contingent liabilities and contingent assets at 31 December 2011 and 2010.
Accounting policy
A contingent liability is a possible obligation that arises from past events and whose existence will only be confirmed by the occurrence or non-occurrence of one or more uncertain future events not wholly within the control of the Group. It can also be a present obligation arising from past events that is not recognised because it is not probable thatoutflowofeconomicresourceswillberequiredortheamountofobligationcannotbemeasuredreliably.
Contingent liabilities are not recognised but are disclosed in the notes to the financial statements when an outflow of economic resources is probable, a provision is recognised.
A contingent asset is a possible asset that arises from past events and whose existence will be confirmed only by the occurrence or non-occurrence of one or more uncertain future events not wholly within the control of the Group.
Contingent assets are not recognised but are disclosed in the notes to the financial statements when an inflow of economic benefits is probable. When an inflow is virtually certain, an asset is recognised.
37 EVENTS AFTER THE BALANCE SHEET DATE
Subsequentto31December2011,theGrouphasdisposedofits100%equityinterestinawholly-ownedsubsidiary,whose principal business is the provision of marine surveying and consultancy service, at a consideration of US$2.2 million which will be settled in cash. No significant gain or loss is expected to arise on the disposal. The valuation of the subsidiary is determined by management. The transaction was completed on 21 February 2012.
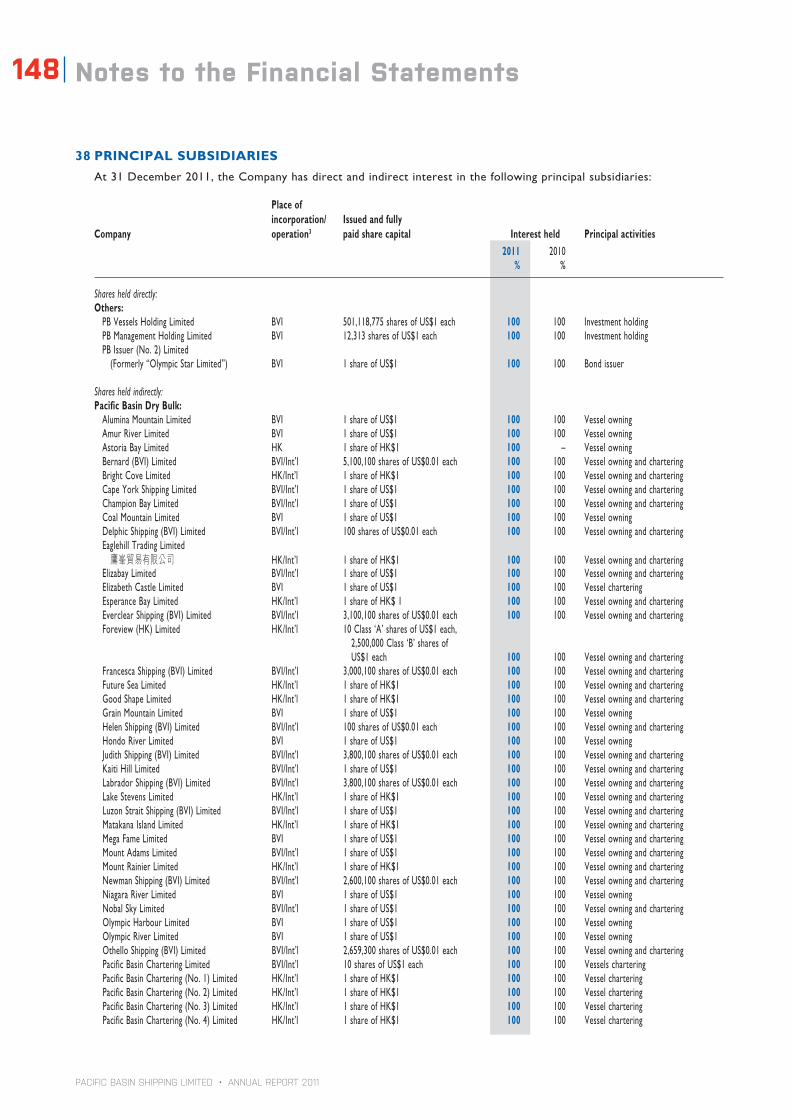
PACIFIC BASIN SHIPPING LIMITED • ANNUAL REPORT 2011
148 Notes to the Financial Statements
38 PRINCIPAL SUBSIDIARIES
At 31 December 2011, the Company has direct and indirect interest in the following principal subsidiaries:
Place of incorporation/ Issued and fully
Company operation3 paid share capital Interest held Principal activities 2011 2010 % %
Shares held directly:Others: PBVesselsHoldingLimited BVI 501,118,775sharesofUS$1each 100 100 Investment holding PB Management Holding Limited BVI 12,313 shares of US$1 each 100 100 Investment holding PB Issuer (No. 2) Limited (Formerly “Olympic Star Limited”) BVI 1 share of US$1 100 100 Bond issuer
Shares held indirectly:Pacific Basin Dry Bulk: Alumina Mountain Limited BVI 1 share of US$1 100 100 Vessel owning Amur River Limited BVI 1 share of US$1 100 100 Vessel owning Astoria Bay Limited HK 1 share of HK$1 100 – Vessel owning Bernard(BVI)Limited BVI/Int’l 5,100,100sharesofUS$0.01each 100 100 Vessel owning and chartering Bright Cove Limited HK/Int’l 1 share of HK$1 100 100 Vessel owning and chartering Cape York Shipping Limited BVI/Int’l 1 share of US$1 100 100 Vessel owning and chartering Champion Bay Limited BVI/Int’l 1 share of US$1 100 100 Vessel owning and chartering Coal Mountain Limited BVI 1 share of US$1 100 100 Vessel owning Delphic Shipping (BVI) Limited BVI/Int’l 100 shares of US$0.01 each 100 100 Vessel owning and chartering Eaglehill Trading Limited 鷹峯貿易有限公司 HK/Int’l 1 share of HK$1 100 100 Vessel owning and chartering Elizabay Limited BVI/Int’l 1 share of US$1 100 100 Vessel owning and chartering Elizabeth Castle Limited BVI 1 share of US$1 100 100 Vessel chartering Esperance Bay Limited HK/Int’l 1 share of HK$ 1 100 100 Vessel owning and chartering Everclear Shipping (BVI) Limited BVI/Int’l 3,100,100 shares of US$0.01 each 100 100 Vessel owning and chartering Foreview (HK) Limited HK/Int’l 10 Class ‘A’ shares of US$1 each,
2,500,000Class‘B’sharesof US$1 each 100 100 Vessel owning and chartering
Francesca Shipping (BVI) Limited BVI/Int’l 3,000,100 shares of US$0.01 each 100 100 Vessel owning and chartering Future Sea Limited HK/Int’l 1 share of HK$1 100 100 Vessel owning and chartering Good Shape Limited HK/Int’l 1 share of HK$1 100 100 Vessel owning and chartering Grain Mountain Limited BVI 1 share of US$1 100 100 Vessel owning Helen Shipping (BVI) Limited BVI/Int’l 100 shares of US$0.01 each 100 100 Vessel owning and chartering Hondo River Limited BVI 1 share of US$1 100 100 Vessel owning Judith Shipping (BVI) Limited BVI/Int’l 3,800,100 shares of US$0.01 each 100 100 Vessel owning and chartering Kaiti Hill Limited BVI/Int’l 1 share of US$1 100 100 Vessel owning and chartering Labrador Shipping (BVI) Limited BVI/Int’l 3,800,100 shares of US$0.01 each 100 100 Vessel owning and chartering Lake Stevens Limited HK/Int’l 1 share of HK$1 100 100 Vessel owning and chartering Luzon Strait Shipping (BVI) Limited BVI/Int’l 1 share of US$1 100 100 Vessel owning and chartering Matakana Island Limited HK/Int’l 1 share of HK$1 100 100 Vessel owning and chartering Mega Fame Limited BVI 1 share of US$1 100 100 Vessel owning and chartering Mount Adams Limited BVI/Int’l 1 share of US$1 100 100 Vessel owning and chartering Mount Rainier Limited HK/Int’l 1 share of HK$1 100 100 Vessel owning and chartering NewmanShipping(BVI)Limited BVI/Int’l 2,600,100sharesofUS$0.01each 100 100 Vessel owning and chartering Niagara River Limited BVI 1 share of US$1 100 100 Vessel owning Nobal Sky Limited BVI/Int’l 1 share of US$1 100 100 Vessel owning and chartering Olympic Harbour Limited BVI 1 share of US$1 100 100 Vessel owning Olympic River Limited BVI 1 share of US$1 100 100 Vessel owning OthelloShipping(BVI)Limited BVI/Int’l 2,659,300sharesofUS$0.01each 100 100 Vessel owning and chartering Pacific Basin Chartering Limited BVI/Int’l 10 shares of US$1 each 100 100 Vessels chartering Pacific Basin Chartering (No. 1) Limited HK/Int’l 1 share of HK$1 100 100 Vessel chartering Pacific Basin Chartering (No. 2) Limited HK/Int’l 1 share of HK$1 100 100 Vessel chartering Pacific Basin Chartering (No. 3) Limited HK/Int’l 1 share of HK$1 100 100 Vessel chartering Pacific Basin Chartering (No. 4) Limited HK/Int’l 1 share of HK$1 100 100 Vessel chartering

PACIFIC BASIN SHIPPING LIMITED • ANNUAL REPORT 2011
149
Group O
verviewBusiness Review
Financial ReviewG
overnance Financial S
tatements
CS
R Report
38 PRINCIPAL SUBSIDIARIES (continued)
Place of incorporation/ Issued and fully
Company operation3 paid share capital Interest held Principal activities 2011 2010 % %
PacificBasinChartering(No.5)Limited HK/Int’l 1shareofHK$1 100 100 Vessel chartering PacificBasinChartering(No.6)Limited HK/Int’l 1shareofHK$1 100 100 Vessel chartering Pacific Basin Chartering (No. 7) Limited HK/Int’l 1 share of HK$1 100 100 Vessel chartering Pacific Basin Chartering (No. 8) Limited HK/Int’l 1 share of HK$1 100 100 Vessel chartering Pacific Basin Chartering (No. 9) Limited HK/Int’l 1 share of HK$1 100 100 Vessel chartering Pacific Basin Chartering (No. 10) Limited HK/Int’l 1 share of HK$1 100 100 Vessel chartering Pacific Basin Chartering (No. 11) Limited HK/Int’l 1 share of HK$1 100 100 Vessel chartering Pacific Basin Chartering (No. 12) Limited HK/Int’l 1 share of HK$1 100 100 Vessel chartering Pacific Basin Chartering (No. 13) Limited HK/Int’l 1 share of HK$1 100 100 Vessel chartering Petcoke Mountain Limited BVI 1 share of US$1 100 100 Vessel owning Phosphate Mountain Limited BVI 1 share of US$1 100 100 Vessel owning Pigeon River Limited BVI 1 share of US$1 100 100 Vessel owning Port Alice Limited BVI 1 share of US$1 100 – Vessel owning and chartering Port Angeles Limited HK 1 share of HK$1 100 100 Vessel owning and chartering Port Botany Limited BVI 1 share of US$1 100 – Vessel owning and chartering Supreme Effort Group Limited BVI/Int’l 1 share of US$1 100 100 Vessel owning and chartering Uhland Shipping (BVI) Limited BVI/Int’l 100 shares of US$0.01 each 100 100 Vessel owning and chartering Verner Shipping (BVI) Limited BVI/Int’l 100 shares of US$0.01 each 100 100 Vessel owning and chartering West Bay Shipping Limited HK/Int’l 1 share of HK$1 100 100 Vessel owning and chartering Wheat Mountain Limited BVI 1 share of US$1 100 100 Vessel owning
PB Energy & Infrastructure Services: AMS Salvage and Towage Pty. Ltd. AUS/Int’l 100 shares of AUD1 each 100 100 Tugs owning and chartering PacMarineServicesCo.,Ltd. Korea 10,000sharesofKRW5,000each 100 100 Surveying and consultancy services PacMarine Services (HK) Limited HK 2 shares of HK$1 each 100 100 Surveying and consultancy services PacMarine Services LLC 1 Texas, USA 1,000 units of US$1 each 100 100 Surveying and consultancy services PacMarine Services Pte. Ltd.1 Singapore 1,000 shares of S$1 each 100 100 Surveying and consultancy services PB Maritime Services (Australia) Pty. Ltd. AUS 1 shares without par value 100 – Ship management services PB Diamantina Limited Cook/Int’l 2 shares of US$1 each 100 100 Tug owning and chartering PB Offshore (No.2) Limited Cook/Int’l 10 shares of US$1 each 100 100 Tug owning and chartering PB Pearl Limited Cook/Int’l 2 shares of US$1 each 100 100 Tug&bargeowningandchartering PB Pride Limited Cook/Int’l 2 shares of US$1 each 100 100 Tug&bargeowningandchartering PB Progress Limited Cook/Int’l 2 shares of US$1 each 100 100 Tug owning and chartering PB Sea-Tow Asia Pte. Ltd. Singapore 1 share of US$1 100 100 Tugs chartering PB Sea-Tow (Australia) Pty Ltd AUS 1 share of AUD1 100 100 Ship management services PB Sea-Tow (Awanuia) Limited New Zealand 100 shares without par value 100 100 Crew management services PB Sea-Tow (BVI) Limited BVI/Int’l 1 share of US$1 100 100 Ship management services PB Sea-Tow Niugini Pte. Ltd. Singapore 1 share of S$1 100 100 Tugs chartering and operation PB Sea-Tow (NZ) Limited New Zealand 1 share without par value 100 100 Ship management services PB Sea-Tow Projects (Australia) Pty Ltd AUS 1 share without par value 100 – Ship management services PB Towage (No.1) Limited Cook/Int’l 2 shares of US$1 each 100 100 Tug owning and chartering PB Towage (No.2) Limited Cook/Int’l 2 shares of US$1 each 100 100 Tug owning and chartering PB Towage (No.3) Limited Cook/Int’l 2 shares of US$1 each 100 100 Barges owning and chartering PB Towage (No.4) Limited Cook/Int’l 2 shares of US$1 each 100 100 Tug owning and chartering PBTowage(No.5)Limited Cook/Int’l 2sharesofUS$1each 100 100 Tugs owning and chartering PB Towage Asset (No.1) Limited Cook/Int’l 2 shares of US$1 each 100 100 Tug owning and chartering PB Towage Asset (No.2) Limited Cook/Int’l 2 shares of US$1 each 100 100 Tug owning and chartering PB Towage Assets #3 Pty Ltd AUS/Int’l 1 share of AUD1 100 100 Tugs owning and chartering PB Towage Assets #4 Pty Ltd AUS/Int’l 1 share of AUD1 100 100 Tugs owning and chartering PB Towage Australia (Onslow) Pty Ltd AUS/Int’l 1 share of AUD1 100 100 Tugs owning and chartering PBTowage(Australia)HoldingsPtyLtd AUS/Int’l 57,589,338sharesofAUD1each 100 100 Tugs owning and chartering PB Towage (Australia) Pty Ltd AUS 1,390,100 shares of AUD2.34 each 100 100 Ship management services PB Towage Middle East Limited Cook/Int’l 2 shares of US$1 each 100 100 Ship management services
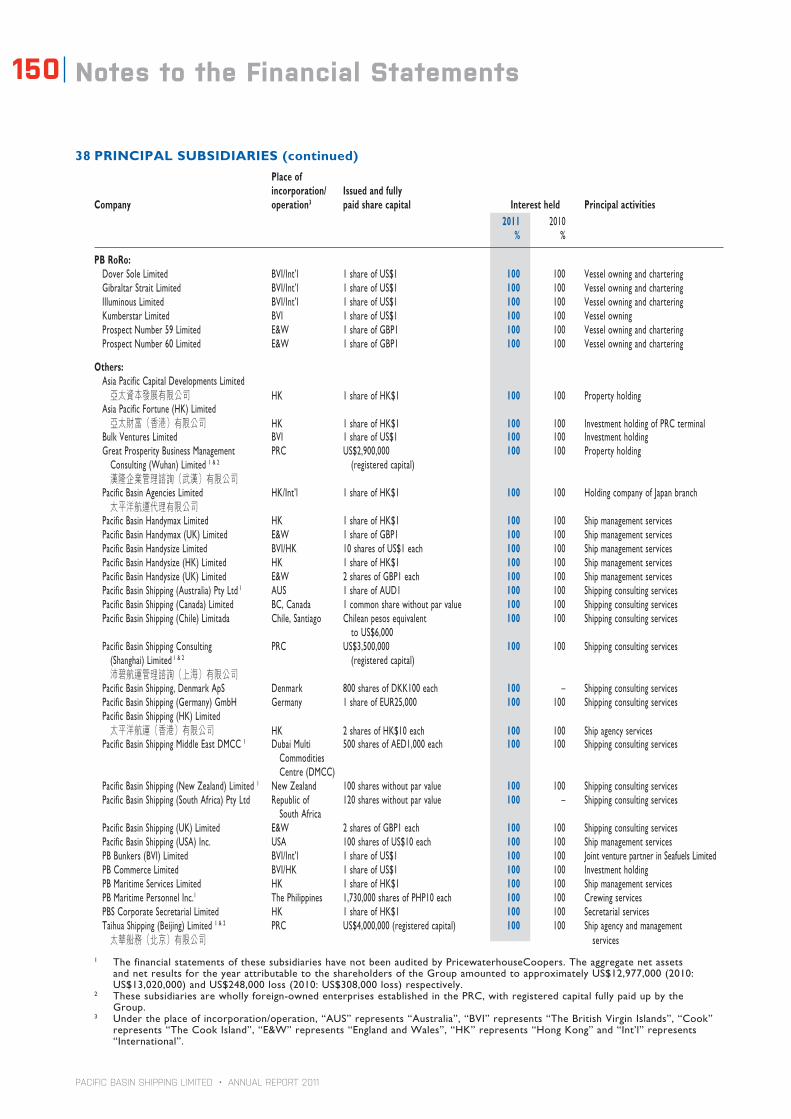
PACIFIC BASIN SHIPPING LIMITED • ANNUAL REPORT 2011
150 Notes to the Financial Statements
38 PRINCIPAL SUBSIDIARIES (continued)
Place of incorporation/ Issued and fully
Company operation3 paid share capital Interest held Principal activities 2011 2010 % %
PB RoRo: Dover Sole Limited BVI/Int’l 1 share of US$1 100 100 Vessel owning and chartering Gibraltar Strait Limited BVI/Int’l 1 share of US$1 100 100 Vessel owning and chartering Illuminous Limited BVI/Int’l 1 share of US$1 100 100 Vessel owning and chartering Kumberstar Limited BVI 1 share of US$1 100 100 Vessel owning ProspectNumber59Limited E&W 1shareofGBP1 100 100 Vessel owning and chartering ProspectNumber60Limited E&W 1shareofGBP1 100 100 Vessel owning and chartering
Others: Asia Pacific Capital Developments Limited 亞太資本發展有限公司 HK 1 share of HK$1 100 100 Property holding Asia Pacific Fortune (HK) Limited 亞太財富(香港)有限公司 HK 1 share of HK$1 100 100 Investment holding of PRC terminal Bulk Ventures Limited BVI 1 share of US$1 100 100 Investment holding Great Prosperity Business Management PRC US$2,900,000 100 100 Property holding Consulting (Wuhan) Limited 1&2 (registered capital) 漢隆企業管理諮詢(武漢)有限公司 Pacific Basin Agencies Limited HK/Int’l 1 share of HK$1 100 100 Holding company of Japan branch 太平洋航運代理有限公司 Pacific Basin Handymax Limited HK 1 share of HK$1 100 100 Ship management services PacificBasinHandymax(UK)Limited E&W 1shareofGBP1 100 100 Ship management services Pacific Basin Handysize Limited BVI/HK 10 shares of US$1 each 100 100 Ship management services Pacific Basin Handysize (HK) Limited HK 1 share of HK$1 100 100 Ship management services PacificBasinHandysize(UK)Limited E&W 2sharesofGBP1each 100 100 Ship management services Pacific Basin Shipping (Australia) Pty Ltd 1 AUS 1 share of AUD1 100 100 Shipping consulting services Pacific Basin Shipping (Canada) Limited BC, Canada 1 common share without par value 100 100 Shipping consulting services PacificBasinShipping(Chile)Limitada Chile,Santiago Chileanpesosequivalent 100 100 Shipping consulting services toUS$6,000 PacificBasinShippingConsulting PRC US$3,500,000 100 100 Shipping consulting services (Shanghai) Limited1&2 (registered capital) 沛碧航運管理諮詢(上海)有限公司 Pacific Basin Shipping, Denmark ApS Denmark 800 shares of DKK100 each 100 – Shipping consulting services PacificBasinShipping(Germany)GmbH Germany 1shareofEUR25,000 100 100 Shipping consulting services Pacific Basin Shipping (HK) Limited 太平洋航運(香港)有限公司 HK 2 shares of HK$10 each 100 100 Ship agency services Pacific Basin Shipping Middle East DMCC 1 DubaiMulti 500sharesofAED1,000each 100 100 Shipping consulting services Commodities Centre (DMCC) Pacific Basin Shipping (New Zealand) Limited 1 New Zealand 100 shares without par value 100 100 Shipping consulting services Pacific Basin Shipping (South Africa) Pty Ltd Republic of 120 shares without par value 100 – Shipping consulting services South Africa PacificBasinShipping(UK)Limited E&W 2sharesofGBP1each 100 100 Shipping consulting services Pacific Basin Shipping (USA) Inc. USA 100 shares of US$10 each 100 100 Ship management services PB Bunkers (BVI) Limited BVI/Int’l 1 share of US$1 100 100 Joint venture partner in Seafuels Limited PB Commerce Limited BVI/HK 1 share of US$1 100 100 Investment holding PB Maritime Services Limited HK 1 share of HK$1 100 100 Ship management services PB Maritime Personnel Inc.1 The Philippines 1,730,000 shares of PHP10 each 100 100 Crewing services PBS Corporate Secretarial Limited HK 1 share of HK$1 100 100 Secretarial services Taihua Shipping (Beijing) Limited 1&2 PRC US$4,000,000 (registered capital) 100 100 Ship agency and management 太華船務(北京)有限公司 services
1 The financial statements of these subsidiaries have not been audited by PricewaterhouseCoopers. The aggregate net assets and net results for the year attributable to the shareholders of the Group amounted to approximately US$12,977,000 (2010: US$13,020,000) and US$248,000 loss (2010: US$308,000 loss) respectively.
2 These subsidiaries are wholly foreign-owned enterprises established in the PRC, with registered capital fully paid up by the Group.
3 Under the place of incorporation/operation, “AUS” represents “Australia”, “BVI” represents “The British Virgin Islands”, “Cook” represents“TheCookIsland”,“E&W”represents“EnglandandWales”,“HK”represents“HongKong”and“Int’l”represents“International”.

PACIFIC BASIN SHIPPING LIMITED • ANNUAL REPORT 2011
Independent Auditor’s Report 151
Group O
verviewBusiness Review
Financial ReviewG
overnance Financial S
tatements
CS
R Report
To the Shareholders of Pacific Basin Shipping Limited(incorporated in Bermuda with limited liability)
We have audited the consolidated financial statements of Pacific Basin Shipping Limited (the “Company”) and its subsidiaries (together, the “Group”) set out on pages 92 to 150, which comprise the consolidated and company balance sheets as at 31 December 2011, and the consolidated income statement, the consolidated statement of comprehensive income, the consolidated statement of changes in equity and the consolidated cash flow statement for the year then ended, and a summary of significant accounting policies and other explanatory information.
DirecTorS’ reSPonSiBiLiTy for The conSoLiDaTeD financiaL STaTemenTS
The Directors of the Company are responsible for the preparation of consolidated financial statements that give a true and fair view in accordance with Hong Kong Financial Reporting Standards issued by the Hong Kong Institute of Certified Public Accountants and the disclosure requirements of the Hong Kong Companies Ordinance, and for such internal control as the Directors determine is necessary to enable the preparation of consolidated financial statements that are free from material misstatement, whether due to fraud or error.
auDiTor’S reSPonSiBiLiTy
Our responsibility is to express an opinion on these consolidated financial statements based on our audit and to report our opinion solely to you, as a body, in accordance with Section 90 of the Companies Act 1981 of Bermuda and for no other purpose. We do not assume responsibility towards or accept liability to any other person for the contents of this report.
We conducted our audit in accordance with Hong Kong Standards on Auditing issued by the Hong Kong Institute of Certified Public Accountants. Those standards require that we comply with ethical requirements and plan and perform the audit to obtain reasonable assurance about whether the consolidated financial statements are free from material misstatement.
An audit involves performing procedures to obtain audit evidence about the amounts and disclosures in the consolidated financial statements. The procedures selected depend on the auditor’s judgment, including the assessment of the risks of material misstatement of the consolidated financial statements, whether due to fraud or error. In making those risk assessments, the auditor considers internal control relevant to the entity’s preparation of consolidated financial statements that give a true and fair view in order to design audit procedures that are appropriate in the circumstances, but not for the purpose of expressing an opinion on the effectiveness of the entity’s internal control. An audit also includes evaluating the appropriateness of accounting policies used and the reasonableness of accounting estimates made by the Directors, as well as evaluating the overall presentation of the consolidated financial statements.
We believe that the audit evidence we have obtained is sufficient and appropriate to provide a basis for our audit opinion.
oPinion
In our opinion, the consolidated financial statements give a true and fair view of the state of affairs of the Company and of the Group as at 31 December 2011, and of the Group’s profit and cash flows for the year then ended in accordance with Hong Kong Financial Reporting Standards and have been properly prepared in accordance with the disclosure requirements of the Hong Kong Companies Ordinance.
PricewaterhousecoopersCertified Public Accountants
Hong Kong, 1 March 2012
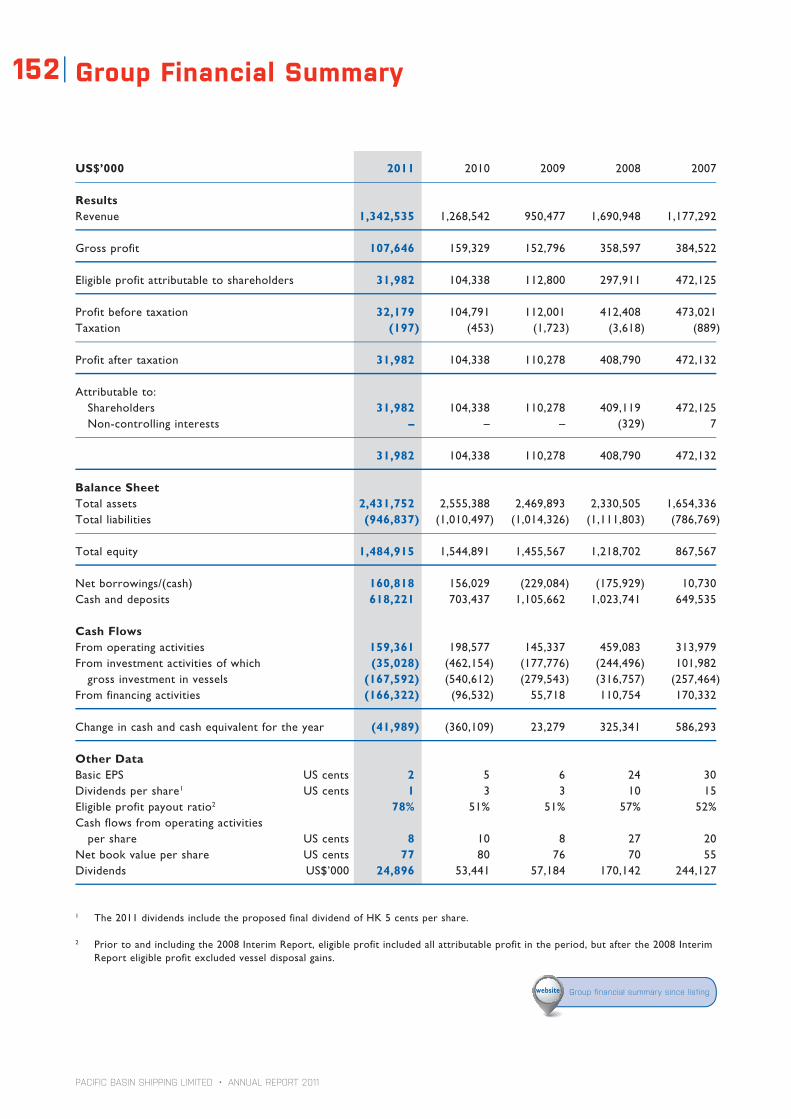
PACIFIC BASIN SHIPPING LIMITED • ANNUAL REPORT 2011
Group Financial Summary152
US$’000 2011 2010 2009 2008 2007
ResultsRevenue 1,342,535 1,268,542 950,477 1,690,948 1,177,292
Gross profit 107,646 159,329 152,796 358,597 384,522
Eligible profit attributable to shareholders 31,982 104,338 112,800 297,911 472,125
Profit before taxation 32,179 104,791 112,001 412,408 473,021Taxation (197) (453) (1,723) (3,618) (889)
Profit after taxation 31,982 104,338 110,278 408,790 472,132
Attributable to: Shareholders 31,982 104,338 110,278 409,119 472,125 Non-controlling interests – – – (329) 7
31,982 104,338 110,278 408,790 472,132
Balance SheetTotal assets 2,431,752 2,555,388 2,469,893 2,330,505 1,654,336Total liabilities (946,837) (1,010,497) (1,014,326) (1,111,803) (786,769)
Total equity 1,484,915 1,544,891 1,455,567 1,218,702 867,567
Net borrowings/(cash) 160,818 156,029 (229,084) (175,929) 10,730Cash and deposits 618,221 703,437 1,105,662 1,023,741 649,535
Cash FlowsFrom operating activities 159,361 198,577 145,337 459,083 313,979From investment activities of which (35,028) (462,154) (177,776) (244,496) 101,982 gross investment in vessels (167,592) (540,612) (279,543) (316,757) (257,464)From financing activities (166,322) (96,532) 55,718 110,754 170,332
Change in cash and cash equivalent for the year (41,989) (360,109) 23,279 325,341 586,293
Other DataBasic EPS US cents 2 5 6 24 30Dividends per share1 US cents 1 3 3 10 15Eligible profit payout ratio2 78% 51% 51% 57% 52%Cash flows from operating activities per share US cents 8 10 8 27 20Net book value per share US cents 77 80 76 70 55Dividends US$’000 24,896 53,441 57,184 170,142 244,127
1 The 2011 dividends include the proposed final dividend of HK 5 cents per share.
2 Prior to and including the 2008 Interim Report, eligible profit included all attributable profit in the period, but after the 2008 Interim Report eligible profit excluded vessel disposal gains.
Group financial summary since listingwebsite

PACIFIC BASIN SHIPPING LIMITED • ANNUAL REPORT 2011
Corporate Information 153
BOARD OF DIRECTORS PRINCIPAL BOARD COMMITTEES
EXECUTIVE DIRECTORS EXECUTIVE COMMITTEEMr. David M. Turnbull (Chairman) Mr. Klaus Nyborg (Chairman)Mr. Klaus Nyborg (Chief Executive Officer) Mr. David M. TurnbullMr. Jan Rindbo (Chief Operating Officer) Mr. Jan RindboMr. Andrew T. Broomhead (Chief Financial Officer) Mr. Andrew T. BroomheadMr. Wang Chunlin Mr. Wang Chunlin
NON-EXECUTIVE DIRECTOR AUDIT COMMITTEEMr. Richard M. Hext Mr. Patrick B. Paul (Chairman)
Mr. Robert C. NicholsonINDEPENDENT NON-EXECUTIVE DIRECTORS Mr. Alasdair G. MorrisonMr. Patrick B. Paul Mr. Daniel R. BradshawMr. Robert C. NicholsonMr. Alasdair G. MorrisonMr. Daniel R. Bradshaw
REMUNERATION AND NOMINATION COMMITTEESMr. Robert C. Nicholson (Chairman)Mr. Patrick B. PaulMr. Alasdair G. MorrisonMr. Daniel R. Bradshaw
PRINCIPAL PLACE OF BUSINESS REGISTERED ADDRESS
7th Floor, Hutchison House Clarendon House10 Harcourt Road, Central 2 Church StreetHong Kong Hamilton HM11tel: + 852 2233 7000 Bermuda
OFFICES WORLD WIDE
Hong Kong, Shanghai, Beijing, Dalian, Nanjing, Manila, Tokyo, Auckland, Sydney, Melbourne, Fremantle, Gladstone, Dubai, Durban, London, Liverpool, Copenhagen, Bad Essen, Stamford, Vancouver and Santiago
SHARE REGISTRAR AUDITORS
Computershare Hong Kong Investor Services Limited
PricewaterhouseCoopers
17M Floor, Hopewell Centre SOLICITORS183 Queen’s Road East Mayer Brown JSMWanchai, Hong Kong Linklaterstel: + 852 2862 8555 fax: + 852 2865 0990 Vincent T.K. Cheung, Yap & Co.e-mail: [email protected]
COMPANY SECRETARY WEBSITE
Mr. Andrew T. Broomhead, FCPA http://www.pacificbasin.come-mail: [email protected]
LISTING VENUE/LISTING DATE STOCK CODE
The Stock Exchange of Hong Kong Limited Stock Exchange: 2343.HK(the “Stock Exchange”)/14 July 2004 Bloomberg: 2343 HK
Reuters: 2343.HK
PUBLIC AND INVESTOR RELATIONS TOTAL SHARES IN ISSUE
The Company 1,936,577,119 as at 31 December 2011e-mail: [email protected]: + 852 2233 7000 fax: + 852 2110 0171
Directors & Senior Management biographies
p.70

Stock Code : 2343
Paci�c Basin Shipping Limited7/F, Hutchison House, 10 Harcourt Road, Central, Hong KongTelephone: (852) 2233 7000 Facsimile: (852) 2865 2810www.paci�cbasin.com