2011 outlook - e&p and mlp - pipelines - 19 january 2011
TRANSCRIPT

©©
Credit Research | Americas
Contributing Research Analysts
Daniel Volpi, [email protected]
Brock [email protected]
January 19, 2011
See Disclosures Appendix A1 for the Analyst Certification and Other Important Disclosures
Nomura Energy Credit ResearchE&P and MLP/Pipelines
2011 Outlook
Page 2
Table of Contents
Overview Page 3 – 16 Recommendation Changes 3 Picks and Trade Ideas 4 – 7 Recommendations 8 – 9 Key Themes 10 Commodity Prices 11 Inventories 12 – 13 Oil-Gas Ratio 14 Rig Counts 15 – 16
Recommendations Page 17 – 68 Exploration & Production Recommendations 17 – 51 Exploration & Production Comparative Tables 52 – 56 Exploration & Production Hedging Profiles 57
Master Limited Partnerships Recommendations 58 – 68
Disclosures Appendix A1 Page 69 – 71

Recommendation Changes
We are revising our ratings on two E&P names.
Nexen Inc. (NXYCN)
We are revising our rating to BUY from HOLD on NXYCN long bonds. Despite the pending downgrade to Ba1 at Moody’s, we believe that current levels provide a good entry point for longer-term tightening potential of 20 bps on the long end. We believe that a Ba1/BBB-rated Nexen, which is our base case scenario, should trade roughly 10-15 bps through Anadarko Petroleum. We like the lower dollar price NXYCN 5.875% of 2035 at +210bp ($90.85), trading flat on a curve basis to the APC 6.45% of 2036 ($97.00). We also note that there is a reasonable possibility that Nexen management obtains IG ratings from Fitch Ratings, which would keep NXYCN in the major IG credit indices and provide greater upside from our base case scenario. We had moved to a HOLD rating based partially on our concerns over technical selling pressures ahead of the pending Moody’s downgrade. However, year-end 2010 positioning is now behind us, and our sense is that bonds have largely transitioned from would-be forced sellers.
Apache Corp. (APA)
We are revising our BUY rating to HOLD on APA senior notes. We had previously expressed the view that APA’s recent acquisition spree provided an opportunity to buy APA paper at a discount to historical trading levels. We still view APA as a core holding in the high-quality energy space but with levels now more in-line with single-A rated energy names, the trade has largely played out and we see little opportunity for material tightening/outperformance from current levels.
Page 3

Picks and Trade Ideas BUY Nexen (NXYXN) 7.5% senior notes 2039, 6.4% senior notes 2037, 5.875% senior notes 2035
We view current levels as a good entry point for 20bp tightening potential on long bonds. See page 40.
BUY Plains Exploration and Production (PXP) 7.625% senior notes due 2020
PXP offers attractive yield relative to upper-tier HY E&Ps and potential for debt reduction from pending asset sales. See page 46.
BUY Kinder Morgan (KMP) 6.95% senior notes due 2038, 6.5% senior notes due 2039, and 6.55% senior notes due 2040
We view the long end of the senior debt complex as most attractive, with long bonds trading at a roughly 30bp spread to 10-year notes. Note that lower-rated EPD and WPZ 10s-30s curves are flat-10bp. See page 64.
Swap into CNQCN 6.25% of 2038, out of CVECN 6.75% of 2039
The trade allows investors to maintain exposure to crude oil, and take out ~$5 dollar price at even spread to the curve.
Swap into WPZ 4.125% of 2020, out of EPD 5.2% of 2020
While benchmark MLP issuer EPD has greater scale, WPZ offers lower-leverage and less commodity price exposure. The trade allows investors to diversify their MLP holdings with a modest pick up 5bp and take out of $9 dollar price.
Swap into ECACN 5.9% of 2017, out of ECACN 6.5% of 2019
Although we are bearish on natural gas fundamentals, ECACN 2017s appear cheap relative to the ECACN senior notes complex. Investors can shorten 1.5 years in the natural gas producer, take out $4 dollar price and give only 5bp to the curve.
Swap into SLB 4.2% of 2021, out of COP 6.0% of 2020
Recent SLB new issuance provides exposure to premier oilfield services player SLB. The trade allows investors to pick up modestyield and take out $15 dollar price into a par bond.
Page 4

Page 5
Despite the pending downgrade to Ba1 at Moody’s, we believe that current levels provide a good entry point for longer-term tightening potential of 20 bps on the long end.
We believe that a Ba1/BBB- rated Nexen, which is our base case scenario, should trade 10-15 bp through Anadarko Petroleum. We like the lower dollar price NXYCN 5.875% of 2035 at +210bp ($90.85), trading flat to the APC 6.45% of 2036 ($97) on a curve basis.
Moody’s review for downgrade remains focused on Nexen’s leverage metrics, which the agency deems as inconsistent with IG ratings. We have argued, however, that debt/EBITDA of 1.4x (1.1x net basis) has improved from 2.5x (1.8x) in the year-ago period and is comparable with low-BBB rated E&Ps. On a net debt/production basis, leverage stands at C$21k per boe/day compared with C$30K last year following C$1.5bn of debt repayment since year-end 2009.
While we may disagree that NXYCN’s credit profile merits below investment grade ratings, we nevertheless must respect the significance of split rating on valuations. As such, we view APC (rated Ba1/BBB) as the best comparison since APC’s crossover ratings reflect an expectation of increased leverage from the spill liability. Again, we would expect NXYCN to trade roughly flat with APC with Ba1/BBB ratings.
There is also the possibility that NXYCN pursues credit ratings from Fitch Ratings. While management can not comment on the matter, we would point out that an “8 B” energy name would remain in the major IG credit indices, alleviating concerns of forced selling pressure.
From a technical perspective, we remain cognizant of the potential selling pressure following the pending downgrade . That said, our sense is that bonds have already transitioned from would-be forced sellers and year-end 2010 positioning is behind us.
BUY Nexen Inc. (NXYCN) long bonds: 7.5% senior notes 2039; 6.4% senior notes 2037; 5.875% senior notes 2035
Company SnapshotReserves (MMBoe) 920
% Oil 93%
% Proved Developed 55%
Reserve Life (R/P) 11.8
Daily Production (MBoe/d) 213
LTM EBITDAX 3,929
2010 EBITDAX 3,607
Cash 1,210
Total Debt 5,678
Market Capitalization 11,490
Enterprise Value 15,958
Debt/EBITDAX 1.4x
Debt/Reserves 6.18
EV/EBITDAX 4.1x
EV/Reserves 17.36
Long Lake, 32%
Syncrude, 31%
United Kingdom,
19%
Canada, 8%
United States, 5%
Yemen, 1% Other, 4%
Proved Reserves
2011 Best Picks
Source: Company Filings, Nomura Securities International.
Page 6
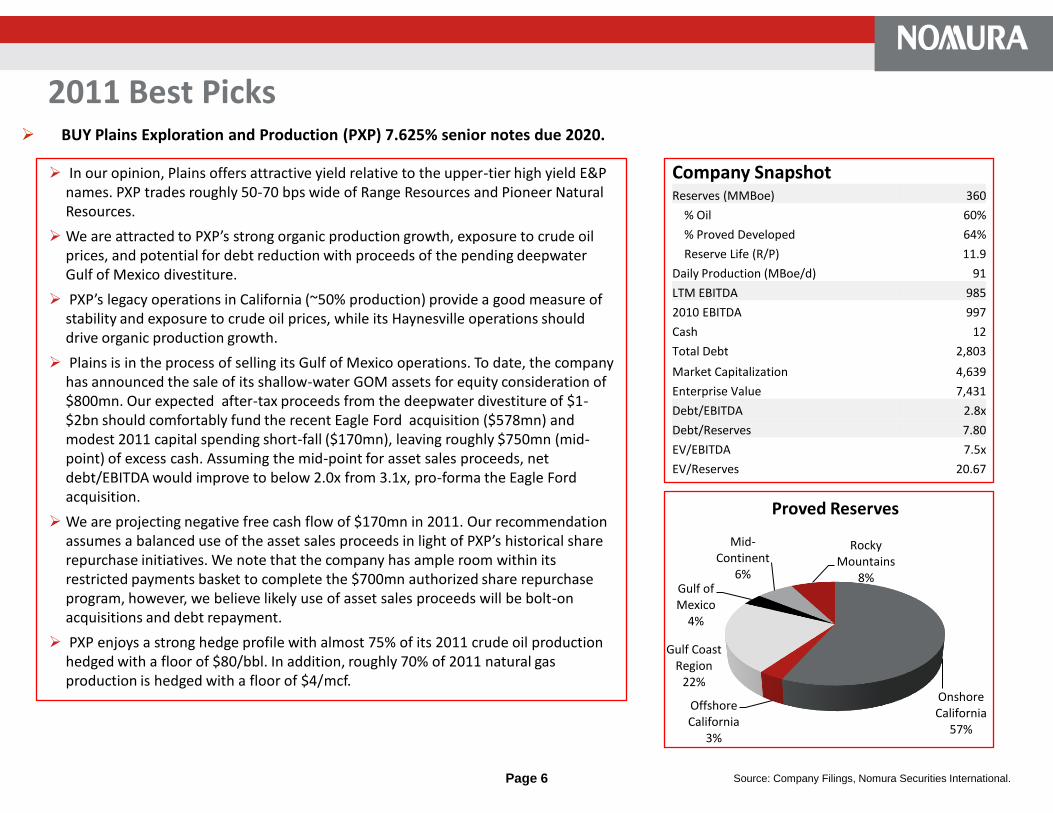
In our opinion, Plains offers attractive yield relative to the upper-tier high yield E&P names. PXP trades roughly 50-70 bps wide of Range Resources and Pioneer Natural Resources.
We are attracted to PXP’s strong organic production growth, exposure to crude oil prices, and potential for debt reduction with proceeds of the pending deepwater Gulf of Mexico divestiture.
PXP’s legacy operations in California (~50% production) provide a good measure of stability and exposure to crude oil prices, while its Haynesville operations should drive organic production growth.
Plains is in the process of selling its Gulf of Mexico operations. To date, the company has announced the sale of its shallow-water GOM assets for equity consideration of $800mn. Our expected after-tax proceeds from the deepwater divestiture of $1-$2bn should comfortably fund the recent Eagle Ford acquisition ($578mn) and modest 2011 capital spending short-fall ($170mn), leaving roughly $750mn (mid-point) of excess cash. Assuming the mid-point for asset sales proceeds, net debt/EBITDA would improve to below 2.0x from 3.1x, pro-forma the Eagle Ford acquisition.
We are projecting negative free cash flow of $170mn in 2011. Our recommendation assumes a balanced use of the asset sales proceeds in light of PXP’s historical share repurchase initiatives. We note that the company has ample room within its restricted payments basket to complete the $700mn authorized share repurchase program, however, we believe likely use of asset sales proceeds will be bolt-on acquisitions and debt repayment.
PXP enjoys a strong hedge profile with almost 75% of its 2011 crude oil production hedged with a floor of $80/bbl. In addition, roughly 70% of 2011 natural gas production is hedged with a floor of $4/mcf.
BUY Plains Exploration and Production (PXP) 7.625% senior notes due 2020.
Proved Reserves
Company SnapshotReserves (MMBoe) 360
% Oil 60%
% Proved Developed 64%
Reserve Life (R/P) 11.9
Daily Production (MBoe/d) 91
LTM EBITDA 985
2010 EBITDA 997
Cash 12
Total Debt 2,803
Market Capitalization 4,639
Enterprise Value 7,431
Debt/EBITDA 2.8x
Debt/Reserves 7.80
EV/EBITDA 7.5x
EV/Reserves 20.67
Onshore California
57%
Offshore California
3%
Gulf Coast Region
22%
Gulf of Mexico
4%
Mid-Continent
6%
Rocky Mountains
8%
2011 Best Picks
Source: Company Filings, Nomura Securities International.

Page 7
As one of the largest and most diversified MLPs, we view KMP as a core holding in the high grade MLP space. While the oil production (CO2) segment stands out as atypical to its competitors’ operations, the related hedging program and very high quality, regulated mix of the conventional segments offsets C02’s higher operational risk. We view the long end of the senior debt complex as most attractive, with long bonds trading at a roughly 30bp spread to 10-year notes. We note that lower-rated EPD and WPZ 10s-30s curves are flat-10bp.
Kinder Morgan’s leverage is ~4.6x debt/EBITDA, above the peer average of 4.3x. Over the past 2 years, KMP’s leverage has been above the peer average due to guaranteed joint venture debt. This debt was used to fund construction of new projects (Rockies Express, Midcontinent Express, Fayetteville Express) and once these projects are placed into service, KMP typically terms out the debt at the asset level, thus becoming non-recourse to KMP. Currently, KMP has ~$500mn of guaranteed JV debt, primarily related to the Fayetteville Express Pipeline. FEP was placed into service on December 2nd and we expect the pipeline to issue debt to term out construction costs. This reduction in debt and the increase in EBITDA from the new project should bring leverage closer to the peer average.
Kinder Morgan’s has a well diversified and stable business mix: ~25% of EBITDA from natural gas pipelines; ~25% from refined products pipelines; ~20% from storage terminals; and ~30% from its CO2 business. While the first three segments are primarily stable, fee-based businesses, the CO2 segment’s oil production represents direct commodity price exposure. Approximately 70% of 2011 expected production is currently hedged.
Products Pipelines
21%
Natural Gas Pipelines
25%CO229%
Terminals19%
Kinder Morgan Canada
6%
Segment EBITDA
BUY Kinder Morgan Energy Partners (KMP) 6.95% senior notes due 2038, 6.5% senior notes due 2039, and 6.55% senior notes due 2040.
2011 Best Picks
Source: Company Filings, Nomura Securities International.

Page 8
Company Recommendation Rationale
Anadarko Petroleum Company HOLDWe still see longer-term upside as the Macondo liability is resolved but we view current spreads are somewhat full considering the uncertainty.
Apache Corporation HOLD
We are revising our BUY rating to HOLD on APA senior notes. We had previously expressed the view that APA’s recent acquisition spree provided an opportunity to buy APA paper at a discount to historical trading levels. We still view APA as a core holding in the high-quality energy space, with levels now more in-line with single-A rated energy names, the trade has largely played out and we see little opportunity for material tightening/outperformance from current levels.
Canadian Natural Resources Ltd. BUYAttractive exposure to crude oil pricing (70% of production), low leverage, and good free cash flow profile. We believe that the Horizon incident will likely be resolved in the near-term.
Cenovus Energy Inc. BUY Exposure to oil (~50% of production), free cash flow generation, and best-in-class oil sands operations.
Chesapeake Energy Company HOLDCore holding in high yield energy. Premier assets and consistent production growth offset by risks attendant to recent strategic shift toward liquids production and negative free cash flow.
Devon Energy Company HOLD A high quality, well-diversified portfolio and conservative credit profile are offset by tight trading levels.
EnCana Corporation SELLChallenging fundamentals in the North American natural gas market, relatively tight spreads, and negative free cash flow.
Hess Corporation SELLMinimal hedging policy, high capital requirements for riskier international prospects in Africa and Asia, and sizeable GOM leases.
Marathon Oil Corporation HOLD
While the recently announced plan to spin-off the refining business will be neutral from a financial leverage perspective, the business profile will be diminished by the loss of the high-quality refining operations. However, management plans to reduce debt by $2.5bn (likely through tender offers) and market technicals will likely keep notes from materially widening from current levels, in our opinion.
Newfield Exploration Company HOLD Low relative yields are offset by a strong hedge profile and free cash flow generation.
Nexen Inc. BUY Attractive entry point for 20bp tightening potential in long end of the curve.
Noble Energy, Inc. HOLDSmaller reserve size and nontraditional international development plans are offset by upside potential at the Tamar discovery and competitive cost structure.
Pioneer Natural Resources Company HOLDManagement is pursuing robust production targets while maintaining spending within cash flows. The company has moderate leverage but relatively high finding costs.
Plains Exploration & Production Company BUY PXP offers attractive yield along with organic production growth, exposure to crude oil prices, and the potential for debt reduction from proceeds of the pending deepwater GOM divestiture.
Range Resources Corporation HOLDRelatively low yield and projected free cash flow deficit are offset by strong operational profile, very low cost structure, and moderate leverage.
Talisman Energy Inc. HOLD Wide spreads are merited due to ongoing strategy shifts and cash flow burn, mitigated to an extent by low leverage.

Company Recommendation Rationale
DCP Midstream LLC BUYWe are attracted to the DCMPID’s strong business position in natural gas gathering and processing, conservative leverage, anddemonstrated support from its 50/50 parents ConocoPhillips (A1/A/A) and Spectra Energy (Baa2/BBB). At 15-20bp wide to benchmark MLPs, we view DCPMID (organized as a c-corp.) as excessively wide.
Enbridge Energy Partners, L.P. HOLD
Despite the recent noise surrounding the pipeline spill, we remain comfortable with EEP’s credit profile. We note that EEP enjoys an excellent business position in oil and refined products pipelines and a relatively high percentage of fee-based cash flow. In addition, EEP is strategically important to its general partner and largest unit holder, Enbridge Inc. (Baa1/A-), which in the past has provided financial support to the MLP. Our HOLD rating is based on what we view as full valuations relative to its MLP peers and limited upside.
Energy Transfer Partners, L.P. HOLD
We believe that ETP‘s credit profile has strong positive momentum but the senior notes appear fairly valued, considering the higher dollar price and weaker liquidity in the issues. We are attracted to ETP’s scale and diversification across interstate, intrastate, and midstream natural gas operations. The completion of two large interstate pipelines will improve the business mixby increasing regulated interstate pipeline earnings to nearly 30% from 16%, and reduce the less stable intrastate contribution to 40% from 47%.
Enterprise Products Partners L.P. HOLD
EPD is one of the better-managed midstream companies and enjoys excellent scale, with a significance presence in existing and emerging natural gas producing regions. While EPD does have above-average commodity price exposure given its NGL operations, this is partially offset by conservative financial policies, including a willingness to issue equity units to balance its capital structure.
Kinder Morgan Energy Partners, L.P. BUY
As one of the largest and most diversified MLPs, we view KMP as a core holding in the high grade MLP space. While the oil production (CO2) segment stands out as atypical to its competitors’ operations, the related hedging program and very high quality, regulated mix of the conventional segments offsets the CO2 operational risk . We view the long end of the senior debt complex as most attractive, with long bonds trading at a roughly 30bp spread to 10-year notes. We note that lower-rated EPD and WPZ 10s-30s is roughly flat-10bp.
ONEOK Partners, L.P. HOLDONEOK should benefit from its exposure to NGL fundamentals and recent growth initiatives in the Bakken and Williston basins. OKS is managing itself to maintain mid-BBB ratings and enjoys support from its parent ONEOK, Inc.(Baa2/BBB), which holds a ~40% interest. We view current levels as roughly fair considering that it is a somewhat illiquid name in the space.
Plains All American Pipeline, L.P. SELLWe maintain a favorable view on Plains’ largely fee-based crude oil and products pipeline business. However, we believe that current spreads do not compensate for the high leverage of 5.2x debt/EBITDA (high 4x adjusted for oil inventory related debt)and risk inherent to the marketing operations (20-25% of earnings).
TransCanada PipeLines Ltd. SELLRespecting the highly regulated nature of the business mix and the single-A ratings, we view current levels as rich considering the company’s high leverage and negative free cash flow profile. Although the name trades wide for its A ratings, we believe that expectations of steady issuance to finance its cash flow deficit will limit upside from current levels.
Williams Partners, LP HOLD
We are attracted to WPZ’s relatively stable business mix and low leverage compared to its MLP peers. The company owns two major, regulated interstate pipelines and its midstream operations are roughly 50% fee-based. At roughly flat to EPD, we would recommend swapping into WPZ senior notes in order to diversify MLP exposure. While EPD is a larger, better diversified benchmark MLP issuer, WPZ operates with lower leverage (3.8x vs. 4.3x) and less commodity exposure.
Page 9

Page 10
Divergent fundamentals for crude oil and U.S natural gas prices. Global economic activity levels and a balanced inventory picture should maintain supportive pricing for crude oil. The U.S natural gas market, however, remains stubbornly over-supplied. While we would expect a tapering off of natural gas drilling required to hold leases, the implied supply curtailment will likely be insufficient to tighten market conditions in the near- to medium-term. The percentage of hedged production for 2011 is reduced from 2010 levels but nevertheless offers a good degree of downside protection. For 2011 modeling assumptions, we are using $85/bbl WTI and $4.50/mcf Henry Hub.
E&P asset repositioning: more drilling, less land-grab. E&Ps will continue executing the broad strategic shift toward increased liquids – crude oil and NGL – production. We expect that acreage acquisition activity will moderate from the torrid pace of 2010. Intensified development drilling on recently acquired acreage should support increased bookings of proved reserves. An increased use of JVs + drilling carries on developing plays and the divestiture of conventional/non-core assets should offset spending.
Gulf of Mexico: focus will be on the regulatory environment. The administration appears poised to institute a policy response to the Macondo incident rather than aggressively pursuing the involved parties. Macondo will be the platform for a more heavily regulated offshore environment. The involved parties will likely be held liable for damages, but the prospect for severe punitive actions against the involved parties is diminishing. Despite the more burdensome regulatory environment, operating conditions should normalize in the second half of 2011.
Master Limited Partnerships (MLPs) have shifted growth spending toward gathering & processing and NGL operations. The industry is nearing completion of large, long-haul pipeline construction. Broadly speaking, the recently completed projects should improve earnings and cash flow quality. We are expecting the next phase of growth projects to be directed toward the infrastructure build-out in the developing shale plays. 2011 growth spending should yield near- to medium-term earnings contributions since these typical midstream projects are smaller scale and require less lead time. However, the latest MLP growth phase will increase exposure to the more commodity price sensitive segments of the industry.
The MLP acquisition market should remain active. Independent E&Ps and majors will continue divesting infrastructure assets in 2011, providing acquisition opportunities for MLPs. M&A financing is expected to remain largely credit neutral given the traditional balanced debt/equity funding approach.
Key Themes for 2011

Page 11
Oil and Natural Gas Prices
Source: Bloomberg
CommentaryCrude oil, gasoline, and distillate inventories have been running at or near five-year highs for the past 12-24 months (See Page 13). Despite this, WTI prices have recovered from the 2009 lows around $35/Bbl and had established a range of $70-85/Bbl before breaking $90/Bbl in December. With the supply picture essentially unchanged since the beginning of 2009, WTI prices appear to be more closely correlated with broader global commodities. On the demand side, with the prospect of a double dip recession decreasing, emerging markets are expected to drive increased global oil demand. We expect the range to hold in the near-term, as neither the supply nor the demand picture is likely to change dramatically.
Natural gas bottomed in the fall of 2009 at just under $2.00/Mcf with industrial demand reaching its lows and supplies accumulating to record highs. Henry Hub prices received support in the December to March time frame because of higher than normal heating degree days, which resulted in a draw of inventories down towards more normal levels (see Page 12). However, this strength was short-lived and except for a brief flirtation with $5.00/Mcf during an especially hot summer, Henry Hub prices have straddled the $4.00/Mcf level. In 2010, the U.S. gas rig count has increased ~30% and the horizontal rig count (primarily shale gas drilling) is up ~60% (see Pages 15 and 16). Prices should continue the temperature-driven grind upwards over the next few months but with the increasing production profile, we expect a heavy inventory build out of the winter withdrawal season and continued Henry Hub weakness.
$1.00
$1.50
$2.00
$2.50
$3.00
$3.50
$4.00
$4.50
$5.00
$5.50
$6.00
$6.50
$7.00
Henry Hub Natural Gas
$35.00
$40.00
$45.00
$50.00
$55.00
$60.00
$65.00
$70.00
$75.00
$80.00
$85.00
$90.00
$95.00
WTI Crude Oil

Page 12
Natural Gas Inventories
Source: Department of Energy
Commentary
The second half of 2009 saw a glut of natural gas, with demand from residential customers, industrials, and power producers waning and producers continuing to ramp up production. Beginning in June 2009, natural gas inventories hit 5-year highs as the 2009 summer was cooler than normal throughout the U.S. Inventory levels dropped slightly at the beginning of 2010, with a cold winter spurring heating and electricity demand. But the prevailing theme over the last 24 months has been the mismatch between supply and demand – the unconventional gas boom has increased potential United States gas reserves substantially while industrial demand has weakened. According to the Department of Energy, U.S. proved shale gas reserves increased ~50% from 22 Tcf to 33 Tcf from 2007 to 2008; total U.S. gas reserves were 245 Tcf at the end of 2008. We expect total reserve growth to continue to be driven by shale gas additions over the next decade. Further, U.S. natural gas production increased ~3% in 2009 and ~2% during the first half of 2010. In terms of demand, industrial consumption of natural gas (which represents ~1/3 of total consumption) has remained weak – 2009 consumption was down ~8% versus 2008 and while 2010 levels were better than last year, they are still approximately 4% below H1 2008 levels.
A hotter than normal 2010 summer eased inventories from their 5-year highs and as a result Henry Hub prices topped $5.00/Mcf briefly. However, a legitimate oversupply reapplied pressure to gas prices into year-end and inventories are back to last year’s 5-year highs. Inventory levels during the first quarter of the year may dip based on weather, but we expect continued elevated levels throughout 2011.
3,232
1,000
1,500
2,000
2,500
3,000
3,500
4,000
Jan Feb Mar Apr May Jun Jul Aug Sep Oct Nov Dec
Natural Gas Inventories (Bcf)
5-Year Range 2009 2010 5-Year Average
Natural Gas Inventories
2010 Inventories Change 2009 Inventories Change 5-Year Avg. Variance
11/19/2010 3,828 (7) 11/20/2009 3,835 2 3,612 216
11/26/2010 3,805 (23) 11/27/2009 3,837 2 3,571 234
12/3/2010 3,716 (89) 12/4/2009 3,773 (64) 3,496 220
12/10/2010 3,552 (164) 12/11/2009 3,566 (207) 3,339 213
12/17/2010 3,368 (184) 12/18/2009 3,400 (166) 3,193 175
12/24/2010 3,232 (136) 12/25/2009 3,276 (124) 3,085 147

Crude Oil and Refined Products Inventories
Page 13 Source: Department of Energy
250,000
270,000
290,000
310,000
330,000
350,000
370,000
390,000
Jan Feb Mar Apr May Jun Jul Aug Sep Oct Nov Dec
Crude Inventories (MBbl)
5-Year Range 2009 2010 5-Year Average
170,000
180,000
190,000
200,000
210,000
220,000
230,000
240,000
Jan Feb Mar Apr May Jun Jul Aug Sep Oct Nov Dec
Gasoline Inventories (MBbl)
5-Year Range 2009 2010 5-Year Average
100,000
110,000
120,000
130,000
140,000
150,000
160,000
170,000
180,000
Jan Feb Mar Apr May Jun Jul Aug Sep Oct Nov Dec
Distillate Inventories (MBbl)
5-Year Range 2009 2010 5-Year Average
20,000
25,000
30,000
35,000
40,000
45,000
50,000
55,000
60,000
65,000
70,000
Jan Feb Mar Apr May Jun Jul Aug Sep Oct Nov Dec
Heating Oil Inventories (MBbl)
5-Year Range 2009 2010 5-Year Average

Oil-Gas Ratio
Page 14 Source: Bloomberg, Nomura Securities International.
CommentaryOver the past 10 years, the oil-gas ratio has averaged approximately 8x. 2009 represented an extreme (average ratio of ~17x) because of the combination of severe natural gas demand erosion and increasing supplies. A new range for the ratio appears to have emerged, however, as the average in 2010 was roughly 19x. Industrial demand has rebounded from the 2009 lows and weather-induced electricity demand has been strong the last 12 months without a large reaction in natural gas prices. Meanwhile, oil prices had been range-bound between $70 and $85/Bbl for much of 2010 before breaking through $90/Bbl in December, correlating with broader global commodities. As a result, several companies have adjusted their capex programs, allocating more capital to oil and liquids-rich projects in order to maximize returns. This is also illustrated in the subsequent rig count data (see Pages 8 and 9) – the U.S. oil rig count has increased over 250% from the June 2009 low, while the U.S. gas rig count is up just under 50%. We expect the oil-gas ratio to remain above historical levels in the near-term, thus continuing to favor oil-weighted producers.
-
5
10
15
20
25
30
35
40
Jan Feb Mar Apr May Jun Jul Aug Sep Oct Nov Dec
Oil-Gas Ratio
5-Year Range 2009 2010 5-Year Average

Rig Counts
Page 15 Source: Baker Hughes Inc.
-
250
500
750
1,000
1,250
1,500
1,750
2,000
2,250
U.S. Rig Count
-
250
500
750
1,000
1,250
International Rig Count
-
200
400
600
800
1,000
1,200
1,400
1,600
1,800
U.S. Gas Rig Count
-
100
200
300
400
500
600
700
800
900
U.S. Oil Rig Count

Rig Counts
Page 16 Source: Baker Hughes Inc.
-
250
500
750
1,000
1,250
1,500
1,750
2,000
2,250
U.S. On Land Rig Count
-
20
40
60
80
100
120
140
160
180
U.S. Offshore Rig Count
-
100
200
300
400
500
600
700
800
900
1,000
U.S. Horizontal Rig Count
-
100
200
300
400
500
600
700
800
900
1,000
1,100
U.S. Vertical Rig Count

Exploration & Production Recommendations
Page 17

Page 18
Relative Value
Source: Company Filings, Nomura Securities International.
Issuer Ratings
Outst.
$mn
Coupon
(%) Maturity STW Z-Sprd Price YTW
Reserves
(Boe)
LTM
EBITDA(X)
Debt /
EBITDA(X)
Debt /
Boe
Apache Corp. Sr. Notes A3 / A- 500 3.625 2/1/2021 72 66 96.18 4.09 2,974 8,231 1.0x 2.14
A3 / A- 1,500 5.100 9/1/2040 91 129 94.50 5.48
A3 / A- 500 5.250 2/1/2042 91 128 96.61 5.48
Anadarko Petroleum Sr. Notes Ba1 / BBB- 1,750 5.950 9/15/2016 220 181 108.95 4.16 2,304 6,737 2.0x 5.53
Ba1 / BBB- 2,000 6.375 9/15/2017 264 195 110.09 4.60
Ba1 / BBB- 300 6.950 6/15/2019 196 231 110.83 5.33
Ba1 / BBB- 600 8.700 3/15/2019 180 224 123.21 5.17
Ba1 / BBB- 1,750 6.450 9/15/2036 213 265 96.98 6.70
Ba1 / BBB- 750 6.200 3/15/2040 208 256 94.26 6.65
Canadian Natural Res. Sr. Notes Baa1 / BBB 1,100 5.700 5/15/2017 140 79 113.24 3.36 3,557 7,284 1.2x 2.72
Baa1 / BBB 400 5.900 2/1/2018 30 91 113.69 3.67
Baa1 / BBB 1,100 6.250 3/15/2038 107 151 108.46 5.64
Cenovus Energy Sr. Notes Baa2 / BBB+ 1,299 5.700 10/15/2019 60 84 112.64 3.97 1,398 3,024 1.2x 2.62
Baa2 / BBB+ 1,400 6.750 11/15/2039 120 164 113.72 5.77
Devon Energy Sr. Notes Baa1 / BBB+ 700 6.300 1/15/2019 41 81 117.21 3.78 2,624 4,875 1.2x 2.66
Baa1 / BBB+ 1,000 7.950 4/15/2032 95 153 130.20 5.52
EnCana Corp. Sr. Notes Baa2 / BBB+ 700 5.900 12/1/2017 165 89 113.84 3.61 1,920 5,460 1.4x 4.05
Baa2 / BBB+ 500 6.500 5/15/2019 59 93 117.83 3.96
Baa2 / BBB+ 500 6.625 8/15/2037 149 197 107.45 6.06
Baa2 / BBB+ 800 6.500 2/1/2038 150 197 105.72 6.07
Hess Corp. Sr. Notes Baa2 / BBB 1,000 8.125 2/15/2019 88 131 126.21 4.25 1,482 6,574 0.8x 3.11
Baa2 / BBB 750 6.000 1/15/2040 118 160 103.55 5.75
Baa2 / BBB 1,250 5.600 2/15/2041 120 160 97.62 5.77
Marathon Oil Sr. Notes Baa1 /*- / BBB+ /*- 687 7.500 2/15/2019 44 85 125.40 3.81 1,076 7,247 1.1x 7.93
Baa1 /*- / BBB+ /*- 750 6.600 10/1/2037 112 158 112.45 5.69
Nexen Inc. Sr. Notes Baa3 /*- / BBB- 300 6.200 7/30/2019 165 195 108.12 5.02 881 3,929 1.4x 7.89
Baa3 /*- / BBB- 1,250 6.400 5/15/2037 207 258 97.07 6.64
Baa3 /*- / BBB- 700 7.500 7/30/2039 218 270 109.49 6.75
Noble Energy Sr. Notes Baa2 / BBB 1,000 8.250 3/1/2019 110 153 125.46 4.47 841 2,130 1.0x 2.48
Baa2 / BBB 250 8.000 4/1/2027 162 240 118.37 6.19
Talisman Energy Sr. Notes Baa2 / BBB 600 3.750 2/1/2021 115 110 93.81 4.52 1,118 4,441 0.8x 3.18
Baa2 / BBB 600 6.250 2/1/2038 130 175 105.16 5.87

Page 19
Relative Value
Debt/Proved Reserves metrics for the following companies are typically in $/Mcfe: Chesapeake ($0.86/Mcfe); Newfield ($0.56/Mcfe); and Range Resources ($0.54/Mcfe)
Source: Company Filings, Nomura Securities International.
Issuer Ratings
Outst.
$mn
Coupon
(%) Maturity STW Z-Sprd Price YTW Next Call
Reserves
(Boe)
LTM
EBITDA(X)
Debt /
EBITDA(X)
Debt /
Boe
Chesapeake Energy Sr. Notes Ba3 / BB 1,425 9.500 2/15/2015 312 338 116.00 5.09 2,102 5,099 2.2x 5.18
Ba3 / BB 1,100 6.500 8/15/2017 410 345 102.25 6.08
Ba3 / BB 600 6.875 8/15/2018 268 376 103.75 6.07 8/15/2013
Ba3 / BB 800 7.250 12/15/2018 281 327 106.50 6.20
Ba3 / BB 1,400 6.625 8/15/2020 289 303 102.50 6.27
Ba3 / BB 499 6.875 11/15/2020 307 318 103.00 6.46
Newfield Exploration Sr. Subordinated Ba2 / BB+ 550 6.625 4/15/2016 253 423 103.75 4.50 4/15/2011 603 1,208 1.8x 3.38
Ba2 / BB+ 600 7.125 5/15/2018 173 417 107.50 5.11 5/15/2013
Ba2 / BB+ 700 6.875 2/1/2020 209 376 107.75 5.48 2/1/2015
Pioneer Natural Res. Sr. Notes Ba1 / BB+ 455 5.875 7/15/2016 301 268 104.25 4.98 899 1,248 2.0x 3.07
Ba1 / BB+ 485 6.650 3/15/2017 337 284 106.75 5.35
Ba1 / BB+ 450 6.875 5/1/2018 234 293 106.75 5.73
Ba1 / BB+ 450 7.500 1/15/2020 255 281 110.75 5.94
Ba1 / BB+ 250 7.200 1/15/2028 232 306 103.00 6.90
Plains E&P Sr. Notes B1 / BB- 600 7.750 6/15/2015 269 435 105.00 4.67 6/15/2011 349 985 2.8x 7.37
B1 / BB- 565 10.000 3/1/2016 343 456 113.50 5.41 3/1/2013
B1 / BB- 500 7.000 3/15/2017 405 427 103.50 6.03 3/15/2012
B1 / BB- 400 7.625 6/1/2018 265 507 106.75 6.04 6/1/2013
B1 / BB- 400 8.625 10/15/2019 321 502 110.00 6.59 10/15/2014
B1 / BB- 300 7.625 4/1/2020 272 433 108.50 6.11 4/1/2015
Range Resources Sr. Subordinated Ba3 / BB 150 6.375 3/15/2015 326 474 102.25 5.24 2/18/2011 521 609 3.0x 3.28
Ba3 / BB 250 7.500 5/15/2016 287 455 104.50 4.85 5/15/2011
Ba3 / BB 250 7.500 10/1/2017 388 518 106.00 5.86 10/1/2012
Ba3 / BB 250 7.250 5/1/2018 250 450 106.00 5.89 5/1/2013
Ba3 / BB 300 8.000 5/15/2019 252 451 109.50 5.91 5/15/2014
Ba3 / BB 500 6.750 8/1/2020 269 322 104.00 6.08 8/1/2015

Page 20 Source: Company Filings, Nomura Securities International.
Anadarko Petroleum Company (APC)
Relative Value
We maintain our HOLD recommendation on Anadarko senior notes. We are comfortable holding the APC senior notes at current levels and we still see longer-term upside once the Macondo liability is resolved. However, we view current spreads as somewhat full given our spread targets and the uncertainty/risk still surrounding the situation.
Note that the APC 2019s trade roughly 120 bp through high yield benchmark issuer Chesapeake Energy and roughly 80 bp outside of wider-trading IG names like Talisman Energy. Under our base case scenario where APC is responsible for $5-8bn in spill liabilities, we would expect split-rated (Ba1/BBB-/BBB-) APC to trade roughly 50-75 bp behind TLM.
Business Description
Anadarko Petroleum Corporation is one of the world’s largest independent oil and gas producers, with proved reserves of 2.3 billion barrels of oil equivalent and operations in the United States, Brazil, Africa, China, and Indonesia. In 2009, the company produced 603 MBoe/d of hydrocarbons, approximately 60% of which was natural gas. In addition to its oil and gas operations, Anadarko owns natural gas gathering, processing, treating, and transportation assets in the United States. Anadarko’s major growth projects include the Marcellus, Eagle Ford, and Haynesville shale plays and self-titled “Mega Projects” in the Gulf of Mexico and Africa.
Company SnapshotReserves (MMBoe) 2,304
% Oil 44%
% Proved Developed 70%
Reserve Life (R/P) 10.5
Daily Production (MBoe/d) 629
LTM EBITDAX 6,737
2011 EBITDAX 7,374
Cash 4,218
Total Debt 13,471
Market Capitalization 37,566
Enterprise Value 46,819
Debt/EBITDAX 2.0x
Debt/Reserves 5.85
EV/EBITDAX 6.9x
EV/Reserves 20.32
RatingsOutstanding
$mm Coupon (%) Maturity STW Z-Sprd Price YTW
Sr. Notes Ba1 / BBB- 1,750 5.950 9/15/2016 220 181 108.79 4.19
Sr. Notes Ba1 / BBB- 2,000 6.375 9/15/2017 264 196 109.97 4.62
Sr. Notes Ba1 / BBB- 300 6.950 6/15/2019 196 230 110.71 5.35
Sr. Notes Ba1 / BBB- 600 8.700 3/15/2019 180 223 123.10 5.19
Sr. Notes Ba1 / BBB- 1,750 6.450 9/15/2036 213 265 96.76 6.72
Sr. Notes Ba1 / BBB- 750 6.200 3/15/2040 208 256 94.03 6.67

Anadarko Petroleum Company (APC)
Source: Company Filings, Nomura Securities International.
2009 Proved Reserves
U.S. Onshore75%
Deepwater GOM12%
International13%
2010 Capital Expenditures
U.S. Onshore44%
International30%
Gulf of Mexico16%
Midstream/ Other12%
Financial Summary
2008 2009 2010E 2011E
EBITDAX 9,304 4,341 6,659 7,374
Operating Cash Flow 6,464 3,926 5,159 5,533
Capital Expenditures (4,801) (4,352) (5,013) (5,400)
Dividends (171) (176) (182) (184)
Free Cash Flow 1,492 (602) (36) (51)
Divestitures 2,455 176 44 -
Share Repurchases (676) (35) (35) -
Adjusted Cash Flow 3,271 (461) (27) (51)
Cash 2,360 3,531 2,917 2,581
Debt/EBITDAX 1.3x 2.9x 1.8x 1.6x
Net Debt/EBITDAX 1.1x 2.1x 1.3x 1.2x
Operations Summary
2008 2009 2010E 2011E
Production (MBoe/d) 563 603 649 693
Realized Price ($/Boe) 60.97 33.96 42.52 44.32
Lease Operating Expenses 8.04 6.92 6.76 6.95
Production Taxes 7.05 3.39 4.70 5.36
G&A 4.20 4.47 3.94 3.73
Interest 3.55 3.19 3.45 3.01
Cash Costs 22.84 17.97 18.84 19.04
F&D Costs 24.37 16.93
Full Cycle Costs 47.21 34.90
Recycle Ratio 1.56 0.94
Page 21
Page 22 Source: Company Filings, Nomura Securities International.
Relative Value
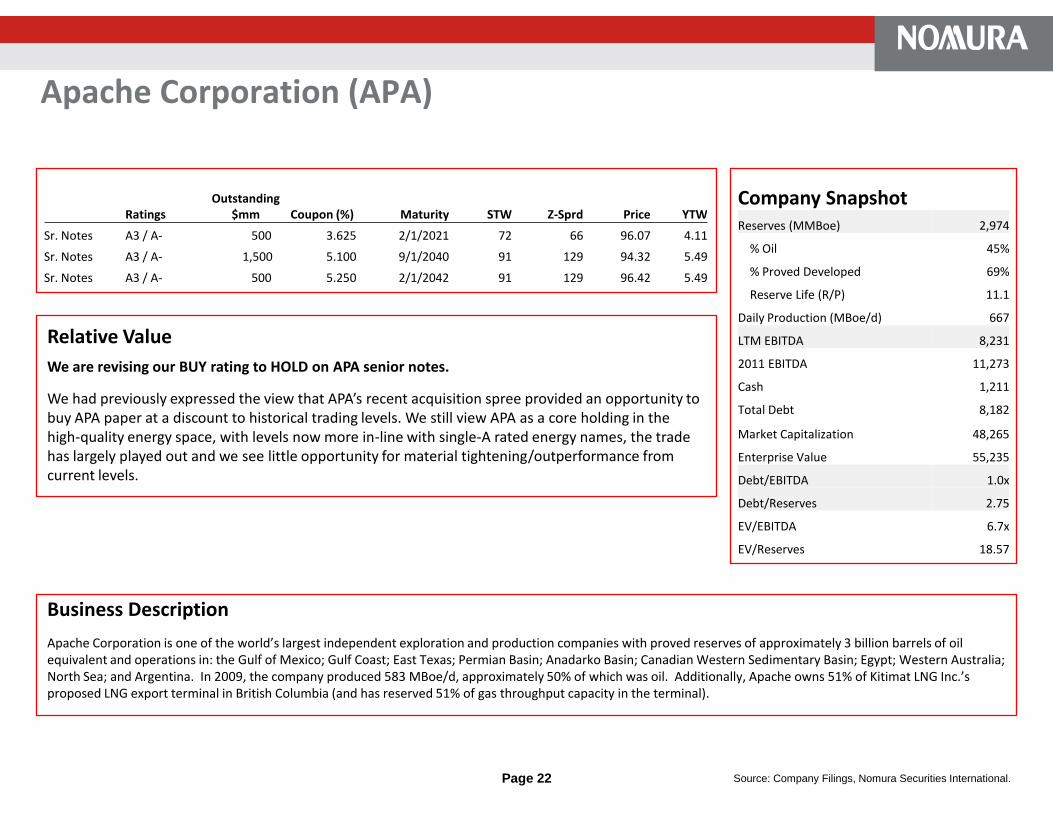
We are revising our BUY rating to HOLD on APA senior notes.
We had previously expressed the view that APA’s recent acquisition spree provided an opportunity to buy APA paper at a discount to historical trading levels. We still view APA as a core holding in the high-quality energy space, with levels now more in-line with single-A rated energy names, the trade has largely played out and we see little opportunity for material tightening/outperformance from current levels.
Apache Corporation (APA)
Business Description
Apache Corporation is one of the world’s largest independent exploration and production companies with proved reserves of approximately 3 billion barrels of oil equivalent and operations in: the Gulf of Mexico; Gulf Coast; East Texas; Permian Basin; Anadarko Basin; Canadian Western Sedimentary Basin; Egypt; Western Australia; North Sea; and Argentina. In 2009, the company produced 583 MBoe/d, approximately 50% of which was oil. Additionally, Apache owns 51% of Kitimat LNG Inc.’s proposed LNG export terminal in British Columbia (and has reserved 51% of gas throughput capacity in the terminal).
Company SnapshotReserves (MMBoe) 2,974
% Oil 45%
% Proved Developed 69%
Reserve Life (R/P) 11.1
Daily Production (MBoe/d) 667
LTM EBITDA 8,231
2011 EBITDA 11,273
Cash 1,211
Total Debt 8,182
Market Capitalization 48,265
Enterprise Value 55,235
Debt/EBITDA 1.0x
Debt/Reserves 2.75
EV/EBITDA 6.7x
EV/Reserves 18.57
RatingsOutstanding
$mm Coupon (%) Maturity STW Z-Sprd Price YTW
Sr. Notes A3 / A- 500 3.625 2/1/2021 72 66 96.07 4.11
Sr. Notes A3 / A- 1,500 5.100 9/1/2040 91 129 94.32 5.49
Sr. Notes A3 / A- 500 5.250 2/1/2042 91 129 96.42 5.49
Page 23 Source: Company Filings, Nomura Securities International.
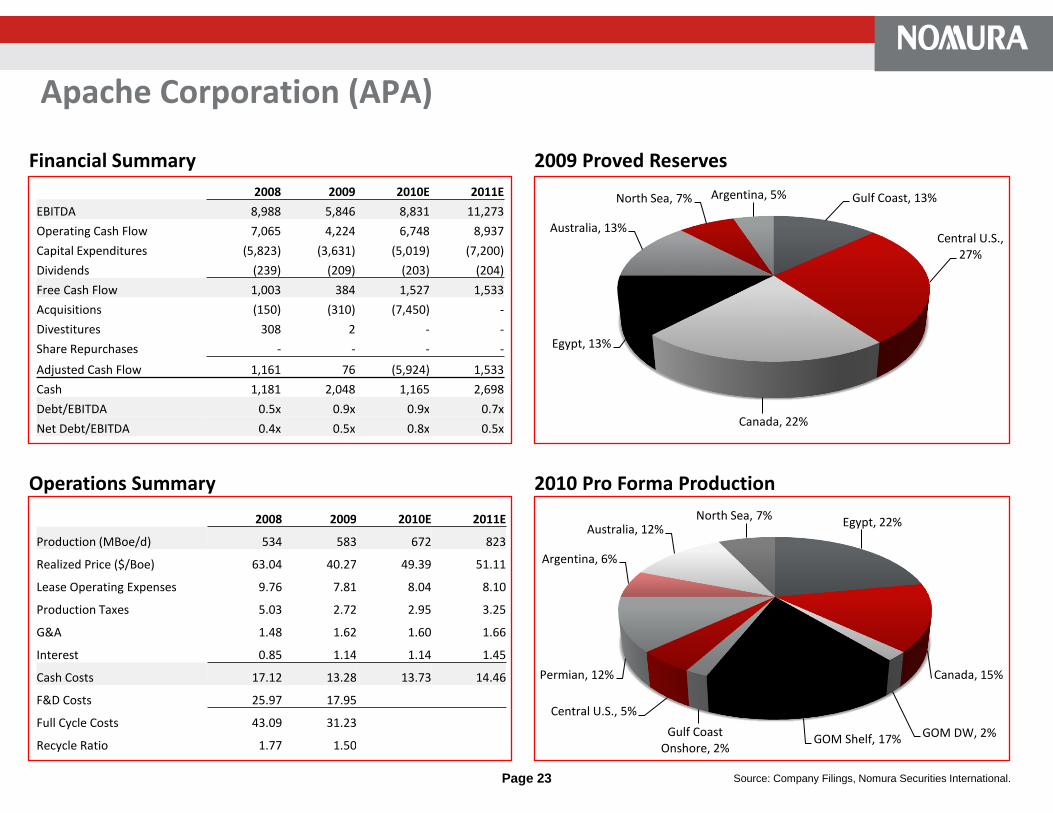
2009 Proved Reserves
2010 Pro Forma Production
Gulf Coast, 13%
Central U.S., 27%
Canada, 22%
Egypt, 13%
Australia, 13%
North Sea, 7% Argentina, 5%
Egypt, 22%
Canada, 15%
GOM DW, 2%GOM Shelf, 17%Gulf Coast
Onshore, 2%
Central U.S., 5%
Permian, 12%
Argentina, 6%
Australia, 12%North Sea, 7%
Apache Corporation (APA)
Financial Summary
2008 2009 2010E 2011E
EBITDA 8,988 5,846 8,831 11,273
Operating Cash Flow 7,065 4,224 6,748 8,937
Capital Expenditures (5,823) (3,631) (5,019) (7,200)
Dividends (239) (209) (203) (204)
Free Cash Flow 1,003 384 1,527 1,533
Acquisitions (150) (310) (7,450) -
Divestitures 308 2 - -
Share Repurchases - - - -
Adjusted Cash Flow 1,161 76 (5,924) 1,533
Cash 1,181 2,048 1,165 2,698
Debt/EBITDA 0.5x 0.9x 0.9x 0.7x
Net Debt/EBITDA 0.4x 0.5x 0.8x 0.5x
Operations Summary
2008 2009 2010E 2011E
Production (MBoe/d) 534 583 672 823
Realized Price ($/Boe) 63.04 40.27 49.39 51.11
Lease Operating Expenses 9.76 7.81 8.04 8.10
Production Taxes 5.03 2.72 2.95 3.25
G&A 1.48 1.62 1.60 1.66
Interest 0.85 1.14 1.14 1.45
Cash Costs 17.12 13.28 13.73 14.46
F&D Costs 25.97 17.95
Full Cycle Costs 43.09 31.23
Recycle Ratio 1.77 1.50

Page 24 Source: Company Filings, Nomura Securities International.
Canadian Natural Resources Ltd. (CNQ)
Relative Value
We are maintaining our BUY recommendation on Canadian Natural Resources (CNQ) senior notes. We are attracted to CNQ’s exposure to crude oil pricing (70% of production), low leverage, and free cash flow profile. We view the company as a core holding in the large independent E&P universe.
From a tactical perspective, we are cognizant that the company may access the debt markets to refinance recent and pending maturities (C$400mn 12/2010 and $400mn 7/2011) and its outstanding revolver draws (C$1.4B at 9/30/10). We believe that new issuance may provide an attractive opportunity to establish or add to existing positions.
We are monitoring the recent (January 2011) damage to the Horizon oil sands project (15% production). Our initial impression is that the damage will be disruptive in the short-term but likely prove to be manageable based on the industry’s historical experience with oil sands accidents. There remains little information available on Horizon, but typical incidents at competitor Suncor have resulted in 2-6 months of downtime. CNQ maintains a C$2bn umbrella policy that covers business interruptions after 90 days.
Business Description
Canadian Natural Resources Ltd. is one of the world’s largest independent exploration and production companies, with approximately 3.6 billion barrels of oil equivalent of proved reserves. With 90% of its production and reserves located in North America, CNQ is the largest heavy oil producer in Canada and 2nd largest independent natural gas producer in Canada. Canadian Natural’s Horizon Oil Sands began development in 2005 and are estimated to contain 16 billion barrels of oil in place and 6-8 billion barrels of mineable reserves and contingent resources. In addition to its North American assets, CNQ has reserves in the North Sea and Offshore West Africa.
Company SnapshotReserves (MMBoe) 3,557
% Oil 85%
% Proved Developed 75%
Reserve Life (R/P) 17.0
Daily Production (MBoe/d) 621
LTM EBITDA 7,284
2011 EBITDA 8,685
Cash 27
Total Debt 8,490
Market Capitalization 45,263
Enterprise Value 53,726
Debt/EBITDA 1.2x
Debt/Reserves 2.39
EV/EBITDA 7.4x
EV/Reserves 15.10
RatingsOutstanding
$mm Coupon (%) Maturity STW Z-Sprd Price YTW
Sr. Notes Baa1 / BBB 1,100 5.700 5/15/2017 140 79 113.12 3.38
Sr. Notes Baa1 / BBB 400 5.900 2/1/2018 30 90 113.60 3.69
Sr. Notes Baa1 / BBB 1,100 6.250 3/15/2038 107 151 108.27 5.65

Canadian Natural Resources Ltd. (CNQ)
Page 25 Source: Company Filings, Nomura Securities International.
2009 Proved Reserves
2010 Capital Expenditures
North America89%
North Sea7%
West Africa4%
North America Conventional
68%
North Sea6%
West Africa7%
Horizon19%
Financial Summary
2008 2009 2010E 2011E
EBITDA 9,520 5,741 7,455 8,685
Operating Cash Flow 6,767 5,812 6,299 6,643
Capital Expenditures (7,433) (2,985) (4,963) (5,800)
Dividends (208) (225) (301) (324)
Free Cash Flow (874) 2,602 1,035 519
Acquisitions - - - -
Divestitures 20 36 3 -
Share Repurchases - - - -
Adjusted Cash Flow (854) 2,638 1,038 519
Cash 27 13 109 228
Debt/EBITDA 1.4x 1.7x 1.2x 1.0x
Net Debt/EBITDA 1.4x 1.7x 1.2x 1.0x
Operations Summary
2008 2009 2010E 2011E
Production (MBoe/d) 565 575 631 676
Realized Price ($/Boe) 68.26 44.15 52.98 59.76
Lease Operating Expenses 21.22 20.05 22.31 20.50
Production Taxes 0.86 0.51 0.59 0.65
G&A 0.87 0.86 0.93 0.95
Interest 0.62 1.95 1.95 2.05
Cash Costs 23.57 23.37 25.78 24.15
F&D Costs 18.81 1.48
Full Cycle Costs 42.38 24.85
Recycle Ratio 2.38 14.01

Page 26 Source: Company Filings, Nomura Securities International.
Cenovus Energy Inc. (CVE)
Relative Value
We are affirming our BUY recommendation on Cenovus Energy senior notes. We still recommend swapping out of EnCana 6.5% of 2019 into Cenovus 5.7% of 2019 for roughly flat spread and a take-out of $5 in dollar price. We prefer CVE’s exposure to crude oil pricing (~50% liquids volumes compared with EnCana’s pure-play natural gas) and superior free cash flow profile (we expect EnCana to generate negative free cash flow in 2011).
We are attracted to the longer-term potential of Cenovus’s best in class oil sands operations at Christina Lake and Foster Creek. While oil sands production currently accounts for ~20% of volumes, CVE plans to steadily ramp up production to 200 MBbl/d by 2018 with staged expansion programs. The conventional natural gas (50% production) and liquids (30% production) operations provide a good measure of stability, generating $1-1.5bn of annual free cash flow. With company-wide capital expenditures peaking in 2010, CVE should generate roughly $300mn in free cash flow in 2011.
Business Description
Cenovus Energy Inc. is an integrated oil company headquartered in Calgary, Alberta. Its operations include enhanced oil recovery properties and established oil and natural gas production in Alberta and Saskatchewan. Cenovus has approximately 1.4 billion barrels of oil equivalent of proven reserves, 80% of which are oil. CVE began independent operations on December 1, 2009 following the arrangement with EnCana Corporation in which two independent publicly traded companies (Cenovus and EnCana) were created. Cenovus’s enhanced oil recovery projects include Foster Lake, Christina Lake, and Pelican Lake, located in the Athabasca region in northeast Alberta. In addition to its upstream assets, Cenovus owns a 50% stake in two refineries in the United States: Wood River in Illinois and Borger in Texas (ConocoPhillips is the other 50% owner and the operator of both refineries).
Company SnapshotReserves (MMBoe) 1,398
% Oil 82%
% Proved Developed 42%
Reserve Life (R/P) 14.6
Daily Production (MBoe/d) 251
LTM EBITDA 3,024
2011 EBITDA 3,669
Cash 464
Total Debt 3,574
Market Capitalization 24,234
Enterprise Value 27,344
Debt/EBITDA 1.2x
Debt/Reserves 2.56
EV/EBITDA 9.0x
EV/Reserves 19.56
RatingsOutstanding
$mm Coupon (%) Maturity STW Z-Sprd Price YTW
Sr. Notes Baa2 / BBB+ 1,299 5.700 10/15/2019 60 83 112.53 3.99
Sr. Notes Baa2 / BBB+ 1,400 6.750 11/15/2039 120 165 113.35 5.79

Page 27 Source: Company Filings, Nomura Securities International.
2009 Production
2010 Capital Expenditures
Foster Creek15%
Christina Lake3%
Athabasca3%
Other Bitumen1%
Weyburn6%
Pelican Lake8%
Southern Alberta
59%
Other Canadian
Plains5%
Cenovus Energy Inc. (CVE)
Financial Summary
Operations Summary
Foster Creek15%
Christina Lake14%
Pelican Lake, Other Oil
28%
Natural Gas10%
Refining33%
Financial Summary2008 2009 2010E 2011E
EBITDA 4,665 3,280 3,146 3,669
Operating Cash Flow 2,845 3,039 2,628 3,089
Capital Expenditures (2,046) (2,165) (2,104) (2,200)
Dividends - (159) (600) (600)
Free Cash Flow 799 715 (76) 289
Acquisitions - - - -
Divestitures 47 222 312 -
Share Repurchases - - - -
Adjusted Cash Flow 846 937 236 289
Cash 188 155 356 645
Debt/EBITDA 0.8x 1.1x 1.1x 1.0x
Net Debt/EBITDA 0.8x 1.1x 1.0x 0.8x
2008 2009 2010E 2011E
Production (MBoe/d) 271 262 253 243
Realized Price ($/Boe) 57.89 52.07 48.37 55.17
Lease Operating Expenses 23.30 21.71 25.89 26.50
Production Taxes 0.81 0.46 0.36 0.30
G&A 1.72 2.21 2.41 2.80
Interest 2.35 2.56 2.98 2.85
Cash Costs 28.17 26.94 31.63 32.45
F&D Costs 28.39 4.76 4.76 4.76
Full Cycle Costs 56.56 31.70 36.40 37.21
Recycle Ratio 1.05 5.28 3.51 4.77

Page 28 Source: Company Filings, Nomura Securities International.
Chesapeake Energy Corporation (CHK)
Relative ValueWe are affirming our HOLD recommendation on Chesapeake Energy senior notes. We view benchmark issuer Chesapeake as a core holding in the HY energy space. CHK has assembled a well diversified, premier-quality asset base in key North American plays. Further, the company continues to post strong organic production and reserve growth.
We view the recent strategic shift toward liquids production (25% production volume target by 2015) as positive, but we remain cognizant of the attendant risks. We acknowledge Chesapeake’s demonstrated success in executing large-scale development of unconventional resource plays. That said, transforming one of the largest natural gas producers toward liquids production carries a measure of operational risk. Management recently (Jan 2011) announced the so-called “25/25” plan, which aims to dial back growth over the next 2 years to 25% from its previous targeted of 30-40%, and to reduce debt by 25% over the same period. CHK plans to achieve these goals through reduced acreage acquisitions and additional asset monetizations. After +$4.5bn of acreage acquisitions in 2010, we view the plan as conservative but we note that CHK will remain free cash flow negative and reliant on asset sales/monetization to make up cash short-falls.
Business Description
Chesapeake Energy Corporation is one of the largest independent exploration and production companies in the world. Chesapeake has approximately 13 trillion cubic feet equivalent of proved reserves and current production of 2.8 Bcfe/d, 90% of which is natural gas. Its core holdings are in the “Big 6” natural gas shale plays: Barnett; Bossier; Fayetteville; Eagle Ford; Haynesville; and Marcellus. In addition to its substantial E&P assets, Chesapeake owns 50% of the General Partner, the associated Incentive Distribution Rights, and approximately 41% of the limited partner units of Chesapeake Midstream Partners (CHKM), a master limited partnership with 2,800 miles of gathering pipelines and approximately 1.5 Bcf/d of natural gas gathering capacity.
Company SnapshotReserves (Bcfe) 16,900
% Gas 95%
% Proved Developed 58%
Reserve Life (R/P) 15.7
Daily Production (MMcfe/d) 3,043
LTM EBITDA(X) 5,099
2011 EBITDA(X) 5,257
Cash 609
Total Debt 11,445
Market Capitalization 18,064
Enterprise Value 31,965
Debt/EBITDAX 2.2x
Debt/Reserves 0.68
EV/EBITDA(X) 6.3x
EV/Reserves 1.89
RatingsOutstanding
$mm Coupon (%) Maturity STW Z-Sprd Price YTW
Sr. Notes Ba3 / BB 1,425 9.500 2/15/2015 312 338 116.00 5.09
Sr. Notes Ba3 / BB 1,100 6.500 8/15/2017 410 345 102.25 6.08
Sr. Notes Ba3 / BB 600 6.875 8/15/2018 268 376 103.75 6.07
Sr. Notes Ba3 / BB 800 7.25 12/15/2018 281 327 106.50 6.20
Sr. Notes Ba3 / BB 499 6.875 11/15/2020 307 318 103.00 6.46
Sr. Notes Ba3 / BB 1,400 6.625 8/15/2020 289 303 102.50 6.27

Chesapeake Energy Corporation (CHK)
Page 29 Source: Company Filings, Nomura Securities International.
2009 Proved Reserves
2009 Capital Expenditures
Barnett Shale, 24%
Fayetteville Shale, 15%
Haynesville Shale, 13%
Marcellus Shale, 2%
Mid-Continent, 29%
Permian & Delaware Basins, 5%
S. Texas/Gulf/Ark-
La-Tex, 4%
Appalachian Basin, 8%
Barnett Shale34%
Fayetteville Shale
5%
Haynesville Shale21%
Marcellus Shale4%
Mid-Continent20%
Permian & Delaware Basins
9%
S. Texas/Gulf/Ark-
La-Tex6%
Appalachian Basin
1%
Financial Summary
Operations Summary
2008 2009 2010E 2011E
Production (MMcfe/d) 2,303 2,481 2,797 3,315
Realized Price ($/Mcfe) 8.38 6.22 4.38 6.62
Lease Operating Expenses 1.05 0.97 0.90 0.90
Production Taxes 0.34 0.12 0.28 0.30
G&A 0.45 0.39 0.35 0.35
Interest 0.82 0.91 0.83 0.85
Cash Costs 2.65 2.38 2.36 2.40
F&D Costs 2.41 1.07
Full Cycle Costs 5.06 3.46
Recycle Ratio 2.38 3.58
2008 2009 2010E 2011E
EBITDAX 5,851 4,509 4,914 5,257
Operating Cash Flow 5,236 4,356 4,766 4,563
Capital Expenditures (9,177) (5,226) (6,785) (6,600)
Dividends (183) (204) (278) (352)
Free Cash Flow (4,124) (1,074) (2,297) (2,389)
Acquisitions (8,472) (2,298) (4,568) (1,000)
Divestitures 7,670 1,926 4,555 3,200
Share Repurchases (5) (7) - -
Adjusted Cash Flow (4,931) (1,453) (2,310) (189)
Cash 1,749 307 609 925
Debt/EBITDAX 2.3x 2.7x 2.4x 2.3x
Net Debt/EBITDAX 2.0x 2.7x 2.3x 2.1x
Page 30 Source: Company Filings, Nomura Securities International.
Devon Energy Corporation (DVN)
Relative Value
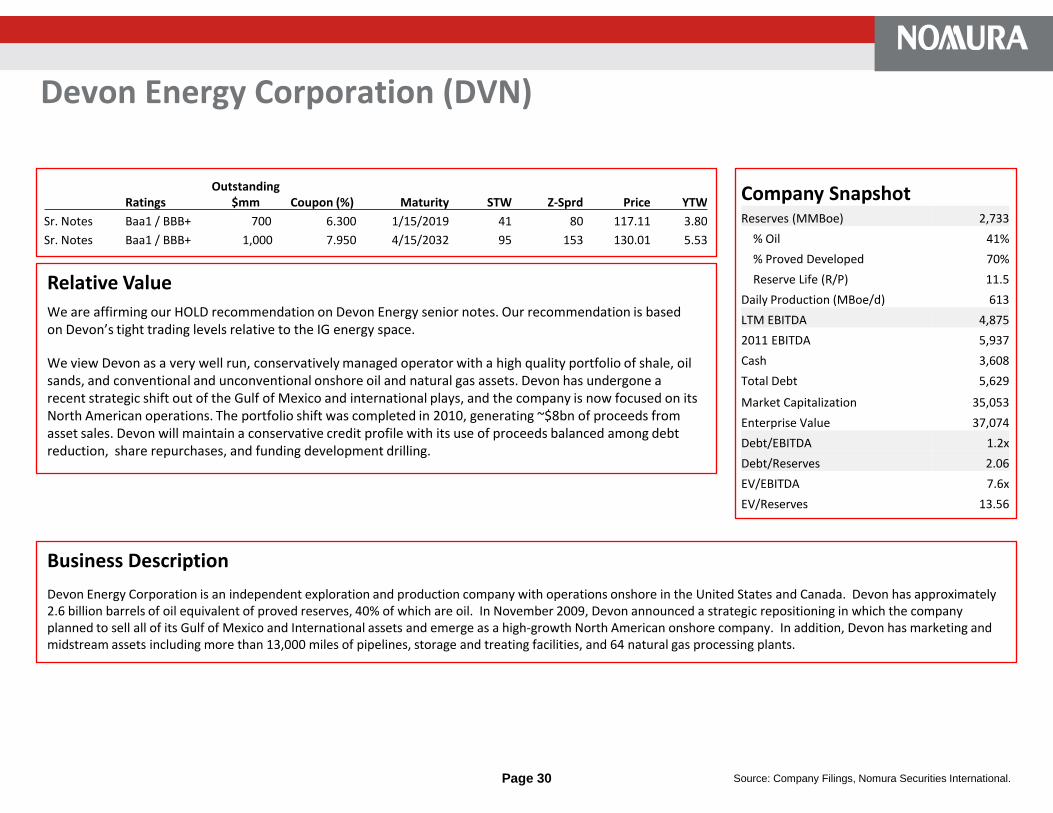
We are affirming our HOLD recommendation on Devon Energy senior notes. Our recommendation is based on Devon’s tight trading levels relative to the IG energy space.
We view Devon as a very well run, conservatively managed operator with a high quality portfolio of shale, oil sands, and conventional and unconventional onshore oil and natural gas assets. Devon has undergone a recent strategic shift out of the Gulf of Mexico and international plays, and the company is now focused on its North American operations. The portfolio shift was completed in 2010, generating ~$8bn of proceeds from asset sales. Devon will maintain a conservative credit profile with its use of proceeds balanced among debt reduction, share repurchases, and funding development drilling.
Business Description
Devon Energy Corporation is an independent exploration and production company with operations onshore in the United States and Canada. Devon has approximately 2.6 billion barrels of oil equivalent of proved reserves, 40% of which are oil. In November 2009, Devon announced a strategic repositioning in which the company planned to sell all of its Gulf of Mexico and International assets and emerge as a high-growth North American onshore company. In addition, Devon has marketing and midstream assets including more than 13,000 miles of pipelines, storage and treating facilities, and 64 natural gas processing plants.
Company SnapshotReserves (MMBoe) 2,733
% Oil 41%
% Proved Developed 70%
Reserve Life (R/P) 11.5
Daily Production (MBoe/d) 613
LTM EBITDA 4,875
2011 EBITDA 5,937
Cash 3,608
Total Debt 5,629
Market Capitalization 35,053
Enterprise Value 37,074
Debt/EBITDA 1.2x
Debt/Reserves 2.06
EV/EBITDA 7.6x
EV/Reserves 13.56
RatingsOutstanding
$mm Coupon (%) Maturity STW Z-Sprd Price YTW
Sr. Notes Baa1 / BBB+ 700 6.300 1/15/2019 41 80 117.11 3.80
Sr. Notes Baa1 / BBB+ 1,000 7.950 4/15/2032 95 153 130.01 5.53

Devon Energy Corporation (DVN)
Page 31 Source: Company Filings, Nomura Securities International.
2009 Proved Reserves
2010 Capital Expenditures
Shale Plays, 47%
Oil Sands, 12%
Conventional Plays, 23%
Other Unconventional,
18%
Barnett39%
Carthage7%Permian
5%Washakie
3%Cana-Woodford
3%
Arkoma-Woodford
2%
Groesbeck2%
Other U.S.11%
Jackfish15%
Northwest4%
Lloydminster3%
Deep Basin2%
Other Canada4%
Financial Summary
2008 2009 2010E 2011E
EBITDA 9,429 3,977 5,288 5,941
Operating Cash Flow 9,408 4,737 5,475 4,920
Capital Expenditures (8,843) (4,879) (6,043) (5,200)
Dividends (289) (284) (283) (288)
Free Cash Flow 276 (426) (851) (568)
Acquisitions - - (500) -
Divestitures 117 34 8,391 -
Share Repurchases (665) - (1,679) (1,500)
Adjusted Cash Flow (272) (392) 5,361 (2,068)
Cash 195 646 6,535 2,717
Debt/EBITDA 0.6x 1.8x 0.7x 0.6x
Net Debt/EBITDA 0.6x 1.7x -0.5x 0.2x
Operations Summary
2008 2009 2010E 2011E
Production (MBoe/d) 610 649 626 652
Realized Price ($/Boe) 52.23 34.54 37.04 34.17
Lease Operating Expenses 7.90 7.05 7.40 7.25
Production Taxes 2.03 1.32 1.59 1.28
G&A 2.75 2.73 2.40 2.70
Interest 1.40 1.47 1.66 1.66
Cash Costs 14.08 12.58
F&D Costs 79.24 5.83
Full Cycle Costs 93.33 18.41
Recycle Ratio 0.48 3.77

Page 32 Source: Company Filings, Nomura Securities International.
EnCana Corporation (ECA)
Relative Value
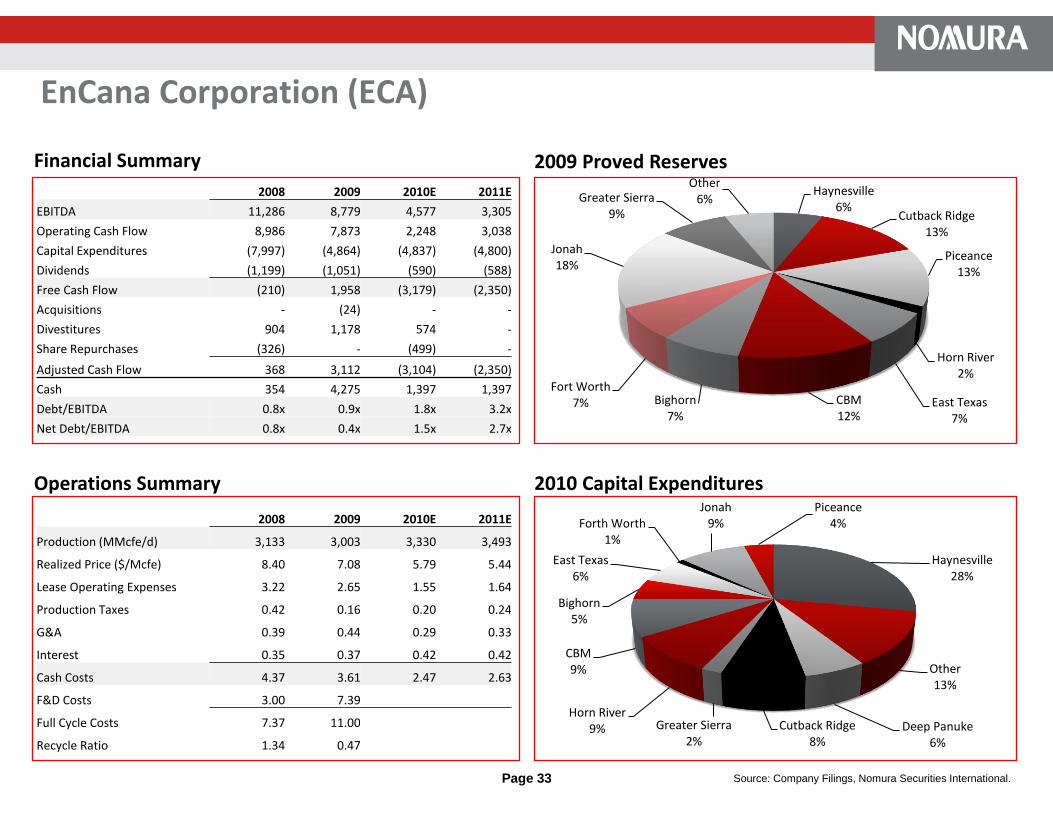
We are affirming our SELL recommendation on EnCana Corporation senior notes. Given the more challenging fundamentals in North American natural gas and relatively tight spread range of the IG E&P peer group, we prefer exposure to the more oil-weighted names such as Canadian Natural Resources and Cenovus Energy. With the recent spin-off of Cenovus, EnCana is a pure-play natural gas producer with top-tier North American properties, including considerable acreage in high-potential plays. While we acknowledge the high asset quality and very competitive cost structure, we expect that high development spending and weaker natural gas prices will result in negative free cash flow of $2.3bn in 2011.
Business Description
EnCana Corporation is an independent exploration and production company with operations in North America, stretching from Louisiana to northeast British Columbia. EnCana has approximately 11.5 trillion cubic feet equivalent of proved reserves, 95% of which are natural gas. On November 30, 2009, EnCana completed its corporate reorganization to split into two independent companies – EnCana Corporation, a natural gas company, and Cenovus Energy, Inc., an integrated oil company. EnCana’s major development areas include: the Haynesville Shale; the Horn River Basin; the Montney shale; the Maverick Basin in South Texas; and the Piceance Basin.
Company SnapshotReserves (Bcfe) 11,522
% Gas 96%
% Proved Developed 59%
Reserve Life (R/P) 10.5
Daily Production (MMcfe/d) 3,319
LTM EBITDA 5,460
2011 EBITDA 3,305
Cash 1,397
Total Debt 7,586
Market Capitalization 22,537
Enterprise Value 28,726
Debt/EBITDA 1.4x
Debt/Reserves 0.66
EV/EBITDA 5.3x
EV/Reserves 2.49
RatingsOutstanding
$mm Coupon (%) Maturity STW Z-Sprd Price YTW
Sr. Notes Baa2 / BBB+ 700 5.900 12/1/2017 165 89 113.70 3.63
Sr. Notes Baa2 / BBB+ 500 6.500 5/15/2019 59 92 117.72 3.98
Sr. Notes Baa2 / BBB+ 500 6.625 8/15/2037 149 197 107.27 6.07
Sr. Notes Baa2 / BBB+ 800 6.500 2/1/2038 150 197 105.54 6.08
EnCana Corporation (ECA)
Page 33 Source: Company Filings, Nomura Securities International.
2009 Proved Reserves
2010 Capital Expenditures
Haynesville28%
Other13%
Deep Panuke6%
Cutback Ridge8%
Greater Sierra2%
Horn River9%
CBM9%
Bighorn5%
East Texas6%
Forth Worth1%
Jonah9%
Piceance4%
Haynesville6%
Cutback Ridge13%
Piceance13%
Horn River2%
East Texas7%
CBM12%
Bighorn7%
Fort Worth7%
Jonah18%
Greater Sierra9%
Other6%
Financial Summary
Operations Summary
2008 2009 2010E 2011E
EBITDA 11,286 8,779 4,577 3,305
Operating Cash Flow 8,986 7,873 2,248 3,038
Capital Expenditures (7,997) (4,864) (4,837) (4,800)
Dividends (1,199) (1,051) (590) (588)
Free Cash Flow (210) 1,958 (3,179) (2,350)
Acquisitions - (24) - -
Divestitures 904 1,178 574 -
Share Repurchases (326) - (499) -
Adjusted Cash Flow 368 3,112 (3,104) (2,350)
Cash 354 4,275 1,397 1,397
Debt/EBITDA 0.8x 0.9x 1.8x 3.2x
Net Debt/EBITDA 0.8x 0.4x 1.5x 2.7x
2008 2009 2010E 2011E
Production (MMcfe/d) 3,133 3,003 3,330 3,493
Realized Price ($/Mcfe) 8.40 7.08 5.79 5.44
Lease Operating Expenses 3.22 2.65 1.55 1.64
Production Taxes 0.42 0.16 0.20 0.24
G&A 0.39 0.44 0.29 0.33
Interest 0.35 0.37 0.42 0.42
Cash Costs 4.37 3.61 2.47 2.63
F&D Costs 3.00 7.39
Full Cycle Costs 7.37 11.00
Recycle Ratio 1.34 0.47

Page 34 Source: Company Filings, Nomura Securities International.
Hess Corporation (HES)
Relative Value
We are affirming our SELL recommendation on Hess Corporation senior notes. HES has one of the highest leverage to oil prices given its production mix (~70% liquids) and minimal hedging policy. In addition, HES has amassed a strong position in the very attractive, liquid-rich Bakken shale. Although the area accounts for ~5% of current production, the basin should support longer-term production growth in the US onshore. That said, we note that roughly half of the company’s production is from Africa (Equatorial Guinea, Libya, Algeria, Gabon) and Asia (Malaysia, Thailand, Indonesia) and the company will direct significant capital to higher-risk international prospects. While the current GOM drilling ban will likely not have a material near-term effect on HES’ production profile (~15% volumes), the company does hold significant leases in the Gulf of Mexico and the area remains a key contributor to longer-term production and reserves growth.
Business Description
Hess Corporation is an integrated energy company with operations in Africa, Europe, Russia, South America, Southeast Asia, the United Kingdom, and the United States. Hess has approximately 1.4 billion barrels of oil equivalent of proved reserves, 65% of which are oil. In addition, Hess owns a 50% interest in HOVENSA L.L.C, a refining joint venture in the U.S. Virgin Islands with PDVSA, and a refinery in Port Reading, New Jersey. The company markets refined products, natural gas and electricity in the United States though its 1,357 HESS gasoline stations, 21 storage terminals, and 50% interest in Bayonne Energy Center, LLC.
Company SnapshotReserves (MMBoe) 1,437
% Oil 67%
% Proved Developed 59%
Reserve Life (R/P) 9.7
Daily Production (MBoe/d) 413
LTM EBITDAX 6,574
2011 EBITDAX 6,537
Cash 2,353
Total Debt 5,584
Market Capitalization 27,012
Enterprise Value 30,243
Debt/EBITDAX 0.8x
Debt/Reserves 3.89
EV/EBITDAX 4.6x
EV/Reserves 21.04
RatingsOutstanding
$mm Coupon (%) Maturity STW Z-Sprd Price YTW
Sr. Notes Baa2 / BBB 1,000 8.125 2/15/2019 88 130 126.10 4.27
Sr. Notes Baa2 / BBB 750 6.000 1/15/2040 118 160 103.36 5.76
Sr. Notes Baa2 / BBB 1,250 5.600 2/15/2041 120 161 97.44 5.78

Hess Corporation (HES)
Page 35 Source: Company Filings, Nomura Securities International.
2009 Proved Reserves
2009 Capital Expenditures
United States21%
Europe30%
Africa23%
Asia and Other26%
United States E&P37%
International E&P59%
Refining and Marketing
4%
Financial Summary
Operations Summary
2008 2009 2010E 2011E
EBITDAX 7,789 5,010 6,397 6,537
Operating Cash Flow 4,688 3,046 4,053 4,391
Capital Expenditures (4,438) (2,918) (4,451) (4,200)
Dividends (130) (131) (164) (139)
Free Cash Flow 120 (3) (562) 53
Acquisitions - - (1,546) -
Divestitures - - 183 -
Share Repurchases - - - -
Adjusted Cash Flow 120 (3) (1,925) 53
Cash 908 1,362 2,353 2,406
Debt/EBITDAX 0.5x 0.9x 1.2x 1.1x
Net Debt/EBITDAX 0.4x 0.6x 0.8x 0.8x
2008 2009 2010E 2011E
Production (MBoe/d) 381 408 414 421
Realized Price ($/Boe) 69.74 44.82 55.94 59.36
Lease Operating Expenses 13.43 12.12 12.50 12.65
G&A 2.17 1.71 1.72 1.75
Interest 1.92 2.42 2.29 2.21
Cash Costs 17.51 16.25 16.51 16.61
F&D Costs 16.48 20.35
Full Cycle Costs 33.99 36.60
Recycle Ratio 3.17 1.40

Page 36 Source: Company Filings, Nomura Securities International.
Marathon Oil Corporation (MRO)
Relative ValueWe are affirming our HOLD recommendation on Marathon Oil senior notes. While the recently announced plan to spin-off the refining business will be neutral from a financial leverage perspective, the business profile will be diminished by the loss of the high-quality refining operations, in our opinion. However, management plans to reduce debt by $2.5bn (likely through tender offers) and market technicals will likely keep the notes from materially widening from current levels, in our opinion.
Marathon recently (Jan 2010) announced a plan to spin off the downstream business, creating an independent E&P and independent refiner. MRO plans to reduce existing debt by $2.5bn from cash on hand ($1.6bn) and distributions from the spin-co, which will raise $2.5-3bn of debt and maintain cash on hand at about $750mn. We estimate that leverage at post-spin MRO will be roughly unchanged at 1.0x debt/EBITDA (0.7x net) and the refining entity, MPE, will be levered at roughly 1.9x debt/EBITDA (1.4x net). S&P and Moody’s have indicated that both entities likely will be rated Baa2/BBB.
Business Description
Marathon Oil Corporation is an integrated energy company with operations in Africa, Europe, North America, and Southeast Asia. Marathon has proved reserves of approximately 1.7 billion barrels of oil equivalent, 70% of which are oil. Additionally, the company’s integrated gas segment markets and transports products manufactured from natural gas, such as LNG and methanol. In its refining, marketing, and transportation segment, Marathon owns and operates six refineries in the United States with aggregate refining capacity of 1.1 million barrels per day and distributes refined products through approximately 5,100 Marathon-branded retail outlets. Marathon also owns a product transportation system including terminals, pipelines, inland waterway tow boats and barges, tractor-trailer units, and rail cars.
Company SnapshotReserves (MMBoe) 1,679
% Oil 73%
% Proved Developed 71%
Reserve Life (R/P) 11.6
Daily Production (MBoe/d) 386
LTM EBITDA 6,636
2011 EBITDA 9,959
Cash 2,062
Total Debt 7,930
Market Capitalization 30,335
Enterprise Value 36,203
Debt/EBITDA 1.2x
Debt/Reserves 4.72
EV/EBITDA 5.5x
EV/Reserves 21.56
RatingsOutstanding
$mm Coupon (%) Maturity STW Z-Sprd Price YTW
Sr. Notes Baa1 /*- / BBB+ /*- 687 7.500 2/15/2019 44 84 125.29 3.83
Sr. Notes Baa1 /*- / BBB+ /*- 750 6.600 10/1/2037 112 158 112.26 5.70

Marathon Oil Corporation (MRO)
Page 37 Source: Company Filings, Nomura Securities International.
2009 Proved Reserves
2010 Capital Expenditures
United States18%
Canada36%
Africa39%
Europe7%
E&P, 56% Oil Sands Mining, 9%
Refining, Marketing and Transportation,
25%
Corporate and Other, 10%
Financial Summary
Operations Summary
2008 2009 2010E 2011E
EBITDA 9,433 5,851 7,868 9,959
Operating Cash Flow 6,752 5,268 5,086 6,560
Capital Expenditures (6,989) (6,231) (4,869) (5,080)
Dividends (681) (679) (706) (712)
Free Cash Flow (918) (1,642) (489) 768
Acquisitions - - - -
Divestitures 999 865 1,361 -
Share Repurchases (402) - - -
Adjusted Cash Flow (321) (777) 872 768
Cash 1,285 2,057 2,301 3,069
Debt/EBITDA 0.8x 1.5x 1.0x 0.8x
Net Debt/EBITDA 0.6x 1.1x 0.7x 0.5x
2008 2009 2010E 2011E
Production (MBoe/d) 363 396 394 414
Realized Price ($/Boe) 62.64 41.46 52.08 57.55
Lease Operating Expenses 9.96 11.02 11.30 11.50
G&A 0.89 0.82 0.82 0.82
Interest 0.21 1.03 0.70 0.74
Cash Costs 11.05 12.86 12.82 13.06
F&D Costs 26.63 48.58
Full Cycle Costs 37.68 61.44
Recycle Ratio 1.94 0.59

Page 38 Source: Company Filings, Nomura Securities International.
Newfield Exploration Company (NFX)
Relative Value
We are affirming our HOLD recommendation on Newfield Exploration senior subordinated notes. With the sub notes trading 20-40 bp inside of Pioneer and Chesapeake Energy, NFX is one of the tightest trading high yield energy names. Newfield’s operations are performing well and management is directing capital toward development of its liquids plays. We expect the company to generate free cash flow in 2011, protected by significant (60-65%) hedges on its natural gas production at attractive prices ($6.35/Mcf).
Business Description
Newfield Exploration Company is an independent oil and gas company with operations in the U.S. in the Anadarko Basin, Arkoma Basin, Rocky Mountains, onshore Texas, and Gulf of Mexico and internationally in Malaysia and China. In 2009, Newfield signed a joint exploration agreement with Hess Corporation covering up to 140,000 gross acres in Marcellus shale play. Newfield has proved reserves of approximately 3.6 trillion cubic feet equivalent, 30% of which are oil. The company’s strategy is to focus on domestic, unconventional resource plays, which represent approximately 80% of proved reserves.
Company SnapshotReserves (Bcfe) 3,619
% Oil 28%
% Proved Developed 53%
Reserve Life (R/P) 14.3
Daily Production (MMcfe/d) 763
LTM EBITDA 1,208
2011 EBITDA 1,692
Cash 128
Total Debt 2,169
Market Capitalization 9,473
Enterprise Value 11,514
Debt/EBITDA 1.8x
Debt/Reserves 0.60
EV/EBITDA 9.5x
EV/Reserves 3.18
RatingsOutstanding
$mm Coupon (%) Maturity STW Z-Sprd Price YTW Next Call
Sr. Subordinated Ba2 / BB+ 550 6.625 4/15/2016 253 423 103.75 4.50 4/15/2011
Sr. Subordinated Ba2 / BB+ 600 7.125 5/15/2018 173 417 107.50 5.11 5/15/2013
Sr. Subordinated Ba2 / BB+ 700 6.875 2/1/2020 209 376 107.75 5.48 2/1/2015

Newfield Exploration Company (NFX)
Page 39 Source: Company Filings, Nomura Securities International.
2009 Proved Reserves
2010 Capital Expenditures
Mid-Continent, 55%
Rocky Mountains, 26%
Gulf of Mexico, 5%
Onshore Texas, 9%
International, 5%
Mid-Continent40%
Rocky Mountains
23%
Gulf of Mexico14%
Onshore Texas10%
International13%
Financial Summary
Operations Summary
2008 2009 2010E 2011E
EBITDA 1,662 872 1,275 1,692
Operating Cash Flow 854 1,578 1,732 1,974
Capital Expenditures (2,067) (1,392) (1,637) (1,680)
Dividends - - - -
Free Cash Flow (1,213) 186 95 294
Acquisitions (223) (9) (209) -
Divestitures 9 33 14 -
Share Repurchases - (1) (14) -
Adjusted Cash Flow (1,427) 209 (114) 294
Cash 24 78 118 412
Debt/EBITDA 1.3x 2.3x 1.7x 1.3x
Net Debt/EBITDA 1.3x 2.2x 1.6x 1.0x
2008 2009 2010E 2011E
Production (MMcfe/d) 646 694 783 887
Realized Price ($/Mcfe) 8.30 8.64 8.13 8.09
Lease Operating Expenses 1.12 1.02 1.15 1.15
Production Taxes 0.66 0.25 0.41 0.40
G&A 0.60 0.57 0.54 0.55
Interest 0.47 0.50 0.55 0.54
Cash Costs 2.86 2.34 2.66 2.64
F&D Costs 2.89 1.35
Full Cycle Costs 5.75 3.69
Recycle Ratio 1.88 4.67

Page 40 Source: Company Filings, Nomura Securities International.
Nexen Inc. (NXY)
Relative Value
We have revised our rating on Nexen long bonds to BUY from HOLD. Despite the pending downgrade to Ba1 at Moody’s, we believe that current levels provide a good entry point for longer-term tightening potential of 20bp on the long end. We believe that a Ba1/BBB- rated Nexen, which is our base case scenario, should trade 10-15bp through Anadarko Petroleum. We like the lower dollar price NXYCN 5.875% of 2035 at +210bp ($90.80), trading flat on a curve basis of the APC 6.45% of 2036 ($97). We also note that there is a reasonable possibility that Nexen management obtains IG ratings from Fitch Ratings, which would keep NXYCN in the major IG credit indices and provide greater upside to our base case scenario. We had moved to a HOLD rating based partially on our concerns over technical selling pressures ahead of the pending Moody’s downgrade. However, year-end 2010 positioning is now behind us and our sense is that bonds have largely transitioned from would-be forced sellers.
Business Description
Nexen Inc. is an independent, Canadian-based global energy company with 3 operating segments: oil sands, which includes a 65% operated interest in the Long Lake project and a 7.23% participating interest in Syncrude; conventional oil and gas, which includes properties in Canada, the Gulf of Mexico, the North Sea, offshore West Africa, and Yemen; and unconventional gas production in the Horn River Basin in northeastern British Columbia. Nexen has approximately 900 million barrels of oil equivalent of proved reserves, 93% of which are oil. In addition, the company has oil and gas marketing operations in North America as well as legacy power and chemicals businesses.
Company SnapshotReserves (MMBoe) 920
% Oil 93%
% Proved Developed 55%
Reserve Life (R/P) 11.8
Daily Production (MBoe/d) 213
LTM EBITDAX 3,929
2011 EBITDAX 4,122
Cash 1,210
Total Debt 5,678
Market Capitalization 12,562
Enterprise Value 17,030
Debt/EBITDAX 1.4x
Debt/Reserves 6.18
EV/EBITDAX 4.3x
EV/Reserves 18.52
RatingsOutstanding
$mm Coupon (%) Maturity STW Z-Sprd Price YTW
Sr. Notes Baa3 /*- / BBB- 300 6.200 7/30/2019 175 205 107.27 5.14
Sr. Notes Baa3 /*- / BBB- 1,250 6.400 5/15/2037 220 272 95.35 6.78
Sr. Notes Baa3 /*- / BBB- 700 7.500 7/30/2039 225 278 108.36 6.83

Nexen Inc. (NXY)
Page 41 Source: Company Filings, Nomura Securities International.
2009 Proved Reserves
2010 Capital Expenditures
Long Lake, 32%
Syncrude, 31%
United Kingdom, 19%
Canada, 8%
United States, 5%
Yemen, 1% Other, 4%
Financial Summary
Operations Summary
2008 2009 2010E 2011E
EBITDAX 5,678 3,232 3,607 4,122
Operating Cash Flow 4,354 1,886 2,665 3,079
Capital Expenditures (3,044) (2,742) (2,760) (2,700)
Dividends (92) (104) (104) (104)
Free Cash Flow 1,218 (960) (199) 275
Acquisitions (22) (755) - -
Divestitures 6 17 1,256 -
Adjusted Cash Flow 1,202 (1,698) 1,057 275
Cash 2,003 1,700 1,288 1,563
Debt/EBITDAX 1.2x 2.2x 1.6x 1.4x
Net Debt/EBITDAX 0.8x 1.7x 1.2x 1.0x
2008 2009 2010E 2011E
Production (MBoe/d) 210 213 218 236
Realized Price ($/Boe) 89.84 59.94 68.53 72.05
Lease Operating Expenses 11.04 11.66 15.00 15.50
G&A 3.34 6.39 5.16 4.50
Interest 1.22 4.01 4.00 4.00
Cash Costs 15.60 22.05 24.16 24.00
F&D Costs 30.03 NM
Full Cycle Costs 45.64 NM
Recycle Ratio 2.47 NM
North Sea33%
Gulf of Mexico7%
West Africa25%
Canada24%
Other Countries7%
Chemicals4%

Page 42 Source: Company Filings, Nomura Securities International.
Noble Energy, Inc. (NBL)
Relative Value
We are affirming our HOLD recommendation on Noble Energy senior notes. Noble is a smaller independent energy company with sizeable non-traditional international development projects. Its recent discovery, Tamar in offshore Israel, has significant upside potential over the next 2-3 years. We note that the company’s far flung operations and acreage positions may appear somewhat unfocused, and we have some concern over the development capital requirements relative to Noble’s smaller size. Still, Noble has to date successfully managed its sizeable development projects, maintaining a competitive cost structure and low financial leverage. We believe that Noble may need to access the capital markets to term out its credit facility and/or fund development spending. We believe that an issuance could provide an interesting entry point.
Business Description
Noble Energy, Inc. is an independent energy company with U.S. operations in the Rocky Mountains, Mid-continent, and deepwater GOM and international operations in West Africa, China, Ecuador, Israel, and the North Sea. Noble has proved reserves of 841 million barrels of oil equivalent, 67% of which are oil. In 2009, Noble produced 210 MBoe/d of hydrocarbons, with natural gas constituting approximately 60%. Noble’s major development projects are: Galapagos and Gunflint (deepwater Gulf of Mexico); Tamar (offshore Israel); and Aseng, Belinda and Diega/Carmen (offshore West Africa).
Company SnapshotReserves (MMBoe) 820
% Oil 41%
% Proved Developed 67%
Reserve Life (R/P) 10.7
Daily Production (MBoe/d) 229
LTM EBITDAX 2,130
2011 EBITDAX 2,582
Cash 1,149
Total Debt 2,194
Market Capitalization 14,547
Enterprise Value 15,592
Debt/EBITDAX 1.0x
Debt/Reserves 2.68
EV/EBITDAX 7.3x
EV/Reserves 19.01
RatingsOutstanding
$mm Coupon (%) Maturity STW Z-Sprd Price YTW
Sr. Notes Baa2 / BBB 1,000 8.250 3/1/2019 110 152 125.35 4.49
Sr. Notes Baa2 / BBB 250 8.000 4/1/2027 162 240 118.22 6.20

Noble Energy, Inc. (NBL)
Page 43 Source: Company Filings, Nomura Securities International.
2009 Proved Reserves
2010 Capital Expenditures
Wattenberg33%
Mid-Continent10%
Deepwater GOM
4%
Other U.S.10%
Equatorial Guinea
30%
Israel5%
Other International
8%
Deepwater GOM, 16%
U.S. Onshore, 34%
Major International,
46%
Other International,
4%
Financial Summary
Operations Summary
2008 2009 2010E 2011E
EBITDAX 3,071 1,551 2,218 2,582
Operating Cash Flow 2,285 1,508 1,930 1,946
Capital Expenditures (1,971) (1,268) (2,126) (2,060)
Dividends (115) (126) (127) (128)
Free Cash Flow 199 114 (323) (242)
Acquisitions (292) - (458) -
Divestitures 131 3 552 -
Share Repurchases (3) (1) (12) -
Adjusted Cash Flow 35 116 (241) (242)
Cash 1,140 1,014 1,149 1,149
Debt/EBITDAX 0.7x 1.3x 1.1x 1.1x
Net Debt/EBITDAX 0.4x 0.7x 0.6x 0.6x
2008 2009 2010E 2011E
Production (MBoe/d) 214 210 216 225
Realized Price ($/Boe) 49.37 28.83 39.11 41.10
Lease Operating Expenses 5.65 5.85 6.00 6.09
Production Taxes 2.19 1.28 1.70 1.90
G&A 3.02 3.09 3.29 3.37
Interest 0.88 1.10 1.00 1.02
Cash Costs 11.74 11.31 11.99 12.38
F&D Costs 32.90 51.97
Full Cycle Costs 44.64 63.28
Recycle Ratio 1.14 0.34

Page 44 Source: Company Filings, Nomura Securities International.
Pioneer Natural Resources Company (PXD)
Relative Value
We are affirming our HOLD recommendation on Pioneer Natural Resources senior notes. Pioneer has good scale, moderate leverage, and management is maintaining spending levels within cash flows despite its robust production targets. As operations ramp up in the Eagle Ford, Pioneer should be able to improve its relatively high company-wide finding costs. Should management continue to execute well and maintain its disciplined capital spending approach, we believe that Pioneer could be a longer-term candidate for a ratings upgrade to IG.
Business Description
Pioneer Natural Resources Company is an independent exploration and production company with operations in the Unites States, South Africa and Tunisia. Pioneer has approximately 900 million barrels of oil equivalent of proved reserves, 54% of which are oil. The company’s core asset base consists of the Spraberry field in West Texas, the Raton field in southern Colorado, the Hugoton field in southwest Kansas, and the West Panhandle field in the Texas Panhandle. In addition, Pioneer has exploration and development opportunities in the Eagle Ford Shale, the Barnett Shale, Alaska, and internationally in South Africa and Tunisia.
Company SnapshotReserves (MMBoe) 899
% Oil 54%
% Proved Developed 58%
Reserve Life (R/P) 21.4
Daily Production (MBoe/d) 113
LTM EBITDAX 1,214
2011 EBITDAX 1,510
Cash 198
Total Debt 2,531
Market Capitalization 10,730
Enterprise Value 13,063
Debt/EBITDAX 2.1x
Debt/Reserves 2.82
EV/EBITDA(X) 10.8x
EV/Reserves 14.54
RatingsOutstanding
$mm Coupon (%) Maturity STW Z-Sprd Price YTW
Sr. Notes Ba1 / BB+ 455 5.875 7/15/2016 301 268 104.25 4.98
Sr. Notes Ba1 / BB+ 485 6.650 3/15/2017 337 284 106.75 5.35
Sr. Notes Ba1 / BB+ 450 6.875 5/1/2018 234 293 106.75 5.73
Sr. Notes Ba1 / BB+ 450 7.500 1/15/2020 255 281 110.75 5.94
Sr. Notes Ba1 / BB+ 250 7.200 1/15/2028 232 306 103.00 6.90

Pioneer Natural Resources Company (PXD)
Page 45 Source: Company Filings, Nomura Securities International.
2009 Proved Reserves
2010 Capital Expenditures
Spraberry56%
Raton21%
Mid-Continent11%
South Texas5%
Barnett2%
Alaska2%
Other3%
Spraberry60%
Eagle Ford10%
Alaska13%
Barnett5%
Tunisia7%
Other5%
Financial Summary
Operations Summary
2008 2009 2010E 2011E
EBITDAX 1,499 991 1,263 1,510
Operating Cash Flow 1,034 543 1,187 1,457
Capital Expenditures (1,444) (463) (1,187) (1,300)
Dividends (36) (9) (10) (9)
Free Cash Flow (446) 71 (10) 147
Acquisitions - - - -
Divestitures 293 52 298 -
Share Repurchases (182) (22) (14) -
Adjusted Cash Flow (335) 101 274 147
Cash 48 27 78 225
Debt/EBITDAX 1.9x 2.8x 2.0x 1.7x
Net Debt/EBITDAX 1.9x 2.8x 2.0x 1.6x
2008 2009 2010E 2011E
Production (MBoe/d) 112 115 115 125
Realized Price ($/Boe) 54.38 38.41 46.22 48.49
Lease Operating Expenses 10.31 9.07 9.39 9.00
Production Taxes 4.01 2.35 2.68 2.50
G&A 3.46 3.35 4.08 4.00
Interest 4.07 4.13 4.35 3.93
Cash Costs 21.86 18.90 20.51 19.43
F&D Costs 49.24 (28.71) (28.71) (28.71)
Full Cycle Costs 71.10 (9.82) (8.21) (9.28)
Recycle Ratio 0.66 (0.68) (0.90) (1.01)

Page 46 Source: Company Filings, Nomura Securities International.
Plains Exploration & Production Company (PXP)
Relative ValueIn our opinion, Plains offers attractive yield relative to the upper-tier high yield E&P names. PXP trades roughly 50-70 bps wide of Range Resources and Pioneer Natural Resources. We are attracted to PXP’s strong organic production growth, exposure to crude oil prices, and potential for debt reduction with proceeds of the pending deepwater Gulf of Mexico divestiture. PXP’s legacy operations in California (~50% production) provide a good measure of stability and exposure to crude oil prices, while its Haynesville operations should drive organic production growth. Plains is in the process of selling its Gulf of Mexico operations. To date, the company has announced the sale of its shallow-water GOM assets for equity consideration of $800mn. Expected after-tax proceeds from the deepwater divestiture of $1-$2bn will comfortably fund the recent Eagle Ford acquisition ($578mn) and modest 2011 capital spending short-fall ($170mn), leaving roughly $750mn (mid-point) of excess cash. Assuming the mid-point for asset sales proceeds, net debt/EBITDA would improve to below 2.0x from 3.1x, pro-forma the Eagle Ford acquisition.
Business Description
Plains Exploration & Production Company is an independent oil and gas company with principal operations in onshore and offshore California, the Gulf Coast, the Gulf of Mexico, the Mid-Continent, and the Rocky Mountains. In addition to these assets, the company has an interest in an exploration block offshore Vietnam. Plains has approximately 350 million barrels of oil equivalent of proved reserves, 60% of which are oil. The company’s development program includes its significant Haynesville Shale and Eagle Ford acreage.
Company SnapshotReserves (MMBoe) 360
% Oil 60%
% Proved Developed 64%
Reserve Life (R/P) 11.9
Daily Production (MBoe/d) 91
LTM EBITDA 985
2011 EBITDA 1,151
Cash 12
Total Debt 2,803
Market Capitalization 4,688
Enterprise Value 7,480
Debt/EBITDA 2.8x
Debt/Reserves 7.80
EV/EBITDA 7.6x
EV/Reserves 20.80
RatingsOutstanding
$mm Coupon (%) Maturity STW Z-Sprd Price YTW Next Call
Sr. Notes B1 / BB- 600 7.750 6/15/2015 269 435 105.00 4.67 6/15/2011
Sr. Notes B1 / BB- 565 10.000 3/1/2016 343 456 113.50 5.41 3/1/2013
Sr. Notes B1 / BB- 500 7.000 3/15/2017 405 427 103.50 6.03 3/15/2012
Sr. Notes B1 / BB- 400 7.625 6/1/2018 265 507 106.75 6.04 6/1/2013
Sr. Notes B1 / BB- 400 8.625 10/15/2019 321 502 110.00 6.59 10/15/2014
Sr. Notes B1 / BB- 300 7.625 4/1/2020 272 433 108.50 6.11 4/1/2015

Plains Exploration & Production Company (PXP)
Page 47 Source: Company Filings, Nomura Securities International.
2009 Proved Reserves
2011 Capital Expenditures
Onshore California
57%
Offshore California
3%
Gulf Coast Region
22%
Guld of Mexico4%
Mid-Continent6%
Rocky Mountains
8%
California, 23%
Haynesville Shale, 18% Eagle Ford, 23%
Granite Wash, 18%
Other, 18%
Financial Summary
Operations Summary
2008 2009 2010E 2011E
EBITDA 1,674 679 997 1,151
Operating Cash Flow 1,371 499 902 1,023
Capital Expenditures (1,161) (1,643) (1,095) (1,190)
Dividends - - - -
Free Cash Flow 210 (1,144) (193) (167)
Acquisitions (2,084) (1,160) (543) -
Divestitures 2,970 - 81 -
Share Repurchases (304) - - -
Adjusted Cash Flow 792 (2,304) (654) (167)
Cash 312 2 12 12
Debt/EBITDA 1.7x 3.9x 3.4x 3.1x
Net Debt/EBITDA 1.5x 3.9x 3.4x 3.1x
2008 2009 2010E 2011E
Production (MBoe/d) 91 83 88 98
Realized Price ($/Boe) 71.77 72.26 46.05 50.11
Lease Operating Expenses 9.88 8.31 8.07 8.25
Production Taxes 2.84 1.28 1.14 1.80
G&A 4.63 4.79 4.25 3.91
Interest 3.53 2.44 3.22 3.13
Cash Costs 20.88 16.82 16.67 17.08
F&D Costs (6.34) 16.52
Full Cycle Costs 14.54 33.35
Recycle Ratio (8.03) 3.35

Page 48 Source: Company Filings, Nomura Securities International.
Range Resources Corporation (RRC)
Relative ValueWe are affirming our HOLD recommendation on Range Resources senior subordinated notes. Range has an excellent operational profile, very low cost structure, and moderate leverage. However, we are projecting roughly $500mn negative free cash flow in 2011. Absent sizeable asset sales, leverage would increase modestly over the next year. Considering the potential funding needs and relatively low yields, we see little upside from current levels.
Range’s core natural gas plays – Marcellus Shale, Barnett Shale, and Nora – support consistently strong production and management is guiding to a 25% production growth rate in 2011. Additionally, Range has one of the lowest cost structures of the HY peer group ($2.30/Mcfe cash costs and $0.78/Mcfe finding costs) and modest leverage of $0.59/Mcfe. Despite a favorable hedge position through 2011, we are projecting negative free cash flow (~$640mn in 2010; ~$450mn in 2011) given the spending levels required to attain its production targets. Management has indicated it may fund a portion of the spending short-fall with asset sales.
Business Description
Range Resources Corporation is an independent natural gas company with principal operations in the Southwestern and Appalachian regions of the United States. Range has proved reserves of approximately 3.1 trillion cubic feet equivalent, 84% of which are natural gas. The company’s strategy is to focus on developing its large acreage position in the Marcellus Shale, with 85% of planned 2010 capital expenditures attributable to the Appalachian region.
Company SnapshotReserves (Bcfe) 3,129
% Oil 16%
% Proved Developed 55%
Reserve Life (R/P) 19.7
Daily Production (MMcfe/d) 503
LTM EBITDAX 609
2011 EBITDAX 911
Cash 2
Total Debt 1,851
Market Capitalization 7,677
Enterprise Value 9,526
Debt/EBITDAX 3.0x
Debt/Reserves 0.59
EV/EBITDAX 15.6x
EV/Reserves 3.04
RatingsOutstanding
$mm Coupon (%) Maturity STW Z-Sprd Price YTW Next Call
Sr. Subordinated Ba3 / BB 150 6.375 3/15/2015 326 474 102.25 5.24 2/14/2011
Sr. Subordinated Ba3 / BB 250 7.500 5/15/2016 287 455 104.50 4.87 5/15/2011
Sr. Subordinated Ba3 / BB 250 7.500 10/1/2017 388 518 106.00 5.86 10/1/2012
Sr. Subordinated Ba3 / BB 250 7.250 5/1/2018 250 450 106.00 5.89 5/1/2013
Sr. Subordinated Ba3 / BB 300 8.000 5/15/2019 252 451 109.50 5.91 5/15/2014
Sr. Subordinated Ba3 / BB 500 6.750 8/1/2020 269 322 104.00 6.08 8/1/2015

Range Resources Corporation (RRC)
Page 49 Source: Company Filings, Nomura Securities International.
2009 Proved Reserves
2010 Capital Expenditures
Southwestern, 34%
Appalachian, 58%
Mid-Continent, 8%
Marcellus, 81%
Southwestern, 8%
Mid-Continent, 6%
Appalachian, 5%
Financial Summary
Operations Summary
2008 2009 2010E 2011E
EBITDAX 941 558 620 911
Operating Cash Flow 825 592 525 704
Capital Expenditures (918) (574) (962) (1,230)
Dividends (25) (25) (26) (26)
Free Cash Flow (118) (8) (462) (551)
Acquisitions (835) (139) (250) -
Divestitures 68 234 327 -
Share Repurchases - - - -
Adjusted Cash Flow (884) 87 (385) (551)
Cash 1 1 2 2
Debt/EBITDAX 1.9x 3.1x 3.4x 2.9x
Net Debt/EBITDAX 1.9x 3.1x 3.4x 2.9x
2008 2009 2010E 2011E
Production (MMcfe/d) 386 436 491 555
Realized Price ($/Mcfe) 8.58 6.44 5.37 6.05
Lease Operating Expenses 1.01 0.84 0.71 0.67
Production Taxes 0.39 0.20 0.19 0.20
G&A 0.65 0.73 0.74 0.70
Interest 0.71 0.74 0.73 0.73
Cash Costs 2.76 2.51 2.36 2.30
F&D Costs 1.95 0.78
Full Cycle Costs 4.71 3.29
Recycle Ratio 2.98 5.04

Page 50 Source: Company Filings, Nomura Securities International.
Talisman Energy Inc. (TLM)
Relative Value
We are affirming our HOLD recommendation on Talisman Energy senior notes. Although Talisman trades somewhat wide to the energy space, we believe that a discount is warranted given the ongoing strategic repositioning of its asset base. Talisman recently announced the acquisition of BP assets in Colombia. We believe that the company may seek further acquisitions to bolster its North American shale plays and international exploration. Although Talisman maintains fairly low leverage, we are projecting a modest free cash flow burn in 2011.
Business Description
Talisman Energy Inc. is an independent oil and gas producer with operations in North America, the North Sea, and Southeast Asia. In addition, the company has development projects in Algeria, Colombia, Peru, Qatar, and the Kurdistan region of northern Iraq. Talisman has proved reserves of approximately 1.1 billion barrels of oil equivalent, 40% of which are oil. The Company’s strategy is to develop its substantial acreage in the Marcellus and Montney shale plays and its Southeast Asia assets, while its North Sea operations act as a stable, cash generator.
Company SnapshotReserves (MMBoe) 1,201
% Oil 39%
% Proved Developed 84%
Reserve Life (R/P) 7.7
Daily Production (MBoe/d) 404
LTM EBITDAX 4,441
2011 EBITDAX 5,341
Cash 2,078
Total Debt 3,705
Market Capitalization 23,165
Enterprise Value 24,792
Debt/EBITDAX 0.8x
Debt/Reserves 3.08
EV/EBITDAX 5.6x
EV/Reserves 20.64
RatingsOutstanding
$mm Coupon (%) Maturity STW Z-Sprd Price YTW
Sr. Notes Baa2 / BBB 600 3.750 2/1/2021 115 109 93.71 4.54
Sr. Notes Baa2 / BBB 600 6.250 2/1/2038 130 176 104.98 5.88

Talisman Energy Inc. (TLM)
Page 51 Source: Company Filings, Nomura Securities International.
2009 Proved Reserves
2010 Capital Expenditures
Canada36%
United States8%
United Kingdom22%
Scandinavia6%
Indonesia20%
Other SE Asia6%
Other2%
Financial Summary
Operations Summary
North America47%
United Kingdom17%
Scandinavia13%
Southeast Asia6%
Other17%
2008 2009 2010E 2011E
EBITDAX 6,890 3,935 4,391 5,341
Operating Cash Flow 6,154 3,599 3,763 4,111
Capital Expenditures (4,872) (4,080) (4,085) (4,000)
Dividends (204) (229) (257) (260)
Free Cash Flow 1,078 (710) (579) (149)
Acquisitions (436) (310) (1,763) -
Divestitures 90 2,541 2,107 260
Adjusted Cash Flow 732 1,521 (235) 111
Cash 91 1,690 2,078 2,388
Debt/EBITDAX 0.6x 1.0x 0.9x 0.8x
Net Debt/EBITDAX 0.6x 0.5x 0.4x 0.3x
2008 2009 2010E 2011E
Production (MBoe/d) 432 425 415 451
Realized Price ($/Boe) 70.45 47.76 53.51 57.74
Lease Operating Expenses 13.76 14.29 14.33 14.70
Production Taxes 1.11 0.70 0.73 0.81
G&A 1.86 2.15 2.45 2.36
Interest 1.06 1.24 1.07 1.20
Cash Costs 17.79 18.38 18.59 19.07
F&D Costs 301.46 14.49
Full Cycle Costs 319.25 32.86
Recycle Ratio 0.17 2.03

Comparative Tables
Page 52
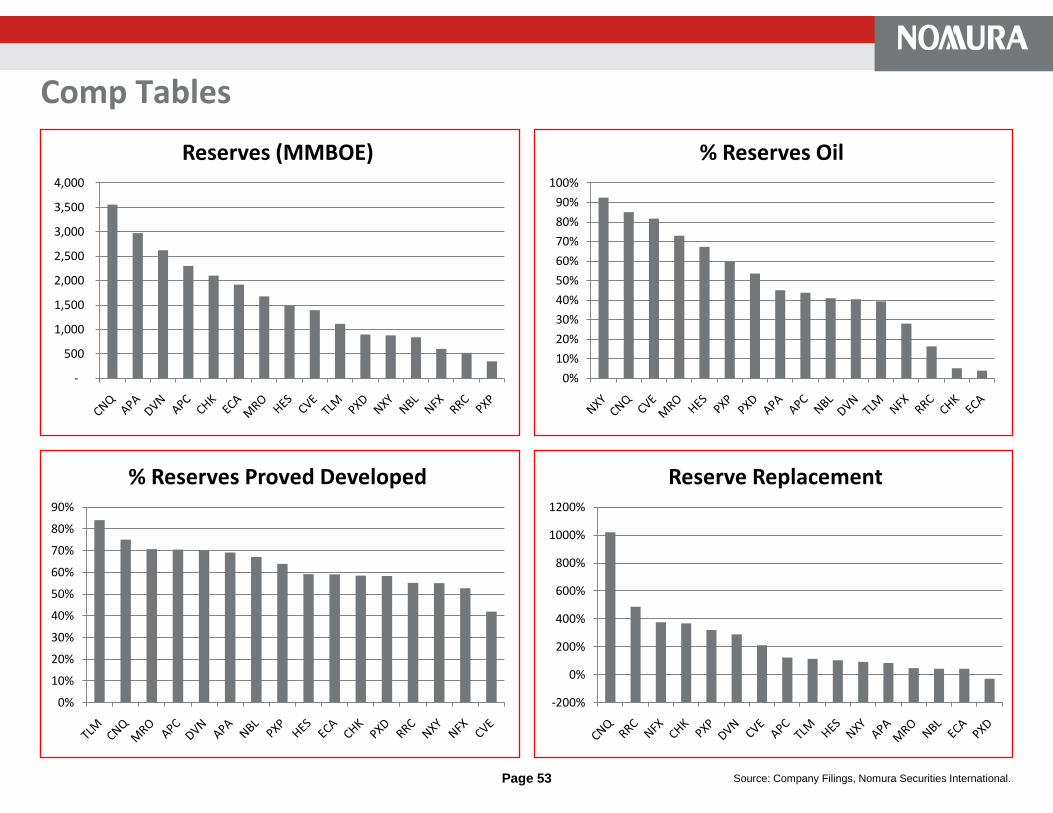
Comp Tables
Page 53 Source: Company Filings, Nomura Securities International.
-200%
0%
200%
400%
600%
800%
1000%
1200%
Reserve Replacement
-
500
1,000
1,500
2,000
2,500
3,000
3,500
4,000
Reserves (MMBOE)
0%
10%
20%
30%
40%
50%
60%
70%
80%
90%
100%
% Reserves Oil
0%
10%
20%
30%
40%
50%
60%
70%
80%
90%
% Reserves Proved Developed
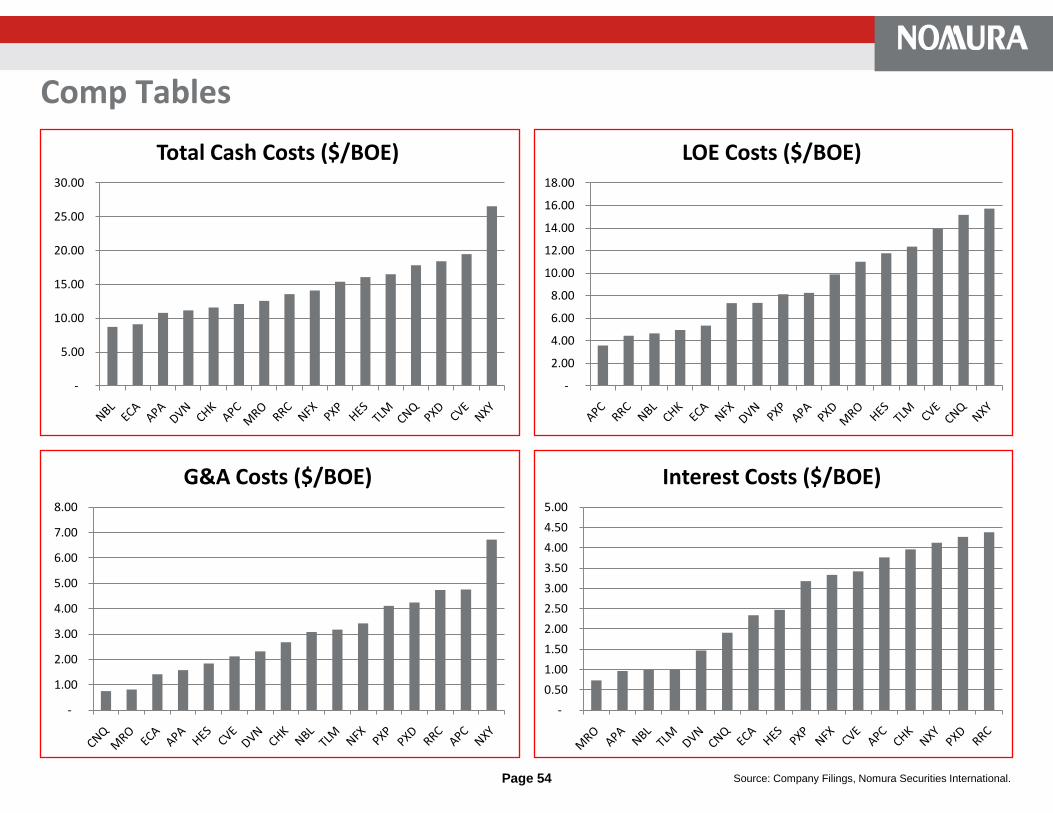
Comp Tables
Page 54 Source: Company Filings, Nomura Securities International.
-
5.00
10.00
15.00
20.00
25.00
30.00
Total Cash Costs ($/BOE)
-
2.00
4.00
6.00
8.00
10.00
12.00
14.00
16.00
18.00
LOE Costs ($/BOE)
-
1.00
2.00
3.00
4.00
5.00
6.00
7.00
8.00
G&A Costs ($/BOE)
-
0.50
1.00
1.50
2.00
2.50
3.00
3.50
4.00
4.50
5.00
Interest Costs ($/BOE)
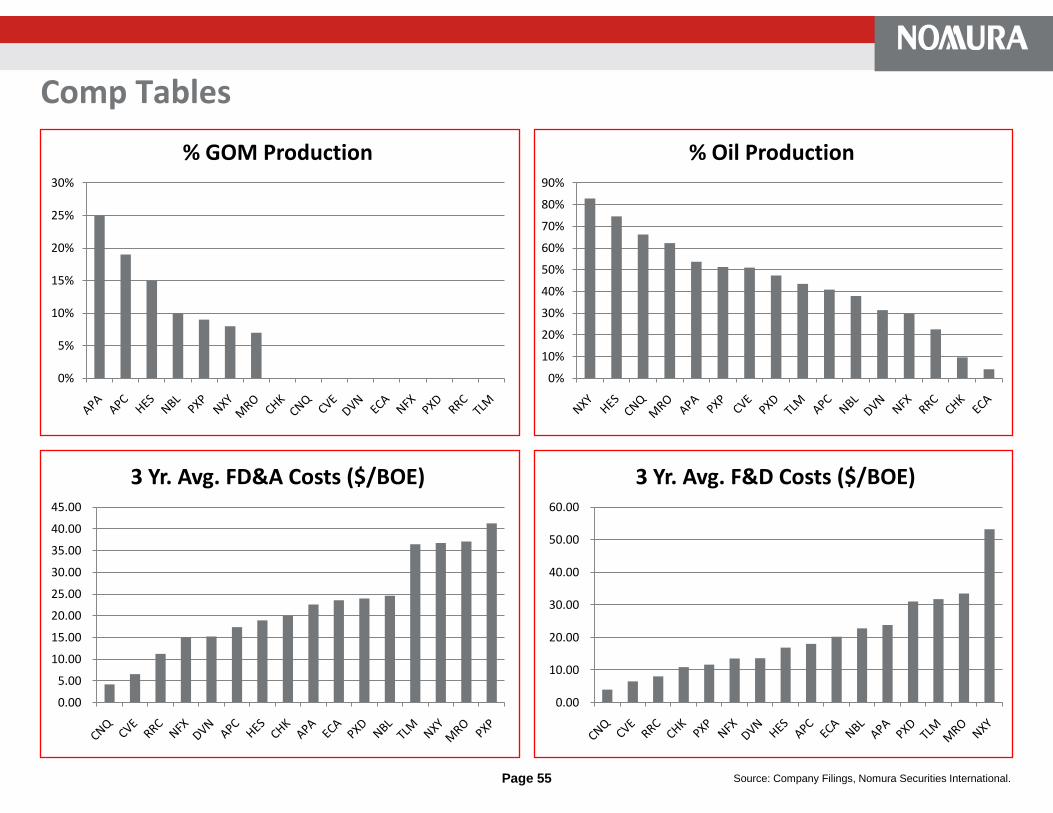
Comp Tables
Page 55 Source: Company Filings, Nomura Securities International.
0.00
5.00
10.00
15.00
20.00
25.00
30.00
35.00
40.00
45.00
3 Yr. Avg. FD&A Costs ($/BOE)
0.00
10.00
20.00
30.00
40.00
50.00
60.00
3 Yr. Avg. F&D Costs ($/BOE)
0%
5%
10%
15%
20%
25%
30%
% GOM Production
0%
10%
20%
30%
40%
50%
60%
70%
80%
90%
% Oil Production

Comp Tables
Page 56 Source: Company Filings, Nomura Securities International.
(2,500)
(2,000)
(1,500)
(1,000)
(500)
-
500
1,000
1,500
2,000
2011 FCF
-
1.00
2.00
3.00
4.00
5.00
6.00
7.00
8.00
9.00
Debt/BOE
-
1.00
2.00
3.00
4.00
5.00
6.00
7.00
8.00
Net Debt/BOE
-
5
10
15
20
25
Reserve Life

Page 57 Source: Company Filings, Nomura Securities International.
2011 % Hedged Oil
2011 % Hedged Gas
2011 Avg. Oil Swap
2011 Avg. Oil Floor
2011 Avg. Oil Ceiling
2011 Avg. Gas Swap
2011 Avg. Gas Floor
2011 Avg. Gas CeilingCompany
APA 20% 12% $70.12 $68.94 $96.05 $6.20 $5.43 $8.35 APC 59% 23% - $79.29 $99.95 $6.17 $6.50 $8.29 CHK 13% 51% $91.17 - - $6.98 $7.70 $11.50
CNQ 5% 10% - $70.00 $102.33 $4.87 - -CVE 71% 53% $86.92 - - $5.82 - -DVN 28% 20% - $75.00 $109.00 $5.56 - -ECA 0% 35% - - - $6.33 - -HES NM NM NM NM NM NM NM NM MRO 0% 0% - - - - - -NBL 31% 27% - $80.15 $94.63 $6.41 $5.95 $6.82 NFX 48% 64% $81.51 $77.58 $107.76 $6.26 $5.95 $7.71 NXY 36% 0% - - - - - -PXD 95% 79% $77.25 $73.75 $99.33 $6.13 $6.32 $8.55 PXP 77% 72% - $80.00 $110.00 - $4.00 $4.92 RRC 0% 90% - - - - $5.56 $6.48 TLM 14% 11% - - - $5.81 $6.04 $6.62
2012 % Hedged Oil
2012 % Hedged Gas
2012 Avg. Oil Swap
2012 Avg. Oil Floor
2012 Avg. Oil Ceiling
2012 Avg. Gas Swap
2012 Avg. Gas Floor
2012 Avg. Gas CeilingCompany
APA 9% 10% $70.99 $69.30 $98.11 $6.58 $5.78 $7.29 APC 1% 20% - $50.00 $92.50 - $6.50 $9.03 CHK 8% 7% $100.00 - - $6.15 - -CNQ 0% 0% - - - - - -CVE 0% 20% - - - $5.96 - -DVN 0% 0% - - - - - -ECA 0% 31% - - - $6.46 - -HES NM NM NM NM NM NM NM NM MRO 0% 0% - - - - - -NBL 30% 6% $87.47 $81.25 $101.06 - $5.50 $7.92 NFX 41% 40% $82.27 $78.13 $111.18 $5.42 $5.63 $6.68 NXY 0% 0% - - - - - -PXD 93% 89% $79.32 $80.48 $119.70 $5.82 $5.83 $7.61 PXP 77% 58% - $80.00 - - $4.30 -RRC 30% 17% - $70.00 $80.00 - $5.50 $6.25 TLM 0% 0% - - - - - -
Hedging Comparison

Master Limited Partnerships/Pipelines Recommendations
Page 58
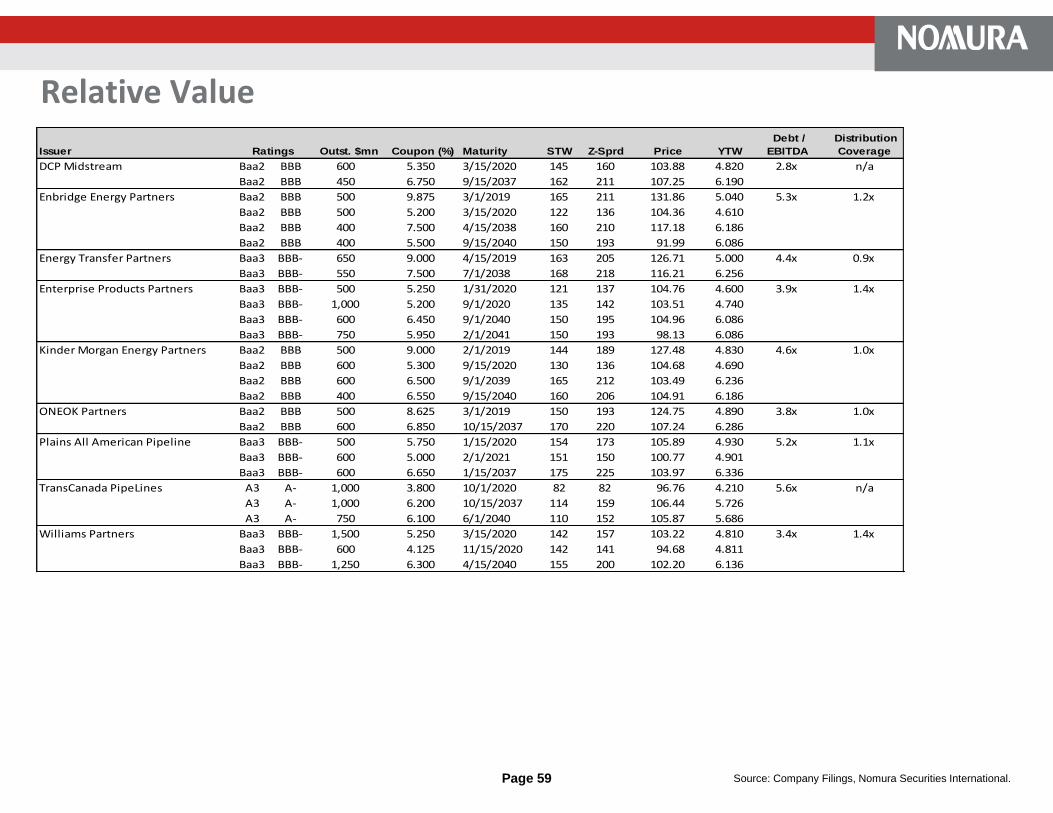
Page 59 Source: Company Filings, Nomura Securities International.
Relative Value
DCP Midstream Baa2 BBB 600 5.350 3/15/2020 145 160 103.88 4.820 2.8x n/a
Baa2 BBB 450 6.750 9/15/2037 162 211 107.25 6.190
Enbridge Energy Partners Baa2 BBB 500 9.875 3/1/2019 165 211 131.86 5.040 5.3x 1.2x
Baa2 BBB 500 5.200 3/15/2020 122 136 104.36 4.610
Baa2 BBB 400 7.500 4/15/2038 160 210 117.18 6.186
Baa2 BBB 400 5.500 9/15/2040 150 193 91.99 6.086
Energy Transfer Partners Baa3 BBB- 650 9.000 4/15/2019 163 205 126.71 5.000 4.4x 0.9x
Baa3 BBB- 550 7.500 7/1/2038 168 218 116.21 6.256
Enterprise Products Partners Baa3 BBB- 500 5.250 1/31/2020 121 137 104.76 4.600 3.9x 1.4x
Baa3 BBB- 1,000 5.200 9/1/2020 135 142 103.51 4.740
Baa3 BBB- 600 6.450 9/1/2040 150 195 104.96 6.086
Baa3 BBB- 750 5.950 2/1/2041 150 193 98.13 6.086
Kinder Morgan Energy Partners Baa2 BBB 500 9.000 2/1/2019 144 189 127.48 4.830 4.6x 1.0x
Baa2 BBB 600 5.300 9/15/2020 130 136 104.68 4.690
Baa2 BBB 600 6.500 9/1/2039 165 212 103.49 6.236
Baa2 BBB 400 6.550 9/15/2040 160 206 104.91 6.186
ONEOK Partners Baa2 BBB 500 8.625 3/1/2019 150 193 124.75 4.890 3.8x 1.0x
Baa2 BBB 600 6.850 10/15/2037 170 220 107.24 6.286
Plains All American Pipeline Baa3 BBB- 500 5.750 1/15/2020 154 173 105.89 4.930 5.2x 1.1x
Baa3 BBB- 600 5.000 2/1/2021 151 150 100.77 4.901
Baa3 BBB- 600 6.650 1/15/2037 175 225 103.97 6.336
TransCanada PipeLines A3 A- 1,000 3.800 10/1/2020 82 82 96.76 4.210 5.6x n/a
A3 A- 1,000 6.200 10/15/2037 114 159 106.44 5.726
A3 A- 750 6.100 6/1/2040 110 152 105.87 5.686
Williams Partners Baa3 BBB- 1,500 5.250 3/15/2020 142 157 103.22 4.810 3.4x 1.4x
Baa3 BBB- 600 4.125 11/15/2020 142 141 94.68 4.811
Baa3 BBB- 1,250 6.300 4/15/2040 155 200 102.20 6.136
Issuer Ratings Outst. $mn Coupon (%) Maturity STW Z-Sprd Price YTW
Debt /
EBITDA
Distribution
Coverage

Page 60 Source: Company Filings, Nomura Securities International.
Recommendation
We maintain our BUY recommendation on DCP Midstream 5.35% senior notes due 2020 and the 6.75% senior notes due 2037. We are attracted to DCMPID’s strong business position in natural gas gathering and processing, conservative leverage, and demonstrated support from its 50/50 parents ConocoPhillips (A1/A/A) and Spectra Energy (Baa2/BBB). At 15-20bp wide to benchmark MLPs like Enterprise Partners Products, we view DCPMID (organized as a c-corp.) as excessively wide.
DCP Midstream (DCPMID, Baa2/BBB)
Segment Analysis
Structure: DCP Midstream LLC (DCPMID) is a 50-50 JV between Spectra Energy and ConocoPhillips. DCPMID is the general partner of DCP Midstream Partners (DPM) and owns ~30% of the common units. DPM owns the propane segment as well as ~4,700 miles of gas pipelines, ~95 Mbbl/d of NGL pipeline capacity, 10 natural gas processing plants, and 2 fractionation facilities.
Natural Gas Gathering and Processing:• Consists of ~60,000 miles of natural gas gathering pipelines in Colorado, Kansas, New Mexico, Oklahoma, Texas, and Wyoming with total system throughput of 7.0 Tbtu/d. In addition, the segment owns or operates 59 natural gas processing plants and owns 6 Bcf of natural gas storage capacity.NGL Logistics:• DCP owns or operates 10 fractionation facilities in Louisiana and Texas and produces an average of ~360 MBbl/d of NGLs. The segment also includes NGL pipeline assets in Louisiana, Texas, and Wyoming. The marketing business markets and trades an average of ~480 MBbl/d of natural gas.Propane:• The propane segment is concentrated in the Northeast and consists of: five owned and operated rail terminals; one owned marine terminal; one leased marine terminal; and one pipeline terminal.
Gathering & Processing /
NGLs98%
Propane2%
Segment Operating Income
Issuer Ratings Outst. $mn Coupon (%) Maturity STW Z-Sprd Price YTW
DCP Midstream Baa2 BBB 600 5.350 3/15/2020 145 160 103.88 4.820
Baa2 BBB 450 6.750 9/15/2037 162 211 107.25 6.190

Enbridge Energy Partners (EEP, Baa2/BBB)
Page 61 Source: Company Filings, Nomura Securities International.
Recommendation
We maintain our HOLD recommendation on Enbridge Energy Partners’ senior notes complex. Despite the recent noise surrounding the pipeline spill, we remain comfortable with EEP’s credit profile. We note that EEP enjoys an excellent business position in oil and refined products pipelines and a relatively high percentage of fee-based cash flow. In addition, EEP is strategically important to its general partner and largest unit holder, Enbridge Inc. (Baa1/A-), which in the past has provided financial support to the MLP. Our HOLD rating is based on what we view as full valuations relative to its MLP peers and limited upside from current levels.
Segment Analysis
Liquids:• Consists of: the Lakehead system, 4,700 miles of crude oil and liquid petroleum pipelines and terminal assets in the Great Lakes and Midwest regions; the Mid-Continent system, which includes the Ozark pipeline, West Tulsa pipeline, and storage terminals at Cushing and El Dorado Kansas (480 miles of pipelines and 15.9 MMBbl of crude storage capacity); and the North Dakota system, 240 miles of crude oil gathering lines connecting to a 730 mile interstate transportation system servicing the Williston Basin in North Dakota and Montana.Natural Gas:• Includes: the East Texas system – ~3,400 miles of natural gas gathering and transportation pipelines, nine natural gas treating plants, and seven natural gas processing plants; the Anadarko system – ~1,800 miles of natural gas gathering and transportation pipelines in southwest Oklahoma and the Texas panhandle and six natural gas processing plants; and the North Texas system – ~4,500 miles of natural gas gathering pipelines and nine natural gas processing plants in the Fort Worth Basin. The processing facilities and the treating facilities have combined capacities of ~1,800 MMcf/d and ~1,200 MMcf/d, respectively.Marketing:• Maximizes the value of the natural gas purchased by its gathering systems and the throughput on its gathering and intrastate pipelines by transacting with various counterparties to provide natural gas supply, transportation, balancing, storage, and sales services.
Liquids82%
Natural Gas17%
Marketing1%
Segment Operating Income
Issuer Ratings Outst. $mn Coupon (%) Maturity STW Z-Sprd Price YTW
Enbridge Energy Partners Baa2 BBB 500 9.875 3/1/2019 165 211 131.86 5.040
Baa2 BBB 500 5.200 3/15/2020 122 136 104.36 4.610
Baa2 BBB 400 7.500 4/15/2038 160 210 117.18 6.186
Baa2 BBB 400 5.500 9/15/2040 150 193 91.99 6.086

Page 62 Source: Company Filings, Nomura Securities International.
Recommendation
We recommend a HOLD rating on Energy Transfer Partners 9.0% senior notes due 2019 and 7.5% senior notes due 2038. We believe that ETP‘s credit profile has strong positive momentum but the 2019s and 2038s appear fairly valued, considering the higher dollar price and weaker liquidity in the issues. We are attracted to ETP’s scale and diversification across interstate, intrastate, and midstream natural gas operations. The completion of two large interstate pipelines should improve the business mix by increasing regulated interstate pipeline earnings to nearly 30% from 16%, and reduce the less stable intrastate contribution to 40% from 47%.
Energy Transfer Partners (ETP, Baa3/BBB-)
Segment Analysis
Intrastate Transportation and Storage:• Consists of ~7,800 miles of natural gas transportation pipelines and three natural gas storage facilities in the state of Texas – the largest intrastate system in the United States. This system includes: the ET fuel system; Oasis Pipeline; Houston Pipeline System; and East Texas Pipeline.Interstate Transportation:• Consists of ~2,700 miles of natural gas pipelines, with additional gross mileage under construction/recently completed of ~350 miles. The anchor of this segment is Transwestern Pipeline, which runs from East Texas to California and has capacity of 2.1 Bcf/d. The recently completed Fayetteville Express Pipeline (50/50 JV with Kinder Morgan Energy Partners) has an initial capacity of 2.0 Bcf/d. The Tiger Pipeline has capacity of 2.4 Bcf/d.Midstream:• Consists of ~7,000 miles of natural gas gathering pipelines, three natural gas processing plants and treating and conditioning plants in Colorado, New Mexico, Texas, and Utah.Retail Propane:• The propane segment is the 3rd largest propane marketer in the United States, with 440 locations in 41 states and ~1.2 million customers. This business is largely seasonal and weather dependant, with nearly all earnings coming in the 1st and 4th quarters.
Intrastate Transportation
and Storage, 47%
Interstate Transportation,
16%
Midstream, 19%
Retail Propane, 18%
Segment Operating Income
Ratings Outst. $mn Coupon (%) Maturity STW Z-Sprd Price YTW
Energy Transfer Partners Baa3 BBB- 650 9.000 4/15/2019 163 205 126.71 5.000
Baa3 BBB- 550 7.500 7/1/2038 168 218 116.21 6.256

Page 63 Source: Company Filings, Nomura Securities International.
Recommendation
We recommend a HOLD on Enterprise Products Partners senior notes. EPD is one of the better-managed midstream companies and enjoys excellent scale, with a significant presence in existing and emerging natural gas producing regions. While EPD does have above-average commodity price exposure given its NGL operations, this is partially offset by conservative financial policies, including a willingness to issue equity units to balance its capital structure.
Enterprise Products Partners (EPD, Baa3/BBB-)
Segment Analysis
NGL Pipelines & Services:• Consists of: 25 natural gas processing plants located in the Gulf Coast, west Texas, and Rocky Mountains and associated NGL marketing activities; 16,300 miles of NGL pipelines; 163.4 MMBbls of NGL and related product storage and terminal facilities; and 16 fractionation facilities.Onshore Crude Oil Pipelines & Services:• Consists of ~4,400 miles of onshore crude oil pipelines in Oklahoma, New Mexico and Texas and 10.5 MMBbls of storage tank capacity in Cushing, OK and Midland, TX.Onshore Natural Gas Pipelines & Services:• Includes ~19,200 miles of onshore natural gas pipeline systems in Alabama, Colorado, Louisiana, Mississippi, New Mexico, Texas, and Wyoming. This segment also includes 2 salt dome storage facilities in Mississippi and leased natural gas storage in Texas and Louisiana.Offshore Pipelines & Services:• Consists of ~1,400 miles of offshore natural gas pipelines, ~1,000 miles of offshore crude oil pipelines, and six offshore hub platforms in the Gulf of Mexico.Petrochemical and Refined Products & Services:• Consists of: 2 propylene fractionation plants and related marketing activities; a butane isomerization complex - 3 butamer reactor units and 8 associated deisobutanizer units; an octane enhancement facility; refined products pipelines in the Gulf Coast; and marine transportation and other services.
Onshore Natural Gas
Pipelines & Svcs15%
NGL Pipelines & Svcs54%
Onshore Crude Oil Pipelines &
Svcs4%
Offshore Pipelines & Svcs
10%
Petrochem. & Refined Prods
Svcs17%
Segment Operating Income
Issuer Ratings Outst. $mn Coupon (%) Maturity STW Z-Sprd Price YTW
Enterprise Products Partners Baa3 BBB- 500 5.250 1/31/2020 121 137 104.76 4.600
Baa3 BBB- 1,000 5.200 9/1/2020 135 142 103.51 4.740
Baa3 BBB- 600 6.450 9/1/2040 150 195 104.96 6.086
Baa3 BBB- 750 5.950 2/1/2041 150 193 98.13 6.086

Page 64 Source: Company Filings, Nomura Securities International.
Recommendation
We are recommending a BUY rating on Kinder Morgan Energy Partners 6.95% senior notes due 2038, 6.5% senior notes due 2039, and 6.55% senior notes due 2040. As one of the largest and most diversified MLPs, we view KMP as a core holding in the high grade MLP space. While the oil production (CO2) segment stands out as atypical to its competitors’ operations, the related hedging program and very high quality, regulated mix of the conventional segments offsets the higher operational risk associated with the CO2 business. We view the long end of the senior debt complex as most attractive, with long bonds trading at a roughly 30bp spread to 10-year notes. We note that lower-rated EPD and WPZ 10s-30s is roughly 10bp.
Kinder Morgan Energy Partners (KMP, Baa2/BBB)
Segment Analysis
Products Pipelines:• Consists of ~8,400 miles of refined petroleum products pipelines delivering gasoline, diesel fuel, jet fuel, and NGLs as well as ~60 associated product terminals and petroleum pipeline transmixprocessing facilities.Natural Gas Pipelines:• Consists of over 15,000 miles of natural gas transmission and gathering pipelines and natural gas storage, treating and processing facilities. Major components of this segment include Rockies Express, Midcontinent Express, the KinderHawk JV, and the Fayetteville Express project. Approximately 60% of this segment is interstate pipelines (virtually all take or pay) and the remaining 40% is Texas intrastate pipelines (~80% take or pay). The average remaining contract life on the pipelines is ~8.9 years.CO2:• Produces, markets, and transports carbon dioxide for increased recovery in oil production, through ~1,400 miles of pipelines. In addition, KMP holds ownership interests in oil-producing fields in west Texas including a 97% working interest in the SACROC field and a 50% working interest in the Yates field, with total proved reserves of ~87 MMBoe.Terminals:• Consists of ~120 owned or operated liquids and bulk terminal facilities and more than 32 rail transloading and materials handling facilities. These facilities transload, store, and deliver a wide variety of bulk, petroleum, petrochemical, and other liquids products.Kinder Morgan Canada:• Consists of ~800 miles of common carrier pipelines, originating in Edmonton, Alberta, for the transportation of crude oil and refined petroleum to the interior of British Columbia and to marketing terminals and refineries in the Greater Vancouver and Puget Sound areas. KM Canada also owns 5 associated product terminals and a 1/3rd interest in the Express Pipeline system.
Products Pipelines
21%
Natural Gas Pipelines
25%
CO229%
Terminals19%
Kinder Morgan Canada
6%
Segment EBITDA
Issuer Ratings Outst. $mn Coupon (%) Maturity STW Z-Sprd Price YTW
Kinder Morgan Energy Partners Baa2 BBB 500 9.000 2/1/2019 144 189 127.48 4.830
Baa2 BBB 600 5.300 9/15/2020 130 136 104.68 4.690
Baa2 BBB 600 6.500 9/1/2039 165 212 103.49 6.236
Baa2 BBB 400 6.550 9/15/2040 160 206 104.91 6.186
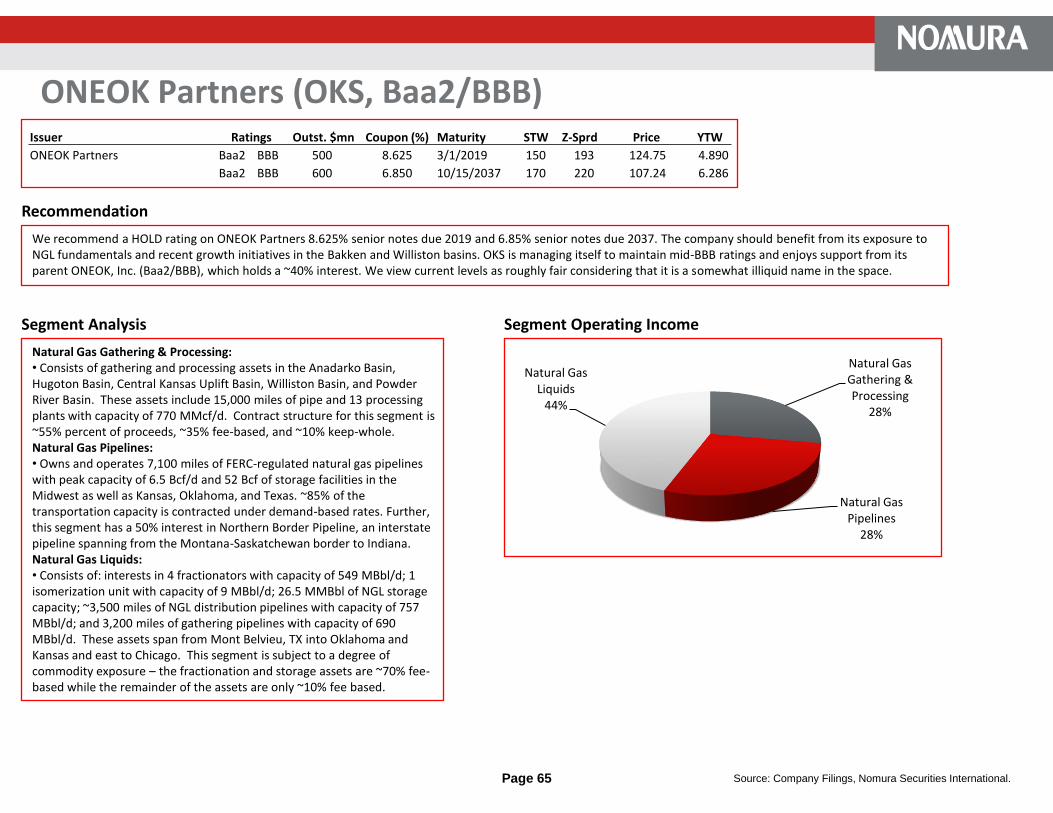
Page 65 Source: Company Filings, Nomura Securities International.
Recommendation
We recommend a HOLD rating on ONEOK Partners 8.625% senior notes due 2019 and 6.85% senior notes due 2037. The company should benefit from its exposure to NGL fundamentals and recent growth initiatives in the Bakken and Williston basins. OKS is managing itself to maintain mid-BBB ratings and enjoys support from its parent ONEOK, Inc. (Baa2/BBB), which holds a ~40% interest. We view current levels as roughly fair considering that it is a somewhat illiquid name in the space.
ONEOK Partners (OKS, Baa2/BBB)
Segment Analysis
Natural Gas Gathering & Processing:• Consists of gathering and processing assets in the Anadarko Basin, Hugoton Basin, Central Kansas Uplift Basin, Williston Basin, and Powder River Basin. These assets include 15,000 miles of pipe and 13 processing plants with capacity of 770 MMcf/d. Contract structure for this segment is ~55% percent of proceeds, ~35% fee-based, and ~10% keep-whole.Natural Gas Pipelines:• Owns and operates 7,100 miles of FERC-regulated natural gas pipelines with peak capacity of 6.5 Bcf/d and 52 Bcf of storage facilities in the Midwest as well as Kansas, Oklahoma, and Texas. ~85% of the transportation capacity is contracted under demand-based rates. Further, this segment has a 50% interest in Northern Border Pipeline, an interstate pipeline spanning from the Montana-Saskatchewan border to Indiana. Natural Gas Liquids:• Consists of: interests in 4 fractionators with capacity of 549 MBbl/d; 1 isomerization unit with capacity of 9 MBbl/d; 26.5 MMBbl of NGL storage capacity; ~3,500 miles of NGL distribution pipelines with capacity of 757 MBbl/d; and 3,200 miles of gathering pipelines with capacity of 690 MBbl/d. These assets span from Mont Belvieu, TX into Oklahoma and Kansas and east to Chicago. This segment is subject to a degree of commodity exposure – the fractionation and storage assets are ~70% fee-based while the remainder of the assets are only ~10% fee based.
Segment Operating Income
Natural Gas Gathering & Processing
28%
Natural Gas Pipelines
28%
Natural Gas Liquids
44%
Issuer Ratings Outst. $mn Coupon (%) Maturity STW Z-Sprd Price YTW
ONEOK Partners Baa2 BBB 500 8.625 3/1/2019 150 193 124.75 4.890
Baa2 BBB 600 6.850 10/15/2037 170 220 107.24 6.286

Page 66 Source: Company Filings, Nomura Securities International.
Recommendation
We maintain our SELL recommendation on Plains All American senior notes. We maintain a favorable view on Plains’ largely fee-based crude oil and products pipeline business. However, we believe that current spreads do not compensate for the high leverage of 5.2x debt/EBITDA (high 4x adjusted for oil inventory related debt) and risk inherent to the marketing operations (20-25% of earnings).
Plains All American Pipeline (PAA, Baa3/BBB-)
Segment Analysis
Transportation:• Consists of ~16,000 miles of crude oil and refined products pipelines and gathering systems as well as trucks, trailers, barges, and transport tugs. Plains has a large gathering system in west Texas as well as systems in California, Canada, Gulf Coast, Mid-Continent, and the Rocky Mountains.Facilities:• Provides storage, terminalling, and throughput services for crude oil, refined products, LPG, and natural gas, as well as LPG fractionation and isomerization services. PAA owns ~51 MMBbls of crude oil and refined products capacity at various locations (including 11 MMBbls at Cushing), 6 MMBbls of LPG storage capacity, ~40 Bcf of natural gas storage capacity, a fractionation plant in Canada with processing capacity of 4,400 Bbl/d, and a fractionation and isomerization facility in California with aggregate processing capacity of 22,500 Bbl/d. This segment includes PAA’s investment in PAA Natural Gas Storage (PNG).Supply & Logistics:• Consists of the following merchant activities: the purchase of U.S. and Canadian crude oil at the wellhead and at pipeline and terminal facilities; the storage of inventory during contango market conditions and seasonal storage of LPG; the purchase of refined products from producers, refiners, and other marketers; the resale or exchange of crude oil, refined products, and LPG at various points along the distribution chain.
Supply & Logistics
22%
Facilities52%
Transportation26%
Segment EBITDA
Issuer Ratings Outst. $mn Coupon (%) Maturity STW Z-Sprd Price YTW
Plains All American Pipeline Baa3 BBB- 500 5.750 1/15/2020 154 173 105.89 4.930
Baa3 BBB- 600 5.000 2/1/2021 151 150 100.77 4.901
Baa3 BBB- 600 6.650 1/15/2037 175 225 103.97 6.336

Page 67 Source: Company Filings, Nomura Securities International.
Recommendation
We are recommending a SELL rating on TransCanada PipeLines senior notes (see above). Respecting the highly regulated nature of the business mix and the single-A ratings, we view current levels as rich considering the company’s high leverage and negative free cash flow profile. Although the name trades wide for its A ratings, we believe that expectations of steady issuance to finance its cash flow deficit will limit upside from current levels.
TransCanada PipeLines Ltd. (TRP, A3/A-)
Segment Analysis
Pipelines:• Consists of ~37,500 miles of wholly-owned natural gas pipelines and ~5,500 miles of partially-owned natural gas pipelines, accounting for ~15 Bcf/d of average daily volume. In addition, TRP owns the Keystone Oil Pipeline, a 2,147 mile pipeline system with capacity of 1.1 BBbl/d (expandable to 1.5 BBbl/d). The first phase began commercial operations in mid-2010 and the full system will be in service by 2013.Canadian Power:• Consists of ~6,400 MW of power generation capacity in Ontario and West Canada, anchored by TRP’s 40% interest in the 6,200 MW Bruce Power nuclear plant. The rest of the Ontario assets are wind and gas plants, while the Western Canada assets are coal and gas. The company-wide capacity breakdown is: 55% gas; 21% nuclear; 14% coal; 5% hydro; and 5% wind.U.S. Power:• Consists of ~4,300 MW of power generation capacity primarily in the Northeast. The Ravenswood gas plant in Queens, NY accounts for ~2,480 MW of this capacity, various hydroelectric plants account for 567 MW, and the balance consists of additional gas plants and wind assets.Natural Gas Storage:• Consists of natural gas storage facilities in Canada and the U.S., with capacity of 380 Bcf. 250 Bcf of this is regulated storage capacity operated by ANR and 130 Bcf is non-regulated.
Canadian Pipelines
49%U.S. Pipelines
24%
Canadian Power16%
U.S. Power7%
Natural Gas Storage
4%
Segment EBITDA
Issuer Ratings Outst. $mn Coupon (%) Maturity STW Z-Sprd Price YTW
TransCanada PipeLines A3 A- 1,000 3.800 10/1/2020 82 82 96.76 4.210
A3 A- 1,000 6.200 10/15/2037 114 159 106.44 5.726
A3 A- 750 6.100 6/1/2040 110 152 105.87 5.686

Page 68 Source: Company Filings, Nomura Securities International.
Recommendation
We rate Williams Partners senior notes as a HOLD. We are attracted to WPZ’s relatively stable business mix and low leverage compared with its MLP peers. The company owns two major, regulated interstate pipelines and its midstream operations are roughly 50% fee-based. At roughly flat to EPD, we would recommend swapping into WPZ senior notes in order to diversify MLP exposure. While EPD is a larger, better diversified benchmark MLP issuer, Williams Partners operates with lower leverage (3.8x vs. 4.3x) and less commodity price exposure. Although likely a longer-term event, WPZ is a better candidate for ratings improvement.
Williams Partners (WPZ, Baa3/BBB-)
Segment Analysis
Gas Pipeline:• WPZ owns Transcontinental Gas Pipe Line, Northwest Pipeline, and a 24.5% interest in Gulfstream Pipeline. These systems have a combined peak-day delivery capacity of ~12 Bcf/d and a total annual throughput of ~2,700 TBtu, which is approximately 12% of the natural gas consumed in the U.S. Transco is a 10,000 mile natural gas pipeline extending from Texas to New York. Northwest is a 3,900 mile system originating in the San Juan basin in New Mexico and Colorado and extending through the northwest United States to Washington. Gulfstream is a 745 mile system extending from the Alabama coast to Florida, under the Gulf of Mexico.Midstream:• WPZ’s midstream assets are concentrated in major producing basins in Colorado, New Mexico, Wyoming, the Gulf of Mexico, and Pennsylvania and provide: natural gas gathering, treating, and processing; NGL fractionation, storage, and transportation; and oil transportation. Major assets include: the Opal and Echo Springs processing plants in Wyoming, which have a combined daily capacity of 1.8 Bcf/d of natural gas and 100,000 Bbl/d of NGL production capacity; the Willow Creek processing plant in Colorado (450 MMcf/d gas capacity and 30,000 Bbl/d of NGL production); the Four Corners system, comprised of 6,400 receipt points and five natural gas processing/treating plants; and four processing plants on the Gulf Coast that are integrated with 5 major deepwater oil and gas pipeline systems and 2 offshore production handling platforms.
Gas Pipelines42%
Midstream58%
Segment Operating Income
Issuer Ratings Outst. $mn Coupon (%) Maturity STW Z-Sprd Price YTW
Williams Partners Baa3 BBB- 1,500 5.250 3/15/2020 142 157 103.22 4.810
Baa3 BBB- 600 4.125 11/15/2020 142 141 94.68 4.811
Baa3 BBB- 1,250 6.300 4/15/2040 155 200 102.20 6.136

Disclosures Appendix A1
Page 69
ANALYST CERTIFICATIONS
We, Daniel Volpi & Brock Jones hereby certify (1) that the views expressed in this report accurately reflect my personal views about any or all of the subject securities or issuers referred to in this report, (2)
no part of my compensation was, is or will be directly or indirectly related to the specific recommendations or views expressed in this report and (3) no part of my compensation is tied to any specific
investment banking transactions performed by Nomura Securities International, Inc., Nomura International plc or any other Nomura Group company.
ISSUER SPECIFIC REGULATORY DISCLOSURES
Additional Disclosures required in the U.SPrincipal Trading: Nomura Securities International, Inc and its affiliates will usually trade as principal in the fixed income securities (or in related derivatives) that are the subject of this research report.
Analyst Interactions with other Nomura Securities International, Inc Personnel: The fixed income research analysts of Nomura Securities International, Inc and its affiliates regularly interact with sales and
trading desk personnel in connection with obtaining liquidity and pricing information for their respective coverage universe.
VALUATION METHODOLOGY
Nomura’s fixed income credit strategists and analysts use relative value as their primary approach for forming the basis of buy, hold and sell recommendations. This valuation methodology analyzes spread
differences between an appropriate benchmark security or index and the security being discussed. Relative value can compare different maturities within the same capital structure, different
collateral/seniority structure within the same capital structure or a unique opportunity associated with a debt security. It is also common for a strategist/analyst to recommend an asset swap—a buy and sell
recommendation between two securities from the same issuer, tranche or sector based on the relative value of where the securities trade at a given point in time.
Disclosures required in the U.S.
123 Market Maker - NSI
Nomura Securities International Inc. makes a market in securities of the company.
Issuer name Ticker Price Price date Stock rating Disclosures
Anadarko Petroleum APC US 79.65 USD 18-Jan-2011 Not Rated 123
Apache Corp APA US 127.56 USD 18-Jan-2011 Not Rated 123
Canadian Natural Resources CNQ CN 42.40 CAD 18-Jan-2011 Not Rated
Chesapeake Energy CHK US 27.67 USD 18-Jan-2011 Not Rated 123
Devon Energy DVN US 84.02 USD 18-Jan-2011 Not Rated 123
Encana Corporation ECA CN 31.88 CAD 18-Jan-2011 Not Rated
Enterprise Products Partners EPD US 43.46 USD 18-Jan-2011 Not Rated
HESS CORP HES US 82.03 USD 18-Jan-2011 Not Rated 123
Kinder Morgan KMI US 107.48 USD 30-May-2007 Not Rated
Marathon Oil Corp MRO US 42.47 USD 18-Jan-2011 Not Rated 123
Nexen NXY CN 24.22 CAD 18-Jan-2011 Not Rated
Noble Energy NBL US 85.55 USD 18-Jan-2011 Not Rated 123
ONEOK INC OKE US 57.83 USD 18-Jan-2011 Not Rated 123
Pioneer Natural Resource PXD US 93.61 USD 18-Jan-2011 Not Rated 123
Talisman Energy TLM CN 23.00 CAD 18-Jan-2011 Not Rated

Page 70
A buy recommendation on an individual security reflects the analyst’s belief that the price/spread on the security will outperform selected securities in the same industry as the issuer (peers).
Outperformance can be the result of, but not limited to, improving fundamentals, trading activity, a major rating agency upgrade, or the acquisition by an issuer with a higher credit rating. Similarly, hold and
sell recommendations represent the analyst’s belief that the security in question will perform in-line or substantially worse than its peers.
Online availability of research and additional conflict-of-interest disclosures:
Nomura Japanese Equity Research is available electronically for clients in the US on NOMURA.COM, REUTERS, BLOOMBERG and THOMSON ONE ANALYTICS. For clients in Europe, Japan and
elsewhere in Asia it is available on NOMURA.COM, REUTERS and BLOOMBERG.
Important disclosures may be accessed through the left hand side of the Nomura Disclosure web page http://www.nomura.com/research or requested from Nomura Securities International, Inc., on 1-877-
865-5752. If you have any difficulties with the website, please email [email protected] for technical assistance.
The analysts responsible for preparing this report have received compensation based upon various factors including the firm's total revenues, a portion of which is generated by Investment Banking
activities.
DISCLAIMERS
This publication contains material that has been prepared by the Nomura entity identified on the banner at the top or the bottom of page 1 herein and, if applicable, with the contributions of one or more
Nomura entities whose employees and their respective affiliations are specified on page 1 herein or elsewhere identified in the publication. Affiliates and subsidiaries of Nomura Holdings, Inc. (collectively,
the "Nomura Group"), include: Nomura Securities Co., Ltd. ("NSC") Tokyo, Japan; Nomura International plc, United Kingdom; Nomura Securities International, Inc. ("NSI"), New York, NY; Nomura
International (Hong Kong) Ltd., Hong Kong; Nomura Financial Investment (Korea) Co., Ltd., Korea; Nomura Singapore Ltd., Singapore (Registration number 197201440E, regulated by the Monetary
Authority of Singapore); Nomura Australia Ltd., Australia (ABN 48 003 032 513), regulated by the Australian Securities and Investment Commission and holder of an Australian financial services licence
number 246412; P.T. Nomura Indonesia, Indonesia; Nomura Securities Malaysia Sdn. Bhd., Malaysia; Nomura International (Hong Kong) Ltd., Taipei Branch, Taiwan; Nomura Financial Advisory and
Securities (India) Private Limited, Mumbai, India (Registered Address: Ceejay House, Level 11, Plot F, Shivsagar Estate, Dr. Annie Besant Road, Worli, Mumbai- 400 018, India; SEBI Registration No: BSE
INB011299030, NSE INB231299034, INF231299034, INE 231299034).
This material is: (i) for your private information, and we are not soliciting any action based upon it; (ii) not to be construed as an offer to sell or a solicitation of an offer to buy any security in any jurisdiction
where such offer or solicitation would be illegal; and (iii) based upon information that we consider reliable. NOMURA GROUP DOES NOT WARRANT OR REPRESENT THAT THE PUBLICATION IS
ACCURATE, COMPLETE, RELIABLE, FIT FOR ANY PARTICULAR PURPOSE OR MERCHANTABLE AND DOES NOT ACCEPT LIABILITY FOR ANY ACT (OR DECISION NOT TO ACT) RESULTING
FROM USE OF THIS PUBLICATION AND RELATED DATA. TO THE MAXIMUM EXTENT PERMISSIBLE ALL WARRANTIES AND OTHER ASSURANCES BY NOMURA GROUP ARE HEREBY
EXCLUDED AND NOMURA GROUP SHALL HAVE NO LIABILITY FOR THE USE, MISUSE, OR DISTRIBUTION OF THIS INFORMATION.
Opinions expressed are current opinions as of the original publication date appearing on this material only and the information, including the opinions contained herein, are subject to change without notice.
Nomura is under no duty to update this publication. If and as applicable, NSI's investment banking relationships, investment banking and non-investment banking compensation and securities ownership
(identified in this report as "Disclosures Required in the United States"), if any, are specified in disclaimers and related disclosures in this report. In addition, other members of the Nomura Group may from
time to time perform investment banking or other services (including acting as advisor, manager or lender) for, or solicit investment banking or other business from, companies mentioned herein. Further, the
Nomura Group, and/or its officers, directors and employees, including persons, without limitation, involved in the preparation or issuance of this material may, to the extent permitted by applicable law and/or
regulation, have long or short positions in, and buy or sell, the securities (including ownership by NSI, referenced above), or derivatives (including options) thereof, of companies mentioned herein, or related
securities or derivatives. In addition, the Nomura Group, excluding NSI, may act as a market maker and principal, willing to buy and sell certain of the securities of companies mentioned herein. Further, the
Nomura Group may buy and sell certain of the securities of companies mentioned herein, as agent for its clients.
Investors should consider this report as only a single factor in making their investment decision and, as such, the report should not be viewed as identifying or suggesting all risks, direct or indirect, that may
be associated with any investment decision. Please see the further disclaimers in the disclosure information on companies covered by Nomura analysts available at www.nomura.com/research under the
"Disclosure" tab. Nomura Group produces a number of different types of research product including, amongst others, fundamental analysis, quantitative analysis and short term trading ideas;
recommendations contained in one type of research product may differ from recommendations contained in other types of research product, whether as a result of differing time horizons, methodologies or
otherwise; it is possible that individual employees of Nomura may have different perspectives to this publication.
NSC and other non-US members of the Nomura Group (i.e., excluding NSI), their officers, directors and employees may, to the extent it relates to non-US issuers and is permitted by applicable law, have
acted upon or used this material prior to, or immediately following, its publication.
Foreign currency-denominated securities are subject to fluctuations in exchange rates that could have an adverse effect on the value or price of, or income derived from, the investment. In addition, investors
in securities such as ADRs, the values of which are influenced by foreign currencies, effectively assume currency risk.
The securities described herein may not have been registered under the U.S. Securities Act of 1933, and, in such case, may not be offered or sold in the United States or to U.S. persons unless they have
been registered under such Act, or except in compliance with an exemption from the registration requirements of such Act. Unless governing law permits otherwise, you must contact a Nomura entity in your
home jurisdiction if you want to use our services in effecting a transaction in the securities mentioned in this material.
Page 71
This publication has been approved for distribution in the United Kingdom and European Union as investment research by Nomura International plc ("NIPlc"), which is authorised and regulated by the U.K.
Financial Services Authority ("FSA") and is a member of the London Stock Exchange. It does not constitute a personal recommendation, as defined by the FSA, or take into account the particular investment
objectives, financial situations, or needs of individual investors. It is intended only for investors who are "eligible counterparties" or "professional clients" as defined by the FSA, and may not, therefore, be
redistributed to retail clients as defined by the FSA. This publication may be distributed in Germany via Nomura Bank (Deutschland) GmbH, which is authorised and regulated in Germany by the Federal
Financial Supervisory Authority ("BaFin"). This publication has been approved by Nomura International (Hong Kong) Ltd. ("NIHK"), which is regulated by the Hong Kong Securities and Futures Commission,
for distribution in Hong Kong by NIHK. This publication has been approved for distribution in Australia by Nomura Australia Ltd, which is authorised and regulated in Australia by the Australian Securities and
Investment Commission (“ASIC”). This publication has also been approved for distribution in Malaysia by Nomura Securities Malaysia Sdn. Bhd. In Singapore, this publication has been distributed by
Nomura Singapore Limited (“NSL”). NSL accepts legal responsibility for the content of this publication, where it concerns securities, futures and foreign exchange, issued by its foreign affiliate in respect of
recipients who are not accredited, expert or institutional investors as defined by the Securities and Futures Act (Chapter 289). Recipients of this publication may contact NSL in respect of matters arising
from, or in connection with, this publication. NSI accepts responsibility for the contents of this material when distributed in the United States.
No part of this material may be (i) copied, photocopied, or duplicated in any form, by any means, or (ii) redistributed without the prior written consent of the Nomura Group member identified in the banner on
page 1 of this report. Further information on any of the securities mentioned herein may be obtained upon request. If this publication has been distributed by electronic transmission, such as e-mail, then
such transmission cannot be guaranteed to be secure or error-free as information could be intercepted, corrupted, lost, destroyed, arrive late or incomplete, or contain viruses. The sender therefore does not
accept liability for any errors or omissions in the contents of this publication, which may arise as a result of electronic transmission. If verification is required, please request a hard-copy version.
This publication has not been approved for distribution in the Kingdom of Saudi Arabia or to clients other than 'professional clients' in the United Arab Emirates by Nomura Saudi Arabia, Nomura International
plc or any other member of the Nomura Group, as the case may be. Neither this publication nor any copy thereof may be taken or transmitted or distributed, directly or indirectly, by any person other than
those authorised to do so into the Kingdom of Saudi Arabia or in the United Arab Emirates or to any person located in the Kingdom of Saudi Arabia or to clients other than 'professional clients' in the United
Arab Emirates. By accepting to receive this publication, you represent that you are not located in the Kingdom of Saudi Arabia or that you are a 'professional client' in the United Arab Emirates and agree to
comply with these restrictions. Any failure to comply with these restrictions may constitute a violation of the laws of the Kingdom of Saudi Arabia or the United Arab Emirates.
Additional information available upon request.
NIPlc and other Nomura Group entities manage conflicts identified through the following: their Chinese Wall, confidentiality and independence policies, maintenance of a Stop List and a Watch List, personal
account dealing rules, policies and procedures for managing conflicts of interest arising from the allocation and pricing of securities and impartial investment research and disclosure to clients via client
documentation.
Disclosure information is available at the Nomura Disclosure web page:
http://www.nomura.com/research/pages/disclosures/disclosures.aspx