2011 kereyn m smith dipphed (otago) (to 16 may) mr john f ward – (chancellor) bcom(otago) fca...
TRANSCRIPT
2011a n n u a l r e p o r t

1
2011a n n u a l r e p o r t
un
ive
rs
ity
of
ota
go
an
nu
al
re
po
rt
20
11
2
University of OtagoLeith Street DunedinNew ZealandMail PO Box 56
Dunedin 9054 New Zealand
Tel 64 3 479 1100Fax 64 3 479 8692Email [email protected] www.otago.ac.nz
ChristchurchUniversity of Otago, Christchurch2 Riccarton AvenueChristchurch New ZealandMail PO Box 4345
Christchurch 8140 New Zealand
Tel 64 3 364 0530Fax 64 3 364 [email protected]
WellingtonUniversity of Otago, WellingtonMein Street, NewtownWellington South New ZealandMail PO Box 7343
Wellington South 6242 New Zealand
Tel 64 4 385 5541Fax 64 4 389 [email protected]
University of Otago Wellington OfficeLevel 9 Revera House 48 Mulgrave Street Thorndon Wellington New ZealandMail PO Box 400
Wellington 6140 New Zealand
Tel 64 4 460 9800Fax 64 4 460 [email protected]
AucklandUniversity of Otago Auckland CentreUniversity of Otago House385 Queen StreetAuckland, New ZealandMail PO Box 5543
Wellesley Street Auckland 1141 New Zealand
Tel 64 9 373 9700Fax 64 9 373 [email protected]
SouthlandCollege of Education Southland Campus100 Nelson StreetInvercargillNew ZealandMail PO Box 886
Invercargill 9840 New Zealand
Tel 64 3 211 6724Fax 64 3 216 [email protected]

3
Vision
A research-led University with an international reputation for excellence.
Ko te ArongaHe Whare Wänanga e Aronui ana ki te Rangahau, e Rongonui ana i ngä Töpito o te Ao i te Ao i töna Ikeiketanga.
Mission
The University of Otago will advance, preserve and promote knowledge, critical thinking and intellectual independence
to enhance the understanding, development and well-being of individuals and society. It will achieve this by building on
foundations of broad research and teaching capabilities, unique campus learning environments, its nationwide presence
and mana, and international links.
Ko tä Te Whare Wänanga o Otägo he whanake, he pupuri, he whakatairanga hoki i te mätauranga, i te ihomatua tätari
kaupapa, i te whakaaroaro motuhake o te tangata, e nui ake ai te möhio, te marama, te hiatotanga, otirä, te oranga o te
tangata, o te iwi hoki. E tutuki ai tënei mä te rangahau me te tika märika o te whakaako, mä te whai wänanga ahurei, mä
te whakaü i töna mana, me öna toronga puta noa i te motu, i te ao.

un
ive
rs
ity
of
ota
go
an
nu
al
re
po
rt
20
11
4
Contents
Vision and Mission 3University Governance 6Organisation Chart 7Council of the University 8Executive Group 9Chancellor’s Introduction 10Vice-Chancellor’s Review 12Significant Events 15Achieving Research Excellence 16Achieving Excellence in Research-Informed Teaching 20Ensuring Outstanding Campus Environments and 23
Student Experience Contributing to the National Good and to International Progress 25Strengthening External Engagement 28Building and Sustaining Capability 31Cost of Outputs 32Statement of Service Performance 34
Statement of Resources 40College of Education Merger Report 47Financial Review 49Statement of Responsibility 50Statement of Accounting Policies 51Statement of Financial Performance 58Statement of Comprehensive Income 59Statement of Changes in Equity 59Statement of Financial Position 60Statement of Cash Flows 61Reconciliation of the Net Surplus 62 Statement of Commitments and Contingencies 63 Notes to the Financial Statements 64Independent Auditor’s Report 91Summary Facts and Figures 94Graphs 101
5
un
ive
rs
ity
of
ota
go
an
nu
al
re
po
rt
20
11
6
University Governance
Legal statusThe University was established by the University of Otago Ordinance of the Provincial Council in 1869, the University of Otago Amendment Act 1961 and the Education Act 1989. It is governed by a Council, which appoints the Vice-Chancellor, who is the chief executive and employer of all other staff.
Statutory roleDefining characteristics of universities in New Zealand, specified in the Education Act 1989, include that their teaching is primarily informed by research, they are repositories of knowledge and expertise, and they accept a role as critic and conscience of society.
The University CouncilThe Council is constituted and empowered according to legislation. Council is chaired by the Chancellor, and comprises elected, appointed and co-opted members representing key stakeholders including alumni, students and staff.
Committees of CouncilSpecific committees report directly to Council on matters including financial management and performance, audit, capital development, ethics, risk management and statutory compliance. It also has a Treaty of Waitangi committee with equal membership from Ngäi Tahu and the University, may, from time to time, establish special working parties to examine particular issues.
The SenateSenate reports directly to Council, advising it primarily on academic matters as the Academic Board of the University. Senate is convened by the Vice-Chancellor and its membership is drawn mainly from the heads of academic departments, but it also includes other senior academics and representatives of other teaching staff and students. It is, in turn, advised by a number of committees and boards.
University autonomy and academic freedomThe Education Act 1989 provides statutory recognition of, and protection for, the institutional autonomy of the University and the academic freedom of its staff and students. In accordance with the Act, the Council and the Vice-Chancellor have a duty to act to preserve and enhance university autonomy and academic freedom.
Governance documentsThe University Charter sets out the vision and mission of the University, its core values, special character and the high-level intent of its contributions to the wider community, nationally and internationally.
The University strategic plan, Strategic Direction to 2012, provides a framework for the development of the University.
The University Investment Plan outlines how the University will give effect to its Charter, the means by which it will contribute to the Government’s strategies and priorities for tertiary education, and how it will monitor its performance in these matters.

7
Organisation Chart
Council
Vice-Chancellor
Deputy Vice-Chancellor(Research and Enterprise)
Secretaryto Council
and Registrar
DirectorHuman
Resources
Director Development and Alumni Relations
Director Mäori
Development
Chief Operating OfficerDeputy Vice-Chancellor
(Academic and International)
Pro-Vice-Chancellor(International)
Faculty ofMedicine
OtagoSchool of
Medical Sciences(5 Departments)
Universityof Otago,
Christchurch(11 Departments)
Universityof Otago,
Wellington(9 Departments)
DunedinSchool ofMedicine
(7 Departments)
School ofPhysiotherapy
Faculty ofDentistry
(3 Departments)
School ofPharmacy
Arts andSocial Sciences
(12 Departments)
Faculty ofLaw
College ofEducation
School ofMäori,
Pacific and Indigenous
Studies
School ofPhysical
Education
Science(12 Departments)
School ofSurveying
Pro-Vice-Chancellor(Health Sciences)
Pro-Vice-Chancellor(Humanities)
Pro-Vice-Chancellor(Commerce)
School of Business(6 Departments)
Pro-Vice-Chancellor(Sciences)
un
ive
rs
ity
of
ota
go
an
nu
al
re
po
rt
20
11
8
Appointed by the Minister of Education
Dr James D Every-Palmer BA(Hons) LLB(Hons)(Otago) LLM((Harv)DPhil(Oxon)
Ms Donna C Matahaere-Atariki BA(Otago) MPhil(Massey) MPA(Exec)(Well)
Ms Kereyn M Smith DipPhEd (Otago) (to 16 May)
Mr John F Ward – (Chancellor) BCom(Otago) FCA FInstD
Ex Officio
Professor Sir David C G Skegg – (Vice-Chancellor)KNZM OBE BMedSc MB ChB(Otago) DPhil(Oxf) FFPHM FAFPHM FRSNZ (to 31 July)
Professor Harlene Hayne – (Vice-Chancellor) ONZM BA (Colorado College) MS PhD(Rutgers) FRSNZ (from 15 August)
Elected by the academic staff
Professor Judith A Bennett BA BEd(Qld) MA(Hawaii) PhD(ANU) DipEdDC(PNG)
Dr Craig J Marshall BSc(Hons) PhD(Otago)
Associate Professor Elisabeth Slooten MSc(Auck) PhD(Cant)
Elected by the Court of Convocation
Judge E Oke K Blaikie LLB(Otago)
Miss Lorraine P Isaacs QSO MA(Otago & Hawaii)
Mr Michael J M Sidey BCom(Otago) ACA
Elected by the general staff
Ms Margaret A Morgan MA (Otago) DipArch/RecMgmt (Monash)
Appointed after consultation with the central organisation of employers
Mr Stuart J McLauchlan BCom(Otago) FCA(PP)
Appointed after consultation with the central organisation of workers
Mr Roger H Tobin BSc(Well)
Appointed by the Students’ Association
Ms Katherine J Reid (to 13 December 2011)
Mr Jonathan K Rowe
Mr Logan Edgar (from 14 December 2011)
Appointed by the Dunedin City Council
Mr David C Cull BA PGDipArts (Otago)
Co-opted
Dr Royden J Somerville QC LLM PhD(Otago) AAMINZ
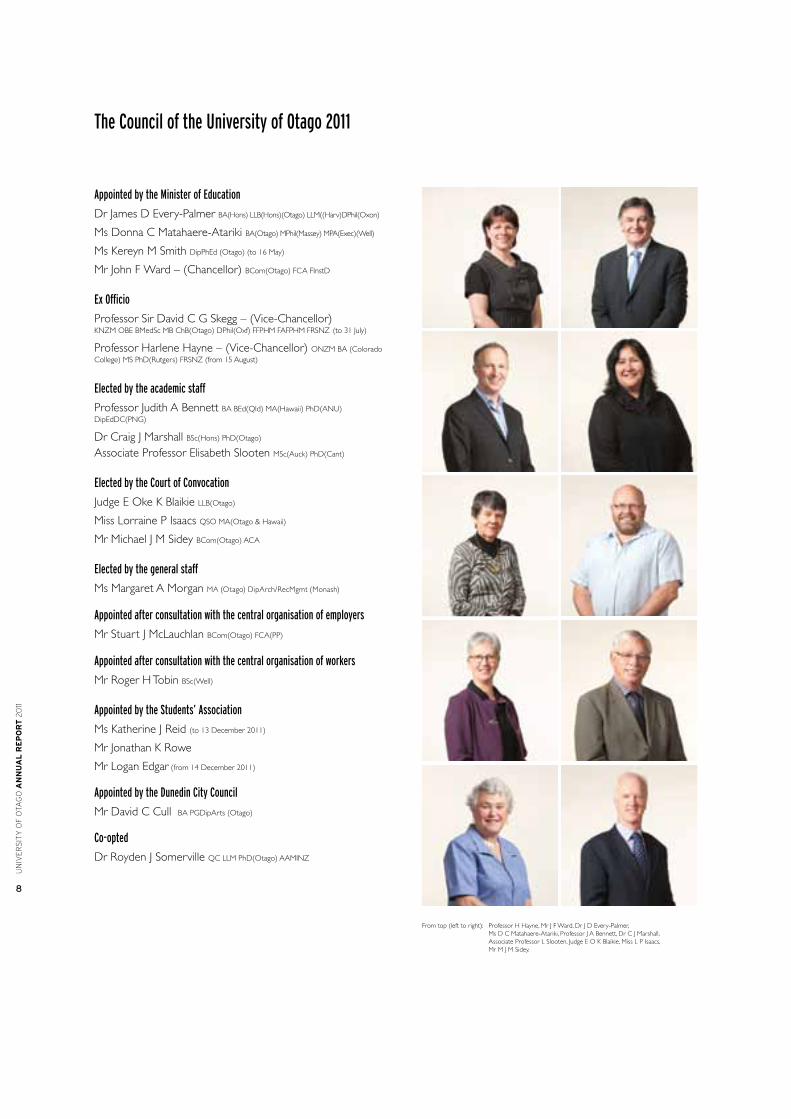
The Council of the University of Otago 2011
From top (left to right): Professor H Hayne, Mr J F Ward, Dr J D Every-Palmer, Ms D C Matahaere-Atariki, Professor J A Bennett, Dr C J Marshall, Associate Professor L Slooten, Judge E O K Blaikie, Miss L P Isaacs, Mr M J M Sidey.
9
Vice-Chancellor Professor Sir David C G Skegg KNZM OBE BMedSc MB ChB(Otago) DPhil(Oxf) FFPHM FAFPHM FRSNZ (to 31 July)
Professor Harlene Hayne ONZM BA (Colorado College) MS PhD(Rutgers) FRSNZ (from 15 August)
Deputy Vice-Chancellor (Academic & International)
Professor Vernon A Squire Polar Medal BSc(Hons)(Wales) PhD(Camb) DSc(Wales) FRSNZ FIMA CMath FNZMS
Deputy Vice-Chancellor (Research & Enterprise)
Professor Harlene Hayne ONZM BA (Colorado College) MS PhD(Rutgers) FRSNZ (to 31 May)
Professor Helen D Nicholson BSc(Hons) MB ChB MD(Brist) (Acting DVC from 1 June to 30 November)
Professor Richard J Blaikie BSc(Hons)(Otago) PhD(Camb) FRSNZ MIEEE MInstP CPhys (from 1 December)
Chief Operating Officer
Mr A John Patrick BCom(Otago) FCA CMA
Pro-Vice-Chancellor (Commerce)
Professor George L Benwell BSurv PhD(Melb) MPhil(City) MNZCS MISAust
Pro-Vice-Chancellor (Health Sciences)
Professor Peter R Crampton MB ChB MPH PhD(Otago) DipObst(Auck)FAFPHM MRNZCGP
Pro-Vice-Chancellor (Humanities)
Professor Brian D Moloughney MA(Cant) PhD(ANU)
Pro-Vice-Chancellor (Sciences)
Professor Keith A Hunter MSc(Auck) PhD(E Anglia) FNZIC FRSNZ
Pro-Vice-Chancellor (International)
Professor Sarah J Todd BA(Massey) MCom PhD(Otago)
Director of Human Resources
Mr Kevin J Seales BCom(Cant) MHRINZ
Registrar and Secretary to Council
Ms Jan A Flood DipPhEd(Otago)
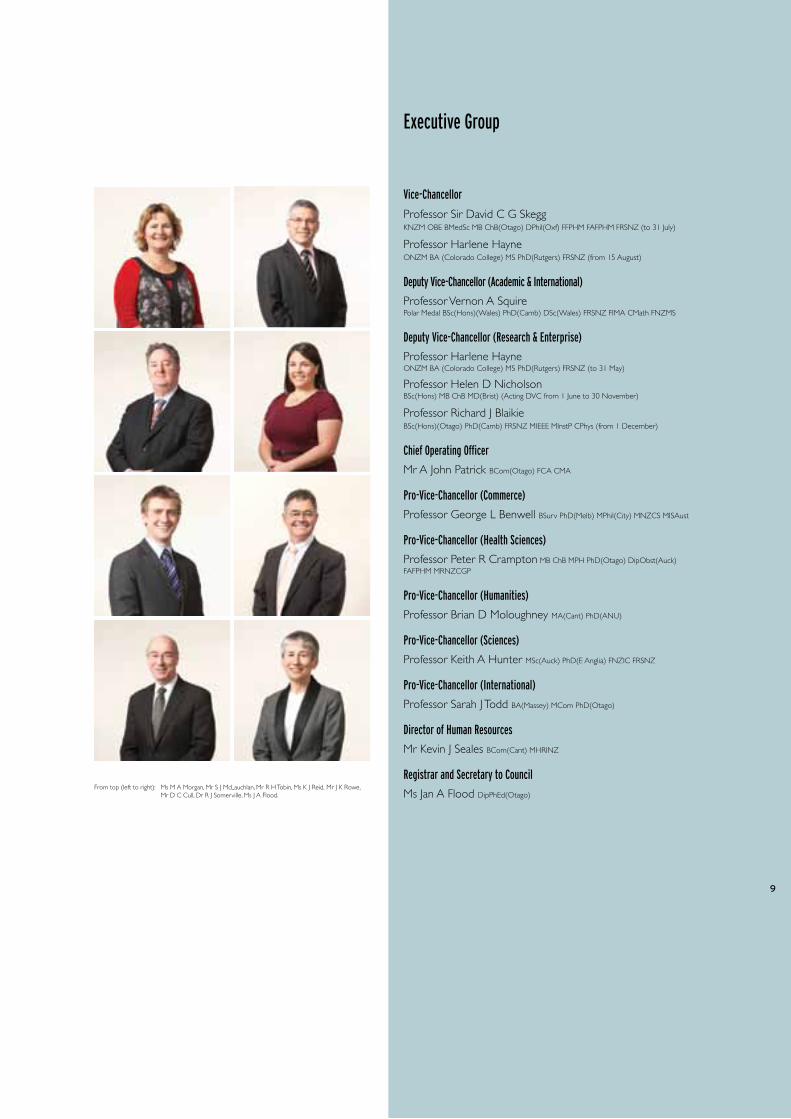
Executive Group
From top (left to right): Ms M A Morgan, Mr S J McLauchlan, Mr R H Tobin, Ms K J Reid, Mr J K Rowe, Mr D C Cull, Dr R J Somerville, Ms J A Flood.
9

un
ive
rs
ity
of
ota
go
an
nu
al
re
po
rt
20
11
10
“Otago’sstaffandstudentshadanotherexcellentyearand…theirtalentsandachievementshaveagainbeenrecognisedinthenationalandinternationalarenas.”
JohnWardChancellor
11
It is once again my great pleasure to present the University of Otago’s Annual Report.
2011 was a year marked by both achievement and change. In July, Professor Sir David Skegg stepped aside from the position of Vice-Chancellor. Throughout the seven years of his tenure, Professor Skegg provided outstanding academic leadership and I wish to thank him most sincerely for his enormous contribution to the University. I have greatly enjoyed working with him during my years on Council and, especially, as Chancellor.
In August, I was delighted to welcome Professor Harlene Hayne as the University’s new Vice-Chancellor. A leading psychology researcher and Otago’s Deputy Vice-Chancellor (Research and Enterprise), Professor Hayne was selected from a highly impressive field of national and international candidates. She has an exemplary academic record, proven administrative skills and a keen political acumen, qualities that will be of enormous benefit to the University in the years to come.
Otago’s staff and students had another excellent year and, as will become apparent in this report, their talents and achievements have again been recognised in the national and international arenas. The University itself remains in a sound position, in spite of operating in a constrained financial environment. Funding remains an ongoing concern – as it does for all universities – and, as the need for more space and infrastructure becomes increasingly urgent, the University may have to increase its operating surplus to finance future projects. In 2011, Council adopted a rolling Priority Development Plan to provide a strategic framework for implementing future capital developments.
Proposed redevelopment of our Christchurch campus will be brought forward as a result of the devastating 22 February earthquake and subsequent aftershocks in which our building was significantly damaged. Over the past year, our Christchurch-based staff and students have continued to work and study under quite extraordinary circumstances. On behalf of the University, I wish to thank and congratulate them for their courage and determination. We are committed to rebuilding and re-opening our facilities as soon as possible.
The economic importance of this institution to the city of Dunedin – and to the country as a whole – was highlighted in the University’s Economic Impact Report, presented to Council in September. This showed that, in 2010, the University contributed around $754.2 million to the Dunedin economy, about 17% of the city’s gross domestic product.
The University contributed a further $43.6 million to the Christchurch economy, $39.6 million in Wellington, $2.6 million in Invercargill and $682,000 in Auckland. In all, when all of the economic flow-on factors were taken into account, the University’s total economic impact was estimated at around $1.6 billion.
One of my privileges as Chancellor each year is to personally congratulate graduates on the completion of their studies. In 2011, there were 12 graduation ceremonies, more than usual as, in the latter part of the year, ceremonies were held in the smaller venue of the Regent Theatre while the Dunedin Town Hall was being refurbished. A particular highlight was the conferring of honorary degrees on Professor Sir David Skegg (Doctor of Laws) and New Zealand poet and writer Brian Turner (Doctor of Literature).
Another privilege for me as Chancellor is the opportunity to keep in touch with Otago alumni and I was fortunate to attend a number of alumni events in New Zealand as well as in Sydney, Ipoh, Toronto, Philadelphia and London. Our alumni chapters and networks around the world continue to provide invaluable support to the University. On behalf of Council, I wish to thank all alumni, staff, students, funders and other stakeholders for their contributions to the University operations and achievements throughout 2011.
Finally, I must acknowledge the hard work and commitment of my fellow Council members. Of particular note, I wish to thank Kereyn Smith who resigned in May after more than seven years on Council. A new ministerial appointment is pending. In December, Council also farewelled academic staff representative Professor Judy Bennett and OUSA representative Katie Smith. Again, I wish to thank them for their service.
John WardCHANCELLOR
Chancellor’s Introduction

un
ive
rs
ity
of
ota
go
an
nu
al
re
po
rt
20
11
12
“WewillenhanceoureffortstorecruitthebestandthebrighteststudentsfromwithinNewZealandandthroughouttheworld.”
ProfessorHarleneHayneVice-Chancellor
13
In August I succeeded Professor Sir David Skegg as Vice-Chancellor of the University of Otago. I would like to pay tribute to Professor Skegg’s outstanding leadership and commitment to this University over the past seven years. During his tenure as Vice-Chancellor, Otago rose to the top of New Zealand’s research rankings and repeatedly secured large amounts of contestable research funding. Professor Skegg successfully advocated for the University of Otago at the highest levels, established the Matariki Network of Universities and continued to maintain his own research career. His contribution will help ensure Otago’s place as a world-class university into the future. Otago has flourished under his collegial leadership and I am determined to build on his legacy. I wish to thank Professor Skegg for leaving the University in such good heart.
2011 was yet another outstanding year for the University of Otago. Many of our achievements will be described in detail in other parts of this Annual Report, but I would like to mention some particular highlights.
New Zealand’s two top science prizes were awarded to Otago researchers in 2011. Professor Christine Winterbourn, who heads the Free Radical Research group at the University of Otago, Christchurch, won the Royal Society’s Rutherford Medal. She was the first woman to receive the medal and the second Otago scientist to receive it in successive years. Then, just a few weeks later, the Centre for Chemical and Physical Oceanography, a collaboration between researchers at the University of Otago and NIWA, was awarded the Prime Minister’s Science Prize. This prize is awarded in recognition of a major scientific achievement that has had an economic, health, social or environmental impact on New Zealand, or the world. The prize heralds the significance of the work being undertaken by the Centre and will project it onto the world’s scientific stage.
Otago’s ongoing success in major external funding rounds continued. For the seventh successive year our researchers attracted the largest share of the prestigious Marsden Fund, gaining one-third of the total pool to undertake 26 projects. A further $27.5 million was secured from the Health Research Council to fund 22 proposals that have the potential to create significant health benefits both in New Zealand and internationally. This funding success is further recognition of the quality, breadth and depth of the research being undertaken on our campuses. Professor Helen Nicholson provided outstanding leadership as the acting Deputy Vice-Chancellor (Research and Enterprise) and the University welcomed Professor Richard Blaikie into the role late in the year.
Otago’s teachers also continued to take national honours, with Senior Teaching Fellow Tony Zaharic, from the Department of Biochemistry, winning an award for sustained excellence in the National Tertiary Teaching Awards. The University was one of only two New Zealand institutions to feature in the top 300 of the Shanghai Jiao Tong Academic Ranking of World Universities and the only one to improve its placing in the 2011–2012 QS World University Rankings.
Here in New Zealand, the Tertiary Education Commission again placed Otago first among New Zealand universities for qualification completion and for the retention of students in study. These rankings and indicators underscore Otago’s international reputation for excellence in both teaching and research.
Faced with the dual challenge of a burgeoning student roll and constrained Government funding, together with our own strategic commitment to recruiting a higher proportion of “top calibre” students, a limitation of enrolment system was introduced for all undergraduate programmes in 2011. I am delighted that the limitation of enrolment has already started to achieve the desired result. The academic pass rate for the entire student cohort increased to 89.3%, compared to 88.4% in 2010 and 87.7% in 2009.
To ensure that the University of Otago can continue to provide the world-class facilities needed to both maintain and attract quality staff and students, we remain committed to enhancing our campus environments. Our vision for our campuses was outlined in the Campus Master Plan, released in 2010. In 2011 Council adopted a rolling eight-year Priority Development Plan to provide a strategy to achieve these goals and a number of exciting capital projects were undertaken during the year. The most significant project was the completion of the University Plaza Building One, adjacent to Dunedin’s new Forsyth Barr Stadium. This building is the new home to Foundation Studies and it also houses our brand new, state-of-the-art gymnasiums and the Plaza Cafe.
We have continued to foster our strong relationship with Ngäi Tahu and other iwi throughout New Zealand. In 2011, we published He Kitenga Mäori, which highlights the outstanding research being conducted by Mäori researchers at Otago as well as research being conducted by non-Mäori researchers on issues that are of special interest to Mäori. This publication will be officially launched in Parliament in May 2012. The number of Mäori students enrolled at Otago continues to grow and was 8.8% of the domestic student population. Nineteen Mäori students successfully completed the Tü Kahika programme which is designed to prepare students for tertiary study, particularly in the Health Sciences. Otago’s science wananga programme, which provides science
Vice-Chancellor’s Review

un
ive
rs
ity
of
ota
go
an
nu
al
re
po
rt
20
11
14
education to secondary students, is now operating in five regions through New Zealand.
The University of Otago is committed to leading the way on issues of social responsibility. We believe that environmental sustainability is an integral part of this commitment and, in the coming years, we will be increasing our efforts in recycling and energy conservation across our campuses. Two recently completed “green” projects – the newly refurbished Robertson Library and the William James Psychology Building – mark important steps in this direction. The William James Building uses just a quarter of the water and energy of a conventional building and, in 2011, was formally awarded a Five Star Green Star rating by the New Zealand Green Building Council.
Our Christchurch campus, already damaged by the September 2010 earthquakes, suffered further serious damage in the 22 February earthquakes, with recovery disrupted by major aftershocks that continued throughout 2011. As a result, our staff and students have been scattered across Christchurch in various temporary forms of alternative accommodation. It is a testament to their fortitude and commitment that they have continued to maintain their research productivity, and fulfil their teaching and learning commitments under such trying conditions. I admire them all for their patience and their courage. Our main building adjoining Christchurch Hospital is being repaired and strengthened and this work is expected to be completed by the second half of 2012. I keep a piece of concrete from the building on my desk in Dunedin as a symbol of my determination to do whatever it takes to put our Christchurch campus back together.
Unfortunately earthquakes will continue to have an ongoing impact on the University. There has already been a 62% increase in insurance premiums across our campuses, further exacerbated by a significant increase in the excesses we would have to pay in the event of a claim. In light of events in Christchurch, the University has also accelerated its seismic strengthening programme on our Dunedin and Wellington campuses. The ongoing costs associated with the earthquakes and the rebuilding of Christchurch will inevitably be a massive financial burden on the New Zealand economy which will undoubtedly also have an impact on government funding of universities.
While there has been a steady improvement in student behaviour since the introduction of the Code of Conduct and Campus Watch in 2007, the actions of some students have continued to cause concern. As new cohorts of students come to the University every year it is important that they fully understand the purpose of the Code and the possible consequences for those who breach it. So, in October, we produced a pamphlet outlining the University’s pastoral responsibilities and expectations, and, equally importantly, the students’ responsibilities as citizens of the University and the wider community. The provisions of the Code, its implications and how it has been applied to date were also explained in
simple terms. This pamphlet has been distributed widely to first-year students and their parents.
One of the most rewarding aspects of my first few months as Vice-Chancellor has been the opportunity to work closely with the Otago University Students’ Association (OUSA). Late last year, the government passed the Education (Freedom of Association) Amendment Act, commonly known as the Voluntary Student Membership (VSM) Act, which prohibited compulsory membership in student unions. This Act effectively eliminated OUSA’s primary source of revenue – compulsory student membership fees – and both the University and OUSA opposed it. Once the Act was passed, the University made a commitment to maintain the high quality of student support that is offered at Otago. We established a service level agreement with OUSA, contracting the association to continue to provide the high quality services that they have provided in the past. This agreement marks a fundamental change in the relationship between the University and OUSA, but it is a change that I welcome. I have been incredibly impressed by the OUSA Executive and I look forward to working with them, not only to provide the best suite of student services possible, but also in tackling areas of mutual concern.
Looking ahead, 2012 will be yet another exciting and challenging year. We are making our final preparations for the Performance-Based Research Funding (PBRF) evaluation. The University’s Strategic Direction document expires at the end of 2012 and very shortly, we will begin consultation on our new document; this process will be characterised by evolution rather than revolution because it is clear to me that the University is already heading in the right direction. Our goal over the next few years will be to go from strength to strength. We will maintain our commitment to be a research-intensive university that is characterised by outstanding teaching. All academic staff, including the Vice-Chancellor, will continue to be actively engaged in research and scholarship. We will enhance our efforts to recruit the best and the brightest students from within New Zealand and throughout the world. Although we anticipate an increasingly constrained funding environment, I am confident that we will continue to work together to enhance our research and teaching programmes.
In closing, I would like to thank the Council, the staff and the students at the University of Otago. You have all made me feel remarkably welcome in my new role as Vice-Chancellor. I look forward to another exciting year.
Professor Harlene HayneVICE-CHANCELLOR

15
Significant Events
Senior Appointments Professor Harlene Hayne as the Vice-Chancellor of the University of Otago
Professor Richard Blaikie as Deputy Vice-Chancellor (Research and Enterprise)
Professor Sunny Collings as Dean and Head of Campus at the University of Otago, Wellington
Dr John Crump as the inaugural McKinlay Professor of Global Health at the Centre for International Health
Mr Philip Kearney as Director of Development and Alumni Relations
Dr Elaine Webster as Director of the University of Otago Summer School and Continuing Education.
Emeritus ProfessorsThe following professors were awarded the status of emeritus professor:
Geoff Wyvill (Computer Science) and Sir David Skegg (Preventive and Social Medicine).
Professorial PromotionsThe following staff were appointed to professor:
John Broughton (Oral Diagnostic and Surgical Sciences, Preventive and Social Medicine); Vicky Cameron (Research Professor – Medicine, Christchurch); Marie Crowe (Psychological Medicine, Centre for Postgraduate Nursing Studies, Christchurch); Andrew Day (Paediatrics, Christchurch); Catherine Day (Biochemistry); Bernadette Drummond (Oral Sciences); Robin Gauld (Preventive and Social Medicine); Juergen Gnoth (Marketing); Kenneth Hodge (Physical Education); Brian Hyland (Physiology); Ian McLennan (Anatomy); Edward Ruffman (Psychology); Struan Scott (Law) and Jean-Claude Theis (Surgical Sciences).
The following staff were appointed to associate professor:
Robert Aitken (Marketing); Phillip Bishop (Zoology); Michael Boyes (Physical Education); Chris Brickell (Sociology, Gender and Social Work); Colin Brown (Physiology); Warwick Duncan (Oral Sciences); Dawn Elder (Paediatrics and Child Health, Wellington); David Gwynne-Jones (Surgical Sciences); Graeme Hammond-Tooke (Medicine); Andrew Harrison (Medicine, Wellington); Penelope Hunt (Medicine, Christchurch); Chrystal Jaye (General Practice and Rural Health); Alistair Knott (Computer Science); Brent Lovelock (Tourism); Karl Lyons (Oral Rehabilitation); James Maclaurin (Philosophy); David McBride (Preventive and Social Medicine); Tony Merriman (Biochemistry); Selene Mize (Law); Susan Pullon (Primary Health Care and General Practice, Wellington); John Reynolds (Anatomy); Anthony Ritchie (Music); Katrina
Sharples (Preventive and Social Medicine); Philip Sheard (Physiology); Takashi Shogimen (History); Zhifa Sun (Physics); Lois Surgenor (Psychological Medicine, Christchurch); Mark Thompson-Fawcett (Surgical Sciences); Lisa Whitehead (Centre for Postgraduate Nursing Studies); Cheryl Wilson (Applied Sciences).
Simon Hales (Public Health, Wellington), Anthony Reeder (Preventive and Social Medicine), Katrina Sharples (Preventive and Social Medicine) and Nicola Taylor (Centre for Research on Children and Families) were appointed to research associate professor. Antony Bird (Surgery, Christchurch) was appointed clinical associate professor.
Honorary DegreesOutgoing Vice-Chancellor Professor Sir David Skegg received an Honorary Doctor of Laws, and New Zealand poet and writer Brian Turner received an Honorary Doctor of Literature.
HonoursStaff awarded Royal honours in 2011 were:
Companion of the New Zealand Order of Merit – Professor Warren Tate.
Officer of the New Zealand Order of Merit – Professor Swee Tan, Professor Jean-Claude Theis.
Member of the New Zealand Order of Merit – Associate Professor John Carter.
ObituariesAssociate Professor David Clark (70). An internationally respected researcher who taught Pharmacology at Otago 1968–2007.
Dr Boris Popoff (79). Accountancy lecturer 1965–1998 and the University’s first accountancy PhD graduate.
Dr Robert Smith (78). Chemistry lecturer 1965–1992.
Maurice Till (84). The University’s inaugural Lecturer in Piano in 1971 and a Department of Music staff member until the end of 1980.
Emeritus Professor James Laurence (Laurie) Wright (96). Professor of Obstetrics and Gynaecology at the Otago Medical School 1951–1981.
un
ive
rs
ity
of
ota
go
an
nu
al
re
po
rt
20
11
16
The University of Otago is New Zealand’s most research-intensive university and is top ranked for research quality. This strong research platform underpins all areas of academic activity through which Otago staff contribute to leading national and international discoveries, to the health and well-being of people here and around the world, and to innovation and the economic progress of New Zealand.
Reflecting this, in 2011 the University was one of only two New Zealand institutions to feature in the top 300 of the Shanghai Jiao Tong Academic Ranking of World Universities and the only one in the country to improve its placing in the 2011–2012 QS World University Rankings.
For the seventh successive year, Otago researchers gained the largest share in the highly-competitive Marsden Funding round, gaining $17.8 million to undertake 26 leading-edge projects in areas as varied as ultra-cold atoms to the notion of “informed choice” in young adult smokers. Eight of the projects were Fast-Start grants which support outstanding early-career researchers.
Otago researchers also secured $27.5 million in the Health Research Council (HRC) funding round to pursue 22 health research proposals across the University’s campuses in Dunedin, Christchurch and Wellington. These projects include research into early detection of urological cancers, weight
regain in people with obesity, Alzheimer’s disease, polycystic ovarian syndrome, housing conditions and bronchiolitis, and colon cancer screening.
The long-running Christchurch Health and Development Study, led by Professor David Fergusson (Psychological Medicine, University of Otago, Christchurch), received $3.19 million from the HRC over five years to extend the study’s research to when participants reach 35, looking at issues such as the consequences of mental disorders and the Canterbury earthquakes. Substantial three-year funding extensions were also granted to programmes investigating risk genes and common chronic conditions, led by Associate Professor Tony Merriman (Biochemistry), and genetic prediction and protection in heart disease, led by Professor Mark Richards (Medicine, University of Otago, Christchurch).
Otago research groups continued to undertake programmes and collaborations both within and beyond the University. The Centre for Reproduction and Genomics held conferences and seminars to link industry and research in the commercially important area of aquaculture. Research aimed at improving health in under-resourced countries was carried out by the Centre for International Health. This research will be greatly assisted by a new PC3 (physical containment level three) laboratory that will become operational in 2012. New Zealand’s ongoing obesity epidemic continued to be
Achieving Research Excellence
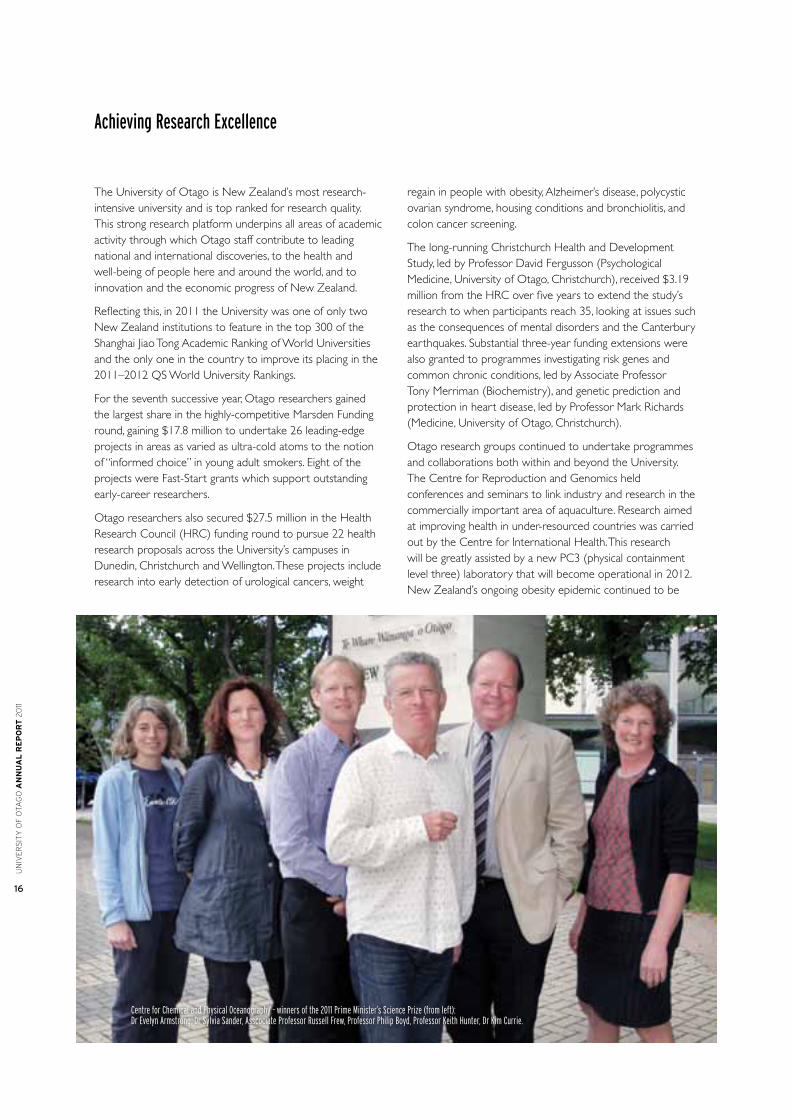
CentreforChemicalandPhysicalOceanography-winnersofthe2011PrimeMinister’sSciencePrize(fromleft):DrEvelynArmstrong,DrSylviaSander,AsscociateProfessorRussellFrew,ProfessorPhilipBoyd,ProfessorKeithHunter,DrKimCurrie.

17
highlighted by the Edgar National Centre for Diabetes and Obesity Research.
Research undertaken by members of the Oxidative Stress in Health and Disease research theme was recognised with the awarding of the Rutherford Medal to the theme’s director, Professor Christine Winterbourn (Pathology, University of Otago, Christchurch) for seminal discoveries in free radical biology, and the promotion of excellence in research and scientific education. This was the second successive year that the medal – New Zealand’s top science and technology honour – was presented to an Otago researcher.
A Times Higher Education magazine analysis of scientific articles published in international journals since 2000 judged the University of Otago as being among the best research institutions in the world for oceanography, with the highest average citations per paper. Otago’s excellence in this field was rewarded with the 2011 Prime Minister’s Science Prize, presented to the Centre for Chemical and Physical Oceanography, a collaborative facility between Otago’s Department of Chemistry and NIWA (National Institute of Water and Atmospheric Research), which is based at the University. The team of scientists, led by Professor Philip Boyd, won the $500,000 prize for investigations into how the ocean controls the Earth’s climate and evaluating ways to reduce greenhouse gases.
Otago geologists took part in a collaborative project to probe the secrets of New Zealand’s Alpine Fault. A new research group, Aspire 2025, led by Otago researchers, was initiated to help achieve a tobacco-free Aotearoa by 2025,
and New Zealand’s first Centre for the Book was established at the University to encourage research in all aspects of book culture and history.
The breadth and depth of Mäori research being undertaken on the Otago campuses was highlighted by the publication of He Kitenga Mäori in December, reinforcing the University’s commitment to research into Te Ao Mäori and, in particular, research which contributes to Mäori development and well-being. These projects include work on Mäori health, resource management, fisheries, muttonbirding, history, culture and more.
Several new research partnerships were developed during the year. A conference held with the New Zealand Defence Force (NZDF) led to the formation of a new research grouping in the University, established to look at collaborative research with the NZDF, particularly in the area of health. A memorandum of understanding was signed with the Salvation Army with the first research collaboration underway in 2011.
A long-term longitudinal study of New Zealand graduates was commenced, with the Otago-based National Centre for Lifecourse Research leading the study on behalf of all New Zealand universities.
Professor Allan Herbison (Physiology) received the University’s own highest research honour, the Distinguished Research Medal, in recognition of his outstanding achievements in investigating how the brain controls fertility. Professor Herbison also received the Triennial Medal of the Physiological Society of New Zealand.
2011RutherfordMedalwinnerProfessorChristineWinterbourn.

un
ive
rs
ity
of
ota
go
an
nu
al
re
po
rt
20
11
18
Reflecting the University’s strong commitment to fostering the careers of emerging researchers, Early Career Awards for Distinction in Research were presented to six academic staff in 2011: Dr James Crowley (Chemistry), Dr Peter Fineran (Microbiology and Immunology), Dr Dione Healey (Psychology), Dr Shinichi Nakagawa (Zoology), Dr Clare Strachan (Pharmacy) and Dr Shieak Tzeng (Surgery and Anaesthesia, Wellington). Dr Fineran was also awarded a five-year Rutherford Discovery Fellowship to pursue investigations into bacterium-viral interactions.
Ms Jacinta Ruru (Law) and Associate Professor Richard Troughton (Medicine, University of Otago, Christchurch) received the University’s Rowheath Trust Award and Carl Smith Medal. Ms Ruru also gained a Fulbright-Ngä Pae o te Märamatanga Senior Scholar Award.
Other staff whose research excellence received significant recognition included:
Deputy Vice-Chancellor (Research and Enterprise) Professor Richard Blaikie and Professor Gerald Tannock (Microbiology and Immunology) who were elected Fellows of the Royal Society of New Zealand
Professor Greg Cook (Microbiology and Immunology) who was awarded a James Cook Research Fellowship to pursue research into bacteria that thrive in extreme environments
Emeritus Professor Jim Flynn (Politics) who received the Royal Society’s inaugural Humanities Aronui Medal for his work in political philosophy
Professor Andrew Geddis (Law) and Associate Professor Fiona McDonald (Physiology) who received Fulbright New Zealand Senior Scholar Awards
Professor Martin Kennedy (Pathology, University of Otago, Christchurch) who received the Life Technologies/New Zealand Society of Biochemistry and Molecular Biology Award for research into genetics and mood disorders
Dr Chris Pemberton (Medicine, University of Otago, Christchurch) who won the Health Research Council of New Zealand’s Liley Medal recognising an outstanding contribution to health and medical sciences
Professor Robert Poulin (Zoology) who was awarded the Royal Society’s Hutton Medal for excellence in animal sciences.
Development activities continued to support the University’s research strengths. In 2011, a proposal was developed for a Chair in Neurosurgery, to be supported by the Neurological Foundation of New Zealand as part of the South Island Neurosurgical Service. Support was sought for

19
the establishment for a Chair in Earthquake Science, and the School of Physical Education Research Endowment Fund was formally launched.
Postgraduate research students make a crucial contribution to research at Otago.
There were a record 1,327 doctoral enrolments at the end of 2011 (2010: 1,325), including 1,259 PhD candidates (2010: 1,258), 22 Doctor of Education candidates (2010: 20), 43 Doctor of Clinical Dentistry candidates (2010: 45) and three Doctor of Musical Arts candidates (2010: one). There were 1,220 enrolments at master’s level (2010: 1,186) and 1,541 in postgraduate diplomas and certificates (2010: 1,660).
A record number (223) of doctoral candidates successfully completed their studies in 2011 (2010: 207) and a record 264 thesis masters’ candidates also finished (2010: 189).
Graduate Research Month was held in August, highlighting the work of postgraduate students through a series of workshops and presentations, information evenings and social events. Jack Rivers, a PhD candidate in the Department of Pharmacology and Toxicology, won the popular Three-Minute Thesis competition that requires participants to summarise their research to a general audience in no more than three minutes.
The importance of the role of supervisors to postgraduate students is recognised by the OUSA (Otago University
Students’ Association) Postgraduate Supervisor Awards. The 2011 Award went to Dr Tara Duncan (Tourism) and the new supervisor award to Dr Karen Bronéus (National Centre for Peace and Conflict Studies). Dr Charles Tustin (Graduate Research Services) was named Honorary Supervisor of the Decade in recognition of his contributions to the supervision of students.
The value of doctoral scholarships was increased from $20,000 to $25,000 plus fees per year. The University awards more than 180 new doctoral scholarships every year, the highest number awarded by any New Zealand university.
A number of students won external scholarships to pursue further study.
Natalie Coates was awarded both a New Zealand Law Foundation Ethel Benjamin Prize (for women) and a Fulbright Ngä Pae o te Märamatanga Graduate Award to complete a Master of Laws degree at Harvard University. Tamsin Jones gained a Frank Knox Memorial Fellowship to conduct doctoral study in genetics at Harvard University.
Medical graduate Nicholas Fancourt received an International Fulbright Science and Technology Award, and William Perry and Laura Woods gained Fulbright-Ministry of Science and Innovation Graduate Awards. Fulbright New Zealand General Graduate Awards were presented to Rachel Fairhurst and Rosemary Wyber.

un
ive
rs
ity
of
ota
go
an
nu
al
re
po
rt
20
11
20
Excellence in teaching and research are equally valued at Otago, with a strong teaching-research synergy. In 2011, the University again performed well in the Tertiary Education Commission’s (TEC) assessment of the educational performance of New Zealand’s tertiary sector. In the three categories in which it was assessed, Otago ranked first for both qualification completion and for retention of students in study. It was also one of three universities to achieve the highest completion rate for papers, at 87%.
In 2011, 183 undergraduate and postgraduate degree, diploma and certificate programmes were offered across the four academic divisions, fewer than in recent years due to the phasing out of a number of sub-degree programmes. Music for Education was introduced as a new major for the Bachelor of Music, and Sports Technology as a major in the Applied Science programme. New minors included Entrepreneurship, Environment and Society, and Supplementary Nutritional Science. New postgraduate programmes included a Master of Fine Arts degree in Theatre Studies, a Graduate Diploma in Bioethics and Health Law, and a Postgraduate Certificate in Technology and Entrepreneurship. From July, the Master of Entrepreneurship programme was also offered in Queenstown.
The Distance Learning programme offered 127 qualifications in 2011 (90% at the postgraduate level) and 343 individual
papers (75% postgraduate). A review of Distance Learning was undertaken in February and the biennial Distance Learning Symposium was held in November, attracting more than 50 participants from the University’s three campuses.
An academic audit was undertaken by the New Zealand Universities’ Academic Audit Unit in October focusing on the way internal processes support, monitor and enhance strategic imperatives. The panel met some 160 staff, students and community representatives. A draft report was received at the end of 2011. Also late in the year, the Business School was advised that it had retained its AACSB (Association to Advance Collegiate Schools of Business) accreditation, first gained in 2006.
The University’s Higher Education Development Centre (HEDC) undertook 2,359 teaching and course evaluations throughout the year. Development began on a new web-based evaluation system and a working group was set up in May to consider an overhaul of the current evaluation system. A two-day “Spotlight on Teaching and Learning at Otago Colloquium” offered more than 50 sessions attended by some 150 staff.
After several years of solid growth, enrolments for the University Group dipped in 2011 to reach a final total of 19,568 EFTS, comprising 19,344 University EFTS and a further 224 EFTS for its Foundation Studies subsidiary. These
Achieving Excellence in Research-Informed Teaching

21
equivalent full-time figures, which were generated by 21,728 individual students, represented an overall drop of 1.8% on 2010, though still providing the University with the second-highest roll in its history.
A key contextual element for 2011 was the University’s introduction of an enrolment limitation system at the undergraduate level to control growth – which had run at an unsustainable rate in recent years – and give priority to high-calibre students.
Other contributing factors were a tightening of academic progress provisions, the winding-down of several sub-degree programmes and a re-focusing of Foundation Studies activities to match reduced Government funding. As was the case at other New Zealand universities, this was further influenced by changes to Government student loans access, prevailing economic conditions and an apparent resurgence in interest for trades-type training.
The Canterbury earthquakes had a directly adverse impact on enrolments at Otago’s Christchurch campus where domestic enrolments (which include overseas students with domestic status for government funding purposes) dipped by 2.5%. While a fall of this level had not been anticipated, the University still finished the year well within its target range for government funding.
Enrolment limitation produced a decline in the size of the University’s commencing student cohort, with tougher
standards having a particular impact on those seeking to transfer to Otago from other universities and on special admission students – those seeking entry by virtue of age, who do not hold entrance qualifications.
While the University continued to draw around two thirds of its students from outside its Otago/Southland home catchment, there were small shifts among the areas from which the University drew its commencing student cohort. The proportion of students from the North Island and overseas rose slightly, and the proportion from Dunedin, Otago/Southland and the rest of the South Island decreased.
Despite the adverse impact of the Canterbury earthquakes on postgraduate enrolments through the University’s Christchurch campus, the proportion of postgraduates within the total roll increased, in accordance with the University’s strategic priorities, reaching 16.5% of total equivalent full-time enrolments (2010: 16.4%).
Mäori student enrolments were less affected by the 2011 enrolment dip than enrolments overall. Thus, while the total number of Mäori enrolled did fall very slightly, their representation in proportional terms rose to 8.7% of the domestic student roll (2010: 8.5%). The percentage of Pacific students remained unchanged from 2010 at 3.1%.
There was little change in the number of students recruited from Australia, with a total Australian commencing cohort of 33 students (2010: 34). Some 60% of this group were New
BiochemistrySeniorTeachingFellowTonyZaharicwhoreceivedanawardforsustainedexcellenceatthenationalTertiaryTeachingExcellenceAwards.

un
ive
rs
ity
of
ota
go
an
nu
al
re
po
rt
20
11
22
Zealand citizens returning from Australia. The total number of enrolments from Australia was 215 (2010: 214).
The 11th Otago Summer School held in January and February was subject to the overall institutional limits on enrolment and consequently capped at 300 domestic EFTS (approximately 2,058 enrolments). Sixty-eight papers were offered, of which 16 were new to the programme. Most papers (57) were taught in Dunedin, two were taught in Auckland, two in Wellington and seven were distance papers. Ten papers were taught by visiting international academics especially contracted for Summer School.
International enrolments increased by 8.7% to 2,798 (head count) (2010: 2,649), primarily underpinned by increases from China, India, Malaysia, Canada, the United States (US), England and Iran, and by the relocation of study abroad students from the University of Canterbury to Otago following the devastating 22 February Christchurch earthquake. The US again provided the largest number of international students by head count, with 652 students enrolled in 2011 (2010: 578). Malaysia contributed the highest number of EFTS with 467 (2010: 402), buoyed by having two cohorts of Malaysian-government sponsored BEd(TESL) students on campus, as well as pipeline growth from government-sponsored students in Pharmacy and Medicine, and the twinning arrangement with the International Medical University (IMU) in Dentistry. Together, the US, China and Malaysia accounted for 50% of all international students on campus by head count.
Canada is now the fourth largest source country for international students, with exchange student (tuition fee waiver) enrolments contributing significantly to that total. Enrolments from Germany continued to decline as a result of funding changes to domestic eligibility dating back to 2009. However, Germany still contributed the highest number of international PhD enrolments in 2011 with 54, marginally ahead of the US (52), Malaysia (51) and India (50). These four countries make up 42% of all international PhD enrolments.
Otago Global, the University’s Student Exchange Programme, experienced further growth in 2011, with 247 of our own students taking the opportunity to spend one or two semesters at one of our partner universities.
Internationalisation of the Curriculum Initiative Grants were awarded to projects that included curriculum collaboration and online delivery in the area of Occupational Health with the University of Washington, and a multinational initiative to produce research-informed case studies regarding business solutions in the mining industry.
Quality teaching is vital for the successful delivery of all academic programmes and the University celebrates this with its annual Teaching Excellence Awards. In 2011 these were presented to Dr James Maclaurin (Philosophy), Associate Professor Craig Rodger (Physics) and Biochemistry Senior Teaching Fellow Tony Zaharic. Mr Zaharic also received
an award for sustained excellence at the national Tertiary Teaching Excellence Awards. Professor Mark Stringer (Anatomy) was named Lecturer of the Year in the 2011 OUSA teaching awards, and Dr Gill Rutherford (Education) won the Disability Awareness and Inclusive Teaching Award.
The Library is an essential source of information, services and expertise to enhance academic activity. In 2011, it increased its collections of printed books, serial volumes, microfilms and other non-book materials to a total of 3,096,521 items (2010: 3,077,860). Electronic alternates continued to be sought where appropriate and there are now 663 electronic databases available via the Dunedin campus. There are also 229,336 e-journals and 380,867 e-books accessible.
Library seating spaces increased by 11% to 4,188, primarily due to the completion of the upgraded Robertson Library. The Library worked with all four academic divisions to support the upcoming 2012 Performance-Based Research Fund (PBRF) evaluation: 35 schools and departments engaged in workshops designed to support PBRF preparation.

23
Ensuring Outstanding Campus Environments and Student Experience
The University is committed to maintaining and, where necessary, enhancing the quality of its campus environments and student experience to ensure that it maintains its attractiveness to students and provides a high-quality environment for staff.
The Campus Master Plan, published in 2010, provides a vision for the University’s campus for the next 20 to 25 years. In developing a strategy to achieve these goals, the Council has adopted a Priority Development Plan that is a rolling six-to-eight year plan for capital developments.
Several significant projects were completed in 2011. The University has been a key partner in the development of the Forsyth Barr Stadium at University Plaza, which proved an enormous success during the 2011 Rugby World Cup. Otago’s own building, University Plaza Building One, backs on to the west wall of the stadium and was all but completed by the end of the year. The four-storey Oamaru stone-clad building will house the Otago Language Centre and Foundation Year Programme, the Unipol Gymnasium and Recreation Centre, and the Plaza Café.
The re-designed and refurbished Robertson Library was officially opened by the Prime Minister, the Rt Hon John Key, in August and the William James Psychology Building was formally awarded a Five Star Green Star rating by the New Zealand Green Building Council. The Richardson Building (formerly the Hocken Building) was given a category one listing from the Historic Places Trust.
The former Bowling Green Tavern, bought by the University in 2009, was redeveloped to provide office and seminar space. Council approved a proposal to establish a new study and social centre at the former Gardens Tavern site, at the north end of Castle Street, to help meet a need for more
study and social spaces. It will be known as the Marsh Study Centre, recognising a substantial gift from Dunedin business man Mr Graeme Marsh and his family.
A $5.7million redevelopment of the Union building began at the end of the year. It is part of a larger project to revitalise the central campus precinct and will provide a better connection between this 1960s construction and the adjacent Link and Central Library. It is expected to be completed in June 2012. A landscape concept plan for the Dunedin campus was also prepared, with the aim of increasing the liveability, usability and navigation of the campus.
The University of Otago’s Christchurch campus, which was damaged in the earthquake of September 2010, suffered further serious damage during subsequent ’quakes in 2011. The main building, which adjoins the Christchurch Hospital, is being repaired and strengthened, with work due for completion in the second half of 2012. Staff from the building are being temporarily housed in various buildings across the wider Christchurch area.
In what signals a fundamental shift in the relationship between the University and the OUSA, a shared student service agreement was reached in December following the passing of the Education (Freedom of Association) Amendment Act that prohibited compulsory membership of student associations. Through this, the University will contract OUSA to continue to provide services considered important for the majority of students. This will provide an opportunity for the University and OUSA to work together collaboratively in areas of mutual concern. During 2011, OUSA also revised its stance on the University’s Code of Student Conduct following a referendum of students. OUSA has now adopted a “neutral stance” on the code, to which it had previously

un
ive
rs
ity
of
ota
go
an
nu
al
re
po
rt
20
11
24
been opposed, paving the way for student representatives on Council to be readmitted to the disciplinary appeals board.
Otago provides an outstanding range of services for students including Student Health, Recreation Services, Career Development Centre, Disability Information and Support and the Student Learning Centre. In 2011, the University enrolled 867 students with disabilities and provided more than 1,200 instances of learning assistance, note-taking, tutoring and other forms of support.
The Student Learning Centre provided 258 workshops across the three campuses and a further 1,110 one-to-one consultations with individual students. Learning support for undergraduate and postgraduate students was extended. In Dunedin, 106 Peer Assisted Study Session (PASS) groups met weekly, covering 12 subjects across the four divisions. Further sessions were offered in Residential Colleges and three PASS groups met weekly on the Southland Campus in Semester One.
Following a robust and careful evaluation of student management systems (SMSs) available in Australasia, the University entered into an agreement with Tribal Education Ltd, the UK’s leading supplier of SMSs, for the supply of their SITS:Vision SMS. A two-year project to install, configure and implement SITS:Vision began in the third quarter of 2011. Over the next few years the new SMS will enable the University to simplify, streamline and automate student
administration processes for staff and students. This will enhance services to students and provide staff with improved tools to do their jobs.
Throughout 2011 the rollout of wireless across the University was extended into the bedrooms and common areas of all University-owned residential colleges. Major technology upgrades were completed in 10 lecture theatres and more than 950,000 podcasts (recorded lectures) were downloaded.
With more than 75% of students coming to Otago from outside Dunedin, the University places great emphasis on the provision of high quality accommodation. In 2011, 3,355 students were accommodated in residential colleges, including 75 postgraduate students in Abbey College, the University’s first exclusive postgraduate college. For the first time, limited places were made available in University-owned colleges for Dunedin students, enabling them to participate more fully in the “Dunedin experience”. A further 653 students were placed in University-managed flats.
The 2011 Student Opinion Survey indicated an overwhelming level of satisfaction with the campus and services provided to students: 95.0% of participants gave a positive assessment of the general campus environment; 98.1% expressed satisfaction with the University libraries, information technology and teaching facilities; and 95.5% provided positive feedback about the University’s administrative and support services.

25
The University of Otago is a committed contributor to work that fosters regional and national good, and international progress.
As outlined earlier in this report, research is encouraged in areas that support national development and well-being, and the needs of the developing world. In 2011, Dr John Crump was appointed Professor of Global Health, a second chair within the Centre for International Health. Associate Professor Russell Poulter (Biochemistry) received a Grand Challenges Explorations grant, funded by the Bill and Melinda Gates Foundation, to pursue innovative global health research on HIV. The University and the Salvation Army signed a memorandum of understanding aimed at ensuring the agency’s social services are based on the best national and international research, informing policy debate around social deprivation, alcohol and gambling, mental health and family violence. Health inequities in New Zealand continued to be a focus of work undertaken by Public Health researchers at the University of Otago, Wellington.
Conferences hosted by the University focused on areas of national and international concern. For example, Genetics Otago, together with the New Zealand Law Foundation Centre for Law and Policy in Emerging Technologies, hosted a two-day “Future of Fairness” symposium examining the relationship between fairness and the opportunities
presented by new technologies. New Zealand’s first major conference on disability studies, “Every Body In”, was held on campus in November.
The Otago Energy Research Centre held a number of high profile events, including a public lecture by leading climate change expert, Dr James Hansen, that attracted more than 1,000 attendees. Renowned British epidemiologist Sir Michael Marmot was the keynote speaker at a symposium on health equity and the social determinants of health held at the Wellington campus in July.
The University, its staff and students stepped in to help the people of Christchurch in the aftermath of that city’s devastating earthquakes. Senior medical students assisted in hospital emergency departments and a team from the School of Dentistry, led by Professor Jules Kieser, was involved in disaster victim identification. The University responded to requests to help relocate ’quake-affected international and domestic students from Christchurch universities to its Dunedin campus. Staff donated food and other essential supplies for ’quake-affected residents, the Business School donated computer equipment to a Christchurch school, and staff and students from the University of Otago, Christchurch offered free medical checks to the Mäori community.
Contributing to the National Good and to International Progress

un
ive
rs
ity
of
ota
go
an
nu
al
re
po
rt
20
11
26
The University remains strategically committed to extending its relationship with its primary Treaty of Waitangi partner, Ngäi Tahu, as well as its other four iwi partners. In 2011, several relationships with Mäori health providers who host the outplacement programme for fifth-year dentistry students were formalised through the signing of memoranda of agreements: Ngäti Hine Health Trust (Kawakawa); Te Taiwhenua o Heretaunga (Hastings); and Te Manu Toroa (Tauranga). A memorandum of understanding, also to support the outplacement programme and other research, will be signed with Waikato-Tainui in February 2012.
The Mäori Strategic Framework (MSF) was further implemented across the divisions, with the appointment of an associate dean Mäori in the Divisions of Humanities and Sciences (a similar appointment was made in the Division of Health Sciences in 2010). A snapshot of achievements arising from the MSF was highlighted in the publication Wananei, distributed in May 2011, as well as He Kitenga Mäori, that focused on Mäori research undertaken across all disciplines, launched in December (www.otago.ac.nz/research/hekitenga). The MSF will be reviewed and updated in 2012.
The number of Mäori students enrolled was 1,662 (2010: 1,683), comprising 8.8% of the domestic student population, by headcount. The University attracts Mäori students from throughout Aotearoa with Ngäi Tahu and Ngäpuhi being the largest iwi groups. Nineteen students completed the Tü Kahika programme in 2011, established to prepare Mäori
students for tertiary study, particularly in the health sciences. Of this cohort, 15 students will continue to study in 2012, with the other four students taking gap years.
The University also continued to work to strengthen its links with the Pacific community. The number of Pacific students attending Otago was 672 (2010: 686). A Pacific Research Protocol was established, setting out guidelines for researchers when interacting and collaborating with Pacific peoples in New Zealand and the Pacific region. Its aim is to ensure that research is conducted in a manner that is sensitive to the cultural ways and protocols of Pacific communities. POPO, a new orientation and support initiative for Pacific Health Sciences First Year students, was funded by the Ministry of Health and operated for the first 13 weeks of Semester One.
Otago has a thriving Pacific Research Cluster and Pacific health is taught in all health professional courses. A postgraduate paper in Applied Health and Social Research was taught in Apia at the National University of Samoa as part of the 2011 Summer School. The commitment to assist in developing staff at the National University of Samoa also continued, with candidates being supported to complete postgraduate qualifications at Otago. The Divisions of Sciences and Health Sciences donated more than 600 textbooks to the Samoan university’s library.

27
A number of outreach programmes continued to target groups within New Zealand that may be disadvantaged. The Science Wänanga programme, which was established in 2008, is now operating in five regions providing science camps for provincial/rural secondary school Mäori students. Six wänanga were held in 2011, from Oraka-Aparima in the south to Omaha marae in the north. The Otago University Advanced School Sciences Academy for talented senior students from provincial/rural, small or low-decile schools hosted its first intake of 50 Year-13 students. Professional development opportunities were also offered to teachers from contributing schools. In another Division of Sciences outreach initiative, 20 students from Dunedin schools attended the first Tapuitea Camp for Years-9–10 Pacific Islands students at Lake Waihola, designed to engage young Pacific Islanders with the relevance and practical nature of science.
The National Poisons Centre, based in the Department of Preventive and Social Medicine, provides a 24-hours, 365-days-a-year service to the people of New Zealand. During the year it received more than 36,000 enquiries concerning acute poisoning and the toxic effects of chemicals. Its TOXINZ database received a further 45,000 enquiries from registered users. The centre is actively involved in the areas of poisons prevention and education, and toxicovigilance. In the past year it has worked closely with government agencies profiling substances of abuse and providing advice on minimising harm from such products, and has also participated with the International Programme on Chemical Safety (WHO/ILO/UNEP).
Otago continued to contribute to the national good through its commitment to the arts and its library collections. The Hocken Library is one of the foremost research libraries in New Zealand. In 2011, 9,393 researchers accessed almost 30,400 collection items, 2,347 remote enquiries were answered and 502 orders involving 2,229 image reproductions were completed. Many of those images appeared in publications, exhibitions and displays, brochures, websites and theses. Almost 100 works were loaned to outside exhibitions.
A further 33,000 high-use photographs from the collection were digitised and made available on the freely searchable website, Hocken Snapshop.
Five exhibitions were staged in the Hocken Gallery to support University activities and to mark significant events, including “Bringing it Home: Pathways from Home Science to Applied Science, University of Otago 1911–2011”, coinciding with the Centenary of Consumer and Applied Sciences; and “Ralph Hotere: Zero to Infinity” to celebrate this esteemed artist’s 80th birthday.
The Special Collections, held within the Central Library, issued around 1,000 books for use in the reading room and hosted four exhibitions, viewed by more than 3,000 people. Two exhibitions were particularly popular – “Faces of Authorship: Constructing the Author in Medieval and
Early Modern Books” and “Experimental Philosophy. Old and New” – each coinciding with University of Otago-based international conferences. The 2011 Printer in Residence was John Denny who produced a limited edition book of poems by poet Peter Olds, illustrated by local artist Kathryn Madill.
Otago’s arts fellowships – in writing, art, music and dance – are also of national significance. The fellows in 2011 were: Christopher Adams (Mozart Fellow); Kushana Bush (Frances Hodgkins Fellow); Fiona Farrell (Burns Fellow); Lyne Pringle (Caroline Plummer Fellow in Community Dance) and Kyle Mewburn (University of Otago College of Education/Creative New Zealand’s Children’s Writer in Residence). University of Otago Wallace Residencies at The Pah Homestead in Auckland were held by former Burns Fellows Catherine Chidgey, Paddy Richardson and Michael Harlow, and Christopher Adams.

un
ive
rs
ity
of
ota
go
an
nu
al
re
po
rt
20
11
28
While the location of Otago’s main campus in Dunedin offers outstanding advantages, it also separates much of the University geographically from the major centres of population and political and economic decision-making. Otago is, therefore, strategically committed to strengthening external engagement through the community service activities of staff, the sharing of expertise and resources, and the development of partnerships and relationships within the research, political and business arenas.
In January, senior Otago staff were appointed to the Science and Innovation Boards set up by government under the Research, Science and Technology Act to improve New Zealand’s science and innovation systems. Professor Sir David Skegg was appointed chairman of the Science Board and Professor Warren Tate (Associate Dean Research, Health Sciences) was appointed a board member. Professor Harlene Hayne was appointed to the Innovation Board. Professor Kurt Krause (Biochemistry) was appointed as head of the Marsden Fund’s Biomedical Sciences Panel.
In 2011, 96.4% of surveyed academic staff reported involvement in community service activities, up from 92.6% in 2010. It is estimated that community service typically absorbs 6.0–10.0% of an academic staff member’s professional time. 28.8% of staff served on government advisory boards and committees, and 75.7% provided services to public
sector departments, statutory authorities, agencies, boards, committees and/or NGOs. The value of community service by academics in 2011 was estimated at $25.0 million (2010: $22.4 million).
Through these activities many Otago staff receive recognition from their peers and the wider community. In 2011 these included:
Dr Phil Bishop (Zoology) who was appointed chief scientist for the Amphibian Survival Alliance
Dr Virginia Cathro (Management) who was appointed to the Geoscience Society of New Zealand national board
Professor Jean Fleming (Science Communication/Anatomy) who was elected a Companion of the Royal Society of New Zealand in recognition of her outstanding leadership in science, and contributions to the promotion and advancement of science and technology in New Zealand
John Harraway (Mathematics and Statistics) who was elected president of the International Association for Statistical Education
Strengthening External Engagement

29
Professor David Lont (Accountancy and Finance) who became the New Zealand president of the Accounting and Finance Association of Australia and New Zealand
Professor Jim Mann (Human Nutrition) who was awarded an honorary doctorate by South Africa’s North-West University for his contributions to the prevention and treatment of non-communicable diseases, and to the fields of medicine and nutrition
Associate Professor Ian McAndrew (Management) who was a government appointment to the Lawyers and Conveyancing Disciplinary Tribunal and chairperson of the International Education Appeal Authority.
A total of 182 open-to-the-public lectures were held during the year, 12 of which constituted the Winter Lecture Series held in Auckland and Wellington. A further 336 short courses, workshops, colloquia, masterclasses, workshops and seminars were offered including three short courses offered collaboratively with the Southern Sinfonia and eight offered under a long-standing agreement with the University of the Third Age. Two continuing education intensive schools and three short courses were offered as part of Summer School and a further 25 short courses were offered in the 15th Public Health Summer School held at the University of Otago, Wellington.
A public lecture given in June by famed chimpanzee researcher and environmentalist Dame Jane Goodall was the largest ever held at Otago. The lecture was “live-streamed” in real time to eight lecture theatres seating more than 2,000 people. The Annual Foreign Policy School attracted leading national and international speakers on the subject of “Science Diplomacy” and the inaugural ScienceTeller Festival, hosted by the Centre for Science Communication in November, attracted some of the world’s great storytellers of science, including Professor Lawrence Krauss, author of The Physics of Star Trek.
More than 200 participants attended the Australia/New Zealand Association of Medieval and Early Modern Studies Conference and Australasian Association of Philosophy Conference respectively. The Department of Tourism and the School of Physical Education co-hosted the 10th biennial Australian and New Zealand Association for Leisure Studies Conference; the Department of Economics hosted the 2011 Australasian Public Choice Conference; and the Business School’s Otago Forum-3, held in December, attracted a diverse audience of academics, marketers, information scientists and accountants.
Continuing a long-established practice, the Department of Music and Theatre Studies staged 76 performances during the year. This regular series of lunchtime concerts and dramatic performances makes a strong contribution to the cultural life of Dunedin, as well as providing valuable experience for students. The Division of Humanities continued its sponsorship of the Southern Sinfonia and the SGCNZ (Shakespeare Globe Centre New Zealand) University of

un
ive
rs
ity
of
ota
go
an
nu
al
re
po
rt
20
11
30
Otago Sheilah Winn Festival of Shakespeare in secondary schools.
Productions by the University’s Media Productions Unit (AVSDU) were one of the more visible ways in which staff communicated directly with the wider community. These included a monthly interactive current affairs panel discussion, The Public Square, hosted by Professor Andrew Bradstock (Centre for Theology and Public Issues) and Vote Chat, hosted by Dr Bryce Edwards (Politics), which comprised a series of interviews with politicians in the lead up to the general election, streamed live on the internet and available on iTunesU. A four-hour election night “special” hosted by Dr Edwards and Professor Andrew Geddis (Law) drew more than 1,250 viewers. Vote Chat has had more than 10,000 views on YouTube.
Members of the O-Zone group – early- to mid-career researchers whose achievements have been formally recognised by the University – presented their work at Parliament in June, to highlight some of the research being undertaken at Otago.
Internationally, a number of activities occurred under the auspices of the Matariki Network of Universities (MNU), a select international group of universities of which Otago is a founding member. The introduction of Matariki Travel Awards, designed to allow academic staff on conference or sabbatical leave to visit relevant MNU institutions, has seen a range of research collaborations from across the wider University further developed or initiated. Otago was also represented at the Student Services Forum hosted by Durham University, England, and at the network’s annual research workshop (held this year at Tübingen University, Germany.)
Otago has formal exchange agreements with 91 universities in 33 countries and the programme continues to play a key role in the internationalisation of Otago study. In 2011, bilateral partnerships were also signed with a number of new institutional partners, including McGill University (Canada), Boston College (US), the Indian Institute of Management (Bangalore) and the University of Mahidol (Thailand). These relationships all include a student exchange component and the latter two, in particular, add to the range of destinations available for Otago students.
Relationships with key Chinese partner universities were also strengthened, with new initiatives occurring under the auspices of the New Zealand Centre at Peking University (in which Otago is a partner together with four other New Zealand universities and three government ministries). An agreement was signed and approval granted by the Chinese government for the University of Otago to formally become a partner in the University of Auckland-hosted Confucius Institute, in conjunction with Fudan University in Shanghai. This collaboration builds on our growing relationship with Fudan, and will also add to the strong sister-city relationship between Dunedin and Shanghai.
The New Zealand Marine Studies Centre (NZMSC), incorporating the Westpac Aquarium, offers a variety of community programmes including school and gifted-and-talented programmes, teacher professional development, and travelling exhibits and workshops for special interest groups. In 2011, the centre had 18,327 casual visitors, a further 6,450 school students and teachers attended curriculum-linked programmes, 2,485 people took part in group marine experiences tours and workshops, and 3,820 attended outreach and off-site programmes. The NZMSC maintained its Enviro-Gold status in the Qualmark tourism standards and continued to offer regular school holiday programmes and a number of special events to coincide with national and local festivals.
Otago maintained contact with more than 85,000 alumni in New Zealand and internationally via the University of Otago Magazine, published in February, June and October. The Office of Development and Alumni Relations organised 11 alumni social events at venues in New Zealand and around the world – in Timaru, Oamaru, Palmerston North, Melbourne, Ipoh, Sydney, Dunedin, Edmonton, Toronto, Philadelphia and London. The Dunedin event was the first function held for local alumni since 2000 and proved very popular, with more than 500 people attending. The office also assisted with events hosted by residential colleges and provided support for reunions organised by class groups.
Sixteen Alumni Scholarships were awarded through the Annual Appeal. Otago’s alumni networks abroad continue to provide invaluable support to the University, and initiatives set up by US, Canadian and Malaysian alumni in 2010 and 2011 have resulted in funding for new prizes, scholarships and research activities. The University’s connection with its alumni community continues to be enhanced by Your Otago Link, the secure website that enables alumni to communicate directly with the University and each other.
31
To achieve its goals the University of Otago must secure sufficient resources and use those resources effectively. As will be covered in greater depth in the Financial Review on page 49 of this report, the University’s financial performance in 2011 was satisfactory, in spite of trying conditions as the world continues to grapple with a prolonged recession involving most Western economies.
The University was successful in increasing its revenue base from government in the last financial year, but was affected by the removal of a significant proportion of the tri-partite funding stream that was provided by government specifically for salary increases for staff. Other income has continued to grow, but at significantly slower rates than in previous years.
Maintaining financial capability will be an important priority – and challenge – in the next few years as a number of important projects from the Priority Development Plan are expected to move from design to construction. Clearly this will not be easy in an environment of severe government fiscal constraint due to the current difficult global financial situation.
The commercialisation of intellectual property provides another avenue of funding for the University, while also providing benefits to the wider economy, enhancing research and providing opportunities for staff and students. In 2011 the University’s commercialisation arm, Otago Innovation Limited, became a founding member of Kiwi Innovation Ltd (KiwiNet). This consortium of University and Crown Research Institute commercialisation offices works together to share networks, resources, knowledge and best practice to maximise the commercialisation opportunities of the parties. KiwiNet was formed in response to the then Foundation for Research, Science and Technology (now Ministry of Science and Innovation) notion of a “national network of commercialisation centres”.
One such commercialisation example is the TOXINZ database developed by the National Poisons Centre. This continues to gain respect in the Australian market, performing well in a number of states and being trialled with a view to adoption in others. Across Australia, a number of universities and private hospitals are subscribing to the service. More recently, several Canadian poisons centres have also subscribed to TOXINZ and there are plans to expand into new markets.
A patent for a revolutionary wound-healing gel, collaboratively developed between Otago, the University of Adelaide and Wellington-based Robinson Squidgel, was sold to a leading US-based medical technology company in 2011.
Pacific Edge Limited’s diagnostic test for bladder cancer, Cxbladder, is now being processed in their new commercial
laboratory in Dunedin, which was opened by Health Minister Tony Ryall in May. Pacific Edge is also establishing another CLIA-approved laboratory in Hershey, Pennsylvania, in order to process Cxbladder tests from the huge US market.
The 2011 Otago Innovation Proof of Concept Grant competition received a record 13 applications. The 2011 award was given to Mr Don Schwass (Dentistry) and Dr Carla Meledandri (Chemistry) for their research into the effectiveness of silver-nanoparticles to fight bacteria in teeth. They are actively working towards a commercial product in conjunction with Otago Innovation.
Staff are regarded as the University’s most important assets and, in 2011, there was an increase in both the number of staff using the Human Resources (HR) professional development programme and in the number of departments represented. A total of 111 scheduled workshops were delivered with 1,605 staff attending – a 71% increase on 2010 (938 participants). There was also greater demand for customised professional training provided in response to issues affecting workplace performance: 37 workshops for 375 participants were delivered, an increase of 164% (2010: 14 workshops for 153 participants).
New initiatives included a Career Steps seminar, focusing on women’s career development and an Essential Management seminar – the first in a series of workshops designed for management level staff. There was a focus on identifying gaps within the current programme for staff at managerial levels and this will continue in 2012 with the introduction of a pilot programme to assess the merits of online leadership and management blended learning tools. One hundred women participated in the Women’s Professional Development Programme, including the Women in Leadership at Otago Programme (WiLO) and the Academic Women’s Mentoring Programme continued to grow.
The Higher Education Development Centre (HEDC) provided professional development support for academic staff through one-on-one consultancies and work in departments to support curriculum initiatives and the use of technology in research collaborations. Ninety-four professional development workshops were offered, attended by 1,286 academic staff, tutors and demonstrators. A further 44 new academics attended the new staff conference. Many sessions were video-streamed, audio- or web-conferenced to enable access by staff in other campuses.
Academic heads of departments, directors of centres and associate deans participated in a range of leadership courses and activities offered in Dunedin and Wellington, including induction meetings with key contacts, networking, leadership coaching and mentoring. To further develop leadership
Building and Sustaining Capability
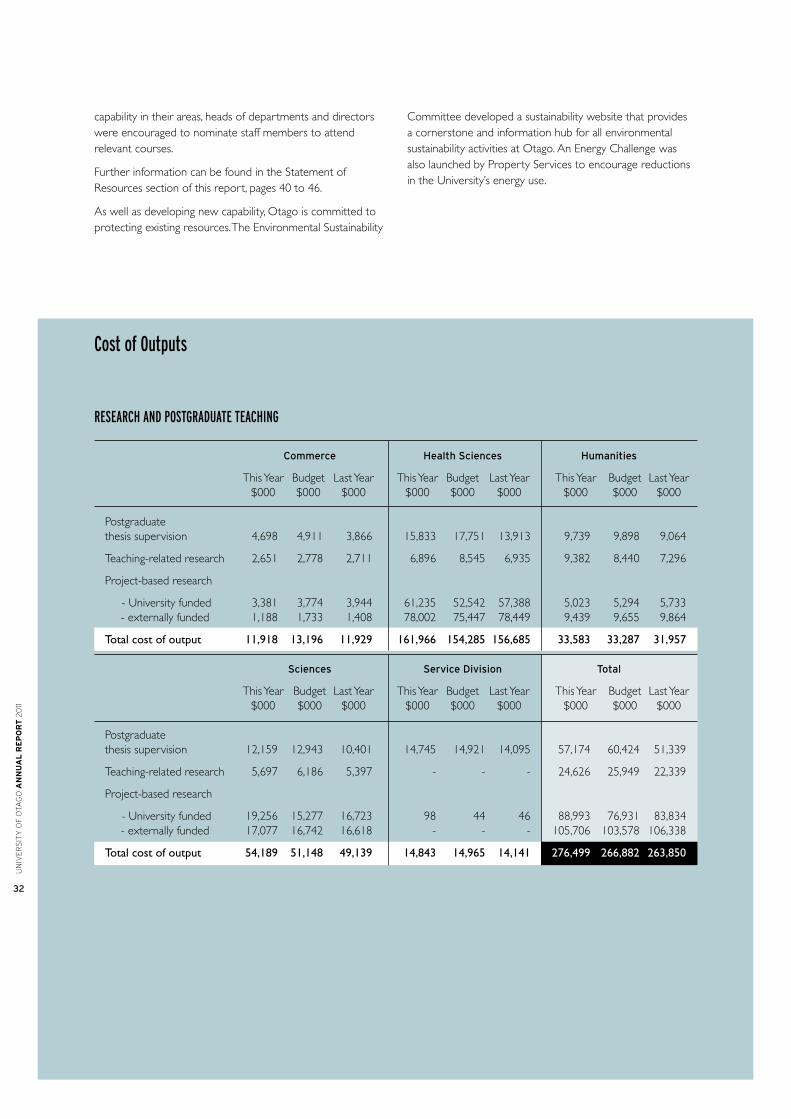
un
ive
rs
ity
of
ota
go
an
nu
al
re
po
rt
20
11
32
capability in their areas, heads of departments and directors were encouraged to nominate staff members to attend relevant courses.
Further information can be found in the Statement of Resources section of this report, pages 40 to 46.
As well as developing new capability, Otago is committed to protecting existing resources. The Environmental Sustainability
Committee developed a sustainability website that provides a cornerstone and information hub for all environmental sustainability activities at Otago. An Energy Challenge was also launched by Property Services to encourage reductions in the University’s energy use.
RESEARCH AND POSTGRADUATE TEACHING
Commerce HealthSciences Humanities
This Year Budget Last Year This Year Budget Last Year This Year Budget Last Year $000 $000 $000 $000 $000 $000 $000 $000 $000
Postgraduate thesis supervision 4,698 4,911 3,866 15,833 17,751 13,913 9,739 9,898 9,064
Teaching-related research 2,651 2,778 2,711 6,896 8,545 6,935 9,382 8,440 7,296
Project-based research
- University funded 3,381 3,774 3,944 61,235 52,542 57,388 5,023 5,294 5,733 - externally funded 1,188 1,733 1,408 78,002 75,447 78,449 9,439 9,655 9,864
Total cost of output 11,918 13,196 11,929 161,966 154,285 156,685 33,583 33,287 31,957 Sciences ServiceDivision Total
This Year Budget Last Year This Year Budget Last Year This Year Budget Last Year $000 $000 $000 $000 $000 $000 $000 $000 $000
Postgraduate thesis supervision 12,159 12,943 10,401 14,745 14,921 14,095 57,174 60,424 51,339
Teaching-related research 5,697 6,186 5,397 - - - 24,626 25,949 22,339
Project-based research
- University funded 19,256 15,277 16,723 98 44 46 88,993 76,931 83,834 - externally funded 17,077 16,742 16,618 - - - 105,706 103,578 106,338
Total cost of output 54,189 51,148 49,139 14,843 14,965 14,141 276,499 266,882 263,850
Cost of Outputs

33
TEACHING AND LEARNING
Commerce HealthSciences Humanities
This Year Budget Last Year This Year Budget Last Year This Year Budget Last Year $000 $000 $000 $000 $000 $000 $000 $000 $000
Total cost of output 22,793 23,416 20,704 73,442 82,966 69,408 41,981 42,065 38,584
Sciences ServiceDivision Total
This Year Budget Last Year This Year Budget Last Year This Year Budget Last Year $000 $000 $000 $000 $000 $000 $000 $000 $000
Total cost of output 40,033 42,776 37,025 3,224 3,463 3,172 181,473 194,686 168,893
COMMUNITy SERVICE
Commerce HealthSciences Humanities
This Year Budget Last Year This Year Budget Last Year This Year Budget Last Year $000 $000 $000 $000 $000 $000 $000 $000 $000
Total cost of output 2,473 2,536 2,244 9,554 9,350 8,621 6,475 6,077 6,218
Sciences ServiceDivision Total
This Year Budget Last Year This Year Budget Last Year This Year Budget Last Year $000 $000 $000 $000 $000 $000 $000 $000 $000
Total cost of output 6,473 6,356 5,281 - - - 24,975 24,320 22,364
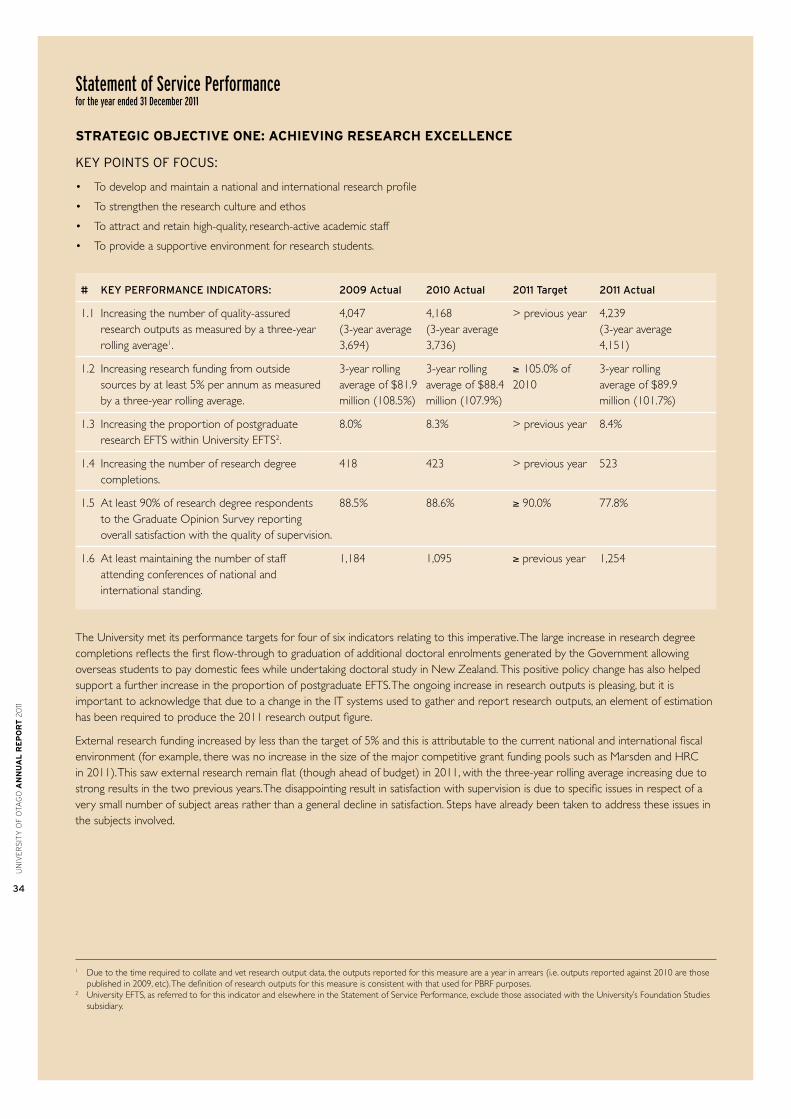
un
ive
rs
ity
of
ota
go
an
nu
al
re
po
rt
20
11
34
Statement of Service Performance for the year ended 31 December 2011
1 Due to the time required to collate and vet research output data, the outputs reported for this measure are a year in arrears (i.e. outputs reported against 2010 are those published in 2009, etc). The definition of research outputs for this measure is consistent with that used for PBRF purposes.
2 University EFTS, as referred to for this indicator and elsewhere in the Statement of Service Performance, exclude those associated with the University’s Foundation Studies subsidiary.
StrateGIC oBJeCtIVe one: aCHIeVInG reSearCH eXCellenCe
KeY poIntS oF FoCuS:
• To develop and maintain a national and international research profile
• To strengthen the research culture and ethos
• To attract and retain high-quality, research-active academic staff
• To provide a supportive environment for research students.
# KEYPERFORMANCEINDICATORS: 2009Actual 2010Actual 2011Target 2011Actual
1.1 Increasing the number of quality-assured 4,047 4,168 > previous year 4,239 research outputs as measured by a three-year (3-year average (3-year average (3-year average rolling average1. 3,694) 3,736) 4,151)
1.2 Increasing research funding from outside 3-year rolling 3-year rolling ≥ 105.0% of 3-year rolling sources by at least 5% per annum as measured average of $81.9 average of $88.4 2010 average of $89.9 by a three-year rolling average. million (108.5%) million (107.9%) million (101.7%)
1.3 Increasing the proportion of postgraduate 8.0% 8.3% > previous year 8.4% research EFTS within University EFTS2.
1.4 Increasing the number of research degree 418 423 > previous year 523 completions.
1.5 At least 90% of research degree respondents 88.5% 88.6% ≥ 90.0% 77.8% to the Graduate Opinion Survey reporting overall satisfaction with the quality of supervision.
1.6 At least maintaining the number of staff 1,184 1,095 ≥ previous year 1,254 attending conferences of national and international standing.
The University met its performance targets for four of six indicators relating to this imperative. The large increase in research degree completions reflects the first flow-through to graduation of additional doctoral enrolments generated by the Government allowing overseas students to pay domestic fees while undertaking doctoral study in New Zealand. This positive policy change has also helped support a further increase in the proportion of postgraduate EFTS. The ongoing increase in research outputs is pleasing, but it is important to acknowledge that due to a change in the IT systems used to gather and report research outputs, an element of estimation has been required to produce the 2011 research output figure.
External research funding increased by less than the target of 5% and this is attributable to the current national and international fiscal environment (for example, there was no increase in the size of the major competitive grant funding pools such as Marsden and HRC in 2011). This saw external research remain flat (though ahead of budget) in 2011, with the three-year rolling average increasing due to strong results in the two previous years. The disappointing result in satisfaction with supervision is due to specific issues in respect of a very small number of subject areas rather than a general decline in satisfaction. Steps have already been taken to address these issues in the subjects involved.

35
StrateGIC oBJeCtIVe tWo: aCHIeVInG eXCellenCe In reSearCH-InForMeD teaCHInG
KeY poIntS oF FoCuS:
• To enrol an increased proportion of high-calibre commencing students as well as an increased proportion of postgraduates
• To maintain innovative and high-quality teaching, leading to excellent academic outcomes
• To maintain a balanced approach to internationalisation.
# KEYPERFORMANCEINDICATORS: 2009Actual 2010Actual 2011Target 2011Actual
2.1 Increasing the proportion of postgraduate 16.0% 16.4% > previous year 16.5% EFTS within University EFTS.
2.2 Increasing the proportion of undergraduate degree-level commencing students admitted 83.8% 84.9% > previous year 89.6% with NCEA Level 3 or an equivalent qualification.
2.3 At least 80% of commencing students passing 80.3% 81.6% > 80% 84.4% at least two thirds of their academic credits in their first year of study.
2.4 Maintaining an average pass rate for papers 87.7% (3-year 88.4% (3-year +/- 2.0% of 89.3% (3-year within 2% of the average for the previous average 88.1%) average 88.0%) rolling average average 88.1%) three years.
2.5 Increasing the number of students successfully 3,458 (UG) 3,485 (UG) > previous 3,663 (UG) completing qualifications at both undergraduate 1,321 (PG) 1,476 (PG) year 1,461 (PG) and postgraduate levels.
2.6 At least 90% of respondents to the annual 87.4% 90.2% ≥ 90.0% 87.0% Student and Graduate Opinion Surveys providing a positive assessment of the quality of teaching.
2.7 Enrolling a diversified international student population3 constituting no more than:
12% of total University EFTS 10.3% 10.6% ≤ 12.0% 11.8%
25% of the international cohort from one country. 16.5% 19.4% ≤ 25.0% 19.3%
Strong progress was made in support of this objective, with seven of the nine performance targets achieved. The gains in the academic achievement indicators were noteworthy, particularly the strong growth in the proportion of undergraduate degree-level commencing students admitted with NCEA Level 3 (or equivalent), and in the proportion of commencing students passing at least two thirds of their academic credits in their first year of study. These improvements were achieved through a combination of new enrolment limitation and academic progress provisions, and through ongoing enhancements to learning support. Despite difficult market conditions, the University also achieved growth in the proportion of international student enrolments. There was, however, a slight drop from 2010 in the number of postgraduate qualification completions, reflecting the decline in postgraduate enrolments at the Christchurch campus (post-earthquake) and an increased proportion of students enrolling in coursework masters’ instead of shorter postgraduate certificate and postgraduate diploma qualifications. The percentage of respondents positively assessing the quality of teaching at the University in 2011 was below the 2010 level, but similar to 2009. The University’s strong overall performance in research-informed teaching was affirmed by the Tertiary Education Commission’s educational performance indicators, which saw Otago ranked first among New Zealand universities for qualification completion and student retention.
3 Including both full-fee international students and those granted domestic student status for fees and funding purposes.

un
ive
rs
ity
of
ota
go
an
nu
al
re
po
rt
20
11
36
StrateGIC oBJeCtIVe tHree: enSurInG outStanDInG CaMpuS enVIronMentS anD StuDent eXperIenCe
KeY poIntS oF FoCuS:
• To nurture and enhance the campus environment and student experience
• To produce well-rounded, independent graduates
• To maintain and develop world-class infrastructure and student support facilities.
#KEYPERFORMANCEINDICATORS: 2009Actual 2010Actual 2011Target 2011Actual
3.1 At least 90% of respondents to the annual Student Opinion Survey providing a positive assessment of:
The general campus environment 99.1% 98.2% ≥ 90.0% 95.0%
University libraries, information technology and teaching facilities 96.9% 95.1% ≥ 90.0% 98.1%
Administrative services and support services. 96.6% 96.1% ≥ 90.0% 95.5%
3.2 At least 90% of residential college respondents 96.6% 93.1% ≥ 90.0% 91.5% to the annual Student Opinion Survey providing a positive assessment of their colleges.
3.3 At least 90% of respondents to the Graduate Opinion Survey reporting some, moderate or extensive development of the following attributes:
Written communication skills 95.3% 95.5% ≥ 90.0% 95.7%
Oral communication skills 88.5% 88.6% ≥ 90.0% 90.6%
Teamwork 82.4% 84.5% ≥ 90.0% 87.0%
A willingness to learn 97.3% 98.4% ≥ 90.0% 95.1%
Independent judgement 95.5% 95.4% ≥ 90.0% 93.6%
Self-confidence 89.8% 89.9% ≥ 90.0% 89.8%
Flexibility and adaptability. 91.6% 92.7% ≥ 90.0% 88.5%
3.4 Providing learning assistance and/or access to 527 503 ≥ 450 503 special equipment for at least 450 students with a disability affecting study.
3.5 Providing annual funding for capital expenditure Funding > Funding > Funding > Funding > no less than the sum of depreciation and the depreciation depreciation depreciation depreciation adjusted surplus (i.e. the surplus adjusted for + adjusted + adjusted + adjusted + adjusted carry forwards and extraordinary items). surplus surplus surplus surplus
Student satisfaction with the campus environment and student experience remained at high levels, with the targeted level of performance reached in eight of the 11 key areas, and narrowly missed in three. The increases reported for the development of oral communication skills and teamwork were especially pleasing, as these are areas in which the University has previously struggled to reach or better the 90% target. While student satisfaction with the residential college experience exceeded the target level, priority will be given to investigating the slight decline recorded against previous years.

37
StrateGIC oBJeCtIVe Four: ContrIButInG to tHe natIonal GooD anD to InternatIonal proGreSS
KeY poIntS oF FoCuS:
• To participate actively in national and international debate
• To extend our partnership with Mäori and support the increased recruitment, retention and achievement of Mäori students
• To strengthen links with Pacific communities and encourage the recruitment, retention and achievement of Pacific students
• To act in an environmentally responsible manner4.
# KEYPERFORMANCEINDICATORS: 2009Actual 2010Actual 2011Target 2011Actual
4.1 Maintaining or increasing the number of 1,280 1,453 ≥ previous year 1,483 national print, radio and television media articles featuring comment by University of Otago academic staff on matters relating to their professional expertise.
4.2 Hosting at least 500 academic visitors to 752 680 ≥ 500 634 the University per annum.
4.3 Increasing the number of research projects being undertaken in association with Mäori. 509 600 > previous year 634
4.4 Raising Mäori student participation and achievement by:
Increasing the number of Mäori students 1,619 1,683 > previous year 1,662 enrolled and Mäori EFTS as a percentage enrolments, enrolments, enrolments, of total domestic student EFTS 8.5% of EFTS 8.5% of EFTS 8.7% of EFTS
Increasing the percentage of first year 66.6% 75.5% > previous year 78.4% Mäori students passing at least two thirds of their academic credits
Increasing the number of Mäori students 276 (UG) 287 (UG) > previous year 260 (UG) completing qualifications at both undergraduate 79 (PG) 91 (PG) 92 (PG) and postgraduate levels.
4.5 Raising the participation and achievement of Pacific students in the tertiary sector by:
Increasing the number of Pacific students 644 enrolments, 686 enrolments, > previous year 672 enrolments, enrolled and domestic Pacific EFTS as a 3.2% of EFTS 3.3% of EFTS 3.3% of EFTS percentage of total domestic student EFTS
Increasing the percentage of first-year Pacific 50.4% 64.7% > previous year 56.3% students passing at least two thirds of their academic credits
Increasing the number of Pacific students 98 (UG) 107 (UG) > previous year 98 (UG) completing qualifications at both 37 (PG) 42 (PG) 45 (PG) undergraduate and postgraduate levels.
The University met eight of its 12 performance targets in relation to the national good and to international progress. A continued improvement in the pass rate for first-year Mäori students was particularly welcome, as was the further increase in the number of research projects being undertaken in association with Mäori. The number of Mäori and Pacific enrolments decreased slightly from 2010, reflecting the overall drop in student enrolments in 2011. Proportionally, however, Mäori were less affected by this drop than the overall student cohort, and Mäori EFTS increased as a percentage of total domestic EFTS. Achieving a small increase in Mäori and Pacific postgraduate completions was also pleasing at a time when – for reasons detailed elsewhere – total postgraduate completions fell slightly.
4 The University is currently developing an Environmental Sustainability Plan and will adopt appropriate key performance indicators for this area once the plan is finalised.

un
ive
rs
ity
of
ota
go
an
nu
al
re
po
rt
20
11
38
The decline in the Mäori undergraduate completion rate is partly explained by a decrease in Mäori student enrolments in the diploma for graduates (it seems likely the tight employment market in 2010 influenced greater numbers of Mäori students to enrol in this one-year programme). While the drop in pass rates for Pacific first-years was disappointing, it should be noted that the number of students involved in each case is sufficiently small that fluctuation in performance by just one or two students can make quite a difference to the percentage achievement of the entire cohort.
StrateGIC oBJeCtIVe FIVe: StrenGtHenInG eXternal enGaGeMent
KeY poIntS oF FoCuS:
• To share the University’s expertise and resources with the local, national and international communities
• To increase engagement and development with research and commercial partners
• To continue to build relationships with the country’s political, business, professional and community leaders.
# KEYPERFORMANCEINDICATORS: 2009Actual 2010Actual 2011Target 2011Actual
5.1 At least 80% of University academic staff 92.0% 92.6% ≥ 80.0% 96.4% involved in community service activities.
5.2 Holding at least 300 open lectures, public 317 328 ≥ 300 548 seminars, and adult and community education courses per annum.
5.3 Providing at least 100 performing arts activities 112 107 ≥ 100 76 open to the public per annum.
5.4 Maintaining appropriate formal agreements 386 402 Existing 334 for collaboration with other organisations for agreements agreements agreements agreements joint research and/or teaching and for the in place in place reviewed, new in place commercialisation of research. agreements entered into as appropriate
5.5 At least 20% of academic staff serving on 24.0% 28.4% ≥ 20.0% 28.8% government advisory boards and committees.
5.6 At least 50% of academic staff providing 73.6% 67.4% ≥ 50.0% 75.7% services to public sector departments, statutory authorities, agencies, boards, committees or inquiries, or to non-governmental organisations.
The University met five of its six performance targets relating to strengthened external engagement, reflecting a high rate of academic staff participation in service to the University’s local, national and international communities. Especially pleasing was the increased involvement of academic staff in government, public sector and non-government committees, boards and processes. The sharp rise in the number of open lectures, public seminars, and adult and community education courses reflects a more rigorous process for capturing information, while the decrease in performing arts activities stems primarily from the Department of Music scaling down the number of public performances at Marama Hall in 2011. This decision was influenced by issues around timetabling and staff availability, and the impact of a constrained fiscal environment.

39
StrateGIC oBJeCtIVe SIX: BuIlDInG anD SuStaInInG CapaBIlItY
KeY poIntS oF FoCuS:
• To ensure financial stability and a diversified funding base
• To support the commercialisation of the University’s intellectual property
• To invest in staff development.
# KEYPERFORMANCEINDICATORS: 2009Actual 2010Actual 2011Target 2011Actual
6.1 Achieving or exceeding the following University 19,017 19,661 19,775 19,344 EFTS enrolment targets:
6.2 Achieving an operating surplus such that the 2.3% of 2.2% of ≥ 2.0% of 2.2% of moving five-year average is at least 2% of net net assets net assets net assets net assets assets (excluding extraordinary items).
6.3 Maintaining a liquid ratio of no worse than 1:1. 1.7:1 1.9:1 ≥ 1:1 1.6:1
6.4 Ensuring that net interest paid is no greater than 0.8% 0.7% ≤ 33.3% 0.7% one third of the operating surplus.
6.5 Maintaining at least 50% of University income 55.1% 54.4% ≥ 50.0% 54.6% from diverse sources other than Government grant funding.
6.6 Increasing the consulting, commercial and $56.6 million $62.3 million ≥ 105.0% $67.5 million intellectual property income of the University (110.9%) of 2010 (108.3%) Group by at least 5% per annum as measured by a three-year rolling average.
6.7 Providing at least 2.0% of the University salary 2.1% 1.2% ≥ 2.0% 1.3% budget for staff training and development.
6.8 At least maintaining the number of academic 115 132 ≥ previous year 104 staff undertaking research and study leave.
The University met five of its eight performance targets in this area, with the strong financial performance measured against all five financial indicators further affirming the value of the University’s commitment to prudent financial management. While 2011 EFTS enrolment figures were the second highest in the University’s history, the drop from 2010 was not forecast. A mixture of internal and external factors that are fully explained elsewhere in this annual report generated this drop.
Allocation of the University salary budget for staff training and development, while rising slightly from 2010, remained below the 2% target, reflecting ongoing awareness across all University units to set training and development budgets that reflect likely actual expenditure. (It should be noted that this indicator does not take account of the many training and development courses provided free-of-charge to University staff.) The reduction in the number of staff taking research and study leave also reflects a cautious approach in the present constrained fiscal environment, as well as tendency for staff to take such leave in earlier years in order to maximise research productivity in advance of the 2012 PBRF round.

un
ive
rs
ity
of
ota
go
an
nu
al
re
po
rt
20
11
40
Statement of Resources 2O11
Land, Buildings and Capital DevelopmentThere was no significant change in the amount of land owned by, or held in Crown title for, the University. Following completion of a detailed review of all University land titles in 2010, the listed amount of endowment land let on long-term leases was revised upwards by 11 hectares. (Endowment leasehold land is high-country pastoral land in the central South Island.)
Several major capital projects were completed in 2011. These included refurbishment of the Robertson Library and redevelopment of the former Bowling Green Tavern into office and seminar space. A major focus for 2011 was construction of the University Plaza Building One (adjacent to the Forsyth Barr Stadium) to house the Otago Language Centre and Foundation Year Programme, the Unipol Gymnasium and Recreation Centre, and the Plaza Café. Work on this facility was substantially complete by the end of 2011, in preparation for opening at the start of the 2012 academic year. Other milestones included Council approval of a proposal to develop the former Gardens Tavern site into a study and social centre (the Marsh Study Centre), and commencement at the end of the year of a $5.7 million redevelopment of the University Union building.
The University’s Christchurch campus sustained serious damage in the 22 February earthquake, and repair and
strengthening work were undertaken on the main University building throughout the year and will continue into 2012.
The University’s net assignable floor space increased by 3,085m² (1.4%) in 2011 to reach 218,318m2. The largest increases in floor space were for Commerce, Information Services, and administration and other purposes.
Following the adoption in 2010 of the Campus Master Plan, which provides a strategic framework to guide the future long-term evolution of the University’s three campuses, a Priority Development Plan (PDP) was developed in 2011 to identify those projects with high priority for development over a rolling six-to-eight-year period. The PDP will be updated annually as projects are added and completed.
Library ResourcesThe Library system continued to evolve as an essential source of information and expertise for the University and the wider community, providing extensive collections, access services, instruction and infrastructure in support of scholarship, creativity and learning. The reopening of the Robertson Library was a particular highlight for the year. Collaboration between academic and Library staff continued to underpin the further development of both physical and online collections.

41
During 2011 the Library’s on-site collections increased by 18,661 items (0.6%) to comprise a total of 3,096,521 items.
The University community also enjoyed desktop access to an increasing component of the Library’s collections. As well as growing to 229,336 electronic serials (a 31.2% increase over 2010), online collections benefitted from a further expansion in the number of e-books, which reached 380,867 (up by 5.0% over 2010). The number of electronic serials continues to grow, with 97.4% of all serials now received in electronic rather than print form in 2011, compared to 96.6% in 2010.
University staff and students continued to make good use of the on-site collections with 452,893 items loaned during the year. Databases, e-journals, e-books and other electronic materials were heavily used, both on campus and off campus.
The Library maintained a programme of discipline-based and resource-specific information skills sessions for students. These are designed to develop effective search techniques and competencies in evaluating quality sources of information.
With the reopening of the Robertson Library, the number of seating places across the Library system increased by 10.9% to reach 4,188.
Information TechnologyThe rapid growth of electronic communications continued in 2011. The volume of off-campus computer and telecommunications network traffic increased from 421,690
gigabytes in 2010 to 464,159 gigabytes in 2011 (an increase of 10%). 950,000 podcasts of recorded lectures were downloaded for the year, compared with 405,000 in 2010 – an increase of 134.6%.
The University continued its strong support of student and staff IT resourcing. There were 1,361 seating places provided in student computer laboratories in 2011 – a marked (81.7%) increase from 749 in 2010 – and 46,295 enquiries were processed through the ITS Helpdesk, up 2.3% from 45,256 in 2010.
The rollout of the University wireless network continued, with coverage provided to bedrooms and common areas in all University-owned residential colleges. This project has an overall aim of extending the existing wireless network across all campuses of the University and, in conjunction with local authorities, establishing a comprehensive wireless network for the North Dunedin residential precinct.
Work continued on the implementation of a new Student Management System, which will see a package-based system replace the multitude of in-house systems collectively student management processes.
Other highlights included major technology upgrades undertaken in 10 lecture theatres across campus, and the delivery of several major events, including the Jane Goodall lecture (the largest lecture ever held at the University of Otago, in which eight lecture theatres were “linked” together
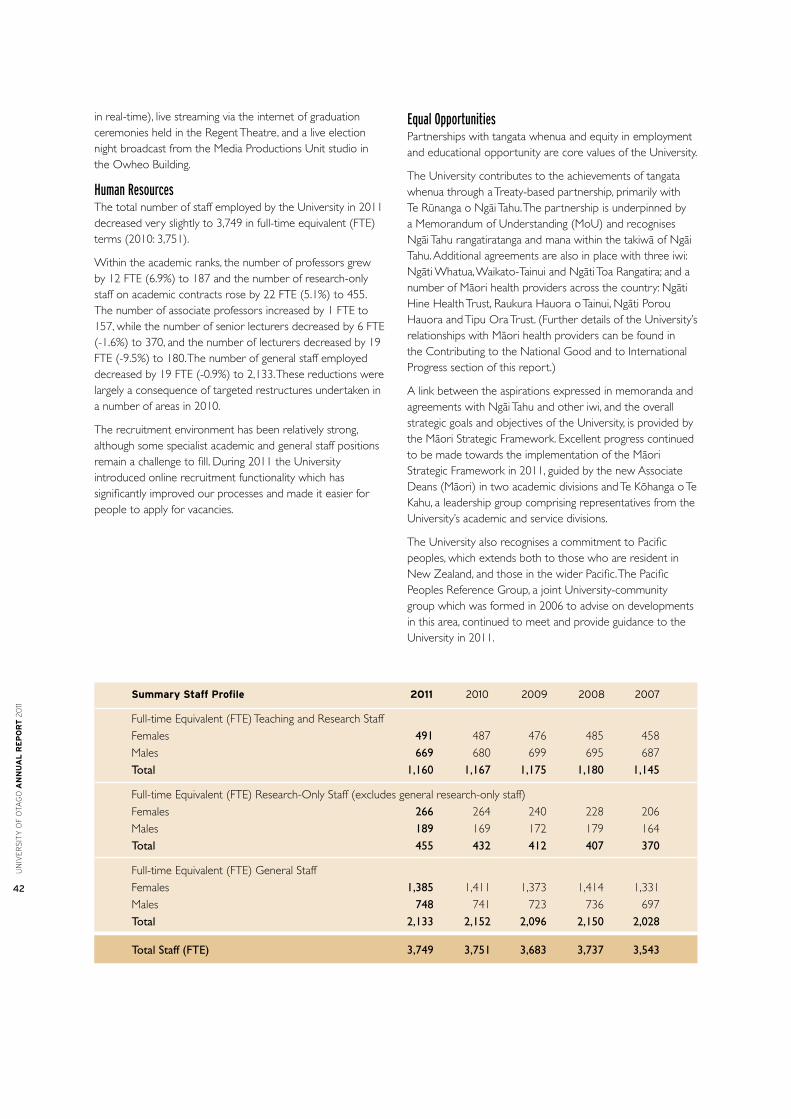
un
ive
rs
ity
of
ota
go
an
nu
al
re
po
rt
20
11
42
in real-time), live streaming via the internet of graduation ceremonies held in the Regent Theatre, and a live election night broadcast from the Media Productions Unit studio in the Owheo Building.
Human ResourcesThe total number of staff employed by the University in 2011 decreased very slightly to 3,749 in full-time equivalent (FTE) terms (2010: 3,751).
Within the academic ranks, the number of professors grew by 12 FTE (6.9%) to 187 and the number of research-only staff on academic contracts rose by 22 FTE (5.1%) to 455. The number of associate professors increased by 1 FTE to 157, while the number of senior lecturers decreased by 6 FTE (-1.6%) to 370, and the number of lecturers decreased by 19 FTE (-9.5%) to 180. The number of general staff employed decreased by 19 FTE (-0.9%) to 2,133. These reductions were largely a consequence of targeted restructures undertaken in a number of areas in 2010.
The recruitment environment has been relatively strong, although some specialist academic and general staff positions remain a challenge to fill. During 2011 the University introduced online recruitment functionality which has significantly improved our processes and made it easier for people to apply for vacancies.
Equal OpportunitiesPartnerships with tangata whenua and equity in employment and educational opportunity are core values of the University.
The University contributes to the achievements of tangata whenua through a Treaty-based partnership, primarily with Te Rünanga o Ngäi Tahu. The partnership is underpinned by a Memorandum of Understanding (MoU) and recognises Ngäi Tahu rangatiratanga and mana within the takiwä of Ngäi Tahu. Additional agreements are also in place with three iwi: Ngäti Whatua, Waikato-Tainui and Ngäti Toa Rangatira; and a number of Mäori health providers across the country: Ngäti Hine Health Trust, Raukura Hauora o Tainui, Ngäti Porou Hauora and Tipu Ora Trust. (Further details of the University’s relationships with Mäori health providers can be found in the Contributing to the National Good and to International Progress section of this report.)
A link between the aspirations expressed in memoranda and agreements with Ngäi Tahu and other iwi, and the overall strategic goals and objectives of the University, is provided by the Mäori Strategic Framework. Excellent progress continued to be made towards the implementation of the Mäori Strategic Framework in 2011, guided by the new Associate Deans (Mäori) in two academic divisions and Te Köhanga o Te Kahu, a leadership group comprising representatives from the University’s academic and service divisions.
The University also recognises a commitment to Pacific peoples, which extends both to those who are resident in New Zealand, and those in the wider Pacific. The Pacific Peoples Reference Group, a joint University-community group which was formed in 2006 to advise on developments in this area, continued to meet and provide guidance to the University in 2011.
Summary Staff profile 2011 2010 2009 2008 2007
Full-time Equivalent (FTE) Teaching and Research Staff Females 491 487 476 485 458 Males 669 680 699 695 687 Total 1,160 1,167 1,175 1,180 1,145
Full-time Equivalent (FTE) Research-Only Staff (excludes general research-only staff) Females 266 264 240 228 206Males 189 169 172 179 164 Total 455 432 412 407 370
Full-time Equivalent (FTE) General Staff Females 1,385 1,411 1,373 1,414 1,331 Males 748 741 723 736 697 Total 2,133 2,152 2,096 2,150 2,028
Total Staff (FTE) 3,749 3,751 3,683 3,737 3,543

43
EqualeducationalopportunitiesThe University is committed to eliminating unnecessary barriers to the admission and progress of students. A key component of its strategy in this area is the provision of support and recruitment initiatives for students from groups which may be under-represented within the institution and who may be disadvantaged in terms of their ability to attend the institution.
Mäori students, Pacific students and students with disabilities are three such groups that the University gives particular focus to.
The University’s package of targeted scholarships and awards was further extended in 2011, with 63 Mäori and Pacific Island Entrance Scholarships awarded to commencing students.
M-aoriThe number of Mäori students enrolled at Otago decreased slightly from 1,683 (in 2010) to 1,662, but represents the second highest Mäori student roll in the history of the University. The slight drop reflected the overall drop in student numbers in 2011. Of note, however, was the proportional increase in the number of Mäori students, who now comprise 8.8% of the University’s domestic student population in headcount terms – up from 8.6% in 2010.
In 2011, 78.4% of Mäori at the University passed at least two thirds of the academic credits for which they had enrolled, up from 75.5% in 2010, and 66.6% in 2009. 352 Mäori students successfully completed qualifications in 2011.
Te Huka Mätauraka, the Mäori Centre, continued to provide academic, cultural and social support for Mäori students at the University. Special recognition of the academic achievement of Mäori students was given in pre-graduation ceremonies, and by holding a full marae-based graduation for those completing the bilingual teacher education programme delivered at the University’s Southland campus.
Several initiatives were undertaken to support increased Mäori student enrolment and success in the sciences and health sciences, with the Division of Sciences’ long-established outreach programme, the appointment of an associate dean (Mäori) in Sciences, and the office of the associate dean (Mäori) in the Division of Health Sciences playing key roles in the implementation of these initiatives. One such initiative was the Tü Kahika foundation programme, a partnership between the University, the Ministry of Health and the Tertiary Education Commission, that aims to prepare Mäori students for the highly competitive Health Sciences First-Year course. Eleven of the 14 students in the 2010 cohort continued with tertiary study in 2011 and nine pursued entry into health sciences professional programmes. Nineteen students were recruited into the Tü Kahika programme in 2011.
The community wänanga programme, which is aimed at increasing the number of Mäori leaving school with the
necessary academic background to study in the sciences and health sciences, continued to expand in 2011. The programme was initially piloted in partnership with Ngäti Porou and schools in the Tolaga Bay area, and over the past year has been extended to operate in partnership with Ngäi Tahu papatipu rünanga in Karitäne (near Dunedin) and Murihiku (Southland), Ngäti Porou in Te Araroa (East Coast) and Te Atiawa and Kimi Hauora Wairau (Te Tau Ihu). Partnerships for further wänanga are progressing with the Waitemata District Health Board and Te Rünanga o Ngäti Whätua, as well as with the Hawke’s Bay District Health Board, Kia Ora Hauora and Te Taiwhenua o Heretaunga in Hastings.
PacificpeoplesThere were 672 Pacific students enrolled at the University in 2011, a 2% drop from the 686 enrolments in 2010. Proportionally, however, Pacific students constituted 3.3% of total domestic student EFTS, the same proportion as for 2010. 143 Pacific students successfully completed qualifications, a slight overall drop from 2010 (149 completions).
As noted above, the University increased its scholarship support for commencing Pacific students in 2011.
The University’s Pacific Islands Centre continued its role as a hub for targeted support and services for Pacific students, with most Pacific students being registered with the centre. It also remained active in outreach activities in Pacific communities. These activities included a special study support programme for Pacific students in Dunedin secondary schools.
The existing space at the Pacific Islands Centre was renovated to provide more room for tutorials and workshops, and a second space was added. The new space (Leithbank 2) houses the Pacific community liaison officer, a postgraduate study room, a computer lab, three tutorial rooms and storage.
A package of targeted scholarships has played an important role in supporting Pacific student recruitment, and the full-time Pacific community liaison officer has provided a strong community focus to this recruitment. Acting on the advice of its Pacific Peoples Reference Group, the University continued to offer achievement awards, recognising the top Pacific first-year student and top Pacific final-year student in each academic division.
Significant achievements for the year were the release of the Division of Health Sciences Pacific Strategic Framework 2011-2015, comprising strategic goals and key activities to enhance Pacific achievement in the Division of Health Sciences, and the University of Otago Pacific Research Protocols, comprising protocols for University researchers undertaking research involving Pacific peoples in New Zealand and overseas.
Progress was made on developing an inaugural Pacific Strategic Framework for the University, and this will continue in 2012.

un
ive
rs
ity
of
ota
go
an
nu
al
re
po
rt
20
11
44
Iwit
ow
hic
hS
tud
en
tsA
ffilia
ted
2
011
20
10
200
9
200
8
200
7
Fi
rst
Any
Fi
rst
Any
Fi
rst
Any
Fi
rst
Any
Fi
rst
Any
Affi
liatio
n A
ffilia
tion
Affi
liatio
n A
ffilia
tion
A
ffilia
tion
Affi
liatio
n A
ffilia
tion
Affi
liatio
n A
ffilia
tion
Affi
liatio
n
Ngä
i Tah
u / K
äi T
ahu
381
438
362
419
357
416
321
376
329
383
Ngä
puhi
19
2 25
4 20
7 28
9 19
7 27
2 20
3 27
1 17
9 23
5N
gäti
Poro
u 13
4 18
3 12
6 16
4 11
9 16
7 11
3 16
5 12
4 17
2Ta
inui
64
10
8 62
94
48
76
34
66
33
55
Ngä
ti M
ania
poto
50
68
54
73
53
73
45
67
48
67
Te A
tiaw
a (T
aran
aki)
42
72
49
68
48
64
48
69
45
68N
gäti
Tüw
hare
toa
39
71
36
74
40
74
38
80
38
76N
gäti
Kahu
ngun
u, r
egio
n un
spec
ified
35
56
32
55
27
50
25
41
22
39
Ngä
ti Ka
hung
unu
ki T
e W
airo
a 34
58
31
62
33
69
26
53
35
65
Ngä
ti Ra
ukaw
a (H
orow
henu
a/M
anaw
atü)
33
48
41
62
44
65
31
48
34
52
Ngä
ti A
wa
30
51
33
50
38
54
37
50
39
54D
on’t
know
30
33
27
27
24
25
13
13
19
21
Ngä
ti Ka
hung
unu
ki H
eret
aung
a 27
41
34
42
37
44
33
43
30
38
Tüho
e 25
62
21
56
26
53
28
54
28
54
Not
sta
ted
25
26
31
32
43
44
44
45
62
63Te
Rar
awa
24
47
32
59
25
48
23
47
27
46Te
Ara
wa
23
42
17
34
14
25
12
20
9 16
Ngä
ti Ka
hung
unu
ki W
aira
rapa
22
35
27
39
23
31
20
28
19
25
Nga
itera
ngi
20
33
17
32
19
31
19
34
14
29N
gäti
Rauk
awa
(Wai
kato
) 19
37
20
40
20
40
16
32
14
22
Wha
katö
hea
15
31
12
28
14
30
22
36
22
34N
gäti
Piki
ao (
Te A
raw
a)
14
22
13
23
8 20
11
26
11
23
Wai
kato
13
32
18
35
20
34
22
38
25
43
Te W
häna
u-a-
Apa
nui
13
36
13
40
12
37
9 29
7
26N
gä R
uahi
ne
13
19
10
15
10
15
10
14
8 16
Ngä
ti W
hätu
a 12
26
13
31
13
28
13
27
13
28
Tara
naki
12
17
4
11
2 6
3 9
10
15Ta
rana
ki (
Tara
naki
) Re
gion
not
furt
her
defin
ed
12
18
18
25
17
22
18
23
11
16N
gäti
Kahu
12
21
13
20
9
19
7 12
7
14O
ther
30
9 69
8 32
3 71
3 28
8 68
6 28
7 67
8 28
0 67
1
Tota
l 16
62
n/a
1683
n/
a 16
19
n/a
1524
n/
a 15
35
n/a

45
LearningAssistanceSupportforStudentswithDisabilities 2011 2010 2009 2008 2007
Note-taking 235 212 296 210 223 Tutoring 164 126 131 127 112 Transcription/typing 3 5 3 5 4 Reader 0 3 0 4 0 Assistant 2 0 0 7 0 Examination arrangements 278 277 271 282 276 Scanning 0 0 0 0 0 Other 120 120 129 116 94
ServicesProvidedbythePacificIslandsCentre 2011 2010 2009 2008 2007
Registered with the centre 702 681 645 430 360 Extra tutorials 72 75 65 47 42 Career Advisory Services seminar 4 6 12 5 4 Students receiving course advice 366 285 420 370 250 Pacific postgraduate seminars 10 11 12 28 24 Student gatherings 31 39 24 18 14 Community meetings/consultation 23 26 25 22 17 Community functions attended 41 45 92 102 87 Students receiving counselling 138 394 85 85 80
DisabilitiessupportThe University takes a proactive approach to the recruitment and support of students with disabilities, with its Disability Information and Support service taking a lead role in this area, and working in conjunction with both academic and administrative departments.
During the year the University undertook a review of the Disability Information and Support service and recommended that the University endorse the principles of “Kia örite Achieving Equity: The New Zealand Code of Practice for an Inclusive Tertiary Education Environment for Students with Impairments”, and that this endorsement be reflected in all high-level strategic documents.
In 2011, the University enrolled 867 students with a disability affecting study, a slight increase on the 852 enrolled in 2010. Provision of support in the form of learning assistance and/or special equipment requiring a specific financial commitment was provided to 503 students with disabilities in 2011 (2010: 503). 680 students received learning support in the form of note-taking, assistance with examinations, tutoring, transcription or typing (2010: 620).
EqualemploymentopportunitiesIn 2011 the number of women in senior academic positions (senior lecturer and above) increased by 4 FTE (1.6%) to 249 FTE staff. Women now comprise 34.4% of staff at these levels, compared to 34.3% in 2010, and 24.7% as recently as 2005.
The overall number of female academic and research staff rose to 757 FTE (from 751 in 2010). While the majority of general staff are female, women continue to be under-represented at the senior levels within the general and management staff.
The University continued its support of the national universities’ Women in Leadership Programme, sending five senior women to the programme in 2011. 124 women attended nine events put on through the Women’s Professional Development Programme (jointly co-ordinated by HEDC and Human Resources), including the Women in Leadership at Otago Programme (WiLO), and 28 new members and 18 new mentors joined the Academic Women’s Mentoring Programme. Mentoring and peer-learning groups increased for general staff women during the year with nine formal mentoring opportunities and 42 individual career counselling sessions undertaken. A committee was established to review and discuss the purpose and framework for Gender Equity Committee activities. The University continued to provide both the Treaty of Waitangi Education Programme and introductory Te Reo classes for staff in 2011. Six Te Reo classes were held with a total of 57 participants. The framework of competencies supporting the University of Otago Mäori Strategic Framework 2007–2012 for use in the staff performance review process was piloted, in conjunction with the Office of Mäori Development. Feedback was analysed and the competency framework refined for intended use in 2012.
The Pacific Peoples culture awareness course continued in 2011 and an additional two sessions were conducted for specific departmental groups. A Pacific Values through Dance, Drama and Dialogue workshop was also conducted. This workshop was the result of collaboration among the Pacific Islands Research and Student Support Unit (Division of Health Sciences), Pacific Trust Otago and Auckland-based Family Life Education Pasifika (FLEP).

un
ive
rs
ity
of
ota
go
an
nu
al
re
po
rt
20
11
46
Disability Information and Support co-hosted the highly successful inaugural Disabilities Studies conference “Every Body In” which was held in November 2011. This was attended by over 300 delegates who participated in 83 papers over three days. The keynote speakers were Sir Tom Shakespeare, Anne Hawker and Patricia O’Brien.
A diversity and inclusivity workshop was conducted during the year, and diversity themes are incorporated within existing programmes such as the Supervisory Skills and Communication workshops. Diversity awareness has been provided as tailored training with specific teams, such as Campus Watch.
The University continues to address the gap in respect of staff equity information by requesting updates to the equity form on staff online profiles. Equity data are now proactively gathered for all new staff via the University’s online recruitment system.
OtherstaffsupportinitiativesThe Employee Assistance Programme (EAP) continued in 2011, providing three confidential, short-term counselling sessions at no cost to individuals. The rate of use of the programme increased to around 4.0% of staff accessing the service (2010: 3%). The majority of issues reported and identified through EAPare in relation to non-work matters.
Occupational Health and Safety training continues and additional courses were offered based on identified needs. The Health and Safety team continued to offer influenza vaccination to staff, with approximately 1,700 staff vaccinated during 2011. The University retained tertiary-level accreditation for the ACC Partnership Programme during 2011. As it has now achieved tertiary level for two consecutive years, only the injury management section will be audited externally during 2012. Work-related ACC claim numbers remain static with very positive rehabilitation outcomes.
Support for childcare continued to be provided through the Otago University Childcare Association, with the University covering the rental cost of premises for the association’s four pre-school care facilities and delivering further support via an annual lump-sum grant. The association provided childcare for approximately 120 University families, but – as in previous years – waiting lists indicated considerable unmet demand for childcare services around the University. Work that the University and the association had commenced in 2010 to address this was further advanced in 2011, with a suitable site for new facilities confirmed and initial plans prepared.

47
This report has been prepared in accordance with clause 13.1 of the agreement between the Crown and the University “Regarding the Crown’s Financial Support for the Merger with the Dunedin College of Education”.
This clause requires the University to publish a summary report on the merger in its Annual Report in the year following the conversion to capital of the suspensory loan provided by the Crown to support the replacement or redevelopment of the College of Education Library.
It should be noted that detailed reports have already been provided to the Crown in respect of these loans and that the Crown, having been satisfied that the conditions associated with each loan have been met, has already activated the conversion of each loan to capital.
Summary of the mergerThe merger took effect on 1 January 2007, following an extended period of pre-merger planning.
The key tasks to be accomplished immediately following the merger were the integration of the college – including its staff, physical and financial assets, students and qualifications - into the University, and the integration of the University’s Faculty of Education into the new college.
The new University of Otago College of Education took its place as an academic unit within the Division of Humanities, under the leadership of its foundation Dean, Professor Helen May. At the same time, a number of administrative and support services previously provided by the Dunedin college were merged into the appropriate service areas of the University.
An initial focus of the new college was the development of a new suite of academic programmes to replace the previous (and sometimes overlapping) qualifications of the former college and faculty. At the same time, staff of the old college and faculty were brought together at one physical location, under a new organisational structure, and significant resources were provided to support the academic staff of the new college in upgrading their qualifications and research activity to the level expected in a research-led University.
By the end of 2010 the new suite of academic programmes was well established, and an organisational re-structure took place within the college. By the end of 2011 – after two years of solid growth – enrolments at the college had reached their highest level (1,088 EFTS) since the merger and an extensively refurbished and upgraded college library was opened (see below).
The general merger loanIt was always accepted that the college would require considerable financial cross-subsidisation in the years immediately following merger, and in light of this, a suspensory loan of $1.2 million was provided to assist with the general costs of the merger.
This loan was drawn down in November 2006 and the funding provided was expended in full as a contribution to transition costs that arose immediately following the merger. These totalled $4.4 million in the first two years following the merger.
The conversion conditions associated with the loan were that the University’s Faculty of Education relocate to the College of Education site, and that the University establish, within the merged college, two centres for research and outreach.
The relocation of the Faculty of Education occurred in 2007, immediately following the merger. Two centres were established: the Centre for Distance Education and Learning Technologies; and the Centre for Educational Leadership and Administration, established in 2010.
Following the establishment of the second centre, the Crown was notified the conditions for the conversion of the merger had been met. Conversion was confirmed by the Crown on 20 December 2010.
The library loanThe agreement referred to above provided for the Crown to supply a capital injection of up to $5 million (GST exempt) as a 50% contribution to the cost of the refurbishment of the Robertson Library, or to the construction of a new library in its place. After giving careful consideration to the possible options, the University decided to proceed with a refurbishment/upgrade of the existing library rather than the construction of a new library1.
The redevelopment project was formally approved by the University Council in June 2009 and the main contract was let in late-2009 after a competitive tendering process. Work started on the site in January 2010 and was substantially completed by December 2010. Having operated from temporary facilities during the main construction period, the library service resumed from the re-developed facility in January 2011. As noted elsewhere in this Annual Report, the re-developed library was formally opened by the Prime Minister in August 2011.
College of Education Merger Report
1 Initial estimates confirmed that the refurbishment provided a more cost-effective solution (at $10 million) than a new library (estimated at $15 million or more, depending on site and scope).

un
ive
rs
ity
of
ota
go
an
nu
al
re
po
rt
20
11
48
This loan was drawn down in April 2010 and applied as a 50% contribution to library redevelopment costs that totalled $10.0 million.
Six conditions were required to be met to trigger the conversion of the library loan. These, along with the summary evidence of their having been satisfied, are provided below. A fuller explanation in respect of each condition appears in the detailed College of Education Library Loan Conversion Report provided to the Tertiary Education Commission in March 2011. Conversion of this loan was confirmed by the Crown in April 2011.
Conversion condition
That the University has commissioned, and made available to the Crown if requested, reports that evaluate the extent of deferred maintenance and delayed refurbishment of the Robertson Library Building and determine the costs of refurbishing the Robertson Library or constructing a new Library.
Comment
Reports were prepared as required. Initial cost estimates for four options to provide a modern library were then sought. The option of upgrading of the existing library (estimated cost $10 million) was selected as the option which met the key project aims in the most cost-effective manner.
Conversion condition
That the University has designed and built the proposed refurbishment of the Robertson Library, or constructed a new library as appropriate.
Comment
Detailed plans were prepared in accordance with the project brief and, as noted above, the library reconstruction took place during 2010. The end result is a library that is both a little larger than its predecessor, and superior in terms of IT connectivity, aesthetics, comfort, the number and range of study places available, and compliance with current safety standards.
Conversion condition
On a best effort basis, made the most efficient use possible of the library funding for the refurbishment of the Robertson Library or construction of the new library.
Comment
This was achieved through following an appropriate tendering and construction project approach. The construction contract was secured in accordance with the principles of the University tendering policy. Construction was subject to the normal monitoring that the University puts in place for a project of this magnitude.
Conversion condition
That the University has provided access and support to the staff and students of Otago Polytechnic, on a basis consistent with the library access agreement reached with the Otago Polytechnic.
Comment
Access and support has been provided on an ongoing basis in accordance with the Service Level Agreement (SLA) between the University and Polytechnic. In accordance with the provisions of the SLA, the allocation of costs associated with the provision of the service is reviewed on an annual basis.
Conversion condition
That the University has transferred to the Robertson Library or new library as much of the University’s specialist education library and resources as required to operate the new school of education.
Comment
These resources were transferred to the college site at the time of merger.
Conversion condition
Provided, on a best effort basis, whatever amount of additional funding is necessary to upgrade the Robertson Library (or new library) to a University standard, principally by improving the IT resources of the Robertson Library or new library to the University Library and computer systems.
Comment
The University has directly applied $5,002,350 of its own funding to this project, this being the difference between the total project cost and the Government’s suspensory loan conversion2. The upgraded library is, in all key respects including IT, equal in quality to that of the University’s main Library, which is internationally recognised as a leading facility of its type.
Concluding commentsThe conclusion of the merger transition phase was also marked by Professor May stepping down as Dean.
Professor May who, as Foundation Dean, has led the college through an extremely busy period following the merger, remains as a professor within the college, but with more time to focus on her world-class research in the field of early childhood education.
She was succeeded as Dean in December 2011 by Professor Lisa Smith.
2 Additionally, the integration of the catalogue, access to online University library and online resources, and connection to the University’s high-speed optic fibre network were undertaken outside of the main project.

49
Financial Review 2011
The University Group, which includes the University of Otago, University of Otago Holdings Limited, the University of Otago Foundation Trust, and the Dunedin City Accommodation Trust, produced an operating surplus of $27.440 million for the year.
This surplus was $4.510 million (19.7%) better than the budget but $7.035 (20.4%) million less than the 2010 result.
The Group surplus represented a return of 4.6% on revenue of $592.394 million and 1.9% on net assets of $1.411 billion. These were comfortably above the Tertiary Education Commission’s minimum guidelines of 3% and 1.2% respectively.
The University’s operating surplus for the year was $26.019 million, a return of 4.5% on revenue and 2.2% on net assets. The surplus was $7.344 million above the budget of $18.675 million and $3.980 million greater than the $22.039 million surplus achieved in 2010. The five year moving average surplus, for the period 2007 to 2011, was $23.525 million, which was a 2.2% return on net assets and exceeded the University’s own financial performance target of 2.0%.
All four of the University’s teaching and research divisions produced favourable operating results for the year. This was a good outcome given a small reduction in student-related income. After a reaching a record level in 2010, enrolments in 2011 declined slightly to 19,344 EFTS. However, this was still the second-highest roll in the University’s history.
A number of factors combined to produce this enrolment result. These included measures taken internally – notably the introduction of general enrolment limitation, a tightening of academic progress policies, and a phasing out of some sub-degree programmes – to curb growth and advance the University strategically in terms of the calibre and nature of its student cohort. At same time a number of external factors – the most important of which were changes to Government student loans and allowances access, local school leaver cohorts, and the impact of the 22 February Canterbury earthquake on the Christchurch medical campus – added their influence to the mix.
The Trusts collectively produced an operating deficit of $160k for the year. This was $5.102 million worse than the budget and $12.213 million worse than last year. This severe downturn was largely caused by the poor performance of local and global equity markets which resulted in a fall in equity values during the year and reduced investment returns.
The University of Otago Holdings Limited group of companies produced a surplus of $1.115 million for the year, which was $2.003 million better than budget and an improvement on the deficit of $41k reported last year. The major contributors to this improved result were better than expected outcomes from Otago Innovation Limited and University of Otago Foundation Studies Limited.
Total cash flow for the Group was an outflow of $7.208 million, which was significantly better than the budgeted outflow of $36.353 million. The improvement was due to strong net cash inflows from operating activities and lower than expected outgoings for capital expenditure, largely due to timing of cash flows. These flows were influenced by the large number of projects in progress during the year. These included the new Foundation Studies teaching and student recreation building on University Plaza at the Forsyth Barr stadium site, which was largely completed in December, the conversion of the old Bowling Green Hotel into teaching and research space for Health Sciences, the renovation of the Student Union Building, which is due for completion in mid 2012, and the continuing development of the new student management and timetabling system.
The Group’s equity is now $1.411 billion, which is 89.3% of the total assets of $1.581 billion. This shows the current low level of debt and demonstrates that the Group is in a strong financial position.
ConclusionThe operating result for the year was higher than budget for the University and its subsidiaries but was affected by the poor result from the Trusts, due to the difficult year experienced in equity markets worldwide. Nevertheless, both the University and the Group exceeded the minimum financial performance guidelines provided by the Tertiary Education Commission and the University exceeded its own financial targets.
The Group’s operating cash flow for the year was strong, although total cash flow was negative for the year due to the high level of capital investment by the University. Despite this the University’s financial position at year end was solid with a satisfactory level of cash on hand and no debt.
The University’s demand for cash is expected to increase substantially over the coming years as approved projects from its eight year Priority Development Plan move from design to construction. In addition to this the construction programme will include a number of seismic strengthening projects for buildings that are assessed as earthquake-prone according to the Building Act 2004.
Essential to these developments will be the need to maintain a healthy operating surplus and strong operating cash flows. This will not be easy in the current environment of funding constraints caused by the difficult global financial situation.
John PatrickCHIEF OPERATING OFFICER

un
ive
rs
ity
of
ota
go
an
nu
al
re
po
rt
20
11
50
Statement of Responsibility
2011 Financial Statements 1. The Council and management of the University of Otago accept responsibility for the preparation of the annual financial
statements and the Statement of Service Performance and the judgements used in them;
2. The Council and management of the University of Otago accept responsibility for establishing and maintaining a system of
internal control designed to provide reasonable assurance as to the integrity and reliability of financial reporting; and
3. In the opinion of the Council and management of the University of Otago, the annual financial statements and the
Statement of Service Performance for the financial year ended 31 December 2011 fairly reflect the financial position and
operations of the University of Otago.
Chancellor
Vice-Chancellor
Chief operating officer
17April,2012
51
The Reporting Entity The University of Otago was founded in 1869 by an Ordinance of the Otago Provincial Council and is New Zealand’s oldest
University. In 1874 the University of Otago became an affiliated college of the University of New Zealand, which was established
by statute in 1870. However, in 1961 the University of New Zealand was disestablished and the University of Otago acquired its
present legal status and was granted the power to confer degrees by the University of Otago Amendment Act 1961.
The financial statements presented here are for the reporting entity University of Otago (Parent) and the Group consisting of
the Associate and Subsidiary companies, controlled Trusts and the Dunedin City Tertiary Accommodation Trust.
The Group Associate and Subsidiary companies are:
~ University of Otago Holdings Limited. Holding company. 100% owned by the University.
~ Otago Innovation Limited. Company to hold and develop the commercial interests of the University. 100% owned by
University of Otago Holdings Limited.
~ University of Otago Foundation Studies Limited. Operates the foundation year programme and an English language school.
100% owned by University of Otago Holdings Limited.
~ New Zealand Genomics Limited. 100% owned by University of Otago Holdings Limited. Was set up in collaboration with
the University of Auckland, Massey University and AgResearch with the objective of creating a national infrastructure for
making advanced genomics technologies accessible and affordable for New Zealand scientists, while also being accessible to
commercial organisations. 2010 was the first year of operation.
~ University Union Limited. Owner of the University Union building. 50% owned by University of Otago Holdings Limited.
~ New Zealand Centre for Reproductive Medicine Limited. No longer trading – business assets sold. 50% owned by University
of Otago Holdings Limited.
~ Unihealth Limited. Not trading. 50% owned by University of Otago Holdings Limited.
~ LCo New Zealand Limited. Owns and operates a software system for libraries serving four universities. 31% owned by
University of Otago Holdings Limited.
~ Unipol Recreation Limited. Provides gymnasium and recreational services to University of Otago and Otago Polytechnic
students and staff. 40% owned by University of Otago Holdings Limited.
~ BPAC NZ Limited. This company works with the Division of Health Sciences to provide best practice advocacy services to
primary, secondary and tertiary health providers in the area of medication prescribing. 20% owned by University of Otago
Holdings Limited.
~ Upstart Incubation Trustee Company Limited. 33% owned by University of Otago Holdings Limited. Non operational – has
no assets or liabilities.
~ Immune Solutions Limited. This company is working with the Department of Microbiology to develop oral vaccines for the
treatment of tuberculosis in animals, particularly possums. 100% owned by Otago Innovation Limited.
~ Photonic Innovations Limited. Developer of revolutionary laser technology. 50% owned by Otago Innovation Limited.
~ Menixis Limited. Developer of particle analysis technology. 26.7% owned by Otago Innovation Limited.
Not yet trading.
The controlled Trusts include the University of Otago Foundation Trust and the Hocken Collections established for the benefit
of the University of Otago. The University is the beneficiary of all the Trusts and appoints the Trustees.
The Dunedin City Tertiary Accommodation Trust owns and operates City College and is jointly controlled by the University of
Otago and the Otago Polytechnic.
The primary objective of the University and Group is to provide goods and services for the community for social benefit rather
than make a financial return. Accordingly, the University has designated itself and the Group as public benefit entities for the
purposes of New Zealand equivalents to the International Financial Reporting standards (NZ IFRS).
Statement of Accounting Policies for the year ended 31 December 2011
un
ive
rs
ity
of
ota
go
an
nu
al
re
po
rt
20
11
52
The financial statements of the University and Group are for the year ended 31 December 2011. The financial statements were
authorised for issue by Council on 17 April 2012.
The University is organised into divisions.
There are four teaching and research divisions: (Commerce, Health Sciences, Humanities, Sciences); and nine service divisions
(Information Technology Services, Property Services, Financial Services, Marketing and Communications, Academic, Student
Services, Human Resources, Research and Enterprise, and Accommodation Services).
BASIS OF PREPARATION OF THE FINANCIAL STATEMENTSThe accompanying financial statements are presented in accordance with Section 220 of the Education Act 1989, the Crown
Entities Act 2004 and New Zealand Generally Accepted Accounting Practice (NZ GAAP). They comply with NZ IAS 1 Sec 15
(1) (d) and other applicable Financial Reporting Standards, as appropriate for public benefit entities.
The accounting policies set out below have been applied consistently to all periods presented in these financial statements.
The accounting principles followed by the Group are those recognised as appropriate for the measurement and reporting
of financial performance and financial position on a historical cost basis, with the exception that certain property, plant and
equipment have been revalued.
The financial statements are presented in New Zealand dollars and all values are rounded to the nearest thousand dollars
($000). The functional currency of the University of Otago is New Zealand dollars.
The financial statements include:
~ Statement of Financial Performance
~ Statement of Comprehensive Income
~ Statement of Changes in Equity
~ Statement of Financial Position
~ Statement of Cash Flows and
~ Statement of Commitments and Contingencies.
The financial statements include the operations of the University of Otago, its subsidiary and associate companies and its
controlled Trusts. The subsidiary companies and Trusts have been included in the consolidated accounts by line aggregation
of assets, liabilities, revenues, expenses and cash flows. Associate companies and the Dunedin City Tertiary Accommodation
Trust have been consolidated on an equity accounting basis, which shows the share of the surpluses/deficits in the University’s
statement of financial performance and the share of post-acquisition increases/decreases in net assets in the University’s
Statement of Financial Position.
All significant inter-entity transactions have been eliminated on consolidation.
ACCOUNTING POLICIESThe following accounting policies, which materially affect the measurement of financial performance and financial position, have
been applied.
1. RevenuesGovernment Grants and Student Fees
Government grants and student fees are recognised as income on entitlement.
research Funds
Income received for research which will provide reciprocal benefits to the research funding provider is recognised in the
Statement of Financial Performance as “Externally Funded Research” income when research expenditure is incurred. Those
research funds which are not expended at year end are included in the Statement of Financial Position as “Funds Received in
Advance” to recognise the future obligations to complete the research. (Refer also to Note 11)
Income for research which provides no reciprocal benefits to the research funding provider is recognised in the Statement of
Financial Performance as “Externally Funded Research” income when received.

53
pledged Donations
Pledged donations are recognised in the Statement of Financial Performance as “Trust Donations” when the pledge agreement is
signed. When payments are made they are recorded against the asset. Pledged donations are recorded at their face value. (Refer
also Note 19)
other
Where physical assets are acquired for nil consideration the fair value of the asset received is recognised as revenue.
Dividends are recognised when the right to receive payment has been established.
Revenue from sale of goods and services are recognised on sale.
2. BudgetsThe budgets reported in these Financial Statements are those approved by University Council on 14 December 2010.
3. Foreign CurrenciesTransactions and balances in foreign currencies are converted at the New Zealand rate of exchange ruling at the date of the
transaction and balance date respectively. Foreign exchange gains and losses have been recognised in the Statement of Financial
Performance.
4. Trade and Other ReceivablesAccounts receivable are valued at estimated realisable value. Amounts not considered recoverable are written off in the period
in which they are identified.
5. Property, Plant and Equipment The University’s land and buildings are revalued when there has been a significant movement in the market value or depreciated
replacement cost. They were revalued on 31 December 2010 in accordance with NZ IAS 16 “Property, Plant and Equipment”
and the New Zealand Property Institute’s Valuation Standard 3, “Valuations for Financial Reporting”. The basis of valuation was as
follows:
~ Land was valued at market value
~ Specialised buildings and improvements were valued at depreciated replacement cost, and
~ Non-specialised buildings and improvements were valued at market value.
The valuation was completed by a registered valuer employed by the University and has been reviewed by an independent
registered valuer (Chapman Consultancy (2008) Limited) and confirmed as appropriate for financial reporting purposes. (Refer
also to Note 8)
No revaluation was deemed necessary in 2011 except for buildings damaged in the Christchurch earthquakes and associated
land. The buildings were impaired by the estimated cost of repair and the land by 50%. This impairment valuation was
completed by a registered valuer employed by the University and was reviewed by an independent registered valuer (Chapman
Consultancy (2008) Limited) and confirmed as appropriate for financial reporting purposes.
Costs incurred in researching and determining the feasibility of acquiring a fixed asset, prior to final approval to purchase, have
been recognised as an expense.
All Crown-owned land and buildings (if any) used by the University are included as part of the University’s assets. Although legal
title has not been transferred, the University has assumed all the normal risks and rewards of ownership.
Capital work in progress is valued at cost and is not depreciated.
Library books and periodicals, with the exception of rare books and special library collections, have been valued at cost less
accumulated depreciation. Library electronic resources in the form of annual subscriptions are written off at the time of purchase.
Rare books and special library collections were valued as at 31 December 1994 by expert University Library staff, based on
the net current value of items following the methodology employed by the Alexander Turnbull Library. Any additions to the
collection have been valued at cost. (Refer also to Note 16)

un
ive
rs
ity
of
ota
go
an
nu
al
re
po
rt
20
11
54
The Hocken Library Collections were revalued at 1 January 2006 by an independent registered valuer (Peter Webb Galleries).
The University elected to adopt optional exemption appendix D1 (c) of NZ IFRS 1 and has recognised the revalued amounts as
fair value, and used this as the deemed cost. Any additions since 1 January 2006 have been valued at cost. (Refer also to Note 17)
University artworks were valued at 1 January 2006 by an independent registered valuer (Peter Webb Galleries). The University
elected to adopt optional exemption appendix D1 (c) of NZ IFRS 1 and has recognised the valued amounts as fair value, and
used this as the deemed cost. Any additions since 1 January 2006 have been valued at cost.
Plant, motor vehicles, equipment and furniture are recorded at cost less accumulated depreciation and impairment losses. Asset
purchases of less than $2,000 are expensed at cost on acquisition, with the exception of furniture and computers which are
capitalised regardless of cost.
The useful life of each asset class and the depreciation rates used in the preparation of these statements are as follows:
AssetClass UsefulLife DepreciationRate
(Years)
Buildings and Components
Site improvements 50 to 100 1.0% to 2.0%
Structure including walls 40 to 250 0.4% to 2.5%
Roof 25 to 100 1.0% to 4.0%
Plumbing 40 to 60 1.7% to 2.5%
Lifts 40 to 50 2.0% to 2.5%
Heating and ventilation 30 to 60 1.7% to 3.3%
Fume cupboards 15 6.7%
Floor coverings and chattels 10 to 40 2.5% to 10.0%
Fit out 30 to 75 1.3% to 3.3%
Fire protection 50 to 60 1.7% to 2.0%
Electrical 40 to 50 2.0% to 2.5%
Data network 15 6.7%
Motor vehicles and trailers 3 to 10 10.0% to 33.3%
Furniture and fittings 5 to 10 10.0% to 20.0%
Plant and equipment 4 to 37 2.7% to 25.0%
Computers and photocopiers 4 to 10 10.0% to 25.0%
Library collections 3 to 10 10.0% to 33.3%
Depreciation of all assets, except for land, artworks, rare books and special library collections is provided for on a straight-line
basis at rates that will write off their cost, less any residual value, over their estimated useful lives. Land, artworks, rare books and
special library collections are not depreciated.
6. Intangible Assets Costs incurred in researching and determining the feasibility of acquiring computer software, prior to final approval to purchase,
have been recognised as an expense.
Acquired computer software is capitalised on the basis of the costs incurred to acquire and bring to use the specific software,
subsequent to final approval to purchase.
Costs that are directly associated with the internal development of software for use by the University of Otago are recognised
as an intangible asset.
Costs associated with maintaining computer software are recognised as an expense when incurred.

55
amortisation
The carrying value of an intangible asset with a finite life is amortised on a straight-line basis over its useful economic life.
Amortisation begins when the asset is available for use and ceases at the date that the asset is derecognised. The amortisation
charge for each period is recognised in the Statement of Financial Performance. (Refer also to Note 9)
The useful lives and associated amortisation rates of major classes of intangible assets have been estimated as follows:
Computer software 3 to 25 years 4% to 33.3%.
7. InventoryInventories have been valued at the lower of cost and net realisable value. Cost is determined on a first-in first-out basis, or by
the weighted average method. Obsolete inventories have been written off.
8. Goods and Services Tax (GST)The financial statements are prepared on a basis which excludes GST. Accounts receivable and accounts payable are GST
inclusive. GST owing to the Inland Revenue Department as at 31 December 2011 is included in accounts payable.
The net GST paid to, or received from, the IRD is classified as an operating cash flow in the statement of cash flows.
Commitments and contingencies are disclosed exclusive of GST.
9. Employee EntitlementsAnnual leave for academic and general staff has been accrued. In addition an accrual has been made for retirement gratuities and
sick leave for both academic and general staff and long service leave for general staff. Retirement gratuities; long service and sick
leave have been accrued on the following basis:
~ Long service leave which has vested to the employee (an entitlement has been established) has been measured at nominal value using remuneration rates current at reporting date. This is included as a Current Liability.
~ Retirement gratuities which have vested to the employee (an entitlement has been established) have been measured at nominal value using remuneration rates current at the time of entitlement. This is included as a Current Liability.
~ Retirement gratuities and long service leave which have not yet vested in the employee (no entitlement has been established) have been measured using the present value measurement basis which discounts expected future cash outflows. This is treated as a Non-Current Liability.
~ Sick leave has been measured using the present value measurement basis which discounts expected future cash outflows. This is treated as a Non-Current Liability.
~ Employee entitlements relating to the sale of intellectual property have been valued using the market value of the intellectual property at balance date as the basis for the entitlement.
10. Finance LeasesFinance leases, which effectively transfer to the University of Otago and Group companies all the risks and benefits incidental to
ownership of the leased item, are capitalised. The leased assets and corresponding lease liabilities are disclosed and the leased
assets are depreciated over the period that benefits are received from their use.
11. Operating LeasesAn operating lease is a lease that does not transfer substantially all the risk and rewards incidental to ownership of an asset.
Lease payments under an operating lease are recognised as an expense on a straight-line basis over the lease term.
12. Other Financial AssetsThe University classifies its Other Financial Assets into the following four categories: financial assets at fair value through the
Statement of Financial Performance; loans and receivables; held to maturity investments and available for sale assets. The
classification depends on the purpose for which the investments were acquired. Management determines the classification of its
investments at initial recognition and re-evaluates this designation at reporting date. Financial assets are initially measured at fair
value plus transition costs.

un
ive
rs
ity
of
ota
go
an
nu
al
re
po
rt
20
11
56
Financial assets at fair value through the Statement of Financial performance
A financial asset is classified in this category if acquired principally for the purpose of selling in the short term or if so designated
by management. These include investments in quoted shares. After initial recognition they are measured at fair values. Gains or
losses on measurement are recognised in the Statement of Financial Performance.
loans and receivables
These are non-derivative financial assets with fixed or determinable payments that are not quoted in an active market. These
include shareholders advances; loans and short term deposits. After initial recognition they are measured at amortised cost using
the effective interest method. Gains and losses where the asset is impaired or derecognised are recognised in the Statement of
Financial Performance.
Held to maturity investments
These are assets with fixed or determinable payments and fixed maturities that the University has the positive intention and
ability to hold to maturity. The University and Group have no investments in this category.
available for sale assets
These are those non-derivative financial assets that are designated as available for sale or are not classified as financial assets at
fair value through the Statement of Financial Performance, loans and receivables or held to maturity investments. The University
and Group have no assets in this category.
University investments in its subsidiaries are carried at cost. Investments in associate companies are valued at cost plus the share
of retained profits.
13. Accounting for Derivative Financial Instruments and Hedging ActivitiesThe University uses derivative financial instruments to hedge exposure to foreign exchange risks arising from operating activities.
The University does not hold or issue derivative financial instruments for trading purposes.
Derivatives are initially recognised at fair value on the date a derivative contract is entered into and subsequently remeasured at
fair value.
14. Statement of Cash FlowsCash and Cash Equivalents include cash in hand, deposits held at call with banks, other short-term highly liquid investments with
original maturities of three months or less, and bank overdrafts.
Operating Activities include cash received from all income sources and record the cash payments made for the supply of goods
and services.
Investing Activities are those activities relating to the acquisition and disposal of non-current assets.
Financing Activities comprise activities that change the debt structure of the University.
15. TaxationThe University, its subsidiaries and Trusts are exempt from the payment of income tax as they are treated by the Inland Revenue
Department as charitable organisations. Accordingly, no charge for income tax applies or has been provided for.

57
16. ACC Partnership ProgrammeThe University of Otago belongs to the ACC Partnership Programme whereby the University accepts the management and
financial responsibility of work related illnesses and accidents of employees. Under the ACC Partnership Programme, the
University is effectively providing accident insurance to employees and this is accounted for as an insurance contract. The value
of this liability represents the expected future payments in relation to accidents and illnesses occurring up to the Statement of
Financial Position date for which the University has responsibility under the terms of the Partnership Programme.
The liability for claims reported prior to balance date has been determined by assuming that the future experience for each
current claim is consistent with historical claim information since the commencement of the programme. The liability for
injuries or illnesses that have occurred up to balance date, but not yet reported or not fully reported, has been determined by
reference to historical information of the time it takes to report injury or illness.
The value of the liability is measured at the present value of the future payments for which the University has responsibility using
a risk free discount rate. The value of the liability includes a risk margin that represents the inherent uncertainty of the present
value of the expected future payments.
17. Superannuation SchemesDefined contribution schemes: Obligations for contributions to defined contribution superannuation schemes are recognised as
an expense in the statement of financial performance.
Defined benefit schemes: The University belongs to the Government Superannuation Fund and the NPFDB scheme which are
Defined Benefit Plan Contribution Schemes. The University has no underwriting responsibilities as any shortfall is met by the
Government. As such, the schemes are accounted for as defined contribution plans.
Further information on this scheme is disclosed in Note 12.
18. Critical Accounting Estimates and Assumptions:In preparing these financial statements the University has made estimates and assumptions concerning the future. These
estimates and assumptions may differ from the subsequent actual results. Estimates and judgements are continually evaluated
and are based on historical experience and other factors, including expectations or future events that are believed to be
reasonable under the circumstances.
CHANGES IN ACCOUNTING POLICIESAll accounting policies have been applied on a basis consistent with the previous year.

un
ive
rs
ity
of
ota
go
an
nu
al
re
po
rt
20
11
58
Consolidated University
This Year Budget Last Year This Year Budget Last Year Note $000 $000 $000 $000 $000 $000
INCOME
Government Grants 1 211,061 210,913 207,847 210,542 210,394 206,881
Domestic Tuition Fees 91,035 95,563 90,360 90,717 95,234 89,927
International Tuition Fees 46,000 45,699 42,169 40,670 40,920 37,342
Investment Income 2 8,256 16,258 15,487 5,266 3,671 4,919
Externally Funded Research 91,783 99,831 92,145 91,535 88,590 91,991
Performance Based Research Funding 54,188 52,401 51,611 54,188 52,401 51,611
Distributions from Trust Funds - - - 3,526 6,251 127
Consulting and Commercial Income 68,387 65,077 66,695 68,534 66,235 67,173
Sale of Intellectual Property 2,298 197 109 1,312 67 34
Trust Donations 2,450 200 3,019 - - -
Other Income 16,936 12,946 16,941 16,328 12,627 16,401
Total Income 592,394 599,085 586,383 582,618 576,390 566,406
EXPENDITURE
Salaries - Academic 191,242 191,291 185,242 188,605 188,677 182,123
Salaries - General 138,339 136,681 132,372 135,696 134,373 130,070
Staff Related Costs 15,111 19,712 23,996 14,935 19,507 23,880
Consumables and General 98,008 113,887 98,976 95,230 100,716 97,103
Depreciation & Amortisation 3 53,792 52,721 49,440 53,674 52,580 49,320
Occupancy Costs 41,339 34,838 37,354 41,336 34,837 37,343
Scholarships 27,123 27,025 24,528 27,123 27,025 24,528
Total Expenditure 3 564,954 576,155 551,908 556,599 557,715 544,367
Net Surplus for the Year 27,440 22,930 34,475 26,019 18,675 22,039
THE STATEMENT OF ACCOUNTING POLICIES AND THE NOTES TO THE FINANCIAL STATEMENTS FORM PART OF, AND ARE TO BE READ IN CONJUNCTION WITH, THIS STATEMENT.
Statement of Financial Performance for the year ended 31 December 2011

59
Consolidated University
This Year Budget Last Year This Year Budget Last Year Note $000 $000 $000 $000 $000 $000
Net Surplus for the Year 27,440 22,930 34,475 26,019 18,675 22,039
Other Comprehensive Income Revaluation/(impairment) of 8 (7,845) 61,331 41,420 (7,845) 61,331 41,420 Fixed Assets
Total Other Comprehensive Income (7,845) 61,331 41,420 (7,845) 61,331 41,420
Total Comprehensive Income 19,595 84,261 75,895 18,174 80,006 63,459
Statement of Changes in Equity for the year ended 31 December 2011
Consolidated University
This Year Budget Last Year This Year Budget Last Year Note $000 $000 $000 $000 $000 $000
Opening Equity Balance 1,391,781 1,337,672 1,310,885 1,156,487 1,081,297 1,088,028
Total Comprehensive Income for the Year 19,595 84,261 75,895 18,174 80,006 63,459
Crown and Other Equity Injection - 6,200 5,000 - 31,200 5,000
Adjustments - - 1 - - -
Closing Equity Balance 1,411,376 1,428,133 1,391,781 1,174,661 1,192,503 1,156,487
THE STATEMENT OF ACCOUNTING POLICIES AND THE NOTES TO THE FINANCIAL STATEMENTS FORM PART OF, AND ARE TO BE READ IN CONJUNCTION WITH, THIS STATEMENT.
Statement of Comprehensive Income for the year ended 31 December 2011
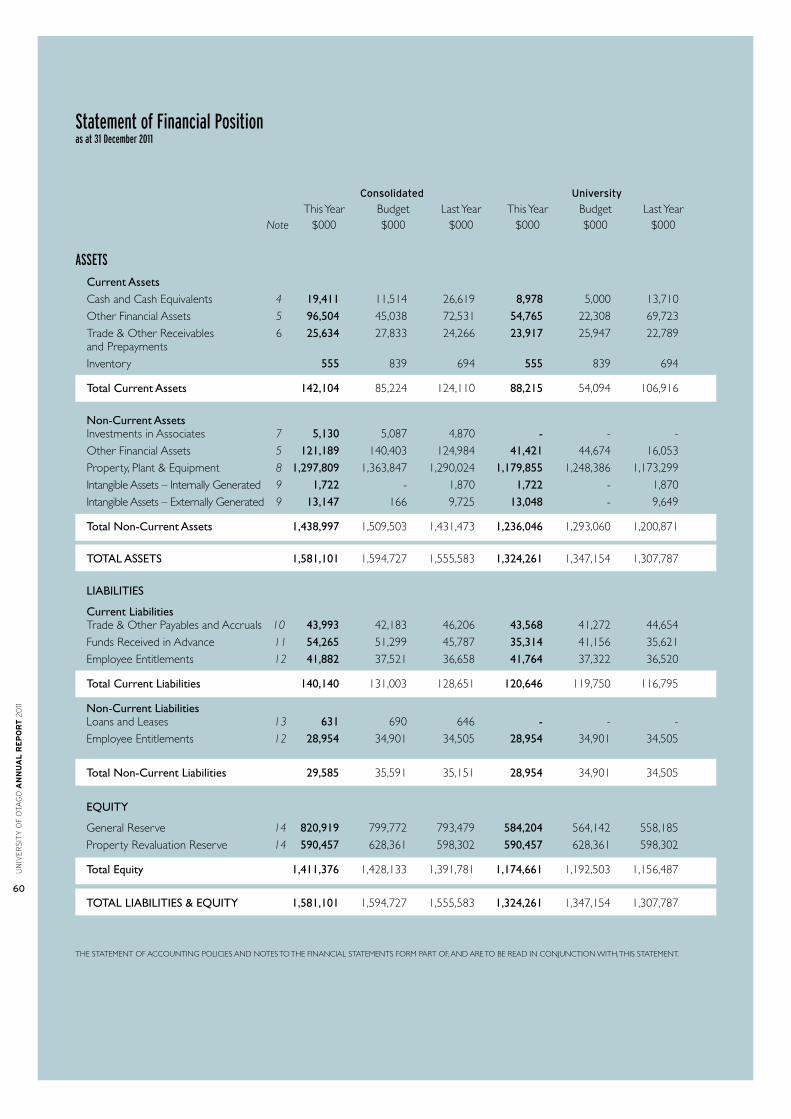
un
ive
rs
ity
of
ota
go
an
nu
al
re
po
rt
20
11
60
Statement of Financial Position as at 31 December 2011
Consolidated University
This Year Budget Last Year This Year Budget Last Year Note $000 $000 $000 $000 $000 $000
ASSETS Current Assets Cash and Cash Equivalents 4 19,411 11,514 26,619 8,978 5,000 13,710 Other Financial Assets 5 96,504 45,038 72,531 54,765 22,308 69,723 Trade & Other Receivables 6 25,634 27,833 24,266 23,917 25,947 22,789 and Prepayments Inventory 555 839 694 555 839 694
Total Current Assets 142,104 85,224 124,110 88,215 54,094 106,916
Non-Current Assets Investments in Associates 7 5,130 5,087 4,870 - - - Other Financial Assets 5 121,189 140,403 124,984 41,421 44,674 16,053 Property, Plant & Equipment 8 1,297,809 1,363,847 1,290,024 1,179,855 1,248,386 1,173,299 Intangible Assets – Internally Generated 9 1,722 - 1,870 1,722 - 1,870 Intangible Assets – Externally Generated 9 13,147 166 9,725 13,048 - 9,649
Total Non-Current Assets 1,438,997 1,509,503 1,431,473 1,236,046 1,293,060 1,200,871
TOTAL ASSETS 1,581,101 1,594,727 1,555,583 1,324,261 1,347,154 1,307,787
LIABILITIES
Current Liabilities Trade & Other Payables and Accruals 10 43,993 42,183 46,206 43,568 41,272 44,654 Funds Received in Advance 11 54,265 51,299 45,787 35,314 41,156 35,621 Employee Entitlements 12 41,882 37,521 36,658 41,764 37,322 36,520
Total Current Liabilities 140,140 131,003 128,651 120,646 119,750 116,795
Non-Current Liabilities Loans and Leases 13 631 690 646 - - - Employee Entitlements 12 28,954 34,901 34,505 28,954 34,901 34,505 Total Non-Current Liabilities 29,585 35,591 35,151 28,954 34,901 34,505 EQUITY
General Reserve 14 820,919 799,772 793,479 584,204 564,142 558,185 Property Revaluation Reserve 14 590,457 628,361 598,302 590,457 628,361 598,302
Total Equity 1,411,376 1,428,133 1,391,781 1,174,661 1,192,503 1,156,487
TOTAL LIABILITIES & EQUITY 1,581,101 1,594,727 1,555,583 1,324,261 1,347,154 1,307,787
THE STATEMENT OF ACCOUNTING POLICIES AND NOTES TO THE FINANCIAL STATEMENTS FORM PART OF, AND ARE TO BE READ IN CONJUNCTION WITH, THIS STATEMENT.

61
Consolidated University
This Year Budget Last Year This Year Budget Last Year Note $000 $000 $000 $000 $000 $000
OPERATING ACTIVITIESCash was provided from: Government Grant 265,108 262,795 258,753 264,630 262,795 257,780 Revenue from Fees 136,531 141,731 132,856 130,852 136,323 127,299 Revenue from Services 191,062 180,346 187,594 181,324 175,324 177,275Investment Income 13,278 10,504 13,128 4,538 3,663 4,411 605,979 595,376 592,331 581,344 578,105 566,765 Cash was applied to: Employees and Suppliers 514,121 520,000 489,374 504,958 502,173 482,406 514,121 520,000 489,374 504,958 502,173 482,406 Net Cash Flows from Operating Activities 91,858 75,376 102,957 76,386 75,932 84,359
INVESTING ACTIVITIES Cash was provided from: Investments 15,366 380 8,269 - - - Investments – Subsidiaries & Associates 404 333 63 404 333 225 Sale of Property, Plant & Equipment 613 - - 613 - - 16,383 713 8,332 1,017 333 225 Cash was applied to: Investments 42,463 21,524 44,621 10,000 21,524 17,000 Investments – Subsidiaries & Associates 1,760 1,136 - 1,820 2,606 900 Property, Plant & Equipment Acquired 70,511 89,782 71,312 70,331 89,551 71,222 114,734 112,442 115,933 82,151 113,681 89,122 Net Cash Flows from Investing Activities (98,351) (111,729) (107,601) (81,134) (113,348) (88,897)
FINANCING ACTIVITIES Cash was provided from: Loans raised 22 - 353 733 - 353 Equity Injection - - 5,000 - - 5,000 22 - 5,353 733 - 5,353 Cash was applied to: Reduce liabilities 737 - 30 717 - - 737 - 30 717 - - Net Cash Flows from Financing Activities (715) - 5,323 16 - 5,353 Total Cash Flows (7,208) (36,353) 679 (4,732) (37,416) 815 Opening Balance 26,619 47,867 25,940 13,710 42,416 12,895 Closing Balance 19,411 11,514 26,619 8,978 5,000 13,710 Represented by: Cash and Cash Equivalents 4 19,411 11,514 26,619 8,978 5,000 13,710 Total 19,411 11,514 26,619 8,978 5,000 13,710
The GST (net) component of operating activities reflects the net GST paid and received with the Inland Revenue Department.
THE STATEMENT OF ACCOUNTING POLICIES AND THE NOTES TO THE FINANCIAL STATEMENTS FORM PART OF, AND ARE TO BE READ IN CONJUNCTION WITH, THIS STATEMENT.
Statement of Cash Flows for the year ended 31 December 2011

un
ive
rs
ity
of
ota
go
an
nu
al
re
po
rt
20
11
62
Consolidated University
This Year Budget Last Year This Year Budget Last Year $000 $000 $000 $000 $000 $000
Net Surplus 27,440 22,930 34,475 26,019 18,675 22,039
Plus (Less) Non Cash Items Adjustment to Staff Entitlements (5,551) 1,115 5,447 (5,551) 1,115 5,447 Adjustment to Investments 6,124 (5,209) (2,128) - - (463)
Dunedin City Tertiary Accommodation Trust (466) (408) (424) - - -
Increase (Decrease) in Loans from 5 53 43 - - - External Trust Funds
Non Cash Donations 447 1,050 (614) - - -
Share of Associates Surpluses (260) (324) (422) - - -
Depreciation and Property, Plant & 53,792 52,721 49,440 53,674 52,580 49,320 Equipment Written Off
Gain/(Loss) on Disposal of Property, (161) (1) 259 (161) (1) 259 Plant & Equipment
Other Non-Cash Items (10) - - - - -
Total Non-Cash Items 53,920 48,997 51,601 47,962 53,694 54,563
Plus (less) movements in other working capital items: Decrease (Increase) in Trade & (779) (588) 3,388 (714) (588) 3,801 Other Receivables
Decrease (Increase) in Prepayments (499) (95) 485 (499) (95) 485
Decrease (Increase) in Inventory 138 (19) 99 138 (19) 99
Increase (Decrease) in Trade & Other Payables (2,064) 534 6,403 (1,457) 648 4,995
Increase (Decrease) in Employee Entitlements 5,224 1,314 1,560 5,244 1,314 1,604
Increase (Decrease) in Funds Received 8,478 2,303 4,946 (307) 2,303 (3,227) in Advance
Total Movements in Other Working 10,498 3,449 16,881 2,405 3,563 7,757 Capital Items
Net Cash Flows from Operating Activities 91,858 75,376 102,957 76,386 75,932 84,359
THE STATEMENT OF ACCOUNTING POLICIES AND THE NOTES TO THE FINANCIAL STATEMENTS FORM PART OF, AND ARE TO BE READ IN CONJUNCTION WITH, THIS STATEMENT.
Reconciliation of the Net Surplus with the Net Cash Flows from Operating Activities

63
UniversityandConsolidated This Year Last Year $000 $000
COMMITMENTS Capital works and equipmentCapital Works 15,370 26,227
Equipment and Other 1,286 1,238
16,656 27,465 Non cancellable property operating leases The University and Group leases property in the normal course of it’s business. The future aggregate minimum lease payments payable under non cancellable operating leases are as follows:
Not later than one year 2752 3,111
Later than one year and not later than two years 2,058 2,503
Later than two years and not later than five years 2,798 3,338
Later than five years 4,132 3,408 Total Commitment 11,740 12,360
Total Commitments 28,396 39,825
UniversityandConsolidated
This Year Last Year $000 $000
CONTINGENT LIABILITIES The University provided a guarantee to the Bank of New Zealand for a bond given by the bank to the Dunedin City Council, over the siting of some temporary buildings. 50 50
There were several personal grievance claims by employees against 14 14 the University.
CONTINGENT ASSETS Insurance Proceeds:
The University has two key insurance policies relevant to the Christchurch earthquakes as follows:
Material Damage – This is a full replacement policy.
Business Interruption – Lost revenues and additional costs are claimable if they arise as a consequence of damage to the Group’s insured assets.
The University is virtually certain to receive insurance proceeds on both policies, but the quantum of the likely proceeds cannot be reliably measured, because of the wide range of possible outcomes that will be negotiated with the University’s insurers following completion of detailed engineering and financial assessments. To date, $697k of insurance proceeds have been recognised as income in the financial statements.
It will be several months before the University will be in a position to put forward definite claims to the underwriters. There are currently no disputes with the University’s underwriters or their assessors.
There were no other Contingent Assets.
Statement of Commitments and Contingencies as at 31 December 2011

un
ive
rs
ity
of
ota
go
an
nu
al
re
po
rt
20
11
64
Consolidated University
This Year Budget Last Year This Year Budget Last Year
$000 $000 $000 $000 $000 $000 GOVERNMENT GRANTS
Vote Education 208,891 208,475 205,616 208,372 207,956 204,650 Vote Health 2,170 2,438 2,231 2,170 2,438 2,231
Total Government Grants 211,061 210,913 207,847 210,542 210,394 206,881
Vote Education includes funding received from Government by way of the tertiary education student achievement component (the latter is based on forecast equivalent full-time student (EFTS) numbers and the funding category values of these EFTS). Vote Health is EFTS funding for health education that is clinically based and is funded by the Ministry of Health, through the Clinical Training Agency.
Consolidated University
This Year Budget Last Year This Year Budget Last Year
$000 $000 $000 $000 $000 $000
INVESTMENT INCOME
Interest from Bank Term Deposits 6,493 4,430 5,115 5,266 3,531 4,456
Loans and Receivables Interest from Government and Public Stock 882 1,036 1,106 - - -
Interest from Corporate Bonds and Notes 3,600 3,534 3,483 - - -
Income from Associate Companies 307 333 452 - - -
Dividends from New Zealand Company Equities 2,356 2,205 1,872 - 140 -
Dividends from Australian & Global Company Equities 1,304 978 1,034 - - -
Realised Gains/(Losses) on Sale of Equities (603) - 239 - - 63
Realised Foreign Exchange Gains 27 - 240 - - -
Unrealised Gains/(Losses) on Revaluations of Investments (6,357) 3,768 1,829 - - 400
Unrealised Foreign Exchange Gains 247 (26) 117 - - -
Total Investment Income 8,256 16,258 15,487 5,266 3,671 4,919
Note1
Note2
Notes to and Forming Part of the Financial Statements for the year ended 31 December 2011
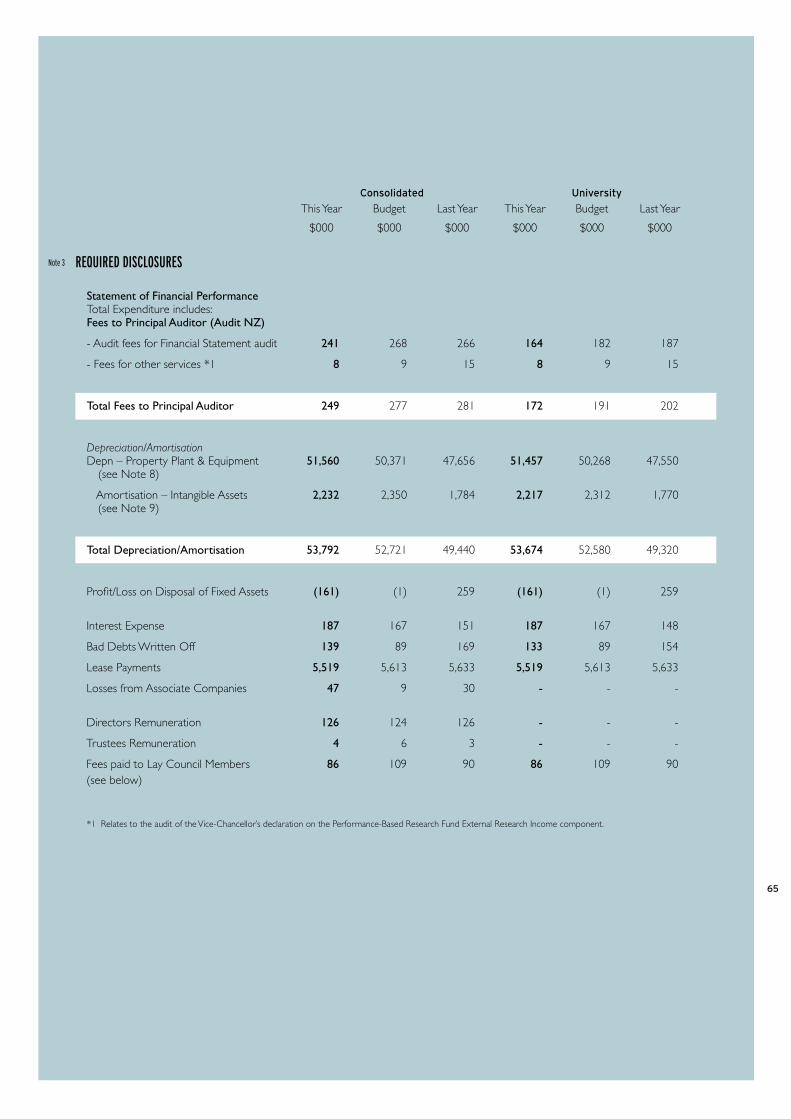
65
Note3
Consolidated University
This Year Budget Last Year This Year Budget Last Year
$000 $000 $000 $000 $000 $000
REQUIRED DISCLOSURES
Statement of Financial Performance Total Expenditure includes: Fees to Principal Auditor (Audit NZ)
- Audit fees for Financial Statement audit 241 268 266 164 182 187
- Fees for other services *1 8 9 15 8 9 15
Total Fees to Principal Auditor 249 277 281 172 191 202
Depreciation/Amortisation Depn – Property Plant & Equipment 51,560 50,371 47,656 51,457 50,268 47,550 (see Note 8)
Amortisation – Intangible Assets 2,232 2,350 1,784 2,217 2,312 1,770 (see Note 9)
Total Depreciation/Amortisation 53,792 52,721 49,440 53,674 52,580 49,320
Profit/Loss on Disposal of Fixed Assets (161) (1) 259 (161) (1) 259
Interest Expense 187 167 151 187 167 148
Bad Debts Written Off 139 89 169 133 89 154
Lease Payments 5,519 5,613 5,633 5,519 5,613 5,633
Losses from Associate Companies 47 9 30 - - -
Directors Remuneration 126 124 126 - - -
Trustees Remuneration 4 6 3 - - -
Fees paid to Lay Council Members 86 109 90 86 109 90 (see below)
*1 Relates to the audit of the Vice-Chancellor’s declaration on the Performance-Based Research Fund External Research Income component.

un
ive
rs
ity
of
ota
go
an
nu
al
re
po
rt
20
11
66
The following fees were earned by members of the Council during the year :
CouncilMember ThisYear LastYear $ $
E O K Blaikie 4,160 3,520
P W H Chin - 3,520
D C Cull 2,880 640
J D Every-Palmer 1,920 1,600
H R Geoghegan 1,920 6,080
K E Grant - 9,920
L P Isaacs 15,360 10,880
S J McLauchlan 8,400 7,600
D C Matahaere-Atariki 1,920 2,880
V A Nicholson - 3,520
K J Reid 3,520 -
J K Rowe 4,480 -
M J M Sidey 3,520 4,480
K M Smith - 3,520
R J Somerville 8,320 1,600
R H Tobin 4,800 4,800
J F Ward 25,350 25,350
Total Earned 86,550 89,910
Note: Council members who are also employees do not receive attendance fees.
The following Director and Trustee remuneration was earned by members of the Council who are directors/trustees of group organisations:
CouncilMember ThisYear LastYear $ $
S J McLauchlan 6,000 6,000
J F Ward 15,000 15,000
L P Isaacs 1,600 1,600
R J Somerville 960 -
Total Earned 23,560 22,600
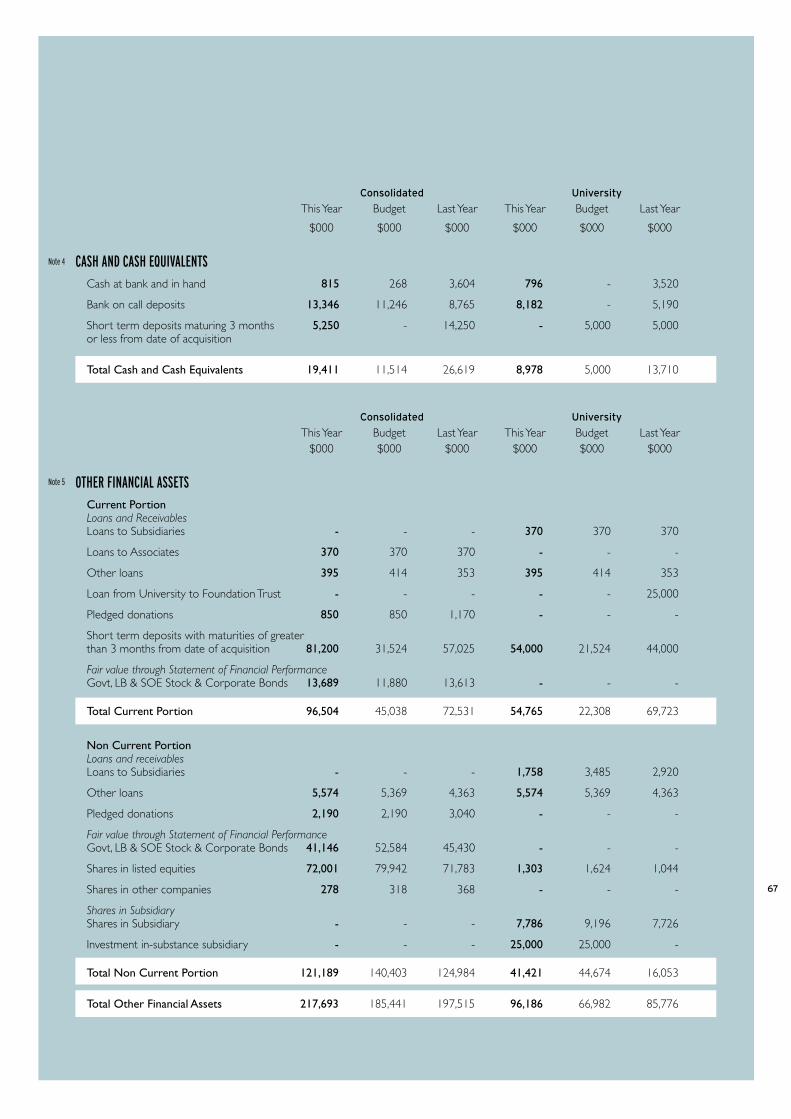
67
Consolidated University
This Year Budget Last Year This Year Budget Last Year
$000 $000 $000 $000 $000 $000
CASH AND CASH EQUIVALENTS Cash at bank and in hand 815 268 3,604 796 - 3,520
Bank on call deposits 13,346 11,246 8,765 8,182 - 5,190
Short term deposits maturing 3 months 5,250 - 14,250 - 5,000 5,000 or less from date of acquisition
Total Cash and Cash Equivalents 19,411 11,514 26,619 8,978 5,000 13,710
Consolidated University
This Year Budget Last Year This Year Budget Last Year $000 $000 $000 $000 $000 $000
OTHER FINANCIAL ASSETS Current Portion Loans and Receivables Loans to Subsidiaries - - - 370 370 370
Loans to Associates 370 370 370 - - -
Other loans 395 414 353 395 414 353
Loan from University to Foundation Trust - - - - - 25,000
Pledged donations 850 850 1,170 - - -
Short term deposits with maturities of greater than 3 months from date of acquisition 81,200 31,524 57,025 54,000 21,524 44,000
Fair value through Statement of Financial Performance Govt, LB & SOE Stock & Corporate Bonds 13,689 11,880 13,613 - - -
Total Current Portion 96,504 45,038 72,531 54,765 22,308 69,723
Non Current Portion Loans and receivables Loans to Subsidiaries - - - 1,758 3,485 2,920
Other loans 5,574 5,369 4,363 5,574 5,369 4,363
Pledged donations 2,190 2,190 3,040 - - -
Fair value through Statement of Financial Performance Govt, LB & SOE Stock & Corporate Bonds 41,146 52,584 45,430 - - -
Shares in listed equities 72,001 79,942 71,783 1,303 1,624 1,044
Shares in other companies 278 318 368 - - -
Shares in Subsidiary Shares in Subsidiary - - - 7,786 9,196 7,726
Investment in-substance subsidiary - - - 25,000 25,000 -
Total Non Current Portion 121,189 140,403 124,984 41,421 44,674 16,053
Total Other Financial Assets 217,693 185,441 197,515 96,186 66,982 85,776
Note4
Note5

un
ive
rs
ity
of
ota
go
an
nu
al
re
po
rt
20
11
68
The maturity profile for other investments is as follows:
Consolidated University Weighted avg Weighted avg effective effective interest rate interest rate This Year Last Year This Year Last Year $000 $000 $000 $000
Less than 1 Year Loans and Receivables Loans to Subsidiaries - - - 370 0.00% 370
Loans to Associates 370 0.00% 370 - - -
Other loans 395 0.00% 353 395 0.00% 353
Loan from University to Foundation Trust - - - - - 25,000
Pledged Donations 850 0.00% 1,170 - - -
Short term deposits with maturities of greater 81,200 4.44% 57,025 54,000 4.52% 44,000 than 3 months from date of acquisition
Fair value through Statement of Financial Performance Govt, LB & SOE Stock & Corporate Bonds 13,689 7.96% 13,613 - - -
Total Current Portion 96,504 - 72,531 54,765 - 69,723
1 to 5 years Loans and Receivables Other loans 1,754 0.00% 1,415 1,754 0.00% 1,415
Pledged Donations 1,890 0.00% 2,460 - - -
Fair value through Statement of Financial Performance Govt, LB & SOE Stock & Corporate Bonds 23,253 7.41% 29,417 - - -
More than 5 years Loans and Receivables
Loans to Subsidiaries - - - 1,758 0.00% 2,920
Other loans 3,820 0.00% 2,948 3,820 0.00% 2,948
Pledged Donations 300 0.00% 580 - - -
Fair value through Statement of Financial Performance Govt, LB & SOE Stock & Corporate Bonds 17,893 7.54% 16,013 - - -
Shares in Listed Companies 72,001 0.00% 71,783 1,303 0.00% 1,044
Shares in Other Companies 278 0.00% 368 - - -
Other Shares in Subsidiary - - - 7,786 0.00% 7,726
Investment in in-substance subsidiary - - - 25,000 0.00% -
Total Term Portion 121,189 - 124,984 41,421 - 16,053 Total Loans and Receivables 217,693 - 197,515 96,186 - 85,776

69
Investments Investments held by the Group include State Owned Enterprises (SOE) stock, local authority (LB) stock, bank bonds, commercial bonds and listed equities. The fair values of these investments are based on quoted market prices at balance date.
Consolidated University
This Year Budget Last Year This Year Budget Last Year $000 $000 $000 $000 $000 $000
TRADE AND OTHER RECEIVABLES AND PREPAyMENTSTrade Receivables 12,458 14,839 12,904 12,011 14,473 12,285
Other Receivables 8,882 8,246 7,572 7,623 6,730 6,720
Prepayments 4,294 4,748 3,790 4,283 4,744 3,784
Total Trade & Other Receivables 25,634 27,833 24,266 23,917 25,947 22,789 and Prepayments
Consolidated University
This Year Last Year This Year Last Year $000 $000 $000 $000
TRADE RECEIVABLES Current 9,758 8,895 9,441 8,604
2 to 3 months 1,105 1,183 994 1,056
> 3 months 1,595 2,826 1,576 2,625
Carrying Amount 12,458 12,904 12,011 12,285
Any impairment or write-off of trade receivables is based on an analysis of past collection history, and a review of specific debtors balances greater than 3 months.
Note6
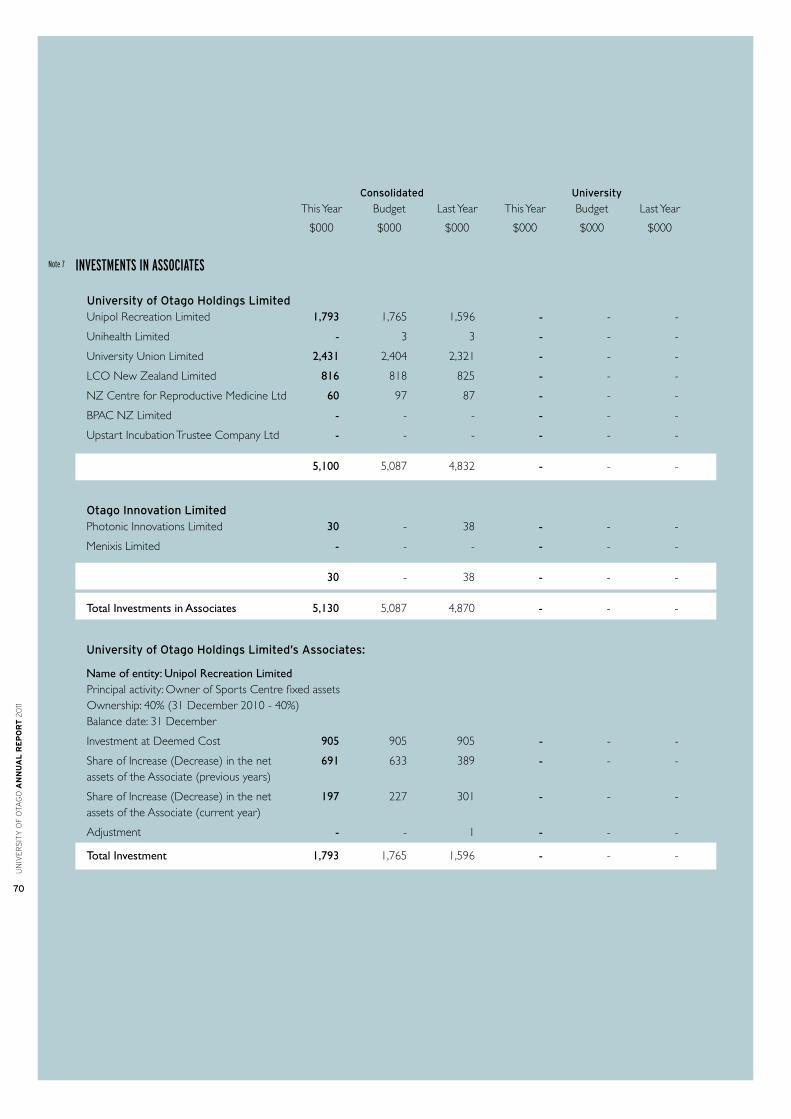
un
ive
rs
ity
of
ota
go
an
nu
al
re
po
rt
20
11
70
Consolidated University
This Year Budget Last Year This Year Budget Last Year
$000 $000 $000 $000 $000 $000
INVESTMENTS IN ASSOCIATES
UniversityofOtagoHoldingsLimited Unipol Recreation Limited 1,793 1,765 1,596 - - -
Unihealth Limited - 3 3 - - -
University Union Limited 2,431 2,404 2,321 - - -
LCO New Zealand Limited 816 818 825 - - -
NZ Centre for Reproductive Medicine Ltd 60 97 87 - - -
BPAC NZ Limited - - - - - -
Upstart Incubation Trustee Company Ltd - - - - - -
5,100 5,087 4,832 - - -
OtagoInnovationLimited Photonic Innovations Limited 30 - 38 - - -
Menixis Limited - - - - - -
30 - 38 - - -
Total Investments in Associates 5,130 5,087 4,870 - - -
UniversityofOtagoHoldingsLimited’sAssociates:
Name of entity: Unipol Recreation Limited Principal activity: Owner of Sports Centre fixed assets Ownership: 40% (31 December 2010 - 40%) Balance date: 31 December
Investment at Deemed Cost 905 905 905 - - -
Share of Increase (Decrease) in the net 691 633 389 - - - assets of the Associate (previous years)
Share of Increase (Decrease) in the net 197 227 301 - - - assets of the Associate (current year)
Adjustment - - 1 - - -
Total Investment 1,793 1,765 1,596 - - -
Note7

71
Consolidated University
This Year Budget Last Year This Year Budget Last Year
$000 $000 $000 $000 $000 $000
Name of entity: Unihealth Limited Principal activity: Not operating Ownership: 50% (31 December 2010 - 50%) Balance date: 31 December
Investment at Deemed Cost 3 3 3 - - -
Share of Increase (Decrease) in the net - - - - - - assets of the Associate (previous years)
Share of Increase (Decrease) in the net (3) - - - - - assets of the Associate (current year)
Total Investment - 3 3 - - -
Name of entity: University Union Limited Principal activity: Owner of University Union Building, University of Otago Ownership: 50% (31 December 2010 - 50%) Balance date: 31 December
Investment at Deemed Cost 1,992 1,992 1,992 - - -
Share of Increase (Decrease) in the net 329 322 220 - - - assets of the Associate (previous years)
Share of Increase (Decrease) in the net 110 90 108 - - - assets of the Associate (current year)
Adjustment - - 1 - - -
Total Investment 2,431 2,404 2,321 - - -
Name of entity: LCO New Zealand Limited Principal activity: Owner and operator of library system Ownership: 31% (31 December 2010 - 31%) Balance date: 31 December
Investment at Deemed Cost 792 792 792 - - -
Share of Increase (Decrease) in the net 33 10 (10) - - - assets of the Associate (previous years)
Share of Increase (Decrease) in the net (9) 16 43 - - - assets of the Associate (current year)
Total Investment 816 818 825 - - -
Name of entity: New Zealand Centre for Reproductive Medicine Limited Principal activity: Not operating, formerly involved in the Provision of Human Fertility Services Ownership: 50% (31 December 2010 - 50%) Balance date: 30 June
Investment at Deemed Cost 310 310 310 - - -
Share of Increase (Decrease) in the net (223) (213) (213) - - - assets of the Associate (previous years)
Share of Increase (Decrease) in the net (27) - (10) - - - assets of the Associate (current year) - - - - - -
Total Investment 60 97 87 - - -

un
ive
rs
ity
of
ota
go
an
nu
al
re
po
rt
20
11
72
Consolidated University
This Year Budget Last Year This Year Budget Last Year $000 $000 $000 $000 $000 $000
Name of entity: BPAC NZ Limited Principal activity: Provision of best practice advocacy to primary, secondary and tertiary health providers in the field of medication prescribing Ownership: 20% (31 December 2010 - 20%) Balance date: 30 June
Value: UOHL doesn’t account for a share of BPAC’s income or net assets, as it has been established there is no prospect of distribution to shareholders.
Name of entity: Upstart Incubation Trustee Company Limited Principal activity: This company is not operational, and has no assets or liabilities Ownership: 33.33% (31 December 2010 - 33.33%)
OtagoInnovationLimited’sAssociates:
Name of entity: Photonic Innovations Limited Principal activity: Development of infra-red laser technology Ownership: 50% (31 December 2010 – 50%) Balance date: 31 December
Unlisted ordinary shares 59 9 59 - - -
Share of Increase (Decrease) in the net (21) - - - - - assets of the Associate (previous years)
Share of Increase (Decrease) in the net (8) (9) (20) - - - assets of the Associate (current year)
Adjustment - - (1) - - -
Total Investment 30 - 38 - - -
Name of entity: Menixis Limited Principal activity: Developing particle analysis technology Ownership: 26.7% (31 December 2010 - 0%) Balance date: 31 December
Unlisted ordinary shares - - - - - -
Share of Increase (Decrease) in the net - - - - - - assets of the Associate (previous years)
Share of Increase (Decrease) in the net - - - - - - assets of the Associate (current year)
Total Investment - - - - - -
Total Investments in Associates 5,130 5,087 4,870 - - -

73
PROP
ERTy
, PLA
NT AN
D EQ
UIPM
ENT
PARE
NT
Lan
d
Bu
ildin
gs
Co
mp
ute
rs
Furn
itu
re
Art
wo
rks
Lib
rary
H
ock
en
R
are
E
qu
ipm
en
tTo
tal
Bo
oks
C
olle
ctio
ns
Bo
oks
$000
$0
00
$000
$0
00
$000
$0
00
$000
$0
00
$000
$0
00
Cos
t
Bala
nce
at 1
Janu
ary
2010
Item
s at
cos
t
39,
050
1
81,7
47
67,
040
1
9,99
2
9,7
96
94,
741
2
,697
9
,363
1
74,5
69
598
,995
Item
s at
val
uatio
n
147,
753
6
84,8
67
-
-
-
-
-
-
-
8
32,6
20
18
6,80
3
866
,614
6
7,04
0
19,
992
9
,796
9
4,74
1
2,6
97
9,3
63
174
,569
1
,431
,615
Reva
luat
ions
/(im
pairm
ent)
1
5,84
9
(60
,540
) -
-
-
-
-
-
-
(44
,691
)
Add
ition
s
2,0
89
40,
260
9
,214
1
,595
7
0
4,5
80
200
5
1
13,
094
7
1,15
3
Disp
osal
s
(22
0)
(95
4)
(1,
477)
-
-
-
-
-
(59
6)
(3,
247)
Tran
sfer
s be
twee
n ca
tego
ries
-
(4,
437)
1
01
1,0
95
47
-
-
-
3,1
94
-
Tran
sfer
s in
tang
ible
ass
ets
-
(50
7)
-
-
-
-
-
-
-
(
507)
Oth
er a
djus
tmen
ts
-
(
390)
(
2)
-
-
-
-
-
(
11)
(40
3)
Ba
lanc
e at
31
Dec
embe
r 20
10
204
,521
8
40,0
46
74,
876
2
2,68
2
9,9
13
99,
321
2
,897
9
,414
1
90,2
50
1,4
53,9
20
Bala
nce
at 1
Janu
ary
2011
Item
s at
cos
t
5,6
02
11,
758
7
4,87
6
22,
682
9
,913
9
9,32
1
2,8
97
9,4
14
190
,250
4
26,7
13
Item
s at
val
uatio
n
198
,919
8
28,2
88
-
-
-
-
-
-
-
1
,027
,207
2
04,5
21
840
,046
7
4,87
6
22,
682
9
,913
9
9,32
1
2,8
97
9,4
14
190
,250
1
,453
,920
Reva
luat
ions
/(im
pairm
ent)
(
1,07
7)
(6,
768)
-
-
-
-
-
-
-
(7,
845)
Add
ition
s
-
4
2,57
5
3,6
94
1,2
28
162
4
,064
1
92
72
1
4,33
6
66,
323
Disp
osal
s
(33
) (
115)
(
7,66
5)
(29
1)
-
-
-
-
(10
,591
) (
18,6
95)
Tran
sfer
s be
twee
n ca
tego
ries
-
-
2
0
-
-
-
-
-
(
20)
-
Tran
sfer
s in
tang
ible
ass
ets
-
-
-
-
-
-
-
-
-
-
Oth
er a
djus
tmen
ts
-
(
6)
(3)
-
(1)
1
-
-
(
4)
(13
)
Bala
nce
at 3
1 D
ecem
ber
2011
2
03,4
11
875
,732
7
0,92
2
23,
619
1
0,07
4
103
,386
3
,089
9
,486
1
93,9
71
1,4
93,6
90
Note
8

un
ive
rs
ity
of
ota
go
an
nu
al
re
po
rt
20
11
74
PROP
ERTy
, PLA
NT AN
D EQ
UIPM
ENT
PARE
NT (c
ontin
ued)
L
and
B
uild
ing
sC
om
pu
ters
Fu
rnit
ure
A
rtw
ork
sL
ibra
ry
Ho
cke
n
Rar
e
Eq
uip
me
nt
Tota
l
Bo
oks
C
olle
ctio
ns
Bo
oks
$000
$0
00
$000
$0
00
$000
$0
00
$000
$0
00
$000
$0
00
Acc
umul
ated
Dep
reci
atio
n an
d
Impa
irm
ent
Loss
es
Bala
nce
at 1
Janu
ary
2010
-
63,
921
5
5,10
5
11,
458
-
75,
135
-
-
1
16,0
87
321
,706
Reva
luat
ions
/(im
pairm
ent)
-
(86
,111
) -
-
-
-
-
-
-
(86
,111
)
Dep
reci
atio
n
-
2
2,88
1
6,0
80
1,6
23
-
4
,502
-
-
1
2,46
4
47,
550
Disp
osal
s
-
(
692)
(
1,42
6)
-
-
-
-
-
(
407)
(
2,52
5)
Tran
sfer
s be
twee
n ca
tego
ries
-
-
-
-
-
-
-
-
-
-
Oth
er a
djus
tmen
ts
-
1
1
1
-
-
-
-
(
2)
1
Bala
nce
at 3
1 D
ecem
ber
2010
-
-
5
9,76
0
13,
082
-
79,
637
-
-
1
28,1
42
280
,621
Bala
nce
at 1
Janu
ary
2011
-
-
5
9,76
0
13,
082
-
79,
637
-
-
1
28,1
42
280
,621
Reva
luat
ions
/(im
pairm
ent)
-
-
-
-
-
-
-
-
-
-
Dep
reci
atio
n
-
2
5,91
5
6,1
39
1,6
58
-
4
,882
-
-
1
2,86
3
51,
457
Disp
osal
s
-
(
5)
(7,
626)
(
283)
-
-
-
-
(
10,3
29)
(18
,243
)
Tran
sfer
s be
twee
n ca
tego
ries
-
-
(
286)
-
-
-
-
-
286
-
Oth
er a
djus
tmen
ts
-
-
(1)
-
-
-
-
-
1
-
Bala
nce
at 3
1 D
ecem
ber
2011
-
25,
910
5
7,98
6
14,
457
-
84,
519
-
-
1
30,9
63
313
,835
Car
ryin
g A
mou
nts
At
1 Ja
nuar
y 20
10
186,
803
8
02,6
93
11,
935
8
,534
9
,796
1
9,60
6
2,6
97
9,3
63
58,
482
1
,109
,909
At
31 D
ecem
ber
2010
& 1
Janu
ary
2011
20
4,52
1
840
,046
1
5,11
6
9,6
00
9,9
13
19,
684
2
,897
9
,414
6
2,10
8
1,1
73,2
99
At
31 D
ecem
ber
2011
2
03,4
11
849
,822
1
2,93
6
9,1
62
10,
074
1
8,86
7
3,0
89
9,4
86
63,
008
1
,179
,855

75
PROP
ERTy
, PLA
NT AN
D EQ
UIPM
ENT
CONS
OLID
ATED
L
and
B
uild
ing
sC
om
pu
ters
Fu
rnit
ure
A
rtw
ork
sL
ibra
ry
Ho
cke
n
Rar
e
Eq
uip
me
nt
Tota
l
Bo
oks
C
olle
ctio
ns
Bo
oks
$000
$0
00
$000
$0
00
$000
$0
00
$000
$0
00
$000
$0
00
Cos
t
Bala
nce
at 1
Janu
ary
2010
Item
s at
cos
t
41,
221
186,
500
67,9
03
20
,419
9,79
6
94
,924
110,
497
9
,363
1
75,1
85
715
,808
Item
s at
val
uatio
n
147,
753
684,
867
-
-
-
-
-
-
-
8
32,6
20
18
8,97
4
87
1,36
7
67
,903
20,4
19
9,
796
94,9
24
11
0,49
7
9,3
63
175
,185
1
,548
,428
Reva
luat
ions
/(im
pairm
ent)
15
,849
(60,
540)
-
-
-
-
-
-
-
(44
,691
)
Add
ition
s
2,21
9
40
,541
9,25
7
1,
597
70
4,
580
1,41
4
51
1
3,10
6
72,
835
Disp
osal
s
(220
)
(954
)
(1,4
83)
(4
)
-
-
-
-
(
596)
(
3,25
7)
Tran
sfer
s be
twee
n ca
tego
ries
-
(4,4
37)
10
1
1,
095
47
-
-
-
3
,194
-
Tran
sfer
s in
tang
ible
ass
ets
-
(
507)
-
-
-
-
-
-
-
(
507)
Oth
er a
djus
tmen
ts
-
(390
)
(2)
-
-
-
-
-
(
11)
(40
3)
Ba
lanc
e at
31
Dec
embe
r 20
10
206,
822
845,
080
75,7
76
23
,107
9,91
3
99
,504
111,
911
9
,414
1
90,8
78
1,5
72,4
05
Bala
nce
at 1
Janu
ary
2011
Item
s at
cos
t
7,9
03
16
,792
75,7
76
23
,107
9,91
3
99
,504
111,
911
9
,414
1
90,8
78
545
,198
Item
s at
val
uatio
n
198,
919
828,
288
-
-
-
-
-
-
-
1,0
27,2
07
20
6,82
2
84
5,08
0
75
,776
23,1
07
9,
913
99,5
04
1
11,9
11
9,4
14
190
,878
1
,572
,405
Reva
luat
ions
/(im
pairm
ent)
(1
,077
)
(6,7
68)
-
-
-
-
-
-
-
(7,
845)
Add
ition
s
143
42,8
84
3,
717
1,25
2
16
2
4,
064
915
7
2
14,
446
6
7,65
5
Disp
osal
s
(33
)
(115
)
(8,2
96)
(5
58)
-
(1
83)
-
-
(10
,764
) (
19,9
49)
Tra
nsfe
rs b
etw
een
cate
gorie
s
-
-
20
-
-
-
-
-
(20
) -
Tra
nsfe
rs in
tang
ible
ass
ets
-
-
-
-
-
-
-
-
-
-
Oth
er a
djus
tmen
ts
-
(6)
(
3)
-
(1)
1
-
-
(
4)
(13
)
Bala
nce
at 3
1 D
ecem
ber
2011
20
5,85
5
88
1,07
5
71
,214
23,8
01
10
,074
103,
386
112,
826
9
,486
1
94,5
36
1,6
12,2
53

un
ive
rs
ity
of
ota
go
an
nu
al
re
po
rt
20
11
76
PROP
ERTy
, PLA
NT AN
D EQ
UIPM
ENT
CONS
OLID
ATED
(con
tinue
d)
Lan
d
Bu
ildin
gs
Co
mp
ute
rs
Furn
itu
re
Art
wo
rks
Lib
rary
H
ock
en
R
are
E
qu
ipm
en
tTo
tal
Bo
oks
C
olle
ctio
ns
Bo
oks
$000
$0
00
$000
$0
00
$000
$0
00
$000
$0
00
$000
$0
00
Acc
umul
ated
Dep
reci
atio
n &
Im
pair
men
t Lo
sses
Bala
nce
at 1
Janu
ary
2010
-
63,
986
5
5,84
1
11,
773
-
75,
318
-
-
1
16,4
52
323
,370
Reva
luat
ions
/(im
pairm
ent)
-
(86
,111
) -
-
-
-
-
-
-
(86
,111
)
Dep
reci
atio
n
-
2
2,88
3
6,1
56
1,6
36
-
4
,502
-
-
1
2,47
9
47,
656
Disp
osal
s
-
(
692)
(
1,43
2)
(4)
-
-
-
-
(
407)
(
2,53
5)
Tran
sfer
s be
twee
n ca
tego
ries
-
-
-
-
-
-
-
-
-
-
Oth
er a
djus
tmen
ts
-
1
1
1
-
-
-
-
(
2)
1
Bala
nce
at 3
1 D
ecem
ber
2010
-
67
6
0,56
6
13,
406
-
79,
820
-
-
1
28,5
22
282
,381
Bala
nce
at 1
Janu
ary
2011
-
67
6
0,56
6
13,
406
-
79,
820
-
-
1
28,5
22
282
,381
Reva
luat
ions
/(im
pairm
ent)
-
-
-
-
-
-
-
-
-
-
Dep
reci
atio
n
-
2
5,91
7
6,1
97
1,6
69
-
4
,882
-
-
1
2,89
5
51,
560
Disp
osal
s
-
(
5)
(8,
257)
(
550)
-
(18
3)
-
-
(10
,502
) (
19,4
97)
Tran
sfer
s be
twee
n ca
tego
ries
-
-
(
294)
-
-
-
-
-
294
-
Oth
er a
djus
tmen
ts
-
-
(1)
-
-
-
-
-
1
-
Bala
nce
at 3
1 D
ecem
ber
2011
-
25,
979
5
8,21
1
14,
525
-
84,
519
-
-
1
31,2
10
314
,444
Car
ryin
g A
mou
nts
At
1 Ja
nuar
y 20
10
188
,974
8
07,3
81
12,
062
8
,646
9
,796
1
9,60
6
110
,497
9
,363
5
8,73
3
1,2
25,0
58
At
31 D
ecem
ber
2010
& 1
Janu
ary
2011
206
,822
8
45,0
13
15,
210
9
,701
9
,913
1
9,68
4
111
,911
9
,414
6
2,35
6
1,2
90,0
24
At
31 D
ecem
ber
2011
2
05,8
55
855
,096
1
3,00
3
9,2
76
10,
074
1
8,86
7
112
,826
9
,486
6
3,32
6
1,2
97,8
09
Build
ings
at
Cos
t in
clud
es W
ork
in P
rogr
ess
$46.
729
milli
on (
2010
: $34
.122
milli
on).

77
INTANGIBLE ASSETS – PARENT Externally Internally Total
Generated Generated
$000 $000 $000
COSTBalance at 1 January 2010 17,589 3,515 21,104
Additions 1,623 - 1,623
Disposals (26) - (26)
Transfers Property Plant & Equipment 507 - 507
Other adjustments (229) - (229)
Balance at 31 December 2010 19,464 3,515 22,979
Balance at 1 January 2011 19,464 3,515 22,979
Additions 5,278 190 5,468
Disposals (65) - (65)
Transfers Property Plant & Equipment - - -
Other adjustments - - -
Balance at 31 December 2011 24,677 3,705 28,382
Accumulated Amortisation & Impairment Losses
Balance at 1 January 2010 8,410 1,307 9,717
Amortisation 1,432 338 1,770
Disposals (26) - (26)
Other adjustments (1) - (1)
Balance at 31 December 2010 9,815 1,645 11,460
Balance at 1 January 2011 9,815 1,645 11,460
Amortisation 1,879 338 2,217
Disposals (65) - (65)
Other adjustments - - -
Balance at 31 December 2011 11,629 1,983 13,612
Carrying Amounts
At 1 January 2010 9,179 2,208 11,387
At 31 December 2010 & 1 January 2011 9,649 1,870 11,519
At 31 December 2011 13,048 1,722 14,770
Note9

un
ive
rs
ity
of
ota
go
an
nu
al
re
po
rt
20
11
78
INTANGIBLE ASSETS – CONSOLIDATED Externally Internally Total
Generated Generated
$000 $000 $000 COSTBalance at 1 January 2010 17,771 3,515 21,286
Additions 1,669 - 1,669
Disposals (52) - (52)
Transfers Property Plant & Equipment 507 - 507
Other adjustments (229) - (229)
Balance at 31 December 2010 19,666 3,515 23,181
Balance at 1 January 2011 19,666 3,515 23,181
Additions 5,316 190 5,506
Disposals (159) - (159)
Transfers Property Plant & Equipment - - -
Other adjustments - - -
Balance at 31 December 2011 24,823 3,705 28,528
Accumulated Amortisation & Impairment Losses
Balance at 1 January 2010 8,548 1,307 9,855
Amortisation 1,446 338 1,784
Disposals (52) - (52)
Other adjustments (1) - (1)
Balance at 31 December 2010 9,941 1,645 11,586
Balance at 1 January 2011 9,941 1,645 11,586
Amortisation 1,894 338 2,232
Disposals (159) - (159)
Other adjustments - - -
Balance at 31 December 2011 11,676 1,983 13,659
Carrying Amounts
At 1 January 2010 9,223 2,208 11,431
At 31 December 2010 & 1 January 2011 9,725 1,870 11,595
At 31 December 2011 13,147 1,722 14,869

79
Consolidated University
This Year Budget Last Year This Year Budget Last Year $000 $000 $000 $000 $000 $000
TRADE & OTHER PAyABLES AND ACCRUALSTrade Payables 8,743 13,998 16,820 8,602 13,658 16,657
Other Payables 21,110 18,006 17,163 21,601 17,708 16,615
Accruals 14,140 10,179 12,223 13,365 9,906 11,382
Total Trade & Other Payables 43,993 42,183 46,206 43,568 41,272 44,654 and Accruals
Consolidated University
This Year Last Year This Year Last Year $000 $000 $000 $000
TRADE PAyABLES Current 5,434 11,872 5,293 11,709
2 to 3 months 2,942 4,515 2,942 4,515
> 3 months 367 433 367 433
Carrying Amount 8,743 16,820 8,602 16,657
Consolidated University
This Year Budget Last Year This Year Budget Last Year $000 $000 $000 $000 $000 $000
FUNDS RECEIVED IN ADVANCEResearch Funding 26,442 31,664 27,491 26,442 31,664 27,491
Student Fees 7,853 7,892 7,968 5,821 5,779 5,929
Other 19,970 11,743 10,328 3,051 3,713 2,201
Total Funds Received in Advance 54,265 51,299 45,787 35,314 41,156 35,621
Note10
Note11
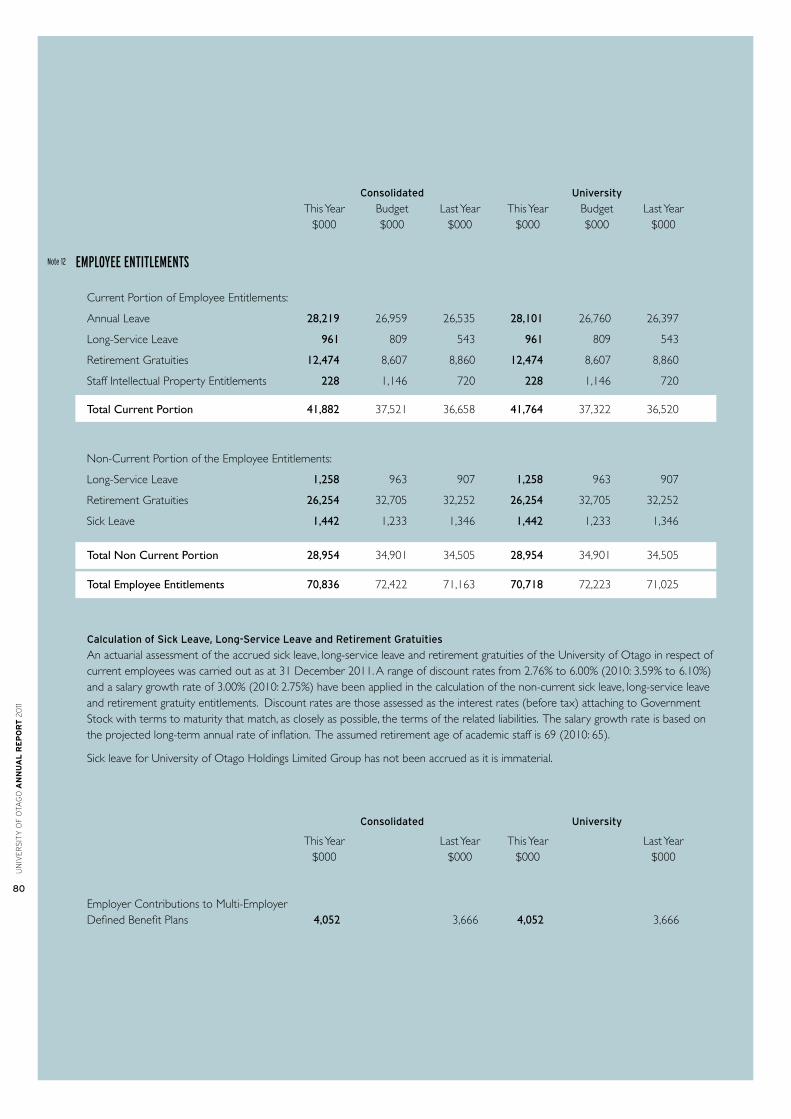
un
ive
rs
ity
of
ota
go
an
nu
al
re
po
rt
20
11
80
Consolidated University
This Year Budget Last Year This Year Budget Last Year $000 $000 $000 $000 $000 $000
EMPLOyEE ENTITLEMENTS
Current Portion of Employee Entitlements:
Annual Leave 28,219 26,959 26,535 28,101 26,760 26,397
Long-Service Leave 961 809 543 961 809 543
Retirement Gratuities 12,474 8,607 8,860 12,474 8,607 8,860
Staff Intellectual Property Entitlements 228 1,146 720 228 1,146 720
Total Current Portion 41,882 37,521 36,658 41,764 37,322 36,520
Non-Current Portion of the Employee Entitlements:
Long-Service Leave 1,258 963 907 1,258 963 907
Retirement Gratuities 26,254 32,705 32,252 26,254 32,705 32,252
Sick Leave 1,442 1,233 1,346 1,442 1,233 1,346
Total Non Current Portion 28,954 34,901 34,505 28,954 34,901 34,505 Total Employee Entitlements 70,836 72,422 71,163 70,718 72,223 71,025
CalculationofSickLeave,Long-ServiceLeaveandRetirementGratuities An actuarial assessment of the accrued sick leave, long-service leave and retirement gratuities of the University of Otago in respect of current employees was carried out as at 31 December 2011. A range of discount rates from 2.76% to 6.00% (2010: 3.59% to 6.10%) and a salary growth rate of 3.00% (2010: 2.75%) have been applied in the calculation of the non-current sick leave, long-service leave and retirement gratuity entitlements. Discount rates are those assessed as the interest rates (before tax) attaching to Government Stock with terms to maturity that match, as closely as possible, the terms of the related liabilities. The salary growth rate is based on the projected long-term annual rate of inflation. The assumed retirement age of academic staff is 69 (2010: 65).
Sick leave for University of Otago Holdings Limited Group has not been accrued as it is immaterial.
Consolidated University
This Year Last Year This Year Last Year $000 $000 $000 $000
Employer Contributions to Multi-Employer Defined Benefit Plans 4,052 3,666 4,052 3,666
Note12

81
Consolidated University
This Year Budget Last Year This Year Budget Last Year $000 $000 $000 $000 $000 $000
LOANS AND LEASES Non-Current Loans & Leases 631 690 646 - - -
Total Loans and Leases 631 690 646 - - -
Non-Current Loans represent funds held on behalf of two external trusts where the University of Otago is not the sole beneficiary. The funds from these trusts have been invested in the University of Otago Foundation Trust and investment income is allocated to these funds monthly. The carrying amount (fair value) of the above loans has been estimated to be the face value of the loans.
Consolidated University
This Year Weighted avg Last Year This Year Weighted avg Last Year $000 effective $000 $000 effective $000 interest rate interest rate
Non-Current
Maturity Analysis 1 to 5 Years - - - - - -
>5 Years 631 0.00% 646 - 0.00% -
Total Loans 646 - 646 - - -
Consolidated University
This Year Last Year This Year Last Year $000 $000 $000 $000
EQUITyGeneral Reserve As at 1 January 793,479 753,293 558,185 530,436
Surplus for year 27,440 34,475 26,019 22,039
Crown Equity Injection - 5,000 - 5,000
Revaluation/(impairment) Movement - 710 - 710in Asset Disposal
Adjustment - 1 - -
As at 31 December 820,919 793,479 584,204 558,185
Property Revaluation Reserve
As at 1 January 598,302 557,592 598,302 557,592
Revaluation/ (impairment) Fixed Assets (7,845) 41,420 (7,845) 41,420
Revaluation/ (impairment) Movement - (710) - (710)in Asset Disposal
As at 31 December 590,457 598,302 590,457 598,302
Total Equity 1,411,376 1,391,781 1,174,661 1,156,487
Note13
Note14

un
ive
rs
ity
of
ota
go
an
nu
al
re
po
rt
20
11
82
FINANCIAL INSTRUMENTS
The Group is party to financial instrument arrangements as part of its everyday operations. The main risks arising from the University and Group’s financial instruments are foreign exchange risk, credit risk, interest rate risk, price risk and liquidity risk.
To manage and limit the effects of those risks, the University Council has approved policy guidelines and authorised the use of various financial instruments. Compliance is monitored monthly and deviations from the target are reported to the Finance and Budget Committee, the Investment Committee or the Foreign Exchange Risk Management Committee. The financial instruments being utilised at balance date are outlined below.
The principal or contract amounts of derivative financial instruments outstanding at balance date are as follows:
Consolidated University This Year Last Year This Year Last Year $000 $000 $000 $000 Fair Value Fair Value Fair Value Fair Value
Forward foreign exchange contracts 9,400 9,499 9,400 9,499
ForeignExchangeRisk The Group has transactional currency exposures arising from sales and purchases in currencies other than NZ dollars. The University regularly monitors its exposure to overseas currency fluctuations. Wherever possible the University transacts in NZ dollars including the setting of fees for international students. The University purchases library items and scientific equipment from overseas, giving rise to and exposure to currency fluctuations, but in the case of ordering major items of equipment (over $50,000) policy requires the University to hedge the purchase when the committed payment date is known. Hedge accounting is not applied. The Group has a Foreign Exchange Risk Management Committee which oversees this risk by applying the foreign exchange policy which is approved by Council.
At 31 December 2011, the University held the following amounts of foreign currency within its current and call deposit accounts:
Consolidated University This Year Last Year This Year Last Year $000 $000 $000 $000
CurrencyExpressed in original currency value
US Dollars 105 1,939 105 1,849
Australian Dollars 139 614 15 38
Euro 235 395 235 395
Great Britain Pounds 90 236 90 236
Swiss Franc 12 3 12 3 In January, the majority of the above funds were used to pay overseas creditors.
SensitivityAnalysis
At 31 December 2011, if the NZD had weakened / strengthened by 5% against the US dollar, Australian dollar, Euro, GB pound or Swiss franc, with all other variables held constant, the surplus / deficit for the year would have been $67,573 / $79,696 (2010: $301,223 / $349,501) higher / lower. This movement is attributable to the foreign exchange gains on translation of foreign denominated bank accounts held in the group.
At 31 December 2011, if the NZD had weakened / strengthened by 5% against the Australian dollar, or US dollar with all other variables held constant, the surplus / deficit for the year would have been $2,253,303 / $1,976,379 (2010: $2,128,695 / $2,427,909)
higher / lower. This movement is attributable to the foreign exchange gains on translation of foreign equities held in the Group.
Note15

83
CreditRisk
Credit risk is the risk that a third party will default on its obligation to the Group, causing the Group to incur a loss.
In the normal course of business, credit risk arises from debtors, deposits with banks and derivative financial instruments assets.
Trade receivables constitute a minimal concentration of credit risk due to the large number of customers included in the Group’s customer base.
The Group consults with professional investment advisors and has an investment policy which is regularly reviewed. The Group places its investments with institutions that have a high credit rating. It also reduces its exposure to risk by limiting the amount that can be invested in any one institution. The Group believes that this policy reduces the risk of any loss which could arise from its investment activities.
Short term deposits are only placed with the major New Zealand trading banks approved under the investment policy. Not more than one third of all cash deposits can be held with any one approved bank.
InterestRateRisk
The Group has minimal exposure to interest rate risk from loans.
Sensitivity analysis
At 31 December 2011, if interest rates on investments had strengthened / weakened by plus or minus 0.5%, the surplus for the year would have been $564,100 (2010: $507,800) higher / lower. This movement is attributable to interest earning deposits held.
PriceRisk
Price risk is the risk that the value of a financial instrument will fluctuate as a result of changes in market prices. The University and Group are exposed to equity security prices on its equity investments. These prices move in line with market movements in listed securities. The University and Group holds listed equity instruments which are publicly traded on the NZX and ASX exchanges
Sensitivity analysis
If the NZX50 and the ASX100 index and the global index at 31 December 2011 had fluctuated by plus or minus 5% and equity instruments moved proportionately, the effect would have been to increase/decrease the fair value by $3,748,603 / $3,355,931 (2010: $3,651,591 / $3,532,626).
LiquidityRisk
Liquidity risk is the risk that the Group will encounter difficulty raising liquid funds to meet commitments as they fall due.
Management of liquidity risk
Prudent liquidity risk management implies maintaining sufficient cash, the availability of funding through an adequate amount of committed credit facilities, and the ability to close out market positions. Flexibility in funding is maintained by keeping committed credit lines available. The University and the Group have a maximum amount that can be drawn down against its overdraft facility of $30 million (2010: $30 million). There are no restrictions on the use of this facility.
The University and the Group manages liquidity risk by continuously monitoring forecast and actual cash flow requirements and matching the maturity profiles of financial assets and liabilities.
RARE BOOKS AND SPECIAL LIBRARy COLLECTIONS
The University holds a number of gifted collections of books, manuscripts, and artworks within the Central, Medical and Dental Libraries. The collections were valued at 31 December 1994, based on net current value, by expert University staff following the generally accepted methodology employed by the Alexander Turnbull Library. The total valuation of the Rare Books and Special Collections is $9.486 million (2010: $9.414 million). Additions at cost in 2011 were $72k (2010: $51k) (see Note 8).
Note16

un
ive
rs
ity
of
ota
go
an
nu
al
re
po
rt
20
11
84
Consolidated University This Year Last Year This Year Last Year $000 $000 $000 $000
HOCKEN COLLECTIONS Opening Balance 111,911 110,497 2,897 2,697
Donated Hocken Additions 915 1,414 192 200
Total 112,826 111,911 3,089 2,897
being: Assets held in Trust 109,737 109,014 - -
Assets owned by the University 3,089 2,897 3,089 2,897
Total 112,826 111,911 3,089 2,897
The University holds in Trust a national archival collection of books and artworks known as the Hocken Collections. Items included in the collections are acquired by gift, bequest and purchase. Items are also accepted on deposit where ownership is retained by the depositor.
The University has included the valuation of the owned and deposited items in the total above as it believes that the Hocken Library is in-substance the owner of all items in the collection. The total collections include deposited items valued at $24.612 million (2010: $24.266 million).
RELATED PARTy INFORMATION
Crown/Government The Government influences the role of the University and Group as well as being a major source of revenue. While the University and Group enter into numerous transactions with Government departments and other Crown agencies, they are on an arm’s length basis and, where those parties are acting in the course of their normal dealings, are not considered to be related party transactions.
Inter-GroupUniversityofOtagoHoldingsLimited(UOHL) a. During the year term loans to UOHL from the University of Otago decreased by $1.162 million (2010: decrease of $0.719
million). The loan movement related to OIL’s shareholdings in BLIS Technologies Limited and Pacific Edge Limited being transferred back to the University, the consideration being the non cash debt remission of the associated loan. The purpose of the term loans is to fund UOHL’s ownership of various investments. Term loan balances at year end for UOHL were $1.758 million (2010: $2.920 million).
b. During the year the current loan to UOHL from the University of Otago did not change. This loan has been used to fund a shareholder advance to Unipol Recreation Limited. This loan balance at year end was $370k (2010: $370k).
c. During the year, the University of Otago provided additional equity funding for UOHL of $60k (2010: $900k).
d. UOHL paid the University of Otago $26k for accounting and secreterial services (2010: $26k).
e. UOHL has a current account with the University of Otago. Since 1 January 2008 this account has been interest-bearing, with interest charged to the University at the average rate achieved by the University on its bank call and term deposits. Interest received on this current account amounted to $10k (2010: $3k). The balance at year end was $723k (2010: $28k).
UniversityofOtagoFoundationStudiesLimited(FSL) a. FSL enters into transactions with the University of Otago, which are made on normal commercial terms and conditions. During the year FSL purchased goods and services from the University to the value of $1.007 million (2010: $1.055 million), including building rentals. At year end the amount owing to the University was $191k (2010: $389k).
b. FSL provided goods and services to the University of Otago to the value of $761k (2010: $1.201 million). This included payments of Vote Education funding of $519k (2010: $966k) and commissions associated with student recruitment of $201k (2010: $216k). At year end the amount owing by the University was $Nil (2010: $4k).
Note17
Note18
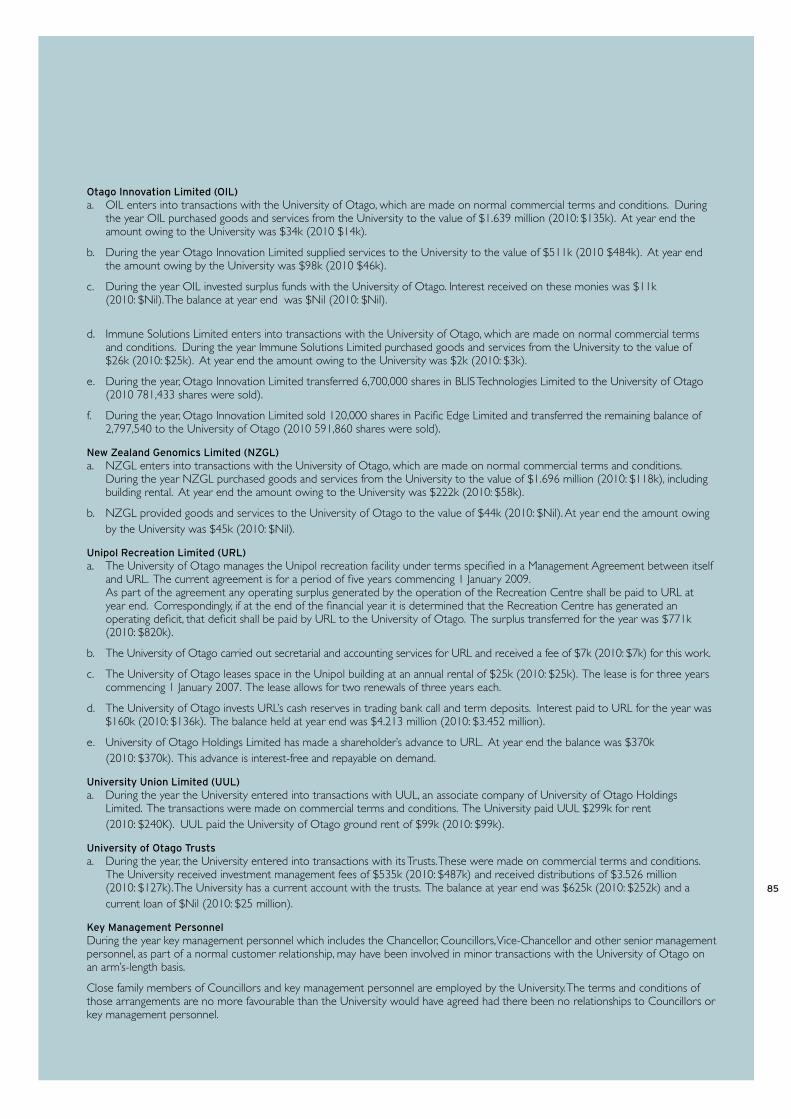
85
OtagoInnovationLimited(OIL) a. OIL enters into transactions with the University of Otago, which are made on normal commercial terms and conditions. During the year OIL purchased goods and services from the University to the value of $1.639 million (2010: $135k). At year end the amount owing to the University was $34k (2010 $14k).
b. During the year Otago Innovation Limited supplied services to the University to the value of $511k (2010 $484k). At year end the amount owing by the University was $98k (2010 $46k).
c. During the year OIL invested surplus funds with the University of Otago. Interest received on these monies was $11k (2010: $Nil). The balance at year end was $Nil (2010: $Nil).
d. Immune Solutions Limited enters into transactions with the University of Otago, which are made on normal commercial terms and conditions. During the year Immune Solutions Limited purchased goods and services from the University to the value of $26k (2010: $25k). At year end the amount owing to the University was $2k (2010: $3k).
e. During the year, Otago Innovation Limited transferred 6,700,000 shares in BLIS Technologies Limited to the University of Otago (2010 781,433 shares were sold).
f. During the year, Otago Innovation Limited sold 120,000 shares in Pacific Edge Limited and transferred the remaining balance of 2,797,540 to the University of Otago (2010 591,860 shares were sold).
NewZealandGenomicsLimited(NZGL) a. NZGL enters into transactions with the University of Otago, which are made on normal commercial terms and conditions. During the year NZGL purchased goods and services from the University to the value of $1.696 million (2010: $118k), including building rental. At year end the amount owing to the University was $222k (2010: $58k).
b. NZGL provided goods and services to the University of Otago to the value of $44k (2010: $Nil). At year end the amount owing by the University was $45k (2010: $Nil).
UnipolRecreationLimited(URL) a. The University of Otago manages the Unipol recreation facility under terms specified in a Management Agreement between itself and URL. The current agreement is for a period of five years commencing 1 January 2009. As part of the agreement any operating surplus generated by the operation of the Recreation Centre shall be paid to URL at year end. Correspondingly, if at the end of the financial year it is determined that the Recreation Centre has generated an operating deficit, that deficit shall be paid by URL to the University of Otago. The surplus transferred for the year was $771k (2010: $820k).
b. The University of Otago carried out secretarial and accounting services for URL and received a fee of $7k (2010: $7k) for this work.
c. The University of Otago leases space in the Unipol building at an annual rental of $25k (2010: $25k). The lease is for three years commencing 1 January 2007. The lease allows for two renewals of three years each.
d. The University of Otago invests URL’s cash reserves in trading bank call and term deposits. Interest paid to URL for the year was $160k (2010: $136k). The balance held at year end was $4.213 million (2010: $3.452 million).
e. University of Otago Holdings Limited has made a shareholder’s advance to URL. At year end the balance was $370k (2010: $370k). This advance is interest-free and repayable on demand.
UniversityUnionLimited(UUL) a. During the year the University entered into transactions with UUL, an associate company of University of Otago Holdings Limited. The transactions were made on commercial terms and conditions. The University paid UUL $299k for rent (2010: $240K). UUL paid the University of Otago ground rent of $99k (2010: $99k).
UniversityofOtagoTrusts a. During the year, the University entered into transactions with its Trusts. These were made on commercial terms and conditions. The University received investment management fees of $535k (2010: $487k) and received distributions of $3.526 million (2010: $127k). The University has a current account with the trusts. The balance at year end was $625k (2010: $252k) and a current loan of $Nil (2010: $25 million).
KeyManagementPersonnel During the year key management personnel which includes the Chancellor, Councillors, Vice-Chancellor and other senior management personnel, as part of a normal customer relationship, may have been involved in minor transactions with the University of Otago on an arm’s-length basis.
Close family members of Councillors and key management personnel are employed by the University. The terms and conditions of those arrangements are no more favourable than the University would have agreed had there been no relationships to Councillors or key management personnel.

un
ive
rs
ity
of
ota
go
an
nu
al
re
po
rt
20
11
86
Consolidated University This Year Last Year This Year Last Year $000 $000 $000 $000
Key Management Remuneration: Salary and Short Term Benefits 3,594 3,541 2,364 2,311
Superannuation 235 184 225 174
University Council fees 87 90 87 90
Directors’ Remuneration 126 126 - -
Trustees Remuneration 4 3 - -
Total 4,046 3,944 2,676 2,575
RELATED PARTIES TRANSACTIONS
Councillors Year:2011 Year:2010 Purchased Purchased Owed by Owed to Purchased Purchased Owed by Owed to by University from University University by University from University University during year University at Balance at Balance during year University at Balance at Balance during year Date Date during year Date Date
Value of Transactions (GST Inclusive) Value of Transactions (GST Inclusive)
Professor J A Bennett (term completed Dec 2011) University of Otago (Council Member) University of Otago (Employee) Judge E O K Blaikie University of Otago (Council Member) Mr D C Cull (term commenced Oct 2010) Dunedin City Council (Mayor of Dunedin) 5,158,754 1,195,681 28,945 11,736 746,626 34,501 96,795 17,207 Popaway Limited (D) (S) University of Otago (Council Member) Dr J D Every-Palmer Russell McVeagh (Partner) - 552 - - - 81 - - University of Otago (Council Member) University of Otago Holdings Limited (D)* See intergroup note above See intergroup note above Ms H R Geoghegan (term completed May 2011) Critical Publications Limited (D) Otago University Students Association (President) 3,016,642 142,312 N/A N/A 3,166,454 241,883 53,819 10,809 Planet Media Dunedin Limited (D) 81,892 14,518 N/A N/A 89,292 21,399 3,450 2,329 Student Job Search (National Councillor) - 71 - N/A - 1,549 - 381 Unipol Recreation Limited (D) See intergroup note above See intergroup note above University of Otago (Council Member) University Sport NZ (Board Member) University Union Limited (D) See intergroup note above See intergroup note above
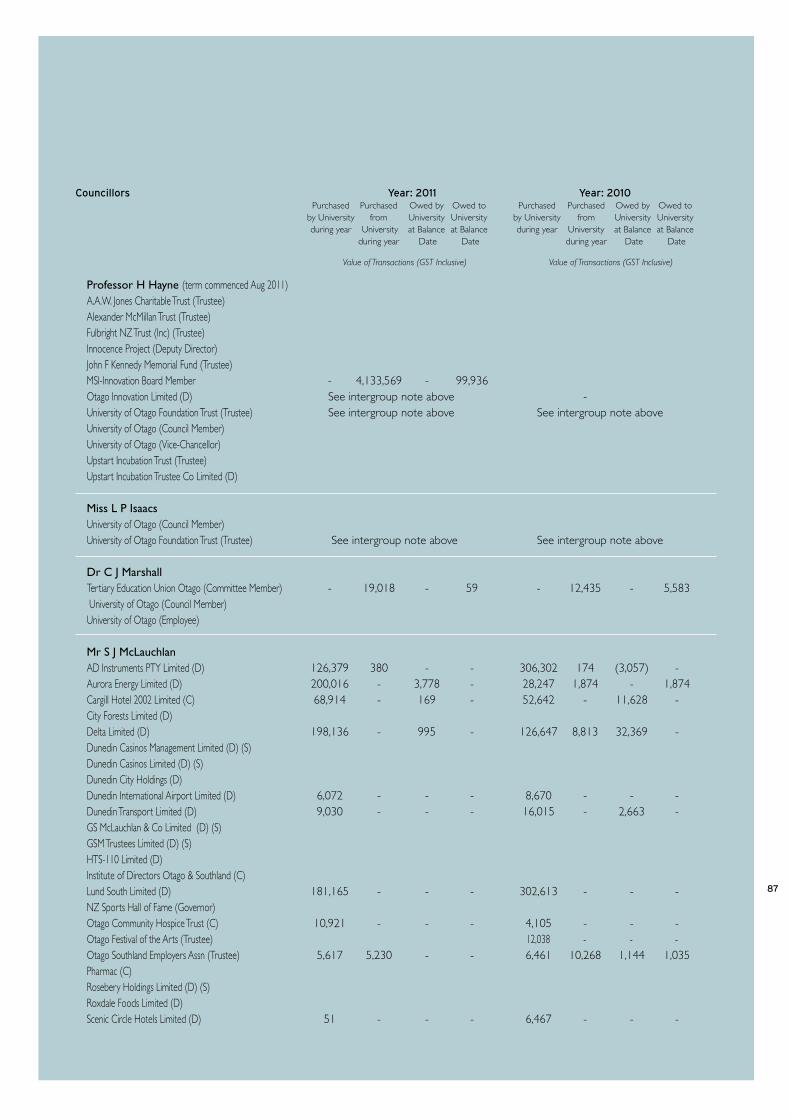
87
Councillors Year:2011 Year:2010 Purchased Purchased Owed by Owed to Purchased Purchased Owed by Owed to by University from University University by University from University University during year University at Balance at Balance during year University at Balance at Balance during year Date Date during year Date Date
Value of Transactions (GST Inclusive) Value of Transactions (GST Inclusive)
Professor H Hayne (term commenced Aug 2011) A.A.W. Jones Charitable Trust (Trustee) Alexander McMillan Trust (Trustee) Fulbright NZ Trust (Inc) (Trustee) Innocence Project (Deputy Director) John F Kennedy Memorial Fund (Trustee) MSI-Innovation Board Member - 4,133,569 - 99,936 Otago Innovation Limited (D) See intergroup note above - University of Otago Foundation Trust (Trustee) See intergroup note above See intergroup note above University of Otago (Council Member) University of Otago (Vice-Chancellor) Upstart Incubation Trust (Trustee) Upstart Incubation Trustee Co Limited (D) Miss L P Isaacs University of Otago (Council Member) University of Otago Foundation Trust (Trustee) See intergroup note above See intergroup note above Dr C J Marshall Tertiary Education Union Otago (Committee Member) - 19,018 - 59 - 12,435 - 5,583 University of Otago (Council Member) University of Otago (Employee) Mr S J McLauchlan AD Instruments PTY Limited (D) 126,379 380 - - 306,302 174 (3,057) - Aurora Energy Limited (D) 200,016 - 3,778 - 28,247 1,874 - 1,874 Cargill Hotel 2002 Limited (C) 68,914 - 169 - 52,642 - 11,628 - City Forests Limited (D) Delta Limited (D) 198,136 - 995 - 126,647 8,813 32,369 - Dunedin Casinos Management Limited (D) (S) Dunedin Casinos Limited (D) (S) Dunedin City Holdings (D) Dunedin International Airport Limited (D) 6,072 - - - 8,670 - - - Dunedin Transport Limited (D) 9,030 - - - 16,015 - 2,663 - GS McLauchlan & Co Limited (D) (S) GSM Trustees Limited (D) (S) HTS-110 Limited (D) Institute of Directors Otago & Southland (C) Lund South Limited (D) 181,165 - - - 302,613 - - - NZ Sports Hall of Fame (Governor) Otago Community Hospice Trust (C) 10,921 - - - 4,105 - - - Otago Festival of the Arts (Trustee) 12,038 - - - Otago Southland Employers Assn (Trustee) 5,617 5,230 - - 6,461 10,268 1,144 1,035 Pharmac (C) Rosebery Holdings Limited (D) (S) Roxdale Foods Limited (D) Scenic Circle Hotels Limited (D) 51 - - - 6,467 - - -

un
ive
rs
ity
of
ota
go
an
nu
al
re
po
rt
20
11
88
Councillors Year:2011 Year:2010 Purchased Purchased Owed by Owed to Purchased Purchased Owed by Owed to by University from University University by University from University University during year University at Balance at Balance during year University at Balance at Balance during year Date Date during year Date Date
Value of Transactions (GST Inclusive) Value of Transactions (GST Inclusive)
Mr S J McLauchlan continued Scott Technology Limited (C) Southern DHB (Crown Monitor) 2,437,091 11,042,191 128,671 1,542,806 1,845,884 7,631,837 210,886 1,581,438 University of Otago Foundation Studies Limited (D)* See intergroup note above See intergroup note above University of Otago (Pro-Chancellor) University of Otago Rugby Club (Committee) - 3,625 - - 368 16,552 - - UDC Finance Limited (C) USC Investments Limited (D) Wagstaff Holdings Limited (D) Wavell Resources Limited ( D ) ZNH Limited (C)
Ms D C Matahaere-Atariki Arai Te Uru Whare Hauora (Executive Director) 10,580 684 - 153 Brockville Primary School Dunedin (Trustee) - 1,502 - - - 1,496 - - Family and Community Services – Advisory Council (Member) Ministry of Health - NGO Working Group (Member) National Taskforce on Violence (Member) Otakou Runanga (Member) 1,208 680 1,208 - Southern Primary Health Organisation (Board Member) University of Otago (Council Member) Ms M A Morgan Arana College (College Council Member) University of Otago (Council Member) University of Otago (Employee) Ms K J Reid (term commenced May 2011, completed Dec 2011) University of Otago (Council Member) University of Otago (Student) Mr J K Rowe University of Otago (Council Member) University of Otago (Student) Mr M J M Sidey Forsyth Barr Limited (Vice-Chairman) (S) 1,104 230 - - 26,563 225 1,472 - Halberg Trust (Trustee) Last Ocean Trust (Trustee) Excellence in Sport-South Island (D) 1,104 115,650 - - 3,288 94,938 1,104 (18)NZ Winter Games Trust (D) Salvation Army Advisory Board (C) St Andrew’s College Foundation (Trustee) 100 2,935 - - 2,682 1,965 - - University of Otago (Council Member) University of Otago Holdings Limited (D)* See intergroup note above See intergroup note above
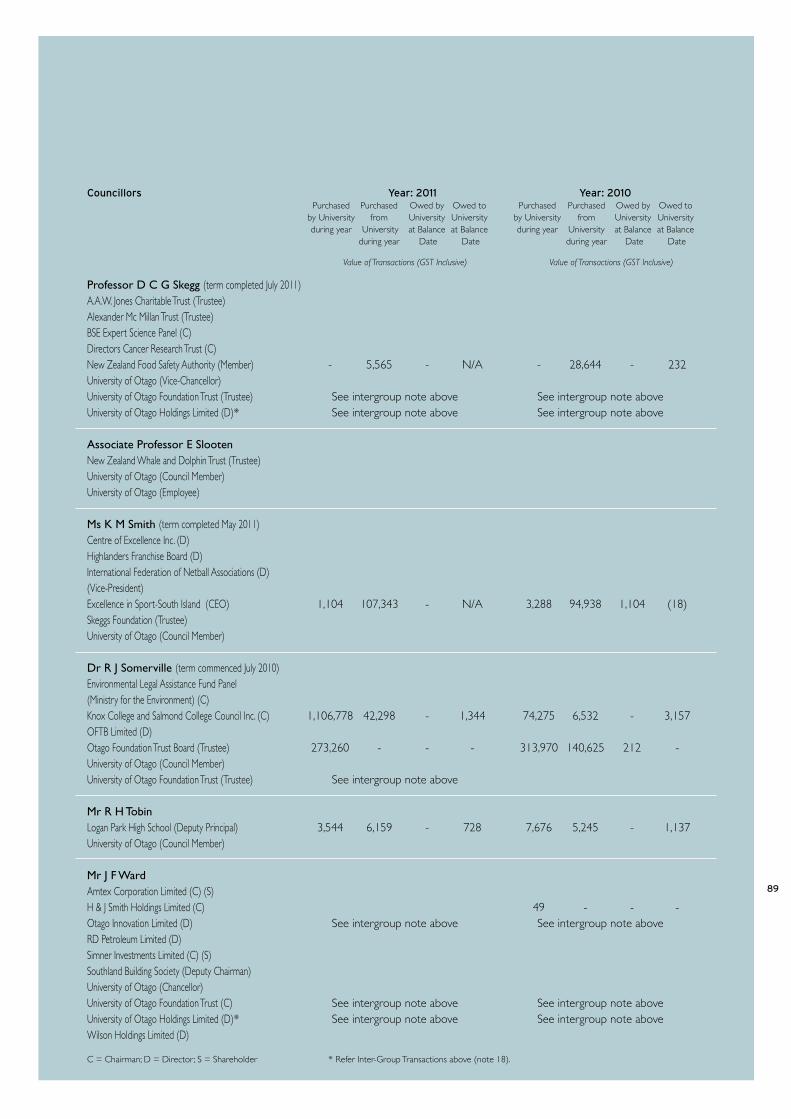
89
Councillors Year:2011 Year:2010 Purchased Purchased Owed by Owed to Purchased Purchased Owed by Owed to by University from University University by University from University University during year University at Balance at Balance during year University at Balance at Balance during year Date Date during year Date Date
Value of Transactions (GST Inclusive) Value of Transactions (GST Inclusive)
Professor D C G Skegg (term completed July 2011) A.A.W. Jones Charitable Trust (Trustee) Alexander Mc Millan Trust (Trustee) BSE Expert Science Panel (C) Directors Cancer Research Trust (C) New Zealand Food Safety Authority (Member) - 5,565 - N/A - 28,644 - 232 University of Otago (Vice-Chancellor) University of Otago Foundation Trust (Trustee) See intergroup note above See intergroup note above University of Otago Holdings Limited (D)* See intergroup note above See intergroup note above Associate Professor E Slooten New Zealand Whale and Dolphin Trust (Trustee) University of Otago (Council Member) University of Otago (Employee) Ms K M Smith (term completed May 2011) Centre of Excellence Inc. (D) Highlanders Franchise Board (D) International Federation of Netball Associations (D) (Vice-President) Excellence in Sport-South Island (CEO) 1,104 107,343 - N/A 3,288 94,938 1,104 (18)Skeggs Foundation (Trustee) University of Otago (Council Member) Dr R J Somerville (term commenced July 2010) Environmental Legal Assistance Fund Panel (Ministry for the Environment) (C) Knox College and Salmond College Council Inc. (C) 1,106,778 42,298 - 1,344 74,275 6,532 - 3,157OFTB Limited (D) Otago Foundation Trust Board (Trustee) 273,260 - - - 313,970 140,625 212 - University of Otago (Council Member) University of Otago Foundation Trust (Trustee) See intergroup note above Mr R H Tobin Logan Park High School (Deputy Principal) 3,544 6,159 - 728 7,676 5,245 - 1,137 University of Otago (Council Member) Mr J F Ward Amtex Corporation Limited (C) (S) H & J Smith Holdings Limited (C) 49 - - - Otago Innovation Limited (D) See intergroup note above See intergroup note above RD Petroleum Limited (D) Simner Investments Limited (C) (S) Southland Building Society (Deputy Chairman) University of Otago (Chancellor) University of Otago Foundation Trust (C) See intergroup note above See intergroup note above University of Otago Holdings Limited (D)* See intergroup note above See intergroup note above Wilson Holdings Limited (D)
C = Chairman; D = Director; S = Shareholder * Refer Inter-Group Transactions above (note 18).

un
ive
rs
ity
of
ota
go
an
nu
al
re
po
rt
20
11
90
PLEDGED DONATIONS
Donations are recognised at face value upon the pledge being made and the contract documents signed. All of the pledges have been made and the University expects that these pledges will be honoured.
Total pledged donations outstanding are $3.040 million (2010: $4.210 million). The Net Present Value of these pledges at an interest
rate of 4.5% (2010: 5%) is $2.769 million (2010: $3.722 million).
Consolidated University This Year Last Year This Year Last Year $000 $000 $000 $000
Analysis of Pledged Donations: Less than 1 year 850 850 1,170 - - -
More than 1 year but less than 5 years 1,890 1,890 2,460 - - -
Greater than 5 years 300 300 580 - - - Total Pledged Donations 3,040 3,040 4,210 - - -
CAPITAL MANAGEMENT
The University’s capital is its equity, which comprises general funds and revaluation reserves. Equity is represented by net assets.
The University manages its revenues, expenses, assets, liabilities, and general financial dealings prudently. The University’s equity is largely managed as a by-product of managing income, expenses, assets and liabilities.
The objective of managing the University’s equity is to ensure the University effectively achieves its goals and objectives for which it has been established, whilst remaining a going concern.
STANDARDS OR INTERPRETATIONS ISSUED BUT NOT yET EFFECTIVE
The University of Otago has elected to not apply the following new standards or interpretations that have been issued but are not yet effective.
NZ IFRS 9 Financial Instruments will eventually replace NZ IAS 39 Financial Instruments: Recognition and Measurement. The new standard is required to be adopted for the year ended 31 December 2013. The entity has not yet assessed the impact of the new standard and expects it will not be early adopted.
There are no other standards or interpretations issued, but not yet effective, that the University of Otago has not yet applied.
EVENTS AFTER THE BALANCE SHEET DATE
There were no other significant events after balance date.
Note19
Note20
Note21
Note22

91
Independent Auditor’s Report
TOTHEREADERSOFTHEUNIvERSITYOFOTAGOANDGROUP’SFINANCIALSTATEMENTSAND
STATEMENTOFSERvICEPERFORMANCEFORTHEYEARENDED31DECEMBER2011
The Auditor-General is the auditor of University of Otago (the University) and group. The Auditor-General has appointed me, Julian Tan, using the staff and resources of Audit New Zealand, to carry out the audit of the financial statements and statement of service performance of the University and group on her behalf.
We have audited:
• thefinancialstatementsoftheUniversityandgrouponpages51to90thatcomprisethestatementoffinancialpositionasat31December 2011, the statement of comprehensive income, statement of changes in equity and statement of cash flows for the year ended on that date and the notes to the financial statements that include accounting policies and other explanatory information; and
• thestatementofserviceperformanceoftheUniversityandgrouponpages34to39.
Opinion
In our opinion:
• thefinancialstatementsoftheUniversityandgrouponpages51to90:
– comply with generally accepted accounting practice in New Zealand; and
– fairly reflect the University and group’s:
~ financial position as at 31 December 2011; and
~ financial performance and cash flows for the year ended on that date;
• thestatementofserviceperformanceoftheUniversityandgrouponpages34to39fairlyreflectstheUniversityandgroup’sservice performance achievements measured against the performance targets adopted for the year ended 31 December 2011.
Our audit was completed on 17 April 2012. This is the date at which our opinion is expressed.
The basis of our opinion is explained below. In addition, we outline the responsibilities of the Council and our responsibilities, and we explain our independence.
Basisofopinion
We carried out our audit in accordance with the Auditor-General’s Auditing Standards, which incorporate the International Standards on Auditing (New Zealand). Those standards require that we comply with ethical requirements and plan and carry out our audit to obtain reasonable assurance about whether the financial statements and statement of service performance are free from material misstatement.
Material misstatements are differences or omissions of amounts and disclosures that would affect a reader’s overall understanding of the financial statements and statement of service performance. If we had found material misstatements that were not corrected, we would have referred to them in our opinion.
An audit involves carrying out procedures to obtain audit evidence about the amounts and disclosures in the financial statements and statement of service performance. The procedures selected depend on our judgement, including our assessment of risks of material misstatement of the financial statements and statement of service performance, whether due to fraud or error. In making those risk assessments, we consider internal control relevant to the University and group’s preparation of the financial statements and statement of service performance that fairly reflect the matters to which they relate. We consider internal control in order to design audit procedures that are appropriate in the circumstances but not for the purpose of expressing an opinion on the effectiveness of the University and group’s internal control.
An audit also involves evaluating:
• theappropriatenessofaccountingpoliciesusedandwhethertheyhavebeenconsistentlyapplied;
• thereasonablenessofthesignificantaccountingestimatesandjudgementsmadebytheCouncil;
• theadequacyofalldisclosuresinthefinancialstatementsandstatementofserviceperformance;and
• theoverallpresentationofthefinancialstatementsandstatementofserviceperformance.

un
ive
rs
ity
of
ota
go
an
nu
al
re
po
rt
20
11
92
We did not examine every transaction, nor do we guarantee complete accuracy of the financial statements and statement of service performance. We have obtained all the information and explanations we have required and we believe we have obtained sufficient and appropriate audit evidence to provide a basis for our audit opinion.
ResponsibilitesoftheCouncil
The Council is responsible for preparing financial statements that:
• complywithgenerallyacceptedaccountingpracticeinNewZealand;and
• fairlyreflecttheUniversityandgroup’sfinancialposition,financialperformanceandcashflows.
The Council is also responsible for preparing a statement of service performance that fairly reflects the University’s service performance achievements.
The Council is responsible for such internal control as it determines is necessary to enable the preparation of financial statements and a statement of service performance that are free from material misstatement, whether due to fraud or error.
The Council’s responsibilities arise from the Education Act 1989 and the Crown Entities Act 2004.
ResponsibilitesoftheAuditor
We are responsible for expressing an independent opinion on the financial statements and statement of service performance and reporting that opinion to you based on our audit. Our responsibility arises from section 15 of the Public Audit Act 2001 and the Crown Entities Act 2004.
Independence
When carrying out the audit, we followed the independence requirements of the Auditor-General, which incorporate the independence requirements of the New Zealand Institute of Chartered Accountants.
In addition to the audit, we carried out an assurance engagement reporting on the Vice-Chancellor’s annual declaration on the Performance-Based Research Fund external research income. This assurance engagement is compatible with those independence requirements.
Other than the audit and the assurance engagement, we have no relationship with or interests in the University or any of its subsidiaries.
JulianTan
audit new Zealandon behalf of the auditor-generalDunedin, new Zealand
MATTERS RELATING TO THE ELECTRONIC PRESENTATION OF THE AUDITED FINANCIAL STATEMENTS AND STATEMENT OF SERVICE PERFORMANCE
This audit report relates to the financial statements and statement of service performance of University of Otago (the University)and group for the year ended 31 December 2011 included on the University’s website. The University’s Council is responsible for the maintenance and integrity of the website. We have not been engaged to report on the integrity of the University’s website. We accept no responsibility for any changes that may have occurred to the financial statements and statement of service performance since they were initially presented on the website.
The audit report refers only to the financial statements and performance information named above. It does not provide an opinion on any other information which may have been hyperlinked to or from the financial statements and statement of service performance. If readers of this report are concerned with the inherent risks arising from electronic data communication they should refer to the published hard copy of the audited financial statements and statement of service performance as well as the related audit report dated 17 April 2012 to confirm the information included in the audited financial statements and statement of service performance presented on this website.
Legislation in New Zealand governing the preparation and dissemination of financial information may differ from legislation in other jurisdictions.

93

un
ive
rs
ity
of
ota
go
an
nu
al
re
po
rt
20
11
94
Summary Facts and FiguresThe 2007 summary facts and figures data include the impact of the merger with the Dunedin College of Education. From 2009, figures include international Foundation Studies students for the first time. Caution is therefore advised when analysing changes between years.
STUDENT ENROLMENTS 2011 2010 2009 2008 2007 Equivalent Full-time Students (EFTS)
Commerce 3,220 3,526 3,586 3,471 3,406Health Sciences 5,761 5,620 5,310 5,150 5,122Humanities 5,910 5,971 5,646 5,449 5,481Sciences 4,418 4,490 4,318 4,094 4,085Other University* 36 55 43 31 64
Subtotal 19,344 19,661 18,903 18,195 18,158
Other Group EFTS** 224 257 269 134 129
Total 19,568 19,918 19,172 18,330 18,287
* Other University EFTS comprise continuing education EFTS not allocated to departments within the four academic divisions. ** Other Group EFTS comprise EFTS enrolled in the Foundation Studies programme of the University subsidary Foundation Studies Limited. ** Prior to 2009 the Foundation Studies programme figure was for domestic EFTS only. From 2010 international EFTS have also been included.
EFTS by Funding Type (University only)
Domestic 17,680 18,130 17,477 16,306 16,108International 1,664 1,531 1,426 1,889 2,050
Total 19,344 19,661 18,903 18,195 18,158
Enrolment By Qualification Type PhD 1,259 1,258 1,206 1,104 1,048Professional Doctorates 68 67 64 48 29Masters – by Thesis 969 979 921 874 838Masters – by Coursework 251 207 196 209 223Postgraduate Diplomas 1,068 1,134 1,095 1,101 1,104Postgraduate Certificates 473 526 525 535 383Graduate Diplomas 475 487 405 385 577Bachelor Honours 873 854 843 797 829Bachelors 15,593 15,780 15,359 14,947 14,812Undergraduate Diplomas 91 121 121 146 251Undergraduate Certificates 25 31 48 28 63Certificate of Proficiency 1,326 1,450 1,419 1,402 1,339Interest Only 0 223 150 138 153Foundation Studies 254 273 282 120 132Other 17 20 25 17 16
Total Students 21,728 22,139 21,507 20,752 20,665
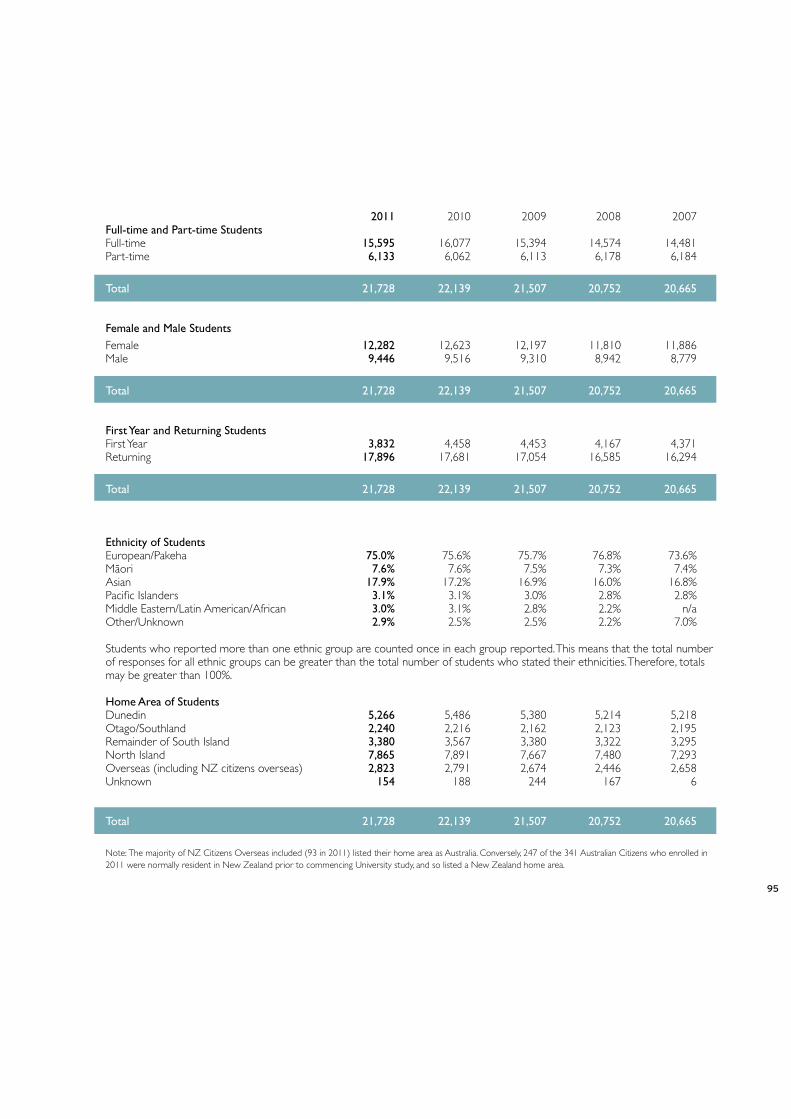
95
2011 2010 2009 2008 2007Full-time and Part-time Students Full-time 15,595 16,077 15,394 14,574 14,481Part-time 6,133 6,062 6,113 6,178 6,184
Total 21,728 22,139 21,507 20,752 20,665
Female and Male Students Female 12,282 12,623 12,197 11,810 11,886Male 9,446 9,516 9,310 8,942 8,779
Total 21,728 22,139 21,507 20,752 20,665
First Year and Returning Students First Year 3,832 4,458 4,453 4,167 4,371Returning 17,896 17,681 17,054 16,585 16,294
Total 21,728 22,139 21,507 20,752 20,665
Ethnicity of Students European/Pakeha 75.0% 75.6% 75.7% 76.8% 73.6%Mäori 7.6% 7.6% 7.5% 7.3% 7.4%Asian 17.9% 17.2% 16.9% 16.0% 16.8%Pacific Islanders 3.1% 3.1% 3.0% 2.8% 2.8%Middle Eastern/Latin American/African 3.0% 3.1% 2.8% 2.2% n/aOther/Unknown 2.9% 2.5% 2.5% 2.2% 7.0% Students who reported more than one ethnic group are counted once in each group reported. This means that the total number of responses for all ethnic groups can be greater than the total number of students who stated their ethnicities. Therefore, totals may be greater than 100%. Home Area of Students Dunedin 5,266 5,486 5,380 5,214 5,218Otago/Southland 2,240 2,216 2,162 2,123 2,195Remainder of South Island 3,380 3,567 3,380 3,322 3,295North Island 7,865 7,891 7,667 7,480 7,293Overseas (including NZ citizens overseas) 2,823 2,791 2,674 2,446 2,658Unknown 154 188 244 167 6
Total 21,728 22,139 21,507 20,752 20,665
Note: The majority of NZ Citizens Overseas included (93 in 2011) listed their home area as Australia. Conversely, 247 of the 341 Australian Citizens who enrolled in 2011 were normally resident in New Zealand prior to commencing University study, and so listed a New Zealand home area.
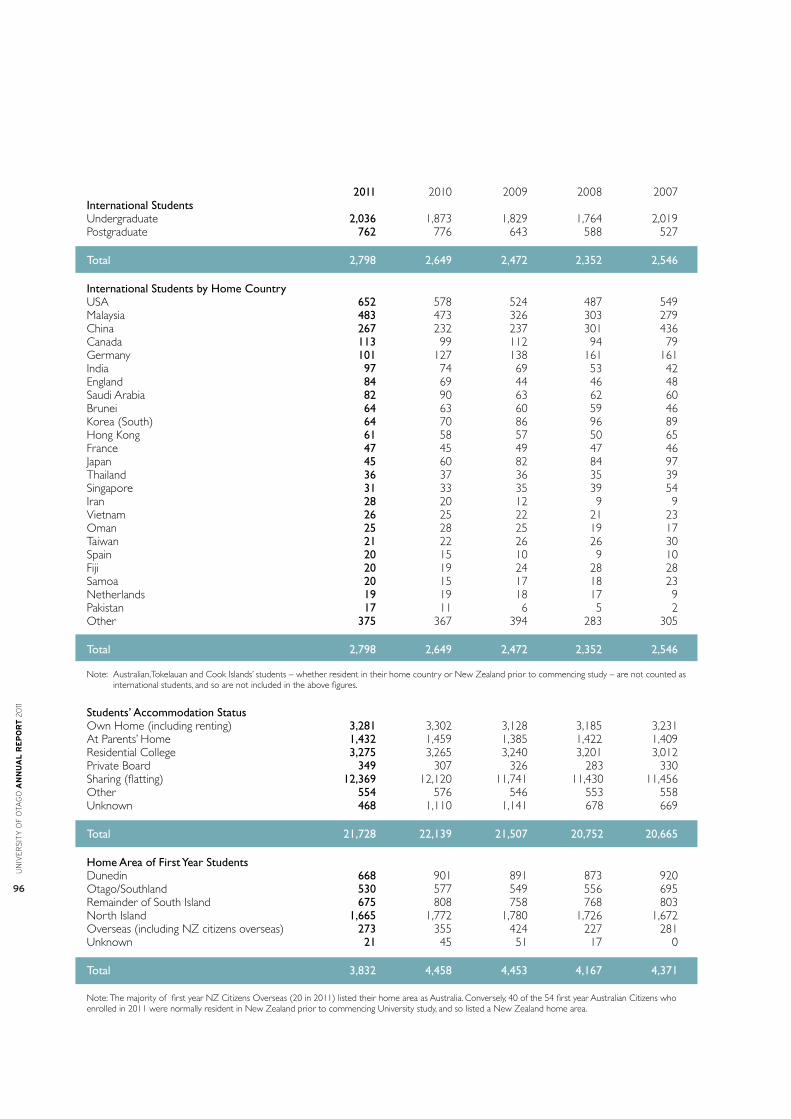
un
ive
rs
ity
of
ota
go
an
nu
al
re
po
rt
20
11
96
2011 2010 2009 2008 2007International Students Undergraduate 2,036 1,873 1,829 1,764 2,019Postgraduate 762 776 643 588 527
Total 2,798 2,649 2,472 2,352 2,546
International Students by Home Country USA 652 578 524 487 549Malaysia 483 473 326 303 279China 267 232 237 301 436Canada 113 99 112 94 79Germany 101 127 138 161 161India 97 74 69 53 42England 84 69 44 46 48Saudi Arabia 82 90 63 62 60Brunei 64 63 60 59 46Korea (South) 64 70 86 96 89Hong Kong 61 58 57 50 65France 47 45 49 47 46Japan 45 60 82 84 97Thailand 36 37 36 35 39Singapore 31 33 35 39 54Iran 28 20 12 9 9Vietnam 26 25 22 21 23Oman 25 28 25 19 17Taiwan 21 22 26 26 30Spain 20 15 10 9 10Fiji 20 19 24 28 28Samoa 20 15 17 18 23Netherlands 19 19 18 17 9Pakistan 17 11 6 5 2Other 375 367 394 283 305
Total 2,798 2,649 2,472 2,352 2,546 Note: Australian,Tokelauan and Cook Islands’ students – whether resident in their home country or New Zealand prior to commencing study – are not counted as international students, and so are not included in the above figures.
Students’ Accommodation Status Own Home (including renting) 3,281 3,302 3,128 3,185 3,231At Parents’ Home 1,432 1,459 1,385 1,422 1,409Residential College 3,275 3,265 3,240 3,201 3,012Private Board 349 307 326 283 330Sharing (flatting) 12,369 12,120 11,741 11,430 11,456Other 554 576 546 553 558Unknown 468 1,110 1,141 678 669
Total 21,728 22,139 21,507 20,752 20,665
Home Area of First Year Students Dunedin 668 901 891 873 920Otago/Southland 530 577 549 556 695Remainder of South Island 675 808 758 768 803North Island 1,665 1,772 1,780 1,726 1,672Overseas (including NZ citizens overseas) 273 355 424 227 281Unknown 21 45 51 17 0
Total 3,832 4,458 4,453 4,167 4,371 Note: The majority of first year NZ Citizens Overseas (20 in 2011) listed their home area as Australia. Conversely, 40 of the 54 first year Australian Citizens who enrolled in 2011 were normally resident in New Zealand prior to commencing University study, and so listed a New Zealand home area.
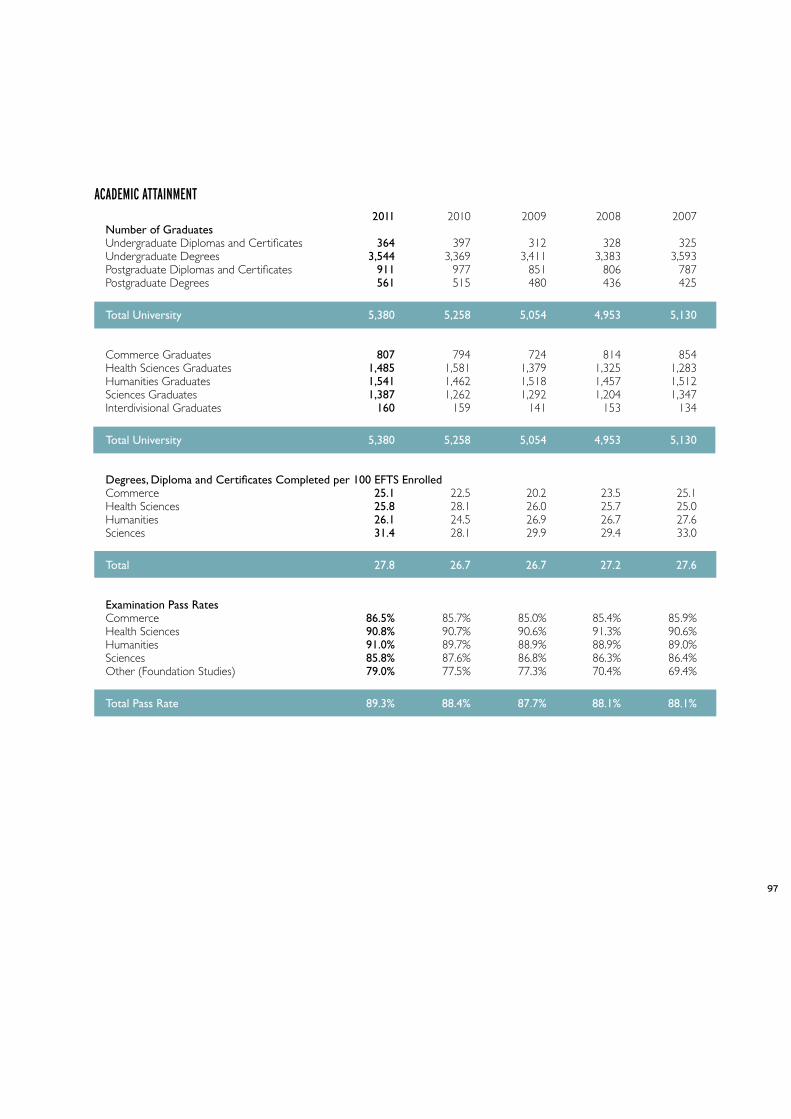
97
ACADEMIC ATTAINMENT 2011 2010 2009 2008 2007Number of Graduates Undergraduate Diplomas and Certificates 364 397 312 328 325Undergraduate Degrees 3,544 3,369 3,411 3,383 3,593Postgraduate Diplomas and Certificates 911 977 851 806 787Postgraduate Degrees 561 515 480 436 425
Total University 5,380 5,258 5,054 4,953 5,130
Commerce Graduates 807 794 724 814 854Health Sciences Graduates 1,485 1,581 1,379 1,325 1,283Humanities Graduates 1,541 1,462 1,518 1,457 1,512Sciences Graduates 1,387 1,262 1,292 1,204 1,347Interdivisional Graduates 160 159 141 153 134
Total University 5,380 5,258 5,054 4,953 5,130
Degrees, Diploma and Certificates Completed per 100 EFTS Enrolled Commerce 25.1 22.5 20.2 23.5 25.1Health Sciences 25.8 28.1 26.0 25.7 25.0Humanities 26.1 24.5 26.9 26.7 27.6Sciences 31.4 28.1 29.9 29.4 33.0
Total 27.8 26.7 26.7 27.2 27.6
Examination Pass Rates Commerce 86.5% 85.7% 85.0% 85.4% 85.9%Health Sciences 90.8% 90.7% 90.6% 91.3% 90.6%Humanities 91.0% 89.7% 88.9% 88.9% 89.0%Sciences 85.8% 87.6% 86.8% 86.3% 86.4%Other (Foundation Studies) 79.0% 77.5% 77.3% 70.4% 69.4%
Total Pass Rate 89.3% 88.4% 87.7% 88.1% 88.1%
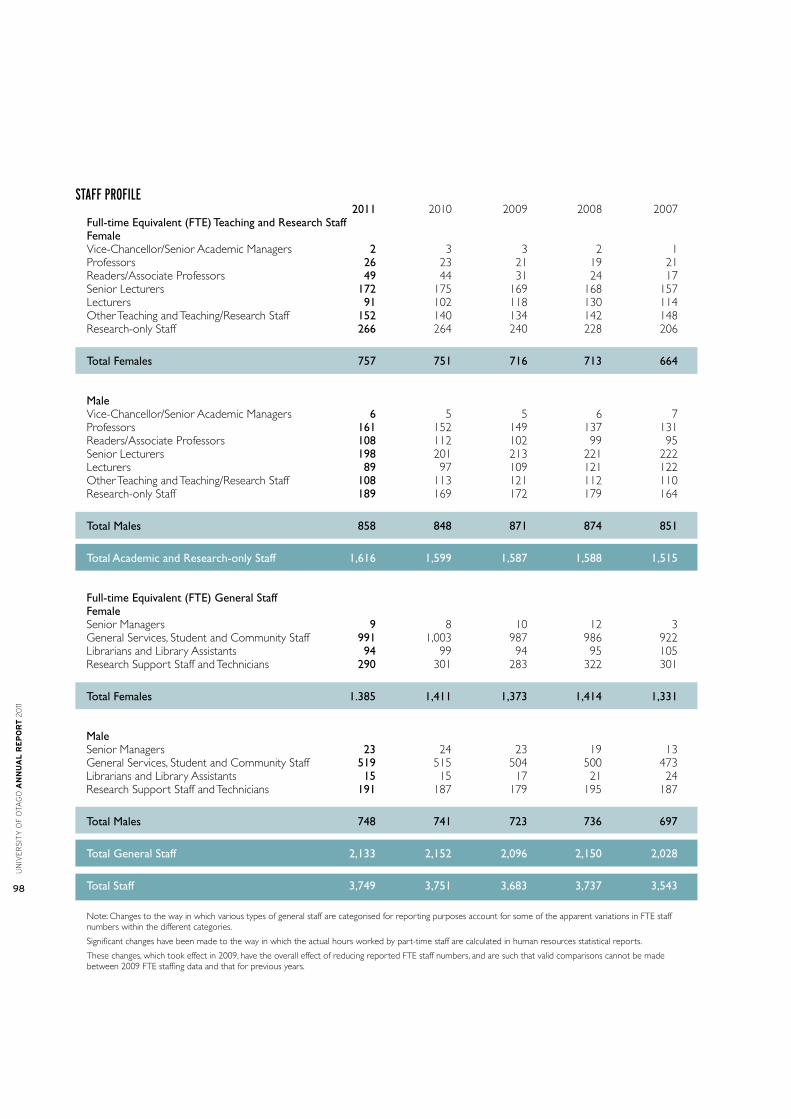
un
ive
rs
ity
of
ota
go
an
nu
al
re
po
rt
20
11
98
STAFF PROFILE 2011 2010 2009 2008 2007Full-time Equivalent (FTE) Teaching and Research Staff Female Vice-Chancellor/Senior Academic Managers 2 3 3 2 1Professors 26 23 21 19 21Readers/Associate Professors 49 44 31 24 17Senior Lecturers 172 175 169 168 157Lecturers 91 102 118 130 114Other Teaching and Teaching/Research Staff 152 140 134 142 148Research-only Staff 266 264 240 228 206
Total Females 757 751 716 713 664
Male Vice-Chancellor/Senior Academic Managers 6 5 5 6 7Professors 161 152 149 137 131Readers/Associate Professors 108 112 102 99 95Senior Lecturers 198 201 213 221 222Lecturers 89 97 109 121 122Other Teaching and Teaching/Research Staff 108 113 121 112 110Research-only Staff 189 169 172 179 164
Total Males 858 848 871 874 851
Total Academic and Research-only Staff 1,616 1,599 1,587 1,588 1,515
Full-time Equivalent (FTE) General Staff Female Senior Managers 9 8 10 12 3General Services, Student and Community Staff 991 1,003 987 986 922Librarians and Library Assistants 94 99 94 95 105Research Support Staff and Technicians 290 301 283 322 301
Total Females 1.385 1,411 1,373 1,414 1,331
Male Senior Managers 23 24 23 19 13General Services, Student and Community Staff 519 515 504 500 473Librarians and Library Assistants 15 15 17 21 24Research Support Staff and Technicians 191 187 179 195 187
Total Males 748 741 723 736 697
Total General Staff 2,133 2,152 2,096 2,150 2,028
Total Staff 3,749 3,751 3,683 3,737 3,543
Note: Changes to the way in which various types of general staff are categorised for reporting purposes account for some of the apparent variations in FTE staff numbers within the different categories.
Significant changes have been made to the way in which the actual hours worked by part-time staff are calculated in human resources statistical reports.
These changes, which took effect in 2009, have the overall effect of reducing reported FTE staff numbers, and are such that valid comparisons cannot be made between 2009 FTE staffing data and that for previous years.

99
2011 2010 2009 2008 2007 Student-Academic Staff Ratios Commerce 28.7 28.4 27.1 26.1 24.7Health Sciences 12.3 12.0 11.5 11.7 10.1Humanities 19.0 18.6 17.0 16.6 16.5Sciences 16.6 17.7 16.5 15.4 15.3
Overall 16.7 16.8 15.9 15.5 14.6
RESEARCH ACTIVITIES (revised for previous years) Research Outputs Produced
Total Publications 4,239 4,168 4,090 3,687 3,432
Note: Publications are shown in the year they are reported in the University’s Research Outputs Report. Actual date of publication or dissemination may differ. Figures for the current year are provisional, subject to final vetting. Figures for previous years are updated as appropriate to account for the impact of vetting.
LAND & BUILDINGS 2011 2010 2009 2008 2007 Land (hectares) Land owned by the University 33 33 31 29 26Land in Crown title for the University 11 11 8 8 8Endowment Leasehold 22,246 22,235 25,585 25,585 25,585
Total Land Controlled by the University 22,289 22,279 25,624 25,622 25,620
Notes: Endowment land is tied up in long-term pastoral lease. Reduction in endowment land in 2010 was due to confirmation of previous changes in land use.
University of Otago Net Assignable Space (floor space in square metres)Commerce 8,929 8,870 9,079 9,021 9,019Health Sciences 65,105 65,904 66,229 65,902 64,485Humanities 20,533 20,600 19,773 21,167 21,903Science 41,943 42,020 39,013 38,046 37,627Administration and Other 62,672 59,013 58,416 50,494 49,387Corporate 3,030 3,033 2,923 4,439 4,492Information Services 16,106 15,793 15,950 16,479 16,320
Total 218,318 215,233 211,383 205,548 203,233
Notes: University-owned flats and residential colleges total a further 56,190 sq m, Unipol and Clubs & Societies 5658 sq m (approx).

un
ive
rs
ity
of
ota
go
an
nu
al
re
po
rt
20
11
100
2011 2010 2009 2008 2007
LIBRARy Library Collection Books (volumes) 1,109,344 1,096,807 1,094,165 1,091,174 975,752Serials (volumes) 536,242 526,937 525,512 517,738 502,252Microfilms 229,493 232,546 224,052 229,582 230,947Non-book Materials 1,221,442 1,221,570 1,218,520 1,215,442 1,196,244
Total 3,096,521 3,077,860 3,062,249 3,053,936 2,905,195
Print Serials Received 6,030 6,210 6,813 7,143 6,964 Electronic Serials Received 229,336 174,844 111,919 73,359 72,224
Total 235,366 181,054 118,732 80,502 79,188 e-books Received 380,867 362,526 348,633 n/a n/a
Space Seating Places Available 4,188 3,776 3,698 3,681 3,553
Note: From 2008 Library collection figures include the Robertson Library.
INFORMATION TECHNOLOGy SERVICES Volume of Computer and Telecommunications Traffic Off-campus Network Traffic (megabytes) 464,158,837 421,690,487 291,222,821 154,474,845 109,357,140
ITS Training and Support Services Enquiries Received by ITS Helpdesk 46,295 45,256 60,502 51,500 47,889Seating Places in Student Computer Laboratories 1,361 749 702 615 713
KEy FINANCIAL INDICATORS Value of Output per EFTS Teaching, Learning and Assessment $9,381 $8,590 $9,088 $9,049 $8,068Research and Postgraduate Teaching $14,294 $13,420 $13,134 $12,772 $12,119Community Service $1,291 $1,137 $1,112 $969 $1,284
Financial Indicators 2011 2010 2009 2008 2007 Consolidated Consolidated Consolidated Consolidated Consolidated Current Ratio (current assets: current liabilities) 1.0 1.0 0.9 1.2 1.3Liquid Ratio (current assets which will result in 1.9 1.8 1.9 2.6 2.9cashflow: current liabilities which will result in cashflow) Level of Debt (debt to equity) 2.1% 2.5% 2.3% 2.3% 1.7%Increase in Net Assets 1.4% 2.3% 2.4% 2.0% 12.0%Return on Total Assets 1.7% 2.2% 2.1% 1.3% 2.3%Return on Revenue 4.6% 5.9% 5.5% 3.6% 6.5%

101
Currentassets:currentliabilities
Operatingsurplusasa%oftotalincome
Operatingsurplusasa%oftotalassets
Currentassetswhichwillresultincashflow:currentliabilitieswhichwillresultincashflow

un
ive
rs
ity
of
ota
go
an
nu
al
re
po
rt
20
11
102
Totaldebtasa%ofnetassets
TotalUniversityrevenuedividedbytotalUniversityEFTS
TotalUniversityexpendituredividedbytotalUniversityEFTS
UniversityoperatingsurplusdividedbytotalUniversityEFTS

103
TotalUniversityassetsdividedbytotalUniversityEFTS
Operatingsurplusasa%oftotalequity
TotaldomesticandinternationalEFTS

un
ive
rs
ity
of
ota
go
an
nu
al
re
po
rt
20
11
104

2011a n n u a l r e p o r t