2011 international trade review - alberta · 2011 international trade review 8 agriculture, food...
TRANSCRIPT

AlbertaInternationalTradeReview2011

2011InternationalTradeReview
1
Table of Contents
About the data ............................................................................................................................................................... 4
The Year in Review ........................................................................................................................................................ 5
Alberta’s Exports by Industry ......................................................................................................................................... 6
Agriculture, Food and Beverages .............................................................................................................................. 8
Energy ...................................................................................................................................................................... 10
Chemicals and Plastics ............................................................................................................................................. 12
Manufacturing ......................................................................................................................................................... 14
Machinery ........................................................................................................................................................... 15
Electrical/Electronic Equipment and Precision Instruments ............................................................................... 17
Forestry ................................................................................................................................................................... 18
Other Exports .......................................................................................................................................................... 19
Alberta’s Exports by Region ......................................................................................................................................... 20
North America ............................................................................................................................................................. 22
United States ........................................................................................................................................................... 22
Asia Pacific ................................................................................................................................................................... 26
North Asia ................................................................................................................................................................ 28
China ................................................................................................................................................................... 28
Japan ................................................................................................................................................................... 28
South Korea ........................................................................................................................................................ 28
South and Southeast Asia and Oceania ................................................................................................................... 29
Australia .............................................................................................................................................................. 29
Indonesia............................................................................................................................................................. 29
Europe & CIS ................................................................................................................................................................ 30
EU 27 ....................................................................................................................................................................... 30
Netherlands ........................................................................................................................................................ 32
Italy ..................................................................................................................................................................... 32
Germany ............................................................................................................................................................. 32
CIS ............................................................................................................................................................................ 33
Russia .................................................................................................................................................................. 33
Ukraine ................................................................................................................................................................ 33
Kazakhstan .......................................................................................................................................................... 33
EFTA and Other Europe ........................................................................................................................................... 34
Switzerland ......................................................................................................................................................... 34
Albania ................................................................................................................................................................ 35
Norway ................................................................................................................................................................ 35

2011InternationalTradeReview
2
Latin America and the Caribbean ................................................................................................................................ 36
Colombia ............................................................................................................................................................. 37
Brazil ................................................................................................................................................................... 37
Venezuela ........................................................................................................................................................... 38
Middle East and North Africa ...................................................................................................................................... 39
United Arab Emirates (UAE) ................................................................................................................................ 40
Saudi Arabia ........................................................................................................................................................ 40
Israel ................................................................................................................................................................... 40
Sub‐Saharan Africa ...................................................................................................................................................... 41
The Global Economy .................................................................................................................................................... 42
Appendices .................................................................................................................................................................. 44
Appendix A: Alberta’s Export Destinations > $25 Million in 2011 ($CDN, Millions) .................................................... 45
Albania .................................................................................................................................................................... 46
Algeria ..................................................................................................................................................................... 47
Australia .................................................................................................................................................................. 48
Bangladesh .............................................................................................................................................................. 49
Belgium.................................................................................................................................................................... 50
Brazil ........................................................................................................................................................................ 51
Chile ......................................................................................................................................................................... 52
China ....................................................................................................................................................................... 53
Colombia ................................................................................................................................................................. 54
Cuba ........................................................................................................................................................................ 55
Ecuador ................................................................................................................................................................... 56
Egypt ........................................................................................................................................................................ 57
France ...................................................................................................................................................................... 58
Germany .................................................................................................................................................................. 59
Ghana ...................................................................................................................................................................... 60
Hong Kong ............................................................................................................................................................... 61
India ......................................................................................................................................................................... 62
Indonesia ................................................................................................................................................................. 63
Iraq .......................................................................................................................................................................... 64
Ireland ..................................................................................................................................................................... 65
Israel ........................................................................................................................................................................ 66
Italy .......................................................................................................................................................................... 67
Japan ....................................................................................................................................................................... 68
Korea, South ............................................................................................................................................................ 69
2011InternationalTradeReview
3
Malaysia .................................................................................................................................................................. 70
Mexico ..................................................................................................................................................................... 71
Morocco .................................................................................................................................................................. 72
Netherlands ............................................................................................................................................................. 73
New Zealand ............................................................................................................................................................ 74
Nigeria ..................................................................................................................................................................... 75
Norway .................................................................................................................................................................... 76
Oman ....................................................................................................................................................................... 77
Pakistan ................................................................................................................................................................... 78
Peru ......................................................................................................................................................................... 79
Philippines ............................................................................................................................................................... 80
Portugal ................................................................................................................................................................... 81
Russia ...................................................................................................................................................................... 82
Saudi Arabia ............................................................................................................................................................ 83
Singapore ................................................................................................................................................................ 84
Slovakia ................................................................................................................................................................... 85
South Africa ............................................................................................................................................................. 86
Spain ........................................................................................................................................................................ 87
Sri Lanka .................................................................................................................................................................. 88
Sudan ....................................................................................................................................................................... 89
Switzerland .............................................................................................................................................................. 90
Taiwan ..................................................................................................................................................................... 91
Thailand ................................................................................................................................................................... 92
United Arab Emirates .............................................................................................................................................. 93
United Kingdom ...................................................................................................................................................... 94
United States ........................................................................................................................................................... 95
Venezuela ................................................................................................................................................................ 96
Vietnam ................................................................................................................................................................... 97
Appendix B: Alberta Exports to US States ($CDN, Millions) ...................................................................................... 101
Appendix C: Alberta Exports to US States Excl. Energy ($CDN, Millions) .................................................................. 102
Appendix D: International Offices ............................................................................................................................. 103
2011InternationalTradeReview
4
Aboutthedata
This publication provides a summary of Alberta’s international trade statistics for 2011, with sections for
exports by industry and exports by region. A profile is also included for each country that imported more
than $20 million of goods from Alberta since 1995, Alberta’s top 20 export products and Canada’s top 10
export products in 2011. Alberta’s exports by each U.S. State, including and excluding energy products,
are also provided.
Because service exports are not currently available for provinces on a country‐specific basis, in this
report “exports” refers only to the export of goods, except in the introductory “Year in Review” section,
which includes an estimate of Alberta’s global services exports. Additionally, “exports” – those grown,
extracted or manufactured in Canada – and does not include “re‐exports” – goods imported into Canada
and minimally processed but not substantially enhanced in value before being exported again.
Most of the trade statistics in this report are based on the international Harmonized System (HS), which
is administered by the World Customs Organization and organizes all traded goods under a
standardized, logically ordered, numeric coding system. This system is used by more than 190 190
countries and forms the basis for customs tariffs, relevant WTO or bilateral free trade negotiations and
international trade statistics. The HS system is used in this report to quantify product‐specific exports.
Sector and industry‐based export statistics in this report, though, are based on the North American
Industry Classification System (NAICS), which was adopted by Canada, the United States and Mexico in
1997 to provide common definitions of the industrial structure of the three countries and a common
statistical framework to facilitate the analysis of the three economies. Because of technical differences
in how trade statistics are tracked with the HS and NAICS systems there may be small differences in
reported exports depending on the system used.
Export data in the country profile tables is presented at the HS 6‐digit level. Product descriptions have
been shortened to fit the space available. Full product descriptions can be found in Statistics Canada’s
“The Canadian Export Classification 2011” at: http://www.statcan.ca/english/tradedata/cec/index.htm.
Statistics Canada is the main source of information on goods trade for this publication. Estimates for
Service exports are developed by Alberta Treasury Board and Enterprise based on special survey’s
conducted by Statistics Canada. Information on GDP growth and forecasts come from the International
Monetary Fund World Economic Outlook (April 2012), unless otherwise noted.

2011InternationalTradeReview
5
TheYearinReview
2011 has seen a continuation of growth since the global economic recession. Alberta’s agricultural;
manufacturing and oil & gas exports all saw a generous increase over the 2010 start to the recovery.
While 2008 still remains a high water mark for Alberta’s exports, Alberta exports have seen positive
growth over the last three years.
In 2011, Alberta exported a total of $101.7 billion worth of goods and services, showing an increase of
17% from the previous year. Exports of merchandise goods from Alberta rose from $78.6 billion in 2010
to $93.1 billion in 2011, up 18%, while service exports increased from $8.2 billion to $8.9 billion, up
8.5%. Alberta’s top export industries were mining and energy, manufacturing (with chemicals, food and
beverage, and machinery again accounting for significant portion), and primary agricultural products.
Alberta goods were imported by 188 countries in 2011. The top five export markets (in order) were the
United States (US), China, Japan, the European Union (EU) and Mexico.
Alberta’s Exports of Goods and Services, 2007‐2011 ($CDN, Millions)
A summary of Alberta’s exports by industry and global regions for 2011 follows.

2011InternationalTradeReview
6
Alberta’sExportsbyIndustry
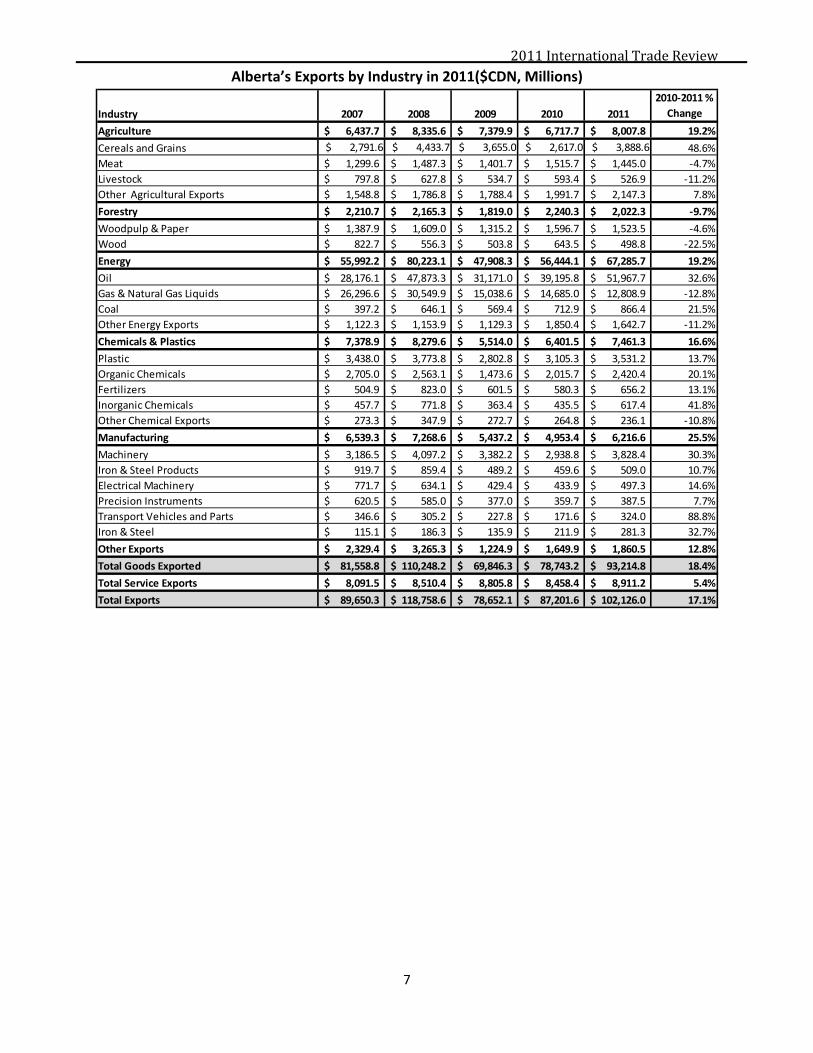
The value of Alberta’s goods exports grew 18% from $78.6 billion in 2010 to $93.1 billion in 2011.Energy
exports grew 19% in 2011, up from $56.4 billion in 2010 to $67.2 billion in 2011. Excluding energy and
mining products, Alberta exported $25.9 billion of other goods, up 16% from the previous year.
Distribution of Alberta’s Exports by Industry in 2011 ($CDN, Millions)
Energy exports totaled $67.2 billion in 2011. Exports from the sector were composed of mostly of crude
oil, worth $51.9 billion (81% of total energy exports), and natural gas, worth $10.9 billion (worth 17% of
the total). Crude oil exports increased 32% from $39.3 billion in 2010; natural gas exports saw a
decrease of 22% from $14.1 billion during the same time period. The value of crude oil and natural gas
exports combined increased 17% from $53.4 billion in 2010 to $62.8 billion in 2011.
Agriculture was Alberta’s second largest export industry in 2011, increasing 19% from $6.7 billion in
2010 to $8.0 billion in 2011. Cereals and Grains were the largest portion of exports in this industry, up
49% from 2010 to $3.8 billion from $2.6 billion in 2010. Meat exports were the second largest portion at
$1.4 billion, followed by livestock which was down 4.7% to $526.9 million in 2011.
Exports of chemicals and plastics were the third largest export sector, up 17% from 2011 to $7.4 billion.
Plastic was the largest contributor in this sector, increasing by 14% to $3.5 billion in 2011 from $3.1
billion in 2010. Organic Chemicals made up the second largest portion of trade in this area, up 20% from
$2.0 billion in 2010 to $2.4 billion in 2011.
2011InternationalTradeReview
7
Alberta’s Exports by Industry in 2011($CDN, Millions)
Industry 2007 2008 2009 2010 2011
2010‐2011 %
Change
Agriculture 6,437.7$ 8,335.6$ 7,379.9$ 6,717.7$ 8,007.8$ 19.2%
Cereals and Grains $ 2,791.6 $ 4,433.7 $ 3,655.0 $ 2,617.0 $ 3,888.6 48.6%
Meat 1,299.6$ 1,487.3$ 1,401.7$ 1,515.7$ 1,445.0$ ‐4.7%
Livestock 797.8$ 627.8$ 534.7$ 593.4$ 526.9$ ‐11.2%
Other Agricultural Exports 1,548.8$ 1,786.8$ 1,788.4$ 1,991.7$ 2,147.3$ 7.8%
Forestry 2,210.7$ 2,165.3$ 1,819.0$ 2,240.3$ 2,022.3$ ‐9.7%
Woodpulp & Paper 1,387.9$ 1,609.0$ 1,315.2$ 1,596.7$ 1,523.5$ ‐4.6%
Wood 822.7$ 556.3$ 503.8$ 643.5$ 498.8$ ‐22.5%
Energy 55,992.2$ 80,223.1$ 47,908.3$ 56,444.1$ 67,285.7$ 19.2%
Oil 28,176.1$ 47,873.3$ 31,171.0$ 39,195.8$ 51,967.7$ 32.6%
Gas & Natural Gas Liquids 26,296.6$ 30,549.9$ 15,038.6$ 14,685.0$ 12,808.9$ ‐12.8%
Coal 397.2$ 646.1$ 569.4$ 712.9$ 866.4$ 21.5%
Other Energy Exports 1,122.3$ 1,153.9$ 1,129.3$ 1,850.4$ 1,642.7$ ‐11.2%
Chemicals & Plastics 7,378.9$ 8,279.6$ 5,514.0$ 6,401.5$ 7,461.3$ 16.6%
Plastic 3,438.0$ 3,773.8$ 2,802.8$ 3,105.3$ 3,531.2$ 13.7%
Organic Chemicals 2,705.0$ 2,563.1$ 1,473.6$ 2,015.7$ 2,420.4$ 20.1%
Fertilizers 504.9$ 823.0$ 601.5$ 580.3$ 656.2$ 13.1%
Inorganic Chemicals 457.7$ 771.8$ 363.4$ 435.5$ 617.4$ 41.8%
Other Chemical Exports 273.3$ 347.9$ 272.7$ 264.8$ 236.1$ ‐10.8%
Manufacturing 6,539.3$ 7,268.6$ 5,437.2$ 4,953.4$ 6,216.6$ 25.5%
Machinery 3,186.5$ 4,097.2$ 3,382.2$ 2,938.8$ 3,828.4$ 30.3%
Iron & Steel Products 919.7$ 859.4$ 489.2$ 459.6$ 509.0$ 10.7%
Electrical Machinery 771.7$ 634.1$ 429.4$ 433.9$ 497.3$ 14.6%
Precision Instruments 620.5$ 585.0$ 377.0$ 359.7$ 387.5$ 7.7%
Transport Vehicles and Parts 346.6$ 305.2$ 227.8$ 171.6$ 324.0$ 88.8%
Iron & Steel 115.1$ 186.3$ 135.9$ 211.9$ 281.3$ 32.7%
Other Exports 2,329.4$ 3,265.3$ 1,224.9$ 1,649.9$ 1,860.5$ 12.8%
Total Goods Exported 81,558.8$ 110,248.2$ 69,846.3$ 78,743.2$ 93,214.8$ 18.4%
Total Service Exports 8,091.5$ 8,510.4$ 8,805.8$ 8,458.4$ 8,911.2$ 5.4%
Total Exports 89,650.3$ 118,758.6$ 78,652.1$ 87,201.6$ 102,126.0$ 17.1%
2011InternationalTradeReview
8
Agriculture,FoodandBeverages
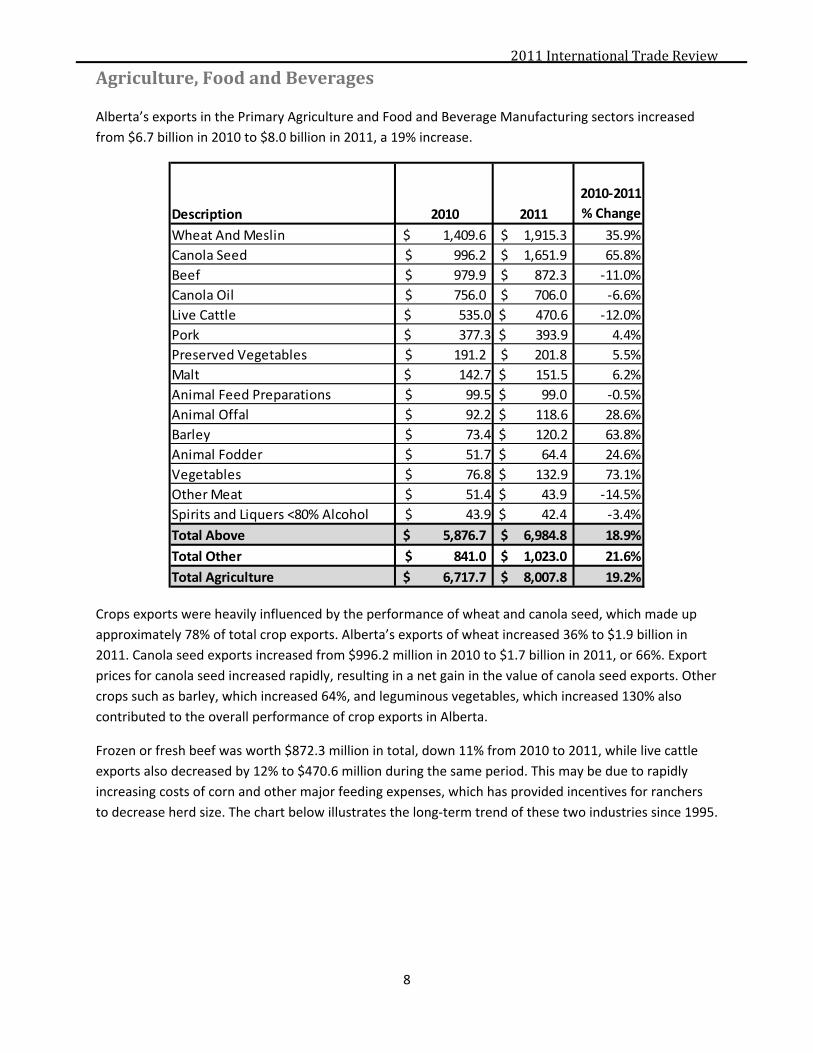
Alberta’s exports in the Primary Agriculture and Food and Beverage Manufacturing sectors increased
from $6.7 billion in 2010 to $8.0 billion in 2011, a 19% increase.
Crops exports were heavily influenced by the performance of wheat and canola seed, which made up
approximately 78% of total crop exports. Alberta’s exports of wheat increased 36% to $1.9 billion in
2011. Canola seed exports increased from $996.2 million in 2010 to $1.7 billion in 2011, or 66%. Export
prices for canola seed increased rapidly, resulting in a net gain in the value of canola seed exports. Other
crops such as barley, which increased 64%, and leguminous vegetables, which increased 130% also
contributed to the overall performance of crop exports in Alberta.
Frozen or fresh beef was worth $872.3 million in total, down 11% from 2010 to 2011, while live cattle
exports also decreased by 12% to $470.6 million during the same period. This may be due to rapidly
increasing costs of corn and other major feeding expenses, which has provided incentives for ranchers
to decrease herd size. The chart below illustrates the long‐term trend of these two industries since 1995.
Description 2010 2011
2010‐2011
% Change
Wheat And Meslin 1,409.6$ 1,915.3$ 35.9%
Canola Seed 996.2$ 1,651.9$ 65.8%
Beef 979.9$ 872.3$ ‐11.0%
Canola Oil 756.0$ 706.0$ ‐6.6%
Live Cattle $ 535.0 $ 470.6 ‐12.0%
Pork $ 377.3 $ 393.9 4.4%
Preserved Vegetables 191.2$ 201.8$ 5.5%
Malt $ 142.7 $ 151.5 6.2%
Animal Feed Preparations $ 99.5 $ 99.0 ‐0.5%
Animal Offal $ 92.2 $ 118.6 28.6%
Barley $ 73.4 $ 120.2 63.8%
Animal Fodder $ 51.7 $ 64.4 24.6%
Vegetables $ 76.8 $ 132.9 73.1%
Other Meat $ 51.4 $ 43.9 ‐14.5%
Spirits and Liquers <80% Alcohol $ 43.9 $ 42.4 ‐3.4%
Total Above 5,876.7$ 6,984.8$ 18.9%
Total Other 841.0$ 1,023.0$ 21.6%
Total Agriculture 6,717.7$ 8,007.8$ 19.2%

2011InternationalTradeReview
9
Alberta’s Exports of Live Cattle and Fresh and Frozen Beef 1995‐2011 ($CDN, Millions)

2011InternationalTradeReview
10
Energy
Mining and energy exports, which account for the largest portion of Alberta’s exports, saw an increase
of 19% in 2011 to $67.9 billion from $56.8 billion in 2010. Mining exports were once again diversified in
their destination markets in 2010, with the United States and China accounting for 57%. Once again,
98% of Alberta’s energy exports were destined for the US.
Alberta’s Energy and Mining Sector Exports in 2011 ($CDN, Millions)
Crude oil exports grew 32% from 2010 to $51.9 billion in 2011, the average price
of crude oil increased by 15% over the same time period. Exports of natural gas
further declined from 2010 by 14% to $10.9 billion in 2011. The following table
shows price, volume and value data for Alberta’s exports of crude oil and natural
gas exports in 2010 and 2011.
Alberta’s Exports of Energy by Quantity, Price and Value
Alberta’s Exports of Energy in 2011 ($CDN, Billions)
Description 2010 2011
2010‐2011 %
Change
Crude Oil 39,320.4$ 51,967.7$ 32%
Natural Gas,Gaseous 12,944.6$ 10,901.9$ ‐16%
Coal 706.1$ 866.4$ 23%
Other Energy 3,924.9$ 4,187.8$ 7%
Energy 56,896.1$ 67,923.8$ 19%
Description 2010 2011
2010‐2011 %
Change
Quantity (cubic metres) 84021954 96,718,745.0$ 15.1%
Average Price ($/cubic metre) 468 537.3$ 14.8%
Value ($CDN, Millions) 39320 51,967.7$ 32.2%
Quantity (thousands of cubic metres) 78114548 75,335,409.0$ ‐3.6%
Average Price ($/thousands of cubic metres) 163 144.7$ ‐11.3%
Value ($CDN, Millions) 12745 10,901.9$ ‐14.5%
Natural Gas (Gaseous)
Crude Oil
2011InternationalTradeReview
11
Coal exports grew 23% in value from 2010 to 2011, reaching $866.3 million. In 2011, Japan was the
largest market for Alberta’s coal products and consumed $251.0 million of the total, up 14% from 2010.
The second largest market for Alberta’s coal in 2011 was South Korea at $198.9 million. The United
States ranked third at $195.8 million.

2011InternationalTradeReview
12
ChemicalsandPlastics
Chemical exports from Alberta increased 17%, from $6.4 billion to $7.54 billion in 2011. Chemical
exports can be subdivided into several categories: ethylene‐based exports/plastics, organic chemicals,
fertilizers, and inorganic chemicals.
Alberta’s Chemical and Plastic Exports in 2011 ($CDN, Millions)
Plastic exports from Alberta to the world totaled $3.5 billion in 2011, up from $3.1 billion in 2010. The
U.S. consumed $3.1 billion of Alberta’s plastic exports in 2011, showing no growth since 2010 when they
also consumed $3.1 billion. Mexico followed the U.S. as the second largest importer of plastics growing
17% in 2011 to $140.2 million from $119.8 million in 2010. Our third largest market of exports from
Alberta in 2011 was China; the Chinese have been decreasing their imports of plastic from Alberta since
2006. In 2011 exports to China further decreased by 21% in to $95.5 million from $120.9 million in 2010.
Organic chemicals ranked as Alberta’s second largest chemical and plastics export in 2011. Organic
chemicals accounted for $2.4 billion worth of exports, up 20% from $2.0 billion in 2010. Exports of
organic chemicals to the US, the largest market for Alberta’s chemicals, expanded 21% from 2010 to
2011, from $1.5 billion to $1.7 billion. China absorbed the $511.2 million in 2011, up 19% from 429.2 in
2010. Within the organic chemicals category, exports of ethylene glycol (antifreeze) accounted for $1.4
Description 2010 2011
2010‐2011 %
Change
Plastic 3,105.3$ 3,531.2$ 14%
Ethylene Polymers 1,798.9$ 1,998.8$ 11%
Polyethylethe specific gravity >= 0.94 574.1$ 734.4$ 28%
Polyethylethe specific gravity < 0.94 326.9$ 330.7$ 1%
Vinyl Acetate 160.7$ 165.8$ 3%
Other Plastics 244.7$ 301.5$ 23%
Organic Chemicals 2,015.7$ 2,420.4$ 20%
Ethylene Glycol 1,117.4$ 1,435.8$ 28%
Styrene 386.4$ 452.0$ 17%
Acyclic Hydrocarbons, Unsaturated 189.1$ 182.5$ ‐3%
Acyclic Hydrocarbons, Saturated 148.1$ 103.0$ ‐30%
Other Organic Chemicals 174.6$ 247.1$ 41%
Fertilizers 580.3$ 656.2$ 13%
Urea 436.7$ 483.2$ 11%
Ammonium Nitrate 58.4$ 63.0$ 8%
Other Fertilizers 85.2$ 110.0$ 29%
Inorganic Chemicals 435.5$ 617.4$ 42%
Anhydrous Ammonia 357.1$ 522.3$ 46%
Carbon Blacks 56.7$ 63.2$ 11%
Other Inorganic Chemicals 21.7$ 31.9$ 47%
Other Chemicals and Plastics 264.7$ 236.1$ ‐11%
Total Chemicals and Plastics 6,401.5$ 7,461.3$ 17%

2011InternationalTradeReview
13
billion of the total in 2011, up from $1.1 billion in 2010. The largest market for ethylene glycol was the
U.S. at $812.8 million, followed by China at $509.0 million. Other significant exports included styrene
($452.0 million) and acyclic hydrocarbons ($285.5 million). Both exports were destined almost entirely
to the U.S.
Alberta’s exports of fertilizers, such as urea and ammonium nitrate, were worth $656.2 million in 2011,
up 13%, from $580.3 million in 2010. Exports of fertilizers where mostly destined for the United States,
which absorbed 97% of the total ($637.4 million).
Inorganic chemical exports grew 42% from $435.5 million in 2010 to $617.4 million in 2011. Anhydrous
ammonia accounted for the bulk of inorganic exports in 2011 at $522.3 million in 2011, up from $357.1
million in 2010. The U.S. was the most significant export destination of inorganic chemicals, at 92%.
2011InternationalTradeReview
14
Manufacturing
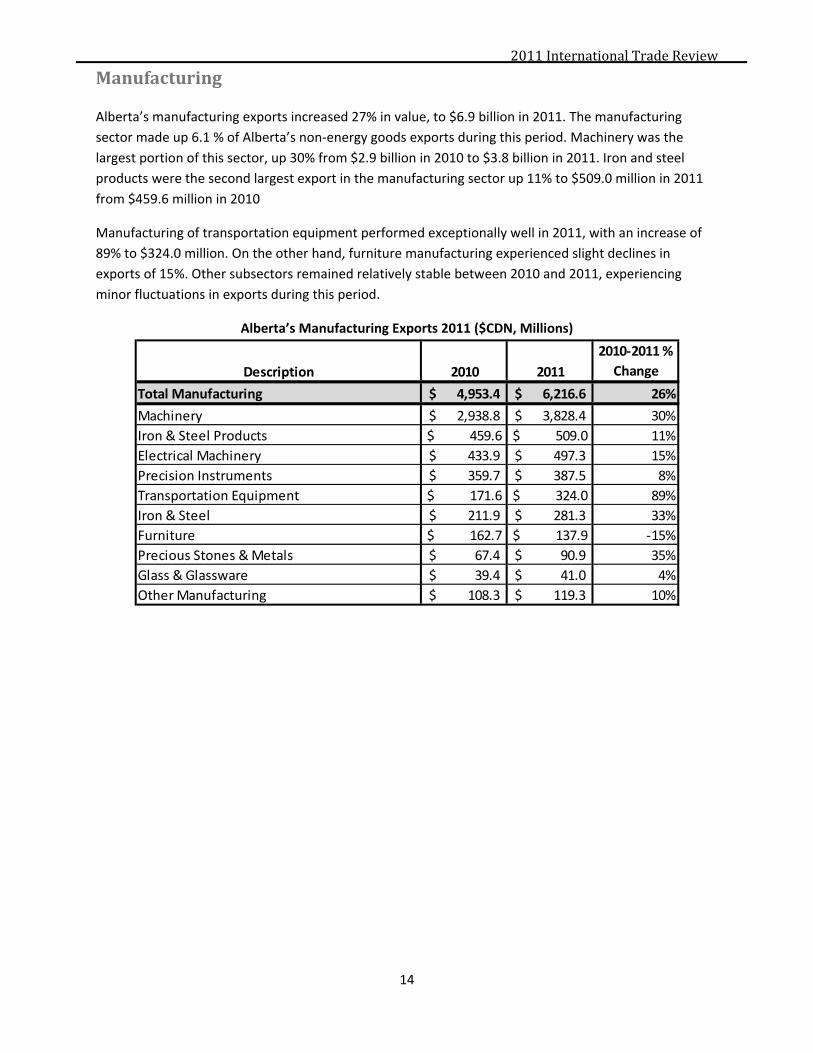
Alberta’s manufacturing exports increased 27% in value, to $6.9 billion in 2011. The manufacturing
sector made up 6.1 % of Alberta’s non‐energy goods exports during this period. Machinery was the
largest portion of this sector, up 30% from $2.9 billion in 2010 to $3.8 billion in 2011. Iron and steel
products were the second largest export in the manufacturing sector up 11% to $509.0 million in 2011
from $459.6 million in 2010
Manufacturing of transportation equipment performed exceptionally well in 2011, with an increase of
89% to $324.0 million. On the other hand, furniture manufacturing experienced slight declines in
exports of 15%. Other subsectors remained relatively stable between 2010 and 2011, experiencing
minor fluctuations in exports during this period.
Alberta’s Manufacturing Exports 2011 ($CDN, Millions)
Description 2010 2011
2010‐2011 %
Change
Total Manufacturing 4,953.4$ 6,216.6$ 26%
Machinery 2,938.8$ 3,828.4$ 30%
Iron & Steel Products $ 459.6 $ 509.0 11%
Electrical Machinery 433.9$ 497.3$ 15%
Precision Instruments 359.7$ 387.5$ 8%
Transportation Equipment $ 171.6 $ 324.0 89%
Iron & Steel 211.9$ 281.3$ 33%
Furniture $ 162.7 $ 137.9 ‐15%
Precious Stones & Metals 67.4$ 90.9$ 35%
Glass & Glassware 39.4$ 41.0$ 4%
Other Manufacturing 108.3$ 119.3$ 10%
2011InternationalTradeReview
15
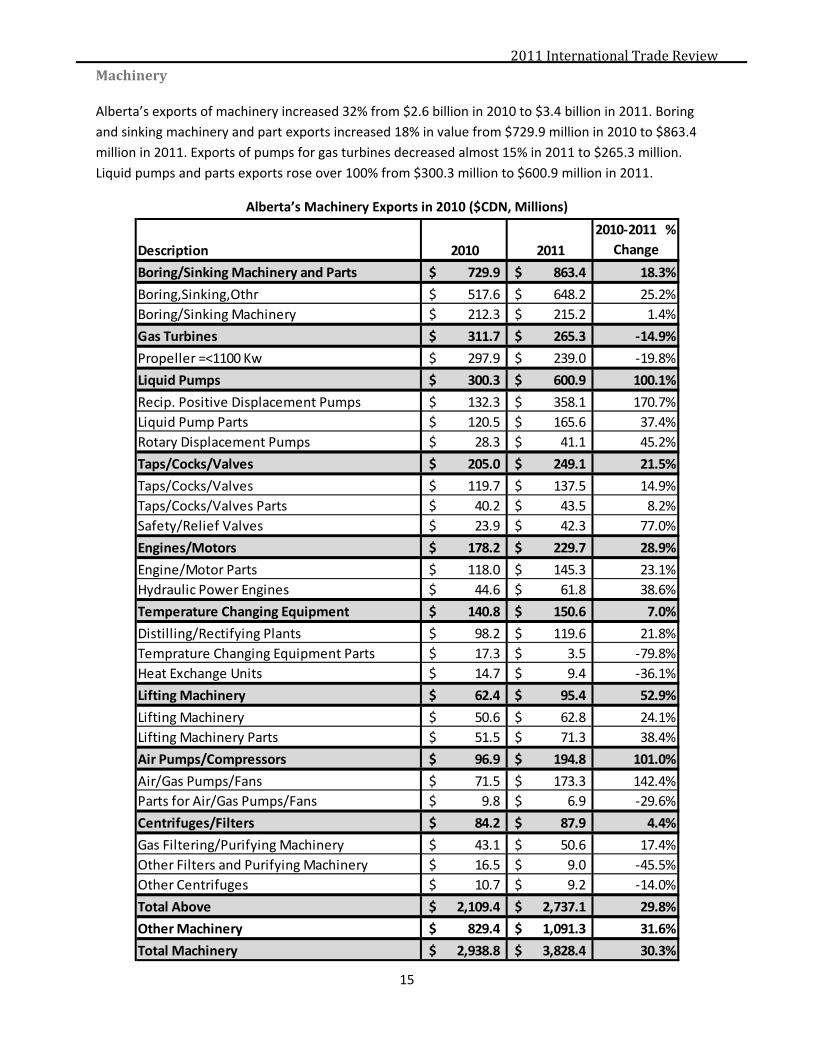
Machinery
Alberta’s exports of machinery increased 32% from $2.6 billion in 2010 to $3.4 billion in 2011. Boring
and sinking machinery and part exports increased 18% in value from $729.9 million in 2010 to $863.4
million in 2011. Exports of pumps for gas turbines decreased almost 15% in 2011 to $265.3 million.
Liquid pumps and parts exports rose over 100% from $300.3 million to $600.9 million in 2011.
Alberta’s Machinery Exports in 2010 ($CDN, Millions)
Description 2010 2011
2010‐2011 %
Change
Boring/Sinking Machinery and Parts 729.9$ 863.4$ 18.3%
Boring,Sinking,Othr 517.6$ 648.2$ 25.2%
Boring/Sinking Machinery 212.3$ 215.2$ 1.4%
Gas Turbines 311.7$ 265.3$ ‐14.9%
Propeller =<1100 Kw 297.9$ 239.0$ ‐19.8%
Liquid Pumps 300.3$ 600.9$ 100.1%
Recip. Positive Displacement Pumps 132.3$ 358.1$ 170.7%
Liquid Pump Parts 120.5$ 165.6$ 37.4%
Rotary Displacement Pumps 28.3$ 41.1$ 45.2%
Taps/Cocks/Valves 205.0$ 249.1$ 21.5%
Taps/Cocks/Valves 119.7$ 137.5$ 14.9%
Taps/Cocks/Valves Parts 40.2$ 43.5$ 8.2%
Safety/Relief Valves 23.9$ 42.3$ 77.0%
Engines/Motors 178.2$ 229.7$ 28.9%
Engine/Motor Parts 118.0$ 145.3$ 23.1%
Hydraulic Power Engines 44.6$ 61.8$ 38.6%
Temperature Changing Equipment 140.8$ 150.6$ 7.0%
Distilling/Rectifying Plants 98.2$ 119.6$ 21.8%
Temprature Changing Equipment Parts 17.3$ 3.5$ ‐79.8%
Heat Exchange Units 14.7$ 9.4$ ‐36.1%
Lifting Machinery 62.4$ 95.4$ 52.9%
Lifting Machinery 50.6$ 62.8$ 24.1%
Lifting Machinery Parts 51.5$ 71.3$ 38.4%
Air Pumps/Compressors 96.9$ 194.8$ 101.0%
Air/Gas Pumps/Fans 71.5$ 173.3$ 142.4%
Parts for Air/Gas Pumps/Fans 9.8$ 6.9$ ‐29.6%
Centrifuges/Filters 84.2$ 87.9$ 4.4%
Gas Filtering/Purifying Machinery 43.1$ 50.6$ 17.4%
Other Filters and Purifying Machinery 16.5$ 9.0$ ‐45.5%
Other Centrifuges 10.7$ 9.2$ ‐14.0%
Total Above 2,109.4$ 2,737.1$ 29.8%
Other Machinery 829.4$ 1,091.3$ 31.6%
Total Machinery 2,938.8$ 3,828.4$ 30.3%

2011InternationalTradeReview
16
The destinations for Alberta’s machinery exports were diversified in 2011. While the U.S. absorbed 65%
of all machinery exports from Alberta, there were significant exports to Russia (4.7%), China (3.9%) and
Australia (3.0%). It should also be noted that South Korea, which had absorbed 3.4% of Alberta’s
machinery exports in 2010, absorbed only 0.7% in 2011. In 2010, South Korea ranked as Alberta’s third
largest destination for machinery exports, while in 2011 it ranked seventeenth. Overall, machinery
exports worth $2.0 million or more were sent to 66 countries in 2011, up from 58 countries in 2010.
2011InternationalTradeReview
17
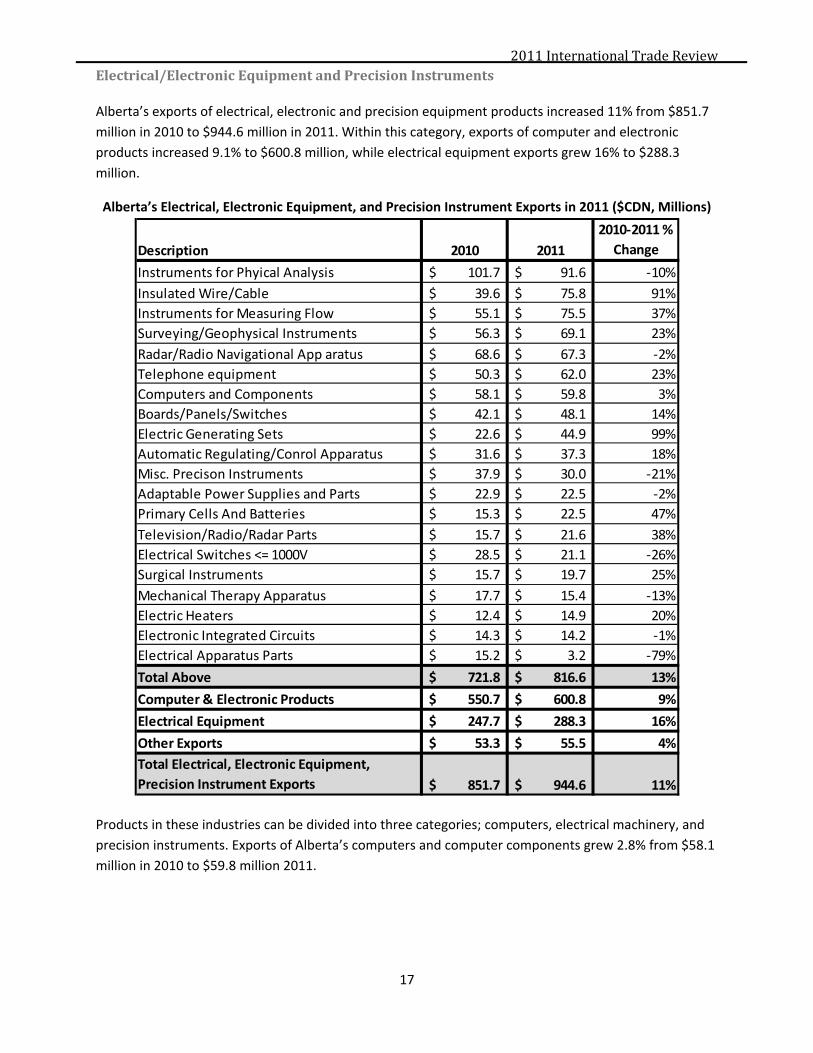
Electrical/ElectronicEquipmentandPrecisionInstruments
Alberta’s exports of electrical, electronic and precision equipment products increased 11% from $851.7
million in 2010 to $944.6 million in 2011. Within this category, exports of computer and electronic
products increased 9.1% to $600.8 million, while electrical equipment exports grew 16% to $288.3
million.
Alberta’s Electrical, Electronic Equipment, and Precision Instrument Exports in 2011 ($CDN, Millions)
Products in these industries can be divided into three categories; computers, electrical machinery, and
precision instruments. Exports of Alberta’s computers and computer components grew 2.8% from $58.1
million in 2010 to $59.8 million 2011.
Description 2010 2011
2010‐2011 %
Change
Instruments for Phyical Analysis 101.7$ 91.6$ ‐10%
Insulated Wire/Cable 39.6$ 75.8$ 91%
Instruments for Measuring Flow 55.1$ 75.5$ 37%
Surveying/Geophysical Instruments 56.3$ 69.1$ 23%
Radar/Radio Navigational App aratus 68.6$ 67.3$ ‐2%
Telephone equipment 50.3$ 62.0$ 23%
Computers and Components 58.1$ 59.8$ 3%
Boards/Panels/Switches 42.1$ 48.1$ 14%
Electric Generating Sets 22.6$ 44.9$ 99%
Automatic Regulating/Conrol Apparatus 31.6$ 37.3$ 18%
Misc. Precison Instruments 37.9$ 30.0$ ‐21%
Adaptable Power Supplies and Parts 22.9$ 22.5$ ‐2%
Primary Cells And Batteries 15.3$ 22.5$ 47%
Television/Radio/Radar Parts 15.7$ 21.6$ 38%
Electrical Switches <= 1000V 28.5$ 21.1$ ‐26%
Surgical Instruments 15.7$ 19.7$ 25%
Mechanical Therapy Apparatus 17.7$ 15.4$ ‐13%
Electric Heaters 12.4$ 14.9$ 20%
Electronic Integrated Circuits 14.3$ 14.2$ ‐1%
Electrical Apparatus Parts 15.2$ 3.2$ ‐79%
Total Above 721.8$ 816.6$ 13%
Computer & Electronic Products 550.7$ 600.8$ 9%
Electrical Equipment 247.7$ 288.3$ 16%
Other Exports 53.3$ 55.5$ 4%
Total Electrical, Electronic Equipment,
Precision Instrument Exports 851.7$ 944.6$ 11%
2011InternationalTradeReview
18
Forestry
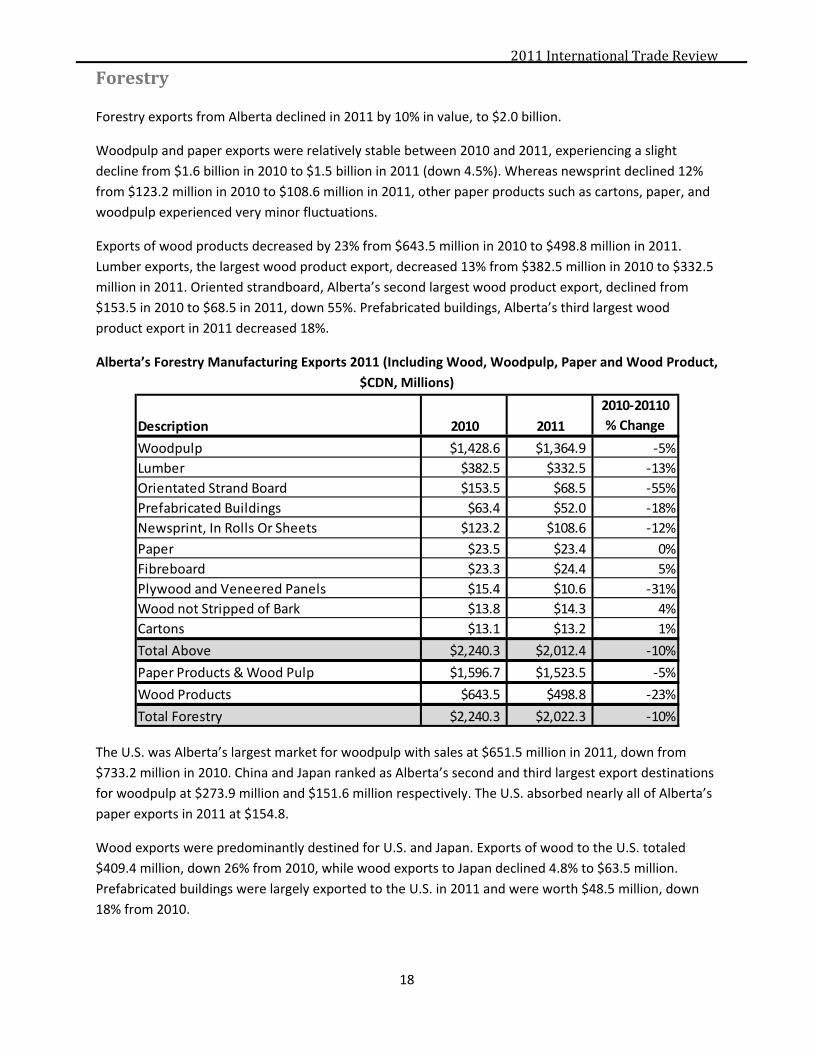
Forestry exports from Alberta declined in 2011 by 10% in value, to $2.0 billion.
Woodpulp and paper exports were relatively stable between 2010 and 2011, experiencing a slight
decline from $1.6 billion in 2010 to $1.5 billion in 2011 (down 4.5%). Whereas newsprint declined 12%
from $123.2 million in 2010 to $108.6 million in 2011, other paper products such as cartons, paper, and
woodpulp experienced very minor fluctuations.
Exports of wood products decreased by 23% from $643.5 million in 2010 to $498.8 million in 2011.
Lumber exports, the largest wood product export, decreased 13% from $382.5 million in 2010 to $332.5
million in 2011. Oriented strandboard, Alberta’s second largest wood product export, declined from
$153.5 in 2010 to $68.5 in 2011, down 55%. Prefabricated buildings, Alberta’s third largest wood
product export in 2011 decreased 18%.
Alberta’s Forestry Manufacturing Exports 2011 (Including Wood, Woodpulp, Paper and Wood Product,
$CDN, Millions)
The U.S. was Alberta’s largest market for woodpulp with sales at $651.5 million in 2011, down from
$733.2 million in 2010. China and Japan ranked as Alberta’s second and third largest export destinations
for woodpulp at $273.9 million and $151.6 million respectively. The U.S. absorbed nearly all of Alberta’s
paper exports in 2011 at $154.8.
Wood exports were predominantly destined for U.S. and Japan. Exports of wood to the U.S. totaled
$409.4 million, down 26% from 2010, while wood exports to Japan declined 4.8% to $63.5 million.
Prefabricated buildings were largely exported to the U.S. in 2011 and were worth $48.5 million, down
18% from 2010.
Description 2010 2011
2010‐20110
% Change
Woodpulp $1,428.6 $1,364.9 ‐5%
Lumber $382.5 $332.5 ‐13%
Orientated Strand Board $153.5 $68.5 ‐55%
Prefabricated Buildings $63.4 $52.0 ‐18%
Newsprint, In Rolls Or Sheets $123.2 $108.6 ‐12%
Paper $23.5 $23.4 0%
Fibreboard $23.3 $24.4 5%
Plywood and Veneered Panels $15.4 $10.6 ‐31%
Wood not Stripped of Bark $13.8 $14.3 4%
Cartons $13.1 $13.2 1%
Total Above $2,240.3 $2,012.4 ‐10%
Paper Products & Wood Pulp $1,596.7 $1,523.5 ‐5%
Wood Products $643.5 $498.8 ‐23%
Total Forestry $2,240.3 $2,022.3 ‐10%

2011InternationalTradeReview
19
OtherExports
Alberta’s other exports grew 13% in 2011 from $1.6 billion in 2010 to $1.8 billion in 2011. This area has
seen slow but steady recovery since dropping off in 2009 by 62%.
Other Exports from Alberta ($CDN, Millions)
The largest export in this category for Alberta is unwrought nickel, used primarily in the production of
stainless steel and other corrosion resistant alloys. Exports of unwrought nickel increased by 6% in 2011,
up from $698.3 million in 2010 to $743.3 million in 2011. The largest importer of Alberta’s nickel was the
Netherlands at $379.3 million in 2011, followed by China who imported $174.3 million worth and Italy at
$49.1 million.
The second largest export was sulfur, which increased by 41% to $638 million in 2011 from $451.9
million in exports in 2010. Sulfur, which is a byproduct of the oil and natural gas industries, benefited
from another year of increases in the average price in 2011. China ($172.8 million), The United States
($171.9 million), and Australia ($94.0 million) were the most significant export markets for Alberta’s
sulfur in 2011.
Cobalt was the third largest export at $175.7 million in 2011, down 11% from $196.6 million in 2010.
Cobalt is used in a variety of items including magnets, ceramics, special glasses, and tools. Aluminum
also fell in 2011, down 3.4% from $103.4 million to $99.9 million.
Description 2010 2011
2010‐2011 %
Change
Other Exports 1,649.9$ 1,860.5$ 12.8%
Unwrought Nickel 698.3$ 743.3$ 6.4%
Sulfur 452.0$ 638.2$ 41.2%
Cobalt 196.6$ 175.7$ ‐10.6%
Aluminum 103.4$ 99.9$ ‐3.4%
Copper 28.9$ 29.2$ 1.0%
All Other 377.47$ 374.04$ ‐0.9%

2011InternationalTradeReview
20
Alberta’sExportsbyRegion
As is the norm, the North American Free Trade Agreement countries continued to be Alberta’s largest
export market in 2011 ($81.7 billion). The United States consumed $80.7 billion of Alberta’s exports,
with energy the dominant export product. Overall energy exports accounted for $66.1 billion to the US,
approximately 82% of total exports. Alberta’s exports in the North Asia region, increased from $5.2
billion in 2010 to $5.9 billion in 2011, 6.3% of Alberta’s total exports. Exports to the South Asia &
Oceania region increased 21% from $1.2 billion in 2010 to $1.4 billion in 2011, equaling 1.5% of our total
exports. The exports consumed by the Europe region increased by 27% in 2011, up from $1.6 billion in
2010 to $2.1 billion in 2011, accounting for approximately 2.2% of our total exports. The following is a
report on Alberta’s exports by region with key countries for each region highlighted. Please see the
Market Profiles in the Appendix for detailed export statistics on individual countries.
Alberta’s Exports by Region in 2011 ($CDN, Millions)
Description 2010 2011
% Change
2010‐2011
2011 Share
of Exports
Share of Non‐
U.S. Exports
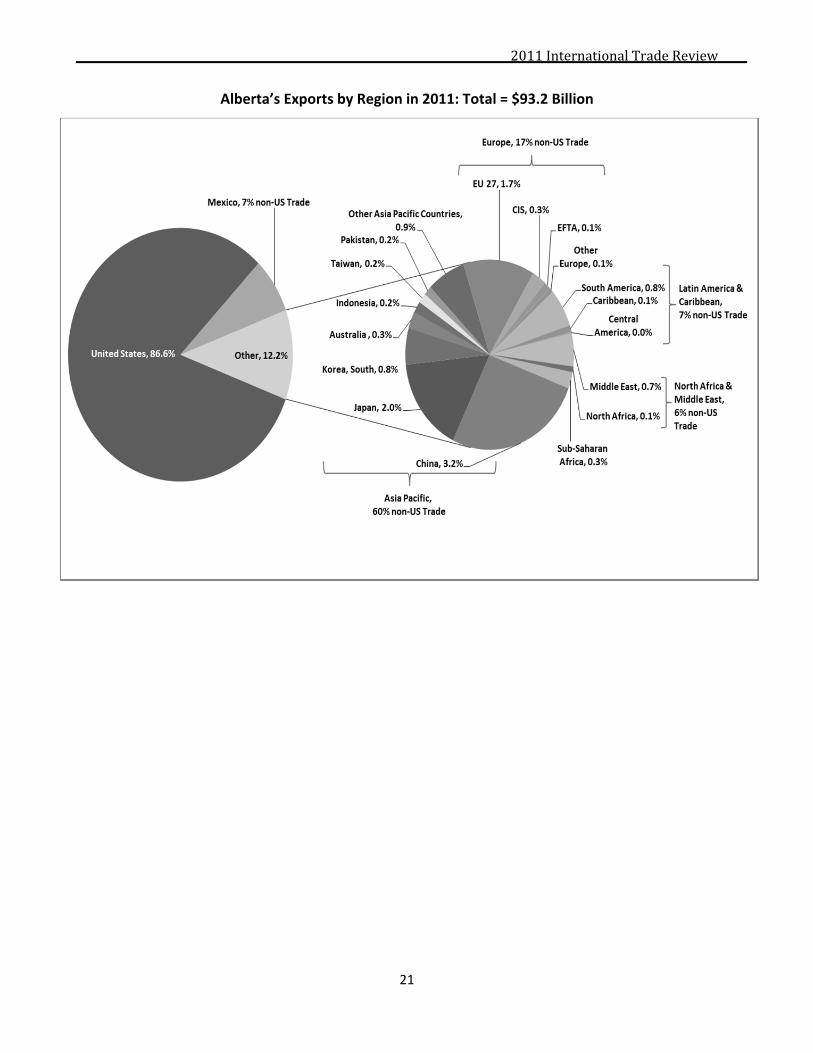
NAFTA 69,017.1$ 81,686.1$ 18.4% 87.6% ‐
United States 68,273.1$ 80,749.7$ 18.3% 86.6% ‐
Mexico 744.0$ 936.4$ 25.9% 1.0% 7.5%
Asia Pacific 6,492.6$ 7,449.2$ 14.7% 8.0% 59.8%
China 2,838.2$ 2,998.3$ 5.6% 3.2% 24.1%
Japan 1,472.4$ 1,832.3$ 24.4% 2.0% 14.7%
Korea, South 537.7$ 707.3$ 31.5% 0.8% 5.7%
Australia 267.0$ 319.1$ 19.5% 0.3% 2.6%
Indonesia 143.4$ 227.2$ 58.4% 0.2% 1.8%
Taiwan 190.0$ 187.6$ ‐1.3% 0.2% 1.5%
Pakistan 107.1$ 175.2$ 63.6% 0.2% 1.4%
Bangladesh 140.9$ 161.6$ 14.7% 0.2% 1.3%
Other Asia Pacific Countries 795.9$ 840.7$ 5.6% 0.9% 6.7%
Europe & CIS 1,649.1$ 2,095.9$ 27.1% 2.2% 16.8%
EU 27 1,151.9$ 1,548.6$ 34.4% 1.7% 12.4%
CIS 310.0$ 315.1$ 1.6% 0.3% 2.5%
EFTA 119.7$ 138.0$ 15.3% 0.1% 1.1%
Other Europe 67.5$ 94.2$ 39.6% 0.1% 0.8%
Latin America & Caribbean 670.4$ 905.0$ 35.0% 1.0% 7.3%
South America 552.2$ 739.9$ 34.0% 0.8% 5.9%
Caribbean 96.8$ 130.9$ 35.3% 0.1% 1.1%
Central America 24.2$ 35.4$ 46.5% 0.0% 0.3%
North Africa & Middle East 668.0$ 740.2$ 10.8% 0.8% 5.9%
Middle East 514.2$ 633.2$ 23.1% 0.7% 5.1%
North Africa 153.8$ 107.1$ ‐30.4% 0.1% 0.9%
Sub‐Saharan Africa 223.2$ 311.1$ 39.4% 0.3% 2.5%
Total Exports to the World 78,743.2$ 93,214.8$ 18.4% 100.0% ‐
2011InternationalTradeReview
21
Alberta’s Exports by Region in 2011: Total = $93.2 Billion
2011InternationalTradeReview
22
NorthAmerica
North America is Alberta’s largest trade region and accounted for 88% of total Alberta exports in 2011.
Merchandise exports to NAFTA partners were valued at $81.7 billion, up 18% from 2010. 99% of
Alberta’s North American exports were destined for the US.
Energy products accounted for 82% of Alberta’s exports to North America, $66.8 billion. Crude oil made
up 63% ($51.6 billion, up 32% from 2010) of energy exports in 2011 while natural gas accounted for 13%
($10.9 billion, down 14%). Calcined petroleum coke, light oils and coal made up the remainder. Most of
Alberta’s energy exports to NAFTA countries were destined for the US.
UnitedStates
The U.S. was Alberta’s single largest trading partner in 2011 at $80.7 billion (88% of Alberta’s total
exports). With exports oriented heavily to that market, Alberta is particularly susceptible to U.S.
economic performance relative to that of other countries. The U.S. economy growth did slow in 2011 as
expected, however was growing at a rate of 1.7% as opposed to the predicted 1.5%.1
Energy was the largest sector to the U.S. in 2011. Exports of energy increased by 19% in 2011, from
$55.5 billion in 2010 to $66.1 billion in 2011. Higher prices and larger export volumes contributed to the
growth of energy exports from 2010 to 2011**. Overall, the quantity of crude oil exports, the largest
export product to the US, grew 19% from 2010 to 2011, while the price of crude oil increased 15%. The
value of crude oil exports to the U.S. rose from $39.1 billion in 2010 to $51.5 billion in 2011, a 32%
increase. Natural gas was Alberta’s second largest export to the US, despite shrinking 14% from $12.7
billion to $10.9 billion in 2011. Liquefied propane exports grew 16%, from $1.5 billion to $1.7 billion
during the same period. Energy prices are still recovering from the dip in 2009, and while a return to
price levels in 2008 are unlikely, the price for crude oil is expected to increase in 2012.
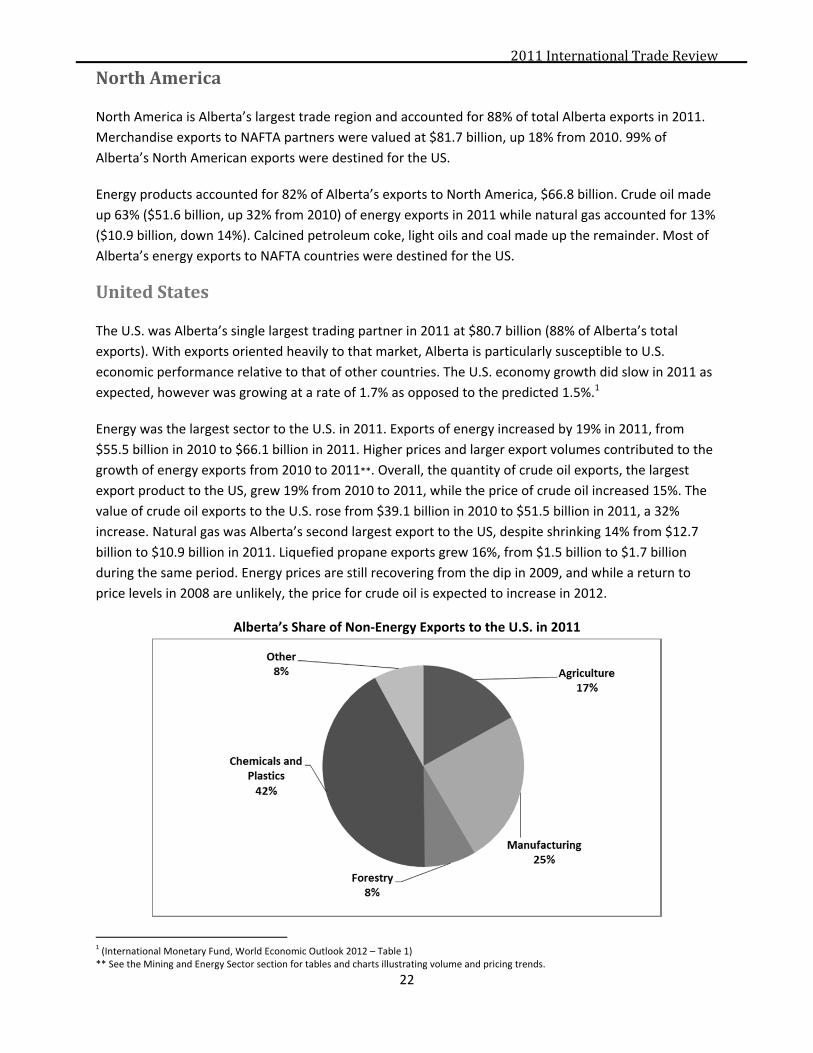
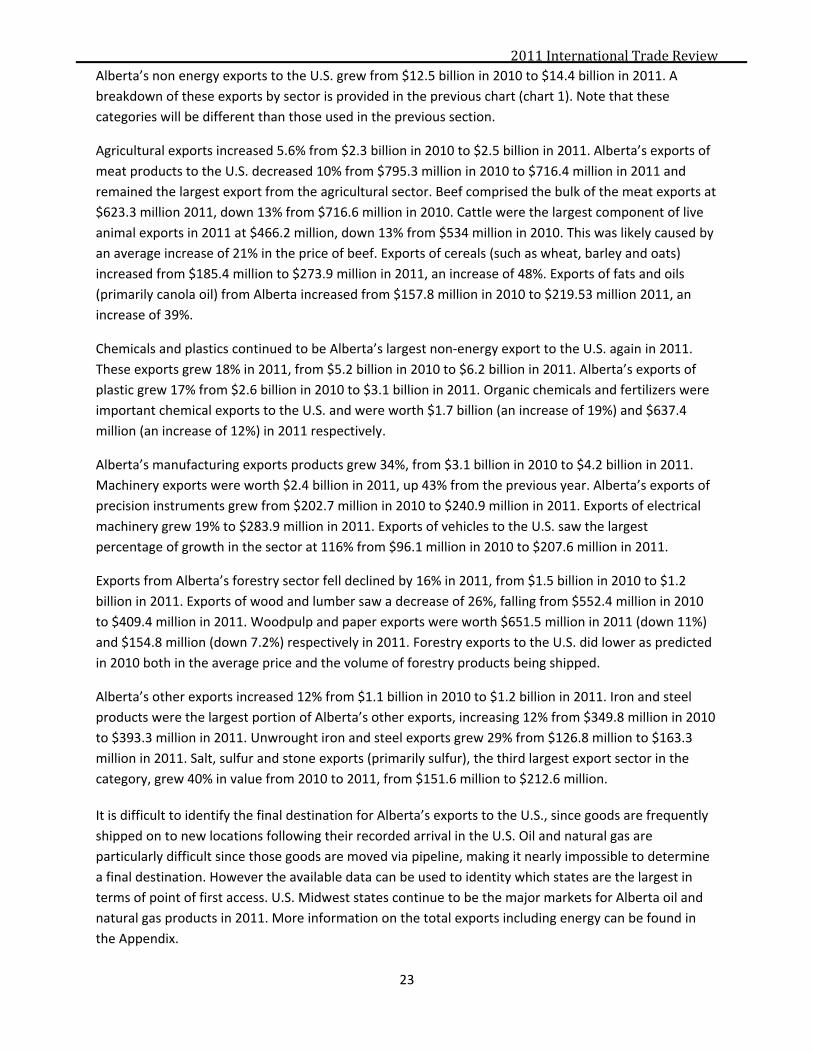
Alberta’s Share of Non‐Energy Exports to the U.S. in 2011
1 (International Monetary Fund, World Economic Outlook 2012 – Table 1) ** See the Mining and Energy Sector section for tables and charts illustrating volume and pricing trends.
2011InternationalTradeReview
23
Alberta’s non energy exports to the U.S. grew from $12.5 billion in 2010 to $14.4 billion in 2011. A
breakdown of these exports by sector is provided in the previous chart (chart 1). Note that these
categories will be different than those used in the previous section.
Agricultural exports increased 5.6% from $2.3 billion in 2010 to $2.5 billion in 2011. Alberta’s exports of
meat products to the U.S. decreased 10% from $795.3 million in 2010 to $716.4 million in 2011 and
remained the largest export from the agricultural sector. Beef comprised the bulk of the meat exports at
$623.3 million 2011, down 13% from $716.6 million in 2010. Cattle were the largest component of live
animal exports in 2011 at $466.2 million, down 13% from $534 million in 2010. This was likely caused by
an average increase of 21% in the price of beef. Exports of cereals (such as wheat, barley and oats)
increased from $185.4 million to $273.9 million in 2011, an increase of 48%. Exports of fats and oils
(primarily canola oil) from Alberta increased from $157.8 million in 2010 to $219.53 million 2011, an
increase of 39%.
Chemicals and plastics continued to be Alberta’s largest non‐energy export to the U.S. again in 2011.
These exports grew 18% in 2011, from $5.2 billion in 2010 to $6.2 billion in 2011. Alberta’s exports of
plastic grew 17% from $2.6 billion in 2010 to $3.1 billion in 2011. Organic chemicals and fertilizers were
important chemical exports to the U.S. and were worth $1.7 billion (an increase of 19%) and $637.4
million (an increase of 12%) in 2011 respectively.
Alberta’s manufacturing exports products grew 34%, from $3.1 billion in 2010 to $4.2 billion in 2011.
Machinery exports were worth $2.4 billion in 2011, up 43% from the previous year. Alberta’s exports of
precision instruments grew from $202.7 million in 2010 to $240.9 million in 2011. Exports of electrical
machinery grew 19% to $283.9 million in 2011. Exports of vehicles to the U.S. saw the largest
percentage of growth in the sector at 116% from $96.1 million in 2010 to $207.6 million in 2011.
Exports from Alberta’s forestry sector fell declined by 16% in 2011, from $1.5 billion in 2010 to $1.2
billion in 2011. Exports of wood and lumber saw a decrease of 26%, falling from $552.4 million in 2010
to $409.4 million in 2011. Woodpulp and paper exports were worth $651.5 million in 2011 (down 11%)
and $154.8 million (down 7.2%) respectively in 2011. Forestry exports to the U.S. did lower as predicted
in 2010 both in the average price and the volume of forestry products being shipped.
Alberta’s other exports increased 12% from $1.1 billion in 2010 to $1.2 billion in 2011. Iron and steel
products were the largest portion of Alberta’s other exports, increasing 12% from $349.8 million in 2010
to $393.3 million in 2011. Unwrought iron and steel exports grew 29% from $126.8 million to $163.3
million in 2011. Salt, sulfur and stone exports (primarily sulfur), the third largest export sector in the
category, grew 40% in value from 2010 to 2011, from $151.6 million to $212.6 million.
It is difficult to identify the final destination for Alberta’s exports to the U.S., since goods are frequently
shipped on to new locations following their recorded arrival in the U.S. Oil and natural gas are
particularly difficult since those goods are moved via pipeline, making it nearly impossible to determine
a final destination. However the available data can be used to identity which states are the largest in
terms of point of first access. U.S. Midwest states continue to be the major markets for Alberta oil and
natural gas products in 2011. More information on the total exports including energy can be found in
the Appendix.
2011InternationalTradeReview
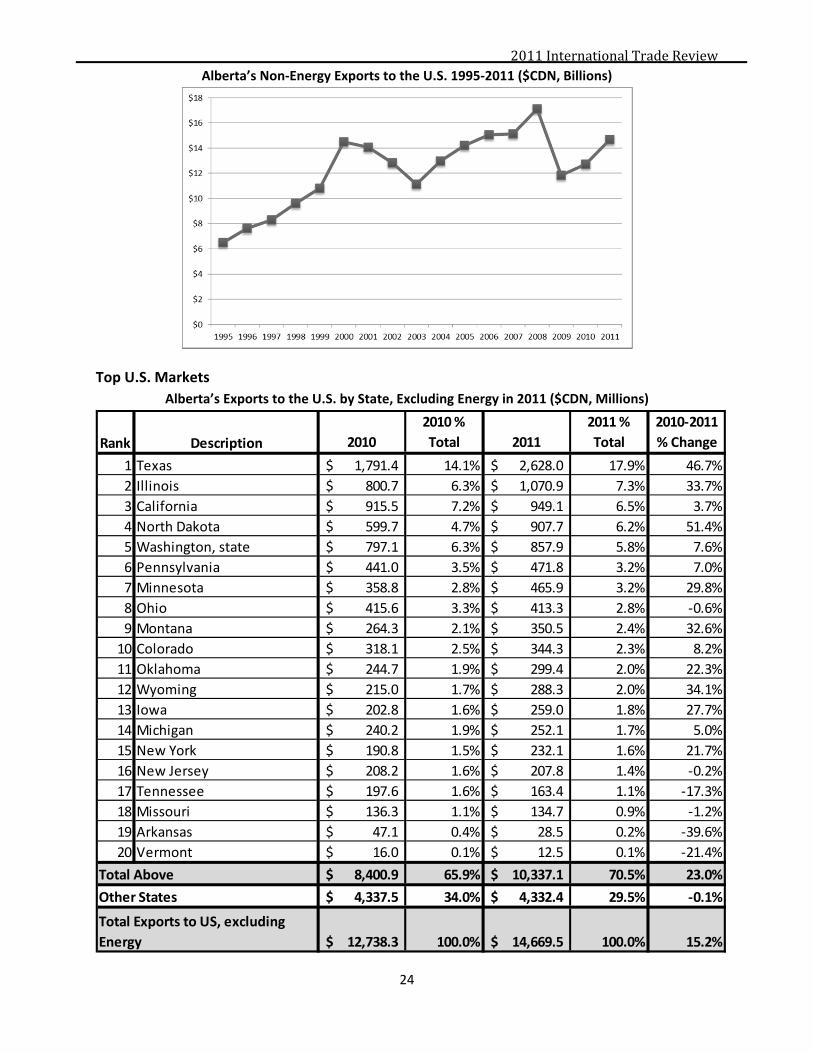
24
Alberta’s Non‐Energy Exports to the U.S. 1995‐2011 ($CDN, Billions)
Top U.S. Markets
Alberta’s Exports to the U.S. by State, Excluding Energy in 2011 ($CDN, Millions)
Rank Description 2010
2010 %
Total 2011
2011 %
Total
2010‐2011
% Change
1 Texas 1,791.4$ 14.1% 2,628.0$ 17.9% 46.7%
2 Illinois 800.7$ 6.3% 1,070.9$ 7.3% 33.7%
3 California 915.5$ 7.2% 949.1$ 6.5% 3.7%
4 North Dakota 599.7$ 4.7% 907.7$ 6.2% 51.4%
5 Washington, state 797.1$ 6.3% 857.9$ 5.8% 7.6%
6 Pennsylvania 441.0$ 3.5% 471.8$ 3.2% 7.0%
7 Minnesota 358.8$ 2.8% 465.9$ 3.2% 29.8%
8 Ohio 415.6$ 3.3% 413.3$ 2.8% ‐0.6%
9 Montana 264.3$ 2.1% 350.5$ 2.4% 32.6%
10 Colorado 318.1$ 2.5% 344.3$ 2.3% 8.2%
11 Oklahoma 244.7$ 1.9% 299.4$ 2.0% 22.3%
12 Wyoming 215.0$ 1.7% 288.3$ 2.0% 34.1%
13 Iowa 202.8$ 1.6% 259.0$ 1.8% 27.7%
14 Michigan 240.2$ 1.9% 252.1$ 1.7% 5.0%
15 New York 190.8$ 1.5% 232.1$ 1.6% 21.7%
16 New Jersey 208.2$ 1.6% 207.8$ 1.4% ‐0.2%
17 Tennessee 197.6$ 1.6% 163.4$ 1.1% ‐17.3%
18 Missouri 136.3$ 1.1% 134.7$ 0.9% ‐1.2%
19 Arkansas 47.1$ 0.4% 28.5$ 0.2% ‐39.6%
20 Vermont 16.0$ 0.1% 12.5$ 0.1% ‐21.4%
8,400.9$ 65.9% 10,337.1$ 70.5% 23.0%
4,337.5$ 34.0% 4,332.4$ 29.5% ‐0.1%
12,738.3$ 100.0% 14,669.5$ 100.0% 15.2%
Total Above
Other States
Total Exports to US, excluding
Energy

2011InternationalTradeReview
25
Excluding oil and natural gas exports (and excluding the U.S. as a whole), Texas continues to be Alberta’s
second largest global export market after China, at $2.6 billion in 2011. Illinois ranked as Alberta’s 4th
largest market for non‐energy exports after Japan, followed by California, Mexico and North Dakota.
Alberta’s exports (excluding oil and gas) to Texas, the largest in the market in the United States, grew
47% to $2.6 billion in 2011, up from $1.7 billion in 2010. Machinery, mostly oil and natural gas
equipment and parts, was the largest export product to Texas from Alberta and accounted for $1.1
billion, up 72% from 2010 levels. Plastic was the second largest export to Texas in 2011, growing 61%
from $297.4 million in 2010 to $478.0 million in 2011. Organic chemicals ranked as Alberta’s third
largest non‐energy export to Texas at $399.0 million up 15% to from 2010.
Non‐energy exports to Illinois increased 34% from $800.7 million in 2010 to $1.1 billion in 2011.
Alberta’s largest exports to Illinois were organic chemicals ($406.7 million, up 28%), plastic ($329.6
million, up 71%), and meat ($51.6 million, no growth in 2011).
California was Alberta’s third largest U.S. market for non‐energy exports and accounted for $949.1
million in 2011, up 3.7% from $915.5 million in 2010. Meat exports were the largest exports to
California, accounting for $254.6 million in 2011, down 6% from 2010. Plastic made up the second
largest export, up 7.3% from $156.9 million in 2010 to $168.4 million in 2011. The third largest export
category to California was Machinery, up 48% from $63.2 million in 2010 to $93.7 million in 2011.
Alberta’s exports to North Dakota, the fourth largest non‐energy U.S. market, grew 51% from $599.7
million in 2010 to $907.7 million in 2011. Machinery exports, largely the type used for the development
of oil and gas increased 142%, from $94.4 million in 2010 to $228.7 million in 2011. Fertilizers and
inorganic chemicals were the second and third largest commodities exported to the state, at $172.4
million in 2011 and $131.42 million respectively. Miscellaneous grain, seed (mostly canola) and fruit,
was the fourth largest export. Exports of the commodity grew 75% from $70.4 million in 2010 to $123.3
million in 2011.
Mexico
Mexico’s economy grew 3.9%2 in 2011, and is expected to grow in the near future by 4.0% in 2012, and
3.5% in 2013. However, similar to Canada, Mexico is heavily reliant on the U.S. as a market for goods
and continuing uncertainty in the U.S. could impact economic growth.
Alberta’s exports to Mexico increased by 26% from $744.0 million in 2010 to $936.4 million in 2011.
Canola seed was the largest export from Alberta to Mexico and totalled $301.6 million, up 56% from
$192.9 million in 2010. Alberta’s exports of cereals grew 55% from $72.5 million in 2010 to $112.7
million in 2011. Plastic exports grew 17% from $119.8 million in 2010 to $139.8 million in 2011. Meat
exports saw further decreases in 2011, down 15% from $162.3 million in 2010 to $138.6 million in 2011.
Machinery exports, mostly boring or sinking machinery parts, grew a modest 12% from $33.4 million
2010 to $37.3 million in 2011, still down significantly from 2009 volumes.
2 International Monetary Fund (IMF), World Economic Outlook 2012.

2011InternationalTradeReview
26
AsiaPacific
The Asia Pacific region was the next largest regional market for Alberta goods after North America.
Exports to the region grew in 2011 owing to strong continued growth in the region’s economies
throughout the year3. Growth is expected to continue; however, some uncertainty still remains in the
marketplace.
Alberta’s Exports to the Asia‐Pacific in 2011 ($CDN, Millions)
Overall, real GDP varied substantially in the region in 2011, from ‐0.7% (Japan) to 17.3% (Mongolia).
China’s GDP is expected to grow in 2012 by 8.0% and 8.5% in 2013, while India is expected to increase
6.1% and 6.5% respectively. Japan’s GDP saw a decline at a growth rate of ‐0.7%, but is projected to see
a growth rate of 2.5% in 2012 and 1.5% in 2013. The South Korean economy grew 3.6% and is expected
to grow at a steady pace by 3.5% in 2012 and 3.9% in 2013. Australia’s GDP grew 2.0% in 2011 and is
projected to see continued growth at a rate of 3.0% in 2012 and 3.5% in 2013.
3 International Monetary Fund (IMF), World Economic Outlook Database.
Rank Country/Region 2009 2010 2011
% Change
2010‐2011
2011 Regional
Share
1 China 2,706.50$ 2,838.19$ 2,998.29$ 5.6% 40.2%
2 Japan 1,491.32$ 1,472.42$ 1,832.28$ 24.4% 24.6%
3 Korea, South 532.73$ 537.71$ 707.25$ 31.5% 9.5%
4 Australia 250.03$ 266.97$ 319.13$ 19.5% 4.3%
5 Indonesia 178.30$ 143.37$ 227.16$ 58.4% 3.0%
6 Taiwan 156.64$ 190.01$ 187.58$ ‐1.3% 2.5%
7 Pakistan 83.83$ 107.13$ 175.25$ 63.6% 2.4%
8 Bangladesh 120.44$ 140.90$ 161.58$ 14.7% 2.2%
9 Singapore 218.8$ 150.8$ 151.88$ 0.7% 2.0%
10 Hong Kong 99.22$ 146.90$ 141.77$ ‐3.5% 1.9%
11 India 121.58$ 66.45$ 116.69$ 75.6% 1.6%
12 Sri Lanka 99.05$ 86.14$ 96.53$ 12.1% 1.3%
13 Thailand 78.5$ 65.2$ 84.63$ 29.8% 1.1%
14 Malaysia 60.0$ 88.0$ 74.41$ ‐15.5% 1.0%
15 New Zealand 47.6$ 70.6$ 66.00$ ‐6.5% 0.9%
16 Philippines 90.7$ 59.2$ 59.28$ 0.1% 0.8%
17 Vietnam 21.41$ 29.21$ 27.81$ ‐4.8% 0.4%
18 Mongolia 0.68$ 1.79$ 10.13$ 465.1% 0.1%
19 Papua New Guinea 1.4$ 1.7$ 5.80$ 251.5% 0.1%
20 Brunei Darussalam 2.3$ 8.8$ 1.67$ ‐81.0% 0.0%
6,361.15$ 6,471.44$ 7,445.12$ 15.0% 99.9%
30.48$ 21.16$ 4.08$ ‐80.7% 0.1%
6,391.63$ 6,492.60$ 7,449.21$ 14.7% 100.0%
Total Above
Other Exports
Asia Pacific
2011InternationalTradeReview
27
At the time of this report, Canada has recently begun negotiating its inclusion into the Trans‐Pacific
Partnership (TPP). The TPP is a regional free trade agreement that will include Australia, Brunei, Chile,
Malaysia, Mexico, New Zealand, Peru, Singapore, the U.S., and Vietnam and may include Japan. This is a
good opportunity for Canada to address a number of outstanding trade issues with the U.S. and further
integrate into the global economy.
Canada has also been pursuing free trade negotiations in the region, notably the Canada‐South Korea
Free Trade Agreement (FTA), which has continued to be dormant. Negotiations started with India on a
Comprehensive Economic Partnership Agreement (CEPA) in November 2010. Canada and Japan have
also recently begun negotiating an Economic Partnership Agreement. .
Exports from Alberta to the Asia‐Pacific region increased by 15% in 2011, up from $6.5 billion in 2010 to
$7.4 billion in 2011. Alberta was the third largest provincial exporter to the region. British Columbia’s
exports to the region grew by 22% from $11.8 billion in 2010 to $14.3 billion in 2011. Ontario was the
second largest exporter to the Asia Pacific in 2011, up 32% to $8.2 billion from $6.2 billion in 2010.
Canada’s exports to the Asia Pacific region grew 25% from $38.0 billion in 2010 to $47.4 billion in 2011.
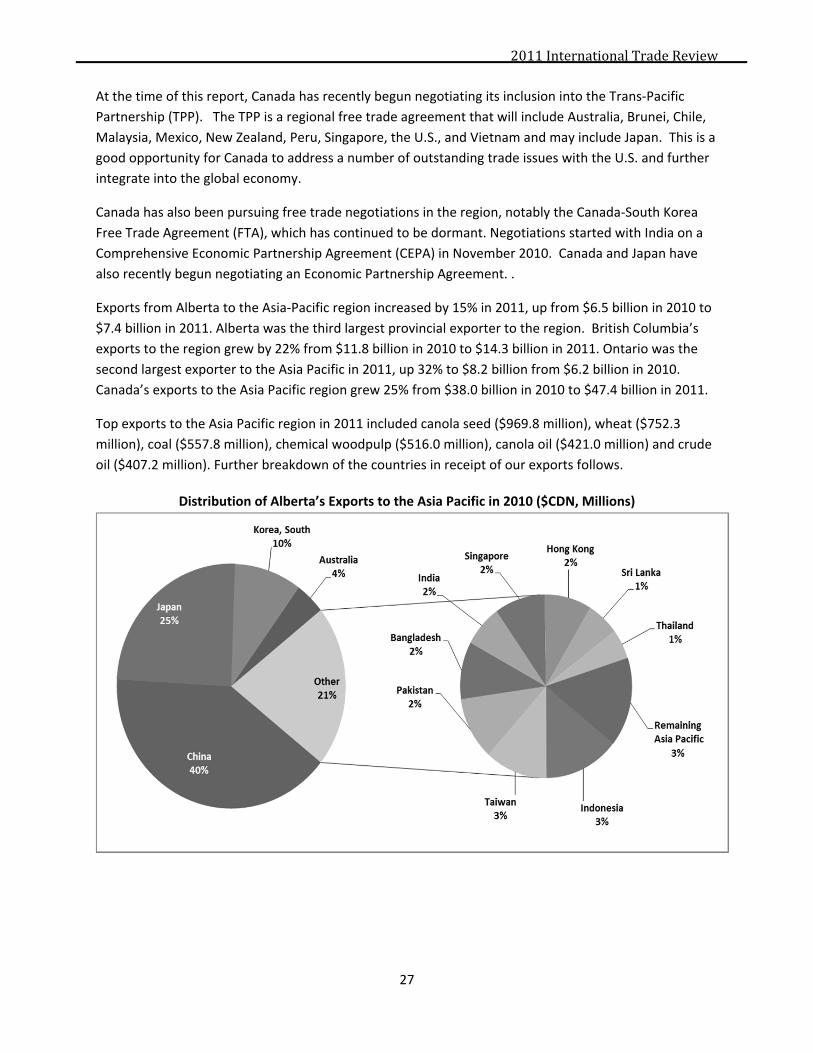
Top exports to the Asia Pacific region in 2011 included canola seed ($969.8 million), wheat ($752.3
million), coal ($557.8 million), chemical woodpulp ($516.0 million), canola oil ($421.0 million) and crude
oil ($407.2 million). Further breakdown of the countries in receipt of our exports follows.
Distribution of Alberta’s Exports to the Asia Pacific in 2010 ($CDN, Millions)
2011InternationalTradeReview
28
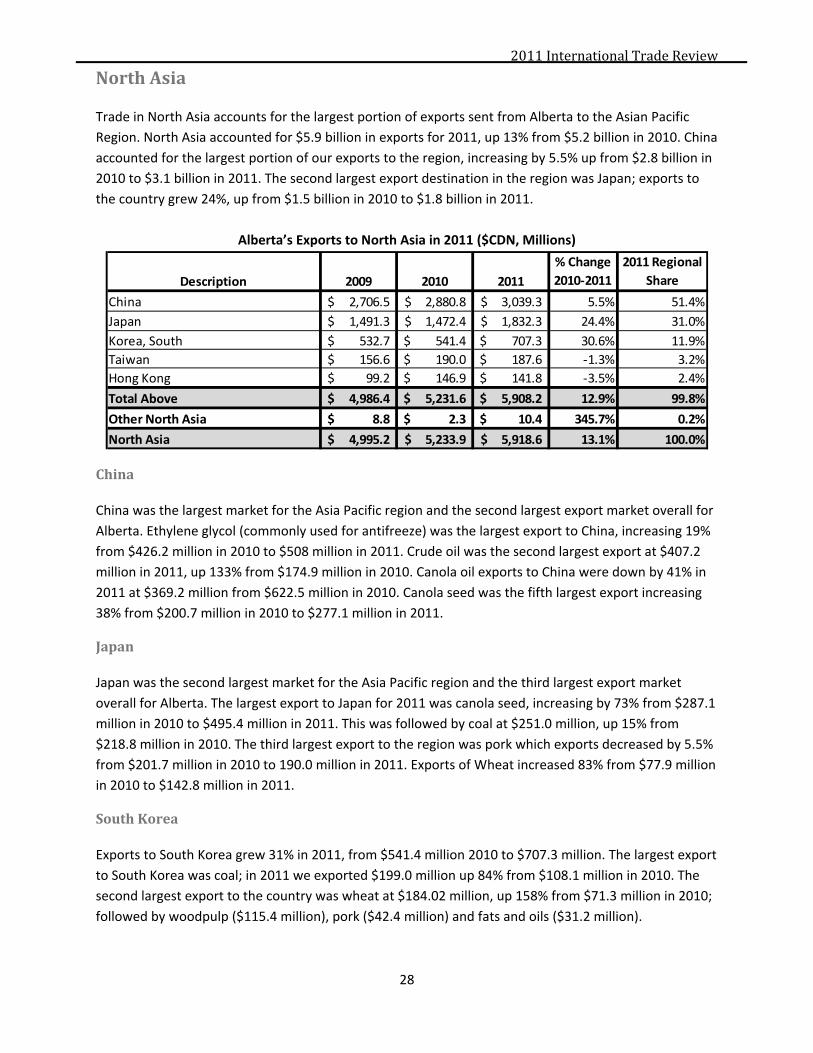
NorthAsia
Trade in North Asia accounts for the largest portion of exports sent from Alberta to the Asian Pacific
Region. North Asia accounted for $5.9 billion in exports for 2011, up 13% from $5.2 billion in 2010. China
accounted for the largest portion of our exports to the region, increasing by 5.5% up from $2.8 billion in
2010 to $3.1 billion in 2011. The second largest export destination in the region was Japan; exports to
the country grew 24%, up from $1.5 billion in 2010 to $1.8 billion in 2011.
Alberta’s Exports to North Asia in 2011 ($CDN, Millions)
China
China was the largest market for the Asia Pacific region and the second largest export market overall for
Alberta. Ethylene glycol (commonly used for antifreeze) was the largest export to China, increasing 19%
from $426.2 million in 2010 to $508 million in 2011. Crude oil was the second largest export at $407.2
million in 2011, up 133% from $174.9 million in 2010. Canola oil exports to China were down by 41% in
2011 at $369.2 million from $622.5 million in 2010. Canola seed was the fifth largest export increasing
38% from $200.7 million in 2010 to $277.1 million in 2011.
Japan
Japan was the second largest market for the Asia Pacific region and the third largest export market
overall for Alberta. The largest export to Japan for 2011 was canola seed, increasing by 73% from $287.1
million in 2010 to $495.4 million in 2011. This was followed by coal at $251.0 million, up 15% from
$218.8 million in 2010. The third largest export to the region was pork which exports decreased by 5.5%
from $201.7 million in 2010 to 190.0 million in 2011. Exports of Wheat increased 83% from $77.9 million
in 2010 to $142.8 million in 2011.
SouthKorea
Exports to South Korea grew 31% in 2011, from $541.4 million 2010 to $707.3 million. The largest export
to South Korea was coal; in 2011 we exported $199.0 million up 84% from $108.1 million in 2010. The
second largest export to the country was wheat at $184.02 million, up 158% from $71.3 million in 2010;
followed by woodpulp ($115.4 million), pork ($42.4 million) and fats and oils ($31.2 million).
Description 2009 2010 2011
% Change
2010‐2011
2011 Regional
Share
China 2,706.5$ 2,880.8$ 3,039.3$ 5.5% 51.4%
Japan 1,491.3$ 1,472.4$ 1,832.3$ 24.4% 31.0%
Korea, South 532.7$ 541.4$ 707.3$ 30.6% 11.9%
Taiwan 156.6$ 190.0$ 187.6$ ‐1.3% 3.2%
Hong Kong 99.2$ 146.9$ 141.8$ ‐3.5% 2.4%
Total Above 4,986.4$ 5,231.6$ 5,908.2$ 12.9% 99.8%
Other North Asia 8.8$ 2.3$ 10.4$ 345.7% 0.2%
North Asia 4,995.2$ 5,233.9$ 5,918.6$ 13.1% 100.0%
2011InternationalTradeReview
29
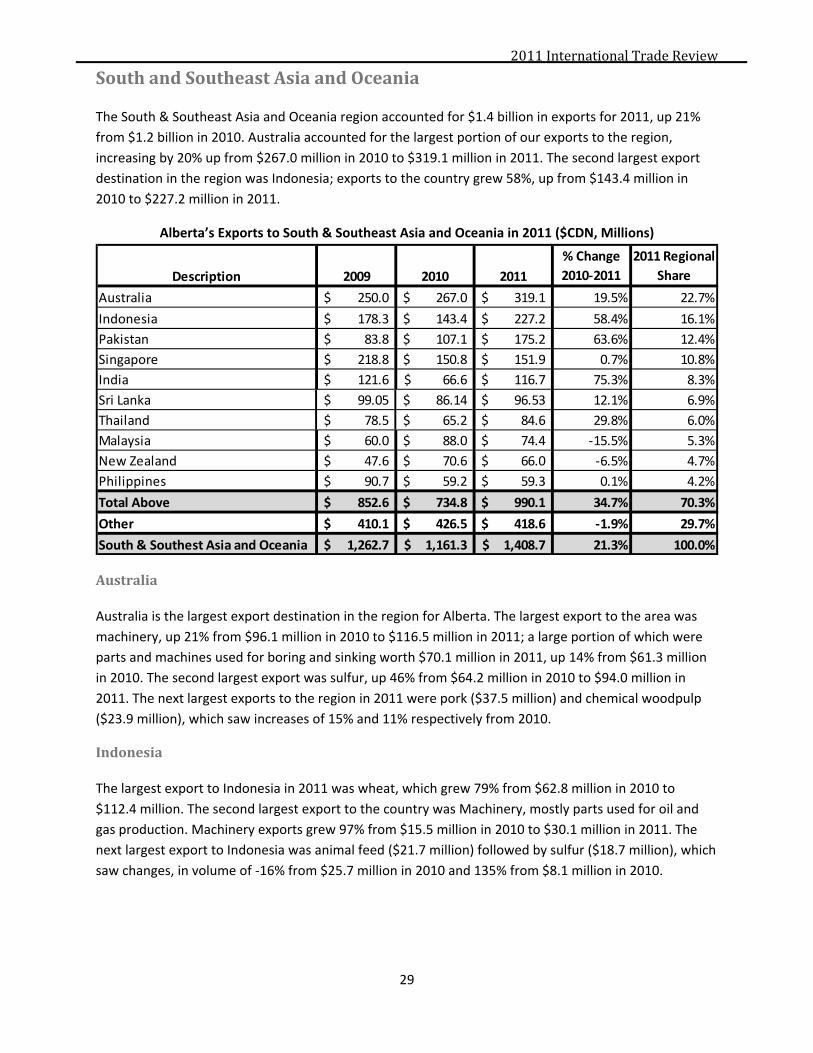
SouthandSoutheastAsiaandOceania
The South & Southeast Asia and Oceania region accounted for $1.4 billion in exports for 2011, up 21%
from $1.2 billion in 2010. Australia accounted for the largest portion of our exports to the region,
increasing by 20% up from $267.0 million in 2010 to $319.1 million in 2011. The second largest export
destination in the region was Indonesia; exports to the country grew 58%, up from $143.4 million in
2010 to $227.2 million in 2011.
Alberta’s Exports to South & Southeast Asia and Oceania in 2011 ($CDN, Millions)
Australia
Australia is the largest export destination in the region for Alberta. The largest export to the area was
machinery, up 21% from $96.1 million in 2010 to $116.5 million in 2011; a large portion of which were
parts and machines used for boring and sinking worth $70.1 million in 2011, up 14% from $61.3 million
in 2010. The second largest export was sulfur, up 46% from $64.2 million in 2010 to $94.0 million in
2011. The next largest exports to the region in 2011 were pork ($37.5 million) and chemical woodpulp
($23.9 million), which saw increases of 15% and 11% respectively from 2010.
Indonesia
The largest export to Indonesia in 2011 was wheat, which grew 79% from $62.8 million in 2010 to
$112.4 million. The second largest export to the country was Machinery, mostly parts used for oil and
gas production. Machinery exports grew 97% from $15.5 million in 2010 to $30.1 million in 2011. The
next largest export to Indonesia was animal feed ($21.7 million) followed by sulfur ($18.7 million), which
saw changes, in volume of ‐16% from $25.7 million in 2010 and 135% from $8.1 million in 2010.
Description 2009 2010 2011
% Change
2010‐2011
2011 Regional
Share
Australia 250.0$ 267.0$ 319.1$ 19.5% 22.7%
Indonesia 178.3$ 143.4$ 227.2$ 58.4% 16.1%
Pakistan 83.8$ 107.1$ 175.2$ 63.6% 12.4%
Singapore 218.8$ 150.8$ 151.9$ 0.7% 10.8%
India 121.6$ 66.6$ 116.7$ 75.3% 8.3%
Sri Lanka 99.05$ 86.14$ 96.53$ 12.1% 6.9%
Thailand 78.5$ 65.2$ 84.6$ 29.8% 6.0%
Malaysia 60.0$ 88.0$ 74.4$ ‐15.5% 5.3%
New Zealand 47.6$ 70.6$ 66.0$ ‐6.5% 4.7%
Philippines 90.7$ 59.2$ 59.3$ 0.1% 4.2%
Total Above 852.6$ 734.8$ 990.1$ 34.7% 70.3%
Other 410.1$ 426.5$ 418.6$ ‐1.9% 29.7%
South & Southest Asia and Oceania 1,262.7$ 1,161.3$ 1,408.7$ 21.3% 100.0%
2011InternationalTradeReview
30
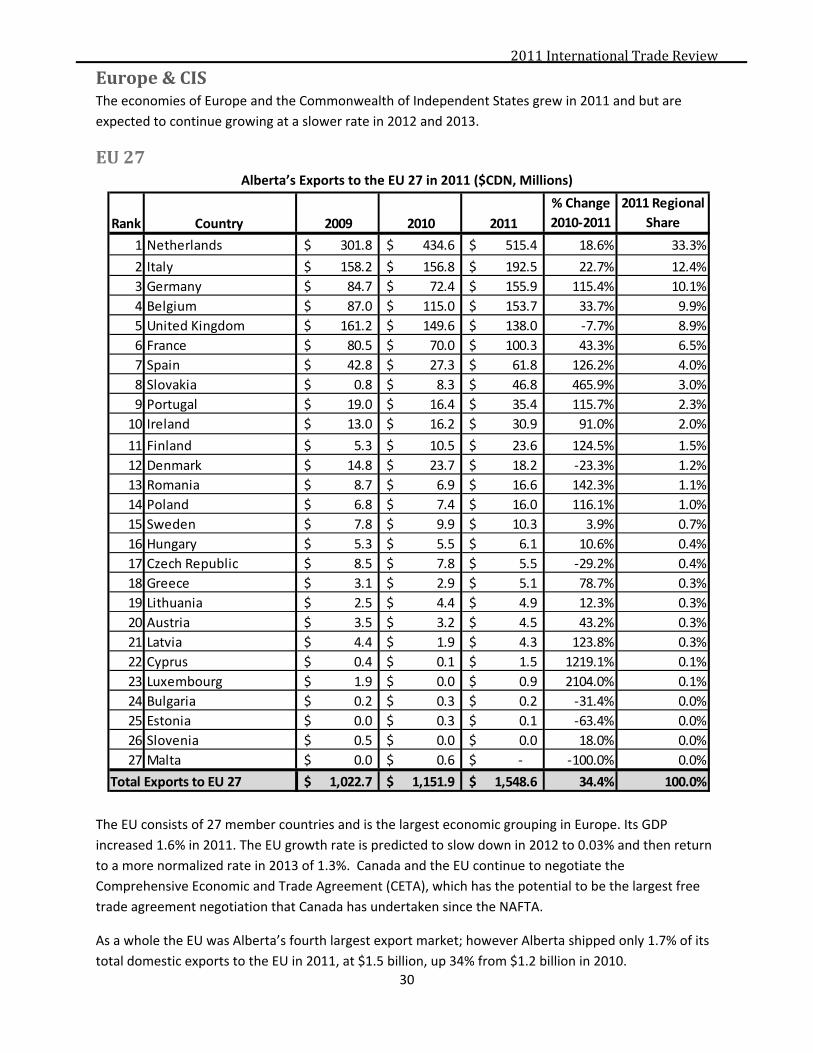
Europe&CISThe economies of Europe and the Commonwealth of Independent States grew in 2011 and but are
expected to continue growing at a slower rate in 2012 and 2013.
EU27Alberta’s Exports to the EU 27 in 2011 ($CDN, Millions)
The EU consists of 27 member countries and is the largest economic grouping in Europe. Its GDP
increased 1.6% in 2011. The EU growth rate is predicted to slow down in 2012 to 0.03% and then return
to a more normalized rate in 2013 of 1.3%. Canada and the EU continue to negotiate the
Comprehensive Economic and Trade Agreement (CETA), which has the potential to be the largest free
trade agreement negotiation that Canada has undertaken since the NAFTA.
As a whole the EU was Alberta’s fourth largest export market; however Alberta shipped only 1.7% of its
total domestic exports to the EU in 2011, at $1.5 billion, up 34% from $1.2 billion in 2010.
Rank Country 2009 2010 2011
% Change
2010‐2011
2011 Regional
Share
1 Netherlands 301.8$ 434.6$ 515.4$ 18.6% 33.3%
2 Italy 158.2$ 156.8$ 192.5$ 22.7% 12.4%
3 Germany 84.7$ 72.4$ 155.9$ 115.4% 10.1%
4 Belgium 87.0$ 115.0$ 153.7$ 33.7% 9.9%
5 United Kingdom 161.2$ 149.6$ 138.0$ ‐7.7% 8.9%
6 France 80.5$ 70.0$ 100.3$ 43.3% 6.5%
7 Spain 42.8$ 27.3$ 61.8$ 126.2% 4.0%
8 Slovakia 0.8$ 8.3$ 46.8$ 465.9% 3.0%
9 Portugal 19.0$ 16.4$ 35.4$ 115.7% 2.3%
10 Ireland 13.0$ 16.2$ 30.9$ 91.0% 2.0%
11 Finland 5.3$ 10.5$ 23.6$ 124.5% 1.5%
12 Denmark 14.8$ 23.7$ 18.2$ ‐23.3% 1.2%
13 Romania 8.7$ 6.9$ 16.6$ 142.3% 1.1%
14 Poland 6.8$ 7.4$ 16.0$ 116.1% 1.0%
15 Sweden 7.8$ 9.9$ 10.3$ 3.9% 0.7%
16 Hungary 5.3$ 5.5$ 6.1$ 10.6% 0.4%
17 Czech Republic 8.5$ 7.8$ 5.5$ ‐29.2% 0.4%
18 Greece 3.1$ 2.9$ 5.1$ 78.7% 0.3%
19 Lithuania 2.5$ 4.4$ 4.9$ 12.3% 0.3%
20 Austria 3.5$ 3.2$ 4.5$ 43.2% 0.3%
21 Latvia 4.4$ 1.9$ 4.3$ 123.8% 0.3%
22 Cyprus 0.4$ 0.1$ 1.5$ 1219.1% 0.1%
23 Luxembourg 1.9$ 0.0$ 0.9$ 2104.0% 0.1%
24 Bulgaria 0.2$ 0.3$ 0.2$ ‐31.4% 0.0%
25 Estonia 0.0$ 0.3$ 0.1$ ‐63.4% 0.0%
26 Slovenia 0.5$ 0.0$ 0.0$ 18.0% 0.0%
27 Malta 0.0$ 0.6$ ‐$ ‐100.0% 0.0%
1,022.7$ 1,151.9$ 1,548.6$ 34.4% 100.0%Total Exports to EU 27
2011InternationalTradeReview
31
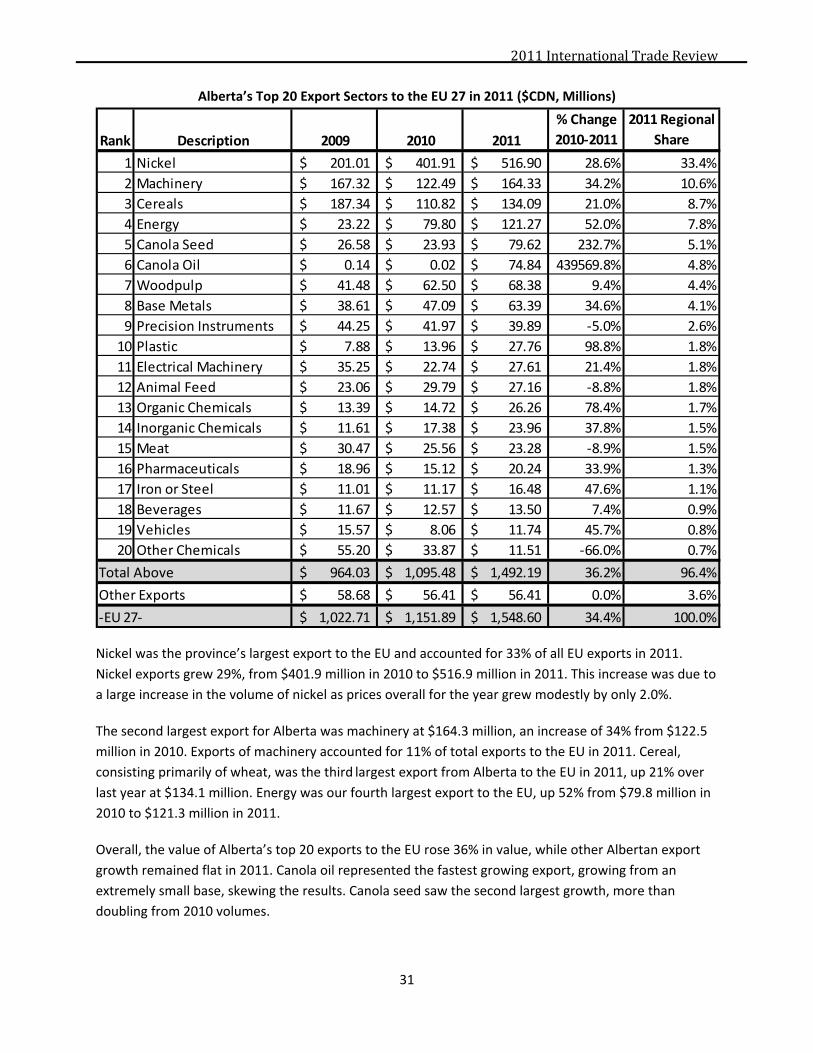
Alberta’s Top 20 Export Sectors to the EU 27 in 2011 ($CDN, Millions)
Nickel was the province’s largest export to the EU and accounted for 33% of all EU exports in 2011.
Nickel exports grew 29%, from $401.9 million in 2010 to $516.9 million in 2011. This increase was due to
a large increase in the volume of nickel as prices overall for the year grew modestly by only 2.0%.
The second largest export for Alberta was machinery at $164.3 million, an increase of 34% from $122.5
million in 2010. Exports of machinery accounted for 11% of total exports to the EU in 2011. Cereal,
consisting primarily of wheat, was the third largest export from Alberta to the EU in 2011, up 21% over
last year at $134.1 million. Energy was our fourth largest export to the EU, up 52% from $79.8 million in
2010 to $121.3 million in 2011.
Overall, the value of Alberta’s top 20 exports to the EU rose 36% in value, while other Albertan export
growth remained flat in 2011. Canola oil represented the fastest growing export, growing from an
extremely small base, skewing the results. Canola seed saw the second largest growth, more than
doubling from 2010 volumes.
Rank Description 2009 2010 2011
% Change
2010‐2011
2011 Regional
Share
1 Nickel 201.01$ 401.91$ 516.90$ 28.6% 33.4%
2 Machinery 167.32$ 122.49$ 164.33$ 34.2% 10.6%
3 Cereals 187.34$ 110.82$ 134.09$ 21.0% 8.7%
4 Energy 23.22$ 79.80$ 121.27$ 52.0% 7.8%
5 Canola Seed 26.58$ 23.93$ 79.62$ 232.7% 5.1%
6 Canola Oil 0.14$ 0.02$ 74.84$ 439569.8% 4.8%
7 Woodpulp 41.48$ 62.50$ 68.38$ 9.4% 4.4%
8 Base Metals 38.61$ 47.09$ 63.39$ 34.6% 4.1%
9 Precision Instruments 44.25$ 41.97$ 39.89$ ‐5.0% 2.6%
10 Plastic 7.88$ 13.96$ 27.76$ 98.8% 1.8%
11 Electrical Machinery 35.25$ 22.74$ 27.61$ 21.4% 1.8%
12 Animal Feed 23.06$ 29.79$ 27.16$ ‐8.8% 1.8%
13 Organic Chemicals 13.39$ 14.72$ 26.26$ 78.4% 1.7%
14 Inorganic Chemicals 11.61$ 17.38$ 23.96$ 37.8% 1.5%
15 Meat 30.47$ 25.56$ 23.28$ ‐8.9% 1.5%
16 Pharmaceuticals 18.96$ 15.12$ 20.24$ 33.9% 1.3%
17 Iron or Steel 11.01$ 11.17$ 16.48$ 47.6% 1.1%
18 Beverages 11.67$ 12.57$ 13.50$ 7.4% 0.9%
19 Vehicles 15.57$ 8.06$ 11.74$ 45.7% 0.8%
20 Other Chemicals 55.20$ 33.87$ 11.51$ ‐66.0% 0.7%
964.03$ 1,095.48$ 1,492.19$ 36.2% 96.4%
58.68$ 56.41$ 56.41$ 0.0% 3.6%
1,022.71$ 1,151.89$ 1,548.60$ 34.4% 100.0%‐EU 27‐
Total Above
Other Exports
2011InternationalTradeReview
32
Historically, the Netherlands, the United Kingdom and Belgium have served as points of entry for
Canadian goods into Europe and do not necessarily represent the final destination for these products.
NetherlandsThe Netherlands was the largest destination for Alberta exports in the EU. Overall, the Netherland’s
economy grew 1.3% in 2011, down from the predicted 1.5%. The International Monetary Fund (IMF) is
predicting a negative growth rate of ‐0.05% for 2012 and a growth of 0.8% in 20124.
Exports to the Netherlands grew by 19% to $515.4 million from 2010 to 2011. Unwrought nickel
remained the dominant export product from Alberta to the Netherlands during this time period. Exports
rose 20% from $317.3 million to $379.3 million during this period. Unwrought nickel accounted for 74%
of exports to the country. The second largest export product to the Netherlands in 2011 was cobalt,
which grew 20% from $26.6 million in 2010 to $31.8 million in 2011. The third largest export was
Woodpulp, up 26% to $23.1 million in 2011.
ItalyThe Real GDP of Italy rose by 0.4% in 2011. Real GDP is expected to shrink here as in many other EU
member countries for 2012. Italy is expected to experience a decrease in growth of ‐1.9% in 2012
followed by ‐0.8% in 20135. Italy was the second largest trading partner for Alberta exports to the EU for
the second year in a row.
Wheat was the most significant export to Italy in 2011, increasing by 8.5% from $62.5 million in 2010 to
$67.7 million in 2011. Wheat accounted for 35% of the total exports to Italy. Unwrought nickel exports
to Italy increased by 33% to $49.1 million in 2011, accounting for 26% of Alberta’s exports to Italy.
Woodpulp (worth $32.5 million) and machinery (worth $20.1 million) were the third and fourth largest
exports to Italy from Alberta and respectively grew by 32% and 34% from 2010 to 2011.
GermanyGermany was Alberta’s third largest trading partner for 2011 at $155.9 million, meaning that the United
Kingdom once again fell in its ranking as an export destination from Alberta. Germany’s GDP grew 3.1%
in 2011 and is expected to grow by 0.6% and 1.5% for 2012 and 2013 respectively.
Canola oil was the most significant export to Germany in 2011 at $59.6 million; this was the first year
since 2007 that Alberta has shipped canola oil to the region. The second largest export was energy,
accounting for 18% of the exports to Germany from Alberta at $27.9 million, up 32% from 2010.
Machinery, mostly boring and sinking, accounted for $17.7 million in exports, up 127% from 2010.
Vehicles were the fourth largest export at $8.29 million, up 65% from $5.01 million in 2010.
4 International Monetary Fund (IMF), World Economic Outlook Database. 5 International Monetary Fund (IMF), World Economic Outlook Database.

2011InternationalTradeReview
33
CISAlberta’s Exports to the CIS in 2011 ($CDN, Millions)
Real GDP in the Commonwealth of Independent States (CIS) grew by 4.8% in 2011 and is forecast to
grow by 4.1% for both 2012 and 2013. Combined the CIS consumed $315.1 million of Alberta’s exports
in 2011. Russia, Ukraine and Kazakhstan, the three largest markets for Alberta goods in the region,
absorbed a total of $301.5 million (96%)
RussiaThe Russian economy grew by 4.3% in 2011 according to the IMF. Russia’s estimated GDP growth in
2012 is 4.0% followed by 3.9% in 2013.
Alberta exports to Russia increased by 15% from $239.9 million in 2010 to $274.8 million in 2011.
Machinery was our largest export to Russia, accounting for 65% of all exports to Russia. Distilling plants
used to supply water to boilers as well as boring and sinking machinery accounted for a large portion of
the exports which grew by only 4.7% in 2011, from $170.2 million in 2010 to $178.1 million in 2011.
Meat, consisting mostly of pork, was the second largest export, up 28% to $55.1 million in 2011.
UkraineUkraine’s economy increased 5.2% in 2011. Growth is expected to continue into 2012 and 2013 at a rate
of 3.0% and 3.5% respectively.
Alberta’s exports to the Ukraine totaled $15.6 million in 2011, down 48% from $29.8 million in 2010. The
majority of exports to the Ukraine were machinery used for oil and gas production. Machinery exports
decreased by 51% from $24.8 million in 2010 to $12.2 million in 2011.
KazakhstanKazakhstan’s economy expanded by 7.5% in 2011 and the economy is expected to grow by 5.9% in 2012,
and 6.0% in 2013.
Alberta’s exports to the country saw a significant decline, down 54% from $24.1 million in 2010 to $11.0
million in 2011. Machinery used for oil and gas production was the largest export to Kazakhstan in 2011,
decreasing 56% from $12.5 million in 2010 to $5.5 million in 2011.
Rank Country 2009 2010 2011
% Change
2010‐2011
2011 Regional
Share
1 Russia 200.7$ 239.9$ 274.8$ 14.5% 87.2%
2 Ukraine 8.3$ 29.8$ 15.6$ ‐47.4% 5.0%
3 Kazakhstan 29.9$ 24.1$ 11.0$ ‐54.4% 3.5%
4 Turkmenistan 3.7$ 1.5$ 5.2$ 241.6% 1.7%
5 Azerbaijan 5.4$ 9.2$ 4.2$ ‐53.8% 1.3%
6 Uzbekistan 2.8$ 1.6$ 2.9$ 76.2% 0.9%
7 Georgia 0.2$ 0.1$ 0.5$ 426.5% 0.2%
8 Kyrgyzstan 1.2$ 0.6$ 0.3$ ‐52.4% 0.1%
9 Belarus 0.0$ 0.2$ 0.3$ 44.2% 0.1%
10 Armenia 0.6$ 0.3$ 0.1$ ‐49.3% 0.04%
11 Moldova ‐$ 0.0$ 0.1$ 2714.0% 0.02%
12 Tajikistan 0.0$ 2.6$ 0.0$ ‐98.4% 0.01%
252.8$ 310.0$ 315.1$ 1.6% 100.0%Total Exports to CIS

2011InternationalTradeReview
34
EFTAandOtherEuropeAlberta’s Exports to EFTA in 2011 ($CDN, Millions)
Canada completed a FTA with the European Free Trade Association (EFTA), made up of Switzerland,
Norway, Iceland and Liechtenstein, and had it enter into force on July 1, 2009. Exports from Alberta to
the EFTA countries grew 15%, from $119.7 million to $138.0 million in 2011.
Within the EFTA, Iceland had the fastest growing economy at 3.0% while Switzerland’s economy grew
only 1.8% and Norway saw a growth rate of 1.7%.
Alberta’s Exports to Other European Countries in 2011 ($CDN, Millions)
Alberta’s exports to other European countries increased 14%, from $37.6 million to $79.7 million in
2011. Albania and Turkey remained the largest export destinations for Alberta’s products at 95% of
exports to this region.
Real GDP in the region grew 5.3% in 2011 but it expected to see slower growth, The IMF estimates that
2012 growth should be 1.9% and 2013 2.9%.
SwitzerlandSwitzerland’s economy grew 1.8% in 2011. Real GDP in Switzerland is expected to grow 0.8% in 2012
and 1.7% in 2013.
Alberta’s exports to Switzerland increased from $83.8 million in 2010 to $88.4 million in 2011, an
increase of 5.5%. Alberta exported $32.9 million worth of turbo‐propellers and their parts to
Switzerland, down 27% from $45.4 million in 2010. Radio and navigation equipment was the second
largest export at $14.8 million
Rank Country 2009 2010 2011
% Change
2010‐2011
2011 Regional
Share
1 Switzerland 69.4$ 83.8$ 88.4$ 5.5% 64.1%
2 Norway 38.5$ 35.2$ 49.0$ 39.3% 35.5%
3 Iceland 0.7$ 0.7$ 0.6$ ‐14.2% 0.5%
4 Lichtenstein ‐$ ‐$ ‐$ N/A 0.0%
108.6$ 119.7$ 138.0$ 15.3% 100.0%Total Exports to EFTA
Rank Country 2009 2010 2011
% Change
2010‐2011
2011 Regional
Share
1 Albania 11.6$ 23.2$ 50.8$ 118.7% 63.7%
2 Turkey 19.8$ 12.8$ 25.0$ 95.1% 31.4%
3 Macedonia 0.5$ 0.7$ 2.5$ 289.4% 3.2%
4 Croatia 0.5$ 0.8$ 0.8$ 3.8% 1.0%
5 Serbia 0.3$ 0.1$ 0.6$ 349.8% 0.7%
6 Andorra ‐$ 0.0$ ‐$ ‐100.0% 0.0%
7 Bosnia & Herzegovina 0.3$ ‐$ ‐$ N/A 0.0%
33.1$ 37.6$ 79.7$ 111.9% 100.0%Total Exports to Other Europe

2011InternationalTradeReview
35
AlbaniaAlbania’s economy grew 3.5% in 2011 and is expected to see real GDP growth of 2.0% in 2012 and 0.5%
in 2013.
Alberta’s exports to Albania increased by 119% in 2011, from $23.3 million in 2010 to $50.8 million.
Machinery was the largest export to the country, worth 57% of the total exports to the country. Pumps,
engines, boring and sinking machinery and parts, and other technology used in the production of oil
were the main export in this area. Exports of machinery grew 108% from $13.7 million in 2010 to $28.7
million in 2011. The second largest export was steel, used for pipes and tubing, which grew 147% from
$7.1 million in 2010 to $17.5 million in 2011.
NorwayNorway’s real GDP increased by 1.7% in 2011 and the country is estimated to see growth in the country
at a rate of 1.8% in 2012 and 2.0% in 2013.
The total exports to Norway increased by 39.3% in 2011, up from $35.2 million in 2010 to $49.0 million
in 2011. The largest export to the region was machinery, mostly for boring and sinking used in oil
production, accounting for 71% of the total exports to Norway from Alberta. Machinery exports
increased by 41% from $24.7 million in 2010 to $34.7 million in 2011. The second largest export was in
precision medical instruments, exports in this area decreased by 14% from $4.8 million in 2010 to $4.1
million in 2011.

2011InternationalTradeReview
36
LatinAmericaandtheCaribbean
Alberta’s Exports to Latin America in 2011 ($CDN, Millions)
Combined, Latin American and Caribbean economies (excluding Mexico) expanded 4.5% in 2010. These
economies are expected to continue growing in 2012 at 3.4% and in 2013 at 4.2%.
Latin America is an area where Canada has been proactive in negotiating FTAs. Canada has pre‐existing
FTAs with Chile and Costa Rica. The Canada‐Peru FTA came into effect on August 1, 2009. The Canada‐
Columbia FTA was signed on May 14, 2010, and the Canada‐Honduras FTA was finalized in August 2011.
Negotiations are still ongoing for a Canada‐Caribbean Community FTA, a Canada‐Dominican Republic
FTA, and for trade agreements with the remaining Central American countries (El Salvador, Guatemala,
and Nicaragua). Canada has also joined the Trans Pacific Partnership trade negotiations with 11 other
countries, among them are Peru and Chile.
Strong economic growth was coupled with exceptional trade growth, as Alberta exports to Latin America
and the Caribbean increased 35% from $671.8 million to $905.0 million in 2011. South American
countries consumed the largest share of Alberta’s exports to the region at 82%, a total of $739.9 million
in 2011. This is an increase of 34% in value from 2010, when exports in the region were $552.2 million.
Rank Description 2009 2010 2011
% Change
2010‐2011
2011 Regional
Share
1 Colombia 114.6$ 136.6$ 169.6$ 24.2% 18.7%
2 Brazil 185.8$ 104.1$ 164.8$ 58.2% 18.2%
3 Venezuela 125.7$ 83.1$ 118.7$ 42.8% 13.1%
4 Chile 107.7$ 80.7$ 113.4$ 40.5% 12.5%
5 Cuba 36.4$ 52.5$ 93.1$ 77.4% 10.3%
6 Peru 93.4$ 85.3$ 78.5$ ‐8.0% 8.7%
7 Ecuador 79.2$ 42.6$ 75.2$ 76.4% 8.3%
8 Argentina 9.8$ 18.1$ 17.0$ ‐6.1% 1.9%
9 Costa Rica 8.2$ 9.3$ 15.2$ 62.7% 1.7%
10 Trinidad & Tobago 7.7$ 5.5$ 13.3$ 141.7% 1.5%
11 Dominican Republic 15.1$ 10.8$ 8.2$ ‐24.1% 0.9%
12 Nicaragua 4.7$ 2.8$ 7.8$ 178.2% 0.9%
13 Guyana 5.8$ 5.3$ 6.7$ 27.3% 0.7%
14 Guatemala 39.1$ 6.3$ 4.9$ ‐22.1% 0.5%
15 Jamaica 9.8$ 16.1$ 4.8$ ‐70.1% 0.5%
16 El Salvador 0.5$ 2.2$ 3.8$ 71.2% 0.4%
17 Panama 0.4$ 1.8$ 2.2$ 22.8% 0.2%
18 Bolivia 0.6$ 0.8$ 2.1$ 163.7% 0.2%
19 Belize 1.5$ 1.4$ 1.2$ ‐15.1% 0.1%
20 Netherlands Antilles 0.3$ 0.6$ 0.8$ 24.1% 0.1%
717.2$ 552.2$ 739.9$ 34.0% 81.8%
81.3$ 96.8$ 130.9$ 35.3% 14.5%
55.0$ 22.8$ 34.2$ 50.0% 3.8%
853.5$ 671.8$ 905.0$ 34.7% 100.0%
South America
Caribbean
Central America
Total Exports to

2011InternationalTradeReview
37
Exports to the Caribbean grew 35% from $96.8 million in 2010 to $130.9 million in 2011. Exports to
Central America grew from $22.8 million to $34.2 million at a rate of 50% during the same period.
Colombia was the largest export market for Alberta products in Latin America during 2011 for the
second consecutive year. Colombia consumed a combined total of $169.6 million, approximately 19% of
Alberta’s total exports to the region. Brazil followed Colombia as the second largest destination for
Alberta’s exports at $164.8 million, up 58% from $104.1 million in 2010. Venezuela rose to third in 2011
at $118.7 million, up 43% since 2010.
Distribution of Alberta’s Exports to Latin America in 2010 ($CDN, Millions)
ColombiaColombia’s economy grew 5.9% in 2011 and is expected to grow 4.7% in 2012 and 4.4% in 2013.
Exports to Columbia grew 24.2% to $169.6 million in 2011, up from $136.6 million in 2010. The largest
export product from Alberta to Colombia in 2011 was wheat at $80.6 million, up 78% from $44.9 million.
Parts for boring and sinking machinery declined 30.9% from $28.8 million to $19.9 million during the
same period. Whereas there were no colza oil exports from Alberta to Colombia in 2010, it was Alberta’s
third largest export to Colombia at $6.2 million in 2011.
Brazil
In 2011, Brazil’s economy grew 2.7%. Real GDP is expected to continue to increase in 2012 at a rate of
3.0% and 4.2% in 2012 and 2013 respectively.
Overall, Alberta’s exports to Brazil increased from $104.1 million in 2010 to $164.8 million in 2011.The
top three exports from Alberta to Brazil were ethylene glycol, bituminous coal, and turbo‐propellers.
Exports to ethylene glycol increased 244% from $21.3 million in 2010 to $73.3 million in 2011.
Bituminous coal increased from zero exports in 2010 to $13 million in 2011. Turbo‐propeller exports
grew 51% from $8.9 million to $13.4 million over the same period.

2011InternationalTradeReview
38
Venezuela
Venezuela’s economy expanded 4.2% in 2011 and is expected to continue growing at 4.7% in 2012 and
3.2% in 2013.
Venezuela consumed $118.7 million worth of Alberta’s goods in 2011, up 43%. Top ranked exports to
Venezuela in 2011 were wheat, parts of pumps for liquid, and durum wheat. Wheat exports increased
28% from $53.8 million in 2010 to $68.9 million in 2011. Parts of pumps for liquids increased 257% in
2011 from $4.9 million to $17.5 million. Exports of durum wheat increased 52% from $10.5 million to
$16 million in the same period.
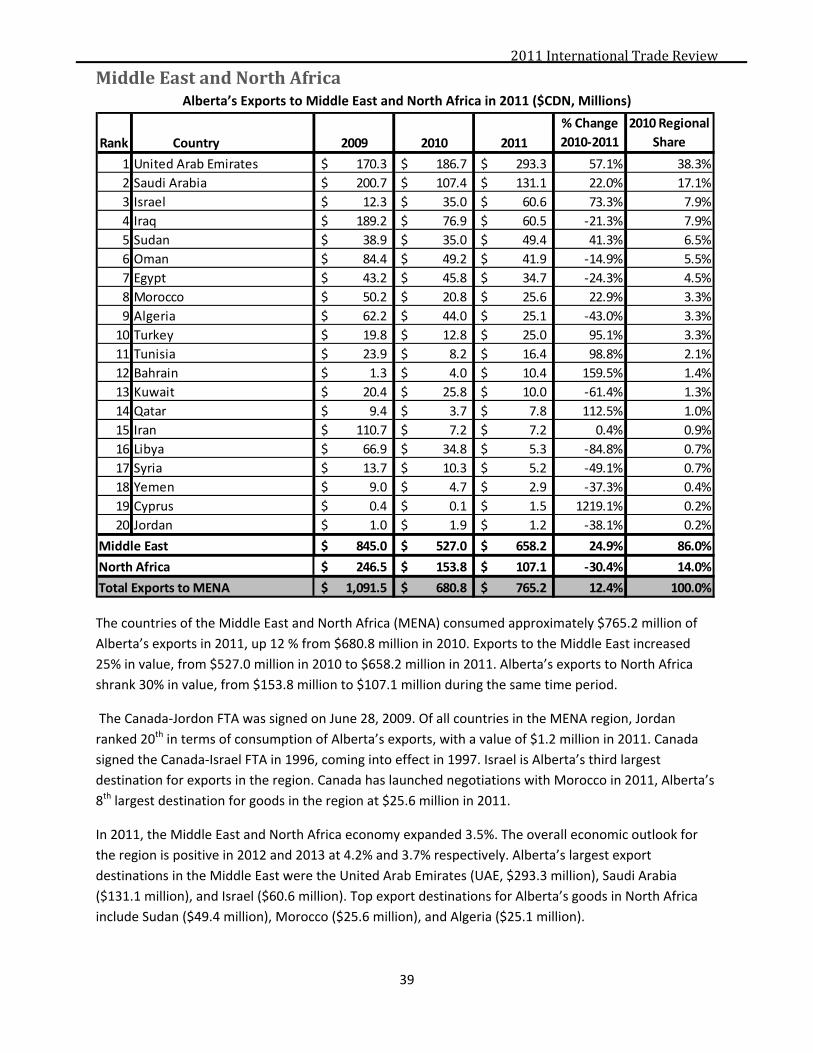
2011InternationalTradeReview
39
MiddleEastandNorthAfricaAlberta’s Exports to Middle East and North Africa in 2011 ($CDN, Millions)
The countries of the Middle East and North Africa (MENA) consumed approximately $765.2 million of
Alberta’s exports in 2011, up 12 % from $680.8 million in 2010. Exports to the Middle East increased
25% in value, from $527.0 million in 2010 to $658.2 million in 2011. Alberta’s exports to North Africa
shrank 30% in value, from $153.8 million to $107.1 million during the same time period.
The Canada‐Jordon FTA was signed on June 28, 2009. Of all countries in the MENA region, Jordan
ranked 20th in terms of consumption of Alberta’s exports, with a value of $1.2 million in 2011. Canada
signed the Canada‐Israel FTA in 1996, coming into effect in 1997. Israel is Alberta’s third largest
destination for exports in the region. Canada has launched negotiations with Morocco in 2011, Alberta’s
8th largest destination for goods in the region at $25.6 million in 2011.
In 2011, the Middle East and North Africa economy expanded 3.5%. The overall economic outlook for
the region is positive in 2012 and 2013 at 4.2% and 3.7% respectively. Alberta’s largest export
destinations in the Middle East were the United Arab Emirates (UAE, $293.3 million), Saudi Arabia
($131.1 million), and Israel ($60.6 million). Top export destinations for Alberta’s goods in North Africa
include Sudan ($49.4 million), Morocco ($25.6 million), and Algeria ($25.1 million).
Rank Country 2009 2010 2011
% Change
2010‐2011
2010 Regional
Share
1 United Arab Emirates 170.3$ 186.7$ 293.3$ 57.1% 38.3%
2 Saudi Arabia 200.7$ 107.4$ 131.1$ 22.0% 17.1%
3 Israel 12.3$ 35.0$ 60.6$ 73.3% 7.9%
4 Iraq 189.2$ 76.9$ 60.5$ ‐21.3% 7.9%
5 Sudan 38.9$ 35.0$ 49.4$ 41.3% 6.5%
6 Oman 84.4$ 49.2$ 41.9$ ‐14.9% 5.5%
7 Egypt 43.2$ 45.8$ 34.7$ ‐24.3% 4.5%
8 Morocco 50.2$ 20.8$ 25.6$ 22.9% 3.3%
9 Algeria 62.2$ 44.0$ 25.1$ ‐43.0% 3.3%
10 Turkey 19.8$ 12.8$ 25.0$ 95.1% 3.3%
11 Tunisia 23.9$ 8.2$ 16.4$ 98.8% 2.1%
12 Bahrain 1.3$ 4.0$ 10.4$ 159.5% 1.4%
13 Kuwait 20.4$ 25.8$ 10.0$ ‐61.4% 1.3%
14 Qatar 9.4$ 3.7$ 7.8$ 112.5% 1.0%
15 Iran 110.7$ 7.2$ 7.2$ 0.4% 0.9%
16 Libya 66.9$ 34.8$ 5.3$ ‐84.8% 0.7%
17 Syria 13.7$ 10.3$ 5.2$ ‐49.1% 0.7%
18 Yemen 9.0$ 4.7$ 2.9$ ‐37.3% 0.4%
19 Cyprus 0.4$ 0.1$ 1.5$ 1219.1% 0.2%
20 Jordan 1.0$ 1.9$ 1.2$ ‐38.1% 0.2%
845.0$ 527.0$ 658.2$ 24.9% 86.0%
246.5$ 153.8$ 107.1$ ‐30.4% 14.0%
1,091.5$ 680.8$ 765.2$ 12.4% 100.0%
Middle East
North Africa
Total Exports to MENA

2011InternationalTradeReview
40
Distribution of Alberta’s Exports to the Middle East and North Africa in 2011 ($CDN, Millions)
UnitedArabEmirates(UAE)Real GDP in the UAE increased in 2011 by 4.9% and is forecast to grow 2.3% and 2.8% in 2012 and 2013
respectively. Exports to the UAE grew 57% to $293.3 million in 2011. The UAE consumed 38% of all
Alberta exports to the MENA region.
Canola seed dominated Alberta’s exports to the UAE in 2011 at $169.2 million, up 64% from $103.2
million in 2010. Wheat was ranked second at $29.1 million, up 83% from 2010. Alberta’s third largest
export to the UAE in 2011 was parts for boring and sinking machinery, at $18.1 million in 2011, up from
$13.8 million in 2010.
SaudiArabiaSaudi Arabia’s economy grew 6.8% in 2011 and is expected to continue growing at rates of 6.0% in 2012
and 4.1% in 2013. Alberta exported goods worth $131.1 million, up 22% from $107.4 million in 2010.
Overall, Saudi Arabia consumed 17% of Alberta’s total exports to the region.
The largest Alberta export product to Saudi Arabia in 2011 was wheat at $76.3 million, up 55% from
$49.2 million in 2010. Barley was Alberta’s second largest export to Saudi Arabia in 2011 at $18.7
million, up 39% from $13.5 million in 2010. Parts for boring and sinking machinery decreased 15% to
$6.5 million in 2011.
IsraelIsrael’s real GDP grew 4.7% and is expected to grow in 2012 at a rate of 2.7% and in 2013 at a rate of
3.8%. Alberta’s exports to Israel increased 73.3% from $35 million in 2010 to $60.6 million in 2011.
Sulfur was the largest export product from Alberta to Israel in 2011. Sulfur exports were worth $46.5
million, up 93% from $24.1 million in 2010. Plastic was Alberta’s second largest export to Israel and
increased 5.5% to $5.8 million in 2011. There were no exports of diamonds from Alberta to Israel in
2010, but diamond exports accounted for $2.1 million of Alberta’s exports to the country in 2011.
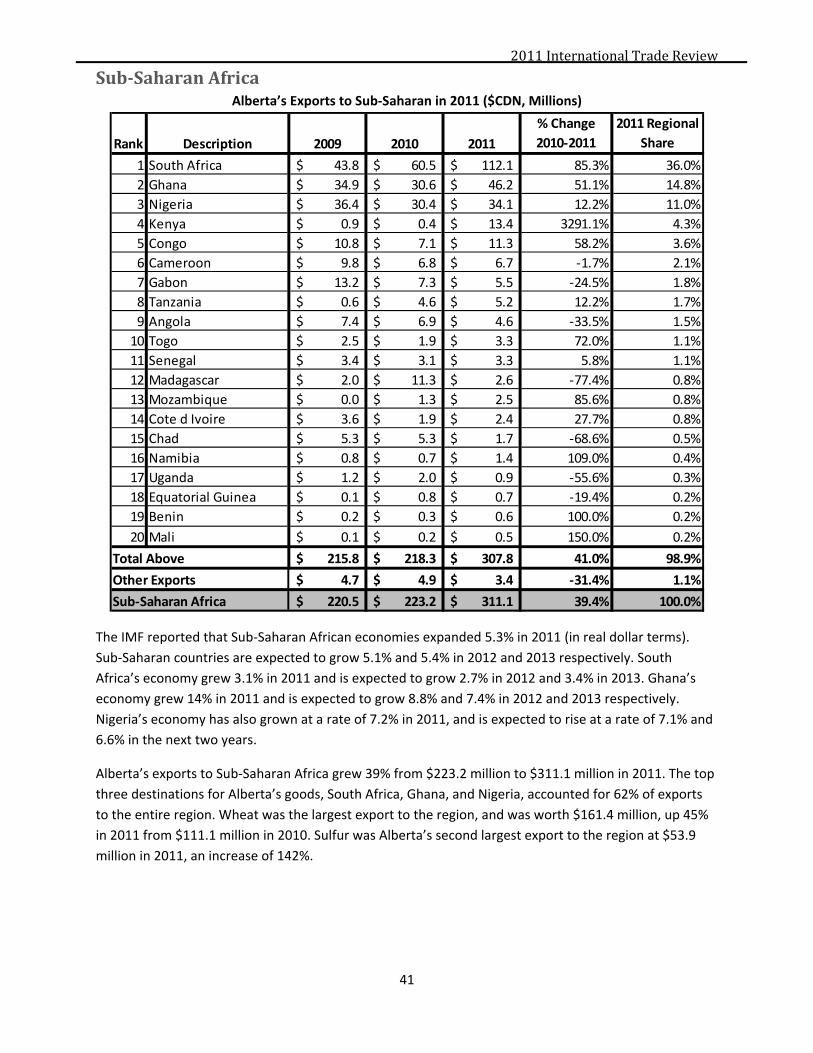
2011InternationalTradeReview
41
Sub‐SaharanAfricaAlberta’s Exports to Sub‐Saharan in 2011 ($CDN, Millions)
The IMF reported that Sub‐Saharan African economies expanded 5.3% in 2011 (in real dollar terms).
Sub‐Saharan countries are expected to grow 5.1% and 5.4% in 2012 and 2013 respectively. South
Africa’s economy grew 3.1% in 2011 and is expected to grow 2.7% in 2012 and 3.4% in 2013. Ghana’s
economy grew 14% in 2011 and is expected to grow 8.8% and 7.4% in 2012 and 2013 respectively.
Nigeria’s economy has also grown at a rate of 7.2% in 2011, and is expected to rise at a rate of 7.1% and
6.6% in the next two years.
Alberta’s exports to Sub‐Saharan Africa grew 39% from $223.2 million to $311.1 million in 2011. The top
three destinations for Alberta’s goods, South Africa, Ghana, and Nigeria, accounted for 62% of exports
to the entire region. Wheat was the largest export to the region, and was worth $161.4 million, up 45%
in 2011 from $111.1 million in 2010. Sulfur was Alberta’s second largest export to the region at $53.9
million in 2011, an increase of 142%.
Rank Description 2009 2010 2011
% Change
2010‐2011
2011 Regional
Share
1 South Africa 43.8$ 60.5$ 112.1$ 85.3% 36.0%
2 Ghana 34.9$ 30.6$ 46.2$ 51.1% 14.8%
3 Nigeria 36.4$ 30.4$ 34.1$ 12.2% 11.0%
4 Kenya 0.9$ 0.4$ 13.4$ 3291.1% 4.3%
5 Congo 10.8$ 7.1$ 11.3$ 58.2% 3.6%
6 Cameroon 9.8$ 6.8$ 6.7$ ‐1.7% 2.1%
7 Gabon 13.2$ 7.3$ 5.5$ ‐24.5% 1.8%
8 Tanzania 0.6$ 4.6$ 5.2$ 12.2% 1.7%
9 Angola 7.4$ 6.9$ 4.6$ ‐33.5% 1.5%
10 Togo 2.5$ 1.9$ 3.3$ 72.0% 1.1%
11 Senegal 3.4$ 3.1$ 3.3$ 5.8% 1.1%
12 Madagascar 2.0$ 11.3$ 2.6$ ‐77.4% 0.8%
13 Mozambique 0.0$ 1.3$ 2.5$ 85.6% 0.8%
14 Cote d Ivoire 3.6$ 1.9$ 2.4$ 27.7% 0.8%
15 Chad 5.3$ 5.3$ 1.7$ ‐68.6% 0.5%
16 Namibia 0.8$ 0.7$ 1.4$ 109.0% 0.4%
17 Uganda 1.2$ 2.0$ 0.9$ ‐55.6% 0.3%
18 Equatorial Guinea 0.1$ 0.8$ 0.7$ ‐19.4% 0.2%
19 Benin 0.2$ 0.3$ 0.6$ 100.0% 0.2%
20 Mali 0.1$ 0.2$ 0.5$ 150.0% 0.2%
215.8$ 218.3$ 307.8$ 41.0% 98.9%
4.7$ 4.9$ 3.4$ ‐31.4% 1.1%
220.5$ 223.2$ 311.1$ 39.4% 100.0%
Total Above
Other Exports
Sub‐Saharan Africa
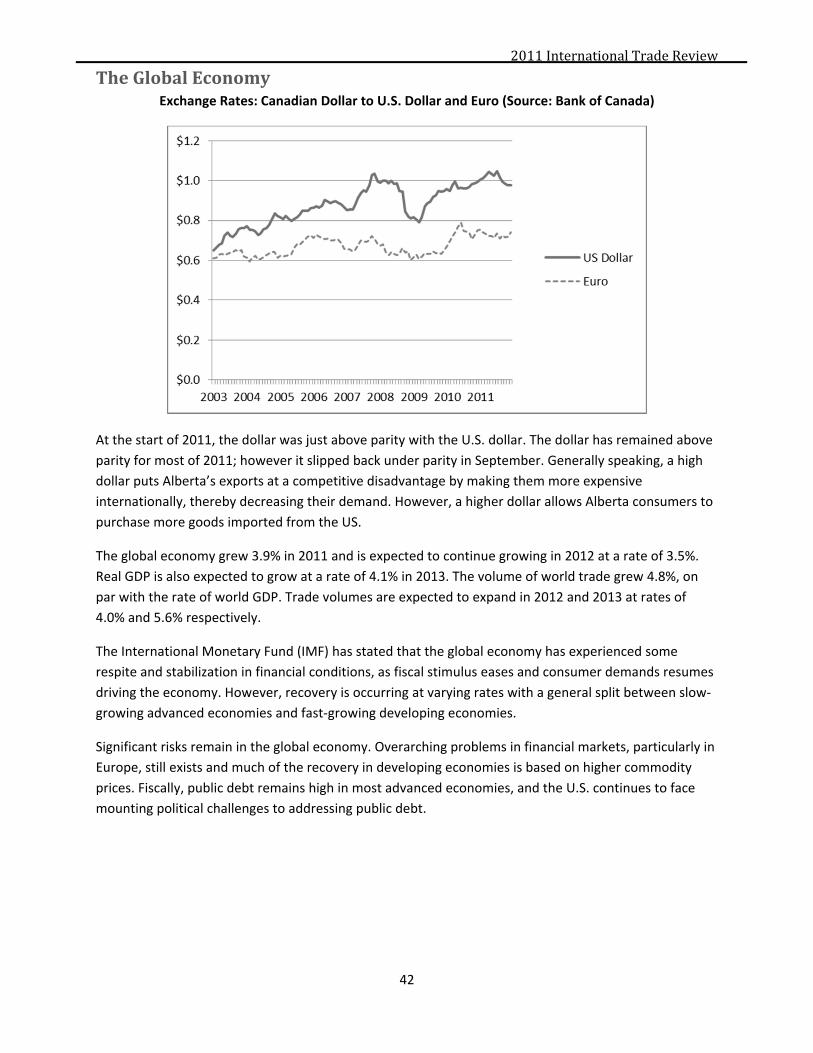
2011InternationalTradeReview
42
TheGlobalEconomyExchange Rates: Canadian Dollar to U.S. Dollar and Euro (Source: Bank of Canada)
At the start of 2011, the dollar was just above parity with the U.S. dollar. The dollar has remained above
parity for most of 2011; however it slipped back under parity in September. Generally speaking, a high
dollar puts Alberta’s exports at a competitive disadvantage by making them more expensive
internationally, thereby decreasing their demand. However, a higher dollar allows Alberta consumers to
purchase more goods imported from the US.
The global economy grew 3.9% in 2011 and is expected to continue growing in 2012 at a rate of 3.5%.
Real GDP is also expected to grow at a rate of 4.1% in 2013. The volume of world trade grew 4.8%, on
par with the rate of world GDP. Trade volumes are expected to expand in 2012 and 2013 at rates of
4.0% and 5.6% respectively.
The International Monetary Fund (IMF) has stated that the global economy has experienced some
respite and stabilization in financial conditions, as fiscal stimulus eases and consumer demands resumes
driving the economy. However, recovery is occurring at varying rates with a general split between slow‐
growing advanced economies and fast‐growing developing economies.
Significant risks remain in the global economy. Overarching problems in financial markets, particularly in
Europe, still exists and much of the recovery in developing economies is based on higher commodity
prices. Fiscally, public debt remains high in most advanced economies, and the U.S. continues to face
mounting political challenges to addressing public debt.
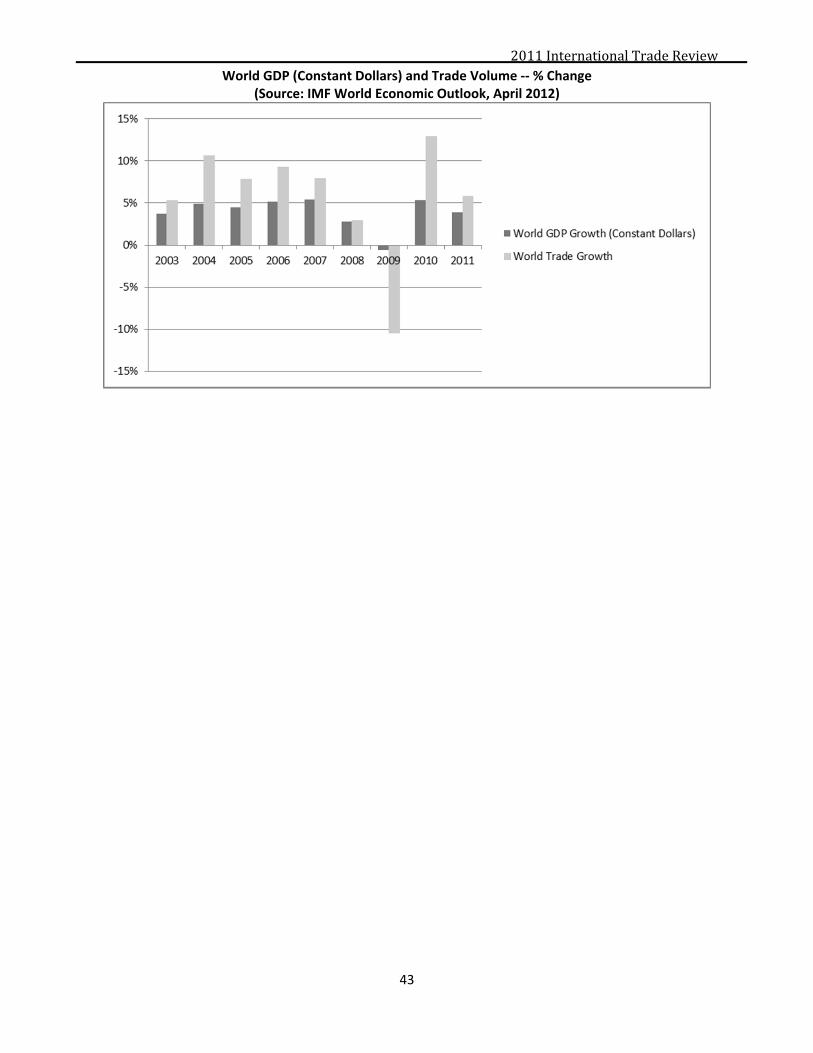
2011InternationalTradeReview
43
World GDP (Constant Dollars) and Trade Volume ‐‐ % Change (Source: IMF World Economic Outlook, April 2012)
2011InternationalTradeReview
44
Appendices
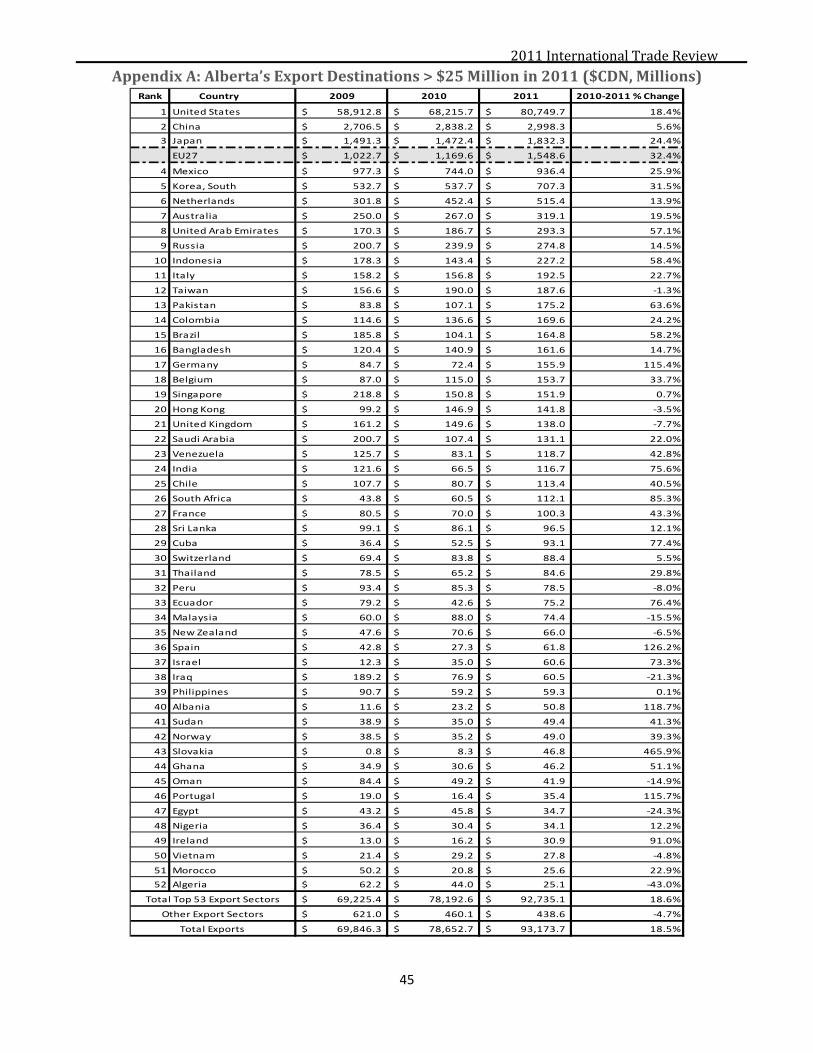
2011InternationalTradeReview
45
AppendixA:Alberta’sExportDestinations>$25Millionin2011($CDN,Millions)
Rank Country 2009 2010 2011 2010‐2011 % Change
1 United States 58,912.8$ 68,215.7$ 80,749.7$ 18.4%
2 China 2,706.5$ 2,838.2$ 2,998.3$ 5.6%
3 Japan 1,491.3$ 1,472.4$ 1,832.3$ 24.4%
EU27 1,022.7$ 1,169.6$ 1,548.6$ 32.4%
4 Mexico 977.3$ 744.0$ 936.4$ 25.9%
5 Korea, South 532.7$ 537.7$ 707.3$ 31.5%
6 Netherlands 301.8$ 452.4$ 515.4$ 13.9%
7 Australia 250.0$ 267.0$ 319.1$ 19.5%
8 United Arab Emirates 170.3$ 186.7$ 293.3$ 57.1%
9 Russia 200.7$ 239.9$ 274.8$ 14.5%
10 Indonesia 178.3$ 143.4$ 227.2$ 58.4%
11 Italy 158.2$ 156.8$ 192.5$ 22.7%
12 Taiwan 156.6$ 190.0$ 187.6$ ‐1.3%
13 Pakistan 83.8$ 107.1$ 175.2$ 63.6%
14 Colombia 114.6$ 136.6$ 169.6$ 24.2%
15 Brazil 185.8$ 104.1$ 164.8$ 58.2%
16 Bangladesh 120.4$ 140.9$ 161.6$ 14.7%
17 Germany 84.7$ 72.4$ 155.9$ 115.4%
18 Belgium 87.0$ 115.0$ 153.7$ 33.7%
19 Singapore 218.8$ 150.8$ 151.9$ 0.7%
20 Hong Kong 99.2$ 146.9$ 141.8$ ‐3.5%
21 United Kingdom 161.2$ 149.6$ 138.0$ ‐7.7%
22 Saudi Arabia 200.7$ 107.4$ 131.1$ 22.0%
23 Venezuela 125.7$ 83.1$ 118.7$ 42.8%
24 India 121.6$ 66.5$ 116.7$ 75.6%
25 Chile 107.7$ 80.7$ 113.4$ 40.5%
26 South Africa 43.8$ 60.5$ 112.1$ 85.3%
27 France 80.5$ 70.0$ 100.3$ 43.3%
28 Sri Lanka 99.1$ 86.1$ 96.5$ 12.1%
29 Cuba 36.4$ 52.5$ 93.1$ 77.4%
30 Switzerland 69.4$ 83.8$ 88.4$ 5.5%
31 Thailand 78.5$ 65.2$ 84.6$ 29.8%
32 Peru 93.4$ 85.3$ 78.5$ ‐8.0%
33 Ecuador 79.2$ 42.6$ 75.2$ 76.4%
34 Malaysia 60.0$ 88.0$ 74.4$ ‐15.5%
35 New Zealand 47.6$ 70.6$ 66.0$ ‐6.5%
36 Spain 42.8$ 27.3$ 61.8$ 126.2%
37 Israel 12.3$ 35.0$ 60.6$ 73.3%
38 Iraq 189.2$ 76.9$ 60.5$ ‐21.3%
39 Philippines 90.7$ 59.2$ 59.3$ 0.1%
40 Albania 11.6$ 23.2$ 50.8$ 118.7%
41 Sudan 38.9$ 35.0$ 49.4$ 41.3%
42 Norway 38.5$ 35.2$ 49.0$ 39.3%
43 Slovakia 0.8$ 8.3$ 46.8$ 465.9%
44 Ghana 34.9$ 30.6$ 46.2$ 51.1%
45 Oman 84.4$ 49.2$ 41.9$ ‐14.9%
46 Portugal 19.0$ 16.4$ 35.4$ 115.7%
47 Egypt 43.2$ 45.8$ 34.7$ ‐24.3%
48 Nigeria 36.4$ 30.4$ 34.1$ 12.2%
49 Ireland 13.0$ 16.2$ 30.9$ 91.0%
50 Vietnam 21.4$ 29.2$ 27.8$ ‐4.8%
51 Morocco 50.2$ 20.8$ 25.6$ 22.9%
52 Algeria 62.2$ 44.0$ 25.1$ ‐43.0%
69,225.4$ 78,192.6$ 92,735.1$ 18.6%
621.0$ 460.1$ 438.6$ ‐4.7%
69,846.3$ 78,652.7$ 93,173.7$ 18.5%
Total Top 53 Export Sectors
Other Export Sectors
Total Exports

2011InternationalTradeReview
46
Albania
Top 20 Exports from Alberta in 2011 ($CDN, Millions)
Top 10 Exports from Canada in 2011 ($CDN, Millions)
Rank HS‐Description 2010 2011 %Change
1 841381 ‐ PUMPS FOR LIQUIDS 1.1$ 10.3$ 801.8%
2 730799 ‐ Pipe Or Tube Fittings, Nesoi, Iron Or Nonstainless 3.2$ 9.7$ 202.4%
3 730629 ‐ CASING OR TUBING FOR OIL OR GAS DRILLING 3.6$ 6.4$ 77.3%
4 841391 ‐ PARTS OF PUMPS FOR LIQUIDS 4.5$ 5.1$ 12.8%
5 841290 ‐PARTS FOR ENGINES AND MOTORS 2.2$ 2.8$ 25.8%
6 847990 ‐ PARTS OF MACHINES AND MECHANICAL APPLIANCES 0.7$ 2.0$ 190.3%
7 847989 ‐ MACHINES AND MECHANICAL APPLIANCES 0.1$ 1.8$ 1799.2%
8 848190 ‐ PARTS FOR TAPS, COCKS, VALVES AND SIMILAR APPLIANCES 0.1$ 1.4$ 2338.8%
9 843143 ‐ PARTS FOR BORING OR SINKING MACHINERY 2.0$ 1.2$ ‐39.5%
10 820713 ‐ ROCK DRILLING OR EARTH BORING TOOLS ‐$ 1.0$ N/A
11 841280 ‐ ENGINES AND MOTORS 1.6$ 0.8$ ‐49.0%
12 901580 ‐ SURVEYING INSTRUMENTS AND APPLIANCES ‐$ 0.6$ N/A
13 848340 ‐ GEARS AND GEARING 0.1$ 0.6$ 396.4%
14 820719 ‐ INTERCHANGEABLE TOOLS FOR HANDTOOLS 0.4$ 0.6$ 32.8%
15 840890 ‐ COMPRESSION ‐ IGNITIONAL INTERNAL COMBUSTION PISTON ‐$ 0.5$ N/A
16 841229 ‐ HYDRAULIC POWER ENGINES AND MOTORS 0.0$ 0.4$ 21941.0%
17 848360 ‐ CLUTCHES AND SHAFT COUPLINGS 0.2$ 0.4$ 136.9%
18 730422 ‐ DRILL PIPE OF A KIND USED IN DRILLING OIL ‐$ 0.3$ N/A
19 848180 ‐ TAPS, COCKS, VALVES AND SIMILAR APPLIANCES FOR PIPELINE 0.2$ 0.3$ 53.9%
20 820790 ‐ INTERCHANGEABLE TOOLS 0.2$ 0.3$ 64.8%
20.2$ 46.5$ 129.6%
3.0$ 4.3$ 44.1%
23.2$ 50.8$ 119.0%
Sub‐total
Other Exports
Total Alberta Exports
Rank HS‐ Description 2010 2011 % Change
1 841381 ‐ EJECTOR PUMPS AND OTHER PUMPS NES 1.1$ 10.3$ 801.8%
2 730799 ‐ OTHER PIPE OR TUBE FITTINGS ‐ IRON OR STEEL NES 3.2$ 9.7$ 202.2%
3 730629 ‐ CASING/TUBING,I/S, WLD O/T SS, RIVETED OR SIM CLSD 3.6$ 6.4$ 77.3%
4 841391 ‐ PARTS OF PUMPS FOR LIQUIDS 4.5$ 5.1$ 12.8%
5 841290 ‐ PARTS OF HYDRAULIC, PNEUMATIC AND OTHER POWER ENGINES 2.2$ 2.8$ 25.9%
6 847990 ‐ PARTS OF MACHINES & MECHANICAL APPLIANCES 0.7$ 2.0$ 190.3%
7 847989 ‐ MACHINES & MECHANICAL APPLIANCES 0.1$ 1.8$ 1799.2%
8 848190 ‐ PARTS OF TAPS, COCKS, VALVES OR OTHER SIMILAR APPLIANCES 0.1$ 1.4$ 2338.8%
9 843143 ‐ PARTS OF BORING OR SINKING MACHINERY 2.1$ 1.3$ ‐40.7%
10 820713 ‐ ROCK DRILLING OR EARTH BORING TOOLS ‐$ 1.0$ N/A
24.3$ 48.8$ 100.7%
6.9$ 5.6$ ‐18.3%
31.2$ 54.5$ 74.4%Total (All Products)
Sub‐total
Others

2011InternationalTradeReview
47
Algeria
Top 20 Exports from Alberta in 2011 ($CDN, Millions)
Top 10 Exports from Canada in 2011 ($CDN, Millions)
Rank HS‐Description 2010 2011 % Change
1 100110 ‐ DURUM WHEAT 12.8$ 9.7$ ‐24.6%
2 848180 ‐ TAPS, COCKS, VALVE, AND SIMILAR APPLIANCES 4.6$ 4.9$ 5.6%
3 732690 ‐ ARTICLES OF IRON OR STEEL 3.4$ 4.1$ 21.8%
4 843143 ‐ PARTS FOR BORING OR SINKING MACHINERY 1.4$ 1.0$ ‐28.4%
5 071340 ‐ LENTILS, DRIED SHELLED, INCLUDING SEEDS 1.3$ 0.8$ ‐34.0%
6 902690 ‐ PARTS AND ACCESSORIES FOR INSTRUMENTS AND APPARATUS 0.0$ 0.7$ 1441.6%
7 842890 ‐ LIFTING, HANDLING, LOADING OR UNLOADING MACHINERY ‐$ 0.6$ N/A
8 730799 ‐ PIPE OR TUBE FITTINGS, NESOI, IRON OR NONSTAINLESS 1.0$ 0.6$ ‐38.9%
9 902620 ‐ INSTRUMENTS AND APPARATUS FOR MEASURING OR CHECKIN 0.1$ 0.4$ 347.0%
10 071339 ‐ BEANS NESOI (BLACK, LIMA, PINTO, COWPEAS, ETC) ‐$ 0.3$ N/A
11 730790 ‐ PIPE OR TUBE FITTINGS, NESOI, IRON OR NONSTAINLESS 0.4$ 0.3$ ‐31.5%
12 902680 ‐ INSTRUMENTS AND APPARATUS FOR MEASURING OR CHECKIN ‐$ 0.2$ N/A
13 847989 ‐ MACHINES AND MECHANICAL APPLIANCES 0.3$ 0.2$ ‐43.9%
14 820780 ‐ TOOLS FOR TURNING, OF BASE METAL ‐$ 0.1$ N/A
15 902610 ‐ INSTRUMENTS AND APPARATUS FOR MEASURING ‐$ 0.1$ N/A
16 852340 ‐ OPTICAL MEDIA FOR THE RECORDING OF SOUND ‐$ 0.1$ N/A
17 847990 ‐ PARTS OF MACHINES AND MECHANICAL APPLIANCES 0.7$ 0.1$ ‐88.4%
18 852560 ‐ TRANSMISSION APPARATUS INCORPORATING RECEPTION ‐$ 0.1$ N/A
19 841360 ‐ ROTARY POSITIVE DISPLACEMENT PUMPS ‐$ 0.1$ N/A
20 847180 ‐ AUTOMATIC DATA PROCESSING UNITS ‐$ 0.1$ N/A
26.0$ 24.4$ ‐6.2%
18.1$ 0.7$ ‐96.0%
44.0$ 25.1$ ‐43.0%
Sub‐total
Other Exports
Total Alberta Exports
Rank HS‐Description 2010 2011 % Change
1 071340 ‐ LENTILS ‐ DRIED AND SHELLED 72.0$ 80.5$ 11.8%
2 100110 ‐ DURUM WHEAT 73.8$ 67.0$ ‐9.1%
3 480100 ‐ NEWSPRINT ‐ IN ROLLS OR SHEETS 18.6$ 28.0$ 50.4%
4 853710 ‐ BOARDS AND PANELS 0.0$ 6.2$ 71904.6%
5 940600 ‐ PREFABRICATED BUILDINGS (''INDUSTRIALIZED BUILDINGS'') 0.9$ 5.5$ 495.2%
6 848180 ‐ TAPS, COCKS, VALVES AND OTHER SIMILAR APPLIANCES, NES 4.8$ 5.2$ 9.2%
7 732690 ‐ OTHER ARTICLES (EXCLUDING WIRE) NES ‐ IRON OR STEEL 3.4$ 4.3$ 28.1%
8 847710 ‐ INJECTION‐MOULDING MACHINES NES ‐$ 2.8$ N/A
9 902690 ‐ PARTS OF INSTRUMENTS AND APPARATUS FOR MEASURING 0.0$ 2.4$ 4850.5%
10 841370 ‐ CENTRIFUGAL PUMPS NES ‐$ 2.2$ N/A
208.6$ 218.8$ 4.9%
79.3$ 20.4$ ‐74.2%
288.0$ 239.2$ ‐16.9%Total (All Products)
Sub‐total
Others

2011InternationalTradeReview
48
Australia
Top 20 Exports from Alberta in 2011 ($CDN, Millions)
Top 10 Exports from Canada in 2011 ($CDN, Millions)
Rank HS‐Description 2010 2011 % Change
1 250300 ‐ SULFUR OF ALL KINDS, OTHER THAN SUBLIMED SULFUR 64.2$ 94.0$ 46.5%
2 843143 ‐ PARTS FOR BORING OR SINKING MACHINERY 43.0$ 46.5$ 8.2%
3 020329 ‐ MEAT OF SWINE, NESOI, FROZEN 22.2$ 24.4$ 10.0%
4 470321 ‐ CHEMICAL WOODPULP, SODA OR SULFATE 20.7$ 23.9$ 15.5%
5 843049 ‐ BORING OR SINKING MACHINERY 18.3$ 23.6$ 29.2%
6 020319 ‐ MEAT OF SWINE, NESOI, FRESH OR CHILLED 10.3$ 13.1$ 26.8%
7 841480 ‐ AIR PUMPS AND AIR OR OTHER GAS COMPRESSORS 0.1$ 4.3$ 6060.4%
8 730890 ‐ STRUCTURES AND PARTS OF STRUCTURES, NESIO, OF IRON 6.5$ 3.1$ ‐51.6%
9 841360 ‐ ROTARY POSITIVE DISPLACEMENT PUMPS 3.3$ 3.1$ ‐8.8%
10 847989 ‐ MACHINES AND MECHANICAL APPLIANCES 3.6$ 3.0$ ‐16.6%
11 852691 ‐ RADIO NAVIGATIONAL AID APPARATUS 2.5$ 2.9$ 16.7%
12 841229 ‐ HYDRAULIC POWER ENGINES AND MOTORS 0.5$ 2.7$ 409.6%
13 850239 ‐ GENERATING SETS, ELECTRIC ‐$ 2.3$ N/A
14 841121 ‐ TURBOPROPELLERS OF A POWER NOT EXCEEDING 1,100 KW 1.6$ 2.3$ 48.8%
15 840790 ‐ SPARK‐IGNITION RECIPROCATING OR ROTARY INTERNAL CO ‐$ 2.3$ N/A
16 843680 ‐ AGRICULTURAL, HORTICULTURAL, FORESTY, BEE‐KEEPING 0.3$ 2.3$ 718.9%
17 853180 ‐ ELECTRIC SOUND OR VISUAL SIGNALING APPARATUS 0.9$ 2.2$ 151.4%
18 848140 ‐ SAFETY OR RELIEF VALVES 1.3$ 2.1$ 66.5%
19 851762 ‐ MACHINES FOR THE RECEPTION, CONVERSION 1.3$ 2.0$ 60.2%
20 847439 ‐ MACHINES FOR MIXING OR KNEADING EARTH, STONE, ORE 3.9$ 1.9$ ‐49.7%
204.3$ 262.2$ 28.3%
62.6$ 56.9$ ‐9.1%
267.0$ 319.1$ 19.5%
Sub‐total
Other Exports
Total Alberta Exports
Rank HS‐Description 2010 2011 % Change
1 880240 ‐ AIRCRAFT NES OF AN UNLADEN WEIGHT (MORE THAN 15,000 KG) 138.3$ 137.6$ ‐0.5%
2 250300 ‐ SULFUR OF ALL KINDS 64.2$ 112.2$ 74.8%
3 020329 ‐ SWINE, CUTS BONELESS ‐ FROZEN 101.4$ 74.7$ ‐26.3%
4 843143 ‐ PARTS OF BORING OR SINKING MACHINERY 74.3$ 74.0$ ‐0.3%
5 470321 ‐ CHEMICAL WOODPULP ‐ SODA OR SULPHATE ‐ CONIFEROUS 53.3$ 59.4$ 11.6%
6 843390 ‐ PARTS OF HARVESTING, THRESHING AND OTHER AGRICULTURAL 31.0$ 45.3$ 46.1%
7 440710 ‐ LUMBER (THICKNESS >6MM) ‐ CONIFEROUS WOOD 34.5$ 32.8$ ‐5.1%
8 710812 ‐ GOLD IN UNWROUGHT FORM (NON‐MONETARY) 0.0$ 28.2$ 441005.5%
9 843049 ‐ BORING OR SINKING MACHINERY NES ‐ NOT SELF‐PROPELLED 19.1$ 24.9$ 30.3%
10 750210 ‐ NICKEL ‐ UNWROUGHT, NOT ALLOYED 5.6$ 24.6$ 342.1%
669.2$ 868.6$ 29.8%
935.4$ 864.8$ ‐7.5%
1,604.6$ 1,733.3$ 8.0%Total (All Products)
Sub‐total
Others

2011InternationalTradeReview
49
Bangladesh
Top 20 Exports from Alberta in 2011 ($CDN, Millions)
Top 10 Exports from Canada in 2011 ($CDN, Millions)
Rank HS‐Description 2010 2011 % Change
1 100910 ‐ WHEAT (OTHER THAN DURUM WHEAT, AND MESLIN 93.1$ 121.6$ 130.6%
2 120510 ‐ LOW ERUCIC ACID RAPE OR COLZA SEED 21.6$ 29.8$ 137.6%
3 071310 ‐ PEAS (PISUM SATIVUM), DRIED SHELLED 14.5$ 2.3$ 16.1%
4 720449 ‐ FERROUS WASTE AND SCRAP 0.5$ 1.8$ 337.1%
5 470321 ‐ CHEMICAL WOODPULP, SODA OR SULFATE 0.9$ 1.6$ 174.8%
6 300450 ‐ MEDICAMENTS, IN MEASURED DOSES, ETC. 1.2$ 1.3$ 109.0%
7 390190 ‐ POLYMERS OF ETHYLENE NESOI, IN PRIMARY FORMS 0.9$ 0.7$ 82.6%
8 720441 ‐ FERROUS WASTE AND SCRAP 2.0$ 0.6$ 29.9%
9 842531 ‐ WINCHES NESOI AND CAPSTANS ‐$ 0.6$ N/A
10 850239 ‐ GENERATING SETS, ELECTRIC, NESOI ‐$ 0.4$ N/A
11 847989 ‐ MACHINES AND MECHANICAL APPLIANCES 0.0$ 0.2$ 4191.1%
12 850440 ‐ ELECTRICAL STATIC CONVERTERS ‐$ 0.1$ N/A
13 848110 ‐ PRESSURE‐REDUCING VALVES 0.0$ 0.1$ 2353.0%
14 848180 ‐ TAPS, COCKS, VALVES AND SIMILAR APPLIANCES 0.0$ 0.1$ 146.0%
15 820559 ‐ HANDTOOLS NESOI, AND PARTS THEROF, OF BASE METAL ‐$ 0.0$ N/A
16 902610 ‐ INSTRUMENTS AND APPARATUS FOR MEASURING 0.0$ 0.0$ 136.4%
17 310590 ‐ FERTILIZERS 0.1$ 0.0$ 77.8%
18 847990 ‐ PARTS OF MACHINES AND MECHANICAL APPLIANCES 0.0$ 0.0$ 702.9%
19 732690 ‐ ARTICLES OF IRON OR STEEL 0.0$ 0.0$ 222.7%
20 848190 ‐ PARTS FOR TAPS, COCKS, VALVES AND SIMILAR APPLIANCES 0.2$ 0.0$ 10.8%
135.3$ 161.5$ 83.8%
5.6$ 0.1$ ‐549.2%
140.9$ 161.6$ 114.7%
Sub‐total
Other Exports
Total Alberta Exports
Rank HS‐Description 2010 2011 % Change
1 100190 ‐ MESLIN AND WHEAT NES: SEED 282.9$ 315.4$ 11.5%
2 120510 ‐ RAPE OR COLZA SEEDS ‐ LOW ERUCIC ACID 73.8$ 82.8$ 12.2%
3 071310 ‐ PEAS ‐ DRIED AND SHELLED 105.0$ 59.3$ ‐43.5%
4 071340 ‐ LENTILS ‐ DRIED AND SHELLED 52.9$ 10.8$ ‐79.6%
5 720918 ‐ FLAT COLD‐ROLLED PRODUCTS ‐ IRON/NON‐ALLOY STEEL 7.8$ 9.9$ 26.0%
6 720990 ‐ FLAT COLD‐ROLLED PRODUCTS ‐ IRON/NON‐ALLOY STEEL 2.2$ 7.7$ 244.0%
7 720836 ‐ FLAT HOT‐ROLLED PRODUCTS ‐ IRON/NON‐ALLOY STEEL 2.9$ 6.1$ 106.9%
8 720441 ‐ FERROUS WASTE AND SCRAP ‐ IRON OR STEEL 2.7$ 5.3$ 97.8%
9 721070 ‐ FLAT ROLLED PRODUCTS ‐ IRON/NON‐ALLOY STEEL 11.4$ 5.3$ ‐54.0%
10 720917 ‐ FLAT COLD‐ROLLED PRODUCTS ‐ IRON/NON‐ALLOY STEEL 4.1$ 4.6$ 11.7%
563.1$ 532.9$ ‐5.4%
30.1$ 17.0$ ‐43.6%
593.2$ 549.9$ ‐7.3%Total (All Products)
Sub‐total
Others
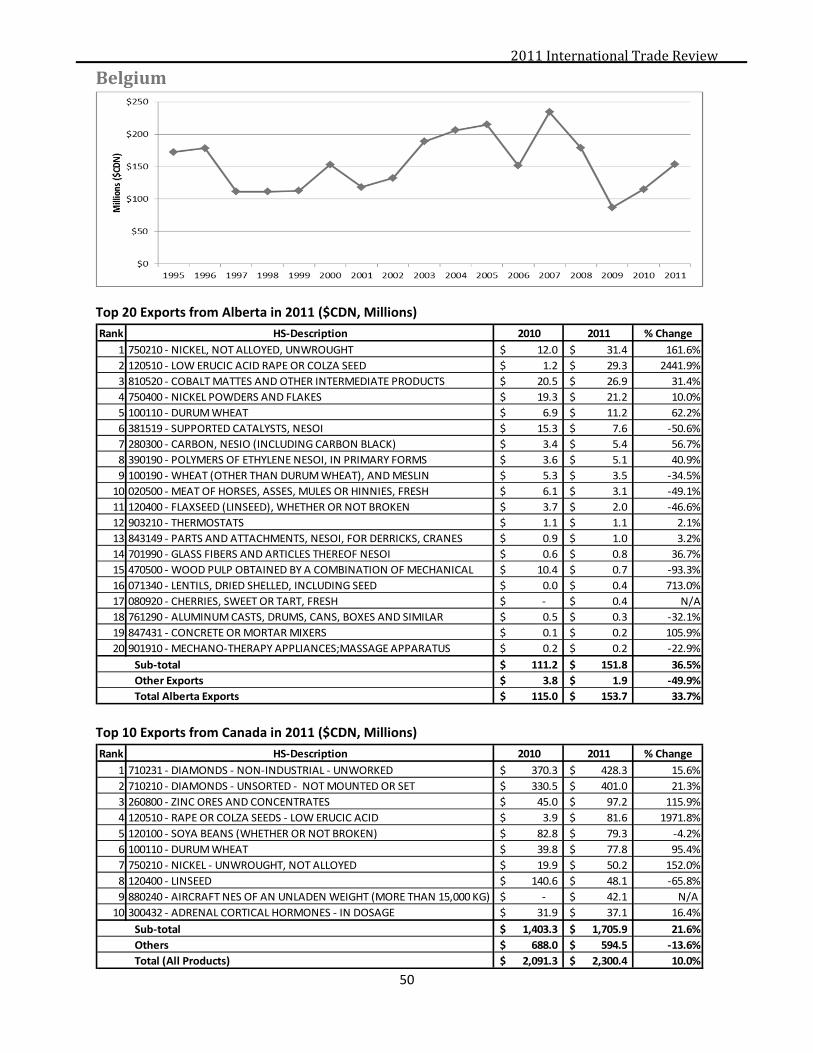
2011InternationalTradeReview
50
Belgium
Top 20 Exports from Alberta in 2011 ($CDN, Millions)
Top 10 Exports from Canada in 2011 ($CDN, Millions)
Rank HS‐Description 2010 2011 % Change
1 750210 ‐ NICKEL, NOT ALLOYED, UNWROUGHT 12.0$ 31.4$ 161.6%
2 120510 ‐ LOW ERUCIC ACID RAPE OR COLZA SEED 1.2$ 29.3$ 2441.9%
3 810520 ‐ COBALT MATTES AND OTHER INTERMEDIATE PRODUCTS 20.5$ 26.9$ 31.4%
4 750400 ‐ NICKEL POWDERS AND FLAKES 19.3$ 21.2$ 10.0%
5 100110 ‐ DURUM WHEAT 6.9$ 11.2$ 62.2%
6 381519 ‐ SUPPORTED CATALYSTS, NESOI 15.3$ 7.6$ ‐50.6%
7 280300 ‐ CARBON, NESIO (INCLUDING CARBON BLACK) 3.4$ 5.4$ 56.7%
8 390190 ‐ POLYMERS OF ETHYLENE NESOI, IN PRIMARY FORMS 3.6$ 5.1$ 40.9%
9 100190 ‐ WHEAT (OTHER THAN DURUM WHEAT), AND MESLIN 5.3$ 3.5$ ‐34.5%
10 020500 ‐ MEAT OF HORSES, ASSES, MULES OR HINNIES, FRESH 6.1$ 3.1$ ‐49.1%
11 120400 ‐ FLAXSEED (LINSEED), WHETHER OR NOT BROKEN 3.7$ 2.0$ ‐46.6%
12 903210 ‐ THERMOSTATS 1.1$ 1.1$ 2.1%
13 843149 ‐ PARTS AND ATTACHMENTS, NESOI, FOR DERRICKS, CRANES 0.9$ 1.0$ 3.2%
14 701990 ‐ GLASS FIBERS AND ARTICLES THEREOF NESOI 0.6$ 0.8$ 36.7%
15 470500 ‐ WOOD PULP OBTAINED BY A COMBINATION OF MECHANICAL 10.4$ 0.7$ ‐93.3%
16 071340 ‐ LENTILS, DRIED SHELLED, INCLUDING SEED 0.0$ 0.4$ 713.0%
17 080920 ‐ CHERRIES, SWEET OR TART, FRESH ‐$ 0.4$ N/A
18 761290 ‐ ALUMINUM CASTS, DRUMS, CANS, BOXES AND SIMILAR 0.5$ 0.3$ ‐32.1%
19 847431 ‐ CONCRETE OR MORTAR MIXERS 0.1$ 0.2$ 105.9%
20 901910 ‐ MECHANO‐THERAPY APPLIANCES;MASSAGE APPARATUS 0.2$ 0.2$ ‐22.9%
111.2$ 151.8$ 36.5%
3.8$ 1.9$ ‐49.9%
115.0$ 153.7$ 33.7%
Sub‐total
Other Exports
Total Alberta Exports
Rank HS‐Description 2010 2011 % Change
1 710231 ‐ DIAMONDS ‐ NON‐INDUSTRIAL ‐ UNWORKED 370.3$ 428.3$ 15.6%
2 710210 ‐ DIAMONDS ‐ UNSORTED ‐ NOT MOUNTED OR SET 330.5$ 401.0$ 21.3%
3 260800 ‐ ZINC ORES AND CONCENTRATES 45.0$ 97.2$ 115.9%
4 120510 ‐ RAPE OR COLZA SEEDS ‐ LOW ERUCIC ACID 3.9$ 81.6$ 1971.8%
5 120100 ‐ SOYA BEANS (WHETHER OR NOT BROKEN) 82.8$ 79.3$ ‐4.2%
6 100110 ‐ DURUM WHEAT 39.8$ 77.8$ 95.4%
7 750210 ‐ NICKEL ‐ UNWROUGHT, NOT ALLOYED 19.9$ 50.2$ 152.0%
8 120400 ‐ LINSEED 140.6$ 48.1$ ‐65.8%
9 880240 ‐ AIRCRAFT NES OF AN UNLADEN WEIGHT (MORE THAN 15,000 KG) ‐$ 42.1$ N/A
10 300432 ‐ ADRENAL CORTICAL HORMONES ‐ IN DOSAGE 31.9$ 37.1$ 16.4%
1,403.3$ 1,705.9$ 21.6%
688.0$ 594.5$ ‐13.6%
2,091.3$ 2,300.4$ 10.0%Total (All Products)
Sub‐total
Others
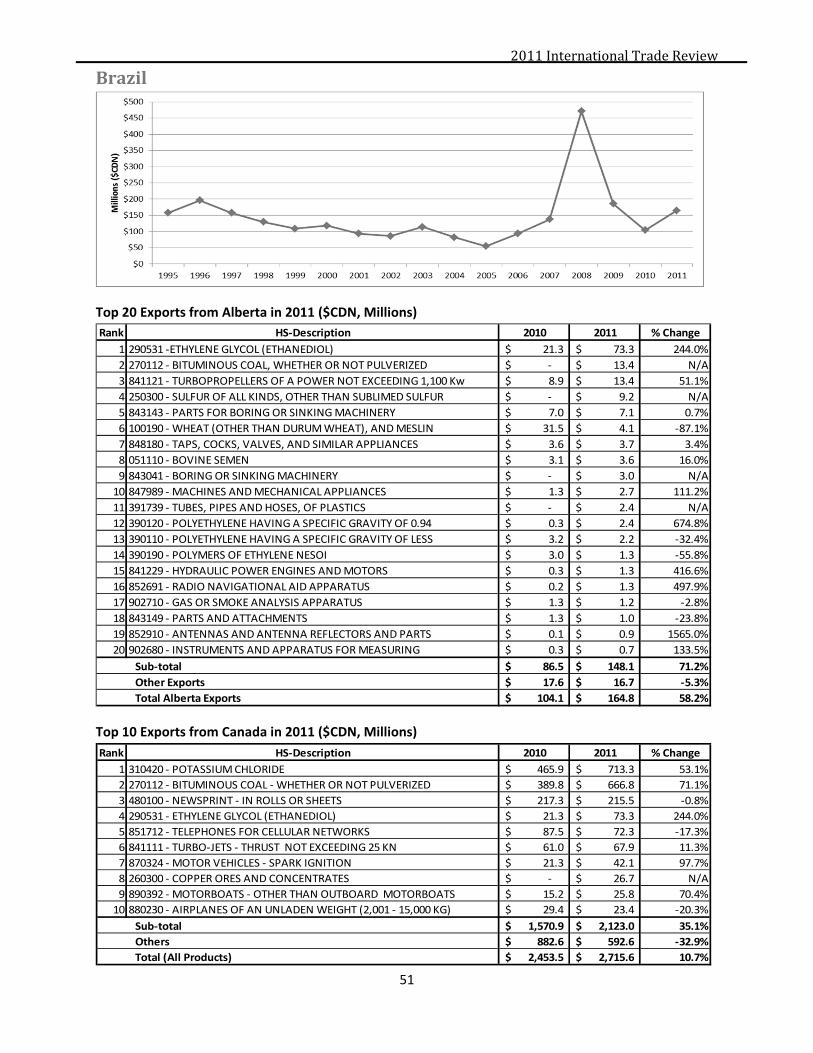
2011InternationalTradeReview
51
Brazil
Top 20 Exports from Alberta in 2011 ($CDN, Millions)
Top 10 Exports from Canada in 2011 ($CDN, Millions)
Rank HS‐Description 2010 2011 % Change
1 290531 ‐ETHYLENE GLYCOL (ETHANEDIOL) 21.3$ 73.3$ 244.0%
2 270112 ‐ BITUMINOUS COAL, WHETHER OR NOT PULVERIZED ‐$ 13.4$ N/A
3 841121 ‐ TURBOPROPELLERS OF A POWER NOT EXCEEDING 1,100 Kw 8.9$ 13.4$ 51.1%
4 250300 ‐ SULFUR OF ALL KINDS, OTHER THAN SUBLIMED SULFUR ‐$ 9.2$ N/A
5 843143 ‐ PARTS FOR BORING OR SINKING MACHINERY 7.0$ 7.1$ 0.7%
6 100190 ‐ WHEAT (OTHER THAN DURUM WHEAT), AND MESLIN 31.5$ 4.1$ ‐87.1%
7 848180 ‐ TAPS, COCKS, VALVES, AND SIMILAR APPLIANCES 3.6$ 3.7$ 3.4%
8 051110 ‐ BOVINE SEMEN 3.1$ 3.6$ 16.0%
9 843041 ‐ BORING OR SINKING MACHINERY ‐$ 3.0$ N/A
10 847989 ‐ MACHINES AND MECHANICAL APPLIANCES 1.3$ 2.7$ 111.2%
11 391739 ‐ TUBES, PIPES AND HOSES, OF PLASTICS ‐$ 2.4$ N/A
12 390120 ‐ POLYETHYLENE HAVING A SPECIFIC GRAVITY OF 0.94 0.3$ 2.4$ 674.8%
13 390110 ‐ POLYETHYLENE HAVING A SPECIFIC GRAVITY OF LESS 3.2$ 2.2$ ‐32.4%
14 390190 ‐ POLYMERS OF ETHYLENE NESOI 3.0$ 1.3$ ‐55.8%
15 841229 ‐ HYDRAULIC POWER ENGINES AND MOTORS 0.3$ 1.3$ 416.6%
16 852691 ‐ RADIO NAVIGATIONAL AID APPARATUS 0.2$ 1.3$ 497.9%
17 902710 ‐ GAS OR SMOKE ANALYSIS APPARATUS 1.3$ 1.2$ ‐2.8%
18 843149 ‐ PARTS AND ATTACHMENTS 1.3$ 1.0$ ‐23.8%
19 852910 ‐ ANTENNAS AND ANTENNA REFLECTORS AND PARTS 0.1$ 0.9$ 1565.0%
20 902680 ‐ INSTRUMENTS AND APPARATUS FOR MEASURING 0.3$ 0.7$ 133.5%
86.5$ 148.1$ 71.2%
17.6$ 16.7$ ‐5.3%
104.1$ 164.8$ 58.2%
Sub‐total
Other Exports
Total Alberta Exports
Rank HS‐Description 2010 2011 % Change
1 310420 ‐ POTASSIUM CHLORIDE 465.9$ 713.3$ 53.1%
2 270112 ‐ BITUMINOUS COAL ‐ WHETHER OR NOT PULVERIZED 389.8$ 666.8$ 71.1%
3 480100 ‐ NEWSPRINT ‐ IN ROLLS OR SHEETS 217.3$ 215.5$ ‐0.8%
4 290531 ‐ ETHYLENE GLYCOL (ETHANEDIOL) 21.3$ 73.3$ 244.0%
5 851712 ‐ TELEPHONES FOR CELLULAR NETWORKS 87.5$ 72.3$ ‐17.3%
6 841111 ‐ TURBO‐JETS ‐ THRUST NOT EXCEEDING 25 KN 61.0$ 67.9$ 11.3%
7 870324 ‐ MOTOR VEHICLES ‐ SPARK IGNITION 21.3$ 42.1$ 97.7%
8 260300 ‐ COPPER ORES AND CONCENTRATES ‐$ 26.7$ N/A
9 890392 ‐ MOTORBOATS ‐ OTHER THAN OUTBOARD MOTORBOATS 15.2$ 25.8$ 70.4%
10 880230 ‐ AIRPLANES OF AN UNLADEN WEIGHT (2,001 ‐ 15,000 KG) 29.4$ 23.4$ ‐20.3%
1,570.9$ 2,123.0$ 35.1%
882.6$ 592.6$ ‐32.9%
2,453.5$ 2,715.6$ 10.7%Total (All Products)
Sub‐total
Others

2011InternationalTradeReview
52
Chile
Top 20 Exports from Alberta in 2011 ($CDN, Millions)
Top 10 Exports from Canada in 2011 ($CDN, Millions)
Rank HS‐Description 2010 2011 % Change
1 722830 ‐ BARS AND RODS ‐ ALLOY NON‐STAINLESS STEEL ‐ 22.1$ 35.1$ 58.8%
2 100190 ‐ MESLIN AND WHEAT NES: SEED 12.9$ 20.8$ 61.5%
3 390190 ‐ POLYMERS OF ETHYLENE NES, IN PRIMARY FORMS 20.2$ 17.9$ ‐11.0%
4 250300 ‐ SULFUR OF ALL KINDS 8.7$ 11.8$ 36.1%
5 851762 ‐ MACHINES F R/C/T OR REGE OF VOICE,IMAGES OR DATA 0.1$ 10.1$ 14430.9%
6 151411 ‐ RAPE (CANOLA) OR COLZA OIL ‐ LOW ERUCIC ACID ‐ CRUDE ‐$ 2.4$ N/A
7 854442 ‐ ELECTRIC CONDUCTORS, VOLTAGE <= 1,000 V 0.0$ 1.8$ 5152.5%
8 870520 ‐ MOBILE DRILLING DERRICKS 0.9$ 1.1$ 13.7%
9 843143 ‐ PARTS OF BORING OR SINKING MACHINERY 1.0$ 0.9$ ‐13.6%
10 843149 ‐ PARTS OF CRANES, WORK‐TRUCKS, SHOVELS 1.7$ 0.6$ ‐64.0%
11 410150 ‐ WHOLE HIDES AND SKINS ‐ BOVINE/EQUINE ANIMALS 0.1$ 0.4$ 360.2%
12 901420 ‐ INSTRUMENTS AND APPLIANCES FOR AERONAUTICAL ‐$ 0.4$ N/A
13 847190 ‐ OTHER DATA PROCESSING MACHINES OR UNITS THEREOF NES ‐$ 0.4$ N/A
14 853720 ‐ BOARDS AND PANELS ‐$ 0.4$ N/A
15 850440 ‐ ELECTRIC STATIC CONVERTERS 0.1$ 0.4$ 210.0%
16 850720 ‐ LEAD‐ACID ELECTRIC ACCUMULATORS ‐$ 0.3$ N/A
17 843139 ‐ PARTS OF LIFTING, HANDLING 0.1$ 0.3$ 141.1%
18 847150 ‐ PROCESS UNITS O/T 8471.41/.49, W/N CNTG ‐$ 0.3$ N/A
19 902290 ‐ PARTS AND ACCESSORIES FOR APPARATUS 0.2$ 0.3$ 27.1%
20 841350 ‐ RECIPROCATING POSITIVE DISPLACEMENT PUMPS 0.3$ 0.3$ ‐3.7%
69.0$ 107.0$ 55.0%
11.7$ 6.4$ ‐45.2%
80.7$ 113.4$ 40.5%Total (All Products)
Sub‐total
Others
Rank HS‐Description 2010 2011 % Change
1 261390 ‐ MOLYBDENUM ORES AND CONCENTRATES ‐ EXCEPT ROASTED 2.4$ 72.4$ 2856.4%
2 270112 ‐ BITUMINOUS COAL ‐ WHETHER OR NOT PULVERIZED 51.3$ 66.6$ 30.0%
3 100190 ‐ MESLIN AND WHEAT NES: SEED 39.1$ 53.8$ 37.9%
4 271019 ‐ PETROLEUM OILS AND OILS FROM BITUMINOUS MINERALS 1.1$ 40.7$ 3755.8%
5 722830 ‐ BARS AND RODS ‐ ALLOY NON‐STAINLESS STEEL 22.1$ 35.1$ 58.8%
6 843143 ‐ PARTS OF BORING OR SINKING MACHINERY 21.9$ 27.0$ 23.1%
7 151411 ‐ RAPE (CANOLA) OR COLZA OIL ‐ LOW ERUCIC ACID ‐ CRUDE ‐$ 26.2$ N/A
8 260300 ‐ COPPER ORES AND CONCENTRATES ‐$ 23.3$ N/A
9 390190 ‐ POLYMERS OF ETHYLENE NES, IN PRIMARY FORMS 21.2$ 18.8$ ‐11.0%
10 847490 ‐ PARTS OF MACHINERY FOR HANDLING STONES, ORES 11.2$ 18.7$ 67.0%
280.3$ 518.4$ 84.9%
259.6$ 261.2$ 0.6%
539.9$ 779.6$ 44.4%Total (All Products)
Sub‐total
Others

2011InternationalTradeReview
53
China
Top 20 Exports from Alberta in 2011 ($CDN, Millions)
Top 10 Exports from Canada in 2011 ($CDN, Millions)
Rank HS‐ Description 2010 2011 % Change
1 290531 ‐ ETHYLENE GLYCOL (ETHANEDIOL) 426.2$ 509.0$ 19.4%
2 270900 ‐ CRUDE PETROLEUM OILS AND OILS OBTAINED 174.9$ 407.2$ 132.8%
3 151411 ‐ RAPE (CANOLA) OR COLZA OIL ‐ LOW ERUCIC ACID ‐ CRUDE 622.5$ 369.2$ ‐40.7%
4 120510 ‐ RAPE OR COLZA SEEDS ‐ LOW ERUCIC ACID 200.7$ 277.1$ 38.1%
5 750210 ‐ NICKEL ‐ UNWROUGHT, NOT ALLOYED 249.3$ 174.3$ ‐30.1%
6 250300 ‐ SULFUR OF ALL KINDS 178.0$ 172.9$ ‐2.9%
7 470321 ‐ CHEMICAL WOODPULP ‐ SODA OR SULPHATE 94.6$ 119.3$ 26.2%
8 841480 ‐ VENTILATING OR AIR/GAS RECYCLING HOODS ‐$ 114.6$ N/A
9 410150 ‐ WHOLE HIDES AND SKINS ‐ BOVINE/EQUINE ANIMALS 69.6$ 104.3$ 50.0%
10 470329 ‐ CHEMICAL WOODPULP ‐ SODA OR SULPHATE 105.2$ 100.2$ ‐4.8%
11 270112 ‐ BITUMINOUS COAL ‐ WHETHER OR NOT PULVERIZED 163.8$ 99.7$ ‐39.1%
12 390190 ‐ POLYMERS OF ETHYLENE NES, IN PRIMARY FORMS 102.2$ 79.8$ ‐21.9%
13 230641 ‐ OIL‐CAKE AND OTHER SOLID RESIDUES 103.0$ 74.6$ ‐27.6%
14 470500 ‐ SEMI‐CHEMICAL WOOD PULP 37.8$ 48.2$ 27.6%
15 071310 ‐ PEAS ‐ DRIED AND SHELLED 2.8$ 30.4$ 990.4%
16 100190 ‐ MESLIN AND WHEAT NES: SEED 22.4$ 23.4$ 4.4%
17 100300 ‐ BARLEY 22.5$ 21.3$ ‐5.5%
18 410190 ‐ OTHER HIDES/SKINS NES BOVINE/EQUINE ANIMALS 7.0$ 17.4$ 150.0%
19 740400 ‐ COPPER WASTE AND SCRAP 16.7$ 15.1$ ‐9.1%
20 271311 ‐ PETROLEUM COKE ‐ NOT CALCINED 23.8$ 12.2$ ‐48.7%
2,655.9$ 2,814.9$ 6.0%
182.2$ 183.4$ 0.6%
2,838.2$ 2,998.3$ 5.6%
Sub‐total
Others
Total (All Products)
Rank HS‐Description 2010 2011 % Change
1 470321 ‐ CHEMICAL WOODPULP ‐ SODA OR SULPHATE ‐ CONIFEROUS 1,072.7$ 1,480.4$ 38.0%
2 440710 ‐ LUMBER (THICKNESS >6MM) ‐ CONIFEROUS WOOD 677.4$ 1,100.8$ 62.5%
3 260111 ‐ IRON ORES AND CONCENTRATES 334.4$ 1,093.4$ 227.0%
4 260300 ‐ COPPER ORES AND CONCENTRATES 476.5$ 850.6$ 78.5%
5 270112 ‐ BITUMINOUS COAL ‐ WHETHER OR NOT PULVERIZED 997.3$ 820.6$ ‐17.7%
6 120510 ‐ RAPE OR COLZA SEEDS ‐ LOW ERUCIC ACID 684.8$ 770.7$ 12.5%
7 151411 ‐ RAPE (CANOLA) OR COLZA OIL ‐ LOW ERUCIC ACID ‐ CRUDE 899.1$ 664.8$ ‐26.1%
8 750210 ‐ NICKEL ‐ UNWROUGHT, NOT ALLOYED 655.8$ 616.4$ ‐6.0%
9 260112 ‐ IRON ORES AND CONCENTRATES 471.6$ 539.7$ 14.4%
10 290531 ‐ ETHYLENE GLYCOL (ETHANEDIOL) 426.2$ 509.0$ 19.4%
9,486.4$ 12,287.4$ 29.5%
3,392.7$ 4,095.2$ 20.7%
12,879.1$ 16,382.6$ 27.2%Total (All Products)
Sub‐total
Others

2011InternationalTradeReview
54
Colombia
Top 20 Exports from Alberta in 2011 ($CDN, Millions)
Top 10 Exports from Canada in 2011 ($CDN, Millions)
Rank HS‐Description 2010 2011 % Change
1 100190 ‐ MESLIN AND WHEAT NES: SEED 44.9$ 80.6$ 80%
2 843143 ‐ PARTS OF BORING OR SINKING MACHINERY 28.8$ 19.9$ ‐31.1%
3 151411 ‐ RAPE (CANOLA) OR COLZA OIL ‐ LOW ERUCIC ACID ‐ CRUDE ‐$ 6.2$ N/A
4 100300 ‐ BARLEY 5.2$ 5.7$ 9.7%
5 842619 ‐ TRANSPORTER, GANTRY OR BRIDGE CRANES ‐$ 4.1$ N/A
6 847989 ‐ MACHINES & MECHANICAL APPLIANCES 2.0$ 4.0$ 100.1%
7 841391 ‐ PARTS OF PUMPS 3.5$ 3.4$ ‐1.0%
8 151419 ‐ RAPE (CANOLA) OR COLZA OIL ‐ LOW ERUCIC ACID ‐ NOT CRUDE 3.0$ 3.3$ 10.5%
9 151710 ‐ MARGARINE (EXCLUDING LIQUID MARGARINE) 2.2$ 3.1$ 44.3%
10 841360 ‐ ROTARY POSITIVE DISPLACEMENT PUMPS NES 1.2$ 2.5$ 106.3%
11 841350 ‐ RECIPROCATING POSITIVE DISPLACEMENT PUMPS NES 2.3$ 2.3$ ‐1.0%
12 870590 ‐ MOTOR VEHICLES ‐ SPECIAL (NON‐TRANSPORT) 6.1$ 2.0$ ‐68.0%
13 843149 ‐ PARTS OF CRANES, WORK‐TRUCKS, SHOVELS 0.1$ 1.9$ 1963.9%
14 841121 ‐ TURBO‐PROPELLERS ‐ POWER NOT EXCEEDING 1,100 KW 1.2$ 1.6$ 40.7%
15 847149 ‐ OTHER AUTOMATIC DATA PROCESSING MACHINES 0.1$ 1.5$ 983.2%
16 854442 ‐ ELECTRIC CONDUCTORS, VOLTAGE <= 1,000 V 0.1$ 1.4$ 918.1%
17 841229 ‐ HYDRAULIC POWER ENGINES AND MOTORS 0.5$ 1.1$ 133.4%
18 848140 ‐ VALVES ‐ SAFETY OR RELIEF 0.6$ 1.0$ 77.5%
19 843139 ‐ PARTS OF LIFTING, HANDLING 0.5$ 0.9$ 102.4%
20 848180 ‐ TAPS, COCKS, VALVES AND OTHER SIMILAR APPLIANCES 1.1$ 0.9$ ‐17.7%
110.4$ 151.5$ 37.2%
26.2$ 18.2$ ‐30.7%
136.6$ 169.6$ 24.2%
Sub‐total
Others
Total (All Products)
Rank HS‐Description 2010 2011 % Change
1 100190 ‐ MESLIN AND WHEAT NES: SEED 127.8$ 209.0$ 63.5%
2 071340 ‐ LENTILS ‐ DRIED AND SHELLED 61.5$ 53.9$ ‐12.5%
3 310420 ‐ POTASSIUM CHLORIDE 36.4$ 48.9$ 34.2%
4 480100 ‐ NEWSPRINT ‐ IN ROLLS OR SHEETS 28.7$ 35.5$ 23.7%
5 843143 ‐ PARTS OF BORING OR SINKING MACHINERY 31.7$ 26.2$ ‐17.2%
6 271019 ‐ PETROLEUM OILS AND OILS FROM BITUMINOUS MINERALS 1.1$ 25.9$ 2207.0%
7 100300 ‐ BARLEY 23.1$ 14.7$ ‐36.3%
8 071310 ‐ PEAS ‐ DRIED AND SHELLED 10.2$ 13.5$ 33.3%
9 820719 ‐ ROCK DRILLING OR EARTH BORING TOOLS 6.9$ 11.5$ 66.3%
10 740811 ‐ WIRE ‐ OF REFINED COPPER 14.1$ 9.9$ ‐29.5%
389.2$ 534.1$ 37.2%
224.7$ 193.5$ ‐13.9%
614.0$ 727.7$ 18.5%Total (All Products)
Sub‐total
Others

2011InternationalTradeReview
55
Cuba
Top 20 Exports from Alberta in 2011 ($CDN, Millions)
Top 10 Exports from Canada in 2011 ($CDN, Millions)
Rank HS‐Description 2010 2011 % Change
1 840290 ‐ PARTS OF STEAM OR VAPOUR GENERATING BOILERS NES ‐$ 27.4$ N/A
2 100190 ‐ MESLIN AND WHEAT NES: SEED 16.7$ 24.6$ 47.3%
3 843143 ‐ PARTS OF BORING OR SINKING MACHINERY 3.5$ 8.7$ 147.7%
4 847989 ‐ MACHINES & MECHANICAL APPLIANCES ‐$ 1.5$ N/A
5 820719 ‐ ROCK DRILLING OR EARTH BORING TOOLS ‐ 0.7$ 1.4$ 81.6%
6 841391 ‐ PARTS OF PUMPS FOR LIQUIDS 1.9$ 1.3$ ‐31.9%
7 848180 ‐ TAPS, COCKS, VALVES AND OTHER SIMILAR APPLIANCES, NES 0.5$ 1.3$ 173.1%
8 020230 ‐ BOVINE, CUTS BONELESS ‐ FROZEN 2.9$ 1.2$ ‐57.3%
9 100110 ‐ DURUM WHEAT 0.4$ 1.1$ 162.9%
10 730900 ‐ RESERVOIRS, TANKS, VATS AND SIMILAR CONTAINERS 0.4$ 1.0$ 138.9%
11 841381 ‐ EJECTOR PUMPS AND OTHER PUMPS NES 1.4$ 1.0$ ‐28.5%
12 902690 ‐ PARTS OF INSTRUMENTS AND APPARATUS FOR MEASURING 0.3$ 0.9$ 168.4%
13 340290 ‐ SURFACE‐ACTIVE PREPARATIONS 1.1$ 0.9$ ‐19.8%
14 730429 ‐ CASINGS, TUBING, OTHER THAN STAINLESS STEEL, SEAMLESS 0.1$ 0.8$ 1253.2%
15 854460 ‐ OTHER ELECTRIC CONDUCTORS (VOLTAGE EXCEEDING 1,000V) 0.0$ 0.8$ 4374.8%
16 841290 ‐ PARTS OF HYDRAULIC, PNEUMATIC AND OTHER POWER ENGINES 1.2$ 0.8$ ‐37.0%
17 853650 ‐ OTHER ELECTRICAL SWITCHES NES 0.0$ 0.7$ 1718.8%
18 381190 ‐ PREPARED ADDITIVES FOR MINERAL OILS 1.9$ 0.7$ ‐64.8%
19 732690 ‐ OTHER ARTICLES (EXCLUDING WIRE) NES ‐ IRON OR STEEL 1.4$ 0.6$ ‐53.7%
20 854449 ‐ ELECTRIC CONDUCTORS 0.3$ 0.6$ 102.5%
36.7$ 79.8$ 117.2%
15.7$ 13.3$ ‐15.5%
52.5$ 93.1$ 77.4%
Sub‐total
Others
Total (All Products)
Rank HS‐Description 2010 2011 % Change
1 100190 ‐ MESLIN AND WHEAT NES: SEED 50.7$ 63.7$ 25.8%
2 280200 ‐ SULFUR (SUBLIMED, PRECIPITATED OR COLLOIDAL) 32.4$ 31.1$ ‐4.0%
3 840290 ‐ PARTS OF STEAM OR VAPOUR GENERATING BOILERS NES 0.0$ 28.0$ 78145.0%
4 071310 ‐ PEAS ‐ DRIED AND SHELLED 20.5$ 19.2$ ‐6.5%
5 310420 ‐ POTASSIUM CHLORIDE 18.3$ 13.2$ ‐27.5%
6 740811 ‐ WIRE ‐ OF REFINED COPPER 7.6$ 11.6$ 52.7%
7 843143 ‐ PARTS OF BORING OR SINKING MACHINERY 5.7$ 9.7$ 70.5%
8 100110 ‐ DURUM WHEAT 2.5$ 8.0$ 216.7%
9 870899 ‐ MOTOR VEHICLE PARTS, NES 2.7$ 6.3$ 130.7%
10 040210 ‐ MILK/CREAM POWDER (<1.6% FAT) 3.8$ 5.8$ 50.9%
180.2$ 240.9$ 33.7%
127.6$ 117.7$ ‐7.8%
307.8$ 358.6$ 16.5%Total (All Products)
Sub‐total
Others

2011InternationalTradeReview
56
Ecuador
Top 20 Exports from Alberta in 2011 ($CDN, Millions)
Top 10 Exports from Canada in 2011 ($CDN, Millions)
Rank HS‐Description 2010 2011 % Change
1 100190 ‐ MESLIN AND WHEAT NES: SEED 31.2$ 56.0$ 79.3%
2 110710 ‐ MALT ‐ NOT ROASTED 5.7$ 6.7$ 18.3%
3 842129 ‐ FILTERING OR PURIFYING MACHINERY AND APPARATUS 0.0$ 2.1$ 374920.4%
4 843143 ‐ PARTS OF BORING OR SINKING MACHINERY 1.2$ 2.1$ 70.8%
5 850220 ‐ GENERATING SETS WITH SPARK‐IGNITION INTERNAL ‐$ 1.7$ N/A
6 870590 ‐ MOTOR VEHICLES ‐ SPECIAL (NON‐TRANSPORT) PURPOSE NES ‐$ 0.7$ N/A
7 151411 ‐ RAPE (CANOLA) OR COLZA OIL ‐ LOW ERUCIC ACID ‐ CRUDE ‐$ 0.7$ N/A
8 100300 ‐ BARLEY 0.6$ 0.6$ 7.1%
9 841229 ‐ HYDRAULIC POWER ENGINES AND MOTORS 0.1$ 0.6$ 810.0%
10 100110 ‐ DURUM WHEAT 0.3$ 0.3$ 29.7%
11 841290 ‐ PARTS OF HYDRAULIC, PNEUMATIC AND OTHER POWER ENGINES 0.4$ 0.3$ ‐22.4%
12 847989 ‐ MACHINES & MECHANICAL APPLIANCES 0.2$ 0.2$ ‐5.8%
13 848210 ‐ BALL BEARINGS (FOR AUTOMOTIVE AND OTHER USES) 0.0$ 0.2$ 690.3%
14 847990 ‐ PARTS OF MACHINES & MECHANICAL APPLIANCES 0.1$ 0.2$ 174.9%
15 853710 ‐ BOARDS AND PANELS ‐$ 0.2$ N/A
16 848330 ‐ BEARING HOUSINGS ‐ NOT INCORPORATING BALL 0.1$ 0.2$ 196.1%
17 848310 ‐ TRANSMISSION SHAFTS AND CRANKS 0.1$ 0.1$ ‐5.6%
18 852560 ‐ TRANSMISSION APPARATUS INCORPORATING 0.1$ 0.1$ 92.8%
19 850300 ‐ PARTS FOR ELECTRIC MOTORS, GENERATORS ‐$ 0.1$ N/A
20 401693 ‐ GASKETS, WASHERS AND OTHER SEALS OF VULCANIZED RUBBER 0.1$ 0.1$ 13.7%
40.6$ 73.8$ 81.6%
2.0$ 1.4$ ‐29.8%
42.6$ 75.2$ 76.4%
Sub‐total
Others
Total (All Products)
Rank HS‐Description 2010 2011 % Change
1 100190 ‐ MESLIN AND WHEAT NES: SEED 94.8$ 145.1$ 53.1%
2 071340 ‐ LENTILS ‐ DRIED AND SHELLED 14.9$ 14.1$ ‐5.3%
3 110710 ‐ MALT ‐ NOT ROASTED 6.3$ 9.6$ 53.4%
4 760511 ‐ ALUMINUM WIRE 5.0$ 8.8$ 77.3%
5 480100 ‐ NEWSPRINT ‐ IN ROLLS OR SHEETS 10.0$ 7.6$ ‐24.4%
6 847170 ‐ STORAGE UNITS FOR COMPUTERS AND OTHER DATA 4.0$ 3.3$ ‐17.7%
7 480511 ‐ SEMI‐CHEMICAL FLUTING PAPER ‐ IN ROLLS/SHEETS 5.7$ 3.2$ ‐43.7%
8 843143 ‐ PARTS OF BORING OR SINKING MACHINERY 2.2$ 2.7$ 22.8%
9 100110 ‐ DURUM WHEAT 1.5$ 2.4$ 56.2%
10 847790 ‐ PARTS OF MACHINES FOR WORKING RUBBER OR PLASTICS 1.3$ 2.2$ 75.0%
160.3$ 223.0$ 39.2%
91.3$ 47.7$ ‐47.8%
251.5$ 270.7$ 7.6%Total (All Products)
Sub‐total
Others

2011InternationalTradeReview
57
Egypt
Top 20 Exports from Alberta in 2011 ($CDN, Millions)
Top 10 Exports from Canada in 2011 ($CDN, Millions)
Rank HS‐Description 2010 2011 % Change
1 100190 ‐ MESLIN AND WHEAT NES: SEED 25.0$ 21.0$ ‐16.3%
2 020230 ‐ BOVINE, CUTS BONELESS ‐ FROZEN 2.1$ 3.7$ 77.2%
3 843143 ‐ PARTS OF BORING OR SINKING MACHINERY 5.0$ 1.6$ ‐67.2%
4 848130 ‐ VALVES ‐ CHECK 0.6$ 0.7$ 13.4%
5 732690 ‐ OTHER ARTICLES (EXCLUDING WIRE) NES ‐ IRON OR STEEL 0.5$ 0.6$ 20.0%
6 848180 ‐ TAPS, COCKS, VALVES AND OTHER SIMILAR APPLIANCES 0.3$ 0.5$ 56.2%
7 841391 ‐ PARTS OF PUMPS FOR LIQUIDS 1.3$ 0.5$ ‐60.6%
8 847989 ‐ MACHINES & MECHANICAL APPLIANCES 1.2$ 0.5$ ‐57.2%
9 470321 ‐ CHEMICAL WOODPULP ‐ SODA OR SULPHATE ‐$ 0.3$ N/A
10 841370 ‐ CENTRIFUGAL PUMPS NES 0.2$ 0.3$ 45.7%
11 401693 ‐ GASKETS, WASHERS AND OTHER SEALS OF VULCANIZED RUBBER 0.2$ 0.3$ 80.5%
12 730799 ‐ OTHER PIPE OR TUBE FITTINGS ‐ IRON OR STEEL NES 0.1$ 0.3$ 265.1%
13 820719 ‐ ROCK DRILLING OR EARTH BORING TOOLS 0.0$ 0.3$ 1706.2%
14 853720 ‐ BOARDS AND PANELS(INCLUDING NUMERICAL CONTROL PANELS) 0.1$ 0.3$ 318.7%
15 841290 ‐ PARTS OF HYDRAULIC, PNEUMATIC AND OTHER POWER ENGINES 0.5$ 0.2$ ‐51.2%
16 841360 ‐ ROTARY POSITIVE DISPLACEMENT PUMPS NES 0.0$ 0.2$ 387.1%
17 841229 ‐ HYDRAULIC POWER ENGINES AND MOTORS 0.3$ 0.2$ ‐23.2%
18 040490 ‐ PRODUCTS CONSISTING OF NATURAL MILK CONSTITUENTS 1.0$ 0.2$ ‐82.8%
19 051110 ‐ BOVINE SEMEN 0.0$ 0.1$ 579.8%
20 848190 ‐ PARTS OF TAPS, COCKS, VALVES OR OTHER SIMILAR APPLIANCES 0.2$ 0.1$ ‐43.4%
39.6$ 32.4$ ‐18.3%
6.2$ 2.4$ ‐62.3%
45.8$ 34.7$ ‐24.3%
Sub‐total
Total (All Products)
Others
Rank HS‐Description 2010 2011 % Change
1 720449 ‐ FERROUS WASTE AND SCRAP ‐ IRON OR STEEL NES 179.1$ 167.5$ ‐6.5%
2 260112 ‐ IRON ORES AND CONCENTRATES, OTHER THAN ROASTED IRON PY 53.9$ 91.5$ 69.8%
3 120100 ‐ SOYA BEANS (WHETHER OR NOT BROKEN) 32.0$ 72.8$ 127.7%
4 100190 ‐ MESLIN AND WHEAT NES: SEED 76.1$ 54.3$ ‐28.5%
5 071340 ‐ LENTILS ‐ DRIED AND SHELLED 44.3$ 54.1$ 22.2%
6 880240 ‐ AIRCRAFT NES OF AN UNLADEN WEIGHT (MORE THAN 15,000 KG) ‐$ 42.9$ N/A
7 480100 ‐ NEWSPRINT ‐ IN ROLLS OR SHEETS 24.4$ 27.7$ 13.5%
8 480421 ‐ SACK KRAFT PAPER ‐ IN ROLLS/SHEETS ‐ UNBLEACHED 27.2$ 27.1$ ‐0.2%
9 270112 ‐ BITUMINOUS COAL ‐ WHETHER OR NOT PULVERIZED BUT NOT AGG ‐$ 18.4$ N/A
10 100590 ‐ MAIZE (CORN) NES (EXCLUDING SWEET CORN) 3.1$ 13.2$ 332.4%
489.3$ 629.0$ 28.6%
121.6$ 61.7$ ‐49.3%
610.9$ 690.7$ 13.1%Total (All Products)
Sub‐total
Others

2011InternationalTradeReview
58
France
Top 20 Exports from Alberta in 2011 ($CDN, Millions)
Top 10 Exports from Canada in 2011 ($CDN, Millions)
Rank HS‐ Description 2010 2011 % Change
1 841121 ‐ TURBO‐PROPELLERS ‐ POWER NOT EXCEEDING 1,100 KW 19.6$ 22.6$ 15.3%
2 020500 ‐ HORSE, ASS, MULE OR HINNY MEAT ‐ FRESH, CHILLED OR FROZEN 14.9$ 13.0$ ‐12.6%
3 120510 ‐ RAPE OR COLZA SEEDS ‐ LOW ERUCIC ACID 0.0$ 9.3$ 28394.0%
4 470500 ‐ SEMI‐CHEMICAL WOOD PULP 6.7$ 6.1$ ‐8.6%
5 220720 ‐ ETHYL ALCOHOL AND OTHER SPIRITS 5.2$ 5.0$ ‐4.4%
6 270112 ‐ BITUMINOUS COAL ‐ WHETHER OR NOT PULVERIZED ‐$ 4.7$ N/A
7 280300 ‐ CARBON (CARBON BLACKS AND OTHER FORMS OF CARBON NES) 2.2$ 4.0$ 78.3%
8 852691 ‐ RADIO NAVIGATIONAL AID APPARATUS 2.4$ 3.9$ 64.2%
9 847990 ‐ PARTS OF MACHINES & MECHANICAL APPLIANCES 1.5$ 3.7$ 145.5%
10 381800 ‐ CHEMICAL ELEMENTS OR COMPOUNDS DOPED 0.2$ 2.4$ 882.2%
11 470329 ‐ CHEMICAL WOODPULP ‐ SODA OR SULPHATE ‐$ 2.2$ N/A
12 841391 ‐ PARTS OF PUMPS FOR LIQUIDS 0.5$ 1.8$ 272.5%
13 230910 ‐ DOG OR CAT FOOD PUT UP FOR RETAIL SALE 1.3$ 1.7$ 38.8%
14 902680 ‐ INSTRUMENTS AND APPARATUS FOR MEASURING 0.0$ 1.6$ 4449.1%
15 844332 ‐ OTHER PRINTING MACHINES, CAPABLE OF 0.8$ 1.3$ 64.6%
16 730429 ‐ CASINGS, TUBING, OTHER THAN STAINLESS STEEL, SEAMLESS ‐$ 1.2$ N/A
17 903180 ‐ OTHER MEASURING OR CHECKING INSTRUMENTS 0.5$ 0.8$ 79.2%
18 820790 ‐ SCREWDRIVER BITS, LAPPING TOOLS AND OTHER ‐$ 0.7$ N/A
19 902710 ‐ GAS OR SMOKE ANALYSIS APPARATUS 0.5$ 0.7$ 51.4%
20 848180 ‐ TAPS, COCKS, VALVES AND OTHER SIMILAR APPLIANCES 0.7$ 0.7$ ‐3.9%
58.6$ 90.6$ 54.6%
11.3$ 9.6$ ‐14.9%
70.0$ 100.3$ 43.3%
Sub‐total
Others
Total (All Products)
Rank HS‐Description 2010 2011 % Change
1 880240 ‐ AIRCRAFT NES OF AN UNLADEN WEIGHT (MORE THAN 15,000 KG) 23.2$ 233.9$ 907.4%
2 271019 ‐ PETROLEUM OILS AND OILS FROM BITUMINOUS MINERALS 0.9$ 188.6$ 21396.8%
3 260112 ‐ IRON ORES AND CONCENTRATES 127.5$ 170.2$ 33.5%
4 841112 ‐ TURBO‐JETS ‐ THRUST EXCEEDING 25 KN 99.2$ 158.1$ 59.5%
5 260111 ‐ IRON ORES AND CONCENTRATES 140.5$ 155.8$ 10.9%
6 880330 ‐ PARTS OF AIRPLANES OR HELICOPTERS NES 106.1$ 124.8$ 17.6%
7 841122 ‐ TURBO‐PROPELLERS ‐ POWER EXCEEDING 1,100 KW 106.3$ 111.2$ 4.6%
8 300220 ‐ VACCINES ‐ HUMAN USES 121.4$ 109.2$ ‐10.0%
9 880320 ‐ UNDER‐CARRIAGES AND PARTS THEREOF ‐ FOR AIRCRAFTS 85.4$ 88.8$ 3.9%
10 760120 ‐ UNWROUGHT ALUMINUM ‐ ALLOYED 45.7$ 70.0$ 53.3%
1,193.6$ 1,938.1$ 62.4%
881.1$ 926.2$ 5.1%
2,074.8$ 2,864.3$ 38.1%Total (All Products)
Sub‐total
Others
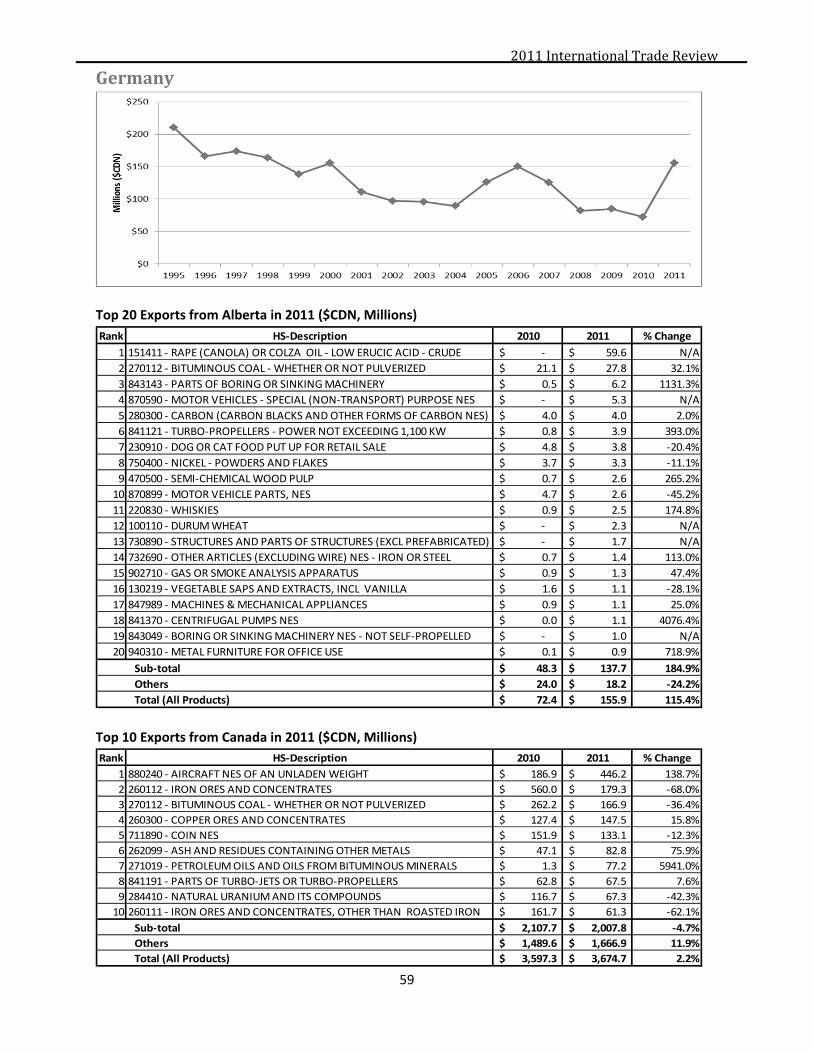
2011InternationalTradeReview
59
Germany
Top 20 Exports from Alberta in 2011 ($CDN, Millions)
Top 10 Exports from Canada in 2011 ($CDN, Millions)
Rank HS‐Description 2010 2011 % Change
1 151411 ‐ RAPE (CANOLA) OR COLZA OIL ‐ LOW ERUCIC ACID ‐ CRUDE ‐$ 59.6$ N/A
2 270112 ‐ BITUMINOUS COAL ‐ WHETHER OR NOT PULVERIZED 21.1$ 27.8$ 32.1%
3 843143 ‐ PARTS OF BORING OR SINKING MACHINERY 0.5$ 6.2$ 1131.3%
4 870590 ‐ MOTOR VEHICLES ‐ SPECIAL (NON‐TRANSPORT) PURPOSE NES ‐$ 5.3$ N/A
5 280300 ‐ CARBON (CARBON BLACKS AND OTHER FORMS OF CARBON NES) 4.0$ 4.0$ 2.0%
6 841121 ‐ TURBO‐PROPELLERS ‐ POWER NOT EXCEEDING 1,100 KW 0.8$ 3.9$ 393.0%
7 230910 ‐ DOG OR CAT FOOD PUT UP FOR RETAIL SALE 4.8$ 3.8$ ‐20.4%
8 750400 ‐ NICKEL ‐ POWDERS AND FLAKES 3.7$ 3.3$ ‐11.1%
9 470500 ‐ SEMI‐CHEMICAL WOOD PULP 0.7$ 2.6$ 265.2%
10 870899 ‐ MOTOR VEHICLE PARTS, NES 4.7$ 2.6$ ‐45.2%
11 220830 ‐ WHISKIES 0.9$ 2.5$ 174.8%
12 100110 ‐ DURUM WHEAT ‐$ 2.3$ N/A
13 730890 ‐ STRUCTURES AND PARTS OF STRUCTURES (EXCL PREFABRICATED) ‐ ‐$ 1.7$ N/A
14 732690 ‐ OTHER ARTICLES (EXCLUDING WIRE) NES ‐ IRON OR STEEL 0.7$ 1.4$ 113.0%
15 902710 ‐ GAS OR SMOKE ANALYSIS APPARATUS 0.9$ 1.3$ 47.4%
16 130219 ‐ VEGETABLE SAPS AND EXTRACTS, INCL VANILLA 1.6$ 1.1$ ‐28.1%
17 847989 ‐ MACHINES & MECHANICAL APPLIANCES 0.9$ 1.1$ 25.0%
18 841370 ‐ CENTRIFUGAL PUMPS NES 0.0$ 1.1$ 4076.4%
19 843049 ‐ BORING OR SINKING MACHINERY NES ‐ NOT SELF‐PROPELLED ‐$ 1.0$ N/A
20 940310 ‐ METAL FURNITURE FOR OFFICE USE 0.1$ 0.9$ 718.9%
48.3$ 137.7$ 184.9%
24.0$ 18.2$ ‐24.2%
72.4$ 155.9$ 115.4%
Sub‐total
Others
Total (All Products)
Rank HS‐Description 2010 2011 % Change
1 880240 ‐ AIRCRAFT NES OF AN UNLADEN WEIGHT 186.9$ 446.2$ 138.7%
2 260112 ‐ IRON ORES AND CONCENTRATES 560.0$ 179.3$ ‐68.0%
3 270112 ‐ BITUMINOUS COAL ‐ WHETHER OR NOT PULVERIZED 262.2$ 166.9$ ‐36.4%
4 260300 ‐ COPPER ORES AND CONCENTRATES 127.4$ 147.5$ 15.8%
5 711890 ‐ COIN NES 151.9$ 133.1$ ‐12.3%
6 262099 ‐ ASH AND RESIDUES CONTAINING OTHER METALS 47.1$ 82.8$ 75.9%
7 271019 ‐ PETROLEUM OILS AND OILS FROM BITUMINOUS MINERALS 1.3$ 77.2$ 5941.0%
8 841191 ‐ PARTS OF TURBO‐JETS OR TURBO‐PROPELLERS 62.8$ 67.5$ 7.6%
9 284410 ‐ NATURAL URANIUM AND ITS COMPOUNDS 116.7$ 67.3$ ‐42.3%
10 260111 ‐ IRON ORES AND CONCENTRATES, OTHER THAN ROASTED IRON 161.7$ 61.3$ ‐62.1%
2,107.7$ 2,007.8$ ‐4.7%
1,489.6$ 1,666.9$ 11.9%
3,597.3$ 3,674.7$ 2.2%Total (All Products)
Sub‐total
Others

2011InternationalTradeReview
60
Ghana
Top 20 Exports from Alberta in 2011 ($CDN, Millions)
Top 10 Exports from Canada in 2011 ($CDN, Millions)
Rank HS‐Description 2010 2011 % Change
1 100190 ‐ MESLIN AND WHEAT NES: SEED 29.2$ 43.4$ 48.5%
2 870324 ‐ MOTOR VEHICLES ‐ SPARK IGNITION ‐ CYLINDER CAPACITY 0.01$ 0.51$ 3794.8%
3 847989 ‐ MACHINES & MECHANICAL APPLIANCES 0.20$ 0.49$ 146.0%
4 842952 ‐ MECHANICAL SHOVELS AND EXCAVATORS ‐$ 0.42$ N/A
5 870323 ‐ MOTOR VEHICLES ‐ SPARK IGNITION 0.07$ 0.38$ 430.1%
6 870510 ‐ CRANE LORRIES (MOBILE CRANES) ‐$ 0.27$ 26.6%
7 020714 ‐ CUTS AND EDIBLE OFFALS (INCL LIVERS) OF FOWLS 0.18$ 0.12$ ‐30.5%
8 310520 ‐ FERTILIZERS WITH THE 3 ELEMENTS ‐$ 0.08$ N/A
9 870322 ‐ MOTOR VEHICLES ‐ SPARK IGNITION 0.18$ 0.05$ ‐72.9%
10 842959 ‐ SELF‐PROPELLED MECHANICAL EXCAVATING MACHINERY NES ‐$ 0.05$ 4.7%
11 020727 ‐ TURKEYS, DOMESTIC, CUTS AND OFFAL ‐ FROZEN 0.04$ 0.04$ 0.2%
12 382490 ‐ CHEMICAL PRODUCTS AND PREPARATIONS OF THE CHEMICAL 0.01$ 0.04$ 441.8%
13 820720 ‐ DIES FOR DRAWING OR EXTRUDING METAL (INCLUDING PARTS) ‐$ 0.03$ N/A
14 160232 ‐ MEAT AND MEAT OFFAL OF POULTRY ‐$ 0.02$ N/A
15 630900 ‐ WORN CLOTHING AND OTHER WORN TEXTILE ARTICLES 0.17$ 0.02$ ‐86.6%
16 843139 ‐ PARTS OF LIFTING, HANDLING, LOADING, UNLOADING ‐$ 0.02$ N/A
17 850650 ‐ PRIMARY CELLS AND BATTERIES ‐ LITHIUM 0.00$ 0.02$ 493.0%
18 902620 ‐ INSTRUMENTS AND APPARATUS FOR MEASURING 0.07$ 0.01$ ‐82.1%
19 401693 ‐ GASKETS, WASHERS AND OTHER SEALS OF VULCANIZED RUBBER ‐$ 0.0095$ N/A
20 293090 ‐ ORGANO‐SULPHUR COMPOUNDS, NES ‐$ 0.0087$ N/A
30.1384$ 45.9787$ 52.6%
0.4$ 0.2$ ‐50.0%
30.6$ 46.2$ 51.1%
Sub‐total
Others
Total (All Products)
Rank HS‐Description 2010 2011 % Change
1 100190 ‐ MESLIN AND WHEAT NES: SEED 88.7$ 112.4$ 26.8%
2 842121 ‐ FILTERING OR PURIFYING MACHINERY AND APPARATUS 0.1$ 14.7$ 17861.6%
3 630900 ‐ WORN CLOTHING AND OTHER WORN TEXTILE ARTICLES 14.5$ 14.6$ 0.3%
4 870323 ‐ MOTOR VEHICLES ‐ SPARK IGNITION 7.1$ 14.0$ 98.4%
5 220710 ‐ UNDENATURED ETHYL ALCOHOL ‐ ALCOHOL STRENGTH 80% 10.8$ 12.3$ 14.2%
6 840211 ‐ WATERTUBE BOILERS ‐ STEAM PRODUCTION EXCEEDING 45 TONS ‐$ 9.7$ N/A
7 820719 ‐ ROCK DRILLING OR EARTH BORING TOOLS 1.1$ 8.8$ 716.0%
8 847490 ‐ PARTS OF MACHINERY FOR HANDLING STONES, ORES 6.3$ 7.4$ 17.1%
9 843143 ‐ PARTS OF BORING OR SINKING MACHINERY 5.4$ 6.2$ 15.2%
10 870324 ‐ MOTOR VEHICLES ‐ SPARK IGNITION 3.0$ 5.3$ 77.3%
143.2$ 225.8$ 57.7%
26.3$ 25.2$ ‐4.1%
169.4$ 251.0$ 48.1%Total (All Products)
Sub‐total
Others

2011InternationalTradeReview
61
HongKong
Top 20 Exports from Alberta in 2011 ($CDN, Millions)
Top 10 Exports from Canada in 2011 ($CDN, Millions)
Rank Description 2010 2011 % Change
1 020230 ‐ BOVINE, CUTS BONELESS ‐ FROZEN 25.0$ 44.8$ 79.1%
2 020220 ‐ BOVINE, CUTS WITH BONE IN ‐ FROZEN 34.9$ 30.3$ ‐13.2%
3 410150 ‐ WHOLE HIDES AND SKINS ‐ BOVINE/EQUINE ANIMALS 17.4$ 8.1$ ‐53.1%
4 390190 ‐ POLYMERS OF ETHYLENE NES, IN PRIMARY FORMS 7.3$ 5.3$ ‐27.0%
5 050400 ‐ GUTS, BLADDERS AND STOMACHS OF ANIMALS 3.8$ 4.9$ 27.6%
6 390120 ‐ POLYETHYLENE ‐ SPECIFIC GRAVITY OF 0.94 OR MORE 11.2$ 4.7$ ‐57.9%
7 851712 ‐ TELEPHONES FOR CELLULAR NETWORKS 0.0$ 2.5$ 24975.9%
8 020649 ‐ SWINE EDIBLE OFFAL NES ‐ FROZEN 2.3$ 2.4$ 4.7%
9 410190 ‐ OTHER HIDES/SKINS NES BOVINE/EQUINE ANIMALS 3.2$ 2.2$ ‐32.9%
10 902710 ‐ GAS OR SMOKE ANALYSIS APPARATUS 2.1$ 2.1$ ‐0.7%
11 854290 ‐ PARTS OF ELECTRONIC INTEGRATED CIRCUITS 4.9$ 1.9$ ‐61.7%
12 020329 ‐ SWINE, CUTS BONELESS ‐ FROZEN 2.1$ 1.9$ ‐12.0%
13 391590 ‐ WASTE, PARINGS AND SCRAP ‐ OF PLASTIC POLYMERS NES 3.1$ 1.8$ ‐42.4%
14 230990 ‐ ANIMAL FEED PREPARATIONS NES 0.1$ 1.7$ 1362.5%
15 050790 ‐ WHALEBONE, HORNS, HOOVES, TORTOISE‐SHELL, ANTLERS 1.4$ 1.4$ 0.6%
16 151411 ‐ RAPE (CANOLA) OR COLZA OIL ‐ LOW ERUCIC ACID ‐ CRUDE ‐$ 1.3$ N/A
17 290531 ‐ ETHYLENE GLYCOL (ETHANEDIOL) 0.8$ 1.3$ 61.2%
18 470321 ‐ CHEMICAL WOODPULP ‐ SODA OR SULPHATE ‐$ 1.2$ N/A
19 020322 ‐ SWINE, CUTS WITH BONE IN ‐ FROZEN 0.8$ 1.1$ 38.1%
20 847989 ‐ MACHINES & MECHANICAL APPLIANCES 0.0$ 1.1$ 4560.9%
129.8$ 126.3$ ‐2.7%
17.1$ 15.5$ ‐9.7%
146.9$ 141.8$ ‐3.5%
Sub‐total
Others
Total (All Products)
Rank HS‐Description 2010 2011 % Change
1 710812 ‐ GOLD IN UNWROUGHT FORM (NON‐MONETARY) 196.5$ 1,047.1$ 432.7%
2 880240 ‐ AIRCRAFT NES OF AN UNLADEN WEIGHT ‐$ 170.8$ N/A
3 750210 ‐ NICKEL ‐ UNWROUGHT, NOT ALLOYED 157.7$ 149.5$ ‐5.1%
4 430110 ‐ RAW FURSKINS WHOLE ‐ MINK 145.2$ 137.3$ ‐5.4%
5 121120 ‐ GINSENG ROOTS USED PRIMARILY IN PHARMACY 111.8$ 65.2$ ‐41.7%
6 020230 ‐ BOVINE, CUTS BONELESS ‐ FROZEN 26.9$ 48.6$ 80.6%
7 480100 ‐ NEWSPRINT ‐ IN ROLLS OR SHEETS 52.7$ 47.9$ ‐9.1%
8 260112 ‐ IRON ORES AND CONCENTRATES ‐$ 38.3$ N/A
9 020220 ‐ BOVINE, CUTS WITH BONE IN ‐ FROZEN 43.7$ 36.9$ ‐15.5%
10 391590 ‐ WASTE, PARINGS AND SCRAP ‐ OF PLASTIC POLYMERS 36.1$ 31.7$ ‐12.3%
1,075.1$ 2,085.3$ 94.0%
633.6$ 629.4$ ‐0.7%
1,708.7$ 2,714.7$ 58.9%Total (All Products)
Sub‐total
Others

2011InternationalTradeReview
62
India
Top 20 Exports from Alberta in 2011 ($CDN, Millions)
Top 10 Exports from Canada in 2011 ($CDN, Millions)
Rank HS‐Description 2010 2011 % Change
1 071310 ‐ PEAS ‐ DRIED AND SHELLED 4.0$ 55.7$ 1297.9%
2 381519 ‐ SUPPORTED CATALYSTS ‐$ 9.4$ N/A
3 390190 ‐ POLYMERS OF ETHYLENE NES, IN PRIMARY FORMS 16.7$ 9.3$ ‐44.1%
4 843110 ‐ PARTS OF JACKS, HOISTS AND OTHER MACHINERY ‐$ 6.4$ N/A
5 841480 ‐ VENTILATING OR AIR/GAS RECYCLING HOODS 0.6$ 2.2$ 288.6%
6 843143 ‐ PARTS OF BORING OR SINKING MACHINERY 6.1$ 2.1$ ‐65.7%
7 470321 ‐ CHEMICAL WOODPULP ‐ SODA OR SULPHATE 0.8$ 1.9$ 142.6%
8 902710 ‐ GAS OR SMOKE ANALYSIS APPARATUS 2.6$ 1.8$ ‐30.7%
9 852691 ‐ RADIO NAVIGATIONAL AID APPARATUS 1.0$ 1.6$ 51.5%
10 841391 ‐ PARTS OF PUMPS 0.1$ 1.4$ 1797.3%
11 280300 ‐ CARBON (CARBON BLACKS AND OTHER FORMS OF CARBON NES) 1.2$ 1.3$ 2.9%
12 847989 ‐ MACHINES & MECHANICAL APPLIANCES, NES 2.3$ 1.2$ ‐47.0%
13 720441 ‐ FERROUS WASTE AND SCRAP ‐ NES 0.0$ 1.1$ 3004.0%
14 841899 ‐ PARTS OF REFRIGERATING OR FREEZING EQUIPMENT NES 0.0$ 1.1$ 149795.3%
15 903289 ‐ AUTOMATIC REGULATING OR CONTROLLING INSTRUMENTS 1.1$ 1.0$ ‐8.0%
16 843149 ‐ PARTS OF CRANES, WORK‐TRUCKS, SHOVELS 0.0$ 0.8$ 5482.6%
17 843049 ‐ BORING OR SINKING MACHINERY NES ‐ NOT SELF‐PROPELLED ‐$ 0.8$ N/A
18 390110 ‐ POLYETHYLENE ‐ SPECIFIC GRAVITY OF LESS THAN 0.94 3.0$ 0.8$ ‐73.8%
19 230690 ‐ VEGETABLE OIL‐CAKE & OTHER SOLID RESIDUES 1.3$ 0.8$ ‐42.6%
20 851762 ‐ MACHINES F R/C/T OR REGE OF VOICE,IMAGES OR DATA 0.6$ 0.8$ 34.0%
43.5$ 103.8$ 138.4%
22.9$ 12.9$ ‐43.8%
66.5$ 116.7$ 75.6%
Sub‐total
Others
Total (All Products)
Rank HS‐Description 2010 2011 % Change
1 071310 ‐ PEAS ‐ DRIED AND SHELLED 301.4$ 563.2$ 86.9%
2 310420 ‐ POTASSIUM CHLORIDE 327.5$ 373.4$ 14.0%
3 480100 ‐ NEWSPRINT ‐ IN ROLLS OR SHEETS 261.4$ 285.8$ 9.3%
4 880240 ‐ AIRCRAFT NES OF AN UNLADEN WEIGHT (MORE THAN 15,000 KG) 24.0$ 189.2$ 688.1%
5 710210 ‐ DIAMONDS ‐ UNSORTED ‐ NOT MOUNTED OR SET 4.9$ 126.8$ 2482.9%
6 260300 ‐ COPPER ORES AND CONCENTRATES 51.1$ 80.5$ 57.4%
7 270112 ‐ BITUMINOUS COAL ‐ WHETHER OR NOT PULVERIZED ‐$ 72.5$ N/A
8 710231 ‐ DIAMONDS ‐ NON‐INDUSTRIAL ‐ UNWORKED 26.7$ 64.7$ 142.3%
9 071340 ‐ LENTILS ‐ DRIED AND SHELLED 111.9$ 64.6$ ‐42.3%
10 470500 ‐ SEMI‐CHEMICAL WOOD PULP 112.1$ 39.4$ ‐64.9%
1,486.9$ 2,109.2$ 41.9%
500.5$ 456.9$ ‐8.7%
1,987.4$ 2,566.1$ 29.1%Total (All Products)
Sub‐total
Others
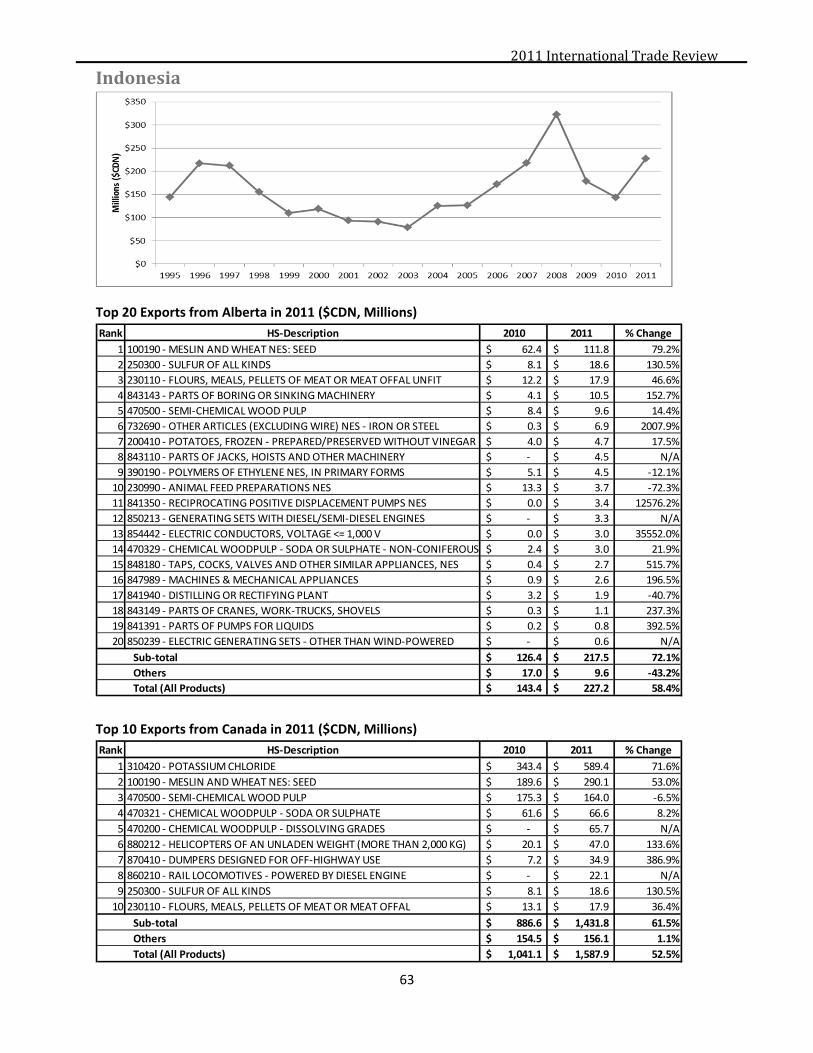
2011InternationalTradeReview
63
Indonesia
Top 20 Exports from Alberta in 2011 ($CDN, Millions)
Top 10 Exports from Canada in 2011 ($CDN, Millions)
Rank HS‐Description 2010 2011 % Change
1 100190 ‐ MESLIN AND WHEAT NES: SEED 62.4$ 111.8$ 79.2%
2 250300 ‐ SULFUR OF ALL KINDS 8.1$ 18.6$ 130.5%
3 230110 ‐ FLOURS, MEALS, PELLETS OF MEAT OR MEAT OFFAL UNFIT 12.2$ 17.9$ 46.6%
4 843143 ‐ PARTS OF BORING OR SINKING MACHINERY 4.1$ 10.5$ 152.7%
5 470500 ‐ SEMI‐CHEMICAL WOOD PULP 8.4$ 9.6$ 14.4%
6 732690 ‐ OTHER ARTICLES (EXCLUDING WIRE) NES ‐ IRON OR STEEL 0.3$ 6.9$ 2007.9%
7 200410 ‐ POTATOES, FROZEN ‐ PREPARED/PRESERVED WITHOUT VINEGAR 4.0$ 4.7$ 17.5%
8 843110 ‐ PARTS OF JACKS, HOISTS AND OTHER MACHINERY ‐$ 4.5$ N/A
9 390190 ‐ POLYMERS OF ETHYLENE NES, IN PRIMARY FORMS 5.1$ 4.5$ ‐12.1%
10 230990 ‐ ANIMAL FEED PREPARATIONS NES 13.3$ 3.7$ ‐72.3%
11 841350 ‐ RECIPROCATING POSITIVE DISPLACEMENT PUMPS NES 0.0$ 3.4$ 12576.2%
12 850213 ‐ GENERATING SETS WITH DIESEL/SEMI‐DIESEL ENGINES ‐$ 3.3$ N/A
13 854442 ‐ ELECTRIC CONDUCTORS, VOLTAGE <= 1,000 V 0.0$ 3.0$ 35552.0%
14 470329 ‐ CHEMICAL WOODPULP ‐ SODA OR SULPHATE ‐ NON‐CONIFEROUS 2.4$ 3.0$ 21.9%
15 848180 ‐ TAPS, COCKS, VALVES AND OTHER SIMILAR APPLIANCES, NES 0.4$ 2.7$ 515.7%
16 847989 ‐ MACHINES & MECHANICAL APPLIANCES 0.9$ 2.6$ 196.5%
17 841940 ‐ DISTILLING OR RECTIFYING PLANT 3.2$ 1.9$ ‐40.7%
18 843149 ‐ PARTS OF CRANES, WORK‐TRUCKS, SHOVELS 0.3$ 1.1$ 237.3%
19 841391 ‐ PARTS OF PUMPS FOR LIQUIDS 0.2$ 0.8$ 392.5%
20 850239 ‐ ELECTRIC GENERATING SETS ‐ OTHER THAN WIND‐POWERED ‐$ 0.6$ N/A
126.4$ 217.5$ 72.1%
17.0$ 9.6$ ‐43.2%
143.4$ 227.2$ 58.4%
Sub‐total
Others
Total (All Products)
Rank HS‐Description 2010 2011 % Change
1 310420 ‐ POTASSIUM CHLORIDE 343.4$ 589.4$ 71.6%
2 100190 ‐ MESLIN AND WHEAT NES: SEED 189.6$ 290.1$ 53.0%
3 470500 ‐ SEMI‐CHEMICAL WOOD PULP 175.3$ 164.0$ ‐6.5%
4 470321 ‐ CHEMICAL WOODPULP ‐ SODA OR SULPHATE 61.6$ 66.6$ 8.2%
5 470200 ‐ CHEMICAL WOODPULP ‐ DISSOLVING GRADES ‐$ 65.7$ N/A
6 880212 ‐ HELICOPTERS OF AN UNLADEN WEIGHT (MORE THAN 2,000 KG) 20.1$ 47.0$ 133.6%
7 870410 ‐ DUMPERS DESIGNED FOR OFF‐HIGHWAY USE 7.2$ 34.9$ 386.9%
8 860210 ‐ RAIL LOCOMOTIVES ‐ POWERED BY DIESEL ENGINE ‐$ 22.1$ N/A
9 250300 ‐ SULFUR OF ALL KINDS 8.1$ 18.6$ 130.5%
10 230110 ‐ FLOURS, MEALS, PELLETS OF MEAT OR MEAT OFFAL 13.1$ 17.9$ 36.4%
886.6$ 1,431.8$ 61.5%
154.5$ 156.1$ 1.1%
1,041.1$ 1,587.9$ 52.5%Total (All Products)
Sub‐total
Others
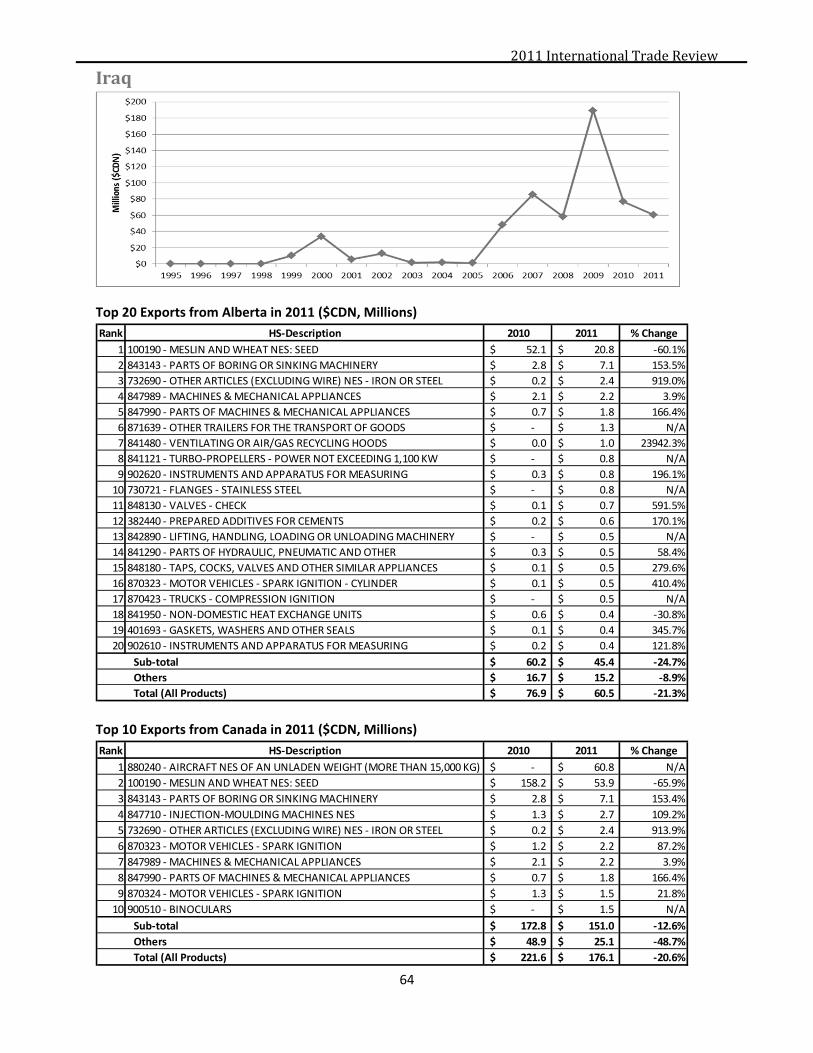
2011InternationalTradeReview
64
Iraq
Top 20 Exports from Alberta in 2011 ($CDN, Millions)
Top 10 Exports from Canada in 2011 ($CDN, Millions)
Rank HS‐Description 2010 2011 % Change
1 100190 ‐ MESLIN AND WHEAT NES: SEED 52.1$ 20.8$ ‐60.1%
2 843143 ‐ PARTS OF BORING OR SINKING MACHINERY 2.8$ 7.1$ 153.5%
3 732690 ‐ OTHER ARTICLES (EXCLUDING WIRE) NES ‐ IRON OR STEEL 0.2$ 2.4$ 919.0%
4 847989 ‐ MACHINES & MECHANICAL APPLIANCES 2.1$ 2.2$ 3.9%
5 847990 ‐ PARTS OF MACHINES & MECHANICAL APPLIANCES 0.7$ 1.8$ 166.4%
6 871639 ‐ OTHER TRAILERS FOR THE TRANSPORT OF GOODS ‐$ 1.3$ N/A
7 841480 ‐ VENTILATING OR AIR/GAS RECYCLING HOODS 0.0$ 1.0$ 23942.3%
8 841121 ‐ TURBO‐PROPELLERS ‐ POWER NOT EXCEEDING 1,100 KW ‐$ 0.8$ N/A
9 902620 ‐ INSTRUMENTS AND APPARATUS FOR MEASURING 0.3$ 0.8$ 196.1%
10 730721 ‐ FLANGES ‐ STAINLESS STEEL ‐$ 0.8$ N/A
11 848130 ‐ VALVES ‐ CHECK 0.1$ 0.7$ 591.5%
12 382440 ‐ PREPARED ADDITIVES FOR CEMENTS 0.2$ 0.6$ 170.1%
13 842890 ‐ LIFTING, HANDLING, LOADING OR UNLOADING MACHINERY ‐$ 0.5$ N/A
14 841290 ‐ PARTS OF HYDRAULIC, PNEUMATIC AND OTHER 0.3$ 0.5$ 58.4%
15 848180 ‐ TAPS, COCKS, VALVES AND OTHER SIMILAR APPLIANCES 0.1$ 0.5$ 279.6%
16 870323 ‐ MOTOR VEHICLES ‐ SPARK IGNITION ‐ CYLINDER 0.1$ 0.5$ 410.4%
17 870423 ‐ TRUCKS ‐ COMPRESSION IGNITION ‐$ 0.5$ N/A
18 841950 ‐ NON‐DOMESTIC HEAT EXCHANGE UNITS 0.6$ 0.4$ ‐30.8%
19 401693 ‐ GASKETS, WASHERS AND OTHER SEALS 0.1$ 0.4$ 345.7%
20 902610 ‐ INSTRUMENTS AND APPARATUS FOR MEASURING 0.2$ 0.4$ 121.8%
60.2$ 45.4$ ‐24.7%
16.7$ 15.2$ ‐8.9%
76.9$ 60.5$ ‐21.3%
Sub‐total
Others
Total (All Products)
Rank HS‐Description 2010 2011 % Change
1 880240 ‐ AIRCRAFT NES OF AN UNLADEN WEIGHT (MORE THAN 15,000 KG) ‐$ 60.8$ N/A
2 100190 ‐ MESLIN AND WHEAT NES: SEED 158.2$ 53.9$ ‐65.9%
3 843143 ‐ PARTS OF BORING OR SINKING MACHINERY 2.8$ 7.1$ 153.4%
4 847710 ‐ INJECTION‐MOULDING MACHINES NES 1.3$ 2.7$ 109.2%
5 732690 ‐ OTHER ARTICLES (EXCLUDING WIRE) NES ‐ IRON OR STEEL 0.2$ 2.4$ 913.9%
6 870323 ‐ MOTOR VEHICLES ‐ SPARK IGNITION 1.2$ 2.2$ 87.2%
7 847989 ‐ MACHINES & MECHANICAL APPLIANCES 2.1$ 2.2$ 3.9%
8 847990 ‐ PARTS OF MACHINES & MECHANICAL APPLIANCES 0.7$ 1.8$ 166.4%
9 870324 ‐ MOTOR VEHICLES ‐ SPARK IGNITION 1.3$ 1.5$ 21.8%
10 900510 ‐ BINOCULARS ‐$ 1.5$ N/A
172.8$ 151.0$ ‐12.6%
48.9$ 25.1$ ‐48.7%
221.6$ 176.1$ ‐20.6%Total (All Products)
Sub‐total
Others
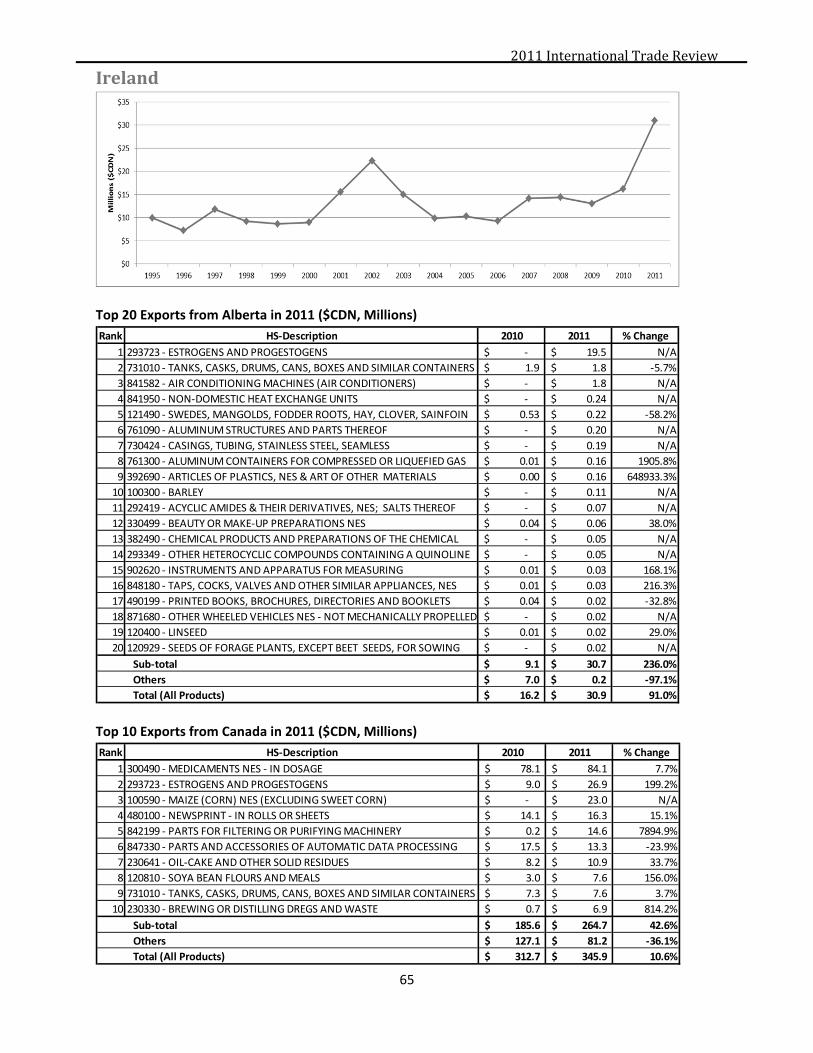
2011InternationalTradeReview
65
Ireland
Top 20 Exports from Alberta in 2011 ($CDN, Millions)
Top 10 Exports from Canada in 2011 ($CDN, Millions)
Rank HS‐Description 2010 2011 % Change
1 293723 ‐ ESTROGENS AND PROGESTOGENS ‐$ 19.5$ N/A
2 731010 ‐ TANKS, CASKS, DRUMS, CANS, BOXES AND SIMILAR CONTAINERS 1.9$ 1.8$ ‐5.7%
3 841582 ‐ AIR CONDITIONING MACHINES (AIR CONDITIONERS) ‐$ 1.8$ N/A
4 841950 ‐ NON‐DOMESTIC HEAT EXCHANGE UNITS ‐$ 0.24$ N/A
5 121490 ‐ SWEDES, MANGOLDS, FODDER ROOTS, HAY, CLOVER, SAINFOIN 0.53$ 0.22$ ‐58.2%
6 761090 ‐ ALUMINUM STRUCTURES AND PARTS THEREOF ‐$ 0.20$ N/A
7 730424 ‐ CASINGS, TUBING, STAINLESS STEEL, SEAMLESS ‐$ 0.19$ N/A
8 761300 ‐ ALUMINUM CONTAINERS FOR COMPRESSED OR LIQUEFIED GAS 0.01$ 0.16$ 1905.8%
9 392690 ‐ ARTICLES OF PLASTICS, NES & ART OF OTHER MATERIALS 0.00$ 0.16$ 648933.3%
10 100300 ‐ BARLEY ‐$ 0.11$ N/A
11 292419 ‐ ACYCLIC AMIDES & THEIR DERIVATIVES, NES; SALTS THEREOF ‐$ 0.07$ N/A
12 330499 ‐ BEAUTY OR MAKE‐UP PREPARATIONS NES 0.04$ 0.06$ 38.0%
13 382490 ‐ CHEMICAL PRODUCTS AND PREPARATIONS OF THE CHEMICAL ‐$ 0.05$ N/A
14 293349 ‐ OTHER HETEROCYCLIC COMPOUNDS CONTAINING A QUINOLINE ‐$ 0.05$ N/A
15 902620 ‐ INSTRUMENTS AND APPARATUS FOR MEASURING 0.01$ 0.03$ 168.1%
16 848180 ‐ TAPS, COCKS, VALVES AND OTHER SIMILAR APPLIANCES, NES 0.01$ 0.03$ 216.3%
17 490199 ‐ PRINTED BOOKS, BROCHURES, DIRECTORIES AND BOOKLETS 0.04$ 0.02$ ‐32.8%
18 871680 ‐ OTHER WHEELED VEHICLES NES ‐ NOT MECHANICALLY PROPELLED ‐$ 0.02$ N/A
19 120400 ‐ LINSEED 0.01$ 0.02$ 29.0%
20 120929 ‐ SEEDS OF FORAGE PLANTS, EXCEPT BEET SEEDS, FOR SOWING ‐$ 0.02$ N/A
9.1$ 30.7$ 236.0%
7.0$ 0.2$ ‐97.1%
16.2$ 30.9$ 91.0%
Sub‐total
Others
Total (All Products)
Rank HS‐Description 2010 2011 % Change
1 300490 ‐ MEDICAMENTS NES ‐ IN DOSAGE 78.1$ 84.1$ 7.7%
2 293723 ‐ ESTROGENS AND PROGESTOGENS 9.0$ 26.9$ 199.2%
3 100590 ‐ MAIZE (CORN) NES (EXCLUDING SWEET CORN) ‐$ 23.0$ N/A
4 480100 ‐ NEWSPRINT ‐ IN ROLLS OR SHEETS 14.1$ 16.3$ 15.1%
5 842199 ‐ PARTS FOR FILTERING OR PURIFYING MACHINERY 0.2$ 14.6$ 7894.9%
6 847330 ‐ PARTS AND ACCESSORIES OF AUTOMATIC DATA PROCESSING 17.5$ 13.3$ ‐23.9%
7 230641 ‐ OIL‐CAKE AND OTHER SOLID RESIDUES 8.2$ 10.9$ 33.7%
8 120810 ‐ SOYA BEAN FLOURS AND MEALS 3.0$ 7.6$ 156.0%
9 731010 ‐ TANKS, CASKS, DRUMS, CANS, BOXES AND SIMILAR CONTAINERS 7.3$ 7.6$ 3.7%
10 230330 ‐ BREWING OR DISTILLING DREGS AND WASTE 0.7$ 6.9$ 814.2%
185.6$ 264.7$ 42.6%
127.1$ 81.2$ ‐36.1%
312.7$ 345.9$ 10.6%Total (All Products)
Sub‐total
Others

2011InternationalTradeReview
66
Israel
Top 20 Exports from Alberta in 2011 ($CDN, Millions)
Top 10 Exports from Canada in 2011 ($CDN, Millions)
Rank HS‐Description 2010 2011 % Change
1 250300 ‐ SULFUR OF ALL KINDS 24.1$ 46.5$ 93.3%
2 390190 ‐ POLYMERS OF ETHYLENE NES, IN PRIMARY FORMS 5.5$ 5.8$ 5.7%
3 710231 ‐ DIAMONDS ‐ NON‐INDUSTRIAL ‐ UNWORKED ‐$ 2.1$ N/A
4 120510 ‐ RAPE OR COLZA SEEDS ‐ LOW ERUCIC ACID 1.2$ 2.0$ 59.8%
5 852691 ‐ RADIO NAVIGATIONAL AID APPARATUS 1.4$ 0.8$ ‐40.9%
6 841121 ‐ TURBO‐PROPELLERS ‐ POWER NOT EXCEEDING 1,100 KW 0.8$ 0.5$ ‐29.7%
7 480100 ‐ NEWSPRINT ‐ IN ROLLS OR SHEETS ‐$ 0.3$ N/A
8 230990 ‐ ANIMAL FEED PREPARATIONS NES 0.2$ 0.3$ 66.3%
9 847989 ‐ MACHINES & MECHANICAL APPLIANCES 0.0$ 0.3$ 13156.9%
10 711320 ‐ ARTICLES OF JEWELLERY ‐$ 0.2$ N/A
11 190120 ‐ MIXES AND DOUGHS FOR THE PREPARATION OF BAKERSWARES 0.1$ 0.2$ 160.1%
12 230910 ‐ DOG OR CAT FOOD PUT UP FOR RETAIL SALE 0.3$ 0.2$ ‐35.9%
13 280300 ‐ CARBON (CARBON BLACKS AND OTHER FORMS OF CARBON NES) 0.3$ 0.2$ ‐41.9%
14 100190 ‐ MESLIN AND WHEAT NES: SEED ‐$ 0.1$ N/A
15 850432 ‐ ELECTRIC TRANSFORMERS NES ‐$ 0.1$ N/A
16 730890 ‐ STRUCTURES AND PARTS OF STRUCTURES (EXCL PREFABRICATED) 0.1$ 0.1$ 8.8%
17 851762 ‐ MACHINES F R/C/T OR REGE OF VOICE,IMAGES OR DATA 0.0$ 0.1$ 254.4%
18 842129 ‐ FILTERING OR PURIFYING MACHINERY AND APPARATUS 0.0$ 0.1$ 123.8%
19 880330 ‐ PARTS OF AIRPLANES OR HELICOPTERS NES 0.0$ 0.0$ 31.8%
20 851718 ‐ TELEPHONE SETS, NES; VIDEOPHONES 0.0$ 0.0$ 755.4%
34.1$ 60.0$ 75.8%
0.8$ 0.6$ ‐30.5%
35.0$ 60.6$ 73.3%
Sub‐total
Others
Total (All Products)
Rank HS‐Description 2010 2011 % Change
1 710231 ‐ DIAMONDS ‐ NON‐INDUSTRIAL ‐ UNWORKED 57.8$ 67.6$ 17.0%
2 250300 ‐ SULFUR OF ALL KINDS 24.1$ 46.5$ 93.3%
3 480100 ‐ NEWSPRINT ‐ IN ROLLS OR SHEETS 43.1$ 39.5$ ‐8.3%
4 840211 ‐ WATERTUBE BOILERS ‐ STEAM PRODUCTION ‐$ 19.9$ N/A
5 841182 ‐ GAS TURBINES NES ‐ POWER EXCEEDING 5,000 KW ‐$ 7.9$ N/A
6 390190 ‐ POLYMERS OF ETHYLENE NES, IN PRIMARY FORMS 5.6$ 5.9$ 4.6%
7 440710 ‐ LUMBER (THICKNESS >6MM) ‐ CONIFEROUS WOOD 4.1$ 5.6$ 35.9%
8 120510 ‐ RAPE OR COLZA SEEDS ‐ LOW ERUCIC ACID 4.2$ 5.5$ 30.2%
9 071340 ‐ LENTILS ‐ DRIED AND SHELLED 6.5$ 5.2$ ‐19.1%
10 300220 ‐ VACCINES ‐ HUMAN USES 5.7$ 4.9$ ‐14.1%
232.6$ 261.7$ 12.5%
115.6$ 102.0$ ‐11.8%
348.2$ 363.6$ 4.4%Total (All Products)
Sub‐total
Others
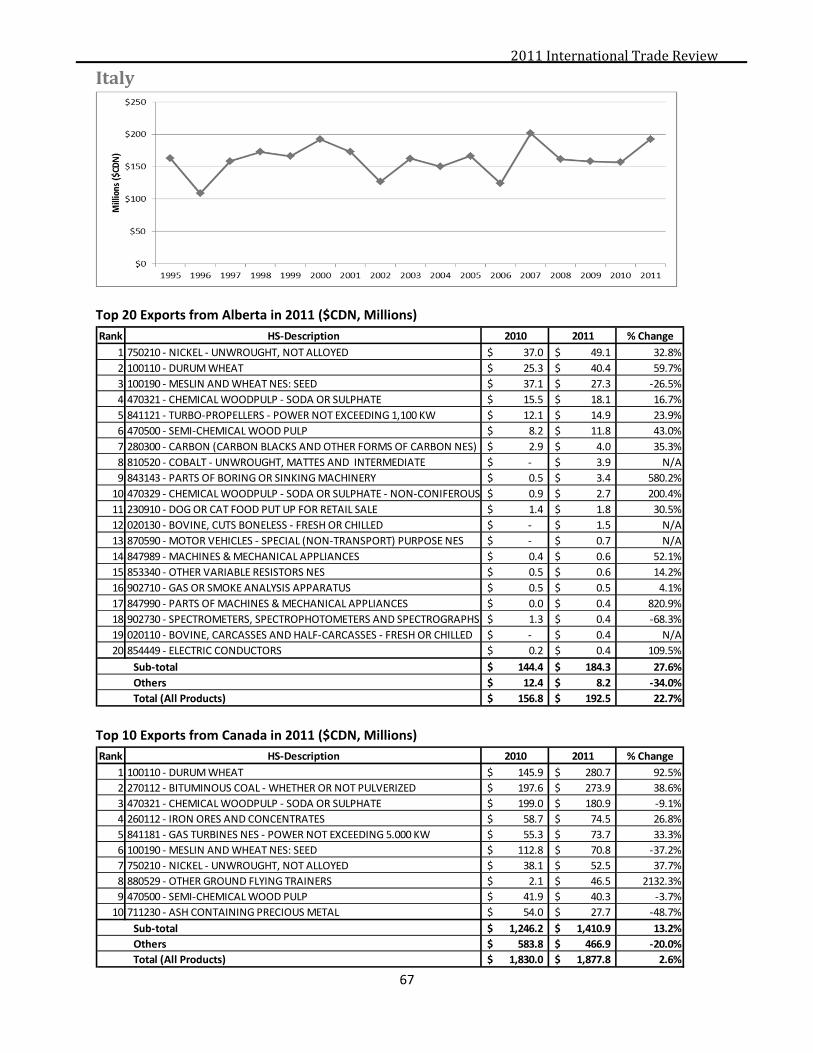
2011InternationalTradeReview
67
Italy
Top 20 Exports from Alberta in 2011 ($CDN, Millions)
Top 10 Exports from Canada in 2011 ($CDN, Millions)
Rank HS‐Description 2010 2011 % Change
1 750210 ‐ NICKEL ‐ UNWROUGHT, NOT ALLOYED 37.0$ 49.1$ 32.8%
2 100110 ‐ DURUM WHEAT 25.3$ 40.4$ 59.7%
3 100190 ‐ MESLIN AND WHEAT NES: SEED 37.1$ 27.3$ ‐26.5%
4 470321 ‐ CHEMICAL WOODPULP ‐ SODA OR SULPHATE 15.5$ 18.1$ 16.7%
5 841121 ‐ TURBO‐PROPELLERS ‐ POWER NOT EXCEEDING 1,100 KW 12.1$ 14.9$ 23.9%
6 470500 ‐ SEMI‐CHEMICAL WOOD PULP 8.2$ 11.8$ 43.0%
7 280300 ‐ CARBON (CARBON BLACKS AND OTHER FORMS OF CARBON NES) 2.9$ 4.0$ 35.3%
8 810520 ‐ COBALT ‐ UNWROUGHT, MATTES AND INTERMEDIATE ‐$ 3.9$ N/A
9 843143 ‐ PARTS OF BORING OR SINKING MACHINERY 0.5$ 3.4$ 580.2%
10 470329 ‐ CHEMICAL WOODPULP ‐ SODA OR SULPHATE ‐ NON‐CONIFEROUS 0.9$ 2.7$ 200.4%
11 230910 ‐ DOG OR CAT FOOD PUT UP FOR RETAIL SALE 1.4$ 1.8$ 30.5%
12 020130 ‐ BOVINE, CUTS BONELESS ‐ FRESH OR CHILLED ‐$ 1.5$ N/A
13 870590 ‐ MOTOR VEHICLES ‐ SPECIAL (NON‐TRANSPORT) PURPOSE NES ‐$ 0.7$ N/A
14 847989 ‐ MACHINES & MECHANICAL APPLIANCES 0.4$ 0.6$ 52.1%
15 853340 ‐ OTHER VARIABLE RESISTORS NES 0.5$ 0.6$ 14.2%
16 902710 ‐ GAS OR SMOKE ANALYSIS APPARATUS 0.5$ 0.5$ 4.1%
17 847990 ‐ PARTS OF MACHINES & MECHANICAL APPLIANCES 0.0$ 0.4$ 820.9%
18 902730 ‐ SPECTROMETERS, SPECTROPHOTOMETERS AND SPECTROGRAPHS 1.3$ 0.4$ ‐68.3%
19 020110 ‐ BOVINE, CARCASSES AND HALF‐CARCASSES ‐ FRESH OR CHILLED ‐$ 0.4$ N/A
20 854449 ‐ ELECTRIC CONDUCTORS 0.2$ 0.4$ 109.5%
144.4$ 184.3$ 27.6%
12.4$ 8.2$ ‐34.0%
156.8$ 192.5$ 22.7%
Sub‐total
Others
Total (All Products)
Rank HS‐Description 2010 2011 % Change
1 100110 ‐ DURUM WHEAT 145.9$ 280.7$ 92.5%
2 270112 ‐ BITUMINOUS COAL ‐ WHETHER OR NOT PULVERIZED 197.6$ 273.9$ 38.6%
3 470321 ‐ CHEMICAL WOODPULP ‐ SODA OR SULPHATE 199.0$ 180.9$ ‐9.1%
4 260112 ‐ IRON ORES AND CONCENTRATES 58.7$ 74.5$ 26.8%
5 841181 ‐ GAS TURBINES NES ‐ POWER NOT EXCEEDING 5.000 KW 55.3$ 73.7$ 33.3%
6 100190 ‐ MESLIN AND WHEAT NES: SEED 112.8$ 70.8$ ‐37.2%
7 750210 ‐ NICKEL ‐ UNWROUGHT, NOT ALLOYED 38.1$ 52.5$ 37.7%
8 880529 ‐ OTHER GROUND FLYING TRAINERS 2.1$ 46.5$ 2132.3%
9 470500 ‐ SEMI‐CHEMICAL WOOD PULP 41.9$ 40.3$ ‐3.7%
10 711230 ‐ ASH CONTAINING PRECIOUS METAL 54.0$ 27.7$ ‐48.7%
1,246.2$ 1,410.9$ 13.2%
583.8$ 466.9$ ‐20.0%
1,830.0$ 1,877.8$ 2.6%Total (All Products)
Sub‐total
Others
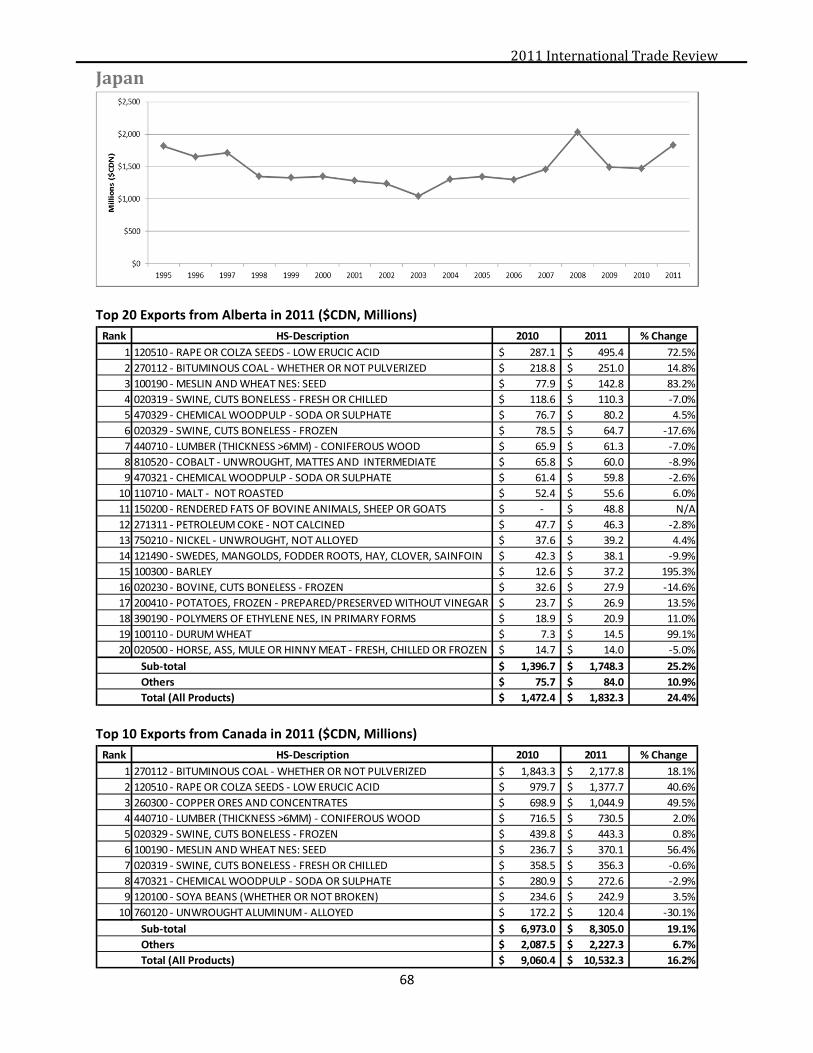
2011InternationalTradeReview
68
Japan
Top 20 Exports from Alberta in 2011 ($CDN, Millions)
Top 10 Exports from Canada in 2011 ($CDN, Millions)
Rank HS‐Description 2010 2011 % Change
1 120510 ‐ RAPE OR COLZA SEEDS ‐ LOW ERUCIC ACID 287.1$ 495.4$ 72.5%
2 270112 ‐ BITUMINOUS COAL ‐ WHETHER OR NOT PULVERIZED 218.8$ 251.0$ 14.8%
3 100190 ‐ MESLIN AND WHEAT NES: SEED 77.9$ 142.8$ 83.2%
4 020319 ‐ SWINE, CUTS BONELESS ‐ FRESH OR CHILLED 118.6$ 110.3$ ‐7.0%
5 470329 ‐ CHEMICAL WOODPULP ‐ SODA OR SULPHATE 76.7$ 80.2$ 4.5%
6 020329 ‐ SWINE, CUTS BONELESS ‐ FROZEN 78.5$ 64.7$ ‐17.6%
7 440710 ‐ LUMBER (THICKNESS >6MM) ‐ CONIFEROUS WOOD 65.9$ 61.3$ ‐7.0%
8 810520 ‐ COBALT ‐ UNWROUGHT, MATTES AND INTERMEDIATE 65.8$ 60.0$ ‐8.9%
9 470321 ‐ CHEMICAL WOODPULP ‐ SODA OR SULPHATE 61.4$ 59.8$ ‐2.6%
10 110710 ‐ MALT ‐ NOT ROASTED 52.4$ 55.6$ 6.0%
11 150200 ‐ RENDERED FATS OF BOVINE ANIMALS, SHEEP OR GOATS ‐$ 48.8$ N/A
12 271311 ‐ PETROLEUM COKE ‐ NOT CALCINED 47.7$ 46.3$ ‐2.8%
13 750210 ‐ NICKEL ‐ UNWROUGHT, NOT ALLOYED 37.6$ 39.2$ 4.4%
14 121490 ‐ SWEDES, MANGOLDS, FODDER ROOTS, HAY, CLOVER, SAINFOIN 42.3$ 38.1$ ‐9.9%
15 100300 ‐ BARLEY 12.6$ 37.2$ 195.3%
16 020230 ‐ BOVINE, CUTS BONELESS ‐ FROZEN 32.6$ 27.9$ ‐14.6%
17 200410 ‐ POTATOES, FROZEN ‐ PREPARED/PRESERVED WITHOUT VINEGAR 23.7$ 26.9$ 13.5%
18 390190 ‐ POLYMERS OF ETHYLENE NES, IN PRIMARY FORMS 18.9$ 20.9$ 11.0%
19 100110 ‐ DURUM WHEAT 7.3$ 14.5$ 99.1%
20 020500 ‐ HORSE, ASS, MULE OR HINNY MEAT ‐ FRESH, CHILLED OR FROZEN 14.7$ 14.0$ ‐5.0%
1,396.7$ 1,748.3$ 25.2%
75.7$ 84.0$ 10.9%
1,472.4$ 1,832.3$ 24.4%
Sub‐total
Others
Total (All Products)
Rank HS‐Description 2010 2011 % Change
1 270112 ‐ BITUMINOUS COAL ‐ WHETHER OR NOT PULVERIZED 1,843.3$ 2,177.8$ 18.1%
2 120510 ‐ RAPE OR COLZA SEEDS ‐ LOW ERUCIC ACID 979.7$ 1,377.7$ 40.6%
3 260300 ‐ COPPER ORES AND CONCENTRATES 698.9$ 1,044.9$ 49.5%
4 440710 ‐ LUMBER (THICKNESS >6MM) ‐ CONIFEROUS WOOD 716.5$ 730.5$ 2.0%
5 020329 ‐ SWINE, CUTS BONELESS ‐ FROZEN 439.8$ 443.3$ 0.8%
6 100190 ‐ MESLIN AND WHEAT NES: SEED 236.7$ 370.1$ 56.4%
7 020319 ‐ SWINE, CUTS BONELESS ‐ FRESH OR CHILLED 358.5$ 356.3$ ‐0.6%
8 470321 ‐ CHEMICAL WOODPULP ‐ SODA OR SULPHATE 280.9$ 272.6$ ‐2.9%
9 120100 ‐ SOYA BEANS (WHETHER OR NOT BROKEN) 234.6$ 242.9$ 3.5%
10 760120 ‐ UNWROUGHT ALUMINUM ‐ ALLOYED 172.2$ 120.4$ ‐30.1%
6,973.0$ 8,305.0$ 19.1%
2,087.5$ 2,227.3$ 6.7%
9,060.4$ 10,532.3$ 16.2%Total (All Products)
Sub‐total
Others

2011InternationalTradeReview
69
Korea,South
Top 20 Exports from Alberta in 2011 ($CDN, Millions)
Top 10 Exports from Canada in 2011 ($CDN, Millions)
Rank HS‐Description 2010 2011 % Change
1 270112 ‐ BITUMINOUS COAL ‐ WHETHER OR NOT PULVERIZED 104.4$ 198.9$ 90.6%
2 100190 ‐ MESLIN AND WHEAT NES: SEED 71.1$ 183.5$ 158.2%
3 470329 ‐ CHEMICAL WOODPULP ‐ SODA OR SULPHATE 108.4$ 100.6$ ‐7.2%
4 020319 ‐ SWINE, CUTS BONELESS ‐ FRESH OR CHILLED 19.4$ 23.6$ 21.6%
5 020329 ‐ SWINE, CUTS BONELESS ‐ FROZEN 7.2$ 17.4$ 142.1%
6 410150 ‐ WHOLE HIDES AND SKINS ‐ BOVINE/EQUINE ANIMALS 8.1$ 14.4$ 78.7%
7 150200 ‐ RENDERED FATS OF BOVINE ANIMALS, SHEEP OR GOATS ‐$ 13.8$ N/A
8 151411 ‐ RAPE (CANOLA) OR COLZA OIL ‐ LOW ERUCIC ACID ‐ CRUDE 12.3$ 12.5$ 2.0%
9 843110 ‐ PARTS OF JACKS, HOISTS AND OTHER MACHINERY 44.1$ 12.3$ ‐72.0%
10 470500 ‐ SEMI‐CHEMICAL WOOD PULP 8.3$ 11.2$ 35.0%
11 750400 ‐ NICKEL ‐ POWDERS AND FLAKES 10.0$ 9.3$ ‐6.8%
12 750210 ‐ NICKEL ‐ UNWROUGHT, NOT ALLOYED 7.3$ 8.5$ 15.6%
13 110710 ‐ MALT ‐ NOT ROASTED 1.4$ 7.9$ 470.6%
14 720449 ‐ FERROUS WASTE AND SCRAP ‐ IRON OR STEEL NES 11.9$ 7.4$ ‐37.9%
15 381519 ‐ SUPPORTED CATALYSTS ‐ WITH OTHER COMPOUND 5.2$ 5.8$ 10.5%
16 841121 ‐ TURBO‐PROPELLERS ‐ POWER NOT EXCEEDING 1,100 KW 21.6$ 5.7$ ‐73.6%
17 440710 ‐ LUMBER (THICKNESS >6MM) ‐ CONIFEROUS WOOD 5.5$ 5.6$ 2.0%
18 848180 ‐ TAPS, COCKS, VALVES AND OTHER SIMILAR APPLIANCES, NES 0.4$ 4.8$ 1051.5%
19 280300 ‐ CARBON (CARBON BLACKS AND OTHER FORMS OF CARBON NES) 3.7$ 4.6$ 24.4%
20 470321 ‐ CHEMICAL WOODPULP ‐ SODA OR SULPHATE ‐ CONIFEROUS 5.3$ 3.6$ ‐32.4%
483.6$ 667.6$ 38.1%
54.1$ 39.6$ ‐26.8%
537.71$ 707.25$ 31.5%
Sub‐total
Others
Total (All Products)
Rank HS‐Description 2010 2011 % Change
1 270112 ‐ BITUMINOUS COAL ‐ WHETHER OR NOT PULVERIZED 1,112.7$ 1,905.6$ 71.3%
2 100190 ‐ MESLIN AND WHEAT NES: SEED 215.9$ 475.9$ 120.4%
3 260300 ‐ COPPER ORES AND CONCENTRATES 145.4$ 251.1$ 72.7%
4 020329 ‐ SWINE, CUTS BONELESS ‐ FROZEN 41.4$ 137.5$ 231.9%
5 440320 ‐ WOODEN TELEPHONE POLES, FENCE POSTS 79.5$ 126.9$ 59.7%
6 880240 ‐ AIRCRAFT NES OF AN UNLADEN WEIGHT (MORE THAN 15,000 KG) ‐$ 125.3$ N/A
7 470500 ‐ SEMI‐CHEMICAL WOOD PULP 91.7$ 115.8$ 26.3%
8 470329 ‐ CHEMICAL WOODPULP ‐ SODA OR SULPHATE 112.6$ 100.6$ ‐10.7%
9 760120 ‐ UNWROUGHT ALUMINUM ‐ ALLOYED 115.3$ 97.8$ ‐15.2%
10 750120 ‐ NICKEL ‐ OXIDE SINTERS AND OTHER INTERMEDIATE 57.4$ 83.9$ 46.0%
2,582.9$ 4,112.2$ 59.2%
1,052.0$ 923.3$ ‐12.2%
3,634.9$ 5,035.5$ 38.5%Total (All Products)
Sub‐total
Others
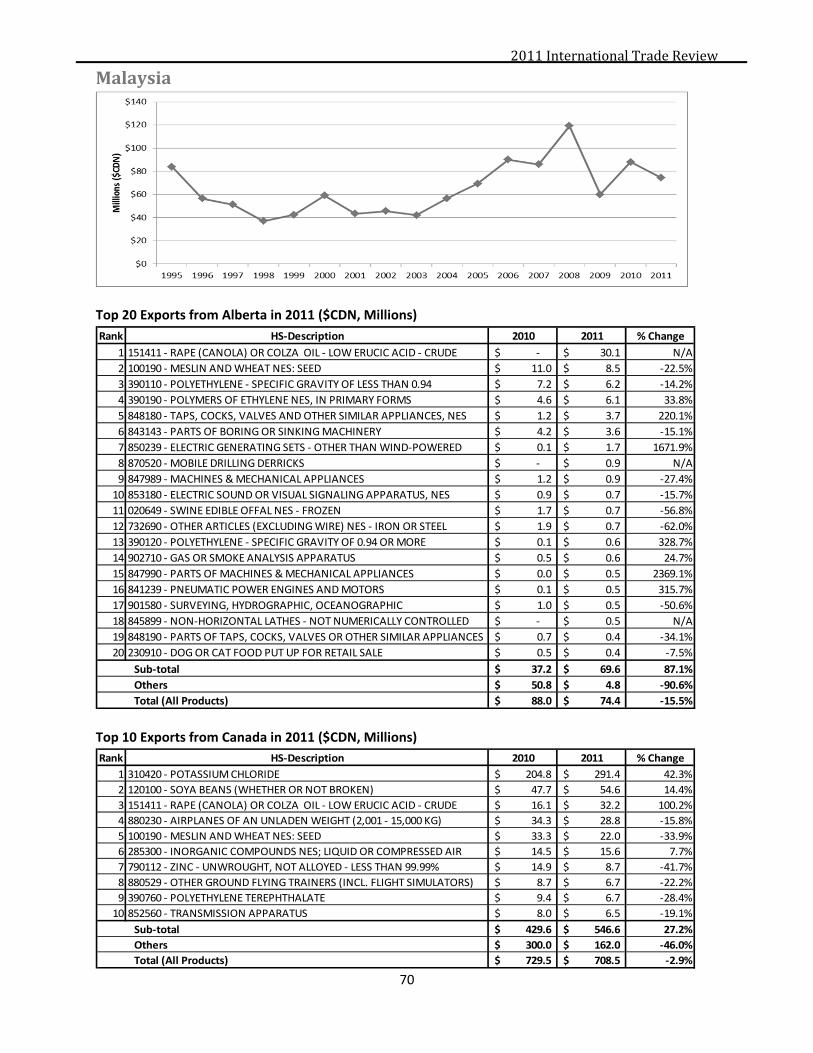
2011InternationalTradeReview
70
Malaysia
Top 20 Exports from Alberta in 2011 ($CDN, Millions)
Top 10 Exports from Canada in 2011 ($CDN, Millions)
Rank HS‐Description 2010 2011 % Change
1 151411 ‐ RAPE (CANOLA) OR COLZA OIL ‐ LOW ERUCIC ACID ‐ CRUDE ‐$ 30.1$ N/A
2 100190 ‐ MESLIN AND WHEAT NES: SEED 11.0$ 8.5$ ‐22.5%
3 390110 ‐ POLYETHYLENE ‐ SPECIFIC GRAVITY OF LESS THAN 0.94 7.2$ 6.2$ ‐14.2%
4 390190 ‐ POLYMERS OF ETHYLENE NES, IN PRIMARY FORMS 4.6$ 6.1$ 33.8%
5 848180 ‐ TAPS, COCKS, VALVES AND OTHER SIMILAR APPLIANCES, NES 1.2$ 3.7$ 220.1%
6 843143 ‐ PARTS OF BORING OR SINKING MACHINERY 4.2$ 3.6$ ‐15.1%
7 850239 ‐ ELECTRIC GENERATING SETS ‐ OTHER THAN WIND‐POWERED 0.1$ 1.7$ 1671.9%
8 870520 ‐ MOBILE DRILLING DERRICKS ‐$ 0.9$ N/A
9 847989 ‐ MACHINES & MECHANICAL APPLIANCES 1.2$ 0.9$ ‐27.4%
10 853180 ‐ ELECTRIC SOUND OR VISUAL SIGNALING APPARATUS, NES 0.9$ 0.7$ ‐15.7%
11 020649 ‐ SWINE EDIBLE OFFAL NES ‐ FROZEN 1.7$ 0.7$ ‐56.8%
12 732690 ‐ OTHER ARTICLES (EXCLUDING WIRE) NES ‐ IRON OR STEEL 1.9$ 0.7$ ‐62.0%
13 390120 ‐ POLYETHYLENE ‐ SPECIFIC GRAVITY OF 0.94 OR MORE 0.1$ 0.6$ 328.7%
14 902710 ‐ GAS OR SMOKE ANALYSIS APPARATUS 0.5$ 0.6$ 24.7%
15 847990 ‐ PARTS OF MACHINES & MECHANICAL APPLIANCES 0.0$ 0.5$ 2369.1%
16 841239 ‐ PNEUMATIC POWER ENGINES AND MOTORS 0.1$ 0.5$ 315.7%
17 901580 ‐ SURVEYING, HYDROGRAPHIC, OCEANOGRAPHIC 1.0$ 0.5$ ‐50.6%
18 845899 ‐ NON‐HORIZONTAL LATHES ‐ NOT NUMERICALLY CONTROLLED ‐$ 0.5$ N/A
19 848190 ‐ PARTS OF TAPS, COCKS, VALVES OR OTHER SIMILAR APPLIANCES 0.7$ 0.4$ ‐34.1%
20 230910 ‐ DOG OR CAT FOOD PUT UP FOR RETAIL SALE 0.5$ 0.4$ ‐7.5%
37.2$ 69.6$ 87.1%
50.8$ 4.8$ ‐90.6%
88.0$ 74.4$ ‐15.5%
Sub‐total
Others
Total (All Products)
Rank HS‐Description 2010 2011 % Change
1 310420 ‐ POTASSIUM CHLORIDE 204.8$ 291.4$ 42.3%
2 120100 ‐ SOYA BEANS (WHETHER OR NOT BROKEN) 47.7$ 54.6$ 14.4%
3 151411 ‐ RAPE (CANOLA) OR COLZA OIL ‐ LOW ERUCIC ACID ‐ CRUDE 16.1$ 32.2$ 100.2%
4 880230 ‐ AIRPLANES OF AN UNLADEN WEIGHT (2,001 ‐ 15,000 KG) 34.3$ 28.8$ ‐15.8%
5 100190 ‐ MESLIN AND WHEAT NES: SEED 33.3$ 22.0$ ‐33.9%
6 285300 ‐ INORGANIC COMPOUNDS NES; LIQUID OR COMPRESSED AIR 14.5$ 15.6$ 7.7%
7 790112 ‐ ZINC ‐ UNWROUGHT, NOT ALLOYED ‐ LESS THAN 99.99% 14.9$ 8.7$ ‐41.7%
8 880529 ‐ OTHER GROUND FLYING TRAINERS (INCL. FLIGHT SIMULATORS) 8.7$ 6.7$ ‐22.2%
9 390760 ‐ POLYETHYLENE TEREPHTHALATE 9.4$ 6.7$ ‐28.4%
10 852560 ‐ TRANSMISSION APPARATUS 8.0$ 6.5$ ‐19.1%
429.6$ 546.6$ 27.2%
300.0$ 162.0$ ‐46.0%
729.5$ 708.5$ ‐2.9%Total (All Products)
Sub‐total
Others
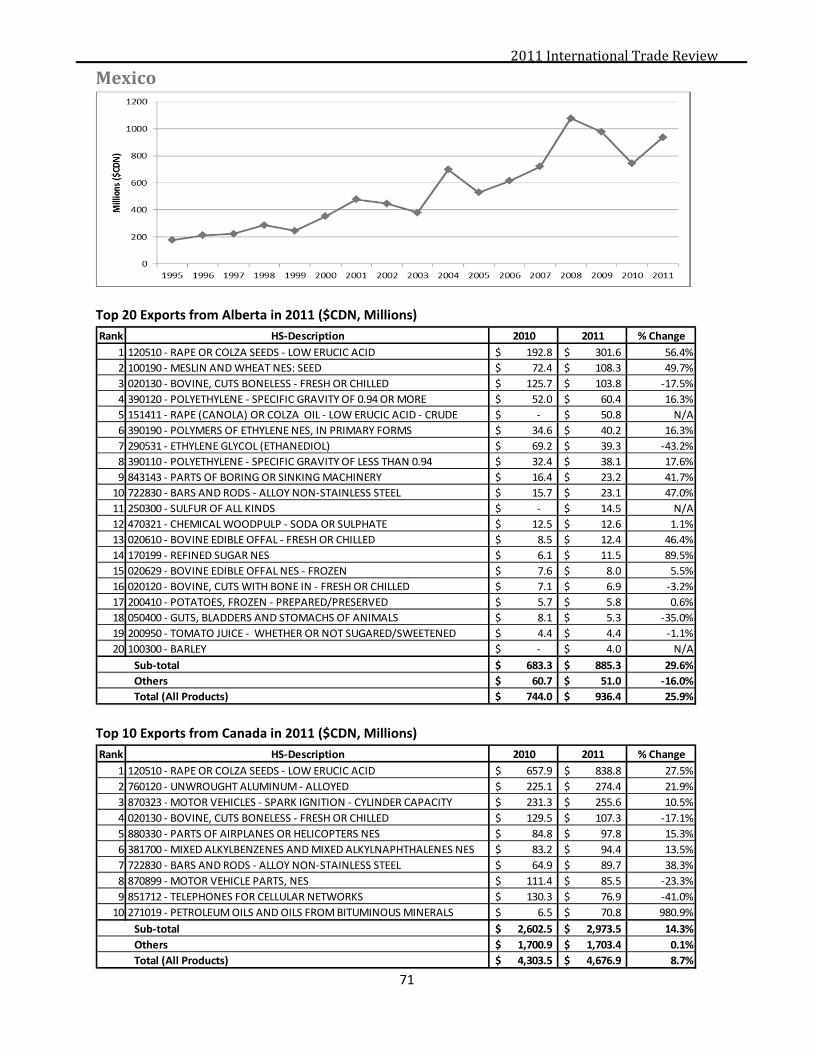
2011InternationalTradeReview
71
Mexico
Top 20 Exports from Alberta in 2011 ($CDN, Millions)
Top 10 Exports from Canada in 2011 ($CDN, Millions)
Rank HS‐Description 2010 2011 % Change
1 120510 ‐ RAPE OR COLZA SEEDS ‐ LOW ERUCIC ACID 192.8$ 301.6$ 56.4%
2 100190 ‐ MESLIN AND WHEAT NES: SEED 72.4$ 108.3$ 49.7%
3 020130 ‐ BOVINE, CUTS BONELESS ‐ FRESH OR CHILLED 125.7$ 103.8$ ‐17.5%
4 390120 ‐ POLYETHYLENE ‐ SPECIFIC GRAVITY OF 0.94 OR MORE 52.0$ 60.4$ 16.3%
5 151411 ‐ RAPE (CANOLA) OR COLZA OIL ‐ LOW ERUCIC ACID ‐ CRUDE ‐$ 50.8$ N/A
6 390190 ‐ POLYMERS OF ETHYLENE NES, IN PRIMARY FORMS 34.6$ 40.2$ 16.3%
7 290531 ‐ ETHYLENE GLYCOL (ETHANEDIOL) 69.2$ 39.3$ ‐43.2%
8 390110 ‐ POLYETHYLENE ‐ SPECIFIC GRAVITY OF LESS THAN 0.94 32.4$ 38.1$ 17.6%
9 843143 ‐ PARTS OF BORING OR SINKING MACHINERY 16.4$ 23.2$ 41.7%
10 722830 ‐ BARS AND RODS ‐ ALLOY NON‐STAINLESS STEEL 15.7$ 23.1$ 47.0%
11 250300 ‐ SULFUR OF ALL KINDS ‐$ 14.5$ N/A
12 470321 ‐ CHEMICAL WOODPULP ‐ SODA OR SULPHATE 12.5$ 12.6$ 1.1%
13 020610 ‐ BOVINE EDIBLE OFFAL ‐ FRESH OR CHILLED 8.5$ 12.4$ 46.4%
14 170199 ‐ REFINED SUGAR NES 6.1$ 11.5$ 89.5%
15 020629 ‐ BOVINE EDIBLE OFFAL NES ‐ FROZEN 7.6$ 8.0$ 5.5%
16 020120 ‐ BOVINE, CUTS WITH BONE IN ‐ FRESH OR CHILLED 7.1$ 6.9$ ‐3.2%
17 200410 ‐ POTATOES, FROZEN ‐ PREPARED/PRESERVED 5.7$ 5.8$ 0.6%
18 050400 ‐ GUTS, BLADDERS AND STOMACHS OF ANIMALS 8.1$ 5.3$ ‐35.0%
19 200950 ‐ TOMATO JUICE ‐ WHETHER OR NOT SUGARED/SWEETENED 4.4$ 4.4$ ‐1.1%
20 100300 ‐ BARLEY ‐$ 4.0$ N/A
683.3$ 885.3$ 29.6%
60.7$ 51.0$ ‐16.0%
744.0$ 936.4$ 25.9%
Sub‐total
Others
Total (All Products)
Rank HS‐Description 2010 2011 % Change
1 120510 ‐ RAPE OR COLZA SEEDS ‐ LOW ERUCIC ACID 657.9$ 838.8$ 27.5%
2 760120 ‐ UNWROUGHT ALUMINUM ‐ ALLOYED 225.1$ 274.4$ 21.9%
3 870323 ‐ MOTOR VEHICLES ‐ SPARK IGNITION ‐ CYLINDER CAPACITY 231.3$ 255.6$ 10.5%
4 020130 ‐ BOVINE, CUTS BONELESS ‐ FRESH OR CHILLED 129.5$ 107.3$ ‐17.1%
5 880330 ‐ PARTS OF AIRPLANES OR HELICOPTERS NES 84.8$ 97.8$ 15.3%
6 381700 ‐ MIXED ALKYLBENZENES AND MIXED ALKYLNAPHTHALENES NES 83.2$ 94.4$ 13.5%
7 722830 ‐ BARS AND RODS ‐ ALLOY NON‐STAINLESS STEEL 64.9$ 89.7$ 38.3%
8 870899 ‐ MOTOR VEHICLE PARTS, NES 111.4$ 85.5$ ‐23.3%
9 851712 ‐ TELEPHONES FOR CELLULAR NETWORKS 130.3$ 76.9$ ‐41.0%
10 271019 ‐ PETROLEUM OILS AND OILS FROM BITUMINOUS MINERALS 6.5$ 70.8$ 980.9%
2,602.5$ 2,973.5$ 14.3%
1,700.9$ 1,703.4$ 0.1%
4,303.5$ 4,676.9$ 8.7%
Sub‐total
Others
Total (All Products)

2011InternationalTradeReview
72
Morocco
Top 20 Exports from Alberta in 2011 ($CDN, Millions)
Top 10 Exports from Canada in 2011 ($CDN, Millions)
Rank HS‐Description 2010 2011 % Change
1 100110 ‐ DURUM WHEAT 18.6$ 18.9$ 1.6%
2 250300 ‐ SULFUR OF ALL KINDS ‐$ 6.5$ N/A
3 051110 ‐ BOVINE SEMEN 0.13$ 0.06$ ‐54.8%
4 382490 ‐ CHEMICAL PRODUCTS AND PREPARATIONS OF THE CHEMICAL ‐$ 0.04$ N/A
5 071310 ‐ PEAS ‐ DRIED AND SHELLED ‐$ 0.03$ N/A
6 940310 ‐ METAL FURNITURE FOR OFFICE USE ‐$ 0.03$ N/A
7 902490 ‐ PARTS AND ACCESSORIES OF MACHINES AND APPLIANCES 0.02$ 0.02$ ‐26.3%
8 120400 ‐ LINSEED 0.01$ 0.01$ ‐28.4%
9 940330 ‐ WOODEN FURNITURE FOR OFFICE USE ‐$ 0.00$ N/A
10 381129 ‐ LUBRICATING OIL ADDITIVES NES ‐$ 0.00$ N/A
11 100190 ‐ MESLIN AND WHEAT NES: SEED 1.79$ ‐$ ‐100.0%
12 843143 ‐ PARTS OF BORING OR SINKING MACHINERY 0.08$ ‐$ ‐100.0%
13 530110 ‐ FLAX FIBRE ‐ RAW OR RETTED 0.05$ ‐$ ‐100.0%
14 843139 ‐ PARTS OF LIFTING, HANDLING, LOADING 0.03$ ‐$ ‐100.0%
15 930599 ‐ PARTS AND ACCESSORIES OF OTHER ARMS NES 0.02$ ‐$ ‐100.0%
16 847990 ‐ PARTS OF MACHINES & MECHANICAL APPLIANCES 0.02$ ‐$ ‐100.0%
17 848130 ‐ VALVES ‐ CHECK 0.01$ ‐$ ‐100.0%
18 732690 ‐ OTHER ARTICLES (EXCLUDING WIRE) 0.01$ ‐$ ‐100.0%
19 401693 ‐ GASKETS, WASHERS AND OTHER SEALS OF VULCANIZED RUBBER 0.01$ ‐$ ‐100.0%
20 850650 ‐ PRIMARY CELLS AND BATTERIES ‐ LITHIUM 0.01$ ‐$ ‐100.0%
20.8$ 25.6$ 22.9%
0.0$ 0.0$ ‐62.9%
20.8$ 25.6$ 22.9%
Sub‐total
Others
Total (All Products)
Rank HS‐Description 2010 2011 % Change
1 100110 ‐ DURUM WHEAT 107.2$ 131.2$ 22.4%
2 880230 ‐ AIRPLANES OF AN UNLADEN WEIGHT (2,001 ‐ 15,000 KG) ‐$ 61.4$ N/A
3 271019 ‐ PETROLEUM OILS AND OILS FROM BITUMINOUS MINERALS 0.0$ 32.9$ 6512563.4%
4 250300 ‐ SULFUR OF ALL KINDS ‐$ 6.5$ N/A
5 071340 ‐ LENTILS ‐ DRIED AND SHELLED 12.9$ 4.7$ ‐63.7%
6 870333 ‐ MOTOR VEHICLES ‐ COMPRESSION IGNITION 4.6$ 4.3$ ‐7.8%
7 870530 ‐ FIRE FIGHTING VEHICLES 6.4$ 3.4$ ‐46.4%
8 880529 ‐ OTHER GROUND FLYING TRAINERS (INCL. FLIGHT SIMULATORS) 0.1$ 2.9$ 4478.2%
9 480100 ‐ NEWSPRINT ‐ IN ROLLS OR SHEETS 3.0$ 2.9$ ‐5.2%
10 720720 ‐ SEMI‐FINISHED PRODUCTS ‐ IRON/NON‐ALLOY STEEL ‐$ 2.7$ N/A
142.9$ 274.2$ 91.9%
24.3$ 15.0$ ‐38.3%
167.2$ 289.2$ 72.9%
Sub‐total
Others
Total (All Products)
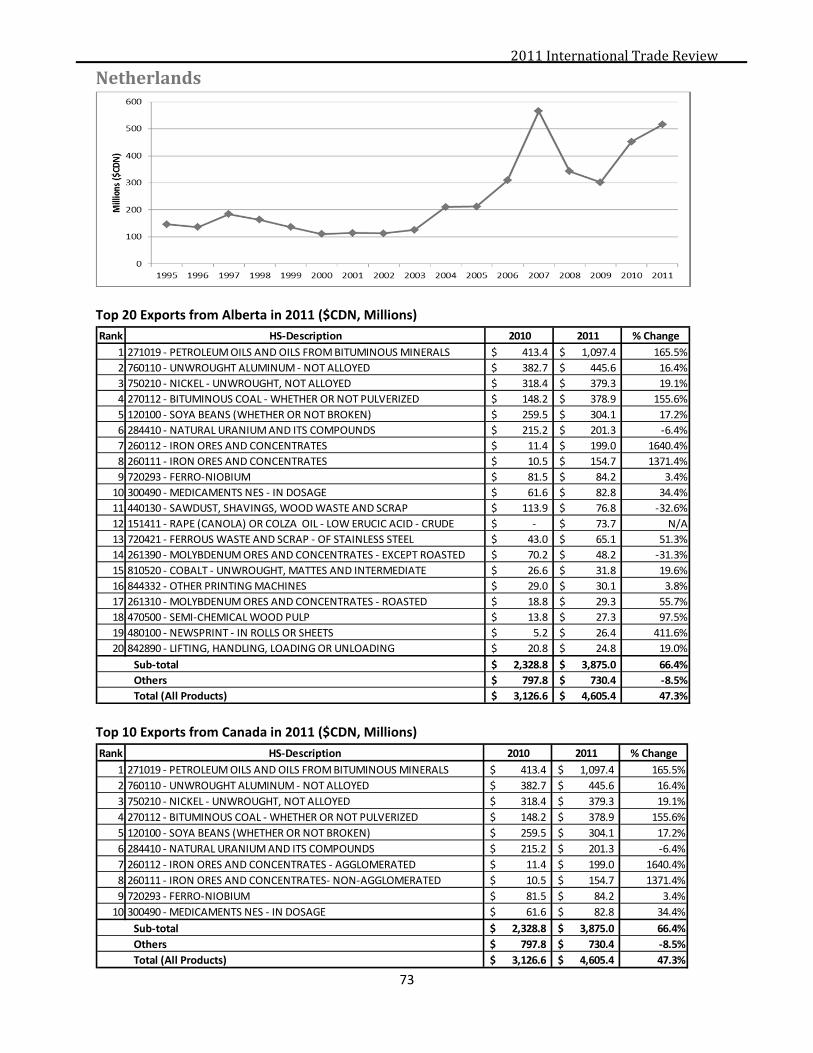
2011InternationalTradeReview
73
Netherlands
Top 20 Exports from Alberta in 2011 ($CDN, Millions)
Top 10 Exports from Canada in 2011 ($CDN, Millions)
Rank HS‐Description 2010 2011 % Change
1 271019 ‐ PETROLEUM OILS AND OILS FROM BITUMINOUS MINERALS 413.4$ 1,097.4$ 165.5%
2 760110 ‐ UNWROUGHT ALUMINUM ‐ NOT ALLOYED 382.7$ 445.6$ 16.4%
3 750210 ‐ NICKEL ‐ UNWROUGHT, NOT ALLOYED 318.4$ 379.3$ 19.1%
4 270112 ‐ BITUMINOUS COAL ‐ WHETHER OR NOT PULVERIZED 148.2$ 378.9$ 155.6%
5 120100 ‐ SOYA BEANS (WHETHER OR NOT BROKEN) 259.5$ 304.1$ 17.2%
6 284410 ‐ NATURAL URANIUM AND ITS COMPOUNDS 215.2$ 201.3$ ‐6.4%
7 260112 ‐ IRON ORES AND CONCENTRATES 11.4$ 199.0$ 1640.4%
8 260111 ‐ IRON ORES AND CONCENTRATES 10.5$ 154.7$ 1371.4%
9 720293 ‐ FERRO‐NIOBIUM 81.5$ 84.2$ 3.4%
10 300490 ‐ MEDICAMENTS NES ‐ IN DOSAGE 61.6$ 82.8$ 34.4%
11 440130 ‐ SAWDUST, SHAVINGS, WOOD WASTE AND SCRAP 113.9$ 76.8$ ‐32.6%
12 151411 ‐ RAPE (CANOLA) OR COLZA OIL ‐ LOW ERUCIC ACID ‐ CRUDE ‐$ 73.7$ N/A
13 720421 ‐ FERROUS WASTE AND SCRAP ‐ OF STAINLESS STEEL 43.0$ 65.1$ 51.3%
14 261390 ‐ MOLYBDENUM ORES AND CONCENTRATES ‐ EXCEPT ROASTED 70.2$ 48.2$ ‐31.3%
15 810520 ‐ COBALT ‐ UNWROUGHT, MATTES AND INTERMEDIATE 26.6$ 31.8$ 19.6%
16 844332 ‐ OTHER PRINTING MACHINES 29.0$ 30.1$ 3.8%
17 261310 ‐ MOLYBDENUM ORES AND CONCENTRATES ‐ ROASTED 18.8$ 29.3$ 55.7%
18 470500 ‐ SEMI‐CHEMICAL WOOD PULP 13.8$ 27.3$ 97.5%
19 480100 ‐ NEWSPRINT ‐ IN ROLLS OR SHEETS 5.2$ 26.4$ 411.6%
20 842890 ‐ LIFTING, HANDLING, LOADING OR UNLOADING 20.8$ 24.8$ 19.0%
2,328.8$ 3,875.0$ 66.4%
797.8$ 730.4$ ‐8.5%
3,126.6$ 4,605.4$ 47.3%
Sub‐total
Others
Total (All Products)
Rank HS‐Description 2010 2011 % Change
1 271019 ‐ PETROLEUM OILS AND OILS FROM BITUMINOUS MINERALS 413.4$ 1,097.4$ 165.5%
2 760110 ‐ UNWROUGHT ALUMINUM ‐ NOT ALLOYED 382.7$ 445.6$ 16.4%
3 750210 ‐ NICKEL ‐ UNWROUGHT, NOT ALLOYED 318.4$ 379.3$ 19.1%
4 270112 ‐ BITUMINOUS COAL ‐ WHETHER OR NOT PULVERIZED 148.2$ 378.9$ 155.6%
5 120100 ‐ SOYA BEANS (WHETHER OR NOT BROKEN) 259.5$ 304.1$ 17.2%
6 284410 ‐ NATURAL URANIUM AND ITS COMPOUNDS 215.2$ 201.3$ ‐6.4%
7 260112 ‐ IRON ORES AND CONCENTRATES ‐ AGGLOMERATED 11.4$ 199.0$ 1640.4%
8 260111 ‐ IRON ORES AND CONCENTRATES‐ NON‐AGGLOMERATED 10.5$ 154.7$ 1371.4%
9 720293 ‐ FERRO‐NIOBIUM 81.5$ 84.2$ 3.4%
10 300490 ‐ MEDICAMENTS NES ‐ IN DOSAGE 61.6$ 82.8$ 34.4%
2,328.8$ 3,875.0$ 66.4%
797.8$ 730.4$ ‐8.5%
3,126.6$ 4,605.4$ 47.3%
Sub‐total
Others
Total (All Products)

2011InternationalTradeReview
74
NewZealand
Top 20 Exports from Alberta in 2011 ($CDN, Millions)
Top 10 Exports from Canada in 2011 ($CDN, Millions)
Rank HS‐Description 2010 2011 % Change
1 310420 ‐ POTASSIUM CHLORIDE 41.7$ 67.5$ 61.8%
2 020329 ‐ SWINE, CUTS BONELESS ‐ FROZEN 17.1$ 19.7$ 15.1%
3 490700 ‐ UNUSED POSTAGE, REVENUE STAMPS, CHEQUE FORMS 14.7$ 17.4$ 18.8%
4 310221 ‐ AMMONIUM SULPHATE 9.1$ 15.6$ 71.3%
5 841121 ‐ TURBO‐PROPELLERS ‐ POWER NOT EXCEEDING 1,100 KW 2.9$ 14.1$ 386.2%
6 440710 ‐ LUMBER (THICKNESS >6MM) ‐ CONIFEROUS WOOD 14.6$ 13.2$ ‐9.2%
7 280200 ‐ SULFUR (SUBLIMED, PRECIPITATED OR COLLOIDAL) 3.7$ 12.7$ 242.7%
8 250300 ‐ SULFUR OF ALL KINDS 11.9$ 12.6$ 5.2%
9 841122 ‐ TURBO‐PROPELLERS ‐ POWER EXCEEDING 1,100 KW ‐$ 11.6$ N/A
10 271019 ‐ PETROLEUM OILS AND OILS FROM BITUMINOUS MINERALS 0.2$ 10.5$ 5911.6%
11 230910 ‐ DOG OR CAT FOOD PUT UP FOR RETAIL SALE 6.1$ 10.3$ 69.6%
12 470500 ‐ SEMI‐CHEMICAL WOOD PULP 12.0$ 7.0$ ‐41.5%
13 721720 ‐ WIRE ‐ IRON/NON‐ALLOY STEEL ‐ PLATED OR COATED WITH ZINC 6.0$ 5.8$ ‐4.8%
14 210390 ‐ SAUCES AND PREPARATIONS NES AND MIXED CONDIMENTS 3.4$ 5.3$ 58.6%
15 300410 ‐ PENICILLINS OR STREPTOMYCINS AND THEIR DERIVATIVES 5.0$ 4.8$ ‐4.3%
16 020322 ‐ SWINE, CUTS WITH BONE IN ‐ FROZEN 4.1$ 4.3$ 3.4%
17 850450 ‐ ELECTRIC INDUCTORS 0.0$ 3.9$ 13658.4%
18 870190 ‐ OTHER WHEELED TRACTORS NES 0.8$ 3.3$ 297.9%
19 730890 ‐ STRUCTURES AND PARTS OF STRUCTURES (EXCL PREFABRICATED) ‐ 0.6$ 2.8$ 340.7%
20 390190 ‐ POLYMERS OF ETHYLENE NES, IN PRIMARY FORMS 2.1$ 2.7$ 26.9%
166.8$ 255.0$ 52.9%
133.6$ 109.4$ ‐18.1%
300.4$ 364.5$ 21.3%
Sub‐total
Others
Total (All Products)
Rank HS‐Description 2010 2011 % Change
1 310420 ‐ POTASSIUM CHLORIDE 41.7$ 67.5$ 61.8%
2 020329 ‐ SWINE, CUTS BONELESS ‐ FROZEN 17.1$ 19.7$ 15.1%
3 490700 ‐ UNUSED POSTAGE, REVENUE STAMPS, CHEQUE FORMS 14.7$ 17.4$ 18.8%
4 310221 ‐ AMMONIUM SULPHATE 9.1$ 15.6$ 71.3%
5 841121 ‐ TURBO‐PROPELLERS ‐ POWER NOT EXCEEDING 1,100 KW 2.9$ 14.1$ 386.2%
6 440710 ‐ LUMBER (THICKNESS >6MM) ‐ CONIFEROUS WOOD 14.6$ 13.2$ ‐9.2%
7 280200 ‐ SULFUR (SUBLIMED, PRECIPITATED OR COLLOIDAL) 3.7$ 12.7$ 242.7%
8 250300 ‐ SULFUR OF ALL KINDS 11.9$ 12.6$ 5.2%
9 841122 ‐ TURBO‐PROPELLERS ‐ POWER EXCEEDING 1,100 KW ‐$ 11.6$ N/A
10 271019 ‐ PETROLEUM OILS AND OILS FROM BITUMINOUS MINERALS 0.2$ 10.5$ 5911.6%
166.8$ 255.0$ 52.9%
133.6$ 109.4$ ‐18.1%
300.4$ 364.5$ 21.3%
Sub‐total
Others
Total (All Products)
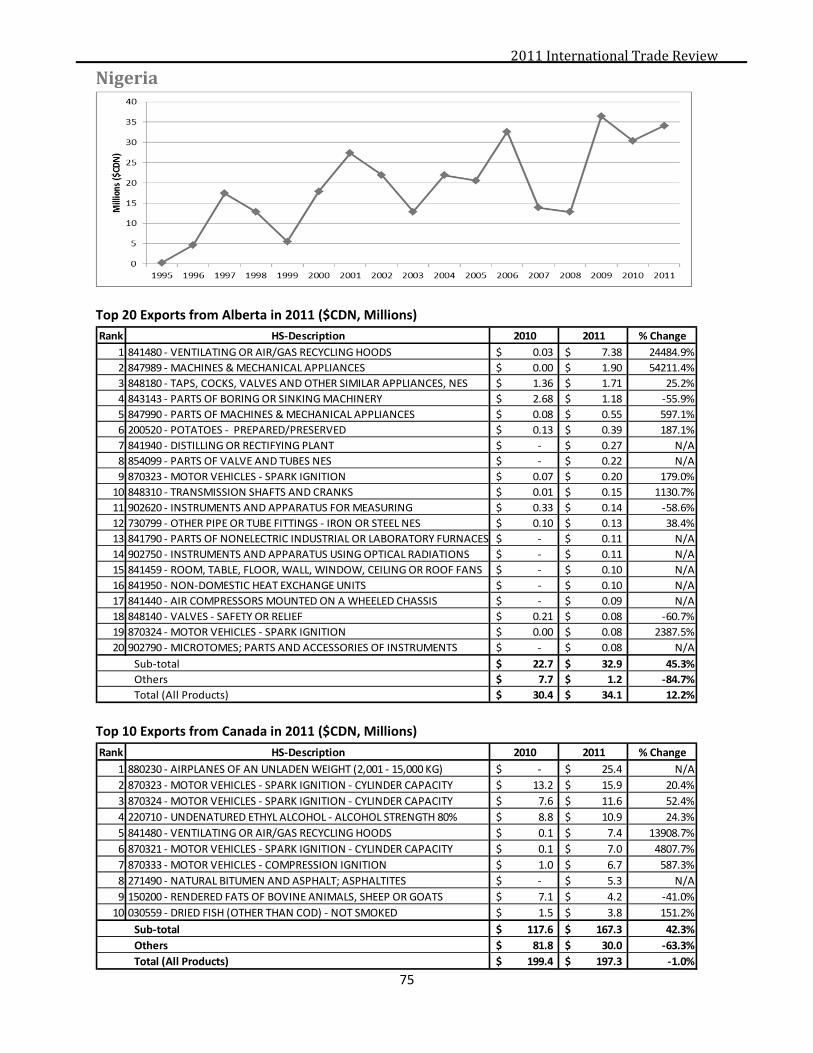
2011InternationalTradeReview
75
Nigeria
Top 20 Exports from Alberta in 2011 ($CDN, Millions)
Top 10 Exports from Canada in 2011 ($CDN, Millions)
Rank HS‐Description 2010 2011 % Change
1 841480 ‐ VENTILATING OR AIR/GAS RECYCLING HOODS 0.03$ 7.38$ 24484.9%
2 847989 ‐ MACHINES & MECHANICAL APPLIANCES 0.00$ 1.90$ 54211.4%
3 848180 ‐ TAPS, COCKS, VALVES AND OTHER SIMILAR APPLIANCES, NES 1.36$ 1.71$ 25.2%
4 843143 ‐ PARTS OF BORING OR SINKING MACHINERY 2.68$ 1.18$ ‐55.9%
5 847990 ‐ PARTS OF MACHINES & MECHANICAL APPLIANCES 0.08$ 0.55$ 597.1%
6 200520 ‐ POTATOES ‐ PREPARED/PRESERVED 0.13$ 0.39$ 187.1%
7 841940 ‐ DISTILLING OR RECTIFYING PLANT ‐$ 0.27$ N/A
8 854099 ‐ PARTS OF VALVE AND TUBES NES ‐$ 0.22$ N/A
9 870323 ‐ MOTOR VEHICLES ‐ SPARK IGNITION 0.07$ 0.20$ 179.0%
10 848310 ‐ TRANSMISSION SHAFTS AND CRANKS 0.01$ 0.15$ 1130.7%
11 902620 ‐ INSTRUMENTS AND APPARATUS FOR MEASURING 0.33$ 0.14$ ‐58.6%
12 730799 ‐ OTHER PIPE OR TUBE FITTINGS ‐ IRON OR STEEL NES 0.10$ 0.13$ 38.4%
13 841790 ‐ PARTS OF NONELECTRIC INDUSTRIAL OR LABORATORY FURNACES ‐$ 0.11$ N/A
14 902750 ‐ INSTRUMENTS AND APPARATUS USING OPTICAL RADIATIONS ‐$ 0.11$ N/A
15 841459 ‐ ROOM, TABLE, FLOOR, WALL, WINDOW, CEILING OR ROOF FANS ‐$ 0.10$ N/A
16 841950 ‐ NON‐DOMESTIC HEAT EXCHANGE UNITS ‐$ 0.10$ N/A
17 841440 ‐ AIR COMPRESSORS MOUNTED ON A WHEELED CHASSIS ‐$ 0.09$ N/A
18 848140 ‐ VALVES ‐ SAFETY OR RELIEF 0.21$ 0.08$ ‐60.7%
19 870324 ‐ MOTOR VEHICLES ‐ SPARK IGNITION 0.00$ 0.08$ 2387.5%
20 902790 ‐ MICROTOMES; PARTS AND ACCESSORIES OF INSTRUMENTS ‐$ 0.08$ N/A
22.7$ 32.9$ 45.3%
7.7$ 1.2$ ‐84.7%
30.4$ 34.1$ 12.2%
Sub‐total
Others
Total (All Products)
Rank HS‐Description 2010 2011 % Change
1 880230 ‐ AIRPLANES OF AN UNLADEN WEIGHT (2,001 ‐ 15,000 KG) ‐$ 25.4$ N/A
2 870323 ‐ MOTOR VEHICLES ‐ SPARK IGNITION ‐ CYLINDER CAPACITY 13.2$ 15.9$ 20.4%
3 870324 ‐ MOTOR VEHICLES ‐ SPARK IGNITION ‐ CYLINDER CAPACITY 7.6$ 11.6$ 52.4%
4 220710 ‐ UNDENATURED ETHYL ALCOHOL ‐ ALCOHOL STRENGTH 80% 8.8$ 10.9$ 24.3%
5 841480 ‐ VENTILATING OR AIR/GAS RECYCLING HOODS 0.1$ 7.4$ 13908.7%
6 870321 ‐ MOTOR VEHICLES ‐ SPARK IGNITION ‐ CYLINDER CAPACITY 0.1$ 7.0$ 4807.7%
7 870333 ‐ MOTOR VEHICLES ‐ COMPRESSION IGNITION 1.0$ 6.7$ 587.3%
8 271490 ‐ NATURAL BITUMEN AND ASPHALT; ASPHALTITES ‐$ 5.3$ N/A
9 150200 ‐ RENDERED FATS OF BOVINE ANIMALS, SHEEP OR GOATS 7.1$ 4.2$ ‐41.0%
10 030559 ‐ DRIED FISH (OTHER THAN COD) ‐ NOT SMOKED 1.5$ 3.8$ 151.2%
117.6$ 167.3$ 42.3%
81.8$ 30.0$ ‐63.3%
199.4$ 197.3$ ‐1.0%
Sub‐total
Others
Total (All Products)
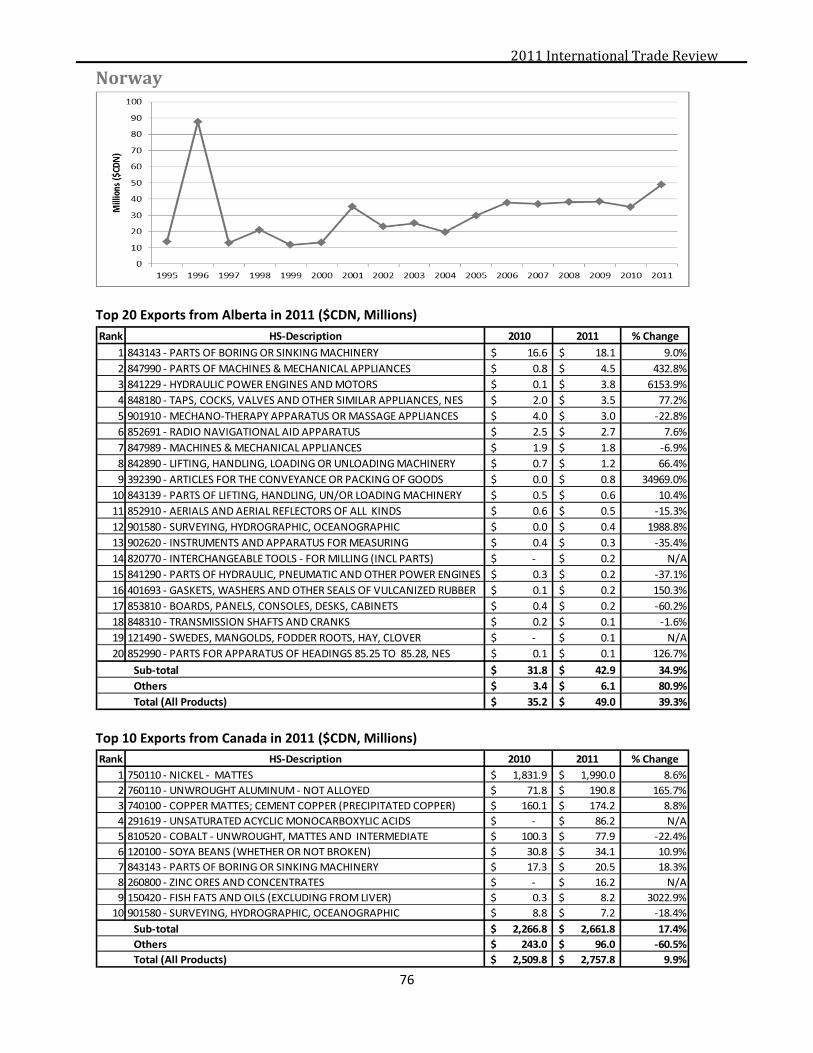
2011InternationalTradeReview
76
Norway
Top 20 Exports from Alberta in 2011 ($CDN, Millions)
Top 10 Exports from Canada in 2011 ($CDN, Millions)
Rank HS‐Description 2010 2011 % Change
1 843143 ‐ PARTS OF BORING OR SINKING MACHINERY 16.6$ 18.1$ 9.0%
2 847990 ‐ PARTS OF MACHINES & MECHANICAL APPLIANCES 0.8$ 4.5$ 432.8%
3 841229 ‐ HYDRAULIC POWER ENGINES AND MOTORS 0.1$ 3.8$ 6153.9%
4 848180 ‐ TAPS, COCKS, VALVES AND OTHER SIMILAR APPLIANCES, NES 2.0$ 3.5$ 77.2%
5 901910 ‐ MECHANO‐THERAPY APPARATUS OR MASSAGE APPLIANCES 4.0$ 3.0$ ‐22.8%
6 852691 ‐ RADIO NAVIGATIONAL AID APPARATUS 2.5$ 2.7$ 7.6%
7 847989 ‐ MACHINES & MECHANICAL APPLIANCES 1.9$ 1.8$ ‐6.9%
8 842890 ‐ LIFTING, HANDLING, LOADING OR UNLOADING MACHINERY 0.7$ 1.2$ 66.4%
9 392390 ‐ ARTICLES FOR THE CONVEYANCE OR PACKING OF GOODS 0.0$ 0.8$ 34969.0%
10 843139 ‐ PARTS OF LIFTING, HANDLING, UN/OR LOADING MACHINERY 0.5$ 0.6$ 10.4%
11 852910 ‐ AERIALS AND AERIAL REFLECTORS OF ALL KINDS 0.6$ 0.5$ ‐15.3%
12 901580 ‐ SURVEYING, HYDROGRAPHIC, OCEANOGRAPHIC 0.0$ 0.4$ 1988.8%
13 902620 ‐ INSTRUMENTS AND APPARATUS FOR MEASURING 0.4$ 0.3$ ‐35.4%
14 820770 ‐ INTERCHANGEABLE TOOLS ‐ FOR MILLING (INCL PARTS) ‐$ 0.2$ N/A
15 841290 ‐ PARTS OF HYDRAULIC, PNEUMATIC AND OTHER POWER ENGINES 0.3$ 0.2$ ‐37.1%
16 401693 ‐ GASKETS, WASHERS AND OTHER SEALS OF VULCANIZED RUBBER 0.1$ 0.2$ 150.3%
17 853810 ‐ BOARDS, PANELS, CONSOLES, DESKS, CABINETS 0.4$ 0.2$ ‐60.2%
18 848310 ‐ TRANSMISSION SHAFTS AND CRANKS 0.2$ 0.1$ ‐1.6%
19 121490 ‐ SWEDES, MANGOLDS, FODDER ROOTS, HAY, CLOVER ‐$ 0.1$ N/A
20 852990 ‐ PARTS FOR APPARATUS OF HEADINGS 85.25 TO 85.28, NES 0.1$ 0.1$ 126.7%
31.8$ 42.9$ 34.9%
3.4$ 6.1$ 80.9%
35.2$ 49.0$ 39.3%
Sub‐total
Others
Total (All Products)
Rank HS‐Description 2010 2011 % Change
1 750110 ‐ NICKEL ‐ MATTES 1,831.9$ 1,990.0$ 8.6%
2 760110 ‐ UNWROUGHT ALUMINUM ‐ NOT ALLOYED 71.8$ 190.8$ 165.7%
3 740100 ‐ COPPER MATTES; CEMENT COPPER (PRECIPITATED COPPER) 160.1$ 174.2$ 8.8%
4 291619 ‐ UNSATURATED ACYCLIC MONOCARBOXYLIC ACIDS ‐$ 86.2$ N/A
5 810520 ‐ COBALT ‐ UNWROUGHT, MATTES AND INTERMEDIATE 100.3$ 77.9$ ‐22.4%
6 120100 ‐ SOYA BEANS (WHETHER OR NOT BROKEN) 30.8$ 34.1$ 10.9%
7 843143 ‐ PARTS OF BORING OR SINKING MACHINERY 17.3$ 20.5$ 18.3%
8 260800 ‐ ZINC ORES AND CONCENTRATES ‐$ 16.2$ N/A
9 150420 ‐ FISH FATS AND OILS (EXCLUDING FROM LIVER) 0.3$ 8.2$ 3022.9%
10 901580 ‐ SURVEYING, HYDROGRAPHIC, OCEANOGRAPHIC 8.8$ 7.2$ ‐18.4%
2,266.8$ 2,661.8$ 17.4%
243.0$ 96.0$ ‐60.5%
2,509.8$ 2,757.8$ 9.9%
Sub‐total
Others
Total (All Products)
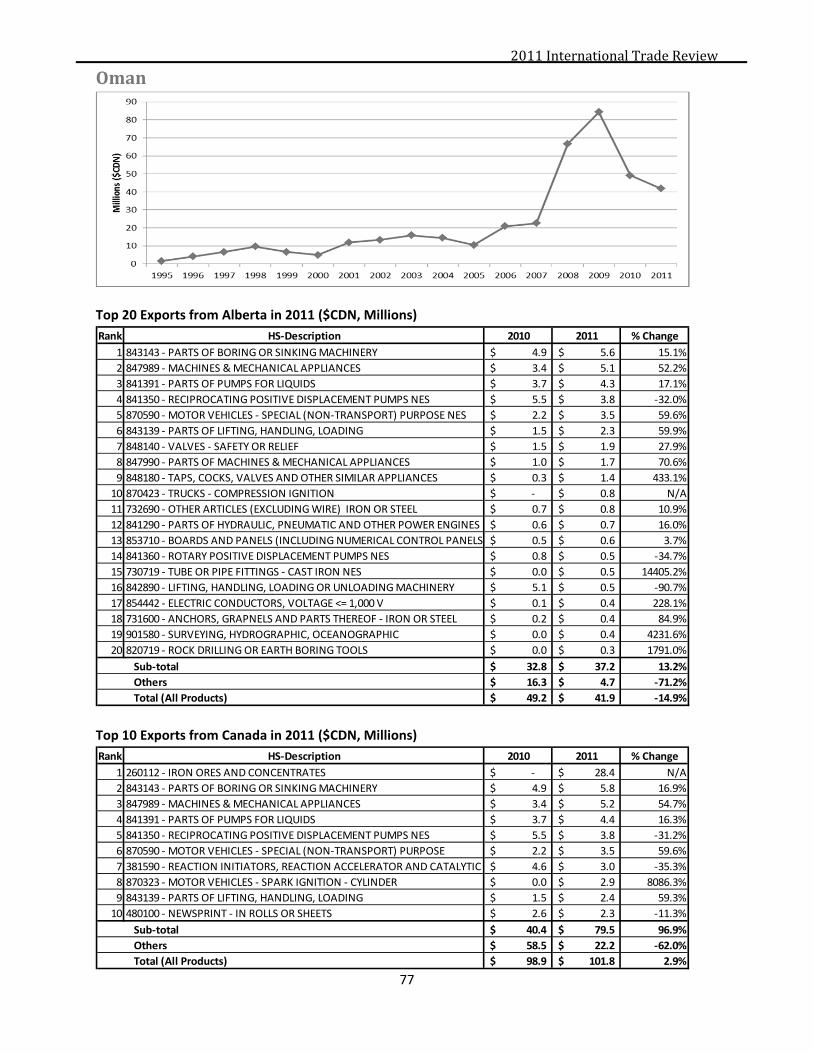
2011InternationalTradeReview
77
Oman
Top 20 Exports from Alberta in 2011 ($CDN, Millions)
Top 10 Exports from Canada in 2011 ($CDN, Millions)
Rank HS‐Description 2010 2011 % Change
1 843143 ‐ PARTS OF BORING OR SINKING MACHINERY 4.9$ 5.6$ 15.1%
2 847989 ‐ MACHINES & MECHANICAL APPLIANCES 3.4$ 5.1$ 52.2%
3 841391 ‐ PARTS OF PUMPS FOR LIQUIDS 3.7$ 4.3$ 17.1%
4 841350 ‐ RECIPROCATING POSITIVE DISPLACEMENT PUMPS NES 5.5$ 3.8$ ‐32.0%
5 870590 ‐ MOTOR VEHICLES ‐ SPECIAL (NON‐TRANSPORT) PURPOSE NES 2.2$ 3.5$ 59.6%
6 843139 ‐ PARTS OF LIFTING, HANDLING, LOADING 1.5$ 2.3$ 59.9%
7 848140 ‐ VALVES ‐ SAFETY OR RELIEF 1.5$ 1.9$ 27.9%
8 847990 ‐ PARTS OF MACHINES & MECHANICAL APPLIANCES 1.0$ 1.7$ 70.6%
9 848180 ‐ TAPS, COCKS, VALVES AND OTHER SIMILAR APPLIANCES 0.3$ 1.4$ 433.1%
10 870423 ‐ TRUCKS ‐ COMPRESSION IGNITION ‐$ 0.8$ N/A
11 732690 ‐ OTHER ARTICLES (EXCLUDING WIRE) IRON OR STEEL 0.7$ 0.8$ 10.9%
12 841290 ‐ PARTS OF HYDRAULIC, PNEUMATIC AND OTHER POWER ENGINES 0.6$ 0.7$ 16.0%
13 853710 ‐ BOARDS AND PANELS (INCLUDING NUMERICAL CONTROL PANELS) 0.5$ 0.6$ 3.7%
14 841360 ‐ ROTARY POSITIVE DISPLACEMENT PUMPS NES 0.8$ 0.5$ ‐34.7%
15 730719 ‐ TUBE OR PIPE FITTINGS ‐ CAST IRON NES 0.0$ 0.5$ 14405.2%
16 842890 ‐ LIFTING, HANDLING, LOADING OR UNLOADING MACHINERY 5.1$ 0.5$ ‐90.7%
17 854442 ‐ ELECTRIC CONDUCTORS, VOLTAGE <= 1,000 V 0.1$ 0.4$ 228.1%
18 731600 ‐ ANCHORS, GRAPNELS AND PARTS THEREOF ‐ IRON OR STEEL 0.2$ 0.4$ 84.9%
19 901580 ‐ SURVEYING, HYDROGRAPHIC, OCEANOGRAPHIC 0.0$ 0.4$ 4231.6%
20 820719 ‐ ROCK DRILLING OR EARTH BORING TOOLS 0.0$ 0.3$ 1791.0%
32.8$ 37.2$ 13.2%
16.3$ 4.7$ ‐71.2%
49.2$ 41.9$ ‐14.9%
Sub‐total
Others
Total (All Products)
Rank HS‐Description 2010 2011 % Change
1 260112 ‐ IRON ORES AND CONCENTRATES ‐$ 28.4$ N/A
2 843143 ‐ PARTS OF BORING OR SINKING MACHINERY 4.9$ 5.8$ 16.9%
3 847989 ‐ MACHINES & MECHANICAL APPLIANCES 3.4$ 5.2$ 54.7%
4 841391 ‐ PARTS OF PUMPS FOR LIQUIDS 3.7$ 4.4$ 16.3%
5 841350 ‐ RECIPROCATING POSITIVE DISPLACEMENT PUMPS NES 5.5$ 3.8$ ‐31.2%
6 870590 ‐ MOTOR VEHICLES ‐ SPECIAL (NON‐TRANSPORT) PURPOSE 2.2$ 3.5$ 59.6%
7 381590 ‐ REACTION INITIATORS, REACTION ACCELERATOR AND CATALYTIC 4.6$ 3.0$ ‐35.3%
8 870323 ‐ MOTOR VEHICLES ‐ SPARK IGNITION ‐ CYLINDER 0.0$ 2.9$ 8086.3%
9 843139 ‐ PARTS OF LIFTING, HANDLING, LOADING 1.5$ 2.4$ 59.3%
10 480100 ‐ NEWSPRINT ‐ IN ROLLS OR SHEETS 2.6$ 2.3$ ‐11.3%
40.4$ 79.5$ 96.9%
58.5$ 22.2$ ‐62.0%
98.9$ 101.8$ 2.9%
Sub‐total
Others
Total (All Products)

2011InternationalTradeReview
78
Pakistan
Top 20 Exports from Alberta in 2011 ($CDN, Millions)
Top 10 Exports from Canada in 2011 ($CDN, Millions)
Rank HS‐Description 2010 2011 % Change
1 120510 ‐ RAPE OR COLZA SEEDS ‐ LOW ERUCIC ACID 98.7$ 166.9$ 69.1%
2 853710 ‐ BOARDS AND PANELS 0.0$ 0.8$ 265937.3%
3 843143 ‐ PARTS OF BORING OR SINKING MACHINERY 1.1$ 0.8$ ‐27.3%
4 847989 ‐ MACHINES & MECHANICAL APPLIANCES 0.0$ 0.5$ 2993.2%
5 850239 ‐ ELECTRIC GENERATING SETS ‐ OTHER THAN WIND‐POWERED 0.8$ 0.4$ ‐51.5%
6 310590 ‐ FERTILIZERS NES 0.0$ 0.2$ 2331.4%
7 848410 ‐ GASKETS AND SIMILAR JOINTS OF METAL SHEETING COMBINED 0.0$ 0.2$ 5542.9%
8 841229 ‐ HYDRAULIC POWER ENGINES AND MOTORS 0.2$ 0.2$ ‐10.8%
9 591110 ‐ TEXTILE FABRICS, FELT, FELT‐LINED WOVEN, CARD CLOTHING 0.1$ 0.2$ 145.2%
10 630900 ‐ WORN CLOTHING AND OTHER WORN TEXTILE ARTICLES 0.3$ 0.2$ ‐42.1%
11 850300 ‐ PARTS FOR ELECTRIC MOTORS, GENERATORS, GENERATING SETS 0.1$ 0.1$ 4.8%
12 732690 ‐ OTHER ARTICLES (EXCLUDING WIRE) NES ‐ IRON OR STEEL 0.2$ 0.1$ ‐38.7%
13 902610 ‐ INSTRUMENTS AND APPARATUS FOR MEASURING 0.6$ 0.1$ ‐84.9%
14 903190 ‐ PARTS AND ACCESSORIES FOR MEASURING ‐$ 0.1$ N/A
15 848190 ‐ PARTS OF TAPS, COCKS, VALVES OR OTHER SIMILAR APPLIANCES 0.1$ 0.1$ ‐22.0%
16 250300 ‐ SULFUR OF ALL KINDS ‐$ 0.1$ N/A
17 848180 ‐ TAPS, COCKS, VALVES AND OTHER SIMILAR APPLIANCES, NES 0.2$ 0.1$ ‐64.3%
18 847190 ‐ OTHER DATA PROCESSING MACHINES OR UNITS THEREOF NES ‐$ 0.1$ N/A
19 845811 ‐ HORIZONTAL LATHES ‐ NUMERICALLY CONTROLLED ‐$ 0.05$ N/A
20 730799 ‐ OTHER PIPE OR TUBE FITTINGS ‐ IRON OR STEEL NES 0.1$ 0.04$ ‐46.4%
102.4$ 174.2$ 70.1%
4.7$ 1.1$ ‐77.8%
107.1$ 175.2$ 63.6%
Sub‐total
Others
Total (All Products)
Rank HS‐Description 2010 2011 % Change
1 120510 ‐ RAPE OR COLZA SEEDS ‐ LOW ERUCIC ACID 336,738.5$ 464,033.5$ 37.8%
2 270112 ‐ BITUMINOUS COAL ‐ WHETHER OR NOT PULVERIZED 21,519.5$ 31,879.5$ 48.1%
3 071340 ‐ LENTILS ‐ DRIED AND SHELLED 38,104.6$ 28,893.1$ ‐24.2%
4 880230 ‐ AIRPLANES OF AN UNLADEN WEIGHT (2,001 ‐ 15,000 KG) 1,612.4$ 20,475.8$ 1169.9%
5 440710 ‐ LUMBER (THICKNESS >6MM) ‐ CONIFEROUS WOOD 10,716.6$ 15,388.8$ 43.6%
6 720711 ‐ SEMI‐FINISHED PRODUCTS ‐ IRON/NON‐ALLOY STEEL 6,052.1$ 10,889.0$ 79.9%
7 720441 ‐ FERROUS WASTE AND SCRAP ‐ IRON OR STEEL 5,048.3$ 8,540.3$ 69.2%
8 630900 ‐ WORN CLOTHING AND OTHER WORN TEXTILE ARTICLES 7,218.2$ 8,102.8$ 12.3%
9 470321 ‐ CHEMICAL WOODPULP ‐ SODA OR SULPHATE 9,897.3$ 7,940.5$ ‐19.8%
10 750210 ‐ NICKEL ‐ UNWROUGHT, NOT ALLOYED 4,635.8$ 5,896.2$ 27.2%
485,701.1$ 642,294.4$ 32.2%
52,769.9$ 39,690.5$ ‐24.8%
538,471.0$ 681,984.9$ 26.7%
Sub‐total
Others
Total (All Products)

2011InternationalTradeReview
79
Peru
Top 20 Exports from Alberta in 2011 ($CDN, Millions)
Top 10 Exports from Canada in 2011 ($CDN, Millions)
Rank HS‐Description 2010 2011 % Change
1 110710 ‐ MALT ‐ NOT ROASTED ‐$ 8.6$ N/A
2 100110 ‐ DURUM WHEAT 3.4$ 5.2$ 52.5%
3 843143 ‐ PARTS OF BORING OR SINKING MACHINERY 8.8$ 1.7$ ‐81.1%
4 843149 ‐ PARTS OF CRANES, WORK‐TRUCKS, SHOVELS 0.5$ 1.1$ 112.1%
5 940600 ‐ PREFABRICATED BUILDINGS (''INDUSTRIALIZED BUILDINGS'') ‐$ 1.1$ N/A
6 250300 ‐ SULFUR OF ALL KINDS ‐$ 1.0$ N/A
7 880330 ‐ PARTS OF AIRPLANES OR HELICOPTERS NES 0.1$ 0.9$ 1558.5%
8 870590 ‐ MOTOR VEHICLES ‐ SPECIAL (NON‐TRANSPORT) PURPOSE ‐$ 0.7$ N/A
9 854232 ‐ ELECTRONIC INTEGRATED CIRCUITS,MEMORIES 0.1$ 0.6$ 1037.5%
10 870120 ‐ ROAD TRACTORS FOR SEMI‐TRAILERS (TRUCK TRACTORS) ‐$ 0.6$ N/A
11 841370 ‐ CENTRIFUGAL PUMPS NES 0.4$ 0.5$ 31.0%
12 847989 ‐ MACHINES & MECHANICAL APPLIANCES 1.0$ 0.4$ ‐58.0%
13 340213 ‐ NON‐IONIC SURFACE‐ACTIVE AGENTS 0.3$ 0.3$ 12.6%
14 051110 ‐ BOVINE SEMEN 0.4$ 0.3$ ‐32.3%
15 902620 ‐ INSTRUMENTS AND APPARATUS FOR MEASURING OR CHECKING 0.0$ 0.2$ 126808.7%
16 071320 ‐ CHICKPEAS OR GARBANZOS ‐ DRIED AND SHELLED ‐$ 0.2$ N/A
17 340399 ‐ LUBRICATING PREPARATIONS (WITHOUT PETROLEUM OILS) 0.1$ 0.2$ 103.5%
18 480261 ‐ PAPER,FINE, >10% FIBRES OBTAINED BY MECH/CHEM‐MEC ‐$ 0.2$ N/A
19 400942 ‐ TUBES, PIPES AND HOSES OF VULCANIZED RUBBER ‐ REINFORCED ‐$ 0.2$ N/A
20 300630 ‐ OPACIFYING PREPARATIONS FOR X‐RAY EXAMINATIONS 0.3$ 0.2$ ‐36.4%
74.9$ 76.6$ 2.2%
10.4$ 1.8$ ‐82.2%
85.3$ 78.5$ ‐8.0%
Sub‐total
Others
Total (All Products)
Rank HS‐Description 2010 2011 % Change
1 100110 ‐ DURUM WHEAT 19.7$ 36.1$ 83.7%
2 071340 ‐ LENTILS ‐ DRIED AND SHELLED 18.7$ 20.1$ 7.6%
3 310420 ‐ POTASSIUM CHLORIDE 9.2$ 15.6$ 68.5%
4 480100 ‐ NEWSPRINT ‐ IN ROLLS OR SHEETS 13.1$ 14.4$ 9.8%
5 847490 ‐ PARTS OF MACHINERY FOR HANDLING STONES, ORES 6.4$ 13.7$ 112.9%
6 843143 ‐ PARTS OF BORING OR SINKING MACHINERY 16.8$ 12.6$ ‐24.7%
7 851712 ‐ TELEPHONES FOR CELLULAR NETWORKS 9.2$ 10.9$ 17.5%
8 950430 ‐ OTHER GAMES OPERATED BY COINS/BANKNOTES/BANK CARDS 3.0$ 9.9$ 226.8%
9 260300 ‐ COPPER ORES AND CONCENTRATES ‐$ 8.9$ N/A
10 110710 ‐ MALT ‐ NOT ROASTED ‐$ 8.6$ N/A
315.1$ 356.4$ 13.1%
130.5$ 132.2$ 1.3%
445.7$ 488.5$ 9.6%
Sub‐total
Others
Total (All Products)

2011InternationalTradeReview
80
Philippines
Top 20 Exports from Alberta in 2011 ($CDN, Millions)
Top 10 Exports from Canada in 2011 ($CDN, Millions)
Rank HS‐Description 2010 2011 % Change
1 200410 ‐ POTATOES, FROZEN ‐ PREPARED/PRESERVED WITHOUT VINEGAR 6.8$ 11.9$ 74.6%
2 390190 ‐ POLYMERS OF ETHYLENE NES, IN PRIMARY FORMS 5.9$ 5.8$ ‐2.8%
3 020329 ‐ SWINE, CUTS BONELESS ‐ FROZEN 5.1$ 5.7$ 12.4%
4 250300 ‐ SULFUR OF ALL KINDS ‐$ 4.9$ N/A
5 020230 ‐ BOVINE, CUTS BONELESS ‐ FROZEN 2.0$ 3.3$ 63.1%
6 730900 ‐ RESERVOIRS, TANKS, VATS AND SIMILAR CONTAINERS ‐$ 1.8$ N/A
7 020714 ‐ CUTS AND EDIBLE OFFALS (INCL LIVERS) OF FOWLS 1.7$ 1.0$ ‐43.3%
8 841121 ‐ TURBO‐PROPELLERS ‐ POWER NOT EXCEEDING 1,100 KW 0.4$ 0.8$ 102.3%
9 020900 ‐ PIG FAT LEAN MEAT FREE AND POULTRY FAT 0.5$ 0.7$ 37.6%
10 230110 ‐ FLOURS, MEALS, PELLETS OF MEAT OR MEAT OFFAL UNFIT 0.0$ 0.4$ 808.5%
11 390120 ‐ POLYETHYLENE ‐ SPECIFIC GRAVITY OF 0.94 OR MORE ‐$ 0.4$ N/A
12 020641 ‐ SWINE LIVERS, EDIBLE OFFAL ‐ FROZEN 0.6$ 0.4$ ‐30.7%
13 020621 ‐ BOVINE TONGUES, EDIBLE OFFAL ‐ FROZEN ‐$ 0.4$ N/A
14 071310 ‐ PEAS ‐ DRIED AND SHELLED 0.4$ 0.3$ ‐9.9%
15 020725 ‐ TURKEYS, DOMESTIC, WHOLE ‐ FROZEN 0.1$ 0.3$ 273.3%
16 843149 ‐ PARTS OF CRANES, WORK‐TRUCKS, SHOVELS 0.0$ 0.3$ 1189.9%
17 230910 ‐ DOG OR CAT FOOD PUT UP FOR RETAIL SALE 0.3$ 0.3$ 3.0%
18 020322 ‐ SWINE, CUTS WITH BONE IN ‐ FROZEN 0.3$ 0.3$ ‐4.8%
19 020319 ‐ SWINE, CUTS BONELESS ‐ FRESH OR CHILLED 0.1$ 0.3$ 135.3%
20 200520 ‐ POTATOES ‐ PREPARED/PRESERVED WITHOUT VINEGAR 0.4$ 0.2$ ‐45.8%
55.2$ 57.3$ 3.8%
4.0$ 2.0$ ‐50.4%
59.2$ 59.3$ 0.1%
Sub‐total
Others
Total (All Products)
Rank HS‐Description 2010 2011 % Change
1 260300 ‐ COPPER ORES AND CONCENTRATES 185.1$ 133.4$ ‐28.0%
2 310420 ‐ POTASSIUM CHLORIDE 21.7$ 44.9$ 106.6%
3 020329 ‐ SWINE, CUTS BONELESS ‐ FROZEN 29.3$ 38.2$ 30.2%
4 440710 ‐ LUMBER (THICKNESS >6MM) ‐ CONIFEROUS WOOD 39.9$ 37.4$ ‐6.5%
5 200410 ‐ POTATOES, FROZEN‐PREPARED/PRESERVED WITHOUT VINEGAR 7.3$ 16.3$ 122.0%
6 020714 ‐ CUTS AND EDIBLE OFFALS (INCL LIVERS) OF FOWLS 15.7$ 16.1$ 2.3%
7 711890 ‐ COIN NES 12.4$ 14.8$ 19.5%
8 230990 ‐ ANIMAL FEED PREPARATIONS 10.7$ 10.3$ ‐3.9%
9 071310 ‐ PEAS ‐ DRIED AND SHELLED 6.8$ 8.2$ 21.3%
10 848180 ‐ TAPS, COCKS, VALVES AND OTHER SIMILAR APPLIANCES 0.3$ 7.4$ 2068.0%
488.3$ 429.5$ ‐12.0%
181.7$ 111.7$ ‐38.5%
669.9$ 541.2$ ‐19.2%
Sub‐total
Others
Total (All Products)

2011InternationalTradeReview
81
Portugal
Top 20 Exports from Alberta in 2011 ($CDN, Millions)
Top 10 Exports from Canada in 2011 ($CDN, Millions)
Rank HS‐Description 2010 2011 % Change
1 120510 ‐ RAPE OR COLZA SEEDS ‐ LOW ERUCIC ACID 13.9$ 33.2$ 139.8%
2 100110 ‐ DURUM WHEAT 0.6$ 0.8$ 30.2%
3 730424 ‐ CASINGS, TUBING, STAINLESS STEEL, SEAMLESS ‐$ 0.4$ N/A
4 071320 ‐ CHICKPEAS OR GARBANZOS ‐ DRIED AND SHELLED 0.3$ 0.2$ ‐32.3%
5 843010 ‐ PILE‐DRIVERS AND PILE‐EXTRACTORS ‐$ 0.2$ N/A
6 230910 ‐ DOG OR CAT FOOD PUT UP FOR RETAIL SALE 0.2$ 0.2$ 3.8%
7 880320 ‐ UNDER‐CARRIAGES AND PARTS THEREOF ‐ FOR AIRCRAFTS ‐$ 0.09$ N/A
8 382490 ‐ CHEMICAL PRODUCTS AND PREPARATIONS OF THE CHEMICAL 0.1$ 0.07$ ‐50.8%
9 820713 ‐ ROCK DRILLING OR EARTH BORING TOOLS ‐$ 0.04$ N/A
10 841391 ‐ PARTS OF PUMPS FOR LIQUIDS ‐$ 0.03$ N/A
11 903180 ‐ OTHER MEASURING OR CHECKING INSTRUMENTS, APPLIANCES ‐$ 0.03$ N/A
12 100830 ‐ CANARY SEEDS 0.01$ 0.02$ 29.1%
13 051110 ‐ BOVINE SEMEN ‐$ 0.02$ N/A
14 880330 ‐ PARTS OF AIRPLANES OR HELICOPTERS NES ‐$ 0.02$ N/A
15 902580 ‐ HYDROMETERS, HYGROMETERS AND PSYCHROMETERS ‐$ 0.02$ N/A
16 382410 ‐ PREPARED BINDERS FOR FOUNDRY MOULDS OR CORES ‐$ 0.02$ N/A
17 851989 ‐ SOUND RECORDING OR REPRODUCING APPARATUS, NES ‐$ 0.01$ N/A
18 730729 ‐ OTHER PIPE OR TUBE FITTINGS ‐ STAINLESS STEEL ‐$ 0.01$ N/A
19 843143 ‐ PARTS OF BORING OR SINKING MACHINERY ‐$ 0.01$ N/A
20 853710 ‐ BOARDS AND PANELS(INCLUDING NUMERICAL CONTROL PANELS) ‐$ 0.01$ N/A
15.1$ 35.4$ 134.3%
1.3$ 0.0$ ‐96.7%
16.4$ 35.4$ 115.7%
Sub‐total
Others
Total (All Products)
Rank HS‐Description 2010 2011 % Change
1 120510 ‐ RAPE OR COLZA SEEDS ‐ LOW ERUCIC ACID 47.3$ 92.4$ 95.4%
2 100590 ‐ MAIZE (CORN) NES (EXCLUDING SWEET CORN) 7.5$ 19.4$ 158.3%
3 151411 ‐ RAPE (CANOLA) OR COLZA OIL ‐ LOW ERUCIC ACID ‐ CRUDE ‐$ 17.2$ N/A
4 480100 ‐ NEWSPRINT ‐ IN ROLLS OR SHEETS 3.7$ 8.3$ 125.6%
5 120100 ‐ SOYA BEANS (WHETHER OR NOT BROKEN) 21.8$ 7.9$ ‐64.0%
6 282911 ‐ SODIUM CHLORATE 8.1$ 6.3$ ‐23.0%
7 100110 ‐ DURUM WHEAT 3.7$ 5.8$ 56.8%
8 841122 ‐ TURBO‐PROPELLERS ‐ POWER EXCEEDING 1,100 KW 1.1$ 4.1$ 292.0%
9 847790 ‐ PARTS OF MACHINES FOR WORKING RUBBER OR PLASTICS 3.8$ 3.9$ 1.8%
10 722850 ‐ BARS AND RODS ‐ ALLOY NON‐STAINLESS STEEL 3.6$ 3.8$ 4.6%
121.8$ 191.8$ 57.5%
146.5$ 29.4$ ‐79.9%
268.3$ 221.2$ ‐17.5%
Sub‐total
Others
Total (All Products)

2011InternationalTradeReview
82
Russia
Top 20 Exports from Alberta in 2011 ($CDN, Millions)
Top 10 Exports from Canada in 2011 ($CDN, Millions)
Rank HS‐Description 2010 2011 % Change
1 841940 ‐ DISTILLING OR RECTIFYING PLANT 87.1$ 111.7$ 28.3%
2 020329 ‐ SWINE, CUTS BONELESS ‐ FROZEN 13.8$ 27.1$ 96.9%
3 843143 ‐ PARTS OF BORING OR SINKING MACHINERY 15.5$ 20.3$ 31.1%
4 843049 ‐ BORING OR SINKING MACHINERY NES ‐ NOT SELF‐PROPELLED 32.7$ 15.6$ ‐52.3%
5 020230 ‐ BOVINE, CUTS BONELESS ‐ FROZEN 14.0$ 10.5$ ‐24.7%
6 880240 ‐ AIRCRAFT NES OF AN UNLADEN WEIGHT ‐$ 8.0$ N/A
7 020322 ‐ SWINE, CUTS WITH BONE IN ‐ FROZEN 6.1$ 7.8$ 28.9%
8 230910 ‐ DOG OR CAT FOOD PUT UP FOR RETAIL SALE 3.9$ 5.9$ 51.4%
9 847989 ‐ MACHINES & MECHANICAL APPLIANCES 2.5$ 5.6$ 129.7%
10 901580 ‐ SURVEYING, HYDROGRAPHIC, OCEANOGRAPHIC 0.5$ 4.8$ 950.3%
11 010290 ‐ BOVINE, LIVE ‐ NOT PURE‐BRED ‐$ 4.1$ N/A
12 843149 ‐ PARTS OF CRANES, WORK‐TRUCKS, SHOVELS 2.0$ 3.5$ 73.5%
13 847982 ‐ MIXING, KNEADING, CRUSHING, GRINDING, SCREENING ‐$ 3.5$ N/A
14 841290 ‐ PARTS OF HYDRAULIC, PNEUMATIC AND OTHER POWER ENGINES 4.6$ 3.3$ ‐26.9%
15 020629 ‐ BOVINE EDIBLE OFFAL NES ‐ FROZEN 4.0$ 3.3$ ‐17.4%
16 730900 ‐ RESERVOIRS, TANKS, VATS AND SIMILAR CONTAINERS 1.6$ 2.9$ 77.9%
17 020622 ‐ BOVINE LIVERS, EDIBLE OFFAL ‐ FROZEN 2.7$ 2.4$ ‐11.4%
18 847990 ‐ PARTS OF MACHINES & MECHANICAL APPLIANCES 0.6$ 2.0$ 213.0%
19 732690 ‐ OTHER ARTICLES (EXCLUDING WIRE) NES ‐ IRON OR STEEL 2.5$ 1.8$ ‐30.2%
20 843139 ‐ PARTS OF LIFTING, HANDLING, LOADING OR UNLOADING 1.4$ 1.5$ 7.8%
199.6$ 251.7$ 26.1%
40.3$ 23.2$ ‐42.6%
239.9$ 274.8$ 14.5%
Sub‐total
Others
Total (All Products)
Rank HS‐Description 2010 2011 % Change
1 020329 ‐ SWINE, CUTS BONELESS ‐ FROZEN 123.1$ 259.3$ 110.6%
2 841940 ‐ DISTILLING OR RECTIFYING PLANT 87.1$ 111.7$ 28.3%
3 030613 ‐ SHRIMPS AND PRAWNS ‐ FROZEN 61.2$ 74.7$ 22.2%
4 020322 ‐ SWINE, CUTS WITH BONE IN ‐ FROZEN 45.1$ 74.0$ 64.0%
5 880240 ‐ AIRCRAFT NES OF AN UNLADEN WEIGHT (MORE THAN 15,000 KG) 38.8$ 58.6$ 50.9%
6 843143 ‐ PARTS OF BORING OR SINKING MACHINERY 48.3$ 45.3$ ‐6.0%
7 870190 ‐ OTHER WHEELED TRACTORS NES 1.4$ 39.1$ 2675.9%
8 880230 ‐ AIRPLANES OF AN UNLADEN WEIGHT (2,001 ‐ 15,000 KG) 25.5$ 29.9$ 17.5%
9 030378 ‐ HAKE (EXCEPT LIVERS OR ROES) ‐ FROZEN (EXCL FISH FILLETS) 17.7$ 23.5$ 33.1%
10 441012 ‐ ORIENTED STRAND BOARD (OSB), OF WOOD 19.5$ 23.5$ 20.4%
687.8$ 974.5$ 41.7%
385.9$ 429.0$ 11.2%
1,073.7$ 1,403.5$ 30.7%
Sub‐total
Others
Total (All Products)
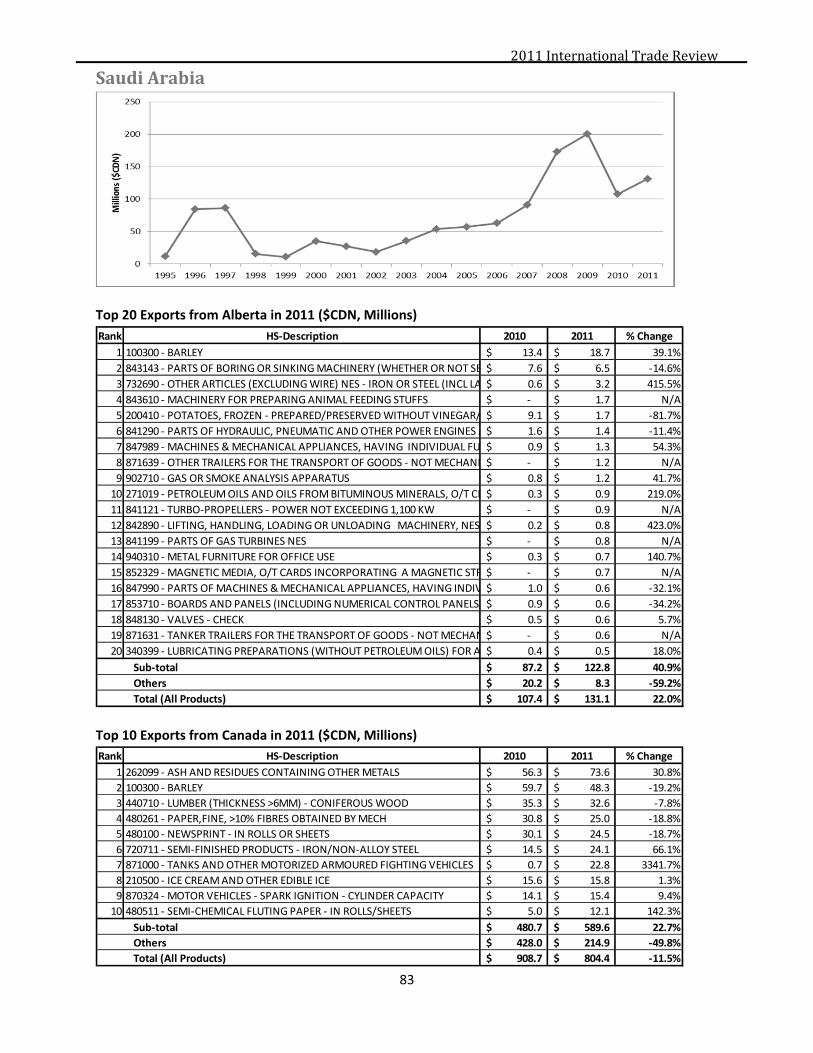
2011InternationalTradeReview
83
SaudiArabia
Top 20 Exports from Alberta in 2011 ($CDN, Millions)
Top 10 Exports from Canada in 2011 ($CDN, Millions)
Rank HS‐Description 2010 2011 % Change
1 100300 ‐ BARLEY 13.4$ 18.7$ 39.1%
2 843143 ‐ PARTS OF BORING OR SINKING MACHINERY (WHETHER OR NOT SE 7.6$ 6.5$ ‐14.6%
3 732690 ‐ OTHER ARTICLES (EXCLUDING WIRE) NES ‐ IRON OR STEEL (INCL LA 0.6$ 3.2$ 415.5%
4 843610 ‐ MACHINERY FOR PREPARING ANIMAL FEEDING STUFFS ‐$ 1.7$ N/A
5 200410 ‐ POTATOES, FROZEN ‐ PREPARED/PRESERVED WITHOUT VINEGAR/ 9.1$ 1.7$ ‐81.7%
6 841290 ‐ PARTS OF HYDRAULIC, PNEUMATIC AND OTHER POWER ENGINES A 1.6$ 1.4$ ‐11.4%
7 847989 ‐ MACHINES & MECHANICAL APPLIANCES, HAVING INDIVIDUAL FU 0.9$ 1.3$ 54.3%
8 871639 ‐ OTHER TRAILERS FOR THE TRANSPORT OF GOODS ‐ NOT MECHANI ‐$ 1.2$ N/A
9 902710 ‐ GAS OR SMOKE ANALYSIS APPARATUS 0.8$ 1.2$ 41.7%
10 271019 ‐ PETROLEUM OILS AND OILS FROM BITUMINOUS MINERALS, O/T CR 0.3$ 0.9$ 219.0%
11 841121 ‐ TURBO‐PROPELLERS ‐ POWER NOT EXCEEDING 1,100 KW ‐$ 0.9$ N/A
12 842890 ‐ LIFTING, HANDLING, LOADING OR UNLOADING MACHINERY, NES 0.2$ 0.8$ 423.0%
13 841199 ‐ PARTS OF GAS TURBINES NES ‐$ 0.8$ N/A
14 940310 ‐ METAL FURNITURE FOR OFFICE USE 0.3$ 0.7$ 140.7%
15 852329 ‐ MAGNETIC MEDIA, O/T CARDS INCORPORATING A MAGNETIC STR ‐$ 0.7$ N/A
16 847990 ‐ PARTS OF MACHINES & MECHANICAL APPLIANCES, HAVING INDIV 1.0$ 0.6$ ‐32.1%
17 853710 ‐ BOARDS AND PANELS (INCLUDING NUMERICAL CONTROL PANELS) 0.9$ 0.6$ ‐34.2%
18 848130 ‐ VALVES ‐ CHECK 0.5$ 0.6$ 5.7%
19 871631 ‐ TANKER TRAILERS FOR THE TRANSPORT OF GOODS ‐ NOT MECHAN ‐$ 0.6$ N/A
20 340399 ‐ LUBRICATING PREPARATIONS (WITHOUT PETROLEUM OILS) FOR A 0.4$ 0.5$ 18.0%
87.2$ 122.8$ 40.9%
20.2$ 8.3$ ‐59.2%
107.4$ 131.1$ 22.0%
Sub‐total
Others
Total (All Products)
Rank HS‐Description 2010 2011 % Change
1 262099 ‐ ASH AND RESIDUES CONTAINING OTHER METALS 56.3$ 73.6$ 30.8%
2 100300 ‐ BARLEY 59.7$ 48.3$ ‐19.2%
3 440710 ‐ LUMBER (THICKNESS >6MM) ‐ CONIFEROUS WOOD 35.3$ 32.6$ ‐7.8%
4 480261 ‐ PAPER,FINE, >10% FIBRES OBTAINED BY MECH 30.8$ 25.0$ ‐18.8%
5 480100 ‐ NEWSPRINT ‐ IN ROLLS OR SHEETS 30.1$ 24.5$ ‐18.7%
6 720711 ‐ SEMI‐FINISHED PRODUCTS ‐ IRON/NON‐ALLOY STEEL 14.5$ 24.1$ 66.1%
7 871000 ‐ TANKS AND OTHER MOTORIZED ARMOURED FIGHTING VEHICLES 0.7$ 22.8$ 3341.7%
8 210500 ‐ ICE CREAM AND OTHER EDIBLE ICE 15.6$ 15.8$ 1.3%
9 870324 ‐ MOTOR VEHICLES ‐ SPARK IGNITION ‐ CYLINDER CAPACITY 14.1$ 15.4$ 9.4%
10 480511 ‐ SEMI‐CHEMICAL FLUTING PAPER ‐ IN ROLLS/SHEETS 5.0$ 12.1$ 142.3%
480.7$ 589.6$ 22.7%
428.0$ 214.9$ ‐49.8%
908.7$ 804.4$ ‐11.5%
Sub‐total
Others
Total (All Products)
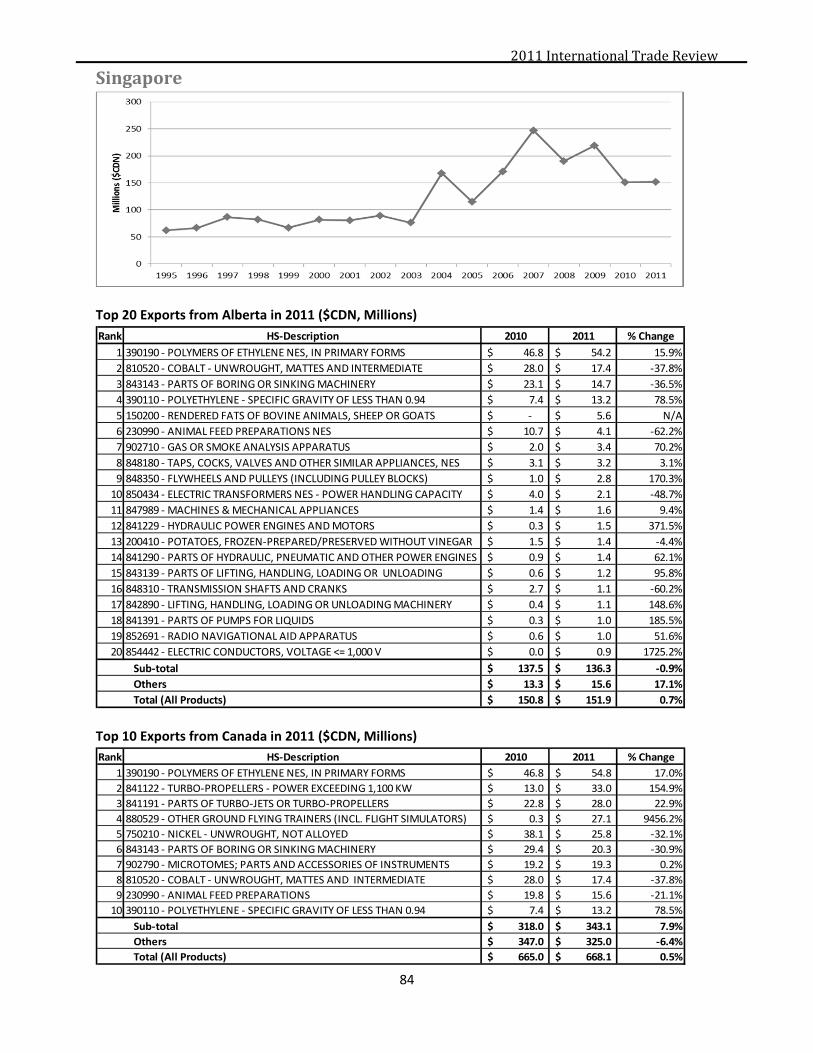
2011InternationalTradeReview
84
Singapore
Top 20 Exports from Alberta in 2011 ($CDN, Millions)
Top 10 Exports from Canada in 2011 ($CDN, Millions)
Rank HS‐Description 2010 2011 % Change
1 390190 ‐ POLYMERS OF ETHYLENE NES, IN PRIMARY FORMS 46.8$ 54.2$ 15.9%
2 810520 ‐ COBALT ‐ UNWROUGHT, MATTES AND INTERMEDIATE 28.0$ 17.4$ ‐37.8%
3 843143 ‐ PARTS OF BORING OR SINKING MACHINERY 23.1$ 14.7$ ‐36.5%
4 390110 ‐ POLYETHYLENE ‐ SPECIFIC GRAVITY OF LESS THAN 0.94 7.4$ 13.2$ 78.5%
5 150200 ‐ RENDERED FATS OF BOVINE ANIMALS, SHEEP OR GOATS ‐$ 5.6$ N/A
6 230990 ‐ ANIMAL FEED PREPARATIONS NES 10.7$ 4.1$ ‐62.2%
7 902710 ‐ GAS OR SMOKE ANALYSIS APPARATUS 2.0$ 3.4$ 70.2%
8 848180 ‐ TAPS, COCKS, VALVES AND OTHER SIMILAR APPLIANCES, NES 3.1$ 3.2$ 3.1%
9 848350 ‐ FLYWHEELS AND PULLEYS (INCLUDING PULLEY BLOCKS) 1.0$ 2.8$ 170.3%
10 850434 ‐ ELECTRIC TRANSFORMERS NES ‐ POWER HANDLING CAPACITY 4.0$ 2.1$ ‐48.7%
11 847989 ‐ MACHINES & MECHANICAL APPLIANCES 1.4$ 1.6$ 9.4%
12 841229 ‐ HYDRAULIC POWER ENGINES AND MOTORS 0.3$ 1.5$ 371.5%
13 200410 ‐ POTATOES, FROZEN‐PREPARED/PRESERVED WITHOUT VINEGAR 1.5$ 1.4$ ‐4.4%
14 841290 ‐ PARTS OF HYDRAULIC, PNEUMATIC AND OTHER POWER ENGINES 0.9$ 1.4$ 62.1%
15 843139 ‐ PARTS OF LIFTING, HANDLING, LOADING OR UNLOADING 0.6$ 1.2$ 95.8%
16 848310 ‐ TRANSMISSION SHAFTS AND CRANKS 2.7$ 1.1$ ‐60.2%
17 842890 ‐ LIFTING, HANDLING, LOADING OR UNLOADING MACHINERY 0.4$ 1.1$ 148.6%
18 841391 ‐ PARTS OF PUMPS FOR LIQUIDS 0.3$ 1.0$ 185.5%
19 852691 ‐ RADIO NAVIGATIONAL AID APPARATUS 0.6$ 1.0$ 51.6%
20 854442 ‐ ELECTRIC CONDUCTORS, VOLTAGE <= 1,000 V 0.0$ 0.9$ 1725.2%
137.5$ 136.3$ ‐0.9%
13.3$ 15.6$ 17.1%
150.8$ 151.9$ 0.7%
Sub‐total
Others
Total (All Products)
Rank HS‐Description 2010 2011 % Change
1 390190 ‐ POLYMERS OF ETHYLENE NES, IN PRIMARY FORMS 46.8$ 54.8$ 17.0%
2 841122 ‐ TURBO‐PROPELLERS ‐ POWER EXCEEDING 1,100 KW 13.0$ 33.0$ 154.9%
3 841191 ‐ PARTS OF TURBO‐JETS OR TURBO‐PROPELLERS 22.8$ 28.0$ 22.9%
4 880529 ‐ OTHER GROUND FLYING TRAINERS (INCL. FLIGHT SIMULATORS) 0.3$ 27.1$ 9456.2%
5 750210 ‐ NICKEL ‐ UNWROUGHT, NOT ALLOYED 38.1$ 25.8$ ‐32.1%
6 843143 ‐ PARTS OF BORING OR SINKING MACHINERY 29.4$ 20.3$ ‐30.9%
7 902790 ‐ MICROTOMES; PARTS AND ACCESSORIES OF INSTRUMENTS 19.2$ 19.3$ 0.2%
8 810520 ‐ COBALT ‐ UNWROUGHT, MATTES AND INTERMEDIATE 28.0$ 17.4$ ‐37.8%
9 230990 ‐ ANIMAL FEED PREPARATIONS 19.8$ 15.6$ ‐21.1%
10 390110 ‐ POLYETHYLENE ‐ SPECIFIC GRAVITY OF LESS THAN 0.94 7.4$ 13.2$ 78.5%
318.0$ 343.1$ 7.9%
347.0$ 325.0$ ‐6.4%
665.0$ 668.1$ 0.5%
Sub‐total
Others
Total (All Products)
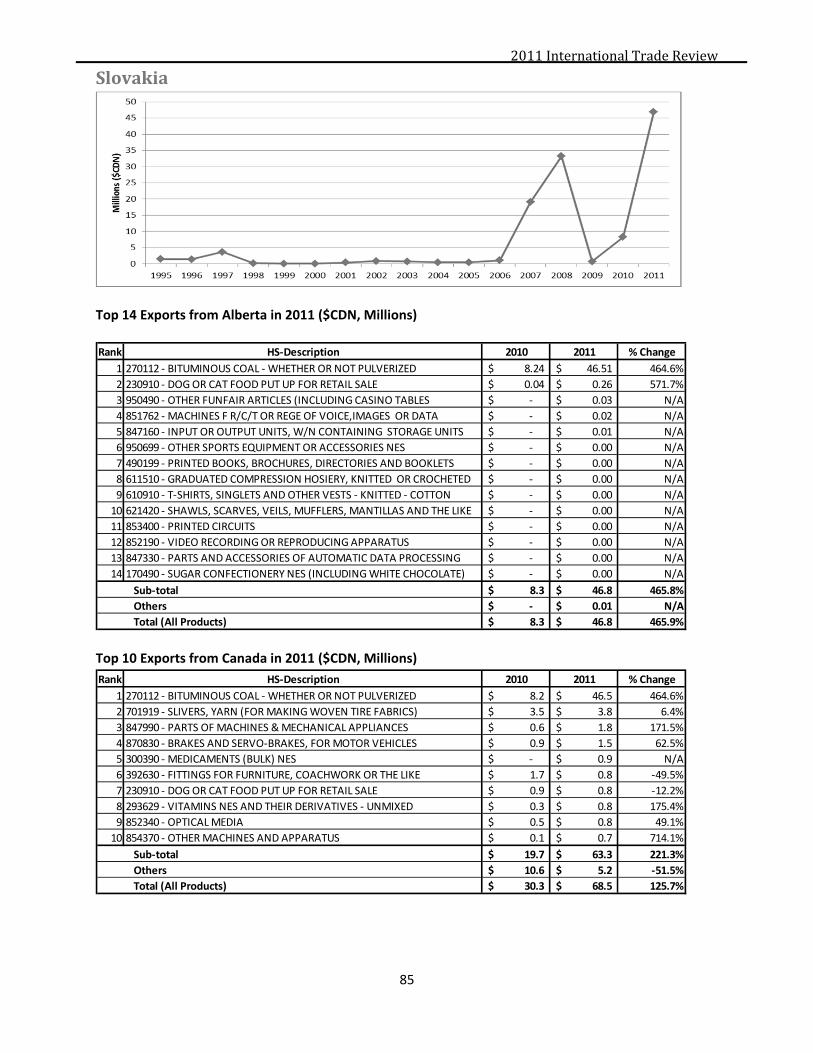
2011InternationalTradeReview
85
Slovakia
Top 14 Exports from Alberta in 2011 ($CDN, Millions)
Top 10 Exports from Canada in 2011 ($CDN, Millions)
Rank HS‐Description 2010 2011 % Change
1 270112 ‐ BITUMINOUS COAL ‐ WHETHER OR NOT PULVERIZED 8.24$ 46.51$ 464.6%
2 230910 ‐ DOG OR CAT FOOD PUT UP FOR RETAIL SALE 0.04$ 0.26$ 571.7%
3 950490 ‐ OTHER FUNFAIR ARTICLES (INCLUDING CASINO TABLES ‐$ 0.03$ N/A
4 851762 ‐ MACHINES F R/C/T OR REGE OF VOICE,IMAGES OR DATA ‐$ 0.02$ N/A
5 847160 ‐ INPUT OR OUTPUT UNITS, W/N CONTAINING STORAGE UNITS ‐$ 0.01$ N/A
6 950699 ‐ OTHER SPORTS EQUIPMENT OR ACCESSORIES NES ‐$ 0.00$ N/A
7 490199 ‐ PRINTED BOOKS, BROCHURES, DIRECTORIES AND BOOKLETS ‐$ 0.00$ N/A
8 611510 ‐ GRADUATED COMPRESSION HOSIERY, KNITTED OR CROCHETED ‐$ 0.00$ N/A
9 610910 ‐ T‐SHIRTS, SINGLETS AND OTHER VESTS ‐ KNITTED ‐ COTTON ‐$ 0.00$ N/A
10 621420 ‐ SHAWLS, SCARVES, VEILS, MUFFLERS, MANTILLAS AND THE LIKE ‐$ 0.00$ N/A
11 853400 ‐ PRINTED CIRCUITS ‐$ 0.00$ N/A
12 852190 ‐ VIDEO RECORDING OR REPRODUCING APPARATUS ‐$ 0.00$ N/A
13 847330 ‐ PARTS AND ACCESSORIES OF AUTOMATIC DATA PROCESSING ‐$ 0.00$ N/A
14 170490 ‐ SUGAR CONFECTIONERY NES (INCLUDING WHITE CHOCOLATE) ‐$ 0.00$ N/A
8.3$ 46.8$ 465.8%
‐$ 0.01$ N/A
8.3$ 46.8$ 465.9%
Sub‐total
Others
Total (All Products)
Rank HS‐Description 2010 2011 % Change
1 270112 ‐ BITUMINOUS COAL ‐ WHETHER OR NOT PULVERIZED 8.2$ 46.5$ 464.6%
2 701919 ‐ SLIVERS, YARN (FOR MAKING WOVEN TIRE FABRICS) 3.5$ 3.8$ 6.4%
3 847990 ‐ PARTS OF MACHINES & MECHANICAL APPLIANCES 0.6$ 1.8$ 171.5%
4 870830 ‐ BRAKES AND SERVO‐BRAKES, FOR MOTOR VEHICLES 0.9$ 1.5$ 62.5%
5 300390 ‐ MEDICAMENTS (BULK) NES ‐$ 0.9$ N/A
6 392630 ‐ FITTINGS FOR FURNITURE, COACHWORK OR THE LIKE 1.7$ 0.8$ ‐49.5%
7 230910 ‐ DOG OR CAT FOOD PUT UP FOR RETAIL SALE 0.9$ 0.8$ ‐12.2%
8 293629 ‐ VITAMINS NES AND THEIR DERIVATIVES ‐ UNMIXED 0.3$ 0.8$ 175.4%
9 852340 ‐ OPTICAL MEDIA 0.5$ 0.8$ 49.1%
10 854370 ‐ OTHER MACHINES AND APPARATUS 0.1$ 0.7$ 714.1%
19.7$ 63.3$ 221.3%
10.6$ 5.2$ ‐51.5%
30.3$ 68.5$ 125.7%
Sub‐total
Others
Total (All Products)

2011InternationalTradeReview
86
SouthAfrica
Top 20 Exports from Alberta in 2011 ($CDN, Millions)
Top 10 Exports from Canada in 2011 ($CDN, Millions)
Rank HS‐Description 2010 2011 % Change
1 250300 ‐ SULFUR OF ALL KINDS 22.3$ 53.9$ 141.3%
2 110710 ‐ MALT ‐ NOT ROASTED 6.5$ 12.7$ 95.0%
3 100300 ‐ BARLEY 1.7$ 5.4$ 218.4%
4 220720 ‐ ETHYL ALCOHOL AND OTHER SPIRITS ‐ DENATURED 3.7$ 3.6$ ‐4.8%
5 853610 ‐ ELECTRICAL FUSES ‐ FOR SWITCHING ,PROTECTING ‐$ 2.1$ N/A
6 731511 ‐ ROLLER CHAIN ‐ IRON OR STEEL ‐$ 0.7$ N/A
7 843149 ‐ PARTS OF CRANES, WORK‐TRUCKS, SHOVELS 0.2$ 0.5$ 235.1%
8 871639 ‐ OTHER TRAILERS FOR THE TRANSPORT OF GOODS ‐$ 0.5$ N/A
9 847989 ‐ MACHINES & MECHANICAL APPLIANCES 0.1$ 0.5$ 667.8%
10 846630 ‐ DIVIDING HEADS AND OTHER SPECIAL ATTACHMENTS 0.7$ 0.4$ ‐40.3%
11 848350 ‐ FLYWHEELS AND PULLEYS (INCLUDING PULLEY BLOCKS) 0.0$ 0.4$ 99969.7%
12 842920 ‐ GRADERS AND LEVELERS‐ SELF‐PROPELLED 0.1$ 0.3$ 175.0%
13 020500 ‐ HORSE, ASS, MULE OR HINNY MEAT ‐ FRESH, CHILLED OR FROZEN 0.2$ 0.3$ 88.6%
14 271019 ‐ PETROLEUM OILS AND OILS FROM BITUMINOUS MINERALS 0.1$ 0.3$ 98.5%
15 854449 ‐ ELECTRIC CONDUCTORS, FOR A VOLTAGE NOT EXCEEDING 0.1$ 0.2$ 74.3%
16 020714 ‐ CUTS AND EDIBLE OFFALS (INCL LIVERS) OF FOWLS 0.3$ 0.2$ ‐25.3%
17 020329 ‐ SWINE, CUTS BONELESS ‐ FROZEN 0.8$ 0.2$ ‐72.8%
18 020713 ‐ CUTS AND EDIBLE OFFALS OF FOWLS OF 'GALLUS DOMESTICUS' 0.1$ 0.2$ 160.4%
19 740400 ‐ COPPER WASTE AND SCRAP ‐$ 0.2$ N/A
20 852691 ‐ RADIO NAVIGATIONAL AID APPARATUS 0.2$ 0.2$ ‐27.4%
53.1$ 109.5$ 106.5%
7.4$ 2.6$ ‐65.5%
60.5$ 112.1$ 85.3%
Sub‐total
Others
Total (All Products)
Rank HS‐Description 2010 2011 % Change
1 250300 ‐ SULFUR OF ALL KINDS 22.3$ 53.9$ 141.3%
2 300490 ‐ MEDICAMENTS NES ‐ IN DOSAGE 5.7$ 42.7$ 651.3%
3 280200 ‐ SULFUR (SUBLIMED, PRECIPITATED OR COLLOIDAL) 13.7$ 42.2$ 207.7%
4 871000 ‐ TANKS AND OTHER MOTORIZED ARMOURED FIGHTING VEHICLES 5.3$ 32.7$ 511.9%
5 110710 ‐ MALT ‐ NOT ROASTED 14.9$ 26.3$ 76.3%
6 843143 ‐ PARTS OF BORING OR SINKING MACHINERY 12.9$ 22.6$ 75.1%
7 100300 ‐ BARLEY 7.5$ 13.9$ 85.0%
8 020714 ‐ CUTS AND EDIBLE OFFALS (INCL LIVERS) OF FOWLS 16.1$ 13.6$ ‐15.9%
9 210690 ‐ FOOD PREPARATIONS NES 8.7$ 12.1$ 38.3%
10 820719 ‐ ROCK DRILLING OR EARTH BORING TOOLS 6.9$ 10.5$ 53.3%
226.3$ 422.8$ 86.8%
208.9$ 209.8$ 0.5%
435.2$ 632.6$ 45.4%
Sub‐total
Others
Total (All Products)
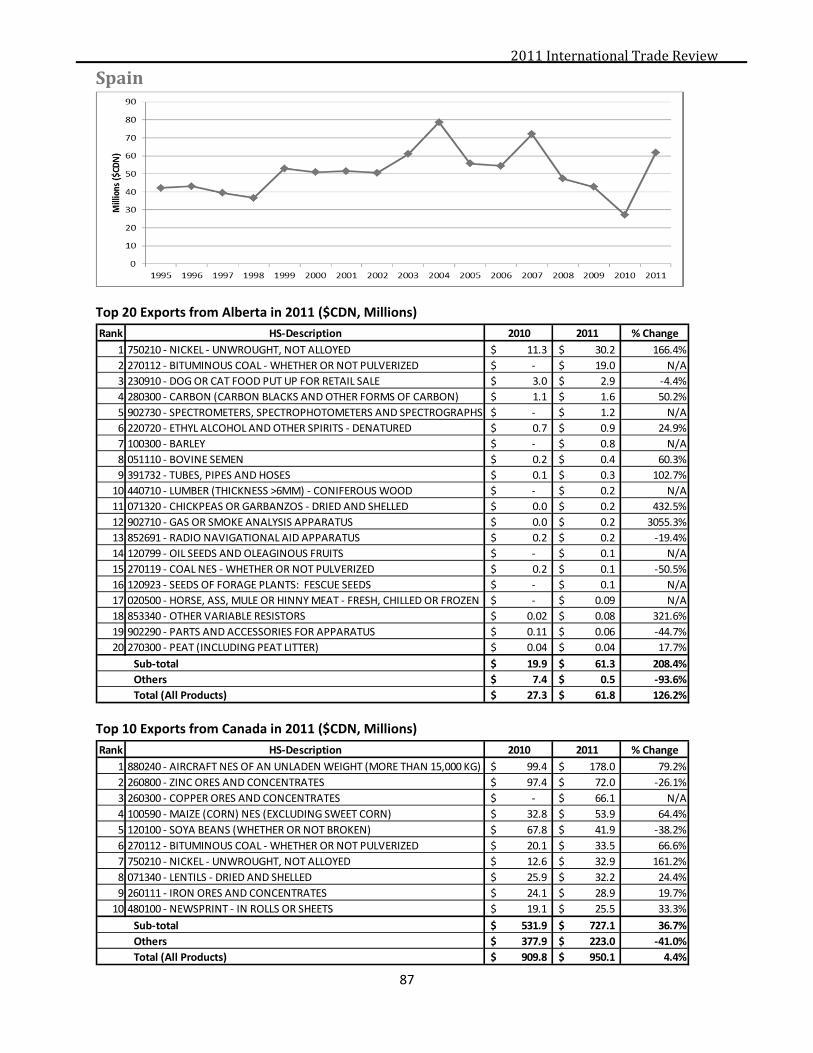
2011InternationalTradeReview
87
Spain
Top 20 Exports from Alberta in 2011 ($CDN, Millions)
Top 10 Exports from Canada in 2011 ($CDN, Millions)
Rank HS‐Description 2010 2011 % Change
1 750210 ‐ NICKEL ‐ UNWROUGHT, NOT ALLOYED 11.3$ 30.2$ 166.4%
2 270112 ‐ BITUMINOUS COAL ‐ WHETHER OR NOT PULVERIZED ‐$ 19.0$ N/A
3 230910 ‐ DOG OR CAT FOOD PUT UP FOR RETAIL SALE 3.0$ 2.9$ ‐4.4%
4 280300 ‐ CARBON (CARBON BLACKS AND OTHER FORMS OF CARBON) 1.1$ 1.6$ 50.2%
5 902730 ‐ SPECTROMETERS, SPECTROPHOTOMETERS AND SPECTROGRAPHS ‐$ 1.2$ N/A
6 220720 ‐ ETHYL ALCOHOL AND OTHER SPIRITS ‐ DENATURED 0.7$ 0.9$ 24.9%
7 100300 ‐ BARLEY ‐$ 0.8$ N/A
8 051110 ‐ BOVINE SEMEN 0.2$ 0.4$ 60.3%
9 391732 ‐ TUBES, PIPES AND HOSES 0.1$ 0.3$ 102.7%
10 440710 ‐ LUMBER (THICKNESS >6MM) ‐ CONIFEROUS WOOD ‐$ 0.2$ N/A
11 071320 ‐ CHICKPEAS OR GARBANZOS ‐ DRIED AND SHELLED 0.0$ 0.2$ 432.5%
12 902710 ‐ GAS OR SMOKE ANALYSIS APPARATUS 0.0$ 0.2$ 3055.3%
13 852691 ‐ RADIO NAVIGATIONAL AID APPARATUS 0.2$ 0.2$ ‐19.4%
14 120799 ‐ OIL SEEDS AND OLEAGINOUS FRUITS ‐$ 0.1$ N/A
15 270119 ‐ COAL NES ‐ WHETHER OR NOT PULVERIZED 0.2$ 0.1$ ‐50.5%
16 120923 ‐ SEEDS OF FORAGE PLANTS: FESCUE SEEDS ‐$ 0.1$ N/A
17 020500 ‐ HORSE, ASS, MULE OR HINNY MEAT ‐ FRESH, CHILLED OR FROZEN ‐$ 0.09$ N/A
18 853340 ‐ OTHER VARIABLE RESISTORS 0.02$ 0.08$ 321.6%
19 902290 ‐ PARTS AND ACCESSORIES FOR APPARATUS 0.11$ 0.06$ ‐44.7%
20 270300 ‐ PEAT (INCLUDING PEAT LITTER) 0.04$ 0.04$ 17.7%
19.9$ 61.3$ 208.4%
7.4$ 0.5$ ‐93.6%
27.3$ 61.8$ 126.2%
Sub‐total
Others
Total (All Products)
Rank HS‐Description 2010 2011 % Change
1 880240 ‐ AIRCRAFT NES OF AN UNLADEN WEIGHT (MORE THAN 15,000 KG) 99.4$ 178.0$ 79.2%
2 260800 ‐ ZINC ORES AND CONCENTRATES 97.4$ 72.0$ ‐26.1%
3 260300 ‐ COPPER ORES AND CONCENTRATES ‐$ 66.1$ N/A
4 100590 ‐ MAIZE (CORN) NES (EXCLUDING SWEET CORN) 32.8$ 53.9$ 64.4%
5 120100 ‐ SOYA BEANS (WHETHER OR NOT BROKEN) 67.8$ 41.9$ ‐38.2%
6 270112 ‐ BITUMINOUS COAL ‐ WHETHER OR NOT PULVERIZED 20.1$ 33.5$ 66.6%
7 750210 ‐ NICKEL ‐ UNWROUGHT, NOT ALLOYED 12.6$ 32.9$ 161.2%
8 071340 ‐ LENTILS ‐ DRIED AND SHELLED 25.9$ 32.2$ 24.4%
9 260111 ‐ IRON ORES AND CONCENTRATES 24.1$ 28.9$ 19.7%
10 480100 ‐ NEWSPRINT ‐ IN ROLLS OR SHEETS 19.1$ 25.5$ 33.3%
531.9$ 727.1$ 36.7%
377.9$ 223.0$ ‐41.0%
909.8$ 950.1$ 4.4%
Sub‐total
Others
Total (All Products)

2011InternationalTradeReview
88
SriLanka
Top 20 Exports from Edmonton in 2011 ($CDN, Millions)
Top 10 Exports from Canada in 2011 ($CDN, Millions)
Rank HS‐Description 2010 2011 % Change
1 100110 ‐ DURUM WHEAT 2.40$ 2.10$ ‐12.5%
2 390190 ‐ POLYMERS OF ETHYLENE NES, IN PRIMARY FORMS 1.90$ 1.46$ ‐23.2%
3 841181 ‐ GAS TURBINES NES ‐ POWER NOT EXCEEDING 5.000 KW ‐$ 0.09$ N/A
4 090920 ‐ CORIANDER SEEDS ‐$ 0.05$ N/A
5 844314 ‐ LETTERPRESS PRINTING MACHINERY, REEL FED, ‐$ 0.03$ N/A
6 950490 ‐ OTHER FUNFAIR ARTICLES ‐$ 0.02$ N/A
7 903180 ‐ OTHER MEASURING OR CHECKING INSTRUMENTS, APPLIANCES ‐$ 0.01$ N/A
8 051110 ‐ BOVINE SEMEN ‐$ 0.01$ N/A
9 851981 ‐ O SOUND RECORDING/REPRODUCING APP,USING MAGNETIC ‐$ 0.01$ N/A
10 521211 ‐ COTTON (<85%) FABRICS NES ‐ UNBLEACHED ‐ <200 G/M2 ‐$ 0.01$ N/A
11 880330 ‐ PARTS OF AIRPLANES OR HELICOPTERS NES ‐$ 0.01$ N/A
12 730799 ‐ OTHER PIPE OR TUBE FITTINGS ‐ IRON OR STEEL NES ‐$ 0.01$ N/A
13 410441 ‐ BOVINE AND EQUINE LEATHER, DEHAIRED, IN DRY STATE (CRUST) 0.00$ 0.01$ 375.9%
14 750890 ‐ NICKEL ‐ OTHER ARTICLES NES 0.01$ 0.01$ 0.0%
15 960719 ‐ SLIDE FASTENERS ‐ NOT FITTED WITH CHAIN SCOOPS 0.00$ 0.00$ 996.8%
16 870899 ‐ MOTOR VEHICLE PARTS, NES ‐$ 0.00$ N/A
17 843143 ‐ PARTS OF BORING OR SINKING MACHINERY ‐$ 0.00$ N/A
18 850680 ‐ PRIMARY CELLS AND BATTERIES ‐ OTHER NES ‐$ 0.00$ N/A
19 847989 ‐ MACHINES & MECHANICAL APPLIANCES ‐$ 0.00$ N/A
20 853120 ‐ INDICATOR PANELS INCORPORATING LIQUID CRYSTAL DEVICES ‐$ 0.00$ N/A
85.8$ 96.5$ 12.6%
0.4$ 0.0$ ‐98.4%
86.1$ 96.5$ 12.1%
Sub‐total
Others
Total (All Products)
Rank HS‐Description 2010 2011 % Change
1 071340 ‐ LENTILS ‐ DRIED AND SHELLED 60.7$ 23.8$ ‐60.7%
2 100110 ‐ DURUM WHEAT 13.8$ 14.6$ 5.4%
3 854290 ‐ PARTS OF ELECTRONIC INTEGRATED CIRCUITS 2.0$ 2.9$ 44.6%
4 390190 ‐ POLYMERS OF ETHYLENE NES, IN PRIMARY FORMS 2.0$ 1.5$ ‐27.4%
5 252490 ‐ ASBESTOS, O/T CROCIDOLITE 4.5$ 1.3$ ‐71.8%
6 090920 ‐ CORIANDER SEEDS 0.6$ 1.2$ 97.8%
7 480100 ‐ NEWSPRINT ‐ IN ROLLS OR SHEETS 1.2$ 1.0$ ‐9.9%
8 820240 ‐ CHAIN SAW BLADES 0.8$ 1.0$ 22.2%
9 630900 ‐ WORN CLOTHING AND OTHER WORN TEXTILE ARTICLES 0.7$ 0.9$ 28.8%
10 040410 ‐ WHEY 1.0$ 0.8$ ‐16.0%
338.4$ 294.8$ ‐12.9%
7.8$ 5.8$ ‐25.9%
346.3$ 300.6$ ‐13.2%
Sub‐total
Others
Total (All Products)

2011InternationalTradeReview
89
Sudan
Top 20 Exports from Alberta in 2011 ($CDN, Millions)
Top 10 Exports from Canada in 2011 ($CDN, Millions)
Rank HS‐Description 2010 2011 % Change
1 721590 ‐ BARS AND RODS ‐ IRON/NON‐ALLOY STEEL ‐ OTHER NES ‐$ 0.68$ N/A
2 732690 ‐ OTHER ARTICLES (EXCLUDING WIRE) NES ‐ IRON OR STEEL 0.10$ 0.42$ 342.8%
3 842951 ‐ MECHANICAL FRONT END SHOVEL LOADERS ‐$ 0.17$ N/A
4 853720 ‐ BOARDS AND PANELS(INCLUDING NUMERICAL CONTROL PANELS) ‐$ 0.09$ N/A
5 848180 ‐ TAPS, COCKS, VALVES AND OTHER SIMILAR APPLIANCES, NES 0.87$ 0.07$ ‐91.9%
6 848190 ‐ PARTS OF TAPS, COCKS, VALVES OR OTHER SIMILAR APPLIANCES 0.05$ 0.07$ 43.3%
7 902780 ‐ INSTRUMENTS AND APPARATUS FOR PHYSICAL OR CHEMICAL ‐$ 0.06$ N/A
8 051110 ‐ BOVINE SEMEN 0.06$ 0.04$ ‐33.5%
9 401693 ‐ GASKETS, WASHERS AND OTHER SEALS OF VULCANIZED RUBBER 0.03$ 0.04$ 48.3%
10 842890 ‐ LIFTING, HANDLING, LOADING OR UNLOADING MACHINERY 0.02$ 0.04$ 104.2%
11 730791 ‐ FLANGES ‐ IRON OR STEEL NES 0.00$ 0.03$ 1706.5%
12 843143 ‐ PARTS OF BORING OR SINKING MACHINERY 0.11$ 0.03$ ‐73.2%
13 847990 ‐ PARTS OF MACHINES & MECHANICAL APPLIANCES 0.00$ 0.02$ 513.6%
14 848410 ‐ GASKETS AND SIMILAR JOINTS OF METAL SHEETING COMBINED 0.01$ 0.02$ 108.0%
15 731815 ‐ OTHER BOLTS OR SCREWS ‐ IRON OR STEEL 0.00$ 0.01$ 144.8%
16 730799 ‐ OTHER PIPE OR TUBE FITTINGS ‐ IRON OR STEEL NES 0.00$ 0.01$ 306.1%
17 903180 ‐ OTHER MEASURING OR CHECKING INSTRUMENTS, APPLIANCES 0.05$ 0.01$ ‐86.6%
18 903084 ‐ INSTRUMENTS AND APPARATUS (WITH RECORDING DEVICE) ‐$ 0.01$ N/A
19 731816 ‐ NUTS ‐ IRON OR STEEL 0.00$ 0.01$ 29.6%
20 844332 ‐ OTHER PRINTING MACHINES, CAPABLE OF CONNECTING ‐$ 0.00$ N/A
32.3$ 49.4$ 53.1%
2.7$ 0.0$ ‐99.9%
35.0$ 49.4$ 41.3%
Sub‐total
Others
Total (All Products)
Rank HS‐Description 2010 2011 % Change
1 490700 ‐ UNUSED POSTAGE, REVENUE STAMPS, CHEQUE FORMS ‐$ 3.8$ N/A
2 040210 ‐ MILK/CREAM POWDER (<1.6% FAT) ‐$ 2.1$ N/A
3 071310 ‐ PEAS ‐ DRIED AND SHELLED 3.3$ 0.9$ ‐71.8%
4 852910 ‐ AERIALS AND AERIAL REFLECTORS OF ALL KINDS 0.3$ 0.8$ 220.0%
5 721590 ‐ BARS AND RODS ‐ IRON/NON‐ALLOY STEEL ‐ OTHER NES ‐$ 0.7$ N/A
6 852550 ‐ TRANSMISSION APPARATUS FOR RADIO 0.4$ 0.7$ 83.7%
7 040221 ‐ MILK/CREAM POWDER UNSWEETENED (>1.5% FAT) ‐$ 0.6$ N/A
8 071340 ‐ LENTILS ‐ DRIED AND SHELLED 3.5$ 0.4$ ‐87.3%
9 732690 ‐ OTHER ARTICLES (EXCLUDING WIRE) NES ‐ IRON OR STEEL 0.1$ 0.4$ 325.2%
10 852990 ‐ PARTS FOR APPARATUS OF HEADINGS 85.25 TO 85.28 ‐$ 0.3$ N/A
103.0$ 135.9$ 31.9%
13.7$ 1.6$ ‐88.6%
116.7$ 137.5$ 17.8%
Sub‐total
Others
Total (All Products)
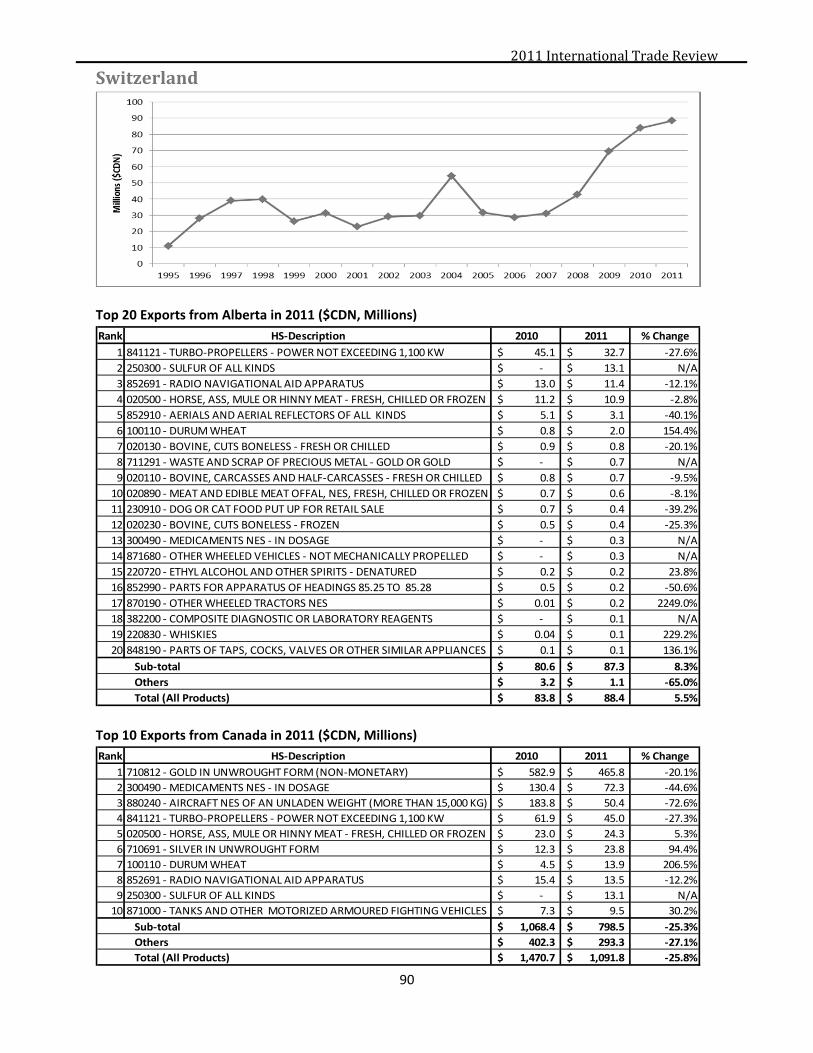
2011InternationalTradeReview
90
Switzerland
Top 20 Exports from Alberta in 2011 ($CDN, Millions)
Top 10 Exports from Canada in 2011 ($CDN, Millions)
Rank HS‐Description 2010 2011 % Change
1 841121 ‐ TURBO‐PROPELLERS ‐ POWER NOT EXCEEDING 1,100 KW 45.1$ 32.7$ ‐27.6%
2 250300 ‐ SULFUR OF ALL KINDS ‐$ 13.1$ N/A
3 852691 ‐ RADIO NAVIGATIONAL AID APPARATUS 13.0$ 11.4$ ‐12.1%
4 020500 ‐ HORSE, ASS, MULE OR HINNY MEAT ‐ FRESH, CHILLED OR FROZEN 11.2$ 10.9$ ‐2.8%
5 852910 ‐ AERIALS AND AERIAL REFLECTORS OF ALL KINDS 5.1$ 3.1$ ‐40.1%
6 100110 ‐ DURUM WHEAT 0.8$ 2.0$ 154.4%
7 020130 ‐ BOVINE, CUTS BONELESS ‐ FRESH OR CHILLED 0.9$ 0.8$ ‐20.1%
8 711291 ‐ WASTE AND SCRAP OF PRECIOUS METAL ‐ GOLD OR GOLD ‐$ 0.7$ N/A
9 020110 ‐ BOVINE, CARCASSES AND HALF‐CARCASSES ‐ FRESH OR CHILLED 0.8$ 0.7$ ‐9.5%
10 020890 ‐ MEAT AND EDIBLE MEAT OFFAL, NES, FRESH, CHILLED OR FROZEN 0.7$ 0.6$ ‐8.1%
11 230910 ‐ DOG OR CAT FOOD PUT UP FOR RETAIL SALE 0.7$ 0.4$ ‐39.2%
12 020230 ‐ BOVINE, CUTS BONELESS ‐ FROZEN 0.5$ 0.4$ ‐25.3%
13 300490 ‐ MEDICAMENTS NES ‐ IN DOSAGE ‐$ 0.3$ N/A
14 871680 ‐ OTHER WHEELED VEHICLES ‐ NOT MECHANICALLY PROPELLED ‐$ 0.3$ N/A
15 220720 ‐ ETHYL ALCOHOL AND OTHER SPIRITS ‐ DENATURED 0.2$ 0.2$ 23.8%
16 852990 ‐ PARTS FOR APPARATUS OF HEADINGS 85.25 TO 85.28 0.5$ 0.2$ ‐50.6%
17 870190 ‐ OTHER WHEELED TRACTORS NES 0.01$ 0.2$ 2249.0%
18 382200 ‐ COMPOSITE DIAGNOSTIC OR LABORATORY REAGENTS ‐$ 0.1$ N/A
19 220830 ‐ WHISKIES 0.04$ 0.1$ 229.2%
20 848190 ‐ PARTS OF TAPS, COCKS, VALVES OR OTHER SIMILAR APPLIANCES 0.1$ 0.1$ 136.1%
80.6$ 87.3$ 8.3%
3.2$ 1.1$ ‐65.0%
83.8$ 88.4$ 5.5%
Sub‐total
Others
Total (All Products)
Rank HS‐Description 2010 2011 % Change
1 710812 ‐ GOLD IN UNWROUGHT FORM (NON‐MONETARY) 582.9$ 465.8$ ‐20.1%
2 300490 ‐ MEDICAMENTS NES ‐ IN DOSAGE 130.4$ 72.3$ ‐44.6%
3 880240 ‐ AIRCRAFT NES OF AN UNLADEN WEIGHT (MORE THAN 15,000 KG) 183.8$ 50.4$ ‐72.6%
4 841121 ‐ TURBO‐PROPELLERS ‐ POWER NOT EXCEEDING 1,100 KW 61.9$ 45.0$ ‐27.3%
5 020500 ‐ HORSE, ASS, MULE OR HINNY MEAT ‐ FRESH, CHILLED OR FROZEN 23.0$ 24.3$ 5.3%
6 710691 ‐ SILVER IN UNWROUGHT FORM 12.3$ 23.8$ 94.4%
7 100110 ‐ DURUM WHEAT 4.5$ 13.9$ 206.5%
8 852691 ‐ RADIO NAVIGATIONAL AID APPARATUS 15.4$ 13.5$ ‐12.2%
9 250300 ‐ SULFUR OF ALL KINDS ‐$ 13.1$ N/A
10 871000 ‐ TANKS AND OTHER MOTORIZED ARMOURED FIGHTING VEHICLES 7.3$ 9.5$ 30.2%
1,068.4$ 798.5$ ‐25.3%
402.3$ 293.3$ ‐27.1%
1,470.7$ 1,091.8$ ‐25.8%
Sub‐total
Others
Total (All Products)
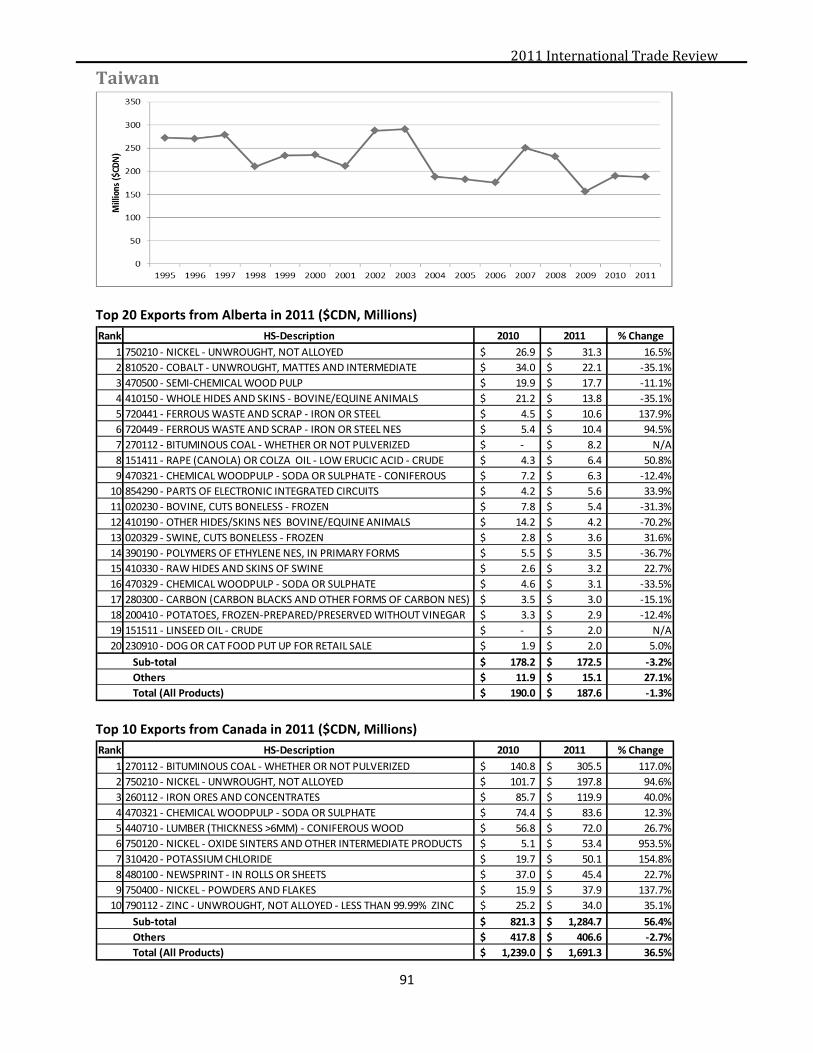
2011InternationalTradeReview
91
Taiwan
Top 20 Exports from Alberta in 2011 ($CDN, Millions)
Top 10 Exports from Canada in 2011 ($CDN, Millions)
Rank HS‐Description 2010 2011 % Change
1 750210 ‐ NICKEL ‐ UNWROUGHT, NOT ALLOYED 26.9$ 31.3$ 16.5%
2 810520 ‐ COBALT ‐ UNWROUGHT, MATTES AND INTERMEDIATE 34.0$ 22.1$ ‐35.1%
3 470500 ‐ SEMI‐CHEMICAL WOOD PULP 19.9$ 17.7$ ‐11.1%
4 410150 ‐ WHOLE HIDES AND SKINS ‐ BOVINE/EQUINE ANIMALS 21.2$ 13.8$ ‐35.1%
5 720441 ‐ FERROUS WASTE AND SCRAP ‐ IRON OR STEEL 4.5$ 10.6$ 137.9%
6 720449 ‐ FERROUS WASTE AND SCRAP ‐ IRON OR STEEL NES 5.4$ 10.4$ 94.5%
7 270112 ‐ BITUMINOUS COAL ‐ WHETHER OR NOT PULVERIZED ‐$ 8.2$ N/A
8 151411 ‐ RAPE (CANOLA) OR COLZA OIL ‐ LOW ERUCIC ACID ‐ CRUDE 4.3$ 6.4$ 50.8%
9 470321 ‐ CHEMICAL WOODPULP ‐ SODA OR SULPHATE ‐ CONIFEROUS 7.2$ 6.3$ ‐12.4%
10 854290 ‐ PARTS OF ELECTRONIC INTEGRATED CIRCUITS 4.2$ 5.6$ 33.9%
11 020230 ‐ BOVINE, CUTS BONELESS ‐ FROZEN 7.8$ 5.4$ ‐31.3%
12 410190 ‐ OTHER HIDES/SKINS NES BOVINE/EQUINE ANIMALS 14.2$ 4.2$ ‐70.2%
13 020329 ‐ SWINE, CUTS BONELESS ‐ FROZEN 2.8$ 3.6$ 31.6%
14 390190 ‐ POLYMERS OF ETHYLENE NES, IN PRIMARY FORMS 5.5$ 3.5$ ‐36.7%
15 410330 ‐ RAW HIDES AND SKINS OF SWINE 2.6$ 3.2$ 22.7%
16 470329 ‐ CHEMICAL WOODPULP ‐ SODA OR SULPHATE 4.6$ 3.1$ ‐33.5%
17 280300 ‐ CARBON (CARBON BLACKS AND OTHER FORMS OF CARBON NES) 3.5$ 3.0$ ‐15.1%
18 200410 ‐ POTATOES, FROZEN‐PREPARED/PRESERVED WITHOUT VINEGAR 3.3$ 2.9$ ‐12.4%
19 151511 ‐ LINSEED OIL ‐ CRUDE ‐$ 2.0$ N/A
20 230910 ‐ DOG OR CAT FOOD PUT UP FOR RETAIL SALE 1.9$ 2.0$ 5.0%
178.2$ 172.5$ ‐3.2%
11.9$ 15.1$ 27.1%
190.0$ 187.6$ ‐1.3%
Sub‐total
Others
Total (All Products)
Rank HS‐Description 2010 2011 % Change
1 270112 ‐ BITUMINOUS COAL ‐ WHETHER OR NOT PULVERIZED 140.8$ 305.5$ 117.0%
2 750210 ‐ NICKEL ‐ UNWROUGHT, NOT ALLOYED 101.7$ 197.8$ 94.6%
3 260112 ‐ IRON ORES AND CONCENTRATES 85.7$ 119.9$ 40.0%
4 470321 ‐ CHEMICAL WOODPULP ‐ SODA OR SULPHATE 74.4$ 83.6$ 12.3%
5 440710 ‐ LUMBER (THICKNESS >6MM) ‐ CONIFEROUS WOOD 56.8$ 72.0$ 26.7%
6 750120 ‐ NICKEL ‐ OXIDE SINTERS AND OTHER INTERMEDIATE PRODUCTS 5.1$ 53.4$ 953.5%
7 310420 ‐ POTASSIUM CHLORIDE 19.7$ 50.1$ 154.8%
8 480100 ‐ NEWSPRINT ‐ IN ROLLS OR SHEETS 37.0$ 45.4$ 22.7%
9 750400 ‐ NICKEL ‐ POWDERS AND FLAKES 15.9$ 37.9$ 137.7%
10 790112 ‐ ZINC ‐ UNWROUGHT, NOT ALLOYED ‐ LESS THAN 99.99% ZINC 25.2$ 34.0$ 35.1%
821.3$ 1,284.7$ 56.4%
417.8$ 406.6$ ‐2.7%
1,239.0$ 1,691.3$ 36.5%
Sub‐total
Others
Total (All Products)

2011InternationalTradeReview
92
Thailand
Top 20 Exports from Alberta in 2011 ($CDN, Millions)
Top 10 Exports from Canada in 2011 ($CDN, Millions)
Rank HS‐Description 2010 2011 % Change
1 470321 ‐ CHEMICAL WOODPULP ‐ SODA OR SULPHATE ‐ CONIFEROUS 14.6$ 9.7$ ‐33.2%
2 848180 ‐ TAPS, COCKS, VALVES AND OTHER SIMILAR APPLIANCES 3.1$ 3.8$ 24.9%
3 853650 ‐ OTHER ELECTRICAL SWITCHES NES 14.0$ 3.7$ ‐73.8%
4 390190 ‐ POLYMERS OF ETHYLENE NES, IN PRIMARY FORMS 2.7$ 3.0$ 8.5%
5 841350 ‐ RECIPROCATING POSITIVE DISPLACEMENT PUMPS NES ‐$ 1.6$ N/A
6 120750 ‐ MUSTARD SEEDS (WHETHER OR NOT BROKEN) 0.5$ 1.5$ 184.1%
7 732690 ‐ OTHER ARTICLES (EXCLUDING WIRE) NES ‐ IRON OR STEEL 0.4$ 1.4$ 232.1%
8 410150 ‐ WHOLE HIDES AND SKINS ‐ BOVINE/EQUINE ANIMALS 1.6$ 1.4$ ‐10.2%
9 850300 ‐ PARTS FOR ELECTRIC MOTORS, GENERATORS 1.7$ 1.2$ ‐30.8%
10 850239 ‐ ELECTRIC GENERATING SETS ‐ OTHER THAN WIND‐POWERED 2.0$ 1.0$ ‐47.7%
11 843143 ‐ PARTS OF BORING OR SINKING MACHINERY 1.1$ 1.0$ ‐11.8%
12 280300 ‐ CARBON (CARBON BLACKS AND OTHER FORMS OF CARBON NES) 1.1$ 0.9$ ‐19.6%
13 720429 ‐ FERROUS WASTE AND SCRAP ‐ OF ALLOY STEEL ‐$ 0.8$ N/A
14 720421 ‐ FERROUS WASTE AND SCRAP ‐ OF STAINLESS STEEL ‐$ 0.7$ N/A
15 841290 ‐ PARTS OF HYDRAULIC, PNEUMATIC AND OTHER POWER ENGINES 0.55$ 0.6$ 0.2%
16 841391 ‐ PARTS OF PUMPS FOR LIQUIDS 0.02$ 0.5$ 2344.8%
17 750400 ‐ NICKEL ‐ POWDERS AND FLAKES 0.24$ 0.5$ 105.2%
18 820719 ‐ ROCK DRILLING OR EARTH BORING TOOLS 0.70$ 0.4$ ‐42.8%
19 848210 ‐ BALL BEARINGS (FOR AUTOMOTIVE AND OTHER USES) 0.09$ 0.4$ 352.4%
20 071310 ‐ PEAS ‐ DRIED AND SHELLED 0.37$ 0.3$ ‐10.3%
56.4$ 80.9$ 43.3%
8.8$ 3.8$ ‐57.0%
65.2$ 84.6$ 29.8%
Sub‐total
Others
Total (All Products)
Rank HS‐Description 2010 2011 % Change
1 310420 ‐ POTASSIUM CHLORIDE 86.2$ 115.8$ 34.5%
2 710812 ‐ GOLD IN UNWROUGHT FORM (NON‐MONETARY) 37.3$ 66.0$ 77.1%
3 470321 ‐ CHEMICAL WOODPULP ‐ SODA OR SULPHATE 44.0$ 38.0$ ‐13.7%
4 470200 ‐ CHEMICAL WOODPULP ‐ DISSOLVING GRADES 0.2$ 30.7$ 12538.9%
5 470500 ‐ SEMI‐CHEMICAL WOOD PULP 60.9$ 30.2$ ‐50.4%
6 470311 ‐ CHEMICAL WOODPULP ‐ SODA OR SULPHATE 28.9$ 26.6$ ‐7.8%
7 750210 ‐ NICKEL ‐ UNWROUGHT, NOT ALLOYED 5.7$ 24.1$ 323.3%
8 854129 ‐ TRANSISTORS ‐ OTHER THAN PHOTOSENSITIVE TRANSISTORS 5.5$ 23.4$ 322.7%
9 120100 ‐ SOYA BEANS (WHETHER OR NOT BROKEN) 13.7$ 19.5$ 42.1%
10 852990 ‐ PARTS FOR APPARATUS OF HEADINGS 85.25 TO 85.28, NES 16.0$ 16.1$ 1.1%
412.5$ 587.0$ 42.3%
207.3$ 182.0$ ‐12.2%
619.8$ 769.0$ 24.1%
Sub‐total
Others
Total (All Products)
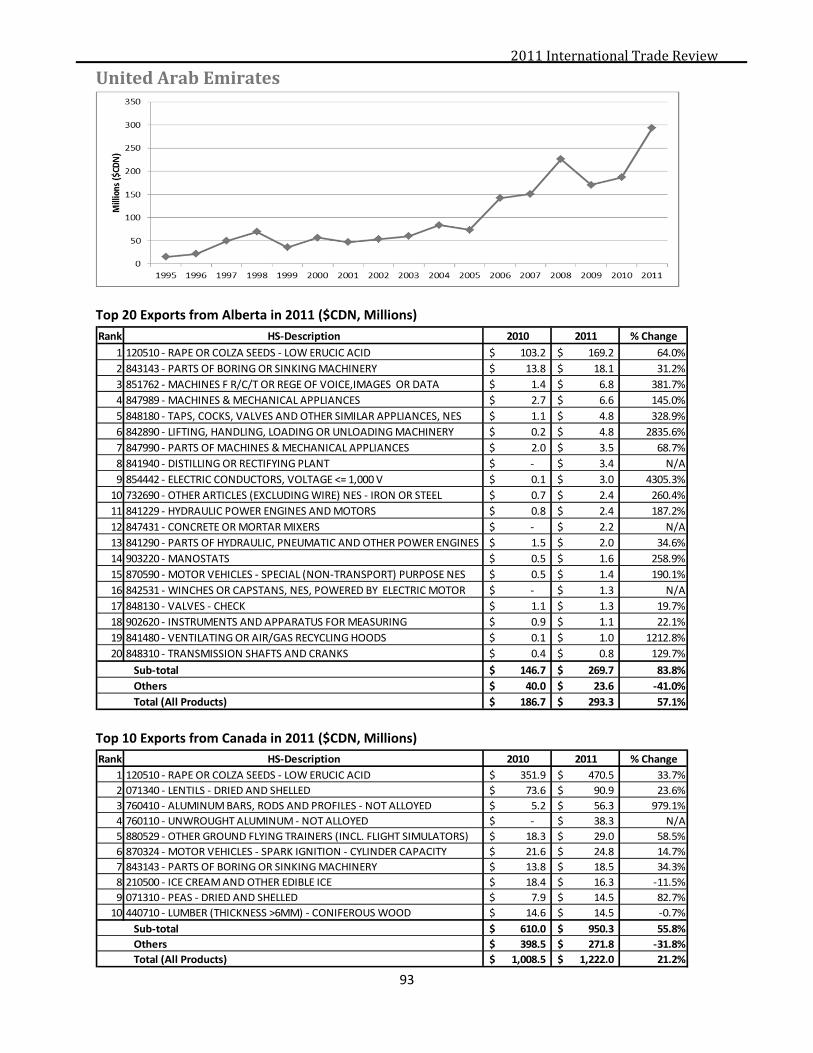
2011InternationalTradeReview
93
UnitedArabEmirates
Top 20 Exports from Alberta in 2011 ($CDN, Millions)
Top 10 Exports from Canada in 2011 ($CDN, Millions)
Rank HS‐Description 2010 2011 % Change
1 120510 ‐ RAPE OR COLZA SEEDS ‐ LOW ERUCIC ACID 103.2$ 169.2$ 64.0%
2 843143 ‐ PARTS OF BORING OR SINKING MACHINERY 13.8$ 18.1$ 31.2%
3 851762 ‐ MACHINES F R/C/T OR REGE OF VOICE,IMAGES OR DATA 1.4$ 6.8$ 381.7%
4 847989 ‐ MACHINES & MECHANICAL APPLIANCES 2.7$ 6.6$ 145.0%
5 848180 ‐ TAPS, COCKS, VALVES AND OTHER SIMILAR APPLIANCES, NES 1.1$ 4.8$ 328.9%
6 842890 ‐ LIFTING, HANDLING, LOADING OR UNLOADING MACHINERY 0.2$ 4.8$ 2835.6%
7 847990 ‐ PARTS OF MACHINES & MECHANICAL APPLIANCES 2.0$ 3.5$ 68.7%
8 841940 ‐ DISTILLING OR RECTIFYING PLANT ‐$ 3.4$ N/A
9 854442 ‐ ELECTRIC CONDUCTORS, VOLTAGE <= 1,000 V 0.1$ 3.0$ 4305.3%
10 732690 ‐ OTHER ARTICLES (EXCLUDING WIRE) NES ‐ IRON OR STEEL 0.7$ 2.4$ 260.4%
11 841229 ‐ HYDRAULIC POWER ENGINES AND MOTORS 0.8$ 2.4$ 187.2%
12 847431 ‐ CONCRETE OR MORTAR MIXERS ‐$ 2.2$ N/A
13 841290 ‐ PARTS OF HYDRAULIC, PNEUMATIC AND OTHER POWER ENGINES 1.5$ 2.0$ 34.6%
14 903220 ‐ MANOSTATS 0.5$ 1.6$ 258.9%
15 870590 ‐ MOTOR VEHICLES ‐ SPECIAL (NON‐TRANSPORT) PURPOSE NES 0.5$ 1.4$ 190.1%
16 842531 ‐ WINCHES OR CAPSTANS, NES, POWERED BY ELECTRIC MOTOR ‐$ 1.3$ N/A
17 848130 ‐ VALVES ‐ CHECK 1.1$ 1.3$ 19.7%
18 902620 ‐ INSTRUMENTS AND APPARATUS FOR MEASURING 0.9$ 1.1$ 22.1%
19 841480 ‐ VENTILATING OR AIR/GAS RECYCLING HOODS 0.1$ 1.0$ 1212.8%
20 848310 ‐ TRANSMISSION SHAFTS AND CRANKS 0.4$ 0.8$ 129.7%
146.7$ 269.7$ 83.8%
40.0$ 23.6$ ‐41.0%
186.7$ 293.3$ 57.1%
Sub‐total
Others
Total (All Products)
Rank HS‐Description 2010 2011 % Change
1 120510 ‐ RAPE OR COLZA SEEDS ‐ LOW ERUCIC ACID 351.9$ 470.5$ 33.7%
2 071340 ‐ LENTILS ‐ DRIED AND SHELLED 73.6$ 90.9$ 23.6%
3 760410 ‐ ALUMINUM BARS, RODS AND PROFILES ‐ NOT ALLOYED 5.2$ 56.3$ 979.1%
4 760110 ‐ UNWROUGHT ALUMINUM ‐ NOT ALLOYED ‐$ 38.3$ N/A
5 880529 ‐ OTHER GROUND FLYING TRAINERS (INCL. FLIGHT SIMULATORS) 18.3$ 29.0$ 58.5%
6 870324 ‐ MOTOR VEHICLES ‐ SPARK IGNITION ‐ CYLINDER CAPACITY 21.6$ 24.8$ 14.7%
7 843143 ‐ PARTS OF BORING OR SINKING MACHINERY 13.8$ 18.5$ 34.3%
8 210500 ‐ ICE CREAM AND OTHER EDIBLE ICE 18.4$ 16.3$ ‐11.5%
9 071310 ‐ PEAS ‐ DRIED AND SHELLED 7.9$ 14.5$ 82.7%
10 440710 ‐ LUMBER (THICKNESS >6MM) ‐ CONIFEROUS WOOD 14.6$ 14.5$ ‐0.7%
610.0$ 950.3$ 55.8%
398.5$ 271.8$ ‐31.8%
1,008.5$ 1,222.0$ 21.2%
Sub‐total
Others
Total (All Products)
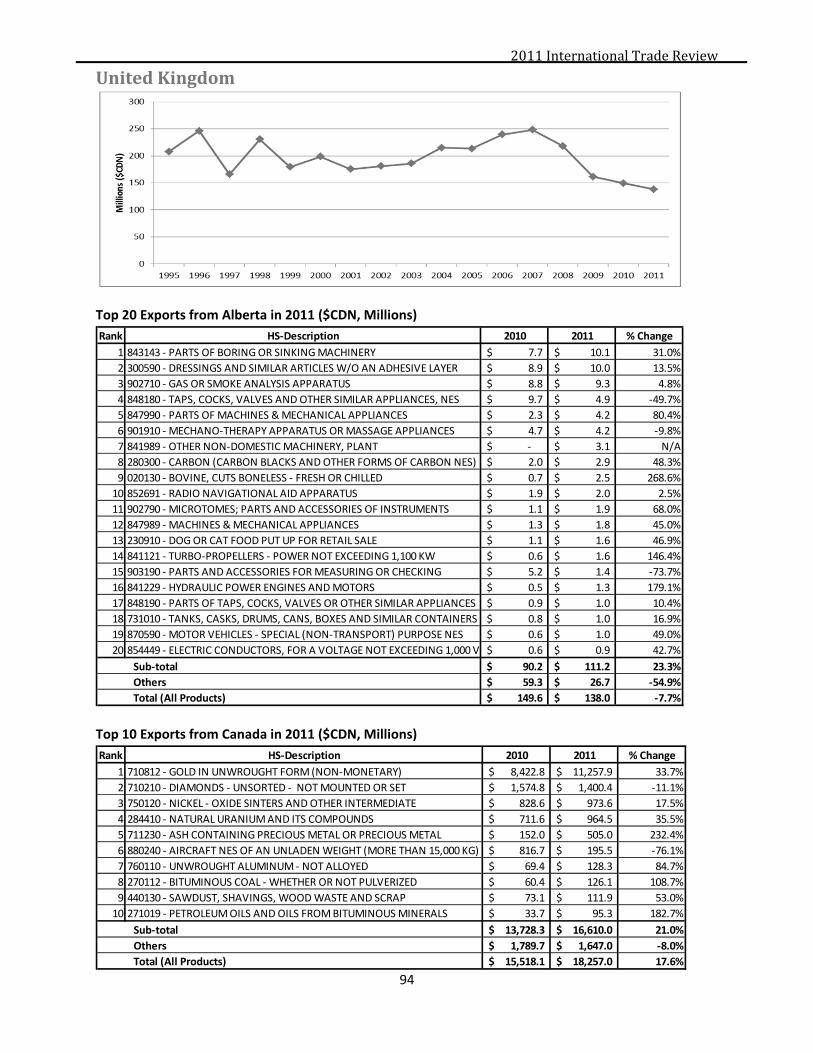
2011InternationalTradeReview
94
UnitedKingdom
Top 20 Exports from Alberta in 2011 ($CDN, Millions)
Top 10 Exports from Canada in 2011 ($CDN, Millions)
Rank HS‐Description 2010 2011 % Change
1 843143 ‐ PARTS OF BORING OR SINKING MACHINERY 7.7$ 10.1$ 31.0%
2 300590 ‐ DRESSINGS AND SIMILAR ARTICLES W/O AN ADHESIVE LAYER 8.9$ 10.0$ 13.5%
3 902710 ‐ GAS OR SMOKE ANALYSIS APPARATUS 8.8$ 9.3$ 4.8%
4 848180 ‐ TAPS, COCKS, VALVES AND OTHER SIMILAR APPLIANCES, NES 9.7$ 4.9$ ‐49.7%
5 847990 ‐ PARTS OF MACHINES & MECHANICAL APPLIANCES 2.3$ 4.2$ 80.4%
6 901910 ‐ MECHANO‐THERAPY APPARATUS OR MASSAGE APPLIANCES 4.7$ 4.2$ ‐9.8%
7 841989 ‐ OTHER NON‐DOMESTIC MACHINERY, PLANT ‐$ 3.1$ N/A
8 280300 ‐ CARBON (CARBON BLACKS AND OTHER FORMS OF CARBON NES) 2.0$ 2.9$ 48.3%
9 020130 ‐ BOVINE, CUTS BONELESS ‐ FRESH OR CHILLED 0.7$ 2.5$ 268.6%
10 852691 ‐ RADIO NAVIGATIONAL AID APPARATUS 1.9$ 2.0$ 2.5%
11 902790 ‐ MICROTOMES; PARTS AND ACCESSORIES OF INSTRUMENTS 1.1$ 1.9$ 68.0%
12 847989 ‐ MACHINES & MECHANICAL APPLIANCES 1.3$ 1.8$ 45.0%
13 230910 ‐ DOG OR CAT FOOD PUT UP FOR RETAIL SALE 1.1$ 1.6$ 46.9%
14 841121 ‐ TURBO‐PROPELLERS ‐ POWER NOT EXCEEDING 1,100 KW 0.6$ 1.6$ 146.4%
15 903190 ‐ PARTS AND ACCESSORIES FOR MEASURING OR CHECKING 5.2$ 1.4$ ‐73.7%
16 841229 ‐ HYDRAULIC POWER ENGINES AND MOTORS 0.5$ 1.3$ 179.1%
17 848190 ‐ PARTS OF TAPS, COCKS, VALVES OR OTHER SIMILAR APPLIANCES 0.9$ 1.0$ 10.4%
18 731010 ‐ TANKS, CASKS, DRUMS, CANS, BOXES AND SIMILAR CONTAINERS 0.8$ 1.0$ 16.9%
19 870590 ‐ MOTOR VEHICLES ‐ SPECIAL (NON‐TRANSPORT) PURPOSE NES 0.6$ 1.0$ 49.0%
20 854449 ‐ ELECTRIC CONDUCTORS, FOR A VOLTAGE NOT EXCEEDING 1,000 V 0.6$ 0.9$ 42.7%
90.2$ 111.2$ 23.3%
59.3$ 26.7$ ‐54.9%
149.6$ 138.0$ ‐7.7%
Sub‐total
Others
Total (All Products)
Rank HS‐Description 2010 2011 % Change
1 710812 ‐ GOLD IN UNWROUGHT FORM (NON‐MONETARY) 8,422.8$ 11,257.9$ 33.7%
2 710210 ‐ DIAMONDS ‐ UNSORTED ‐ NOT MOUNTED OR SET 1,574.8$ 1,400.4$ ‐11.1%
3 750120 ‐ NICKEL ‐ OXIDE SINTERS AND OTHER INTERMEDIATE 828.6$ 973.6$ 17.5%
4 284410 ‐ NATURAL URANIUM AND ITS COMPOUNDS 711.6$ 964.5$ 35.5%
5 711230 ‐ ASH CONTAINING PRECIOUS METAL OR PRECIOUS METAL 152.0$ 505.0$ 232.4%
6 880240 ‐ AIRCRAFT NES OF AN UNLADEN WEIGHT (MORE THAN 15,000 KG) 816.7$ 195.5$ ‐76.1%
7 760110 ‐ UNWROUGHT ALUMINUM ‐ NOT ALLOYED 69.4$ 128.3$ 84.7%
8 270112 ‐ BITUMINOUS COAL ‐ WHETHER OR NOT PULVERIZED 60.4$ 126.1$ 108.7%
9 440130 ‐ SAWDUST, SHAVINGS, WOOD WASTE AND SCRAP 73.1$ 111.9$ 53.0%
10 271019 ‐ PETROLEUM OILS AND OILS FROM BITUMINOUS MINERALS 33.7$ 95.3$ 182.7%
13,728.3$ 16,610.0$ 21.0%
1,789.7$ 1,647.0$ ‐8.0%
15,518.1$ 18,257.0$ 17.6%
Sub‐total
Others
Total (All Products)

2011InternationalTradeReview
95
UnitedStates
Top 20 Exports from Alberta in 2011 ($CDN, Millions)
Top 10 Exports from Canada in 2011 ($CDN, Millions)
Rank HS‐Description 2010 2011 % Change
1 270900 ‐ CRUDE PETROLEUM OILS AND OILS OBTAINED FROM BITUMINOUS 51,684.6$ 68,390.7$ 32.3%
2 870324 ‐ MOTOR VEHICLES ‐ SPARK IGNITION ‐ CYLINDER CAPACITY MORE T 25,663.1$ 25,306.2$ ‐1.4%
3 271121 ‐ NATURAL GAS IN GASEOUS STATE 15,619.4$ 13,462.8$ ‐13.8%
4 870323 ‐ MOTOR VEHICLES ‐ SPARK IGNITION ‐ CYLINDER CAPACITY 1501‐30 11,274.2$ 12,573.3$ 11.5%
5 271019 ‐ PETROLEUM OILS AND OILS FROM BITUMINOUS MINERALS, O/T CR 8,075.9$ 8,393.3$ 3.9%
6 710812 ‐ GOLD IN UNWROUGHT FORM (NON‐MONETARY) 4,338.4$ 3,594.1$ ‐17.2%
7 310420 ‐ POTASSIUM CHLORIDE 3,063.2$ 3,569.6$ 16.5%
8 440710 ‐ LUMBER (THICKNESS >6MM) ‐ CONIFEROUS WOOD 2,937.5$ 2,786.9$ ‐5.1%
9 870829 ‐ PARTS AND ACCESSORIES OF MOTOR VEHICLE BODIES NES 2,444.9$ 2,626.2$ 7.4%
10 760110 ‐ UNWROUGHT ALUMINUM ‐ NOT ALLOYED 2,612.6$ 2,516.9$ ‐3.7%
11 840734 ‐ RECIPROCATING PISTON ENGINES FOR ROAD OR OFF‐HIGHWAY M 2,646.7$ 2,461.1$ ‐7.0%
12 760120 ‐ UNWROUGHT ALUMINUM ‐ ALLOYED 2,076.3$ 2,294.2$ 10.5%
13 870899 ‐ MOTOR VEHICLE PARTS, NES 1,942.8$ 2,196.9$ 13.1%
14 271600 ‐ ELECTRICAL ENERGY 2,022.4$ 2,031.3$ 0.4%
15 300490 ‐ MEDICAMENTS NES ‐ IN DOSAGE 2,348.9$ 2,025.5$ ‐13.8%
16 271112 ‐ LIQUEFIED PETROLEUM OR HYDROCARBON GASES ‐ PROPANE 1,731.9$ 1,888.3$ 9.0%
17 390190 ‐ POLYMERS OF ETHYLENE NES, IN PRIMARY FORMS 1,540.6$ 1,870.4$ 21.4%
18 470321 ‐ CHEMICAL WOODPULP ‐ SODA OR SULPHATE ‐ CONIFEROUS, BLEA 1,894.8$ 1,853.0$ ‐2.2%
19 480261 ‐ PAPER,FINE, >10% FIBRES OBTAINED BY MECH /CHEM‐MEC PROCE 1,833.3$ 1,679.9$ ‐8.4%
20 711890 ‐ COIN NES 1,143.4$ 1,568.8$ 37.2%
157,140.2$ 174,833.7$ 11.3%
122,368.7$ 132,376.4$ 8.2%
279,508.8$ 307,210.1$ 9.9%
Sub‐total
Others
Total (All Products)
Rank HS‐Description 2010 2011 % Change
1 270900 ‐ CRUDE PETROLEUM OILS AND OILS FROM BITUMINOUS 51,684.6$ 68,390.7$ 32.3%
2 870324 ‐ MOTOR VEHICLES ‐ SPARK IGNITION 25,663.1$ 25,306.2$ ‐1.4%
3 271121 ‐ NATURAL GAS IN GASEOUS STATE 15,619.4$ 13,462.8$ ‐13.8%
4 870323 ‐ MOTOR VEHICLES ‐ SPARK IGNITION ‐ CYLINDER 11,274.2$ 12,573.3$ 11.5%
5 271019 ‐ PETROLEUM OILS AND OILS FROM BITUMINOUS MINERALS 8,075.9$ 8,393.3$ 3.9%
6 710812 ‐ GOLD IN UNWROUGHT FORM (NON‐MONETARY) 4,338.4$ 3,594.1$ ‐17.2%
7 310420 ‐ POTASSIUM CHLORIDE 3,063.2$ 3,569.6$ 16.5%
8 440710 ‐ LUMBER (THICKNESS >6MM) ‐ CONIFEROUS WOOD 2,937.5$ 2,786.9$ ‐5.1%
9 870829 ‐ PARTS AND ACCESSORIES OF MOTOR VEHICLE BODIES NES 2,444.9$ 2,626.2$ 7.4%
10 760110 ‐ UNWROUGHT ALUMINUM ‐ NOT ALLOYED 2,612.6$ 2,516.9$ ‐3.7%
157,140.2$ 174,833.7$ 11.3%
122,368.7$ 132,376.4$ 8.2%
279,508.8$ 307,210.1$ 9.9%
Sub‐total
Others
Total (All Products)

2011InternationalTradeReview
96
Venezuela
Top 20 Exports from Alberta in 2011 ($CDN, Millions)
Top 10 Exports from Canada in 2011 ($CDN, Millions)
Rank HS‐Description 2010 2011 % Change
1 841391 ‐ PARTS OF PUMPS FOR LIQUIDS 4.9$ 17.5$ 258.3%
2 100110 ‐ DURUM WHEAT 10.5$ 16.0$ 52.0%
3 843143 ‐ PARTS OF BORING OR SINKING MACHINERY 1.3$ 2.6$ 103.6%
4 732690 ‐ OTHER ARTICLES (EXCLUDING WIRE) NES ‐ IRON OR STEEL 1.0$ 2.3$ 144.5%
5 120750 ‐ MUSTARD SEEDS (WHETHER OR NOT BROKEN) 0.8$ 2.1$ 162.5%
6 841360 ‐ ROTARY POSITIVE DISPLACEMENT PUMPS NES 1.2$ 1.7$ 35.6%
7 841229 ‐ HYDRAULIC POWER ENGINES AND MOTORS 0.5$ 1.3$ 150.8%
8 848140 ‐ VALVES ‐ SAFETY OR RELIEF 0.5$ 1.0$ 99.5%
9 841290 ‐ PARTS OF HYDRAULIC, PNEUMATIC AND OTHER 0.5$ 0.9$ 80.5%
10 847989 ‐ MACHINES & MECHANICAL APPLIANCES 0.2$ 0.6$ 174.3%
11 848340 ‐ GEARS AND GEARING; BALL OR ROLLER SCREWS ‐$ 0.4$ N/A
12 731600 ‐ ANCHORS, GRAPNELS AND PARTS THEREOF ‐ IRON OR STEEL ‐$ 0.3$ N/A
13 848130 ‐ VALVES ‐ CHECK 0.1$ 0.3$ 152.7%
14 902680 ‐ INSTRUMENTS AND APPARATUS FOR MEASURING OR CHECKING 0.0$ 0.2$ 385.7%
15 800700 ‐ ARTICLES OF TIN, NES ‐$ 0.2$ N/A
16 848330 ‐ BEARING HOUSINGS ‐ NOT INCORPORATING BALL OR ROLLER 0.1$ 0.2$ 48.2%
17 902620 ‐ INSTRUMENTS AND APPARATUS FOR MEASURING OR CHECKING 0.1$ 0.1$ 23.0%
18 853710 ‐ BOARDS AND PANELS‐INCLUDING NUMERICAL CONTROL PANELS 0.1$ 0.1$ 2.1%
19 853650 ‐ OTHER ELECTRICAL SWITCHES‐VOLTAGE NOT EXCEEDING 1,000 V 0.0$ 0.1$ 5644.4%
20 843139 ‐ PARTS OF LIFTING, HANDLING, LOADING OR UNLOADING 0.0$ 0.1$ 3034.4%
75.8$ 117.4$ 54.8%
7.3$ 1.3$ ‐82.0%
83.1$ 118.7$ 42.8%
Sub‐total
Others
Total (All Products)
Rank HS‐Description 2010 2011 % Change
1 100110 ‐ DURUM WHEAT 60.6$ 111.0$ 83.1%
2 480100 ‐ NEWSPRINT ‐ IN ROLLS OR SHEETS 67.4$ 73.7$ 9.4%
3 071340 ‐ LENTILS ‐ DRIED AND SHELLED 36.6$ 33.0$ ‐9.7%
4 841391 ‐ PARTS OF PUMPS FOR LIQUIDS 5.7$ 20.2$ 254.0%
5 841182 ‐ GAS TURBINES NES ‐ POWER EXCEEDING 5,000 KW 18.3$ 8.4$ ‐54.2%
6 200410 ‐ POTATOES, FROZEN‐PREPARED/PRESERVED WITHOUT VINEGAR 14.7$ 8.1$ ‐45.0%
7 071310 ‐ PEAS ‐ DRIED AND SHELLED 12.2$ 8.1$ ‐34.0%
8 841112 ‐ TURBO‐JETS ‐ THRUST EXCEEDING 25 KN ‐$ 7.4$ N/A
9 210690 ‐ FOOD PREPARATIONS 1.4$ 6.8$ 391.2%
10 251810 ‐ DOLOMITE ‐ NOT CALCINED 2.9$ 6.7$ 133.1%
425.3$ 511.9$ 20.4%
118.8$ 70.5$ ‐40.6%
544.1$ 582.5$ 7.0%
Sub‐total
Others
Total (All Products)

2011InternationalTradeReview
97
Vietnam
Top 20 Exports from Alberta in 2011 ($CDN, Millions)
Top 10 Exports from Canada in 2011 ($CDN, Millions)
Rank HS‐Description 2010 2011 % Change
1 410190 ‐ OTHER HIDES/SKINS BOVINE/EQUINE ANIMALS ‐ UNTANNED 1.9$ 4.3$ 124.1%
2 390190 ‐ POLYMERS OF ETHYLENE NES, IN PRIMARY FORMS 4.7$ 3.2$ ‐31.8%
3 720449 ‐ FERROUS WASTE AND SCRAP ‐ IRON OR STEEL NES 0.0$ 3.2$ 7682.5%
4 410150 ‐ WHOLE HIDES AND SKINS ‐ BOVINE/EQUINE ANIMALS 8.1$ 2.4$ ‐69.8%
5 843143 ‐ PARTS OF BORING OR SINKING MACHINERY 2.9$ 2.0$ ‐31.1%
6 390120 ‐ POLYETHYLENE ‐ SPECIFIC GRAVITY OF 0.94 OR MORE 0.4$ 1.2$ 216.5%
7 470321 ‐ CHEMICAL WOODPULP ‐ SODA OR SULPHATE ‐ CONIFEROUS 0.9$ 1.2$ 30.6%
8 020230 ‐ BOVINE, CUTS BONELESS ‐ FROZEN 1.4$ 1.0$ ‐32.0%
9 760612 ‐ ALUMINUM PLATES, SHEETS AND STRIP ‐ ALLOYED ‐$ 0.9$ N/A
10 100300 ‐ BARLEY 0.4$ 0.8$ 99.4%
11 848180 ‐ TAPS, COCKS, VALVES AND OTHER SIMILAR APPLIANCES, NES 0.3$ 0.6$ 95.2%
12 020329 ‐ SWINE, CUTS BONELESS ‐ FROZEN ‐$ 0.4$ N/A
13 010310 ‐ SWINE, LIVE ‐ PURE‐BRED BREEDING ‐$ 0.3$ N/A
14 470329 ‐ CHEMICAL WOODPUL ‐SODA OR SULPHATE‐NON‐CONIFEROUS ‐$ 0.3$ N/A
15 841221 ‐ HYDRAULIC POWER ENGINES AND MOTORS ‐ LINEAR ACTING 0.1$ 0.3$ 124.5%
16 020210 ‐ BOVINE, CARCASSES AND HALF‐CARCASSES ‐ FROZEN ‐$ 0.2$ N/A
17 847989 ‐ MACHINES & MECHANICAL APPLIANCES 0.3$ 0.2$ ‐43.9%
18 020714 ‐ CUTS AND EDIBLE OFFALS (INCL LIVERS) OF FOWLS 0.03$ 0.17$ 400.8%
19 842952 ‐ MECHANICAL SHOVELS AND EXCAVATORS 0.40$ 0.16$ ‐61.1%
20 847990 ‐ PARTS OF MACHINES & MECHANICAL APPLIANCES 0.01$ 0.14$ 866.6%
22.5$ 25.1$ 11.7%
6.7$ 2.7$ ‐60.1%
29.2$ 27.8$ ‐4.8%
Sub‐total
Others
Total (All Products)
Rank HS‐Description 2010 2011 % Change
1 310420 ‐ POTASSIUM CHLORIDE 23.0$ 88.8$ 285.2%
2 120100 ‐ SOYA BEANS (WHETHER OR NOT BROKEN) 8.1$ 48.1$ 493.3%
3 710239 ‐ DIAMONDS ‐ NON‐INDUSTRIAL ‐ WORKED ‐ NOT MOUNTED 12.7$ 10.3$ ‐19.2%
4 720449 ‐ FERROUS WASTE AND SCRAP ‐ IRON OR STEEL NES 5.3$ 9.8$ 86.0%
5 030331 ‐ HALIBUT (EXCEPT LIVERS OR ROES) ‐ FROZEN (EXCL FISH FILLETS) 3.5$ 9.6$ 174.3%
6 030614 ‐ CRABS ‐ FROZEN 3.7$ 6.6$ 78.0%
7 030613 ‐ SHRIMPS AND PRAWNS ‐ FROZEN 4.5$ 6.2$ 39.2%
8 410150 ‐ WHOLE HIDES AND SKINS‐BOVINE/EQUINE ANIMALS‐UNTANNED 11.4$ 5.1$ ‐55.1%
9 410190 ‐ OTHER HIDES/SKINS BOVINE/EQUINE ANIMALS ‐ UNTANNED 1.9$ 4.3$ 124.1%
10 400239 ‐ SYNTHETIC RUBBER ‐ HALO‐ISOBUTENE‐ISOPRENE RUBBER 2.4$ 4.1$ 71.9%
143.2$ 239.6$ 67.3%
104.4$ 77.8$ ‐25.5%
247.6$ 317.4$ 28.2%
Sub‐total
Others
Total (All Products)

2011InternationalTradeReview
98
2007 2008 2009 2010 2011 Rank 2007 2008 2009 2010 2011 Rank
World 81,558.82$ 110,248.21$ 69,846.34$ 78,743.19$ 93,214.77$ World 419,943.8$ 455,337.0$ 334,448.4$ 374,014.8$ 419,141.3$
Afghanistan 0.68$ 0.73$ 13.02$ 2.09$ 0.72$ 122 Afghanistan 10.0$ 21.9$ 48.4$ 55.2$ 34.6$ 107
Albania 9.59$ 23.73$ 11.60$ 23.21$ 50.76$ 49 Albania 12.1$ 34.1$ 18.7$ 31.2$ 54.5$ 154
Algeria 65.67$ 135.58$ 62.23$ 44.04$ 25.08$ 34 Algeria 485.1$ 868.0$ 318.0$ 288.0$ 239.2$ 46
American Samoa ‐$ ‐$ 0.11$ ‐$ ‐$ 192 American Samoa 1.3$ 0.8$ 1.1$ 1.4$ 1.2$ 183
Andorra 0.04$ 0.00$ ‐$ 0.00$ ‐$ 214 Andorra 0.2$ 0.2$ 0.1$ 0.1$ 0.1$ 205
Angola 9.95$ 5.80$ 7.38$ 6.86$ 4.56$ 70 Angola 58.6$ 122.6$ 66.3$ 189.5$ 118.0$ 73
Anguilla 0.01$ 0.00$ ‐$ 0.00$ ‐$ 216 Anguilla 1.4$ 2.6$ 1.8$ 0.9$ 2.3$ 179
Antarctica 0.83$ 1.33$ 1.29$ 0.20$ 0.39$ 131 Antarctica 0.9$ 3.3$ 1.3$ 0.2$ 0.5$ 174
Antigua & Barbuda 0.28$ 0.42$ 0.16$ 0.06$ 0.08$ 158 Antigua & Barbuda 17.2$ 21.2$ 20.1$ 19.2$ 9.6$ 114
Argentina 48.66$ 41.89$ 9.76$ 18.10$ 17.00$ 63 Argentina 222.4$ 235.9$ 155.6$ 259.2$ 471.8$ 50
Armenia 0.06$ 0.51$ 0.61$ 0.26$ 0.13$ 113 Armenia 8.7$ 20.8$ 8.2$ 11.7$ 15.8$ 156
Aruba 0.23$ 0.36$ 0.06$ 0.12$ 0.26$ 157 Aruba 11.5$ 6.3$ 6.0$ 26.1$ 5.5$ 123
Australia 209.39$ 413.87$ 250.03$ 266.97$ 319.13$ 8 Australia 1,597.4$ 1,961.9$ 1,636.7$ 1,604.6$ 1,733.3$ 13
Austria 5.40$ 2.73$ 3.52$ 3.16$ 4.52$ 99 Austria 334.3$ 450.0$ 369.3$ 348.2$ 377.3$ 29
Azerbaijan 7.21$ 6.49$ 5.36$ 9.17$ 4.24$ 80 Azerbaijan 14.2$ 16.2$ 15.8$ 15.3$ 11.3$ 120
Bahamas 0.47$ 1.06$ 0.22$ 0.49$ 0.32$ 48 Bahamas 91.2$ 226.4$ 146.2$ 150.6$ 127.3$ 78
Bahrain 2.79$ 3.29$ 1.28$ 4.02$ 10.43$ 82 Bahrain 38.2$ 48.9$ 36.6$ 62.3$ 69.6$ 98
Bangladesh 90.68$ 68.84$ 120.44$ 140.90$ 161.58$ 22 Bangladesh 366.8$ 286.1$ 625.4$ 591.5$ 549.9$ 64
Barbados 1.73$ 1.18$ 0.76$ 0.54$ 0.49$ 133 Barbados 55.2$ 45.5$ 53.9$ 36.7$ 66.7$ 79
Belarus 0.00$ ‐$ 0.00$ 0.20$ 0.29$ 125 Belarus 5.8$ 4.1$ 1.4$ 1.5$ 1.5$ 138
Belgium 234.28$ 178.75$ 86.96$ 114.98$ 153.70$ 18 Belgium 2,895.1$ 3,336.7$ 1,818.4$ 2,091.3$ 2,300.4$ 9
Belize 1.81$ 2.24$ 1.49$ 1.41$ 1.20$ 95 Belize 6.4$ 6.6$ 5.5$ 5.5$ 5.0$ 146
Benin 0.11$ 0.46$ 0.23$ 0.27$ 0.59$ 118 Benin 6.8$ 12.2$ 7.6$ 12.4$ 12.0$ 161
Bermuda 0.98$ 1.29$ 0.43$ 0.41$ 0.27$ 147 Bermuda 59.0$ 61.8$ 56.6$ 37.6$ 73.8$ 75
Bhutan 0.04$ ‐$ 0.00$ ‐$ 0.01$ 221 Bhutan 0.3$ 0.0$ 0.2$ 1.6$ 0.6$ 207
Bolivia 2.18$ 13.18$ 0.64$ 0.81$ 2.13$ 97 Bolivia 12.2$ 42.2$ 10.7$ 40.7$ 14.6$ 119
Bosnia & Herzegovina 0.39$ 0.11$ 0.34$ ‐$ ‐$ 172 Bosnia & Herzegovina 4.5$ 6.0$ 3.1$ 4.5$ 4.3$ 172
Botswana 0.10$ 3.94$ 0.02$ 0.87$ 0.51$ 151 Botswana 11.3$ 9.5$ 4.1$ 3.6$ 4.0$ 148
Bouvet Island ‐$ ‐$ ‐$ ‐$ ‐$ 219 Bouvet Island ‐$ 0.0$ ‐$ ‐$ ‐$ 227
Brazil 137.52$ 471.25$ 185.80$ 104.15$ 164.77$ 24 Brazil 1,395.4$ 2,500.0$ 1,470.5$ 2,455.7$ 2,715.6$ 17
British Indian Ocean Ter ‐$ 0.01$ ‐$ ‐$ ‐$ 204 British Indian Ocean Ter 0.9$ 0.9$ 1.2$ 2.2$ 0.0$ 173
Brunei Darussalam 0.63$ 0.15$ 2.32$ 8.79$ 1.67$ 110 Brunei Darussalam 2.8$ 2.4$ 4.2$ 10.5$ 2.6$ 168
Bulgaria 0.27$ 0.29$ 0.16$ 0.28$ 0.19$ 130 Bulgaria 28.7$ 76.1$ 68.4$ 116.4$ 189.5$ 83
Burkina Faso 0.32$ 0.40$ 0.18$ 0.57$ 0.08$ 141 Burkina Faso 7.7$ 6.3$ 27.1$ 20.2$ 31.2$ 117
Burundi 0.03$ 0.03$ 0.08$ 0.04$ 0.05$ 179 Burundi 1.8$ 1.5$ 1.1$ 0.9$ 0.9$ 167
Cambodia 0.20$ ‐$ 2.30$ 0.01$ 0.24$ 144 Cambodia 5.6$ 3.0$ 6.8$ 3.8$ 7.9$ 169
Cameroon 4.66$ 6.09$ 9.80$ 6.78$ 6.66$ 65 Cameroon 18.0$ 21.8$ 32.2$ 28.0$ 24.7$ 115
Canada ‐$ ‐$ ‐$ ‐$ ‐$ 215 Canada ‐$ ‐$ ‐$ ‐$ ‐$ 213
Cape Verde 0.04$ 0.01$ ‐$ 0.03$ ‐$ 205 Cape Verde 0.1$ 1.0$ 1.4$ 1.0$ 1.8$ 193
Cayman Islands 1.14$ 1.77$ 0.35$ 0.36$ 0.29$ 139 Cayman Islands 55.1$ 14.0$ 6.4$ 6.2$ 7.0$ 100
Central African Republic 0.00$ ‐$ ‐$ 0.01$ 0.00$ 206 Central African Republic 0.4$ 0.3$ 0.7$ 0.1$ 0.3$ 195
Chad 12.03$ 3.93$ 5.30$ 5.34$ 1.67$ 101 Chad 12.9$ 5.8$ 11.7$ 6.6$ 2.7$ 152
Chile 71.67$ 142.57$ 107.72$ 80.72$ 113.42$ 27 Chile 654.7$ 684.0$ 588.1$ 539.9$ 779.6$ 33
China 2,816.93$ 3,117.52$ 2,706.50$ 2,880.83$ 3,039.34$ 2 China 9,016.2$ 10,084.3$ 10,935.8$ 12,879.1$ 16,382.7$ 4
Christmas Island 0.01$ ‐$ 0.17$ ‐$ 0.12$ 175 Christmas Island 0.1$ 0.3$ 0.3$ 0.9$ 0.4$ 190
Cocos (Keeling) Islands ‐$ ‐$ ‐$ ‐$ ‐$ N/A Cocos (Keeling) Islands 0.1$ 0.7$ 0.2$ 0.1$ 0.3$ 206
Colombia 77.97$ 99.36$ 114.57$ 136.60$ 169.62$ 13 Colombia 564.6$ 647.5$ 568.8$ 614.0$ 727.7$ 28
Comoros ‐$ ‐$ 0.03$ ‐$ 0.11$ 207 Comoros 0.4$ 0.5$ 3.1$ 0.1$ 0.3$ 187
Congo 5.56$ 5.46$ 10.82$ 7.13$ 11.27$ 94 Congo 18.5$ 28.9$ 23.4$ 16.1$ 21.2$ 124
Congo, Dem. Rep. 3.26$ 0.13$ 0.62$ 0.32$ 0.17$ 140 Congo, Dem. Rep. 36.1$ 21.9$ 16.1$ 12.8$ 18.2$ 118
Cook Islands ‐$ ‐$ ‐$ ‐$ 0.08$ 127 Cook Islands 0.5$ 0.5$ 0.1$ 0.1$ 0.2$ 192
Costa Rica 9.13$ 12.34$ 8.17$ 9.35$ 15.21$ 60 Costa Rica 75.9$ 102.6$ 78.5$ 91.4$ 155.4$ 68
Cote d Ivoire 0.85$ 2.37$ 3.56$ 1.88$ 2.39$ 93 Cote d Ivoire 11.3$ 22.3$ 23.2$ 19.4$ 18.0$ 125
Croatia 0.33$ 0.61$ 0.54$ 0.80$ 0.83$ 124 Croatia 23.2$ 65.4$ 99.2$ 92.2$ 15.7$ 106
Cuba 76.78$ 86.52$ 36.41$ 52.47$ 93.05$ 33 Cuba 403.7$ 614.0$ 250.9$ 307.8$ 358.6$ 38
Cyprus 0.60$ 0.23$ 0.36$ 0.11$ 1.51$ 126 Cyprus 16.5$ 16.1$ 11.2$ 48.0$ 12.0$ 130
Czech Republic 6.15$ 9.44$ 8.54$ 7.76$ 5.49$ 84 Czech Republic 228.8$ 218.7$ 127.4$ 110.6$ 101.1$ 57
Denmark 33.70$ 16.51$ 14.84$ 23.68$ 18.15$ 58 Denmark 342.4$ 397.2$ 597.4$ 286.8$ 243.7$ 43
Djibouti ‐$ 0.00$ 0.01$ 0.38$ 0.19$ 136 Djibouti 1.1$ 2.2$ 2.5$ 3.5$ 1.3$ 176
Dominica 0.03$ 0.01$ 0.07$ 0.24$ 0.18$ 171 Dominica 4.5$ 5.6$ 4.4$ 4.4$ 3.7$ 157
Dominican Republic 12.46$ 9.24$ 15.06$ 10.76$ 8.17$ 75 Dominican Republic 179.8$ 205.8$ 128.0$ 181.9$ 138.4$ 56
East Timor 0.01$ ‐$ ‐$ ‐$ ‐$ 184 East Timor 0.3$ 0.3$ 0.0$ 0.0$ 0.3$ 203
Ecuador 47.00$ 44.14$ 79.18$ 42.63$ 75.20$ 30 Ecuador 226.6$ 225.6$ 255.1$ 251.5$ 270.7$ 52
Egypt 43.35$ 84.45$ 43.25$ 45.83$ 34.70$ 50 Egypt 317.8$ 607.6$ 619.4$ 610.9$ 690.7$ 40
El Salvador 0.58$ 8.50$ 0.51$ 2.22$ 3.80$ 91 El Salvador 46.0$ 47.2$ 49.1$ 33.1$ 34.3$ 80
Equatorial Guinea 0.11$ 0.34$ 0.08$ 0.83$ 0.67$ 129 Equatorial Guinea 2.4$ 12.6$ 4.2$ 4.5$ 8.8$ 175
Eritrea ‐$ ‐$ 0.10$ 0.00$ 0.03$ 159 Eritrea 0.6$ 0.8$ 2.2$ 2.3$ 3.3$ 182
Estonia 4.43$ 1.08$ 0.04$ 0.28$ 0.10$ 116 Estonia 30.7$ 22.3$ 29.1$ 21.1$ 102.9$ 96
Ethiopia 1.95$ 18.85$ 0.28$ 0.26$ 0.11$ 120 Ethiopia 15.0$ 69.1$ 10.2$ 176.6$ 19.9$ 97
Falkland Islands ‐$ ‐$ ‐$ ‐$ ‐$ 213 Falkland Islands 0.0$ 0.1$ 0.0$ 0.1$ 0.1$ 212
Faroe Islands ‐$ 0.03$ 0.00$ ‐$ ‐$ 185 Faroe Islands 1.8$ 1.9$ 1.0$ 0.5$ 0.5$ 170
Fiji 0.04$ 0.07$ 0.14$ 0.29$ 0.25$ 163 Fiji 4.7$ 3.9$ 5.7$ 3.3$ 6.9$ 133
Finland 19.95$ 4.33$ 5.30$ 10.51$ 23.59$ 55 Finland 645.6$ 959.6$ 297.1$ 380.0$ 722.1$ 36
France 80.37$ 93.95$ 80.52$ 69.97$ 100.30$ 26 France 2,775.0$ 2,988.5$ 2,423.3$ 2,074.8$ 2,864.3$ 8
French Guiana ‐$ ‐$ ‐$ ‐$ ‐$ N/A French Guiana ‐$ ‐$ ‐$ ‐$ ‐$ 224
French Polynesia 0.97$ 0.14$ 0.02$ 0.01$ ‐$ 181 French Polynesia 15.3$ 17.8$ 10.4$ 11.6$ 11.7$ 116
French Southern Terr. 0.00$ 0.01$ ‐$ ‐$ ‐$ 201 French Southern Terr. 0.2$ 0.1$ 0.3$ 0.0$ 0.0$ 197
Gabon 9.82$ 17.28$ 13.25$ 7.35$ 5.55$ 77 Gabon 17.3$ 26.4$ 24.9$ 17.0$ 17.4$ 126
Gambia 0.01$ ‐$ 0.00$ 0.07$ 0.03$ 182 Gambia 0.5$ 0.7$ 0.7$ 0.8$ 0.6$ 199
Georgia 1.25$ 0.69$ 0.18$ 0.09$ 0.50$ 111 Georgia 14.8$ 23.0$ 16.9$ 18.7$ 21.8$ 141
Germany 125.62$ 82.07$ 84.68$ 72.38$ 155.93$ 32 Germany 3,459.3$ 4,089.3$ 3,396.7$ 3,597.4$ 3,674.7$ 6
Ghana 17.58$ 34.82$ 34.90$ 30.56$ 46.19$ 43 Ghana 150.1$ 175.8$ 156.4$ 169.4$ 251.0$ 65
Gibraltar ‐$ 0.05$ ‐$ ‐$ ‐$ 162 Gibraltar 43.1$ 596.7$ 17.2$ 25.1$ 94.3$ 86
Greece 7.93$ 8.63$ 3.07$ 2.87$ 5.12$ 78 Greece 143.6$ 134.4$ 102.0$ 109.3$ 82.8$ 58
Greenland 1.55$ 0.74$ 0.14$ 0.24$ 0.04$ 132 Greenland 13.9$ 11.3$ 11.2$ 9.1$ 12.7$ 112
Grenada 0.30$ 0.12$ 0.04$ ‐$ 0.00$ 173 Grenada 5.9$ 5.7$ 5.5$ 5.1$ 4.4$ 144
Guadeloupe ‐$ ‐$ ‐$ ‐$ ‐$ 217 Guadeloupe ‐$ ‐$ ‐$ ‐$ ‐$ 223
Guam 0.06$ 0.15$ 0.08$ 0.19$ 0.11$ 166 Guam 2.6$ 2.6$ 1.8$ 1.8$ 2.0$ 159
Guatemala 7.64$ 11.71$ 39.12$ 6.33$ 4.94$ 79 Guatemala 123.3$ 147.5$ 108.5$ 87.2$ 103.8$ 49
Guinea 0.80$ 0.53$ 0.19$ 0.11$ 0.52$ 137 Guinea 8.3$ 16.5$ 13.5$ 7.9$ 23.2$ 139
Guinea‐Bissau ‐$ ‐$ ‐$ 0.00$ 0.01$ 202 Guinea‐Bissau 0.1$ 0.7$ 0.0$ 0.0$ 0.1$ 211
Guyana 4.17$ 2.94$ 5.83$ 5.29$ 6.73$ 88 Guyana 25.7$ 20.2$ 27.0$ 27.8$ 35.4$ 113
Haiti 0.41$ 2.36$ 1.97$ 0.69$ 0.31$ 153 Haiti 26.4$ 48.6$ 38.6$ 46.1$ 36.3$ 91
Heard & McDonald Is. ‐$ ‐$ ‐$ ‐$ ‐$ 189 Heard & McDonald Is. 0.0$ ‐$ 0.1$ 0.0$ ‐$ 208
High Seas ‐$ ‐$ ‐$ ‐$ ‐$ N/A High Seas 0.0$ ‐$ ‐$ ‐$ ‐$ 217
Honduras 2.94$ 5.62$ 2.05$ 0.25$ 0.26$ 138 Honduras 43.6$ 80.0$ 31.7$ 35.8$ 42.3$ 85
Hong Kong 132.80$ 106.97$ 99.22$ 146.93$ 141.77$ 21 Hong Kong 1,324.5$ 1,580.9$ 1,337.4$ 1,708.7$ 2,714.7$ 15
Canada's Exports ($CDN, Millions)
Country Country
Alberta's Exports ($CDN, Millions)

2011InternationalTradeReview
99
2007 2008 2009 2010 2011 Rank 2007 2008 2009 2010 2011 Rank
Hungary 7.40$ 7.83$ 5.30$ 5.53$ 6.11$ 89 Hungary 82.0$ 136.2$ 84.2$ 99.5$ 93.8$ 82
Iceland 2.97$ 2.57$ 0.72$ 0.75$ 0.64$ 119 Iceland 87.4$ 47.8$ 77.8$ 103.1$ 50.3$ 69
India 109.35$ 85.47$ 121.58$ 66.56$ 116.69$ 23 India 1,712.5$ 2,324.7$ 2,037.3$ 1,985.7$ 2,566.1$ 18
Indonesia 217.53$ 322.79$ 178.30$ 143.37$ 227.16$ 9 Indonesia 972.6$ 1,445.7$ 953.0$ 1,041.1$ 1,587.9$ 20
Iran 16.42$ 195.18$ 110.70$ 7.17$ 7.20$ 57 Iran 261.0$ 662.6$ 405.6$ 105.9$ 112.0$ 42
Iraq 85.58$ 58.37$ 189.16$ 76.91$ 60.55$ 12 Iraq 245.1$ 180.5$ 477.1$ 221.6$ 176.1$ 72
Ireland 14.17$ 14.39$ 13.05$ 16.19$ 30.92$ 41 Ireland 324.5$ 436.3$ 516.8$ 312.7$ 345.9$ 41
Israel 34.04$ 83.78$ 12.35$ 34.99$ 60.62$ 67 Israel 375.3$ 542.9$ 302.4$ 347.7$ 363.6$ 31
Italy 201.69$ 161.35$ 158.22$ 156.83$ 192.48$ 19 Italy 2,464.1$ 2,232.3$ 1,659.0$ 1,830.0$ 1,877.8$ 11
Jamaica 27.88$ 31.21$ 9.81$ 16.12$ 4.81$ 59 Jamaica 190.2$ 188.0$ 118.4$ 124.8$ 106.1$ 54
Japan 1,458.97$ 2,030.75$ 1,491.32$ 1,472.42$ 1,832.28$ 3 Japan 8,941.3$ 10,889.1$ 8,071.4$ 9,060.4$ 10,532.3$ 2
Jordan 1.41$ 1.62$ 0.95$ 1.91$ 1.18$ 92 Jordan 56.4$ 71.8$ 58.6$ 58.6$ 61.4$ 60
Kazakhstan 40.73$ 96.68$ 29.90$ 24.15$ 11.00$ 52 Kazakhstan 156.1$ 224.8$ 190.4$ 123.2$ 137.2$ 63
Kenya 1.84$ 5.92$ 0.89$ 0.40$ 13.44$ 86 Kenya 63.5$ 72.7$ 64.7$ 67.7$ 77.0$ 88
Kiribati 0.00$ 0.00$ ‐$ ‐$ 0.05$ 190 Kiribati 0.2$ 0.0$ 0.1$ 0.1$ 0.1$ 201
Korea, North 3.24$ 2.75$ 0.62$ 0.21$ 0.07$ 188 Korea, North 19.3$ 22.1$ 23.0$ 10.6$ 5.1$ 102
Korea, South 463.25$ 517.30$ 532.73$ 541.37$ 707.25$ 5 Korea, South 2,900.8$ 3,739.4$ 3,306.4$ 3,636.2$ 5,035.5$ 7
Kuwait 21.81$ 50.60$ 20.44$ 25.85$ 9.99$ 72 Kuwait 102.2$ 145.4$ 93.0$ 84.3$ 95.5$ 62
Kyrgyzstan 0.87$ 1.29$ 1.20$ 0.65$ 0.31$ 121 Kyrgyzstan 6.1$ 6.3$ 3.6$ 5.0$ 10.6$ 162
Laos 0.00$ 0.01$ 0.04$ 0.03$ 0.04$ 187 Laos 0.7$ 17.6$ 2.6$ 2.7$ 6.6$ 188
Latvia 0.94$ 2.86$ 4.39$ 1.90$ 4.25$ 56 Latvia 36.4$ 45.8$ 22.8$ 171.6$ 46.2$ 90
Lebanon 1.69$ 1.33$ 2.81$ 1.46$ 1.04$ 135 Lebanon 54.2$ 74.1$ 184.3$ 60.8$ 71.7$ 84
Lesotho 0.23$ ‐$ ‐$ ‐$ ‐$ 203 Lesotho 0.3$ 0.0$ 0.2$ 0.1$ 0.1$ 198
Liberia 0.06$ 0.03$ 0.08$ 1.32$ 0.04$ 169 Liberia 7.4$ 10.5$ 4.0$ 11.7$ 12.6$ 160
Libya 18.37$ 38.59$ 66.92$ 34.84$ 5.31$ 64 Libya 181.9$ 109.6$ 236.2$ 211.4$ 44.5$ 70
Lithuania 0.86$ 1.08$ 2.53$ 4.40$ 4.95$ 71 Lithuania 36.0$ 44.9$ 38.4$ 34.9$ 46.2$ 95
Luxembourg 1.74$ 1.31$ 1.87$ 0.04$ 0.91$ 143 Luxembourg 231.2$ 170.5$ 62.6$ 50.9$ 79.5$ 74
Macau 24.90$ 27.02$ 7.52$ 0.33$ 0.18$ 160 Macau 41.2$ 43.1$ 13.9$ 2.3$ 3.1$ 92
Macedonia 0.39$ 0.28$ 0.52$ 0.65$ 2.54$ 112 Macedonia 15.8$ 11.4$ 14.9$ 11.0$ 17.4$ 132
Madagascar 0.24$ 1.32$ 1.97$ 11.34$ 2.56$ 103 Madagascar 7.7$ 10.7$ 54.4$ 44.7$ 14.0$ 189
Malawi 0.01$ 0.02$ 0.00$ ‐$ 0.02$ 154 Malawi 4.8$ 5.6$ 4.2$ 3.5$ 4.4$ 165
Malaysia 85.89$ 119.26$ 60.01$ 92.33$ 74.41$ 25 Malaysia 531.4$ 780.2$ 564.0$ 729.5$ 708.5$ 34
Maldives 2.03$ 2.04$ 1.61$ 1.86$ 0.97$ 107 Maldives 3.6$ 5.1$ 11.1$ 4.6$ 4.9$ 145
Mali 0.86$ 0.18$ 0.05$ 0.17$ 0.52$ 128 Mali 6.1$ 8.2$ 5.7$ 8.0$ 21.6$ 147
Malta 0.41$ 0.30$ 0.05$ 0.60$ ‐$ 161 Malta 9.6$ 16.4$ 45.3$ 108.0$ 53.1$ 136
Martinique ‐$ ‐$ ‐$ ‐$ ‐$ 218 Martinique ‐$ ‐$ ‐$ ‐$ ‐$ 222
Mauritania 1.71$ 0.00$ 0.10$ 0.35$ 0.19$ 123 Mauritania 8.6$ 4.4$ 2.3$ 5.0$ 13.3$ 163
Mauritius 0.02$ 0.00$ 0.00$ 0.00$ 0.05$ 168 Mauritius 4.5$ 6.4$ 5.2$ 4.9$ 5.0$ 177
Mexico 720.02$ 1,077.12$ 977.34$ 743.99$ 936.37$ 4 Mexico 4,300.1$ 5,152.1$ 3,837.2$ 4,303.5$ 4,676.9$ 5
Moldova 0.00$ 0.23$ ‐$ 0.00$ 0.07$ 165 Moldova 1.2$ 10.0$ 2.5$ 2.2$ 0.9$ 185
Mongolia 0.54$ 1.38$ 0.68$ 1.79$ 10.13$ 104 Mongolia 8.9$ 8.7$ 4.3$ 25.2$ 87.3$ 121
Montenegro ‐$ 0.18$ 0.09$ ‐$ 0.00$ 223 Montenegro 1.5$ 7.5$ 2.2$ 1.7$ 1.4$ 225
Montserrat ‐$ ‐$ ‐$ ‐$ ‐$ 186 Montserrat 0.3$ 0.4$ 0.3$ 0.2$ 0.3$ 191
Morocco 27.27$ 38.65$ 50.22$ 20.80$ 25.56$ 39 Morocco 235.1$ 299.9$ 370.6$ 167.2$ 289.2$ 47
Mozambique 6.57$ 1.62$ 0.01$ 1.34$ 2.49$ 74 Mozambique 16.3$ 10.6$ 7.5$ 12.5$ 12.4$ 110
Myanmar 0.00$ ‐$ ‐$ ‐$ ‐$ 105 Myanmar 0.0$ 0.1$ 0.0$ 2.7$ 0.8$ 194
Namibia 1.41$ 0.07$ 0.75$ 0.66$ 1.37$ 96 Namibia 4.9$ 5.3$ 4.2$ 11.2$ 7.5$ 180
Nauru ‐$ 0.17$ ‐$ ‐$ ‐$ 191 Nauru ‐$ 0.2$ 0.1$ 1.3$ ‐$ 214
Nepal 0.20$ 0.23$ 0.18$ 0.83$ 0.63$ 152 Nepal 10.0$ 2.9$ 3.9$ 5.3$ 6.2$ 149
Netherlands 565.60$ 342.98$ 301.77$ 434.64$ 515.42$ 6 Netherlands 3,593.5$ 3,457.6$ 2,554.9$ 3,114.1$ 4,605.4$ 10
Netherlands Antilles 3.19$ 0.93$ 0.26$ 0.65$ 0.80$ 109 Netherlands Antilles 52.0$ 41.2$ 72.4$ 44.4$ 129.8$ 108
New Caledonia 4.92$ 9.69$ 4.25$ 13.80$ 0.01$ 174 New Caledonia 23.1$ 29.9$ 12.0$ 44.1$ 8.0$ 122
New Zealand 57.80$ 80.87$ 47.56$ 70.62$ 66.00$ 37 New Zealand 372.4$ 429.2$ 270.9$ 300.4$ 364.5$ 37
Nicaragua 2.02$ 2.90$ 4.73$ 2.80$ 7.80$ 145 Nicaragua 19.8$ 25.6$ 17.0$ 38.1$ 33.6$ 104
Niger 0.03$ 0.06$ 0.25$ 0.26$ 0.31$ 150 Niger 3.8$ 3.6$ 3.0$ 2.4$ 4.7$ 155
Nigeria 13.87$ 12.82$ 36.41$ 30.39$ 34.10$ 35 Nigeria 160.2$ 84.2$ 196.8$ 199.4$ 197.3$ 66
Niue ‐$ ‐$ ‐$ ‐$ ‐$ 193 Niue 0.0$ ‐$ ‐$ ‐$ 0.1$ 215
Norfolk Island 0.00$ 0.01$ 0.29$ ‐$ ‐$ 194 Norfolk Island 0.1$ 0.1$ 0.3$ 0.1$ ‐$ 200
Norway 36.99$ 38.19$ 38.45$ 35.16$ 48.99$ 42 Norway 3,654.0$ 2,802.8$ 1,745.6$ 2,509.8$ 2,757.8$ 12
Oman 22.61$ 66.65$ 84.36$ 49.16$ 41.85$ 36 Oman 112.6$ 101.4$ 112.4$ 98.9$ 101.8$ 103
Pakistan 102.22$ 167.34$ 83.83$ 107.13$ 175.25$ 40 Pakistan 446.4$ 542.0$ 400.9$ 538.4$ 682.0$ 39
Panama 3.62$ 0.95$ 0.41$ 1.83$ 2.25$ 87 Panama 74.5$ 110.3$ 80.3$ 116.5$ 100.6$ 81
Papua New Guinea 0.64$ 1.07$ 1.42$ 1.65$ 5.80$ 73 Papua New Guinea 3.4$ 11.1$ 30.2$ 37.7$ 44.9$ 151
Paraguay 0.03$ 0.22$ 0.09$ 0.06$ 0.09$ 146 Paraguay 7.1$ 15.5$ 10.6$ 14.3$ 11.5$ 135
Peru 42.21$ 64.18$ 93.44$ 85.32$ 78.46$ 28 Peru 290.7$ 355.3$ 390.9$ 445.7$ 488.5$ 44
Philippines 66.74$ 73.04$ 90.72$ 59.20$ 59.28$ 45 Philippines 428.8$ 524.9$ 513.0$ 669.9$ 541.2$ 35
Pitcairn ‐$ ‐$ 0.00$ ‐$ ‐$ 180 Pitcairn 0.1$ 0.3$ 0.2$ 0.1$ 0.0$ 196
Poland 2.80$ 6.72$ 6.85$ 7.38$ 15.96$ 62 Poland 246.3$ 316.6$ 178.3$ 169.1$ 209.9$ 45
Portugal 4.38$ 1.06$ 18.96$ 16.42$ 35.42$ 51 Portugal 159.7$ 204.5$ 191.1$ 268.3$ 221.2$ 51
Qatar 23.35$ 8.60$ 9.42$ 3.66$ 7.78$ 69 Qatar 84.4$ 78.6$ 207.6$ 77.6$ 149.6$ 67
Reunion Reunion ‐$ ‐$ ‐$ ‐$ ‐$ 219
Romania 6.17$ 7.35$ 8.67$ 6.86$ 16.61$ 83 Romania 133.8$ 226.5$ 84.4$ 91.8$ 56.0$ 53
Russia 210.99$ 213.85$ 200.65$ 239.95$ 274.81$ 10 Russia 1,055.5$ 1,406.1$ 800.0$ 1,073.7$ 1,403.5$ 21
Rwanda ‐$ 0.07$ 0.05$ 0.03$ 0.11$ 149 Rwanda 1.6$ 4.0$ 3.2$ 1.0$ 1.0$ 171
Samoa (Western) ‐$ ‐$ 0.10$ ‐$ ‐$ 195 Samoa (Western) 0.2$ 0.4$ 0.4$ 0.3$ 0.3$ 204
Sao Tome & Principe ‐$ ‐$ ‐$ ‐$ ‐$ 211 Sao Tome & Principe 0.1$ 0.0$ 0.1$ 0.0$ 0.1$ 210
Saudi Arabia 90.92$ 173.35$ 200.65$ 107.42$ 131.08$ 17 Saudi Arabia 649.4$ 969.4$ 1,110.6$ 908.7$ 804.4$ 32
Senegal 2.67$ 3.43$ 3.40$ 3.11$ 3.29$ 85 Senegal 32.9$ 27.5$ 33.8$ 25.6$ 25.5$ 99
Serbia 0.09$ 0.46$ 0.27$ 0.13$ 0.57$ 117 Serbia 10.4$ 14.7$ 17.8$ 7.1$ 8.2$ 226
Serbia and Montenegro ‐$ ‐$ ‐$ ‐$ ‐$ 222 Serbia and Montenegro ‐$ ‐$ ‐$ ‐$ ‐$ 140
Seychelles 0.00$ 0.01$ ‐$ 0.01$ 0.07$ 90 Seychelles 1.2$ 1.7$ 1.1$ 1.0$ 4.2$ 186
Sierra Leone 0.15$ 0.72$ 0.03$ 0.05$ 0.11$ 148 Sierra Leone 9.7$ 9.1$ 4.6$ 9.6$ 9.9$ 158
Singapore 247.10$ 190.40$ 218.84$ 150.79$ 151.88$ 14 Singapore 719.9$ 686.6$ 839.1$ 665.0$ 669.8$ 24
Slovakia 19.09$ 33.24$ 0.77$ 8.28$ 46.84$ 100 Slovakia 89.6$ 57.5$ 25.0$ 30.3$ 68.5$ 105
Slovenia 0.07$ 0.17$ 0.53$ 0.04$ 0.05$ 142 Slovenia 90.8$ 70.5$ 54.2$ 32.3$ 10.1$ 76
Solomon Islands 0.00$ ‐$ 0.06$ 0.03$ 0.01$ 196 Solomon Islands 0.2$ 0.1$ 0.7$ 0.1$ 0.3$ 209
Somalia 0.19$ 0.19$ ‐$ ‐$ ‐$ 209 Somalia 1.8$ 4.8$ 2.9$ 2.3$ 1.1$ 181
South Africa 105.83$ 232.56$ 43.84$ 60.49$ 112.11$ 38 South Africa 640.3$ 851.2$ 404.7$ 435.2$ 632.6$ 30
Spain 72.05$ 47.28$ 42.76$ 27.30$ 61.77$ 47 Spain 1,159.9$ 1,078.4$ 1,037.9$ 909.8$ 950.1$ 16
Sri Lanka 73.33$ 127.84$ 99.05$ 86.14$ 96.53$ 20 Sri Lanka 246.1$ 391.4$ 332.2$ 346.3$ 300.6$ 59
St. Helena ‐$ 0.01$ ‐$ 0.00$ ‐$ 210 St. Helena 0.5$ 0.4$ 0.1$ 0.0$ 0.1$ 218
St. Kitts & Nevis 0.07$ 0.21$ 0.04$ 0.05$ 0.09$ 170 St. Kitts & Nevis 8.8$ 7.9$ 6.2$ 6.7$ 5.7$ 153
St. Lucia 0.23$ 0.43$ 0.15$ 0.01$ 0.17$ 156 St. Lucia 15.1$ 12.3$ 10.0$ 35.7$ 8.5$ 142
St. Pierre & Miquelon 0.00$ 0.03$ 0.02$ 0.02$ 0.02$ 176 St. Pierre & Miquelon 12.8$ 14.0$ 14.8$ 14.6$ 16.5$ 109
St. Vincent & the Grenadi 0.21$ 0.13$ 0.08$ 0.17$ 0.04$ 167 St. Vincent & the Grenadi 9.8$ 7.7$ 11.6$ 10.8$ 6.7$ 143
Sudan 75.85$ 83.00$ 38.94$ 34.97$ 49.42$ 44 Sudan 207.7$ 220.5$ 110.3$ 116.7$ 137.5$ 61
Suriname 0.05$ 0.22$ 0.26$ 0.00$ 0.19$ 178 Suriname 9.0$ 9.8$ 11.1$ 9.9$ 11.7$ 129
Swaziland 0.25$ 0.36$ 2.57$ 0.01$ 0.01$ 155 Swaziland 4.9$ 6.0$ 11.0$ 1.5$ 1.0$ 166
Sweden 13.91$ 10.04$ 7.78$ 9.94$ 10.32$ 68 Sweden 496.2$ 529.7$ 345.1$ 442.4$ 456.3$ 27
Country
Alberta's Exports ($CDN, Millions)
Country
Canada's Exports ($CDN, Millions)

2011InternationalTradeReview
100
Country Alberta's Exports ($CDN, Millions) Country Canada's Exports ($CDN, Millions)
2007 2008 2009 2010 2011 Rank 2007 2008 2009 2010 2011 Rank
Switzerland 31.14$ 42.70$ 69.43$ 83.81$ 88.41$ 29 Switzerland 1,295.7$ 1,241.0$ 1,146.3$ 1,470.7$ 1,091.8$ 19
Syria 7.25$ 10.25$ 13.71$ 10.32$ 5.25$ 183 Syria 62.2$ 63.2$ 46.0$ 57.6$ 51.7$ 77
Taiwan 250.24$ 231.80$ 156.64$ 190.02$ 187.58$ 16 Taiwan 1,483.6$ 1,507.8$ 1,050.5$ 1,239.0$ 1,691.3$ 14
Tajikistan ‐$ 0.02$ 0.05$ 2.65$ 0.04$ 220 Tajikistan 2.2$ 4.6$ 3.5$ 5.2$ 3.6$ 178
Tanzania 4.50$ 2.46$ 0.64$ 4.63$ 5.20$ 66 Tanzania 41.4$ 51.6$ 34.1$ 49.7$ 53.7$ 93
Thailand 77.18$ 94.11$ 78.55$ 65.19$ 84.63$ 31 Thailand 537.0$ 660.5$ 513.4$ 619.8$ 769.0$ 26
Togo 2.42$ 4.13$ 2.52$ 1.92$ 3.30$ 81 Togo 12.2$ 18.1$ 18.3$ 11.4$ 13.4$ 127
Tokelau ‐$ ‐$ ‐$ ‐$ ‐$ 197 Tokelau ‐$ ‐$ ‐$ ‐$ ‐$ 220
Tonga 0.03$ ‐$ ‐$ 1.40$ ‐$ 198 Tonga 0.6$ 0.5$ 0.2$ 4.5$ 0.2$ 202
Trinidad & Tobago 6.25$ 10.18$ 7.73$ 5.51$ 13.33$ 76 Trinidad & Tobago 210.2$ 262.7$ 247.7$ 289.0$ 332.9$ 55
Tunisia 23.80$ 14.57$ 23.93$ 8.25$ 16.40$ 54 Tunisia 104.4$ 82.0$ 102.6$ 88.5$ 93.0$ 87
Turkey 22.62$ 35.88$ 19.82$ 12.80$ 24.99$ 61 Turkey 652.2$ 1,212.5$ 811.5$ 823.6$ 1,250.4$ 25
Turkmenistan 6.48$ 12.94$ 3.75$ 1.53$ 5.21$ 102 Turkmenistan 6.9$ 13.5$ 6.7$ 5.1$ 12.1$ 94
Turks & Caicos Islands 0.03$ 0.02$ 0.11$ 0.48$ 0.01$ 164 Turks & Caicos Islands 11.6$ 7.0$ 6.2$ 4.3$ 1.8$ 137
U.S. Minor Outlying Is. 0.07$ 0.12$ 0.11$ 0.05$ 0.67$ 108 U.S. Minor Outlying Is. 11.5$ 15.8$ 12.3$ 14.5$ 12.3$ 128
Uganda 0.77$ 1.17$ 1.18$ 2.04$ 0.90$ 115 Uganda 11.0$ 19.5$ 11.9$ 9.7$ 8.7$ 131
Ukraine 10.14$ 10.43$ 8.31$ 29.77$ 15.65$ 53 Ukraine 114.2$ 221.1$ 100.2$ 145.1$ 132.3$ 71
United Arab Emirates 150.83$ 225.91$ 170.32$ 186.68$ 293.27$ 7 United Arab Emirates 999.2$ 1,333.0$ 1,157.2$ 1,008.5$ 1,222.0$ 23
United Kingdom 248.20$ 218.36$ 161.24$ 149.56$ 137.97$ 15 United Kingdom 11,381.8$ 12,388.5$ 11,473.4$ 15,518.1$ 18,257.3$ 3
United States 70,573.41$ 96,686.60$ 58,912.81$ 68,273.15$ 80,749.74$ 1 United States 332,965.3$ 353,293.4$ 251,098.8$ 279,396.0$ 307,192.9$ 1
Uruguay 0.64$ 0.40$ 0.31$ 0.71$ 0.52$ 114 Uruguay 21.0$ 207.9$ 21.1$ 108.5$ 113.7$ 101
Uzbekistan 2.64$ 1.49$ 2.75$ 1.63$ 2.88$ 98 Uzbekistan 7.8$ 16.0$ 15.0$ 5.8$ 7.2$ 134
Vanuatu 0.00$ 0.00$ ‐$ ‐$ ‐$ 199 Vanuatu 0.2$ 0.6$ 2.0$ 1.7$ 1.0$ 184
Venezuela 102.89$ 155.53$ 125.66$ 83.14$ 118.71$ 11 Venezuela 659.1$ 804.0$ 583.5$ 544.2$ 582.5$ 22
Vietnam 64.98$ 58.64$ 21.41$ 29.21$ 27.81$ 46 Vietnam 273.5$ 298.2$ 205.6$ 247.6$ 317.4$ 48
Virgin Islands (British) 0.21$ 3.37$ 0.04$ 0.97$ 0.12$ 212 Virgin Islands (British) 2.1$ 8.7$ 3.3$ 22.2$ 48.2$ 164
Wallis & Futuna Islands ‐$ 0.05$ ‐$ ‐$ ‐$ 200 Wallis & Futuna Islands ‐$ 0.0$ 0.0$ ‐$ 0.0$ 221
Western Sahara ‐$ ‐$ ‐$ ‐$ ‐$ 208 Western Sahara ‐$ 0.0$ 0.0$ 0.0$ ‐$ 216
Yemen 16.69$ 13.42$ 9.00$ 4.70$ 2.95$ 106 Yemen 22.3$ 82.1$ 25.9$ 18.0$ 9.2$ 89
Zambia 0.15$ 0.23$ 0.01$ 0.01$ 0.07$ 134 Zambia 65.8$ 23.1$ 9.4$ 27.4$ 28.6$ 111
Zimbabwe 0.02$ ‐$ 0.01$ 0.06$ 0.07$ 177 Zimbabwe 6.3$ 5.0$ 8.0$ 5.6$ 8.8$ 150
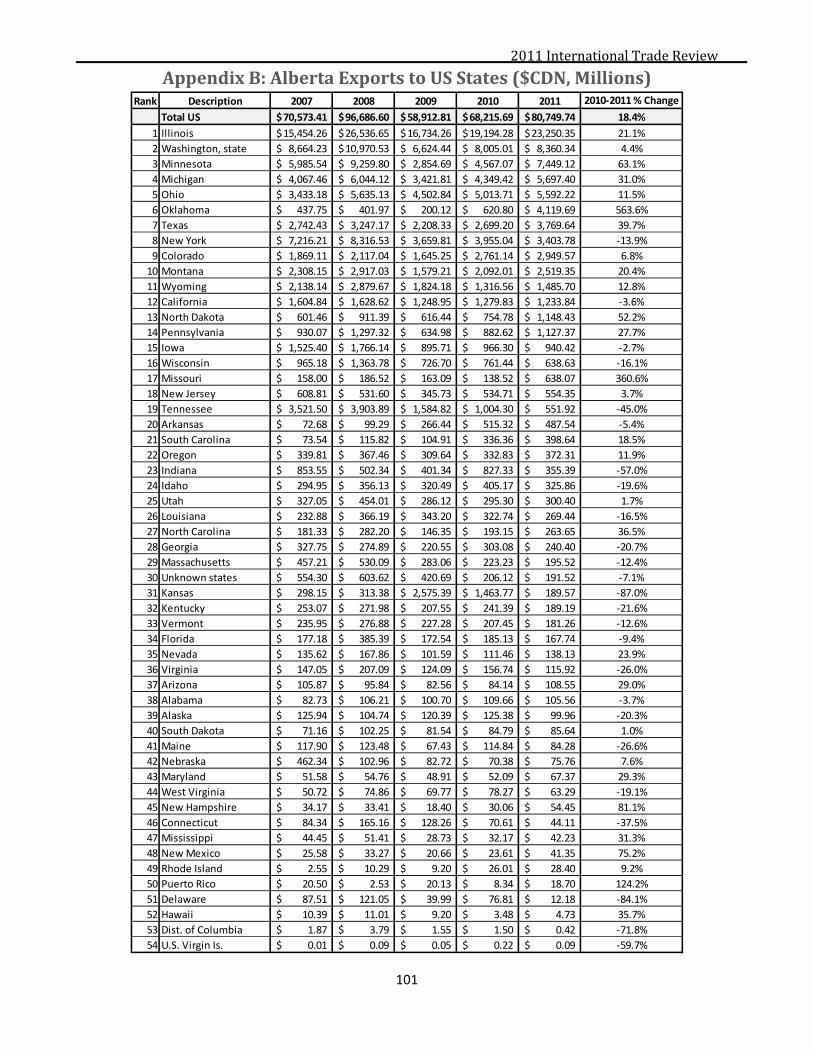
2011InternationalTradeReview
101
AppendixB:AlbertaExportstoUSStates($CDN,Millions)
Rank Description 2007 2008 2009 2010 2011 2010‐2011 % Change
Total US 70,573.41$ 96,686.60$ 58,912.81$ 68,215.69$ 80,749.74$ 18.4%
1 Illinois 15,454.26$ 26,536.65$ 16,734.26$ 19,194.28$ 23,250.35$ 21.1%
2 Washington, state 8,664.23$ 10,970.53$ 6,624.44$ 8,005.01$ 8,360.34$ 4.4%
3 Minnesota 5,985.54$ 9,259.80$ 2,854.69$ 4,567.07$ 7,449.12$ 63.1%
4 Michigan 4,067.46$ 6,044.12$ 3,421.81$ 4,349.42$ 5,697.40$ 31.0%
5 Ohio 3,433.18$ 5,635.13$ 4,502.84$ 5,013.71$ 5,592.22$ 11.5%
6 Oklahoma 437.75$ 401.97$ 200.12$ 620.80$ 4,119.69$ 563.6%
7 Texas 2,742.43$ 3,247.17$ 2,208.33$ 2,699.20$ 3,769.64$ 39.7%
8 New York 7,216.21$ 8,316.53$ 3,659.81$ 3,955.04$ 3,403.78$ ‐13.9%
9 Colorado 1,869.11$ 2,117.04$ 1,645.25$ 2,761.14$ 2,949.57$ 6.8%
10 Montana 2,308.15$ 2,917.03$ 1,579.21$ 2,092.01$ 2,519.35$ 20.4%
11 Wyoming 2,138.14$ 2,879.67$ 1,824.18$ 1,316.56$ 1,485.70$ 12.8%
12 California 1,604.84$ 1,628.62$ 1,248.95$ 1,279.83$ 1,233.84$ ‐3.6%
13 North Dakota 601.46$ 911.39$ 616.44$ 754.78$ 1,148.43$ 52.2%
14 Pennsylvania 930.07$ 1,297.32$ 634.98$ 882.62$ 1,127.37$ 27.7%
15 Iowa 1,525.40$ 1,766.14$ 895.71$ 966.30$ 940.42$ ‐2.7%
16 Wisconsin 965.18$ 1,363.78$ 726.70$ 761.44$ 638.63$ ‐16.1%
17 Missouri 158.00$ 186.52$ 163.09$ 138.52$ 638.07$ 360.6%
18 New Jersey 608.81$ 531.60$ 345.73$ 534.71$ 554.35$ 3.7%
19 Tennessee 3,521.50$ 3,903.89$ 1,584.82$ 1,004.30$ 551.92$ ‐45.0%
20 Arkansas 72.68$ 99.29$ 266.44$ 515.32$ 487.54$ ‐5.4%
21 South Carolina 73.54$ 115.82$ 104.91$ 336.36$ 398.64$ 18.5%
22 Oregon 339.81$ 367.46$ 309.64$ 332.83$ 372.31$ 11.9%
23 Indiana 853.55$ 502.34$ 401.34$ 827.33$ 355.39$ ‐57.0%
24 Idaho 294.95$ 356.13$ 320.49$ 405.17$ 325.86$ ‐19.6%
25 Utah 327.05$ 454.01$ 286.12$ 295.30$ 300.40$ 1.7%
26 Louisiana 232.88$ 366.19$ 343.20$ 322.74$ 269.44$ ‐16.5%
27 North Carolina 181.33$ 282.20$ 146.35$ 193.15$ 263.65$ 36.5%
28 Georgia 327.75$ 274.89$ 220.55$ 303.08$ 240.40$ ‐20.7%
29 Massachusetts 457.21$ 530.09$ 283.06$ 223.23$ 195.52$ ‐12.4%
30 Unknown states 554.30$ 603.62$ 420.69$ 206.12$ 191.52$ ‐7.1%
31 Kansas 298.15$ 313.38$ 2,575.39$ 1,463.77$ 189.57$ ‐87.0%
32 Kentucky 253.07$ 271.98$ 207.55$ 241.39$ 189.19$ ‐21.6%
33 Vermont 235.95$ 276.88$ 227.28$ 207.45$ 181.26$ ‐12.6%
34 Florida 177.18$ 385.39$ 172.54$ 185.13$ 167.74$ ‐9.4%
35 Nevada 135.62$ 167.86$ 101.59$ 111.46$ 138.13$ 23.9%
36 Virginia 147.05$ 207.09$ 124.09$ 156.74$ 115.92$ ‐26.0%
37 Arizona 105.87$ 95.84$ 82.56$ 84.14$ 108.55$ 29.0%
38 Alabama 82.73$ 106.21$ 100.70$ 109.66$ 105.56$ ‐3.7%
39 Alaska 125.94$ 104.74$ 120.39$ 125.38$ 99.96$ ‐20.3%
40 South Dakota 71.16$ 102.25$ 81.54$ 84.79$ 85.64$ 1.0%
41 Maine 117.90$ 123.48$ 67.43$ 114.84$ 84.28$ ‐26.6%
42 Nebraska 462.34$ 102.96$ 82.72$ 70.38$ 75.76$ 7.6%
43 Maryland 51.58$ 54.76$ 48.91$ 52.09$ 67.37$ 29.3%
44 West Virginia 50.72$ 74.86$ 69.77$ 78.27$ 63.29$ ‐19.1%
45 New Hampshire 34.17$ 33.41$ 18.40$ 30.06$ 54.45$ 81.1%
46 Connecticut 84.34$ 165.16$ 128.26$ 70.61$ 44.11$ ‐37.5%
47 Mississippi 44.45$ 51.41$ 28.73$ 32.17$ 42.23$ 31.3%
48 New Mexico 25.58$ 33.27$ 20.66$ 23.61$ 41.35$ 75.2%
49 Rhode Island 2.55$ 10.29$ 9.20$ 26.01$ 28.40$ 9.2%
50 Puerto Rico 20.50$ 2.53$ 20.13$ 8.34$ 18.70$ 124.2%
51 Delaware 87.51$ 121.05$ 39.99$ 76.81$ 12.18$ ‐84.1%
52 Hawaii 10.39$ 11.01$ 9.20$ 3.48$ 4.73$ 35.7%
53 Dist. of Columbia 1.87$ 3.79$ 1.55$ 1.50$ 0.42$ ‐71.8%
54 U.S. Virgin Is. 0.01$ 0.09$ 0.05$ 0.22$ 0.09$ ‐59.7%
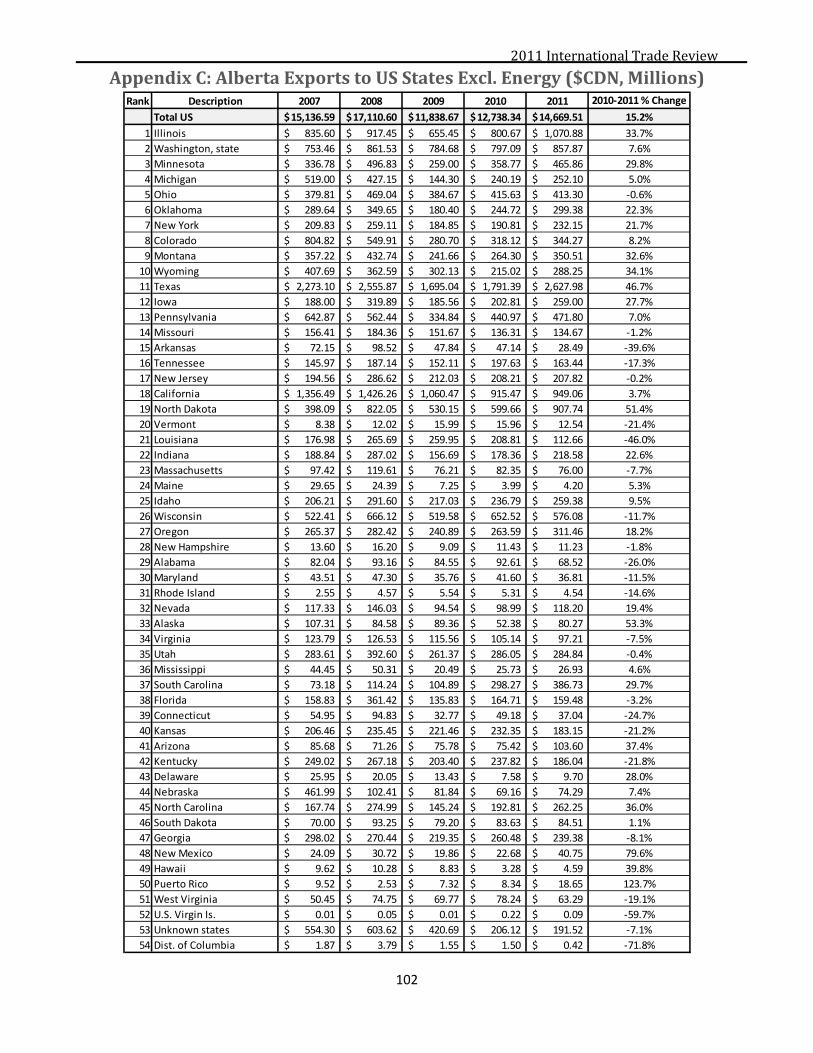
2011InternationalTradeReview
102
AppendixC:AlbertaExportstoUSStatesExcl.Energy($CDN,Millions)
Rank Description 2007 2008 2009 2010 2011 2010‐2011 % Change
Total US 15,136.59$ 17,110.60$ 11,838.67$ 12,738.34$ 14,669.51$ 15.2%
1 Illinois 835.60$ 917.45$ 655.45$ 800.67$ 1,070.88$ 33.7%
2 Washington, state 753.46$ 861.53$ 784.68$ 797.09$ 857.87$ 7.6%
3 Minnesota 336.78$ 496.83$ 259.00$ 358.77$ 465.86$ 29.8%
4 Michigan 519.00$ 427.15$ 144.30$ 240.19$ 252.10$ 5.0%
5 Ohio 379.81$ 469.04$ 384.67$ 415.63$ 413.30$ ‐0.6%
6 Oklahoma 289.64$ 349.65$ 180.40$ 244.72$ 299.38$ 22.3%
7 New York 209.83$ 259.11$ 184.85$ 190.81$ 232.15$ 21.7%
8 Colorado 804.82$ 549.91$ 280.70$ 318.12$ 344.27$ 8.2%
9 Montana 357.22$ 432.74$ 241.66$ 264.30$ 350.51$ 32.6%
10 Wyoming 407.69$ 362.59$ 302.13$ 215.02$ 288.25$ 34.1%
11 Texas 2,273.10$ 2,555.87$ 1,695.04$ 1,791.39$ 2,627.98$ 46.7%
12 Iowa 188.00$ 319.89$ 185.56$ 202.81$ 259.00$ 27.7%
13 Pennsylvania 642.87$ 562.44$ 334.84$ 440.97$ 471.80$ 7.0%
14 Missouri 156.41$ 184.36$ 151.67$ 136.31$ 134.67$ ‐1.2%
15 Arkansas 72.15$ 98.52$ 47.84$ 47.14$ 28.49$ ‐39.6%
16 Tennessee 145.97$ 187.14$ 152.11$ 197.63$ 163.44$ ‐17.3%
17 New Jersey 194.56$ 286.62$ 212.03$ 208.21$ 207.82$ ‐0.2%
18 California 1,356.49$ 1,426.26$ 1,060.47$ 915.47$ 949.06$ 3.7%
19 North Dakota 398.09$ 822.05$ 530.15$ 599.66$ 907.74$ 51.4%
20 Vermont 8.38$ 12.02$ 15.99$ 15.96$ 12.54$ ‐21.4%
21 Louisiana 176.98$ 265.69$ 259.95$ 208.81$ 112.66$ ‐46.0%
22 Indiana 188.84$ 287.02$ 156.69$ 178.36$ 218.58$ 22.6%
23 Massachusetts 97.42$ 119.61$ 76.21$ 82.35$ 76.00$ ‐7.7%
24 Maine 29.65$ 24.39$ 7.25$ 3.99$ 4.20$ 5.3%
25 Idaho 206.21$ 291.60$ 217.03$ 236.79$ 259.38$ 9.5%
26 Wisconsin 522.41$ 666.12$ 519.58$ 652.52$ 576.08$ ‐11.7%
27 Oregon 265.37$ 282.42$ 240.89$ 263.59$ 311.46$ 18.2%
28 New Hampshire 13.60$ 16.20$ 9.09$ 11.43$ 11.23$ ‐1.8%
29 Alabama 82.04$ 93.16$ 84.55$ 92.61$ 68.52$ ‐26.0%
30 Maryland 43.51$ 47.30$ 35.76$ 41.60$ 36.81$ ‐11.5%
31 Rhode Island 2.55$ 4.57$ 5.54$ 5.31$ 4.54$ ‐14.6%
32 Nevada 117.33$ 146.03$ 94.54$ 98.99$ 118.20$ 19.4%
33 Alaska 107.31$ 84.58$ 89.36$ 52.38$ 80.27$ 53.3%
34 Virginia 123.79$ 126.53$ 115.56$ 105.14$ 97.21$ ‐7.5%
35 Utah 283.61$ 392.60$ 261.37$ 286.05$ 284.84$ ‐0.4%
36 Mississippi 44.45$ 50.31$ 20.49$ 25.73$ 26.93$ 4.6%
37 South Carolina 73.18$ 114.24$ 104.89$ 298.27$ 386.73$ 29.7%
38 Florida 158.83$ 361.42$ 135.83$ 164.71$ 159.48$ ‐3.2%
39 Connecticut 54.95$ 94.83$ 32.77$ 49.18$ 37.04$ ‐24.7%
40 Kansas 206.46$ 235.45$ 221.46$ 232.35$ 183.15$ ‐21.2%
41 Arizona 85.68$ 71.26$ 75.78$ 75.42$ 103.60$ 37.4%
42 Kentucky 249.02$ 267.18$ 203.40$ 237.82$ 186.04$ ‐21.8%
43 Delaware 25.95$ 20.05$ 13.43$ 7.58$ 9.70$ 28.0%
44 Nebraska 461.99$ 102.41$ 81.84$ 69.16$ 74.29$ 7.4%
45 North Carolina 167.74$ 274.99$ 145.24$ 192.81$ 262.25$ 36.0%
46 South Dakota 70.00$ 93.25$ 79.20$ 83.63$ 84.51$ 1.1%
47 Georgia 298.02$ 270.44$ 219.35$ 260.48$ 239.38$ ‐8.1%
48 New Mexico 24.09$ 30.72$ 19.86$ 22.68$ 40.75$ 79.6%
49 Hawaii 9.62$ 10.28$ 8.83$ 3.28$ 4.59$ 39.8%
50 Puerto Rico 9.52$ 2.53$ 7.32$ 8.34$ 18.65$ 123.7%
51 West Virginia 50.45$ 74.75$ 69.77$ 78.24$ 63.29$ ‐19.1%
52 U.S. Virgin Is. 0.01$ 0.05$ 0.01$ 0.22$ 0.09$ ‐59.7%
53 Unknown states 554.30$ 603.62$ 420.69$ 206.12$ 191.52$ ‐7.1%
54 Dist. of Columbia 1.87$ 3.79$ 1.55$ 1.50$ 0.42$ ‐71.8%
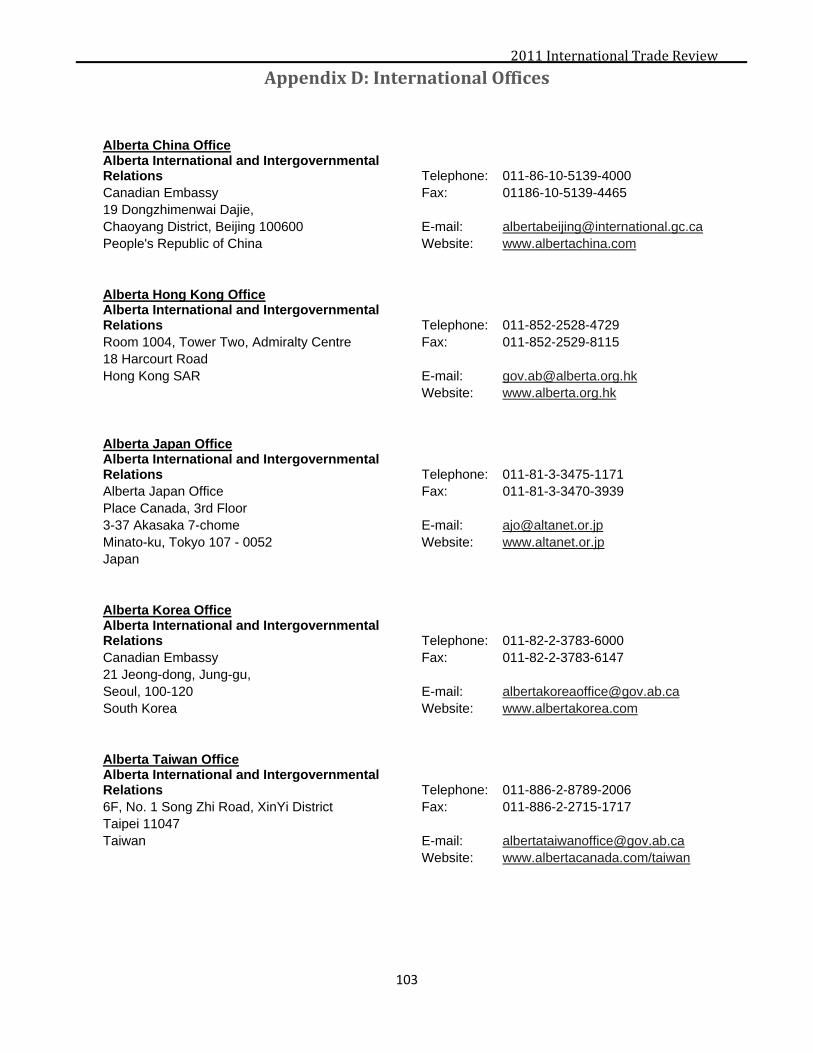
2011InternationalTradeReview
103
AppendixD:InternationalOffices Alberta China Office Alberta International and Intergovernmental Relations Telephone: 011-86-10-5139-4000 Canadian Embassy Fax: 01186-10-5139-4465 19 Dongzhimenwai Dajie, Chaoyang District, Beijing 100600 E-mail: [email protected] People's Republic of China Website: www.albertachina.com Alberta Hong Kong Office Alberta International and Intergovernmental Relations Telephone: 011-852-2528-4729 Room 1004, Tower Two, Admiralty Centre Fax: 011-852-2529-8115 18 Harcourt Road Hong Kong SAR E-mail: [email protected] Website: www.alberta.org.hk Alberta Japan Office Alberta International and Intergovernmental Relations Telephone: 011-81-3-3475-1171 Alberta Japan Office Fax: 011-81-3-3470-3939 Place Canada, 3rd Floor 3-37 Akasaka 7-chome E-mail: [email protected] Minato-ku, Tokyo 107 - 0052 Website: www.altanet.or.jp Japan Alberta Korea Office Alberta International and Intergovernmental Relations Telephone: 011-82-2-3783-6000 Canadian Embassy Fax: 011-82-2-3783-6147 21 Jeong-dong, Jung-gu, Seoul, 100-120 E-mail: [email protected] South Korea Website: www.albertakorea.com Alberta Taiwan Office Alberta International and Intergovernmental Relations Telephone: 011-886-2-8789-2006 6F, No. 1 Song Zhi Road, XinYi District Fax: 011-886-2-2715-1717 Taipei 11047 Taiwan E-mail: [email protected] Website: www.albertacanada.com/taiwan

2011InternationalTradeReview
104
Alberta Shanghai Office Alberta International and Intergovernmental Relations Telephone: 011-8621-5116-6858 Suite 2082, 20th Floor, The Center 989 Changle Road Website: www.albertacanada.com/shanghai/ Shanghai, 200031 People’s Republic of China Alberta Germany Office Alberta International and Intergovernmental Relations Telephone: 011-49-89-2199-5740 Consulate of Canada Fax: 011-49-89-2199-5745 Tal 29 80331 Munich E-mail: [email protected] Germany Website: www.albertacanada.com/germany/86.htm Alberta United Kingdom Office Alberta International and Intergovernmental Relations Telephone: 011-44-20-7258-6349 Canadian High Commission Fax: 011-44-20-7258-6309 Macdonald House 1 Grosvenor Square E-mail: [email protected] London, England W1K 4AB Website: www.albertacanada.com/uk Alberta Mexico Office Alberta International and Intergovernmental Relations Telephone: 011-52-55-5724-7971 Calle Schiller No. 529 Fax: 011-52-55-5724-7913 Colonia Polanco Del. Miguel Hidalgo E-mail: [email protected] Mexico D. F., Mexico 11560 Website: www.albertacanada.com/mexico Alberta Washington D.C. Office Alberta International and Intergovernmental Relations Telephone: 1-202-448-6475 Canadian Embassy 501 Pennsylvania Avenue N.W. Washington, D.C. 20001 Website: www.albertacanada.com/us United States of America

2011InternationalTradeReview
105
OFFICES WITH GOVERNMENT OF ALBERTA REPRESENTATIVES CNPC - Alberta Petroleum Centre Alberta International and Intergovernmental Relations Telephone: 011-86-10-620-98522 2nd Floor Science & Technology Building, Fax: 011-86-10-620-98529 #20 Xue Yuan Road, Haidian District Beijing 100083 E-mail: [email protected] People's Republic of China Website: www.capcbj.com.cn
Alberta International and Intergovernmental Relations12th Floor, Commerce Place10155-102 StreetEdmonton, Alberta T5J 4G8CanadaTelephone 780.427.6543Fax 780.427.0699www.international.alberta.ca
You can access the Alberta International Trade Reviewon the internet at: www.albertacanada.com/statpub
ISSN: 0844-6318 (print)ISSN: 1911-2491 (online)ISBN: 978-0-7785-5901-6 (print)ISBN: 978-0-7785-5902-3 (online)