2011 global sales compensation practices survey© … · ... pay plan competitiveness ... 42.11%...
TRANSCRIPT

©2011 The Alexander Group, Inc.
2011 Global Sales Compensation
Practices Survey© Results
August 19, 2011
Survey Editor:
David J. Cichelli Senior Vice President The Alexander Group
480.315.5828 [email protected]

The Alexander Group, Inc. Page 1
Table of Contents
Executive Summary ........................................................................................................ 2 Survey Summary Findings .............................................................................................. 6 Full Survey Results ....................................................................................................... 14 Annual Design Practices ............................................................................................... 15 Governance ................................................................................................................... 22 Trends In Global Uniformity ........................................................................................... 33 Automation Support....................................................................................................... 38 Region/Country Practices .............................................................................................. 42 Survey Sources ............................................................................................................. 50 Demographics ............................................................................................................... 60

The Alexander Group, Inc. Page 2
2011 Global Sales Compensation Practices Survey © EXECUTIVE SUMMARY
The Alexander Group, Inc. and WorldatWork
Editor: David J. Cichelli, Senior Vice President [email protected]
Overall Observations Global sales compensation is becoming, well, more global! Many of the participating 117 companies are investing in governance, design, approval and automation tools to manage sales compensation more globally. This is particularly true among the 66 reporting companies that employ a worldwide sales organization model. However, even for companies that deploy local sales management models (world region or county), global management exerts significant control over program approval, pay plan competitiveness philosophy and sales compensation plan design principles. Generally, many companies are still striving for greater global program uniformity. The primary reason is to ensure pay program alignment with business strategy. Emerging is a growing trend to adopt global sales compensation automation solutions. Appropriately, the assignment of quotas remains a local domain expertise. In our view, effective global sales compensation practices feature global design principles that are applied to local jobs. Additionally, the use of ―platform‖ jobs suggesting preferred (or required) designs improve global management of sales compensation. Universal assignment of a single plan seems improbable given local market conditions, local job design and distinct local government, labor and social practices.
Introduction 117 sales departments participated in the 2011—Global Sales Compensation Practices Survey
©, co-
sponsored by the Alexander Group and WorldatWork. Survey questions included: Annual Design Process, Governance, Global Versus Local, Trends in Program Global Uniformity, Automation Support, Government Regulations and Restrictions, Labor/Works Council Practices, Cultural and Social Norms and Survey Sources.
Annual Design Process
71.79% of companies made substantive changes to their sales compensation plan for this fiscal year. 73.51% of the companies made meaningful sales compensation plan changes within the last two years. 49.57% changed their program to improve sales objective alignment with business strategy. 43.86% expect to change their sales compensation plan for next fiscal year. 38.53% will change next year’s plan to improve sales objectives alignment with business strategy.
Governance Percent of reporting companies who follow global governance practices (headquarter or global business unit leadership):
78.07% program approval 77.78% pay plan competitiveness philosophy 73.51% sales compensation plan design principles

The Alexander Group, Inc. Page 3
68.37% job evaluation at the global level 67.52% sales compensation formula mechanics 67.52% annual updates to the sales compensation plan 64.96% pay mix by job 64.10% identifying competitor benchmark companies 64.04% sales compensation program assessment 62.39% performance measures at the global level 58.40% annual sales recognition event 57.02% technical to the automation system 53.51% payout administration/calculation support 45.61% quota setting practices 41.23% contests and spiffs And, 23.68% use a combination of global, region and local practices operating to set quotas
Global Versus Local
Governance Practices Between Globally Versus Locally Organized Sales Functions: 66 companies have global sales functions. 49 companies have local sales functions. 26.01% is the average shift in governance from local to global accountability for global versus local organization structure.
Trends in Program Global Uniformity
More central design oversight and program design principles are preferred global uniformity practices.
Greater global automation uniformity is an objective for many program managers.
37 companies have no uniformity changes planned for next fiscal year.
Automation Support 68 companies use desktop solutions (spreadsheets or databases). 36 companies use an internal custom solution. 20 companies use Oracle.
Government Regulations and Restrictions The following were mentioned as government regulations regarding sales compensation practices:
Signed plan acknowledgement
Dispute resolutions rules: duration and topics
Base pay reductions: restrictions, consent requirements or notification requirements
Base pay increases: mandatory increase requirements
Plan changes: restricted or consent required, or notification required
Local language requirement of plan documents
Labor/Works Council Practices The following were mentioned as Labor/Works Council Practices affecting sales compensation practices:
Works Council’s approval for: plan design, base pay, target compensation
Restrictions on: changing quotas, base pay reductions, changing target compensation
Requirements: for cost of living increases, signed plan acknowledgments, local language of plan documents

The Alexander Group, Inc. Page 4
Cultural and Social Norms The following were mentioned as Cultural and Social Norms affecting sales compensation practices:
Pay mix: greater portion of target compensation assigned to base pay versus incentive component
Retention: high growth economies driving high turnover
Equal treatment: rewards tied to group performance and less on individual performance
Limitations on subjective measures
Survey Sources The following companies were cited as sources of global sales compensation data:
Aon Hewitt: www.aon.com
Comptryx: www.comptryx.com
Culpepper: www.culpepper.com
Hay: www.haygroup.com
Kenexa (IPAS): www.kenexa.com
McLagan: www.mclagan.com
Mercer: www.mercer.com
Radford: www.radford.com
Towers Watson: www.towerswatson.com
Western Management Group: www.wmgnet.com
Data Collection/Methodology The 2011 Global Sales Compensation Survey
© presents responses from 117 participants. In some
cases, multiple sales departments from the same company participated. To participate, company or business unit sales departments needed to have at least 20 sales persons and operate in at least two different world regions. Participants provided data during the month of July and August 2011. Alexander Group gathered responses via a web-based survey. We published the results in the third week of August 2011. Would You Like to Participate in Future Surveys Like This One? Please send an email to [email protected] to join our Sales Effectiveness Survey Panel. Put ―Survey Panel‖ in the subject line and provide your (complete) business card information. To be accepted as a survey panelist, you must meet the following criteria: 1) you must have at least 20 customer contact sales representatives, 2) you have no commercial interest in marketing/selling products or services to sales departments and 3) you agree to fully complete surveys submitted to you. Survey panelists receive a free copy of survey results. Being a Sales Effectiveness Survey Panelist is voluntary and you can opt-out at any time. We keep all responses in strict confidence.
About the Sponsors The Alexander Group, Inc.
® Preferred Consultants to Premier Sales Organizations
The Alexander Group provides sales management consulting services to the world's leading sales organizations, serving Global 2000 companies from across all industries. Founded in 1985, the Alexander Group combines deep experience, a proven methodology and data-driven insights to help sales leaders anticipate change, align their sales force with company goals and make better informed decisions with one goal in mind – to grow sales. The Alexander Group has offices in Atlanta, Chicago, San Francisco,

The Alexander Group, Inc. Page 5
Scottsdale and Stamford. To learn more about Alexander Group's services visit www.alexandergroup.com or call 480.998.9644.
WorldatWork
WorldatWork (www.worldatwork.org) is a not-for-profit organization providing education, conference and research focused on global human resources issues including compensation, benefits, work-life and integrated total rewards to attract, motivate and retain a talented workforce. Founded in 1955, WorldatWork has nearly 30,000 members in more than 100 countries. Its affiliate organization, WorldatWork Society of Certified Professionals
®, is the certifying body for the prestigious Certified Sales
Compensation Professional™ (CSCP™) and other professional designations. WorldatWork has offices in Scottsdale, Arizona, and Washington, D.C.
About the Editor David J. Cichelli is Senior Vice President of the Alexander Group. He is author of McGraw-Hill’s ―Compensating the Sales Force‖ and ―The Sales Growth Imperative.‖ He is a frequent speaker and instructor on sales effectiveness issues. His articles appear in numerous publications. To learn more about David’s books, visit www.compensatingthesalesforce.com and www.salesgrowthimperative.com. To learn about Alexander Group’s sales compensation services, visit www.salescompsolutions.com.
Survey Panelists The following individuals provided guidance on the scope and design of the survey instrument. We extend our gratitude for their invaluable assistance in shaping and improving the effectiveness of the survey. Cindy O'Shaughnessy ACS Honeywell Wendy Forrester Agilent Technologies Pete Wagener ARRIS David Egloff Citrix Systems Sue Hansen Honeywell Building Solutions Amy Ricca Merck
Douglas de Vries
Sony Ericsson Jorg Kasparek Tyco International

The Alexander Group, Inc. Page 6
Survey Summary Findings

The Alexander Group, Inc. Page 7
Annual Design Process
Program Changes This Fiscal Year: 71.79% of companies made substantive changes to their sales compensation plan for this fiscal year. This number is consistent with previous studies confirming the tactical importance of the sales compensation program as it supports current strategic sales objectives. Editor’s Observations: Adopt “best practices” design practices; changes to the sales compensation plan are inevitable. Years Since Last Revision: Over 73.51% of the companies made meaningful sales compensation plan changes within the last two years prior to this fiscal year. This number increases to 84.62% when looking back three years and 97.44% when looking back four years. Editor’s Observations: Most sales compensation plans will have a major revision at least every four years, if not sooner. Sales compensation stakeholders should anticipate regular and necessary changes to the sales compensation program by adopting ongoing design principles and processes. Reasons For Changing This Fiscal Year: The three most prevalent reasons companies changed their sales compensation programs for this fiscal year include: improve sales objectives alignment with business strategy (49.57%), improve sales productivity (33.04%) and improve sales profitability (21.74%). Editor’s Observations: As companies shift their strategic sales focus each year, sales management correctly needs to realign the sales compensation program to serve these evolving objectives. Next Fiscal Year Changes: 43.86% expect to change their sales compensation plan for next fiscal year. 42.11% don’t know yet if there will be changes. Only 14.04% will not change their sales compensation plan for next fiscal year. Editor’s Observations: Surprisingly, 42.11% don’t know if their sales compensation plan will be revised for next year. For many, this
third-fiscal quarter observation will most likely convert to “yes” as
the fourth-
quarter fiscal period progresses. This “end-of-year” uncertainty often precludes the early and necessary program design planning that will inevitably be necessary to prepare for next year’s sales compensation re-design effort. Reasons For Next Fiscal Year Changes: Improve sales objectives alignment with business strategy (38.53%), improve sales productivity (26.61%) and improve sales profitability (18.35%) are reported as the top three reasons for changing the sales compensation program for the next fiscal year. Editor’s Observations: These are the same three reasons, in the same order, that are the source of changes for this fiscal year. As objectives and market conditions change, the sales compensation program needs to ensure the right focus on goals, productivity and profitable selling.
Governance
Governance—Overall Pay Plan Competitiveness Philosophy: 77.78% follow global (corporate 59.83% and business unit 17.95%) practices when setting a pay plan competitiveness philosophy. A distant second is country management at 11.11%. Editor’s Observations: The participants place a significant emphasis on corporate directed pay level competitiveness, on a worldwide basis. Governance—Program Design Principles: 73.51% follow global (corporate 48.72% and business unit 24.79%) practices when establishing sales compensation plan design principles. 10.26% establish these principles at the country level. Editor’s Observations: Participants favor a strong, central set of design principles for sales compensation.
Governance—Annual Design Updates for Next Year: 67.52% follow global (corporate 44.44% and business unit 23.08%) practices for annual updates to the sales compensation plan. 12.82% give local country management the authority to oversee annual updates to the sales compensation plans. Editor’s Observations: Most participants assign annual design updates to the global management team.

The Alexander Group, Inc. Page 8
Governance—Formula Mechanics: 67.52% follow global (corporate 45.30% and business unit 22.22%) practices for sales compensation formula mechanics. 13.68% assign this responsibility to country management. Editor’s Observations: Participants show a strong preference for globally designed sales compensation payout formula mechanics.
Governance—Survey Benchmark Companies: 64.10% use global (corporate 46.15% and business unit 17.95%) for identifying competitor benchmark companies for compensation comparison purposes. However, 18.80% assign this responsibility to local country management. Editor’s Observations: While the primary responsibility for selecting benchmark comparators is usually assigned to the global entity, a few companies give local country management this responsibility.
Governance—Job Evaluation: 68.37% keep the responsibility for job evaluation at the global level (corporate 49.57% and business unit 18.80%). 17.09% give job evaluation responsibility to country management. Editor’s Observations: Most companies retain job evaluation at the global level. A small group of companies allow local country management to assign job levels. Governance—Pay Mix: 64.96% follow global (corporate 47.01% and business unit 17.95%) to establish pay mix by job. 18.80% give local country management the responsibility to set pay mix. Editor’s Observations: Most reporting companies favor global pay mix decisions. However, a modest number allow pay mix to be set at the local country level.
Governance—Performance Measures: 62.39% keep the selection of performance measures at the global level (corporate 35.04% and business unit 27.35%). 15.38% allow local country management to select sales compensation program payout performance measures. Editor’s Observations: Global oversight still prevails when selecting sales compensation design performance measures.
Governance—Quota Setting Method: 45.61% follow global quota setting practices (corporate 23.68% and business unit 21.93%).19.30% establish quota setting methods at the country level. Editor’s Observations: While the results show a global preference, a variety of stakeholders at the global, business unit, region and country level help craft quota setting methods. Governance—Quota Amounts for Sales Personnel: Practices vary widely among the reporting companies with 23.68% reporting they have some combination of global, region and local practices operating at one time to set quotas. Global practices represent 36.84% (corporate 17.54% and business unit 19.30%) of the reporting companies. 21.93% report that local country management is responsible for setting quotas. Editor’s Observations: When setting quotas, global practices are less prevalent than compared to other governance factors. In our view, local management will most likely have the best understanding of local market opportunities, which could affect quota assignment. Governance—Program Assessment: 64.04% of the participants provide global oversight (corporate 38.60% and business unit 25.44%) to sales compensation program assessment. 14.04% assign this responsibility to some combination of global, business unit, region and country resources. Editor’s Observations. Most survey participants provide global oversight to program assessment. Governance—Payout Administration/Calculations: 53.51% of the participants provide global (corporate 39.47% and business unit 14.04%) payout administration/calculation support. 29.82% provide these resources at the country level. Editor’s Observations: Most companies provide global automation resources; however, one-third assign

The Alexander Group, Inc. Page 9
this administrative responsibility to local country management. Governance—Technical Automation Support: 57.02% provide global governance (corporate 42.11% and business unit 14.91%) oversight to the automation system. The major focus is from the corporate headquarters. 17.54% have local country personnel address automation needs. Editor’s Observations: Most likely those with a commercial automation solution purchase and oversee automation at a global level and those still using desktop solutions assign this role to local resources.
Governance—Program Approval: 78.07% require global level (corporate 60.53% and business unit 17.54%) program approval. 7.02% give this responsibility to world-regions. Editor’s Observations: Clearly, most global stakeholders want to approve any program changes to the sales compensation program. Governance—Contests and Spiffs: 41.23% of the participating companies provide global (corporate 21.05% and business unit 20.18%) direction to contests and spiffs. 21.93% allow local country management to provide oversight to local contests and spiffs. Editor’s Observations: A surprisingly high number (almost one-fourth) of participating companies allow local country management to oversee local contests and spiffs.
Governance—Annual Recognition Event: 58.40% provide global direction (corporate 39.82% and business unit 18.58%) to the annual sales recognition event. 13.27% do not offer such a program. 12.39% leave such programs in the hands of local country management. Editor’s Observations: We would have expected a higher global oversight to such programs; however, their use is situational to each company and practices vary substantially from one company to another.

The Alexander Group, Inc. Page 10
Governance Practices Between Global Sales Organizations Versus Local Sales Organizations.
Globally Organized (66 Companies)
Locally Organized (49 Companies)
Preferred Governance Practice
Most Global to Least Global Global
(sorted) Local Global Local
Program Approval 89.07% 10.94% 62.50% 35.42%
Program Design Principles 84.85% 15.15% 57.15% 40.82%
Overall Pay Competitiveness Philosophy 84.85% 15.16% 67.34% 32.66%
Annual Design Updates for Next Fiscal Year 80.31% 19.70% 48.98% 48.98%
Formula Mechanics 80.30% 19.70% 51.02% 46.94%
Survey Benchmark Companies 77.27% 21.22% 44.90% 53.05%
Pay Mix 75.76% 22.74% 51.02% 48.97%
Job Evaluation 75.76% 18.19% 57.15% 42.86%
Performance Measures 74.24% 25.76% 46.94% 53.06%
Program Assessment 73.44% 25.00% 50.00% 47.91%
Technical Automation Support 71.88% 15.64% 35.42% 50.00%
Annual Recognition Event 69.84% 14.28% 41.67% 47.91%
Payout Administration/Calculations 68.75% 31.25% 31.25% 66.67%
Quota Setting Method 56.25% 42.19% 31.25% 62.50%
Contests and Spiffs 46.88% 40.63% 33.33% 60.42%
Quota Amounts for Sales Personnel 43.76% 54.69% 27.09% 66.67%
Governance Practices Between Globally Versus Locally Organized Sales Functions: 66 companies have globally organized sales organizations (corporate headquarter or business unit). 49 companies have locally organized sales organizations (world-region, country and combination). Editor’s Observations: Generally, the governance practices for 16 program elements are ranked in a similar but not exact order between globally organized versus locally organized sales functions. Interestingly, organization design (global versus local) accounts for an average of 26.01% shift in governance from local accountably to global accountability based on global versus local organization structure.

The Alexander Group, Inc. Page 11
Trends in Program Global Uniformity
Sales Compensation Program Design Uniformity Trends
Trends in Program Global Uniformity: The reporting companies identified central design oversight and program design principles as preferred global uniformity practices. Greater global automation tools uniformity is an objective for many program managers. Quota allocation and contests and spiffs are more removed from global uniformity objectives. Editor’s Observations: We would expect that design oversight and program principles would be at the top of the list for program global uniformity. The importance of global automation tools is a growing trend. As compared to other practices, quota allocation methods and contests and spiffs follow more local practices.
Next Fiscal Year Program Global Uniformity Initiatives: 37 companies have no uniformity changes goals for next fiscal year. 26 companies plan to improve global design and principles. 8 companies have global automation uniformity objectives. 4 plan to improve uniformity of global assessment. 3 plan to resolve uniformity issues caused by organization and job design changes. 3 plan to lessen global uniformity practices by providing more autonomy to local sales entities. Editor’s Observations: Companies want to provide better design support and more uniform principles to the worldwide sales organizations. It’s interesting that three companies are ready to provide more autonomy to local sales entities. Is this an inkling of a trend?

The Alexander Group, Inc. Page 12
Automation Support
Selection of Automation Support: 71.05% of the participating companies make decisions about automation support at a global level (corporate 52.63% and business unit 18.42%). 10.53% allow local management to make these decisions. Editor’s Observations: Automation systems are expensive. It’s not surprising that global stakeholders would be making these decisions. Also, such systems help extend the reach of global leaders, thus making it easier to review and assess such programs on a worldwide basis.
Automation Support. Solution Assessment.
Automation Solutions
(Counts: Number of Companies)
Automation Support: For the reporting companies, the top three automation solutions are desktop (spreadsheets and databases) (68), in-house applications (custom) (36) and Oracle (20). The reporting companies rated these same three solutions in the same order of not recommend, neutral and recommend. Reporting companies are interested in exploring the use of Varicent 13, in-house application 10, SAP 9 and Synygy 9. Editor’s Observations: Automation use and assessment findings reflect the observations of reporting companies in this survey only. Prior to making any automation commitments, explore all alternatives. Compensation administrators should critically assess current solutions, in particular desktop solutions, to ensure accurate, timely, auditable and meaningful reporting. Most providers (both internal and external) continue to advance their proficiency to provide automation support—gather contemporary information, investigate, assess and then upgrade, if needed.

The Alexander Group, Inc. Page 13
Government Regulations and Restrictions The following were mentioned as government regulations regarding sales compensation practices:
Signed plan acknowledgement
Dispute resolutions rules: duration and topics
Base pay reductions: restrictions, consent requirements or notification requirements
Base pay increases: mandatory increase requirements
Plan changes: restricted or consent required, or notification required
Local language requirement of plan documents
Labor/Works Council Practices The following were mentioned as Labor/Works Council Practices affecting sales compensation practices:
Works Council’s approval for: plan design, base pay, target compensation
Restrictions on: changing quotas, base pay reductions, changing target compensation
Requirements: for cost of living increases, signed plan acknowledgments, local language of plan documents
Cultural and Social Norms The following were mentioned as Cultural and Social Norms affecting sales compensation practices:
Pay mix: greater portion of target compensation assigned to base pay versus incentive component
Retention: high growth economies driving high turnover
Equal treatment: rewards tied to group performance and less on individual performance
Limitations on subjective measures
Survey Sources The following companies were cited as sources of global sales compensation data:
Aon Hewitt: www.aon.com
Comptryx: www.comptryx.com
Culpepper: www.culpepper.com
Hay: www.haygroup.com
Kenexa (IPAS): www.kenexa.com
McLagan: www.mclagan.com
Mercer: www.mercer.com
Radford: www.radford.com
Towers Watson: www.towerswatson.com
Western Management Group: www.wmgnet.com

The Alexander Group, Inc. Page 14
Full Survey Results

The Alexander Group, Inc. Page 15
Annual Design Practices

The Alexander Group, Inc. Page 16
Annual Design Process
Program Changes This Fiscal Year. Did you revise your sales compensation plan for this fiscal year? (This question refers to meaningful changes to your plan(s) that might include changes in eligibility, target comp, mix, leverage, measures, weights, etc.)
117 Responses
[1] - Yes (71.79% : 84)
[2] - No (27.35% : 32)
[3] - Not applicable (0.85% : 1)
Program Changes This Fiscal Year: 71.79% of companies made substantive changes to their sales compensation plan for this fiscal year. This number is consistent with previous studies confirming the tactical importance of the sales compensation program as it supports current strategic sales objectives. Editor’s Observations: Adopt “best practices” design practices; changes to the sales compensation plan are inevitable.
Years Since Last Revision. Prior to this year’s sales plan revision, how many years has it been since the last meaningful sales plan revision?
117 Responses
[1] - One year (53.85% : 63)
[2] - Two years (19.66% : 23)
[3] - Three years (11.11% : 13)
[4] - Four or more years (12.82% : 15)
[5] - Not applicable (2.56% : 3)
Years Since Last Revision: Over 73.51% of the companies made meaningful sales compensation plan changes within the last two years prior to this fiscal year. This number increases to 84.62% when looking back three years and 97.44% when looking back four years. Editor’s Observations: Most sales compensation plans will have a major revision at least every four years, if not sooner. Sales compensation stakeholders should anticipate regular and necessary changes to the sales compensation program by adopting ongoing design principles and processes.

The Alexander Group, Inc. Page 17
Reasons For Changes This Fiscal Year. Which of the following statements best describes the reason your organization revised this fiscal year’s sales plan?
115 Responses
[1] - Improve sales objectives alignment with business strategy (49.57% : 57)
[2] - Improve sales productivity (33.04% : 38)
[3] - Did not make significant changes (26.96% : 31)
[4] - Improve sales profitability (21.74% : 25)
[5] - Improve product sales results (20.00% : 23)
[6] - Better align pay with preferred market pay practices? (17.39% : 20)
[7] - Better manage costs (17.39% : 20)
[8] - Company re-organization (13.91% : 16)
[9] - New/revised sales channel model (10.43% : 12)
[10] - Improve recruitment/retention of top talent (10.43% : 12)
[11] - Change in job design (9.57% : 11)
[12] - Improve customer type sales results (7.83% : 9)
[13] - Acquisition/divesture/merger (6.96% : 8)
[14] - Other (please explain below) (6.96% : 8)
[15] - Make more jobs eligible for sales compensation (6.09% : 7)
[16] - Make fewer jobs eligible for sales compensation (1.74% : 2)
Describe “Other” Reasons For Changes This Fiscal Year:
Created one global plan with common measures, admin., etc.
Better align pay with performance to target; design to have an increased focus on customer churn
Removed from quota the riskier - low probability new market/customer/product business
Plan was managed by sales team and it was brought into the corporate office for design, management and payout
Better align pay for performance We redesigned management plans to align them worldwide. We are taking a deep dive for FY13 on all sales roles and plan a large redesign for that year.
Added new products Simplification for reps
Reasons For Changes This Fiscal Year: The three most prevalent reasons companies changed their sales compensation programs for this fiscal year include: improve sales objectives alignment with business strategy (49.57%), improve sales productivity (33.04%) and improve sales profitability (21.74%). Editor’s Observations: As companies shift their strategic sales focus each year, sales management correctly needs to realign the sales compensation program to serve these evolving objectives.

The Alexander Group, Inc. Page 18
Next Fiscal Year Changes. Do you plan to change your sales compensation plans for next fiscal year?
114 Responses
[1] - Don’t know yet (42.11% : 48)
[2] - Yes (43.86% : 50)
[3] - No (14.04% : 16)
[4] - Not applicable (0.00% : 0)
Next Fiscal Year Changes: 43.86% expect to change their sales compensation plan for next fiscal year. 42.11% don’t know yet if there will be changes. Only 14.04% will not change their sales compensation plan for next fiscal year. Editor’s Observations: Surprisingly, 42.11% don’t know if their sales compensation plan will be revised for next year. For many, this
third- fiscal quarter observation will most likely convert to “yes” as
the fourth-
quarter fiscal period progresses. This “end-of-year” uncertainty often precludes the early and necessary program design planning that will inevitably be necessary to prepare for next year’s sales compensation re-design effort.

The Alexander Group, Inc. Page 19
Reasons For Next Fiscal Year Changes. Why will you change your sales compensation plan for next fiscal year?
109 Responses
[1] - Improve sales objectives alignment with business strategy (38.53% : 42)
[2] - Could, don’t know, yet (30.28% : 33)
[3] - Improve sales productivity (26.61% : 29)
[4] - Improve sales profitability (18.35% : 20)
[5] - Improve product sales results (15.60% : 17)
[6] - Better align pay with preferred market pay practices (13.76% : 15)
[7] - Better manage costs (11.93% : 13)
[8] - Will not change (11.01% : 12)
[9] - Acquisition/divesture/merger (7.34% : 8)
[10] - Other (please explain below) (7.34% : 8)
[11] - Company re-organization (6.42% : 7)
[12] - Improve recruitment/retention of top talent (6.42% : 7)
[13] - Improve customer type sales results (5.50% : 6)
[14] - Change in job design (4.59% : 5)
[15] - New/revised sales channel model (4.59% : 5)
[16] - Make more jobs eligible for sales compensation (2.75% : 3)
[17] - Make fewer jobs eligible for sales compensation (0.92% : 1)
Describe “Other” Reasons For Next Fiscal Year Changes:
Improve consistency of design approach across plans Bringing consultant in this year; if we change the comp plans this year it will be based on this review.
Align with FY13 business strategy Minor changes are being proposed to ensure global alignment
Change pay mix to better focus sales employees and reduce fixed costs
Legal review and audit
Simplify design Looking at changing to global plan based on business unit versus region effective fiscal 2013
Need better mechanics to pay for software and services
Reasons For Next Fiscal Year Changes: Improve sales objectives alignment with business strategy (38.53%), improve sales productivity (26.61%) and improve sales profitability (18.35%) are reported as the top three reasons for changing the sales compensation program for the next fiscal year. Editor’s Observations: These are the same three reasons, in the same order, that are the source of changes for this fiscal year. As objectives and market conditions change, the sales compensation program needs to ensure the right focus on goals, productivity and profitable selling.

The Alexander Group, Inc. Page 20
Design Process. How centralized is your business unit's sales compensation design process for all your jobs around the world? Provide the most prevalent practice.
108 Responses
[1] - Global design effort that covers all jobs in all countries (48.15% : 52)
[2] - Each world-region designs its own plans (14.81% : 16)
[3] - Corporate HQ creates global design practices and the business unit designs its own plans within those parameters (10.19% : 11)
[4] - Each country designs its own plans (9.26% : 10)
[5] - Business unit leadership team creates global design practices and each world-region designs its own plans within those parameters (8.33% : 9)
[6] - Diverse combination of the above (5.56% : 6)
[7] - Leadership (business unit or world-region) team creates design practices and each country designs its own plans with those parameters (1.85% : 2)
[8] - Other (please describe below) (1.85% : 2)
Describe “Other” Design Process:
Corporate HQ designs plans utilizing best practices and tailors fit to strategic business objectives.
Consumer/Retail Operations in HQ designs plans for all retail participants.
Corporate HQ creates global design practices and each world-region designs its own plans within those parameters.
Design Process: 48.15% of the reporting companies feature a single global sales compensation design effort for all jobs. 14.81% have the world-regions responsible for sales compensation design. 10.19% provide a corporate template for business units’ to follow. Editor’s Observations: The reporting companies show a strong preference for worldwide sales compensation design process covering all sales jobs in all countries.

The Alexander Group, Inc. Page 21
Highest Level Of Design Approval. What is the highest level of approval needed for sales compensation plan changes?
113 Responses
[1] - Corporate HQ leadership (56.64% : 64)
[2] - Board of Directors/compensation committee (9.73% : 11)
[3] - Business unit management (9.73% : 11)
[4] - World-region management and staff (7.08% : 8)
[5] - Country management and staff (6.19% : 7)
[6] - Corporate HR/compensation management (4.42% : 5)
[7] - Other (please describe below) (4.42% : 5)
[8] - Business unit HR/compensation (1.77% : 2)
Describe “Other” Highest Level of Design Approval:
Sales Planning Committee: HR Rep, Sales Ops, Sales WW, VP Finance World-region management and Corporate HQ compensation mgmt.
Compensation Committee approves changes to incentive programs at the executive level. Corporate HQ Leadership approves changes to programs below executive level.
Corporate HR/Comp Mgmt/ BU Mgmt
Sales compensation review board consisting of sales leadership, HR leadership and finance leadership.
Highest Level of Design Approval: 56.64% require corporate HQ leadership to approve sales
compensation program changes. The next two most selected responses, each coming in at 9.73%, are the board of directors and business unit management.
Editor’s Observations: The practice of having HQ leadership approve the sales compensation plans
underscores the importance of sales compensation as a significant and impactful sales management program.

The Alexander Group, Inc. Page 22
Governance

The Alexander Group, Inc. Page 23
Governance
Governance For Overall Pay Plan Competitiveness Philosophy:
117 Responses
[1] - Global corporate HQ (59.83% : 70)
[2] - Global business unit HQ (17.95% : 21)
[3] - Country (11.11% : 13)
[4] - World-region (6.84% : 8)
[5] - Combination (4.27% : 5)
[6] - Not applicable/do not have (0.00% : 0)
Governance—Overall Pay Plan Competitiveness Philosophy: 77.78% follow global (corporate 59.83% and business unit 17.95%) practices when setting a pay plan competitiveness philosophy. A distant second is country management at 11.11%. Editor’s Observations: The participants place a significant emphasis on corporate directed pay level competitiveness, on a worldwide basis.
Governance For Program Design Principles:
117 Responses
[1] - Global corporate HQ (48.72% : 57)
[2] - Global business unit HQ (24.79% : 29)
[3] - Country (10.26% : 12)
[4] - World-region (8.55% : 10)
[5] - Combination (6.84% : 8)
[6] - Not applicable/do not have (0.85% : 1)
Governance—Program Design Principles: 73.51% follow global (corporate 48.72% and business unit 24.79%) practices when establishing sales compensation plan design principles. 10.26% establish these principles at the country level. Editor’s Observations: Participants favor a strong, central set of design principles for sales compensation.

The Alexander Group, Inc. Page 24
Governance For Annual Design Updates for Next Fiscal Year:
117 Responses
[1] - Global corporate HQ (44.44% : 52)
[2] - Global business unit HQ (23.08% : 27)
[3] - Country (12.82% : 15)
[4] - World-region (11.11% : 13)
[5] - Combination (7.69% : 9)
[6] - Not applicable/do not have (0.85% : 1)
Governance—Annual Design Updates for Next Year: 67.52% follow global (corporate 44.44% and business unit 23.08%) practices for annual updates to the sales compensation plan. 12.82% give local country management the authority to oversee annual updates to the sales compensation plans. Editor’s Observations: Most participants assign annual design updates to the global management team.
Governance For Formula Mechanics:
117 Responses
[1] - Global corporate HQ (45.30% : 53)
[2] - Global business unit HQ (22.22% : 26)
[3] - Country (13.68% : 16)
[4] - World-region (9.40% : 11)
[5] - Combination (8.55% : 10)
[6] - Not applicable/do not have (0.85% : 1)
Governance—Formula Mechanics: 67.52% follow global (corporate 45.30% and business unit 22.22%) practices for sales compensation formula mechanics. 13.68% assign this responsibility to country management. Editor’s Observations: Participants show a strong preference for globally designed sales compensation payout formula mechanics.

The Alexander Group, Inc. Page 25
Governance For Survey Benchmark Companies:
117 Responses
[1] - Global corporate HQ (46.15% : 54)
[2] - Country (18.80% : 22)
[3] - Global business unit HQ (17.95% : 21)
[4] - Combination (9.40% : 11)
[5] - World-region (5.98% : 7)
[6] - Not applicable/do not have (1.71% : 2)
Governance—Survey Benchmark Companies: 64.10% use global (corporate 46.15% and business unit 17.95%) for identifying competitor benchmark companies for compensation comparison purposes. However, 18.80% assign this responsibility to local country management. Editor’s Observations: While the primary responsibility for selecting benchmark comparators is usually assigned to the global entity, a few companies give local country management this responsibility.
Governance For Job Evaluation (job rankings/grades—not pay ranges):
117 Responses
[1] - Global corporate HQ (49.57% : 58)
[2] - Global business unit HQ (18.80% : 22)
[3] - Country (17.09% : 20)
[4] - World-region (9.40% : 11)
[5] - Not applicable/do not have (3.42% : 4)
[6] - Combination (1.71% : 2)
Governance—Job Evaluation: 68.37% keep the responsibility for job evaluation at the global level (corporate 49.57% and business unit 18.80%). 17.09% give job evaluation responsibility to country management. Editor’s Observations: Most companies retain job evaluation at the global level. A small group of companies allow local country management to assign job levels.

The Alexander Group, Inc. Page 26
Governance For Pay Mix (relationship between base and incentive) for Jobs:
117 Responses
[1] - Global corporate HQ (47.01% : 55)
[2] - Country (18.80% : 22)
[3] - Global business unit HQ (17.95% : 21)
[4] - Combination (9.40% : 11)
[5] - World-region (5.98% : 7)
[6] - Not applicable/do not have (0.85% : 1)
Governance—Pay Mix: 64.96% follow global (corporate 47.01% and business unit 17.95%) to establish pay mix by job. 18.80% give local country management the responsibility to set pay mix. Editor’s Observations: Most reporting companies favor global pay mix decisions. However, a modest number allow pay mix to be set at the local country level.
Governance For Performance Measures:
117 Responses
[1] - Global corporate HQ (35.04% : 41)
[2] - Global business unit HQ (27.35% : 32)
[3] - Country (15.38% : 18)
[4] - Combination (12.82% : 15)
[5] - World-region (9.40% : 11)
[6] - Not applicable/do not have (0.00% : 0)
Governance—Performance Measures: 62.39% keep the selection of performance measures at the global level (corporate 35.04% and business unit 27.35%). 15.38% allow local country management to select sales compensation program payout performance measures. Editor’s Observations: Global oversight still prevails when selecting sales compensation design performance measures.

The Alexander Group, Inc. Page 27
Governance For Quota Setting Method:
114 Responses
[1] - Global corporate HQ (23.68% : 27)
[2] - Global business unit HQ (21.93% : 25)
[3] - Country (19.30% : 22)
[4] - Combination (16.67% : 19)
[5] - World-region (14.91% : 17)
[6] - Not applicable/do not have (3.51% : 4)
Quota Setting Method: 45.61% follow global quota setting practices (corporate 23.68% and business unit 21.93%). 19.30% establish quota setting methods at the country level. Editor’s Observations: While the results show a global preference, a variety of stakeholders at the global, business unit, region and country level help craft quota setting methods.
Governance For Quota Amounts for Sales Personnel:
114 Responses
[1] - Combination (23.68% : 27)
[2] - Country (21.93% : 25)
[3] - Global business unit HQ (19.30% : 22)
[4] - Global corporate HQ (17.54% : 20)
[5] - World-region (14.04% : 16)
[6] - Not applicable/do not have (3.51% : 4)
Governance—Quota Amounts for Sales Personnel: Practices vary widely among the reporting companies with 23.68% reporting they have some combination of global, region and local practices operating at one time to set quotas. Global practices represent 36.84% (corporate 17.54% and business unit 19.30%) of the reporting companies. 21.93% report that local country management is responsible for setting quotas. Editor’s Observations: When setting quotas, global practices are less prevalent than compared to other governance factors. In our view, local management will most likely have the best understanding of local market opportunities, which could affect quota assignment.

The Alexander Group, Inc. Page 28
Governance For Program Assessment:
114 Responses
[1] - Global corporate HQ (38.60% : 44)
[2] - Global business unit HQ (25.44% : 29)
[3] - Combination (14.04% : 16)
[4] - Country (13.16% : 15)
[5] - World-region (7.02% : 8)
[6] - Not applicable/do not have (1.75% : 2)
Governance—Program Assessment: 64.04% of the participants provide global oversight (corporate 38.60% and business unit 25.44%) to sales compensation program assessment.14.04% assign this responsibility to some combination of global, business unit, region and country resources. Editor’s Observations: Most survey participants provide global oversight to program assessment.
Governance For Payout Administration/Calculations:
114 Responses
[1] - Global corporate HQ (39.47% : 45)
[2] - Country (29.82% : 34)
[3] - Global business unit HQ (14.04% : 16)
[4] - World-region (8.77% : 10)
[5] - Combination (7.02% : 8)
[6] - Not applicable/do not have (0.88% : 1)
Governance—Payout Administration/Calculations: 53.51% of the participants provide global (corporate 39.47% and business unit 14.04%) payout administration/calculation support. 29.82% provide these resources at the country level. Editor’s Observations: Most companies provide global automation resources; however, one-third assign this administrative responsibility to local country management.

The Alexander Group, Inc. Page 29
Governance For Technical Automation Support:
114 Responses
[1] - Global corporate HQ (42.11% : 48)
[2] - Country (17.54% : 20)
[3] - Global business unit HQ (14.91% : 17)
[4] - Not applicable/do not have (13.16% : 15)
[5] - World-region (9.65% : 11)
[6] - Combination (2.63% : 3)
Governance—Technical Automation Support: 57.02% provide global governance (corporate 42.11% and business unit 14.91%) oversight to the automation system. The major focus is from the corporate headquarters.17.54% have local country personnel address automation needs. Editor’s Observations: Most likely those with a commercial automation solution purchase and oversee automation at a global level and those still using desktop solutions assign this role to local resources.
Governance For Program Approval:
114 Responses
[1] - Global corporate HQ (60.53% : 69)
[2] - Global business unit HQ (17.54% : 20)
[3] - Country (8.77% : 10)
[4] - World-region (7.02% : 8)
[5] - Combination (5.26% : 6)
[6] - Not applicable/do not have (0.88% : 1)
Governance—Program Approval: 78.07% require global level (corporate 60.53% and business unit 17.54%) program approval. 7.02% give this responsibility to world-regions. Editor’s Observations: Clearly, most global stakeholders want to approve any program changes to the sales compensation program.

The Alexander Group, Inc. Page 30
Governance For Contests and Spiffs:
114 Responses
[1] - Country (21.93% : 25)
[2] - Global corporate HQ (21.05% : 24)
[3] - Global business unit HQ (20.18% : 23)
[4] - World-region (14.04% : 16)
[5] - Combination (13.16% : 15)
[6] - Not applicable/do not have (9.65% : 11)
Governance—Contests and Spiffs: 41.23% of the participating companies provide global (corporate 21.05% and business unit 20.18%) direction to contests and spiffs. 21.93% allow local country management to provide oversight to local contests and spiffs. Editor’s Observations: A surprisingly high number (almost one-fourth) of participating companies allow local country management to oversee local contests and spiffs.
Governance For Annual Recognition Event (such as President's Club):
113 Responses
[1] - Global corporate HQ (39.82% : 45)
[2] - Global business unit HQ (18.58% : 21)
[3] - Not applicable/do not have (13.27% : 15)
[4] - Country (12.39% : 14)
[5] - World-region (10.62% : 12)
[6] - Combination (5.31% : 6)
Governance—Annual Recognition Event: 58.40% provide global direction (corporate 39.82% and business unit 18.58%) to the annual sales recognition event. 13.27% do not offer such a program. 12.39% leave such programs in the hands of local country management. Editor’s Observations: We would have expected a higher global oversight to such programs; however, their use is situational to each company and practices vary substantially from one company to another.
The Alexander Group, Inc. Page 31
Program Governance (117 Reporting Companies)
Most Global to Least Global (all companies)
HQ (Sorted)
Global BU
World Region
Country Combo N/A
Program Approval 60.53% 17.54% 7.02% 8.77% 5.26% 0.88%
Overall Pay Competitiveness Philosophy
59.83% 17.95% 6.84% 11.11% 4.27% 0.00%
Job Evaluation 49.57% 18.80% 9.40% 17.09% 1.71% 3.42%
Program Design Principles 48.72% 24.79% 8.55% 10.26% 6.84% 0.85%
Pay Mix 47.01% 17.95% 5.98% 18.80% 9.40% 0.85%
Survey Benchmark Companies 46.15% 17.95% 5.98% 18.80% 9.40% 1.71%
Formula Mechanics 45.30% 22.22% 9.40% 13.68% 8.55% 0.85%
Annual Design Updates for Next Fiscal Year
44.44% 23.08% 11.11% 12.82% 7.69% 0.85%
Technical Automation Support 42.11% 14.91% 9.65% 17.54% 2.63% 13.16%
Annual Recognition Event 39.82% 18.58% 10.62% 12.39% 5.31% 13.27%
Payout Administration/Calculations 39.47% 14.04% 8.77% 29.82% 7.02% 0.88%
Program Assessment 38.60% 25.44% 7.02% 13.16% 14.04% 1.75%
Performance Measures 35.04% 27.35% 9.40% 15.38% 12.82% 0.00%
Quota Setting Method 23.68% 21.93% 14.91% 19.30% 16.67% 3.51%
Contests and Spiffs 21.05% 20.18% 14.04% 21.93% 13.16% 9.65%
Quota Amounts for Sales Personnel 17.54% 19.30% 14.04% 21.93% 23.68% 3.51%
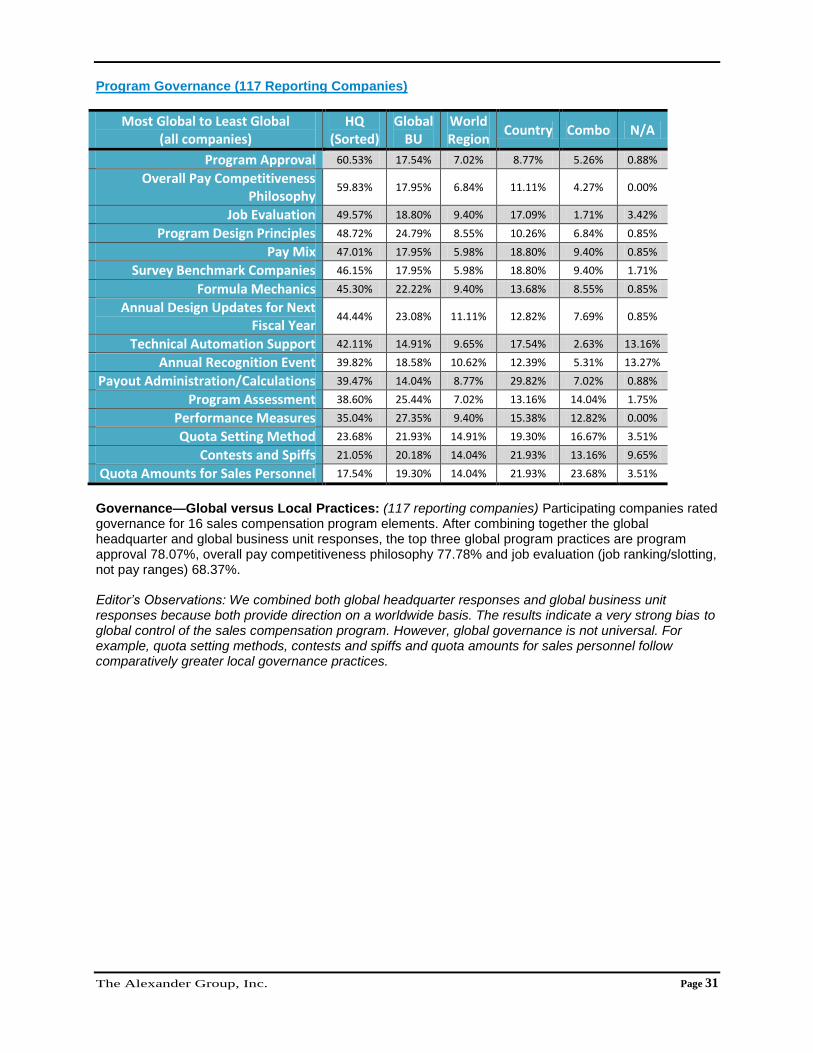
Governance—Global versus Local Practices: (117 reporting companies) Participating companies rated governance for 16 sales compensation program elements. After combining together the global headquarter and global business unit responses, the top three global program practices are program approval 78.07%, overall pay competitiveness philosophy 77.78% and job evaluation (job ranking/slotting, not pay ranges) 68.37%. Editor’s Observations: We combined both global headquarter responses and global business unit responses because both provide direction on a worldwide basis. The results indicate a very strong bias to global control of the sales compensation program. However, global governance is not universal. For example, quota setting methods, contests and spiffs and quota amounts for sales personnel follow comparatively greater local governance practices.

The Alexander Group, Inc. Page 32
Globally Organized (66 Companies)
Locally Organized (49 Companies)
Preferred Governance Practice
Most Global to Least Global Global
(sorted) Local Global Local
Program Approval 89.07% 10.94% 62.50% 35.42%
Program Design Principles 84.85% 15.15% 57.15% 40.82%
Overall Pay Competitiveness Philosophy 84.85% 15.16% 67.34% 32.66%
Annual Design Updates for Next Fiscal Year 80.31% 19.70% 48.98% 48.98%
Formula Mechanics 80.30% 19.70% 51.02% 46.94%
Survey Benchmark Companies 77.27% 21.22% 44.90% 53.05%
Pay Mix 75.76% 22.74% 51.02% 48.97%
Job Evaluation 75.76% 18.19% 57.15% 42.86%
Performance Measures 74.24% 25.76% 46.94% 53.06%
Program Assessment 73.44% 25.00% 50.00% 47.91%
Technical Automation Support 71.88% 15.64% 35.42% 50.00%
Annual Recognition Event 69.84% 14.28% 41.67% 47.91%
Payout Administration/Calculations 68.75% 31.25% 31.25% 66.67%
Quota Setting Method 56.25% 42.19% 31.25% 62.50%
Contests and Spiffs 46.88% 40.63% 33.33% 60.42%
Quota Amounts for Sales Personnel 43.76% 54.69% 27.09% 66.67%
Governance Practices Between Globally Versus Locally Organized Sales Functions: 66 companies have globally organized sales organizations (corporate headquarter or business unit). 49 companies have locally organized sales organizations (world-region, country and combination). Editor’s Observations: Generally, the governance practices for 16 program elements are ranked in a similar but not exact order between globally organized versus locally organized sales functions. Interestingly, organization design (global versus local) accounts for an average of 26.01% shift in governance from local accountably to global accountability based on global versus local organization structure.

The Alexander Group, Inc. Page 33
Trends In Global Uniformity

The Alexander Group, Inc. Page 34
Trends In Global Uniformity
Sales Compensation Program Design Uniformity Trends
Component/Element Global
Uniformity (Mean)
Next Year’s Uniformity
(Mean)
Central Design Oversight 4.1 3.9
Program Design Principles 4.1 3.9
Market Competitiveness Objectives 4.0 3.7
Survey Benchmark Companies 3.7 3.6
Job Grades (Job Slotting) 3.9 3.8
Pay Mix (base/incentive) for Jobs 3.4 3.6
Formula Mechanics 3.9 3.8
Performance Measures 3.8 3.8
Quota Allocation Method 3.4 3.5
Program Assessment Methods 3.7 3.7
Contests and Spiffs 3.1 3.3
Recognition Program (President's Club) 4.0 3.7
Automation Tools 3.5 3.8

The Alexander Group, Inc. Page 35
Trends in Global Uniformity: The reporting companies identified central design oversight and program design principles as preferred global uniformity practices. Greater global automation tools uniformity is an objective for many program managers. Quota allocation and contests and spiffs are more removed from global uniformity objectives. Editor’s Observations: We would expect that design oversight and program principles would be at the top of the list for program global uniformity. The importance of global automation tools is a growing trend. As compared to other practices, quota allocation methods and contests and spiffs follow more local practices.
The Alexander Group, Inc. Page 36
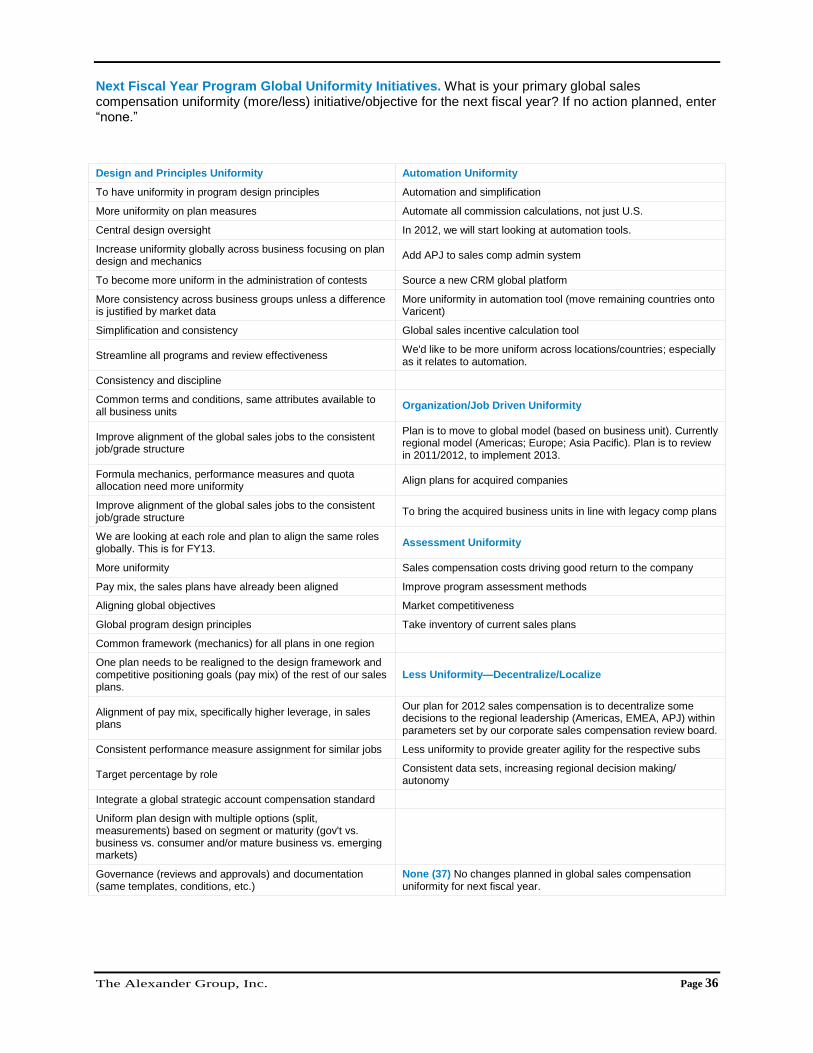
Next Fiscal Year Program Global Uniformity Initiatives. What is your primary global sales compensation uniformity (more/less) initiative/objective for the next fiscal year? If no action planned, enter ―none.‖
Design and Principles Uniformity Automation Uniformity
To have uniformity in program design principles Automation and simplification
More uniformity on plan measures Automate all commission calculations, not just U.S.
Central design oversight In 2012, we will start looking at automation tools.
Increase uniformity globally across business focusing on plan design and mechanics
Add APJ to sales comp admin system
To become more uniform in the administration of contests Source a new CRM global platform
More consistency across business groups unless a difference is justified by market data
More uniformity in automation tool (move remaining countries onto Varicent)
Simplification and consistency Global sales incentive calculation tool
Streamline all programs and review effectiveness We'd like to be more uniform across locations/countries; especially as it relates to automation.
Consistency and discipline
Common terms and conditions, same attributes available to all business units
Organization/Job Driven Uniformity
Improve alignment of the global sales jobs to the consistent job/grade structure
Plan is to move to global model (based on business unit). Currently regional model (Americas; Europe; Asia Pacific). Plan is to review in 2011/2012, to implement 2013.
Formula mechanics, performance measures and quota allocation need more uniformity
Align plans for acquired companies
Improve alignment of the global sales jobs to the consistent job/grade structure
To bring the acquired business units in line with legacy comp plans
We are looking at each role and plan to align the same roles globally. This is for FY13.
Assessment Uniformity
More uniformity Sales compensation costs driving good return to the company
Pay mix, the sales plans have already been aligned Improve program assessment methods
Aligning global objectives Market competitiveness
Global program design principles Take inventory of current sales plans
Common framework (mechanics) for all plans in one region
One plan needs to be realigned to the design framework and competitive positioning goals (pay mix) of the rest of our sales plans.
Less Uniformity—Decentralize/Localize
Alignment of pay mix, specifically higher leverage, in sales plans
Our plan for 2012 sales compensation is to decentralize some decisions to the regional leadership (Americas, EMEA, APJ) within parameters set by our corporate sales compensation review board.
Consistent performance measure assignment for similar jobs Less uniformity to provide greater agility for the respective subs
Target percentage by role Consistent data sets, increasing regional decision making/ autonomy
Integrate a global strategic account compensation standard
Uniform plan design with multiple options (split, measurements) based on segment or maturity (gov't vs. business vs. consumer and/or mature business vs. emerging markets)
Governance (reviews and approvals) and documentation (same templates, conditions, etc.)
None (37) No changes planned in global sales compensation uniformity for next fiscal year.

The Alexander Group, Inc. Page 37
Next Fiscal Year Program Global Uniformity Initiatives: 37 companies have no uniformity changes goals for next fiscal year. 26 companies plan to improve global design and principles. 8 companies have global automation uniformity objectives. 4 plan to improve uniformity of global assessment. 3 plan to resolve uniformity issues caused by organization and job design changes. 3 plan to lessen global uniformity practices by providing more autonomy to local sales entities. Editor’s Observations: Companies want to provide better design support and more uniform principles to the worldwide sales organizations. It’s interesting that three companies are ready to provide more autonomy to local sales entities. Is this an inkling of a trend?
The Alexander Group, Inc. Page 38
Automation Support

The Alexander Group, Inc. Page 39
Automation Support
Selection Of Automation Support. The selection of incentive compensation automation support is made at what level?
114 Responses
[1] - Global corporate HQ (52.63% : 60)
[2] - Global business unit HQ (18.42% : 21)
[3] - Country (10.53% : 12)
[4] - World-region (8.77% : 10)
[5] - Combination (5.26% : 6)
[6] - Not applicable/do not have (4.39% : 5)
Selection Of Automation Support: 71.05% of the participating companies make decisions about automation support at a global level (corporate 52.63% and business unit 18.42%). 10.53% allow local management to make these decisions. Editor’s Observations: Automation systems are expensive. It’s not surprising that global stakeholders would be making these decisions. Also, such systems help extend the reach of global leaders, thus making it easier to review and assess such programs on a worldwide basis.

The Alexander Group, Inc. Page 40
Automation Support. Solution Assessment.
Automation Solutions
(Counts: Number of Companies)
Use and Would Not
Recommend
Use and Neutral
Use and Would
Recommend Might Use Do Not Use
Desktop Solutions 17 / 17.35% 42 / 42.86% 9 / 9.18% 2 / 2.04% 28 / 28.57%
In-House Application
10 / 11.24% 20 / 22.47% 6 / 6.74% 10 / 11.24% 43 / 48.31%
Oracle 5 / 6.10% 12 / 14.63% 3 / 3.66% 4 / 4.88% 58 / 70.73%
Callidus 2 / 2.35% 10 / 11.76% 2 / 2.35% 7 / 8.24% 64 / 75.29%
SAP 2 / 2.38% 8 / 9.52% 2 / 2.38% 9 / 10.71% 63 / 75.00%
Varicent 3 / 3.57% 2 / 2.38% 3 / 3.57% 13 / 15.48% 63 / 75.00%
Xactly 3 / 3.75% 6 / 7.50% 2 / 2.50% 6 / 7.50% 63 / 78.75%
Synygy 1 / 1.19% 3 / 3.57% 1 / 1.19% 9 / 10.71% 70 / 83.33%
Merced 1 / 1.28% 1 / 1.28% 0 / 0.00% 4 / 5.13% 72 / 92.31%
ZS Associates 1 / 1.35% 1 / 1.35% 1 / 1.35% 2 / 2.70% 69 / 93.24%
CSC-Performance Plus
1 / 1.32% 1 / 1.32% 0 / 0.00% 2 / 2.63% 72 / 94.74%
Versata 1 / 1.30% 1 / 1.30% 0 / 0.00% 2 / 2.60% 73 / 94.81%
Vue 1 / 1.30% 1 / 1.30% 0 / 0.00% 2 / 2.60% 73 / 94.81%
The Alexander Group, Inc. Page 41
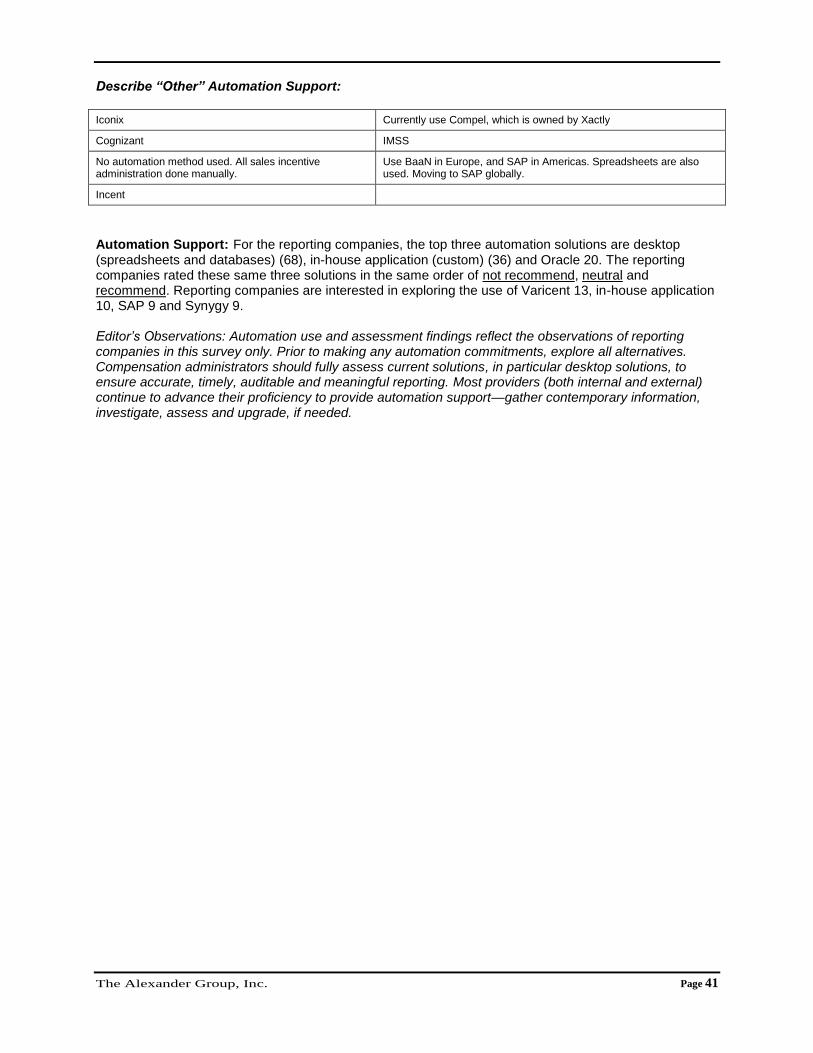
Describe “Other” Automation Support:
Iconix Currently use Compel, which is owned by Xactly
Cognizant IMSS
No automation method used. All sales incentive administration done manually.
Use BaaN in Europe, and SAP in Americas. Spreadsheets are also used. Moving to SAP globally.
Incent
Automation Support: For the reporting companies, the top three automation solutions are desktop (spreadsheets and databases) (68), in-house application (custom) (36) and Oracle 20. The reporting companies rated these same three solutions in the same order of not recommend, neutral and recommend. Reporting companies are interested in exploring the use of Varicent 13, in-house application 10, SAP 9 and Synygy 9. Editor’s Observations: Automation use and assessment findings reflect the observations of reporting companies in this survey only. Prior to making any automation commitments, explore all alternatives. Compensation administrators should fully assess current solutions, in particular desktop solutions, to ensure accurate, timely, auditable and meaningful reporting. Most providers (both internal and external) continue to advance their proficiency to provide automation support—gather contemporary information, investigate, assess and upgrade, if needed.

The Alexander Group, Inc. Page 42
Region/Country Practices

The Alexander Group, Inc. Page 43
Government Regulations and Restrictions The following were mentioned as government regulations regarding sales compensation practices:
Signed plan acknowledgement
Dispute resolutions rules: duration and topics
Base pay reductions: restrictions, consent requirements or notification requirements
Base pay increases: mandatory increase requirements
Plan changes: restricted or consent required, or notification required
Local language requirement of plan documents
Labor/Works Council Practices The following were mentioned as Labor/Works Council Practices affecting sales compensation practices:
Works Council’s approval for: plan design, base pay, target compensation
Restrictions on: changing quotas, base pay reductions, changing target compensation
Requirements: for cost of living increases, signed plan acknowledgments, local language of plan documents
Cultural and Social Norms The following were mentioned as Cultural and Social Norms affecting sales compensation practices:
Pay mix: greater portion of target compensation assigned to base pay versus incentive component.
Retention: high growth economies driving high turnover
Equal treatment: rewards tied to group performance and less on individual performance
Limitations on subjective measures
The Alexander Group, Inc. Page 44
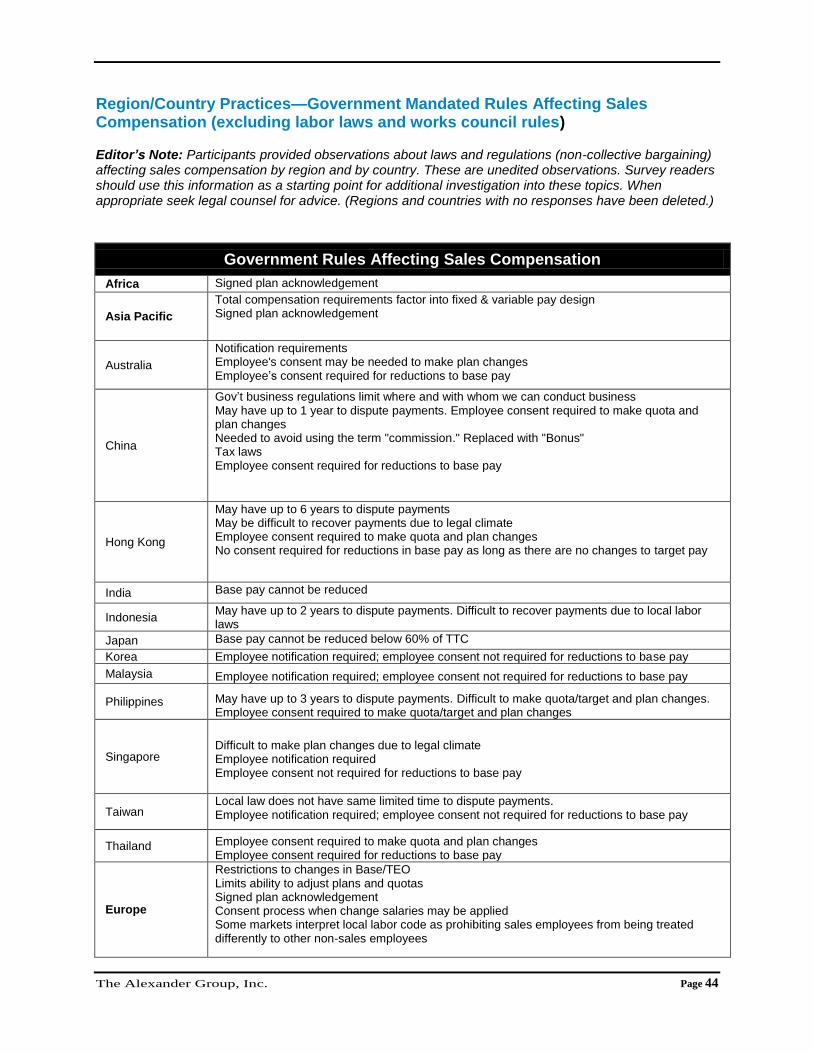
Region/Country Practices—Government Mandated Rules Affecting Sales Compensation (excluding labor laws and works council rules)
Editor’s Note: Participants provided observations about laws and regulations (non-collective bargaining) affecting sales compensation by region and by country. These are unedited observations. Survey readers should use this information as a starting point for additional investigation into these topics. When appropriate seek legal counsel for advice. (Regions and countries with no responses have been deleted.)
Government Rules Affecting Sales Compensation
Africa Signed plan acknowledgement
Asia Pacific
Total compensation requirements factor into fixed & variable pay design Signed plan acknowledgement
Australia
Notification requirements Employee's consent may be needed to make plan changes Employee’s consent required for reductions to base pay
China
Gov’t business regulations limit where and with whom we can conduct business May have up to 1 year to dispute payments. Employee consent required to make quota and plan changes Needed to avoid using the term "commission." Replaced with "Bonus" Tax laws Employee consent required for reductions to base pay
Hong Kong
May have up to 6 years to dispute payments May be difficult to recover payments due to legal climate Employee consent required to make quota and plan changes No consent required for reductions in base pay as long as there are no changes to target pay
India Base pay cannot be reduced
Indonesia May have up to 2 years to dispute payments. Difficult to recover payments due to local labor laws
Japan Base pay cannot be reduced below 60% of TTC
Korea Employee notification required; employee consent not required for reductions to base pay
Malaysia Employee notification required; employee consent not required for reductions to base pay
Philippines May have up to 3 years to dispute payments. Difficult to make quota/target and plan changes. Employee consent required to make quota/target and plan changes
Singapore Difficult to make plan changes due to legal climate Employee notification required Employee consent not required for reductions to base pay
Taiwan Local law does not have same limited time to dispute payments. Employee notification required; employee consent not required for reductions to base pay
Thailand Employee consent required to make quota and plan changes Employee consent required for reductions to base pay
Europe
Restrictions to changes in Base/TEO Limits ability to adjust plans and quotas Signed plan acknowledgement Consent process when change salaries may be applied Some markets interpret local labor code as prohibiting sales employees from being treated differently to other non-sales employees

The Alexander Group, Inc. Page 45
Government Rules Affecting Sales Compensation (continued)
Austria
Target incentive cannot be changed unilaterally Works Council Employee consent required for reductions to base pay Under Labor Works Council – cannot reduce basic salary
Belgium Employee consent required for reductions to base pay
Denmark
Unable to recover unearned advances Payments maybe disputed up to 5 years Difficult to make quota/target and plan changes due to local legal climate Employee consent required for reductions to base pay If sales quotas are not clear, the employer is required to pay 100% of IC
Finland Payments may be disputed up to 5 years. Employee consent required to make quota and plan changes Employee consent required for reductions to base pay
France
Payments may be disputed up to 5 years. Employee consent required to make quota/target and plan changes All plan documents required to be written in French Total cash compensation is safeguarded Signed plan acknowledgement required Employee consent required for reductions to base pay
Germany
Difficult to recover unearned advances. Payments may be disputed up to 60 days Works Council Employee consent required for reductions to base pay Under Labor Works Council – cannot reduce basic salary If sales quotas are not clear, the employer is required to pay 100% of IC
Hungary Difficult to make quota/target and plan changes due to local legal climate
Ireland Employee consent required for reductions to base pay
Italy Base pay never lower than minimum salary as prescribed by the National Bargain Agreement
Netherlands Difficult to recover unearned advances. Employee consent required to make plan changes
Russia Difficult to recover unearned advances Employee consent required for base pay reduction
Spain
Requires employee consent to recover unearned advances Payments can be disputed for up to 1 year Employee consent required to make quota/target and plan changes Employee consent required for base pay reduction
Sweden Payments may be disputed for up to 10 years. Difficult to make quota/target and plan changes due to legal climate. Employee consent required for base pay reduction
Switzerland Employee consent required for base pay reduction
United Kingdom Difficulty in changing plans because of employment contracts
Middle East Restrictions to changes in Base/TEO Signed plan acknowledgement
Israel Difficult to recover unearned advances. Difficult to make quota/target and plan changes due to legal climate. Employee consent required for base pay reduction
Saudi Arabia Difficult to make quota/target and plan changes due to legal climate
North America Signed plan acknowledgement Off-label usage
Canada
Requires employee consent to recover unearned advances. Employee consent required to make quota/ target and plan changes Laws vary regarding base pay reduction; generally 10% reduction deemed low risk; higher than that recommend employee consent for reductions to base Provincial restrictions on reducing pay

The Alexander Group, Inc. Page 46
Government Rules Affecting Sales Compensation (continued)
United States
Signed plan acknowledgement with targets Overtime rules for non-exempt roles Special addendums to plans required for California, New York and New Hampshire to address state law requirements California rules used as model Several states mandate when sales compensation is required to be paid after earned. California - All commissions paid on termination, whether earned or not.
United State(s)
Policies/practices regarding sales compensation while on LOA or benefits California = 1 1/2 overtime New York - signed plan acknowledgment required Nebraska - If Employee was employed prior to current plan effective date and ceases participation within 90 days of current plan effective date, prior plan governs incentive payment for any common components of both plans. Tennessee - cannot recover incentive without participant signed plan acknowledgment on record
Latin America
Total compensation requirements factor into fixed and variable pay design Signed plan acknowledgement Must have hard copy acknowledgments; base pay cannot be reduced in sales/non-sales transfers Limited ability to reduce sales compensation payouts from one year to another, regardless if performance is down
Argentina Difficult to recover unearned advances. Payments may be disputed up to two years. Difficult to make quota/target and plan changes due to legal climate. Mandatory increases
Brazil
No change to base salary Difficult to make quota/target and plan changes due to legal climate Mandatory increases Cannot lower base pay Annual merit Increases
Chile Difficult to recover unearned advances. Difficult to make quota/target due to legal climate. Consent from employee required for plan changes
Mexico
Difficult to recover unearned advances. Payments may be disputed for up to 1 year. May not be able to make quota/target and plan changes due to legal climate Mandatory increases Cannot lower base pay
Panama No change to base salary
Venezuela Mandatory increases

The Alexander Group, Inc. Page 47
Labor/Works Council Practices Affecting Sales Compensation
Editor’s Note: Participants provided observations about labor laws and works councils affecting sales compensation by region and by country. These are unedited observations. Survey readers should use this information as a starting point for additional investigation into these topics. When appropriate seek legal counsel for advice. (Regions and countries with no responses have been deleted.)
Labor/Works Council Practices Affecting Sales Compensation
Africa HR legal prefers each sales ee acknowledging plan and T&Cs
Japan Must consult works council in order to decrease any benefit Not reduce total target annual cash
Taiwan Unable to make mid-flight plan changes due to restriction in local labor law Unable to make mid-flight quota/target changes due to restriction in local labor law
Europe
Involvement with review and approval of changes Changes need to be approved by councils in specific countries Line of sight measurements, concerns over global measures Salary change restriction HR legal prefers each sales ee acknowledging plan and T&Cs Works Council should be notified one month before the plan changes In some countries, Works Council consent is required for sales incentive plan implementation
Austria
Mandatory CLA Increase Annual Notify WC if base pay will be reduced Under Labor Works Council – cannot reduce basic salary Limits ability for Change/Salary Adjustment
Belgium
Limits reducing target total cash Notification and approval requirements Notify WC if base pay will be reduced Works Council
France
Need approval from Works Council on comp plan changes Notification and approval requirements Need to be careful about use of quarterly or annual earnings adjustment factors Moderate involvement with sales plan changes Must consult Works Council in order to decrease any benefit 3 months’ notice to WC for base pay reductions Under Labor Works Council – cannot reduce basic salary Limits ability for change/salary adjustment Works Council rules Under Labor Works Council – cannot reduce basic salary, signed hardcopy of comp plan on file, must be in French
Germany
Need approval on comp plan changes Notification and approval requirements Works Council Difficult to change plans because of employment contracts Require Worker's Council approval of any changes to quota/target and plans Heavy Works Council involvement with sales plan changes TTC Pay may not be decreased, may not make any changes to plans/structures unless approved by workers council/CLA Need to inform Works Council of SIP changes, which if are neutral or positive ends up being a mere formality so far for us. Must consult Works Council in order to decrease any benefit Sales compensation plans need to be approved by local worker council Notify WC if base pay will be reduced Under Labor Works Council – cannot reduce basic salary Limits ability for change/salary adjustment 250% incentive pay cap

The Alexander Group, Inc. Page 48
Labor/Works Council Practices Affecting Sales Compensation (continued)
Italy
Pay increases regardless of performance; difficulty in changing plans because of employment contracts Notify if major change only Under Labor Works Council – CBA Agreements in place
Netherlands
Limits reducing target total cash Notification and approval requirements Works Council Automatic CLA Increase 3x per year to base and commission, may not make any changes to plans/structures unless approved by workers council/CLA
Portugal Payments dispute timeframe up to local labor law requirement
Spain Mandatory CLA increase annual
United Kingdom Actual employee signature for base pay reduction
Middle East Involvement with review and approval of changes HR legal prefers each sales ee acknowledging plan and T&Cs
North America HR legal prefers each sales ee acknowledging plan and T&Cs
Canada Notification requirements
Latin America Strongly influence pay and plan design. Source of recommendation and change HR legal prefers each sales ee acknowledging plan and T&Cs
Brazil Mandated salary increases, whether performance merits or not; not being able to change plan because of employment contracts Union involvement and approvals

The Alexander Group, Inc. Page 49
Cultural and Social Norms Affecting Sales Compensation
Editor’s Note: Participants provided observations about cultural and social norms affecting sales compensation by region and by country. These are unedited observations. Survey readers should use this information as a starting point for additional investigation into these topics. (Regions and countries with no responses have been deleted.)
Cultural and Social Norms Affecting Sales Compensation
Africa More emphasis on fixed pay versus variable pay
Asia Pacific
More emphasis on fixed pay versus variable pay Employees change companies very easily for more money, causing problems with retention
China
The way business is conducted may be counter to our policies and processes - makes enforcement difficult. Expectations around notification Split SIP payout to reduce the tax Quickly expanding/growing Differing pay mix practices for like jobs
Hong Kong Differing pay mix practices for like jobs
India More focused on fixed Quickly expanding/growing
Japan
Unwillingness to accept changes that reward differences in individual performance - want equal targets and achievements for all sales staff More focused on fixed Expectations around notification; preference to maintain conservative approaches
Singapore Very challenging market due to competitiveness Differing pay mix practices for like jobs
Europe Plan component usage constrained by pension & severance concerns Typically more conservative/lower at-risk pay Differing pay mix practices for like jobs
France Local language plan
Germany Strong concerns about discretion applied to plan awards Pay mix
Netherlands What pension is calculated off of, this year we changed to pension calculated off of TTC instead of base so that we could move to a more highly leveraged plan in Europe
Spain 30-day notification
Middle East More emphasis on fixed pay versus variable pay
United Arab Emirates Differing pay mix practices for like jobs
North America Pay for performance environment
Canada Difficult to terminate for performance, so performance becomes a moot issue
Latin America More emphasis on fixed pay versus variable pay
Brazil Local Language Plan
Mexico Expectations of comp increases regardless of performance

The Alexander Group, Inc. Page 50
Survey Sources

The Alexander Group, Inc. Page 51
Survey Sources The following companies were cited as sources of global sales compensation data:
Aon Hewitt: www.aon.com
Comptryx: www.comptryx.com
Culpepper: www.culpepper.com
Hay: www.haygroup.com
Kenexa (IPAS): www.kenexa.com
McLagan: www.mclagan.com
Mercer: www.mercer.com
Radford: www.radford.com
Towers Watson: www.towerswatson.com
Western Management Group: www.wmgnet.com

The Alexander Group, Inc. Page 52
Survey Sources—Compensation Levels
Editor’s Notes: Each reporting company could list up to three survey sources per world-region and country. These are unedited responses. Please contact the survey company for additional information about their surveys and they may apply to your workforce. Multiple entries of the same survey mean that multiple companies reported its use.
Survey Source #1 Survey Source #2 Survey Source #3
Africa IPAS Mercer Radford Radford and Towers Watson Benchmark Pay and Practice Surveys Radford Global Sales Survey Radford Global Sales Towers Watson Watson Wyatt - high tech survey WW Radford Compensation Survey
Alexander Group, ad-hoc surveys Comptryx IPAS IPAS Global Compensation Surveys Mercer Radford Towers Towers Watson WW CQH Benchmark WW
Aon Hewitt HAY Radford Towers Watson
Egypt Radford Sales Survey Radford WW
IPAS Mercer
Watson Wyatt CompITE
South Africa Mercer TRS Radford Sales Survey Radford TP – Gbl CDB MMPS
IPAS LMO Exec
Watson Wyatt CompITE WMG – HP Eur Mgmt Res
Asia Pacific AGI IPAS Mercer Mercer - APITT forum (high tech group) Radford Radford and Towers Watson Benchmark Pay and Practice Surveys Radford - Benchmarking - Global Radford Global Sales Survey Radford Sales Compensation Survey Towers Watson Towers Watson for Asia Pacific
Alexander Group, ad-hoc surveys CHiPS Comptryx IPAS IPAS Global Compensation Surveys Mercer Radford Radford Global Sales Survey Towers Watson
Comptryx Global Pay and Organizational Metrics Survey Hewitt HRBS Mercer Radford Towers Perrin Towers Watson
Australia Aon/Hewitt Clas Sal Info Svcs Ply Ltc Culpepper Culpepper Sales Survey Radford Hewitt Mercer Radford Sales Survey Towers Watson Global Grading System
Hewitt IPAS Mercer Mercer APITT Aus High Tech Radford Global Sales Survey
Mercer APITT

The Alexander Group, Inc. Page 53
China Culpepper Sales Survey Hay Hewitt Hewitt Sales Mercer Mercer Hi-Tech Total Remuneration Survey Mercer - TRS Radford Radford Sales Survey Towers Perrin Towers Watson Global Grading System WMM - High Tech WMM-Tot Rem Svy Hi Tech
Hewitt IPAS Mercer Mercer TRS High Tech Industry Radford Radford Global Sales Survey Radford - high tech Radford Sales Towers Towers Watson Global Sales
McLagan Mercer APITT Towers Watson
Hong Kong Mercer Mercer - Pay Monitor Radford Radford - Global Sales Radford Sales Survey Towers Watson Towers Watson Global Grading System
Hay IPAS Radford Towers
McLagan Mercer APITT
India Culpepper Sales Survey Hay Hewitt Mercer Mercer - High Tech Mercer Hi-Tech Total Remuneration Survey Mercer - TRS Radford Radford Sales Survey Towers Watson Global Grading System Zinnov
Hewitt - IT TES IPAS Mercer Mercer TRS High Tech Industry Radford Radford Global Sales Survey
Mercer APITT Radford Towers Watson
Indonesia Mercer Radford Radford Aon Radford Sales Survey
IPAS Towers Watson
Mercer APITT
Japan Culpepper Sales Survey Hay Mercer Mercer - High Tech Mercer Hi-Tech Total Remuneration Survey Mercer - TRS Radford Radford Sales Survey
IPAS Mercer Radford Radford Global Sales Survey Towers Watson
Mercer APITT

The Alexander Group, Inc. Page 54
Korea Mercer Mercer - High Tech Mercer Hi-Tech Total Remuneration Survey Radford Radford - Global Sales Radford Sales Survey Towers Watson Global Grading System
IPAS Radford
Mercer APITT Towers Watson
Malaysia Hay Mercer Mercer - High Tech Radford Radford Sales Survey Towers Watson Global Grading System
IPAS Mercer Radford
Mercer APITT Towers Watson
Pakistan Radford Radford Sales Survey WW - General Ind Svy
IPAS Mercer APITT
Philippines Mercer Mercer APITT Radford Radford Sales Survey Towers Watson
Hewitt IT TES IPAS
Mercer APITT
Singapore Culpepper Sales Survey Hay Mercer Mercer High Tech Radford Radford - Global Sales Radford Sales Survey Towers Watson Global Grading System
Hewitt IT TES IPAS Mercer Radford
McLagan Mercer APITT Towers Watson
Taiwan Mercer Mercer High Tech Radford Radford Sales Survey Radford - Global Sales Towers Watson
Hewitt IT TES IPAS Mercer Radford
Mercer APITT
Thailand Mercer Radford Radford Sales Survey Towers Watson Global Grading System
IPAS Radford
Mercer APITT Towers Watson

The Alexander Group, Inc. Page 55
Europe AGI Hay IPAS Mercer Radford Radford Global Sales Survey Radford Sales Compensation Survey Radford and Towers Watson Benchmark Pay and Practice Surveys Sibson Consulting - Global Towers Watson Watson Wyatt - high tech survey WW
Alexander Group, ad-hoc surveys Aon CHiPS IPAS HPES Local Recruiting survey Mercer Radford Radford - Benchmarking - Global Radford Global Sales Survey Towers Towers Watson
Comptryx Comptryx Global Pay and Organizational Metrics Survey HAY McLagan Mercer Towers Watson Watson
Austria Mercer Radford Radford - Global Sales Radford Sales Survey TP – Gbl CDB MMPS
IPAS Radford
Towers Watson Towers Watson Hi-Tech
Belgium Mercer Radford Radford Sales Survey TP – Gbl CDB MMPS
IPAS Radford
Towers Watson Towers Watson Hi-Tech
Czech Republic
Mercer Radford Radford Sales Survey TP – Gbl CDB MMPS
IPAS Watson Wyatt CompITE
Denmark Mercer Radford Radford Sales Survey Towers Watson Global Grading System TP – Gbl CDB MMPS
IPAS Radford
Towers Watson Towers Watson Hi-Tech
Finland Mercer Radford Radford Sales Survey TP – Gbl CDB MMPS
IPAS Radford
Towers Watson Towers Watson Hi-Tech
France Culpepper Culpepper Sales Survey Radford Mercer Radford - Global Sales Radford Sales Survey Towers Watson Global Grading System Towers Watson High Tech Compensation Survey TP – Gbl CDB MMPS
IPAS Mercer Radford Global Sales Survey
Radford Towers Watson Hi-Tech

The Alexander Group, Inc. Page 56
Germany Culpepper Culpepper Sales Survey Mercer Radford Radford Aon Global Sales Radford - Global Sales Radford Sales Survey Towers Watson Global Grading System Towers Watson High Tech Compensation Survey TP – Gbl CDB MMPS
IPAS Mercer Radford Global Sales Survey Towers Watson
Radford Towers Watson Hi-Tech
Hungary Radford Radford Sales Survey TP – Gbl CDB MMPS
IPAS Watson Wyatt CompITE
Ireland Mercer Radford Radford - Global Sales Radford Sales Survey TP – Gbl CDB MMPS
IPAS Towers Watson
Towers Watson Hi-Tech
Italy Culpepper Sales Survey Mercer Radford Radford Aon Global Sales Radford Sales Survey Towers Watson Global Grading System Towers Watson High Tech Compensation Survey TP – Gbl CDB MMPS
IPAS Radford Radford Global Sales Survey Towers Watson
Towers Watson Towers Watson Hi-Tech
Netherlands Culpepper Mercer Radford Radford Sales Survey Towers Watson Global Grading System TP – Gbl CDB MMPS
IPAS Mercer
Radford Towers Watson Hi-Tech
Norway Mercer Radford Radford Sales Survey TP – Gbl CDB MMPS
IPAS Radford WMG – HP Eur Mgmt Res
Towers Watson Towers Watson Hi-Tech
Poland Actual recruiting experience4 Mercer Radford Radford Sales Survey WW - CompITE
IPAS Radford
Towers Watson Watson Wyatt CompITE
Portugal Mercer Radford Radford Sales Survey TP – Gbl CDB MMPS
IPAS Towers Watson WW-CompITE
Towers Watson Hi-Tech

The Alexander Group, Inc. Page 57
Russia Mercer Radford Radford Aon Global Radford Sales Survey Towers Watson Global Grading System
IPAS Radford Towers Watson
Watson Wyatt CompITE
Spain Culpepper Sales Survey Mercer Radford Radford - Global Sales Radford Sales Survey Towers Watson Global Grading System TP – Gbl CDB MMPS
IPAS Radford Radford Global Sales Survey
Towers Watson Towers Watson Hi-Tech
Sweden Mercer Radford Radford Sales Survey Towers Watson Global Grading System TP – Gbl CDB MMPS
IPAS Radford
Towers Watson Towers Watson Hi-Tech
Switzerland Mercer Radford Radford - Global Sales Radford Sales Survey TP – Gbl CDB MMPS
IPAS Radford
Towers Watson Towers Watson Hi-Tech
Middle East IPAS Radford Radford Global Sales Survey Radford and Towers Watson Benchmark Pay and Practice Surveys Towers Watson Watson Wyatt - high tech survey WW
Alexander Group, ad-hoc surveys CHiPS IPAS IPAS Global Compensation Surveys Mercer Radford Towers Watson Towers Watson - high tech
Comptryx Mercer Towers Watson
Israel Mercer Radford Radford Sales Survey Towers Watson High Tech Compensation Survey Zviran
IPAS Radford
Towers Watson Zviran Comp
Saudi Arabia
Radford Radford Sales Survey
IPAS Watson Wyatt CompITE
Turkey Mercer
Radford Radford Sales Survey
IPAS Radford
Watson Wyatt CompITE
United Arab Emirates
Culpepper Sales Survey Radford Aon Global Sales Towers Watson Global Grading System Radford Radford Sales Survey
IPAS Radford Global Sales Survey Towers
McLagan

The Alexander Group, Inc. Page 58
North America
AGI Hay Group Hewitt Sales Ipas Mercer Radford Radford - high tech Radford Global Sales Survey Radford Sales Compensation Survey Radford and Towers Watson Benchmark Pay and Practice Surveys Sibson Consulting - Global Towers Watson
Alexander Group, ad-hoc surveys CHiPS Comptryx IPAS Mercer Radford Radford - Benchmarking - Global Radford Global Sales Survey Towers Towers Watson Watson Wyatt Western Management ZS Associates
Alexander Comptryx Global Pay and Organizational Metrics Survey Hay McLagan Mercer Pearl Meyer SIRS and Hay Towers Towers Perrin Watson Wyatt
Canada Culpepper Culpepper Sales Survey Hay Hewitt Hewitt - MCA (Custom Survey) Limra Mercer Mercer Sales/Marketing Monster.ca Radford Radford Sales Survey Radford - Global Sales Towers Watson Global Grading System
Culpepper Sales IPAS McLagan Mercer - TRS Radford Radford Global Sales Survey Towers Watson Watson Wyatt WMG
Culpepper Hewitt Loma Radford Benchmark Radford Global Sales Survey Towers Watson
United State(s)
Companalyst Culpepper Custom Hewitt Hewitt - MCA (Custom Survey) Hewitt Sales Compensation Mercer Mercer SIRS Pearl Meyer & Partners CHiPS One and Executive Surveys PM-CHiPs Sales Radford Radford Aon Global Sales Radford SalesRadford Sales Survey Towers Watson Frito Lay Survey Towers Watson Global Grading System WorldatWork/Alexander Group
Clark Culpepper Culpepper Sales Employers Group Hay Hewitt IPAS Mercer Sales Radford Radford Bench Radford Global Sales Survey Towers Perrin Executive Survey Towers Watson Towers Watson - CSR (Custom Cut) Towers Watson FIG Survey Western Mgmt WMG WorldatWork
Alexander Group APAS CHiPS One Hay Hewitt Hewitt MCA and TCM Surveys Mercer Benchmarking Survey Radford Benchmark Salary.com & CompData Towers Watson Watson Wyatt WMG - Govt Cont Wolf - Sales & Marketing Positions

The Alexander Group, Inc. Page 59
Latin America
AGI Hay IPAS Mercer Mercer - TRS Radford Radford and Towers Watson Benchmark Pay and Practice Surveys Radford Global Sales Survey Towers Watson
Alexander Group, ad-hoc surveys CHiPS Comptryx IPAS IPAS Global Compensation Surveys Mercer Radford Watson
Comptryx Global Pay and Organizational Metrics Survey Mercer Towers Watson
Argentina Mercer Mercer TRS Radford Radford Sales Survey TP - Hi Tech
IPAS Radford
Mercer LACITT Towers Watson
Brazil Mercer Mercer TRS Radford Radford Aon Global Sales Radford Sales Survey Towers Watson Global Grading System TP - Hi Tech
IPAS Radford Towers Watson
Mercer LACITT Towers Watson
Chile Mercer Radford Radford Sales Survey TP - Hi Tech
IPAS Mercer LACITT
Colombia Radford Radford Sales Survey TP - Hi Tech
IPAS Mercer LACITT
Costa Rica Radford Radford Sales Survey TP - Hi Tech
IPAS PWC - SisEmprInfoSalPrim
Mercer LACITT
Mexico Culpepper Sales Survey
Hewitt Mercer Mercer General Mercer TRSRadford Aon Global Sales Radford Radford Sales Survey Towers Watson Global Grading System TP - Hi Tech
IPAS Radford Radford Global Sales Survey Towers Watson
Mercer LACITT Towers Watson
Panama Radford Radford Sales Survey
IPAS Mercer LACITT
Venezuela Mercer TRS Radford Sales Survey TP - Hi Tech
IPAS Mercer LACITT

The Alexander Group, Inc. Page 60
Demographics

The Alexander Group, Inc. Page 61
Demographics
Number Of Sales Compensation Eligible Employees. For your business unit, how many employees are eligible to participate in the sales compensation program on a worldwide basis?
115 Responses
[1] - 10+ (18.26% : 21)
[2] - 100+ (54.78% : 63)
[3] - 1,000+ (22.61% : 26)
[4] - 10,000+ (4.35% : 5)
Business Unit Approximate Revenue. What is your business unit's approximate annual revenue expressed in millions of U.S. dollars?
116 Responses
[1] - <$100M (7.76% : 9)
[2] - $100M - $500M (19.83% : 23)
[3] - $501M - $1B (14.66% : 17)
[4] - $1.1B - $10B (41.38% : 48)
[5] - >$10B (16.38% : 19)
Types of Customers. The business unit sells products primarily for which types of customers:
116 Responses
[1] - Businesses (commercial/industrial/institutional) (59.48% : 69)
[2] - Hybrid of the above (27.59% : 32)
[3] - Consumers (12.07% : 14)
[4] - Tax-supported entities (government et al.) (0.86% : 1)

The Alexander Group, Inc. Page 62
Sales Organization Structure. How is your business unit's sales organization structured?
116 Responses
[1] - Single global sales organization run by one global sales executive (37.93% : 44)
[2] - Multiple global sales entities run by different sales executives (18.97% : 22)
[3] - World-region sales entities run by world-region sales executives reporting to world-region CEO/GM (14.66% : 17)
[4] - Country-specific sales entities reporting to primarily local business leaders (12.07% : 14)
[5] - Hybrid of global, region and country sales entities (15.52% : 18)
[6] - Other (please describe below) (0.86% : 1)
Type Of Product. Your business unit is primarily selling a:
115 Responses
[1] - Product (physical) (40.87% : 47)
[2] - Solution: hybrid product and service (39.13% : 45)
[3] - Service (non-physical) (17.39% : 20)
[4] - Other (2.61% : 3)
Sales Model. Your primary sales model for the business unit is:
115 Responses
[1] - Direct sales (sell to end-users >70% of revenue) (54.78% : 63)
[2] - Hybrid: mix of the above, with none of the above >70% (24.35% : 28)
[3] - Indirect sales (sell to partners who sell to others >70% of revenue) (20.00% : 23)
[4] - Other (0.87% : 1)
[5] - Telesales to end-users or partners (>70% of revenue) (0.00% : 0)
[6] - Internet sales (>70% of revenue) (0.00% : 0)

The Alexander Group, Inc. Page 63
Number of Sales Incentive Plans. For your business unit, how many separate sales incentive plans are in your program on a worldwide basis, including plans for managers (provide estimate)?
116 Responses
[1] - 1-5 (32.76% : 38)
[2] - 6-10 (22.41% : 26)
[3] - 11-15 (8.62% : 10)
[4] - 16-20 (7.76% : 9)
[5] - 21-25 (3.45% : 4)
[6] - 26-50 (11.21% : 13)
[7] - 51-75 (4.31% : 5)
[8] - 76-100 (1.72% : 2)
[9] - 101-200 (4.31% : 5)
[10] - >200 (3.45% : 4)

The Alexander Group, Inc. Page 64
Industry. For the business unit, your industry is:
114 Responses
[1] - Software and IT Services (21.93% : 25)
[2] - Technology Hardware (Computing, Energy, Telecom, Electronic, Test and Measurement) (19.30% : 22)
[3] - Other (8.77% : 10)
[4] - Healthcare Equipment Mfg (Capital, Devices, Disposables) (6.14% : 7)
[5] - Telecom Service Provider (6.14% : 7)
[6] - Transportation Services (Logistics, Land, Sea, Rail and Air). Plus Rental, Leasing (5.26% : 6)
[7] - Capital Equipment (Hard Goods Mfg) (4.39% : 5)
[8] - Consumer Durables Products (Mfg) (4.39% : 5)
[9] - Food, Beverage, Tobacco (Mfg/Processor) (3.51% : 4)
[10] - Pharmaceutical and Biotechnology (3.51% : 4)
[11] - Construction: Commercial/Residential (2.63% : 3)
[12] - Materials (Chemical, Metal, Construction, Packaging, Agricultural) (2.63% : 3)
[13] - Commercial Service Provider (Accounting, Consulting, Engineering, Legal, Outsourcing, Information, Advertising, Training) (1.75% : 2)
[14] - Consumer Sales Retail, Dealer, Internet, Catalog (1.75% : 2)
[15] - Household, Apparel, Personal Products (Mfg) (1.75% : 2)
[16] - Semi-Conductor and Equipment (1.75% : 2)
[17] - Automobile, Truck, Motorcycle, Components (Mfg) (0.88% : 1)
[18] - Banks, Credit Unions (0.88% : 1)
[19] - Entertainment, Publishing, Media, Music, Film, Stage, Theme Parks (0.88% : 1)
[20] - Healthcare Service Provider (0.88% : 1)
[21] - Oil, Gas Producer, Mining (0.88% : 1)
[22] - Diversified Financial (0.00% : 0)
[23] - Hotels, Restaurants, Leisure (0.00% : 0)
[24] - Insurance (0.00% : 0)
[25] - Non-Profit (0.00% : 0)
[26] - Real Estate Services, Mortgage (0.00% : 0)
[27] - Utilities (Electric, Gas, Power) (0.00% : 0)
[28] - Wholesale, Distribution (0.00% : 0)
Describe “Other” Demographics: Laundry services Telecommunications, voice and data services with some hardware
Electronics manufacturing services Oil, commercial business services, chemical
Business services Agricultural and construction equipment manufacturing (heavy machinery)
Manufacturing (30%) and drilling construction (70%)
Healthcare information technology
Information services provider Electronic payment related services, solutions and hardware
N/A

The Alexander Group, Inc. Page 65
Business Unit Name: Enter the name of the business unit for which you are submitting survey responses. (Please provide full formal name—no abbreviations.)
Accenture
Acxiom Corporation
Advent Software Inc.
Affymetrix
Agilent Technologies
Akamai Technologies
APL
Applied Materials
Armstrong World Industries
ARRIS
ArthroCare Corporation
Attachmate Group
Autodesk, Inc.
Avis Budget Group, Inc.
Baxter International
Boart Longyear
BP plc
Cardinal Health
Carl Zeiss Industrial Metrology
Celestica
Ceridian Corporation
Cessna Aircraft Company
Cisco
Citrix Systems
CNH Global
Cognex
Comcast
Comverse
Con-way, Inc.
Datacard Group
Dell, Inc.
Digi International, Inc.
Dun & Bradstreet Corporation
Eaton Corporation
Ecolab Inc.
EFI
EMC – Storage EMC Corporation – Information
Intelligence Group
Equinix
FedEx Services
FEI Company
FinancialCAD Corporation
First Data Corporation
Forest Laboratories, Inc.
G&K Services
GE Healthcare
General Mills – U.S. & Canada Sales
General Mills – Latin America & South Africa
Globalstar Inc.
Healthways
Hewlett-Packard
Honeywell International
Hughes Network Systems
Hypertherm
i365
Ingersoll Rand
inPro Corporation
Insight Enterprises
Integrated Device Technology
Intel Corporation
Internap Network Services
International Business Machines (IBM)
INTTRA, Inc.
Kraft Foods
Kronos Incorporated
Levi Strauss & Co.
LG Electronics USA, Inc.
LifeScan Europe Middle East and Africa
Lifetouch, Inc.
McKesson Corporation – U.S. Pharma Distribution Services
McKesson Corporation – Provider Technologies
Microsoft
MSD K.K.
National Instruments
Neptune Orient Liens Limited
Neustar
Nokia
Northwest Pipe Company
Noven Pharmaceuticals, Inc.
Old Point National Bank
PAETEC Communications

The Alexander Group, Inc. Page 66
Parametric Technology Corporation Pegasystems Inc.
Pentair
Polycom
Powerwave Technologies
Research in Motion
Research Now
Ross Controls
Ryerson Inc.
Safety-Kleen Systems
Salesforce.com
SAP
Seagate Technology
SES (Société Européenne des Satellites)
SimplexGrinnell
Sony Ericsson Mobile Communications
Spectrum Brands Inc.
Sprint
Sun Life Financial
Syniverse Technologies
Tellabs Tellabs Operations, Inc. – Sales
Operations
Terex, Inc.
The Cooper Companies
The JM Smucker Company
The ServiceMaster Company
TomTom NV
Tripwire Unisys Corporation – Technology
Consulting and Integration Solutions Unisys Corporation – Global Outsourcing
and Infrastructure Services
UPS
Varian Medical Systems
Verathon Medical
Verizon
Websense, Incorporated
Zee Medical, Inc.

©2011 The Alexander Group, Inc.
Spo
Sponsored By:
SpSp