"2011 football bowl subdivision records" -...
TRANSCRIPT

Football Bowl Subdivision RecordsIndividual Records ....................................... 2Team Records ................................................ 17Annual Champions,
All-Time Leaders ....................................... 23Team Champions ......................................... 57Toughest-Schedule
Annual Leaders ......................................... 62Annual Most-Improved Teams............... 63All-Time Team Won-Lost Records ......... 64Winningest Teams by Decade ................ 67National Poll Rankings ............................... 70Bowl Coalition, Alliance and Bowl
Championship Series History ............. 100Streaks and Rivalries ................................... 111Overtime Games .......................................... 113FBS Stadiums ................................................. 115Major-College Statistics Trends.............. 118College Football Rules Changes ............ 125
2 2011 NCAA FOOTBALL RECORDS - FBS INDIVIDUAL RECORDS
Individual RecordsUnder a three-division reorganization plan ad-opted by the special NCAA Convention of August 1973, teams classifi ed major-college in football on August 1, 1973, were placed in Division I. College-division teams were divided into Division II and Division III. At the NCAA Convention of January 1978, Division I was divided into Division I-A and Division I-AA for football only (In 2006, I-A was re-named Football Bowl Subdivision, and I-AA was renamed Football Championship Subdivision.) Before 2002, postseason games were not in-cluded in NCAA fi nal football statistics or records. Beginning with the 2002 season, all postseason games were included in NCAA fi nal football sta-tistics and records.From 1937, when offi cial national statistics rank-ings began, through 1969, individual rankings were by totals. Beginning in 1970, most season individual rankings were by per-game averages. In total off ense, rushing and scoring, it is yards or points per game; in receiving, catches per game and yards per game; in interceptions, catches per game; and in punt and kickoff returns, yards per return. Punting always has been by average, and all team rankings have been per game. Beginning in 1979, passers were rated in all divisions on “pass effi ciency rating points,” which are derived from a formula that compares passers to the national averages for 14 seasons of two-platoon Division I football starting with the 1965 season. One hun-dred points equals the 14-year averages for all players in Division I. Those averages break down to 6.29 yards per attempt, 47.14 percent comple-tions, 3.97 percent touchdown passes and 6.54 percent interceptions. The formula assumes that touchdowns are as good as interceptions are bad; therefore, these two fi gures off set each other for the average player. To determine effi ciency rat-ing points, multiply a passer’s yards per attempt by 8.4, add his completion percentage, add his touchdown percentage times 3.3, then subtract his interception percentage times two.Passers must have a minimum of 15 attempts per game to determine rating points because fewer attempts could allow a player to win the cham-pionship with fewer than 100 attempts in a sea-son. A passer must play in at least 75 percent of his team’s games to qualify for the rankings (for example, a player on a team with a nine-game season could qualify by playing in seven games); thus, a passer with 105 attempts could qualify for the national rankings.A pass effi ciency rating comparison for each year since 1979 has been added to the passing section of all-time leaders to compare that season’s pass-ers with the average rating for all passers during that year.In 2000, defensive stats became a part of the sta-tistics. Individual and team records and rankings included only regular-season games through the 2001 season. Beginning in 2002, all individual and team records included postseason games. Career records of players include only those years in which they competed in the FBS.Statistics in some team categories were not tabu-lated until the advent of the computerized statis-tics program in 1966. The records listed in those categories begin with the 1966 season and are so indicated.A player whose career includes statistics from fi ve seasons (or an active player who will play in fi ve seasons) because he was granted an additional
season of competition for reasons of hardship or a freshman redshirt is denoted by “$.”
COLLEGIATE RECORDSIndividual and team collegiate records are deter-mined by comparing the best records in all four divisions (FBS, FCS, II and III) in comparable cate-gories. Included are career records of players who played parts of their careers in diff erent divisions (such as Dennis Shaw of San Diego State, Howard Stevens of Randolph-Macon and Louisville, and Doug Williams of Grambling). For individual col-legiate career leaders and team records, see the collegiate records section.
NCAA DEFENSIVE FOOTBALL STATISTICS COMPILATION POLICIESAll individual defensive statistics reported to the NCAA must be compiled by the press box statis-tics crew during the game. Defensive numbers compiled by the coaching staff or other univer-sity/college personnel using game fi lm will not be considered “offi cial” NCAA statistics.This policy does not preclude a conference or institution from making after-the-game changes to press box numbers. This is consistent with ex-isting NCAA policies involving corrections to any off ensive statistics after a contest. Any changes to press box numbers must be obvious errors, such as misidentifi ed players, and this should not be interpreted as a way for press box statistics to be later “updated” by the coaching fi lms. Changes should be made within one week after the game is played. Statisticians also are reminded that NCAA policy does not permit changes to away-game statistics unless approved by the home sports information director.It is important to note that this policy applies ONLY to offi cial NCAA statistics and national rankings, and does not mean a coaching staff cannot compile separate defensive statistics for institutional use. Those compilations also could appear in the institution's press releases and/or website, as long as they are identifi ed as coach-ing fi lm numbers rather than offi cial statistics as used by the NCAA.The NCAA statistics staff reserves the right to review any statistics provided to the national of-fi ce and may withhold publishing/posting those numbers until the accuracy of those statistics can be substantiated.
Total Offense(Rushing Plus Passing)
MOST PLAYSQuarter
41—Jason Davis, UNLV vs. Idaho, Sept. 17, 1994 (4th; 41 passes)
Half57—Rusty LaRue, Wake Forest vs. Duke, Oct. 28, 1995
(2nd; 56 passes, 1 rush)Game
98—Mike Kafka, Northwestern vs. Auburn, Jan. 1, 2010 (78 passes, 20 rushes; 562 yards)
Season814—Kliff Kingsbury, Texas Tech, 2002 (4,903 yards)
2 Yrs1,425—Case Keenum, Houston, 2008-09 (11,070 yards)
3 Yrs2,072—Kliff Kingsbury, Texas Tech, 2000-02 (11,794
yards)
Career(4 yrs.) 2,587—Timmy Chang, Hawaii, $2000-04 (16,910
yards)$See introduction for explanation.MOST PLAYS PER GAMESeason
64.0—David Klingler, Houston, 1990 (704 in 11)2 Yrs
61.6—David Klingler, Houston, 1990-91 (1,293 in 21)Career
50.1—Kliff Kingsbury, Texas Tech, 1999-02 (2,156 in 43)MOST PLAYS BY A FRESHMANGame
80—Luke McCown, Louisiana Tech vs. Miami (FL), Oct. 28, 2000 (444 yards); Tim Hiller, Western Mich. vs. Ball St., Oct. 8, 2005 (308 yards)
Season635—Jared Lorenzen, Kentucky, 2000 (3,827 yards) Also holds per-game record with 57.7 (635 in 11)
MOST YARDS GAINEDQuarter
347—Jason Davis, UNLV vs. Idaho, Sept. 17, 1994 (4th)Half
510—Andre Ware, Houston vs. SMU, Oct. 21, 1989 (1st)Game
732—David Klingler, Houston vs. Arizona St., Dec. 2, 1990 (16 rushing, 716 passing)
Season5,976—B.J. Symons, Texas Tech, 2003 (143 rushing, 5,833
passing)2 Yrs
11,070—Case Keenum, Houston, 2008-09 (379 rushing, 10,691 passing)
3 Yrs15,187—Graham Harrell, Texas Tech, 2006-08 (-184 rush-
ing, 15,371 passing)Career
16,910—Timmy Chang, Hawaii, $2000-04 (-162 rushing, 17,072 passing)
$See introduction for explanation.MOST YARDS GAINED PER GAMESeason
474.6—David Klingler, Houston, 1990 (5,221 in 11)2 Yrs
411.9—Graham Harrell, Texas Tech, 2007-08 (10,710 in 26 games)
Career387.9—Colt Brennan, Hawaii, 2005-07 (14,740 in 38)
MOST YARDS GAINED, FIRST TWO SEASONS10,370—Colt Brennan, Hawaii, 2005-06Also holds per-game record with 398.8 (10,370 in 26)
MOST SEASONS GAINING 4,000 YARDSOR MORE
3—Ty Detmer, BYU, 1989-91; Timmy Chang, Hawaii, 2002-04; Colt Brennan, Hawaii, 2005-07; Graham Harrell, Texas Tech, 2006-08
MOST SEASONS GAINING 3,000 YARDSOR MORE
4—Dan LeFevour, Central Mich., 2006-09MOST SEASONS GAINING 2,500 YARDSOR MORE
4—Antwaan Randle El, Indiana, 1998-01; Phillip Rivers, North Carolina St., 2000-03; Timmy Chang, Hawaii, 2000, 2002-04; Kevin Kolb, Houston, 2003-06; Dan LeFevour, Central Mich., 2006-09; Colt McCoy, Texas, 2006-09; Colin Kaepernick, Nevada, 2007-10; Trevor Vittatoe, UTEP, 2007-10; Andy Dalton, TCU, 2007-10
MOST YARDS GAINED BY A FRESHMANGame
582—David Neill, Nevada vs. New Mexico St., Oct. 10, 1998 (61 plays)
Season3,827—Jared Lorenzen, 2000, Kentucky (635 plays)Per-game record—372.3, David Neill, Nevada, 1998
MOST YARDS GAINED BY A SOPHOMOREGame
657—Brian Lindgren, Idaho vs. Middle Tenn., Oct. 6, 2001 (20 rushing, 637 passing)
Season5,241—Case Keenum, Houston, 2008 (665 plays)Also holds per-game record with 403.2 (5,241 in 13)

2011 NCAA FOOTBALL RECORDS - FBS INDIVIDUAL RECORDS 3
FOO
TBA
LL B
OW
LSU
BD
IVIS
IONMOST YARDS GAINED IN FIRST GAME
OF CAREER483—Billy Stevens, UTEP vs. North Texas, Sept. 18, 1965
MOST YARDS GAINED IN TWO, THREE AND FOUR CONSECUTIVE GAMES2 Games
1,310—David Klingler, Houston, 1990 (578 vs. Eastern Wash., Nov. 17; 732 vs. Arizona St., Dec. 2)
3 Games1,799—B.J. Symons, Texas Tech, 2003 (618 vs. North
Carolina St., Sept. 20; 681 vs. Mississippi, Sept. 27; 500 vs. Texas A&M, Oct. 4)
4 Games2,328—B.J. Symons, Texas Tech, 2003 (618 vs. North
Carolina St., Sept. 20; 681 vs. Mississippi, Sept. 27; 500 vs. Texas A&M, Oct. 4; 529 vs. Iowa St., Oct. 11)
MOST GAMES GAINING 300 YARDS OR MORESeason
14—Colt Brennan, Hawaii, 2006; Paul Smith, Tulsa, 2007Career
33—Ty Detmer, BYU, 1988-91MOST CONSECUTIVE GAMES GAINING300 YARDS OR MORESeason
14—Colt Brennan, Hawaii, 2006; Paul Smith, Tulsa, 2007Career
24—Colt Brennan, Hawaii, 2005-07MOST GAMES GAINING 400 YARDS OR MORESeason
11—B.J. Symons, Texas Tech, 2003Career
21—Graham Harrell, Texas Tech, 2006-08MOST CONSECUTIVE GAMES GAINING400 YARDS OR MORESeason
9—B.J. Symons, Texas Tech, 2003Also holds career record with 9
MOST YARDS GAINED AGAINST ONE OPPONENTCareer—5 Yrs
1,719—Timmy Chang, Hawaii vs. Rice, $2000-04Career—4 Yrs
1,575—Dan LeFevour, Central Mich. vs. Ball St., 2006-09$See page 2 for explanation.MOST YARDS GAINED PER GAME AGAINST ONE OPPONENTCareer
(Min. 3 games) 471.3—Colt Brennan, Hawaii vs. San Jose St., 2005-07 (1,414 yards)
(Min. 4 games) 393.8—Dan LeFevour, Central Mich. vs. Ball St., 2006-09 (1,575 yards)
MOST YARDS GAINED BY TWO OPPOSING PLAYERSGame
1,321—Matt Vogler, TCU (696) & David Klingler, Houston (625), Nov. 3, 1990
GAINING 1,000 YARDS RUSHING AND1,000 YARDS PASSINGSeason
Johnny Bright (HB), Drake, 1950 (1,232 rushing, 1,168 pass-ing); Reggie Collier, Southern Miss., 1981 (1,005 rush-ing, 1,004 passing); Bart Weiss, Air Force, 1985 (1,032 rushing, 1,449 passing); Darian Hagan, Colorado, 1989 (1,004 rushing, 1,002 passing); Dee Dowis, Air Force, 1989 (1,286 rushing, 1,285 passing); Brian Mitchell, La.-Lafayette, 1989 (1,311 rushing, 1,966 passing); Michael Carter, Hawaii, 1991 (1,092 rushing, 1,172 passing); Beau Morgan, Air Force, 1995 (1,285 rushing, 1,165 passing); Beau Morgan, Air Force, 1996 (1,494 rushing, 1,210 passing); Chris McCoy, Navy, 1997 (1,370 rushing, 1,203 passing); Scott Frost, Nebraska, 1997 (1,095 rush-ing, 1,237 passing); Antwaan Randle El, Indiana, 2000 (1,270 rushing, 1,783 passing); Keith Boyea, Air Force, 2001 (1,216 rushing, 1,253 passing); Woodrow Dantzler, Clemson, 2001 (1,004 rushing, 2,360 passing); Joshua Cribbs, Kent St., 2001 (1,019 rushing, 1,516 passing) (one of only two freshmen to accomplish the feat); Eric Crouch, Nebraska, 2001 (1,115 rushing, 1,510 pass-ing); Brad Smith, Missouri, 2002 (1,029 rushing, 2,333 passing) (one of only two freshmen to accomplish the feat); Joshua Cribbs, Kent St., 2002 (1,057 rushing, 1,014 passing); Jammal Lord, Nebraska, 2002 (1,412 rush-ing, 1,362 passing); Chance Harridge, Air Force, 2002 (1,229 rushing, 1,062 passing); Ell Roberson, Kansas St., 2002 (1,032 rushing, 1,580 passing); Craig Candeto,
Navy, 2003 (1,112 rushing, 1,140 passing); Brad Smith, Missouri, 2003 (1,406 rushing, 1,977 passing); Vince Young, Texas, 2004 (1,079 rushing, 1,849 passing); Brad Smith, Missouri, 2005 (1,301 rushing, 2,304 passing); Vince Young, Texas, 2005 (1,050 rushing, 3,036 passing); Patrick White, West Virginia, 2006 (1,219 rushing, 1,655 passing); Patrick White, West Virginia, 2007 (1,335 rush-ing, 1,724 passing); Michael Desormeaux, La.-Lafayette, 2007 (1,141 rushing, 1,405 passing); Dan LeFevour, Central Mich., 2007 (1,122 rushing, 3,652 passing); Joe Webb, UAB, 2008 (1,021 rushing, 2,367 passing); Colin Kaepernick, Nevada, 2008 (1,130 rushing, 2,849 pass-ing); Joe Webb, UAB, 2009 (1,427 rushing, 2,299 pass-ing); Dwight Dasher, Middle Tenn., 2009 (1,154 rushing, 2,789 passing); Colin Kaepernick, Nevada, 2009 (1,183 rushing, 2,052 passing); Josh Nesbitt, Georgia Tech, 2009 (1,037 rushing, 1,701 passing); Ricky Dobbs, Navy, 2009 (1,203 rushing, 1,031 passing); Denard Robinson, Michigan, 2010 (1,702 rushing, 2,570 passing); Cam Newton, Auburn, 2010 (1,473 rushing, 2,854 passing); Colin Kaepernick, Nevada, 2010 (1,206 rushing, 3,022 passing).
Note: All are quarterbacks unless otherwise noted.
A QUARTERBACK GAINING 2,000 YARDS PASSING AND 1,000 YARDS RUSHINGSeason
Woodrow Dantzler, Clemson, 2001 (2,360 passing, 1,004 rushing); Brad Smith, Missouri, 2002 (2,333 passing, 1,029 rushing) (only freshman to accomplish the feat); Vince Young, Texas, 2005 (3,036 passing, 1,050 rushing); Brad Smith, Missouri, 2005 (2,304 passing, 1,301 rush-ing); Dan LeFevour, Central Mich., 2007 (3,652 passing, 1,122 rushing); Joe Webb, UAB, 2008 (2,367 passing, 1,021 rushing); Colin Kaepernick, Nevada, 2008 (2,849 passing, 1,130 rushing); Joe Webb, UAB, 2009 (2,299 passing, 1,427 rushing); Dwight Dasher, Middle Tenn., 2009 (2,789 passing, 1,154 rushing); Colin Kaepernick, Nevada, 2009 (2,052 passing, 1,183 rushing); Denard Robinson, Michigan, 2010 (2,570 passing, 1,702 rush-ing); Cam Newton, Auburn, 2010 (2,854 passing, 1,473 rushing); Colin Kaepernick, Nevada, 2010 (3,022 pass-ing, 1,206 rushing)
Note: Brad Smith, Missouri (2002 and 2005), Joe Webb, UAB (2008 and 2009) and Colin Kaepernick, Nevada (2008-09-10) are the only players to accomplish this multiple times in their careers; Webb and Kaepernick are only players to do it in back-to-back seasons and Kaepernick is the only player to do so in three or more seasons.
A QUARTERBACK GAINING 3,000 YARDS PASSING AND 1,000 YARDS RUSHINGSeason
Vince Young, Texas, 2005 (3,036 passing, 1,050 rushing); Dan LeFevour, Central Mich., 2007 (3,652 passing, 1,122 rushing; Colin Kaepernick, Nevada, 2010 (3,022 pass-ing, 1,206 rushing).
A QUARTERBACK GAINING 2,000 YARDS RUSHING AND 4,000 YARDS PASSINGCareer
Prince McJunkins, Wichita St., 1979-82 (2,047 rushing, 4,544 passing); John Bond, Mississippi St., 1980-83 (2,280 rushing, 4,621 passing); Rickey Foggie, Minnesota, 1984-87 (2,038 rushing, 4,903 passing); Brian Mitchell, La.-Lafayette, 1986-89 (3,335 rush-ing, 5,447 passing); Major Harris, West Virginia, 1987-89 (2,030 rushing, 4,834 passing); Antwaan Randle El, Indiana, 1998-01 (3,895 rushing, 7,469 passing); Woodrow Dantzler, Clemson, 1998-01 (2,615 rush-ing, 5,634 passing); Eric Crouch, Nebraska, 1998-01 (3,434 rushing, 4,481 passing); Joshua Cribbs, Kent St., 2001-04 (3,670 rushing, 7,169 passing); Vince Young, Texas, 2003-05 (3,127 rushing, 6,040 passing); Brad Smith, Missouri, 2002-05 (4,289 rushing, 8,799 passing); Patrick White, West Virginia, 2005-08 (4,480 rushing, 6,049 passing); Dan LeFevour, Central Mich., 2006-09 (2,948 rushing, 12,905 passing); Tim Tebow, Florida, 2006-09 (2,947 rushing, 9,285 passing); Juice Williams, Illinois, 2006-09 (2,557 rushing, 8,037 pass-ing); Matt Grothe, South Fla., 2006-09 (2,206 rushing, 8,669 passing); Joe Webb, UAB, 2006-09 (2,774 rushing, 5,771 passing); Colin Kaepernick, Nevada, 2007-10 (4,112 rushing, 10,098 passing); Tyrod Taylor, Virginia Tech, 2007-10 (2,196 rushing, 7,017 passing); Terrelle Pryor, Ohio St., 2008-10 (2,164 rushing, 6,177 passing); Dwight Dasher, Middle Tenn., 2007-10 (2,419 rushing, 5,643 passing)
A QUARTERBACK GAINING 3,000 YARDS RUSHING AND 3,000 YARDS PASSINGCareer
Brian Mitchell, La.-Lafayette, 1986-89 (3,335 rushing, 5,447 passing); Beau Morgan, Air Force, 1994-96 (3,379 rush-ing, 3,248 passing); Eric Crouch, Nebraska, 1998-01 (3,434 rushing, 4,481 passing); Antwaan Randle El, Indiana, 1998-01 (3,895 rushing, 7,469 passing); Joshua Cribbs, Kent St., 2001-04 (3,670 rushing, 7,169 pass-ing); Vince Young, Texas, 2003-05 (3,127 rushing, 6,040 passing); Brad Smith, Missouri, 2002-05 (4,289 rushing, 8,799 passing); Pat White, West Virginia, 2005-08 (4,480 rushing, 6,049 passing); Colin Kaepernick, Nevada, 2007-10 (4,112 rushing, 10,098 passing)
A QUARTERBACK GAINING 3,500 YARDS RUSHING AND 7,000 YARDS PASSINGCareer
Antwaan Randle El, Indiana, 1998-01 (3,895 rushing, 7,469 passing); Joshua Cribbs, Kent St., 2001-04 (3,670 rushing, 7,169 passing); Brad Smith, Missouri, 2002-05 (4,289 rushing, 8,799 passing); Colin Kaepernick, Nevada, 2007-10 (4,112 rushing, 10,098 passing)
A QUARTERBACK GAINING 4,000 YARDS RUSHING AND 8,000 YARDS PASSINGCareer
Brad Smith, Missouri, 2002-05 (4,289 rushing, 8,799 pass-ing); Colin Kaepernick, Nevada, 2007-10 (4,112 rushing, 10,098 passing)
A QUARTERBACK GAINING 300 YARDS PASSING AND 100 YARDS RUSHINGGame
Archie Manning, Ole Miss vs. Alabama, Oct. 4, 1969 (104 rushing, 436 passing); Steve Young, BYU vs. Baylor, Sept. 10, 1983 (113 rushing, 351 passing); Ned James, New Mexico vs. Wyoming, Nov. 1, 1986 (118 rushing, 406 passing); Randy Welniak, Wyoming vs. Air Force, Sept. 24, 1988 (108 rushing, 359 passing); Donald Douglas, Houston vs. SMU, Oct. 19, 1991 (103 rushing, 319 passing); Shaun King, Tulane vs. Army, Nov. 14, 1998 (133 rushing, 332 passing); Michael Bishop, Kansas St. vs. Nebraska, Nov. 14, 1998 (140 rushing, 306 pass-ing); Michael Bishop, Kansas St. vs. Texas A&M, Dec. 5, 1998 (101 rushing, 341 passing); Marques Tuiasosopo, Washington vs. Stanford, Oct. 30, 1999 (207 rush-ing, 302 passing); Brian Broadwater, Navy vs. Tulane, Nov. 11, 2000 (115 rushing, 302 passing); Woodrow Dantzler, Clemson vs. North Carolina St., Oct. 13, 2001 (184 rushing, 333 passing); Shaun Hill, Maryland vs. Duke, Oct. 20, 2001 (105 rushing, 323 passing); Zak Kustok, Northwestern vs. Bowling Green, Nov. 17, 2001 (111 rushing, 421 passing); Kevin Kolb, Houston vs. TCU, Oct. 25, 2003 (144 rushing, 434 passing); Cory Randolph, Wake Forest vs. East Carolina, Sept. 11, 2004 (117 rushing, 334 passing); Drew Stanton, Michigan St. vs. Minnesota, Oct. 16, 2004 (102 rushing, 308 passing); Joshua Cribbs, Kent St. vs. Eastern Mich., Nov. 13, 2004 (104 rushing, 306 passing); Kent Smith, Central Mich. vs. Miami (OH), Sept. 10, 2005 (122 rushing, 356 passing); Reggie McNeal, Texas A&M vs. SMU, Sept. 17, 2005 (100 rushing, 349 passing); Dan LeFevour, Central Mich. vs. Ball St., Oct. 6, 2007 (146 rushing, 360 passing); Omar Clayton, UNLV vs. Colorado St., Oct. 20, 2007 (135 rush-ing, 304 passing); Jake Locker, Washington vs. Arizona, Oct. 27, 2007 (157 rushing, 336 passing); Tim Tebow, Florida vs. South Carolina, Nov. 10, 2007 (120 rushing, 304 passing); Dan LeFevour, Central Mich. vs. Akron, Nov. 23, 2007 (132 rushing, 382 passing); Justin Willis, SMU vs. Memphis, Nov. 24, 2007 (114 rushing, 375 pass-ing); Chase Clement, Rice vs. UTEP, Nov. 3, 2007 (103 rushing, 395 passing); Chase Clement, Rice vs. SMU, Nov. 10, 2007 (124 rushing, 364 passing); Juice Williams, Illinois vs. Michigan, Oct. 4, 2008 (121 rushing, 310 pass-ing); Aaron Opelt, Toledo vs. Colorado, Sept. 11, 2009 (109 rushing, 319 passing); Zac Dysert, Miami (OH) vs. Kent St., Sept. 26, 2009 (107 rushing, 337 passing); G.J. Kinne, Tulsa vs. Houston, Nov. 7, 2009 (100 yard, 334 passing); B.J. Daniels, South Fla. vs. Louisville, Nov. 21, 2009 (141 rushing, 304 passing); Colt McCoy, Texas vs. Texas A&M, Nov. 26, 2009 (175 rushing, 304 passing); Joe Webb, UAB vs. UCF, Nov. 28, 2009 (137 rushing, 322 passing); Taylor Martinez, Nebraska vs. Oklahoma St., Oct. 23, 2010 (112 rushing, 323 passing)
(Note: Chase Clement is the only player to accomplish this in back-to-back games.)

4 2011 NCAA FOOTBALL RECORDS - FBS INDIVIDUAL RECORDS
A QUARTERBACK GAINING 400 YARDS PASSING AND 100 YARDS RUSHINGGame
Archie Manning, Ole Miss vs. Alabama, Oct. 4, 1969 (104 rushing, 436 passing); Ned James, New Mexico vs. Wyoming, Nov. 1, 1986 (118 rushing, 406 passing); Zak Kustok, Northwestern vs. Bowling Green, Nov. 17, 2001 (111 rushing, 421 passing); Kevin Kolb, Houston vs. TCU, Oct. 25, 2003 (144 rushing, 434 passing)
A QUARTERBACK GAINING 300 YARDSPASSING AND 200 YARDS RUSHINGGame
Marques Tuiasosopo, Washington vs. Stanford, Oct. 30, 1999 (207 rushing, 302 passing)
A QUARTERBACK GAINING 200 YARDS RUSHING AND 200 YARDS PASSINGGame
Reds Bagnell, Penn vs. Dartmouth, Oct. 14, 1950 (214 rush-ing, 276 passing); Steve Gage, Tulsa vs. New Mexico, Nov. 8, 1986 (212 rushing, 209 passing); Brian Mitchell, La.-Lafayette vs. Colorado St., Nov. 21, 1987 (271 rush-ing, 205 passing); Marques Tuiasosopo, Washington vs. Stanford, Oct. 30, 1999 (207 rushing, 302 passing); Antwaan Randle El, Indiana vs. Minnesota, Oct. 21, 2000 (210 rushing, 263 passing); Brad Smith, Missouri vs. Nebraska, Oct. 22, 2005 (246 rushing, 234 passing); Vince Young, Texas vs. Oklahoma St., Oct. 29, 2005 (267 rushing, 239 passing); Patrick White, West Virginia vs. Pittsburgh, Nov. 16, 2006 (220 rushing, 204 passing); Denard Robinson, Michigan vs. Notre Dame, Sept. 11, 2010 (258 rushing, 244 passing); Denard Robinson, Michigan vs. Indiana, Oct. 2, 2010 (217 rushing, 277 passing)
TEAM HAVING A 300-YARD RECEIVER AND A 200-YARD RUSHER IN THE SAME GAME
Houston, Donnie Avery (346 receiving) and Anthony Alridge (205 rushing) vs. Rice, Oct. 13, 2007 (Houston won, 56-48)
TEAM HAVING A 200-YARD RUSHER AND A 200-YARD RECEIVER IN THE SAME GAME
San Diego St., George Jones (208 rushing) and Will Blackwell (210 receiving) vs. New Mexico, Nov. 4, 1995 (San Diego St. won, 38-29); Pittsburgh, Kevan Barlow (209 rushing) and Antonio Bryant (222 receiving) vs. Boston College, Oct. 21, 2000 (Pittsburgh won, 42-26); Wisconsin, Anthony Davis (247 rushing) and Lee Evans (214 receiving) vs. Akron, Sept. 6, 2003 (Wisconsin won, 48-31); Wisconsin, Dwayne Smith (207 rushing) and Lee Evans (258 receiving) vs. Michigan St., Nov. 15, 2003 (Wisconsin won, 56-21); Oklahoma St., Kendall Hunter (210 rushing) and Dez Bryant (235 receiving) vs. Houston, Sept. 6, 2008 (Oklahoma St. won, 56-37)
TEAM HAVING A 300-YARD PASSER,200-YARD RUSHER AND A 200-YARD RECEIVER IN THE SAME GAME
San Diego St., Billy Blanton (328 passing), George Jones (208 rushing) and Will Blackwell (210 receiving) vs. New Mexico, Nov. 4, 1995 (San Diego St. won, 38-29); Pittsburgh, John Thurman (332 passing), Kevan Barlow (209 rushing) and Antonio Bryant (222 receiving) vs. Boston College, Oct. 21, 2000 (Pittsburgh won, 42-26); Wisconsin, Jim Sorgi (380 passing), Dwayne Smith (207 rushing) and Lee Evans (258 receiving) vs. Michigan St., Nov. 15, 2003 (Wisconsin won, 56-21); Oklahoma St., Zac Robinson (320 passing), Kendall Hunter (210 rush-ing) and Dez Bryant (235 receiving) vs. Houston, Sept. 6, 2008 (Oklahoma St. won, 56-37)
TEAMS HAVING A 3,000-YARD PASSER,2,000-YARD RUSHER AND TWO 1,000-YARD RECEIVERS IN THE SAME YEAR
Rutgers, 2007 (Mike Teel [3,147 passer], Ray Rice [2,012 rusher], Kenny Britt [1,232 receiver] and Tiquan Underwood [1,100 receiver])
TEAMS HAVING A 4,000-YARD PASSER,1,000-YARD RUSHER AND 1,000-YARD RECEIVER IN THE SAME YEAR
13— Houston, 1989 (Andre Ware [4,699 passer], Chuck Weatherspoon [1,146 rusher] and Manny Hazard [1,689 receiver]); Louisville, 1998 (Chris Redman [4,042 passer], Leroy Collins [1,134 rusher] and Arnold Jackson [1,165 receiver]); Miami (OH), 2003 (Ben Roethlisberger [4,486 passer], Cal Murphy, Jr. [1,030 rusher] and Martin Nance [1,498 receiver]); Boise St., 2003 (Ryan Dinwiddie [4,356 passer], David Mikell [1,142 rusher] and Tim Gilligan [1,192 receiver]); Bowling Green, 2004 (Omar Jacobs [4,002 passer], P.J. Pope [1,098 rusher] and Charles Sharon [1,070 receiver]); Tulsa, 2007 (Paul Smith [5,065
passer], Tarrion Adams [1,225 rusher], Brennan Marion [1,244 receiver], Trae Johnson [1,088 receiver] and Charles Clay [1,024 receiver]); Missouri, 2007 (Chase Daniel [4,306 passer], Tony Temple [1,039 rusher] and Jeremy Maclin [1,055 receiver]); Houston, 2008 (Case Keenum [5,020 passer]), Bryce Beall [1,247 rusher] and Tyron Carrier [1,029 receiver]); Missouri, 2008 (Chase Daniel [4,335 passer], Derrick Washington [1,036 rush-er] and Jeremy Maclin [1,260 receiver]); Oklahoma, 2008 (Sam Bradford [4,720 passer], Chris Brown [1,220 rusher], DeMarco Murray [1,002 rusher] and Juaquin Iglesias [1,150 receiver]); Hawaii, 2010 (Bryant Moniz [5,040 passer], Alex Green [1,199 rusher], Greg Salas [1,889 receiver] and Kealoha Pilares [1,306 receiver]); Oklahoma, 2010 (Landry Jones [4,718 passer], DeMarco Murray [1,253 rusher] and Ryan Broyles [1,622 receiv-er]); Oklahoma St., 2010 (Brandon Weeden [4,277 pass-er], Kendall Hunter [1,548 rusher] and Justin Blackmon [1,782 receiver])
TEAMS HAVING A 2,000-YARD RUSHER AND 2,000-YARD PASSER IN THE SAME YEAR
6—Oklahoma St., 1988 (Barry Sanders [2,628 rusher] and Mike Gundy [2,163 passer]); Colorado, 1994 (Rashaan Salaam [2,055 rusher] and Kordell Stewart [2,071 pass-er]); Texas, 1998 (Ricky Williams [2,124 rusher] and Major Applewhite [2,453 passer]); Penn St., 2002 (Larry Johnson [2,087 rusher] and Zach Mills [2,417 passer]); UCF, 2007 (Kevin Smith [2,567 rusher] and Kyle Israel [2,173 passer]); Rutgers, 2007 (Ray Rice [2,012 rusher] and Mike Teel [3,147 passer])
TEAMS HAVING A 2,000-YARD RUSHER, 2,000-YARD PASSER AND 1,000-YARDRECEIVER IN THE SAME YEAR
3—Oklahoma St., 1988 (Barry Sanders [2,628 rusher], Mike Gundy [2,163 passer] and Hart Lee Dykes [1,278 receiver]); Texas, 1998 (Ricky Williams [2,124 rusher], Major Applewhite [2,453 passer] and Wane McGarity [1,087 receiver]); Rutgers, 2007 (Ray Rice [2,012 rusher], Mike Teel [3,147 passer], Kenny Britts [1,232 receiver] and Tiquan Underwood [1,100 receiver])
TEAMS HAVING A 5,000-YARD PASSER,1,000-YARD RUSHER AND1,000-YARD RECEIVER IN THE SAME YEAR
3—Tulsa, 2007 (Paul Smith [5,065 passer], Tarrion Adams [1,225 rusher], Brennan Marion [1,244 receiver], Trae Johnson [1,088 receiver] and Charles Clay [1,024 receiv-er]); Houston, 2008 (Case Keenum [5,020 passer], Bryce Beall [1,247 rusher] and Tyron Carrier [1,029 receiver]); Hawaii, 2010 (Bryant Moniz [5,040 passer], Alex Green [1,199 rusher], Greg Salas [1,889 receiver] and Kealoha Pilares [1,306 receiver])
TEAMS HAVING A 5,000-YARD PASSER AND 1,000-YARD RUSHER IN THE SAME YEAR
4—Houston, 1990 (David Klingler [5,140 passer] and Chuck Weatherspoon [1,097 rusher]); Tulsa, 2007 (Paul Smith [5,065 passer] and Tarrion Adams [1,225 rusher]); Houston, 2008 (Case Keenum [5,020 passer] and Bryce Beall [1,247 rusher]); Hawaii, 2010 (Bryant Moniz [5,040 passer] and Alex Green [1,199 rusher])
TEAMS HAVING A 4,000-YARD PASSER AND 1,000-YARD RUSHER IN THE SAME YEAR
15—Houston, 1989 (Andre Ware [4,699 passer] and Chuck Weatherspoon [1,146 rusher]); Houston, 1990 (David Klingler [5,140 passer] and Chuck Weatherspoon [1,097 rusher]); Louisville, 1998 (Chris Redman [4,042 pass-er] and Leroy Collins [1,134 rusher]); Fresno St., 2001 (David Carr [4,308 passer] and Paris Gaines [1,018 rusher]); Boise St., 2003 (Ryan Dinwiddie [4,356 passer] and David Mikell [1,142 rusher]); Miami (OH), 2003 (Ben Roethlisberger [4,486 passer] and Cal Murphy Jr. [1,030 rusher]); Bowling Green, 2004 (Omar Jacobs [4,002 passer] and P.J. Pope [1,098 rusher]); Missouri, 2007 (Chase Daniel [4,306 passer] and Tony Temple [1,039 rusher]); Tulsa, 2007 (Paul Smith [5,065 passer] and Tarrion Adams [1,225 rusher]); Missouri, 2008 (Chase Daniel [4,335 passer] and Derrick Washington [1,036 rusher]; Oklahoma, 2008 (Sam Bradford [4,720 passer], Chris Brown [1,220 rusher] and DeMarco Murray [1,002 rusher]); Houston, 2008 (Case Keenum [5,020 passer] and Bryce Beall [1,247 rusher]); Oklahoma St., 2010 (Brandon Weeden [4,277 passer] and Kendall Hunter [1,548 rusher]; Hawaii, 2010 (Bryant Moniz [5,040 pass-er] and Alex Green [1,199 rusher]); Oklahoma, 2010 (Landry Jones [4,718 passer] and DeMarco Murray [1,253 rusher]).
(Note: Oklahoma in 2008 is the only team to have two 1,000-yard rushers in the same year with a 4,000-yard passer.)
HIGHEST AVERAGE GAIN PER PLAYGame
(Min. 37-62 plays) 14.3—Jason Martin, Louisiana Tech vs. Toledo, Oct. 19, 1996 (37 for 529)
(Min. 63 plays) 9.9—David Klingler, Houston vs. TCU, Nov. 3, 1990 (63 for 625)
Season(Min. 3,000 yards) 9.2—Colt Brennan, Hawaii, 2006 (645
for 5,915)Career
(Min. 7,500 yards) 8.70—Sam Bradford, Oklahoma, 2007-09 (970 for 8,439)
MOST TOUCHDOWNS RESPONSIBLE FOR(TDS SCORED AND PASSED FOR)Game
11—David Klingler, Houston vs. Eastern Wash., Nov. 17, 1990 (passed for 11)
Season63—Colt Brennan, Hawaii, 2006 (scored 5, passed for 58)
2 Yrs103—Graham Harrell, Texas Tech, 2007-08 (scored 10,
passed for 93)3 Yrs
146—Colt Brennan, Hawaii, 2005-07 (scored 15, passed for 131)
Career(3 yrs.) 146—Colt Brennan, Hawaii, 2005-07 (scored 15,
passed for 131)(4 yrs.) 150—Dan LeFevour, Central Mich., 2006-09 (scored
48, passed for 102)MOST TOUCHDOWNS RESPONSIBLE FOR PER GAMESeason
5.0—David Klingler, Houston, 1990 (55 in 11)2 Yrs
4.0—David Klingler, Houston, 1990-91 (85 in 21)3 Yrs
3.8—Colt Brennan, Hawaii, 2005-07 (146 in 38)4 Yrs
2.9—Ty Detmer, BYU, 1988-91 (135 in 46)Career
3.8—Colt Brennan, Hawaii, 2005-07 (146 in 38); also the collegiate record
MOST POINTS RESPONSIBLE FOR(Points Scored and Passed For)Game
66—David Klingler, Houston vs. Eastern Wash., Nov. 17, 1990 (passed for 11 TDs)
Season384—Colt Brennan, Hawaii, 2006 (scored 5 TDs, passed
for 58 TDs, accounted for 3 two-point conversions)2 Yrs
624—Graham Harrell, Texas Tech, 2007-08 (scored 10 TDs, passed for 93 TDs, accounted for 3 two-point conversions)
3 Yrs884—Colt Brennan, Hawaii, 2005-07 (scored 15 TDs, passed
for 131 TDs, accounted for 4 two-point conversions)Career
910—Dan LeFevour, Central Mich., 2006-09 (scored 48 TDs, passed for 102 TDs, accounted for 5 two-point conversions)
MOST POINTS RESPONSIBLE FOR PER GAMESeason
30.4—David Klingler, Houston, 1990 (334 in 11)2 Yrs
24.0—Graham Harrell, Texas Tech, 2007-08 (624 in 26)3 Yrs
23.3—Colt Brennan, Hawaii, 2005-07 (884 in 38)4 Yrs
19.6—Graham Harrell, Texas Tech, 2005-08 (882 in 45)Career
23.3—Colt Brennan, Hawaii, 2005-07 (884 in 38); also the collegiate record
SCORING 200 POINTS AND PASSINGFOR 200 POINTSCareer
Rick Leach, Michigan, 1975-78 (scored 204, passed for 270); Antwaan Randle El, Indiana, 1998-01 (scored 264, passed for 258); Brad Smith, Missouri, 2002-05 (scored 270, passed for 336); Pat White, West Virginia, 2005-08 (scored 286, passed for 336); Dan LeFevour, Central Mich., 2006-09 (scored 298, passed for 612); Tim Tebow, Florida, 2006-09 (scored 342, passed for 528); Colin Kaepernick, Nevada, 2007-10 (scored 362, passed for 492)

2011 NCAA FOOTBALL RECORDS - FBS INDIVIDUAL RECORDS 5
FOO
TBA
LL B
OW
LSU
BD
IVIS
IONRUSHED FOR 40 TOUCHDOWNS AND PASSED
FOR 40 TOUCHDOWNSCareer
Antwaan Randle El, Indiana, 1998-01 (44 rushing, 42 pass-ing); Josh Harris, Bowling Green, 2000-03 (43 rushing, 55 passing); Brad Smith, Missouri, 2002-05 (45 rushing, 56 passing); Pat White, West Virginia, 2005-08 (47 rush-ing, 56 passing); Dan LeFevour, Central Mich., 2006-09 (47 rushing, 102 passing); Tim Tebow, Florida, 2006-09 (57 rushing, 88 passing); Colin Kaepernick, Nevada, 2007-10 (59 rushing, 82 passing)
RushingMOST RUSHESQuarter
22—Alex Smith, Indiana vs. Michigan St., Nov. 11, 1995 (1st, 114 yards)
Half34—Tony Sands, Kansas vs. Missouri, Nov. 23, 1991 (2nd,
240 yards)Game
58—Tony Sands, Kansas vs. Missouri, Nov. 23, 1991 (396 yards)
Season450—Kevin Smith, UCF, 2007 (2,567 yards)
2 Yrs757—Marcus Allen, Southern California, 1980-81 (3,905
yards)Career
(3 yrs.) 994—Herschel Walker, Georgia, 1980-82 (5,259 yards)
(4 yrs.) 1,215—Steve Bartalo, Colorado St., 1983-86 (4,813 yards)
MOST RUSHES PER GAMESeason
39.6—Ed Marinaro, Cornell, 1971 (356 in 9)2 Yrs
36.0—Marcus Allen, Southern California, 1980-81 (757 in 21)
Career34.0—Ed Marinaro, Cornell, 1969-71 (918 in 27)
MOST RUSHES BY A FRESHMANGame
52—Michael Turner, Northern Ill. vs. Central Mich., Nov. 18, 2000 (281 yards)
Season339—Adrian Peterson, Oklahoma, 2004 (1,925 yards)
MOST RUSHES PER GAME BY A FRESHMANSeason
29.2—Steve Bartalo, Colorado St., 1983 (292 in 10)
MOST CONSECUTIVE RUSHES BY SAME PLAYERGame
16—William Howard, Tennessee vs. Ole Miss, Nov. 15, 1986 (during two possessions)
MOST RUSHES IN TWO CONSECUTIVE GAMESSeason
102—Lorenzo White, Michigan St., 1985 (53 vs. Purdue, Oct. 26; 49 vs. Minnesota, Nov. 2)
MOST CONSECUTIVE RUSHES WITHOUT LOSING A FUMBLESeason
365—Travis Prentice, Miami (OH), 1998Career
862—Travis Prentice, Miami (OH), 1997-99
MOST YARDS GAINEDQuarter
222—Corey Dillon, Washington vs. San Jose St., Nov. 16, 1996 (1st, 16 rushes)
Half287—Stacey Robinson, Northern Ill. vs. Fresno St., Oct. 6,
1990 (1st; 114 in first quarter, 173 in second quarter; 20 rushes); LaDainian Tomlinson, TCU vs. UTEP, Nov. 20, 1999 (2nd; 121 in third quarter, 166 in fourth quarter; 28 rushes)
Game406—LaDainian Tomlinson, TCU vs. UTEP, Nov. 20, 1999
(43 rushes) (59 yards in first quarter, 60 in second quar-ter, 121 in third quarter, 166 in fourth quarter)
Season2,628—Barry Sanders, Oklahoma St., 1988 (344 rushes,
11 games)
2 Yrs4,195—Troy Davis, Iowa St., 1995-96 (747 rushes)
Career(3 yrs.) 5,259—Herschel Walker, Georgia, 1980-82 (994
rushes)(4 yrs.) 6,397—Ron Dayne, Wisconsin, 1996-99 (1,115
rushes)
MOST YARDS GAINED PER GAMESeason
238.9—Barry Sanders, Oklahoma St., 1988 (2,628 in 11)2 Yrs
190.7—Troy Davis, Iowa St., 1995-96 (4,195 in 22)Career
174.6—Ed Marinaro, Cornell, 1969-71 (4,715 in 27)
MOST YARDS GAINED BY A FRESHMANGame
386—Marshall Faulk, San Diego St. vs. Pacific, Sept. 14, 1991 (37 rushes)
Season1,925—Adrian Peterson, Oklahoma, 2004 (339 rushes)Per-game record—180.1, Jamario Thomas, North Texas,
2004 (1,801 in 10)
MOST YARDS GAINED BY A SOPHOMOREGame
351—Scott Harley, East Carolina vs. North Carolina St., Nov. 30, 1996 (42 rushes)
Season2,010—Troy Davis, Iowa St., 1995 (345 rushes)Also holds per-game record with 182.7 (2,010 in 11)
FRESHMEN GAINING 1,000 YARDS OR MORESeason
By 95 players (see chart after Annual Rushing Champions, pages 27 and 28)
TWO FRESHMEN, SAME TEAM,GAINING 1,000 YARDS OR MORESeason
Mike Smith (1,062) & Gwain Durden (1,049), Chattanooga, 1977
FIRST PLAYER TO GAIN 1,000 YARDS OR MORESeason
Byron “Whizzer” White, Colorado, 1937 (1,121)
(Note: Before NCAA records began in 1937, Morley Drury of Southern California gained 1,163 yards in 1927.)
EARLIEST GAME REACHING 1,000 YARDSSeason
5th—Ed Marinaro, Cornell, 1971 (1,026); Ricky Bell, Southern California, 1976 (1,008); Marcus Allen, Southern California, 1981 (1,136); Ernest Anderson, Oklahoma St., 1982 (1,042); Barry Sanders, Oklahoma St., 1988 (1,002); Troy Davis, Iowa St., 1995 (1,001); Troy Davis, Iowa St., 1996 (1,047); Byron Hanspard, Texas Tech, 1996 (1,112); Ricky Williams, Texas, 1998 (1,086); Garrett Wolfe, Northern Ill., 2006 (1,181)
EARLIEST GAME BY A FRESHMAN REACHING1,000 YARDSSeason
7th—Emmitt Smith, Florida, 1987 (1,011 vs. Temple, Oct. 17); Marshall Faulk, San Diego St., 1991 (1,157 vs. Colorado St., Nov. 9); Adrian Peterson, Oklahoma, 2004 (1,023 vs. Kansas, Oct. 23); Jamario Thomas, North Texas, 2004 (1,216 vs. La.-Monroe, Oct. 30); P.J. Hill, Wisconsin, 2006 (1,011 vs. Minnesota, Oct. 14)
MOST YARDS GAINED BY A QUARTERBACKGame
308—Stacey Robinson, Northern Ill. vs. Fresno St., Oct. 6, 1990 (22 rushes)
Season1,702—Denard Robinson, Michigan, 2010 (256 rushes)Per-game record—135.8, Beau Morgan, Air Force, 1996
(1,494 in 11)Career
4,480—Pat White, West Virginia, 2005-08 (684 rushes)Per-game record—109.1, Stacey Robinson, Northern Ill.,
1988-90 (2,727 in 25)
MOST YARDS GAINED BY A FRESHMAN QUARTERBACKSeason
1,029—Brad Smith, Missouri, 2002 (193 rushes)
LONGEST GAIN BY A QUARTERBACKGame
98—Mark Malone, Arizona St. vs. Utah St., Oct. 27, 1979 (TD)
MOST GAMES GAINING 100 YARDS OR MORESeason
13—Shonn Green, Iowa, 2008Career
34—DeAngelo Williams, Memphis, 2002-05 (44 games)
MOST GAMES GAINING 100 YARDS OR MORE BY A FRESHMANSeason
11—Adrian Peterson, Oklahoma, 2004
MOST CONSECUTIVE GAMES GAINING100 YARDS OR MORECareer
31—Archie Griffin, Ohio St., began Sept. 15, 1973 (vs. Minnesota), ended Nov. 22, 1975 (vs. Michigan)
MOST CONSECUTIVE GAMES GAINING100 YARDS OR MORE BY A FRESHMANSeason
9—Adrian Peterson, Oklahoma, 2004
MOST CONSECUTIVE GAMES GAINING100 YARDS OR MORE BY A QUARTERBACKSeason
5—Beau Morgan, Air Force, 1995; Brian Madden, Navy, 1999; Joe Webb, UAB, 2009; Ricky Dobbs, Navy, 2009; Denard Robinson, Michigan, 2010
MOST GAMES GAINING 200 YARDS OR MORESeason
8—Marcus Allen, Southern California, 1981Career
11—Marcus Allen, Southern California, 1978-81 (in 21 games during 1980-81); Ricky Williams, Texas, 1995-98; Ron Dayne, Wisconsin, 1996-99
MOST GAMES GAINING 200 YARDS OR MORE BY A FRESHMANSeason
6—Jamario Thomas, North Texas, 2004
MOST CONSECUTIVE GAMES GAINING200 YARDS OR MORESeason
5—Marcus Allen, Southern California, 1981 (210 vs. Tennessee, Sept. 12; 274 vs. Indiana, Sept. 19; 208 vs. Oklahoma, Sept. 26; 233 vs. Oregon St., Oct. 3; 211 vs. Arizona, Oct. 10); Barry Sanders, Oklahoma St., 1988 (320 vs. Kansas St., Oct. 29; 215 vs. Oklahoma, Nov. 5; 312 vs. Kansas, Nov. 12; 293 vs. Iowa St., Nov. 19; 332 vs. Texas Tech, Dec. 3); Jamario Thomas, North Texas, 2004 (256 vs. Utah St., Oct. 9; 258 vs. New Mexico St., Oct. 23; 218 vs. La.-Monroe, Oct. 30; 203 vs. La.-Lafayette, Nov. 5; 291 vs. Idaho, Nov. 13)
MOST GAMES GAINING 300 YARDS OR MORESeason
4—Barry Sanders, Oklahoma St., 1988Also holds career record with 4
MOST CONSECUTIVE GAMES GAINING300 YARDS OR MORESeason
2—Ricky Williams, Texas, 1998 (318 vs. Rice, Sept. 26; 350 vs. Iowa St., Oct. 3)
MOST YARDS GAINED IN TWO, THREE, FOUR AND FIVE CONSECUTIVE GAMES2 Games
668—Ricky Williams, Texas, 1998 (318 vs. Rice, Sept. 26; 350 vs. Iowa St., Oct. 3)
3 Games937—Barry Sanders, Oklahoma St., 1988 (312 vs. Kansas,
Nov. 12; 293 vs. Iowa St., Nov. 19; 332 vs. Texas Tech, Dec. 3)
4 Games1,152—Barry Sanders, Oklahoma St., 1988 (215 vs.
Oklahoma, Nov. 5; 312 vs. Kansas, Nov. 12; 293 vs. Iowa St., Nov. 19; 332 vs. Texas Tech, Dec. 3)
5 Games1,472—Barry Sanders, Oklahoma St., 1988 (320 vs. Kansas
St., Oct. 29; 215 vs. Oklahoma, Nov. 5; 312 vs. Kansas, Nov. 12; 293 vs. Iowa St., Nov. 19; 332 vs. Texas Tech, Dec. 3)
MOST SEASONS GAINING 1,500 YARDSOR MORECareer
3—Tony Dorsett, Pittsburgh, 1973, 1975-76; Herschel Walker, Georgia, 1980-82; Travis Prentice, Miami (OH), 1997-99; Garrett Wolfe, Northern Ill., 2004-06

6 2011 NCAA FOOTBALL RECORDS - FBS INDIVIDUAL RECORDS
MOST SEASONS GAINING 1,000 YARDSOR MORECareer
4—Tony Dorsett, Pittsburgh, 1973-76; Amos Lawrence, North Carolina, 1977-80; Denvis Manns, New Mexico St., 1995-98; Ron Dayne, Wisconsin, 1996-99; Cedric Benson, Texas, 2002-05; DonTrell Moore, New Mexico, 2002-05; Tyrell Fenroy, La.-Lafayette, 2005-08; Damion Fletcher, Southern Miss., 2006-09
Collegiate record tied by Howard Stevens, Randolph-Macon, 1968-69; Louisville, 1971-72
MOST PLAYERS, SAME TEAM, REACHING 2,000 CAREER RUSHING YARDS IN THE SAME SEASON
3—Nebraska, 2000 (Correll Buckhalter, 2,522; Dan Alexander, 2,456; Eric Crouch, 2,319); Nevada, 2009 (Luke Lippincott, 3,014; Vai Taua, 2,978; and Colin Kaepernick, 2,906)
THREE PLAYERS, SAME TEAM, EACH GAINING 1,000 YARDS OR MORESeason
Nevada, 2009—Vai Taua (1,345), Colin Kaepernick (1,183) and Luke Lippincott (1,034)
TWO PLAYERS, SAME TEAM, EACH GAINING 1,000 YARDS OR MORESeason
52 times. Most recent: Nevada, 2010—Vai Taua (1,610) & Colin Kaepernick (1,206); Auburn, 2010—Cam Newton (1,473) & Michael Dyer (1,093); Wisconsin, 2010—James White (1,052) & John Clay (1,012); Nevada, 2009—Vai Taua (1,345), Colin Kaepernick (1,183) & Luke Lippincott (1,034); Connecticut, 2009—Jordan Todman (1,188) & Andre Dixon (1,093); Georgia Tech, 2009—Jonathan Dwyer (1,395) & Josh Nesbitt (1,037); La.-Lafayette, 2008—Tyrell Fenroy (1,375) & Michael Desormeaux (1,035); Nevada, 2008—Vai Taua (1,521) & Colin Kaepernick (1,130); Oklahoma, 2008—Chris Brown (1,220) & DeMarco Murray (1,002); Oregon, 2008—Jeremiah Johnson (1,201) & LeGarrette Blount (1,002); Arkansas, 2007—Darren McFadden (1,830) & Felix Jones (1,162); La.-Lafayette, 2007—Michael Desormeaux (1,141) & Tyrell Fenroy (1,021); West Virginia, 2007—Pat White (1,335) & Steve Slaton (1,051)Minnesota (2004-05), Arkansas (2006-07), West Virginia (2006-07), La.-Lafayette (2007-08) and Nevada (2008-09-10) are the only teams to have two players with 1,000 yards or more in consecutive years. Nevada is the only team to do so in three-straight years.
TWO PLAYERS, SAME TEAM, EACH GAINING 200 YARDS OR MOREGame
Gordon Brown, 214 (23 rushes) & Steve Gage (QB), 206 (26 rushes), Tulsa vs. Wichita St., Nov. 2, 1985; Sedrick Irvin, 238 (28 rushes) & Marc Renaud, 203 (21 rushes), Michigan St. vs. Penn St., Nov. 29, 1997; Patrick White 220 (22 rushes) & Steve Slaton, 215 (23 rushes), West Virginia vs. Pittsburgh, Nov. 16, 2006; MiQuale Lewis, 301 (26 rushes) & Cory Sykes, 203 (23 rushes), Ball St. vs. Eastern Mich., Oct. 24, 2009
TWO OPPOSING FBS PLAYERS EACH GAINING 200 YARDS OR MOREGame
George Swarn, Miami (OH) (239) & Otis Cheathem, Western Mich. (219), Sept. 8, 1984; Barry Sanders, Oklahoma St. (215) & Mike Gaddis, Oklahoma (213), Nov. 5, 1988; Ricky Williams, Texas (249) & Michael Perry, Rice (211), Sept. 27, 1997; De’Mond Parker, Oklahoma (291) & Ricky Williams, Texas (223), Oct. 11, 1997; Chris Barclay, Wake Forest (243) & Bruce Perry, Maryland (237), Nov. 29, 2003; Garrett Wolfe, Northern Ill. (245) & Tyrell Sutton, Northwestern (214), Sept. 10, 2005
MOST YARDS GAINED BY TWO OPPOSING PLAYERSGame
553—Marshall Faulk, San Diego St. (386) & Ryan Benjamin, Pacific (167), Sept. 14, 1991
MOST YARDS GAINED BY TWO PLAYERS,SAME TEAMGame
504—MiQuale Lewis (301) & Cory Sykes (203), Ball St. vs. Eastern Mich., Oct. 24, 2009
Season2,997—Barry Sanders (2,628) & Gerald Hudson (369),
Oklahoma St., 1988Also hold per-game record with 272.5
Note: Reggie Bush (1,740) & LenDale White (1,302), com-bined for 3,042 yards rushing for Southern California in 2005 (13 games), but Bush’s statistics were later vacated by the NCAA Committee on Infractions.
Career8,193—Eric Dickerson (4,450) & Craig James (3,743), SMU,
1979-82 (alternated at the same position during the last 36 games)
MOST YARDS GAINED IN FIRST GAMEOF CAREER
273—Chris McCoy (Soph.), Navy vs. SMU, Sept. 9, 1995
MOST YARDS GAINED BY A FRESHMAN IN FIRST GAME OF CAREER
212—Greg Hill, Texas A&M vs. LSU, Sept. 14, 1991 (30 carries)
LONGEST RUSH BY A FRESHMAN IN FIRST GAME OF CAREER
98—Jerald Sowell, Tulane vs. Alabama, Sept. 4, 1993
MOST YARDS GAINED IN OPENING GAMEOF SEASON
348—Shun White, Navy vs. Towson, Aug. 30, 2008 (19 rushes)
MOST YARDS GAINED AGAINST ONE OPPONENTCareer
788—LaDainian Tomlinson, TCU vs. UTEP, 1997, 1999-00 (95 rushes)
MOST YARDS GAINED PER GAME AGAINST ONE OPPONENTCareer
(Min. 2 games) 292.0—Anthony Thompson, Indiana vs. Wisconsin, 1986, 89 (584 yards, 91 rushes)
(Min. 3 games) 262.7—LaDainian Tomlinson, TCU vs. UTEP, 1997, 1999-00 (788 yards, 95 rushes)
MOST YARDS GAINED BY TWO BROTHERSSeason
3,690—Barry Sanders, Oklahoma St. (2,628) & Byron Sanders, Northwestern (1,062), 1988
RUSHING FOR AT LEAST 1,500 YARDS WITH AT LEAST 500 RECEIVING YARDSSeason
Ryan Benjamin, Pacific, 1991 (1,581 rushing and 612 receiving); Brian Calhoun, Wisconsin, 2005 (1,636 yards rushing and 571 receiving)
HIGHEST AVERAGE GAIN PER RUSHGame
(Min. 8-14 rushes) 30.2—Kevin Lowe, Wyoming vs. South Dakota St., Nov. 10, 1984 (10 for 302)
(Min. 15-25 rushes) 21.4—Tony Jeffery, TCU vs. Tulane, Sept. 13, 1986 (16 for 343)
(Min. 26 rushes) 13.7—Eddie Lee Ivery, Georgia Tech vs. Air Force, Nov. 11, 1978 (26 for 356)
Season(Min. 75-100 rushes) 11.5—Glenn Davis, Army, 1945 (82
for 944)(Min. 101-213 rushes) 9.6—Chuck Weatherspoon,
Houston, 1989 (119 for 1,146)(Min. 214-281 rushes) 7.8—Mike Rozier, Nebraska, 1983
(275 for 2,148)(Min. 282 rushes) 7.6—Barry Sanders, Oklahoma St., 1988
(344 for 2,628)Career
(Min. 300-413 rushes) 8.3—Glenn Davis, Army, 1943-46 (358 for 2,957)
(Min. 414-780 rushes) 7.2—Mike Rozier, Nebraska, 1981-83 (668 for 4,780)Note: Reggie Bush averaged 7.3 yards per rush (433 for 3,169) for Southern California in 2003-05, but his statistics were later vacated by NCAA Committee on Infractions.
(Min. 781 rushes) 6.40—Garrett Wolfe, Northern Ill., 2004-06 (807 for 5,164)
MOST TOUCHDOWNS SCORED BY RUSHINGQuarter
4—Dick Felt, BYU vs. San Jose St., Nov. 8, 1952 (4th); Howard Griffith, Illinois vs. Southern Ill., Sept. 22, 1990 (3rd); Frank Moreau, Louisville vs. East Carolina, Nov. 1, 1997 (2nd); Phillip Tanner, Middle Tenn. vs. North Texas, Nov. 22, 2008 (2nd)
Game8—Howard Griffith, Illinois vs. Southern Ill., Sept. 22, 1990
(5, 51, 7, 41, 5, 18, 5, 3 yards; Griffith scored three touch-downs [51, 7, 41] on consecutive carries and scored four touchdowns in the third quarter)
Season37—Barry Sanders, Oklahoma St., 1988 (11 games)Also holds per-game record at 3.4 (37 in 11)
Career73—Travis Prentice, Miami (OH), 1996-99
MOST GAMES SCORING TWO OR MORE TOUCHDOWNS BY RUSHINGSeason
11—Barry Sanders, Oklahoma St., 1988
MOST CONSECUTIVE GAMES SCORING TWO OR MORE TOUCHDOWNS BY RUSHINGCareer
12—Barry Sanders, Oklahoma St. (last game of 1987, all 11 in 1988)
MOST TOUCHDOWNS SCORED BY RUSHINGBY A FRESHMAN IN FIRST COLLEGIATE GAMEGame
5—DeMarco Murray, Oklahoma vs. North Texas, Sept. 1, 2007
MOST TOUCHDOWNS SCORED BY RUSHINGBY A FRESHMANGame
7—Marshall Faulk, San Diego St. vs. Pacific, Sept. 14, 1991Season
21—Marshall Faulk, San Diego St., 1991; Ryan Williams, Virginia Tech, 2009
Faulk also holds per-game record with 2.3 (21 in 9)
MOST RUSHING TOUCHDOWNS SCOREDBY A QUARTERBACKGame
6—Dee Dowis, Air Force vs. San Diego St., Sept. 1, 1989 (55, 28, 12, 16, 60, 17 yards; 249 yards rushing on 13 carries); Craig Candeto, Navy vs. Army, Dec. 7, 2002 (1, 1, 42, 7, 3, 1 yards; 103 yards rushing on 18 carries)
Season27—Ricky Dobbs, Navy, 2009 (14 games)
Career59—Eric Crouch, Nebraska, 1998-01 (43 games); Colin
Kaepernick, Nevada, 2007-10 (51 games)
MOST CONSECUTIVE RUSHESFOR A TOUCHDOWN IN A GAME
3—Howard Griffith, Illinois vs. Southern Ill., Sept. 22, 1990 (TDs of 51, 7 and 41 yards); Tiki Barber, Virginia vs. Texas, Sept. 28, 1996 (TDs of 16, 26 and 12 yards); Chris McCoy, Navy vs. Rutgers, Sept. 13, 1997 (TDs of 2, 9 and 2 yards); Aaron Greving, Iowa vs. Kent St., Sept. 1, 2001 (TDs of 14, 1 and 26 yards); Michael Robinson, Penn St. vs. Louisiana Tech, Sept. 21, 2002 (TDs of 8, 5 and 6 yards); Joe Ayoob, California vs. New Mexico St., Sept. 23, 2005 (TDs of 1, 5 and 7 yards)
MOST RUSHING TOUCHDOWNS SCOREDBY A QUARTERBACK IN TWO CONSECUTIVE SEASONS
38—Stacey Robinson, Northern Ill., 1989-90 (19 and 19); Eric Crouch, Nebraska, 2000-01 (20 and 18)
PLAYER RUSHING FOR AT LEAST 200 YARDS AND RECEIVING FOR AT LEAST 100 YARDSGame
Thomas Jones, Virginia vs. Buffalo, Nov. 13, 1999 (221 rushing, 110 receiving); Emmett White, Utah St. vs. New Mexico St., Nov. 4, 2000 (322 rushing, 134 receiving); Steve Slaton, West Virginia vs. Pittsburgh, Nov. 16, 2006 (215 rushing, 130 receiving); Donald Buckram, UTEP vs. Tulane, Nov. 7, 2009 (234 rushing, 109 receiving)
PassingHIGHEST PASSING EFFICIENCY RATING POINTSGame
(Min. 12-24 atts.) 403.4—Tim Clifford, Indiana vs. Colorado, Sept. 26, 1980 (14 attempts, 11 completions, 0 intercep-tions, 345 yards, 5 TD passes)
(Min. 25-49 atts.) 317.4—Bruce Gradkowski, Toledo vs. Buffalo, Nov. 1, 2003 (25 attempts, 23 completions, 0 interceptions, 435 yards, 6 TD passes)
(Min. 50 atts.) 199.2—Chris Redman, Louisville vs. East Carolina, Nov. 14, 1998 (56 attempts, 44 completions, 1 interception, 592 yards, 6 TD passes)
Season(Min. 15 atts. per game) 186.0—Colt Brennan, Hawaii,
2006 (559 attempts, 406 completions, 12 interceptions, 5,549 yards, 58 TD passes)

2011 NCAA FOOTBALL RECORDS - FBS INDIVIDUAL RECORDS 7
FOO
TBA
LL B
OW
LSU
BD
IVIS
IONCareer
(Min. 325 comps.) 175.6—Sam Bradford, Oklahoma, 2007-09 (893 attempts, 604 completions, 16 interceptions, 8,403 yards, 88 TD passes)
HIGHEST PASSING EFFICIENCY RATING POINTS BY A FRESHMANSeason
(Min. 15 atts. per game) 180.4—Michael Vick, Virginia Tech, 1999 (152 attempts, 90 completions, 5 intercep-tions, 1,840 yards, 12 TD passes)
MOST PASSES ATTEMPTEDQuarter
41—Jason Davis, UNLV vs. Idaho, Sept. 17, 1994 (4th, completed 28)
Half56—Rusty LaRue, Wake Forest vs. Duke, Oct. 28, 1995
(2nd, completed 41)Game
83—Drew Brees, Purdue vs. Wisconsin, Oct. 10, 1998 (completed 55)
Season719—B.J. Symons, Texas Tech, 2003 (13 games, com-
pleted 470)2 Yrs
1,339—Graham Harrell, Texas Tech, 2007-08 (completed 954)
3 Yrs1,955—Graham Harrell, Texas Tech, 2006-08 (completed
1,366)Career
(4 yrs.) 2,436—Timmy Chang, Hawaii, $2000-04 (com-pleted 1,388)
$See page 2 for explanation.
MOST PASSES ATTEMPTED PER GAMESeason
58.5—David Klingler, Houston, 1990 (643 in 11)Career
47.0—Tim Rattay, Louisiana Tech, 1997-99 (1,552 in 33)
MOST PASSES ATTEMPTED BY A FRESHMANGame
72—Luke McCown, Louisiana Tech vs. Miami (FL), Oct. 28, 2000 (completed 42)
Season559—Jared Lorenzen, Kentucky, 2000 (completed 321)
MOST PASSES COMPLETEDQuarter
28—Jason Davis, UNLV vs. Idaho, Sept. 17, 1994 (4th, attempted 41)
Half41—Rusty LaRue, Wake Forest vs. Duke, Oct. 28, 1995
(2nd, attempted 56)Game
58—Andy Schmitt, Eastern Mich. vs. Central Mich., Nov. 28, 2008 (attempted 80)
Season512—Graham Harrell, Texas Tech, 2007 (13 games,
attempted 713)2 Yrs
954—Graham Harrell, Texas Tech, 2007-08 (attempted 1,339)
Also holds per-game record with 36.7 (954 in 26)3 Yrs
1,366—Graham Harrell, Texas Tech, 2006-08 (attempted 1,955)
Also holds per-game record with 35.0 (1,366 in 39)Career
(4 yrs.) 1,403—Graham Harrell, Texas Tech, 2005-08 (attempted 2,010)
MOST PASSES COMPLETED PER GAMESeason
39.4—Graham Harrell, Texas Tech, 2007 (512 in 13)Career
31.2—Graham Harrell, Texas Tech, 2005-08 (1,403 in 45)
MOST PASSES COMPLETED BY A FRESHMANGame
47—Luke McCown, Louisiana Tech vs. Auburn, Oct. 21, 2000 (attempted 65)
Season321—Jared Lorenzen, Kentucky, 2000 (attempted 559);
Corey Robinson, Troy, 2010 (attempted 505)Lorenzen also holds per-game record with 29.2 (321 in 11)
MOST CONSECUTIVE PASSES COMPLETEDGame
23—Tee Martin, Tennessee vs. South Carolina, Oct. 31, 1998; Aaron Rodgers, California vs. Southern California, Oct. 9, 2004
Season26—Aaron Rodgers, California, 2004 (completed last
three attempts vs. Oregon St., Oct. 2 and first 23 vs. Southern California, Oct. 9)
MOST PASSES COMPLETED IN TWO, THREE AND FOUR CONSECUTIVE GAMES2 Games
108—Andy Schmitt, Eastern Mich., 2008 (50 vs. Temple, Nov. 22; 58 vs. Central Mich., Nov. 28)
3 Games146—Rusty LaRue, Wake Forest, 1995 (55 vs. Duke, Oct.
28; 41 vs. Georgia Tech, Nov. 4; 50 vs. North Carolina St., Nov. 18)
4 Games176—Kliff Kingsbury, Texas Tech, 2002 (41 vs. New Mexico,
Sept. 27; 49 vs. Texas A&M, Oct. 5; 37 vs. Iowa, Oct. 12; 49 vs. Missouri, Oct. 19)
HIGHEST PERCENTAGE OF PASSES COMPLETEDGame
(Min. 20-29 comps.) 95.8%—Tee Martin, Tennessee vs. South Carolina, Oct. 31, 1998 (23 of 24)
(Min. 30-39 comps.) 91.2%—Steve Sarkisian, BYU vs. Fresno St., Nov. 25, 1995 (31 of 34)
(Min. 40 comps.) 83.3%—Kliff Kingsbury, Texas Tech vs. Texas A&M, Oct. 5, 2002 (49 of 59)
Season(Min. 150 atts.) 76.7%—Colt McCoy, Texas, 2008 (332 of
433)Career
(Min. 875-999 atts.) 67.6%—Sam Bradford, Oklahoma, 2007-09 (604 of 893)
(Min. 1,000 atts.) 70.4%—Colt Brennan, Hawaii, 2005-07 (1,115 of 1,584)
HIGHEST PERCENTAGE OF PASSES COMPLETED BY A FRESHMANSeason
(Min. 200 atts.) 69.5%—Sam Bradford, Oklahoma, 2007 (237 of 341)
MOST PASSES HAD INTERCEPTEDGame
9—John Reaves, Florida vs. Auburn, Nov. 1, 1969 (attempt-ed 66)
Season34—John Eckman, Wichita St., 1966 (attempted 458)Also holds per-game record with 3.4 (34 in 10)
Career(3 yrs.) 68—Zeke Bratkowski, Georgia, 1951-53 (attempt-
ed 734)(4 yrs.) 80—Timmy Chang, Hawaii, $2000-04 (attempted
2,436)Per-game record—2.3, Steve Ramsey, North Texas,
1967-69 (67 in 29)
$See page 2 for explanation.
LOWEST PERCENTAGE OF PASSES HAD INTERCEPTEDSeason
(Min. 150-349 atts.) 0.0%—Matt Blundin, Virginia, 1991 (0 of 224)
(Min. 350 atts.) 0.70%—Kellen Moore, Boise St., 2009 (3 of 431)
Career(Min. 600-1,049 atts.) 1.3%—Billy Volek, Fresno St., 1997-
99 (12 of 934)(Min. 1,050 atts.) 1.69%—Graham Harrell, Texas Tech,
2005-08 (34 of 2,010)
MOST PASSES ATTEMPTED WITHOUT AN INTERCEPTIONGame
76—Andy Schmitt, Eastern Mich. vs. Temple, Nov. 22, 2008 (completed 50); Case Keenum, Houston vs. UTEP, Oct. 3, 2009 (completed 51)
Entire Season224—Matt Blundin, Virginia, 1991 (completed 135)
MOST CONSECUTIVE PASSES ATTEMPTED WITHOUT AN INTERCEPTIONSeason
271—Trent Dilfer, Fresno St., 1993
Career379—Russell Wilson, North Carolina St., 2008-09 (dur-
ing 14 games; began Sept. 20, 2008, vs. East Carolina, ended Oct. 3, 2009, vs. Wake Forest)
MOST CONSECUTIVE PASSES ATTEMPTED WITH JUST ONE INTERCEPTIONCareer
405—Russell Wilson, North Carolina St., 2008-09 (dur-ing 14 games; began Sept. 20, 2008, vs. East Carolina, ended Oct. 3, 2009, vs. Wake Forest)
MOST CONSECUTIVE PASSES ATTEMPTED WITHOUT AN INTERCEPTION AT THE START OF A CAREER BY A FRESHMAN
209—Robert Griffin, Baylor, 2008 (during 9 games)
MOST CONSECUTIVE PASSES ATTEMPTED WITHOUT AN INTERCEPTION AT THE START OF AN FBS CAREER
209—Robert Griffin, Baylor, 2008 (during 9 games)
MOST YARDS GAINEDQuarter
347—Jason Davis, UNLV vs. Idaho, Sept. 17, 1994 (4th)Half
517—Andre Ware, Houston vs. SMU, Oct. 21, 1989 (1st, completed 25 of 41)
Game716—David Klingler, Houston vs. Arizona St., Dec. 2, 1990
(completed 41 of 70)Season
(11 games) 5,140—David Klingler, Houston, 1990 (com-pleted 374 of 643)
(12 games) 5,336—B.J. Symons, Texas Tech, 2003 (com-pleted 429 of 666)
(13 games) 5,833—B.J. Symons, Texas Tech, 2003 (com-pleted 470 of 719)
2 Yrs10,816—Graham Harrell, Texas Tech, 2007-08 (completed
954 of 1,339)3 Yrs
15,371—Graham Harrell, Texas Tech, 2006-08 (completed 1,366 of 1,955)
Career(4 yrs.) 17,072—Timmy Chang, Hawaii, $2000-04 (com-
pleted 1,388 of 2,436)
$See page 2 for explanation.
MOST YARDS GAINED PER GAMESeason
467.3—David Klingler, Houston, 1990 (5,140 in 11)2 Yrs
406.2—Ty Detmer, BYU, 1989-90 (9,748 in 24)Career
(3 yrs.) 386.2—Tim Rattay, Louisiana Tech, 1997-99 (12,746 in 33)
(4 yrs.) 351.0—Graham Harrell, Texas Tech, 2005-08 (15,793 in 45)
MOST YARDS GAINED BY A FRESHMANGame
611—David Neill, Nevada vs. New Mexico St., Oct. 10, 1998
Season3,726—Corey Robinson, Troy, 2010Per-game record—361.0, David Neill, Nevada, 1998 (3,249
in 9)
MOST YARDS GAINED BY A SOPHOMOREGame
631—Scott Mitchell, Utah vs. Air Force, Oct. 15, 1988Season
5,020—Case Keenum, Houston, 2008Per-game record—392.9, Scott Mitchell, Utah, 1988 (4,322
in 11)

8 2011 NCAA FOOTBALL RECORDS - FBS INDIVIDUAL RECORDS
MOST SEASONS GAINING 2,000 YARDSOR MORECareer
4—Kevin Sweeney, Fresno St., 1983-86 (2,359—3,259—2,604—2,363); Todd Santos, San Diego St., 1984-87 (2,063—2,877—2,553—3,932); Tom Hodson, LSU, 1986-89 (2,261—2,125—2,074—2,655); T.J. Rubley, Tulsa, 1987-89, 1991 (2,058—2,497—2,292—2,054); Alex Van Pelt, Pittsburgh, 1989-92 (2,527—2,427—2,796—3,163); Glenn Foley, Boston College, 1990-93 (2,189—2,225—2,231—3,397); Tim Lester, Western Mich., 1996-99 (2,189—2,160—3,311—3,639); David Garrard, East Carolina, 1998-01 (2,091—2,359—2,332—2,247); Jared Lorenzen, Kentucky, 2000-03 (3,678—2,179—2,267—2,227); Luke McCown, Louisiana Tech, 2000-03 (2,544—3,337—3,539—3,246); Philip Rivers, North Carolina St., 2000-03 (3,054—2,586—3,353—4,491); Timmy Chang, Hawaii, 2000, 2002-04 (3,041—4,474—4,199—4,258); Charlie Frye, Akron, 2001-04 (2,053—2,824—3,549—2,623); Kevin Kolb, Houston, 2003-06 (3,131—2,766—3,258—3,809); Rudy Carpenter, Arizona St., 2005-08 (2,273—2,523—3,202—2,493); Colt McCoy, Texas, 2006-09 (2,570—3,303—3,859—3,521); Dan LeFevour, Central Mich., 2006-09 (3,031—3,652—2,784—3,438); Thaddeus Lewis, Duke, 2006-09 (2,134—2,430—2,171—3,330); Riley Skinner, Wake Forest, 2006-09 (2,051—2,204—2,347—3,160); Trevor Vittatoe, UTEP, 2007-10 (3,101—3,274—3,308—2,756); Adam Weber, Minnesota, 2007-10 (2,895—2,761—2,582—2,679); Andy Dalton, TCU, 2007-10 (2,691—2,242—2,756—2,857); Colin Kaepernick, Nevada, 2007-10 (2,175—2,849—2,052—3,022)
MOST YARDS GAINED IN TWO, THREE AND FOUR CONSECUTIVE GAMES2 Games
1,288—David Klingler, Houston, 1990 (572 vs. Eastern Wash., Nov. 17; 716 vs. Arizona St., Dec. 2)
3 Games1,798—David Klingler, Houston, 1990-91 (572 vs. Eastern
Wash., Nov. 17, 1990; 716 vs. Arizona St., Dec. 2, 1990; 510 vs. Louisiana Tech, Aug. 31, 1991)
4 Games2,239—B.J. Symons, Texas Tech, 2003 (586 vs. North
Carolina St., Sept. 20; 661 vs. Ole Miss, Sept. 27; 505 vs. Texas A&M, Oct. 4; 487 vs. Iowa St., Oct. 11)
MOST GAMES GAINING 200 YARDS OR MORESeason
14—Ben Roethlisberger, Miami (OH), 2003; Colt Brennan, Hawaii, 2006; Paul Smith, Tulsa, 2007; Case Keenum, Houston, 2009
Career47—Timmy Chang, Hawaii, $2000-04
$See page 2 for explanation.
MOST CONSECUTIVE GAMES GAINING200 YARDS OR MORESeason
14—Ben Roethlisberger, Miami (OH), 2003; Colt Brennan, Hawaii, 2006; Paul Smith, Tulsa, 2007; Case Keenum, Houston, 2009
Career39—Graham Harrell, Texas Tech (from Sept. 2, 2006, to
Jan. 2, 2009)
MOST GAMES GAINING 300 YARDS OR MORESeason
14—Paul Smith, Tulsa, 2007 (14 games)Career
36—Timmy Chang, Hawaii, $2000-04
$See page 2 for explanation.
MOST CONSECUTIVE GAMES GAINING300 YARDS OR MORESeason
14—Paul Smith, Tulsa, 2007Career
24—Ty Detmer, BYU (from Sept. 2, 1989, to Dec. 1, 1990)
MOST GAMES GAINING 400 YARDS OR MORESeason
11—Graham Harrell, Texas Tech, 2007 (13 games)Career
20—Colt Brennan, Hawaii, 2005-07; Graham Harrell, Texas Tech, 2005-08
MOST YARDS GAINED BY TWO OPPOSING PLAYERSGame
1,253—Matt Vogler, TCU (690) & David Klingler, Houston (563), Nov. 3, 1990
TWO PLAYERS, SAME TEAM, EACH PASSING FOR 250 YARDS OR MOREGame
Steve Cottrell (311) & John Elway (270), Stanford vs. Arizona St., Oct. 24, 1981; Andre Ware (517) & David Klingler (254), Houston vs. SMU, Oct. 21, 1989; Jason Davis (381) & Jared Brown (254), UNLV vs. Idaho, Sept. 17, 1994
MOST CONSECUTIVE GAMES THROWING FOR 300 YARDS AND RUSHING FOR 100 YARDS
2—Chase Clement, Rice vs. UTEP (passed for 395 yards and rushed for 103 yards), Nov. 3, 2007, & vs. SMU (passed for 364 yards and rushed for 124 yards), Nov. 10, 2007
MOST YARDS GAINED IN OPENING GAMEOF SEASON
590—Tim Rattay, Louisiana Tech vs. Nebraska, Aug. 29, 1998
MOST YARDS GAINED AGAINST ONE OPPONENTCareer
1,718—Timmy Chang, Hawaii vs. Rice, $2000-04
$See page 2 for explanation.
MOST YARDS GAINED PER GAME AGAINST ONE OPPONENTCareer
(Min. 3 games) 486.3—Graham Harrell, Texas Tech vs. Texas, 2006-08 (1,459 yards in 3 games)
(Min. 4 games) 373.8—Ty Detmer, BYU vs. New Mexico, 1988-91 (1,495 yards in 4 games)
MOST YARDS GAINED PER ATTEMPTGame
(Min. 25-39 atts.) 18.5—David Neill, Nevada vs. Idaho, Oct. 24, 1998 (26 for 480)
(Min. 40-59 atts.) 14.1—John Walsh, BYU vs. Utah St., Oct. 30, 1993 (44 for 619)
(Min. 60 atts.) 10.5—Scott Mitchell, Utah vs. Air Force, Oct. 15, 1988 (60 for 631)
Season(Min. 412 atts.) 11.1—Ty Detmer, BYU, 1989 (412 for
4,560)Career
(Min. 900 atts.) 9.90—Ryan Dinwiddie, Boise St., 2000-03 (992 for 9,819)
MOST YARDS GAINED PER COMPLETIONGame
(Min. 22-41 comps.) 22.9—John Walsh, BYU vs. Utah St., Oct. 30, 1993 (27 for 619)
(Min. 42 comps.) 15.7—Matt Vogler, TCU vs. Houston, Nov. 3, 1990 (44 for 690)
Season(Min. 109-204 comps.) 18.2—Doug Williams, Grambling,
1977 (181 for 3,286)(Min. 205 comps.) 17.5—Danny Wuerffel, Florida, 1996
(207 for 3,625)Career
(Min. 275-399 comps.) 17.3—J.J. Joe, Baylor, 1990-93 (347 for 5,995)
(Min. 400 comps.) 15.8—Ryan Dinwiddie, Boise St., 2000-03 (662 for 9,819)
MOST TOUCHDOWN PASSESQuarter
6—David Klingler, Houston vs. Louisiana Tech, Aug. 31, 1991 (2nd)
Half7—Dennis Shaw, San Diego St. vs. New Mexico St., Nov.
15, 1969 (1st); Terry Dean, Florida vs. New Mexico St., Sept. 3, 1994 (1st); Doug Johnson, Florida vs. Central Mich., Sept. 6, 1997 (1st)
Game11—David Klingler, Houston vs. Eastern Wash., Nov. 17,
1990Season
58—Colt Brennan, Hawaii, 2006 (14 games)2 Yrs
93—Colt Brennan, Hawaii, 2005-06; Graham Harrell, 2007-08
Per-game record—4.0, David Klingler, Houston, 1990-91 (83 in 21)
3 Yrs131—Colt Brennan, Hawaii, 2005-07; Graham Harrell,
Texas Tech, 2006-08Career
(3 yrs.) 131—Colt Brennan, Hawaii, 2005-07(4 yrs.) 134—Graham Harrell, Texas Tech, 2005-08
MOST TOUCHDOWN PASSES PER GAMESeason
4.9—David Klingler, Houston, 1990 (54 in 11)Career
3.5—Tim Rattay, Louisiana Tech, 1997-99 (115 in 33)
HIGHEST PERCENTAGE OF PASSES FOR TOUCHDOWNSSeason
(Min. 175-374 atts.) 11.6%—Dennis Shaw, San Diego St., 1969 (39 of 335)
(Min. 375 atts.) 11.5%—Jim McMahon, BYU, 1980 (46 of 400)
Career(Min. 400-499 atts.) 9.7%—Rick Leach, Michigan, 1975-78
(45 of 462)(Min. 500 atts.) 9.9%—Sam Bradford, Oklahoma, 2007-09
(88 of 893)
MOST CONSECUTIVE GAMES THROWING A TOUCHDOWN PASSCareer
36—Graham Harrell, Texas Tech (from Sept. 23, 2006, to Jan. 2, 2009)
MOST CONSECUTIVE PASSES COMPLETED FOR TOUCHDOWNSGame
6—Brooks Dawson, UTEP vs. New Mexico, Oct. 28, 1967 (first six completions of the game)
MOST TOUCHDOWN PASSES THROWN ON CONSECUTIVE PLAYSGame
3—Jay Stuckey, UTEP vs. New Mexico St., Sept. 25, 1999 (9, 80 and 33 yards in 1:53 of playing time in second quarter); Tim Hiller, Western Mich. vs. Central Mich., Nov. 12, 2005 (76, 7 and 40 yards in 1:59 of playing time overlapping first and second quarters)
MOST TOUCHDOWN PASSES IN FIRST GAME OF CAREER
5—John Reaves, Florida vs. Houston, Sept. 20, 1969
TOUCHDOWN PASS THROWN ON FIRST PASS OF CAREER
Steve Owens, Oklahoma vs. Kansas, Nov. 9, 1968 (13 yards); Matt Leinart, Southern California vs. Auburn, Aug. 30, 2003 (5 yards); Jeff Ballard, TCU vs. SMU, Sept. 11, 2004 (9 yards); Taylor Bennett, Georgia Tech vs. Connecticut, Sept. 17, 2005 (42 yards); Michael McDonald, Southern California vs. Arkansas, Sept. 17, 2005 (4 yards); Thomas Brown, Georgia vs. Florida, Oct. 29, 2005 (9 yards); Richie Falgout, La.-Lafayette vs. Ohio, Sept. 8, 2007 (23 yards); Garrett Green, Southern California vs. Illinois, Jan. 1, 2008 (34 yards); Keith Toston, Oklahoma St. vs. Ole Miss, Jan. 2, 2010 (1 yard); Hutson Mason, Georgia vs. La.-Lafayette, Sept. 4, 2010 (26 yards)
TOUCHDOWN PASS THROWN ON FIRST AND SECOND PASS OF A CAREER
Steve Owens, Oklahoma vs. Kansas, Nov. 9, 1968 (13 yards); vs. Missouri, Nov. 16, 1968 (9 yards); Michael McDonald, Southern California vs. Arkansas, Sept. 17, 2005 (4 yards); vs. Washington, Oct. 7, 2006 (20 yards); Richie Falgout, La.-Lafayette vs. Ohio, Sept. 8, 2007 (23 yards); vs. Kansas St., Sept. 27, 2008 (27 yards)
TOUCHDOWN PASS THROWN ON FIRST THREE PASSES OF A CAREER
Steve Owens, Oklahoma vs. Kansas, Nov. 9, 1968 (13 yards); vs. Missouri, Nov. 16, 1968 (9 yards); vs. SMU, Dec. 31, 1968 (21 yards); Richie Falgout, La.-Lafayette vs. Ohio, Sept. 8, 2007 (23 yards); vs. Kansas St., Sept. 27, 2008 (27 yards); vs. Arkansas St., Oct. 18, 2008 (18 yards)
TOUCHDOWN PASS THROWN ON FIRST FOUR PASSES OF A CAREER
Richie Falgout, La.-Lafayette vs. Ohio, Sept. 8, 2007 (23 yards); vs. Kansas St., Sept. 27, 2008 (27 yards); vs. Arkansas St., Oct. 18, 2008 (18 yards); vs. Southern U., Sept. 5, 2009 (42 yards)
MOST TOUCHDOWN PASSES BY A FRESHMANGame
8—Giovanni Vizza, North Texas vs. Navy, Nov. 10, 2007Season
36—Sam Bradford, Oklahoma, 2007
MOST TOUCHDOWN PASSES IN FRESHMAN AND SOPHOMORE SEASONS
86—Sam Bradford, Oklahoma, 2007 (36) & 2008 (50)

2011 NCAA FOOTBALL RECORDS - FBS INDIVIDUAL RECORDS 9
FOO
TBA
LL B
OW
LSU
BD
IVIS
IONMOST TOUCHDOWN PASSES
BY A SOPHOMORE50—Sam Bradford, Oklahoma, 2008
MOST TOUCHDOWN PASSES AT CONCLUSION OF JUNIOR SEASON
102—Case Keenum, Houston, 2007 (14), 2008 (44) & 2009 (44)
MOST TOUCHDOWN PASSES, SAME PASSER AND RECEIVERSeason
26—Tim Rattay to Troy Edwards, Louisiana Tech, 1998Career
51—Chase Clement to Jarrett Dillard, Rice, 2005-08
MOST PASSES ATTEMPTED WITHOUT A TOUCHDOWN PASSSeason
266—Stu Rayburn, Kent St., 1984 (completed 125)
FEWEST TIMES SACKED ATTEMPTING TO PASSSeason
(Min. 300 atts.) 3—Erik Ainge, Tennessee, 2007, in 519 attempts (California, 1 for -8; South Carolina, 1 for -9; Kentucky, 1 for -20)
ReceivingMOST PASSES CAUGHTGame
23—Randy Gatewood, UNLV vs. Idaho, Sept. 17, 1994 (363 yards); Tyler Jones, Eastern Mich. vs. Central Mich., Nov. 28, 2008 (170 yards)
Season155—Freddie Barnes, Bowling Green, 2009 (1,770 yards)
Career(2 yrs.) 231—Michael Crabtree, Texas Tech, 2007-08 (3,127
yards)(3 yrs.) 305—Antonio Brown, Central Mich., 2007-09
(3,199 yards)(4 yrs.) 316—Taylor Stubblefield, Purdue, 2001-04 (3,433
yards)MOST PASSES CAUGHT PER GAMESeason
13.4—Howard Twilley, Tulsa, 1965 (134 in 10)Career
10.5—Manny Hazard, Houston, 1989-90 (220 in 21)MOST PASSES CAUGHT BY TWO PLAYERS, SAME TEAMSeason
243—Michael Crabtree (134) & Danny Amendola (109), Texas Tech, 2007 (3,207 yards, 28 TDs)
MOST PASSES CAUGHT IN CONSECUTIVE GAMES
40—Tyler Jones, Eastern Mich., 2008 (17 vs. Temple, Nov. 22; 23 vs. Central Mich., Nov. 28)
MOST CONSECUTIVE GAMES CATCHING A PASSCareer
54—Bryan Anderson, Central Mich., 2006-09Note: Jarett Dillard, Rice (2005-08) caught at least two passes in 49 straight games.
MOST PASSES CAUGHT BY A TIGHT ENDGame
17—Emilio Vallez, New Mexico vs. UTEP, Oct. 27, 1967 (257 yards); Jon Harvey, Northwestern vs. Michigan, Oct. 23, 1982 (208 yards)
Season111—James Casey, Rice, 2008 (1,329 yards)
Career247—Chase Coffman, Missouri, 2005-08 (2,659 yards)
MOST PASSES CAUGHT PER GAME BY A TIGHT ENDSeason
8.5—James Casey, Rice, 2008 (111 in 13)Career
5.4—Gordon Hudson, BYU, 1980-83 (178 in 33)MOST PASSES CAUGHT BY A RUNNING BACKGame
18—Mark Templeton, Long Beach St. vs. Utah St., Nov. 1, 1986 (173 yards)
Season99—Mark Templeton, Long Beach St., 1986 (688 yards)
Career303—Taurean Henderson, Texas Tech, 2002-05 (2,058
yards)MOST PASSES CAUGHT BY A FRESHMANGame
18—Richard Woodley (WR), TCU vs. Texas Tech, Nov. 10, 1990 (180 yards)
Season134—Michael Crabtree, Texas Tech, 2007 (1,962 yards)Also holds per-game record with 10.3 (134 in 13 games)
CATCHING AT LEAST 50 PASSES AND GAINING AT LEAST 1,000 YARDS RUSHINGSeason
By 15 players. Most recent: Jacquizz Rodgers, Oregon St., 2009 (78 catches and 1,440 yards rushing)
Darrin Nelson, Stanford, holds record for most seasons at 3 (1977-78, 1981)
CATCHING AT LEAST 60 PASSES AND GAINING AT LEAST 1,000 YARDS RUSHING
Darrin Nelson, Stanford, 1981 (67 catches and 1,014 yards rushing); Brad Muster, Stanford, 1986 (61 catches and 1,053 yards rushing); Johnny Johnson, San Jose St., 1988 (61 catches and 1,219 yards rushing); Brett Biggs, Akron, 2005 (65 catches and 1,230 yards rush-ing); Curtis Brown, BYU, 2006 (62 catches and 1,010 yards rushing); Jacquizz Rodgers, Oregon St., 2009 (78 catches and 1,440 yards rushing)
MOST YARDS GAINEDGame
405—Troy Edwards, Louisiana Tech vs. Nebraska, Aug. 29, 1998 (caught 21)
Season2,060—Trevor Insley, Nevada, 1999 (caught 134)
Career5,005—Trevor Insley, Nevada, 1996-99 (caught 298)
MOST YARDS GAINED PER GAMESeason
187.3—Trevor Insley, Nevada, 1999 (2,060 in 11)Career
140.9—Alex Van Dyke, Nevada, 1994-95 (3,100 in 22)
MOST YARDS GAINED BY A TIGHT ENDGame
259—Gordon Hudson, BYU vs. Utah, Nov. 21, 1981 (caught 13)
Season1,329—James Casey, Rice, 2008 (caught 111)
Career2,901—Dennis Pitta, BYU, 2004, 2007-09 (caught 221)
MOST YARDS GAINED PER GAMEBY A TIGHT ENDSeason
102.2—James Casey, Rice, 2008 (1,329 in 13)Career
75.3—Gordon Hudson, BYU, 1980-83 (2,484 in 33)
MOST YARDS GAINED BY A FRESHMANGame
263—Corey Alston, Western Mich. vs. Eastern Mich., Nov. 1, 1997 (caught 9)
Season1,962—Michael Crabtree, Texas Tech, 2007 (caught 134,
13 games)Also holds per-game record with 150.9 (1,932 in 13)
MOST YARDS GAINED BY A SOPHOMORESeason
1,782—Justin Blackmon, Oklahoma St., 2010
MOST GAMES GAINING 100 YARDS OR MORESeason
12—Justin Blackmon, Oklahoma St., 2010Also holds consecutive record with 12
Career26—Trevor Insley, Nevada, 1996-99Consecutive record: 12, Justin Blackmon, Oklahoma St.,
2010-present
MOST GAMES GAINING 200 YARDS OR MORESeason
6—Trevor Insley, Nevada, 1999Consecutive record: 3, Howard Twilley, Tulsa, 1965 &
Trevor Insley, Nevada, 1999
MOST YARDS GAINED BY TWO PLAYERS,SAME TEAMGame
640—Rick Eber (322) & Harry Wood (318), Tulsa vs. Idaho St., Oct. 7, 1967 (caught 33, 6 TDs)
Season3,337—J.R. Tolver (1,785) & Kassim Osgood (1,552), San
Diego St., 2002 (13 games)
TWO OR MORE PLAYERS, SAME TEAM, EACH GAINING 1,000 YARDSSeason
40 times. Jason Phillips (1,444; 108 catches) & James Dixon (1,103; 102 catches), Houston, 1988; Patrick Rowe (1,392; 71 catches) & Dennis Arey (1,118; 68 catches), San Diego St., 1990; Andy Boyce (1,241; 79 catches) & Chris Smith (1,156; 68 catches), BYU, 1990; Charles Johnson (1,149; 57 catches) & Michael Westbrook (1,060; 76 catches), Colorado, 1992; Bryan Reeves (1,362; 91 catches) & Michael Stephens (1,062; 80 catches), Nevada, 1993; Will Blackwell (1,207; 86 catches) & Az Hakim (1,022; 57 catches), San Diego St., 1995; E.G. Green (1,007; 60 catches) & Andre Cooper (1,002; 71 catches), Florida St., 1995; Chris Doering (1,045; 70 catches) & Ike Hilliard (1,008; 57 catch-es), Florida, 1995; Geoff Noisy (1,435; 98 catches) & Damond Wilkins (1,121; 114 catches), Nevada, 1996; Geoff Noisy (1,184; 86 catches) & Trevor Insley (1,151; 59 catches), Nevada, 1997; Geoff Noisy (1,405; 94 catches) & Trevor Insley (1,220; 69 catches), Nevada, 1998; Jajuan Dawson (1,051; 96 catches) & Adrian Burnette (1,095; 79 catches), Tulane, 1999; Rodney Wright (1,331; 91 catches) & Bernard Berrian (1,270; 76 catches), Fresno St., 2001; J.R. Tolver (1,785; 128 catch-es) & Kassim Osgood (1,552; 108 catches), San Diego St., 2002; Doug Gabriel (1,237; 75 catches) & Jimmy Fryzel (1,126; 58 catches), UCF, 2002; Mike Williams (1,265; 81 catches) & Keary Colbert (1,029; 71 catches), Southern California, 2002; Mike Williams (1,314; 95 catches) & Keary Colbert (1,013; 69 catches), Southern California, 2003; Carlos Francis (1,177; 75 catches), Wes Welker (1,099; 97 catches) & Nehemiah Glover (1,081; 77 catches), Texas Tech, 2003; Jarrett Hicks (1,177; 76 catches) & Trey Haverty (1,019; 77 catches), Texas Tech, 2004; Ryan Grice-Mullen (1,228; 85 catches) & Davone Bess (1,124; 89 catches), Hawaii, 2005; Ryne Robinson (1,119; 75 catches) & Martin Nance (1,107; 81 catches), Miami (OH), 2005; Davone Bess (1,220; 96 catches) & Jason Rivers (1,178; 72 catches), Hawaii, 2006; Steve Smith (1,083; 71 catches) and Dwayne Jarrett (1,015; 70 catches), Southern California, 2006; Michael Crabtree (1,962, 134 catches) and Danny Amendola, (1,245, 109 catches), Texas Tech, 2007; Ryan Grice-Mullen (1,372; 106 catches), Davone Bess (1,266; 108 catches) & Jason Rivers (1,174; 92 catches), Hawaii, 2007; Brennan Marion (1,244; 39 catches), Trae Johnson (1,088; 70 catches) & Charles Clay (1,024; 69 catches), Tulsa, 2007; Bryan Anderson (1,132; 90 catches) & Antonio Brown (1,003; 102 catches), Central Mich., 2007; Marcus Smith (1,125; 91 catches) & Travis Brown (1,031; 76 catches), New Mexico, 2007; James Casey (1,329; 111 catches) & Jarett Dillard (1,310; 87 catches), Rice, 2008; Quan Cosby (1,123; 92 catches) & Jordan Shipley (1,060; 89 catches), Texas, 2008; Dezmon Briscoe (1,407; 92 catches) & Kerry Meier (1,045; 97 catches), Kansas, 2008; Mardy Gilyard (1,276; 81 catches) & Dominick Goodman (1,028; 84 catches), Cincinnati, 2008; Austin Collie (1,538; 106 catches) & Dennis Pitta (1,083; 83 catches), BYU, 2008; James Cleveland (1,214; 104 catch-es), Tyron Carrier (1,029; 91 catches) & Patrick Edwards (1,021; 85 catches), Houston, 2009; Eric Page (1,159; 82 catches) & Stephen Williams (1,065; 79 catches), Toledo, 2009; Greg Salas (1,889; 119 catches) & Kealoha Pilares (1,306; 88 catches), Hawaii, 2010; Jordan White (1,378 yards; 94 catches) & Juan Nunez (1,032; 91 catch-es), Western Mich., 2010; Aldrick Robinson (1,301; 65 catches) & Cole Beasley (1,060; 87 catches), SMU, 2010; Vincent Brown (1,352; 69 catches) & DeMarco Sampson (1,220; 67 catches), San Diego St., 2010; Dwayne Harris (1,123; 101 catches) & Lance Lewis (1,116; 89 catches), East Carolina, 2010.
(Note: Hawaii in 2005 is the only team on which both 1,000-yard receivers were freshmen.)
THREE PLAYERS, SAME TEAM, EACH GAINING 1,000 YARDSSeason
Carlos Francis (1,177; 75 catches), Wes Welker (1,099; 97 catches) & Nehemiah Glover (1,081; 77 catches), Texas Tech, 2003; Ryan Grice-Mullen (1,372; 106 catches), Davone Bess (1,266; 108 catches) & Jason Rivers (1,174; 92 catches), Hawaii, 2007; Brennan Marion (1,244; 39 catches), Trae Johnson (1,088; 70 catches) & Charles Clay (1,024; 69 catches), Tulsa, 2007; James Cleveland (1,214; 104 catches), Tyron Carrier (1,029; 91 catches) & Patrick Edwards (1,021; 85 catches), Houston, 2009

10 2011 NCAA FOOTBALL RECORDS - FBS INDIVIDUAL RECORDS
TWO PLAYERS, SAME TEAM, RANKED NO. 1& NO. 2 IN FINAL RECEIVING RANKINGSSeason
Jason Phillips (No. 1, 9.8 catches per game) & James Dixon (No. 2, 9.3 catches per game), Houston, 1988
THREE OR MORE PLAYERS, SAME TEAM, EACH CATCHING 60 PASSES OR MORESeason
Patrick Rowe (71), Dennis Arey (68) & Jimmy Raye (62), San Diego St., 1990; James Jordan (81), John Simon (79), Delwyn Daigre (77) & Sean Cangelosi (62), Louisiana Tech, 1999; Arnold Jackson (101), Ibn Green (60) & Lavell Boyd (60), Louisville, 1999; Wes Welker (97), Mickey Peters (78), Taurean Henderson (78), Nehemiah Glover (77) & Carlos Francis (75), Texas Tech, 2003 (only team with five players with at least 60 catches in a sea-son -- see record below); Robert Johnson (67), Taurean Henderson (67), Joel Filani (65) & Jarrett Hicks (65), Texas Tech, 2005; Davone Bess (96), Jason Rivers (72) & Nate Ilaoa (67), Hawaii, 2006; Joel Filani (91), Robert Johnson (89) & Shannon Woods (75), Texas Tech, 2006; Michael Crabtree (134), Danny Amendola, (109) & Eric Morris (75), Texas Tech, 2007; Davone Bess (108), Ryan Grice-Mullen (106), Jason Rivers (92) & CJ Hawthrone (61), Hawaii, 2007; Michael Crabtree (97), Detron Lewis (76) & Eric Morris (74), Texas Tech, 2008; Jeremy Maclin (102), Chase Coffman (90) & Tommy Saunders (72), Missouri, 2008; James Cleveland (104), Tyron Carrier (91), Patrick Edwards (85) & Charles Sims (70), Houston, 2009; Greg Salas (119), Kealoha Pilares (88) & Royce Pollard (64), Hawaii, 2010; Ryan Broyles (131), DeMarco Murray (71) & Kenny Stills (61), Oklahoma, 2010
FOUR OR MORE PLAYERS, SAME TEAM, EACH CATCHING 60 PASSES OR MORESeason
James Jordan (81), John Simon (79), Delwyn Daigre (77) & Sean Cangelosi (62), Louisiana Tech, 1999; Wes Welker (97), Mickey Peters (78), Taurean Henderson (78), Nehemiah Glover (77) & Carlos Francis (75), Texas Tech, 2003 (only team with five players with at least 60 catches in a season -- see record below); Robert Johnson (67), Taurean Henderson (67), Joel Filani (65) & Jarrett Hicks (65), Texas Tech, 2005; Davone Bess (108), Ryan Grice-Mullen (106), Jason Rivers (92) & CJ Hawthorne (61), Hawaii, 2007; James Cleveland (104), Tyron Carrier (91), Patrick Edwards (85) & Charles Sims (70), Houston, 2009
FIVE PLAYERS, SAME TEAM, EACH CATCHING 60 PASSES OR MORESeason
Wes Welker (97), Mickey Peters (78), Taurean Henderson (78), Nehemiah Glover (77) & Carlos Francis (75), Texas Tech, 2003
MOST 1,000-YARD RECEIVING SEASONS3—Marc Zeno, Tulane, 1985-87 (1,137 in 1985; 1,033 in
1986; 1,206 in 1987); Clarkston Hines, Duke, 1987-89 (1,084 in 1987; 1,067 in 1988; 1,149 in 1989); Aaron Turner, Pacific, 1990-92 (1,264 in 1990; 1,604 in 1991; 1,171 in 1992); Ryan Yarborough, Wyoming, 1991-93 (1,081 in 1991; 1,351 in 1992; 1,512 in 1993); Marcus Harris, Wyoming, 1993-96 (1,431 in 1994; 1,423 in 1995; 1,650 in 1996); Brandon Stokley, La.-Lafayette, 1995-96, 98 (1,121 in 1995; 1,160 in 1996; 1,175 in 1998); Geoff Noisy, Nevada, 1996-98 (1,435 in 1996; 1,184 in 1997; 1,405 in 1998); Trevor Insley, Nevada, 1997-99 (1,151 in 1997; 1,220 in 1998; 2,060 in 1999); Braylon Edwards, Michigan, 2002-04 (1,035 in 2002; 1,138 in 2003; 1,330 in 2004); Derek Hagan, Arizona St., 2003-05 (1,076 in 2003; 1,248 in 2004; 1,210 in 2005); Greg Jennings, Western Mich., 2003-05 (1,050 in 2003; 1,092 in 2004; 1,259 in 2005); Davone Bess, Hawaii, 2005-07 (1,124 in 2005; 1,220 in 2006; 1,266 in 2007); Jarett Dillard, Rice, 2006-08 (1,247 in 2006; 1,057 in 2007; 1,310 in 2008)
MOST SEASONS WITH AT LEAST 1,400 YARDS3—Marcus Harris, Wyoming, 1993-96 (1,431 in 1994;
1,423 in 1995; 1,650 in 1996)HIGHEST AVERAGE GAIN PER RECEPTIONGame
(Min. 3-4 receps.) 72.7—Terry Gallaher, East Carolina vs. Appalachian St., Sept. 13, 1975 (3 for 218; 82, 77, 59 yards)
(Min. 5-9 receps.) 52.6—Alexander Wright, Auburn vs. Pacific, Sept. 9, 1989 (5 for 263; 78, 60, 41, 73, 11 yards)
(Min. 10 receps.) 34.9—Chuck Hughes, UTEP vs. North Texas, Sept. 18, 1965 (10 for 349)
Season(Min. 30-49 receps.) 31.9—Brennan Marion, Tulsa, 2007
(39 for 1,244)
(Min. 50 receps.) 24.4—Henry Ellard, Fresno St., 1982 (62 for 1,510)
Career(Min. 75-104 receps.) 25.7—Wesley Walker, California,
1973-76 (86 for 2,206)(Min. 105 receps.) 22.0—Herman Moore, Virginia, 1988-90
(114 for 2,504)(Min. 200 receps.) 19.0—Ryan Yarborough, Wyoming,
1990-93 (229 for 4,357)
HIGHEST AVERAGE GAIN PER RECEPTIONBY A TIGHT ENDSeason
(Min. 30 receps.) 22.6—Jay Novacek, Wyoming, 1984 (33 for 745)
Career(Min. 75 receps.) 19.2—Clay Brown, BYU, 1978-80 (88
for 1,691)
MOST TOUCHDOWN PASSES CAUGHTHalf
5—Rashaun Woods, Oklahoma St. vs. SMU, Sept. 20, 2003 (TD catches of 2, 10, 34, 32 and 25 yards) (finished with 7 TD receptions)
Game7—Rashaun Woods, Oklahoma St. vs. SMU, Sept. 20, 2003
(12 receptions for 232 yards; TD catches of 2, 10, 34, 32, 25, 5 and 11 yards)
Season27—Troy Edwards, Louisiana Tech, 1998 (140 receptions)Per-game record—2.3, Tom Reynolds, San Diego St., 1969
(18 in 8); Troy Edwards, Louisiana Tech, 1998 (27 in 12) Career
60—Jarett Dillard, Rice, 2005-08 (292 receptions)
MOST GAMES CATCHING A TOUCHDOWN PASSSeason
13—Jarett Dillard, Rice, 2006Career
38—Jarett Dillard, Rice, 2005-08 (caught a total of 60 in 49 games)
MOST CONSECUTIVE GAMES CATCHING A TOUCHDOWN PASSSeason
13—Jarett Dillard, Rice, 2006Career
18—Larry Fitzgerald, Pittsburgh, 2002-03 (last six games of 2002 and first 12 games of 2003)
MOST TOUCHDOWN PASSES CAUGHT BY A TIGHT ENDSeason
18—Dennis Smith, Utah, 1989 (73 receptions)Career
33—Ibn Green, Louisville, 1996-99 (217 receptions)
HIGHEST PERCENTAGE OF PASSES CAUGHT FOR TOUCHDOWNSSeason
(Min. 10 TDs) 58.8%—Kevin Williams, Southern California, 1978 (10 of 17)
Career(Min. 20 TDs) 35.3%—Kevin Williams, Southern California,
1977-80 (24 of 68)
HIGHEST AVERAGE YARDS PER TOUCHDOWN PASSES CAUGHTSeason
(Min. 10 TDs) 56.1—Elmo Wright, Houston, 1968 (11 for 617 yards; 87, 50, 75, 2, 80, 79, 13, 67, 61, 43, 60 yards)
Career(Min. 15 TDs) 46.5—Charles Johnson, Colorado, 1990-93
(15 for 697 yards)
MOST TOUCHDOWN PASSES CAUGHT, 50 YARDS OR MORESeason
8—Elmo Wright, Houston, 1968 (87, 50, 75, 80, 79, 67, 61, 60 yards); Henry Ellard, Fresno St., 1982 (68, 51, 80, 61, 67, 72, 80, 72 yards)
MOST CONSECUTIVE PASSES CAUGHT FOR TOUCHDOWNS
6—Carlos Carson, LSU, 1977 (5 vs. Rice, Sept. 24; 1 vs. Florida, Oct. 1; first receptions of his career); Gerald Armstrong, Nebraska, 1992 (1 vs. Utah, Sept. 5; 1 vs. Arizona St., Sept. 26; 1 vs. Oklahoma St., Oct. 10; 1 vs. Colorado, Oct. 31; 2 vs. Kansas, Nov. 7)
MOST TOUCHDOWN PASSES CAUGHT BY A FRESHMANSeason
22—Michael Crabtree, Texas Tech, 2007
MOST TOUCHDOWN PASSES CAUGHT IN FRESHMAN AND SOPHOMORE SEASONS
41—Michael Crabtree, Texas Tech, 2007 (22) & 2008 (19)
MOST YARDS GAINED IN A GAME WITHOUT SCORING A TOUCHDOWN
326—Nate Burleson, Nevada vs. San Jose St., Nov. 10, 2001 (12 receptions)
PuntingMOST PUNTSGame
36—Charlie Calhoun, Texas Tech vs. Centenary (LA), Nov. 11, 1939 (1,318 yards; 20 were returned, 8 went out of bounds, 6 were downed, 1 was blocked [blocked kicks counted against the punter until 1955] and 1 went into the end zone for a touchback. Thirty-three of the punts occurred on first down during a heavy downpour in the game played at Shreveport, Louisiana
Season101—Jim Bailey, VMI, 1969 (3,507 yards)
Career(3 yrs.) 276—Jim Bailey, VMI, 1969-71 (10,127 yards)(4 yrs.) 322—Nick Harris, California, 1997-00 (13,621
yards)
HIGHEST AVERAGE PER PUNTGame
(Min. 5-9 punts) 60.4—Lee Johnson, BYU vs. Wyoming, Oct. 8, 1983 (5 for 302; 53, 44, 63, 62, 80 yards)
(Min. 10 punts) 53.6—Jim Benien, Oklahoma St. vs. Colorado, Nov. 13, 1971 (10 for 536)
Season(Min. 36-39 punts) 50.3—Chad Kessler, LSU, 1997 (39
for 1,961)(Min. 40-49 punts) 49.8—Reggie Roby, Iowa, 1981 (44
for 2,193)(Min. 50-74 punts) 48.4—Todd Sauerbrun, West Virginia,
1994 (72 for 3,486)(Min. 75 punts) 46.6—Bill Marinangel, Vanderbilt, 1996
(77 for 3,586)Career
(Min. 150-199 punts) 46.3—Todd Sauerbrun, West Virginia, 1991-94 (167 for 7,733)
(Min. 200-249 punts) 45.3—Ryan Plackemeier, Wake Forest, 2002-05 (220 for 9,957)
(Min. 250 punts) 45.2—Daniel Sepulveda, Baylor, 2003-06 (277 for 12,531)
HIGHEST AVERAGE PER PUNT BY A FRESHMANSeason
(Min. 40 punts) 47.0—Tom Tupa, Ohio St., 1984 (41 for 1,927)
MOST YARDS ON PUNTSGame
1,318—Charlie Calhoun, Texas Tech vs. Centenary (LA), Nov. 11, 1939 (36 punts)
Season4,138—Johnny Pingel, Michigan St., 1938 (99 punts)
Career13,621—Nick Harris, California, 1997-00 (322 punts)
MOST GAMES WITH A 40-YARD AVERAGE OR MORECareer
(Min. 4 punts) 37—Shane Lechler, Texas A&M, 1996-99 (punted in 48 games); Ryan Plackemeier, Wake Forest, 2002-05 (punted in 42 games)
MOST PUNTS, 50 YARDS OR MOREGame
7—Mark Mariscal, Colorado vs. Southern California, Sept. 14, 2002 (8 punts)
Season32—Todd Sauerbrun, West Virginia, 1994 (72 punts)
Career(2 yrs.) 51—Marv Bateman, Utah, 1970-71 (133 punts)(3 yrs.) 61—Russ Henderson, Virginia, 1976-78 (226
punts)(4 yrs.) 94—Daniel Sepulveda, Baylor, 2003-06 (277
punts)
2011 NCAA FOOTBALL RECORDS - FBS INDIVIDUAL RECORDS 11
FOO
TBA
LL B
OW
LSU
BD
IVIS
IONMOST CONSECUTIVE GAMES WITH AT LEAST
ONE PUNT OF 50 YARDS OR MORECareer
32—Bill Smith, Mississippi, 1983-86
MOST PUNTS, 60 YARDS OR MORESeason
13—Ryan Plackemeier, Wake Forest, 2005 (67 punts)
MOST PUNTS IN A CAREER WITHOUT HAVING ONE BLOCKED
300—Tony DeLeone, Kent St., 1981-84Also holds consecutive record with 300
LONGEST PUNT99—Pat Brady, Nevada vs. Loyola Marymount, Oct. 28,
1950
RANKING IN TOP 12 IN BOTH PUNTINGAND FIELD GOALS
Steve Little, Arkansas, 1977 (No. 4 in punting, 44.3-yard average and No. 2 in field goals, 1.73 per game); Rob Keen, California, 1988 (No. 11 in punting, 42.6-yard average and No. 3 in field goals, 1.91 per game); Chris Gardocki, Clemson, 1989 (No. 10 in punting, 42.7-yard average and No. 6 in field goals, 1.82 per game), 1990 (No. 4 in punting, 44.3-yard average and No. 4 in field goals, 1.73 per game); Dan Eichloff, Kansas, 1991 (No. 12 in punting, 42.3-yard average and No. 3 in field goals, 1.64 per game); Daron Alcorn, Akron, 1992 (No. 11 in punting, 43.6-yard average and tied for No. 9 in field goals, 1.64 per game)
InterceptionsMOST PASSES INTERCEPTEDGame
5—Lee Cook, Oklahoma St. vs. Detroit, Nov. 28, 1942 (15 yards); Walt Pastuszak, Brown vs. Rhode Island, Oct. 8, 1949 (47 yards); Byron Beaver, Houston vs. Baylor, Sept. 22, 1962 (18 yards); Dan Rebsch, Miami (OH) vs. Western Mich., Nov. 4, 1972 (88 yards). Special note: Before NCAA College Division records, Dick Miller of Akron intercepted six passes vs. Baldwin-Wallace on Oct. 23, 1937.
Season14—Al Worley, Washington, 1968 (130 yards)
Career29—Al Brosky, Illinois, 1950-52 (356 yards)
MOST PASSES INTERCEPTED PER GAMESeason
1.4—Al Worley, Washington, 1968 (14 in 10)Career
1.1—Al Brosky, Illinois, 1950-52 (29 in 27)
MOST PASSES INTERCEPTEDBY A LINEBACKERGame
3—Nate Kvamme, Colorado St. vs. San Jose St., Oct. 11, 1997; Aaron Humphrey, Texas vs. Rutgers, Sept. 6, 1997; Joseph Phipps, TCU vs. Oklahoma, Sept. 12, 1998; Lorenzo Ferguson, Virginia Tech vs. Clemson, Sept. 12, 1998; Dan Dawson, Rice vs. Hawaii, Oct. 21, 2000; Will Derting, Washington St. vs. Nevada, Aug. 31, 2002; Grant Steen, Iowa vs. Indiana, Oct. 19, 2002; Korey Hall, Boise St. vs. Oregon St., Sept. 10, 2004; Michael LeDet, Tulsa vs. UTEP, Nov. 27, 2004
Season9—Bill Sibley, Texas A&M, 1941 (57 yards)
MOST PASSES INTERCEPTED BY A FRESHMANGame
4—Mario Edwards, Florida St. vs. Wake Forest, Nov. 14, 1998 (60 yards)
Season13—George Shaw, Oregon, 1951 (136 yards)Also holds per-game record with 1.3 (13 in 10)
MOST YARDS ON INTERCEPTION RETURNSGame
182—Ashley Lee, Virginia Tech vs. Vanderbilt, Nov. 12, 1983 (2 interceptions)
Season302—Charles Phillips, Southern California, 1974
(7 interceptions)Career
501—Terrell Buckley, Florida St., 1989-91 (21 intercep-tions)
MOST TOUCHDOWNS SCORED ON INTERCEPTION RETURNSGame
3—Johnny Jackson, Houston vs. Texas, Nov. 7, 1987 (31, 53, 97 yards)
Season4—Deltha O’Neal, California, 1999 (9 interceptions)
Career5—Jackie Walker, Tennessee, 1969-71 (11 interceptions);
Ken Thomas, San Jose St., 1979-82 (14 interceptions); Deltha O’Neal, California, 1996-99 (11 interceptions); Darrent Williams, Oklahoma St., 2001-04 (11 intercep-tions)
MOST TOUCHDOWNS SCORED ON INTERCEPTION RETURNS BY A LINEBACKERGame
2—Tom Fisher, New Mexico St. vs. Lamar, Nov. 14, 1970 (52 & 28 yards in one quarter); Randy Neal, Virginia vs. Virginia Tech, Nov. 21, 1992 (37 & 30 yards); Patrick Brown, Kansas vs. UAB, Aug. 28, 1997 (51 & 23 yards); Nate Kvamme, Colorado St. vs. San Jose St., Oct. 11, 1997 (15 & 57 yards); Darryl Gamble, Georgia vs. LSU, Oct. 25, 2008 (40 & 53 yards)
Season3—Malcolm Postell, Pittsburgh, 2004; Aaron Curry, Wake
Forest, 2007Career
4—Randy Neal, Virginia, 1991-94; Dustin Cohen, Miami (OH), 1996-99
HIGHEST AVERAGE GAIN PER INTERCEPTIONGame
(Min. 2 ints.) 91.0—Ashley Lee, Virginia Tech vs. Vanderbilt, Nov. 12, 1983 (2 for 182)
Season(Min. 5 ints.) 51.8—Norm Thompson, Utah, 1969 (5 for
259)Career
(Min. 15 ints.) 26.5—Tom Pridemore, West Virginia, 1975-77 (15 for 398)
MOST CONSECUTIVE GAMES INTERCEPTING A PASS
15—Al Brosky, Illinois, began Nov. 11, 1950 (vs. Iowa), ended Oct. 18, 1952 (vs. Minnesota)
MOST CONSECUTIVE INTERCEPTIONS RETURNED FOR A TOUCHDOWN
3—Trae Williams, South Fla., 2007 (73 yards vs. Cincinnati, Nov. 3; 64 yards vs. Louisville, Nov. 17; 21 yards vs. Pittsburgh, Nov. 24); Alphonso Smith, Wake Forest, 2007 (21 yards vs. Boston College, Sept. 1; 100 yards vs. Maryland, Sept. 22; 30 yards vs. Duke, Oct. 6); Prentiss Wagner, Tennessee, 2010 (54 yards vs. Tenn.-Martin, Sept. 4; 9 yards vs. UAB, Sept. 25; 10 yards vs. Ole Miss, Nov. 13)
Punt ReturnsMOST PUNT RETURNSGame
20—Milton Hill, Texas Tech vs. Centenary (LA), Nov. 11, 1939 (110 yards)
Season57—Wes Welker, Texas Tech, 2002 (752 yards, 14 games)Per-game record—5.5, Dick Adams, Miami (OH), 1970
(55 in 10)Career
153—Vai Sikahema, BYU, 1980-81, 1984-85 (1,312 yards)
MOST YARDS ON PUNT RETURNSGame
277—Antonio Perkins, Oklahoma vs. UCLA, Sept. 20, 2003 (7 returns)
Season791—Lee Nalley, Vanderbilt, 1948 (43 returns)Also holds per-game record with 79.1 (791 in 10)
Career1,761—Wes Welker, Texas Tech, 2000-03 (152 returns)
HIGHEST AVERAGE GAIN PER RETURNGame
(Min. 3-4 rets.) 59.7—Chip Hough, Air Force vs. SMU, Oct. 9, 1971 (3 for 179)
(Min. 5 rets.) 43.8—Golden Richards, BYU vs. North Texas, Sept. 10, 1971 (5 for 219)
Season(Min. 1.2 rets. per game) 28.5—Maurice Drew, UCLA, 2005
(15 for 427)
(Min. 1.5 rets. per game) 25.0—George Sims, Baylor, 1948 (15 for 375)
Career(Min. 1.2 rets. per game) 23.6—Jack Mitchell, Oklahoma,
1946-48 (39 for 922)(Min. 1.5 rets. per game) 20.5—Gene Gibson, Cincinnati,
1949-50 (37 for 760)
MOST TOUCHDOWNS SCORED ON PUNT RETURNSGame
3—Antonio Perkins, Oklahoma vs. UCLA, Sept. 20, 2003 (74, 84 & 55 yards)
Season5—Chad Owens, Hawaii, 2004
Career8—Wes Welker, Texas Tech, 2000-03 (2 in 2000, 1 in 2001,
3 in 2002, 2 in 2003); Antonio Perkins, Oklahoma, 2001-04 (3 in 2002, 4 in 2003, 1 in 2004)
CONSECUTIVE GAMES WITH PUNT RETURNFOR A TOUCHDOWN
3—David Allen, Kansas St., 1998 (63 yards vs. Indiana St., Sept. 5; 69 yards vs. Northern Ill., Sept. 12; 93 yards vs. Texas, Sept. 19)
(Allen also returned punts for touchdowns in consecutive games in 1999 [94 yards vs. Iowa St., Sept. 25, & 74 yards vs. Texas, Oct. 2])
Kickoff ReturnsMOST KICKOFF RETURNSGame
11—Trevor Cobb, Rice vs. Houston, Dec. 2, 1989 (166 yards)
Season55—William White, Army, 2002 (1,239 yards, 11 games)
Career134—David Gilreath, Wisconsin, 2007-10 (3,008 yards);
^Damaris Johnson, Tulsa, 2008-10 (3,417 yards)
^Active player.
MOST RETURNS PER GAMESeason
5.0—William White, Army, 2002 (55 in 11)Career
3.06—Davion Mauldin, San Diego St., 2008-09 (55 in 18)
MOST YARDS ON KICKOFF RETURNSGame
319—Leonard Johnson, Iowa St. vs. Oklahoma St., Nov. 1, 2008 (9 returns)
Season1,444—Kerwynn Williams, Utah St., 2010 (53 returns, 12
games)Career
3,417—^Damaris Johnson, Tulsa, 2008-10 (134 returns)
^Active player.
MOST YARDS RETURNED PER GAMESeason
120.3—Kerwynn Williams, Utah St., 2010 (1,444 in 12)Career
78.2—Steve Odom, Utah, 1971-73 (2,582 in 33)
HIGHEST AVERAGE GAIN PER RETURNGame
(Min. 3 rets.) 72.7—Anthony Davis, Southern California vs. Notre Dame, Dec. 2, 1972 (3 for 218)
Season(Min. 1.2 rets. per game) 40.1—Paul Allen, BYU, 1961 (12
for 481)(Min. 1.5 rets. per game) 38.2—Forrest Hall, San Francisco,
1946 (15 for 573)Career
(Min. 1.2 rets. per game) 36.2—Forrest Hall, San Francisco, 1946-47 (22 for 796)
(Min. 1.5 rets. per game) 31.0—Overton Curtis, Utah St., 1957-58 (32 for 991)

12 2011 NCAA FOOTBALL RECORDS - FBS INDIVIDUAL RECORDS
MOST TOUCHDOWNS SCORED ON KICKOFF RETURNSGame
2—Paul Copoulos, Marquette vs. Iowa Pre-Flight, Nov. 6, 1943 (85 & 82 yards); Ron Horwath, Detroit vs. Hillsdale, Sept. 22, 1950 (96 & 96 yards); Ollie Matson, San Francisco vs. Fordham, Oct. 20, 1951 (94 & 90 yards); Anthony Davis, Southern California vs. Notre Dame, Dec. 2, 1972 (97 & 96 yards); Raghib Ismail, Notre Dame vs. Rice, Nov. 5, 1988 (87 & 83 yards); *Raghib Ismail, Notre Dame vs. Michigan, Sept. 16, 1989 (88 & 92 yards); Stacey Corley, BYU vs. Air Force, Nov. 11, 1989 (99 & 85 yards); Leeland McElroy, Texas A&M vs. Rice, Oct. 23, 1993 (93 & 88 yards); Tutu Atwell, Minnesota vs. Iowa St., Sept. 13, 1997 (89 & 93 yards); Tony Lukins, New Mexico St. vs. Tulsa, Oct. 6, 2001 (83 & 100 yards); Justin Miller, Clemson vs. Florida St., Sept. 25, 2004 (97 & 86 yards); Brandon Breazell, UCLA vs. Northwestern, Dec. 30, 2005 (42 & 45 yards, both onside kicks); Brandon Banks, Kansas St. vs. Tennessee Tech, Sept. 26, 2009 (91 & 92 yards)
Season5—Ashlan Davis, Tulsa, 2004
Career7—C.J. Spiller, Clemson, 2006-09
*Ismail is the only player in history to score twice in two games.
CONSECUTIVE GAMES WITH KICKOFF RETURN FOR A TOUCHDOWN
4—Ashlan Davis, Tulsa, 2004 (100 yards vs. Boise St., Oct. 16; 94 yards vs. Nevada, Oct. 23; 83 yards vs. Rice, Oct. 30; 96 yards vs. SMU, Nov. 6)
SCORING A TOUCHDOWN ON TEAM’S OPENING KICKOFF OF TWO SEASONSSeason
Barry Sanders, Oklahoma St., 1988 [100 yards vs. Miami (OH), Sept. 10] & 1987 (100 yards vs. Tulsa, Sept. 5)
Total Kick Returns(Combined Punt and Kickoff Returns)
MOST KICK RETURNSGame
20—Milton Hill, Texas Tech vs. Centenary (LA), Nov. 11, 1939 (20 punts, 110 yards)
Season78—Steve Suter, Maryland, 2002 (56 punts, 22 kickoffs,
1,317 yards)Career
229—Brandon James, Florida, 2006-09 (117 punts, 112 kickoffs, 4,089 yards)
MOST YARDS ON KICK RETURNSGame
342—Chad Owens, Hawaii vs. BYU, Dec. 8, 2001 (93 on punt returns, 249 on kickoff returns)
Season1,483—Mardy Gilyard, Cincinnati, 2009 (202 on punt
returns, 1,281 on kickoff returns)Per-game record—116.2, Dion Johnson, East Carolina,
1990 (1,046 yards, with 167 on punt returns and 879 on kickoff returns in 9 games)
Career4,089—Brandon James, Florida, 2006-09 (1,371 on punt
returns, 2,718 on kickoff returns)
GAINING 1,000 YARDS ON PUNT RETURNS AND 1,000 YARDS ON KICKOFF RETURNSCareer
Troy Slade, Duke, 1973-75 (1,021 & 1,757); Devon Ford, Appalachian St., 1973-76 (1,197 & 1,761); Anthony Carter, Michigan, 1979-82 (1,095 & 1,504); Willie Drewrey, West Virginia, 1981-84 (1,072 & 1,302); Tony James, Mississippi St., 1989-92 (1,332 & 1,862); Thomas Bailey, Auburn, 1991-94 (1,170 & 1,520); Tim Dwight, Iowa, 1994-97 (1,051 & 1,133); Deltha O’Neal, California, 1996-99 (1,169 & 2,286); Nick Davis, Wisconsin, 1998-01 (1,001 & 1,697); Derek Abney, Kentucky, 2000-03 (1,042 & 2,315); Javier Arenas, Alabama, 2006-09 (1,752 & 2,166); Brandon James, Florida, 2006-09 (1,371 & 2,718); Jeremy Kerley, TCU, 2007-10 (1,299 & 1,006)
HIGHEST AVERAGE PER KICK RETURN(Min. 1.2 Punt Returns and 1.2 Kickoff Returns Per Game)Season
27.2—Erroll Tucker, Utah, 1985 (40 for 1,087; 16 for 389 on punt returns, 24 for 698 on kickoff returns)
Career22.0—Erroll Tucker, Utah, 1984-85 (79 for 1,741; 38 for 650
on punt returns, 41 for 1,091 on kickoff returns)
AVERAGING 20 YARDS EACH ON PUNT RETURNS AND KICKOFF RETURNS(Min. 1.2 Returns Per Game Each)Season
By 8 players. Most recent: Antonio Brown, Central Mich., 2008 (20.5 on punt returns, 20 for 410; 20.8 on kickoff returns, 38 for 791)
MOST TOUCHDOWNS SCORED ON KICK RETURNS(Must Have at Least One Punt Return and One Kickoff Return)Game
2—By nine players. Most recent: Brandon Tate, North Carolina vs. Duke, Nov. 25, 2006. Other players: Derek Abney, Kentucky vs. Florida, Sept. 28, 2002; Chad Owens, Hawaii vs. BYU, Dec. 8, 2001; Kahlil Hill, Iowa vs. Western Mich., Sept. 5, 1998; Joe Rowe, Virginia vs. Central Mich., Sept. 7, 1996; Eric Blount, North Carolina vs. William & Mary, Oct. 5, 1991; Dion Johnson, East Carolina vs. Temple, Oct. 27, 1990; Charlie Justice, North Carolina vs. Florida, Oct. 26, 1946; Ernie Steele, Washington vs. Washington St., Nov. 30, 1940
Season6—Derek Abney, Kentucky, 2002 (4 punts, 2 kickoffs);
Ashlan Davis, Tulsa, 2004 (5 kickoffs, 1 punt)Career
8—Cliff Branch, Colorado, 1970-71 (6 punts, 2 kickoffs); Johnny Rodgers, Nebraska, 1970-72 (7 punts, 1 kickoff); Derek Abney, Kentucky, 2000-03 (6 punts, 2 kickoffs); Chad Owens, Hawaii, 2001-04 (6 punts, 2 kickoffs); C.J. Spiller, Clemson, 2006-09 (1 punt, 7 kickoffs); Phillip Livas, Louisiana Tech, 2007-10 (4 punts, 4 kickoffs)
WINNING BOTH PUNT RETURN AND KICKOFF RETURN CHAMPIONSHIPSSeason
Erroll Tucker, Utah, 1985Career
Ira Matthews, Wisconsin, kickoff returns (1976) and punt returns (1978); Erroll Tucker, Utah, 1985
All Runbacks(Combined Interception Returns, Blocked Kick Returns, Fumble Returns, Punt Returns and Kickoff Returns)SCORING MORE THAN ONE TOUCHDOWN IN AT LEAST THREE CATEGORIESSeason
Erroll Tucker, Utah, 1985 (3 interceptions, 2 punt returns, 2 kickoff returns)
SCORING AT LEAST ONE TOUCHDOWN IN AT LEAST THREE CATEGORIESSeason
Dick Harris, South Carolina, 1970; Mark Haynes, Arizona St., 1974; Scott Thomas, Air Force, 1985; Erroll Tucker, Utah, 1985; Joe Crocker, Virginia, 1994; Joe Walker, Nebraska, 1998; Deltha O’Neal, California, 1999; Jerrard Tarrant, Georgia Tech, 2009
HIGHEST AVERAGE PER RUNBACKSeason
(Min. 40 rets.) 28.3—Erroll Tucker, Utah, 1985 (46 for 1,303; 6 for 216 on interceptions, 16 for 389 on punt returns, 24 for 698 on kickoff returns)
HIGHEST AVERAGE PER RUNBACK(At Least 7 Interceptions and Min. 1.3 Punt Returns and 1.3 Kickoff Returns Per Game)Career
22.6—Erroll Tucker, Utah, 1984-85 (87 for 1,965; 8 for 224 on interceptions, 38 for 650 on punt returns, 41 for 1,091 on kickoff returns)
MOST TOUCHDOWNS SCORED ON RUNBACKSGame
3—Johnny Jackson, Houston vs. Texas, Nov. 7, 1987 (3 interceptions); Antonio Perkins, Oklahoma St. vs. UCLA, Sept. 20, 2003 (3 punt returns).
MOST TOUCHDOWNS SCORED ON RUNBACKS(Must Have at Least One Touchdown in At Least Three Categories)Season
7—Erroll Tucker, Utah, 1985 (3 interceptions, 2 punt returns, 2 kickoff returns)
Career9—Allen Rossum, Notre Dame, 1994-97 (3 interceptions,
3 punt returns, 3 kickoff returns)
Blocked KicksMOST PUNTS BLOCKED BYGame
4—Ken Irvin, Memphis vs. Arkansas, Sept. 26, 1992; James King, Central Mich. vs. Michigan St., Sept. 8, 2001
Season7—James King, Central Mich., 2001. Special Note: Before
NCAA records, Joe Stydahar of West Virginia blocked seven punts in 1934.
Career10—James King, Central Mich., 2001-04
MOST BLOCKED FIELD GOALSQuarter
2—Jerald Henry, Southern California vs. California, Oct. 22, 1994 (1st, returned first one 60 yards for touch-down); Pat Larson, Wyoming vs. Fresno St., Nov. 18, 1995 (2nd); Fili Moala, Southern California vs. Arizona St., Oct. 11, 2008 (3rd)
Game2—Mike Washington, Alabama vs. Mississippi St., Nov. 3,
1973; Louis Meadows, North Carolina St. vs. Maryland, Oct. 10, 1981; Matt Harding, Hawaii vs. San Diego St., Oct. 9, 1993; Jerald Henry, Southern California vs. California, Oct. 22, 1994; Pat Larson, Wyoming vs. Fresno St., Nov. 18, 1995; Kyle Vanden Bosch, Nebraska vs. Texas A&M, Nov. 6, 1999; Antwan Peek, Cincinnati vs. Miami (OH), Oct. 28, 2000; Justin Pendry, Air Force vs. Tennessee Tech, Sept. 8, 2001; Alton Moore, Auburn vs. Georgia, Nov. 10, 2001; Chris Barry, Nevada vs. Washington, Oct. 11, 2003; Daniel Bazuin, Central Mich. vs. Kent St., Oct. 2, 2004; Curtis Pulley, Kentucky vs. Ole Miss, Oct. 22, 2005; Cory Flom, Western Mich. vs. Indiana, Sept. 2, 2006; Kenny Iwebema, Iowa vs. Syracuse, Sept. 8, 2007; Fili Moala, Southern California vs. Arizona St., Oct. 11, 2008; Margus Hunt, SMU vs. East Carolina, Oct. 10, 2009
Season6—Lonnell Dewalt, Kentucky, 2004
Career8—James Ferebee, New Mexico St., 1978-81; Terrence
Holt, North Carolina St., 1999-02
MOST BLOCKED EXTRA POINTSGame
2—Corey Nelson, Air Force vs. Colorado St., Nov. 11, 2000; Josh Buhl, Kansas St. vs. Syracuse, Dec. 29, 2001; Kareem Bland, Middle Tenn. vs. North Texas, Nov. 23, 2002; Linval Joseph, East Carolina vs. Kentucky, Jan. 2, 2009
Season5—Ray Farmer, Duke, 1993
Career8—Ray Farmer, Duke, 1992-95
MOST COMBINED BLOCKED KICKS(Includes Punts, PAT Attempts, FG Attempts)Game
4—Ken Irvin, Memphis vs. Arkansas, Sept. 26, 1992 (4 punts); James King, Central Mich. vs. Michigan St., Sept. 8, 2001 (4 punts)
Season8—Jimmy Lisko, Arkansas St., 1975 (4 PATs, 3 punts, 1
FG); James Francis, Baylor, 1989 (4 PATs, 3 punts, 1 FG); James King, Central Mich., 2001 (7 punts, 1 FG)
Career19—James Ferebee, New Mexico St., 1978-81 (5 punts,
6 PATs, 8 FGs)

2011 NCAA FOOTBALL RECORDS - FBS INDIVIDUAL RECORDS 13
FOO
TBA
LL B
OW
LSU
BD
IVIS
IONMOST TOUCHDOWNS SCORED
ON BLOCKED PUNTSGame
2—David Langner, Auburn vs. Alabama, Dec. 2, 1972 (2nd half); Frank Staine-Pyne, Air Force vs. Hawaii, Nov. 1, 1997 (1st half)
Season3—Joe Wessel, Florida St., 1984
All-Purpose Yards(Yardage Gained From Rushing, Receiving and All Runbacks)MOST PLAYSGame
58—Tony Sands, Kansas vs. Missouri, Nov. 23, 1991 (58 rushes)
Season432—Marcus Allen, Southern California, 1981 (403 rushes,
29 receptions)Career
(3 yrs.) 1,034—Herschel Walker, Georgia, 1980-82 (994 rushes, 26 receptions, 14 kickoff returns)
(4 yrs.) 1,347—Steve Bartalo, Colorado St., 1983-86 (1,215 rushes, 132 receptions)
MOST YARDS GAINEDQuarter
305—Corey Dillon, Washington vs. San Jose St., Nov. 16, 1996 (1st, 222 rushing, 83 receiving)
Game578—Emmett White, Utah St. vs. New Mexico St., Nov. 4,
2000 (322 rushing, 134 receiving, 2 punt returns, 120 kickoff returns)
Season3,250—Barry Sanders, Oklahoma St., 1988 (2,628 rushing,
106 receiving, 95 punt returns, 421 kickoff returns; 11 games)
Career7,796—^Damaris Johnson, Tulsa, 2008-10 (1,062 rushing,
2,746 receiving, 571 punt returns, 3,417 kickoff returns; 491 plays)
^Active player.
MOST YARDS GAINED PER GAMESeason
295.5—Barry Sanders, Oklahoma St., 1988 (3,250 in 11 games; 2,628 rushing, 106 receiving, 95 punt returns, 421 kickoff returns)
Career237.8—Ryan Benjamin, Pacific, 1990-92 (5,706 in 24
games; 3,119 rushing, 1,063 receiving, 100 punt returns, 1,424 kickoff returns)
MOST YARDS GAINED BY A FRESHMANGame
422—Marshall Faulk, San Diego St. vs. Pacific, Sept. 14, 1991 (386 rushing, 11 receiving, 25 kickoff returns)
Season2,776—Jeremy Maclin, Missouri, 2007 (375 rushing, 1,055
receiving, 1,039 kickoff returns, 307 punt returns; 199 plays)
Also holds the per-game record with 198.3 (2,776 in 14)
MOST SEASONS WITH 2,000 OR MORE YARDS3—DeAngelo Williams, Memphis, 2003 (2,113), 2004
(2,230) & 2005 (2,075); Antonio Brown, Central Mich., 2007 (2,267), 2008 (2,315) & 2009 (2,582); Damaris Johnson, Tulsa, 2008 (2,475), 2009 (2,693) & 2010 (2,628)
GAINED 1,000 YARDS RUSHING AND 1,000 YARDS RECEIVING Career
By many players. Most recent: James Rodgers, Oregon St., 2007-10 (1,335 rushing & 2,064 receiving); Jacquizz Rodgers, Oregon St., 2007-10 (3,877 rushing & 1,056 receiving); DeMarco Murray, Oklahoma, 2007-10 (3,685 rushing & 1,571 receiving); ^Damaris Johnson, Tulsa, 2008-10 (1,062 rushing & 2,746 receiving); Randall Cobb, Kentucky, 2008-10 (1,313 rushing & 1,661 receiv-ing)
^Active player.
GAINED 2,000 YARDS RECEIVING,1,000 YARDS ON PUNT RETURNSAND 2,000 YARDS ON KICKOFF RETURNS Career
Derek Abney, Kentucky, 2000-03 (2,639 receiving, 1,042 punt returns & 2,315 kickoff returns)
HIGHEST AVERAGE GAIN PER PLAYGame
(Min. 300 yards, 25 plays) 16.8—Randy Gatewood, UNLV vs. Idaho, Sept. 17, 1994 (419 on 25)
Season(Min. 1,500 yards, 100-124 plays) 19.8—T.Y. Hilton, FIU,
2008 (2,163 on 109)(Min. 1,500 yards, 125 plays) 17.9—Mardy Gilyard,
Cincinnati, 2009 (2,690 on 150) Career
(Min. 5,000 yards, 275-374 plays) 17.4—Anthony Carter, Michigan, 1979-82 (5,197 on 298)
(Min. 5,000 yards, 375 plays) 16.2—Kevin Robinson, Utah St., 2004-07 (6,479 on 401)
TEAM HAVING A 200-YARD RUSHER AND 200-YARD RECEIVER IN SAME GAME
San Diego St., George Jones (208 rushing) and Will Blackwell (210 receiving) vs. New Mexico, Nov. 4, 1995 (San Diego St. won, 38-29); Pittsburgh, Kevan Barlow (209 rushing) and Antonio Bryant (222 receiving) vs. Boston College, Oct. 21, 2000 (Pittsburgh won, 42-26); Wisconsin, Anthony Davis (247 rushing) and Lee Evans (214 receiving) vs. Akron, Sept. 6, 2003 (Wisconsin won, 48-31); Wisconsin, Dwayne Smith (207 rushing) and Lee Evans (258 receiving) vs. Michigan St., Nov. 15, 2003 (Wisconsin won, 56-21); Oklahoma St., Kendall Hunter (210 rushing) and Dez Bryant (236 receiving) vs. Houston, Sept. 6, 2008 (Oklahoma St. won, 56-37)
MOST YARDS GAINED BY TWO PLAYERS, SAME TEAMCareer
10,253—Marshall Faulk (5,595) & Darnay Scott (4,658), San Diego St., 1991-93
ScoringMOST POINTS SCORED(By Non-Kickers)Game
48—Howard Griffith, Illinois vs. Southern Ill., Sept. 22, 1990 (8 TDs on runs of 5, 51, 7, 41, 5, 18, 5, 3 yards)
Game vs. Major-College Opponent44—Marshall Faulk, San Diego St. vs. Pacific, Sept. 14,
1991 (7 TDs, 1 two-point conversion)Season
234—Barry Sanders, Oklahoma St., 1988 (39 TDs in 11 games)
2 Yrs320—Ricky Williams, Texas, 1997-98 (53 TDs, 1 two-point
conversion in 22 games)3 Yrs
404—Ricky Williams, Texas, 1996-98 (67 TDs, 1 two-point conversion in 34 games)
Career(4 yrs.) 468—Travis Prentice, Miami (OH), 1996-99 (78
TDs)
MOST POINTS SCORED PER GAMESeason
21.3—Barry Sanders, Oklahoma St., 1988 (234 in 11)2 Yrs
14.5—Ricky Williams, Texas 1997-98 (320 in 22)Career
12.1—Marshall Faulk, San Diego St., 1991-93 (376 in 31)
MOST POINTS SCORED BY A FRESHMANGame
44—Marshall Faulk, San Diego St. vs. Pacific, Sept. 14, 1991 (7 TDs, 1 two-point conversion)
Season140—Marshall Faulk, San Diego St., 1991 (23 TDs, 1 two-
point conversion)Also holds per-game record with 15.6 (140 in 9)
MOST TOUCHDOWNS SCOREDQuarter
4—Dick Felt, BYU vs. San Jose St., Nov. 8, 1952 (all rush-ing, 4th); Howard Griffith, Illinois vs. Southern Ill., Sept. 22, 1990 (all rushing, 3rd); Eric Bieniemy, Colorado vs. Nebraska, Nov. 2, 1990 (all rushing, 4th); Corey Dillon, Washington vs. San Jose St., Nov. 16, 1996 (3 rush-ing, 1 receiving, 1st); Frank Moreau, Louisville vs. East Carolina, Nov. 1, 1997 (all rushing, 2nd); Corey Thomas, Duke vs. Georgia Tech, Nov. 15, 1997 (all receiving, 4th); Terry Caulley, Connecticut vs. Kent St., Nov. 9, 2002 (3 rushing, 1 receiving, 2nd)
Game8—Howard Griffith, Illinois vs. Southern Ill., Sept. 22, 1990
(all 8 by rushing on runs of 5, 51, 7, 41, 5, 18, 5, 3 yards)Game vs. Major-College Opponent
7—Arnold “Showboat” Boykin, Ole Miss vs. Mississippi St., Dec. 1, 1951; Marshall Faulk, San Diego St. vs. Pacific, Sept. 14, 1991; Rashaun Woods, Oklahoma St. vs. SMU, Sept. 20, 2003
Season39—Barry Sanders, Oklahoma St., 1988 (11 games)Also holds per-game record with 3.5 (39 in 11)
2 Yrs53—Ricky Williams, Texas 1997-98 (22 games)Also holds per-game record with 2.4 (53 in 22)
3 Yrs67—Ricky Williams, Texas, 1996-98 (34 games)
Career(4 yrs.) 78—Travis Prentice, Miami (OH), 1996-99 (73 rush-
ing, 5 pass receptions)
MOST TOUCHDOWNS SCORED IN TWO AND THREE CONSECUTIVE GAMES2 Games
11—Kelvin Bryant, North Carolina, 1981 (6 vs. East Carolina, Sept. 12; 5 vs. Miami [OH], Sept. 19); Ricky Williams, Texas, 1998 (6 vs. Rice, Sept. 26; 5 vs. Iowa St., Oct. 3)
3 Games15—Kelvin Bryant, North Carolina, 1981 (6 vs. East
Carolina, Sept. 12; 5 vs. Miami [OH], Sept. 19; 4 vs. Boston College, Sept. 26)
MOST TOUCHDOWNS SCORED BY PLAYERS ON THE SAME TEAM IN CONSECUTIVE GAMES
5—Tielor Robinson, Army vs. Cincinnati, Oct. 9, 2004 (3 rushing, 2 receiving) and Carlton Jones, Army vs. South Fla., Oct. 16, 2004 (5 rushing)
MOST TOUCHDOWNS SCORED BY A FRESHMANGame
7—Marshall Faulk, San Diego St. vs. Pacific, Sept. 14, 1991 (all by rushing)
Season23—Marshall Faulk, San Diego St., 1991 (21 rushing, 2
pass receptions)Also holds per-game record with 2.6 (23 in 9)
MOST GAMES SCORING A TOUCHDOWNSeason
14—Lee Suggs, Virginia Tech, 2002 (14 games); C.J. Spiller, Clemson, 2009 (14 games)
Career38—Tim Tebow, Florida, 2006-09
MOST CONSECUTIVE GAMES SCORING A TOUCHDOWNCareer
27—Lee Suggs, Virginia Tech (from Sept. 2, 2000, through Dec. 31, 2002; 57 touchdowns)
MOST GAMES SCORING TWO OR MORE TOUCHDOWNSSeason
11—Barry Sanders, Oklahoma St., 1988Career
25—Travis Prentice, Miami (OH), 1996-99
MOST CONSECUTIVE GAMES SCORING TWO OR MORE TOUCHDOWNSSeason
11—Barry Sanders, Oklahoma St., 1988Career
13—Barry Sanders, Oklahoma St. (from Nov. 14, 1987, through 1988)
MOST GAMES SCORING THREE OR MORE TOUCHDOWNSSeason
9—Barry Sanders, Oklahoma St., 1988

14 2011 NCAA FOOTBALL RECORDS - FBS INDIVIDUAL RECORDS
MOST CONSECUTIVE GAMES SCORING THREE OR MORE TOUCHDOWNSSeason
5—Paul Hewitt, San Diego St., 1987 (from Oct. 10 through Nov. 7); Barry Sanders, Oklahoma St., 1988 (from Sept. 10 through Oct. 15)
MOST TOUCHDOWNS AND POINTS SCORED BY TWO PLAYERS, SAME TEAMSeason
54 and 324—Barry Sanders (39-234) & Hart Lee Dykes (15-90), Oklahoma St., 1988
Career97 and 585—Glenn Davis (59-354) & Doc Blanchard (38-
231), Army, 1943-46
Note: LenDale White (57-342) & Reggie Bush (42-252) had 99 and 594 for Southern California in 2003-05, but Bush’s statis-tics were later vacated by NCAA Committee on Infractions.
PASSING FOR A TOUCHDOWN AND SCORING TOUCHDOWNS BY RUSHING AND RECEIVINGGame
By many players. Most recent: Chase Clement, Rice vs. Western Mich., Dec. 30, 2008; James Casey, Rice vs. Houston, Nov. 29, 2008; James Casey, Rice vs. Tulsa, Oct. 4, 2008
(Note: James Casey of Rice in 2008 is the only player to pass for a TD and score a rushing and receiving TD in a game twice in one season, and Rice in 2008 is the only team to have a player do so in three games in one season.)
SCORING TOUCHDOWNS BY RUSHING, RECEIVING AND RETURNING A FUMBLEGame
Marco Nelson, Navy vs. Stanford, Sept. 10, 2005
PASSING FOR A TOUCHDOWN AND SCORING ON A PASS RECEPTION AND PUNT RETURNGame
By many players. Most recent: Tim Dwight, Iowa vs. Indiana, Oct. 25, 1997
MOST CONSECUTIVE GAMES SCORING A TOUCHDOWN BY RUSHING AND PASSINGSeason
13—Tim Tebow, Florida, 2007 (13 games)Career
14—Tim Tebow, Florida, Jan. 8, 2007-Jan. 1, 2008
SCORING 20 TOUCHDOWNS BY RUSHING AND RECEIVING AND PASSING FOR 20 TOUCHDOWNSSeason
Tim Tebow, Florida, 2007 (32 passing and 23 rushing); Dan LeFevour, Central Mich., 2007 (27 passing, 19 rushing, 1 receiving); Cam Newton, Auburn 2010 (30 passing, 20 rushing, 1 receiving)
SCORING 20 OR MORE TOUCHDOWNS BY RUSHING AND PASSINGSeason
Tim Tebow, Florida, 2007 (32 passing and 23 rushing); Cam Newton, Auburn, 2010 (30 passing and 20 rushing)
PLAYER RETURNING A BLOCKED PUNT, FUMBLE RECOVERY AND INTERCEPTION RETURN FOR A TOUCHDOWNSeason
By many players. Most recent: Tim Curry, Air Force, 1997
PLAYER SCORING A TOUCHDOWN BY RECEIV-ING, RUSHING, PUNT RETURN AND KICKOFF RETURNSeason
By many players. Most recent: Jeremy Maclin, Missouri, 2008 (also 2007); T.Y. Hilton, FIU, 2008; Phillip Livas, Louisiana Tech, 2008
Note: Maclin (2007) and Hilton (2008) are the only freshmen to accomplish this feat.
MOST EXTRA POINTS ATTEMPTED BY KICKINGGame
14—Terry Leiweke, Houston vs. Tulsa, Nov. 23, 1968 (13 made)
Season99—Jimmy Stevens, Oklahoma, 2008 (94 made)
Career255—Art Carmody, Louisville, 2004-07 (253 made)
MOST EXTRA POINTS MADE BY KICKINGGame
13—Terry Leiweke, Houston vs. Tulsa, Nov. 23, 1968 (14 attempts); Derek Mahoney, Fresno St. vs. New Mexico, Oct. 5, 1991 (13 attempts)
Season94—Jimmy Stevens, Oklahoma, 2008 (99 attempted)Per-game record—6.71, Jimmy Stevens, Oklahoma, 2008
(94 in 14)Career
253—Art Carmody, Louisville, 2004-07 (255 attempts)Per-game record—5.3, Bart Edmiston, Florida, 1993-96
(137 in 26)
BEST PERFECT RECORD OF EXTRA POINTS MADESeason
77 of 77—Art Carmody, Louisville, 2004
HIGHEST PERCENTAGE OF EXTRA POINTS MADECareer
(Min. 100 atts.) 100%—Van Tiffin, Alabama, 1983-86 (135 of 135); Pete Stoyanovich, Indiana, 1985-88 (101 of 101); David Browndyke, LSU, 1986-89 (109 of 109); John Becksvoort, Tennessee, 1991-94 (161 of 161); Luke Manget, Georgia Tech, 1999-02 (160 of 160); Damon Duval, Auburn, 1999-02 (125 of 125); Alex Trlica, Texas Tech, 2004-07 (233 of 233); Brandon Coutu, Georgia, 2004-07 (114 of 114); Jeff Wolfert, Missouri, 2006-08 (185 of 185)
MOST CONSECUTIVE EXTRA POINTS MADEGame
13—Derek Mahoney, Fresno St. vs. New Mexico, Oct. 5, 1991 (13 attempts)
Season77—Art Carmody, Louisville, 2004 (77 attempts)
Career233—Alex Trlica, Texas Tech, 2004-07
MOST POINTS SCORED BY KICKINGGame
24—Mike Prindle, Western Mich. vs. Marshall, Sept. 29, 1984 (7 FGs, 3 PATs)
Season149—Dan Bailey, Oklahoma St., 2010 (27 FGs, 68 PATs)Per-game record—11.9, Roman Anderson, Houston, 1989
(131 in 11)Career
439—Kyle Brotzman, Boise St., 2007-10 (67 FGs, 238 PATs)Per-game record—9.6, Roman Anderson, Houston, 1988-
91 (70 FGs, 213 PATs; 423 in 44)
HIGHEST PERCENTAGE OF EXTRA POINTS AND FIELD GOALS MADESeason
(Min. 20 PATs and 12 FGs made) 100.0%—Marc Primanti, North Carolina St., 1996 (24 of 24 PATs, 20 of 20 FGs); Ryan White, Memphis, 1998 (22 of 22 PATs, 16 of 16 FGs)
(Min. 30 PATs and 15 FGs made) 98.6%—Alex Henery, Nebraska, 2010 (54 of 54 PATs, 18 of 19 FGs)
(Min. 40 PATs and 20 FGs made) 97.3%—Chris Jacke, UTEP, 1988 (48 of 48 PATs, 25 of 27 FGs)
Career(Min. 100 PATs and 50 FGs made) 96.7%—Alex Henery,
Nebraska, 2007-10 (193 of 194 PATs, 68 of 76 FGs)
MOST TWO-POINT ATTEMPTS MADEGame
6—Jim Pilot, New Mexico St. vs. Hardin-Simmons, Nov. 25, 1961 (all by running, attempted 7)
Season6—Pat McCarthy, Holy Cross, 1960 (all by running); Jim
Pilot, New Mexico St., 1961 (all by running); Howard Twilley, Tulsa, 1964 (all on pass receptions)
Career13—Pat McCarthy, Holy Cross, 1960-62 (all by running)
MOST SUCCESSFUL TWO-POINT PASSESSeason
12—John Hangartner, Arizona St., 1958 (attempted 21)Career
19—Pat McCarthy, Holy Cross, 1960-62 (attempted 33)
Defensive Extra PointsMOST DEFENSIVE EXTRA POINTS RETURNED Game
2—Corey Ivy, Oklahoma vs. California, Sept. 20, 1997; Tony Holmes, Texas vs. Iowa St., Oct. 3, 1998
MOST DEFENSIVE EXTRA POINTS SCOREDGame
2—Tony Holmes, Texas vs. Iowa St., Oct. 3, 1998Season
2—Tony Holmes, Texas, 1998MOST DEFENSIVE EXTRA POINTS SCORED BY BOTH TEAMS(Must Have One Scored by Each Team)Game
2—Eric Kelly (fumbled snap return), Kentucky, and Mark Roman (blocked kick return), LSU, Oct. 17, 1998
LONGEST RETURN OF A DEFENSIVE EXTRA-POINT ATTEMPTGame
100—Lee Ozmint (SS), Alabama vs. LSU, Nov. 11, 1989 (intercepted pass); Quintin Parker (DB), Illinois vs. Wisconsin, Oct. 28, 1989 (returned kick); Curt Newton (LB), Washington St. vs. Oregon St., Oct. 20, 1990 (inter-cepted pass); William Price (CB), Kansas St. vs. Indiana St., Sept. 7, 1991 (intercepted pass); Joe Crocker (CB), Virginia vs. North Carolina St., Nov. 25, 1994 (inter-cepted pass); Laymar Grant, Duke vs. Maryland, Oct. 26, 1996 (intercepted pass); Tony Holmes, Texas vs. Iowa St., Oct. 3, 1998 (intercepted pass); Brandon Ratcliff, New Mexico vs. UNLV, Oct. 12, 2002 (intercepted pass)
FIRST DEFENSIVE EXTRA-POINT ATTEMPTThomas King (S), La.-Lafayette vs. Cal St. Fullerton, Sept. 3,
1988 (returned blocked kick 6 yards)MOST DEFENSIVE EXTRA-POINT KICKS BLOCKEDGame
2—Nigel Codrington (DB), Rice vs. Notre Dame, Nov. 5, 1988 (1 resulted in a score)
Also holds season record with 2
Defensive Records(Since 2000)
TOTAL TACKLESGame
26—Brian Leigeb, Central Mich. vs. Northern Ill., Nov. 17, 2000; Doug Szymul, Northwestern vs. Navy, Sept. 21, 2002; Bryce Hudman, SMU vs. Arkansas St., Sept. 15, 2007
Season193—Lawrence Flugence, Texas Tech, 2002 (14 games)Per-game record—15.6, Rick Sherrod, West Virginia, 2001
(156 in 10)Career
545—Tim McGarigle, Northwestern, 2002-05 (48 games)Per-game record—12.4, E.J. Henderson, Maryland, 2000-
02 (434 in 35)SOLO TACKLESGame
20—Tyrell Johnson, Arkansas St. vs. North Texas, Nov. 26, 2005
Season135—E.J. Henderson, Maryland, 2002 (14 games)Per-game record—10.2, Rick Sherrod, West Virginia, 2001
(102 in 10)Career
360—Rod Davis, Southern Miss., 2000-03 (47 games)Per-game record—8.8, E.J. Henderson, Maryland, 2000-02
(308 in 35)ASSISTED TACKLESGame
19—Brad White, Wake Forest vs. Navy, Nov. 23, 2002Season
104—Don Molls, Toledo, 2010Also holds per-game record with 8.0 (104 in 13)
Career258—Daniel Holtzclaw, Eastern Mich., 2005-08 (47
games)Also holds per-game record with 5.49 (258 in 47)
2011 NCAA FOOTBALL RECORDS - FBS INDIVIDUAL RECORDS 15
FOO
TBA
LL B
OW
LSU
BD
IVIS
IONMOST GAMES KICKING A FIELD GOAL
Career40—Gary Gussman, Miami (OH), 1984-87 (in 44 games
played)
MOST CONSECUTIVE GAMES KICKINGA FIELD GOAL
31—Kevin Kelly, Penn St., 2006-08
MOST FIELD GOALS MADE, 60 YARDSOR MOREGame
2—Tony Franklin, Texas A&M vs. Baylor, Oct. 16, 1976 (65 & 64 yards)
Season3—Russell Erxleben, Texas, 1977 (67 vs. Rice, Oct. 1; 64 vs.
Baylor, Oct. 16; 60 vs. Texas Tech, Oct. 29) (4 attempts)Career
3—Russell Erxleben, Texas, 1975-78 (see Season Record above)
MOST FIELD GOALS ATTEMPTED, 60 YARDSOR MORESeason
5—Tony Franklin, Texas A&M, 1976 (2 made)Career
11—Tony Franklin, Texas A&M, 1975-78 (2 made)
MOST FIELD GOALS MADE, 50 YARDSOR MOREGame
3—Jerry DePoyster, Wyoming vs. Utah, Oct. 8, 1966 (54, 54, 52 yards); Sergio Lopez-Chavero, Wichita St. vs. Drake, Oct. 27, 1984 (54, 54, 51 yards); Tim Douglas, Iowa vs. lllinois, Sept. 26, 1998 (51, 58, 51 yards); Dan Orner, North Carolina vs. Syracuse, Sept. 7, 2002 (52, 51, 51 yards); Sam Swank, Wake Forest vs. North Carolina St., Oct. 14, 2006 (51, 53, 53 yards)
Season8—Fuad Reveiz, Tennessee, 1982 (10 attempts)
Career20—Jason Hanson, Washington St., 1988-91 (35
attempts)
MOST FIELD GOALS ATTEMPTED, 50 YARDSOR MORESeason
17—Jerry DePoyster, Wyoming, 1966 (5 made)Career
38—Tony Franklin, Texas A&M, 1975-78 (16 made)
HIGHEST PERCENTAGE OF FIELD GOALS MADE, 50 YARDS OR MORESeason
(Min. 10 atts.) 80.0%—Fuad Reveiz, Tennessee, 1982 (8 of 10)
Career(Min. 15 atts.) 60.9%—Max Zendejas, Arizona, 1982-85
(14 of 23)
MOST FIELD GOALS MADE, 40 YARDSOR MOREGame
5—Alan Smith, Texas A&M vs. Arkansas St., Sept. 17, 1983 (44, 45, 42, 59, 57 yards)
Season14—Chris Jacke, UTEP, 1988 (16 attempts)
Career39—Jason Hanson, Washington St., 1988-91 (66 attempts)
(19 of 31, 40-49 yards; 20 of 35, 50 or more yards)
MOST FIELD GOALS ATTEMPTED, 40 YARDSOR MORESeason
25—Jerry DePoyster, Wyoming, 1966 (6 made)Career
66—Jason Hanson, Washington St., 1988-91 (39 made)
HIGHEST PERCENTAGE OF FIELD GOALS MADE, 40 YARDS OR MORESeason
(Min. 10 made) 93.3%—Matt Payne, BYU, 2004 (14 of 15)Career
(Min. 20 made) 78.8%—Alex Henery, Nebraska, 2007-10 (26 of 33)
HIGHEST PERCENTAGE OF FIELD GOALS MADE, 40-49 YARDSSeason
(Min. 10 made) 100%—John Carney, Notre Dame, 1984 (10 of 10)
TACKLES FOR LOSSGame
8.0—Nate Irving, North Carolina St. vs. Wake Forest, Nov. 13, 2010
Season32.0—Jason Babin, Western Mich., 2003 (31 solo, 2 assist-
ed in 12 games)Per-game record—2.8, Kenny Philpot, Eastern Mich., 2001
(30.5 in 11)Career
75.0—Jason Babin, Western Mich., 2000-03 (73 solo, 4 assisted in 47 games)
Per-game record—1.87, Julius Peppers, North Carolina, 2000-01 (43 in 23)
PASS SACKSGame
6.0—Elvis Dumervil, Louisville vs. Kentucky, Sept. 4, 2005; Ameer Ismail, Western Mich. vs. Ball St., Oct. 21, 2006
Season24.0—Terrell Suggs, Arizona St., 2002 (23 solo, 2 assisted
in 14 games)Also holds per-game record with 1.71 (24.0 in 14)
Career44.0—Terrell Suggs, Arizona St., 2000-02 (43 solo, 2 assist-
ed in 36 games)Per-game record—1.61, Dwight Freeney, Syracuse, 2000-
01 (30.5 in 19)PASSES DEFENDEDGame
8—Joselio Hanson, Texas Tech vs. Oklahoma St., Nov. 9, 2002
Season32—Jason Goss, TCU, 2002 (24 pass breakups, 8 pass
interceptions in 12 games); Nathan Vasher, Texas, 2003 (26 pass breakups, 6 pass interceptions in 13 games); Corey Webster, LSU, 2003 (25 pass breakups, 7 pass interceptions in 14 games)
Per-game record—2.8, Aqib Talib, Kansas, 2006 [28 (22 pass breakups, 6 pass interceptions) in 10]
Career78—Nathan Vasher, Texas, 2000-03 (61 pass breakups, 17
pass interceptions in 46 games)Per-game record—2.15, Eugene Wilson, Illinois, 2000-02
[71 (60 pass breakups, 11 pass interceptions) in 33]FORCED FUMBLESGame
3—DeLawrence Grant, Oregon St. vs. San Diego St., Sept. 23, 2000; Antwan Peek, Cincinnati vs. La.-Monroe, Dec. 1, 2001; Mason Unck, Arizona St. vs. Stanford, Sept. 28, 2002; Quintin Mikell, Boise St. vs. Hawaii, Oct. 5, 2002; Grant Wiley, West Virginia vs. Cincinnati, Sept. 13, 2003; Derrick Johnson, Texas vs. North Texas, Sept. 4, 2004; Ramel Meekins, Rutgers vs. Navy, Oct. 14, 2006; Cody Grimm, Virginia Tech vs. North Carolina St., Nov. 21, 2009; Armond Staten, Central Mich. vs. Western Mich., Nov. 5, 2010
Season10—Elvis Dumervil, Louisville, 2005Also holds per-game record with 0.83 (10 in 12)
Career14—Terrell Suggs, Arizona St., 2000-02; Antwan Peek,
Cincinnati, 2000-02; Kenechi Udeze, Southern California, 2001-03; Ryan Kerrigan, Purdue, 2007-10
Per-game record—0.42, Jonal Saint-Dic, Michigan St., 2005-07 (10 in 24)
TOUCHDOWNS SCORED BY FUMBLE RETURN AND INTERCEPTION RETURN IN SAME GAME
2—Paul McClendon, Texas Tech vs. North Texas, Sept. 22, 2001 (six-yard fumble return and 50-yard intercep-tion return); Shawn Hackett, West Virginia vs. Rutgers, Nov. 3, 2001 (50-yard interception return and 10-yard fumble return)
Fumble Returns(Since 1992)
LONGEST FUMBLE RETURN FOR A TOUCHDOWN
100—Paul Rivers, Rutgers vs. Pittsburgh, Oct. 28, 1995; Dan Dawson, Rice vs. UNLV, Nov. 14, 1998; Kevin Thomas, UNLV vs. Baylor, Sept. 11, 1999
MOST FUMBLE RETURNSGame
2—By many players
MOST FUMBLE RETURNS RETURNED FOR TOUCHDOWNSGame
2—Tyrone Carter, Minnesota vs. Syracuse, Sept. 21, 1996 (63 & 20 yards); Tony Driver, Notre Dame vs. Navy, Oct. 14, 2000 (24 & 22 yards); Alvin Nnabuife, SMU vs. Nevada, Nov. 13, 2004 (17 & 95 yards)
Field GoalsMOST FIELD GOALS ATTEMPTEDGame
9—Mike Prindle, Western Mich. vs. Marshall, Sept. 29, 1984 (7 made); Denis Hopovac, North Texas vs. FIU, Oct. 7, 2006 (5 made)
Season38—Jerry DePoyster, Wyoming, 1966 (13 made in 10
games); Billy Bennett, Georgia, 2003 (31 made in 14 games)
DePoyster holds per-game record with 3.8 (38 in 10)Career
(3 yrs.) 93—Jerry DePoyster, Wyoming, 1965-67 (36 made)Also holds per-game record with 3.1 (93 in 30)(4 yrs.) 111—Jeremy Ito, Rutgers, 2004-07 (80 made);
Leigh Tiffin, Alabama, 2006-09 (83 made)Per-game record—2.4, Philip Doyle, Alabama, 1987-90
(105 in 43)
MOST FIELD GOALS MADEQuarter
4—By 5 players. Most recent: Jose Cortez, Oregon St. vs. California, Oct. 31, 1998 (2nd)
Half5—Dale Klein, Nebraska vs. Missouri, Oct. 19, 1985 (1st);
Dat Ly, New Mexico St. vs. Kansas, Oct. 1, 1988 (1st) Game
7—Mike Prindle, Western Mich. vs. Marshall, Sept. 29, 1984 (32, 44, 42, 23, 48, 41, 27 yards), 9 attempts; Dale Klein, Nebraska vs. Missouri, Oct. 19, 1985 (32, 22, 43, 44, 29, 43, 43 yards), 7 attempts
Season31—Billy Bennett, Georgia, 2003 (38 attempts in 14
games)2 Yrs
57—Billy Bennett, Georgia, 2002-03 (71 attempts)Career
87—Billy Bennett, Georgia, 2000-03 (110 attempts)
MOST FIELD GOALS MADE PER GAMESeason
2.6—John Lee, UCLA, 1984 (29 in 11)Career
1.84—John Lee, UCLA, 1982-85 (79 in 43)
BEST PERFECT RECORD OF FIELD GOALS MADEGame
7 of 7—Dale Klein, Nebraska vs. Missouri, Oct. 19, 1985Season
20 of 20—Marc Primanti, North Carolina St., 1996
MOST FIELD GOALS MADE BY A FRESHMANGame
6—*Mickey Thomas, Virginia Tech vs. Vanderbilt, Nov. 4, 1989 (6 attempts)
Season25—Kai Forbath, UCLA, 2007 (30 attempts)
*Conventional-style kicker.
HIGHEST PERCENTAGE OF FIELD GOALS MADESeason
(Min. 15 atts.) 100.0%—Marc Primanti, North Carolina St., 1996 (20 of 20); Ryan White, Memphis, 1998 (16 of 16)
Career(Min. 45-54 atts.) 87.8%—Bobby Raymond, Florida, 1983-
84 (43 of 49)(Min. 55 atts.) 89.5%—Alex Henery, Nebraska, 2007-10
(68 of 76)
MOST CONSECUTIVE FIELD GOALS MADESeason
25—Chuck Nelson, Washington, 1982 (first 25, missed last attempt of season vs. Washington St., Nov. 20)
Career30—Chuck Nelson, Washington, 1981-82 (last 5 in 1981,
from vs. Southern California, Nov. 14, and first 25 in 1982, ending with last attempt vs. Washington St., Nov. 20)

16 2011 NCAA FOOTBALL RECORDS - FBS INDIVIDUAL RECORDS
Career(Min. 15 made) 95.5%—Alex Henery, Nebraska, 2007-10
(21 of 22)MOST CONSECUTIVE FIELD GOALS MADE,40-49 YARDSCareer
14—Matt Payne, BYU, 2003-04HIGHEST PERCENTAGE OF FIELD GOALS MADE, UNDER 40 YARDSSeason
(Min. 16 made) 100%—Paul Woodside, West Virginia, 1982 (23 of 23); Randy Pratt, California, 1983 (16 of 16); John Lee, UCLA, 1984 (16 of 16); Bobby Raymond, Florida, 1984 (18 of 18); Scott Slater, Texas A&M, 1986 (16 of 16); Philip Doyle, Alabama, 1989 (19 of 19); Michael Reeder, TCU, 1995 (19 of 19); Kai Forbath, UCLA, 2009 (19 of 19))
Career(Min. 30-39 made) 97.0%—Bobby Raymond, Florida,
1983-84 (32 of 33)(Min. 40 made) 97.7%—Alex Henery, Nebraska, 2007-10
(42 of 43)LONGEST AVERAGE DISTANCE FIELD GOALS MADEGame
(Min. 4 made) 49.5—Jeff Heath, East Carolina vs. Texas-Arlington, Nov. 6, 1982 (58, 53, 42, 45 yards)
Season(Min. 10 made) 50.9—Jason Hanson, Washington St.,
1991 (10 made)Career
(Min. 25 made) 42.4—Russell Erxleben, Texas, 1975-78 (49 made)
LONGEST AVERAGE DISTANCE FIELD GOALS ATTEMPTEDSeason
(Min. 20 atts.) 51.2—Jason Hanson, Washington St., 1991 (22 attempts)
Career(Min. 40 atts.) 44.7—Russell Erxleben, Texas, 1975-78 (78
attempts)MOST TIMES MAKING TWO OR MORE FIELD GOALS IN A GAMESeason
10—Paul Woodside, West Virginia, 1982; John Sullivan, New Mexico, 2007; Kai Forbath, UCLA, 2007; Dan Bailey, Oklahoma St., 2010
Career31—Kai Forbath, UCLA, 2007-10
MOST TIMES MAKING THREE OR MORE FIELD GOALS IN A GAMESeason
6—Luis Zendejas, Arizona St., 1983; Joe Allison, Memphis, 1992
Career13—Luis Zendejas, Arizona St., 1981-84; Leigh Tiffin,
Alabama, 2006-09; Kai Forbath, UCLA, 2007-10MOST TIMES MAKING FOUR FIELD GOALSIN A GAMESeason
4—Matt Bahr, Penn St., 1978Career
6—John Lee, UCLA, 1982-85; Leigh Tiffin, Alabama, 2006-09; Alex Henery, Nebraska, 2007-10
LONGEST FIELD GOAL MADE67—Russell Erxleben, Texas vs. Rice, Oct. 1, 1977; Steve
Little, Arkansas vs. Texas, Oct. 15, 1977; Joe Williams, Wichita St. vs. Southern Ill., Oct. 21, 1978
LONGEST INDOOR FIELD GOAL MADE62—Chip Lohmiller, Minnesota vs. Iowa, Nov. 22, 1986 (in
Minnesota’s Metrodome)LONGEST FIELD GOAL MADE WITHOUT USEOF A KICKING TEE
65—Martin Gramatica, Kansas St. vs. Northern Ill., Sept. 12, 1998
LONGEST FIELD GOAL MADE BY A FRESHMAN61—Kyle Bryant, Texas A&M vs. Southern Miss., Sept.
24, 1994LONGEST FIELD GOAL MADE ON FIRST ATTEMPT OF CAREER
61—Ralf Mojsiejenko, Michigan St. vs. Illinois, Sept. 11, 1982
MOST FIELD GOALS MADE IN FIRST GAME OF CAREER
5—Joe Liljenquist, BYU vs. Colorado St., Sept. 20, 1969 (6 attempts); Nathan Ritter, North Carolina St. vs. East Carolina, Sept. 9, 1978 (6 attempts); Jose Oceguera, Long Beach St. vs. Kansas St., Sept. 3, 1983 (5 attempts)
MOST GAMES IN WHICH FIELD GOAL(S) PROVIDED THE WINNING MARGINSeason
6—Henrik Mike-Mayer, Drake, 1981Career
10—Dan Miller, Miami (FL), 1978-81; John Lee, UCLA, 1982-85; Jeff Ward, Texas, 1983-86

2011 NCAA FOOTBALL RECORDS - FBS TEAM RECORDS 17
FOO
TBA
LL B
OW
LSU
BD
IVIS
ION
SINGLE GAME—Offense
Total OffenseMOST PLAYS
115—Northwestern (35) vs. Auburn (38), Jan. 1, 2010, ot (621 yards)
MOST PLAYS, BOTH TEAMS (REGULATION)196—San Diego St. (99) & North Texas (97), Dec. 4, 1971
(851 yards)
MOST PLAYS, BOTH TEAMS (OVERTIME)202—Kentucky (103) & Arkansas (99), Nov. 1, 2003, 7 ot
(1,111 yards)
FEWEST PLAYS12—Texas Tech vs. Centenary (LA), Nov. 11, 1939 (10
rushes, 2 passes, -1 yard)
FEWEST PLAYS, BOTH TEAMS33—Texas Tech (12) & Centenary (LA) (21), Nov. 11, 1939
(28 rushes, 5 passes, 30 yards)
MOST YARDS GAINED1,021—Houston vs. SMU, Oct. 21, 1989 (250 rushing, 771
passing, 86 plays)
MOST YARDS GAINED, BOTH TEAMS1,640—San Jose St. (849) & Nevada (791), Nov. 10, 2001
(168 plays)
FEWEST YARDS GAINEDMinus 47—Syracuse vs. Penn St., Oct. 18, 1947 (-107 rush-
ing, gained 60 passing, 49 plays)
FEWEST YARDS GAINED, BOTH TEAMS30—Texas Tech (-1) & Centenary (LA) (31), Nov. 11, 1939
(33 plays)
MOST YARDS GAINED BY A LOSING TEAM791—Nevada vs. San Jose St., Nov. 10, 2001 (lost 64-45)
BOTH TEAMS GAINING 600 YARDS OR MOREIn 33 games. Most recent: Navy (680) & North Texas (635),
Nov. 10, 2007 (141 plays); Texas Tech (718) & Oklahoma St. (610), Sept. 22, 2007 (182 plays); Texas Tech (661) & Oklahoma St. (673), Oct. 18, 2003 (168 plays); TCU (782) & Houston (684), Oct. 25, 2003 (167 plays); San Jose St. (664) & UTEP (630), Nov. 8, 2003 (156 plays); Hawaii (638) & Louisiana Tech (623), Oct. 18, 2003 (164 plays); San Diego St. (632) & Hawaii (610), Dec. 7, 2002 (157 plays); Hawaii (646) & BYU (612), Dec. 8, 2001 (178 plays); Northwestern (624) & Bowling Green (618), Nov. 17, 2001 (183 plays); San Jose St. (849) & Nevada (791), Nov. 10, 2001 (168 plays); Idaho (760) & Middle Tenn. (685), Oct. 6, 2001 (166 plays)
FEWEST YARDS GAINED BY A WINNING TEAM10—North Carolina St. vs. Virginia, Sept. 30, 1944 (won
13-0)
HIGHEST AVERAGE GAIN PER PLAY(Min. 75 Plays)
11.9—Houston vs. SMU, Oct. 21, 1989 (86 for 1,021)
MOST TOUCHDOWNS SCORED BY RUSHING AND PASSING
15—Wyoming vs. Northern Colo., Nov. 5, 1949 (9 rushing, 6 passing)
LONGEST DRIVE IN A GAME26 plays, 14:26 elapsed time—Navy vs. New Mexico, Dec.
30, 2004 (Emerald Bowl).Navy started at its one-yard line with 1:41 left in the third
quarter and drove 94 yards to the New Mexico five-yard line. The drive ended with a 22-yard field goal with 2:15 remaining in the game. Navy won, 34-19.
RushingMOST RUSHES
99—Missouri vs. Colorado, Oct. 12, 1968 (421 yards)
MOST RUSHES, BOTH TEAMS141—Colgate (82) & Bucknell (59), Nov. 6, 1971 (440
yards)
FEWEST RUSHES5—Houston vs. Texas Tech, Nov. 25, 1989 (36 yards)
Team RecordsFEWEST RUSHES, BOTH TEAMS
28—Texas Tech (10) & Centenary (LA) (18), Nov. 11, 1939 (23 yards)
MOST YARDS GAINED768—Oklahoma vs. Kansas St., Oct. 15, 1988 (72 rushes)
MOST YARDS GAINED, BOTH TEAMS1,039—Lenoir-Rhyne (837) & Davidson (202), Oct. 11,
1975 (111 rushes)MOST YARDS GAINED, BOTH TEAMS, MAJOR-COLLEGE OPPONENTS
956—Oklahoma (711) & Kansas St. (245), Oct. 23, 1971 (111 rushes)
FEWEST YARDS GAINEDMinus 109—Northern Ill. vs. Toledo, Nov. 11, 1967 (33
rushes)FEWEST YARDS GAINED, BOTH TEAMS
Minus 24—San Jose St. (-102) & UTEP (78), Oct. 22, 1966 (75 rushes)
MOST YARDS GAINED WITHOUT LOSS677—Nebraska vs. New Mexico St., Sept. 18, 1982 (78
rushes)MOST YARDS GAINED BY A LOSING TEAM
570—Rice vs. San Jose St., Oct. 2, 2004 (85 rushes, lost 70-63)
HIGHEST AVERAGE GAIN PER RUSH(Min. 50 Rushes)
11.9—Alabama vs. Virginia Tech, Oct. 27, 1973 (63 for 748)
MOST PLAYERS ON ONE TEAM EACH GAINING 100 YARDS OR MORE
4—Arizona St. vs. Arizona, Nov. 10, 1951 (Bob Tarwater 140, Harley Cooper 123, Duane Morrison 118, Buzz Walker 113); Texas vs. SMU, Nov. 1, 1969 (Jim Bertelsen 137, Steve Worster 137, James Street 121, Ted Koy 111); Alabama vs. Virginia Tech, Oct. 27, 1973 (Jimmy Taylor 142, Wilbur Jackson 138, Calvin Culliver 127, Richard Todd 102); Army vs. Montana, Nov. 17, 1984 (Doug Black 183, Nate Sassaman 155, Clarence Jones 130, Jarvis Hollingsworth 124); Nebraska vs. Baylor, Oct. 13, 2001 (Thunder Collins 165, Dahrran Diedrick 137, Eric Crouch 132, Judd Davies 119); Nevada vs. San Jose St., Nov. 8, 2009 (Vai Taua 144, Colin Kaepernick 115, Mark Lampford 114, Luke Lippincott 112)
MOST TOUCHDOWNS SCORED BY RUSHING12—UTEP vs. New Mexico St., Nov. 25, 1948
PassingMOST PASSES ATTEMPTED
83—Purdue vs. Wisconsin, Oct. 10, 1998 (completed 55)MOST PASSES ATTEMPTED, BOTH TEAMS
135—TCU (79) & Houston (56), Nov. 3, 1990 (completed 81)
FEWEST PASSES ATTEMPTED0—By many teams. Most recent: Navy vs. Wake Forest,
Oct. 24, 2009 (64 rushes; won 13-10)FEWEST PASSES ATTEMPTED, BOTH TEAMS
1—Michigan St. (0) & Maryland (1), Oct. 20, 1944 (not completed)
MOST PASSES ATTEMPTED WITHOUT COMPLETION
18—West Virginia vs. Temple, Oct. 18, 1946MOST PASSES ATTEMPTED WITHOUT INTERCEPTION
76—Eastern Mich. vs. Temple, Nov. 22, 2008 (completed 50); Houston vs. UTEP, Oct. 3, 2009 (completed 51)
MOST PASSES ATTEMPTED WITHOUT INTERCEPTION, BOTH TEAMS
114—Illinois (67) & Purdue (47), Oct. 12, 1985 (completed 67)
MOST CONSECUTIVE PASSES ATTEMPTED WITHOUT A RUSHING PLAY
32—North Carolina St. vs. Duke, Nov. 11, 1989 (3rd & 4th quarters, completed 16)
MOST PASSES COMPLETED58—Eastern Mich. vs. Central Mich., Nov. 28, 2008
(attempted 80)
MOST PASSES COMPLETED, BOTH TEAMS81—TCU (44) & Houston (37), Nov. 3, 1990 (attempted
135)BEST PERFECT GAME (100 PCT.)
12 of 12—Iowa vs. Northwestern, Nov. 9, 2002HIGHEST PERCENTAGE OF PASSES COMPLETED
(Min. 15-24 comps.) 96.0%—Tennessee vs. South Carolina, Oct. 31, 1998 (24 of 25)
(Min. 25-34 comps.) 92.6%—UCLA vs. Washington, Oct. 29, 1983 (25 of 27)
(Min. 35 comps.) 87.0%—South Carolina vs. Mississippi St., Oct. 14, 1995 (40 of 46)
HIGHEST PERCENTAGE OF PASSES COMPLETED, BOTH TEAMS(Min. 40 Completions)
84.6%—UCLA & Washington, Oct. 29, 1983 (44 of 52)MOST PASSES HAD INTERCEPTED
10—Detroit vs. Oklahoma St., Nov. 28, 1942; California vs. UCLA, Oct. 21, 1978 (52 attempts)
MOST YARDS GAINED771—Houston vs. SMU, Oct. 21, 1989 (completed 40
of 61)MOST YARDS GAINED, BOTH TEAMS
1,253—TCU (690) & Houston (563), Nov. 3, 1990 (135 attempts)
FEWEST YARDS GAINED, BOTH TEAMSMinus 13—North Carolina (-7 on 1 of 3 attempts) & Penn
(-6 on 2 of 12 attempts), Nov. 13, 1943MOST YARDS GAINED PER ATTEMPT
(Min. 30-39 atts.) 17.0—Nevada vs. Idaho, Oct. 24, 1998 (35 for 596)
(Min. 40 atts.) 15.9—UTEP vs. North Texas, Sept. 18, 1965 (40 for 634)
MOST YARDS GAINED PER COMPLETION(Min. 15-24 comps.) 31.9—UTEP vs. New Mexico, Oct. 28,
1967 (16 for 510)(Min. 25 comps.) 25.4—UTEP vs. North Texas, Sept. 18,
1965 (25 for 634)MOST TOUCHDOWN PASSES
11—Houston vs. Eastern Wash., Nov. 17, 1990MOST TOUCHDOWN PASSES AGAINST A MAJOR-COLLEGE OPPONENT
10—San Diego St. vs. New Mexico St., Nov. 15, 1969; Houston vs. SMU, Oct. 21, 1989
MOST TOUCHDOWN PASSES, BOTH TEAMS14—Houston (11) & Eastern Wash. (3), Nov. 17, 1990
MOST TOUCHDOWN PASSES, BOTH TEAMS, MAJOR-COLLEGE OPPONENTS
13—San Diego St. (10) & New Mexico St. (3), Nov. 15, 1969; Hawaii (8) & BYU (5), Dec. 8, 2001
PuntingMOST PUNTS
39—Texas Tech vs. Centenary (LA), Nov. 11, 1939 (1,377 yards)
38—Centenary (LA) vs. Texas Tech, Nov. 11, 1939 (1,248 yards)
MOST PUNTS, BOTH TEAMS77—Texas Tech (39) & Centenary (LA) (38), Nov. 11, 1939
(2,625 yards) (The game was played in a heavy down-pour in Shreveport, Louisiana. Forty-two punts were returned, 19 went out of bounds, 10 were downed, 1 went into the end zone for a touchback, 4 were blocked and 1 was fair caught. Sixty-seven punts [34 by Texas Tech and 33 by Centenary] occurred on first-down plays, including 22 consecutively in the third and fourth quarters. The game was a scoreless tie.)
FEWEST PUNTS0—By many teams. Most recent: Oklahoma St. vs. Kansas,
Nov. 20, 2010 (won 48-14)FEWEST PUNTS BY A LOSING TEAM
0—By many teams. Most recent: Notre Dame vs. Navy, Nov. 3, 2007 (lost 46-44)
HIGHEST AVERAGE PER PUNT(Min. 5-9 punts) 60.4—BYU vs. Wyoming, Oct. 8, 1983 (5
for 302)

18 2011 NCAA FOOTBALL RECORDS - FBS TEAM RECORDS
(Min. 10 punts) 53.6—Oklahoma St. vs. Colorado, Nov. 13, 1971 (10 for 536)
HIGHEST AVERAGE PER PUNT, BOTH TEAMS(Min. 10 Punts)
55.3—BYU & Wyoming, Oct. 8, 1983 (11 for 608)
Punt ReturnsMOST PUNT RETURNS
22—Texas Tech vs. Centenary (LA), Nov. 11, 1939 (112 yards)
MOST PUNT RETURNS, BOTH TEAMS42—Texas Tech (22) & Centenary (LA) (20), Nov. 11, 1939
(233 yards)
MOST YARDS ON PUNT RETURNS319—Texas A&M vs. North Texas, Sept. 21, 1946 (10
returns)
HIGHEST AVERAGE GAIN PER RETURN(Min. 5 Returns)
44.2—Denver vs. Colorado Col., Sept. 17, 1956 (6 for 265)
MOST TOUCHDOWNS SCORED ON PUNT RETURNS
3—Wisconsin vs. Iowa, Nov. 8, 1947; Wichita St. vs. Northern St., Oct. 22, 1949; LSU vs. Ole Miss, Dec. 5, 1970; Holy Cross vs. Brown, Sept. 21, 1974; Arizona St. vs. Pacific, Nov. 15, 1975; Notre Dame vs. Pittsburgh, Nov. 16, 1996; Oklahoma vs. UCLA, Sept. 20, 2003.
Kickoff ReturnsMOST KICKOFF RETURNS
14—Arizona St. vs. Nevada, Oct. 12, 1946 (290 yards)
MOST YARDS ON KICKOFF RETURNS344—Rice vs. Tulane, Nov. 13, 2010 (10 returns)
HIGHEST AVERAGE GAIN PER RETURN(Min. 6 Returns)
46.2—Southern California vs. Washington St., Nov. 7, 1970 (6 for 277)
MOST TOUCHDOWNS SCORED ON KICKOFF RETURNS
2—By many teams. Most recent: Kansas St. vs. Tennessee Tech, Sept. 26, 2009; UCLA vs. Northwestern, Dec. 30, 2005 (Sun Bowl; consecutive returns, both onside kicks); Clemson vs. Florida St., Sept. 25, 2004; New Mexico St. vs. Tulsa, Oct. 6, 2001
TOUCHDOWNS SCORED ON BACK-TO-BACK KICKOFF RETURNS, BOTH TEAMS
2—By many teams. Most recent: Ohio & Ball St., Oct. 22, 2005
Total Kick Returns(Combined Punt and Kickoff Returns)
MOST YARDS ON KICK RETURNS376—Florida St. vs. Virginia Tech, Nov. 16, 1974 (9 returns)
HIGHEST AVERAGE GAIN PER RETURN(Min. 7 Returns)
41.8—Florida St. vs. Virginia Tech, Nov. 16, 1974(9 for 376)
ScoringMOST POINTS SCORED
103—Wyoming vs. Northern Colo. (0), Nov. 5, 1949 (15 TDs, 13 PATs)
MOST POINTS SCORED AGAINST A MAJOR-COLLEGE OPPONENT
100—Houston vs. Tulsa (6), Nov. 23, 1968 (14 TDs, 13 PATs, 1 FG)
MOST POINTS SCORED, BOTH TEAMS (REGULATION)
136—Navy (74) & North Texas (62), Nov. 10, 2007
MOST POINTS SCORED BY A LOSING TEAM (REGULATION)
63—Rice vs. San Jose St. (70), Oct. 2, 2004
MOST POINTS SCORED BY A LOSING TEAM (OVERTIME)
67—Nevada vs. Boise St. (69), Oct. 14, 2007 (4 ot)
MOST POINTS, BOTH TEAMS IN A TIE GAME104—BYU (52) & San Diego St. (52), Nov. 16, 1991
MOST POINTS, BOTH TEAMS, AT THE END OF REGULATION, OVERTIME GAME
104—Akron (52) & Eastern Mich. (52), Nov. 24, 2001 (Akron won in three overtime periods, 65-62)
MOST POINTS, BOTH TEAMS, OVERTIME GAME
136—Boise St. (69) & Nevada (67), Oct. 14, 2007 (4 ot)
MOST POINTS SCORED IN ONE QUARTER49—Houston vs. Tulsa, Nov. 23, 1968 (4th); Davidson vs.
Furman, Sept. 27, 1969 (2nd); Fresno St. vs. New Mexico, Oct. 5, 1991 (2nd)
Note: Western Ky. scored 49 points in the first quarter against West Va. Tech, Sept. 8, 2007, as an FBS reclassifying team.
MOST POINTS SCORED IN ONE QUARTER, BOTH TEAMS
63—Navy (35) vs. North Texas (28), Nov. 10, 2007 (2nd; Navy won, 74-62)
MOST POINTS SCORED IN ONE HALF76—Houston vs. Tulsa, Nov. 23, 1968 (2nd)
MOST POINTS SCORED IN ONE HALF, BOTH TEAMS
94—North Texas (49) & Navy (45), Nov. 10, 2007 (1st)
MOST TOUCHDOWNS SCORED15—Wyoming vs. Northern Colo., Nov. 5, 1949
(9 rushing, 6 passing)
MOST TOUCHDOWNS SCORED, BOTH TEAMS19—San Jose St. (10) & Rice (9), Oct. 2, 2004 (San Jose St.
won, 70-63) (San Jose St. had 6 passing TDs, 2 rushing TDs, 1 punt return TD, 1 interception return TD; Rice had 8 rushing TDs, 1 interception return TD); Navy (10) & North Texas (9), Nov. 10, 2007 (Navy won, 74-62) (Navy had 8 rushing TDs, 1 passing TD, 1 kickoff return TD; North Texas had 8 passing TDs, 1 rushing TD)
MOST EXTRA POINTS MADE BY KICKING13—Wyoming vs. Northern Colo., Nov. 5, 1949 (attempt-
ed 15); Houston vs. Tulsa, Nov. 23, 1968 (attempted 14); Fresno St. vs. New Mexico, Oct. 5, 1991 (attempted 13)
MOST TWO-POINT ATTEMPTS SCORED7—Pacific vs. San Diego St., Nov. 22, 1958 (attempted 9)
MOST DEFENSIVE TOUCHDOWNS4—Houston vs. Texas, Nov. 7, 1987 (4 interception
returns); Florida vs. La.-Lafayette, Aug. 31, 1996 (2 fumble returns, 2 interception returns); Arizona St. vs. UCLA, Nov. 28, 2008 (3 interception returns, 1 fumble return)
MOST DEFENSIVE EXTRA-POINT ATTEMPTS2—Rice vs. Notre Dame, Nov. 5, 1988 (2 kick returns; 1
scored); Northern Ill. vs. Akron, Nov. 3, 1990 (2 intercep-tion returns); Oklahoma vs. California, Sept. 20, 1997 (2 kick returns; 1 scored); Texas vs. Iowa St., Oct. 3, 1998 (2 kick returns; 2 scored)
MOST DEFENSIVE EXTRA POINTS SCORED2—Texas vs. Iowa St., Oct. 3, 1998 (2 kick returns)
MOST FIELD GOALS MADE7—Western Mich. vs. Marshall, Sept. 29, 1984 (attempted
9); Nebraska vs. Missouri, Oct. 19, 1985 (attempted 7)
MOST FIELD GOALS MADE, BOTH TEAMS9—La.-Lafayette (5) & Central Mich. (4), Sept. 9, 1989
(attempted 11)
MOST FIELD GOALS ATTEMPTED9—Western Mich. vs. Marshall, Sept. 29, 1984 (made 7);
North Texas vs. FIU, Oct. 7, 2006 (made 5)
MOST FIELD GOALS ATTEMPTED, BOTH TEAMS
16—North Texas (9) & FIU (7), Oct. 7, 2006 (made 8)
MOST FIELD GOALS MISSED7—LSU vs. Florida, Nov. 25, 1972 (attempted 8)
First DownsMOST FIRST DOWNS
45—Texas Tech vs. Iowa St., Oct. 11, 2003 (16 rush, 28 pass, 1 penalty)
MOST FIRST DOWNS, BOTH TEAMS72—New Mexico (37) & San Diego St. (35), Sept. 27, 1986
FEWEST FIRST DOWNS BY A WINNING TEAM0—North Carolina St. vs. Virginia, Sept. 30, 1944 (won 13-
0); Michigan vs. Ohio St., Nov. 25, 1950 (won 9-3)
MOST FIRST DOWNS BY RUSHING36—Nebraska vs. New Mexico St., Sept. 18, 1982
MOST FIRST DOWNS BY PASSING33—Idaho vs. Middle Tenn., Oct. 6, 2001
FumblesMOST FUMBLES
17—Wichita St. vs. Florida St., Sept. 20, 1969 (lost 10)
MOST FUMBLES, BOTH TEAMS27—Wichita St. (17) & Florida St. (10), Sept. 20, 1969
(lost 17)
MOST FUMBLES LOST10—Wichita St. vs. Florida St., Sept. 20, 1969 (17 fumbles)
MOST FUMBLES LOST, BOTH TEAMS17—Wichita St. (10) & Florida St. (7), Sept. 20, 1969 (27
fumbles)
MOST FUMBLES LOST IN A QUARTER5—East Carolina vs. La.-Lafayette, Sept. 13, 1980 (3rd
quarter on 5 consecutive possessions); San Diego St. vs. California, Sept. 18, 1982 (1st)
PenaltiesMOST PENALTIES AGAINST
24—San Jose St. vs. Fresno St., Oct. 4, 1986 (199 yards)
MOST PENALTIES, BOTH TEAMS36—San Jose St. (24) & Fresno St. (12), Oct. 4, 1986 (317
yards)
FEWEST PENALTIES, BOTH TEAMS0—By many teams. Most recent: Army & Navy, Dec. 6,
1986
MOST YARDS PENALIZED238—Arizona St. vs. UTEP, Nov. 11, 1961 (13 penalties)
MOST YARDS PENALIZED, BOTH TEAMS421—Grambling (16 for 216 yards) & Texas Southern (17
for 205 yards), Oct. 29, 1977
Turnovers(Number of Times Losing the Ball on Fumbles and Interceptions)
MOST TURNOVERS LOST13—Georgia vs. Georgia Tech, Dec. 1, 1951 (5 fumbles, 8
interceptions)
MOST TURNOVERS, BOTH TEAMS20—Wichita St. (12) & Florida St. (8), Sept. 20, 1969 (17
fumbles, 3 interceptions)
MOST TOTAL PLAYS WITHOUT A TURNOVER(Rushes, Passes, All Runbacks)
110—California vs. San Jose St., Oct. 5, 1968 (also did not fumble); Baylor vs. Rice, Nov. 13, 1976
MOST TOTAL PLAYS WITHOUT A TURNOVER, BOTH TEAMS
184—Arkansas (93) & Texas A&M (91), Nov. 2, 1968
MOST TOTAL PLAYS WITHOUT A TURNOVER OR A FUMBLE, BOTH TEAMS
158—Stanford (88) & Oregon (70), Nov. 2, 1957
MOST TURNOVERS BY A WINNING TEAM11—Purdue vs. Illinois, Oct. 2, 1943 (9 fumbles, 2 intercep-
tions; won 40-21)
MOST PASSES HAD INTERCEPTED BY A WINNING TEAM
7—Pittsburgh vs. Army, Nov. 15, 1980 (54 attempts; won 45-7); Florida vs. Kentucky, Sept. 11, 1993 (52 attempts; won 24-20)
MOST FUMBLES LOST BY A WINNING TEAM9—Purdue vs. Illinois, Oct. 2, 1943 (10 fumbles; won
40-21); Arizona St. vs. Utah, Oct. 14, 1972 (10 fumbles; won 59-48)

2011 NCAA FOOTBALL RECORDS - FBS TEAM RECORDS 19
FOO
TBA
LL B
OW
LSU
BD
IVIS
IONOvertimes
MOST OVERTIME PERIODS7—Arkansas (58) vs. Ole Miss (56), Nov. 3, 2001; Arkansas
(71) vs. Kentucky (63), Nov. 1, 2003; North Texas (25) vs. FIU (22), Oct. 7, 2006
MOST PLAYS IN OVERTIME GAME115—Northwestern (35) vs. Auburn (38), Jan. 1, 2010 (1
overtime period)
MOST PLAYS IN OVERTIME GAME, BOTH TEAMS
202—Kentucky (103) & Arkansas (99), Nov. 1, 2003 (7 overtime periods)
MOST POINTS SCORED IN OVERTIME PERIODS47—Arkansas (71) vs. Kentucky (63), Nov. 1, 2003 (7
overtime periods)
MOST POINTS SCORED IN OVERTIME PERI-ODS, BOTH TEAMS
86—Arkansas (47) & Kentucky (39), Nov. 1, 2003 (7 over-time periods; Arkansas won, 71-63)
LARGEST WINNING MARGIN IN OVERTIME13—Arizona St. (48) vs. Southern California (35), Oct. 19,
1996 (2 overtime periods); Central Mich. (36) vs. Eastern Mich. (23), Oct. 10, 1998 (one overtime period)
CONSECUTIVE OVERTIME GAMES (SEASON)2—Southern California (41) vs. UCLA (48), Nov. 23, 1996,
& Southern California (27) vs. Notre Dame (20), Nov. 30, 1996; Oklahoma St. (50) vs. Missouri (51), Oct. 25, 1997, & Oklahoma St. (25) vs. Texas A&M (28), Nov. 1, 1997; Cincinnati (38) vs. Houston (41), Oct. 18, 1997, & Cincinnati (34) vs. Miami (OH) (31), Oct. 25, 1997; La.-Lafayette (42) vs. North Ala. (48), Oct. 11, 1997, & La.-Lafayette (21) vs. La.-Monroe (28), Oct. 25, 1997; San Diego St. (36) vs. New Mexico (33), Oct. 17, 1998, & San Diego St. (21) vs. Utah (20), Oct. 24, 1998; Ole Miss (34) vs. Vanderbilt (37), Sept. 18, 1999, & Ole Miss (24) vs. Auburn (17), Sept. 25, 1999; Wisconsin (28) vs. Cincinnati (25), Sept. 16, 2000, & Wisconsin (44) vs. Northwestern (47), Sept. 23, 2000; Oregon (56) vs. Arizona St. (55), Oct. 28, 2000, & Oregon (27) vs. Washington St. (24), Nov. 4, 2000; Rice (33) vs. Nevada (30), Oct. 20, 2001, & Rice (38) vs. Louisiana Tech (41), Oct. 27, 2001; New Mexico (44) vs. Utah St. (45), Oct. 19, 2002, & New Mexico (42) vs. Utah (35), Oct. 26, 2002; Utah St. (45) vs. New Mexico (42), Oct. 19, 2002, & Utah St. (48) vs. La.-Monroe (51), Oct. 26, 2002; Missouri (38) vs. Colorado (45), Nov. 9, 2002, & Missouri (33) vs. Texas A&M (27), Nov. 16, 2002; Northwestern (33) vs. Ohio St. (27), Oct. 2, 2004, & Northwestern (31) vs. Indiana (24), Oct. 9, 2004; Texas A&M (29) vs. Colorado (26), Oct. 23, 2004, & Baylor (35) vs. Texas A&M (34), Oct. 30, 2004; Central Mich. (24) vs. Western Mich. (21), Oct. 30, 2004, & Central Mich. (58) vs. Eastern Mich. (61), Nov. 6, 2004; TCU (23) vs. Utah (20), Sept. 15, 2005, & TCU (51) vs. BYU (50), Sept. 24, 2005; Clemson (30) vs. Miami (FL) (36), Sept. 17, 2005, & Clemson (13) vs. Boston College (16), Sept. 24, 2005; Boston College (34) vs. Clemson (33), Sept. 9, 2006, & Boston College (30) vs. BYU (23), Sept. 16, 2006; Buffalo (9) vs. Temple (3), Aug. 31, 2006, & Buffalo (40) vs. Bowling Green (48), Sept. 9, 2006; Washington (21) vs. California (28), Oct. 21, 2006, & Washington (23) vs. Arizona St. (26), Oct. 28, 2006; Fla. Atlantic (39) vs. La.-Lafayette (32), Oct. 20, 2007, & Fla. Atlantic (30) vs. La.-Monroe (33), Oct. 27, 2007; Minnesota (31) vs. Bowling Green (32), Sept. 1, 2007, & Minnesota (41) vs. Miami (OH) (35), Sept. 8, 2007; Buffalo (28) vs. Western Mich. (34), Oct. 11, 2008, & Buffalo (27) vs. Army (24), Oct. 18, 2008; East Carolina (13) vs. UCF (10), Nov. 2, 2008, & East Carolina (19) vs. Marshall (16), Nov. 8, 2008; Buffalo (43) vs. Akron (40), Nov. 13, 2008, & Buffalo (40) vs. Bowling Green (34), Nov. 21, 2008; Arkansas (30) vs. LSU (33), Nov. 28, 2009, & Arkansas (20) vs. East Carolina (17), Jan. 2, 2010
OVERTIME GAMES WITH SAME OPPONENTIN CONSECUTIVE YEARS
3—Central Mich. (24) vs. Eastern Mich. (17), Sept. 23, 2006, Eastern Mich. (23) vs. Central Mich. (20), Sept. 24, 2005 & Eastern Mich. (61) vs. Central Mich. (58), Nov. 6, 2004
2—Cincinnati (34) vs. Miami (OH) (31), Oct. 25, 1997, & Cincinnati (30) vs. Miami (OH) (23), Sept. 28, 1996; Oregon (43) vs. Fresno St. (40), Sept. 20, 1997, & Oregon (30) vs. Fresno St. (27), Aug. 31, 1996; Missouri (51) vs. Oklahoma St. (50), Oct. 25, 1997, & Missouri (35) vs. Oklahoma St. (28), Oct. 26, 1996; Arizona (41) vs. California (38), Nov. 15, 1997, & Arizona (55) vs. California (56), Nov. 2, 1996; Boston College (34) vs. Clemson (33), Sept. 9, 2006 & Boston College (16) vs. Clemson (13), Sept. 24, 2005
SINGLE GAME—Defense
Total DefenseFEWEST PLAYS ALLOWED
12—Centenary (LA) vs. Texas Tech, Nov. 11, 1939 (10 rushes, 2 passes; -1 yard)
FEWEST YARDS ALLOWEDMinus 47—Penn St. vs. Syracuse, Oct. 18, 1947 (-107 rush-
ing, 60 passing; 49 plays)
MOST YARDS ALLOWED1,021—SMU vs. Houston, Oct. 21, 1989 (250 rushing, 771
passing)
Rushing DefenseFEWEST RUSHES ALLOWED
5—Texas Tech vs. Houston, Nov. 25, 1989 (36 yards)
FEWEST RUSHING YARDS ALLOWEDMinus 109—Toledo vs. Northern Ill., Nov. 11, 1967 (33
rushes)
Pass DefenseFEWEST ATTEMPTS ALLOWED
0—By many teams. Most recent: Wake Forest vs. Navy, Oct. 24, 2009
FEWEST COMPLETIONS ALLOWED(Min. 1 Attempt)
0—By many teams. Most recent: Houston vs. Air Force, Sept. 13, 2008 (7 attempts)
LOWEST COMPLETION PERCENTAGE ALLOWED(Min. 10 Attempts)
0.0%—North Carolina vs. Penn St., Oct. 2, 1943 (0 of 12 attempts); Temple vs. West Virginia, Oct. 18, 1946 (0 of 18 attempts); San Jose St. vs. Cal St. Fullerton, Oct. 10, 1992 (0 of 11 attempts)
FEWEST YARDS ALLOWEDMinus 16—VMI vs. Richmond, Oct. 5, 1957 (2 comple-
tions)
MOST PASSES INTERCEPTED BY11—Brown vs. Rhode Island, Oct. 8, 1949 (136 yards)
MOST PASSES INTERCEPTED BY AGAINST A MAJOR-COLLEGE OPPONENT
10—Oklahoma St. vs. Detroit, Nov. 28, 1942; UCLA vs. California, Oct. 21, 1978
MOST PASSES INTERCEPTED BY A LOSING TEAM
7—Army vs. Pittsburgh, Nov. 15, 1980 (54 attempts); Kentucky vs. Florida, Sept. 11, 1993 (52 attempts)
MOST YARDS ON INTERCEPTION RETURNS240—Kentucky vs. Mississippi, Oct. 1, 1949 (6 returns)
MOST TOUCHDOWNS ON INTERCEPTION RETURNS
4—Houston vs. Texas, Nov. 7, 1987 (198 yards; 3 TDs in the 4th quarter)
Defensive Records(Since 2000)
TACKLES FOR LOSS23—North Carolina St. vs. Florida St., Nov. 11, 2004;
Arizona St. vs. Washington St., Oct. 10, 2009
PASS SACKS15—TCU vs. Nevada, Sept. 9, 2000
PASSES DEFENDED (Pass Interceptions and Pass Breakups)
19—South Carolina vs. Alabama, Oct. 2, 2000
FORCED FUMBLES7—Miami (OH) vs. North Carolina, Aug. 31, 2002; Virginia
vs. South Carolina, Sept. 7, 2002; West Virginia vs. Cincinnati, Sept. 13, 2003; Miami (OH) vs. Buffalo, Nov. 5, 2005
First DownsFEWEST FIRST DOWNS ALLOWED
0—By many teams. Most recent: North Carolina St. vs. Western Caro., Sept. 1, 1990
Opponent’s Kicks BlockedMOST OPPONENT’S PUNTS BLOCKED
4—SMU vs. Texas-Arlington, Sept. 30, 1944; Michigan vs. Ohio St., Nov. 25, 1950; Memphis vs. Arkansas, Sept. 26, 1992 (10 attempts); Central Mich. vs. Michigan St., Sept. 8, 2001 (6 attempts)
MOST OPPONENT’S PUNTS BLOCKED,ONE QUARTER
3—Purdue vs. Northwestern, Nov. 11, 1989 (4 attempts)
BLOCKED OPPONENT’S FIELD GOAL, PUNT AND EXTRA-POINT KICK
Oregon St. blocked each type of kick against Southern California, Sept. 14, 1996
MOST OPPONENT’S FIELD GOALS BLOCKED, ONE QUARTER
2—Southern California vs. California, Oct. 22, 1994; Wyoming vs. Fresno St., Nov. 18, 1995; Central Mich. vs. Kent St., Oct. 2, 2004; Southern California vs. Arizona St., Oct. 11, 2008 (3rd); Iowa vs. UNI, Sept. 5, 2009 (4th)
Turnovers Gained(Number of Times Gaining the Ball on Fumbles and Interceptions)
MOST TURNOVERS GAINED13—Georgia Tech vs. Georgia, Dec. 1, 1951 (5 fumbles, 8
interceptions)
MOST CONSECUTIVE OPPONENT’S SERIES RESULTING IN TURNOVERS
7—Florida vs. Florida St., Oct. 7, 1972 (4 fumbles lost, 3 interceptions; first seven series of the game)
Fumble Returns(Since 1992)
MOST TOUCHDOWNS ON FUMBLE RETURNS2—Toledo vs. Arkansas St., Sept. 5, 1992; Arizona vs.
Illinois, Sept. 18, 1993; Duke vs. Wake Forest, Oct. 22, 1994 (both occurred in 1st quarter); Iowa vs. Minnesota, Nov. 19, 1994; Minnesota vs. Syracuse, Sept. 21, 1996; Florida vs. La.-Lafayette, Aug. 31, 1996; Arizona St. vs. Washington St., Nov. 1, 1997; Mississippi St. vs. BYU, Sept. 14, 2000; Notre Dame vs. Navy, Oct. 14, 2000; Southern California vs. UCLA, Nov. 22, 2003; SMU vs. Nevada, Nov. 13, 2004
LONGEST RETURN OF A FUMBLE100—Rutgers vs. Pittsburgh, Oct. 28, 1995; Rice vs. UNLV,
Nov. 14, 1998; UNLV vs. Baylor, Sept. 11, 1999
Defensive Extra PointsMOST DEFENSIVE EXTRA POINTSSCORED AGAINST
2—Iowa St. vs. Texas, Oct. 3, 1998 (2 kick returns)

20 2011 NCAA FOOTBALL RECORDS - FBS TEAM RECORDS
MOST DEFENSIVE EXTRA-POINTATTEMPTS AGAINST
2—Notre Dame vs. Rice, Nov. 5, 1988 (2 blocked kick returns, 1 scored); Akron vs. Northern Ill., Nov. 3, 1990 (2 interception returns); California vs. Oklahoma, Sept. 20, 1997 (2 kick returns; 1 scored); Iowa St. vs. Texas, Oct. 3, 1998 (2 kick returns; 2 scored)
MOST DEFENSIVE EXTRA POINTS SCOREDBY BOTH TEAMS(Must Have One Scored by Each Team)
2—Kentucky (fumbled snap return) and LSU (blocked kick return), Oct. 17, 1998
SafetiesMOST SAFETIES
3—Penn St. vs. Maryland, Sept. 17, 1966; Arizona St. vs. Nebraska, Sept. 21, 1996; North Texas vs. La.-Lafayette, Sept. 27, 2003; Bowling Green vs. Miami (OH), Nov. 15, 2005
SEASON—Offense
Total OffenseMOST YARDS GAINED PER GAME
624.9—Houston, 1989 (6,874 in 11)
MOST YARDS GAINED7,978—Tulsa, 2008 (14 games)
HIGHEST AVERAGE GAIN PER PLAY8.6—Hawaii, 2006 (913 for 7,829)
GAINING 300 YARDS OR MORE PER GAME RUSHING AND 200 YARDS OR MORE PER GAME PASSING
Houston, 1968 (361.7 rushing, 200.3 passing); Arizona St., 1973 (310.2 rushing, 255.3 passing)
MOST PLAYS PER GAME92.4—Notre Dame, 1970 (924 in 10)
MOST TOUCHDOWNS RUSHING AND PASSING96—Oklahoma, 2008 (14 games)Nebraska holds per-game record at 7.0 (84 in 12) in 1983
RushingMOST YARDS GAINED PER GAME
472.4—Oklahoma, 1971 (5,196 in 11)
HIGHEST AVERAGE GAIN PER RUSH7.6—Army, 1945 (424 for 3,238)
HIGHEST AVERAGE GAIN PER RUSH(Min. 500 Rushes)
7.4—Nevada, 2009 (607 for 4,484)
MOST RUSHES PER GAME73.9—Oklahoma, 1974 (813 in 11)
MOST TOUCHDOWNS RUSHING PER GAME5.5—Nebraska, 1997 (66 in 12)
PassingMOST YARDS GAINED PER GAME
511.3—Houston, 1989 (5,624 in 11)
MOST YARDS GAINED6,179—Texas Tech, 2003 (13 games)
HIGHEST AVERAGE GAIN PER ATTEMPT(Min. 350 Attempts)
10.9—BYU, 1989 (433 for 4,732)
HIGHEST AVERAGE GAIN PER COMPLETION(Min. 100-174 comps.) 19.1—Houston, 1968 (105 for 2,003)(Min. 175-224 comps.) 18.0—Grambling, 1977 (187 for
3,360)(Min. 225 comps.) 17.1—Florida, 1996 (234 for 4,007)
MOST PASSES ATTEMPTED PER GAME63.1—Houston, 1989 (694 in 11)
MOST PASSES COMPLETED PER GAME41.8—Texas Tech, 2007 (544 in 13)
HIGHEST PERCENTAGE COMPLETED(Min. 150 Attempts)
76.7%—Texas, 2008 (343 of 447)
LOWEST PERCENTAGE HAD INTERCEPTED(Min. 300 atts.) 0.66%—Boise St., 2009 (3 of 458)
MOST TOUCHDOWN PASSES PER GAME5.0—Houston, 1989 (55 in 11)
MOST TOUCHDOWN PASSES62—Hawaii, 2006 (14 games)
FEWEST TOUCHDOWN PASSES0—By 6 teams since 1975. Most recent: Vanderbilt, 1993
(11 games, 157 attempts)
HIGHEST PASSING EFFICIENCY RATING POINTS(Min. 150 Attempts)
185.9—Hawaii, 2006 (615 attempts, 444 completions, 12 interceptions, 6,178 yards, 62 TD passes)
A TEAM WITH THE NO. 1 & NO. 2 RECEIVERSHouston, 1988 (Jason Phillips, No. 1, 9.82 catches per
game & James Dixon, No. 2, 9.27 catches per game)
MOST 100-YARD RECEIVING GAMESIN A SEASON, ONE TEAM
20—Hawaii, 2006 (Davone Bess 6, Jason Rivers 5, Ryan Grice-Mullen 4, Ross Dickerson 2, Ian Sample 2 & Nate Ilaoa 1)
PuntingMOST PUNTS PER GAME
13.9—Tennessee, 1937 (139 in 10)
FEWEST PUNTS PER GAME1.2—Hawaii, 2006 (17 in 14)
HIGHEST PUNTING AVERAGE50.6—BYU, 1983 (24 for 1,215 yards)
HIGHEST PUNTING AVERAGE(Min. 40 Punts)
48.1—Georgia, 2009 (56 for 2,691)
HIGHEST NET PUNTING AVERAGE45.0—BYU, 1983 (24 for 1,215 yards, 134 yards in punts
returned)
HIGHEST NET PUNTING AVERAGE(Min. 40 Punts)
44.9—San Diego St., 1996 (48 for 2,234 yards, 77 yards in punts returned)
Punt ReturnsMOST PUNT RETURNS PER GAME
6.9—Texas A&M, 1943 (69 in 10)
FEWEST PUNT RETURNS PER GAME0.45—Iowa St., 1996 (5 in 11)
MOST PUNT-RETURN YARDS PER GAME114.5—Colgate, 1941 (916 in 8)
HIGHEST AVERAGE GAIN PER RETURN(Min. 15-29 rets.) 25.2—Arizona St., 1952 (18 for 454)(Min. 30 rets.) 22.5—Kansas St., 2007 (34 for 766)
MOST TOUCHDOWNS SCOREDON PUNT RETURNS(Since 1966)
7—Southern Miss., 1987 (on 46 returns); Miami (FL), 2004 (on 42 returns)
Kickoff ReturnsMOST KICKOFF RETURNS PER GAME
7.3—Cal St. Fullerton, 1990 (80 in 11)
FEWEST KICKOFF RETURNS PER GAME0.7—Boston College, 1939 (7 in 10)
MOST KICKOFF-RETURN YARDS1,797—Western Ky., 2009 (81 returns)
MOST KICKOFF-RETURN YARDS PER GAME149.8—Western Ky., 2009 (1,797 in 12)
HIGHEST AVERAGE GAIN PER RETURN(Min. 25-34 rets.) 30.3—Florida St., 1992 (27 for 819)(Min. 35 rets.) 28.5—Cincinnati, 2009 (54 for 1,540)
MOST TOUCHDOWNS SCOREDON KICKOFF RETURNS(Since 1966)
5—Tulsa, 2004 (on 52 returns); Houston, 2009 (on 67 returns)
ScoringMOST POINTS PER GAME
56.0—Army, 1944 (504 in 9)
MOST POINTS SCORED(13 games) 652—Texas, 2005(14 games) 716—Oklahoma, 2008
HIGHEST SCORING MARGIN52.1—Army, 1944 (scored 504 points for 56.0 average and
allowed 35 points for 3.9 average in 9 games)
MOST POINTS SCORED, TWO CONSECUTIVE GAMES
177—Houston, 1968 (77-3 vs. Idaho, Nov. 16, and 100-6 vs. Tulsa, Nov. 23)
MOST TOUCHDOWNS PER GAME8.2—Army, 1944 (74 in 9)
MOST TOUCHDOWNS99—Oklahoma, 2008 (14 games)
MOST EXTRA POINTS MADE BY KICKING94—Oklahoma, 2008 (14 games)Also holds per-game record with 6.71 (94 in 14)
MOST CONSECUTIVE EXTRA POINTSMADE BY KICKING
77—Louisville, 2004 (Entire Season)
MOST TWO-POINT ATTEMPTS MADE PER GAME
2.2—Rutgers, 1958 (20 in 9, attempted 31)
MOST DEFENSIVE EXTRA-POINT ATTEMPTS3—Rice, 1988 (1 vs. La.-Lafayette, Sept. 24, blocked kick
return; 2 vs. Notre Dame, Nov. 5, 2 blocked kick returns, 1 scored)
MOST DEFENSIVE EXTRA POINTS SCORED2—Texas, 1998 (2 vs. Iowa St., Oct. 3, 2 blocked kick
returns); Tulsa, 2010 (1 vs. Notre Dame, Oct. 30, blocked kick return; 1 vs. Rice, Nov. 6, blocked kick return)
MOST FIELD GOALS PER GAME2.6—UCLA, 1984 (29 in 11); Cincinnati, 2000 (29 in 11)
First DownsMOST FIRST DOWNS PER GAME
32.2—Texas Tech, 2003 (418 in 13)
MOST RUSHING FIRST DOWNS PER GAME21.4—Oklahoma, 1974 (235 in 11)
MOST PASSING FIRST DOWNS PER GAME23.5—Texas Tech, 2003 (305 in 13)
FumblesMOST FUMBLES
73—Cal St. Fullerton, 1992 (lost 41)
MOST FUMBLES LOST41—Cal St. Fullerton, 1992 (73 fumbles)
FEWEST OWN FUMBLES LOST1—Bowling Green, 1996; Miami (OH), 1998; Northern
Ill., 2004
FEWEST OWN FUMBLES LOST IN TWO CONSECUTIVE SEASONS
3—Miami (OH), 1998-99 (1 in 1998; 2 in 1999)
MOST CONSECUTIVE FUMBLES LOST14—Oklahoma, 1983 (during 5 games, Oct. 8-Nov. 5)
PenaltiesMOST PENALTIES PER GAME
12.9—Grambling, 1977 (142 in 11, 1,476 yards)
MOST YARDS PENALIZED PER GAME134.2—Grambling, 1977 (1,476 in 11, 142 penalties)

2011 NCAA FOOTBALL RECORDS - FBS TEAM RECORDS 21
FOO
TBA
LL B
OW
LSU
BD
IVIS
IONTurnovers (Giveaways)
(Fumbles Lost and Passes Had Intercepted)
FEWEST TURNOVERS8—Clemson, 1940 (2 fumbles lost, 6 interceptions); Miami
(OH), 1966 (4 fumbles lost, 4 interceptions); Notre Dame, 2000 (4 fumbles lost, 4 interceptions)
FEWEST TURNOVERS PER GAME0.69—Wisconsin, 2010 (9 in 13 games)
MOST TURNOVERS61—North Texas, 1971 (28 fumbles lost, 33 interceptions);
Tulsa, 1976 (37 fumbles lost, 24 interceptions)
MOST TURNOVERS PER GAME6.1—Mississippi St., 1949 (55 in 9 games; 30 fumbles lost,
25 interceptions)
SEASON—Defense
Total DefenseFEWEST YARDS ALLOWED PER GAME
69.9—Santa Clara, 1937 (559 in 8)
FEWEST RUSHING AND PASSING TOUCHDOWNS ALLOWED PER GAME
0.0—Duke, 1938; Tennessee, 1939
LOWEST AVERAGE YARDS ALLOWED PER PLAY
(Min. 400-599 plays) 1.7—Texas A&M, 1939 (447 for 763) (Min. 600-699 plays) 2.5—Nebraska, 1967 (627 for 1,576)(Min. 700 plays) 2.7—Toledo, 1971 (734 for 1,795)
MOST YARDS ALLOWED PER GAME553.0—Maryland, 1993 (6,083 in 11)
Rushing DefenseFEWEST YARDS ALLOWED PER GAME
17.0—Penn St., 1947 (153 in 9)
MOST YARDS LOST BY OPPONENTS PER GAME70.1—Wyoming, 1968 (701 in 10, 458 rushes)
LOWEST AVERAGE YARDS ALLOWED PER RUSH
(Min. 240-399 rushes) 0.6—Penn St., 1947 (240 for 153)(Min. 400-499 rushes) 1.3—North Texas, 1966 (408 for
513)(Min. 500 rushes) 2.1—Nebraska, 1971 (500 for 1,031)
Pass DefenseFEWEST YARDS ALLOWED PER GAME
13.1—Penn St., 1938 (105 in 8)
FEWEST YARDS ALLOWED PER ATTEMPT(Min. 200-299 atts.) 3.4—Toledo, 1970 (251 for 856)(Min. 300 atts.) 3.8—Notre Dame, 1967 (306 for 1,158)
FEWEST YARDS ALLOWED PER COMPLETION(Min. 100-149 comps.) 8.8—Michigan, 1997 (145 for
1,275)(Min. 150 comps.) 8.8—Southern California, 2008 (199
for 1,747)
LOWEST COMPLETION PERCENTAGE ALLOWED
(Min. 150-199 atts.) 31.1%—Virginia, 1952 (50 of 161)(Min. 200 atts.) 33.3%—Notre Dame, 1967 (102 of 306)
FEWEST TOUCHDOWNS ALLOWED BY PASSING
0—By many teams. Most recent: LSU, 1959; North Texas, 1959
LOWEST PASS EFFICIENCY DEFENSIVE RATING(Since 1990)
65.7—Kansas St., 1999 (315 attempts, 118 completions, 21 interceptions, 1,364 yards, 5 TDs)
MOST PASSES INTERCEPTED BY PER GAME4.1—Penn, 1940 (33 in 8)
HIGHEST PERCENTAGE INTERCEPTED BY(Min. 200 Attempts)
17.9%—Army, 1944 (36 of 201)
MOST YARDS GAINED ON INTERCEPTION RETURNS
782—Tennessee, 1971 (25 interceptions)
MOST INTERCEPTION YARDS PER GAME72.5—Texas, 1943 (580 in 8)
HIGHEST AVERAGE PER INTERCEPTION RETURN
(Min. 10-14 ints.) 36.3—Oregon St., 1959 (12 for 436)(Min. 15 ints.) 31.3—Tennessee, 1971 (25 for 782)
MOST TOUCHDOWNS ON INTERCEPTION RETURNS
7—Tennessee, 1971 (25 interceptions; 287 pass attempts against)
Punt ReturnsFEWEST RETURNS ALLOWED
5—Notre Dame, 1968 (52 yards); Nebraska, 1995 (12 yards); Florida, 2009 (21 yards)
FEWEST YARDS ALLOWED2—Miami (FL), 1989 (12 returns)
LOWEST AVERAGE YARDSALLOWED PER PUNT RETURN
0.2—Miami (FL), 1989 (12 for 2 yards)
Kickoff ReturnsLOWEST AVERAGE YARDS ALLOWEDPER KICKOFF RETURN
8.3—Richmond, 1951 (23 for 192 yards)
Opponents’ Kicks BlockedMOST PUNTS BLOCKED
11—Arkansas St., 1975 (11 games, 95 punts against)
MOST FIELD GOALS BLOCKED6—Kentucky, 2004
MOST BLOCKED FIELD GOALS RETURNED FOR A TOUCHDOWN
2—La.-Lafayette, 2003 (vs. South Carolina, Aug. 30 & FIU, Nov. 8)
MOST PAT KICKS BLOCKED6—Duke, 1993
ScoringFEWEST POINTS ALLOWED PER GAME
0.0—Duke, 1938 (9 games); Tennessee, 1939 (10 games)
MOST POINTS ALLOWED572—East Carolina, 2010 (13 games)
MOST POINTS ALLOWED PER GAME50.3—La.-Lafayette, 1997 (553 in 11)
FumblesMOST OPPONENTS’ FUMBLES RECOVERED
36—North Texas, 1972; BYU, 1977
MOST TOUCHDOWNSSCORED ON FUMBLE RETURNS
7—Georgia Tech, 1998
Turnovers (Takeaways)(Opponents’ Fumbles Recovered and Passes Intercepted)
MOST OPPONENTS’ TURNOVERS57—Tennessee, 1970 (21 fumbles recovered, 36 intercep-
tions)
MOST OPPONENTS’ TURNOVERS PER GAME5.4—Wyoming, 1950 (49 in 9); Penn, 1950 (49 in 9), UCLA;
1952 (49 in 9); UCLA, 1954 (49 in 9)
HIGHEST MARGIN OF TURNOVERS PER GAME OVER OPPONENTS
4.0—UCLA, 1952 (36 in 9; 13 giveaways vs. 49 takeaways)Also holds total-margin record with 36
HIGHEST MARGIN OF TURNOVERS PER GAME BY OPPONENTS
3.1—Southern Miss., 1969 (31 in 10; 45 giveaways vs. 14 takeaways)
CONSECUTIVE GAMES WITH A TAKEAWAY67—Colorado, 1974-80
Defensive Extra PointsMOST DEFENSIVE EXTRA-POINT ATTEMPTS AGAINST
2—La.-Lafayette, 1988 (2 kick returns, none scored); Notre Dame, 1988 (2 kick returns, 1 scored); Akron, 1990 (2 interception returns, none scored); Oklahoma, 1992 (2 kick returns, 2 scored); Oklahoma, 1997 (2 kick returns, 1 scored); Texas, 1998 (2 kick returns, 2 scored)
MOST DEFENSIVE EXTRA POINTS SCORED AGAINST
2—Oklahoma, 1992 (vs. Texas Tech, Sept. 3, and vs. Oklahoma St., Nov. 14); Texas, 1998 (vs. Iowa St., Oct. 3)
SafetiesMOST SAFETIES
5—Wake Forest, 2001
Consecutive RecordsMOST CONSECUTIVE VICTORIES
47—Oklahoma, 1953-57
MOST CONSECUTIVE GAMES WITHOUT DEFEAT (Includes pre-1937 teams)
63—Washington, 1907-17 (4 ties)
MOST CONSECUTIVE GAMES WITHOUT DEFEAT (Modern Era, 1937-present)
48—Oklahoma, 1953-57 (1 tie)
MOST CONSECUTIVE LOSSES34—Northwestern, from Sept. 22, 1979, vs. Syracuse
through Sept. 18, 1982, vs. Miami (OH) (ended with 31-6 victory over Northern Ill., Sept. 25, 1982)
MOST CONSECUTIVE GAMES WITHOUT A VICTORY ON THE ROAD
46—Northwestern (including one tie), from Nov. 23, 1974, through Oct. 30, 1982
MOST CONSECUTIVE GAMES WITHOUT A TIE(Includes Bowl Games)
345—Miami (FL), from Nov. 11, 1968, through 1995 sea-son (after 1995, tiebreaker used in FBS)
MOST CONSECUTIVE GAMES WITHOUT BEING SHUT OUT
361—BYU, Oct. 3, 1975, through Nov. 15, 2003 (ended with 3-0 loss to Utah, Nov. 22, 2003)
MOST CONSECUTIVE SHUTOUTS(Regular Season)
17—Tennessee, from Nov. 5, 1938, through Oct. 12, 1940
MOST CONSECUTIVE QUARTERS OPPONENTS HELD SCORELESS(Regular Season)
71—Tennessee, from 2nd quarter vs. LSU, Oct. 29, 1938, to 2nd quarter vs. Alabama, Oct. 19, 1940
MOST CONSECUTIVE VICTORIES AT HOME58—Miami (FL) (Orange Bowl), from Oct. 12, 1985, to
Sept. 24, 1994 (lost to Washington, 38-20)
MOST CONSECUTIVE VICTORIES OVER ASSOCIATED PRESS TOP 25 TEAMS
21—Southern California, 2002-06

22 2011 NCAA FOOTBALL RECORDS - FBS TEAM RECORDS
MOST CONSECUTIVE WINNING SEASONS(All-Time)
42—Notre Dame, 1889-32 (no teams in 1890 & 1891)
MOST CONSECUTIVE WINNING SEASONS (After 1932)
40—Nebraska, 1962-01
MOST CONSECUTIVE NON-LOSING SEASONS49—Penn St., 1939-87 (includes two .500 seasons)
MOST CONSECUTIVE LOSING SEASONS28—Oregon St., 1971-98
MOST CONSECUTIVE NON-WINNING SEASONS
28—Rice, 1964-91 (includes two .500 seasons)
MOST CONSECUTIVE SEASONS WINNING NINE OR MORE GAMES
33—Nebraska, 1969-01
MOST CONSECUTIVE SEASONS WINNING 11 OR MORE GAMES
7—Southern California, 2002-08
MOST CONSECUTIVE SEASONS PLAYING IN A BOWL GAME
35—Nebraska, 1969-03
MOST CONSECUTIVE SEASONS PLAYING IN A BCS BOWL GAME
7—Southern California, 2002-08
MOST CONSECUTIVE GAMES SCORINGON A PASS
62—Florida, from Oct. 1, 1992, to Oct. 4, 1997
MOST CONSECUTIVE GAMES PASSINGFOR 200 YARDS OR MORE
64—BYU, from Sept. 13, 1980, through Oct. 19, 1985
MOST CONSECUTIVE GAMES INTERCEPTING A PASS(Includes Bowl Games)
39—Virginia, from Nov. 6, 1993, through Nov. 29, 1996
MOST CONSECUTIVE GAMES WITHOUT POSTING A SHUTOUT
283—New Mexico St., from Sept. 21, 1974, to Sept. 29, 2001 (31-0 over La.-Monroe)
MOST CONSECUTIVE EXTRA POINTS MADE262—Syracuse, from Nov. 18, 1978, to Sept. 9, 1989 (By
the following kickers: Dave Jacobs, last PAT of 1978; Gary Anderson, 72 from 1979 through 1981; Russ Carpentieri, 17 in 1982; Don McAulay, 62 from 1983 through 1985; Tim Vesling, 71 in 1986 and 1987; Kevin Greene, 37 in 1988; John Biskup, 2 in 1989.)
MOST CONSECUTIVE STADIUM SELLOUTS*312—Nebraska (current), from 1962 to 2010
*Active streak.
Additional RecordsHIGHEST-SCORING TIE GAME
52-52—BYU & San Diego St., Nov. 16, 1991
MOST TIE GAMES IN A SEASON4—Temple, 1937 (9 games); UCLA, 1939 (10 games);
Central Mich., 1991 (11 games)
MOST SCORELESS TIE GAMES IN A SEASON4—Temple, 1937 (9 games)
MOST CONSECUTIVE SCORELESS TIE GAMES2—Georgia Tech, 1938, vs. Florida, Nov. 19, & vs. Georgia,
Nov. 26; Alabama, 1954, vs. Georgia, Oct. 30, & vs. Tulane, Nov. 6
LAST TIE GAMENov. 25, 1995—Wisconsin 3, Illinois 3
LAST SCORELESS TIE GAMENov. 19, 1983—Oregon & Oregon St.
MOST POINTS OVERCOME TO WIN A GAME(Between FBS Teams)
35—Michigan St. (41) vs. Northwestern (38), Oct. 21, 2006 (trailed 38-3 with 9:54 remaining in 3rd quarter)
31—Maryland (42) vs. Miami (FL) (40), Nov. 10, 1984 (trailed 31-0 with 12:35 remaining in 3rd quarter); Ohio St. (41) vs. Minnesota (37), Oct. 28, 1989 (trailed 31-0 with 4:29 remaining in 2nd quarter); Texas Tech (44) vs. Minnesota (41) (ot), Dec. 29, 2006 (trailed 38-7 with 7:37 remaining in 3rd quarter)
30—California (42) vs. Oregon (41), Oct. 2, 1993 (trailed 30-0 in 2nd quarter)
MOST POINTS OVERCOME IN SECOND HALFTO WIN A GAME
35—Michigan St. (41) vs. Northwestern (38), Oct. 21, 2006 (trailed 38-3 with 9:54 remaining in 3rd quarter)
MOST POINTS SCORED IN FOURTH QUARTER TO WIN OR TIE A GAME
36—BYU (50) vs. Washington St. (36), Sept. 15, 1990 (trailed 29-14 at start of 4th quarter)
34—Northern Ill. (48) vs. Miami (OH) (41), Oct. 12, 2002 (trailed 27-14 at start of 4th quarter)
29—Bowling Green (43) vs. Northwestern (42), Nov. 17, 2001 (trailed 28-14 at start of 4th quarter)
28—Utah (28) vs. Arizona (27), Nov. 4, 1972 (trailed 27-0 at start of 4th quarter); Washington St. (49) vs. Stanford (42), Oct. 20, 1984 (trailed 42-14 with 5:38 remaining in 3rd quarter and scored 35 consecutive points); Florida St. (31) vs. Florida (31), Nov. 26, 1994 (trailed 31-3 at start of 4th quarter); Middle Tenn. (39) vs. New Mexico St. (35), Oct. 27, 2001 (trailed 35-11 at start of 4th quarter)
MOST POINTS SCORED IN A BRIEF PERIODOF TIME BY ONE TEAM
49 in 6:25 of possession time—Fresno St. (70) vs. Utah St. (21), Dec. 1, 2001 (7 TDs, 7 PATs. The longest drive lasted 1:42 during the first and second quarters.)
41 in 2:55 of possession time during six drives—Nebraska (69) vs. Colorado (19), Oct. 22, 1983 (6 TDs, 5 PATs in 3rd quarter. Drives occurred during 9:10 of total playing time in the period.)
41 in 4:30 of possession time during six drives—Northern Ill. (48) vs. Miami (OH) (41), Oct. 12, 2002 (6 TDs, 5 PATs in final two periods)
28 in 1:32 of possession time during four drives—South-ern California (70) vs. Arkansas (17), Sept. 17, 2005 (4 TDs, 4 PATs in 1st quarter. Drives occurred during 7:42 of total playing time in the period.)
21 in 1:00 of total playing time—Miami (OH) (51) vs. Akron (23), Oct. 15, 2005 (3 TDs, 3 PATs in 4th quarter; rush TD at 6:46, pass TD at 6:07 and rush TD at 5:46)
21 in 1:04 of total playing time—Kent St. (32) vs. Akron (17), Oct. 5, 1996 (3 TDs, 3 PATs in 4th quarter; rush TD at 2:01, rush TD at 1:33 and interception return TD at 0:57)
21 in 1:24 of total playing time—San Jose St. (42) vs. Fresno St. (7), Nov. 17, 1990 (3 TDs, 3 PATs in 2nd quarter; 1:17 of possession time on two drives and one intercepted pass returned for a TD)
20 in 0:55 of total playing time—Colorado St. (55) vs. San Jose St. (20), Oct. 11, 1997 (3 TDs, 2 PATs in 4th quarter; pass TD at 10:39, interception return TD at 10:16 and interception return TD at 9:45)
15 in :10 of total playing time—Utah (22) vs. Air Force (21), Oct. 21, 1995 (2 TDs, 2-point conversion, 1 PAT. Drives occurred during :41 of 4th quarter.)
MOST POINTS SCORED IN A BRIEF PERIODOF TIME BY BOTH TEAMS
29 in 1:34 of possesion time during four drives (4th quar-ter)—Hawaii (62) vs. San Jose St. (41), Nov. 6, 1999 (4 TDs, 1 PAT, two 2-point conversions). San Jose St. scores TDs on a blocked punt and pass reception (adds two 2-point conversions); Hawaii scores TDs on rush and interception return (adds PAT)
20 in 0:28 of possession time during third and fourth quarters—Southern California (47) vs. UCLA (22), Nov. 22, 2003 (3 TDs, 2 PATs)
16 in 0:29 of possession time during fourth quarter—Northwestern (27) vs. Michigan St. (26), Sept. 29, 2001 (2 TDs, 1 PAT, 1 FG)
MOST POSSESSION TIME IN A QUARTER15:00—Auburn vs. South Carolina (3rd quarter, 30 plays
for 136 yards), Sept. 28, 2006MOST CONSECUTIVE GAMES SCORING AT LEAST 20 POINTS
63—Southern California, 2002-06MOST CONSECUTIVE GAMES SCORING AT LEAST 60 POINTS
5—Oklahoma, 2008MOST IMPROVED WON-LOST RECORD
8½ games—Hawaii, 1999 (9-4-0, including a bowl win) from 1998 (0-12-0)
MOST IMPROVED WON-LOST RECORDAFTER WINLESS SEASON
8½ games—Hawaii, 1999 (9-4-0, including a bowl win) from 1998 (0-12-0)
MOST GAMES PLAYED IN A SEASON(Modern Era, 1937-present)
15—BYU, 1996; Kansas St., 2003 (See Most Games Played List following Annual Team Champions, page 61)
MOST VICTORIES IN A SEASON(Modern Era, 1937-present)
14—BYU, 1996; Ohio St., 2002; Alabama, 2009; Boise St., 2009; Auburn 2010 (See Most Victories in a Season List following Annual Team Champions, page 61)
MOST LOSSES IN A SEASON(Modern Era, 1937-present)
13—Army, 2003 (0-13 record) (See Most Losses in a Season List following Annual Team Champions, page 61)

2011 NCAA FOOTBALL RECORDS - FBS ALL-TIME LEADERS 23
FOO
TBA
LL B
OW
LSU
BD
IVIS
ION Annual Champions, All-Time Leaders
Total Offense
CAREER YARDS PER GAME(Minimum 5,500 yards; Player must have concluded his career)
Player, Team Years G Plays Yards TDR‡ Yd. PGColt Brennan, Hawaii ............................................................................. 2005-07 38 1,851 14,740 146 387.9Tim Rattay, Louisiana Tech .................................................................. 1997-99 33 1,705 12,618 117 382.4Graham Harrell, Texas Tech ................................................................. 2005-08 45 2,124 15,599 146 346.6Chase Holbrook, New Mexico St. ..................................................... 2005-08 36 1,783 11,570 93 321.4Chris Vargas, Nevada ............................................................................. 1992-93 20 872 6,417 48 320.9Timmy Chang, Hawaii ........................................................................... $2000-04 53 *2,587 *16,910 123 319.1Ty Detmer, BYU ........................................................................................ 1988-91 46 1,795 14,665 135 318.8Daunte Culpepper, UCF ....................................................................... 1996-98 33 1,468 10,344 91 313.5Mike Perez, San Jose St. ...................................................................... 1986-87 20 875 6,182 37 309.1Josh Wallwork, Wyoming .................................................................... 1995-96 22 845 6,753 60 307.0Doug Gaynor, Long Beach St. .......................................................... 1984-85 22 1,067 6,710 45 305.0Josh Heupel, Oklahoma ....................................................................... 1999-00 23 923 6,898 62 299.9Tony Eason, Illinois ................................................................................. 1981-82 22 1,016 6,589 43 299.5Dan LeFevour, Central Mich. .............................................................. 2006-09 53 2,434 15,853 *150 299.1Chad Pennington, Marshall ................................................................ 1997-99 36 1,433 10,758 104 298.9Max Hall, BYU ............................................................................................ 2007-09 39 1,571 11,569 101 296.6Luke McCown, Louisiana Tech .......................................................... 2000-03 43 2,050 12,731 97 296.1Omar Jacobs, Bowling Green ............................................................ 2003-05 25 964 7,388 78 295.5Drew Brees, Purdue ................................................................................ 1997-00 40 1,754 11,815 97 295.4David Klingler, Houston ....................................................................... 1988-91 32 1,439 9,363 93 292.6David Neill, Nevada ................................................................................ 1998-01 40 1,376 11,664 87 291.6Ben Roethlisberger, Miami (OH) ....................................................... 2001-03 38 1,573 11,075 91 291.4Steve Sarkisian, BYU............................................................................... 1995-96 25 953 7,253 56 290.1Chris Redman, Louisville ...................................................................... 1996-99 42 1,846 12,129 87 288.8Todd Reesing, Kansas ............................................................................ 2006-09 41 1,796 11,840 105 288.8*Record. ‡Touchdowns-responsible-for are player’s TDs scored and passed for. $See page 2 for explanation.
SEASON YARDS PER GAMEPlayer, Team Year G Plays Yards TDR‡ Yd. PGDavid Klingler, Houston ............................................................................. †1990 11 704 5,221 55 474.6B.J. Symons, Texas Tech .............................................................................. †2003 13 798 *5,976 52 459.7Graham Harrell, Texas Tech ....................................................................... †2007 13 751 5,614 52 431.8Andre Ware, Houston .................................................................................. †1989 11 628 4,661 49 423.7Colt Brennan, Hawaii .................................................................................. †2006 14 645 5,915 *63 422.5Ty Detmer, BYU .............................................................................................. 1990 12 635 5,022 45 418.5Case Keenum, Houston .............................................................................. †2009 14 760 5,829 48 416.4Tim Rattay, Louisiana Tech ........................................................................ †1998 12 602 4,840 47 403.3Case Keenum, Houston .............................................................................. †2008 13 665 5,241 51 403.2Mike Maxwell, Nevada ................................................................................ †1995 9 443 3,623 34 402.6Chris Redman, Louisville ............................................................................ 1998 10 513 4,009 31 400.9Steve Young, BYU .......................................................................................... †1983 11 531 4,346 41 395.1Chris Vargas, Nevada ................................................................................... †1993 11 535 4,332 35 393.8Graham Harrell, Texas Tech ....................................................................... 2008 13 667 5,096 51 392.0Scott Mitchell, Utah ..................................................................................... †1988 11 589 4,299 29 390.8Sonny Cumbie, Texas Tech ........................................................................ †2004 12 694 4,575 34 381.3Tim Rattay, Louisiana Tech ........................................................................ †1999 10 562 3,810 35 381.0Chase Holbrook, New Mexico St. ........................................................... 2006 12 647 4,541 38 378.4Daunte Culpepper, UCF ............................................................................. 1998 11 543 4,153 40 377.5Tim Couch, Kentucky .................................................................................. 1998 11 617 4,151 37 377.4David Neill, Nevada ...................................................................................... 1998 9 409 3,351 31 372.3Colt Brennan, Hawaii .................................................................................. †2005 12 614 4,455 37 371.3Paul Smith, Tulsa ............................................................................................ 2007 14 649 5,184 60 370.3Chase Clement, Rice .................................................................................... 2008 13 626 4,812 56 370.2Ty Detmer, BYU .............................................................................................. 1989 12 497 4,433 38 369.4*Record. †National champion. ‡Touchdowns-responsible-for are player’s TDs scored and passed for.
CAREER YARDSPlayer, Team Years Plays Rush Pass Total Yds. Avg.Timmy Chang, Hawaii ..................................................................... $2000-04 *2,587 -162 *17,072 16,910 6.54Dan LeFevour, Central Mich. ........................................................ 2006-09 2,434 2,948 12,905 15,853 6.51Graham Harrell, Texas Tech ........................................................... 2005-08 2,124 -194 15,793 15,599 7.34Colt McCoy, Texas ............................................................................. 2006-09 2,092 1,571 13,253 14,824 7.09Colt Brennan, Hawaii ....................................................................... 2005-07 1,851 547 14,193 14,740 7.96Ty Detmer, BYU .................................................................................. 1988-91 1,795 -366 15,031 14,665 8.17^Case Keenum, Houston ............................................................... 2007-10 1,869 862 13,586 14,448 7.73Colin Kaepernick, Nevada ............................................................. 2007-10 1,871 4,112 10,098 14,210 7.59Kevin Kolb, Houston ........................................................................ 2003-06 2,037 751 12,964 13,715 6.73Philip Rivers, North Carolina St. ................................................. 2000-03 1,963 98 13,484 13,582 6.92Chase Daniel, Missouri.................................................................... 2005-08 1,972 971 12,515 13,486 6.84Brad Smith, Missouri ........................................................................ 2002-05 2,283 4,289 8,799 13,088 5.73Luke McCown, Louisiana Tech .................................................... 2000-03 2,049 65 12,666 12,731 6.21Tim Rattay, Louisiana Tech ............................................................ 1997-99 1,705 -128 12,746 12,618 7.40Trevor Vittatoe, UTEP ....................................................................... 2007-10 1,828 -148 12,439 12,291 6.72

24 2011 NCAA FOOTBALL RECORDS - FBS ALL-TIME LEADERS
Kliff Kingsbury, Texas Tech ............................................................ 1999-02 2,156 -166 12,429 12,263 5.69Tim Tebow, Florida ........................................................................... 2006-09 1,687 2,947 9,285 12,232 7.25Chris Redman, Louisville ................................................................ 1996-99 1,846 -412 12,541 12,129 6.57Byron Leftwich, Marshall ............................................................... $1998-02 1,621 181 11,903 12,084 7.45Brady Quinn, Notre Dame............................................................. 2003-06 1,856 182 11,762 11,944 6.44Andy Dalton, TCU .............................................................................. 2007-10 1,730 1,611 10,314 11,925 6.89Todd Reesing, Kansas ...................................................................... 2006-09 1,796 646 11,194 11,840 6.59Drew Brees, Purdue .......................................................................... 1997-00 1,754 906 10,909 11,815 6.74Adam Weber, Minnesota ............................................................... 2007-10 1,992 873 10,917 11,790 5.92David Neill, Nevada .......................................................................... 1998-01 1,727 761 10,903 11,664 6.75*Record. $See page 2 for explanation. ^Active player.
CAREER YARDS RECORD PROGRESSION(Record Yards—Player, Team, Seasons Played)3,481—Davey O’Brien, TCU, 1936-38; 3,882—Paul Christman, Missouri, 1938-40; 4,602—Frank Sinkwich, Georgia, 1940-42; 4,627—Bob Fenimore, Oklahoma St., 1943-46; 4,871—Charlie Justice, North Carolina, 1946-49; 5,903—Johnny Bright, Drake, 1949-51; 6,354—Virgil Carter, BYU, 1964-66; 6,568—Steve Ramsey, North Texas, 1967-69; 7,887—Jim Plunkett, Stanford, 1968-70; 8,074—Gene Swick, Toledo, 1972-75; 8,444—Mark Herrmann, Purdue, 1977-80; 9,723—Jim McMahon, BYU, 1977-78, 1980-81; 11,317—Doug Flutie, Boston College, 1981-84; 14,665—Ty Detmer, BYU, 1988-91; 16,910—Timmy Chang, Hawaii, $2000-04.$See page 2 for explanation.
SEASON YARDSPlayer, Team Year G Plays Rush Pass Total Yds. Avg.B.J. Symons, Texas Tech .......................................................... †2003 13 798 143 *5,833 5,976 7.49Colt Brennan, Hawaii .............................................................. †2006 14 645 366 5,549 5,915 *9.17Case Keenum, Houston .......................................................... †2009 14 760 158 5,671 5,829 7.67Graham Harrell, Texas Tech ................................................... †2007 13 751 -91 5,705 5,614 7.48Case Keenum, Houston .......................................................... †2008 13 665 221 5,020 5,241 7.88David Klingler, Houston ......................................................... †1990 11 704 81 5,140 5,221 7.42Paul Smith, Tulsa ........................................................................ 2007 14 649 119 5,065 5,184 7.99Bryant Moniz, Hawaii .............................................................. †2010 14 636 102 5,040 5,142 8.08Graham Harrell, Texas Tech ................................................... 2008 13 667 -15 5,111 5,096 7.64Ty Detmer, BYU .......................................................................... 1990 12 635 -106 5,188 5,022 7.91Kliff Kingsbury, Texas Tech .................................................... 2002 14 *814 -114 5,017 4,903 6.02Tim Rattay, Louisiana Tech .................................................... †1998 12 602 -103 4,943 4,840 8.04Chase Clement, Rice ................................................................ 2008 13 644 693 4,119 4,812 7.47Dan LeFevour, Central Mich. ................................................ 2007 14 731 1,122 3,652 4,774 6.53Sam Bradford, Oklahoma ...................................................... 2008 14 525 47 4,720 4,767 9.08Andre Ware, Houston .............................................................. †1989 11 628 -38 4,699 4,661 7.42Josh Harris, Bowling Green ................................................... 2003 14 709 830 3,813 4,643 6.55Jim McMahon, BYU .................................................................. †1980 12 540 56 4,571 4,627 8.57Chase Daniel, Missouri .......................................................... 2008 14 597 281 4,335 4,616 7.73Philip Rivers, North Carolina St. .......................................... 2003 13 561 109 4,491 4,600 8.20Ben Roethlisberger, Miami (OH) ......................................... 2003 14 562 111 4,486 4,597 8.18Landry Jones, Oklahoma ....................................................... 2010 14 668 -128 4,718 4,590 6.87Sonny Cumbie, Texas Tech .................................................... †2004 12 694 -167 4,742 4,575 6.59Chase Daniel, Missouri............................................................ 2007 14 672 253 4,306 4,559 6.78Chase Holbrook, New Mexico St. ....................................... 2006 12 647 -78 4,619 4,541 7.02*Record. †National champion.
SINGLE-GAME YARDSYds. Rush Pass Player, Team (Opponent) Date732 16 716 David Klingler, Houston (Arizona St.) ..................................................................................Dec. 2, 1990696 6 690 Matt Vogler, TCU (Houston).....................................................................................................Nov. 3, 1990681 20 661 B.J. Symons, Texas Tech (Ole Miss) ...................................................................................Sept. 27, 2003643 -3 646 Graham Harrell, Texas Tech (Oklahoma St.) .................................................................Sept. 22, 2007657 20 637 Brian Lindgren, Idaho (Middle Tenn.) ..................................................................................Oct. 6, 2001625 -6 631 Scott Mitchell, Utah (Air Force) ............................................................................................Oct. 15, 1988625 62 563 David Klingler, Houston (TCU) ...............................................................................................Nov. 3, 1990618 32 586 B.J. Symons, Texas Tech (North Carolina St.) ................................................................Sept. 20, 2003612 -1 613 Jimmy Klingler, Houston (Rice) ........................................................................................... Nov. 28, 1992604 -39 643 Cody Hodges, Texas Tech (Kansas St.) ..............................................................................Oct. 15, 2005603 4 599 Ty Detmer, BYU (San Diego St.) .......................................................................................... Nov. 16, 1991601 37 564 Troy Kopp, Pacific (New Mexico St.) ..................................................................................Oct. 20, 1990601 60 541 Chase Clement, Rice (Tulsa) ................................................................................................. Nov. 24, 2007599 86 513 Virgil Carter, BYU (UTEP) ...........................................................................................................Nov. 5, 1966597 -22 619 John Walsh, BYU (Utah St.) ....................................................................................................Oct. 30, 1993597 -4 601 Daniel Meager, North Texas (SMU) .....................................................................................Sept. 8, 2007594 -28 622 Jeremy Leach, New Mexico (Utah) ................................................................................... Nov. 11, 1989585 -36 621 Dave Wilson, Illinois (Ohio St.)................................................................................................Nov. 8, 1980582 11 571 Marc Wilson, BYU (Utah) ...........................................................................................................Nov. 5, 1977582 -29 611 David Neill, Nevada (New Mexico St.) ..............................................................................Oct. 10, 1998581 49 532 Bryant Moniz, Hawaii (Louisiana Tech)................................................................................Oct. 2, 2010578 6 572 David Klingler, Houston (Eastern Wash.) ........................................................................ Nov. 17, 1990578 -14 592 Chris Redman, Louisville (East Carolina) ........................................................................ Nov. 14, 1998578 144 434 Kevin Kolb, Houston (TCU) ....................................................................................................Oct. 25, 2003574 15 559 Colt Brennan, Hawaii (Arizona St.) .................................................................................... Dec. 24, 2006
Player, Team Years Plays Rush Pass Total Yds. Avg.

2011 NCAA FOOTBALL RECORDS - FBS ALL-TIME LEADERS 25
FOO
TBA
LL B
OW
LSU
BD
IVIS
IONANNUAL CHAMPIONS
Year Player, Team Class Plays Rush Pass Tot. Yds.1937 Byron “Whizzer” White, Colorado ....................................................... Sr. 224 1,121 475 1,5961938 Davey O’Brien, TCU ................................................................................... Sr. 291 390 1,457 1,8471939 Kenny Washington, UCLA ...................................................................... Sr. 259 811 559 1,3701940 Johnny Knolla, Creighton ...................................................................... Sr. 298 813 607 1,4201941 Bud Schwenk, Washington-St. Louis ................................................ Sr. 354 471 1,457 1,9281942 Frank Sinkwich, Georgia ......................................................................... Sr. 341 795 1,392 2,1871943 Bob Hoernschemeyer, Indiana ............................................................ Fr. 355 515 1,133 1,6481944 Bob Fenimore, Oklahoma St. .............................................................. So. 241 897 861 1,7581945 Bob Fenimore, Oklahoma St. .............................................................. Jr. 203 1,048 593 1,6411946 Travis Tidwell, Auburn ............................................................................. Fr. 339 772 943 1,7151947 Fred Enke, Arizona .................................................................................... So. 329 535 1,406 1,9411948 Stan Heath, Nevada .................................................................................. Sr. 233 -13 2,005 1,9921949 Johnny Bright, Drake ............................................................................... So. 275 975 975 1,9501950 Johnny Bright, Drake ............................................................................... Jr. 320 1,232 1,168 2,4001951 Dick Kazmaier, Princeton ....................................................................... Sr. 272 861 966 1,8271952 Ted Marchibroda, Detroit ....................................................................... Sr. 305 176 1,637 1,8131953 Paul Larson, California ............................................................................. Jr. 262 141 1,431 1,5721954 George Shaw, Oregon ............................................................................. Sr. 276 178 1,358 1,5361955 George Welsh, Navy ................................................................................. Sr. 203 29 1,319 1,3481956 John Brodie, Stanford .............................................................................. Sr. 295 9 1,633 1,6421957 Bob Newman, Washington St. ............................................................ Jr. 263 53 1,391 1,4441958 Dick Bass, Pacific ........................................................................................ Jr. 218 1,361 79 1,4401959 Dick Norman, Stanford ........................................................................... Jr. 319 55 1,963 2,0181960 Bill Kilmer, UCLA ......................................................................................... Sr. 292 803 1,086 1,8891961 Dave Hoppmann, Iowa St. ..................................................................... Jr. 320 920 718 1,6381962 Terry Baker, Oregon St. ........................................................................... Sr. 318 538 1,738 2,2761963 George Mira, Miami (FL) ......................................................................... Sr. 394 163 2,155 2,3181964 Jerry Rhome, Tulsa .................................................................................... Sr. 470 258 2,870 3,1281965 Bill Anderson, Tulsa ................................................................................... Sr. 580 -121 3,464 3,3431966 Virgil Carter, BYU ........................................................................................ Sr. 388 363 2,182 2,5451967 Sal Olivas, New Mexico St. .................................................................... Sr. 368 -41 2,225 2,1841968 Greg Cook, Cincinnati .............................................................................. Sr. 507 -62 3,272 3,2101969 Dennis Shaw, San Diego St. ................................................................. Sr. 388 12 3,185 3,197Beginning in 1970, ranked on per-game (instead of total) yards Class G Plays Rush Pass Total Avg.1970 Pat Sullivan, Auburn................................................................... Jr. 10 333 270 2,586 2,856 285.61971 Gary Huff, Florida St. ................................................................. Jr. 11 386 -83 2,736 2,653 241.21972 Don Strock, Virginia Tech ......................................................... Sr. 11 480 -73 3,243 3,170 288.21973 Jesse Freitas, San Diego St. .................................................... Sr. 11 410 -92 2,993 2,901 263.71974 Steve Joachim, Temple ............................................................. Sr. 10 331 277 1,950 2,227 222.71975 Gene Swick, Toledo .................................................................... Sr. 11 490 219 2,487 2,706 246.01976 Tommy Kramer, Rice .................................................................. Sr. 11 562 -45 3,317 3,272 297.51977 Doug Williams, Grambling ...................................................... Sr. 11 377 -57 3,286 3,229 293.51978 Mike Ford, SMU ............................................................................ So. 11 459 -50 3,007 2,957 268.81979 Marc Wilson, BYU ........................................................................ Sr. 11 488 -140 3,720 3,580 325.51980 Jim McMahon, BYU .................................................................... Jr. 12 540 56 4,571 4,627 385.61981 Jim McMahon, BYU .................................................................... Sr. 10 487 -97 3,555 3,458 345.81982 Todd Dillon, Long Beach St. .................................................. Jr. 11 585 70 3,517 3,587 326.11983 Steve Young, BYU ........................................................................ Sr. 11 531 444 3,902 4,346 395.11984 Robbie Bosco, BYU ..................................................................... Jr. 12 543 57 3,875 3,932 327.71985 Jim Everett, Purdue .................................................................... Sr. 11 518 -62 3,651 3,589 326.31986 Mike Perez, San Jose St. ........................................................... Jr. 9 425 35 2,934 2,969 329.91987 Todd Santos, San Diego St. .................................................... Sr. 12 562 -244 3,932 3,688 307.31988 Scott Mitchell, Utah .................................................................... So. 11 589 -23 4,322 4,299 390.81989 Andre Ware, Houston ................................................................ Jr. 11 628 -38 4,699 4,661 423.71990 David Klingler, Houston ........................................................... Jr. 11 704 81 5,140 5,221 *474.61991 Ty Detmer, BYU ............................................................................ Sr. 12 478 -30 4,031 4,001 333.41992 Jimmy Klingler, Houston .......................................................... So. 11 544 -50 3,818 3,768 342.51993 Chris Vargas, Nevada ................................................................. Sr. 11 535 67 4,265 4,332 393.81994 Mike Maxwell, Nevada .............................................................. Jr. 11 477 -39 3,537 3,498 318.01995 Mike Maxwell, Nevada .............................................................. Sr. 9 443 12 3,611 3,623 402.61996 Josh Wallwork, Wyoming......................................................... Sr. 12 525 119 4,090 4,209 350.81997 Tim Rattay, Louisiana Tech ...................................................... So. 11 541 87 3,881 3,968 360.71998 Tim Rattay, Louisiana Tech ...................................................... Jr. 12 602 -103 4,943 4,840 403.31999 Tim Rattay, Louisiana Tech ...................................................... Sr. 10 562 -112 3,922 3,810 381.02000 Drew Brees, Purdue .................................................................... Sr. 11 564 546 3,393 3,939 358.12001 Rex Grossman, Florida .............................................................. So. 11 429 8 3,896 3,904 354.92002 Byron Leftwich, Marshall ......................................................... Sr. 12 528 -1 4,268 4,267 355.62003 B.J. Symons, Texas Tech............................................................. Sr. 13 798 143 *5,833 *5,976 459.72004 Sonny Cumbie, Texas Tech ...................................................... Sr. 12 694 -167 4,742 4,575 381.32005 Colt Brennan, Hawaii ................................................................. So. 12 614 154 4,301 4,455 371.32006 Colt Brennan, Hawaii ................................................................. Jr. 14 645 366 5,549 5,915 422.52007 Graham Harrell, Texas Tech ..................................................... Jr. 13 751 -91 5,706 5,614 431.82008 Case Keenum, Houston ............................................................ So. 13 665 221 5,020 5,241 403.22009 Case Keenum, Houston ............................................................ Jr. 14 760 158 5,671 5,829 416.42010 Bryant Moniz, Hawaii ................................................................. Jr. 14 636 102 5,040 5,142 367.3*Record.

26 2011 NCAA FOOTBALL RECORDS - FBS ALL-TIME LEADERS
Rushing
CAREER YARDS PER GAME(Minimum 2,500 yards; Player must have concluded his career)
Player, Team Years G Carries Yards TD Yd. PGEd Marinaro, Cornell ................................ 1969-71 27 918 4,715 50 174.6O.J. Simpson, Southern California ..... 1967-68 19 621 3,124 33 164.4Herschel Walker, Georgia ....................... 1980-82 33 994 5,259 49 159.4Garrett Wolfe, Northern Ill. .................. 2004-06 33 807 5,164 52 156.5LeShon Johnson, Northern Ill. ............ 1992-93 22 592 3,314 18 150.6Ron Dayne, Wisconsin ............................. 1996-99 43 1,115 *6,397 63 148.8Marshall Faulk, San Diego St. .............. 1991-93 31 766 4,589 57 148.0George Jones, San Diego St. ............... 1995-96 19 486 2,810 34 147.9Tony Dorsett, Pittsburgh ........................ 1973-76 43 1,074 6,082 55 141.4Troy Davis, Iowa St. .................................. 1994-96 31 782 4,382 36 141.4DeAngelo Williams, Memphis ............. 2002-05 44 969 6,026 55 137.0Mike Rozier, Nebraska ............................. 1981-83 35 668 4,780 50 136.6Ricky Williams, Texas ................................ 1995-98 46 1,011 6,279 72 136.5Howard Stevens, Louisville ................... 1971-72 20 509 2,723 25 136.2Jerome Persell, Western Mich. ............ 1976-78 31 842 4,190 39 135.2Rudy Mobley, Hardin-Simmons ......... 1942,46 19 414 2,543 32 133.8Adrian Peterson, Oklahoma ................. 2004-06 31 747 4,045 41 130.5Kevin Smith, UCF ....................................... 2005-07 36 905 4,679 45 130.0Ray Rice, Rutgers ....................................... 2005-07 38 910 4,926 49 129.6Alex Smith, Indiana .................................. 1994-96 27 723 3,492 21 129.3Vaughn Dunbar, Indiana........................ 1990-91 22 565 2,842 24 129.2Steve Owens, Oklahoma ....................... 1967-69 30 905 3,867 56 128.9Byron Hanspard, Texas Tech ................. 1994-96 33 760 4,219 29 127.8Jerome Harrison, Washington St. ..... 2004-05 22 482 2,800 25 127.3Charles White, Southern California ... 1976-79 44 1,023 5,598 46 127.2*Record.
SEASON YARDS PER GAMEPlayer, Team Year G Carries Yards TD Yd. PGBarry Sanders, Oklahoma St. ................... †1988 11 344 *2,628 *37 238.9Marcus Allen, Southern California .......... †1981 11 403 2,342 22 212.9Ed Marinaro, Cornell ..................................... †1971 9 356 1,881 24 209.0Troy Davis, Iowa St. ....................................... †1996 11 402 2,185 21 198.6LaDainian Tomlinson, TCU ......................... †2000 11 369 2,158 22 196.2Ricky Williams, Texas ..................................... †1998 11 361 2,124 27 193.1Byron Hanspard, Texas Tech ...................... 1996 11 339 2,084 13 189.5Rashaan Salaam, Colorado ........................ †1994 11 298 2,055 24 186.8Kevin Smith, UCF ............................................ †2007 14 *450 2,567 29 183.4Troy Davis, Iowa St. ....................................... †1995 11 345 2,010 15 182.7Charles White, Southern California ........ †1979 10 293 1,803 18 180.3Jamario Thomas, North Texas ................... †2004 10 285 1,801 17 180.1LeShon Johnson, Northern Ill. ................. †1993 11 327 1,976 12 179.6Mike Rozier, Nebraska .................................. †1983 12 275 2,148 29 179.0DeAngelo Williams, Memphis .................. †2005 11 310 1,964 18 178.5Matt Forte, Tulane .......................................... 2007 12 361 2,127 23 177.3Tony Dorsett, Pittsburgh ............................. †1976 11 338 1,948 21 177.1Garrett Wolfe, Northern Ill. ........................ 2005 9 242 1,580 16 175.6Ollie Matson, San Francisco ....................... †1951 9 245 1,566 20 174.0Damien Anderson, Northwestern .......... 2000 11 293 1,914 22 174.0Lorenzo White, Michigan St. .................... †1985 11 386 1,908 17 173.5Wasean Tait, Toledo ....................................... 1995 11 357 1,905 20 173.2Jerome Harrison, Washington St. .......... 2005 11 308 1,900 16 172.7Ricky Williams, Texas ..................................... †1997 11 279 1,893 25 172.1Herschel Walker, Georgia ............................ 1981 11 385 1,891 18 171.9*Record. †National champion.
CAREER YARDSPlayer, Team Years Carries Yards Avg. LongRon Dayne, Wisconsin ................................. 1996-99 1,115 6,397 5.74 80Ricky Williams, Texas .................................... 1995-98 1,011 6,279 6.21 87Tony Dorsett, Pittsburgh ............................ 1973-76 1,074 6,082 5.66 73DeAngelo Williams, Memphis ................. 2002-05 969 6,026 6.22 86Charles White, Southern California ....... 1976-79 1,023 5,598 5.47 79Travis Prentice, Miami (OH) ....................... 1996-99 1,138 5,596 4.92 55Cedric Benson, Texas ................................... 2001-04 1,112 5,540 4.98 64Damion Fletcher, Southern Miss. ........... 2006-09 1,009 5,302 5.25 69LaDainian Tomlinson, TCU ........................ 1997-00 907 5,263 5.80 89Herschel Walker, Georgia ........................... 1980-82 994 5,259 5.29 76Archie Griffin, Ohio St. ............................... 1972-75 845 5,177 6.13 75Avon Cobourne, West Virginia ................ 1999-02 1,050 5,164 4.92 60Garrett Wolfe, Northern Ill. ....................... 2004-06 807 5,164 ††6.40 84Mike Hart, Michigan .................................... 2004-07 1,015 5,040 4.97 64Darren Lewis, Texas A&M ........................... 1987-90 909 5,012 5.51 84Darren Sproles, Kansas St. ........................ 2001-04 815 4,979 6.11 45DonTrell Moore, New Mexico .................. 2002-05 1,028 4,973 4.84 61Anthony Thompson, Indiana ................... 1986-89 1,089 4,965 4.56 52
George Rogers, South Carolina .............. 1977-80 902 4,958 5.50 80Trevor Cobb, Rice .......................................... 1989-92 1,091 4,948 4.54 79Michael Turner, Northern Ill. .................... 2000-03 940 4,941 5.26 82Ray Rice, Rutgers ........................................... 2005-07 910 4,926 5.41 90Paul Palmer, Temple ..................................... 1983-86 948 4,895 5.16 78Steve Bartalo, Colorado St. ...................... 1983-86 *1,215 4,813 3.96 39Ken Simonton, Oregon St. ....................... 1998-01 1,005 4,802 4.78 64*Record. ††Record for minimum 781 carries.
CAREER YARDS RECORD PROGRESSION(Record Yards—Player, Team, Seasons Played)1,961—Marshall Goldberg, Pittsburgh, 1936-38; 2,105—Tom Harmon, Michigan, 1938-40; 2,271—Frank Sinkwich, Georgia, 1940-42; 2,301—Bill Daley, Minnesota, 1940-42, Michigan, 1943; 2,957—Glenn Davis, Army, 1943-46; 3,095—Eddie Price, Tulane, 1946-49; 3,238—John Papit, Virginia, 1947-50; 3,381—Art Luppino, Arizona, 1953-56; 3,388—Eugene “Mercury” Morris, West Tex. A&M, 1966-68; 3,867—Steve Owens, Oklahoma, 1967-69; 4,715—Ed Marinaro, Cornell, 1969-71; 5,177—Archie Griffin, Ohio St., 1972-75; 6,082—Tony Dorsett, Pittsburgh, 1973-76; 6,279—Ricky Williams, Texas, 1995-98; 6,397—Ron Dayne, Wisconsin, 1996-99.
CAREER RUSHING TOUCHDOWNSPlayer, Team Years G TDTravis Prentice, Miami (OH) ...................................................................... 1996-99 44 73Ricky Williams, Texas ................................................................................... 1995-98 46 72Anthony Thompson, Indiana .................................................................. 1986-89 41 64Cedric Benson, Texas .................................................................................. 2001-04 49 64Ron Dayne, Wisconsin ................................................................................ 1996-99 43 63Eric Crouch, Nebraska (QB) ...................................................................... 1998-01 43 59Colin Kaepernick, Nevada (QB) .............................................................. 2007-10 51 59Ian Johnson, Boise St. ................................................................................. 2005-08 49 58Marshall Faulk, San Diego St. ................................................................. 1991-93 31 57Tim Tebow, Florida (QB) ............................................................................ 2006-09 55 57Steve Owens, Oklahoma .......................................................................... 1967-69 30 56Ken Simonton, Oregon St. ...................................................................... 1998-01 44 56Tony Dorsett, Pittsburgh ........................................................................... 1973-76 43 55Chester Taylor, Toledo ................................................................................ 1998-01 42 55DeAngelo Williams, Memphis ................................................................ 2002-05 44 55LaDainian Tomlinson, TCU ....................................................................... 1997-00 44 54Dwone Hicks, Middle Tenn. .................................................................... 1999-02 44 53Chris Lemon, Nevada ................................................................................. 1996-99 44 52LenDale White, Southern California .................................................... 2003-05 39 52Garrett Wolfe, Northern Ill. ...................................................................... 2004-06 33 52Pete Johnson, Ohio St. .............................................................................. 1973-76 41 51DonTrell Moore, New Mexico ................................................................. 2002-05 48 51Ed Marinaro, Cornell ................................................................................... 1969-71 27 50Billy Sims, Oklahoma ........................................................................... 1975, 77-79 42 50Mike Rozier, Nebraska ................................................................................ 1982-83 35 50Brock Forsey, Boise St. ............................................................................... 1999-02 47 50Taurean Henderson, Texas Tech ............................................................ 2002-05 51 50Steve Slaton, West Virginia ....................................................................... 2005-07 36 50DeMarco Murray, Oklahoma ................................................................... 2007-10 50 50(Note: Howard Stevens of Louisville played two years at college division Randolph-Macon, 1968-69, with 33 touchdowns and two years at Louisville, 1971-72, with 25 touchdowns, scoring a total of 58 touchdowns in four years.)
SEASON YARDSPlayer, Team Year G Carries Yards Avg.Barry Sanders, Oklahoma St............................... †1988 11 344 2,628 ‡7.64Kevin Smith, UCF ..................................................... †2007 14 *450 2,567 5.70Marcus Allen, Southern California ................... †1981 11 403 2,342 5.81Troy Davis, Iowa St. ................................................ †1996 11 402 2,185 5.44LaDainian Tomlinson, TCU .................................. †2000 11 369 2,158 5.85Mike Rozier, Nebraska ........................................... †1983 12 275 2,148 #7.81Matt Forte, Tulane ................................................... 2007 12 361 2,127 5.89Ricky Williams, Texas .............................................. †1998 11 361 2,124 5.88Larry Johnson, Penn St. ....................................... †2002 13 271 2,087 7.70Byron Hanspard, Texas Tech ............................... 1996 11 339 2,084 6.15Donald Brown, Connecticut ............................... †2008 13 367 2,083 5.68Rashaan Salaam, Colorado ................................. †1994 11 298 2,055 6.90J.J. Arrington, California........................................ 2004 12 289 2,018 6.98Ray Rice, Rutgers ..................................................... 2007 13 380 2,012 5.29Troy Davis, Iowa St. ................................................ †1995 11 345 2,010 5.83LeShon Johnson, Northern Ill. .......................... †1993 11 327 1,976 6.04DeAngelo Williams, Memphis ........................... †2005 11 310 1,964 6.34Tony Dorsett, Pittsburgh ...................................... †1976 11 338 1,948 5.76DeAngelo Williams, Memphis ........................... 2004 12 313 1,948 6.22Garrett Wolfe, Northern Ill. ................................. †2006 13 309 1,928 6.24Adrian Peterson, Oklahoma ............................... 2004 13 339 1,925 5.68Michael Turner, Northern Ill. .............................. 2002 12 338 1,915 5.67Damien Anderson, Northwestern ................... 2000 11 293 1,914 6.53Lorenzo White, Michigan St. ............................. †1985 11 386 1,908 4.94Wasean Tait, Toledo ................................................ 1995 11 357 1,905 5.34*Record. †National champion. ‡Record for minimum 282 carries. #Record for minimum 214 carries.
Player, Team Years Carries Yards Avg. Long

2011 NCAA FOOTBALL RECORDS - FBS ALL-TIME LEADERS 27
FOO
TBA
LL B
OW
LSU
BD
IVIS
IONSINGLE-GAME YARDS
Yds. Player, Team (Opponent) Date406 LaDainian Tomlinson, TCU (UTEP) ...........................................................Nov. 20, 1999396 Tony Sands, Kansas (Missouri)...................................................................Nov. 23, 1991386 Marshall Faulk, San Diego St. (Pacific) ................................................. Sept. 14, 1991378 Troy Davis, Iowa St. (Missouri) ................................................................. Sept. 28, 1996377 Anthony Thompson, Indiana (Wisconsin) ...........................................Nov. 11, 1989377 Robbie Mixon, Central Mich. (Eastern Mich.)........................................ Nov. 2, 2002376 Travis Prentice, Miami (OH) (Akron) .......................................................... Nov. 6, 1999373 Astron Whatley, Kent St. (Eastern Mich.)............................................. Sept. 20, 1997357 Rueben Mayes, Washington St. (Oregon) .............................................Oct. 27, 1984357 Mike Pringle, Cal St. Fullerton (New Mexico St.) ................................. Nov. 4, 1989356 Eddie Lee Ivery, Georgia Tech (Air Force) .............................................Nov. 11, 1978356 Brian Pruitt, Central Mich. (Toledo) ........................................................... Nov. 5, 1994353 Garrett Wolfe, Northern Ill. (Ball St.) ..................................................... Sept. 30, 2006351 Scott Harley, East Carolina (North Carolina St.) .................................Nov. 30, 1996350 Eric Allen, Michigan St. (Purdue) ...............................................................Oct. 30, 1971350 Ricky Williams, Texas (Iowa St.) ....................................................................Oct. 3, 1998349 Paul Palmer, Temple (East Carolina) .........................................................Oct. 11, 1986348 Shun White, Navy (Towson) ...................................................................... Aug. 30, 2008347 Ricky Bell, Southern California (Washington St.) .................................Oct. 9, 1976347 Ron Johnson, Michigan (Wisconsin) ......................................................Nov. 16, 1968Note: There have been 90 300-yard rushing games in FBS history.
ANNUAL CHAMPIONSYear Player, Team Class Carries Yards1937 Byron “Whizzer” White, Colorado ...................................... Sr. 181 1,1211938 Len Eshmont, Fordham ......................................................... So. 132 8311939 John Polanski, Wake Forest ................................................. So. 137 8821940 Al Ghesquiere, Detroit ........................................................... Sr. 146 9571941 Frank Sinkwich, Georgia ....................................................... Jr. 209 1,1031942 Rudy Mobley, Hardin-Simmons ........................................ So. 187 1,2811943 Creighton Miller, Notre Dame ............................................ Sr. 151 9111944 Wayne “Red” Williams, Minnesota .................................... Jr. 136 9111945 Bob Fenimore, Oklahoma St. ............................................. Jr. 142 1,0481946 Rudy Mobley, Hardin-Simmons ........................................ Sr. 227 1,2621947 Wilton Davis, Hardin-Simmons .......................................... So. 193 1,1731948 Fred Wendt, UTEP .................................................................... Sr. 184 1,5701949 John Dottley, Ole Miss ........................................................... Jr. 208 1,3121950 Wilford White, Arizona St. ................................................... Sr. 199 1,5021951 Ollie Matson, San Francisco ................................................ Sr. 245 1,5661952 Howie Waugh, Tulsa ............................................................... Sr. 164 1,3721953 J.C. Caroline, Illinois ................................................................. So. 194 1,2561954 Art Luppino, Arizona .............................................................. So. 179 1,3591955 Art Luppino, Arizona .............................................................. Jr. 209 1,3131956 Jim Crawford, Wyoming ....................................................... Sr. 200 1,1041957 Leon Burton, Arizona St. ...................................................... Sr. 117 1,1261958 Dick Bass, Pacific ....................................................................... Jr. 205 1,3611959 Pervis Atkins, New Mexico St. ........................................... Jr. 130 9711960 Bob Gaiters, New Mexico St. .............................................. Sr. 197 1,3381961 Jim Pilot, New Mexico St. .................................................... So. 191 1,2781962 Jim Pilot, New Mexico St. .................................................... Jr. 208 1,2471963 Dave Casinelli, Memphis ...................................................... Sr. 219 1,0161964 Brian Piccolo, Wake Forest ................................................... Sr. 252 1,0441965 Mike Garrett, Southern California ..................................... Sr. 267 1,4401966 Ray McDonald, Idaho ............................................................. Sr. 259 1,3291967 O.J. Simpson, Southern California .................................... Jr. 266 1,4151968 O.J. Simpson, Southern California .................................... Sr. 355 1,7091969 Steve Owens, Oklahoma ...................................................... Sr. 358 1,523Beginning in 1970, ranked on per-game (instead of total) yardsYear Player, Team Class G Carries Yards Avg.1970 Ed Marinaro, Cornell ................................... Jr. 9 285 1,425 158.31971 Ed Marinaro, Cornell ................................... Sr. 9 356 1,881 209.01972 Pete VanValkenburg, BYU......................... Sr. 10 232 1,386 138.61973 Mark Kellar, Northern Ill. .......................... Sr. 11 291 1,719 156.31974 Louie Giammona, Utah St. ...................... Jr. 10 329 1,534 153.41975 Ricky Bell, Southern California ............... Jr. 11 357 1,875 170.51976 Tony Dorsett, Pittsburgh ........................... Sr. 11 338 1,948 177.11977 Earl Campbell, Texas ................................... Sr. 11 267 1,744 158.51978 Billy Sims, Oklahoma .................................. Jr. 11 231 1,762 160.21979 Charles White, Southern California ...... Sr. 10 293 1,803 180.31980 George Rogers, South Carolina ............. Sr. 11 297 1,781 161.91981 Marcus Allen, Southern California ........ Sr. 11 403 2,342 212.91982 Ernest Anderson, Oklahoma St. ........... Jr. 11 353 1,877 170.61983 Mike Rozier, Nebraska ................................ Sr. 12 275 2,148 179.01984 Keith Byars, Ohio St. ................................... Jr. 11 313 1,655 150.51985 Lorenzo White, Michigan St. .................. So. 11 386 1,908 173.51986 Paul Palmer, Temple .................................... Sr. 11 346 1,866 169.61987 Elbert “Ickey” Woods, UNLV ..................... Sr. 11 259 1,658 150.71988 Barry Sanders, Oklahoma St. ................. Jr. 11 344 *2,628 *238.91989 Anthony Thompson, Indiana .................. Sr. 11 358 1,793 163.01990 Gerald Hudson, Oklahoma St. ............... Sr. 11 279 1,642 149.31991 Marshall Faulk, San Diego St. ................ Fr. 9 201 1,429 158.8
1992 Marshall Faulk, San Diego St. ................ So. 10 265 1,630 163.01993 LeShon Johnson, Northern Ill. ............... Sr. 11 327 1,976 179.61994 Rashaan Salaam, Colorado ...................... Jr. 11 298 2,055 186.81995 Troy Davis, Iowa St. .................................... So. 11 345 2,010 182.71996 Troy Davis, Iowa St. .................................... Jr. 11 402 2,185 198.61997 Ricky Williams, Texas ................................... Jr. 11 279 1,893 172.11998 Ricky Williams, Texas ................................... Sr. 11 361 2,124 193.11999 LaDainian Tomlinson, TCU ....................... Jr. 11 268 1,850 168.22000 LaDainian Tomlinson, TCU ....................... Sr. 11 369 2,158 196.22001 Chance Kretschmer, Nevada ................... Fr. 11 302 1,732 157.52002 Larry Johnson, Penn St. ............................. Sr. 13 271 2,087 160.52003 Patrick Cobbs, North Texas ...................... Jr. 11 307 1,680 152.72004 Jamario Thomas, North Texas ................ Fr. 10 285 1,801 180.12005 DeAngelo Williams, Memphis ................ Sr. 11 310 1,964 178.52006 Garrett Wolfe, Northern Ill. ...................... Sr. 13 309 1,928 148.32007 Kevin Smith, UCF ......................................... Jr. 14 *450 2,567 183.42008 Donald Brown, Connecticut ................... Jr. 13 367 2,083 160.22009 Ryan Matthews, Fresno St. ....................... Jr. 12 276 1,808 150.72010 LaMichael James, Oregon ........................ So. 12 294 1,731 144.3*Record.
FRESHMAN 1,000-YARD RUSHERS(Listed Chronologically)
Player, Team Year YardsRon “Po” James, New Mexico St. ...................................................................... 1968 1,291Tony Dorsett, Pittsburgh ...................................................................................... 1973 1,586James McDougald, Wake Forest ...................................................................... 1976 1,018Mike Harkrader, Indiana ....................................................................................... 1976 1,003Amos Lawrence, North Carolina ...................................................................... 1977 1,211Darrin Nelson, Stanford ........................................................................................ 1977 1,069Mike Smith, Chattanooga ................................................................................... 1977 1,062Gwain Durden, Chattanooga ............................................................................ 1977 1,049Allen Ross, Northern Ill. ....................................................................................... 1977 1,043Allen Harvin, Cincinnati........................................................................................ 1978 1,238Joe Morris, Syracuse .............................................................................................. 1978 1,001Ron Lear, Marshall ................................................................................................... 1979 1,162Herschel Walker, Georgia ..................................................................................... 1980 1,616Kerwin Bell, Kansas................................................................................................. 1980 1,114Joe McIntosh, North Carolina St. .................................................................... 1981 1,190Steve Bartalo, Colorado St. ................................................................................ 1983 1,113Spencer Tillman, Oklahoma ............................................................................... 1983 1,047D.J. Dozier, Penn St. ............................................................................................... 1983 1,002Eddie Johnson, Utah ............................................................................................. 1984 1,021Darrell Thompson, Minnesota........................................................................... 1986 1,240Emmitt Smith, Florida ........................................................................................... 1987 1,341Reggie Cobb, Tennessee ...................................................................................... 1987 1,197Bernie Parmalee, Ball St. ...................................................................................... 1987 1,064Curvin Richards, Pittsburgh ................................................................................ 1988 1,228Chuck Webb, Tennessee ...................................................................................... 1989 1,236Robert Smith, Ohio St. ......................................................................................... 1990 1,064Marshall Faulk, San Diego St. ............................................................................ 1991 1,429Greg Hill, Texas A&M .............................................................................................. 1991 1,216David Small, Cincinnati......................................................................................... 1991 1,004Winslow Oliver, New Mexico ............................................................................. 1992 1,063Deland McCullough, Miami (OH) ..................................................................... 1992 1,026Terrell Willis, Rutgers .............................................................................................. 1993 1,261June Henley, Kansas .............................................................................................. 1993 1,127Marquis Williams, Arkansas St. ......................................................................... 1993 1,060Leon Johnson, North Carolina ......................................................................... 1993 1,012Alex Smith, Indiana ................................................................................................ 1994 1,475Astron Whatley, Kent St. ..................................................................................... 1994 1,003Denvis Manns, New Mexico St. ........................................................................ 1995 1,120Silas Massey, Central Mich. ................................................................................ 1995 1,089Ahman Green, Nebraska ..................................................................................... 1995 1,086Ron Dayne, Wisconsin ........................................................................................... 1996 1,863Demond Parker, Oklahoma ................................................................................ 1996 1,184Sedrick Irvin, Michigan St. .................................................................................. 1996 1,036Jamal Lewis, Tennessee ........................................................................................ 1997 1,364Robert Sanford, Western Mich. ........................................................................ 1997 1,033Derrick Nix, Southern Miss. ............................................................................... 1998 1,180Ken Simonton, Oregon St. ................................................................................. 1998 1,028Avon Cobourne, West Virginia .......................................................................... 1999 1,139Chance Kretschmer, Nevada .............................................................................. 2001 1,732Anthony Davis, Wisconsin ................................................................................... 2001 1,466Cedric Benson, Texas ............................................................................................. 2001 1,053Joshua Cribbs, Kent St. (QB) ............................................................................... 2001 1,019Terry Caulley, Connecticut .................................................................................. 2002 1,247Maurice Clarett, Ohio St. ..................................................................................... 2002 1,237DonTrell Moore, New Mexico ............................................................................ 2002 1,134Matt Milton, Nevada .............................................................................................. 2002 1,108T.A. McLendon, North Carolina St. ................................................................ 2002 1,101Lonta Hobbs, TCU ................................................................................................... 2002 1,029
Year Player, Team Class G Carries Yards Avg.

28 2011 NCAA FOOTBALL RECORDS - FBS ALL-TIME LEADERS
Brad Smith, Missouri (QB).................................................................................... 2002 1,029Laurence Maroney, Minnesota ......................................................................... 2003 1,121Jerry Seymour, Central Mich. ............................................................................ 2003 1,117Robert Merrill, TCU ................................................................................................. 2003 1,107Lynell Hamilton, San Diego St. ......................................................................... 2003 1,087Courtney Lewis, Texas A&M ............................................................................... 2003 1,024Justin Vincent, LSU ................................................................................................. 2003 1,001Adrian Peterson, Oklahoma ............................................................................... 2004 *1,925Jamario Thomas, North Texas ............................................................................ 2004 1,801Michael Hart, Michigan ........................................................................................ 2004 1,455Kevin Smith, UCF ..................................................................................................... 2005 1,178Steve Slaton, West Virginia .................................................................................. 2005 1,128Ray Rice, Rutgers ..................................................................................................... 2005 1,120Darren McFadden, Arkansas .............................................................................. 2005 1,113Ontario Sneed, Central Mich. ........................................................................... 2005 1,065Tyrell Fenroy, La.-Lafayette ................................................................................. 2005 1,053P.J. Hill, Wisconsin ................................................................................................... 2006 1,569Damion Fletcher, Southern Miss. .................................................................... 2006 1,388Reggie Arnold, Arkansas St. .............................................................................. 2006 1,076Knowshon Moreno, Georgia .............................................................................. 2007 1,334LeSean McCoy, Pittsburgh .................................................................................. 2007 1,328Harvey Unga, BYU .................................................................................................. 2007 1,227Deonte Jackson, Idaho ......................................................................................... 2007 1,175Darren Evans, Virginia Tech ................................................................................. 2008 1,265Jacquizz Rodgers, Oregon St. ............................................................................ 2008 1,253Bryce Beall, Houston .............................................................................................. 2008 1,247Vic Anderson, Louisville ....................................................................................... 2008 1,047Morgan Williams, Toledo ..................................................................................... 2008 1,010Dion Lewis, Pittsburgh .......................................................................................... 2009 1,799Ryan Williams, Virginia Tech ............................................................................... 2009 1,655LaMichael James, Oregon ................................................................................... 2009 1,546Bernard Pierce, Temple ......................................................................................... 2009 1,361Chris Polk, Washington ......................................................................................... 2009 1,113Ronnie Hillman, San Diego St. .......................................................................... 2010 1,532Marcus Lattimore, South Carolina ................................................................... 2010 1,197Michael Dyer, Auburn ........................................................................................... 2010 1,093James White, Wisconsin ....................................................................................... 2010 1,052*Record for freshman.
Quarterback Rushing
SEASON YARDSPlayer, Team Year G Carries Yards TD Avg.Denard Robinson, Michigan ..................... 2010 13 256 1,702 14 6.65Beau Morgan, Air Force ............................... 1996 11 225 1,494 18 6.64Cam Newton, Auburn .................................. 2010 14 264 1,473 20 5.58Stacey Robinson, Northern Ill. ................. 1989 11 223 1,443 19 6.47Joe Webb, UAB ................................................ 2009 12 227 1,427 11 6.29Jammal Lord, Nebraska ............................... 2002 14 251 1,412 8 5.63Brad Smith, Missouri ..................................... 2003 13 212 1,406 18 6.63Chris McCoy, Navy ......................................... 1997 11 246 1,370 20 5.57Julian Edelman, Kent St. .............................. 2008 12 215 1,370 13 6.37Patrick White, West Virginia ....................... 2007 13 197 1,335 14 6.78Dee Dowis, Air Force .................................... 1987 12 194 1,315 10 6.78Brian Mitchell, La.-Lafayette ...................... 1989 11 237 1,311 19 5.53Brad Smith, Missouri ..................................... 2005 12 229 1,301 16 5.68Fred Solomon, Tampa .................................. 1974 11 193 1,300 19 6.74
Dee Dowis, Air Force .................................... 1989 12 172 1,286 18 #7.48Beau Morgan, Air Force ............................... 1995 12 229 1,285 19 5.61Antwaan Randle El, Indiana ...................... 2000 11 218 1,270 13 5.83Stacey Robinson, Northern Ill. ................. 1990 11 193 1,238 19 6.41Chance Harridge, Air Force ........................ 2002 13 252 1,229 23 4.88Chris McCoy, Navy ......................................... 1996 11 268 1,228 16 4.58Pat White, West Virginia ............................... 2006 12 165 1,219 18 7.39Keith Boyea, Air Force .................................. 2001 12 230 1,216 18 5.29Colin Kaepernick, Nevada .......................... 2010 14 173 1,206 20 6.97Ricky Dobbs, Navy ......................................... 2009 13 315 1,203 *27 3.82Colin Kaepernick, Nevada .......................... 2009 13 161 1,183 16 7.35*Record. #Record for a minimum of 150 carries.
CAREER YARDSPlayer, Team Years G Carries Yards TD Avg.Pat White, West Virginia .......................... 2005-08 49 684 4,480 47 91.4Brad Smith, Missouri ............................... 2002-05 48 799 4,289 45 89.4Colin Kaepernick, Nevada ..................... 2007-10 51 600 4,112 *59 80.6Antwaan Randle El, Indiana ................. 1998-01 44 857 3,895 44 88.5Joshua Cribbs, Kent St. .......................... 2001-04 43 632 3,670 38 85.3Dee Dowis, Air Force ............................... 1986-89 47 543 3,612 41 76.9Kareem Wilson, Ohio ............................... 1995-98 45 *885 3,597 49 79.9Eric Crouch, Nebraska ............................. 1998-01 43 648 3,434 *59 79.9Chris McCoy, Navy .................................... 1995-97 32 682 3,401 43 106.3Beau Morgan, Air Force .......................... 1994-96 35 594 3,379 42 96.5Brian Mitchell, La.-Lafayette ................. 1986-89 43 678 3,335 47 77.6Fred Solomon, Tampa ............................. 1971-74 43 557 3,299 39 76.7Vince Young, Texas ................................... 2003-05 37 457 3,127 37 84.5Dan LeFevour, Central Mich. ................ 2006-09 53 671 2,948 47 55.6Tim Tebow, Florida ................................... 2006-09 55 692 2,947 57 53.6Ell Roberson, Kansas St. ......................... 2000-03 47 604 2,818 40 60.0Joe Webb, UAB ........................................... 2006-09 37 516 2,774 24 75.0Stacey Robinson, Northern Ill. .......... 1988-90 25 429 2,727 38 *109.1Jamelle Holieway, Oklahoma .............. 1985-88 38 505 2,699 30 71.0Ricky Dobbs, Navy .................................... 2008-10 33 687 2,665 49 80.8Woodrow Dantzler, Clemson ............... 1998-01 36 549 2,615 27 72.6Jammal Lord, Nebraska .......................... 2000-03 39 516 2,573 24 66.0Shaun Carney, Air Force ......................... 2004-07 46 652 2,561 31 55.7Bill Hurley, Syracuse ................................. 1975-79 46 685 2,551 19 55.5Matt Jones, Arkansas ............................... 2001-04 46 382 2,535 24 55.1*Record.
Player, Team Year Yards Player, Team Year G Carries Yards TD Avg.

2011 NCAA FOOTBALL RECORDS - FBS ALL-TIME LEADERS 29
FOO
TBA
LL B
OW
LSU
BD
IVIS
ION
CAREER PASSING EFFICIENCY(Minimum 500 Completions; Player must have concluded his career)
Player, Team Years Att. Cmp. Int. Pct. Yds. TD Pts.Sam Bradford, Oklahoma ......................................... 2007-09 893 604 16 .676 8,403 88 175.6Tim Tebow, Florida ...................................................... 2006-09 995 661 16 .664 9,285 88 170.8Ryan Dinwiddie, Boise St. ........................................ 2000-03 992 622 21 .627 9,819 82 168.9Colt Brennan, Hawaii .................................................. 2005-07 1,584 1,115 42 ‡.704 14,193 131 167.7Danny Wuerffel, Florida............................................. 1993-96 1,170 708 42 .605 10,875 114 163.6Omar Jacobs, Bowling Green ................................. 2003-05 811 523 11 .645 6,937 71 163.5Ty Detmer, BYU ............................................................. 1988-91 1,530 958 65 .626 15,031 121 162.7Steve Sarkisian, BYU.................................................... 1995-96 789 528 26 .669 7,464 53 162.0Matt Leinart, Southern California ......................... 2002-05 1,245 807 23 .648 10,693 99 159.5Brian Brohm, Lousiville .............................................. 2004-07 1,185 780 24 .658 10,775 71 157.9Bruce Gradkowski, Toledo ........................................ 2002-05 1,123 766 27 .682 9,225 85 157.4Billy Blanton, San Diego St. .................................... 1993-96 920 588 25 .639 8,165 67 157.1Jim McMahon, BYU ........................................... 1977-78, 80-81 1,060 653 34 .616 9,536 84 156.9Chad Pennington, Marshall ..................................... 1997-99 1,265 807 30 .638 10,698 100 156.2Donovan McNabb, Syracuse ................................... 1995-98 938 548 26 .584 8,389 77 155.1Colt McCoy, Texas ........................................................ 2006-09 1,645 1,157 45 .703 13,253 112 155.0Graham Harrell, Texas Tech ...................................... 2005-08 2,010 *1,403 34 .698 15,793 *134 154.4Tim Rattay, Louisiana Tech ....................................... 1997-99 1,552 1,015 35 .654 12,746 115 154.3Daunte Culpepper, UCF ............................................ 1996-98 1,097 721 32 .657 9,341 72 153.1David Carr, Fresno St. ................................................ 1997-98, 00-01 877 551 21 .628 7,309 66 152.9Jason White, Oklahoma ............................................ $1999-04 990 627 24 .633 7,922 81 152.7Ben Roethlisberger, Miami (OH) ............................ 2001-03 1,304 854 34 .655 10,829 84 151.3Chris Weinke, Florida St. ........................................... 1997-00 1,107 650 32 .587 9,839 79 151.1Max Hall, BYU ................................................................. 2007-09 1,382 903 40 .653 11,365 94 151.1Byron Leftwich, Marshall .......................................... $1998-02 1,442 939 28 .651 11,903 89 150.9(400-499 Completions)Player, Team Years Att. Cmp. Int. Pct. Yds. TD Pts.Troy Smith, Ohio St. ................................................... $2002-06 670 420 13 .627 5,720 54 157.1Greg McElroy, Alabama ............................................. 2007-10 658 436 10 .663 5,691 39 155.4Scott Tolzien, Wisconsin ............................................ 2008-10 602 410 18 .681 5,271 32 153.2Vinny Testaverde, Miami (FL) .............................. 1982, 84-86 674 413 25 .613 6,058 48 152.9Josh Wallwork, Wyoming ......................................... 1995-96 729 449 28 .616 6,453 54 152.7Trent Dilfer, Fresno St. ............................................... 1991-93 774 461 21 .596 6,944 51 151.2
SAMPLE COMPILATION OF NCAA PASSING EFFICIENCY RATINGPlayer G Att. Cmp. Yds. TD Int.Ryan Dinwiddie, Boise St. ......................................................................................... 45 992 622 9,819 82 21 Completion Percentage: 62.70 Yards Per Attempted Pass: 9.90 Percent of Passes for TDs: 8.27 Percent of Passes Intercepted: 2.12ADD the first three factors: Rating Points Completion Percentage: 62.70 62.70 Yards Per Attempted Pass: 9.898 times 8.4 83.14 Percent of Passes for TDs: 8.27 times 3.3 27.29 173.13SUBTRACT the last factor: Percent of Passes Intercepted: 2.12 times 2 -4.24 Round off to: 168.9
FBS PASSING EFFICIENCY RATING COMPARISON1979-10
Passing statistics in the FBS have increased dramatically since 1979, the first year that the NCAA official national statistics used the passing efficiency formula to rank passers in all divisions. Because passers have become more proficient every year, the average passing efficiency rating (based on final regular-season trends) also has risen at a similar rate. For historical purposes, the average passing efficiency rating for the division by year is presented below to show how any individual or team might rank in a particular season.
1979 ..................................................... 104.491980 ..................................................... 106.631981 ..................................................... 107.001982 ..................................................... 110.771983 ..................................................... 113.561984 ..................................................... 113.021985 ..................................................... 114.581986 ..................................................... 115.001987 ..................................................... 112.671988 ..................................................... 114.321989 ..................................................... 118.351990 ..................................................... 117.391991 ..................................................... 117.941992 ..................................................... 114.501993 ..................................................... 122.431994 ..................................................... 120.59
1995 ..................................................... 120.171996 ..................................................... 120.241997 ..................................................... 122.861998 ..................................................... 122.971999 ..................................................... 120.502000 ..................................................... 119.662001 ..................................................... 123.802002 ..................................................... 123.002003 ..................................................... 125.892004 ..................................................... 125.362005 ..................................................... 126.132006 ..................................................... 127.542007 ..................................................... 127.352008 ..................................................... 127.892009 ..................................................... 129.272010 ..................................................... 131.02
Year Pass Effic. Rating Year Pass Effic. Rating
Passing

30 2011 NCAA FOOTBALL RECORDS - FBS ALL-TIME LEADERS
Aaron Rodgers, California ........................................ 2002-04 665 424 13 .638 5,469 43 150.3Troy Aikman, Oklahoma/UCLA .................... 1984-85, 87-88 637 401 18 .630 5,436 40 149.7Chuck Hartlieb, Iowa .................................................. 1985-88 716 461 17 .643 6,269 34 148.9Elvis Grbac, Michigan ................................................. 1989-92 754 477 29 .633 5,859 64 148.9JaMarcus Russell, LSU ................................................ 2003-06 796 492 21 .618 6,619 52 147.9Bobby Hoying, Ohio St. ............................................ 1992-95 782 463 33 .592 6,751 54 146.1Gifford Nielsen, BYU .................................................... 1975-77 708 415 29 .586 5,833 55 145.3Ryan Colburn, Fresno St. ........................................... 2007-10 663 412 20 .621 5,334 42 144.6Tom Ramsey, UCLA ..................................................... 1979-82 691 411 33 .595 5,844 48 143.9Shawn Moore, Virginia ............................................... 1987-90 762 421 32 .552 6,629 55 143.8George Godsey, Georgia Tech ................................ 1998-01 765 484 18 .633 6,137 41 143.6Moses Moreno, Colorado St. .................................. 1994-97 787 457 28 .581 6,689 49 142.9Jerry Rhome, SMU/Tulsa ...................................... 1961, 63-64 713 448 23 .628 5,472 47 142.6Thad Busby, Florida St................................................ 1994-97 715 420 27 .587 5,916 46 141.9(325-399 Completions)Player, Team Years Att. Cmp. Int. Pct. Yds. TD Pts.Alex Smith, Utah ........................................................... 2002-04 587 389 8 .663 5,203 47 164.4Joe Ganz, Nebraska ..................................................... 2005-08 585 381 18 .651 5,125 44 157.4Joe Germaine, Ohio St. ............................................. 1996-98 660 399 18 .605 5,844 52 155.4Jim Harbaugh, Michigan .......................................... 1983-86 582 368 19 .632 5,215 31 149.6Danny White, Arizona St. ......................................... 1971-73 649 345 36 .532 5,932 59 148.9Koy Detmer, Colorado ........................................... 1992, 94-96 594 350 25 .589 5,390 40 148.9Cody Hodges, Texas Tech ......................................... 2002-05 543 360 13 .662 4,308 33 148.2Tim Gutierrez, San Diego St. .................................. 1992-94 580 357 19 .616 4,740 36 144.1Scott McBrien, Maryland .......................................... 2002-03 598 335 16 .560 5,169 34 142.0Jim Karsatos, Ohio St. ................................................ 1983-86 573 330 19 .576 4,698 36 140.6Jerry Tagge, Nebraska ............................................ 1969-71 581 348 19 .599 4,704 33 140.1Mike Fouts, Utah .......................................................... 1995-96 625 356 19 .570 5,107 39 140.1Garrett Gabriel, Hawaii .............................................. 1987-90 661 356 31 .539 5,631 47 139.5Rick Mirer, Notre Dame ............................................. 1989-92 698 377 23 .540 5,996 41 139.0Gary Sheide, BYU ......................................................... 1973-74 594 358 31 .603 4,524 45 138.8Joey Lynch, Ball St.................................................... 2003-06 613 391 12 .638 4,292 37 138.6Jeff Ballard, TCU ............................................................ $2002-06 540 330 12 .611 4,204 27 138.5Dan Speltz, Cal St. Fullerton .................................... 1988-89 583 350 19 .600 4,595 33 138.4Mike Moschetti, Colorado ........................................ 1998-99 607 366 19 .603 4,797 33 138.4Don McPherson, Syracuse ....................................... $1983-87 687 367 29 .534 5,812 46 138.1*Record. $See page 2 for explanation. ‡Record for minimum 1,000 attempts.
SEASON PASSING EFFICIENCY(Minimum 15 Attempts Per Game)
Player, Team Year G Att. Cmp. Int. Pct. Yds. TD Pts.Colt Brennan, Hawaii .............................................. #†2006 14 559 406 12 .726 5,549 *58 186.0Shaun King, Tulane .................................................. †1998 11 328 223 6 .680 3,232 36 183.3Kellen Moore, Boise St. .......................................... †2010 13 383 273 6 .713 3,845 35 182.6Cam Newton, Auburn ............................................ 2010 14 280 185 7 .661 2,854 30 182.1Stefan LeFors, Louisville ........................................ †2004 12 257 189 3 .735 2,596 20 181.7Sam Bradford, Oklahoma ..................................... †2008 14 483 328 8 .679 4,720 50 180.8Michael Vick, Virginia Tech ................................... †1999 10 152 90 5 .592 1,840 12 180.4David Johnson, Tulsa .............................................. 2008 14 400 258 18 .645 4,059 46 178.7Danny Wuerffel, Florida......................................... †1995 11 325 210 10 .646 3,266 35 178.4Jim McMahon, BYU ................................................. #†1980 12 445 284 18 .638 4,571 47 176.9Sam Bradford, Oklahoma ..................................... †2007 14 341 237 8 .695 3,121 36 176.5Alex Smith, Utah ....................................................... 2004 12 317 214 4 .675 2,952 32 176.5Ty Detmer, BYU ......................................................... †1989 12 412 265 15 .643 4,560 32 175.6Rudy Carpenter, Arizona St. .............................. †2005 9 228 156 2 .684 2,273 17 175.0Joe Hamilton, Georgia Tech ................................ 1999 11 305 203 11 .666 3,060 29 175.0Colt McCoy, Texas .................................................... 2008 13 433 332 8 *.767 3,859 34 173.8Steve Sarkisian, BYU................................................ †1996 14 404 278 12 .688 4,027 33 173.6Trent Dilfer, Fresno St. ........................................... †1993 11 333 217 4 .652 3,276 28 173.1Jason Campbell, Auburn ...................................... 2004 13 270 188 7 .696 2,700 20 172.9Kerry Collins, Penn St. ........................................... †1994 11 264 176 7 .667 2,679 21 172.9Jerry Rhome, Tulsa ................................................... #†1964 10 326 224 4 .687 2,870 32 172.6Tim Tebow, Florida .................................................. 2007 13 350 234 6 .669 3,286 32 172.5Tim Tebow, Florida .................................................. 2008 14 298 192 4 .644 2,746 30 172.4Chad Pennington, Marshall ................................. 1999 12 405 275 11 .679 3,799 37 171.4Rex Grossman, Florida ........................................... †2001 11 395 259 12 .656 3,896 34 170.8*Record. †National pass-efficiency champion. #National total-offense champion.
ANNUAL PASSING EFFICIENCY LEADERS(% Minimum 11 Attempts Per Game)1946—Bill Mackrides, Nevada, 176.9; 1947—Bobby Layne, Texas, 138.9; 1948—Stan Heath, Nevada, 157.2 (#); 1949—Bob Williams, Notre Dame, 159.1; 1950—Claude Arnold, Oklahoma, 157.3; 1951—Dick Kazmaier, Princeton, 155.3 (#); 1952—Ron Morris, Tulsa, 177.4; 1953—Bob Garrett, Stanford, 142.2; 1954—Pete Vann, Army, 166.5; 1955—George Welsh, Navy, 146.1 (#); 1956—Tom Flores, Pacific, 147.5; 1957—Lee Grosscup, Utah, 175.5; 1958—John Hangartner, Arizona St., 150.1; 1959—Charley Johnson, New Mexico St., 135.7; 1960—Eddie Wilson, Arizona, 140.8; 1961—Ron DiGravio, Purdue, 140.1; 1962—John Jacobs, Arizona St., 153.9; 1963—Bob Berry, Oregon, 164.0; 1964—Jerry Rhome, Tulsa, 172.6 (#).
Player, Team Years Att. Cmp. Int. Pct. Yds. TD Pts.

2011 NCAA FOOTBALL RECORDS - FBS ALL-TIME LEADERS 31
FOO
TBA
LL B
OW
LSU
BD
IVIS
ION(Minimum 15 Attempts Per Game)
1946—Ben Raimondi, Indiana, 117.0; 1947—Charley Conerly, Ole Miss, 125.8; 1948—Stan Heath, Nevada, 157.2 (#); 1949—Dick Doheny, Fordham, 153.3; 1950—Dick Doheny, Fordham, 149.5; 1951—Babe Parilli, Kentucky, 130.8; 1952—Gene Rossi, Cincinnati, 149.7; 1953—Bob Garrett, Stanford, 142.2; 1954—Len Dawson, Purdue, 145.8; 1955—George Welsh, Navy, 146.1 (#); 1956—Bob Reinhart, San Jose St., 121.3; 1957—Bob Newman, Washington St., 126.5 (#); 1958—Randy Duncan, Iowa, 135.1; 1959—Charley Johnson, New Mexico St., 135.7; 1960—Charley Johnson, New Mexico St., 134.1; 1961—Eddie Wilson, Arizona, 134.2; 1962—Terry Baker, Oregon St., 146.5 (#); 1963—Bob Berry, Oregon, 164.0; 1964—Jerry Rhome, Tulsa, 172.6 (#).(Minimum 15 Attempts Per Game)Year Player, Team G Att. Cmp. Int. Pct. Yds. TD Pts.1965 Steve Sloan, Alabama ........................................ 10 160 97 3 .606 1,453 10 153.81966 Dewey Warren, Tennessee .............................. 10 229 136 7 .594 1,716 18 142.21967 Bill Andrejko, Villanova ..................................... 10 187 114 6 .610 1,405 13 140.61968 Brian Dowling, Yale ............................................. 9 160 92 10 .575 1,554 19 165.81969 # Dennis Shaw, San Diego St. ........................... 10 335 199 26 .594 3,185 39 162.21970 Jerry Tagge, Nebraska ....................................... 11 165 104 7 .630 1,383 12 149.01971 Jerry Tagge, Nebraska ....................................... 12 239 143 4 .598 2,019 17 150.91972 John Hufnagel, Penn St. .................................. 11 216 115 8 .532 2,039 15 148.01973 Danny White, Arizona St. ................................ 11 265 146 12 .551 2,609 23 157.41974 # Steve Joachim, Temple ..................................... 10 221 128 13 .579 1,950 20 150.11975 James Kubacki, Harvard ................................... 8 137 77 9 .562 1,273 11 147.61976 Steve Haynes, Louisiana Tech ........................ 10 216 120 11 .556 1,981 16 146.91977 Dave Wilson, Ball St. .......................................... 11 177 115 7 .650 1,589 17 164.21978 Paul McDonald, Southern California .......... 11 194 111 7 .572 1,667 18 152.8(See page 34 for annual leaders beginning in 1979)
#National total-offense champion. % In many seasons during 1946-64, only a few passers threw as many as 15 passes per game; thus, a lower minimum was used.
CAREER YARDSPlayer, Team Years Att. Cmp. Int. Pct. Yds. TD LongTimmy Chang, Hawaii ......................................... $2000-04 *2,436 1,388 *80 .570 17,072 117 75Graham Harrell, Texas Tech ............................... 2005-08 2,010 *1,403 34 .698 15,793 *134 82Ty Detmer, BYU ...................................................... 1988-91 1,530 958 65 .626 15,031 121 76Colt Brennan, Hawaii ........................................... 2005-07 1,584 1,115 42 *.704 14,193 131 87^Case Keenum, Houston ................................... 2007-10 1,626 1,118 41 .688 13,586 107 86Philip Rivers, North Carolina St. ..................... 2000-03 1,710 1,147 34 .671 13,484 95 88Colt McCoy, Texas ................................................. 2006-09 1,645 1,157 45 .703 13,253 112 91Kevin Kolb, Houston ........................................... 2003-06 1,565 964 31 .616 12,964 85 83Dan LeFevour, Central Mich. ............................ 2006-09 1,763 1,171 36 .664 12,905 102 93Tim Rattay, Louisiana Tech ................................ 1997-99 1,552 1,015 35 .654 12,746 115 94Luke McCown, Louisiana Tech ........................ 2000-03 1,775 1,063 62 .599 12,666 87 80Chris Redman, Louisville .................................... 1996-99 1,679 1,031 51 .614 12,541 84 86Chase Daniel, Missouri........................................ 2005-08 1,609 1,094 41 .680 12,515 101 82Trevor Vittatoe, UTEP ........................................... 2007-10 1,641 914 42 .557 12,439 97 85Kliff Kingsbury, Texas Tech ................................ 1999-02 1,883 1,231 40 .654 12,429 95 75Byron Leftwich, Marshall ................................... $1998-02 1,442 939 28 .651 11,903 89 86Chase Holbrook, New Mexico St. ................... 2005-08 1,566 1,087 41 .694 11,846 85 96Brady Quinn, Notre Dame................................. 2003-06 1,602 929 39 .580 11,762 95 85David Greene, Georgia ....................................... 2001-04 1,440 849 32 .590 11,528 72 93Gino Guidugli, Cincinnati .................................. 2001-04 1,556 880 48 .566 11,453 78 80Todd Santos, San Diego St. .............................. 1984-87 1,484 910 57 .613 11,425 70 84Carson Palmer, Southern California .............. $1998-02 1,515 895 49 .591 11,388 71 93Max Hall, BYU .......................................................... 2007-09 1,382 903 40 .653 11,365 94 80Tim Hiller, Western Mich. ................................... $2005-09 1,607 1,013 41 .630 11,329 99 89Tim Lester, Western Mich. ................................ 1996-99 1,507 875 49 .581 11,299 87 82*Record. $See page 2 for explanation. ^Active player
Through 2010, there are 67 players who have reached 10,000 career passing yards (including one player active in 2010).
CAREER YARDS RECORD PROGRESSION(Record Yards—Player, Team, Seasons Played)3,075—Billy Patterson, Baylor, 1936-38; 3,777—Bud Schwenk, Washington-St. Louis, 1939-41; 4,004—Johnny Rauch, Georgia, 1945-48; 4,736—John Ford, Hardin-Simmons, 1947-50; 4,863—Zeke Bratkowski, Georgia, 1951-53; 5,472—Jerry Rhome, SMU, 1961, Tulsa, 1963-64; 6,495—Billy Stevens, UTEP, 1965-67; 7,076—Steve Ramsey, North Texas, 1967-69; 7,544—Jim Plunkett, Stanford, 1968-70; 7,549—John Reaves, Florida, 1969-71; 7,818—Jack Thompson, Washington St., 1975-78; 9,188—Mark Herrmann, Purdue, 1977-80; 9,536—Jim McMahon, BYU, 1977-78, 1980-81; 9,614—Ben Bennett, Duke, 1980-83; 10,579—Doug Flutie, Boston College, 1981-84; 10,623—Kevin Sweeney, Fresno St., $1982-86; 11,425—Todd Santos, San Diego St., 1984-87; 15,031—Ty Detmer, BYU, 1988-91; 17,072—Timmy Chang, Hawaii, $2000-04.$See page 2 for explanation.
CAREER YARDS PER GAME(Minimum 5,000 yards; Player must have concluded his career)
Player, Team Years G Att. Cmp. Int. Pct. Yds. TD Yd. PGTim Rattay, Louisiana Tech ........................ 1997-99 33 1,552 1,015 35 .654 12,746 115 386.2Colt Brennan, Hawaii ................................... 2005-07 38 1,584 1,115 42 *.704 14,193 131 373.5Graham Harrell, Texas Tech ...................... 2005-08 45 2,010 *1,403 34 .698 15,793 *134 351.0Chase Holbrook, New Mexico St. ........... 2005-08 36 1,566 1,087 41 .694 11,846 85 329.1Ty Detmer, BYU .............................................. 1988-91 46 1,530 958 65 .626 15,031 121 326.8Timmy Chang, Hawaii ................................. $2000-04 53 *2,436 1,388 *80 .570 *17,072 117 322.1Chris Vargas, Nevada ................................... 1992-93 20 806 502 34 .623 6,359 47 318.0Mike Perez, San Jose St. ............................. 1986-87 20 792 471 30 .595 6,194 36 309.7Doug Gaynor, Long Beach St. ................ 1984-85 22 837 569 35 .680 6,793 35 308.8

32 2011 NCAA FOOTBALL RECORDS - FBS ALL-TIME LEADERS
Tony Eason, Illinois ....................................... 1981-82 22 856 526 29 .614 6,608 37 300.4Steve Sarkisian, BYU..................................... 1995-96 25 789 528 26 .669 7,464 53 298.6Chris Redman, Louisville ............................ 1996-99 42 1,679 1,031 51 .614 12,541 84 298.6Josh Heupel, Oklahoma ............................. 1999-00 23 933 590 29 .632 6,852 50 297.9Chad Pennington, Marshall ...................... 1997-99 36 1,265 807 30 .638 10,698 100 297.2David Klingler, Houston ............................. 1988-91 32 1,268 732 38 .577 9,466 91 295.8Luke McCown, Louisiana Tech ................ 2000-03 43 1,775 1,063 62 .599 12,666 87 294.6Josh Wallwork, Wyoming .......................... 1995-96 22 729 449 28 .616 6,453 54 293.3Max Hall, BYU .................................................. 2007-09 39 1,382 903 40 .653 11,365 94 291.4Tim Couch, Kentucky .................................. 1996-98 29 1,184 795 35 .671 8,435 74 290.9Kliff Kingsbury, Texas Tech ........................ 1999-02 43 1,883 1,231 40 .654 12,429 95 289.0Ben Roethlisberger, Miami (OH) ............. 2001-03 38 1,304 854 34 .655 10,829 84 285.0Daunte Culpepper, UCF ............................. 1996-98 33 1,097 721 32 .657 9,341 72 283.1Ryan Schneider, UCF ................................... 2000-03 39 1,354 840 51 .620 10,976 82 281.4Brent Snyder, Utah St. ................................ 1987-88 22 875 472 36 .539 6,105 39 277.5Omar Jacobs, Bowling Green ................. 2003-05 25 811 523 11 .645 6,937 71 277.5*Record. $See page 2 for explanation.
CAREER TOUCHDOWN PASSESTD
Player, Team Years G PassesGraham Harrell, Texas Tech ......................................................................................................... 2005-08 45 134Colt Brennan, Hawaii ..................................................................................................................... 2005-07 38 131Ty Detmer, BYU ................................................................................................................................ 1988-91 46 121Timmy Chang, Hawaii ................................................................................................................... $2000-04 53 117Tim Rattay, Louisiana Tech .......................................................................................................... 1997-99 33 115Danny Wuerffel, Florida................................................................................................................ 1993-96 46 114Colt McCoy, Texas ........................................................................................................................... 2006-09 53 112^Case Keenum, Houston ............................................................................................................. 2007-10 43 107Dan LeFevour, Central Mich. ...................................................................................................... 2006-09 53 102Chase Daniel, Missouri.................................................................................................................. 2005-08 51 101Chad Pennington, Marshall ........................................................................................................ 1997-99 39 100Matt Leinart, Southern California ............................................................................................ 2002-05 41 99Chase Clement, Rice ...................................................................................................................... 2005-08 45 99Tim Hiller, Western Mich. ............................................................................................................. $2005-09 44 99^Kellen Moore, Boise St. .............................................................................................................. 2008-10 40 99Trevor Vittatoe, UTEP ..................................................................................................................... 2007-10 49 97Kliff Kingsbury, Texas Tech .......................................................................................................... 1999-02 43 95Philip Rivers, North Carolina St. ............................................................................................... 2000-03 49 95Brady Quinn, Notre Dame ......................................................................................................... 2003-06 49 95Max Hall, BYU .................................................................................................................................... 2007-09 39 94David Klingler, Houston ............................................................................................................... 1988-91 32 91Todd Reesing, Kansas .................................................................................................................... 2006-09 41 90Peyton Manning, Tennessee ...................................................................................................... 1994-97 44 89Byron Leftwich, Marshall ............................................................................................................. $1998-02 43 89Chris Leak, Florida .......................................................................................................................... 2003-06 51 88Jordan Palmer, UTEP ..................................................................................................................... $2002-06 53 88Tim Tebow, Florida ......................................................................................................................... 2006-09 55 88Sam Bradford, Oklahoma ............................................................................................................ 2007-09 31 88$See page 2 for explanation. ^Active player.
SEASON YARDSYds. Per
Player, Team Year G Att. Cmp. Int. Pct. Yards TD Att.B.J. Symons, Texas Tech ........................................... 2003 13 *719 470 22 .654 5,833 52 8.11Graham Harrell, Texas Tech .................................... 2007 13 713 *512 14 .718 5,705 48 8.00Case Keenum, Houston ........................................... 2009 14 700 492 15 .703 5,671 44 8.10Colt Brennan, Hawaii ............................................... †2006 14 559 406 12 .726 5,549 *58 9.93Ty Detmer, BYU ........................................................... 1990 12 562 361 28 .642 5,188 41 9.23David Klingler, Houston .......................................... 1990 11 643 374 20 .582 5,140 54 7.99Graham Harrell, Texas Tech .................................... 2008 13 626 442 9 .706 5,111 45 8.16Paul Smith, Tulsa ......................................................... 2007 14 544 327 19 .601 5,065 47 9.31Bryant Moniz, Hawaii ............................................... 2010 14 555 361 15 .650 5,040 39 9.08Case Keenum, Houston ........................................... 2008 13 589 397 11 .674 5,020 44 8.52Kliff Kingsbury, Texas Tech ..................................... 2002 14 712 479 13 .673 5,017 45 7.05Tim Rattay, Louisiana Tech ..................................... 1998 12 559 380 13 .680 4,943 46 8.84Sonny Cumbie, Texas Tech ..................................... 2004 12 642 421 18 .656 4,742 32 7.39Sam Bradford, Oklahoma ....................................... †2008 14 483 328 8 .679 4,720 50 9.77Landry Jones, Oklahoma ........................................ 2010 14 617 405 12 .656 4,718 38 7.65Andre Ware, Houston ............................................... 1989 11 578 365 15 .631 4,699 46 8.13Chase Holbrook, New Mexico St. ....................... 2006 12 567 397 9 .700 4,619 34 8.15Jim McMahon, BYU ................................................... †1980 12 445 284 18 .638 4,571 47 10.27Ty Detmer, BYU ........................................................... †1989 12 412 265 15 .643 4,560 32 *11.07Graham Harrell, Texas Tech .................................... 2006 13 616 412 11 .669 4,555 38 7.39Matt Ryan, Boston College .................................... 2007 14 654 388 19 .593 4,507 31 6.89Philip Rivers, North Carolina St. .......................... †2003 13 483 348 7 .721 4,491 34 9.30Ben Roethlisberger, Miami (OH) .......................... 2003 14 495 342 10 .691 4,486 37 9.06Timmy Chang, Hawaii .............................................. 2002 14 624 349 22 .559 4,474 25 7.17Cody Pickett, Washington ...................................... 2002 13 612 365 14 .596 4,458 28 7.28*Record. †National pass-efficiency champion.
Player, Team Years G Att. Cmp. Int. Pct. Yds. TD Yd. PG

2011 NCAA FOOTBALL RECORDS - FBS ALL-TIME LEADERS 33
FOO
TBA
LL B
OW
LSU
BD
IVIS
ION
SEASON YARDS PER GAMEPlayer, Team Year G Att. Cmp. Int. Pct. Yards TD Yd. PGDavid Klingler, Houston .................................. 1990 11 643 374 20 .582 5,140 54 467.3B.J. Symons, Texas Tech ................................... 2003 13 *719 470 22 .654 *5,833 52 448.7Graham Harrell, Texas Tech ............................ 2007 13 713 *512 14 .718 5,705 48 438.8Ty Detmer, BYU ................................................... 1990 12 562 361 28 .642 5,188 41 432.3Andre Ware, Houston ....................................... 1989 11 578 365 15 .631 4,699 46 427.2Tim Rattay, Louisiana Tech ............................. 1998 12 559 380 13 .680 4,943 46 411.9Case Keenum, Houston ................................... 2009 14 700 492 15 .703 5,671 44 405.1Chris Redman, Louisville ................................. 1998 10 473 309 15 .653 4,042 29 404.2Mike Maxwell, Nevada ..................................... 1995 9 409 277 17 .677 3,611 33 401.2Colt Brennan, Hawaii ....................................... †2006 14 559 406 12 .726 5,549 *58 396.4Sonny Cumbie, Texas Tech ............................. 2004 12 642 421 18 .656 4,742 32 395.2Graham Harrell, Texas Tech ............................ 2008 13 626 442 9 .706 5,111 45 393.2Scott Mitchell, Utah .......................................... 1988 11 533 323 15 .606 4,322 29 392.9Tim Rattay, Louisiana Tech ............................. 1999 10 516 342 12 .663 3,922 35 392.2Tim Couch, Kentucky ....................................... 1998 11 553 400 15 .723 4,275 36 388.6Chris Vargas, Nevada ........................................ 1993 11 490 331 18 .676 4,265 34 387.7Case Keenum, Houston ................................... 2008 13 589 397 11 .674 5,020 44 386.2Chase Holbrook, New Mexico St. ............... 2006 12 567 397 9 .700 4,619 34 384.9Jim McMahon, BYU ........................................... †1980 12 445 284 18 .638 4,571 47 380.9Ty Detmer, BYU ................................................... †1989 12 412 265 15 .643 4,560 32 380.0Troy Kopp, Pacific ............................................... 1990 9 428 243 14 .568 3,311 31 367.9Colt Brennan, Hawaii ........................................ 2007 12 510 359 17 .704 4,343 38 361.9Paul Smith, Tulsa ................................................. 2007 14 544 327 19 .601 5,065 47 361.8David Neill, Nevada ........................................... 1998 9 344 199 9 .578 3,249 29 361.0Bryant Moniz, Hawaii ....................................... 2010 14 361 555 15 .650 5,040 39 360.0*Record. †National pass-efficiency champion.
SEASON TOUCHDOWN PASSESTD
Player, Team Year G PassesColt Brennan, Hawaii .......................................................................................................................... 2006 14 58David Klingler, Houston ..................................................................................................................... 1990 11 54B.J. Symons, Texas Tech ...................................................................................................................... 2003 13 52Sam Bradford, Oklahoma .................................................................................................................. 2008 14 50Graham Harrell, Texas Tech ............................................................................................................... 2007 13 48Jim McMahon, BYU .............................................................................................................................. 1980 12 47Paul Smith, Tulsa .................................................................................................................................... 2007 14 47Andre Ware, Houston .......................................................................................................................... 1989 11 46Tim Rattay, Louisiana Tech ................................................................................................................ 1998 12 46David Johnson, Tulsa ........................................................................................................................... 2008 14 46Kliff Kingsbury, Texas Tech ................................................................................................................ 2002 14 45Graham Harrell, Texas Tech ............................................................................................................... 2008 13 45Chase Clement, Rice ............................................................................................................................ 2008 13 44Case Keenum, Houston ...................................................................................................................... 2008 13 44Case Keenum, Houston ...................................................................................................................... 2009 14 44David Carr, Fresno St. ......................................................................................................................... 2001 13 42Ty Detmer, BYU ...................................................................................................................................... 1990 12 41Omar Jacobs, Bowling Green .......................................................................................................... 2004 12 41Jason White, Oklahoma ..................................................................................................................... 2003 14 40Andre Woodson, Kentucky ............................................................................................................... 2007 13 40Dennis Shaw, San Diego St. ............................................................................................................ 1969 10 39Danny Wuerffel, Florida...................................................................................................................... 1996 12 39Chad Pennington, Marshall .............................................................................................................. 1997 12 39Chase Daniel, Missouri........................................................................................................................ 2008 14 39Kellen Moore, Boise St. ....................................................................................................................... 2009 14 39Bryant Moniz, Hawaii .......................................................................................................................... 2010 14 39
CAREER YARDS PER ATTEMPT(Minimum 900 Attempts; Player must have concluded his career) Per PerPlayer, Team Years Att. Cmp. Pct. Yards Cmp. Att.Ryan Dinwiddie, Boise St. ................................................ 2000-03 992 622 .627 9,819 *15.79 9.90Ty Detmer, BYU ..................................................................... 1988-91 1,530 958 .626 15,031 15.69 9.82Tim Tebow, Florida .............................................................. 2006-09 995 661 .664 9,285 14.05 9.33Danny Wuerffel, Florida..................................................... 1993-96 1,170 708 .605 10,875 15.36 9.29Brian Brohm, Louisville ...................................................... 2004-07 1,185 780 .658 10,775 13.81 9.09Jim McMahon, BYU ................................................... 1977-78, 80-81 1,060 653 .616 9,536 14.60 9.00Marvin Graves, Syracuse ................................................... 1990-93 943 563 .597 8,466 15.04 8.98Colt Brennan, Hawaii .......................................................... 2005-07 1,584 1,115 #.704 14,193 12.73 8.96Donovan McNabb, Syracuse ........................................... 1995-98 938 548 .584 8,389 15.31 8.94Chris Weinke, Florida St. ................................................... 1997-00 1,107 650 .587 9,839 15.14 8.89Billy Blanton, San Diego St. ............................................ 1993-96 920 588 .639 8,165 13.89 8.88Ryan Mallett, Michigan/Arkansas ....................... 2007, 2009-10 955 552 .578 8,385 15.19 8.78Joe Hamilton, Georgia Tech ............................................ 1996-99 1,020 629 .617 8,882 14.12 8.71Cade McNown, UCLA ......................................................... 1995-98 1,153 646 .560 10,008 15.49 8.68John Walsh, BYU ................................................................... 1991-94 973 587 .603 8,375 14.27 8.61Chuck Long, Iowa ................................................................ $1981-85 1,072 692 .646 9,210 13.31 8.59Matt Leinart, Southern California ................................. 2002-05 1,245 807 .648 10,693 13.30 8.59Steve Young, BYU ................................................................. 1981-83 908 592 .652 7,733 13.06 8.52Daunte Culpepper, UCF .................................................... 1996-98 1,097 721 .657 9,341 12.96 8.52

34 2011 NCAA FOOTBALL RECORDS - FBS ALL-TIME LEADERS
Paul Smith, Tulsa ................................................................... $2003-07 1,292 808 .625 10,924 13.52 8.46Chad Pennington, Marshall ............................................. 1997-99 1,265 807 .638 10,698 13.26 8.45Robbie Bosco, BYU .............................................................. 1983-85 997 638 .640 8,400 13.17 8.43Dan McGwire, Iowa/San Diego St. .................... 1986-87, 89-90 973 575 .591 8,164 14.20 8.39Doug Flutie, Boston College ........................................... 1981-84 1,270 677 .533 10,579 15.63 8.33Zac Robinson, Oklahoma St. .......................................... 2006-09 999 610 .611 8,317 13.63 8.33*Record for minimum 400 completions. $See page 2 for explanation. #Record for minimum 1,000 attempts.
SINGLE-GAME YARDSYds. Player, Team (Opponent) Date716 David Klingler, Houston (Arizona St.) .....................................................................................................................Dec. 2, 1990690 Matt Vogler, TCU (Houston) .......................................................................................................................................Nov. 3, 1990661 B.J. Symons, Texas Tech (Ole Miss) ......................................................................................................................Sept. 27, 2003646 Graham Harrell, Texas Tech (Oklahoma St.) ....................................................................................................Sept. 22, 2007643 Cody Hodges, Texas Tech (Kansas St.) .................................................................................................................Oct. 15, 2005637 Brian Lindgren, Idaho (Middle Tenn.) .....................................................................................................................Oct. 6, 2001631 Scott Mitchell, Utah (Air Force) ...............................................................................................................................Oct. 15, 1988622 Jeremy Leach, New Mexico (Utah) ...................................................................................................................... Nov. 11, 1989621 Dave Wilson, Illinois (Ohio St.) ..................................................................................................................................Nov. 8, 1980619 John Walsh, BYU (Utah St.) .......................................................................................................................................Oct. 30, 1993613 Jimmy Klingler, Houston (Rice).............................................................................................................................. Nov. 28, 1992611 David Neill, Nevada (New Mexico St.) .................................................................................................................Oct. 10, 1998601 Daniel Meager, North Texas (SMU) ........................................................................................................................Sept. 8, 2007599 Ty Detmer, BYU (San Diego St.) ............................................................................................................................. Nov. 16, 1991592 Chris Redman, Louisville (East Carolina) ........................................................................................................... Nov. 14, 1998590 Tim Rattay, Louisiana Tech (Nebraska) ...............................................................................................................Aug. 29, 1998586 B.J. Symons, Texas Tech (North Carolina St.) ...................................................................................................Sept. 20, 2003585 Robbie Bosco, BYU (New Mexico) .........................................................................................................................Oct. 19, 1985572 David Klingler, Houston (Eastern Wash.) ........................................................................................................... Nov. 17, 1990571 Marc Wilson, BYU (Utah) ..............................................................................................................................................Nov. 5, 1977
SINGLE-GAME ATTEMPTSNo. Player, Team (Opponent) Date83 Drew Brees, Purdue (Wisconsin) ............................................................................................................................Oct. 10, 199880 Andy Schmitt, Eastern Mich. (Central Mich.) ................................................................................................... Nov. 28, 200879 Matt Vogler, TCU (Houston) .......................................................................................................................................Nov. 3, 199078 Rusty LaRue, Wake Forest (Duke) ..........................................................................................................................Oct. 28, 199578 Mike Kafka, Northwestern (Auburn) .......................................................................................................................Jan. 1, 201076 David Klingler, Houston (SMU) ...............................................................................................................................Oct. 20, 199076 Andy Schmitt, Eastern Mich. (Temple) ............................................................................................................... Nov. 22, 200876 Case Keenum, Houston (UTEP) .................................................................................................................................Oct. 3, 200975 Chris Vargas, Nevada (McNeese St.) ...................................................................................................................Sept. 19, 199275 Colt Brennan, Hawaii (San Jose St.) ......................................................................................................................Oct. 12, 200775 Case Keenum, Houston (East Carolina) ................................................................................................................Dec. 5, 200973 Shane Montgomery, North Carolina St. (Duke) ............................................................................................. Nov. 11, 198973 Troy Kopp, Pacific (Hawaii) .......................................................................................................................................Oct. 27, 199073 Jeff Handy, Missouri (Oklahoma St.) ....................................................................................................................Oct. 17, 199273 Chase Holbrook, New Mexico St. (UTEP) ........................................................................................................Sept. 30, 200672 Matt Vogler, TCU (Texas Tech) ................................................................................................................................ Nov. 10, 199072 Luke McCown, Louisiana Tech [Miami (FL)] ......................................................................................................Oct. 28, 200072 Graham Harrell, Texas Tech (Oklahoma) ............................................................................................................ Nov. 17, 200772 Levi Brown, Troy (LSU) ............................................................................................................................................... Nov. 15, 200871 Sandy Schwab, Northwestern (Michigan) .........................................................................................................Oct. 23, 198271 Jimmy Klingler, Houston (Rice).............................................................................................................................. Nov. 28, 199271 Brian Lindgren, Idaho (Middle Tenn.) .....................................................................................................................Oct. 6, 200170 Dave Telford, Fresno St. (Utah St.) ........................................................................................................................ Nov. 14, 198770 David Klingler, Houston (Arizona St.) .....................................................................................................................Dec. 2, 199070 David Klingler, Houston (Texas Tech).................................................................................................................. Nov. 30, 199170 Kliff Kingsbury, Texas Tech (Missouri) ..................................................................................................................Oct. 19, 200270 Timmy Chang, Hawaii (Rice) ..................................................................................................................................Sept. 27, 200370 Kent Smith, Central Mich. (Western Mich.) ...................................................................................................... Nov. 12, 200570 Brett Basanez, Northwestern (UCLA) .................................................................................................................. Dec. 30, 2005
SINGLE-GAME COMPLETIONSNo. Player, Team (Opponent) Date58 Andy Schmitt, Eastern Mich. (Central Mich.) ................................................................................................... Nov. 28, 200856 Case Keenum, Houston (East Carolina) ................................................................................................................Dec. 5, 200955 Rusty LaRue, Wake Forest (Duke) ..........................................................................................................................Oct. 28, 199555 Drew Brees, Purdue (Wisconsin) ............................................................................................................................Oct. 10, 199851 Case Keenum, Houston (UTEP) .................................................................................................................................Oct. 3, 200950 Rusty LaRue, Wake Forest (North Carolina St.) ............................................................................................... Nov. 18, 199550 Andy Schmitt, Eastern Mich. (Temple) ............................................................................................................... Nov. 22, 200849 Brian Lindgren, Idaho (Middle Tenn.) .....................................................................................................................Oct. 6, 200149 Kliff Kingsbury, Texas Tech (Texas A&M) ................................................................................................................Oct. 5, 200249 Kliff Kingsbury, Texas Tech (Missouri) ..................................................................................................................Oct. 19, 200249 Bruce Gradkowski, Toledo (Pittsburgh) ............................................................................................................Sept. 20, 200349 Chase Holbrook, New Mexico St. (Boise St.) ....................................................................................................Oct. 15, 200648 David Klingler, Houston (SMU) ...............................................................................................................................Oct. 20, 199048 Chase Holbrook, New Mexico St. (UTEP) ........................................................................................................Sept. 30, 200648 Graham Harrell, Texas Tech (UTEP) ........................................................................................................................Sept. 8, 200747 Tim Couch, Kentucky (Arkansas) ..............................................................................................................................Oct. 3, 1998
Per PerPlayer, Team Years Att. Cmp. Pct. Yards Cmp. Att.

2011 NCAA FOOTBALL RECORDS - FBS ALL-TIME LEADERS 35
FOO
TBA
LL B
OW
LSU
BD
IVIS
ION
47 Luke McCown, Louisiana Tech (Auburn) ............................................................................................................Oct. 21, 200047 Chase Holbrook, New Mexico St. (New Mexico) .............................................................................................Sept. 8, 200747 Graham Harrell, Texas Tech (Oklahoma) ............................................................................................................ Nov. 17, 200747 Mike Kafka, Northwestern (Auburn) .......................................................................................................................Jan. 1, 201046 Jimmy Klingler, Houston (Rice).............................................................................................................................. Nov. 28, 199246 Scott Milanovich, Maryland (Florida St.) ........................................................................................................... Nov. 18, 199546 Tim Rattay, Louisiana Tech (Nebraska) ...............................................................................................................Aug. 29, 199846 Tim Rattay, Louisiana Tech (UCF) ...........................................................................................................................Oct. 23, 199946 Kent Smith, Central Mich. (Western Mich.) ...................................................................................................... Nov. 12, 200546 Daniel Meager, North Texas (SMU) ........................................................................................................................Sept. 8, 200746 Graham Harrell, Texas Tech (Oklahoma St.) ....................................................................................................Sept. 22, 200746 Graham Harrell, Texas Tech (Colorado) ...............................................................................................................Oct. 27, 200746 Taylor Potts, Texas Tech (Texas) ............................................................................................................................Sept. 19, 2009
ANNUAL CHAMPIONSYear Player, Team Class Att. Cmp. Int. Pct. Yds. TD1937 Davey O’Brien, TCU .............................................................................. Jr. 234 94 18 .402 969 —1938 Davey O’Brien, TCU .............................................................................. Sr. 167 93 4 .557 1,457 —1939 Kay Eakin, Arkansas ............................................................................. Sr. 193 78 18 .404 962 —1940 Billy Sewell, Washington St. ............................................................ Sr. 174 86 17 .494 1,023 —1941 Bud Schwenk, Washington-St. Louis ........................................... Sr. 234 114 19 .487 1,457 —1942 Ray Evans, Kansas ................................................................................. Jr. 200 101 9 .505 1,117 —1943 Johnny Cook, Georgia ........................................................................ Fr. 157 73 20 .465 1,007 —1944 Paul Rickards, Pittsburgh................................................................... So. 178 84 20 .472 997 —1945 Al Dekdebrun, Cornell ........................................................................ Sr. 194 90 15 .464 1,227 —1946 Travis Tidwell, Auburn ........................................................................ Fr. 158 79 10 .500 943 51947 Charlie Conerly, Ole Miss ................................................................... Sr. 233 133 7 .571 1,367 181948 Stan Heath, Nevada ............................................................................. Sr. 222 126 9 .568 2,005 221949 Adrian Burk, Baylor .............................................................................. Sr. 191 110 6 .576 1,428 141950 Don Heinrich, Washington ............................................................... Jr. 221 134 9 .606 1,846 141951 Don Klosterman, Loyola Marymount .......................................... Sr. 315 159 21 .505 1,843 91952 Don Heinrich, Washington ............................................................... Sr. 270 137 17 .507 1,647 131953 Bob Garrett, Stanford .......................................................................... Sr. 205 118 10 .576 1,637 171954 Paul Larson, California ........................................................................ Sr. 195 125 8 .641 1,537 101955 George Welsh, Navy ............................................................................ Sr. 150 94 6 .627 1,319 81956 John Brodie, Stanford ......................................................................... Sr. 240 139 14 .579 1,633 121957 Ken Ford, Hardin-Simmons .............................................................. Sr. 205 115 11 .561 1,254 141958 Buddy Humphrey, Baylor .................................................................. Sr. 195 112 8 .574 1,316 71959 Dick Norman, Stanford ...................................................................... Jr. 263 152 12 .578 1,963 111960 Harold Stephens, Hardin-Simmons .............................................. Sr. 256 145 14 .566 1,254 31961 Chon Gallegos, San Jose St. ............................................................ Sr. 197 117 13 .594 1,480 141962 Don Trull, Baylor .................................................................................... Jr. 229 125 12 .546 1,627 111963 Don Trull, Baylor .................................................................................... Sr. 308 174 12 .565 2,157 121964 Jerry Rhome, Tulsa ............................................................................... Sr. 326 224 4 .687 2,870 321965 Bill Anderson, Tulsa .............................................................................. Sr. 509 296 14 .582 3,464 301966 John Eckman, Wichita St. ................................................................. Jr. 458 195 *34 .426 2,339 71967 Terry Stone, New Mexico .................................................................. Jr. 336 160 19 .476 1,946 91968 Chuck Hixson, SMU ............................................................................. So. 468 265 23 .566 3,103 211969 John Reaves, Florida ............................................................................ So. 396 222 19 .561 2,896 24Beginning in 1970, ranked on per-game (instead of total) completionsYear Player, Team Class G Att. Cmp. Avg. Int. Pct. Yds. TD1970 Sonny Sixkiller, Washington ..................................... So. 10 362 186 18.6 22 .514 2,303 151971 Brian Sipe, San Diego St. .......................................... Sr. 11 369 196 17.8 21 .531 2,532 171972 Don Strock, Virginia Tech .......................................... Sr. 11 427 228 20.7 27 .534 3,243 161973 Jesse Freitas, San Diego St. ..................................... Sr. 11 347 227 20.6 17 .654 2,993 211974 Steve Bartkowski, California .................................... Sr. 11 325 182 16.5 7 .560 2,580 121975 Craig Penrose, San Diego St. .................................. Sr. 11 349 198 18.0 24 .567 2,660 151976 Tommy Kramer, Rice ................................................... Sr. 11 501 269 24.5 19 .537 3,317 211977 Guy Benjamin, Stanford ............................................ Sr. 10 330 208 20.8 15 .630 2,521 191978 Steve Dils, Stanford ...................................................... Sr. 11 391 247 22.5 15 .632 2,943 22Beginning in 1979, ranked on passing efficiency rating points (instead of per-game completions)Year Player, Team Class G Att. Cmp. Int. Pct. Yds. TD Pts.1979 Turk Schonert, Stanford .......................................... Sr. 11 221 148 6 .670 1,922 19 163.01980 Jim McMahon, BYU .................................................. Jr. 12 445 284 18 .638 4,571 47 176.91981 Jim McMahon, BYU .................................................. Sr. 10 423 272 7 .643 3,555 30 155.01982 Tom Ramsey, UCLA ................................................... Sr. 11 311 191 10 .614 2,824 21 153.51983 Steve Young, BYU ...................................................... Sr. 11 429 306 10 .713 3,902 33 168.51984 Doug Flutie, Boston College ................................. Sr. 11 386 233 11 .604 3,454 27 152.91985 Jim Harbaugh, Michigan ........................................ Jr. 11 212 139 6 .656 1,913 18 163.71986 Vinny Testaverde, Miami (FL) ................................ Sr. 10 276 175 9 .634 2,557 26 165.81987 Don McPherson, Syracuse ..................................... Sr. 11 229 129 11 .563 2,341 22 164.31988 Timm Rosenbach, Washington St. .................... Jr. 11 302 199 10 .659 2,791 23 162.01989 Ty Detmer, BYU ........................................................... So. 12 412 265 15 .643 4,560 32 175.61990 Shawn Moore, Virginia ............................................ Sr. 10 241 144 8 .598 2,262 21 160.71991 Elvis Grbac, Michigan ............................................... Jr. 11 228 152 5 .667 1,955 24 169.01992 Elvis Grbac, Michigan ............................................... Sr. 9 169 112 12 .663 1,465 15 154.21993 Trent Dilfer, Fresno St. ............................................. Jr. 11 333 217 4 .652 3,276 28 173.11994 Kerry Collins, Penn St. ............................................. Sr. 11 264 176 7 .667 2,679 21 172.91995 Danny Wuerffel, Florida .......................................... Jr. 11 325 210 10 .646 3,266 35 178.41996 Steve Sarkisian, BYU ................................................. Sr. 14 404 278 12 .688 4,027 33 173.61997 Cade McNown, UCLA .............................................. Jr. 11 283 173 5 .611 2,877 22 168.61998 Shaun King, Tulane ................................................... Sr. 11 328 223 6 .680 3,232 36 183.31999 Michael Vick, Virginia Tech. .................................... So. 10 152 90 5 .592 1,840 12 180.4
No. Player, Team (Opponent) Date

36 2011 NCAA FOOTBALL RECORDS - FBS ALL-TIME LEADERS
2000 Bart Hendricks, Boise St. ........................................ Sr. 11 347 210 8 .605 3,364 35 170.62001 Rex Grossman, Florida ............................................. So. 11 395 259 12 .656 3,896 34 170.82002 Brad Banks, Iowa ........................................................ Sr. 13 294 170 5 .578 2,573 26 157.12003 Philip Rivers, North Carolina St. ........................... Sr. 13 483 348 7 .721 4,491 34 170.52004 Stefan LeFors, Louisville .......................................... Sr. 12 257 189 3 .735 2,596 20 181.72005 Rudy Carpenter, Arizona St. ................................. Fr. 9 228 156 2 .684 2,273 17 175.02006 Colt Brennan, Hawaii .............................................. Jr. 14 559 406 12 .726 5,549 *58 186.02007 Sam Bradford, Oklahoma ....................................... Fr. 14 341 237 8 .695 3,121 36 176.52008 Sam Bradford, Oklahoma ....................................... So. 14 483 328 8 .679 4,720 50 180.82009 Tim Tebow, Florida .................................................... Sr. 14 314 213 5 .678 2,895 21 164.22010 Kellen Moore, Boise St. ............................................ Jr. 13 383 273 6 .713 3,845 35 182.6*Record.
Receiving
CAREER RECEPTIONS PER GAME(Minimum 125 Receptions; Player must have concluded his career)
Player, Team Years G Rec. Yards TD Rec.PGManny Hazard, Houston ....................... 1989-90 21 220 2,635 31 10.5Alex Van Dyke, Nevada .......................... 1994-95 22 227 3,100 26 10.3Howard Twilley, Tulsa ............................. 1963-65 26 261 3,343 32 10.0Jason Phillips, Houston ......................... 1987-88 22 207 2,319 18 9.4Michael Crabtree, Texas Tech .............. 2007-08 26 231 3,127 41 8.9Troy Edwards, Louisiana Tech ............. 1996-98 34 280 4,352 50 8.2Bryan Reeves, Nevada............................ 1992-93 21 172 2,476 27 8.2Kevin Curtis, Utah St. ............................. 2001-02 22 174 2,789 19 7.9Nate Burleson, Nevada .......................... 2000-02 32 248 3,293 22 7.8Davone Bess, Hawaii ............................... 2005-07 39 293 3,610 41 7.5Siaha Burley, UCF ..................................... 1997-98 22 165 2,248 15 7.5Antonio Brown, Central Mich. ............ 2007-09 41 305 3,199 22 7.4David Williams, Illinois ........................... 1983-85 33 245 3,195 22 7.4Geoff Noisy, Nevada ............................... 1995-98 40 295 4,249 21 7.4James Dixon, Houston ........................... 1987-88 22 161 1,762 14 7.3John Love, North Texas ......................... 1965-66 20 144 2,124 17 7.2Fred Gilbert, UCLA/Houston ......... 1989, 91-92 22 158 1,672 14 7.2Ron Sellers, Florida St. ........................... 1966-68 30 212 3,598 23 7.1Keyshawn Johnson,
Southern California ............................ 1994-95 21 148 2,358 12 7.1Nakia Jenkins, Utah St. ......................... 1996-97 22 155 2,483 14 7.0Barry Moore, North Texas ..................... 1968-69 20 140 2,183 12 7.0James Cleveland, Houston .................. 2009-10 23 161 2,014 20 7.0Taylor Stubblefield, Purdue ................. 2001-04 45 *316 3,433 19 6.9Arnold Jackson, Louisville .................... 1997-00 44 300 3,670 31 6.8Dante Ridgeway, Ball St. ...................... 2002-04 35 238 3,030 22 6.8*Record.
SEASON RECEPTIONS PER GAMEPlayer, Team Year G Rec. Yards TD Rec.PGHoward Twilley, Tulsa ................................. †1965 10 134 1,779 16 13.4Manny Hazard, Houston ........................... †1989 11 142 1,689 22 12.9Trevor Insley, Nevada ................................. †1999 11 134 *2,060 13 12.2Freddie Barnes, Bowling Green ............. †2009 13 *155 1,770 19 11.9Alex Van Dyke, Nevada .............................. †1995 11 129 1,854 16 11.7Troy Edwards, Louisiana Tech ................. †1998 12 140 1,996 *27 11.7Nate Burleson, Nevada .............................. †2002 12 138 1,629 12 11.5Damond Wilkins, Nevada ......................... †1996 11 114 1,121 4 10.4Michael Crabtree, Texas Tech .................. †2007 13 134 1,962 22 10.3Jordy Nelson, Kansas St............................. 2007 12 122 1,606 11 10.2Chris Daniels, Purdue ................................. 1999 11 109 1,133 5 9.9J.R. Tolver, San Diego St. ........................... 2002 13 128 1,785 13 9.9Jason Phillips, Houston ............................. †1988 11 108 1,444 15 9.8Fred Gilbert, Houston............................. †1991 11 106 957 7 9.6Jajuan Dawson, Tulane .............................. 1999 10 96 1,051 8 9.6Dante Ridgeway, Ball St. .......................... †2004 11 105 1,399 8 9.6Howard Twilley, Tulsa ................................. †1964 10 95 1,178 13 9.5Jerry Hendren, Idaho .................................. †1969 10 95 1,452 12 9.5Chris Penn, Tulsa ....................................... †1993 11 105 1,578 12 9.5Casey Fitzgerald, North Texas ............ †2008 12 113 1,119 6 9.4Sherman Smith, Houston ......................... †1992 11 103 923 6 9.4Eugene Baker, Kent St. .............................. †1997 11 103 1,549 18 9.4Ryan Broyles, Oklahoma ........................... †2010 14 131 1,622 14 9.4James Dixon, Houston ............................... 1988 11 102 1,103 11 9.3Troy Edwards, Louisiana Tech ................. 1997 11 102 1,707 13 9.3*Record. †National champion.
CAREER RECEPTIONSPlayer, Team Years Rec. Yards Avg. TDTaylor Stubblefield, Purdue ................................. 2001-04 316 3,433 10.9 19Josh Davis, Marshall ................................................ 2001-04 306 3,889 12.7 23
Antonio Brown, Central Mich. ............................ 2007-09 305 3,199 10.5 22Taurean Henderson, Texas Tech ........................ 2002-05 303 2,058 6.8 19Arnold Jackson, Louisville .................................... 1997-00 300 3,670 12.2 31Trevor Insley, Nevada ............................................. 1996-99 298 *5,005 16.8 35Freddie Barnes, Bowling Green ......................... 2006-09 298 3,299 11.1 30Geoff Noisy, Nevada ............................................... 1995-98 295 4,249 14.4 21Rashaun Woods, Oklahoma St. ......................... 2000-03 293 4,414 15.1 42Davone Bess, Hawaii ............................................... 2005-07 293 3,610 12.3 41Jason Rivers, Hawaii ................................... 2003-04, 06-07 292 3,919 13.4 35Dorien Bryant, Purdue ........................................... 2004-07 292 3,548 12.2 21Jarett Dillard, Rice .................................................... 2005-08 292 4,138 14.2 *60Bryan Anderson, Central Mich. .......................... 2006-09 290 3,648 12.6 28Emmanuel Sanders, SMU ..................................... 2006-09 285 3,791 13.3 34Greg Salas, Hawaii ................................................... 2007-10 285 4,345 15.2 26Ryan Wolfe, UNLV ..................................................... 2006-09 283 3,495 12.3 15Troy Edwards, Louisiana Tech ............................. 1996-98 280 4,352 15.5 50Darius Watts, Marshall ............................................ 2000-03 272 4,031 14.8 47Vincent Marshall, Houston .................................. 2003-06 272 3,770 13.9 26A.J. Harris, New Mexico St. ................................... 2005-08 269 2,561 9.5 16Naaman Roosevelt, Buffalo ................................. 2006-09 268 3,551 13.3 28Aaron Turner, Pacific ............................................... 1989-92 266 4,345 16.3 43Chad Mackey, Louisiana Tech ............................. 1993-96 264 3,789 14.4 22Terance Mathis, New Mexico ........................ 1985-87, 89 263 4,254 16.2 36*Record.
SEASON RECEPTIONSPlayer, Team Year G Rec. Yards TDFreddie Barnes, Bowling Green ............................... †2009 13 155 1,770 19Manny Hazard, Houston ............................................. †1989 11 142 1,689 22Troy Edwards, Louisiana Tech ................................... †1998 12 140 1,996 *27Nate Burleson, Nevada ................................................ †2002 12 138 1,629 12Howard Twilley, Tulsa ................................................... †1965 10 134 1,779 16Trevor Insley, Nevada ................................................... †1999 11 134 *2,060 13Michael Crabtree, Texas Tech .................................... †2007 13 134 1,962 22Ryan Broyles, Oklahoma ............................................. †2010 14 131 1,622 14Alex Van Dyke, Nevada ................................................ †1995 11 129 1,854 16J.R. Tolver, San Diego St. ............................................. 2002 13 128 1,785 13Jordy Nelson, Kansas St............................................... 2007 12 122 1,606 11Greg Salas, Hawaii ......................................................... 2010 14 119 1,889 14Damond Wilkins, Nevada ........................................... †1996 11 114 1,121 4Casey Fitzgerald, North Texas ................................... †2008 12 113 1,119 6Danario Alexander, Missouri ..................................... 2009 13 113 1,781 14Casey Fitzgerald, North Texas ................................... 2007 12 111 1,322 12James Casey, Rice........................................................... 2008 13 111 1,329 13Justin Blackmon, Oklahoma St. ............................... 2010 12 111 1,782 20Marcus Harris, Wyoming ............................................. 1996 12 109 1,650 13Chris Daniels, Purdue ................................................... 1999 11 109 1,133 5James Jordan, Louisiana Tech .................................. †2000 12 109 1,003 4Danny Amendola, Texas Tech ................................... 2007 13 109 1,245 6Jason Phillips, Houston ............................................... †1988 11 108 1,444 15Kassim Osgood, San Diego St. ................................ 2002 13 108 1,552 8Davone Bess, Hawaii ..................................................... 2007 13 108 1,266 12*Record. †National champion in per-game catches.
SINGLE-GAME RECEPTIONSRec. Player, Team (Opponent) Date23 Randy Gatewood, UNLV (Idaho) ............................................................ Sept. 17, 199423 Tyler Jones, Eastern Mich. (Central Mich.) ............................................Nov. 28, 200822 Jay Miller, BYU (New Mexico)....................................................................... Nov. 3, 197322 Freddie Barnes, Bowling Green (Kent St.) .............................................Oct. 10, 200921 Troy Edwards, Louisiana Tech (Nebraska) ........................................... Aug. 29, 199821 Chris Daniels, Purdue (Michigan St.) .......................................................Oct. 16, 199920 Rick Eber, Tulsa (Idaho St.) ..............................................................................Oct. 7, 196720 Kenny Christian, Eastern Mich. (Temple) ............................................ Sept. 23, 200020 Nick Moore, Toledo (Michigan) ..................................................................Oct. 11, 200819 Howard Twilley, Tulsa (Colorado St.) .......................................................Nov. 27, 196519 Ron Fair, Arizona St. (Washington St.) .....................................................Oct. 28, 198919 Manny Hazard, Houston (TCU) ................................................................... Nov. 4, 198919 Manny Hazard, Houston (Texas) ..............................................................Nov. 11, 1989
Year Player, Team Class G Att. Cmp. Int. Pct. Yds. TD Pts.

2011 NCAA FOOTBALL RECORDS - FBS ALL-TIME LEADERS 37
FOO
TBA
LL B
OW
LSU
BD
IVIS
ION
19 Josh Reed, LSU (Alabama) ............................................................................ Nov. 3, 200119 Nate Burleson, Nevada (UTEP) .................................................................... Nov. 9, 200219 James Cleveland, Houston (East Carolina) .............................................Dec. 5, 200918 Howard Twilley, Tulsa (Southern Ill.) ........................................................Oct. 30, 196518 Mark Templeton (RB), Long Beach St. (Utah St.) ................................. Nov. 1, 198618 Richard Woodley, TCU (Texas Tech) ........................................................Nov. 10, 199018 Alex Van Dyke, Nevada (Toledo) ............................................................ Sept. 23, 199518 Alex Van Dyke, Nevada (UNLV) ..................................................................Oct. 28, 199518 Albert Connell, Texas A&M (Colorado) ................................................ Sept. 28, 199618 Geoff Noisy, Nevada (Arkansas St.) .........................................................Nov. 16, 199618 Geoff Noisy, Nevada (Oregon) ................................................................ Sept. 13, 199718 Randall Lane, Purdue (Wisconsin) ............................................................Oct. 10, 199818 J.R. Tolver, San Diego St. (Hawaii) ................................................................Dec. 7, 200218 Casey Fitzgerald, North Texas (SMU) .......................................................Sept. 8, 200718 Jacory Stone, Eastern Mich. (Temple) ....................................................Nov. 22, 200818 Emmanuel Sanders, SMU (Washington St.) ...................................... Sept. 19, 200918 Kealoha Pilares, Hawaii (Louisiana Tech) .................................................Oct. 2, 2010
CAREER TOUCHDOWN RECEPTIONSPlayer, Team Years G TDJarett Dillard, Rice ...................................................................................... 2005-08 49 60Troy Edwards, Louisiana Tech ............................................................... 1996-98 34 50Darius Watts, Marshall .............................................................................. 2000-03 48 47Aaron Turner, Pacific ................................................................................. 1989-92 44 43Ryan Yarborough, Wyoming ................................................................. 1990-93 46 42Rashaun Woods, Oklahoma St. ........................................................... 2000-03 48 42Dwayne Jarrett, Southern California ................................................ 2004-06 38 41Davone Bess, Hawaii ................................................................................. 2005-07 39 41Michael Crabtree, Texas Tech ................................................................ 2007-08 26 41Braylon Edwards, Michigan ................................................................... 2001-04 44 39Greg Jennings, Western Mich. ............................................................. 2002-05 42 39Austin Pettis, Boise St. .............................................................................. 2007-10 51 39Clarkston Hines, Duke .............................................................................. 1986-89 44 38Marcus Harris, Wyoming ......................................................................... 1993-96 46 38Terance Mathis, New Mexico ........................................................... 1985-87, 89 44 36Roy Williams, Texas .................................................................................... 2000-03 48 36James Hardy, Indiana ............................................................................... 2005-07 33 36Ryan Grice-Mullens, Hawaii ................................................................... 2005-07 35 36Eugene Baker, Kent St. ............................................................................ 1995-98 39 35Trevor Insley, Nevada ............................................................................... 1996-99 44 35Roydell Williams, Tulane .......................................................................... 2001-04 48 35^Ryan Broyles, Oklahoma ...................................................................... 2008-10 39 35Elmo Wright, Houston ............................................................................. 1968-70 30 34Larry Fitzgerald, Pittsburgh ................................................................... 2002-03 26 34Charles Sharon, Bowling Green ........................................................... 2002-05 48 34Emmanuel Sanders, SMU ....................................................................... 2006-09 47 34
SEASON TOUCHDOWN RECEPTIONSPlayer, Team Year G TDTroy Edwards, Louisiana Tech ...................................................................... 1998 12 27Randy Moss, Marshall ..................................................................................... 1997 12 25Manny Hazard, Houston ................................................................................ 1989 11 22Larry Fitzgerald, Pittsburgh .......................................................................... 2003 13 22Michael Crabtree, Texas Tech ....................................................................... 2007 13 22Jarett Dillard, Rice ............................................................................................ 2006 13 21Jarett Dillard, Rice ............................................................................................. 2008 13 20Justin Blackmon, Oklahoma St. .................................................................. 2010 12 20Desmond Howard, Michigan ...................................................................... 1991 11 19Ashley Lelie, Hawaii .......................................................................................... 2001 12 19Dez Bryant, Oklahoma St. ............................................................................. 2008 13 19Michael Crabtree, Texas Tech ....................................................................... 2008 13 19Freddie Barnes, Bowling Green .................................................................. 2009 13 19Lyle Leong, Texas Tech .................................................................................... 2010 13 19Tom Reynolds, San Diego St. ...................................................................... 1971 10 18Dennis Smith, Utah .......................................................................................... 1989 12 18Aaron Turner, Pacific ........................................................................................ 1991 11 18Reidel Anthony, Florida .................................................................................. 1996 12 18Eugene Baker, Kent St. ................................................................................... 1997 11 18Darius Watts, Marshall ..................................................................................... 2001 12 18Clarkston Hines, Duke ..................................................................................... 1989 11 17Mario Bailey, Washington .............................................................................. 1991 11 17Bryan Reeves, Nevada..................................................................................... 1993 10 17J.J. Stokes, UCLA ................................................................................................ 1993 11 17Terry Glenn, Ohio St. ....................................................................................... 1995 11 17Chris Doering, Florida ..................................................................................... 1995 12 17Rashaun Woods, Oklahoma St. .................................................................. 2002 13 17Chad Owens, Hawaii........................................................................................ 2004 13 17
CAREER YARDS PER GAME(Minimum 2,200 Yards; Player must have concluded his career)
Player, Team Years G Yards Yd.PGAlex Van Dyke, Nevada ......................................................... 1994-95 22 3,100 140.9Troy Edwards, Louisiana Tech ............................................ 1996-98 34 4,352 128.0Kevin Curtis, Utah St. ............................................................ 2001-02 22 2,789 126.8Manny Hazard, Houston ...................................................... 1989-90 21 2,635 125.5Michael Crabtree, Texas Tech ............................................. 2007-08 26 3,127 120.3Ron Sellers, Florida St. .......................................................... 1966-68 30 3,598 119.9Bryan Reeves, Nevada........................................................... 1992-93 21 2,476 117.9Trevor Insley, Nevada ............................................................ 1996-99 44 *5,005 113.8Nakia Jenkins, Utah St. ........................................................ 1996-97 22 2,483 112.9Keyshawn Johnson, Southern California ...................... 1994-95 21 2,358 112.3Elmo Wright, Houston .......................................................... 1968-70 30 3,347 111.6Howard Twilley, Tulsa ............................................................ 1963-65 30 3,343 111.4Chris Penn, Tulsa ...................................................................... 1991, 93 22 2,370 107.7Geoff Noisy, Nevada .............................................................. 1995-98 40 4,249 106.2Jason Phillips, Houston ........................................................ 1987-88 22 2,319 105.4Larry Fitzgerald, Pittsburgh ................................................ 2002-03 26 2,677 103.0Nate Burleson, Nevada ......................................................... 2000-02 32 3,293 102.9Siaha Burley, UCF .................................................................... 1997-98 22 2,248 102.2Brandon Stokley, La.-Lafayette ......................................... 1995-98 37 3,702 100.1James Newson, Oregon St. ................................................ 2001-03 36 3,558 98.8Aaron Turner, Pacific .............................................................. 1989-92 44 4,345 98.8Reggie Williams, Washington ............................................ 2001-03 36 3,536 98.2Marcus Harris, Wyoming ...................................................... 1993-96 46 4,518 98.2Rick Beasley, Appalachian St. ........................................... †1977-80 32 3,124 97.6David Williams, Illinois .......................................................... 1982-85 33 3,195 96.8*Record. †Played defensive back in 1977.
CAREER YARDSPlayer, Team Years Rec. Yards Avg. TDTrevor Insley, Nevada .......................................... 1996-99 298 5,005 16.8 35Marcus Harris, Wyoming .................................... 1993-96 259 4,518 17.4 38Rashaun Woods, Oklahoma St. ...................... 2000-03 293 4,414 15.1 42Ryan Yarborough, Wyoming ............................ 1990-93 229 4,357 #19.0 42Troy Edwards, Louisiana Tech .......................... 1996-98 280 4,352 15.5 50Aaron Turner, Pacific ............................................ 1989-92 266 4,345 16.3 43Greg Salas, Hawaii ................................................ 2007-10 285 4,345 15.2 26Terance Mathis, New Mexico ...................... 1985-87, 89 263 4,254 16.2 36Geoff Noisy, Nevada ............................................ 1995-98 295 4,249 14.4 21Jarett Dillard, Rice ................................................. 2005-08 292 4,138 14.2 *60Darius Watts, Marshall ......................................... 2000-03 272 4,031 14.8 47Troy Walters, Stanford ......................................... 1996-99 244 3,986 16.3 26Derek Hagan, Arizona St. .................................. 2002-05 258 3,939 15.3 27Mike Hass, Oregon St. ....................................... 2002-05 220 3,924 17.8 20Jason Rivers, Hawaii ................................. 2003-04, 06-07 292 3,919 13.4 35Josh Davis, Marshall ............................................. 2001-04 306 3,889 12.7 23Roy Williams, Texas ............................................... 2000-03 241 3,866 16.0 36Emmanuel Sanders, SMU .................................. 2006-09 285 3,791 13.3 34Chad Mackey, Louisiana Tech .......................... 1993-96 264 3,789 14.4 22Vincent Marshall, Houston ................................ 2003-06 272 3,770 13.9 26Marc Zeno, Tulane ................................................ 1984-87 236 3,725 15.8 25Brandon Stokley, La.-Lafayette ....................... 1995-98 241 3,702 15.4 25Ryne Robinson, Miami (OH) ............................ 2003-06 258 3,697 14.3 22Arnold Jackson, Louisville ................................. 1997-00 300 3,670 12.2 31Bryan Anderson, Central Mich. ....................... 2006-09 290 3,648 12.6 28*Record. #Record for minimum 200 catches.
SEASON YARDSPlayer, Team Year Rec. Yards Avg. TDTrevor Insley, Nevada ............................................... †1999 134 2,060 15.4 13Troy Edwards, Louisiana Tech ............................... †1998 140 1,996 14.3 *27Michael Crabtree, Texas Tech ................................ †2007 134 1,962 14.6 22Greg Salas, Hawaii ..................................................... 2010 119 1,889 15.9 14Alex Van Dyke, Nevada ............................................ †1995 129 1,854 14.4 16J.R. Tolver, San Diego St. ......................................... †2002 128 1,785 14.0 13Justin Blackmon, Oklahoma St. ........................... †2010 111 1,782 16.1 20Danario Alexander, Missouri ................................. †2009 113 1,781 15.8 14Howard Twilley, Tulsa ............................................... 1965 134 1,779 13.3 16Freddie Barnes, Bowling Green ........................... 2009 *155 1,770 11.4 19Josh Reed, LSU ............................................................ †2001 94 1,740 18.5 7Ashley Lelie, Hawaii ................................................... 2001 84 1,713 20.4 19Troy Edwards, Louisiana Tech ............................... †1997 102 1,707 16.7 13Rashaun Woods, Oklahoma St. ........................... 2002 107 1,695 15.8 17Manny Hazard, Houston ......................................... 1989 142 1,689 11.9 22Larry Fitzgerald, Pittsburgh ................................... †2003 92 1,672 18.2 22Marcus Harris, Wyoming ......................................... †1996 109 1,650 15.1 13Randy Moss, Marshall .............................................. 1997 90 1,647 18.3 25Nate Burleson, Nevada ............................................ 2002 138 1,629 11.8 12Ryan Broyles, Oklahoma ......................................... 2010 131 1,622 12.4 14
Rec. Player, Team (Opponent) Date Player, Team Year G TD

38 2011 NCAA FOOTBALL RECORDS - FBS ALL-TIME LEADERS
Jordy Nelson, Kansas St........................................... 2007 122 1,606 13.2 11Aaron Turner, Pacific ................................................. †1991 92 1,604 17.4 18Torry Holt, North Carolina St. ............................... 1998 88 1,604 18.2 11Greg Salas, Hawaii ..................................................... 2009 106 1,590 15.0 8Chris Penn, Tulsa ......................................................... †1993 105 1,578 15.0 12*Record. †National champion in yards per game.
SINGLE-GAME YARDSYds. Player, Team (Opponent) Date405 Troy Edwards, Louisiana Tech (Nebraska) ........................................... Aug. 29, 1998363 Randy Gatewood, UNLV (Idaho) ............................................................ Sept. 17, 1994349 Chuck Hughes, UTEP (North Texas) ...................................................... Sept. 18, 1965346 Donnie Avery, Houston (Rice) ....................................................................Oct. 13, 2007327 Casey Fitzgerald, North Texas (SMU) .......................................................Sept. 8, 2007326 Nate Burleson, Nevada (San Jose St.) .....................................................Nov. 10, 2001322 Rick Eber, Tulsa (Idaho St.) ..............................................................................Oct. 7, 1967318 Harry Wood, Tulsa (Idaho St.) ........................................................................Oct. 7, 1967316 Jeff Evans, New Mexico St. (Southern Ill.) ........................................... Sept. 30, 1978314 Alex Van Dyke, Nevada (San Jose St.) ....................................................Nov. 18, 1995310 Chad Mackey, Louisiana Tech (Toledo) ..................................................Oct. 19, 1996308 Jason Rivers, Hawaii (Arizona St.) .............................................................Dec. 24, 2006301 Chris Daniels, Purdue (Michigan St.) .......................................................Oct. 16, 1999300 Adarius Bowman, Oklahoma St. (Kansas) .............................................Oct. 14, 2006297 Brian Oliver, Ball St. (Toledo) .........................................................................Oct. 9, 1993297 Aaron Jones, Utah St. (Boise St.) ...............................................................Nov. 11, 2000296 Geoff Noisy, Nevada (Utah St.) .................................................................... Nov. 9, 1996296 J.R. Tolver, San Diego St. (Arizona St.) ................................................... Sept. 14, 2002293 Josh Reed, LSU (Alabama) ..........................................................................Nov. 23, 2001293 Mike Hass, Oregon St. (Boise St.) ............................................................ Sept. 10, 2004290 Tom Reynolds, San Diego St. (Utah St.) ..................................................Oct. 22, 1971289 Wesley Walker, California (San Jose St.) ....................................................Oct. 2, 1976288 Mike Siani, Villanova (Xavier) ......................................................................Oct. 30, 1971285 Thomas Lewis, Indiana (Penn St.) .............................................................. Nov. 6, 1993285 Ashley Lelie, Hawaii (Air Force) .................................................................Nov. 24, 2001
ANNUAL CHAMPIONSYear Player, Team Class Rec. Yards TD1937 Jim Benton, Arkansas ....................................................... Sr. 48 814 71938 Sam Boyd, Baylor ................................................................ Sr. 32 537 —1939 Ken Kavanaugh, LSU ........................................................ Sr. 30 467 —1940 Eddie Bryant, Virginia ....................................................... So. 30 222 21941 Hank Stanton, Arizona ..................................................... Sr. 50 820 —1942 Bill Rogers, Texas A&M ..................................................... Sr. 39 432 —1943 Neil Armstrong, Oklahoma St. ..................................... Fr. 39 317 —1944 Reid Moseley, Georgia ..................................................... So. 32 506 —1945 Reid Moseley, Georgia ..................................................... Jr. 31 662 —1946 Neil Armstrong, Oklahoma St. ..................................... Sr. 32 479 11947 Barney Poole, Ole Miss ..................................................... Jr. 52 513 81948 Johnny “Red” O’Quinn, Wake Forest .......................... Jr. 39 605 71949 Art Weiner, North Carolina ............................................. Sr. 52 762 71950 Gordon Cooper, Denver .................................................. Jr. 46 569 81951 Dewey McConnell, Wyoming ....................................... Sr. 47 725 91952 Ed Brown, Fordham........................................................... Sr. 57 774 61953 John Carson, Georgia ....................................................... Sr. 45 663 41954 Jim Hanifan, California ..................................................... Sr. 44 569 71955 Hank Burnine, Missouri.................................................... Sr. 44 594 21956 Art Powell, San Jose St. ................................................... So. 40 583 51957 Stuart Vaughan, Utah ....................................................... Sr. 53 756 51958 Dave Hibbert, Arizona ...................................................... Jr. 61 606 41959 Chris Burford, Stanford .................................................... Sr. 61 756 61960 Hugh Campbell, Washington St. ................................ So. 66 881 101961 Hugh Campbell, Washington St. ................................ Jr. 53 723 51962 Vern Burke, Oregon St. ................................................... Jr. 69 1,007 101963 Lawrence Elkins, Baylor ................................................... Jr. 70 873 81964 Howard Twilley, Tulsa ....................................................... Jr. 95 1,178 131965 Howard Twilley, Tulsa ....................................................... Sr. 134 1,779 161966 Glenn Meltzer, Wichita St. .............................................. So. 91 1,115 41967 Bob Goodridge, Vanderbilt ............................................ Sr. 79 1,114 61968 Ron Sellers, Florida St. ..................................................... Sr. 86 1,496 121969 Jerry Hendren, Idaho ........................................................ Sr. 95 1,452 12Beginning in 1970, ranked on per-game (instead of total) catches Class G Rec. Avg. Yards TD1970 Mike Mikolayunas, Davidson .................... Sr. 10 87 8.7 1,128 81971 Tom Reynolds, San Diego St. ................... Sr. 10 67 6.7 1,070 71972 Tom Forzani, Utah St. .................................. Sr. 11 85 7.7 1,169 81973 Jay Miller, BYU .................................................. So. 11 100 9.1 1,181 81974 Dwight McDonald, San Diego St. .......... Sr. 11 86 7.8 1,157 71975 Bob Farnham, Brown .................................... Jr. 9 56 6.2 701 21976 Billy Ryckman, Louisiana Tech .................. Sr. 11 77 7.0 1,382 101977 Wayne Tolleson, Western Caro. ............... Sr. 11 73 6.6 1,101 71978 Dave Petzke, Northern Ill. .......................... Sr. 11 91 8.3 1,217 111979 Rick Beasley, Appalachian St. ................... Jr. 11 74 6.7 1,205 12
1980 Dave Young, Purdue ..................................... Sr. 11 67 6.1 917 81981 Pete Harvey, North Texas ............................ Sr. 9 57 6.3 743 31982 Vincent White, Stanford .............................. Sr. 10 68 6.8 677 81983 Keith Edwards, Vanderbilt .......................... Jr. 11 97 8.8 909 81984 David Williams, Illinois .................................. Jr. 11 101 9.2 1,278 81985 Rodney Carter, Purdue ................................. Sr. 11 98 8.9 1,099 41986 Mark Templeton, Long Beach St. (RB) ... Sr. 11 99 9.0 688 21987 Jason Phillips, Houston ................................ Jr. 11 99 9.0 875 31988 Jason Phillips, Houston ................................ Sr. 11 108 9.8 1,444 151989 Manny Hazard, Houston ............................. Jr. 11 142 12.9 1,689 22Beginning in 1990, ranked on both per-game catches and yards per gamePER-GAME CATCHESYear Player, Team Class G Rec. Avg. Yards TD1990 Manny Hazard, Houston ........................... Sr. 10 78 7.8 946 91991 Fred Gilbert, Houston ................................. Jr. 11 106 9.6 957 71992 Sherman Smith, Houston ......................... Jr. 11 103 9.4 923 61993 Chris Penn, Tulsa ........................................... Sr. 11 105 9.6 1,578 121994 Alex Van Dyke, Nevada .............................. Jr. 11 98 8.9 1,246 101995 Alex Van Dyke, Nevada .............................. Sr. 11 129 11.7 1,854 161996 Damond Wilkins, Nevada ......................... Sr. 11 114 10.4 1,121 41997 Eugene Baker, Kent St. .............................. Jr. 11 103 9.4 1,549 181998 Troy Edwards, Louisiana Tech ................. Sr. 12 140 11.7 1,996 *271999 Trevor Insley, Nevada ................................. Sr. 11 134 12.2 *2,060 132000 James Jordan, Louisiana Tech ................. Jr. 12 109 9.1 1,003 42001 Kevin Curtis, Utah St. .................................. Jr. 11 100 9.1 1,531 102002 Nate Burleson, Nevada .............................. Sr. 12 138 11.5 1,629 122003 Lance Moore, Toledo .................................. Jr. 12 103 8.6 1,194 92004 Dante Ridgeway, Ball St. ............................ Jr. 11 105 9.6 1,399 82005 Greg Jennings, Western Mich. ............... Sr. 11 98 8.9 1,259 142006 Chris Williams, New Mexico St. ............. So. 12 92 7.7 1,415 122007 Michael Crabtree, Texas Tech .................. Fr. 13 134 10.3 1,962 222008 Casey Fitzgerald, North Texas ................. Sr. 12 113 9.4 1,119 62009 Freddie Barnes, Bowling Green.............. Sr. 13 *155 11.9 1,770 192010 Ryan Broyles, Oklahoma ........................... Jr. 14 131 9.4 1,622 14YARDS PER GAMEYear Player, Team Class G Rec. Yards Avg. TD1990 Patrick Rowe, San Diego St. .................. Jr. 11 71 1,392 126.6 81991 Aaron Turner, Pacific ................................. Jr. 11 92 1,604 145.8 181992 Lloyd Hill, Texas Tech ................................ Jr. 11 76 1,261 114.6 121993 Chris Penn, Tulsa ......................................... Sr. 11 105 1,578 143.5 121994 Marcus Harris, Wyoming ......................... So. 12 71 1,431 119.3 111995 Alex Van Dyke, Nevada ............................ Sr. 11 129 1,854 168.6 161996 Marcus Harris, Wyoming ......................... Sr. 12 109 1,650 137.5 131997 Troy Edwards, Louisiana Tech ............... Jr. 11 102 1,707 155.2 131998 Troy Edwards, Louisiana Tech ............... Sr. 12 140 1,996 166.3 *271999 Trevor Insley, Nevada ............................... Sr. 11 134 *2,060 *187.3 132000 Antonio Bryant, Pittsburgh .................... So. 10 68 1,302 130.2 112001 Josh Reed, LSU ............................................ Jr. 12 94 1,740 145.0 72002 J.R. Tolver, San Diego St. .......................... Sr. 13 128 1,785 137.3 132003 Larry Fitzgerald, Pittsburgh ................... So. 13 92 1,672 128.6 222004 Dante Ridgeway, Ball St. .......................... Jr. 11 105 1,399 127.2 82005 Mike Hass, Oregon St. ............................. Sr. 11 90 1,532 139.3 62006 Chris Williams, New Mexico St. ........... So. 12 92 1,415 117.9 122007 Michael Crabtree, Texas Tech ................ Fr. 13 134 1,962 150.9 222008 Austin Collie, BYU ....................................... Jr. 13 106 1,538 118.3 152009 Danario Alexander, Missouri ................. Sr. 13 113 1,781 137.0 142010 Justin Blackmon, Oklahoma St. ........... So. 12 111 1,782 148.5 20*Record.
Scoring
CAREER POINTS PER GAME(Minimum 225 Points; Player must have concluded his career)
Extra Pts.Player, Team Years G TD Scored FG Pts. Pt.PGMarshall Faulk, San Diego St. ............ 1991-93 31 ‡62 4 0 ‡376 12.1Ed Marinaro, Cornell .............................. 1969-71 27 52 6 0 318 11.8Bill Burnett, Arkansas ............................ 1968-70 26 49 0 0 294 11.3Steve Owens, Oklahoma ..................... 1967-69 30 56 0 0 336 11.2Eddie Talboom, Wyoming ................... 1948-50 28 34 99 0 303 10.8Travis Prentice, Miami (OH) ................. 1996-99 44 *78 0 0 *468 10.6Garrett Wolfe, Northern Ill. ................. 2004-06 33 57 2 0 344 10.4Troy Edwards, Louisiana Tech ............ 1996-98 34 57 0 0 342 10.1Howard Twilley, Tulsa ............................ 1963-65 26 32 67 0 259 10.0Tom Harmon, Michigan ....................... 1938-40 24 33 33 2 237 9.9Ricky Williams, Texas .............................. 1995-98 46 75 2 0 452 9.8Lee Suggs, Virginia Tech ....................... 1999-02 35 56 0 0 336 9.6Glenn Davis, Army .................................. 1943-46 37 59 0 0 354 9.6Johnny Bright, Drake ............................. 1949-51 25 40 0 0 240 9.6
Player, Team Year Rec. Yards Avg. TD Class G Rec. Avg. Yards TD

2011 NCAA FOOTBALL RECORDS - FBS ALL-TIME LEADERS 39
FOO
TBA
LL B
OW
LSU
BD
IVIS
ION
Anthony Thompson, Indiana ............. 1986-89 41 65 4 0 394 9.6Roman Anderson, Houston ................ 1988-91 44 0 213 70 423 9.6Michael Crabtree, Texas Tech ............. 2007-08 26 41 0 0 246 9.5Stacey Robinson, Northern Ill. (QB) . 1988-90 25 38 6 0 234 9.4Floyd Little, Syracuse ............................. 1964-66 30 46 2 0 278 9.3Felix “Doc” Blanchard, Army ............... 1944-46 25 38 3 0 231 9.2*Record. ‡Three-year totals record.
SEASON POINTS PER GAMEExtra Pts.
Player, Team Years G TD Scored FG Pts. Pt.PGBarry Sanders, Oklahoma St. ................ †1988 11 *39 0 0 *234 21.3Bobby Reynolds, Nebraska ..................... †1950 9 22 25 0 157 17.4Art Luppino, Arizona ................................. †1954 10 24 22 0 166 16.6Ed Marinaro, Cornell .................................. †1971 9 24 4 0 148 16.4Lydell Mitchell, Penn St. .......................... 1971 11 29 0 0 174 15.8Marshall Faulk, San Diego St. ................ †1991 9 23 2 0 140 15.6Troy Edwards, Louisiana Tech ................ †1998 12 31 0 0 186 15.5Luke Staley, BYU .......................................... †2001 11 28 2 0 170 15.5Ricky Williams, Texas .................................. 1998 11 28 0 0 168 15.3Lee Suggs, Virginia Tech ........................... †2000 11 28 0 0 168 15.3Byron “Whizzer” White, Colorado ......... †1937 8 16 23 1 122 15.3*Record. †National champion.
CAREER POINTS(Non-Kickers)
Extra Pts.Player, Team Years TD Scored FG Pts.Travis Prentice, Miami (OH) ................................ 1996-99 *78 0 0 468Ricky Williams, Texas ............................................. 1995-98 75 2 0 452Taurean Henderson, Texas Tech ...................... 2002-05 69 0 0 414Brock Forsey, Boise St. ......................................... 1999-02 68 0 0 408Cedric Benson, Texas ............................................ 2001-04 67 2 0 404Anthony Thompson, Indiana ............................ 1986-89 65 4 0 394DeMarco Murray, Oklahoma ............................. 2007-10 65 0 0 390Ron Dayne, Wisconsin .......................................... 1996-99 63 0 0 378Marshall Faulk, San Diego St. ........................... 1991-93 ‡62 4 0 ‡376Eric Crouch, Nebraska (QB) ................................ 1998-01 59 20 0 374DeAngelo Williams, Memphis .......................... 2002-05 60 2 0 362Colin Kaepernick, Nevada (QB) ........................ 2007-10 60 2 0 362Jarett Dillard, Rice .................................................. 2005-08 60 0 0 360Dwone Hicks, Middle Tenn. .............................. 1999-02 59 4 0 358Tony Dorsett, Pittsburgh ..................................... 1973-76 59 2 0 356DonTrell Moore, New Mexico ........................... 2002-05 59 2 0 356Ian Johnson, Boise St. ........................................... 2005-08 59 2 0 356Glenn Davis, Army ................................................. 1943-46 59 0 0 354Ken Simonton, Oregon St. ................................ 1998-01 57 4 0 346Garrett Wolfe, Northern Ill. ................................ 2004-06 57 0 2 344Troy Edwards, Louisiana Tech ........................... 1995-98 57 0 0 342LenDale White, Southern California .............. 2002-05 57 0 0 342Tim Tebow, Florida (QB) ...................................... 2006-09 57 0 0 342Art Luppino, Arizona ............................................ 1953-56 48 49 0 337Steve Owens, Oklahoma .................................... 1967-69 56 0 0 336Chris Lemon, Nevada ........................................... 1996-99 56 0 0 336Lee Suggs, Virginia Tech ...................................... 1999-02 56 0 0 336*Record. $See page 2 for explanation. ‡Three-year totals record.
CAREER POINTS(Kickers)
PAT FGPlayer, Team Years PAT Att. FG Att. Pts.Kyle Brotzman, Boise St. ........................ 2007-10 238 241 67 92 439Art Carmody, Louisville ......................... 2004-07 *253 *255 60 73 433Kevin Kelly, Penn St. ................................ 2005-08 183 185 78 107 ^425Roman Anderson, Houston ................. 1988-91 213 217 70 101 423Billy Bennett, Georgia ............................ 2000-03 148 151 *87 110 409Jeremy Ito, Rutgers .................................. 2004-07 160 162 80 *111 400Carlos Huerta, Miami (FL) ..................... 1988-91 178 181 73 91 397Alex Henery, Nebraska .......................... 2007-10 193 194 68 76 397Jason Elam, Hawaii .................................. $1988-92 158 161 79 100 395Derek Schmidt, Florida St. ................... 1984-87 174 178 73 102 393Nick Novak, Maryland ............................ 2001-04 153 159 80 107 393Kris Brown, Nebraska ............................. 1995-98 217 222 57 77 388Leigh Tiffin, Alabama .............................. 2006-09 136 142 83 111 385Alexis Serna, Oregon St. ........................ 2004-07 144 147 80 104 384Pat McAfee, West Virginia ..................... 2005-08 210 212 58 79 384Alex Trlica, Texas Tech ............................. 2004-07 233 233 48 73 377Brett Swenson, Michigan St. ............... 2006-09 164 166 71 91 377Xavier Beitia, Florida St. ........................ 2001-04 174 179 67 92 375Jeff Hall, Tennessee ................................. 1995-98 188 202 61 89 371Shayne Graham, Virginia Tech ............ 1996-99 167 169 68 93 371
Steve Azar, Northern Ill. ........................ 2000-03 151 158 73 92 370Justin Ayat, Hawaii................................... 2001-04 193 211 59 89 370Dan Bailey, Oklahoma St. ..................... 2007-10 199 201 57 72 370Stephen Gostkowski, Memphis ......... 2002-05 159 165 70 92 369Colt David, LSU.......................................... 2005-08 201 204 54 72 ^369*Record. $See page 2 for explanation. ^Includes one TD rushing (Kevin Kelly, Penn St., also had a 2-point conversion rush).
SEASON POINTSExtra Pts.
Player, Team Year TD Scored FG Pts.Barry Sanders, Oklahoma St. ................................. †1988 *39 0 0 234Brock Forsey, Boise St. ............................................... †2002 32 0 0 192Troy Edwards, Louisiana Tech ................................. †1998 31 0 0 186Kevin Smith, UCF .......................................................... †2007 30 0 0 180Lydell Mitchell, Penn St. ........................................... 1971 29 0 0 174Mike Rozier, Nebraska ................................................ †1983 29 0 0 174Toby Gerhart, Stanford .............................................. †2009 28 0 0 172Luke Staley, BYU ........................................................... †2001 28 2 0 170Ricky Williams, Texas ................................................... 1998 28 0 0 168Lee Suggs, Virginia Tech ............................................ †2000 28 0 0 168Willis McGahee, Miami (FL) ...................................... 2002 28 0 0 168Art Luppino, Arizona .................................................. †1954 24 22 0 166Ricky Dobbs, Navy ....................................................... 2009 27 0 0 162Bobby Reynolds, Nebraska ...................................... †1950 22 25 0 157LenDale White, Southern California .................... 2005 26 0 0 156Anthony Thompson, Indiana .................................. †1989 25 4 0 154Fred Wendt, UTEP ........................................................ †1948 20 32 0 152Randy Moss, Marshall ................................................ 1997 25 2 0 152Ricky Williams, Texas ................................................... †1997 25 2 0 152Ian Johnson, Boise St. ............................................... †2006 25 2 0 152Pete Johnson, Ohio St. .............................................. †1975 25 0 0 150Skip Hicks, UCLA........................................................... 1997 25 0 0 150Travis Prentice, Miami (OH) ...................................... 1997 25 0 0 150Ray Rice, Rutgers .......................................................... 2007 25 0 0 150*Record. †National champion.
SINGLE-GAME POINTSNo. Player, Team (Opponent) Date48 Howard Griffith, Illinois (Southern Ill.) ................................................. Sept. 22, 199044 Marshall Faulk, San Diego St. (Pacific) ................................................. Sept. 14, 199143 Jim Brown, Syracuse (Colgate) ..................................................................Nov. 17, 195642 Fred Wendt, UTEP (New Mexico St.) .......................................................Nov. 25, 194842 Arnold “Showboat” Boykin, Ole Miss (Mississippi St.) ........................Dec. 1, 195142 Rashaun Woods, Oklahoma St. (SMU) ................................................. Sept. 20, 200338 Dick Bass, Pacific (San Diego St.) ..............................................................Nov. 22, 195837 Jimmy Nutter, Wichita St. (Northern St.) ................................................Oct. 22, 194936 Tom Powers, Duke (Richmond) .................................................................Oct. 21, 195036 Pete Pedro, West Tex. A&M (UTEP) ........................................................ Sept. 30, 196136 Howard Twilley, Tulsa (Louisville) ............................................................... Nov. 6, 196536 Tom Francisco, Virginia Tech (VMI) ..........................................................Nov. 24, 196636 Tim Delaney, San Diego St. (New Mexico St.) ....................................Nov. 15, 196936 Anthony Davis, Southern California (Notre Dame).............................Dec. 2, 197236 Andre Herrera, Southern Ill. (Northern Ill.) ............................................Oct. 23, 197636 Kelvin Bryant, North Carolina (East Carolina) ................................... Sept. 12, 198136 Dee Dowis, Air Force (San Diego St.).......................................................Sept. 2, 198936 Blake Ezor, Michigan St. (Northwestern) ..............................................Nov. 18, 198936 Calvin Jones, Nebraska (Kansas) ................................................................ Nov. 9, 199136 Madre Hill, Arkansas (South Carolina) ....................................................Sept. 9, 199536 Antowain Smith, Houston (Southern Miss.).......................................... Nov. 9, 199636 Scott Harley, East Carolina (Ohio) ............................................................Nov. 16, 199636 Ricky Williams, Texas (New Mexico St.) ...................................................Sept. 5, 199836 Ricky Williams, Texas (Rice) ....................................................................... Sept. 26, 199836 LaDainian Tomlinson, TCU (UTEP) ...........................................................Nov. 20, 199936 Dwone Hicks, Middle Tenn. (Louisiana Tech) ........................................Oct. 7, 200036 Quentin Griffin, Oklahoma (Texas) .............................................................Oct. 7, 200036 Levron Williams, Indiana (Michigan St.) ................................................Nov. 10, 200136 Chris Brown, Colorado (Nebraska) ..........................................................Nov. 23, 200136 Chance Kretschmer, Nevada (UTEP) .......................................................Nov. 24, 200136 Jonathan Golden, Baylor (Samford) ........................................................Sept. 7, 200236 Craig Candeto, Navy (Army) ..........................................................................Dec. 7, 200236 Willis McGahee, Miami (FL) (Virginia Tech) .............................................Dec. 7, 200236 Carnell Williams, Auburn (Mississippi St.) ..............................................Oct. 18, 200336 Steve Slaton, West Virginia (Louisville) ...................................................Oct. 15, 200536 Phillip Tanner, Middle Tenn. (North Texas) ...........................................Nov. 22, 200836 Jeremy Brown, Florida (Kentucky) ......................................................... Sept. 25, 2010
ANNUAL CHAMPIONSExtra Pts.
Year Player, Team Class TD Scored FG Pts.1937 Byron “Whizzer” White, Colorado ............. Sr. 16 23 1 1221938 Parker Hall, Ole Miss ....................................... Sr. 11 7 0 73
Extra Pts.Player, Team Years G TD Scored FG Pts. Pt.PG
PAT FGPlayer, Team Years PAT Att. FG Att. Pts.

40 2011 NCAA FOOTBALL RECORDS - FBS ALL-TIME LEADERS
1939 Tom Harmon, Michigan ............................... Jr. 14 15 1 1021940 Tom Harmon, Michigan ............................... Sr. 16 18 1 1171941 Bill Dudley, Virginia ......................................... Sr. 18 23 1 1341942 Bob Steuber, Missouri ................................... Sr. 18 13 0 1211943 Steve Van Buren, LSU .................................... Sr. 14 14 0 981944 Glenn Davis, Army .......................................... So. 20 0 0 1201945 Felix “Doc” Blanchard, Army ....................... Jr. 19 1 0 1151946 Gene Roberts, Chattanooga....................... Sr. 18 9 0 1171947 Lou Gambino, Maryland .............................. Jr. 16 0 0 961948 Fred Wendt, UTEP ........................................... Sr. 20 32 0 1521949 George Thomas, Oklahoma ........................ Sr. 19 3 0 1171950 Bobby Reynolds, Nebraska ......................... So. 22 25 0 1571951 Ollie Matson, San Francisco ........................ Sr. 21 0 0 1261952 Jackie Parker, Mississippi St. ...................... Jr. 16 24 0 1201953 Earl Lindley, Utah St. ..................................... Sr. 13 3 0 811954 Art Luppino, Arizona...................................... So. 24 22 0 1661955 Jim Swink, TCU ................................................. Jr. 20 5 0 1251956 Clendon Thomas, Oklahoma ..................... Jr. 18 0 0 1081957 Leon Burton, Arizona St. ............................. Jr. 16 0 0 961958 Dick Bass, Pacific .............................................. Jr. 18 8 0 1161959 Pervis Atkins, New Mexico St. ................... Jr. 17 5 0 1071960 Bob Gaiters, New Mexico St. ..................... Sr. 23 7 0 1451961 Jim Pilot, New Mexico St. ............................ So. 21 12 0 1381962 Jerry Logan, West Tex. A&M ........................ Sr. 13 32 0 1101963 Cosmo Iacavazzi, Princeton ........................ Jr. 14 0 0 84 Dave Casinelli, Memphis .............................. Sr. 14 0 0 841964 Brian Piccolo, Wake Forest ........................... Sr. 17 9 0 1111965 Howard Twilley, Tulsa .................................... Sr. 16 31 0 1271966 Ken Hebert, Houston ..................................... Jr. 11 41 2 1131967 Leroy Keyes, Purdue ....................................... Jr. 19 0 0 1141968 Jim O’Brien, Cincinnati .................................. Jr. 12 31 13 1421969 Steve Owens, Oklahoma.............................. Sr. 23 0 0 138Beginning in 1970, ranked on per-game (instead of total) points
Extra Pts.Year Player, Team Class G TD Scored FG Pts. Avg.1970 Brian Bream, Air Force ............. Jr. 10 20 0 0 120 12.0 Gary Kosins, Dayton ................. Jr. 9 18 0 0 108 12.01971 Ed Marinaro, Cornell ................ Sr. 9 24 4 0 148 16.41972 Harold Henson, Ohio St. ........ So. 10 20 0 0 120 12.01973 Jim Jennings, Rutgers ............. Sr. 11 21 2 0 128 11.61974 Bill Marek, Wisconsin ............... Jr. 9 19 0 0 114 12.71975 Pete Johnson, Ohio St. ........... Jr. 11 25 0 0 150 13.61976 Tony Dorsett, Pittsburgh ........ Sr. 11 22 2 0 134 12.21977 Earl Campbell, Texas ................ Sr. 11 19 0 0 114 10.41978 Billy Sims, Oklahoma ............... Jr. 11 20 0 0 120 10.91979 Billy Sims, Oklahoma ............... Sr. 11 22 0 0 132 12.01980 Sammy Winder,
Southern Miss. ..................... Jr. 11 20 0 0 120 10.91981 Marcus Allen,
Southern California ............. Sr. 11 23 0 0 138 12.51982 Greg Allen, Florida St. ............. So. 11 21 0 0 126 11.51983 Mike Rozier, Nebraska ............. Sr. 12 29 0 0 174 14.51984 Keith Byars, Ohio St. ................ Jr. 11 24 0 0 144 13.11985 Bernard White,
Bowling Green ...................... Sr. 11 19 0 0 114 10.41986 Steve Bartalo, Colorado St. ... Sr. 11 19 0 0 114 10.41987 Paul Hewitt, San Diego St. .... Jr. 12 24 0 0 144 12.01988 Barry Sanders,
Oklahoma St. ........................ Jr. 11 *39 0 0 *234 *21.31989 Anthony Thompson,
Indiana ...................................... Sr. 11 25 4 0 154 14.01990 Stacey Robinson,
Northern Ill. (QB) .................. Sr. 11 19 6 0 120 10.91991 Marshall Faulk,
San Diego St. ........................ Fr. 9 23 2 0 140 15.61992 Garrison Hearst, Georgia ........ Jr. 11 21 0 0 126 11.51993 Byron Morris, Texas Tech ........ Jr. 11 22 2 0 134 12.21994 Rashaan Salaam, Colorado ... Jr. 11 24 0 0 144 13.11995 Eddie George, Ohio St. ........... Sr. 12 24 0 0 144 12.01996 Corey Dillon, Washington ...... Jr. 11 23 0 0 138 12.61997 Ricky Williams, Texas ................ Jr. 11 25 2 0 152 13.81998 Troy Edwards,
Louisiana Tech ....................... Sr. 12 31 0 0 186 15.51999 Shaun Alexander, Alabama .. Sr. 11 24 0 0 144 13.12000 Lee Suggs, Virginia Tech ......... So. 11 28 0 0 168 15.32001 Luke Staley, BYU ........................ Jr. 11 28 2 0 170 15.52002 Brock Forsey, Boise St. ............. Sr. 13 32 0 0 192 14.82003 Patrick Cobbs, North Texas ... Jr. 11 21 0 0 126 11.52004 Tyler Jones, Boise St. ................ Sr. 12 0 69 24 141 11.82005 Michael Bush, Louisville ......... Jr. 10 24 0 0 144 14.42006 Ian Johnson, Boise St. ............. So. 12 25 2 0 152 12.72007 Kevin Smith, UCF ....................... Jr. 14 30 0 0 180 12.92008 Javon Ringer, Michigan St. .... Sr. 13 22 0 0 132 10.2
2009 Toby Gerhart, Stanford ........... Sr. 13 28 0 0 172 13.22010 LaMichael James, Oregon ..... So. 12 24 0 0 144 12.0*Record.
Interceptions
CAREER INTERCEPTIONSPlayer, Team Years No. Yards Avg.Al Brosky, Illinois ...................................................................... 1950-52 29 356 12.3John Provost, Holy Cross ..................................................... 1972-74 27 470 17.4Martin Bayless, Bowling Green ......................................... 1980-83 27 266 9.9Tom Curtis, Michigan ............................................................ 1967-69 25 440 17.6Tony Thurman, Boston College ........................................ 1981-84 25 221 8.8Tracy Saul, Texas Tech ............................................................ 1989-92 25 425 17.0Jeff Nixon, Richmond ............................................................ 1975-78 23 377 16.4Jim Bolding, East Carolina .................................................. 1973-76 22 143 6.5Bennie Blades, Miami (FL) ................................................... 1984-87 22 355 16.1Mike Sensibaugh, Ohio St. ................................................. 1968-70 21 226 10.8Barry Hill, Iowa St. .................................................................. 1972-74 21 202 9.6Chuck Cecil, Arizona .............................................................. 1984-87 21 241 11.5Terrell Buckley, Florida St. ................................................... 1989-91 21 *501 23.9Jamar Fletcher, Wisconsin ................................................... 1998-00 21 459 21.9Jim Leonhard, Wisconsin ..................................................... 2001-04 21 251 12.0Alphonso Smith, Wake Forest ........................................... 2005-08 21 254 12.1Lynn Chandnois, Michigan St. .......................................... 1946-49 20 410 20.5Bobby Wilson, Ole Miss ........................................................ 1946-49 20 369 18.5Tom Wilson, Colgate .............................................................. 1964-66 20 215 10.8Jackie Wallace, Arizona ......................................................... 1970-72 20 250 12.5Dave Atkinson, BYU ............................................................... 1971-73 20 222 11.1Artimus Parker, Southern California ............................... 1971-73 20 268 13.4Charles Jefferson, McNeese St. ........................................ 1975-78 20 95 4.8Chris Williams, LSU ................................................................. 1977-80 20 91 4.6Anthony Young, Temple....................................................... 1981-84 20 230 11.5Mark Collins, Cal St. Fullerton ............................................ 1982-85 20 193 9.7Kevin Smith, Texas A&M ....................................................... 1988-91 20 289 14.5Dre’ Bly, North Carolina ......................................................... 1996-98 20 198 9.9Mitch Meeuwsen, Oregon St. ........................................... 2001-04 20 149 7.5*Record.
SEASON INTERCEPTIONSPlayer, Team Year No. YardsAl Worley, Washington .......................................................................... †1968 14 130George Shaw, Oregon .......................................................................... †1951 13 136Hank Rich, Arizona St. .......................................................................... †1950 12 135Bill Albrecht, Washington .................................................................... 1951 12 140Frank Polito, Villanova ........................................................................... †1971 12 261Terry Hoage, Georgia ............................................................................ †1982 12 51Tony Thurman, Boston College ........................................................ †1984 12 99Bob Navarro, Eastern Mich. ............................................................... †1989 12 73Cornelius Price, Houston ..................................................................... †1989 12 187Terrell Buckley, Florida St. ................................................................... †1991 12 238†National champion.
ANNUAL CHAMPIONSYear Player, Team Class No. Yards1938 Elmer Tarbox, Texas Tech ............................................................ Sr. 11 891939 Harold Van Every, Minnesota ................................................... Sr. 8 591940 Dick Morgan, Tulsa ....................................................................... Jr. 7 2101941 Bobby Robertson, Southern California ............................... Sr. 9 1261942 Ray Evans, Kansas ......................................................................... Jr. 10 761943 Jay Stoves, Washington .............................................................. Sr. 7 1391944 Jim Hardy, Southern California ............................................... Sr. 8 731945 Jake Leicht, Oregon ...................................................................... So. 9 1951946 Larry Hatch, Washington ........................................................... So. 8 1141947 John Bruce, William & Mary ...................................................... Jr. 9 781948 Jay Van Noy, Utah St. .................................................................. Jr. 8 2281949 Bobby Wilson, Ole Miss .............................................................. Sr. 10 701950 Hank Rich, Arizona St. ................................................................ Sr. 12 1351951 George Shaw, Oregon ................................................................. Fr. 13 1361952 Cecil Ingram, Alabama ................................................................ Jr. 10 1631953 Bob Garrett, Stanford .................................................................. Sr. 9 801954 Gary Glick, Colorado St. ............................................................. Jr. 8 1681955 Sam Wesley, Oregon St. ............................................................. Jr. 7 611956 Jack Hill, Utah St. .......................................................................... Sr. 7 1321957 Ray Toole, North Texas ................................................................ Sr. 7 1331958 Jim Norton, Idaho ......................................................................... Jr. 9 2221959 Bud Whitehead, Florida St. ....................................................... Jr. 6 1111960 Bob O’Billovich, Montana .......................................................... Jr. 7 711961 Joe Zuger, Arizona St. ................................................................. Sr. 10 121
Extra Pts.Year Player, Team Class TD Scored FG Pts.
Extra Pts.Year Player, Team Class G TD Scored FG Pts. Avg.

2011 NCAA FOOTBALL RECORDS - FBS ALL-TIME LEADERS 41
FOO
TBA
LL B
OW
LSU
BD
IVIS
ION
1962 Byron Beaver, Houston ............................................................... Sr. 10 561963 Dick Kern, William & Mary ......................................................... Sr. 8 1161964 Tony Carey, Notre Dame ............................................................ Jr. 8 1211965 Bob Sullivan, Maryland ............................................................... Sr. 10 611966 Henry King, Utah St. .................................................................... Sr. 11 1801967 Steve Haterius, West Tex. A&M ................................................ Sr. 11 901968 Al Worley, Washington ................................................................ Sr. *14 1301969 Seth Miller, Arizona St. ............................................................... Sr. 11 63Beginning in 1970, ranked on per-game (instead of total) numberYear Player, Team Class G No. Avg. Yards1970 Mike Sensibaugh, Ohio St. ............................ Sr. 8 8 1.00 401971 Frank Polito, Villanova ...................................... So. 10 12 1.20 2611972 Mike Townsend, Notre Dame ....................... Jr. 10 10 1.00 391973 Mike Gow, Illinois ............................................... Jr. 11 10 0.91 1421974 Mike Haynes, Arizona St. ............................... Jr. 12 11 0.92 1151975 Jim Bolding, East Carolina ............................. Jr. 10 10 1.00 511976 Anthony Francis, Houston ............................. Jr. 11 10 0.91 1181977 Paul Lawler, Colgate ......................................... Sr. 9 7 0.78 531978 Pete Harris, Penn St. ......................................... Jr. 11 10 0.91 1551979 Joe Callan, Ohio .................................................. Sr. 9 9 1.00 1101980 Ronnie Lott, Southern California ................ Sr. 11 8 0.73 166 Steve McNamee, William & Mary ................ Sr. 11 8 0.73 125 Greg Benton, Drake .......................................... Sr. 11 8 0.73 119 Jeff Hipp, Georgia .............................................. Sr. 11 8 0.73 104 Mike Richardson, Arizona St. ....................... So. 11 8 0.73 89 Vann McElroy, Baylor ........................................ Jr. 11 8 0.73 731981 Sam Shaffer, Temple ......................................... Sr. 10 9 0.90 761982 Terry Hoage, Georgia ....................................... Jr. 10 12 1.20 511983 Martin Bayless, Bowling Green .................... Sr. 11 10 0.91 641984 Tony Thurman, Boston College ................... Sr. 11 12 1.09 991985 Chris White, Tennessee .................................... Sr. 11 9 0.82 168 Kevin Walker, East Carolina ........................... Sr. 11 9 0.82 1551986 Bennie Blades, Miami (FL) .............................. Jr. 11 10 0.91 1281987 Keith McMeans, Virginia ................................. Fr. 10 9 0.90 351988 Kurt Larson, Michigan St. (LB) ...................... Sr. 11 8 0.73 78 Andy Logan, Kent St. ....................................... Sr. 11 8 0.73 541989 Cornelius Price, Houston ................................ Jr. 11 12 1.09 187 Bob Navarro, Eastern Mich. .......................... Jr. 11 12 1.09 731990 Jerry Parks, Houston ......................................... Jr. 11 8 0.73 1241991 Terrell Buckley, Florida St. .............................. Jr. 12 12 1.00 2381992 Carlton McDonald, Air Force ......................... Sr. 11 8 0.73 1091993 Orlanda Thomas, La.-Lafayette ................... Jr. 11 9 0.82 841994 Aaron Beasley, West Virginia ......................... Jr. 12 10 0.83 1331995 Willie Smith, Louisiana Tech .......................... Jr. 10 8 0.80 651996 Dre’ Bly, North Carolina .................................. Fr. 11 11 1.00 1411997 Brian Lee, Wyoming .......................................... Sr. 11 8 0.73 1031998 Jamar Fletcher, Wisconsin .............................. Fr. 9 6 0.67 991999 Deltha O’Neal, California ................................ Sr. 11 9 0.82 280 Deon Grant, Tennessee ................................... Jr. 11 9 0.82 167 Rodregis Brooks, UAB ....................................... Jr. 11 9 0.82 1522000 Dwight Smith, Akron ....................................... Sr. 11 10 0.91 208 Anthony Floyd, Louisville ............................... So. 11 10 0.91 1522001 Edward Reed, Miami (FL) ................................ Sr. 11 9 0.82 2062002 Jim Leonhard, Wisconsin ................................ So. 14 11 0.79 1152003 Sean Taylor, Miami (FL) .................................... Jr. 12 10 0.83 1842004 Chris Harris, La.-Monroe .................................. Sr. 11 7 0.64 11 Charles Gordon, Kansas .................................. So. 11 7 0.64 522005 Aaron Gibson, Oregon .................................... Sr. 12 7 0.64 1172006 Stanley Franks, Idaho ...................................... Jr. 12 9 0.75 2202007 Elbert Mack, Troy ................................................ Sr. 12 8 0.67 482008 Eric Berry, Tennessee ........................................ So. 12 7 0.58 265 Kevin Sanders, UAB ........................................... Sr. 12 7 0.58 552009 Rahim Moore, UCLA ......................................... So. 13 10 0.77 792010 Jayron Hosley, Virginia Tech .......................... So. 13 9 0.69 110*Record.
DEFENSIVE RECORDS(Since 2000)
Total Tackles
CAREER TOTAL TACKLES PER GAME(Min. 300 Total Tackles; Player must have concluded his career)
Player, Team Years G Solo Ast. Total Avg.E.J. Henderson, Maryland ............................ 2000-02 35 308 126 434 12.40Hanik Milligan, Houston .............................. 2000-02 34 235 170 405 11.91Tim McGarigle, Northwestern ................... 2002-05 48 319 226 *545 11.35Rod Davis, Southern Miss. .......................... 2000-03 47 *360 166 526 11.21Justin Beriault, Ball St. .................................. 2001-04 46 267 241 508 11.04
Ryan Fowler, Duke .......................................... 2000-03 46 286 209 495 10.76Dantonio Burnette, North Carolina St. . 2000-02 34 185 178 363 10.68Grant Wiley, West Virginia ............................ 2000-03 47 298 194 492 10.47Josh Smith, Navy ............................................. 2002-04 34 164 190 354 10.41Jerry Schumacher, Illinois ............................ 2000-02 35 236 115 351 10.03Alex Wujciak, Maryland ................................ 2008-10 38 157 224 381 10.03Dexter Reid, North Carolina ....................... 2000-03 47 304 162 466 9.91Michael Tauiliili, Duke .................................... 2005-08 35 145 197 342 9.77Alfred Fincher, Connecticut ........................ 2002-04 36 181 166 347 9.64Matt Pusateri, Miami (OH) .......................... 2001-04 51 313 172 485 9.51Thomas Keith, Central Mich. ...................... 2004-07 50 233 241 474 9.48Adam Seward, UNLV...................................... 2001-04 46 215 218 433 9.41Frantz Joseph, Fla. Atlantic ......................... 2005-08 37 187 159 346 9.35Derrick Johnson, Texas ................................. 2001-04 49 281 177 458 9.35Daniel Holtzclaw, Eastern Mich. ............... 2005-08 47 179 *258 437 9.30Matthew Castelo, San Jose St. ................... 2004-07 43 192 205 397 9.23Davonte Shannon, Buffalo .......................... 2007-10 50 258 202 460 9.20Mario Harvey, Marshall ................................. 2007-10 46 181 239 420 9.13James King, Central Mich. .......................... 2001-04 45 268 141 409 9.09Nick Bellore, Central Mich. .......................... 2007-10 52 229 243 472 9.08*Record.
SEASON TOTAL TACKLES PER GAMEPlayer, Team Year G Solo Ast. Total Avg.Rick Sherrod, West Virginia ............................ †2001 10 102 54 156 15.6Jimmy Cottrell, New Mexico St. .................. †2005 12 90 89 179 14.9Hanik Milligan, Houston ................................. 2001 10 82 67 149 14.9Levar Fisher, North Carolina St. ................... †2000 11 93 70 163 14.8Kyle Kayden, West Virginia ............................. 2001 11 88 71 159 14.5Jack Brewer, Minnesota ................................... 2001 11 89 66 155 14.1Luke Kuechly, Boston College ...................... †2010 13 110 73 183 14.1Hunter Hillenmeyer, Vanderbilt ................... †2002 12 116 52 168 14.0Nick Greisen, Wisconsin .................................. 2001 12 101 66 167 13.9Pernell Griffin, East Carolina ......................... 2001 11 72 81 153 13.9Dexter Reid, North Carolina .......................... 2002 12 107 59 166 13.8Lawrence Flugence, Texas Tech ................... 2002 14 124 69 *193 13.8*Record. †National champion.
CAREER TOTAL TACKLESPlayer, Team Years G Solo Ast. TotalTim McGarigle, Northwestern ........................ 2002-05 48 319 226 545Rod Davis, Southern Miss. ............................... 2000-03 47 *360 166 526Justin Beriault, Ball St. ....................................... 2001-04 46 267 241 508Ryan Fowler, Duke ............................................... 2000-03 46 286 209 495Grant Wiley, West Virginia ................................. 2000-03 47 298 194 492Matt Pusateri, Miami (OH) ................................ 2001-04 51 313 172 485Thomas Keith, Central Mich. ........................... 2004-07 57 233 241 474Nick Bellore, Central Mich. ............................... 2007-10 52 229 243 472Dexter Reid, North Carolina ............................ 2000-03 47 304 162 466Greg Jones, Michigan St. .................................. 2007-10 52 236 229 465Davonte Shannon, Buffalo ............................... 2007-10 50 258 202 460Derrick Johnson, Texas ...................................... 2001-04 49 281 177 458Abdul Hodge, Iowa ............................................. 2002-05 50 289 164 453Lawrence Wilson, Connecticut....................... 2007-10 52 246 203 449John Leake, Clemson ......................................... 2000-03 49 244 199 443Daniel Holtzclaw, Eastern Mich. .................... 2005-08 47 179 *258 437E.J. Henderson, Maryland ................................. 2000-02 35 308 126 434Solomon Elimimian, Hawaii ............................ 2005-08 52 243 191 434Adam Seward, UNLV ......................................... 2001-04 46 215 218 433Barrett Ruud, Nebraska ..................................... 2001-04 50 218 214 432Terrell Jones, Miami (OH) .................................. 2000-03 47 258 166 424Joe Pawelek, Baylor ............................................. 2006-09 48 191 231 422Mario Harvey, Marshall ...................................... 2007-10 46 181 239 420Chad Greenway, Iowa ........................................ 2002-05 50 252 164 416Chris Moore, East Carolina ............................... 2002-05 46 264 151 415*Record.
SEASON TOTAL TACKLESPlayer, Team Year G Solo Ast. TotalLawrence Flugence, Texas Tech ................................ 2002 14 124 69 193Josh Buhl, Kansas St. ..................................................... 2003 15 109 75 184Luke Kuechly, Boston College ................................... †2010 13 110 73 183Tom Ward, Toledo ........................................................... 2002 14 107 73 180Jimmy Cottrell, New Mexico St. .............................. †2005 12 90 89 179E.J. Henderson, Maryland ............................................ 2002 14 *135 40 175John Leake, Clemson .................................................... 2002 13 81 88 169Hunter Hillenmeyer, Vanderbilt ................................ †2002 12 116 52 168Byron Hardmon, Florida............................................... 2002 13 104 64 168Nick Greisen, Wisconsin ............................................... 2001 12 101 66 167Rodney Thomas, Clemson .......................................... 2002 13 82 85 167Rod Davis, Southern Miss. .......................................... 2002 13 121 46 167Grant Wiley, West Virginia ............................................ 2003 13 99 68 167
Player, Team Years G Solo Ast. Total Avg.Year Player, Team Class No. Yards
42 2011 NCAA FOOTBALL RECORDS - FBS ALL-TIME LEADERS
Dexter Reid, North Carolina ....................................... 2002 12 107 59 166Matthew Castelo, San Jose St. .................................. 2006 13 81 84 165Chris Chamberlian, Tulsa ............................................. 2007 14 104 61 165Rod Davis, Southern Miss. .......................................... †2003 12 111 53 164Levar Fisher, North Carolina St. ................................ †2000 11 93 70 163Mason Foster, Washington ......................................... 2010 13 106 57 163Jordon Dizon, Colorado ............................................... 2007 13 114 48 162Carmen Messina, New Mexico .................................. †2009 12 80 82 162*Record. †National champion.
SINGLE-GAME TOTAL TACKLES (Since 2000)
No. Player, Team (Opponent) Date26 Brian Leigeb, Central Mich. (Northern Ill.) ............................................Nov. 17, 200026 Doug Szymul, Northwestern (Navy) .................................................... Sept. 21, 200226 Bryce Hudman, SMU (Arkansas St.) ...................................................... Sept. 15, 200725 Bob Sanders, Iowa (Indiana) .......................................................................Oct. 20, 200125 DeMeco Ryans, Alabama (Arkansas) .................................................... Sept. 27, 200325 Tim McGarigle, Northwestern (Wisconsin) ............................................Oct. 8, 200524 Pernell Griffin, East Carolina (Wake Forest) ..........................................Sept. 1, 200124 Dantonio Burnette, North Carolina St. (Clemson) .............................Oct. 13, 200124 Brad White, Wake Forest (Navy) ................................................................Nov. 23, 200224 Chris Moore, East Carolina (Cincinnati) ..................................................Sept. 1, 200324 Rich Constantine, Ohio (Marshall) ...........................................................Nov. 28, 2003
ANNUAL CHAMPIONSYear Player, Team Class G Solo Ast. Total Avg.2000 Levar Fisher, North Carolina St. ........ Jr. 11 93 70 163 14.82001 Rick Sherrod, West Virginia ................. Sr. 10 102 54 156 *15.62002 Hunter Hillenmeyer, Vanderbilt ........ Sr. 12 116 52 168 14.02003 Rod Davis, Southern Miss. ................... Sr. 12 111 53 164 13.72004 Greg Washington, Army ....................... Sr. 11 73 76 149 13.62005 Jimmy Cottrell, New Mexico St. ....... Sr. 12 90 89 179 14.92006 Alvin Bowen, Iowa St. ........................... Jr. 12 95 60 155 12.92007 Scott McKillop, Pittsburgh................... Jr. 12 98 53 151 12.62008 Derrick Richardson, New Mexico St. Sr. 11 66 71 137 12.52009 Carmen Messina, New Mexico .......... So. 12 80 82 162 13.52010 Luke Kuechly, Boston College ........... So. 13 110 73 183 14.1*Record.
Solo Tackles
CAREER SOLO TACKLES PER GAME(Min. 225 Solo Tackles; Player must have concluded his career)
Player, Team Years G Solo Avg.E.J. Henderson, Maryland .................................................... 2000-02 35 308 8.80Rod Davis, Southern Miss. .................................................. 2000-03 47 *360 7.66Hanik Milligan, Houston ...................................................... 2000-02 34 235 6.91Jerry Schumacher, Illinois .................................................... 2000-02 35 236 6.74Tim McGarigle, Northwestern ........................................... 2002-05 48 319 6.65Dexter Reid, North Carolina ............................................... 2000-03 47 304 6.47Grant Wiley, West Virginia .................................................... 2000-03 47 298 6.34Ryan Fowler, Duke .................................................................. 2000-03 46 286 6.22Matt Pusateri, Miami (OH) .................................................. 2001-04 51 313 6.14Nick Duffy, Northern Ill. ....................................................... 2000-03 39 236 6.05James King, Central Mich. .................................................. 2001-04 45 268 5.96Akil Grant, Northern Ill. ........................................................ 2000-03 42 246 5.86Justin Beriault, Ball St. .......................................................... 2001-04 46 267 5.80Abdul Hodge, Iowa ................................................................ 2002-05 50 289 5.78Chris Moore, East Carolina .................................................. 2002-05 46 264 5.74Derrick Johnson, Texas ......................................................... 2001-04 49 281 5.73Wesley Woodyard, Kentucky ............................................. 2004-07 47 259 5.51Terrell Jones, Miami (OH) ..................................................... 2000-03 47 258 5.49Davonte Shannon, Buffalo .................................................. 2007-10 50 258 5.16Kirk Morrison, San Diego St. ............................................... $2000-04 47 241 5.13*Record. $See page 2 for explanation.
SEASON SOLO TACKLES PER GAMEPlayer, Team Year G Solo Avg.Rick Sherrod, West Virginia ....................................................... †2001 10 102 10.2Hunter Hillenmeyer, Vanderbilt .............................................. †2002 12 116 9.7E.J. Henderson, Maryland .......................................................... 2002 14 *135 9.6E.J. Henderson, Maryland .......................................................... 2001 11 104 9.5Rod Davis, Southern Miss. ........................................................ 2002 13 121 9.3Rod Davis, Southern Miss. ........................................................ †2003 12 111 9.3Tito Rodriquez, UCF ..................................................................... 2001 11 100 9.1Chris Moore, East Carolina ....................................................... 2003 11 100 9.1Patrick Willis, Mississippi ............................................................ †2005 10 90 9.0Dexter Reid, North Carolina ..................................................... 2002 12 107 8.9
Tito Rodriquez, UCF ..................................................................... 2001 9 80 8.9Lawrence Flugence, Texas Tech .............................................. 2002 14 124 8.9*Record. †National champion.
CAREER SOLO TACKLESPlayer, Team Years G SoloRod Davis, Southern Miss. ................................................................... 2000-03 47 360Tim McGarigle, Northwestern ............................................................ 2002-05 48 319Matt Pusateri, Miami (OH) .................................................................... 2001-04 51 313E.J. Henderson, Maryland ..................................................................... 2000-02 35 308Dexter Reid, North Carolina ................................................................ 2000-03 47 304Grant Wiley, West Virginia ..................................................................... 2000-03 47 298Abdul Hodge, Iowa ................................................................................. 2002-05 50 289Ryan Fowler, Duke ................................................................................... 2000-03 46 286Derrick Johnson, Texas .......................................................................... 2001-04 49 281James King, Central Mich. ................................................................... 2001-04 45 268Justin Beriault, Ball St. ........................................................................... 2001-04 46 267Chris Moore, East Carolina ................................................................... 2002-05 46 264Wesley Woodyard, Kentucky .............................................................. 2004-07 47 259Terrell Jones, Miami (OH) ...................................................................... 2000-03 47 258Davonte Shannon, Buffalo ................................................................... 2007-10 50 258Chad Greenway, Iowa ............................................................................ 2002-05 50 252Akil Grant, Northern Ill. ......................................................................... 2000-03 42 246Lawrence Wilson, Connecticut........................................................... 2007-10 52 246John Leake, Clemson ............................................................................. 2000-03 49 244Solomon Elimimian, Hawaii ................................................................ 2005-08 52 243Mason Foster, Washington .................................................................. 2007-10 50 243
$See page 2 for explanation.
SEASON SOLO TACKLESPlayer, Team Year G SoloE.J. Henderson, Maryland ............................................................................ 2002 14 135Lawrence Flugence, Texas Tech ................................................................ 2002 14 124Rod Davis, Southern Miss. .......................................................................... 2002 13 121Hunter Hillenmeyer, Vanderbilt ................................................................ †2002 12 116Jordon Dizon, Colorado ............................................................................... †2007 13 114Andre Maddox, North Carolina St. ......................................................... 2003 13 113Rod Davis, Southern Miss. .......................................................................... †2003 12 111Leroy Hill, Clemson......................................................................................... 2003 13 110Luke Kuechly, Boston College ................................................................... 2010 13 110Josh Buhl, Kansas St. ..................................................................................... 2003 15 109Dexter Reid, North Carolina ....................................................................... 2002 12 107Tom Ward, Toledo ........................................................................................... 2002 14 107†National champion.
SINGLE-GAME SOLO TACKLES (Since 2000)
Solo Player, Team (Opponent) Date20 Tyrell Johnson, Arkansas St. (North Texas)...........................................Nov. 26, 200519 Doug Szymul, Northwestern (Navy) .................................................... Sept. 21, 200218 Brian Leigeb, Central Mich. (Northern Ill.) ............................................Nov. 17, 200018 Nick Duffy, Northern Ill. (Ball St.) ..............................................................Nov. 17, 200117 Tom Ward, Toledo (UNLV) ......................................................................... Sept. 21, 200217 Matt McCoy, San Diego St. (Michigan) ................................................ Sept. 18, 200417 A.J. Nicholson, Florida St. (Boston College) ....................................... Sept. 17, 200517 Nelson Coleman, Tulsa (Rice) ......................................................................Oct. 15, 200516 Quincy Monk, North Carolina (Wake Forest) ......................................Nov. 10, 200116 Dexter Reid, North Carolina (Clemson) ................................................... Nov. 9, 200216 E.J. Henderson, Maryland (Wake Forest) ..............................................Nov. 30, 200216 Lewis Moore, Pittsburgh (Toledo) ......................................................... Sept. 20, 200316 Rod Davis, Southern Miss. (TCU) ..............................................................Nov. 20, 200316 Barrett Ruud, Nebraska (Kansas St.).........................................................Oct. 23, 200416 Cardia Jackson, La.-Monroe (Tulane) ................................................... Sept. 20, 200816 Christopher Buckner, New Mexico St. (Hawaii) .................................Nov. 14, 2009
ANNUAL CHAMPIONSYear Player, Team Class G Solo Avg.2001 Rick Sherrod, West Virginia ........................................... Sr. 10 102 *10.22002 Hunter Hillenmeyer, Vanderbilt .................................. Sr. 12 116 9.72003 Rod Davis, Southern Miss. ............................................ Sr. 12 111 9.32004 Tim McGarigle, Northwestern ..................................... Jr. 12 102 8.52005 Patrick Willis, Ole Miss ..................................................... Jr. 10 90 9.02006 Alvin Bowen, Iowa St. ..................................................... Jr. 12 95 7.92007 Jordon Dizon, Colorado ................................................. Sr. 13 114 8.82008 Quan Sturdivant, North Carolina ............................... So. 13 87 6.72009 Travis Bradshaw, Rice ....................................................... Jr. 12 90 7.52010 Luke Kuechly, Boston College ..................................... So. 13 110 8.5*Record.
Player, Team Year G Solo Avg.Player, Team Year G Solo Ast. Total
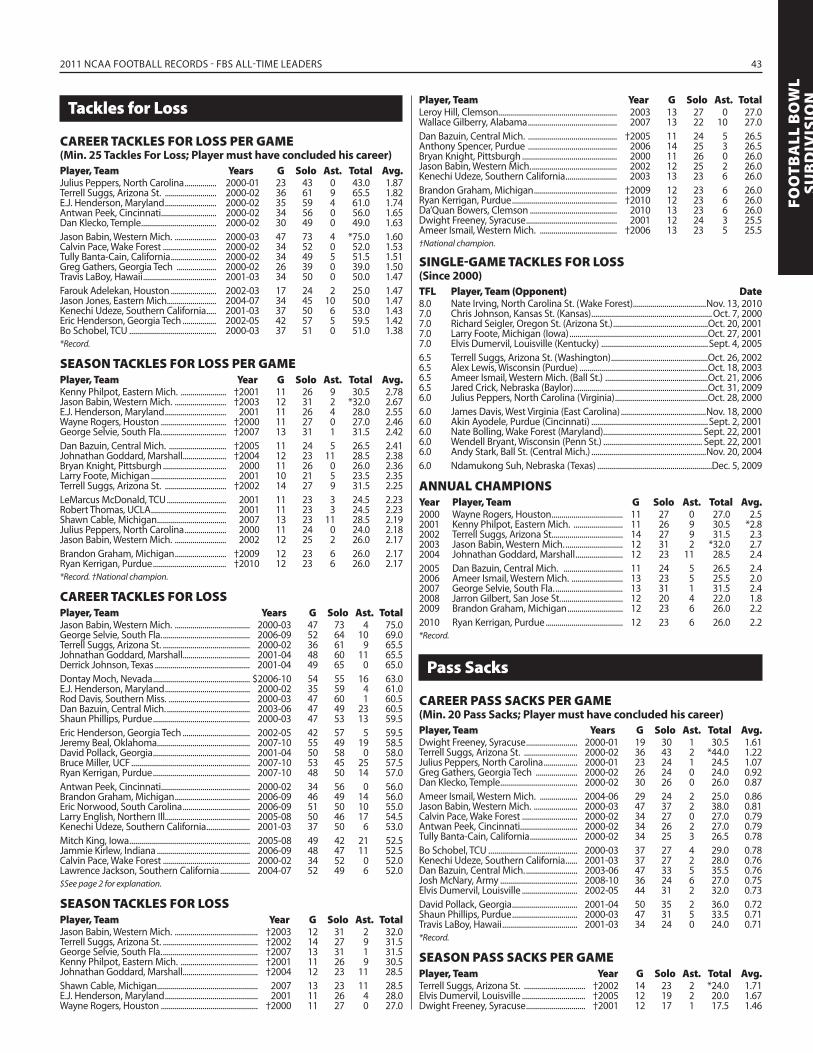
2011 NCAA FOOTBALL RECORDS - FBS ALL-TIME LEADERS 43
FOO
TBA
LL B
OW
LSU
BD
IVIS
IONTackles for Loss
CAREER TACKLES FOR LOSS PER GAME(Min. 25 Tackles For Loss; Player must have concluded his career)
Player, Team Years G Solo Ast. Total Avg.Julius Peppers, North Carolina ................ 2000-01 23 43 0 43.0 1.87Terrell Suggs, Arizona St. .......................... 2000-02 36 61 9 65.5 1.82E.J. Henderson, Maryland .......................... 2000-02 35 59 4 61.0 1.74Antwan Peek, Cincinnati ............................ 2000-02 34 56 0 56.0 1.65Dan Klecko, Temple ...................................... 2000-02 30 49 0 49.0 1.63Jason Babin, Western Mich. ..................... 2000-03 47 73 4 *75.0 1.60Calvin Pace, Wake Forest ........................... 2000-02 34 52 0 52.0 1.53Tully Banta-Cain, California ....................... 2000-02 34 49 5 51.5 1.51Greg Gathers, Georgia Tech .................... 2000-02 26 39 0 39.0 1.50Travis LaBoy, Hawaii ..................................... 2001-03 34 50 0 50.0 1.47Farouk Adelekan, Houston ....................... 2002-03 17 24 2 25.0 1.47Jason Jones, Eastern Mich......................... 2004-07 34 45 10 50.0 1.47Kenechi Udeze, Southern California ..... 2001-03 37 50 6 53.0 1.43Eric Henderson, Georgia Tech ................. 2002-05 42 57 5 59.5 1.42Bo Schobel, TCU ............................................ 2000-03 37 51 0 51.0 1.38*Record.
SEASON TACKLES FOR LOSS PER GAMEPlayer, Team Year G Solo Ast. Total Avg.Kenny Philpot, Eastern Mich. ....................... †2001 11 26 9 30.5 2.78Jason Babin, Western Mich. .......................... †2003 12 31 2 *32.0 2.67E.J. Henderson, Maryland ............................... 2001 11 26 4 28.0 2.55Wayne Rogers, Houston ................................. †2000 11 27 0 27.0 2.46George Selvie, South Fla. ................................ †2007 13 31 1 31.5 2.42Dan Bazuin, Central Mich. ............................. †2005 11 24 5 26.5 2.41Johnathan Goddard, Marshall...................... †2004 12 23 11 28.5 2.38Bryan Knight, Pittsburgh ................................ 2000 11 26 0 26.0 2.36Larry Foote, Michigan ...................................... 2001 10 21 5 23.5 2.35Terrell Suggs, Arizona St. ............................... †2002 14 27 9 31.5 2.25LeMarcus McDonald, TCU .............................. 2001 11 23 3 24.5 2.23Robert Thomas, UCLA ...................................... 2001 11 23 3 24.5 2.23Shawn Cable, Michigan ................................... 2007 13 23 11 28.5 2.19Julius Peppers, North Carolina ..................... 2000 11 24 0 24.0 2.18Jason Babin, Western Mich. .......................... 2002 12 25 2 26.0 2.17Brandon Graham, Michigan .......................... †2009 12 23 6 26.0 2.17Ryan Kerrigan, Purdue ..................................... †2010 12 23 6 26.0 2.17*Record. †National champion.
CAREER TACKLES FOR LOSSPlayer, Team Years G Solo Ast. TotalJason Babin, Western Mich. ...................................... 2000-03 47 73 4 75.0George Selvie, South Fla. ............................................ 2006-09 52 64 10 69.0Terrell Suggs, Arizona St. ............................................ 2000-02 36 61 9 65.5Johnathan Goddard, Marshall.................................. 2001-04 48 60 11 65.5Derrick Johnson, Texas ................................................ 2001-04 49 65 0 65.0Dontay Moch, Nevada ................................................. $2006-10 54 55 16 63.0E.J. Henderson, Maryland ........................................... 2000-02 35 59 4 61.0Rod Davis, Southern Miss. ......................................... 2000-03 47 60 1 60.5Dan Bazuin, Central Mich. .......................................... 2003-06 47 49 23 60.5Shaun Phillips, Purdue ................................................. 2000-03 47 53 13 59.5Eric Henderson, Georgia Tech .................................. 2002-05 42 57 5 59.5Jeremy Beal, Oklahoma............................................... 2007-10 55 49 19 58.5David Pollack, Georgia ................................................. 2001-04 50 58 0 58.0Bruce Miller, UCF ............................................................ 2007-10 53 45 25 57.5Ryan Kerrigan, Purdue ................................................. 2007-10 48 50 14 57.0Antwan Peek, Cincinnati ............................................. 2000-02 34 56 0 56.0Brandon Graham, Michigan ...................................... 2006-09 46 49 14 56.0Eric Norwood, South Carolina .................................. 2006-09 51 50 10 55.0Larry English, Northern Ill........................................... 2005-08 50 46 17 54.5Kenechi Udeze, Southern California ...................... 2001-03 37 50 6 53.0Mitch King, Iowa ............................................................. 2005-08 49 42 21 52.5Jammie Kirlew, Indiana ............................................... 2006-09 48 47 11 52.5Calvin Pace, Wake Forest ............................................ 2000-02 34 52 0 52.0Lawrence Jackson, Southern California ............... 2004-07 52 49 6 52.0$See page 2 for explanation.
SEASON TACKLES FOR LOSSPlayer, Team Year G Solo Ast. TotalJason Babin, Western Mich. .......................................... †2003 12 31 2 32.0Terrell Suggs, Arizona St. ................................................ †2002 14 27 9 31.5George Selvie, South Fla. ................................................ †2007 13 31 1 31.5Kenny Philpot, Eastern Mich. ....................................... †2001 11 26 9 30.5Johnathan Goddard, Marshall...................................... †2004 12 23 11 28.5Shawn Cable, Michigan ................................................... 2007 13 23 11 28.5E.J. Henderson, Maryland ............................................... 2001 11 26 4 28.0Wayne Rogers, Houston ................................................. †2000 11 27 0 27.0
Leroy Hill, Clemson............................................................ 2003 13 27 0 27.0Wallace Gilberry, Alabama ............................................. 2007 13 22 10 27.0Dan Bazuin, Central Mich. ............................................. †2005 11 24 5 26.5Anthony Spencer, Purdue ............................................. 2006 14 25 3 26.5Bryan Knight, Pittsburgh ................................................ 2000 11 26 0 26.0Jason Babin, Western Mich. ........................................... 2002 12 25 2 26.0Kenechi Udeze, Southern California .......................... 2003 13 23 6 26.0Brandon Graham, Michigan .......................................... †2009 12 23 6 26.0Ryan Kerrigan, Purdue ..................................................... †2010 12 23 6 26.0Da’Quan Bowers, Clemson ............................................ 2010 13 23 6 26.0Dwight Freeney, Syracuse .............................................. 2001 12 24 3 25.5Ameer Ismail, Western Mich. ....................................... †2006 13 23 5 25.5†National champion.
SINGLE-GAME TACKLES FOR LOSS (Since 2000)
TFL Player, Team (Opponent) Date8.0 Nate Irving, North Carolina St. (Wake Forest).....................................Nov. 13, 20107.0 Chris Johnson, Kansas St. (Kansas) .............................................................Oct. 7, 20007.0 Richard Seigler, Oregon St. (Arizona St.) ................................................Oct. 20, 20017.0 Larry Foote, Michigan (Iowa) ......................................................................Oct. 27, 20017.0 Elvis Dumervil, Louisville (Kentucky) ......................................................Sept. 4, 20056.5 Terrell Suggs, Arizona St. (Washington) .................................................Oct. 26, 20026.5 Alex Lewis, Wisconsin (Purdue) .................................................................Oct. 18, 20036.5 Ameer Ismail, Western Mich. (Ball St.) ....................................................Oct. 21, 20066.5 Jared Crick, Nebraska (Baylor) ....................................................................Oct. 31, 20096.0 Julius Peppers, North Carolina (Virginia) ...............................................Oct. 28, 20006.0 James Davis, West Virginia (East Carolina) ...........................................Nov. 18, 20006.0 Akin Ayodele, Purdue (Cincinnati) ...........................................................Sept. 2, 20016.0 Nate Bolling, Wake Forest (Maryland).................................................. Sept. 22, 20016.0 Wendell Bryant, Wisconsin (Penn St.) .................................................. Sept. 22, 20016.0 Andy Stark, Ball St. (Central Mich.) ..........................................................Nov. 20, 20046.0 Ndamukong Suh, Nebraska (Texas) ..........................................................Dec. 5, 2009
ANNUAL CHAMPIONSYear Player, Team G Solo Ast. Total Avg.2000 Wayne Rogers, Houston .................................... 11 27 0 27.0 2.52001 Kenny Philpot, Eastern Mich. ......................... 11 26 9 30.5 *2.82002 Terrell Suggs, Arizona St. ................................... 14 27 9 31.5 2.32003 Jason Babin, Western Mich. ............................. 12 31 2 *32.0 2.72004 Johnathan Goddard, Marshall ........................ 12 23 11 28.5 2.42005 Dan Bazuin, Central Mich. .............................. 11 24 5 26.5 2.42006 Ameer Ismail, Western Mich. .......................... 13 23 5 25.5 2.02007 George Selvie, South Fla. .................................. 13 31 1 31.5 2.42008 Jarron Gilbert, San Jose St. ............................... 12 20 4 22.0 1.82009 Brandon Graham, Michigan ............................ 12 23 6 26.0 2.22010 Ryan Kerrigan, Purdue ....................................... 12 23 6 26.0 2.2*Record.
Pass Sacks
CAREER PASS SACKS PER GAME(Min. 20 Pass Sacks; Player must have concluded his career)
Player, Team Years G Solo Ast. Total Avg.Dwight Freeney, Syracuse .......................... 2000-01 19 30 1 30.5 1.61Terrell Suggs, Arizona St. ........................... 2000-02 36 43 2 *44.0 1.22Julius Peppers, North Carolina ................. 2000-01 23 24 1 24.5 1.07Greg Gathers, Georgia Tech ..................... 2000-02 26 24 0 24.0 0.92Dan Klecko, Temple ....................................... 2000-02 30 26 0 26.0 0.87Ameer Ismail, Western Mich. ................... 2004-06 29 24 2 25.0 0.86Jason Babin, Western Mich. ...................... 2000-03 47 37 2 38.0 0.81Calvin Pace, Wake Forest ............................ 2000-02 34 27 0 27.0 0.79Antwan Peek, Cincinnati ............................. 2000-02 34 26 2 27.0 0.79Tully Banta-Cain, California ........................ 2000-02 34 25 3 26.5 0.78Bo Schobel, TCU ............................................. 2000-03 37 27 4 29.0 0.78Kenechi Udeze, Southern California ...... 2001-03 37 27 2 28.0 0.76Dan Bazuin, Central Mich. .......................... 2003-06 47 33 5 35.5 0.76Josh McNary, Army ....................................... 2008-10 36 24 6 27.0 0.75Elvis Dumervil, Louisville ............................ 2002-05 44 31 2 32.0 0.73David Pollack, Georgia ................................. 2001-04 50 35 2 36.0 0.72Shaun Phillips, Purdue ................................. 2000-03 47 31 5 33.5 0.71Travis LaBoy, Hawaii ...................................... 2001-03 34 24 0 24.0 0.71*Record.
SEASON PASS SACKS PER GAMEPlayer, Team Year G Solo Ast. Total Avg.Terrell Suggs, Arizona St. ............................... †2002 14 23 2 *24.0 1.71Elvis Dumervil, Louisville ................................ †2005 12 19 2 20.0 1.67Dwight Freeney, Syracuse .............................. †2001 12 17 1 17.5 1.46
Player, Team Year G Solo Ast. Total

44 2011 NCAA FOOTBALL RECORDS - FBS ALL-TIME LEADERS
Dan Bazuin, Central Mich. ............................. 2005 11 15 2 16.0 1.45Michael Josiah, Louisville ............................... †2000 9 12 1 12.5 1.39Julius Peppers, North Carolina ..................... 2000 11 15 0 15.0 1.36Dewayne White, Louisville ............................. 2001 11 15 0 15.0 1.36Willie Evans, Mississippi St. ........................... 2005 11 12 6 15.0 1.36Johnathan Goddard, Marshall...................... †2004 12 15 2 16.0 1.33Osi Umenyiora, Troy .......................................... 2002 12 16 0 16.0 1.33Tom Canada, California ................................... 2002 9 12 0 12.0 1.33Ameer Ismail, Western Mich. ....................... †2006 13 16 2 17.0 1.31Von Miller, Texas A&M ...................................... †2009 13 16 2 17.0 1.31Bryan Thomas, UAB ........................................... 2001 11 14 0 14.0 1.27Justin Parrish, Kent St. ...................................... 2004 11 13 2 14.0 1.27Dave Ball, UCLA .................................................. †2003 13 16 1 16.5 1.27Kenechi Udeze, Southern California .......... †2003 13 16 1 16.5 1.27D.D. Acholonu, Washington St. ................... †2003 13 16 1 16.5 1.27Antwan Peek, Cincinnati ................................. 2001 10 12 1 12.5 1.25Jason Babin, Western Mich. .......................... 2003 12 15 0 15.0 1.25Brandon Sharpe, Texas Tech .......................... 2009 12 14 2 15.0 1.25*Record. †National champion.
CAREER PASS SACKSPlayer, Team Years G Solo Ast. TotalTerrell Suggs, Arizona St. ........................................... 2000-02 36 43 2 44.0Jason Babin, Western Mich. ...................................... 2000-03 47 37 2 38.0David Pollack, Georgia ................................................. 2001-04 50 35 2 36.0Dan Bazuin, Central Mich. .......................................... 2003-06 47 33 5 35.5Bruce Miller, UCF ............................................................ 2007-10 53 33 5 35.5Shaun Phillips, Purdue ................................................. 2000-03 47 31 5 33.5Phillip Hunt, Houston ................................................... 2005-08 52 30 7 33.5Ryan Kerrigan, Purdue ................................................. 2007-10 48 32 3 33.5Von Miller, Texas A&M .................................................. 2007-10 47 31 4 33.0Elvis Dumervil, Louisville ............................................ 2002-05 44 31 2 32.0Larry English, Northern Ill........................................... 2005-08 50 28 7 31.5Dexter Davis, Arizona St. ............................................. 2006-09 50 30 2 31.0Dwight Freeney, Syracuse .......................................... 2000-01 19 30 1 30.5Dave Ball, UCLA .............................................................. 2000-03 49 30 1 30.5Lawrence Jackson, Southern California ............... 2004-07 52 30 1 30.5Matt Roth, Iowa .............................................................. 2001-04 50 30 0 30.0Dontay Moch, Nevada ................................................. 2007-10 54 27 6 30.0Nick Reed, Oregon ........................................................ 2005-08 51 27 5 29.5Brandon Graham, Michigan ...................................... 2006-09 46 27 5 29.5Jorge Cordova, Nevada ............................................... 2000-03 42 28 2 29.0Bo Schobel, TCU ............................................................. 2000-03 37 27 4 29.0Daniel Te’o-Nesheim, Washington .......................... 2006-09 49 27 4 29.0Eric Norwood, South Carolina .................................. 2006-09 51 26 6 29.0Jeremy Beal, Oklahoma............................................... 2007-10 55 25 8 29.0Jerry Hughes, TCU.......................................................... 2006-09 49 27 3 28.5Jan Jorgensen, BYU ....................................................... 2006-09 52 26 5 28.5George Selvie, South Fla. ............................................ 2006-09 52 26 5 28.5
SEASON PASS SACKSPlayer, Team Year G Solo Ast. TotalTerrell Suggs, Arizona St. ................................................ †2002 14 23 2 24.0Elvis Dumervil, Louisville ................................................ †2005 12 19 2 20.0Dwight Freeney, Syracuse ............................................... †2001 12 17 1 17.5Ameer Ismail, Western Mich. ........................................ †2006 13 16 2 17.0Von Miller, Texas A&M ....................................................... †2009 13 16 2 17.0Dave Ball, UCLA ................................................................... †2003 13 16 1 16.5Kenechi Udeze, Southern California ........................... †2003 13 16 1 16.5D.D. Acholonu, Washington St. .................................... †2003 13 16 1 16.5Osi Umenyiora, Troy ........................................................... 2002 12 16 0 16.0Johnathan Goddard, Marshall....................................... †2004 12 15 2 16.0Dan Bazuin, Central Mich. .............................................. 2005 11 15 2 16.0Greg Middleton, Indiana ................................................. †2007 13 15 2 16.0Da’Quan Bowers, Clemson ............................................. †2010 13 15 1 15.5Julius Peppers, North Carolina ...................................... 2000 11 15 0 15.0Dewayne White, Louisville .............................................. 2001 11 15 0 15.0Michael Haynes, Penn St. ............................................... 2002 13 14 2 15.0Jason Babin, Western Mich. ........................................... 2003 12 15 0 15.0Bo Schobel, TCU .................................................................. 2003 13 13 4 15.0Willie Evans, Mississippi St. ............................................ 2005 11 12 6 15.0Jerry Hughes, TCU............................................................... 2008 13 15 0 15.0Brandon Sharpe, Texas Tech ........................................... 2009 12 14 2 15.0†National champion.
SINGLE-GAME PASS SACKS (Since 2000)
PS Player, Team (Opponent) Date6.0 Elvis Dumervil, Louisville (Kentucky) .......................................................Sept. 4, 20056.0 Ameer Ismail, Western Mich. (Ball St.) .....................................................Oct. 21, 20065.0 Wendell Bryant, Wisconsin (Penn St.) .................................................. Sept. 22, 2001
5.0 James Harrison, Kent St. [Miami (OH)] ...................................................Nov. 24, 20015.0 Alex Lewis, Wisconsin (Purdue) .................................................................Oct. 18, 20035.0 Mkristo Bruce, Washington St. (Stanford) .......................................... Sept. 23, 20065.0 Larry English, Northern Ill. (Idaho) ........................................................ Sept. 22, 20075.0 Jared Crick, Nebraska (Baylor) ....................................................................Oct. 31, 20094.5 Dwight Freeney, Syracuse (Virginia Tech) .............................................Oct. 21, 20004.5 Tully Banta-Cain, California (New Mexico St.) ......................................Sept. 7, 20024.5 Terrell Suggs, Arizona St. (Washington) .................................................Oct. 26, 20024.5 Jorge Cordova, Nevada (Washington) ...................................................Oct. 11, 20034.5 Brandon Perkins, Kansas (Louisiana Tech) ......................................... Sept. 17, 20054.5 Larry English, Northern Ill. (Temple) .......................................................Oct. 21, 20064.5 Ndamukong Suh, Nebraska (Texas) ..........................................................Dec. 5, 20094.5 Robert Eddins, Ball St. (Central Mich.) .......................................................Oct. 2, 20104.5 Guy Miller, Colorado St. (UNLV) .................................................................Oct. 16, 2010
ANNUAL CHAMPIONSYear Player, Team G Solo Ast. Total Avg.2000 Michael Josiah, Louisville .................................. 9 12 1 12.5 1.42001 Dwight Freeney, Syracuse ................................ 12 17 1 17.5 1.52002 Terrell Suggs, Arizona St. ................................... 14 23 2 *24.0 *1.712003 Dave Ball, UCLA ..................................................... 13 16 1 16.5 1.3 Kenechi Udeze, Southern California ............ 13 16 1 16.5 1.3 D.D. Acholonu, Washington St. ...................... 13 16 1 16.5 1.32004 Johnathan Goddard, Marshall ........................ 12 15 2 16.0 1.32005 Elvis Dumervil, Louisville .................................. 12 19 2 20.0 1.672006 Ameer Ismail, Western Mich. .......................... 13 16 2 17.0 1.312007 Greg Middleton, Indiana ................................... 13 15 2 16.0 1.232008 Jerry Hughes, TCU ................................................ 13 15 0 15.0 1.152009 Von Miller, Texas A&M ........................................ 13 16 2 17.0 1.312010 Da’Quan Bowers, Clemson ............................... 13 15 1 15.5 1.19*Record.
Passes Defended
CAREER PASSES DEFENDED PER GAME(Min. 30 Passes Defended; Player must have concluded his career)
Player, Team Years G PBU Int. Total Avg.Eugene Wilson, Illinois ................................. 2000-02 33 60 11 71 2.15Rayshun Reed, Troy ...................................... 2000-03 31 43 10 53 1.71Nathan Vasher, Texas .................................... 2000-03 46 61 17 *78 1.70Michael Jolivette, Arizona .......................... 2000-03 36 44 12 56 1.56Christian Morton, Illinois ............................ 2000-03 33 41 5 46 1.39Brian King, West Virginia ............................. 2000-03 46 54 10 64 1.39Greg Brooks, Southern Miss. .................... 2000-03 43 47 9 56 1.30Blue Adams, Cincinnati ............................... 2000-02 35 30 12 42 1.20Alphonso Smith, Wake Forest .................. 2005-08 51 40 21 61 1.20Randee Drew, Northern Ill. ....................... 2000-03 44 38 14 52 1.18Jameel Powell, California ............................ 2000-02 28 23 10 33 1.18Ricky Sharpe, San Diego St. ...................... 2000-02 35 34 6 40 1.14Michael Lehan, Minnesota ......................... 2000-02 33 33 4 37 1.12Dustin Fox, Ohio St. ...................................... 2001-03 38 34 7 41 1.08Scott Starks, Wisconsin ................................ 2001-04 51 46 6 52 1.02*Record.
SEASON PASSES DEFENDED PER GAMEPlayer, Team Year G PBU Int. Total Avg.Aqib Talib, Kansas ................................................ †2006 10 22 6 28 2.8Jason Goss, TCU .................................................... †2002 12 24 8 *32 2.7Eugene Wilson, Illinois ....................................... †2001 11 23 6 29 2.6Nathan Vasher, Texas .......................................... †2003 13 26 6 *32 2.5Justin Perkins, Connecticut ............................. 2003 11 21 6 27 2.5Lynaris Elpheage, Tulane .................................. 2002 13 23 8 31 2.4Christian Morton, Illinois .................................. 2001 11 22 4 26 2.4Corey Webster, LSU ............................................. 2003 14 25 7 *32 2.3Ken Lucas, Ole Miss ............................................. †2000 11 20 5 25 2.3Fred Smoot, Mississippi St. ............................. 2000 11 19 5 24 2.2Steve Smith, Oregon .......................................... 2001 11 18 6 24 2.2Jason Goss, TCU .................................................... 2001 11 21 3 24 2.2Daniel Wilturner, Baylor ..................................... 2000 11 21 2 23 2.1Edward Reed, Miami (FL) .................................. 2000 11 15 8 23 2.1Quentin Jammer, Texas ..................................... 2000 11 20 3 23 2.1Lawrence Richardson, Arkansas .................... 2001 11 20 3 23 2.1Darrent Williams, Oklahoma St. .................... 2003 11 17 6 23 2.1*Record. †National champion.
CAREER PASSES DEFENDEDPlayer, Team Years G PBU Int. TotalNathan Vasher, Texas .................................................... 2000-03 46 61 17 78Eugene Wilson, Illinois ................................................. 2000-02 33 60 11 71
PS Player, Team (Opponent) DatePlayer, Team Year G Solo Ast. Total Avg.

2011 NCAA FOOTBALL RECORDS - FBS ALL-TIME LEADERS 45
FOO
TBA
LL B
OW
LSU
BD
IVIS
ION
Brian King, West Virginia ............................................. 2000-03 46 54 10 64Alphonso Smith, Wake Forest .................................. 2005-08 51 40 21 61Michael Jolivette, Arizona .......................................... 2000-03 36 44 12 56Greg Brooks, Southern Miss. .................................... 2000-03 43 47 6 53Rayshun Reed, Troy ....................................................... 2000-03 31 43 10 53Randee Drew, Northern Ill. ....................................... 2000-03 44 38 14 52Scott Starks, Wisconsin ................................................ 2001-04 51 46 6 52Jim Leonhard, Wisconsin ............................................ 2001-04 51 29 21 50Christian Morton, Illinois ............................................ 2000-03 33 41 5 46Perrish Cox, Oklahoma St. .......................................... 2006-09 49 36 10 46Vince Thompson, Northern Ill. ................................ 2000-03 30 28 15 43Jamar Wall, Texas Tech ................................................. 2006-09 49 34 9 43Blue Adams, Cincinnati ............................................... 2000-02 35 30 12 42Abraham Elimimiam, Hawaii .................................... 2001-04 49 30 12 42Dustin Fox, Ohio St. ...................................................... 2001-03 38 34 7 41Ricky Sharpe, San Diego St. ...................................... 2000-02 35 34 6 40Zach Norton, Cincinnati .............................................. 2000-03 43 31 9 40
SEASON PASSES DEFENDEDPlayer, Team Year G PBU Int. TotalJason Goss, TCU .................................................................. †2002 12 24 8 32Nathan Vasher, Texas ........................................................ †2003 13 26 6 32Corey Webster, LSU ........................................................... 2003 14 25 7 32Lynaris Elpheage, Tulane ................................................ 2002 13 23 8 31Eugene Wilson, Illinois ..................................................... †2001 11 23 6 29Travis Daniels, LSU ............................................................. 2003 14 26 2 28Aqib Talib, Kansas .............................................................. †2006 10 22 6 28Justin Perkins, Connecticut ........................................... 2003 11 21 6 27Christian Morton, Illinois ................................................ 2001 11 22 4 26Joselio Hanson, Texas Tech ............................................ 2002 14 23 3 26Will Poole, Southern California .................................... 2003 13 19 7 26Ken Lucas, Ole Miss ........................................................... †2000 11 20 5 25Jim Leonhard, Wisconsin ................................................ 2002 14 14 11 25Brian King, West Virginia ................................................. 2003 13 19 6 25†National champion.
SINGLE-GAME PASSES DEFENDED (Since 2000)
PD Player, Team (Opponent) Date8 Joselio Hanson, Texas Tech (Oklahoma St.) ........................................... Nov. 9, 20027 Demerist Whitfield, Northern Ill. (Illinois St.) ........................................Sept. 9, 20007 Nashville Dyer, Kent St. (Bucknell) ............................................................Sept. 8, 20017 Korey Banks, Mississippi St. (Memphis) .................................................Oct. 19, 20027 Jason Goss, TCU (Tulane) ............................................................................... Nov. 9, 20027 Fabian Washington, Nebraska (Kansas) ...................................................Oct. 2, 20046 Bobby Jackson, Illinois (Northern Ill.) ......................................................Sept. 8, 20016 Terence Newman, Kansas St. (Oklahoma) ......................................... Sept. 29, 20016 Marlin Jackson, Michigan (Washington) ............................................. Aug. 31, 20026 Keiwan Ratliff, Florida (Arkansas) ..............................................................Oct. 18, 20036 Wes Nurse, Boise St. (BYU) ...........................................................................Oct. 30, 20036 Chris Carr, Boise St. (Nevada) .....................................................................Nov. 29, 20036 Willie Gaston, Houston (UTEP) ............................................................... Sept. 16, 20056 Aaron Ross, Texas (Iowa St.) .................................................................... Sept. 23, 20066 Mark Parson, Ohio (Akron)..........................................................................Nov. 16, 20066 Londen Fryar, Western Mich. (Akron) ........................................................Oct. 6, 20076 Gary Anderson, Rice (UTEP) ......................................................................... Nov. 3, 20076 Josh Lumar, Tulane (Rice) ............................................................................Nov. 17, 2007 6 Marquis Johnson, Alabama (South Carolina) ......................................Oct. 17, 20096 Miguel Graham, Akron (Kent St.) ............................................................... Nov. 7, 2009
ANNUAL CHAMPIONSYear Player, Team G PBU Int. Total Avg.2000 Ken Lucas, Ole Miss ............................................. 11 20 5 25 2.32001 Eugene Wilson, Illinois ....................................... 11 23 6 29 2.62002 Jason Goss, TCU .................................................... 12 24 8 *32 2.72003 Nathan Vasher, Texas .......................................... 13 26 6 *32 2.52004 Brandon Payne, New Mexico .......................... 12 17 6 23 1.92005 Tramon Williams, Louisiana Tech ................... 11 16 3 19 1.72006 Aqib Talib, Kansas ................................................ 10 22 6 28 *2.82007 Trey Brown, UCLA ................................................ 13 18 5 23 1.77 Walter Thurmond III, Oregon .......................... 13 18 5 23 1.772008 Alterraun Verner, UCLA ...................................... 12 18 2 20 1.672009 Perrish Cox, Oklahoma St. ................................ 11 15 4 19 1.732010 Cliff Harris, Oregon .............................................. 13 17 6 23 1.77*Record.
Forced Fumbles
CAREER FORCED FUMBLES PER GAME(Min. 20 Games Played; Player must have concluded his career)
Player, Team Years G FF Avg.Jonal Saint-Dic, Michigan St. ......................................... 2005-07 24 10 0.42Antwan Peek, Cincinnati ................................................. 2000-02 34 *14 0.41Tom Canada, California ................................................... 2001-02 20 8 0.40Terrell Suggs, Arizona St. ............................................... 2000-02 36 *14 0.39Kenechi Udeze, Southern California .......................... 2001-03 37 *14 0.38Ryan Kerrigan, Purdue ..................................................... 2007-10 48 *14 0.29Zack Follett, California ..................................................... 2005-08 49 13 0.27Nate Jackson, Hawaii ........................................................ 2000-01 23 6 0.26Heath Farwell, San Diego St. ........................................ 2001-03 36 9 0.25Adekunle Akingba, Buffalo ............................................ 2005-08 24 6 0.25James Lockett, Tulsa ......................................................... 2006-09 32 8 0.25David Sims, Iowa St. .......................................................... 2009-10 24 6 0.25Stryker Sulak, Missouri ..................................................... 2005-08 54 13 0.24Stephen Paea, Oregon St. .............................................. 2007-10 38 9 0.24Stephen Anderson, Army ............................................... 2007-10 43 10 0.23Clinton Snyder, Stanford ................................................. 2006-09 44 10 0.23*Record.
SEASON FORCED FUMBLES PER GAMEPlayer, Team Year G FF Avg.Elvis Dumervil, Louisville ....................................................... †2005 12 *10 0.83Dwight Freeney, Syracuse ..................................................... †2001 12 8 0.67Tom Canada, California .......................................................... †2002 9 6 0.67Dwayne Slay, Texas Tech ........................................................ 2005 12 8 0.67Jonal Saint-Dic, Michigan St. ................................................ †2007 12 8 0.67Quintin Mikell, Boise St. ........................................................ 2002 13 8 0.62Bob Sanders, Iowa .................................................................... †2003 10 6 0.60Sherrod Martin, Troy ................................................................ 2007 10 6 0.60Derrick Johnson, Texas ........................................................... †2004 12 7 0.58Ryan Kerrigan, Purdue ............................................................ †2009 12 7 0.58Mychal Sisson, Colorado St. ................................................. †2010 12 7 0.58Robert Thomas, UCLA ............................................................. 2000 11 6 0.55Brian Lape, Western Mich. .................................................... 2001 11 6 0.55Cory Smith, North Carolina St. ........................................... 2001 11 6 0.55Ryan Claridge, UNLV ................................................................ 2001 11 6 0.55Oshiomogho Atogwe, Stanford ......................................... 2003 11 6 0.55Byron Santiago, Louisiana Tech .......................................... 2005 11 6 0.55*Record. †National champion.
CAREER FORCED FUMBLESPlayer, Team Years G FFTerrell Suggs, Arizona St. ...................................................................... 2000-02 36 14Antwan Peek, Cincinnati ....................................................................... 2000-02 34 14Kenechi Udeze, Southern California ................................................ 2001-03 37 14Ryan Kerrigan, Purdue ........................................................................... 2007-10 48 14Zack Follett, California ........................................................................... 2005-08 49 13Stryker Sulak, Missouri ........................................................................... 2005-08 54 13Guss Scott, Florida ................................................................................... 2000-03 49 11Derrick Johnson, Texas .......................................................................... 2001-04 49 11Elvis Dumervil, Louisville ...................................................................... 2002-05 44 11
SEASON FORCED FUMBLESPlayer, Team Year G FFElvis Dumervil, Louisville .......................................................................... †2005 12 10Dwight Freeney, Syracuse ......................................................................... †2001 12 8Quintin Mikell, Boise St. ............................................................................ 2002 13 8Dwayne Slay, Texas Tech ............................................................................ 2005 12 8Jonal Saint-Dic, Michigan St. .................................................................... †2007 12 8Claude Harriott, Pittsburgh ...................................................................... 2002 13 7Michael Haynes, Penn St. ......................................................................... 2002 13 7Phillip Perry, San Jose St. .......................................................................... 2002 13 7Antwan Peek, Cincinnati ............................................................................ 2002 14 7Grant Wiley, West Virginia .......................................................................... 2003 13 7Derrick Johnson, Texas ............................................................................... †2004 12 7Ryan Kerrigan, Purdue ................................................................................ †2009 12 7Cody Grimm, Virginia Tech........................................................................ 2009 13 7Mychal Sisson, Colorado St. ..................................................................... †2010 12 7†National champion.
SINGLE-GAME FORCED FUMBLES (Since 2000)
FF Player, Team (Opponent) Date3 DeLawrence Grant, Oregon St. (San Diego St.) ............................... Sept. 23, 20003 Antwan Peek, Cincinnati (La.-Monroe).....................................................Dec. 1, 2001
Player, Team Years G PBU Int. Total

46 2011 NCAA FOOTBALL RECORDS - FBS ALL-TIME LEADERS
3 Mason Unck, Arizona St. (Stanford) ...................................................... Sept. 28, 20023 Quintin Mikell, Boise St. (Hawaii) ................................................................Oct. 5, 20023 Grant Wiley, West Virginia (Cincinnati)................................................. Sept. 13, 20033 Derrick Johnson, Texas (North Texas)......................................................Sept. 4, 20043 Ramel Meekins, Rutgers (Navy) .................................................................Oct. 14, 20063 Cody Grimm, Virginia Tech (North Carolina St.) ................................Nov. 21, 20093 Armond Staten, Central Mich. (Western Mich.) ................................... Nov. 5, 2010
ANNUAL CHAMPIONSYear Player, Team G FF Avg.2000 Marques Anderson, UCLA .............................................................. 10 ‡7 0.70 Tony Hardman, UCF .......................................................................... 10 ‡7 0.70‡In 2000, the total was forced fumbles plus fumbles recovered. Beginning in 2001, FF was forced fumbles only.
Year Player, Team G FF Avg.2001 Dwight Freeney, Syracuse .............................................................. 12 8 0.672002 Tom Canada, California .................................................................... 9 6 0.672003 Bob Sanders, Iowa ............................................................................. 10 6 0.602004 Derrick Johnson, Texas .................................................................... 12 7 0.582005 Elvis Dumervil, Louisville ............................................................... 12 *10 *0.832006 Jeramie Johnson, Mississippi St. ................................................ 12 5 0.42 Clint Session, Pittsburgh ................................................................. 12 5 0.42 Jack Williams, Kent St. ..................................................................... 12 5 0.422007 Jonal Saint-Dic, Michigan St. ......................................................... 12 8 0.672008 Zach Arnett, New Mexico ............................................................... 12 6 0.50 Stephen Anderson, Army ............................................................... 10 5 0.502009 Ryan Kerrigan, Purdue ..................................................................... 12 7 0.582010 Mychal Sisson, Colorado St. ........................................................... 12 7 0.58*Record.
BLOCKED KICKS RECORDSSpecial Note About Blocked-Kick Records:The blocked-kick records include players from 1937. Even though the other defen-sive statistics and records began in 2000, blocked-kick records are compiled by most institutions, and those records are more reliable than tackles, assists, tackles for loss, pass sacks, passes defended and forced fumbles. The statistics service has been compiling national statistics and records since 1937.
Blocked Punts
CAREER BLOCKED PUNTSPlayer, Team Years BPJames King, Central Mich. ................................................................................ 2001-04 10Barron Miles, Nebraska ....................................................................................... 1992-94 7Tim Curry, Air Force .............................................................................................. 1996-98 7Woody Jones, North Carolina St. .................................................................. 1939-41 6Max McGeary, Baylor ........................................................................................... 1977-80 6Bracey Walker, North Carolina ......................................................................... 1990-93 6Matt Harding, Hawaii .......................................................................................... 1992-95 6Jermaine Mays, Minnesota ........................................................................... 1998-00, 02 6Joshua Adams, Ohio ........................................................................................ $2003-07 6James Ferebee, New Mexico St. .................................................................... 1978-81 5Merton Hanks, Iowa ............................................................................................. 1987-90 5$See page 2 for explanation.
SEASON BLOCKED PUNTSPlayer, Team Year BPJames King, Central Mich. ...................................................................................... 2001 7Jermaine Mays, Minnesota ..................................................................................... 2002 5Ken Irvin, Memphis .................................................................................................... 1992 4Bracey Walker, North Carolina ............................................................................... 1993 4Tim Curry, Air Force .................................................................................................... 1997 4Terrol Dillon, Texas ...................................................................................................... 1999 4Chris James, Alabama ............................................................................................... 2003 4Rashad Washington, Kansas St. ........................................................................... 2003 4Mark Capuano, North Carolina St. ...................................................................... 1967 3Jimmy Lisko, Arkansas St. ....................................................................................... 1975 3Richard Johnson, Wisconsin ................................................................................... 1984 3James Francis, Baylor ................................................................................................. 1989 3Barron Miles, Nebraska ............................................................................................. 1994 3Kendrell Bell, Georgia ................................................................................................ 1999 3Manny Lawson, North Carolina St. ..................................................................... 2002 3Charles Tillman, La.-Lafayette ................................................................................ 2002 3Joshua Adams, Ohio .................................................................................................. 2007 3Note: Before NCAA records, Joe Stydahar of West Virginia blocked seven punts in 1934.
SINGLE-GAME BLOCKED PUNTS BP Player, Team (Opponent) Date4 Ken Irvin, Memphis (Arkansas) ............................................................... Sept. 26, 19924 James King, Central Mich. (Michigan St.) ..............................................Sept. 8, 20013 Joshua Adams, Ohio (Gardner-Webb) ....................................................Sept. 1, 20072 Mark Capuano, North Carolina St. (Georgia) .................................... Sept. 14, 19672 Richard Johnson, Wisconsin (Missouri) ............................................... Sept. 15, 19842 Carlton McDonald, Air Force (Colorado St.) .........................................Sept. 1, 19902 Mike Reid, North Carolina St. (Kent St.) ............................................... Sept. 14, 19912 Brian McCray, Air Force (Colorado St.) ................................................. Sept. 11, 19932 Barron Miles, Nebraska (Pacific) ............................................................. Sept. 24, 19942 Bill Chopp, Western Mich. (Michigan St.) ..............................................Sept. 6, 19972 Tim Curry, Air Force (Fresno St.) ................................................................Oct. 18, 19972 Terrence Holt, North Carolina St. (Texas) ............................................. Aug. 28, 19992 Chris Crocker, Marshall (Michigan St.) ....................................................Sept. 9, 20002 Robert Grant, Hawaii (SMU) ..........................................................................Oct. 6, 20012 Terrence Holt, North Carolina St. (Navy) ................................................Sept. 7, 20022 Lannie Hopkins, Nebraska (Kansas) .......................................................... Nov. 9, 20022 Sean Considine, Iowa (Iowa St.) .............................................................. Sept. 13, 20032 Fashad Washington, Kansas St. (Colorado) ..........................................Oct. 18, 20032 Tyrone Henderson, Colorado (Washington St.) .............................. Sept. 11, 20042 Ivan Clark, Marshall (Buffalo) ......................................................................Oct. 23, 2004
Blocked Field Goals
CAREER BLOCKED FIELD GOALSPlayer, Team Years BFGJames Ferebee, New Mexico St. .................................................................... 1978-81 8Terrence Holt, North Carolina St. .................................................................. 1999-02 8Max McGeary, Baylor ........................................................................................... 1977-80 6Greg Thomas, Colorado ..................................................................................... 1988-91 6Lonnell Dewalt, Kentucky ................................................................................. 2004 6^Margus Hunt, SMU ............................................................................................ 2009-10 6Matt Harding, Hawaii .......................................................................................... 1992-95 5Rosevelt Colvin, Purdue ..................................................................................... 1995-98 5Bobby Iwuchukwu, Purdue .............................................................................. 2002-05 5Ben Jacobs, Fresno St. ......................................................................................... 2007-10 5^ Active player
SEASON BLOCKED FIELD GOALSPlayer, Team Year BFGLonnell Dewalt, Kentucky ....................................................................................... 2004 6Mike Akiu, Hawaii ....................................................................................................... 1982 4Greg Thomas, Colorado ........................................................................................... 1991 4Matt Harding, Hawaii ................................................................................................ 1992 4Rosevelt Colvin, Purdue ........................................................................................... 1998 4Margus Hunt, SMU ..................................................................................................... 2009 4Kyle Vanden Bosch, Nebraska ............................................................................... 1999 3Terrence Holt, North Carolina St. ........................................................................ 2000 3Boss Bailey, Georgia ................................................................................................... 2002 3Sean Jones, Georgia................................................................................................... 2003 3Brian Robison, Texas .................................................................................................. 2003 3Daniel Bazuin, Central Mich. ................................................................................. 2004 3
SINGLE-GAME BLOCKED FIELD GOALS BFG Player, Team (Opponent) Date2 Mike Washington, Alabama (Mississippi St.) ........................................ Nov. 3, 19732 Louie Meadows, North Carolina St. (Maryland) .................................Oct. 10, 19812 Matt Harding, Hawaii (San Diego St.)........................................................Oct. 9, 19932 Jerald Henry, Southern California (California) .....................................Oct. 22, 19942 Pat Larson, Wyoming (Fresno St.) ............................................................Nov. 18, 19952 Kyle Vanden Bosch, Nebraska (Texas A&M) .......................................... Nov. 6, 19992 Antwan Peek, Cincinnati [Miami (OH)] ...................................................Oct. 28, 20002 Justin Pendry, Air Force (Tennessee Tech) ............................................Sept. 8, 20012 Alton Moore, Auburn (Georgia)................................................................Nov. 10, 20012 Chris Barry, Nevada (Washington) ...........................................................Oct. 11, 20032 Daniel Bazuin, Central Mich. (Kent St.) .....................................................Oct. 2, 20042 Curtis Pulley, Kentucky (Ole Miss).............................................................Oct. 22, 20052 Cory Flom, Western Mich. (Indiana).........................................................Sept. 2, 20062 Kenny Iwebema, Iowa (Syracuse) .............................................................Sept. 8, 20072 Fili Moala, Southern California (Arizona St.) .........................................Oct. 11, 20082 Margus Hunt, SMU (East Carolina) ...........................................................Oct. 10, 2009
FF Player, Team (Opponent) Date

2011 NCAA FOOTBALL RECORDS - FBS ALL-TIME LEADERS 47
FOO
TBA
LL B
OW
LSU
BD
IVIS
IONBlocked Extra Points
CAREER BLOCKED EXTRA POINTSPlayer, Team Years BEPRay Farmer, Duke .................................................................................................. 1992-95 8James Ferebee, New Mexico St. .................................................................... 1978-81 6Jimmy Lisko, Arkansas St. ................................................................................. 1972-75 4Max McGeary, Baylor ........................................................................................... 1977-80 4James Francis, Baylor ........................................................................................... 1986-89 4Chad Patton, SMU................................................................................................. 1990-93 4Bernard Williams, Georgia ................................................................................. 1990-93 4^Margus Hunt, SMU ............................................................................................ 2009-10 4Doug Mills, Purdue ............................................................................................... 1970-72 3Corey Nelson, Air Force ..................................................................................... 1998-00 3Kareem Bland, Middle Tenn. ........................................................................... 1999-02 3Zach Potter, Nebraska ......................................................................................... 2005-08 3Ndamukong Suh, Nebraska ............................................................................. $2005-09 3$See page 2 for explanation. ^Active player
SEASON BLOCKED EXTRA POINTSPlayer, Team Year BEPRay Farmer, Duke ........................................................................................................ 1993 5Jimmy Lisko, Arkansas St. ....................................................................................... 1975 4James Francis, Baylor ................................................................................................. 1989 4Bernard Williams, Georgia ....................................................................................... 1990 3Corey Nelson, Air Force ............................................................................................ 2000 3Margus Hunt, SMU ..................................................................................................... 2009 3Doug Mills, Purdue ..................................................................................................... 1972 2Falaniko Noga, Hawaii .............................................................................................. 1983 2Chad Patton, SMU....................................................................................................... 1992 2Josh Buhl, Kansas St. ................................................................................................. 2001 2Sean Butts, Hawaii ...................................................................................................... 2001 2Kareem Bland, Middle Tenn. ................................................................................. 2002 2Charley Smith, La.-Lafayette .................................................................................. 2002 2James King, Central Mich. ...................................................................................... 2004 2Linval Joseph, East Carolina ................................................................................... 2008 2Matt Roark, Kentucky ................................................................................................ 2008 2Zach Potter, Nebraska ............................................................................................... 2008 2Tyron Smith, Southern California ......................................................................... 2010 2
SINGLE-GAME BLOCKED EXTRA POINTS BEP Player, Team (Opponent) Date2 Corey Nelson, Air Force (Colorado St.) .................................................Nov. 11, 20002 Josh Buhl, Kansas St. (Syracuse) ...............................................................Dec. 29, 20012 Kareem Bland, Middle Tenn. (North Texas)..........................................Nov. 23, 20022 Linval Joseph, East Carolina (Kentucky) ....................................................Jan. 2, 2009
Combined Blocked Kicks
CAREER COMBINED BLOCKED KICKSPlayer, Team Years BK (#Breakdown)James Ferebee, New Mexico St. .................. 1978-81 19 (8 FGs; 6 PATs; 5 Punts)Max McGeary, Baylor ......................................... 1977-80 16 (6 FGs; 6 Punts; 4 PATs)James King, Central Mich. .............................. 2001-04 13 (10 Punts; 2 PATs; 1 FG)Matt Harding, Hawaii ........................................ 1992-95 12 (6 Punts; 5 FGs; 1 PAT)Terrence Holt, North Carolina St. ................ 1999-02 12 (8 FGs; 4 Punts)^Margus Hunt, SMU .......................................... 2009-10 10 (6 FGs; 4 PATs)Richard Johnson, Wisconsin ........................... 1982-84 9 (4 Punts; 3 FGs; 2 PATs)Tim Curry, Air Force ............................................ 1996-98 9 (7 Punts; 2 FGs)Corey Nelson, Air Force .................................... 1998-00 9 (4 Punts; 3 PAT; 2 FGs)Jimmy Lisko, Arkansas St. ............................... 1972-75 8 (4 PATs; 3 Punts; 1 FG)James Francis, Baylor ......................................... 1986-89 8 (4 PATs; 3 Punts; 1 FG)Carlton McDonald, Air Force .......................... 1989-92 8 (4 Punts; 2 FGs; 2 PAT)Chad Patton, SMU............................................... 1990-93 8 (4 PATs; 2 Punts; 2 FGs)Merton Hanks, Iowa ........................................... 1987-90 7 (5 Punts; 2 FGs)Barron Miles, Nebraska ..................................... 1992-94 7 (7 Punts)Lonnell Dewalt, Kentucky ...................................... 2004 7 (6 FGs; 1 PATBen Jacobs, Fresno St. ...................................... 2007-10 7 (5 FGs; 2 PATs)$See page 2 for explanation. ^Active player
SEASON COMBINED BLOCKED KICKSPlayer, Team Year BK (#Breakdown)Jimmy Lisko, Arkansas St. ..................................... 1975 8 (4 PATs; 3 Punts; 1 FG)James Francis, Baylor ............................................... 1989 8 (4 PATs; 3 Punts; 1 FG)James King, Central Mich. .................................... 2001 8 (7 Punts; 1 FG)Lonnell Dewalt, Kentucky ..................................... 2004 7 (6 FGs; 1 PAT)Margus Hunt, SMU ................................................... 2009 7 (4 FGs; 3 PATs)Bill Hornbacher, Nebraska ..................................... 1967 6 (No Breakdown)
Mike Akiu, Hawaii ..................................................... 1982 6 (4 FGs; 1 PAT; 1 Punt)Richard Johnson, Wisconsin ................................. 1984 6 (3 Punts; 2 FGs; 1 PAT)Tim Curry, Air Force .................................................. 1997 5 (4 Punts; 1 FG)Kendrell Bell, Georgia .............................................. 1999 5 (3 Punts; 2 FGs)Jermaine Mays, Minnesota ................................... 2002 5 (5 Punts)
SINGLE-GAME COMBINED BLOCKED KICKS BK Player, Team (Opponent) Date #Breakdown4 Ken Irvin, Memphis (Arkansas) Sept. 26, 1992 4 Punts4 James King, Central Mich. (Michigan St.) Sept. 8, 2001 4 Punts3 Richard Johnson, Wisconsin (Missouri) Sept. 15, 1984 2 Punts; 1 PAT3 Carlton McDonald, Air Force
(Colorado St.) Sept. 1, 1990 2 Punts; 1 PAT3 Joshua Adams, Ohio (Gardner-Webb) Sept. 1, 2007 3 Punts#Breakdown=No. of Punts, No. of FGs and No. of Extra Points Blocked.
Punting
CAREER AVERAGE(Minimum 250 Punts; Player must have concluded his career)Player, Team Years No. Yards Avg. LongDaniel Sepulveda, Baylor .................................. 2003-06 277 12,531 45.2 78Shane Lechler, Texas A&M ................................ 1996-99 268 11,977 44.7 76Bill Smith, Ole Miss .............................................. 1983-86 254 11,260 44.3 92Jim Arnold, Vanderbilt ....................................... 1979-82 277 12,171 43.9 79Ralf Mojsiejenko, Michigan St. ...................... 1981-84 275 11,997 43.6 72Jim Miller, Ole Miss .............................................. 1976-79 266 11,549 43.4 82Russ Henderson, Virginia .................................. 1975-78 276 11,957 43.3 74Rob Long, Syracuse ............................................. 2007-10 262 11,340 43.3 73Maury Buford, Texas Tech ................................. 1978-81 293 12,670 43.2 75Nate Cochran, Pittsburgh ................................. 1993-96 252 10,851 43.1 80Chris Becker, TCU .................................................. 1985-88 265 11,407 43.0 77Reid Forrest, Washington St. ........................... 2007-10 275 11,753 42.7 84James Gargus, TCU .............................................. 1981-84 255 10,862 42.6 74Ron Keller, New Mexico ..................................... 1983-86 252 10,737 42.6 77Brendan Carney, Syracuse ................................ $2002-06 270 11,490 42.6 71Brian Morton, Duke............................................. 1997-00 282 12,000 42.6 80(150-249 Punts)Player, Team Years No. Yards Avg. LongTodd Sauerbrun, West Virginia ........................ 1991-94 167 7,733 46.3 90Reggie Roby, Iowa ................................................. 1979-82 172 7,849 45.6 69Greg Montgomery, Michigan St. ................... 1985-87 170 7,721 45.4 86Ryan Plackemeier, Wake Forest ....................... 2002-05 220 9,957 45.3 82Tom Tupa, Ohio St. ............................................... 1984-87 196 8,854 45.2 75Brandon Fields, Michigan St. ........................... 2003-06 209 9,405 45.0 79Barry Helton, Colorado ........................................ 1984-87 153 6,873 44.9 68Chris Miller, Ball St.................................................. 2005-08 231 10,342 44.8 78Aron Langley, Wyoming ..................................... 1996-98 171 7,649 44.7 72Ray Guy, Southern Miss. .................................... 1970-72 200 8,934 44.7 93Dave Zastudil, Ohio ............................................... 1998-01 207 9,225 44.6 75Bucky Scribner, Kansas ........................................ 1980-82 217 9,670 44.6 70Terry Daniel, Auburn ............................................ 1992-94 169 7,522 44.5 71Greg Horne, Arkansas .......................................... 1983-86 180 8,002 44.5 72$See page 2 for explanation.
SEASON AVERAGE(Qualifiers for Championship)
Player, Team Year No. Yards Avg.Chad Kessler, LSU ...................................................................... †1997 39 1,961 50.3Reggie Roby, Iowa .................................................................... †1981 44 2,193 49.8Kirk Wilson, UCLA ...................................................................... †1956 30 1,479 49.3Todd Sauerbrun, West Virginia ............................................ †1994 72 3,486 ‡48.4Travis Dorsch, Purdue ............................................................. †2001 49 2,370 48.4Zack Jordan, Colorado ............................................................ †1950 38 1,830 48.2Ricky Anderson, Vanderbilt .................................................. †1984 58 2,793 48.2Marv Bateman, Utah................................................................ †1971 68 3,269 48.1Reggie Roby, Iowa .................................................................... †1982 52 2,501 48.1Andrew Bayes, East Carolina ............................................... †1999 47 2,259 48.1Drew Butler, Georgia ............................................................... †2009 56 2,691 48.1Owen Price, UTEP ...................................................................... †1940 30 1,440 48.0Matt Prater, UCF ......................................................................... †2003 58 2,781 48.0†National champion. ‡Record for minimum 50 punts.
ANNUAL CHAMPIONSYear Player, Team Class No. Yards Avg.1937 Johnny Pingel, Michigan St. ................................... Jr. 49 2,101 42.91938 Jerry Dowd, St. Mary’s (CA) ...................................... Sr. 62 2,711 43.71939 Harry Dunkle, North Carolina ................................ So. 37 1,725 46.6
Player, Team Year BK (#Breakdown)
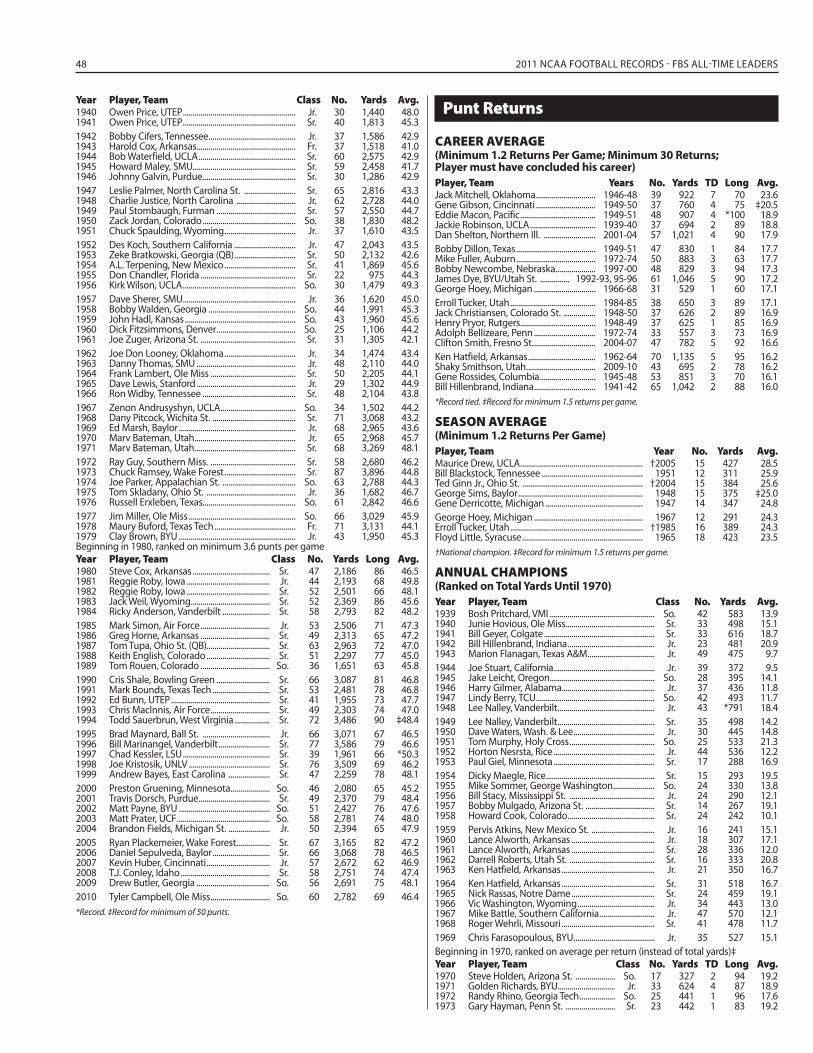
48 2011 NCAA FOOTBALL RECORDS - FBS ALL-TIME LEADERS
1940 Owen Price, UTEP ......................................................... Jr. 30 1,440 48.01941 Owen Price, UTEP ......................................................... Sr. 40 1,813 45.31942 Bobby Cifers, Tennessee ............................................ Jr. 37 1,586 42.91943 Harold Cox, Arkansas .................................................. Fr. 37 1,518 41.01944 Bob Waterfield, UCLA ................................................. Sr. 60 2,575 42.91945 Howard Maley, SMU.................................................... Sr. 59 2,458 41.71946 Johnny Galvin, Purdue ............................................... Sr. 30 1,286 42.91947 Leslie Palmer, North Carolina St. .......................... Sr. 65 2,816 43.31948 Charlie Justice, North Carolina .............................. Jr. 62 2,728 44.01949 Paul Stombaugh, Furman ........................................ Sr. 57 2,550 44.71950 Zack Jordan, Colorado ............................................... So. 38 1,830 48.21951 Chuck Spaulding, Wyoming .................................... Jr. 37 1,610 43.51952 Des Koch, Southern California ............................... Jr. 47 2,043 43.51953 Zeke Bratkowski, Georgia (QB) ............................... Sr. 50 2,132 42.61954 A.L. Terpening, New Mexico .................................... Sr. 41 1,869 45.61955 Don Chandler, Florida ................................................ Sr. 22 975 44.31956 Kirk Wilson, UCLA ......................................................... So. 30 1,479 49.31957 Dave Sherer, SMU ......................................................... Jr. 36 1,620 45.01958 Bobby Walden, Georgia ............................................ So. 44 1,991 45.31959 John Hadl, Kansas ........................................................ So. 43 1,960 45.61960 Dick Fitzsimmons, Denver ........................................ So. 25 1,106 44.21961 Joe Zuger, Arizona St. ................................................ Sr. 31 1,305 42.11962 Joe Don Looney, Oklahoma .................................... Jr. 34 1,474 43.41963 Danny Thomas, SMU .................................................. Jr. 48 2,110 44.01964 Frank Lambert, Ole Miss ........................................... Sr. 50 2,205 44.11965 Dave Lewis, Stanford .................................................. Jr. 29 1,302 44.91966 Ron Widby, Tennessee ............................................... Sr. 48 2,104 43.81967 Zenon Andrusyshyn, UCLA ...................................... So. 34 1,502 44.21968 Dany Pitcock, Wichita St. .......................................... Sr. 71 3,068 43.21969 Ed Marsh, Baylor ........................................................... Jr. 68 2,965 43.61970 Marv Bateman, Utah ................................................... Jr. 65 2,968 45.71971 Marv Bateman, Utah ................................................... Sr. 68 3,269 48.11972 Ray Guy, Southern Miss. ........................................... Sr. 58 2,680 46.21973 Chuck Ramsey, Wake Forest .................................... Sr. 87 3,896 44.81974 Joe Parker, Appalachian St. ..................................... So. 63 2,788 44.31975 Tom Skladany, Ohio St. ............................................. Jr. 36 1,682 46.71976 Russell Erxleben, Texas............................................... So. 61 2,842 46.61977 Jim Miller, Ole Miss ...................................................... So. 66 3,029 45.91978 Maury Buford, Texas Tech ......................................... Fr. 71 3,131 44.11979 Clay Brown, BYU ........................................................... Jr. 43 1,950 45.3Beginning in 1980, ranked on minimum 3.6 punts per gameYear Player, Team Class No. Yards Long Avg.1980 Steve Cox, Arkansas ....................................... Sr. 47 2,186 86 46.51981 Reggie Roby, Iowa .......................................... Jr. 44 2,193 68 49.81982 Reggie Roby, Iowa .......................................... Sr. 52 2,501 66 48.11983 Jack Weil, Wyoming ........................................ Sr. 52 2,369 86 45.61984 Ricky Anderson, Vanderbilt ........................ Sr. 58 2,793 82 48.21985 Mark Simon, Air Force ................................... Jr. 53 2,506 71 47.31986 Greg Horne, Arkansas ................................... Sr. 49 2,313 65 47.21987 Tom Tupa, Ohio St. (QB)................................ Sr. 63 2,963 72 47.01988 Keith English, Colorado ................................ Sr. 51 2,297 77 45.01989 Tom Rouen, Colorado ................................... So. 36 1,651 63 45.81990 Cris Shale, Bowling Green ........................... Sr. 66 3,087 81 46.81991 Mark Bounds, Texas Tech ............................. Sr. 53 2,481 78 46.81992 Ed Bunn, UTEP .................................................. Sr. 41 1,955 73 47.71993 Chris MacInnis, Air Force .............................. Sr. 49 2,303 74 47.01994 Todd Sauerbrun, West Virginia .................. Sr. 72 3,486 90 ‡48.41995 Brad Maynard, Ball St. .................................. Jr. 66 3,071 67 46.51996 Bill Marinangel, Vanderbilt .......................... Sr. 77 3,586 79 46.61997 Chad Kessler, LSU ............................................ Sr. 39 1,961 66 *50.31998 Joe Kristosik, UNLV ......................................... Sr. 76 3,509 69 46.21999 Andrew Bayes, East Carolina ..................... Sr. 47 2,259 78 48.12000 Preston Gruening, Minnesota.................... So. 46 2,080 65 45.22001 Travis Dorsch, Purdue .................................... Sr. 49 2,370 79 48.42002 Matt Payne, BYU .............................................. So. 51 2,427 76 47.62003 Matt Prater, UCF ............................................... So. 58 2,781 74 48.02004 Brandon Fields, Michigan St. ..................... Jr. 50 2,394 65 47.92005 Ryan Plackemeier, Wake Forest ................. Sr. 67 3,165 82 47.22006 Daniel Sepulveda, Baylor ............................. Sr. 66 3,068 78 46.52007 Kevin Huber, Cincinnati ................................ Jr. 57 2,672 62 46.92008 T.J. Conley, Idaho ............................................. Sr. 58 2,751 74 47.42009 Drew Butler, Georgia ..................................... So. 56 2,691 75 48.12010 Tyler Campbell, Ole Miss .............................. So. 60 2,782 69 46.4*Record. ‡Record for minimum of 50 punts.
Punt Returns
CAREER AVERAGE(Minimum 1.2 Returns Per Game; Minimum 30 Returns; Player must have concluded his career)
Player, Team Years No. Yards TD Long Avg.Jack Mitchell, Oklahoma .............................. 1946-48 39 922 7 70 23.6Gene Gibson, Cincinnati .............................. 1949-50 37 760 4 75 ‡20.5Eddie Macon, Pacific ...................................... 1949-51 48 907 4 *100 18.9Jackie Robinson, UCLA ................................. 1939-40 37 694 2 89 18.8Dan Shelton, Northern Ill. .......................... 2001-04 57 1,021 4 90 17.9Bobby Dillon, Texas ........................................ 1949-51 47 830 1 84 17.7Mike Fuller, Auburn ........................................ 1972-74 50 883 3 63 17.7Bobby Newcombe, Nebraska .................... 1997-00 48 829 3 94 17.3James Dye, BYU/Utah St. ............... 1992-93, 95-96 61 1,046 5 90 17.2George Hoey, Michigan ............................... 1966-68 31 529 1 60 17.1Erroll Tucker, Utah ........................................... 1984-85 38 650 3 89 17.1Jack Christiansen, Colorado St. ................ 1948-50 37 626 2 89 16.9Henry Pryor, Rutgers ...................................... 1948-49 37 625 1 85 16.9Adolph Bellizeare, Penn ............................... 1972-74 33 557 3 73 16.9Clifton Smith, Fresno St. ............................... 2004-07 47 782 5 92 16.6Ken Hatfield, Arkansas .................................. 1962-64 70 1,135 5 95 16.2Shaky Smithson, Utah ................................... 2009-10 43 695 2 78 16.2Gene Rossides, Columbia ............................ 1945-48 53 851 3 70 16.1Bill Hillenbrand, Indiana ............................... 1941-42 65 1,042 2 88 16.0*Record tied. ‡Record for minimum 1.5 returns per game.
SEASON AVERAGE(Minimum 1.2 Returns Per Game)
Player, Team Year No. Yards Avg.Maurice Drew, UCLA .............................................................. †2005 15 427 28.5Bill Blackstock, Tennessee ................................................... 1951 12 311 25.9Ted Ginn Jr., Ohio St. ............................................................. †2004 15 384 25.6George Sims, Baylor ............................................................... 1948 15 375 ‡25.0Gene Derricotte, Michigan ................................................. 1947 14 347 24.8George Hoey, Michigan ....................................................... 1967 12 291 24.3Erroll Tucker, Utah ................................................................... †1985 16 389 24.3Floyd Little, Syracuse ............................................................. 1965 18 423 23.5†National champion. ‡Record for minimum 1.5 returns per game.
ANNUAL CHAMPIONS(Ranked on Total Yards Until 1970)
Year Player, Team Class No. Yards Avg.1939 Bosh Pritchard, VMI ..................................................... So. 42 583 13.91940 Junie Hovious, Ole Miss ............................................. Sr. 33 498 15.11941 Bill Geyer, Colgate ........................................................ Sr. 33 616 18.71942 Bill Hillenbrand, Indiana ............................................ Jr. 23 481 20.91943 Marion Flanagan, Texas A&M .................................. Jr. 49 475 9.71944 Joe Stuart, California ................................................... Jr. 39 372 9.51945 Jake Leicht, Oregon ..................................................... So. 28 395 14.11946 Harry Gilmer, Alabama............................................... Jr. 37 436 11.81947 Lindy Berry, TCU ............................................................ So. 42 493 11.71948 Lee Nalley, Vanderbilt ................................................. Jr. 43 *791 18.41949 Lee Nalley, Vanderbilt ................................................. Sr. 35 498 14.21950 Dave Waters, Wash. & Lee ......................................... Jr. 30 445 14.81951 Tom Murphy, Holy Cross ........................................... So. 25 533 21.31952 Horton Nesrsta, Rice ................................................... Jr. 44 536 12.21953 Paul Giel, Minnesota ................................................... Sr. 17 288 16.91954 Dicky Maegle, Rice ....................................................... Sr. 15 293 19.51955 Mike Sommer, George Washington ..................... So. 24 330 13.81956 Bill Stacy, Mississippi St. ........................................... Jr. 24 290 12.11957 Bobby Mulgado, Arizona St. ................................... Sr. 14 267 19.11958 Howard Cook, Colorado ............................................ Sr. 24 242 10.11959 Pervis Atkins, New Mexico St. ................................ Jr. 16 241 15.11960 Lance Alworth, Arkansas .......................................... Jr. 18 307 17.11961 Lance Alworth, Arkansas .......................................... Sr. 28 336 12.01962 Darrell Roberts, Utah St. ........................................... Sr. 16 333 20.81963 Ken Hatfield, Arkansas ............................................... Jr. 21 350 16.71964 Ken Hatfield, Arkansas ............................................... Sr. 31 518 16.71965 Nick Rassas, Notre Dame .......................................... Sr. 24 459 19.11966 Vic Washington, Wyoming ....................................... Jr. 34 443 13.01967 Mike Battle, Southern California ............................ Jr. 47 570 12.11968 Roger Wehrli, Missouri ............................................... Sr. 41 478 11.71969 Chris Farasopoulous, BYU ......................................... Jr. 35 527 15.1Beginning in 1970, ranked on average per return (instead of total yards)‡Year Player, Team Class No. Yards TD Long Avg.1970 Steve Holden, Arizona St. .................... So. 17 327 2 94 19.21971 Golden Richards, BYU............................. Jr. 33 624 4 87 18.91972 Randy Rhino, Georgia Tech .................. So. 25 441 1 96 17.61973 Gary Hayman, Penn St. ......................... Sr. 23 442 1 83 19.2
Year Player, Team Class No. Yards Avg.
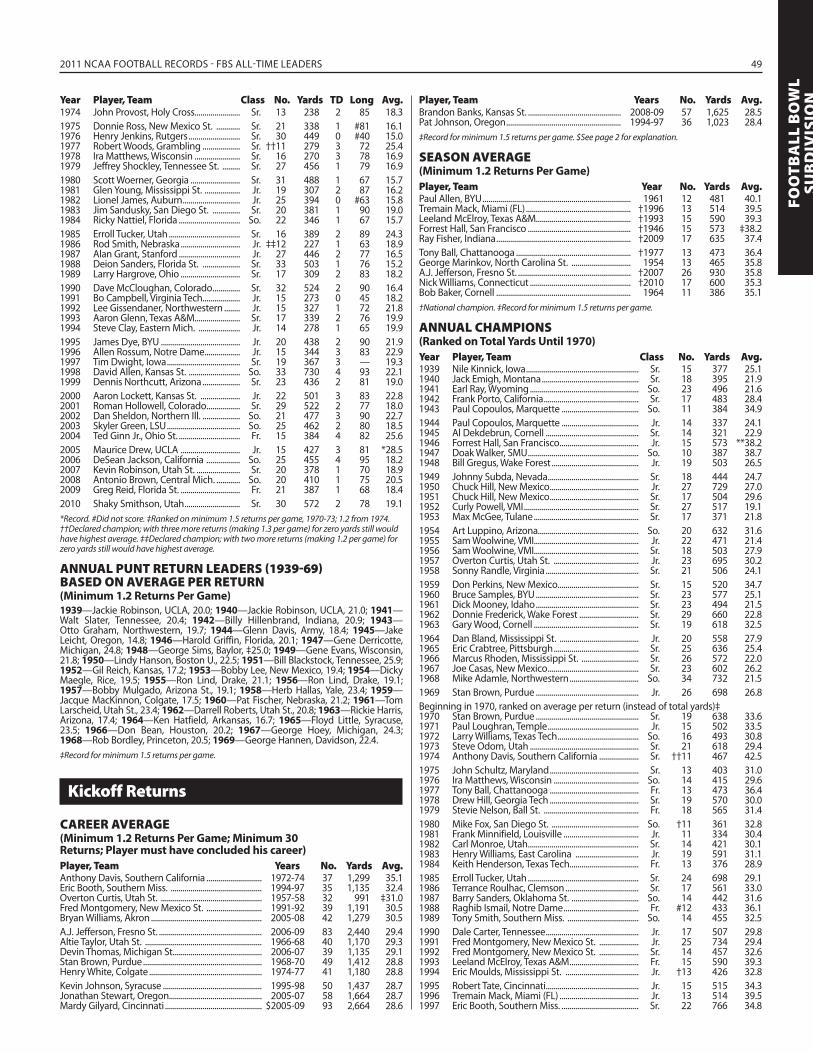
2011 NCAA FOOTBALL RECORDS - FBS ALL-TIME LEADERS 49
FOO
TBA
LL B
OW
LSU
BD
IVIS
ION
1974 John Provost, Holy Cross....................... Sr. 13 238 2 85 18.31975 Donnie Ross, New Mexico St. ............ Sr. 21 338 1 #81 16.11976 Henry Jenkins, Rutgers .......................... Sr. 30 449 0 #40 15.01977 Robert Woods, Grambling ................... Sr. ††11 279 3 72 25.41978 Ira Matthews, Wisconsin ....................... Sr. 16 270 3 78 16.91979 Jeffrey Shockley, Tennessee St. ......... Sr. 27 456 1 79 16.91980 Scott Woerner, Georgia ......................... Sr. 31 488 1 67 15.71981 Glen Young, Mississippi St. .................. Jr. 19 307 2 87 16.21982 Lionel James, Auburn ............................. Jr. 25 394 0 #63 15.81983 Jim Sandusky, San Diego St. .............. Sr. 20 381 1 90 19.01984 Ricky Nattiel, Florida ............................... So. 22 346 1 67 15.71985 Erroll Tucker, Utah .................................... Sr. 16 389 2 89 24.31986 Rod Smith, Nebraska .............................. Jr. ‡‡12 227 1 63 18.91987 Alan Grant, Stanford ............................... Jr. 27 446 2 77 16.51988 Deion Sanders, Florida St. ................... Sr. 33 503 1 76 15.21989 Larry Hargrove, Ohio .............................. Sr. 17 309 2 83 18.21990 Dave McCloughan, Colorado .............. Sr. 32 524 2 90 16.41991 Bo Campbell, Virginia Tech................... Jr. 15 273 0 45 18.21992 Lee Gissendaner, Northwestern ........ Jr. 15 327 1 72 21.81993 Aaron Glenn, Texas A&M....................... Sr. 17 339 2 76 19.91994 Steve Clay, Eastern Mich. ..................... Jr. 14 278 1 65 19.91995 James Dye, BYU ........................................ Jr. 20 438 2 90 21.91996 Allen Rossum, Notre Dame.................. Jr. 15 344 3 83 22.91997 Tim Dwight, Iowa ..................................... Sr. 19 367 3 — 19.31998 David Allen, Kansas St. .......................... So. 33 730 4 93 22.11999 Dennis Northcutt, Arizona ................... Sr. 23 436 2 81 19.02000 Aaron Lockett, Kansas St. .................... Jr. 22 501 3 83 22.82001 Roman Hollowell, Colorado................. Sr. 29 522 2 77 18.02002 Dan Sheldon, Northern Ill. ................... So. 21 477 3 90 22.72003 Skyler Green, LSU ..................................... So. 25 462 2 80 18.52004 Ted Ginn Jr., Ohio St. ............................... Fr. 15 384 4 82 25.62005 Maurice Drew, UCLA .............................. Jr. 15 427 3 81 *28.52006 DeSean Jackson, California ................. So. 25 455 4 95 18.22007 Kevin Robinson, Utah St. ...................... Sr. 20 378 1 70 18.92008 Antonio Brown, Central Mich. ............ So. 20 410 1 75 20.52009 Greg Reid, Florida St. .............................. Fr. 21 387 1 68 18.42010 Shaky Smithson, Utah ............................ Sr. 30 572 2 78 19.1*Record. #Did not score. ‡Ranked on minimum 1.5 returns per game, 1970-73; 1.2 from 1974. ††Declared champion; with three more returns (making 1.3 per game) for zero yards still would have highest average. ‡‡Declared champion; with two more returns (making 1.2 per game) for zero yards still would have highest average.
ANNUAL PUNT RETURN LEADERS (1939-69)BASED ON AVERAGE PER RETURN(Minimum 1.2 Returns Per Game)
1939—Jackie Robinson, UCLA, 20.0; 1940—Jackie Robinson, UCLA, 21.0; 1941—Walt Slater, Tennessee, 20.4; 1942—Billy Hillenbrand, Indiana, 20.9; 1943—Otto Graham, Northwestern, 19.7; 1944—Glenn Davis, Army, 18.4; 1945—Jake Leicht, Oregon, 14.8; 1946—Harold Griffin, Florida, 20.1; 1947—Gene Derricotte, Michigan, 24.8; 1948—George Sims, Baylor, ‡25.0; 1949—Gene Evans, Wisconsin, 21.8; 1950—Lindy Hanson, Boston U., 22.5; 1951—Bill Blackstock, Tennessee, 25.9; 1952—Gil Reich, Kansas, 17.2; 1953—Bobby Lee, New Mexico, 19.4; 1954—Dicky Maegle, Rice, 19.5; 1955—Ron Lind, Drake, 21.1; 1956—Ron Lind, Drake, 19.1; 1957—Bobby Mulgado, Arizona St., 19.1; 1958—Herb Hallas, Yale, 23.4; 1959—Jacque MacKinnon, Colgate, 17.5; 1960—Pat Fischer, Nebraska, 21.2; 1961—Tom Larscheid, Utah St., 23.4; 1962—Darrell Roberts, Utah St., 20.8; 1963—Rickie Harris, Arizona, 17.4; 1964—Ken Hatfield, Arkansas, 16.7; 1965—Floyd Little, Syracuse, 23.5; 1966—Don Bean, Houston, 20.2; 1967—George Hoey, Michigan, 24.3; 1968—Rob Bordley, Princeton, 20.5; 1969—George Hannen, Davidson, 22.4.‡Record for minimum 1.5 returns per game.
Kickoff Returns
CAREER AVERAGE(Minimum 1.2 Returns Per Game; Minimum 30 Returns; Player must have concluded his career)
Player, Team Years No. Yards Avg.Anthony Davis, Southern California ............................ 1972-74 37 1,299 35.1Eric Booth, Southern Miss. .............................................. 1994-97 35 1,135 32.4Overton Curtis, Utah St. ................................................... 1957-58 32 991 ‡31.0Fred Montgomery, New Mexico St. ............................ 1991-92 39 1,191 30.5Bryan Williams, Akron ........................................................ 2005-08 42 1,279 30.5A.J. Jefferson, Fresno St. .................................................... 2006-09 83 2,440 29.4Altie Taylor, Utah St. ........................................................... 1966-68 40 1,170 29.3Devin Thomas, Michigan St. ............................................ 2006-07 39 1,135 29.1Stan Brown, Purdue ............................................................ 1968-70 49 1,412 28.8Henry White, Colgate ......................................................... 1974-77 41 1,180 28.8Kevin Johnson, Syracuse .................................................. 1995-98 50 1,437 28.7Jonathan Stewart, Oregon............................................... 2005-07 58 1,664 28.7Mardy Gilyard, Cincinnati ................................................. $2005-09 93 2,664 28.6
Brandon Banks, Kansas St. ............................................... 2008-09 57 1,625 28.5Pat Johnson, Oregon .......................................................... 1994-97 36 1,023 28.4‡Record for minimum 1.5 returns per game. $See page 2 for explanation.
SEASON AVERAGE(Minimum 1.2 Returns Per Game)
Player, Team Year No. Yards Avg.Paul Allen, BYU ........................................................................... 1961 12 481 40.1Tremain Mack, Miami (FL) ..................................................... †1996 13 514 39.5Leeland McElroy, Texas A&M................................................ †1993 15 590 39.3Forrest Hall, San Francisco .................................................... †1946 15 573 ‡38.2Ray Fisher, Indiana .................................................................... †2009 17 635 37.4Tony Ball, Chattanooga .......................................................... †1977 13 473 36.4George Marinkov, North Carolina St. .............................. 1954 13 465 35.8A.J. Jefferson, Fresno St. ......................................................... †2007 26 930 35.8Nick Williams, Connecticut ................................................... †2010 17 600 35.3Bob Baker, Cornell .................................................................... 1964 11 386 35.1†National champion. ‡Record for minimum 1.5 returns per game.
ANNUAL CHAMPIONS(Ranked on Total Yards Until 1970)
Year Player, Team Class No. Yards Avg.1939 Nile Kinnick, Iowa ......................................................... Sr. 15 377 25.11940 Jack Emigh, Montana ................................................. Sr. 18 395 21.91941 Earl Ray, Wyoming ....................................................... So. 23 496 21.61942 Frank Porto, California ................................................ Sr. 17 483 28.41943 Paul Copoulos, Marquette ....................................... So. 11 384 34.91944 Paul Copoulos, Marquette ....................................... Jr. 14 337 24.11945 Al Dekdebrun, Cornell ............................................... Sr. 14 321 22.91946 Forrest Hall, San Francisco ........................................ Jr. 15 573 **38.21947 Doak Walker, SMU ........................................................ So. 10 387 38.71948 Bill Gregus, Wake Forest ............................................ Jr. 19 503 26.51949 Johnny Subda, Nevada .............................................. Sr. 18 444 24.71950 Chuck Hill, New Mexico ............................................. Jr. 27 729 27.01951 Chuck Hill, New Mexico ............................................. Sr. 17 504 29.61952 Curly Powell, VMI .......................................................... Sr. 27 517 19.11953 Max McGee, Tulane ..................................................... Sr. 17 371 21.81954 Art Luppino, Arizona................................................... So. 20 632 31.61955 Sam Woolwine, VMI..................................................... Jr. 22 471 21.41956 Sam Woolwine, VMI..................................................... Sr. 18 503 27.91957 Overton Curtis, Utah St. ........................................... Jr. 23 695 30.21958 Sonny Randle, Virginia ............................................... Sr. 21 506 24.11959 Don Perkins, New Mexico......................................... Sr. 15 520 34.71960 Bruce Samples, BYU .................................................... Sr. 23 577 25.11961 Dick Mooney, Idaho .................................................... Sr. 23 494 21.51962 Donnie Frederick, Wake Forest .............................. Sr. 29 660 22.81963 Gary Wood, Cornell ..................................................... Sr. 19 618 32.51964 Dan Bland, Mississippi St. ........................................ Jr. 20 558 27.91965 Eric Crabtree, Pittsburgh ........................................... Sr. 25 636 25.41966 Marcus Rhoden, Mississippi St. ............................. Sr. 26 572 22.01967 Joe Casas, New Mexico .............................................. Sr. 23 602 26.21968 Mike Adamle, Northwestern ................................... So. 34 732 21.51969 Stan Brown, Purdue .................................................... Jr. 26 698 26.8Beginning in 1970, ranked on average per return (instead of total yards)‡1970 Stan Brown, Purdue .................................................... Sr. 19 638 33.61971 Paul Loughran, Temple .............................................. Jr. 15 502 33.51972 Larry Williams, Texas Tech ......................................... So. 16 493 30.8 1973 Steve Odom, Utah ....................................................... Sr. 21 618 29.41974 Anthony Davis, Southern California .................... Sr. ††11 467 42.51975 John Schultz, Maryland ............................................. Sr. 13 403 31.01976 Ira Matthews, Wisconsin ........................................... So. 14 415 29.61977 Tony Ball, Chattanooga ............................................. Fr. 13 473 36.41978 Drew Hill, Georgia Tech ............................................. Sr. 19 570 30.01979 Stevie Nelson, Ball St. ................................................ Fr. 18 565 31.41980 Mike Fox, San Diego St. ............................................ So. †11 361 32.81981 Frank Minnifield, Louisville ...................................... Jr. 11 334 30.41982 Carl Monroe, Utah ........................................................ Sr. 14 421 30.11983 Henry Williams, East Carolina ................................ Jr. 19 591 31.11984 Keith Henderson, Texas Tech................................... Fr. 13 376 28.91985 Erroll Tucker, Utah ........................................................ Sr. 24 698 29.11986 Terrance Roulhac, Clemson ..................................... Sr. 17 561 33.01987 Barry Sanders, Oklahoma St. .................................. So. 14 442 31.61988 Raghib Ismail, Notre Dame ...................................... Fr. #12 433 36.11989 Tony Smith, Southern Miss. .................................... So. 14 455 32.51990 Dale Carter, Tennessee ............................................... Jr. 17 507 29.81991 Fred Montgomery, New Mexico St. .................... Jr. 25 734 29.41992 Fred Montgomery, New Mexico St. .................... Sr. 14 457 32.61993 Leeland McElroy, Texas A&M ................................... Fr. 15 590 39.31994 Eric Moulds, Mississippi St. ..................................... Jr. †13 426 32.81995 Robert Tate, Cincinnati ............................................... Jr. 15 515 34.31996 Tremain Mack, Miami (FL) ........................................ Jr. 13 514 39.51997 Eric Booth, Southern Miss. ....................................... Sr. 22 766 34.8
Player, Team Years No. Yards Avg.Year Player, Team Class No. Yards TD Long Avg.

50 2011 NCAA FOOTBALL RECORDS - FBS ALL-TIME LEADERS
1998 Broderick McGrew, North Texas ............................. Jr. 18 587 32.61999 James Williams, Marshall .......................................... Sr. 15 493 32.92000 LaTarence Dunbar, TCU .............................................. So. 15 506 33.72001 Chris Massey, Oklahoma St. .................................... Jr. 15 522 34.82002 Charles Pauley, San Jose St. ..................................... Sr. 31 978 31.62003 Michael Waddell, North Carolina .......................... Sr. 15 475 31.7 J.R. Reed, South Fla. ..................................................... Sr. 18 570 31.72004 Justin Miller, Clemson ................................................ Jr. 20 661 33.12005 Jonathan Stewart, Oregon ....................................... Fr. 12 404 33.72006 Marcus Thigpen, Indiana .......................................... So. 24 723 30.12007 A.J. Jefferson, Fresno St. ............................................ So. 26 930 35.82008 Travis Shelton, Temple ............................................... Sr. 23 720 31.32009 Ray Fisher, Indiana ....................................................... Sr. 17 635 37.42010 Nick Williams, Connecticut ...................................... So. 17 600 35.3**Record for minimum 1.5 returns per game. #Declared champion; with two more re turns (mak-ing 1.3 per game) for zero yards still would have highest average. †Declared champion; with one more return (making 1.2 per game) for zero yards still would have highest average. ††Declared champion; with three more returns (making 1.3 per game) for zero yards still would have high-est average. ‡Ranked on minimum 1.5 returns per game, 1970-73; 1.2 from 1974.
ANNUAL KICKOFF RETURN LEADERS (1939-69)BASED ON AVERAGE PER RETURN(Minimum 1.2 Returns Per Game)
1939—Nile Kinnick, Iowa, 25.1; 1940—Bill Geyer, Colgate, 27.0; 1941—Vern Lockard, Colorado, 24.4; 1942-45—Not compiled; 1946—Forrest Hall, San Francisco, ‡38.2; 1947—Skippy Minisi, Penn, 28.8; 1948—Jerry Williams, Wash-ington St., 29.9; 1949—Billy Conn, Georgetown, 31.1; 1950—Johnny Turco, Holy Cross, 27.4; 1951—Bob Mischak, Army, 31.3; 1952—Carroll Hardy, Colorado, 32.2; 1953—Carl Bolt, Wash. & Lee, 27.1; 1954—George Marinkov, North Carolina St., 35.8; 1955—Jim Brown, Syracuse, 32.0; 1956—Paul Hornung, Notre Dame, 31.0; 1957—Overton Curtis, Utah St., 30.2; 1958—Marshall Starks, Illinois, 26.3; 1959—Don Perkins, New Mexico, 34.7; 1960—Tom Hennessey, Holy Cross, 33.4; 1961—Paul Allen, BYU, *40.1; 1962—Larry Coyer, Marshall, 30.2; 1963—Gary Wood, Cornell, 32.5; 1964—Bob Baker, Cornell, 35.1; 1965—Tom Barrington, Ohio St., 34.3; 1966—Frank Moore, Louisville, 27.9; 1967—Altie Taylor, Utah St., 31.9; 1968—Kerry Reardon, Iowa, 32.1; 1969—Chris Farasopoulous, BYU, 32.2.*Record. ‡Record for minimum 1.5 returns per game.
Year Player, Team Class No. Yards Avg.

2011 NCAA FOOTBALL RECORDS - FBS ALL-TIME LEADERS 51
FOO
TBA
LL B
OW
LSU
BD
IVIS
IONAll-Purpose Yards
CAREER YARDS PER GAME(Minimum 3,500 Yards; Player must have concluded his career)
Player, Team Years G Rush Rcv. Int. PR KOR Yds. Yd.PGRyan Benjamin, Pacific ...........................................1990-92 24 3,119 1,063 0 100 1,424 5,706 237.8Sheldon Canley, San Jose St. .............................1988-90 25 2,513 828 0 5 1,800 5,146 205.8Jeremy Maclin, Missouri ........................................2007-08 28 668 2,315 0 577 2,049 5,609 200.3Howard Stevens, Louisville ..................................1971-72 20 2,723 389 0 401 360 3,873 193.7O.J. Simpson, Southern California ....................1967-68 19 3,124 235 0 0 307 3,666 192.9Alex Van Dyke, Nevada ..........................................1994-95 22 7 3,100 0 5 1,034 4,146 188.5Ed Marinaro, Cornell ...............................................1969-71 27 4,715 225 0 0 0 4,940 183.0Garrett Wolfe, Northern Ill. ..................................2004-06 33 5,164 588 0 0 231 5,983 181.3Marshall Faulk, San Diego St. .............................1991-93 31 4,589 973 0 0 33 5,595 180.5Troy Edwards, Louisiana Tech .............................1996-98 34 447 4,352 0 241 991 6,031 177.4Herschel Walker, Georgia ......................................1980-82 33 5,259 243 0 0 247 5,749 174.2Louie Giammona, Utah St. ..................................1973-75 30 3,499 171 0 188 1,345 5,203 173.4
SEASON YARDS PER GAMEPlayer, Team Year Rush Rcv. Int. PR KOR Yds. Yd.PGBarry Sanders, Oklahoma St. ................................... †1988 *2,628 106 0 95 421 *3,250 295.5Ryan Benjamin, Pacific ................................................. †1991 1,581 612 0 4 798 2,995 249.6Byron “Whizzer” White, Colorado ............................ †1937 1,121 0 103 587 159 1,970 246.3Mike Pringle, Cal St. Fullerton ................................... †1989 1,727 249 0 0 714 2,690 244.6Paul Palmer, Temple ...................................................... †1986 1,866 110 0 0 657 2,633 239.4Emmett White, Utah St. .............................................. †2000 1,322 592 0 183 531 2,628 238.9Ryan Benjamin, Pacific ................................................. †1992 1,441 434 0 96 626 2,597 236.1Marcus Allen, Southern California .......................... †1981 2,342 217 0 0 0 2,559 232.6Troy Edwards, Louisiana Tech ................................... †1998 227 1,996 0 235 326 2,784 232.0Sheldon Canley, San Jose St. ................................... 1989 1,201 353 0 0 959 2,513 228.5Chris Johnson, East Carolina ..................................... †2007 1,423 528 0 0 1,009 2,960 227.7Ollie Matson, San Francisco ....................................... †1951 1,566 58 18 115 280 2,037 226.3Damaris Johnson, Tulsa ............................................... †2009 175 1,131 0 256 1,131 2,693 224.4Troy Davis, Iowa St. ....................................................... †1995 2,010 159 0 0 297 2,466 224.2Alex Van Dyke, Nevada ................................................ 1995 6 1,854 0 0 583 2,443 222.1Art Luppino, Arizona .................................................... †1954 1,359 50 84 68 632 2,193 219.3Chuck Weatherspoon, Houston .............................. 1989 1,146 735 0 715 95 2,391 217.4Anthony Thompson, Indiana .................................... 1989 1,793 201 0 0 394 2,388 217.1Ricky Williams, Texas ..................................................... 1998 2,124 262 0 0 0 2,386 216.9Napoleon McCallum, Navy ........................................ †1983 1,587 166 0 272 360 2,385 216.8Troy Davis, Iowa St. ....................................................... †1996 2,185 61 0 0 118 2,364 214.9Ed Marinaro, Cornell ..................................................... †1971 1,881 51 0 0 0 1,932 214.7Rashaan Salaam, Colorado ........................................ †1994 2,055 294 0 0 0 2,349 213.6Howard Stevens, Louisville ........................................ †1972 1,294 221 0 337 240 2,132 213.2*Record. †National champion.
CAREER YARDSPlayer, Team Years Rush Rcv. Int. PR KOR Yds. Yd.PP^Damaris Johnson, Tulsa ...................................... 2008-10 1,062 2,746 0 571 3,417 7,796 15.9Brandon West, Western Mich.............................. 2006-09 3,671 958 0 17 3,118 7,764 7.9C.J. Spiller, Clemson ................................................ 2006-09 3,547 1,420 0 569 2,052 7,588 8.9DeAngelo Williams, Memphis ............................ 2002-05 6,026 723 0 0 824 7,573 7.0Ricky Williams, Texas ............................................... 1995-98 6,279 927 0 0 0 7,206 6.6Napoleon McCallum, Navy .................................. $1981-85 4,179 796 0 858 1,339 7,172 6.3Antonio Brown, Central Mich. ............................ 2007-09 531 3,199 0 822 2,612 ‡7,164 13.2Chris Johnson, East Carolina ............................... 2004-07 2,982 1,296 0 0 2,715 6,993 8.1Darrin Nelson, Stanford ............................. 1977-78, 80-81 4,033 2,368 0 471 13 6,885 7.1Kevin Faulk, LSU ....................................................... 1995-98 4,557 600 0 857 819 6,833 6.8Darren Sproles, Kansas St. ................................... 2001-04 4,979 609 0 378 846 6,812 7.1DeMarco Murray, Oklahoma ............................... 2007-10 3,685 1,571 0 0 1,462 6,718 6.9Ron Dayne, Wisconsin ............................................ 1996-99 *6,397 304 0 0 0 6,701 5.8Terance Mathis, New Mexico ......................... 1985-87, 89 329 4,254 0 115 1,993 6,691 14.6Tony Dorsett, Pittsburgh ....................................... 1973-76 6,082 406 0 0 127 6,615 5.9Paul Palmer, Temple ................................................ 1983-86 4,895 705 0 12 997 6,609 6.1Charles White, Southern California .................. 1976-79 5,598 507 0 0 440 6,545 6.0Trevor Cobb, Rice ..................................................... 1989-92 4,948 892 0 21 651 6,512 5.3Mewelde Moore, Tulane ....................................... 2000-03 4,364 2,059 0 0 82 6,505 5.9Kevin Robinson, Utah St. ...................................... 2004-07 165 2,485 0 1,104 2,725 6,479 #16.2Dwayne Harris, East Carolina .............................. 2007-10 526 3,001 0 479 2,374 6,380 12.6LaDainian Tomlinson, TCU ................................... 1997-00 5,263 236 0 0 838 6,337 6.4Damion Fletcher, Southern Miss. ...................... 2006-09 5,302 904 0 0 47 6,253 5.6Dorien Bryant, Purdue ........................................... 2004-07 421 3,548 0 125 2,125 6,219 13.4Glyn Milburn, Oklahoma/Stanford............... 1988, 90-92 2,302 1,495 0 1,145 1,246 6,188 8.1*Record. $See page 2 for explanation. ‡Three-year totals. ^Active player. #Record for minimum 5,000 yards and 375 plays.
SEASON YARDSPlayer, Team Year Rush Rcv. Int. PR KOR Yds. Yd.PPBarry Sanders, Oklahoma St. ................................... †1988 *2,628 106 0 95 421 3,250 8.3Ryan Benjamin, Pacific ................................................. †1991 1,581 612 0 4 798 2,995 9.6Chris Johnson, East Carolina ..................................... †2007 1,423 528 0 0 1,009 2,960 9.6
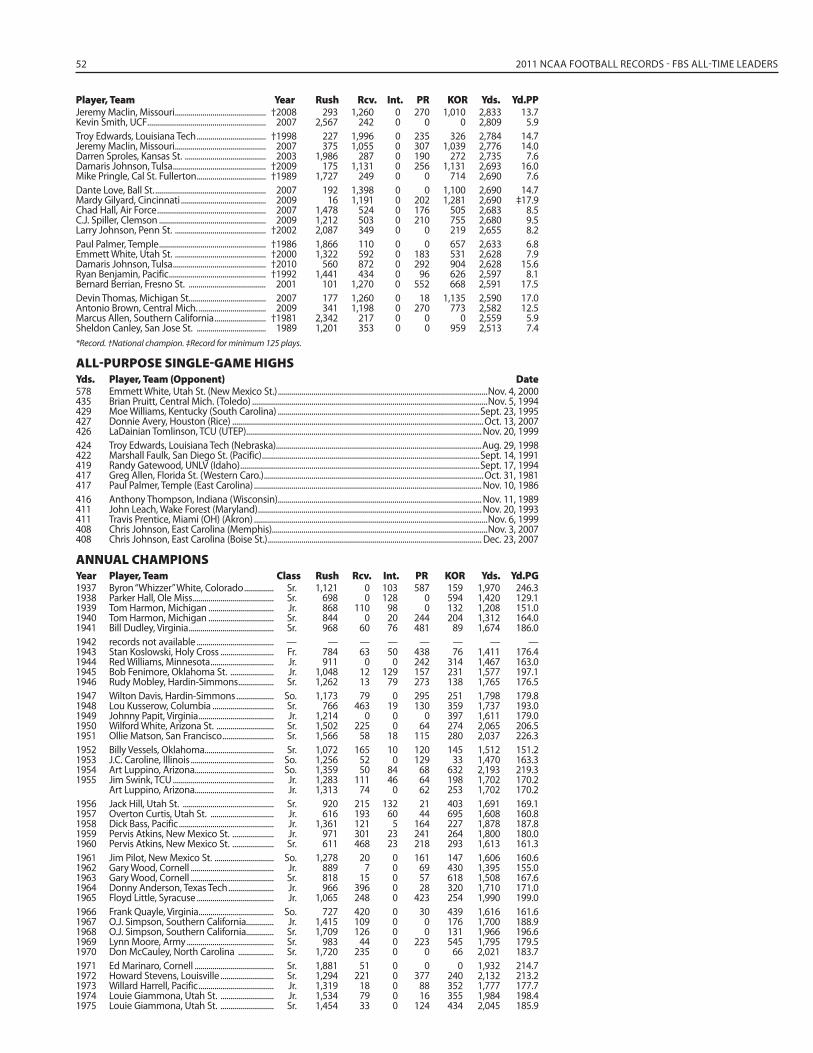
52 2011 NCAA FOOTBALL RECORDS - FBS ALL-TIME LEADERS
Jeremy Maclin, Missouri .............................................. †2008 293 1,260 0 270 1,010 2,833 13.7Kevin Smith, UCF ............................................................ 2007 2,567 242 0 0 0 2,809 5.9Troy Edwards, Louisiana Tech ................................... †1998 227 1,996 0 235 326 2,784 14.7Jeremy Maclin, Missouri .............................................. 2007 375 1,055 0 307 1,039 2,776 14.0Darren Sproles, Kansas St. ......................................... 2003 1,986 287 0 190 272 2,735 7.6Damaris Johnson, Tulsa ............................................... †2009 175 1,131 0 256 1,131 2,693 16.0Mike Pringle, Cal St. Fullerton ................................... †1989 1,727 249 0 0 714 2,690 7.6Dante Love, Ball St. ........................................................ 2007 192 1,398 0 0 1,100 2,690 14.7Mardy Gilyard, Cincinnati ........................................... 2009 16 1,191 0 202 1,281 2,690 ‡17.9Chad Hall, Air Force ....................................................... 2007 1,478 524 0 176 505 2,683 8.5C.J. Spiller, Clemson ...................................................... 2009 1,212 503 0 210 755 2,680 9.5Larry Johnson, Penn St. .............................................. †2002 2,087 349 0 0 219 2,655 8.2Paul Palmer, Temple ...................................................... †1986 1,866 110 0 0 657 2,633 6.8Emmett White, Utah St. .............................................. †2000 1,322 592 0 183 531 2,628 7.9Damaris Johnson, Tulsa ............................................... †2010 560 872 0 292 904 2,628 15.6Ryan Benjamin, Pacific ................................................. †1992 1,441 434 0 96 626 2,597 8.1Bernard Berrian, Fresno St. ....................................... 2001 101 1,270 0 552 668 2,591 17.5Devin Thomas, Michigan St. ...................................... 2007 177 1,260 0 18 1,135 2,590 17.0Antonio Brown, Central Mich. .................................. 2009 341 1,198 0 270 773 2,582 12.5Marcus Allen, Southern California .......................... †1981 2,342 217 0 0 0 2,559 5.9Sheldon Canley, San Jose St. ................................... 1989 1,201 353 0 0 959 2,513 7.4*Record. †National champion. ‡Record for minimum 125 plays.
ALL-PURPOSE SINGLE-GAME HIGHSYds. Player, Team (Opponent) Date578 Emmett White, Utah St. (New Mexico St.) ..........................................................................................................Nov. 4, 2000435 Brian Pruitt, Central Mich. (Toledo) .......................................................................................................................Nov. 5, 1994429 Moe Williams, Kentucky (South Carolina) ......................................................................................................Sept. 23, 1995427 Donnie Avery, Houston (Rice) ...............................................................................................................................Oct. 13, 2007426 LaDainian Tomlinson, TCU (UTEP)....................................................................................................................... Nov. 20, 1999424 Troy Edwards, Louisiana Tech (Nebraska) ........................................................................................................Aug. 29, 1998422 Marshall Faulk, San Diego St. (Pacific) ..............................................................................................................Sept. 14, 1991419 Randy Gatewood, UNLV (Idaho) .........................................................................................................................Sept. 17, 1994417 Greg Allen, Florida St. (Western Caro.) ...............................................................................................................Oct. 31, 1981417 Paul Palmer, Temple (East Carolina) ................................................................................................................... Nov. 10, 1986416 Anthony Thompson, Indiana (Wisconsin) ....................................................................................................... Nov. 11, 1989411 John Leach, Wake Forest (Maryland) ................................................................................................................. Nov. 20, 1993411 Travis Prentice, Miami (OH) (Akron) ......................................................................................................................Nov. 6, 1999408 Chris Johnson, East Carolina (Memphis).............................................................................................................Nov. 3, 2007408 Chris Johnson, East Carolina (Boise St.) ............................................................................................................ Dec. 23, 2007
ANNUAL CHAMPIONSYear Player, Team Class Rush Rcv. Int. PR KOR Yds. Yd.PG1937 Byron “Whizzer” White, Colorado ............... Sr. 1,121 0 103 587 159 1,970 246.31938 Parker Hall, Ole Miss ......................................... Sr. 698 0 128 0 594 1,420 129.11939 Tom Harmon, Michigan ................................. Jr. 868 110 98 0 132 1,208 151.01940 Tom Harmon, Michigan ................................. Sr. 844 0 20 244 204 1,312 164.01941 Bill Dudley, Virginia ........................................... Sr. 968 60 76 481 89 1,674 186.01942 records not available ....................................... — — — — — — — —1943 Stan Koslowski, Holy Cross ........................... Fr. 784 63 50 438 76 1,411 176.41944 Red Williams, Minnesota ................................ Jr. 911 0 0 242 314 1,467 163.01945 Bob Fenimore, Oklahoma St. ...................... Jr. 1,048 12 129 157 231 1,577 197.11946 Rudy Mobley, Hardin-Simmons .................. Sr. 1,262 13 79 273 138 1,765 176.51947 Wilton Davis, Hardin-Simmons ................... So. 1,173 79 0 295 251 1,798 179.81948 Lou Kusserow, Columbia ............................... Sr. 766 463 19 130 359 1,737 193.01949 Johnny Papit, Virginia ...................................... Jr. 1,214 0 0 0 397 1,611 179.01950 Wilford White, Arizona St. ............................. Sr. 1,502 225 0 64 274 2,065 206.51951 Ollie Matson, San Francisco .......................... Sr. 1,566 58 18 115 280 2,037 226.31952 Billy Vessels, Oklahoma................................... Sr. 1,072 165 10 120 145 1,512 151.21953 J.C. Caroline, Illinois .......................................... So. 1,256 52 0 129 33 1,470 163.31954 Art Luppino, Arizona........................................ So. 1,359 50 84 68 632 2,193 219.31955 Jim Swink, TCU ................................................... Jr. 1,283 111 46 64 198 1,702 170.2 Art Luppino, Arizona........................................ Jr. 1,313 74 0 62 253 1,702 170.21956 Jack Hill, Utah St. .............................................. Sr. 920 215 132 21 403 1,691 169.11957 Overton Curtis, Utah St. ................................ Jr. 616 193 60 44 695 1,608 160.81958 Dick Bass, Pacific ................................................ Jr. 1,361 121 5 164 227 1,878 187.81959 Pervis Atkins, New Mexico St. ..................... Jr. 971 301 23 241 264 1,800 180.01960 Pervis Atkins, New Mexico St. ..................... Sr. 611 468 23 218 293 1,613 161.31961 Jim Pilot, New Mexico St. .............................. So. 1,278 20 0 161 147 1,606 160.61962 Gary Wood, Cornell .......................................... Jr. 889 7 0 69 430 1,395 155.01963 Gary Wood, Cornell .......................................... Sr. 818 15 0 57 618 1,508 167.61964 Donny Anderson, Texas Tech ....................... Jr. 966 396 0 28 320 1,710 171.01965 Floyd Little, Syracuse ....................................... Jr. 1,065 248 0 423 254 1,990 199.01966 Frank Quayle, Virginia ...................................... So. 727 420 0 30 439 1,616 161.61967 O.J. Simpson, Southern California.............. Jr. 1,415 109 0 0 176 1,700 188.91968 O.J. Simpson, Southern California.............. Sr. 1,709 126 0 0 131 1,966 196.61969 Lynn Moore, Army ............................................ Sr. 983 44 0 223 545 1,795 179.51970 Don McCauley, North Carolina .................. Sr. 1,720 235 0 0 66 2,021 183.71971 Ed Marinaro, Cornell ........................................ Sr. 1,881 51 0 0 0 1,932 214.71972 Howard Stevens, Louisville ........................... Sr. 1,294 221 0 377 240 2,132 213.21973 Willard Harrell, Pacific ...................................... Jr. 1,319 18 0 88 352 1,777 177.71974 Louie Giammona, Utah St. ........................... Jr. 1,534 79 0 16 355 1,984 198.41975 Louie Giammona, Utah St. ........................... Sr. 1,454 33 0 124 434 2,045 185.9
Player, Team Year Rush Rcv. Int. PR KOR Yds. Yd.PP

2011 NCAA FOOTBALL RECORDS - FBS ALL-TIME LEADERS 53
FOO
TBA
LL B
OW
LSU
BD
IVIS
ION
1976 Tony Dorsett, Pittsburgh ................................ Sr. 1,948 73 0 0 0 2,021 183.71977 Earl Campbell, Texas ........................................ Sr. 1,744 111 0 0 0 1,855 168.61978 Charles White, Southern California ........... Jr. 1,760 191 0 0 145 2,096 174.71979 Charles White, Southern California ........... Sr. 1,803 138 0 0 0 1,941 194.11980 Marcus Allen, Southern California ............. Jr. 1,563 231 0 0 0 1,794 179.41981 Marcus Allen, Southern California ............. Sr. 2,342 217 0 0 0 2,559 232.61982 Carl Monroe, Utah ............................................. Sr. 1,507 108 0 0 421 2,036 185.11983 Napoleon McCallum, Navy ........................... Jr. 1,587 166 0 272 360 2,385 216.81984 Keith Byars, Ohio St. ........................................ Jr. 1,655 453 0 0 176 2,284 207.61985 Napoleon McCallum, Navy ........................... Sr. 1,327 358 0 157 488 2,330 211.81986 Paul Palmer, Temple ......................................... Sr. 1,866 110 0 0 657 2,633 239.41987 Eric Wilkerson, Kent St. .................................. Jr. 1,221 269 0 0 584 2,074 188.61988 Barry Sanders, Oklahoma St. ....................... Jr. *2,628 106 0 95 421 *3,250 *295.51989 Mike Pringle, Cal St. Fullerton ...................... Sr. 1,727 249 0 0 714 2,690 244.61990 Glyn Milburn, Stanford ................................... So. 729 632 0 267 594 2,222 202.01991 Ryan Benjamin, Pacific .................................... Jr. 1,581 612 0 4 798 2,995 249.61992 Ryan Benjamin, Pacific .................................... Sr. 1,441 434 0 96 626 2,597 236.11993 LeShon Johnson, Northern Ill. ..................... Sr. 1,976 106 0 0 0 2,082 189.31994 Rashaan Salaam, Colorado ........................... Jr. 2,055 294 0 0 0 2,349 213.61995 Troy Davis, Iowa St. .......................................... So. 2,010 159 0 0 297 2,466 224.21996 Troy Davis, Iowa St. .......................................... Jr. 2,185 61 0 0 118 2,364 214.91997 Troy Edwards, Louisiana Tech. ..................... Jr. 190 1,707 0 6 241 2,144 194.91998 Troy Edwards, Louisiana Tech ...................... Sr. 227 1,996 0 235 326 2,784 232.01999 Trevor Insley, Nevada ...................................... Sr. 5 *2,060 0 111 0 2,176 197.82000 Emmett White, Utah St. ................................. Jr. 1,322 592 0 183 531 2,628 238.92001 Levron Williams, Indiana ................................ Sr. 1,401 289 0 0 511 2,201 200.12002 Larry Johnson, Penn St. .................................. Sr. 2,087 349 0 0 219 2,655 204.22003 DeAngelo Williams, Memphis ..................... So. 1,430 384 0 0 299 2,113 192.12004 Darren Sproles, Kansas St. ............................. Sr. 1,318 223 0 34 492 2,067 187.92005 #Reggie Bush, Southern California............ Jr. 1,740 478 0 179 493 2,890 222.32006 Garrett Wolfe, Northern Ill. ........................... Sr. 1,928 249 0 0 0 2,177 167.52007 Chris Johnson, East Carolina ........................ Sr. 1,423 528 0 0 1,009 2,960 227.72008 Jeremy Maclin, Missouri ................................. So. 293 1,260 0 270 1,010 2,833 202.42009 Damaris Johnson, Tulsa .................................. So. 175 1,131 0 256 1,131 2,693 224.42010 Damaris Johnson, Tulsa .................................. Jr. 560 872 0 292 904 2,628 202.2*Record. #Bush’s 2005 statistics (and statistical championship) vacated by NCAA Committee on Infractions.
Field Goals
CAREER FIELD GOALS(One-inch tees were permitted in 1949, two-inch tees were permitted in 1965, and use of tees was eliminated in 1989. The goal posts were widened from 18 feet, 6 inches to 23 feet, 4 inches in 1959 and were narrowed back to 18 feet, 6 inches in 1991. In 1993, the hash marks were moved 6 feet, 8 inches closer to the center of the field, to 60 feet from each sideline.) Under 40Player, Team Years Total Pct. 40 Yds. Plus Long ‡WonBilly Bennett, Georgia (S) .......................................... 2000-03 87-110 .791 56-67 31-43 55 3Kai Forbath, UCLA (S) ................................................. 2007-10 85-101 .842 54-58 31-43 54 4Leigh Tiffin, Alabama (S) ........................................... 2006-09 83-*111 .748 *61-*74 22-37 54 3Jeff Jaeger, Washington (S) ...................................... 1983-86 80-99 .808 59-68 21-31 52 5Nick Novak, Maryland (S) ......................................... 2001-04 80-107 .748 49-59 31-48 54 3Alexis Serna, Oregon St. (S) ..................................... 2004-07 80-104 .769 55-63 25-41 58 2Jeremy Ito, Rutgers (S) ............................................... 2004-07 80-*111 .721 58-71 22-40 53 3John Lee, UCLA (S) ....................................................... 1982-85 79-92 .859 54-56 25-36 52 **10Jason Elam, Hawaii (S)................................................ $1988-92 79-100 .790 50-55 29-45 56 3Luis Zendejas, Arizona St. (S) .................................. 1981-84 78-105 .743 53-59 25-46 55 1Philip Doyle, Alabama (S) ......................................... 1987-90 78-105 .743 57-61 21-44 53 6Kevin Kelly, Penn St. (S) ............................................. 2005-08 78-107 .729 65-74 13-33 53 1Kevin Butler, Georgia (S) ........................................... 1981-84 77-98 .786 50-56 27-42 60 7Max Zendejas, Arizona (S) ........................................ 1982-85 77-104 .740 47-53 30-51 57 7Derek Schmidt, Florida St. (S) ................................. 1984-87 73-104 .702 44-55 29-49 54 1Carlos Huerta, Miami (FL) (S)................................... 1988-91 73-91 .802 56-60 17-31 52 3Steve Azar, Northern Ill. (S) ...................................... 2000-03 73-92 .793 57-63 16-29 52 2Fuad Reveiz, Tennessee (S) ...................................... 1981-84 71-95 .747 45-53 26-42 60 7Mason Crosby, Colorado (S) ................................... 2003-06 71-95 .747 39-45 32-50 60 2Sam Swank, Wake Forest (S).................................... 2005-08 71-93 .763 43-50 28-43 53 4Brett Swenson, Michigan St. (S) ............................. 2006-09 71-91 .780 52-62 19-29 52 3Barry Belli, Fresno St. (S) ............................................ 1984-87 70-99 .707 47-53 23-46 55 5Roman Anderson, Houston (S) .............................. 1988-91 70-101 .693 *61-72 9-29 53 3Nelson Welch, Clemson (S) ...................................... 1991-94 70-100 .700 49-64 21-36 53 7Stephen Gostkowski, Memphis (S) ...................... 2002-05 70-92 .761 47-59 23-33 53 0*Record. $See page 2 for explanation. **Record tied. ‡Number of games in which his field goal(s) provided the winning margin. (S) Soccer-style kicker.
SEASON FIELD GOALS Under 40Player, Team Years Total Pct. 40 Yds. Plus Long ‡WonBilly Bennett, Georgia (S) .......................................... †2003 31-*38 .816 20-23 11-15 52 1Leigh Tiffin, Alabama (S) ........................................... 2009 30-35 .857 24-26 6-9 50 1John Lee, UCLA (S) ....................................................... †1984 29-33 .879 16-16 13-17 51 5John Sullivan, New Mexico (S) ............................... †2007 29-35 .829 18-22 11-13 53 2Paul Woodside, West Virginia (S) ........................... †1982 28-31 .903 23-23 5-8 45 2
Year Player, Team Class Rush Rcv. Int. PR KOR Yds. Yd.PG

54 2011 NCAA FOOTBALL RECORDS - FBS ALL-TIME LEADERS
Luis Zendejas, Arizona St. (S) .................................. †1983 28-37 .757 19-22 9-15 52 1Nick Browne, TCU (S) .................................................. 2003 28-33 .848 20-22 8-11 50 1Justin Medlock, UCLA (S) .......................................... †2006 28-32 .875 21-22 7-10 51 1Kai Forbath, UCLA (S) ................................................. †2009 28-31 .903 19-19 9-12 53 1Josh Jasper, LSU (S) ..................................................... †2010 28-34 .824 18-19 10-15 53 0Fuad Reveiz, Tennessee (S) ...................................... 1982 27-31 .871 14-14 13-17 60 2Sebastian Janikowski, Florida St. (S) .................... †1998 27-32 .844 17-19 10-13 53 1Drew Dunning, Washington St. (S) ....................... 2003 27-31 .871 19-20 8-11 49 0Gary Cismesia, Florida St. (S) ................................... 2007 27-34 .794 19-21 8-13 60 0Dan Bailey, Oklahoma St. (S) ................................... 2010 27-31 .871 16-18 11-13 52 1Jonathan Ruffin, Cincinnati (S) ............................... †2000 26-29 .897 24-26 2-3 42 4Billy Bennett, Georgia (S) .......................................... 2002 26-33 .788 15-18 11-15 47 2Colt David, LSU (S) ....................................................... 2007 26-33 .788 20-23 6-10 49 0Grant Ressel, Missouri (S) .......................................... 2009 26-27 .963 19-19 7-8 46 1Danny Hrapmann, Southern Miss. (S) ................. 2010 26-31 .839 18-20 8-11 54 0*Record. †National champion. ‡Number of games in which his field goal(s) provided the winning margin.(S) Soccer-style kicker.
SINGLE-GAME FIELD GOALSNo. Player, Team (Opponent) Date7 Mike Prindle, Western Mich. (Marshall) ...........................................................................................................Sept. 29, 19847 Dale Klein, Nebraska (Missouri) ............................................................................................................................Oct. 19, 19856 By 16 players (last time by Richard Jackson, Clemson vs. Boston College, Sept. 19, 2009)
ANNUAL CHAMPIONS(From 1959 to 1990, goal uprights were 23 feet, 4 inches apart; and from 1991 to the present, have been 18 feet, 6 inches apart) Under 40Year Player, Team Total PG Pct. 40 Yds. Plus Long ‡Won1959 Karl Holzwarth, Wisconsin (C) ............................. 7-8 0.8 .875 7-8 0-0 29 41960 Ed Dyas, Auburn (C) ................................................ 13-18 1.3 .722 13-17 0-1 37 21961 Greg Mather, Navy (C) ............................................ 11-15 1.1 .733 9-12 2-3 45 11962 Bob Jencks, Miami (OH) (C).................................. 8-11 0.8 .727 7-9 1-2 52 3 Al Woodall, Auburn (C) .......................................... 8-20 0.8 .400 8-13 0-7 35 01963 Billy Lothridge, Georgia Tech (C) ....................... 12-16 1.2 .750 10-14 2-2 41 31964 Doug Moreau, LSU (C) ........................................... 13-20 1.3 .650 13-20 0-0 36 01965 Charley Gogolak, Princeton (S) .......................... 16-23 1.8 .696 7-10 9-13 54 01966 Jerry DePoyster, Wyoming (C) ............................ 13-*38 1.3 .342 7-13 6-*25 54 11967 Gerald Warren, North Carolina St. (C) .............. 17-22 1.7 .773 13-14 4-8 47 11968 Bob Jacobs, Wyoming (C) ..................................... 14-29 1.4 .483 10-15 4-14 51 21969 Bob Jacobs, Wyoming (C) ..................................... 18-27 1.8 .667 13-16 5-11 43 2Beginning in 1970, ranked on per-game (instead of total) made Under 40Year Player, Team Total PG Pct. 40 Yds. Plus Long ‡Won1970 Kim Braswell, Georgia (C)...................................... 13-17 1.3 .765 11-14 2-3 43 01971 Nick Mike-Mayer, Temple (S) ............................... 12-17 1.3 .706 8-10 4-7 48 11972 Nick Mike-Mayer, Temple (S) ............................... 13-20 1.4 .650 10-11 3-9 44 31973 Rod Garcia, Stanford (S)......................................... 18-29 1.6 .621 10-14 8-15 59 21974 Dave Lawson, Air Force (C) .................................. 19-31 1.7 .613 13-14 6-17 60 11975 Don Bitterlich, Temple (S) ..................................... 21-31 1.9 .677 13-14 8-17 56 01976 Tony Franklin, Texas A&M (S) ............................... 17-26 1.6 .654 9-12 8-14 65 01977 Paul Marchese, Kent St. (S) ................................... 18-27 1.8 .667 13-15 5-12 51 21978 Matt Bahr, Penn St. (S) ............................................ 22-27 2.0 .815 19-20 3-7 50 31979 Ish Ordonez, Arkansas (S) ..................................... 18-22 1.6 .818 12-14 6-8 50 21980 Obed Ariri, Clemson (S) ......................................... 23-30 2.1 .767 18-19 5-11 52 31981 Bruce Lahay, Arkansas (S) ..................................... 19-24 1.7 .792 12-15 7-9 49 4 Kevin Butler, Georgia (S) ........................................ 19-26 1.7 .731 11-14 8-12 52 0 Larry Roach, Oklahoma St. (S) ............................ 19-28 1.7 .679 12-14 7-14 56 31982 Paul Woodside, West Virginia (S) ....................... 28-31 2.6 .903 23-23 5-8 45 21983 Luis Zendejas, Arizona St. (S)............................... 28-37 2.6 .757 19-22 9-15 52 11984 John Lee, UCLA (S) ................................................... 29-33 *2.6 .879 16-16 13-17 51 51985 John Diettrich, Ball St. (S) ...................................... 25-29 2.3 .862 16-17 9-12 54 21986 Chris Kinzer, Virginia Tech (C) .............................. 22-27 2.0 .815 14-17 8-10 50 51987 Collin Mackie, South Carolina (S) ...................... 23-30 2.1 .767 17-21 6-9 49 0 Derek Schmidt, Florida St. (S).............................. 23-31 2.1 .742 16-21 7-10 53 01988 Kendall Trainor, Arkansas (S) ............................... 24-27 2.2 .889 14-15 10-12 58 41989 Philip Doyle, Alabama (S) ..................................... 22-25 2.0 .880 19-19 3-6 44 2 Gregg McCallum, Oregon (S) .............................. 22-29 2.0 .759 15-15 7-14 47 2 Roman Anderson, Houston (S) .......................... 22-34 2.0 .647 17-20 5-14 51 01990 Philip Doyle, Alabama (S) ..................................... 24-29 2.2 .828 16-17 8-12 47 21991 Doug Brien, California (S)...................................... 19-28 1.7 .679 15-20 4-8 50 21992 Joe Allison, Memphis (S) ....................................... 23-25 2.1 .920 13-14 10-11 51 11993 Michael Proctor, Alabama (S) .............................. 22-29 1.8 .759 15-20 7-9 53 01994 Remy Hamilton, Michigan (S) ............................. 24-29 2.2 .828 23-27 1-2 42 21995 Michael Reeder, TCU (S) ......................................... 23-25 2.1 .920 19-19 4-6 47 31996 Rafael Garcia, Virginia (S)....................................... 21-27 1.9 .778 16-17 5-10 46 11997 Brad Palazzo, Tulane (S) ......................................... 23-28 2.1 .821 15-15 8-15 52 01998 Sebastian Janikowski, Florida St. (S) ................ 27-32 2.3 .844 17-19 10-13 53 11999 Sebastian Janikowski, Florida St. (S) ................ 23-30 2.1 .767 15-18 8-12 54 02000 Jonathan Ruffin, Cincinnati (S) ........................... 26-29 2.4 .897 24-26 2-3 42 42001 Todd Sievers, Miami (FL) (S) ................................. 21-26 1.9 .808 14-17 7-9 48 12002 Nick Browne, TCU (S) .............................................. 23-30 1.9 .767 18-20 5-10 50 0
Under 40Player, Team Years Total Pct. 40 Yds. Plus Long ‡Won

2011 NCAA FOOTBALL RECORDS - FBS ALL-TIME LEADERS 55
FOO
TBA
LL B
OW
LSU
BD
IVIS
ION
All-Time Longest PlaysSince 1941, official maximum length of all plays fixed at 100 yards.
RUSHINGYds. Player, Team (Opponent) Year 99 Broderick Green, Arkansas (Eastern Mich.) ...........................................................2009 99 Terry Caulley, Connecticut (Army) ...........................................................................2006 99 Eric Vann, Kansas (Oklahoma) ....................................................................................1997 99 Kelsey Finch, Tennessee (Florida) ..............................................................................1977 99 Ralph Thompson, West Tex. A&M (Wichita St.) ...................................................1970 99 Max Anderson, Arizona St. (Wyoming) ..................................................................1967 99 Gale Sayers, Kansas (Nebraska) ..................................................................................1963 98 11 times (most recent-Jerald Sowell, Tulane [Alabama]) ................................1993
PASSINGYds. Passer-Receiver, Team (Opponent) Year 99 Jeff Tuel-Johnny Forzani, Washington St. (Arizona St.) ....................................2009 99 Giovanni Vizza-Casey Fitzgerald, North Texas (La.-Monroe) .........................2007 99 Dondrial Pinkins-Troy Williamson, South Carolina (Virginia) ........................2003 99 Jim Sorgi-Lee Evans, Wisconsin (Akron) .................................................................2003 99 Jason Johnson-Brandon Marshall, Arizona (Idaho) ..........................................2001 99 Dan Urban-Justin McCariens, Northern Ill. (Ball St.) ..........................................2000 99 Drew Brees-Vinny Sutherland, Purdue (Northwestern) ..................................1999 99 Troy DeGar-Wes Caswell, Tulsa (Oklahoma) .........................................................1996 99 John Paci-Thomas Lewis, Indiana (Penn St.) ........................................................1993 99 Gino Torretta-Horace Copeland, Miami (FL) (Arkansas) ..................................1991 99 Scott Ankrom-James Maness, TCU (Rice) ..............................................................1984 99 Cris Collinsworth-Derrick Gaffney, Florida (Rice) ...............................................1977 99 Terry Peel-Robert Ford, Houston (San Diego St.) ...............................................1972 99 Terry Peel-Robert Ford, Houston (Syracuse) ........................................................1970 99 Colin Clapton-Eddie Jenkins, Holy Cross (Boston U.) .......................................1970 99 Bo Burris-Warren McVea, Houston (Washington St.) .......................................1966 99 Fred Owens-Jack Ford, Portland [St. Mary’s (CA)] ..............................................1947 98 21 times (last time-Christian Ponder-Rod Owens, Florida St. vs. North Carolina) ................................................................................2007
INTERCEPTION RETURNSSince 1941, 88 players have returned interceptions 100 yards. The most recent:
Yds. Player, Team (Opponent) Year 100 Jordan Ozerities, UCF (Tulane) ...................................................................................2010Quintin Demps (UTEP) is the only player in FBS history to have two 100-yard interception returns in one season. In 2007, he had 100-yard interception returns vs. New Mexico St. and vs. UCF.
PUNT RETURNSYds. Player, Team (Opponent) Year100 Keo Shiloh, Idaho (Northern Ill.) ................................................................................2007100 Courtney Davis, Bowling Green (Kent St.) .............................................................1996 100 Eddie Kennison, LSU (Mississippi St.) ......................................................................1994 100‡ Richie Luzzi, Clemson (Georgia) ................................................................................1968 100‡ Don Guest, California (Washington St.) ..................................................................1966 100 Jimmy Campagna, Georgia (Vanderbilt) ...............................................................1952 100 Hugh McElhenny, Washington (Southern California) ......................................1951 100 Frank Brady, Navy (Maryland) .....................................................................................1951 100 Bert Rechichar, Tennessee (Wash. & Lee)...............................................................1950 100 Eddie Macon, Pacific (Boston U.) ...............................................................................1950‡Return of field goal attempt.
KICKOFF RETURNSSince 1941, 289 players have returned kickoffs 100 yards. The most recent:
Yds. Player, Team (Opponent) Year 100 Lindsey Lamar, South Fla. (Louisville)......................................................................2010 100 Marlon McClure, UTEP (Arkansas) ............................................................................2010 100 LeQuan Lewis, Arizona St. (Southern California) ................................................2010
100 Coryell Judie, Texas A&M (Oklahoma) ....................................................................2010 100 Brandon Boykin, Georgia (Kentucky) ......................................................................2010 100 William Powell, Kansas St. (Baylor) ...........................................................................2010 100 Niles Paul, Nebraska (Oklahoma St.) ........................................................................2010 100 Jon Warzeka, Air Force (Colorado St.) ......................................................................2010 100 Reggie Dunn, Utah (Iowa St.) ......................................................................................2010 100 Nick Williams, Connecticut (Rutgers) ......................................................................2010 100 Troy Evans, Marshall (Southern Miss.) .....................................................................2010 100 Myles Daughtry, New Mexico (UTEP) ......................................................................2010 100 Travis Cobb, Arizona (Iowa) .........................................................................................2010 100 Jerrel Jernigan, Troy (Oklahoma St.) ........................................................................2010 100 Chaz Powell, Penn St. (Youngstown St.).................................................................2010
PUNTSYds. Player, Team (Opponent) Year 99 Pat Brady, Nevada (Loyola Marymount) ................................................................1950 96 George O’Brien, Wisconsin (Iowa).............................................................................1952 94 John Hadl, Kansas (Oklahoma) ..................................................................................1959 94 Carl Knox, TCU (Oklahoma St.) ...................................................................................1947 94 Preston Johnson, SMU (Pittsburgh) .........................................................................1940
FUMBLE RETURNS(Since 1992)
Yds. Player, Team (Opponent) Year 100 Kevin Thomas, UNLV (Baylor) ......................................................................................1999 100 Dan Dawson, Rice (UNLV) ............................................................................................1998 100 Paul Rivers, Rutgers (Pittsburgh) ...............................................................................1995 99 David Williams, Houston (East Carolina) ................................................................1998 99 Dennis Gibbs, Idaho (Boise St.) ..................................................................................1997 99 Izell McGill, Mississippi St. (Memphis) .....................................................................1996 98 Cornelius Pearson, Eastern Mich. (Western Mich.) ............................................1996 97 Josh Morgan, Mississippi St. (BYU) ...........................................................................2000 97 Chris Martin, Northwestern (Air Force) ...................................................................1994 97 Mike Collins, West Virginia (Missouri) ......................................................................1993 97 Ernie Lewis, East Carolina (West Virginia) ..............................................................1992
FIELD GOALSYds. Player, Team (Opponent) Year 67 Joe Williams, Wichita St. (Southern Ill.) ...................................................................1978 67 Steve Little, Arkansas (Texas) ......................................................................................1977 67 Russell Erxleben, Texas (Rice) ......................................................................................1977 65† Martin Gramatica, Kansas St. (Northern Ill.)..........................................................1998 65 Tony Franklin, Texas A&M (Baylor) ............................................................................1976 64 Jose Martinez, UTEP (UCF) ...........................................................................................2008 64 Russell Erxleben, Texas (Oklahoma) .........................................................................1977 64 Tony Franklin, Texas A&M (Baylor) ............................................................................1976 63 Morten Andersen, Michigan St. (Ohio St.) ............................................................1981 63 Clark Kemble, Colorado St. (Arizona) ......................................................................1975 62 Terance Kitchens, Texas A&M (Southern Miss.) ...................................................1999 62 Jason Hanson, Washington St. (UNLV) ...................................................................1991 62 John Diettrich, Ball St. (OH) ..........................................................................................1986 62# Chip Lohmiller, Minnesota (Iowa) .............................................................................1986 62 Tom Whelihan, Missouri (Colorado) .........................................................................1986 62 Dan Christopulos, Wyoming (Colorado St.) ..........................................................1977 62 Iseed Khoury, North Texas (Richmond) ..................................................................1977 62 Dave Lawson, Air Force (Iowa St.) .............................................................................1975 61 Matt Szymanski, SMU (Texas Tech) ..........................................................................2010 61 Garret Courtney, North Texas (Idaho) .....................................................................1998 61$ Kyle Bryant, Texas A&M (Southern Miss.) ...............................................................1994 61 Dan Eichloff, Kansas (Ball St.) ......................................................................................1992 61 Mark Porter, Kansas St. (Nebraska) ...........................................................................1988 61 Ralf Mojsiejenko, Michigan St. (Illinois) ..................................................................1982 61 Steve Little, Arkansas (Tulsa) .......................................................................................1976 61 Wayne Latimer, Virginia Tech (Florida St.) ..............................................................1975 61 Ray Guy, Southern Miss. (Utah St.) ...........................................................................1972†Longest collegiate field goal without use of a kicking tee; all kicks after 1988 season were with-out the use of a tee. Also longest field goal with narrower (18’6”) goal posts. $Longest field goal made by a freshman. #Longest field goal made indoors.
Under 40Year Player, Team Total PG Pct. 40 Yds. Plus Long ‡Won2003 Billy Bennett, Georgia (S) ...................................... *31-*38 2.2 .816 20-23 11-15 52 12004 Mike Nugent, Ohio St. (S) ..................................... 24-27 2.0 .889 12-12 12-15 55 2 Tyler Jones, Boise St. (S) ......................................... 24-27 2.0 .889 19-20 5-7 48 22005 Paul Martinez, Oregon (S) ................................... 19-24 2.1 .792 11-15 8-9 51 12006 Justin Medlock, UCLA (S) ...................................... 28-32 2.2 .875 21-22 7-10 51 12007 John Sullivan, New Mexico (S)............................ 29-35 2.4 .829 18-22 11-13 53 22008 Graham Gano, Florida St. (S) ............................... 24-26 2.2 .923 14-14 10-12 53 02009 Kai Forbath, UCLA (S) ............................................. 28-31 2.2 .903 19-19 9-12 53 12010 Josh Jasper, LSU (S) ................................................. 28-34 2.2 .824 18-19 10-15 53 0*Record. ‡Number of games in which his field goal(s) provided the winning margin. (C) Conventional kicker. (S) Soccer-style kicker.
Yds. Player, Team (Opponent) Year
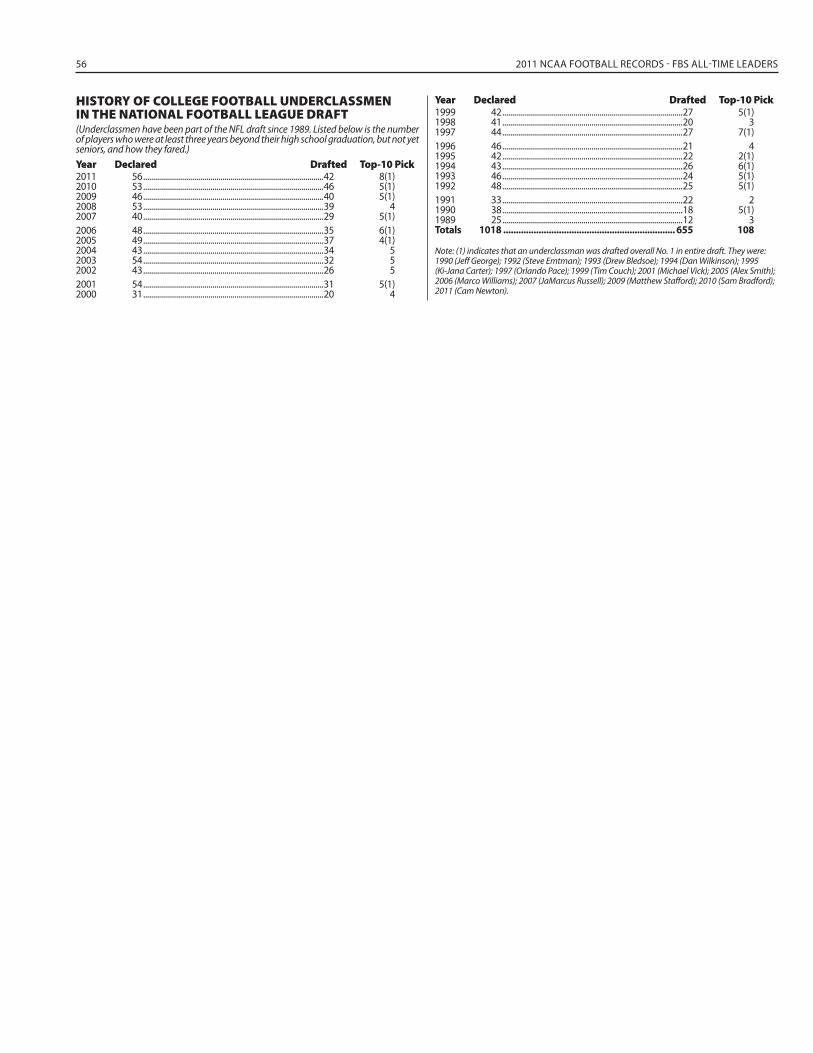
56 2011 NCAA FOOTBALL RECORDS - FBS ALL-TIME LEADERS
HISTORY OF COLLEGE FOOTBALL UNDERCLASSMENIN THE NATIONAL FOOTBALL LEAGUE DRAFT(Underclassmen have been part of the NFL draft since 1989. Listed below is the number of players who were at least three years beyond their high school graduation, but not yet seniors, and how they fared.) Year Declared Drafted Top-10 Pick2011 56 ...........................................................................................42 8(1)2010 53 ...........................................................................................46 5(1)2009 46 ...........................................................................................40 5(1)2008 53 ...........................................................................................39 42007 40 ...........................................................................................29 5(1)2006 48 ...........................................................................................35 6(1)2005 49 ...........................................................................................37 4(1)2004 43 ...........................................................................................34 52003 54 ...........................................................................................32 52002 43 ...........................................................................................26 52001 54 ...........................................................................................31 5(1)2000 31 ...........................................................................................20 4
1999 42 ...........................................................................................27 5(1)1998 41 ...........................................................................................20 31997 44 ...........................................................................................27 7(1)1996 46 ...........................................................................................21 41995 42 ...........................................................................................22 2(1)1994 43 ...........................................................................................26 6(1)1993 46 ...........................................................................................24 5(1)1992 48 ...........................................................................................25 5(1)1991 33 ...........................................................................................22 21990 38 ...........................................................................................18 5(1)1989 25 ...........................................................................................12 3Totals 1018 .................................................................... 655 108
Note: (1) indicates that an underclassman was drafted overall No. 1 in entire draft. They were: 1990 (Jeff George); 1992 (Steve Emtman); 1993 (Drew Bledsoe); 1994 (Dan Wilkinson); 1995 (Ki-Jana Carter); 1997 (Orlando Pace); 1999 (Tim Couch); 2001 (Michael Vick); 2005 (Alex Smith); 2006 (Marco Williams); 2007 (JaMarcus Russell); 2009 (Matthew Stafford); 2010 (Sam Bradford); 2011 (Cam Newton).
Year Declared Drafted Top-10 Pick

2011 NCAA FOOTBALL RECORDS - TEAM CHAMPIONS 57
FOO
TBA
LL B
OW
LSU
BD
IVIS
ION Team Champions
Annual Offense Champions
TOTAL OFFENSEYear Team Avg.1937 Colorado ................................................................375.41938 Fordham .................................................................341.61939 Ohio St. ..................................................................309.31940 Lafayette ................................................................368.21941 Duke .........................................................................372.21942 Georgia ...................................................................429.51943 Notre Dame ..........................................................418.01944 Tulsa .........................................................................434.71945 Army ........................................................................462.71946 Notre Dame ..........................................................441.31947 Michigan ................................................................412.71948 Nevada ....................................................................487.01949 Notre Dame ..........................................................434.81950 Arizona St. ............................................................470.41951 Tulsa .........................................................................480.11952 Tulsa .........................................................................466.61953 Cincinnati ...............................................................409.51954 Army ........................................................................448.71955 Oklahoma ..............................................................410.71956 Oklahoma ..............................................................481.71957 Arizona St. ............................................................444.91958 Iowa ..........................................................................405.91959 Syracuse .................................................................451.51960 New Mexico St. ..................................................419.61961 Ole Miss ..................................................................418.71962 Arizona St. ............................................................384.41963 Utah St. ..................................................................395.31964 Tulsa .........................................................................461.81965 Tulsa .........................................................................427.81966 Houston ..................................................................437.21967 Houston ..................................................................427.91968 Houston ..................................................................562.01969 San Diego St. .......................................................532.21970 Arizona St. ............................................................514.51971 Oklahoma ..............................................................566.51972 Arizona St. ............................................................516.51973 Arizona St. ............................................................565.51974 Oklahoma ..............................................................507.71975 California ................................................................458.51976 Michigan ................................................................448.11977 Colgate....................................................................486.11978 Nebraska ................................................................501.41979 BYU ...........................................................................521.41980 BYU ...........................................................................535.01981 Arizona St. ............................................................498.71982 Nebraska ................................................................518.61983 BYU ...........................................................................584.21984 BYU ...........................................................................486.51985 BYU ...........................................................................500.21986 San Jose St. ..........................................................481.41987 Oklahoma ..............................................................499.71988 Utah..........................................................................526.81989 Houston ................................................................*624.91990 Houston ..................................................................586.81991 Fresno St. ..............................................................541.91992 Houston ..................................................................519.51993 Nevada ....................................................................569.11994 Penn St. ..................................................................520.21995 Nevada ....................................................................569.41996 Nevada ....................................................................527.31997 Nebraska ................................................................513.71998 Louisville ................................................................559.61999 Georgia Tech.........................................................509.02000 Florida St. ..............................................................549.02001 BYU ...........................................................................542.92002 Boise St. ..................................................................501.52003 Texas Tech ..............................................................582.82004 Louisville ................................................................539.02005 Southern California ..........................................579.72006 Hawaii ....................................................................559.22007 Tulsa ........................................................................543.92008 Tulsa .........................................................................569.92009 Houston ..................................................................563.42010 Oregon ....................................................................530.7*Record.
RUSHING OFFENSEYear Team Avg.1937 Colorado ................................................................310.01938 Fordham .................................................................297.11939 Wake Forest ..........................................................290.31940 Lafayette ................................................................306.41941 Missouri ..................................................................307.71942 Hardin-Simmons ................................................307.41943 Notre Dame ..........................................................313.71944 Army ........................................................................298.61945 Army ........................................................................359.81946 Notre Dame ..........................................................340.11947 Detroit .....................................................................319.71948 UTEP .........................................................................378.31949 UTEP .........................................................................333.21950 Arizona St. ............................................................347.01951 Arizona St. ............................................................334.81952 Tulsa .........................................................................321.51953 Oklahoma ..............................................................306.91954 Army ........................................................................322.01955 Oklahoma ..............................................................328.91956 Oklahoma ..............................................................391.01957 Colorado ................................................................322.41958 Pacific.......................................................................259.61959 Syracuse .................................................................313.61960 Utah St. ..................................................................312.01961 New Mexico St. ..................................................299.11962 Ohio St. ..................................................................278.91963 Nebraska ................................................................262.61964 Syracuse .................................................................251.01965 Nebraska ................................................................290.01966 Harvard ...................................................................269.01967 Houston ..................................................................270.91968 Houston ..................................................................361.71969 Texas ........................................................................363.01970 Texas ........................................................................374.51971 Oklahoma ............................................................*472.41972 Oklahoma ..............................................................368.81973 UCLA ........................................................................400.31974 Oklahoma ..............................................................438.81975 Arkansas St. ..........................................................340.51976 Michigan ................................................................362.61977 Oklahoma ..............................................................328.91978 Oklahoma ..............................................................427.51979 East Carolina ........................................................368.51980 Nebraska ................................................................378.31981 Oklahoma ..............................................................334.31982 Nebraska ................................................................394.31983 Nebraska ................................................................401.71984 Army ........................................................................345.31985 Nebraska ................................................................374.31986 Oklahoma ..............................................................404.71987 Oklahoma ..............................................................428.81988 Nebraska ................................................................382.31989 Nebraska ................................................................375.31990 Northern Ill. ..........................................................344.61991 Nebraska ................................................................353.21992 Nebraska ................................................................328.21993 Army ........................................................................298.51994 Nebraska ................................................................340.01995 Nebraska ................................................................399.81996 Army ........................................................................346.51997 Nebraska ................................................................392.61998 Army ........................................................................293.81999 Navy .........................................................................292.22000 Nebraska ................................................................349.32001 Nebraska ................................................................314.72002 Air Force .................................................................307.82003 Navy .........................................................................323.22004 Rice ...........................................................................306.62005 Navy .........................................................................318.72006 Navy .........................................................................327.02007 Navy .........................................................................348.72008 Navy .........................................................................292.42009 Nevada ....................................................................344.92010 Georgia Tech.........................................................323.3*Record.
PASSING OFFENSEYear Team Avg.1937 Arkansas .................................................................185.01938 TCU ...........................................................................164.11939 TCU ...........................................................................148.51940 Cornell .....................................................................186.31941 Arizona ....................................................................177.71942 Tulsa .........................................................................233.91943 Brown ......................................................................133.11944 Tulsa .........................................................................206.31945 St. Mary’s (CA) ......................................................161.31946 Nevada ....................................................................198.11947 Michigan ................................................................173.91948 Nevada ....................................................................255.01949 Fordham .................................................................183.41950 SMU ..........................................................................214.61951 Loyola Marymount ............................................210.61952 Fordham .................................................................225.81953 Stanford ..................................................................179.51954 Purdue .....................................................................177.31955 Navy .........................................................................185.11956 Washington St. ...................................................206.81957 Utah..........................................................................195.21958 Army ........................................................................172.21959 Stanford ..................................................................227.81960 Washington St. ...................................................185.51961 Wisconsin ...............................................................188.41962 Tulsa .........................................................................199.31963 Tulsa .........................................................................244.81964 Tulsa .........................................................................317.91965 Tulsa .........................................................................346.41966 Tulsa .........................................................................272.01967 UTEP .........................................................................301.11968 Cincinnati ...............................................................335.81969 San Diego St. .......................................................374.21970 Auburn ....................................................................288.51971 San Diego St. .......................................................251.41972 Virginia Tech .........................................................304.41973 San Diego St. .......................................................305.01974 Colorado St. .........................................................261.81975 San Diego St. .......................................................291.31976 BYU ...........................................................................307.81977 BYU ...........................................................................341.61978 SMU ..........................................................................276.21979 BYU ...........................................................................368.31980 BYU ...........................................................................409.81981 BYU ...........................................................................356.91982 Long Beach St. ....................................................326.81983 BYU ...........................................................................381.21984 BYU ...........................................................................346.21985 BYU ...........................................................................354.51986 San Jose St. ..........................................................312.51987 San Jose St. ..........................................................338.11988 Utah..........................................................................395.91989 Houston ................................................................*511.31990 Houston ..................................................................473.91991 Houston ..................................................................372.81992 Houston ..................................................................407.11993 Nevada ....................................................................397.51994 Georgia ...................................................................338.31995 Nevada ....................................................................416.31996 Wyoming ...............................................................359.21997 Nevada ....................................................................370.21998 Louisiana Tech .....................................................432.11999 Louisiana Tech .....................................................403.12000 Florida St. ..............................................................384.02001 Florida .....................................................................405.22002 Texas Tech ..............................................................388.92003 Texas Tech ..............................................................475.32004 Texas Tech ..............................................................399.72005 Texas Tech ..............................................................388.82006 Hawaii ....................................................................441.32007 Texas Tech .............................................................470.32008 Texas Tech ..............................................................413.22009 Houston ..................................................................433.72010 Hawaii ......................................................................394.3*Record.

58 2011 NCAA FOOTBALL RECORDS - TEAM CHAMPIONS
SCORING OFFENSEYear Team Avg.1937 Colorado ...................................................................31.01938 Dartmouth ...............................................................28.21939 Utah.............................................................................28.41940 Boston College .......................................................32.01941 Texas ...........................................................................33.81942 Tulsa ............................................................................42.71943 Duke ............................................................................37.21944 Army .........................................................................*56.01945 Army ...........................................................................45.81946 Georgia ......................................................................37.21947 Michigan ...................................................................38.31948 Nevada .......................................................................44.41949 Army ...........................................................................39.31950 Princeton ...................................................................38.81951 Maryland ...................................................................39.21952 Oklahoma .................................................................40.71953 Texas Tech .................................................................38.91954 UCLA ...........................................................................40.81955 Oklahoma .................................................................36.51956 Oklahoma .................................................................46.61957 Arizona St. ...............................................................39.71958 Rutgers .......................................................................33.41959 Syracuse ....................................................................39.01960 New Mexico St. .....................................................37.41961 Utah St. .....................................................................38.71962 Wisconsin ..................................................................31.71963 Utah St. .....................................................................31.71964 Tulsa ............................................................................38.41965 Arkansas ....................................................................32.41966 Notre Dame .............................................................36.21967 UTEP ............................................................................35.91968 Houston .....................................................................42.51969 San Diego St. ..........................................................46.41970 Texas ...........................................................................41.21971 Oklahoma .................................................................44.91972 Arizona St. ...............................................................46.61973 Arizona St. ...............................................................44.61974 Oklahoma .................................................................43.01975 Ohio St. .....................................................................34.01976 Michigan ...................................................................38.71977 Grambling ................................................................42.01978 Oklahoma .................................................................40.01979 BYU ..............................................................................40.61980 BYU ..............................................................................46.71981 BYU ..............................................................................38.71982 Nebraska ...................................................................41.11983 Nebraska ...................................................................52.01984 Boston College .......................................................36.71985 Fresno St. .................................................................39.11986 Oklahoma .................................................................42.41987 Oklahoma .................................................................43.51988 Oklahoma St. ..........................................................47.51989 Houston .....................................................................53.51990 Houston .....................................................................46.51991 Fresno St. .................................................................44.21992 Fresno St. .................................................................40.51993 Florida St. .................................................................43.21994 Penn St. .....................................................................47.81995 Nebraska ...................................................................52.41996 Florida ........................................................................46.61997 Nebraska ...................................................................47.11998 Kansas St. .................................................................48.01999 Virginia Tech ............................................................41.42000 Boise St. ....................................................................44.92001 BYU ..............................................................................46.82002 Boise St. .....................................................................45.62003 Boise St. .....................................................................43.0 Miami (OH) ...............................................................43.02004 Louisville ...................................................................49.82005 Texas ..........................................................................50.22006 Hawaii .......................................................................46.72007 Hawaii .......................................................................43.42008 Oklahoma .................................................................51.12009 Boise St. .....................................................................42.2 Houston .....................................................................42.22010 Oregon .......................................................................47.0*Record.
Annual Defense Champions
TOTAL DEFENSEYear Team Avg.1937 Santa Clara .............................................................*69.91938 Alabama ....................................................................77.91939 San Jose St. .............................................................71.31940 Navy ............................................................................96.01941 Duquesne ..............................................................110.61942 Texas ........................................................................117.31943 Duke .........................................................................121.71944 Virginia .......................................................................96.81945 Alabama .................................................................109.91946 Notre Dame ..........................................................141.71947 Penn St. .....................................................................76.81948 Georgia Tech.........................................................151.31949 Kentucky ................................................................153.81950 Wake Forest ..........................................................163.21951 Wisconsin ...............................................................154.81952 Tennessee ..............................................................166.71953 Cincinnati ...............................................................184.31954 Ole Miss ..................................................................172.31955 Army ........................................................................160.71956 Miami (FL) ..............................................................189.41957 Auburn ....................................................................133.01958 Auburn ....................................................................157.51959 Syracuse ....................................................................96.21960 Wyoming ...............................................................149.61961 Alabama .................................................................132.61962 Ole Miss ..................................................................142.21963 Southern Miss. ....................................................131.21964 Auburn ....................................................................164.71965 Southern Miss. ....................................................161.11966 Southern Miss. ....................................................163.71967 Nebraska ................................................................157.61968 Wyoming ...............................................................206.81969 Toledo......................................................................209.11970 Toledo......................................................................185.81971 Toledo......................................................................179.51972 Louisville ................................................................202.51973 Miami (OH) ............................................................177.41974 Notre Dame ..........................................................195.21975 Texas A&M .............................................................183.81976 Rutgers ....................................................................179.21977 Jackson St. ............................................................207.01978 Penn St. ..................................................................203.91979 Yale ...........................................................................175.41980 Pittsburgh ..............................................................205.51981 Pittsburgh ..............................................................224.81982 Arizona St. ............................................................228.91983 Texas ........................................................................212.01984 Nebraska ................................................................203.31985 Oklahoma ..............................................................193.51986 Oklahoma ..............................................................169.61987 Oklahoma ..............................................................208.11988 Auburn ....................................................................218.11989 Miami (FL) ..............................................................216.51990 Clemson .................................................................216.91991 Texas A&M .............................................................222.41992 Alabama .................................................................194.21993 Ole Miss ..................................................................234.51994 Miami (FL) ..............................................................220.91995 Kansas St. ..............................................................250.81996 West Virginia ........................................................217.51997 Michigan ................................................................206.91998 Florida St. ..............................................................214.81999 Mississippi St. .......................................................222.52000 TCU ...........................................................................245.02001 Texas ........................................................................236.22002 TCU ...........................................................................240.32003 LSU ............................................................................252.02004 North Carolina St. ...............................................221.42005 Virginia Tech .........................................................247.62006 Virginia Tech .........................................................219.52007 Ohio St. ..................................................................233.02008 TCU ...........................................................................217.82009 TCU ...........................................................................239.72010 TCU ...........................................................................228.5*Record.
RUSHING DEFENSEYear Team Avg.1937 Santa Clara ...............................................................25.31938 Oklahoma .................................................................43.31939 San Jose St. ..............................................................34.21940 Texas A&M ................................................................44.31941 Duquesne .................................................................56.01942 Boston College .......................................................48.91943 Duke ............................................................................39.41944 Navy ............................................................................53.81945 Alabama ....................................................................33.91946 Oklahoma .................................................................58.01947 Penn St. ...................................................................*17.01948 Georgia Tech............................................................74.91949 Oklahoma .................................................................55.61950 Ohio St. .....................................................................64.01951 San Francisco ..........................................................51.61952 Michigan St. ............................................................83.91953 Maryland ...................................................................83.91954 UCLA ...........................................................................73.21955 Maryland ...................................................................75.91956 Miami (FL) ..............................................................106.91957 Auburn .......................................................................67.41958 Auburn .......................................................................79.61959 Syracuse ....................................................................19.31960 Wyoming ..................................................................82.41961 Utah St. .....................................................................50.81962 Minnesota ................................................................52.21963 Ole Miss .....................................................................77.31964 Washington .............................................................61.31965 Michigan St. ............................................................45.61966 Wyoming ..................................................................38.51967 Wyoming ..................................................................42.31968 Arizona St. ...............................................................57.01969 LSU ...............................................................................38.91970 LSU ...............................................................................52.21971 Michigan ...................................................................63.31972 Louisville ...................................................................82.11973 Miami (OH) ...............................................................77.01974 Notre Dame ..........................................................102.81975 Texas A&M ................................................................80.31976 Rutgers .......................................................................83.91977 Jackson St. ...............................................................67.81978 Penn St. .....................................................................54.51979 Yale ..............................................................................75.01980 Pittsburgh .................................................................65.31981 Pittsburgh .................................................................62.41982 Virginia Tech ............................................................49.51983 Virginia Tech ............................................................69.41984 Oklahoma .................................................................68.81985 UCLA ...........................................................................70.31986 Oklahoma .................................................................60.71987 Michigan St. ............................................................61.51988 Auburn .......................................................................63.21989 Southern California ..............................................61.51990 Washington .............................................................66.81991 Clemson ....................................................................53.41992 Alabama ....................................................................55.01993 Arizona .......................................................................30.11994 Virginia .......................................................................63.61995 Virginia Tech ............................................................77.41996 Florida St. .................................................................59.01997 Florida St. ..................................................................51.91998 Ohio St. .....................................................................67.41999 Mississippi St. ..........................................................66.92000 Memphis ...................................................................72.72001 UAB ..............................................................................57.32002 TCU ..............................................................................64.82003 Southern California ..............................................60.22004 Southern California ..............................................79.42005 Ohio St. ....................................................................73.42006 Michigan ..................................................................43.42007 Oregon St. ...............................................................70.62008 TCU ..............................................................................47.12009 Texas ...........................................................................72.42010 Boston College .......................................................82.8*Record.
PASSING DEFENSEYear Team $Avg.1937 Harvard ......................................................................31.01938 Penn St. ...................................................................*13.11939 Kansas ........................................................................34.1

2011 NCAA FOOTBALL RECORDS - TEAM CHAMPIONS 59
FOO
TBA
LL B
OW
LSU
BD
IVIS
ION
1940 Harvard ......................................................................33.31941 Purdue ........................................................................27.11942 Harvard ......................................................................45.41943 North Carolina .......................................................36.51944 Michigan St. ............................................................26.71945 Holy Cross .................................................................37.71946 Holy Cross .................................................................53.71947 North Carolina St. .................................................39.31948 Northwestern ..........................................................54.11949 Miami (FL) .................................................................54.71950 Tennessee .................................................................67.51951 Wash. & Lee ..............................................................67.91952 Virginia .......................................................................50.31953 Richmond .................................................................40.31954 Alabama ....................................................................45.81955 Florida ........................................................................42.01956 Villanova ....................................................................43.81957 Georgia Tech............................................................33.41958 Iowa St. .....................................................................39.01959 Alabama ....................................................................45.71960 Iowa St. .....................................................................30.21961 Penn ............................................................................56.91962 New Mexico .............................................................56.81963 UTEP ............................................................................43.81964 Kent St. ......................................................................53.61965 Toledo.........................................................................69.81966 Toledo.........................................................................70.41967 Nebraska ...................................................................90.11968 Kent St. ...................................................................107.61969 Dayton .......................................................................90.01970 Toledo.........................................................................77.81971 Texas Tech .................................................................60.11972 Vanderbilt .................................................................80.31973 Nebraska ...................................................................39.91974 Iowa .............................................................................65.71975 VMI ...............................................................................51.11976 Western Mich. ........................................................78.51977 Tennessee St. ..........................................................67.91978 Boston College .......................................................65.11979 Western Caro. . ........................................................77.51980 Kansas St. .................................................................91.41981 Nebraska ................................................................100.11982 Missouri ..................................................................123.51983 Ohio..........................................................................115.31984 Texas Tech ..............................................................114.81985 Oklahoma ..............................................................103.61986 Oklahoma ..............................................................108.91987 Oklahoma ..............................................................102.41988 Baylor .......................................................................117.81989 Kansas St. ..............................................................129.31990 $Alabama .................................................................82.51991 Texas ...........................................................................77.41992 Western Mich. ........................................................83.21993 Texas A&M ................................................................75.01994 Miami (FL) .................................................................81.31995 Miami (OH) ...............................................................85.51996 Ohio St. .....................................................................81.31997 Michigan ...................................................................75.81998 Florida St. .................................................................79.91999 Kansas St. ..................................................................65.72000 Texas ...........................................................................88.02001 Miami (FL) .................................................................75.62002 Miami (FL) .................................................................83.92003 Nebraska ...................................................................88.72004 North Carolina St. ..................................................91.82005 Miami (FL) .................................................................89.52006 Wisconsin .................................................................84.22007 Utah ...........................................................................96.52008 Southern California ..............................................85.82009 Nebraska ...................................................................87.32010 TCU ..............................................................................94.9*Record. $Beginning in 1990, ranked on passing-efficiency defense rating points instead of per-game yardage allowed.
SCORING DEFENSEYear Team Avg.1937 Santa Clara ................................................................. 1.11938 Duke ..........................................................................**0.01939 Tennessee ...............................................................**0.01940 Tennessee ................................................................... 2.61941 Duquesne ................................................................... 2.91942 Tulsa .............................................................................. 3.21943 Duke .............................................................................. 3.8
1944 Army ............................................................................. 3.91945 St. Mary’s (CA) ........................................................... 4.01946 Notre Dame ............................................................... 2.71947 Penn St. ....................................................................... 3.01948 Michigan ..................................................................... 4.91949 Kentucky ..................................................................... 4.81950 Army ............................................................................. 4.41951 Wisconsin .................................................................... 5.91952 Southern California ................................................ 4.71953 Maryland ..................................................................... 3.11954 UCLA ............................................................................. 4.41955 Georgia Tech.............................................................. 4.61956 Georgia Tech.............................................................. 3.31957 Auburn ......................................................................... 2.81958 Oklahoma ................................................................... 4.91959 Ole Miss ....................................................................... 2.11960 LSU ................................................................................. 5.01961 Alabama ...................................................................... 2.21962 LSU ................................................................................. 3.41963 Ole Miss ....................................................................... 3.71964 Arkansas ...................................................................... 5.71965 Michigan St. .............................................................. 6.21966 Alabama ...................................................................... 3.71967 Oklahoma ................................................................... 6.81968 Georgia ........................................................................ 9.81969 Arkansas ...................................................................... 7.61970 Dartmouth ................................................................. 4.71971 Michigan ..................................................................... 6.41972 Michigan ..................................................................... 5.21973 Ohio St. ....................................................................... 4.31974 Michigan ..................................................................... 6.81975 Alabama ...................................................................... 6.01976 Michigan ..................................................................... 7.4 Rutgers ......................................................................... 7.41977 North Carolina ......................................................... 7.41978 Ball St. .......................................................................... 7.51979 Alabama ...................................................................... 5.31980 Florida St. ................................................................... 7.71981 Southern Miss. ......................................................... 8.11982 Arkansas ....................................................................10.51983 Virginia Tech .............................................................. 8.31984 Nebraska ..................................................................... 9.51985 Michigan ..................................................................... 6.81986 Oklahoma ................................................................... 6.61987 Oklahoma ................................................................... 7.51988 Auburn ......................................................................... 7.21989 Miami (FL) ................................................................... 9.31990 Central Mich. ............................................................ 8.91991 Miami (FL) ................................................................... 9.11992 Arizona ........................................................................ 8.91993 Florida St. ................................................................... 9.41994 Miami (FL) .................................................................10.81995 Northwestern ..........................................................12.71996 North Carolina .......................................................10.01997 Michigan ..................................................................... 8.91998 Wisconsin ..................................................................10.21999 Virginia Tech ............................................................10.52000 TCU ................................................................................ 9.62001 Miami (FL) ................................................................... 9.42002 Kansas St. ..................................................................11.82003 LSU ...............................................................................11.02004 Auburn .......................................................................11.32005 Alabama ....................................................................10.72006 Virginia Tech ............................................................11.02007 Ohio St. .....................................................................12.82008 Southern California ................................................ 9.02009 Nebraska ...................................................................10.42010 TCU ..............................................................................12.0**Record tied.
Other Annual Team Champions
NET PUNTING#Year Team #Avg.1937 Iowa .............................................................................43.01938 Arkansas ....................................................................41.61939 Auburn .......................................................................43.31940 Auburn .......................................................................42.31941 Clemson ....................................................................42.3
1942 Tulsa ............................................................................41.31943 Michigan ...................................................................39.21944 UCLA ...........................................................................43.01945 Miami (FL) .................................................................39.91946 UTEP ............................................................................41.21947 Duke ............................................................................41.91948 North Carolina .......................................................44.01949 Furman.......................................................................44.71950 Colorado ...................................................................45.11951 Alabama ....................................................................41.81952 Colorado ...................................................................43.31953 Georgia ......................................................................41.21954 New Mexico .............................................................42.61955 Michigan St. ............................................................41.21956 Colorado St. ............................................................42.21957 Utah St. .....................................................................40.11958 Georgia ......................................................................41.91959 BYU ..............................................................................43.21960 Georgia ......................................................................43.71961 Arizona St. ...............................................................42.11962 Wyoming ..................................................................42.61963 SMU .............................................................................41.41964 Ole Miss .....................................................................44.11965 Arizona St. ...............................................................44.01966 Tennessee .................................................................43.41967 Houston .....................................................................44.41968 Wichita St. ................................................................43.21969 Georgia ......................................................................43.51970 Utah.............................................................................45.01971 Utah.............................................................................46.71972 Southern Miss. .......................................................45.11973 Wake Forest .............................................................44.11974 Ohio St. .....................................................................44.91975 Ohio St. .....................................................................44.11976 Colorado St. ............................................................44.41977 Ole Miss .....................................................................43.41978 Texas ...........................................................................41.71979 Ole Miss .....................................................................42.41980 Florida St. .................................................................42.61981 Michigan ...................................................................43.11982 Vanderbilt .................................................................42.11983 BYU ............................................................................*45.01984 Ohio St. .....................................................................44.01985 Colorado ...................................................................43.61986 Michigan ...................................................................43.11987 Ohio St. .....................................................................40.71988 BYU ..............................................................................42.91989 Colorado ...................................................................43.81990 Pittsburgh .................................................................41.21991 Texas Tech .................................................................40.61992 Nebraska ...................................................................41.71993 New Mexico .............................................................41.81994 Ball St. ........................................................................42.21995 Ball St. ........................................................................41.31996 San Diego St. ..................................................... **44.91997 LSU .............................................................................43.31998 UNLV ...........................................................................41.41999 Texas A&M ................................................................42.72000 Wisconsin ..................................................................42.92001 Ohio.............................................................................42.72002 BYU ..............................................................................42.72003 Southern California ..............................................43.72004 Colorado ...................................................................42.72005 Wake Forest .............................................................41.42006 Utah.............................................................................41.62007 Cincinnati ..................................................................39.62008 Cincinnati ..................................................................41.52009 Georgia ......................................................................41.92010 UCLA ...........................................................................41.3#Beginning in 1975, ranked on net punting average. *Record for net punting average. **Record for net punting average, minimum 40 punts.
PUNT RETURNSYear Team Avg.1937 — —1938 — —1939 UCLA ...........................................................................16.31940 UCLA ...........................................................................16.21941 Colgate.......................................................................18.71942 — —1943 Columbia ..................................................................20.91944 New York U. .............................................................22.0
Year Team $Avg. Year Team Avg. Year Team #Avg.

60 2011 NCAA FOOTBALL RECORDS - TEAM CHAMPIONS
1945 — —1946 Columbia ..................................................................16.81947 Florida ........................................................................19.71948 Oklahoma .................................................................22.41949 Wichita St. ................................................................18.31950 Texas A&M ................................................................17.61951 Holy Cross .................................................................18.11952 Arizona St. .......................................................... **25.21953 Kansas St. .................................................................23.81954 Miami (FL) .................................................................19.71955 North Carolina .......................................................22.51956 Cincinnati ..................................................................17.71957 North Texas ..............................................................17.51958 Notre Dame .............................................................17.61959 Wyoming ..................................................................16.61960 Arizona .......................................................................17.71961 Memphis ...................................................................17.41962 West Tex. A&M ........................................................18.41963 Army ...........................................................................18.11964 UTEP ............................................................................16.91965 Georgia Tech............................................................23.01966 Brown .........................................................................21.01967 Memphis ...................................................................16.31968 Army ...........................................................................17.41969 Davidson ...................................................................21.31970 Wichita St. ................................................................28.51971 Mississippi St. .........................................................20.81972 Georgia Tech............................................................17.31973 Utah.............................................................................23.41974 Auburn .......................................................................16.61975 New Mexico St. .....................................................15.31976 Wichita St. ................................................................15.01977 Grambling ................................................................16.91978 McNeese St. ............................................................15.71979 Tennessee St. ..........................................................16.91980 Georgia ......................................................................16.51981 North Carolina St. .................................................13.41982 Auburn .......................................................................15.81983 San Diego St. ..........................................................17.01984 Florida ........................................................................13.81985 Utah.............................................................................20.71986 Arizona St. ...............................................................17.91987 Stanford .....................................................................15.41988 Florida St. .................................................................15.51989 Ohio.............................................................................18.21990 Michigan ...................................................................15.61991 Alabama ....................................................................16.91992 Northwestern ..........................................................21.81993 Texas A&M ................................................................17.91994 Ball St. ........................................................................19.91995 Eastern Mich. ..........................................................20.81996 Kansas ........................................................................19.51997 Iowa .............................................................................18.21998 Kansas St. .................................................................21.31999 UAB ..............................................................................19.12000 Virginia Tech ............................................................18.22001 Colorado ...................................................................17.42002 Northern Ill. ..............................................................20.22003 Miami (OH) ...............................................................16.32004 Utah St. ......................................................................18.32005 UCLA ...........................................................................25.02006 Kentucky ..................................................................20.42007 Kansas St. ...............................................................*22.52008 Central Mich. ...........................................................20.52009 LSU ...............................................................................18.92010 Utah.............................................................................17.6*Record for minimum 30 punt returns. **Record for minimum 15 punt returns.
KICKOFF RETURNSYear Team Avg.1937 — —1938 — —1939 Wake Forest .............................................................32.91940 Minnesota ................................................................36.41941 Tulane .........................................................................32.11942 — —1943 Navy ............................................................................28.81944 — —1945 — —1946 William & Mary .......................................................31.71947 SMU .............................................................................31.41948 Wyoming ..................................................................27.4
1949 Army ...........................................................................34.11950 Wyoming ..................................................................29.31951 Marquette .................................................................25.01952 Wake Forest .............................................................25.11953 Texas Tech .................................................................23.81954 Arizona .......................................................................26.11955 Southern California ..............................................25.81956 Georgia Tech............................................................24.61957 Notre Dame .............................................................27.61958 Tulsa ............................................................................25.81959 Auburn .......................................................................25.81960 Yale ..............................................................................26.71961 Harvard ......................................................................25.91962 Alabama ....................................................................28.91963 Memphis ...................................................................27.71964 Cornell ........................................................................27.11965 Dartmouth ...............................................................28.71966 Notre Dame .............................................................29.61967 Air Force ....................................................................25.31968 Louisville ...................................................................25.71969 BYU ..............................................................................28.71970 South Carolina ........................................................26.51971 Miami (FL) .................................................................24.11972 Michigan ...................................................................26.91973 Rice ..............................................................................27.51974 Southern California ..............................................25.71975 Maryland ...................................................................29.51976 South Carolina ........................................................27.01977 Miami (OH) ...............................................................24.61978 Utah St. ......................................................................26.71979 BYU ..............................................................................26.31980 Oklahoma .................................................................33.21981 Iowa .............................................................................29.11982 Utah.............................................................................25.51983 Tennessee .................................................................28.81984 Texas Tech .................................................................25.21985 Air Force ....................................................................27.01986 Clemson ....................................................................26.11987 Oklahoma St. ..........................................................23.71988 Notre Dame .............................................................24.21989 Colorado ...................................................................26.11990 Nebraska ...................................................................27.81991 New Mexico St. .....................................................25.21992 Florida St. ...............................................................*30.31993 Texas A&M ................................................................31.21994 Texas A&M ................................................................27.81995 New Mexico .............................................................27.11996 Miami (FL) .................................................................28.91997 Southern Miss. ........................................................28.21998 Utah.............................................................................27.11999 TCU ..............................................................................27.52000 TCU ..............................................................................28.82001 Hawaii .........................................................................30.32002 Iowa .............................................................................25.12003 Utah.............................................................................28.22004 Indiana .......................................................................28.12005 Arkansas ....................................................................29.22006 Kansas St. ..................................................................27.12007 Oklahoma ................................................................28.32008 Temple .......................................................................26.62009 TCU ..............................................................................29.22010 UCF ..............................................................................27.8*Record for minimum 25 kickoff returns.
TURNOVER MARGINYear Team Avg.1992 Nebraska ...................................................................1.641993 UCLA ...........................................................................1.731994 Clemson ....................................................................1.551995 Toledo.........................................................................2.001996 North Carolina ........................................................2.001997 Colorado St. .............................................................2.081998 Wisconsin ..................................................................2.001999 Kansas St. ..................................................................1.552000 Toledo.........................................................................2.002001 Miami (FL) .................................................................2.362002 South Fla. ..................................................................1.912003 Nebraska ...................................................................1.772004 Southern California ..............................................1.462005 TCU ..............................................................................1.752006 Minnesota ...............................................................1.382007 Kansas .......................................................................1.622008 Oklahoma .................................................................1.64
2009 Air Force ....................................................................1.692010 Virginia Tech ............................................................1.36
Defensive Single-Game Records
(Since 2000)
TACKLES FOR LOSSTFL Team (Opponent) Date 23 North Carolina St. (Florida St.) ......... Nov. 11, 2004 23 Arizona St. (Washington St.) .............Oct. 10, 2009 21 TCU (Tulane) ..............................................Nov. 9, 2002 20 TCU (Nevada) ............................................Sept. 9, 2000 19 Kansas St. (Kansas) ...................................Oct. 7, 2000 18 Air Force (Navy) .........................................Oct. 6, 2000 18 Colorado (Missouri) ................................Nov. 4, 2000 18 Kansas (Missouri St.) ..............................Sept. 1, 2001 18 Washington (Idaho) ............................Sept. 22, 2002 18 North Carolina St. (Georgia Tech) ......Oct. 4, 2003 17 Toledo (Penn St.) .....................................Sept. 2, 2000 17 Oregon St. (San Diego St.) ...............Sept. 23, 2000 17 Kansas St. (Oklahoma) .........................Oct. 14, 2000 17 Texas (Missouri) ......................................Oct. 21, 2000 17 Toledo (Navy) ..........................................Oct. 28, 2000 17 Arizona St. (Washington) ...................Oct. 26, 2002 17 Houston (Army) ..................................... Nov. 15, 2003 17 Oklahoma (Idaho St.) .........................Sept. 12, 2009
PASS SACKSNo. Team (Opponent) Date 15 TCU (Nevada) ............................................Sept. 9, 2000 14 Colorado (Missouri) ................................Nov. 4, 2000 13 Toledo (Penn St.) .....................................Sept. 2, 2000 12 Arizona St. (Washington St.) .............Oct. 10, 2009 11 TCU (Louisville) ...................................... Nov. 23, 2001 11 Cincinnati (Syracuse) ........................... Nov. 24, 2007 11 Ole Miss (Mississippi St.) .................... Nov. 28, 2008 10 North Carolina (Wake Forest) ............Sept. 9, 2000 10 Maryland (Duke) ....................................Oct. 28, 2000 10 Northern Ill. (Wisconsin) ...................Sept. 14, 2002 10 North Carolina St. (Virginia Tech)..Sept. 25, 2004 10 Hawaii (Idaho) ........................................ Nov. 20, 2004 10 Cincinnati [Miami (OH)] .........................Oct. 3, 2009 9 17 times (last by: Louisville vs. Rutgers, Nov. 26, 2010)
PASSES DEFENDED (Pass Interceptions and Pass Break-ups)
PD Team (Opponent) Date 19 South Carolina (Alabama) .....................Oct. 2, 2000 17 Nebraska (Iowa St.) ..................................Oct. 7, 2000 17 Northern Ill. (Ball St.)................................Oct. 5, 2002 17 Mississippi St. (Troy) .............................Oct. 12, 2002 17 Nebraska (Kansas) ....................................Oct. 2, 2004 16 West Virginia (Rutgers) ........................Oct. 12, 2002 16 TCU (Tulane) ..............................................Nov. 9, 2002 16 Nebraska (Pittsburgh) ........................Sept. 18, 2004 15 Wisconsin (Indiana) ............................. Nov. 11, 2000 15 Toledo (Eastern Mich.) ..........................Sept. 7, 2002 15 Kansas St. (Oklahoma St.) ..................Oct. 12, 2002 14 Iowa (Penn St.) ..........................................Nov. 4, 2000 14 Auburn (LSU) .............................................Dec. 1, 2001 14 Oregon St. (California) .........................Oct. 26, 2002 14 Florida (Arkansas) ..................................Oct. 18, 2003 14 San Diego St. (Nevada) .....................Sept. 25, 2004
FORCED FUMBLESFF Team (Opponent) Date 7 Miami (OH) (North Carolina) ............Aug. 31, 2002 7 Virginia (South Carolina) .....................Sept. 7, 2002 7 West Virginia (Cincinnati) .................Sept. 13, 2003 7 Miami (OH) (Buffalo)...............................Nov. 5, 2005 6 Washington (Idaho) ...............................Sept. 2, 2002 6 Washington (Arizona St.) ....................Oct. 14, 2002 6 Boston College (Navy) .........................Oct. 19, 2002 6 North Carolina St. (Georgia Tech) ......Oct. 4, 2003 6 Troy (La.-Monroe) ................................. Nov. 22, 2003 5 Georgia (New Mexico St.) ................Sept. 23, 2000 5 Fresno St. (Colorado) ...........................Aug. 26, 2001
Year Team Avg.Year Team Avg. Year Team Avg.

2011 NCAA FOOTBALL RECORDS - TEAM CHAMPIONS 61
FOO
TBA
LL B
OW
LSU
BD
IVIS
ION
5 Clemson (UCF) .........................................Sept. 1, 2001 5 Arizona St. (San Jose St.) ...................Sept. 29, 2001 5 Cincinnati (La.-Monroe) ........................Dec. 1, 2001 5 Iowa (Minnesota) .................................. Nov. 16, 2002 5 Cincinnati (West Virginia) .................Sept. 13, 2003 5 Hawaii (Idaho) ........................................ Nov. 20, 2004
Team Single-Season Highs
MOST GAMES PLAYED(Counts Postseason Games)
Team, Year No.BYU, 1996 ..................................................................................... 15Kansas St., 2003 ......................................................................... 15Since 1999, 90 teams have played 14. Most recent:Auburn, 2010 .............................................................................. 14UCF, 2010 ...................................................................................... 14Florida St., 2010 ......................................................................... 14Hawaii, 2010 ................................................................................ 14Miami (OH), 2010 ...................................................................... 14Nebraska, 2010 .......................................................................... 14Nevada, 2010 .............................................................................. 14Northern Ill., 2010 ..................................................................... 14Oklahoma, 2010 ........................................................................ 14South Carolina, 2010 ............................................................... 14SMU, 2010 .................................................................................... 14Virginia Tech, 2010 .................................................................... 14Before 1937 (Pre-NCAA Records):Yale, 1889 ...................................................................................... 16Penn, 1892 ................................................................................... 16Yale, 1894 ...................................................................................... 16Penn, 1896 ................................................................................... 15Penn, 1897 ................................................................................... 15Minnesota, 1903 ........................................................................ 15Yale, 1890 ...................................................................................... 14Harvard, 1891 ............................................................................. 14Penn, 1895 ................................................................................... 14Yale, 1896 ...................................................................................... 14
MOST VICTORIES (Counts Postseason Games)
Team, Year No.BYU, 1996 ..................................................................................... 14Ohio St., 2002 .............................................................................. 14Alabama, 2009 ........................................................................... 14Boise St., 2009 ............................................................................. 14Auburn, 2010 .............................................................................. 14Nebraska, 1971 .......................................................................... 13BYU, 1984 ..................................................................................... 13Alabama, 1992 ........................................................................... 13Nebraska, 1994 .......................................................................... 13Nebraska, 1997 .......................................................................... 13Tennessee, 1998 ........................................................................ 13Marshall, 1999 ............................................................................ 13Oklahoma, 2000 ........................................................................ 13Georgia, 2002 ............................................................................. 13Boise St., 2003 ............................................................................. 13LSU, 2003 ...................................................................................... 13Miami (OH), 2003 ...................................................................... 13Auburn, 2004 .............................................................................. 13Southern California, 2004...................................................... 13
Texas, 2005 ................................................................................... 13Boise St., 2006 ............................................................................. 13Florida, 2006 ................................................................................ 13Florida, 2008 ................................................................................ 13Utah, 2008 .................................................................................... 13Florida, 2009 ................................................................................ 13Texas, 2009 ................................................................................... 13Nevada, 2010 .............................................................................. 13TCU, 2010 ...................................................................................... 13Georgia Tech, 1952 ................................................................... 12Southern California, 1972...................................................... 12Western Mich., 1974 ................................................................ 12Pittsburgh, 1976 ........................................................................ 12Southern California, 1978...................................................... 12Georgia, 1980 ............................................................................. 12Clemson, 1981 ............................................................................ 12Nebraska, 1982 .......................................................................... 12Nebraska, 1983 .......................................................................... 12Florida, 1995 ................................................................................ 12Nebraska, 1995 .......................................................................... 12Michigan, 1997 .......................................................................... 12Marshall, 1998 ............................................................................ 12Nebraska, 1999 .......................................................................... 12Southern California, 2003...................................................... 12Oklahoma, 2003 ........................................................................ 12Oklahoma, 2004 ........................................................................ 12Utah, 2004 .................................................................................... 12Southern California, 2005...................................................... 12Louisville, 2006 ........................................................................... 12Ohio St., 2006 .............................................................................. 12Wisconsin, 2006 ........................................................................ 12Hawaii, 2007 ................................................................................ 12Kansas, 2007 ................................................................................ 12LSU, 2007 ...................................................................................... 12Missouri, 2007 ............................................................................ 12Alabama, 2008 ........................................................................... 12Ball St., 2008 ................................................................................ 12Boise St., 2008 ............................................................................. 12Oklahoma, 2008 ........................................................................ 12Southern California, 2008...................................................... 12Texas, 2008 ................................................................................... 12Central Mich., 2009................................................................... 12Cincinnati, 2009 ......................................................................... 12TCU, 2009 ...................................................................................... 12Boise St., 2010 ............................................................................. 12Ohio St., 2010 .............................................................................. 12Oklahoma, 2010 ........................................................................ 12Oregon, 2010 .............................................................................. 12Stanford, 2010 ............................................................................ 12Before 1937 (Pre-NCAA Records):Yale, 1894 ...................................................................................... 16Yale, 1889 ...................................................................................... 15Penn, 1892 ................................................................................... 15Penn, 1897 ................................................................................... 15Penn, 1895 ................................................................................... 14Penn, 1896 ................................................................................... 14Yale, 1888 ...................................................................................... 13Yale, 1890 ...................................................................................... 13Harvard, 1891 ............................................................................. 13Yale, 1891 ...................................................................................... 13Yale, 1892 ...................................................................................... 13Yale, 1895 ...................................................................................... 13Yale, 1896 ...................................................................................... 13Minnesota, 1903 ........................................................................ 13
Minnesota, 1904 ........................................................................ 13
MOST LOSSES Team, Year No.Army, 2003 ................................................................................... 13Colorado St., 1981..................................................................... 12Hawaii, 1998 ................................................................................ 12SMU, 2003 .................................................................................... 12New Mexico St., 2005 .............................................................. 12Duke, 2006 ................................................................................... 12FIU, 2006 ....................................................................................... 12Washington, 2008 ..................................................................... 12Eastern Mich., 2009 .................................................................. 12San Jose St., 2010 ...................................................................... 12Mississippi St., 1976 (NCAA Sanctions) .......................... 11Mississippi St., 1977 (NCAA Sanctions) ........................... 11Rice, 1982 ..................................................................................... 11New Mexico, 1987 .................................................................... 11Rice, 1988 ..................................................................................... 11Kent St., 1993 .............................................................................. 11Ohio, 1994 .................................................................................... 11Duke, 1996 ................................................................................... 11Illinois, 1997 ................................................................................. 11Northern Ill., 1997 ..................................................................... 11Rutgers, 1997 .............................................................................. 11UNLV, 1998 ................................................................................... 11Kent St., 1998 .............................................................................. 11Ball St., 1999 ................................................................................ 11South Carolina, 1999 ............................................................... 11Duke, 2000 ................................................................................... 11Duke, 2001 ................................................................................... 11Houston, 2001 ............................................................................ 11Buffalo, 2002 ............................................................................... 11Buffalo, 2003 ............................................................................... 11East Carolina, 2003 ................................................................... 11Illinois, 2003 ................................................................................. 11La.-Monroe, 2003 ...................................................................... 11Temple, 2003 ............................................................................... 11UTEP, 2003 .................................................................................... 11UCF, 2004 ...................................................................................... 11Temple, 2005 ............................................................................... 11Eastern Mich., 2006 .................................................................. 11Stanford, 2006 ........................................................................... 11Temple, 2006 ............................................................................... 11Utah St., 2006 .............................................................................. 11Duke, 2007 ................................................................................... 11FIU, 2007 ....................................................................................... 11Idaho, 2007 .................................................................................. 11Minnesota, 2007 ........................................................................ 11SMU, 2007 .................................................................................... 11North Texas, 2008 ..................................................................... 11SMU, 2008 .................................................................................... 11Washington St., 2008 .............................................................. 11Miami (OH), 2009 ...................................................................... 11New Mexico, 2009 .................................................................... 11Washington St., 2009 .............................................................. 11Akron, 2010 ................................................................................. 11Memphis, 2010 .......................................................................... 11New Mexico, 2010 .................................................................... 11UNLV, 2010 ................................................................................... 11
Team, Year No.FF Team (Opponent) Date Team, Year No.

62 2011 NCAA FOOTBALL RECORDS - TOUGHEST-SCHEDULE ANNUAL LEADERS
Top 10 Toughest-ScheduleLeaders for 2002-10
2002 $Opp.Team Record Pct.
1. Southern California .............................107-58 .649 2. Iowa St. .....................................................107-62 .633 3. Texas Tech ...............................................108-66 .621 4. Arkansas ...................................................104-64 .619 5. Florida ......................................................... 97-60 .618 6. Stanford...................................................... 87-54 .617 7. Florida St. .................................................112-70 .615 8. Miami (FL).................................................. 91-57 .615 9. Wisconsin ................................................108-68 .614 10. Alabama ..................................................... 98-62 .613
2003 $Opp.Team Record Pct.
1. Alabama ..................................................... 98-50 .662 2. Florida ......................................................... 89-48 .650 3. Notre Dame .............................................. 89-49 .645 4. Texas A&M ................................................. 82-53 .607 5. Arizona ....................................................... 84-55 .604 6. Iowa St. ....................................................... 76-50 .603 7. Bowling Green ........................................ 77-51 .602 8. Kansas St. ................................................... 86-59 .593 9. Ohio St. ....................................................... 87-60 .592 10. South Carolina......................................... 80-56 .588
2004 $Opp.Team Record Pct.
1. Texas A&M ................................................. 86-42 .672 2. North Carolina ......................................... 74-39 .655 3. Arizona ....................................................... 69-39 .639 4. Arizona St. ................................................ 79-48 .622 5. Auburn ....................................................... 76-47 .618 6. Baylor .......................................................... 66-41 .617 7. Notre Dame .............................................. 78-49 .614 8. Arkansas ..................................................... 68-43 .613 9. Georgia ....................................................... 71-45 .612 10. Iowa ............................................................. 76-49 .608
2005 $Opp.Team Record Pct.
1. Oklahoma .................................................. 84-38 .689 2. Stanford...................................................... 66-37 .641 3. Michigan .................................................... 80-46 .635 4. Ohio St. ...................................................... 80-47 .630 5. North Carolina ......................................... 74-45 .622 6. Northwestern .......................................... 78-49 .614 7. Texas ............................................................ 81-51 .614 8. Arkansas ..................................................... 63-40 .612 9. Southern California ............................... 81-52 .609 10. Texas Tech ................................................. 60-39 .606
2006 $Opp.Team Record Pct.
1. Florida ......................................................100-49 .671 2. Michigan .................................................... 91-53 .632 3. Cincinnati .................................................. 83-50 .624 4. Kentucky ................................................... 83-52 .615 South Carolina......................................... 83-52 .615 6. Connecticut .............................................. 73-47 .608 7. Southern California .............................. 90-58 .608 8. Arizona ...................................................... 76-50 .603 9. Arkansas ..................................................... 86-59 .593 10. Tennessee .................................................. 85-59 .590
2007 $Opp.Team Record Pct.
1. Texas A&M ............................................... 85-50 .630 2. Virginia Tech ............................................ 91-55 .623 3. Florida ........................................................ 87-53 .621 4. Oklahoma St. .......................................... 83-51 .619 5. Mississippi ................................................ 75-48 .610 6. Illinois ......................................................... 81-53 .605 7. Georgia ...................................................... 79-52 .603 8. Nebraska ................................................... 82-54 .603 9. South Carolina ....................................... 74-49 .602 10. Kentucky ................................................... 81-54 .600
2008 $Opp.Team Record Pct.
1. Oklahoma ................................................ 95-50 .655 2. Florida ........................................................ 93-53 .637 3. Texas ........................................................... 89-54 .622 4. Georgia ...................................................... 83-51 .619 5. Arkansas ................................................... 76-47 .618 6. Ohio St. ...................................................... 80-52 .606 7. Kansas ........................................................ 79-53 .598 8. Florida St. .................................................. 73-49 .598 9. Syracuse .................................................... 73-50 .593 Virginia ....................................................... 73-50 .593
2009 $Opp.Team Record Pct.
1. Mississippi St. .......................................... 84-41 .672 2. Alabama .................................................... 93-54 .633 3. Oklahoma ................................................ 82-52 .612 4. Arkansas ................................................... 83-53 .610 5. Oregon ...................................................... 90-58 .608 6. Florida ........................................................ 88-57 .607 7. Arizona ...................................................... 83-55 .601 8. Florida St. .................................................. 78-52 .600 9. Iowa ............................................................ 78-53 .595 10. Miami (FL) ................................................ 76-53 .589
2010 $Opp.Team Record Pct.
1. Texas A&M ................................................. 88-47 .652 2. Arkansas ..................................................... 85-48 .639 3. Auburn ....................................................... 90-51 .638 4. Notre Dame .............................................. 90-53 .629 5. LSU ............................................................... 82-49 .626 6. South Carolina......................................... 90-55 .621 7. Minnesota ................................................. 75-48 .610 8. Iowa St. ....................................................... 76-49 .608 9. Missouri ...................................................... 82-53 .607 10. Alabama ..................................................... 79-52 .603 Oregon St. ................................................. 79-52 .603$When not playing the team listed. †Bowl games are not included in records for 1977-2001.
Toughest-Schedule Annual LeadersThe toughest-schedule (which began in 1977) is based on what all FBS teams did against FBS oppo-nents when not playing the team in question. Games against non-FBS teams are deleted, and nine intradivi-sion games are required to qualify. (Bowl games are not included for 1977-2001). The leaders: $Opponents’
RecordYear Team (†Record) W L T Pct.1977 Miami (FL) (3-8-0) ........................ 66 42 2 .609 Penn St. (10-1-0) .......................... 61 39 2 .6081978 Notre Dame (8-3-0) .................... 77 31 2 .709 Southern California (11-1-0) ... 79 40 1 .6631979 UCLA (5-6-0) .................................. 71 37 2 .655 South Carolina (8-3-0) ............... 69 38 2 .6421980 Florida St. (10-1-0) ....................... 70 34 0 .673 Miami (FL) (8-3-0) ........................ 64 33 1 .6581981 Penn St. (9-2-0) ............................. 71 33 2 .679 Temple (5-5-0)............................... 71 33 2 .6691982 Penn St. (10-1-0) .......................... 63 34 2 .646 Kentucky (0-10-1) ........................ 63 34 5 .642
1983 Auburn (10-1-0) ........................... 70 31 3 .688 UCLA (6-4-1) .................................. 68 37 5 .6411984 Penn St. (6-5-0) ............................. 58 36 3 .613 Georgia (7-4-0) ............................. 60 39 4 .6021985 Notre Dame (5-6-0) .................... 72 29 3 .707 Alabama (8-2-1) ........................... 65 32 5 .6621986 Florida (6-5-0) ................................ 64 29 3 .682 LSU (9-2-0) ...................................... 67 36 2 .6481987 Notre Dame (8-3-0) .................... 71 34 2 .673 Florida St. (10-1-0) ....................... 60 29 4 .6671988 Virginia Tech (3-8-0).................... 74 36 0 .673 Arizona (7-4-0) .............................. 70 37 3 .6501989 Notre Dame (11-1-0) .................. 74 38 4 .655 LSU (4-7-0) ...................................... 67 41 1 .6191990 Colorado (10-1-1) ........................ 72 42 3 .628 Stanford (5-6-0) ............................ 67 39 4 .6271991 South Carolina (3-6-2) ............... 57 31 2 .644 Florida (10-2-0) ............................. 66 37 1 .6391992 Southern California (6-5-1)...... 68 38 4 .636 Stanford (10-3-0) ......................... 73 43 4 .625
1993 LSU (5-6-0) ...................................... 67 38 5 .632 Purdue (1-10-0) ............................ 66 38 3 .6311994 Michigan (8-4-0) .......................... 67 38 6 .631 Oklahoma (6-6-0) ........................ 66 39 4 .6241995 Notre Dame (9-3-0) .................... 67 37 5 .638 Illinois (5-5-1) ................................. 69 40 2 .6311996 Florida (12-1) ................................. 70 41 0 .631 UCLA (5-6) ...................................... 66 41 0 .6171997 Colorado (5-6) ............................... 76 37 0 .673 Auburn (10-3)................................ 80 39 0 .6721998 Auburn (3-8) .................................. 74 34 0 .685 Missouri (7-4) ................................ 66 36 0 .6471999 Alabama (10-3) ............................. 80 38 0 .678 Auburn (5-6) .................................. 62 36 0 .6332000 Florida (10-2) ................................. 79 42 0 .653 Florida St. (11-1) ........................... 78 44 0 .6392001 California (1-10) ............................ 73 39 0 .652 Colorado (10-2) ............................ 79 45 0 .637
$Opponents’Record
Year Team (†Record) W L T Pct.
$Opponents’Record
Year Team (†Record) W L T Pct.

2011 NCAA FOOTBALL RECORDS - ANNUAL MOST-IMPROVED TEAMS 63
FOO
TBA
LL B
OW
LSU
BD
IVIS
IONAnnual Most-Improved Teams
$GamesYear Team Improved From To Coach1937 California 4½ 1936 6-5-0 1937 *10-0-1 Stub Allison Syracuse 4½ 1936 1-7-0 1937 5-2-1 #Ossie Solem1938 TCU 5½ 1937 4-4-2 1938 *11-0-0 Dutch Meyer1939 Texas A&M 5½ 1938 4-4-1 1939 *11-0-0 Homer Norton1940 Stanford 8 1939 1-7-1 1940 *10-0-0 #Clark Shaughnessy1941 Vanderbilt 4½ 1940 3-6-1 1941 8-2-0 Red Sanders1942 Utah St. 5½ 1941 0-8-0 1942 6-3-1 Dick Romney1943 Purdue 8 1942 1-8-0 1943 9-0-0 Elmer Burnham1944 Ohio St. 6 1943 3-6-0 1944 9-0-0 #Carroll Widdoes1945 Miami (FL) 7 1944 1-7-1 1945 *9-1-1 Jack Harding1946 Illinois 5 1945 2-6-1 1946 *8-2-0 Ray Eliot Kentucky 5 1945 2-8-0 1946 7-3-0 #Paul “Bear” Bryant1947 California 6½ 1946 2-7-0 1947 9-1-0 #Lynn “Pappy” Waldorf1948 Clemson 6 1947 4-5-0 1948 *11-0-0 Frank Howard1949 Tulsa 5 1948 0-9-1 1949 5-4-1 J. O. Brothers1950 BYU 5 1949 0-11-0 1950 4-5-1 Chick Atkinson Texas A&M 5 1949 1-8-1 1950 *7-4-0 Harry Stiteler1951 Georgia Tech 6 1950 5-6-0 1951 *11-0-1 Bobby Dodd1952 Alabama 4½ 1951 5-6-0 1952 *10-2-0 Harold “Red” Drew1953 Texas Tech 7 1952 3-7-1 1953 *11-1-0 DeWitt Weaver1954 Denver 5 1953 3-5-2 1954 9-1-0 Bob Blackman1955 Texas A&M 6½ 1954 1-9-0 1955 7-2-1 Paul “Bear” Bryant1956 Iowa 5 1955 3-5-1 1956 *9-1-0 Forest Evashevski1957 Notre Dame 5 1956 2-8-0 1957 7-3-0 Terry Brennan Texas 5 1956 1-9-0 1957 †6-4-1 #Darrell Royal1958 Air Force 6 1957 3-6-1 1958 ‡9-0-1 #Ben Martin1959 Washington 6½ 1958 3-7-0 1959 *10-1-0 Jim Owens1960 Minnesota 5½ 1959 2-7-0 1960 †8-2-0 Murray Warmath North Carolina St. 5½ 1959 1-9-0 1960 6-3-1 Earle Edwards1961 Villanova 6 1960 2-8-0 1961 *8-2-0 Alex Bell1962 Southern California 6 1961 4-5-1 1962 *11-0-0 John McKay1963 Illinois 6 1962 2-7-0 1963 *8-1-1 Pete Elliott1964 Notre Dame 6½ 1963 2-7-0 1964 9-1-0 #Ara Parseghian1965 UTEP 6½ 1964 0-8-2 1965 *8-3-0 #Bobby Dobbs1966 Dayton 6½ 1965 1-8-1 1966 8-2-0 John McVay1967 Indiana 7 1966 1-8-1 1967 †9-2-0 John Pont1968 Arkansas 5 1967 4-5-1 1968 *10-1-0 Frank Broyles1969 UCLA 5½ 1968 3-7-0 1969 8-1-1 Tommy Prothro1970 Tulsa 5 1969 1-9-0 1970 6-4-0 #Claude Gibson1971 Army 5 1970 1-9-1 1971 6-4-0 Tom Cahill Georgia 5 1970 5-5-0 1971 *11-1-0 Vince Dooley1972 Pacific 5 1971 3-8-0 1972 8-3-0 Chester Caddas Southern California 5 1971 6-4-1 1972 *12-0-0 John McKay UCLA 5 1971 2-7-1 1972 8-3-0 Pepper Rodgers1973 Pittsburgh 5 1972 1-10-0 1973 †6-5-1 #Johnny Majors1974 Baylor 5½ 1973 2-9-0 1974 †8-4-0 Grant Teaff1975 Arizona St. 5 1974 7-5-0 1975 *12-0-0 Frank Kush1976 Houston 7 1975 2-8-0 1976 *10-2-0 Bill Yeoman1977 Miami (OH) 7 1976 3-8-0 1977 10-1-0 Dick Crum1978 Tulsa 6 1977 3-8-0 1978 9-2-0 John Cooper1979 Wake Forest 6½ 1978 1-10-0 1979 †8-4-0 John Mackovic1980 Florida 7 1979 0-10-1 1980 *8-4-0 Charley Pell1981 Clemson 5½ 1980 6-5-0 1981 *12-0-0 Danny Ford1982 La.-Lafayette 6 1981 1-9-1 1982 7-3-1 Sam Robertson New Mexico 6 1981 4-7-1 1982 10-1-0 Joe Morrison1983 Kentucky 5½ 1982 0-10-1 1983 †6-5-1 Jerry Claiborne Memphis 5½ 1982 1-10-0 1983 6-4-1 Rex Dockery1984 Army 6 1983 2-9-0 1984 *8-3-1 Jim Young1985 Colorado 5½ 1984 1-10-0 1985 †7-5-0 Bill McCartney Fresno St. 5½ 1984 6-6-0 1985 *11-0-1 Jim Sweeney1986 San Jose St. 7 1985 2-8-1 1986 *10-2-0 Claude Gilbert1987 Syracuse 6 1986 5-6-0 1987 ‡11-0-1 Dick MacPherson1988 Washington St. 5 1987 3-7-1 1988 *9-3-0 Dennis Erickson West Virginia 5 1987 6-6-0 1988 †11-1-0 Don Nehlen1989 Tennessee 5½ 1988 5-6-0 1989 *11-1-0 Johnny Majors1990 Temple 6 1989 1-10-0 1990 7-4-0 Jerry Berndt1991 Tulsa 6½ 1990 3-8-0 1991 *10-2-0 Dave Rader1992 Hawaii 6 1991 4-7-1 1992 *11-2-0 Bob Wagner1993 La.-Lafayette 6 1992 2-9-0 1993 8-3-0 Nelson Stokley Virginia Tech 6 1992 2-8-1 1993 *9-3-0 Frank Beamer1994 Colorado St. 4½ 1993 5-6-0 1994 †10-2-0 Sonny Lubick Duke 4½ 1993 3-8-0 1994 †8-4-0 #Fred Goldsmith East Carolina 4½ 1993 2-9-0 1994 †7-5-0 Steve Logan1995 Northwestern 6 1994 3-7-1 1995 †10-2-0 Gary Barnett1996 BYU 5 1995 7-4-0 1996 *14-1-0 LaVell Edwards1997 Western Mich. 6 1996 2-9-0 1997 8-3-0 Gary Darnell1998 Louisville 5½ 1997 1-10-0 1998 7-5-0 #John L. Smith TCU 5½ 1997 1-10-0 1998 7-5-0 #Dennis Franchione1999 Hawaii 8½ 1998 0-12-0 1999 *9-4-0 #June Jones2000 South Carolina 7½ 1999 0-11-0 2000 *8-4-0 Lou Holtz

64 2011 NCAA FOOTBALL RECORDS - ALL-TIME TEAM WON-LOST RECORDS
All-Time Team Won-Lost RecordsIncludes records as senior college only. Bowl and playoff games are includ-ed, and each tie game is computed as half won and half lost. Teams listed with years in parentheses indicates reclassifi cation to the FBS. The year in parentheses is the fi rst year of FBS active membership. Note: Tiebreaker rule began with 1996 season.
BY PERCENTAGETotal
Team Yrs. Won Lost Tied Pct. GamesMichigan .................................................... 131 884 308 36 .735 1,228Notre Dame .............................................. 122 845 295 42 .733 1,182Ohio St. ....................................................... 121 831 309 53 .719 1,193Texas ............................................................ 118 850 325 33 .717 1,208Oklahoma .................................................. 116 811 304 53 .717 1,168Boise St. (1996) ........................................ 43 365 145 2 .715 512Alabama# .................................................. 116 802 319 43 .707 1,164Southern California#............................. 118 769 312 54 .701 1,135Nebraska .................................................... 121 837 345 40 .701 1,222Tennessee .................................................. 114 789 340 53 .690 1,182Penn St. ....................................................... 124 818 357 41 .690 1,216Florida St.# ................................................ 64 464 231 17 .664 712Georgia ....................................................... 117 737 396 54 .644 1,187LSU ............................................................... 117 720 389 47 .643 1,156Miami (FL) .................................................. 85 568 320 19 .637 907Auburn ........................................................ 118 703 400 47 .632 1,150Florida ......................................................... 104 662 379 40 .631 1,081South Fla. (2001) ..................................... 14 103 62 0 .624 165Miami (OH) ................................................ 122 660 394 44 .621 1,098Washington .............................................. 121 663 412 50 .612 1,125Arizona St. ................................................. 98 555 349 24 .611 928Virginia Tech ............................................. 117 678 432 46 .606 1,156Central Mich. ............................................ 110 573 366 36 .606 975Colorado .................................................... 121 671 442 36 .600 1,149West Virginia............................................. 118 691 454 45 .600 1,190Texas A&M ................................................. 116 674 444 48 .599 1,166Georgia Tech ............................................ 118 679 456 43 .595 1,178Arkansas ..................................................... 117 669 450 40 .594 1,159Southern Miss. ......................................... 94 544 368 26 .594 938Fresno St. ................................................... 89 553 375 27 .593 955UCLA ............................................................ 92 549 373 37 .592 959Michigan St. .............................................. 114 627 427 44 .591 1,098Utah ............................................................. 117 615 423 31 .590 1,069Clemson ..................................................... 115 647 444 45 .589 1,136
Bowling Green ........................................ 92 492 338 52 .587 882Western Ky. (2009) ................................. 92 513 359 30 .585 902Boston College ........................................ 112 622 436 37 .585 1,095Syracuse ..................................................... 121 686 484 49 .583 1,219Army ............................................................ 121 649 462 51 .580 1,162Pittsburgh .................................................. 121 671 483 42 .579 1,196Middle Tenn. (1999) .............................. 96 527 382 28 .577 937Minnesota ................................................. 127 643 472 44 .574 1,159Arizona........................................................ 107 561 415 33 .572 1,009Troy (2002) ................................................ 90 485 359 28 .572 872BYU ............................................................... 86 512 380 26 .572 918Hawaii ......................................................... 95 511 384 25 .569 920Wisconsin .................................................. 122 624 467 53 .569 1,144North Carolina ......................................... 120 655 493 54 .567 1,202Louisiana Tech (1989) ........................... 107 554 419 37 .567 1,010Stanford ...................................................... 104 572 433 49 .566 1,054California# ................................................. 118 648 494 52 .564 1,194Tulsa ............................................................. 106 565 433 27 .564 1,025Texas Tech ................................................. 86 519 398 32 .564 949Ole Miss ...................................................... 116 619 476 35 .563 1,130Western Mich. .......................................... 105 515 405 24 .558 944San Diego St. ............................................ 88 484 389 32 .552 905Navy ............................................................. 130 651 524 57 .552 1,232Oregon........................................................ 115 580 468 46 .551 1,094Air Force ..................................................... 55 337 278 13 .547 628Toledo ......................................................... 90 472 398 24 .541 894Missouri ...................................................... 120 617 520 52 .541 1,189Nevada (1992) ......................................... 104 503 435 33 .535 971Purdue ........................................................ 123 579 502 48 .534 1,129Maryland .................................................... 118 611 535 43 .532 1,189TCU ............................................................... 114 582 512 57 .530 1,151Iowa ............................................................. 122 586 517 39 .530 1,142Virginia ........................................................ 121 618 550 48 .528 1,216Houston ..................................................... 65 370 333 15 .526 718Northern Ill. ............................................... 109 512 460 51 .525 1,023Ball St. .......................................................... 86 406 371 32 .522 809Illinois .......................................................... 121 573 528 50 .520 1,151East Carolina ............................................. 75 391 366 12 .516 769UCF ............................................................... 32 186 175 1 .515 362North Texas (1995) ................................. 95 470 451 33 .510 954Louisville .................................................... 92 448 431 17 .509 896
TotalTeam Yrs. Won Lost Tied Pct. Games
All-Time Most-Improved Teams 2010 Most-Improved Teams$Games
Team (Coach) 2009 2010 ImprovedMiami (OH) (Mike Haywood/Lance Guidry) .................... 1-11 10-4 8Maryland (Ralph Friedgen) ...................................................... 2-10 9-4 6½Auburn (Gene Chizek) .............................................................. 8-5 14-0 5½Michigan St. (Mark Dantonio) ................................................ 6-7 11-2 5Nevada (Chris Ault) .................................................................... 8-5 13-1 4½San Diego St. (Brady Hoke) ..................................................... 4-8 9-4 4½Tulsa (Todd Graham) .................................................................. 5-7 10-3 4½$To determine games improved, add the difference in victories between the two seasons to the difference in losses, then divide by two. Includes bowl games.
Games Team (Year)8½ Hawaii (1999)8 Stanford (1940)8 Purdue (1943)8 Miami (OH) (2010)7½ South Carolina (2000)7 Miami (FL) (1945)7 Texas Tech (1953)7 Indiana (1967)7 Houston (1976)7 Miami (OH) (1977)7 Florida (1980)7 San Jose St. (1986)7 UCF (2005)6½ California (1947)6½ Texas A&M (1955)
6½ Washington (1959)6½ Notre Dame (1964)6½ UTEP (1965)6½ Dayton (1966)6½ Toledo (1967)6½ Wake Forest (1979)6½ Tulsa (1991)6½ Tulsa (2003)6½ UTEP (2004)6½ Penn St. (2005)6½ Illinois (2007)6½ Rice (2008)6½ SMU (2009)6½ Maryland (2010)
Games Team (Year)
2001 Bowling Green 6 2000 2-9-0 2001 8-3-0 #Urban Meyer Colorado 6 2000 3-8-0 2001 †10-3-0 Gary Barnett Hawaii 6 2000 3-9-0 2001 9-3-0 June Jones2002 Ohio St. 6 2001 7-5-0 2002 *14-0-0 Jim Tressel2003 Tulsa 6½ 2002 1-11-0 2003 8-5-0 #Steve Kragthorpe2004 UTEP 6½ 2003 2-11-0 2004 †8-4-0 #Mike Price2005 UCF 7 2004 0-11-0 2005 †8-5-0 #George O’Leary2006 Wake Forest 5½ 2005 4-7-0 2006 †11-3-0 Jim Grobe2007 Illinois 6½ 2006 2-10-0 2007 †9-4-0 Ron Zook2008 Rice 6½ 2007 3-9-0 2008 *10-3-0 David Bailiff2009 SMU 6½ 2008 1-11-0 2009 *8-5-0 June Jones2010 Miami (OH) 8 2009 1-11-0 2010 *10-4-0 Mike Haywood/Lance Guidry$To determine games improved, add the difference in victories between the two seasons to the difference in losses, then divide by two; ties not counted. Bowl victory (*), loss (†), tie (‡) included in record. #First year as head coach at that college.
$GamesYear Team Improved From To Coach

2011 NCAA FOOTBALL RECORDS - ALL-TIME TEAM WON-LOST RECORDS 65
FOO
TBA
LL B
OW
LSU
BD
IVIS
ION
Marshall (1997)........................................ 111 526 507 47 .509 1,080North Carolina St. ................................... 119 542 530 55 .505 1,127Kansas ......................................................... 121 570 559 58 .505 1,187Kentucky .................................................... 120 573 565 44 .503 1,182Rutgers ....................................................... 141 607 600 42 .503 1,249Akron ........................................................... 110 487 482 36 .502 1,005South Carolina ......................................... 117 544 540 44 .502 1,128Cincinnati .................................................. 123 550 551 51 .500 1,152Oklahoma St. ........................................... 109 518 522 48 .498 1,088San Jose St. ............................................... 93 448 452 38 .498 938Baylor .......................................................... 109 531 536 44 .498 1,111Vanderbilt .................................................. 121 558 567 50 .496 1,175Washington St. ........................................ 115 493 509 45 .492 1,047Ohio ............................................................. 115 505 522 48 .492 1,075Utah St. ....................................................... 113 479 497 31 .491 1,007Duke ............................................................ 98 456 474 31 .491 961Connecticut (2002) ................................ 112 481 503 38 .489 1,022Wyoming ................................................... 114 487 519 28 .485 1,034La.-Lafayette ............................................. 109 481 516 34 .483 1,031SMU .............................................................. 94 454 488 54 .483 996Memphis .................................................... 95 436 469 33 .482 938Oregon St. ................................................. 114 499 538 50 .482 1,087Mississippi St. ........................................... 111 499 538 39 .482 1,076Fla. Atlantic (2006) ................................. 10 57 63 0 .475 120Arkansas St. (1992) ................................ 96 406 451 37 .475 894Colorado St. .............................................. 112 474 527 33 .474 1,034UAB (1996) ................................................ 20 104 119 2 .467 225Tulane .......................................................... 117 494 579 38 .462 1,111New Mexico .............................................. 112 452 533 31 .460 1,016Iowa St. ....................................................... 119 494 587 46 .459 1,127UNLV ............................................................ 43 221 262 4 .458 487Eastern Mich............................................. 119 428 529 47 .450 1,004Idaho (1996) ............................................. 112 437 548 26 .445 1,011Temple ........................................................ 112 420 533 52 .444 1,005Rice ............................................................... 99 432 556 32 .439 1,020Northwestern .......................................... 123 482 625 44 .438 1,151Kansas St. ................................................... 115 465 609 42 .435 1,116La.-Monroe (1994) ................................. 60 272 361 8 .431 641Indiana ........................................................ 123 448 617 44 .424 1,109New Mexico St. ....................................... 114 408 566 30 .421 1,004Buffalo (1999) .......................................... 97 337 473 28 .419 838UTEP ............................................................. 93 364 526 30 .412 920Wake Forest .............................................. 109 414 602 33 .410 1,049Kent St. ........................................................ 88 311 498 28 .388 837FIU (2006) .................................................. 9 31 74 0 .295 105
BY VICTORIESTotal
Team Yrs. Won Lost Tied Pct. GamesMichigan .................................................... 131 884 308 36 .735 1,228Texas ............................................................ 118 850 325 33 .717 1,208Notre Dame .............................................. 122 845 295 42 .733 1,182Nebraska .................................................... 121 837 345 40 .701 1,222Ohio St. ....................................................... 121 831 309 53 .719 1,193Penn St. ....................................................... 124 818 357 41 .690 1,216Oklahoma .................................................. 116 811 304 53 .717 1,168Alabama# .................................................. 116 802 319 43 .707 1,164Tennessee .................................................. 114 789 340 53 .690 1,182Southern California#............................. 118 769 312 54 .701 1,135Georgia ....................................................... 117 737 396 54 .644 1,187LSU ............................................................... 117 720 389 47 .643 1,156Auburn ........................................................ 118 703 400 47 .632 1,150West Virginia............................................. 118 691 454 45 .600 1,190Syracuse ..................................................... 121 686 484 49 .583 1,219Georgia Tech ............................................ 118 679 456 43 .595 1,178Virginia Tech ............................................. 117 678 432 46 .606 1,156Texas A&M ................................................. 116 674 444 48 .599 1,166Colorado .................................................... 121 671 442 36 .600 1,149Pittsburgh .................................................. 121 671 483 42 .579 1,196Arkansas ..................................................... 117 669 450 40 .594 1,159Washington .............................................. 121 663 412 50 .612 1,125Florida ......................................................... 104 662 379 40 .631 1,081Miami (OH) ................................................ 122 660 394 44 .621 1,098North Carolina ......................................... 120 655 493 54 .567 1,202Navy ............................................................. 130 651 524 57 .552 1,232Army ............................................................ 121 649 462 51 .580 1,162California# ................................................. 118 648 494 52 .564 1,194Clemson ..................................................... 115 647 444 45 .589 1,136Minnesota ................................................. 127 643 472 44 .574 1,159Michigan St. .............................................. 114 627 427 44 .591 1,098Wisconsin .................................................. 122 624 467 53 .569 1,144Boston College ........................................ 112 622 436 37 .585 1,095Ole Miss ...................................................... 116 619 476 35 .563 1,130
Virginia ........................................................ 121 618 550 48 .528 1,216Missouri ...................................................... 120 617 520 52 .541 1,189Utah ............................................................. 117 615 423 31 .590 1,069Maryland .................................................... 118 611 535 43 .532 1,189Rutgers ....................................................... 141 607 600 42 .503 1,249Iowa ............................................................. 122 586 517 39 .530 1,142TCU ............................................................... 114 582 512 57 .530 1,151Oregon........................................................ 115 580 468 46 .551 1,094Purdue ........................................................ 123 579 502 48 .534 1,129Central Mich. ............................................ 110 573 366 36 .606 975Illinois .......................................................... 121 573 528 50 .520 1,151Kentucky .................................................... 120 573 565 44 .503 1,182Stanford ...................................................... 104 572 433 49 .566 1,054Kansas ......................................................... 121 570 559 58 .505 1,187Miami (FL) .................................................. 85 568 320 19 .637 907Tulsa ............................................................. 106 565 433 27 .564 1,025Arizona........................................................ 107 561 415 33 .572 1,009Vanderbilt .................................................. 121 558 567 50 .496 1,175Arizona St. ................................................. 98 555 349 24 .611 928Louisiana Tech (1989) ........................... 107 554 419 37 .567 1,010Fresno St. ................................................... 89 553 375 27 .593 955Cincinnati .................................................. 123 550 551 51 .500 1,152UCLA ............................................................ 92 549 373 37 .592 959Southern Miss. ......................................... 94 544 368 26 .594 938South Carolina ......................................... 117 544 540 44 .502 1,128North Carolina St. ................................... 119 542 530 55 .505 1,127Baylor .......................................................... 109 531 536 44 .498 1,111Middle Tenn. (1999) .............................. 96 527 382 28 .577 937Marshall (1997)........................................ 111 526 507 47 .509 1,080Texas Tech ................................................. 86 519 398 32 .564 949Oklahoma St. ........................................... 109 518 522 48 .498 1,088Western Mich. .......................................... 105 515 405 24 .558 944Western Ky. (2009) ................................. 92 513 359 30 .585 902BYU ............................................................... 86 512 380 26 .572 918Northern Ill. ............................................... 109 512 460 51 .525 1,023Hawaii ......................................................... 95 511 384 25 .569 920Ohio ............................................................. 115 505 522 48 .492 1,075Nevada (1992) ......................................... 104 503 435 33 .535 971Oregon St. ................................................. 114 499 538 50 .482 1,087Mississippi St. ........................................... 111 499 538 39 .482 1,076Tulane .......................................................... 117 494 579 38 .462 1,111Iowa St. ....................................................... 119 494 587 46 .459 1,127Washington St. ........................................ 115 493 509 45 .492 1,047Bowling Green ........................................ 92 492 338 52 .587 882Akron ........................................................... 110 487 482 36 .502 1,005Wyoming ................................................... 114 487 519 28 .485 1,034Troy (2002) ................................................ 90 485 359 28 .572 872San Diego St. ............................................ 88 484 389 32 .552 905Northwestern .......................................... 123 482 625 44 .438 1,151Connecticut (2002) ................................ 112 481 503 38 .489 1,022La.-Lafayette ............................................. 109 481 516 34 .483 1,031Utah St. ....................................................... 113 479 497 31 .491 1,007Colorado St. .............................................. 112 474 527 33 .474 1,034Toledo ......................................................... 90 472 398 24 .541 894North Texas (1995) ................................. 95 470 451 33 .510 954Kansas St. ................................................... 115 465 609 42 .435 1,116Florida St.# ................................................ 64 464 231 17 .664 712Duke ............................................................ 98 456 474 31 .491 961SMU .............................................................. 94 454 488 54 .483 996New Mexico .............................................. 112 452 533 31 .460 1,016Louisville .................................................... 92 448 431 17 .509 896San Jose St. ............................................... 93 448 452 38 .498 938Indiana ........................................................ 123 448 617 44 .424 1,109Idaho (1996) ............................................. 112 437 548 26 .445 1,011Memphis .................................................... 95 436 469 33 .482 938Rice ............................................................... 99 432 556 32 .439 1,020Eastern Mich............................................. 119 428 529 47 .450 1,004Temple ........................................................ 112 420 533 52 .444 1,005Wake Forest .............................................. 109 414 602 33 .410 1,049New Mexico St. ....................................... 114 408 566 30 .421 1,004Ball St. .......................................................... 86 406 371 32 .522 809Arkansas St. (1992) ................................ 96 406 451 37 .475 894East Carolina ............................................. 75 391 366 12 .516 769Houston ..................................................... 65 370 333 15 .526 718Boise St. (1996) ........................................ 43 365 145 2 .715 512UTEP ............................................................. 93 364 526 30 .412 920Air Force ..................................................... 55 337 278 13 .547 628Buffalo (1999) .......................................... 97 337 473 28 .419 838Kent St. ........................................................ 88 311 498 28 .388 837La.-Monroe (1994) ................................. 60 272 361 8 .431 641UNLV ............................................................ 43 221 262 4 .458 487UCF ............................................................... 32 186 175 1 .515 362
TotalTeam Yrs. Won Lost Tied Pct. Games
TotalTeam Yrs. Won Lost Tied Pct. Games

66 2011 NCAA FOOTBALL RECORDS - ALL-TIME TEAM WON-LOST RECORDS
UAB (1996) ................................................ 20 104 119 2 .467 225South Fla. (2001) ..................................... 14 103 62 0 .624 165Fla. Atlantic (2006) ................................. 10 57 63 0 .475 120FIU (2006) .................................................. 9 31 74 0 .295 105
ALPHABETICAL LISTINGTotal
Team Yrs. Won Lost Tied Pct. GamesAir Force ..................................................... 55 337 278 13 .547 628Akron ........................................................... 110 487 482 36 .502 1,005Alabama# .................................................. 116 802 319 43 .707 1,164UAB (1996) ................................................ 20 104 119 2 .467 225Arizona........................................................ 107 561 415 33 .572 1,009Arizona St. ................................................. 98 555 349 24 .611 928Arkansas ..................................................... 117 669 450 40 .594 1,159Arkansas St. (1992) ................................ 96 406 451 37 .475 894Army ............................................................ 121 649 462 51 .580 1,162Auburn ........................................................ 118 703 400 47 .632 1,150Ball St. .......................................................... 86 406 371 32 .522 809Baylor .......................................................... 109 531 536 44 .498 1,111Boise St. (1996) ........................................ 43 365 145 2 .715 512Boston College ........................................ 112 622 436 37 .585 1,095Bowling Green ........................................ 92 492 338 52 .587 882BYU ............................................................... 86 512 380 26 .572 918Buffalo (1999) .......................................... 97 337 473 28 .419 838California# ................................................. 118 648 494 52 .564 1,194UCF ............................................................... 32 186 175 1 .515 362Central Mich. ............................................ 110 573 366 36 .606 975Cincinnati .................................................. 123 550 551 51 .500 1,152Clemson ..................................................... 115 647 444 45 .589 1,136Colorado .................................................... 121 671 442 36 .600 1,149Colorado St. .............................................. 112 474 527 33 .474 1,034Connecticut (2002) ................................ 112 481 503 38 .489 1,022Duke ............................................................ 98 456 474 31 .491 961East Carolina ............................................. 75 391 366 12 .516 769Eastern Mich............................................. 119 428 529 47 .450 1,004Florida ......................................................... 104 662 379 40 .631 1,081Fla. Atlantic (2006) ................................. 10 57 63 0 .475 120FIU (2006) .................................................. 9 31 74 0 .295 105Florida St.# ................................................ 64 464 231 17 .664 712Fresno St. ................................................... 89 553 375 27 .593 955Georgia ....................................................... 117 737 396 54 .644 1,187Georgia Tech ............................................ 118 679 456 43 .595 1,178Hawaii ......................................................... 95 511 384 25 .569 920Houston ..................................................... 65 370 333 15 .526 718Idaho (1996) ............................................. 112 437 548 26 .445 1,011Illinois .......................................................... 121 573 528 50 .520 1,151Indiana ........................................................ 123 448 617 44 .424 1,109Iowa ............................................................. 122 586 517 39 .530 1,142Iowa St. ....................................................... 119 494 587 46 .459 1,127Kansas ......................................................... 121 570 559 58 .505 1,187Kansas St. ................................................... 115 465 609 42 .435 1,116Kent St. ........................................................ 88 311 498 28 .388 837Kentucky .................................................... 120 573 565 44 .503 1,182La.-Lafayette ............................................. 109 481 516 34 .483 1,031La.-Monroe (1994) ................................. 60 272 361 8 .431 641LSU ............................................................... 117 720 389 47 .643 1,156Louisiana Tech (1989) ........................... 107 554 419 37 .567 1,010Louisville .................................................... 92 448 431 17 .509 896Marshall (1997)........................................ 111 526 507 47 .509 1,080Maryland .................................................... 118 611 535 43 .532 1,189Memphis .................................................... 95 436 469 33 .482 938Miami (FL) .................................................. 85 568 320 19 .637 907Miami (OH) ................................................ 122 660 394 44 .621 1,098Michigan .................................................... 131 884 308 36 .735 1,228
Michigan St. .............................................. 114 627 427 44 .591 1,098Middle Tenn. (1999) .............................. 96 527 382 28 .577 937Minnesota ................................................. 127 643 472 44 .574 1,159Ole Miss ...................................................... 116 619 476 35 .563 1,130Mississippi St. ........................................... 111 499 538 39 .482 1,076Missouri ...................................................... 120 617 520 52 .541 1,189Navy ............................................................. 130 651 524 57 .552 1,232Nebraska .................................................... 121 837 345 40 .701 1,222Nevada (1992) ......................................... 104 503 435 33 .535 971UNLV ............................................................ 43 221 262 4 .458 487New Mexico .............................................. 112 452 533 31 .460 1,016New Mexico St. ....................................... 114 408 566 30 .421 1,004North Carolina ......................................... 120 655 493 54 .567 1,202North Carolina St. ................................... 119 542 530 55 .505 1,127North Texas (1995) ................................. 95 470 451 33 .510 954Northern Ill. ............................................... 109 512 460 51 .525 1,023Northwestern .......................................... 123 482 625 44 .438 1,151Notre Dame .............................................. 122 845 295 42 .733 1,182Ohio ............................................................. 115 505 522 48 .492 1,075Ohio St. ....................................................... 121 831 309 53 .719 1,193Oklahoma .................................................. 116 811 304 53 .717 1,168Oklahoma St. ........................................... 109 518 522 48 .498 1,088Oregon........................................................ 115 580 468 46 .551 1,094Oregon St. ................................................. 114 499 538 50 .482 1,087Penn St. ....................................................... 124 818 357 41 .690 1,216Pittsburgh .................................................. 121 671 483 42 .579 1,196Purdue ........................................................ 123 579 502 48 .534 1,129Rice ............................................................... 99 432 556 32 .439 1,020Rutgers ....................................................... 141 607 600 42 .503 1,249San Diego St. ............................................ 88 484 389 32 .552 905San Jose St. ............................................... 93 448 452 38 .498 938South Carolina ......................................... 117 544 540 44 .502 1,128South Fla. (2000) ..................................... 14 103 62 0 .624 165Southern California#............................. 118 769 312 54 .701 1,135SMU .............................................................. 94 454 488 54 .483 996Southern Miss. ......................................... 94 544 368 26 .594 938Stanford ...................................................... 104 572 433 49 .566 1,054Syracuse ..................................................... 121 686 484 49 .583 1,219Temple ........................................................ 112 420 533 52 .444 1,005Tennessee .................................................. 114 789 340 53 .690 1,182Texas ............................................................ 118 850 325 33 .717 1,208Texas A&M ................................................. 116 674 444 48 .599 1,166TCU ............................................................... 114 582 512 57 .530 1,151UTEP ............................................................. 93 364 526 30 .412 920Texas Tech ................................................. 86 519 398 32 .564 949Toledo ......................................................... 90 472 398 24 .541 894Troy (2002) ................................................ 90 485 359 28 .572 872Tulane .......................................................... 117 494 579 38 .462 1,111Tulsa ............................................................. 106 565 433 27 .564 1,025UCLA ............................................................ 92 549 373 37 .592 959Utah ............................................................. 117 615 423 31 .590 1,069Utah St. ....................................................... 113 479 497 31 .491 1,007Vanderbilt .................................................. 121 558 567 50 .496 1,175Virginia ........................................................ 121 618 550 48 .528 1,216Virginia Tech ............................................. 117 678 432 46 .606 1,156Wake Forest .............................................. 109 414 602 33 .410 1,049Washington .............................................. 121 663 412 50 .612 1,125Washington St. ........................................ 115 493 509 45 .492 1,047West Virginia............................................. 118 691 454 45 .600 1,190Western Ky. (2009) ................................. 92 513 359 30 .585 902Western Mich. .......................................... 105 515 405 24 .558 944Wisconsin .................................................. 122 624 467 53 .569 1,144Wyoming ................................................... 114 487 519 28 .485 1,034#Indicates record adjusted by action of the NCAA Committee on Infractions.
TotalTeam Yrs. Won Lost Tied Pct. Games
TotalTeam Yrs. Won Lost Tied Pct. Games

2011 NCAA FOOTBALL RECORDS - WINNINGEST TEAMS BY DECADE 67
FOO
TBA
LL B
OW
LSU
BD
IVIS
ION
BY PERCENTAGETeam W-L Pct.Boise St. ............................. 112-17 .868Texas ................................... 110-19 .853Oklahoma ......................... 110-24 .821Ohio St. ............................. 102-25 .803Southern California#.... 88-25 .779Florida ................................ 100-30 .769TCU ...................................... 95-29 .766LSU ...................................... 99-31 .762Georgia ............................. 98-31 .760Virginia Tech .................... 99-32 .756Miami (FL) ........................ 92-33 .736Utah .................................... 86-36 .705Oregon............................... 87-38 .696Auburn ............................... 88-39 .693West Virginia .................. 86-39 .688Boston College .............. 88-40 .688Louisville ........................... 83-41 .669Wisconsin ......................... 86-43 .667Texas Tech ........................ 85-43 .664Nebraska ........................... 84-44 .656Tennessee ......................... 83-44 .654Michigan ........................... 81-43 .653BYU ...................................... 81-44 .648Iowa .................................... 80-45 .640Oregon St. ....................... 80-45 .640South Fla. .......................... 75-44 .630Georgia Tech ................... 81-48 .628Clemson ............................ 79-47 .627Penn St. ............................ 77-46 .626Florida St.# ....................... 73-44 .624Fresno St. ......................... 81-49 .623Cincinnati ........................ 78-48 .619Hawaii ............................... 80-51 .611Pittsburgh ......................... 74-49 .602Toledo ................................ 73-49 .598Southern Miss. ................ 74-52 .587Bowling Green .............. 70-51 .579Troy ...................................... 70-51 .579Maryland ........................... 71-52 .577Notre Dame ..................... 70-52 .574California ........................... 71-53 .573Western Ky. ...................... 70-53 .569Arkansas ............................ 71-54 .568Kansas St. .......................... 71-54 .568Missouri ............................. 70-54 .565Northern Ill. .................... 68-53 .562Air Force ........................... 68-54 .557South Carolina ................ 68-54 .557Alabama# ......................... 58-48 .547Marshall ............................. 67-56 .545Oklahoma St. ................. 67-56 .545Purdue ............................... 67-57 .540UCLA ................................... 67-57 .540Arizona St. ....................... 65-58 .528North Carolina St. ........ 65-58 .528Virginia ............................... 65-59 .524Ole Miss ............................. 63-58 .521Navy .................................... 64-59 .520
Records in the 2000s(2000-01-02-03-04-05-06-07-08-09, Including bowls)
Connecticut ..................... 62-58 .517Texas A&M ........................ 63-59 .516Wake Forest ..................... 61-60 .504Minnesota ........................ 62-62 .500Northwestern ................. 61-61 .500Colorado St. .................... 61-62 .496Tulsa .................................... 62-64 .492Michigan St. ..................... 60-62 .492Middle Tenn. .................... 58-60 .492Fla. Atlantic ..................... 53-55 .491Central Mich. .................. 60-63 .488Western Mich. ................ 58-61 .487Houston ........................... 60-64 .484Miami (OH) ....................... 59-63 .484Nevada............................... 59-64 .480New Mexico .................... 59-64 .480Rutgers .............................. 58-63 .479East Carolina .................... 59-65 .476Kansas ................................ 57-63 .475Washington St. .............. 57-63 .475UCF ...................................... 57-64 .471Colorado ........................... 58-67 .464Iowa St. ............................. 55-68 .447Memphis ........................... 53-68 .438North Carolina ............... 53-68 .438Ball St. ............................... 52-67 .437Akron ................................. 51-67 .432Louisiana Tech ................ 52-69 .430UAB ...................................... 49-68 .419Kentucky ........................... 50-70 .417Ohio ................................... 50-70 .417Arizona............................... 49-69 .415Washington ..................... 49-71 .408Stanford ............................. 47-69 .405UTEP .................................... 48-72 .400Rice ...................................... 46-72 .390San Jose St. ..................... 46-73 .387Syracuse ............................ 46-73 .387Illinois ................................. 45-73 .381Arkansas St. ..................... 44-74 .373La.-Lafayette .................... 42-74 .362Mississippi St. .................. 42-76 .356Tulane ................................. 42-76 .356Wyoming .......................... 42-76 .356North Texas ...................... 42-78 .350UNLV .................................. 41-77 .347Kent St. ............................... 39-77 .336Indiana ............................... 39-78 .333San Diego St. .................. 38-80 .322La.-Monroe ....................... 37-79 .319New Mexico St. ............. 37-83 .308Baylor ................................. 34-82 .293Temple ............................... 34-83 .291Vanderbilt ......................... 34-83 .291SMU ..................................... 34-84 .288Utah St. ............................. 32-83 .278Idaho................................... 31-87 .263FIU ........................................ 24-68 .261Buffalo ................................ 30-88 .254
Eastern Mich. ................. 27-89 .233Army ................................... 25-92 .214Duke ................................... 19-97 .164
BY VICTORIESTeam WinsBoise St. ........................................................ 112Oklahoma .................................................... 110Texas .............................................................. 110Ohio St. ........................................................ 102Florida ........................................................... 100LSU ....................................................................99Virginia Tech ..................................................99Georgia ...........................................................98TCU ....................................................................95Miami (FL) ......................................................92Auburn .............................................................88Boston College ............................................88Southern California#..................................88Oregon.............................................................87Utah ..................................................................86West Virginia ................................................86Wisconsin .......................................................86Texas Tech ......................................................85Nebraska .........................................................84Louisville .........................................................83Tennessee .......................................................83BYU ....................................................................81Fresno St. .......................................................81Georgia Tech .................................................81Michigan .........................................................81Hawaii .............................................................80Iowa ..................................................................80Oregon St. .....................................................80Clemson ..........................................................79Cincinnati ......................................................78Penn St. ..........................................................77South Fla. ........................................................75Pittsburgh .......................................................74Southern Miss. ..............................................74Florida St.# .....................................................73Toledo ..............................................................73Arkansas ..........................................................71California .........................................................71Maryland .........................................................71Kansas St. ........................................................71Bowling Green ............................................70Missouri ...........................................................70Notre Dame ...................................................70Troy ....................................................................70Western Ky. ....................................................70Air Force .........................................................68Northern Ill. ..................................................68South Carolina ..............................................68Marshall ...........................................................67Oklahoma St. ...............................................67Purdue .............................................................67UCLA .................................................................67Arizona St. .....................................................65North Carolina St. ......................................65Virginia .............................................................65Navy ..................................................................64Ole Miss ...........................................................63Texas A&M ......................................................63
Connecticut ...................................................62Minnesota ......................................................62Tulsa ..................................................................62Colorado St. ..................................................61Northwestern ...............................................61Wake Forest ...................................................61Central Mich. ................................................60Houston .........................................................60Michigan St. ...................................................60East Carolina ..................................................59Miami (OH) .....................................................59Nevada.............................................................59New Mexico ..................................................59Alabama# .......................................................58Colorado .........................................................58Middle Tenn. ..................................................58Rutgers ............................................................58Western Mich. ..............................................58UCF ....................................................................57Kansas ..............................................................57Washington St. ............................................57Iowa St. ...........................................................55Fla. Atlantic ...................................................53Memphis .........................................................53North Carolina .............................................53Ball St. .............................................................52Louisiana Tech ..............................................52Akron ...............................................................51Kentucky .........................................................50Ohio .................................................................50UAB ....................................................................49Arizona.............................................................49Washington ...................................................49UTEP ..................................................................48Stanford ...........................................................47Rice ....................................................................46San Jose St. ...................................................46Syracuse ..........................................................46Illinois ...............................................................45Arkansas St. ...................................................44La.-Lafayette ..................................................42Mississippi St. ................................................42North Texas ....................................................42Tulane ...............................................................42Wyoming ........................................................42UNLV ................................................................41Indiana .............................................................39Kent St. .............................................................39San Diego St. ................................................38La.-Monroe .....................................................37New Mexico St. ...........................................37Baylor ...............................................................34SMU ...................................................................34Vanderbilt .......................................................34Temple .............................................................34Utah St. ...........................................................32Idaho.................................................................31Buffalo ..............................................................30Eastern Mich. ...............................................27Army .................................................................25FIU ......................................................................24Duke .................................................................19#Indicates record adjusted by action of the NCAA Committee on Infractions.
Team W-L *Pct. Team Wins
Team W-L *Pct.
Winningest Teams by Decade
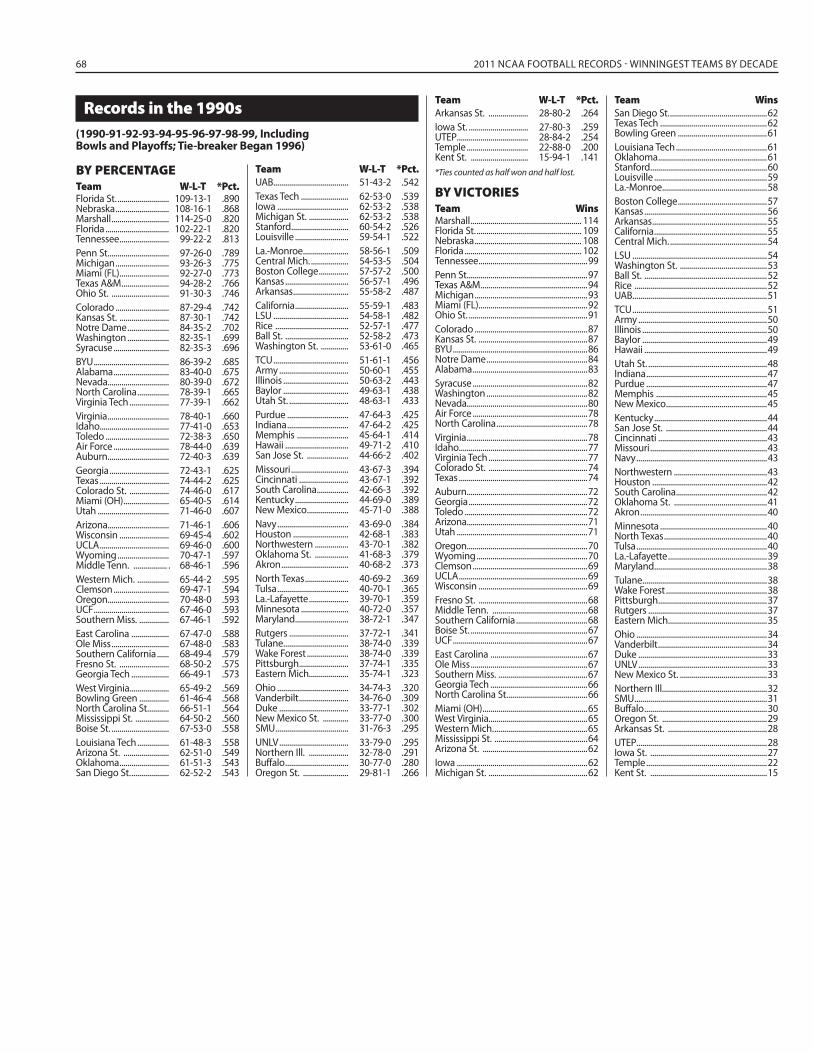
68 2011 NCAA FOOTBALL RECORDS - WINNINGEST TEAMS BY DECADE
Records in the 1990s(1990-91-92-93-94-95-96-97-98-99, Including Bowls and Playoffs; Tie-breaker Began 1996)
BY PERCENTAGETeam W-L-T *Pct.Florida St. .......................... 109-13-1 .890Nebraska ........................... 108-16-1 .868Marshall ............................. 114-25-0 .820Florida ................................ 102-22-1 .820Tennessee ......................... 99-22-2 .813Penn St. .............................. 97-26-0 .789Michigan ........................... 93-26-3 .775Miami (FL) ......................... 92-27-0 .773Texas A&M ........................ 94-28-2 .766Ohio St. ............................. 91-30-3 .746Colorado ........................... 87-29-4 .742Kansas St. ......................... 87-30-1 .742Notre Dame ..................... 84-35-2 .702Washington ..................... 82-35-1 .699Syracuse ............................ 82-35-3 .696BYU ...................................... 86-39-2 .685Alabama ............................ 83-40-0 .675Nevada............................... 80-39-0 .672North Carolina ................ 78-39-1 .665Virginia Tech .................... 77-39-1 .662Virginia ............................... 78-40-1 .660Idaho................................... 77-41-0 .653Toledo ................................ 72-38-3 .650Air Force ............................ 78-44-0 .639Auburn ............................... 72-40-3 .639Georgia .............................. 72-43-1 .625Texas ................................... 74-44-2 .625Colorado St. .................... 74-46-0 .617Miami (OH) ....................... 65-40-5 .614Utah .................................... 71-46-0 .607Arizona............................... 71-46-1 .606Wisconsin ......................... 69-45-4 .602UCLA ................................... 69-46-0 .600Wyoming .......................... 70-47-1 .597Middle Tenn. ................. . 68-46-1 .596Western Mich. ................ 65-44-2 .595Clemson ............................ 69-47-1 .594Oregon............................... 70-48-0 .593UCF ...................................... 67-46-0 .593Southern Miss. ............... 67-46-1 .592East Carolina ................... 67-47-0 .588Ole Miss ............................. 67-48-0 .583Southern California ...... 68-49-4 .579Fresno St. ......................... 68-50-2 .575Georgia Tech ................... 66-49-1 .573West Virginia.................... 65-49-2 .569Bowling Green ............... 61-46-4 .568North Carolina St. .......... 66-51-1 .564Mississippi St. ................. 64-50-2 .560Boise St. ............................. 67-53-0 .558Louisiana Tech ................ 61-48-3 .558Arizona St. ....................... 62-51-0 .549Oklahoma ......................... 61-51-3 .543San Diego St. ................... 62-52-2 .543
UAB ...................................... 51-43-2 .542Texas Tech ........................ 62-53-0 .539Iowa .................................... 62-53-2 .538Michigan St. .................... 62-53-2 .538Stanford ............................. 60-54-2 .526Louisville ........................... 59-54-1 .522La.-Monroe ....................... 58-56-1 .509Central Mich. ................... 54-53-5 .504Boston College ............... 57-57-2 .500Kansas ................................ 56-57-1 .496Arkansas ............................ 55-58-2 .487California ........................... 55-59-1 .483LSU ...................................... 54-58-1 .482Rice ..................................... 52-57-1 .477Ball St. ................................ 52-58-2 .473Washington St. .............. 53-61-0 .465TCU ...................................... 51-61-1 .456Army ................................... 50-60-1 .455Illinois ................................. 50-63-2 .443Baylor ................................. 49-63-1 .438Utah St. .............................. 48-63-1 .433Purdue ............................... 47-64-3 .425Indiana ............................... 47-64-2 .425Memphis .......................... 45-64-1 .414Hawaii ................................ 49-71-2 .410San Jose St. ..................... 44-66-2 .402Missouri ............................. 43-67-3 .394Cincinnati ......................... 43-67-1 .392South Carolina ................ 42-66-3 .392Kentucky ........................... 44-69-0 .389New Mexico ..................... 45-71-0 .388Navy .................................... 43-69-0 .384Houston ............................ 42-68-1 .383Northwestern ................. 43-70-1 .382Oklahoma St. ................. 41-68-3 .379Akron .................................. 40-68-2 .373North Texas ...................... 40-69-2 .369Tulsa .................................... 40-70-1 .365La.-Lafayette .................... 39-70-1 .359Minnesota ........................ 40-72-0 .357Maryland ........................... 38-72-1 .347Rutgers .............................. 37-72-1 .341Tulane ................................. 38-74-0 .339Wake Forest ..................... 38-74-0 .339Pittsburgh ......................... 37-74-1 .335Eastern Mich.................... 35-74-1 .323Ohio .................................... 34-74-3 .320Vanderbilt ......................... 34-76-0 .309Duke ................................... 33-77-1 .302New Mexico St. ............. 33-77-0 .300SMU ..................................... 31-76-3 .295UNLV ................................... 33-79-0 .295Northern Ill. .................... 32-78-0 .291Buffalo ................................ 30-77-0 .280Oregon St. ....................... 29-81-1 .266
Arkansas St. .................... 28-80-2 .264Iowa St. .............................. 27-80-3 .259UTEP .................................... 28-84-2 .254Temple ............................... 22-88-0 .200Kent St. ............................. 15-94-1 .141*Ties counted as half won and half lost.
BY VICTORIESTeam WinsMarshall ........................................................ 114Florida St. ..................................................... 109Nebraska ...................................................... 108Florida ........................................................... 102Tennessee .......................................................99Penn St. ............................................................97Texas A&M ......................................................94Michigan .........................................................93Miami (FL) .......................................................92Ohio St. ............................................................91Colorado .........................................................87Kansas St. .......................................................87BYU ....................................................................86Notre Dame ...................................................84Alabama ..........................................................83Syracuse ..........................................................82Washington ...................................................82Nevada.............................................................80Air Force ..........................................................78North Carolina ..............................................78Virginia .............................................................78Idaho.................................................................77Virginia Tech ..................................................77Colorado St. ..................................................74Texas .................................................................74Auburn .............................................................72Georgia ............................................................72Toledo ..............................................................72Arizona.............................................................71Utah ..................................................................71Oregon.............................................................70Wyoming ........................................................70Clemson ..........................................................69UCLA .................................................................69Wisconsin .......................................................69Fresno St. .......................................................68Middle Tenn. ................................................68Southern California ....................................68Boise St. ...........................................................67UCF ....................................................................67East Carolina .................................................67Ole Miss ...........................................................67Southern Miss. .............................................67Georgia Tech .................................................66North Carolina St. ........................................66Miami (OH) .....................................................65West Virginia..................................................65Western Mich. ...............................................65Mississippi St. ...............................................64Arizona St. .....................................................62Iowa ..................................................................62Michigan St. ..................................................62
San Diego St. .................................................62Texas Tech ......................................................62Bowling Green .............................................61Louisiana Tech ..............................................61Oklahoma .......................................................61Stanford ...........................................................60Louisville .........................................................59La.-Monroe .....................................................58Boston College .............................................57Kansas ..............................................................56Arkansas ..........................................................55California .........................................................55Central Mich. .................................................54LSU ....................................................................54Washington St. ............................................53Ball St. ..............................................................52Rice ...................................................................52UAB ....................................................................51TCU ....................................................................51Army .................................................................50Illinois ...............................................................50Baylor ...............................................................49Hawaii ..............................................................49Utah St. ............................................................48Indiana .............................................................47Purdue .............................................................47Memphis ........................................................45New Mexico ...................................................45Kentucky .........................................................44San Jose St. ...................................................44Cincinnati .......................................................43Missouri ...........................................................43Navy ..................................................................43Northwestern ...............................................43Houston ..........................................................42South Carolina ..............................................42Oklahoma St. ...............................................41Akron ................................................................40Minnesota ......................................................40North Texas ....................................................40Tulsa ..................................................................40La.-Lafayette ..................................................39Maryland .........................................................38Tulane ...............................................................38Wake Forest ...................................................38Pittsburgh .......................................................37Rutgers ............................................................37Eastern Mich..................................................35Ohio ..................................................................34Vanderbilt .......................................................34Duke .................................................................33UNLV .................................................................33New Mexico St. ............................................33Northern Ill. ....................................................32SMU ...................................................................31Buffalo ..............................................................30Oregon St. .....................................................29Arkansas St. ..................................................28UTEP ..................................................................28Iowa St. ...........................................................27Temple .............................................................22Kent St. ...........................................................15
Team W-L-T *Pct.
Team W-L-T *Pct. Team Wins
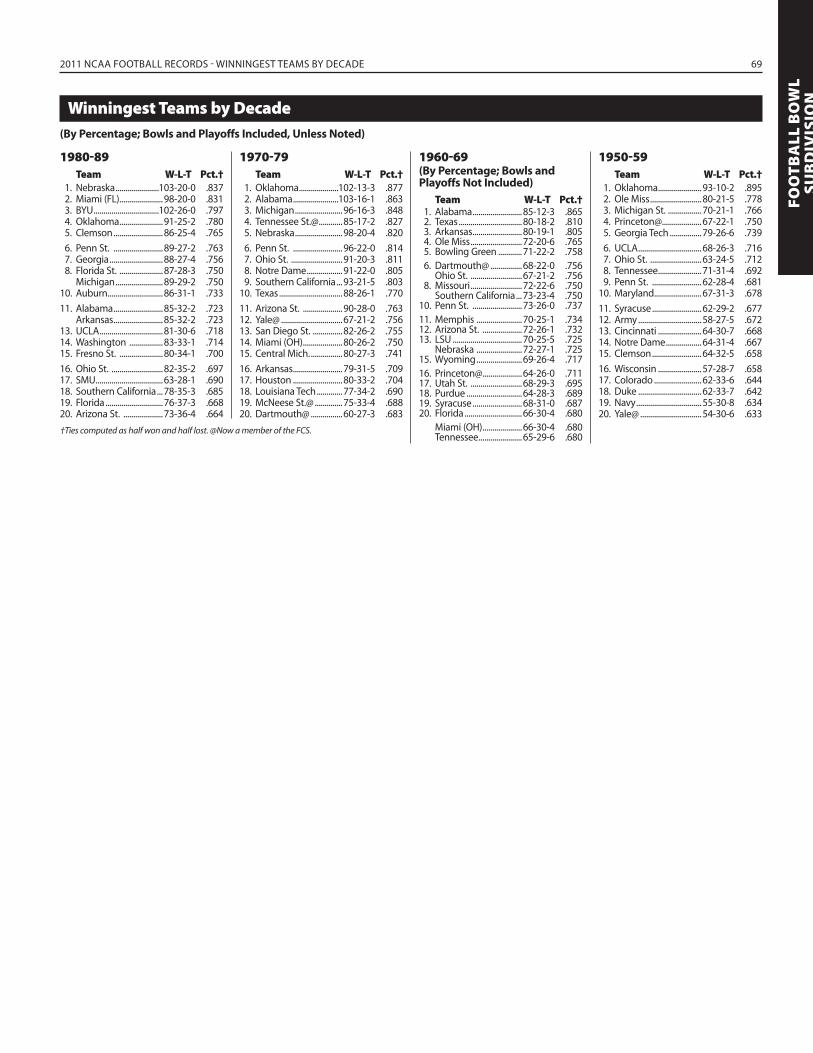
2011 NCAA FOOTBALL RECORDS - WINNINGEST TEAMS BY DECADE 69
FOO
TBA
LL B
OW
LSU
BD
IVIS
IONWinningest Teams by Decade
(By Percentage; Bowls and Playoffs Included, Unless Noted)
1980-89Team W-L-T Pct.†
1. Nebraska ......................103-20-0 .837 2. Miami (FL) ......................98-20-0 .831 3. BYU .................................102-26-0 .797 4. Oklahoma ......................91-25-2 .780 5. Clemson .........................86-25-4 .765 6. Penn St. .........................89-27-2 .763 7. Georgia ...........................88-27-4 .756 8. Florida St. ......................87-28-3 .750 Michigan ........................89-29-2 .75010. Auburn............................86-31-1 .733 11. Alabama .........................85-32-2 .723 Arkansas .........................85-32-2 .723 13. UCLA ................................81-30-6 .718 14. Washington .................83-33-1 .714 15. Fresno St. ......................80-34-1 .700 16. Ohio St. ..........................82-35-2 .697 17. SMU ..................................63-28-1 .690 18. Southern California ...78-35-3 .685 19. Florida .............................76-37-3 .668 20. Arizona St. ....................73-36-4 .664
1970-79Team W-L-T Pct.†
1. Oklahoma ....................102-13-3 .877 2. Alabama .......................103-16-1 .863 3. Michigan ........................96-16-3 .848 4. Tennessee St.@ ............85-17-2 .827 5. Nebraska ........................98-20-4 .820 6. Penn St. .........................96-22-0 .814 7. Ohio St. ..........................91-20-3 .811 8. Notre Dame ..................91-22-0 .805 9. Southern California ...93-21-5 .803 10. Texas ................................88-26-1 .770 11. Arizona St. ....................90-28-0 .763 12. Yale@ ...............................67-21-2 .756 13. San Diego St. ...............82-26-2 .755 14. Miami (OH) ....................80-26-2 .750 15. Central Mich. ................80-27-3 .741 16. Arkansas .........................79-31-5 .709 17. Houston .........................80-33-2 .704 18. Louisiana Tech .............77-34-2 .690 19. McNeese St.@ ..............75-33-4 .688 20. Dartmouth@ ................60-27-3 .683
1960-69(By Percentage; Bowls and Playoffs Not Included)
Team W-L-T Pct.† 1. Alabama .........................85-12-3 .865 2. Texas ................................80-18-2 .810 3. Arkansas .........................80-19-1 .805 4. Ole Miss ..........................72-20-6 .765 5. Bowling Green ............71-22-2 .758 6. Dartmouth@ ................68-22-0 .756 Ohio St. ..........................67-21-2 .756 8. Missouri ..........................72-22-6 .750 Southern California ...73-23-4 .750 10. Penn St. .........................73-26-0 .737 11. Memphis .......................70-25-1 .734 12. Arizona St. ....................72-26-1 .732 13. LSU ...................................70-25-5 .725 Nebraska .......................72-27-1 .725 15. Wyoming .......................69-26-4 .717 16. Princeton@ ....................64-26-0 .711 17. Utah St. ..........................68-29-3 .695 18. Purdue ............................64-28-3 .689 19. Syracuse .........................68-31-0 .687 20. Florida .............................66-30-4 .680 Miami (OH) ....................66-30-4 .680 Tennessee ......................65-29-6 .680
1950-59Team W-L-T Pct.†
1. Oklahoma ......................93-10-2 .895 2. Ole Miss ..........................80-21-5 .778 3. Michigan St. .................70-21-1 .766 4. Princeton@ ....................67-22-1 .750 5. Georgia Tech ................79-26-6 .739 6. UCLA ................................68-26-3 .716 7. Ohio St. ..........................63-24-5 .712 8. Tennessee ......................71-31-4 .692 9. Penn St. .........................62-28-4 .681 10. Maryland........................67-31-3 .678 11. Syracuse .........................62-29-2 .677 12. Army ................................58-27-5 .672 13. Cincinnati ......................64-30-7 .668 14. Notre Dame ..................64-31-4 .667 15. Clemson .........................64-32-5 .658 16. Wisconsin ......................57-28-7 .658 17. Colorado ........................62-33-6 .644 18. Duke ................................62-33-7 .642 19. Navy .................................55-30-8 .634 20. Yale@ ...............................54-30-6 .633
†Ties computed as half won and half lost. @Now a member of the FCS.
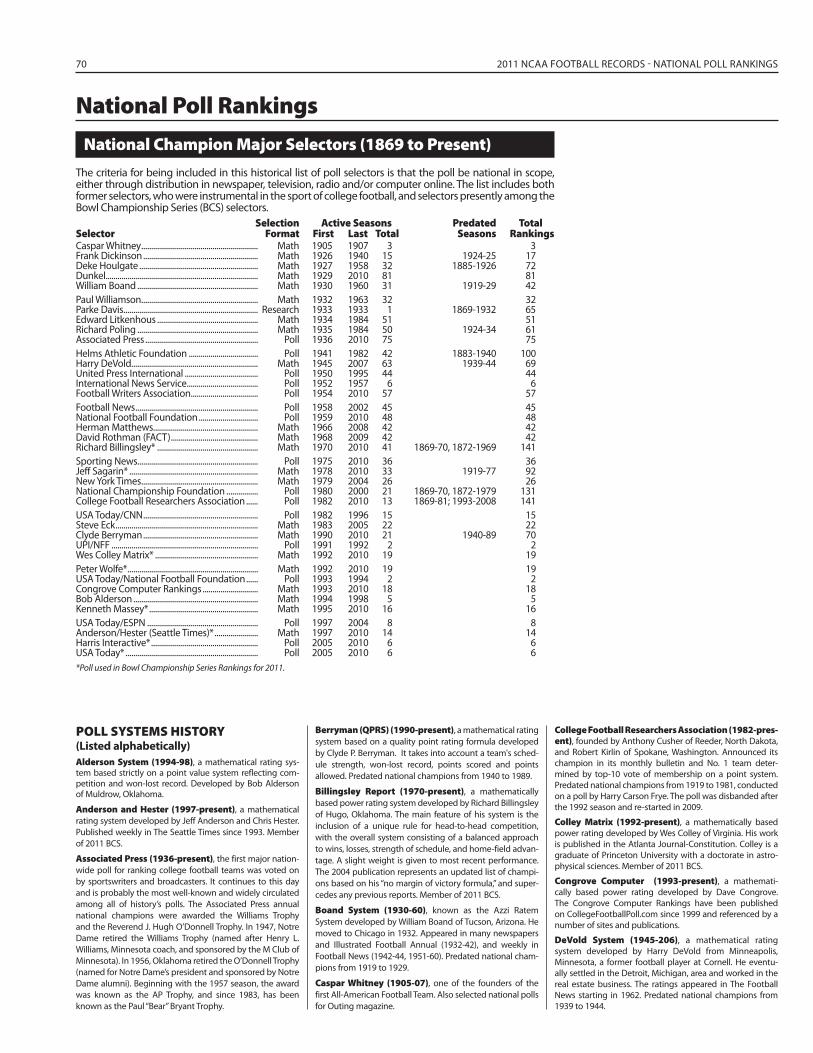
70 2011 NCAA FOOTBALL RECORDS - NATIONAL POLL RANKINGS
National Poll RankingsNational Champion Major Selectors (1869 to Present)
The criteria for being included in this historical list of poll selectors is that the poll be national in scope, either through distribution in newspaper, television, radio and/or computer online. The list includes both former selectors, who were instrumental in the sport of college football, and selectors presently among the Bowl Championship Series (BCS) selectors. Selection Active Seasons Predated TotalSelector Format First Last Total Seasons RankingsCaspar Whitney ........................................................... Math 1905 1907 3 3Frank Dickinson .......................................................... Math 1926 1940 15 1924-25 17Deke Houlgate ............................................................ Math 1927 1958 32 1885-1926 72Dunkel............................................................................. Math 1929 2010 81 81William Boand ............................................................. Math 1930 1960 31 1919-29 42Paul Williamson ........................................................... Math 1932 1963 32 32Parke Davis.................................................................... Research 1933 1933 1 1869-1932 65Edward Litkenhous ................................................... Math 1934 1984 51 51Richard Poling ............................................................. Math 1935 1984 50 1924-34 61Associated Press ......................................................... Poll 1936 2010 75 75Helms Athletic Foundation ................................... Poll 1941 1982 42 1883-1940 100Harry DeVold................................................................ Math 1945 2007 63 1939-44 69United Press International ..................................... Poll 1950 1995 44 44International News Service .................................... Poll 1952 1957 6 6Football Writers Association.................................. Poll 1954 2010 57 57Football News .............................................................. Poll 1958 2002 45 45National Football Foundation .............................. Poll 1959 2010 48 48Herman Matthews..................................................... Math 1966 2008 42 42David Rothman (FACT) ............................................ Math 1968 2009 42 42Richard Billingsley* ................................................... Math 1970 2010 41 1869-70, 1872-1969 141Sporting News............................................................. Poll 1975 2010 36 36Jeff Sagarin* ................................................................. Math 1978 2010 33 1919-77 92New York Times ........................................................... Math 1979 2004 26 26National Championship Foundation ................ Poll 1980 2000 21 1869-70, 1872-1979 131College Football Researchers Association ...... Poll 1982 2010 13 1869-81; 1993-2008 141USA Today/CNN .......................................................... Poll 1982 1996 15 15Steve Eck ........................................................................ Math 1983 2005 22 22Clyde Berryman .......................................................... Math 1990 2010 21 1940-89 70UPI/NFF .......................................................................... Poll 1991 1992 2 2Wes Colley Matrix* .................................................... Math 1992 2010 19 19Peter Wolfe* .................................................................. Math 1992 2010 19 19USA Today/National Football Foundation ...... Poll 1993 1994 2 2Congrove Computer Rankings ............................ Math 1993 2010 18 18Bob Alderson ............................................................... Math 1994 1998 5 5Kenneth Massey* ....................................................... Math 1995 2010 16 16USA Today/ESPN ........................................................ Poll 1997 2004 8 8Anderson/Hester (Seattle Times)* ...................... Math 1997 2010 14 14Harris Interactive* ...................................................... Poll 2005 2010 6 6USA Today* ................................................................... Poll 2005 2010 6 6*Poll used in Bowl Championship Series Rankings for 2011.
POLL SYSTEMS HISTORY(Listed alphabetically)
Alderson System (1994-98), a mathematical rating sys-tem based strictly on a point value system reflecting com-petition and won-lost record. Developed by Bob Alderson of Muldrow, Oklahoma.
Anderson and Hester (1997-present), a mathematical rating system developed by Jeff Anderson and Chris Hester. Published weekly in The Seattle Times since 1993. Member of 2011 BCS.
Associated Press (1936-present), the first major nation-wide poll for ranking college football teams was voted on by sportswriters and broadcasters. It continues to this day and is probably the most well-known and widely circulated among all of history’s polls. The Associated Press annual national champions were awarded the Williams Trophy and the Reverend J. Hugh O’Donnell Trophy. In 1947, Notre Dame retired the Williams Trophy (named after Henry L. Williams, Minnesota coach, and sponsored by the M Club of Minnesota). In 1956, Oklahoma retired the O’Donnell Trophy (named for Notre Dame’s president and sponsored by Notre Dame alumni). Beginning with the 1957 season, the award was known as the AP Trophy, and since 1983, has been known as the Paul “Bear” Bryant Trophy.
Berryman (QPRS) (1990-present), a mathematical rating system based on a quality point rating formula developed by Clyde P. Berryman. It takes into account a team's sched-ule strength, won-lost record, points scored and points allowed. Predated national champions from 1940 to 1989.
Billingsley Report (1970-present), a mathematically based power rating system developed by Richard Billingsley of Hugo, Oklahoma. The main feature of his system is the inclusion of a unique rule for head-to-head competition, with the overall system consisting of a balanced approach to wins, losses, strength of schedule, and home-field advan-tage. A slight weight is given to most recent performance. The 2004 publication represents an updated list of champi-ons based on his “no margin of victory formula,” and super-cedes any previous reports. Member of 2011 BCS.
Boand System (1930-60), known as the Azzi Ratem System developed by William Boand of Tucson, Arizona. He moved to Chicago in 1932. Appeared in many newspapers and Illustrated Football Annual (1932-42), and weekly in Football News (1942-44, 1951-60). Predated national cham-pions from 1919 to 1929.
Caspar Whitney (1905-07), one of the founders of the first All-American Football Team. Also selected national polls for Outing magazine.
College Football Researchers Association (1982-pres-ent), founded by Anthony Cusher of Reeder, North Dakota, and Robert Kirlin of Spokane, Washington. Announced its champion in its monthly bulletin and No. 1 team deter-mined by top-10 vote of membership on a point system. Predated national champions from 1919 to 1981, conducted on a poll by Harry Carson Frye. The poll was disbanded after the 1992 season and re-started in 2009.
Colley Matrix (1992-present), a mathematically based power rating developed by Wes Colley of Virginia. His work is published in the Atlanta Journal-Constitution. Colley is a graduate of Princeton University with a doctorate in astro-physical sciences. Member of 2011 BCS.
Congrove Computer (1993-present), a mathemati-cally based power rating developed by Dave Congrove. The Congrove Computer Rankings have been published on CollegeFootballPoll.com since 1999 and referenced by a number of sites and publications.
DeVold System (1945-206), a mathematical rating system developed by Harry DeVold from Minneapolis, Minnesota, a former football player at Cornell. He eventu-ally settled in the Detroit, Michigan, area and worked in the real estate business. The ratings appeared in The Football News starting in 1962. Predated national champions from 1939 to 1944.

2011 NCAA FOOTBALL RECORDS - NATIONAL POLL RANKINGS 71
FOO
TBA
LL B
OW
LSU
BD
IVIS
IONDickinson System (1926-40), a mathematical point sys-
tem devised by Frank Dickinson, a professor of economics at Illinois. The annual Dickinson ratings were emblematic of the national championship and the basis for awarding the Rissman National Trophy and the Knute K. Rockne Intercollegiate Memorial Trophy. Notre Dame gained per-manent possession of the Rissman Trophy (named for Jack F. Rissman, a Chicago clothing manufacturer) after its third vic-tory in 1930. Minnesota retired the Rockne Trophy (named in honor of the famous Notre Dame coach) after winning it for a third time in 1940.
Dunkel System (1929-present), a power index system devised by Dick Dunkel Sr., founder/owner (1929-75); by Dick Dunkel Jr., owner (1975-02); and by Bob Dunkel, co-owner (2002-present), Richard H. Dunkel Jr., co-owner (2002-present) and John Duck, executive producer, of the Daytona (FL) Beach News-Journal.
Eck Ratings System (1983-2005), a mathematical point system developed by Steve Eck, an aerospace worker with a master’s degree from UCLA. The factors in the poll were game outcome, strength of opponent and location of game.
Football News (1958-02), weekly poll of its staff writers had named a national champion since 1958.
Football Writers Association of America (1954-pres-ent), the No. 1 team of the year is determined by a five-person panel representing the nation’s football writers. The national championship team named receives the Grantland Rice Award.
Harris Interactive (2005-present), a panel of former players, coaches, administrators and current and former media, who committed to ranking college teams each week. Panelists were randomly selected from among more than 300 nominations submitted by FBS conference offices and Notre Dame. The panel has been designed to be a sta-tistically valid representation of all 11 FBS conferences and independent institutions. Member of 2011 BCS.
Helms Athletic Foundation (1941-82), originally known by this name from 1936 to 1969 and established by the founding sponsor, Paul H. Helms, Los Angeles sportsman and philanthropist. After Helms’ death in 1957, United Savings & Loan Association became its benefactor during 1970-72. A merger of United Savings and Citizen Savings was completed in 1973, and the Athletic Foundation became known as Citizens Savings Athletic Foundation. In 1982, First Interstate Bank assumed sponsorship for its final rankings. In 1941, Bill Schroeder, managing director of the Helms Athletic Foundation, retroactively selected the national football champions for the period beginning in 1883 (the first year of a scoring system) through 1940. Thereafter, Schroeder, who died in 1988, then chose, with the assistance of a Hall Board, the annual national champion after the bowl games.
Houlgate System (1927-58), a mathematical rating sys-tem developed by Deke Houlgate of Los Angeles, California. His ratings were syndicated in newspapers and published in Illustrated Football and the Football Thesaurus (1946-58).
International News Service (1952-57), a poll conducted for six years by members of the International News Service (INS) before its merger with United Press in 1958.
Litkenhous (1934-84), a difference-by-score formula developed by Edward E. Litkenhous, a professor of chemical engineering at Vanderbilt, and his brother, Frank.
Massey College Football Ratings (1995-present), a mathematical rating system developed by Kenneth Massey, a graduate student at Virginia Tech in mathematics. His rat-ings account for home-field advantage. Member of 2009 BCS.
Matthews Grid Ratings (1966-2006), a mathematical rating system developed by college mathematics profes-sor Herman Matthews of Middlesboro, Kentucky. It has appeared in Scripps-Howard newspapers and The Football News.
National Championship Foundation (1980-2000), established by Mike Riter of Hudson, New York. Issued annual report. Predated national champions from 1869 to 1979, with the exception of 1871.
National Football Foundation (1959-present), the National Football Foundation and Hall of Fame named its first national champion in 1959. Headquartered in Irving, Texas, the present National Football Foundation was estab-lished in 1947 to promote amateur athletics in America. The national champion was awarded the MacArthur Bowl from 1959 to 1990. In 1991 and 1992, the NFF/HOF joined with UPI to award the MacArthur Bowl, and in 1993, the NFF/HOF joined with USA Today to award the MacArthur Bowl.
New York Times (1979-2004), a mathematical poll that combined the voting of a panel of sportswriters.
Parke Davis (1933), a noted college football historian and former Princeton lineman, Parke H. Davis went back and named the championship teams from 1869 through the 1932 season. He also named a national champion at the conclusion of the 1933 season. Interestingly, the years 1869-75 were identified by Davis as the Pioneer Period; the years 1876-93 were called the Period of the American Intercollegiate Football Association, and the years 1894-1933 were referred to as the Period of Rules Committees and Conferences. He also coached at Wisconsin, Amherst and Lafayette.
Poling System (1935-84), a mathematical rating system for college football teams developed by Richard Poling from Mansfield, Ohio, a former football player at Ohio Wesleyan. Poling’s football ratings were published annually in the
Football Review Supplement and in various newspapers. Predated national champions from 1924 to 1934.
Rothman (FACT) (1968-present), a computerized math-ematical ranking system developed by David Rothman of Hawthorne, California. FACT is the Founda tion for the Analysis of Competitions and Tournaments, which began selecting a national champion in 1968. Rothman is a semi-retired defense and aerospace statistician and was co-chair of the Committee on Statistics in Sports and Competition of the American Statistical Association in the 1970s.
Sagarin Ratings (1978-present), a mathematical rating system developed by Jeff Sagarin of Bloomington, Indiana, a 1970 MIT mathematics graduate. Runs annually in USA Today newspaper. Predated national champions from 1919 to 1977. Member of 2011 BCS.
Sporting News (1975-present), voted on annually by the staff of this St. Louis-based nationally circulated sports publication.
United Press International (1950-90, 1993-95), in 1950, the United Press news service began its poll of foot-ball coaches (replaced as coaches’ poll after 1990 season). When the United Press merged with the International News Service in 1958, it became known as United Press International. The weekly UPI rankings were featured in newspapers and on radio and television nationwide. UPI and the National Football Foundation formed a coalition for 1991 and 1992 to name the MacArthur Bowl national champion. Returned to single poll in 1993-95.
USA Today/Cable News Network and ESPN (1982-present), introduced a weekly poll of sportswrit-ers in 1982 and ranked the top 25 teams in the nation with a point system. The poll results were featured in USA Today, a national newspaper, and on the Cable News Network, a national cable television network. Took over as the coaches’ poll in 1991. USA Today also formed a coalition with the National Football Foundation in 1993 to name the MacArthur Bowl national champion. Combined with ESPN in 1997-2004 to distribute the coaches’ poll nationally. Currently just listed as USA Today Coaches’ Poll. Member of 2011 BCS.
Williamson System (1932-63), a power rating system chosen by Paul Williamson of New Orleans, a geologist and member of the Sugar Bowl committee.
Wolfe (1992-present), a mathematically based power rating matrix developed by Peter Wolfe and Ross Baker. Member of 2011 BCS.
Thanks from the NCAA Statistics Service to Robert A. Rosiek of Dearborn, Michigan, who researched much of the former polls’ history, and to Tex Noel, who provided information about Parke H. Davis.

72 2011 NCAA FOOTBALL RECORDS - NATIONAL POLL CHAMPIONS
During the last 142 years, there have been more than 30 selectors of national champions using polls, historical research and mathematical rating systems. Beginning in 1936, The Associated Press began the best-known and most widely circulated poll of sportswriters and broadcasters. Before 1936, national champions were determined by his-torical research and retroactive ratings and polls.
Note: * indicates selectors that chose multiple schools. The national champion was selected before bowl games as follows: AP (1936-64 and 1966-67); UP-UPI (1950-73); FWAA (1954); NFF-HOF (1959-70). In all other latter-day polls, champions were selected after bowl games. The Sagarin Rating includes his actual rating that combines scores and pure won-lost records. Sagarin also now provides an ELO-Chess rating that uses only pure won-lost records, and is the one utilized in the Bowl Championship Series (BCS) rankings. The Billingsley Ratings were converted in 2003 to conform to his “no margin of victory” formula to match the requirements of the BCS.
1869Princeton: Billingsley, National Championship Foun da tion, Parke Davis*Rutgers: Parke Davis*
1870Princeton: Billingsley, National Championship Founda tion, Parke Davis
1871No national champions selected.
1872Princeton: Billingsley, National Championship Founda tion, Parke Davis*Yale: Parke Davis*
1873Princeton: Billingsley, National Championship Founda tion, Parke Davis
1874Harvard: Parke Davis*Princeton: Billingsley, Parke Davis*Yale: National Championship Foundation, Parke Davis*
1875Columbia: Parke Davis*Harvard: National Championship Foundation, Parke Davis*Princeton: Billingsley, Parke Davis*
1876Yale: Billingsley, National Championship Foundation, Parke Davis
1877Princeton: Billingsley, Parke Davis*Yale: National Championship Foundation, Parke Davis*
1878Princeton: Billingsley, National Championship Founda tion, Parke Davis
1879Princeton: Billingsley, National Championship Founda tion, Parke Davis*Yale: Parke Davis*
1880Princeton: National Championship Foundation*, Parke Davis*Yale: Billingsley, National Championship Foundation*, Parke Davis*
1881Princeton: Billingsley, Parke Davis*Yale: National Championship Foundation, Parke Davis*
1882Yale: Billingsley, National Championship Foundation, Parke Davis
1883Yale: Billingsley, Helms, National Championship Foun da-tion, Parke Davis
1884Princeton: Billingsley, Parke Davis*Yale: Helms, National Championship Foun da tion, Parke Davis*
1885Princeton: Billingsley, Helms, Houlgate, National Cham pi -onship Foundation, Parke Davis
1886Princeton: Billingsley, Parke Davis*Yale: Helms, National Championship Foun da tion, Parke Davis*
1887Yale: Billingsley, Helms, Houlgate, National Cham pi on ship Foun dation, Parke Davis
1888Yale: Billingsley, Helms, Houlgate, National Cham pion ship Foun dation, Parke Davis
1889Princeton: Billingsley, Helms, Houlgate, National Cham pi-onship Foundation, Parke Davis
1890Harvard: Billingsley, Helms, Houlgate, National Cham pi -onship Foundation, Parke Davis
1891Yale: Billingsley, Helms, Houlgate, National Cham pi on ship Foun dation, Parke Davis
1892Yale: Billingsley, Helms, Houlgate, National Cham pi on ship Founda tion, Parke Davis
1893Princeton: Billingsley, Helms, Houlgate, National Cham pi -onship FoundationYale: Parke Davis
1894Penn: Parke Davis*Princeton: HoulgateYale: Billingsley, Helms, National Championship Foun da -tion, Parke Davis*
1895Penn: Billingsley, Helms, Houlgate, National Cham pion ship Foundation, Parke Davis*Yale: Parke Davis*
1896Lafayette: National Championship Foundation*, Parke Davis*Princeton: Billingsley, Helms, Houlgate, National Cham pi-onship Foun dation*, Parke Davis*
1897Penn: Billingsley, Helms, Houlgate, National Cham pion ship Foundation, Parke Davis*Yale: Parke Davis*
1898Harvard: Billingsley, Helms, Houlgate, National Cham pi -onship FoundationPrinceton: Parke Davis
1899Harvard: Helms, Houlgate, National Cham pi onship FoundationPrinceton: Billingsley, Parke Davis
1900Yale: Billingsley, Helms, Houlgate, National Cham pion ship Foun da tion, Parke Davis
1901Harvard: BillingsleyMichigan: Helms, Houlgate, National Cham pi onship FoundationYale: Parke Davis
1902Michigan: Billingsley, Helms, Houlgate, National Cham pi -onship Foundation, Parke Davis*Yale: Parke Davis*
1903Michigan: National Championship Foun da tion*Princeton: Billingsley, Helms, Houlgate, National Cham -pionship Foun dation*, Parke Davis
1904Michigan: National Championship Foun da tion*Minnesota: BillingsleyPenn: Helms, Houlgate, National Cham pion ship Foundation*, Parke Davis
1905Chicago: Billingsley, Helms, Houlgate, National Cham pi -onship FoundationYale: Parke Davis, Whitney
1906Princeton: Helms, National Championship FoundationYale: Billingsley, Parke Davis, Whitney
1907Yale: Billingsley, Helms, Houlgate, National Cham pionship Foun da tion, Parke Davis, Whitney
1908Harvard: BillingsleyLSU: National Championship Foundation*Penn: Helms, Houlgate, National Cham pion ship Foundation*, Parke Davis
1909Yale: Billingsley, Helms, Houlgate, National Cham pi on ship Foun dation, Parke Davis
1910Harvard: Billingsley, Helms, Houlgate, National Championship Foun da tion*Pittsburgh: National Championship Foundation*
1911Penn St.: National Championship Foundation*Princeton: Billingsley, Helms, Houlgate, National Cham-pionship Foun dation*, Parke Davis
1912Harvard: Billingsley, Helms, Houlgate, National Cham-pionship Foun dation*, Parke DavisPenn St.: National Championship Foundation*
1913Auburn: BillingsleyChicago: Parke Davis*Harvard: Helms, Houlgate, National Cham pionship Foun -dation, Parke Davis*
1914Army: Helms, Houlgate, National Cham pionship Foun da -tion, Parke Davis*Illinois: Parke Davis*Texas: Billingsley
1915Cornell: Helms, Houlgate, National Cham pionship Foun -dation, Parke Davis*Oklahoma: BillingsleyPittsburgh: Parke Davis*
1916Army: Parke Davis*Pittsburgh: Billingsley, Helms, Houlgate, National Cham -pionship Foundation, Parke Davis*
National Poll Champions

2011 NCAA FOOTBALL RECORDS - NATIONAL POLL CHAMPIONS 73
FOO
TBA
LL B
OW
LSU
BD
IVIS
ION1917
Georgia Tech: Billingsley, Helms, Houlgate, National Cham -pion ship Foundation
1918Michigan: Billingsley, National Championship Foun da tion*Pittsburgh: Helms, Houlgate, National Championship Foun dation*
1919Harvard: Football Research*, Helms, Houlgate, Na tional Cham pionship Foundation*, Parke Davis*Illinois: Boand, Football Research*, Parke Davis*, Sagarin (ELO-Chess)*Notre Dame: National Championship Foundation*, Parke Davis*Texas A&M: Billingsley, National Championship Foundation*Centre: Sagarin*
1920California: Football Research, Helms, Houlgate, Na tional Championship Foundation, Sagarin, Sagarin (ELO-Chess)Harvard: Boand*Notre Dame: Billingsley, Parke Davis*Princeton: Boand*, Parke Davis*
1921California: Billingsley, Boand*, Football Research, Sagarin, Sagarin (ELO-Chess)Cornell: Helms, Houlgate, National Cham pionship Foun -dation, Parke Davis*Iowa: Parke Davis*Lafayette: Boand*, Parke Davis*Wash. & Jeff.: Boand*
1922California: Billingsley, Houlgate, National Championship Foun da tion*, Sagarin*Cornell: Helms, Parke Davis* Princeton: Boand, Football Research, Na tional Cham pi on -ship Foundation*, Parke Davis*, Sagarin (ELO-Chess)*
1923California: HoulgateCornell: Sagarin*Illinois: Boand, Football Research, Helms, National Cham -pionship Foundation*, Parke Davis, Sagarin (ELO-Chess)*Michigan: Billingsley, National Championship Foun da tion*
1924Notre Dame: Billingsley, Boand, Dickinson, Football Re search, Helms, Houl gate, National Championship Foun-da tion, Poling, Sagarin, Sagarin (ELO-Chess)Penn: Parke Davis
1925Alabama: Billingsley, Boand, Football Research, Helms, Houl gate, National Championship Foundation, Poling, Sagarin (ELO-Chess)*Dartmouth: Dickinson, Parke DavisMichigan: Sagarin*
1926Alabama: Billingsley, Football Research, Helms*, Na tion al Cham pionship Foundation*, PolingLafayette: Parke DavisMichigan: Sagarin*Navy: Boand, HoulgateStanford: Dickinson, Helms*, National Championship Foun da tion*, Sagarin (ELO-Chess)*
1927Georgia: Boand, PolingIllinois: Billingsley, Dickinson, Helms, National Cham pi on -ship Foun dation, Parke DavisNotre Dame: HoulgateTexas A&M: Sagarin, Sagarin (ELO-Chess)Yale: Football Research
1928Detroit: Parke Davis*Georgia Tech: Billingsley, Boand, Football Research, Helms, Houl gate, National Championship Foun dation, Parke Davis*, Poling, Sagarin (ELO-Chess)*Southern California: Dickinson, Sagarin*
1929Notre Dame: Billingsley, Boand, Dickinson, Dunkel, Foot -ball Re search, Helms, Na tional Championship Foun da tion, Poling, Sagarin (ELO-Chess)*Pittsburgh: Parke DavisSouthern California: Houlgate, Sagarin*
1930Alabama: Football Research, Parke Davis*, Sagarin, Sagarin (ELO-Chess) Notre Dame: Billingsley, Boand, Dickinson, Dunkel, Helms, Houl gate, National Championship Foundation, Parke Davis*, Poling
1931Pittsburgh: Parke Davis*Purdue: Parke Davis*Southern California: Billingsley, Boand, Dickinson, Dunkel, Helms, Houl gate, Football Research, National Champion ship Founda tion, Poling, Sagarin, Sagarin (ELO-Chess), Williamson
1932Colgate: Parke Davis*Michigan: Dickinson, Parke Davis*, Sagarin (ELO-Chess)*Southern California: Billingsley, Boand, Dunkel, Foot ball Re search, Helms, Houlgate, National Championship Foun da-tion, Parke Davis*, Poling, Sagarin*, Williamson
1933Michigan: Billingsley, Boand, Dickinson, Helms, Houlgate, Football Research, National Championship Foun da tion, Parke Davis*, Poling, Sagarin, Sagarin (ELO-Chess)Ohio St.: DunkelPrinceton: Parke Davis*Southern California: Williamson
1934Alabama: Dunkel, Houlgate, Poling, William sonMinnesota: Billingsley, Boand, Dickinson, Foot ball Research, Helms, Litkenhous, National Championship Foundation, Sagarin, Sagarin (ELO-Chess)
1935LSU: Williamson*Minnesota: Billingsley, Boand, Football Research, Helms, Litken hous, National Championship Foundation, PolingPrinceton: DunkelSMU: Dickinson, Houlgate, Sagarin, Sagarin (ELO-Chess)TCU: Williamson*
1936LSU: Sagarin, Sagarin (ELO-Chess), WilliamsonMinnesota: AP, Billingsley, Dickinson, Dunkel, Helms, Litken hous, National Championship Foundation, PolingPittsburgh: Boand, Football Research, Houlgate
1937California: Dunkel, HelmsPittsburgh: AP, Billingsley, Boand, Dickinson, Football Re search, Houlgate, Litkenhous, National Championship Founda tion, Poling, Sagarin, Sagarin (ELO-Chess), Williamson
1938Notre Dame: DickinsonTennessee: Billingsley, Boand, Dunkel, Football Re search, Houl gate, Litkenhous, Poling, Sagarin, Sagarin (ELO-Chess)TCU: AP, Helms, National Championship Foun dation, Williamson
1939Cornell: Litkenhous, Sagarin*Southern California: DickinsonTexas A&M: AP, Billingsley, Boand, DeVold, Dunkel, Foot ball Re search, Helms, Houlgate, National Cham pion ship Foun da-tion, Poling, Sagarin (ELO-Chess)*, Williamson
1940Minnesota: AP, Berryman, Boand, DeVold, Dickinson, Football Research, Houlgate, Litkenhous, Na tion al Cham-pionship Foundation, Sagarin, Sagarin (ELO-Chess)Stanford: Billingsley, Helms, PolingTennessee: Dunkel, Williamson
1941Alabama: HoulgateMinnesota: AP, Billingsley, Boand, DeVold, Dunkel, Foot ball Re search, Helms, Litkenhous, National Cham pi on ship Foun-dation, Poling, Sagarin, Sagarin (ELO-Chess)Texas: Berryman, Williamson
1942Georgia: Berryman, Billingsley, DeVold, Houlgate, Litkenhous, Poling, Sagarin, Sagarin (ELO-Chess), WilliamsonOhio St.: AP, Boand, Dunkel, Football Re search, Nation al Championship FoundationWisconsin: Helms
1943Notre Dame: AP, Berryman, Billingsley, Boand, DeVold, Dunkel, Football Research, Helms, Houlgate, Litkenhous, National Championship Foundation, Poling, Sagarin, Sagarin (ELO-Chess), Williamson
1944Army: AP, Berryman, Billingsley, Boand, DeVold, Dunkel, Football Research, Helms, Houlgate, Litkenhous, Na tional Cham pionship Foundation*, Poling, Sagarin*, WilliamsonOhio St.: National Championship Foundation*, Sagarin (ELO-Chess)*
1945Alabama: National Championship Foundation*Army: AP, Berryman, Billingsley, Boand, DeVold, Dunkel, Football Research, Helms, Houlgate, Litkenhous, Na tional Cham pion ship Foundation*, Poling, Sagarin, Sagarin (ELO-Chess), Williamson
1946Army: Billingsley, Boand*, Football Research, Helms*, Houlgate, Poling*Georgia: WilliamsonNotre Dame: AP, Berryman, Boand*, DeVold, Dunkel, Helms*, Litkenhous, National Cham pi on ship Foundation, Poling*, Sagarin, Sagarin (ELO-Chess)
1947Michigan: Berryman, Billingsley, Boand, DeVold, Dunkel, Football Research, Helms*, Houlgate, Litkenhous, Na tional Cham pionship Foundation, Poling, Sagarin, Sagarin (ELO-Chess)Notre Dame: AP, Helms*, Williamson
1948Michigan: AP, Berryman, Billingsley, Boand, DeVold, Dunkel, Foot ball Research, Helms, Houlgate, Litken hous, Na tional Championship Foundation, Poling, Sagarin, Sagarin (ELO-Chess), Williamson
1949Notre Dame: AP, Berryman, Billingsley, Boand, DeVold, Dunkel, Helms, Houlgate, Litkenhous, National Champion-ship Foun dation, Poling, Sagarin, Sagarin (ELO-Chess), WilliamsonOklahoma: Football Research
1950Kentucky: Sagarin*Oklahoma: AP, Berryman, Helms, Litkenhous, UPI, William-sonPrinceton: Boand, PolingTennessee: Billingsley, DeVold, Dunkel, Football Re search, Na tional Championship Foundation, Sagarin (ELO-Chess)*
1951Georgia Tech: Berryman, Boand*Illinois: Boand*Maryland: DeVold, Dunkel, Football Re search, Na tional Championship Foundation, Sagarin, Sagarin (ELO-Chess)Michigan St.: Billingsley, Helms, PolingTennessee: AP, Litkenhous, UPI, Williamson
1952Georgia Tech: Berryman, Billingsley, INS, Poling, Sagarin (ELO-Chess)*Michigan St.: AP, Boand, DeVold, Dunkel, Foot ball Re search, Helms, Litkenhous, National Cham pi on ship Foun-dation, Sagarin*, UPI, Williamson

74 2011 NCAA FOOTBALL RECORDS - NATIONAL POLL CHAMPIONS
1953Maryland: AP, INS, UPINotre Dame: Billingsley, Boand, DeVold, Dunkel, Helms, Lit kenhous, National Championship Foundation, Poling, Sagarin, Sagarin (ELO-Chess), WilliamsonOklahoma: Berryman, Football Research
1954Ohio St.: AP, Berryman, Billingsley, Boand, DeVold, Football Re search*, Helms*, INS, National Championship Foun da-tion*, Poling, Sagarin, Sagarin (ELO-Chess), WilliamsonUCLA: Dunkel, Football Research*, FW, Helms*, Litkenhous, National Championship Foun da tion*, UPI
1955Michigan St.: BoandOklahoma: AP, Berryman, Billingsley, DeVold, Dunkel, Foot-ball Research, FW, Helms, INS, Litkenhous, National Cham -pionship Foundation, Poling, Sagarin, Sagarin (ELO-Chess), UPI, Williamson
1956Georgia Tech: Berryman, Sagarin*Iowa: Football ResearchOklahoma: AP, Billingsley, Boand, DeVold, Dunkel, FW, Helms, INS, Litkenhous, National Championship Foun dation, Sagarin, UPI, William sonTennessee: Sagarin (ELO-Chess)*
1957Auburn: AP, Billingsley, Football Research, Helms, National Cham pi onship Foundation, Poling, Sagarin, Sagarin (ELO-Chess), WilliamsonMichigan St.: DunkelOhio St.: Boand, DeVold, FW, INS, Litkenhous, UPIOklahoma: Berryman
1958Iowa: FW LSU: AP, Berryman, Billingsley, Boand, DeVold, Dunkel, FB News, Football Research, Helms, Litkenhous, National Cham-pionship Foundation, Poling, Sagarin, Sagarin (ELO-Chess), UPI, Williamson
1959Ole Miss: Berryman, Dunkel, Sagarin*Syracuse: AP, Billingsley, Boand, DeVold, FB News, Football Re search, FW, Helms, Litkenhous, National Champion-ship Foun dation, NFF, Poling, Sagarin (ELO-Chess)*, UPI, Williamson
1960Iowa: Berryman, Boand, Litkenhous, Sagarin, Sagarin (ELO-Chess)Minnesota: AP, FB News, NFF, UPIOle Miss: Billingsley, DeVold, Dunkel, Football Research, FW, Na tional Championship Foundation, WilliamsonMissouri: PolingWashington: Helms
1961Alabama: AP, Berryman, Billingsley, DeVold, Dunkel, FB News, Football Research, Helms, Litkenhous, National Cham-pionship Foundation, NFF, Sagarin, Sagarin (ELO-Chess), UPI, WilliamsonOhio St.: FW, Poling
1962LSU: Berryman*Southern California: AP, Berryman*, DeVold, Dunkel, FB News, Foot ball Research, FW, Helms, National Cham pi on-ship Foundation, NFF, Poling, UPI, WilliamsonOle Miss: Billingsley, Litkenhous, Sagarin, Sagarin (ELO-Chess)
1963Texas: AP, Berryman, Billingsley, DeVold, Dunkel, FB News, Foot ball Research, FW, Helms, Litkenhous, Na tion al Championship Foundation, NFF, Poling, Sagarin, Sagarin (ELO-Chess), UPI, Williamson
1964Alabama: AP, Berryman, Litkenhous, UPIArkansas: Billingsley, Football Research, FW, Helms, Na tional Championship Foundation, Poling, Sagarin, Sagarin (ELO-Chess)Michigan: DunkelNotre Dame: DeVold, FB News, NFF
1965Alabama: AP, Football Research, FW*, Na tion al Championship FoundationMichigan St.: Berryman, Billingsley, DeVold, Dunkel, FB News, FW*, Helms, Litkenhous, NFF, Poling, Sagarin, Sagarin (ELO-Chess), UPI
1966Alabama: Berryman, Sagarin (ELO-Chess)*Michigan St.: Football Research, Helms*, NFF*, Poling*Notre Dame: AP, Billingsley, DeVold, Dunkel, FB News, FW, Helms*, Litkenhous, Matthews, National Cham pionship Foundation, NFF*, Poling*, Sagarin*, UPI
1967Notre Dame: DunkelOklahoma: PolingSouthern California: AP, Berryman, Billingsley, DeVold, FB News, Football Research, FW, Helms, Matthews, Na tion-al Championship Foundation, NFF, Sagarin, Sagarin (ELO-Chess), UPITennessee: Litkenhous
1968Georgia: LitkenhousOhio St.: AP, Berryman, Billingsley, Dunkel, FACT, FB News, Football Research, FW, Helms, National Cham pi on ship Foundation, NFF, Poling, Sagarin (ELO-Chess)*, UPITexas: DeVold, Matthews, Sagarin*
1969Ohio St.: MatthewsPenn St.: FACT*, Sagarin (ELO-Chess)*Texas: AP, Berryman, Billingsley, DeVold, Dunkel, FACT*, FB News, Football Research, FW, Helms, Litkenhous, National Championship Foundation, NFF, Poling, Sagarin*, UPI
1970Arizona St.: PolingNebraska: AP, Billingsley, DeVold, Dunkel, FACT*, FB News, Football Research, FW, Helms, National Cham pi on ship Foundation, Sagarin (ELO-Chess)*Notre Dame: FACT*, Matthews, Sagarin* Ohio St.: NFF*Texas: Berryman, FACT*, Litkenhous, NFF*, UPI
1971Nebraska: AP, Berryman, Billingsley, DeVold, Dunkel, FACT, FB News, Football Research, FW, Helms, Litken hous, Matthews, National Championship Foun dation, NFF, Poling, Sagarin, Sagarin (ELO-Chess), UPI
1972Southern California: AP, Berryman, Billingsley, DeVold, Dunkel, FACT, FB News, Football Research, FW, Helms, Litkenhous, Matthews, National Championship Founda tion, NFF, Poling, Sagarin, Sagarin (ELO-Chess), UPI
1973Alabama: Berryman, UPIMichigan: National Championship Foundation*, Poling*Notre Dame: AP, Billingsley, FB News, FW, Helms, National Cham pionship Foundation*, NFFOhio St.: FACT, National Championship Foundation*, Poling*, Sagarin (ELO-Chess)*Oklahoma: DeVold, Dunkel, Football Re search, Sagarin*
1974Ohio St.: MatthewsOklahoma: AP, Berryman, Billingsley, DeVold, Dunkel, FACT, FB News, Football Research, Helms*, Litkenhous, Na tional Championship Foundation*, Poling, Sagarin, Sagarin (ELO-Chess)Southern California: FW, Helms*, National Championship Foundation*, NFF, UPI
1975Alabama: Matthews*Arizona St.: National Championship Foundation*, Sporting NewsOhio St.: Berryman, FACT*, Helms*, Matthews*, PolingOklahoma: AP, Billingsley, DeVold, Dunkel, FACT*, FB News, Football Research, FW, Helms*, National Cham pi on ship Foundation*, NFF, Sagarin, Sagarin (ELO-Chess), UPI
1976Pittsburgh: AP, FACT, FB News, FW, Helms, National Cham-pionship Foundation, NFF, Poling, Sagarin, Sagarin (ELO-Chess), Spor ting News, UPISouthern California: Berryman, Billingsley, DeVold, Dunkel, Foot ball Research, Matthews
1977Alabama: Football Research*Arkansas: FACT*Notre Dame: AP, Billingsley, DeVold, Dunkel, FACT*, FB News, Football Research*, FW, Helms, Matthews, Na tion al Championship Foundation, NFF, Poling, Sagarin*, Spor ting News, UPITexas: Berryman, FACT*, Sagarin (ELO-Chess)*
1978Alabama: AP, FACT*, Football Research, FW, Helms*, Na tion al Championship Foundation*, NFFOklahoma: DeVold, Dunkel, FACT*, Helms*, Litkenhous, Matthews, Poling, Sagarin*Southern California: Berryman, Billingsley, FACT*, FB News, Helms*, National Championship Foundation*, Sagarin (ELO-Chess)*, Spor ting News, UPI
1979Alabama: AP, Berryman, Billingsley, DeVold, Dunkel, FACT, FB News, FW, Helms, Matthews, National Cham pi onship Foundation, NFF, NY Times, Poling, Sagarin, Sagarin (ELO-Chess), Spor ting News, UPISouthern California: Football Research
1980Florida St.: FACT*Georgia: AP, Berryman, Billingsley, FACT*, FB News, FW, Helms, Na tional Championship Foundation, NFF, Poling, Sagarin (ELO-Chess)*, Spor ting News, UPINebraska: FACT*Oklahoma: Dunkel, MatthewsPittsburgh: DeVold, FACT*, Football Research, NY Times, Sagarin*
1981Clemson: AP, Berryman, Billingsley, DeVold, FACT, FB News, Football Research, FW, Helms, Litkenhous, Matthews, National Championship Foundation*, NFF, NY Times, Poling, Sagarin, Sagarin (ELO-Chess), Sporting News, UPINebraska: National Championship Foundation*Penn St.: DunkelPittsburgh: National Championship Foundation*SMU: National Championship Foun dation*Texas: National Championship Foundation*
1982Nebraska: BerrymanPenn St.: AP, Billingsley, DeVold, Dunkel, FACT, FB News, Football Research, FW, Helms*, Litkenhous, Matthews, National Championship Foundation, NFF, NY Times, Poling, Sagarin, Sagarin (ELO-Chess), Sporting News, UPI, USA/CNN SMU: Helms*
1983Auburn: Billingsley, FACT*, Football Research, NY Times, Sagarin (ELO-Chess)*Miami (FL): AP, Dunkel, FB News, FW, Na tional Championship Foundation, NFF, Sporting News, UPI, USA/CNNNebraska: Berryman, DeVold, FACT*, Litkenhous, Matthews, Poling, Sagarin*

2011 NCAA FOOTBALL RECORDS - NATIONAL POLL CHAMPIONS 75
FOO
TBA
LL B
OW
LSU
BD
IVIS
ION1984
BYU: AP, Billingsley, Football Research, FW, National Cham-pionship Foundation*, NFF, Poling, Sagarin (ELO-Chess)*, UPI, USA/CNNFlorida: DeVold, Dunkel, FACT, Matthews, NY Times, Sagarin*, Sporting NewsNebraska: LitkenhousWashington: Berryman, FB News, National Champion ship Foundation*
1985Florida: Sagarin (ELO-Chess)*Michigan: MatthewsOklahoma: AP, Berryman, Billingsley, DeVold, Dunkel, FACT, FB News, Football Research, FW, National Cham pi-onship Foundation, NFF, NY Times, Sagarin*, Sporting News, UPI, USA/CNN
1986Miami (FL): FACT*Oklahoma: Berryman, DeVold, Dunkel, Foot ball Research, NY Times, Sagarin*Penn St.: AP, Billingsley, FACT*, FB News, FW, Matthews, Na tion al Championship Foundation, NFF, Sagarin (ELO-Chess)*, Sporting News, UPI, USA/CNN
1987Florida St.: BerrymanMiami (FL): AP, Billingsley, DeVold, Dunkel, Eck, FACT, FB News, Football Research, FW, Matthews, National Cham -pion ship Foundation, NFF, NY Times, Sagarin, Sagarin (ELO-Chess), Sporting News, UPI, USA/CNN
1988Miami (FL): Berryman, Sagarin*Notre Dame: AP, Billingsley, DeVold, Dunkel, Eck, FACT, FB News, Football Research, FW, Matthews, National Cham-pionship Foundation, NFF, NY Times, Sagarin, (ELO-Chess)*, Sporting News, UPI, USA/CNN
1989Miami (FL): AP, Billingsley, DeVold, Dunkel, FACT*, FB News, Foot ball Research, FW, Matthews, National Champion ship Foundation, NFF, NY Times, Sporting News, UPI, USA/CNNNotre Dame: Berryman, Eck, FACT*, Sagarin, Sagarin (ELO-Chess)
1990Colorado: AP, Berryman, Billingsley, DeVold, FACT*, FB News, Foot ball Research, FW, Matthews, National Champion-ship Foundation*, NFF, Sporting News, USA/CNNGeorgia Tech: Dunkel, FACT*, National Championship Foun dation*, Sagarin (ELO-Chess)*, UPIMiami (FL): Eck, FACT*, NY Times, Sagarin*Washington: FACT*
1991Miami (FL): AP, Billingsley, Eck, Football Research, National Cham pi on ship Foundation*, NY Times, Sagarin (ELO-Chess)*, Sporting NewsWashington: Berryman, DeVold, Dunkel, FACT, FB News, FW, Matthews, National Championship Foun dation*, Sagarin*, UPI/NFF, USA/CNN
1992Alabama: AP, Berryman, Billingsley, DeVold, Dunkel, Eck, FACT, FB News, Football Research, FW, Matthews, Na tion al Championship Foundation, NY Times, Sagarin (ELO-Chess)*, Sporting News, UPI/NFF, USA/CNNFlorida St.: Sagarin*
1993Auburn: National Championship Foundation*Florida St.: AP, Berryman, Billingsley, DeVold, Dunkel, Eck, FACT, FB News, FW, National Cham pionship Foun da tion*, NY Times, Sagarin, Sagarin (ELO-Chess), Sporting News, UPI, USA/CNN, USA/NFFNebraska: National Championship Foundation*Notre Dame: Matthews, National Championship Foun-da tion*
1994Florida St.: DunkelNebraska: Alderson, AP, Berryman, Billingsley, FACT*, FB News, FW, National Championship Foun dation*, Sagarin (ELO-Chess)*, Sporting News, UPI, USA/CNN, USA/NFFPenn St.: DeVold, Eck, FACT*, Matthews, Na tion al Championship Foundation*, NY Times, Sagarin*
1995Nebraska: Alderson, AP, Berryman, Billingsley, DeVold, Dunkel, Eck, FACT, FB News, FW, Matthews, National Championship Foundation, NFF, NY Times, Sagarin, Sagarin (ELO-Chess), Sporting News, UPI, USA/CNN
1996Florida: AP, Berryman, Billingsley, Eck, FACT, FB News, FW, NFF, Sagarin, Sagarin (ELO-Chess), Sporting News, USA/CNN, NY Times, National Championship Foundation, Dunkel, Matthews, DeVoldFlorida St.: Alderson
1997Michigan: AP, FB News, FW, National Championship Foundation*, NFF, Sporting NewsNebraska: Alderson, Berryman, Billingsley, DeVold, Dunkel, Eck, FACT, Matthews, National Championship Foundation*, NY Times, Sagarin, Sagarin (ELO-Chess), Seattle Times, USA/ESPN
1998Tennessee: Alderson, AP, Berryman, Billingsley, DeVold, Dunkel, Eck, FACT, FB News, FW, Matthews, National Championship Foundation, NFF, NY Times, Sagarin, Sagarin (ELO-Chess), Seattle Times, Sporting News, USA/ESPN
1999Florida St.: AP, Berryman, Billingsley, DeVold, Dunkel, Eck, FACT, FB News, FW, Massey, Matthews, National Championship Foundation, NFF, NY Times, Sagarin, Sagarin (ELO-Chess), Seattle Times, Sporting News, USA/ESPN
2000Oklahoma: AP, Berryman, Billingsley, DeVold, Dunkel, Eck, FACT, FB News, FW, Massey, Matthews, National Championship Foundation, NFF, Sagarin, Sagarin (ELO-Chess), Seattle Times, Sporting News, USA/ESPNMiami (FL): NY Times
2001Miami (FL): AP, Berryman, Billingsley, Colley Matrix, DeVold, Dunkel, Eck, FACT, FB News, FW, Massey, Matthews, NFF, NY Times, Sagarin, Sagarin (ELO-Chess), Seattle Times, Sporting News, USA/ESPN, Wolfe
2002Ohio St.: AP, Berryman, Billingsley, Colley Matrix, DeVold, Eck, FACT, FB News, FW, Massey, NFF, NY Times, Sagarin (ELO-Chess)*, Seattle Times, Sporting News, USA/ESPN, Wolfe Southern California: Dunkel, Matthews, Sagarin*
2003LSU: Billingsley, Colley Matrix, DeVold, Dunkel, FACT, Massey, NFF, Sagarin, Sagarin (ELO-Chess), Seattle Times, USA/ESPN, WolfeOklahoma: BerrymanSouthern California: AP, Eck, FW, Matthews, NY Times, Sporting News
2004#Southern California: AP, Berryman, Billingsley, Colley Matrix, DeVold, Dunkel, Eck, FACT, FW, Massey, Matthews, NY Times, NFF, Sagarin, Sagarin (ELO-Chess), Seattle Times, Sporting News, USA/ESPN, Wolfe
# BCS later vacated Southern California’s 2004 BCS champion-ship.
2005Southern California: HarrisTexas: AP, Berryman, Billingsley, Colley Matrix, DeVold, Dunkel, Eck, FACT, FW, Massey, Matthews, NFF, Sagarin,
Sagarin (ELO-Chess), Seattle Times, Sporting News, USA Today, Wolfe
2006Florida: AP, Berryman, Billingsley, Colley Matrix, DeVold, Dunkel, FACT, FW, Massey, Matthews, NFF, Sagarin, Sagarin (ELO-Chess), Seattle Times, Sporting News, USA Today, WolfeOhio St.: Harris
2007LSU: ^BCS, USA Today, AP; FW, NFFOhio St.: HarrisSouthern California: Dunkel
2008Florida: ^BCS, USA Today, AP; FW, NFF, Harris
2009Alabama: ^BCS, USA Today, AP; FW, NFF, Harris
2010Auburn: ^BCS, USA Today, AP; FW, NFF Legend of Present Major Selectors: Associated Press (AP), 1936-present; Football Writers Association of America, (FW) 1954-present; National Football Foundation and Hall of Fame (NFF), 1959-90 and 1995-present; USA Today/ESPN (USA/ESPN), 1997-2004; USA Today, 2005-10. The Associated Press has been the designated media poll since 1936. United Press International served as the coaches’ poll from 1950 to 1991 when it was taken over by USA Today/Cable News Network and in 1997 became USA Today/ESPN. In 1991-92, the No. 1 team in the final UPI/NFF ratings received the MacArthur Bowl as the national champion by the NFF. In 1993-94 and again in 1996, the No. 1 team in the USA Today/NFF final poll received the MacArthur Bowl. ^BCS includes all national champion major selectors on page 68 not mentioned above.

76 2011 NCAA FOOTBALL RECORDS - NATIONAL POLL CHAMPIONS
Major Selectors Since 1936
ASSOCIATED PRESSYear Team Record1936 Minnesota .............................. 7-1-01937 Pittsburgh............................... 9-0-11938 TCU ............................................ 11-0-01939 Texas A&M .............................. 11-0-01940 Minnesota .............................. 8-0-01941 Minnesota .............................. 8-0-01942 Ohio St. ................................... 9-1-01943 Notre Dame ........................... 9-1-01944 Army ......................................... 9-0-01945 Army ......................................... 9-0-01946 Notre Dame ........................... 8-0-11947 Notre Dame ........................... 9-0-01948 Michigan ................................. 9-0-01949 Notre Dame ........................... 10-0-01950 Oklahoma ............................... 10-1-01951 Tennessee ............................... 10-1-01952 Michigan St. ......................... 9-0-01953 Maryland ................................ 10-1-01954 Ohio St. ................................... 10-0-01955 Oklahoma ............................... 11-0-01956 Oklahoma ............................... 10-0-01957 Auburn .................................... 10-0-01958 LSU ............................................ 11-0-01959 Syracuse .................................. 11-0-01960 Minnesota .............................. 8-2-01961 Alabama .................................. 11-0-01962 Southern California ............ 11-0-01963 Texas ......................................... 11-0-01964 Alabama .................................. 10-1-01965 Alabama .................................. 9-1-11966 Notre Dame ........................... 9-0-11967 Southern California ............ 10-1-01968 Ohio St. ................................... 10-0-01969 Texas ......................................... 11-0-01970 Nebraska ................................. 11-0-11971 Nebraska ................................. 13-0-01972 Southern California ............ 12-0-01973 Notre Dame ........................... 11-0-01974 Oklahoma ............................... 11-0-01975 Oklahoma ............................... 11-1-01976 Pittsburgh............................... 12-0-01977 Notre Dame ........................... 11-1-01978 Alabama .................................. 12-1-01979 Alabama .................................. 12-0-01980 Georgia .................................... 12-0-01981 Clemson .................................. 12-0-01982 Penn St. .................................. 11-1-01983 Miami (FL)............................... 11-1-01984 BYU ............................................ 13-0-01985 Oklahoma ............................... 11-1-01986 Penn St. .................................. 12-0-01987 Miami (FL)............................... 12-0-01988 Notre Dame ........................... 12-0-01989 Miami (FL)............................... 11-1-01990 Colorado ................................. 11-1-11991 Miami (FL)............................... 12-0-01992 Alabama .................................. 13-0-01993 Florida St. ............................... 12-1-01994 Nebraska ................................. 13-0-01995 Nebraska ................................. 12-0-01996 Florida ...................................... 12-1-01997 Michigan ................................. 12-0-01998 Tennessee ............................... 13-0-01999 Florida St. ................................ 12-0-02000 Oklahoma ............................... 13-0-02001 Miami (FL)............................... 12-0-02002 Ohio St. .................................... 14-0-02003 Southern California ............ 12-1-02004 Southern California ............ 13-0-02005 Texas ......................................... 13-0-02006 Florida ..................................... 13-1-02007 LSU ........................................... 12-2-02008 Florida ...................................... 13-1-02009 Alabama .................................. 14-0-02010 Auburn .................................... 14-0-0
NATIONAL FOOTBALL FOUNDATION AND COLLEGE FOOTBALL HALL OF FAME(MacArthur Bowl)
Year Team Record1959 Syracuse .................................. 11-0-01960 Minnesota .............................. 8-2-01961 Alabama .................................. 11-0-01962 Southern California ............ 11-0-01963 Texas ......................................... 11-0-01964 Notre Dame ........................... 9-1-01965 Michigan St. ......................... 10-1-01966 Michigan St. ........................... 9-0-1 Notre Dame ........................... 9-0-11967 Southern California ............ 10-1-01968 Ohio St. ................................... 10-0-01969 Texas ......................................... 11-0-01970 Ohio St. .................................... 10-1-0 Texas ......................................... 10-1-01971 Nebraska ................................. 13-0-01972 Southern California ............ 12-0-01973 Notre Dame ........................... 11-0-01974 Southern California ............ 10-1-11975 Oklahoma ............................... 11-1-01976 Pittsburgh............................... 12-0-01977 Notre Dame ........................... 11-1-01978 Alabama .................................. 11-1-01979 Alabama .................................. 12-0-01980 Georgia .................................... 12-0-01981 Clemson .................................. 12-0-01982 Penn St. .................................. 11-1-01983 Miami (FL)............................... 11-1-01984 BYU ............................................ 13-0-01985 Oklahoma ............................... 11-1-01986 Penn St. .................................. 12-0-01987 Miami (FL)............................... 12-0-01988 Notre Dame ........................... 12-0-01989 Miami (FL)............................... 11-1-01990 Colorado ................................. 11-1-11991 Washington (UPI/NFF) ...... 12-0-01992 Alabama (UPI/NFF) ............. 13-0-01993 Florida St. (USA/NFF) ......... 12-1-01994 Nebraska (USA/NFF) .......... 13-0-01995 Nebraska (USA/NFF) .......... 12-0-01996 Florida (USA/NFF) ............... 12-1-01997 Michigan ................................. 12-0-01998 Tennessee ............................... 13-0-01999 Florida St. ............................... 12-0-02000 Oklahoma ............................... 13-0-02001 Miami (FL)............................... 12-0-02002 Ohio St. .................................... 14-0-02003 LSU ............................................ 13-1-02004 Southern California ............ 13-0-02005 Texas ......................................... 13-0-02006 Florida ..................................... 13-1-02007 LSU ........................................... 12-2-02008 Florida ...................................... 13-1-02009 Alabama .................................. 14-0-02010 Auburn .................................... 14-0-0
UNITED PRESSYear Team Record1950 Oklahoma ............................... 10-1-01951 Tennessee ............................... 10-1-01952 Michigan St. ......................... 9-0-01953 Maryland ................................ 10-1-01954 UCLA ......................................... 9-0-01955 Oklahoma ............................... 11-0-01956 Oklahoma ............................... 10-0-01957 Ohio St. ................................... 9-1-01958 LSU ............................................ 11-0-01959 Syracuse .................................. 11-0-01960 Minnesota .............................. 8-2-01961 Alabama .................................. 11-0-01962 Southern California ............ 11-0-0
1963 Texas ......................................... 11-0-01964 Alabama .................................. 10-1-01965 Michigan St. ......................... 10-1-01966 Notre Dame ........................... 9-0-11967 Southern California ............ 10-1-01968 Ohio St. ................................... 10-0-01969 Texas ......................................... 11-0-01970 Texas ......................................... 10-1-01971 Nebraska ................................. 13-0-01972 Southern California ............ 12-0-01973 Alabama .................................. 11-1-01974 Southern California ............ 10-1-11975 Oklahoma ............................... 11-1-01976 Pittsburgh............................... 12-0-01977 Notre Dame ........................... 11-1-01978 Southern California ............ 12-1-01979 Alabama .................................. 12-0-01980 Georgia .................................... 12-0-01981 Clemson .................................. 12-0-01982 Penn St. ................................... 11-1-01983 Miami (FL)............................... 11-1-01984 BYU ............................................ 13-0-01985 Oklahoma ............................... 11-1-01986 Penn St. .................................. 12-0-01987 Miami (FL)............................... 12-0-01988 Notre Dame ........................... 12-0-01989 Miami (FL)............................... 11-1-01990 Georgia Tech ......................... 11-0-11991 Washington ........................... 12-0-01992 Alabama .................................. 13-0-01993 Florida St. ............................... 12-1-01994 Nebraska ................................. 13-0-01995 Nebraska ................................. 12-0-0
FOOTBALL WRITERS’Year Team Record1954 UCLA ......................................... 9-0-01955 Oklahoma ............................... 11-0-01956 Oklahoma ............................... 10-0-01957 Ohio St. ................................... 9-1-01958 Iowa .......................................... 8-1-11959 Syracuse .................................. 11-0-01960 Ole Miss ................................... 10-0-11961 Ohio St. ................................... 8-0-11962 Southern California ............ 11-0-01963 Texas ......................................... 11-0-01964 Arkansas .................................. 11-0-01965 Alabama .................................. 9-1-1/
Michigan St. ......................... 10-1-01966 Notre Dame ........................... 9-0-11967 Southern California ............ 10-1-01968 Ohio St. ................................... 10-0-01969 Texas ......................................... 11-0-01970 Nebraska ................................. 11-0-11971 Nebraska ................................. 13-0-01972 Southern California ............ 12-0-01973 Notre Dame ........................... 11-0-01974 Southern California ............ 10-1-11975 Oklahoma ............................... 11-1-01976 Pittsburgh............................... 12-0-01977 Notre Dame ........................... 11-1-01978 Alabama .................................. 11-1-01979 Alabama .................................. 12-0-01980 Georgia .................................... 12-0-01981 Clemson .................................. 12-0-01982 Penn St. .................................. 11-1-01983 Miami (FL)............................... 11-1-01984 BYU ............................................ 13-0-01985 Oklahoma ............................... 11-1-01986 Penn St. .................................. 12-0-01987 Miami (FL)............................... 12-0-01988 Notre Dame ........................... 12-0-01989 Miami (FL)............................... 11-1-01990 Colorado ................................. 11-1-11991 Washington ........................... 12-0-01992 Alabama .................................. 13-0-0
1993 Florida St. ............................... 12-1-01994 Nebraska ................................. 13-0-01995 Nebraska ................................. 12-0-01996 Florida ...................................... 12-1-01997 Michigan ................................. 12-0-01998 Tennessee ............................... 13-0-01999 Florida St. ............................... 12-0-02000 Oklahoma ............................... 13-0-02001 Miami (FL)............................... 12-0-02002 Ohio St. .................................... 14-0-02003 Southern California ............ 12-1-02004 Southern California ............ 13-0-02005 Texas ......................................... 13-0-02006 Florida ..................................... 13-1-02007 LSU ........................................... 12-2-02008 Florida ...................................... 13-1-02009 Alabama .................................. 14-0-02010 Auburn .................................... 14-0-0
USA TODAYYear Team Record1982 Penn St. .................................. 11-1-01983 Miami (FL) (CNN) ................. 11-1-01984 BYU (CNN) .............................. 13-0-01985 Oklahoma (CNN) ................. 11-1-01986 Penn St. (CNN) ...................... 12-0-01987 Miami (FL) (CNN) ................. 12-0-01988 Notre Dame (CNN) ............. 12-0-01989 Miami (FL) (CNN) ................. 11-1-01990 Colorado (CNN) .................... 11-1-11991 Washington (CNN).............. 12-0-01992 Alabama (CNN) .................... 13-0-01993 Florida St. (CNN) .................. 12-1-01994 Nebraska (CNN) ................... 13-0-01995 Nebraska (CNN) ................... 12-0-01996 Florida (CNN)......................... 12-1-01997 Nebraska (ESPN) .................. 13-0-01998 Tennessee (ESPN) ................ 13-0-01999 Florida St. (ESPN) ................. 12-0-02000 Oklahoma (ESPN) ................ 13-0-02001 Miami (FL) (ESPN) ................ 12-0-02002 Ohio St. (ESPN) ..................... 14-0-02003 LSU (ESPN) ............................. 13-1-02004 Southern California
(ESPN) ....................................... 13-0-02005 Texas ......................................... 13-0-02006 Florida ...................................... 13-1-02007 LSU ............................................ 12-2-02008 Florida ...................................... 13-1-02009 Alabama .................................. 14-0-02010 Auburn .................................... 14-0-0
Year Team Record Year Team Record

2011 NCAA FOOTBALL RECORDS - NATIONAL POLL CHAMPIONS 77
FOO
TBA
LL B
OW
LSU
BD
IVIS
IONNational Poll Champions in Bowl Games
Year Team Coach (Years†) Record Bowl (Result)1900 Yale Malcolm McBride 12-0-0 None1901 Michigan Fielding Yost 11-0-0 Rose (beat Stanford, 49-0) Harvard William Reid 12-0-0 None1902 Michigan Fielding Yost 11-0-0 None Yale Joseph Swan 11-0-1 None1903 Princeton Art Hillebrand 11-0-0 None1904 Penn Carl Williams 12-0-0 None1905 Chicago Amos Alonzo Stagg 11-0-0 None Yale J.E. Owsley 10-0-0 None1906 Princeton Bill Roper 9-0-1 None Yale Foster Rockwell 9-0-1 None1907 Yale William Knox 9-0-1 None1908 Penn Sol Metzer 11-0-1 None Harvard Percy Haughton 9-0-1 None1909 Yale Howard Jones 10-0-0 None1910 Harvard Percy Haughton 8-0-1 None1911 Princeton Bill Roper 8-0-2 None1912 Harvard Percy Haughton 9-0-0 None1913 Harvard Percy Haughton 9-0-0 None1914 Army Charley Daly 9-0-0 None1915 Cornell Al Sharpe 9-0-0 None1916 Pittsburgh Glenn “Pop” Warner 8-0-0 None1917 Georgia Tech John Heisman 9-0-0 None1918 Pittsburgh Glenn “Pop” Warner 4-1-0 None1919 Harvard Robert Fisher 9-0-1 Rose (beat Oregon, 7-6)1920 California Andy Smith 9-0-0 Rose (beat Ohio St., 28-0) Princeton Bill Roper 6-0-1 None1921 Cornell Gil Dobie 8-0-0 None1922 Cornell Gil Dobie 8-0-0 None Princeton Bill Roper 8-0-0 None1923 Illinois Robert Zuppke 8-0-0 None1924 Notre Dame Knute Rockne 10-0-0 Rose (beat Stanford, 27-10)1925 Alabama Wallace Wade 10-0-0 Rose (beat Washington, 20-19) Dartmouth Jesse Hawley 8-0-0 None1926 Alabama Wallace Wade 9-0-1 Rose (tied Stanford, 7-7) Stanford Glenn “Pop” Warner 10-0-1 Rose (tied Alabama, 7-7)1927 Illinois Robert Zuppke 7-0-1 None1928 Georgia Tech Bill Alexander 10-0-0 Rose (beat California, 8-7) Southern California Howard Jones 9-0-1 None1929 Notre Dame Knute Rockne 9-0-0 None1930 Notre Dame Knute Rockne 10-0-0 None1931 Southern California Howard Jones 10-1-0 Rose (beat Tulane, 21-12)1932 Michigan Harry Kipke 8-0-0 None Southern California Howard Jones 10-0-0 Rose (beat Pittsburgh, 35-0)1933 Michigan Harry Kipke 7-0-1 None1934 Minnesota Bernie Bierman 8-0-0 None1935 Minnesota Bernie Bierman 8-0-0 None SMU Matty Bell 12-1-0 Rose (lost to Stanford, 7-0)1936 Minnesota Bernie Bierman (5-15) 7-1-0 None1937 Pittsburgh Jock Sutherland (13-18) 9-0-1 None1938 TCU Dutch Meyer (5-5) 11-0-0 Sugar (beat Carnegie Mellon, 15-7)1939 Texas A&M Homer Norton (6-16) 11-0-0 Sugar (beat Tulane, 14-13)1940 Minnesota Bernie Bierman (9-19) 8-0-0 None1941 Minnesota Bernie Bierman (10-20) 8-0-0 None1942 Ohio St. Paul Brown (2-2) 9-1-0 None1943 Notre Dame Frank Leahy (3-5) 9-1-0 None1944 Army Earl “Red” Blaik (4-11) 9-0-0 None1945 Army Earl “Red” Blaik (5-12) 9-0-0 None1946 Notre Dame Frank Leahy (4-6) 8-0-1 None1947 Notre Dame Frank Leahy (5-7) 9-0-0 None1948 Michigan Bennie Oosterbaan (1-1) 9-0-0 None1949 Notre Dame Frank Leahy (7-9) 10-0-0 None1950 Oklahoma Bud Wilkinson (4-4) 10-1-0 Sugar (lost to Kentucky, 13-7)1951 Tennessee Robert Neyland (20-20) 10-0-0 Sugar (lost to Maryland, 28-13)1952 Michigan St. Clarence “Biggie” Munn (6-9) 9-0-0 None1953 Maryland Jim Tatum (7-9) 10-1-0 Orange (lost to Oklahoma, 7-0)1954 Ohio St. Woody Hayes (4-9) 10-0-0 Rose (beat Southern California, 20-7) UCLA Red Sanders (6-12) 9-0-0 None1955 Oklahoma Bud Wilkinson (9-9) 11-0-0 Orange (beat Maryland, 20-6)1956 Oklahoma Bud Wilkinson (10-10) 10-0-0 None1957 Auburn Ralph “Shug” Jordan (7-7) 10-0-0 None Ohio St. Woody Hayes (7-12) 9-1-0 Rose (beat Oregon, 10-7)1958 LSU Paul Dietzel (4-4) 11-0-0 Sugar (beat Clemson, 7-0) Iowa Forest Evashevski (5-8) 8-1-1 Rose (beat California, 38-12)1959 Syracuse Ben Schwartzwalder (11-14) 11-0-0 Cotton (beat Texas, 23-14)1960 Minnesota Murray Warmath (7-9) 8-2-0 Rose (lost to Washington, 17-7) Ole Miss Johnny Vaught (14-14) 10-0-1 Sugar (beat Rice, 14-6)1961 Alabama Paul “Bear” Bryant (4-17) 11-0-0 Sugar (beat Arkansas, 10-3) Ohio St. Woody Hayes (11-16) 8-0-1 None1962 Southern California John McKay (3-3) 11-0-0 Rose (beat Wisconsin, 42-37)

78 2011 NCAA FOOTBALL RECORDS - NATIONAL POLL CHAMPIONS
1963 Texas Darrell Royal (7-10) 11-0-0 Cotton (beat Navy, 28-6)1964 Alabama Paul “Bear” Bryant (7-20) 10-1-0 Orange (lost to Texas, 21-17) Arkansas Frank Broyles (3-4) 11-0-0 Cotton (beat Nebraska, 10-7) Notre Dame Ara Parseghian (1-14) 9-1-0 None1965 Alabama Paul “Bear” Bryant (8-21) 9-1-1 Orange (beat Nebraska, 39-28) Michigan St. Duffy Daugherty (12-12) 10-1-0 Rose (lost to UCLA, 14-12)1966 Michigan St. Duffy Daugherty (13-13) 9-0-1 None Notre Dame Ara Parseghian (3-17) 9-0-1 None1967 Southern California John McKay (8-8) 10-1-0 Rose (beat Indiana, 14-3)1968 Ohio St. Woody Hayes (18-23) 10-0-0 Rose (beat Southern California, 27-16)1969 Texas Darrell Royal (13-16) 11-0-0 Cotton (beat Notre Dame, 21-17)1970 Nebraska Bob Devaney (9-14) 11-0-1 Orange (beat LSU, 17-12) Ohio St. Woody Hayes (20-25) 9-1-0 Rose (lost to Stanford, 27-17) Texas Darrell Royal (14-17) 10-1-0 Cotton (lost to Notre Dame, 24-11)1971 Nebraska Bob Devaney (10-15) 13-0-0 Orange (beat Alabama, 38-6)1972 Southern California John McKay (13-13) 12-0-0 Rose (beat Ohio St., 42-17)1973 Alabama Paul “Bear” Bryant (16-29) 11-1-0 Sugar (lost to Notre Dame, 24-23) Notre Dame Ara Parseghian (10-23) 11-0-0 Sugar (beat Alabama, 24-23)1974 Oklahoma Barry Switzer (2-2) 11-0-0 None Southern California John McKay (15-15) 10-1-1 Rose (beat Ohio St., 18-17)1975 Oklahoma Barry Switzer (3-3) 11-1-0 Orange (beat Michigan, 14-6)1976 Pittsburgh Johnny Majors (4-9) 12-0-0 Sugar (beat Georgia, 27-3)1977 Notre Dame Dan Devine (3-19) 11-1-0 Cotton (beat Texas, 38-10)1978 Alabama Paul “Bear” Bryant (21-34) 11-1-0 Sugar (beat Penn St., 14-7) Southern California John Robinson (3-3) 12-1-0 Rose (beat Michigan, 17-10)1979 Alabama Paul “Bear” Bryant (22-35) 12-0-0 Sugar (beat Arkansas, 24-9)1980 Georgia Vince Dooley (17-17) 12-0-0 Sugar (beat Notre Dame, 17-10)1981 Clemson Danny Ford (4-4#) 12-0-0 Orange (beat Nebraska, 22-15)1982 Penn St. Joe Paterno (17-17) 11-1-0 Sugar (beat Georgia, 27-23)1983 Miami (FL) Howard Schnellenberger (5-5) 11-1-0 Orange (beat Nebraska, 31-30)1984 BYU LaVell Edwards (13-13) 13-0-0 Holiday (beat Michigan, 24-17)1985 Oklahoma Barry Switzer (13-13) 11-1-0 Orange (beat Penn St., 25-10)1986 Penn St. Joe Paterno (21-21) 12-0-0 Fiesta (beat Miami [FL], 14-10)1987 Miami (FL) Jimmy Johnson (3-9) 12-0-0 Orange (beat Oklahoma, 20-14)1988 Notre Dame Lou Holtz (3-19) 12-0-0 Fiesta (beat West Virginia, 34-21)1989 Miami (FL) Dennis Erickson (1-8) 11-1-0 Sugar (beat Alabama, 33-25)1990 Colorado Bill McCartney (9-9) 11-1-1 Orange (beat Notre Dame, 10-9) Georgia Tech Bobby Ross (4-14) 11-0-1 Fla. Citrus (beat Nebraska, 45-21)1991 Miami (FL) Dennis Erickson (3-10) 12-0-0 Orange (beat Nebraska, 22-0) Washington Don James (17-21) 12-0-0 Rose (beat Michigan, 34-14)1992 Alabama Gene Stallings (3-10) 13-0-0 Sugar (beat Miami [FL], 34-13)1993 Florida St. Bobby Bowden (18-28) 12-1-0 Orange (beat Nebraska, 18-16)1994 Nebraska Tom Osborne (22-22) 13-0-0 Orange (beat Miami [FL], 24-17)1995 Nebraska Tom Osborne (23-23) 12-0-0 Fiesta (beat Florida, 62-24)1996 Florida Steve Spurrier (7-10) 12-1-0 Sugar (beat Florida St., 52-20)1997 Michigan Lloyd Carr (3-3) 12-0-0 Rose (beat Washington St., 21-16) Nebraska Tom Osborne (25-25) 13-0-0 Orange (beat Tennessee, 42-17)1998* Tennessee Phillip Fulmer (7-7) 13-0-0 Fiesta (beat Florida St., 23-16)1999 Florida St. Bobby Bowden (25-35) 12-0-0 Sugar (beat Virginia Tech, 46-29)2000 Oklahoma Bob Stoops (2-2) 13-0-0 Orange (beat Florida St., 13-2)2001 Miami (FL) Larry Coker (1-1) 12-0-0 Rose (beat Nebraska, 37-14)2002 Ohio St. Jim Tressel (2-17) 14-0-0 Fiesta (beat Miami [FL] 31-24 [2 ot])2003 LSU Nick Saban (4-10) 13-1-0 Sugar (beat Oklahoma, 21-14) Southern California Pete Carroll (3-3) 12-1-0 Rose (beat Michigan, 28-14)2004 Southern California Pete Carroll (4-4) 13-0-0 Orange (beat Oklahoma, 55-19)2005 Texas Mack Brown (8-22) 13-0-0 Rose (beat Southern California, 41-38)2006 Florida Urban Meyer (2-6) 13-1-0 BCS National Championship (beat Ohio St., 41-14)2007 LSU Les Miles (3-7) 12-2-0 BCS National Championship (beat Ohio St., 38-24)2008 Florida Urban Meyer (4-8) 13-1-0 BCS National Championship (beat Oklahoma, 24-14)2009 Alabama Nick Saban (3-14) 14-0-0 BCS National Championship (beat Texas, 37-21)2010 Auburn Gene Chizek (2-4) 14-0-0 BCS National Championship (beat Oregon, 22-19)†Years head coach at that college and total years at four-year colleges. #Includes last game of 1978 season. *First year of BCS ranking system.
Year Team Coach (Years†) Record Bowl (Result)
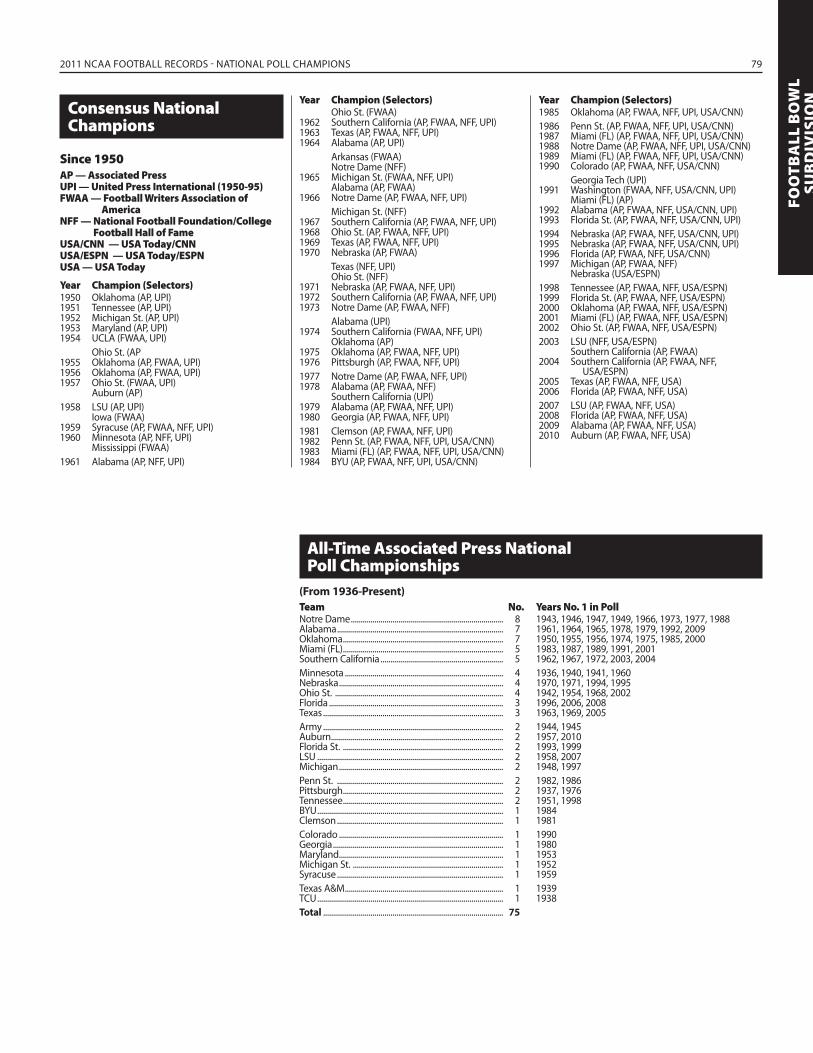
2011 NCAA FOOTBALL RECORDS - NATIONAL POLL CHAMPIONS 79
FOO
TBA
LL B
OW
LSU
BD
IVIS
IONConsensus National
Champions
Since 1950AP — Associated Press UPI — United Press International (1950-95)FWAA — Football Writers Association of AmericaNFF — National Football Foundation/College
Football Hall of FameUSA/CNN — USA Today/CNNUSA/ESPN — USA Today/ESPNUSA — USA Today
Year Champion (Selectors)1950 Oklahoma (AP, UPI)1951 Tennessee (AP, UPI)1952 Michigan St. (AP, UPI)1953 Maryland (AP, UPI)1954 UCLA (FWAA, UPI) Ohio St. (AP1955 Oklahoma (AP, FWAA, UPI)1956 Oklahoma (AP, FWAA, UPI)1957 Ohio St. (FWAA, UPI) Auburn (AP)1958 LSU (AP, UPI) Iowa (FWAA)1959 Syracuse (AP, FWAA, NFF, UPI)1960 Minnesota (AP, NFF, UPI) Mississippi (FWAA)1961 Alabama (AP, NFF, UPI)
Ohio St. (FWAA)1962 Southern California (AP, FWAA, NFF, UPI)1963 Texas (AP, FWAA, NFF, UPI)1964 Alabama (AP, UPI) Arkansas (FWAA) Notre Dame (NFF)1965 Michigan St. (FWAA, NFF, UPI) Alabama (AP, FWAA)1966 Notre Dame (AP, FWAA, NFF, UPI) Michigan St. (NFF)1967 Southern California (AP, FWAA, NFF, UPI)1968 Ohio St. (AP, FWAA, NFF, UPI)1969 Texas (AP, FWAA, NFF, UPI)1970 Nebraska (AP, FWAA) Texas (NFF, UPI) Ohio St. (NFF)1971 Nebraska (AP, FWAA, NFF, UPI)1972 Southern California (AP, FWAA, NFF, UPI)1973 Notre Dame (AP, FWAA, NFF) Alabama (UPI)1974 Southern California (FWAA, NFF, UPI) Oklahoma (AP)1975 Oklahoma (AP, FWAA, NFF, UPI)1976 Pittsburgh (AP, FWAA, NFF, UPI)1977 Notre Dame (AP, FWAA, NFF, UPI)1978 Alabama (AP, FWAA, NFF) Southern California (UPI)1979 Alabama (AP, FWAA, NFF, UPI)1980 Georgia (AP, FWAA, NFF, UPI)1981 Clemson (AP, FWAA, NFF, UPI)1982 Penn St. (AP, FWAA, NFF, UPI, USA/CNN)1983 Miami (FL) (AP, FWAA, NFF, UPI, USA/CNN)1984 BYU (AP, FWAA, NFF, UPI, USA/CNN)
1985 Oklahoma (AP, FWAA, NFF, UPI, USA/CNN)1986 Penn St. (AP, FWAA, NFF, UPI, USA/CNN)1987 Miami (FL) (AP, FWAA, NFF, UPI, USA/CNN)1988 Notre Dame (AP, FWAA, NFF, UPI, USA/CNN)1989 Miami (FL) (AP, FWAA, NFF, UPI, USA/CNN)1990 Colorado (AP, FWAA, NFF, USA/CNN) Georgia Tech (UPI)1991 Washington (FWAA, NFF, USA/CNN, UPI) Miami (FL) (AP)1992 Alabama (AP, FWAA, NFF, USA/CNN, UPI)1993 Florida St. (AP, FWAA, NFF, USA/CNN, UPI)1994 Nebraska (AP, FWAA, NFF, USA/CNN, UPI)1995 Nebraska (AP, FWAA, NFF, USA/CNN, UPI)1996 Florida (AP, FWAA, NFF, USA/CNN)1997 Michigan (AP, FWAA, NFF) Nebraska (USA/ESPN)1998 Tennessee (AP, FWAA, NFF, USA/ESPN)1999 Florida St. (AP, FWAA, NFF, USA/ESPN)2000 Oklahoma (AP, FWAA, NFF, USA/ESPN)2001 Miami (FL) (AP, FWAA, NFF, USA/ESPN)2002 Ohio St. (AP, FWAA, NFF, USA/ESPN)2003 LSU (NFF, USA/ESPN) Southern California (AP, FWAA)2004 Southern California (AP, FWAA, NFF,
USA/ESPN)2005 Texas (AP, FWAA, NFF, USA)2006 Florida (AP, FWAA, NFF, USA)2007 LSU (AP, FWAA, NFF, USA)2008 Florida (AP, FWAA, NFF, USA)2009 Alabama (AP, FWAA, NFF, USA)2010 Auburn (AP, FWAA, NFF, USA)
All-Time Associated Press National Poll Championships
(From 1936-Present)
Team No. Years No. 1 in PollNotre Dame ............................................................................. 8 1943, 1946, 1947, 1949, 1966, 1973, 1977, 1988Alabama .................................................................................... 7 1961, 1964, 1965, 1978, 1979, 1992, 2009Oklahoma ................................................................................. 7 1950, 1955, 1956, 1974, 1975, 1985, 2000Miami (FL) ................................................................................. 5 1983, 1987, 1989, 1991, 2001Southern California .............................................................. 5 1962, 1967, 1972, 2003, 2004Minnesota ................................................................................ 4 1936, 1940, 1941, 1960Nebraska ................................................................................... 4 1970, 1971, 1994, 1995Ohio St. ..................................................................................... 4 1942, 1954, 1968, 2002Florida ........................................................................................ 3 1996, 2006, 2008Texas ........................................................................................... 3 1963, 1969, 2005Army ........................................................................................... 2 1944, 1945Auburn ....................................................................................... 2 1957, 2010Florida St. ................................................................................. 2 1993, 1999LSU .............................................................................................. 2 1958, 2007Michigan ................................................................................... 2 1948, 1997Penn St. .................................................................................... 2 1982, 1986Pittsburgh ................................................................................. 2 1937, 1976Tennessee ................................................................................. 2 1951, 1998BYU .............................................................................................. 1 1984Clemson .................................................................................... 1 1981Colorado ................................................................................... 1 1990Georgia ...................................................................................... 1 1980Maryland ................................................................................... 1 1953Michigan St. ............................................................................ 1 1952Syracuse .................................................................................... 1 1959Texas A&M ................................................................................ 1 1939TCU .............................................................................................. 1 1938Total ........................................................................................... 75
Year Champion (Selectors)Year Champion (Selectors)

80 2011 NCAA FOOTBALL RECORDS - ASSOCIATED PRESS WEEKLY POLL LEADERS
Associated Press Weekly Poll Leaders
193610-20 Minnesota .....................................................(3-0-0)10-27 Minnesota .....................................................(4-0-0)11-3 Northwestern ....................................... (5-0-0) (3)11-10 Northwestern ..............................................(6-0-0)11-17 Northwestern ..............................................(7-0-0)11-24 Minnesota .............................................. (7-1-0) (2)12-1 Minnesota ..................................................(7-1-0)
193710-20 California .......................................................(5-0-0)10-27 California .......................................................(6-0-0)11-2 California .......................................................(7-0-0)11-9 Pittsburgh .............................................. (6-0-1) (3)11-16 Pittsburgh .....................................................(7-0-1)11-23 Pittsburgh .....................................................(8-0-1)11-30 Pittsburgh ..................................................(9-0-1)
193810-18 Pittsburgh .....................................................(4-0-0)10-25 Pittsburgh .....................................................(5-0-0)11-1 Pittsburgh .....................................................(6-0-0)11-8 TCU ........................................................... (7-0-0) (2)11-15 Notre Dame .......................................... (7-0-0) (2)11-22 Notre Dame .................................................(8-0-0)11-29 Notre Dame .................................................(8-0-0)12-6 TCU .......................................................(10-0-0) (2)
193910-17 Pittsburgh .....................................................(3-0-0)10-24 Tennessee .............................................. (4-0-0) (5)10-31 Tennessee .....................................................(5-0-0)11-7 Tennessee .....................................................(6-0-0)11-14 Tennessee .....................................................(7-0-0)11-21 Texas A&M ............................................. (9-0-0) (2)11-28 (tie) Texas A&M ....................................................(9-0-0) (tie) Southern California ........................... (6-0-1) (4)12-5 Texas A&M ................................................. (10-0-0)12-12 Texas A&M ..............................................(10-0-0)
194010-15 Cornell ............................................................(2-0-0)10-22 Cornell ............................................................(3-0-0)10-29 Cornell ............................................................(4-0-0)11-5 Cornell ............................................................(5-0-0)11-12 Minnesota .............................................. (6-0-0) (2)11-19 Minnesota .....................................................(7-0-0)11-26 Minnesota .....................................................(8-0-0)12-3 Minnesota ..................................................(8-0-0)
194110-14 Minnesota .....................................................(2-0-0)10-21 Minnesota .....................................................(3-0-0)10-28 (tie) Minnesota .....................................................(4-0-0) (tie) Texas ......................................................... (5-0-0) (2)11-4 Texas ................................................................(6-0-0)11-11 Minnesota .............................................. (6-0-0) (2)11-18 Minnesota .....................................................(7-0-0)11-25 Minnesota .....................................................(8-0-0)12-2 Minnesota ..................................................(8-0-0)
194210-13 Ohio St............................................................(3-0-0)10-20 Ohio St............................................................(4-0-0)10-27 Ohio St............................................................(5-0-0)11-3 Georgia ................................................... (7-0-0) (2)11-10 Georgia ..........................................................(8-0-0)11-17 Georgia ..........................................................(9-0-0)11-24 Boston College .................................... (8-0-0) (3)12-1 Ohio St. .................................................(9-1-0) (3)
194310-5 Notre Dame .................................................(2-0-0)10-12 Notre Dame .................................................(3-0-0)10-19 Notre Dame .................................................(4-0-0)10-26 Notre Dame .................................................(5-0-0)11-2 Notre Dame .................................................(6-0-0)11-9 Notre Dame .................................................(7-0-0)11-16 Notre Dame ................................................(8-0-0)11-23 Notre Dame .................................................(9-0-0)11-30 Notre Dame ...............................................(9-1-0)
194410-10 Notre Dame .................................................(2-0-0)10-17 Notre Dame .................................................(3-0-0)10-24 Notre Dame .................................................(4-0-0)10-31 Army ......................................................... (5-0-0) (2)11-7 Army ................................................................(6-0-0)11-14 Army ................................................................(7-0-0)11-21 Army ................................................................(8-0-0)11-28 Army ................................................................(8-0-0)12-5 Army ..............................................................(9-0-0)
194510-9 Army ................................................................(2-0-0)10-16 Army ................................................................(3-0-0)10-23 Army ................................................................(4-0-0)10-30 Army ................................................................(5-0-0)11-6 Army ................................................................(6-0-0)11-13 Army ................................................................(7-0-0)11-20 Army ................................................................(8-0-0)11-27 Army ................................................................(8-0-0)12-4 Army ..............................................................(9-0-0)
194610-8 Texas ................................................................(3-0-0)10-15 Army ......................................................... (4-0-0) (2)10-22 Army ................................................................(5-0-0)10-29 Army ................................................................(6-0-0)11-5 Army ................................................................(7-0-0)11-12 Army ................................................................(7-0-1)11-19 Army ................................................................(8-0-1)11-26 Army ................................................................(8-0-1)12-3 Notre Dame ........................................(8-0-1) (2)
1947*10-7 Notre Dame .................................................(1-0-0)10-14 Michigan ................................................ (3-0-0) (2)10-21 Michigan .......................................................(4-0-0)10-28 Notre Dame .......................................... (4-0-0) (2)11-4 Notre Dame .................................................(5-0-0)11-11 Notre Dame .................................................(6-0-0)11-18 Michigan ................................................ (8-0-0) (2)11-25 Notre Dame .......................................... (8-0-0) (2)12-2 Notre Dame .................................................(8-0-0)12-9 Notre Dame ...............................................(9-0-0)
194810-5 Notre Dame .................................................(2-0-0)10-12 North Carolina ..................................... (3-0-0) (2)10-19 Michigan ................................................ (4-0-0) (4)10-26 Michigan .......................................................(5-0-0)11-2 Notre Dame .......................................... (6-0-0) (2)11-9 Michigan ................................................ (7-0-0) (2)11-16 Michigan .......................................................(8-0-0)11-23 Michigan .......................................................(9-0-0)11-30 Michigan .....................................................(9-0-0)
194910-4 Michigan .......................................................(2-0-0)10-11 Notre Dame .......................................... (3-0-0) (2)10-18 Notre Dame .................................................(4-0-0)10-25 Notre Dame .................................................(4-0-0)11-1 Notre Dame .................................................(5-0-0)11-8 Notre Dame .................................................(6-0-0)11-15 Notre Dame .................................................(7-0-0)11-22 Notre Dame .................................................(8-0-0)11-29 Notre Dame ...............................................(9-0-0)
195010-3 Notre Dame .................................................(1-0-0)10-10 Army ......................................................... (2-0-0) (4)10-17 Army ................................................................(3-0-0)10-24 SMU .......................................................... (5-0-0) (3)10-31 SMU .................................................................(5-0-0)11-7 Army ......................................................... (6-0-0) (2)11-14 Ohio St..................................................... (6-1-0) (2)11-21 Oklahoma .............................................. (8-0-0) (2)11-28 Oklahoma ...................................................(9-0-0)
195110-2 Michigan St. ................................................(2-0-0)10-9 Michigan St. ................................................(3-0-0)10-16 California ................................................ (4-0-0) (2)10-23 Tennessee .............................................. (4-0-0) (2)10-30 Tennessee .....................................................(5-0-0)11-6 Tennessee .....................................................(6-0-0)11-13 Michigan St. ......................................... (7-0-0) (5)11-20 Tennessee .............................................. (8-0-0) (2)11-27 Tennessee .....................................................(9-0-0)12-4 Tennessee ................................................(10-0-0)
19529-30 Michigan St. ................................................(1-0-0)10-7 Wisconsin ............................................... (2-0-0) (8)10-14 Michigan St. ......................................... (3-0-0) (2)10-21 Michigan St. ................................................(4-0-0)10-28 Michigan St. ................................................(5-0-0)11-4 Michigan St. ................................................(6-0-0)11-11 Michigan St. ................................................(7-0-0)11-18 Michigan St. ................................................(8-0-0)11-25 Michigan St. ................................................(9-0-0)12-1 Michigan St. .............................................(9-0-0)
19539-29 Notre Dame .................................................(1-0-0)10-6 Notre Dame .................................................(2-0-0)10-13 Notre Dame .................................................(2-0-0)10-20 Notre Dame .................................................(3-0-0)10-27 Notre Dame .................................................(4-0-0)11-3 Notre Dame .................................................(5-0-0)11-10 Notre Dame .................................................(6-0-0)11-17 Notre Dame .................................................(7-0-0)11-24 Maryland ..............................................(10-0-0) (2)12-1 Maryland .................................................(10-0-0)
19549-21 Oklahoma .....................................................(1-0-0)9-28 Notre Dame .......................................... (1-0-0) (2)10-5 Oklahoma .............................................. (2-0-0) (2)10-12 Oklahoma .....................................................(3-0-0)10-19 Oklahoma .....................................................(4-0-0)10-26 Ohio St..................................................... (5-0-0) (4)11-2 UCLA ........................................................ (7-0-0) (3)11-9 UCLA ...............................................................(8-0-0)11-16 Ohio St..................................................... (8-0-0) (2)11-23 Ohio St............................................................(9-0-0)11-30 Ohio St. ........................................................(9-0-0)
19559-20 UCLA ...............................................................(1-0-0)9-27 Maryland ................................................ (2-0-0) (5)10-4 Maryland .......................................................(3-0-0)10-11 Michigan ................................................ (3-0-0) (2)10-18 Michigan .......................................................(4-0-0)10-25 Maryland ................................................ (6-0-0) (2)11-1 Maryland .......................................................(7-0-0)11-8 Oklahoma .............................................. (7-0-0) (2)11-15 Oklahoma .....................................................(8-0-0)11-22 Oklahoma .....................................................(9-0-0)11-29 Oklahoma ................................................(10-0-0)
19569-25 Oklahoma .....................................................(0-0-0)10-2 Oklahoma .....................................................(1-0-0)10-9 Oklahoma .....................................................(2-0-0)10-16 Oklahoma .....................................................(3-0-0)10-23 Michigan St. ......................................... (4-0-0) (2)10-30 Oklahoma .............................................. (5-0-0) (2)11-6 Oklahoma .....................................................(6-0-0)11-13 Tennessee .............................................. (7-0-0) (3)11-20 Oklahoma .............................................. (8-0-0) (2)11-27 Oklahoma .....................................................(9-0-0)12-4 Oklahoma ................................................(10-0-0)
19579-24 Oklahoma .....................................................(1-0-0)10-1 Oklahoma .....................................................(1-0-0)10-8 Oklahoma .....................................................(2-0-0)10-15 Michigan St. ......................................... (3-0-0) (2)10-22 Oklahoma .............................................. (4-0-0) (2)10-29 Texas A&M ............................................. (6-0-0) (2)11-5 Texas A&M ....................................................(7-0-0)11-12 Texas A&M ....................................................(8-0-0)11-19 Michigan St. ......................................... (7-1-0) (4)11-26 Auburn .................................................... (9-0-0) (2)12-3 Auburn ......................................................(10-0-0)
The weekly dates are for Monday or Tuesday, the most frequent release dates of the poll, except when the fi nal poll was taken after early January bowl games. A team’s record includes its last game before the weekly poll. A new weekly leader’s rank the previous week is indicated in parentheses after its re-cord. Final poll leaders (annual champions) are in bold face. (Note: Only 10 teams were ranked in the weekly polls during 1962, 1963, 1964, 1965, 1966 and 1967; 20 were ranked in all other seasons until 1989, when 25 were ranked.)

2011 NCAA FOOTBALL RECORDS - ASSOCIATED PRESS WEEKLY POLL LEADERS 81
FOO
TBA
LL B
OW
LSU
BD
IVIS
ION1958
9-23 Ohio St............................................................(0-0-0)9-30 Oklahoma .............................................. (1-0-0) (2)10-7 Auburn .................................................... (2-0-0) (2)10-14 Army ......................................................... (3-0-0) (3)10-21 Army ................................................................(4-0-0)10-28 LSU ............................................................ (6-0-0) (3)11-4 LSU ...................................................................(7-0-0)11-11 LSU ...................................................................(8-0-0)11-18 LSU ...................................................................(9-0-0)11-25 LSU ................................................................ (10-0-0)12-2 LSU ..............................................................(10-0-0)
19599-22 LSU ...................................................................(1-0-0)9-29 LSU ...................................................................(2-0-0)10-6 LSU ...................................................................(3-0-0)10-13 LSU ...................................................................(4-0-0)10-20 LSU ...................................................................(5-0-0)10-27 LSU ...................................................................(6-0-0)11-3 LSU ...................................................................(7-0-0)11-10 Syracuse .................................................. (7-0-0) (4)11-17 Syracuse .........................................................(8-0-0)11-24 Syracuse .........................................................(9-0-0)12-1 Syracuse .........................................................(9-0-0)12-8 Syracuse ...................................................(10-0-0)
19609-20 Ole Miss .........................................................(1-0-0)9-27 Ole Miss .........................................................(2-0-0)10-4 Syracuse .................................................. (2-0-0) (2)10-11 Ole Miss .................................................. (4-0-0) (2)10-18 Iowa .......................................................... (4-0-0) (2)10-25 Iowa .................................................................(5-0-0)11-1 Iowa .................................................................(6-0-0)11-8 Minnesota .............................................. (7-0-0) (3)11-15 Missouri .................................................. (9-0-0) (2)11-22 Minnesota .............................................. (8-1-0) (4)11-29 Minnesota ..................................................(8-1-0)
19619-26 Iowa .................................................................(0-0-0)10-3 Iowa .................................................................(1-0-0)10-10 Ole Miss .................................................. (3-0-0) (2)10-17 Michigan St. ......................................... (3-0-0) (5)10-24 Michigan St. ................................................(4-0-0)10-31 Michigan St. ................................................(5-0-0)11-7 Texas ......................................................... (7-0-0) (3)11-14 Texas ................................................................(8-0-0)11-21 Alabama ................................................. (9-0-0) (2)11-28 Alabama ........................................................(9-0-0)12-5 Alabama ...................................................(10-0-0)
19629-25 Alabama ........................................................(1-0-0)10-2 Ohio St..................................................... (1-0-0) (2)10-9 Alabama ................................................. (3-0-0) (2)10-16 Texas ......................................................... (4-0-0) (2)10-23 Texas ................................................................(5-0-0)10-30 Northwestern ....................................... (5-0-0) (3)11-6 Northwestern ..............................................(6-0-0)11-13 Alabama ................................................. (8-0-0) (3)11-20 Southern California............................ (8-0-0) (2)11-27 Southern California...................................(9-0-0)12-4 Southern California ...........................(10-0-0)
19639-24 Southern California...................................(1-0-0)10-1 Oklahoma .............................................. (1-0-0) (3)10-8 Oklahoma .....................................................(2-0-0)10-15 Texas ......................................................... (4-0-0) (3)10-22 Texas ................................................................(5-0-0)10-29 Texas ................................................................(6-0-0)11-5 Texas ................................................................(7-0-0)11-12 Texas ................................................................(8-0-0)11-19 Texas ................................................................(9-0-0)11-26 Texas ................................................................(9-0-0)12-3 Texas ............................................................. (10-0-0)12-10 Texas ...........................................................(10-0-0)
19649-29 Texas ................................................................(2-0-0)10-6 Texas ................................................................(3-0-0)10-13 Texas ................................................................(4-0-0)10-20 Ohio St..................................................... (4-0-0) (2)10-27 Ohio St............................................................(5-0-0)11-3 Notre Dame .......................................... (6-0-0) (2)11-10 Notre Dame .................................................(7-0-0)11-17 Notre Dame .................................................(8-0-0)11-24 Notre Dame .................................................(9-0-0)12-1 Alabama ............................................(10-0-0) (2)
19659-21 Notre Dame .................................................(1-0-0)9-28 Texas ......................................................... (2-0-0) (3)10-5 Texas ................................................................(3-0-0)10-12 Texas ................................................................(4-0-0)10-19 Arkansas ................................................. (5-0-0) (3)10-26 Michigan St. ......................................... (6-0-0) (2)11-2 Michigan St. ................................................(7-0-0)11-9 Michigan St. ................................................(8-0-0)11-16 Michigan St. ................................................(9-0-0)11-23 Michigan St. ............................................. (10-0-0)11-30 Michigan St. ............................................. (10-0-0)1-4 Alabama ...............................................(9-1-1) (4)
19669-20 Michigan St. ................................................(1-0-0)9-27 Michigan St. ................................................(2-0-0)10-4 Michigan St. ................................................(3-0-0)10-11 Michigan St. ................................................(4-0-0)10-18 Notre Dame .......................................... (4-0-0) (2)10-25 Notre Dame .................................................(5-0-0)11-1 Notre Dame .................................................(6-0-0)11-8 Notre Dame .................................................(7-0-0)11-15 Notre Dame .................................................(8-0-0)11-22 Notre Dame .................................................(8-0-1)11-29 Notre Dame .................................................(9-0-1)12-5 Notre Dame ...............................................(9-0-1)
19679-19 Notre Dame .................................................(0-0-0)9-26 Notre Dame .................................................(1-0-0)10-3 Southern California............................ (3-0-0) (2)10-10 Southern California...................................(4-0-0)10-17 Southern California...................................(5-0-0)10-24 Southern California...................................(6-0-0)10-31 Southern California...................................(7-0-0)11-7 Southern California...................................(8-0-0)11-14 UCLA ........................................................ (7-0-1) (2)11-21 Southern California............................ (9-1-0) (4)11-28 Southern California ..............................(9-1-0)
19689-17 Purdue ............................................................(0-0-0)9-24 Purdue ............................................................(1-0-0)10-1 Purdue ............................................................(2-0-0)10-8 Purdue ............................................................(3-0-0)10-15 Southern California............................ (4-0-0) (2)10-22 Southern California...................................(5-0-0)10-29 Southern California...................................(5-0-0)11-5 Southern California...................................(6-0-0)11-12 Southern California...................................(7-0-0)11-19 Southern California...................................(8-0-0)11-26 Ohio St..................................................... (9-0-0) (2)12-2 Ohio St............................................................(9-0-0)1-4 Ohio St. ....................................................(10-0-0)
19699-23 Ohio St............................................................(0-0-0)9-30 Ohio St............................................................(1-0-0)10-7 Ohio St............................................................(2-0-0)10-14 Ohio St............................................................(3-0-0)10-21 Ohio St............................................................(4-0-0)10-28 Ohio St............................................................(5-0-0)11-4 Ohio St............................................................(6-0-0)11-11 Ohio St............................................................(7-0-0)11-18 Ohio St............................................................(8-0-0)11-25 Texas ......................................................... (8-0-0) (2)12-2 Texas ................................................................(9-0-0)12-9 Texas ............................................................. (10-0-0)1-4 Texas ...........................................................(11-0-0)
19709-15 Ohio St............................................................(0-0-0)9-22 Ohio St............................................................(0-0-0)9-29 Ohio St............................................................(1-0-0)10-6 Ohio St............................................................(2-0-0)10-13 Ohio St............................................................(3-0-0)10-20 Ohio St............................................................(4-0-0)10-27 Texas ......................................................... (5-0-0) (2)11-3 Texas ................................................................(6-0-0)11-10 Texas ................................................................(7-0-0)11-17 Texas ................................................................(8-0-0)11-24 Texas ................................................................(8-0-0)12-1 Texas ................................................................(9-0-0)12-8 Texas ............................................................. (10-0-0)1-6 Nebraska ...........................................(11-0-1) (3)
19719-14 Nebraska .......................................................(1-0-0)9-21 Nebraska .......................................................(2-0-0)9-28 Nebraska .......................................................(3-0-0)10-5 Nebraska .......................................................(4-0-0)10-12 Nebraska .......................................................(5-0-0)10-19 Nebraska .......................................................(6-0-0)10-26 Nebraska .......................................................(7-0-0)11-2 Nebraska .......................................................(8-0-0)11-9 Nebraska .......................................................(9-0-0)11-16 Nebraska .................................................... (10-0-0)11-23 Nebraska .................................................... (10-0-0)11-30 Nebraska .................................................... (11-0-0)12-7 Nebraska .................................................... (12-0-0)1-4 Nebraska ..................................................(13-0-0)
19729-12 Southern California...................................(1-0-0)9-19 Southern California...................................(2-0-0)9-26 Southern California...................................(3-0-0)10-3 Southern California...................................(4-0-0)10-10 Southern California...................................(5-0-0)10-17 Southern California...................................(6-0-0)10-24 Southern California...................................(7-0-0)10-31 Southern California...................................(8-0-0)11-7 Southern California...................................(9-0-0)11-14 Southern California...................................(9-0-0)11-21 Southern California................................ (10-0-0)11-28 Southern California................................ (10-0-0)12-5 Southern California................................ (11-0-0)1-3 Southern California ...........................(12-0-0)
19739-11 Southern California...................................(0-0-0)9-18 Southern California...................................(1-0-0)9-25 Southern California...................................(2-0-0)10-2 Ohio St..................................................... (2-0-0) (3)10-9 Ohio St............................................................(3-0-0)10-16 Ohio St............................................................(4-0-0)10-23 Ohio St............................................................(5-0-0)10-30 Ohio St............................................................(6-0-0)11-6 Ohio St............................................................(7-0-0)11-13 Ohio St............................................................(8-0-0)11-20 Ohio St............................................................(9-0-0)11-27 Alabama ...............................................(10-0-0) (2)12-4 Alabama ..................................................... (11-0-0)1-3 Notre Dame .....................................(11-0-0) (3)
19749-10 Oklahoma .....................................................(0-0-0)9-17 Notre Dame .......................................... (1-0-0) (2)9-24 Ohio St..................................................... (2-0-0) (2)10-1 Ohio St............................................................(3-0-0)10-8 Ohio St............................................................(4-0-0)10-15 Ohio St............................................................(5-0-0)10-22 Ohio St............................................................(6-0-0)10-29 Ohio St............................................................(7-0-0)11-5 Ohio St............................................................(8-0-0)11-12 Oklahoma .............................................. (8-0-0) (2)11-19 Oklahoma .....................................................(9-0-0)11-26 Oklahoma .................................................. (10-0-0)12-3 Oklahoma .................................................. (11-0-0)1-3 Oklahoma ................................................(11-0-0)
19759-9 Oklahoma .....................................................(0-0-0)9-16 Oklahoma .....................................................(1-0-0)9-23 Oklahoma .....................................................(2-0-0)9-30 Oklahoma .....................................................(3-0-0)10-7 Ohio St..................................................... (4-0-0) (2)10-14 Ohio St............................................................(5-0-0)10-21 Ohio St............................................................(6-0-0)10-28 Ohio St............................................................(7-0-0)11-4 Ohio St............................................................(8-0-0)11-11 Ohio St............................................................(9-0-0)11-18 Ohio St......................................................... (10-0-0)11-25 Ohio St......................................................... (11-0-0)12-2 Ohio St......................................................... (11-0-0)1-3 Oklahoma .........................................(11-1-0) (3)

82 2011 NCAA FOOTBALL RECORDS - ASSOCIATED PRESS WEEKLY POLL LEADERS
19769-14 Michigan .......................................................(1-0-0)9-21 Michigan .......................................................(2-0-0)9-28 Michigan .......................................................(3-0-0)10-5 Michigan .......................................................(4-0-0)10-12 Michigan .......................................................(5-0-0)10-19 Michigan .......................................................(6-0-0)10-26 Michigan .......................................................(7-0-0)11-2 Michigan .......................................................(8-0-0)11-9 Pittsburgh .............................................. (9-0-0) (2)11-16 Pittsburgh .................................................. (10-0-0)11-23 Pittsburgh .................................................. (10-0-0)11-30 Pittsburgh .................................................. (11-0-0)1-5 Pittsburgh ...............................................(12-0-0)
19779-13 Michigan .......................................................(1-0-0)9-20 Michigan .......................................................(2-0-0)9-27 Oklahoma .............................................. (3-0-0) (3)10-4 Southern California............................ (4-0-0) (2)10-11 Michigan ................................................ (5-0-0) (3)10-18 Michigan .......................................................(6-0-0)10-25 Texas ......................................................... (6-0-0) (2)11-1 Texas ................................................................(7-0-0)11-8 Texas ................................................................(8-0-0)11-15 Texas ................................................................(9-0-0)11-22 Texas ............................................................. (10-0-0)11-29 Texas ............................................................. (11-0-0)1-4 Notre Dame .....................................(11-1-0) (5)
19789-12 Alabama ........................................................(1-0-0)9-19 Alabama ........................................................(2-0-0)9-26 Oklahoma ........................................(3-0-0) (tie 3)10-3 Oklahoma .....................................................(4-0-0)10-10 Oklahoma .....................................................(5-0-0)10-17 Oklahoma .....................................................(6-0-0)10-24 Oklahoma .....................................................(7-0-0)10-31 Oklahoma .....................................................(8-0-0)11-7 Oklahoma .....................................................(9-0-0)11-14 Penn St. ................................................(10-0-0) (2)11-21 Penn St. ...................................................... (10-0-0)11-28 Penn St. ...................................................... (11-0-0)12-5 Penn St. ...................................................... (11-0-0)1-4 Alabama ............................................(11-1-0) (2)
19799-11 Southern California...................................(1-0-0)9-18 Southern California...................................(2-0-0)9-25 Southern California...................................(3-0-0)10-2 Southern California...................................(4-0-0)10-9 Southern California...................................(5-0-0)10-16 Alabama ................................................. (5-0-0) (2)10-23 Alabama ........................................................(6-0-0)10-30 Alabama ........................................................(7-0-0)11-6 Alabama ........................................................(8-0-0)11-13 Alabama ........................................................(9-0-0)11-20 Alabama ..................................................... (10-0-0)11-27 Alabama ..................................................... (10-0-0)12-4 Ohio St...................................................(11-0-0) (3)1-3 Alabama ............................................(12-0-0) (2)
19809-9 Ohio St............................................................(0-0-0)9-16 Alabama ................................................. (1-0-0) (2)9-23 Alabama ........................................................(2-0-0)9-30 Alabama ........................................................(3-0-0)10-7 Alabama ........................................................(4-0-0)10-14 Alabama ........................................................(5-0-0)10-21 Alabama ........................................................(6-0-0)10-28 Alabama ........................................................(7-0-0)11-4 Notre Dame .......................................... (7-0-0) (3)11-11 Georgia ................................................... (9-0-0) (2)11-18 Georgia ....................................................... (10-0-0)11-25 Georgia ....................................................... (10-0-0)12-2 Georgia ....................................................... (11-0-0)12-9 Georgia ....................................................... (11-0-0)1-4 Georgia .....................................................(12-0-0)
19819-8 Michigan .......................................................(0-0-0)9-15 Notre Dame .......................................... (1-0-0) (4)9-22 Southern California............................ (2-0-0) (2)9-29 Southern California...................................(3-0-0)10-6 Southern California...................................(4-0-0)10-13 Texas ......................................................... (4-0-0) (3)10-20 Penn St. .................................................. (5-0-0) (2)10-27 Penn St. .........................................................(6-0-0)11-3 Pittsburgh .............................................. (7-0-0) (2)11-10 Pittsburgh .....................................................(8-0-0)11-17 Pittsburgh .....................................................(9-0-0)11-24 Pittsburgh .................................................. (10-0-0)12-1 Clemson ................................................(11-0-0) (2)1-3 Clemson....................................................(12-0-0)
19829-7 Pittsburgh .....................................................(0-0-0)9-14 Washington ........................................... (1-0-0) (2)9-21 Washington ..................................................(2-0-0)9-28 Washington ..................................................(3-0-0)10-5 Washington ..................................................(4-0-0)10-12 Washington ..................................................(5-0-0)10-19 Washington ..................................................(6-0-0)10-26 Pittsburgh .............................................. (6-0-0) (2)11-2 Pittsburgh .....................................................(7-0-0)11-9 Georgia ................................................... (9-0-0) (3)11-16 Georgia ....................................................... (10-0-0)11-23 Georgia ....................................................... (10-0-0)11-30 Georgia ....................................................... (11-0-0)12-7 Georgia ....................................................... (11-0-0)1-3 Penn St. ..............................................(11-1-0) (2)
19839-6 Nebraska .......................................................(1-0-0)9-13 Nebraska .......................................................(2-0-0)9-20 Nebraska .......................................................(3-0-0)9-27 Nebraska .......................................................(4-0-0)10-4 Nebraska .......................................................(5-0-0)10-11 Nebraska .......................................................(6-0-0)10-18 Nebraska .......................................................(7-0-0)10-25 Nebraska .......................................................(8-0-0)11-1 Nebraska .......................................................(9-0-0)11-8 Nebraska .................................................... (10-0-0)11-15 Nebraska .................................................... (11-0-0)11-22 Nebraska .................................................... (11-0-0)11-29 Nebraska .................................................... (12-0-0)12-6 Nebraska .................................................... (12-0-0)1-3 Miami (FL) ........................................(11-1-0) (5)
19849-4 Miami (FL) .....................................................(2-0-0)9-11 Nebraska ................................................ (1-0-0) (2)9-18 Nebraska .......................................................(2-0-0)9-25 Nebraska .......................................................(3-0-0)10-2 Texas ......................................................... (2-0-0) (2)10-9 Texas ................................................................(3-0-0)10-16 Washington ........................................... (6-0-0) (2)10-23 Washington ..................................................(7-0-0)10-30 Washington ..................................................(8-0-0)11-6 Washington ..................................................(9-0-0)11-13 Nebraska ................................................ (9-1-0) (2)11-20 BYU .........................................................(11-0-0) (3)11-27 BYU ............................................................... (12-0-0)12-4 BYU ............................................................... (12-0-0)1-3 BYU ..............................................................(13-0-0)
19859-3 Oklahoma .....................................................(0-0-0)9-10 Auburn .................................................... (1-0-0) (2)9-17 Auburn ...........................................................(2-0-0)9-24 Auburn ...........................................................(2-0-0)10-1 Iowa .......................................................... (3-0-0) (3)10-8 Iowa .................................................................(4-0-0)10-15 Iowa .................................................................(5-0-0)10-22 Iowa .................................................................(6-0-0)10-29 Iowa .................................................................(7-0-0)11-5 Florida ...................................................... (7-0-1) (2)11-12 Penn St. .................................................. (9-0-0) (2)11-19 Penn St. ...................................................... (10-0-0)11-26 Penn St. ...................................................... (11-0-0)12-3 Penn St. ...................................................... (11-0-0)1-3 Oklahoma .........................................(11-1-0) (4)
19869-9 Oklahoma .....................................................(1-0-0)9-16 Oklahoma .....................................................(1-0-0)9-23 Oklahoma .....................................................(2-0-0)9-30 Miami (FL) .............................................. (4-0-0) (2)10-7 Miami (FL) .....................................................(5-0-0)10-14 Miami (FL) .....................................................(6-0-0)10-21 Miami (FL) .....................................................(7-0-0)10-28 Miami (FL) .....................................................(7-0-0)11-4 Miami (FL) .....................................................(8-0-0)11-11 Miami (FL) .....................................................(9-0-0)11-18 Miami (FL) .................................................. (10-0-0)11-25 Miami (FL) .................................................. (10-0-0)12-2 Miami (FL) .................................................. (11-0-0)1-4 Penn St. ..............................................(12-0-0) (2)
19879-8 Oklahoma .....................................................(1-0-0)9-15 Oklahoma .....................................................(2-0-0)9-22 Oklahoma .....................................................(2-0-0)9-29 Oklahoma .....................................................(3-0-0)10-6 Oklahoma .....................................................(4-0-0)10-13 Oklahoma .....................................................(5-0-0)10-20 Oklahoma .....................................................(6-0-0)10-27 Oklahoma .....................................................(7-0-0)11-3 Oklahoma .....................................................(8-0-0)11-10 Oklahoma .....................................................(9-0-0)11-17 Nebraska ................................................ (9-0-0) (2)11-24 Oklahoma ............................................(11-0-0) (2)12-1 Oklahoma .................................................. (11-0-0)12-8 Oklahoma .................................................. (11-0-0)1-3 Miami (FL) ........................................(12-0-0) (2)
19889-6 Miami (FL) .....................................................(1-0-0)9-13 Miami (FL) .....................................................(1-0-0)9-20 Miami (FL) .....................................................(2-0-0)9-27 Miami (FL) .....................................................(3-0-0)10-4 Miami (FL) .....................................................(4-0-0)10-11 Miami (FL) .....................................................(4-0-0)10-18 UCLA ........................................................ (6-0-0) (2)10-25 UCLA ...............................................................(7-0-0)11-1 Notre Dame .......................................... (8-0-0) (2)11-8 Notre Dame .................................................(9-0-0)11-15 Notre Dame .................................................(9-0-0)11-22 Notre Dame .............................................. (10-0-0)11-29 Notre Dame .............................................. (11-0-0)12-6 Notre Dame .............................................. (11-0-0)1-3 Notre Dame ............................................(12-0-0)
19899-5 Notre Dame .................................................(1-0-0)9-12 Notre Dame .................................................(1-0-0)9-19 Notre Dame .................................................(2-0-0)9-26 Notre Dame .................................................(3-0-0)10-3 Notre Dame .................................................(4-0-0)10-10 Notre Dame .................................................(5-0-0)10-17 Notre Dame .................................................(6-0-0)10-24 Notre Dame .................................................(7-0-0)10-31 Notre Dame .................................................(8-0-0)11-7 Notre Dame .................................................(9-0-0)11-14 Notre Dame .............................................. (10-0-0)11-21 Notre Dame .............................................. (11-0-0)11-28 Colorado ...............................................(11-0-0) (2)12-5 Colorado ..................................................... (11-0-0)1-2 Miami (FL) ........................................(11-1-0) (2)
19909-4 Miami (FL) .....................................................(0-0-0)9-11 Notre Dame .......................................... (0-0-0) (2)9-18 Notre Dame .................................................(1-0-0)9-25 Notre Dame .................................................(2-0-0)10-2 Notre Dame .................................................(3-0-0)10-9 Michigan ................................................ (3-1-0) (3)10-16 Virginia .................................................... (6-0-0) (2)10-23 Virginia ...........................................................(7-0-0)10-30 Virginia ...........................................................(7-0-0)11-6 Notre Dame .......................................... (7-1-0) (2)11-13 Notre Dame .................................................(8-1-0)11-20 Colorado ...............................................(10-1-1) (2)11-27 Colorado ..................................................... (10-1-1)12-4 Colorado ..................................................... (10-1-1)1-2 Colorado ..................................................(11-1-1)

2011 NCAA FOOTBALL RECORDS - ASSOCIATED PRESS WEEKLY POLL LEADERS 83
FOO
TBA
LL B
OW
LSU
BD
IVIS
ION1991
9-3 Florida St. .....................................................(1-0-0)9-10 Florida St. .....................................................(2-0-0)9-17 Florida St. .....................................................(3-0-0)9-23 Florida St. .....................................................(3-0-0)9-30 Florida St. .....................................................(4-0-0)10-7 Florida St. .....................................................(5-0-0)10-14 Florida St. .....................................................(6-0-0)10-21 Florida St. .....................................................(7-0-0)10-28 Florida St. .....................................................(8-0-0)11-4 Florida St. .....................................................(9-0-0)11-11 Florida St. .................................................. (10-0-0)11-18 Miami (FL) .............................................. (9-0-0) (2)11-25 Miami (FL) .................................................. (10-0-0)12-2 Miami (FL) .................................................. (11-0-0)1-2 Miami (FL) ...............................................(12-0-0)
19929-8 Miami (FL) .....................................................(1-0-0)9-15 Miami (FL) .....................................................(1-0-0)9-22 Miami (FL) .....................................................(2-0-0)9-29 Washington ........................................... (3-0-0) (2)10-6 Washington ..................................................(4-0-0)10-13 Washington ..................................................(5-0-0)10-20 Miami (FL)† ............................................ (6-0-0) (2)10-27 Miami (FL) .....................................................(7-0-0)11-3 Washington ........................................... (8-0-0) (2)11-10 Miami (FL) .............................................. (8-0-0) (2)11-17 Miami (FL) .....................................................(9-0-0)11-24 Miami (FL) .................................................. (10-0-0)12-1 Miami (FL) .................................................. (11-0-0)12-8 Miami (FL) .................................................. (11-0-0)1-2 Alabama ............................................(13-0-0) (2)
19938-31 Florida St. .....................................................(1-0-0)9-7 Florida St. .....................................................(2-0-0)9-14 Florida St. .....................................................(3-0-0)9-21 Florida St. .....................................................(4-0-0)9-28 Florida St. .....................................................(4-0-0)10-5 Florida St. .....................................................(5-0-0)10-12 Florida St. .....................................................(6-0-0)10-19 Florida St. .....................................................(7-0-0)10-26 Florida St. .....................................................(7-0-0)11-2 Florida St. .....................................................(8-0-0)11-9 Florida St. .....................................................(9-0-0)11-16 Notre Dame ........................................(10-0-0) (2)11-23 Florida St. ............................................(10-1-0) (2)11-30 Florida St. .................................................. (11-1-0)12-7 Florida St. .................................................. (11-1-0)1-3 Florida St. ................................................(12-1-0)
19948-31 Florida .............................................................(0-0-0)9-6 Nebraska ................................................ (1-0-0) (2)9-13 Florida ...................................................... (2-0-0) (2)9-20 Florida .............................................................(3-0-0)9-27 Florida .............................................................(3-0-0)10-4 Florida .............................................................(4-0-0)10-11 Florida .............................................................(5-0-0)10-18 Penn St. .................................................. (6-0-0) (3)10-25 Penn St. .........................................................(6-0-0)11-1 Nebraska ................................................ (9-0-0) (3)11-8 Nebraska .................................................... (10-0-0)11-15 Nebraska .................................................... (11-0-0)11-22 Nebraska .................................................... (11-0-0)11-29 Nebraska .................................................... (12-0-0)12-6 Nebraska .................................................... (12-0-0)1-3 Nebraska ..................................................(13-0-0)
19958-29 Florida St. .....................................................(0-0-0)9-5 Florida St. .....................................................(1-0-0)9-12 Florida St. .....................................................(2-0-0)9-19 Florida St. .....................................................(3-0-0)9-26 Florida St. .....................................................(4-0-0)10-3 Florida St. .....................................................(4-0-0)10-10 Florida St. .....................................................(5-0-0)10-17 Florida St. .....................................................(6-0-0)10-24 Florida St. .....................................................(7-0-0)10-31 Nebraska ................................................ (8-0-0) (2)11-7 Nebraska .......................................................(9-0-0)11-14 Nebraska .................................................... (10-0-0)11-21 Nebraska .................................................... (10-0-0)11-28 Nebraska .................................................... (11-0-0)12-5 Nebraska .................................................... (11-0-0)1-3 Nebraska ..................................................(12-0-0)
19968-26 Nebraska .......................................................(0-0-0)9-2 Nebraska .......................................................(0-0-0)9-9 Nebraska .......................................................(1-0-0)9-16 Nebraska .......................................................(1-0-0)9-23 Florida ...................................................... (3-0-0) (4)9-30 Florida .............................................................(4-0-0)10-7 Florida .............................................................(5-0-0)10-14 Florida .............................................................(6-0-0)10-21 Florida .............................................................(7-0-0)10-28 Florida .............................................................(7-0-0)11-4 Florida .............................................................(8-0-0)11-11 Florida .............................................................(9-0-0)11-18 Florida .......................................................... (10-0-0)11-25 Florida .......................................................... (10-0-0)12-2 Florida St. ............................................(11-0-0) (2)12-9 Florida St. .................................................. (11-0-0)1-3 Florida ................................................(12-1-0) (3)
19978-25 Penn St. .........................................................(0-0-0)9-2 Penn St. .........................................................(0-0-0)9-8 Penn St. .........................................................(1-0-0)9-15 Penn St. .........................................................(2-0-0)9-22 Florida ...................................................... (3-0-0) (3)9-29 Florida .............................................................(4-0-0)10-6 Florida .............................................................(5-0-0)10-13 Penn St. ................................................... (5-0-0) (2)10-20 Nebraska ................................................ (6-0-0) (2)10-27 Nebraska .......................................................(7-0-0)11-3 Nebraska .......................................................(8-0-0)11-10 Michigan ................................................ (9-0-0) (4)11-17 Michigan .................................................... (10-0-0)11-24 Michigan .................................................... (11-0-0)12-1 Michigan .................................................... (11-0-0)12-8 Michigan .................................................... (11-0-0)1-3 Michigan ..................................................(12-0-0)
19989-7 Ohio St. .........................................................(1-0-0)9-14 Ohio St. .........................................................(2-0-0)9-21 Ohio St. .........................................................(3-0-0)9-28 Ohio St. .........................................................(3-0-0)10-5 Ohio St. .........................................................(4-0-0)10-12 Ohio St. .........................................................(5-0-0)10-19 Ohio St. .........................................................(6-0-0)10-26 Ohio St. .........................................................(7-0-0)11-2 Ohio St. .........................................................(8-0-0)11-9 Tennessee .............................................. (8-0-0) (2)11-16 Tennessee .....................................................(9-0-0)11-23 Tennessee .................................................. (10-0-0)11-30 Tennessee .................................................. (11-0-0)12-7 Tennessee .................................................. (12-0-0)1-5 Tennessee ................................................(13-0-0)
19998-30 Florida St. .....................................................(1-0-0)9-6 Florida St. .....................................................(1-0-0)9-13 Florida St. .....................................................(2-0-0)9-20 Florida St. .....................................................(3-0-0)9-27 Florida St. .....................................................(4-0-0)10-4 Florida St. .....................................................(5-0-0)10-11 Florida St. .....................................................(6-0-0)10-18 Florida St. .....................................................(7-0-0)10-25 Florida St. .....................................................(8-0-0)11-1 Florida St. .....................................................(9-0-0)11-8 Florida St. .....................................................(9-0-0)11-15 Florida St. .................................................. (10-0-0)11-22 Florida St. .................................................. (11-0-0)11-29 Florida St. .................................................. (11-0-0)12-6 Florida St. .................................................. (11-0-0)1-5 Florida St. ...............................................(12-0-0)
20008-28 Nebraska .......................................................(0-0-0)9-4 Nebraska .......................................................(1-0-0)9-11 Nebraska .......................................................(2-0-0)9-18 Nebraska .......................................................(2-0-0)9-25 Nebraska .......................................................(3-0-0)10-2 Nebraska .......................................................(4-0-0)10-9 Nebraska .......................................................(5-0-0)10-16 Nebraska .......................................................(6-0-0)10-23 Nebraska .......................................................(7-0-0)10-30 Oklahoma .............................................. (7-0-0) (3)11-6 Oklahoma .....................................................(8-0-0)11-13 Oklahoma .....................................................(9-0-0)11-20 Oklahoma .................................................. (10-0-0)11-27 Oklahoma .................................................. (11-0-0)12-4 Oklahoma .................................................. (12-0-0)1-5 Oklahoma ................................................(13-0-0)
20018-27 Florida .............................................................(0-0-0)9-2 Florida .............................................................(1-0-0)9-9 Miami (FL) .............................................. (2-0-0) (2)9-23 Miami (FL) .....................................................(2-0-0)9-30 Miami (FL) .....................................................(3-0-0)10-7 Florida ...................................................... (4-0-0) (2)10-14 Miami (FL) .............................................. (5-0-0) (2)10-21 Miami (FL) .....................................................(6-0-0)10-28 Miami (FL) .....................................................(7-0-0)11-4 Miami (FL) .....................................................(7-0-0)11-11 Miami (FL) .....................................................(8-0-0)11-18 Miami (FL) .....................................................(9-0-0)11-24 Miami (FL) .................................................. (10-0-0)12-2 Miami (FL) .................................................. (11-0-0)12-8 Miami (FL) .................................................. (11-0-0)1-4 Miami (FL) ...............................................(12-0-0)
20028-26 Miami (FL) ....................................................(0-0-0)9-2 Miami (FL) ....................................................(1-0-0)9-9 Miami (FL) .................................................... (2-0-0)9-16 Miami (FL) .................................................... (3-0-0)9-23 Miami (FL) .................................................... (4-0-0)9-30 Miami (FL) .................................................... (4-0-0)10-7 Miami (FL) .................................................... (5-0-0)10-14 Miami (FL) .................................................... (6-0-0)10-21 Miami (FL) .................................................... (6-0-0)10-28 Miami (FL) .................................................... (7-0-0)11-4 Oklahoma .............................................. (8-0-0) (2)11-11 Miami (FL) ............................................. (9-0-0) (2)11-18 Miami (FL) .................................................... (9-0-0)11-25 Miami (FL) ................................................. (10-0-0)12-2 Miami (FL) ................................................. (11-0-0)12-9 Miami (FL) ................................................. (12-0-0)1-3 Ohio St. .............................................(14-0-0) (2)
20038-25 Oklahoma .................................................... (0-0-0)9-1 Oklahoma .................................................... (1-0-0)9-8 Oklahoma .................................................... (2-0-0)9-15 Oklahoma .................................................... (3-0-0)9-22 Oklahoma .................................................... (4-0-0)9-29 Oklahoma .................................................... (4-0-0)10-6 Oklahoma .................................................... (5-0-0)10-13 Oklahoma .................................................... (6-0-0)10-20 Oklahoma .................................................... (7-0-0)10-27 Oklahoma .................................................... (8-0-0)11-3 Oklahoma .................................................... (9-0-0)11-10 Oklahoma ................................................. (10-0-0)11-17 Oklahoma ................................................. (11-0-0)11-24 Oklahoma ................................................. (12-0-0)12-1 Oklahoma ................................................. (12-0-0)12-8 Southern California ........................(11-1-0) (2)1-5 Southern California ..........................(12-1-0)
20048-30 Southern California...................................(0-0-0)9-6 Southern California...................................(1-0-0)9-13 Southern California...................................(2-0-0)9-20 Southern California...................................(3-0-0)9-27 Southern California...................................(4-0-0)10-4 Southern California...................................(4-0-0)10-11 Southern California...................................(5-0-0)10-18 Southern California...................................(6-0-0)10-25 Southern California...................................(7-0-0)11-1 Southern California...................................(8-0-0)11-8 Southern California...................................(9-0-0)11-15 Southern California...................................(9-0-0)11-22 Southern California................................ (10-0-0)11-29 Southern California................................ (11-0-0)12-6 Southern California................................ (12-0-0)1-5 Southern California ...........................(13-0-0)
2005Pre. Southern California...................................(0-0-0)9-4 Southern California...................................(1-0-0)9-11 Southern California...................................(1-0-0)9-18 Southern California...................................(2-0-0)9-25 Southern California...................................(3-0-0)10-2 Southern California...................................(4-0-0)10-9 Southern California...................................(5-0-0)10-16 Southern California...................................(6-0-0)10-23 Southern California...................................(7-0-0)10-30 Southern California...................................(8-0-0)11-6 Southern California...................................(9-0-0)11-13 Southern California................................ (10-0-0)11-20 Southern California................................ (11-0-0)11-27 Southern California................................ (11-0-0)12-4 Southern California................................ (12-0-0)1-6 Texas ....................................................(13-0-0) (2)

84 2011 NCAA FOOTBALL RECORDS - ASSOCIATED PRESS WEEKLY POLL LEADERS
2006Pre. Ohio St............................................................(0-0-0)9-3 Ohio St............................................................(1-0-0)9-10 Ohio St............................................................(2-0-0)9-17 Ohio St............................................................(3-0-0)9-24 Ohio St............................................................(4-0-0)10-1 Ohio St............................................................(5-0-0)10-8 Ohio St............................................................(6-0-0)10-15 Ohio St............................................................(7-0-0)10-22 Ohio St............................................................(8-0-0)10-29 Ohio St............................................................(9-0-0)11-5 Ohio St......................................................... (10-0-0)11-12 Ohio St......................................................... (11-0-0)11-19 Ohio St......................................................... (12-0-0)11-26 Ohio St......................................................... (12-0-0)12-3 Ohio St......................................................... (12-0-0)1-9 Florida ................................................(13-1-0) (2)
2007Pre. Southern California...................................(0-0-0)9-2 Southern California...................................(1-0-0)9-9 Southern California...................................(1-0-0)9-16 Southern California...................................(2-0-0)9-23 Southern California...................................(3-0-0)9-30 LSU ............................................................ (5-0-0) (2)10-7 LSU ...................................................................(6-0-0)10-14 Ohio St..................................................... (7-0-0) (3)10-21 Ohio St............................................................(8-0-0)10-28 Ohio St............................................................(9-0-0)11-4 Ohio St......................................................... (10-0-0)11-11 LSU ............................................................ (9-1-0) (2)11-18 LSU ................................................................ (10-1-0)11-25 Missouri ................................................(11-1-0) (3)12-2 Ohio St..................................................(11-1-0) (3)1-8 LSU ......................................................(12-2-0) (2)
2008Pre. Georgia ..........................................................(0-0-0)8-31 Southern California........................ (1-0-0) (T-3)9-7 Southern California...................................(1-0-0)9-14 Southern California...................................(2-0-0)9-21 Southern California...................................(2-0-0)9-28 Oklahoma .............................................. (4-0-0) (2)10-5 Oklahoma .....................................................(5-0-0)10-12 Texas ......................................................... (6-0-0) (5)10-19 Texas ................................................................(7-0-0)10-26 Texas ................................................................(8-0-0)11-2 Alabama ................................................. (9-0-0) (2)11-9 Alabama ..................................................... (10-0-0)11-16 Alabama ..................................................... (11-0-0)11-23 Alabama ..................................................... (11-0-0)11-30 Alabama ..................................................... (12-0-0)12-8 Florida ....................................................(12-1-0) (2)1-8 Florida .......................................................(13-1-0)
2009Pre. Florida .............................................................(0-0-0)9-6 Florida .............................................................(1-0-0)9-13 Florida .............................................................(2-0-0)9-20 Florida .............................................................(3-0-0)9-27 Florida .............................................................(4-0-0)10-4 Florida .............................................................(4-0-0)10-11 Florida .............................................................(5-0-0)10-18 Alabama ................................................. (7-0-0) (2)10-25 Florida ...................................................... (7-0-0) (2)11-1 Florida .............................................................(8-0-0)11-8 Florida .............................................................(9-0-0)11-15 Florida .......................................................... (10-0-0)11-22 Florida .......................................................... (11-0-0)11-29 Florida .......................................................... (12-0-0)12-6 Alabama ...............................................(13-0-0) (2)1-8 Alabama ...................................................(14-0-0)
2010Pre. Alabama ........................................................(0-0-0)9-5 Alabama ........................................................(1-0-0)9-12 Alabama ........................................................(2-0-0)9-19 Alabama ........................................................(3-0-0)9-26 Alabama ........................................................(4-0-0)10-3 Alabama ........................................................(5-0-0)10-10 Ohio St..................................................... (6-0-0) (2)10-17 Oregon .................................................... (6-0-0) (2)10-24 Oregon ...........................................................(7-0-0)10-31 Oregon ...........................................................(8-0-0)11-7 Oregon ...........................................................(9-0-0)11-14 Oregon ........................................................ (10-0-0)11-21 Oregon ........................................................ (10-0-0)11-28 Oregon ........................................................ (11-0-0)12-5 Auburn ..................................................(13-0-0) (2)1-10 Auburn ......................................................(14-0-0)
*On January 6, 1948, in a special postseason poll after the Rose Bowl, The Associated Press voted Michigan No. 1 and Notre Dame No. 2. However, the postseason poll did not supersede the final regular-season poll of December 9, 1947. †A first-place tie occurred in The Associated Press poll for the first time in 51 years, but Miami (FL) had one more first-place vote, 31-30, than Washington.
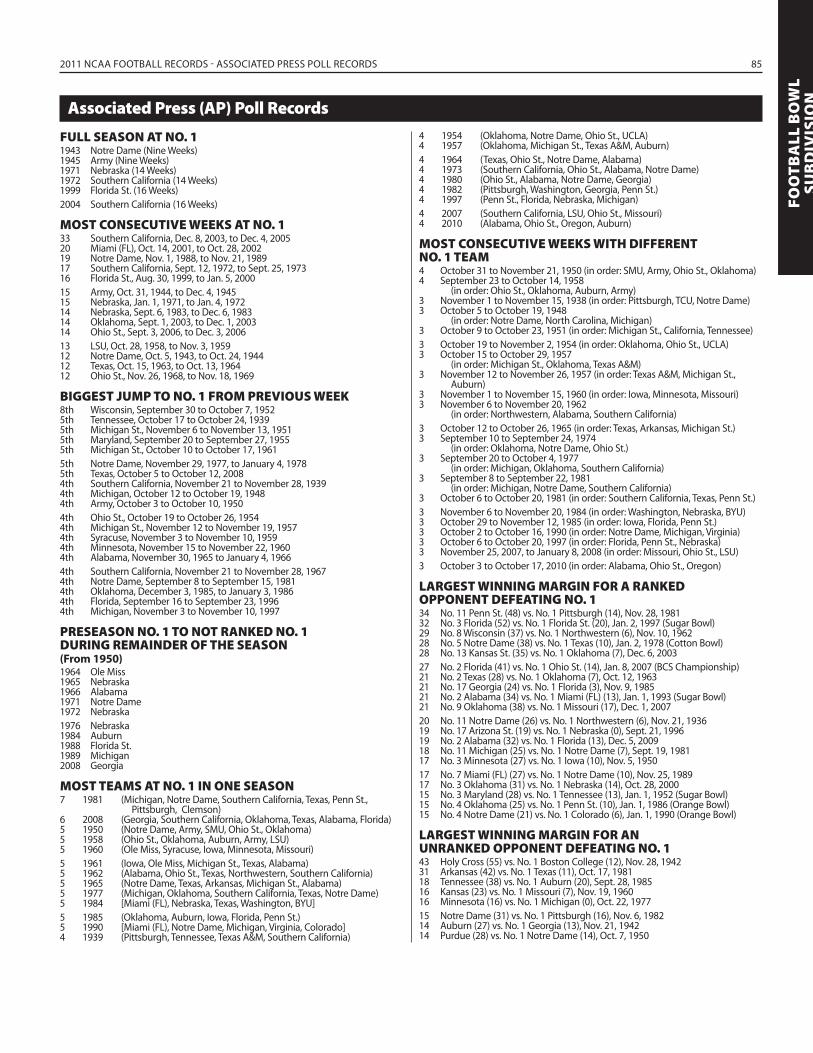
2011 NCAA FOOTBALL RECORDS - ASSOCIATED PRESS POLL RECORDS 85
FOO
TBA
LL B
OW
LSU
BD
IVIS
IONAssociated Press (AP) Poll Records
FULL SEASON AT NO. 11943 Notre Dame (Nine Weeks)1945 Army (Nine Weeks)1971 Nebraska (14 Weeks)1972 Southern California (14 Weeks)1999 Florida St. (16 Weeks)2004 Southern California (16 Weeks)
MOST CONSECUTIVE WEEKS AT NO. 133 Southern California, Dec. 8, 2003, to Dec. 4, 200520 Miami (FL), Oct. 14, 2001, to Oct. 28, 200219 Notre Dame, Nov. 1, 1988, to Nov. 21, 198917 Southern California, Sept. 12, 1972, to Sept. 25, 197316 Florida St., Aug. 30, 1999, to Jan. 5, 200015 Army, Oct. 31, 1944, to Dec. 4, 194515 Nebraska, Jan. 1, 1971, to Jan. 4, 197214 Nebraska, Sept. 6, 1983, to Dec. 6, 198314 Oklahoma, Sept. 1, 2003, to Dec. 1, 200314 Ohio St., Sept. 3, 2006, to Dec. 3, 200613 LSU, Oct. 28, 1958, to Nov. 3, 195912 Notre Dame, Oct. 5, 1943, to Oct. 24, 194412 Texas, Oct. 15, 1963, to Oct. 13, 196412 Ohio St., Nov. 26, 1968, to Nov. 18, 1969
BIGGEST JUMP TO NO. 1 FROM PREVIOUS WEEK8th Wisconsin, September 30 to October 7, 19525th Tennessee, October 17 to October 24, 19395th Michigan St., November 6 to November 13, 19515th Maryland, September 20 to September 27, 19555th Michigan St., October 10 to October 17, 19615th Notre Dame, November 29, 1977, to January 4, 19785th Texas, October 5 to October 12, 20084th Southern California, November 21 to November 28, 19394th Michigan, October 12 to October 19, 19484th Army, October 3 to October 10, 19504th Ohio St., October 19 to October 26, 19544th Michigan St., November 12 to November 19, 19574th Syracuse, November 3 to November 10, 19594th Minnesota, November 15 to November 22, 19604th Alabama, November 30, 1965 to January 4, 19664th Southern California, November 21 to November 28, 19674th Notre Dame, September 8 to September 15, 19814th Oklahoma, December 3, 1985, to January 3, 19864th Florida, September 16 to September 23, 19964th Michigan, November 3 to November 10, 1997
PRESEASON NO. 1 TO NOT RANKED NO. 1DURING REMAINDER OF THE SEASON(From 1950)1964 Ole Miss1965 Nebraska1966 Alabama1971 Notre Dame1972 Nebraska1976 Nebraska1984 Auburn1988 Florida St.1989 Michigan2008 Georgia
MOST TEAMS AT NO. 1 IN ONE SEASON7 1981 (Michigan, Notre Dame, Southern California, Texas, Penn St.,
Pittsburgh, Clemson)6 2008 (Georgia, Southern California, Oklahoma, Texas, Alabama, Florida)5 1950 (Notre Dame, Army, SMU, Ohio St., Oklahoma)5 1958 (Ohio St., Oklahoma, Auburn, Army, LSU)5 1960 (Ole Miss, Syracuse, Iowa, Minnesota, Missouri)5 1961 (Iowa, Ole Miss, Michigan St., Texas, Alabama)5 1962 (Alabama, Ohio St., Texas, Northwestern, Southern California)5 1965 (Notre Dame, Texas, Arkansas, Michigan St., Alabama)5 1977 (Michigan, Oklahoma, Southern California, Texas, Notre Dame)5 1984 [Miami (FL), Nebraska, Texas, Washington, BYU]5 1985 (Oklahoma, Auburn, Iowa, Florida, Penn St.)5 1990 [Miami (FL), Notre Dame, Michigan, Virginia, Colorado]4 1939 (Pittsburgh, Tennessee, Texas A&M, Southern California)
4 1954 (Oklahoma, Notre Dame, Ohio St., UCLA)4 1957 (Oklahoma, Michigan St., Texas A&M, Auburn)4 1964 (Texas, Ohio St., Notre Dame, Alabama)4 1973 (Southern California, Ohio St., Alabama, Notre Dame)4 1980 (Ohio St., Alabama, Notre Dame, Georgia)4 1982 (Pittsburgh, Washington, Georgia, Penn St.)4 1997 (Penn St., Florida, Nebraska, Michigan)4 2007 (Southern California, LSU, Ohio St., Missouri)4 2010 (Alabama, Ohio St., Oregon, Auburn)
MOST CONSECUTIVE WEEKS WITH DIFFERENTNO. 1 TEAM4 October 31 to November 21, 1950 (in order: SMU, Army, Ohio St., Oklahoma)4 September 23 to October 14, 1958
(in order: Ohio St., Oklahoma, Auburn, Army)3 November 1 to November 15, 1938 (in order: Pittsburgh, TCU, Notre Dame)3 October 5 to October 19, 1948
(in order: Notre Dame, North Carolina, Michigan)3 October 9 to October 23, 1951 (in order: Michigan St., California, Tennessee)3 October 19 to November 2, 1954 (in order: Oklahoma, Ohio St., UCLA)3 October 15 to October 29, 1957
(in order: Michigan St., Oklahoma, Texas A&M)3 November 12 to November 26, 1957 (in order: Texas A&M, Michigan St.,
Auburn)3 November 1 to November 15, 1960 (in order: Iowa, Minnesota, Missouri)3 November 6 to November 20, 1962
(in order: Northwestern, Alabama, Southern California)3 October 12 to October 26, 1965 (in order: Texas, Arkansas, Michigan St.)3 September 10 to September 24, 1974
(in order: Oklahoma, Notre Dame, Ohio St.)3 September 20 to October 4, 1977
(in order: Michigan, Oklahoma, Southern California)3 September 8 to September 22, 1981
(in order: Michigan, Notre Dame, Southern California)3 October 6 to October 20, 1981 (in order: Southern California, Texas, Penn St.)3 November 6 to November 20, 1984 (in order: Washington, Nebraska, BYU)3 October 29 to November 12, 1985 (in order: Iowa, Florida, Penn St.)3 October 2 to October 16, 1990 (in order: Notre Dame, Michigan, Virginia)3 October 6 to October 20, 1997 (in order: Florida, Penn St., Nebraska)3 November 25, 2007, to January 8, 2008 (in order: Missouri, Ohio St., LSU)3 October 3 to October 17, 2010 (in order: Alabama, Ohio St., Oregon)
LARGEST WINNING MARGIN FOR A RANKED OPPONENT DEFEATING NO. 134 No. 11 Penn St. (48) vs. No. 1 Pittsburgh (14), Nov. 28, 198132 No. 3 Florida (52) vs. No. 1 Florida St. (20), Jan. 2, 1997 (Sugar Bowl)29 No. 8 Wisconsin (37) vs. No. 1 Northwestern (6), Nov. 10, 196228 No. 5 Notre Dame (38) vs. No. 1 Texas (10), Jan. 2, 1978 (Cotton Bowl)28 No. 13 Kansas St. (35) vs. No. 1 Oklahoma (7), Dec. 6, 200327 No. 2 Florida (41) vs. No. 1 Ohio St. (14), Jan. 8, 2007 (BCS Championship)21 No. 2 Texas (28) vs. No. 1 Oklahoma (7), Oct. 12, 196321 No. 17 Georgia (24) vs. No. 1 Florida (3), Nov. 9, 198521 No. 2 Alabama (34) vs. No. 1 Miami (FL) (13), Jan. 1, 1993 (Sugar Bowl)21 No. 9 Oklahoma (38) vs. No. 1 Missouri (17), Dec. 1, 200720 No. 11 Notre Dame (26) vs. No. 1 Northwestern (6), Nov. 21, 193619 No. 17 Arizona St. (19) vs. No. 1 Nebraska (0), Sept. 21, 199619 No. 2 Alabama (32) vs. No. 1 Florida (13), Dec. 5, 200918 No. 11 Michigan (25) vs. No. 1 Notre Dame (7), Sept. 19, 198117 No. 3 Minnesota (27) vs. No. 1 Iowa (10), Nov. 5, 195017 No. 7 Miami (FL) (27) vs. No. 1 Notre Dame (10), Nov. 25, 198917 No. 3 Oklahoma (31) vs. No. 1 Nebraska (14), Oct. 28, 200015 No. 3 Maryland (28) vs. No. 1 Tennessee (13), Jan. 1, 1952 (Sugar Bowl)15 No. 4 Oklahoma (25) vs. No. 1 Penn St. (10), Jan. 1, 1986 (Orange Bowl)15 No. 4 Notre Dame (21) vs. No. 1 Colorado (6), Jan. 1, 1990 (Orange Bowl)
LARGEST WINNING MARGIN FOR AN UNRANKED OPPONENT DEFEATING NO. 143 Holy Cross (55) vs. No. 1 Boston College (12), Nov. 28, 194231 Arkansas (42) vs. No. 1 Texas (11), Oct. 17, 198118 Tennessee (38) vs. No. 1 Auburn (20), Sept. 28, 198516 Kansas (23) vs. No. 1 Missouri (7), Nov. 19, 196016 Minnesota (16) vs. No. 1 Michigan (0), Oct. 22, 197715 Notre Dame (31) vs. No. 1 Pittsburgh (16), Nov. 6, 198214 Auburn (27) vs. No. 1 Georgia (13), Nov. 21, 194214 Purdue (28) vs. No. 1 Notre Dame (14), Oct. 7, 1950

86 2011 NCAA FOOTBALL RECORDS - ASSOCIATED PRESS POLL RECORDS
MOST WEEKS AT NO. 1 — ALL-TIME(Complete List; Does not count preseason polls)
CONSECUTIVE LONGEST ACTIVE STREAK OF WEEKS APPEARING IN THE AP POLLNo. Team (Since Year) 100 Ohio St. (2004)Texas streak of 163 weeks (started in 2000) ended the week of Oct. 4, 2010
LONGEST CONSECUTIVE STREAK OF WEEKS APPEARING IN THE AP TOP 10No. Team (Years) 62 Southern California (2002-2007)
MOST WEEKLY APPEARANCES IN THE AP POLL(Since 1936)781 Ohio St.755 Michigan708 Notre Dame701 Oklahoma692 Southern California676 Texas664 Nebraska659 Alabama580 Penn St.559 Tennessee
LOWEST FINAL RANKING OF NO. 1 IN FIRST RANKING11th Oklahoma (2001)
No. Team, First Yr. as No. 1 89 Notre Dame, 1938 88 Oklahoma, 1954 87 Ohio St., 1942 85 Southern California, 1939 65 Nebraska, 1970 62 Miami (FL), 1983 53 Florida St., 1991 46 Texas, 1940 42 Alabama, 1962 39 Florida, 1985 32 Michigan, 1947 28 Michigan St., 1951 27 Army, 1944 20 Pittsburgh, 1937 19 Penn St., 1978 18 LSU, 1958 18 Minnesota, 1936 17 Tennessee, 1939 14 Georgia, 1942 14 Washington, 1982 10 Iowa, 1960 8 Auburn, 1957
7 Oregon, 2010 7 Texas A&M, 1939 6 Colorado, 1989 6 Maryland, 1953 6 Syracuse, 1959 6 UCLA, 1954 5 Northwestern, 1936 4 BYU, 1984 4 California, 1937 4 *Cornell, 1940 4 Ole Miss, 1960 4 Purdue, 1968 3 Virginia, 1990 2 Clemson, 1981 2 Missouri, 1960 2 SMU, 1950 2 TCU, 1938 1 Arkansas, 1965 1 Boston College, 1942 1 North Carolina, 1948 1 Wisconsin, 1952*No longer FBS.
No. Team, First Yr. as No. 1
MOST TIMES DEFEATING NO. 1 (Complete List)(Since 1936)
8 Notre Dame 7 Miami (FL) 7 Oklahoma 7 Purdue 7 Southern California 5 Texas 4 Alabama 4 Arkansas 4 Ohio St. 4 Penn St. 4 Wisconsin 3 Auburn 3 Florida 3 Illinois 3 Kentucky 3 Michigan 3 Michigan St. 3 Minnesota 3 UCLA 2 Arizona 2 Georgia Tech 2 LSU 2 Maryland 2 Oregon St. 2 Tennessee
1 Arizona St. 1 Army 1 Boston College 1 BYU 1 Carnegie Mellon 1 Duquesne 1 Florida St. 1 Georgia 1 Great Lakes NTS 1 Holy Cross 1 Kansas 1 Kansas St. 1 Mississippi St. 1 Nebraska 1 Northwestern 1 Rice 1 South Carolina 1 Stanford 1 Syracuse 1 Texas A&M 1 TCU 1 Texas Tech 1 Washington 1 Washington St.
2010 Associated Press Week-By-Week PollsTeam Pre S6 S13 S20 S27 O4 O11 O18 O25 N1 N8 N15 N22 N29 D5 J11Alabama ..................................... 1 1 1 1 1 1 8 7 6 5 11 10 9 17 15 10Ohio St. ....................................... 2 2 2 2 2 2 1 11 10 8 8 8 8 6 6 5Boise St. ...................................... 3 3 3 3 3 4 3 2 2 2 4 3 3 9 10 9Florida ......................................... 4 8 10 9 7 14 22 NR NR NR 24 NR NR NR NR NRTexas ............................................ 5 5 6 7 21 NR NR 22 NR NR NR NR NR NR NR NRTCU ............................................... 6 4 4 4 5 5 4 4 4 4 3 4 4 3 3 2Oklahoma .................................. 7 10 7 8 8 6 6 3 11 11 19 16 14 10 9 6Nebraska .................................... 8 6 8 6 6 7 5 14 14 9 9 9 16 13 17 20Iowa ............................................. 9 9 9 18 17 15 15 13 18 15 13 21 24 NR NR NRVirginia Tech ............................. 10 13 NR NR NR NR NR 23 21 20 16 14 13 12 12 16Oregon........................................ 11 7 5 5 4 3 2 1 1 1 1 1 1 1 2 3Wisconsin .................................. 12 11 11 11 11 20 18 10 9 7 6 6 5 4 4 7Miami (FL) .................................. 13 12 17 19 16 13 NR 25 22 NR NR 24 NR NR NR NRSouthern California ............... 14 16 18 20 18 NR NR NR 24 NR NR 20 NR NR NR NRPittsburgh .................................. 15 NR NR NR NR NR NR NR NR NR NR NR NR NR NR NRGeorgia Tech ............................ 16 15 NR NR NR NR NR NR NR NR NR NR NR NR NR NRArkansas ..................................... 17 14 12 10 15 11 12 21 19 17 14 13 12 8 8 12North Carolina ......................... 18 NR NR NR NR NR NR NR NR NR NR NR NR NR NR NRPenn St. ....................................... 19 18 22 23 22 NR NR NR NR NR NR NR NR NR NR NRFlorida St. ................................... 20 17 NR NR NR 23 16 16 16 24 NR NR 22 20 23 17LSU ............................................... 21 19 15 15 12 12 9 6 12 12 5 5 6 11 11 8Auburn ........................................ 22 21 16 17 10 8 7 5 3 3 2 2 2 2 1 1Georgia ....................................... 23 22 NR NR NR NR NR NR NR NR NR NR NR NR NR NROregon St. ................................. 24 NR 25 24 NR NR 24 NR NR NR NR NR NR NR NR NR

2011 NCAA FOOTBALL RECORDS - ASSOCIATED PRESS WEEK-BY-WEEK POLLS 87
FOO
TBA
LL B
OW
LSU
BD
IVIS
ION
West Virginia............................. 25 23 21 22 NR NR 25 20 NR NR NR NR NR 23 22 NRUtah ............................................. NR 20 14 13 13 10 11 9 8 6 15 25 23 21 20 NRSouth Carolina ......................... NR 24 13 12 20 19 10 19 17 18 22 17 18 18 19 22Stanford ...................................... NR 25 19 16 9 16 14 12 13 10 7 7 7 5 5 4Michigan .................................... NR NR 20 21 19 18 NR NR NR NR NR NR NR NR NR NRHouston ..................................... NR NR 23 NR NR NR NR NR NR NR NR NR NR NR NR NRArizona........................................ NR NR 24 14 14 9 17 15 15 13 18 23 20 NR NR NRMichigan St. .............................. NR NR NR 25 24 17 13 8 5 16 10 11 11 7 7 14North Carolina St. ................... NR NR NR NR 23 NR NR NR NR 23 NR NR 21 NR NR 25Nevada........................................ NR NR NR NR 25 21 19 NR NR 25 21 19 19 14 13 11Oklahoma St. ........................... NR NR NR NR NR 22 20 17 20 19 12 12 10 16 16 13Missouri ...................................... NR NR NR NR NR 24 21 18 7 14 20 15 15 15 14 18Air Force ..................................... NR NR NR NR NR 25 23 NR NR NR NR NR NR NR NR NRMississippi St. ........................... NR NR NR NR NR NR NR 24 23 21 17 22 25 22 21 15Baylor .......................................... NR NR NR NR NR NR NR NR 25 22 NR NR NR NR NR NRTexas A&M ................................. NR NR NR NR NR NR NR NR NR NR 23 18 17 19 18 19UCF ............................................... NR NR NR NR NR NR NR NR NR NR 25 NR NR NR NR 21Northern Ill. ............................... NR NR NR NR NR NR NR NR NR NR NR NR NR 24 NR NRHawaii ......................................... NR NR NR NR NR NR NR NR NR NR NR NR NR 25 24 NRConnecticut .............................. NR NR NR NR NR NR NR NR NR NR NR NR NR NR 25 NRMaryland .................................... NR NR NR NR NR NR NR NR NR NR NR NR NR NR NR 23Tulsa ............................................. NR NR NR NR NR NR NR NR NR NR NR NR NR NR NR 24T-Tie for ranking.
No. 1 vs. No. 2The No. 1 and No. 2 teams in The Associated Press poll (begun in 1936) have faced each other 45 times (22 in regular-season games, 21 in bowl games and two conference championship games). The No. 1 team has won 26, with two games ending in ties.Date Score Stadium (Site)10-9-43 No. 1 Notre Dame 35, No. 2 Michigan 12 Michigan Stadium (Ann Arbor)11-20-43 No. 1 Notre Dame 14, No. 2 Iowa Pre-Flight 13 Notre Dame (South Bend)12-2-44 No. 1 Army 23, No. 2 Navy 7 Municipal (Baltimore)11-10-45 No. 1 Army 48, No. 2 Notre Dame 0 Yankee (New York)12-1-45 No. 1 Army 32, No. 2 Navy 13 Municipal (Philadelphia)11-9-46 No. 1 Army 0, No. 2 Notre Dame 0 (tie) Yankee (New York)1-1-63 No. 1 Southern California 42, No. 2 Wisconsin 37 (Rose Bowl) Rose Bowl (Pasadena)10-12-63 No. 2 Texas 28, No. 1 Oklahoma 7 Cotton Bowl (Dallas)1-1-64 No. 1 Texas 28, No. 2 Navy 6 (Cotton Bowl) Cotton Bowl (Dallas)11-19-66 No. 1 Notre Dame 10, No. 2 Michigan St. 10 (tie) Spartan (East Lansing)9-28-68 No. 1 Purdue 37, No. 2 Notre Dame 22 Notre Dame (South Bend)1-1-69 No. 1 Ohio St. 27, No. 2 Southern California 16 (Rose Bowl) Rose Bowl (Pasadena)12-6-69 No. 1 Texas 15, No. 2 Arkansas 14 Razorback (Fayetteville)11-25-71 No. 1 Nebraska 35, No. 2 Oklahoma 31 Owen Field (Norman)1-1-72 No. 1 Nebraska 38, No. 2 Alabama 6 (Orange Bowl) Orange Bowl (Miami)1-1-79 No. 2 Alabama 14, No. 1 Penn St. 7 (Sugar Bowl) Sugar Bowl (New Orleans)9-26-81 No. 1 Southern California 28, No. 2 Oklahoma 24 Coliseum (Los Angeles)1-1-83 No. 2 Penn St. 27, No. 1 Georgia 23 (Sugar Bowl) Sugar Bowl (New Orleans)10-19-85 No. 1 Iowa 12, No. 2 Michigan 10 Kinnick (Iowa City)9-27-86 No. 2 Miami (FL) 28, No. 1 Oklahoma 16 Orange Bowl (Miami)1-2-87 No. 2 Penn St. 14, No. 1 Miami (FL) 10 (Fiesta Bowl) Sun Devil (Tempe)11-21-87 No. 2 Oklahoma 17, No. 1 Nebraska 7 Memorial (Lincoln)1-1-88 No. 2 Miami (FL) 20, No. 1 Oklahoma 14 (Orange Bowl) Orange Bowl (Miami)11-26-88 No. 1 Notre Dame 27, No. 2 Southern California 10 Coliseum (Los Angeles)9-16-89 No. 1 Notre Dame 24, No. 2 Michigan 19 Michigan (Ann Arbor)11-16-91 No. 2 Miami (FL) 17, No. 1 Florida St. 16 Doak Campbell (Tallahassee)1-1-93 No. 2 Alabama 34, No. 1 Miami (FL) 13 (Sugar Bowl) Superdome (New Orleans)11-13-93 No. 2 Notre Dame 31, No. 1 Florida St. 24 Notre Dame (South Bend)1-1-94 No. 1 Florida St. 18, No. 2 Nebraska 16 (Orange Bowl) Orange Bowl (Miami)1-2-96 No. 1 Nebraska 62, No. 2 Florida 24 (Fiesta Bowl) Sun Devil (Tempe)11-30-96 No. 2 Florida St. 24, No. 1 Florida 21 Doak Campbell (Tallahassee)1-4-99 No. 1 Tennessee 23, No. 2 Florida St. 16 (Fiesta Bowl) Sun Devil (Tempe)1-4-00 No. 1 Florida St. 46, No. 2 Virginia Tech 29 (Sugar Bowl) Superdome (New Orleans)1-3-03 No. 2 Ohio St. 31, No. 1 Miami (FL) 24 (2 ot) (Fiesta Bowl) Sun Devil (Tempe)1-4-05 No. 1 Southern California 55, No. 2 Oklahoma 19 (Orange Bowl) Dolphins Stadium (Miami)1-5-06 No. 2 Texas 41, No. 1 Southern California 38 (Rose Bowl) Rose Bowl (Pasadena)9-9-06 No. 1 Ohio St. 24, No. 2 Texas 7 Darrell K. Royal-Texas Memorial (Austin)11-18-06 No. 1 Ohio St. 42, No. 2 Michigan 39 Ohio (Columbus)1-8-07 No. 2 Florida 41, No. 1 Ohio St. 14 (BCS Championship) University of Phoenix (Glendale)1-7-08 No. 2 LSU 38, No. 1 Ohio St. 24 (BCS Championship) Superdome (New Orleans)12-6-08 No. 2 Florida 31, No. 1 Alabama 20 (SEC Championship) Georgia Dome (Atlanta)1-8-09 No. 1 Florida 24, No. 2 Oklahoma 14 (BCS Championship) Dolphins (Miami)12-5-09 No. 2 Alabama 32, No. 1 Florida 13 (SEC Championship) Georgia Dome (Atlanta)1-7-10 No. 1 Alabama 37, No. 2 Texas 21 (BCS Championship) Rose Bowl (Pasadena)1-10-11 No. 1 Auburn 22, No. 2 Oregon 19 (BCS Championship) University of Phoenix (Glendale)
Team Pre S6 S13 S20 S27 O4 O11 O18 O25 N1 N8 N15 N22 N29 D6 J8

88 2011 NCAA FOOTBALL RECORDS - GAMES A NO. 1-RANKED TEAM WAS DEFEATED OR TIED
Games in Which a No. 1-Ranked Team Was Defeated or Tied
Listed here are 133 games in which the No. 1-ranked team in The Associated Press poll was defeated or tied. An asterisk (*) indicates the home team, an (N) or the name of the bowl game indicates a neutral site. In parentheses after the winning or tying team is its rank in the previous week’s poll (NR indi-cates it was not ranked) and its won-lost record entering the game, followed by its score. The defeated or tied No. 1-ranked team follows with its score, and in parentheses is its rank in the poll the following week. Before 1965, the polls were fi nal before bowl games. (Note: Only 10 teams were ranked in the weekly polls during 1962, 1963, 1964, 1965, 1966 and 1967; 20 teams all other seasons until 1989, when 25 teams were ranked.)10-31-36 *Northwestern (3, 4-0-0) 6, Minnesota 0 (2)11-21-36 *Notre Dame (11, 5-2-0) 26, Northwestern 6 (7)10-30-37 (Tie) Washington (NR, 3-2-1) 0, *California 0 (2)10-29-38 Carnegie Mellon (T19, 4-1-0) 20, *Pittsburgh 10 (3)12-3-38 *Southern California (8, 7-2-0) 13, Notre Dame 0 (5)10-14-39 Duquesne (NR, 3-0-0) 21, *Pittsburgh 13 (18)11-8-41 (Tie) Baylor (NR, 3-4-0) 7, *Texas 7 (2)10-31-42 *Wisconsin (6, 5-0-1) 17, Ohio St. 7 (6)11-21-42 (N) Auburn (NR, 4-4-1) 27, Georgia 13 (5)11-28-42 Holy Cross (NR, 4-4-1) 55, *Boston College 12 (8)11-27-43 *Great Lakes NTS (NR, 9-2-0) 19, Notre Dame 14 (1)11-9-46 (Tie) (N) Notre Dame (2, 5-0-0) 0, Army 0 (1)10-8-49 Army (7, 2-0-0) 21, *Michigan 7 (7)10-7-50 Purdue (NR, 0-1-0) 28, *Notre Dame 14 (10)11-4-50 *Texas (7, 4-1-0) 23, SMU 20 (7)11-18-50 *Illinois (10, 6-1-0) 14, Ohio St. 7 (8)1-1-51 (Sugar Bowl) Kentucky (7, 10-1-0) 13, Oklahoma 7 (1)10-20-51 Southern California (11, 4-1-0) 21, *California 14 (9)1-1-52 (Sugar Bowl) Maryland (3, 9-0-0) 28, Tennessee 13 (1)10-11-52 *Ohio St. (NR, 1-1-0) 23, Wisconsin 14 (12)11-21-53 (Tie) Iowa (20, 5-3-0) 14, *Notre Dame 14 (2)1-1-54 (Orange Bowl) Oklahoma (4, 8-1-1) 7, Maryland 0 (1)10-2-54 Purdue (19, 1-0-0) 27, *Notre Dame 14 (8)9-24-55 *Maryland (5, 1-0-0) 7, UCLA 0 (7)10-27-56 *Illinois (NR, 1-3-0) 20, Michigan St. 13 (4)10-19-57 Purdue (NR, 0-3-0) 20, *Michigan St. 13 (8)11-16-57 *Rice (20, 4-3-0) 7, Texas A&M 6 (4)10-25-58 (Tie) *Pittsburgh (NR, 4-1-0) 14, Army 14 (3)11-7-59 *Tennessee (13, 4-1-1) 14, LSU 13 (3)11-5-60 *Minnesota (3, 6-0-0) 27, Iowa 10 (5)11-12-60 Purdue (NR, 2-4-1) 23, *Minnesota 14 (4)11-19-60 Kansas (NR, 6-2-1) 23, *Missouri 7 (5)1-1-61 (Rose Bowl) Washington (6, 9-1-0) 17, Minnesota 7 (1)11-4-61 *Minnesota (NR, 4-1-0) 13, Michigan St. 0 (6)11-18-61 TCU (NR, 2-4-1) 6, *Texas 0 (5)10-6-62 *UCLA (NR, 0-0-0) 9, Ohio St. 7 (10)10-27-62 (Tie) *Rice (NR, 0-3-1) 14, Texas 14 (5)11-10-62 *Wisconsin (8, 5-1-0) 37, Northwestern 6 (9)11-17-62 *Georgia Tech (NR, 5-2-1) 7, Alabama 6 (6)9-28-63 Oklahoma (3, 1-0-0) 17, *Southern California 12 (8)10-12-63 (N) Texas (2, 3-0-0) 28, Oklahoma 7 (6)9-26-64 Kentucky (NR, 1-0-0) 27, *Ole Miss 21 (NR)10-17-64 Arkansas (8, 4-0-0) 14, *Texas 13 (6)11-28-64 *Southern California (NR, 6-3-0) 20, Notre Dame 17 (3)1-1-65 (Orange Bowl) Texas (5, 9-1-0) 21, Alabama 17 (1)9-25-65 *Purdue (6, 1-0-0) 25, Notre Dame 21 (8)10-16-65 *Arkansas (3, 4-0-0) 27, Texas 24 (5)1-1-66 (Rose Bowl) UCLA (5, 7-2-1) 14, Michigan St. 12 (2)11-19-66 (Tie) *Michigan St. (2, 9-0-0) 10, Notre Dame 10 (1)9-30-67 *Purdue (10, 1-0-0) 28, Notre Dame 21 (6)11-11-67 *Oregon St. (NR, 5-2-1) 3, Southern California 0 (4)11-18-67 *Southern California (4, 8-1-0) 21, UCLA 20 (4)10-12-68 *Ohio St. (4, 2-0-0) 13, Purdue 0 (5)11-22-69 *Michigan (12, 7-2-0) 24, Ohio St. 12 (4)1-1-71 (Cotton Bowl) Notre Dame (6, 8-1-1) 24, Texas 11 (3)9-29-73 (Tie) Oklahoma (8, 1-0-0) 7, *Southern California 7 (4)11-24-73 (Tie) *Michigan (4, 10-0-0) 10, Ohio St. 10 (3)12-31-73 (Sugar Bowl) Notre Dame (3, 10-0-0) 24, Alabama 23 (4)11-9-74 *Michigan St. (NR, 4-3-1) 16, Ohio St. 13 (4)1-1-76 (Rose Bowl) UCLA (11, 8-2-1) 23, Ohio St. 10 (4)11-6-76 *Purdue (NR, 3-5-0) 16, Michigan 14 (4)
10-8-77 Alabama (T7, 3-1-0) 21, *Southern California 20 (6)10-22-77 *Minnesota (NR, 4-2-0) 16, Michigan 0 (6)1-2-78 (Cotton Bowl) Notre Dame (5, 10-1-0) 38, Texas 10 (4)9-23-78 (N) Southern California (7, 2-0-0) 24, Alabama 14 (3)11-11-78 *Nebraska (4, 8-1-0) 17, Oklahoma 14 (4)1-1-79 (Sugar Bowl) Alabama (2, 10-1-0) 14, Penn St. 7 (4)10-13-79 (Tie) Stanford (NR, 3-2-0) 21, *Southern California 21 (4)1-1-80 (Rose Bowl) Southern California (3, 10-0-1) 17, Ohio St. 16 (4)11-1-80 (N) Mississippi St. (NR, 6-2-0) 6, Alabama 3 (6)11-8-80 (Tie) *Georgia Tech (NR, 1-7-0) 3, Notre Dame 3 (6)9-12-81 *Wisconsin (NR, 0-0-0) 21, Michigan 14 (11)9-19-81 *Michigan (11, 0-1-0) 25, Notre Dame 7 (13)10-10-81 Arizona (NR, 2-2-0) 13, *Southern California 10 (7)10-17-81 *Arkansas (NR, 4-1-0) 42, Texas 11 (10)10-31-81 *Miami (FL) (NR, 4-2-0) 17, Penn St. 14 (5)11-28-81 Penn St. (11, 8-2-0) 48, *Pittsburgh 14 (10)11-6-82 Notre Dame (NR, 5-1-1) 31, *Pittsburgh 16 (8)1-1-83 (Sugar Bowl) Penn St. (2, 10-1-0) 27, Georgia 23 (4)1-2-84 (Orange Bowl) Miami (FL) (5, 10-1-0) 31, Nebraska 30 (4)9-8-84 *Michigan (14, 0-0-0) 22, Miami (FL) 14 (5)9-29-84 *Syracuse (NR, 2-1-0) 17, Nebraska 9 (8)10-13-84 (N) (Tie) Oklahoma (3, 4-0-0) 15, Texas 15 (3)11-10-84 *Southern California (12, 7-1-0) 16, Washington 7 (5)11-17-84 Oklahoma (6, 7-1-1) 17, *Nebraska 7 (7)9-28-85 *Tennessee (NR, 0-0-1) 38, Auburn 20 (14)11-2-85 *Ohio St. (7, 6-1-0) 22, Iowa 13 (6)11-9-85 (N) Georgia (17, 6-1-1) 24, Florida 3 (11)1-1-86 (Orange Bowl) Oklahoma (4, 9-1-0) 25, Penn St. 10 (3)9-27-86 *Miami (FL) (2, 3-0-0) 28, Oklahoma 16 (6)1-2-87 (Fiesta Bowl) Penn St. (2, 11-0-0) 14, Miami (FL) 10 (2)11-21-87 Oklahoma (2, 11-0-0) 17, *Nebraska 7 (5)1-1-88 (Orange Bowl) Miami (FL) (2, 11-1-0) 20, Oklahoma 14 (3)10-15-88 *Notre Dame (4, 5-0-0) 31, Miami (FL) 30 (4)10-29-88 Washington St. (NR, 4-3-0) 34, *UCLA 30 (6)11-25-89 *Miami (FL) (7, 9-1-0) 27, Notre Dame 10 (5)1-1-90 (Orange Bowl) Notre Dame (4, 11-1-0) 21, Colorado 6 (4)9-8-90 *BYU (16, 1-0-0) 28, Miami (FL) 21 (10)10-6-90 Stanford (NR, 1-3-0) 36, *Notre Dame 31 (8)10-13-90 Michigan St. (NR, 1-2-1) 28, *Michigan 27 (10)11-3-90 Georgia Tech (16, 6-0-1) 41, *Virginia 38 (11)11-17-90 Penn St. (18, 7-2-0) 24, *Notre Dame 21 (7)11-16-91 Miami (FL) (2, 8-0-0) 17, *Florida St. 16 (3)11-7-92 *Arizona (12, 5-2-1) 16, Washington 3 (6)1-1-93 (Sugar Bowl) Alabama (2, 12-0) 34, Miami (FL) 13 (3)11-13-93 *Notre Dame (2, 9-0-0) 31, Florida St. 24 (2)11-20-93 Boston College (17, 7-2-0) 41, *Notre Dame 39 (4)10-15-94 Auburn (6, 6-0-0) 36, *Florida 33 (5)9-21-96 *Arizona St. (17, 2-0-0) 19, Nebraska 0 (8)11-30-96 *Florida St. (2, 10-0-0) 24, Florida 21 (4)1-2-97 (Sugar Bowl) Florida (3, 11-1-0) 52, Florida St. 20 (3)10-11-97 *LSU (14, 4-1-0) 28, Florida 21 (7)11-7-98 Michigan St. (NR, 4-4) 28, *Ohio St. 24 (7)10-7-00 *Miami (FL) (7, 3-1) 27, Florida St. 24 (7)10-28-00 *Oklahoma (3, 6-0) 31, Nebraska 14 (5)10-13-01 *Auburn (NR, 4-1) 23, Florida 20 (7)11-9-02 *Texas A&M (NR, 5-4) 30, Oklahoma 26 (4)1-3-03 (Fiesta Bowl) Ohio St. (2, 13-0) 31, Miami (FL) 24 (2 ot) (2)12-6-03 (N) Kansas St. (13, 10-3) 35, Oklahoma 7 (3)1-5-06 (Rose Bowl) Texas (2, 12-0) 41, Southern California 38 (2)1-8-07 (BCS Championship) Florida (2, 12-1) 41, Ohio St. 14 (2)10-13-07 *Kentucky (17, 5-1) 43, LSU 37 (3 ot) (5)11-10-07 Illinois (NR, 7-3) 28, *Ohio St. 21 (7)11-23-07 Arkansas (NR, 7-4) 50, *LSU 48 (ot) (5)12-1-07 (N) Oklahoma (10, 9-2) 38, Missouri 17 (7)1-7-08 (BCS Championship) LSU (2, 11-2) 38, Ohio St. 24 (2)9-25-08 *Oregon St. (NR, 1-2) 27, Southern California 21 (9)10-11-08 (N) Texas (5, 5-0) 45, Oklahoma 35 (4)11-1-08 *Texas Tech (6, 8-0) 39, Texas 33 (5)12-6-08 (N) Florida (2, 11-1) 31, Alabama 20 (4)12-5-09 (N) Alabama (2, 12-0) 32, Florida 13 (5)10-9-10 *South Carolina (19, 3-1) 35, Alabama 21 (8)10-16-10 *Wisconsin (18, 5-1) 31, Ohio St. 18 (11)

2011 NCAA FOOTBALL RECORDS - PRESEASON NO. 1 TEAMS 89
FOO
TBA
LL B
OW
LSU
BD
IVIS
ION
Year Team1950 Notre Dame1951 Tennessee+1952 Michigan St.+1953 Notre Dame1954 Notre Dame1955 UCLA1956 Oklahoma+1957 Oklahoma1958 Ohio St.1959 LSU1960 Syracuse
1961 Iowa1962 Ohio St.1963 Southern California1964 Ole Miss1965 Nebraska1966 Alabama1967 Notre Dame1968 Purdue1969 Ohio St.1970 Ohio St.1971 Notre Dame
1972 Nebraska1973 Southern California1974 Oklahoma+1975 Oklahoma+1976 Nebraska1977 Oklahoma1978 Alabama+1979 Southern California1980 Ohio St.1981 Michigan1982 Pittsburgh
1983 Nebraska1984 Auburn1985 Oklahoma+1986 Oklahoma1987 Oklahoma1988 Florida St.1989 Michigan1990 Miami (FL)1991 Florida St.1992 Miami (FL)1993 Florida St.+1994 Florida1995 Florida St.1996 Nebraska1997 Penn St.1998 Ohio St. 1999 Florida St.+
2000 Nebraska2001 Florida2002 Miami (FL)2003 Oklahoma2004 Southern California+2005 Southern California2006 Ohio St.2007 Southern California2008 Georgia2009 Florida2010 Alabama+ Indicated eventual national champion.
Associated Press Preseason No. 1 Teams(The No. 1-ranked team in the annual Associated Press preseason college football poll. The preseason poll started in 1950.)
Year Team Year Team
Year Team Year Team
A Year-By-Year Historyof the Associated Press Poll
1936—The Associated Press Poll began with sports editors of AP newspapers voting for the top 20 teams nationally. Minnesota and Northwestern each had 7-1 records and, even though Northwestern whipped the Golden Gophers in the regular season, Minnesota was named No. 1 in the final poll.1937—California began with a 5-0 record and was ranked No. 1 in the first three polls, but Jock Sutherland’s Pittsburgh Panthers took over the lead in November and finished 9-0-1 and No. 1.1938—Previous year’s AP leader Pittsburgh was ranked No. 1 to begin the season, but Dutch Meyer’s TCU Horned Frogs, behind legendary QB Davey O’Brien, posted an undefeated 10-0 regular season for the poll championship.1939—Pittsburgh and Tennessee, two powerhouses, exchanged the No. 1 spot in the poll until Homer Norton’s Texas A&M Aggies, behind big fullback John Kimbrough, took over the top spot late and finished 10-0 in the regular season for the mythical AP title.1940—Eastern power Cornell led for the first four weeks until eventual champion Minnesota, behind coach Bernie Bierman and All-Americans George Franck and Urban Odson, finished No. 1. It was the second of three national poll champions for Bierman.1941—Minnesota made it two in row behind Heisman Trophy winner Bruce Smith as the Gophers posted a perfect 8-0 record.1942—Ohio State started the season as the No. 1 team until a midseason loss dropped the Buckeyes back into the pack. Georgia and Boston College shared the No. 1 spot until the last week, when Ohio State, behind legendary coach Paul Brown, finished as the top team.1943—Notre Dame led wire-to-wire, the first time a team had led every week since the poll originated in 1936. Coach Frank Leahy, in only his third year, had plenty of tools to work with, including backs Angelo Bertelli (Heisman Trophy winner and consensus All-American) and Creighton Miller (fourth in the Heisman voting and consensus All-American). The line was loaded also with end John Yonaker, tackle Jim White and guard Pat Filley, all consensus All-Americans.1944—Notre Dame started off the year as the No. 1 team, but Red Blaik’s Army team, behind consensus All-Americans Doc Blanchard (Mr. Inside) and Glenn Davis (Mr. Outside), rolled to an undefeated season and the first of two consecutive No. 1 finishes.1945—During the last year of World War II, no team more personified America’s determi-nation than Army, which ran the table again behind Blanchard and Davis, and consensus All-America linemen John Green and Tex Coulter. The Cadets posted a perfect 9-0 record, but service academies did not participate in bowl games then.1946—This was a pivotal year for the AP poll in that Army was expected to sweep to the No. 1 spot easily, again behind Blanchard and Davis. During the season, Army finished 9-0-1, highlighted by a 0-0 tie at Yankee Stadium against Johnny Lujack-led Notre Dame (8-0-1) in the “Game of the Decade.” However, Army barely beat an outclassed Navy team in its final game, and the voters selected Notre Dame No. 1.1947—Notre Dame and Michigan alternated Nos. 1 and 2 slots throughout the year with Notre Dame getting the final regular-season nod, even though both teams were 9-0. In the ensuing bowl game, Michigan rolled over Southern California, 49-0. The public demanded that the voters release another post-bowl poll and the Wolverines won easily. AP decided, however, that the postseason poll did not supercede the final regular-season poll of December 6, 1947. 1948—Defending champion Notre Dame alternated with North Carolina and Michigan as No. 1 in the first few polls, but the Wolverines took over in November and raced to a 9-0 record and a poll championship in coach Bennie Oosterbaan’s first year as a head coach.1949—Michigan was No. 1 the first week before Notre Dame took over and cruised to a perfect 9-0 mark and the national poll title. It was the last of four No. 1 finishes in seven years for coach Frank Leahy. The stars were end Leon Hart (Heisman Trophy winner and consensus All-American) and consensus All-America backs Emil Sitko and Bob Williams.1950—This was another pivotal year as AP’s rival United Press began its own top-20 poll, voted on by a panel of coaches. The two polls would go head-to-head for the next 45 years. On the field, Notre Dame, Army (behind Dan Foldberg), SMU (behind Kyle Rote) and Ohio State (led by Heisman winner Vic Janowicz) all led at least one week. But Oklahoma, behind coach Bud Wilkinson and consensus All-Americans Leon Heath and Jim Weatherall, posted
a 9-0 record for the No. 1 spot and then promptly lost in the Sugar Bowl to Kentucky, led by Babe Parilli.1951—Tennessee raced to a No. 1 ranking on the heels of Bob Neyland’s coaching and the fleet feet of consensus All-American Hank Lauricella. Michigan State and California both mounted weekly challenges, but the Volunteers held on for Neyland's first title in 20 years of coaching.1952—Michigan State took over in the third week and raced to a perfect 9-0 record behind coach Clarence “Biggie” Munn. The Spartans did not play in a bowl game.1953—Notre Dame looked like a sure winner as the Irish led for the first eight weeks of the season behind Heisman Trophy winner Johnny Lattner. But Maryland, behind the coaching of Jim Tatum and the play of consensus All-America tackle Stan Jones, made a late bid with a 10-0 mark. The Terrapins lost in the Orange Bowl to Oklahoma, 7-0.1954—The two polls split for the first time as Ohio State prevailed in the AP and UCLA in the UP. The two teams did not meet in the Rose Bowl to decide the “on-the-field” champion. UCLA had to stay behind because of the Pacific-8’s “Rose Bowl no-repeater” rule since they had played in Pasadena the year before against Michigan. Ohio State gave coach Woody Hayes his first AP championship with a 10-0 record and the Buckeyes defeated Southern California, 20-7, in the Rose Bowl.1955—Oklahoma continued with major college football’s all-time 47-game winning streak by cruising to an AP No. 1 spot with a 10-0 mark and handing Bud Wilkinson the second of three national poll titles.1956—This year was a continuation of Oklahoma’s powerhouse team, which posted a perfect 11-0 record in the all-time 47-game winning streak that lasted almost four years (1953-57). Led by center Jerry Tubbs and back Tommy McDonald, the Sooners gave Bud Wilkinson his final AP national title.1957—Again there was a split vote in the two polls as AP selected as No. 1 unbeaten Auburn (10-0), under Shug Jordan, even though the Tigers were on probation. UP, the coaches’ poll, threw out Auburn from poll consideration and went with Woody Hayes’ Ohio State Buckeyes (9-1). Auburn did not go to a bowl, and Ohio State beat Oregon, 10-7, in the Rose Bowl.1958—1958 turned out to be the year of the Chinese Bandits in the AP poll. Led by consen-sus All-America back Billy Cannon on offense and a swarming defense called the Chinese Bandits, coach Paul Dietzel’s surprising LSU Tigers took over the No. 1 spot in midseason. LSU finished 11-0 and beat Clemson in the Sugar Bowl.1959—Even though LSU had Heisman winner Billy Cannon returning, Syracuse took over the No. 1 slot in early November and posted an 11-0 mark to claim its first poll title. Coach Ben Schwartzwalder was rewarded with his only championship behind the All-America play of guard Roger Davis, and Syracuse defeated Texas, 23-14, in the Cotton Bowl.1960—Minnesota, under Murray Warmath, led in both polls before the bowl games but was upset by Washington, 17-7, in the Rose Bowl. That prompted the Football Writers Association of America (FWAA) to conduct a post-bowl poll that named Johnny Vaught’s Ole Miss Rebels as champion. Minnesota remained the official winner in both AP and UPI polls.1961—Alabama avoided a minefield of upsets and raced to a 10-0 record to claim the AP title, even though Iowa, Ole Miss, Michigan State and Texas all were No. 1 at one time during the year. It was Bear Bryant’s first of six AP championships.1962—Coach John McKay got his first national title as Southern California bided its time waiting for four other teams to share No. 1 during the year. The Trojans slipped into the top spot late with a 10-0 regular-season mark and then downed Wisconsin, 42-37, in the Rose Bowl.1963—Texas, under Darrell Royal, was a unanimous choice of all of the polls as the Longhorns took over the No. 1 slot in October, finished 10-0 and then beat a Navy team, led by Heisman winner Roger Staubach, in the Cotton Bowl. The Longhorns’ top player was tackle Scott Appleton.1964—The 1964 season saw the AP and UPI polls both agree on Alabama as No. 1, while the other two consensus polls picked Arkansas (FWAA) and Notre Dame (National Football Foundation). It was Bear Bryant’s second of six AP titles.1965—AP had its first post-bowl poll while UPI remained with a pre-bowl selection. AP selected Alabama for the second straight year. UPI went with Michigan State, which then lost in the Rose Bowl to UCLA, 14-12. Alabama had a 9-1-1 record and then whipped Nebraska, 39-28, in the Orange Bowl.1966—Both Notre Dame and Michigan State were unbeaten as they headed into the November 19 match-up. The Irish came back from a 10-0 deficit to tie the game in the fourth quarter. Ara Parseghian’s Irish actually got the ball back with 1:30 remaining and decided to

90 2011 NCAA FOOTBALL RECORDS - YEAR-BY-YEAR HISTORY OF THE ASSOCIATED PRESS POLL
run the clock out rather than try to win. His strategy paid off the next week as Notre Dame crushed Southern California, 51-0, and the Irish were picked No. 1 in both final polls.1967—Southern California rebounded from an early loss to post a 9-1 record and move into the No. 1 slot in late November. John McKay’s Trojans beat Indiana, 14-3, in the Rose Bowl to cap off the season. USC stars were O.J. Simpson, Ron Yary, Tim Rossovich and Adrian Young, all consensus All-America selections.1968—Ohio State overtook a crowded field of Purdue and defending champion Southern California to become No. 1 in late November. The Buckeyes finished 10-0 and drilled Southern California, 27-16, in the Rose Bowl.1969—Defending champ Ohio State led the pack for most of the year before Darrell Royal’s Texas Longhorns made a strong bid for No. 1 late. The Longhorns finished 11-0, including the first “Game of the Century” vs. Arkansas, in which Texas scored a 15-14 victory after trailing 14-0. The team from the Lone Star State then beat Notre Dame, 21-17, in the Cotton Bowl. Texas had only one consensus All-America player, lineman Bob McKay, but had many pro-ductive players, such as James Street, Ted Koy and Steve Worster.1970—It looked like this year might be a repeat of Texas’ ascension in 1969. The Longhorns dominated the AP poll for the entire second half of the season, but a 24-11 loss to Notre Dame in the Cotton Bowl gave Nebraska a chance to take the final No. 1 spot. Bob Devaney’s Cornhuskers had only a tie to mar their final record (11-0-1) and beat LSU, 17-12, in the Orange Bowl.1971—Nebraska’s 1971 team, which many say was the best squad of its era, held the No. 1 spot from wire to wire for Bob Devaney, the first team to do it since Army in 1945. The Cornhuskers were led by future Heisman winner Johnny Rodgers and defensive stalwarts Willie Harper and Larry Jacobson, all consensus All-America selections. The year’s showdown for Nebraska was a match-up with Oklahoma in Norman in what many still consider the best "Game of the Century." Nebraska won the hyped contest, 35-31, to finish 13-0, including a 38-6 victory over Alabama in the Orange Bowl.1972—It was all Southern California in 1972 as John McKay’s Trojans became the second school in a row to take the No. 1 spot in the poll from first week to last. The 12-0 record included a 42-17 pounding of Ohio State in the Rose Bowl. Southern California was chosen the winner in all four consensus polls.1973—First defending champion Southern California, and then Ohio State, combined to keep a lock on the No. 1 position throughout most of the season. But Alabama took over the last week of November and met No. 3 Notre Dame in the Sugar Bowl for the AP title. Notre Dame won a close 24-23 victory and captured the No. 1 final prize. Coach Ara Parseghian got his second of two championships behind such players as Dave Casper and Mike Townsend.1974—In the year in which UPI finally moved its final poll until after the bowl games, Ohio State and Oklahoma led in the AP poll most of the year. Oklahoma, behind a crushing rush-ing attack headed by Joe Washington, was on probation and not ranked by UPI, but finished 11-0 to take the top AP poll spot. Oklahoma consensus All-America picks were Washington, guard John Roush and linebacker Rod Shoate. Coach Barry Switzer started his tenure with two AP titles in his first three seasons and a 32-1-1 record. UPI selected Southern California, which finished 10-1-1.1975—Oklahoma led the AP poll through September and seemed invincible. However, a roadblock cropped up in a surprise 23-3 loss to Kansas that snapped the Sooners’ 28-game winning streak. That sent Ohio State into the No. 1 AP slot until the crucial bowl games behind Archie Griffin, who was on track for his second straight Heisman. While Oklahoma was beating Michigan, 14-6, in the Orange, Ohio State fell, 23-10, to UCLA in the Rose, and the Sooners had their second straight AP championship. The Oklahoma squad had big-time talent in Joe Washington, Billy Brooks, Dewey Selmon, Lee Roy Selmon and Tinker Owens, who all earned All-America mention. Arizona State finished 12-0 and was the only unde-feated, untied team. The Sun Devils, however, played in the Western Athletic Conference, not known as a strong league at the time.1976—Michigan raced to an 8-0 record and led the poll for the first eight weeks. Pittsburgh, under Johnny Majors, finished strong with a 12-0 mark, including a 27-3 victory over Georgia in the Sugar Bowl. The Panthers were on top at the end of the season and featured Heisman winner Tony Dorsett and defensive lineman Al Romano, both consensus All-America picks.1977—Five teams alternated taking the No. 1 AP ranking during the year, and five teams fin-ished the season with 11-1 records, including pre-bowl leader Texas. However, Notre Dame (11-1) upset the No. 1 Longhorns, 38-10, in the Cotton Bowl by keeping Heisman winner Earl Campbell in check. Dan Devine’s Irish, behind consensus All-America players Ross Browner, Ken MacAfee and Luther Bradley, were also voted No. 1 in the UPI poll.1978—Penn State was No. 1 going into the bowl games but was upset, 14-7, by Alabama in the Sugar Bowl. The Crimson Tide (11-1) was voted No. 1 by AP, but Southern California got the nod in the UPI poll because it beat Alabama, 24-14, during the regular season. USC (12-1) was led by coach John Robinson and future Heisman winner Charles White. The Trojans whipped Michigan, 17-10, in the Rose Bowl.1979—Alabama (12-0) made it two AP titles in a row and six overall for coach Bear Bryant as the Crimson Tide drilled Arkansas, 24-9, in the Sugar Bowl to forge ahead of pre-bowl No. 1 Ohio State. The Buckeyes (11-1) dropped out of contention when they lost in the Gator Bowl to Clemson, 17-15, in the famous “coach-slugging-player” incident by Ohio State coach Woody Hayes. 1980—Alabama seemed to be in charge early, taking over the No. 1 AP slot for seven straight weeks until Notre Dame grabbed the spot November 4. But the Irish dropped out the next week as Georgia pushed into the No. 1 spot behind the running of freshman sensa-tion Herschel Walker. Vince Dooley’s Bulldogs finished 12-0 and beat Notre Dame, 17-10, in the Sugar Bowl.1981—Michigan began as the AP leader before giving way after one week to Notre Dame, which was passed by Southern California, which was overtaken for a week by Texas, which then surrendered the top spot to Penn State, which then saw Pittsburgh rise to No. 1. All six of these teams fell by the wayside as Clemson, under Danny Ford, finished strong with a 12-0 record, including a 22-15 victory over Nebraska in the Orange Bowl.
1982—Pittsburgh and Washington alternated sharing the No. 1 spot until Georgia took over November 9. The Bulldogs were still the leader going into the bowl games. However, No. 2 Penn State beat No. 1 Georgia, 27-23, in the Sugar Bowl for the AP poll championship. It was coach Joe Paterno’s first of two AP national championships.1983—It was a disappointing season for Nebraska, which held the No. 1 AP slot for 14 con-secutive weeks, but was edged by fifth-ranked Miami (Florida), 31-30, in the Orange Bowl. Coach Howard Schnellenberger’s Hurricanes took the AP title after winning a battle with a Nebraska team that had Heisman winner Mike Rozier and consensus All-America picks Irving Fryar and Dean Steinkuhler.1984—In a year that saw four other teams alternate as No. 1, BYU (13-0) hung around until fortune pushed the Cougars into the final No. 1 slot. Coach LaVell Edwards’ charges played no AP team in the top 20 in the regular season, but dispatched Michigan, 24-17, in the Holiday Bowl. When No. 1 Nebraska and No. 2 South Carolina both lost November 17, the No. 3 Cougars vaulted into the top spot and never gave it up.1985—Oklahoma stayed the course after an early loss to beat No. 1 Penn State, 25-10, in the Orange Bowl and give Barry Switzer his second AP title. Brian Bosworth and Tony Casillas were the top players for the Sooners.1986—Penn State had not been No. 1 all year, but the Nittany Lions finished 12-0, capped by a 14-10 victory over pre-bowl No. 1 Miami (Florida) in the Fiesta Bowl. The bowl was arranged to match No. 1 vs. No. 2 because the two top teams had no conference affiliation. It was Joe Paterno’s second AP title.1987—Oklahoma held the No. 1 spot for all but one week during the year, but Miami (Florida) grabbed the national poll title by downing the Sooners, 20-14, in the Orange Bowl. Miami featured a bruising defense with Daniel Stubbs and Bennie Blades topping the con-sensus All-America team. Coach Jimmy Johnson’s 12-0 Hurricanes garnered the second of four AP titles in 10 years.1988—Notre Dame made a late-season run for AP’s No. 1 spot and finished a perfect 12-0 after a 34-21 win over West Virginia in the Fiesta Bowl to grab the title. Miami (Florida) had control of the No. 1 spot early before UCLA took over for a couple of weeks, followed by the Irish’s push.1989—Defending AP champion Notre Dame held the No. 1 slot for 12 consecutive weeks. Colorado took over when the Irish lost a game. The Buffaloes were No. 1 for only two weeks before Dennis Erickson’s Miami (Florida) team moved into No. 1 in the final poll by beating Alabama, 33-25, in the Sugar Bowl. Colorado lost its chance by losing to Notre Dame, 21-6, in the Orange Bowl.1990—This was another split between the polls with AP going with Colorado (11-1-1) while UPI went with undefeated Georgia Tech (10-0-1). In the ensuing bowl games, both teams won – Colorado beating Notre Dame, 10-9, in the Orange, and Georgia Tech downing Nebraska, 45-21, in the Florida Citrus. This was the season that critics of the bowl system began talking about creating another way to determine a national champion, indicating that the polls were not adequate.1991—UPI, which fell on hard times financially, saw its coaches’ poll switch affiliation to USA Today/CNN. With two teams each posting 12-0 records, the polls again split with AP naming Miami (Florida) No. 1 and the coaches’ poll going with Washington. Again, the media and public grumbled about not having a clear-cut national titlist, and the Bowl Coalition people started to think about replacing the poll champions.1992—The Bowl Coalition made its debut to decide a national champion, and Alabama, under Gene Stallings, upset Miami (Florida), 34-13, in the Sugar Bowl for the title. The Crimson Tide finished 13-0 to take No. 1 in both polls. Miami (Florida) was No. 1 in the AP poll for 10 of the season's 15 weeks.1993—Florida State almost led the poll from first week to last, save for November 16 after a loss to Notre Dame, which took one quick week in the No. 1 roost. But Lou Holtz’s Irish were upended by Boston College, and Bobby Bowden’s Seminoles regained the No. 1 spot the next week. The Seminoles posted a 12-1 record, including an 18-16 victory over Nebraska in the Orange Bowl. Florida State QB Charlie Ward was the Heisman Trophy winner, and LB Derrick Brooks and DB Corey Sawyer were consensus All-America selections.1994—Florida and Nebraska held the No. 1 spot for most of the first half of the season and Penn State went undefeated, but it was Nebraska (also unbeaten at 13-0) that took the cham-pionship. The Cornhuskers squeezed by Miami (Florida), 24-17, in the Orange Bowl to hand Tom Osborne his first AP title after 22 years as the head coach in Lincoln. Joe Paterno saw his Penn State squad go undefeated and uncrowned for the fourth time.1995—Florida State was the team to beat as the Seminoles held the No. 1 slot for the first nine weeks, before giving way to defending champion Nebraska. The Cornhuskers ran their winning streak to 25 straight games with a 12-0 record. The Bowl Coalition matched No. 1 Nebraska with No. 2 Florida in the Fiesta Bowl. Nebraska whipped the Gators, 62-24, to remove any doubt about the No. 1 team, and the Cornhuskers took the AP prize for the second straight year.1996—This year marked a change from the Bowl Coalition to the Bowl Alliance, but it also proved less than satisfying as the top two teams – Florida State and Arizona State – did not meet because Arizona State was bound to the Rose Bowl and a game versus the Big Ten champion. Interestingly, both Florida State and Arizona State lost in their respective bowl games (Florida State lost to Florida, 52-20), which was enough to lift the Gators into the final No. 1 spot in both polls. Steve Spurrier got a measure of revenge over the Gator doubters from 1995, when Florida lost in the title game. Florida QB Danny Wuerffel was the Heisman winner, and Ike Hilliard and Reidel Anthony were consensus All-Americans.1997—ESPN replaced CNN in the USA Today coaches’ poll that named Nebraska as its champion. Michigan finished No. 1 in the AP poll. The Wolverines and Nebraska were both unbeaten heading into the bowls, and the Cornhuskers finished 13-0 with a 41-21 win over Virginia Tech in the Orange Bowl. Meanwhile, Michigan (12-0) beat Washington, 21-16, in the Rose Bowl. Even though both teams won in the bowls, 21 coaches changed their votes in the USA Today/ESPN poll on the strength of Nebraska’s margin of victory and handed Tom Osborne the third poll championship for Nebraska in four years. Lloyd Carr got his first AP

2011 NCAA FOOTBALL RECORDS - YEAR-BY-YEAR HISTORY OF THE ASSOCIATED PRESS POLL 91
FOO
TBA
LL B
OW
LSU
BD
IVIS
IONtitle in only his third year as head coach of the Wolverines. Michigan DB Charles Woodson
was the first defensive player ever selected as the Heisman Trophy winner.1998—This was the first year of the Bowl Championship Series (BCS), and Ohio State, under John Cooper, was voted No. 1 in the AP poll for the first nine weeks. Phillip Fulmer’s Tennessee Volunteers took over the top spot when the Buckeyes lost, and raced to a 13-0 record, including a 23-16 victory over No. 2 Florida State in the Fiesta Bowl. Tennessee was voted No. 1 in all four major polls – Associated Press (AP), USA Today/ESPN (USA/ESPN), National Football Foundation/College Football Hall of Fame (NFF) and Football Writers Association of America (FWAA). 1999—For the first time since Nebraska did so in 1983, Florida State led the AP poll from wire to wire. It was not easy for Bobby Bowden’s Seminoles, as they posted a perfect 12-0 record, but had close calls in beating Georgia Tech, 41-35; Clemson, 17-14; and in-state rival Florida, 30-23. But Florida State ripped No. 2 Virginia Tech, 46-29, in the BCS Sugar Bowl. Peter Warrick, Jason Whitaker, Sebastian Janikowski and Corey Simon were all consensus All-America selections as Florida State finished No. 1 in all four major polls (AP, USA/ESPN, NFF and FWAA).2000—Nebraska, 12-1 and No. 3 in the AP poll the previous year, looked strong and was voted No. 1 for nine consecutive weeks to begin the season. Oklahoma, unranked the previ-ous year, took over the No. 1 spot October 30 and cruised into the BCS Orange Bowl to face No. 2 Florida State. The Seminoles had one loss but the second-best strength of schedule. Bob Stoops’ Sooners clamped down on Florida State’s offense to post a 13-2 victory. For Stoops, in only his second year as a head coach, it was the first Oklahoma AP poll title since 1985 under Barry Switzer. Oklahoma finished 13-0 behind QB Josh Heupel (Heisman runner-up to QB Chris Weinke of Florida State), LB Rocky Calmus and DB J.T. Thatcher, all consensus All-Americans.2001—Florida and Miami (Florida) fought it out all year for a BCS crown and No. 1 spots in all four major polls. Miami finally came out on top by posting a perfect 12-0 mark and a decisive 37-14 victory over No. 2 Nebraska in the Rose Bowl, which finally became a part of the BCS process. Florida ended up fifth in the BCS rankings because of two regular-season defeats. Associated Press’ No. 2 Nebraska (11-2) overcame a 62-36 pounding by AP No. 14 Colorado in its final regular-season game to hold on to the No. 2 BCS ranking and the Rose Bowl date. Miami’s Larry Coker was only the second first-year head coach to win a national title (Bennie Oosterbaan of Michigan in 1948) as the Hurricanes were No. 1 in all four major polls and BCS champion.2002—Defending consensus champion Miami (Florida) held the AP No. 1 spot almost the entire year (Oklahoma was No. 1 during the week of November 4) and was No. 1 in the BCS rankings. The Hurricanes then faced undefeated Ohio State, No. 2 in both the BCS and AP poll, in the Fiesta Bowl. The Buckeyes, under second-year head coach Jim Tressel, held on for a double-overtime 31-24 victory, snapping the Hurricanes’ 34-game winning streak, sixth longest of all-time. The Buckeyes had many talented players, including consensus All-Americans Mike Nugent (PK), Matt Wilhelm (LB) and Mike Doss (DB). It was the sixth straight year that the AP poll champion posted an undefeated season.2003—Grumblings about the Bowl Championship Series (BCS) began after the season as the polls split yet again. AP selected Southern California (12-1) as No. 1 and USA Today/ESPN picked LSU (13-1) as champion. In a strange turn of events, Oklahoma was No. 1 in the AP poll for 14 consecutive weeks, and the Sooners looked unbeatable as they rolled to an 11-0 regular-season record. In the Big 12 Conference championship game, however, the Sooners were rocked, 35-7, by Kansas State. Oklahoma had built up such a lead in the BCS rankings, however, that it was still ranked No. 1 and faced BCS No. 2 LSU in the Sugar Bowl. Even though BCS No. 3 Southern California was ranked No. 1 in both the AP and USA Today/ESPN polls before the bowls, the Trojans were relegated to the Rose Bowl, in which they defeated Michigan, 28-14, to finish 12-1. LSU then edged Oklahoma, 21-14, in the Sugar Bowl in the BCS No. 1 vs. No. 2 match-up. The AP pollsters voted Southern California No. 1 and the USA Today/ESPN voters picked LSU No. 1 and split the nation again. Momentum began gathering toward a slightly tweaked BCS system that tentatively would add another BCS bowl to the mix in the future.2004—Southern California left little doubt in the BCS-decided match-up with No. 2 Oklahoma that the Trojans were top dogs by racing to a 55-19 victory in the Orange Bowl. The Trojans were No. 1 in the weekly polls from wire to wire with Oklahoma No. 2, and both were 12-0 going into the bowl games. The only fans who had a problem with the
BCS championship game were the Auburn supporters, who saw their Tigers post a perfect 13-0 record, yet not be included in the title match-up. Again, talk of a playoff system was heard, with Auburn not only having a perfect record playing in one of the toughest confer-ences (Southeastern), but finishing No. 2 in the final poll ahead of Oklahoma. Mountain West Conference power Utah also had an argument to be included after posting a 12-0 mark.2005—For the first time in BCS history, and it was unanimous, the top two teams in the country faced each other in the national championship game, as Southern California and Texas met in the Rose Bowl. The game lived up to all its hype, as the Longhorns rallied from a 38-26 deficit with two touchdowns in the final five minutes of the fourth quarter, capped by Vince Young’s eight-yard scamper with 19 seconds left for the 41-38 victory.2006—Preseason No. 1 Ohio State played like a national champion from week one to earn a spot in the BCS championship game against the Gators of Florida. The Buckeyes had already taken care of another No. 2 in Texas in September, and after the opening kickoff, a 93-yard return for a touchdown by Ted Ginn Jr., it looked like they would hold off another challenge. However, the Gators answered quickly and often as Florida grabbed a 34-14 lead at halftime, coasted to a 41-14 win and was voted the 2006 AP championship. 2007—It was a year of upsets as four different schools, including one team three different times, held the No. 1 spot throughout the year, before LSU claimed the 2007 AP champion-ship. Southern California was the preseason favorite and ran with the top spot the first four weeks before handing it off to the Tigers. It only took two weeks before LSU moved over for Ohio State. The Buckeyes hung on to the top spot for four weeks before giving it back to LSU. The Tigers would fall two weeks later, and this time the Tigers of Missouri would jump to the No. 1 spot for the first time since 1960. It only lasted one week as Ohio State jumped back into the driver’s seat. For the second straight year, the Buckeyes would lose in the national championship game, and LSU for the third and final time elevated itself to the top spot with a 38-24 win.2008—Six different teams held the top spot in the AP poll during the 2008 season. It marked the second-most teams to be No. 1 in the history of the poll and the most since 1981 when seven teams were in the top spot. Preseason No. 1, Georgia, was the only team not in the top spot for multiple weeks as Southern California, Oklahoma, Texas, Alabama and Florida each held the top spot at least two weeks. After Texas Tech’s dramatic 39-33 victory over Texas knocked the Longhorns out of the top spot in the first week of November, Alabama began a five-week reign in the top spot. Florida, however, claimed both an SEC championship and the top spot in the AP poll with a 31-20 victory over the Crimson Tide in the SEC championship game. The Gators, playing in their second straight 1 vs. 2 matchup, then claimed the BCS and AP titles with a 24-14 victory over second-ranked Oklahoma in the BCS championship game, and undefeated Utah used its victory over Alabama in the Sugar Bowl to secure the No. 2 spot in the final poll.2009—Only two teams held the top spot in the AP poll, both of which were members of the Southeastern Conference, and for the fourth straight year, an SEC team held the top spot in the final poll. The defending national champion, Florida, entered the year as the preseason No. 1 and held that spot for 13 of 14 weeks going into an SEC championship matchup against No. 2 Alabama. The Crimson Tide claimed the SEC title with a 32-13 victory over Florida to move into the AP poll's top spot for the second time in 2009. The BCS championship game pitted No. 1 Alabama against No. 2 Texas and the Crimson Tide's 37-21 win clinched the national title and the No. 1 spot in the final rankings. While five teams (Alabama, Texas, TCU, Cincinnati and Boise State) entered the bowl season undefeated, only Alabama (No. 1) and Boise State (No. 4) completed perfect seasons. Texas and Florida, which each lost only to Alabama, finished second and third, respectively, while Ohio State rounded out the top five.2010—Four teams spent at least one week in the top spot of the AP poll in 2010, including three different teams in a three-week stretch in October. 2009 national champion Alabama was tabbed the preseason No. 1 and held that spot for six weeks until a Crimson Tide loss allowed Ohio State to take the top spot. A Buckeyes' loss in their first week in the top spot allowed Oregon to claim its first AP No. 1 ranking in the poll's history. The Ducks held the top spot for seven weeks until Auburn took over after the final week of the regular season. In the BCS championship No. 1 Auburn outlasted No. 2 Oregon to give the Southeastern Conference the top spot in the final AP poll for the fifth straight year. TCU joined Auburn among the ranks of the undefeated and finished at No. 2. The Tigers and Horned Frogs were joined in the top-five by No. 3 Oregon, No. 4 Stanford and No. 5 Ohio State
Associated Press (Writers and Broadcasters) Final Polls
1936 1. Minnesota 2. LSU 3. Pittsburgh 4. Alabama 5. Washington 6. Santa Clara 7. Northwestern 8. Notre Dame 9. Nebraska 10. Penn 11. Duke 12. Yale 13. Dartmouth 14. Duquesne 15. Fordham 16. TCU 17. Tennessee 18. Arkansas
Navy 20. Marquette
1937 1. Pittsburgh 2. California 3. Fordham 4. Alabama 5. Minnesota 6. Villanova 7. Dartmouth 8. LSU 9. Notre Dame Santa Clara 11. Nebraska 12. Yale 13. Ohio St. 14. Holy Cross Arkansas 16. TCU
17. Colorado 18. Rice 19. North Carolina 20. Duke
1938 1. TCU 2. Tennessee 3. Duke 4. Oklahoma 5. Notre Dame 6. Carnegie Mellon 7. Southern California 8. Pittsburgh 9. Holy Cross 10. Minnesota 11. Texas Tech 12. Cornell 13. Alabama 14. California
15. Fordham 16. Michigan 17. Northwestern 18. Villanova 19. Tulane 20. Dartmouth
1939 1. Texas A&M 2. Tennessee 3. Southern California 4. Cornell 5. Tulane 6. Missouri 7. UCLA 8. Duke 9. Iowa 10. Duquesne 11. Boston College 12. Clemson
13. Notre Dame 14. Santa Clara 15. Ohio St. 16. Georgia Tech 17. Fordham 18. Nebraska 19. Oklahoma 20. Michigan
1940 1. Minnesota 2. Stanford 3. Michigan 4. Tennessee 5. Boston College 6. Texas A&M 7. Nebraska 8. Northwestern 9. Mississippi St. 10. Washington
11. Santa Clara 12. Fordham 13. Georgetown 14. Penn 15. Cornell 16. SMU 17. Hardin-Simmons 18. Duke 19. Lafayette
1941 1. Minnesota 2. Duke 3. Notre Dame 4. Texas 5. Michigan 6. Fordham 7. Missouri 8. Duquesne 9. Texas A&M

92 2011 NCAA FOOTBALL RECORDS - ASSOCIATED PRESS FINAL POLLS
10. Navy 11. Northwestern 12. Oregon St. 13. Ohio St. 14. Georgia 15. Penn 16. Mississippi St. 17. Ole Miss 18. Tennessee 19. Washington St. 20. Alabama
1942 1. Ohio St. 2. Georgia 3. Wisconsin 4. Tulsa 5. Georgia Tech 6. Notre Dame 7. Tennessee 8. Boston College 9. Michigan 10. Alabama 11. Texas 12. Stanford 13. UCLA 14. William & Mary 15. Santa Clara 16. Auburn 17. Washington St. 18. Mississippi St. 19. Minnesota Holy Cross Penn St.
1943 1. Notre Dame 2. Iowa Pre-Flight 3. Michigan 4. Navy 5. Purdue 6. Great Lakes 7. Duke 8. Del Monte P-F 9. Northwestern 10. March Field 11. Army 12. Washington 13. Georgia Tech 14. Texas 15. Tulsa 16. Dartmouth 17. Bainbridge NTS 18. Colorado Col. 19. Pacific 20. Penn
1944 1. Army 2. Ohio St. 3. Randolph Field 4. Navy 5. Bainbridge NTS 6. Iowa Pre-Flight 7. Southern California 8. Michigan 9. Notre Dame 10. March Field 11. Duke 12. Tennessee 13. Georgia Tech Norman Pre-Flight 15. Illinois 16. El Toro Marines 17. Great Lakes 18. Fort Pierce 19. St. Mary’s Pre-Flight 20. Second Air Force
1945 1. Army 2. Alabama 3. Navy 4. Indiana 5. Oklahoma St. 6. Michigan 7. St. Mary’s (CA) 8. Penn 9. Notre Dame 10. Texas
11. Southern California 12. Ohio St. 13. Duke 14. Tennessee 15. LSU 16. Holy Cross 17. Tulsa 18. Georgia 19. Wake Forest 20. Columbia
1946 1. Notre Dame 2. Army 3. Georgia 4. UCLA 5. Illinois 6. Michigan 7. Tennessee 8. LSU 9. North Carolina 10. Rice 11. Georgia Tech 12. Yale 13. Penn 14. Oklahoma 15. Texas 16. Arkansas 17. Tulsa 18. North Carolina St. 19. Delaware 20. Indiana
*1947 1. Notre Dame 2. Michigan 3. SMU 4. Penn St. 5. Texas 6. Alabama 7. Penn 8. Southern California 9. North Carolina 10. Georgia Tech 11. Army 12. Kansas 13. Ole Miss 14. William & Mary 15. California 16. Oklahoma 17. North Carolina St. 18. Rice 19. Duke 20. Columbia
1948 1. Michigan 2. Notre Dame 3. North Carolina 4. California 5. Oklahoma 6. Army 7. Northwestern 8. Georgia 9. Oregon 10. SMU 11. Clemson 12. Vanderbilt 13. Tulane 14. Michigan St. 15. Ole Miss 16. Minnesota 17. William & Mary 18. Penn St. 19. Cornell 20. Wake Forest
1949 1. Notre Dame 2. Oklahoma 3. California 4. Army 5. Rice 6. Ohio St. 7. Michigan 8. Minnesota 9. LSU 10. Pacific 11. Kentucky 12. Cornell
13. Villanova 14. Maryland 15. Santa Clara 16. North Carolina 17. Tennessee 18. Princeton 19. Michigan St. 20. Missouri Baylor
1950 1. Oklahoma 2. Army 3. Texas 4. Tennessee 5. California 6. Princeton 7. Kentucky 8. Michigan St. 9. Michigan 10. Clemson 11. Washington 12. Wyoming 13. Illinois 14. Ohio St. 15. Miami (FL) 16. Alabama 17. Nebraska 18. Wash. & Lee 19. Tulsa 20. Tulane
1951 1. Tennessee 2. Michigan St. 3. Maryland 4. Illinois 5. Georgia Tech 6. Princeton 7. Stanford 8. Wisconsin 9. Baylor 10. Oklahoma 11. TCU 12. California 13. Virginia 14. San Francisco 15. Kentucky 16. Boston U. 17. UCLA 18. Washington St. 19. Holy Cross 20. Clemson
1952 1. Michigan St. 2. Georgia Tech 3. Notre Dame 4. Oklahoma 5. Southern California 6. UCLA 7. Ole Miss 8. Tennessee 9. Alabama 10. Texas 11. Wisconsin 12. Tulsa 13. Maryland 14. Syracuse 15. Florida 16. Duke 17. Ohio St. 18. Purdue 19. Princeton 20. Kentucky
1953 1. Maryland 2. Notre Dame 3. Michigan St. 4. Oklahoma 5. UCLA 6. Rice 7. Illinois 8. Georgia Tech 9. Iowa 10. West Virginia 11. Texas 12. Texas Tech 13. Alabama
14. Army 15. Wisconsin 16. Kentucky 17. Auburn 18. Duke 19. Stanford 20. Michigan
1954 1. Ohio St. 2. UCLA 3. Oklahoma 4. Notre Dame 5. Navy 6. Ole Miss 7. Army 8. Maryland 9. Wisconsin 10. Arkansas 11. Miami (FL) 12. West Virginia 13. Auburn 14. Duke 15. Michigan 16. Virginia Tech 17. Southern California 18. Baylor 19. Rice 20. Penn St.
1955 1. Oklahoma 2. Michigan St. 3. Maryland 4. UCLA 5. Ohio St. 6. TCU 7. Georgia Tech 8. Auburn 9. Notre Dame 10. Ole Miss 11. Pittsburgh 12. Michigan 13. Southern California 14. Miami (FL) 15. Miami (OH) 16. Stanford 17. Texas A&M 18. Navy 19. West Virginia 20. Army
1956 1. Oklahoma 2. Tennessee 3. Iowa 4. Georgia Tech 5. Texas A&M 6. Miami (FL) 7. Michigan 8. Syracuse 9. Michigan St. 10. Oregon St. 11. Baylor 12. Minnesota 13. Pittsburgh 14. TCU 15. Ohio St. 16. Navy 17. George Washington 18. Southern California 19. Clemson 20. Colorado
1957 1. Auburn 2. Ohio St. 3. Michigan St. 4. Oklahoma 5. Navy 6. Iowa 7. Ole Miss 8. Rice 9. Texas A&M 10. Notre Dame 11. Texas 12. Arizona St. 13. Tennessee 14. Mississippi St. 15. North Carolina St.
16. Duke 17. Florida 18. Army 19. Wisconsin 20. VMI
1958 1. LSU 2. Iowa 3. Army 4. Auburn 5. Oklahoma 6. Air Force 7. Wisconsin 8. Ohio St. 9. Syracuse 10. TCU 11. Ole Miss 12. Clemson 13. Purdue 14. Florida 15. South Carolina 16. California 17. Notre Dame 18. SMU 19. Oklahoma St. 20. Rutgers
1959 1. Syracuse 2. Ole Miss 3. LSU 4. Texas 5. Georgia 6. Wisconsin 7. TCU 8. Washington 9. Arkansas 10. Alabama 11. Clemson 12. Penn St. 13. Illinois 14. Southern California 15. Oklahoma 16. Wyoming 17. Notre Dame 18. Missouri 19. Florida 20. Pittsburgh
1960 1. Minnesota 2. Ole Miss 3. Iowa 4. Navy 5. Missouri 6. Washington 7. Arkansas 8. Ohio St. 9. Alabama 10. Duke 11. Kansas 12. Baylor 13. Auburn 14. Yale 15. Michigan St. 16. Penn St. 17. New Mexico St. 18. Florida 19. Syracuse Purdue
1961 1. Alabama 2. Ohio St. 3. Texas 4. LSU 5. Ole Miss 6. Minnesota 7. Colorado 8. Michigan St. 9. Arkansas 10. Utah St. 11. Missouri 12. Purdue 13. Georgia Tech 14. Syracuse 15. Rutgers 16. UCLA 17. Rice
Penn St. Arizona 20. Duke
1962 1. Southern California 2. Wisconsin 3. Ole Miss 4. Texas 5. Alabama 6. Arkansas 7. LSU 8. Oklahoma 9. Penn St. 10. MinnesotaOnly 10 ranked
1963 1. Texas 2. Navy 3. Illinois 4. Pittsburgh 5. Auburn 6. Nebraska 7. Ole Miss 8. Alabama 9. Oklahoma 10. Michigan St.Only 10 ranked
1964 1. Alabama 2. Arkansas 3. Notre Dame 4. Michigan 5. Texas 6. Nebraska 7. LSU 8. Oregon St. 9. Ohio St. 10. Southern CaliforniaOnly 10 ranked
1965 1. Alabama 2. Michigan St. 3. Arkansas 4. UCLA 5. Nebraska 6. Missouri 7. Tennessee 8. LSU 9. Notre Dame 10. Southern CaliforniaOnly 10 ranked
1966 1. Notre Dame 2. Michigan St. 3. Alabama 4. Georgia 5. UCLA 6. Nebraska 7. Purdue 8. Georgia Tech 9. Miami (FL) 10. SMUOnly 10 ranked
1967 1. Southern California 2. Tennessee 3. Oklahoma 4. Indiana 5. Notre Dame 6. Wyoming 7. Oregon St. 8. Alabama 9. Purdue 10. Penn St.Only 10 ranked
1968 1. Ohio St. 2. Penn St. 3. Texas 4. Southern California 5. Notre Dame 6. Arkansas

2011 NCAA FOOTBALL RECORDS - ASSOCIATED PRESS FINAL POLLS 93
FOO
TBA
LL B
OW
LSU
BD
IVIS
ION 7. Kansas
8. Georgia 9. Missouri 10. Purdue 11. Oklahoma 12. Michigan 13. Tennessee 14. SMU 15. Oregon St. 16. Auburn 17. Alabama 18. Houston 19. LSU 20. Ohio
1969 1. Texas 2. Penn St. 3. Southern California 4. Ohio St. 5. Notre Dame 6. Missouri 7. Arkansas 8. Ole Miss 9. Michigan 10. LSU 11. Nebraska 12. Houston 13. UCLA 14. Florida 15. Tennessee 16. Colorado 17. West Virginia 18. Purdue 19. Stanford 20. Auburn
1970 1. Nebraska 2. Notre Dame 3. Texas 4. Tennessee 5. Ohio St. 6. Arizona St. 7. LSU 8. Stanford 9. Michigan 10. Auburn 11. Arkansas 12. Toledo 13. Georgia Tech 14. Dartmouth 15. Southern California 16. Air Force 17. Tulane 18. Penn St. 19. Houston 20. Oklahoma Ole Miss
1971 1. Nebraska 2. Oklahoma 3. Colorado 4. Alabama 5. Penn St. 6. Michigan 7. Georgia 8. Arizona St. 9. Tennessee 10. Stanford 11. LSU 12. Auburn 13. Notre Dame 14. Toledo 15. Ole Miss 16. Arkansas 17. Houston 18. Texas 19. Washington 20. Southern California
1972 1. Southern California 2. Oklahoma 3. Texas 4. Nebraska 5. Auburn 6. Michigan 7. Alabama
8. Tennessee 9. Ohio St. 10. Penn St. 11. LSU 12. North Carolina 13. Arizona St. 14. Notre Dame 15. UCLA 16. Colorado 17. North Carolina St. 18. Louisville 19. Washington St. 20. Georgia Tech
1973 1. Notre Dame 2. Ohio St. 3. Oklahoma 4. Alabama 5. Penn St. 6. Michigan 7. Nebraska 8. Southern California 9. Arizona St. Houston 11. Texas Tech 12. UCLA 13. LSU 14. Texas 15. Miami (OH) 16. North Carolina St. 17. Missouri 18. Kansas 19. Tennessee 20. Maryland Tulane
1974 1. Oklahoma 2. Southern California 3. Michigan 4. Ohio St. 5. Alabama 6. Notre Dame 7. Penn St. 8. Auburn 9. Nebraska 10. Miami (OH) 11. North Carolina St. 12. Michigan St. 13. Maryland 14. Baylor 15. Florida 16. Texas A&M 17. Mississippi St. Texas 19. Houston 20. Tennessee
1975 1. Oklahoma 2. Arizona St. 3. Alabama 4. Ohio St. 5. UCLA 6. Texas 7. Arkansas 8. Michigan 9. Nebraska 10. Penn St. 11. Texas A&M 12. Miami (OH) 13. Maryland 14. California 15. Pittsburgh 16. Colorado 17. Southern California 18. Arizona 19. Georgia 20. West Virginia
1976 1. Pittsburgh 2. Southern California 3. Michigan 4. Houston 5. Oklahoma 6. Ohio St. 7. Texas A&M 8. Maryland
9. Nebraska 10. Georgia 11. Alabama 12. Notre Dame 13. Texas Tech 14. Oklahoma St. 15. UCLA 16. Colorado 17. Rutgers 18. Kentucky 19. Iowa St. 20. Mississippi St.
1977 1. Notre Dame 2. Alabama 3. Arkansas 4. Texas 5. Penn St. 6. Kentucky 7. Oklahoma 8. Pittsburgh 9. Michigan 10. Washington 11. Ohio St. 12. Nebraska 13. Southern California 14. Florida St. 15. Stanford 16. San Diego St. 17. North Carolina 18. Arizona St. 19. Clemson 20. BYU
1978 1. Alabama 2. Southern California 3. Oklahoma 4. Penn St. 5. Michigan 6. Clemson 7. Notre Dame 8. Nebraska 9. Texas 10. Houston 11. Arkansas 12. Michigan St. 13. Purdue 14. UCLA 15. Missouri 16. Georgia 17. Stanford 18. North Carolina St. 19. Texas A&M 20. Maryland
1979 1. Alabama 2. Southern California 3. Oklahoma 4. Ohio St. 5. Houston 6. Florida St. 7. Pittsburgh 8. Arkansas 9. Nebraska 10. Purdue 11. Washington 12. Texas 13. BYU 14. Baylor 15. North Carolina 16. Auburn 17. Temple 18. Michigan 19. Indiana 20. Penn St.
1980 1. Georgia 2. Pittsburgh 3. Oklahoma 4. Michigan 5. Florida St. 6. Alabama 7. Nebraska 8. Penn St. 9. Notre Dame 10. North Carolina
11. Southern California 12. BYU 13. UCLA 14. Baylor 15. Ohio St. 16. Washington 17. Purdue 18. Miami (FL) 19. Mississippi St. 20. SMU
1981 1. Clemson 2. Texas 3. Penn St. 4. Pittsburgh 5. SMU 6. Georgia 7. Alabama 8. Miami (FL) 9. North Carolina 10. Washington 11. Nebraska 12. Michigan 13. BYU 14. Southern California 15. Ohio St. 16. Arizona St. 17. West Virginia 18. Iowa 19. Missouri 20. Oklahoma
1982 1. Penn St. 2. SMU 3. Nebraska 4. Georgia 5. UCLA 6. Arizona St. 7. Washington 8. Clemson 9. Arkansas 10. Pittsburgh 11. LSU 12. Ohio St. 13. Florida St. 14. Auburn 15. Southern California 16. Oklahoma 17. Texas 18. North Carolina 19. West Virginia 20. Maryland
1983 1. Miami (FL) 2. Nebraska 3. Auburn 4. Georgia 5. Texas 6. Florida 7. BYU 8. Michigan 9. Ohio St. 10. Illinois 11. Clemson 12. SMU 13. Air Force 14. Iowa 15. Alabama 16. West Virginia 17. UCLA 18. Pittsburgh 19. Boston College 20. East Carolina
1984 1. BYU 2. Washington 3. Florida 4. Nebraska 5. Boston College 6. Oklahoma 7. Oklahoma St. 8. SMU 9. UCLA 10. Southern California 11. South Carolina 12. Maryland
13. Ohio St. 14. Auburn 15. LSU 16. Iowa 17. Florida St. 18. Miami (FL) 19. Kentucky 20. Virginia
1985 1. Oklahoma 2. Michigan 3. Penn St. 4. Tennessee 5. Florida 6. Texas A&M 7. UCLA 8. Air Force 9. Miami (FL) 10. Iowa 11. Nebraska 12. Arkansas 13. Alabama 14. Ohio St. 15. Florida St. 16. BYU 17. Baylor 18. Maryland 19. Georgia Tech 20. LSU
1986 1. Penn St. 2. Miami (FL) 3. Oklahoma 4. Arizona St. 5. Nebraska 6. Auburn 7. Ohio St. 8. Michigan 9. Alabama 10. LSU 11. Arizona 12. Baylor 13. Texas A&M 14. UCLA 15. Arkansas 16. Iowa 17. Clemson 18. Washington 19. Boston College 20. Virginia Tech
1987 1. Miami (FL) 2. Florida St. 3. Oklahoma 4. Syracuse 5. LSU 6. Nebraska 7. Auburn 8. Michigan St. 9. UCLA 10. Texas A&M 11. Oklahoma St. 12. Clemson 13. Georgia 14. Tennessee 15. South Carolina 16. Iowa 17. Notre Dame 18. Southern California 19. Michigan 20. Arizona St.
1988 1. Notre Dame 2. Miami (FL) 3. Florida St. 4. Michigan 5. West Virginia 6. UCLA 7. Southern California 8. Auburn 9. Clemson 10. Nebraska 11. Oklahoma St. 12. Arkansas 13. Syracuse 14. Oklahoma
15. Georgia 16. Washington St. 17. Alabama 18. Houston 19. LSU 20. Indiana
†1989 1. Miami (FL) 2. Notre Dame 3. Florida St. 4. Colorado 5. Tennessee 6. Auburn 7. Michigan 8. Southern California 9. Alabama 10. Illinois 11. Nebraska 12. Clemson 13. Arkansas 14. Houston 15. Penn St. 16. Michigan St. 17. Pittsburgh 18. Virginia 19. Texas Tech 20. Texas A&M 21. West Virginia 22. BYU 23. Washington 24. Ohio St. 25. Arizona
1990 1. Colorado 2. Georgia Tech 3. Miami (FL) 4. Florida St. 5. Washington 6. Notre Dame 7. Michigan 8. Tennessee 9. Clemson 10. Houston 11. Penn St. 12. Texas 13. Florida 14. Louisville 15. Texas A&M 16. Michigan St. 17. Oklahoma 18. Iowa 19. Auburn 20. Southern California 21. Ole Miss 22. BYU 23. Virginia 24. Nebraska 25. Illinois
1991 1. Miami (FL) 2. Washington 3. Penn St. 4. Florida St. 5. Alabama 6. Michigan 7. Florida 8. California 9. East Carolina 10. Iowa 11. Syracuse 12. Texas A&M 13. Notre Dame 14. Tennessee 15. Nebraska 16. Oklahoma 17. Georgia 18. Clemson 19. UCLA 20. Colorado 21. Tulsa 22. Stanford 23. BYU 24. North Carolina St. 25. Air Force
1992 1. Alabama

94 2011 NCAA FOOTBALL RECORDS - ASSOCIATED PRESS FINAL POLLS
2. Florida St. 3. Miami (FL) 4. Notre Dame 5. Michigan 6. Syracuse 7. Texas A&M 8. Georgia 9. Stanford 10. Florida 11. Washington 12. Tennessee 13. Colorado 14. Nebraska 15. Washington St. 16. Ole Miss 17. North Carolina St. 18. Ohio St. 19. North Carolina 20. Hawaii 21. Boston College 22. Kansas 23. Mississippi St. 24. Fresno St. 25. Wake Forest
1993 1. Florida St. 2. Notre Dame 3. Nebraska 4. Auburn 5. Florida 6. Wisconsin 7. West Virginia 8. Penn St. 9. Texas A&M 10. Arizona 11. Ohio St. 12. Tennessee 13. Boston College 14. Alabama 15. Miami (FL) 16. Colorado 17. Oklahoma 18. UCLA 19. North Carolina 20. Kansas St. 21. Michigan 22. Virginia Tech 23. Clemson 24. Louisville 25. California
1994 1. Nebraska 2. Penn St. 3. Colorado 4. Florida St. 5. Alabama 6. Miami (FL) 7. Florida 8. Texas A&M 9. Auburn 10. Utah 11. Oregon 12. Michigan 13. Southern California 14. Ohio St. 15. Virginia 16. Colorado St. 17. North Carolina St. 18. BYU 19. Kansas St. 20. Arizona 21. Washington St. 22. Tennessee 23. Boston College 24. Mississippi St. 25. Texas
1995 1. Nebraska 2. Florida 3. Tennessee 4. Florida St. 5. Colorado 6. Ohio St. 7. Kansas St.
8. Northwestern 9. Kansas 10. Virginia Tech 11. Notre Dame 12. Southern California 13. Penn St. 14. Texas 15. Texas A&M 16. Virginia 17. Michigan 18. Oregon 19. Syracuse 20. Miami (FL) 21. Alabama 22. Auburn 23. Texas Tech 24. Toledo 25. Iowa1996 1. Florida (12-1) 2. Ohio St. (11-1) 3. Florida St. (11-1) 4. Arizona St. (11-1) 5. BYU (14-1) 6. Nebraska (11-2) 7. Penn St. (11-2) 8. Colorado (10-2) 9. Tennessee (10-2) 10. North Carolina (10-2) 11. Alabama (10-3) 12. LSU (10-2) 13. Virginia Tech (10-2) 14. Miami (FL) (9-3) 15. Northwestern (9-3) 16. Washington (9-3) 17. Kansas St. (9-3) 18. Iowa (9-3) 19. Notre Dame (8-3) 20. Michigan (8-4) 21. Syracuse (9-3) 22. Wyoming (10-2) 23. Texas (8-5) 24. Auburn (8-4) 25. Army (10-2)
1997 1. Michigan (12-0) 2. Nebraska (13-0) 3. Florida St. (11-1) 4. Florida (10-2) 5. UCLA (10-2) 6. North Carolina (11-1) 7. Tennessee (11-2) 8. Kansas St. (11-1) 9. Washington St. (10-2) 10. Georgia (10-2) 11. Auburn (10-3) 12. Ohio St. (10-3) 13. LSU (9-3) 14. Arizona St. (9-3) 15. Purdue (9-3) 16. Penn St. (9-3) 17. Colorado St. (11-2) 18. Washington (8-4) 19. Southern Miss. (9-3) 20. Texas A&M (9-4) 21. Syracuse (9-4) 22. Ole Miss (8-4) 23. Missouri (7-5) 24. Oklahoma St. (8-4) 25. Georgia Tech (7-5)
1998 1. Tennessee (13-0) 2. Ohio St. (11-1) 3. Florida St. (11-2) 4. Arizona (12-1) 5. Florida (10-2) 6. Wisconsin (11-1) 7. Tulane (12-0) 8. UCLA (10-2) 9. Georgia Tech (10-2) 10. Kansas St. (11-2) 11. Texas A&M (11-3) 12. Michigan (10-3) 13. Air Force (12-1) 14. Georgia (9-3)
15. Texas (9-3) 16. Arkansas (9-3) 17. Penn St. (9-3) 18. Virginia (9-3) 19. Nebraska (9-4) 20. Miami (FL) (9-3) 21. Missouri (8-4) 22. Notre Dame (9-3) 23. Virginia Tech (9-3) 24. Purdue (9-4) 25. Syracuse (8-4)
1999 1. Florida St. (12-0) 2. Virginia Tech (11-1) 3. Nebraska (12-1) 4. Wisconsin (10-2) 5. Michigan (10-2) 6. Kansas St. (11-1) 7. Michigan St. (10-2) 8. Alabama (10-3) 9. Tennessee (9-3) 10. Marshall (13-0) 11. Penn St. (10-3) 12. Florida (9-4) 13. Mississippi St. (10-2) 14. Southern Miss. (9-3) 15. Miami (FL) (9-4) 16. Georgia (8-4) 17. Arkansas (8-4) 18. Minnesota (8-4) 19. Oregon (9-3) 20. Georgia Tech (8-4) 21. Texas (9-5) 22. Ole Miss (8-4) 23. Texas A&M (8-4) 24. Illinois (8-4) 25. Purdue (7-5)
2000 1. Oklahoma (13-0) 2. Miami (FL) (11-1) 3. Washington (11-1) 4. Oregon St. (11-1) 5. Florida St. (11-2) 6. Virginia Tech (11-1) 7. Oregon (10-2) 8. Nebraska (10-2) 9. Kansas St. (11-3) 10. Florida (10-3) 11. Michigan (9-3) 12. Texas (9-3) 13. Purdue (8-4) 14. Colorado St. (10-2) 15. Notre Dame (9-3) 16. Clemson (9-3) 17. Georgia Tech (9-3) 18. Auburn (9-4) 19. South Carolina (8-4) 20. Georgia (8-4) 21. TCU (10-2) 22. LSU (8-4) 23. Wisconsin (9-4) 24. Mississippi St. (8-4) 25. Iowa St. (9-3)
2001 1. Miami (FL) (12-0) 2. Oregon (11-1) 3. Florida (10-2) 4. Tennessee (11-2) 5. Texas (11-2) 6. Oklahoma (11-2) 7. LSU (10-3) 8. Nebraska (11-2) 9. Colorado (10-3) 10. Washington St. (10-2) 11. Maryland (10-2) 12. Illinois (10-2) 13. South Carolina (9-3) 14. Syracuse (10-3) 15. Florida St. (8-4) 16. Stanford (9-3) 17. Louisville (11-2) 18. Virginia Tech (8-4) 19. Washington (8-4) 20. Michigan (8-4)
21. Boston College (8-4) 22. Georgia (8-4) 23. Toledo (10-2) 24. Georgia Tech (8-5) 25. BYU (12-2)
2002 1. Ohio St. (14-0) 2. Miami (FL) (12-1) 3. Georgia (13-1) 4. Southern California
(11-2) 5. Oklahoma (12-2) 6. Texas (11-2) 7. Kansas St. (11-2) 8. Iowa (11-2) 9. Michigan (10-3) 10. Washington St. (10-3) 11. Alabama (10-3) 12. North Carolina St.
(11-3) 13. Maryland (11-3) 14. Auburn (9-4) 15. Boise St. (12-1) 16. Penn St. (9-4) 17. Notre Dame (10-3) 18. Virginia Tech (10-4) 19. Pittsburgh (9-4) 20. Colorado (9-5) 21. Florida St. (9-5) 22. Virginia (9-5) 23. TCU (10-2) 24. Marshall (11-2) 25. West Virginia (9-4)
2003 1. Southern California
(12-1) 2. LSU (13-1) 3. Oklahoma (12-2) 4. Ohio St. (11-2) 5. Miami (FL) (11-2) 6. Michigan (10-3) 7. Georgia (11-3) 8. Iowa (10-3) 9. Washington St. (10-3) 10. Miami (OH) (13-1) 11. Florida St. (10-3) 12. Texas (10-3) 13. Ole Miss (10-3) 14. Kansas St. (11-4) 15. Tennessee (10-3) 16. Boise St. (13-1) 17. Maryland (10-3) 18. Purdue (9-4) 19. Nebraska (10-3) 20. Minnesota (10-3) 21. Utah (10-2) 22. Clemson (9-4) 23. Bowling Green (11-3) 24. Florida (8-5) 25. TCU (11-2)
2004 1. Southern California
(13-0) 2. Auburn (13-0) 3. Oklahoma (12-1) 4. Utah (12-0) 5. Texas (11-1) 6. Louisville (11-1) 7. Georgia (10-2) 8. Iowa (10-2) 9. California (10-2) 10. Virginia Tech (10-3) 11. Miami (FL) (9-3) 12. Boise St. (11-1) 13. Tennessee (10-3) 14. Michigan (9-3) 15. Florida St. (9-3) 16. LSU (9-3) 17. Wisconsin (9-3) 18. Texas Tech (8-4) 19. Arizona St. (9-3) 20. Ohio St. (8-4) 21. Boston College (9-3) 22. Fresno St. (9-3)
23. Virginia (8-4) 24. Navy (10-2) 25. Pittsburgh (8-4)
2005 1. Texas (13-0) 2. Southern California
(12-1) 3. Penn St. (11-1) 4. Ohio St. (10-2) 5. West Virginia (11-1) 6. LSU (11-2) 7. Virginia Tech (11-2) 8. Alabama (10-2) 9. Notre Dame (9-3) 10. Georgia (10-3) 11. TCU (11-1) 12. Florida (9-3) Oregon (10-2) 14. Auburn (9-3) 15. Wisconsin (10-3) 16. UCLA (10-2) 17. Miami (FL) (9-3) 18. Boston College (9-3) 19. Louisville (9-3) 20. Texas Tech (9-3) 21. Clemson (8-4) 22. Oklahoma (8-5) 23. Florida St. (8-5) 24. Nebraska (8-4) 25. California (8-4)
2006 1. Florida (13-1) 2. Ohio St. (12-1) 3. LSU (11-2) 4. Southern California
(11-2) 5. Boise St. (13-0) 6. Louisville (12-1) 7. Wisconsin (12-1) 8. Michigan (11-2) 9. Auburn (11-2) 10. West Virginia (11-2) 11. Oklahoma (11-3) 12. Rutgers (11-2) 13. Texas (10-3) 14. California (10-3) 15. Arkansas (10-4) 16. BYU (11-2) 17. Notre Dame (10-3) 18. Wake Forest (11-3) 19. Virginia Tech (10-3) 20. Boston College (10-3) 21. Oregon St. (10-4) 22. TCU (11-2) 23. Georgia (9-4) 24. Penn St. (9-4) 25. Tennessee (9-4)
2007 1. LSU (12-2) 2. Georgia (11-2) 3. Southern California
(11-2) 4. Missouri (12-2) 5. Ohio St. (11-2) 6. West Virginia (11-2) 7. Kansas (12-1) 8. Oklahoma (11-3) 9. Virginia Tech (11-3) 10. Texas (10-3) Boston College (11-3) 12. Tennessee (10-4) 13. Florida (9-4) 14. BYU (11-2) 15. Auburn (9-4) 16. Arizona St. (10-3) 17. Cincinnati (10-3) 18. Michigan (9-4) 19. Hawaii (12-1) 20. Illinois (9-4) 21. Clemson (9-4) 22. Texas Tech (9-4) 23. Oregon (9-4) 24. Wisconsin (9-4) 25. Oregon St. (9-4)
2008 1. Florida (13-1) 2. Utah (13-0) 3. Southern California
(12-1) 4. Texas (12-1) 5. Oklahoma (12-2) 6. Alabama (12-2) 7. TCU (11-2) 8. Penn St. (11-2) 9. Ohio St. (10-3) 10. Oregon (10-3) 11. Boise St. (12-1) 12. Texas Tech (11-2) 13. Georgia (10-3) 14. Ole Miss (9-4) 15. Virginia Tech (10-4) 16. Oklahoma St. (9-4) 17. Cincinnati (11-3) 18. Oregon St. (9-4) 19. Missouri (10-4) 20. Iowa (9-4) 21. Florida St. (9-4) 22. Georgia Tech (9-4) 23. West Virginia (9-4) 24. Michigan St. (9-4) 25. BYU (10-3)
2009 1. Alabama (14-0) 2. Texas (13-1) 3. Florida (13-1) 4. Boise St. (14-0) 5. Ohio St. (11-2) 6. TCU (12-1) 7. Iowa (11-2) 8. Cincinnati (12-1) 9. Penn St. (11-2) 10. Virginia Tech (10-3) 11. Oregon (10-3) 12. BYU (11-2) 13. Georgia Tech (11-3) 14. Nebraska (10-4) 15. Pittsburgh (10-3) 16. Wisconsin (10-3) 17. LSU (9-4) 18. Utah (10-3) 19. Miami (FL) (9-4) 20. Ole Miss (9-4) 21. Texas Tech (9-4) 22. Southern California
(9-4) 23. Central Mich. (12-2) 24. Clemson (9-5) 25. West Virginia (9-4)
2010 1. Auburn (14-0) 2. TCU (13-0) 3. Oregon (12-1) 4. Stanford (12-1) 5. Ohio St. (12-1) 6. Oklahoma (12-2) 7. Wisconsin (11-2) 8. LSU (11-2) 9. Boise St. (12-1) 10. Alabama (10-3) 11. Nevada (13-1) 12. Arkansas (10-3) 13. Oklahoma St. (11-2) 14. Michigan St. (11-2) 15. Mississippi St. (9-4) 16. Virginia Tech (11-3) 17. Florida St. (10-4) 18. Missouri (10-3) 19. Texas A&M (9-4) 20. Nebraska (10-4) 21. UCF (11-3) 22. South Carolina (9-5) 23. Maryland (9-4) 24. Tulsa (10-3) 25. North Carolina St.
(9-4)
* On January 6, 1948, in a special postseason poll after the Rose Bowl, the Associated Press voted Michigan No. 1 and Notre Dame No. 2. However, the postseason poll did not supersede the final regular-season poll of December 6, 1947. †Beginning in 1989 season, AP selected top 25 teams instead of 20.
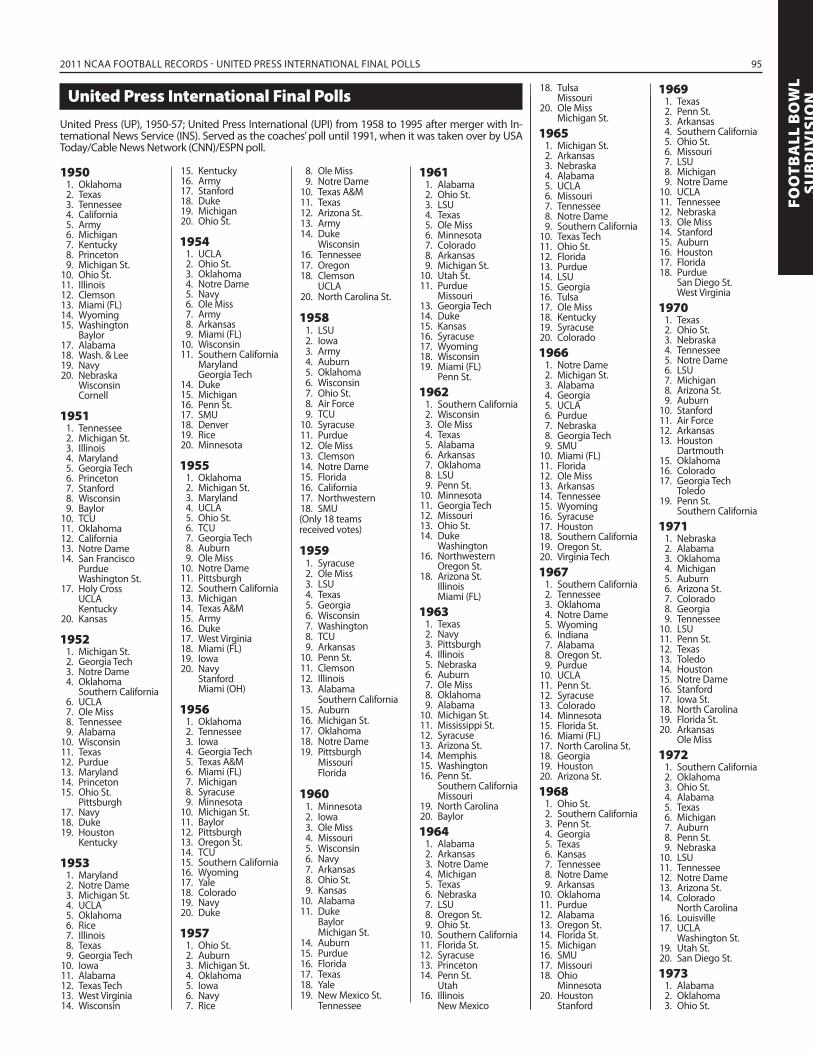
2011 NCAA FOOTBALL RECORDS - UNITED PRESS INTERNATIONAL FINAL POLLS 95
FOO
TBA
LL B
OW
LSU
BD
IVIS
IONUnited Press International Final Polls
United Press (UP), 1950-57; United Press International (UPI) from 1958 to 1995 after merger with In-ternational News Service (INS). Served as the coaches’ poll until 1991, when it was taken over by USA Today/Cable News Network (CNN)/ESPN poll.
1950 1. Oklahoma 2. Texas 3. Tennessee 4. California 5. Army 6. Michigan 7. Kentucky 8. Princeton 9. Michigan St. 10. Ohio St. 11. Illinois 12. Clemson 13. Miami (FL) 14. Wyoming 15. Washington Baylor 17. Alabama 18. Wash. & Lee 19. Navy 20. Nebraska Wisconsin Cornell
1951 1. Tennessee 2. Michigan St. 3. Illinois 4. Maryland 5. Georgia Tech 6. Princeton 7. Stanford 8. Wisconsin 9. Baylor 10. TCU 11. Oklahoma 12. California 13. Notre Dame 14. San Francisco Purdue Washington St. 17. Holy Cross UCLA Kentucky 20. Kansas
1952 1. Michigan St. 2. Georgia Tech 3. Notre Dame 4. Oklahoma Southern California 6. UCLA 7. Ole Miss 8. Tennessee 9. Alabama 10. Wisconsin 11. Texas 12. Purdue 13. Maryland 14. Princeton 15. Ohio St. Pittsburgh 17. Navy 18. Duke 19. Houston Kentucky
1953 1. Maryland 2. Notre Dame 3. Michigan St. 4. UCLA 5. Oklahoma 6. Rice 7. Illinois 8. Texas 9. Georgia Tech 10. Iowa 11. Alabama 12. Texas Tech 13. West Virginia 14. Wisconsin
15. Kentucky 16. Army 17. Stanford 18. Duke 19. Michigan 20. Ohio St.
1954 1. UCLA 2. Ohio St. 3. Oklahoma 4. Notre Dame 5. Navy 6. Ole Miss 7. Army 8. Arkansas 9. Miami (FL) 10. Wisconsin 11. Southern California Maryland Georgia Tech 14. Duke 15. Michigan 16. Penn St. 17. SMU 18. Denver 19. Rice 20. Minnesota
1955 1. Oklahoma 2. Michigan St. 3. Maryland 4. UCLA 5. Ohio St. 6. TCU 7. Georgia Tech 8. Auburn 9. Ole Miss 10. Notre Dame 11. Pittsburgh 12. Southern California 13. Michigan 14. Texas A&M 15. Army 16. Duke 17. West Virginia 18. Miami (FL) 19. Iowa 20. Navy Stanford Miami (OH)
1956 1. Oklahoma 2. Tennessee 3. Iowa 4. Georgia Tech 5. Texas A&M 6. Miami (FL) 7. Michigan 8. Syracuse 9. Minnesota 10. Michigan St. 11. Baylor 12. Pittsburgh 13. Oregon St. 14. TCU 15. Southern California 16. Wyoming 17. Yale 18. Colorado 19. Navy 20. Duke
1957 1. Ohio St. 2. Auburn 3. Michigan St. 4. Oklahoma 5. Iowa 6. Navy 7. Rice
8. Ole Miss 9. Notre Dame 10. Texas A&M 11. Texas 12. Arizona St. 13. Army 14. Duke Wisconsin 16. Tennessee 17. Oregon 18. Clemson UCLA 20. North Carolina St.
1958 1. LSU 2. Iowa 3. Army 4. Auburn 5. Oklahoma 6. Wisconsin 7. Ohio St. 8. Air Force 9. TCU 10. Syracuse 11. Purdue 12. Ole Miss 13. Clemson 14. Notre Dame 15. Florida 16. California 17. Northwestern 18. SMU(Only 18 teamsreceived votes)
1959 1. Syracuse 2. Ole Miss 3. LSU 4. Texas 5. Georgia 6. Wisconsin 7. Washington 8. TCU 9. Arkansas 10. Penn St. 11. Clemson 12. Illinois 13. Alabama Southern California 15. Auburn 16. Michigan St. 17. Oklahoma 18. Notre Dame 19. Pittsburgh Missouri Florida
1960 1. Minnesota 2. Iowa 3. Ole Miss 4. Missouri 5. Wisconsin 6. Navy 7. Arkansas 8. Ohio St. 9. Kansas 10. Alabama 11. Duke Baylor Michigan St. 14. Auburn 15. Purdue 16. Florida 17. Texas 18. Yale 19. New Mexico St. Tennessee
1961 1. Alabama 2. Ohio St. 3. LSU 4. Texas 5. Ole Miss 6. Minnesota 7. Colorado 8. Arkansas 9. Michigan St. 10. Utah St. 11. Purdue Missouri 13. Georgia Tech 14. Duke 15. Kansas 16. Syracuse 17. Wyoming 18. Wisconsin 19. Miami (FL) Penn St.1962 1. Southern California 2. Wisconsin 3. Ole Miss 4. Texas 5. Alabama 6. Arkansas 7. Oklahoma 8. LSU 9. Penn St. 10. Minnesota 11. Georgia Tech 12. Missouri 13. Ohio St. 14. Duke Washington 16. Northwestern Oregon St. 18. Arizona St. Illinois Miami (FL)1963 1. Texas 2. Navy 3. Pittsburgh 4. Illinois 5. Nebraska 6. Auburn 7. Ole Miss 8. Oklahoma 9. Alabama 10. Michigan St. 11. Mississippi St. 12. Syracuse 13. Arizona St. 14. Memphis 15. Washington 16. Penn St. Southern California Missouri 19. North Carolina 20. Baylor1964 1. Alabama 2. Arkansas 3. Notre Dame 4. Michigan 5. Texas 6. Nebraska 7. LSU 8. Oregon St. 9. Ohio St. 10. Southern California 11. Florida St. 12. Syracuse 13. Princeton 14. Penn St. Utah 16. Illinois New Mexico
18. Tulsa Missouri 20. Ole Miss Michigan St.1965 1. Michigan St. 2. Arkansas 3. Nebraska 4. Alabama 5. UCLA 6. Missouri 7. Tennessee 8. Notre Dame 9. Southern California 10. Texas Tech 11. Ohio St. 12. Florida 13. Purdue 14. LSU 15. Georgia 16. Tulsa 17. Ole Miss 18. Kentucky 19. Syracuse 20. Colorado1966 1. Notre Dame 2. Michigan St. 3. Alabama 4. Georgia 5. UCLA 6. Purdue 7. Nebraska 8. Georgia Tech 9. SMU 10. Miami (FL) 11. Florida 12. Ole Miss 13. Arkansas 14. Tennessee 15. Wyoming 16. Syracuse 17. Houston 18. Southern California 19. Oregon St. 20. Virginia Tech1967 1. Southern California 2. Tennessee 3. Oklahoma 4. Notre Dame 5. Wyoming 6. Indiana 7. Alabama 8. Oregon St. 9. Purdue 10. UCLA 11. Penn St. 12. Syracuse 13. Colorado 14. Minnesota 15. Florida St. 16. Miami (FL) 17. North Carolina St. 18. Georgia 19. Houston 20. Arizona St.1968 1. Ohio St. 2. Southern California 3. Penn St. 4. Georgia 5. Texas 6. Kansas 7. Tennessee 8. Notre Dame 9. Arkansas 10. Oklahoma 11. Purdue 12. Alabama 13. Oregon St. 14. Florida St. 15. Michigan 16. SMU 17. Missouri 18. Ohio Minnesota 20. Houston Stanford
1969 1. Texas 2. Penn St. 3. Arkansas 4. Southern California 5. Ohio St. 6. Missouri 7. LSU 8. Michigan 9. Notre Dame 10. UCLA 11. Tennessee 12. Nebraska 13. Ole Miss 14. Stanford 15. Auburn 16. Houston 17. Florida 18. Purdue San Diego St. West Virginia1970 1. Texas 2. Ohio St. 3. Nebraska 4. Tennessee 5. Notre Dame 6. LSU 7. Michigan 8. Arizona St. 9. Auburn 10. Stanford 11. Air Force 12. Arkansas 13. Houston Dartmouth 15. Oklahoma 16. Colorado 17. Georgia Tech Toledo 19. Penn St. Southern California1971 1. Nebraska 2. Alabama 3. Oklahoma 4. Michigan 5. Auburn 6. Arizona St. 7. Colorado 8. Georgia 9. Tennessee 10. LSU 11. Penn St. 12. Texas 13. Toledo 14. Houston 15. Notre Dame 16. Stanford 17. Iowa St. 18. North Carolina 19. Florida St. 20. Arkansas Ole Miss1972 1. Southern California 2. Oklahoma 3. Ohio St. 4. Alabama 5. Texas 6. Michigan 7. Auburn 8. Penn St. 9. Nebraska 10. LSU 11. Tennessee 12. Notre Dame 13. Arizona St. 14. Colorado North Carolina 16. Louisville 17. UCLA Washington St. 19. Utah St. 20. San Diego St.1973 1. Alabama 2. Oklahoma 3. Ohio St.

96 2011 NCAA FOOTBALL RECORDS - UNITED PRESS INTERNATIONAL FINAL POLLS
4. Notre Dame 5. Penn St. 6. Michigan 7. Southern California 8. Texas 9. UCLA 10. Arizona St. 11. Nebraska Texas Tech 13. Houston 14. LSU 15. Kansas Tulane 17. Miami (OH) 18. Maryland 19. San Diego St. Florida
*1974 1. Southern California 2. Alabama 3. Ohio St. 4. Notre Dame 5. Michigan 6. Auburn 7. Penn St. 8. Nebraska 9. North Carolina St. 10. Miami (OH) 11. Houston 12. Florida 13. Maryland 14. Baylor 15. Texas A&M Tennessee 17. Mississippi St. 18. Michigan St. 19. Tulsa1975 1. Oklahoma 2. Arizona St. 3. Alabama 4. Ohio St. 5. UCLA 6. Arkansas 7. Texas 8. Michigan 9. Nebraska 10. Penn St. 11. Maryland 12. Texas A&M 13. Arizona Pittsburgh 15. California 16. Miami (OH) 17. Notre Dame West Virginia 19. Georgia Southern California1976 1. Pittsburgh 2. Southern California 3. Michigan 4. Houston 5. Ohio St. 6. Oklahoma 7. Nebraska 8. Texas A&M 9. Alabama 10. Georgia 11. Maryland 12. Notre Dame 13. Texas Tech 14. Oklahoma St. 15. UCLA 16. Colorado 17. Rutgers 18. Iowa St. 19. Baylor Kentucky1977 1. Notre Dame 2. Alabama 3. Arkansas 4. Penn St. 5. Texas 6. Oklahoma 7. Pittsburgh 8. Michigan
9. Washington 10. Nebraska 11. Florida St. 12. Ohio St. Southern California 14. North Carolina 15. Stanford 16. North Texas BYU 18. Arizona St. 19. San Diego St. North Carolina St.
1978 1. Southern California 2. Alabama 3. Oklahoma 4. Penn St. 5. Michigan 6. Notre Dame 7. Clemson 8. Nebraska 9. Texas 10. Arkansas 11. Houston 12. UCLA 13. Purdue 14. Missouri 15. Georgia 16. Stanford 17. Navy 18. Texas A&M 19. Arizona St. North Carolina St.1979 1. Alabama 2. Southern California 3. Oklahoma 4. Ohio St. 5. Houston 6. Pittsburgh 7. Nebraska 8. Florida St. 9. Arkansas 10. Purdue 11. Washington 12. BYU 13. Texas 14. North Carolina 15. Baylor 16. Indiana 17. Temple 18. Penn St. 19. Michigan 20. Missouri1980 1. Georgia 2. Pittsburgh 3. Oklahoma 4. Michigan 5. Florida St. 6. Alabama 7. Nebraska 8. Penn St. 9. North Carolina 10. Notre Dame 11. BYU 12. Southern California 13. Baylor 14. UCLA 15. Ohio St. 16. Purdue 17. Washington 18. Miami (FL) 19. Florida 20. SMU1981 1. Clemson 2. Pittsburgh 3. Penn St. 4. Texas 5. Georgia 6. Alabama 7. Washington 8. North Carolina 9. Nebraska 10. Michigan 11. BYU 12. Ohio St.
13. Southern California 14. Oklahoma 15. Iowa 16. Arkansas 17. Mississippi St. 18. West Virginia 19. Southern Miss. 20. Missouri1982 1. Penn St. 2. SMU 3. Nebraska 4. Georgia 5. UCLA 6. Arizona St. 7. Washington 8. Arkansas 9. Pittsburgh 10. Florida St. 11. LSU 12. Ohio St. 13. North Carolina 14. Auburn 15. Michigan 16. Oklahoma 17. Alabama 18. Texas 19. West Virginia 20. Maryland1983 1. Miami (FL) 2. Nebraska 3. Auburn 4. Georgia 5. Texas 6. Florida 7. BYU 8. Ohio St. 9. Michigan 10. Illinois 11. SMU 12. Alabama 13. UCLA 14. Iowa 15. Air Force 16. West Virginia 17. Penn St. 18. Oklahoma St. 19. Pittsburgh 20. Boston College1984 1. BYU 2. Washington 3. Nebraska 4. Boston College 5. Oklahoma St. 6. Oklahoma 7. Florida 8. SMU 9. Southern California 10. UCLA 11. Maryland 12. Ohio St. 13. South Carolina 14. Auburn 15. Iowa 16. LSU 17. Virginia 18. West Virginia 19. Kentucky Florida St.1985 1. Oklahoma 2. Michigan 3. Penn St. 4. Tennessee 5. Air Force 6. UCLA 7. Texas A&M 8. Miami (FL) 9. Iowa 10. Nebraska 11. Ohio St.
12. Arkansas 13. Florida St. 14. Alabama 15. Baylor 16. Fresno St. 17. BYU 18. Georgia Tech 19. Maryland 20. LSU1986 1. Penn St. 2. Miami (FL) 3. Oklahoma 4. Nebraska 5. Arizona St. 6. Ohio St. 7. Michigan 8. Auburn 9. Alabama 10. Arizona 11. LSU 12. Texas A&M 13. Baylor 14. UCLA 15. Iowa 16. Arkansas 17. Washington 18. Boston College 19. Clemson 20. Florida St.1987 1. Miami (FL) 2. Florida St. 3. Oklahoma 4. Syracuse 5. LSU 6. Nebraska 7. Auburn 8. Michigan St. 9. Texas A&M 10. Clemson 11. UCLA 12. Oklahoma St. 13. Tennessee 14. Georgia 15. South Carolina 16. Iowa 17. Southern California 18. Michigan 19. Texas 20. Indiana1988 1. Notre Dame 2. Miami (FL) 3. Florida St. 4. Michigan 5. West Virginia 6. UCLA 7. Auburn 8. Clemson 9. Southern California 10. Nebraska 11. Oklahoma St. 12. Syracuse 13. Arkansas 14. Oklahoma 15. Georgia 16. Washington St. 17. North Carolina St. Alabama 19. Indiana 20. Wyoming1989 1. Miami (FL) 2. Florida St. 3. Notre Dame 4. Colorado 5. Tennessee 6. Auburn 7. Alabama 8. Michigan 9. Southern California 10. Illinois
11. Clemson 12. Nebraska 13. Arkansas 14. Penn St. 15. Virginia 16. Texas Tech Michigan St. 18. BYU 19. Pittsburgh 20. Washington#1990 1. Georgia Tech 2. Colorado 3. Miami (FL) 4. Florida St. 5. Washington 6. Notre Dame 7. Tennessee 8. Michigan 9. Clemson 10. Penn St. 11. Texas 12. Louisville 13. Texas A&M 14. Michigan St. 15. Virginia 16. Iowa 17. BYU Nebraska 19. Auburn 20. San Jose St. 21. Syracuse 22. Southern California 23. Ole Miss 24. Illinois 25. Virginia Tech¢1991 1. Washington 2. Miami (FL) 3. Penn St. 4. Florida St. 5. Alabama 6. Michigan 7. Florida 8. California 9. East Carolina 10. Iowa 11. Syracuse 12. Notre Dame 13. Texas A&M 14. Tennessee 15. Nebraska 16. Oklahoma 17. Clemson 18. Colorado 19. UCLA 20. Georgia 21. Tulsa 22. Stanford 23. North Carolina St. 24. BYU 25. Ohio St.1992 1. Alabama 2. Florida St. 3. Miami (FL) 4. Notre Dame 5. Michigan 6. Syracuse 7. Texas A&M 8. Georgia 9. Stanford 10. Florida 11. Washington 12. Tennessee 13. Colorado 14. Nebraska 15. Washington St. 16. Ole Miss 17. North Carolina St. 18. North Carolina 19. Ohio St. 20. Hawaii 21. Boston College
22. Kansas 23. Fresno St. 24. Penn St. 25. Mississippi St.
1993 1. Florida St. 2. Notre Dame 3. Nebraska 4. Florida 5. Wisconsin 6. Texas A&M 7. Penn St. 8. West Virginia 9. Ohio St. 10. Arizona 11. Boston College 12. Tennessee 13. Alabama 14. Miami (FL) 15. Oklahoma 16. Colorado 17. UCLA 18. Kansas St. 19. Michigan 20. North Carolina 21. Virginia Tech 22. Louisville 23. Clemson 24. California 25. Southern California
1994 1. Nebraska 2. Penn St. 3. Colorado 4. Florida St. 5. Alabama 6. Miami (FL) 7. Florida 8. Utah 9. Michigan 10. Ohio St. 11. Oregon 12. BYU 13. Southern California 14. Colorado St. 15. Virginia 16. Kansas St. 17. North Carolina St. 18. Tennessee 19. Washington St. 20. Arizona 21. North Carolina 22. Boston College 23. Texas 24. Virginia Tech 25. Mississippi St.
1995 1. Nebraska 2. Florida 3. Tennessee 4. Colorado 5. Florida St. 6. Ohio St. 7. Kansas St. 8. Northwestern 9. Virginia Tech 10. Kansas 11. Southern California 12. Penn St. 13. Notre Dame 14. Texas A&M 15. Texas 16. Virginia 17. Syracuse 18. Oregon 19. Michigan 20. Texas Tech 21. Auburn 22. Toledo 23. Iowa 24. East Carolina 25. LSU
*Beginning in 1974, by agreement with the Ameri can Football Coaches Asso cia tion, teams on probation by the NCAA were ineligible for ranking and national championship consideration by the UPI Board of Coaches. #Beginning in the 1990 season, UPI selected top 25 teams instead of 20. ¢In 1991-92, the No. 1 team in the final UPI/NFF poll received the MacArthur Bowl, awarded by the NFF since 1959 to recog-nize its national champion. Beginning in 1993, the No. 1 team in the USA Today/Hall of Fame poll was awarded the MacArthur Bowl. The National Football Foundation and Hall of Fame MacArthur Bowl national champions before 1991 are listed in national polls section.

2011 NCAA FOOTBALL RECORDS - USA TODAY WEEKLY POLL LEADERS 97
FOO
TBA
LL B
OW
LSU
BD
IVIS
ION
19929-8 Miami (FL) ............................(1-0-0)9-15 Miami (FL) ............................(1-0-0)9-22 Miami (FL) ............................(2-0-0)9-29 Washington .................(3-0-0) (2)10-6 Washington ........................(4-0-0)10-13 Miami (FL) .....................(5-0-0) (2)10-20 Miami (FL) ............................(6-0-0)10-27 Miami (FL) ............................(7-0-0)11-3 Miami (FL) ............................(8-0-0)11-10 Miami (FL) ............................(8-0-0)11-17 Miami (FL) ............................(9-0-0)11-24 Miami (FL) .........................(10-0-0)12-1 Miami (FL) .........................(11-0-0)12-8 Miami (FL) .........................(11-0-0)1-2 Alabama ...................(13-0-0) (2)
19938-31 Florida St. .............................(1-0-0)9-7 Florida St. .............................(2-0-0)9-14 Florida St. .............................(3-0-0)9-21 Florida St. .............................(4-0-0)9-28 Florida St. .............................(4-0-0)10-5 Florida St. .............................(5-0-0)10-12 Florida St. .............................(6-0-0)10-19 Florida St. .............................(7-0-0)10-26 Florida St. .............................(7-0-0)11-2 Florida St. .............................(8-0-0)11-9 Florida St. .............................(9-0-0)11-16 Notre Dame .............. (10-0-0) (2)11-23 Nebraska .................... (10-0-0) (2)11-30 Nebraska ...........................(11-0-0)12-7 Nebraska ...........................(11-0-0)1-3 Florida St. ................(12-1-0) (3)
19949-6 Nebraska ..............................(1-0-0)9-13 Nebraska ..............................(2-0-0)9-20 Nebraska ..............................(3-0-0)9-27 Nebraska ..............................(4-0-0)10-4 Florida ............................(4-0-0) (2)10-11 Florida ...................................(5-0-0)10-18 Penn St. .........................(6-0-0) (3)10-25 Penn St. ................................(6-0-0)11-1 Penn St. ................................(7-0-0)11-8 Nebraska .................... (10-0-0) (2)11-15 Nebraska ...........................(11-0-0)11-22 Nebraska ...........................(11-0-0)11-29 Nebraska ...........................(12-0-0)12-6 Nebraska ...........................(12-0-0)1-3 Nebraska ........................(13-0-0)
19959-5 Florida St. ............................(1-0-0)9-12 Florida St. ............................(2-0-0)9-19 Florida St. ............................(3-0-0)9-26 Florida St. ............................(4-0-0)10-3 Florida St. ............................(4-0-0)10-10 Florida St. ............................(5-0-0)10-17 Florida St. ............................(6-0-0)10-24 Florida St. ............................(7-0-0)10-31 Nebraska .......................(8-0-0) (2)11-7 Nebraska ..............................(9-0-0)11-14 Nebraska ...........................(10-0-0)11-21 Nebraska ...........................(10-0-0)11-28 Nebraska ...........................(11-0-0)12-5 Nebraska ...........................(11-0-0)1-3 Nebraska ........................(12-0-0)
19969-2 Nebraska ..............................(0-0-0)9-9 Nebraska ..............................(1-0-0)9-16 Nebraska ..............................(1-0-0)9-23 Florida ............................(3-0-0) (4)9-30 Florida ...................................(4-0-0)10-7 Florida ...................................(5-0-0)10-14 Florida ...................................(6-0-0)10-21 Florida ...................................(7-0-0)10-28 Florida ...................................(7-0-0)11-4 Florida ...................................(8-0-0)11-11 Florida ...................................(9-0-0)11-18 Florida ................................(10-0-0)11-25 Florida ................................(10-0-0)12-2 Florida St. .................. (11-0-0) (2)12-9 Florida St. .........................(11-0-0)
1-3 Florida ......................(12-1-0) (3)
19979-2 Florida ...................................(1-0-0)9-8 Florida ...................................(2-0-0)9-15 Florida ...................................(2-0-0)9-22 Florida ...................................(3-0-0)9-29 Florida ...................................(4-0-0)10-6 Florida ...................................(5-0-0)10-13 Penn St. .........................(5-0-0) (2)10-20 Nebraska .......................(6-0-0) (2)10-27 Nebraska ..............................(7-0-0)11-3 Nebraska ..............................(8-0-0)11-10 Florida St. .....................(9-0-0) (2)11-17 Florida St. .........................(10-0-0)11-24 Michigan ................... (11-0-0) (2)12-1 Michigan ...........................(11-0-0)12-8 Michigan ...........................(11-0-0)1-3 Nebraska .................(13-0-0) (2)
19989-7 Ohio St. ................................(1-0-0)9-14 Ohio St. ................................(2-0-0)9-21 Ohio St. ................................(3-0-0)9-28 Ohio St. ................................(3-0-0)10-5 Ohio St. ................................(4-0-0)10-12 Ohio St. ................................(5-0-0)10-19 Ohio St. ................................(6-0-0)10-26 Ohio St. ................................(7-0-0)11-2 Ohio St. ................................(8-0-0)11-9 Tennessee (8-0-0) (3)
& Kansas St. (9-0-0) (2)11-16 Kansas St. .........................(10-0-0)11-23 Kansas St. .........................(11-0-0)11-30 Kansas St. .........................(11-0-0)12-7 Tennessee .................. (12-0-0) (2)1-5 Tennessee ......................(13-0-0)
19998-30 Florida St. ............................(1-0-0)9-6 Florida St. ............................(1-0-0)9-13 Florida St. ............................(2-0-0)9-20 Florida St. ............................(3-0-0)9-27 Florida St. ............................(4-0-0)10-4 Florida St. ............................(5-0-0)10-11 Florida St. ............................(6-0-0)10-18 Florida St. ............................(7-0-0)10-25 Florida St. ............................(8-0-0)11-1 Florida St. ............................(9-0-0)11-8 Florida St. ............................(9-0-0)11-15 Florida St. .........................(10-0-0)11-22 Florida St. .........................(11-0-0)11-29 Florida St. .........................(11-0-0)12-6 Florida St. .........................(11-0-0)1-5 Florida St. ......................(12-0-0)
20008-28 Nebraska ..............................(0-0-0)9-4 Nebraska ..............................(1-0-0)9-11 Nebraska ..............................(2-0-0)9-18 Nebraska ..............................(2-0-0)9-25 Nebraska ..............................(3-0-0)10-2 Nebraska ..............................(4-0-0)10-9 Nebraska ..............................(5-0-0)10-16 Nebraska ..............................(6-0-0)10-23 Nebraska ..............................(7-0-0)10-30 Oklahoma .....................(7-0-0) (3)11-6 Oklahoma ............................(8-0-0)11-13 Oklahoma ............................(9-0-0)11-20 Oklahoma .........................(10-0-0)11-27 Oklahoma .........................(11-0-0)12-4 Oklahoma .........................(12-0-0)1-5 Oklahoma ......................(13-0-0)
20018-27 Florida ...................................(0-0-0)9-2 Florida ...................................(1-0-0)9-9 Miami (FL). ....................(2-0-0) (2)9-23 Miami (FL) ............................(2-0-0)9-30 Miami (FL) ............................(3-0-0)10-7 Miami (FL) ............................(4-0-0)10-14 Miami (FL) ............................(5-0-0)10-21 Miami (FL) ............................(6-0-0)10-28 Miami (FL) ............................(7-0-0)11-4 Miami (FL) ............................(7-0-0)
11-11 Nebraska .......................(8-0-0) (2)11-18 Miami (FL) .....................(9-0-0) (2)11-24 Miami (FL) .........................(10-0-0)12-2 Miami (FL) .........................(11-0-0)12-8 Miami (FL) .........................(11-0-0)1-4 Miami (FL) ......................(12-0-0)
20028-26 Miami (FL) ............................(0-0-0)9-2 Miami (FL) ............................(1-0-0)9-9 Miami (FL) ............................(2-0-0)9-16 Miami (FL) ............................(3-0-0)9-23 Miami (FL) ............................(4-0-0)9-30 Miami (FL) ............................(4-0-0)10-7 Miami (FL) ............................(5-0-0)10-14 Miami (FL) ............................(6-0-0)10-21 Miami (FL) ............................(6-0-0)10-28 Miami (FL) ............................(7-0-0)11-4 Oklahoma .....................(8-0-0) (2)11-11 Miami (FL) .....................(9-0-0) (2)11-18 Miami (FL) ............................(9-0-0)11-25 Miami (FL) .........................(10-0-0)12-2 Miami (FL) .........................(11-0-0)12-9 Miami (FL) .........................(12-0-0)1-4 Ohio St. ...................(14-0-0) (2)
20038-25 Oklahoma .......................... (0-0-0)9-1 Oklahoma .......................... (1-0-0)9-8 Oklahoma .......................... (2-0-0)9-15 Oklahoma .......................... (3-0-0)9-22 Oklahoma .......................... (4-0-0)9-29 Oklahoma .......................... (4-0-0)10-6 Oklahoma .......................... (5-0-0)10-13 Oklahoma .......................... (6-0-0)10-20 Oklahoma .......................... (7-0-0)10-27 Oklahoma .......................... (8-0-0)11-3 Oklahoma .......................... (9-0-0)11-10 Oklahoma ........................ (10-0-0)11-17 Oklahoma ........................ (11-0-0)11-24 Oklahoma ........................ (12-0-0)12-1 Oklahoma ........................ (12-0-0)12-8 Southern California ... (11-1-0) (2)1-5 LSU ............................. (13-1-0) (2)
20048-30 Southern California .........(0-0-0)9-6 Southern California .........(1-0-0)9-13 Southern California .........(2-0-0)9-20 Southern California .........(3-0-0)9-27 Southern California .........(4-0-0)10-4 Southern California .........(4-0-0)10-11 Southern California .........(5-0-0)10-18 Southern California .........(6-0-0)10-25 Southern California .........(7-0-0)11-1 Southern California .........(8-0-0)11-8 Southern California .........(9-0-0)11-15 Southern California .........(9-0-0)11-22 Southern California ......(10-0-0)11-29 Southern California ......(11-0-0)12-6 Southern California ......(12-0-0)1-5 Southern California ..(13-0-0)
2005Pre. Southern California .........(0-0-0)9-4 Southern California .........(1-0-0)9-11 Southern California .........(1-0-0)9-18 Southern California .........(2-0-0)9-25 Southern California .........(3-0-0)10-2 Southern California .........(4-0-0)10-9 Southern California .........(5-0-0)10-16 Southern California .........(6-0-0)10-23 Southern California .........(7-0-0)10-30 Southern California .........(8-0-0)11-6 Southern California .........(9-0-0)11-13 Southern California ......(10-0-0)11-20 Southern California ......(11-0-0)11-27 Southern California ......(11-0-0)12-4 Southern California ......(12-0-0)1-5 Texas ..........................(13-0-0) (2)
2006Pre. Ohio St. .................................(0-0-0)9-3 Ohio St. .................................(1-0-0)9-10 Ohio St. .................................(2-0-0)
9-17 Ohio St. .................................(3-0-0)9-24 Ohio St. .................................(4-0-0)10-1 Ohio St. .................................(5-0-0)10-8 Ohio St. .................................(6-0-0)10-15 Ohio St. .................................(7-0-0)10-22 Ohio St. .................................(8-0-0)10-29 Ohio St. .................................(9-0-0)11-5 Ohio St. ..............................(10-0-0)11-12 Ohio St. ..............................(11-0-0)11-19 Ohio St. ..............................(12-0-0)11-26 Ohio St. ..............................(12-0-0)12-3 Ohio St. ..............................(12-0-0)1-9 Florida .......................(13-1-0) (2)
2007Pre. Southern California .........(0-0-0)9-2 Southern California .........(1-0-0)9-9 Southern California .........(1-0-0)9-16 Southern California .........(2-0-0)9-23 Southern California .........(3-0-0)9-30 Southern California .........(4-0-0)10-7 LSU ...................................(6-0-0) (2)10-14 Ohio St. ..........................(7-0-0) (3)10-21 Ohio St ..................................(8-0-0)10-28 Ohio St ..................................(9-0-0)11-4 Ohio St ...............................(10-0-0)11-11 LSU ...................................(9-1-0) (2)11-18 LSU .......................................(10-1-0)11-25 West Virginia ............. (10-1-0) (3)12-2 Ohio St. ....................... (11-1-0) (3)1-8 LSU ..............................(12-2-0) (2)
2008Pre. Georgia .................................(0-0-0)8-31 Southern California ..(1-0-0) (2)9-7 Southern California .........(1-0-0)9-14 Southern California .........(2-0-0)9-21 Southern California .........(2-0-0)9-28 Oklahoma .....................(4-0-0) (2)10-5 Oklahoma ............................(5-0-0)10-12 Texas ...............................(6-0-0) (5)10-19 Texas ......................................(7-0-0)10-26 Texas ......................................(8-0-0)11-2 Alabama ........................(9-0-0) (2)11-9 Alabama ............................(10-0-0)11-16 Alabama ............................(11-0-0) 11-23 Alabama ............................(11-0-0)11-30 Alabama ............................(12-0-0)12-8 Oklahoma .................. (12-1-0) (2)1-8 Florida .......................(13-1-0) (2)
2009Pre. Florida ...................................(0-0-0)9-6 Florida ...................................(1-0-0)9-13 Florida ...................................(2-0-0)9-20 Florida ...................................(3-0-0)9-27 Florida ...................................(4-0-0)10-4 Florida ...................................(4-0-0)10-11 Florida ...................................(5-0-0)10-18 Florida ...................................(6-0-0)10-25 Florida ...................................(7-0-0)11-1 Florida ...................................(8-0-0)11-8 Florida ...................................(9-0-0)11-15 Florida ................................(10-0-0) 11-22 Florida ................................(11-0-0)11-29 Florida ................................(12-0-0)12-6 Alabama ..................... (13-0-0) (3)1-8 Alabama ..........................(14-0-0)
2010Pre. Alabama ...............................(0-0-0)9-5 Alabama ...............................(1-0-0)9-12 Alabama ...............................(2-0-0)9-19 Alabama ...............................(3-0-0)9-26 Alabama ...............................(4-0-0)10-3 Alabama ...............................(5-0-0)10-10 Ohio St. ..........................(6-0-0) (2)10-17 Oregon ...........................(6-0-0) (2)10-24 Oregon ..................................(7-0-0)10-31 Oregon ..................................(8-0-0)11-7 Oregon ..................................(9-0-0)11-14 Oregon ...............................(10-0-0)11-21 Oregon ...............................(10-0-0)11-28 Oregon ...............................(11-0-0)12-5 Oregon ...............................(12-0-0)1-10 Auburn ......................(14-0-0) (2)
USA Today (Coaches) Weekly Poll LeadersA team’s record includes its last game before the weekly poll. A new weekly leader’s rank the previous week is indicated in parentheses after its record. Final poll leaders (annual champions) are in bold face.

98 2011 NCAA FOOTBALL RECORDS - 2010 USA TODAY WEEK-BY-WEEK POLLS
2010 USA Today Week-by-Week PollsTeam Pre S6 S13 S20 S27 O4 O11 O18 O25 N1 N8 N15 N22 N29 D6 J8Alabama ..................................... 1 1 1 1 1 1 8 7 6 5 12 12 11 19 18 11Ohio St. ....................................... 2 2 2 2 2 2 1 10 10 8 7 7 7 6 6 5Florida ......................................... 3 6 7 8 7 12 22 NR NR NR 24 NR NR NR NR NRTexas ............................................ 4 4 4 4 16 NR NR 22 NR NR NR NR NR NR NR NRBoise St. ...................................... 5 3 3 3 3 4 3 2 2 3 4 3 3 10 10 7Virginia Tech ............................. 6 13 NR NR NR NR NR 23 21 20 17 15 14 11 11 15TCU ............................................... 7 5 5 5 5 5 5 4 4 4 3 4 4 3 3 2Oklahoma .................................. 8 10 9 9 8 7 6 3 11 9 16 14 13 9 T-8 6Nebraska .................................... 9 7 8 7 6 6 4 13 12 10 8 9 15 13 16 19Iowa ............................................. 10 9 10 18 18 15 14 12 19 16 13 20 24 NR NR NROregon........................................ 11 8 6 6 4 3 2 1 1 1 1 1 1 1 1 3Wisconsin .................................. 12 11 11 10 9 19 16 11 9 7 5 5 5 4 4 T8Miami (FL) .................................. 13 12 17 19 17 14 NR 25 22 NR NR 21 NR NR NR NRPenn St. ....................................... 14 14 20 20 20 NR NR NR NR NR NR NR NR NR NR NRPittsburgh .................................. 15 NR NR NR NR NR NR NR NR NR NR NR NR NR NR NRLSU ............................................... 16 16 12 12 10 9 9 6 13 11 6 6 6 12 12 T8Georgia Tech ............................ 17 17 NR NR NR NR NR NR NR NR NR NR NR NR NR NRNorth Carolina ......................... 18 NR NR NR NR NR NR NR NR NR NR NR NR NR NR NRArkansas ..................................... 19 15 13 11 15 13 13 21 18 19 14 13 12 8 T-8 12Florida St. ................................... 20 18 NR NR NR 24 17 17 15 24 NR NR 21 20 23 16Georgia ....................................... 21 19 NR NR NR NR NR NR NR NR NR NR NR NR NR NROregon St. ................................. 22 NR NR NR NR NR NR NR NR NR NR NR NR NR NR NRAuburn ........................................ 23 T-20 15 14 11 8 7 5 3 2 2 2 2 2 2 1Utah ............................................. 24 T-20 14 13 12 10 10 9 7 6 15 24 22 21 19 23West Virginia............................. 25 22 21 21 NR NR 25 19 NR NR NR NR NR 24 21 NRArizona........................................ NR 23 18 16 14 11 20 18 16 13 19 23 20 NR NR NRBYU ............................................... NR 24 NR NR NR NR NR NR NR NR NR NR NR NR NR NRSouth Carolina ......................... NR 25 16 15 22 20 12 20 17 17 22 17 17 16 20 22Stanford ...................................... NR NR 19 17 13 18 15 14 14 12 9 8 8 5 5 4Michigan .................................... NR NR 22 22 19 17 24 NR 25 NR NR NR NR NR NR NRHouston .................................... NR NR 23 NR NR NR NR NR NR NR NR NR NR NR NR NRCalifornia .................................... NR NR 24 NR NR NR NR NR NR NR NR NR NR NR NR NRMissouri ...................................... NR NR 25 24 23 22 19 16 8 14 20 16 16 14 14 18Michigan St. .............................. NR NR NR 23 21 16 11 8 5 15 10 11 10 7 7 14Oklahoma St. ........................... NR NR NR 25 24 21 18 15 20 18 11 10 9 15 13 10Nevada........................................ NR NR NR NR 25 23 21 NR NR 23 21 18 19 17 15 13Northwestern .......................... NR NR NR NR NR 25 NR NR NR NR NR 25 NR NR NR NRAir Force ..................................... NR NR NR NR NR NR 23 NR NR NR NR NR NR NR NR NRMississippi St. ........................... NR NR NR NR NR NR NR 25 23 21 18 22 25 22 23 17Baylor .......................................... NR NR NR NR NR NR NR NR 24 22 NR NR NR NR NR NRNorth Carolina St. ................... NR NR NR NR NR NR NR NR NR 25 NR NR 23 NR NR 25UCF ............................................... NR NR NR NR NR NR NR NR NR NR 23 NR NR 25 24 20Texas A&M ................................. NR NR NR NR NR NR NR NR NR NR 25 19 18 18 17 21Northern Ill. ............................... NR NR NR NR NR NR NR NR NR NR NR NR NR 23 NR NRHawaii ......................................... NR NR NR NR NR NR NR NR NR NR NR NR NR NR 25 NRMaryland .................................... NR NR NR NR NR NR NR NR NR NR NR NR NR NR NR 25T-Tie for ranking.
USA Today Preseason No. 1 Teams(Since 1993)
Year Team+1993 Florida St.+1994 Florida1995 Florida St.1996 Nebraska1997 Florida1998 Ohio St.1999 Florida St.+2000 Nebraska2001 Florida2002 Miami (FL)2003 Oklahoma2004 Southern California+2005 Southern California2006 Ohio St.2007 Southern California2008 Georgia2009 Florida2010 Alabama+Indicates eventual national champion.

2011 NCAA FOOTBALL RECORDS - USA TODAY FINAL POLLS (COACHES) 99
FOO
TBA
LL B
OW
LSU
BD
IVIS
IONUSA Today Final Polls (Coaches)
Took over as coaches poll in 1991. (Cable News Network, 1982-96; ESPN 1997-2004)
1982 1. Penn St. 2. SMU 3. Nebraska 4. Georgia 5. UCLA 6. Arizona St. 7. Pittsburgh 8. Arkansas 9. Clemson 10. Washington 11. LSU 12. Florida St. 13. Ohio St. 14. Southern California 15. Oklahoma 16. Auburn 17. West Virginia 18. Maryland 19. North Carolina 20. Texas 21. Michigan 22. Alabama 23. Tulsa 24. Iowa 25. Florida
1983 1. Miami (FL) 2. Auburn 3. Nebraska 4. Georgia 5. Texas 6. BYU 7. Michigan 8. Ohio St. 9. Florida 10. Clemson 11. Illinois 12. SMU 13. Alabama 14. Air Force 15. West Virginia 16. Iowa 17. Tennessee 18. UCLA 19. Pittsburgh 20. Penn St. 21. Oklahoma 22. Boston College 23. Oklahoma St. 24. Maryland 25. East Carolina
1984 1. BYU 2. Washington 3. Florida 4. Nebraska 5. Oklahoma 6. Boston College 7. Oklahoma St. 8. SMU 9. Maryland 10. South Carolina 11. Southern California 12. UCLA 13. LSU 14. Ohio St. 15. Auburn 16. Miami (FL) 17. Florida St. 18. Virginia 19. Kentucky 20. Iowa 21. West Virginia 22. Army 23. Georgia 24. Air Force 25. Notre Dame
1985 1. Oklahoma 2. Penn St. 3. Michigan
4. Tennessee 5. Florida 6. Miami (FL) 7. Air Force 8. Texas A&M 9. UCLA 10. Iowa 11. Nebraska 12. Alabama 13. Ohio St. 14. Florida St. 15. Arkansas 16. BYU 17. Maryland 18. Georgia Tech 19. Baylor 20. Auburn 21. LSU 22. Army 23. Fresno St. 24. Georgia 25. Oklahoma St.
1986 1. Penn St. 2. Miami (FL) 3. Oklahoma 4. Nebraska 5. Arizona St. 6. Ohio St. 7. Auburn 8. Michigan 9. Alabama 10. LSU 11. Arizona 12. Texas A&M 13. UCLA 14. Baylor 15. Boston College 16. Iowa 17. Arkansas 18. Clemson 19. Washington 20. Virginia Tech 21. Florida St. 22. Stanford 23. Georgia 24. North Carolina St. 25. San Diego St.
1987 1. Miami (FL) 2. Florida St. 3. Oklahoma 4. Syracuse 5. Nebraska 6. LSU 7. Auburn 8. Michigan St. 9. Texas A&M 10. UCLA 11. Clemson 12. Oklahoma St. 13. Georgia 14. Tennessee 15. Iowa 16. Notre Dame 17. Southern California 18. South Carolina 19. Michigan 20. Texas 21. Pittsburgh 22. Indiana 23. Penn St. 24. Ohio St. 25. Alabama
1988 1. Notre Dame 2. Miami (FL) 3. Florida St. 4. UCLA 5. Michigan 6. West Virginia 7. Southern California 8. Nebraska
9. Auburn 10. Clemson 11. Oklahoma St. 12. Syracuse 13. Oklahoma 14. Arkansas 15. Washington St. 16. Georgia 17. Alabama 18. North Carolina St. 19. Houston 20. Indiana 21. Wyoming 22. LSU 23. Colorado 24. Southern Miss. 25. BYU
1989 1. Miami (FL) 2. Notre Dame 3. Florida St. 4. Colorado 5. Tennessee 6. Auburn 7. Southern California 8. Michigan 9. Alabama 10. Illinois 11. Nebraska 12. Clemson 13. Arkansas 14. Houston 15. Penn St. 16. Virginia 17. Michigan St. 18. Texas Tech 19. Pittsburgh 20. Texas A&M 21. West Virginia 22. BYU 23. Syracuse 24. Ohio St. 25. Washington
1990 1. Colorado 2. Georgia Tech 3. Miami (FL) 4. Florida St. 5. Washington 6. Notre Dame 7. Tennessee 8. Michigan 9. Clemson 10. Texas 11. Penn St. 12. Houston 13. Florida 14. Louisville 15. Michigan St. 16. Texas A&M 17. Oklahoma 18. Iowa 19. Auburn 20. BYU 21. Ole Miss 22. Southern California 23. Nebraska 24. Illinois 25. Virginia
1991 1. Washington 2. Miami (FL) 3. Penn St. 4. Florida St. 5. Alabama 6. Michigan 7. California 8. Florida 9. East Carolina 10. Iowa 11. Syracuse 12. Notre Dame 13. Texas A&M
14. Oklahoma 15. Tennessee 16. Nebraska 17. Clemson 18. UCLA 19. Georgia 20. Colorado 21. Tulsa 22. Stanford 23. BYU 24. Air Force 25. North Carolina St.
1992 1. Alabama 2. Florida St. 3. Miami (FL) 4. Notre Dame 5. Michigan 6. Texas A&M 7. Syracuse 8. Georgia 9. Stanford 10. Washington 11. Florida 12. Tennessee 13. Colorado 14. Nebraska 15. North Carolina St. 16. Ole Miss 17. Washington St. 18. North Carolina 19. Ohio St. 20. Hawaii 21. Boston College 22. Fresno St. 23. Kansas 24. Penn St. 25. Wake Forest
1993 1. Florida St. 2. Notre Dame 3. Nebraska 4. Florida 5. Wisconsin 6. West Virginia 7. Penn St. 8. Texas A&M 9. Arizona 10. Ohio St. 11. Tennessee 12. Boston College 13. Alabama 14. Oklahoma 15. Miami (FL) 16. Colorado 17. UCLA 18. Kansas St. 19. Michigan 20. Virginia Tech 21. North Carolina 22. Clemson 23. Louisville 24. California 25. Southern California
1994 1. Nebraska 2. Penn St. 3. Colorado 4. Alabama 5. Florida St. 6. Miami (FL) 7. Florida 8. Utah 9. Ohio St. 10. BYU 11. Oregon 12. Michigan 13. Virginia 14. Colorado St. 15. Southern California 16. Kansas St. 17. North Carolina St. 18. Tennessee
19. Washington St. 20. Arizona 21. North Carolina 22. Boston College 23. Texas 24. Virginia Tech 25. Mississippi St.
1995 1. Nebraska 2. Tennessee 3. Florida 4. Colorado 5. Florida St. 6. Kansas St. 7. Northwestern 8. Ohio St. 9. Virginia Tech 10. Kansas 11. Southern California 12. Penn St. 13. Notre Dame 14. Texas 15. Texas A&M 16. Syracuse 17. Virginia 18. Oregon 19. Michigan 20. Texas Tech 21. Auburn 22. Iowa 23. East Carolina 24. Toledo 25. LSU
1996 1. Florida (12-1) 2. Ohio St. (11-1) 3. Florida St. (11-1) 4. Arizona St. (11-1) 5. BYU (14-1) 6. Nebraska (11-2) 7. Penn St. (11-2) 8. Colorado (10-2) 9. Tennessee (10-2) 10. North Carolina (10-2) 11. Alabama (10-3) 12. Virginia Tech (10-2) 13. LSU (10-2) 14. Miami (FL) (9-3) 15. Washington (9-3) 16. Northwestern (9-3) 17. Kansas St. (9-3) 18. Iowa (9-3) 19. Syracuse (9-3) 20. Michigan (8-4) 21. Notre Dame (8-3) 22. Wyoming (10-2) 23. Texas (8-5) 24. Army (10-2) 25. Auburn (8-4)
1997 1. Nebraska (13-0) 2. Michigan (12-0) 3. Florida St. (11-1) 4. North Carolina (11-1) 5. UCLA (10-2) 6. Florida (10-2) 7. Kansas St. (11-1) 8. Tennessee (11-2) 9. Washington St. (10-2) 10. Georgia (10-2) 11. Auburn (10-3) 12. Ohio St. (10-3) 13. LSU (9-3) 14. Arizona St. (9-3) 15. Purdue (9-3) 16. Colorado St. (11-2) 17. Penn St. (9-3) 18. Washington (8-4) 19. Southern Miss. (9-3) 20. Syracuse (9-4) 21. Texas A&M (9-4) 22. Ole Miss (8-4) 23. Missouri (7-5)
24. Oklahoma St. (8-4) 25. Air Force (10-3)
1998 1. Tennessee (13-0) 2. Ohio St. (11-1) 3. Florida St. (11-2) 4. Arizona (12-1) 5. Wisconsin (11-1) 6. Florida (10-2) 7. Tulane (12-0) 8. UCLA (10-2) 9. Kansas St. (11-2) 10. Air Force (12-1) 11. Georgia Tech (10-2) 12. Michigan (10-3) 13. Texas A&M (11-3) 14. Georgia (9-3) 15. Penn St. (9-3) 16. Texas (9-3) 17. Arkansas (9-3) 18. Virginia (9-3) 19. Virginia Tech (9-3) 20. Nebraska (9-4) 21. Miami (FL) (9-3) 22. Notre Dame (9-3) 23. Purdue (9-4) 24. Syracuse (8-4) 25. Missouri (8-4)
1999 1. Florida St. (12-0) 2. Nebraska (12-1) 3. Virginia Tech (11-1) 4. Wisconsin (10-2) 5. Michigan (10-2) 6. Kansas St. (11-1) 7. Michigan St. (10-2) 8. Alabama (10-3) 9. Tennessee (9-3) 10. Marshall (13-0) 11. Penn St. (10-3) 12. Mississippi St. (10-2) 13. Southern Miss. (9-3) 14. Florida (9-4) 15. Miami (FL) (9-4) 16. Georgia (8-4) 17. Minnesota (8-4) 18. Oregon (9-3) 19. Arkansas (8-4) 20. Texas A&M (8-4) 21. Georgia Tech (8-4) 22. Ole Miss (8-4) 23. Texas (9-5) 24. Stanford (8-4) 25. Illinois (8-4)
2000 1. Oklahoma (13-0) 2. Miami (FL) (11-1) 3. Washington (11-1) 4. Florida St. (11-2) 5. Oregon St. (11-1) 6. Virginia Tech (11-1) 7. Nebraska (10-2) 8. Kansas St. (11-3) 9. Oregon (10-2) 10. Michigan (9-3) 11. Florida (10-3) 12. Texas (9-3) 13. Purdue (8-4) 14. Clemson (9-3) 15. Colorado St. (10-2) 16. Notre Dame (9-3) 17. Georgia (8-4) 18. TCU (10-2) 19. Georgia Tech (9-3) 20. Auburn (9-4) 21. South Carolina (8-4) 22. Mississippi St. (8-4) 23. Iowa St. (9-3) 24. Wisconsin (9-4) 25. Tennessee (8-4)

100 2011 NCAA FOOTBALL RECORDS - USA TODAY FINAL POLLS (COACHES)
2001 1. Miami (FL) (12-0) 2. Oregon (11-1) 3. Florida (10-2) 4. Tennessee (11-2) 5. Texas (11-2) 6. Oklahoma (11-2) 7. Nebraska (11-2) 8. LSU (10-3) 9. Colorado (10-3) 10. Maryland (10-2) 11. Washington St. (10-2) 12. Illinois (10-2) 13. South Carolina (9-3) 14. Syracuse (10-3) 15. Florida St. (8-4) 16. Louisville (11-2) 17. Stanford (9-3) 18. Virginia Tech (8-4) 19. Washington (8-4) 20. Michigan (8-4) 21. Marshall (11-2) 22. Toledo (10-2) 23. Boston College (8-4) 24. BYU (12-2) 25. Georgia (8-4)
2002 1. Ohio St. (14-0) 2. Miami (FL) (12-1) 3. Georgia (13-1) 4. Southern California
(11-2) 5. Oklahoma (12-2) 6. Kansas St. (11-2) 7. Texas (11-2) 8. Iowa (11-2) 9. Michigan (10-3) 10. Washington St. (10-3) 11. North Carolina St.
(11-3) 12. Boise St. (12-1) 13. Maryland (11-3) 14. Virginia Tech (10-4) 15. Penn St. (9-4) 16. Auburn (9-4) 17. Notre Dame (10-3)
18. Pittsburgh (9-4) 19. Marshall (11-2) 20. West Virginia (9-4) 21. Colorado (9-5) 22. TCU (10-2) 23. Florida St. (9-5) 24. Florida (8-5) 25. Virginia (9-5)
2003 1. LSU (13-1) 2. Southern California
(12-1) 3. Oklahoma (12-2) 4. Ohio St. (11-2) 5. Miami (FL) (11-2) 6. Georgia (11-3) 7. Michigan (10-3) 8. Iowa (10-3) 9. Washington St. (10-3) 10. Florida St. (10-3) 11. Texas (10-3) 12. Miami (OH) (13-1) 13. Kansas St. (11-4) 14. Ole Miss (10-3) 15. Boise St. (13-1) 16. Tennessee (10-3) 17. Minnesota (10-3) 18. Nebraska (10-3) 19. Purdue (9-4) 20. Maryland (10-3) 21. Utah (10-2) 22. Clemson (9-4) 23. Bowling Green (11-3) 24. TCU (11-2) 25. Florida (8-5)
2004 1. Southern California
(13-0) 2. Auburn (13-0) 3. Oklahoma (12-1) 4. Texas (11-1) 5. Utah (12-0) 6. Georgia (10-2) 7. Louisville (11-1) 8. Iowa (10-2)
9. California (10-2) 10. Virginia Tech (10-3) 11. Miami (FL) (9-3) 12. Michigan (9-3) 13. Boise St. (11-1) 14. Florida St. (9-3) 15. Tennessee (10-3) 16. LSU (9-3) 17. Texas Tech (8-4) 18. Wisconsin (9-3) 19. Ohio St. (8-4) 20. Arizona St. (9-3) 21. Boston College (9-3) 22. Fresno St. (9-3) 23. Virginia (8-4) 24. Navy (10-2) 25. Florida (7-5)
2005 1. Texas (13-0) 2. Southern California
(12-1) 3. Penn St. (11-1) 4. Ohio St. (10-2) 5. LSU (11-2) 6. West Virginia (11-1) 7. Virginia Tech (11-2) 8. Alabama (10-2) 9. TCU (11-1) 10. Georgia (10-3) 11. Notre Dame (9-3) 12. Oregon (10-2) 13. UCLA (10-2) 14. Auburn (9-3) 15. Wisconsin (10-3) 16. Florida (9-3) 17. Boston College (9-3) 18. Miami (FL) (9-3) 19. Texas Tech (9-3) 20. Louisville (9-3) 21. Clemson (8-4) 22. Oklahoma (8-5) 23. Florida St. (8-5) 24. Nebraska (8-4) 25. California (8-4)
2006 1. Florida (13-1) 2. Ohio St. (12-1) 3. LSU (11-2) 4. Southern California
(11-2) 5. Wisconsin (12-1) 6. Boise St. (13-0) 7. Louisville (12-1) 8. Auburn (11-2) 9. Michigan (11-2) 10. West Virginia (11-2) 11. Oklahoma (11-3) 12. Rutgers (11-2) 13. Texas (10-3) 14. California (10-3) 15. BYU (11-2) 16. Arkansas (10-4) 17. Wake Forest (11-3) 18. Virginia Tech (10-3) 19. Notre Dame (10-3) 20. Boston College (10-3) 21. TCU (11-2) 22. Oregon St. (10-4) 23. Tennessee (9-4) 24. Hawaii (11-3) 25. Penn St. (9-4)
2007 1. LSU (12-2) 2. Southern California
(11-2) 3. Georgia (11-2) 4. Ohio St. (11-2) 5. Missouri (12-2) 6. West Virginia (11-2) 7. Kansas (12-1) 8. Oklahoma (11-3) 9. Virginia Tech (11-3) 10. Texas (10-3) 11. Boston College (11-3) 12. Tennessee (10-4) 13. Arizona St. (10-3) 14. Auburn (9-4) BYU (11-2) 16. Florida (9-4) 17. Hawaii (12-1)
18. Illinois (9-4) 19. Michigan (9-4) 20. Cincinnati (10-3) 21. Wisconsin (9-4) 22. Clemson (9-4) 23. Texas Tech (9-4) 24. Oregon (9-4) 25. Penn St. (9-4)
2008 1. Florida (13-1) 2. Southern California
(12-1) 3. Texas (12-1) 4. Utah (13-0) 5. Oklahoma (12-2) 6. Alabama (12-2) 7. TCU (11-2) 8. Penn St. (11-2) 9. Oregon (10-3) 10. Georgia (10-3) 11. Ohio St. (10-3) 12. Texas Tech (11-2) 13. Boise St. (12-1) 14. Virginia Tech (10-4) 15. Ole Miss (9-4) 16. Missouri (10-4) 17. Cincinnati (11-3) 18. Oklahoma St. (9-4) 19. Oregon St. (9-4) 20. Iowa (9-4) 21. BYU (10-3) 22. Georgia Tech (9-4) 23. Florida St. (9-4) 24. Michigan St. (9-4) 25. California (9-4)
2009 1. Alabama (14-0) 2. Texas (13-1) 3. Florida (13-1) 4. Boise St. (14-0) 5. Ohio St. (11-2) 6. TCU (12-1) 7. Iowa (11-2) 8. Penn St. (11-2) 9. Cincinnati (12-1)
10. Virginia Tech (10-3) 11. Oregon (10-3) 12. BYU (11-2) 13. Georgia Tech (11-3) 14. Nebraska (10-4) 15. Pittsburgh (10-3) 16. Wisconsin (10-3) 17. LSU (9-4) 18. Utah (10-3) 19. Miami (FL) (9-4) 20. Southern California
(9-4) 21. Ole Miss (9-4) 22. West Virginia (9-4) 23. Texas Tech (9-4) 24. Central Mich. (12-2) 25. Oklahoma St. (9-4)
2010 1. Auburn (14-0) 2. TCU (13-0) 3. Oregon (12-1) 4. Stanford (12-1) 5. Ohio St. (12-1) 6. Oklahoma (12-2) 7. Boise St. (12-1) 8. LSU (11-2) . Wisconsin (11-2) 10. Oklahoma St. (11-2) 11. Alabama (10-3) 12. Arkansas (10-3) 13. Nevada (13-1) 14. Michigan St. (11-2) 15. Virginia Tech (11-3) 16. Florida St. (10-4) 17. Mississippi St. (9-4) 18. Missouri (10-3) 19. Nebraska (10-4) 20. UCF (11-3) 21. Texas A&M (9-4) 22. South Carolina (9-5) 23. Utah (10-3) 24. Maryland (9-4) 25. North Carolina St.
(9-4)
Bowl Coalition, Alliance andBowl Championship Series HistoryBOWL COALITION
The history of the College Football Bowl Co-alition began in 1992 and lasted for three years through the 1994 season. The Bowl Coalition featured four games -- the Orange, Sugar, Cotton and Fiesta Bowls -- with conference champions locked into the Orange (Big Eight), Sugar (South-eastern) and Cotton (Southwest) Bowls and the Fiesta Bowl pairing two at-large teams.
The Fiesta Bowl had the ability to select one Coalition-eligible team, that was not a conference champion, before the national selection date. The original Coalition also involved champions from the Big East and Atlantic Coast Conferences, as well as Notre Dame.
Selections were made on the basis of how the champions of the Big Eight, Southeastern and Southwest Conferences fi nished in the fi nal regular-season poll, which was a combination of the Associated Press and CNN/USA Today rank-ings. All selections were made by the Coalition as a group on the fi rst Sunday in December after the fi nal weekend of the regular season.
All teams had to have at least six wins against FBS opponents, and Notre Dame was guaranteed a spot with seven wins and could still qualify with six wins given mutual agreement between the bowls.
There were 56 FBS members that were mem-bers of the original Coalition, which also included original involvement with the Gator and John Hancock Bowls. The remainder of the bowls re-mained in place, many with predetermined con-ference tie-ins. A second layer of bowls eventu-ally was identifi ed and came to be known as the Tier Two bowls.
BOWL COALITION (1992-94)
1992 SEASONSUGAR BOWL
Alabama 34, Miami (FL) 13[Had first selection, but had automatic matchup between SEC champion Alabama, which was ranked No. 2 in final regular-season AP poll, and Big East champion Miami (Florida), which was ranked No. 1.]
COTTON BOWL Notre Dame 28, Texas A&M 3
(Had second selection based on SWC champion Texas A&M being ranked No. 4 at end of regular season and chose at-large selection Notre Dame.)
ORANGE BOWLFlorida St. 27, Nebraska 14
(Had third selection based on Big Eight champion Nebraska being ranked No. 11 at end of regular season and chose ACC champion Florida State.)
FIESTA BOWLSyracuse 26, Colorado 22
(Had fourth selection and chose at-large selection Syracuse and at-large selection Colorado.)
1993 SEASONORANGE BOWL
Florida St. 18, Nebraska 14(Had first selection, but had automatic matchup between Big Eight champion Nebraska, which was ranked No. 1 in final regular-season coalition poll, and ACC champion Florida State, which was ranked No. 2.)
COTTON BOWL Notre Dame 24, Texas A&M 21
(Had second selection based on SWC champion Texas A&M being ranked No. 7 at end of regular season and chose at-large selection Notre Dame.)
SUGAR BOWL Florida 41, West Virginia 7
(Had third selection based on SEC champion Florida being ranked No. 10 at end of regular season and chose Big East champion West Virginia.)
FIESTA BOWLArizona 29, Miami (FL) 0
[Had fourth selection and chose at-large selection Miami (Florida) and also picked at-large Arizona.]

2011 NCAA FOOTBALL RECORDS - BOWL COALITION, ALLIANCE AND BOWL CHAMPIONSHIP SERIES HISTORY 101
FOO
TBA
LL B
OW
LSU
BD
IVIS
ION1994 SEASON
ORANGE BOWLNebraska 24, Miami (FL) 17
[Had first selection based on Big Eight champion Nebraska being ranked No. 1 at end of regular season in coalition poll and chose Big East champion Miami (Florida).]
SUGAR BOWLFlorida St. 23, Florida 17
(Had second selection based on SEC champion Florida being ranked No. 5 and chose ACC champion Florida State.)
COTTON BOWLSouthern California 55, Texas Tech 14
(Had third selection based on SWC champion Texas Tech being unranked and chose at-large Southern California.)
FIESTA BOWLColorado 41, Notre Dame 24
(Had fourth selection and chose at-large Notre Dame and at-large Colorado.)
BOWL ALLIANCEThe Bowl Alliance lasted three seasons, 1995
through 1997, and involved three games -- the Fi-esta, Orange and Sugar Bowls. A predetermined rotation created a situation in which each year a diff erent bowl had the fi rst two choices, while a second bowl chose third and fi fth and the third bowl chose fourth and sixth.
Conferences that were a part of the Alliance were the Big 12, Atlantic Coast, Big East and Southeastern, leaving two at-large slots.
The most noteworthy change from the Co-alition to the Alliance was the elimination of the conference tie-ins, which had been in existence for years. The goal was to provide the best oppor-tunity to match the top two teams and provide the greatest fl exibility in creating the postseason matchups between Alliance partners.
In 1995, the fi rst season of the Alliance, there was only one at-large position since the merger of the Big Eight and Southwest Conferences into the Big 12 had not yet taken place, providing fi ve guaranteed conference champions that season.
Notre Dame was guaranteed the at-large slot in 1995 by fi nishing in the top 10 of either the As-sociated Press or CNN/USA Today poll.
BOWL ALLIANCE (1995-97)
1995 SEASONFIESTA BOWL
Nebraska 62, Florida 24(Had first and second selections and picked Big Eight champion Nebraska, which was ranked No. 1 in the regular-season AP poll, against SEC champion Florida, which was ranked No. 2. This pick was required through mandatory No. 1 vs. No. 2 matchup rules.)
ORANGE BOWL Florida St. 31, Notre Dame 26
(Had third and fifth selections and picked ACC champion Florida State against at-large Notre Dame.)
SUGAR BOWLVirginia Tech 28, Texas 10
(Had fourth and sixth selections and picked Big East champion Virginia Tech against SWC champion Texas.)
1996 SEASONSUGAR BOWL
Florida 52, Florida St. 20(Had first and second selections and picked SEC champion Florida and ACC champion Florida State.)
FIESTA BOWLPenn St. 38, Texas 15
(Had third and fifth selections and picked at-large Penn State and Big 12 champion Texas.)
ORANGE BOWLNebraska 41, Virginia Tech 21
(Had fourth and sixth selections and picked at-large selection Nebraska and Big East champion Virginia Tech.)
1997 SEASONORANGE BOWL
Nebraska 42, Tennessee 17(Had first and second selections and picked Big 12 champion Nebraska and SEC champion Tennessee.)
SUGAR BOWLFlorida St. 31, Ohio St. 14
(Had third and fifth selections and picked ACC champion Florida State and at-large Ohio State.)
FIESTA BOWL Kansas St. 35, Syracuse 18
(Had fourth and sixth selections and picked at-large Kansas State and Big East champion Syracuse.)
Bowl Championship SeriesThe Bowl Championship Series (BCS) was launched in 1998 to match the No. 1 and No. 2 teams in the BCS rankings in a bowl game to determine a na-
tional champion in the absence of NCAA-sponsored playoff s. The No.1 vs. No. 2 game rotated between the Fiesta, Orange, Rose and Sugar Bowls from 1998 through 2005. A BCS Championship Game was added in 2006 for the contest between the No.1 and No. 2 teams in the BCS rankings.1998—Top-ranked Tennessee beat Florida State, 23-16, in the Fiesta Bowl to cap the fi rst BCS year.1999—Florida State returned to the title game again in 1999, this time appearing in the Sugar Bowl as the No. 1 team. The Seminoles upended Virginia Tech, 46-29.2000—It was the Orange Bowl’s turn to host the fi nal game, and Florida State kept its streak of appearances alive. However, Oklahoma’s defense ruled the evening as the Sooners won, 13-2.2001—Miami (Florida) was the only unbeaten team in the FBS through the regular season and earned the top spot in the BCS rankings. Nebraska edged Colorado for the second spot and joined the Hurricanes in the Rose Bowl. Miami exploded for 34 unanswered points in the fi rst half on its way to a 37-14 triumph.2002—Miami (Florida) again topped the BCS regular-season standings with a 2.93 mark and Ohio State was second at 3.97. However, the Buckeyes captured the No. 1 vs. No. 2 victory in the Fiesta Bowl, 31-24 in two overtimes, to take the national title.2003—Oklahoma led the BCS rankings going in to the bowl games with a 5.11 mark, LSU was second at 5.99 and Southern California was third at 6.15. LSU captured the BCS title by defeating Oklahoma, 21-14, in the matchup of No. 1 against No. 2 in the Sugar Bowl. However, in the Associated Press (media) fi nal poll, Southern California was voted No. 1 while LSU was No. 1 in the USA Today/ESPN (coaches) fi nal poll.2004—Southern California led from the opening bell to the fi nal BCS game, in which the No. 1 Trojans demolished No. 2 Oklahoma, 55-19, in the Orange Bowl. The season was not without controversy, however, as many upset Auburn fans thought the Tigers should have been in the title game after posting a perfect 13-0 record.2005—For the fi rst time in BCS history, the undisputed top two teams in the country faced each other in the national championship game, as Southern California and Texas met in the Rose Bowl. The Longhorns rallied from a 38-26 defi cit with two touchdowns in the fi nal fi ve minutes of the fourth quarter, capped by Vince Young’s eight-yard scamper with 19 seconds left, for the 41-38 victory.2006—Preseason No. 1 Ohio State played like a national champion from week one to earn a spot in the BCS Championship Game against the Gators of Florida. The Buckeyes had already taken care of another No. 2 in Texas in September, and after the opening kickoff , a 93-yard return for a touchdown by Ted Ginn Jr., it looked like they would hold off another challenge. However, the Gators answered quickly and often as Florida grabbed a 34-14 lead at halftime, coasted to a 41-14 win and claimed the 2006 BCS Championship. 2007—It was a year of upsets as three diff erent schools, including one team two diff erent times, held the No. 1 spot throughout the year, before LSU claimed the 2007 BCS Championship. Ohio State was the week one favorite and ran with the top spot the fi rst four weeks before handing it off to the LSU Tigers. It only took two weeks before LSU moved over for Missouri. It only lasted one week as Ohio State jumped back into the driver’s seat. For the second straight year, the Buckeyes would lose in the national championship game as LSU claimed the trophy with a 38-24 win.2008—For the second time in three years, Florida claimed a BCS Championship despite entering the game ranked No. 2 in the fi nal BCS standings. The Gators were fourth in the BCS standings going into the fi nal week of the season, but Florida won a showdown against Alabama, which was the top-ranked team in the BCS standings. Florida’s win over the Crimson Tide moved Oklahoma into the BCS top spot and set up the BCS Championship Game between the Sooners and the Gators. Head coach Urban Meyer’s Florida squad controlled the potent Oklahoma off ense and clinched the BCS Championship with a 24-14 victory.

102 2011 NCAA FOOTBALL RECORDS - BOWL CHAMPIONSHIP SERIES
2009—Alabama scored 13 points in the fourth quarter to clinch a 37-21 victory over Texas in the BCS Championship Game and give the Southeastern Con-ference its fourth BCS title in as many years. The Crimson Tide was the top-ranked team in the BCS rankings followed by Texas after Alabama beat Florida, 32-13, in the SEC championship game. Florida held the BCS top spot 13 of the fi rst 14 weeks of the rankings until the loss to Alabama in the SEC title game. 2010—Auburn's Wes Byrum kicked a 19-yard fi eld goal as time expired to give Auburn a 22-19 victory over Oregon in the BCS Championship Game and give the Southeastern Conference its fi fth straight BCS title. Auburn held the top spot in the BCS rankings, followed by Oregon. TCU made it three undefeated teams going into the bowl season and the Horned Frogs earned a spot in the Rose Bowl.
BCS CHAMPIONS1998—Tennessee1999—Florida St.2000—Oklahoma2001—Miami (FL)2002—Ohio St.2003—LSU2004—Southern California2005—Texas2006—Florida2007—LSU2008—Florida2009—Alabama2010—Auburn
NOTE: The NCAA has not enacted, adopted or otherwise approved of the process described below. The NCAA has no role in the selection of the institutions that participate in postseason bowl games and does not sponsor an Football Bowl Subdivision championship.
2010 FINAL REGULAR-SEASON BOWL CHAMPIONSHIP SERIES RANKINGS Harris Interactive USA Today Computer BCS Pct. Pct. Pct. Avg. 1. Auburn ...................................... .9856 .9742 1.000 .9866 2. Oregon ...................................... .9730 .9831 .960 .9720 3. TCU ............................................. .9168 .9139 .900 .9102 4. Stanford .................................... .8495 .8400 .820 .8365 5. Wisconsin ................................. .8572 .8651 .690 .8041 6. Ohio St. ..................................... .8046 .8136 .680 .7660 7. Oklahoma ................................ .6758 .6834 .830 .7297 8. Arkansas ................................... .6989 .6834 .800 .7274 9. Michigan St. ............................ .7382 .7485 .590 .7485 10. Boise St. .................................... .6316 .6197 .590 .6137 11. LSU .............................................. .5702 .5600 .710 .6134 12. Missouri .................................... .4800 .4827 .620 .5276 13. Virginia Tech ........................... .5695 .6102 .330 .5032 14. Oklahoma St. .......................... .4323 .4868 .550 .4897 15. Nevada ...................................... .4568 .4339 .410 .4336 16. Alabama ................................... .4053 .3532 .540 .4328 17. Texas A&M ............................... .3779 .3675 .500 .4151 18. Nebraska .................................. .3986 .4115 .380 .3967 19. Utah ............................................ .2404 .2542 .270 .2549 20. South Carolina ....................... .2214 .2339 .270 .2418 21. Mississippi St. ......................... .1754 .1729 .200 .1828 22. West Virginia ........................... .1821 .1769 .040 .1330 23. Florida St. ................................. .0961 .1058 .140 .1140 24. Hawaii ........................................ .0670 .0664 .100 .0778 25. UCF ............................................. .0667 .0969 .000 .0545
EXPLANATIONTo derive a team’s poll percentages in the Harris Interactive and USA Today polls, each team’s point total is divided by a maximum 2,850 possible points in the Harris
Interactive poll and 1,575 possible points in the USA Today poll.Teams are assigned an inverse point total (25 for No. 1, 24 for No. 2, etc.) for each of their respective computer poll rankings to determine the overall computer compo-
nent. The highest and lowest ranking for each team is dropped, and the sum total of the remaining four rankings is divided by 100 (the maximum possible points).This figure produces a Computer Rankings Percentage. The six computer ranking providers are Anderson and Hester, Richard Billingsley, Colley Matrix, Kenneth
Massey, Jeff Sagarin, and Peter Wolfe. Each computer ranking accounts for schedule strength within its formula.The BCS Average is calculated by averaging the percent totals of the Harris Interactive and USA Today polls, and the computer rankings. The highest BCS Average
receives the No. 1 ranking; the second highest receives No. 2, and so forth.BCS RESULTS FOR 2010-11:BCS Championship (Glendale, Arizona)—Auburn 22, Oregon 19Fiesta Bowl—Oklahoma 48, Connecticut 20Orange Bowl—Stanford 40, Virginia Tech 12Rose Bowl—TCU 21, Wisconsin 19Sugar Bowl—Ohio St. 31, Arkansas 26
2009 FINAL REGULAR-SEASON BOWL CHAMPIONSHIP SERIES RANKINGS Harris Interactive USA Today Computer BCS Pct. Pct. Pct. Avg. 1. Alabama ................................... .9968 .9966 1.000 .9978 2. Texas .......................................... .9547 .9553 .920 .9433 3. Cincinnati ................................. .8656 .8678 .930 .8878 4. TCU ............................................. .9049 .9058 .840 .8836 5. Florida ....................................... .8404 .8407 .910 .8637 6. Boise St. .................................... .8274 .8244 .780 .8106 7. Oregon ...................................... .7474 .7431 .780 .7568

2011 NCAA FOOTBALL RECORDS - BOWL CHAMPIONSHIP SERIES 103
FOO
TBA
LL B
OW
LSU
BD
IVIS
ION
8. Ohio St. ..................................... .7302 .7302 .510 .6568 9. Georgia Tech........................... .6270 .6244 .690 .6471 10. Iowa ............................................ .6218 .6224 .610 .6180 11. Virginia Tech ........................... .5505 .5620 .590 .5675 12. LSU .............................................. .4856 .4868 .640 .5375 13. Penn St. ..................................... .6316 .6441 .320 .5319 14. BYU ............................................. .4733 .4759 .410 .4531 15. Miami (FL) ................................ .4116 .4142 .500 .4419 16. West Virginia ........................... .2561 .2908 .460 .3357 17. Pittsburgh ................................ .3491 .3431 .250 .3141 18. Oregon St................................. .2533 .2495 .360 .2876 19. Oklahoma St. .......................... .2944 .2739 .220 .2628 20. Arizona ...................................... .1337 .1607 .380 .2248 21. Stanford .................................... .2193 .1715 .150 .1803 22. Nebraska .................................. .2214 .2651 .010 .1655 23. Utah ............................................ .1793 .1241 .070 .1245 24. Southern California ............. .0435 .0285 .290 .1207 25. Wisconsin ................................. .1435 .1675 .050 .1203
EXPLANATIONTo derive a team’s poll percentages in the Harris Interactive and USA Today polls, each team’s point total is divided by a maximum 2,850 possible points in the Harris
Interactive poll and 1,575 possible points in the USA Today poll.Teams are assigned an inverse point total (25 for No. 1, 24 for No. 2, etc.) for each of their respective computer poll rankings to determine the overall computer compo-
nent. The highest and lowest ranking for each team is dropped, and the sum total of the remaining four rankings is divided by 100 (the maximum possible points).This figure produces a Computer Rankings Percentage. The six computer ranking providers are Anderson and Hester, Richard Billingsley, Colley Matrix, Kenneth
Massey, Jeff Sagarin, and Peter Wolfe. Each computer ranking accounts for schedule strength within its formula.The BCS Average is calculated by averaging the percent totals of the Harris Interactive and USA Today polls, and the computer rankings. The highest BCS Average
receives the No. 1 ranking; the second highest receives No. 2, and so forth.BCS RESULTS FOR 2009-10:BCS Championship (Pasadena, California)—Alabama 37, Texas 21Fiesta Bowl—Boise St. 17, TCU 10Orange Bowl—Iowa 24, Georgia Tech 14Rose Bowl—Ohio St. 26, Oregon 17Sugar Bowl—Florida 51, Cincinnati 24
2008 FINAL REGULAR-SEASON BOWL CHAMPIONSHIP SERIES RANKINGS Harris Interactive USA Today Computer BCS Pct. Pct. Pct. Avg. 1. Oklahoma ................................ .9554 .9718 1.000 .9757 2. Florida ....................................... .9827 .9711 .890 .9479 3. Texas .......................................... .9260 .9233 .940 .9298 4. Alabama ................................... .8644 .8584 .810 .8443 5. Southern California ............. .8542 .8584 .750 .8208 6. Utah ............................................ .7501 .7436 .860 .7846 7. Texas Tech ................................ .7398 .7423 .870 .7840 8. Penn St. ..................................... .7738 .7823 .660 .7387 9. Boise St. .................................... .6860 .6780 .730 .6980 10. Ohio St. ..................................... .6577 .6584 .590 .6354 11. TCU ............................................. .5593 .5751 .620 .5848 12. Cincinnati ................................. .5409 .5443 .530 .5384 13. Oklahoma St. .......................... .4963 .4734 .490 .4866 14. Georgia Tech........................... .4322 .4525 .470 .4516 15. Georgia ..................................... .3604 .3521 .420 .3775 16. BYU ............................................. .3791 .3548 .340 .3580 17. Oregon ...................................... .4287 .4898 .100 .3395 18. Michigan St. ............................ .2942 .3056 .260 .2866 19. Virginia Tech ........................... .1809 .2210 .330 .2440 20. Pittsburgh ................................ .2258 .2072 .280 .2377 21. Missouri .................................... .1352 .1430 .210 .1627 22. Ball St. ........................................ .1436 .2156 .080 .1464 23. Northwestern ......................... .1940 .2190 .000 .1377 24. Boston College ...................... .0609 .0630 .190 .1046 25. Ole Miss .................................... .1462 .1049 .000 .0837
EXPLANATIONTo derive a team’s poll percentages in the Harris Interactive and USA Today polls, each team’s point total is divided by a maximum 2,825 possible points in the Harris
Interactive poll and 1,525 possible points in the USA Today poll.Teams are assigned an inverse point total (25 for No. 1, 24 for No. 2, etc.) for each of their respective computer poll rankings to determine the overall computer compo-
nent. The highest and lowest ranking for each team is dropped, and the sum total of the remaining four rankings is divided by 100 (the maximum possible points).This figure produces a Computer Rankings Percentage. The six computer ranking providers are Anderson and Hester, Richard Billingsley, Colley Matrix, Kenneth
Massey, Jeff Sagarin, and Peter Wolfe. Each computer ranking accounts for schedule strength within its formula.The BCS Average is calculated by averaging the percent totals of the Harris Interactive and USA Today polls, and the computer rankings. The highest BCS Average
receives the No. 1 ranking; the second highest receives No. 2, and so forth.BCS RESULTS FOR 2008-09:BCS Championship (Miami)—Florida 24, Oklahoma 14Fiesta Bowl—Texas 24, Ohio St. 21Orange Bowl—Virginia Tech 20, Cincinnati 7Rose Bowl—Southern California 38, Penn St. 24Sugar Bowl—Utah 31, Alabama 17
Harris Interactive USA Today Computer BCS Pct. Pct. Pct. Avg.
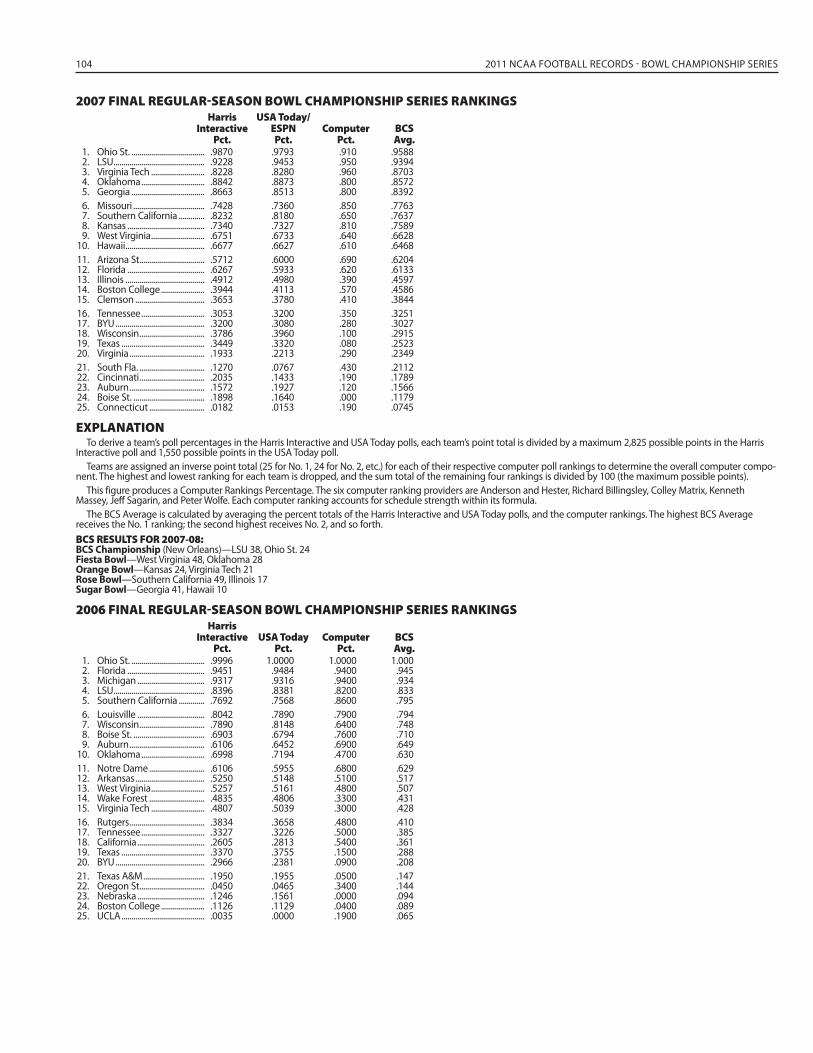
104 2011 NCAA FOOTBALL RECORDS - BOWL CHAMPIONSHIP SERIES
2007 FINAL REGULAR-SEASON BOWL CHAMPIONSHIP SERIES RANKINGS Harris USA Today/ Interactive ESPN Computer BCS Pct. Pct. Pct. Avg. 1. Ohio St. ..................................... .9870 .9793 .910 .9588 2. LSU .............................................. .9228 .9453 .950 .9394 3. Virginia Tech ........................... .8228 .8280 .960 .8703 4. Oklahoma ................................ .8842 .8873 .800 .8572 5. Georgia ..................................... .8663 .8513 .800 .8392 6. Missouri .................................... .7428 .7360 .850 .7763 7. Southern California ............. .8232 .8180 .650 .7637 8. Kansas ....................................... .7340 .7327 .810 .7589 9. West Virginia ........................... .6751 .6733 .640 .6628 10. Hawaii ........................................ .6677 .6627 .610 .6468 11. Arizona St................................. .5712 .6000 .690 .6204 12. Florida ....................................... .6267 .5933 .620 .6133 13. Illinois ........................................ .4912 .4980 .390 .4597 14. Boston College ...................... .3944 .4113 .570 .4586 15. Clemson ................................... .3653 .3780 .410 .3844 16. Tennessee ................................ .3053 .3200 .350 .3251 17. BYU ............................................. .3200 .3080 .280 .3027 18. Wisconsin ................................. .3786 .3960 .100 .2915 19. Texas .......................................... .3449 .3320 .080 .2523 20. Virginia ...................................... .1933 .2213 .290 .2349 21. South Fla. ................................. .1270 .0767 .430 .2112 22. Cincinnati ................................. .2035 .1433 .190 .1789 23. Auburn ...................................... .1572 .1927 .120 .1566 24. Boise St. .................................... .1898 .1640 .000 .1179 25. Connecticut ............................ .0182 .0153 .190 .0745
EXPLANATIONTo derive a team’s poll percentages in the Harris Interactive and USA Today polls, each team’s point total is divided by a maximum 2,825 possible points in the Harris
Interactive poll and 1,550 possible points in the USA Today poll.Teams are assigned an inverse point total (25 for No. 1, 24 for No. 2, etc.) for each of their respective computer poll rankings to determine the overall computer compo-
nent. The highest and lowest ranking for each team is dropped, and the sum total of the remaining four rankings is divided by 100 (the maximum possible points).This figure produces a Computer Rankings Percentage. The six computer ranking providers are Anderson and Hester, Richard Billingsley, Colley Matrix, Kenneth
Massey, Jeff Sagarin, and Peter Wolfe. Each computer ranking accounts for schedule strength within its formula.The BCS Average is calculated by averaging the percent totals of the Harris Interactive and USA Today polls, and the computer rankings. The highest BCS Average
receives the No. 1 ranking; the second highest receives No. 2, and so forth.BCS RESULTS FOR 2007-08:BCS Championship (New Orleans)—LSU 38, Ohio St. 24Fiesta Bowl—West Virginia 48, Oklahoma 28Orange Bowl—Kansas 24, Virginia Tech 21Rose Bowl—Southern California 49, Illinois 17Sugar Bowl—Georgia 41, Hawaii 10
2006 FINAL REGULAR-SEASON BOWL CHAMPIONSHIP SERIES RANKINGS Harris Interactive USA Today Computer BCS Pct. Pct. Pct. Avg. 1. Ohio St. ..................................... .9996 1.0000 1.0000 1.000 2. Florida ....................................... .9451 .9484 .9400 .945 3. Michigan .................................. .9317 .9316 .9400 .934 4. LSU .............................................. .8396 .8381 .8200 .833 5. Southern California ............. .7692 .7568 .8600 .795 6. Louisville .................................. .8042 .7890 .7900 .794 7. Wisconsin ................................. .7890 .8148 .6400 .748 8. Boise St. .................................... .6903 .6794 .7600 .710 9. Auburn ...................................... .6106 .6452 .6900 .649 10. Oklahoma ................................ .6998 .7194 .4700 .630 11. Notre Dame ............................ .6106 .5955 .6800 .629 12. Arkansas ................................... .5250 .5148 .5100 .517 13. West Virginia ........................... .5257 .5161 .4800 .507 14. Wake Forest ............................ .4835 .4806 .3300 .431 15. Virginia Tech ........................... .4807 .5039 .3000 .428 16. Rutgers ...................................... .3834 .3658 .4800 .410 17. Tennessee ................................ .3327 .3226 .5000 .385 18. California .................................. .2605 .2813 .5400 .361 19. Texas .......................................... .3370 .3755 .1500 .288 20. BYU ............................................. .2966 .2381 .0900 .208 21. Texas A&M ............................... .1950 .1955 .0500 .147 22. Oregon St................................. .0450 .0465 .3400 .144 23. Nebraska .................................. .1246 .1561 .0000 .094 24. Boston College ...................... .1126 .1129 .0400 .089 25. UCLA .......................................... .0035 .0000 .1900 .065

2011 NCAA FOOTBALL RECORDS - BOWL CHAMPIONSHIP SERIES 105
FOO
TBA
LL B
OW
LSU
BD
IVIS
IONEXPLANATION
To derive a team's poll percentages in the Harris Interactive and USA Today polls, each team's point total is divided by a maximum 2,825 possible points in the Harris Interactive poll and 1,550 possible points in the USA Today poll.
Teams are assigned an inverse point total (25 for No. 1, 24 for No. 2, etc.) for each of their respective computer poll rankings to determine the overall computer compo-nent. The highest and lowest ranking for each team is dropped, and the sum total of the remaining four rankings is divided by 100 (the maximum possible points).
This figure produces a Computer Rankings Percentage. The six computer ranking providers are Anderson and Hester, Richard Billingsley, Colley Matrix, Kenneth Massey, Jeff Sagarin, and Peter Wolfe. Each computer ranking accounts for schedule strength within its formula.
The BCS Average is calculated by averaging the percent totals of the Harris Interactive and USA Today polls, and the computer rankings. The highest BCS Average receives the No. 1 ranking; the second highest receives No. 2, and so forth.BCS RESULTS FOR 2006-07:BCS Championship (Glendale, Ariz.)—Florida 41, Ohio St. 14Fiesta Bowl—Boise St. 43, Oklahoma 42 (ot)Orange Bowl—Louisville 24, Wake Forest 13Rose Bowl—Southern California 32, Michigan 18Sugar Bowl—LSU 41, Notre Dame 14
2005 FINAL REGULAR-SEASON BOWL CHAMPIONSHIP SERIES RANKINGS Harris Interactive USA Today Computer BCS Pct. Pct. Pct. Avg. 1. Southern California ............. .9950 .9955 .970 .9868 2. Texas .......................................... .9650 .9645 .990 .9732 3. Penn St. .................................... .9175 .9187 .920 .9187 4. Ohio St. .................................... .8488 .8387 .880 .8559 5. Oregon ...................................... .7805 .7961 .820 .7989 6. Notre Dame ............................ .8124 .7865 .600 .7329 7. Georgia ..................................... .7267 .7077 .720 .7182 8. Miami (FL) ................................ .6874 .6935 .730 .7037 9. Auburn ...................................... .7381 .7361 .550 .6747 10. Virginia Tech ........................... .6085 .6161 .790 .6715 11. West Virginia ........................... .5922 .6187 .710 .6403 12. LSU .............................................. .6414 .6465 .600 .6293 13. Alabama ................................... .5136 .5077 .340 .4538 14. TCU ............................................. .4701 .4735 .390 .4445 15. Texas Tech ................................ .4060 .4103 .470 .4288
EXPLANATIONTo derive a team’s poll percentages in the Harris Interactive and USA Today polls, each team’s point total is divided by a maximum 2,825 possible points in the Harris
Interactive poll and 1,550 possible points in the USA Today poll.Teams are assigned an inverse point total (25 for No. 1, 24 for No. 2, etc.) for each of their respective computer poll rankings to determine the overall computer compo-
nent. The highest and lowest ranking for each team is dropped, and the sum total of the remaining four rankings is divided by 100 (the maximum possible points).This figure produces a Computer Rankings Percentage. The six computer ranking providers are Anderson and Hester, Richard Billingsley, Colley Matrix, Kenneth
Massey, Jeff Sagarin, and Peter Wolfe. Each computer ranking accounts for schedule strength within its formula.The BCS Average is calculated by averaging the percent totals of the Harris Interactive and USA Today polls, and the computer rankings. The highest BCS Average
receives the No. 1 ranking; the second highest receives No. 2, and so forth.BCS RESULTS FOR 2005-06:Rose Bowl—Texas 41, Southern California 38Orange Bowl—Penn St. 26, Florida St. 23 (3 ot)Fiesta Bowl—Ohio St. 34, Notre Dame 20Sugar Bowl—West Virginia 38, Georgia 35
2004 FINAL REGULAR-SEASON BOWL CHAMPIONSHIP SERIES RANKINGS USA Today/ AP ESPN Computer BCS Pct. Pct. Pct. Avg. 1. Southern California ............. .9840 .9770 .970 .9770 2. Oklahoma ................................ .9575 .9567 .990 .9681 3. Auburn ...................................... .9385 .9410 .920 .9331 4. Texas .......................................... .8228 .8400 .880 .8476 5. California .................................. .8609 .8433 .800 .8347 6. Utah ............................................ .8277 .7967 .830 .8181 7. Georgia ..................................... .6874 .7325 .670 .6966 8. Virginia Tech ........................... .6837 .6800 .650 .6712 9. Boise St. .................................... .5908 .6184 .760 .6564 10. Louisville .................................. .7280 .6990 .520 .6490 11. LSU .............................................. .5717 .6111 .650 .6109 12. Iowa ............................................ .5834 .5325 .550 .5553 13. Michigan .................................. .5643 .5731 .380 .5058 14. Miami (FL) ................................ .4775 .4839 .450 .4705 15. Tennessee ................................ .4006 .3666 .450 .4057
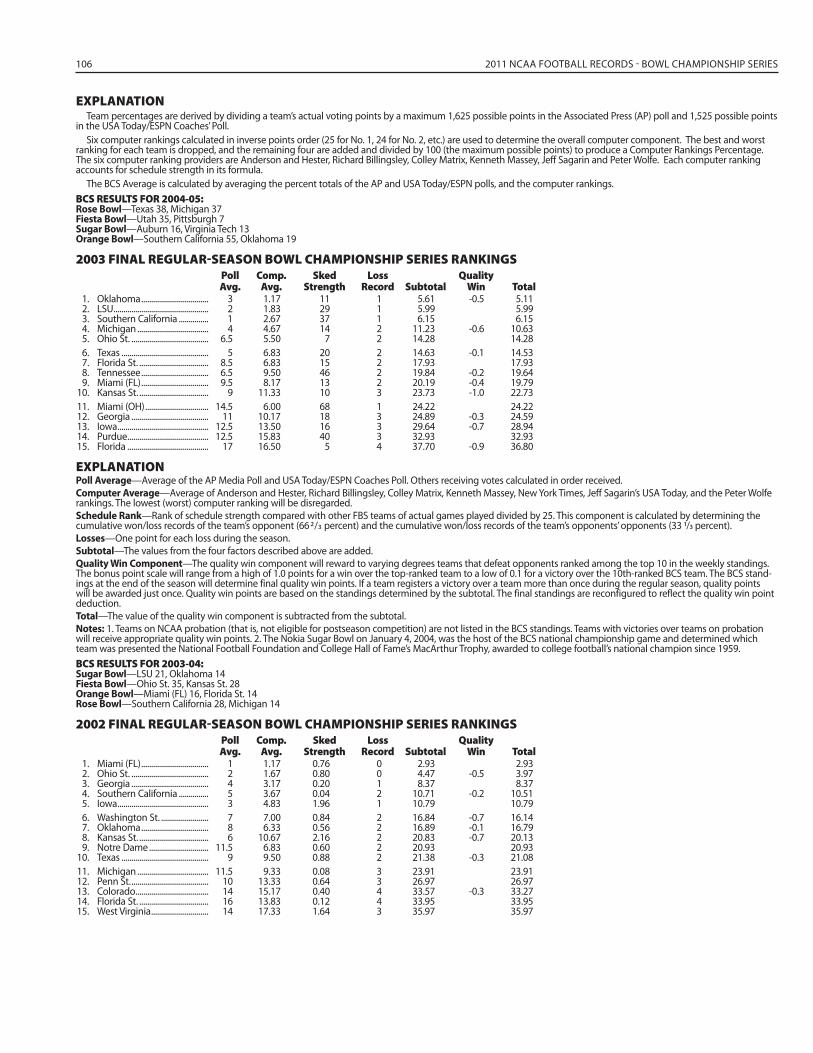
106 2011 NCAA FOOTBALL RECORDS - BOWL CHAMPIONSHIP SERIES
EXPLANATIONTeam percentages are derived by dividing a team’s actual voting points by a maximum 1,625 possible points in the Associated Press (AP) poll and 1,525 possible points
in the USA Today/ESPN Coaches’ Poll.Six computer rankings calculated in inverse points order (25 for No. 1, 24 for No. 2, etc.) are used to determine the overall computer component. The best and worst
ranking for each team is dropped, and the remaining four are added and divided by 100 (the maximum possible points) to produce a Computer Rankings Percentage. The six computer ranking providers are Anderson and Hester, Richard Billingsley, Colley Matrix, Kenneth Massey, Jeff Sagarin and Peter Wolfe. Each computer ranking accounts for schedule strength in its formula.
The BCS Average is calculated by averaging the percent totals of the AP and USA Today/ESPN polls, and the computer rankings.BCS RESULTS FOR 2004-05:Rose Bowl—Texas 38, Michigan 37Fiesta Bowl—Utah 35, Pittsburgh 7Sugar Bowl—Auburn 16, Virginia Tech 13Orange Bowl—Southern California 55, Oklahoma 19
2003 FINAL REGULAR-SEASON BOWL CHAMPIONSHIP SERIES RANKINGS Poll Comp. Sked Loss Quality Avg. Avg. Strength Record Subtotal Win Total 1. Oklahoma .................................. 3 1.17 11 1 5.61 -0.5 5.11 2. LSU ................................................ 2 1.83 29 1 5.99 5.99 3. Southern California ............... 1 2.67 37 1 6.15 6.15 4. Michigan .................................... 4 4.67 14 2 11.23 -0.6 10.63 5. Ohio St. ....................................... 6.5 5.50 7 2 14.28 14.28 6. Texas ............................................ 5 6.83 20 2 14.63 -0.1 14.53 7. Florida St. ................................... 8.5 6.83 15 2 17.93 17.93 8. Tennessee .................................. 6.5 9.50 46 2 19.84 -0.2 19.64 9. Miami (FL) .................................. 9.5 8.17 13 2 20.19 -0.4 19.79 10. Kansas St. ................................... 9 11.33 10 3 23.73 -1.0 22.73 11. Miami (OH) ................................ 14.5 6.00 68 1 24.22 24.22 12. Georgia ....................................... 11 10.17 18 3 24.89 -0.3 24.59 13. Iowa .............................................. 12.5 13.50 16 3 29.64 -0.7 28.94 14. Purdue ......................................... 12.5 15.83 40 3 32.93 32.93 15. Florida ......................................... 17 16.50 5 4 37.70 -0.9 36.80
EXPLANATIONPoll Average—Average of the AP Media Poll and USA Today/ESPN Coaches Poll. Others receiving votes calculated in order received. Computer Average—Average of Anderson and Hester, Richard Billingsley, Colley Matrix, Kenneth Massey, New York Times, Jeff Sagarin’s USA Today, and the Peter Wolfe rankings. The lowest (worst) computer ranking will be disregarded. Schedule Rank—Rank of schedule strength compared with other FBS teams of actual games played divided by 25. This component is calculated by determining the cumulative won/loss records of the team’s opponent (66 2/3 percent) and the cumulative won/loss records of the team’s opponents’ opponents (33 1/3 percent).Losses—One point for each loss during the season.Subtotal—The values from the four factors described above are added.Quality Win Component—The quality win component will reward to varying degrees teams that defeat opponents ranked among the top 10 in the weekly standings. The bonus point scale will range from a high of 1.0 points for a win over the top-ranked team to a low of 0.1 for a victory over the 10th-ranked BCS team. The BCS stand-ings at the end of the season will determine final quality win points. If a team registers a victory over a team more than once during the regular season, quality points will be awarded just once. Quality win points are based on the standings determined by the subtotal. The final standings are reconfigured to reflect the quality win point deduction.Total—The value of the quality win component is subtracted from the subtotal.Notes: 1. Teams on NCAA probation (that is, not eligible for postseason competition) are not listed in the BCS standings. Teams with victories over teams on probation will receive appropriate quality win points. 2. The Nokia Sugar Bowl on January 4, 2004, was the host of the BCS national championship game and determined which team was presented the National Football Foundation and College Hall of Fame’s MacArthur Trophy, awarded to college football’s national champion since 1959.BCS RESULTS FOR 2003-04:Sugar Bowl—LSU 21, Oklahoma 14Fiesta Bowl—Ohio St. 35, Kansas St. 28Orange Bowl—Miami (FL) 16, Florida St. 14Rose Bowl—Southern California 28, Michigan 14
2002 FINAL REGULAR-SEASON BOWL CHAMPIONSHIP SERIES RANKINGS Poll Comp. Sked Loss Quality Avg. Avg. Strength Record Subtotal Win Total 1. Miami (FL) .................................. 1 1.17 0.76 0 2.93 2.93 2. Ohio St. ....................................... 2 1.67 0.80 0 4.47 -0.5 3.97 3. Georgia ....................................... 4 3.17 0.20 1 8.37 8.37 4. Southern California ............... 5 3.67 0.04 2 10.71 -0.2 10.51 5. Iowa .............................................. 3 4.83 1.96 1 10.79 10.79 6. Washington St. ........................ 7 7.00 0.84 2 16.84 -0.7 16.14 7. Oklahoma .................................. 8 6.33 0.56 2 16.89 -0.1 16.79 8. Kansas St. ................................... 6 10.67 2.16 2 20.83 -0.7 20.13 9. Notre Dame .............................. 11.5 6.83 0.60 2 20.93 20.93 10. Texas ............................................ 9 9.50 0.88 2 21.38 -0.3 21.08 11. Michigan .................................... 11.5 9.33 0.08 3 23.91 23.91 12. Penn St. ....................................... 10 13.33 0.64 3 26.97 26.97 13. Colorado..................................... 14 15.17 0.40 4 33.57 -0.3 33.27 14. Florida St. ................................... 16 13.83 0.12 4 33.95 33.95 15. West Virginia ............................. 14 17.33 1.64 3 35.97 35.97

2011 NCAA FOOTBALL RECORDS - BOWL CHAMPIONSHIP SERIES 107
FOO
TBA
LL B
OW
LSU
BD
IVIS
IONEXPLANATION
Poll Average—Average of the AP Media Poll and USA Today/ESPN Coaches Poll. Others receiving votes calculated in order received. Computer Average—Average of Anderson and Hester, Richard Billingsley, Colley Matrix, Kenneth Massey, New York Times, Jeff Sagarin’s USA Today, and the Peter Wolfe rankings. The lowest (worst) computer ranking will be disregarded. Schedule Rank—Rank of schedule strength compared with other FBS teams of actual games played divided by 25. This component is calculated by determining the cumulative won/loss records of the team’s opponent (66 2/3 percent) and the cumulative won/loss records of the team’s opponents’ opponents (33 1/3 percent).Losses—One point for each loss during the season.Subtotal—The values from the four factors described above are added.Quality Win Component—The quality win component will reward to varying degrees teams that defeat opponents ranked among the top 10 in the weekly stand-ings. The bonus point scale will range from a high of 1.0 points for a win over the top-ranked team to a low of 0.1 for a victory over the 10th-ranked BCS team. The BCS Standings at the end of the season will determine final quality win points. If a team registers a victory over a team more than once during the regular season, quality points will be awarded just once. Quality win points are based on the standings determined by the subtotal. The final standings are reconfigured to reflect the quality win point deduction.Total—The value of the quality win component is subtracted from the subtotal.Notes: 1. Teams on NCAA probation (that is, not eligible for postseason competition) are not listed in the BCS standings. Teams with victories over teams on probation will receive appropriate quality win points. 2. The Tostitos Fiesta Bowl on January 3, 2003, was the host of the BCS national championship game and determined which team was presented the National Football Foundation and College Hall of Fame’s MacArthur Trophy, awarded to college football’s national champion since 1959.BCS RESULTS FOR 2002-03:Fiesta Bowl—Ohio St. 31, Miami (FL) 24 (2 ot)Orange Bowl—Southern California 38, Iowa 17Sugar Bowl—Georgia 26, Florida St. 13Rose Bowl—Oklahoma 34, Washington St. 14
2001 FINAL REGULAR-SEASON BOWL CHAMPIONSHIP SERIES RANKINGS USA Today/ Poll And. & AJC Scripps- Comp. Sched. Sched. QualityRk Team AP ESPN Avg. Hester Colley Bill. Massey Roth. Sagar. How. Wolfe Avg. Strength Rank Losses Subotal Win Total 1. Miami (FL) .......................1 1 1.0 1 1 1 1 1 1 1 1 1.00 18 0.72 0 2.72 -0.1 2.62 2. Nebraska .........................4 4 4.0 2 2 2 3 2 3 2 2 2.17 14 0.56 1 7.73 -0.5 7.23 3. Colorado ..........................3 3 3.0 4 5 4 4 5 5 5 3 4.50 2 0.08 2 9.58 -2.3 7.28 4. Oregon .............................2 2 2.0 3 3 3 2 8 7 6 7 4.83 31 1.24 1 9.07 -0.4 8.67 5. Florida ...............................5 5 5.0 9 8 7 8 4 2 3 5 5.83 19 0.76 2 13.59 -0.5 13.09 6. Tennessee .......................8 8 8.0 5 4 8 6 7 8 7 4 6.17 3 0.12 2 16.29 -1.6 14.69 7. Texas ..................................9 9 9.0 8 9 10 9 3 4 4 6 6.67 33 1.32 2 18.99 -1.2 17.79 8. Illinois ................................7 7 7.0 7 6 6 12 13 12 10 12 9.83 37 1.48 1 19.31 0.0 19.31 9. Stanford ........................11 11 11.0 6 7 11 5 9 9 8 8 7.83 22 0.88 2 21.71 -1.3 20.41 10. Maryland .........................6 6 6.0 14 10 5 10 11 11 14 11 11.17 78 3.12 1 21.29 0.0 21.29 11. Oklahoma ....................10 10 10.0 10 11 9 13 6 6 9 9 9.00 36 1.44 2 22.44 -0.9 21.54 12. Washington St. .........13 13 13.0 12 12 12 7 10 10 11 10 10.83 42 1.68 2 27.51 -0.6 26.91 13. LSU ..................................12 12 12.0 11 13 14 14 12 18 13 14 13.33 10 0.40 3 28.73 -1.0 27.73 14. South Carolina ...........14 14 14.0 20 19 19 17 17 23 23 17 19.17 40 1.60 3 37.77 0.0 37.77 15. Washington .................21 20 20.5 13 15 15 11 16 25 17 13 14.83 21 0.84 3 39.17 -1.0 38.17Key: AP (Associated Press poll); USA/ESPN (USA Today/ESPN coaches poll); Poll Avg. (Average of two polls); Bill (Richard Billingsley); Dunk (Dunkel Index); Mass (Kenneth Massey); Roth (David Rothman); Sagar. (Jeff Sagarin); Scripps-How. (Scripps-Howard); Comp. Avg. (Computer Services Average); Sched. Strength (Schedule Strength); Sched. Rank (Schedule Rank).
EXPLANATIONPoll Average—Average of the AP Media Poll and USA Today/ESPN Coaches Poll. Others receiving votes calculated in order received. Computer Average—Average of Anderson and Hester (And. & Hester), Atlanta Journal-Constitution Colley Matrix (AJC Colley), Richard Billingsley (Bill.), Kenneth Massey (Massey), David Rothman (Roth.), Jeff Sagarin’s USA Today (Sagar.), Matthews/Scripps-Howard (Scripps-How.), and the Peter Wolfe (Wolfe) rankings. The computer compo-nent will be determined by averaging six rankings. The highest and the lowest will be disregarded. Schedule Rank—Rank of schedule strength compared with other FBS teams of actual games played divided by 25. This component is calculated by determining the cumulative won/loss records of the team’s opponent (66 2/3 percent) and the cumulative won/loss records of the team’s opponents’ opponents (33 1/3 percent).Losses—One point for each loss during the season.Subtotal—The values from the four factors described above are added.Quality Win Component—The quality win component will reward to varying degrees teams that defeat opponents ranked among the top 15 in the weekly standings. The bonus point scale will range from a high of 1.5 points for a win over the top-ranked team to a low of 0.1 for a victory over the 15th-ranked BCS team. The BCS stand-ings at the end of the season will determine final quality win points. If a team registers a victory over a team more than once during the regular season, quality points will be awarded just once. Quality win points are based on the standings determined by the subtotal. The final standings are reconfigured to reflect the quality win point deduction.Total—The value of the quality win component is subtracted from the subtotal.BCS RESULTS FOR 2001-02:Rose Bowl—Miami (FL) 37, Nebraska 14Fiesta Bowl—Oregon 38, Colorado 16Orange Bowl—Florida 56, Maryland 23Sugar Bowl—LSU 47, Illinois 34
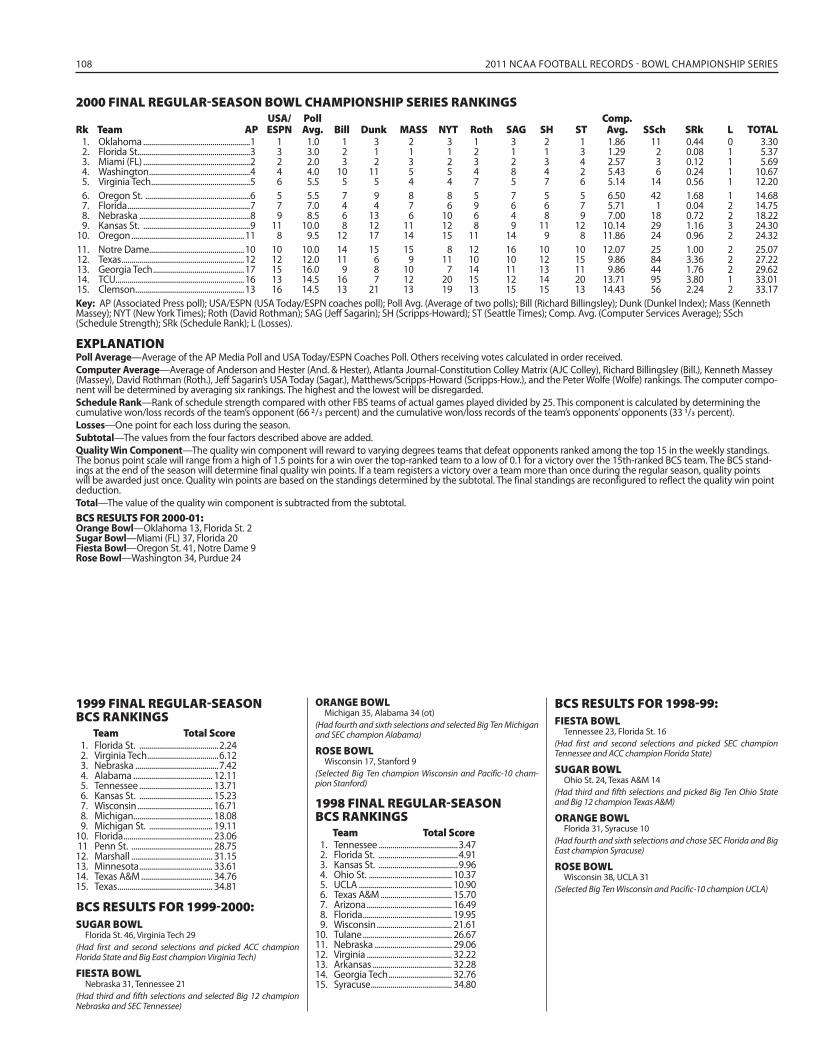
108 2011 NCAA FOOTBALL RECORDS - BOWL CHAMPIONSHIP SERIES
1999 FINAL REGULAR-SEASON BCS RANKINGS
Team Total Score 1. Florida St. ........................................2.24 2. Virginia Tech ....................................6.12 3. Nebraska ..........................................7.42 4. Alabama ........................................ 12.11 5. Tennessee ..................................... 13.71 6. Kansas St. ..................................... 15.23 7. Wisconsin ...................................... 16.71 8. Michigan........................................ 18.08 9. Michigan St. ................................ 19.11 10. Florida ............................................. 23.06 11 Penn St. ......................................... 28.75 12. Marshall ......................................... 31.15 13. Minnesota ..................................... 33.61 14. Texas A&M .................................... 34.76 15. Texas ................................................ 34.81
BCS RESULTS FOR 1999-2000:SUGAR BOWL
Florida St. 46, Virginia Tech 29(Had first and second selections and picked ACC champion Florida State and Big East champion Virginia Tech)
FIESTA BOWLNebraska 31, Tennessee 21
(Had third and fifth selections and selected Big 12 champion Nebraska and SEC Tennessee)
ORANGE BOWLMichigan 35, Alabama 34 (ot)
(Had fourth and sixth selections and selected Big Ten Michigan and SEC champion Alabama)
ROSE BOWLWisconsin 17, Stanford 9
(Selected Big Ten champion Wisconsin and Pacific-10 cham-pion Stanford)
1998 FINAL REGULAR-SEASONBCS RANKINGS
Team Total Score 1. Tennessee ........................................3.47 2. Florida St. ........................................4.91 3. Kansas St. ........................................9.96 4. Ohio St. .......................................... 10.37 5. UCLA ............................................... 10.90 6. Texas A&M .................................... 15.70 7. Arizona ........................................... 16.49 8. Florida ............................................. 19.95 9. Wisconsin ...................................... 21.61 10. Tulane ............................................. 26.67 11. Nebraska ....................................... 29.06 12. Virginia ........................................... 32.22 13. Arkansas ........................................ 32.28 14. Georgia Tech ................................ 32.76 15. Syracuse ......................................... 34.80
BCS RESULTS FOR 1998-99:FIESTA BOWL
Tennessee 23, Florida St. 16(Had first and second selections and picked SEC champion Tennessee and ACC champion Florida State)
SUGAR BOWLOhio St. 24, Texas A&M 14
(Had third and fifth selections and picked Big Ten Ohio State and Big 12 champion Texas A&M)
ORANGE BOWLFlorida 31, Syracuse 10
(Had fourth and sixth selections and chose SEC Florida and Big East champion Syracuse)
ROSE BOWLWisconsin 38, UCLA 31
(Selected Big Ten Wisconsin and Pacific-10 champion UCLA)
2000 FINAL REGULAR-SEASON BOWL CHAMPIONSHIP SERIES RANKINGS USA/ Poll Comp.Rk Team AP ESPN Avg. Bill Dunk MASS NYT Roth SAG SH ST Avg. SSch SRk L TOTAL 1. Oklahoma ......................................................1 1 1.0 1 3 2 3 1 3 2 1 1.86 11 0.44 0 3.30 2. Florida St.........................................................3 3 3.0 2 1 1 1 2 1 1 3 1.29 2 0.08 1 5.37 3. Miami (FL) ......................................................2 2 2.0 3 2 3 2 3 2 3 4 2.57 3 0.12 1 5.69 4. Washington ...................................................4 4 4.0 10 11 5 5 4 8 4 2 5.43 6 0.24 1 10.67 5. Virginia Tech ..................................................5 6 5.5 5 5 4 4 7 5 7 6 5.14 14 0.56 1 12.20 6. Oregon St. .....................................................6 5 5.5 7 9 8 8 5 7 5 5 6.50 42 1.68 1 14.68 7. Florida ..............................................................7 7 7.0 4 4 7 6 9 6 6 7 5.71 1 0.04 2 14.75 8. Nebraska ........................................................8 9 8.5 6 13 6 10 6 4 8 9 7.00 18 0.72 2 18.22 9. Kansas St. ......................................................9 11 10.0 8 12 11 12 8 9 11 12 10.14 29 1.16 3 24.30 10. Oregon .........................................................11 8 9.5 12 17 14 15 11 14 9 8 11.86 24 0.96 2 24.32 11. Notre Dame................................................10 10 10.0 14 15 15 8 12 16 10 10 12.07 25 1.00 2 25.07 12. Texas ..............................................................12 12 12.0 11 6 9 11 10 10 12 15 9.86 84 3.36 2 27.22 13. Georgia Tech ..............................................17 15 16.0 9 8 10 7 14 11 13 11 9.86 44 1.76 2 29.62 14. TCU.................................................................16 13 14.5 16 7 12 20 15 12 14 20 13.71 95 3.80 1 33.01 15. Clemson .......................................................13 16 14.5 13 21 13 19 13 15 15 13 14.43 56 2.24 2 33.17Key: AP (Associated Press poll); USA/ESPN (USA Today/ESPN coaches poll); Poll Avg. (Average of two polls); Bill (Richard Billingsley); Dunk (Dunkel Index); Mass (Kenneth Massey); NYT (New York Times); Roth (David Rothman); SAG (Jeff Sagarin); SH (Scripps-Howard); ST (Seattle Times); Comp. Avg. (Computer Services Average); SSch (Schedule Strength); SRk (Schedule Rank); L (Losses).
EXPLANATIONPoll Average—Average of the AP Media Poll and USA Today/ESPN Coaches Poll. Others receiving votes calculated in order received. Computer Average—Average of Anderson and Hester (And. & Hester), Atlanta Journal-Constitution Colley Matrix (AJC Colley), Richard Billingsley (Bill.), Kenneth Massey (Massey), David Rothman (Roth.), Jeff Sagarin’s USA Today (Sagar.), Matthews/Scripps-Howard (Scripps-How.), and the Peter Wolfe (Wolfe) rankings. The computer compo-nent will be determined by averaging six rankings. The highest and the lowest will be disregarded. Schedule Rank—Rank of schedule strength compared with other FBS teams of actual games played divided by 25. This component is calculated by determining the cumulative won/loss records of the team’s opponent (66 2/3 percent) and the cumulative won/loss records of the team’s opponents’ opponents (33 1/3 percent).Losses—One point for each loss during the season.Subtotal—The values from the four factors described above are added.Quality Win Component—The quality win component will reward to varying degrees teams that defeat opponents ranked among the top 15 in the weekly standings. The bonus point scale will range from a high of 1.5 points for a win over the top-ranked team to a low of 0.1 for a victory over the 15th-ranked BCS team. The BCS stand-ings at the end of the season will determine final quality win points. If a team registers a victory over a team more than once during the regular season, quality points will be awarded just once. Quality win points are based on the standings determined by the subtotal. The final standings are reconfigured to reflect the quality win point deduction.Total—The value of the quality win component is subtracted from the subtotal.BCS RESULTS FOR 2000-01:Orange Bowl—Oklahoma 13, Florida St. 2Sugar Bowl—Miami (FL) 37, Florida 20Fiesta Bowl—Oregon St. 41, Notre Dame 9Rose Bowl—Washington 34, Purdue 24

2011 NCAA FOOTBALL RECORDS - UNDEFEATED, UNTIED TEAMS 109
FOO
TBA
LL B
OW
LSU
BD
IVIS
IONUndefeated, Untied Teams
(Regular-Season Games Only)
Minimum of fi ve games played against opponents above the high school level. Subsequent bowl win is indicated by (†), a bowl loss by (‡) and a bowl tie by ($). Unscored-on teams are indicated by (•). Begin-ning in 2002, all postseason games were counted in won-lost records and statistics. However, unde-feated, untied teams will continue for regular-season only with postseason results indicated.[Note: Following are undefeated, untied teams in regular-season games not included with major colleges at the time—Centre, 1919 & 1921; Lafayette, 1921, 1926 & 1937; Wash. & Jeff., 1921; Marquette, 1923; Louisville, 1925; Centenary (LA), 1927; Memphis, 1938; San Jose St., 1939; Hardin-Simmons, 1940; Arizona, 1945; Pacific, 1949; Fresno St., 1961; and San Diego St., 1966.] Beginning in 1996, tiebreaker procedures were in place for all FBS games.
Year College Wins1878 Princeton .......................................................................61882 Yale ..................................................................................81883 Yale ..................................................................................81885 Princeton .......................................................................91887 Yale ..................................................................................91888 Yale ..............................................................................•131889 Princeton .................................................................... 101890 Harvard ....................................................................... 111891 Yale ..............................................................................•131892 Minnesota ....................................................................5 Purdue ............................................................................8 Yale ..............................................................................•131893 Minnesota ....................................................................6 Princeton .................................................................... 111894 Penn ............................................................................. 12 VMI ...................................................................................5 Yale ............................................................................... 161895 Penn ............................................................................. 141896 LSU ...................................................................................61897 Penn ............................................................................. 151898 Harvard ....................................................................... 11 Kentucky ..................................................................... •7 Michigan .................................................................... 10 North Carolina ............................................................91899 Kansas ......................................................................... 10 Sewanee ..................................................................... 121900 Clemson ........................................................................6 Texas ...............................................................................6 Tulane ........................................................................... •5 Yale ............................................................................... 121901 Harvard ....................................................................... 12 Michigan ................................................................ †•10 Wisconsin ......................................................................91902 Arizona ......................................................................... •5 California .......................................................................8 Michigan .................................................................... 11 Nebraska ..................................................................... •91903 Nebraska .................................................................... 10 Princeton .................................................................... 111904 Auburn ...........................................................................5 Michigan .................................................................... 10 Minnesota ................................................................. 13 Penn ............................................................................. 12 Pittsburgh .................................................................. 10 Vanderbilt .....................................................................91905 Chicago....................................................................... 10 Stanford .........................................................................8 Yale ............................................................................... 101906 New Mexico St. ...........................................................5 Washington St. ......................................................... •6 Wisconsin ......................................................................51907 Oregon St. .................................................................. •61908 Kansas ............................................................................9 LSU ................................................................................ 101909 Arkansas ........................................................................7 Colorado ..................................................................... •6 Washington .................................................................7 Yale ..............................................................................•101910 Colorado .......................................................................6 Illinois ........................................................................... •7 Pittsburgh ................................................................... •9 Washington .................................................................61911 Colorado .......................................................................6 Oklahoma .....................................................................8 Utah St. ........................................................................ •5 Washington .................................................................71912 Harvard ..........................................................................9 Notre Dame .................................................................7 Penn St. ..........................................................................8 Washington .................................................................6 Wisconsin ......................................................................71913 Auburn ...........................................................................8 Chicago..........................................................................7 Harvard ..........................................................................9 Michigan St. .................................................................7
Nebraska .......................................................................8 Notre Dame .................................................................7 Washington .................................................................71914 Army ...............................................................................9 Illinois .............................................................................7 Tennessee .....................................................................9 Texas ...............................................................................8 Wash. & Lee ..................................................................91915 Colorado St. .................................................................7 Columbia ......................................................................5 Cornell ............................................................................9 Nebraska .......................................................................8 Oklahoma .................................................................. 10 Pittsburgh .....................................................................8 Washington .................................................................7 Washington St. ........................................................ †61916 Army ...............................................................................9 Ohio St. ..........................................................................7 Pittsburgh .....................................................................8 Tulsa ............................................................................. 101917 Denver............................................................................9 Georgia Tech................................................................9 Pittsburgh .....................................................................9 Texas A&M .................................................................. •8 Washington St. ...........................................................61918 Michigan .......................................................................5 Oklahoma .....................................................................6 Texas ...............................................................................9 Virginia Tech ................................................................7 Washington-St. Louis ...............................................61919 Notre Dame .................................................................9 Texas A&M ................................................................•101920 Boston College ...........................................................8 California .................................................................... †8 Notre Dame .................................................................9 Ohio St. ....................................................................... ‡7 Southern California ..................................................6 Texas ...............................................................................9 VMI ...................................................................................91921 California .................................................................... $9 Cornell ............................................................................8 Iowa .................................................................................71922 California .......................................................................9 Cornell ............................................................................8 Drake ..............................................................................7 Iowa .................................................................................7 Princeton .......................................................................8 Tulsa ................................................................................71923 Colorado .......................................................................9 Cornell ............................................................................8 Illinois .............................................................................8 Michigan .......................................................................8 SMU .................................................................................9 Yale ..................................................................................81924 Notre Dame .............................................................. †91925 Alabama ..................................................................... †9 Dartmouth ...................................................................81926 Alabama ..................................................................... $9 Stanford ....................................................................$10 Utah.................................................................................71927 (None)1928 Boston College ...........................................................9 Detroit ............................................................................9 Georgia Tech............................................................. †91929 Notre Dame .................................................................9 Pittsburgh .................................................................. ‡9 Purdue ............................................................................8 Tulane .............................................................................9 Utah.................................................................................71930 Alabama ..................................................................... †9 Notre Dame .............................................................. 10 Utah.................................................................................8 Washington St. ........................................................ ‡91931 Tulane ........................................................................‡111932 Colgate......................................................................... •9
Michigan .......................................................................8 Southern California ............................................... †91933 Princeton .......................................................................91934 Alabama ..................................................................... †9 Minnesota ....................................................................81935 Minnesota ....................................................................8 Princeton .......................................................................9 SMU. ...........................................................................‡121936 (None)1937 Alabama ..................................................................... ‡9 Colorado .................................................................... ‡8 Santa Clara ................................................................ †81938 Duke ............................................................................‡•9 Georgetown ................................................................8 Oklahoma ................................................................‡10 Tennessee ................................................................†10 TCU .............................................................................†10 Texas Tech ................................................................‡101939 Cornell ............................................................................8 Tennessee .............................................................. ‡•10 Texas A&M ...............................................................†101940 Boston College ......................................................†10 Lafayette .......................................................................9 Minnesota ....................................................................8 Stanford ...................................................................... †9 Tennessee ................................................................‡101941 Duke ............................................................................. ‡9 Duquesne .....................................................................8 Minnesota ....................................................................81942 Tulsa ...........................................................................‡101943 Purdue ............................................................................91944 Army ...............................................................................9 Ohio St. ..........................................................................91945 Alabama ..................................................................... †9 Army ...............................................................................9 Oklahoma St. ............................................................ †81946 Georgia .....................................................................†10 Hardin-Simmons ..................................................†10 UCLA ..........................................................................‡101947 Michigan .................................................................... †9 Notre Dame .................................................................9 Penn St. ....................................................................... $91948 California ..................................................................‡10 Clemson ...................................................................†10 Michigan .......................................................................91949 Army ...............................................................................9 California ..................................................................‡10 Notre Dame .............................................................. 10 Oklahoma ................................................................†101950 Oklahoma ................................................................‡10 Princeton .......................................................................9 Wyoming ................................................................... †91951 Maryland .................................................................... †9 Michigan St. ................................................................9 Princeton .......................................................................9 San Francisco ..............................................................9 Tennessee ................................................................‡101952 Georgia Tech...........................................................†11 Michigan St. .................................................................91953 Maryland ..................................................................‡101954 Ohio St. ....................................................................... †9 Oklahoma .................................................................. 10 UCLA ...............................................................................91955 Maryland ..................................................................‡10 Oklahoma ................................................................†101956 Oklahoma .................................................................. 10 Tennessee ................................................................‡10 Wyoming ................................................................... 101957 Arizona St. ................................................................ 10 Auburn ........................................................................ 101958 LSU ..............................................................................†101959 Syracuse ...................................................................†101960 New Mexico St. ....................................................†10 Yale ..................................................................................91961 Alabama ...................................................................†10 Rutgers ...........................................................................91962 Dartmouth ...................................................................9 Ole Miss ...................................................................... †9 Southern California .............................................†101963 Texas ..........................................................................†101964 Alabama ...................................................................‡10 Arkansas ...................................................................†10 Princeton .......................................................................91965 Arkansas ...................................................................‡10 Dartmouth ...................................................................9 Michigan St. ...........................................................‡10 Nebraska ..................................................................‡101966 Alabama ...................................................................†101967 Wyoming .................................................................‡101968 Ohio............................................................................‡10
Year College Wins
Year College Wins

110 2011 NCAA FOOTBALL RECORDS - THE SPOILERS
The Spoilers(From 1937 Season)
Following is a list of the spoilers of major-college teams that lost their perfect (unde-feated, untied) record in their final game of the season, including a bowl game (in parentheses). Confrontations of two undefeated, untied teams at the time are in bold face. An asterisk (*) indicates the home team in a regular-season game; a dag-ger (†) indicates a neutral site.Date Spoiler Victim Score1-1-38 California................................... Alabama (Rose) ..........................................13-01-1-38 Rice .............................................. Colorado (Cotton) ..................................28-1412-3-38 * Southern California .............. Notre Dame .................................................13-01-2-39 Southern California .............. Duke (Rose) ....................................................7-31-2-39 Tennessee ............................... Oklahoma (Orange) ..............................17-01-2-39 St. Mary’s (CA) ......................... Texas Tech (Cotton) ...............................20-1312-2-39 * Duquesne ................................. Detroit ...................................................tie 10-101-1-40 Southern California .............. Tennessee (Rose) .......................................14-01-1-41 Boston College .................... Tennessee (Sugar) ...............................19-131-1-42 Oregon St. ................................ Duke (Rose) ...............................................20-161-1-43 Tennessee ................................ Tulsa (Sugar) ...............................................14-711-27-43 * Great Lakes .............................. Notre Dame ..............................................19-141-1-44 Southern California .............. Washington (Rose) ...................................29-011-25-44 * Virginia....................................... Yale ..............................................................tie 6-61-1-47 Illinois ......................................... UCLA (Rose) ..............................................45-141-1-48 SMU ............................................ Penn St. (Cotton) ..............................tie 13-1311-27-48 † Navy ............................................ Army.......................................................tie 21-2112-2-48 * Southern California .............. Notre Dame ........................................tie 14-141-1-49 Northwestern ......................... California (Rose) ......................................20-141-2-50 Ohio St. ...................................... California (Rose) ......................................17-1412-2-50 † Navy ............................................ Army................................................................14-21-1-51 Kentucky ................................... Oklahoma (Sugar) .....................................13-71-1-52 Maryland................................. Tennessee (Sugar) ...............................28-1311-22-52 Southern California .............. * UCLA ............................................................14-121-1-54 Oklahoma ................................ Maryland (Orange) .....................................7-01-2-56 Oklahoma ............................... Maryland (Orange) ................................20-61-1-57 Baylor ......................................... Tennessee (Sugar) .....................................13-711-28-64 * Southern California .............. Notre Dame ..............................................20-171-1-65 Texas ........................................... Alabama (Orange)..................................21-1711-20-65 Dartmouth ............................. * Princeton ..................................................28-141-1-66 UCLA ........................................... Michigan St. (Rose) ................................14-121-1-66 Alabama .................................... Nebraska (Orange) .................................39-281-1-66 LSU .............................................. Arkansas (Cotton) ......................................14-711-19-66 Notre Dame ........................... * Michigan St. ......................................tie 10-101-1-68 LSU .............................................. Wyoming (Sugar) ...................................20-1311-23-68 * Harvard .................................... Yale ........................................................tie 29-2912-27-68 Richmond ................................. Ohio (Tangerine) ....................................49-4211-22-69 * Michigan ................................... Ohio St. .......................................................24-1211-22-69 * Princeton .................................. Dartmouth ...................................................35-711-21-70 * Ohio St...................................... Michigan ......................................................20-91-1-71 Stanford .................................... Ohio St. (Rose) .........................................27-17
1-1-71 Notre Dame ............................. Texas (Cotton) ..........................................24-111-1-72 Stanford .................................... Michigan (Rose) ......................................13-121-1-72 Nebraska ................................. Alabama (Orange) ..................................38-611-25-72 * Ohio St. ...................................... Michigan ....................................................14-1111-24-73 Ohio St...................................... * Michigan .............................................tie 10-1012-31-73 Notre Dame ........................... Alabama (Sugar) ..................................24-2311-23-74 * Ohio St. ...................................... Michigan ....................................................12-1011-23-74 * Harvard ..................................... Yale ...............................................................21-161-1-75 Notre Dame ............................. Alabama (Orange)..................................13-111-1-76 UCLA .......................................... Ohio St. (Rose) .........................................23-101-1-77 Houston .................................... Maryland (Cotton) .................................30-2111-19-77 * Delaware ................................... Colgate ...........................................................21-31-2-78 Notre Dame ............................. Texas (Cotton) ..........................................38-101-1-79 Alabama .................................... Penn St. (Sugar) ..........................................14-711-17-79 Harvard ..................................... * Yale ..................................................................22-712-15-79 Syracuse .................................... McNeese St. (Independence) ...............31-712-21-79 Indiana ....................................... BYU (Holiday) ...........................................38-371-1-80 Southern California .............. Ohio St. (Rose) .........................................17-161-1-80 Oklahoma ................................ Florida St. (Orange) ...................................24-71-1-83 Penn St. ..................................... Georgia (Sugar) .......................................27-231-2-84 Georgia ...................................... Texas (Cotton) .............................................10-91-2-84 Miami (FL) ................................ Nebraska (Orange) .................................31-3012-14-85 Fresno St. .................................. Bowling Green (California) ....................51-71-1-86 Oklahoma ................................ Penn St. (Orange) ...................................25-101-2-87 Penn St. .................................... Miami (FL) (Fiesta) ...............................14-101-1-88 Auburn ...................................... Syracuse (Sugar) ...............................tie 16-161-1-88 Miami (FL) ............................... Oklahoma (Orange) ...........................20-141-2-89 Notre Dame ........................... West Virginia (Fiesta) .........................34-211-1-90 Notre Dame ............................. Colorado (Orange) ....................................21-61-1-93 Notre Dame ............................. Texas A&M (Cotton) ..................................28-31-1-93 Alabama .................................. Miami (FL) (Sugar) ...............................34-131-1-94 Florida St. .................................. Nebraska (Orange) .................................18-161-1-94 Florida ........................................ West Virginia (Sugar) ................................41-71-2-96 Nebraska ................................. Florida (Fiesta).......................................62-241-1-97 Ohio St. ..................................... Arizona St. (Rose) ....................................20-171-2-97 Florida ........................................ Florida St. (Sugar) ...................................52-201-4-00 Florida St. .................................. Virginia Tech (Sugar) .............................46-291-3-03 Ohio St...................................... Miami (FL) (Fiesta) ...............31-24 (2 ot)1-5-06 Texas .......................................... Southern California (Rose) ........... 41-381-8-07 Florida ....................................... Ohio St. (BCS Championship) ...........41-141-1-08 Georgia ...................................... Hawaii (Sugar) ..........................................41-1012-23-08 TCU .............................................. Boise St. (Poinsettia) ..............................17-161-1-10 Florida ........................................ Cincinnati (Sugar) ...................................51-241-4-10 Boise St. ........................... TCU (Fiesta) .................................. 17-10
1-7-10 Alabama ........................... Texas (BCS Championship) ........ 37-211-10-11 Auburn ............................. Oregon (BCS Championship) ..... 22-19
Date Spoiler Victim Score
Ohio St. ....................................................................... †9 Penn St. .....................................................................†101969 Penn St. .....................................................................†10 San Diego St. ..........................................................†10 Texas ..........................................................................†10 Toledo........................................................................†101970 Arizona St. ...............................................................†10 Dartmouth ...................................................................9 Ohio St. ....................................................................... ‡9 Texas ..........................................................................‡10 Toledo........................................................................†111971 Alabama ...................................................................‡11 Michigan ..................................................................‡11 Nebraska ..................................................................†12 Toledo........................................................................†111972 Southern California .............................................†111973 Alabama ...................................................................‡11 Miami (OH) ..............................................................†10 Notre Dame ............................................................†10 Penn St. .....................................................................†111974 Alabama ...................................................................‡11 Oklahoma .................................................................. 111975 Arizona St. ...............................................................†11 Arkansas St. ............................................................... 11 Ohio St. .....................................................................‡111976 Maryland ..................................................................‡11 Pittsburgh ................................................................†11 Rutgers ........................................................................ 111977 Texas ..........................................................................‡111978 Penn St. .....................................................................‡111979 Alabama ...................................................................†11 BYU .............................................................................‡11 Florida St. .................................................................‡11 McNeese St. ...........................................................‡11 Ohio St. .....................................................................‡11
1980 Georgia .....................................................................†111981 Clemson ...................................................................†111982 Georgia .....................................................................‡111983 Nebraska ..................................................................‡12 Texas ..........................................................................‡111984 BYU .............................................................................†121985 Bowling Green .......................................................‡11 Penn St. .....................................................................‡111986 Miami (FL) ................................................................‡11 Penn St. .....................................................................†111987 Miami (FL) ................................................................†11 Oklahoma ................................................................‡11 Syracuse ...................................................................$111988 Notre Dame ............................................................†11 West Virginia ...........................................................‡111989 Colorado ..................................................................‡111990 (None)1991 Miami (FL) ................................................................†11 Washington ............................................................†111992 Alabama ...................................................................†12 Miami (FL) ................................................................‡11 Texas A&M ...............................................................‡121993 Auburn ........................................................................ 11 Nebraska ..................................................................‡11 West Virginia ...........................................................‡111994 Nebraska ..................................................................†12 Penn St. .....................................................................†111995 Florida .......................................................................‡12 Nebraska ..................................................................†11Beginning in 1996, tiebreaker system added.1996 Arizona St. ..............................................................‡11 Florida St. ...............................................................‡111997 Michigan ..................................................................†12 Nebraska ..................................................................†13
1998 Tennessee ................................................................†12 Tulane ........................................................................†111999 Florida St. ................................................................†11 Marshall ....................................................................†12 Virginia Tech ...........................................................‡112000 Oklahoma ................................................................†132001 Miami (FL) ................................................................†12Beginning in 2002, postseason games included in won-lost records.Year College Wins2002 Miami (FL) (12-1 overall record) .....................‡12 Ohio St. (14-0 overall record) ..........................†132003 (None)2004 Auburn (13-0 overall record) ...........................†12 Oklahoma (12-1 overall record) ....................‡12 Southern California (13-0 overall record) ..†12 Utah (12-0 overall record).................................†11 Boise St. (11-1 overall record) .........................‡112005 Southern California (12-1 overall record) ..‡12 Texas (13-0 overall record) ...............................†122006 Boise St. (13-0 overall record) .........................†12 Ohio St. (12-1 overall record) .........................‡122007 Hawaii (12-1 overall record).............................‡122008 Boise St. (12-1 overall record) .........................‡12 Utah (13-0 overall record).................................†122009 Alabama (14-0 overall record) ........................†13 Boise St. (14-0 overall record) .........................†13 Cincinnati (12-1 overall record) ......................‡12 Texas (13-1 overall record) ...............................‡13 TCU (12-1 overall record) ..................................‡122010 Auburn (14-0 overall record) ...........................†13 TCU (13-0 overall record) ..................................†12 Oregon (12-1 overall record) ...........................‡12

2011 NCAA FOOTBALL RECORDS - STREAKS AND RIVALRIES 111
FOO
TBA
LL B
OW
LSU
BD
IVIS
IONStreaks and Rivalries
Longest Winning Streaks(Includes Bowl Games)
Wins Team Years Ended by Score47 Oklahoma ............................1953-57 Notre Dame ...............................................7-039 Washington .........................1908-14 Oregon St. .................................................0-037 Yale ..........................................1890-93 Princeton .....................................................6-037 Yale ..........................................1887-89 Princeton ...................................................10-035 Toledo ....................................1969-71 Tampa .........................................................21-034 Miami (FL) ............................2000-03 Ohio St. ....................................*31-24 (2 ot)34 Penn .......................................1894-96 Lafayette......................................................6-431 Oklahoma ............................1948-50 Kentucky .................................................*13-731 Pittsburgh ............................1914-18 Cleveland Naval Reserve ....................10-931 Penn .......................................1896-98 Harvard ......................................................10-030 Texas .......................................1968-70 Notre Dame ........................................*24-1129 Miami (FL) ............................1990-93 Alabama ...............................................*34-1329 Michigan...............................1901-03 Minnesota...................................................6-628 Alabama ...............................1978-80 Mississippi St. ...........................................6-328 Oklahoma ............................1973-75 Kansas ........................................................23-328 Michigan St. .......................1950-53 Purdue ..........................................................6-026 Nebraska ..............................1994-96 Arizona St. ...............................................19-026 Cornell ...................................1921-24 Williams .....................................................14-726 Michigan...............................1903-05 Chicago ........................................................2-025 BYU .........................................1983-85 UCLA ........................................................27-2425 San Diego St. .....................1965-67 Utah St. ..................................................31-2525 Michigan...............................1946-49 Army............................................................21-725 Army .......................................1944-46 Notre Dame ...............................................0-025 Southern California ..........1931-33 Oregon St. .................................................0-0*Streak ended in bowl game.
Longest Unbeaten Streaks(Includes Bowl Games; May Include Ties)
No. Wins Ties Team Years Ended by Score63 59 4 Washington .....................1907-17 ........California................................27-056 55 1 Michigan ...........................1901-05 ........Chicago ....................................2-050 46 4 California ...........................1920-25 ........Olympic Club .......................15-048 47 1 Oklahoma .........................1953-57 ........Notre Dame ............................7-048 47 1 Yale ......................................1885-89 ........Princeton ...............................10-047 42 5 Yale ......................................1879-85 ........Princeton .................................6-544 42 2 Yale ......................................1894-96 ........Princeton ...............................24-642 39 3 Yale ......................................1904-08 ........Harvard.....................................4-039 37 2 Notre Dame .....................1946-50 ........Purdue .................................28-1437 37 0 Yale ......................................1890-93 ........Princeton .................................6-037 36 1 Oklahoma .........................1972-75 ........Kansas .....................................23-335 35 0 Toledo ................................1969-71 ........Tampa .....................................21-035 34 1 Minnesota ........................1903-05 ........Wisconsin ...........................16-1234 34 0 Miami (FL) .........................2000-03 ........Ohio St. ...................31-24 (2 ot)34 34 0 Penn ....................................1894-96 ........Lafayette ..................................6-434 33 1 Nebraska ...........................1912-16 ........Kansas .......................................7-334 32 2 Princeton ..........................1884-87 ........Harvard...................................12-034 29 5 Princeton ..........................1877-82 ........Harvard.....................................1-033 31 2 Georgia Tech ...................1914-18 ........Pittsburgh .............................32-033 30 3 Tennessee .........................1926-30 ........Alabama .................................18-633 30 3 Harvard ..............................1911-15 ........Cornell ....................................10-032 31 1 Nebraska ...........................1969-71 ........UCLA .....................................20-1732 31 1 Harvard ..............................1898-00 ........Yale ...........................................28-032 30 2 Army ...................................1944-47 ........Columbia ............................21-2031 31 0 Oklahoma .........................1948-50 ........Kentucky ................................13-731 31 0 Pittsburgh .........................1914-18 ........Cleveland Naval ..................10-931 31 0 Penn ....................................1896-98 ........Harvard...................................10-031 30 1 Penn St. ............................1967-70 ........Colorado .............................41-1331 30 1 San Diego St. ..................1967-70 ........Long Beach St. ................27-1131 29 2 Georgia Tech ...................1950-53 ........Notre Dame .......................27-14
Longest Home Winning Streaks(Includes Bowl Games)
Wins Team Years Ended by Score58 Miami (FL) ............................1985-94 Washington ..........................................38-2057 Alabama ...............................1963-82 Southern Miss. ....................................38-2956 Harvard .................................1890-95 Boston AA ...................................................0-050 Michigan...............................1901-07 Penn ..............................................................6-047 Nebraska ..............................1991-98 Texas ........................................................20-1644 Washington .........................1908-17 Oregon St. .................................................0-042 Texas .......................................1968-76 Houston .....................................................30-040 Notre Dame ........................1907-18 Great Lakes.................................................7-738 Notre Dame ........................1919-27 Minnesota...................................................7-737 Florida St. ............................1992-01 Miami (FL) ..............................................49-2737 Yale ..........................................1904-08 Brown ......................................................10-1037 Yale ..........................................1900-03 Princeton ...................................................11-636 Oklahoma ............................2005-10 Current Streak33 Marshall ................................1995-00 Western Mich. .....................................30-1033 Nebraska ..............................1901-06 Iowa St. .....................................................14-233 Harvard .................................1900-03 Amherst .......................................................5-032 Boise St. .................................2006-10 Current Streak31 Boise St. .................................2001-05 Boston College ....................................27-2131 Texas A&M ...........................1990-95 Texas ...........................................................16-631 Yale ..........................................1890-93 Princeton .....................................................6-030 Florida ....................................1994-99 Alabama .........................................40-39 (ot)30 Auburn ..................................1952-61 Kentucky ................................................14-1230 Tennessee ............................1928-33 Alabama ....................................................12-6
Longest Losing StreaksLosses Team Years Ended with Score34 Northwestern .................1979-82 Northern Ill. .............................................31-628 Virginia ..............................1958-61 William & Mary .......................................21-628 Kansas St. ........................1945-48 Arkansas St. .............................................37-627 New Mexico St. .............1988-90 Cal St. Fullerton ......................................43-927 Eastern Mich. .................1980-82 Kent St. ........................................................9-726 Western Ky. ......................2008-10 La.-Lafayette .........................................54-2126 Colorado St. ...................1960-63 Pacific ..........................................................20-023 Duke ...................................1999-02 East Carolina ........................................23-1623 Northern Ill. .....................1996-98 Central Mich. ..........................................16-622 Duke ...................................2005-07 Northwestern .......................................20-1421 Ball St. ...............................1998-00 Miami (OH) ............................................15-1021 South Carolina ...............1998-00 New Mexico St. ......................................31-021 Kent St. .............................1981-83 Eastern Mich. .......................................37-1321 New Mexico ....................1967-69 Kansas ........................................................16-720 Temple ...............................2004-06 Bowling Green ....................................28-1420 TCU .....................................1974-75 Rice ...........................................................28-2120 Florida St. ........................1972-74 Miami (FL) ..............................................21-1419 Hawaii ................................1997-99 Eastern Ill. ...............................................31-2718 Eastern Mich. ..................2009-10 Ball St. ..............................................41-38 (ot)18 Illinois .................................1996-98 Middle Tenn. ........................................48-2018 Rice .....................................1987-89 SMU .............................................................35-618 Wisconsin .........................1967-69 Iowa ..........................................................23-1718 Wake Forest .....................1962-63 South Carolina .....................................20-1918 Kansas St. ........................1961-62 BYU ..............................................................24-717 Tulsa ...................................2000-02 UTEP ............................................................20-017 Kent St. .............................1992-94 Akron .......................................................32-1617 Kent St. .............................1989-90 Ohio ..........................................................44-1517 Memphis ..........................1981-82 Arkansas St. .............................................12-017 Kansas St. ........................1964-66 Kansas .........................................................3-317 Tulane ................................1961-63 South Carolina ........................................20-717 Alabama ...........................1954-56 Mississippi St. ......................................13-1217 Kansas ................................1953-55 Washington St. ......................................13-016 UNLV...................................1997-98 North Texas ..............................................26-316 Kansas St. ........................1987-89 North Texas ...........................................20-1716 Indiana ..............................1983-85 Louisville ................................................41-2816 Vanderbilt ........................1961-62 Tulane .........................................................20-016 Iowa St. .............................1929-30 Simpson ......................................................6-0

112 2011 NCAA FOOTBALL RECORDS - STREAKS AND RIVALRIES
Most Consecutive Non-Losing Seasons(All-Time and Current) (.500 percentage and above)
No. School Years49 Penn St. ...........................................................................................................1939-8742 Nebraska .........................................................................................................1962-0342 Notre Dame ...................................................................................................1889-32#40 Michigan..........................................................................................................1968-0740 Texas ..................................................................................................................1893-3238 Alabama ..........................................................................................................1911-50†34 Florida St. ......................................................................................................1977-10*31 Florida ...............................................................................................................1980-10*29 Oklahoma .......................................................................................................1966-9429 Texas ..................................................................................................................1957-8529 Boston College .............................................................................................1916-4428 BYU ....................................................................................................................1974-0128 Virginia .............................................................................................................1888-1527 Washington ....................................................................................................1977-0327 Michigan..........................................................................................................1892-1826 Virginia Tech ...................................................................................................1894-1923 Syracuse ...........................................................................................................1913-3523 Ohio St. ...........................................................................................................1899-2121 Marshall ...........................................................................................................1984-0421 Ohio St. ...........................................................................................................1967-8721 Southern California .....................................................................................1962-8221 Wyoming .........................................................................................................1949-6921 Northern Ill. ...................................................................................................1929-4921 Vanderbilt .......................................................................................................1915-3521 Minnesota .......................................................................................................1899-19*Active streak. #No teams in 1890 and 1891. †No teams in 1918 and 1943.
Longest Streak of GamesWithout Being Shut Out
No. School Years361 BYU ....................................................................................................................1975-03336 *Michigan .......................................................................................................1984-present284 *Florida .............................................................................................................1988-present282 Texas ..................................................................................................................1980-04280 Washington St. ............................................................................................1984-08271 Washington ....................................................................................................1981-04267 Oregon .............................................................................................................1985-07242 Colorado ..........................................................................................................1988-08233 UCLA .................................................................................................................1971-92233 Nebraska .........................................................................................................1974-91232 Florida St. ......................................................................................................1988-06229 *TCU ..................................................................................................................1992-present220 *Air Force .........................................................................................................1992-present219 Hawaii ...............................................................................................................1976-95210 *Tennessee .....................................................................................................1994-present203 *Virginia Tech.................................................................................................1995-present195 Virginia .............................................................................................................1984-00192 *Nebraska .......................................................................................................1996-present187^ Nevada .............................................................................................................1992-07186 Southern California .....................................................................................1967-83172 *Boise St. ..........................................................................................................1997-present165 Central Mich. ................................................................................................1982-98*Active streak. ^Games as a member of the FBS — total streak of 329 games includes 142 as an FCS member before 1992.
Most-Played Rivalries(Ongoing Unless Indicated)
Rivalry FirstGames Opponents (Series leader listed first) Record Game120 Minnesota-Wisconsin ......................................................................59-53-8 1890119 **Kansas-Missouri ..............................................................................55-55-9 1891117 Nebraska-Kansas ................................................................................91-23-3 1892117 Texas-Texas A&M ................................................................................75-37-5 1894115 Miami (OH)-Cincinnati .....................................................................59-49-7 1888115 *North Carolina-Virginia .................................................................58-53-4 1892114 Auburn-Georgia .................................................................................54-52-8 1892114 Oregon-Oregon St. ........................................................................58-46-10 1894113 Purdue-Indiana ...................................................................................70-37-6 1891113 Stanford-California ..........................................................................56-46-11 1892111 Navy-Army ............................................................................................55-49-7 1890109 Utah-Utah St. (did not play in 2010) ........................................77-28-4 1892108 Clemson-South Carolina ................................................................65-39-4 1896
108 Kansas-Kansas St. ..............................................................................65-38-5 1902107 Michigan-Ohio St. .............................................................................57-44-6 1897107 Ole Miss-Mississippi St. ..................................................................60-41-6 1901106 TCU-Baylor ............................................................................................50-49-7 1899106 Tennessee-Kentucky ........................................................................74-23-9 1893105 Georgia-Georgia Tech ......................................................................61-39-5 1893105 Nebraska-Iowa St. .............................................................................86-17-2 1896105 Texas-Oklahoma.................................................................................59-41-5 1900105 Oklahoma-Oklahoma St. ...............................................................82-16-7 1904104 ***Tennessee-Vanderbilt ................................................................72-27-5 1892103 North Carolina-Wake Forest (did not play in 2010) ............67-34-2 1888*Disputed series record: Virginia claims North Carolina leads the series 57-54-4, based on a forfeited game in 1956.
**Disputed series record: Missouri claims a series lead 56-54-9, based on a forfeited game in 1960.
***Disputed series record: Vanderbilt claims Tennessee has 72-28-5 series lead due to Vanderbilt vicotory in 1918 but Tennessee records claim 1918 team was "unofficial [team] formed from Army recruits and students."
Additional RecordsLongest Uninterrupted Series (Must have played every year)105 games—Kansas-Nebraska (from 1906)104 games—Minnesota-Wisconsin (from 1907)102 games—Clemson-South Carolina (from 1909)101 games—Wake Forest-North Carolina St. (from 1910)100 games—Kansas-Kansas St. (from 1911)99 games—North Carolina-Virginia (from 1910)*97 games—Kansas-Oklahoma (1903-97)96 games—Texas-Texas A&M (from 1915)96 games—Ole Miss-Mississippi St. (from 1915)**^93 games—Michigan-Ohio St. (from 1918)92 games—Kansas-Missouri (from 1919)92 games—Missouri-Iowa St. (from 1919)91 games—Tennessee-Kentucky (from 1919)**91 games—Auburn-Georgia (from 1919)**91 games—Indiana-Purdue (from 1920)*Neither school fielded a team in 1917-18 due to World War I. **Neither school fielded a team in 1943 due to World War II. ^Ole Miss and Mississippi St. played twice in 1918
Most Consecutive Wins Over a Major Opponent in an Uninterrupted Series (Must have played in consecutive years)43—Notre Dame over Navy, 1964-0636—Nebraska over Kansas, 1969-0432—Oklahoma over Kansas St., 1937-6829—Nebraska over Kansas St., 1969-9728—Texas over Rice, 1966-9326—Syracuse over Hobart, 1906-3126—Tennessee over Kentucky, 1985-10 (current)25—Penn St. over West Virginia, 1959-8324—Nebraska over Missouri, 1979-0224—Florida over Kentucky, 1987-10 (current)22—Tennessee over Vanderbilt, 1983-0422—Nebraska over Oklahoma St., 1974-9522—Arkansas over TCU, 1959-8022—Alabama over Mississippi St., 1958-7920—Purdue over Iowa, 1961-80Most Consecutive Wins Over a Major Opponent in a Nonconsecutive Series (Did not play in consecutive years)29—Clemson over Virginia, 1955-90 (over 36-year period)26—Southern California over Oregon St., 1968-99 (32-year period)25—Penn St. over Temple, 1952-07 (55-year period)24—Nebraska over Oklahoma St., 1974-99 (26-year period)21—Ohio St. over Northwestern, 1972-98 (27-year period)19—Washington over California, 1977-01 (25-year period)19—Michigan over Northwestern, 1966-92 (27-year period)19—Vanderbilt over Ole Miss, 1894-38 (45-year period)17—Tulsa over Drake, 1939-85 (47-year period)17—Ole Miss over Memphis, 1921-62 (42-year period)17—North Carolina over Wake Forest, 1893-23 (29-year period)Most Consecutive Wins Over a Major Opponent in a Current Series (Must have played every year)43—Notre Dame over Navy, 1964-06 (72-11-1 in rivalry)36—Nebraska over Kansas, 1969-04 (91-23-3 in rivalry)26—Tennessee over Kentucky, 1985-10 (74-23-9 in rivalry)24—Florida over Kentucky, 1987-10 (44-17-0 in rivalry)22—Tennessee over Vanderbilt, 1983-04 (72-27-5 in rivalry)Most Consecutive Games Without a Loss Against a Major Opponent43—Notre Dame over Navy, 1964-06 (0 ties)36—Nebraska over Kansas, 1969-04 (0 ties)34—Oklahoma over Kansas St., 1935-68 (1 tie)
Rivalry FirstGames Opponents (Series leader listed first) Record Game

2011 NCAA FOOTBALL RECORDS - OVERTIME GAMES 113
FOO
TBA
LL B
OW
LSU
BD
IVIS
ION
In 1981, the NCAA Football Rules Committee approved an overtime tiebreaker system to decide a tie game for the purpose of determining a conference champion in regular-season play. In 1996, the tie-breaker became mandatory in all games tied after four periods.
MOST OVERTIME GAMES IN A DAYDate OT GamesSept. 9, 2006 ...........................................................................7 Nov. 6, 2004 ............................................................................6 Sept. 24, 2005 ........................................................................6 Sept. 23, 2006 ........................................................................5Sept. 8, 2007 ...........................................................................5
All-Time FBS Won-Lost Recordsin Overtime Games 1996-10
OverallTeam 1996 1997 1998 1999 2000 2001 2002 2003 2004 2005 2006 2007 2008 2009 2010 W-LAir Force .............................. 2-0 1-0 — — 0-1 — 1-0 0-1 — — — 1-0 — 0-2 — 5-4Akron .................................... — — — — — 1-0 — — — 1-0 — — 1-1 — 0-2 3-3Alabama .............................. — 0-1 1-0 1-1 — — — 0-2 — 0-1 1-1 0-1 1-0 — — 4-7UAB ........................................ — — 0-1 1-0 0-1 — — — — — 0-1 — — — 1-1 2-4Arizona................................. 0-1 1-1 — — 1-0 — — 0-1 — — — — — 0-1 0-1 2-5Arizona St. ......................... 1-0 — 1-0 — 1-2 — — — — — 1-0 — 0-1 — 1-0 5-3Arkansas .............................. 1-0 — — — 1-0 1-0 0-1 2-0 — — 1-0 1-0 — 1-1 1-0 9-2Arkansas St. ...................... — — 1-0 0-1 0-2 — — — — 1-0 — — — — 0-1 2-4Army ..................................... — — — 1-0 — — — — — — 2-0 2-0 0-1 1-0 0-1 6-2Auburn ................................. 0-1 — — 0-1 1-0 1-0 1-1 — — 0-1 — 1-1 — 1-0 1-0 6-5Ball St. .................................. 1-0 1-0 — — — — 1-0 — 0-1 1-1 — 1-0 — — 1-1 6-3Baylor ................................... 0-1 — — 0-1 — 1-0 — — 1-0 0-2 1-1 — — — — 3-5Boise St. .............................. — 1-0 0-1 — — — — — 1-0 — 1-0 1-0 — — 0-1 4-2Boston College ................. — 0-1 — 1-0 — — 0-1 — 0-1 1-0 2-0 — — 1-0 — 5-3Bowling Green ................. 0-1 — — 1-0 — — 1-0 — — 0-1 1-0 1-0 0-1 — — 4-3BYU ........................................ 1-0 1-0 — 1-0 1-0 — — 1-0 — 0-2 0-1 — — 1-0 — 6-3Buffalo .................................. — — — — 1-0 — — — — — 1-1 1-0 3-1 0-1 — 6-3California ............................. 2-0 0-1 — — 1-0 — — 1-1 — 0-1 1-0 — — — — 5-4UCF ........................................ — 0-1 — 0-1 — — — — 0-1 0-1 — — 0-2 — — 0-6Central Mich. .................... — 0-1 1-0 — 0-1 — — — 1-1 1-1 1-0 — 1-0 1-0 0-1 6-5Cincinnati ........................... 1-0 1-1 — 0-1 1-1 — 1-0 1-1 — — — — 1-0 — — 6-4Clemson .............................. — 1-0 — — — 1-0 — 1-0 2-0 0-2 0-1 0-1 — 1-0 0-1 6-5Colorado ............................. — — — 1-1 — — 1-1 1-0 0-1 — 0-1 1-0 1-0 — — 5-4Colorado St. ...................... — — — — — 0-1 — — — — — 0-1 — — — 0-2Connecticut ....................... * * * * * * 0-1 1-0 — — 1-0 — 1-0 1-0 1-0 5-1Duke ..................................... — 0-1 0-1 1-2 — — — 1-0 — — — 0-1 0-1 — — 2-6East Carolina ..................... — — — — — 0-1 1-0 0-1 — — 1-0 1-0 2-1 0-1 1-1 6-5Eastern Mich. ................... — — 0-1 0-1 — 0-1 1-0 — 1-0 1-0 0-1 — — — 1-0 4-4Florida .................................. — — 0-1 0-1 — — 1-0 — — 1-0 — — — — 1-0 3-2Fla. Atlantic ........................ * * * * * * * * 1-0 0-1 — 1-1 1-0 — — 3-2FIU .......................................... * * * * * * * * * — 0-1 — 0-1 1-0 1-0 2-2Florida St. ........................... — — — — — — 0-1 1-0 0-1 0-1 — — — — — 1-3Fresno St. ........................... 0-2 0-1 — 2-1 — 1-0 — — 1-0 — — 0-1 1-1 0-2 — 5-8Georgia ................................ 1-0 — — 1-1 0-1 — — 1-0 — — — 1-0 — — 0-1 4-3Georgia Tech ..................... — — — 2-0 — 0-2 — 1-0 — — — — — 1-0 — 4-3Hawaii .................................. — 0-1 — 1-0 — 1-0 — 1-0 0-1 — — 2-0 1-0 1-0 — 7-2Houston .............................. 2-0 1-0 — — 1-1 — 0-1 0-1 0-1 0-1 1-0 — — — — 5-5Idaho..................................... — 0-1 1-0 1-0 1-0 0-1 — 0-1 — 1-0 — — — — 1-0 5-3Illinois ................................... 1-0 — — 0-1 — — 1-1 — 0-1 1-0 — — — — 0-1 3-4Indiana ................................. 0-1 — 0-1 1-0 — — — 0-1 0-1 — — — — — 1-0 2-4Iowa ...................................... — — — — 1-0 — 1-0 — — 0-1 1-0 1-0 — 0-1 — 4-2Iowa St. ............................... 0-1 — — — — — — — 0-1 0-3 1-0 — 0-1 — 0-1 1-7Kansas .................................. — — 1-0 — — 1-0 — 0-1 — 1-0 0-2 — — — — 3-3Kansas St. ........................... — — 0-1 — — — — — — — — — — — — 0-1Kent St. ............................... — — — — 1-1 — — 0-1 — — 0-1 0-1 0-1 — — 1-5Kentucky ............................. — 1-0 — — 0-1 — — 0-1 — — — 1-1 — 0-1 — 2-4La.-Lafayette ..................... — 0-2 — 1-0 0-1 — — 1-0 — 1-0 — 0-1 — 0-1 — 3-5La.-Monroe ......................... 1-0 2-0 — — — — 1-0 — — — — 1-0 — — 0-1 5-1LSU ........................................ — — 0-1 — 2-0 — — — 1-0 2-1 1-0 0-2 0-1 1-0 — 7-5Louisiana Tech .................. — — — — 0-1 1-1 — — — — — 0-1 — — — 1-3Louisville ............................. — — — 0-1 1-0 — 2-0 0-1 — 0-1 — — — — 0-1 3-4Marshall ............................... — — — — — 1-0 — — — 1-1 — — 0-1 — 0-1 2-3Maryland ............................. — — — — 1-0 1-0 — 0-1 0-1 1-0 — 0-1 — 1-0 — 4-3Memphis ............................. — — — — 0-2 — — — — 0-1 0-1 1-0 — 0-1 — 1-5Miami (FL) ........................... — 1-0 0-1 — — — 0-1 — 1-1 1-0 — 0-1 1-0 0-1 0-1 4-6Miami (OH) ......................... 0-1 0-1 — — — — — — — — 0-1 0-1 — — — 0-4Michigan ............................. — — — 1-0 — — 1-0 — 1-0 2-0 — — — 0-1 1-0 6-1Michigan St. ...................... — — 1-0 — — — — — 0-1 1-1 — 0-2 — 1-0 1-0 4-4Middle Tenn. .................... — — — — 1-0 — — 1-2 — — — — — — — 2-2Minnesota .......................... — — — 0-1 — 0-1 — — — 1-0 0-2 1-2 — 1-0 — 3-6Ole Miss ............................... — 1-0 2-1 1-1 1-0 0-1 — — 1-0 — 0-2 — — — 0-1 6-6
Overtime Games

114 2011 NCAA FOOTBALL RECORDS - OVERTIME GAMES
Mississippi St. ................... 0-1 — — — 0-2 — — — — — 1-0 — — — 0-1 2-4Missouri ............................... 2-0 1-1 — 0-1 — 1-0 1-1 1-0 1-0 1-0 — — 1-0 — — 9-3Navy ...................................... — — — — — — — — — — 0-1 2-1 1-0 2-0 — 5-2Nebraska ............................. — 1-0 — 1-0 1-0 — — — — 1-0 1-0 — 0-1 — 1-0 6-1Nevada................................. — — — — — 0-1 — — 1-0 1-0 — 0-1 — — 1-0 3-2UNLV ..................................... — 0-2 0-1 — 0-1 — 1-0 0-1 0-1 — 0-1 — 2-0 — — 3-7New Mexico ....................... — — 1-1 — — 0-1 1-2 — — — 1-0 — — — — 3-4New Mexico St. ............... — 0-1 0-2 — 1-1 — — — — 0-1 — — — — — 1-5North Carolina .................. — — 1-0 0-1 — — — 0-1 — 0-1 — 1-0 0-1 — 1-0 3-4North Carolina St. .......... — 1-0 0-1 1-0 1-1 — 1-0 0-2 1-0 — — 1-0 1-0 — 0-1 8-5North Texas ........................ — — — — — — — — — — 1-0 — — 0-1 — 1-1Northern Ill. ...................... — — — — — — 1-0 2-0 1-0 0-1 — — 0-1 — — 4-2Northwestern ................... — — — 1-0 1-0 — — 1-0 3-1 — — 2-0 0-1 0-1 — 8-3Notre Dame ....................... 0-2 — — — 1-1 — — 1-0 — 0-1 — 0-1 0-1 1-1 0-1 3-8Ohio ...................................... 0-1 — — — — — — 0-1 1-0 1-0 — — — 1-0 — 3-2Ohio St. ............................... — — — — — — 2-0 2-0 0-1 — — — — 1-0 — 5-1Oklahoma ........................... 1-0 — — — — — — — — 1-0 0-1 — — — — 2-1Oklahoma St. ................... 1-1 0-2 — — — 0-1 — — — — 0-1 — — — — 1-5Oregon................................. 1-1 1-0 0-2 1-0 2-0 2-0 — — — 1-0 — 0-1 1-0 1-0 — 8-4Oregon St. ......................... 0-1 — 1-0 — — 0-1 — — 0-1 — — 1-0 — — 0-1 2-4Penn St. .............................. — — — — 0-1 — 0-2 — — 1-0 1-0 — — — — 2-3Pittsburgh ........................... 0-1 2-0 — — 0-1 — 1-0 — 2-1 0-1 0-1 0-1 1-0 — 0-1 6-7Purdue ................................. — — — 0-1 1-0 1-0 0-1 0-2 — 0-1 1-0 — 0-1 — 0-1 3-7Rice ........................................ — — 1-0 — 1-0 1-1 — 0-1 0-1 — 1-0 — — — — 4-3Rutgers ................................ — 0-1 — 1-0 0-1 — — — — 0-1 0-1 — — — 1-0 2-4San Diego St. .................... — 1-1 2-0 — — — — — — — — — — — — 3-1San Jose St. ....................... — 1-0 — — — — — — 0-1 — — 0-1 — 0-1 0-1 1-4South Carolina .................. — — — — — — — 0-1 — — — 0-1 — — — 0-2South Fla. ........................... — — — — — — — 3-0 1-0 — — 1-0 1-0 — 2-0 8-0Southern California ........ 1-2 — — 0-1 1-0 1-0 0-1 0-1 — — — — — — — 3-5SMU ....................................... — 0-1 0-2 — — 0-1 — — 1-0 0-1 — 0-3 — 0-2 1-0 2-10Southern Miss. ................. 0-1 — — — 1-0 — 0-1 — 1-0 1-0 0-1 — 1-1 — 0-1 4-5Stanford ............................... 1-0 — 0-1 — — — — — — 0-1 — — — — 2-2Syracuse .............................. — 0-1 — 0-1 1-0 — 1-1 1-0 1-0 — 1-1 — — 0-1 — 5-5Temple ................................. — — — — — — — 0-3 — — 0-1 — 0-2 — 1-0 1-6Tennessee ........................... — — 1-0 — 0-1 — 1-0 2-0 — 1-0 — 2-0 0-1 1-0 1-1 9-2Texas ..................................... 0-1 — — — — — — — — — — — — — — 0-1UTEP ...................................... — — 0-1 0-1 — — — — 1-0 1-0 — 1-1 1-0 0-1 — 4-4Texas A&M .......................... — 1-0 1-0 — — — 0-2 — 2-1 1-0 1-0 1-0 — — — 7-4TCU ........................................ — — 1-0 0-1 — 0-1 0-1 1-0 1-1 2-0 0-1 0-1 — — — 5-6Texas Tech .......................... — — — — — 0-1 1-1 — 0-1 — 2-0 — 1-0 — — 4-3Toledo .................................. 1-0 — — — — — — — — 1-0 1-1 — 0-1 — — 3-2Troy ........................................ * * * * * * 0-1 — — 0-1 — — 0-1 0-1 — 0-4Tulane ................................... — — — — — — — 1-0 — — — 1-1 1-0 — 3-1Tulsa ...................................... — — — — — — — — 0-2 1-0 1-1 — — 1-0 — 3-3UCLA ..................................... 1-0 — 1-0 1-0 0-1 — — 1-0 — 2-0 — — 1-0 — — 7-1Utah ...................................... — — 1-1 — — — 0-1 1-0 — 1-1 — — — 1-1 1-0 5-4Utah St. ............................... — — 1-1 0-1 — 0-1 2-1 — — — — — — — — 3-4Vanderbilt ........................... — — 1-1 — — — — 0-1 0-1 0-1 — — — 0-1 — 1-5Virginia ................................. — — — 0-1 0-1 — — 0-1 0-1 — 1-0 — 1-1 — — 2-5Virginia Tech ...................... — — 1-0 1-0 — — 0-1 1-0 — — — — — — — 3-1Wake Forest ....................... — — — — — — 0-1 — 0-2 — — 1-0 1-0 0-2 — 2-5Washington ....................... 1-0 — — 0-1 — — 1-0 — — — 0-2 — 0-1 0-1 1-0 3-5Washington St. ................ 0-1 1-0 — — 0-3 — 1-1 0-1 — 0-1 — — 1-0 1-0 — 4-7West Virginia...................... — 0-1 — — 1-0 — — — 1-0 1-0 1-0 — 0-2 — 1-1 5-4Western Ky. ........................ * * * * * * * * * * * * * * 1-0 1-0Western Mich. .................. 1-1 — — 1-0 — — 0-1 — 0-1 0-1 — — 1-0 1-0 — 4-4Wisconsin ........................... — — — 1-0 1-2 — 1-0 — — — — — 1-0 1-0 — 5-2Wyoming ............................ 1-1 — 1-0 — — — 0-1 — 1-0 — 0-2 — — 1-0 — 4-4FCS, II Opponents ........... 0-2 2-0 — — 1-0 2-1 0-1 1-1 0-1 — — 0-1 0-1 0-1 2-0 5-8Totals ................................... 26-26 25-25 24-24 27-27 33-33 18-18 31-31 34-34 32-32 39-39 34-34 34-34 32-32 29-29 29-29 447-447
*Not an FBS member at the time.
BY CONFERENCE OverallTeam 1996 1997 1998 1999 2000 2001 2002 2003 2004 2005 2006 2007 2008 2009 2010 W-LAtlantic Coast .................... — 2-1 1-2 3-4 2-2 2-2 1-2 4-5 4-7 3-4 3-1 3-4 4-3 4-3 1-3 37-43Big East ................................ 0-1 3-4 1-2 2-1 2-2 — 2-4 2-3 4-2 1-3 3-3 1-1 4-2 1-1 5-3 31-32Big Ten ................................. 1-1 — 1-1 4-3 4-3 1-1 6-4 3-3 4-5 6-3 3-2 4-4 1-2 4-3 3-2 45-37Big 12.................................... 4-4 3-3 2-1 2-3 1-0 3-2 3-5 2-1 4-4 5-5 6-6 2-0 3-2 — 1-1 41-37Big West ............................... — 1-2 3-4 1-2 2-3 — — — — — — — — — — 7-11Conference USA .............. 3-1 2-1 — 2-2 4-5 0-2 4-3 6-4 3-2 4-5 4-5 4-5 4-5 2-5 3-4 45-49Mid-American ................... 3-4 1-2 1-0 2-1 2-2 2-1 4-1 2-2 4-4 6-5 4-5 3-2 6-8 3-1 3-4 46-42Mountain West ................. — — — 1-0 1-2 0-2 3-4 2-2 1-1 3-3 1-4 1-2 2-0 3-3 1-0 19-23Pacific-10 ............................. 8-6 3-2 3-3 2-2 6-6 1-1 2-2 2-4 0-1 3-3 2-2 1-1 3-2 2-2 2-2 40-39Southeastern .................... 2-2 2-1 5-4 5-5 5-5 2-1 3-2 5-5 2-0 4-4 4-3 6-6 1-2 4-3 4-4 54-47Sun Belt ............................... — — — — — 0-1 1-0 2-3 — 2-2 1-1 2-2 1-2 1-3 2-2 12-16Western Athletic .............. 4-3 4-6 7-6 3-3 1-0 5-4 — 1-1 5-5 2-1 1-0 3-4 2-1 1-3 2-2 41-39FBS Independents .......... 1-2 2-3 0-1 0-1 2-3 — 2-3 2-0 1-0 0-1 2-2 4-2 1-2 4-1 0-2 21-23FCS, Div. II Opponents .. 0-2 2-0 — — 1-0 2-1 0-1 1-1 0-1 — — 0-1 0-1 0-1 2-0 8-9Totals ................................... 26-26 25-25 24-24 27-27 33-33 18-18 31-31 34-34 32-32 39-39 34-34 34-34 32-32 29-29 29-29 447-447
OverallTeam 1996 1997 1998 1999 2000 2001 2002 2003 2004 2005 2006 2007 2008 2009 2010 W-L

2011 NCAA FOOTBALL RECORDS - FBS STADIUMS 115
FOO
TBA
LL B
OW
LSU
BD
IVIS
IONFBS Stadiums
LISTED ALPHABETICALLY BY SCHOOL Year Surface*School Stadium Conference Built Cap. (Year)Air Force ...............................Falcon Mountain West 1962 46,692 FieldTurfAkron .....................................InfoCision Mid-American-E 2009 30,000 ArtificialAlabama ...............................Bryant-Denny Southeastern-W 1929 92,138 PAT (S91)UAB .........................................^Legion Field Conference USA-E 1927 72,000 Grass (S95)Arizona..................................Arizona Pacific-12-S 1928 57,803 GrassArizona St. ...........................Sun Devil Pacific-12-S 1959 73,656 GrassArkansas ...............................Razorback Southeastern-W 1938 72,000 Grass (S95)Arkansas St. .......................ASU Sun Belt 1974 30,708 GrassArmy ......................................Michie Independent 1924 39,929 AstroTurf (92)Auburn ..................................Jordan-Hare Southeastern-W 1939 87,451 GrassBall St. ...................................Scheumann Mid-American-W 1967 22,500 FieldTurf (S06)Baylor ....................................Floyd Casey Big 12 1950 50,000 Turf (S04)Boise St. ...............................Bronco Mountain West 1970 32,000 Blue AstroTurfBoston College ..................Alumni Atlantic Coast-Atl. 1957 44,500 AstroTurf (97)Bowling Green ..................Doyt Perry Mid-American-E 1966 24,000 GrassBYU .........................................LaVell Edwards Independent 1964 64,045 FieldTurf (01)Buffalo ...................................UB Stadium Mid-American-E 1993 29,013 GrassCalifornia ..............................Memorial Pacific-12-N 1923 71,799 Momentum Turf (S03)UCF .........................................Bright House Network Conference USA-E 2007 45,000 GrassCentral Mich. ......................Kelly-Shorts Mid-American-W 1972 30,255 FieldTurf (04)Cincinnati ............................Nippert Big East 1916 35,000 FieldTurf (00)Clemson ...............................Memorial Atlantic Coast-Co. 1942 80,301 GrassColorado ..............................Folsom Pacific-12-S 1924 53,613 Grass (S99)Colorado St. .......................Hughes Mountain West 1968 32,500 GrassConnecticut ........................^Rentschler Field Big East 2003 40,000 GrassDuke ......................................Wallace Wade Atlantic Coast-Co. 1929 33,941 GrassEast Carolina .......................Dowdy-Ficklen Conference USA-E 1963 50,000 Grass (83)Eastern Mich. ....................Rynearson Mid-American-W 1969 30,200 AstroTurf (98)Florida ...................................Florida Field Southeastern-E 1929 88,548 Grass (S90)Fla. Atlantic .........................Lockhart Sun Belt 1987 20,450 GrassFIU ...........................................FIU Stadium Sun Belt 1995 20,000 AstroPlay (04)Florida St. ............................Doak S. Campbell Atlantic Coast-Atl. 1950 82,300 PAT (88)Fresno St. ............................Bulldog Western Athletic 1980 41,031 GrassGeorgia .................................Sanford Southeastern-E 1929 92,746 GrassGeorgia Tech ......................Bobby Dodd/Grant Field Atlantic Coast-Co. 1913 55,000 GrassHawaii ...................................^Aloha Western Athletic 1975 50,000 FieldTurf (01)Houston ...............................Robertson Conference USA-W 1942 32,000 GrassIdaho......................................#Kibbie Dome Western Athletic 1975 16,000 AstroTurfIllinois ....................................Memorial Big Ten-Leaders 1923 62,870 FieldTurf (08)Indiana ..................................Memorial Big Ten-Leaders 1960 52,692 AstroPlay (S03)Iowa .......................................Kinnick Big Ten-Legends 1929 70,585 FieldTurf (09)Iowa St. ................................Cyclone-Jack Trice Big 12 1975 55,000 Grass (S96)Kansas ...................................Memorial Big 12 1921 50,250 AstroPlay (00)Kansas St. .............................Bill Snyder-Wagner Field Big 12 1968 50,000 FieldTurf (02)Kent St. ..................................Dix Mid-American-E 1969 25,000 AstroTurf (S97)Kentucky ..............................Commonwealth Southeastern-E 1973 67,606 GrassLa.-Lafayette .......................Cajun Field Sun Belt 1971 31,000 GrassLa.-Monroe ..........................Malone Sun Belt 1978 30,427 GrassLSU .........................................Tiger Southeastern-W 1924 92,400 GrassLouisiana Tech ...................Joe Aillet Western Athletic 1968 30,600 GrassLouisville ..............................Papa John’s Cardinal Big East 1998 42,000 FieldTurf (03)Marshall ................................Joan C. Edwards Conference USA-E 1991 38,019 PolyTurfMaryland ..............................Byrd/Chevy Chase
Bank Field Atlantic Coast-Atl. 1950 51,500 FieldTurf (01)Memphis ..............................^Liberty Bowl Conference USA-E 1965 62,380 FieldTurf (S05)Miami (FL) ............................^Sun Life Atlantic Coast-Co. 1987 74,916 Grass (87)Miami (OH) ..........................Fred C. Yager Mid-American-E 1983 24,286 FieldTurf (S03)Michigan ..............................Michigan Big Ten-Legends 1927 109,901 FieldTurf (03)Michigan St. .......................Spartan Big Ten-Legends 1957 75,005 Grass (02)Middle Tenn. .....................Floyd/Jones Field Sun Belt 1998 31,000 AstroTurfMinnesota ...........................TCF Bank Stadium Big Ten-Legends 2009 50,000 FieldTurfOle Miss ................................Vaught-Hemingway Southeastern-W 1941 60,580 GrassMississippi St. ....................Davis Wade at Scott Field Southeastern-W 1914 55,082 PAT (86)Missouri ................................Memorial/Faurot Field Big 12 1926 68,349 FieldTurf (S03)Navy .......................................Navy-Marine Corps Independent 1959 34,000 FieldTurfNebraska ..............................Memorial/Osborne Field Big Ten-Legends 1923 81,067 FieldTurf (2005)Nevada..................................Mackay Western Athletic 1967 29,993 FieldTurf (S00)UNLV ......................................^Sam Boyd Mountain West 1971 36,800 Grass (S99)New Mexico ........................University Mountain West 1960 39,224 GrassNew Mexico St. ................Aggie Memorial Western Athletic 1978 30,343 GrassNorth Carolina ...................Kenan Memorial Atlantic Coast-Co. 1927 60,000 GrassNorth Carolina St. ...........^Carter-Finley Atlantic Coast-Atl. 1966 57,583 GrassNorth Texas .........................Fouts Field Sun Belt 1952 30,500 All-Pro TurfNorthern Ill. .......................Huskie Mid-American-W 1965 31,000 FieldTurf (01)Northwestern ....................Ryan Field Big Ten-Legends 1926 47,129 Grass (S97)Notre Dame ........................Notre Dame Independent 1930 80,795 GrassOhio .......................................Peden Mid-American-E 1929 24,000 FieldTurf (S02)Ohio St. ................................Ohio Big Ten-Leaders 1922 102,329 FieldTurf (07)

116 2011 NCAA FOOTBALL RECORDS - FBS STADIUMS
Oklahoma ............................Memorial Big 12 1923 82,112 Grass (S94)Oklahoma St. ....................Boone Pickens Big 12 1920 60,218 Football Pro (05)Oregon..................................Autzen Pacific-12-N 1967 54,000 FieldTurf (02)Oregon St. ...........................Reser Pacific-12-N 1953 45,674 FieldTurf (01)Penn St. ...............................Beaver Big Ten-Leaders 1960 107,282 GrassPittsburgh ............................Heinz Field Big East 2001 65,000 GrassPurdue ..................................Ross-Ade Big Ten-Leaders 1924 62,500 PAT (75)Rice .........................................Rice Conference USA-W 1950 47,000 AstroTurf-12 (97)Rutgers .................................Rutgers Big East 1994 52,454 GrassSan Diego St. .....................^Qualcomm Mountain West 1967 51,000 FieldTurf (03)San Jose St. .........................Spartan Western Athletic 1933 30,456 GrassSouth Carolina ...................Williams-Brice Southeastern-E 1934 80,250 GrassSouth Fla. .............................^Raymond James Big East 1998 41,441 GrassSouthern California .........^L.A. Memorial Coliseum Pacific-12-S 1923 93,607 GrassSMU ........................................Gerald J. Ford Conference USA-W 2000 32,000 AstroTurf (03)Southern Miss. ..................Roberts Conference USA-E 1976 36,000 GrassStanford ................................Stanford Pacific-12-N 1921 50,000 GrassSyracuse ...............................#Carrier Dome Big East 1980 52,000 AstroTurfTemple ..................................Lincoln Financial Field Mid-American-E 2003 68,532 GrassTennessee ............................Neyland Southeastern-E 1921 102,459 Grass (S94)Texas ......................................Royal-Memorial Big 12 1924 100,119 FieldTurf (09)UTEP .......................................^Sun Bowl Conference USA-W 1963 52,000 AstroTurf (97)Texas A&M ...........................Kyle Field Big 12 1925 82,600 Grass (S96)TCU .........................................Amon G. Carter Mountain West 1929 44,008 FieldTurf (S04)Texas Tech ...........................Jones Big 12 1947 52,882 AstroTurf-8 (88)Toledo ...................................Glass Bowl Mid-American-W 1937 26,248 NexTurf (01)Troy .........................................Veterans Memorial/
Larry Blakeney Field Sun Belt 1950 30,000 AstroPlay (S03)Tulane ....................................^#Superdome Conference USA-W 1975 69,767 AstroTurf (95)Tulsa .......................................Skelly Conference USA-W 1930 30,000 FieldTurf (00)UCLA ......................................^Rose Bowl Pacific-12-S 1922 91,136 GrassUtah .......................................Rice-Eccles Pacific-12-S 1927 45,634 FieldTurf (S02)Utah St. ................................E.L. Romney Western Athletic 1968 25,513 GrassVanderbilt ............................Vanderbilt Southeastern-E 1981 39,790 Grass (S99)Virginia ..................................Scott/Harrison Field Atlantic Coast-Co. 1931 61,500 PAT (S95)Virginia Tech .......................Lane Atlantic Coast-Co. 1965 65,115 GrassWake Forest ........................Groves Atlantic Coast-Atl. 1968 31,500 GrassWashington ........................Husky Pacific-12-N 1920 72,500 FieldTurf (00)Washington St. .................Clarence D. Martin Pacific-12-N 1972 37,600 FieldTurf (00)West Virginia.......................Mountaineer Field Big East 1980 60,000 AstroTurf-12 (97)Western Ky. .........................L.T. Smith Sun Belt 1968 22,113 AstroPlay (S03)Western Mich. ...................Waldo Mid-American-W 1939 30,200 NexTurf (01)Wisconsin ............................Camp Randall Big Ten-Leaders 1917 80,321 FieldTurf (S03)Wyoming .............................War Memorial Mountain West 1950 30,514 Grass^Not located on campus. #Indoor facility.
Surface Notes: *This column indicates the type of surface (either artificial or natural grass) present this year in the stadium. The brand name of the artificial turf, if known, is listed as well as the year the last installation occurred. The “S” preceding the year indicates that the school has switched either from natural grass to artificial turf or vice-versa. Legend: Turf—Any of several types of artificial turfs (name brands include AstroTurf, All-Pro, Omni-Turf, SuperTurf, FieldTurf, etc.); Grass—Natural grass surface; PAT—Prescription Athletic Turf (a “natural-artificial” surface featuring a network of pipes connected to pumps capable of sucking water from the natural turf or watering it. The pipes are located 18 inches from the surface and covered with a mixture of sand and filler. The turf also is lined with heating coils to keep it from freezing in tempera-tures below 32 degrees). SportGrass—Combines natural grass with a below-the-surface system of synthetic elements. FieldTurf—Hybrid fibers made from a polyethlyene blend, treated and tufted into a unique porous surface. The infill is made from graded silica sand and ground rubber, and provides a noncompactible, resilient, natural earth feel. The current trends in college football field surfaces have been to switch back to a natural grass field or to a very safety-minded artificial hybrid surface.
FBS Stadium Facts: Houston and Tulsa claim to be the first college football teams to play in an indoor stadium (the Astrodome on September 11, 1965). But actually, Utah and West Virginia met December 19, 1964, in the Liberty Bowl in the Atlantic City Convention Hall. Technically, the Astrodome was the first indoor stadium built specially for football and baseball. The first major-college football game ever played on artificial turf was between Houston and Washington State on September 23, 1966.
STADIUMS LISTED BY CAPACITY (TOP 25)School Stadium CapacityMichigan .....................................................Michigan ............................................................... 109,901Penn St. ......................................................Beaver .................................................................... 107,282Tennessee ...................................................Neyland ................................................................. 102,459Ohio St. .......................................................Ohio ........................................................................ 102,329Texas .............................................................Royal-Memorial ................................................. 100,119Southern California ................................^L.A. Memorial Coliseum .................................93,607Georgia ........................................................Sanford .....................................................................92,746LSU ................................................................Tiger ...........................................................................92,400Alabama ......................................................Bryant-Denny ........................................................92,138UCLA .............................................................^Rose Bowl .............................................................91,136Florida ..........................................................Florida Field ............................................................88,548Auburn .........................................................Jordan-Hare ............................................................87,451Texas A&M ..................................................Kyle Field .................................................................82,600Florida St. ...................................................Doak S. Campbell ................................................82,300Oklahoma ...................................................Memorial .................................................................82,112Nebraska .....................................................Memorial/Osborne Field ..................................81,067Notre Dame ...............................................Notre Dame ............................................................80,795Wisconsin ...................................................Camp Randall ........................................................80,321Clemson ......................................................Memorial .................................................................80,301South Carolina ..........................................Williams-Brice ........................................................80,250
Year Surface*School Stadium Conference Built Cap. (Year)

2011 NCAA FOOTBALL RECORDS - FBS STADIUMS 117
FOO
TBA
LL B
OW
LSU
BD
IVIS
ION
Michigan St. ..............................................Spartan .....................................................................75,005Miami (FL) ...................................................^Sun Life ..................................................................74,916Arizona St. .................................................Sun Devil .................................................................73,656Washington ...............................................Husky ........................................................................72,500UAB ................................................................^Legion Field .........................................................72,000Arkansas ......................................................Razorback ................................................................72,000^Not located on campus.
School Stadium Capacity
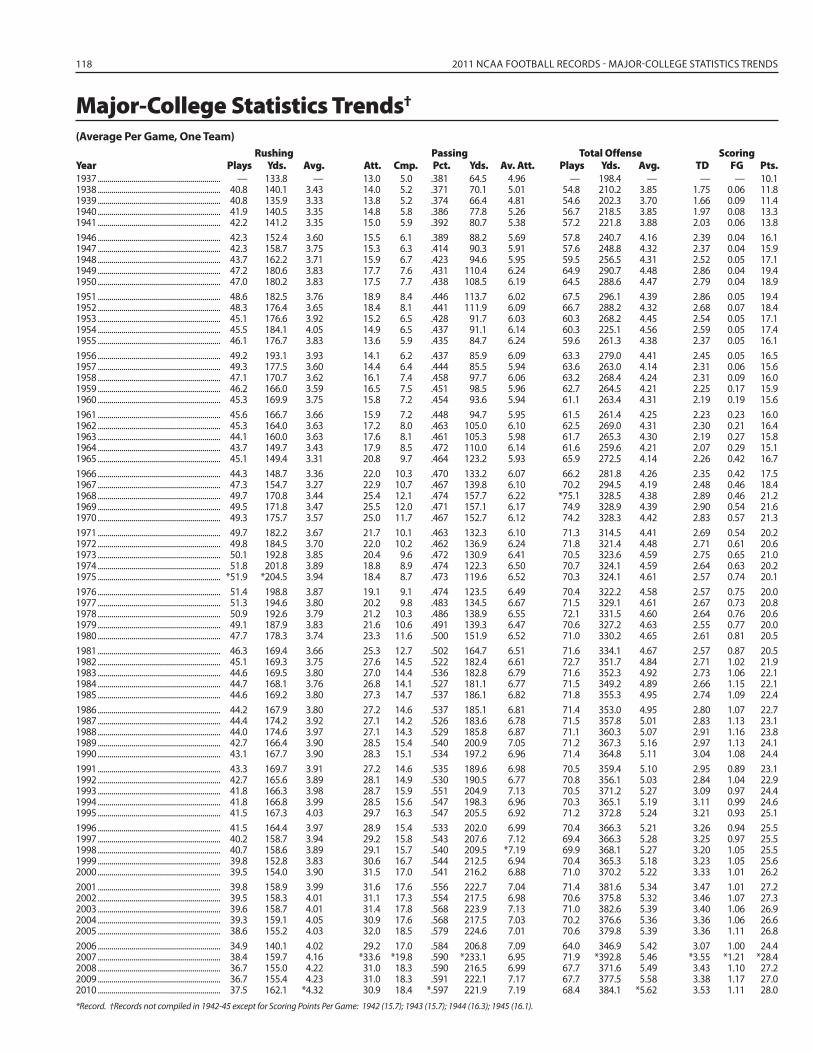
118 2011 NCAA FOOTBALL RECORDS - MAJOR-COLLEGE STATISTICS TRENDS
(Average Per Game, One Team)
Rushing Passing Total Offense ScoringYear Plays Yds. Avg. Att. Cmp. Pct. Yds. Av. Att. Plays Yds. Avg. TD FG Pts.1937 .............................................................. — 133.8 — 13.0 5.0 .381 64.5 4.96 — 198.4 — — — 10.11938 .............................................................. 40.8 140.1 3.43 14.0 5.2 .371 70.1 5.01 54.8 210.2 3.85 1.75 0.06 11.81939 .............................................................. 40.8 135.9 3.33 13.8 5.2 .374 66.4 4.81 54.6 202.3 3.70 1.66 0.09 11.41940 .............................................................. 41.9 140.5 3.35 14.8 5.8 .386 77.8 5.26 56.7 218.5 3.85 1.97 0.08 13.31941 .............................................................. 42.2 141.2 3.35 15.0 5.9 .392 80.7 5.38 57.2 221.8 3.88 2.03 0.06 13.81946 .............................................................. 42.3 152.4 3.60 15.5 6.1 .389 88.2 5.69 57.8 240.7 4.16 2.39 0.04 16.11947 .............................................................. 42.3 158.7 3.75 15.3 6.3 .414 90.3 5.91 57.6 248.8 4.32 2.37 0.04 15.91948 .............................................................. 43.7 162.2 3.71 15.9 6.7 .423 94.6 5.95 59.5 256.5 4.31 2.52 0.05 17.11949 .............................................................. 47.2 180.6 3.83 17.7 7.6 .431 110.4 6.24 64.9 290.7 4.48 2.86 0.04 19.41950 .............................................................. 47.0 180.2 3.83 17.5 7.7 .438 108.5 6.19 64.5 288.6 4.47 2.79 0.04 18.91951 .............................................................. 48.6 182.5 3.76 18.9 8.4 .446 113.7 6.02 67.5 296.1 4.39 2.86 0.05 19.41952 .............................................................. 48.3 176.4 3.65 18.4 8.1 .441 111.9 6.09 66.7 288.2 4.32 2.68 0.07 18.41953 .............................................................. 45.1 176.6 3.92 15.2 6.5 .428 91.7 6.03 60.3 268.2 4.45 2.54 0.05 17.11954 .............................................................. 45.5 184.1 4.05 14.9 6.5 .437 91.1 6.14 60.3 225.1 4.56 2.59 0.05 17.41955 .............................................................. 46.1 176.7 3.83 13.6 5.9 .435 84.7 6.24 59.6 261.3 4.38 2.37 0.05 16.11956 .............................................................. 49.2 193.1 3.93 14.1 6.2 .437 85.9 6.09 63.3 279.0 4.41 2.45 0.05 16.51957 .............................................................. 49.3 177.5 3.60 14.4 6.4 .444 85.5 5.94 63.6 263.0 4.14 2.31 0.06 15.61958 .............................................................. 47.1 170.7 3.62 16.1 7.4 .458 97.7 6.06 63.2 268.4 4.24 2.31 0.09 16.01959 .............................................................. 46.2 166.0 3.59 16.5 7.5 .451 98.5 5.96 62.7 264.5 4.21 2.25 0.17 15.91960 .............................................................. 45.3 169.9 3.75 15.8 7.2 .454 93.6 5.94 61.1 263.4 4.31 2.19 0.19 15.61961 .............................................................. 45.6 166.7 3.66 15.9 7.2 .448 94.7 5.95 61.5 261.4 4.25 2.23 0.23 16.01962 .............................................................. 45.3 164.0 3.63 17.2 8.0 .463 105.0 6.10 62.5 269.0 4.31 2.30 0.21 16.41963 .............................................................. 44.1 160.0 3.63 17.6 8.1 .461 105.3 5.98 61.7 265.3 4.30 2.19 0.27 15.81964 .............................................................. 43.7 149.7 3.43 17.9 8.5 .472 110.0 6.14 61.6 259.6 4.21 2.07 0.29 15.11965 .............................................................. 45.1 149.4 3.31 20.8 9.7 .464 123.2 5.93 65.9 272.5 4.14 2.26 0.42 16.71966 .............................................................. 44.3 148.7 3.36 22.0 10.3 .470 133.2 6.07 66.2 281.8 4.26 2.35 0.42 17.51967 .............................................................. 47.3 154.7 3.27 22.9 10.7 .467 139.8 6.10 70.2 294.5 4.19 2.48 0.46 18.41968 .............................................................. 49.7 170.8 3.44 25.4 12.1 .474 157.7 6.22 *75.1 328.5 4.38 2.89 0.46 21.21969 .............................................................. 49.5 171.8 3.47 25.5 12.0 .471 157.1 6.17 74.9 328.9 4.39 2.90 0.54 21.61970 .............................................................. 49.3 175.7 3.57 25.0 11.7 .467 152.7 6.12 74.2 328.3 4.42 2.83 0.57 21.31971 .............................................................. 49.7 182.2 3.67 21.7 10.1 .463 132.3 6.10 71.3 314.5 4.41 2.69 0.54 20.21972 .............................................................. 49.8 184.5 3.70 22.0 10.2 .462 136.9 6.24 71.8 321.4 4.48 2.71 0.61 20.61973 .............................................................. 50.1 192.8 3.85 20.4 9.6 .472 130.9 6.41 70.5 323.6 4.59 2.75 0.65 21.01974 .............................................................. 51.8 201.8 3.89 18.8 8.9 .474 122.3 6.50 70.7 324.1 4.59 2.64 0.63 20.21975 .............................................................. *51.9 *204.5 3.94 18.4 8.7 .473 119.6 6.52 70.3 324.1 4.61 2.57 0.74 20.11976 .............................................................. 51.4 198.8 3.87 19.1 9.1 .474 123.5 6.49 70.4 322.2 4.58 2.57 0.75 20.01977 .............................................................. 51.3 194.6 3.80 20.2 9.8 .483 134.5 6.67 71.5 329.1 4.61 2.67 0.73 20.81978 .............................................................. 50.9 192.6 3.79 21.2 10.3 .486 138.9 6.55 72.1 331.5 4.60 2.64 0.76 20.61979 .............................................................. 49.1 187.9 3.83 21.6 10.6 .491 139.3 6.47 70.6 327.2 4.63 2.55 0.77 20.01980 .............................................................. 47.7 178.3 3.74 23.3 11.6 .500 151.9 6.52 71.0 330.2 4.65 2.61 0.81 20.51981 .............................................................. 46.3 169.4 3.66 25.3 12.7 .502 164.7 6.51 71.6 334.1 4.67 2.57 0.87 20.51982 .............................................................. 45.1 169.3 3.75 27.6 14.5 .522 182.4 6.61 72.7 351.7 4.84 2.71 1.02 21.91983 .............................................................. 44.6 169.5 3.80 27.0 14.4 .536 182.8 6.79 71.6 352.3 4.92 2.73 1.06 22.11984 .............................................................. 44.7 168.1 3.76 26.8 14.1 .527 181.1 6.77 71.5 349.2 4.89 2.66 1.15 22.11985 .............................................................. 44.6 169.2 3.80 27.3 14.7 .537 186.1 6.82 71.8 355.3 4.95 2.74 1.09 22.41986 .............................................................. 44.2 167.9 3.80 27.2 14.6 .537 185.1 6.81 71.4 353.0 4.95 2.80 1.07 22.71987 .............................................................. 44.4 174.2 3.92 27.1 14.2 .526 183.6 6.78 71.5 357.8 5.01 2.83 1.13 23.11988 .............................................................. 44.0 174.6 3.97 27.1 14.3 .529 185.8 6.87 71.1 360.3 5.07 2.91 1.16 23.81989 .............................................................. 42.7 166.4 3.90 28.5 15.4 .540 200.9 7.05 71.2 367.3 5.16 2.97 1.13 24.11990 .............................................................. 43.1 167.7 3.90 28.3 15.1 .534 197.2 6.96 71.4 364.8 5.11 3.04 1.08 24.41991 .............................................................. 43.3 169.7 3.91 27.2 14.6 .535 189.6 6.98 70.5 359.4 5.10 2.95 0.89 23.11992 .............................................................. 42.7 165.6 3.89 28.1 14.9 .530 190.5 6.77 70.8 356.1 5.03 2.84 1.04 22.91993 .............................................................. 41.8 166.3 3.98 28.7 15.9 .551 204.9 7.13 70.5 371.2 5.27 3.09 0.97 24.41994 .............................................................. 41.8 166.8 3.99 28.5 15.6 .547 198.3 6.96 70.3 365.1 5.19 3.11 0.99 24.61995 .............................................................. 41.5 167.3 4.03 29.7 16.3 .547 205.5 6.92 71.2 372.8 5.24 3.21 0.93 25.11996 .............................................................. 41.5 164.4 3.97 28.9 15.4 .533 202.0 6.99 70.4 366.3 5.21 3.26 0.94 25.51997 .............................................................. 40.2 158.7 3.94 29.2 15.8 .543 207.6 7.12 69.4 366.3 5.28 3.25 0.97 25.51998 .............................................................. 40.7 158.6 3.89 29.1 15.7 .540 209.5 *7.19 69.9 368.1 5.27 3.20 1.05 25.51999 .............................................................. 39.8 152.8 3.83 30.6 16.7 .544 212.5 6.94 70.4 365.3 5.18 3.23 1.05 25.62000 .............................................................. 39.5 154.0 3.90 31.5 17.0 .541 216.2 6.88 71.0 370.2 5.22 3.33 1.01 26.22001 .............................................................. 39.8 158.9 3.99 31.6 17.6 .556 222.7 7.04 71.4 381.6 5.34 3.47 1.01 27.22002 .............................................................. 39.5 158.3 4.01 31.1 17.3 .554 217.5 6.98 70.6 375.8 5.32 3.46 1.07 27.32003 .............................................................. 39.6 158.7 4.01 31.4 17.8 .568 223.9 7.13 71.0 382.6 5.39 3.40 1.06 26.92004 .............................................................. 39.3 159.1 4.05 30.9 17.6 .568 217.5 7.03 70.2 376.6 5.36 3.36 1.06 26.62005 .............................................................. 38.6 155.2 4.03 32.0 18.5 .579 224.6 7.01 70.6 379.8 5.39 3.36 1.11 26.82006 .............................................................. 34.9 140.1 4.02 29.2 17.0 .584 206.8 7.09 64.0 346.9 5.42 3.07 1.00 24.42007 .............................................................. 38.4 159.7 4.16 *33.6 *19.8 .590 *233.1 6.95 71.9 *392.8 5.46 *3.55 *1.21 *28.42008 .............................................................. 36.7 155.0 4.22 31.0 18.3 .590 216.5 6.99 67.7 371.6 5.49 3.43 1.10 27.22009 .............................................................. 36.7 155.4 4.23 31.0 18.3 .591 222.1 7.17 67.7 377.5 5.58 3.38 1.17 27.02010 .............................................................. 37.5 162.1 *4.32 30.9 18.4 *.597 221.9 7.19 68.4 384.1 *5.62 3.53 1.11 28.0*Record. †Records not compiled in 1942-45 except for Scoring Points Per Game: 1942 (15.7); 1943 (15.7); 1944 (16.3); 1945 (16.1).
Major-College Statistics Trends†

2011 NCAA FOOTBALL RECORDS - MAJOR-COLLEGE STATISTICS TRENDS 119
FOO
TBA
LL B
OW
LSU
BD
IVIS
IONAdditional Major-College Statistics Trends†
Rules changes and statistics changes affecting trends: PUNTING—Beginning in 1965, 20 yards not deducted from a punt into the end zone for a touchback. INTERCEPTIONS—Interception yards not compiled, 1958-65. KICKOFF RETURNS—During 1937-45, if a kickoff went out of bounds, the receiving team put the ball in play on its 35-yard line instead of a second kickoff; in 1984 (rescinded in 1985), a 30-yard-line touchback for kickoffs crossing the goal line in flight and first touching the ground out of the end zone; in 1986, kickoffs from the 35-yard line; in 2007, kickoffs from the 30-yard line. PUNT RETURNS—In 1967, interior linemen restricted from leaving until the ball is kicked.(Average Per Game, One Team) Punting Interceptions Punt Returns Kickoff Returns Net Avg. Avg. Avg.Year No. Avg. Avg. No. Ret. Yds. No. Ret. Yds. No. Ret. Yds.1937 ................................................................................................... 9.2 36.3 — 1.68 — — — — — — — —1938 ................................................................................................... 9.3 37.2 — 1.70 9.19 15.8 — — — — — —1939 ................................................................................................... *9.4 36.7 — 1.67 9.84 16.5 *4.42 9.40 41.6 2.14 19.3 41.31940 ................................................................................................... 9.1 36.6 — 1.79 10.05 18.0 4.21 10.58 44.5 2.32 20.4 47.51941 ................................................................................................... 8.9 36.1 — *1.81 11.28 20.4 4.27 11.10 *47.4 2.41 20.2 48.61946 ................................................................................................... 7.3 35.7 — 1.75 11.79 20.6 3.70 11.32 41.9 3.01 18.9 56.91947 ................................................................................................... 6.7 36.4 30.3 1.61 11.93 19.2 3.47 11.73 40.7 3.04 18.9 57.31948 ................................................................................................... 6.3 36.3 30.2 1.60 12.59 20.2 3.09 *12.16 37.6 3.17 18.5 58.61949 ................................................................................................... 6.3 36.6 30.3 1.69 13.23 *22.3 3.21 12.13 38.9 3.51 17.9 62.81950 ................................................................................................... 6.0 36.3 30.8 1.61 11.99 19.3 3.04 10.72 32.6 3.46 16.6 57.41951 ................................................................................................... 6.4 35.9 30.7 1.67 12.00 20.1 3.10 10.58 32.8 3.53 17.0 59.91952 ................................................................................................... 6.3 36.4 31.6 1.60 11.60 18.5 3.07 9.95 30.5 3.45 17.6 60.71953 ................................................................................................... 5.2 34.9 29.7 1.37 12.12 16.6 2.57 10.66 27.4 3.27 17.8 58.21954 ................................................................................................... 4.9 34.9 29.4 1.36 12.48 16.9 2.42 11.16 27.0 3.32 18.4 61.01955 ................................................................................................... 4.9 34.9 29.8 1.26 12.96 16.8 2.39 10.54 25.2 3.09 18.5 57.21956 ................................................................................................... 5.0 35.1 30.1 1.29 12.86 16.6 2.49 10.07 25.1 3.19 18.0 57.41957 ................................................................................................... 5.3 34.8 30.2 1.26 11.95 15.0 2.53 9.57 24.2 3.05 18.7 57.11958 ................................................................................................... 5.6 35.4 30.9 1.33 — — 2.57 9.70 24.9 3.02 18.9 57.01959 ................................................................................................... 5.5 35.9 31.5 1.33 — — 2.67 9.06 24.2 3.09 18.7 57.81960 ................................................................................................... 5.1 36.0 31.4 1.24 — — 2.39 9.73 23.3 3.05 18.8 57.31961 ................................................................................................... 5.2 35.5 35.5 1.22 — — 2.43 9.44 22.9 3.06 18.3 56.11962 ................................................................................................... 5.2 35.7 35.7 1.25 — — 2.36 9.66 22.8 3.10 19.6 60.71963 ................................................................................................... 5.2 36.3 32.5 1.19 — — 2.34 9.71 22.7 3.08 20.1 61.91964 ................................................................................................... 5.3 36.4 32.5 1.20 — — 2.33 8.99 20.9 2.93 19.6 57.31965 ................................................................................................... 5.9 38.5 38.5 1.42 — — 2.73 9.99 27.3 3.15 18.8 59.31966 ................................................................................................... 5.9 37.5 33.5 1.50 12.07 18.1 2.63 8.82 23.2 3.24 18.7 60.81967 ................................................................................................... 6.5 36.8 31.6 1.52 11.39 17.3 3.42 9.92 33.9 3.31 18.7 61.71968 ................................................................................................... 6.7 37.4 33.3 1.61 11.51 18.6 3.01 8.95 26.9 3.64 19.1 69.61969 ................................................................................................... 6.6 37.5 33.4 1.70 11.07 18.8 3.00 9.00 27.0 3.67 18.9 69.41970 ................................................................................................... 6.3 37.4 37.4 1.66 11.65 19.4 2.89 9.28 26.9 3.69 19.0 70.11971 ................................................................................................... 6.2 37.6 33.4 1.49 11.75 17.5 2.89 9.04 26.2 3.57 19.2 68.61972 ................................................................................................... 6.1 37.2 33.4 1.54 11.54 17.7 2.72 8.61 23.4 3.50 19.0 66.41973 ................................................................................................... 5.8 37.8 34.1 1.36 11.30 15.4 2.52 8.65 21.8 3.54 19.6 69.21974 ................................................................................................... 5.6 37.6 34.2 1.23 11.30 13.9 2.40 7.92 19.0 3.38 19.1 64.31975 ................................................................................................... 5.4 38.1 35.0 1.21 11.26 13.6 2.39 7.19 17.2 3.20 19.3 61.71976 ................................................................................................... 5.7 38.0 35.1 1.23 11.44 14.0 2.42 6.83 16.5 3.14 18.3 57.41977 ................................................................................................... 5.8 38.0 35.0 1.26 11.05 13.9 2.45 7.10 17.3 3.16 18.4 58.11978 ................................................................................................... 6.0 38.0 34.9 1.34 10.83 14.5 2.51 7.39 18.6 3.18 18.7 59.61979 ................................................................................................... 5.8 37.7 34.8 1.31 10.66 14.0 2.38 7.09 16.9 3.02 18.8 56.91980 ................................................................................................... 5.8 38.3 35.4 1.37 10.85 14.9 2.44 7.01 17.1 2.91 19.0 55.11981 ................................................................................................... 6.0 38.9 35.9 1.38 10.22 14.1 2.45 7.22 17.7 2.86 18.8 53.91982 ................................................................................................... 5.9 39.8 *36.5 1.39 10.70 14.9 2.40 8.00 19.2 2.69 19.3 51.91983 ................................................................................................... 5.5 39.5 35.9 1.37 10.43 14.3 2.47 7.95 19.7 2.65 19.2 50.81984 ................................................................................................... 5.6 39.7 36.3 1.31 10.07 13.2 2.47 7.61 18.8 3.03 18.6 56.21985 ................................................................................................... 5.5 39.6 36.1 1.30 10.47 13.6 2.45 7.92 19.4 2.94 19.4 57.01986 ................................................................................................... 5.4 39.2 35.4 1.30 10.99 14.3 2.51 8.23 20.7 3.78 19.8 74.61987 ................................................................................................... 5.4 38.6 34.7 1.32 10.82 14.3 2.48 8.31 20.6 3.89 19.1 74.51988 ................................................................................................... 5.2 38.4 34.7 1.24 11.17 14.0 2.39 7.96 19.1 3.97 19.4 77.11989 ................................................................................................... 5.2 38.5 34.3 1.28 10.75 13.8 2.36 8.46 20.0 3.92 19.7 77.21990 ................................................................................................... 5.3 38.6 34.3 1.23 11.40 14.0 2.45 9.33 22.9 3.79 19.6 74.51991 ................................................................................................... 5.3 38.4 34.3 1.18 11.30 13.3 2.50 8.74 21.9 3.43 19.4 66.61992 ................................................................................................... 5.6 39.0 34.9 1.20 11.00 13.2 2.63 9.04 23.8 3.30 20.1 66.41993 ................................................................................................... 5.2 38.8 35.1 1.14 11.00 12.5 2.28 8.28 18.9 3.43 20.0 68.71994 ................................................................................................... 5.3 39.2 35.3 1.10 12.10 13.3 2.38 8.64 20.5 3.50 20.0 69.81995 ................................................................................................... 5.3 38.7 34.9 1.12 11.67 13.1 2.23 8.98 20.0 3.57 19.5 69.71996 ................................................................................................... 5.5 40.0 35.8 1.04 12.83 13.4 2.39 9.56 22.8 3.34 20.4 68.01997 ................................................................................................... 5.4 40.5 36.2 1.05 12.45 13.0 2.47 9.49 23.4 3.47 20.3 70.51998 ................................................................................................... 5.5 39.8 35.5 1.05 12.80 13.4 2.53 9.45 23.9 3.52 20.6 72.41999 ................................................................................................... 5.6 39.8 35.3 1.12 13.00 14.5 2.61 9.61 25.1 3.36 20.3 68.22000 ................................................................................................... 5.6 39.0 34.2 1.12 13.55 15.2 2.64 10.15 26.8 3.49 19.6 68.62001 ................................................................................................... 5.3 39.8 35.0 1.12 12.66 14.2 2.59 9.84 25.4 3.43 20.7 71.02002 ................................................................................................... 5.2 39.5 34.2 1.10 12.61 13.8 2.73 10.59 28.9 3.47 20.2 70.42003 ................................................................................................... 5.3 40.4 34.7 1.06 12.69 13.4 2.67 9.84 26.3 3.30 20.6 67.82004 ................................................................................................... 5.3 39.9 35.5 1.04 13.29 13.9 2.45 9.95 24.4 3.34 20.4 68.12005 ................................................................................................... 5.2 39.9 ^33.7 1.04 12.37 12.9 2.33 9.81 22.8 3.30 20.8 68.62006 ................................................................................................... 4.6 39.9 34.3 0.98 13.03 13.2 2.0 9.28 18.4 3.1 20.5 64.02007 ................................................................................................... 5.1 40.3 34.7 1.07 13.39 14.6 2.1 9.45 19.7 *4.5 21.5 *95.92008 ................................................................................................... 4.7 40.2 35.0 1.02 *14.28 14.6 1.92 9.51 18.2 4.2 21.3 88.52009 ................................................................................................... 4.8 40.6 35.3 0.97 13.61 13.2 1.82 9.34 17.0 4.3 21.9 93.92010 ................................................................................................... 4.8 *40.9 36.2 1.00 13.62 13.6 1.77 8.89 15.7 4.2 *21.9 92.7*Record. †Records not compiled in 1942-45. ^Starting in 2005, touchbacks were included in net punting.

120 2011 NCAA FOOTBALL RECORDS - MAJOR-COLLEGE STATISTICS TRENDS
Field Goal Trends (1938-68)
Field Goal Trends (From 1969)(Includes Field Goal Attempts by FCS, Divisions II and III Opponents)
Totals Breakdown by DistancesYear Made Atts. Pct. 16-39 Pct. 16-49 Pct. 40-49 Pct. 50-59 Pct. 60 Plus1969 ................................ 669 1,402 .477 .......................................... 538-872 .617 654-1,267 .516 116-395 .294 15-135 .111 0-81970 ................................ 754 1,548 .487 .......................................... 614-990 .620 740-1,380 .536 126-390 .323 14-168 .083 1-91971 ................................ 780 1,625 .480 .......................................... 607-1,022 .594 760-1,466 .518 153-444 .345 20-159 .126 0-111972 ................................ 876 1,828 .479 .......................................... 705-1,150 .613 855-1,641 .521 150-491 .305 21-187 .112 1-121973 ................................ 958 1,920 .499 .......................................... 728-1,139 .639 914-1,670 .547 186-531 .350 44-250 .176 1-211974 ................................ 947 1,905 .497 .......................................... 706-1,096 .644 906-1,655 .547 200-559 .358 41-250 .164 1-171975 ................................ 1,164 2,237 .520 .......................................... 849-1,255 .676 1,088-1,896 .574 239-641 .373 76-341 .223 4-321976 ................................ 1,187 2,330 .509 .......................................... 854-1,301 .656 1,131-1,997 .566 277-696 .398 56-333 .168 3-241977 ................................ 1,238 2,514 .492 .......................................... 882-1,315 .671 1,160-2,088 .556 278-773 .360 78-426 .183 6-401978 ................................ 1,229 2,113 .582 .......................................... 938-1,361 .689 1,193-1,982 .602 255-621 .411 36-131 .275 1-4 Totals Breakdown by DistancesYear Made Atts. Pct. Under 20 20-29 30-39 40-49 50-59 60 Plus1979 ................................ 1,241 2,129 .583 ................ 34-43 .791 455-601 .757 425-706 .602 286-600 .477 41-173 .237 0-6 .0001980 ................................ 1,245 2,128 .585 ................ 31-39 .795 408-529 .771 452-696 .649 317-682 .465 37-175 .211 0-7 .0001981 ................................ 1,368 2,254 .607 ................ 42-48 .875 471-598 .788 461-731 .631 335-698 .480 58-169 .343 1-10 .1001982 ................................ 1,224 1,915 .639 ................ 31-34 .912 384-475 .808 415-597 .695 319-604 .528 73-190 .384 2-15 .1331983 ................................ 1,329 2,025 .656 ................ 34-37 .919 417-508 .821 477-636 .750 329-628 .524 72-201 .358 0-15 .0001984 ................................ 1,442 2,112 .683 ................ 44-49 .898 450-532 .846 503-681 .739 363-630 .576 80-206 .388 2-14 .1431985 ................................ 1,360 2,106 .646 ................ 40-47 .851 416-511 .814 478-657 .728 341-647 .527 84-227 .370 1-17 .0591986 ................................ 1,326 2,034 .652 ................ 45-48 .938 445-525 .848 448-641 .699 340-629 .541 44-182 .242 4-9 .4441987 ................................ 1,381 2,058 .671 ................ 45-48 .938 484-559 .866 469-638 .735 311-604 .515 72-200 .360 0-9 .0001988 ................................ 1,421 2,110 .673 ................ 33-35 .943 487-573 .850 495-664 .745 337-610 .552 68-217 .313 1-11 .0911989# .............................. 1,389 2,006 .692 ................ 50-53 .943 497-565 .880 471-655 .719 319-573 .557 52-154 .338 0-6 .0001990 ................................ 1,348 2,011 .670 ................ 39-42 .929 477-546 .874 454-626 .725 319-625 .510 59-167 .353 0-5 .0001991$ .............................. 1,092 1,831 .596 ................ 31-32 .969 395-519 .761 366-612 .598 254-531 .478 45-132 .341 1-5 .2001992 ................................ 1,288 1,986 .649 ................ 32-38 .842 464-569 .815 447-673 .664 294-577 .510 49-126 .389 2-3 .6671993§.............................. 1,182 1,832 .645 ................ 23-25 .920 490-599 .818 407-617 .660 224-488 .459 38-98 .388 0-5 .0001994 ................................ 1,220 1,877 .650 ................ 39-40 .975 458-528 .867 419-626 .669 263-547 .481 40-128 .313 1-8 .1251995 ................................ 1,150 1,759 .654 ................ 32-32 1.000 468-549 .852 373-587 .635 244-489 .499 31-100 .310 2-2 1.0001996 ................................ 1,207 1,899 .636 ................ 28-29 .966 431-509 .847 422-632 .668 277-581 .477 49-147 .333 0-1 .0001997 ................................ 1,255 1,895 .662 ................ 47-48 .979 445-524 .849 446-659 .677 272-540 .504 45-122 .369 0-2 .0001998 ................................ 1,376 2,075 .663 ................ 50-60 .833 475-563 .844 466-681 .684 336-622 .540 48-144 .333 1-5 .2001999 ................................ 1,387 2,074 .669 ................ 36-38 .947 499-608 .821 480-671 .715 321-611 .525 50-142 .352 1-4 .2502000 ................................ 1,285 1,906 .674 ................ 29-32 .906 442-517 .855 469-667 .703 297-539 .551 48-149 .322 0-2 .0002001 ................................ 1,302 1,941 .671 ................ 34-37 .919 459-530 .866 458-655 .699 306-572 .535 45-143 .315 0-4 .0002002 ................................ 1,580 2,355 .671 ................ 55-63 .873 541-637 .849 546-789 .692 389-717 .543 49-143 .343 0-6 .0002003 ................................ 1,560 2,260 .690 ................ 53-58 .914 552-650 .849 540-768 .703 359-608 .590 56-169 .331 0-7 .0002004 ................................ 1,435 2,131 .673 ................ 48-54 .889 460-538 .855 461-649 .710 422-752 .561 43-133 .323 1-5 .2002005 ................................ 1,525 2,209 .690 ................ 42-43 .977 572-666 .859 514-726 .708 346-647 .535 51-127 .402 0-0 .0002006 ................................ 1,500 2,127 .705 ................ 47-50 .940 540-617 .875 535-748 .715 314-559 .562 64-149 .430 0-4 .0002007 ................................ *1,829 *2,540 .720 ................ 42-44 .955 644-730 .882 625-860 .723 444-738 .602 73-165 .442 1-3 .3332008 ................................ 1,647 2,343 .703 ................ 45-48 .938 616-719 .857 547-728 .751 374-681 .549 64-161 .398 1-6 .1672009 ................................ 1,775 2,434 .729 ................ 51-53 .962 669-757 .884 595-812 .733 399-657 .607 61-153 .399 0-2 .0002010 ................................ 1,686 2,286 *.738 ................ 41-43 .953 605-684 .885 580-750 .773 391-671 .583 68-136 .500 1-2 .500*Record. #First year after kicking tee became illegal. $First year after goal-post width narrowed back to 18’6’’ from 23’4’’. §First year after hash marks narrowed to 60 feet from each sideline.
Field Goal Trends by Soccer-Style and Conventional Kickers(FBS Kickers Only)
(Pete Gogolak of Cornell was documented as the first soccer-style kicker in college football history. The Hungarian-born kicker played at Cornell from 1961 through 1963. He set a national major-college record of 44 consecutive extra-point conversions and finished 54 of 55 for his career. His younger brother, Charley, also a soccer-styler, kicked at Princeton from 1963 through 1965.)
SOCCER-STYLE Totals Breakdown by DistancesYear †No. Made Atts. Pct. 16-39 Pct. 16-49 Pct. 40-49 Pct. 50-59 Pct. 60 Plus1975 ........................................................ 70 528 1,012 .522............... 370-540 .685 479-816 .587 109-276 .395 49-196 .250 1-17
Year Made1938 ..................................................................471939 ..................................................................801940 ..................................................................841941 ..................................................................591942-45 ..............................................................*1946 ..................................................................441947 ..................................................................381948 ..................................................................531949 ..................................................................461950 ..................................................................46
1961 ............................................................... 2771962 ............................................................... 2611963 ............................................................... 3141964 ............................................................... 368Year Made Atts. Pct.1965 ............................................................... 484 1,035 .4681966 ............................................................... 522 1,125 .4641967 ............................................................... 555 1,266 .4381968 ............................................................... 566 1,287 .440*Records not compiled. †Goal uprights widened from 18 feet, 6 inches to 23 feet, 4 inches in 1959.
1951 ..................................................................531952 ..................................................................831953 ..................................................................501954 ..................................................................481955 ..................................................................571956 ..................................................................531957 ..................................................................641958 ............................................................... 1031959 .............................................................†1991960 ............................................................... 224
Year Made Year Made

2011 NCAA FOOTBALL RECORDS - MAJOR-COLLEGE STATISTICS TRENDS 121
FOO
TBA
LL B
OW
LSU
BD
IVIS
ION
1976 ........................................................ 84 517 1,019 .507............... 350-517 .677 477-831 .574 127-314 .404 40-188 .213 3-161977 ........................................................ 96 665 1,317 .505............... 450-649 .693 615-1,047 .587 165-398 .415 50-270 .185 2-271978 ........................................................ 98 731 1,244 .588............... 540-768 .703 703-1,148 .612 163-380 .429 28-96 .292 1-3 Under 20 20-29 30-39 40-49 50-59 60 Plus1979 ........................................................ 116 839 1,413 .594.......................................................... 23-28 288-380 282-455 214-419 32-126 0-51980 ........................................................ 121 988 1,657 .596.......................................................... 26-32 327-416 342-522 261-540 32-147 0-51981 ........................................................ 138 1,108 1,787 .620.......................................................... 32-36 377-476 376-576 279-551 43-142 1-61982 ........................................................ 105 1,026 1,548 .663.......................................................... 26-27 317-375 346-482 273-495 62-156 2-131983 ........................................................ 110 1,139 1,724 .661.......................................................... 29-31 345-416 403-541 294-543 68-179 0-141984 ........................................................ 127 1,316 1,898 .694.......................................................... 43-47 414-480 438-589 341-572 78-197 2-131985 ........................................................ 133 1,198 1,838 .652.......................................................... 35-41 369-452 415-578 306-560 72-191 1-161986 ........................................................ 128 1,201 1,829 .657.......................................................... 37-40 398-467 410-575 313-576 39-162 4-91987 ........................................................ 122 1,275 1,892 .674.......................................................... 40-43 458-523 424-574 290-566 63-177 0-91988 ........................................................ 140 1,317 1,947 .676.......................................................... 31-33 445-521 468-630 311-562 61-201 1-111989 ........................................................ 138 1,313 1,897 .692.......................................................... 49-52 462-526 441-612 310-551 51-150 0-61990 ........................................................ 135 1,282 1,890 .678.......................................................... 36-38 450-515 432-589 308-590 56-154 0-41991 ........................................................ 132 1,048 1,763 .594.......................................................... 30-31 381-500 349-589 243-512 44-130 1-11992 ........................................................ 135 1,244 1,926 .646.......................................................... 31-37 447-554 429-647 288-561 47-124 2-31993 ........................................................ 132 1,153 1,776 .649.......................................................... 23-25 475-578 398-600 219-475 38-93 0-51994 ........................................................ 138 1,203 1,856 .648.......................................................... 38-39 452-522 410-617 263-543 39-127 1-81995 ........................................................ 148 1,150 1,759 .654.......................................................... 32-32 468-549 373-587 244-489 31-100 2-21996 ........................................................ 149 1,207 1,899 .636.......................................................... 28-29 431-509 422-632 277-581 49-147 0-11997 ........................................................ 146 1,255 1,895 .662.......................................................... 47-48 445-524 446-659 272-540 45-122 0-21998 ........................................................ 149 1,376 2,075 .663.......................................................... 50-60 475-563 466-681 336-622 48-144 1-51999 ........................................................ 153 1,387 2,074 .669.......................................................... 36-38 499-608 480-671 321-611 50-142 1-42000 ........................................................ 147 1,285 1,906 .674.......................................................... 29-32 442-517 469-667 297-539 48-149 0-22001 ........................................................ 151 1,302 1,941 .671.......................................................... 34-37 459-530 458-655 306-572 45-143 0-42002 ........................................................ 159 1,580 2,355 .671.......................................................... 55-63 541-637 546-789 389-717 49-143 0-62003 ........................................................ 162 1,560 2,260 .690.......................................................... 53-58 552-650 540-768 359-608 56-169 0-72004 ........................................................ 169 1,435 2,131 .673.......................................................... 48-54 460-538 461-649 422-752 43-133 1-52005 ........................................................ NA 1,525 2,209 .690.......................................................... 42-43 572-666 514-726 346-647 51-127 0-02006 ........................................................ NA 1,500 2,127 .705.......................................................... 47-50 540-617 535-748 314-559 64-149 0-42007 ........................................................ NA *1,829 *2,540 .720.......................................................... 42-44 644-730 625-860 444-738 73-165 1-32008 ........................................................ NA 1,647 2,343 .703.......................................................... 45-48 616-719 547-728 374-681 64-161 1-62009 ........................................................ NA 1,775 2,434 .729.......................................................... 51-53 669-757 595-812 399-657 61-153 0-22010 ........................................................ NA 1,686 2,286 *.738.......................................................... 41-43 605-684 580-750 391-671 68-136 1-2
CONVENTIONAL Totals Breakdown by DistancesYear †No. Made Atts. Pct. 16-39 Pct. 16-49 Pct. 40-49 Pct. 50-59 Pct. 60 Plus1975 ........................................................ 116 564 1,085 .520................427-640 .667 541-959 .564 114-319 .357 23-126 .183 3-131976 ........................................................ 101 608 1,192 .510................460-720 .639 594-1,065 .558 134-345 .388 14-127 .110 0-71977 ........................................................ 98 513 1,054 .487................384-586 .655 487-916 .532 103-330 .312 26-138 .188 4-141978 ........................................................ 86 440 761 .578................352-516 .682 434-729 .595 82-213 .385 6-32 .188 0-0 Under 20 20-29 30-39 40-49 50-59 60 Plus1979 ........................................................ 70 333 585 .569.......................................................... 10-14 140-185 111-198 63-150 9-37 0-11980 ........................................................ 62 258 471 .548............................................................ 5-7 81-113 110-174 56-142 6-33 0-21981 ........................................................ 50 195 367 .531............................................................ 8-9 70-97 69-126 41-112 7-22 0-11982 ........................................................ 25 103 195 .528............................................................ 3-4 36-50 34-62 25-59 5-18 0-21983 ........................................................ 23 112 181 .619............................................................ 4-5 40-55 46-58 22-50 0-12 0-11984 ........................................................ 10 44 76 .579............................................................ 0-1 17-26 20-33 7-15 0-1 0-01985 ........................................................ 12 81 138 .587............................................................ 3-4 22-29 29-40 19-44 8-20 0-11986 ........................................................ 8 58 89 .652............................................................ 4-4 21-28 17-27 14-24 2-6 0-01987 ........................................................ 4 35 50 .700............................................................ 4-4 10-14 14-16 6-9 1-7 0-01988 ........................................................ 5 26 40 .650............................................................ 0-0 17-21 5-7 4-10 0-2 0-01989 ........................................................ 2 37 47 .787............................................................ 1-1 19-20 12-16 5-9 0-1 0-01990 ........................................................ 2 23 38 .605............................................................ 1-1 8-10 8-9 4-13 2-5 0-01991 ........................................................ 2 16 24 .667............................................................ 0-0 5-9 6-7 5-7 0-1 0-01992 ........................................................ 1 12 18 .667............................................................ 0-0 5-6 6-8 1-4 0-0 0-01993 ........................................................ 1 6 11 .545............................................................ 0-0 4-5 2-3 0-3 0-0 0-01994 ........................................................ 1 17 21 *.810............................................................ 1-1 6-6 9-9 0-4 1-1 0-01995 ........................................................ 0 0 0 .000............................................................ 0-0 0-0 0-0 0-0 0-0 0-01996 ........................................................ 0 0 0 .000............................................................ 0-0 0-0 0-0 0-0 0-0 0-01997 ........................................................ 0 0 0 .000............................................................ 0-0 0-0 0-0 0-0 0-0 0-01998 ........................................................ 0 0 0 .000............................................................ 0-0 0-0 0-0 0-0 0-0 0-01999 ........................................................ 0 0 0 .000............................................................ 0-0 0-0 0-0 0-0 0-0 0-02000 ........................................................ 0 0 0 .000............................................................ 0-0 0-0 0-0 0-0 0-0 0-02001 ........................................................ 0 0 0 .000.............................................................0-0 0-0 0-0 0-0 0-0 0-02002 ........................................................ 0 0 0 .000.............................................................0-0 0-0 0-0 0-0 0-0 0-02003 ........................................................ 0 0 0 .000.............................................................0-0 0-0 0-0 0-0 0-0 0-02004 ........................................................ 0 0 0 .000.............................................................0-0 0-0 0-0 0-0 0-0 0-02005 ........................................................ 0 0 0 .000.............................................................0-0 0-0 0-0 0-0 0-0 0-02006 ........................................................ 0 0 0 .000.............................................................0-0 0-0 0-0 0-0 0-0 0-02007 ........................................................ 0 0 0 .000.............................................................0-0 0-0 0-0 0-0 0-0 0-02008 ........................................................ 0 0 0 .000.............................................................0-0 0-0 0-0 0-0 0-0 0-02009 ........................................................ 0 0 0 .000.............................................................0-0 0-0 0-0 0-0 0-0 0-02010 ........................................................ 0 0 0 .000.............................................................0-0 0-0 0-0 0-0 0-0 0-0*Record. †Number of kickers attempting at least one field goal.
Totals Breakdown by DistancesYear †No. Made Atts. Pct. 16-39 Pct. 16-49 Pct. 40-49 Pct. 50-59 Pct. 60 Plus

122 2011 NCAA FOOTBALL RECORDS - MAJOR-COLLEGE STATISTICS TRENDS
Average Yardage of Field Goals(FBS Kickers Only)
Soccer-Style Conventional OverallYear Made Missed Tot. Made Missed Tot. Made Missed Tot.1975 35.1 43.2 39.0 33.1 41.3 37.0 34.1 42.2 37.91976 35.0 43.1 39.0 33.2 40.7 36.9 34.0 41.8 37.91977 34.7 44.3 39.5 33.3 41.9 37.7 34.1 43.2 38.71978 34.0 39.9 36.4 31.9 38.3 34.6 33.2 39.3 35.71979 33.7 39.9 36.2 31.9 38.0 34.5 33.2 39.3 35.71980 34.0 40.7 36.7 33.4 39.6 36.2 33.8 40.4 36.61981 33.9 40.1 36.2 33.2 38.6 35.7 33.8 39.8 36.11982 34.8 41.8 37.2 34.0 39.8 36.7 34.7 41.5 37.11983 34.7 42.1 37.2 32.3 40.5 35.5 34.5 41.9 37.01984 34.4 41.8 36.7 32.3 34.9 33.4 34.3 41.5 36.51985 34.5 41.3 36.8 35.4 41.7 38.0 34.5 41.3 36.91986 33.9 41.6 36.6 32.5 38.6 34.7 33.9 41.4 36.51987 33.5 41.8 36.2 32.3 41.4 35.1 33.5 41.8 36.21988 33.9 41.7 36.4 30.0 37.6 32.7 32.0 39.3 34.41989 33.5 41.2 35.9 30.5 39.6 32.4 33.4 41.2 35.81990 33.4 41.3 36.0 33.4 42.0 36.7 33.4 41.3 36.01991 33.2 40.7 35.8 28.6 31.9 40.7 35.9 40.4 36.11992 34.1 41.2 36.7 30.1 37.8 32.7 37.2 41.3 37.81993 32.4 38.9 34.7 26.8 38.0 31.9 32.3 38.9 34.61994 32.9 40.6 35.6 31.4 45.5 34.0 32.9 40.7 35.61995 32.4 40.1 35.0 — — — 32.4 40.1 35.01996 33.4 40.5 36.0 — — — 33.4 40.5 36.01997 33.2 40.1 35.5 — — — 33.2 40.1 35.51998 33.4 40.6 36.1 — — — 33.4 40.6 36.11999 34.0 40.9 36.8 — — — 34.0 40.9 36.82000 33.8 40.3 36.2 — — — 33.8 40.3 36.22001 34.1 40.2 36.4 — — — 34.1 40.2 36.42002 34.9 40.5 36.6 — — — 34.9 40.5 36.62003 34.8 40.6 36.7 — — — 34.8 40.6 36.72004 34.4 40.8 36.8 — — — 34.4 40.8 36.82005 33.1 39.9 35.2 — — — 33.1 39.9 35.22006 33.1 39.8 35.1 — — — 33.1 39.8 35.12007 33.5 40.1 35.4 — — — 33.5 40.1 35.42008 33.1 40.1 35.2 — — — 33.1 40.1 35.22009 33.0 39.9 34.8 — — — 33.0 39.9 34.82010 33.4 40.1 35.1 — — — 33.4 40.1 35.1
FBS Extra-Point Trends(From Start of Two-Point Attempts)
Percent of Total Tries Kick Attempts 2-Point AttemptsYear Games Kick 2-Pt. Atts. Made Pct. Atts. Made Pct.1958 578 #.486 *.514 1,295 889 .686 *1,371 *613 .4471959 578 .598 .402 1,552 1,170 .754 1,045 421 .4031960 596 .701 .299 1,849 1,448 .783 790 345 .4371961 574 .723 .277 1,842 1,473 .800 706 312 .4421962 602 .724 .276 1,987 1,549 .780 757 341 .4501963 605 .776 .224 2,057 1,659 .807 595 256 .4301964 613 .814 .186 2,053 1,704 .830 469 189 .4031965 619 .881 .119 2,460 2,083 .847 331 134 .4051966 626 .861 .139 2,530 2,167 .857 410 165 .4021967 611 .869 .131 2,629 2,252 .857 397 160 .4031968 615 .871 .129 3,090 2,629 .851 456 181 .3971969 621 .880 .120 3,168 2,781 .878 432 170 .3941970 667 .862 .138 3,255 2,875 .883 522 246 *.4711971 726 .889 .111 3,466 3,081 .889 433 173 .4001972 720 .872 .128 3,390 3,018 .890 497 219 .4411973 741 .893 .107 3,637 3,258 .896 435 180 .4141974 749 .885 .115 3,490 3,146 .901 455 211 .4641975 785 .891 .109 3,598 3,266 .908 440 171 .3891976 796 .877 .123 3,579 3,241 .906 502 203 .4041977 849 .891 .109 4,041 3,668 .908 495 209 .4221978 816 .884 .116 3,808 3,490 .916 498 208 .4181979 811 .897 .103 3,702 3,418 .923 424 176 .4151980 810 .895 .105 3,785 3,480 .919 442 170 .3841981 788 .901 .099 3,655 3,387 .927 403 172 .4271982 599 .901 .099 2,920 2,761 .946 320 120 .3751983 631 .896 .104 3,080 2,886 .937 356 151 .4241984 626 .889 .111 2,962 2,789 .942 370 173 .4681985 623 .899 .101 3,068 2,911 .949 345 121 #.3511986 619 .905 .095 3,132 2,999 .958 330 131 .3971987 615 .892 .108 3,094 2,935 .949 375 163 .4351988 616 .899 .101 3,215 3,074 .956 363 156 .4301989 614 .888 .112 3,233 3,090 .956 409 179 .4381990 623 .911 .089 3,429 3,291 .960 335 138 .412
1991 617 .906 .094 3,279 3,016 .920 342 128 .3741992 619 .899 .101 3,156 2,967 .940 353 159 .4501993 613 .912 .088 3,455 3,251 .941 333 143 .4291994 617 .897 .103 3,433 3,207 .934 395 163 .4131995 622 .902 .098 3,594 3,354 .933 389 173 .4451996 644 .923 .077 3,862 3,630 .940 322 144 .4471997 646 .913 .087 3,828 3,572 .933 367 155 .4221998 652 .919 .081 3,826 3,590 .938 339 146 .4311999 663 .926 .074 3,957 3,725 .941 315 128 .4062000 638 .934 .066 3,955 3,701 .936 278 114 .4102001 645 .923 .077 4,125 3,897 .945 342 138 .4042002 740 .930 .070 4,744 4,452 .938 359 156 .4352003 735 .943 .057 4,705 4,482 .953 287 116 .4042004 677 .950 .050 4,317 4,112 .953 229 97 .4242005 691 .953 .047 4,361 4,160 .954 215 98 .4562006 792^ .951 .049 4,370 4,158 .951 238 88 .3702007 798^ .952 .048 5,070 4,886 .964 254 107 .4212008 797^ *.965 #.035 4,972 4,792 *.964 #181 #67 .3702009 808^ .951 .049 4,873 4,669 .958 249 101 .4062010 807^ .959 .041 *5,163 *4,975 .964 220 88 .400*Record high. #Record low. ^Includes games against opponents from all divisions.
Percent of Total Tries Kick Attempts 2-Point AttemptsYear Games Kick 2-Pt. Atts. Made Pct. Atts. Made Pct.
1951 .............................................................. .7111952 .............................................................. .7441953 .............................................................. .6501954 .............................................................. .6561955 .............................................................. .6691956 .............................................................. .6661957 .............................................................. .653*Not compiled.
Year Pct. Made1938 .............................................................. .6081939 .............................................................. .6251940 .............................................................. .6071941 .............................................................. .6381942-45 ..............................................................*1946 .............................................................. .6571947 .............................................................. .6571948 .............................................................. .7081949 .............................................................. .7381950 .............................................................. .713
Year Pct. Made
FBS Extra-Point Kick Attempts (1938-57)
FBS Defensive Extra-Point TrendsIn 1988, the NCAA Football Rules Committee adopted a rule that gave defensive teams an opportunity to score two points on point-after-touchdown tries. The two points were awarded for returning an interception or advancing a blocked kick for a touchdown on point-after tries. Kick Int. TotalYear Games Ret./TDs Ret./TDs Ret./TDs1988 .......................................................616 8/2 6/0 14/21989 .......................................................614 12/3 9/2 21/51990 .......................................................623 9/3 5/2 14/51991 .......................................................617 9/3 10/3 19/61992 .......................................................619 8/5 1/0 9/51993 .......................................................613 5/2 6/1 11/31994 .......................................................617 4/0 8/3 12/31995 .......................................................622 12/5 5/3 17/81996 .......................................................644 9/4 7/3 16/71997 .......................................................646 13/3 6/1 19/41998 .......................................................652 11/4 7/4 18/81999 .......................................................663 8/2 3/0 11/22000 .......................................................638 10/3 5/2 15/52001 .......................................................645 11/4 7/3 18/72002 .......................................................740 19/4 6/3 25/72003 .......................................................735 16/5 5/3 21/82004 .......................................................677 13/3 4/2 17/52005 .......................................................691 17/7 8/2 25/92006 ....................................................792^ 12/3 5/3 17/62007 ....................................................798^ 14/5 6/2 20/72008 ....................................................797^ 22/8 7/2 29/102009 ....................................................808^ 16/5 6/1 22/62010 ....................................................807^ 15/5 1/1 16/6 Totals ...........................................15,674 273/88 133/46 406/134
^Includes games against opponents from all divisions.
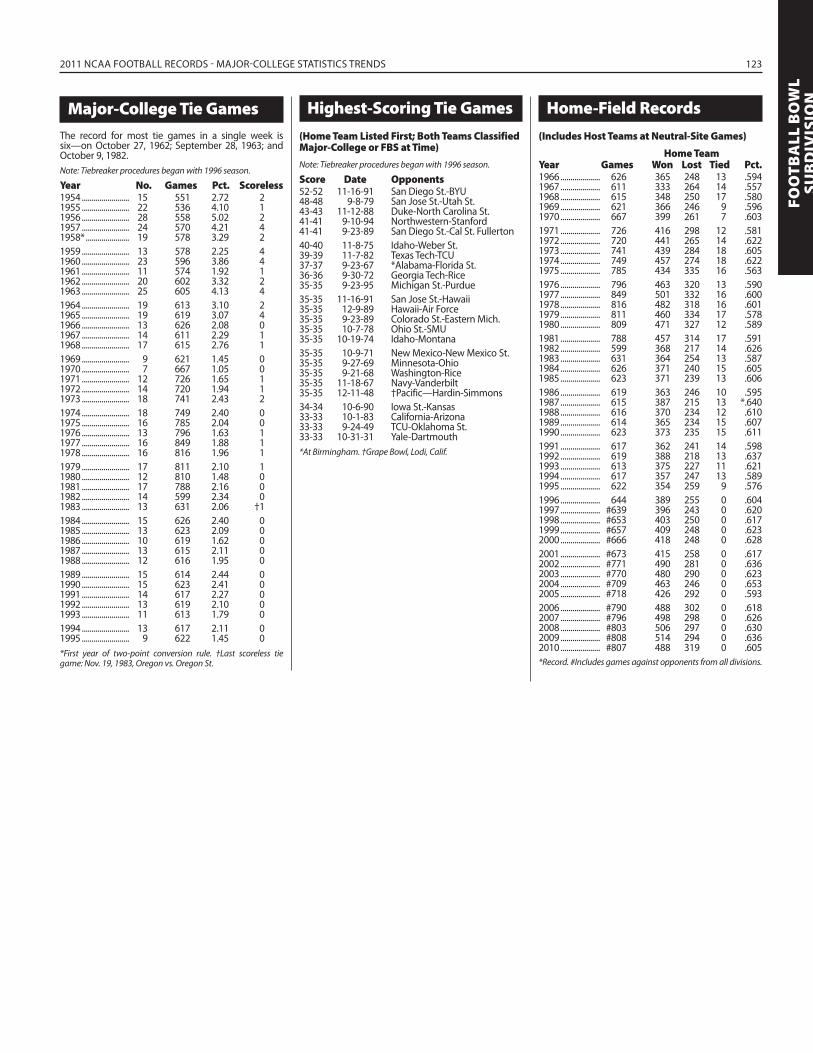
2011 NCAA FOOTBALL RECORDS - MAJOR-COLLEGE STATISTICS TRENDS 123
FOO
TBA
LL B
OW
LSU
BD
IVIS
IONMajor-College Tie Games
The record for most tie games in a single week is six—on October 27, 1962; September 28, 1963; and October 9, 1982.Note: Tiebreaker procedures began with 1996 season.
Year No. Games Pct. Scoreless1954 ........................ 15 551 2.72 21955 ........................ 22 536 4.10 11956 ........................ 28 558 5.02 21957 ........................ 24 570 4.21 41958* ...................... 19 578 3.29 21959 ........................ 13 578 2.25 41960 ........................ 23 596 3.86 41961 ........................ 11 574 1.92 11962 ........................ 20 602 3.32 21963 ........................ 25 605 4.13 41964 ........................ 19 613 3.10 21965 ........................ 19 619 3.07 41966 ........................ 13 626 2.08 01967 ........................ 14 611 2.29 11968 ........................ 17 615 2.76 11969 ........................ 9 621 1.45 01970 ........................ 7 667 1.05 01971 ........................ 12 726 1.65 11972 ........................ 14 720 1.94 11973 ........................ 18 741 2.43 21974 ........................ 18 749 2.40 01975 ........................ 16 785 2.04 01976 ........................ 13 796 1.63 11977 ........................ 16 849 1.88 11978 ........................ 16 816 1.96 11979 ........................ 17 811 2.10 11980 ........................ 12 810 1.48 01981 ........................ 17 788 2.16 01982 ........................ 14 599 2.34 01983 ........................ 13 631 2.06 †11984 ........................ 15 626 2.40 01985 ........................ 13 623 2.09 01986 ........................ 10 619 1.62 01987 ........................ 13 615 2.11 01988 ........................ 12 616 1.95 01989 ........................ 15 614 2.44 01990 ........................ 15 623 2.41 01991 ........................ 14 617 2.27 01992 ........................ 13 619 2.10 01993 ........................ 11 613 1.79 01994 ........................ 13 617 2.11 01995 ........................ 9 622 1.45 0*First year of two-point conversion rule. †Last scoreless tie game: Nov. 19, 1983, Oregon vs. Oregon St.
Highest-Scoring Tie Games(Home Team Listed First; Both Teams Classified Major-College or FBS at Time)Note: Tiebreaker procedures began with 1996 season.
Score Date Opponents52-52 11-16-91 San Diego St.-BYU48-48 9-8-79 San Jose St.-Utah St.43-43 11-12-88 Duke-North Carolina St.41-41 9-10-94 Northwestern-Stanford41-41 9-23-89 San Diego St.-Cal St. Fullerton40-40 11-8-75 Idaho-Weber St.39-39 11-7-82 Texas Tech-TCU37-37 9-23-67 *Alabama-Florida St.36-36 9-30-72 Georgia Tech-Rice35-35 9-23-95 Michigan St.-Purdue35-35 11-16-91 San Jose St.-Hawaii35-35 12-9-89 Hawaii-Air Force35-35 9-23-89 Colorado St.-Eastern Mich.35-35 10-7-78 Ohio St.-SMU35-35 10-19-74 Idaho-Montana35-35 10-9-71 New Mexico-New Mexico St.35-35 9-27-69 Minnesota-Ohio35-35 9-21-68 Washington-Rice35-35 11-18-67 Navy-Vanderbilt35-35 12-11-48 †Pacific—Hardin-Simmons34-34 10-6-90 Iowa St.-Kansas33-33 10-1-83 California-Arizona33-33 9-24-49 TCU-Oklahoma St.33-33 10-31-31 Yale-Dartmouth*At Birmingham. †Grape Bowl, Lodi, Calif.
Home-Field Records(Includes Host Teams at Neutral-Site Games)
Home TeamYear Games Won Lost Tied Pct.1966 .................... 626 365 248 13 .5941967 .................... 611 333 264 14 .5571968 .................... 615 348 250 17 .5801969 .................... 621 366 246 9 .5961970 .................... 667 399 261 7 .6031971 .................... 726 416 298 12 .5811972 .................... 720 441 265 14 .6221973 .................... 741 439 284 18 .6051974 .................... 749 457 274 18 .6221975 .................... 785 434 335 16 .5631976 .................... 796 463 320 13 .5901977 .................... 849 501 332 16 .6001978 .................... 816 482 318 16 .6011979 .................... 811 460 334 17 .5781980 .................... 809 471 327 12 .5891981 .................... 788 457 314 17 .5911982 .................... 599 368 217 14 .6261983 .................... 631 364 254 13 .5871984 .................... 626 371 240 15 .6051985 .................... 623 371 239 13 .6061986 .................... 619 363 246 10 .5951987 .................... 615 387 215 13 *.6401988 .................... 616 370 234 12 .6101989 .................... 614 365 234 15 .6071990 .................... 623 373 235 15 .6111991 .................... 617 362 241 14 .5981992 .................... 619 388 218 13 .6371993 .................... 613 375 227 11 .6211994 .................... 617 357 247 13 .5891995 .................... 622 354 259 9 .5761996 .................... 644 389 255 0 .6041997 .................... #639 396 243 0 .6201998 .................... #653 403 250 0 .6171999 .................... #657 409 248 0 .6232000 .................... #666 418 248 0 .6282001 .................... #673 415 258 0 .6172002 .................... #771 490 281 0 .6362003 .................... #770 480 290 0 .6232004 .................... #709 463 246 0 .6532005 .................... #718 426 292 0 .5932006 .................... #790 488 302 0 .6182007 .................... #796 498 298 0 .6262008 .................... #803 506 297 0 .6302009 .................... #808 514 294 0 .6362010 .................... #807 488 319 0 .605*Record. #Includes games against opponents from all divisions.

124 2011 NCAA FOOTBALL RECORDS - FBS CLASSIFICATION LIST
FBS Members Since 1978
The following list shows years of active member-ship for current and former FBS football-playing institutions. The lists are from 1978, the year Divi-sion I was divided into the FBS and FCS.
ACTIVE MEMBERSTeam Year(s)Air Force ..................................................................1978-presentAkron ........................................................................1987-presentAlabama ..................................................................1978-presentUAB ............................................................................1996-presentArizona.....................................................................1978-presentArizona St. .............................................................1978-presentArkansas ..................................................................1978-presentArkansas St. ............................................1978-81, 92-presentArmy .........................................................................1978-presentAuburn .....................................................................1978-presentBall St. ........................................................1978-81, 83-presentBaylor .......................................................................1978-presentBoise St. ..................................................................1996-presentBoston College .....................................................1978-presentBowling Green .......................................1978-81, 83-presentBYU ............................................................................1978-presentBuffalo ......................................................................1999-presentCalifornia .................................................................1978-presentUCF ............................................................................1996-presentCentral Mich. ........................................................1978-presentCincinnati .................................................1978-81, 83-present Clemson ..................................................................1978-presentColorado .................................................................1978-presentColorado St. ..........................................................1978-presentConnecticut ...........................................................2002-presentDuke .........................................................................1978-presentEast Carolina .........................................................1978-presentEastern Mich. .........................................1978-81, 83-presentFlorida ......................................................................1978-presentFla. Atlantic ............................................................2006-presentFIU ..............................................................................2006-presentFlorida St. ...............................................................1978-presentFresno St. ...............................................................1978-presentGeorgia ....................................................................1978-presentGeorgia Tech .........................................................1978-presentHawaii ......................................................................1978-presentHouston ..................................................................1978-presentIdaho.........................................................................1996-presentIllinois .......................................................................1978-presentIndiana .....................................................................1978-presentIowa ..........................................................................1978-presentIowa St. ...................................................................1978-presentKansas ......................................................................1978-presentKansas St. ...............................................................1978-presentKent St. .......................................................1978-81, 83-presentKentucky .................................................................1978-presentLa.-Lafayette ..........................................................1978-presentLa.-Monroe ...............................................1978-81, 94-present
LSU ............................................................................1978-presentLouisiana Tech ........................................1978-81, 89-presentLouisville .................................................................1978-presentMarshall .....................................................1978-81, 97-presentMaryland .................................................................1978-presentMemphis .................................................................1978-presentMiami (FL) ...............................................................1978-presentMiami (OH) ...............................................1978-81, 83-presentMichigan .................................................................1978-presentMichigan St. ..........................................................1978-presentMiddle Tenn. ........................................................1999-presentMinnesota ..............................................................1978-presentOle Miss ...................................................................1978-presentMississippi St. .......................................................1978-presentMissouri ...................................................................1978-presentNavy ..........................................................................1978-presentNebraska .................................................................1978-presentNevada.....................................................................1992-presentUNLV .........................................................................1978-presentNew Mexico ...........................................................1978-presentNew Mexico St. ...................................................1978-presentNorth Carolina ......................................................1978-presentNorth Carolina St. ..............................................1978-presentNorth Texas ..............................................1978-81, 95-presentNorthern Ill. ............................................1978-81, 83-presentNorthwestern .......................................................1978-presentNotre Dame ...........................................................1978-presentOhio ............................................................1978-81, 83-presentOhio St. ...................................................................1978-presentOklahoma ...............................................................1978-presentOklahoma St. .......................................................1978-presentOregon.....................................................................1978-presentOregon St. .............................................................1978-presentPenn St. ..................................................................1978-presentPittsburgh ...............................................................1978-presentPurdue .....................................................................1978-presentRice ............................................................................1978-presentRutgers ....................................................................1978-presentSan Diego St. ........................................................1978-presentSan Jose St. ...........................................................1978-presentSouth Carolina .....................................................1978-presentSouth Fla. ...............................................................2001-presentSouthern California ............................................1978-presentSMU .............................................................1978-86, 89-presentSouthern Miss. .....................................................1978-presentStanford ...................................................................1978-presentSyracuse ..................................................................1978-presentTemple .....................................................................1978-presentTennessee ...............................................................1978-presentTexas .........................................................................1978-presentUTEP ..........................................................................1978-presentTexas A&M ..............................................................1978-presentTCU ............................................................................1978-presentTexas Tech ..............................................................1978-presentToledo ......................................................................1978-presentTroy ............................................................................2002-present
Tulane .......................................................................1978-presentTulsa ..........................................................................1978-presentUCLA .........................................................................1978-presentUtah ..........................................................................1978-presentUtah St. ...................................................................1978-presentVanderbilt ...............................................................1978-presentVirginia .....................................................................1978-presentVirginia Tech ..........................................................1978-presentWake Forest ...........................................................1978-presentWashington ...........................................................1978-presentWashington St. ....................................................1978-presentWest Virginia..........................................................1978-presentWestern Ky. ............................................................2009-presentWestern Mich. ........................................1978-81, 83-presentWisconsin ...............................................................1978-presentWyoming ................................................................1978-present
FORMER MEMBERSTeam Year(s)Appalachian St. ............................................................. 1978-81Brown ................................................................................. 1978-81Cal St. Fullerton ............................................................ 1978-92*Chattanooga ................................................................... 1978-81Citadel ................................................................................ 1978-81Colgate .............................................................................. 1978-81Columbia .......................................................................... 1978-81Cornell ................................................................................ 1978-81Dartmouth ....................................................................... 1978-81Drake .................................................................................. 1978-81East Tenn. St. ................................................................ 1978-81*Furman .............................................................................. 1978-81Harvard .............................................................................. 1978-81Holy Cross......................................................................... 1978-81Illinois St. .......................................................................... 1978-81Indiana St. ....................................................................... 1978-81Lamar ............................................................................... 1978-81*Long Beach St. ............................................................. 1978-91*McNeese St. .................................................................... 1978-81Pacific .............................................................................. 1978-95*Penn .................................................................................... 1978-81Princeton .......................................................................... 1978-81Richmond ......................................................................... 1978-81Southern Ill. .................................................................... 1978-81Tennessee St. ................................................................. 1978-80Texas-Arlington ............................................................ 1978-81*Villanova............................................................................ 1978-80VMI ...................................................................................... 1978-81West Tex. A&M ................................................................ 1978-80Western Caro. ................................................................ 1978-81Wichita St. ...................................................................... 1978-86*William & Mary .............................................................. 1978-81Yale ...................................................................................... 1978-81*Dropped football program.

2011 NCAA FOOTBALL RECORDS - COLLEGE FOOTBALL RULES CHANGES 125
FOO
TBA
LL B
OW
LSU
BD
IVIS
ION
The Ball1869—Round, rubber Association ball.1875—Egg-shaped, leather-covered Rugby ball.1896—Prolate spheroid, without specific measure-
ments.1912—28-28½ inches around ends, 22½-23 inches
around middle, weight 14-15 ounces.1929—28-28½ inches around ends, 22-22½ inches
around middle, weight 14-15 ounces.1934—28-28½ inches around ends, 21¼-21½ inches
around middle, weight 14-15 ounces.1941—For night games, a white ball or other colored
ball with two black stripes around the ball may be used at the discretion of the referee.
1952—Ball may be inclined no more than 45 degrees by snapper.
1956—Rubber-covered ball permitted.1973—Teams allowed to use ball of their choice while
in possession.1978—Ball may not be altered, and new or nearly new
balls added.1982—107/8 to 117/16 inches long, 20¾ to 21¼ inches
around middle, and 27¾ to 28½ inches long-axis circumference.
1993—Rubber or composition ball ruled illegal.
The Field1869—120 yards by 75 yards; uprights 24 feet apart.1871—1662/3 yards by 100 yards.1872—1331/3 yards by 831/3 yards.1873—Uprights 25 feet apart.1876—110 yards by 531/3 yards. Uprights 18½ feet
apart; crossbar 10 feet high.1882—Field marked with transverse lines every five
yards. This distance to be gained in three downs to retain possession.
1912—Field 120 yards by 531/3 yards, including two 10-yard end zones.
1927—Goal posts moved back 10 yards, to end line.1957—Team area at 35-yard lines.1959—Uprights widened to 23 feet, 4 inches apart.1966—Pylons placed in corners of end zone and at
goal lines, mandatory in 1974.1991—Uprights moved back to 18 feet, 6 inches
apart.1993—Hash marks moved six feet, eight inches closer
to center of field to 60 feet from each sideline (40 feet apart).
Scoring1869—All goals count 1 each.1883—Safety 1, touchdown 4, goal after TD 4, goal
from field 5.1884—Safety 2, touchdown 4, goal from field 5.1897—Touchdown 4, field goal 5, touchdown failing
goal 5, safety 2.1902—Teams change goals after every try at goal fol-
lowing a touchdown, after every goal from the field and also at the beginning of the half.
1904—Goal from field 4.1909—Goal from field 3.1912—Touchdown 4.1921—Ball put in play at 30-yard line after a safety,
20-yard line after a touchback.1922—Try-for-point by scrimmage play from 5-yard
line.1924—Try-for-point by scrimmage play from 3-yard
line.1927—Goal posts placed on end lines.1929—Try-for-point by scrimmage play from 2-yard
line.1958—One-point & two-point conversion (from 3-
yard line). One-point safety added.1974—Ball must go between the uprights for a suc-
cessful field goal, over the uprights previously scored.
1976—Forfeit score changed from 1-0 to score at time of forfeit if the offended team is ahead at time of forfeit.
1984—Try may be eliminated at end of game if both captains agree.
1995—Try at end of game mandatory unless team behind in score leaves field.
Scoring Values1882—Touchdown 2 points; field goal 5 points; extra
points 4 points1883—Touchdown 2 points; field goal 5 points; extra
points 4 points1884-97—Touchdown 4 points; field goal 5 points;
extra points 2 points1898-1903—Touchdown 5 points; field goal 5 points;
extra points 1 point1904-08—Touchdown 5 points; field goal 4 points;
extra points 1 point1909-11—Touchdown 5 points; field goal 3 points;
extra points 1 point1912-57—Touchdown 6 points; field goal 3 points;
extra points 1 point1958-present—Touchdown 6 points; field goal 3
points; extra points 1 point/kick, 2 points/run or pass.
1988-present—Extra points 2 points/defense.Note: Safety worth 1 point from 1882 to 1883, 2 points in all seasons since 1884.
Players1869—Each team consisted of 25 players.1873—Each team consisted of 20 players.1876—Each team consisted of 15 players.1880—Each team consisted of 11 players.1895—Only one man in motion forward before the
snap. No more than three players behind the line. One player permitted in motion toward own goal line.
1910—Seven players required on line.1911—Illegal to conceal ball beneath a player’s cloth-
ing.1947—All players urged to be numbered in a uniform
manner. Ends to wear numbers in the 80s; tackles, 70s; guards, 60s; centers, 50s; and backs, 10-49.
1966—Mandatory numbering of five players on the line 50-79.
1970—All players numbered 1-99.
Equipment1894—No one wearing projecting nails or iron plates
on his shoes, or any metal substance upon his person, is allowed to play. No greasy or sticky substance shall be used on the person of players.
1903—If head protectors are worn, there can be no sole leather or other hard or unyielding sub-stances in their construction. Leather cleats on shoes allowed.
1908—First documented jersey numbers used by Washington & Jefferson.
1915—Numbers added to jerseys.1927—Rubber cleats allowed, but under no condi-
tions are cleats to be dangerously sharp.1930—No player shall wear equipment that endan-
gers players. The committee forbids the use of head protectors or jerseys that are so similar in color to the ball that they give the wearer an unfair and unsportsmanlike advantage over the opponent. Stripes may be used to break up the solid colors.
1933—Head protectors or helmets recommended to be worn by all players.
1937—All players must wear minimum 6-inch Arabic numerals on the front and minimum 8-inch Arabic numerals on the back of jerseys.
1939—All players must wear helmets.1946—All players must wear minimum 8-inch Arabic
numerals on front (changed from 6 inches) and minimum 10-inch Arabic numerals on back of jerseys (changed from 8 inches), of a single color which must be in sharp contrast with the color of the jerseys.
1948—One-inch kicking tees permitted.1951—Any circular or ring cleat prohibited unless it
has rounded edges and a wall at least 3/16-inch thick. Face masks added to helmet. Must be made of nonbreakable, molded plastic with rounded edges.
1962—All players recommended to wear properly fitted mouth protectors.
1965—Two-inch kicking tees permitted.1966—Players prohibited from wearing equipment
with electronic, mechanical or other signal devices for the purpose of communicating with any source.
1968—Metal face masks having surfaces with mate-rial as resilient as rubber are allowed.
1970—Shoe cleats more than one-half inch in length (changed from three-quarters inch) prohib-ited.
1972—All players must wear mouth protectors, beginning with 1973 season.
1973—All players shall wear head protectors with a secured chin strap.
1974—All players shall wear shoulder pads.1976—All players shall wear hip pads and thigh
guards.1979—Beginning in 1981, one team shall wear white
jerseys.1982—Tearaway jersey eliminated by charging a
timeout.1983—Mandatory white jersey for visiting teams.1986—Therapeutic or preventive knee braces must
be worn under the pants.1989—Kicking tees eliminated for field goals and
extra-point attempts.1991—Rib and back pad covering mandatory.1994—Standards established to limit glove stickiness.
Jerseys that extend below the top of the pants must be tucked into the pants.
1995—Home team may wear white jerseys if both teams agree before the season.
1996—Cleats limited to one-half inch in length (see 1970). Violators disqualified for remainder of game and entire next game. Rule a dead ball when a ball carrier’s helmet comes completely off, with the ball belonging to runner’s team at that spot. Jerseys must extend to top of pants and must be tucked in if longer.
1997—Require all players on the same team to wear white or team-colored socks of the same design and length. Leg coverings, such as tights, if worn, must be in team colors and of a uniform design for all players on the same team.
1998—All eye shields, if worn, must be clear (transpar-ent) and made from molded and rigid mate-rial. NCAA member institutions can, in the case of a death or catastrophic injury or illness, memorialize a player or person with a patch or decal not greater than 1½ inches in diameter that displays the number, name or initials of the individual on the uniform or helmet.
1999—Visible bandanas are ruled an illegal uniform attachment. Eye shields that are not clear are permitted, only with proper documentation from the player's institution and approval from a medical doctor designated by the NCAA Committee on Competitive Safeguards and Medical Aspects of Sports.
2000—A maximum of two defensive players are allowed to wear 4-inch-by-12-inch white tow-els without markings attached to the front belt.
2004—A glove cannot include any additional material that connects any of the fingers and/or thumb. On scrimmage plays, one white towel without
College Football Rules Changes

126 2011 NCAA FOOTBALL RECORDS - COLLEGE FOOTBALL RULES CHANGES
markings may be worn by one interior offen-sive lineman, one offensive backfield player and a maximum of two defensive players. The towels of the offensive backfield and defen-sive players must be 4 inches by 12 inches and must be worn on the front or side belt. There are no restrictions on the size or location of the towel worn by the offensive lineman. On free kicks, one white towel without markings may be worn by a maximum of two Team A and two Team B players. The towels worn on free kicks must be 4 inches by 12 inches and must be worn on the front or side belt.
2006—The length of the kicking tee was shortened to one inch. Also, the use of eye shields that are not clear during games was eliminated.
Substitutions1876—Fifteen players to a team and few if any sub-
stitutions.1882—Replacements for disqualified or injured play-
ers.1897—Substitutions may enter the game any time at
discretion of captains.1922—Players withdrawn during the first half may be
returned during the second half. A player with-drawn in the second half may not return.
1941—A player may substitute any time but may not be withdrawn or the outgoing player returned to the game until one play had intervened. Platoon football made possible.
1948—Unlimited substitution on change of team possession.
1953—Two-platoon abolished and players allowed to enter the game only once in each quarter.
1954-64—Changes each year toward more liberal-ized substitution rule and platoon football.
1965—Platoon football returns. Unlimited substitu-tions between periods, after a score or try.
1974—Substitutes must be in for one play and replaced players out for one play.
1993—Players who are bleeding or whose uniforms are saturated with blood must come out of the game until their return has been approved by medical personnel.
2000—Offensive teams, while in the process of sub-stitution or simulated substitution, are prohib-ited from rushing quickly to the line of scrim-mage and snapping the ball with the obvious attempt to create a defensive disadvantage.
2004—The defensive team will be given the opportu-nity to complete its substitutions when offen-sive teams, while in the process of substitution or simulated substitution, rush quickly to the line of scrimmage with the obvious attempt to create a defensive disadvantage.
Passing Game1906—One forward pass legalized behind the line
if made five yards right or left of center. Ball went to opponents if it failed to touch a player of either side before touching the ground. Either team could recover a pass touched by an opponent. One pass each scrimmage down.
1910—Pass interference does not apply 20 yards beyond the line of scrimmage. Passer must be five yards behind the line of scrimmage. One forward pass permitted during each down.
1914—Roughing the passer added.1923—Handing the ball forward is an illegal forward
pass and receivers going out of bounds and returning prohibited.
1934—Three changes encourage use of pass. (1) First forward pass in series of downs can be incomplete in the end zone without loss of ball except on fourth down. (2) Circumference of ball reduced, making it easier to throw. (3) Five-yard penalty for more than one incom-plete pass in same series of downs elimi-nated.
1941—Fourth-down forward pass incomplete in end zone no longer a touchback. Ball goes to opponent at spot where put in play.
1945—Forward pass may be thrown from anywhere behind the line, encouraging use of modern T formation.
1949—Intentional grounding of a pass shall result in a loss of down and a five-yard penalty from the spot of the foul.
1966—Compulsory numbering system makes only players numbered other than 50-79 eligible forward-pass receivers.
1976—Offensive blocking changed to provide half extension of arms to assist pass blocking.
1980—Retreat blocking added with full arm exten-sion to assist pass blocking, and illegal use of hands reduced to five yards.
1982—Pass interference only on a catchable forward pass. Forward pass intentionally grounded to conserve time permitted.
1983—First down added to roughing the passer.1985—Retreat block deleted and open hands and
extended arms permitted anywhere on the field.
1990—Pass thrown immediately to the ground to conserve time legal.
1994—Ball must be catchable for offensive player to be charged with pass interference.
1996—Principle of “reasonable opportunity to catch the pass” applied to intentional grounding situations.
1998—A backward pass can be recovered and advanced by the defense.
1999—Intentional grounding of a pass shall result in a loss of down at the spot of the foul.
2000—Allowing a passer, who is five yards or more toward the sideline from the original position of the ball at the snap, to throw the ball so that it lands beyond the neutral zone to avoid loss of yardage without penalty.
2004—A defensive player who is blocked into the passer is exempt from being penalized for roughing the passer.
General Changes1876—Holding and carrying the ball permitted.1880—Eleven players on a side and a scrimmage line
established.1882—Downs and yards to gain enter the rules.1883—Scoring system established.1906—Forward passes permitted. Ten yards for first
down.1920—Clipping defined.1922—Try-for-point introduced. Ball brought out five
yards from goal line for scrimmage, allowing try for extra point by place kick, drop kick, run or forward pass.
1925—Kickoff returned to 40-yard line. Clipping made a violation, with penalty of 25 yards.
1927—One-second pause imposed on shift. Thirty seconds allowed for putting ball in play. Huddle limited to 15 seconds. To encourage use of lateral pass, missed backward pass other than from center declared dead ball when it hits the ground and cannot be recov-ered by opponents.
1929—All fumbles ruled dead at point of recovery.1932—Most far-reaching changes in nearly a quarter
of a century set up safeguards against hazards of game. (1) Ball declared dead when any por-tion of player in possession, except his hands or feet, touches ground. (2) Use of flying block and flying tackle barred under penalty of five yards. (3) Players on defense forbidden to strike opponents on head, neck or face. (4) Hard and dangerous equipment must be covered with padding.
1941—Legal to hand ball forward behind the neutral zone.
1949—Blockers required to keep hands against their chest.
1951—Fair catch restored.
1952—Penalty for striking with forearm, elbow or locked hands, or for flagrantly rough play or unsportsmanlike conduct, changed from 15 yards to mandatory suspension.
1957—Penalty for grabbing face mask.1959—Distance penalties limited to one-half distance
to offending team’s goal line.1967—Coaching from sideline permitted.1970—Eleven-game schedule permitted.1971—Crack-back block (blocking below waist) ille-
gal.1972—Freshman eligibility restored.1977—Clock started on snap after a penalty.1978—Unsuccessful field goal returned to the previ-
ous spot.1983—Offensive encroachment changed ... no offen-
sive player permitted in or beyond the neutral zone after snapper touches ball.
1984—Defensive pass interference penalty changed from spot of foul to 15 yards from previous spot.
1985—One or both feet on ground required for blocking below waist foul.
1986—Kickoff from the 35-yard line.1988—Defensive team allowed to score two points
on return of blocked extra-point kick attempt or interception of extra-point pass attempt.
1990—Defense allowed to advance fumbles that occur beyond the neutral zone.
1991—Width between goal-post uprights reduced from 23 feet, 4 inches to 18 feet, 6 inches. Kickoffs out of bounds allow receiving team to elect to take ball 30 yards beyond yard line where kickoff occurred. Holding behind the neutral zone penalized 10 yards from the spot of the foul.
1992—Defense allowed to advance fumbles regard-less of where they occur. Changes ruling of 1990 fumble advancement.
1993—Guard-around or “fumblerooski” play ruled illegal.
1994—Players involved in a fight after halftime dis-qualified for first half of next game; substitutes and coaches who participate in a fight in their team area or leave the team area to join a fight disqualified for entire next game; squad members and coaches involved in a fight during halftime disqualified for first half of next game.
1995—Defense penalized five yards for entering neu-tral zone before snap and causing offensive player to react immediately. Players prohibited from removing helmets on the field. Players disqualified after second unsportsmanlike-conduct foul in one game. Fight suspensions allowed to carry over to next season.
1996—NCAA tiebreaker system to be used in all games tied after four periods.
1997—In overtime tiebreaker system, required a team that scores a touchdown to attempt a two-point conversion in the third overtime period. Approved a rule requiring a game to be declared a tie if it is in overtime but cannot be finished due to weather, darkness or other conditions. Chop block redefined to be penalized if “obviously delayed” and added restrictions to the “crack-back” block to make it illegal up to five yards beyond line of scrimmage regardless of position of the ball. Officials prompted to enforce mouthpiece rule, charging a timeout to offending team if clock is stopped and player does not have mouthpiece in place. To prevent opponents from leveling punt returners with unnecessar-ily vicious hits, the penalty was increased from five to 15 yards.
1998—For the first time in history, a backward pass can be recovered and advanced by the defense. It is now consistent with the applica-tion of the rules similar to how the defense is allowed to advance a fumble.
1999—Holding behind the neutral zone will be penal-ized 10 yards from the previous line of scrim-mage. Dead-ball fouls by both teams that are part of continuing action or of a retalia-tory nature and reported at the same time will be canceled and the penalties disregarded.

2011 NCAA FOOTBALL RECORDS - COLLEGE FOOTBALL RULES CHANGES 127
FOO
TBA
LL B
OW
LSU
BD
IVIS
IONHowever, any disqualified player must leave
the game. Teams may not break the huddle with 12 or more players.
2000—An illegal block shall now include any high-low, low-high or low-low combination block by any two offensive players beyond the neutral zone regardless of simultaneous contact by both. Also, blocking below the waist by offensive players (“crack-back block“) now includes not only wide receivers or players in motion but any player in motion in any direction at the snap and the area is expanded to included the neutral zone and 10 yards beyond. Also, prohibiting a defensive player(s) aligned in a stationary position within one yard of the line of scrimmage from making quick or abrupt actions that are not part of normal player movement in an obvious attempt to cause an offensive player(s) to foul.
2001—A charged team timeout can be 30 seconds in duration if so desired by the team calling the timeout. Most penalties for offensive-team fouls that occur behind the neutral zone will be enforced from the previous spot.
2002—The penalty for interference with the oppor-tunity to catch a kick, when no contact is involved, increased from five to 10 yards. Yardage enforcement of flagrant personal fouls during possession by the defensive team may carry from one extra period to the next.
2003—The game clock on all kickoffs will start when the ball is legally touched in field of play. The two-yard restricted area around player posi-tioned to catch free or scrimmage kick is delet-ed. Offensive linemen at the snap positioned more than seven yards in any direction from the middle lineman of the offensive formation are prohibited from blocking below the waist toward the original position of the ball in or behind the neutral zone and within 10 yards beyond the neutral zone. Backs at the snap positioned outside the normal tackle position in either direction toward a sideline, or in motion at the snap, are prohibited from blocking below the waist toward the original position of the ball in or behind the neutral zone and within 10 yards beyond the neutral zone.
2004—A camera, with no audio component, may be attached to cables that hang over the team area. The head coach may now request a charged team timeout when timeouts are not exhausted, and when the ball is dead. No defensive player who runs forward and leaps in an obvious attempt to block a field goal or try may land on an opponent. The referee, if he is equipped with a microphone, will announce the number of the player committing the foul. The receiving team has the option of assessing the penalty for encroachment by the kick-ing team during a free kick from either the previous spot or from the end of the receiving team’s run.
2005—Expanded experimental use of in-game video officiating review to all member conferences and institutions for the 2005 season. The same parameters approved for 2004 for the Big Ten Conference will be used. The video replay will not be allowed in postseason bowl games or in NCAA championships. Blocking from behind near the line of scrimmage was limited to contact above the knee. Another safety con-cern – helmet-to-helmet contact and spearing – was addressed by taking a player’s intention out of the equation to assist officials in the proper enforcement of the rule governing that type of contact. The committee also defined regulation of unsportsmanlike conduct and celebration penalties to assist officials, play-ers and coaches in understanding what type of action warrants a penalty. That means the committee does believe that spontaneous cel-ebrations that are not prolonged or intended to bring attention to the individual should be allowed on a limited basis. A defined list of unacceptable behaviors was included in the 2005 rules book.
2006—After allowing instant replay to review a game official’s call on the field for two seasons on an experimental basis, the committee approved one procedure for all institutions and confer-ences that choose to use it. The procedure calls for the replay official in the press box to review all plays on the field and stop the game. The committee also decided to allow each team one challenge during the course of a game, as long as the challenging team has a timeout. The head coach may request a review by signaling for a timeout. If the challenge overturns the call on the field, the challenging team is not charged a timeout. If the call is not overturned, the team is charged a timeout. If a team does not have any timeouts remain-ing, it is not allowed to request a review. In hopes of shortening the length of games, halftime is recommended to be 20 minutes in duration, but competing institutions are now permitted to shorten or lengthen halftime by mutual consent. Other changes include starting the game clock on kickoffs when the kicker’s foot touches the ball, rather than when the returning team touches the ball, and starting the game clock when the ball is ready for play after a change of possession. In addition, the enforcement of all procedural fouls committed by the kicking team that occur before a scrimmage kick (except field goals) was changed. Now, the receiving team will have the option of accepting the penalty after the return or forcing the kicking team to kick again five yards from the original line of scrimmage.
2007—The committee altered its rule to have the clock start on the snap after a change in possession, as opposed to the 2006 rule that started the clock when the referee signaled the ball ready for play. Also, the commit-tee returned its rules on free kicks to 2005 standards, starting the clock on kickoffs only when the ball is legally touched in the field of play. Other changes include limiting the play clock to 15 seconds after a television timeout. Kickoffs moved from the 35-yard line to 30-yard line. In addition, charged team timeouts were reduced by 30 seconds and penalties for all kicking team fouls that occur during the kick can be enforced at the end of the run. Finally, the play clock is started when the ball is handed to the kicker by the umpire on all free kicks and instant replay reviews are limited to two minutes to decide to overturn or confirm the ruling on the field.
2008— Helmet Crown and Defenseless Players. The committee has refined the rules regarding the use of the helmet as a weapon and the target-ing of defenseless players. Emphasis on these actions highlights concern about potentially debilitating injuries. It is now a foul when a player targets an opponent and initiates con-tact with the crown (top) of the helmet. This rule is intended primarily for the safety of the player who initiates the contact. It is also a foul if a player targets a defenseless opponent and initiates contact above the shoulders. Each of these is a personal foul and thus carries a 15-yard penalty.
The definition of the chop block has been simplified to assist in the understanding of this rule and to encourage more consistent officiating. A chop block is now defined as a high-low or low-high combination block by any two players against an opponent (other than the runner) anywhere on the field, with or without a delay between contacts. The “low” component is at the opponent’s thigh or below. A dangerous action that can lead to serious injury, the chop block is a personal foul that carries a 15-yard penalty.
“Horse-Collar” tackle. The committee addressed the potential hazard to a ball car-rier that is grabbed by the inside collar of the jersey or shoulder pad and quickly jerked down. The rule prohibits all players from grab-bing the inside back collar of the shoulder pads or jersey, or the inside collar of the side of
the shoulder pads or jersey, and immediately pulling the runner down. This does not apply to a runner who is inside the tackle box or to a quarterback who is in the pocket. A key element is the immediacy of the runner being pulled down, because of the risk of injury. The horse-collar tackle is a personal foul and the penalty is 15 yards.
Face-Mask Foul. There is no longer a foul if any player grabs an opponent’s face mask without pulling, twisting or turning it. The five-yard penalty has been eliminated. This change does not change the safety aspect of this rule. Pulling, twisting, or turning an oppo-nent’s face mask remains a personal foul with a 15-yard penalty.
40-Second Play Clock. The 40-second play clock represents a major change in the timing of the game and will affect how the game looks and flows. The purpose of this change is to enhance the consistency of how soon the ball is ready for play once it has become dead. In the past, the play clock was set at 25 seconds and started on the referee’s signal on every play. Now, the play clock will be set to 40 seconds after the ball becomes dead on every play and started immediately. In circum-stances when the officials stop the game clock for administrative and other reasons, the play clock will be set to 25 seconds and started on the referee’s signal in the familiar manner. The 25-second clock will be in effect for pen-alty administration, charged team timeout, media timeout, injury timeout, measurement, change of possession and after a kick, score, start of each period, start of a team’s series in extra period, instant replay review, other administrative stoppage.
Also, the committee has eliminated the 15-sec-ond play clock, which was used after television timeouts.
Ball Out of Bounds. When a ball is carried or fumbled out of bounds, the game clock will stop, as always. Beginning in 2008, the game clock will start on the referee’s signal when the ball is ready for play, not on the snap. In the last two minutes of the half, however, the clock will start on the snap as before, preserving the ability of the offensive team to maximize strategic use of the clock.
Instant Replay- Reviewable Plays. The new rules expand the range of plays for which the replay official may stop the game to review. These include certain field-goal attempts, plays in which the ball carrier is ruled down and a loose ball is immediately recovered, and plays in which the ball carrier is ruled out of bounds when he immediately carries the ball across the goal line.
Field-Goal Attempts. A field goal attempt may be reviewed only if the ball is ruled below or above the crossbar, or inside or outside the uprights when it is lower than the top of the uprights. If the ball is higher than the top of the uprights, the play may not be reviewed.
Ball Carrier Ruled Down. When a ball carrier is judged down by rule and the ball is fumbled, the play may be reviewed if the recovery of the ball occurs in the immediate action after the fumble and is before any official signaling that the ball is dead. However, if the replay official does not have indisputable video evidence as to which player recovers the fumble, the ruling of down-by-rule stands. If the call of down-by-rule is reversed, the ball belongs to the recovering player at the spot of the recovery and no advance is allowed.
Ball Carrier Ruled Down Near The Goal Line. When a ball carrier is ruled out of bounds, the play may be reviewed if his immediate action takes him into the opponent’s end zone and is before any official signaling that the ball is dead.
Head Coach’s Challenge. A new rule expands the ability of a head coach to challenge a reviewable ruling on the field. The head coach now retains a challenge if his initial challenge is successful and thus results in a reversal by

128 2011 NCAA FOOTBALL RECORDS - COLLEGE FOOTBALL RULES CHANGES
the replay official. The coach will then still have a single challenge that he may use anytime during the game if his team has not used all of its timeouts. Thus a team may have a total of two challenges in the game, but only if the first results in a reversal of the on-field ruling.
Game Administration. Sideline Infraction. The committee has changed the rule regarding sideline personnel being in the restricted area, which is between the sideline and the coaching box. The former sideline warning has given way to a sideline infraction, which carries an immediate yardage penalty. The first two infractions have a five-yard delay of game penalty, and the third and subsequent violations now carry a 15-yard penalty for unsportsmanlike conduct.
Obtaining Opponent’s Signals. The rules now prohibit any attempt to record, either by video or audio means, the signals given by an opposing player, coach or other team person-nel. Violations should be brought to the atten-tion of the proper disciplinary authority.
2009— Roughing the Kicker. The rules now say that if the punter carries the ball outside the tackle box, he loses protections provided as a kicker.
Game Administration. The committee approved a request to allow teams, when approved by conference office and agreed to by both teams, to wear colored jerseys as long as they are clearly contrasting in color. When agreement is unable to be reached, the visit-ing team shall wear white.
2010— Illegal Wedge Formation. On a free-kick down, the rules now make it illegal for three or more members of the receiving team to intention-ally form a wedge (defined as two or more players aligned shoulder to shoulder witin two yards of each other) for the purpose of block-ing for the ball carrier.
2011— 10-Second Subtraction from Game Clock. The rules now say if a penalty is committed with the game clock running and less than one minute remaining in either half, the officials may subtract 10 seconds from the game clock at the option of the offended team.
Blocking Below the Waist. The rules now pro-hibit blocking below the waist except under specific circumstances. This rule establishes the principle that blocking below the waist should be a foul except for some limited cir-cumstances where its danger is less.
Unsportsmanlike Conduct Fouls. In situations involving taunting and/or unsportsmanlike conduct, the fouls will now be treated as they occur, instead of as dead-ball fouls. Therefore, if the foul occurs when the ball is live (e.g., in the field of play), the foul will be enforced from that position instead of treating all fouls of this type as dead ball fouls (after the play is complete).