©2011 educause. cc by-nc-nd highlights and insights from the educause 2011 core data survey susan...
TRANSCRIPT

©2011 EDUCAUSE. CC by-nc-nd
HIGHLIGHTS AND INSIGHTS FROM THE EDUCAUSE 2011 CORE DATA SURVEY
Susan Grajek | October 19, 2011
©2011 EDUCAUSE. CC by-nc-nd
WELCOME, PHILADELPHIA AND ONLINE ATTENDEES!
• Who are you?• Fill out CDS this year?• Type of institution: Associate’s, BA, MA, DR, public,
private, system• From Canada? Other international?• Role: CIO, support, infosec, infrastructure, enterprise,
research, teaching and learning, faculty, vendor?• CDS role: Primary representative, author, review,
manager?
• What color is your institution?
2

©2011 EDUCAUSE. CC by-nc-nd
TOPICS COVERED TODAY
• The IT organization• Leadership• Governance and service
level agreements• Outsourcing• Staffing and
Managing the workforce• IT budgets and funding• Support for faculty use of IT
in teaching and learning• Support for students
• Support of research• IT in the institution• IT support• Student e-mail• Enterprise systems• Information security• Data centers• Sustainability• There’s so much more in
the Core Data Survey...
3
©2011 EDUCAUSE. CC by-nc-nd
THE IT ORGANIZATION
4

©2011 EDUCAUSE. CC by-nc-nd
TODAY’S RESULTS ARE BASED ON
Response Rates of US Institutions
Participation in CDS Modules
5
Initial analyses!
©2011 EDUCAUSE. CC by-nc-nd
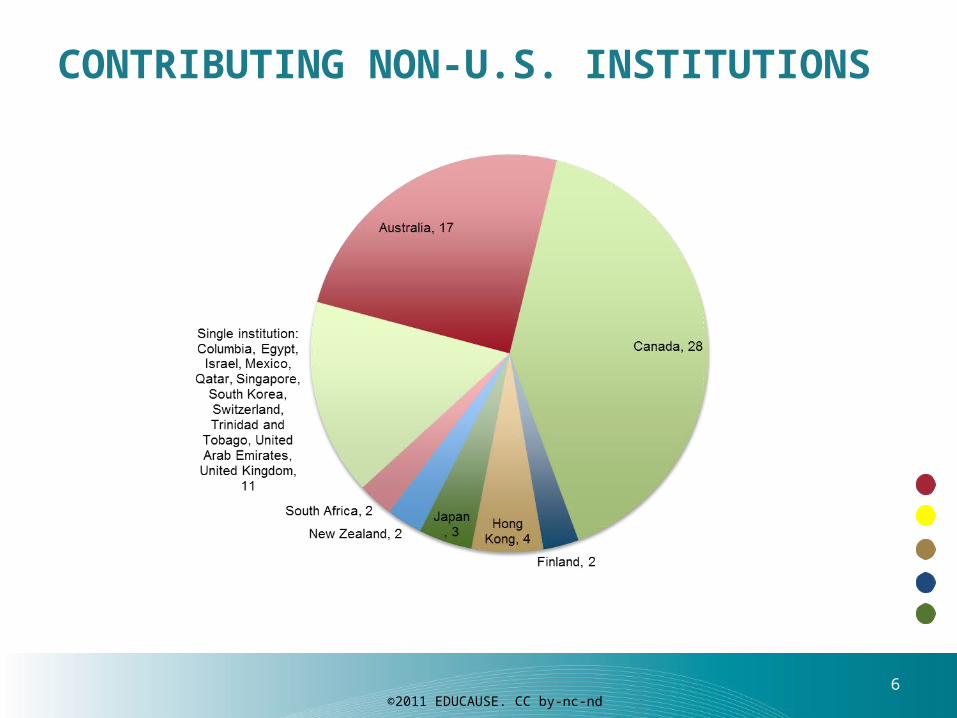
CONTRIBUTING NON-U.S. INSTITUTIONS
6

©2011 EDUCAUSE. CC by-nc-nd
THE IT ORGANIZATION
• Which CIOs are most likely to have strategic impact as measured by:• Membership on the president’s or chancellor’s cabinet• Having an institutional strategic plan that incorporates IT
• Here are your options. Pick the two you think are correct:
• Reports to the provost• Has been a CIO elsewhere• At community colleges• At bachelor’s-level institutions• At doctoral universities• At master’s-level institutions• At international institutions
• Recently appointed• Long-serving• At private institutions• At public institutions• Report directly to the
president or chancellor• Has an academic title such as
dean
7

©2011 EDUCAUSE. CC by-nc-nd
THE IT ORGANIZATION
• Which CIOs are most likely to have strategic impact?• Members of the president’s or chancellor’s cabinet• An institutional strategic plan that incorporates IT
• Here are your options. Pick the two you think are correct: • Reports to the Provost• Has been a CIO elsewhere• At community colleges• At Bachelors-level
institutions• At doctoral universities• At Masters-level institutions• At international institutions
• Recently appointed• Long-serving• At private institutions• At public institutions• Report directly to the
President or Chancellor• Has an academic title such as
Dean
8

©2011 EDUCAUSE. CC by-nc-nd
ACADEMIC INVOLVEMENT IN IT GOVERNANCE
• It is most common in doctoral and BA liberal arts institutions:• Doctoral: 79% with a faculty and 57% with a student
advisory committee• BA liberal arts: 70% with faculty, 48% with students
9

©2011 EDUCAUSE. CC by-nc-nd
PERCENT OF INSTITUTIONS USING SLAs
10

©2011 EDUCAUSE. CC by-nc-nd
IT FUNCTIONS COVERED BY SLAsIN INSTITUTIONS THAT USE SLAs
11

©2011 EDUCAUSE. CC by-nc-nd
WHO DELIVERS IT SERVICES TO THE INSTITUTION?
Central IT dominates (>75% of institutions) 9 services
But 11 services are commonly shared between IT and other units in the institution (50–25%)
Other units in the institution dominate (>50%) 3 services
Web support services 46%Classroom and learning space support
33%
Network infrastructure and services
32%
Telephony 32%Admin. info. systems—Other (facilities, grants mgt, etc.)
31%
Project management/business process/systems analysis
30%
Print/copier services 30%Admin. info. systems—alumni/advancement/fundraising
30%
Admin. info. systems—student 29%Admin. info. systems—finance 28%Admin. info. systems—HR 27%
Administration of central IT organization
96%
Data center operations 96%Research technology services
95%
IT security 91%
Help desk 90%Desktop computing, user support, training, computer store
87%
Enterprise infrastructure and services; identity management
84%
IT policy 83%Student technology (labs, training, support, etc.)
78%
Mailroom 79%
Institutional research 66%Library 63%
12

©2011 EDUCAUSE. CC by-nc-nd
OUTSOURCING: MORE TALK THAN ACTION
• Only 2.5% of institutions’ IT staff are “all or nearly all” provided through an outsourcing arrangement.
• Only 4% of institutions have outsourced “all or nearly all” central IT services.
13

©2011 EDUCAUSE. CC by-nc-nd
OUTSOURCING ALL OR NEARLY ALL IT STAFF BY INSTITUTIONAL TYPE
Ave
rag
e p
erc
en
t o
f in
stitu
tion
s o
uts
ou
rcin
g I
T f
un
ctio
ns
14

©2011 EDUCAUSE. CC by-nc-nd
IT OUTSOURCING FOR ENTIRE FUNCTIONS
15

©2011 EDUCAUSE. CC by-nc-nd
IT OUTSOURCING/ASPs FOR SERVICES“RUN PARTIALLY OR ENTIRELY BY AN EXTERNAL SUPPLIER”
16
©2011 EDUCAUSE. CC by-nc-nd
MANAGING THE IT WORKFORCE
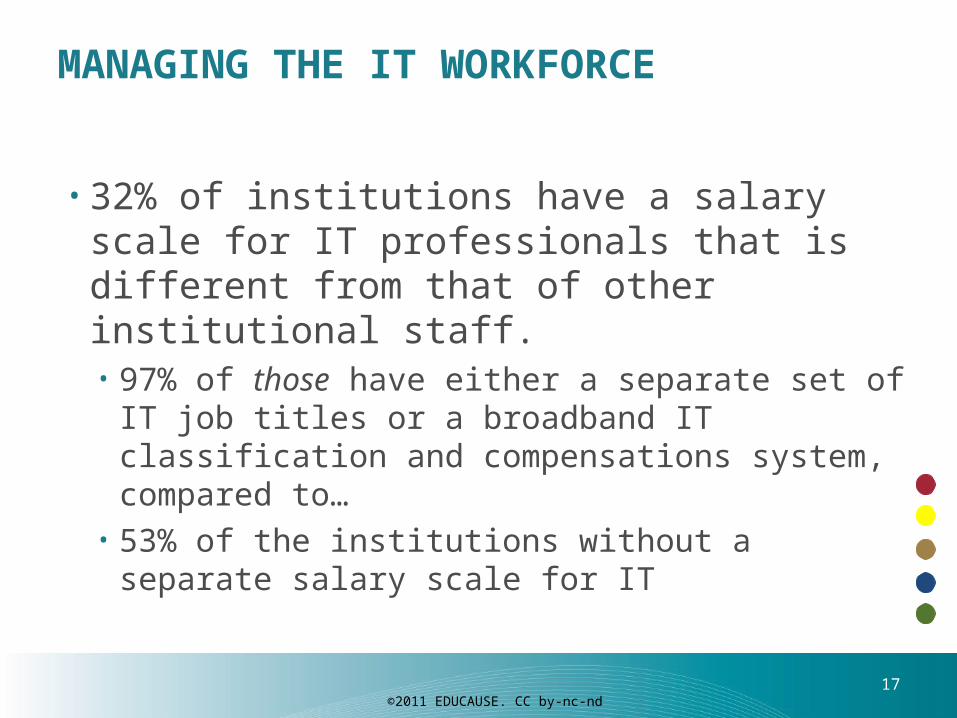
• 32% of institutions have a salary scale for IT professionals that is different from that of other institutional staff. • 97% of those have either a separate set of IT job titles
or a broadband IT classification and compensations system, compared to…
• 53% of the institutions without a separate salary scale for IT
17

©2011 EDUCAUSE. CC by-nc-nd
MANAGING THE IT WORKFORCE: STAFF DEVELOPMENT
Travel budgets decrease for all, training dollars decline for most, but not all
Average travel dollars per IT FTE declined from $744 to $477
Training per IT FTE decreased from $610 to $422
18

©2011 EDUCAUSE. CC by-nc-nd
IT BUDGETS AND FUNDING
19

©2011 EDUCAUSE. CC by-nc-nd
CENTRAL IT FUNDING SOURCESAn operating appropriation funds more than 80% of the central IT budget in all institutional types except public doctorals:
• 27% of their IT funds are from chargeback or sales of services to institutional departments, schools, and individuals
20
©2011 EDUCAUSE. CC by-nc-nd
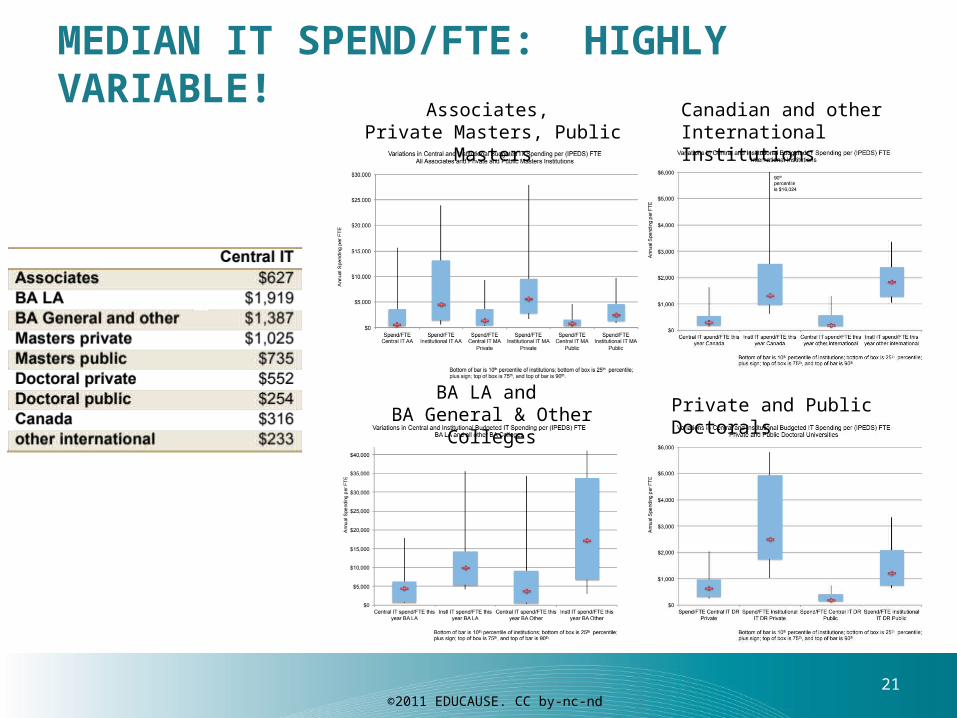
MEDIAN IT SPEND/FTE: HIGHLY VARIABLE!Associates,
Private Masters, Public Masters
BA LA and BA General & Other Colleges Private and Public Doctorals
Canadian and other International Institutions
21

©2011 EDUCAUSE. CC by-nc-nd
SUPPORT FOR FACULTY USE OF IT IN TEACHING AND LEARNING
22

©2011 EDUCAUSE. CC by-nc-nd
SUPPORT FOR FACULTY USE OF ITTEACHING AND LEARNING SERVICES
Per
cent
of
inst
itutio
ns o
ffer
ing
serv
ice
23
©2011 EDUCAUSE. CC by-nc-nd
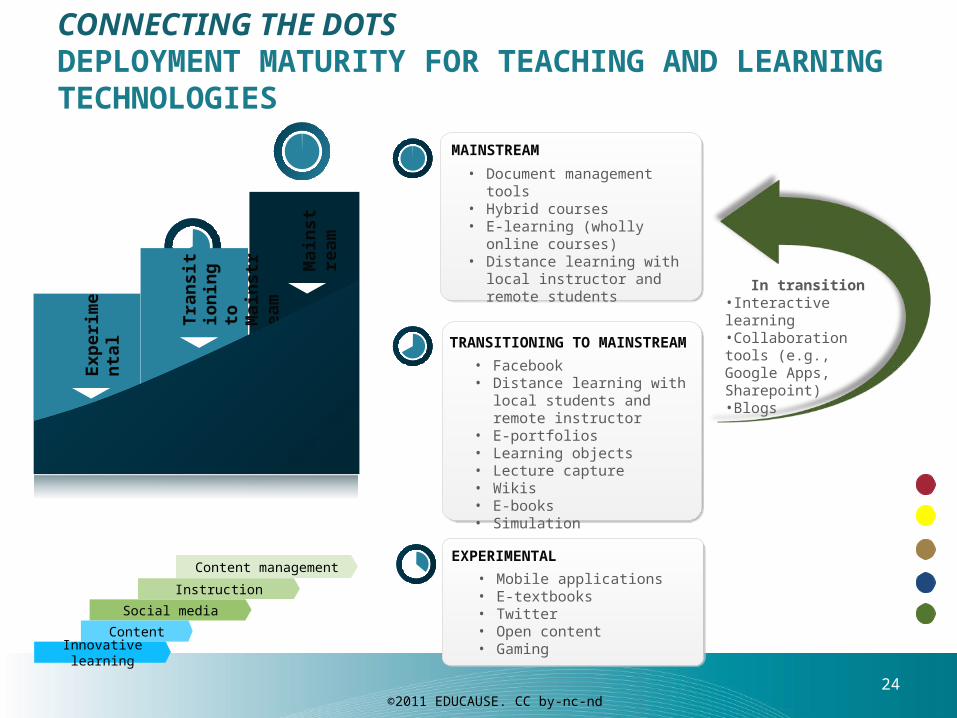
CONNECTING THE DOTS DEPLOYMENT MATURITY FOR TEACHING AND LEARNING TECHNOLOGIES
• Facebook• Distance learning with local
students and remote instructor• E-portfolios• Learning objects• Lecture capture• Wikis• E-books• Simulation
TRANSITIONING TO MAINSTREAM
• Document management tools• Hybrid courses• E-learning (wholly online
courses)• Distance learning with local
instructor and remote students
MAINSTREAM
EXPERIMENTAL
• Mobile applications• E-textbooks• Twitter• Open content• Gaming
In transition•Interactive learning•Collaboration tools (e.g., Google Apps, Sharepoint)•BlogsE
xper
ime
nta
l
Tra
nsi
tio
nin
g t
o
Mai
nst
ream
Mai
nst
rea
m
Content management
Instruction
Social media
Content
Innovative learning
24

©2011 EDUCAUSE. CC by-nc-nd
LEARNING MANAGEMENT SYSTEMS
• Use of commercial LMSs is more common in all types of institutions except BA Liberal Arts colleges
• But faculty and students are most satisfied in institutions using a single open-source LMS
25

©2011 EDUCAUSE. CC by-nc-nd
USE OF COMMERCIAL VS. OPEN-SOURCE LEARNING MANAGEMENT SYSTEMS
26

©2011 EDUCAUSE. CC by-nc-nd
STUDENT AND FACULTY SATISFACTION WITH LEARNING MANAGEMENT SYSTEMS
27

©2011 EDUCAUSE. CC by-nc-nd
IT SUPPORT FOR STUDENTS
28
©2011 EDUCAUSE. CC by-nc-nd
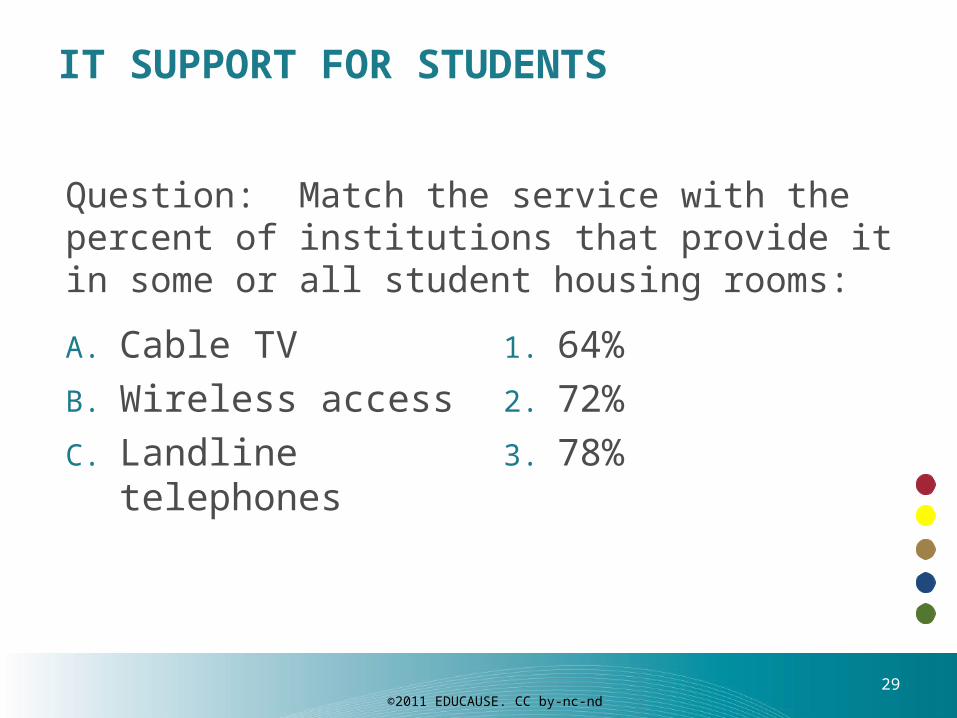
IT SUPPORT FOR STUDENTS
Question: Match the service with the percent of institutions that provide it in some or all student housing rooms:
A. Cable TV
B. Wireless access
C. Landline telephones
1. 64%
2. 72%
3. 78%
29

©2011 EDUCAUSE. CC by-nc-nd
IT SUPPORT FOR STUDENTS
Answer: Match the service with the percent of institutions that provide it in some or all student housing rooms:
A. Landline telephones
B. Cable TV
C. Wireless access
1. 64%
2. 72%
3. 78%
30

©2011 EDUCAUSE. CC by-nc-nd
INSTITUTIONS THAT REGISTER STUDENT CELL PHONES MAKE USE OF THEM
47% of institutions require students to register their cell phone numbers•94% of those institutions offer students the option of receiving emergency communications (vs. 51%)•15% of those institutions offer students the option to access institutional information systems via text message (vs. 5%)
31

©2011 EDUCAUSE. CC by-nc-nd
POLICIES FOR STUDENT COMPUTERS
32

©2011 EDUCAUSE. CC by-nc-nd
INSTITUTIONS CHARGING A STUDENT TECHNOLOGY FEE
• Fee averages $200/year
• Only 4% charge a fee that is a % of tuition, except associate’s (69% of them do)
• Fee averages $200/year
• Only 4% charge a fee that is a % of tuition, except associate’s (69% of them do)
33

©2011 EDUCAUSE. CC by-nc-nd
SUPPORT FOR RESEARCH
34

©2011 EDUCAUSE. CC by-nc-nd
IT IN SUPPORT OF RESEARCHWHAT DOES IT COST IT TO SUPPORT RESEARCH?
• For every 10% increase in the institution’s research expenditures, IT spending increases by:• 2.0% in central IT• 0.5% in distributed IT
35

©2011 EDUCAUSE. CC by-nc-nd
RESEARCH SERVICES PROVIDED BY CENTRAL IT
36

©2011 EDUCAUSE. CC by-nc-nd
INSTITUTIONAL DIFFERENCES IN CENTRAL IT SERVICES FOR RESEARCH
The break in the bar represents the overall average for higher education.
37

©2011 EDUCAUSE. CC by-nc-nd
INSTITUTIONAL DIFFERENCES IN CENTRAL IT SERVICES FOR RESEARCH
DR
MA
BA LA
BA other
AA
Institutional type averages
The break in the bar represents the overall average for higher education.
38

©2011 EDUCAUSE. CC by-nc-nd
CONNECTING THE DOTS MATURITY OF IT SUPPORT FOR RESEARCH IN RESEARCH-INTENSIVE INSTITUTIONS
• Storage and hosting• Data management• Community-building• Research and education
Network access and services• High-performance computing
and related
FREQUENT
• High-performance networking• Videoconferencing
PERVASIVE
MODERATELY COMMON
• Content-related support• Support for grants• Cyberinfrastructure
services to other institutions
Mo
der
ate
ly
Co
mm
on
Fre
qu
ent
Per
vasi
ve
Based on•Doctoral universities•Institutions specializing in medicine or engineering
39

©2011 EDUCAUSE. CC by-nc-nd
IT IN THE INSTITUTION
40

©2011 EDUCAUSE. CC by-nc-nd
IT IN THE INSTITUTION: BEYOND CENTRAL IT
Reporting Lines for Information and Technology Functions
Per
cen
t of
Ins
titut
ions
41

©2011 EDUCAUSE. CC by-nc-nd
IT FUNCTIONS PROVIDED OUTSIDE CENTRAL IT
42

©2011 EDUCAUSE. CC by-nc-nd
ACADEMIC DEPARTMENTS ARE MORE LIKELY THAN ADMINISTRATIVE TO DELIVER IT SERVICES
43

©2011 EDUCAUSE. CC by-nc-nd
PERCENT OF NON-IT DEPARTMENTS PROVIDING IT FUNCTIONS(DOCTORAL AND CANADIAN INSTITUTIONS ONLY)
Administrative departments Academic departments 44
©2011 EDUCAUSE. CC by-nc-nd
IT SUPPORT
45

©2011 EDUCAUSE. CC by-nc-nd
IT SUPPORT: COMPUTERS SUPPORTED PER IT SUPPORT FTE
46
©2011 EDUCAUSE. CC by-nc-nd
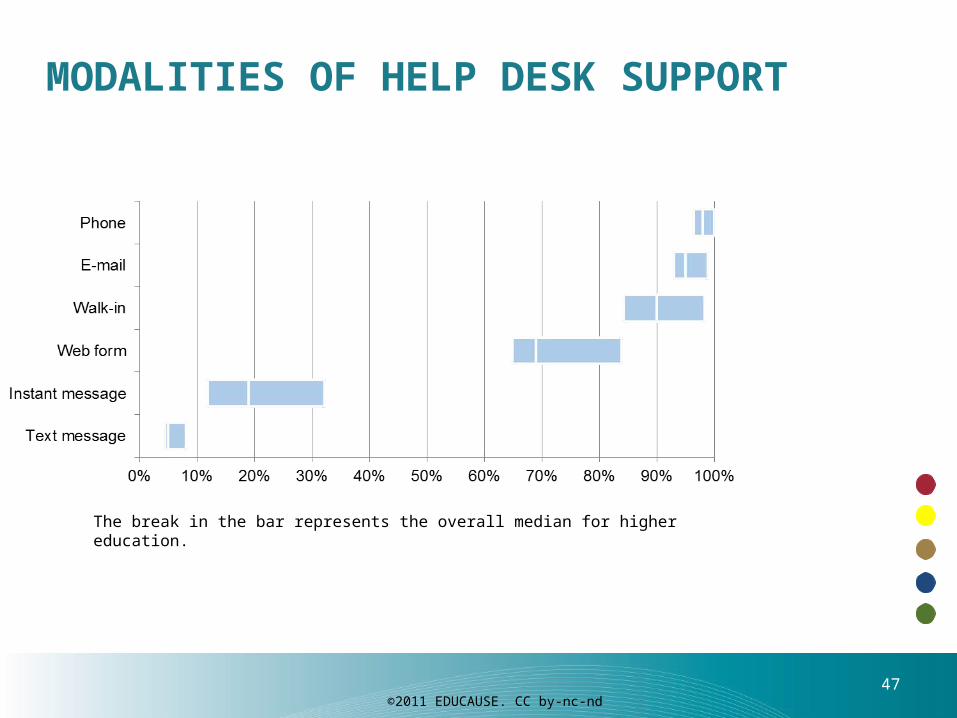
MODALITIES OF HELP DESK SUPPORT
The break in the bar represents the overall median for higher education.
47

©2011 EDUCAUSE. CC by-nc-nd
MODALITIES OF HELP DESK SUPPORT
The break in the bar represents the overall median for higher education.
DR
MA
BA LA
BA other
AA
Institutional type averages
48
©2011 EDUCAUSE. CC by-nc-nd
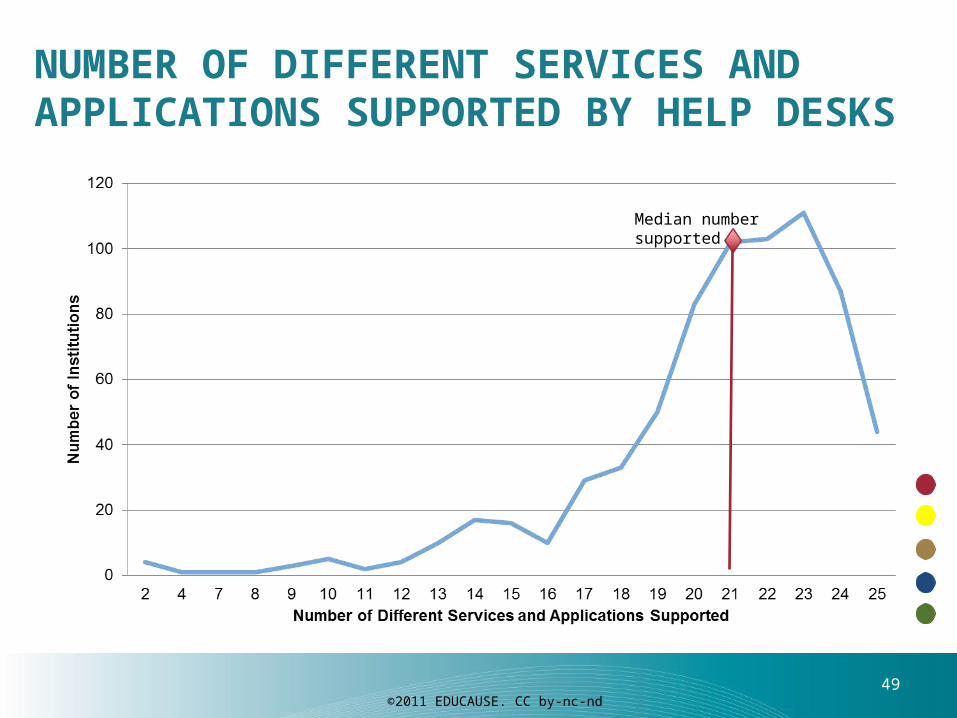
NUMBER OF DIFFERENT SERVICES AND APPLICATIONS SUPPORTED BY HELP DESKS
Median number supported
49

©2011 EDUCAUSE. CC by-nc-nd
HELP DESKS PROVIDE THE BEST SUPPORT FOR THE BASICS, BUT MOBILE DEVICES ARE NOT IGNORED
50

©2011 EDUCAUSE. CC by-nc-nd
STUDENT E-MAIL
51

©2011 EDUCAUSE. CC by-nc-nd
STUDENT E-MAIL OUTSOURCING
62% of institutions have outsourced student e-mail.
Another 12%-46% are planning to.
52

©2011 EDUCAUSE. CC by-nc-nd
REASONS FOR OUTSOURCING STUDENT E-MAIL: COSTS AND FEATURES
53
©2011 EDUCAUSE. CC by-nc-nd
ENTERPRISE SYSTEMS
54

©2011 EDUCAUSE. CC by-nc-nd
ENTERPRISE SYSTEMS TODAY:VENDOR APPLICATIONS MANAGED IN-HOUSE
• Application management• 79% of enterprise applications are managed in-house• 8% by a system office (30% for community colleges)• 11% are outsourced (6% for doctorals, 5% for
international institutions)
• Application origin• Vendors (85% of applications)• Home-grown = 9%, open-source = 6%• Grants management has most homegrown (31%)• Content (21%) and learning (24%) management most
open source
55
©2011 EDUCAUSE. CC by-nc-nd
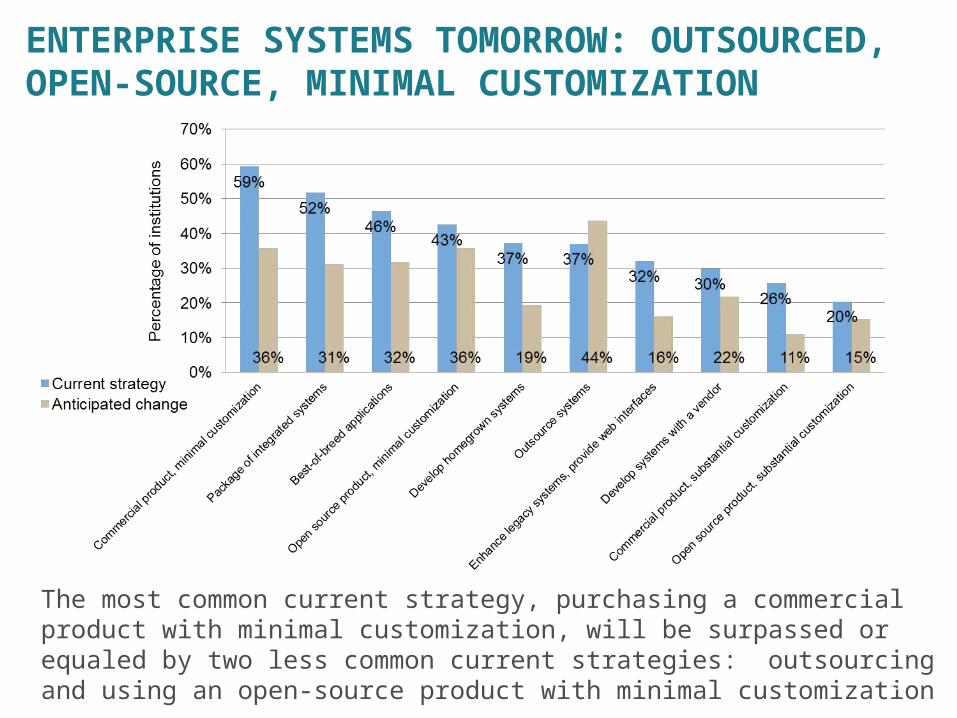
ENTERPRISE SYSTEMS TOMORROW: OUTSOURCED, OPEN-SOURCE, MINIMAL CUSTOMIZATION
The most common current strategy, purchasing a commercial product with minimal customization, will be surpassed or equaled by two less common current strategies: outsourcing and using an open-source product with minimal customization 56

©2011 EDUCAUSE. CC by-nc-nd
WHERE MIGHT WE SEE THESE TRENDS FIRST?
Average Age of Enterprise Systems and Plans to Replace or Implement Within Three Years
57

©2011 EDUCAUSE. CC by-nc-nd
USER SATISFACTION WITH ENTERPRISE SYSTEMS: IT DEPENDS
Estimated user satisfaction with enterprise systems overall (no data on particular applications)•High general satisfaction: 72% satisfied vs. 11% dissatisfied•Mixed user assessments of ease-of-use (39% vs. 29%)•Low satisfaction with data access and reporting capabilities (only 38% satisfied vs. 41% dissatisfied) •Institutions gave themselves high marks for systems implementations and upgrades: 68% satisfaction and only 10% dissatisfaction
58
©2011 EDUCAUSE. CC by-nc-nd
INFORMATION SECURITY
59

©2011 EDUCAUSE. CC by-nc-nd
INFORMATION SECURITY
The lead role varies greatly•35% have executive/officer titles•20% are directors•8% are managers•8% are line staff•29% of CIOs occupy the role
60
©2011 EDUCAUSE. CC by-nc-nd
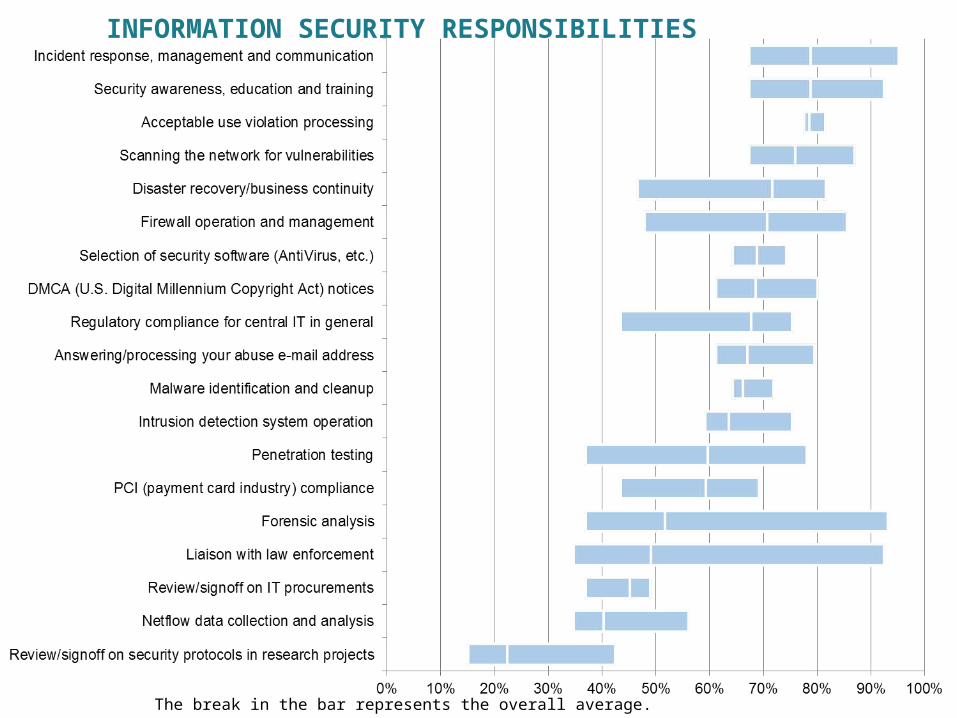
INFORMATION SECURITY RESPONSIBILITIES
The break in the bar represents the overall average.61

©2011 EDUCAUSE. CC by-nc-nd
INFORMATION SECURITY RESPONSIBILITIES
The break in the bar represents the overall average.
DR
MA
BA LA
BA other
AA
Institutional type averages
Private institutions
Public institutions
62

©2011 EDUCAUSE. CC by-nc-nd
INFORMATION SECURITY ACTIVITIES
Most common (>75% of institutions):•Firewall at external Internet connection(s)•Require all critical systems to be expeditiously patched or updated•IT security personnel have authority and ability to disable a network port in the event that a device has been detected to be violating institutional policy or disrupting network services•Require institutionally owned or leased computers to be expeditiously patched or updated•Enterprise directory
63

©2011 EDUCAUSE. CC by-nc-nd
LEAST COMMON ACTIVITIES (<25% OF INSTITUTIONS)• Security assessments are required prior
to contracting for hosted services• PKI implemented (broadly or sparsely)• Electronic signatures implemented
(broadly or sparsely)• Risk assessments on Instructional
systems and data• Firewalls deployed by or on behalf of
individual departments• Security assessments are required prior
to licensing commercial software• Two-factor authentication implemented
(broadly or sparsely)• Requirement that personal firewall
product be turned on when connected to the institutional network
• Conduct proactive scans to detect known security exposures in all personally owned computers connected to our network.
• Smart Cards implemented (broadly or sparsely)
• Require all institutionally owned portable devices to be encrypted
• Biometrics implemented (broadly or sparsely
• Member of a federation such as InCommon and support inter-domain authentication
• Tokens implemented (broadly or sparsely)
• Require IT Security Professional certification
• Risk assessments on Medical center systems and data
• Have deployed DNSSEC (domain name system security extensions)
• Risk assessments on research systems and data
64
©2011 EDUCAUSE. CC by-nc-nd
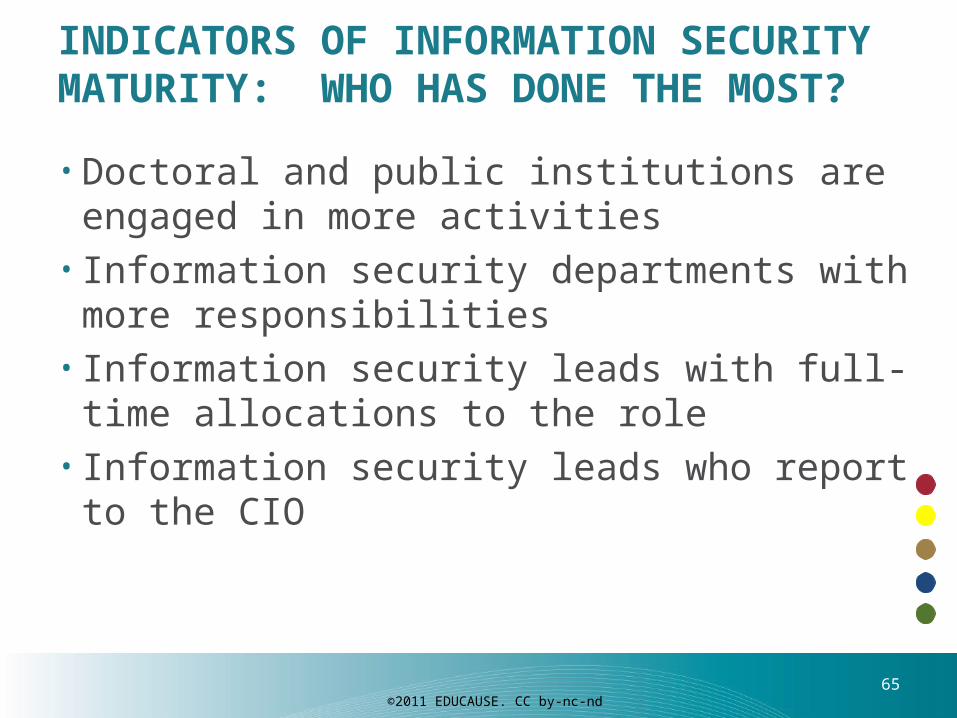
INDICATORS OF INFORMATION SECURITY MATURITY: WHO HAS DONE THE MOST?
• Doctoral and public institutions are engaged in more activities
• Information security departments with more responsibilities
• Information security leads with full-time allocations to the role
• Information security leads who report to the CIO
65

©2011 EDUCAUSE. CC by-nc-nd
DATA CENTERS
66

©2011 EDUCAUSE. CC by-nc-nd
DATA CENTERS: WHO MANAGES THEM?
Central IT manages more than 9 of 10 data centers in associates and BA colleges but fewer than two-thirds of data centers at doctoral and Canadian institutions.
67

©2011 EDUCAUSE. CC by-nc-nd
DATA CENTERS COME IN ALL SIZES
Average size of central IT data centers varies more than tenfold
68

©2011 EDUCAUSE. CC by-nc-nd
DATA CENTER UTILIZATION: UNDER CONTROL
Is it due to virtualization? Half the servers in U.S. higher education data centers are virtualized, ranging from 37% of doctoral to 57% for BA liberal arts and 53% of other BA colleges. (34% of Canadian)
69
Data centers have capacity:

©2011 EDUCAUSE. CC by-nc-nd
WHEN DISASTER STRIKES
• 24% of data centers managed by central IT do not have a secondary power source
• 77% lack a tertiary power source• 23% of institutions have no disaster recovery
provisions in place for their data centers• 81% with a disaster recovery site have not tested
it in the past year
70

©2011 EDUCAUSE. CC by-nc-nd
DATA CENTER DISASTER RECOVERY PROVISIONS(OF THOSE WITH PROVISIONS)
Most disaster recovery sites are on campus
71

©2011 EDUCAUSE. CC by-nc-nd
IT’S CONTRIBUTIONS TO SUSTAINABILITY
72

©2011 EDUCAUSE. CC by-nc-nd
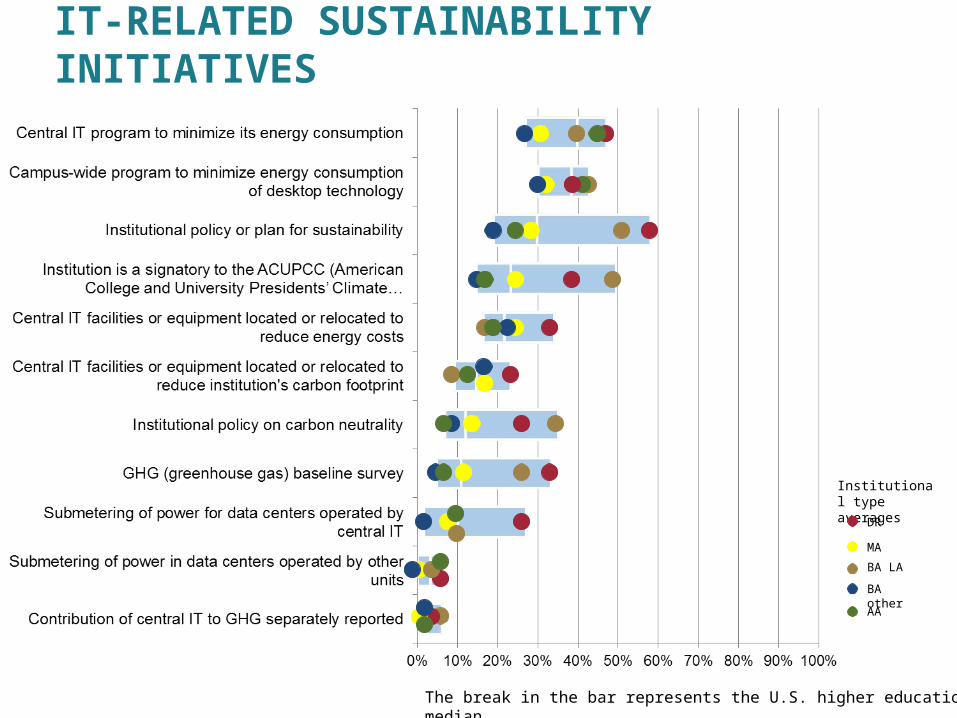
IT-RELATED SUSTAINABILITY INITIATIVES
The break in the bar represents the U.S. higher education median.73
©2011 EDUCAUSE. CC by-nc-nd
IT-RELATED SUSTAINABILITY INITIATIVES
The break in the bar represents the U.S. higher education median.
DR
MA
BA LA
BA other
AA
Institutional type averages
74

©2011 EDUCAUSE. CC by-nc-nd
• Institution is a signatory to the ACUPCC (American College and University Presidents’ Climate Commitment
• Central IT facilities or equipment located or relocated to reduce energy costs
• Institutional policy on carbon neutrality
MODERATELY COMMON
• Central IT program to minimize its energy consumption
• Campus-wide program to minimize energy consumption of desktop technology
• Institutional policy or plan for sustainability
FREQUENT
RARELY CONSIDERED• Submetering of power in data centers operated
by other units• Contribution of central IT to GHG separately
reported
Rar
ely C
on
sid
ered D
eplo
yed
by
So
me
Fre
qu
en
t
Mo
der
atel
y C
om
mo
n
DEPLOYED BY SOME• Central IT facilities or equipment located or
relocated to reduce institution's carbon footprint• GHG (greenhouse gas) baseline survey• Submetering of power for data centers
operated by central IT
CONNECTING THE DOTS DEPLOYMENT MATURITY FOR IT-RELATED SUSTAINABILITY INITIATIVES

©2011 EDUCAUSE. CC by-nc-nd
A WORD ABOUT THE CORE DATA SERVICE
• Big redesign this year• Some hits, some misses• We’re reviewing your evaluations to adapt the
service for this year• We have plans to do more: Come learn more
about our plans for data, benchmarking, and analytics tomorrow at 12:30 in room 201A
76
