2011 annual report - port of edmonds
TRANSCRIPT

2011 Annual Report
336 Admiral Way, Edmonds, WA 98020 Phone: 425-774-0549
Web site: www.portofedmonds.org

2011 Commissioners
Jim Orvis President Bruce Faires Vice-President Marianne Zagorski Secretary Mary Lou Block Commissioner Fred Gouge Commissioner
Port Officers
Robert McChesney Executive Director Marla Kempf Deputy Director Tina Drennan Finance Manager Brian Menard Facilities Maintenance Manager

Port of Edmonds 2011 Annual Report
Contents
Management’s Discussion and Analysis: 1 Financial Highlights 1 Using the Annual Report 2 Financial Analysis – Statement of Net Assets 3 Financial Analysis – Revenues, Expenses, and Changes in Fund Net Assets 6 Program Impacts 7 Contacting the Port’s Financial Management 8 Financial Statements:
Statement of Net Assets 9 Statement of Revenues, Expenses, and Changes in Fund Net Assets 11 Statement of Cash Flows 12 Notes to the Financial Statements 13
Supplementary Information to the Financial Statements: 35
Other Postemployment Benefits Schedule of Funding Progress 36 Detail of Revenues and Expenses (Schedule 04/05) 37 Schedule of Long-Term Debt (Schedule 09) 38 Limitation of Indebtedness (Schedule 10) 39 Schedule of State and Local Assistance (Schedule 16) 42 Schedule of Labor Relations Consultant(s) (Schedule 19) 43

ANNUAL REPORT
Port of Edmonds
MCAG No. 1759
Submitted pursuant to RCW 43.09.230 to the
State Auditor’s Office
For the Fiscal Year Ended December 31, 2011
Certified correct this 21st day of May, 2012, to the best of my knowledge and belief: Government Information Official Mailing Address 336 Admiral Way, Edmonds, WA 98020 Official Web Site Address www.portofedmonds.org Preparer Information and Certification Preparer Name and Title Tina Drennan, Finance Manager Contact Phone Number 425-774-0549 Contact Fax Number 425-774-7837 Contact E-mail Address [email protected] Signature
1
PORT OF EDMONDS MANAGEMENT’S DISCUSSION AND ANALYSIS
The discussion and analysis of the Port of Edmonds’ (the Port’s) financial performance provides an overview of the Port’s financial activities for the fiscal year ended December 31, 2011. This discussion and analysis is designed to assist the reader in focusing on the significant financial issues and activities of the Port and to identify any significant changes in financial position. Please read it in conjunction with the Port’s financial statements. The Port of Edmonds is a Special Purpose Municipal Government. The Port was created in 1948 by a vote of the citizens of the Port district. The district encompasses portions of the City of Edmonds and all of the Town of Woodway. Ports exist to build infrastructure and promote economic development within their districts. Ports are often, though not always, involved in transportation activities. The Port of Edmonds operates a marina for recreational boating on Puget Sound and rents its land to commercial users who then build suitable facilities on the land. The facility consists of the marina with approximately 665 slips, a dry stack storage facility with approximately 230 spaces, two public boat launches, a boatyard, a fuel dock, guest moorage, offices, and parking facilities. In addition to the Port’s marina operations, the Port owns and manages 8 buildings, and rents portions of those buildings to approximately 50 tenants. Major tenants include a hotel, an athletic club, and 2 restaurants. Five elected Port Commissioners administer the Port. In accordance with the laws of Washington, the Commissioners have appointed an Executive Director to manage Port operations.
FINANCIAL HIGHLIGHTS
The Port’s overall operating revenues increased by $67,394, or 1% over 2010. The increase is primarily due to increases in marina operations revenue. The Port’s non-operating revenues increased by $6,236, or 1.4% over 2010. This increase is primarily due to reimbursements the Port received for damage done to Port property. The Port’s overall operating expenses decreased by $102,020 in 2011, or 1.7% less than 2010 operating expense levels. The Port’s non-operating expenses decreased by $107,616, or 11% less than 2010 non-operating expense levels. The Port’s overall operating income was $1,085,738 in 2011, as compared to $916,324 in 2010. The Port’s net assets increased by $478,290 in 2011. The Port’s assets exceeded its liabilities by $28,932,628 (net assets) as of December 31, 2011.
2
USING THE ANNUAL REPORT Government accounting falls under the control of the Government Accounting Standards Board (GASB). The Port uses the “one proprietary fund” model in compliance with the rules of GASB Statement No. 34. Since the Port is comprised of a single enterprise fund, no fund level financial statements are shown. Ports perform their accounting and financial reporting of their activities very much like a business. The Port prepares an income statement, manages operations, and plans capital investment strategies. Ports collect revenues from services performed for customers and pay for expenses related to those services. However, ports are municipal governments. As such, ports may collect property tax revenues from the property owners within the Port district. These tax revenues may go to support the capital investments made by the Port. Often, ports will use tax revenues to pay for debt incurred to construct facilities that are used to support port functions. Sometimes, ports may use a portion of their tax revenue to pay for operating expenses. The Port of Edmonds uses its tax revenue to pay for Commission costs, public amenities, and economic development. The financial statements provide a broad view of the Port’s operations in a manner similar to a private-sector business. The financial statements take into account all revenues and expenses connected with the fiscal year even if cash involved has not been received or paid. The Statement of Net Assets (also known as the Balance Sheet) presents all of the Port’s assets and liabilities, with the difference between the two reported as net assets. Over time, increases and decreases in the Port’s net assets may serve as a useful indicator of whether the financial position of the Port is improving or deteriorating. The Statement of Revenues, Expenses, and Changes in Fund Net Assets presents information showing how the Port’s net assets changed during the year. Revenues less expenses, when combined with other nonoperating items such as investment income, tax receipts and interest expense, results in a net increase or decrease in the Port’s net assets for the year. The Statement of Cash Flows reports cash receipts, cash payments, and net changes in cash resulting from operations, and investing and financing activities. A reconciliation of the cash provided by operating activities to the Port’s operating income as reflected on the Statement of Revenues, Expenses, and Changes in Fund Net Assets is also included. The notes to the financial statements provide additional information that may not be readily apparent from the actual financial statements. The notes to the financial statements can be found immediately following the financial statements. One of the questions to be answered by the financial statements would be, “Is the Port as a whole better off or worse off as a result of this year’s activities?” Changes in net assets and cash flows are two ways of measuring the financial position of the Port. Increases in Net Assets as a result of the year’s operations indicate an improved financial position. In 2011, the Port’s Net Assets increased by $478,290 or 1.7%, which shows that the Port of Edmonds performed slightly better
3
in 2011 than in 2010. Cash flows show if the Port is spending more money than it received. In 2011, the Port of Edmonds received $879,420 more than it spent. Overall, the Port is in a better financial position than it was in 2010. FINANCIAL ANALYSIS – STATEMENT OF NET ASSETS
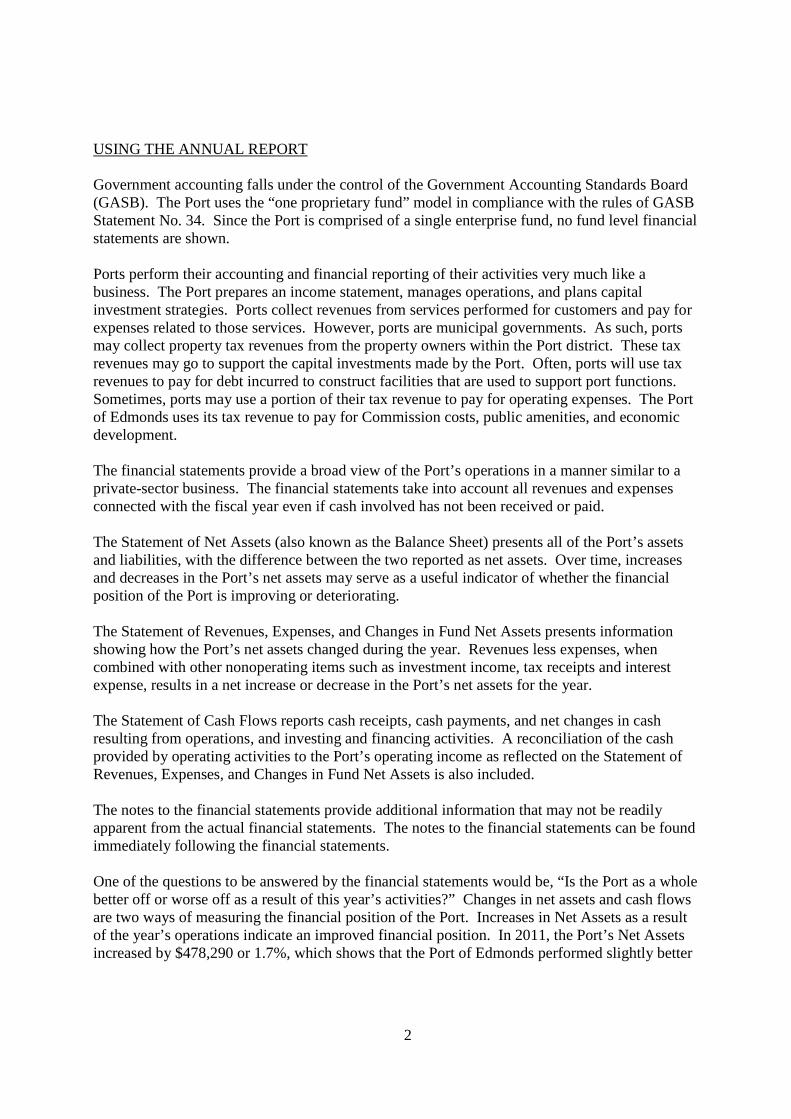
This discussion of the Port’s financial statements includes an analysis of major changes in the assets and liabilities for 2011, as well as reviewing changes in revenues and expenses reflected in the financial statements. The Port’s Total Net Assets increased by $478,290, or 1.7% in 2011, for a total of $28,932,628. Of this amount $22,100,686 reflects the Port’s investment in capital assets, net of debt.
Increase
2011 2010 (Decrease) % Change
Current Assets 7,877,398$ 6,935,086$ 942,312$ 13.59%
Restricted Assets 801,888 800,900 988 0.12%
Capital Assets 35,609,626 36,895,956 (1,286,330) -3.49%
Other Noncurrent Assets 103,650 150,087 (46,437) -30.94%
Total Assets 44,392,562 44,782,029 (389,467) -0.87%
Current Liabilities 1,999,029 1,914,018 85,011 4.44%
Noncurrent Liabilities 13,460,905 14,413,673 (952,768) -6.61%
Total Liabil ities 15,459,934 16,327,691 (867,757) -5.31%
Invested in Capital Assets, Net of Related Debt 22,100,686 22,264,199 (163,513) -0.73%
Unrestricted 6,831,942 6,190,139 641,803 10.37%
Total Net Assets 28,932,628 28,454,338 478,290 1.68%
Total Liabil ities and Net Assets 44,392,562$ 44,782,029$ (389,467)$ -0.87%
Summary of Statement of Net Assets

4
The Port has booked the acquisition of all assets at historical costs on its Statement of Net Assets. The Port received FEMA grants to aid in reconstruction of the marina after the marina collapsed in 1996. The contributions received from other governments for these assets are shown in the “Invested in Capital Assets, Net of Related Debt” account on the Port’s Statement of Net Assets. GASB 34 requires the Port to capitalize and depreciate all of the assets owned or controlled by the Port, which is done on these financial statements. The Port maintained capital assets of $35,609,626 as of December 31, 2011. The book value of the assets decreased by $1,286,330 in 2011 as a result of investments in capital assets, offset by depreciation charged against revenue in the year. When the Port invests more than depreciation in new capital assets in a year, the book value of its asset base increases. The Port’s capital assets are classified into the following categories: land, construction in progress, buildings, marina and other improvements, and machinery and equipment. Marina and other improvements include assets such as docks, breakwaters, the dry stack facility, roads, and landscaping. See Note 4 in the Notes to the Financial Statements for more information. The Port’s current liabilities as of December 31, 2011 are debts that the Port will repay in 2012. The total current liabilities increased by $85,011 in 2011. Current liabilities include payments
Capital Asset 2011 2010Land 4,323,675$ 4,323,675$ Construction in progress - 14,618 Buildings 15,023,437 14,980,128 Machinery and equipment 1,140,204 1,254,788 Marina and other improvements 36,071,717 35,797,323
56,559,033$ 56,370,532$
5
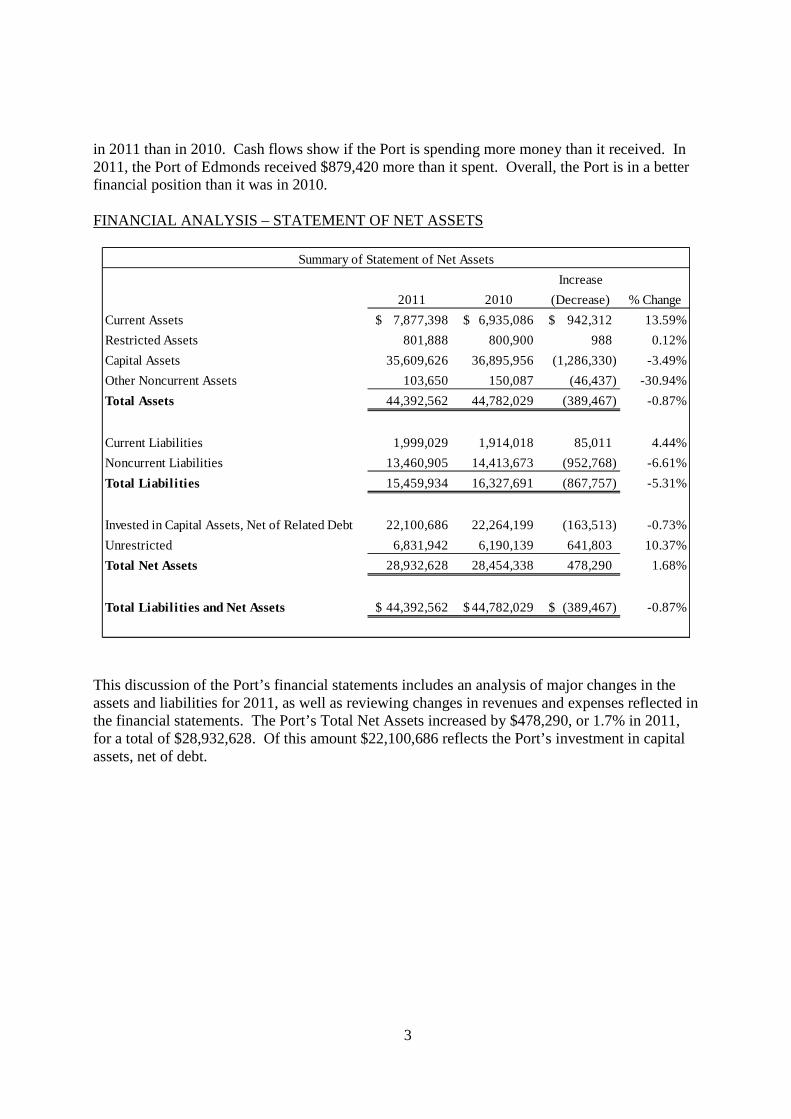
for expenses already incurred, accrued interest on the Port’s bonds, customer deposits, and the principal amount of the bond payments due in 2012.
The Port’s long term liabilities decreased by $952,768 in 2011, as the Port made principal payments on its bonds. General Obligation bonds outstanding at December 31, 2011 were $3,595,000, a decrease of $65,000 from 2010. Revenue and Refunding bonds outstanding at December 31, 2011 were $9,993,434, a decrease of $1,021,218 from the previous year. See Note 8 in the Notes to the Financial Statements for more information.
$- $1,000,000 $2,000,000 $3,000,000 $4,000,000 $5,000,000 $6,000,000 $7,000,000 $8,000,000 $9,000,000
2009 2010 2011
Bon
d P
rinci
pal R
emai
ning
Year
Bond Debt Outstanding
1998 Revenue andRefunding Bonds
2005 LTGO andRefunding Bonds
2006 Special RevenueBonds
2011 Special RevenueRefunding Bonds
Bond 2009 2010 20111998 Revenue and Refunding Bonds 3,625,000$ 2,925,000$ 2,195,000$ 2005 LTGO and Refunding Bonds 3,730,000$ 3,660,000$ 3,595,000$ 2006 Special Revenue Bonds 8,358,887$ 8,089,652$ -$ 2011 Special Revenue Refunding Bonds -$ -$ 7,798,434$
6
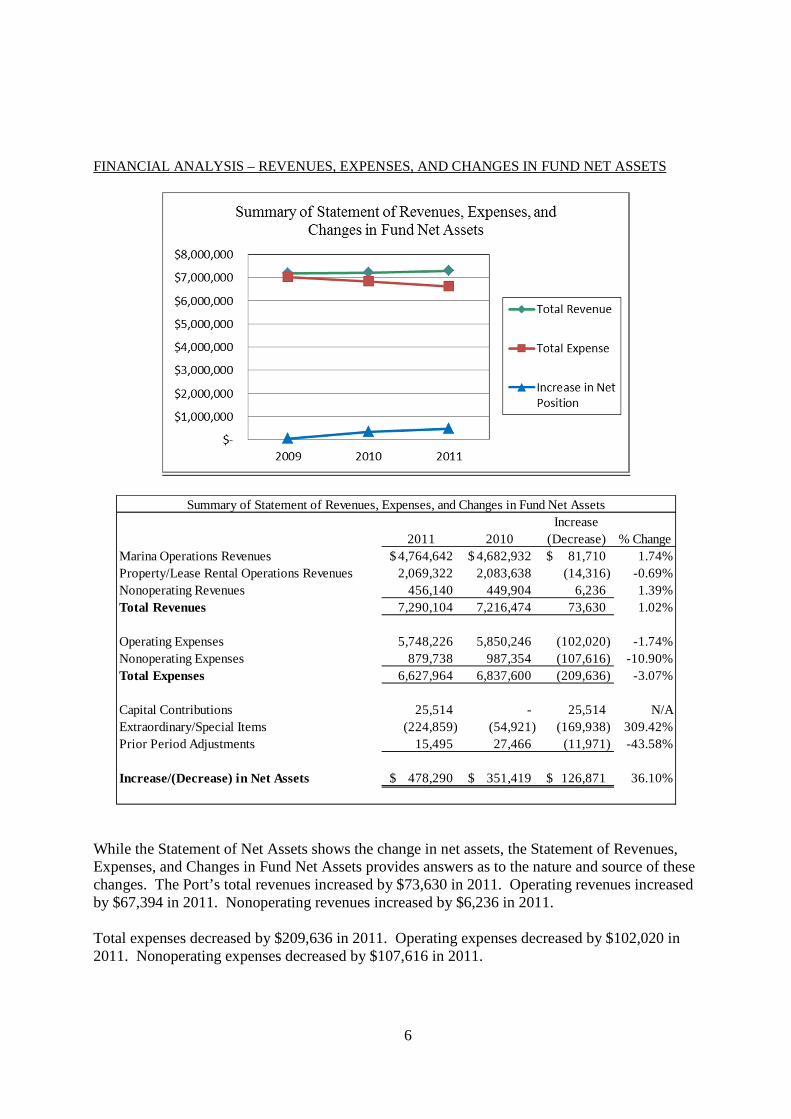
FINANCIAL ANALYSIS – REVENUES, EXPENSES, AND CHANGES IN FUND NET ASSETS
While the Statement of Net Assets shows the change in net assets, the Statement of Revenues, Expenses, and Changes in Fund Net Assets provides answers as to the nature and source of these changes. The Port’s total revenues increased by $73,630 in 2011. Operating revenues increased by $67,394 in 2011. Nonoperating revenues increased by $6,236 in 2011. Total expenses decreased by $209,636 in 2011. Operating expenses decreased by $102,020 in 2011. Nonoperating expenses decreased by $107,616 in 2011.
Increase2011 2010 (Decrease) % Change
Marina Operations Revenues 4,764,642$ 4,682,932$ 81,710$ 1.74%Property/Lease Rental Operations Revenues 2,069,322 2,083,638 (14,316) -0.69%Nonoperating Revenues 456,140 449,904 6,236 1.39%Total Revenues 7,290,104 7,216,474 73,630 1.02%
Operating Expenses 5,748,226 5,850,246 (102,020) -1.74%Nonoperating Expenses 879,738 987,354 (107,616) -10.90%Total Expenses 6,627,964 6,837,600 (209,636) -3.07%
Capital Contributions 25,514 - 25,514 N/AExtraordinary/Special Items (224,859) (54,921) (169,938) 309.42%Prior Period Adjustments 15,495 27,466 (11,971) -43.58%
Increase/(Decrease) in Net Assets 478,290$ 351,419$ 126,871$ 36.10%
Summary of Statement of Revenues, Expenses, and Changes in Fund Net Assets

7
Interest income decreased by $10,923 as a result of lower interest rates. Interest expense decreased by $105,665 as the Port paid down the principal on its bonds. All of the functions of the Port are considered in the numbers shown on the previous pages, including the cost of general government of the Port District. Since the Port is a Special Purpose government, all of its assets and liabilities are shown in its Proprietary Fund. The Port incurs a substantial amount of governmental activity expense, such as Port management and administration, public facility maintenance, and public meeting expenses. All of these expenses of the Port are reported in the Proprietary Fund. The “one fund” model is used in compliance with the rules of GASB 34, which state that separately issued debt and separately issued classified assets are needed in order for a separate fund to exist. Most of these governmental costs are contained in the General and Administrative cost centers shown on the Port’s financial reports. PROGRAM IMPACTS There is one major program impact facing the Port that could result in material changes in its financial position in the long term. The Port of Edmonds purchased the Harbor Square land in 1978 from the Union Oil Company. From 1924 to 1968, portions of the property were used as an oil and gasoline depot and distribution facility, a railcar cleaning facility, an asphalt batch plant, and heavy-equipment storage. Several remedial investigations were conducted at the property from 1989 to 2003. In June 2003, a supplemental site investigation was conducted at the direction of the Department of Ecology to further define the extent of contamination identified at the property during previous investigations, to help identify any additional areas of contamination, and to further evaluate any impacts to groundwater. The Port developed a remediation plan based on that investigation. The estimated costs presented in the plan are for all remediation activities anticipated at the site, which are described as Phase I through Phase III remediation in the report. Phase I and Phase II remediation efforts were essentially completed in 2005 and 2006. Phase III remediation remains to be completed. The majority of the contamination to be addressed in Phase III remediation is located under existing buildings; some areas of residual contamination (expected to be relatively small) are located outside building footprints, but underneath paved surfaces. Phase III activities were not undertaken due to the inaccessibility of the contaminated areas, although the Port has committed to remediation at such time that the structures at the Harbor Square complex are removed for future development.
The estimated cost of Phase III remediation is expected to range between $175,000 and $1,050,000. Please see Note 11 for further information.

8
CONTACTING THE PORT’S FINANCIAL MANAGEMENT This financial report is designed to provide our citizens, taxpayers, customers, investors, and creditors with a general overview of the Port’s finances and to show the Port’s accountability for the money it receives. If you have questions about this report, or if you need additional financial information, please contact Tina Drennan, Finance Manager, at the Port of Edmonds, 336 Admiral Way, Edmonds, WA 98020 or by telephone at 425-774-0549.
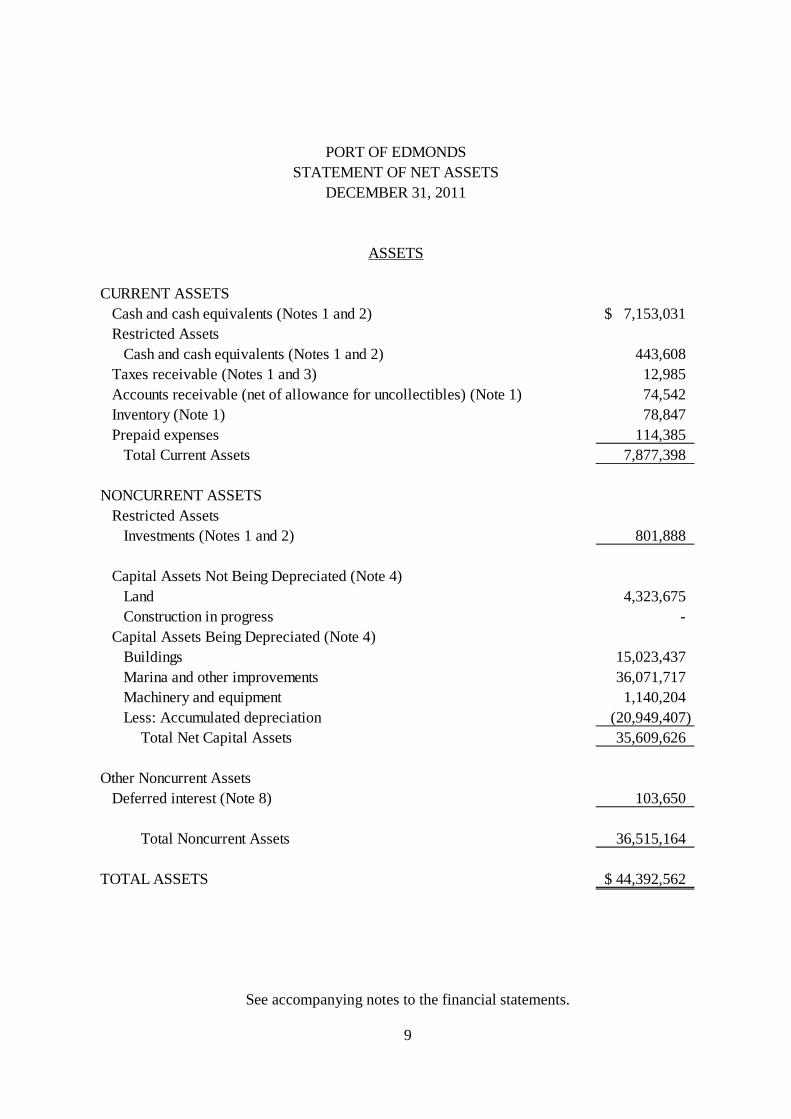
See accompanying notes to the financial statements. 9
CURRENT ASSETSCash and cash equivalents (Notes 1 and 2) 7,153,031$ Restricted Assets
Cash and cash equivalents (Notes 1 and 2) 443,608 Taxes receivable (Notes 1 and 3) 12,985 Accounts receivable (net of allowance for uncollectibles) (Note 1) 74,542 Inventory (Note 1) 78,847 Prepaid expenses 114,385
Total Current Assets 7,877,398
NONCURRENT ASSETSRestricted Assets
Investments (Notes 1 and 2) 801,888
Capital Assets Not Being Depreciated (Note 4)Land 4,323,675 Construction in progress -
Capital Assets Being Depreciated (Note 4)Buildings 15,023,437 Marina and other improvements 36,071,717 Machinery and equipment 1,140,204 Less: Accumulated depreciation (20,949,407)
Total Net Capital Assets 35,609,626
Other Noncurrent AssetsDeferred interest (Note 8) 103,650
Total Noncurrent Assets 36,515,164
TOTAL ASSETS 44,392,562$
PORT OF EDMONDSSTATEMENT OF NET ASSETS
DECEMBER 31, 2011
ASSETS
See accompanying notes to the financial statements.
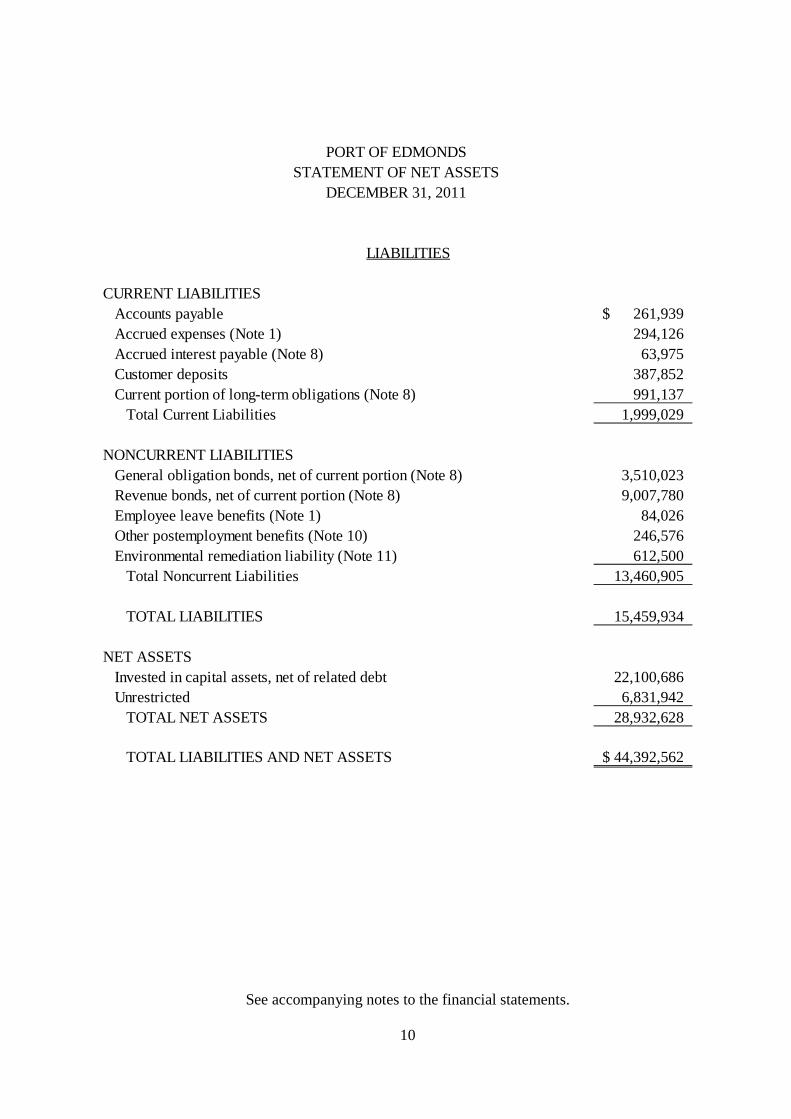
10
LIABILITIES
CURRENT LIABILITIESAccounts payable 261,939$ Accrued expenses (Note 1) 294,126 Accrued interest payable (Note 8) 63,975 Customer deposits 387,852 Current portion of long-term obligations (Note 8) 991,137
Total Current Liabilities 1,999,029
NONCURRENT LIABILITIESGeneral obligation bonds, net of current portion (Note 8) 3,510,023 Revenue bonds, net of current portion (Note 8) 9,007,780 Employee leave benefits (Note 1) 84,026 Other postemployment benefits (Note 10) 246,576 Environmental remediation liability (Note 11) 612,500
Total Noncurrent Liabilities 13,460,905
TOTAL LIABILITIES 15,459,934
NET ASSETSInvested in capital assets, net of related debt 22,100,686 Unrestricted 6,831,942
TOTAL NET ASSETS 28,932,628
TOTAL LIABILITIES AND NET ASSETS 44,392,562$
PORT OF EDMONDSSTATEMENT OF NET ASSETS
DECEMBER 31, 2011
See accompanying notes to the financial statements.
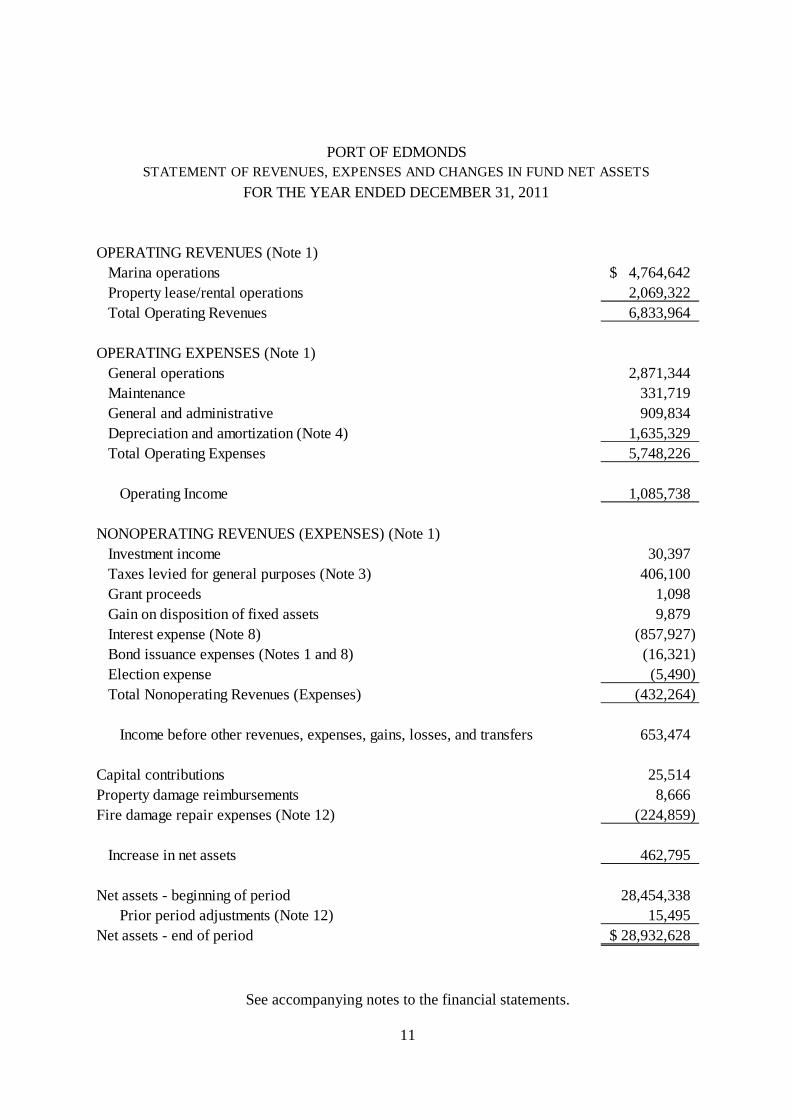
11
PORT OF EDMONDSSTATEMENT OF REVENUES, EXPENSES AND CHANGES IN FUND NET ASSETS
FOR THE YEAR ENDED DECEMBER 31, 2011
OPERATING REVENUES (Note 1)Marina operations 4,764,642$ Property lease/rental operations 2,069,322 Total Operating Revenues 6,833,964
OPERATING EXPENSES (Note 1)General operations 2,871,344 Maintenance 331,719 General and administrative 909,834 Depreciation and amortization (Note 4) 1,635,329 Total Operating Expenses 5,748,226
Operating Income 1,085,738
NONOPERATING REVENUES (EXPENSES) (Note 1)Investment income 30,397 Taxes levied for general purposes (Note 3) 406,100 Grant proceeds 1,098 Gain on disposition of fixed assets 9,879 Interest expense (Note 8) (857,927) Bond issuance expenses (Notes 1 and 8) (16,321) Election expense (5,490) Total Nonoperating Revenues (Expenses) (432,264)
Income before other revenues, expenses, gains, losses, and transfers 653,474
Capital contributions 25,514 Property damage reimbursements 8,666 Fire damage repair expenses (Note 12) (224,859)
Increase in net assets 462,795
Net assets - beginning of period 28,454,338 Prior period adjustments (Note 12) 15,495
Net assets - end of period 28,932,628$
See accompanying notes to the financial statements.
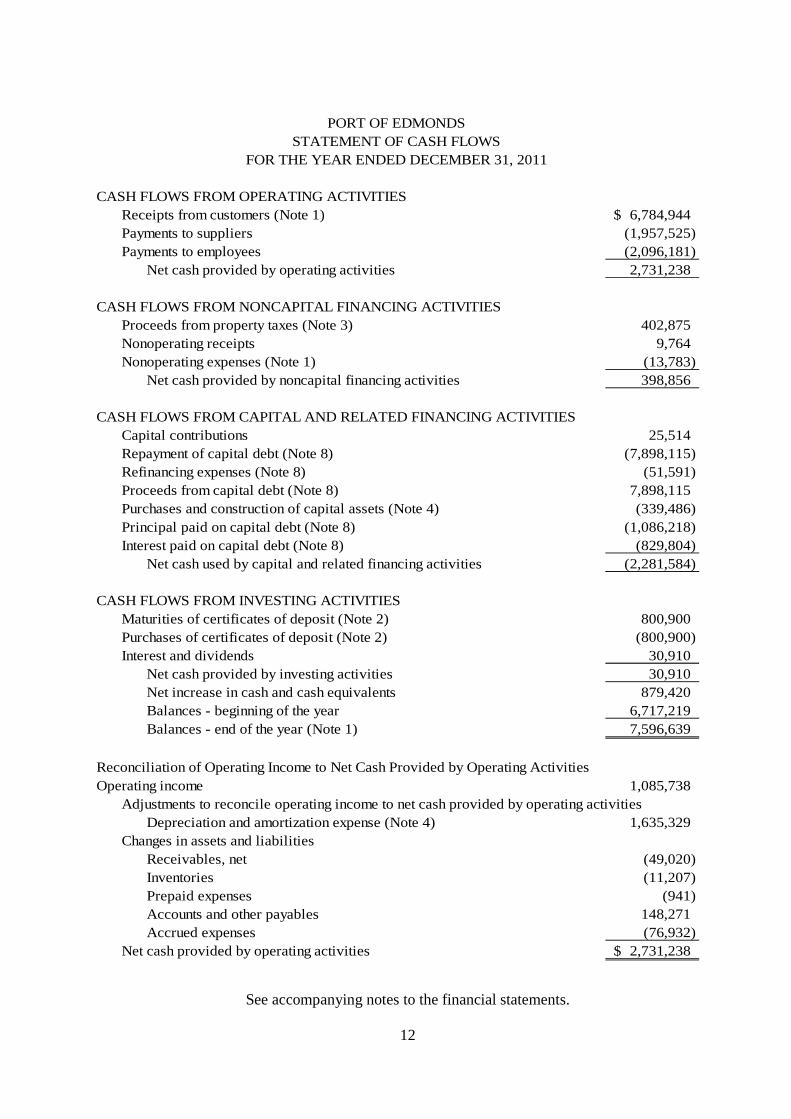
12
CASH FLOWS FROM OPERATING ACTIVITIESReceipts from customers (Note 1) 6,784,944$ Payments to suppliers (1,957,525) Payments to employees (2,096,181)
Net cash provided by operating activities 2,731,238
CASH FLOWS FROM NONCAPITAL FINANCING ACTIVITIESProceeds from property taxes (Note 3) 402,875 Nonoperating receipts 9,764 Nonoperating expenses (Note 1) (13,783)
Net cash provided by noncapital financing activities 398,856
CASH FLOWS FROM CAPITAL AND RELATED FINANCING ACTIVITIESCapital contributions 25,514 Repayment of capital debt (Note 8) (7,898,115) Refinancing expenses (Note 8) (51,591) Proceeds from capital debt (Note 8) 7,898,115 Purchases and construction of capital assets (Note 4) (339,486) Principal paid on capital debt (Note 8) (1,086,218) Interest paid on capital debt (Note 8) (829,804)
Net cash used by capital and related financing activities (2,281,584)
CASH FLOWS FROM INVESTING ACTIVITIESMaturities of certificates of deposit (Note 2) 800,900 Purchases of certificates of deposit (Note 2) (800,900) Interest and dividends 30,910
Net cash provided by investing activities 30,910 Net increase in cash and cash equivalents 879,420 Balances - beginning of the year 6,717,219 Balances - end of the year (Note 1) 7,596,639
Reconciliation of Operating Income to Net Cash Provided by Operating ActivitiesOperating income 1,085,738
Adjustments to reconcile operating income to net cash provided by operating activitiesDepreciation and amortization expense (Note 4) 1,635,329
Changes in assets and liabilitiesReceivables, net (49,020) Inventories (11,207) Prepaid expenses (941) Accounts and other payables 148,271 Accrued expenses (76,932)
Net cash provided by operating activities 2,731,238$
PORT OF EDMONDSSTATEMENT OF CASH FLOWS
FOR THE YEAR ENDED DECEMBER 31, 2011
13
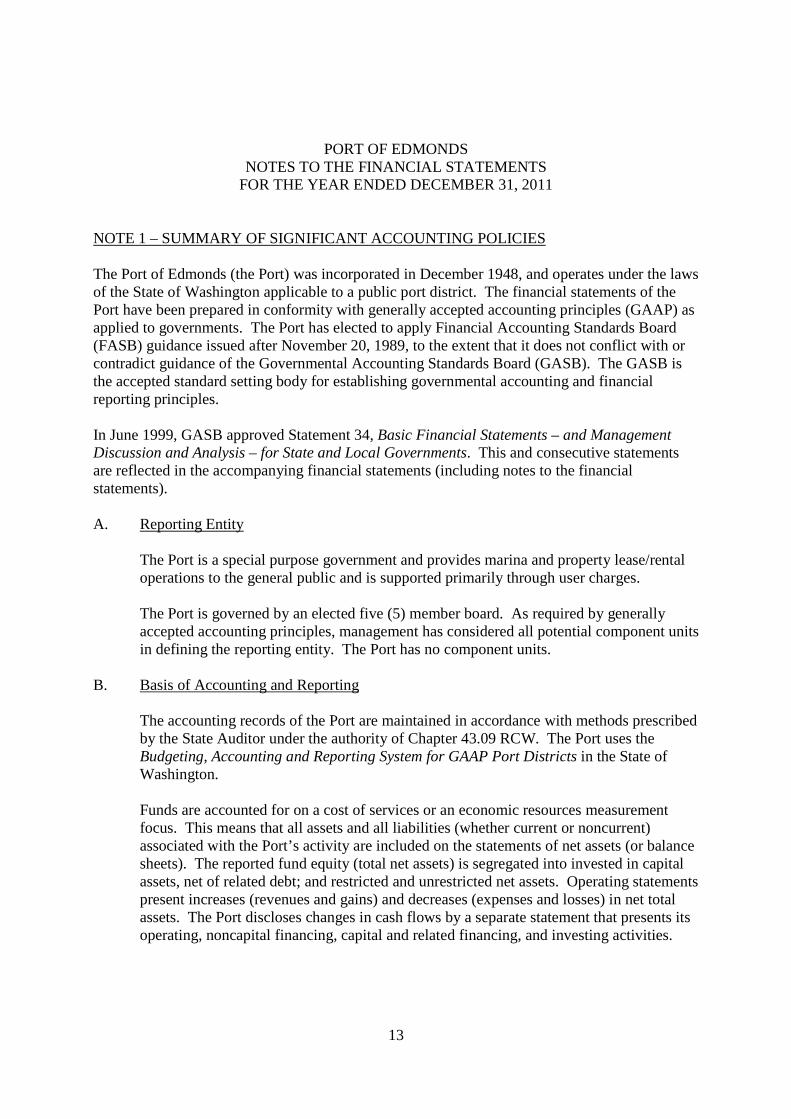
PORT OF EDMONDS NOTES TO THE FINANCIAL STATEMENTS
FOR THE YEAR ENDED DECEMBER 31, 2011 NOTE 1 – SUMMARY OF SIGNIFICANT ACCOUNTING POLICIES The Port of Edmonds (the Port) was incorporated in December 1948, and operates under the laws of the State of Washington applicable to a public port district. The financial statements of the Port have been prepared in conformity with generally accepted accounting principles (GAAP) as applied to governments. The Port has elected to apply Financial Accounting Standards Board (FASB) guidance issued after November 20, 1989, to the extent that it does not conflict with or contradict guidance of the Governmental Accounting Standards Board (GASB). The GASB is the accepted standard setting body for establishing governmental accounting and financial reporting principles. In June 1999, GASB approved Statement 34, Basic Financial Statements – and Management Discussion and Analysis – for State and Local Governments. This and consecutive statements are reflected in the accompanying financial statements (including notes to the financial statements). A. Reporting Entity
The Port is a special purpose government and provides marina and property lease/rental operations to the general public and is supported primarily through user charges.
The Port is governed by an elected five (5) member board. As required by generally accepted accounting principles, management has considered all potential component units in defining the reporting entity. The Port has no component units.
B. Basis of Accounting and Reporting
The accounting records of the Port are maintained in accordance with methods prescribed by the State Auditor under the authority of Chapter 43.09 RCW. The Port uses the Budgeting, Accounting and Reporting System for GAAP Port Districts in the State of Washington.
Funds are accounted for on a cost of services or an economic resources measurement focus. This means that all assets and all liabilities (whether current or noncurrent) associated with the Port’s activity are included on the statements of net assets (or balance sheets). The reported fund equity (total net assets) is segregated into invested in capital assets, net of related debt; and restricted and unrestricted net assets. Operating statements present increases (revenues and gains) and decreases (expenses and losses) in net total assets. The Port discloses changes in cash flows by a separate statement that presents its operating, noncapital financing, capital and related financing, and investing activities.

14
The Port uses the full-accrual basis of accounting where revenues are recognized when earned and expenses are recognized when incurred. Capital asset purchases are capitalized and depreciated over their useful life, and long-term liabilities are accounted for in the appropriate fund. The Port distinguishes between operating revenues and expenses and nonoperating ones. Operating revenues and expenses result from providing services and producing and delivering goods in connection with the Port’s principal ongoing operations. The principal operating revenues of the Port are charges to customers for boating services. The Port also recognizes land and building lease revenue as operating revenue. Operating expenses for the district include general operations, maintenance, general and administrative, and depreciation and amortization. Revenues and expenses not meeting this definition are reported as nonoperating revenues and expenses. The preparation of financial statements in conformity with general accepted accounting principles requires management to make estimates and assumptions that affect certain reported amounts and disclosures. Accordingly, actual results could differ from those estimates.
C. Assets, Liabilities, and Equities
1. Cash and Cash Equivalents
It is the Port’s policy to invest all temporary cash surpluses. At December 31, 2011, the treasurer was holding $7,596,639 in short-term residual investments of surplus cash. This amount is classified on the Statement of Net Assets as cash and cash equivalents and restricted assets, cash and cash equivalents. The amounts reported as cash and cash equivalents also include compensating balances maintained with certain banks in lieu of payments for services rendered. The average compensating balances maintained during 2011 were approximately $294,000. For purposes of the Statement of Cash Flows, the Port considers all highly liquid investments (including restricted assets) with a maturity of three months or less when purchased to be cash equivalents.
2. Short-Term Investments - See Note 2.
3. Receivables
Taxes receivable consists of property taxes and related interest and penalties (See Note 3). Accrued interest receivable consists of amounts earned on investments, notes, and contracts at the end of the year.
15
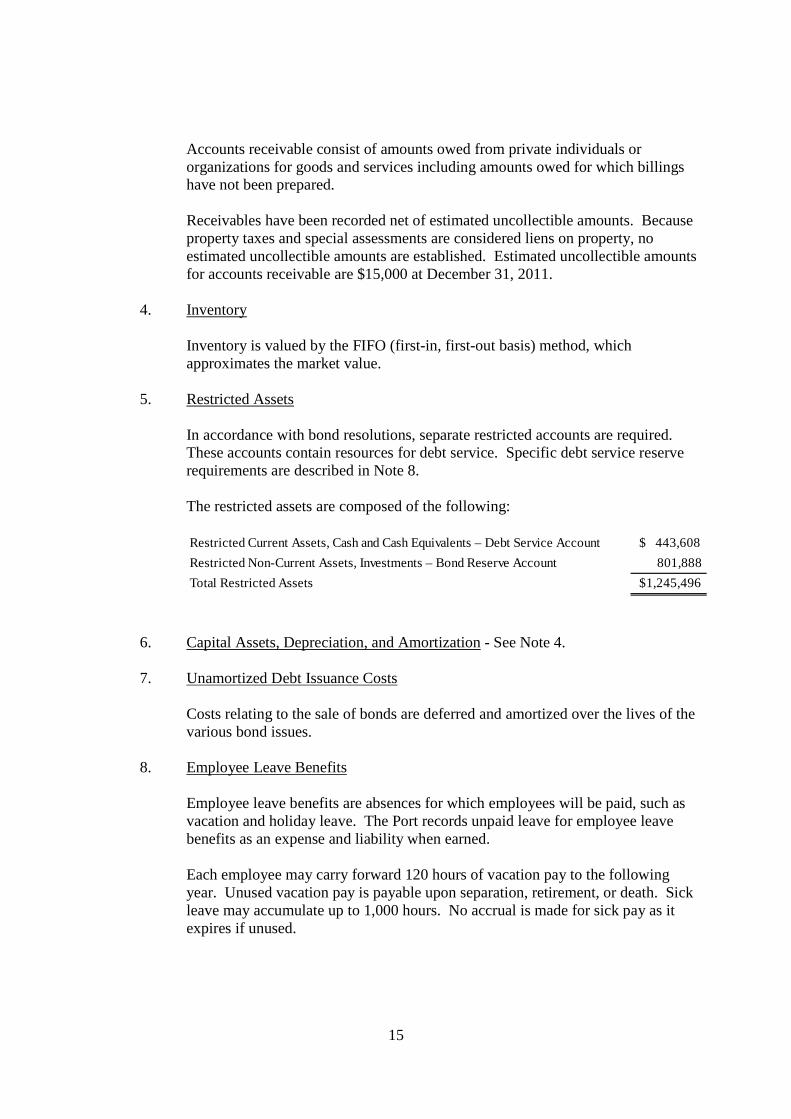
Accounts receivable consist of amounts owed from private individuals or organizations for goods and services including amounts owed for which billings have not been prepared.
Receivables have been recorded net of estimated uncollectible amounts. Because property taxes and special assessments are considered liens on property, no estimated uncollectible amounts are established. Estimated uncollectible amounts for accounts receivable are $15,000 at December 31, 2011.
4. Inventory
Inventory is valued by the FIFO (first-in, first-out basis) method, which approximates the market value.
5. Restricted Assets
In accordance with bond resolutions, separate restricted accounts are required. These accounts contain resources for debt service. Specific debt service reserve requirements are described in Note 8. The restricted assets are composed of the following:
6. Capital Assets, Depreciation, and Amortization - See Note 4. 7. Unamortized Debt Issuance Costs
Costs relating to the sale of bonds are deferred and amortized over the lives of the various bond issues.
8. Employee Leave Benefits
Employee leave benefits are absences for which employees will be paid, such as vacation and holiday leave. The Port records unpaid leave for employee leave benefits as an expense and liability when earned. Each employee may carry forward 120 hours of vacation pay to the following year. Unused vacation pay is payable upon separation, retirement, or death. Sick leave may accumulate up to 1,000 hours. No accrual is made for sick pay as it expires if unused.
Restricted Current Assets, Cash and Cash Equivalents – Debt Service Account $ 443,608
Restricted Non-Current Assets, Investments – Bond Reserve Account 801,888
Total Restricted Assets $1,245,496

16
9. Accrued Expenses
These accounts consist of accrued leasehold, payroll, sales, and business taxes, employee withholdings, wages payable, and abandoned property.
10. Long-Term Debt - See Note 8.
NOTE 2 – DEPOSITS AND INVESTMENTS
A. Deposits The Port’s deposits and certificates of deposit are entirely covered by federal depository insurance (FDIC) or by collateral held in a multiple financial institution collateral pool administered by the Washington Public Deposit Protection Commission (PDPC).
B. Investments
The Port may invest in all types of securities approved by State law. Those securities include: 1. Savings or time accounts, including certificates of deposit, in designated qualified
public depositories in accordance with RCW 39.58. 2. Certificates of deposit in commercial banks, savings and loan associations, and
mutual savings banks doing business in this state, but not holding collateral pur-suant to RCW 39.58, in an amount not in excess of FDIC or FSLIC insurance coverage.
3. Certificates, notes, or bonds of the United States, or other obligations of the U.S.
government or its agencies, or of any corporation wholly owned by the govern-ment of the United States.
4. Bankers’ acceptances purchased on the secondary market. 5. Federal home loan bank notes and bonds, Federal land bank bonds, Federal na-
tional mortgage association notes, debentures, and guaranteed certificates of par-ticipation.
6. Obligations of any other government sponsored corporation whose obligations are
or may become eligible as collateral for advances to member banks as determined by the board of governors of the federal reserve systems.
7. Bonds of the state of Washington and any local government in the state of Wash-
ington that carry one of the three highest ratings of a nationally recognized rating agency.

17
8. General obligation bonds of a state other than the state of Washington and general
obligation bonds of a local government of a state other than the state of Washing-ton that carry one of the three highest ratings of a nationally recognized rating agency.
9. Shares of mutual funds with portfolios consisting of only United States govern-
ment bonds or United States government guaranteed bonds issued by federal agencies with average maturities less than four years, or bonds described in (11) or (12).
10. Shares of money market funds with portfolios consisting of only bonds of states
and local governments or other issuers authorized by law for investment by local governments, which bonds have at the time of investment one of the two highest credit ratings of a nationally recognized rating agency.
11. Shares of money market funds with portfolios consisting of securities otherwise
authorized by law for investment by local governments. 12. Washington State Local Government Investment Pool.
Port staff invests surplus cash according to Port Resolution Number 05-13. Investment objectives, in priority order, are safety, liquidity, and return on investment.
As of December 31, 2011, the Port had the following investment: Certificate of deposit Matures September 27, 2012 $801,888
Custodial credit risk is the risk that in event of a failure of the counterparty to an investment transaction the Port would not be able to recover the value of the investment or collateral securities. None of the Port’s investments are held by counterparties.
NOTE 3 – PROPERTY TAXES
The county treasurer acts as an agent to collect property taxes levied in the county for all taxing authorities.
Property Tax Calendar January 1 Taxes are levied and become an enforceable lien against properties. February 14 Tax bills are mailed. April 30 First of two equal installment payments is due.
May 31 Assessed value of property established for next year’s levy at 100
percent of market value. October 31 Second installment is due.
18
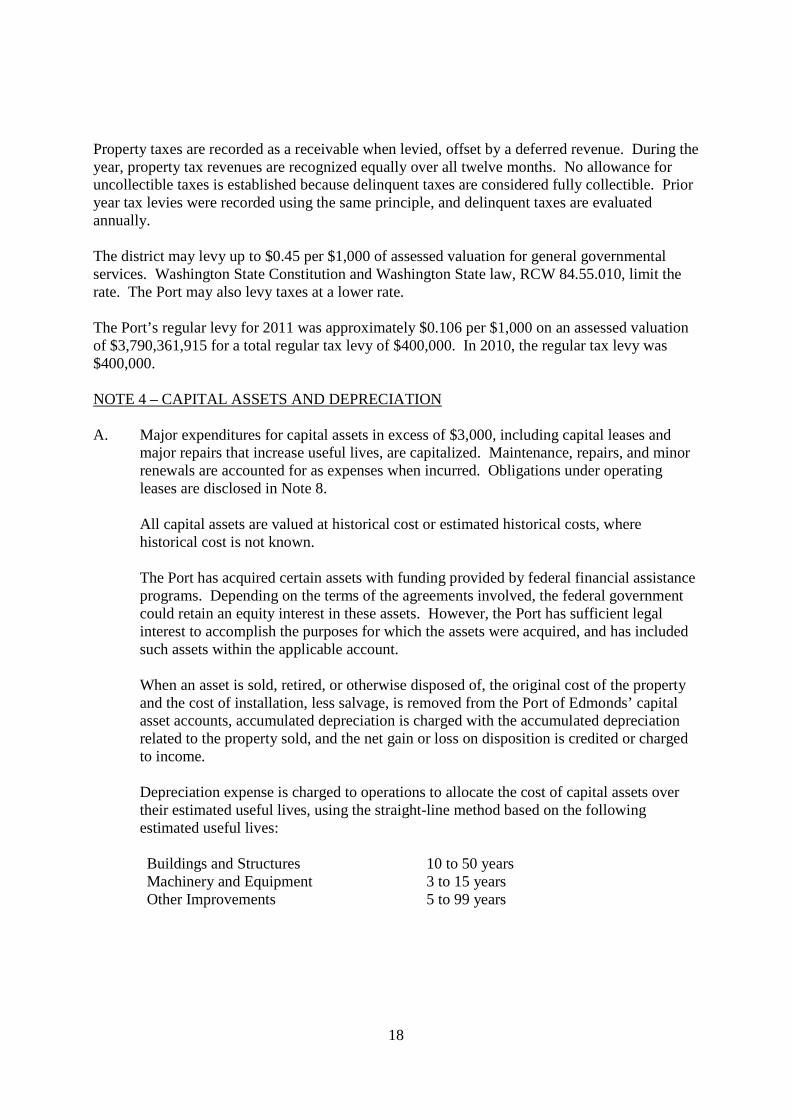
Property taxes are recorded as a receivable when levied, offset by a deferred revenue. During the year, property tax revenues are recognized equally over all twelve months. No allowance for uncollectible taxes is established because delinquent taxes are considered fully collectible. Prior year tax levies were recorded using the same principle, and delinquent taxes are evaluated annually. The district may levy up to $0.45 per $1,000 of assessed valuation for general governmental services. Washington State Constitution and Washington State law, RCW 84.55.010, limit the rate. The Port may also levy taxes at a lower rate. The Port’s regular levy for 2011 was approximately $0.106 per $1,000 on an assessed valuation of $3,790,361,915 for a total regular tax levy of $400,000. In 2010, the regular tax levy was $400,000. NOTE 4 – CAPITAL ASSETS AND DEPRECIATION A. Major expenditures for capital assets in excess of $3,000, including capital leases and
major repairs that increase useful lives, are capitalized. Maintenance, repairs, and minor renewals are accounted for as expenses when incurred. Obligations under operating leases are disclosed in Note 8.
All capital assets are valued at historical cost or estimated historical costs, where historical cost is not known.
The Port has acquired certain assets with funding provided by federal financial assistance programs. Depending on the terms of the agreements involved, the federal government could retain an equity interest in these assets. However, the Port has sufficient legal interest to accomplish the purposes for which the assets were acquired, and has included such assets within the applicable account. When an asset is sold, retired, or otherwise disposed of, the original cost of the property and the cost of installation, less salvage, is removed from the Port of Edmonds’ capital asset accounts, accumulated depreciation is charged with the accumulated depreciation related to the property sold, and the net gain or loss on disposition is credited or charged to income.
Depreciation expense is charged to operations to allocate the cost of capital assets over their estimated useful lives, using the straight-line method based on the following estimated useful lives:
Buildings and Structures 10 to 50 years Machinery and Equipment 3 to 15 years Other Improvements 5 to 99 years

19
B. Capital assets activity for the year ended December 31, 2011, was as follows:
C. Construction Commitments
The Port does not have any active construction projects as of December 31, 2011. NOTE 5 – STEWARDSHIP, COMPLIANCE, AND ACCOUNTABILITY There have been no material violations of finance-related legal or contractual provisions. NOTE 6 – PENSION PLANS Substantially all Port full-time and qualifying part-time employees participate in one of the following statewide retirement systems administered by the Washington State Department of Retirement Systems, under cost-sharing multiple-employer public employee defined benefit retirement plans. The Department of Retirement Systems (DRS), a department within the primary government of the State of Washington, issues a publicly available comprehensive annual financial report (CAFR) that includes financial statements and required supplementary information for each plan. The DRS CAFR may be obtained by writing to: Department of Retirement Systems, Communications Unit, P.O. Box 48380, Olympia, WA 98504-8380; or it may be downloaded from the DRS website at www.drs.wa.gov. The following disclosures are made pursuant to GASB Statements No. 27, Accounting for Pensions by State and Local
Beginning EndingBalance Balance1/1/2011 Increases Decreases 12/31/2011
Capital assets, not being depreciatedLand 4,323,675$ -$ -$ 4,323,675$ Construction in progress 14,618 261,789 276,407 -
Total capital assets, not being depreciated 4,338,293 261,789 276,407 4,323,675
Capital assets, being depreciatedBuildings 14,980,128 43,309 - 15,023,437 Marina and other improvements 35,797,323 287,051 12,656 36,071,718 Machinery and equipment 1,254,788 33,257 147,841 1,140,204
Total capital assets being depreciated 52,032,239 363,617 160,497 52,235,359
Less accumulated depreciation forBuildings 3,620,563 568,912 - 4,189,475 Marina and other improvements 15,199,555 966,597 12,656 16,153,496 Machinery and equipment 654,458 99,818 147,840 606,436
Total accumulated depreciation 19,474,576 1,635,327$ 160,496$ 20,949,407$
Total capital assets, being depreciated, net 32,557,663$ 31,285,952$
20
Government Employers and No. 50, Pension Disclosures, an Amendment of GASB Statements No. 25 and No. 27. Public Employees’ Retirement System (PERS) Plans 1, 2, and 3 Plan Description The Legislature established PERS in 1947. Membership in the system includes: elected officials; state employees; employees of the Supreme, Appeals, and Superior courts (other than judges currently in the Judicial Retirement System); employees of legislative committees; community and technical colleges, college and university employees not participating in higher education retirement programs; judges of district and municipal courts; and employees of local governments. PERS retirement benefit provisions are established in Chapters 41.34 and 41.40 RCW and may amended only by the State Legislature. PERS is a cost-sharing multiple-employer retirement system comprised of three separate plans for membership purposes: Plans 1 and 2 are defined benefit plans and Plan 3 is a defined benefit plan with a defined contribution component. PERS members who joined the system by September 30, 1977, are Plan 1 members. Those who joined on or after October 1, 1977, and by either February 28, 2002, for state and higher education employees, or August 31, 2002, for local government employees, are Plan 2 members unless they exercised an option to transfer their membership to Plan 3. PERS members joining the system on or after March 1, 2002, for state and higher education employees, or September 1, 2002, for local government employees, have the irrevocable option of choosing membership in either PERS Plan 2 or PERS Plan 3. The option must be exercised within 90 days of employment. An employee is reported in Plan 2 until a choice is made. Employees who fail to choose within 90 days default to PERS Plan 3. Notwithstanding, PERS Plan 2 and Plan 3 members may opt out of plan membership if terminally ill, with less than five years to live. PERS Plan 1 and Plan 2 defined benefit retirement benefits are financed from a combination of investment earnings and employer and employee contributions. PERS Plan 1 members are vested after the completion of five years of eligible service. Plan 1 members are eligible for retirement after 30 years of service, or at the age of 60 with five years of service, or at the age of 55 with 25 years of service. The monthly benefit is two percent of the average final compensation (AFC) per year of service. (AFC is the monthly average of the 24 consecutive highest-paid service credit months.) The retirement benefit may not exceed 60 percent of AFC. The monthly benefit is subject to a minimum for PERS Plan 1 retirees who have 25 years of service and have been retired for 20 years, or who have 20 years of service and have been retired for 25 years. Plan 1 members retiring from inactive status prior to the age of 65 may receive actuarially reduced benefits. If a survivor option is chosen, the benefit is further reduced. A cost-of-living allowance (COLA) was granted at age 66 based upon years of service times the COLA amount. This benefit was eliminated by the Legislature, effective July 1, 2011. Plan 1 members may elect to receive an optional COLA that provides an automatic annual

21
adjustment based on the Consumer Price Index. The adjustment is capped at 3 percent annually. To offset the cost of this annual adjustment, the benefit is reduced. PERS Plan 1 provides duty and non-duty disability benefits. Duty disability retirement benefits for disablement prior to the age of 60 consist of a temporary life annuity payable to the age of 60. The allowance amount is $350 a month, or two-thirds of the monthly AFC, whichever is less. The benefit is reduced by any workers’ compensation benefit and is payable as long as the member remains disabled or until the member attains the age of 60. A member with five years of covered employment is eligible for non-duty disability retirement. Prior to the age of 55, the allowance amount is two percent of the AFC for each year of service reduced by two percent for each year that the member’s age is less than 55. The total benefit is limited to 60 percent of the AFC and is actuarially reduced to reflect the choice of a survivor option. A cost-of-living allowance was granted at age 66 based upon years of service times the COLA amount. This benefit was eliminated by the Legislature, effective July 1, 2011. Plan 1 members may elect to receive an optional COLA that provides automatic annual adjustment based on the Consumer Price Index. This adjustment is capped at three percent annually. To offset the cost of this annual adjustment, the benefit is reduced. PERS Plan 1 members can receive credit for military service. Members can also purchase up to 24 months of service credit lost because of an on-the-job injury. PERS Plan 2 members are vested after the completion of five years of eligible service. Plan 2 members are eligible for normal retirement at the age of 65 with five years of service. The monthly benefit is two percent of the average final compensation per year of service. (AFC is the monthly average of the 60 consecutive highest-paid service months.) PERS Plan 2 members who have at least 20 years of service credit and are 55 years of age or older are eligible for early retirement with a reduced benefit. The benefit is reduced by an early retirement factor (ERF) that varies according to age, for each year before age 65. PERS Plan 2 members who have 30 or more years of service credit and are at least 55 years old can retire under one of two provisions:
• With a benefit that is reduced by 3 percent for each year before age 65. • With a benefit that has a smaller (or no) reduction (depending on age) that imposes
stricter return-to work rules. PERS Plan 2 retirement benefits are also actuarially reduced to reflect the choice, if made, of a survivor option. There is no cap on years of service credit; and a cost-of-living allowance is granted (based on the Consumer Price Index), capped at 3 percent annually. The surviving spouse or eligible child or children of a PERS Plan 2 member who dies after leaving eligible employment having earned ten years of service credit may request a refund of the member’s accumulated contributions.

22
PERS Plan 3 has a dual benefit structure. Employer contributions finance a defined benefit component, and member contributions finance a defined contribution component. The defined benefit portion provides a monthly benefit that is one percent of the average final compensation per year of service. (AFC is the monthly average of the 60 consecutive highest-paid service months.) Effective June 7, 2006, PERS Plan 3 members are vested in the defined benefit portion of their plan after ten years of service; or after five years of service, if twelve months of that service are earned after age 44; or after five service credit years earned in PERS Plan 2 prior to June 1, 2003. Plan 3 members are immediately vested in the defined contribution portion of their plan. Vested Plan 3 members are eligible for normal retirement at age 65, or they may retire early with the following conditions and benefits:
• If they have at least ten service credit years and are 55 years old, the benefit is reduced by an ERF that varies with age, for each year before age 65.
• If they have 30 service credit years and are at least 55 years old, they have the choice of a benefit that is reduced by 3 percent for each year before age 65; or a benefit with a smaller (or no) reduction factor (depending on age) that imposes stricter return-to-work rules.
PERS Plan 3 defined benefit retirement benefits are also actuarially reduced to reflect the choice, if made, of a survivor option. There is no cap on years of service credit and Plan 3 provides the same cost-of-living allowance as Plan 2. PERS Plan 3 defined contribution retirement benefits are solely dependent upon contributions and the results of investment activities. The defined contribution portion can be distributed in accordance with an option selected by the member, either as a lump sum or pursuant to other options authorized by the Director of the Department of Retirement Systems. PERS Plan 2 and Plan 3 provide disability benefits. There is no minimum amount of service credit required for eligibility. The Plan 2 monthly benefit amount is two percent of the AFC per year of service. For Plan 3, the monthly benefit is one percent of the AFC per year of service. These disability amounts are actuarially reduced for each year that the member’s age is less than 65, and to reflect the choice of a survivor option. There is no cap on years of service credit, and a cost-of-living allowance is granted (based on the Consumer Price Index) capped at three percent annually. PERS Plan 2 and Plan 3 members may have up to ten years of interruptive military service credit; five years at no cost and five years that may be purchased by paying the required contributions. Effective July 24, 2005, a member who becomes totally incapacitated for continued employment while serving the uniformed services, or a surviving spouse or eligible

23
children, may apply for interruptive military service credit. Additionally, PERS Plan 2 and Plan 3 members can purchase up to 24 months of service credit lost because of an on-the-job injury. PERS members may also purchase up to five years of additional service credit once eligible for retirement. This credit can only be purchased at the time of retirement and can be used only to provide the member with a monthly annuity that is paid in addition to the member’s retirement benefit. Beneficiaries of a PERS Plan 2 or Plan 3 member with ten years of service who is killed in the course of employment receive retirement benefits without actuarial reduction, if the member was not at normal retirement age at death. This provision applies to any member killed in the course of employment, on or after June 10, 2004, if found eligible by the Department of Labor and Industries. A one-time duty-related death benefit is provided to the estate (or duly designated nominee) of a PERS member who dies in the line of service as a result of injuries sustained in the course of employment, or if the death resulted from an occupational disease or infection that arose naturally and proximately out of said member’s covered employment, if found eligible by the Department of Labor and Industries. There are 1,197 participating employers in PERS. Membership in PERS consisted of the following as of the latest actuarial valuation date for the plans of June 30, 2010:
Funding Policy Each biennium, the state Pension Funding Council adopts PERS Plan 1 employer contribution rates, PERS Plan 2 employer and employee contribution rates, and PERS Plan 3 employer contribution rates. Employee contribution rates for Plan 1 are established by statute at six percent for state agencies and local government unit employees, and at 7.5 percent for state government elected officials. The employer and employee contribution rates for Plan 2 and the employer contribution rate for Plan 3 are developed by the Office of the State Actuary to fully fund Plan 2 and the defined benefit portion of Plan 3. All employers are required to contribute at the level established by the Legislature. Under PERS Plan 3, employer contributions finance the defined benefit portion of the plan, and member contributions finance the defined contribution portion. The Plan 3 employee contribution rates range from 5 to 15 percent, based on member choice. Two of the options are graduated rates dependent on the employee’s age. As a result of the implementation of the Judicial Benefit Multiplier Program in January 2007, a second tier of employer and employee rates was developed to fund, along with investment earnings, the increased retirement benefits of those justices and judges that participate in the program.
Retirees and Beneficiaries Receiving Benefits 76,899 Terminated Plan Members Entitled to But Not Yet Receiving Benefits 28,860 Active Plan Members Vested 105,521 Active Plan Members Non-Vested 51,005
Total 262,285
24
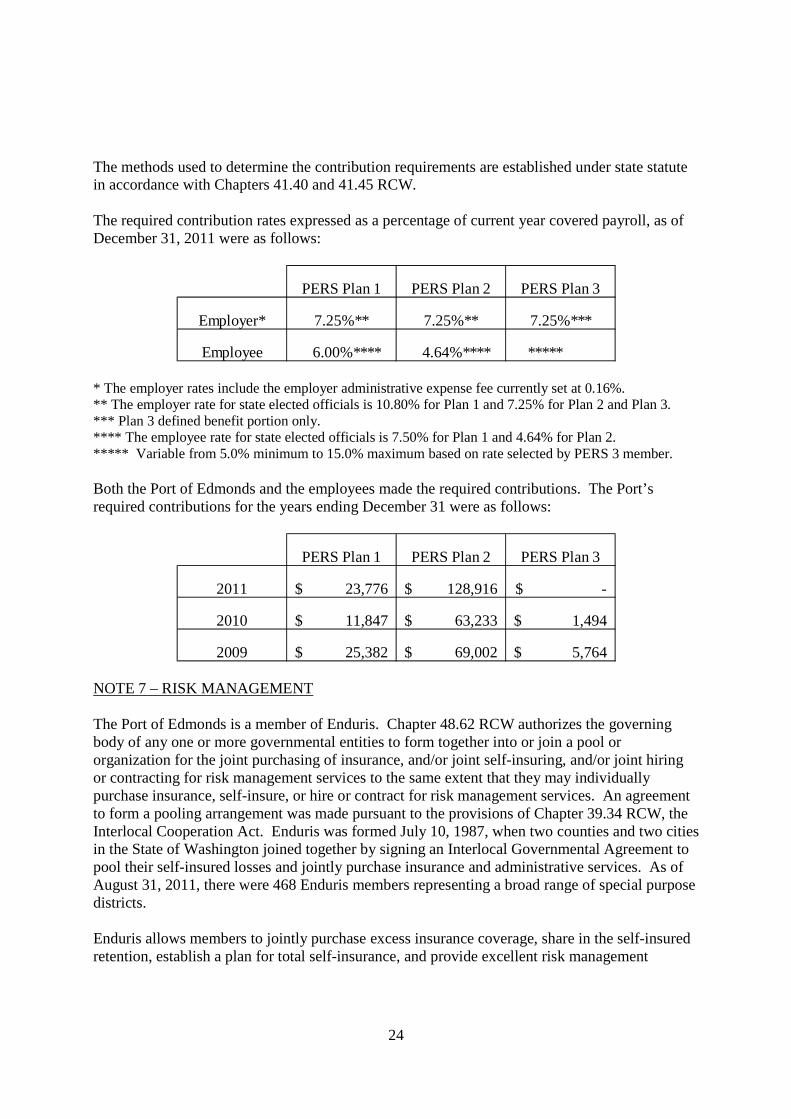
The methods used to determine the contribution requirements are established under state statute in accordance with Chapters 41.40 and 41.45 RCW. The required contribution rates expressed as a percentage of current year covered payroll, as of December 31, 2011 were as follows:
* The employer rates include the employer administrative expense fee currently set at 0.16%. ** The employer rate for state elected officials is 10.80% for Plan 1 and 7.25% for Plan 2 and Plan 3. *** Plan 3 defined benefit portion only. **** The employee rate for state elected officials is 7.50% for Plan 1 and 4.64% for Plan 2. ***** Variable from 5.0% minimum to 15.0% maximum based on rate selected by PERS 3 member. Both the Port of Edmonds and the employees made the required contributions. The Port’s required contributions for the years ending December 31 were as follows:
NOTE 7 – RISK MANAGEMENT The Port of Edmonds is a member of Enduris. Chapter 48.62 RCW authorizes the governing body of any one or more governmental entities to form together into or join a pool or organization for the joint purchasing of insurance, and/or joint self-insuring, and/or joint hiring or contracting for risk management services to the same extent that they may individually purchase insurance, self-insure, or hire or contract for risk management services. An agreement to form a pooling arrangement was made pursuant to the provisions of Chapter 39.34 RCW, the Interlocal Cooperation Act. Enduris was formed July 10, 1987, when two counties and two cities in the State of Washington joined together by signing an Interlocal Governmental Agreement to pool their self-insured losses and jointly purchase insurance and administrative services. As of August 31, 2011, there were 468 Enduris members representing a broad range of special purpose districts. Enduris allows members to jointly purchase excess insurance coverage, share in the self-insured retention, establish a plan for total self-insurance, and provide excellent risk management
PERS Plan 1 PERS Plan 2 PERS Plan 3
Employer* 7.25%** 7.25%** 7.25%***
Employee 6.00%**** 4.64%**** *****
PERS Plan 1 PERS Plan 2 PERS Plan 3
2011 23,776$ 128,916$ -$
2010 11,847$ 63,233$ 1,494$
2009 25,382$ 69,002$ 5,764$

25
services and other related services. Enduris provides “occurrence” policies for all lines of liability coverage including Public Official’s Liability. Property coverage is written on an “all risk” basis blanket form using current Statement of Values. Property coverage includes mobile equipment, electronic data processing equipment, valuable papers, building ordinance coverage, property in transit, extra expense, consequential loss, accounts receivable, fine arts, inventory or appraisal cost, and automobile physical damage to insured vehicles. Boiler and machinery coverage is included on a blanket limit of $100 million for all members. Enduris offers employee dishonesty coverage up to a liability limit of $1,000,000. Members make an annual contribution to fund Enduris. Enduris acquires insurance from unrelated insurance companies that is subject to a “per occurrence:”
• $1,000,000 deductible on liability loss – the member is responsible for the first $5,000 of the deductible amount of each claim, while Enduris is responsible for the remaining $995,000 on liability loss.
• $250,000 deductible on property loss – the member is responsible for the first $5,000 of the deductible amount of each claim, while Enduris is responsible for the remaining $245,000 on property loss. Enduris is not responsible for any deductible on boiler and machinery loss.
Insurance carriers cover all losses over the deductibles as shown to the policy maximum limits. Since Enduris is a cooperative program, there is a joint liability among the participating members. The contract requires members to continue membership for a period of not less than one year, and must give notice 60 days before terminating participation. The Master Agreement (Intergovernmental Contract) is automatically renewed after the initial one full fiscal year commitment. Even after termination, a member is still responsible for contribution to Enduris for any unresolved, unreported, and in-process claims for the period they were a signatory to the Master Agreement. Enduris is fully funded by its member participants. Claims are filed by members with Enduris, and are administered in house. A Board of Directors consisting of seven board members governs Enduris. Board members serve a specific term, and are elected by the Enduris member participants. The Board meets quarterly and is responsible for conducting the business affairs of Enduris. NOTE 8 – LONG-TERM DEBT AND LEASES A. Long-Term Debt The Port of Edmonds issues general obligation and revenue bonds to finance the acquisition, purchase, or construction of various projects. Bonded indebtedness has also been entered into in 1998 and 2005 to advance refund several general obligation and revenue bonds.
26
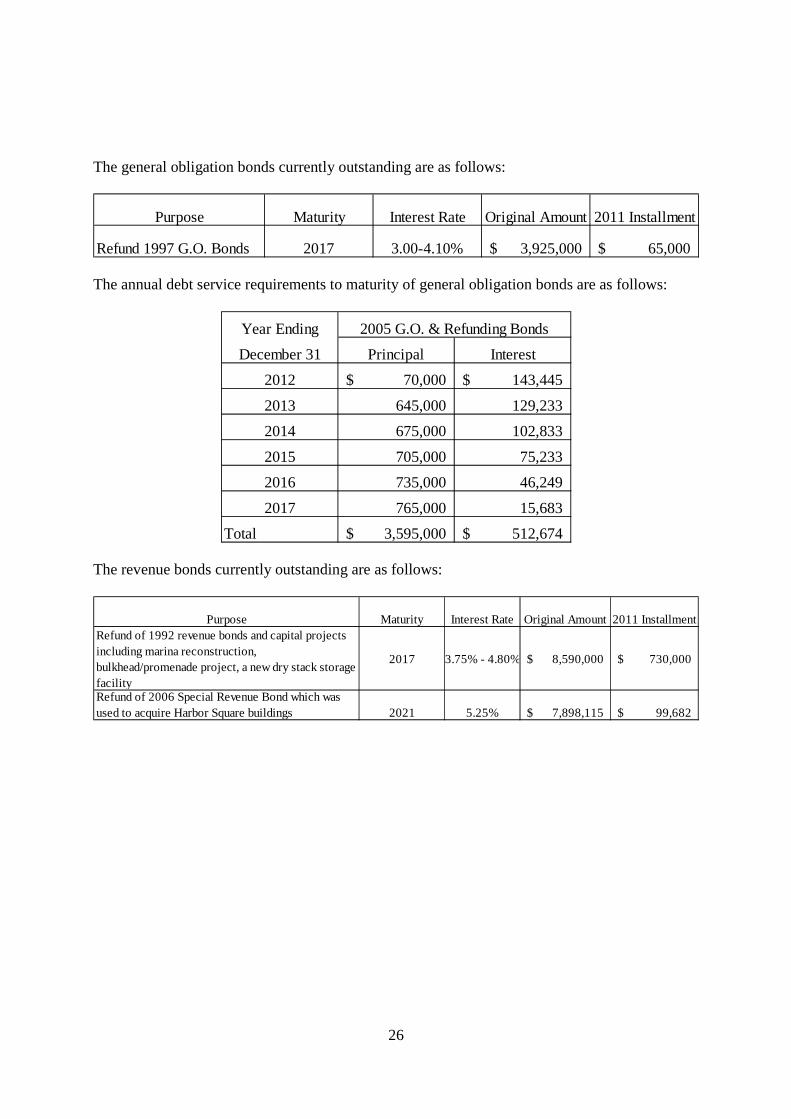
The general obligation bonds currently outstanding are as follows:
The annual debt service requirements to maturity of general obligation bonds are as follows:
The revenue bonds currently outstanding are as follows:
Purpose Maturity Interest Rate Original Amount 2011 Installment
Refund 1997 G.O. Bonds 2017 3.00-4.10% 3,925,000$ 65,000$
Year Ending
December 31 Principal Interest
2012 70,000$ 143,445$
2013 645,000 129,233
2014 675,000 102,833
2015 705,000 75,233
2016 735,000 46,249
2017 765,000 15,683
Total 3,595,000$ 512,674$
2005 G.O. & Refunding Bonds
Purpose Maturity Interest Rate Original Amount 2011 InstallmentRefund of 1992 revenue bonds and capital projects including marina reconstruction, bulkhead/promenade project, a new dry stack storage facility
2017 3.75% - 4.80% 8,590,000$ 730,000$
Refund of 2006 Special Revenue Bond which was used to acquire Harbor Square buildings 2021 5.25% 7,898,115$ 99,682$

27
The annual debt service requirements to maturity of revenue bonds are as follows:
Unamortized debt issuance costs are recorded as deferred charges and bonds are displayed net of premium or discount on the Statement of Net Assets. Annual interest expense is decreased by amortization of debt premium and increased by the amortization of debt issuance costs and discount. At December 31, 2011, the Port had $1,245,496 available in sinking funds and reserves as required by bond indentures. The Port has pledged future marina operations and property lease revenue other than Harbor Square Property revenue, net of normal costs of maintenance and operation of the facilities of the Port and normal costs of administration of the business of the Port not paid from general tax levies but before depreciation, to repay $8,590,000 in Revenue and Refunding Bonds issued in January 1998. Proceeds from the bonds provided financing for refunding the Port’s 1992 Revenue Bonds, marina reconstruction, a bulkhead/promenade project, construction of a new dry stack storage facility, and other projects listed in the Port’s 1998 Capital Budget. The bonds are payable solely from marina operations and property lease revenue other than Harbor Square Property revenue and are payable through 2017. Annual principal and interest payments on the bonds are expected to require less than 45% of net revenues. The total principal and interest remaining to be paid on the bonds is $2,511,408. Principal and interest paid for the current year were $867,403. Pledged revenues were $5,298,660. The Port has pledged future Harbor Square Property revenue and net revenues of the Port available after satisfying all requirements set forth the in 1998 Revenue and Refunding Bond agreement, to repay $7,898,115 in Special Revenue Refunding Bonds issued in August 2011. Proceeds from the 2011 bonds provided financing for refunding the 2006 Special Revenue Bond. Proceeds from the 2006 Special Revenue Bond were used to purchase the Harbor Square buildings and leasehold interest in the Harbor Square Property. The bonds are payable from Harbor Square revenue and net revenues of the Port available after satisfying all requirements set forth in the 1998 Revenue and Refunding Bond agreement, and are payable through 2021. Annual principal and interest payments on the bonds are expected to require less than 59% of Harbor Square Property net revenues. The total principal and interest remaining to be paid on
Year Ending
December 31 Principal Interest Principal Interest
2012 760,000$ 103,823$ 161,137$ 412,344$
2013 260,000 68,483 171,107 402,374
2014 275,000 56,263 180,440 393,041
2015 285,000 43,200 190,283 383,199
2016 300,000 29,520 199,590 373,891
2017-2021 315,000 15,120 6,895,877 1,612,324
Total 2,195,000$ 316,408$ 7,798,434$ 3,577,173$
2011 Special Rev. Ref. Bonds1998 Rev. and Ref. Bonds
28
the bonds is $11,375,607. Principal and interest paid for the current year were $837,684. Pledged Harbor Square revenues were $1,535,304.
B. Refunded Debt
The following bond issue was refunded in 2011:
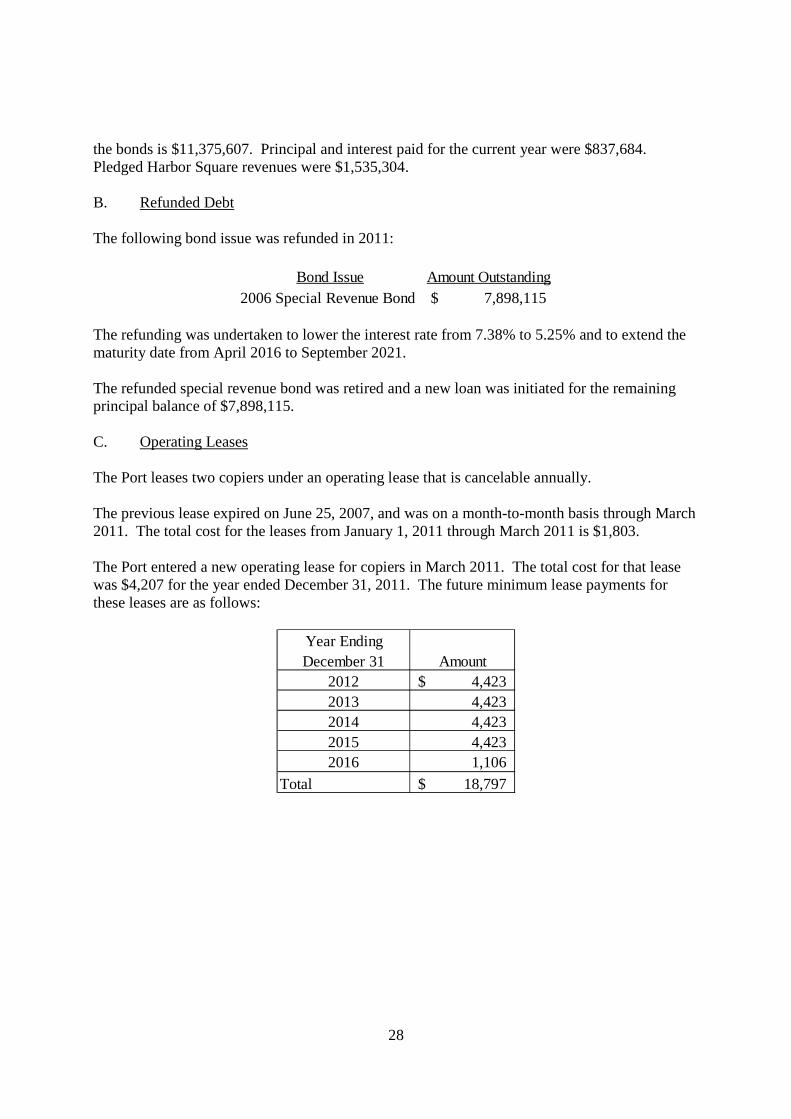
The refunding was undertaken to lower the interest rate from 7.38% to 5.25% and to extend the maturity date from April 2016 to September 2021. The refunded special revenue bond was retired and a new loan was initiated for the remaining principal balance of $7,898,115. C. Operating Leases The Port leases two copiers under an operating lease that is cancelable annually. The previous lease expired on June 25, 2007, and was on a month-to-month basis through March 2011. The total cost for the leases from January 1, 2011 through March 2011 is $1,803. The Port entered a new operating lease for copiers in March 2011. The total cost for that lease was $4,207 for the year ended December 31, 2011. The future minimum lease payments for these leases are as follows:
Bond Issue Amount Outstanding2006 Special Revenue Bond 7,898,115$
Year EndingDecember 31 Amount
2012 4,423$ 2013 4,423 2014 4,423 2015 4,423 2016 1,106
Total 18,797$
29
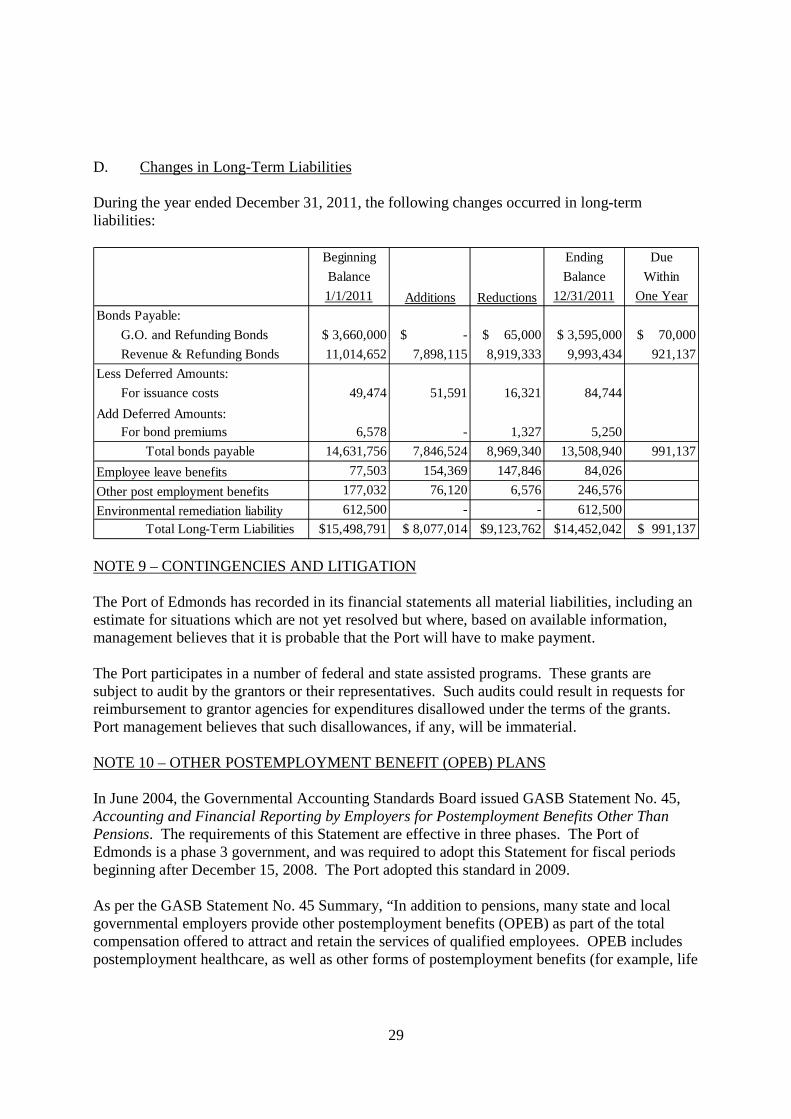
D. Changes in Long-Term Liabilities During the year ended December 31, 2011, the following changes occurred in long-term liabilities:
NOTE 9 – CONTINGENCIES AND LITIGATION The Port of Edmonds has recorded in its financial statements all material liabilities, including an estimate for situations which are not yet resolved but where, based on available information, management believes that it is probable that the Port will have to make payment. The Port participates in a number of federal and state assisted programs. These grants are subject to audit by the grantors or their representatives. Such audits could result in requests for reimbursement to grantor agencies for expenditures disallowed under the terms of the grants. Port management believes that such disallowances, if any, will be immaterial. NOTE 10 – OTHER POSTEMPLOYMENT BENEFIT (OPEB) PLANS In June 2004, the Governmental Accounting Standards Board issued GASB Statement No. 45, Accounting and Financial Reporting by Employers for Postemployment Benefits Other Than Pensions. The requirements of this Statement are effective in three phases. The Port of Edmonds is a phase 3 government, and was required to adopt this Statement for fiscal periods beginning after December 15, 2008. The Port adopted this standard in 2009. As per the GASB Statement No. 45 Summary, “In addition to pensions, many state and local governmental employers provide other postemployment benefits (OPEB) as part of the total compensation offered to attract and retain the services of qualified employees. OPEB includes postemployment healthcare, as well as other forms of postemployment benefits (for example, life
Beginning Ending Due
Balance Balance Within
1/1/2011 Additions Reductions 12/31/2011 One Year
Bonds Payable:
G.O. and Refunding Bonds $ 3,660,000 $ - $ 65,000 $ 3,595,000 $ 70,000
Revenue & Refunding Bonds 11,014,652 7,898,115 8,919,333 9,993,434 921,137
Less Deferred Amounts:
For issuance costs 49,474 51,591 16,321 84,744
Add Deferred Amounts:For bond premiums 6,578 - 1,327 5,250
Total bonds payable 14,631,756 7,846,524 8,969,340 13,508,940 991,137
Employee leave benefits 77,503 154,369 147,846 84,026
Other post employment benefits 177,032 76,120 6,576 246,576
Environmental remediation liability 612,500 - - 612,500
Total Long-Term Liabilities $15,498,791 $ 8,077,014 $9,123,762 $14,452,042 $ 991,137
30
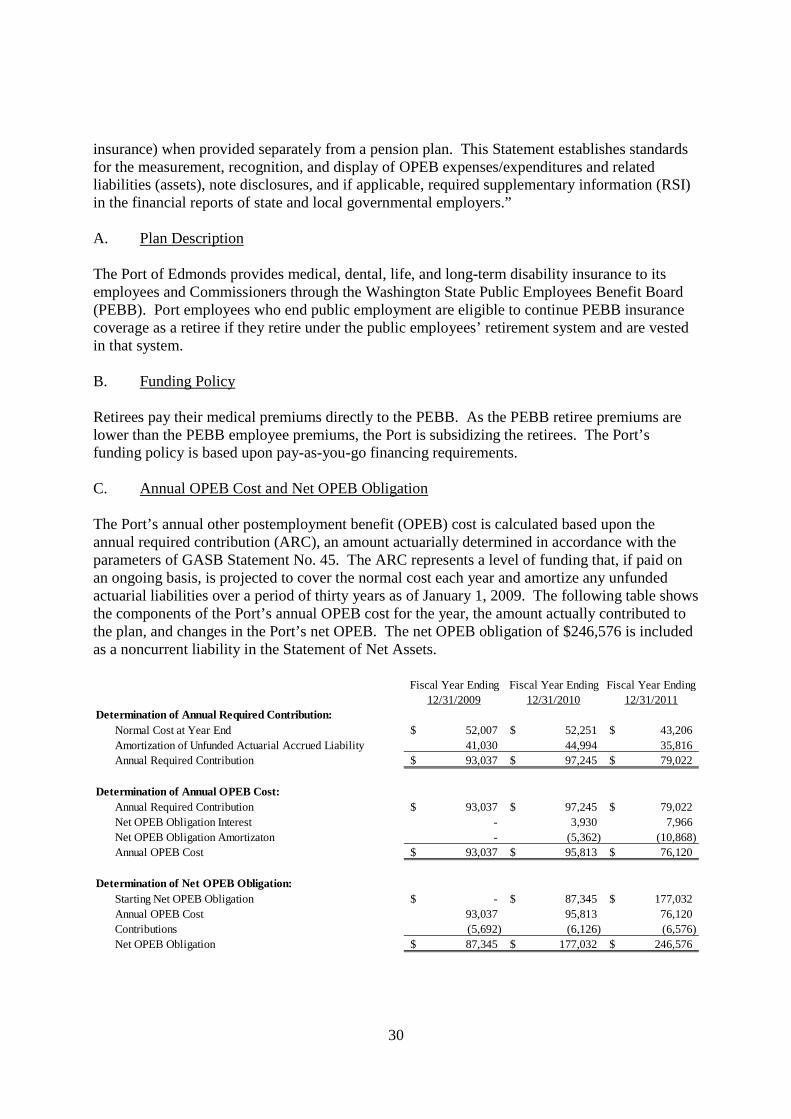
insurance) when provided separately from a pension plan. This Statement establishes standards for the measurement, recognition, and display of OPEB expenses/expenditures and related liabilities (assets), note disclosures, and if applicable, required supplementary information (RSI) in the financial reports of state and local governmental employers.” A. Plan Description The Port of Edmonds provides medical, dental, life, and long-term disability insurance to its employees and Commissioners through the Washington State Public Employees Benefit Board (PEBB). Port employees who end public employment are eligible to continue PEBB insurance coverage as a retiree if they retire under the public employees’ retirement system and are vested in that system. B. Funding Policy Retirees pay their medical premiums directly to the PEBB. As the PEBB retiree premiums are lower than the PEBB employee premiums, the Port is subsidizing the retirees. The Port’s funding policy is based upon pay-as-you-go financing requirements. C. Annual OPEB Cost and Net OPEB Obligation The Port’s annual other postemployment benefit (OPEB) cost is calculated based upon the annual required contribution (ARC), an amount actuarially determined in accordance with the parameters of GASB Statement No. 45. The ARC represents a level of funding that, if paid on an ongoing basis, is projected to cover the normal cost each year and amortize any unfunded actuarial liabilities over a period of thirty years as of January 1, 2009. The following table shows the components of the Port’s annual OPEB cost for the year, the amount actually contributed to the plan, and changes in the Port’s net OPEB. The net OPEB obligation of $246,576 is included as a noncurrent liability in the Statement of Net Assets.
Fiscal Year Ending Fiscal Year Ending Fiscal Year Ending12/31/2009 12/31/2010 12/31/2011
Determination of Annual Required Contribution:Normal Cost at Year End 52,007$ 52,251$ 43,206$ Amortization of Unfunded Actuarial Accrued Liability 41,030 44,994 35,816 Annual Required Contribution 93,037$ 97,245$ 79,022$
Determination of Annual OPEB Cost:Annual Required Contribution 93,037$ 97,245$ 79,022$ Net OPEB Obligation Interest - 3,930 7,966 Net OPEB Obligation Amortizaton - (5,362) (10,868) Annual OPEB Cost 93,037$ 95,813$ 76,120$
Determination of Net OPEB Obligation:Starting Net OPEB Obligation -$ 87,345$ 177,032$ Annual OPEB Cost 93,037 95,813 76,120 Contributions (5,692) (6,126) (6,576) Net OPEB Obligation 87,345$ 177,032$ 246,576$
31
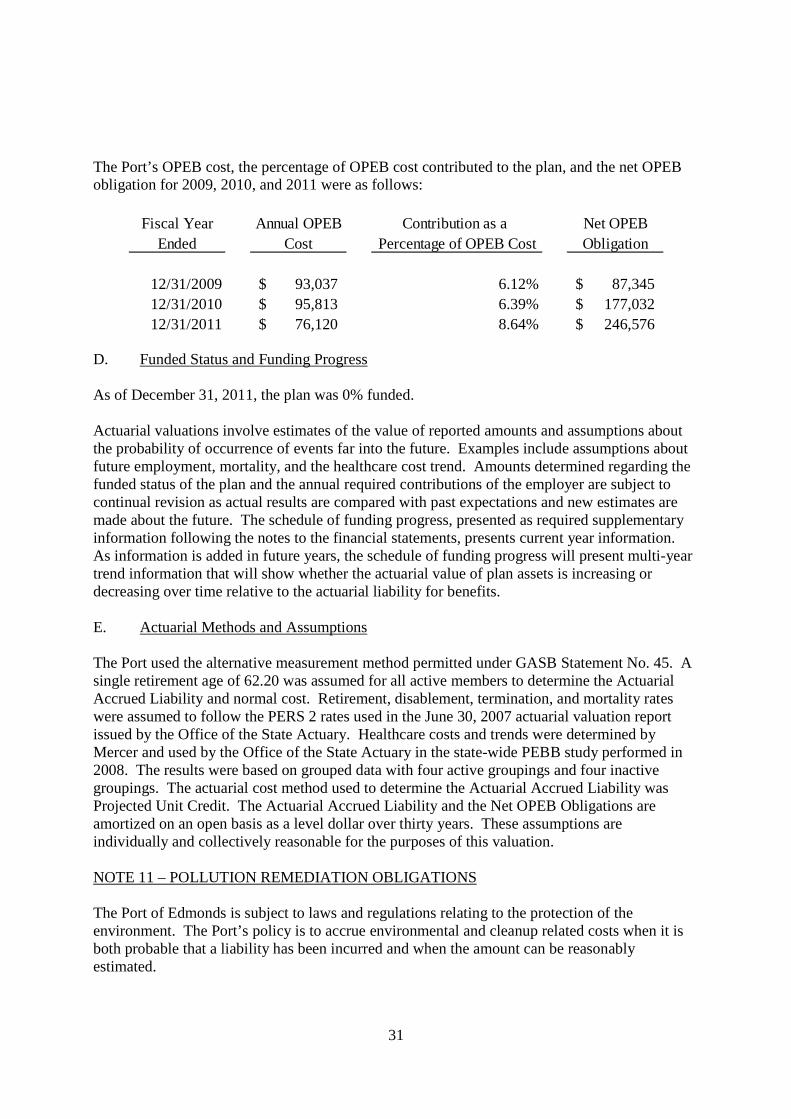
The Port’s OPEB cost, the percentage of OPEB cost contributed to the plan, and the net OPEB obligation for 2009, 2010, and 2011 were as follows:
D. Funded Status and Funding Progress As of December 31, 2011, the plan was 0% funded. Actuarial valuations involve estimates of the value of reported amounts and assumptions about the probability of occurrence of events far into the future. Examples include assumptions about future employment, mortality, and the healthcare cost trend. Amounts determined regarding the funded status of the plan and the annual required contributions of the employer are subject to continual revision as actual results are compared with past expectations and new estimates are made about the future. The schedule of funding progress, presented as required supplementary information following the notes to the financial statements, presents current year information. As information is added in future years, the schedule of funding progress will present multi-year trend information that will show whether the actuarial value of plan assets is increasing or decreasing over time relative to the actuarial liability for benefits. E. Actuarial Methods and Assumptions The Port used the alternative measurement method permitted under GASB Statement No. 45. A single retirement age of 62.20 was assumed for all active members to determine the Actuarial Accrued Liability and normal cost. Retirement, disablement, termination, and mortality rates were assumed to follow the PERS 2 rates used in the June 30, 2007 actuarial valuation report issued by the Office of the State Actuary. Healthcare costs and trends were determined by Mercer and used by the Office of the State Actuary in the state-wide PEBB study performed in 2008. The results were based on grouped data with four active groupings and four inactive groupings. The actuarial cost method used to determine the Actuarial Accrued Liability was Projected Unit Credit. The Actuarial Accrued Liability and the Net OPEB Obligations are amortized on an open basis as a level dollar over thirty years. These assumptions are individually and collectively reasonable for the purposes of this valuation. NOTE 11 – POLLUTION REMEDIATION OBLIGATIONS The Port of Edmonds is subject to laws and regulations relating to the protection of the environment. The Port’s policy is to accrue environmental and cleanup related costs when it is both probable that a liability has been incurred and when the amount can be reasonably estimated.
Fiscal Year Annual OPEB Contribution as a Net OPEBEnded Cost Percentage of OPEB Cost Obligation
12/31/2009 93,037$ 6.12% 87,345$ 12/31/2010 95,813$ 6.39% 177,032$ 12/31/2011 76,120$ 8.64% 246,576$
32
In November 2006, the Governmental Accounting Standards Board issued GASB Statement No. 49, Accounting and Financial Reporting for Pollution Remediation Obligations. The provisions of this Statement are effective for fiscal periods beginning after December 15, 2007. The Port adopted this standard in 2008. GASB Statement No. 49 requires disclosure of “obligations to address current or potential detrimental effects of existing pollution by participating in pollution remediation activities.” GASB Statement No. 49 identifies five “obligating events” that require a government agency to disclose future outlays associated with remediation of contaminated sites. Once any of the five obligating events occurs, the government agency must document the components of expected pollution remediation outlays that are reasonably estimable. At this time, the Port has determined that future cleanup costs associated with one site constitute the Port’s pollution remediation obligations. A. Nature and Source of Pollution Remediation Obligations From 2003 to 2006, the Port of Edmonds was involved in cleaning up a property known as the Harbor Square property, which was purchased by the Port from the Union Oil Company in 1978. From 1924 to 1968, portions of the property were used as an oil and gasoline depot and distribution facility, a railcar cleaning facility, an asphalt batch plant, and heavy-equipment storage. Several remedial investigations were conducted at the property from 1989 to 2003. In June 2003, a supplemental site investigation was conducted at the direction of the Department of Ecology to further define the extent of contamination at the property identified during previous investigations, to help identify any additional areas of contamination, and to further evaluate any impacts to groundwater. The Port developed a remediation plan based on that investigation, and commenced cleanup activities. The Port’s environmental engineering firm, Landau Associates, prepared a report for the Port of Edmonds in November 2003 that provided estimates of the cost of remediation activities at the Port of Edmonds’ Harbor Square complex due to past industrial activities at the site. The estimated costs presented in the report are for all remediation activities anticipated at the site, which are described as Phase I through Phase III remediation in the report. Phase I and Phase II remediation efforts were essentially completed in 2005 and 2006. Phase III remediation remains to be completed. B. Amount of Estimated Liability The estimated cost of Phase III remediation was a range of $150,000 to $900,000, reflecting the uncertainty of the extent of contamination under existing structures that could not be readily accessed for assessment. Landau Associates estimates the liability to the Port of Edmonds associated with the future cleanup of known areas of contamination on Port property to be $175,000 to $1,050,000 (in 2008 dollars). The middle point of this estimated range is $612,500. The Governmental Accounting Standards Board implemented new standards for recording pollution remediation obligations for financial periods beginning after December 15, 2007. The

33
Port increased its liability from $175,000 in 2007 to $612,500 in 2008 in accordance with these standards. As per GASB Statement No. 49, “Estimates of a pollution remediation liability should be adjusted when benchmarks are met or when new information indicates changes in estimated outlays due to, for example, changes in the remediation plan or operating conditions. These changes may include the type of equipment, facilities, and services that will be used, price increases or reductions for specific outlay elements such as ongoing monitoring requirements, changes in technology, and changes in legal or regulatory requirements.” The Port did not meet any benchmarks or receive new information that indicates changes in estimated outlays in 2011. Therefore, the Port did not make any adjustments to Environmental Remediation Liability in 2011. A. Methods and Assumptions Used for the Estimate The majority of the contamination to be addressed in Phase III remediation is located under existing buildings; some areas of residual contamination (expected to be relatively small) are located outside building footprints, but underneath paved surfaces. Phase III activities were not undertaken due to the inaccessibility of the contaminated areas, although the Port has committed to remediation at such time that the structures at the Harbor Square complex are removed for future development. The Port has chosen to use only the best case and worse case for the ranges of potential outcomes. As the Port does not have a reasonable basis for specifying the probability and amount of a most likely potential cash flow, it is using only two data points, a range of $175,000 to $1,050,000. B. Potential for Changes As Phase III remediation may only be completed when the Harbor Square property is redeveloped, this estimate may be revised due to price increases or reductions, technology, and applicable laws or regulations. C. Estimated Recoveries Reducing the Liability The Port does not expect to receive any recoveries to reduce this liability. NOTE 12 – OTHER DISCLOSURES A. Reclassification Certain amounts in the prior year financial statements have been reclassified to conform to the presentation in the current year financial statements.

34
B. Prior Period Adjustments
In 2008, the Port of Edmonds was experiencing collection issues with one of its Harbor Square tenants. The Port recorded a bad debt expense of $15,488 in 2008, believing that it may not be able to collect from this tenant. In 2009, the Port and the tenant made arrangements for the tenant to catch up with back rent, and to be fully caught up by May 31, 2010. At the end of 2009, the Port found that the tenant was not fulfilling his agreement, and the Port recorded additional bad debt expense of $15,145. In addition, the Port notified the guarantor of the lease that the lease was in default. In 2010, the guarantor took over the lease agreement, and paid the Port half of the balance due, with the agreement to pay back the remainder over the life of the lease. The guarantor has continued to make monthly payments as per the agreement, and it appears that the entire balance will be paid. Therefore, the Port recorded a prior period adjustment of $15,146 in 2011 to reflect that the Port estimates that all Harbor Square accounts receivables are collectible.
The Port also recorded a prior period adjustment of $79.45 in 2011 to adjust an overaccrual of meeting room revenue in 2010.
C. Extraordinary/Special Items
On December 31, 2011, two boats moored at the Port of Edmonds caught fire, causing damage to the Port’s floats, dock, roof, roof supports, and electrical system that provides lighting on the dock. A claim for damages has been filed with the Port of Edmonds’ insurance company, and they have agreed to pay for repairs to the Port’s facility, less the Port’s deductible of $5,000. If the fire investigators determine a responsible party, it is likely that the Port’s insurance company will subrogate to the responsible party’s insurance company. GASB Statement Number 42 requires that the loss should be reported net of the associated insurance recovery when the recovery and loss occur in the same year. In this case, the loss occurred in 2011, and the recovery will occur in 2012.
35
SUPPLEMENTARY INFORMATION
36
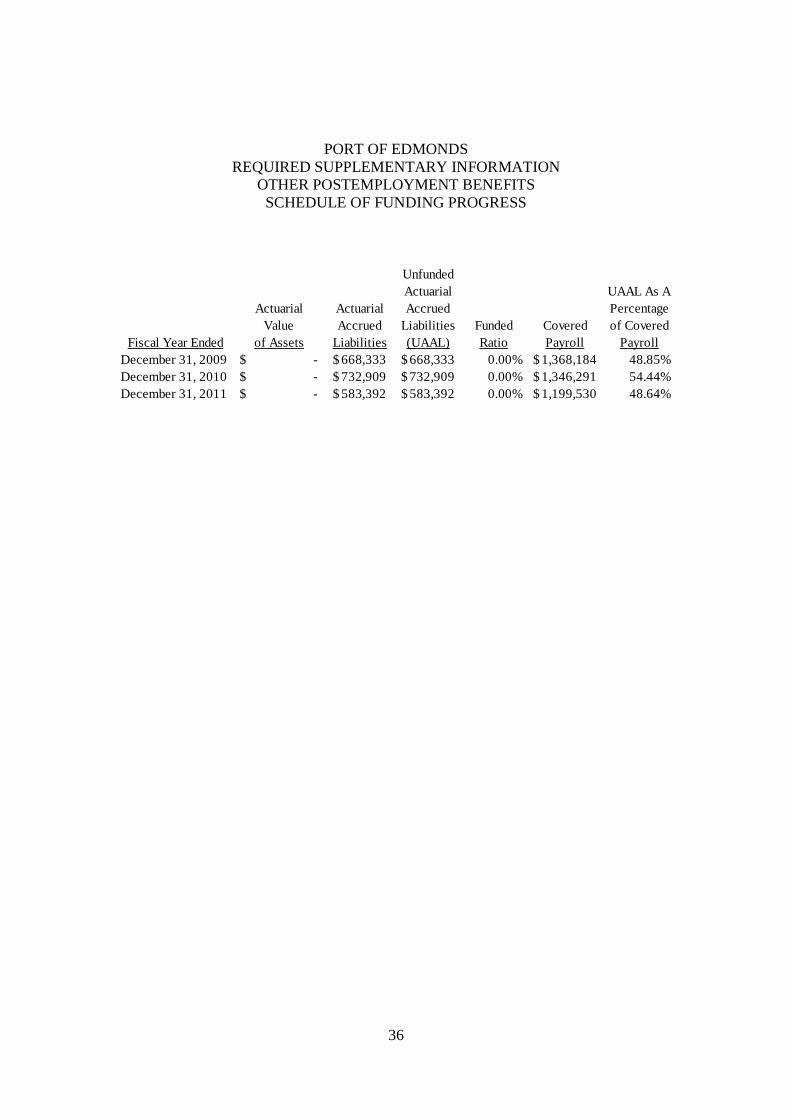
PORT OF EDMONDS REQUIRED SUPPLEMENTARY INFORMATION
OTHER POSTEMPLOYMENT BENEFITS SCHEDULE OF FUNDING PROGRESS
UnfundedActuarial UAAL As A
Actuarial Actuarial Accrued PercentageValue Accrued Liabilities Funded Covered of Covered
Fiscal Year Ended of Assets Liabilities (UAAL) Ratio Payroll PayrollDecember 31, 2009 -$ 668,333$ 668,333$ 0.00% 1,368,184$ 48.85%December 31, 2010 -$ 732,909$ 732,909$ 0.00% 1,346,291$ 54.44%December 31, 2011 -$ 583,392$ 583,392$ 0.00% 1,199,530$ 48.64%

PORT OF EDMONDS DETAIL OF REVENUES AND EXPENSES
For the Year Ended December 31, 2011
37
MCAG No. 1759 Schedule 04/05
ActualAccount Code Account Title Amount
621.00 Marina user charges 2,905,109 622.00 Marina user charges 149,020 625.00 Marina real property rentals – facilities 102,422 626.00 Marina real property rentals – facilities 1,397,894 627.00 Marina personal property rentals – w/ port operators 166,822 629.00 Other 43,375
651.02.4X Capital contributions 25,514 661.00 Property lease/rental - user charges 128,704 664.00 Real property rentals – land 299,078 665.00 Real property rentals – facilities 1,641,540
693.02.4X Operating grant 1,098 699.10 Interest income 30,397 699.20 Ad valorem taxes 406,100 699.40 Gains and losses 9,879 699.50 Extraordinary/special items (216,193)721.00 Marina operations 2,449,196 723.00 Marina maintenance 165,937 725.00 Marina allocated general and administrative 634,337 727.00 Marina depreciation 1,070,281 761.00 Property lease/rental operations 422,147 763.00 Property lease/rental maintenance 165,782 765.00 Property lease/rental allocated general and
administrative 275,497
767.00 Property lease/rental depreciation 565,048 799.91 Interest expense 874,248 799.92 Election expense 5,490
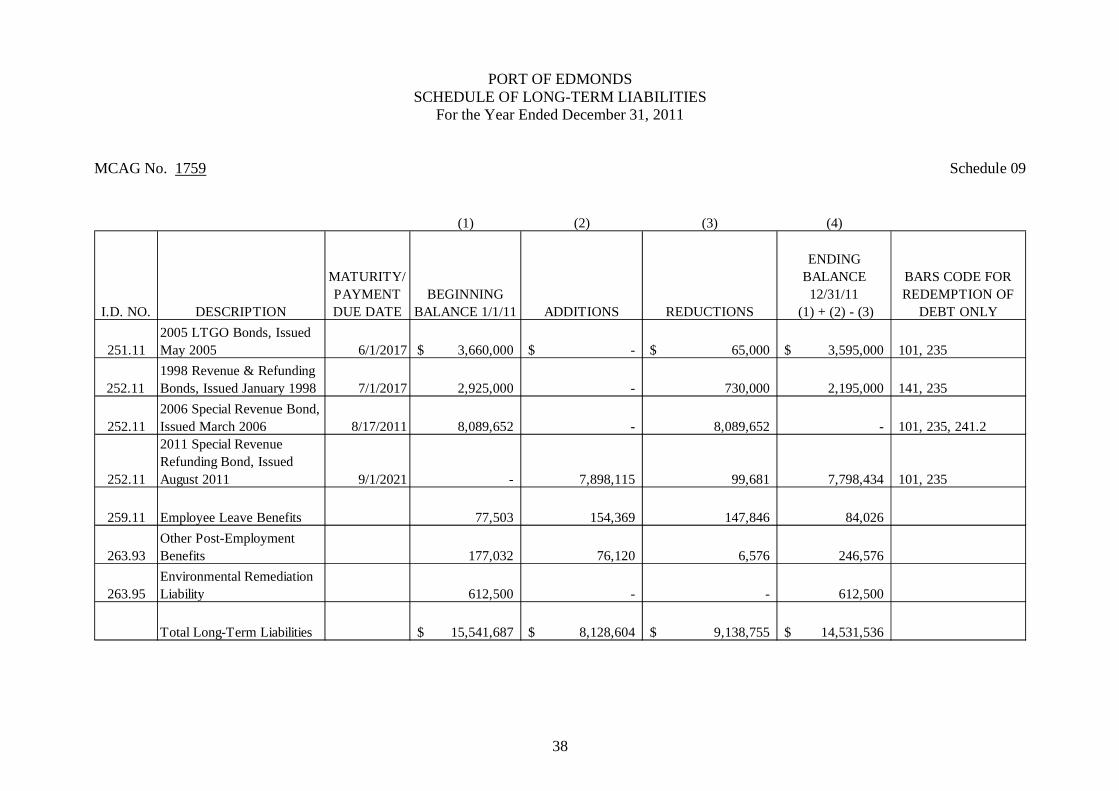
PORT OF EDMONDS SCHEDULE OF LONG-TERM LIABILITIES
For the Year Ended December 31, 2011
38
MCAG No. 1759 Schedule 09
(1) (2) (3) (4)
I.D. NO. DESCRIPTION
MATURITY/PAYMENT DUE DATE
BEGINNING BALANCE 1/1/11 ADDITIONS REDUCTIONS
ENDING BALANCE 12/31/11
(1) + (2) - (3)
BARS CODE FOR REDEMPTION OF
DEBT ONLY
251.112005 LTGO Bonds, Issued May 2005 6/1/2017 3,660,000$ -$ 65,000$ 3,595,000$ 101, 235
252.111998 Revenue & Refunding Bonds, Issued January 1998 7/1/2017 2,925,000 - 730,000 2,195,000 141, 235
252.112006 Special Revenue Bond, Issued March 2006 8/17/2011 8,089,652 - 8,089,652 - 101, 235, 241.2
252.11
2011 Special Revenue Refunding Bond, Issued August 2011 9/1/2021 - 7,898,115 99,681 7,798,434 101, 235
259.11 Employee Leave Benefits 77,503 154,369 147,846 84,026
263.93Other Post-Employment Benefits 177,032 76,120 6,576 246,576
263.95Environmental Remediation Liability 612,500 - - 612,500
Total Long-Term Liabilities 15,541,687$ 8,128,604$ 9,138,755$ 14,531,536$
39
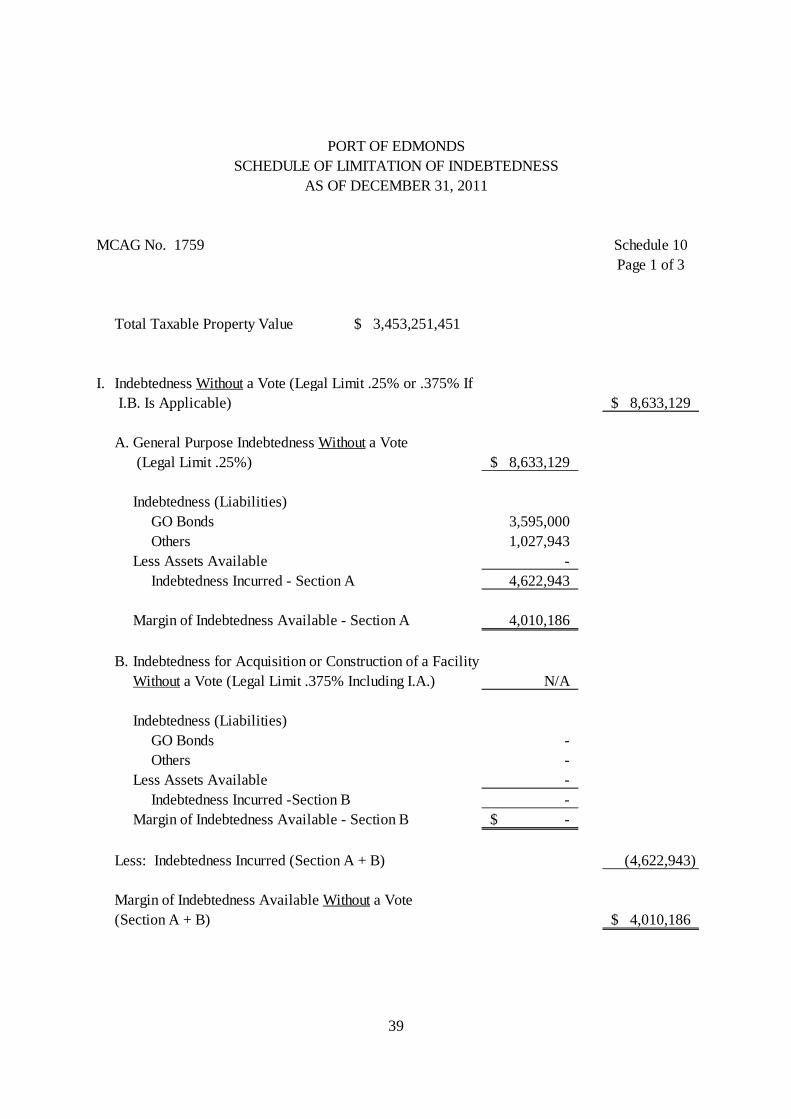
PORT OF EDMONDSSCHEDULE OF LIMITATION OF INDEBTEDNESS
AS OF DECEMBER 31, 2011
MCAG No. 1759 Schedule 10Page 1 of 3
Total Taxable Property Value 3,453,251,451$
I. Indebtedness Without a Vote (Legal Limit .25% or .375% If I.B. Is Applicable) 8,633,129$
A. General Purpose Indebtedness Without a Vote (Legal Limit .25%) 8,633,129$
Indebtedness (Liabilities)GO Bonds 3,595,000 Others 1,027,943
Less Assets Available - Indebtedness Incurred - Section A 4,622,943
Margin of Indebtedness Available - Section A 4,010,186
B. Indebtedness for Acquisition or Construction of a FacilityWithout a Vote (Legal Limit .375% Including I.A.) N/A
Indebtedness (Liabilities)GO Bonds - Others -
Less Assets Available - Indebtedness Incurred -Section B -
Margin of Indebtedness Available - Section B -$
Less: Indebtedness Incurred (Section A + B) (4,622,943)
Margin of Indebtedness Available Without a Vote(Section A + B) 4,010,186$

40
MCAG No. 1759 Schedule 10Page 2 of 3
II. Indebtedness With a 3/5 Vote 17,266,257$
Indebtedness (Liabilities)GO Bonds - Others -
Less Assets Available - Indebtedness Incurred - Section II -
Margin of Indebtedness Available with a 3/5 Vote 17,266,257
Total Indebtedness Allowable - Section I and II(Legal Limit .75%) 25,899,386$
Less: Indebtedness Incurred (Section I + II) (4,622,943)
MARGIN OF INDEBTEDNESS AVAILABLE 21,276,443
III. Additional Indebtedness for Airport Capital ImprovementPurposes Without a Vote (Legal Limit .125%) N/A
Indebtedness (Liabilities)GO Bonds - Others -
Less Assets Available - Indebtedness Incurred - Section III -
Margin Of Indebtedness Available - Section III -
IV. Additional Indebtedness for Airport Capital ImprovementPurposes with a 3/5 Vote (Legal Limit .125%) N/A
Indebtedness (Liabilities)GO Bonds - Others -
Less Assets Available - Indebtedness Incurred - Section IV -
Margin Of Indebtedness Available - Section IV -$
Total Indebtedness Allowable - Section I - IV(Legal Limit 1.25%) 25,899,386
Less: Indebtedness Incurred (Section I - IV) (4,622,943)
MARGIN OF INDEBTEDNESS AVAILABLE 21,276,443$
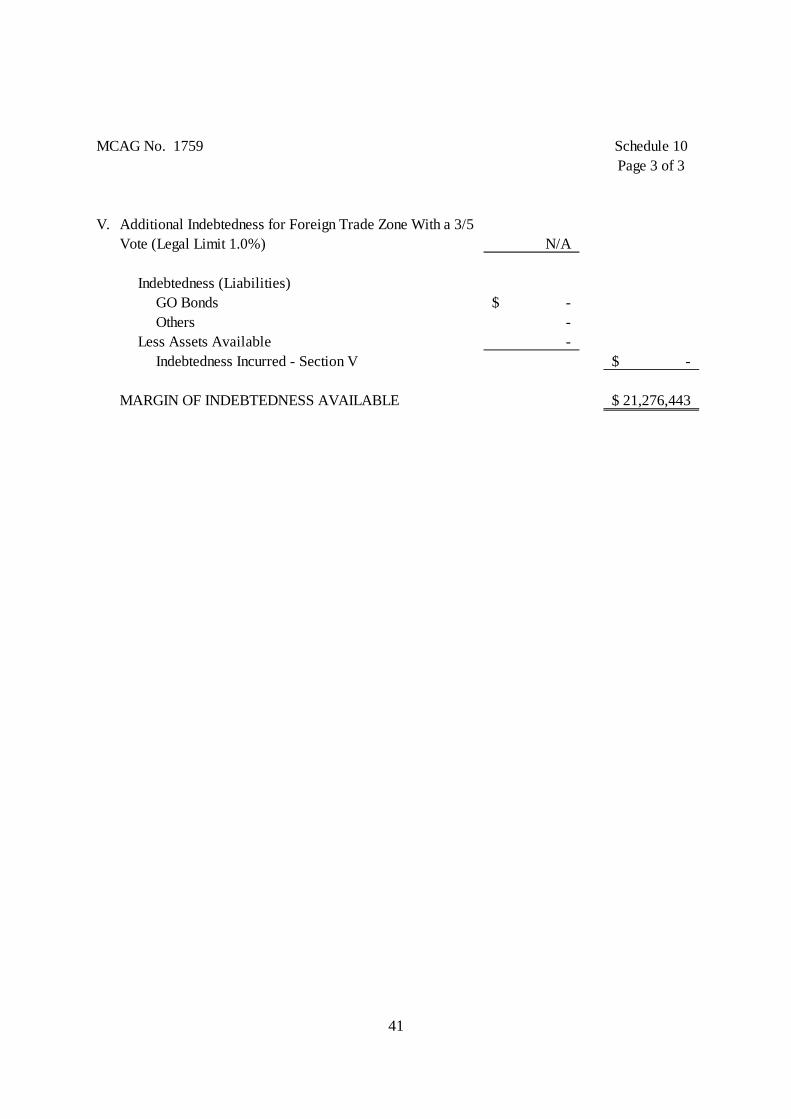
41
MCAG No. 1759 Schedule 10Page 3 of 3
V. Additional Indebtedness for Foreign Trade Zone With a 3/5Vote (Legal Limit 1.0%) N/A
Indebtedness (Liabilities)GO Bonds -$ Others -
Less Assets Available - Indebtedness Incurred - Section V -$
MARGIN OF INDEBTEDNESS AVAILABLE 21,276,443$
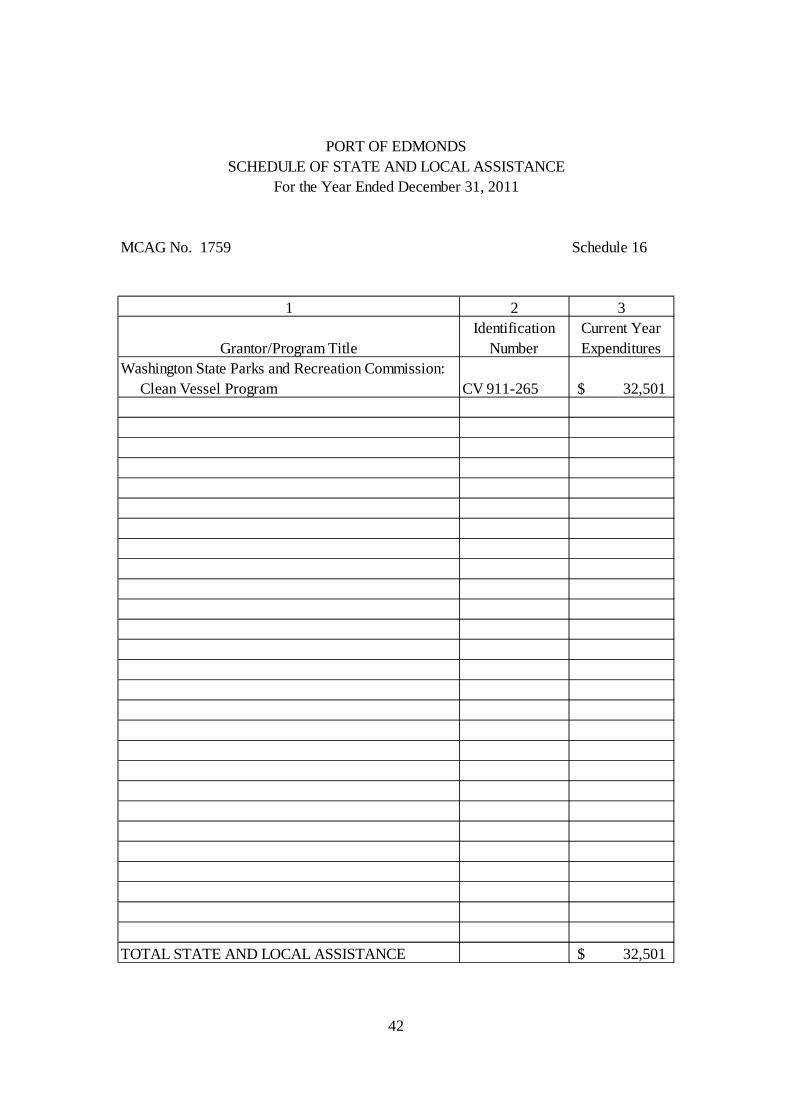
42
MCAG No. 1759 Schedule 16
1 2 3
Grantor/Program TitleIdentification
NumberCurrent Year Expenditures
Washington State Parks and Recreation Commission: Clean Vessel Program CV 911-265 32,501$
TOTAL STATE AND LOCAL ASSISTANCE 32,501$
PORT OF EDMONDSSCHEDULE OF STATE AND LOCAL ASSISTANCE
For the Year Ended December 31, 2011
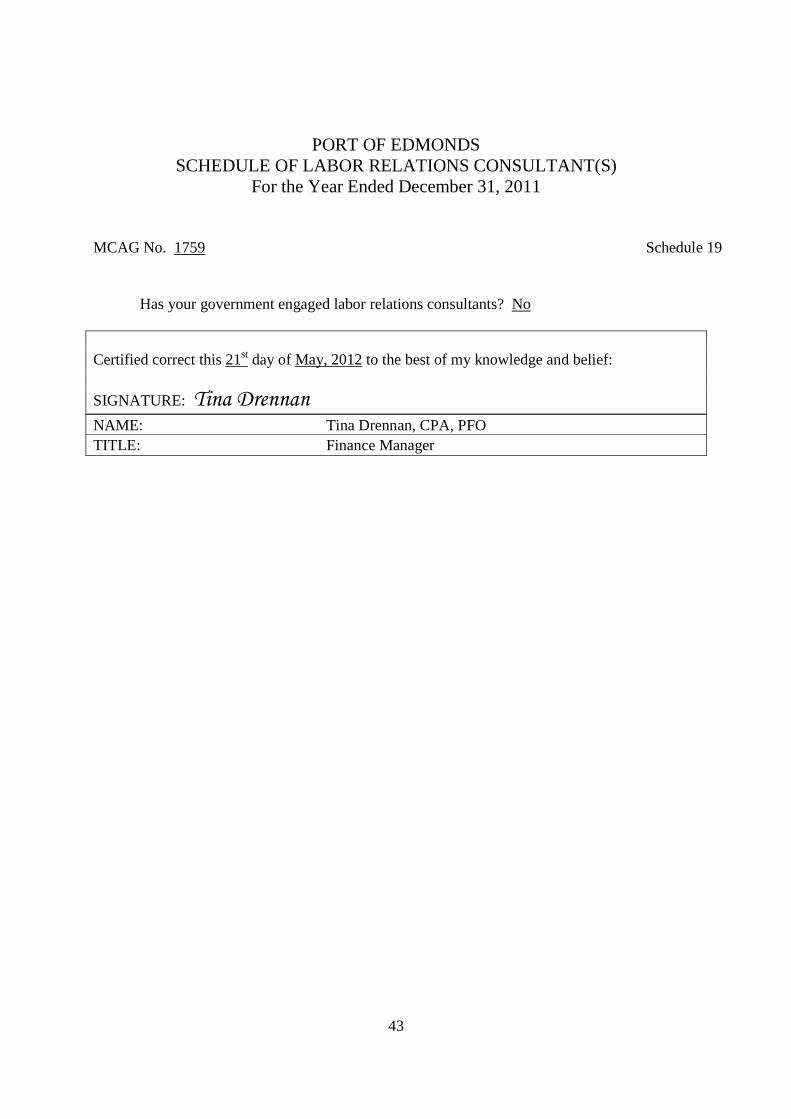
43
PORT OF EDMONDS SCHEDULE OF LABOR RELATIONS CONSULTANT(S)
For the Year Ended December 31, 2011
MCAG No. 1759 Schedule 19
Has your government engaged labor relations consultants? No
Certified correct this 21st day of May, 2012 to the best of my knowledge and belief:
SIGNATURE: Tina Drennan
NAME: Tina Drennan, CPA, PFO TITLE: Finance Manager