2011 annual report - ayala · 2011 annual report we are ... it continues to create a future that...
TRANSCRIPT

2011 Annual Report2011 Annual Report
we are well-positionedto participate in ThE developmentof the country’sinfrastructureneeds.

This Ayala Corporation 2011 Annual Report cover is printed on FSC®-certified
Mohawk Options 100% PC, which is made of 100% process chlorine-free post-
consumer recycled fiber with the balance comprised of elemental chlorine-free virgin
fiber. This paper is made carbon neutral with Mohawk’s production processes by
offsetting thermal manufacturing emissions with Verified Emission Reduction Credits
(VERs), and by purchasing enough Green-e certified Renewable Energy Certificates
(RECs) to match 100% of the electricity used in our operations. This paper is certified
by Green Seal.
The main section of this report is printed on Limited Edition Sinar Woodfree 100%
R. White PCW 80gsm, which is 100% recycled uncoated paper made from post-
consumer collected waste.
The Financial Section of this report is printed on Econobond, which is 100% recycled
uncoated paper made from post-consumer collected waste.
Our cover quote is taken from the Message of our Chairman & CEO, Jaime Augusto Zobel de Ayala, which begins on page 10.
Our cover collage emphasizes how Ayala’s strategy remains focused on key industries that are fundamental to our nation’s economy. As we strengthen our presence in these industries, we will pursue opportunities in the power and transportation infrastructure sectors to build a platform for long-term growth while remaining aligned with national development goals.

2 Ayala at a Glance
7 Financial Highlights
8 Consolidated Financial Highlights
10 The Chairman’s Message to Stockholders
12 President’s Report to Stockholders
16 Growth Initiatives
16 Expanding Into New Markets
20 Diversifying Geographies
22 Strengthening the Core
24 Investing in New Businesses
26 Sustainable Development in Ayala
30 Business Reviews
30 Real Estate
32 Financial Services
34 Telecom
36 Water and Wastewater Services
38 Electronics
40 Automotive
41 International Real Estate
42 Business Process Outsourcing
44 Social Commitment
48 Corporate Governance
56 Board of Directors
58 Management Committee
60 Senior Leadership Team
61 Management’s Discussion and Analysis of
Financial Condition and Results of Operations
65 Report of the Audit and Risk Committee to the
Board of Directors
66 Statement of Management’s Responsibility
67 Independent Auditors’ Report
68 Financial Statements
Corporate Directory
Shareholder Information
OUR MISSION
Ayala Corporation, a holding company with a diverse business portfolio, has a legacy of pioneering the future. Founded in 1834, it has achieved its position of leadership by being values oriented, goals driven, and stakeholder focused. Anchored on values of integrity, long-term vision, empowering leadership, and with a strong commitment to national development, it fulfills its mission to ensure long-term profitability and value creation. Ayala provides career opportunities and creates synergies as it builds mutually beneficial partnerships and alliances with those who share its philosophy and values. With entrepreneurial strength, it continues to create a future that nurtures to fruition its business endeavors and its aspirations for sustainable national development.
198

• Achieved16%growthinconsolidatedcorenetincome
• CommittedP7billionworthofinvestmentsinnew
businessinitiatives
• Established AC Energy Holdings Inc. as platform for
investments in power sector, and assembled 180MW of
capacityacrosshydro,windandthermaltechnologies.
• WonthebidfortheDaangHari–SLEXLinkRoadProject,the
firstprojectrolledoutunderthePPPprogram
• Repurchased 5.5 million shares under its P10 billion
buybackprogram
-1.2% 5-year TSR CAGR
5-year average return on equity11.2%
2011AnnualReport2
10.1% 5-year average return on equity
4.2% 5-year TSR CAGR
14.6% 5-year average net income growth
• All-time high consolidated revenues and net income of
P44.2billionandP7.1billionrespectively
• Doubled last year’s residential unit launches to 20,613 with
corresponding record take-up and sales booking across
allbrands
• MaidenofferinginthesocializedhousingsegmentviaBellaVita
inCavite
• Significant improvement in the Hotels and Resorts business
largely due to the impact of consolidation of the El Nido
ResortsoperationsinPalawan
• CapitalexpenditurereachedarecordP29.9billion
5-year average net income growth1.0%
‘10‘09‘08
103,870234,115 150,745 191,344
‘11
179,527
‘10‘09‘08
8,109 8,154 11,161
‘07
16,257
‘07
‘11
9,395
8.8% 8.2% 10.6%19.8% 8.8%
1.9% 1.4% 1.0%1.7% 1.2%
NET I
NCOM
E (IN
MILL
ION
PESO
S) a
nd
retu
rn o
n eq
uity
(%)
Mar
ket C
apita
lizat
ion
(in m
illio
n pe
sos)
and
Div
iden
d Yi
eld
(%)
‘10‘09‘08
82,963185,743 146,264 214,365
‘11
197,434
‘10‘09‘08
4,812 4,039 5,458
‘07
4,386
‘07
‘11
7,140
10.2% 8.0% 10.0%10.2% 12.0%
0.6% 0.7% 0.6%0.4% 0.8%
Mar
ket C
apita
lizat
ion
and
Divi
dend
Yie
ldNE
T INC
OME (
IN M
ILLIO
N PE
SOS)
and
re
turn
on
equi
ty (%
) M
arke
t Cap
italiz
atio
n (in
mill
ion
peso
s) a
nd D
ivid
end
Yiel
d (%
)
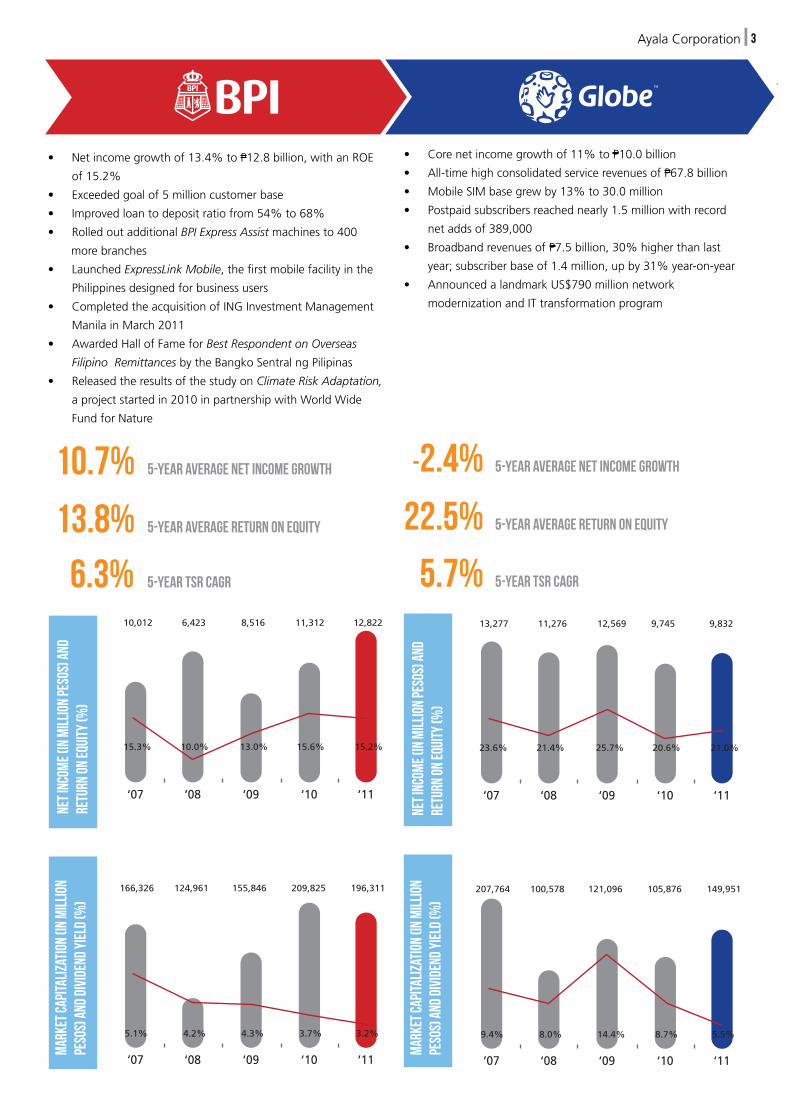
• Corenetincomegrowthof11%toP10.0billion
• All-timehighconsolidatedservicerevenuesofP67.8billion
• MobileSIMbasegrewby13%to30.0million
• Postpaidsubscribersreachednearly1.5millionwithrecord
netaddsof389,000
• BroadbandrevenuesofP7.5billion,30%higherthanlast
year;subscriberbaseof1.4million,upby31%year-on-year
• AnnouncedalandmarkUS$790millionnetwork
modernizationandITtransformationprogram
AyalaCorporation 3
• Netincomegrowthof13.4%toP12.8billion,withanROE
of15.2%
• Exceededgoalof5millioncustomerbase
• Improvedloantodepositratiofrom54%to68%
• RolledoutadditionalBPI Express Assistmachinesto400
morebranches
• LaunchedExpressLink Mobile,thefirstmobilefacilityinthe
Philippinesdesignedforbusinessusers
• CompletedtheacquisitionofINGInvestmentManagement
ManilainMarch2011
• AwardedHallofFameforBest Respondent on Overseas
Filipino RemittancesbytheBangkoSentralngPilipinas
• ReleasedtheresultsofthestudyonClimate Risk Adaptation,
aprojectstartedin2010inpartnershipwithWorldWide
FundforNature
13.8% 5-year average return on equity
6.3% 5-year TSR CAGR
10.7% 5-year average net income growth
22.5% 5-year average return on equity
5.7% 5-year TSR CAGR
-2.4% 5-year average net income growth
‘10‘09‘08
124,961166,326 155,846 209,825
‘11
196,311
‘10‘09‘08
6,423 8,516 11,312
‘07
10,012
‘07
‘11
12,822
10.0% 13.0% 15.6%15.3% 15.2%
4.2% 4.3% 3.7%5.1% 3.2%
‘10‘09‘08
100,578207,764 121,096 105,876
‘11
149,951
‘10‘09‘08
11,276 12,569 9,745
‘07
13,277
‘07
‘11
9,832
21.4% 25.7% 20.6%23.6% 21.0%
8.0% 14.4% 8.7%9.4% 5.5%
NET I
NCOM
E (IN
MILL
ION
PESO
S) a
nd
retu
rn o
n eq
uity
(%)
NET I
NCOM
E (IN
MILL
ION
PESO
S) a
nd
retu
rn o
n eq
uity
(%)
Mar
ket C
apita
lizat
ion
(in m
illio
n pe
sos)
and
Div
iden
d Yi
eld
(%)
Mar
ket C
apita
lizat
ion
(in m
illio
n pe
sos)
and
Div
iden
d Yi
eld
(%)

20.2%
• Netincomegrowthof7.3%toP4.3billion
• Billedvolumegrowthof1.0%year-on-year
• Non-revenuewaterof11.2%
• Acquired49.0%ownershipofThuDucWaterBOOin
Vietnam
• Acquired100.0%ofClarkWaterCorporation
• RecognizedasthefirstFilipinocompanyrecipientofthe
AsianHumanCapitalAwardforitsoutstandingpracticesin
HumanResource
• Revenuesup40%toUS$575.5million
• Chinaoperationsincreasedturnkeybusiness
• Expandedglobalfootprintwiththeacquisitionoffactories
inEasternEuropeandMexico
• Prepared Jiaxing facility for more automotive business as
wellasformanufactureofsolarpanels
• PositivecashbalanceofUS$54.1millionatyear-end
12.5%
2011AnnualReport4
5-year average return on equity
5-year TSR CAGR
5-year average net income growth
17.9%
9.1%
5-year average return on equity
5-year average net income growth
5.0%
‘10‘09‘08
31,87244,501 38,283 46,665
‘11
46,777
‘10‘09‘08
2,788 3,231 3,978
‘07
2,597
‘07
‘11
4,266
20.7% 20.7% 20.0%20.8% 19.0%
2.6% 2.5% 2.4%1.6% 2.9%
‘10‘09‘08
22,530* 10,066 4,739
‘07
35,693
‘11
3,289
‘10‘09‘08‘07 ‘11
-10.6% 6.2% 2.8%24.5% 1.8%
NET I
NCOM
E (IN
MILL
IONS
OF P
ESOS
)Re
turn
on
equi
ty (%
)
NET I
NCOM
E (IN
MILL
ION
PESO
S) a
nd
retu
rn o
n eq
uity
(%)
Mar
ket C
apita
lizat
ion
(in m
illio
n pe
sos)
and
Div
iden
d Yi
eld
(%)

‘10‘09‘08
4.0 16 15
‘11
25
‘10‘09‘08
128 227 274
‘11
318
• NetincomeofP95million,down68%primarily
attributabletolowersalesvolumeduetosupplydisruptions
• HondaandIsuzuhadacombinedmarketshareof13%of
totalindustrysales
• Ayala’sHondadealershipsaccountedfor47%oftotal
Hondanetworksales
• Ayala’sIsuzudealershipscornered31%oftotalIsuzu
networksales
• ShareofrevenuesofUS$318million,up16%,andshareof
EBITDAofUS$25million,up63%
• Streamachieved10%improvementinemployeesatisfaction
scores,20%gainsinclientsatisfaction,andalmost30%growth
inEBITDA
• IntegreonappointedRobertGogelasCEO,withover35yearsof
experienceinglobaloutsourcing,technologyandconsultingservices
• AffinityExpresswasnamedtotheGlobal Services 100listof
leadingoutsourcersforthesecondyearinarow
• HRMallacquiredIQBackoffice,aproviderofoutsourcedFinance
andAccountingservicestoU.S.middlemarketcompanies
AyalaCorporation 5
Shar
e in
reve
nues
(iIn
mill
ion
US$)
Shar
e In
EBIT
DA (i
In m
illio
n US
$)
35% 3-year CAGR
82% 3-year CAGR
-7.4%5-year average return on equity
5-year average net income growth
10.0%
‘10‘09‘08‘07 ‘11
10.7% 8.5% 11.0%16.7% 3.0%
‘10‘09‘08
275 229 295
‘07
387
‘11
95
Retu
rn o
n Eq
uity
(%)
NET I
NCOM
E (IN
MILL
IONS
OF P
ESOS
)
‘10‘09‘08‘07 ‘11
10.7% 8.5% 11.0%16.7% 3.0%
‘10‘09‘08
275 229 295
‘07
387
‘11
95

• CompletedexchangeinownershipinARCHManagement
andARCHGPwithTheRohatynGroup(TRG)Management
andTRGAllocationinterests
• Aftercompletingtheexchangeofownershipinterestsin
ARCHCapitalforanadditionalstakeinTRG,AGHoldings
committedtobeananchorinvestorinARCHCapital–TRG
AsianRealEstateFund
• U.S.subsidiarysawcontinuedprogressinsalesandleasing
activitiesatitsvariousprojectsaswellasthecompletionof
itscondominiumproject
• Seasons Marketplace,itsretailprojectinNorthernCalifornia,
achieved97%lease-outrate
• NamedprojectleadforTEN Moves,amulti-sectorinitiativethat
aimstobuild10,000publicschoolclassroomsinthecountry.
• FilipinasHeritageLibrary’sOur Librarycompletedthree
librariesforschoolsinAngeles,PampangaandatCENTEX
TondoCampus
• TheAyalaMuseumlaunchedthePhilippine Ancestral Gold
book,acompanioncatalogueofthemuseum’sGold of
Ancestorsexhibit
• Collectedover130tonsofrecyclablematerialsunderits
Solid Waste Management Program
• PhilippineDevelopmentFoundationestablisheda
Superfund for Science and Engineering Scholarship
2011AnnualReport6
19%
81%
US
ASIA
Total - US$156M
GROS
S ASS
ET VA
LUE (
IN U
S$ M
ILLIO
NS)
uses
of f
unds
Ayala Museum
Total - P282M
FHL
Education snd Leadership Development
Environment and sustainability
Entrepreneurship
Community Development
Centex
Executive Office and Resource Development UnitFinance & Corporate Services
22%
11%
25%
17%
6%
9%
6%
2%
2%
2011 2010 2009 2008
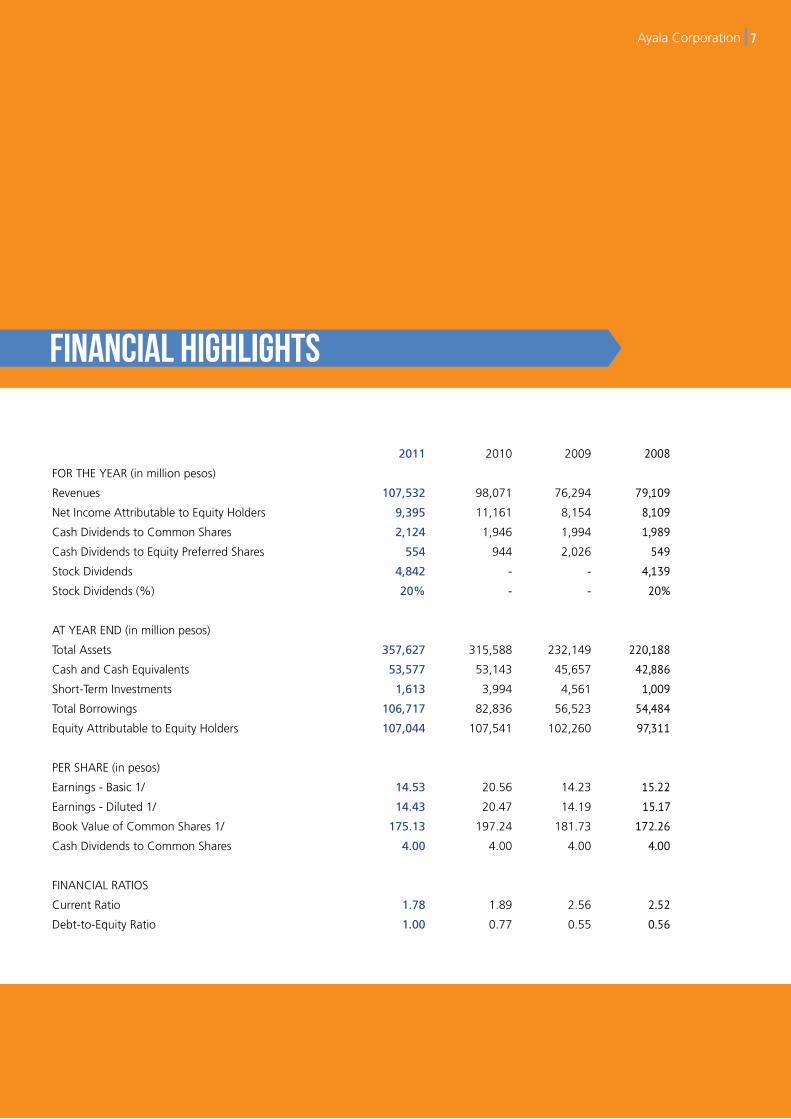
FOR THE YEAR (in million pesos)
Revenues 107,532 98,071 76,294 79,109
Net Income Attributable to Equity Holders 9,395 11,161 8,154 8,109
Cash Dividends to Common Shares 2,124 1,946 1,994 1,989
Cash Dividends to Equity Preferred Shares 554 944 2,026 549
Stock Dividends 4,842 - - 4,139
Stock Dividends (%) 20% - - 20%
AT YEAR END (in million pesos)
Total Assets 357,627 315,588 232,149 220,188
Cash and Cash Equivalents 53,577 53,143 45,657 42,886
Short-Term Investments 1,613 3,994 4,561 1,009
Total Borrowings 106,717 82,836 56,523 54,484
Equity Attributable to Equity Holders 107,044 107,541 102,260 97,311
PER SHARE (in pesos)
Earnings - Basic 1/ 14.53 20.56 14.23 15.22
Earnings - Diluted 1/ 14.43 20.47 14.19 15.17
Book Value of Common Shares 1/ 175.13 197.24 181.73 172.26
Cash Dividends to Common Shares 4.00 4.00 4.00 4.00
FINANCIAL RATIOS
Current Ratio 1.78 1.89 2.56 2.52
Debt-to-Equity Ratio 1.00 0.77 0.55 0.56
Financial Highlights
AyalaCorporation 7

Consolidated Financial Highlights
2011AnnualReport8
AYALA CORPORATION AYALA LAND BPI GLOBE MANILA WATER
2011 2010 2009 2008 2007 2011 2010 2009 2008 2007 2011 2010 2009 2008 2007 2011 2010 2009 2008 2007 2011 2010 2009 2008 2007
FOR THE YEAR (in million pesos)
Revenues 107,532 98,071 76,294 79,109 78,767 44,206 37,814 30,455 33,749 25,707 41,758 38,407 34,395 29,784 32,554 71,564 65,548 63,861 64,818 65,509 12,004 11,013 9,533 8,914 7,332
Net Income Attributable to Equity Holders
9,395 11,161 8,154 8,109 16,257 7,140 5,458 4,039 4,812 4,386 12,822 11,312 8,516 6,423 10,012 9,832 9,745 12,569 11,276 13,277 4,266 3,978 3,231 2,788 2,597
Cash Dividends to Common Shares 2,124 1,946 1,994 1,989 3,312 1,911 1,211 780 780 782 6,401 6,123 5,844 5,842 7,573 8,206 10,588 15,087 16,542 15,339 1,141 934 811 787 605
Cash Dividends to Equity Preferred Shares
554 944 2,026 549 549 60 60 60 66 - - - - - - 81 - 50 49 65 264 224 200 180 132
Stock Dividends 4,842 - - 4,139 3,450 - - - - 2,172 - - - 5,409 - - - - - - - - - -
Stock Dividends (%) 20% - - 20% 20% - - - - 20% - - - 20% - - - - - - - - - -
AT YEAR END (in million pesos)
Total Assets 357,627 315,588 232,149 220,188 196,131 154,619 121,675 107,742 100,453 82,981 842,616 878,146
724,420 666,612 637,285 130,839 130,628 127,644 119,743 116,621 60,897 48,621 43,758 36,368 27,942
Cash and Cash Equivalents 53,577 53,143 45,657 42,886 38,836 24,603 18,019 10,529 12,655 11,272 106,154 146,638 81,524 70,788 86,121 5,159 5,869 5,940 5,782 6,191 5,235 2,413 4,038 3,989 1,537
Short-Term Investments 1,613 3,994 4,561 1,009 3,688 192 1,434 4,561 1,009 2,036 86,140 123,972 124,962 98,228 112,758 658 - 3 - 2,850 658 1,546 3,724 3,368 1,388
Total Borrowings 106,717 82,836 56,523 54,484 50,032 34,531 20,971 18,812 16,752 10,139 25,853 31,868 38,942 16,430 6,678 48,679 50,371 47,477 40,588 30,373 23,268 14,134 14,361 13,352 6,236
Equity Attributable to Equity Holders 107,044 107,541 102,260 97,311 86,887 62,357 56,857 52,392 49,028 45,705 89,152 81,031 66,798 62,934 70,011 48,428 46,869 47,709 50,092 55,417 22,637 19,815 16,817 14,458 12,479
PER SHARE (in pesos)
Earnings - Basic 2/ 14.53 17.13 11.86 12.68 26.35 0.55 0.41 0.31 0.36 0.34 3.61 3.38 2.62 1.98 3.09 74.02 73.29 94.59 84.75 100.07 1.74 1.62 1.31 1.13 1.06
Earnings - Diluted 2/ 14.43 17.01 11.77 12.60 26.19 0.55 0.41 0.31 0.36 0.33 3.61 3.38 2.62 1.98 3.09 73.77 73.12 94.31 84.61 99.58 1.73 1.62 1.31 1.13 1.06
Book Value of Common Shares 2/ 175.13 164.37 151.44 143.55 135.99 4.68 4.26 3.93 3.68 3.41 25.07 22.78 20.56 19.39 25.89 359.91 348.15 354.50 372.52 412.78 10.67 9.31 7.92 6.70 5.88
Cash Dividends to Common Shares 4.00 4.00 4.00 4.00 8.00 0.15 0.09 0.06 0.06 0.06 1.80 1.80 1.80 1.80 2.80 62.00 80.00 114.00 125.00 116.00 0.56 0.46 0.40 0.35 0.30
FINANCIAL RATIOS
Current Ratio 1.78 1.89 2.56 2.52 1.92 1.65 1.67 1.95 1.89 1.65 - - - - - 0.60 0.61 0.55 0.52 0.68 1.24 1.09 1.76 2.03 0.93
Debt-to-Equity Ratio 1.00 0.77 0.55 0.56 0.58 0.55 0.37 0.36 0.34 0.22 - - - - - 1.01 1.07 1.00 0.81 0.55 1.03 0.71 0.85 0.92 0.51

AyalaCorporation 9
AYALA CORPORATION AYALA LAND BPI GLOBE MANILA WATER
2011 2010 2009 2008 2007 2011 2010 2009 2008 2007 2011 2010 2009 2008 2007 2011 2010 2009 2008 2007 2011 2010 2009 2008 2007
FOR THE YEAR (in million pesos)
Revenues 107,532 98,071 76,294 79,109 78,767 44,206 37,814 30,455 33,749 25,707 41,758 38,407 34,395 29,784 32,554 71,564 65,548 63,861 64,818 65,509 12,004 11,013 9,533 8,914 7,332
Net Income Attributable to Equity Holders
9,395 11,161 8,154 8,109 16,257 7,140 5,458 4,039 4,812 4,386 12,822 11,312 8,516 6,423 10,012 9,832 9,745 12,569 11,276 13,277 4,266 3,978 3,231 2,788 2,597
Cash Dividends to Common Shares 2,124 1,946 1,994 1,989 3,312 1,911 1,211 780 780 782 6,401 6,123 5,844 5,842 7,573 8,206 10,588 15,087 16,542 15,339 1,141 934 811 787 605
Cash Dividends to Equity Preferred Shares
554 944 2,026 549 549 60 60 60 66 - - - - - - 81 - 50 49 65 264 224 200 180 132
Stock Dividends 4,842 - - 4,139 3,450 - - - - 2,172 - - - 5,409 - - - - - - - - - -
Stock Dividends (%) 20% - - 20% 20% - - - - 20% - - - 20% - - - - - - - - - -
AT YEAR END (in million pesos)
Total Assets 357,627 315,588 232,149 220,188 196,131 154,619 121,675 107,742 100,453 82,981 842,616 878,146
724,420 666,612 637,285 130,839 130,628 127,644 119,743 116,621 60,897 48,621 43,758 36,368 27,942
Cash and Cash Equivalents 53,577 53,143 45,657 42,886 38,836 24,603 18,019 10,529 12,655 11,272 106,154 146,638 81,524 70,788 86,121 5,159 5,869 5,940 5,782 6,191 5,235 2,413 4,038 3,989 1,537
Short-Term Investments 1,613 3,994 4,561 1,009 3,688 192 1,434 4,561 1,009 2,036 86,140 123,972 124,962 98,228 112,758 658 - 3 - 2,850 658 1,546 3,724 3,368 1,388
Total Borrowings 106,717 82,836 56,523 54,484 50,032 34,531 20,971 18,812 16,752 10,139 25,853 31,868 38,942 16,430 6,678 48,679 50,371 47,477 40,588 30,373 23,268 14,134 14,361 13,352 6,236
Equity Attributable to Equity Holders 107,044 107,541 102,260 97,311 86,887 62,357 56,857 52,392 49,028 45,705 89,152 81,031 66,798 62,934 70,011 48,428 46,869 47,709 50,092 55,417 22,637 19,815 16,817 14,458 12,479
PER SHARE (in pesos)
Earnings - Basic 2/ 14.53 17.13 11.86 12.68 26.35 0.55 0.41 0.31 0.36 0.34 3.61 3.38 2.62 1.98 3.09 74.02 73.29 94.59 84.75 100.07 1.74 1.62 1.31 1.13 1.06
Earnings - Diluted 2/ 14.43 17.01 11.77 12.60 26.19 0.55 0.41 0.31 0.36 0.33 3.61 3.38 2.62 1.98 3.09 73.77 73.12 94.31 84.61 99.58 1.73 1.62 1.31 1.13 1.06
Book Value of Common Shares 2/ 175.13 164.37 151.44 143.55 135.99 4.68 4.26 3.93 3.68 3.41 25.07 22.78 20.56 19.39 25.89 359.91 348.15 354.50 372.52 412.78 10.67 9.31 7.92 6.70 5.88
Cash Dividends to Common Shares 4.00 4.00 4.00 4.00 8.00 0.15 0.09 0.06 0.06 0.06 1.80 1.80 1.80 1.80 2.80 62.00 80.00 114.00 125.00 116.00 0.56 0.46 0.40 0.35 0.30
FINANCIAL RATIOS
Current Ratio 1.78 1.89 2.56 2.52 1.92 1.65 1.67 1.95 1.89 1.65 - - - - - 0.60 0.61 0.55 0.52 0.68 1.24 1.09 1.76 2.03 0.93
Debt-to-Equity Ratio 1.00 0.77 0.55 0.56 0.58 0.55 0.37 0.36 0.34 0.22 - - - - - 1.01 1.07 1.00 0.81 0.55 1.03 0.71 0.85 0.92 0.51

CHAIRMAN’s message
FellowShareholders:ThePhilippineeconomyremainedresilientin2011,despitetheweakglobaleconomicenvironment.Domesticconsumption
continuedtodrivetheeconomy,underpinnedbyrisingFilipinoexpatriateremittances,abenigninflationaryenvironment,andlowinterestrates.Thesevariablesfuelleddomesticliquidityandcreditexpansion,supportingthegrowthofbusinessesacrossvarioussectorsoftheeconomy.
Thispositiveoperatingenvironmentbenefittedourcorebusinesses—AyalaLand,BankofthePhilippineIslands,GlobeTelecom,andManilaWater—giventheirrespectiveindustrypositionsasPhilippine-centricbusinesseswithleadingpositionsinthemarket.Thesecorebusinesses,combined,achievedrecordearningsin2011andcontinuedtocontributetoourgoalofachievingdouble-digitgrowthinconsolidatedearnings.Overtheperiod2006to2010,ourconsolidatednetincomegrewbyanaverageof14%.In2011,whilereportednetincomedeclinedtoP9.4billionfromP11.2billion,corenetincomewhichexcludestheextraordinarygainsrealizedthisyearandtheyearprior,grewby16%.
Weseeourcoredomesticbusinessescontinuingtobethemaindriversofearningsgrowthandvalueinthenearfuture.Theyeachhaveaggressivegrowthplansthatcaptureopportunitiespresentedbyanever-growing,andstilllargelyunderservedanduntapped,domesticconsumermarket.Theyareexpandingintonewcustomersegments,redefiningproductsandservices,andexploringnewgeographieswheretheycanreplicatetheirbusinessmodelsaroundthePhilippinesoroverseas,asinthecaseofManilaWater.
Ourinternationalbusinessesinelectronicsmanufacturingandbusinessprocessoutsourcinghavebothbuiltsufficientscaleinrecentyearstocreatetheirownmomentumforgrowth.Thisenabledustotakefurtherstepsinestablishingaglobalfootprintinmanufacturingandservicesandenhanceourcapabilitiestoprovideadifferentiatedvaluepropositionforourcustomers.Wearefocusedonimprovingprofitabilityaswellasrevenuesintheseglobalbusinesses.

Chairman’sMessage 11
JAIMEAUGUSTOZOBELDEAYALA
Whileourcurrentportfolioofbusinesseshasprovidedsignificantgrowth,wealsorecognizetheneedtoestablishnewplatformsforlonger-termvaluecreation.In2010wemadeadecisiontoinvestinnewsectorswhichencouragedprivatesectorinvestment,particularlyinthepowerandinfrastructureindustries.Thesearetwovitalindustrygroupsthatarelinkedtothecountry’sdevelopmentgoalsandfuturecompetitiveness.Asabusinessgroupwithsignificantfinancialandmanagementresources,asuccessfultrackrecordforbuildingtelecomandwaterinfrastructure,andtheexperienceofoperatingwithintheframeworkofpublic-privatesectorpartnerships(PPP),webelievewearewell-positionedtoparticipateinthedevelopmentofthecountry’sinfrastructureneeds.
WeestablishedACEnergyHoldingsInc.asourholdingcompanyforourpowerinvestments.Overthenextfiveyearsweintendtobuildaportfolioofpowergenerationassetsofupto1,000megawatts(MW),combiningconventionalandrenewableenergysources.Whilewerecognizetheneedtodevelopalternativeenergysources,wealsohavetoberesponsivetotheurgentneedforbaseloadcapacityasthecountryfacesanimminenttightnessinsupply.OverthepastyearaloneACEnergyassembledaround180MWofcapacityacrossthermal,wind,hydro,andsolartechnologies.WecontinuetoexploreopportunitiesinthisspacewiththeintentionofinvestingasmuchasUS$500millionoverthenextfiveyearsfortheseprojects.
Ourmovetoinvestinthetransportinfrastructurespaceisdrivenbothbyourdesiretocontributetothenation’sdevelopmentagendaandtoexecuteonourcapacitytodeveloplarge-scaleprojects.Weseeclearopportunitiesforselectivetollroad,rail,andairport-relatedprojectsunderthegovernment’sPPPprogramthatcanenhancethevaluepropositionofourexistingbusinesses.Lastyear,wewonthebidforthe4-kilometerDaangHari-SouthLuzonExpresswaylinkroadproject,whichwasthefirstPPPprojectundertheAquinoadministration.ThisprojectprovidesstrategicaccessandconveniencetoAyalaLand’snumerousprojectsintheCaviteareaandservesasarelativelylow-riskplatformforinvestmentaswepursuesimilarprojectsmovingforward.
Weremainoptimisticthatthepositivemacro-economictrendswillsustainourgrowthmomentuminthecomingyear,withincreasedpublicsectorspendingcreatinggreaterstimulusfortheeconomy.Undertheseconditionswehavetakenanaggressivestance,asagroup,toexpandourPhilippineportfolio.TheAyalagrouphasallottedoverP90billionforcapitalexpendituresin2012acrossourkeybusinesses;anincreaseof38%fromourcapitalexpenditureslastyear.Thiswillbeusedprimarilyforrealestatedevelopmentaswebroadenourreachtocustomersatthebaseoftheeconomicpyramid,thetransformationofGlobe’stelecomnetworkasweprepareforthefuturedemandsofaneweraofconnectivity,andforinvestmentsinwaterinfrastructureasweincreaseaccesstothisvitalservice.Ourcountry’sfuturewillbedependentonaprogressiveinfrastructurebaseandweintendtoparticipateinbuildingthatcapacityacrossmultiplesectors.
Inclosing,Ithankourboardofdirectors,ourmanagementteam,ourbusinesspartners,andourfellowshareholdersfortheircontinuedtrustinAyala’scapacitytodelivergrowthandvalueforthefuture.Wehopetoremainpartnerswithyouaswebuildaplatformforsustainablelong-termgrowthandvalue.

FellowShareholders:OverthepastfewyearsthePhilippineshasenjoyedaverystablemacro-economicenvironmentwithconsistentlylowinflation
andinterestrates.Thishascreatedconditionssupportiveofinvestmentsandgrowth.Renewedconfidenceinthenationalleadershiphasalsohelpedimproveinvestorsentimentinthecountry.ThishasledthePhilippinestockmarkettobethebestperformingmarketinAsiain2011,reachingevennewerhighsinearly2012.
TheseconditionsreinforcedourearlierconvictiononthePhilippines’potentialtoraiseitsgrowthtrajectoryinthecomingyears.Thecountry’shighlyconsumer-driveneconomywhichbenefitsfromtheregularinflowofoverseasremittances,itsyoungandexpandingpopulation,andtheemergenceofnewindustriesthatarebecomingsignificantdriversoftheeconomy,presentgreatopportunitiesforbusinessexpansionforAyala.
Whilethetraditionalmarketsweservecontinuetogrow,therearenewsourcesofgrowththatcanbederivedfromtappingalargesegmentofthepopulationthatremainsunderserved,ifnotunserved.Thisisincreasinglyevidentaswefocusonastrategyofsocialandeconomicinclusionineachofourcorebusinesses.
Overthepastthreeyearswehaveembarkedonanaggressivegrowthagendaacrossourrealestate,banking,telecom,andwaterbusinesses.Thesegrowthimperativesarecenteredon:1)expandingintonewmarketsandcustomersegments;2)diversifyingintonewgeographies;3)strengtheningourbusinessesinourtraditionalmarkets;andfinally,4)enteringnewbusinessestocreateafoundationforourlong-termgrowth.In2011,wemovedprogressivelyineachofthesegrowthimperativesandachievedsignificantmilestonesacrossourbusinesses.
Expanding into New Markets and Customer Segments
Ourrealestatebusiness,AyalaLandInc.,expandedaggressivelyacrossallproductsegments.ActivitylevelswereunprecedentedasthecompanydeployedclosetoP30billionincapitalexpendituresin2011,49%higherthantheprioryear.Itlaunchedatotal
president’s message

President’sMessage 13
of67projectsanddoubledthenumberofresidentialunitlaunchesto20,613,onceagainsettinganewall-timehigh.AyalaLandcontinuestopursueabroad-basedapproachtoitsexpansionalongvariousproductlinesandacrossdifferentmarketsegmentsoftheeconomicpyramid.
Intheresidentialbusiness,AyalaLandenteredthesocializedhousingsegmentwherethereisasignificanthousingbacklog.ItsmaidenofferingundertheBellaVitabrandisanchoredonavaluepropositionofintegratingcomfortablelivingandlivelihood.BellaVitabringsAyalaLand’sresidentialbrandstoatotaloffiveandcompletesarangeofresidentialproductofferingsthatcoverasignificantsegmentofthesocio-economicpyramid.
Itscommercialleasingbusinessisalsoopeninginnewmarketsandlocationsasitaimstodoublemallgrossleasablearea(GLA)andincreaseitsBPOofficeportfolioinareasoutsideMetroManila.Byyear-endAyalaLand’sleasingportfoliohadatotalof1.4millionsquaremetersofGLA.
AyalaLandcontinuestoextenditsresidentialdevelopmentsandcommercialleasingprojectsintonewareasaroundthecountry,fromDavao,CagayandeOro,andBacolodinthesouth,toBataan,Pampanga,andCabanatuaninthenorth.
ThegrowingtourismindustryinthePhilippinesalsopresentsopportunitiesforAyalaLandtobuilditshotelandresortsportfolio.In2011,itbrokegroundfortwomoreKukun Hotels,addingtothetwothatarealreadyunderconstruction.ItisalsonearingcompletionofthePangulasianIslandResortinPalawan,whichwilladdtoitsportfolioofaward-winningresortsundertheEl Nido Resortsbrand.
Asaresultofthesustainedstrongtake-upofprojectsacrossitsvariousproductsandconsistentmarginimprovements,AyalaLandachievedarecordnetincomeofP7.1billion,31%higherthantheprioryear,withreturnonequityat12%.
Ourbankingunit,BankofthePhilippineIslands(BPI),isalsoexpandingitscustomerbase.In2011,itexceededitsgoaltoincreaseitscustomerbaseto5million.Itisintensifyingitspresenceinthemiddle
marketandconsumersegment,whilecontinuingtoenhancethestrengthofitsfranchiseinthetop-tiercorporateandhigh-networthclients.In2011,BPIincreaseditsloanstothemicro,smallandmediumenterprisessegmentby20%toP71.5billionwithdouble-digitgrowthregisteredacrossthesesectors.
BPIimplementedthe“communitybanking”conceptthroughBPIGlobeBanKO,apioneeringjointventurewithGlobeandAyalaCorporation.BanKOisthefirstmobilephone-basedmicrofinancesavingsbankinthecountrythattargetstheestimated72millionpeoplethatarestillunbankedamongthepopulation.Withtheuseofourtelecomcompany’stechnologyplatformandbypartneringwithinstitutionsthathaveapervasivepresenceinlow-incomecommunities,BanKOisabletodeliverbasicbankingservicesinacost-effectivemannertoabroadsegmentofthepopulationthatpreviouslyhadnoaccesstoformalbankingchannels.
WithBPI’sextensivebranchnetworkandabilitytoattractbroad-baseddeposits,netinterestincomegrewby7%duringtheyearasitexpandeditsassetbasebyP48billion.Thebankfurtherimprovednetinterestmarginsevenamidstthelowinterestrateenvironment.BPIregisteredarecordnetincomeofP12.8billionin2011,13.4%higherthanprioryearwithareturnonequityof15.2%.ItwasalsorecognizedbytheAlpha Southeast Asia Magazinein2011astheBest SME Bank foritsinnovativeproductsandservicesgearedforthemiddlemarket.
Diversifying into New Geographies
Diversifyingintonewgeographiesiscriticalforourwaterinfrastructurebusiness,ManilaWaterCo.BuildingonitssuccessinMetroManila’seastzonethecompanyisexpandingitsgrowthplatformoutsidethecity.ItsnewbusinessesinBoracayandLagunaexperiencedhealthygrowthonitssecondyearofoperationsasbothcontributedpositivelytogrouprevenuesandnetincome.
In2011,ManilaWateracquiredClarkWaterinPampangaandThuDucBulkWaterBOOinHoChiMinhCity,Vietnam.Theseacquisitionsfurtherdiversifyitspresenceinnewgeographies.WebelieveClarkWaterisimportantinbuildingapresenceina

president’s message
fast-growingmetropolisoutsideMetroManila,whiletheacquisitionofThuDucenhancesthecompany’spositionasacompellingwaterinfrastructureproviderintheregion.
Waterisacriticalresourceanditsreliablesupplyisvitaltothesustainablegrowthofanynation.ManilaWater’sprovencapabilitygivesitanadvantageinparticipatingandexpandingitsbusinessinthewatersupplychain.ItpersistsinitseffortstodevelopnewwatersourcesforManilaandthecompanyisintheprocessofsecuringthepermittodeveloptheLagunaLakeasanadditionalwatersourceforthecity.ItalsorecentlywonabulkwatersupplyprojectinCebu.ThecompanyspentatotalofP9.2billionincapitalexpenditurein2011,halfofwhichwasallocatedforexpansionprojects.ManilaWaterpostedarecordnetincomeofP4.3billionin2011,7%higherthanprioryear.
Strengthening Business in Traditional Markets
Ourtelecombusiness,Globe,exhibitedaremarkableturnaroundasitconsistentlyregainedmarketshareoverthepastyear.Itsmobilebusinessdeliveredastrongperformancedrivenbyrecordacquisitionsinthepostpaidsegmentandcompetitivevalueoffersintheprepaidbrands.Thiswasencouraginggivenanenvironmentofpeakingpenetrationratesandpricepressure.Itsfixedlineandbroadbandbusinessalsosustaineddouble-digitrevenuegrowth.Asaresult,Globepostedall-timehighservicerevenuesofP67.8billion,8%higherthantheprioryearandaheadoftheindustry’s1%growth.
GlobeisembarkingonamassiveUS$790millionnetworkandITtransformationoverthenextfiveyearsthatwilldramaticallyimprovenetworkqualityandcustomerexperienceaswellasincreasevoiceanddatacapacity.ThiswillallowGlobetorespondmoreeffectivelytothedemandsofadata-driventelecommunicationsenvironment,particularlyinthissmartphoneera.Ultimately,thiswillfurtherstrengthenandsolidifyGlobe’spresenceinthemobilemarketandimproveitscompetitivenessfollowingthemarket’sreversiontoatwo-playerindustry.Thenetworktransformationshouldalsogiverevenuesanupliftandgeneratesavingsoverthenextfiveyears.
“WebelievethatthegrowthstrategythatwearepursuingwilltranslatetosustainedearningsmomentumforAyalainthecomingyears.”
FERNANDOZOBELDEAYALA
Withhealthysubscriberandrevenuegrowth,GlobepostedanetincomeofP9.8billionin2011,slightlyhigherthantheprioryear.Corenetincome,however,grewby11%toP10.0billion.Returnonequity,basedonreportednetincomewasat21%.
New Businesses—Planting Seeds for Long-Term Growth
ToensureAyala’scontinuedgrowth,werecognizetheneedtoestablishaplatformtodaytoenhanceandsecurefuturesourcesofgrowth.InthesamemannerwebuiltGlobeandManilaWaterbyinvestinginthesebusinessesadecadeago,webelievewehavetoplanttheseedstodayforthefuture.
Wehavemadesignificantprogressinthepastyear.Inthepowersector,weformedSouthLuzonThermalEnergyCorp.,a50-50jointventurewithTrans-AsiaOilandDevelopmentCo.whichisamemberofthePhinmaGrouptobuildandoperateaP12-billion135-MWthermalplantinCalaca,Batangas.Thisplantisexpectedtobeoperationalbytheendof2014.
Wehavealsoextendedourrenewableenergyportfoliotoincluderun-of-the-riverhydroprojectsinpartnershipwithSta.ClaraInternationalCorp.,acompanyhighlyfocusedandexperiencedinbuildinghydropowerinfrastructure.Thereisstrongpotentialtobuildthisportfoliogivenithasanumberofapprovedservicecontractsinplace.Weareconductingpre-developmentworkinselectedareasacrossthecountryandwearepilotingourfirstmini-hydroprojectintheVisayas.
ThesetwoprojectsaddtoourinitialinvestmentsinNorthwindDevelopmentCorporationwhichhasa33-MWwindfarmoperatinginBangui,IlocosNorte,andoursolarpowerjointventurewithMitsubishiCorporationunderPhilNewEnergyCorp.whichisintheprocessofpre-developmentwork.
Intransportinfrastructure,wewereawardedthefirsttollroadprojectunderthegovernment’sPPPprograminDecember2011.Weexpecttocompletethe4-kilometerDaangHari-SLEXconnectorroadby2013.Wecontinuetomonitoropportunitiesinthetransportinfrastructuresectorandweintendtoparticipateinselecttollroad,rail,
andairportprojectswhichwebelievewillbestrategicandvalue-enhancingforourrealestateportfolio.
Outlook
WebelievethatthegrowthstrategythatwearepursuingwilltranslatetosustainedearningsmomentumforAyalainthecomingyears.Weanticipateastrongdomesticmacro-economicenvironment.Weexpectthegovernment’seffortstoacceleratethecountry’sinfrastructurethroughpublic-privatepartnershipswillcreatefurtherstimulusforeconomicgrowthandopennewinvestmentopportunitiesfortheGroup.Competition,however,willremainintenseinthesectorswhereweparticipatebutwebelievewearewell-positionedinthemarkettoofferproductsandservicesthathaveacompellingvaluepropositionandarerelevanttotheneedsofamuchbroaderbaseofcustomers.
Inclosing,Ithankourmanagementteamandstaffaswellasourbusinesspartnersfortheircontinuedsupport,ourboardofdirectorsfortheirsupportandguidanceandourshareholdersfortheirunwaveringtrustinthecompany.
President’sMessage 15

Broadening our Product OfferingsAyalaLandisattractingnewcustomersasitofferswell-designed,highqualityresidentialproductsatpricepointsthatareaffordableforthecountry’syoungandemerginghouseholds.Amaialaunched6newprojectsin2011totalingnearly7,300unitsunderthreenewdevelopmentconcepts:Amaia Steps,Amaia Skies,andAmaia Scapes.Thisisexpectedtodoublein2012.BellaVita’smaidenofferingofover600unitsinthesocializedhousingsegmentwaslaunchedinDecember2011.
expanding into new
marketsAnnualReport201116
NUVALI Livelihood ec0-friendly resorts
AyalaLandhasbeenassistingthecommunitiessurroundingitsdevelopmentswithvariousemploymentandlivelihoodopportunities.
TogetherwithAsianConservationFoundation,AyalaLnadinstalledandcontinuedmaintenanceofmooringbuoysin21sitesaroundBacuitBay,Palawan,whereEl Nido Resortsarelocated.
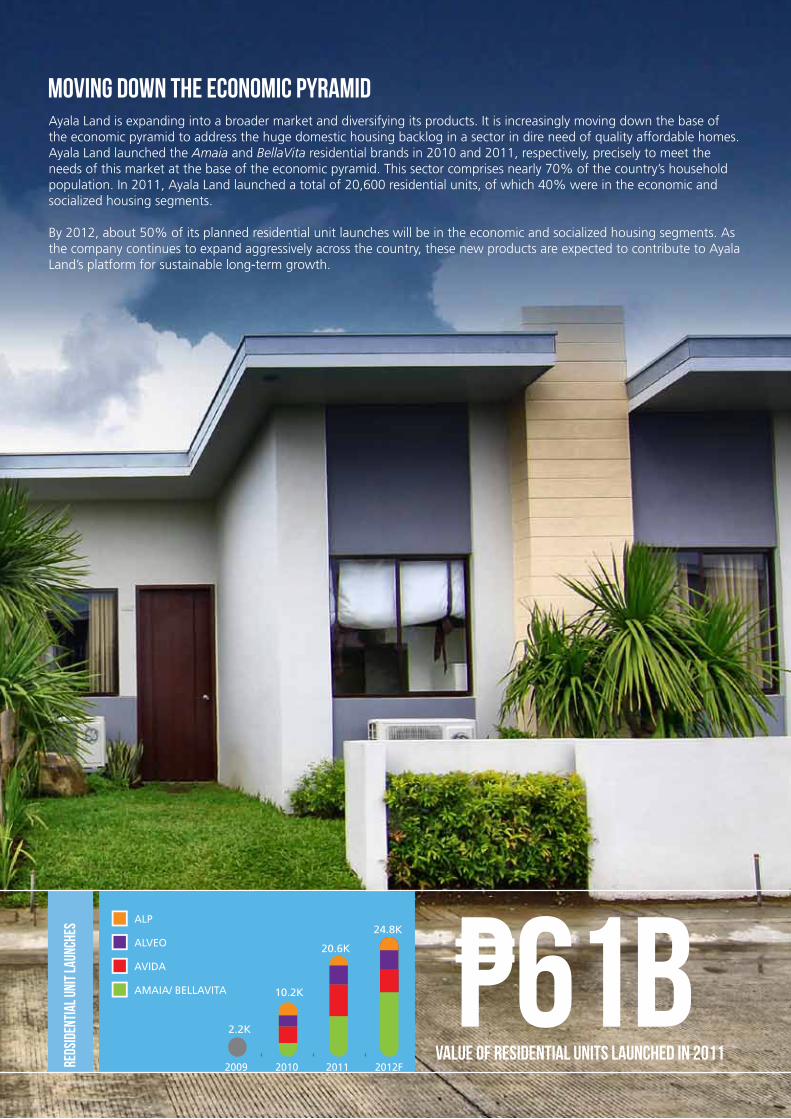
2012F201120102009
2.2K
10.2K
20.6K
24.8KALP
ALVEO
AVIDA
AMAIA/ BELLAVITA P61BValue of residential units launched in 2011re
dsid
enti
al u
nit l
aunc
hes
MOVING DOWN THE ECONOMIC PYRAMIDAyalaLandisexpandingintoabroadermarketanddiversifyingitsproducts.Itisincreasinglymovingdownthebaseoftheeconomicpyramidtoaddressthehugedomestichousingbackloginasectorindireneedofqualityaffordablehomes.AyalaLandlaunchedtheAmaiaandBellaVitaresidentialbrandsin2010and2011,respectively,preciselytomeettheneedsofthismarketatthebaseoftheeconomicpyramid.Thissectorcomprisesnearly70%ofthecountry’shouseholdpopulation.In2011,AyalaLandlaunchedatotalof20,600residentialunits,ofwhich40%wereintheeconomicandsocializedhousingsegments.
By2012,about50%ofitsplannedresidentialunitlauncheswillbeintheeconomicandsocializedhousingsegments.Asthecompanycontinuestoexpandaggressivelyacrossthecountry,thesenewproductsareexpectedtocontributetoAyalaLand’splatformforsustainablelong-termgrowth.
AnnualReport201118
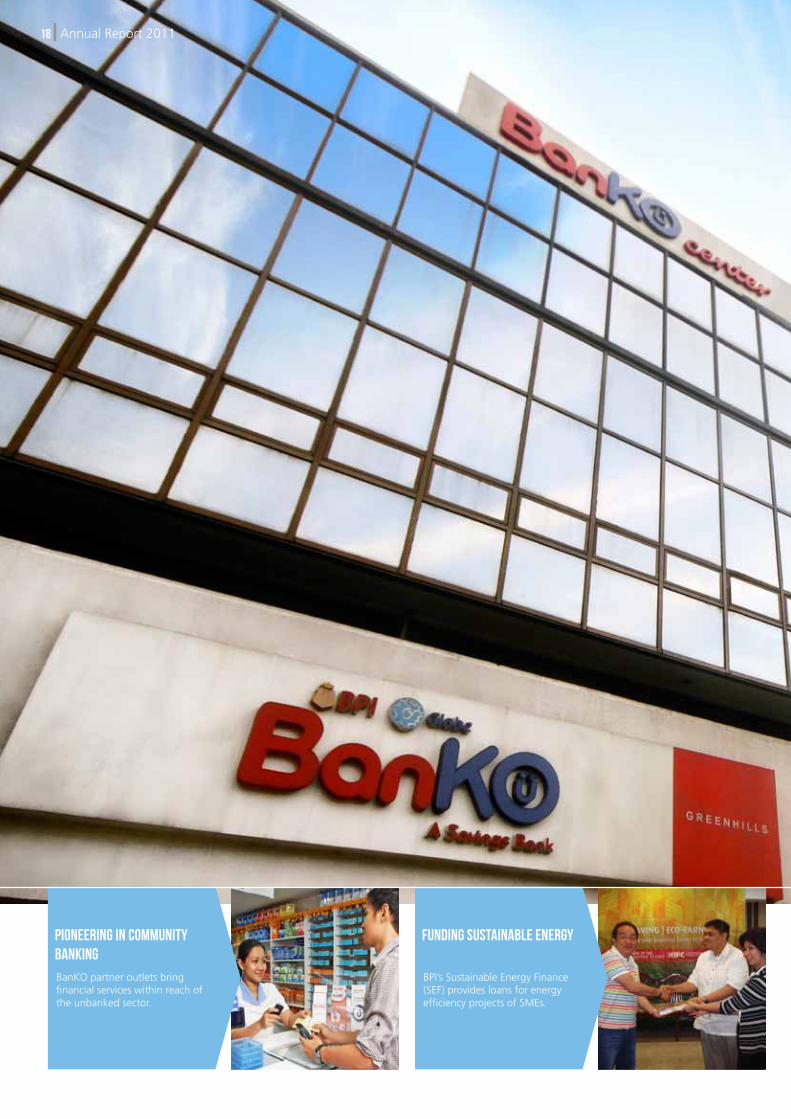
Pioneering in Community Banking
Funding Sustainable Energy
BanKOpartneroutletsbringfinancialserviceswithinreachoftheunbankedsector.
BPI’sSustainableEnergyFinance(SEF)providesloansforenergyefficiencyprojectsofSMEs.
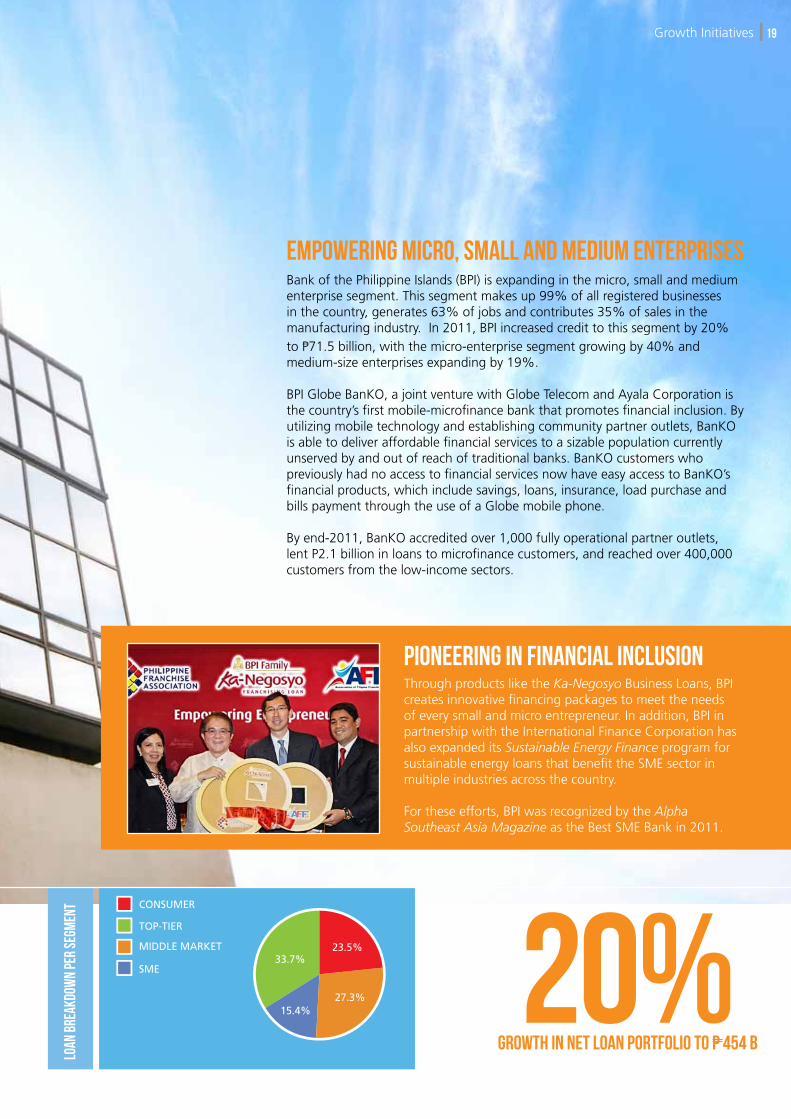
TOP-TIER
CONSUMER
SME
MIDDLE MARKET
27.3%
23.5%33.7%
15.4% 20% Growth in Net Loan Portfolio to P 454 B
GrowthInitiatives 19
Loan
Bre
akdo
wn
Per
Segm
ent
Pioneering in Financial Inclusion ThroughproductsliketheKa-NegosyoBusinessLoans,BPIcreatesinnovativefinancingpackagestomeettheneedsofeverysmallandmicroentrepreneur.Inaddition,BPIinpartnershipwiththeInternationalFinanceCorporationhasalsoexpandeditsSustainable Energy Finance programforsustainableenergyloansthatbenefittheSMEsectorinmultipleindustriesacrossthecountry.
Fortheseefforts,BPIwasrecognizedbytheAlpha Southeast Asia MagazineastheBestSMEBankin2011.
EMPOWERING MICRO, SMALL AND MEDIUM ENTERPRISES BankofthePhilippineIslands(BPI)isexpandinginthemicro,smallandmediumenterprisesegment.Thissegmentmakesup99%ofallregisteredbusinessesinthecountry,generates63%ofjobsandcontributes35%ofsalesinthemanufacturingindustry.In2011,BPIincreasedcredittothissegmentby20%toP71.5billion,withthemicro-enterprisesegmentgrowingby40%andmedium-sizeenterprisesexpandingby19%.
BPIGlobeBanKO,ajointventurewithGlobeTelecomandAyalaCorporationisthecountry’sfirstmobile-microfinancebankthatpromotesfinancialinclusion.Byutilizingmobiletechnologyandestablishingcommunitypartneroutlets,BanKOisabletodeliveraffordablefinancialservicestoasizablepopulationcurrentlyunservedbyandoutofreachoftraditionalbanks.BanKOcustomerswhopreviouslyhadnoaccesstofinancialservicesnowhaveeasyaccesstoBanKO’sfinancialproducts,whichincludesavings,loans,insurance,loadpurchaseandbillspaymentthroughtheuseofaGlobemobilephone.
Byend-2011,BanKOaccreditedover1,000fullyoperationalpartneroutlets,lentP2.1billioninloanstomicrofinancecustomers,andreachedover400,000customersfromthelow-incomesectors.

INCREASING PRESENCE OVERSEASThuDucWaterBOOCorporationisthelargestprivatebulkwatersupplycompanyinsouthernVietnamservingtwonewurbanandthreesuburbandistrictsinHoChiMinhCity.ManilaWater’sacquisitionofa49%stakeinthecompanystrengthensitspresenceinVietnam,oneofitskeyfocusareasforbusinessexpansion.Currently,ManilaWaterhasanon-goingleakagereductionprojectinZone1ofHoChiMinhCityunderSaigonWaterCorporation(SAWACO).Thecompanyispresentlyexploringprojectsinotherzones.
DIVERSIFYING
geographiesAnnualReport201120
EXPANDING TO CENTRAL LUZON PROTECTING THE SHORES OF BORACAY
ManilaWateracquired100%ofClarkWaterCorporation(CWC),thewaterandwastewaterconcessionaireofClarkFreeportZone(CFZ)locatedinAngeles,Pampanga.ManilaWaterviewsthisasastrategicentryintoanotherpromisingmarket,giventheprojectedurbanizationinthearea.
TherehabiliationandupgradeofBoracayIslandWater’swastewaterfacilitieshaveresultedtothedoublingofthewastewatertreatmentcapacity.Currentlyat6.5millionlitersperday(mld),BoracayIslandWaterwillsignificantlycontributetothereversalofthedegradationoftheisland’swatershorequality.

201120102009200520011997
1,189
63%
% in NRW
11.2%440
1,132
1,275
In Million Liters per day Billed Volume(in million liters per day)
P9.2Bin capex invested in 2011
NRW,
WAT
ER SU
PPLY
AND
BI
LLED
VOL
UME
ENHANCING GROWTH IN THE EAST ZONEAstheEastZoneentersanewphaseofgrowth,ManilaWaterwillcontinuetodeliverqualityservicetocustomersamidstvariousmarketconditionsandchallenges.Networkexpansionwillremainoneofthegrowthdriversofthecompanywithanadditionalonemillionpeopleexpectedtobeconnectedtothewaternetworkwithinthenextfiveyears.Continuedeconomicdevelopmentandtheneedtosupporttherequirementsofanincreasingpopulationhavealsosustaineddemandfornewcommercialandmixed-usedevelopments.ManilaWateralsoembarkedonnewinitiativestodeeplyunderstandthediverseneedsofkeycustomersintheEastZoneanddevelopvaluepropositionsthatcanhelpbuildlonger-termpartnershipsandensureservicesustainability.
ManilaWaterisalsopreparingfortheRateRebasingin2013withtheguidingthemeof“Partnering towards Sustainability”.ThiswillserveastheblueprintofthebusinessplanfortheEastZoneforthenextfiveyears.Theproposedinvestmentplanwillfocusonfourpillars:ServiceContinuity,WaterSecurity,ServiceAccessibility,andEnvironmentalSustainability.
GrowthInitiatives 21

4Q113Q112Q111Q114Q103Q10
15,0
84
16,2
14
16,4
52
16,5
54
16,9
81
17,8
24strengthening
the coreP67.8B
Service Revenues at an all-time high and outperforming industry growth QU
ARTE
RLY
CONS
OLID
ATED
REV
ENUE
S
AnnualReport201122
In M
illio
n Pe
sos

NETWORK MODERNIZATION FOR IMPROVED CUSTOMER EXPERIENCE AND SUSTAINED GROWTH Astelecommunicationsbecomemorepervasive,GlobeTelecomismodernizingitsinfrastructuretorespondtothechallengesofglobalization,theexplosionofdatatraffic,andthedemandsofasmartphoneera.GlobeisinvestinguptoUS$790millionoverthenextfiveyearstosupportthesector’scontinuedgrowthanddevelopmentandsignificantlyimproveitscoststructure.
In2011,Globeunveiledamassivenetworkmodernizationandinformationtechnologytransformationprogramthatcutsacrossallnetworkelements,acrossalllayers,andacrossallregionsofthecountry.Globe’snetworktransformationprogramwillresultindramaticimprovementsincallquality,SMSdeliverytimes,speed,coverage,andnetworkavailabilityandreliability.Itwillalsoreduceoperatingandmaintenancecostsandresultinimprovedenergyefficiencyasitadoptsmoregreensolutionsthatreducecarbonfootprintandenergyconsumption.
GrowthInitiatives 23
DELIVERING RELEVANT AND PERSONALIZED SERVICES Globeintroducednewproductsandservicesforitscoremobileandbroadbandservices.Itscustomizablepostpaidplanwaspopularamong
subscriberswhileitslaunchofthenewApple™ iPhone 4S inDecemberwasitsbiggestandmostsuccessfuleverwithsubscribertake-upexceedingforecast.Tattoo broadbandservicesalsointroducednewprepaidsticksandenhancedpromosthatoffereddifferentbrowsingspeedstosuitthevariedneedsofsubscribers.
Globeprovidesadifferentiatedcustomerexperiencethroughits69newstoreswhichopenedinMetroManilaandinkeycitiesacrossthecountry.Thesestoresofferanintegratedretailenvironment,givingcustomerstotalshoppingexperience.
CASH FOR WORK empowerment through education
Globe’smobilecash-transferserviceisusedtodeliverimmediateassistanceforhumanitarianservicesaspartoftheCash-for-WorkendeavoroftheUnitedNationsWorldFoodProgramme.
Globe’sInternet in Schoolsprogramconnectedmorethan2,000publicschoolstotheInternetanditsGlobal Filipino Teachers programenhancedteachers’knowledgethroughtraining.

investing in new
businesses PLANTING THE SEEDS FOR FUTURE GROWTH AsAyalainvestsinnewgrowthplatforms,itrecognizestheneedtosupportpublicinfrastructure.Thisisimperativeforanycountry’sgrowthandanimportantfoundationforbusinessestoflourishinthelongterm.Ayalaisuniquelypositionedtodeployresourcesandriskcapitaltohelpbuildcapacityandacceleratethecountry’sinfrastructuredevelopment.
In2011,AyalacommittedP7billionincapitalasitbegantocarveanicheinthepowergenerationandtransportinfrastructuresectors.ThesearetwohighlyimportantsectorsforthePhilippineeconomythatpresentinvestmentopportunitiesunderwell-establishedframeworksthatenableprivatesectorparticipation.
Ayalahasthecapacitytoinvestandwillbuilditsportfolioinboththesesectorsoverthenextfiveyears.ThesenotonlycreateasteadysourceoffutureearningsandvalueforAyala,butalsoenhancethevaluepropositionofitsexistingbusinesseswhilecontributingtonationalgrowthanddevelopment.
AnnualReport201124
AYALA wins FIRST PPP PROJECTInDecember2011,Ayalawonthebidforthefirstpublic-privatepartnershipprojectundertheAquinogovernment.Thisisa30-yearconcessionfortheconstruction,operationandmaintenanceofa4-kilometerroadthatwilllinkDaangHariRoadinCavitetotheSouthLuzonExpressway(SLEX).DaangHariisamajorarterialroadconnectingrapidlyexpandingtownsinCavitetoMetroManila.Thisprojectprovidesopportunitiesforsynergies,especiallywithAyalaLandInc.,asitimprovesaccesstoitsresidentialandcommercialprojectsinthisfast-growingpartofthemetropolis.AyalaengagedGetinsa,aSpanishengineeringcompanywithdeepexpertiseininfrastructureprojectsglobally,toconductthedetaileddesignandengineering.Ayalaexpectstobeginroadconstructionin2012.
THERMAL ENERGY SUSTAINABILITY REPORTING
JointventurepartnersinSouthLuzonThermalEnergyCorporationleadthegroundbreakingceremonyfortheconstructionofacirculatingfluidizedbedthermalplantinCalaca,Batangas.
In2011,Ayalapublishedits2ndconglomerate-widesustainabilityreportwithaself-declaredratingof“B”usingtheGlobalReportingInitiative(GRI)G3Guidelines.

GrowthInitiatives 25
CAPI
TAL E
XPEN
DITU
RE
amount Ayala is prepared to invest over the next five years for power and transport infrastructure projects
US $1B2012E20112010
65.4 65.9
91.2ALI
BPI
GLOBE
MWC
IMI
AC
In B
illio
n Pe
sos
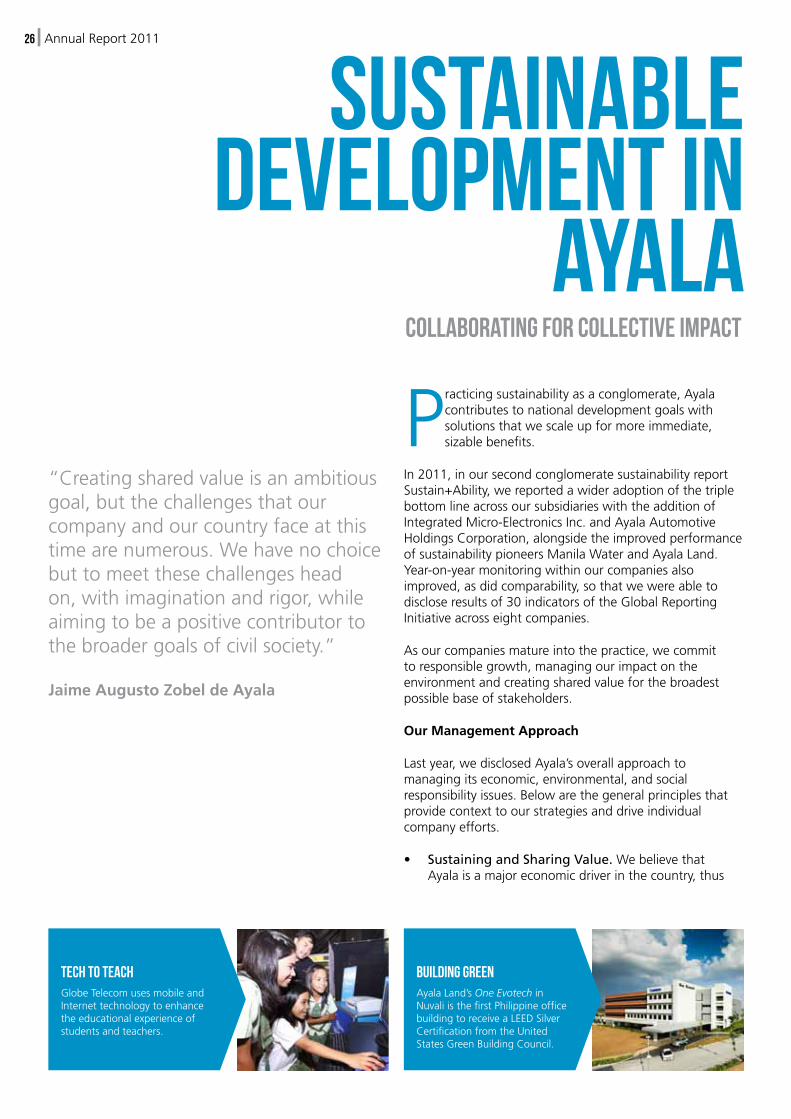
Tech to TeachGlobeTelecomusesmobileandInternettechnologytoenhancetheeducationalexperienceofstudentsandteachers.
Building GreenAyalaLand’sOne EvotechinNuvaliisthefirstPhilippineofficebuildingtoreceiveaLEEDSilverCertificationfromtheUnitedStatesGreenBuildingCouncil.
AnnualReport201126
SustainableDevelopment IN
AYALACOLLABORATING FOR COLLECTIVE IMPACT
Practicingsustainabilityasaconglomerate,Ayalacontributestonationaldevelopmentgoalswithsolutionsthatwescaleupformoreimmediate,sizablebenefits.
In2011,inoursecondconglomeratesustainabilityreportSustain+Ability,wereportedawideradoptionofthetriplebottomlineacrossoursubsidiarieswiththeadditionofIntegratedMicro-ElectronicsInc.andAyalaAutomotiveHoldingsCorporation,alongsidetheimprovedperformanceofsustainabilitypioneersManilaWaterandAyalaLand.Year-on-yearmonitoringwithinourcompaniesalsoimproved,asdidcomparability,sothatwewereabletodiscloseresultsof30indicatorsoftheGlobalReportingInitiativeacrosseightcompanies.
Asourcompaniesmatureintothepractice,wecommittoresponsiblegrowth,managingourimpactontheenvironmentandcreatingsharedvalueforthebroadestpossiblebaseofstakeholders.
Our Management Approach
Lastyear,wedisclosedAyala’soverallapproachtomanagingitseconomic,environmental,andsocialresponsibilityissues.Belowarethegeneralprinciplesthatprovidecontexttoourstrategiesanddriveindividualcompanyefforts.
• Sustaining and Sharing Value.WebelievethatAyalaisamajoreconomicdriverinthecountry,thus
“Creatingsharedvalueisanambitiousgoal,butthechallengesthatourcompanyandourcountryfaceatthistimearenumerous.Wehavenochoicebuttomeetthesechallengesheadon,withimaginationandrigor,whileaimingtobeapositivecontributortothebroadergoalsofcivilsociety.”
Jaime Augusto Zobel de Ayala

GrowthInitiatives 27
Financing for a better worldBPIinvestsinsustainableenergyprograms,includingthecountry’sfirstgreenhotelinPuertoPrincesa,Palawan.
A drink from every tapManilaWaterensureswatersupplysecurityamidstclimatechange.
ourcompanies’long-termprofitabilityiscloselylinkedwiththewellbeingofthecountry.Weimproveoureconomicvaluewhenwemeettheneedsofalargercommunityinwaysthatencourageoveralldevelopment.
• Greening and Growing Our Business. Wepromotesustainabilityamidstprogress.Climatechangeisalegitimatebusinessrisk,thuswecommittoresourcestewardship,solidwastemanagement,impactmitigation,supplierengagement,andregulatorycompliancetoreduceourcollectivecarbonfootprintevenasportfoliosdiversifyandbusinessescontinuetogrow.
• Changing the Social Landscape. Wemakeadifferenceinsocietybypracticingstrategiccorporatesocialresponsibility,creatingsustainablesolutionstobenefitthebottomofthepyramid.Throughoutouractivities,weabidebytheprincipleof“doingtherightthing,”conductingourselveswithintegrity,transparency,andaccountability.Weadheretotheidealsofjusticeandfairnessinalldealingswithouremployees,customers,contractors,andcommunities.
Our Sustainability Stories
ToAyala,thecountry’sdevelopmentchallengesserveascatalystsforinnovation.Ourcompaniesmadeheadwayintotheirrespectiveobjectives,innovatingonproductsand
services,strengtheningpolicies,engagingthesupplychain,raisingthebaronperformancetargets,andbroadeningexposuretonewmarketsparticularlyinthelow-incomesegments.Amorefocusedapplicationofthesustainabilityprinciplesvis-à-visthegoalsandstrategiesofeachsubsidiarymarkedthereportingperiod.Wesharedbestpracticesasvariousinitiativesevolvedaccordingtoeachcompany’svisionandcontext.
AyalaLand’sOne EvotechinNUVALIreceivedtheLeadershipinEnergyandEnvironmentalDesign(LEED)SilverCertificationfromtheUnitedStatesGreenBuildingCouncil(USGBC)in2010.Asthefirstofficebuildinginthecountrytobeawardedtheprestigiousaward,One Evotechhasgreenbuildingfeaturessuchasanenergyefficientdistrictcoolingfacility;occupant-controlledair-conditioningtoconserveenergy;waterrecyclingfortoiletflushing,irrigation,andcooling;optimizedbuildingdesign;theuseoflow-volatileorganiccompoundmaterials;andmethodstoensuregoodindoorairquality.AyalaLandalsoparticipatedindiscussionsongreenpolicymeasurestoshaperelevantnationalandlocalregulations.ItpushedforthewidespreaduseofthePhilippines’greenratingsystemBERDEbyadoptingthestandardineightotherbuildings.
BPIledthePhilippinebankingindustryinthefinancingofinvestmentsinenergyefficiencyandrenewableenergy.UndertheSustainable Energy Finance(SEF) programoftheInternationalFinanceCorporation,BPIconducted119energywalkthrough-auditstoassistbusinessowners
AyalaFoundationanditspartnersusetechnologytofosterculturalrespectbetweenMuslimandChristianyouth

identifywaystoimprovetheirprofitabilitywhileengaginginclimatechangemitigationthroughlesscarbon-intensiveoperations.ThesecompanieshavepotentialSEFopportunitiesofP17billion,andBPIcompletedatotalof22projectsundertheprogramattheendof2010,approvingSEFloansworthP2billion.SEF-financedprojectsincludedthepurchaseofenergy-efficientequipmentforcartonmanufacturing,solarabsorptioncoolingsystemforahospital,andthefinancingofthefirstgreenhotelandspainPalawanamongothers.
Globe’sInternet-in-Schoolsprogramhasconnectedatotalof2,012publicelementaryandhighschoolsalloverthecountryasof2010.Foralmostadecadenow,Globehasbeenprovidingpublicschoolswithaccesstothelateste-learningtoolssothatteacherscandesignefficientandup-to-dateworkingandlearningprocessesregardlessoftheirlocation.GlobealsocreatedGlobal Filipino Teachers (GFT),aholisticteacher-enhancementprogramtohelpeducatorsadapttotheirnewICTlearningenvironment.In2010,GFTexpandeditscoverageinLuzon,WesternVisayas,EasternVisayas,andCagayandeOro,training247GFTsalloverthecountry.Global Filipino Schools,acompetency-buildinginitiativethatenvisionsICT-excellentpublicschoolsintheregions,wasalsolaunchedinDecember2010,pilotinginPaloNationalHighSchoolinLeyteandBilarNationalHighSchoolinBohol.
ManilaWatercontinuedtoupholdtheprinciplesofitsClimateChangepolicytoensureenvironmentalsustainabilityandbusinesscontinuityamidstdisaster.CustomersenjoyeduninterruptedwaterserviceduringEl Niñobecauseofthecompany’sveryefficientnetwork.Non-revenuewaterwasalsosignificantlyreducedfrom1997’s63%toanewlowof11%byend-2010,downbyalmostthreepercentagepointsfromtheend-2009levelof15.8%.Eachpercentagepointreductionmeansanadditionalsupplyof13millionlitersperday.Thecompanyalsofinetuneditsdisaster-preparednessprogramandre-evaluatedtheresilienceofitsfacilities.Throughitslong-runningTubig Para Sa Barangay,itaddressedthewatersecurityandwaterqualityissuesofmorethan1.7millionresidentsinlow-incomecommunities,whileminimizingcompanylossesduetoleakageandpilferage.
An oasis in the city
TheAyalaTriangleGardensinMakatiCityfostersauniqueoutdoorcommunityexperienceusingelementsofsustainabledesign.
Collective effort
EmployeesparticipateinvariousenergyandenvironmentalconservationprogramsintheAyalagroup.
“Implicitinourundertakingsarecreativity,innovation,andcommitmenttosustainability.Asthesebenefitbothourclientsandourbusinesses,weexpecttheirsuccesstolastforthelongterm.”
Fernando Zobel de Ayala
AnnualReport201128
IMIengagedinresponsiblemanufacturingasitestablishedIMI Energy Solutions,astrategicpartnershipwithCalifornia-basedRenewableEnergyTestCenter,toengageinthemanufactureofsolarpanelsandotherrelatedtechnologies.IMIalsoimplementedtheHazardousSubstanceProcessManagementSystem,whichrestrictstheuseofhazardousandcontrolledsubstancesinitsproductsandcomplieswithallapplicableenvironmentallawsandregulations.Topromotegreenprocurement,IMIworkedwithsupplierstocheckandvalidatethecontentofhazardouschemicalsandchoosethebestandfullycompliantitemsforitsproducts.ItdevelopedtheHazardousSubstanceProcessManagement(HSPM)Database,whichstoresalltheinformationnecessarytoanalyzerawmaterialsincompliancewithitsHSPM,andasystemforcompliancewiththeEurope’sRegistration,Evaluation,AuthorizationandRestrictionofChemicalSubstances.
AyalaAutomotiveengagedwithitsnetworkofHondaandIsuzudealerstoidentifythemostpressingsustainabilityissuesandcommontoallwasproperwastemanagement.Adheringtolocalandnationalgovernmentregulations,ournetworkdevelopedawastemanagementpolicytolimitthedealerships’impactontheenvironment.AyalaAutomotivemeasured,evaluated,andimprovedonday-to-dayoperationsaccordingtotheseregulations.Itreviewedandaddressedhowdealersconductedtheirsegregation,collection,storage,andwastedisposal.Italsocontractedgovernment-accreditedvendorswhofollowrigidwaste-handlingproceduresforvariouscategories,especiallythoseidentifiedashazardous.
AyalaFoundationInc.(AFI)spearheadedtheconglomerate’sdisastermanagementeffortsasamemberofOur Lighthouse Alliance,whichimplementsacommunity-baseddisasterpreparednessprojectcalledNoah’s Ark.Theprojectconsistsoftheconstructionofanevacuationcenter;retrofittingofschoolsandotherpublicplacesintosuitableevacuationareas;capacitybuildingofvulnerablecommunitiestoprepareforflooding;risk-mappingactivitiestodelineateareasofhigh-,moderate-,andlow-riskareas;contingencyplanningandinstitutionalizationofalocal,real-timeEarlyWarningSystemonfloods;andsimulationexercisesanddrills.Ayala,throughAFI,providedthe
P1.8millionfunding.In2010,theprojectwaspilotedinBarangayMalandayinMarikinaCity,where2,079familieswereaffectedbyTyphoon Ondoy.BarangayGuitnangBayan1inRizalwasidentifiedasthenextNoah’s Arkprojectsite.
Our Commitment to Sustainability
Ayalacommitstosustainabilitybecauseitapowerfuldriverofnationaldevelopment.Allcompanieswillcontinuetopursueprofitabilitymindfulofmanagingtheimpactoftheirgrowthontheenvironmentandsocietythroughadaptationandmitigationmeasures,conservationandefficiencyimprovements,equitableandinclusivedevelopment,andstakeholderandsupplierengagement.Morecompanieswillbeincludedinthereportingandmoreperformanceindicatorswillbeappliedtoimprovethemateriality,comparability,accuracy,androbustnessofourdata.Ayalaalsomakesitaprioritytoberesponsivetostakeholders’inputsandexpectationsonsustainability.WebelievethesecommitmentsallowAyalatotrulydeliveronitspromisetobeatransformationalforceinnationbuilding.
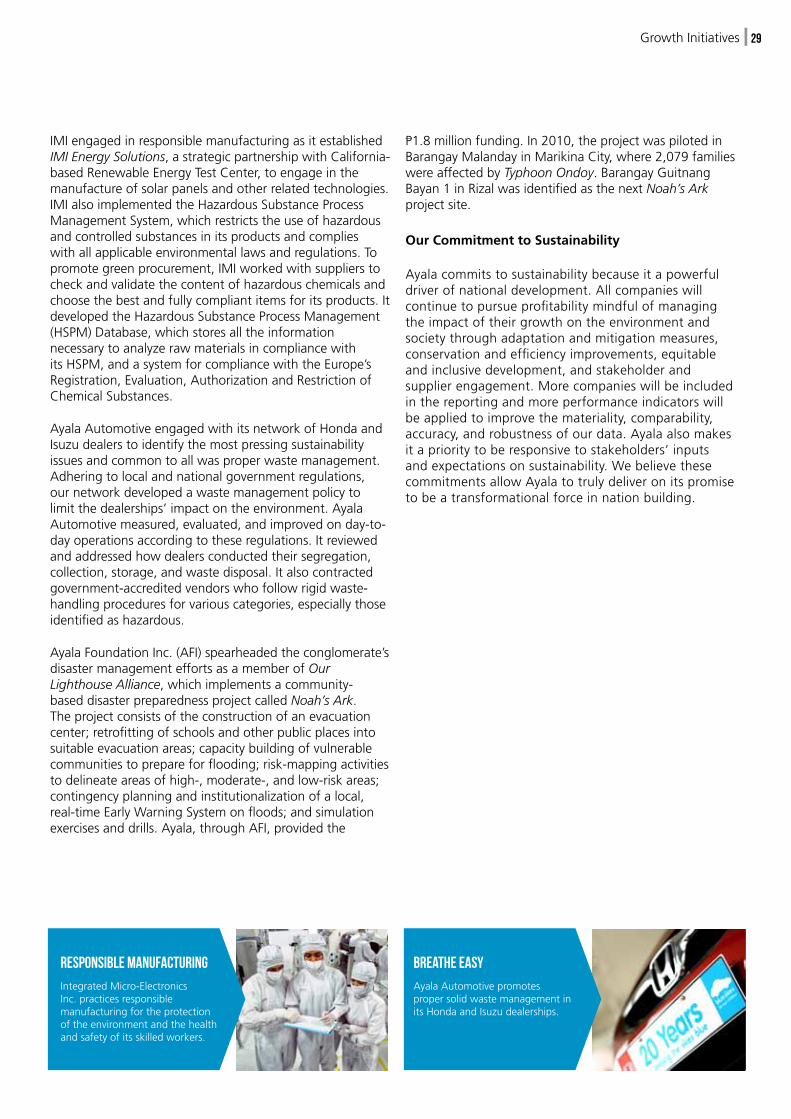
Responsible manufacturing
IntegratedMicro-ElectronicsInc.practicesresponsiblemanufacturingfortheprotectionoftheenvironmentandthehealthandsafetyofitsskilledworkers.
Breathe easy
AyalaAutomotivepromotespropersolidwastemanagementinitsHondaandIsuzudealerships.
GrowthInitiatives 29

CONSOLIDATEDFINANCIALHIGHLIGHTS(inmillionpesosexceptpershareamountsandratios)
2011 2010Total assets 154,619 122,302 Stockholders’ equity 62,357 56,857 Revenues 44,205 37,813 Net income attributable to equity holders 7,140 5,458 Per share
Earnings 0.55 0.41 Return on equity 12.0% 10.0%
Top ShareholdersAyala Corporation 53.2% 53.2%Aberdeen Asset Management Asia Ltd. 19.7% 8.9%
AyalaLandachievedanotherbanneryearin2011.NetincomeandrevenuesreachedarecordP7.1billionandP44.2billion,respectively,31%higherthannetincomethepreviousyearand
17%higherthanrevenuesin2010.Thisyieldedareturnonequityof12%,significantlyhigherthanwhenitstarteditsaggressive5-yeargrowthplanin2010.
Capitalexpendituresreachedanall-timehighofP30billion,50%higherthanthepreviousrecordofP20billionin2010asitlaunched67projectsinallitsbusinesslines,fornewsegmentsofthemarket,andinnewareasacrossthecountry.
Revenuesfromtheresidentialdevelopmentbusinessgrewby29%in2011toP24billion.Thecompanylaunched20,613residentialunitsin2011,doublethelaunchesin2010.OfferingsextendedtothesouthernareasofthecountrylikeCebu,Davao,CagayandeOro,andBacolod,aswellastothenorthinBataan,Pampanga,andCabanatuan.Asitexpandsintonewmarketsandgeographiesaroundthecountry,AyalaLandalsocontinuestobuildarounditsstrategiclandbankareasinMakati,BonifacioGlobalCity,andNUVALI.
ItslatestbreakthroughintheresidentialbusinesslastyearwasitsentryintothesocializedhousingsegmentundertheBellaVitabrand.Thereremainsahugehousingbackloginthissegmentofthemarket.BellaVita’smaidenprojectinCavitewhichisanchoredonitsvaluepropositionof
“Realestateiskeytoeconomicgrowth.Wewillcontinuetobuildmorehomesandexcellentvenuesforworkandleisure.”
AnnualReport201130
Estatereal
going boutique master-planned, sustainable
KukunBonifacioGlobalCity,thefirstinanewchainofboutiquehotels,willopenitsdoorstoguestsin2012.
ALI’sstrategiclandbankareassuchasNUVALIinLagunacontinuetogrow.

integratingcomfortablelivingandlivelihoodgeneratedstronginterestfromthemarket.Bella VitacompletesAyalaLand’srangeofresidentialbrandsthatcatertoallsegmentsofthePhilippineeconomicpyramid.Movingforward,BellaVitaandAmaiawillaccountforhalfofitsresidentialunitlaunchesastheytargetandservemostlythe“end-user”residentialmarket.
AyalaLand’sstrategyofgeographicexpansion,marketbroadening,anddiversificationwasduplicatedinitscommercialleasingbusinessasitaimstodoublegrossleasablearea(GLA)by2014.In2011,itlaunchedatotalof141,000squaremetersofmallGLAandatotalof46,000squaremetersofBPOGLA.Byyear-end,occupiedmallGLAreachedover1millionsquaremetersandoccupiedBPOGLAwasat230,000squaremeters.Revenuesfromtheleasingbusinessroseby16%toP7.4billionin2011.
AyalaLandcontinuedtobuilditshotelsandresortsportfolioandbrokegroundfortwomoreKukun HotelsinNUVALIandCagayandeOro.ItisalsonearingcompletionofitsPangulasian Island Resorttoaddtoitsportfolioofaward-winningresortsundertheElNidoResortschain.
Thecompanycontinuestopositionforlandparcelswithinkeyurbanandprovincialareasnationwidetosustainitsexpansionandgrowth.LandbankinginareaslikeManila,Bicutan,Alabang,NUVALI,Bataan,Pampanga,CebuandBacolodwillserveasplatformsforitsgrowingportfolioofmasterplanned,integrated,mixed-useandsustainable
developments.Theseareacquiredviaanasset-lightapproachthroughjointdevelopmentagreementsandlong-termleases.
Marginsimprovedwithstrictspendmanagementprogramsgearedtowardsreducingprojectcost,anddirectandgeneraladministrativeexpenses.Italsoexpandeditssharedservicesarrangementstofurtherenhanceoperationalefficiencies.Asaresult,consolidatednetincomeaftertaxmarginroseby2percentagepointsin2011to16%from14%theprioryear.
AyalaLandpaidoutP1.9billionincashdividendsin2011,representingadividendpayoutof35%of2010netearnings.
AyalaLandwillsustainitsexpansionplanin2012anchoredonitsstrategyofgeographicdiversity,productvariety,andadeliberatemoveintothebaseoftheeconomicpyramid.AyalaLandplanstolaunchin2012nearly25,000moreresidentialunitsinnewandexistinggrowthcentersnationwideacrossitsfivebrands.Italsohasinthepipelinearound365,000squaremetersofcommercialleasingGLAforitsofficeandshoppingcenters,andwillbreakgroundontwomoreKukun hotelsinthecomingyear.Asitexpandsandgrowsaggressively,AyalaLandwillleverageonitscompetitiveadvantagestoensurethehighestlevelofquality,service,andsatisfactionforitsbroadrangeofcustomers.
capi
tal e
xpen
ditu
re(in
mill
ion
peso
s)
P7.1B Net income, 31% higher than previous year
20,613 Residential units launched, double the number in 2010
17% Increase in revenues, a record P44.2 billion
P30B All-time high capital expenditures in 2011
BusinessReview 31
‘10‘09‘08
18,893 16,233 20,055
‘07
15,413
‘11
29,914
‘10‘09‘08
4,2385,182 2,229 10,115
‘11
20,613
‘07NUm
ber
of r
esid
enti
al
unit
s lau
nche
d

CONSOLIDATEDFINANCIALHIGHLIGHTS(inmillionpesosexceptpershareamountsandratios)
2011 2010Total assets 842,616 878,146 Stockholders’ equity 89,152 81,031 Revenues 41,758 38,407 Net income attributable to equity holders 12,822 11,312 Per share
Earnings 3.61 3.38 Book Value 25.07 22.78 Return on equity 15.2% 15.6%
Top ShareholdersAyala Corporation 33.5% 33.6%Ayala DBS Holdings, Inc. 20.3% 21.3%
“Wewilldifferentiatethroughcostandcapitalefficiency,RelationshipManagersforkeyclients,andsuperioron-lineandmobilebankingforall.”
BankofthePhilippineIslandsrecordedanetincomeofP12.8billionin2011,up13.4%fromprioryear’sP11.3billion.Thisyieldedareturnonequityof15.2%andreturnonassetsof1.6%.
Totalrevenuesgrewby9%asnetinterestincomeimprovedby9%duetotheP49billionexpansioninaverageassetbasecombinedwiththe12basispointimprovementinnetinterestmargin.Non-interestincomewasupby8%duetohigherservicecharges,trustfees,incomefromtheinsurancecompaniesandcreditcardincome.
Operatingexpensesgrewby12%whilecosttoincomeratiowasat56.2%.ImpairmentlosseswereloweratP2.1billioninviewofthedeclineinnon-performingassets.
Withtheprevailinglowinterestrateenvironment,BPIpursuedastrategyofincreasinglow-costdepositstofunditsloangrowth.Totalresourcesdeclinedslightlyby4%toP843billionasthebankfocusedonthesafetyofitsassetsandthepreservationofitsyieldsoverassetgrowth.Totaldepositslikewisecontractedbyabout5%toP681billion,buttotalintermediatedfundsincreasedby12%toP1.3trillionasassetsundermanagementgrewby38%.
Netloansgrewby20%toP454billion,whileassetqualitycontinuedtoimprovewithnet30-daynon-performingloansratiodownto1.9%fromprioryear’s2.1%andareservecoverageratioof116%.
financial
servicesAnnualReport201132
Best Sme Bank in 2011 Empowering smesBPIwasawardedBestSMEBankin2011bytheAlphaSoutheastAsiaMagazineforitscreativeandinnovativeproductstargetedtothemicro,smallandmediumenterprisesegment.
BPIFamilySavingsBank’sKa-NegosyoBusinessloansmakeiteasyforsmallandmicroentrepreneurstogrowtheirbusinesses.

TotalcashdividendsdeclaredfortheyearamountedtoP6.4billion,equivalenttoapayoutratioof50%.
BPIcontinuedtoexpanditspresenceinthesmallandmediumenterpriseandmiddlemarketsegments.
Credittothemicro,smallandmediumenterprise(MSME)segmentin2011grewby20%toP71.5billion.Double-digitgrowthwasregisteredinallsectors,mostnoteworthyofwhichwastothemicro(40%)andmedium-size(19%)customerbase.TheMSMEsegmentaccountedfor15%ofthebank’sloanportfolio.
TherobustloandemandcamefromSMEsintheconstruction,utilities,transportation/storage,agriculture,servicesandwholesale/retailtradeindustries.ThiswasfurtheraugmentedwithBPIofferingsofafullsuiteoffinancialsolutionsandservicesforfundsmanagementandtradefinancingtodeepenitsbankingrelationshipsinthissegment.
Inaddition,BPIFamilySavingsBankintroducedKa-Negosyo Business Loans,aloanprogramforsmallandmicroentrepreneurs.InFebruary2011,itlauncheditsKa-Negosyo Franchising Loanwhichwasdesignedforstart-upentrepreneurswhowanttoownafranchisebusiness.ThisproductfeaturedthePay Litevariantwherefranchiseesneedonlytopayinterestforthefirst6monthsandthefullamortizationfromtheseventhmonthonwards.Afranchiseeacquiringafranchisefromanyofthebank’saccreditedfranchisorsenjoyedunsecuredcredits.
ForitseffortsinservingtheMSMEsector,thebankwasawardedtheBestSMEBankbytheAlpha Southeast Asia Magazinein2011.BPI’sSustainable Energy Finance (SEF)programalsoplayedavitalroleinexpandingrelationshipswithSMEs.NowonitsthirdyearofpartnershipwiththeInternationalFinanceCorporation,sustainableenergyloansandleasesextendedbythebankgrewtoP4.0billionbenefittingmostlytheSMEsector.Theloansweremostlyforenergyefficiencyprojectscateringtoseveralindustriesthatincludedmanufacturing,realestate,tourism,healthcareandeducation,amongothers.ThesustainableinitiativesprovidedimmediateimpactonSMEbusinessoperationsintermsofcostsavingsandoperationalefficiency.
Oneofthebank’ssustainabilityactivitieswastheClimate Risk AdaptationprojectinpartnershipwithWorldWideFund(WWF)forNature.Itaimedtogathercity-specificsocio-economicbaselinedataforthosemostlikelytobeadverselyaffectedbyclimatechange.In2011,resultsofthestudywerereleasedforfourmajorcities:Cebu,Davao,BaguioandIloilo.Thegoverningbodiesofthesecitieswereadvisedonhowtocreateanadaptivestrategytoclimatechange.Notwithstandingachallengingyear,BPI,underitstagline“Let’s Make It Easy”,deliveredinnovativeproductsandservicesandsustainabilityinitiativestoits5millioncustomers.
68% loan-to-deposit ratio from 54% in 2010
12% Iincrease in Total intermediated funds to P1.3T
20% growth in NET loaNS
15% RETURN ON EQUITY
BusinessReview 33
‘10‘09‘08
320,216 327,474 378,728
‘07
273,759
‘11 ‘10‘09‘08‘07 ‘11
454,499 3.76%3.83% 3.72% 3.55% 3.67%NE
T LOA
NS(in
mill
ion
peso
s)
NET I
NTER
EST M
ARGI
N

CONSOLIDATEDFINANCIALHIGHLIGHTS(inmillionpesosexceptpershareamountsandratios)
2011 2010Total assets 130,839 130,628 Stockholders’ equity 48,428 46,869 Revenues 71,564 65,548 Net income attributable to equity holders 9,832 9,745 Per share
Earnings 74.02 73.63 Book Value 359.91 348.15
RatiosCurrent ratio 0.61 0.60 Debt-to-equity ratio 1.01 1.07 Return on equity 21.0% 20.6%
Top ShareholdersAyala Corporation 30.5% 30.5%Singapore Telecom International Pte Ltd
47.3% 47.3%
“ThecustomerisattheheartofGlobe.Thisdrivesourtransformationandinnovationforanexperiencethattrulydelights.”
GlobeTelecom’sconsolidatedservicerevenuessoaredtoanall-timehighofP67.8billion,up8%againstP62.6billionin2010.Thelatterincludedaone-timeupwardadjustmentof
P526millionfromprepaidloadcreditsthathaveeitherexpiredorhavebeenusedup.Itsmobilebusinessdeliveredastrongperformance.Mobilerevenuesroseby7%yearonyeartoaboutP54.0billionfromP50.5billion,drivenbyinnovativecustomizablepostpaidplans,revitalizedprepaidbrands,robustgrowthinmobilebrowsingservices,anddifferentiatedcustomerservice.Globe Postpaidnetacquisitionsreachedarecord389,000in2011,81%higherthanlastyear.Itendedtheyearwithabout1.5millionsubscribers.Globe Prepaidhad15.5millionsubscribers,up12%fromthepreviousyear’slevel,whileTMendedwith13.1millionsubscribers,13%fromprioryear.Combined,Globe’stotalmobilesubscriberbasereachedover30.0millionbyyear-end.DemandformobileserviceswasalsofuelledbytheintroductionofgadgetsliketheApple™ iPhone 4S,iPad 2,thenewestBlackBerry®handsets,andthepopularAndroiddevices.
Globe’sbroadbandbusinessexpandedwithrevenuesup30%toaboutP7.5billionin2011.Thiswasdrivenbya31%growthinsubscriberbase.Globeendedtheyearwithover1.4millionbroadbandcustomerscomparedtoabout1.1millionin2010.Duringtheyear,Globealsorolledoutits4GnetworkviatheHSPA+ standard,enablingthebusinesstoupgradethespeedperformanceofkeyproductsforTattoo-On-The-Goservices.
Fixed-linedatarevenuesgrewby9%toP3.8billionasaresultofsustaineddemandfordomesticleasedlinesand
TELEcommunications
AnnualReport201134
PSTD Award FULL NETWORK UPGRADEGlobe’strainingprogramwinsbiginthefirst-everPhilippineSocietyofTrainingandDevelopmentGawad Maestro Awards
GlobelaunchedaUS$700millionnetworkupgradeprogram.Thiswillensuremorestableandreliablenetworkcoverageforits30millionsubscribers.

high-speedInternetservicesforlargeenterprises.
Operatingexpensesandsubsidiesincreasedby13%toP32.7billionduetotheoverallriseinmarketingandsubsidycosts.Notwithstandingthis,consolidatedEBITDAgrewby5%toP35.1billion.ConsolidatedEBITDAmargin,however,waslowerat52%frompreviousyear’s54%.ButmobileEBITDAmarginremainedhealthyat60%ofmobilerevenues,whilefixed-lineandbroadbandmarginsimprovedto22%from14%alongwithimprovedscale.
Asaresult,netincomeaftertaximprovedby1%toP9.8billionin2011fromP9.7billionin2010.Corenetincome,whichexcludesforeignexchangeandmark-to-marketgainsandlosses,aswellasnon-recurringitems,wasup11%toP10.0billionfromP9.1billionin2010.
Globe’sbalancesheetandcashflowsremainedstrong.Gearingwaswithinoptimumlevels.Grossdebttoequityratioonaconsolidatedbasiswasat1.01:1,whilenetdebttoequitywasat0.90:1asofyear-end2011from0.95:1in2010.
Thecompany’sstrongfinancialpositionenabledittofinanceitsoperatingandcapitalinvestmentsduringtheyear,whilesustainingdividendstoshareholders.Capitalexpendituresin2011amountedtoP17.4billion,11%lowerthanpreviousyear’sP19.5billion.Thesewereusedtoexpandandupgradethecompany’sbroadbandandmobilenetworksaswellasdeploy4GmobiletechnologyviaHSPA+inkeyareasnationwide.
GlobepaidoutP8.2billionincashdividends,representing84%of2010netincome.Thiswasinlinewiththe
company’sdividendpolicyofdistributing75%to90%ofprioryear’snetincome.
NETWORK TRANSFORMATIONInNovember2011,Globeembarkedonanetworkmodernizationprogramdesignedtosignificantlyimprovenetworkqualityandcustomerexperience,increasevoiceanddatacapacity,anddrivedowncosts.Thecompanyisalsoinitiatinganinformationtechnology(IT)transformationprojecttocreateastreamlinedandintegratedinformationenvironmentthatismoreresponsivetomarketandbusinessdemands.TotalcapitalexpendituresoverthenextfiveyearsfortheseinitiativesareestimatedtoreacharoundUS$790million,ofwhichUS$700millionisallottedforthenetworkmodernizationprogramandUS$90millionfortheITtransformationinitiative.AroundUS$530millionisexpectedtobespentin2012andUS$110millionin2013.Onceinplace,theimprovednetworkandITfacilitiesareexpectedtohelpliftrevenuesandgeneratesavingsinoperatingexpensesandcapitalexpendituresofaroundUS$180millionandUS$210million,respectivelyoverthenextfiveyears.
Itisexpected,however,thatassetswortharoundUS$388millionwillbedecommissionedastheprogramwillinvolvethereplacementofoldnetworkequipmentandITsystems.ThismayimpactGlobe’sprofitabilitythroughanaccelerationofthedepreciationovertheremainingusefullifeoftheassets.Astheseaccelerateddepreciationchargesarenon-recurringandnon-cashinnature,thesewillnotcompromisethecompany’scashflowsandabilitytopaycashdividendsmovingforward.Thesechargeswilllikewisenotbeconsideredinthedeterminationofthecompany’scorenetincomein2012.
P67.8B All-time high consolidated service revenues
US$790M Total capex over the next five years for network modernization and IT transformation
81% Increase in Globe Postpaid net acquisitions
P8.2B Cash dividends paid out, representing 84% of 2010 net income
BusinessReview 35
‘10‘09
23,245 26,471
‘11‘10‘09 ‘11
30,04062.4 62.6 67.8CO
NSOL
IDAT
ED SE
RVIC
E RE
VENU
ES (i
n bi
llio
n pe
sos)
MOB
ILE SU
BSCR
IBER
S(in
‘000
)

ManilaWaterCompanyInc.’s(MWC)consolidatednetincomegrewby7%toP4.3billionin2011fromnearlyP4.0billionin2010.Thisgrowthwas
broughtaboutbyhigherconsolidatedrevenuesandwell-managedoperatingexpenses.
Consolidatedrevenuesroseby9%in2011toP12.0billion.Waterrevenuesgrewby7.3%,boostedbya7.7%increaseinaveragetariffanda0.8%increaseinbilledvolume.NewbusinessesLagunaAAAWaterCorporation(LWC),BoracayIslandWaterCompany(BIWC)andClarkWaterCorporation(CWC)contributedatotalof8.2millioncubicmeters(mcm)inbilledvolumein2011.Thiswasa37%improvementfromthatoflastyearwiththeadditionofCWCinDecemberof2011.Theincreaseinvolumewaspartlyduetothe58%growthinconnections.BilledvolumeintheEastZonegrewby0.4%to411.6mcmversuslastyear’s409.8mcm.Thiswaslikewisesupportedbytheexpansioninbilledconnectionsto857,981from813,942in2010.
Earningsbeforeinterest,taxes,depreciationandamortization(EBITDA)roseby12.3%toP8.4billionfromP7.5billion,underpinnedbycontinuedimprovementsinoperatingefficiencies.Itsnon-revenuewaterwasat11.2%whilenetincomemarginwassteadyat36.0%
serviceswater and wastewater
CONSOLIDATEDFINANCIALHIGHLIGHTS(inmillionpesosexceptpershareamountsandratios)
2011 2010Total assets 60,897 48,621 Stockholders’ equity 22,812 19,978Revenues 12,004 11,013 Net income attributable to equity holders 4,266 3,978 Per share Earnings 1.74 1.62 Book Value 10.67 9.39 Ratios Current ratio 1.24 1.09 Debt-to-equity ratio* 1.03 0.71 Return on equity 19.0% 20.0%Top Shareholders
Ayala Corporation 43.1% 43.1%Mitsubishi Corporation 8.31% 8.31%
“Wecontinuetobuildon15yearsofservice,improvinglivesandupholdingsustainability.”
AnnualReport201136
55,270 NEW SERVICE CONNECTIONS ESTABLISHED
1% CONSOLIDATED BILLED VOLUME GROWTH
44,039newconnectionswereestablishedintheEastZone;LWC,BIWCandCWCgeneratedacombinedtotalof11,231newserviceconnections.
TheEastZonegeneratedamodestgrowthof0.4%whileLWCandBIWCagressivelyincreasedbilledvolumesby25%and22%.CWCgeneratedarobustbilledvolumeincreaseof32%onDecember2011.
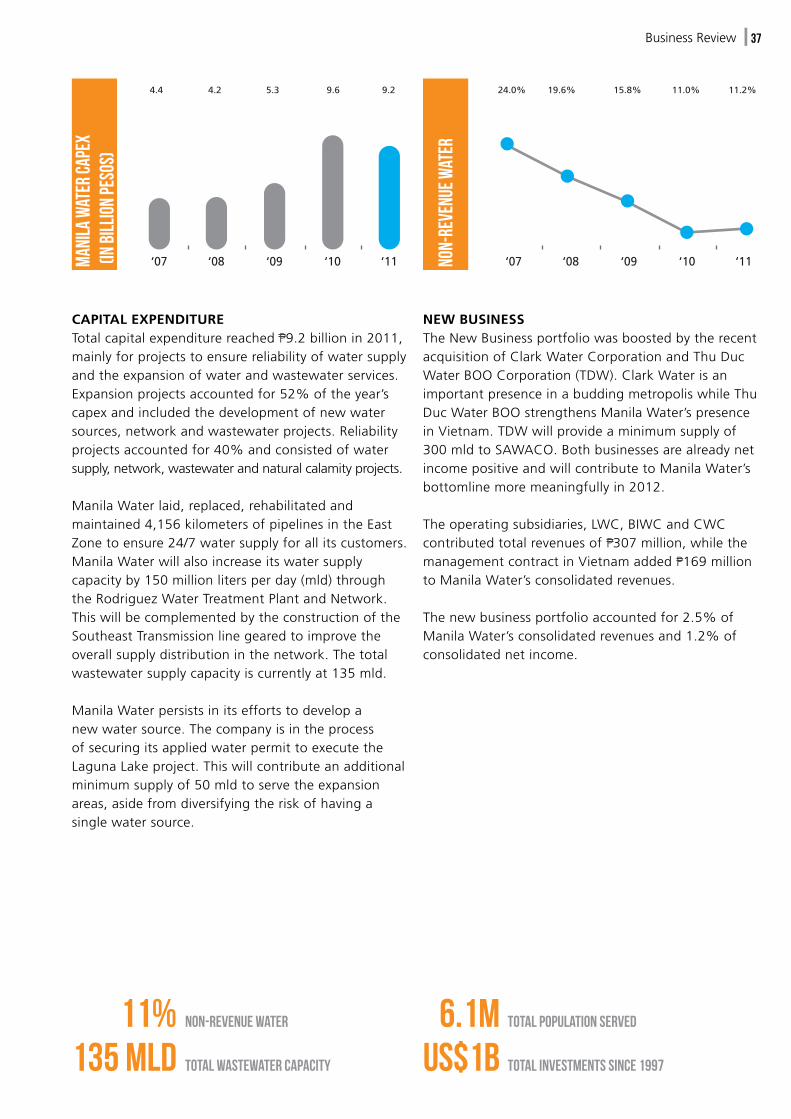
CAPITAL EXPENDITURETotalcapitalexpenditurereachedP9.2billionin2011,mainlyforprojectstoensurereliabilityofwatersupplyandtheexpansionofwaterandwastewaterservices.Expansionprojectsaccountedfor52%oftheyear’scapexandincludedthedevelopmentofnewwatersources,networkandwastewaterprojects.Reliabilityprojectsaccountedfor40%andconsistedofwatersupply,network,wastewaterandnaturalcalamityprojects.
ManilaWaterlaid,replaced,rehabilitatedandmaintained4,156kilometersofpipelinesintheEastZonetoensure24/7watersupplyforallitscustomers.ManilaWaterwillalsoincreaseitswatersupplycapacityby150millionlitersperday(mld)throughtheRodriguezWaterTreatmentPlantandNetwork.ThiswillbecomplementedbytheconstructionoftheSoutheastTransmissionlinegearedtoimprovetheoverallsupplydistributioninthenetwork.Thetotalwastewatersupplycapacityiscurrentlyat135mld.
ManilaWaterpersistsinitseffortstodevelopanewwatersource.ThecompanyisintheprocessofsecuringitsappliedwaterpermittoexecutetheLagunaLakeproject.Thiswillcontributeanadditionalminimumsupplyof50mldtoservetheexpansionareas,asidefromdiversifyingtheriskofhavingasinglewatersource.
NEW BUSINESSTheNewBusinessportfoliowasboostedbytherecentacquisitionofClarkWaterCorporationandThuDucWaterBOOCorporation(TDW).ClarkWaterisanimportantpresenceinabuddingmetropoliswhileThuDucWaterBOOstrengthensManilaWater’spresenceinVietnam.TDWwillprovideaminimumsupplyof300mldtoSAWACO.BothbusinessesarealreadynetincomepositiveandwillcontributetoManilaWater’sbottomlinemoremeaningfullyin2012.
Theoperatingsubsidiaries,LWC,BIWCandCWCcontributedtotalrevenuesofP307million,whilethemanagementcontractinVietnamaddedP169milliontoManilaWater’sconsolidatedrevenues.
Thenewbusinessportfolioaccountedfor2.5%ofManilaWater’sconsolidatedrevenuesand1.2%ofconsolidatednetincome.
11% Non-Revenue Water
US$1B Total Investments since 1997
6.1m Total Population Served
135 mlD Total Wastewater Capacity
BusinessReview 37
‘10‘09‘08
4.2 5.3 9.6
‘07
4.4
‘11 ‘10‘09‘08‘07 ‘11
9.2 19.6%24.0% 15.8% 11.0% 11.2%M
ANILA
WAT
ER C
APEX
(in
bill
ion
peso
s)
Non-
Reve
nue W
ater

IntegratedMicro-ElectronicsregisteredconsolidatedsalesrevenuesofUS$575.5millionin2011,40%higherthantheUS$412.3millionin2010.Theabove-industryaveragerevenuegrowthwasdue
toincreasedturnkeybusinessesinChina,thestronggrowthintheautomotiveandindustrialsegments,andadditionalrevenuesfromitsrecentacquisitions.
OperationsinChinaandSingaporepostedcombinedrevenuesofUS$279.7million,a12%growthversustheprioryearduemainlytonewturnkeyprogramsformajorcustomers.Philippineoperationsgenerated8%growthinrevenuestoUS$154.2milliondrivenbyprogramsintheautomotiveandindustrialsectors.NewacquisitionsPSiTechnologiesandthenewIMIentitiesinEasternEuropeandMexicocontributedacombinedUS$140.2million.Towardsyear-end,IMI’sassemblyoperationsforthestoragedevicemanufacturersalsoincreasedasharddiskdrivemanufacturersaffectedbythefloodsinThailandtransferredproductiontothePhilippines.
Highermaterialanddirectlaborcosts,however,negativelyimpactedmargins.Thisresultedina31%dropinconsolidatednetincometoUS$3.3million.Thisalsoincludedaone-timenon-cashgainrealizedfromIMI’sacquisitionoftheEPIQsubsidiaries.
Overall,IMImaintainedfinancialstability,endingtheyearwithcashofUS$54.1million.Currentratioanddebt-to-equityratiowere1.5:1and0.42:1,respectively.
Electronics
CONSOLIDATEDFINANCIALHIGHLIGHTS(inmillionU.S.dollarsexceptpershareamountsandratios)
2011 2010Total assets 445 339 Stockholders' equity 190 169 Revenues 575 412 Net income attributable to equity holders 3 5 Per Share
Earnings 0.001 0.002Book Value 0.10 0.10
RatiosCurrent ratio 1.51 1.23Debt-to-equity ratio 0.42 0.33Return on equity 1.8% 2.8%
Top ShareholdersAyala Corporation 66.9% 67.8%Resins, Inc. 16.81% 16.81%
“Futuregrowthwillbedrivenbyourbroaderglobalpresence,expandedtechnicalcapabilitiesandrenewedfocusonhighvalueproducts.”
AnnualReport201138
Renewable energy global footprint
IMIwillventureintomassproductionofsolarpanelsin2012.
Recentacquisitionsleadtoadiversityinmarketsandoperationsandanincreaseinprograms.

GLOBAL EXPANSIONTheacquisitionoftheEPIQsubsidiariesinBulgaria,theCzechRepublic,andMexico,markstheculminationofIMI’slong-termplanin2003toexpandIMI’sglobalfootprintandthusbringitsservicestovariousoriginalequipmentmanufacturing(OEMs)acrosstheglobe.
FollowingtheacquisitionoftheEMSassetsofSaturnElectronicsandEngineeringInc.andSpeedy-TechElectronicsLtd.in2005,IMIfoundedIMIEnergySolutionsandacquiredpowersemiconductorcompanyPSiTechnologiesInc.in2010.ItalsoestablisheditssixthmanufacturingfacilityinChina.TheacquisitionofEPIQfacilitiesin2011strengthensIMI’scapabilitiesintheautomotiveandindustrialequipment.
IMI’sinternationalpresencediversifiesitsmarketsinmultiplesegmentsoftheelectronicsindustryaroundtheworld.Thismitigatestheimpactofanymarketdownturnandminimizesdependenceonanysinglecustomer,market,orsite.IMInowoperatesin17manufacturingsiteswithacombinedareaof241,295squaremetersinvariouslocationsinthePhilippines,China,Singapore,theUnitedStates,Mexico,Bulgaria,andtheCzechRepublic.Totalmanpowercountbyyear-endwas15,372.
BUSINESS IN RENEWABLE ENERGyIMIispursuingopportunitiesintherenewableenergymarket.FollowingitspartnershipwithRETC(RenewableEnergyTestCenter),aCalifornia-basedengineeringservices,test,andcertificationproviderforphotovoltaics
(PV)andrenewableenergyproducts,IMIestablishedIMIEnergySolutionstodevelopandmanufacturesolarpanelsandotherrelatedtechnologies.In2011,IMIEnergySolutionsprovidedsolarpanelco-development,prototyping,andlow-volumeproductiontoNorthAmericancompanieswithvariedtechnologies.By2012,IMIwillventureintomassproductionofsolarpanels.Complementarytothis,IMI’sDesignandDevelopmentGroupinSingaporewhichhasmorethan20yearsofexperienceinpowerelectronicsalsodevelopedasolarinverterplatform,acriticalcomponentinaphotovoltaicsystem.Inthenear-term,IMIwillofferthisproducttoaPVinverterOEMoraPVsystemintegrator.
IMI’sexpandedreachandcapabilitiesanditsgrowingpresenceintheregionandinmoreprofitableandlessvolatilemarketssuchastheautomotiveandindustrialsectorswillbeacompetitiveadvantage.Asiaisexpectedtogrowhealthilywhichwillpushelectronicsandautomotiveconsumptionhigher.IMIwillcontinuetofocusonChina’slargemarketbase.Despiterisingcosts,itwillremainthecenteroflow-costmanufacturing.IMIseespocketsofgrowthoutsideAsiawhereitsglobalfootprintprovidesanidealplatformtocross-sellitsservices.
US$575.5M 40% increase in consolidated sales revenues
17 Manufacturing sites around the world
15,372 total manpower count by year end
241,295sqm combined manufacturing area
BusinessReview 39
15%
18%
19%
4%6%
18%
20%
Multiple marketsMedical
Computing
Industrial
Automotive
Telecom
Consumer13%
13%
24%
50%
Rest of Asia
Japan
North America
EMEA EuropeMiddle EastAfrica
2011
REV
ENUE
S BY
BUSI
NESS
SEGM
ENT
2011
REV
ENUE
S BY
CUST
OMER
NAT
IONA
LITY
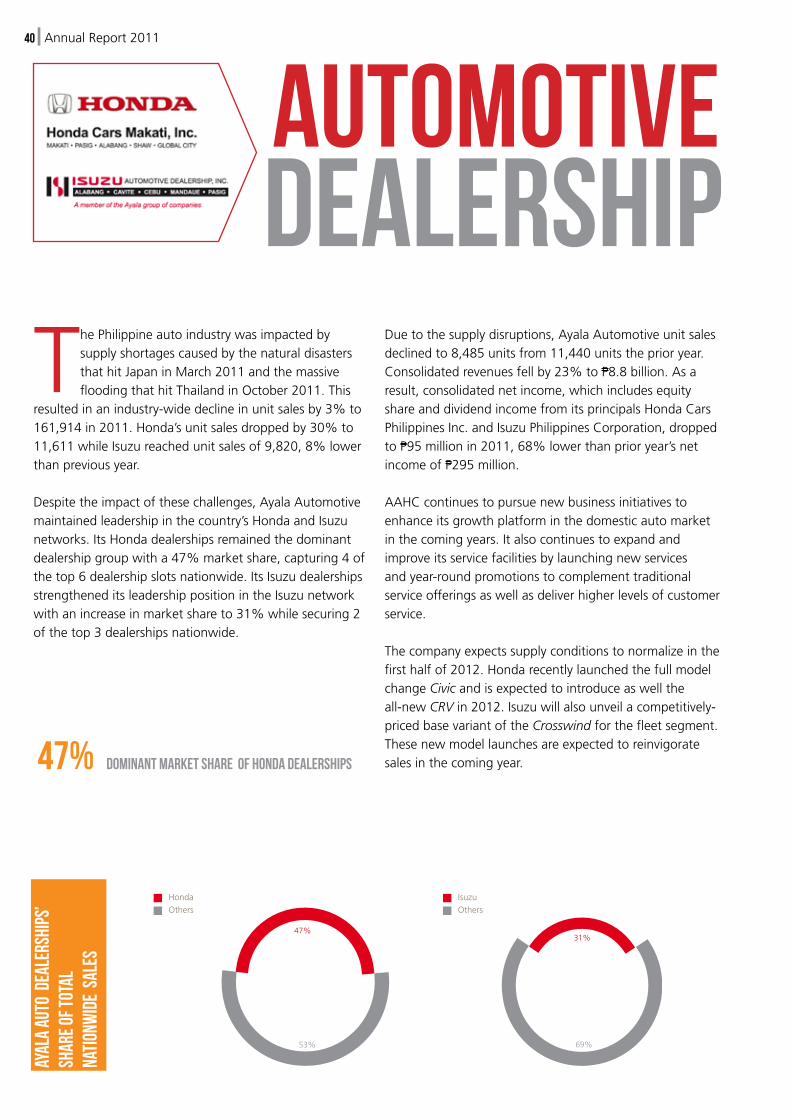
ThePhilippineautoindustrywasimpactedbysupplyshortagescausedbythenaturaldisastersthathitJapaninMarch2011andthemassivefloodingthathitThailandinOctober2011.This
resultedinanindustry-widedeclineinunitsalesby3%to161,914in2011.Honda’sunitsalesdroppedby30%to11,611whileIsuzureachedunitsalesof9,820,8%lowerthanpreviousyear.
Despitetheimpactofthesechallenges,AyalaAutomotivemaintainedleadershipinthecountry’sHondaandIsuzunetworks.ItsHondadealershipsremainedthedominantdealershipgroupwitha47%marketshare,capturing4ofthetop6dealershipslotsnationwide.ItsIsuzudealershipsstrengtheneditsleadershippositionintheIsuzunetworkwithanincreaseinmarketshareto31%whilesecuring2ofthetop3dealershipsnationwide.
Duetothesupplydisruptions,AyalaAutomotiveunitsalesdeclinedto8,485unitsfrom11,440unitstheprioryear.Consolidatedrevenuesfellby23%toP8.8billion.Asaresult,consolidatednetincome,whichincludesequityshareanddividendincomefromitsprincipalsHondaCarsPhilippinesInc.andIsuzuPhilippinesCorporation,droppedtoP95millionin2011,68%lowerthanprioryear’snetincomeofP295million.
AAHCcontinuestopursuenewbusinessinitiativestoenhanceitsgrowthplatforminthedomesticautomarketinthecomingyears.Italsocontinuestoexpandandimproveitsservicefacilitiesbylaunchingnewservicesandyear-roundpromotionstocomplementtraditionalserviceofferingsaswellasdeliverhigherlevelsofcustomerservice.
Thecompanyexpectssupplyconditionstonormalizeinthefirsthalfof2012.HondarecentlylaunchedthefullmodelchangeCivicandisexpectedtointroduceaswelltheall-newCRVin2012.Isuzuwillalsounveilacompetitively-pricedbasevariantoftheCrosswindforthefleetsegment.Thesenewmodellaunchesareexpectedtoreinvigoratesalesinthecomingyear.
automotive
47% dominant market share of honda dealerships
AnnualReport201140
Dealership
AYAL
A AU
TO D
EALE
RSHI
PS’
SHAR
E OF T
OTAL
NA
TION
WID
E SA
LES
HondaOthers
IsuzuOthers
47%
53%
31%
69%

NET ASSET VALUE (USD Mn as of Dec. 31, 2011)
2011
Asia 125.5
U.S. 29.5
Net Other Assets/ (Liabilities) 1.0
TOTAL 156.0
BusinessReview 41
In2011,AGHoldingsbenefittedfromtherationalizationofcostandmanagementoperationsintheU.S.andAsia.
ASIAAGHoldingscontinuestobethelargestinvestorinARCHCapitalAsianPartnership(ARCH),whichcompleteditssecondinvestmentinSingaporeconsistingofaprimeofficespaceinSamsungHubatRafflesPlaceatthecentralbusinessdistrict.
ARCH’sprojectinChengdu,Chinalaunchedthreeoutoffourtowerscomprising504units.Theprojectis88%sold.Inthemeantime,theConcordiaprojectinMacausold99%ofPhase1totaling863unitsand94%ofPhase2’s664units.Phase3whichhas1,056unitsistargetedtolaunchinthefirstquarterof2012.
AGHoldingsreceivedareturnofcapitalfromARCHrepresentingdistributionsfromitssuccessfulprojectsinThailandandMacau.ItcommittedtosupportasecondAsianpropertyfund,ARCHCapital-TRGAsianPartnersLP,whichhasoverUS$300millionincommitments.Thisfundisexpectedtocloseinmid2012.
AGHoldingsexchangeditsownershipinterestsinARCHCapital’smanagementcompanyandgeneralpartnerfor
additionalownershipinterestsinTheRohatynGroup(TRG),anemergingmarkets-focusedprivateinvestmentfirmwithapproximatelyUS$3billioninassetsundermanagement.ThetransactionresultedinasignificantgainforAGHoldings.ItalsomadeanadditionalinvestmentinTRGtobecomeoneofitslargestoutsideinvestors.
NORTH AMERICAResidentialtake-upimprovedslightlyintheU.S.,particularlyinthelower-pricedsegments.Thiswasdrivenbyanimprovinglabormarketandhistoriclowmortgagerates.Inthehigherendsegment,leaseswithoptionstopurchasewereattractiveforthemarket.Weexpectthistocontinuein2012duetothetightcreditenvironmentforresidentialdevelopments.
TherewerealsonoticeableimprovementsintheFontanaandMilpitasretailprojects.Fontanasuccessfullyrenewedandextendeditsloanatacompetitiverate.Stronginterestfrominvestorsresultedinasaleofaparcelofthedevelopment.TheMilpitasprojectalsosecured5-yearfinancingatacompetitiverate.Theprojectendedtheyearwithaleaserateof97%.Improvingretailmarketconditionsarealsoexpectedtocontinuein2012.
US$156MNet Asset Value as of year-end 2011, driven by 28% increase in the investments in Asia including the additional stake in TRG.
US$4.6M
Full year 2011 net income, a turnaround over last year’s $50.0 million loss which included one-time revaluation and restructuring charges.
REAL ESTATEINTERNATIONAL

STREAM 33,587
INTEGREON 2,006
AFFINITY 1,009
HRM/IQB 349
GLOBAL TOTAL 36,951
PHILIPPINE TOTAL 12,321
LiveIt’sshareofrevenueswasUS$318million,up16%versus2010,anditsshareofEBITDAwasUS$25million,up63%,asaresultofgreaterscaleandoperationalefficiencies.Itsnetloss
wasUS$18million,inclusiveofUS$22millioninnon-operatingitemssuchasnon-cashamortizationofacquisition-relatedintangiblesandinterestexpensefromtheleveragedbuyoutofStream.
LiveItexited2011withrecordfourthquartershareofrevenuesofUS$84million,up14%year-on-year,andrecordfourthquartershareofEBITDAofUS$9million,up102%,resultinginfourthquarternetincomeofUS$1million.
In2012,LiveItexpectscontinuedgrowthandmarginimprovementforallofitsinvesteesasaresultoffurtherscaleandoperatingleverage.However,itwillremainvigilantagainstrisksofadoubledipglobalslowdownandaweakeningofthedollar.
OUTSOURCINGBUSINESS PROCESS
“CombinedrevenuesofLiveIt’sfourBPObusinessesincreasedby10%toUS$1billion,andcombinedEBITDAincreasedby39%toUS$92million,duetosignificantlybetterperformanceacrossallinvestees.”
AnnualReport201142
Liveit’s global employee base

STREAM GLOBAL SERVICESStreamisaleadingCustomerRelationshipManagementBPOcompanywithover33,000employeesglobally,ofwhich35%areinthePhilippines.
In2011,Stream’srevenuesgrewby6%toUS$847million,duetogrowthofitsexistingcustomersandnewlogosinwireless,travelande-commerce.Streamendedthefourthquarterof2011withrecordEBITDAofUS$31million,up32%year-on-year,andnetincomeofUS$4million,asaresultofgrowthandcostefficiencyinitiatives.
StreamsignificantlyenhanceditsgeographicofferingbyopeningitsfirstsiteinChina,amarketofgreatinteresttoitsmultinationalclients.
INTEGREONIntegreonisthelargestproviderofintegratedlegal,researchandbusinesssupportsolutionstocorporationsandlawfirms.Itisatrustedpartnerto9ofthetop10globallawfirms,9ofthetop10investmentbanks,and17ofthetop50globalbrands,withover2,000associatesoperatingfrom17officesacrossNorthAmerica,Europe,AsiaandAfrica.
In2011,Integreon’srevenuesgrewby43%toUS$125millionandsignificantlyimproveditsprofitability.ItsnotablesuccessesincludeexpandinganagreementwithMicrosofttoprovidelegalprocessoutsourcing(LPO)services,andsigningthelargestoutsourcingagreementinthehistoryofthelegalprofessionwithCMSCameronMcKenna,aleadinglawfirmintheUnitedKingdom.
AFFINITy EXPRESSAffinityExpressmaintaineditsstatusastheleadingproviderofoutsourceddigitalandprintadvertisingandmarketingproductionformulti-mediapublishers.Ithasaprovenonshore/offshoreproductionmodelwithover1,000employeesandaninnovativecloud-baseddigitalworkflow.
In2011,AffinityExpressgrewitsrevenuesby22%toUS$19millionandexpandedmarginssignificantly.Italsomadesignificantprogressinitshigh-growthinteractive,pre-mediaandeditorialcategoriestargetsegments,withanemphasisonnewdigitalmediaofferingsincludingvideo,iPadad,mobilead,websiteandemailservices.ThecompanywasnamedtotheGlobal Services 100 listofleadingglobaloutsourcingcompaniesforthesecondconsecutiveyear.
HRMALL/IQ BACKOFFICEHRMallgrewrevenuesby183%toUS$7millionin2011,largelyduetotheacquisitionofIQBackOffice,aLosAngeles-basedspecialistproviderofoutsourcedfinanceandaccountingservicestoU.S.companies.HRMall’sHRoutsourcingbusinessgrewby22%toUS$3millionduetotheadditionofnewclients.EBITDAmarginsimprovedtothehighteensasaresultofthecombination.
Thecombinedcompaniesarenowabletoprovideacompletesuiteoflow-cost,best-in-classHR,financeandaccountingservicestotheunderservedmid-sizedenterprisesectorintheU.S.andAsia,withover300employeesacrosssitesinManila,ChennaiandLosAngeles.Clientsnowincludeover30U.S.companiesinthemanufacturing,restaurant,hotelandpropertymanagementsectorsandseveralAyalagroupcompanies.
Com
bine
d Re
venu
es (I
n M
illio
ns U
S$)
BusinessReview 43
‘10‘09‘08
29 41 66
‘11‘10‘09‘08 ‘11
91346 492 905 998
Com
bine
d EB
ITDA
(In
Mill
ions
US$
)
37,000 Employees US$318M share of revenues, up 16%
50+ Sites in 23 countries us$ 25M share of ebitda, up 63%
up 1
0%
up 3
8%
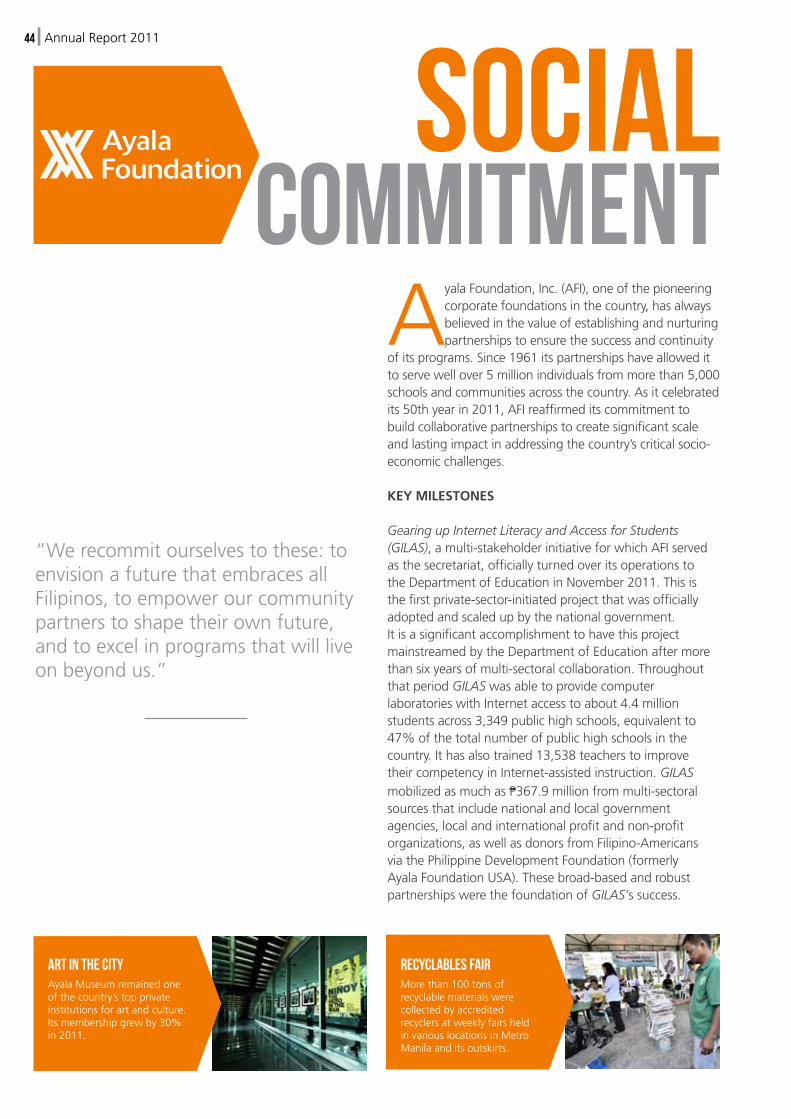
AyalaFoundation,Inc.(AFI),oneofthepioneeringcorporatefoundationsinthecountry,hasalwaysbelievedinthevalueofestablishingandnurturingpartnershipstoensurethesuccessandcontinuity
ofitsprograms.Since1961itspartnershipshaveallowedittoservewellover5millionindividualsfrommorethan5,000schoolsandcommunitiesacrossthecountry.Asitcelebratedits50thyearin2011,AFIreaffirmeditscommitmenttobuildcollaborativepartnershipstocreatesignificantscaleandlastingimpactinaddressingthecountry’scriticalsocio-economicchallenges.
KEy MILESTONES
Gearing up Internet Literacy and Access for Students (GILAS),amulti-stakeholderinitiativeforwhichAFIservedasthesecretariat,officiallyturnedoveritsoperationstotheDepartmentofEducationinNovember2011.Thisisthefirstprivate-sector-initiatedprojectthatwasofficiallyadoptedandscaledupbythenationalgovernment.ItisasignificantaccomplishmenttohavethisprojectmainstreamedbytheDepartmentofEducationaftermorethansixyearsofmulti-sectoralcollaboration.ThroughoutthatperiodGILASwasabletoprovidecomputerlaboratorieswithInternetaccesstoabout4.4millionstudentsacross3,349publichighschools,equivalentto47%ofthetotalnumberofpublichighschoolsinthecountry.Ithasalsotrained13,538teacherstoimprovetheircompetencyinInternet-assistedinstruction.GILASmobilizedasmuchasP367.9millionfrommulti-sectoralsourcesthatincludenationalandlocalgovernmentagencies,localandinternationalprofitandnon-profitorganizations,aswellasdonorsfromFilipino-AmericansviathePhilippineDevelopmentFoundation(formerlyAyalaFoundationUSA).Thesebroad-basedandrobustpartnershipswerethefoundationofGILAS’ssuccess.
commitmentSocial
ART IN THE CITY RECYCLABLES FAIRAyalaMuseumremainedoneofthecountry’stopprivateinstitutionsforartandculture.Itsmembershipgrewby30%in2011.
Morethan100tonsofrecyclablematerialswerecollectedbyaccreditedrecyclersatweeklyfairsheldinvariouslocationsinMetroManilaanditsoutskirts.
“Werecommitourselvestothese:toenvisionafuturethatembracesallFilipinos,toempowerourcommunitypartnerstoshapetheirownfuture,andtoexcelinprogramsthatwillliveonbeyondus.”
AnnualReport201144

In2011,AFIinitiatednewprojectsandengagednewpartnershipstoexpanditsreach.
InMarch2011,AFIlaunchedEnabling Education Communities (EEC).EECbringstogetherkeystakeholdersinacommunitytoassesstheirvariouseducationalchallengeswiththegoalofdevelopingavisionandcourseofactionfortheireducationsector.Theprojectwasbroughttofivesites—TiwiandLigaoCityinAlbay;MalaybalayCity,Bukidnon;Camiguin;andSibalom,Antique.AFIpartneredwithAgenciaEspañoladeCooperaciónInternacionalparaelDesarrollo(AECID)andtheAustralianAgencyforInternationalDevelopmentaswellaswiththelocalgovernmentunitsintheseareasandothermembersofthecommunity.
AFI’sflagshipyouthdevelopmentprogram,theAyala Young Leaders Congress (AYLC),continuedtoexpandin2011throughLeadership Communities (LeadCom).LeadComisapartnershipinitiatedbyAFIandtherestoftheAyalagroupwithvariouscollegesanduniversitiesindifferentpartsofthecountrytoestablishtheirownlocalleadershipcongressandbuildanetworkforcommunity-basedyoungservantleaders.PriortoitslaunchinNovember,LeadComwaspilotedinCatanduanesandOrientalMindoro.Itwillbeexpandedto12newsitesinthecountryin2012.
AFImarkedanothermilestonewiththesigningofacontractwiththeUnitedStatesAgencyforInternationalDevelopment(USAID)fortheimplementationoftheproject,“Strengthening the Capacity of Civil Society Organizations in the Philippines.”Theprojectseekstobuildthecapacitiesof120selectedcivilsocietyorganizationssotheycanbetterservetheirtargetcommunitiesthroughsustainablesolutions,improvedaccountability,andbettermanagementofdonorresources.TheprojectwillbeimplementedbyAFI
anditsconsortiumpartnersoverathree-yearperiod.AmongitspartnersaretheAssociationofFoundations,CaucusofDevelopmentNGOs(CODE-NGO),NationalCollegeofPublicAdministrationandGovernance(NCPAG),PhilippineBusinessforSocialProgress(PBSP),andthePhilippineCouncilforNGOCertification(PCNC).
In2011,AFIalsobecametheprojectleadforThe Entire Nation Moves! (TEN Moves).Thisisamulti-sectorinitiativethataimstobuild10,000publicschoolclassroomsindifferentpartsofthecountry.Theprojectestimatesthatifatleast2millionFilipinosdonateP10overaperiodof10months,itwouldbeabletoraiseatotalofP6billionfortheconstructionoftheclassrooms.TEN Movesisaprojectofthe57-75Movement,ledbytheLeagueofCorporateFoundationsandPhilippineBusinessforSocialProgress,ofwhichAFIisamember.
EXPANDING REACH
Manyofthefoundation’son-goingprojectsalsocontinuedtoexpand.
EDUCATIONText2Teach,aprogramthatusesmobiletechnologytodelivereducationalmaterialsforpublicelementaryschools,completeditsthirdphase.AsofDecember2011,itreached337outofits350targetschools,servingover54,000studentsandover1,500teachers.ItsignedanagreementwithNokia,theDepartmentofEducation,GlobeTelecomandSEAMEO-INNOTECHtostartthefourthphasewhichwillstepuptheprogrambyreviewingandupdatingitsexistingmaterials,upgradingoldtechnology,andreachingoutto850newschools.
BusinessReview 45
Lupta il inulpa platius aut
Integerliberomagna,pulvinarutultriciesa,ultriciesatmauris.Maecenassedeuismodest.Inelementumduiatligulasemper
Lupta il inulpa platius aut
Integerliberomagna,pulvinarutultriciesa,ultriciesatmauris.Maecenassedeuismodest.Inelementumduiatligulasemper
NURTURING DREAMS MAINSTREAMING GILASCENTEXManilaobtainedoneofthehighestaveragescoresintheDepartmentofEducation’sNationalAchievementTest.
TheGILASinitiativewasformallyturnedovertotheDepartmentofEducationafterprovidingInternetaccesstonearlyhalfofthecountry’spublichighschools.

OurLibrary,aprojectundertheFilipinasHeritageLibrary(FHL),alsoworkedwithvariouspartnerstodevelopcommunitylibrariesalloverthecountryandpromoteacultureofreading.Theprojectcompletedthreelibraries—apublichighschoollibraryatSapangBatoNationalHighSchoolandamusiclibraryandrecordingstudioatHolyAngelUniversity,bothlocatedinAngeles,Pampanga.ThesewerecompletedthroughapartnershipofinternationalrecordingartistApl.de.ApoftheBlack Eyed Peas,theFHLandthePhilippineDevelopmentFoundation.ThethirdlibrarywasagradeschoolandcommunitylibraryattheCenter of Excellence in Public Elementary EducationinTondo,ManilawhichwasmadepossiblebytheofficersandmembersoftheAyalaMulti-PurposeCooperative.
FHLisnowonits15thyearandhasincreasedeffortstoreachouttoabroaderaudiencethroughtheInternet.Apartofthelibrary’scollectionofrarebooksandothermaterialsarenowonline(onlinelibrary.filipinaslibrary.org.ph).ItalsoestablishedtheFHLOnlineEnglish–FilipinoDictionary.FHLalsoorganizedeventspromotingreadingandliterature,suchastheFirst Libros Festival,whichfeaturedbooksales,storytellingsessions,andlectures;andtheSecondManilaInternationalLiteraryFestival,co-organizedwiththeNationalBookDevelopmentBoard,whichfeaturedtalksbysomeoftheworld’smostrespectedpublishers,editors,literaryagents,andwriters,includingPulitzerwinnersJunotDiazandEdwardP.Jones.
Center of Excellence in Public Elementary Education (CENTEX)continuedtoprovidequalityeducationtoitsstudentsinitsManilaandBatangasschools.Itcontinuedtoimplementprogramsthatnurturedstudents’academiccapabilitiesandtalentinmusic,dance,andsports,withthesupportofJPMorganChase&Co.andStepsDanceStudio.Inaddition,CENTEXteachersreceivedtrainingaswellasscholarshipgrantstoenhanceteachingskills.CENTEX continuedtoprovidescholarshipsforitsstudentsandalumni.Withthehelpofdonorsfromdifferentsectors,CENTEX isabletokeepbrightstudentsfrompoorfamiliesinschool,providingthemopportunitiestocontinuetohighschoolandcollegeeducation.
Forschoolyear2010-2011CENTEXManilahadatotalof508students,66ofwhomgraduatedfromGrade6,whileCENTEXBatangashad470students,70ofwhomgraduatedfromgradeschool.CENTEXManilaregisteredoneofthe
highestaveragescoresintheNationalAchievementTests(NAT)administeredbytheDepartmentofEducation.Forschoolyears2009-2010and2010-2011,CENTEXManilastudentshadameanpercentagescoreof77.35intheNAT—thehighestintheDivisionofManilaoftheDepEd.
TheAyalaMuseumremainedoneofthecountry’stopprivateinstitutionsforartandculture.Itsvariousexhibitionsandprogramsattractedatotalof78,671visitorsin2011,whilemuseummembershipgrewby30%.Asidefromitspermanentexhibitions,themuseumalsohostedanumberofshows,includingaphotoexhibitbyphotojournalistKimKomenich,featuringphotosfromtheEDSARevolutionin1986;retrospectivesfeaturingAraceliLimcaco-DansandJoseJoya;anexhibitionofnewworksbyJaimeZobeldeAyalaandIganD’Bayan;El Guernica: Deconstrucción,featuringworksinspiredbyPicasso’sGuernica;Manga Realities,featuringtheartofJapanesemanga;andAng INK: 20 Taon,acelebrationoftheworksofthegroup,Ang Ilustrador ng Kabataan.Themuseum’seducationalprograms—includingthelectureseries,History Comes Alive!andDesignTalkswerealsowellattended.
Complementingthemuseum’shighlypopularGold of Ancestorsexhibition,themuseumlaunchedPhilippine Ancestral GoldinMarch,ascholarlypublicationandcompanioncatalogforthisexhibit.ThebookshedslightonPhilippinelifeandculturebeforetheSpanishColonialperiod,depictingawidecollectionof1,000-oddpre-colonialgoldartifactsandcraftsthatscholarssayevokearenewedunderstandingofPhilippinehistory.AftertheofficiallaunchinManila,PhilippineAncestralGoldwaslaunchedinNewYorkandsubsequentlyinSingapore.ThebookwaseditedbyformerAyalaMuseumdirector(andGold of Ancestorscurator)FlorinaCapistrano-Bakerandco-writtenbyJohnMiksicandJohnGuy,curatorofSouthandSoutheastAsianArtattheMetropolitanMuseumofArtinNewYorkCity.ThebookalsofeaturesimagesbyphotographerNealOshima.
ENVIRONMENTTheSolid Waste Management(SWM)programcontinuedtogrowin2011with262buildings,representingroughly70%ofallthebuildingsintheMakatiCentralBusinessDistrict,nowimplementingtheprogram.Asmuchas1,852tonsofrecyclableswasrecoveredfromthesebuildings,4%in2010withanestimatedvalueofP16.46million.Thiswas22%
TEXT2TEACH LITERARY FEASTProjectpartnersagreedtoupgradeeducationalmaterialsandtechnologyandreachouttomoreschoolsinthefourthphaseofthisuniqueprogramenabledbymobiletechnology.
FilipinasHeritageLibraryco-organizedtheSecondManilaInternationalLiteraryFestivalwhosespeakersincludedPulitzerPrizewinnersEdwardJonesandJunotDiaz.
AnnualReport201146

higherinvaluethan2010’sP12.84million.ThisprogramwascomplementedbytheregularRecyclables Fair (RF).In2011,atotalof88RFswereheldinvariouslocationswhichcollectedatotalof131.21tonsofrecyclablesworthP1.42million.
ENTREPRENEURSHIPTheAyala Technology Business Incubator (Ayala TBI) continuedtoprovidemuch-neededtechnicalassistancetothecountry’snewbreedoftechno-entrepreneurs.Asidefromhostingstart-upsinthefieldsofbusinessprocessoutsourcing,e-learning,andsoftwaredevelopment,Ayala TBIalsoencouragedstart-upsfocusedondevelopingsolutionstosocialproblems.Telehealth,ortheuseoftelecommunicationsservicesinhealth-caredelivery,becameaproductivejump-offpointforitsseriesofregularforumsandtrainingprograms—Kape + Teknolohiya,Innovation Forum,andTechBootCamp.
AFIalsoenhanceditseducational,health,livelihood,andhousingprogramsfortheIrayaMangyansofPuertoGalera,OrientalMindoro.SeveralIraya-Mangyanfamilieshadtheopportunitytomoveintotheirnewhomes,theconstructionofwhichwasfacilitatedbythefoundation.Inadditiontoregularscholarships,daycareservices,andfeedingprograms,AFIalsostartedimplementingabasicliteracyprogram,analternativelearningsystemforthebenefitof65IrayaMangyansinitially.Inaddition,60IrayaMangyanadultsbenefitedfromskillstraininginbasicmasonry,soapmaking,anddressmaking.
Ayearafterbeingturnedovertotheprogram’snaturalstakeholders(theFilipino-Americancommunity),thePhilippineDevelopmentFoundation(PhilDev)continueditseffortsinbuilding“anecosystemofscienceandtechnology–basedentrepreneurshipandinnovationforsocialandeconomicdevelopmentinthePhilippines.”OneofitsfirstinitiativestoachievethisgoalwastheestablishmentofaSuperfund for Science and Engineering Scholarship.PhilDevalsohostedtwoseparateforumsinManilaandinNewYorktodiscusstheimportanceofinnovationandcompetitivenessforFilipinostosucceedintheglobalmarket.
BusinessReview 47
Dearpartnersandstakeholders,AyalaFoundation’smissionofcontributingtotheeradicationofpovertyinallitsformsisthebedrockuponwhichallitsprogramsandactivitiesstand.Inthepast50years,thismissionhasinspiredthefoundationtointroduceandsustaininnovativeprogramsthathavebecomebestpracticesinthefieldsofcorporatesocialresponsibilityandsocialdevelopment.Inthepast20yearsalone,underthechairmanshipofJaimeZobeldeAyalaandthepresidencyofVictoriaGarchitorena,AFIexperiencedunprecedentedgrowth:itsoperationsexpanded,itspartnershipsmultiplied,anditsprojectsachievedgreaterreachandimpact.IjoinAFIasitspresidentwiththeknowledgethatithasasolidhistoryofserviceandinnovation,butalsowiththeknowledgethatthereisstillmuchthatitcandoforthecountry.WhileAFI’spastsuccessesaretrulyworthcelebrating,theyalsopresentuswithnewopportunitiestogrowandevolve.Guidedbyourvisionforourcountry,weshallcontinuetodevelopandimplementstrategic,scalable,andsustainableprojects,andwearehopingthatyou,ourpartners,donors,andfriends,willcontinuetosupportus.AsAFIentersits51styear,Iamcountingonyourcontinuedenthusiasmforourprograms.Theclimbtowardfreeingourcountryfromvariousformsofpovertyissteepandchallenging,butIamhopefulthatifwestrengthenourpartnershipsandcontinuetoworkcloselytogether,wewillbeabletoachievethisvision.
MariaLourdesHeras-deLeonPresidentAyalaFoundation,Inc.
DIFFERENT STROKES A CULTURE OF READINGAsidefrompermanentexhibitionsandeducationallectures,AyalaMuseumhostednotableartshowssuchasIlustradorngKabataaan’s20thanniversarycollection.
OurLibrarycompletedthreecommunitylibrarieswithvariouspartnerstofosteracultureofreadingamongtheyouth.
Moving Forward

CORPORATEGOVERNANCE
CorporateGovernance48
Ayalaremainsattheforefrontofgoodcorporategovernance.Thisisattestedbytherecognitionsgivenbyvariousreputableinstitutions.In2011,AyalawascitedasBest in Corporate Governance
byFinanceAsiaandAsiaMoneyintheirregionalpolls.Corporate Governance AsiaalsonamedAyalaasamongtheBest in Asiaforitsadherencetogoodcorporategovernance.Likewise,afterhavingbeenaaGoldawardeesince2005,AyalareceivedtheprestigiousPlatinumawardfromtheInstituteofCorporateDirectors(ICD),oneofahandfulofcompaniestobesohonoredsinceICDstarteditsAnnualCorporateGovernanceScorecardforPublicly-ListedCompanies.Thesecitationssealourcommitmenttokeepthetrustofourstakeholders.
BOARD STRUCTURE AND PROCESS
Key Role and ResponsibilitiesTheBoardrepresentsthecompanyandtheshareholdersandisaccountabletothemforcreatinganddeliveringvalue,aswellasprotectingtheirbestintereststhrougheffectiveandgoodgovernance.
TheBoardestablishesthevision,strategicobjectives,keypolicies,andproceduresofthecompany,aswellasthemechanismtoproperlymonitorandevaluatemanagementperformance.TheBoardalsoensuresthatinternalcontrolmechanismsforgoodgovernanceareadequate.
CompositionTheBoardiscomposedofsevendirectorselectedannuallybythestockholders.
TheBoardrepresentsadiversityofexperience,background,andknowledgedisciplinesintheareaofbusiness,finance,andlegalcompetencies,witheachdirectoraddingvalueandexercisingindependentjudgment.Decision-makingattheBoardleveladherestoaprocessthatfosterstheindependenceandintegrityofjudgmentofeachdirector.TheBoardstructureprovidesacleardivisionofresponsibilitiesbetweentheBoardandManagement.
Noneoftheindependentdirectorsownstwoormorepercentoftheoutstandingcapitalstock.ThenameandprofileofeachdirectorarefoundintheBoardofDirectorssectionofthisannualreportonpages56and57.Allthedirectorshaveattendedtrainingoncorporategovernance.
Independent DirectorsAyalacomplieswiththerulesoftheSecuritiesandExchangeCommission(SEC)onthequalifications,
“CorporateGovernancehasbecomeahighlycomplextask.Itrequirescontinuousreview,monitoring,andcoordinationamongkeystakeholders.Governancestartswiththeboardofdirectorsandmanagementexecutives,andcontinuesontothecorporation’sinternalandexternalauditors,institutionalinvestors,andregulatorybodies.Combined,theycompriseanecosystemwhereeachcomponentisaccountabletoanotherandeachmustperformwithequaldiligence,vigilance,andrigor.”
-FernandoZobeldeAyalaKeynoteSpeechattheInstituteofCorporateDirectors’6thAnnualDinner
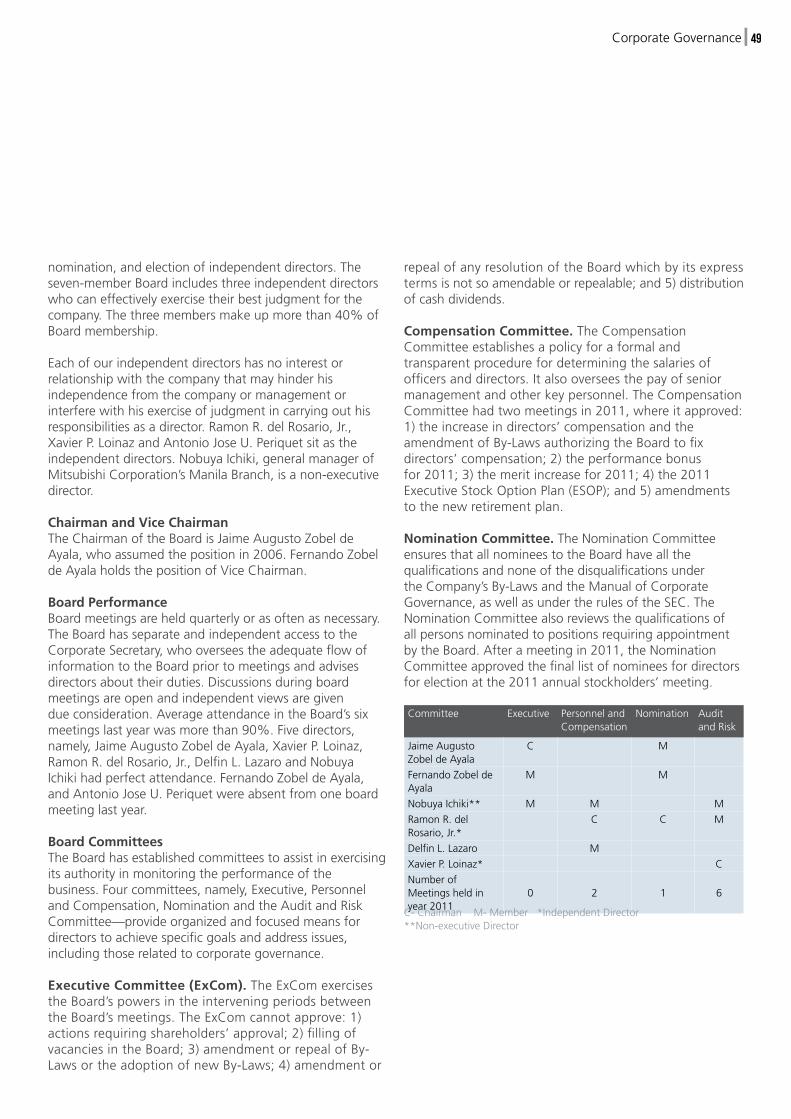
CorporateGovernance 49
nomination,andelectionofindependentdirectors.Theseven-memberBoardincludesthreeindependentdirectorswhocaneffectivelyexercisetheirbestjudgmentforthecompany.Thethreemembersmakeupmorethan40%ofBoardmembership.
Eachofourindependentdirectorshasnointerestorrelationshipwiththecompanythatmayhinderhisindependencefromthecompanyormanagementorinterferewithhisexerciseofjudgmentincarryingouthisresponsibilitiesasadirector.RamonR.delRosario,Jr.,XavierP.LoinazandAntonioJoseU.Periquetsitastheindependentdirectors.NobuyaIchiki,generalmanagerofMitsubishiCorporation’sManilaBranch,isanon-executivedirector.
Chairman and Vice ChairmanTheChairmanoftheBoardisJaimeAugustoZobeldeAyala,whoassumedthepositionin2006.FernandoZobeldeAyalaholdsthepositionofViceChairman.
Board PerformanceBoardmeetingsareheldquarterlyorasoftenasnecessary.TheBoardhasseparateandindependentaccesstotheCorporateSecretary,whooverseestheadequateflowofinformationtotheBoardpriortomeetingsandadvisesdirectorsabouttheirduties.Discussionsduringboardmeetingsareopenandindependentviewsaregivendueconsideration.AverageattendanceintheBoard’ssixmeetingslastyearwasmorethan90%.Fivedirectors,namely,JaimeAugustoZobeldeAyala,XavierP.Loinaz,RamonR.delRosario,Jr.,DelfinL.LazaroandNobuyaIchikihadperfectattendance.FernandoZobeldeAyala,andAntonioJoseU.Periquetwereabsentfromoneboardmeetinglastyear.
Board CommitteesTheBoardhasestablishedcommitteestoassistinexercisingitsauthorityinmonitoringtheperformanceofthebusiness.Fourcommittees,namely,Executive,PersonnelandCompensation,NominationandtheAuditandRiskCommittee—provideorganizedandfocusedmeansfordirectorstoachievespecificgoalsandaddressissues,includingthoserelatedtocorporategovernance.
Executive Committee (ExCom).TheExComexercisestheBoard’spowersintheinterveningperiodsbetweentheBoard’smeetings.TheExComcannotapprove:1)actionsrequiringshareholders’approval;2)fillingofvacanciesintheBoard;3)amendmentorrepealofBy-LawsortheadoptionofnewBy-Laws;4)amendmentor
repealofanyresolutionoftheBoardwhichbyitsexpresstermsisnotsoamendableorrepealable;and5)distributionofcashdividends.
Compensation Committee. TheCompensationCommitteeestablishesapolicyforaformalandtransparentprocedurefordeterminingthesalariesofofficersanddirectors.Italsooverseesthepayofseniormanagementandotherkeypersonnel.TheCompensationCommitteehadtwomeetingsin2011,whereitapproved:1)theincreaseindirectors’compensationandtheamendmentofBy-LawsauthorizingtheBoardtofixdirectors’compensation;2)theperformancebonusfor2011;3)themeritincreasefor2011;4)the2011ExecutiveStockOptionPlan(ESOP);and5)amendmentstothenewretirementplan.
Nomination Committee.TheNominationCommitteeensuresthatallnomineestotheBoardhaveallthequalificationsandnoneofthedisqualificationsundertheCompany’sBy-LawsandtheManualofCorporateGovernance,aswellasundertherulesoftheSEC.TheNominationCommitteealsoreviewsthequalificationsofallpersonsnominatedtopositionsrequiringappointmentbytheBoard.Afterameetingin2011,theNominationCommitteeapprovedthefinallistofnomineesfordirectorsforelectionatthe2011annualstockholders’meeting.Committee Executive Personneland
CompensationNomination Audit
andRisk
JaimeAugustoZobeldeAyala
C M
FernandoZobeldeAyala
M M
NobuyaIchiki** M M M
RamonR.delRosario,Jr.*
C C M
DelfinL.Lazaro M
XavierP.Loinaz* C
NumberofMeetingsheldinyear2011
0 2 1 6
C-ChairmanM-Member*IndependentDirector**Non-executiveDirector

CorporateGovernance50
Audit and Risk Committee. TheAuditandRiskCommitteeoverseestheinternalcontrol,financialreportingandriskmanagementprocessesofthecompany.TheCommitteeheldsixmeetingsin2011whereitreviewedandapprovedthe2011consolidatedauditedfinancialstatementsofAyalaasauditedbytheexternalauditors,SycipGorresVelayo&Co.(SGV),theunauditedfinancialstatementsofthecompanyforJanuarytoSeptember2011andthe2012InternalAuditPlan.TheCommitteelikewiserecommendedtheappointmentofSGVasthecompany’sexternalauditorfor2011andtheapprovaloftheproposedfeeofSGV.TheactivitiesoftheAuditandRiskCommitteearefurtherdiscussedintheAccountabilityandAuditsectiononpage53andtheReportoftheAuditandRiskCommitteetotheBoardofDirectorsonpage66.
Director and Senior Executive Compensation
Non-executivedirectorsareBoardmemberswhoarenotofficersorconsultantsofthecompanyandwhoreceiveremunerationconsistingof:1)aretainerfeeofP1,200,000;2)perdiemofP200,000foreachboardmeetingattended;3)perdiemofP100,000perAuditandRiskCommitteemeetingattended;and4)P50,000perdiemforothercommitteemeetingsattended.Theremunerationofnon-executivedirectorswasratifiedduringtheannualstockholders’meetingin2011.Noneofthenon-executivedirectorshasbeencontractedandcompensatedbyAyalaforservicesotherthanservicesprovidedasadirector.
Ayalaadoptsaperformance-basedcompensationschemeforitsseniorexecutives.AsadditionalincentivetoManagement,theBoardapprovedstockoptionplansforofficerscovering3%ofthecompany’sauthorizedcapitalstock.Thegranteeisselectedbasedonperformanceoverathree-yearperiod.
Thetotalcompensationpaidtonon-executivedirectorsandofficersisdisclosedyearlyintheDefinitiveInformationStatementsenttoshareholdersatleast15businessdaysbeforetheannualstockholders’meeting.Thetotalannualcompensationincludesbasicsalary,guaranteedbonus,andvariablepay(i.e.,performance-basedbonusandgainsfromexerciseofstockoptions).
MANAGEMENTManagementisaccountabletotheBoardofDirectorsfortheoperationsofthecompany.Itputsthecompany’stargetsinconcretetermsandformulatesthebasicstrategiesforachievingthetargets.JaimeAugustoZobeldeAyalaisthechiefexecutiveofficer(CEO)andconcurrentlyservesaschairmanoftheboard,whileFernandoZobeldeAyalaisthepresidentandchiefoperatingofficer(COO).
CorporateGovernance 51
TherespectiverolesoftheCEOandthePresident/COOarecomplementaryandensureastrategicdistributionofleadershiproleswithdefinedaccountability.TheCEOtakestheleadoncompanystrategy,visioning,anddevelopingbusinesspartnershipsinclosecoordinationwiththePresident/COOwhoisprimarilyresponsiblefortheday-to-dayoperations,newbusinessinitiatives,corporatepolicyandresourceallocation.Inallfunctionsandcriticalissues,bothcoordinatecloselywitheachother.TheChairman/CEOandPresident/COOaresupportedbyamanagementcommitteecomposedofkeyexecutiveswhomeettwiceamonthtodiscussbusinessperformanceandotherissuescriticaltothegrowthofthecompany.Thisoperatingstructurewithpermeableboundariesspeedstheflowofstrategicandoperationalinformationamongexecutivedecisionmakers.
Acultureofgoodgovernanceisfosteredthroughouttheorganization,withManagementandBoardequallyresponsibleinensuringthatthemechanismsandstructureforgoodgovernanceareinplace.
TheChairman/CEO,President/COO,andmembersofthemanagementcommitteeattendtheannualstockholders’meetings.
Enterprise Risk Management
Inlinewithitscorporategovernanceinfrastructure,Ayalaadoptedagroup-wideenterpriseriskmanagementframeworkin2002.TheAuditandRiskCommitteeapprovedtheEnterpriseRiskManagementPolicyin2003andregularlyreviewsandupdatesit.Thepolicyenhancestheriskmanagementprocessandinstitutionalizesafocusedanddisciplinedapproachtomanagingthecompany’sbusinessrisks.Theriskmanagementpolicywasupdatedin2008followingtheframeworkandstandardsrecommendedbytheCommitteeofSponsoringOrganization.
Theriskmanagementframeworkcoversthefollowing:• Identificationandassessmentofbusinessrisks;• Developmentofriskmanagementstrategies;• Assessment,design,andimplementationofrisk
managementcapabilities;• Monitoringandevaluationofriskmitigationstrategies
andmanagementperformance;and• Identificationofareasandopportunitiesfor
improvementintheriskmanagementprocess.
TheAuditandRiskCommitteeprovidesoversightoftheriskmanagementfunction.
In2008,amorefocusedenterpriseriskmanagementframeworkwasrolledoutwiththehelpofanexternal
consultant.Thisincludedaformalrisk-awarenesssessionandself-assessmentworkshopswiththefunctionalunitsofthecompany.TheAuditandRiskCommitteehasinitiatedeffortstoinstitutionalizeanenterpriseriskmanagementfunctionacrossallthesubsidiariesandaffiliates.
InMay2010,theChiefFinanceOfficerwasappointedastheChiefRiskOfficer(CRO)inconcurrentcapacity.TheCROoverseestheriskmanagementfunctionandprovidesperiodicreportsonriskmanagementinitiativesandmitigationeffortstotheAuditandRiskCommittee.
Atpresent,thepolicy,proceduresandprocessesareunderstudyforfurtherenhancementandareviewoftheassessmentdonein2008beganin2011.TheworkisinprogressandthecompanyshallcontinuetoengageexternaltechnicalsupportasitdeemsnecessarytostrengthenitsEnterpriseRiskManagementexpertiseandcapabilities.
Ayala’sinternalauditorsmonitorthecompliancewithriskmanagementpoliciestoensurethataneffectivecontrolenvironmentexistswithintheentireAyalagroup.
ACCOUNTABILITy AND AUDITTheAuditandRiskCommitteeoverseestheperformanceofexternalandinternalauditors.TherolesandresponsibilitiesoftheCommitteeareoutlinedintheexpandedAuditandRiskCommitteeCharteronthecompany’swebsite.TheinternalauditfunctionisgovernedbyaseparateInternalAuditCharter.
Independent Public Accountants
TheexternalauditorofthecompanyisSGV&Co.,amemberofErnstandYoung.LucyL.Chanhasbeenthepartner-in-chargesince2007.
TheAuditandRiskCommitteereviewsAyala’sfinancialreportingtoensureitsintegrityandoverseestheworkoftheexternalauditor.
TheCommitteerecommendstotheBoardandstockholderstheappointmentoftheexternalauditorandappropriateauditfees.
Thecompanypaidoraccruedthefollowingfees,includingVAT,toitsexternalauditorinthepasttwoyears:
Audit&Audit-relatedFees(inpesos)
OtherFees
2011 5.30M 1.15M
2010 3.18M 3.52M

In2011,SGV&Co.billedthecompanyforanaggregatefeeofP1.15Mforthefollowingservices:
i. UpdatesonPhilippineReportingStandardsforthe entiregroupofcompaniesii. Enterprise-WideRiskManagementStudy
In2010,SGV&Co.billedthecompanyforanaggregatefeeofP3.52millionforthefollowingservices:
i. Duediligencereviewforapotentialacquisitionii. Financialreviewofoperationsofaforeign subsidiary
NotaxconsultancyservicesweresecuredfromSGV&Co.forthepasttwoyears.
Internal Audit TheInternalAuditunitindependentlyreviewsAyala’sorganizationalandoperationalcontrolsandriskmanagementpolicies,andcompliance.Theauditteam,consistingofcertifiedpublicaccountantsandacertifiedinternalauditor,reportstotheAuditandRiskCommittee.BusinessandsupportunitsareregularlyauditedaccordingtoannualauditprogramsapprovedbytheAuditandRiskCommittee.
In2011,theAuditandRiskCommiteereceived,noted,and/orapprovedauditreportsfromInternalAuditManagementaccordingtotheapprovedInternalAuditPlan.TheInternalAuditfunctionwasrated“GenerallyConforms”afterathoroughthird-partyqualityassessmentreview(QAR)bytheInstituteofInternalAuditorsInc.(USA)inMay2007.Therating,consideredthehighestpossiblescoreinconnectionwiththeQAR,confirmedthatInternalAudit’sactivitiesconformedwiththeInternationalStandardsfortheProfessionalPracticeofInternalAuditing.TheQARhastobeundertakeneveryfive(5)years.Thecompanycontinuestoimprovetheinternalauditfunctionbyusingarisk-basedauditapproachandbybenchmarkingagainstbestpractices.
Compliance OfficerTheComplianceOfficerensuresthatAyalaadherestosoundcorporategovernanceandbestpractices.SolomonM.Hermosura,managingdirectorandgeneralcounsel,istheComplianceOfficer.
TheComplianceOfficeridentifiesandmanagescompliancerisks,implementsandmonitorscompliancewiththeManualofCorporateGovernance;andcertifiesyearlytheextentofAyala’scompliancewiththeManual.
TheComplianceOfficerconductsayearlyperformanceassessmentofeachmemberoftheBoardtoassesstheleveloftheBoard’scompliancewithleadingpracticesand
CorporateGovernance52

principlesofgoodcorporategovernance.Thisisaformalself-ratingsystemthattakesintoaccountfactorssuchasindependence,effectiveness,experience,judgment,knowledge,timecommitmentandteamwork,andidentifiesclearareasforimprovement.
DISCLOSURE AND TRANSPARENCy
Ayalaiscommittedtothehighstandardsofdisclosureandtransparencytogivetheinvestingcommunityatruepictureofthecompany’sfinancialconditionandthequalityofitscorporategovernance.
AyalahighlyconformstothebestpracticessetbythePhilippineStockExchange(PSE)initsCorporateGovernanceGuidelineswhichwerereleasedinNovember2010.
Ownership StructureAyalahasatransparentownershipstructure.ItdisclosesquarterlytheTop100shareholdersofthecompany.TheDefinitiveInformationStatementsenttoshareholdersdisclosesthestockownershipofdirectorsandmanagement,aswellasofrecordandbeneficialownersofmorethan5%.AsofDecember31,2011,MermacInc.held303.7millioncommonsharesrepresenting52.61%ofAyala’stotaloutstandingcommonshares.PCDNomineeCorporationheld170.18millioncommonsharesor29.48%andMitsubishiCorporationheld63.08millioncommonsharesor10.93%.Outofthetotal577millionoutstandingcommonshares,199millionor34.47%werebeneficiallyownedbynon-Filipinos.
Therewere12millionoutstandinglistedPreferredAshares,95.28%ofwhichwereownedbyvariousholdersregisteredunderthroughthePCDNomineeCorporation.OftheoutstandingPreferredAshares,0.16%werebeneficiallyownedbynon-Filipinos.
Outofthe200millionoutstandingnon-listedvotingpreferredshares,34.36millionsharesor17.18%wereownedbyforeigners.
Ofthe789milliontotalissuedandoutstandingcommonandpreferredsharesofthecompany,233.38millioncommonandpreferredsharesor29.57%wereownedbyforeigners.
AsoftheendofthefiscalyearDecember2011,35.42%ofAyala’scommonshareswereownedbythepublic.
Therewerenocrossorpyramidshareholdings.
Content and Timing of DisclosuresAyalaupdatestheinvestingpublicwithstrategic,operating,andfinancialinformationthroughadequateandtimelydisclosuresfiledwiththeSECandPSEandwhicharereadilyavailableonthecompany’swebsite:www.ayala.com.ph.
Asidefromcompliancewithperiodicreportorialrequirements,Ayalapunctuallydisclosesmajorandmarketsensitiveinformationsuchasdividenddeclarations,jointventuresandacquisitions,thesaleanddispositionofsignificantassets,aswellasothermaterialinformationthatmayaffectthedecisionoftheinvestingpublic.
In2011,thecompanyfiled,amongothers,unstructureddisclosuresinvolvingtheamendmentofthecompany’sArticlesofIncorporationontheincreaseincapitalstockandthepaymentof20%stockdividendoncommonshares;theamendmentofthecompany’sBy-lawsondirectors’compensationandelectroniccommunicationtoshareholders;submissionofthehighestbidfortheDaangHari/SLEXRoadProject;theearlyredemptionoftheP6billionBondsandofthepreferred“B”shares;thedevelopmentofrun-of-the-riverhydroelectricpowerprojectsthroughthesubsidiary,ACEnergyHoldings,awholly-ownedsubsidiaryofthecompany;theacquisitionof50%interestinNorthWindPowerDevelopmentCorporation;togetherwithAyalaLand,theexchangeofownershipinterestsinARCHCapitalwithTheRohatynGroup;SECapprovalofbonds;andthecompany’sbuy-backpurchasesofitscommonsharesinaccordancewiththecompany’ssharebuybackprogram.
ConsolidatedauditedfinancialstatementsforthelatestfinancialyearweresubmittedtotheSECbytheApril15deadline,whiletheauditedannualreportwassubmittedatleast15workingdaysbeforetheannualstockholders’meeting.
In2011,theauditedfinancialstatementsascontainedintheDefinitiveInformationStatementweresubmittedtotheSECandPSEonMarch18,2011andtothePSEonthesameday,morethanthreeweeksbeforetheApril18,2011annualstockholders’meeting.
Interimorquarterlyfinancialstatementswerereleasedbetween30to45daysfromtheendofthefinancialperiod.Theresultsweredisclosedtotheregulatorswithin24hoursfromthetimetheAuditandRiskCommitteemettoaccepttheresults.Theresultswerealsoprovidedtofinancialandstockmarketanalystsduringananalysts’briefing,wheremembersofseniormanagementpresentedtheresultspersonally,aswellasthroughthecompanywebsiteassoonastheSECreceivedthestatements.
Financial ReportingAyala’sfinancialstatementscomplywithPhilippineAccountingStandardsandPhilippineFinancialReportingStandards.
Theannualconsolidatedfinancialstatementsbreakdowntotalassets,totalliabilitiesandequity,revenues,costsandexpenses,incomebeforeincometax,netincomeattributable
CorporateGovernance 53

Thecompany’ssecuritiesincludepolicycoversthecompany’ssharesofstock,optionstopurchasestocks,bonds,andotherevidenceofindebtedness.
Duringtheyear,noticesoftradingblackoutsforstructureddisclosureswereissuedforaperiodcoveringten(10)tradingdaysbeforeandthree(3)tradingdaysafterthedisclosureofquarterlyandannualfinancialresults.Thecompanystrictlyenforcescompliancewiththesetradingblackoutperiodsandtherehavebeennoviolationsofthecompany’spolicyoninsidertrading.
STAKEHOLDER RELATIONS
Ayalaadherestoahighlevelofmoralstandardsandfairnessindealingwithallitsshareholders,customers,employees,andbusinesspartnerstolaythefoundationforlong-term,beneficialrelationships.
Shareholder Meeting and Voting ProceduresStockholdersareinformedatleastfifteen(15)businessdaysinadvanceofthescheduleddateoftheirmeetings.Thenoticeofregularorspecialmeetingscontainstheagendaandsetsthedate,timeandplaceforvalidatingproxies,whichmustbedoneatleastfivebusinessdayspriortotheannualstockholders’meeting.Eachoutstandingcommonandvotingpreferredsharesofstockentitlestheregisteredholdertoonevote.
Shareholder and Investor RelationsAyalabelievesthatopenandtransparentcommunicationisneededtosustaingrowthandbuildinvestorconfidence.Ourinvestorcommunicationsprogrampromotesgreaterunderstandingofthecompany’slong-termpropositiontocreatevalue.
Thecompany,throughitsInvestorRelationsUnitunderCorporateStrategyandDevelopment,addressesthevariousinformationrequirementsoftheinvestingpublicandminorityshareholdersbyfullydisclosingtheseinatimelymannertothelocalbourse,aswellasviaquarterlybriefings,annualstockholders’meetings,one-on-onemeetings,conferencecalls,roadshowsandinvestorconferences,website,ande-mailsortelephonecalls.
Thecompanyholdsregularbriefingsandmeetingswithanalysts,includingfinancialanalystsfromthebankingcommunity.In2011,fourbriefingswereheldannouncingthe2010year-endresultsand2011firstquarter,firstsemester,andthirdquarterresults.Analystswerealsogivenaccesstoseniormanagementduringthesebriefings.
AyalahasupdatedtheInvestorRelationssectionofitswebsitetoincludetheorganizationalstructure,performance,ownershipandgovernanceofthecompany.Thesectionisupdatedasdisclosurestotheregulators
CorporateGovernance54
toequityholdersofAyalaandnoncontrollinginterests,andearningspershare.
Amorecomprehensivedisclosureofbusinesssegmentresultsisprovidedtohelpshareholdersappreciatethevariousbusinessesandtheirimpactonoverallvalueenhancement.ThefollowingaredisclosedinthenoteonBusinessSegments,pages149to151:1)totalrevenue,2)operatingprofit,3)netincome,4)segmentassets,5)investmentsinassociatesandjointlycontrolledentities,6)segmentliabilities,and7)depreciationandamortization.
AsectiononGeographicalSegmentincludesthefollowinginformation:1)Revenue,2)SegmentAssets,and3)InvestmentProperties.
Transactionsenteredintowithassociatesandotherrelatedpartiesareonanarm’slengthbasis.Salesandpurchasesofgoodsandservicestoandfromrelatedpartiesareinaccordancewithmarketprices.RelatedpartytransactionsarediscussedandquantifiedintheNotestotheConsolidatedFinancialStatementsonpages166to169.
InformationonAyala’sfinancialinstrumentsisguidedbythecompany’sriskmanagementobjectivesandpoliciestoallowabetterassessmentoffinancialperformanceandcashflows.Significantaccountingjudgmentsandestimatesarealsodisclosed.
DEALINGS IN SECURITIES
Ayalahasadoptedapolicyoninsidertradingstocktransactionstoensurecompliancewithdisclosurerulesandpreventunlawfulthegovernmentregulationsagainstinsidertrading.
Reporting of TransactionsAyalacomplieswiththerequirementfordirectorsandprincipalofficerstoreporttotheSECandthePSEwithinfivetradingdaysanyacquisitionordisposal,orchangeintheirshareholdingsinthecompany.
AyalahasexpandedcoverageofthisrequirementtoincludemembersoftheManagementCommitteeandallthemanagingdirectors.AllotherofficersmustsubmitaquarterlyreportontheirtradesofcompanysharestotheComplianceOfficer.
Trading BlackoutsThecompanyhasadoptedapolicyoninsidertrading,whichcoversdirectors,officersandemployees,consultants,membersofkeyofficers’immediatefamilies,andallotheremployeeswhohaveknowledgeofmaterialfactsorchangesintheaffairsofAyalawhichhavenotbeendisclosedtothepublic.Coveredpersonsareprohibitedfrombuyingorsellingthecompany’ssecuritiesduringtradingblackouts.

aremade,whilepresentationsatanalysts’briefingsareimmediatelymadeavailableontheWebtoprovideeasyaccessfortheinvestingcommunity.
Employee RelationsAyalaiscommittedtopromotingthesafetyandwelfareofitsemployees.Itbelievesininspiringitsemployees,developingtheirtalents,andrecognizingtheirneedsasbusinesspartners.Strongandopenlinesofcommunicationaremaintainedtorelaythecompany’sconcernfortheirwelfareandsafety,anddeepentheirunderstandingofthecompany’sbusinessdirections.Thecompanyencouragesemployeestoparticipateinvariouscompany-sponsoredinterestgroups,sportsprograms,volunteerismopportunitiesandsocialeventstofostercamaraderieandengagement.
CODE OF ETHICAL BEHAVIOR
Ayalastronglybelievesin,andadoptsaspartofitsbasicoperatingprinciples,theprimacyoftheperson,sharedvaluesandtheempowermentofpeople.Thecompanyanditsemployeesareguidedbyfourcorevalues:integrity,long-termvision,empoweringleadership,andcommitmenttonationaldevelopment.Thesevaluesareexpressedinthecompany’sCodeofEthicalBehavior,whichoutlinesthegeneralexpectationsof,andsetsstandardsforemployeebehaviorandethicalconduct.Itisinconjunctionwiththecompany’shumanresourcespolicies,whichincludestheCodeofConductgoverningacceptablebehaviortoensureorderlycompanyoperationsandprotecttherights,safety,andworkforthebenefitoftheemployeeforce.Companyemployeesarerequiredtodiscloseanybusinessandfamily-relatedtransactionstoensurethatpotentialconflictsofinterestarebroughttomanagementattention.
RecognitionsIn2011,variousorganizationsrecognizedthecompany’sgovernancepractices.FinanceAsiarankedAyala1stoverallinthePhilippinesinitsBestManagedCompaniesPoll,aswellasBest in Corporate Governance,1stforBestforCorporateSocialResponsibility,and2ndforInvestorRelations.ThecompanyalsotoppedAsiamoney’sCorporateGovernancePoll,whileCorporate Governance AsiacitedAyalaastheBestinAsiaforthesixthconsecutiveyear.
OTHERSAnti-MoneyLaundering.Asaholdingcompany,Ayaladoesnotfaceissuesonanti-moneylaundering.ThecompanystrictlycomplieswiththeprovisionsoftheAnti-MoneyLaunderinglaw.
WEBSITE
Additionalinformationonthecompany’scorporategovernanceinitiativesmaybeviewedatwww.ayala.com.ph.
OUR CORE VALUES
Values drive behavior in an organization. Over the years, the corporate character of Ayala has not substantially changed in nature and orientation. It has evolved only to become stronger. These are the four core values that guide the way Ayala citizens work in all aspects of the business and its interaction with various stakeholders:
IntegrityIntegrity means “doing the right thing” - being held accountable for all our actions. Doing the right thing has earned Ayala a position of trust among its stakeholders.
Long-Term VisionAyala’s track record of success was built by looking to the future. In banking, real estate, telecommunications, and utilities, our CEOs had a vision that they transformed into reality by fostering the spirit of entrepreneurship, excellence and synergy and by rewarding intelligent risk-taking while holding each one accountable for doing the best thing today in order to reap tomorrow’s rewards.
Empowering LeadershipAt Ayala, we realize that leaders today need to manage a whole range of issues in increasingly complex situations. These challenges can only be met by empowering people at all levels of the organization to make decisions and to take action, within the framework of a shared vision and a shared corporate culture of innovation, responsibility and accountability.
Committment to National DevelopmentWe take seriously our responsibilities as corporate citizens over and above compliance with the rule of law. We believe that beyond our business objectives, we must also do our share in nation building through programs in corporate social responsibility that help develop individuals, communities, and the country as a whole.
By remaining true to these values, keeping them vibrant and relevant, and using them to bring out the best in its people, partners and other stakeholders, Ayala can count on keeping its position of trust and leadership for years to come.
CorporateGovernance 55

2011AnnualReport56
DIRECTORSboard of

BoardofDirectors 57
123
456
7
FERNANDO ZOBEL DE AYALA
Director, Ayala Corporation (since 1994). Vice Chairman, President, and COO, Ayala Corporation; Chairman, Ayala Land Inc., Manila Water Company Inc., Ayala DBS Holdings Inc., Alabang Commercial Corporation, AC International Finance Limited and Ayala International Pte Ltd.; Co-Vice Chairman, Ayala Foundation Inc. and Mermac Inc.; Director, Bank of the Philippine Islands, Globe Telecom Inc., Integrated Micro-Electronics Inc., and Asiacom Philippines Inc.; Member, The Asia Society, World Economic Forum, INSEAD East Asia Council, and World Presidents’ Organization; Vice Chairman, Habitat for Humanity International, and Chairman, Habitat for Humanity’s Asia-Pacific Capital Campaign Steering Committee; Member, Board of Directors of Caritas Manila, Kapit Bisig para sa Ilog Pasig Advisory Board, Pilipinas Shell Corporation, and Pilipinas Shell Foundation.
JAIME AUGUSTO ZOBEL DE AYALA
Director, Ayala Corporation (since 1997). Chairman and CEO of Ayala Corporation, Chairman of Globe Telecom Inc., Bank of the Philippine Islands, and Integrated Micro-Electronics, Inc.; Vice Chairman of Ayala Land Inc., Co-Vice Chairman of Mermac Inc., and Ayala Foundation Inc.; Director of Manila Water Co. Inc., Alabang Commercial Corporation, and Ayala International Pte Ltd.; Chairman of Harvard Business School Asia-Pacific Advisory Board, World Wildlife Fund Philippine Advisory Council and Children’s Hour Philippines Inc.; Vice Chairman of the Asia Business Council; Co-Vice Chair of the Makati Business Club; Member of Harvard University Asia Center Advisory Committee; Member of the Mitsubishi Corporation International Advisory Committee, JP Morgan International Council, The Asia Society, International Business Council of the World Economic Forum, Pacific Basin Economic Council, Philippine Economic Society and Toshiba International Advisory Group; and Member of the Board of Trustees of the Eisenhower Fellowships, and the Singapore Management University.
NOBUYA ICHIKI
Director of Ayala Corporation (since 2009). General Manager of Mitsubishi Corporation - Manila Branch, Chairman of International Elevator & Equipment Inc.; Chairman and President of MCPL (Philippines) Inc.; President of Japanese Chamber of Commerce & Industry of the Philippines Inc., Director of The Japanese Association Manila Inc., Isuzu Philippines Corporation, Imasen Philippines Manufacturing Corp., Kepco Ilijan Corporation, Team Diamond Holdings, UniCharm Philippines, Inc., Robinsons Convenience Stores, Inc., Trans World Agro-Products Corp., West of Laguna Development Corporation and Seneca Holdings, Inc.
ANTONIO JOSE U. PERIQUET
Independent Director of Ayala Corporation (since September 2010). Chairman of Pacific Main Holdings, Inc.; Director of the Development Bank of the Philippines, DBP Leasing Corporation, DBP Insurance Brokerage Inc., Metro Rail Transit Corporation, Capstone Technologies Inc., and the Straits Wine Company Inc.; Independent Director of BPI Capital Corporation, DMCI Holdings Inc., and the Philippine Seven Corp.; Member of the Board of Trustees of Lyceum of the Philippines University.
XAVIER P. LOINAZ
Independent Director of Ayala Corporation (since 2009). Independent Director of Bank of the Philippine Islands, BPI Family Savings Bank, Inc., BPI Capital Corporation, BPI Direct Savings Bank, Inc., BPI/MS Insurance Corporation, and Globe Telecom Inc.; Trustee of PETA, BPI Foundation Inc., and E. Zobel Foundation; Chairman of the Alay Kapwa Kilusan Pangkalusugan.
DELFIN L. LAZARO
Director of Ayala Corporation (since 2007). Member of the Management Committee of Ayala Corporation. Chairman of Philwater Holdings Company Inc. and Atlas Fertilizer & Chemicals Inc.; Chairman and President of Purefoods International Ltd., and A.C.S.T. Business Holdings Inc.; Director of Globe Telecom Inc., Ayala Land Inc., Integrated Micro-Electronics Inc., Manila Water Co. Inc., Ayala DBS Holdings Inc., AI North America Inc., Probe Productions Inc., and Empire Insurance Company.
RAMON R. DEL ROSARIO, JR.
Independent Director of Ayala Corporation (since 2010). President and Chief Executive Officer of Philippine Investment Management (PHINMA), Inc.; President, Chief Executive Officer and Vice-Chairman of PHINMA Corp.; Chairman of Araullo University, University of Iloilo, University of Pangasinan, Cagayan de Oro College, AB Capital and Investment Corporation, United Pulp and Paper Co. Inc., Microtel Inns and Suites (Pilipinas) Inc., Microtel Development Corp., Trans-Asia Oil & Energy Development Corporation, CIP II Power Corp., PHINMA A&E Outsource Corp., PHINMA F&A Outsource Corp., Toon City Animation Inc.; Vice-President of Trans-Asia Oil & Energy Development Corporation, PHINMA Property Holdings Corp., PHINMA Foundation; Director of Holcim (Philippines) Inc., Trans-Asia Power Generation Corp., Roxas Holdings Inc., Union Galvasteel Corp.; and Atlas Holdings Corp.
1 4 6
2 5 7
3

MANAGEMENT
Left to Right
Fernando Zobel de Ayala (standing), Jaime Augusto Zobel de Ayala, Delfin C. Gonzalez, Jr., Solomon M. Hermosura, John Eric T. Francia (standing), Gerardo C. Ablaza Jr.
1
2011AnnualReport58
1 23
4

COMMITTEE
Left to Right
Alfredo I. Ayala, John Philip S. Orbeta, Ernest L. Cu
2
Left to Right
Aurelio R. Montinola III, Arthur R. Tan
3
Left to Right
Rufino Luis T. Manotok, Victoria P. Garchitorena,Antonino T. Aquino
4
ManagementCommittee 59

senior leadership team
MANAGING DIRECTORS ASSOCIATE DIRECTORS CONSULTANTS/ADVISERS
FerdinandM.DeLaCruz3
MariaLourdesHeras-deLeon4
GilB.GenioRonaldLuisS.GosecoRicardoNicanorN.Jacinto5
JoseTeodoroK.LimcaocoRufinoF.MeloIIISherisaP.Nuesa5
RamonG.OpulenciaTreasurer
LuisJuanB.OretaGinaflorC.OrisVirgilioC.Rivera,Jr.JaimeE.YsmaelRamonM.Zialcita
FatimaP.AgbayaniRubyP.ChiongAlexanderT.CorderoEmilyC.DeLaraRosallieA.DimaanoFelipeAntonioP.EstrellaRomualdoL.KatigbakNoelEliB.Kintanar6
ErwinP.LocsinGuillermoM.LuzMoninaC.MacavintaRafaelNestorV.MantaringJenaraRosannaF.OngMa.TeresaS.PalmaReneD.PaningbatanMariaAngelicaB.RapadasAlfonsoJavierD.ReyesMa.VictoriaP.SugapongSheilaMarieU.TanNormaP.TorresJaimeP.Villegas
DelfinL.LazaroMerceditaS.NolledoCorporateSecretary7andSeniorCounsel8
PatriceR.ClausseCarlosC.ReyesEliezerC.Tanlapco
1UptoDecember31,20112AppointedApril18,20113TransferredfromGlobeTelecom,Inc.effectiveJuly1,20114AppointedPresidentofAyalaFoundationJanuary1,2012
5RetiredasofDecember31,20116TransferredfromAyalaLand,Inc.effectiveJanuary1,20117UptoApril18,20118UptoDecember31,2011
JAIMEAUGUSTOZOBELDEAYALAChairmanandChiefExecutiveOfficer
FERNANDOZOBELDEAYALAPresidentandChiefOperatingOfficer
GERARDOC.ABLAZA,JR.PresidentandChiefExecutiveOfficer
ManilaWaterCompany,Inc.
ANTONINOT.AQUINOPresidentandChiefExecutiveOfficer
AyalaLand,Inc.
ALFREDOI.AYALAChiefExecutiveOfficer
LiveItInvestments,Ltd.
ERNESTL.CUPresidentandChiefExecutiveOfficer
GlobeTelecom,Inc.
JOHNERICT.FRANCIAGroupHead
CorporateStrategyandDevelopment
VICTORIAP.GARCHITORENA1
PresidentAyalaFoundation,Inc.
DELFINC.GONZALEZ,JR.ChiefFinanceOfficer
ChiefRiskOfficer
SOLOMONM.HERMOSURAGeneralCounsel
GroupHead,LegalandCompliance
CorporateSecretary2
RUFINOLUIST.MANOTOKChairmanandChiefExecutiveOfficer
AyalaAutomotiveHoldings
Corporation
AURELIOR.MONTINOLAIIIPresidentandChiefExecutiveOfficer
BankofthePhilippineIslands
JOHNPHILIPS.ORBETAGroupHead
CorporateResources
ARTHURR.TANPresidentandChiefExecutiveOfficer
IntegratedMicro-Electronics,Inc.
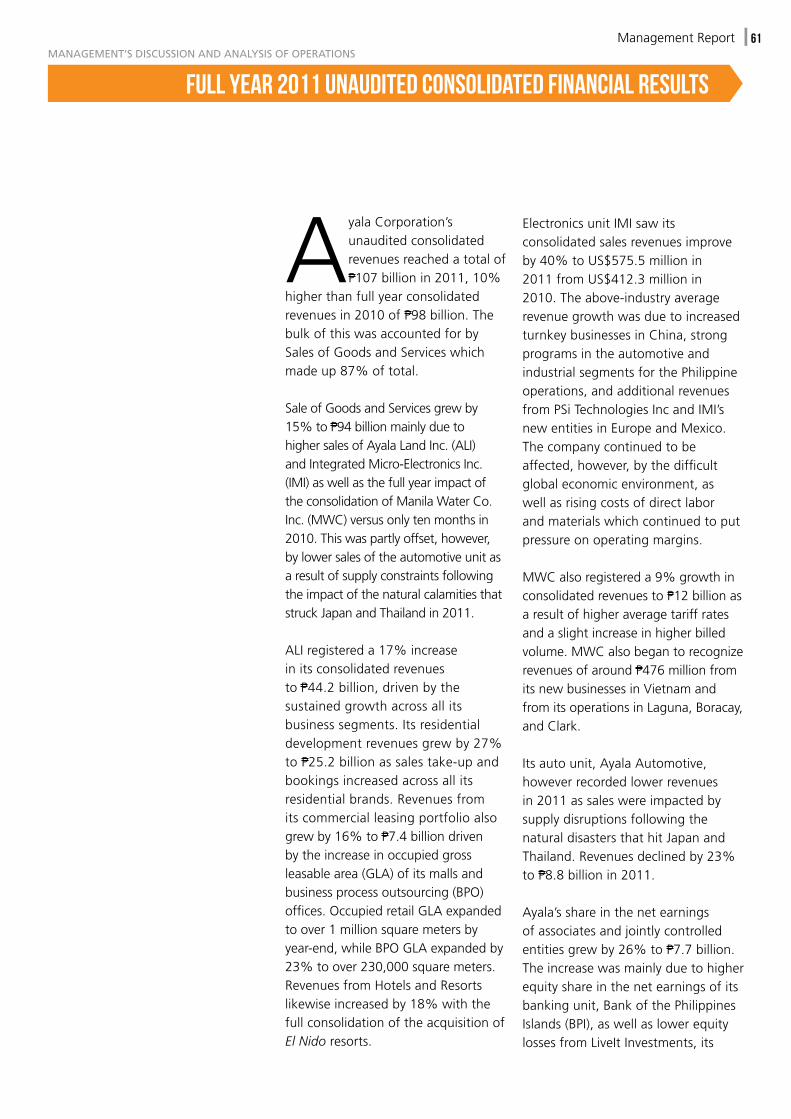
FULL YEAR 2011 UNAUDITED CONSOLIDATED FINANCIAL RESULTSMANAGEMENT’S DISCUSSION AND ANALYSIS OF OPERATIONS
AyalaCorporation’sunauditedconsolidatedrevenuesreachedatotalofP107billionin2011,10%
higherthanfullyearconsolidatedrevenuesin2010ofP98billion.ThebulkofthiswasaccountedforbySalesofGoodsandServiceswhichmadeup87%oftotal.
SaleofGoodsandServicesgrewby15%toP94billionmainlyduetohighersalesofAyalaLandInc.(ALI)andIntegratedMicro-ElectronicsInc.(IMI)aswellasthefullyearimpactoftheconsolidationofManilaWaterCo.Inc.(MWC)versusonlytenmonthsin2010.Thiswaspartlyoffset,however,bylowersalesoftheautomotiveunitasaresultofsupplyconstraintsfollowingtheimpactofthenaturalcalamitiesthatstruckJapanandThailandin2011.
ALIregistereda17%increaseinitsconsolidatedrevenuestoP44.2billion,drivenbythesustainedgrowthacrossallitsbusinesssegments.Itsresidentialdevelopmentrevenuesgrewby27%toP25.2billionassalestake-upandbookingsincreasedacrossallitsresidentialbrands.Revenuesfromitscommercialleasingportfolioalsogrewby16%toP7.4billiondrivenbytheincreaseinoccupiedgrossleasablearea(GLA)ofitsmallsandbusinessprocessoutsourcing(BPO)offices.OccupiedretailGLAexpandedtoover1millionsquaremetersbyyear-end,whileBPOGLAexpandedby23%toover230,000squaremeters.RevenuesfromHotelsandResortslikewiseincreasedby18%withthefullconsolidationoftheacquisitionofEl Nidoresorts.
ElectronicsunitIMIsawitsconsolidatedsalesrevenuesimproveby40%toUS$575.5millionin2011fromUS$412.3millionin2010.Theabove-industryaveragerevenuegrowthwasduetoincreasedturnkeybusinessesinChina,strongprogramsintheautomotiveandindustrialsegmentsforthePhilippineoperations,andadditionalrevenuesfromPSiTechnologiesIncandIMI’snewentitiesinEuropeandMexico.Thecompanycontinuedtobeaffected,however,bythedifficultglobaleconomicenvironment,aswellasrisingcostsofdirectlaborandmaterialswhichcontinuedtoputpressureonoperatingmargins.
MWCalsoregistereda9%growthinconsolidatedrevenuestoP12billionasaresultofhigheraveragetariffratesandaslightincreaseinhigherbilledvolume.MWCalsobegantorecognizerevenuesofaroundP476millionfromitsnewbusinessesinVietnamandfromitsoperationsinLaguna,Boracay,andClark.
Itsautounit,AyalaAutomotive,howeverrecordedlowerrevenuesin2011assaleswereimpactedbysupplydisruptionsfollowingthenaturaldisastersthathitJapanandThailand.Revenuesdeclinedby23%toP8.8billionin2011.
Ayala’sshareinthenetearningsofassociatesandjointlycontrolledentitiesgrewby26%toP7.7billion.Theincreasewasmainlyduetohigherequityshareinthenetearningsofitsbankingunit,BankofthePhilippinesIslands(BPI),aswellaslowerequitylossesfromLiveItInvestments,its
ManagementReport 61

holdingcompanyforitsBPOinvestments.
BPIpostedanetincomeofP12.8billionforfullyear2011,a13%increaseovertheP11.3billionearningsitreportedin2010.Thiswasmainlyonthebackofa7%growthinrevenuesasnetinterestincomeimprovedby10%duetoahealthygrowthinaverageassetbaseandaslightexpansioninnetinterestmargin.Non-interestincomealsoincreased,albeitmarginallyby3%.Thebank’sloangrowthwasstrongasitgrewby20%duringtheyeardrivenbyallmarketsegments.
Telecomunit,GlobeTelecom,reportedstablenetincomeofP9.8billionin2011,1%higherthanlastyear’sP9.7billion.Thelatterincludedaone-timeupwardadjustmentofP526millionfromprepaidloadcreditsthathaveeitherexpiredorhavebeenusedup.Corenetincome,however,whichexcludesforeignexchangeandmark-to-marketgainsandlosses,aswellasnon-recurringitems,wasupby11%toP10.0billionfromP9.1billiontheprioryear.GlobecontinueditsupwardmomentumasithitrecordconsolidatedservicerevenuesofP67.8billion,up8%againstprioryearandsignificantlyoutperformingtheindustry’slessthan2%growthduringtheperiod.
LiveItInvestments,whichhasinvestmentsinfourBPOcompanies,sawsignificantimprovementin2011.ThecompanyachievedsignificantgrowthinitsshareofrevenuesandEBITDA.FullyearshareofrevenueswereUS$318million,up16%year-on-yearduetogrowth
acrossallthefourinvesteecompanies.FullyearshareofEBITDAwasUS$25million,up63%asaresultofgreaterscaleandoperationalefficiencies.LiveItrecordedafullyearnetlossofUS$18million,whichrepresentsanimprovementofUS$14millionover2010’snetloss,afterexcludingthe2010non-cashnetrevaluationgainof$37millionduelargelytotheinvestmentofActisinIntegreon.Thenetlossin2011wasafternon-operatingitemsofUS$22millionrelatedtoacquisitionssuchasnon-cashamortizationofintangiblesandinterestexpensefortheleveragedbuyoutofStream.
Ayala’sconsolidatedinterestincomeincreasedby30%toP3.3billionmainlyduetohigherfundsinvestedbyALIandMWC.Otherincome,however,declinedby66%toP2.5billionin2011as2010includedanextraordinarynetgainofP6.4billion.ThiswasfromtherevaluationgainonAyala’sinvestmentinManilaWaterafteritincreaseditsstakeinthecompany.Inaddition,LiveItalsorecognizedarevaluationgainafterthebuy-inofaprivateentityintoIntegreon.thepurchasepriceallocationgainontheacquisitionofMWCpreferredsharesandtherevaluationgainoftheinvestmentsinIntegreonarisingfromtheentryofActis.
ConsolidatedcostsandexpensesreachedP91.7billion,12%higherversus2010.Costofsalesandservicesincreasedby14%toP70.1billioninlinewiththegrowthinconsolidatedsalesandservices.ConsolidatedgeneralandadministrativeexpensesdeclinedslightlytoP10.91
ManagementReport62
AYAL
A LA
ND, IN
C. C
ONSO
LIDAT
ED
REVE
NUES
AND
NET
INCO
ME
‘10‘09‘08‘07 ‘11
33,749
25,707
30,455
37,814
44,206
4,812
4,386 4,039
5,458
7,140
RevenuesNet Income
AYAL
A CO
RPOR
ATIO
N CO
NSOL
IDAT
ED
REVE
NUES
AND
NET
INCO
ME
‘10‘09‘08‘07 ‘11
79,109
78,767
76,294
98,071
107,532
8,10916,257
8,154 11,161
9,395
Consolidated RevenuesConsolidated Net Income
In M
illio
n Pe
sos
In M
illio
n Pe
sos
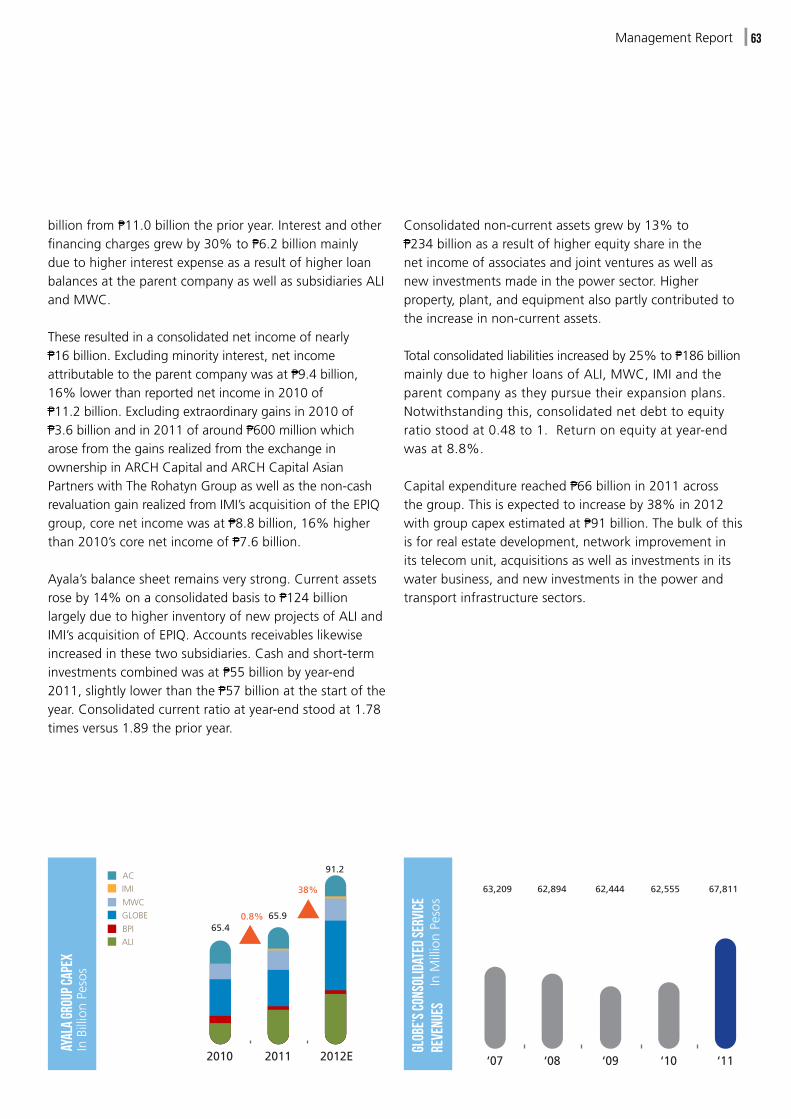
billionfromP11.0billiontheprioryear.Interestandotherfinancingchargesgrewby30%toP6.2billionmainlyduetohigherinterestexpenseasaresultofhigherloanbalancesattheparentcompanyaswellassubsidiariesALIandMWC.
TheseresultedinaconsolidatednetincomeofnearlyP16billion.Excludingminorityinterest,netincomeattributabletotheparentcompanywasatP9.4billion,16%lowerthanreportednetincomein2010ofP11.2billion.Excludingextraordinarygainsin2010ofP3.6billionandin2011ofaroundP600millionwhicharosefromthegainsrealizedfromtheexchangeinownershipinARCHCapitalandARCHCapitalAsianPartnerswithTheRohatynGroupaswellasthenon-cashrevaluationgainrealizedfromIMI’sacquisitionoftheEPIQgroup,corenetincomewasatP8.8billion,16%higherthan2010’scorenetincomeofP7.6billion.
Ayala’sbalancesheetremainsverystrong.Currentassetsroseby14%onaconsolidatedbasistoP124billionlargelyduetohigherinventoryofnewprojectsofALIandIMI’sacquisitionofEPIQ.Accountsreceivableslikewiseincreasedinthesetwosubsidiaries.Cashandshort-terminvestmentscombinedwasatP55billionbyyear-end2011,slightlylowerthantheP57billionatthestartoftheyear.Consolidatedcurrentratioatyear-endstoodat1.78timesversus1.89theprioryear.
ManagementReport 63
Consolidatednon-currentassetsgrewby13%toP234billionasaresultofhigherequityshareinthenetincomeofassociatesandjointventuresaswellasnewinvestmentsmadeinthepowersector.Higherproperty,plant,andequipmentalsopartlycontributedtotheincreaseinnon-currentassets.
Totalconsolidatedliabilitiesincreasedby25%toP186billionmainlyduetohigherloansofALI,MWC,IMIandtheparentcompanyastheypursuetheirexpansionplans.Notwithstandingthis,consolidatednetdebttoequityratiostoodat0.48to1.Returnonequityatyear-endwasat8.8%.
CapitalexpenditurereachedP66billionin2011acrossthegroup.Thisisexpectedtoincreaseby38%in2012withgroupcapexestimatedatP91billion.Thebulkofthisisforrealestatedevelopment,networkimprovementinitstelecomunit,acquisitionsaswellasinvestmentsinitswaterbusiness,andnewinvestmentsinthepowerandtransportinfrastructuresectors.
‘10‘09‘08
62,894 62,444 62,555
‘07
63,209
‘11
67,811
20112010 2012E
65.465.9
38%
0.8%
91.2AC
IMI
MWC
GLOBE
BPI
ALI
Ayal
a Gr
oup C
apex
Glob
e’s C
onso
lidat
ed Se
rvic
e Re
venu
esIn
Mill
ion
Peso
s
In B
illio
n Pe
sos

Financial Statements
FinancialStatements64

report of audit committee to the board of directors
FortheYearEnded31December2011
TheAuditandRiskCommittee’srolesandresponsibilitiesaredefinedintheAuditandRiskCommitteeCharterapprovedbytheBoardofDirectors.TheCommitteeprovidesassistancetotheBoardofDirectorsinfulfillingitsoversightresponsibilitytotheshareholdersrelatingto:(a)theintegrityoftheCompany’sfinancialstatements,thefinancialreportingprocessandthesystemsofinternalcontrols;(b)thequalityandintegrityoftheriskmanagementprocess;(c)theperformanceoftheCompany’sinternalauditfunctionandindependentauditors;and(d)thecompliancewithlegalandregulatorymattersandotherreportingstandards.
IncompliancewiththeAuditandRiskCommitteeCharter,weconfirmthat:
• AnindependentdirectorchairstheCommittee;
• Wehadfour(4)regularmeetingsandone(1)specialmeetingduringtheyear;
• WehavereviewedanddiscussedthequarterlyunauditedconsolidatedfinancialstatementsandtheannualauditedconsolidatedfinancialstatementsofAyalaCorporationandSubsidiaries,includingtheManagement’sDiscussionandAnalysisofFinancialConditionandResultsofOperations,withthemanagement,internalauditorsandSGV&Co.,theindependentauditorofAyalaCorporation.Theseactivitieswereperformedinthefollowingcontext:
- Thatmanagementhastheprimaryresponsibilityforthefinancialstatementsandthefinancialreportingprocess;and
- ThatSGV&Co.isresponsibleforexpressinganopinionontheconformityoftheAyalaCorporation’sauditedconsolidatedfinancialstatementswithPhilippineFinancialReportingStandards;
• WehavediscussedandapprovedtheoverallscopeandtherespectiveauditplansoftheCompany’sinternalauditorsandSGV&Co.WehavealsodiscussedtheresultsoftheirauditsandtheirassessmentoftheCompany’sinternalcontrolsandtheoverallqualityofthefinancialreportingprocessincludingtheirmanagementletterofcomments;
• Wehavereviewedandapprovedallaudit,audit-relatedandpermittednon-auditservicesprovidedbySGV&Co.toAyalaCorporationandtherelatedfeesforsuchservices.Wehavealsoassessedthecompatibilityofnon-auditserviceswiththeauditors’independencetoensurethatsuchserviceswillnotimpairtheirindependence;
• Wehavereviewedthereportsoftheinternalauditorsensuringthatmanagementistakingappropriatecorrectiveactionsinatimelymanner,includingaddressinginternalcontrolandcomplianceissues.AlltheactivitiesperformedbyInternalAuditwereconductedinaccordancewiththeStandardsfortheProfessionalPracticeofInternalAuditing;
• WehavereviewedtheresultsoftheworkoutsourcedtoIslaLipana&Co.relatedtothereviewsoftheTreasuryfunctionandtheFinancefunctionprocessesandinternalcontrols.
• TheCompany’senterpriseriskmanagementproceduresandprocessesarecurrentlyunderreviewforfurtherenhancement.Acompany-wideriskassessmentwasconductedinDecember2011andcompletedinFebruary2012.Wewillreviewtheadequacyoftheriskmanagementprocessandtheeffectivenessofthecontrolenvironmentinsucceedingperiodicreviews.
Basedonthereviewsanddiscussionsundertaken,andsubjecttothelimitationsonourrolesandresponsibilitiesreferredtoabove,theAuditandRiskCommitteerecommendstotheBoardofDirectorsthattheauditedconsolidatedfinancialstatementsbeincludedintheAnnualReportfortheyearendedDecember31,2011,forfilingwiththeSecuritiesandExchangeCommissionandthePhilippineStockExchange.WearealsorecommendingtotheBoardofDirectorsthere-appointmentofSGV&Co.asAyalaCorporation’sindependentauditorfor2012basedontheirperformanceandqualifications.
08March2012
XAVIERP.LOINAZ NOBUYAICHIKI RAMONR.DELROSARIOJR.Chairman Member Member
FinancialStatements 65

statement of management’s responsibility for the financial statements
ThemanagementofAyalaCorporationisresponsibleforthepreparationandfairpresentationoftheconsolidatedfinancialstatementsfortheyearsendedDecember31,2011and2010,includingtheadditionalcomponentsattachedtherein,inaccordancewithPhilippineFinancialReportingStandards.Thisresponsibilityincludesdesigningandimplementinginternalcontrolsrelevanttothepreparationandfairpresentationofconsolidatedfinancialstatementsthatarefreefrommaterialmisstatement,whetherduetofraudorerror,selectingandapplyingappropriateaccountingpolicies,andmakingaccountingestimatesthatarereasonableinthecircumstances.
TheBoardofDirectorsreviewsandapprovestheconsolidatedfinancialstatementsandsubmitsthesametothestockholdersoftheCompany
SyCipGorresVelayo&Co.,theindependentauditorsappointedbytheBoardofDirectorsandstockholders,hasexaminedtheconsolidatedfinancialstatementsoftheCompanyanditssubsidiariesinaccordancewithPhilippineStandardsonAuditing,andinitsreporttothestockholders,hasexpresseditsopiniononthefairnessofpresentationuponcompletionofsuchexamination.
JAIMEAUGUSTOZOBELDEAYALAChairman,BoardofDirectorsandChiefExecutiveOfficer
FERNANDOZOBELDEAYALAPresident&ChiefOperatingOfficer
DELFINC.GONZALEZ,JR.ChiefFinanceOfficer
FinancialStatements66

The Stockholders and the Board of Directors Ayala Corporation Tower One, Ayala Triangle Ayala Avenue, Makati City We have audited the accompanying consolidated financial statements of Ayala Corporation and its subsidiaries, which comprise the consolidated statements of financial position as at December 31, 2011 and 2010, and the consolidated statements of income, statements of comprehensive income, statements of changes in equity and statements of cash flows for each of the three years in the period ended December 31, 2011, and a summary of significant accounting policies and other explanatory information. In the consolidated financial statements, the Group’s equity in the net income of Bank of the Philippine Islands and Subsidiaries is stated at P=2,707 million in 2009. The consolidated financial statements of Bank of the Philippine Islands and Subsidiaries as at December 31, 2009, in which the Group has a 33.5% effective interest, were audited by other auditors whose report has been furnished to us, and our opinion on the consolidated financial statements, insofar, as it relates to the amounts included for Bank of the Philippine Islands and Subsidiaries, is based solely on the report of the other auditors. Management’s Responsibility for the Consolidated Financial Statements Management is responsible for the preparation and fair presentation of these consolidated financial statements in accordance with Philippine Financial Reporting Standards, and for such internal control as management determines is necessary to enable the preparation of consolidated financial statements that are free from material misstatement, whether due to fraud or error. Auditors’ Responsibility Our responsibility is to express an opinion on these consolidated financial statements based on our audits. We conducted our audits in accordance with Philippine Standards on Auditing. Those standards require that we comply with ethical requirements and plan and perform the audit to obtain reasonable assurance about whether the consolidated financial statements are free from material misstatement. An audit involves performing procedures to obtain audit evidence about the amounts and disclosures in the consolidated financial statements. The procedures selected depend on the auditor’s judgment, including the assessment of the risks of material misstatement of the financial statements, whether due to fraud or error. In making those risk assessments, the auditor considers internal control relevant to the entity’s preparation and fair presentation of the consolidated financial statements in order to design audit procedures that are appropriate in the circumstances, but not for the purpose of expressing an opinion on the effectiveness of the entity’s internal control. An audit also includes evaluating the appropriateness of accounting policies used and the reasonableness of accounting estimates made by management, as well as evaluating the overall presentation of the consolidated financial statements. We believe that the audit evidence we have obtained and the report of other auditors are sufficient and appropriate to provide a basis for our audit opinion. Opinion In our opinion, based on our audits and the report of the other auditors, the consolidated financial statements present fairly, in all material respects, the financial position of Ayala Corporation and its subsidiaries as at December 31, 2011 and 2010, and their financial performance and their cash flows for each of the three years in the period ended December 31, 2011 in accordance with Philippine Financial Reporting Standards. SYCIP GORRES VELAYO & CO. Lucy L. Chan Partner CPA Certificate No. 88118 SEC Accreditation No. 0114-AR-2 (Group A), February 11, 2010, valid until February 10, 2013 Tax Identification No. 152-884-511 BIR Accreditation No. 08-001998-46-2009, June 1, 2009, valid until May 31, 2012 PTR No. 3174587, January 2, 2012, Makati City March 14, 2012
independent auditor’s report
FinancialStatements 67

AYALA CORPORATION AND SUBSIDIARIES CONSOLIDATED STATEMENTS OF FINANCIAL POSITION (Amounts in Thousands) December 31 2011 2010 ASSETS Current Assets Cash and cash equivalents (Notes 4, 30 and 31) P=53,577,252 P=53,142,777 Short-term investments (Notes 5, 30 and 31) 1,613,058 3,993,533 Accounts and notes receivable - net (Notes 6, 30 and 31) 31,319,696 25,934,922 Inventories (Note 7) 27,765,842 18,374,656 Other current assets (Notes 8 and 31) 9,288,682 6,911,634 Total Current Assets 123,564,530 108,357,522 Noncurrent Assets Noncurrent accounts and notes receivable (Notes 6 and 31) 8,251,363 4,793,315 Investments in bonds and other securities (Notes 9, 30 and 31) 3,745,168 4,854,337 Land and improvements (Note 10) 18,530,915 16,433,698 Investments in associates and jointly controlled entities - net (Note 11) 79,659,081 72,004,879 Investment properties - net (Note 12) 33,134,958 29,488,275 Property, plant and equipment - net (Note 13) 13,850,956 11,698,923 Service concession assets - net (Note 14) 66,247,192 59,097,769 Intangible assets - net (Note 15) 4,312,163 3,113,938 Pension assets (Note 26) 189,287 190,658 Deferred tax assets - net (Note 24) 3,080,584 2,749,148 Other noncurrent assets (Note 16) 3,060,399 2,587,254 Total Noncurrent Assets 234,062,066 207,012,194 Total Assets P=357,626,596 P=315,369,716 LIABILITIES AND EQUITY Current Liabilities Accounts payable and accrued expenses (Notes 17, 30 and 31) P=51,013,700 P=37,712,638 Short-term debt (Notes 19, 30 and 31) 6,665,841 4,519,287 Income tax payable 483,265 440,834 Current portion of: Long-term debt (Notes 19, 30 and 31) 7,459,658 11,237,343 Service concession obligation (Notes 14 and 31) 980,620 794,473 Other current liabilities (Notes 18 and 31) 2,704,718 2,631,344 Total Current Liabilities 69,307,802 57,335,919 Noncurrent Liabilities Long-term debt - net of current portion (Notes 19, 30 and 31) 92,592,368 67,079,948 Service concession obligation - net of current portion (Notes 14 and 31) 6,916,998 7,025,751 Deferred tax liabilities - net (Note 24) 6,118,857 5,893,442 Pension liabilities (Note 26) 413,709 340,903 Other noncurrent liabilities (Notes 20 and 31) 11,038,827 10,942,289 Total Noncurrent Liabilities 117,080,759 91,282,333 Total Liabilities 186,388,561 148,618,252 Equity Equity attributable to owners of the parent Paid-in capital (Note 21) 42,832,819 37,855,466 Share-based payments (Note 27) 553,743 1,243,055 Net unrealized gain on available-for-sale financial assets (Note 9) 1,725,394 1,128,734 Cumulative translation adjustments (2,311,050) (1,763,471) Equity reserve 1,016,259 148,302 Retained earnings (Note 21) 75,885,784 74,011,144 Parent Company preferred shares held by subsidiaries (Note 21) (250,000) (250,000) Treasury stock (Note 21) (12,408,886) (4,832,262) 107,044,063 107,540,968 Non-controlling interests 64,193,972 59,210,496 Total Equity 171,238,035 166,751,464 Total Liabilities and Equity P=357,626,596 P=315,369,716 See accompanying Notes to Consolidated Financial Statements.
Ayala Corporation and Subsidiaries
Consolidated Statements of Financial Position(Amounts in Thousands)
FinancialStatements68 FinancialStatements68

AYALA CORPORATION AND SUBSIDIARIES CONSOLIDATED STATEMENTS OF INCOME (Amounts in Thousands, Except Earnings Per Share Figures) Years Ended December 31 2011 2010 2009 INCOME Sale of goods (Note 30) P=55,703,984 P=46,531,033 P=44,582,238 Rendering of services (Notes 12 and 30) 38,328,675 35,548,883 18,654,551 Share of profit of associates and jointly controlled entities 7,727,215 6,124,137 7,361,015 Interest income (Note 30) 3,281,596 2,520,658 2,634,533 Other income (Note 22) 2,490,926 7,346,589 3,061,478 107,532,396 98,071,300 76,293,815 COSTS AND EXPENSES Costs of sales (Notes 7 and 30) 43,934,281 36,956,810 34,152,062 Costs of rendering services (Notes 7, 22 and 30) 26,142,564 24,395,401 15,166,232 General and administrative (Notes 22, 26 and 30) 10,874,972 11,005,676 9,214,570 Interest expense and other financing charges (Notes 19, 22 and 30) 6,175,343 4,755,989 3,822,342 Other charges (Note 22) 737,361 2,071,909 1,435,038 87,864,521 79,185,785 63,790,244 INCOME BEFORE INCOME TAX 19,667,875 18,885,515 12,503,571 PROVISION FOR INCOME TAX (Note 24) Current 4,079,235 3,057,133 2,010,214 Deferred (210,494) (157,543) (311,530) 3,868,741 2,899,590 1,698,684 NET INCOME P=15,799,134 P=15,985,925 P=10,804,887 Net Income Attributable to: Owners of the parent (Note 25) P=9,394,887 P=11,161,092 P=8,154,345 Non-controlling interests 6,404,247 4,824,833 2,650,542 P=15,799,134 P=15,985,925 P=10,804,887 EARNINGS PER SHARE (Note 25) Basic P=14.53 P=17.13* P=11.86* Diluted P=14.43 P=17.01* P=11.77* See accompanying Notes to Consolidated Financial Statements. *As restated due to the declaration of stock dividends.
Ayala Corporation and Subsidiaries
Consolidated Statements of income(Amounts in Thousands, except earnings per share figures)
FinancialStatements 69FinancialStatements 69
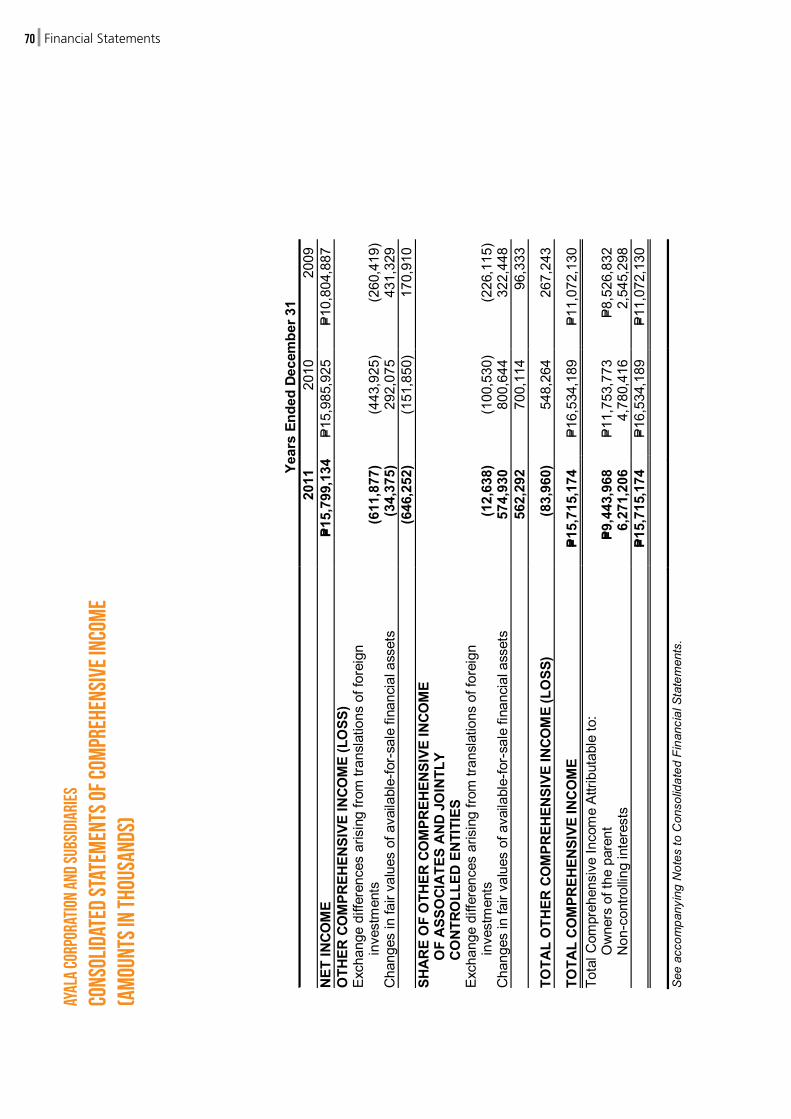
AYA
LA C
OR
POR
ATI
ON
AN
D S
UB
SID
IARI
ES
CO
NSO
LID
ATE
D ST
ATE
MEN
TS O
F C
OM
PREH
ENSI
VE IN
CO
ME
(Am
ount
s in
Tho
usan
ds)
Ye
ars
Ende
d De
cem
ber 3
1
2011
20
10
2009
N
ET IN
COM
E P=1
5,79
9,13
4P=1
5,98
5,92
5 P=1
0,80
4,88
7 O
THER
CO
MPR
EHEN
SIVE
INCO
ME
(LO
SS)
Ex
chan
ge d
iffer
ence
s ar
isin
g fro
m tr
ansl
atio
ns o
f for
eign
in
vest
men
ts
(611
,877
) (4
43,9
25)
(260
,419
) C
hang
es in
fair
valu
es o
f ava
ilabl
e-fo
r-sa
le fi
nanc
ial a
sset
s (3
4,37
5)
292,
075
431,
329
(6
46,2
52)
(151
,850
) 17
0,91
0 SH
AR
E O
F O
THER
CO
MPR
EHEN
SIVE
INCO
ME
O
F A
SSO
CIA
TES
AN
D JO
INTL
Y
CO
NTR
OLL
ED E
NTI
TIES
Exch
ange
diff
eren
ces
aris
ing
from
tran
slat
ions
of f
orei
gn
inve
stm
ents
(1
2,63
8)
(100
,530
) (2
26,1
15)
Cha
nges
in fa
ir va
lues
of a
vaila
ble-
for-
sale
fina
ncia
l ass
ets
574,
930
800,
644
322,
448
56
2,29
2 70
0,11
4 96
,333
TOTA
L O
THER
CO
MPR
EHEN
SIVE
INCO
ME
(LO
SS)
(83,
960)
54
8,26
4 26
7,24
3
TOTA
L C
OM
PREH
ENSI
VE IN
CO
ME
P=1
5,71
5,17
4 P=1
6,53
4,18
9 P=1
1,07
2,13
0 To
tal C
ompr
ehen
sive
Inco
me
Attri
buta
ble
to:
O
wne
rs o
f the
par
ent
P=9,4
43,9
68
P=11,
753,
773
P=8,5
26,8
32
Non
-con
trollin
g in
tere
sts
6,
271,
206
4,78
0,41
6 2,
545,
298
P=1
5,71
5,17
4 P=1
6,53
4,18
9 P=1
1,07
2,13
0
S
ee a
ccom
pany
ing
Not
es to
Con
solid
ated
Fin
anci
al S
tate
men
ts.
Ayal
a Co
rpor
atio
n an
d Su
bsid
iari
es
Cons
olid
ated
Stat
emen
ts o
f com
preh
ensi
ve in
com
e(A
mou
nts i
n Th
ousa
nds)
FinancialStatements70
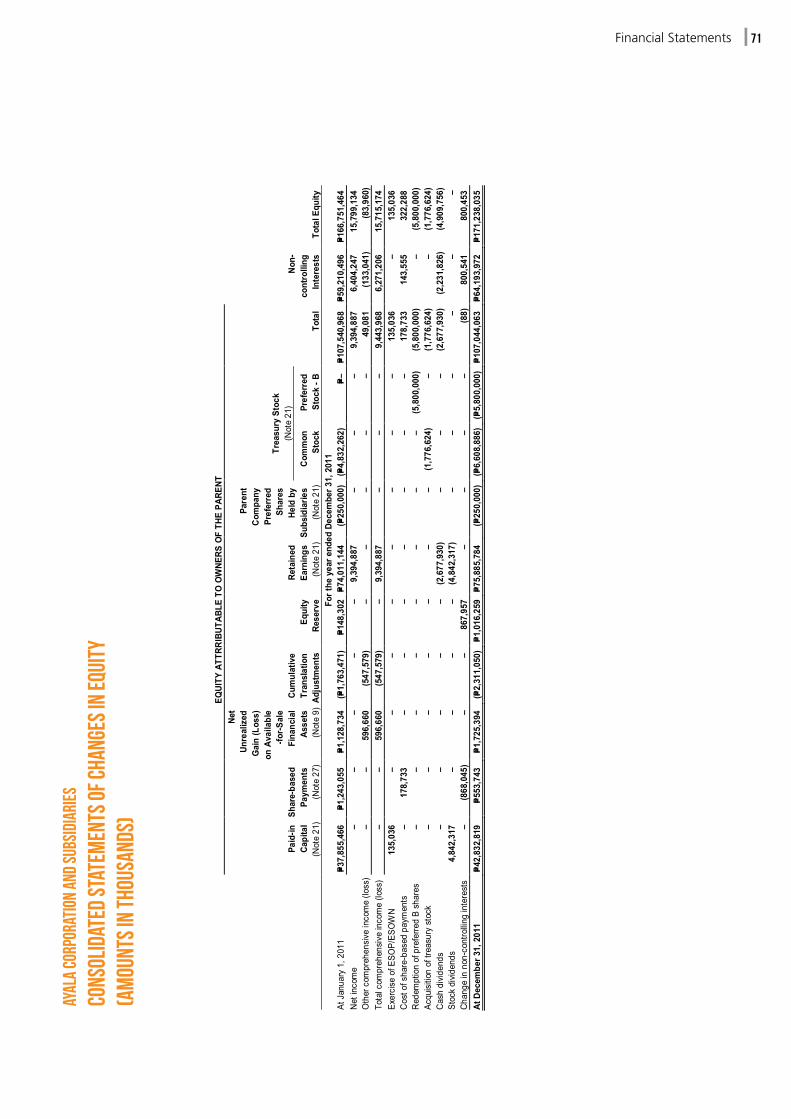
AYAL
A CO
RPO
RATI
ON
AND
SUBS
IDIA
RIES
CO
NSO
LIDA
TED
STAT
EMEN
TS O
F CH
ANG
ES IN
EQ
UITY
(A
mou
nts
in T
hous
ands
)
EQUI
TY A
TTRR
IBUT
ABLE
TO
OWNE
RS O
F TH
E PA
RENT
Paid
-in
Capi
tal
(Not
e 21
)
Shar
e-ba
sed
Paym
ents
(N
ote
27)
Net
Unre
aliz
ed
Gai
n (L
oss)
on
Ava
ilabl
e -fo
r-Sal
e Fi
nanc
ial
Asse
ts
(Not
e 9)
Cum
ulat
ive
Tran
slat
ion
Adju
stm
ents
Eq
uity
Re
serv
e
Reta
ined
Ea
rnin
gs
(Not
e 21
)
Pare
nt
Com
pany
Pr
efer
red
Shar
es
Held
by
Subs
idia
ries
(Not
e 21
)
Trea
sury
Sto
ck
(Not
e 21
)
Non-
co
ntro
lling
In
tere
sts
Tota
l Equ
ity
Com
mon
St
ock
Pref
erre
d St
ock
- B
Tota
l
For t
he y
ear e
nded
Dec
embe
r 31,
201
1 At
Jan
uary
1, 2
011
P=37,
855,
466
P=1,2
43,0
55
P=1,1
28,7
34
(P=1,
763,
471)
P=1
48,3
02
P=74,
011,
144
(P=25
0,00
0)
(P=4,
832,
262)
P=–
P=1
07,5
40,9
68
P=59,
210,
496
P=166
,751
,464
N
et in
com
e –
– –
– –
9,39
4,88
7 –
– –
9,39
4,88
7 6,
404,
247
15,7
99,1
34
Oth
er c
ompr
ehen
sive
inco
me
(loss
) –
– 59
6,66
0 (5
47,5
79)
– –
– –
– 49
,081
(1
33,0
41)
(83,
960)
To
tal c
ompr
ehen
sive
inco
me
(loss
) –
– 59
6,66
0 (5
47,5
79)
– 9,
394,
887
– –
– 9,
443,
968
6,27
1,20
6 15
,715
,174
Ex
erci
se o
f ESO
P/ES
OW
N 13
5,03
6 –
– –
– –
– –
– 13
5,03
6 –
135,
036
Cos
t of s
hare
-bas
ed p
aym
ents
–
178,
733
– –
– –
– –
– 17
8,73
3 14
3,55
5 32
2,28
8 R
edem
ptio
n of
pre
ferre
d B
shar
es
– –
– –
– –
– –
(5,8
00,0
00)
(5,8
00,0
00)
– (5
,800
,000
) Ac
quisi
tion
of tr
easu
ry s
tock
–
– –
– –
– –
(1,7
76,6
24)
– (1
,776
,624
) –
(1,7
76,6
24)
Cas
h di
viden
ds
– –
– –
– (2
,677
,930
) –
– –
(2,6
77,9
30)
(2,2
31,8
26)
(4,9
09,7
56)
Stoc
k di
viden
ds
4,84
2,31
7 –
– –
– (4
,842
,317
) –
– –
– –
– Ch
ange
in n
on-c
ontro
lling
inte
rest
s –
(868
,045
) –
– 86
7,95
7 –
– –
– (8
8)
800,
541
800,
453
At D
ecem
ber 3
1, 2
011
P=42,
832,
819
P=553
,743
P=1
,725
,394
(P=
2,31
1,05
0)
P=1,0
16,2
59
P=75,
885,
784
(P=25
0,00
0)
(P=6,
608,
886)
(P=
5,80
0,00
0)
P=107
,044
,063
P=6
4,19
3,97
2 P=1
71,2
38,0
35
Ayal
a Co
rpor
atio
n an
d Su
bsid
iari
es
Cons
olid
ated
Stat
emen
ts o
f cha
nges
in eq
uity
(am
ount
s in
thou
sand
s)
FinancialStatements 71

- 2 -
E
QU
ITY
ATT
RR
IBU
TAB
LE T
O O
WN
ER
S O
F TH
E P
AR
EN
T
Pai
d-in
C
apita
l (N
ote
21)
Sha
re-b
ased
P
aym
ents
(N
ote
27)
Net
Unr
ealiz
ed
Gai
n on
A
vaila
ble-
for-
S
ale
Fina
ncia
l A
sset
s (N
ote
9)
Cum
ulat
ive
Tran
slat
ion
Adj
ustm
ents
E
quity
R
eser
ve
Ret
aine
d E
arni
ngs
(Not
e 21
)
Par
ent
Com
pany
P
refe
rred
S
hare
s H
eld
by
Sub
sidi
arie
s (N
ote
21)
Trea
sury
S
tock
(N
ote
21)
Tota
l N
on-c
ontro
lling
In
tere
sts
Tota
l Equ
ity
Fo
r the
yea
r end
ed D
ecem
ber 3
1, 2
010
At J
anua
ry 1
, 201
0 P=
37,4
77,8
75
P=1,
059,
588
P=12
3,91
6 (P=
1,35
1,33
4)
P=–
P=65
,739
,096
(P=
100,
000)
(P=
688,
714)
P=10
2,26
0,42
7 P=
33,1
57,7
23 P=
135,
418,
150
Net
inco
me
– –
–
– 11
,161
,092
–
– 11
,161
,092
4,
824,
833
15,9
85,9
25
Oth
er c
ompr
ehen
sive
inco
me
(loss
) –
– 1,
004,
818
(412
,137
) –
–
– 59
2,68
1 (4
4,41
7)
548,
264
Tota
l com
preh
ensi
ve in
com
e (lo
ss)
– –
1,00
4,81
8 (4
12,1
37)
– 11
,161
,092
–
– 11
,753
,773
4,
780,
416
16,5
34,1
89
Exe
rcis
e/C
ance
llatio
n of
E
SO
P/E
SO
WN
17
8,59
1 –
– –
– –
– –
178,
591
– 17
8,59
1 Is
suan
ce o
f sha
res
199,
000
– –
– –
– –
– 19
9,00
0 –
199,
000
Cos
t of s
hare
-bas
ed p
aym
ents
–
183,
467
– –
– –
– –
183,
467
58,1
90
241,
657
Par
ent C
ompa
ny p
refe
rred
sha
res
held
by
a su
bsid
iary
–
– –
– –
– (1
50,0
00)
– (1
50,0
00)
– (1
50,0
00)
Acq
uisi
tion
of tr
easu
ry s
tock
–
– –
– –
– –
(4,1
43,5
48)
(4,1
43,5
48)
– (4
,143
,548
) C
ash
divi
dend
s –
– –
– –
(2,8
89,0
44)
– –
(2,8
89,0
44)
(1,6
41,8
17)
(4,5
30,8
61)
Incr
ease
in n
on-c
ontr
ollin
g in
tere
sts
– –
– –
– –
– –
– 22
,519
,111
22
,519
,111
E
ffect
of c
hang
es in
ow
ners
hip
inte
rest
s in
sub
sidi
arie
s –
– –
– 14
8,30
2 –
– –
148,
302
336,
873
485,
175
At D
ecem
ber 3
1, 2
010
P=37
,855
,466
P=
1,24
3,05
5 P=
1,12
8,73
4 (P=
1,76
3,47
1)
P=14
8,30
2 P=
74,0
11,1
44
(P=25
0,00
0)
(P=4,
832,
262)
P=10
7,54
0,96
8 P=
59,2
10,4
96 P=
166,
751,
464
FinancialStatements72

- 3 -
E
QU
ITY
ATT
RIB
UTA
BLE
TO
OW
NE
RS
OF
THE
PA
RE
NT
Pai
d-in
C
apita
l (N
ote
21)
Sha
re-b
ased
P
aym
ents
(N
ote
27)
Net
Unr
ealiz
ed
Gai
n (L
oss)
on
Ava
ilabl
e-fo
r-
Sal
e Fi
nanc
ial
Ass
ets
(Not
e 9)
Cum
ulat
ive
Tran
slat
ion
Adj
ustm
ents
Ret
aine
d E
arni
ngs
(Not
e 21
)
Par
ent
Com
pany
P
refe
rred
Sha
res
Hel
d by
a
Sub
sidi
ary
(Not
e 21
) Tr
easu
ry S
tock
(N
ote
21)
Tota
l N
on-c
ontro
lling
In
tere
sts
Tota
l Equ
ity
Fo
r the
yea
r end
ed D
ecem
ber 3
1, 2
009
At J
anua
ry 1
, 200
9 P=
37,2
51,7
14
P=70
5,45
7 (P=
631,
127)
(P=
968,
778)
P=
61,6
04,4
66
(P=10
0,00
0)
(P=55
0,54
0)
P=97
,311
,192
P=
30,8
76,1
03
P=12
8,18
7,29
5 N
et in
com
e –
– –
– 8,
154,
345
– –
8,15
4,34
5 2,
650,
542
10,8
04,8
87
Oth
er c
ompr
ehen
sive
inco
me
(loss
) –
– 75
5,04
3 (3
82,5
56)
– –
– 37
2,48
7 (1
05,2
44)
267,
243
Tota
l com
preh
ensi
ve in
com
e (lo
ss)
– –
755,
043
(382
,556
) 8,
154,
345
– –
8,52
6,83
2 2,
545,
298
11,0
72,1
30
Exe
rcis
e of
ES
OP
/ES
OW
N
226,
161
(1,7
08)
– –
– –
– 22
4,45
3 –
224,
453
Cos
t of s
hare
-bas
ed p
aym
ents
–
355,
839
– –
– –
– 35
5,83
9 63
,398
41
9,23
7 A
cqui
sitio
n of
trea
sury
sto
ck
– –
– –
– –
(138
,174
) (1
38,1
74)
– (1
38,1
74)
Cas
h di
vide
nds
– –
– –
(4,0
19,7
15)
– –
(4,0
19,7
15)
(537
,017
) (4
,556
,732
) In
crea
se in
non
-con
trol
ling
inte
rest
s –
– –
– –
– –
– 20
9,94
1 20
9,94
1 A
t Dec
embe
r 31,
200
9 P=
37,4
77,8
75
P=1,
059,
588
P=12
3,91
6 (P=
1,35
1,33
4)
P=65
,739
,096
(P=
100,
000)
(P=
688,
714)
P=
102,
260,
427
P=33
,157
,723
P=
135,
418,
150
See
acc
ompa
nyin
g N
otes
to C
onso
lidat
ed F
inan
cial
Sta
tem
ents
.
FinancialStatements 73
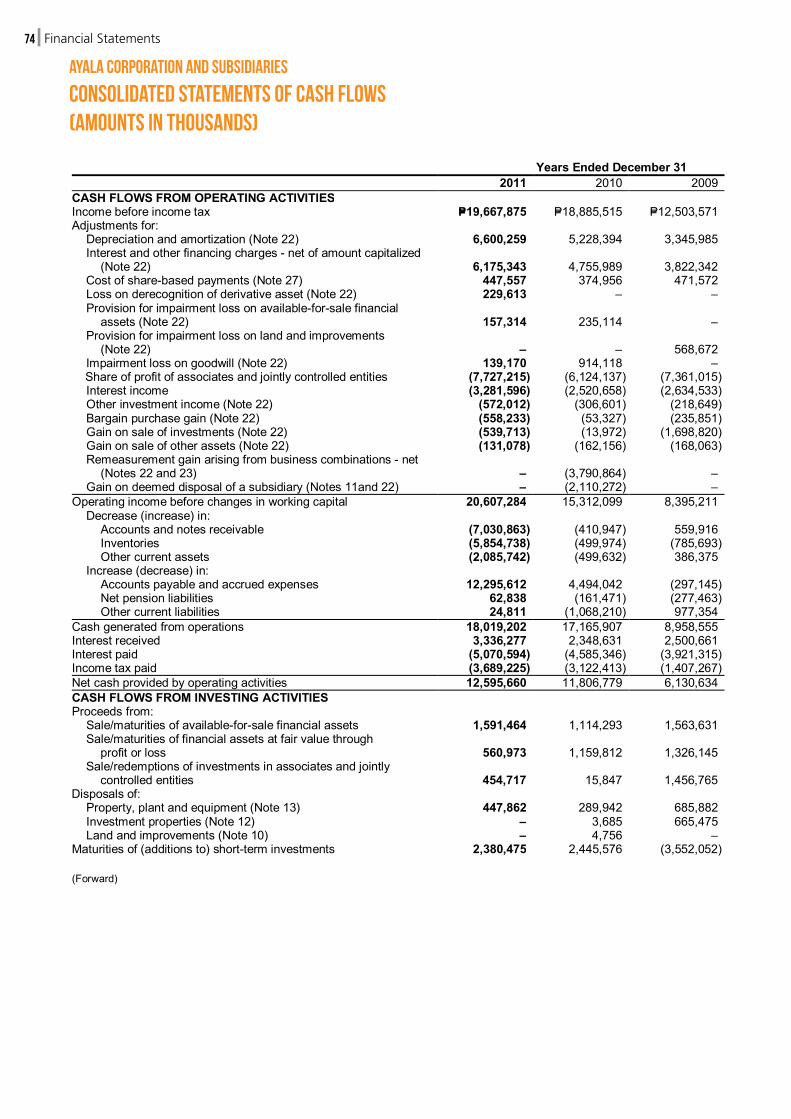
AYALA CORPORATION AND SUBSIDIARIES CONSOLIDATED STATEMENTS OF CASH FLOWS (Amounts in Thousands) Years Ended December 31 2011 2010 2009 CASH FLOWS FROM OPERATING ACTIVITIES Income before income tax P=19,667,875 P=18,885,515 P=12,503,571 Adjustments for: Depreciation and amortization (Note 22) 6,600,259 5,228,394 3,345,985 Interest and other financing charges - net of amount capitalized
(Note 22) 6,175,343 4,755,989 3,822,342 Cost of share-based payments (Note 27) 447,557 374,956 471,572 Loss on derecognition of derivative asset (Note 22) 229,613 – – Provision for impairment loss on available-for-sale financial
assets (Note 22) 157,314 235,114 – Provision for impairment loss on land and improvements
(Note 22) – – 568,672 Impairment loss on goodwill (Note 22) 139,170 914,118 –
Share of profit of associates and jointly controlled entities (7,727,215) (6,124,137) (7,361,015) Interest income (3,281,596) (2,520,658) (2,634,533) Other investment income (Note 22) (572,012) (306,601) (218,649) Bargain purchase gain (Note 22) (558,233) (53,327) (235,851) Gain on sale of investments (Note 22) (539,713) (13,972) (1,698,820) Gain on sale of other assets (Note 22) (131,078) (162,156) (168,063) Remeasurement gain arising from business combinations - net
(Notes 22 and 23) – (3,790,864) – Gain on deemed disposal of a subsidiary (Notes 11and 22) – (2,110,272) – Operating income before changes in working capital 20,607,284 15,312,099 8,395,211 Decrease (increase) in: Accounts and notes receivable (7,030,863) (410,947) 559,916 Inventories (5,854,738) (499,974) (785,693) Other current assets (2,085,742) (499,632) 386,375 Increase (decrease) in: Accounts payable and accrued expenses 12,295,612 4,494,042 (297,145) Net pension liabilities 62,838 (161,471) (277,463) Other current liabilities 24,811 (1,068,210) 977,354 Cash generated from operations 18,019,202 17,165,907 8,958,555 Interest received 3,336,277 2,348,631 2,500,661 Interest paid (5,070,594) (4,585,346) (3,921,315) Income tax paid (3,689,225) (3,122,413) (1,407,267) Net cash provided by operating activities 12,595,660 11,806,779 6,130,634 CASH FLOWS FROM INVESTING ACTIVITIES Proceeds from: Sale/maturities of available-for-sale financial assets 1,591,464 1,114,293 1,563,631 Sale/maturities of financial assets at fair value through profit or loss 560,973 1,159,812 1,326,145 Sale/redemptions of investments in associates and jointly controlled entities 454,717 15,847 1,456,765 Disposals of: Property, plant and equipment (Note 13) 447,862 289,942 685,882 Investment properties (Note 12) – 3,685 665,475 Land and improvements (Note 10) – 4,756 – Maturities of (additions to) short-term investments 2,380,475 2,445,576 (3,552,052) (Forward)
Ayala Corporation and Subsidiaries
Consolidated Statements of cash flows(Amounts in Thousands)
FinancialStatements74
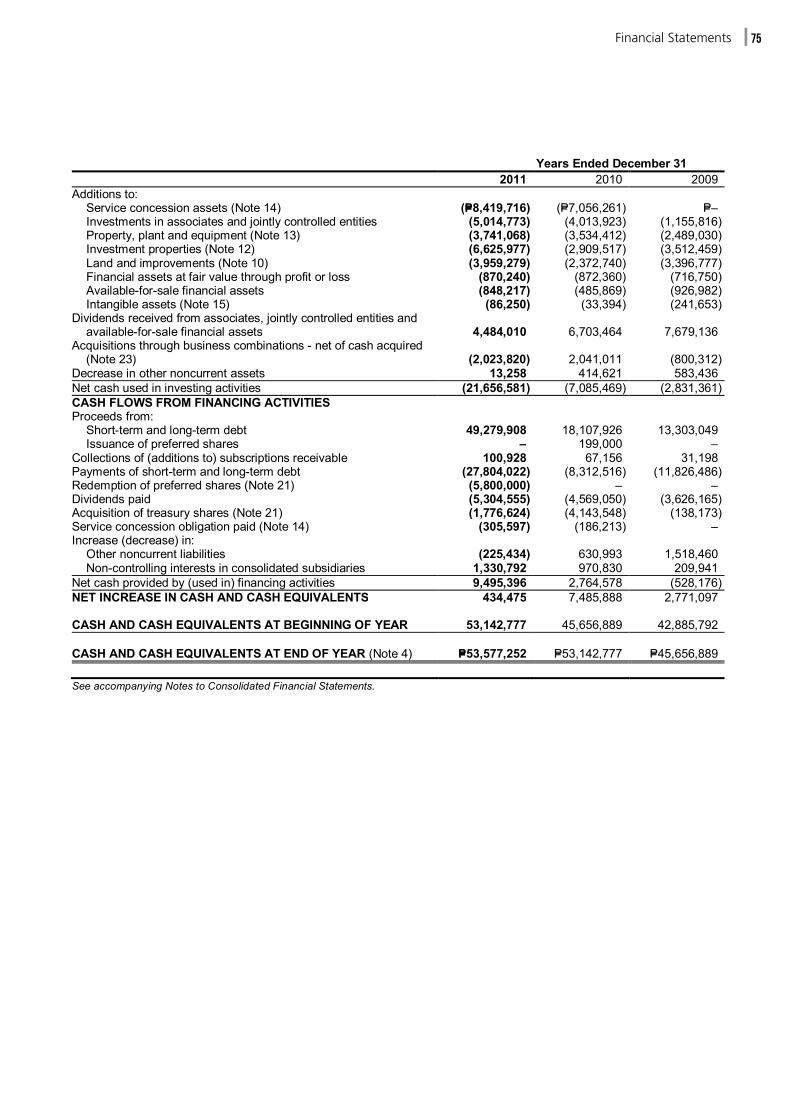
- 2 -
Years Ended December 31 2011 2010 2009 Additions to: Service concession assets (Note 14) (P=8,419,716) (P=7,056,261) P=– Investments in associates and jointly controlled entities (5,014,773) (4,013,923) (1,155,816) Property, plant and equipment (Note 13) (3,741,068) (3,534,412) (2,489,030) Investment properties (Note 12) (6,625,977) (2,909,517) (3,512,459) Land and improvements (Note 10) (3,959,279) (2,372,740) (3,396,777) Financial assets at fair value through profit or loss (870,240) (872,360) (716,750) Available-for-sale financial assets (848,217) (485,869) (926,982) Intangible assets (Note 15) (86,250) (33,394) (241,653) Dividends received from associates, jointly controlled entities and
available-for-sale financial assets 4,484,010 6,703,464 7,679,136 Acquisitions through business combinations - net of cash acquired
(Note 23) (2,023,820) 2,041,011 (800,312) Decrease in other noncurrent assets 13,258 414,621 583,436 Net cash used in investing activities (21,656,581) (7,085,469) (2,831,361) CASH FLOWS FROM FINANCING ACTIVITIES Proceeds from: Short-term and long-term debt 49,279,908 18,107,926 13,303,049 Issuance of preferred shares – 199,000 – Collections of (additions to) subscriptions receivable 100,928 67,156 31,198 Payments of short-term and long-term debt (27,804,022) (8,312,516) (11,826,486) Redemption of preferred shares (Note 21) (5,800,000) – – Dividends paid (5,304,555) (4,569,050) (3,626,165) Acquisition of treasury shares (Note 21) (1,776,624) (4,143,548) (138,173) Service concession obligation paid (Note 14) (305,597) (186,213) – Increase (decrease) in: Other noncurrent liabilities (225,434) 630,993 1,518,460 Non-controlling interests in consolidated subsidiaries 1,330,792 970,830 209,941 Net cash provided by (used in) financing activities 9,495,396 2,764,578 (528,176) NET INCREASE IN CASH AND CASH EQUIVALENTS 434,475 7,485,888 2,771,097 CASH AND CASH EQUIVALENTS AT BEGINNING OF YEAR 53,142,777 45,656,889 42,885,792 CASH AND CASH EQUIVALENTS AT END OF YEAR (Note 4) P=53,577,252 P=53,142,777 P=45,656,889 See accompanying Notes to Consolidated Financial Statements.
FinancialStatements 75
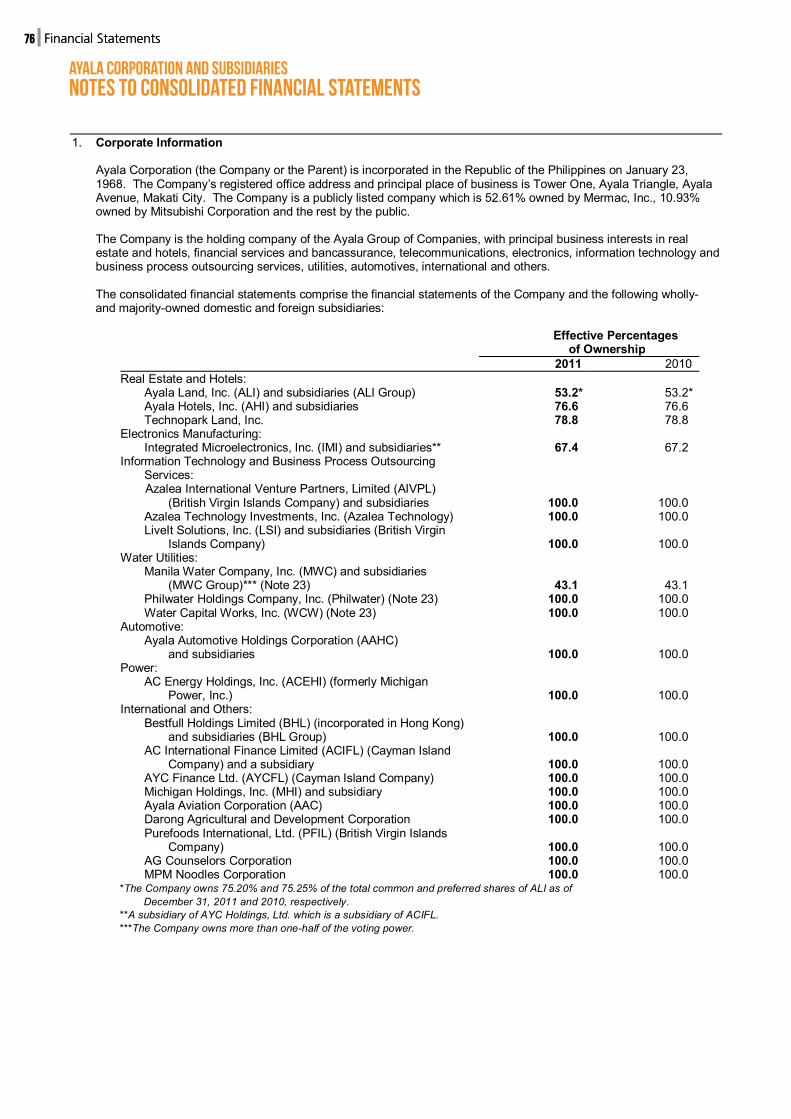
Ayala Corporation and Subsidiariesnotes to Consolidated financial statements
FinancialStatements76
AYALA CORPORATION AND SUBSIDIARIES NOTES TO CONSOLIDATED FINANCIAL STATEMENTS 1. Corporate Information
Ayala Corporation (the Company or the Parent) is incorporated in the Republic of the Philippines on January 23, 1968. The Company’s registered office address and principal place of business is Tower One, Ayala Triangle, Ayala Avenue, Makati City. The Company is a publicly listed company which is 52.61% owned by Mermac, Inc., 10.93% owned by Mitsubishi Corporation and the rest by the public. The Company is the holding company of the Ayala Group of Companies, with principal business interests in real estate and hotels, financial services and bancassurance, telecommunications, electronics, information technology and business process outsourcing services, utilities, automotives, international and others. The consolidated financial statements comprise the financial statements of the Company and the following wholly- and majority-owned domestic and foreign subsidiaries:
Effective Percentages of Ownership 2011 2010 Real Estate and Hotels: Ayala Land, Inc. (ALI) and subsidiaries (ALI Group) 53.2* 53.2* Ayala Hotels, Inc. (AHI) and subsidiaries 76.6 76.6 Technopark Land, Inc. 78.8 78.8 Electronics Manufacturing: Integrated Microelectronics, Inc. (IMI) and subsidiaries** 67.4 67.2 Information Technology and Business Process Outsourcing
Services: Azalea International Venture Partners, Limited (AIVPL)
(British Virgin Islands Company) and subsidiaries 100.0 100.0 Azalea Technology Investments, Inc. (Azalea Technology) 100.0 100.0 LiveIt Solutions, Inc. (LSI) and subsidiaries (British Virgin
Islands Company) 100.0 100.0 Water Utilities: Manila Water Company, Inc. (MWC) and subsidiaries
(MWC Group)*** (Note 23) 43.1 43.1 Philwater Holdings Company, Inc. (Philwater) (Note 23) 100.0 100.0 Water Capital Works, Inc. (WCW) (Note 23) 100.0 100.0 Automotive: Ayala Automotive Holdings Corporation (AAHC)
and subsidiaries 100.0 100.0 Power: AC Energy Holdings, Inc. (ACEHI) (formerly Michigan
Power, Inc.) 100.0 100.0 International and Others: Bestfull Holdings Limited (BHL) (incorporated in Hong Kong)
and subsidiaries (BHL Group) 100.0 100.0 AC International Finance Limited (ACIFL) (Cayman Island
Company) and a subsidiary 100.0 100.0 AYC Finance Ltd. (AYCFL) (Cayman Island Company) 100.0 100.0 Michigan Holdings, Inc. (MHI) and subsidiary 100.0 100.0 Ayala Aviation Corporation (AAC) 100.0 100.0 Darong Agricultural and Development Corporation 100.0 100.0 Purefoods International, Ltd. (PFIL) (British Virgin Islands
Company) 100.0 100.0 AG Counselors Corporation 100.0 100.0 MPM Noodles Corporation 100.0 100.0 *The Company owns 75.20% and 75.25% of the total common and preferred shares of ALI as of December 31, 2011 and 2010, respectively. **A subsidiary of AYC Holdings, Ltd. which is a subsidiary of ACIFL. ***The Company owns more than one-half of the voting power.
FinancialStatements76

FinancialStatements 77
On February 18, 2010, AIVPL and LiveIt Investments Ltd. (LIL), a wholly-owned subsidiary of AIVPL, entered into a deed of return of deposits for future subscription wherein LIL returned the amount of US$21.6 million to AIVPL. On February 19, 2010, AIVPL and the Company entered into a deed of return of deposits for future subscription wherein AIVPL returned the amount of US$17.4 million to the Company. On March 2, 2010, Azalea Technology and AIVPL entered into a deed of return of deposits for future subscription wherein AIVPL returned the amount of P=8.2 million to Azalea Technology. On June 25, 2010, AIVPL repurchased all the shares held by Azalea Technology representing 2.22% ownership interest in AIVPL amounting to US$4.1 million. This resulted in AIVPL becoming a wholly-owned subsidiary of the Company. On September 27, 2010, AIVPL and the Company entered into a subscription agreement wherein the Company subscribed to 35.8 million shares of AIVPL and paid US$1 per share (equivalent to the par value) for a total of US$35.8 million. Consequently, AIVPL and LIL entered into a subscription agreement wherein AIVPL subscribed to 3.6 million shares of LIL and paid US$10 per share (equivalent to the par value) for a total of US$35.8 million. On the same date, LIL and NewBridge International Investments, Ltd. (NewBridge), a wholly-owned subsidiary of LIL, entered into a subscription agreement wherein LIL subscribed to 3.6 million shares of NewBridge and paid US$10 per share (equivalent to the par value) for a total of US$35.8 million.
On December 22, 2010, AIVPL and the Company entered into a subscription agreement wherein the Company subscribed to 1.0 million shares of AIVPL and paid US$1 per share (equivalent to the par value) for a total of US$1.0 million which AIVPL used to invest in Preferred C units of Victoria 1522 Investments, LP (see Note 11). On February 21, 2011, AIVPL and the Company entered into a subscription agreement wherein the Company subscribed to 2,371,699 shares of AIVPL and paid US$1 per share (equivalent to the par value) for a total of US$2.4 million. Consequently, AIVPL and LIL entered into a subscription agreement wherein AIVPL subscribed to 237,169 shares of LIL and paid US$10 per share (equivalent to the par value) for a total of US$2.4 million. On the same date, AIVPL and the Company also entered into a deposit for future subscription wherein the Company deposited US$0.6 million to AIVPL. On various dates from September to December 2011, the Company entered into subscription agreements with AIVPL wherein the Company subscribed to a total of 43.7 million shares of AIVPL by converting deposits for future stock subscription in AIVPL amounting to US$43.7 million. On various dates in 2011, the Company provided additional capital in the form of deposit for future stock subscription to ACEHI amounting to P=2.6 billion. The proceeds were used to finance the various renewable energy projects of ACEHI. On November 11, 2011, the Company converted advances to BHL amounting to P=2.0 billion by subscribing to 4.6 million redeemable preferred shares of BHL. In December 2011, the Company converted advances to PFIL amounting to US$5.0 million by subscribing to 5.0 million common shares of PFIL. On various dates in 2011, the Company infused additional capital to AAC amounting to P=8.1 million. The consolidated financial statements of Ayala Corporation and Subsidiaries (the Group) as of December 31, 2011 and 2010 and for each of the three years in the period ended December 31, 2011 were endorsed for approval by the Audit and Risk Committee on March 8, 2012 and authorized for issue by the Board of Directors (BOD) on March 14, 2012.
2. Summary of Significant Accounting Policies
Basis of Preparation The accompanying consolidated financial statements of the Group have been prepared on a historical cost basis, except for financial assets at fair value through profit or loss (FVPL), available-for-sale (AFS) financial assets and derivative financial instruments that have been measured at fair value. The consolidated financial statements are presented in Philippine Peso (P=) and all values are rounded to the nearest thousand pesos (P=000) unless otherwise indicated.
FinancialStatements 77

Ayala Corporation and Subsidiariesnotes to Consolidated financial statements
FinancialStatements78
Statement of Compliance The consolidated financial statements of the Group have been prepared in compliance with Philippine Financial Reporting Standards (PFRS). Basis of Consolidation The consolidated financial statements comprise the financial statements of the Group as of December 31, 2011 and 2010 and for each of the three years in the period ended December 31, 2011. Basis of consolidation from January 1, 2010 Subsidiaries are fully consolidated from the date of acquisition, being the date on which the Group obtains control, and continue to be consolidated until the date when such control ceases. The financial statements of the subsidiaries are prepared for the same reporting period as the Company, using consistent accounting policies. All intra-group balances, transactions, unrealized gains and losses resulting from intra-group transactions and dividends are eliminated in full. Non-controlling interests pertain to the equity in a subsidiary not attributable, directly or indirectly to the Company. Any equity instruments issued by a subsidiary that are not owned by the Company are non-controlling interests including preferred shares and options under share-based transactions. Non-controlling interests represent the portion of profit or loss and net assets in subsidiaries not wholly-owned and are presented separately in the consolidated statements of income, consolidated statements of comprehensive income, consolidated statements of changes in equity and consolidated statements of financial position, separately from the Company’s equity. Non-controlling interests are net of any outstanding subscription receivable. Losses within a subsidiary are attributed to the non-controlling interest even if that results in a deficit balance. A change in the ownership interest of a subsidiary, without a loss of control, is accounted for as an equity transaction. Any difference between the amount by which the non-controlling interests are adjusted and the fair value of the consideration paid or received is recognized directly in equity as “Equity reserve” and attributed to the owners of the Company. If the Group loses control over a subsidiary, it:
Derecognizes the assets (including goodwill) and liabilities of the subsidiary Derecognizes the carrying amount of any non-controlling interest Derecognizes the cumulative translation differences recorded in equity Recognizes the fair value of the consideration received Recognizes the fair value of any investment retained Recognizes any surplus or deficit in profit or loss Reclassifies the parent’s share of components previously recognized in other comprehensive income to
profit or loss or retained earnings, as appropriate. Basis of consolidation prior to January 1, 2010 Certain of the above-mentioned requirements were applied on a prospective basis. The following differences, however, are carried forward in certain instances from the previous basis of consolidation:
Acquisitions of non-controlling interests, prior to January 1, 2010, were accounted for using the parent entity extension method, whereby, the difference between the consideration and the book value of the share of the net assets acquired were recognized in goodwill.
Losses incurred by the Group were attributed to the non-controlling interest until the balance was reduced to nil. Any further excess losses were attributed to the parent, unless the non-controlling interest had a binding obligation to cover these. Losses prior to January 1, 2010 were not reallocated between non-controlling interest and the parent shareholders.
Upon loss of control, the Group accounted for the investment retained at its proportionate share of net asset value at the date control was lost. The carrying value of such investments at January 1, 2010 have not been restated.
Changes in Accounting Policies The accounting policies adopted are consistent with those of the previous financial years except for the adoption of the following new and amended PFRS and Philippine Interpretations of International Financial Reporting Interpretation Committee (IFRIC) which became effective beginning January 1, 2011. Except as otherwise stated, the adoption of these new and amended Standards and Philippine Interpretations did not have any impact on the consolidated financial statements.

FinancialStatements 79
Philippine Accounting Standard (PAS) 24 (Amendment), Related Party Disclosures PAS 24 clarifies the definitions of a related party. The new definitions emphasize a symmetrical view of related party relationships and clarify the circumstances in which persons and key management personnel affect related party relationships of an entity. In addition, the amendment introduces an exemption from the general related party disclosure requirements for transactions with government and entities that are controlled, jointly controlled or significantly influenced by the same government as the reporting entity. PAS 32 (Amendment), Financial Instruments: Presentation - Classification of Rights Issues The Amendment alters the definition of a financial liability in PAS 32 to enable entities to classify rights issues and certain options or warrants as equity instruments. The Amendment is applicable if the rights are given pro rata to all of the existing owners of the same class of an entity’s non-derivative equity instruments, to acquire a fixed number of the entity’s own equity instruments for a fixed amount in any currency. Philippine Interpretation IFRIC 14 (Amendment), Prepayments of a Minimum Funding Requirement The Amendment removes an unintended consequence when an entity is subject to minimum funding requirements and makes an early payment of contributions to cover such requirements. The Amendment permits a prepayment of future service cost by the entity to be recognized as a pension asset. Philippine Interpretation IFRIC 19, Extinguishing Financial Liabilities with Equity Instruments The Philippine Interpretation clarifies that equity instruments issued to a creditor to extinguish a financial liability qualify as consideration paid. The equity instruments issued are measured at their fair value. In case that this cannot be reliably measured, the instruments are measured at the fair value of the liability extinguished. Any gain or loss is recognized immediately in profit or loss. Improvements to PFRS (issued 2010) The omnibus amendments to PFRSs issued in May 2010 were issued primarily with a view to removing inconsistencies and clarifying wordings. The amendments are effective for annual periods beginning January 1, 2011, except as otherwise stated. The adoption of the following amendments resulted in changes to accounting policies but did not have impact on the financial position or performance of the Group. PFRS 3, Business Combinations
This Amendment clarifies that the Amendments to PFRS 7, Financial Instruments: Disclosures, PAS 32 and PAS 39 that eliminate the exemption for contingent consideration, do not apply to contingent consideration that arose from business combinations whose acquisition dates precede the application of PFRS 3 (as revised in 2008). It also limits the scope of the measurement choices that only the components of non-controlling interest that are present ownership interests that entitle their holders to a proportionate share of the entity’s net assets, in the event of liquidation, shall be measured either at fair value or at the present ownership instruments’ proportionate share of the acquiree’s identifiable net assets. Other components of non-controlling interest are measured at their acquisition date fair value, unless another measurement basis is required by another PFRS. The Amendment also requires an entity (in a business combination) to account for the replacement of the acquiree’s share-based payment transactions (whether obliged or voluntarily), i.e., split between consideration and post-combination expenses. However, if the entity replaces the acquiree’s awards that expire as a consequence of the business combination, these are recognized as post-combination expenses. It further specifies the accounting for share-based payment transactions that the acquirer does not exchange for its own awards: if vested - they are part of non-controlling interest and measured at their market-based measure; if unvested - they are measured at market-based value as if granted at acquisition date, and allocated between non-controlling interest and post-combination expense.
PFRS 7, Financial Instruments: Disclosures The Amendment was intended to simplify the disclosures provided by reducing the volume of disclosures around collateral held and improving disclosures by requiring qualitative information to put the quantitative information in context.
PAS 1, Presentation of Financial Statements This Amendment clarifies that an entity will present an analysis of other comprehensive income for each component of equity, either in the statement of changes in equity or in the notes to the financial statements.
PAS 27, Consolidated and Separate Financial Statements This Amendment clarifies that the consequential amendments from PAS 27 made to PAS 21, The Effect of Changes in Foreign Exchange Rates, PAS 28, Investments in Associates and PAS 31, Interests in Joint Ventures apply prospectively for annual periods beginning on or after July 1, 2009 or earlier when PAS 27 is applied earlier.

Ayala Corporation and Subsidiariesnotes to Consolidated financial statements
FinancialStatements80
PAS 34, Interim Financial Reporting
This Amendment provides guidance to illustrate how to apply disclosure principles in PAS 34 and add disclosure requirements around: a) The circumstances likely to affect fair values of financial instruments and their classification; b) Transfers of financial instruments between different levels of the fair value hierarchy; c) Changes in classification of financial assets; and d) Changes in contingent liabilities and assets.
Philippine Interpretation IFRIC 13, Customer Loyalty Programmes
This Amendment clarifies that when the fair value of award credits is measured based on the value of the awards for which they could be redeemed, the amount of discounts or incentives otherwise granted to customers not participating in the award credit scheme, is to be taken into account.
Securities Regulation Code (SRC) Rule 68, as Amended (2011) SRC Rule 68, as Amended, Annex 68-D, requires companies to present sale of goods and rendering of services and their corresponding costs as separate line items on the face of the statement of income. To comply with this requirement, the Company segregated the sale of goods from the sale of services and their respective costs in the 2011 consolidated statement of income. The Company restated the 2010 and 2009 consolidated statements of income to be consistent with current year presentation. Likewise, 2010 expenses amounting to P=1.1 billion which was previously classified under general and administrative expenses was reclassified to cost of rendering services to be consistent with current year presentation. The restatement affected only the statement of income accounts and does not affect any other item within the 2009 statement of financial position and thus, is not considered material to the 2009 consolidated financial statements. Accordingly, the Company did not present a third statement of financial position in its 2011 consolidated financial statements. Future Changes in Accounting Policies The Group will adopt the following new and amended Standards and Philippine Interpretations enumerated below when these become effective. Except as otherwise indicated, the Group does not expect the adoption of these new and amended PFRS and Philippine Interpretations to have significant impact on the consolidated financial statements. Effective 2012 PAS 12 (Amendment), Income Taxes - Deferred Tax: Recovery of Underlying Assets This Amendment is effective for annual periods beginning on or after January 1, 2012. It clarified the determination of deferred tax on investment property measured at fair value. The Amendment introduces a rebuttable presumption that deferred tax on investment property measured using the fair value model in PAS 40, Investment Property, should be determined on the basis that its carrying amount will be recovered through sale. Furthermore, it introduces the requirement that deferred tax on non-depreciable assets that are measured using the revaluation model in PAS 16, Property, Plant and Equipment, always be measured on a sale basis of the asset.
PFRS 7 (Amendment), Financial Instruments: Disclosures - Enhanced Derecognition Disclosure Requirements This Amendment is effective for annual periods beginning on or after July 1, 2011. The Amendment requires additional disclosure about financial assets that have been transferred but not derecognized to enable the user of the entity’s financial statements to understand the relationship with those assets that have not been derecognized and their associated liabilities. In addition, the Amendment requires disclosures about continuing involvement in derecognized assets to enable the user to evaluate the nature of, and risks associated with, the entity’s continuing involvement in those derecognized assets.
Effective 2013
PAS 1 (Amendment), Financial Statement Presentation, Presentation of Items of Other Comprehensive Income This Amendment is effective for annual periods beginning on or after July 1, 2012. It changed the grouping of items presented in OCI. Items that could be reclassified (or ‘recycled’) to profit or loss at a future point in time (for example, upon derecognition or settlement) would be presented separately from items that will never be reclassified. The amendment affects presentation only and will have no impact on the Group’s financial position or performance.
PAS 19 (Amendments), Employee Benefits The Amendments to PAS 19 range from fundamental changes such as removing the corridor mechanism and the concept of expected returns on plan assets to simple clarifications and re-wording. The Group is currently assessing the impact of the amendment to PAS 19.
PAS 27, Separate Financial Statements (as revised in 2011) As a consequence of the new PFRS 10, Consolidated Financial Statements and PFRS 12, Disclosure of Interests in Other Entities, what remains of PAS 27 is limited to accounting for subsidiaries, jointly controlled entities, and associates in separate financial statements.

FinancialStatements 81
PAS 28, Investments in Associates and Joint Ventures (as revised in 2011) As a consequence of the new PFRS 11, Joint Arrangements and PFRS 12, PAS 28 has been renamed PAS 28, Investments in Associates and Joint Ventures, and describes the application of the equity method to investments in joint ventures in addition to associates. PFRS 7 (Amendments), Financial instruments: Disclosures - Offsetting Financial Assets and Financial Liabilities These Amendments require an entity to disclose information about rights of set-off and related arrangements (such as collateral agreements). The new disclosures are required for all recognized financial instruments that are set off in accordance with PAS 32. These disclosures also apply to recognized financial instruments that are subject to an enforceable master netting arrangement or ‘similar agreement’, irrespective of whether they are set-off in accordance with PAS 32. The Amendments require entities to disclose, in a tabular format unless another format is more appropriate, the following minimum quantitative information. This is presented separately for financial assets and financial liabilities recognized at the end of the reporting period: a) The gross amounts of those recognized financial assets and recognized financial liabilities; b) The amounts that are set off in accordance with the criteria in PAS 32 when determining the net amounts
presented in the statement of financial position; c) The net amounts presented in the statement of financial position; d) The amounts subject to an enforceable master netting arrangement or similar agreement that are not otherwise
included in (b) above, including: i. Amounts related to recognized financial instruments that do not meet some or all of the offsetting criteria in
PAS 32; and ii. Amounts related to financial collateral (including cash collateral); and
e) The net amount after deducting the amounts in (d) from the amounts in (c) above. The Amendments are to be applied retrospectively. The Amendments affect disclosures only and has no impact on the Group’s financial position or performance.
PFRS 10, Consolidated Financial Statements PFRS 10 replaces the portion of PAS 27, Consolidated and Separate Financial Statements that addresses the accounting for consolidated financial statements. It also includes the issues raised in SIC-12, Consolidation - Special Purpose Entities. PFRS 10 establishes a single control model that applies to all entities including special purpose entities. The changes introduced by PFRS 10 will require management to exercise significant judgment to determine which entities are controlled, and therefore, are required to be consolidated by a parent, compared with the requirements that were in PAS 27. The Group is currently assessing the full impact that this Standard will have on the Group’s financial position and performance. PFRS 11, Joint Arrangements PFRS 11 replaces PAS 31, Interests in Joint Ventures and SIC-13, Jointly-controlled Entities - Non-monetary Contributions by Venturers. PFRS 11 removes the option to account for jointly controlled entities (JCEs) using proportionate consolidation. Instead, JCEs that meet the definition of a joint venture must be accounted for using the equity method. PFRS 12, Disclosure of Interests with Other Entities PFRS 12 includes all of the disclosures that were previously in PAS 27 related to consolidated financial statements, as well as all of the disclosures that were previously included in PAS 31 and PAS 28. These disclosures relate to an entity’s interests in subsidiaries, joint arrangements, associates and structured entities. A number of new disclosures are also required. PFRS 13, Fair Value Measurement PFRS 13 establishes a single source of guidance under PFRS for all fair value measurements. PFRS 13 does not change when an entity is required to use fair value, but rather provides guidance on how to measure fair value under PFRS when fair value is required or permitted. The Group is currently assessing the impact that this standard will have on the Group’s financial position and performance. Effective 2014 PAS 32 (Amendments), Financial Instruments: Presentation - Offsetting Financial Assets and Financial Liabilities These Amendments are to be retrospectively applied for annual periods beginning on or after January 1, 2014. These amendments to PAS 32 clarify the meaning of “currently has a legally enforceable right to set-off” and also clarify the application of the PAS 32 offsetting criteria to settlement systems (such as central clearing house systems) which apply gross settlement mechanisms that are not simultaneous. The Group is currently assessing the impact of the amendments to PAS 32.
Ayala Corporation and Subsidiariesnotes to Consolidated financial statements
FinancialStatements82
Effective 2015
PFRS 9, Financial Instruments: Classification and Measurement PFRS 9, as issued in 2010, reflects the first phase of the work on the replacement of PAS 39 and applies to classification and measurement of financial assets and financial liabilities as defined in PAS 39. In subsequent phases, hedge accounting and impairment of financial assets will be addressed with the completion of this project expected on the first half of 2012. The adoption of the first phase of PFRS 9 will have an effect on the classification and measurement of the Group’s financial assets, but will potentially have no impact on classification and measurements of financial liabilities. The Group will quantify the effect in conjunction with the other phases, when issued, to present a more comprehensive picture.
Philippine Interpretation IFRIC 15, Agreements for the Construction of Real Estate This Philippine Interpretation covers accounting for revenue and associated expenses by entities that undertake the construction of real estate directly or through subcontractors. The Interpretation requires that revenue on construction of real estate be recognized only upon completion, except when such contract qualifies as construction contract to be accounted for under PAS 11, Construction Contracts, or involves rendering of services in which case revenue is recognized based on stage of completion. Contracts involving provision of services with the construction materials and where the risks and reward of ownership are transferred to the buyer on a continuous basis will also be accounted for based on stage of completion. The SEC and the Financial Reporting Standards Council (FRSC) have deferred the effectivity of this interpretation until the final Revenue standard is issued by International Accounting Standards Board (IASB) and an evaluation of the requirements of the final Revenue standard against the practices of the Philippine real estate industry is completed. The adoption of this Philippine Interpretation may significantly affect the determination of the revenue from real estate sales and the corresponding costs, and the related trade receivables, deferred tax liabilities and retained earnings accounts. The Group is in the process of quantifying the adoption of this Interpretation.
Cash and Cash Equivalents Cash includes cash on hand and in banks. Cash equivalents are short-term, highly liquid investments that are readily convertible to known amounts of cash with original maturities of three months or less from dates of acquisition and which are subject to an insignificant risk of change in value.
Short-term Investments
Short-term investments are short-term placements with maturities of more than three months but less than one year from the date of acquisition. These earn interest at the respective short-term investment rates.
Financial Instruments Date of recognition The Group recognizes a financial asset or a financial liability in the consolidated statement of financial position when it becomes a party to the contractual provisions of the instrument. Purchases or sales of financial assets that require delivery of assets within the time frame established by regulation or convention in the marketplace are recognized on the settlement date. In the case of derivatives, the Group follows the trade date accounting.
Initial recognition of financial instruments All financial assets and financial liabilities are recognized initially at fair value. Except for securities at FVPL, the initial measurement of financial instruments includes transaction costs. The Group classifies its financial assets in the following categories: financial assets at FVPL, loans and receivables, held-to-maturity (HTM) investments and AFS financial assets. The Group also classifies its financial liabilities into financial liabilities at FVPL and other financial liabilities. The classification depends on the purpose for which the investments were acquired and whether they are quoted in an active market.
The Group determines the classification of its financial instruments at initial recognition and, where allowed and appropriate, re-evaluates such designation at every reporting date.
Financial instruments are classified as liability or equity in accordance with the substance of the contractual arrangement. Interest, dividends, gains and losses relating to a financial instrument or a component that is a financial liability, are reported as expense or income. Distributions to holders of financial instruments classified as equity are charged directly to equity, net of any related income tax benefits.
Determination of fair value The fair value for financial instruments traded in active markets at the reporting date is based on their quoted market price or dealer price quotations (bid price for long positions and ask price for short positions), without any deduction for transaction costs. When current bid and ask prices are not available, the price of the most recent transaction provides evidence of the current fair value as long as there has not been a significant change in economic circumstances since the time of the transaction.

FinancialStatements 83
For all other financial instruments not listed in an active market, the fair value is determined by using appropriate valuation methodologies. Valuation methodologies include net present value techniques, comparison to similar instruments for which market observable prices exist, option pricing models, and other relevant valuation models.
Day 1 difference Where the transaction price in a non-active market is different from the fair value from other observable current market transactions in the same instrument or based on a valuation technique whose variables include only data from observable market, the Group recognizes the difference between the transaction price and fair value (a ‘Day 1’ difference) in the consolidated statement of income under “Interest income” or “Interest expense and other financing charges” unless it qualifies for recognition as some other type of asset or liability. In cases where use is made of data which is not observable, the difference between the transaction price and model value is only recognized in the consolidated statement of income when the inputs become observable or when the instrument is derecognized. For each transaction, the Group determines the appropriate method of recognizing the ‘Day 1’ difference amount.
Financial assets and financial liabilities at FVPL Financial assets and financial liabilities at FVPL include derivatives, financial assets and financial liabilities held for trading and financial assets and financial liabilities designated upon initial recognition as at FVPL.
Financial assets and financial liabilities are classified as held for trading if they are acquired for the purpose of selling or repurchasing in the near term. Derivatives, including separated embedded derivatives, are also classified as held for trading unless they are designated as effective hedging instruments or a financial guarantee contract. Fair value gains or losses on investments held for trading, net of interest income or expense accrued on these assets, are recognized in the consolidated statement of income under “Other income” or “Other charges”. Interest earned or incurred is recorded in “Interest income” or “Interest expense and other financing charges” while dividend income is recorded in “Other income” when the right of payments has been established.
Where a contract contains one or more embedded derivatives, the hybrid contract may be designated as financial asset or financial liability at FVPL, except where the embedded derivative does not significantly modify the cash flows or it is clear that separation of the embedded derivative is prohibited.
Financial assets and financial liabilities may be designated at initial recognition as at FVPL if any of the following criteria are met: (i) the designation eliminates or significantly reduces the inconsistent treatment that would otherwise arise from measuring the assets or liabilities or recognizing gains or losses on them on a different basis; or (ii) the assets or liabilities are part of a group of financial assets, financial liabilities or both which are managed and their performance evaluated on a fair value basis, in accordance with a documented risk management or investment strategy; or (iii) the financial instrument contains an embedded derivative that would need to be separately recorded.
The Group’s financial assets and financial liabilities at FVPL pertain to government securities, other investment securities, derivatives not designated as accounting hedges and embedded derivative arising from the acquisition of PSi.
Derivative instruments (including bifurcated embedded derivatives) are initially recognized at fair value on the date in which a derivative transaction is entered into or bifurcated, and are subsequently remeasured at fair value. Any gains or losses arising from changes in fair value of derivatives that do not qualify for hedge accounting are taken directly to the consolidated statement of income. Derivatives are carried as assets when the fair value is positive and as liabilities when the fair value is negative.
The Group uses derivative instruments such as structured currency options and currency forwards to hedge its risks associated with foreign currency fluctuations. Such derivative instruments provide economic hedges under the Group’s policies but are not designated as accounting hedges.
An embedded derivative is separated from the host contract and accounted for as a derivative if all of the following conditions are met: a) the economic characteristics and risks of the embedded derivative are not closely related to the economic characteristics and risks of the host contract; b) a separate instrument with the same terms as the embedded derivative would meet the definition of a derivative; and c) the hybrid or combined instrument is not recognized at FVPL.
The Group assesses whether embedded derivatives are required to be separated from the host contracts when the Group first becomes a party to the contract. Reassessment of embedded derivatives is only done when there are changes in the contract that significantly modifies the contractual cash flows.

Ayala Corporation and Subsidiariesnotes to Consolidated financial statements
FinancialStatements84
HTM investments HTM investments are quoted nonderivative financial assets with fixed or determinable payments and fixed maturities that the Group has the positive intention and ability to hold to maturity. Where the Group sells other than an insignificant amount of HTM investments, the entire category would be tainted and reclassified as AFS financial assets. After initial measurement, these investments are measured at amortized cost using the effective interest rate method, less impairment in value. Amortized cost is calculated by taking into account any discount or premium on acquisition and fees that are an integral part of the effective interest rate. The amortization is included in “Interest income” in the consolidated statement of income. Gains and losses are recognized in the consolidated statement of income when the HTM investments are derecognized or impaired, as well as through the amortization process. The losses arising from impairment of such investments are recognized in the consolidated statement of income under “Provision for impairment losses” account. HTM investments are included under “Other current assets” if the maturity falls within 12 months from reporting date.
As of December 31, 2011 and 2010, the Group has no outstanding HTM investments.
Loans and receivables Loans and receivables are nonderivative financial assets with fixed or determinable payments that are not quoted in an active market. They are not entered into with the intention of immediate or short-term resale and are not designated as AFS financial assets or financial asset at FVPL. This accounting policy relates to the consolidated statement of financial position captions “Cash and cash equivalents”, “Short-term investments” and “Accounts and notes receivable” (except for Advances to contractors and suppliers).
After initial measurement, loans and receivables are subsequently measured at amortized cost using the effective interest rate method, less any allowance for impairment losses. Amortized cost is calculated by taking into account any discount or premium on acquisition and fees that are an integral part of the effective interest rate. Gains and losses are recognized in the consolidated statement of income when the loans and receivables are derecognized or impaired, as well as through the amortization process. The amortization is included in the “Interest income” account in the consolidated statement of income. The losses arising from impairment of such loans and receivables are recognized under “Provision for doubtful accounts” in the consolidated statement of income.
Loans and receivables are included in current assets if maturity is within 12 months or when the Group expects to realize or collect within 12 months from the reporting date. Otherwise, they are classified as noncurrent assets.
AFS financial assets AFS financial assets are those which are designated as such or do not qualify to be classified as designated at FVPL, HTM, or loans and receivables.
Financial assets may be designated at initial recognition as AFS if they are purchased and held indefinitely, and may be sold in response to liquidity requirements or changes in market conditions.
After initial measurement, AFS financial assets are measured at fair value. The unrealized gains or losses arising from the fair valuation of AFS financial assets are recognized in other comprehensive income and are reported as “Net unrealized gain (loss) on available-for-sale financial assets” (net of tax where applicable) in equity. The Group’s share in its associates’/jointly controlled entities’ net unrealized gain (loss) on AFS is likewise included in this account.
When the security is disposed of, the cumulative gain or loss previously recognized in equity is recognized in the consolidated statement of income under “Other income” or “Other charges”. Where the Group holds more than one investment in the same security, the cost is determined using the weighted average method. Interest earned on AFS financial assets is reported as interest income using the effective interest rate. Dividends earned are recognized under “Other income” in the consolidated statement of income when the right to receive payment is established. The losses arising from impairment of such investments are recognized under “Provision for impairment losses” in the consolidated statement of income.
When the fair value of AFS financial assets cannot be measured reliably because of lack of reliable estimates of future cash flows and discount rates necessary to calculate the fair value of unquoted equity instruments, these investments are carried at cost, less any allowance for impairment losses.
The Group’s AFS financial assets pertain to investments in debt and equity securities included under “Investments in
bonds and other securities” in the consolidated statement of financial position. AFS financial assets are included under “Other current assets” if expected to be realized within 12 months from reporting date.
FinancialStatements 85
Other financial liabilities Issued financial instruments or their components, which are not designated at FVPL are classified as other financial liabilities where the substance of the contractual arrangement results in the Group having an obligation either to deliver cash or another financial asset to the holder, or to satisfy the obligation other than by the exchange of a fixed amount of cash or another financial asset for a fixed number of its own equity shares. The components of issued financial instruments that contain both liability and equity elements are accounted for separately, with the equity component being assigned the residual amount, after deducting from the instrument as a whole the amount separately determined as the fair value of the liability component on the date of issue. After initial measurement, other financial liabilities are subsequently measured at amortized cost using the effective interest rate method. Amortized cost is calculated by taking into account any discount or premium on the issue and fees that are an integral part of the effective interest rate. Any effects of restatement of foreign currency-denominated liabilities are recognized in the consolidated statement of income.
This accounting policy applies primarily to the Group’s short-term and long-term debt, accounts payable and accrued expenses, and other current and noncurrent liabilities and obligations that meet the above definition (other than liabilities covered by other accounting standards, such as income tax payable).
Deposits and retentions payable Deposits and retentions payable are initially measured at fair value. After initial recognition, deposits and retentions payable are subsequently measured at amortized cost using the effective interest rate method.
For deposits, the difference between the cash received and its fair value is deferred (included in the “Deferred credits” account in the consolidated statement of financial position) and amortized using the straight-line method with the amortization included under the “Rendering of services” account in the consolidated statement of income.
Customers’ guaranty and other deposits
Customers’ guaranty and other deposits are initially measured at fair value. After initial recognition, these deposits are subsequently measured at amortized cost using the effective interest rate method. Amortization of customers’ guaranty and other deposits are included under “Interest expense and other financing charges” in the consolidated statement of income. The difference between the cash received and its fair value is recognized as “Deferred credits”. Deferred credits are amortized over the remaining concession period using the effective interest rate method. Financial guarantee contracts Financial guarantee contracts are recognized initially as a liability at fair value, adjusted for transaction costs that are directly attributable to the issuance of the guarantee. Subsequently, the liability is measured at the higher of the best estimate of expenditure required to settle the present obligation at the reporting date and the amount recognized less cumulative amortization.
Derecognition of Financial Assets and Liabilities Financial asset A financial asset (or, where applicable, a part of a financial asset or part of a group of financial assets) is derecognized where: the rights to receive cash flows from the assets have expired; the Group retains the right to receive cash flows from the asset, but has assumed an obligation to pay them in full
without material delay to a third-party under a “pass-through” arrangement; or the Group has transferred its right to receive cash flows from the asset and either (a) has transferred substantially
all the risks and rewards of the asset, or (b) has neither transferred nor retained the risks and rewards of the asset but has transferred control of the asset.
Where the Group has transferred its rights to receive cash flows from an asset or has entered into a pass-through arrangement, and has neither transferred nor retained substantially all the risks and rewards of the asset nor transferred control of the asset, the asset is recognized to the extent of the Group’s continuing involvement in the asset. Continuing involvement that takes the form of a guarantee over the transferred asset is measured at the lower of the original carrying amount of the asset and the maximum amount of consideration that the Group could be required to repay.
Financial liability A financial liability is derecognized when the obligation under the liability is discharged or cancelled or has expired. Where an existing financial liability is replaced by another from the same lender on substantially different terms, or the terms of an existing liability are substantially modified, such an exchange or modification is treated as a derecognition of the original liability and the recognition of a new liability, and the difference in the respective carrying amounts is recognized in the consolidated statement of income.

Ayala Corporation and Subsidiariesnotes to Consolidated financial statements
FinancialStatements86
Impairment of Financial Assets The Group assesses at each reporting date whether there is objective evidence that a financial asset or group of financial assets is impaired. A financial asset or a group of financial assets is deemed to be impaired if, and only if, there is objective evidence of impairment as a result of one or more events that has occurred after the initial recognition of the asset (an incurred ‘loss event’) and that loss event (or events) has an impact on the estimated future cash flows of the financial asset or the group of financial assets that can be reliably estimated. Evidence of impairment may include indications that the borrower or a group of borrowers is experiencing significant financial difficulty, default or delinquency in interest or principal payments, the probability that they will enter bankruptcy or other financial reorganization and where observable data indicate that there is measurable decrease in the estimated future cash flows, such as changes in arrears or economic conditions that correlate with defaults.
Loans and receivables For loans and receivables carried at amortized cost, the Group first assesses whether objective evidence of impairment exists individually for financial assets that are individually significant, or collectively for financial assets that are not individually significant. If the Group determines that no objective evidence of impairment exists for an individually assessed financial asset, whether significant or not, it includes the asset in a group of financial assets with similar credit risk characteristics and collectively assesses for impairment. Those characteristics are relevant to the estimation of future cash flows for groups of such assets by being indicative of the debtors’ ability to pay all amounts due according to the contractual terms of the assets being evaluated. Assets that are individually assessed for impairment and for which an impairment loss is, or continues to be, recognized are not included in a collective assessment for impairment.
If there is objective evidence that an impairment loss has been incurred, the amount of the loss is measured as the difference between the asset’s carrying amount and the present value of estimated future cash flows (excluding future credit losses that have not been incurred) discounted at the financial asset’s original effective interest rate (i.e., the effective interest rate computed at initial recognition). The carrying amount of the asset is reduced through the use of an allowance account and the amount of the loss is charged to the consolidated statement of income under “Provision for doubtful accounts”. Interest income continues to be recognized based on the original effective interest rate of the asset. Loans and receivables, together with the associated allowance accounts, are written off when there is no realistic prospect of future recovery and all collateral has been realized. If, in a subsequent period, the amount of the estimated impairment loss decreases because of an event occurring after the impairment was recognized, the previously recognized impairment loss is reversed. Any subsequent reversal of an impairment loss is recognized in consolidated statement of income, to the extent that the carrying value of the asset does not exceed its amortized cost at the reversal date.
For the purpose of a collective evaluation of impairment, financial assets are grouped on the basis of such credit risk characteristics such as customer type, payment history, past-due status and term.
Future cash flows in a group of financial assets that are collectively evaluated for impairment are estimated on the basis of historical loss experience for assets with credit risk characteristics similar to those in the group. Historical loss experience is adjusted on the basis of current observable data to reflect the effects of current conditions that did not affect the period on which the historical loss experience is based and to remove the effects of conditions in the historical period that do not exist currently. The methodology and assumptions used for estimating future cash flows are reviewed regularly by the Group to reduce any differences between loss estimates and actual loss experience.
Financial assets carried at cost If there is an objective evidence that an impairment loss has been incurred on an unquoted equity instrument that is not carried at fair value because its fair value cannot be reliably measured, or on derivative asset that is linked to and must be settled by delivery of such an unquoted equity instrument, the amount of the loss is measured as the difference between the carrying amount and the present value of estimated future cash flows discounted at the current market rate of return for a similar financial asset.
AFS financial assets In the case of equity investments classified as AFS financial assets, impairment would include a significant or prolonged decline in the fair value of the investments below its cost. “Significant” is to be evaluated against the original cost of the investment and “prolonged” against the period in which the fair value has been below its original cost. Where there is evidence of impairment loss, the cumulative loss - measured as the difference between the acquisition cost and the current fair value, less any impairment loss on that financial asset previously recognized in the consolidated statement of income - is removed from other comprehensive income and recognized in the consolidated statement of income under “Other charges.” Impairment losses on equity investments are not reversed through the consolidated statement of income. Increases in fair value after impairment are recognized directly in the consolidated statement of comprehensive income.
FinancialStatements 87
In the case of debt instruments classified as AFS, impairment is assessed based on the same criteria as financial assets carried at amortized cost. Future interest income is based on the reduced carrying amount and is accrued using the rate of interest used to discount future cash flows for the purpose of measuring impairment loss and is recorded as part of “Interest income” account in the consolidated statement of income. If, in a subsequent year, the fair value of a debt instrument increased and the increase can be objectively related to an event occurring after the impairment loss was recognized in the consolidated statement of income, the impairment loss is reversed through the consolidated statement of income.
Offsetting Financial Instruments Financial assets and financial liabilities are offset and the net amount reported in the consolidated statement of financial position if, and only if, there is a currently enforceable legal right to offset the recognized amounts and there is an intention to settle on a net basis, or to realize the asset and settle the liability simultaneously.
Inventories Inventories are carried at the lower of cost and net realizable value (NRV). Costs incurred in bringing each product to its present location and conditions are generally accounted for as follows:
Real estate inventories - cost includes land cost, amounts paid to contractors for construction, capitalized borrowing costs, planning and design costs, costs of site preparation, professional fees, property transfer taxes, construction overheads and other related costs. The cost of inventory recognized in profit or loss on disposal is determined with reference to the specific costs incurred on the property sold and an allocation of any non-specific costs based on the relative size of the property sold.
Club shares - cost is determined on the basis mainly of the actual development cost incurred plus the estimated development cost to complete the project based on the estimates as determined by the in-house engineers, adjusted with the actual costs incurred as the development progresses, including borrowing costs during the development stage. Club shares amounting to P=342.2 million and P=354.3 million as of December 31, 2011 and 2010 have been included under the “Subdivision land for sale” account.
Vehicles - purchase cost on specific identification basis.
Finished goods and work-in-process - determined on a moving average basis; cost includes direct materials and labor and a proportion of manufacturing overhead costs based on normal operating capacity.
Parts and accessories, materials, supplies and others - purchase cost on a moving average basis.
NRV for real estate inventories, vehicles, finished goods and work-in-process and parts and accessories is the estimated selling price in the ordinary course of business, less estimated costs of completion and estimated costs necessary to make the sale, while NRV for materials, supplies and others represents the related replacement costs. In the event that NRV is lower than cost, the decline shall be recognized as an expense in the consolidated statement of income.
An allowance for inventory losses is provided for slow-moving, obsolete and defective inventories based on management’s physical inspection and evaluation. When inventories are sold, the cost and related allowance is removed from the account and the difference is charged against operations.
Prepaid Expenses Prepaid expenses are carried at cost less the amortized portion. These typically comprise prepayments for commissions, marketing fees, advertising and promotions, taxes and licenses, rentals and insurance.
Creditable Withholding Tax
This pertains to the tax withheld at source by the Group’s customer and is creditable against the income tax liability of the Group.
Value-Added Tax (VAT)
The input value-added tax pertains to the 12% indirect tax paid by the Group in the course of the Group’s trade or business on local purchase of goods or services.
Output VAT pertains to the 12% tax due on the local sale of goods or services by the Group.
If at the end of any taxable month, the output VAT exceeds the input VAT, the outstanding balance is included under “Other current liabilities” account. If the input VAT exceeds the output VAT, the excess shall be carried over to the succeeding months and included under “Other current asset” account.
Ayala Corporation and Subsidiariesnotes to Consolidated financial statements
FinancialStatements88
Land and Improvements Land and improvements consist of properties for future development and are carried at the lower of cost and NRV. NRV is the estimated selling price in the ordinary course of business, less estimated cost of completion and estimated costs necessary to make the sale. Cost includes cost of purchase and those costs incurred for improvement of the properties.
Investments in Associates and Jointly Controlled Entities Investments in associates and jointly controlled entities (investee companies) are accounted for under the equity method. An associate is an entity in which the Group has significant influence and which is neither a subsidiary nor a joint venture. A joint venture is a contractual arrangement whereby two or more parties undertake an economic activity that is subject to joint control, and a jointly controlled entity is a joint venture that involves the establishment of a separate entity in which each venturer has an interest.
An investment in an associate or joint venture is accounted for using the equity method from the day it becomes an associate or joint venture. On acquisition of investment, the excess of the cost of investment over the investor’s share in the net fair value of the investee’s identifiable assets, liabilities and contingent liabilities is accounted for as goodwill and included in the carrying amount of the investment and neither amortized nor individually tested for impairment. Any excess of the investor’s share of the net fair value of the associate’s identifiable assets, liabilities and contingent liabilities over the cost of the investment is excluded from the carrying amount of the investment, and is instead included as income in the determination of the share in the earnings of the investees.
Under the equity method, investments in associates and jointly controlled entities are carried in the consolidated statement of financial position at cost plus post-acquisition changes in the Group’s share in the net assets of the investees, less any impairment in value. The Group’s share in the investee’s post-acquisition profits or losses is recognized in the consolidated statement of income, and its share of post-acquisition movements in the investee’s other comprehensive income is recognized directly in equity. Profits and losses resulting from transactions between the Group and the investee companies are eliminated to the extent of the interest in the investee companies and to the extent that for unrealized losses, there is no evidence of impairment of the asset transferred. Dividends received are treated as a reduction of the carrying value of the investment.
The Group discontinues applying the equity method when its investment in an investee company is reduced to zero. Accordingly, additional losses are not recognized unless the Group has guaranteed certain obligations of the investee company. When the investee company subsequently reports profits, the Group resumes recognizing its share of the profits only after its share of the profits equals the share of net losses not recognized during the period the equity method was suspended.
The reporting dates of the investee companies and the Group are identical and the investee companies’ accounting policies conform to those used by the Group for like transactions and events in similar circumstances.
The Group recognizes gain or loss on partial disposals of interests in associates (including deemed disposals) without loss of significant influence. Likewise, the Group reclassifies to profit or loss the portion of its share in the associates’ other comprehensive income which has been disposed of.
Beginning January 1, 2010, upon loss of significant influence over the associate, the Group measures and recognizes any retaining investment at its fair value. Any difference between the carrying amount of the associate upon loss of significant influence and the fair value of the retained investment and proceeds from disposal is recognized in profit or loss.
Interest in a Joint Venture Makati Development Corporation (MDC), an ALI subsidiary, has an interest in a joint venture, whereby the venturers have a contractual arrangement that establishes joint control. MDC recognizes its interest in the joint venture using proportionate consolidation. MDC combines its share of each of the assets, liabilities, income and expenses of the joint venture with similar items, line by line, in its financial statements. The financial statements of the joint venture are prepared for the same reporting period as the Group. Adjustments are made where necessary to bring the accounting policies into line with those of MDC.
Adjustments are made in the consolidated financial statements to eliminate the Group’s share of unrealized gains and losses on transactions between the Group and the joint venture. Losses on transactions are recognized immediately if the loss provides evidence of a reduction in the NRV of current assets or an impairment loss. The joint venture is proportionately consolidated until the date on which the Group ceases to have joint control over the joint venture.

FinancialStatements 89
Investment Properties Investment properties comprise completed property and property under construction or re-development that are held to earn rentals, and are not occupied by the companies in the Group. Investment properties, except for land, are carried at cost less accumulated depreciation and amortization and any impairment in value. Land is carried at cost less any impairment in value. Expenditures incurred after the investment property has been put in operation, such as repairs and maintenance costs, are normally charged against income in the period in which the costs are incurred.
Construction-in-progress are carried at cost and transferred to the related investment property account when the construction and related activities to prepare the property for its intended use are complete, and the property is ready for occupation. Depreciation and amortization are computed using the straight-line method over the estimated useful lives of the assets, regardless of utilization. The estimated useful lives and the depreciation and amortization method are reviewed periodically to ensure that the period and method of depreciation and amortization are consistent with the expected pattern of economic benefits from items of investment properties.
The estimated useful lives of buildings range from 20-40 years.
Investment properties are derecognized when either they have been disposed of or when the investment property is permanently withdrawn from use and no future economic benefit is expected from its disposal. Any gain or loss on the retirement or disposal of an investment property is recognized in the consolidated statement of income in the year of retirement or disposal.
Transfers are made to investment property when there is a change in use, evidenced by ending of owner-occupation, commencement of an operating lease to another party or ending of construction or development. Transfers are made from investment property when, and only when, there is a change in use, evidenced by commencement of owner-occupation or commencement of development with a view to sale. Transfers between investment property, owner-occupied property and inventories do not change the carrying amount of the property transferred and they do not change the cost of the property for measurement or for disclosure purposes.
Property, Plant and Equipment Property, plant and equipment, except for land, are carried at cost less accumulated depreciation and amortization and any impairment in value. Land is carried at cost less any impairment in value. The initial cost of property, plant and equipment consists of its construction cost or purchase price and any directly attributable costs of bringing the property, plant and equipment to its working condition and location for its intended use.
Construction-in-progress is stated at cost. This includes cost of construction and other direct costs. Construction-in-progress is not depreciated until such time that the relevant assets are completed and put into operational use.
Major repairs are capitalized as part of property, plant and equipment only when it is probable that future economic benefits associated with the item will flow to the Group and the cost of the items can be measured reliably. All other repairs and maintenance are charged against current operations as incurred.
Depreciation and amortization of property, plant and equipment commences once the property, plant and equipment are available for use and computed on a straight-line basis over the estimated useful lives of the property, plant and equipment as follows:
Buildings and improvements 3-40 years Machinery and equipment 3-10 years Hotel property and equipment 20-50 years Furniture, fixtures and equipment 2-10 years Transportation equipment 3-5 years
The assets’ residual values, useful lives and depreciation and amortization methods are reviewed periodically to ensure that the amounts, periods and method of depreciation and amortization are consistent with the expected pattern of economic benefits from items of property, plant and equipment. When property, plant and equipment are retired or otherwise disposed of, the cost and the related accumulated depreciation and amortization and accumulated provision for impairment losses, if any, are removed from the accounts and any resulting gain or loss is credited to or charged against current operations.

Ayala Corporation and Subsidiariesnotes to Consolidated financial statements
FinancialStatements90
Service Concession Assets and Obligations MWC Group accounts for its concession arrangements with Metropolitan Waterworks and Sewerage System (MWSS), Province of Laguna (POL), Tourism Infrastructure and Enterprise Zone Authority (TIEZA), and Clark Development Corporation (CDC) under the Intangible Asset model as it receives the right (license) to charge users of public service. Under these concession agreements, MWC Group is granted the sole and exclusive right and discretion during the concession period to manage, occupy, operate, repair, maintain, decommission and refurbish the identified facilities required to provide water services. The legal title to these assets shall remain with MWSS, POL, TIEZA and CDC at the end of the concession period.
The “Service concession assets” (SCA) pertain to the fair value of the service concession obligations at drawdown date and construction costs related to the rehabilitation works performed by the Group. The SCA are amortized using the straight-line method over the life of the concession.
In addition, MWC recognizes and measures revenue from rehabilitation works in accordance with PAS 11, Construction Contracts, and PAS 18, Revenue, for the services it performs.
Intangible Assets Intangible assets acquired separately are measured on initial recognition at cost. The cost of intangible assets acquired in a business combination is the fair value as at the date of acquisition. Subsequently, intangible assets are measured at cost less accumulated amortization and provision for impairment loss, if any. The useful lives of intangible assets with finite lives are assessed at the individual asset level. Intangible assets with finite lives are amortized over their useful lives on a straight line basis. Periods and method of amortization for intangible assets with finite useful lives are reviewed annually or earlier when an indicator of impairment exists.
The estimated useful lives of intangible assets follow:
Developed software 15 years Customer relationships 2-5 years Order backlog 6 months Unpatented technology 5 years Licenses 3 years Technical service agreement 3 years
A gain or loss arising from derecognition of an intangible asset is measured as the difference between the net disposal proceeds and the carrying amount of the intangible assets and is recognized in the consolidated statement of income when the intangible asset is derecognized.
Business Combinations and Goodwill Business combinations are accounted for using the acquisition method. The cost of an acquisition is measured as the aggregate of the consideration transferred, measured at acquisition date fair value and the amount of any non-controlling interest in the acquiree. For each business combination, the acquirer measures the non-controlling interest in the acquiree either at fair value or at the proportionate share of the acquiree’s identifiable net assets. Acquisition costs are expensed as incurred. When the Group acquires a business, it assesses the financial assets and liabilities assumed for appropriate classification and designation in accordance with the contractual terms, economic circumstances and pertinent conditions as at the acquisition date. This includes the separation of embedded derivatives in host contracts by the acquiree.
If the business combination is achieved in stages, the acquisition date fair value of the acquirer’s previously held equity interest in the acquiree is remeasured to fair value at the acquisition date and included under “Remeasurement gain/loss arising from business combination” in the consolidated statement of income.
Any contingent consideration to be transferred by the acquirer will be recognized at fair value at the acquisition date. Subsequent changes to the fair value of the contingent consideration which is deemed to be an asset or liability will be recognized in accordance with PAS 39 either in profit or loss or as a change to other comprehensive income. If the contingent consideration is classified as equity, it should not be remeasured until it is finally settled within equity.
Goodwill is initially measured at cost being the excess of the aggregate of the consideration transferred and the amount recognized for non-controlling interest over the net identifiable assets acquired and liabilities assumed. If this consideration is lower than the fair value of the net assets of the subsidiary acquired, the difference is recognized in profit or loss as bargain purchase gain.
FinancialStatements 91
Following initial recognition, goodwill is measured at cost less any accumulated impairment loss. Goodwill is reviewed for impairment, annually or more frequently if events or changes in circumstances indicate that the carrying value may be impaired. For purposes of impairment testing, goodwill acquired in a business combination is, from the acquisition date, allocated to each of the Group’s cash-generating units (CGUs), or groups of CGUs, that are expected to benefit from the synergies of the combination, irrespective of whether other assets or liabilities of the Group are assigned to those units or groups of units. Each unit or group of units to which the goodwill is allocated should:
represent the lowest level within the Group at which the goodwill is monitored for internal management purposes;
and not be larger than an operating segment determined in accordance with PFRS 8.
Impairment is determined by assessing the recoverable amount of the CGU (or group of CGUs), to which the goodwill relates. Where the recoverable amount of the CGU (or group of CGUs) is less than the carrying amount, an impairment loss is recognized. Where goodwill forms part of a CGU (or group of CGUs) and part of the operation within that unit is disposed of, the goodwill associated with the operation disposed of is included in the carrying amount of the operation when determining the gain or loss on disposal of the operation. Goodwill disposed of in these circumstances is measured based on the relative values of the operation disposed of and the portion of the CGU retained. If the acquirer’s interest in the net fair value of the identifiable assets, liabilities and contingent liabilities exceeds the cost of the business combination, the acquirer shall recognize immediately in the consolidated statement of income any excess remaining after reassessment.
Asset Acquisitions If the assets acquired and liabilities assumed in an acquisition transaction do not constitute a business, the transaction is accounted for as an asset acquisition. The Group identifies and recognizes the individual identifiable assets acquired (including those assets that meet the definition of, and recognition criteria for, intangible assets) and liabilities assumed. The acquisition cost is allocated to the individual identifiable assets and liabilities on the basis of their relative fair values at the date of purchase. Such a transaction or event does not give rise to goodwill. Where the Group acquires a controlling interest in an entity that is not a business, but obtains less than 100% of the entity, after it has allocated the cost to the individual assets acquired, it notionally grosses up those assets and recognizes the difference as non-controlling interest. Impairment of Nonfinancial Assets The Group assesses at each reporting date whether there is an indication that an asset may be impaired. If any such indication exists, or when annual impairment testing for an asset is required, the Group makes an estimate of the asset’s recoverable amount. An asset’s recoverable amount is calculated as the higher of the asset’s or CGU’s fair value less costs to sell and its value in use and is determined for an individual asset, unless the asset does not generate cash inflows that are largely independent of those from other assets or groups of assets. Where the carrying amount of an asset exceeds its recoverable amount, the asset is considered impaired and is written down to its recoverable amount. In assessing value in use, the estimated future cash flows are discounted to their present value using a pre-tax discount rate that reflects current market assessment of the time value of money and the risks specific to the asset. In determining fair value less cost to sell, an appropriate valuation model is used. These calculations are corroborated by valuation multiples or other fair value indicators. Impairment losses of continuing operations are recognized in the consolidated statement of income in those expense categories consistent with the function of the impaired asset.
For assets excluding goodwill, an assessment is made at each reporting date as to whether there is any indication that previously recognized impairment losses may no longer exist or may have decreased. If such indication exists, the recoverable amount is estimated. A previously recognized impairment loss is reversed only if there has been a change in the estimates used to determine the asset’s recoverable amount since the last impairment loss was recognized. If that is the case, the carrying amount of the asset is increased to its recoverable amount. That increased amount cannot exceed the carrying amount that would have been determined, net of depreciation and amortization, had no impairment loss been recognized for the asset in prior years. Such reversal is recognized in the consolidated statement of income unless the asset is carried at revalued amount, in which case the reversal is treated as revaluation increase. After such a reversal, the depreciation and amortization charge is adjusted in future periods to allocate the asset’s revised carrying amount, less any residual value, on a systematic basis over its remaining useful life.
Ayala Corporation and Subsidiariesnotes to Consolidated financial statements
FinancialStatements92
Investments in associates and jointly controlled entities After application of the equity method, the Group determines whether it is necessary to recognize any additional impairment loss with respect to the Group’s net investment in the investee company. The Group determines at each reporting date whether there is any objective evidence that the investment in the investee company is impaired. If this is the case, the Group calculates the amount of impairment as being the difference between the recoverable amount of the investee company and the carrying cost and recognizes the amount as a reduction of the “Share of profit of associates and jointly controlled entities” account in the consolidated statement of income.
Impairment of goodwill For assessing impairment of goodwill, a test for impairment is performed annually and when circumstances indicate that the carrying value may be impaired. Impairment is determined for goodwill by assessing the recoverable amount of each CGU (or group of CGUs) to which the goodwill relates. Where the recoverable amount of the CGU is less than its carrying amount, an impairment loss is recognized. Impairment losses relating to goodwill cannot be reversed in future periods. Provisions Provisions are recognized when the Group has a present obligation (legal or constructive) as a result of a past event, it is probable that an outflow of resources embodying economic benefits will be required to settle the obligations and a reliable estimate can be made of the amount of the obligation.
Where the Group expects a provision to be reimbursed, the reimbursement is recognized as a separate asset but only when the reimbursement is virtually certain. If the effect of the time value of money is material, provisions are determined by discounting the expected future cash flows at a pre-tax rate that reflects current market assessments of the time value of money and, where appropriate, the risks specific to the liability. Where discounting is used, the increase in the provision due to the passage of time is recognized as interest expense. Provisions are reviewed at each reporting date and adjusted to reflect the current best estimate.
Equity Capital stock is measured at par value for all shares subscribed, issued and outstanding. When the shares are sold at premium, the difference between the proceeds at the par value is credited to “Additional paid-in capital” account. Direct costs incurred related to equity issuance are chargeable to “Additional paid-in capital” account. If additional paid-in capital is not sufficient, the excess is charged against retained earnings. When the Group issues more than one class of stock, a separate account is maintained for each class of stock and the number of shares issued.
Subscriptions receivable pertains to the uncollected portion of the subscribed shares and is presented as reduction from equity.
Retained earnings represent accumulated earnings of the Group less dividends declared.
Own equity instruments which are reacquired (treasury shares) are recognized at cost and deducted from equity. No gain or loss is recognized in the consolidated statement of income on the purchase, sale, issue or cancellation of the Group’s own equity instruments. Any difference between the carrying amount and the consideration, if reissued, is recognized in additional paid-in capital. Voting rights related to treasury shares are nullified for the Group and no dividends are allocated to them respectively. When the shares are retired, the capital stock account is reduced by its par value and the excess of cost over par value upon retirement is debited to additional paid-in capital when the shares were issued and to retained earnings for the remaining balance.
Revenue and Cost Recognition Revenue is recognized to the extent that it is probable that the economic benefits will flow to the Group and the revenue can be reliably measured.
For real estate sales, the Group assesses whether it is probable that the economic benefits will flow to the Group when the sales prices are collectible. Collectibility of the sales price is demonstrated by the buyer’s commitment to pay, which in turn is supported by substantial initial and continuing investments that give the buyer a stake in the property sufficient that the risk of loss through default motivates the buyer to honor its obligation to the seller. Collectibility is also assessed by considering factors such as the credit standing of the buyer, age and location of the property.
Revenue from sales of completed real estate projects is accounted for using the full accrual method. In accordance with Philippine Interpretations Committee (PIC), Q&A 2006-01, the percentage-of-completion method is used to recognize income from sales of projects where the Group has material obligations under the sales contract to complete the project after the property is sold, the equitable interest has been transferred to the buyer, construction is beyond preliminary stage (i.e., engineering, design work, construction contracts execution, site clearance and preparation, excavation and the building foundation are finished, and the costs incurred or to be incurred can be measured reliably). Under this method, revenue is recognized as the related obligations are fulfilled, measured principally on the basis of the estimated completion of a physical proportion of the contract work.
FinancialStatements 93
Any excess of collections over the recognized receivables are included under “Other current liabilities” in the liabilities section of the consolidated statement of financial position.
If any of the criteria under the full accrual or percentage-of-completion method is not met, the deposit method is applied until all the conditions for recording a sale are met. Pending recognition of sale, cash received from buyers are presented under the “Other current liabilities” account in the liabilities section of the consolidated statement of financial position.
Cost of real estate sales is recognized consistent with the revenue recognition method applied. Cost of subdivision land and condominium units sold before the completion of the development is determined on the basis of the acquisition cost of the land plus its full development costs, which include estimated costs for future development works, as determined by the Group’s in-house technical staff.
Revenue from construction contracts are recognized using the percentage-of-completion method, measured principally on the basis of the estimated physical completion of the contract work.
Contract costs include all direct materials and labor costs and those indirect costs related to contract performance.
Expected losses on contracts are recognized immediately when it is probable that the total contract costs will exceed total contract revenue. Changes in contract performance, contract conditions and estimated profitability, including those arising from contract penalty provisions, and final contract settlements which may result in revisions to estimated costs and gross margins are recognized in the year in which the changes are determined.
Rental income under noncancellable and cancellable leases on investment properties is recognized in the
consolidated statement of income on a straight-line basis over the lease term and the terms of the lease, respectively, or based on a certain percentage of the gross revenue of the tenants, as provided under the terms of the lease contract.
Rooms revenue from hotel and resort operations are recognized when services are rendered. Revenue from
banquets and other special events are recognized when the events take place.
Water and sewer revenue are recognized when the related water and sewerage services are rendered. Water and sewerage are billed every month according to the bill cycles of the customers. As a result of bill cycle cut-off, monthly service revenue earned but not yet billed at end of the month are estimated and accrued. These estimates are based on historical consumption of the customers. A certain percentage of the water revenue are recognized as environmental charges as provided for in the concession agreement. Other customer related fees such as reconnection and disconnection fees are recognized when these services have been rendered.
Revenue from rehabilitation works is recognized and measured by MWC in accordance with PAS 11 and PAS 18 for the services it performs. Costs related to rehabilitation works is recorded as part of SCA.
When MWC Group provides construction or upgrade services, the consideration received or receivable is recognized at its fair value. MWC Group accounts for revenue and costs relating to operation services in accordance with PAS 18.
Revenue from sales of electronic products and vehicles and related parts and accessories are recognized when the
significant risks and rewards of ownership of the goods have passed to the buyer and the amount of revenue can be measured reliably. Revenue is measured at the fair value of the consideration received excluding discounts, returns, rebates and sales taxes.
Marketing fees, management fees from administrative and property management and revenue from vehicle repairs
are recognized when services are rendered.
Revenue from business process outsourcing services is recognized when services are rendered. Revenue from digitizing and document creation services are recognized when the service is completed and electronically sent to the customer. Provision for discounts and other adjustments are provided for in the same period the related sales are recorded.
Interest income is recognized as it accrues using the effective interest method.
Dividend income is recognized when the Group’s right to receive payment is established.
Gain/loss on sale of investments Prior to January 1, 2010, gain or loss is recognized in the consolidated statement of income if the Group disposes some of its investment in a subsidiary, associate or jointly controlled entities. Gain or loss is computed as the difference between the proceeds of the disposal and its carrying amount, including the carrying amount of goodwill, if any.

Ayala Corporation and Subsidiariesnotes to Consolidated financial statements
FinancialStatements94
Leases The determination of whether an arrangement is, or contains a lease is based on the substance of the arrangement at inception date of whether the fulfillment of the arrangement is dependent on the use of a specific asset or assets or the arrangement conveys a right to use the asset. A reassessment is made after inception of the lease only if one of the following applies: (a) there is a change in contractual terms, other than a renewal or extension of the arrangement; (b) a renewal option is exercised or extension granted, unless the term of the renewal or extension was initially included in the lease term; (c) there is a change in the determination of whether fulfillment is dependent on a specified asset; or (d) there is a substantial change to the asset. Where a reassessment is made, lease accounting shall commence or cease from the date when the change in circumstances gave rise to the reassessment for scenarios (a), (c) or (d) and at the date of renewal or extension period for scenario (b).
Group as lessee
Leases where the lessor retains substantially all the risks and benefits of ownership of the consolidated asset are classified as operating leases. Fixed lease payments are recognized as an expense in the consolidated statement of income on a straight-line basis while the variable rent is recognized as an expense based on terms of the lease contract.
Finance leases, which transfer substantially all the risks and benefits incidental to ownership of the leased item, are capitalized at the inception of the lease at the fair value of the leased property or, if lower, at the present value of the minimum lease payments. Lease payments are apportioned between the finance charges and reduction of the lease liability so as to achieve a constant rate of interest on the remaining balance of the liability. Finance charges are charged directly against income.
Capitalized leased assets are depreciated over the shorter of the estimated useful lives of the assets or the respective lease terms.
Group as lessor
Leases where the Group does not transfer substantially all the risks and benefits of ownership of the assets are classified as operating leases. Lease payments received are recognized as income in the consolidated statement of income on a straight-line basis over the lease term. Initial direct costs incurred in negotiating operating leases are added to the carrying amount of the leased asset and recognized over the lease term on the same basis as the rental income. Contingent rent is recognized as revenue in the period in which it is earned.
Commission Expense Commissions paid to sales or marketing agents on the sale of pre-completed real estate units are deferred when recovery is reasonably expected and are charged to expense in the period in which the related revenue is recognized as earned. Accordingly, when the percentage-of-completion method is used, commissions are likewise charged to expense in the period the related revenue is recognized. Commission expense is included under “Costs of sales and services” in the consolidated statement of income.
Expenses Cost of services and general and administrative expenses, except for lease agreements, are recognized as expense as they are incurred.
Borrowing Costs Borrowing costs directly attributable to the acquisition or construction of an asset that necessarily takes a substantial period of time to get ready for its intended use or sale are capitalized as part of the cost of the respective assets (included in “Real estate inventories”, “Investment properties”, “Property, plant and equipment” and “Service concession assets” accounts in the consolidated statement of financial position). All other borrowing costs are expensed in the period in which they occur. Borrowing costs consist of interest and other costs that an entity incurs in connection with the borrowing of funds.
The interest capitalized is calculated using the Group’s weighted average cost of borrowings after adjusting for borrowings associated with specific developments. Where borrowings are associated with specific developments, the amounts capitalized is the gross interest incurred on those borrowings less any investment income arising on their temporary investment. Interest is capitalized from the commencement of the development work until the date of practical completion. The capitalization of borrowing costs is suspended if there are prolonged periods when development activity is interrupted. If the carrying amount of the asset exceeds its recoverable amount, an impairment loss is recorded.

FinancialStatements 95
Pension Cost Defined benefit plans Pension cost is actuarially determined using the projected unit credit method. This method reflects services rendered by employees up to the date of valuation and incorporates assumptions concerning employees’ projected salaries. Actuarial valuations are conducted with sufficient regularity, with option to accelerate when significant changes to underlying assumptions occur. Pension cost includes current service cost, interest cost, expected return on any plan assets, recognized actuarial gains and losses and the effect of any curtailments or settlements.
The net pension liability recognized in the consolidated statement of financial position in respect of the defined benefit pension plans is the present value of the defined benefit obligation at the reporting date less the fair value of the plan assets. The defined benefit obligation is calculated annually by independent actuaries using the projected unit credit method. The present value of the defined benefit obligation is determined by using risk-free interest rates of government bonds that have terms to maturity approximating the terms of the related pension liabilities or applying a single weighted average discount rate that reflects the estimated timing and amount of benefit payments. The net pension asset is the lower of the fair value of the plan assets less the present value of the defined benefit obligation at the reporting date, together with adjustments for unrecognized actuarial gains or losses and past service costs that shall be recognized in future periods, or the total of any cumulative unrecognized net actuarial losses and past service cost and the present value of any economic benefits available in the form of refunds from the plan or reductions in the future contributions to the plan. Actuarial gains and losses are recognized as income or expense if the cumulative unrecognized actuarial gains and losses at the end of the previous reporting period exceeded the greater of 10% of the present value of defined benefit obligation or 10% of the fair value of plan assets. These gains or losses are recognized over the expected average remaining working lives of the employees participating in the plans.
Defined contribution plans Certain foreign subsidiaries participate in their respective country’s pension schemes which are considered as defined contribution plans. A defined contribution plan is a pension plan under which the subsidiary pays fixed contributions. The subsidiary has no legal or constructive obligations to pay further contributions if the fund does not hold sufficient assets to pay all the employees the benefits relating to employee service in the current and prior periods. The required contributions to the national pension schemes are recognized as pension cost as accrued.
Income Tax Current tax Current tax assets and liabilities for the current and prior periods are measured at the amount expected to be recovered from or paid to the taxation authorities. The tax rates and tax laws used to compute the amount are those that are enacted or substantively enacted as of reporting date.
Deferred tax Deferred income tax is provided, using the liability method, on all temporary differences, with certain exceptions, at the reporting date between the tax bases of assets and liabilities and their carrying amounts for financial reporting purposes.
Deferred tax liabilities are recognized for all taxable temporary differences, with certain exceptions. Deferred tax assets are recognized for all deductible temporary differences, carryforward benefit of unused tax credits from excess of minimum corporate income tax (MCIT) over the regular corporate income tax and unused net operating loss carryover (NOLCO), to the extent that it is probable that taxable income will be available against which the deductible temporary differences and carryforward benefits of MCIT and NOLCO can be utilized.
Deferred tax liabilities are not provided on nontaxable temporary differences associated with investments in domestic subsidiaries, associates and interests in jointly controlled entities. With respect to investments in foreign subsidiaries, associates and interests in jointly controlled entities, deferred tax liabilities are recognized except where the timing of the reversal of the temporary difference can be controlled and it is probable that the temporary difference will not reverse in the foreseeable future.
The carrying amount of deferred tax assets is reviewed at each reporting date and reduced to the extent that it is no longer probable that sufficient taxable income will be available to allow all as part of the deferred tax assets to be utilized. Unrecognized deferred tax assets are reassessed at each reporting date and are recognized to the extent that it has become probable that future taxable income will allow all as part of the deferred tax assets to be recovered.
Deferred tax assets and liabilities are measured at the tax rate that is expected to apply to the period when the asset is realized or the liability is settled, based on tax rates and tax laws that have been enacted or substantively enacted reporting date. Movements in the deferred income tax assets and liabilities arising from changes in tax rates are charged or credited to income for the period.
Ayala Corporation and Subsidiariesnotes to Consolidated financial statements
FinancialStatements96
Income tax relating to items recognized directly in equity is recognized in equity.
Deferred tax assets and deferred tax liabilities are offset, if a legally enforceable right exists to set off current tax assets against current tax liabilities and the deferred taxes relate to the same taxable entity and the same taxation authority.
For periods where the income tax holiday (ITH) is in effect, no deferred taxes are recognized in the consolidated financial statements as the ITH status of the subsidiary neither results in a deductible temporary difference or temporary taxable difference. However, for temporary differences that are expected to reverse beyond the ITH, deferred taxes are recognized.
Foreign Currency Transactions The functional and presentation currency of Ayala Corporation and its subsidiaries (except for PFIL, BHL, AIVPL and IMI), is the Philippine Peso (P=). Each entity in the Group determines its own functional currency and items included in the financial statements of each entity are measured using that functional currency. Transactions in foreign currencies are initially recorded in the functional currency rate ruling at the date of the transaction. Monetary assets and liabilities denominated in foreign currencies are retranslated at the functional currency rate of exchange ruling at the reporting date. All differences are taken to the consolidated statement of income with the exception of differences on foreign currency borrowings that provide a hedge against a net investment in a foreign entity. These are recognized in the consolidated statement of comprehensive income until the disposal of the net investment, at which time they are recognized in the consolidated statement of income. Tax charges and credits attributable to exchange differences on those borrowings are also dealt with in equity. Nonmonetary items that are measured in terms of historical cost in a foreign currency are translated using the exchange rate as at the date of initial transaction. Nonmonetary items measured at fair value in a foreign currency are translated using the exchange rate at the date when the fair value was determined.
The functional currency of PFIL, BHL, AIVPL and IMI is the US Dollar (US$). As of the reporting date, the assets and liabilities of these subsidiaries are translated into the presentation currency of the Group at the rate of exchange ruling at the reporting date and their statement of income accounts are translated at the weighted average exchange rates for the year. The exchange differences arising on the translation are recognized in the consolidated statement of comprehensive income and reported as a separate component of equity as Cumulative Translation Adjustment. On disposal of a foreign entity, the deferred cumulative amount recognized in the consolidated statement of comprehensive income relating to that particular foreign operation shall be recognized in the consolidated statement of income.
The Group’s share in the associates’ translation adjustments are likewise included under the Cumulative translation adjustments account in the consolidated statement of comprehensive income.
MWC
As approved by the MWSS Board of Trustees (BOT) under Amendment No. 1 of the Concession Agreement, the following will be recovered through billings to customers: a. Restatement of foreign currency-denominated loans;
b. Excess of actual Concession Fee payment over the amounts of Concession Fees translated using the base
exchange rate assumed in the business plan approved every rate rebasing exercise. The current base exchange rate is P=44.0:US$1.0 based on the last rate rebasing exercise effective on January 1, 2008.
c. Excess of actual interest payment translated at exchange spot rate on settlement date over the amount of
interest translated at drawdown rate; and
d. Excess of actual payment of other financing charges relating to foreign currency-denominated loans translated at exchange spot rate on settlement date over the amount of other financing charges translated at drawdown rate.
In view of the automatic reimbursement mechanism, MWC recognizes deferred foreign currency differential adjustment (FCDA) (included as part of “Other noncurrent assets” in the consolidated statement of financial position) for both the realized and unrealized foreign exchange gains and losses. Other water revenue-FCDA is credited (debited) upon recovery (refund) of realized foreign exchange losses (gains). The write-off or reversal of the deferred FCDA pertaining to concession fees will be made upon determination of the rebased foreign exchange rate, which is assumed in the business plan approved by MWSS-RO during the latest Rate Rebasing exercise, unless indication of impairment of the deferred FCDA would be evident at an earlier date.

FinancialStatements 97
Share-based Payments The Group has equity-settled, share-based compensation plans with its employees.
PFRS 2 Options For options granted after November 7, 2002 that have not vested on or before January 1, 2005, the cost of equity-settled transactions with employees is measured by reference to the fair value at the date on which they are granted. In valuing equity-settled transactions, vesting conditions, including performance conditions, other than market conditions (conditions linked to share prices), shall not be taken into account when estimating the fair value of the shares or share options at the measurement date. Instead, vesting conditions are taken into account in estimating the number of equity instruments that will ultimately vest. Fair value is determined by using the Black-Scholes model, further details of which are provided in Note 27 to the consolidated financial statements.
The cost of equity-settled transactions is recognized, together with a corresponding increase in equity, over the period in which the performance conditions are fulfilled, ending on the date on which the relevant employees become fully entitled to the awards (‘vesting date’). The cumulative expense recognized for equity-settled transactions at each reporting date until the vesting date reflects the extent to which the vesting period has expired and the Group’s best estimate of the number of equity instruments that will ultimately vest. The income or expense for a period represents the movement in cumulative expense recognized as of the beginning and end of that period.
No expense is recognized for awards that do not ultimately vest, except for awards where vesting is conditional upon a market condition, which are treated as vesting irrespective of whether or not the market condition is satisfied, provided that all other performance conditions are satisfied.
Where the terms of an equity-settled award are modified, as a minimum, an expense is recognized as if the terms had not been modified. In addition, an expense is recognized for any increase in the value of the transaction as a result of the modification, as measured at the date of modification.
Where an equity-settled award is cancelled, it is treated as if it had vested on the date of cancellation, and any expense not yet recognized for the award is recognized immediately.
However, if a new award is substituted for the cancelled award, and designated as a replacement award on the date that it is granted, the cancelled and new awards are treated as if they were a modification of the original award, as described in the previous paragraph.
Pre-PFRS 2 Options For options granted before November 7, 2002 that have vested before January 1, 2005, the intrinsic value of stock options determined as of grant date is recognized as expense over the vesting period.
The dilutive effect of outstanding options is reflected as additional share dilution in the computation of diluted earnings per share (see Note 25).
Employee share purchase plans
The Company and some of its subsidiaries have employee share purchase plans (ESOWN) which allow the grantees to purchase the Company’s and its respective subsidiaries’ shares at a discounted price. The Group recognizes the difference between the market price at the time of subscription and the subscription price as stock compensation expense over the holding period.
Where the subscription receivable is payable over more than one year, the subscription price is adjusted for the time value and treated as additional stock compensation expense. For the unsubscribed shares where the employees still have the option to subscribe in the future, these are accounted for as options.
Earnings Per Share Basic earnings per share (EPS) is computed by dividing net income attributable to common equity holders by the weighted average number of common shares issued and outstanding during the year. Diluted EPS is computed by dividing net income attributable to common equity holders by the weighted average number of common shares issued and outstanding during the year plus the weighted average number of common shares that would be issued on conversion of all the dilutive potential common shares. Calculation of diluted EPS considers the potential ordinary shares of subsidiaries, associates and jointly controlled entities that have dilutive effect on the basic EPS of the Company. The calculation of diluted EPS does not assume conversion, exercise or other issue of potential common shares that would have an antidilutive effect on earnings per share. Basic and diluted EPS are adjusted to give retroactive effect to any stock dividends declared during the period.
Assets Held in Trust Assets which are owned by MWSS, POL and TIEZA but are operated by MWC under the concession agreements are not reflected in the consolidated statement of financial position but are considered as Assets Held in Trust (see Note 37).
Ayala Corporation and Subsidiariesnotes to Consolidated financial statements
FinancialStatements98
Operating Segments The Group’s operating businesses are organized and managed separately according to the nature of the products and services provided, with each segment representing a strategic business unit that offers different products and serves different markets. Financial information on operating segments is presented in Note 28 to the consolidated financial statements.
Contingencies Contingent liabilities are not recognized in the consolidated financial statements. These are disclosed unless the possibility of an outflow of resources embodying economic benefits is remote. Contingent assets are not recognized in the consolidated financial statements but disclosed when an inflow of economic benefits is probable.
Events after the Reporting Period Post year-end events that provide additional information about the Group’s position at the reporting date (adjusting events) are reflected in the consolidated financial statements. Post year-end events that are not adjusting events are disclosed in the consolidated financial statements when material.
3. Significant Accounting Judgments and Estimates
The preparation of the accompanying consolidated financial statements in conformity with PFRS requires management to make estimates and assumptions that affect the amounts reported in the consolidated financial statements and accompanying notes. The estimates and assumptions used in the accompanying consolidated financial statements are based upon management’s evaluation of relevant facts and circumstances as of the date of the consolidated financial statements. Actual results could differ from such estimates.
Judgments
In the process of applying the Group’s accounting policies, management has made the following judgments, apart from those involving estimations, which have the most significant effect on the amounts recognized in the consolidated financial statements:
Service concession arrangement In applying Philippine Interpretation IFRIC 12, MWC Group has made a judgment that its concession agreements qualify under the Intangible Asset model. Refer to the accounting policy on SCA for the discussion of Intangible Asset model (see Note 2).
Operating lease commitments - Group as lessor The Group has entered into commercial property leases on its investment property portfolio. The Group has
determined that it retains all significant risks and rewards of ownership of these properties as the Group considered among others the length of the lease term as compared with the estimated useful life of the assets.
A number of the Group’s operating lease contracts are accounted for as noncancellable operating leases and the rest
are cancellable. In determining whether a lease contract is cancellable or not, the Group considers among others, the significance of the penalty, including the economic consequence to the lessee.
Operating lease commitments - Group as lessee The Group has entered into contracts with various parties to develop commercial or retail properties. The Group has determined that all significant risks and rewards of ownership of these properties are retained by the lessor.
Finance lease commitments - Group as lessee Certain subsidiaries have entered into finance lease agreements related to office equipment, machineries and production equipment. They have determined, based on the evaluation of the terms and conditions of the arrangement, that they bear substantially all the risks and rewards incidental to ownership of the said machineries and equipment and so account for the contracts as finance leases. Classification of property as investment property or real estate inventories The Group determines whether a property is classified as investment property or inventory property as follows:
Investment property comprises land and buildings (principally offices, commercial and retail property) which are
not occupied substantially for use by, or in the operations of, the Group, nor for sale in the ordinary course of business, but are held primarily to earn rental income and capital appreciation.
Inventory comprises property that is held for sale in the ordinary course of business. Principally, this is
residential, commercial and industrial property that the Group develops and intends to sell before or on completion of construction.
FinancialStatements 99
Distinction between investment properties and owner-occupied properties The Group determines whether a property qualifies as investment property. In making its judgment, the Group considers whether the property is not occupied substantially for use by, or in operations of the Group, not for sale in the ordinary course of business, but are held primarily to earn rental income and capital appreciation. Owner-occupied properties generate cash flows that are attributable not only to property but also to the other assets used in the production or supply process. Some properties comprise a portion that is held to earn rentals or for capital appreciation and another portion that is held for use in the production or supply of goods or services or for administrative purposes. If these portions cannot be sold separately as of reporting date, the property is accounted for as investment property only if an insignificant portion is held for use in the production or supply of goods or services or for administrative purposes. Judgment is applied in determining whether ancillary services are so significant that a property does not qualify as investment property. The Group considers each property separately in making its judgment.
Distinction between real estate inventories and land and improvements
The Group determines whether a property will be classified as real estate inventories or land and improvements. In making this judgment, the Group considers whether the property will be sold in the normal operating cycle (Real estate inventories) or whether it will be retained as part of the Group’s strategic landbanking activities for development or sale in the medium or long-term (Land and improvements).
Property acquisitions and business combinations The Group acquires subsidiaries that own real estate. At the time of acquisition, the Group assesses whether the
acquisitions represent the acquisition of a business. The Group accounts for an acquisition as a business combination when an integrated set of activities is acquired in addition to the property. More specifically, consideration is made of the extent to which significant processes are acquired and, in particular, the extent of ancillary services provided by the subsidiary.
Collectibility of the sales price
For real estate sales, in determining whether the sales prices are collectible, the Group considers that initial and continuing investments by the buyer of about 10% would demonstrate the buyer’s commitment to pay.
Impairment of AFS equity investments The Group treats AFS equity investments as impaired when there has been a significant or prolonged decline in the fair value below its cost or where other objective evidence of impairment exists. The determination of what is ‘significant’ or ‘prolonged’ requires judgment. The Group treats ‘significant’ generally as 20% or more and ‘prolonged’ as greater than 6 months for quoted equity securities. In addition, the Group evaluates other factors, including normal volatility in share price for quoted equities and the future cash flows and the discount factors for unquoted equities.
Financial assets not quoted in an active market The Group classifies financial assets by evaluating, among others, whether the asset is quoted or not in an active market. Included in the evaluation on whether a financial asset is quoted in an active market is the determination on whether quoted prices are readily and regularly available, and whether those prices represent actual and regularly occurring market transactions on an arm’s length basis.
Contingencies The Group is currently involved in various legal proceedings. The estimate of the probable costs for the resolution of these claims has been developed in consultation with outside counsel handling the defense in these matters and is based upon an analysis of potential results. The Group currently does not believe that these proceedings will have a material effect on the Group’s financial position (see Note 36).
Management’s Use of Estimates
The key assumptions concerning the future and other sources of estimation uncertainty at the reporting date that have a significant risk of causing a material adjustment to the carrying amounts of assets and liabilities within the next financial year are discussed below.
Revenue and cost recognition The Group’s revenue recognition policies require management to make use of estimates and assumptions that may affect the reported amounts of revenue and costs. The Group’s revenue from real estate, pipeworks, construction and management contracts are recognized based on the percentage-of-completion measured principally on the basis of the estimated completion of a physical proportion of the contract work, and by reference to the actual costs incurred to date over the estimated total costs of the project.
Ayala Corporation and Subsidiariesnotes to Consolidated financial statements
FinancialStatements100
Estimating allowance for impairment losses The Group maintains allowance for doubtful accounts based on the result of the individual and collective assessment under PAS 39. Under the individual assessment, the Group is required to obtain the present value of estimated cash flows using the receivable’s original effective interest rate. Impairment loss is determined as the difference between the receivable’s carrying balance and the computed present value. Factors considered in individual assessment are payment history, past due status and term. The collective assessment would require the Group to group its receivables based on the credit risk characteristics (customer type, payment history, past-due status and term) of the customers. Impairment loss is then determined based on historical loss experience of the receivables grouped per credit risk profile. Historical loss experience is adjusted on the basis of current observable data to reflect the effects of current conditions that did not affect the period on which the historical loss experience is based and to remove the effects of conditions in the historical period that do not exist currently. The methodology and assumptions used for the individual and collective assessments are based on management’s judgment and estimate. Therefore, the amount and timing of recorded expense for any period would differ depending on the judgments and estimates made for the year.
As of December 31, 2011 and 2010, allowance for impairment losses amounted to P=1.1 billion and P=1.2 billion, respectively. Accounts and notes receivable, net of allowance for doubtful accounts, amounted to P=39.6 billion and P=30.7 billion as of December 31, 2011 and 2010, respectively (see Note 6).
Evaluation of net realizable value of inventories and land and improvements
Inventories and land and improvements are valued at the lower of cost and NRV. This requires the Group to make an estimate of the inventories’ and land and improvements’ estimated selling price in the ordinary course of business, cost of completion and costs necessary to make a sale to determine the NRV. For real estate inventories and land and improvements, the Group adjusts the cost of its real estate inventories and land and improvements to net realizable value based on its assessment of the recoverability of the real estate inventories and land and improvements. In determining the recoverability of the inventories and land and improvements, management considers whether those inventories and land and improvements are damaged or if their selling prices have declined. Likewise, management also considers whether the estimated costs of completion or the estimated costs to be incurred to make the sale have increased. In the event that NRV is lower than the cost, the decline is recognized as an expense. The amount and timing of recorded expenses for any period would differ if different judgments were made or different estimates were utilized.
Inventories carried at cost amounted to P=25.8 billion and P=16.2 billion as of December 31, 2011 and 2010, respectively. Inventories carried at NRV amounted to P=1.9 billion and P=2.1 billion as of December 31, 2011 and 2010, respectively (see Note 7).
Evaluation of impairment of nonfinancial assets The Group reviews investments in associates and jointly controlled entities, land and improvements, investment properties, property, plant and equipment, service concession assets and intangible assets for impairment of value. Impairment for goodwill is assessed at least annually. This includes considering certain indications of impairment such as significant changes in asset usage, significant decline in assets’ market value, obsolescence or physical damage of an asset, plans in the real estate projects, significant underperformance relative to expected historical or projected future operating results and significant negative industry or economic trends.
The Group estimates the recoverable amount as the higher of the fair value less costs to sell and value in use. For investments in associates and jointly controlled entities, fair value less costs to sell pertain to quoted prices (listed equities) and to fair values determined using discounted cash flows or other valuation technique such as multiples. In determining the present value of estimated future cash flows expected to be generated from the continued use of the assets, the Group is required to make estimates and assumptions that may affect investments in associates and jointly controlled entities, investment properties, property, plant and equipment, service concession assets and intangible assets.
For goodwill, this requires an estimation of the recoverable amount which is the fair value less costs to sell or value in use of the cash-generating units to which the goodwill is allocated. Estimating a value in use amount requires management to make an estimate of the expected future cash flows for the cash generating unit and also to choose a suitable discount rate in order to calculate the present value of cash flows.
IMI’s impairment tests for goodwill are based on value in use and fair value less cost to sell calculations. The value in use calculations in 2011 and 2010 used a discounted cash flow model. The cash flows are derived from the budget for the next five years and assume a steady growth rate. The recoverable amount is most sensitive to discount rate used for the discounted cash flow model as well as the expected future cash inflows and the growth rate used for extrapolation purposes.

FinancialStatements 101
Investments in associates and jointly controlled entities, investment properties, property, plant and equipment, service concession assets and intangible assets amounted to P=197.2 billion and P=175.4 billion as of December 31, 2011 and 2010, respectively (see Notes 11, 12, 13,14 and 15). Estimating useful lives of investment properties, property, plant and equipment, and intangible assets The Group estimated the useful lives of its investment properties, property, plant and equipment and intangible assets with finite useful lives based on the period over which the assets are expected to be available for use. The estimated useful lives of investment properties, property, plant and equipment and intangible assets are reviewed at least annually and are updated if expectations differ from previous estimates due to physical wear and tear and technical or commercial obsolescence on the use of these assets. It is possible that future results of operations could be materially affected by changes in these estimates brought about by changes in factors mentioned above. A reduction in the estimated useful lives would increase depreciation and amortization expense and decrease noncurrent assets.
Investment properties, property, plant and equipment, and intangible assets with finite useful lives amounted to P=47.7 billion and P=41.4 billion as of December 31, 2011 and 2010, respectively (see Notes 12, 13 and 15).
Deferred FCDA and deferred credits Under Amendment No. 1 of the Concession Agreement, MWC is entitled to recover (refund) foreign exchange losses (gains) arising from MWSS loans and any concessionaire loans. For the unrealized foreign exchange losses, MWC recognized deferred FCDA as an asset since this is a resource controlled by MWC as a result of past events and from which future economic benefits are expected to flow to MWC. Unrealized foreign exchange gains, however, which will be refunded to the customers, are presented as deferred credits.
Deferred tax assets The Group reviews the carrying amounts of deferred income taxes at each reporting date and reduces deferred tax assets to the extent that it is no longer probable that sufficient taxable income will be available to allow all or part of the deferred tax assets to be utilized. However, there is no assurance that the Group will generate sufficient taxable income to allow all or part of deferred tax assets to be utilized. The Group looks at its projected performance in assessing the sufficiency of future taxable income.
As of December 31, 2011 and 2010, the Group has net deferred tax assets amounting to P=3.1 billion and P=2.7 billion, respectively, and net deferred tax liabilities amounting to P=6.1 billion and P=5.9 billion, respectively (see Note 24).
Recognition and measurement of taxes The Group has exposure to taxes in numerous jurisdictions. Significant judgment is involved in determining the group-wide provision for taxes including value-added tax, consumption tax and customs duty. There are certain transactions and computations for which the ultimate tax determination is uncertain during the ordinary course of business. The Group recognizes liabilities for expected tax issues based on estimates of whether additional taxes are due. Where the final tax outcome of these matters is different from the amounts that were initially recognized, such differences will impact the profit and loss in the period in which such determination is made. The carrying amount of the Group’s income taxes payable as of December 31, 2011 and 2010 amounted to P=483.3 million and P=440.8 million, respectively.
Share-based payments The expected life of the options is based on the expected exercise behavior of the stock option holders and is not necessarily indicative of the exercise patterns that may occur. The volatility is based on the average historical price volatility which may be different from the expected volatility of the shares of stock of the Group.
Total expense arising from share-based payments recognized by the Group amounted to P=447.6 million, P=375.0 million and P=471.6 million in 2011, 2010 and 2009, respectively (see Note 27).
Estimating pension obligation and other retirement benefits The determination of the Group’s obligation and cost of pension and other retirement benefits is dependent on the selection of certain assumptions used by actuaries in calculating such amounts. Those assumptions are described in Note 26 to the consolidated financial statements and include among others, discount rates, expected returns on plan assets and rates of salary increase. While the Group believes that the assumptions are reasonable and appropriate, significant differences in the actual experience or significant changes in the assumptions materially affect retirement obligations. See Note 26 to the consolidated financial statements for the related balances.

Ayala Corporation and Subsidiariesnotes to Consolidated financial statements
FinancialStatements102
Fair value of financial instruments Where the fair values of financial assets and financial liabilities recorded in the consolidated statement of financial position or disclosed in the notes to the consolidated financial statements cannot be derived from active markets, they are determined using internal valuation techniques using generally accepted market valuation models. The inputs to these models are taken from observable markets where possible, but where this is not feasible, estimates are used in establishing fair values. These estimates may include considerations of liquidity, volatility, and correlation. Certain financial assets and liabilities were initially recorded at fair values by using the discounted cash flow methodology. See Note 31 for the related balances.
Fair value of put and call options The acquisition of PSi on October 6, 2010 gave rise to a long equity call option and written equity put option for IMI. The call and put options were valued using the binomial option pricing model. This valuation technique considers the probability of PSi’s share price based on a five-year discounted cash flow to move up or down depending on the volatility, risk free rate and exercise price based on a 12-month trailing EBITDA of PSi as of the valuation date. As of December 31, 2011 and 2010, the call option has a positive value of US$2.74 million (P=119.9 million) and US$1.21 million (P=53.1 million), respectively, while the put option has nil value and negative value of US$3.83 million (P=168.0 million), respectively (see Note 31).
Fair value measurement of intangible assets resulting from business combination Intangible assets resulting from business combinations are valued at fair value at the acquisition date as part of the business combination. Valuation techniques are used to determine the fair value of the intangible assets. Valuation techniques include relief from royalty method (RRM), multi-period excess earnings method (MEEM) and other relevant valuation techniques. The table below summarizes the carrying amount of the intangible assets and the related valuation techniques used to determine fair value at the acquisition date for business combinations in 2011 and 2010 (amounts in thousands):
2011 Intangible
Asset Valuation
Technique Carrying
Value
EPIQ EA Customer
relationships MEEM P=271,928 IQ BackOffice Trademark RRM 7,419
Customer
relationships MEEM 100,200
Developed
software RRM 165,228 P=544,775
2010 Intangible
Asset Valuation
Technique Carrying
Value
WCW
Technical service
agreement MEEM P=56,010
Purchase price allocation 2011 Acquisition As of December 31, 2011, the purchase price allocation relating to the Group’s acquisition of EPIQ subsidiaries and Clark Water Corporation (CWC) have been prepared on a preliminary basis. The provisional fair values of the assets acquired and liabilities assumed as of date of acquisition were based on the net book values of the identifiable assets and liabilities since these approximate the fair values. The difference between the total consideration and the net assets are either recognized as goodwill or bargain purchase gain as follows:
EPIQ EA EPIQ CZ EPIQ MX In US$ In Php* In US$ In Php* In US$ In Php* CWC
(In Thousands) Total consideration US$28,287 P=1,192,019 US$725 P=30,571 US$13,957 P=588,141 P=1,200,658 Net Assets 39,949 1,683,442 75 3,163 15,314 645,316 1,070,339 Goodwill (gain from
bargain purchase) (US$11,662) (P=491,423) US$650 P=27,408 (US$1,357) (P=57,175) P=130,319 *Translated using the exchange rate at the transaction date (US$1:P=42.14).

FinancialStatements 103
2010 Acquisition As of December 31, 2010, the purchase price allocation relating to the Group’s acquisition of PSi Technologies, Inc. (PSi) and Ten Knots have been prepared on a preliminary basis. The provisional fair values of the assets acquired and liabilities assumed as of date of acquisition were based on the net book values of the identifiable assets and liabilities since these approximate the fair values. For PSi, the difference between the total consideration and the net assets amounting to P=413.0 million was initially allocated to goodwill as of December 31, 2010. The acquisition of Ten Knots resulted in the recognition of a bargain purchase gain amounting to P=0.5 million as of December 31, 2010.
4. Cash and Cash Equivalents
This account consists of the following:
2011 2010 (In Thousands) Cash on hand and in banks (Note 30) P=8,784,740 P=8,822,040 Cash equivalents (Note 30) 44,792,512 44,320,737 P=53,577,252 P=53,142,777
Cash in banks earns interest at the prevailing bank deposit rates. Cash equivalents are short-term, highly liquid
investments that are made for varying periods of up to three months depending on the immediate cash requirements of the Group and earn interest at the prevailing short-term rates.
5. Short-term Investments
Short-term investments pertain to money market placements made for varying periods of more than three months but less than one year and earn interest at the respective short-term investment rates. The ranges of interest rates of the short-term investments follow:
2011 2010 PHP 1.3% to 5.0% 3.5% to 4.8% USD 0.2% to 2.0% 1.5% to 2.3%
6. Accounts and Notes Receivable
This account consists of the following:
2011 2010 (In Thousands) Trade: Real estate P=18,921,685 P=13,898,871 Electronics manufacturing 5,628,560 4,215,059 Water utilities 1,086,389 1,006,082 Automotive 534,975 869,557 Information technology and business process outsourcing (BPO) 117,305 67,227 International and others 2,493 2,770 Advances to contractors and suppliers 4,493,325 3,586,986
Advances to other companies 3,247,162 3,593,632 Related parties (Note 30) 2,700,765 2,199,191 Dividend receivable (Note 30) 815,220 318,279 Receivable from officers and employees (Note 30) 738,549 854,313 Receivable from BWC (Note 23) 599,342 – Investment in bonds classified as loans and receivables 200,000 200,000 Others (Note 30) 1,627,326 1,076,499 40,713,096 31,888,466 Less allowance for doubtful accounts 1,142,037 1,160,229 39,571,059 30,728,237 Less noncurrent portion 8,251,363 4,793,315 P=31,319,696 P=25,934,922
Ayala Corporation and Subsidiariesnotes to Consolidated financial statements
FinancialStatements104
The classes of trade receivables of the Group follow:
Real estate Real estate receivables are receivables relating to residential development which pertain to receivables from the sale of high-end; upper middle-income and affordable residential lots and units, economic housing development and leisure community developments; construction contracts which pertain to receivables from third party construction projects; shopping centers which pertain to lease receivables of retail space; corporate business which pertain to lease receivables of office and factory buildings and receivables from the sale of office buildings and industrial lots; and management fees which pertain to facility management fees receivable.
The sales contracts receivable, included in real estate receivables, are collectible in monthly installments over a period of one to ten years and bear annual interest rates ranging from 2.2% to 20.0% computed based on the diminishing balance of the principal. Titles to real estate properties are not transferred to the buyers until full payment has been made.
Receivables from construction contracts, shopping centers and management fee are due within 30 days upon billing. Corporate business receivables are collectible on a monthly or quarterly basis depending on the terms of the lease.
Electronics manufacturing Electronics manufacturing receivables pertain to receivables arising from manufacturing and other related services for electronic products and components and billings to customers for production and test equipment and all other charges agreed with the customers in carrying out business operations. These are collectible within 30- to 60- days from invoice date.
Electronics manufacturing receivables include receivables of PSi from certain customers amounting to US$5.40 million (P=38.4 million) as of December 31, 2010, which were assigned as collateral for a credit facility from a local bank. The credit facility was renewed in April 2011 without required security (see Note 19).
Water utilities Water utilities receivable arise from water and sewer services rendered to residential, commercial, semi-business and industrial customers of MWC Group and are collectible within 30 days from bill generation. Automotive Automotive receivables are receivables relating to manufacture and sale of passenger cars and commercial vehicles and are collectible within 30- to 90- days from date of sale. Information technology and BPO Information technology and BPO receivables arise from venture capital for technology businesses; provision of value-added content for wireless services, online business-to-business and business-to-consumer services; electronic commerce; technology infrastructure sales and technology services; and onshore- and offshore-BPO services and are normally collected within 30- to 60- days of invoice date.
International and others International and other receivables arose from investments in overseas property companies and projects, charter services, agri-business and others and are generally on 30- to 60- day terms. The nature of the Group’s other receivables follows: Advances to contractors and suppliers Advances to contractors and suppliers are recouped every progress billing payment date depending on the percentage of accomplishment. Receivables from related parties and advances to other companies Receivables from related parties include notes receivable issued by related parties which are interest-bearing ranging from 4.0% to 15.0% and payable with various maturities up to 2012. Advances to other companies are due and demandable. Advances to other companies include receivable from SAWACO which pertains to the unpaid portion of services rendered by MWC in relation to its management contract with SAWACO. Receivables from officers and employees Receivable from officers and employees pertain to housing, car, salary and other loans granted to the Group’s officers and employees which are collectible through salary deduction, are interest bearing ranging from 6.0% to 13.5% per annum and have various maturity dates ranging from 2012 to 2026.
Investment in bonds classified as loans and receivables Investment in bonds classified as loans and receivables pertain to ALI’s investment in Land Bank of the Philippines’ (LBP’s) 7.3% unsecured subordinated notes due 2019, callable with step-up interest in 2014. Fitch Ratings assigned a National Long-term rating of AA (phl) to LBP. Others Other receivables include accrued interest receivable and other nontrade receivables which are non-interest bearing and are due and demandable. Other receivables also include IMI’s insurance claim amounting to US$1.2 million (P=53.9 million) and US$1.9 million (P=81.5 million) as of December 31, 2011 and 2010, respectively, for damages to equipment and inventories caused by a fire incident in IMI’s plant in Cebu, Philippines in May 2009. The gain from the insurance claim is included under “Other income” in the 2009 consolidated statement of income (see Note 22).
Movements in the allowance for doubtful accounts follow (in thousands):
2011
Real
Estate Electronics
Manufacturing Water
Utilities Automotive
Information Technology
and BPO International
and Others Others Total At January 1 P=245,059 P=28,183 P=479,524 P=36,516 P=7,330 P=67 P=363,550 P=1,160,229 Additions through business
combinations (Note 23) – – 3,764 – – – – 3,764 Provisions during the year
(Note 22) 8,195 83,763 49,965 1,513 25,240 – 154,258 322,934 Write-offs (1,611) (590) (18,516) – – – (109,147) (129,864) Reversals (4,219) (18,559) (95,469) (2,026) (3,551) – (91,202) (215,026) At December 31 P=247,424 P=92,797 P=419,268 P=36,003 P=29,019 P=67 P=317,459 P=1,142,037 Individually impaired P=221,260 P=92,797 P=42,992 P=36,003 P=25,148 P=67 P=177,192 P=595,459 Collectively impaired 26,164 – 376,276 – 3,871 – 140,267 546,578 Total P=247,424 P=92,797 P=419,268 P=36,003 P=29,019 P=67 P=317,459 P=1,142,037 Gross amount of loans and
receivables individually determined to be impaired P=277,731 P=92,797 P=42,992 P=36,003 P=25,148 P=67 P=177,192 P=651,930
2010
Real Estate Electronics
Manufacturing Water
Utilities Automotive
Information Technology
and BPO International and Others Others Total
At January 1 P=202,810 P=14,436 P=– P=30,451 P=77,405 P=103 P=47,777 P=372,982 Additions through business
combinations (Note 23) 14,264 – 556,430 – – – 105,802 676,496 Deconsolidation (Note 33) – – – – (45,372) – – (45,372) Provisions during the year
(Note 22) 57,206 34,931 – 6,065 3,248 1,607 353,162 456,219 Write-offs (27,209) (21,184) (49,398) – (27,951) (1,643) (143,191) (270,576) Reversals (2,012) – (27,508) – – – – (29,520) At December 31 P=245,059 P=28,183 P=479,524 P=36,516 P=7,330 P=67 P=363,550 P=1,160,229 Individually impaired P=221,715 P=28,183 P=61,474 P=36,516 P=7,330 P=67 P=250,668 P=605,953 Collectively impaired 23,344 – 418,050 – – – 112,882 554,276 Total P=245,059 P=28,183 P=479,524 P=36,516 P=7,330 P=67 P=363,550 P=1,160,229 Gross amount of loans and
receivables individually determined to be impaired P=331,280 P=28,183 P=61,474 P=36,516 P=7,330 P=67 P=250,668 P=715,518
As of December 31, 2011 and 2010, certain real estate receivables and receivables from officers and employees with a nominal amount of P=16,183.4 million and P=9,682.9 million, respectively, were recorded initially at fair value. The fair value of the receivables was obtained by discounting future cash flows using the applicable rates of similar types of instruments. The unamortized discount amounted to P=2,735.5 million and P=1,272.3 million as of December 31, 2011 and 2010, respectively. Additions amounted to P=2,380.4 million and P=1,250.5 million in 2011 and 2010, respectively, while amortization amounted to P=918.0 million and P=601.4 million in 2011 and 2010, respectively. Amortization of discounts are included as part of “Interest income” in the consolidated statement of income.
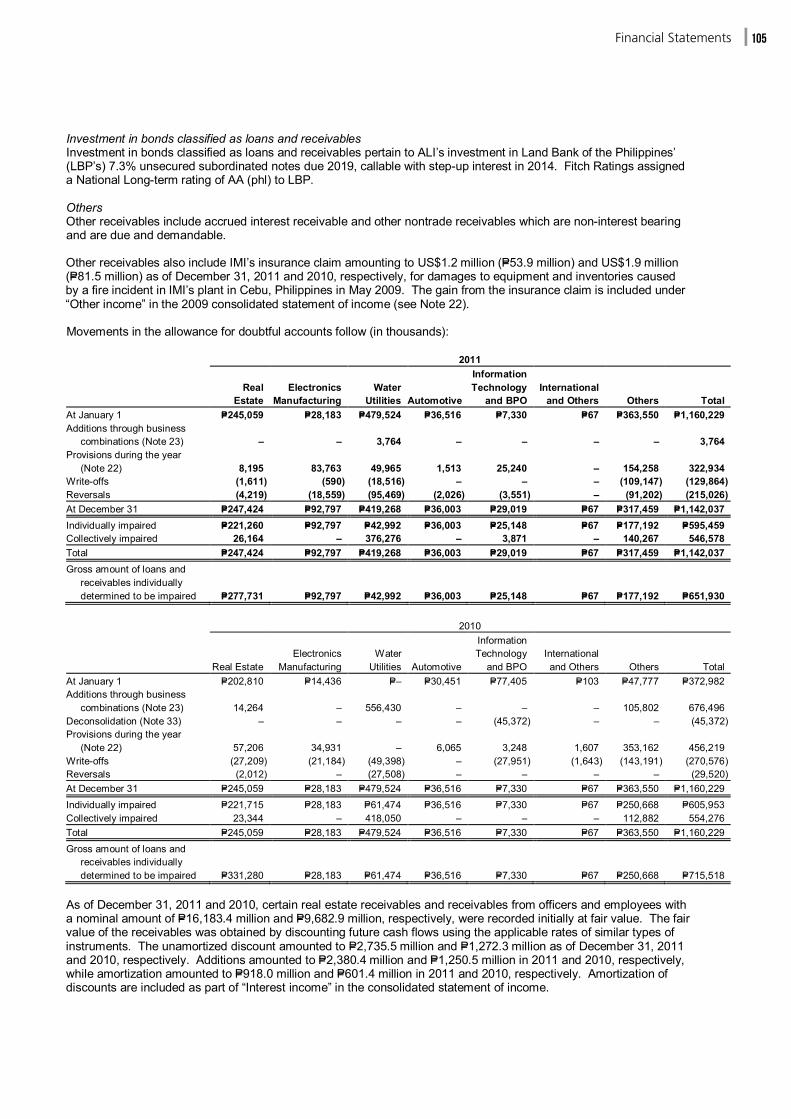
FinancialStatements 105
Investment in bonds classified as loans and receivables Investment in bonds classified as loans and receivables pertain to ALI’s investment in Land Bank of the Philippines’ (LBP’s) 7.3% unsecured subordinated notes due 2019, callable with step-up interest in 2014. Fitch Ratings assigned a National Long-term rating of AA (phl) to LBP. Others Other receivables include accrued interest receivable and other nontrade receivables which are non-interest bearing and are due and demandable. Other receivables also include IMI’s insurance claim amounting to US$1.2 million (P=53.9 million) and US$1.9 million (P=81.5 million) as of December 31, 2011 and 2010, respectively, for damages to equipment and inventories caused by a fire incident in IMI’s plant in Cebu, Philippines in May 2009. The gain from the insurance claim is included under “Other income” in the 2009 consolidated statement of income (see Note 22).
Movements in the allowance for doubtful accounts follow (in thousands):
2011
Real
Estate Electronics
Manufacturing Water
Utilities Automotive
Information Technology
and BPO International
and Others Others Total At January 1 P=245,059 P=28,183 P=479,524 P=36,516 P=7,330 P=67 P=363,550 P=1,160,229 Additions through business
combinations (Note 23) – – 3,764 – – – – 3,764 Provisions during the year
(Note 22) 8,195 83,763 49,965 1,513 25,240 – 154,258 322,934 Write-offs (1,611) (590) (18,516) – – – (109,147) (129,864) Reversals (4,219) (18,559) (95,469) (2,026) (3,551) – (91,202) (215,026) At December 31 P=247,424 P=92,797 P=419,268 P=36,003 P=29,019 P=67 P=317,459 P=1,142,037 Individually impaired P=221,260 P=92,797 P=42,992 P=36,003 P=25,148 P=67 P=177,192 P=595,459 Collectively impaired 26,164 – 376,276 – 3,871 – 140,267 546,578 Total P=247,424 P=92,797 P=419,268 P=36,003 P=29,019 P=67 P=317,459 P=1,142,037 Gross amount of loans and
receivables individually determined to be impaired P=277,731 P=92,797 P=42,992 P=36,003 P=25,148 P=67 P=177,192 P=651,930
2010
Real Estate Electronics
Manufacturing Water
Utilities Automotive
Information Technology
and BPO International and Others Others Total
At January 1 P=202,810 P=14,436 P=– P=30,451 P=77,405 P=103 P=47,777 P=372,982 Additions through business
combinations (Note 23) 14,264 – 556,430 – – – 105,802 676,496 Deconsolidation (Note 33) – – – – (45,372) – – (45,372) Provisions during the year
(Note 22) 57,206 34,931 – 6,065 3,248 1,607 353,162 456,219 Write-offs (27,209) (21,184) (49,398) – (27,951) (1,643) (143,191) (270,576) Reversals (2,012) – (27,508) – – – – (29,520) At December 31 P=245,059 P=28,183 P=479,524 P=36,516 P=7,330 P=67 P=363,550 P=1,160,229 Individually impaired P=221,715 P=28,183 P=61,474 P=36,516 P=7,330 P=67 P=250,668 P=605,953 Collectively impaired 23,344 – 418,050 – – – 112,882 554,276 Total P=245,059 P=28,183 P=479,524 P=36,516 P=7,330 P=67 P=363,550 P=1,160,229 Gross amount of loans and
receivables individually determined to be impaired P=331,280 P=28,183 P=61,474 P=36,516 P=7,330 P=67 P=250,668 P=715,518
As of December 31, 2011 and 2010, certain real estate receivables and receivables from officers and employees with a nominal amount of P=16,183.4 million and P=9,682.9 million, respectively, were recorded initially at fair value. The fair value of the receivables was obtained by discounting future cash flows using the applicable rates of similar types of instruments. The unamortized discount amounted to P=2,735.5 million and P=1,272.3 million as of December 31, 2011 and 2010, respectively. Additions amounted to P=2,380.4 million and P=1,250.5 million in 2011 and 2010, respectively, while amortization amounted to P=918.0 million and P=601.4 million in 2011 and 2010, respectively. Amortization of discounts are included as part of “Interest income” in the consolidated statement of income.

Ayala Corporation and Subsidiariesnotes to Consolidated financial statements
FinancialStatements106
In 2011, the Company and ALI sold to Bank of the Philippine Islands (BPI) its loans receivable from officers and employees and real estate receivables without recourse amounting to P=452.5 million and P=322.8 million, respectively. The discount on these receivables amounting to P=37.3 million has been included under “Other expenses” in the consolidated statement of income (see Note 22).
7. Inventories
This account consists of the following:
2011 2010 (In Thousands) At cost: Condominium, residential and commercial units P=13,316,731 P=6,984,154 Subdivision land for sale 9,624,053 7,706,164 Vehicles 472,230 621,358 Finished goods 273,178 333,591 Work-in-process 277,452 232,021 Materials, supplies and others 1,875,127 355,905 25,838,771 16,233,193 At NRV: Subdivision land for sale 524,158 524,158 Finished goods 191,481 12,120 Work-in-process 82,227 80,688 Parts and accessories 140,461 143,453 Materials, supplies and others 988,744 1,381,044 1,927,071 2,141,463 P=27,765,842 P=18,374,656
The cost of the inventories carried at NRV amounted to P=1.9 billion and P=2.1 billion as of December 31, 2011 and 2010, respectively. Inventories recognized as cost of sales amounted to P=43.9 billion, P=37.0 billion and P=34.2 billion in 2011, 2010 and 2009, respectively, and were included under “Costs of sales” in the consolidated statement of income.
The Group recorded provision for impairment losses on inventories amounting to P=49.9 million, nil and P=78.1 million in 2011, 2010 and 2009, respectively. The P=78.1 million provided in 2009 was for the development cost of real estate inventories which may no longer be recovered. The provision is included under “Other charges” in the consolidated statement of income (see Note 22).
For the years ended December 31, 2011, 2010 and 2009, gain from sale of scrapped packaging supplies amounting to US$0.01 million (P=0.43 million), US$0.23 million (P=10.38 million) and US$0.11 million (P=5.24 million), respectively, are included under “Other income” in the consolidated statement of income (see Note 22).
Inventories amounting to P=299.6 million in 2011 and 2010 was used to secure an interest bearing loan (see Note 19).
8. Other Current Assets This account consists of the following:
2011 2010 (In Thousands) Prepaid expenses P=3,179,854 P=1,989,109 Creditable withholding tax 2,278,279 1,201,204 Input VAT 1,826,450 1,801,747 Financial assets at FVPL 1,470,829 872,080 Deposits in escrow 147,529 317,597 Derivative assets (Note 31) 122,704 74,226 Investments in bonds and other securities (Note 9) – 357,129 Others 263,037 298,542 P=9,288,682 P=6,911,634

FinancialStatements 107
Prepaid expenses mainly include prepayments for commissions, marketing fees, advertising and promotion, taxes and licenses, rentals and insurance.
Input VAT is applied against output VAT. The remaining balance is recoverable in future periods.
Financial assets at FVPL consists of:
2011 2010 (In Thousands) Held for trading: Investment securities P=1,470,829 P=468,072 Government securities – 404,008 P=1,470,829 P=872,080
Investment securities pertains to the Group’s investment in The Rohatyn Group (TRG) Allocation LLC and TRG Management LP (collectively TRG investments), which have a combined fair value of US$33.4 million and US$10.5 million as of December 31, 2011 and 2010, respectively. These investments are accounted for at FVPL. There is no change in management’s intention to hold the investments for trading purpose. It was concluded in the past that there was no appropriate valuation method to value these unquoted investments and reference to equity transactions by external party would be the best approximation to fair value. In March 2011, the Group acquired additional 5.96% interest in TRG investments (see Note 11). Subsequent to the equity transaction, the Group’s existing 4.04% equity investments in TRG were revalued based on the most recent equity transaction with an external party. Unrealized gains recognized on this investment amounted to US$3.0 million (P=132.2 million), nil and US$0.3 million (P=14.7 million) in 2011, 2010 and 2009 (see Note 22). In the absence of equity transaction at reporting date, the Group uses the last transaction price as the fair value as of reporting date. Government securities pertain to treasury bonds and treasury bills with an aggregate face value of P=400.0 million that have yields to maturity of 1.3% in 2010. All of the government securities held by the Group matured in 2011. Net changes in fair value amounted to P=4.9 million, P=8.6 million and P=0.7 million in 2011, 2010 and 2009, respectively.
Net changes in fair value of financial assets at FVPL is included under “Mark to market gain on financial assets at FVPL and derivatives” in the consolidated statement of income (see Note 22). Deposits in escrow pertain to the proceeds from the sale of real estate project of an ALI subsidiary. Under its temporary license to sell, all payments, inclusive of down payments, reservation, and monthly amortization, among others, made by the buyer within the selling period shall be deposited in an escrow account. Derivative assets consist of:
2011 2010 (In Thousands) Call option P=119,939 P=267,763 Currency forwards 2,765 21,073 122,704 288,836 Less noncurrent portion (Note 16) – 214,610 P=122,704 P=74,226
9. Investments in Bonds and Other Securities
This account consists of investments in:
2011 2010 (In Thousands) AFS financial assets
Quoted equity investments P=992,612 P=1,702,552 Unquoted equity investments 1,439,324 2,692,960
2,431,936 4,395,512 Quoted debt investments 874,161 288,007 Unquoted debt investments 439,071 527,947 3,745,168 5,211,466 Less current portion (Note 8) – 357,129 P=3,745,168 P=4,854,337
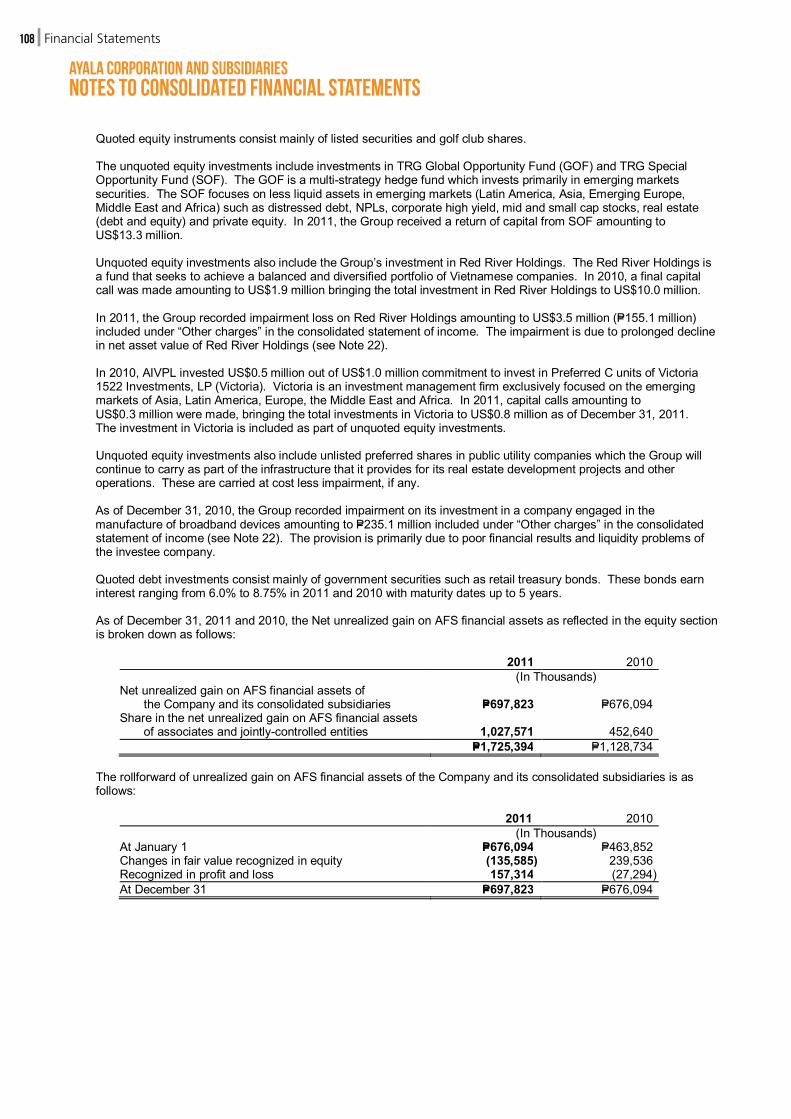
Ayala Corporation and Subsidiariesnotes to Consolidated financial statements
FinancialStatements108
Quoted equity instruments consist mainly of listed securities and golf club shares.
The unquoted equity investments include investments in TRG Global Opportunity Fund (GOF) and TRG Special Opportunity Fund (SOF). The GOF is a multi-strategy hedge fund which invests primarily in emerging markets securities. The SOF focuses on less liquid assets in emerging markets (Latin America, Asia, Emerging Europe, Middle East and Africa) such as distressed debt, NPLs, corporate high yield, mid and small cap stocks, real estate (debt and equity) and private equity. In 2011, the Group received a return of capital from SOF amounting to US$13.3 million.
Unquoted equity investments also include the Group’s investment in Red River Holdings. The Red River Holdings is a fund that seeks to achieve a balanced and diversified portfolio of Vietnamese companies. In 2010, a final capital call was made amounting to US$1.9 million bringing the total investment in Red River Holdings to US$10.0 million.
In 2011, the Group recorded impairment loss on Red River Holdings amounting to US$3.5 million (P=155.1 million) included under “Other charges” in the consolidated statement of income. The impairment is due to prolonged decline in net asset value of Red River Holdings (see Note 22).
In 2010, AIVPL invested US$0.5 million out of US$1.0 million commitment to invest in Preferred C units of Victoria 1522 Investments, LP (Victoria). Victoria is an investment management firm exclusively focused on the emerging markets of Asia, Latin America, Europe, the Middle East and Africa. In 2011, capital calls amounting to US$0.3 million were made, bringing the total investments in Victoria to US$0.8 million as of December 31, 2011. The investment in Victoria is included as part of unquoted equity investments.
Unquoted equity investments also include unlisted preferred shares in public utility companies which the Group will continue to carry as part of the infrastructure that it provides for its real estate development projects and other operations. These are carried at cost less impairment, if any.
As of December 31, 2010, the Group recorded impairment on its investment in a company engaged in the manufacture of broadband devices amounting to P=235.1 million included under “Other charges” in the consolidated statement of income (see Note 22). The provision is primarily due to poor financial results and liquidity problems of the investee company. Quoted debt investments consist mainly of government securities such as retail treasury bonds. These bonds earn interest ranging from 6.0% to 8.75% in 2011 and 2010 with maturity dates up to 5 years.
As of December 31, 2011 and 2010, the Net unrealized gain on AFS financial assets as reflected in the equity section is broken down as follows:
2011 2010 (In Thousands) Net unrealized gain on AFS financial assets of the Company and its consolidated subsidiaries P=697,823 P=676,094 Share in the net unrealized gain on AFS financial assets of associates and jointly-controlled entities 1,027,571 452,640 P=1,725,394 P=1,128,734
The rollforward of unrealized gain on AFS financial assets of the Company and its consolidated subsidiaries is as follows:
2011 2010 (In Thousands) At January 1 P=676,094 P=463,852 Changes in fair value recognized in equity (135,585) 239,536 Recognized in profit and loss 157,314 (27,294) At December 31 P=697,823 P=676,094
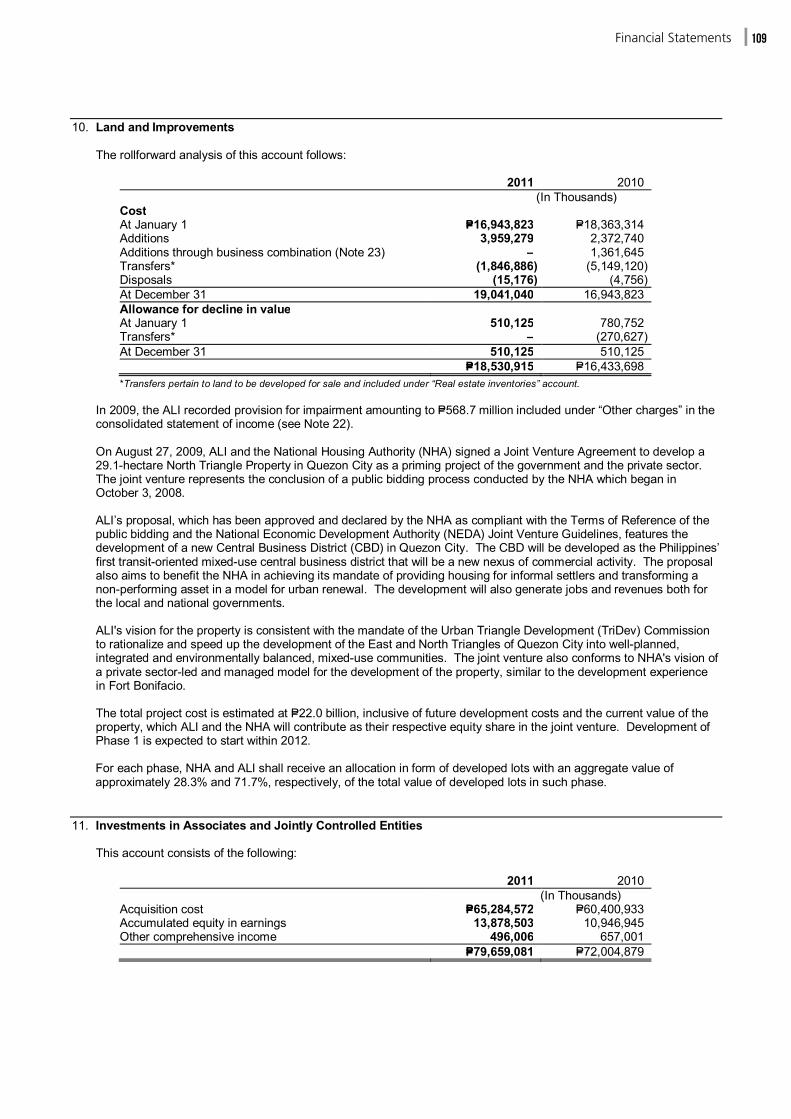
FinancialStatements 109
10. Land and Improvements
The rollforward analysis of this account follows:
2011 2010 (In Thousands) Cost At January 1 P=16,943,823 P=18,363,314 Additions 3,959,279 2,372,740 Additions through business combination (Note 23) – 1,361,645 Transfers* (1,846,886) (5,149,120) Disposals (15,176) (4,756) At December 31 19,041,040 16,943,823 Allowance for decline in value At January 1 510,125 780,752 Transfers* – (270,627) At December 31 510,125 510,125 P=18,530,915 P=16,433,698
*Transfers pertain to land to be developed for sale and included under “Real estate inventories” account.
In 2009, the ALI recorded provision for impairment amounting to P=568.7 million included under “Other charges” in the consolidated statement of income (see Note 22). On August 27, 2009, ALI and the National Housing Authority (NHA) signed a Joint Venture Agreement to develop a 29.1-hectare North Triangle Property in Quezon City as a priming project of the government and the private sector. The joint venture represents the conclusion of a public bidding process conducted by the NHA which began in October 3, 2008.
ALI’s proposal, which has been approved and declared by the NHA as compliant with the Terms of Reference of the public bidding and the National Economic Development Authority (NEDA) Joint Venture Guidelines, features the development of a new Central Business District (CBD) in Quezon City. The CBD will be developed as the Philippines’ first transit-oriented mixed-use central business district that will be a new nexus of commercial activity. The proposal also aims to benefit the NHA in achieving its mandate of providing housing for informal settlers and transforming a non-performing asset in a model for urban renewal. The development will also generate jobs and revenues both for the local and national governments.
ALI's vision for the property is consistent with the mandate of the Urban Triangle Development (TriDev) Commission to rationalize and speed up the development of the East and North Triangles of Quezon City into well-planned, integrated and environmentally balanced, mixed-use communities. The joint venture also conforms to NHA's vision of a private sector-led and managed model for the development of the property, similar to the development experience in Fort Bonifacio.
The total project cost is estimated at P=22.0 billion, inclusive of future development costs and the current value of the property, which ALI and the NHA will contribute as their respective equity share in the joint venture. Development of Phase 1 is expected to start within 2012.
For each phase, NHA and ALI shall receive an allocation in form of developed lots with an aggregate value of approximately 28.3% and 71.7%, respectively, of the total value of developed lots in such phase.
11. Investments in Associates and Jointly Controlled Entities
This account consists of the following:
2011 2010 (In Thousands) Acquisition cost P=65,284,572 P=60,400,933 Accumulated equity in earnings 13,878,503 10,946,945 Other comprehensive income 496,006 657,001 P=79,659,081 P=72,004,879
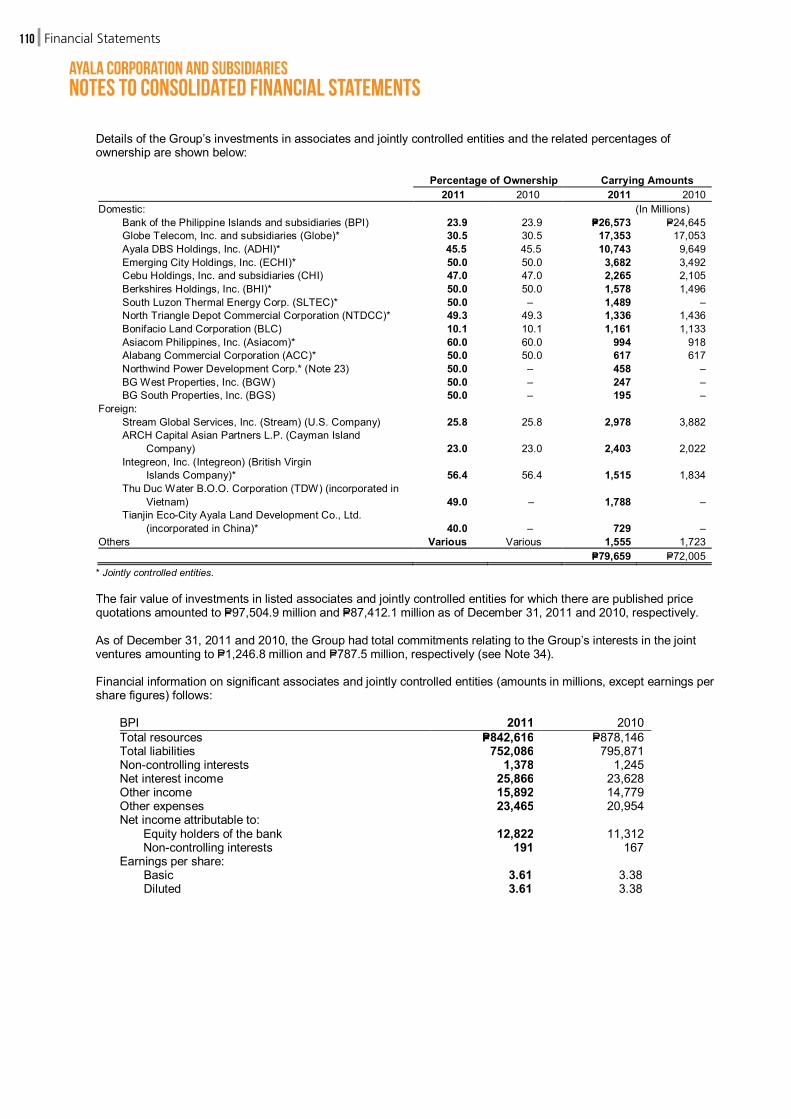
Ayala Corporation and Subsidiariesnotes to Consolidated financial statements
FinancialStatements110
Details of the Group’s investments in associates and jointly controlled entities and the related percentages of
ownership are shown below:
Percentage of Ownership Carrying Amounts 2011 2010 2011 2010 Domestic: (In Millions) Bank of the Philippine Islands and subsidiaries (BPI) 23.9 23.9 P=26,573 P=24,645 Globe Telecom, Inc. and subsidiaries (Globe)* 30.5 30.5 17,353 17,053 Ayala DBS Holdings, Inc. (ADHI)* 45.5 45.5 10,743 9,649 Emerging City Holdings, Inc. (ECHI)* 50.0 50.0 3,682 3,492 Cebu Holdings, Inc. and subsidiaries (CHI) 47.0 47.0 2,265 2,105 Berkshires Holdings, Inc. (BHI)* 50.0 50.0 1,578 1,496 South Luzon Thermal Energy Corp. (SLTEC)* 50.0 – 1,489 – North Triangle Depot Commercial Corporation (NTDCC)* 49.3 49.3 1,336 1,436 Bonifacio Land Corporation (BLC) 10.1 10.1 1,161 1,133 Asiacom Philippines, Inc. (Asiacom)* 60.0 60.0 994 918 Alabang Commercial Corporation (ACC)* 50.0 50.0 617 617 Northwind Power Development Corp.* (Note 23) 50.0 – 458 – BG West Properties, Inc. (BGW) 50.0 – 247 – BG South Properties, Inc. (BGS) 50.0 – 195 – Foreign: Stream Global Services, Inc. (Stream) (U.S. Company) 25.8 25.8 2,978 3,882 ARCH Capital Asian Partners L.P. (Cayman Island
Company) 23.0 23.0 2,403 2,022 Integreon, Inc. (Integreon) (British Virgin Islands Company)* 56.4 56.4 1,515 1,834 Thu Duc Water B.O.O. Corporation (TDW) (incorporated in
Vietnam) 49.0 – 1,788 – Tianjin Eco-City Ayala Land Development Co., Ltd.
(incorporated in China)* 40.0 – 729 – Others Various Various 1,555 1,723 P=79,659 P=72,005 * Jointly controlled entities.
The fair value of investments in listed associates and jointly controlled entities for which there are published price
quotations amounted to P=97,504.9 million and P=87,412.1 million as of December 31, 2011 and 2010, respectively.
As of December 31, 2011 and 2010, the Group had total commitments relating to the Group’s interests in the joint ventures amounting to P=1,246.8 million and P=787.5 million, respectively (see Note 34). Financial information on significant associates and jointly controlled entities (amounts in millions, except earnings per share figures) follows:
BPI 2011 2010 Total resources P=842,616 P=878,146 Total liabilities 752,086 795,871 Non-controlling interests 1,378 1,245 Net interest income 25,866 23,628 Other income 15,892 14,779 Other expenses 23,465 20,954 Net income attributable to:
Equity holders of the bank 12,822 11,312 Non-controlling interests 191 167
Earnings per share: Basic 3.61 3.38 Diluted 3.61 3.38

FinancialStatements 111
Globe 2011 2010 Current assets P=23,564 P=21,585 Noncurrent assets 107,275 109,043 Total assets 130,839 130,628 Current liabilities 38,987 35,309 Noncurrent liabilities 43,424 48,450 Total liabilities 82,411 83,759 Revenues 72,437 66,623 Costs and expenses 58,659 52,618 Net income 9,832 9,745 Earnings per share: Basic 74.02 73.29 Diluted 73.77 73.12
ADHI 2011 2010 Current assets P=707 P=706 Noncurrent assets 18,820 17,098 Total assets 19,527 17,804 Total liabilities – 682 Net income 2,734 2,442
ECHI and Subsidiaries 2011 2010 Current assets P=22,094 P=22,885 Noncurrent assets 20,577 18,733 Total assets 42,671 41,618 Current liabilities 3,767 2,551 Noncurrent liabilities 3,890 4,010 Total liabilities 7,657 6,561 Net operating revenue 5,668 5,732 Costs and expenses 4,272 4,299 Net income 1,396 1,433
CHI and Subsidiaries 2011 2010 Total assets P=7,130 P=5,992 Total liabilities 2,102 1,267 Net operating revenue 1,349 1,447 Costs and expenses 884 1,002 Net income 465 445 Earnings per share 0.22 0.21
BHI and Subsidiaries 2011 2010 Current assets P=60 P=– Noncurrent assets 3,756 3,704 Total assets 3,817 3,704 Total liabilities 7 7 Net operating revenue 114 164 Costs and expenses – 7 Net income 114 157
SLTEC** 2011 Current assets P=472 Noncurrent assets 2,498 Total assets 2,970 Total liabilities 53 Net operating revenue 5 Costs and expenses 47 Net loss 44
**Incorporated in 2011.
NTDCC 2011 2010 Total assets P=7,243 P=7,479 Total liabilities 4,771 4,906 Net operating revenue 1,777 1,688 Costs and expenses 1,359 1,472 Net income 418 216
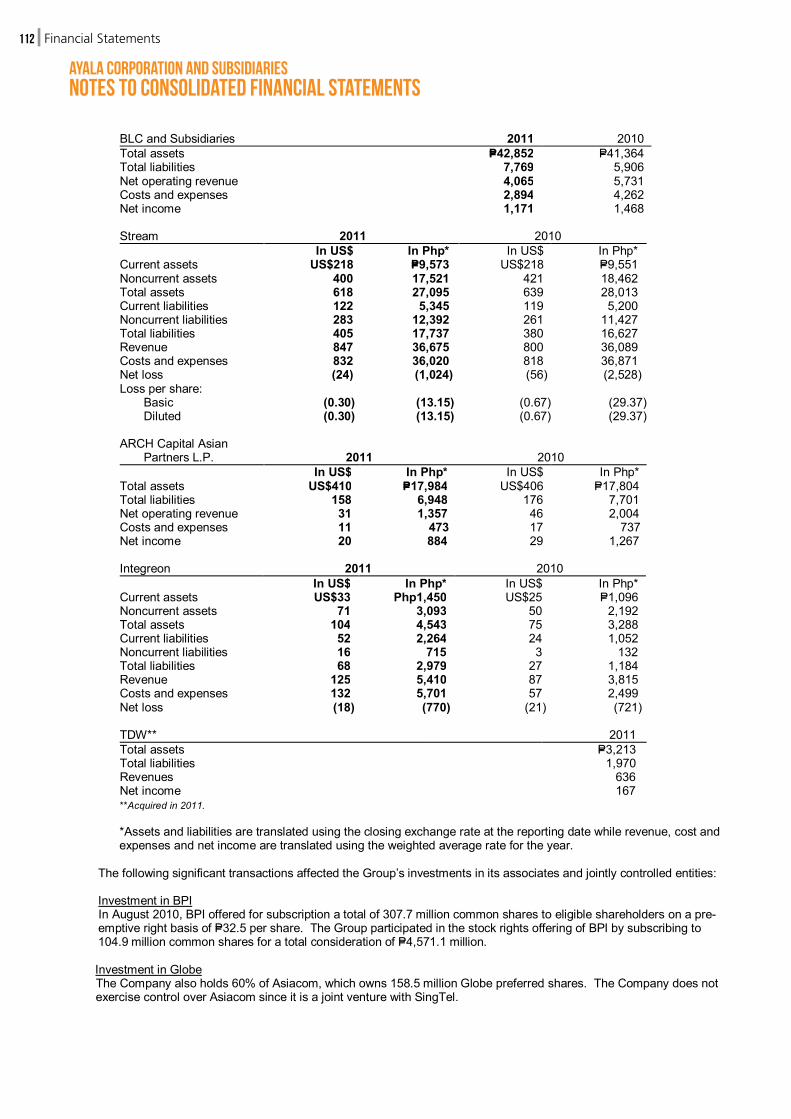
Ayala Corporation and Subsidiariesnotes to Consolidated financial statements
FinancialStatements112
BLC and Subsidiaries 2011 2010 Total assets P=42,852 P=41,364 Total liabilities 7,769 5,906 Net operating revenue 4,065 5,731 Costs and expenses 2,894 4,262 Net income 1,171 1,468
Stream 2011 2010 In US$ In Php* In US$ In Php* Current assets US$218 P=9,573 US$218 P=9,551 Noncurrent assets 400 17,521 421 18,462 Total assets 618 27,095 639 28,013 Current liabilities 122 5,345 119 5,200 Noncurrent liabilities 283 12,392 261 11,427 Total liabilities 405 17,737 380 16,627 Revenue 847 36,675 800 36,089 Costs and expenses 832 36,020 818 36,871 Net loss (24) (1,024) (56) (2,528) Loss per share: Basic (0.30) (13.15) (0.67) (29.37) Diluted (0.30) (13.15) (0.67) (29.37)
ARCH Capital Asian Partners L.P. 2011 2010 In US$ In Php* In US$ In Php* Total assets US$410 P=17,984 US$406 P=17,804 Total liabilities 158 6,948 176 7,701 Net operating revenue 31 1,357 46 2,004 Costs and expenses 11 473 17 737 Net income 20 884 29 1,267
Integreon 2011 2010 In US$ In Php* In US$ In Php* Current assets US$33 Php1,450 US$25 P=1,096 Noncurrent assets 71 3,093 50 2,192 Total assets 104 4,543 75 3,288 Current liabilities 52 2,264 24 1,052 Noncurrent liabilities 16 715 3 132 Total liabilities 68 2,979 27 1,184 Revenue 125 5,410 87 3,815 Costs and expenses 132 5,701 57 2,499 Net loss (18) (770) (21) (721) TDW** 2011 Total assets P=3,213 Total liabilities 1,970 Revenues 636 Net income 167
**Acquired in 2011.
*Assets and liabilities are translated using the closing exchange rate at the reporting date while revenue, cost and expenses and net income are translated using the weighted average rate for the year.
The following significant transactions affected the Group’s investments in its associates and jointly controlled entities:
Investment in BPI In August 2010, BPI offered for subscription a total of 307.7 million common shares to eligible shareholders on a pre-
emptive right basis of P=32.5 per share. The Group participated in the stock rights offering of BPI by subscribing to 104.9 million common shares for a total consideration of P=4,571.1 million.
Investment in Globe The Company also holds 60% of Asiacom, which owns 158.5 million Globe preferred shares. The Company does not exercise control over Asiacom since it is a joint venture with SingTel.
FinancialStatements 113
Investment in ADHI
As of December 31, 2011 and 2010, ADHI owns 757.8 million common shares of BPI. ADHI’s direct ownership in BPI is equal to 21.3% as of December 31, 2011 and 2010. The fair value of investments in BPI owned by ADHI amounted to P=41,642.8 million and P=43,764.8 million in 2011 and 2010, respectively. Investment in ECHI and BHI On April 17, 2003, the following transactions were consummated pursuant to the terms and conditions of the Assignment Agreement (Agreement), dated February 8, 2003, among ALI, Evergreen Holdings, Inc. (EHI), Greenfield Development Corporation and Larouge, B.V. (Larouge), as amended, and the Agreement, dated November 23, 2002, among ALI, EHI and Metro Pacific Investment Corporation (MPIC) as amended:
(a) The assignment to ALI and EHI of the rights and obligations of Larouge under the loan agreement between
Larouge and MPIC, pursuant to which, Larouge extended MPIC a loan in the principal amount of US$90.0 million, together with all the rights, title and interests of Larouge in the pledge constituted on 50.38% of the outstanding shares in BLC. The consideration paid by ALI and EHI for such assignment was approximately US$90 million, subject in part to foreign exchange adjustment.
(b) The assignment to ALI and EHI (acting in this instance through the joint venture corporation, Columbus Holdings,
Inc. (Columbus)) of the controlling interest in BLC representing 50.38% of BLC’s outstanding capital stock. This assignment was effected by MPIC under a dacion en pago arrangement, and included an assignment of payables of BLC in the principal amount of P=655.0 million together with its underlying security in the form of shares in Fort Bonifacio Development Corporation (FBDC) representing 5.55% of its outstanding capital stock.
The Agreement, as amended, also provides for the constitution of a pledge over 5% of BLC’s unencumbered shares as security for contingent liabilities and breach of representation and warranties. The pledge lien over the 5% BLC shares shall continue to subsist until the third anniversary of the closing date.
ALI and EHI jointly hold the 50.38% equity interest in BLC through ECHI and BHI. ALI and EHI assigned the notes receivable from MPIC to ECHI and BHI, which acquired the shares of stock of Columbus. Columbus directly owns the 50.38% interest in BLC. BLC owns 55% interest in FBDC, the primary developer of certain areas in Fort Bonifacio Global City for residential, commercial and business development.
Columbus accounted for the acquisition of the 50.38% interest in BLC using the purchase method, resulting in a negative goodwill of P=1.4 billion. Subsequent to this, ALI and EHI acquired additional shares of BLC through a combination of direct acquisition and through its associates at varying dates as follows:
On July 31, 2008, the Group acquired, through ALI, Regent and Columbus, additional 4,360,178 shares of BLC from FBDC amounting to P=689.0 million, equivalent to 7.66% ownership in BLC.
In January and October 2009, a total of 2,295,207 BLC shares were acquired from Development Bank of the Philippines and MPIC, pertaining to the pledged shares, through Columbus amounting to P=362.6 million. This resulted in an increase in the Group’s effective interest in BLC to 45.05% as of December 31, 2009.
ALI’s 5.32% direct investment in BLC and 4.78% through Regent are accounted for using the equity method because ALI has significant influence over BLC. Investment in SLTEC On June 29, 2011, ACEHI entered into a 50-50 joint venture with Trans-Asia Oil and Energy Development Corporation to incorporate SLTEC which will undertake the construction and operation of a 135-megawatt power plant in Calaca, Batangas. The power plant will employ the environment-friendly Circulating Fluidized Bed boiler technology and is expected to start commercial operations by mid-2014.
Investment in BGW and BGS BGW and BGS were incorporated on August 5 and 10, 2011, respectively, to engage in the development of residential and retail projects in Bonifacio Global City.
Investment in Stream [Formerly eTelecare Global Solutions (eTelecare)]
On September 19, 2008, NewBridge, a subsidiary of the Company through LIL, together with Providence Equity Partners (Providence), entered into a Definitive Agreement to acquire up to all of the outstanding shares of eTelecare common shares and American Depository Shares (ADS) for US$9.0 per share. New Bridge and Providence formed a 50-50 joint venture company, EGS Corporation to own 100% of EGS Acquisition Corp.

Ayala Corporation and Subsidiariesnotes to Consolidated financial statements
FinancialStatements114
On December 12, 2008, EGS Acquisition Corp. acquired through a tender offer, 98.7% of the outstanding eTelecare common shares and ADS for a total consideration of US$285.3 million plus US$9.4 million in transactions costs. The 22.2% eTelecare shares owned by Newbridge were tendered and included in the purchase.
On August 14, 2009, a Share Exchange Agreement (the Agreement) was entered into by Stream, EGS, EGS Dutchco B.V. (EGS Dutchco), and NewBridge to combine in a stock-for-stock exchange. Under the Agreement:
NewBridge shall contribute all its rights with respect to the US$35.8 million advances from EGS (see Note 30).
These advances were originally borrowed by EGS from AYC Holdings. AYC Holdings assigned the advances to NewBridge;
NewBridge shall transfer to Stream all the shares of EGS that it owns including shares that would result from the conversion of the US$35.8 million advances; and
Stream shall issue and deliver to NewBridge an aggregate of 20,192,068 common shares with US$0.001 par value per share provided that at the election of Stream, Stream may pay an aggregate of US$5,994 in cash for an aggregate of 1,131 shares (at US$5.3 per share) of Stream Common Stock otherwise issuable to NewBridge.
On October 1, 2009 (the Closing Date), NewBridge received a total of 20,190,937 shares of Stream’s capital stock representing 25.5% interest in Stream and cash amounting to US$5,994 in lieu of 1,131 shares. As a result of the transaction, NewBridge:
derecognized its Investment in and Loan receivable from EGS amounting to US$61.5 million and
US$35.8 million, respectively; recognized an Investment in Stream amounting to US$107.0 million; and, recognized a gain from the transaction amounting to US$8.8 million.
After the Closing Date, Newbridge acquired additional 320,146 common shares of Stream at a total cost of US$1.9 million.
As of December 31, 2009, Newbridge’s effective ownership in Stream is 25.8%.
In 2010, the Group recorded an adjustment for the excess of the carrying value over the fair value of its investment in Stream amounting to P=365.6 million. The adjustment was recorded mainly due to the decline in the quoted share price of Stream. The recoverable amount of the investment in Stream is based on its quoted share price as of December 31, 2010. The adjustment is netted against the share of profit of associates and jointly controlled entities in the consolidated statement of income.
Investment in ARCH Fund In 2006, the Company and ALI entered into a Shareholders’ Agreement with ARCH Capital Management Co. Ltd. (ARCH Capital) and Great ARCH Co. Limited, wherein the Company and ALI committed to invest a total of US$75.0 million in a private equity fund that will explore property markets in Asia, excluding Japan and the Philippines. In the same year, an Amendment and Adherence Agreement was entered into by the same parties, together with Fine State Group Limited (Fine State) and Green Horizons Holdings Limited (Green Horizons), transferring the interests of the Company and ALI in ARCH Capital into Fine State and Green Horizons, respectively. Fine State and Green Horizons are effectively 100% owned Hong Kong based subsidiaries of the Company and ALI, respectively.
The Company (through Fine State) and ALI (through Green Horizons) both have interests in the fund management company, ARCH Capital, which is tasked to raise third party capital and pursue investments for the Fund. On March 7, 2011, the Company and ALI entered into a Contribution and Exchange Agreement with TRG for the exchange of ownership interests in ARCH Capital and ARCH Capital Asian Partners G.P. (a Cayman Islands company) which resulted to a gain amounting to US$9.4 million (P=407.1 million). The gain on the exchange is recorded as part of “Other income” in the consolidated statement of income (see Note 22). The exchange ownership interest with a cash consideration of US$13.3 million resulted in TRG acquiring the Company’s 33% and ALI’s 17% stake in ARCH Capital and increase in ownership interest in TRG Allocation LLC and TRG Management LP to 10% (Note 8). As of December 31, 2011 and 2010, the Company and ALI owned a combined interest in ARCH Capital of nil and 50%, respectively.

FinancialStatements 115
In 2007, the private equity fund, called ARCH Capital Asian Partners, L.P. (Fund) was established. As of December 31, 2007, the Fund achieved its final closing, resulting in a total investor commitment of US$330.0 million. As a result, a portion of the funds disbursed by the Company and ALI which were invested into the Fund has been returned in 2007, reducing the Company and ALI’s overall invested capital to P=580.3 million as of December 31, 2007. On various dates in 2011 and 2010, the Fund made capital calls where the Company and ALI’s share amounted to US$6.7 million and US$27.1 million as of December 31, 2011 and 2010, respectively.
In 2011, the Company, through one of its subsidiaries, committed to invest US$50.0 million in ARCH Capital’s second real estate fund, ARCH Capital-TRG Asian Partners, L.P., which had its first closing on June 30, 2011. As of December 31, 2011, the Company had contributed US$2.6 million (P=114.0 million) into the fund.
Investment in Integreon On February 16, 2010, Actis LLP, an emerging markets private equity specialist, invested US$50.0 million to acquire a 37.68% stake in Integreon, a subsidiary of LIL. The transaction resulted in the Group losing control over Integreon. Integreon became a jointly controlled entity by LIL and Actis although LIL owns 56.36% of Integreon. LIL recorded gain on deemed disposal amounting to US$44.7 million (P=2.1 billion) which primarily arose from recognizing the retained investment in Integreon at fair value at the date when control was lost. The gain on deemed disposal is recorded as part of “Other income” in the consolidated statement of income (see Note 22).
Investment in TDW On October 12, 2011, Thu Duc Water Holdings Pte. Ltd. (TDH), a subsidiary of MWC, together with Ho Chi Minh City Infrastructure Investment Joint Stock Company (CII) entered into a share sale and purchase agreement whereby CII will sell to TDH its 49% interest (2.02 million common shares) in TDW. On December 8, 2011, TDH completed the acquisition of CII’s interest in the common shares of TDW after which TDH obtained significant influence in TDW. The acquisition cost of the investment amounted to VND858 billion (P=1.8 billion). Investment in Tianjin Eco-City Ayala Land Development Co., Ltd. Regent Wise, a wholly-owned subsidiary of ALI, signed an Equity Joint Venture Agreement with Sino-Singapore Tianjin Eco-City Investment and Development Co., Ltd for the development of a 9.78 hectare residential project in China. The project will be located in Tianjin Eco-City, a 3,000 hectare collaboration between the Chinese and Singaporean governments which will showcase future direction of urban planning and sustainable development. Interest in Limited Partnerships of Ayala International North America (AINA) Other investments include AINA’s interest in various Limited Partnerships with a carrying value of P=281.4 million and P=462.0 million as of December 31, 2011 and 2010, respectively. These investments are all incorporated in the United States of America (USA) and are mainly involved in developing properties in different states in the USA. Although the interest of AINA in certain limited partnerships exceeds 50%, these limited partnerships are accounted for under the equity method of accounting because AINA does not have control over the financial and operating policies of these partnerships.
In 2009, impairment loss amounting to P=574.0 million were provided for property development projects of certain limited partnerships with projected negligible residual values after deducting amount of repayment on loans drawn for the support and costs incurred for the projects and those that have been served with notices of default by banks. In 2010, additional impairment loss amounting to P=191.4 million was recorded for a property development of a certain limited partnership. The impairment loss is based on the property development’s fair value less cost to sell. The impairment loss is netted against the share of profit of associates and jointly controlled entities in the consolidated statement of income. The excess of cost of investments over the Group’s equity in the net assets of its associates and jointly controlled entities accounted for under the equity method amounted to P=10.5 billion as of December 31, 2011 and 2010.
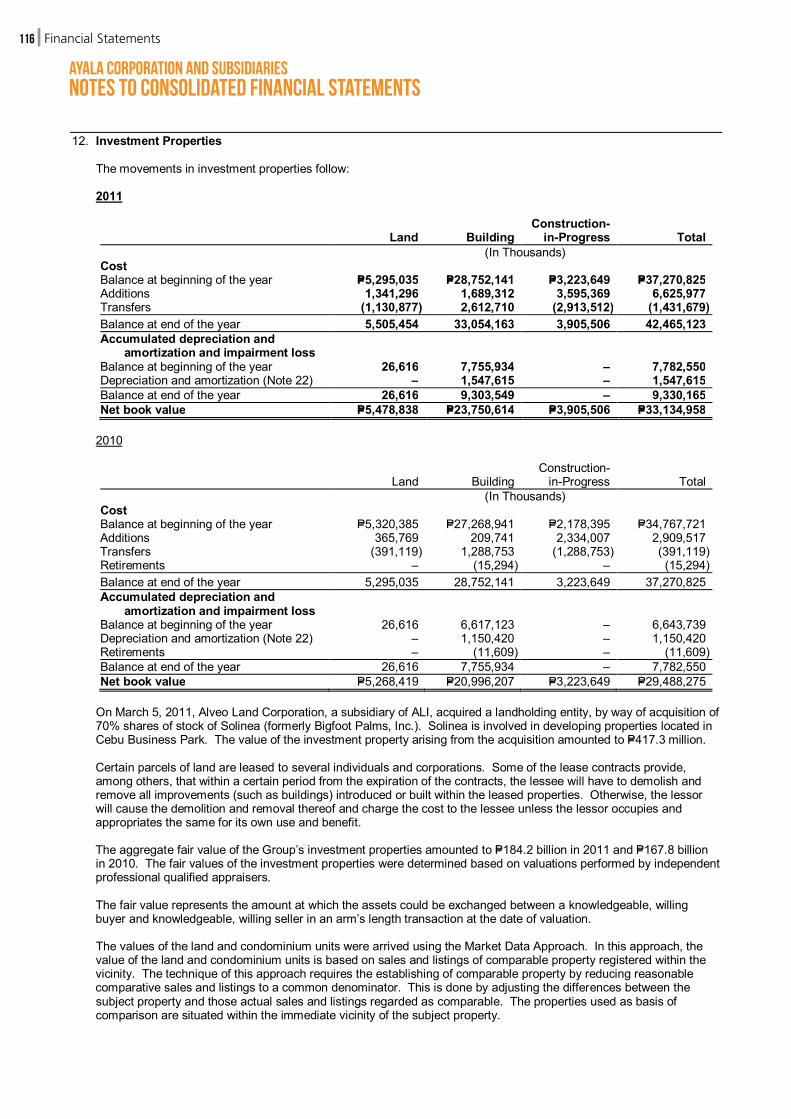
Ayala Corporation and Subsidiariesnotes to Consolidated financial statements
FinancialStatements116
12. Investment Properties
The movements in investment properties follow:
2011
Land Building Construction-
in-Progress Total (In Thousands) Cost Balance at beginning of the year P=5,295,035 P=28,752,141 P=3,223,649 P=37,270,825 Additions 1,341,296 1,689,312 3,595,369 6,625,977 Transfers (1,130,877) 2,612,710 (2,913,512) (1,431,679) Balance at end of the year 5,505,454 33,054,163 3,905,506 42,465,123 Accumulated depreciation and amortization and impairment loss Balance at beginning of the year 26,616 7,755,934 – 7,782,550 Depreciation and amortization (Note 22) – 1,547,615 – 1,547,615 Balance at end of the year 26,616 9,303,549 – 9,330,165 Net book value P=5,478,838 P=23,750,614 P=3,905,506 P=33,134,958
2010
Land Building Construction-
in-Progress Total (In Thousands) Cost Balance at beginning of the year P=5,320,385 P=27,268,941 P=2,178,395 P=34,767,721 Additions 365,769 209,741 2,334,007 2,909,517 Transfers (391,119) 1,288,753 (1,288,753) (391,119) Retirements – (15,294) – (15,294) Balance at end of the year 5,295,035 28,752,141 3,223,649 37,270,825 Accumulated depreciation and amortization and impairment loss Balance at beginning of the year 26,616 6,617,123 – 6,643,739 Depreciation and amortization (Note 22) – 1,150,420 – 1,150,420 Retirements – (11,609) – (11,609) Balance at end of the year 26,616 7,755,934 – 7,782,550 Net book value P=5,268,419 P=20,996,207 P=3,223,649 P=29,488,275
On March 5, 2011, Alveo Land Corporation, a subsidiary of ALI, acquired a landholding entity, by way of acquisition of 70% shares of stock of Solinea (formerly Bigfoot Palms, Inc.). Solinea is involved in developing properties located in Cebu Business Park. The value of the investment property arising from the acquisition amounted to P=417.3 million.
Certain parcels of land are leased to several individuals and corporations. Some of the lease contracts provide, among others, that within a certain period from the expiration of the contracts, the lessee will have to demolish and remove all improvements (such as buildings) introduced or built within the leased properties. Otherwise, the lessor will cause the demolition and removal thereof and charge the cost to the lessee unless the lessor occupies and appropriates the same for its own use and benefit.
The aggregate fair value of the Group’s investment properties amounted to P=184.2 billion in 2011 and P=167.8 billion in 2010. The fair values of the investment properties were determined based on valuations performed by independent professional qualified appraisers.
The fair value represents the amount at which the assets could be exchanged between a knowledgeable, willing buyer and knowledgeable, willing seller in an arm’s length transaction at the date of valuation.
The values of the land and condominium units were arrived using the Market Data Approach. In this approach, the value of the land and condominium units is based on sales and listings of comparable property registered within the vicinity. The technique of this approach requires the establishing of comparable property by reducing reasonable comparative sales and listings to a common denominator. This is done by adjusting the differences between the subject property and those actual sales and listings regarded as comparable. The properties used as basis of comparison are situated within the immediate vicinity of the subject property.
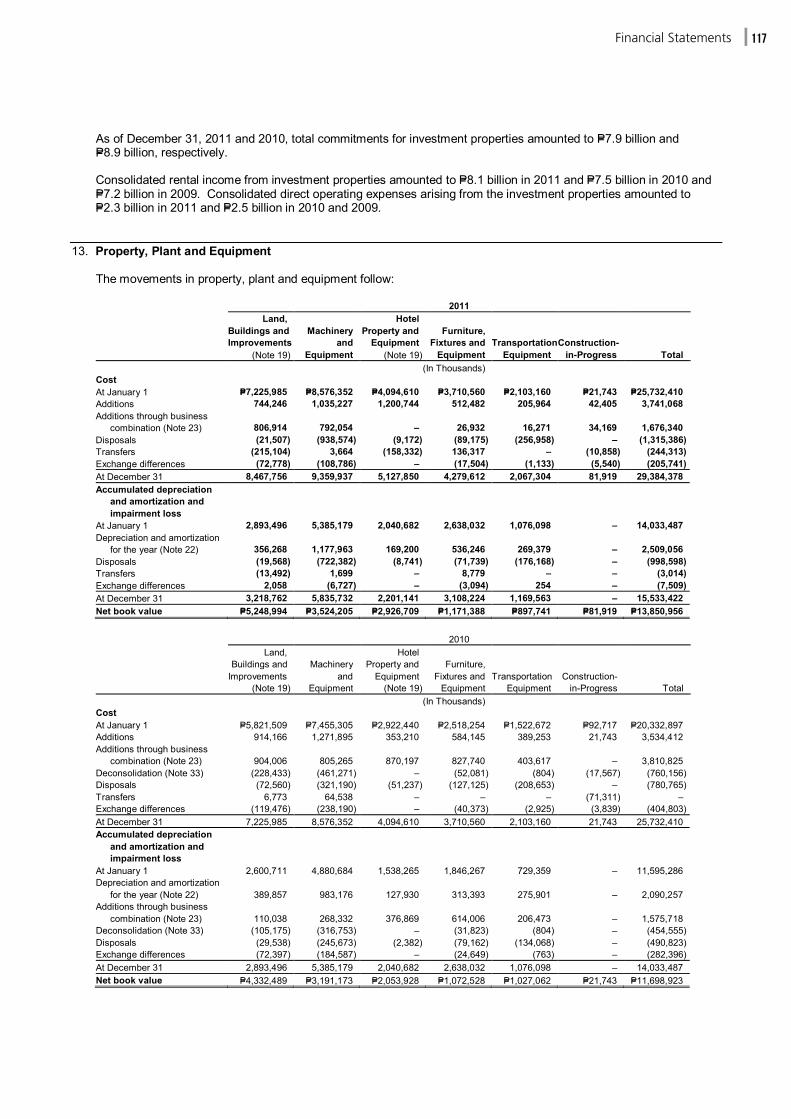
FinancialStatements 117
As of December 31, 2011 and 2010, total commitments for investment properties amounted to P=7.9 billion and P=8.9 billion, respectively.
Consolidated rental income from investment properties amounted to P=8.1 billion in 2011 and P=7.5 billion in 2010 and P=7.2 billion in 2009. Consolidated direct operating expenses arising from the investment properties amounted to P=2.3 billion in 2011 and P=2.5 billion in 2010 and 2009.
13. Property, Plant and Equipment
The movements in property, plant and equipment follow:
2011
Land, Buildings and Improvements
(Note 19)
Machinery and
Equipment
Hotel Property and
Equipment (Note 19)
Furniture, Fixtures and
Equipment Transportation
Equipment Construction-
in-Progress Total (In Thousands) Cost At January 1 P=7,225,985 P=8,576,352 P=4,094,610 P=3,710,560 P=2,103,160 P=21,743 P=25,732,410 Additions 744,246 1,035,227 1,200,744 512,482 205,964 42,405 3,741,068 Additions through business
combination (Note 23) 806,914 792,054 – 26,932 16,271 34,169 1,676,340 Disposals (21,507) (938,574) (9,172) (89,175) (256,958) – (1,315,386) Transfers (215,104) 3,664 (158,332) 136,317 – (10,858) (244,313) Exchange differences (72,778) (108,786) – (17,504) (1,133) (5,540) (205,741) At December 31 8,467,756 9,359,937 5,127,850 4,279,612 2,067,304 81,919 29,384,378 Accumulated depreciation
and amortization and impairment loss
At January 1 2,893,496 5,385,179 2,040,682 2,638,032 1,076,098 – 14,033,487 Depreciation and amortization
for the year (Note 22) 356,268 1,177,963 169,200 536,246 269,379 – 2,509,056 Disposals (19,568) (722,382) (8,741) (71,739) (176,168) – (998,598) Transfers (13,492) 1,699 – 8,779 – – (3,014) Exchange differences 2,058 (6,727) – (3,094) 254 – (7,509) At December 31 3,218,762 5,835,732 2,201,141 3,108,224 1,169,563 – 15,533,422 Net book value P=5,248,994 P=3,524,205 P=2,926,709 P=1,171,388 P=897,741 P=81,919 P=13,850,956
2010
Land, Buildings and
Improvements (Note 19)
Machinery and
Equipment
Hotel Property and
Equipment (Note 19)
Furniture, Fixtures and
Equipment Transportation
Equipment Construction-
in-Progress Total (In Thousands) Cost At January 1 P=5,821,509 P=7,455,305 P=2,922,440 P=2,518,254 P=1,522,672 P=92,717 P=20,332,897 Additions 914,166 1,271,895 353,210 584,145 389,253 21,743 3,534,412 Additions through business
combination (Note 23) 904,006 805,265 870,197 827,740 403,617 – 3,810,825 Deconsolidation (Note 33) (228,433) (461,271) – (52,081) (804) (17,567) (760,156) Disposals (72,560) (321,190) (51,237) (127,125) (208,653) – (780,765) Transfers 6,773 64,538 – – – (71,311) – Exchange differences (119,476) (238,190) – (40,373) (2,925) (3,839) (404,803) At December 31 7,225,985 8,576,352 4,094,610 3,710,560 2,103,160 21,743 25,732,410 Accumulated depreciation
and amortization and impairment loss
At January 1 2,600,711 4,880,684 1,538,265 1,846,267 729,359 – 11,595,286 Depreciation and amortization
for the year (Note 22) 389,857 983,176 127,930 313,393 275,901 – 2,090,257 Additions through business
combination (Note 23) 110,038 268,332 376,869 614,006 206,473 – 1,575,718 Deconsolidation (Note 33) (105,175) (316,753) – (31,823) (804) – (454,555) Disposals (29,538) (245,673) (2,382) (79,162) (134,068) – (490,823) Exchange differences (72,397) (184,587) – (24,649) (763) – (282,396) At December 31 2,893,496 5,385,179 2,040,682 2,638,032 1,076,098 – 14,033,487 Net book value P=4,332,489 P=3,191,173 P=2,053,928 P=1,072,528 P=1,027,062 P=21,743 P=11,698,923

Ayala Corporation and Subsidiariesnotes to Consolidated financial statements
FinancialStatements118
Consolidated depreciation and amortization expense on property, plant and equipment amounted to P=2,509.1 million in 2011, P=2,090.3 million in 2010 and P=2,147.7 million in 2009 (see Note 22).
PSi has a Mortgage Trust Indenture (MTI) with the Trust and Investment Division of a local bank, as Trustee. The mortgaged properties securing the Mortgage Obligations under the MTI are composed of machinery and equipment. The holders of the Mortgage Participation Certificates (MPC) under the MTI in 2010 includes a creditor bank and a major supplier of PSi, with a participation of US$3.0 million each (see Notes 17 and 19). In 2011, the creditor bank cancelled its participation in the MTI (see Note 19). As of December 31, 2011 and 2010, mortgaged machinery and equipment have a net carrying amount of US$2.2 million (P=95.6 million) and US$2.68 million (P=117.5 million), respectively. The carrying values of IMI’s equipment under finance lease amounted to US$2.2 million (P=97.3 million) and US$1.9 million (P=82.0 million), as of December 31, 2011 and 2010, respectively (see Note 29). The cost of fully depreciated property, plant and equipment amounted to P=5,017.9 million and P=4,906.1 million in 2011 and 2010, respectively.
14. Service Concession Assets and Obligations
SCA The movements in this account follow:
2011 2010 (In Thousands) Cost At January 1 P=69,526,353 P=62,470,092 Additions during the year 8,419,716 7,056,261 Additions through business combination (Note 23) 1,077,361 – At December 31 79,023,430 69,526,353 Accumulated amortization At January 1 10,428,584 8,632,857 Amortization (Note 22) 2,347,654 1,795,727 At December 31 12,776,238 10,428,584 Net book value P=66,247,192 P=59,097,769
SCA consist of the present value of total estimated concession fee payments, including regulatory maintenance cost, pursuant to the MWC Group’s concession agreements and the costs of rehabilitation works incurred.
Total interest and other borrowing costs capitalized as part of SCA amounted to P=243.1 million and P=207.9 million in 2011 and 2010, respectively. The capitalization rates used ranged from 4.0% to 6.6% in 2011 and 3.7% to 6.0% in 2010.
MWC Group have concession agreements with MWSS, POL, TIEZA and CDC. These concession agreements set forth the rights and obligations of MWC Group throughout the concession period.
Service Concession Obligations
MWSS Concession Fees Under the concession agreement with MWSS, MWC is granted (as contractor to perform certain functions and as agent for the exercise of certain rights and powers under RA No. 6234) the sole right to manage, operate, repair, decommission, and refurbish all fixed and movable assets (except certain retained assets) required to provide water delivery and sewerage services in the East Zone for a period of 25 years commencing on August 1, 1997 (the Commencement Date) to May 6, 2022 (the Expiration Date). While MWC has the right to manage, operate, repair and refurbish specified MWSS facilities in the East Zone, legal title to these assets remains with MWSS. The legal title to all fixed assets contributed to the existing MWSS system by MWC during the Concession remains with MWC until the Expiration Date (or an early termination date) at which time all rights, titles and interest in such assets will automatically vest in MWSS.
On April 16, 2009, the MWSS Board of Trustees passed Resolution No. 2009-072 approving the fifteen (15) year extension of the Agreement (the Extension) from May 7, 2022 to May 6, 2037. This resolution was confirmed by the Department of Finance (by authority from the office of the President of the Republic of the Philippines) on October 19, 2009. With the approval of the Extension, the recovery period for the MWC investment is now extended to another 15 years from 2022 to 2037.
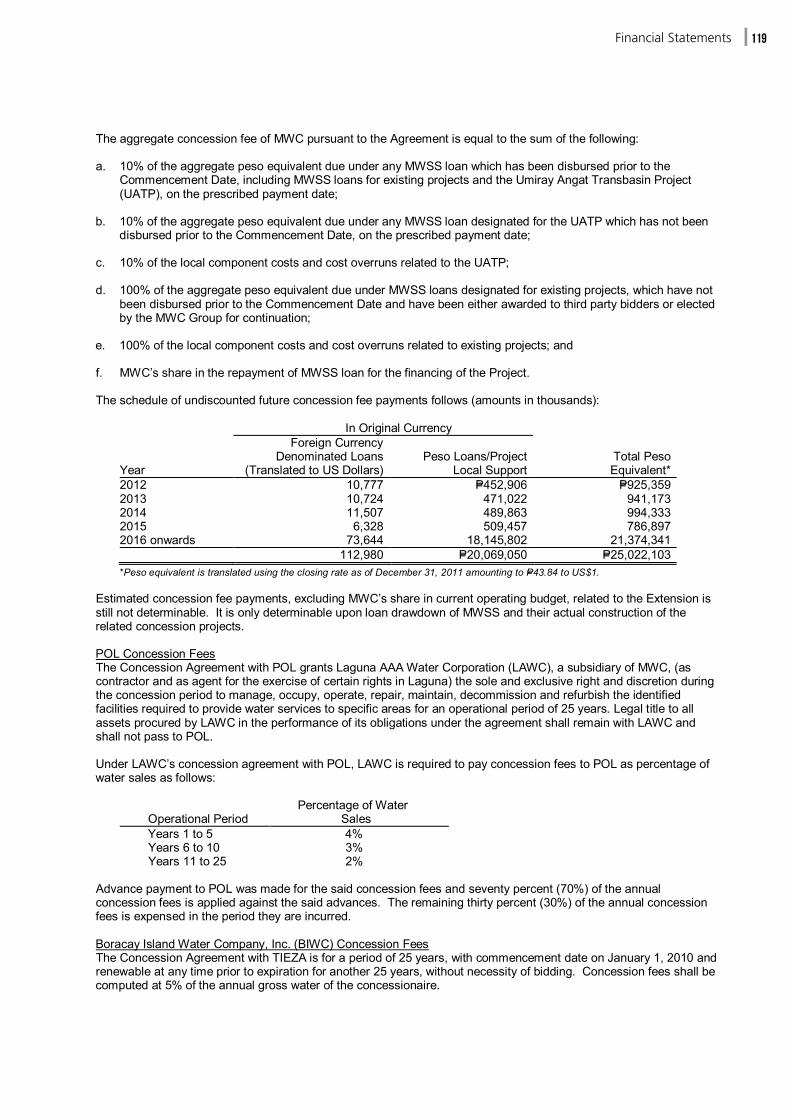
FinancialStatements 119
The aggregate concession fee of MWC pursuant to the Agreement is equal to the sum of the following:
a. 10% of the aggregate peso equivalent due under any MWSS loan which has been disbursed prior to the
Commencement Date, including MWSS loans for existing projects and the Umiray Angat Transbasin Project (UATP), on the prescribed payment date;
b. 10% of the aggregate peso equivalent due under any MWSS loan designated for the UATP which has not been
disbursed prior to the Commencement Date, on the prescribed payment date;
c. 10% of the local component costs and cost overruns related to the UATP;
d. 100% of the aggregate peso equivalent due under MWSS loans designated for existing projects, which have not been disbursed prior to the Commencement Date and have been either awarded to third party bidders or elected by the MWC Group for continuation;
e. 100% of the local component costs and cost overruns related to existing projects; and
f. MWC’s share in the repayment of MWSS loan for the financing of the Project.
The schedule of undiscounted future concession fee payments follows (amounts in thousands):
In Original Currency
Year
Foreign Currency Denominated Loans
(Translated to US Dollars) Peso Loans/Project
Local Support Total Peso
Equivalent* 2012 10,777 P=452,906 P=925,359 2013 10,724 471,022 941,173 2014 11,507 489,863 994,333 2015 6,328 509,457 786,897 2016 onwards 73,644 18,145,802 21,374,341 112,980 P=20,069,050 P=25,022,103
*Peso equivalent is translated using the closing rate as of December 31, 2011 amounting to P=43.84 to US$1.
Estimated concession fee payments, excluding MWC’s share in current operating budget, related to the Extension is still not determinable. It is only determinable upon loan drawdown of MWSS and their actual construction of the related concession projects.
POL Concession Fees The Concession Agreement with POL grants Laguna AAA Water Corporation (LAWC), a subsidiary of MWC, (as contractor and as agent for the exercise of certain rights in Laguna) the sole and exclusive right and discretion during the concession period to manage, occupy, operate, repair, maintain, decommission and refurbish the identified facilities required to provide water services to specific areas for an operational period of 25 years. Legal title to all assets procured by LAWC in the performance of its obligations under the agreement shall remain with LAWC and shall not pass to POL.
Under LAWC’s concession agreement with POL, LAWC is required to pay concession fees to POL as percentage of water sales as follows:
Operational Period Percentage of Water Sales
Years 1 to 5 4% Years 6 to 10 3% Years 11 to 25 2%
Advance payment to POL was made for the said concession fees and seventy percent (70%) of the annual concession fees is applied against the said advances. The remaining thirty percent (30%) of the annual concession fees is expensed in the period they are incurred.
Boracay Island Water Company, Inc. (BIWC) Concession Fees The Concession Agreement with TIEZA is for a period of 25 years, with commencement date on January 1, 2010 and renewable at any time prior to expiration for another 25 years, without necessity of bidding. Concession fees shall be computed at 5% of the annual gross water of the concessionaire.
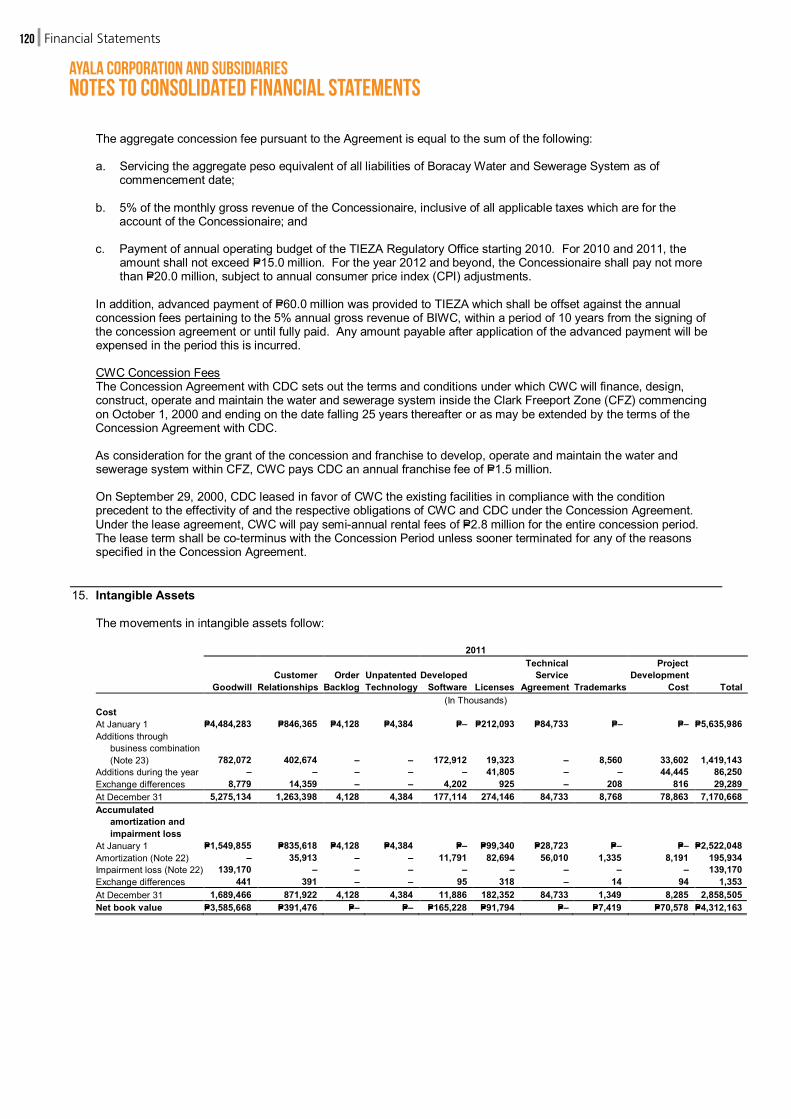
Ayala Corporation and Subsidiariesnotes to Consolidated financial statements
FinancialStatements120
The aggregate concession fee pursuant to the Agreement is equal to the sum of the following: a. Servicing the aggregate peso equivalent of all liabilities of Boracay Water and Sewerage System as of
commencement date;
b. 5% of the monthly gross revenue of the Concessionaire, inclusive of all applicable taxes which are for the account of the Concessionaire; and
c. Payment of annual operating budget of the TIEZA Regulatory Office starting 2010. For 2010 and 2011, the
amount shall not exceed P=15.0 million. For the year 2012 and beyond, the Concessionaire shall pay not more than P=20.0 million, subject to annual consumer price index (CPI) adjustments.
In addition, advanced payment of P=60.0 million was provided to TIEZA which shall be offset against the annual concession fees pertaining to the 5% annual gross revenue of BIWC, within a period of 10 years from the signing of the concession agreement or until fully paid. Any amount payable after application of the advanced payment will be expensed in the period this is incurred.
CWC Concession Fees The Concession Agreement with CDC sets out the terms and conditions under which CWC will finance, design, construct, operate and maintain the water and sewerage system inside the Clark Freeport Zone (CFZ) commencing on October 1, 2000 and ending on the date falling 25 years thereafter or as may be extended by the terms of the Concession Agreement with CDC.
As consideration for the grant of the concession and franchise to develop, operate and maintain the water and sewerage system within CFZ, CWC pays CDC an annual franchise fee of P=1.5 million.
On September 29, 2000, CDC leased in favor of CWC the existing facilities in compliance with the condition precedent to the effectivity of and the respective obligations of CWC and CDC under the Concession Agreement. Under the lease agreement, CWC will pay semi-annual rental fees of P=2.8 million for the entire concession period. The lease term shall be co-terminus with the Concession Period unless sooner terminated for any of the reasons specified in the Concession Agreement.
15. Intangible Assets
The movements in intangible assets follow:
2011
Goodwill Customer
Relationships Order
Backlog Unpatented Technology
Developed Software Licenses
Technical Service
Agreement Trademarks
Project Development
Cost Total (In Thousands) Cost At January 1 P=4,484,283 P=846,365 P=4,128 P=4,384 P=– P=212,093 P=84,733 P=– P=– P=5,635,986 Additions through
business combination (Note 23) 782,072 402,674 – – 172,912 19,323 – 8,560 33,602 1,419,143
Additions during the year – – – – – 41,805 – – 44,445 86,250 Exchange differences 8,779 14,359 – – 4,202 925 – 208 816 29,289 At December 31 5,275,134 1,263,398 4,128 4,384 177,114 274,146 84,733 8,768 78,863 7,170,668 Accumulated
amortization and impairment loss
At January 1 P=1,549,855 P=835,618 P=4,128 P=4,384 P=– P=99,340 P=28,723 P=– P=– P=2,522,048 Amortization (Note 22) – 35,913 – – 11,791 82,694 56,010 1,335 8,191 195,934 Impairment loss (Note 22) 139,170 – – – – – – – – 139,170 Exchange differences 441 391 – – 95 318 – 14 94 1,353 At December 31 1,689,466 871,922 4,128 4,384 11,886 182,352 84,733 1,349 8,285 2,858,505 Net book value P=3,585,668 P=391,476 P=– P=– P=165,228 P=91,794 P=– P=7,419 P=70,578 P=4,312,163
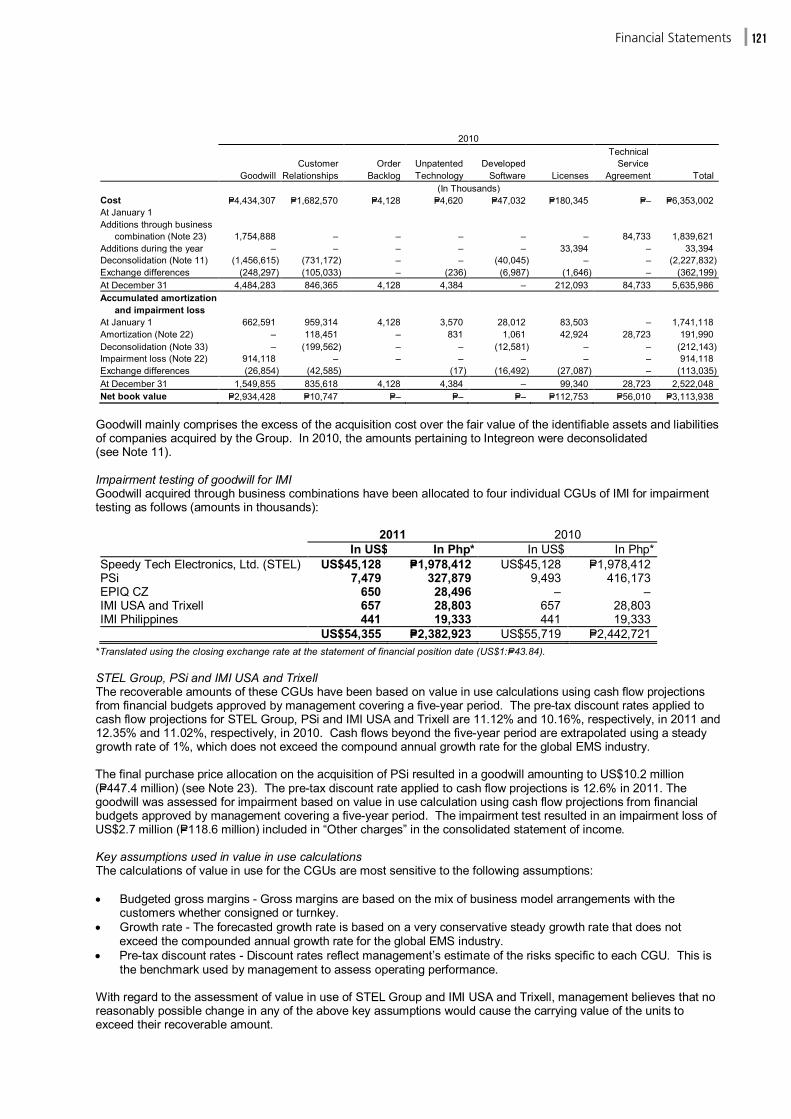
FinancialStatements 121
2010
Goodwill Customer
Relationships Order
Backlog Unpatented Technology
Developed Software Licenses
Technical Service
Agreement Total (In Thousands) Cost P=4,434,307 P=1,682,570 P=4,128 P=4,620 P=47,032 P=180,345 P=– P=6,353,002 At January 1 Additions through business
combination (Note 23) 1,754,888 – – – – –
84,733 1,839,621 Additions during the year – – – – – 33,394 – 33,394 Deconsolidation (Note 11) (1,456,615) (731,172) – – (40,045) – – (2,227,832) Exchange differences (248,297) (105,033) – (236) (6,987) (1,646) – (362,199) At December 31 4,484,283 846,365 4,128 4,384 – 212,093 84,733 5,635,986 Accumulated amortization
and impairment loss At January 1 662,591 959,314 4,128 3,570 28,012 83,503 – 1,741,118 Amortization (Note 22) – 118,451 – 831 1,061 42,924 28,723 191,990 Deconsolidation (Note 33) – (199,562) – – (12,581) – – (212,143) Impairment loss (Note 22) 914,118 – – – – – – 914,118 Exchange differences (26,854) (42,585) (17) (16,492) (27,087) – (113,035) At December 31 1,549,855 835,618 4,128 4,384 – 99,340 28,723 2,522,048 Net book value P=2,934,428 P=10,747 P=– P=– P=– P=112,753 P=56,010 P=3,113,938
Goodwill mainly comprises the excess of the acquisition cost over the fair value of the identifiable assets and liabilities of companies acquired by the Group. In 2010, the amounts pertaining to Integreon were deconsolidated (see Note 11).
Impairment testing of goodwill for IMI Goodwill acquired through business combinations have been allocated to four individual CGUs of IMI for impairment testing as follows (amounts in thousands):
2011 2010 In US$ In Php* In US$ In Php* Speedy Tech Electronics, Ltd. (STEL) US$45,128 P=1,978,412 US$45,128 P=1,978,412 PSi 7,479 327,879 9,493 416,173 EPIQ CZ 650 28,496 – – IMI USA and Trixell 657 28,803 657 28,803 IMI Philippines 441 19,333 441 19,333 US$54,355 P=2,382,923 US$55,719 P=2,442,721
*Translated using the closing exchange rate at the statement of financial position date (US$1:P=43.84).
STEL Group, PSi and IMI USA and Trixell The recoverable amounts of these CGUs have been based on value in use calculations using cash flow projections from financial budgets approved by management covering a five-year period. The pre-tax discount rates applied to cash flow projections for STEL Group, PSi and IMI USA and Trixell are 11.12% and 10.16%, respectively, in 2011 and 12.35% and 11.02%, respectively, in 2010. Cash flows beyond the five-year period are extrapolated using a steady growth rate of 1%, which does not exceed the compound annual growth rate for the global EMS industry.
The final purchase price allocation on the acquisition of PSi resulted in a goodwill amounting to US$10.2 million (P=447.4 million) (see Note 23). The pre-tax discount rate applied to cash flow projections is 12.6% in 2011. The goodwill was assessed for impairment based on value in use calculation using cash flow projections from financial budgets approved by management covering a five-year period. The impairment test resulted in an impairment loss of US$2.7 million (P=118.6 million) included in “Other charges” in the consolidated statement of income.
Key assumptions used in value in use calculations The calculations of value in use for the CGUs are most sensitive to the following assumptions:
Budgeted gross margins - Gross margins are based on the mix of business model arrangements with the
customers whether consigned or turnkey. Growth rate - The forecasted growth rate is based on a very conservative steady growth rate that does not
exceed the compounded annual growth rate for the global EMS industry. Pre-tax discount rates - Discount rates reflect management’s estimate of the risks specific to each CGU. This is
the benchmark used by management to assess operating performance. With regard to the assessment of value in use of STEL Group and IMI USA and Trixell, management believes that no reasonably possible change in any of the above key assumptions would cause the carrying value of the units to exceed their recoverable amount.

Ayala Corporation and Subsidiariesnotes to Consolidated financial statements
FinancialStatements122
IMI Philippines In 2011 and 2010, the recoverable amount was based on the market price of its shares at valuation date less estimated costs to sell. The comparison of the recoverable amount and the carrying amount resulted in no impairment.
EPIQ CZ and CWC Goodwill from the acquisition of EPIQ CZ and CWC arose from excess of acquisition cost over the provisional estimated fair value of assets acquired. As discussed in Note 23, provisional accounting has been adopted for the acquisition of EPIQ subsidiaries and CWC. As a result, the goodwill recognized is still subject to finalization.
MWC and Philwater
Goodwill from the acquisition of MWC and Philwater amounted to P=393.8 million. The recoverable amount in 2011 and 2010 was based on the market price of MWC shares at valuation date less estimated cost to sell. The comparison of the recoverable amount and the carrying amount resulted in no impairment.
Customer relationships Customer relationships pertain to STEL Group’s and EPIQ EA’s noncontractual agreements and contractual agreements with certain customers, respectively, which lay out the principal terms upon which the parties agree to undertake business.
Unpatented technology Unpatented technology pertains to products which are technologically feasible. IMI Group’s patents were applied for the following technologies, both of which are unique, difficult to design around and which meet the separability criteria:
Self bias double-ended switching circuit; and A zero power consumption switch circuit to simplify the energy star solution for external power adapter.
Developed software Developed software pertains to IQ BackOffice's (IQB) internally developed web-based process management tool that is used jointly with customers to manage transactions in real-time. The developed software augments IQB's existing accounting system and automates traditionally paper-based processes (e.g.,electronic/paper receipt, electronic routing, approvals. etc.).
Licenses These pertain to the IMI’s acquisitions of various computer software and applications such as APIS IQ - FMEA Pro, Microsoft Visio and MS Project v6 in 2010 and Acrobat Pro 9, Quest DBA Module, and Toad Oracle Professional in 2009. EPIQ EA and EPIQ MX also have computer software with carrying value of US$0.11 million and US$0.24 million, respectively, as of December 31, 2011.
Project development cost ACEHI expenses all project development costs until a project is deemed probable of being technically, commercially and financially viable. ACEHI capitalizes project development costs generally once a project is deemed probable of being technically, commercially and financially viable. This generally occurs in tandem with management’s determination that a project should be classified as advanced project, such as when favorable results of a system impact study are received, interconnection agreements obtained and project financing is in place. Project development cost will be reclassified to property, plant and equipment when construction of the project commences.
16. Other Noncurrent Assets
This account consists of the following:
2011 2010 (In Thousands) Deposits P=1,662,224 P=725,873 Deferred FCDA 742,588 664,017 Deferred charges 243,446 317,063 Derivative assets (Notes 8 and 31) – 214,610 Others 412,141 665,691 P=3,060,399 P=2,587,254
Deposits include security deposits on land leases, electric and water meter deposits.

FinancialStatements 123
Deferred FCDA refers to the unrecovered amounts from/or amounts for refund to customers of MWC for realized gains (losses) from loan payments of foreign loans. This is the difference between the drawdown or rebased rate versus the closing rate at payment date. This account also covers the unrealized gains (losses) from loan valuations, accrual of interest and accretion of transaction and related costs.
Derivative asset pertains to the embedded call option on MWC’s P=4.0 billion bonds that gives MWC the right to redeem all but not in part the outstanding bonds on the twelfth quarterly interest payment date. On October 23, 2011, the option was exercised by MWC. The loss recognized due to derecognition of derivative asset amounted to P=229.6 million (see Note 22).
“Others” includes leasehold right of a subsidiary amounting to P=120.2 million and P=126.8 million in 2011 and 2010, respectively. This pertains to the right to use an island property expiring on December 31, 2029. The cost amounted to P=127.4 million and accumulated amortization expense for 2011 and 2010 amounted to P=7.2 million and P=0.5 million, respectively. Amortization expense amounted to P=6.7 million and P=0.5 million in 2011 and 2010, respectively.
17. Accounts Payable and Accrued Expenses
This account consists of the following:
2011 2010 (In Thousands) Accounts payable P=29,432,808 P=17,995,363 Accrued expenses 7,109,950 9,846,614 Accrued project costs 5,684,761 2,808,045 Taxes payable 2,599,384 2,187,639 Dividends payable 1,831,318 2,226,117 Related parties (Note 30) 1,226,606 1,399,199 Retentions payable 1,174,760 119,151 Interest payable (Note 30) 1,139,681 572,921 Accrued personnel costs 814,432 557,589 P=51,013,700 P=37,712,638
Accounts payable and accrued expenses are non-interest bearing and are normally settled on 15- to 60-day terms. Other payables are non-interest bearing and are normally settled within one year.
Accounts payable include PSi’s liability to a certain supplier amounting to US$2.07 million (P=90.7 million) and US$3.39 million (P=148.6 million) as of December 31, 2011 and 2010, respectively, which is covered by an MPC amounting to US$3.0 million under PSi’s MTI with a local bank (see Notes 13 and 19). In addition, all overdue accounts from July 1, 2010 to December 31, 2010 with the supplier are subject to 0.5% interest per month.
Accrued expenses consist mainly of accruals for utilities, marketing costs, film share, professional fees, postal and communication, supplies, repairs and maintenance, transportation and travel, security, insurance, and representation.
Accrued expenses also includes provisions on restructuring of operations by the IMI Group. In 2011, PSi and IMI Singapore announced a restructuring of operations due to unfavorable economic and business situation. PSi made actual payout in September and November 2011 aggregating to US$1.14 million. US$0.58 million of the amount paid by PSi is not covered by its retirement plan. On the other hand, IMI Singapore recognized provision amounting to US$0.25 million and paid US$0.18 million in February 2012, with the remaining balance to be paid in phases in 2012.
18. Other Current Liabilities
This account consists of:
2011 2010 (In Thousands) Customers’ deposits P=1,340,148 P=2,204,010 Derivative liability (Note 31) 1,515 168,016 Installment payable 3,793 7,090 Others 1,359,262 252,228 P=2,704,718 P=2,631,344

Ayala Corporation and Subsidiariesnotes to Consolidated financial statements
FinancialStatements124
19. Short-term and Long-term Debt
Short-term debt consists of:
2011 2010 (In Thousands) Philippine peso debt - with interest rates ranging
from 4.25% to 8.0% in 2011 and 3.5% to 8.0% per annum in 2010 P=3,318,500 P=2,483,413
Foreign currency debt - with interest rates ranging from 1.16% to 4.13% in 2011 and 1.16% to 3.72% per annum in 2010 3,347,341 2,035,874
P=6,665,841 P=4,519,287
ALI Group The short-term debt of ALI Group amounting to P=4,638.8 million and P=2,890.0 million in 2011 and 2010, respectively, represents unsecured peso-denominated bank loans and dollar-denominated bank loans. Interest rates for peso-denominated bank loans ranged from 3.5% to 5.0% per annum (p.a.) in 2011 and 3.5% to 5.7% p.a. in 2010. Interest rates for dollar-denominated bank loans of the ALI Group, which amounted to P=1,509.8 million and P=643.0 million in 2011 and 2010, respectively, ranged from 1.18% to 2.01% in 2011 and 1.45% to 2.30% in 2010.
AAHC Group The Philippine peso debt of AAHC Group pertain to short-term loans with various banks amounting to P=144.5 million and P=171.4 million as of December 31, 2011 and 2010, respectively. These loans are unsecured and bear interest rates ranging from 4.0% to 5.1% per annum in 2011 and 4.0% to 8.0% per annum in 2010.
AIVPL Group The Philippine peso debt of AIVPL Group pertain to short-term loans with various banks amounting to P=45.0 million and P=65.0 million as of December 31, 2011 and 2010, respectively. These loans are unsecured and bear interest rate of 8.0% per annum in 2011 and interest rates ranging from 7.0% to 8.0% per annum in 2010. BHL Group BHL’s loans are unsecured dollar-denominated bank loans amounting to US$4.5 million and US$10,364.3 million as of December 31, 2011 and 2010, respectively, and bear interest rate of 4.13% and 2.9% in 2011 and 2010, respectively.
IMI Group
IMI has two (2) 90-day term loans amounting to US$5.0 million each, and one (1) 60-day term loan amounting to €5.00 million, which are subject to fixed interest rates of 1.16% and 2.27%, respectively.
EPIQ EA has two (2) loans amounting to US$11.07 million from their existing revolving credit facilities with terms ranging from one year and six months, respectively. These loans bear interest based on 1-month EURIBOR + 3.0% and 3-month EURIBOR +2.5%, respectively.
PSi has an unsecured Omnibus Line Credit Facility with a local bank amounting to US$10.0 million which was granted on November 24, 2010 and will expire on October 30, 2012. It includes 30 to 360 days Promissory Notes (maybe denominated in USD or Philippine peso (PHP)), Letter of Credit/Trust Receipt (LC/TR) Line, Export Packing Credit Line, FX Forward Cover, and Foreign Bills Line and Domestic Bill Purchase Line, subject to interest rates ranging from 2.3% to 2.9% in 2011 and 2.6% in 2010. The undrawn credit facility amounted to US$5.0 million as of December 31, 2011.
PSi has short-term credit facility with a local bank in 2010, which expired in April 2011 and was renewed up to April 2012. In 2010, the facility is secured by trade receivables from certain customers (see Note 6) and MTI on machinery and equipment (see Note 13). Upon renewal in 2011, the retained security only pertains to the MTI on machinery and equipment. The interest rates in 2011 and 2010 range from 2.36% to 2.71% and 3.16% to 3.72%, respectively. The undrawn credit facility amounted to US$2.07 million and US$1.37 million as of December 31, 2011 and 2010 respectively.
The loans of STEL amounting to P=57.6 million and P=53.8 million as of Decemebr 31, 2011 and 2010, respectively, are clean loans from various Singapore banks from existing revolving credit facilities and bear interest rates ranging from 3.35% to 3.50% and 3.52% to 3.70% in 2011 and 2010, respectively, and have maturities of 30 to 240 days from the date of issue with renewal options.
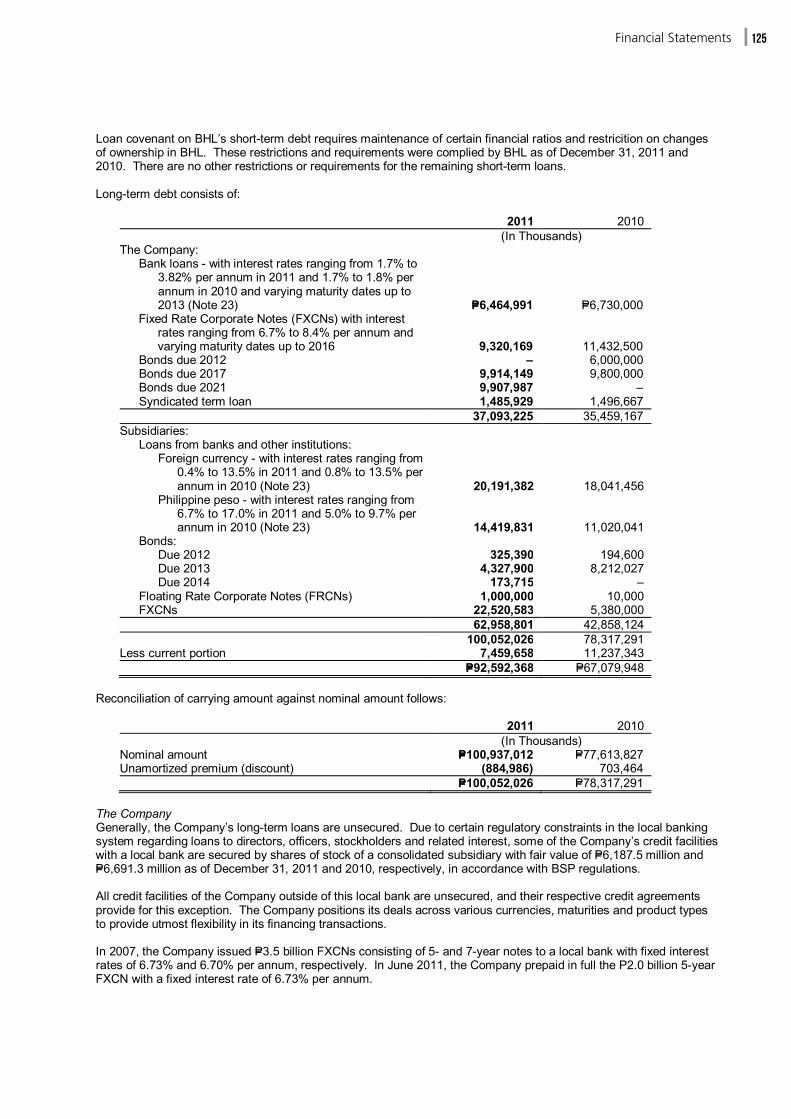
FinancialStatements 125
Loan covenant on BHL’s short-term debt requires maintenance of certain financial ratios and restricition on changes of ownership in BHL. These restrictions and requirements were complied by BHL as of December 31, 2011 and 2010. There are no other restrictions or requirements for the remaining short-term loans.
Long-term debt consists of:
2011 2010 (In Thousands) The Company: Bank loans - with interest rates ranging from 1.7% to
3.82% per annum in 2011 and 1.7% to 1.8% per annum in 2010 and varying maturity dates up to 2013 (Note 23) P=6,464,991 P=6,730,000
Fixed Rate Corporate Notes (FXCNs) with interest rates ranging from 6.7% to 8.4% per annum and varying maturity dates up to 2016 9,320,169 11,432,500
Bonds due 2012 – 6,000,000 Bonds due 2017 9,914,149 9,800,000 Bonds due 2021 9,907,987 – Syndicated term loan 1,485,929 1,496,667 37,093,225 35,459,167 Subsidiaries: Loans from banks and other institutions: Foreign currency - with interest rates ranging from
0.4% to 13.5% in 2011 and 0.8% to 13.5% per annum in 2010 (Note 23) 20,191,382 18,041,456
Philippine peso - with interest rates ranging from 6.7% to 17.0% in 2011 and 5.0% to 9.7% per annum in 2010 (Note 23) 14,419,831 11,020,041
Bonds: Due 2012 325,390 194,600 Due 2013 4,327,900 8,212,027 Due 2014 173,715 – Floating Rate Corporate Notes (FRCNs) 1,000,000 10,000 FXCNs 22,520,583 5,380,000 62,958,801 42,858,124 100,052,026 78,317,291 Less current portion 7,459,658 11,237,343 P=92,592,368 P=67,079,948
Reconciliation of carrying amount against nominal amount follows:
2011 2010 (In Thousands) Nominal amount P=100,937,012 P=77,613,827 Unamortized premium (discount) (884,986) 703,464 P=100,052,026 P=78,317,291
The Company
Generally, the Company’s long-term loans are unsecured. Due to certain regulatory constraints in the local banking system regarding loans to directors, officers, stockholders and related interest, some of the Company’s credit facilities with a local bank are secured by shares of stock of a consolidated subsidiary with fair value of P=6,187.5 million and P=6,691.3 million as of December 31, 2011 and 2010, respectively, in accordance with BSP regulations.
All credit facilities of the Company outside of this local bank are unsecured, and their respective credit agreements
provide for this exception. The Company positions its deals across various currencies, maturities and product types to provide utmost flexibility in its financing transactions.
In 2007, the Company issued P=3.5 billion FXCNs consisting of 5- and 7-year notes to a local bank with fixed interest rates of 6.73% and 6.70% per annum, respectively. In June 2011, the Company prepaid in full the P2.0 billion 5-year FXCN with a fixed interest rate of 6.73% per annum.

Ayala Corporation and Subsidiariesnotes to Consolidated financial statements
FinancialStatements126
In 2007, the Company issued 6.83% Fixed Rate Bonds with an aggregate principal amount of P=6.0 billion to mature in 2012. Prior to maturity, the Company may redeem in whole the outstanding and due bonds on the twelfth and sixteenth coupon payment date. The bonds have been rated “PRS Aaa” by the Philippine Ratings Services Corporation (PhilRatings). In 2011, the Company fully redeemed its P=6.0 billion Fixed Rate Bonds and recognized P=30.0 million penalty on early redemption in the consolidated statement of income.
In the first quarter of 2008, the Company availed of a syndicated term loan amounting to P=1.5 billion which bears fixed
interest rate of 6.75% per annum and will mature in 2018.
In February 2009, the Company issued P=4.0 billion FXCNs consisting of three 5-year notes and a 6-year note to various financial institutions with fixed interest rates of 7.75% and 7.95% per annum for the 5-year notes and 8.15% per annum for the 6-year note.
In March 2009, the Company issued P=1.0 billion FXCNs consisting of 7-year note to a local financial institution with fixed interest rate of 8.40% per annum.
In August 2009, the Company issued P=3.0 billion FXCNs consisting of a 5-year note to various institutions with fixed interest rate of 7.45% per annum.
In April 2010, the Company issued 7.2% Fixed Rate Bonds with an aggregate principal amount of P=10.0 billion to mature in 2017. On the twentieth (20th) Coupon Payment Date (the “Put Option Date”), each Bondholder shall have the option, but not the obligation, to require the Company to redeem the outstanding Bonds. The bonds have been rated “PRS Aaa” by PhilRatings.
In May 2011, the Company issued 6.8% Fixed Rate Multiple Put Bonds with an aggregate principal amount of P=10.0 billion to mature in 2021. On fifth (5th) anniversary of the Issue Date, Bondholders shall have the right, but not the obligation, to require the Company to redeem up to 20% of all outstanding Bonds registered in such Bondholder’s name at such time (the “Five Year Put Option”); and on the eighth (8th) anniversary of the Issue Date, Bondholders shall have the right, but not the obligation, to require the Company to redeem up to 100% of all outstanding Bonds registered in such Bondholder’s name at such time (the “Eight Year Put Option”). The Bonds have been rated PRS Aaa by PhilRatings.
Subsidiaries Foreign Currency Debt In 2008, the Company, through a wholly-owned subsidiary, entered into a 5-year syndicated term loan with a foreign
bank, with the Company as guarantor, for US$50.0 million at a rate of 52 points over the 1-, 3- or 6- month LIBOR at the Company’s option. As of Decemeber 31, 2011 and 2010, the outstanding balance of the loan amounted to US$45.0 million and US$50.0 million, respectively.
In 2007, the Company, through a wholly-owned subsidiary, entered into a 5-year syndicated loan for US$150.0 million
at a rate of 71.4 basis points over the 1-, 3- or 6-month LIBOR at the Company’s option.
In 2006, IMI obtained a US$40.0 million 5-year term clean loan from a local bank payable in a single balloon payment at the end of the loan term. IMI may, at its option, prepay the loan in part or in full, together with the accrued interest without penalty. The interest is repriced quarterly at the rate of 3-month LIBOR plus margin of 0.8% and is payable quarterly. In 2007, IMI prepaid a portion of the loan amounting to US$10.0 million. In October 2011, IMI fully paid the remaining balance of US$30.0 million. On the same date, IMI obtained another five-year clean loan with the same bank amounting to US$40.0 million with the same terms as the previous loan.
In 2006, STEL, a wholly-owned subsidiary of IMI, obtained a US$40.0 million variable rate 5-year loan, repayable in 10 equal semi-annual installments of US$4.0 million commencing on May 29, 2007 and maturing on November 29, 2011. The interest is repriced semi-annually at the LIBOR rate plus 0.75% quoted by the bank and is payable semi-annually. As of December 31, 2010, the outstanding balance of the loan amounted to US$8.0 million (P=35.1 million). The loan was fully paid in November 2011.
IMI’s long-term debt includes deferred payment aggregating to US$20.4 million arising from the acquisition of EPIQ shares and receivables of EPIQ NV from the EPIQ subsidiaries (see Note 23). This is subject to interest rate of 1.5999% plus 1.5%.
On July 1, 2002, MWC entered into a loan agreement with Deutsche Investitions-und Entwicklungsgesellschaft mbH (DEG) to partially finance capital expenditures required to expand water supply and sanitation services and improve the existing facilities of MWC. The loan was made available in US Dollars in the aggregate principal amount of US$20.0 million and is payable in 10 years, inclusive of the 3-year grace period. As of December 31, 2011 and 2010, the outstanding balance amounted to US$2.17 million and US$4.1 million, respectively.

FinancialStatements 127
On March 28, 2003, MWC entered into a loan agreement with International Finance Corporation (IFC) (the “First IFC Loan”) to partially finance MWC’s investment program from 2002-2005 to expand water supply and sanitation services, improvement on the existing facilities of the MWC, and concession fee payments. The First IFC Loan will be made available in Japanese Yen (JPY) in the aggregate principal amount of JPY3,591.6 million equivalent to US$30.0 million and shall be payable in 25 semi-annual installments, within 12 years starting on July 15, 2006. As of December 31, 2011 and 2010, the outstanding balance amounted to JPY1,867.6 million and JPY2,155.0 million, respectively.
On May 31, 2004, MWC entered into a loan agreement with IFC (the “Second IFC Loan”) comprising of regular loan in the amount of up to US$20.0 million and a standby loan in the amount of up to US$10.0 million to finance the investment program from 2004 to 2007 to expand water supply and sanitation services, improvement of existing facilities of MWC, and concession fee payments. This loan was subsequently amended on November 22, 2006, when MWC executed the Amended and Restated Loan Agreement for the restructuring of the Second IFC Loan. The terms of the second loan were amended to a loan in the aggregate amount of up to US$30.0 million, no part of which shall consist of a standby loan. On December 12, 2008, MWC has made a full drawdown on the said facility. As of December 31, 2011 and 2010, the outstanding balance amounted to US$18.0 million and US$22.0 million, respectively.
On October 20, 2005, MWC entered into a Subsidiary Loan Agreement with Land Bank of the Philippines (LBP Loan) to finance the improvement of the sewerage and sanitation conditions in the East Zone. The loan has a term of 17 years, and was made available in Japanese Yen in the aggregate principal amount of JPY6.59 billion payable via semi-annual installments after the 5-year grace period. As of December 31, 2011 and 2010, outstanding loans amounted to JPY3,348.7 million and JPY3,125.4 million, respectively.
On June 20, 2007, MWC entered into a Finance Contract (the “EIB Loan”) with the European Investment Bank (EIB) to partially finance the capital expenditures of MWC from 2007 to 2010, as specified under Schedule 1 of the Finance Contract. The loan, in the aggregate principal amount of EUR€60 million, having a term of 10 years, is subject to the Relevant Interbank Rate plus a spread to be determined by EIB, and may be drawn in either fixed-rate or floating-rate tranches. The loan has two tranches as described below:
Sub-Credit A: In an amount of EUR€40 million to be disbursed in US Dollars or Japanese yen payable via semi-
annual installments after the two and a half-year grace period. This loan tranche is guaranteed against all commercial risks by a consortium of international commercial banks composed of ING Bank, Development Bank of Singapore and Sumitomo-Mitsui Banking Corporation under a Guaranty Facility Agreement; and
Sub-Credit B: In an amount of EUR€20 million to be disbursed in US Dollars, European Euro or Japanese Yen
payable via semi-annual installments after the two and a half-year grace period. This loan tranche is guaranteed against all commercial risks by ING Bank under a Guaranty Facility Agreement.
The outstanding balance of the EIB loan amounted to JPY3,812.0 million and US$20.4 million in 2011 and JPY4,700.7 million and US$24.4 million in 2010.
On October 21, 2010, MWC entered into a term loan agreement amounting to US$150.0 million to partially finance capital expenditures within the East Zone. The loan has a tenor of 10 years and is financed by a syndication of four banks - ING N.V Tokyo, Mizuho Corporate Bank, Ltd., The Bank of Tokyo-Mitsubishi UFJ Ltd. and Sumitomo Mitsui Banking Corporation insured by Nippon Export and Investment Insurance. First draw of the loan was made in January 2011 amounting to US$84.0 million. The carrying value of this loan as of December 31, 2011 amounted to US$80.0 million.
In 2010, BHL entered into a secured loan agreement with a foreign bank at variable interest of 3.5% spread over 90-day LIBOR with floor of 6.0% and a ceiling of 14.25% which will mature on January 1, 2013. This loan is secured by certain inventories (see Note 7). As of December 31, 2011 and 2010, the outstanding balance of the loan amounted to US$1.1 million and US$2.8 million.
Philippine Peso Debt The Philippine Peso bank loans include ALI subsidiaries’ loans that will mature on various dates up to 2018 with floating interest rates at 50 basis points to 200 basis points spread over benchmark 91-day PDST-R1/R2 and fixed interest rates of 4.50% to 9.72% per annum. The term loan facility of a subsidiary is secured by a Mortgage Trust Indenture over land and building with a total carrying value of P=1,041.3 million and P=911.3 million as of December 31, 2011 and 2010, respectively.
On August 22, 2006, MWC entered into a Credit Facility Agreement with five banks and four financial institutions to finance the capital expenditures of MWC pursuant to the Concession Agreement. This 7-year term loan with an aggregate principal amount of P=2.0 billion consists of the following:
Ayala Corporation and Subsidiariesnotes to Consolidated financial statements
FinancialStatements128
Tranche 1: 7-year term loan amounting to P=1.5 billion (the Tranche 1 Loan). Such loan shall be subject to a
yearly amortization of P=10.0 million at the end of the 5th and 6th years, and bullet repayment of the balance at the end of the 7th year; and
Tranche 2: 7-year term loan, with a Put Option at the end of the fifth (5th) year, amounting to P=500.0 million (the
Tranche 2 Loan). Such loan shall be subject to a bullet repayment at the end of the 5th year if the lenders exercise their Put Option. If the Put Option is not exercised, the loan will be subject to a yearly amortization of P=10.0 million at the end of the 5th and 6th years, and bullet repayment of the balance at the end of the 7th year.
On June 16, 2008, MWC prepaid a portion of the loan from one financial institution amounting to P=600.0 million. As of December 31, 2011 and 2010, the outstanding balance for this loan amounted to P=1.37 billion and P=1.40 billion, respectively.
On October 9, 2006, MWC entered into a Credit Facility Agreement with three banks and a financial institution to finance the capital expenditures of MWC pursuant to the Agreement. This 7-year term loan with an aggregate principal amount of P=1.5 billion consists of the following:
Tranche 1: 7-year term loan amounting to P=950.0 million (the Tranche 1 Loan). Such loan shall be subject to a
yearly amortization of one percent (1%) of the Tranche 1 Loan at the end of the 5th and 6th years, and bullet repayment of the balance at the end of the 7th year; and
Tranche 2: 7-year term loan, with a Put Option at the end of the fifth (5th) year, amounting to P=550.0 million (the
Tranche 2 Loan). Such loan shall be subject to a bullet repayment at the end of the 5th year if the lenders exercise their Put Option. If the Put Option is not exercised, the loan will be subject to a yearly amortization of one percent (1%) of the Tranche 2 Loan at the end of the 5th and 6th years, and bullet repayment of the balance at the end of the 7th year.
On June 16, 2008, MWC prepaid a portion of the loan from one financial institution amounting to P=400.0 million. As of December 31, 2011 and 2010, the outstanding balance for this loan amounted to P=1.07 billion and P=1.1 billion, respectively.
On September 7, 2010, LAWC entered into a loan agreement with two local banks for the financing of its construction, operation, maintenance and expansion of facilities in its servicing area. Pursuant to the loan agreement, the lenders have agreed to provide loans to LAWC up to P=500.0 million, principal payments of which will be made in 30 consecutive equal quarterly installments starting August 2013. First draw of the loan was made in November 2010 and July 2011 amounting to P=250.0 million each. The carrying value of the loans amounted to P=493.9 million and P=246.9 million as of December 31, 2011 and 2010, respectively. On July 29, 2011, BIWC, a subsidiary of MWC, entered into an omnibus loan and security agreement with the Development Bank of the Philippines (DBP) and Security Bank Corporation (SBC) to finance the construction, operation, maintenance and expansion of facilities for the fulfillment of certain service targets for water supply and waste water services for the Service Area under the Concession Agreement, as well as the operation and maintenance of the completed drainage system. The loan shall not exceed the principal amount of P=500.0 million or as the context may require, the amount thereof then outstanding and is payable in twenty (20) years inclusive of a three (3)-year grace period. The loan shall be available in three sub-tranches, as follows: Sub-tranche 1A, the loan in the amount of P=250.0 million to be provided by DBP and funded through Philippine
Water Revolving Fund (PWRF); Sub-tranche 1B, the loan in the amount of P=125.0 million to be provided by SBC and funded through PWRF; and Sub-tranche 1C, the loan in the amount of P=125.0 million to be provided by SBC and funded through its
internally-generated funds.
On August 25, 2011, BIWC made its first loan drawdown amounting to P=150.0 million. The carrying value of the loan as of December 31, 2011 amounted to P=146.9 million.
Homestarter Bond due 2012 ALI launched a new issue of the Homestarter Bond in October 2009. The bond is to be issued over a series of 36 issues, once every month which commenced on October 16, 2009, up to P=14.0 million per series or up to an aggregate issue amount of P=504.0 million over a 3-year period. The bond carries an interest rate of 5% per annum, payable on the final maturity date or upon the bondholder’s exercise of the option to apply the bond to partial or full payment for a residential property offered for sale by ALI or its affiliates. In the event of application of the bond to partial or full payment for property, the bondholder shall be entitled to, in addition to interest, a notional credit equivalent to 10% of the aggregate face value of the bond (the “bonus credit”). The bonus credit is subject to a

FinancialStatements 129
maximum of 5% of the net selling price of the property selected. The bond is alternatively redeemable at par plus accrued interest on the third anniversary of the initial issue date. As of December 31, 2011 and 2010, bond issued amounted to P=325.4 million and P=194.6 million, respectively.
Homestarter Bond due 2013 ALI launched another new issue of the Homestarter Bond in April 2010. The bond is to be issued over a series of 36 issues, once every month which commenced on April 16, 2010, up to P=28.0 million per series or up to an aggregate issue amount of P=1,008.0 million over a 3-year period. The bond carries an interest rate of 5% per annum, payable at the final maturity date or upon the bondholder’s exercise of the option to apply the bond to partial or full payment for a residential property offered for sale by ALI or its affiliates. In the event of application of the bond to partial or full payment for property, the bondholder shall be entitled to, in addition to interest, a notional credit equivalent to 10% of the aggregate face value of the bond. The bonus credit is subject to a maximum of 5% of the net selling price of the property selected. The bond is alternatively redeemable at par plus accrued interest on the third anniversary of the initial issue date. As of December 31, 2011 and 2010, bond issued amounted to P=418.1 million and P=204.0 million, respectively.
5-Year Bonds due 2013 In 2008, ALI issued P=4.0 billion bonds due 2013 with fixed rate equivalent to 8.75% per annum. The PhilRatings assigned a “PRS Aaa” rating on the bonds indicating that it has the smallest degree of investment risk. Interest payments are protected by a large or by an exceptionally stable margin and principal is assured. While the various protective elements are likely to change, such changes as can be visualized are most unlikely to impair the fundamentally strong position of such issues. PRS Aaa is the highest credit rating possible on PhilRatings’ rating scales for long-term issuances. PhilRatings maintained its rating of PRS Aaa for the P=4.0 billion bond in 2011 and 2010.
On October 22, 2008, MWC issued P=4.0 billion bonds having a term of five years from the issue date with a fixed interest rate equivalent to 8.25% payable quarterly. Prior to maturity, MWC may redeem in whole, and not in part only, the relevant outstanding bonds on the twelfth interest payment date. The amount payable to the bondholders in respect of such redemptions shall be calculated based on the principal amount of the bonds being redeemed, as the sum of 102% of the principal amount and accrued interest on the bonds on the optional redemption date.
On September 2, 2011, MWC approved the early redemption of its P=4.0 billion bonds due 2013. The bonds were redeemed by payment in cash at a redemption price set at 102% of the principal amount and accrued interest computed up to October 23, 2011 to bondholders as of October 19, 2011. Upon payment, the listing of the bonds on the Philippine Dealing & Exchange Corp. (PDEx) was terminated. The loss incurred on the early redemption of the bonds amounted to P=6.15 million.
Homestarter Bond due 2014
In May 2011, ALI launched a new issue of the Homestarter Bond. The bond is to be issued over a series of 36 issues, once every month which commenced on May 16, 2011, with an initial issue amount of up to P=56.0 million or up to an aggregate issue amount of P=2.02 billion over a 3-year period. The bond carries an interest rate of 5% per annum, payable at the final maturity date or upon the bondholder’s exercise of the option to apply the bond to partial or full payment for a residential property offered for sale by ALI or its affiliates. In the event of application of the bond to partial or full payment for a property, the bondholder shall be entitled to, in addition to interest, a notional credit equivalent to 10% of the aggregate face value of the bond. The bonus credit is also subject to a maximum of 5% of the net selling price of the property selected. The bond is alternatively redeemable at par plus accrued interest on the third anniversary of the initial issue date. As of December 31, 2011, bond issued amounted to P=173.7 million.
5-,7- and 10-year FXCNs due in 2011, 2013 and 2016 In 2006, ALI issued P=3.0 billion FXCNs consisting of 5-, 7- and 10-year notes issued to various financial institutions and will mature on various dates up to 2016. The FXCNs bear fixed interest rates ranging from 7.3% to 7.8% per annum depending on the term of the notes. In January 2011, simultaneous to a new corporate note offering, ALI undertook a liability management exercise by offering to prepay holders of the corporate notes issued in 2006 while inviting the same institutions to participate in the new issuance. A number of investors holding on to P=875.0 million worth of notes maturing in 2013 and 2016 accepted the offer to be prepaid. Loss on prepayment of the FXCNs amounted to P=25.7 million. On September 23, 2011, the 5-year and one (1) day FXCNs amounting to P=1,830.0 million matured and were fully repaid by ALI.
5-, 7- and 10-year FXCN due 2014, 2016 and 2019 In 2009, ALI issued an aggregate P=2.38 billion in 5-, 7- and 10-year notes to various financial institutions and retail investors. The notes will mature on various dates up to 2019. The FXCNs bear fixed interest rates ranging from 7.76% to 8.90%.

Ayala Corporation and Subsidiariesnotes to Consolidated financial statements
FinancialStatements130
7-year FRCN due 2016 In 2009, ALI executed a P=1.0 billion committed FRCN facility with a local bank, of which an initial P=10.0 million was drawn on October 12, 2009. The balance of P=990.0 million was subsequently drawn on November 18, 2011. The FRCN bears a floating interest rate based on the 3-month PDST-R1 plus a spread of 0.96%, repriceable quarterly. The initial note drawn, together with any future drawings, will mature on the seventh anniversary of the initial drawdown date.
5-, 10-, 15-Year FXCN due on 2016, 2021 and 2026 In 2011, ALI issued P=10.0 billion FXCNs to various financial institutions and retail investors. The notes will mature on various dates up to 2026. The FXCNs bear fixed interest rates ranging from 5.62% to 7.50% p.a. depending on the term of the notes.
On April 8, 2011, MWC issued P=10.0 billion FXCNs. The notes were divided to P=5.0 billion with an interest rate of 6.385% and have a term of five years and 10 years for the remaining P=5.0 billion from the issue date with a fixed interest rate equivalent to 8.25% payable quarterly. Prior to maturity, MWC may redeem in whole, and not in part only, the relevant outstanding bonds on the seventh anniversary. The amount payable to the holders in respect of such redemptions shall be calculated based on the principal amount of the bonds being redeemed, as the sum of 102% of the principal amount and accrued interest on the bonds on the optional redemption date. The carrying value of the notes as of Decemeber 31, 2011 amounted to P=9.92 billion.
The loans of MWC were secured by way of first ranking charge over all assigned interests, including the right to receive payments or other consideration under the Agreement, all receivables and bank accounts, interests over all fixed assets (subject to the limitations under the Agreement) and assignment of proceeds of insurance policies. The agreement for the signing of these rights and interests were signed with the lenders at various dates of the loan signing.
On July 17, 2008, MWC, together with all of its Lenders signed an Omnibus Amendment Agreement and Intercreditor Agreement and these agreements became effective on September 30, 2008.
Under the Omnibus Amendment Agreement, the lenders effectively released MWC from the assignment of its present and future fixed assets, receivables and present and future bank accounts, all the Project Documents (except for the Agreement, Technical Corrections Agreement and the Department of Finance Undertaking Letter), all insurance policies where MWC is the beneficiary and performance bonds posted in its favor by contractors or suppliers.
In consideration for the release of the assignment of the above-mentioned assets, MWC agreed not to create, assume, incur, permit or suffer to exist, any mortgage, lien, pledge, security interest, charge, encumbrance or other preferential arrangement of any kind, upon or with respect to any of its properties or assets, whether now owned or hereafter acquired, or upon or with respect to any right to receive income, subject only to some legal exceptions. The lenders shall continue to enjoy their rights and privileges as Concessionaire Lenders (as defined under the Agreement), which include the right to appoint a qualified replacement operator and the right to receive payments and/or other consideration pursuant to the Agreement in case of a default of either MWC or MWSS. Currently, all lenders of MWC (including the bondholders) are considered Concessionaire Lenders and are on pari passu status with one another.
The loan agreements on long-term debt of the Company and certain subsidiaries provide for certain restrictions and requirements with respect to, among others, payment of dividends, incurrence of additional liabilities, investment and guaranties, mergers or consolidations or other material changes in their ownership, corporate set-up or management, acquisition of treasury stock, disposition and mortgage of assets and maintenance of financial ratios at certain levels. These restrictions and requirements were complied with by the Group as of December 31, 2011 and 2010.
Total interest paid amounted to P=5.5 billion in 2011, P=4.0 billion in 2010 and P=3.9 billion in 2009.
Interest capitalized by subsidiaries amounted to P=279.0 million in 2011 and P=239.6 million in 2010. The average
capitalization rate is 2.1% to 6.88% in 2011 and 3.7% to 7.06% in 2010. 20. Other Noncurrent Liabilities
This account consists of the following:
2011 2010 (In Thousands) Deposits and deferred credits P=7,450,083 P=7,219,372 Retentions payable 2,338,399 2,630,344 Provisions (Note 36) 739,626 622,150 Others 510,719 470,423 P=11,038,827 P=10,942,289
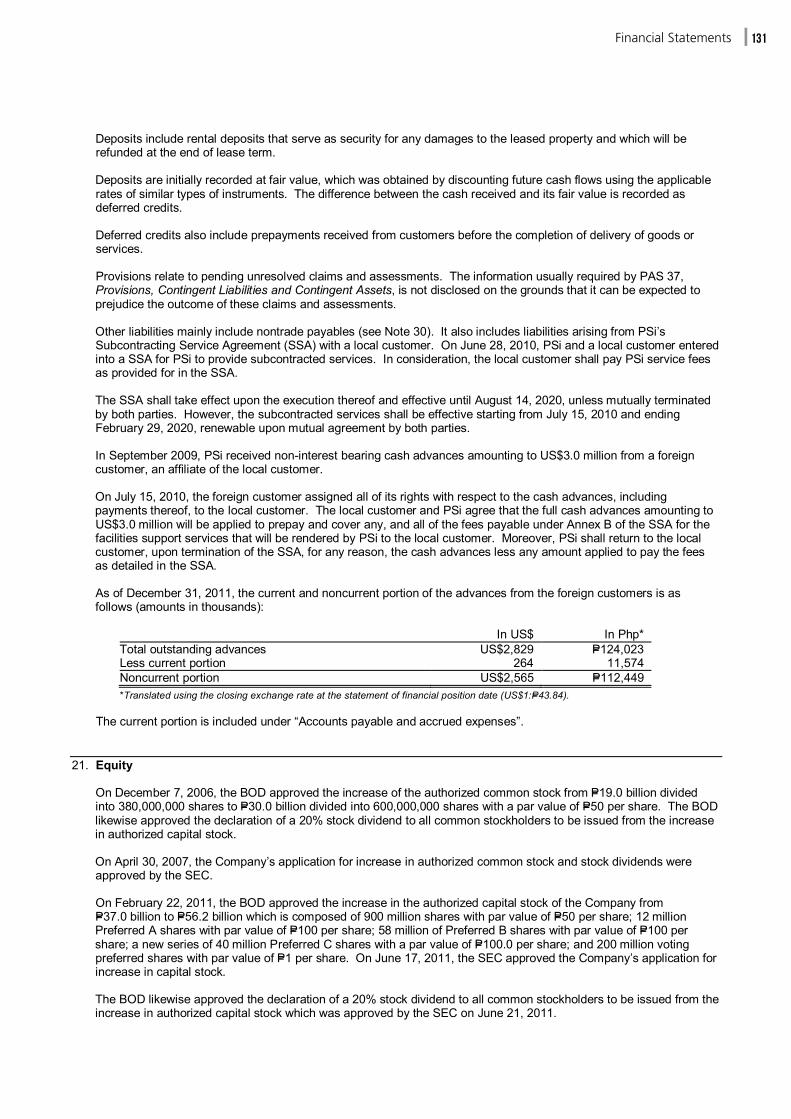
FinancialStatements 131
Deposits include rental deposits that serve as security for any damages to the leased property and which will be refunded at the end of lease term. Deposits are initially recorded at fair value, which was obtained by discounting future cash flows using the applicable rates of similar types of instruments. The difference between the cash received and its fair value is recorded as deferred credits.
Deferred credits also include prepayments received from customers before the completion of delivery of goods or
services.
Provisions relate to pending unresolved claims and assessments. The information usually required by PAS 37, Provisions, Contingent Liabilities and Contingent Assets, is not disclosed on the grounds that it can be expected to prejudice the outcome of these claims and assessments.
Other liabilities mainly include nontrade payables (see Note 30). It also includes liabilities arising from PSi’s Subcontracting Service Agreement (SSA) with a local customer. On June 28, 2010, PSi and a local customer entered into a SSA for PSi to provide subcontracted services. In consideration, the local customer shall pay PSi service fees as provided for in the SSA.
The SSA shall take effect upon the execution thereof and effective until August 14, 2020, unless mutually terminated by both parties. However, the subcontracted services shall be effective starting from July 15, 2010 and ending February 29, 2020, renewable upon mutual agreement by both parties.
In September 2009, PSi received non-interest bearing cash advances amounting to US$3.0 million from a foreign customer, an affiliate of the local customer.
On July 15, 2010, the foreign customer assigned all of its rights with respect to the cash advances, including payments thereof, to the local customer. The local customer and PSi agree that the full cash advances amounting to US$3.0 million will be applied to prepay and cover any, and all of the fees payable under Annex B of the SSA for the facilities support services that will be rendered by PSi to the local customer. Moreover, PSi shall return to the local customer, upon termination of the SSA, for any reason, the cash advances less any amount applied to pay the fees as detailed in the SSA. As of December 31, 2011, the current and noncurrent portion of the advances from the foreign customers is as follows (amounts in thousands):
In US$ In Php* Total outstanding advances US$2,829 P=124,023 Less current portion 264 11,574 Noncurrent portion US$2,565 P=112,449
*Translated using the closing exchange rate at the statement of financial position date (US$1:P=43.84).
The current portion is included under “Accounts payable and accrued expenses”. 21. Equity
On December 7, 2006, the BOD approved the increase of the authorized common stock from P=19.0 billion divided into 380,000,000 shares to P=30.0 billion divided into 600,000,000 shares with a par value of P=50 per share. The BOD likewise approved the declaration of a 20% stock dividend to all common stockholders to be issued from the increase in authorized capital stock.
On April 30, 2007, the Company’s application for increase in authorized common stock and stock dividends were approved by the SEC. On February 22, 2011, the BOD approved the increase in the authorized capital stock of the Company from P=37.0 billion to P=56.2 billion which is composed of 900 million shares with par value of P=50 per share; 12 million Preferred A shares with par value of P=100 per share; 58 million of Preferred B shares with par value of P=100 per share; a new series of 40 million Preferred C shares with a par value of P=100.0 per share; and 200 million voting preferred shares with par value of P=1 per share. On June 17, 2011, the SEC approved the Company’s application for increase in capital stock. The BOD likewise approved the declaration of a 20% stock dividend to all common stockholders to be issued from the increase in authorized capital stock which was approved by the SEC on June 21, 2011.

Ayala Corporation and Subsidiariesnotes to Consolidated financial statements
FinancialStatements132
The details of the Company’s preferred and common shares follow:
Preferred shares
Preferred A shares Preferred B shares Preferred C shares Voting Preferred shares
2011 2010 2009 2011 2010 2009 2011 2010 2009 2011 2010 2009 (In Thousands, except for par value figures) Authorized shares 12,000 12,000 12,000 58,000 58,000 58,000 40,000 – – 200,000 200,000 – Par value per share P=100 P=100 P=100 P=100 P=100 P=100 P=100 P=– P=– P=1 P=1 P=– Issued and subscribed shares 12,000 12,000 12,000 58,000 58,000 58,000 – – – 200,000 200,000 –
Preferred B shares In February 2006, the BOD approved the reclassification of the unissued preferred shares and redeemed preferred shares of the Company into 58.0 million new class of Preferred B shares with a par value of P=100 per share or an aggregate par value of P=5,800.0 million. The Preferred B shares have the following features: (a) optional redemption by the Company; (b) issue value, dividend rate and declaration thereof to be determined by the BOD; (c) cumulative in payment of current dividends as well as any unpaid back dividends and non-participating in any other further dividends; (d) nonconvertible into common shares; (e) preference over holders of common stock in the distribution of corporate assets in the event of dissolution and liquidation of the Company and in the payment of the dividend at the rate specified at the time of issuance; (f) nonvoting except in those cases specifically provided by law; (g) no pre-emptive rights to any issue of shares, common or preferred; and (h) reissuable when fully redeemed.
In July 2006, the Company filed a primary offer in the Philippines of its Preferred B shares at an offer price of P=100 per share to be listed and traded on the Philippine Stock Exchange (PSE). The Preferred B shares are cumulative, nonvoting and redeemable at the option of the Company under such terms that the BOD may approve at the time of the issuance of shares and with a dividend rate of 9.5% per annum. The Preferred B shares may be redeemed at the option of the Company starting in the fifth year. On March 14, 2011, the BOD approved and authorized the exercise of call option on Preferred B shares effective July 21, 2011 based on the dividend rate of 9.5% per annum. The redemption of Preferred B shares is presented as part of treasury stock. Preferred A shares On January 31, 2008, the BOD approved the reissuance and reclassification of 1.2 billion redeemed Preferred A and AA shares with a par value of P=1.0 per share into 12.0 million new Preferred A shares with a par value of P=100 per share with the same features as the existing Preferred B shares, except on the issue price and dividend rate and the amendment of the Company’s amended Articles of Incorporation to reflect the reclassification of the redeemed Preferred shares into new Preferred A shares. On April 4, 2008, the Company’s stockholders ratified the reissuance and reclassification.
On July 9, 2008, the SEC approved the amendments to the Company’s Articles of Incorporation embodying the reclassification of the redeemed Preferred shares.
In November 2008, the Company filed a primary offer in the Philippines of its Preferred A shares at an offer price of P=500 per share to be listed and traded on the PSE. The Preferred A shares are cumulative, nonvoting and redeemable at the option of the Company under such terms that the BOD may approve at the time of the issuance of shares and with a dividend rate of 8.9% per annum. The Preferred A shares may be redeemed at the option of the Company starting in the fifth year.
Preferred C shares Preferred C shares are cumulative, non-participating, nonvoting and redeemable at the option of the Company under such terms that the BOD may approve at the time of the issuance of the shares.
Voting Preferred shares
On March 15, 2010, the BOD approved the reclassification of 4.0 million unissued common shares with a par value of P=50 per share into 200.0 million Voting Preferred shares with a par value of P=1 per share and the amendment of the Company’s amended Articles of Incorporation to reflect the reclassification of the unissued common shares into new Voting Preferred shares. On April 16, 2010, the Company’s stockholders ratified the reclassification.
On April 22, 2010, the SEC approved the amendments to the Company’s Articles of Incorporation embodying the reclassification of the unissued common shares to new Voting Preferred shares.
The Voting Preferred shares are cumulative, voting and redeemable at the option of the Company under such terms that the BOD may approve at the time of the issuance of shares and with a dividend rate of 5.3% per annum.

FinancialStatements 133
Common shares
2011 2010 2009 (In Thousands, except par value figures) Authorized shares 900,000 596,000 600,000 Par value per share P=50 P=50 P=50 Issued and subscribed shares 597,441 500,322 500,176 Treasury shares 20,184 14,677 1,844
The common shares may be owned or subscribed by or transferred to any person, partnership, association or corporation regardless of nationality, provided that at anytime at least 60% of the outstanding capital stock shall be owned by citizens of the Philippines or by partnerships, associations or corporations 60% of the voting stock or voting power of which is owned and controlled by citizens of the Philippines.
The details of the Company’s paid-in capital follow: 2011
Preferred Stock - A
Preferred Stock - B
Preferred Stock - Voting
Common Stock Subscribed
Additional Paid-in Capital
Subscriptions Receivable
Total Paid-in Capital
(In Thousands) As of January 1, 2011 P=1,200,000 P=5,800,000 P=200,000 P=24,784,980 P=231,114 P=6,243,383 (P=604,011) P=37,855,466 Exercise/Cancellation of ESOP/ESOWN – – – 28,536 (14,905) 96,210 25,195 135,036 Stock dividend – – – 4,842,317 – – – 4,842,317 As of December 31, 2011 P=1,200,000 P=5,800,000 P=200,000 P=29,655,833 P=216,209 P=6,339,593 (P=578,816) P=42,832,819
2010
Preferred Stock - A
Preferred Stock - B
Preferred Stock - Voting
Common Stock Subscribed
Additional Paid-in Capital
Subscriptions Receivable
Total Paid-in Capital
(In Thousands) As of January 1, 2010 P=1,200,000 P=5,800,000 P=– P=24,773,540 P=235,251 P=6,080,755 (P=611,671) P=37,477,875 Exercise/Cancellation of ESOP/ESOWN – – – 11,440 (4,137) 163,628 7,660 178,591 Issuance of shares – – 200,000 – – (1,000) – 199,000 As of December 31, 2010 P=1,200,000 P=5,800,000 P=200,000 P=24,784,980 P=231,114 P=6,243,383 (P=604,011) P=37,855,466
2009
Preferred Stock - A
Preferred Stock - B
Common Stock Subscribed
Additional Paid-in Capital
Subscriptions Receivable
Total Paid-in Capital
(In Thousands) As of January 1, 2009 P=1,200,000 P=5,800,000 P=24,772,493 P=145,598 P=5,734,748 (P=401,125) P=37,251,714 Exercise of ESOP/ESOWN – – 1,047 89,653 346,007 (210,546) 226,161 As of December 31, 2009 P=1,200,000 P=5,800,000 P=24,773,540 P=235,251 P=6,080,755 (P=611,671) P=37,477,875 The movements in the Company’s outstanding number of common shares follow:
2011 2010 2009 (In Thousands) At January 1 485,645 498,332 496,984 Stock dividends 96,846 – – Exercise of ESOP/ESOWN 273 146 1,814 Treasury stock (5,506) (12,833) (466) At December 31 577,258 485,645 498,332

Ayala Corporation and Subsidiariesnotes to Consolidated financial statements
FinancialStatements134
On September 10, 2007, the BOD approved the creation of a share buyback program involving P=2.5 billion worth of common capital stock. On June 2, 2010, the BOD approved to increase the share buyback program from P=2.5 billion to P=5.0 billion. In 2011 and 2010, the Company acquired 5,506,476 and 12,832,860 common shares, respectively, at a total cost of P=1,776.6 million and P=4,143.5 million, respectively. As of December 31, 2011 and 2010, treasury stock arising from common shares amounted to P=6,608.9 million and P=4,832.3 million, respectively.
In addition, P=250.0 million Preferred A shares of the Company have been acquired by ALI (P=100.0 million) and MWC (P=150.0 million). This has been accounted for as “Parent Company Preferred shares held by subsidiaries” and presented as a reduction in equity.
In accordance with SRC Rule 68, as Amended (2011), Annex 68-D, below is a summary of the Company’s track record of registration of securities.
Number of shares registered Issue/offer price Date of approval
Number of holders of securities as of
December 31, 2011 Common shares 200,000,000* P=1.00 par value**;
P=4.21 issue price July 21, 1976 7,451
Preferred A shares 12,000,000 P=100 par value; P=500 issue price
November 11, 2008 55
Preferred B shares 58,000,000 P=100 par value; P=100 issue price
July 5, 2006 None***
*Initial number of registered shares only. **Par value now is P=50.00. ***The Preferred B shares are fully redeemed on July 21, 2011.
Retained Earnings Retained earnings include the accumulated equity in undistributed net earnings of consolidated subsidiaries, associates and jointly controlled entities accounted for under the equity method amounting to P=49,628.5 million, P=41,655.3 million and P=33,990.7 million as of December 31, 2011, 2010 and 2009, respectively, which are not available for dividend declaration by the Company.
Retained earnings are further restricted for the payment of dividends to the extent of the cost of the shares held in treasury.
In accordance with the SRC Rule 68, as Amended (2011), Annex 68-C, the Company’s retained earnings available for dividend declaration as of December 31, 2011 and 2010 amounted to P=13,848.4 million and P=27,523 million, respectively.
Dividends consist of the following:
2011 2010 2009 (In Thousands, except dividends per share) Dividends to common shares Cash dividends declared during the year P=2,124,004 P=1,944,830 P=1,994,148 Cash dividends per share P=4.00 P=4.00 P=4.00 Stock dividends P=4,842,317 P=– P=– Dividends to equity preferred shares declared
during the year Cash dividends to Preferred A shares P=532,800 P=532,800 P=1,065,600 Cash dividends to Preferred B shares P=– P=411,414 P=959,967 Cash dividends to Voting Preferred shares P=21,126 P=– P=–
On December 9, 2011, the BOD approved the declaration and payment of cash dividends out of the unappropriated
retained earnings of the Company amounting to P=1,154.5 million or P=2 per share, payable to all common shares shareholders of record as of December 28, 2011. The said dividends are payable on January 24, 2012. Also on the same date, the BOD approved the declaration and payment of the quarterly cash dividends of 8.88% to all shareholders of the Company’s Preferred A shares for the calendar year 2012 and declaration and payment of the annual cash dividends of 5.2817% per annum to all shareholders of the Company’s Voting Preferred shares.
On December 10, 2010, the BOD approved the declaration and payment of cash dividends out of the unappropriated retained earnings of the Company amounting to P=971.4 million or P=2 per share, payable to all common shares shareholders of record as of January 7, 2011. The said dividends are payable on February 2, 2011. Also on the same date, the BOD approved the declaration and payment of the quarterly dividends to all shareholders of the Company’s Preferred A for the calendar year 2011 and the declaration and payment of the quarterly dividends for the first three quarters of 2011 to all Preferred B shareholders for calendar year 2011.

FinancialStatements 135
On December 10, 2009, the BOD approved the declaration and payment of cash dividends out of the unappropriated retained earnings of the Company amounting to P=996.7 million or P=2 per share, payable to all common shares shareholders of record as of January 8, 2010. The said dividends are payable on February 2, 2010. Also on the same date, the BOD approved the declaration and payment of the quarterly dividends to all shareholders of the Company’s Preferred A and Preferred B shares for calendar year 2010.
Capital Management The primary objective of the Company’s capital management policy is to ensure that it maintains a strong credit rating and healthy capital ratios in order to support its business and maximize shareholder value. The Company manages its capital structure and makes adjustments to it, in light of changes in economic conditions. To maintain or adjust the capital structure, the Company may adjust the dividend payment to shareholders or issue new shares. No changes were made in the objectives, policies or processes for the years ended December 31, 2011 and 2010.
The Company is not subject to externally imposed capital requirements.
The Company monitors capital using a gearing ratio of debt to equity and net debt to equity. Debt consists of short-term and long-term debt. Net debt includes short-term and long-term debt less cash and cash equivalents and short-term investments. The Company considers as capital the equity attributable to equity holders of the Company.
2011 2010 (In Thousands) Short-term debt P=6,665,841 P=4,519,287 Long-term debt 100,052,026 78,317,291 Total debt 106,717,867 82,836,578 Less: Cash and cash equivalents 53,577,252 53,142,777 Short-term investments 1,613,058 3,993,533 Net debt P=51,527,557 P=25,700,268 Equity attributable to owners of the parent P=107,044,063 P=107,540,968 Debt to equity 99.7% 77.0% Net debt to equity 48.1% 23.9%
22. Other Income and Costs and Expenses
Other income consists of:
2011 2010 2009 (In Thousands) Bargain purchase gain (Note 23) P=558,233 P=53,327 P=235,851 Gain on sale of investments (Note 11) 539,713 13,972 1,698,820 Mark to market gain on financial assets at
FVPL and derivatives(Notes 8 and 31) 337,679 146,299 13,958 Dividend income 234,333 146,962 204,691 Gain on sale of other assets 131,078 162,156 168,063 Foreign exchange gain (loss) (Note 31) 90,060 39,105 (64,974) Remeasurement gain arising from business
combination (Note 23) – 4,386,789 – Gain on deemed disposal of a subsidiary
(Note 11) – 2,110,272 – Insurance claim (Note 6) – – 280,100 Others (Note 7) 599,830 287,707 524,969 P=2,490,926 P=7,346,589 P=3,061,478
In 2009, gain on sale of investments consists mostly of gain arising from the sale of the Company’s investments in a listed subsidiary, an associate and jointly controlled entities.
Other income includes income derived from ancillary services of consolidated subsidiaries.
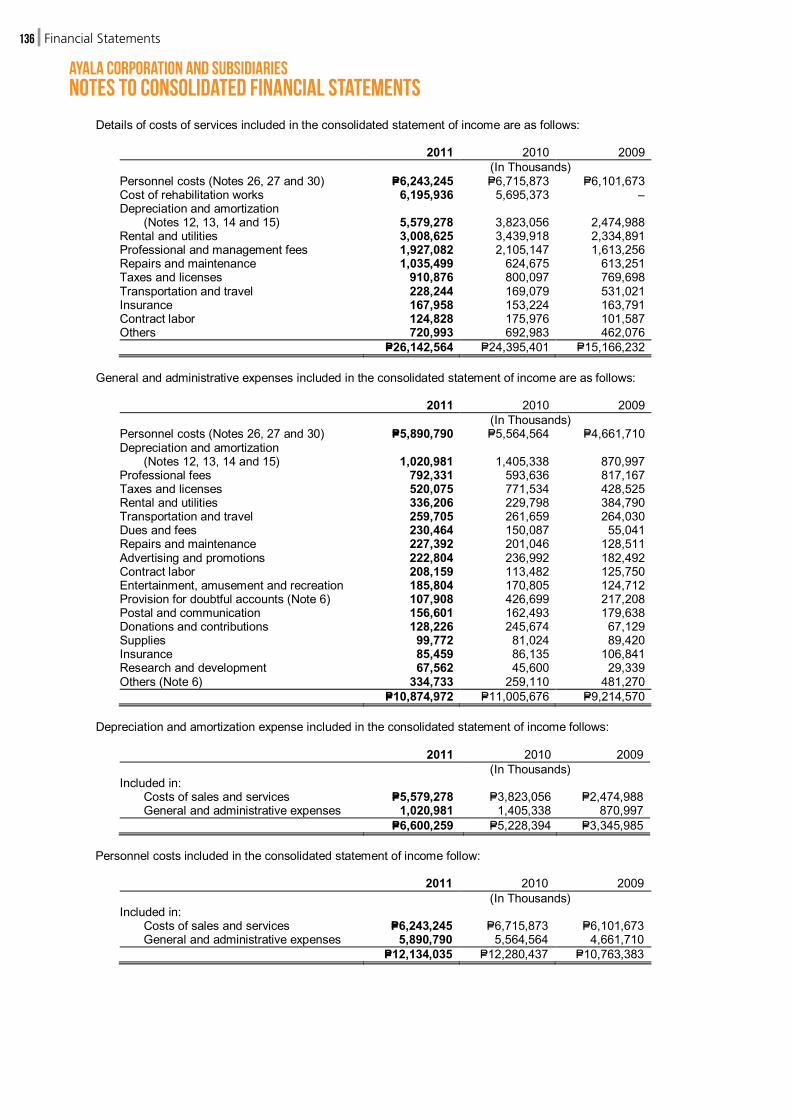
Ayala Corporation and Subsidiariesnotes to Consolidated financial statements
FinancialStatements136
Details of costs of services included in the consolidated statement of income are as follows:
2011 2010 2009 (In Thousands) Personnel costs (Notes 26, 27 and 30) P=6,243,245 P=6,715,873 P=6,101,673 Cost of rehabilitation works 6,195,936 5,695,373 – Depreciation and amortization
(Notes 12, 13, 14 and 15) 5,579,278 3,823,056 2,474,988 Rental and utilities 3,008,625 3,439,918 2,334,891 Professional and management fees 1,927,082 2,105,147 1,613,256 Repairs and maintenance 1,035,499 624,675 613,251 Taxes and licenses 910,876 800,097 769,698 Transportation and travel 228,244 169,079 531,021 Insurance 167,958 153,224 163,791 Contract labor 124,828 175,976 101,587 Others 720,993 692,983 462,076 P=26,142,564 P=24,395,401 P=15,166,232
General and administrative expenses included in the consolidated statement of income are as follows:
2011 2010 2009 (In Thousands) Personnel costs (Notes 26, 27 and 30) P=5,890,790 P=5,564,564 P=4,661,710 Depreciation and amortization
(Notes 12, 13, 14 and 15) 1,020,981 1,405,338 870,997 Professional fees 792,331 593,636 817,167 Taxes and licenses 520,075 771,534 428,525 Rental and utilities 336,206 229,798 384,790 Transportation and travel 259,705 261,659 264,030 Dues and fees 230,464 150,087 55,041 Repairs and maintenance 227,392 201,046 128,511 Advertising and promotions 222,804 236,992 182,492 Contract labor 208,159 113,482 125,750 Entertainment, amusement and recreation 185,804 170,805 124,712 Provision for doubtful accounts (Note 6) 107,908 426,699 217,208 Postal and communication 156,601 162,493 179,638 Donations and contributions 128,226 245,674 67,129 Supplies 99,772 81,024 89,420 Insurance 85,459 86,135 106,841 Research and development 67,562 45,600 29,339 Others (Note 6) 334,733 259,110 481,270 P=10,874,972 P=11,005,676 P=9,214,570
Depreciation and amortization expense included in the consolidated statement of income follows:
2011 2010 2009 (In Thousands) Included in: Costs of sales and services P=5,579,278 P=3,823,056 P=2,474,988 General and administrative expenses 1,020,981 1,405,338 870,997 P=6,600,259 P=5,228,394 P=3,345,985
Personnel costs included in the consolidated statement of income follow:
2011 2010 2009 (In Thousands) Included in: Costs of sales and services P=6,243,245 P=6,715,873 P=6,101,673 General and administrative expenses 5,890,790 5,564,564 4,661,710 P=12,134,035 P=12,280,437 P=10,763,383

FinancialStatements 137
Interest expense and other financing charges consist of:
2011 2010 2009 (In Thousands) Interest expense on:
Short-term debt P=199,717 P=236,906 P=271,057 Long-term debt 5,276,219 3,832,346 3,474,892 Amortization of discount on long-term debt 206,258 50,495 405 Amortization of service concession obligations and deposits 345,978 546,528 – Others 147,171 89,714 75,988 P=6,175,343 P=4,755,989 P=3,822,342
Other charges consist of:
2011 2010 2009 (In Thousands) Loss on derecognition of derivative asset
(Note 16) P=229,613 P=– P=– Provision for impairment losses
AFS financial assets (Note 9) 157,314 235,114 – Inventories (Note 7) 49,937 – 78,091 Land and improvements (Note 10) – – 568,672
Write-offs and other charges 142,741 221,306 350,265 Impairment loss on goodwill (Notes 15 and
23) 139,170 914,118 – Remeasurement loss arising from business
combination (Note 23) – 595,925 – Others (Note 7) 18,586 105,446 438,010 P=737,361 P=2,071,909 P=1,435,038
In 2009, write-offs and other charges include the write-down of ALI’s inventory from purchase of steel bars which amounted to P=350.3 million and IMI’s lost inventories amounting to US$0.6 million (P=27.7 million), due to a fire incident in its plant in Cebu, Philippines.
23. Business Combinations
PFRS 3 provides that if the initial accounting for a business combination can be determined only provisionally by the end of the period in which the combination is effected because either the fair values to be assigned to the acquiree’s identifiable assets, liabilities or contingent liabilities or the cost of the combination can be determined only provisionally, the acquirer shall account for the combination using those provisional values. The acquirer shall recognize any adjustments to those provisional values as a result of completing the initial accounting within twelve months of the acquisition date as follows: (i) the carrying amount of the identifiable asset, liability or contingent liability that is recognized or adjusted as a result of completing the initial accounting shall be calculated as if its fair value at the acquisition date had been recognized from that date; (ii) goodwill or any gain recognized shall be adjusted by an amount equal to the adjustment to the fair value at the acquisition date of the identifiable asset, liability or contingent liability being recognized or adjusted; and (iii) comparative information presented for the periods before the initial accounting for the combination is complete shall be presented as if the initial accounting has been completed from the acquisition date.
2011 Acquisitions
EPIQ subsidiaries On April 28, 2011, IMI Philippines infused additional capital to its subsidiary, IMI Singapore, equivalent to US$35.8 million (consisting of US$7.0 million cash and 200 million of IMI Philippines’ own shares with fair value of US$28.8 million) in exchange for 43,077,144 newly issued ordinary shares of the latter with par value of SGD1.00 per share. This was used by IMI Singapore to set up Monarch and Cooperatief as holding companies and facilitate the acquisition of EPIQ subsidiaries from EPIQ NV.
On May 4, 2011, IMI Philippines, Cooperatief (the Purchaser), and EPIQ NV (the Seller), entered into a Sale and Purchase Agreement (SPA), for the Purchaser to buy the Seller’s 100% direct or indirect ownership shares (EPIQ shares) in the EPIQ subsidiaries.

Ayala Corporation and Subsidiariesnotes to Consolidated financial statements
FinancialStatements138
IMI Philippines, Cooperatief and EPIQ NV agreed that the consideration for the EPIQ shares would include issuance of 200 million of IMI Philippines’ shares (the IMI Consideration Shares); deferred payment of EUR€7.3 million (P=443.1 million) from 2013 to 2018 subject to interest rate of 1.599% plus 1.5%; and assumption of liabilities of EPIQ NV to the EPIQ subsidiaries aggregating to EUR€2.5 million (US$153.6 million). The acquisition costs are allocated as follows: EPIQ EA EPIQ CZ EPIQ MX Total (In Thousands) Issuance of 200 million IMI
Consideration Shares US$20,639 US$525 US$7,645 US$28,809 Deferred payment 7,533 191 2,791 10,515 Assumed liabilities of EPIQ NV to
EPIQ subsidiaries 115 9 3,521 3,645 US$28,287 US$725 US$13,957 US$42,969
On July 29, 2011, all of the completion conditions under the SPA were fulfilled by the responsible parties, and the acquisition of the EPIQ subsidiaries by Cooperatief was completed. The issuance of IMI shares resulted in equity reserve amounting to P=694.5 million in 2011.
Under the SPA, Cooperatief also purchased receivables of EPIQ NV from the EPIQ subsidiaries aggregating to EUR€11.7 million (P=707.9 million). On July 29, 2011, EUR€4.8 million (P=291.4 million) of this was settled through cash payment, while the rest will be settled through additional deferred payment from 2013 to 2018 subject to interest rate of 1.599% plus 1.5% (see Note 19). The provisional fair values of the identifiable assets and liabilities acquired and goodwill (gain from bargain purchase) arising as at the date of acquisition follow:
EPIQ EA EPIQ CZ EPIQ MX In US$ In Php* In US$ In Php* In US$ In Php*
(In Thousands) Assets Cash and cash equivalents US$1,153 P=48,569 US$515 P=21,711 US$3,386 P=142,668 Receivables 26,486 1,116,115 3,334 140,492 10,508 442,811 Inventories 20,701 872,338 2,985 125,769 4,476 188,632 Property, plant and equipment 24,811 1,045,517 5,734 241,639 8,618 363,172 Intangible assets 6,925 291,838 – – 300 12,631 Deferred tax assets – – 444 18,720 – – Other assets 193 8,141 – – 121 5,092 80,269 3,382,518 13,012 548,331 27,409 1,155,006 Liabilities Accounts payable 17,651 745,824 2,445 103,025 6,410 270,107 Bank loans 12,871 542,394 – – – – Accrued charges and deferred income 1,159 48,831 378 15,919 – – Taxes payable 352 14,857 – – 1,090 45,932 Provisions 1,320 55,615 – – – – Deferred tax liabilities 2,139 90,131 – – 1,686 71,060 Long term debt 4,780 201,424 10,114 426,224 2,909 122,591 40,272 1,699,076 12,937 545,168 12,095 509,690 Net Assets US$39,997 P=1,683,442 US$75 P=3,163 US$15,314 P=645,316 Cooperatief’s share in the fair value of net assets acquired 39,949 1,683,442 75 3,163 15,314 645,316 Goodwill (gain from bargain purchase) (11,662) (491,423) 650 27,408 (1,357) (57,175) Acquisition cost US$28,287 P=1,192,019 US$725 P=30,571 US$13,957 P=588,141 *Translated using the exchange rate at the transaction date (US$1:P=42.14)
The purchase price allocation for the acquisition of the EPIQ subsidiaries has been prepared on a preliminary basis due to unavailability of certain information to facilitate fair valuation computation, and reasonable changes are expected as additional information becomes available. The accounts that are subject to provisional accounting are property, plant and equipment, intangible assets, contingent liabilities and goodwill. The goodwill recognized on the acquisition of EPIQ CZ can be attributed to the acquisition of its automotive and turnkey experience, platforms in Europe and North America that serve global customers, access to suppliers and scale benefit in materials.

FinancialStatements 139
Acquisition related costs which consist of professional fees, representation and travel expenses amounting to US$2.86 million (P=123.9 million) were recognized as expense in 2011.
From the date of acquisition, the Group’s share in the revenue and net income of EPIQ subsidiaries amounted to US$66.2 million (P=2.9 billion) and US$2.42 million (P=104.8 million), respectively. If the combination had taken place at the beginning of 2011, the Group’s total revenue and net income would have been P=99.4 billion and P=16.1 billion, respectively.
CWC On November 8, 2011, MWC and Veolia Water Philippines, Inc. (VWPI) entered into a share sale and purchase agreement whereby VWPI will sell to MWC its 100% interest in CWC and receivable from Bonifacio Water Corporation (BWC). On November 29, 2011, MWC completed the acquisition of VWPI’s 100% interest in the common shares of CWC and the BWC receivable at a total contract price of P=1.8 billion, broken down as follows:
BWC Receivable (see Note 6) P=0.6 billionInvestment in CWC 1.2 billion P=1.8 billion
The terms of the BWC receivable provide that payments will be made on a quarterly basis at an amount based on a certain percentage of BWC’s revenue until 2022, the end of BWC’s concession period. The fair value of the BWC receivable has been determined based on the present value of forecasted collections of the receivable. The purchase price allocation of CWC has been prepared on a preliminary basis due to unavailability of certain information to facilitate fair valuation computation, and reasonable changes are expected as additional information becomes available. The following is a summary of the provisional fair values of the assets acquired and liabilities assumed as of the date of the acquisition (amounts in thousands):
Assets Cash P=31,621 Receivable - net 38,854 Materials and supplies - at cost 1,132 Other current assets 1,324 Property, plant and equipment - net 5,188 Service concession assets 1,077,361 Other noncurrent assets 13,900 1,169,380 Liabilities Accounts and other payables P=22,178 Income tax payable 838 Service concession liabilities 37,013 Deferred tax liability 244 Customers’ deposits 27,429 Pension liability 11,339 99,041 Net assets P=1,070,339 Goodwill 130,319 Acquisition cost P=1,200,658
Cash on acquisition follows:
Cash acquired from CWC P=31,621 Cash paid 1,200,658 Net cash flow P=1,169,037
From the date of acquisition, the Group’s share in the revenue and net income of CWC amounted to P=27.6 million and P=6.8 million, respectively. If the contribution had taken place at the beginning of the year, the revenue of the Group would have been P=97.3 billion and net income would have been P=15.9 billion in 2011.
IQ BackOffice, LLC (IQB) On April 29, 2011, AIVPL through LIL and HRMall acquired IQB for a total consideration of US$12.5 million. IQB is engaged in the business of providing outsourced back office accounting and financial management services. AIVPL dissolved IQB upon its acquisition to create a new company in the name of IQ BackOffice, Inc. (IQB Delaware).
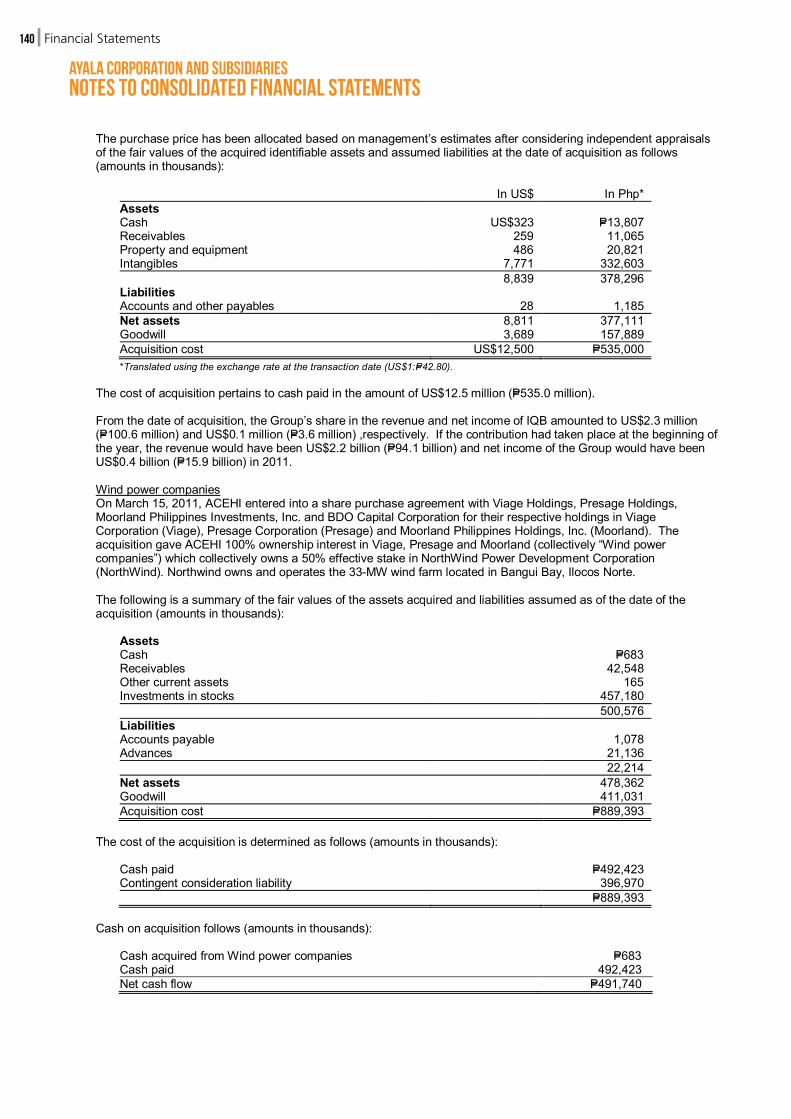
Ayala Corporation and Subsidiariesnotes to Consolidated financial statements
FinancialStatements140
The purchase price has been allocated based on management’s estimates after considering independent appraisals of the fair values of the acquired identifiable assets and assumed liabilities at the date of acquisition as follows (amounts in thousands):
In US$ In Php* Assets Cash US$323 P=13,807 Receivables 259 11,065 Property and equipment 486 20,821 Intangibles 7,771 332,603 8,839 378,296 Liabilities Accounts and other payables 28 1,185 Net assets 8,811 377,111 Goodwill 3,689 157,889 Acquisition cost US$12,500 P=535,000
*Translated using the exchange rate at the transaction date (US$1:P=42.80).
The cost of acquisition pertains to cash paid in the amount of US$12.5 million (P=535.0 million).
From the date of acquisition, the Group’s share in the revenue and net income of IQB amounted to US$2.3 million (P=100.6 million) and US$0.1 million (P=3.6 million) ,respectively. If the contribution had taken place at the beginning of the year, the revenue would have been US$2.2 billion (P=94.1 billion) and net income of the Group would have been US$0.4 billion (P=15.9 billion) in 2011.
Wind power companies On March 15, 2011, ACEHI entered into a share purchase agreement with Viage Holdings, Presage Holdings, Moorland Philippines Investments, Inc. and BDO Capital Corporation for their respective holdings in Viage Corporation (Viage), Presage Corporation (Presage) and Moorland Philippines Holdings, Inc. (Moorland). The acquisition gave ACEHI 100% ownership interest in Viage, Presage and Moorland (collectively “Wind power companies”) which collectively owns a 50% effective stake in NorthWind Power Development Corporation (NorthWind). Northwind owns and operates the 33-MW wind farm located in Bangui Bay, Ilocos Norte.
The following is a summary of the fair values of the assets acquired and liabilities assumed as of the date of the acquisition (amounts in thousands):
Assets Cash P=683 Receivables 42,548 Other current assets 165 Investments in stocks 457,180 500,576 Liabilities Accounts payable 1,078 Advances 21,136 22,214 Net assets 478,362 Goodwill 411,031 Acquisition cost P=889,393
The cost of the acquisition is determined as follows (amounts in thousands):
Cash paid P=492,423 Contingent consideration liability 396,970 P=889,393
Cash on acquisition follows (amounts in thousands):
Cash acquired from Wind power companies P=683 Cash paid 492,423 Net cash flow P=491,740
FinancialStatements 141
As part of the share purchase agreement with the previous owners of the Wind power companies, a contingent consideration has been agreed. There will be additional payments to the previous owners for Feed-in-Tariff (FiT) Adjustment and Achieved Capacity Factor Adjustment within one year from closing date (March 15, 2012).
As at the acquisition date, the fair value of the contingent consideration is P=396.97 million.
As of December 31, 2011, Northwind was able to exceed the agreed capacity factor with the previous owners. However, the FiT provision of the Renewable Energy Act of 2008 is pending approval by the Energy Regulatory Commission (ERC).
From the date of acquisition, the Group’s share in the revenue and net income of the wind power companies amounted to P=3.6 million and P=2.2 million, respectively. If the combination had taken place at the beginning of the year, the revenue of the Group would have been P=94.0 billion and net income would have been P=15.8 billion in 2011.
Hydro power companies On April 19, 2011, ACEHI and Sta. Clara Power Corporation (SCP) entered into a Shareholder’s Agreement (the Agreement) to develop various mini-hydro power projects in various locations in the Philippines. ACEHI and SCP shall carry out the Agreement through Quadriver Energy Corporation (QEC), Philnew Hydro Power Corporation (PHPC) and Philnew River Power Corporation (PRPC) (collectively “Hydro power companies”), wholly-owned subsidiaries of SCP. QEC and PHPC were incorporated on April 5, 2011 while PRPC was incorporated on June 24, 2011.
Under the Agreement, SCP issued an irrevocable proxy in favor of ACEHI wherein ACEHI will hold 70% of the subscribed capital stock, vote on any and all corporate actions therein, and elect such number of directors as corresponds to its intended 70% stake in QEC, PHPC and PRPC. This enabled ACEHI to exercise control over QEC, PHPC and PRPC.
Simultaneous with the signing of the Agreement, SCP transferred 25% of its ownership interest in QEC and PHPC to ACEHI.
The following is a summary of the fair values of the asset acquired from QEC and PHPC as of the date of the acquisition (amounts in thousands).
Assets Cash P=500 Share in the fair value of the asset acquired (25%) 125 Goodwill 55,423 Acquisition cost P=55,548
The acquisition cost pertains to the cash consideration paid to SCP.
Cash on acquisition of QEC and PHPC follows (amounts in thousands):
Cash acquired from PRPC P=500 Cash paid 55,548 Net cash flow P=55,048
As of December 31, 2011, ACEHI does not own any shares of PRPC but the balances were still consolidated by virtue of the irrevocable proxy issued by SCP.
The asset of PRPC as of acquisition date pertain to cash amounting to P=0.25 million.
Cash on acquisition of PRPC follows (amounts in thousands):
Cash acquired from PRPC P=250 Cash paid – Net cash flow P=250
Subsequent to acquisition date, renewable energy contracts under the name of SCP were transferred to the respective Hydro power companies.
From the date of acquisition, the Group’s share in the revenue and net loss of Hydro power companies amounted to P=0.1 million and (P=3.01 million), respectively. Since the business combination happened close to the date of incorporation of the Hydro power companies, the Group’s total revenue and net income would be the same as presented in the consolidated statement of income.
Ayala Corporation and Subsidiariesnotes to Consolidated financial statements
FinancialStatements142
2010 Acquisitions
PSi On June 25, 2010, IMI and Narra Venture Capital II, LP (Narra VC) (collectively referred to as the “New Investors”) entered into an Investors’ Agreement (the Agreement) with PSi Technology Holdings, Inc. (PSiH) and Merrill Lynch Global Emerging Markets Partners, LLC (MLGEMP) (collectively referred to as the “Old Investors”), to take on 55.8% and 11.2% equity share in PSi, respectively. Under the Agreement, IMI subscribed to 13.2 billion common shares or 55.8% of PSi’s outstanding common shares in exchange for a cash consideration of US$8.3 million.
The Agreement also provided for the following:
1) The grant of Put and Call Options as follows (see Note 31):
Put Option Option to require the New Investors to purchase all but not
some of the shares held by the Old Investors (Option Shares) at the time of exercise, at anytime during the Put Option Period.
Put Option Period The period from acquisition date up to 24 months from completion date, with 7-day exercise notice.
Put Option Strike Price The higher of (a) US$1.0 and (b) value of the shares calculated based on 5.5x trailing 12-month Earnings before interest, taxes, depreciation and amortization (EBITDA) of PSi as of receipt of the exercise notice less net debt.
Call Option Option to require the Old Investors to sell all but not some only of the shares held by the Old Investors at the time of exercise, at anytime during the Call Option Period.
Call Option Period The period commencing 6 days prior to the lapse of the Put Option Period and ending 30 days after the lapse of the Put Option Period.
Call Option Strike Price The higher of (a) US$1.0 and (b) value of the shares calculated based on 6.0x trailing 12-month EBITDA of PSi as of the date of receipt of the exercise notice less net debt.
2) The assumption of the Old Investors of certain pre-completion liabilities of PSi. However, payment of such
liabilities would come from and is limited to any proceeds from the exercise of either the Put Option or the Call Option.
3) The New Investors agreed to proportionately assume one-third (1/3) of the initial US$3.0 million of the pre-
completion liabilities assumed by the Old Investors.
The equity subscription of the New Investors was finalized on October 6, 2010. On that date, IMI paid the US$8,325,000 subscription price and four (4) of its officers were appointed as members of PSi’s BOD. As of this date, IMI effectively obtained control of PSi.
The purchase price allocation has been prepared on a preliminary basis due to unavailability of certain information to facilitate fair valuation computation, and reasonable changes are expected as additional information becomes available. The following is a summary of the provisional fair values of the assets acquired and liabilities assumed as of the date of the acquisition.
In US$ In Php* (In Thousands) Assets Cash US$10,528 P=461,966 Accounts receivable - net 18,420 808,263 Inventories - net 6,581 288,774 Property, plant and equipment - net (Note 13) 9,210 404,152 Other assets 1,312 57,568 46,051 2,020,723
(Forward)
FinancialStatements 143
In US$ In Php* (In Thousands) Liabilities Accounts payable and accrued expenses US$35,783 P=1,570,180 Loans payable 2,348 103,013 Deferred revenue 2,923 128,259 Accrued rental noncurrent 902 39,581 Other long-term benefits 372 16,327 42,328 1,857,360 Net assets 3,723 163,363 IMI’s share in the fair value of net assets acquired
(55.78%) 2,077 91,123 Goodwill 9,493 416,570 Acquisition cost US$11,570 P=507,693
*Translated using the exchange rate at the transaction date (US$1:P=43.88)
The cost of the acquisition is determined as follows:
In US$ In Php* (In Thousands) Cash paid US$8,325 P=365,301 IMI’s share in acquisition-date fair value of Call Option granted to New Investors (1,404) (61,608) IMI’s share in acquisition-date fair value of Put Option granted to Old Investors 3,816 167,447 IMI’s share in Pre-Completion liabilities assumed from the Old Investors 833 36,553 Cost of acquisition US$11,570 P=507,693
*Translated using the exchange rate at the transaction date (US$1:P=43.88)
Cash on acquisition follows:
In US$ In Php* (In Thousands) Cash acquired from PSi US$10,528 P=461,966 Cash paid 8,325 365,301 Net cash flow US$2,203 P=96,665
*Translated using the exchange rate at the transaction date (US$1:P=43.88)
The non-controlling interest amounted to US$1.6 million (P=71.6 million) and is measured at the proportionate share of the value of the net identifiable assets acquired and liabilities assumed.
Acqusition related costs which consists of professional fees, representation and travel expenses amounting to
US$0.2 million were recognized as expense in 2010.
From the date of acquisition, the Group’s share in PSi’s revenue and net loss amounted to P=486.8 million and P=20.8 million, respectively. If the combination had taken place at the beginning of the year, the Group’s total revenue would have been P=82.8 billion, while the Group’s net income would have been P=16.0 billion.
In 2011, IMI finalized the purchase price allocation and the fair value computation of accounts receivable, accounts payable and accrued expenses, and goodwill.
In US$ In Php* (In Thousands) Accounts receivable US$12,454 P=546,490 Accounts payable and accrued expenses 31,591 1,386,242 Goodwill (Note 10) 10,196 447,419
*Translated using the exchange rate at the transaction date (US$1:P=43.88)
The 2010 comparative information was restated to reflect the above adjustments. Accounts receivable, accounts payable and accrued expenses, and cost of acquisition decreased by US$5.97 million (P=261.8 million), US$4.19 million (P=183.9 million), and US$0.29 million (P=12.6 million), respectively. The final purchase price allocation resulted in goodwill of US$10.20 million (P=447.4 million).

Ayala Corporation and Subsidiariesnotes to Consolidated financial statements
FinancialStatements144
Ten Knots ALI entered into an agreement with Asian Conservation Company and ACC Resorts, Inc. (the ACC Group) to create a new company which will serve as a holding vehicle for Ten Knots Phils, Inc. (TKPI) and Ten Knots Development Corp (TKDC) (wholly-owned subsidiaries of the ACC Group before ALI’s entry). TKPI/TKDC are mainly involved in the development of parcels of land and islands into resorts in Miniloc, Lagen, Pangulasian and Apulit islands in the municipalities of El Nido and Taytay in Northern Palawan.
The agreement will eventually result in ALI obtaining 60% interest in the new company and ACC Group acquiring 40%. ALI will infuse P=2.0 billion cash to obtain the 60% stake.
As of December 31, 2010, ALI has subscribed to 60% of the shares of TKPI and TKDC, thereby providing ALI with the ability to exercise control over TKPI and TKDC effective April 23, 2010. Accordingly, TKPI and TKDC financial statements are consolidated on a line-by-line basis with that of the Group as of December 31, 2010.
The following are the fair values of the identifiable assets and liabilities assumed (amounts in thousands):
Assets Cash and cash equivalents P=365,652 Trade and other receivables 1,455,940 Inventories 16,393 Other current assets 25,401 Land and improvements - net (Note 10) 1,361,645 Deposit on land purchase 444,622 Property and equipment - net (Note 13) 493,328 Other assets 140,640 4,303,621 Liabilities Accounts and other payables 310,177 Deposits and other current liabilities 21,446 Due to related parties 89,232 Loans payable 81,621 Income tax payable 18,630 Deferred tax liabilities 399,155 920,261 Net assets P=3,383,360 Non-controlling interest in TKDC and TKPI 1,353,344 Total net assets acquired 2,030,016 Acquisition cost 2,029,500 Negative goodwill P=516
ALI’s share in the fair value of the net assets amounted to P=2.0 billion, which resulted in a negative goodwill amounting to P=0.5 million included under “Other income” in the consolidated statement of income (see Note 22).
The fair value of the trade receivables and other receivables approximate their carrying amounts since these are short-term in nature. None of the trade receivables have been impaired and it is expected that the full contractual amounts can be collected.
The non-controlling interest has been measured at the proportionate share of the value of the net identifiable assets acquired and liabilities assumed.
From the date of acquisition, TKDC and TKPI contributed P=260.0 million of revenue and P=10.6 million to the net income of the Group. If the combination had taken place at the beginning of the year, revenue from continuing operations would have been P=82.3 billion and the net income of the Group would have been P=16.0 billion.
Transaction costs of P=1.0 million have been expensed and are included in administrative expenses.
In 2011, ALI finalized its purchase price allocation and there were no changes to the fair market values of the assets acquired and liabilities assumed for TKDC and TKPI.
FinancialStatements 145
Water Capital Works (WCW)
On November 11, 2009, the Company and United Utilities Pacific Holdings, BV (UU) entered into a share sale and purchase agreement whereby UU will sell to the Company its 28% interest (0.2 million common shares) in WCW. On January 18, 2010, the Company completed the acquisition of UU’s interest in the common shares of WCW resulting in the Company obtaining 100% control in WCW. In prior years, WCW was treated as a jointly controlled entity of the Company.
The following is a summary of the fair values of the assets acquired and liabilities assumed as of the date of the acquisition (amounts in thousands):
Assets Cash and cash equivalents P=22,828 Receivable - net 90 22,918 Liabilities Accounts payable and accrued expenses 63 Income tax payable 1,219 Deferred tax liability 25,420 26,702 Net assets (3,784) Intangible asset (Note 15) 84,733 Bargain purchase gain (52,811) Acquisition cost P=28,138
In accordance with PFRS 3, the bargain purchase gain is recognized as part of “Other income” in the consolidated statement of income (see Note 22).
The cost of the acquisition is determined as follows (amounts in thousands):
Cash paid P=8,490 Fair value of the Company’s equity interest in WCW held before the business combination 19,648 P=28,138
The Company recognized a gain of P=3.0 million as a result of remeasuring to fair value its 72% equity interest in WCW held before the business combination. The gain is included as part of remeasurement gain under the “Other income” account in the consolidated statement of income (see Note 22).
Cash on acquisition follows (amounts in thousands):
Cash acquired from WCW P=22,828 Cash paid 8,490 Net cash flow P=14,338
From the date of acquisition, the Group’s share in WCW’s revenue and net income amounted to P=51.4 million and P=35.5 million, respectively. Since the business combination happened close to the beginning of the year, the Group’s total revenue and net income would be the same as presented in the consolidated statement of income.
MWCI and Philwater On November 11, 2009, the Company and UU entered into a share sale and purchase agreement whereby UU will sell to the Company its interest in: a) 81.9 million common shares of MWC representing 3.4% interest in MWC and b) 133.4 million common shares of Philwater representing 40% interest in Philwater. On the same date, UU and Philwater entered into a share sale and purchase agreement for the sale of UU’s interest in 666.7 million participating preferred shares of MWC to Philwater.
On March 4, 2010, the Company completed the acquisition of UU’s interest in the common shares of MWC and Philwater and participating preferred shares in MWC resulting in the Company increasing its ownership interest in MWC to 43.1% and obtaining control to more than one-half (1/2) of the voting power in MWC and Philwater becoming a subsidiary. In prior years, MWC and Philwater were treated as jointly controlled entities of the Company.

Ayala Corporation and Subsidiariesnotes to Consolidated financial statements
FinancialStatements146
The following is a summary of the fair values of the assets acquired and liabilities assumed as of the date of the acquisition (amounts in thousands).
Assets Cash and cash equivalents P=6,106,284 Short-term investments 1,854,763 Receivables - net 578,522 Materials and supplies 16,664 Other current assets 736,509 Property and equipment - net (Note 13) 1,341,081 Service concession asset - net (Note 14) 53,904,778 AFS financial assets 1,978,644 Other noncurrent assets 1,331,605 67,848,850 Liabilities Accounts payable and accrued expenses 3,006,485 Long-term debt 15,761,983 Service concession obligation 8,006,437 Income tax payable 375,994 Payable to related parties 806,781 Customers’ guaranty and other deposits 1,279,315 Pension liabilities 216,775 Deferred tax liability 5,014,393 Deferred credits 196,984 34,665,147 Net assets 33,183,703 Goodwill 393,777 Acquisition cost P=33,577,480
The cost of the acquisition is determined as follows (amounts in thousands):
Cash paid P=2,614,687 Fair value of the Company’s equity interest in MWC and Philwater held before the business combination 10,317,101 Fair value of the non-controlling interest in MWC 20,645,692 P=33,577,480
The non-controlling interest has been measured at fair value based on the share price of the MWC common shares as of acquisition date.
The Company recognized a gain of P=4.4 billion as a result of remeasuring to fair value its equity interest in MWC and Philwater held before the business combination. The gain is included as part of remeasurement gain under the “Other income” account in the consolidated statement of income (see Note 22).
Cash on acquisition follows (amounts in thousands):
Cash acquired from MWC and Philwater P=6,106,284 Cash paid 2,614,687 Net cash flow P=3,491,597
From the date of acquisition, the Group’s share in the revenue and net income of MWC and Philwater amounted to P=13.7 billion and P=2.5 billion, respectively. If the combination had taken place at the beginning of the year, the Group’s total revenue would have been P=98.2 billion, while the Group’s net income would have been P=18.0 billion.
Wardley/WDF-AY, LLC (Wardley) AY Saratoga, Inc. (AY Saratoga), a subsidiary of AINA, executed a settlement agreement and mutual general release and assignment of member interest in January 2010 whereby the 75% remaining interest owned by the other partner was transferred to AY Saratoga for US$2.4 million. As a result of the acquisition, Wardley became a subsidiary of WDF-AY, LLC.
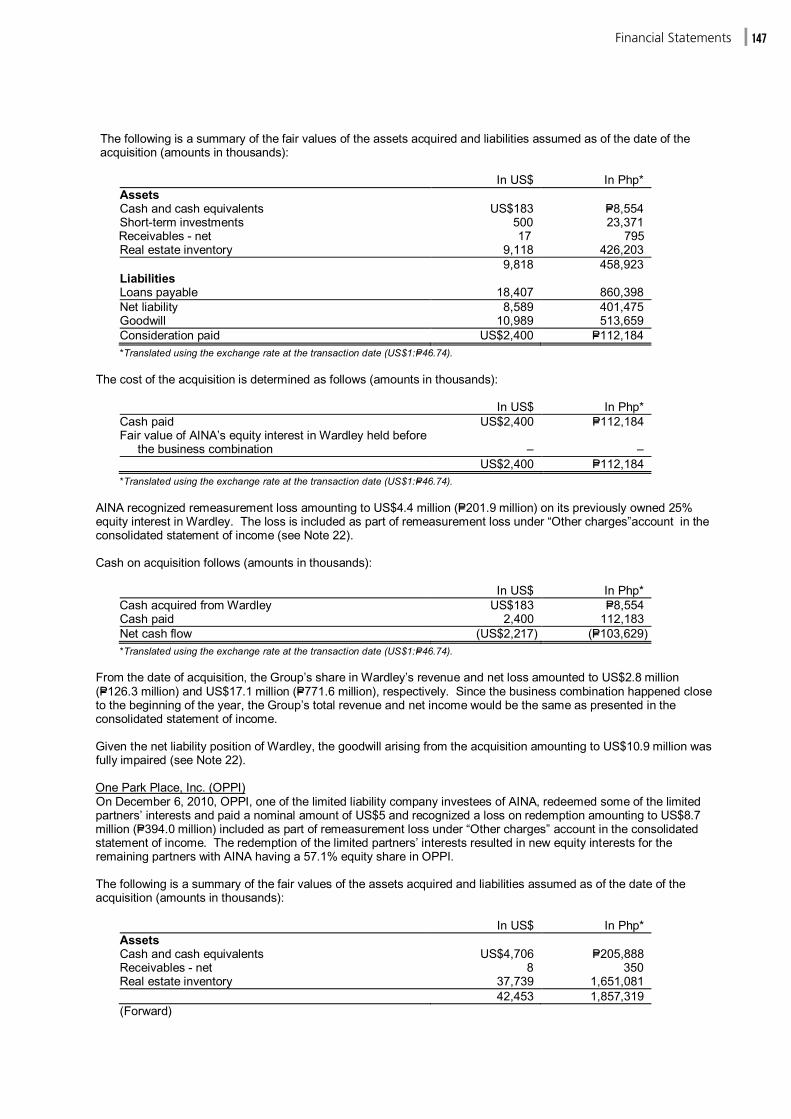
FinancialStatements 147
The following is a summary of the fair values of the assets acquired and liabilities assumed as of the date of the acquisition (amounts in thousands):
In US$ In Php* Assets Cash and cash equivalents US$183 P=8,554 Short-term investments 500 23,371 Receivables - net 17 795 Real estate inventory 9,118 426,203 9,818 458,923 Liabilities Loans payable 18,407 860,398 Net liability 8,589 401,475 Goodwill 10,989 513,659 Consideration paid US$2,400 P=112,184 *Translated using the exchange rate at the transaction date (US$1:P=46.74).
The cost of the acquisition is determined as follows (amounts in thousands):
In US$ In Php* Cash paid US$2,400 P=112,184 Fair value of AINA’s equity interest in Wardley held before the business combination – – US$2,400 P=112,184
*Translated using the exchange rate at the transaction date (US$1:P=46.74).
AINA recognized remeasurement loss amounting to US$4.4 million (P=201.9 million) on its previously owned 25% equity interest in Wardley. The loss is included as part of remeasurement loss under “Other charges”account in the consolidated statement of income (see Note 22).
Cash on acquisition follows (amounts in thousands):
In US$ In Php* Cash acquired from Wardley US$183 P=8,554 Cash paid 2,400 112,183 Net cash flow (US$2,217) (P=103,629) *Translated using the exchange rate at the transaction date (US$1:P=46.74).
From the date of acquisition, the Group’s share in Wardley’s revenue and net loss amounted to US$2.8 million (P=126.3 million) and US$17.1 million (P=771.6 million), respectively. Since the business combination happened close to the beginning of the year, the Group’s total revenue and net income would be the same as presented in the consolidated statement of income.
Given the net liability position of Wardley, the goodwill arising from the acquisition amounting to US$10.9 million was fully impaired (see Note 22).
One Park Place, Inc. (OPPI) On December 6, 2010, OPPI, one of the limited liability company investees of AINA, redeemed some of the limited partners’ interests and paid a nominal amount of US$5 and recognized a loss on redemption amounting to US$8.7 million (P=394.0 million) included as part of remeasurement loss under “Other charges” account in the consolidated statement of income. The redemption of the limited partners’ interests resulted in new equity interests for the remaining partners with AINA having a 57.1% equity share in OPPI.
The following is a summary of the fair values of the assets acquired and liabilities assumed as of the date of the acquisition (amounts in thousands):
In US$ In Php* Assets Cash and cash equivalents US$4,706 P=205,888 Receivables - net 8 350 Real estate inventory 37,739 1,651,081 42,453 1,857,319
(Forward)

Ayala Corporation and Subsidiariesnotes to Consolidated financial statements
FinancialStatements148
In US$ In Php* Liabilities Loans payable US$57,886 P=2,532,513 Net liability before redemption 15,433 675,194 Share in the net liability of redeemed shares 8,672 379,400 Net liability after redemption 6,761 295,794 Partners’ deficit from consolidation 2,464 107,800 Goodwill US$9,225 P=403,594
*Translated using the exchange rate at the transaction date (US$1:P=43.75).
The fair value of the non-controlling interests has been measured at the proportionate share of the value of the net identifiable assets acquired and liabilities assumed.
From the date of acquisition, the Group’s share in OPPI’s revenue and net loss amounted to US$0.4 million (P=18.0 million) and US$9.5 million (P=426.4 million), respectively. If the combination had taken place at the beginning of the year, the Group’s total revenue would have been P=82.1 billion, while the Group’s net income would have been P=15.9 billion.
Given the net liability position of OPPI, the goodwill arising from the acquisition of US$9.2 million was fully impaired (see Note 22).
24. Income Tax
The components of the Group’s deferred taxes as of December 31, 2011 and 2010 are as follows: Net deferred tax assets
2011 2010 (In Thousands) Deferred tax assets on: Difference between tax and book basis of accounting
for real estate transactions P=1,071,486 P=1,352,511 Allowance for probable losses 908,155 779,823 Service concession obligation 750,240 429,032 Retirement benefits 257,628 109,924 Advanced rental 129,087 52,907 Share-based payments 90,057 115,147 MCIT 13,715 523 Unrealized foreign exchange loss 13,154 110,107 NOLCO 3,996 24,375 Others 334,432 240,723 3,571,950 3,215,072 Deferred tax liabilities on: Capitalized interest and other expenses (477,015) (422,390)
Excess of financial realized gross profit over taxable realized gross profit (14,279) (29,504)
Others (72) (14,030) (491,366) (465,924) Net deferred tax assets P=3,080,584 P=2,749,148
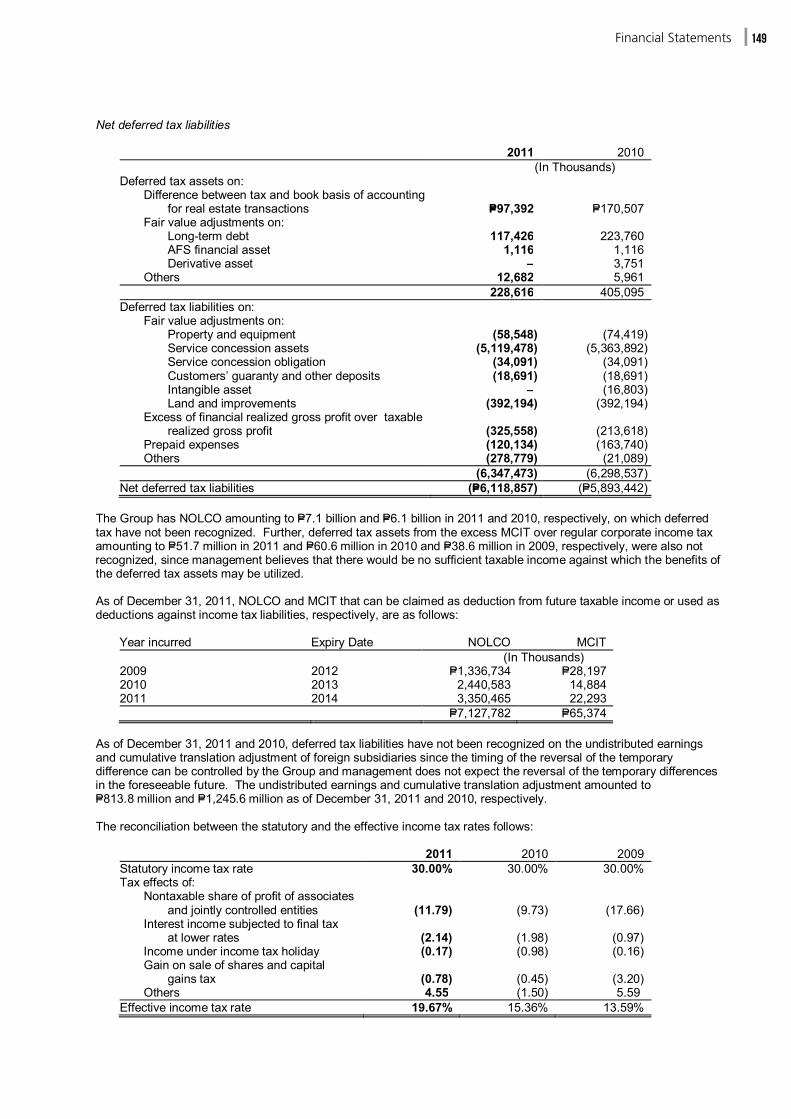
FinancialStatements 149
Net deferred tax liabilities
2011 2010 (In Thousands) Deferred tax assets on: Difference between tax and book basis of accounting
for real estate transactions P=97,392 P=170,507 Fair value adjustments on: Long-term debt 117,426 223,760 AFS financial asset 1,116 1,116 Derivative asset – 3,751 Others 12,682 5,961 228,616 405,095 Deferred tax liabilities on:
Fair value adjustments on: Property and equipment (58,548) (74,419) Service concession assets (5,119,478) (5,363,892) Service concession obligation (34,091) (34,091) Customers’ guaranty and other deposits (18,691) (18,691) Intangible asset – (16,803) Land and improvements (392,194) (392,194) Excess of financial realized gross profit over taxable
realized gross profit (325,558) (213,618) Prepaid expenses (120,134) (163,740) Others (278,779) (21,089) (6,347,473) (6,298,537) Net deferred tax liabilities (P=6,118,857) (P=5,893,442)
The Group has NOLCO amounting to P=7.1 billion and P=6.1 billion in 2011 and 2010, respectively, on which deferred tax have not been recognized. Further, deferred tax assets from the excess MCIT over regular corporate income tax amounting to P=51.7 million in 2011 and P=60.6 million in 2010 and P=38.6 million in 2009, respectively, were also not recognized, since management believes that there would be no sufficient taxable income against which the benefits of the deferred tax assets may be utilized.
As of December 31, 2011, NOLCO and MCIT that can be claimed as deduction from future taxable income or used as deductions against income tax liabilities, respectively, are as follows:
Year incurred Expiry Date NOLCO MCIT (In Thousands) 2009 2012 P=1,336,734 P=28,197 2010 2013 2,440,583 14,884 2011 2014 3,350,465 22,293 P=7,127,782 P=65,374
As of December 31, 2011 and 2010, deferred tax liabilities have not been recognized on the undistributed earnings
and cumulative translation adjustment of foreign subsidiaries since the timing of the reversal of the temporary difference can be controlled by the Group and management does not expect the reversal of the temporary differences in the foreseeable future. The undistributed earnings and cumulative translation adjustment amounted to P=813.8 million and P=1,245.6 million as of December 31, 2011 and 2010, respectively.
The reconciliation between the statutory and the effective income tax rates follows:
2011 2010 2009 Statutory income tax rate 30.00% 30.00% 30.00% Tax effects of: Nontaxable share of profit of associates and jointly controlled entities (11.79) (9.73) (17.66) Interest income subjected to final tax at lower rates (2.14) (1.98) (0.97) Income under income tax holiday (0.17) (0.98) (0.16) Gain on sale of shares and capital gains tax (0.78) (0.45) (3.20) Others 4.55 (1.50) 5.59 Effective income tax rate 19.67% 15.36% 13.59%
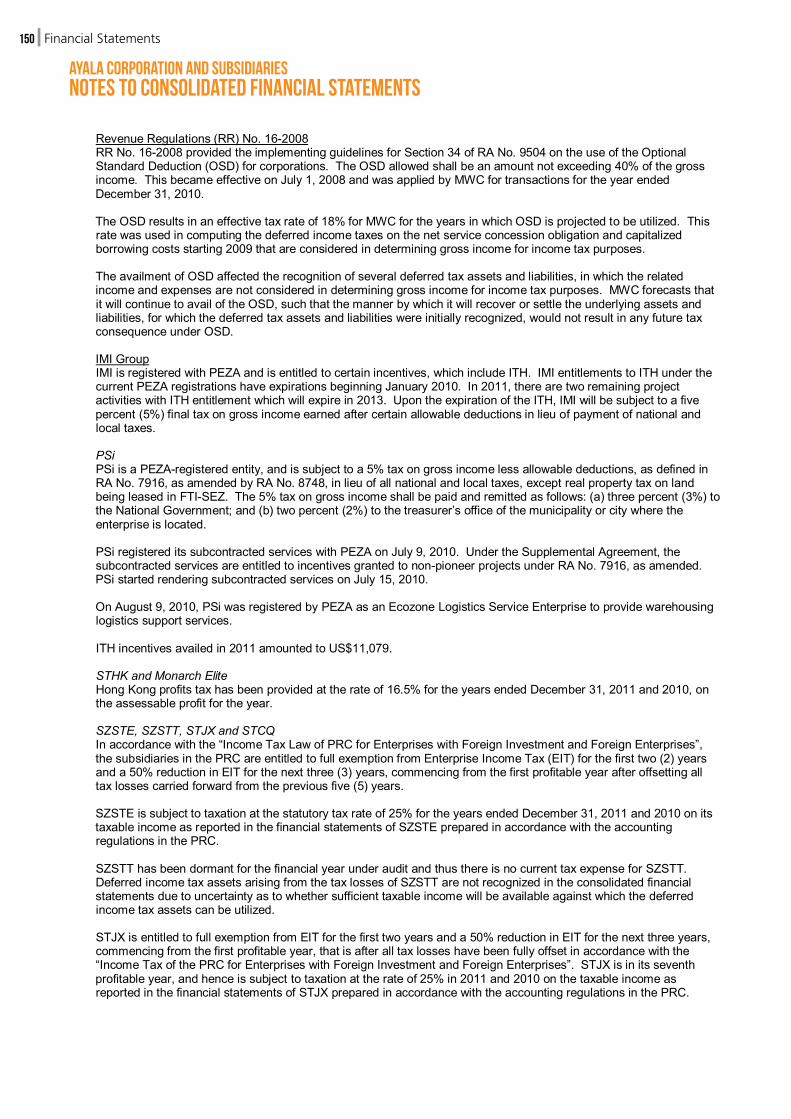
Ayala Corporation and Subsidiariesnotes to Consolidated financial statements
FinancialStatements150
Revenue Regulations (RR) No. 16-2008 RR No. 16-2008 provided the implementing guidelines for Section 34 of RA No. 9504 on the use of the Optional Standard Deduction (OSD) for corporations. The OSD allowed shall be an amount not exceeding 40% of the gross income. This became effective on July 1, 2008 and was applied by MWC for transactions for the year ended December 31, 2010.
The OSD results in an effective tax rate of 18% for MWC for the years in which OSD is projected to be utilized. This rate was used in computing the deferred income taxes on the net service concession obligation and capitalized borrowing costs starting 2009 that are considered in determining gross income for income tax purposes.
The availment of OSD affected the recognition of several deferred tax assets and liabilities, in which the related income and expenses are not considered in determining gross income for income tax purposes. MWC forecasts that it will continue to avail of the OSD, such that the manner by which it will recover or settle the underlying assets and liabilities, for which the deferred tax assets and liabilities were initially recognized, would not result in any future tax consequence under OSD.
IMI Group
IMI is registered with PEZA and is entitled to certain incentives, which include ITH. IMI entitlements to ITH under the current PEZA registrations have expirations beginning January 2010. In 2011, there are two remaining project activities with ITH entitlement which will expire in 2013. Upon the expiration of the ITH, IMI will be subject to a five percent (5%) final tax on gross income earned after certain allowable deductions in lieu of payment of national and local taxes.
PSi PSi is a PEZA-registered entity, and is subject to a 5% tax on gross income less allowable deductions, as defined in RA No. 7916, as amended by RA No. 8748, in lieu of all national and local taxes, except real property tax on land being leased in FTI-SEZ. The 5% tax on gross income shall be paid and remitted as follows: (a) three percent (3%) to the National Government; and (b) two percent (2%) to the treasurer’s office of the municipality or city where the enterprise is located.
PSi registered its subcontracted services with PEZA on July 9, 2010. Under the Supplemental Agreement, the subcontracted services are entitled to incentives granted to non-pioneer projects under RA No. 7916, as amended. PSi started rendering subcontracted services on July 15, 2010. On August 9, 2010, PSi was registered by PEZA as an Ecozone Logistics Service Enterprise to provide warehousing logistics support services.
ITH incentives availed in 2011 amounted to US$11,079.
STHK and Monarch Elite Hong Kong profits tax has been provided at the rate of 16.5% for the years ended December 31, 2011 and 2010, on the assessable profit for the year.
SZSTE, SZSTT, STJX and STCQ In accordance with the “Income Tax Law of PRC for Enterprises with Foreign Investment and Foreign Enterprises”, the subsidiaries in the PRC are entitled to full exemption from Enterprise Income Tax (EIT) for the first two (2) years and a 50% reduction in EIT for the next three (3) years, commencing from the first profitable year after offsetting all tax losses carried forward from the previous five (5) years.
SZSTE is subject to taxation at the statutory tax rate of 25% for the years ended December 31, 2011 and 2010 on its taxable income as reported in the financial statements of SZSTE prepared in accordance with the accounting regulations in the PRC.
SZSTT has been dormant for the financial year under audit and thus there is no current tax expense for SZSTT. Deferred income tax assets arising from the tax losses of SZSTT are not recognized in the consolidated financial statements due to uncertainty as to whether sufficient taxable income will be available against which the deferred income tax assets can be utilized.
STJX is entitled to full exemption from EIT for the first two years and a 50% reduction in EIT for the next three years, commencing from the first profitable year, that is after all tax losses have been fully offset in accordance with the “Income Tax of the PRC for Enterprises with Foreign Investment and Foreign Enterprises”. STJX is in its seventh profitable year, and hence is subject to taxation at the rate of 25% in 2011 and 2010 on the taxable income as reported in the financial statements of STJX prepared in accordance with the accounting regulations in the PRC.
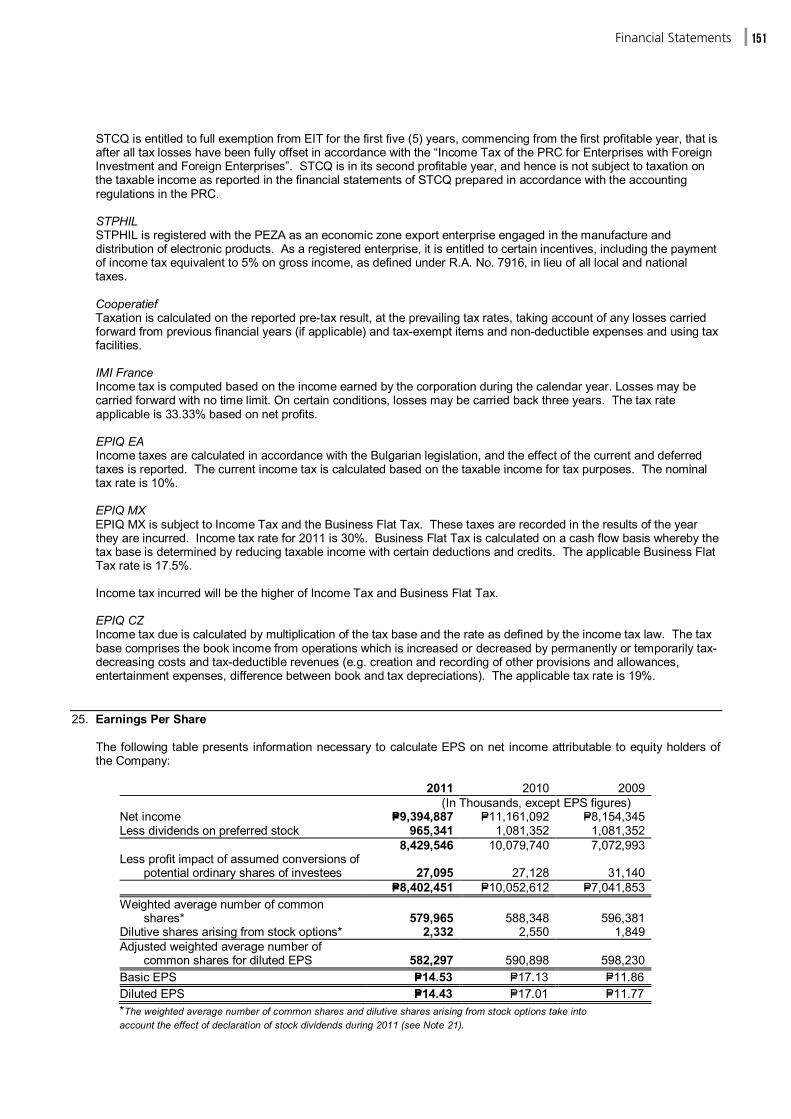
FinancialStatements 151
STCQ is entitled to full exemption from EIT for the first five (5) years, commencing from the first profitable year, that is after all tax losses have been fully offset in accordance with the “Income Tax of the PRC for Enterprises with Foreign Investment and Foreign Enterprises”. STCQ is in its second profitable year, and hence is not subject to taxation on the taxable income as reported in the financial statements of STCQ prepared in accordance with the accounting regulations in the PRC.
STPHIL STPHIL is registered with the PEZA as an economic zone export enterprise engaged in the manufacture and distribution of electronic products. As a registered enterprise, it is entitled to certain incentives, including the payment of income tax equivalent to 5% on gross income, as defined under R.A. No. 7916, in lieu of all local and national taxes.
Cooperatief Taxation is calculated on the reported pre-tax result, at the prevailing tax rates, taking account of any losses carried forward from previous financial years (if applicable) and tax-exempt items and non-deductible expenses and using tax facilities.
IMI France Income tax is computed based on the income earned by the corporation during the calendar year. Losses may be carried forward with no time limit. On certain conditions, losses may be carried back three years. The tax rate applicable is 33.33% based on net profits.
EPIQ EA Income taxes are calculated in accordance with the Bulgarian legislation, and the effect of the current and deferred taxes is reported. The current income tax is calculated based on the taxable income for tax purposes. The nominal tax rate is 10%.
EPIQ MX EPIQ MX is subject to Income Tax and the Business Flat Tax. These taxes are recorded in the results of the year they are incurred. Income tax rate for 2011 is 30%. Business Flat Tax is calculated on a cash flow basis whereby the tax base is determined by reducing taxable income with certain deductions and credits. The applicable Business Flat Tax rate is 17.5%.
Income tax incurred will be the higher of Income Tax and Business Flat Tax.
EPIQ CZ Income tax due is calculated by multiplication of the tax base and the rate as defined by the income tax law. The tax base comprises the book income from operations which is increased or decreased by permanently or temporarily tax-decreasing costs and tax-deductible revenues (e.g. creation and recording of other provisions and allowances, entertainment expenses, difference between book and tax depreciations). The applicable tax rate is 19%.
25. Earnings Per Share
The following table presents information necessary to calculate EPS on net income attributable to equity holders of the Company:
2011 2010 2009 (In Thousands, except EPS figures) Net income P=9,394,887 P=11,161,092 P=8,154,345 Less dividends on preferred stock 965,341 1,081,352 1,081,352 8,429,546 10,079,740 7,072,993 Less profit impact of assumed conversions of
potential ordinary shares of investees 27,095 27,128 31,140 P=8,402,451 P=10,052,612 P=7,041,853 Weighted average number of common
shares* 579,965 588,348 596,381 Dilutive shares arising from stock options* 2,332 2,550 1,849 Adjusted weighted average number of
common shares for diluted EPS 582,297 590,898 598,230 Basic EPS P=14.53 P=17.13 P=11.86 Diluted EPS P=14.43 P=17.01 P=11.77
*The weighted average number of common shares and dilutive shares arising from stock options take into account the effect of declaration of stock dividends during 2011 (see Note 21).
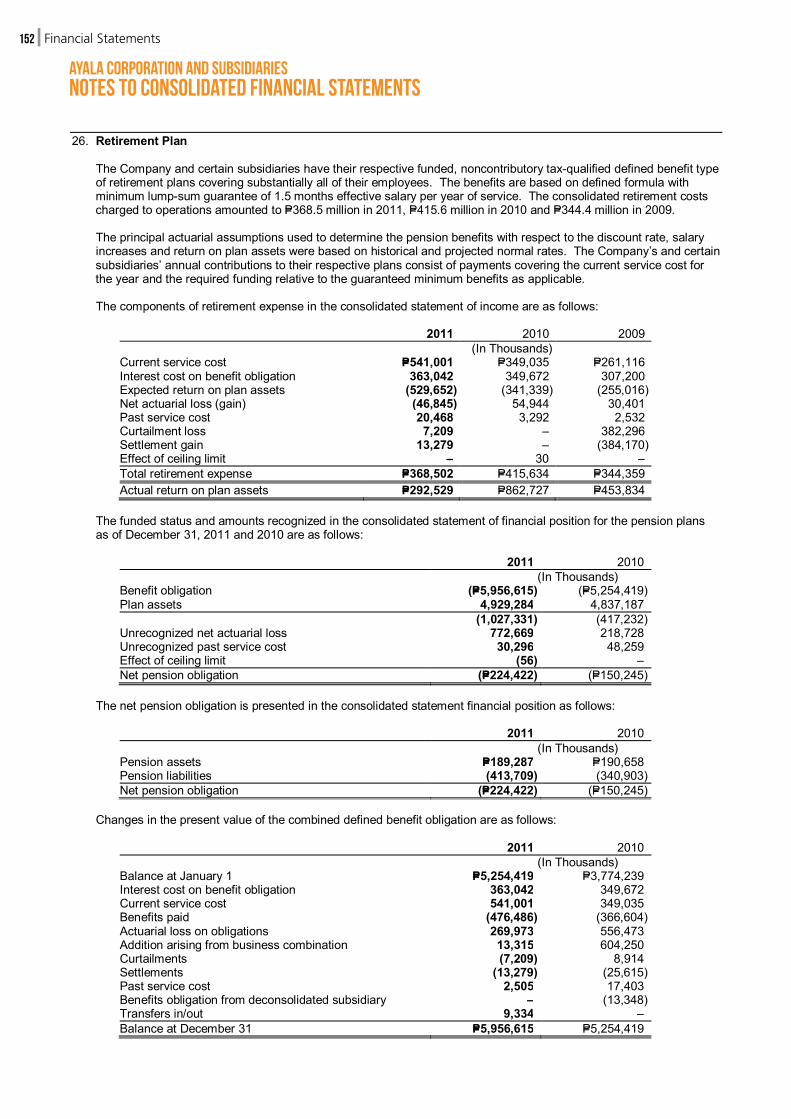
Ayala Corporation and Subsidiariesnotes to Consolidated financial statements
FinancialStatements152
26. Retirement Plan
The Company and certain subsidiaries have their respective funded, noncontributory tax-qualified defined benefit type of retirement plans covering substantially all of their employees. The benefits are based on defined formula with minimum lump-sum guarantee of 1.5 months effective salary per year of service. The consolidated retirement costs charged to operations amounted to P=368.5 million in 2011, P=415.6 million in 2010 and P=344.4 million in 2009.
The principal actuarial assumptions used to determine the pension benefits with respect to the discount rate, salary increases and return on plan assets were based on historical and projected normal rates. The Company’s and certain subsidiaries’ annual contributions to their respective plans consist of payments covering the current service cost for the year and the required funding relative to the guaranteed minimum benefits as applicable.
The components of retirement expense in the consolidated statement of income are as follows:
2011 2010 2009 (In Thousands) Current service cost P=541,001 P=349,035 P=261,116 Interest cost on benefit obligation 363,042 349,672 307,200 Expected return on plan assets (529,652) (341,339) (255,016) Net actuarial loss (gain) (46,845) 54,944 30,401 Past service cost 20,468 3,292 2,532 Curtailment loss 7,209 – 382,296 Settlement gain 13,279 – (384,170) Effect of ceiling limit – 30 – Total retirement expense P=368,502 P=415,634 P=344,359 Actual return on plan assets P=292,529 P=862,727 P=453,834
The funded status and amounts recognized in the consolidated statement of financial position for the pension plans as of December 31, 2011 and 2010 are as follows:
2011 2010 (In Thousands) Benefit obligation (P=5,956,615) (P=5,254,419) Plan assets 4,929,284 4,837,187 (1,027,331) (417,232) Unrecognized net actuarial loss 772,669 218,728 Unrecognized past service cost 30,296 48,259 Effect of ceiling limit (56) – Net pension obligation (P=224,422) (P=150,245)
The net pension obligation is presented in the consolidated statement financial position as follows:
2011 2010 (In Thousands) Pension assets P=189,287 P=190,658 Pension liabilities (413,709) (340,903) Net pension obligation (P=224,422) (P=150,245)
Changes in the present value of the combined defined benefit obligation are as follows:
2011 2010 (In Thousands) Balance at January 1 P=5,254,419 P=3,774,239 Interest cost on benefit obligation 363,042 349,672 Current service cost 541,001 349,035 Benefits paid (476,486) (366,604) Actuarial loss on obligations 269,973 556,473 Addition arising from business combination 13,315 604,250 Curtailments (7,209) 8,914 Settlements (13,279) (25,615) Past service cost 2,505 17,403 Benefits obligation from deconsolidated subsidiary – (13,348) Transfers in/out 9,334 – Balance at December 31 P=5,956,615 P=5,254,419
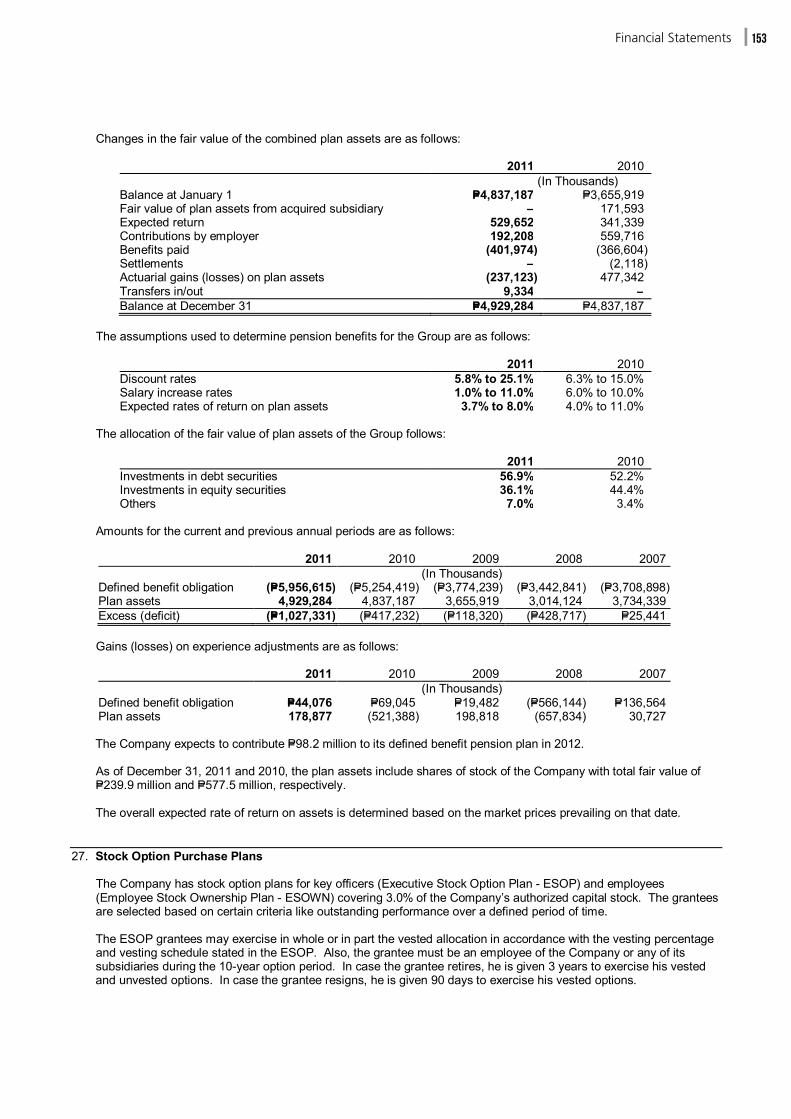
FinancialStatements 153
Changes in the fair value of the combined plan assets are as follows:
2011 2010 (In Thousands) Balance at January 1 P=4,837,187 P=3,655,919 Fair value of plan assets from acquired subsidiary – 171,593 Expected return 529,652 341,339 Contributions by employer 192,208 559,716 Benefits paid (401,974) (366,604) Settlements – (2,118) Actuarial gains (losses) on plan assets (237,123) 477,342 Transfers in/out 9,334 – Balance at December 31 P=4,929,284 P=4,837,187
The assumptions used to determine pension benefits for the Group are as follows:
2011 2010 Discount rates 5.8% to 25.1% 6.3% to 15.0% Salary increase rates 1.0% to 11.0% 6.0% to 10.0% Expected rates of return on plan assets 3.7% to 8.0% 4.0% to 11.0%
The allocation of the fair value of plan assets of the Group follows:
2011 2010 Investments in debt securities 56.9% 52.2% Investments in equity securities 36.1% 44.4% Others 7.0% 3.4%
Amounts for the current and previous annual periods are as follows:
2011 2010 2009 2008 2007 (In Thousands) Defined benefit obligation (P=5,956,615) (P=5,254,419) (P=3,774,239) (P=3,442,841) (P=3,708,898) Plan assets 4,929,284 4,837,187 3,655,919 3,014,124 3,734,339 Excess (deficit) (P=1,027,331) (P=417,232) (P=118,320) (P=428,717) P=25,441 Gains (losses) on experience adjustments are as follows:
2011 2010 2009 2008 2007 (In Thousands) Defined benefit obligation P=44,076 P=69,045 P=19,482 (P=566,144) P=136,564 Plan assets 178,877 (521,388) 198,818 (657,834) 30,727
The Company expects to contribute P=98.2 million to its defined benefit pension plan in 2012.
As of December 31, 2011 and 2010, the plan assets include shares of stock of the Company with total fair value of
P=239.9 million and P=577.5 million, respectively. The overall expected rate of return on assets is determined based on the market prices prevailing on that date. 27. Stock Option Purchase Plans
The Company has stock option plans for key officers (Executive Stock Option Plan - ESOP) and employees (Employee Stock Ownership Plan - ESOWN) covering 3.0% of the Company’s authorized capital stock. The grantees are selected based on certain criteria like outstanding performance over a defined period of time.
The ESOP grantees may exercise in whole or in part the vested allocation in accordance with the vesting percentage and vesting schedule stated in the ESOP. Also, the grantee must be an employee of the Company or any of its subsidiaries during the 10-year option period. In case the grantee retires, he is given 3 years to exercise his vested and unvested options. In case the grantee resigns, he is given 90 days to exercise his vested options.

Ayala Corporation and Subsidiariesnotes to Consolidated financial statements
FinancialStatements154
ESOP
A summary of the Company’s stock option activity and related information for the years ended December 31, 2011, 2010 and 2009 follows:
2011 2010 2009
Number
of Shares
Weighted Average Exercise
Price Number
of Shares
Weighted Average Exercise
Price Number
of Shares
Weighted Average Exercise
Price Outstanding, at beginning of year 4,266,129 P=179.36 3,340,118 P=141.17 3,352,018 P=141.18 Exercised (411,743) (150.90) (304,838) (152.77) (11,900) (143.51) Grants 894,371 316.87 1,230,849 273.03 – – Stock dividends 906,620 – – – – – Cancelled (341,903) 171.88 – – – – Outstanding, at end of year 5,313,474 P=174.63 4,266,129 P=179.36 3,340,118 P=141.17
The options have a contractual term of 10 years. As of December 31, 2011 and 2010, the weighted average remaining contractual life of options outstanding is 3.70 and 4.01 years, respectively, and the range of exercise prices amounted from P=89.41 to P=264.06.
The fair value of each option is estimated on the date of grant using the Black-Scholes option-pricing model. The fair values of stock options granted under ESOP at each grant date and the assumptions used to determine the fair value of the stock options are as follows:
April 18, 2011 April 16, 2010 June 30, 2005 June 10, 2004 Weighted average share price P=352.08 P=303.70 P=327.50 P=244.00 Exercise price P=316.87 P=273.03 P=295.00 P=220.00 Expected volatility 41.21% 41.31% 46.78% 46.71% Option life 10 years 10 years 10 years 10 years Expected dividends 0.86% 0.92% 1.27% 1.43% Risk-free interest rate 6.64% 8.56% 12.03% 12.75%
The expected volatility reflects the assumption that the historical volatility is indicative of future trends, which may also necessarily be the actual outcome.
ESOWN
The Company also has ESOWN granted to qualified officers and employees wherein grantees may subscribe in whole or in part to the shares awarded to them based on the 10% discounted market price as offer price set at grant date. To subscribe, the grantee must be an employee of the Group during the 10-year payment period. In case the grantee resigns, unsubscribed shares are cancelled, while the subscription may be paid up to the percent of holding period completed and payments may be converted into the equivalent number of shares. In case the grantee is separated, not for cause, but through retrenchment and redundancy, subscribed shares may be paid in full, unsubscribed shares may be subscribed, or payments may be converted into the equivalent number of shares. In case the grantee retires, the grantee may subscribe to the unsubscribed shares anytime within the 10-year period. The plan does not allow sale or assignment of the shares. All shares acquired through the plan are subject to the Company’s Right to Repurchase.
Shares granted and subscribed under the ESOWN in 2009 follows:
Granted 1,831,782 Subscribed 1,813,994 Exercise price P=180.13
Subscriptions receivable from the stock option plans covering the Company’s shares are presented as deduction under equity.

FinancialStatements 155
For the unsubscribed shares, the employee still has the option to subscribe from the start of the fifth year but not later than on the start of the seventh year from date of grant. Movements in the number of options outstanding under ESOWN as of December 31, 2011 and 2010 follow:
2011 2010
Number of
options
Weighted average
exercise price Number of
options
Weighted average
exercise price At January 1 141,906 P=260.72 160,150 P=252.34 Stock dividends 17,644 – – – Exercised/cancelled (53,683) 272.06 (18,244) 187.19 At December 31 105,867 P=211.51 141,906 P=260.72
The fair value of stock options granted on April 30, 2009 is estimated on the date of grant using the Black-Scholes Merton Formula, taking into account the terms and conditions upon which the options were granted. The expected volatility was determined based on an independent valuation. The fair value of stock options granted under ESOWN at grant date and the assumptions used to determine the fair value of the stock options follow:
Number of unsubscribed shares 17,788 Fair value of each option P=112.87 Weighted average share price P=263.38 Exercise price P=180.13 Expected volatility 49.88% Dividend yield 1.59% Interest rate 7.49%
Total expense arising from share-based payments recognized by the Group in the consolidated statement of income amounted to P=447.6 million in 2011, P=375.0 million in 2010 and P=471.6 million in 2009. ALI Group ALI has stock option plans for key officers (Executive Stock Option Plan - ESOP) and employees (ESOWN) covering 2.5% of the ALI’s authorized capital stock. The grantee is selected based on certain criteria like outstanding performance over a three-year period.
The ESOP grantees may exercise in whole or in part the vested allocation in accordance with the vesting percentage and vesting schedule stated in the ESOP. Also, the grantee must be an employee of ALI or any of its subsidiaries during the 10-year option period. In case the grantee retires, he is given 3 years to exercise his vested and unvested options. In case the grantee resigns, he is given 90 days to exercise his vested options. ESOP Movements in the number of stock options outstanding under ESOP are as follows:
Pre-PFRS 2 Options
2011
Weighted average
exercise price 2010
Weighted average
exercise price At January 1 17,449,397 P=4.26 22,271,511 P=4.16 Exercised (2,087,014) 3.80 (4,822,114) 3.71 Cancelled (1,349,352) – – – At December 31 14,013,031 P=4.15 17,449,397 P=4.26
PFRS 2 Options
2011
Weighted average
exercise price 2010
Weighted average
exercise price At January 1 14,025,648 P=4.26 16,647,814 P=4.16 Exercised (1,139,489) 3.80 (2,622,166) 3.71 At December 31 12,886,159 P=4.26 14,025,648 P=4.26

Ayala Corporation and Subsidiariesnotes to Consolidated financial statements
FinancialStatements156
The options exercised had a weighted average exercise price of P=3.80 per share or P=12.3 million in 2011 and P=3.71 per share or P=27.6 million in 2010. The average fair market value of the shares at the exercise date was P=15.52 per share or about P= 50.1 million in 2011 and P=16.45 per share or about P=122.5 million in 2010.
The fair value of stock options granted is estimated as at the date of grant using the Black-Scholes Merton Formula, taking into account the terms and conditions upon which the options were granted. The fair value of stock options granted under ESOP at June 30, 2005 grant date, and the assumptions used to determine the fair value of the stock options are as follows:
Weighted average share price P=8.36 Exercise price P=6.75 Expected volatility 46.30% Option life 10 years Dividend yield 3.21% Interest rate 12.60%
The expected volatility reflects the assumption that the historical volatility is indicative of future trends, which may also necessarily be the actual outcome.
ESOWN In November 2001, ALI offered all its ESOWN subscribers with outstanding ESOWN subscriptions the option to cancel the subscriptions within the 5-year holding period. In December 2001, the program for ESOWN was indefinitely suspended.
In 2005, ALI introduced a revised ESOWN and granted to qualified officers wherein grantees may subscribe in whole or in part to the shares awarded to them based on a discounted market price that was determined by the Compensation Committee as the offer price set at grant date. The grantees paid for the shares subscribed through installments over a maximum period of ten (10) years. The subscription is subject to a holding period stated in the plan. To subscribe, the grantee must be an employee of ALI or any of its subsidiaries during the ten (10)-year payment period. In case the grantee resigns, unsubscribed shares are cancelled, while the subscription may be paid up to the percent of holding period completed and payments may be converted into the equivalent number of shares. In case the grantee is separated, not for cause, but through retrenchment and redundancy, subscribed shares may be paid in full, unsubscribed shares may be subscribed, or payments may be converted into the equivalent number of shares. In case the grantee retires, the grantee may subscribe to the unsubscribed shares anytime within the ten (10)-year period. The plan does not allow sale or assignment of the shares. All shares acquired through the plan are subject to ALI’s Right to Repurchase.
For the unsubscribed shares, the employee still has the option to subscribe within seven (7) years.
Movements in the number of options outstanding and weighted average exercise prices (WAEP) under ESOWN follow:
2011 WAEP 2010 WAEP At January 1 27,412,217 P=8.67 24,849,066 P=8.67 Granted 4,852,343 13.63 2,563,151 10.02 Cancelled (1,391,042) – – – At December 31 30,873,518 P=9.52 27,412,217 P=8.67
The fair value of stock options granted is estimated on the date of grant using the Black-Scholes Merton Formula,
taking into account the terms and conditions upon which the options were granted. The expected volatility was determined based on an independent valuation. Option maturity is four years from the date of grant. The fair value of stock options granted under ESOWN at grant date and the assumptions used to determine the fair value of the stock options follow:
Grant Date
March 31,
2011 March 31,
2010 April 30,
2009 May 15,
2008 September 20,
2007 June 5,
2006 November 16,
2005 Number of unsubscribed shares
3,843,057 2,298,247 5,418,619 15,057,840 494,400 5,270,333 3,036,933
Fair value of each option P=7.27 P=8.88 P=4.05 P=6.77 P=6.93 P=7.33 P=5.58 Weighted average share price P=15.5 P=13.00 P=6.40 P=10.50 P=15.00 P=13.00 P=9.30 Exercise price P=13.2 P=9.74 P=4.96 P=9.74 P=12.00 P=10.35 P=7.03 Expected volatility 36.25% 43.57% 37.45% 32.04% 34.67% 46.03% 46.32% Dividend yield 1.01% 0.48% 0.85% 0.49% 0.41% 1.56% 0.77% Interest rate 5.60% 5.95% 5.94% 8.53% 6.93% 10.55% 11.30%

FinancialStatements 157
MWC Group
ESOP, Expanded ESOP and ESOWN
On February 26, 2004, MWC’s BOD authorized the allocation of up to 20.0 million of the treasury shares for distribution from time to time as may be authorized by the Chairman of the Board (Chairman) as incentive and reward to deserving officers of MWC with rank of Manager 2 and above, including senior officers seconded from any parent company, under the ESOP.
On October 28, 2004, MWC’s BOD approved the allocation of an additional 3.6 million shares for the ESOP, which will come from the MWC’s unissued shares or common shares held in treasury. Accordingly, total allocation for the ESOP increased to 23.6 million shares.
On the same date, MWC’s BOD approved the allocation of 136.40 million common shares for the Expanded ESOP covering 96.40 million common shares and the ESOWN covering 40.00 million common shares. The common shares for the ESOWN and the Expanded Executive SOP will come from the MWC’s unissued common shares or common shares held in treasury. The common shares under the Expanded ESOP and ESOWN will be distributed from time to time as an incentive and reward to deserving MWC’s executives (Expanded ESOP) and employees (ESOWN) of the MWC as may be authorized by the Chairman.
In March 2005, MWC granted 23.6 million options under the ESOP with an exercise price of P=2.71 per share. To enjoy the rights provided for in the plan, the option holder should be with MWC at the time the options vest. The vesting schedule of the options is as follows:
Year Vesting Percentage 2006 40% 2007 30% 2008 30%
On November 15, 2005, MWC’s BOD approved the allocation of 25.0 million common shares, consisting of unissued shares and/or undisposed treasury shares, for distribution from time to time as may be authorized by the Chairman, as an incentive and reward to deserving executives of MWC with rank of Manager 1 and above, under the ESOWN.
On February 2, 2006, MWC’s BOD authorized the migration of the ESOP covering 23.6 million common shares to ESOWN by giving ESOP grantees a one-time opportunity to convert their ESOP allocation into an ESOWN subscription using the ESOP subscription price of P=2.71 per share. The ESOWN terms are described in the succeeding paragraphs. The migration resulted in the recognition of the additional fair value of the replacement options amounting to P=26.50 million. For the exercised options, the fair value was computed using the market price at the date of grant less the discounted strike price. Details of MWC’s grants under the ESOWN follow:
Grant Dates September 19, 2011 April 30, 2009 June 15, 2008 May 21, 2007 May 2, 2006 Number of shares granted 4,617,000 9,241,025 7,798,483 2,130,000 13,625,000 Number of unsubscribed
shares 54,000 1,442,000 1,580,000 520,000 2,265,000 Fair value of each option P=8.68 P=5.90 P=10.65 P=9.85 P=4.59 Weighted average share
price P=19.8 P=13.50 P=18.00 P=12.00 P=6.50 Exercise price P=17.38 P=9.63 P=15.13 P=8.08 P=5.47 Expected volatility 33.68% 44.66% 25.64% 27.29% 24.65% Dividend yield 2.68% 2.92% 1.96% 2.58% 3.40% Risk-free interest rate 4.76% 8.53% 6.93% 10.55% 11.30% Expected life of option 4 years 4 years 4 years 7 years 7 years
To enjoy the rights provided for in the ESOWN, the grantee should be with MWC at the time the Holding Period expires. The Holding Period of the ESOWN shares follows:
Year Holding Period After one year from subscription date 40% After two years from subscription date 30% After three years from subscription date 30%

Ayala Corporation and Subsidiariesnotes to Consolidated financial statements
FinancialStatements158
The ESOWN grantees are allowed to subscribe fully or partially to whatever allocation may have been granted to them. In case of initial partial subscriptions, the employees are still allowed to subscribe to the remaining unsubscribed shares granted to them provided that this would be made at the start of Year 5 from grant date up to the end of Year 6. Any additional subscription made by the employee (after the initial subscription) will be subjected to another 3-year holding period.
Movements in the number of stock options outstanding under ESOWN are as follows:
2011
Weighted average
exercise price 2010
Weighted average
exercise price At January 1 5,422,000 P=6.45 7,362,000 P=9.63 Granted 4,617,000 17.38 – – Exercised (4,563,000) 17.38 (1,920,000) 6.45 At December 31 5,476,000 5,442,000
The fair value of equity-settled share options granted was estimated at the date of grant using the Black-Scholes option pricing model, taking into account the terms and conditions upon which the options were granted. The expected life of the options is based on management’s estimate and is not necessarily indicative of exercise patterns that may occur. The expected volatility used for the 2007 and 2006 grants was based on the average historical price volatility of several water utility companies within the Asian region. For the 2011 grants, MWC’s volatility was used as input in the valuation. The expected volatility reflects the assumption that the historical volatility is indicative of future trends, which may also not necessarily reflect the actual outcome. No other features of the options granted were incorporated into the measurement of fair value. IMI Group ESOWN The IMI group has an ESOWN which is a privilege extended to IMI’s eligible managers and staff whereby IMI allocates up to 10% of its authorized capital stock for subscription by said personnel under certain terms and conditions stipulated in the plan. Under the ESOWN, for as long as IMI remains privately-owned, the subscription price of the shares granted shall be determined based on the multiples of net book value, earnings before income tax, depreciation and amortization and net income of 10 comparable Asian EMS companies as at the close of the calendar year prior to the grant. Once IMI becomes publicly listed, the subscription price per share shall be based on market price with a discount to be determined by the Compensation Committee of the BOD at the date of grant.
To subscribe, the grantee must be an eligible participant as defined in the plan. However, should the grantee cease to be employed by or connected with the IMI group before the full payment is made for the subscribed shares, the remaining balance becomes due and demandable upon separation, except for special circumstances as provided for by the ESOWN. In such instances, the grantee/heirs may be allowed to continue paying for the balance for the duration of the original payment period. If the grantee is separated for cause, shares not fully paid will be forfeited and whatever the amount the grantee has partially paid will be returned to him with no interest; if fully paid prior to separation, the shares shall be subject to the Right to Repurchase. If the grantee separates voluntarily, fully vested but not fully paid shares may be paid for in full upon separation subject to Right to Repurchase; and payments made for subscribed shares up to the time of separation may be converted into the equivalent number of shares based on the stipulated subscription price when the shares were availed of. If the grantee separates involuntarily, shares not fully paid for, whether fully vested or not, may be paid for in full within ninety (90) days from separation subject to the Right to Repurchase; and payments made for subscribed shares up to the time of separation may be converted into the equivalent number of shares based on the stipulated subscription price.
A subscription is declared delinquent when the minimum payment required remains unpaid one month after the due date. Any cash dividend of a delinquent subscription will be applied to pay the subscription due. Stock dividends paid while the subscription is delinquent will only be released to the grantee when the delinquent account is paid. Sixty (60) days after the due date and account is still delinquent, the remaining shares are forfeited and the employee will not be eligible for future ESOWN grants.
On February 21, 2007, IMI’s BOD approved the granting of 45,150,000 shares of IMI under the ESOWN at the subscription price of P=12.50 to various employees of STEL and to IMI’s top performers and key personnel. In 2008, additional 1,539,000 shares were granted to STEL and to IMI’s top performers and key personnel subject to the same terms as the shares subscribed in 2007.

FinancialStatements 159
All the granted shares have been subscribed. The grantees will pay for the shares subscribed through installments over a period of 8 years, wherein an initial payment of 2.5% of the value of the subscribed shares is payable upon subscription. It shall serve as a down payment for the subscription. The subscribed shares have a holding period as follows: (a) 40% after one year from subscription date; (b) 30% after two years from subscription date; and (c) 30% after three years from subscription date. The actual grant date of the above two grants was on October 15, 2007. The fair value, determined based on a private bank’s valuation of IMI to be used by a potential investor, was P=14.98 per share. The difference between the fair value and the subscription price will be recognized as employee benefit expense over the required service period. In 2008, the management has approved a two-year moratorium on the scheduled payments due in 2008 and 2009 which resulted in an extension of the payment period from eight (8) to ten (10) years. This extension resulted in a net reversal of accretion amounting to US$0.25 million in 2009. The outstanding shares under this grant have fully vested in September 2010.
On December 14, 2009, the Chairman of IMI’s BOD approved the terms for granting 30,885,000 shares of IMI under ESOWN at the subscription price of P=5.54 per share to various employees of the IMI group. The grant date was on January 21, 2010. The payment scheme and holding period for this grant are similar to the grant in 2007. The fair value per share used in valuing the grant is P=9.30, which is the closing price of IMI’s stock at the PSE at the date of grant.
Movements in the number of shares outstanding under ESOWN for the years ended December 31, 2011 and 2010 follow:
2011 2010
Number of shares Weighted average
exercise price Number of shares Weighted average
exercise price At January 1 120,987,477 P=6.59 111,297,000 P=6.88 Granted – – 30,885,000 5.54 Forfeitures (4,737,168) 6.59 (21,194,523) 6.59 At December 31 116,250,309 P=6.59 120,987,477 P=6.59
28. Operating Segment Information
For management purposes, the Group is organized into the following business units:
Real estate and hotels - planning and development of large-scale fully integrated residential and commercial communities; development and sale of residential, leisure and commercial lots and the development and leasing of retail and office space and land in these communities; construction and sale of residential condominiums and office buildings; development of industrial and business parks; development and sale of upper middle-income and affordable housing; strategic land bank management; hotel, cinema and theater operations; and construction and property management.
Financial services and bancassurance - universal banking operations, including savings and time deposits in
local and foreign currencies; commercial, consumer, mortgage and agri-business loans; leasing; payment services, including card products, fund transfers, international trade settlement and remittances from overseas workers; trust and investment services including portfolio management, unit funds, trust administration and estate planning; fully integrated bancassurance operations, including life, non-life, pre-need and reinsurance services; internet banking; on-line stock trading; corporate finance and consulting services; foreign exchange and securities dealing; and safety deposit facilities.
Telecommunications - provider of digital wireless communications services, wireline voice communication
services, consumer broadband services, other wireline communication services, domestic and international long distance communication or carrier services and mobile commerce services.
Electronics - electronics manufacturing services provider for original equipment manufacturers in the computing,
communications, consumer, automotive, industrial and medical electronics markets, service provider for test development and systems integration and distribution of related products and services.
Information technology and BPO services - venture capital for technology businesses and emerging markets;
provision of value-added content for wireless services, on-line business-to-business and business-to-consumer services; electronic commerce; technology infrastructure hardware and software sales and technology services; and onshore and offshore outsourcing services in the research, analytics, legal, electronic discovery, document management, finance and accounting, IT support, graphics, advertising production, marketing and communications, human resources, sales, retention, technical support and customer care areas.

Ayala Corporation and Subsidiariesnotes to Consolidated financial statements
FinancialStatements160
Water utilities - contractor to manage, operate, repair, decommission, and refurbish all fixed and movable assets
(except certain retained assets) required to provide water delivery services and sewerage services in the East Zone Service Area.
Automotive - manufacture and sale of passenger cars and commercial vehicles.
International - investments in overseas property companies and projects. Others - power and infrastructure, air-charter services, agri-business and others.
Management monitors the operating results of its business units separately for the purpose of making decisions about resource allocation and performance assessment. Segment performance is evaluated based on operating profit or loss and is measured consistently with operating profit or loss in the consolidated financial statements.
Intersegment transfers or transactions are entered into under the normal commercial terms and conditions that would also be available to unrelated third parties. Segment revenue, segment expense and segment results include transfers between operating segments. Those transfers are eliminated in consolidation.
In 2010, the Company re-organized AC Capital to focus on asset management and business development initiatives. The group was also subsequently renamed and re-assigned to report to the Chief Financial Officer. Segments formerly under AC Capital’s purview, including, Water Utilities, Electronics, Information Technology and BPO Services, International, and Automotive are now presented, monitored, and analyzed independently. This has no impact on the 2009 presentation of operating segment information.

FinancialStatements 161
The
follo
win
g ta
bles
rega
rdin
g op
erat
ing
segm
ents
pre
sent
ass
ets
and
liabi
litie
s as
of D
ecem
ber 3
1, 2
011
and
2010
and
reve
nue
and
prof
it in
form
atio
n fo
r eac
h of
the
thre
e ye
ars
in th
e pe
riod
ende
d D
ecem
ber 3
1, 2
011
(am
ount
s in
milli
ons)
. 20
11
Pare
nt
Com
pany
R
eal E
stat
e an
d H
otel
s
Fina
ncia
l Se
rvic
es a
nd
Banc
assu
ranc
e Te
leco
mm
unic
atio
ns
Wat
er
Util
ities
El
ectr
onic
s
Info
rmat
ion
Tech
nolo
gy
and
BPO
Ser
vice
s In
tern
atio
nal
Auto
mot
ive
and
Oth
ers
Inte
rseg
men
t El
imin
atio
ns
Con
solid
ated
In
com
e
Sale
s to
ext
erna
l cus
tom
ers
P=30
P=39,
731
P=–
P=–
P=18,
944
P=24,
845
P=1,1
23
P=186
P=9
,174
P=–
P=9
4,03
3 In
ters
egm
ent
94
1,89
3 –
– 12
4 –
5 –
140
(2,2
56)
– Sh
are
of p
rofit
of a
ssoc
iate
s an
d
join
tly c
ontro
lled
entit
ies
59
899
4,28
8 3,
045
– –
(596
) 98
(6
6)
– 7,
727
Inte
rest
inco
me
1,16
5 1,
460
– –
575
14
49
12
10
(3)
3,28
2 O
ther
inco
me
501
276
– –
75
1,09
4 89
46
7 25
4 (2
66)
2,49
0 To
tal i
ncom
e 1,
849
44,2
59
4,28
8 3,
045
19,7
18
25,9
53
670
763
9,51
2 (2
,525
) 10
7,53
2 O
pera
ting
expe
nses
1,
643
31,4
87
– –
13,3
97
25,4
45
1,34
0 41
9 9,
479
(2,2
58)
80,9
52
Ope
ratin
g pr
ofit
206
12,7
72
4,28
8 3,
045
6,32
1 50
8 (6
70)
344
33
(267
) 26
,580
In
tere
st e
xpen
se a
nd o
ther
fin
anci
ng c
harg
es
2,84
8 1,
880
– –
1,27
4 10
9 11
30
26
(3
) 6,
175
Oth
er c
harg
es
(89)
14
3 –
– 35
2 14
9 1
177
4 –
737
Prov
isio
n fo
r inc
ome
tax
221
2,61
9 –
– 79
0 20
1 33
30
45
(7
0)
3,86
9 N
et in
com
e (P=
2,77
4)
P=8,1
30
P=4,2
88
P=3,0
45
P=3,9
05
P=49
(P=71
5)
P=107
(P=
42)
(P=19
4)
P=15,
799
Oth
er in
form
atio
n
Segm
ent a
sset
s 10
4,15
0 14
2,21
2 –
– 79
,996
19
,390
3,
287
4,90
5 3,
932
(82,
985)
27
4,88
7 In
vest
men
ts in
ass
ocia
tes
and
jo
intly
con
trolle
d en
titie
s 54
,670
12
,626
–
– 1,
788
– 4,
973
2,35
2 3,
250
– 79
,659
D
efer
red
tax
asse
ts
– 1,
949
– –
760
24
– –
46
302
3,08
1 To
tal a
sset
s P=1
58,8
20
P=156
,787
–
– P=8
2,54
4 P=1
9,41
4 P=8
,260
P=7
,257
P=7
,228
(P=
82,6
83)
P=357
,627
Se
gmen
t lia
bilit
ies
55,6
67
81,7
55
– –
39,1
51
10,9
23
330
968
1,75
8 (1
0,28
2)
180,
270
Def
erre
d ta
x lia
bilit
ies
– 74
4 –
– 5,
109
204
9 43
10
6,11
9 To
tal l
iabi
litie
s P=5
5,66
7 P=8
2,49
9 –
– P=4
4,26
0 P=1
1,12
7 P=3
39
P=1,0
11
P=1,7
68
(P=10
,282
) P=1
86,3
89
Segm
ent a
dditi
ons
to p
rope
rty,
plan
t and
equ
ipm
ent a
nd
inve
stm
ent p
rope
rties
P=8
9 P=8
,907
P=–
P=–
P=5
81
P=2,3
46
P=69
P=2
P=49
P=–
P=12,
043
Dep
reci
atio
n an
d am
ortiz
atio
n P=9
0 P=2
,304
P=–
P=–
P=1
,890
P=1
,116
P=8
1 P=2
P=1
,117
P=–
P=6
,600
N
on-c
ash
expe
nses
oth
er th
an
depr
ecia
tion
and
amor
tizat
ion
P=21
P=143
P=–
P=–
P=3
31
P=149
P=1
P=1
77
P=5
P=–
P=827

Ayala Corporation and Subsidiariesnotes to Consolidated financial statements
FinancialStatements162
2010
Pare
nt
Com
pany
R
eal E
stat
e an
d H
otel
s
Fina
ncia
l Se
rvic
es a
nd
Banc
assu
ranc
e Te
leco
mm
unic
atio
ns
Wat
er
Util
ities
El
ectro
nics
Info
rmat
ion
Tech
nolo
gy a
nd
BPO
Ser
vice
s In
tern
atio
nal
Auto
mot
ive
and
Oth
ers
Inte
rseg
men
t El
imin
atio
ns
Con
solid
ated
In
com
e
Sale
s to
ext
erna
l cus
tom
ers
P=522
P=3
5,35
2 P=–
P=–
P=1
4,74
8 P=1
8,61
1 P=1
,129
P=2
2 P=1
1,69
6 P=–
P=8
2,08
0 In
ters
egm
ent
– 45
4 –
– –
– 13
–
60
(527
) –
Shar
e of
pro
fit o
f ass
ocia
tes
and
join
tly c
ontro
lled
entit
ies
(85)
90
6 3,
807
2,98
9 22
2 –
(1,6
03)
(161
) 49
–
6,12
4 In
tere
st in
com
e 1,
152
1,04
4 –
– 24
4 16
53
41
2
(31)
2,
521
Oth
er in
com
e 4,
748
27
– –
416
199
2,11
1 35
25
0 (4
40)
7,34
6 To
tal i
ncom
e 6,
337
37,7
83
3,80
7 2,
989
15,6
30
18,8
26
1,70
3 (6
3)
12,0
57
(998
) 98
,071
O
pera
ting
expe
nses
1,
700
28,1
93
– –
10,7
51
18,4
17
1,50
2 95
8 11
,832
(9
95)
72,3
58
Ope
ratin
g pr
ofit
4,63
7 9,
590
3,80
7 2,
989
4,87
9 40
9 20
1 (1
,021
) 22
5 (3
) 25
,713
In
tere
st e
xpen
se a
nd o
ther
fin
anci
ng c
harg
es
2,35
3 1,
539
– –
720
41
50
61
13
(21)
4,
756
Oth
er c
harg
es
349
221
– –
(15)
5
– 1,
513
10
(11)
2,
072
Prov
isio
n fo
r inc
ome
tax
209
1,56
2 –
– 94
8 15
5 (3
7)
2 61
–
2,90
0 N
et in
com
e P=1
,726
P=6
,268
P=3
,807
P=2
,989
P=3
,226
P=2
08
P=188
(P=
2,59
7)
P=141
P=2
9 P=1
5,98
6 O
ther
info
rmat
ion
Se
gmen
t ass
ets
P=108
,855
P=1
12,0
36
P=–
P=–
P=70,
665
P=15,
284
P=2,4
19
P=4,6
30
P=3,0
74
(P= 7
6,34
7)
P=240
,616
In
vest
men
ts in
ass
ocia
tes
and
join
tly c
ontro
lled
entit
ies
51,3
40
10,8
46
– –
6 –
6,18
2 2,
323
1,30
8 –
72,0
05
Def
erre
d ta
x as
sets
–
2,91
7 –
– 32
5
– –
27
(232
) 2,
749
Tota
l ass
ets
P=160
,195
P=1
25,7
99
P=–
P=–
P=70,
703
P=15,
289
P=8,6
01
P=6,9
53
P=4,4
09
(P=76
,579
) P=3
15,3
70
Segm
ent l
iabi
litie
s P=5
4,37
7 P=5
6,23
4 P=–
P=–
P=3
0,10
6 P=7
,305
P=3
53
P=2,9
39
P=1,6
54
(P=10
,243
) P=1
42,7
25
Def
erre
d ta
x lia
bilit
ies
– 59
8 –
– 5,
279
– 4
7 5
– 5,
893
Tota
l lia
bilit
ies
P=54,
377
P=56,
832
P=–
P=–
P=35,
385
P=7,3
05
P=357
P=2
,946
P=1
,659
(P=
10,2
43)
P=148
,618
Se
gmen
t add
ition
s to
pro
perty
, pl
ant a
nd e
quip
men
t and
in
vest
men
t pro
perti
es
P=94
P=4
,926
P=–
P=–
P=3
,564
P=1
,456
P=9
3
P=3
P=119
P=–
P=1
0,25
5 D
epre
ciat
ion
and
amor
tizat
ion
P=100
P=1
,814
P=–
P=–
P=1
,957
P=9
94
P=204
P=4
6 P=1
13
P=–
P=5,2
28
Non
-cas
h ex
pens
es o
ther
than
de
prec
iatio
n an
d am
ortiz
atio
n P=4
98
P=279
P=–
P=–
P=–
P=2
2 P=3
69
P=1,2
19
P=6
P=–
P=2,3
93
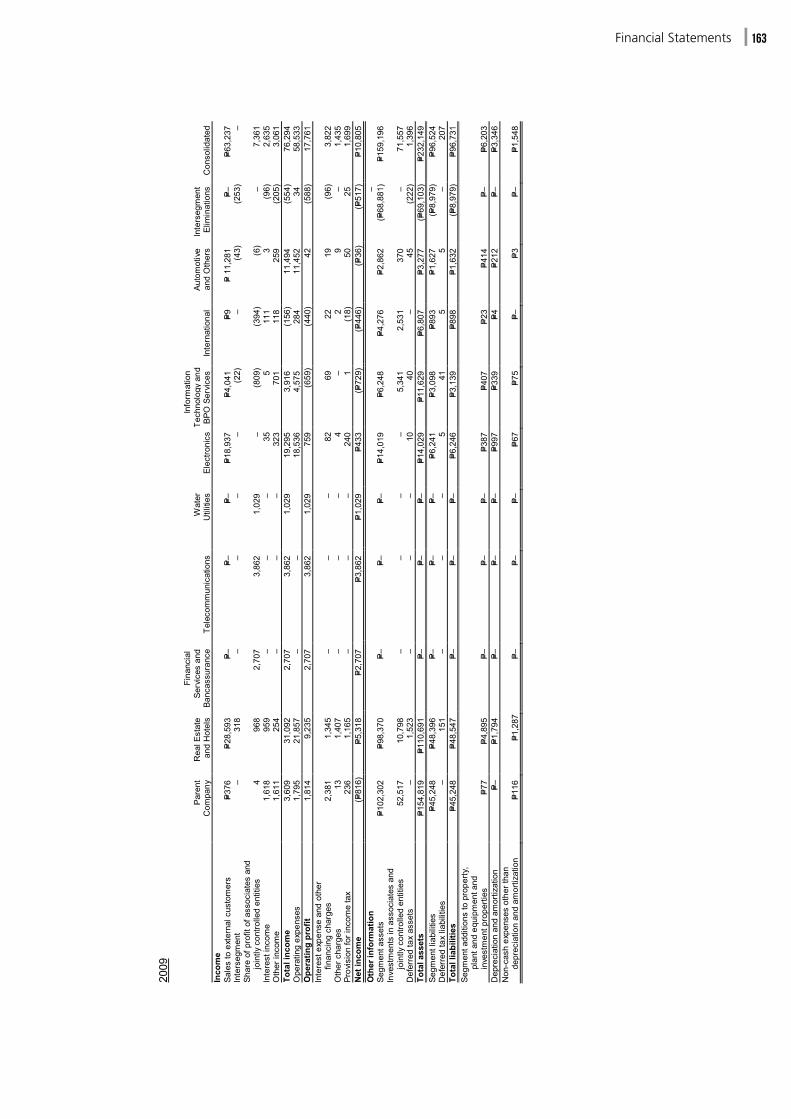
FinancialStatements 163
2009
Pare
nt
Com
pany
R
eal E
stat
e an
d H
otel
s
Fina
ncia
l Se
rvic
es a
nd
Banc
assu
ranc
e Te
leco
mm
unic
atio
ns
Wat
er
Util
ities
El
ectro
nics
Info
rmat
ion
Tech
nolo
gy a
nd
BPO
Ser
vice
s In
tern
atio
nal
Auto
mot
ive
and
Oth
ers
Inte
rseg
men
t El
imin
atio
ns
Con
solid
ated
In
com
e
Sale
s to
ext
erna
l cus
tom
ers
P=376
P=2
8,59
3 P=–
P=–
P=–
P=1
8,93
7 P=4
,041
P=9
P=
11,2
81
P=–
P=63,
237
Inte
rseg
men
t –
318
– –
– –
(22)
–
(43)
(2
53)
– Sh
are
of p
rofit
of a
ssoc
iate
s an
d
join
tly c
ontro
lled
entit
ies
4 96
8
2,70
7
3,86
2 1,
029
–
(809
) (3
94)
(6)
– 7,
361
Inte
rest
inco
me
1,61
8 95
9 –
– –
35
5 11
1 3
(96)
2,
635
Oth
er in
com
e 1,
611
254
– –
– 32
3 70
1 11
8 25
9 (2
05)
3,06
1 To
tal i
ncom
e 3,
609
31,0
92
2,70
7 3,
862
1,02
9 19
,295
3,
916
(156
) 11
,494
(5
54)
76,2
94
Ope
ratin
g ex
pens
es
1,79
5 21
,857
–
–
18,5
36
4,57
5 28
4 11
,452
34
58
,533
O
pera
ting
prof
it 1,
814
9,23
5 2,
707
3,86
2 1,
029
759
(659
) (4
40)
42
(588
) 17
,761
In
tere
st e
xpen
se a
nd o
ther
fin
anci
ng c
harg
es
2,38
1 1,
345
– –
–
82
69
22
19
(9
6)
3,82
2 O
ther
cha
rges
13
1,
407
– –
– 4
– 2
9 –
1,43
5 Pr
ovis
ion
for i
ncom
e ta
x 23
6 1,
165
– –
– 24
0 1
(18)
50
25
1,
699
Net
inco
me
(P=81
6)
P=5,3
18
P=2,7
07
P=3,8
62
P=1,0
29
P=433
(P=
729)
(P=
446)
(P=
36)
(P=51
7)
P=10,
805
Oth
er in
form
atio
n
–
Segm
ent a
sset
s P=1
02,3
02
P=98,
370
P=–
P=–
P=–
P=14,
019
P=6,2
48
P=4,2
76
P=2,8
62
(P=68
,881
) P=1
59,1
96
Inve
stm
ents
in a
ssoc
iate
s an
d
join
tly c
ontro
lled
entit
ies
52,5
17
10,7
98
– –
– –
5,34
1 2,
531
370
– 71
,557
D
efer
red
tax
asse
ts
– 1,
523
– –
– 10
40
–
45
(222
) 1,
396
Tota
l ass
ets
P=154
,819
P=1
10,6
91
P=–
P=–
P=–
P=14,
029
P=11,
629
P=6,8
07
P=3,2
77
(P=69
,103
) P=2
32,1
49
Segm
ent l
iabi
litie
s P=4
5,24
8 P=4
8,39
6 P=–
P=–
P=–
P=6
,241
P=3
,098
P=8
93
P=1,6
27
(P=8,
979)
P=9
6,52
4 D
efer
red
tax
liabi
litie
s –
151
– –
– 5
41
5 5
– 20
7 To
tal l
iabi
litie
s P=4
5,24
8 P=4
8,54
7 P=–
P=–
P=–
P=6
,246
P=3
,139
P=8
98
P=1,6
32
(P=8,
979)
P=9
6,73
1 Se
gmen
t add
ition
s to
pro
perty
, pl
ant a
nd e
quip
men
t and
in
vest
men
t pro
perti
es
P=77
P=4,8
95
P=–
P=–
P=–
P=3
87
P=4
07
P=23
P=414
P=–
P=6
,203
D
epre
ciat
ion
and
amor
tizat
ion
P=–
P=1,7
94
P=–
P=–
P=–
P=997
P=3
39
P=4
P=212
P=–
P=3
,346
N
on-c
ash
expe
nses
oth
er th
an
depr
ecia
tion
and
amor
tizat
ion
P=116
P=1
,287
P=–
P=–
P=–
P=67
P=7
5 P=–
P=3
P=–
P=1
,548
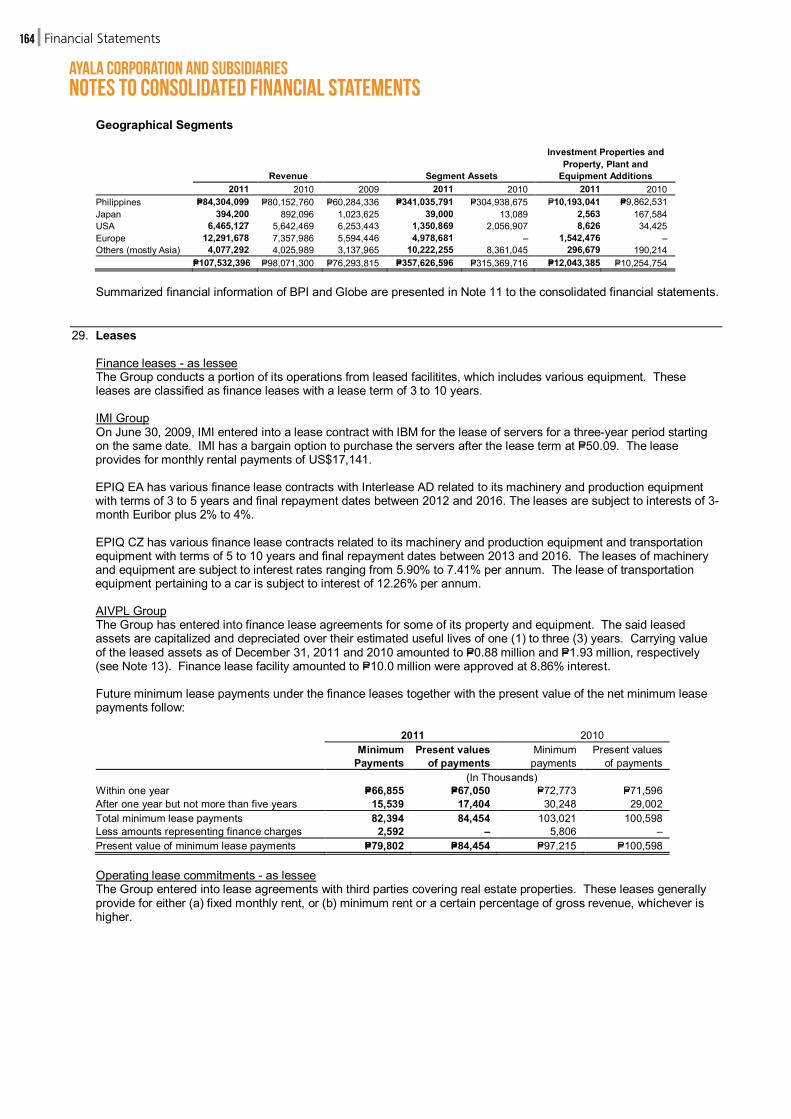
Ayala Corporation and Subsidiariesnotes to Consolidated financial statements
FinancialStatements164
Geographical Segments
Revenue Segment Assets
Investment Properties and Property, Plant and
Equipment Additions 2011 2010 2009 2011 2010 2011 2010 Philippines P=84,304,099 P=80,152,760 P=60,284,336 P=341,035,791 P=304,938,675 P=10,193,041 P=9,862,531 Japan 394,200 892,096 1,023,625 39,000 13,089 2,563 167,584 USA 6,465,127 5,642,469 6,253,443 1,350,869 2,056,907 8,626 34,425 Europe 12,291,678 7,357,986 5,594,446 4,978,681 – 1,542,476 – Others (mostly Asia) 4,077,292 4,025,989 3,137,965 10,222,255 8,361,045 296,679 190,214
P=107,532,396 P=98,071,300 P=76,293,815 P=357,626,596 P=315,369,716 P=12,043,385 P=10,254,754
Summarized financial information of BPI and Globe are presented in Note 11 to the consolidated financial statements.
29. Leases Finance leases - as lessee
The Group conducts a portion of its operations from leased facilitites, which includes various equipment. These leases are classified as finance leases with a lease term of 3 to 10 years. IMI Group On June 30, 2009, IMI entered into a lease contract with IBM for the lease of servers for a three-year period starting on the same date. IMI has a bargain option to purchase the servers after the lease term at P=50.09. The lease provides for monthly rental payments of US$17,141. EPIQ EA has various finance lease contracts with Interlease AD related to its machinery and production equipment with terms of 3 to 5 years and final repayment dates between 2012 and 2016. The leases are subject to interests of 3-month Euribor plus 2% to 4%.
EPIQ CZ has various finance lease contracts related to its machinery and production equipment and transportation equipment with terms of 5 to 10 years and final repayment dates between 2013 and 2016. The leases of machinery and equipment are subject to interest rates ranging from 5.90% to 7.41% per annum. The lease of transportation equipment pertaining to a car is subject to interest of 12.26% per annum.
AIVPL Group The Group has entered into finance lease agreements for some of its property and equipment. The said leased assets are capitalized and depreciated over their estimated useful lives of one (1) to three (3) years. Carrying value of the leased assets as of December 31, 2011 and 2010 amounted to P=0.88 million and P=1.93 million, respectively (see Note 13). Finance lease facility amounted to P=10.0 million were approved at 8.86% interest. Future minimum lease payments under the finance leases together with the present value of the net minimum lease payments follow:
2011 2010
Minimum
Payments Present values
of payments Minimum payments
Present values of payments
(In Thousands) Within one year P=66,855 P=67,050 P=72,773 P=71,596 After one year but not more than five years 15,539 17,404 30,248 29,002 Total minimum lease payments 82,394 84,454 103,021 100,598 Less amounts representing finance charges 2,592 – 5,806 – Present value of minimum lease payments P=79,802 P=84,454 P=97,215 P=100,598
Operating lease commitments - as lessee The Group entered into lease agreements with third parties covering real estate properties. These leases generally provide for either (a) fixed monthly rent, or (b) minimum rent or a certain percentage of gross revenue, whichever is higher.

FinancialStatements 165
IMI Group
On December 13, 2005, IMI entered into a lease contract with Technopark Land, Inc. (TLI), an affiliate, for the lease of parcels of land situated at the Special Export Processing Zone, Laguna Technopark, Biñan, Laguna. The lease shall be for a three-year period commencing on December 31, 2005 up to December 31, 2008. On December 23, 2008, IMI extended the lease contract for another three (3) years commencing on December 31, 2008 up to December 31, 2011. On January 2, 2012, IMI again extended the lease contract for another three years commencing January 2, 2012 up to December 31, 2015. The lease contract is renewable at the option of TLI upon such terms and conditions and upon such rental rates as the parties may agree upon at the time of the renewal, taking into consideration comparable rental rates for similar properties prevailing at the time of renewal. IMI shall advise TLI in writing at least sixty (60) days before the expiration of the term of its desire to renew the contract, which TLI may consider upon such terms and conditions as may be agreed upon between the parties. IMI shall pay, as monthly rental for and in consideration of the use of the leased premises, the amount of US$1,642 exclusive of value-added tax. IMI also leases condominium units for the use of its officers and certain managers. The terms are usually for two (2) to four (4) months and are normally renewable under conditions specified in separate lease contracts. IMI leases two office condominium units where some of its facilities are located under noncancellable operating leases with Cyberzone Properties, Inc. The lease agreements are for three-year periods up to July 2008 and August 2008. On August 15, 2008, the lease agreements were extended for another three (3) years commencing September 1, 2008 up to August 31, 2011. The leases contain provisions including, but not limited to, an escalation rate of 7% per year and early termination penalties. The leases provide for quarterly rental payments of US$26,364 during the first year of the lease term. IMI Japan On December 1, 2006, IMI Japan entered into a two-year contract with Kaneshichi Administration for lease of office premises commencing on December 1, 2006, whereby it is committed to pay a monthly rental of US$6,406. The lease agreement provides for automatic renewal of the lease contract for another two (2) years unless prior notice of termination is given to the lessor. This was terminated on April 21, 2010.
On February 15, 2010, IMI Japan entered into a two-year contract with Kabushikigaisha Tokyu Community for lease of office premises located in Nagoya whereby it is committed to pay a monthly rental of 245,490 Yen inclusive of tax and monthly maintenance fee of 35,070 Yen inclusive of tax. The lease agreement provides for automatic renewal of the lease contract unless prior notice of termination is given to the lessor. IMI USA On July 17, 2008, IMI USA entered into seven-year contract with Roy G.G. Harris and Patricia S. Harris for lease of office premises commencing in August 2008 up to November 2014. The lease contains provisions including, but not limited to, an escalation rate of 3% per year and early termination penalties. The lease provides for monthly rental payments of US$13,464 during the first year of the lease term. On January 28, 2010, IMI USA entered into a six-year lease agreement with Fremont Ventures, LLC commencing two months from issuance of building permit or maximum of three months if Fremont caused the delay. The base monthly rental rate is US$3,687 on the first 6 months with escalation every 11 months as listed in the lease contract. Average monthly rental rate amounts to US$9,523. IMI Singapore and STEL IMI Singapore and STEL Group have various operating lease agreements in respect of office premises and land. These noncancellable leases have remaining noncancellable lease terms of between 1 to 50 years commencing on January 1, 1992 to April 1, 2011 and ending on February 28, 2010 to April 30, 2050. Most leases contain renewable options. There are no restrictions placed upon the lessee by entering into these leases.
PSi PSi has a 15-year non-cancellable operating lease agreement with Food Terminal, Inc. (FTI) for its plant facilities, office spaces, and other facilities commencing on August 15, 2004 up to August 14, 2020. The lease agreement with FTI provides for increase in rental per year starting on the second year and annually thereafter until the end of the lease term. The lease agreement provides a late payment penalty of 2% per month for the monthly rental not paid on time. Moreover, PSi leases its plant facilities, office spaces and other facilities from RBF Development Corporation for 36 months until March 31, 2011. PSi has the option to extend the term of the lease for another two (2) years and the contract was extended up to March 2013. The lease agreement with RBF provides for increase in rental at varying rates over the term of the lease. The lease agreement provides penalty interest of 3% per month compounded for the late payment of monthly rental.
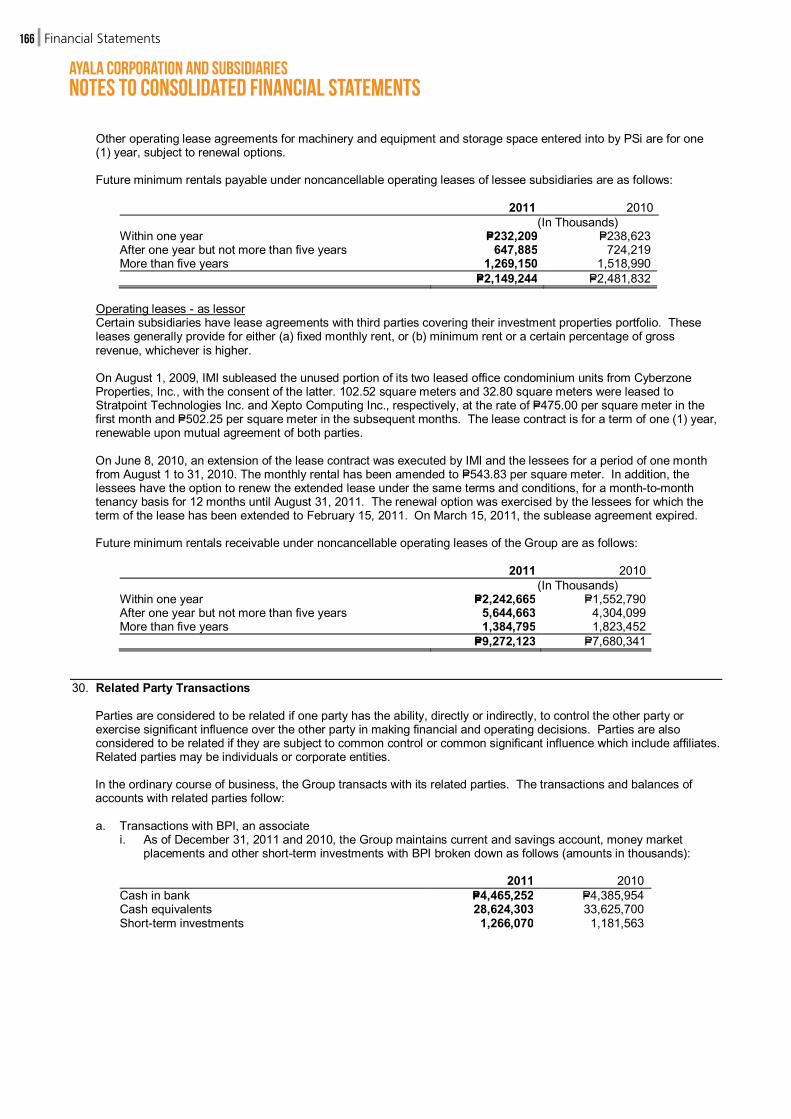
Ayala Corporation and Subsidiariesnotes to Consolidated financial statements
FinancialStatements166
Other operating lease agreements for machinery and equipment and storage space entered into by PSi are for one (1) year, subject to renewal options. Future minimum rentals payable under noncancellable operating leases of lessee subsidiaries are as follows:
2011 2010 (In Thousands) Within one year P=232,209 P=238,623 After one year but not more than five years 647,885 724,219 More than five years 1,269,150 1,518,990 P=2,149,244 P=2,481,832
Operating leases - as lessor Certain subsidiaries have lease agreements with third parties covering their investment properties portfolio. These leases generally provide for either (a) fixed monthly rent, or (b) minimum rent or a certain percentage of gross revenue, whichever is higher.
On August 1, 2009, IMI subleased the unused portion of its two leased office condominium units from Cyberzone
Properties, Inc., with the consent of the latter. 102.52 square meters and 32.80 square meters were leased to Stratpoint Technologies Inc. and Xepto Computing Inc., respectively, at the rate of P=475.00 per square meter in the first month and P=502.25 per square meter in the subsequent months. The lease contract is for a term of one (1) year, renewable upon mutual agreement of both parties.
On June 8, 2010, an extension of the lease contract was executed by IMI and the lessees for a period of one month from August 1 to 31, 2010. The monthly rental has been amended to P=543.83 per square meter. In addition, the lessees have the option to renew the extended lease under the same terms and conditions, for a month-to-month tenancy basis for 12 months until August 31, 2011. The renewal option was exercised by the lessees for which the term of the lease has been extended to February 15, 2011. On March 15, 2011, the sublease agreement expired.
Future minimum rentals receivable under noncancellable operating leases of the Group are as follows:
2011 2010 (In Thousands) Within one year P=2,242,665 P=1,552,790 After one year but not more than five years 5,644,663 4,304,099 More than five years 1,384,795 1,823,452 P=9,272,123 P=7,680,341
30. Related Party Transactions
Parties are considered to be related if one party has the ability, directly or indirectly, to control the other party or exercise significant influence over the other party in making financial and operating decisions. Parties are also considered to be related if they are subject to common control or common significant influence which include affiliates. Related parties may be individuals or corporate entities.
In the ordinary course of business, the Group transacts with its related parties. The transactions and balances of accounts with related parties follow:
a. Transactions with BPI, an associate
i. As of December 31, 2011 and 2010, the Group maintains current and savings account, money market placements and other short-term investments with BPI broken down as follows (amounts in thousands):
2011 2010 Cash in bank P=4,465,252 P=4,385,954 Cash equivalents 28,624,303 33,625,700 Short-term investments 1,266,070 1,181,563

FinancialStatements 167
From the Group’s placements and short-term investments with BPI, the Group has accrued interest receivable amounting to P=40.0 million and P=71.3 million as of December 31, 2011 and December 31, 2010, respectively. Interest income earned amounted to P=1,655.2 million in 2011, P=1,199.7 million in 2010 and P=1,089.6 million in 2009.
ii. On November 16, 2011, BPI declared cash dividends amounting to P=0.9 per share. Cash dividends declared by BPI are payable to common shareholders of record as of 15th day from the receipt of approval by Bangko Sentral ng Pilipinas and distributable on the 15th day from the said record date. As of December 31, 2011, the Group has dividend receivable from BPI amounting to P=764.2 million.
iii. The Group also has short-term and long-term debt payable to BPI amounting to P=7.5 billion and P=5.4 billion as of December 31, 2011 and 2010, respectively. The Group has accrued interest payable amounting to P=5.7 million and P=3.3 million as of December 31, 2011 and 2010, respectively, pertaining to the outstanding loans. Interest expense incurred from the debt amounted to P=165.5 million and P=232.9 million in 2011 and 2010, respectively.
b. Receivable from related parties follow (amounts in thousands):
2011 2010 Associates: Interest in limited partnerships of AINA P=151,681 P=49,311 BPI 92,003 – CHI 82,638 108,239 BLC 50,522 – NTDCC 17,160 15,790 ASTI 16,120 13,238 First Gen Northern Energy (FGNEC) 5,531 – Naraya Development Co. Ltd. 1,293 17,146 Arch Capital – 216 PPI Prime Ventures, Inc. (PPI Prime) – 5 416,948 203,945 Jointly controlled entities: Integreon 475,751 359,067 Globe 66,150 29,987 Northwind Power Development Corp. 45,017 – ACC 17,802 743 Asiacom – 9 604,720 389,806 Other related parties: Columbus Holdings, Inc. (Columbus) 888,810 888,810 Glory High 420,013 542,674 Fort Bonifacio Development Corporation (FBDC) 271,096 109,279 Cebu Property Ventures Development 58,571 – Isuzu Philippines Corporation (IPC) 33,787 29,742 Bonifacio Hotel Ventures, Inc. 4,067 – Honda Cars Philippines, Inc. (HCP) 2,428 23,998 Innove Communications, Inc. (Innove) 325 7,281 MyAyala – 3,656 1,679,097 1,605,440 P=2,700,765 P=2,199,191
i. Receivables from AINA’s interest in limited partnerships are nontrade in nature and bear interests ranging
from 10% to 15% and will mature on May 31, 2013. Interest income earned amounted to P=9.5 million and P=36.7 million in 2011 and 2010, respectively.
ii. Amounts owed by CHI represents management fee of the Group for CHI’s Cebu Business Park and Amara projects.
iii. Receivables from ASTI and FGNEC are advances made for working capital requirements which are non-interest bearing and demandable.
iv. Receivable from Integreon has an interest rate of 15% in 2011 and 14% in 2010 which will mature on February 16, 2012. Interest income earned amounted to P=44.5 million and P=47.2 million in 2011 and 2010, respectively.
v. Receivable from Northwind represents unpaid cash dividends on preferred shareholders declared on November 23, 2007 that was converted into a promissory note due in November 2017 and bear interest of 8% per annum. As of December 31, 2011, accrued interest on the promissory note amounted to P=10.9 million. Interest income in 2011 amounted to P=2.7 million. The promissory note stipulates, among others, that Northwind shall not declare any dividends to any shareholder without first paying in full the note and interest on the note.
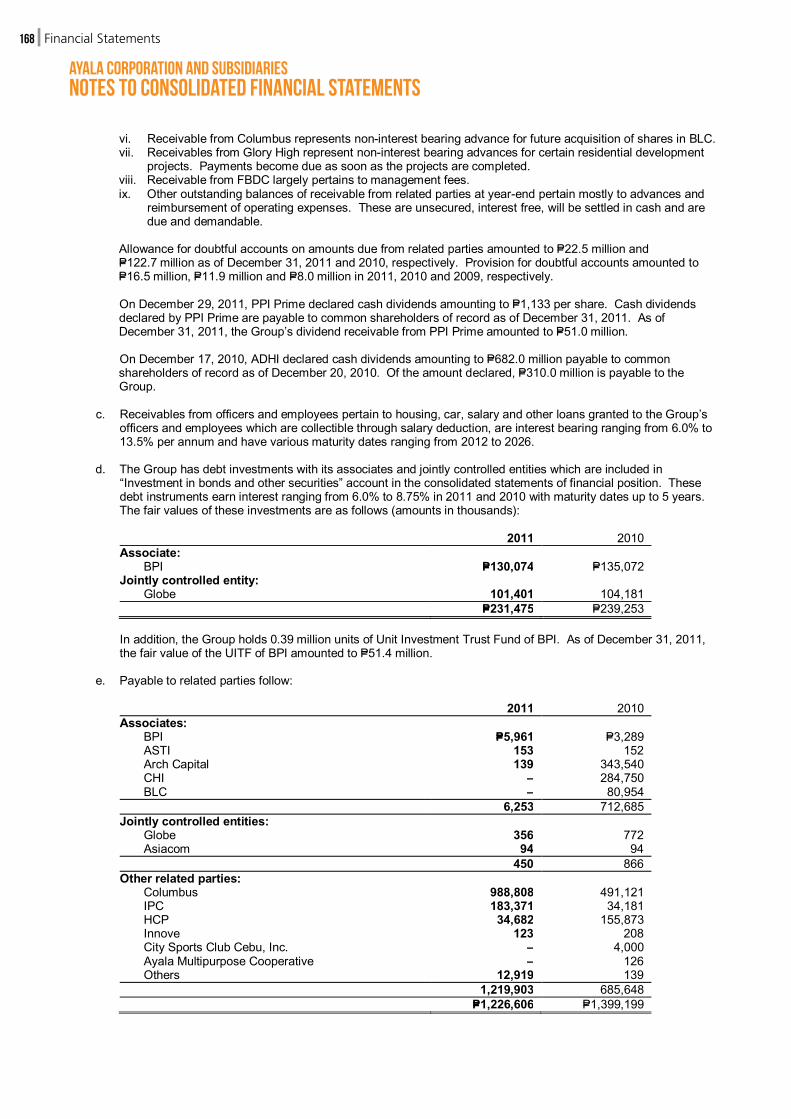
Ayala Corporation and Subsidiariesnotes to Consolidated financial statements
FinancialStatements168
vi. Receivable from Columbus represents non-interest bearing advance for future acquisition of shares in BLC. vii. Receivables from Glory High represent non-interest bearing advances for certain residential development
projects. Payments become due as soon as the projects are completed. viii. Receivable from FBDC largely pertains to management fees. ix. Other outstanding balances of receivable from related parties at year-end pertain mostly to advances and
reimbursement of operating expenses. These are unsecured, interest free, will be settled in cash and are due and demandable.
Allowance for doubtful accounts on amounts due from related parties amounted to P=22.5 million and P=122.7 million as of December 31, 2011 and 2010, respectively. Provision for doubtful accounts amounted to P=16.5 million, P=11.9 million and P=8.0 million in 2011, 2010 and 2009, respectively.
On December 29, 2011, PPI Prime declared cash dividends amounting to P=1,133 per share. Cash dividends declared by PPI Prime are payable to common shareholders of record as of December 31, 2011. As of December 31, 2011, the Group’s dividend receivable from PPI Prime amounted to P=51.0 million. On December 17, 2010, ADHI declared cash dividends amounting to P=682.0 million payable to common shareholders of record as of December 20, 2010. Of the amount declared, P=310.0 million is payable to the Group.
c. Receivables from officers and employees pertain to housing, car, salary and other loans granted to the Group’s
officers and employees which are collectible through salary deduction, are interest bearing ranging from 6.0% to 13.5% per annum and have various maturity dates ranging from 2012 to 2026.
d. The Group has debt investments with its associates and jointly controlled entities which are included in
“Investment in bonds and other securities” account in the consolidated statements of financial position. These debt instruments earn interest ranging from 6.0% to 8.75% in 2011 and 2010 with maturity dates up to 5 years. The fair values of these investments are as follows (amounts in thousands):
2011 2010 Associate: BPI P=130,074 P=135,072 Jointly controlled entity: Globe 101,401 104,181 P=231,475 P=239,253
In addition, the Group holds 0.39 million units of Unit Investment Trust Fund of BPI. As of December 31, 2011, the fair value of the UITF of BPI amounted to P=51.4 million.
e. Payable to related parties follow:
2011 2010 Associates: BPI P=5,961 P=3,289 ASTI 153 152 Arch Capital 139 343,540 CHI – 284,750 BLC – 80,954 6,253 712,685 Jointly controlled entities: Globe 356 772 Asiacom 94 94 450 866 Other related parties: Columbus 988,808 491,121 IPC 183,371 34,181 HCP 34,682 155,873 Innove 123 208 City Sports Club Cebu, Inc. – 4,000 Ayala Multipurpose Cooperative – 126 Others 12,919 139 1,219,903 685,648 P=1,226,606 P=1,399,199

FinancialStatements 169
i. Payable to Arch Capital as of December 31, 2010 is nontrade in nature, unsecured, interest-free and
payable on demand. ii. Payable to CHI comprise mainly of cost of lots for joint development projects. iii. Payable to Columbus represents non-interest bearing advance for future stock redemption. iv. Payable to IPC and HCP consist of purchased parts and accessories and vehicles that are trade in nature,
interest-free, unsecured and are payable within 15 to 30 days. v. The other outstanding balances of payable to related parties at year-end are unsecured, interest-free, will
be settled in cash and are due and demandable.
f. Income from related parties follow:
2011 2010 2009 (In Thousands) Associates P=1,250,190 P=1,202,628 P=2,046,351 Jointly controlled entities 142,024 138,971 140,652 Other related parties 18,527 19,899 15,062 P=1,410,741 P=1,361,498 P=2,202,065
Revenue recognized from related parties includes:
i. Leasing and developmental projects services rendered by ALI group. ii. Water and sewerage services rendered by MWC. iii. Automotive sales and repair services rendered by AAHC group.
g. Cost and expenses from related parties follow:
2011 2010 2009 (In Thousands) Associates P=172,362 P=228,461 P=606,641 Jointly controlled entities 22,449 104,493 47,732 Other related parties 83,995 18,901 7,294 P=278,806 P=351,855 P=661,667
Expenses recognized from related parties include:
i. Interest expense from short-term and long-term debt payable to BPI. ii. Purchases of Blackberry software and billings for cellphone charges and WiFi connections with Globe. iii. Building rental, leased lines, internet connections and ATM connections with Innove.
h. Compensation of key management personnel by benefit type follows:
2011 2010 2009 (In Thousands) Short-term employee benefits P=1,222,511 P=1,219,128 P=864,014 Share-based payments (Note 27) 195,154 207,746 167,886 Post-employment benefits (Note 26) 57,460 98,949 103,979 P=1,475,125 P=1,525,823 P=1,135,879
31. Financial Instruments
Fair Value of Financial Instruments The table below presents a comparison by category of carrying amounts and estimated fair values of all of the Group’s financial instruments (amounts in thousands):
2011 2010 Carrying Value Fair Value Carrying Value Fair Value FINANCIAL ASSETS AT FVPL
Held for trading P=1,470,829 P=1,470,829 P=872,080 P=872,080 Derivative assets
Embedded 119,939 119,939 267,763 267,763 Freestanding 2,765 2,765 21,073 21,073
Total financial assets at FVPL 1,593,533 1,593,533 1,160,916 1,160,916 (Forward)
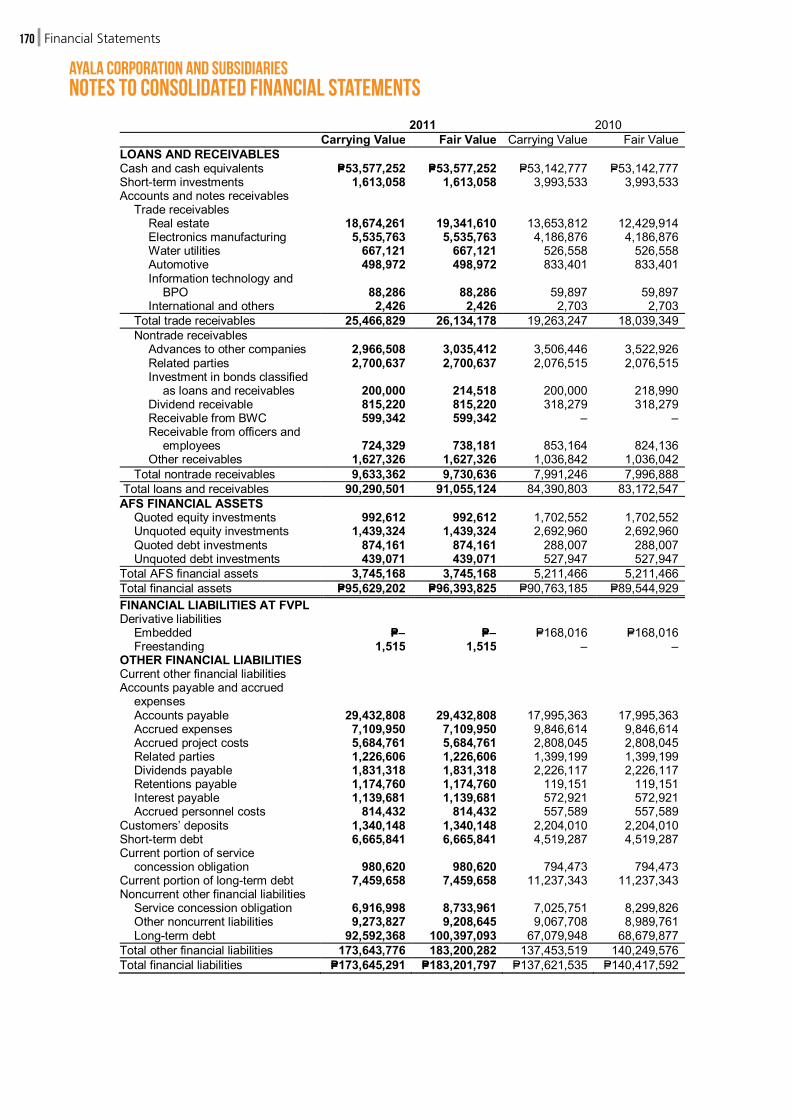
Ayala Corporation and Subsidiariesnotes to Consolidated financial statements
FinancialStatements170
2011 2010 Carrying Value Fair Value Carrying Value Fair Value LOANS AND RECEIVABLES Cash and cash equivalents P=53,577,252 P=53,577,252 P=53,142,777 P=53,142,777 Short-term investments 1,613,058 1,613,058 3,993,533 3,993,533 Accounts and notes receivables Trade receivables Real estate 18,674,261 19,341,610 13,653,812 12,429,914 Electronics manufacturing 5,535,763 5,535,763 4,186,876 4,186,876
Water utilities 667,121 667,121 526,558 526,558 Automotive 498,972 498,972 833,401 833,401 Information technology and
BPO 88,286 88,286 59,897 59,897 International and others 2,426 2,426 2,703 2,703 Total trade receivables 25,466,829 26,134,178 19,263,247 18,039,349 Nontrade receivables
Advances to other companies 2,966,508 3,035,412 3,506,446 3,522,926 Related parties 2,700,637 2,700,637 2,076,515 2,076,515 Investment in bonds classified as loans and receivables 200,000 214,518 200,000 218,990 Dividend receivable 815,220 815,220 318,279 318,279 Receivable from BWC 599,342 599,342 – – Receivable from officers and employees 724,329 738,181 853,164 824,136 Other receivables 1,627,326 1,627,326 1,036,842 1,036,042
Total nontrade receivables 9,633,362 9,730,636 7,991,246 7,996,888 Total loans and receivables 90,290,501 91,055,124 84,390,803 83,172,547 AFS FINANCIAL ASSETS Quoted equity investments 992,612 992,612 1,702,552 1,702,552 Unquoted equity investments 1,439,324 1,439,324 2,692,960 2,692,960 Quoted debt investments 874,161 874,161 288,007 288,007 Unquoted debt investments 439,071 439,071 527,947 527,947 Total AFS financial assets 3,745,168 3,745,168 5,211,466 5,211,466 Total financial assets P=95,629,202 P=96,393,825 P=90,763,185 P=89,544,929 FINANCIAL LIABILITIES AT FVPL Derivative liabilities Embedded P=– P=– P=168,016 P=168,016 Freestanding 1,515 1,515 – – OTHER FINANCIAL LIABILITIES Current other financial liabilities Accounts payable and accrued
expenses Accounts payable 29,432,808 29,432,808 17,995,363 17,995,363 Accrued expenses 7,109,950 7,109,950 9,846,614 9,846,614 Accrued project costs 5,684,761 5,684,761 2,808,045 2,808,045 Related parties 1,226,606 1,226,606 1,399,199 1,399,199 Dividends payable 1,831,318 1,831,318 2,226,117 2,226,117 Retentions payable 1,174,760 1,174,760 119,151 119,151 Interest payable 1,139,681 1,139,681 572,921 572,921 Accrued personnel costs 814,432 814,432 557,589 557,589 Customers’ deposits 1,340,148 1,340,148 2,204,010 2,204,010 Short-term debt 6,665,841 6,665,841 4,519,287 4,519,287 Current portion of service
concession obligation 980,620 980,620 794,473 794,473 Current portion of long-term debt 7,459,658 7,459,658 11,237,343 11,237,343 Noncurrent other financial liabilities Service concession obligation 6,916,998 8,733,961 7,025,751 8,299,826 Other noncurrent liabilities 9,273,827 9,208,645 9,067,708 8,989,761 Long-term debt 92,592,368 100,397,093 67,079,948 68,679,877 Total other financial liabilities 173,643,776 183,200,282 137,453,519 140,249,576 Total financial liabilities P=173,645,291 P=183,201,797 P=137,621,535 P=140,417,592

FinancialStatements 171
The following methods and assumptions were used to estimate the fair value of each class of financial instrument for which it is practicable to estimate such value:
Cash and cash equivalents, short-term investments and current receivables - Carrying amounts approximate fair values due to the relative short-term maturities of these investments.
Financial assets at FVPL - Fair values of investments in government securities are based on quoted prices as of the reporting date. For other investment securities with no reliable measure of fair value, these are carried at its last transaction price.
Derivative instruments - The fair value of the freestanding currency forwards is based on counterparty valuation. The embedded call and put options of IMI were valued using binomial model. This valuation technique considers the probability of PSi's share price which is based on a 5-year discounted cash flow valuation to move up or down depending on the volatility, the risk free rate and exercise price that is based on a 12-month trailing EBITDA. The fair value of the embedded call option of MWC was determined using Black’s option pricing model. Valuation inputs such as discount rates were based on credit adjusted interest rates ranging from 2% to 5% in 2010 while interest rate volatility was computed based on historical rates or data.
Noncurrent trade and nontrade receivables - The fair values are based on the discounted value of future cash flows using the applicable rates for similar types of instruments. The discount rates used ranged from 1.22% to 6.06% in 2011 and 1.13% to 13.8% in 2010. The carrying value of the receivable from BWC approximates its fair value since the receivable was recognized only on November 29, 2011.
AFS quoted investments - Fair values are based quoted prices published in markets.
AFS unquoted shares - Fair value of equity funds are based on the net asset value per share. For other unquoted equity shares where the fair value is not reasonably determinable due to the unpredictable nature of future cash flows and the lack of suitable method of arriving at a reliable fair value, these are carried at cost less impairment, if any.
AFS unquoted debt investments - Fair values are based on the discounted value of future cash flows using the applicable rates for similar types of instruments. The discount rates used ranged from 1% to 7% in 2011 and 2% to 7% in 2010.
Accounts payable and accrued expenses, customers’ deposits, short-term debt and current portion of long-term debt and service concession obligation - The fair values of accounts payable and accrued expenses and short-term debt approximate the carrying amounts due to the short-term nature of these transactions.
Customers’ deposits - non-current - The fair values are estimated using the discounted cash flow methodology using the Group’s current incremental borrowing rates for similar borrowings with maturities consistent with those remaining for the liability being valued. The discount rates used for Peso-denominated loans were 1.35% to 7.60% in 2011 and 1.99% to 7.27% in 2010 while the discount rates used for the foreign currency-denominated loans ranged from 1.02% to 3.16% in 2011 and 1.13% to 3.66% in 2010.
The fair value of noncurrent other financial liabilities (fixed rate and variable rate loans repriced on a semi-annual/annual basis and deposits) are estimated using the discounted cash flow methodology using the current incremental borrowing rates for similar borrowings with maturities consistent with those remaining for the liability being valued. The discount rates used ranged from 1.02% to 7.60% in 2011 and 2.70% to 7.40% in 2010.
For variable rate loans that reprice every three months, the carrying value approximates the fair value because of recent and regular repricing based on current market rates.
Fair Value Hierarchy The Group uses the following hierarchy for determining and disclosing the fair value of financial instruments by valuation technique:
Level 1: quoted (unadjusted) prices in active markets for identical assets or liabilities
Level 2: other techniques for which all inputs which have a significant effect on the recorded fair value are observable, either directly or indirectly
Level 3: techniques which use inputs that have a significant effect on the recorded fair value that are not based on observable market data.

Ayala Corporation and Subsidiariesnotes to Consolidated financial statements
FinancialStatements172
The following table shows the Group’s financial instruments carried at fair value as of December 31, 2011 and 2010, based on fair value hierarchy (amounts in thousands):
Level 1 Level 2 Level 3 Total 2011 Financial assets at FVPL P=– P=– P=1,470,829 P=1,470,829 Derivative assets
Embedded – – 119,939 119,939 Freestanding – 2,765 – 2,765
AFS financial assets Quoted equity investments 992,612 – – 992,612 Quoted debt investments 874,161 – – 874,161 Unquoted debt investments – 439,071 – 439,071
Derivative liabilities Freestanding – 1,515 – 1,515
P=1,866,773 P=443,351 P=1,590,768 P=3,900,892
Level 1 Level 2 Level 3 Total 2010 Financial assets at FVPL P=404,008 P=– P=468,072 P=872,080 Derivative assets
Embedded – – 267,763 267,763 Freestanding – 21,073 – 21,073
AFS financial assets Quoted equity investments 1,702,552 – – 1,702,552 Quoted debt investments 288,007 – – 288,007 Unquoted debt investments – 527,947 – 527,947
Derivative liabilities Embedded – – 168,016 168,016
P=2,394,567 P=549,020 P=903,851 P=3,847,438
There were no transfers between Level 1 and Level 2 fair value measurements, and no transfers into and out of Level 3 fair value measurements. A reconciliation of the beginning and closing balances of Level 3 fair value measurements are summarized below
2011 2010 At January 1 P=903,851 P=493,039 Additions 876,010 61,607 Additions through business combination – 214,610 Disposals (229,613) – Recognized in profit or loss 40,520 134,595 At December 31 P=1,590,768 P=903,851
The sensitivity analysis for the TRG investments cannot be performed because there is no appropriate basis to value these unquoted investments and reference to equity transactions by external parties would be the best approximation of fair value (see Note 8). The fair value of the embedded put and call option of IMI are highly sensitive to the estimated 12-month trailing EBITDA of PSi during the option period and PSi’s cost of equity as of valuation date.
The following are the estimated changes in the fair values of the embedded derivatives assuming the estimated EBITDA used in the fair value calculation would vary by 5% (amounts in thousands):
2011 2010
Increase (Decrease)
in net income
Increase (Decrease)
in net income Estimated EBITDA is 5% higher Call option (P=11,758) (P=5,278) Put option – (22,579) Estimated EBITDA is 5% lower Call option 7,011 5,890 Put option – 22,131

FinancialStatements 173
The following are the estimated changes in the fair values of the embedded derivatives assuming the cost of equity will change by 5% (amounts in thousands):
2011 2010 Increase
(Decrease) in net income
Increase (Decrease)
in net income Cost of equity is 5% higher Call option P=– (P=12,818) Put option – (20,901) Cost of equity is 5% lower Call option – 17,690 Put option – 22,687
The embedded call option bifurcated from the MWC P=4.0 billion bonds was classified under Level 3 because of the use of credit spread as input to its fair value calculation which was assessed by the Group as having a significant impact to its fair value.
The following are the estimated changes in the fair values of the embedded call option on MWC’s P=4.0 billion Bonds using an assumed increase (decrease) in the credit spread (amounts in thousands):
Changes in
Basis Points (bps) Effect on Income
before Income Tax 2010 +25 (P=5,626)
-25 6,925
Derivatives
2011 2010 Derivative Assets Embedded call options of IMI P=119,939 P=53,153 Embedded call option of MWC – 214,610 Freestanding currency forwards of IMI 2,765 21,073 P=122,704 P=288,836 Derivative Liabilities Embedded put options of IMI P=– P=168,016 Freestanding currency forwards of IMI 1,515 – P=1,515 P=168,016
Freestanding Derivatives In 2011 and 2010, IMI entered into various short-term currency forwards with aggregate nominal amount of US$59.0 million (P=2,586.0 million) and US$27.6 million (P=1,210.0 million), respectively. As of December 31, 2011 and 2010, the outstanding forward contracts have a net positive fair value of US$0.03 million (P=1,250.5 million) and US$0.5 million (P=21,073.7 million). Net fair value gain recognized in 2011, 2010 and 2009 amounted to US$1.2 million (P=52.0 million) US$2.1 million (P=94.2 million) and US$0.2 million (P=7.7 million), respectively (see Note 22).
Embedded derivatives
MWC
P=4.0 billion Bonds Embedded Call Option MWC has an embedded call option on the P=4.0 billion Peso Bonds issued on October 22, 2008. The embedded call option gives MWC the right to redeem all but not in part the outstanding bonds on the twelfth interest payment date. The amount payable to the bondholders in respect of such redemptions shall be calculated based on the principal amount of the bonds being redeemed, as the sum of 102% of the principal amount and accrued interest on the bonds on the optional redemption date. On issue date, MWC recognized separately the fair value of the embedded call option, resulting in recognition of a derivative asset and loan premium amounting to P=210.6 million. The embedded derivative is carried at FVPL while the loan premium is amortized at effective interest rate over the life of the loan.
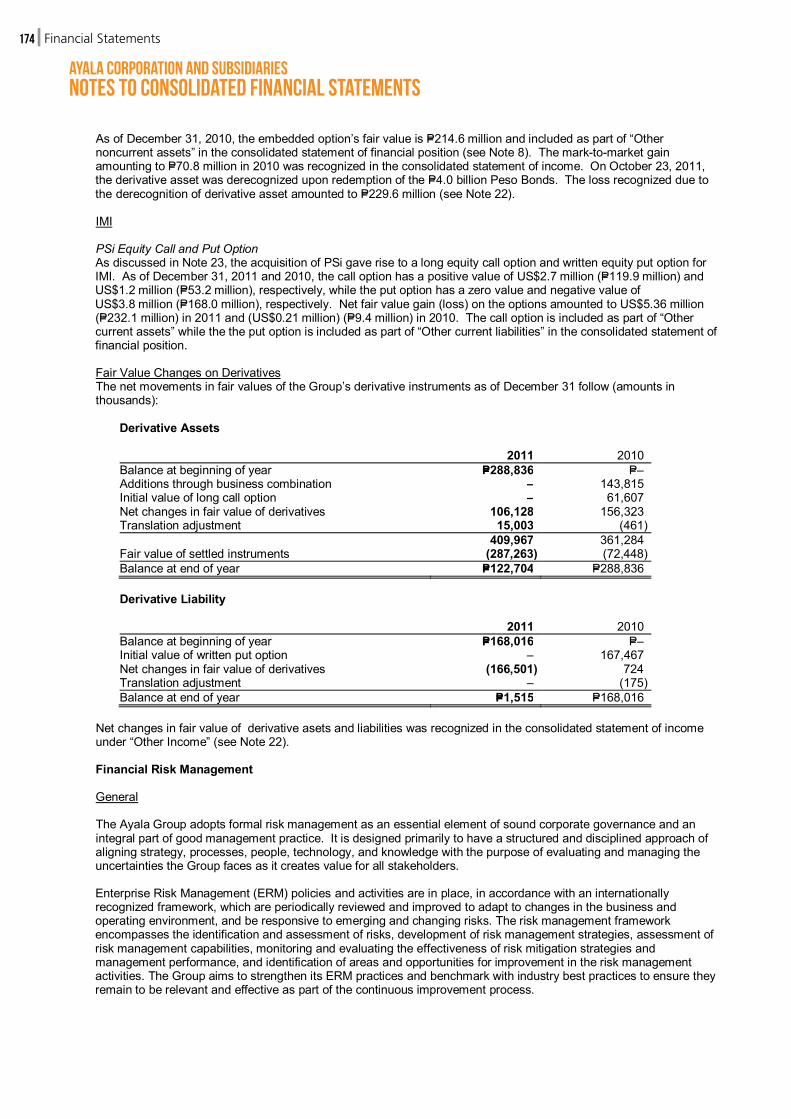
Ayala Corporation and Subsidiariesnotes to Consolidated financial statements
FinancialStatements174
As of December 31, 2010, the embedded option’s fair value is P=214.6 million and included as part of “Other noncurrent assets” in the consolidated statement of financial position (see Note 8). The mark-to-market gain amounting to P=70.8 million in 2010 was recognized in the consolidated statement of income. On October 23, 2011, the derivative asset was derecognized upon redemption of the P=4.0 billion Peso Bonds. The loss recognized due to the derecognition of derivative asset amounted to P=229.6 million (see Note 22).
IMI
PSi Equity Call and Put Option As discussed in Note 23, the acquisition of PSi gave rise to a long equity call option and written equity put option for IMI. As of December 31, 2011 and 2010, the call option has a positive value of US$2.7 million (P=119.9 million) and US$1.2 million (P=53.2 million), respectively, while the put option has a zero value and negative value of US$3.8 million (P=168.0 million), respectively. Net fair value gain (loss) on the options amounted to US$5.36 million (P=232.1 million) in 2011 and (US$0.21 million) (P=9.4 million) in 2010. The call option is included as part of “Other current assets” while the the put option is included as part of “Other current liabilities” in the consolidated statement of financial position.
Fair Value Changes on Derivatives The net movements in fair values of the Group’s derivative instruments as of December 31 follow (amounts in thousands):
Derivative Assets
2011 2010 Balance at beginning of year P=288,836 P=– Additions through business combination – 143,815 Initial value of long call option – 61,607 Net changes in fair value of derivatives 106,128 156,323 Translation adjustment 15,003 (461) 409,967 361,284 Fair value of settled instruments (287,263) (72,448) Balance at end of year P=122,704 P=288,836
Derivative Liability
2011 2010 Balance at beginning of year P=168,016 P=– Initial value of written put option – 167,467 Net changes in fair value of derivatives (166,501) 724 Translation adjustment – (175) Balance at end of year P=1,515 P=168,016
Net changes in fair value of derivative asets and liabilities was recognized in the consolidated statement of income under “Other Income” (see Note 22).
Financial Risk Management General The Ayala Group adopts formal risk management as an essential element of sound corporate governance and an integral part of good management practice. It is designed primarily to have a structured and disciplined approach of aligning strategy, processes, people, technology, and knowledge with the purpose of evaluating and managing the uncertainties the Group faces as it creates value for all stakeholders. Enterprise Risk Management (ERM) policies and activities are in place, in accordance with an internationally recognized framework, which are periodically reviewed and improved to adapt to changes in the business and operating environment, and be responsive to emerging and changing risks. The risk management framework encompasses the identification and assessment of risks, development of risk management strategies, assessment of risk management capabilities, monitoring and evaluating the effectiveness of risk mitigation strategies and management performance, and identification of areas and opportunities for improvement in the risk management activities. The Group aims to strengthen its ERM practices and benchmark with industry best practices to ensure they remain to be relevant and effective as part of the continuous improvement process.
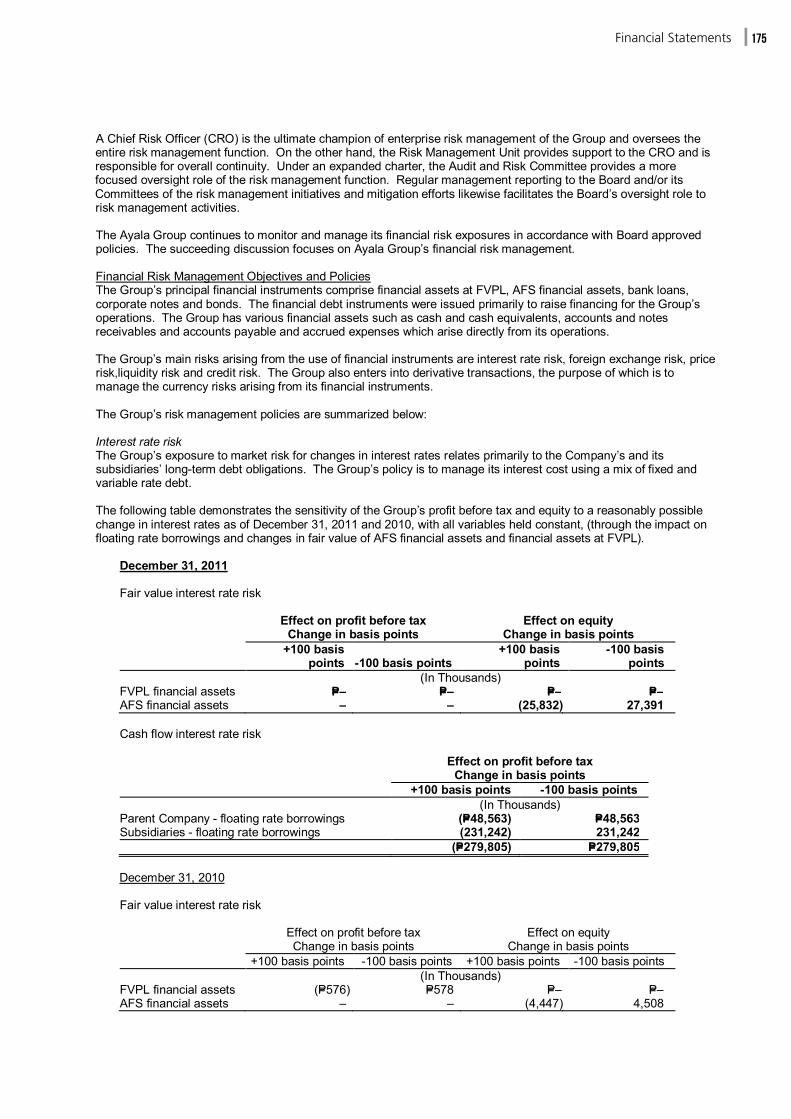
FinancialStatements 175
A Chief Risk Officer (CRO) is the ultimate champion of enterprise risk management of the Group and oversees the entire risk management function. On the other hand, the Risk Management Unit provides support to the CRO and is responsible for overall continuity. Under an expanded charter, the Audit and Risk Committee provides a more focused oversight role of the risk management function. Regular management reporting to the Board and/or its Committees of the risk management initiatives and mitigation efforts likewise facilitates the Board’s oversight role to risk management activities.
The Ayala Group continues to monitor and manage its financial risk exposures in accordance with Board approved policies. The succeeding discussion focuses on Ayala Group’s financial risk management.
Financial Risk Management Objectives and Policies The Group’s principal financial instruments comprise financial assets at FVPL, AFS financial assets, bank loans, corporate notes and bonds. The financial debt instruments were issued primarily to raise financing for the Group’s operations. The Group has various financial assets such as cash and cash equivalents, accounts and notes receivables and accounts payable and accrued expenses which arise directly from its operations.
The Group’s main risks arising from the use of financial instruments are interest rate risk, foreign exchange risk, price risk,liquidity risk and credit risk. The Group also enters into derivative transactions, the purpose of which is to manage the currency risks arising from its financial instruments.
The Group’s risk management policies are summarized below:
Interest rate risk The Group’s exposure to market risk for changes in interest rates relates primarily to the Company’s and its subsidiaries’ long-term debt obligations. The Group’s policy is to manage its interest cost using a mix of fixed and variable rate debt.
The following table demonstrates the sensitivity of the Group’s profit before tax and equity to a reasonably possible change in interest rates as of December 31, 2011 and 2010, with all variables held constant, (through the impact on floating rate borrowings and changes in fair value of AFS financial assets and financial assets at FVPL).
December 31, 2011 Fair value interest rate risk
Effect on profit before tax Effect on equity Change in basis points Change in basis points
+100 basis
points -100 basis points +100 basis
points -100 basis
points (In Thousands) FVPL financial assets P=– P=– P=– P=– AFS financial assets – – (25,832) 27,391
Cash flow interest rate risk
Effect on profit before tax Change in basis points +100 basis points -100 basis points (In Thousands) Parent Company - floating rate borrowings (P=48,563) P=48,563 Subsidiaries - floating rate borrowings (231,242) 231,242 (P=279,805) P=279,805
December 31, 2010
Fair value interest rate risk
Effect on profit before tax Effect on equity Change in basis points Change in basis points +100 basis points -100 basis points +100 basis points -100 basis points (In Thousands) FVPL financial assets (P=576) P=578 P=– P=– AFS financial assets – – (4,447) 4,508

Ayala Corporation and Subsidiariesnotes to Consolidated financial statements
FinancialStatements176
Cash flow interest rate risk
Effect on profit before tax Change in basis points +100 basis points -100 basis points (In Thousands) Parent Company - floating rate borrowings (P=50,475) P=50,475 Subsidiaries - floating rate borrowings (119,106) 119,106 (P=170,157) P=170,159
There is no other impact on the Group’s equity other than those already affecting the net income.
The terms and maturity profile of the interest-bearing financial assets and liabilities, together with its corresponding nominal amounts and carrying values (in thousands), are shown in the following table:
2011
Interest terms (p.a.) Rate Fixing
Period Nominal Amount < 1 year 1 to 5 years > 5 years Carrying Value
Group Cash and cash
equivalents Fixed at the date of investment
Various P=53,524,835 P=53,524,835 P=– P=– P=53,524,835
Short-term investments
Fixed at the date of investment or revaluation cut-off
Various 1,613,058 1,613,058 – – 1,613,058
Accounts and notes receivable
Fixed at the date of investment or revaluation cut-off
Various 16,183,396 7,372,039 5,930,444 151,585 13,454,068
AFS financial asset - Quoted debt investments
Fixed at the date of investment or revaluation cut-off
Various 874,161 132,332 723,664 18,165 874,161
AFS financial asset - Unquoted debt investments
Fixed at the date of investment or revaluation cut-off
Various 420,000 126,053 268,905 44,113 439,071
P=72,615,450 P=62,768,317 P=6,923,013 P=213,863 P=69,905,193
Company Long-term debt Fixed
Fixed at 7.45% to 7.95% 5 years P=5,890,000 P=3,009,938 P=2,856,066 P=– P=5,866,004 Fixed at 8.15% 6 years 1,000,000 995,233 – – 995,233 Fixed at 6.70% to 8.40% 7 years 12,470,000 – 2,384,395 9,988,686 12,373,081 Fixed at 6.75% to 6.80% 10 years 11,495,000 – – 11,393,916 11,393,916 Floating Variable at 0.60% to
0.67% over 3M PDST-R1
3 months 6,475,000 249,940 6,215,051 – 6,464,991
Subsidiaries Short-term debt Ranging from 1.16% to
4.13% Monthly, quarterly
3,347,341 3,347,341 – – 3,347,341
Ranging from 3.50% to 8.00%
Monthly, quarterly
3,318,500 3,318,500 – – 3,318,500
Long-term debt Fixed
Fixed at 2.08% to 13.50% 3,5,7,10 and 12 years
41,204,600 2,345,485 30,065,253 8,394,537 40,805,275
Floating Variable at Libor+0.50%
to 3.50% 3 months,
semi-annual 22,402,412 873,934 17,705,624 3,573,968 22,153,526
P=107,602,853 P=14,140,371 P=59,226,389 P=33,351,107 P=106,717,867

FinancialStatements 177
2010
Interest terms (p.a.) Rate Fixing
Period Nominal Amount < 1 year 1 to 5 years > 5 years Carrying Value
Group Cash and cash
equivalents Fixed at the date of investment
Various P=53,125,220 P=53,125,220 P=– P=– P=53,125,220
Short-term investments
Fixed at the date of investment or revaluation cut-off
Various 3,993,533 3,993,533 – – 3,993,533
Financial assets at FVPL
Fixed at the date of investment or revaluation cut-off
Various 404,008 404,008 – – 404,008
Accounts and notes receivable
Fixed at the date of investment or revaluation cut-off
Various 9,682,862 6,107,831 1,666,651 652,991 8,427,473
AFS financial asset - Quoted debt investments
Fixed at the date of investment or revaluation cut-off
Various 288,007 – 228,755 59,252 288,007
AFS financial asset - Unquoted debt investments
Fixed at the date of investment or revaluation cut-off
Various 513,912 357,129 170,818 – 527,947
P=68,007,542 P=63,987,721 P=2,066,224 P=712,243 P=66,766,188
Company Long-term debt Fixed
Fixed at 6.725% to 7.95% 5 years P=14,955,000 P=65,000 P=14,890,000 P=– P=14,955,000 Fixed at 8.15% 6 years 1,000,000 – 1,000,000 – 1,000,000 Fixed at 6.70% to 8.40% 7 years 1,477,500 7,500 1,470,000 – 1,477,500 Fixed at 6.75% 10 years 1,496,667 1,667 6,667 1,488,333 1,496,667 Fixed at 7.20% 7 years 9,800,000 – – 9,800,000 9,800,000 Floating Variable at 0.50% to
0.67% over 91-day T-bills PDST-R1
3 months 6,730,000 255,000 6,475,000 6,730,000
Subsidiaries Short-term debt Ranging from 1.16% to
3.72% Monthly, quarterly
2,035,874 2,035,874 – – 2,035,874
Ranging from 3.50% to 8.0%
Monthly, quarterly
2,483,413 2,483,413 – – 2,483,413
Long-term debt Fixed
Fixed at 4.57% to 9% 3,5,7,10 and 12 years
27,241,778 3,248,671 21,699,076 2,791,029 27,738,776
Floating Variable 3 months,
semi-annual 14,912,882 7,659,840 3,901,729 3,557,779 15,119,348
P=82,133,114 P=15,756,965 P=49,442,472 P=17,637,141 P=82,836,578
Foreign exchange risk The Group’s foreign exchange risk results from movements of the Philippine Peso (P=) against foreign currency. The Group may enter into foreign currency forwards and foreign currency swap contracts in order to hedge its US$ obligations.
IMI Group The IMI Group’s foreign exchange risk results primarily from movements of the U.S. Dollar against other currencies. As a result of significant operating expenses in Philippine Peso, IMI Group’s consolidated statements of comprehensive income can be affected significantly by movements in the U.S. Dollar versus the Philippine Peso. In 2011 and 2010, IMI Group entered into currency forward contracts to hedge its risks associated with foreign currency fluctuations. IMI Group also has transactional currency exposures. Such exposure arises from sales or purchases denominated in other than IMI Group’s functional currency. Approximately 37% and 20% of IMI Group’s sales for the years ended December 31, 2011 and 2010, respectively, and 51% and 31% of costs for the years ended December 31, 2011 and 2010, respectively, are denominated in other than IMI Group’s functional currency.
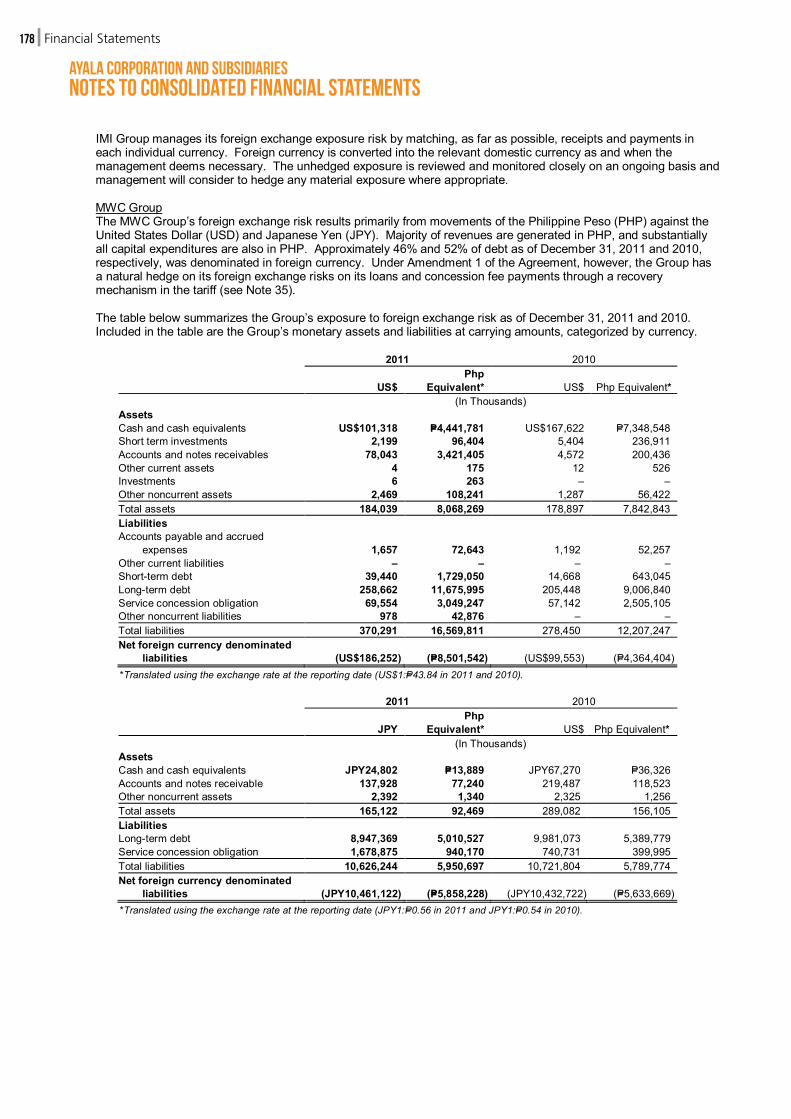
Ayala Corporation and Subsidiariesnotes to Consolidated financial statements
FinancialStatements178
IMI Group manages its foreign exchange exposure risk by matching, as far as possible, receipts and payments in each individual currency. Foreign currency is converted into the relevant domestic currency as and when the management deems necessary. The unhedged exposure is reviewed and monitored closely on an ongoing basis and management will consider to hedge any material exposure where appropriate. MWC Group The MWC Group’s foreign exchange risk results primarily from movements of the Philippine Peso (PHP) against the United States Dollar (USD) and Japanese Yen (JPY). Majority of revenues are generated in PHP, and substantially all capital expenditures are also in PHP. Approximately 46% and 52% of debt as of December 31, 2011 and 2010, respectively, was denominated in foreign currency. Under Amendment 1 of the Agreement, however, the Group has a natural hedge on its foreign exchange risks on its loans and concession fee payments through a recovery mechanism in the tariff (see Note 35). The table below summarizes the Group’s exposure to foreign exchange risk as of December 31, 2011 and 2010. Included in the table are the Group’s monetary assets and liabilities at carrying amounts, categorized by currency.
2011 2010
US$ Php
Equivalent* US$ Php Equivalent* (In Thousands) Assets Cash and cash equivalents US$101,318 P=4,441,781 US$167,622 P=7,348,548 Short term investments 2,199 96,404 5,404 236,911 Accounts and notes receivables 78,043 3,421,405 4,572 200,436 Other current assets 4 175 12 526 Investments 6 263 – – Other noncurrent assets 2,469 108,241 1,287 56,422 Total assets 184,039 8,068,269 178,897 7,842,843 Liabilities Accounts payable and accrued
expenses 1,657 72,643 1,192 52,257 Other current liabilities – – – – Short-term debt 39,440 1,729,050 14,668 643,045 Long-term debt 258,662 11,675,995 205,448 9,006,840 Service concession obligation 69,554 3,049,247 57,142 2,505,105 Other noncurrent liabilities 978 42,876 – – Total liabilities 370,291 16,569,811 278,450 12,207,247 Net foreign currency denominated
liabilities (US$186,252) (P=8,501,542) (US$99,553) (P=4,364,404) *Translated using the exchange rate at the reporting date (US$1:P=43.84 in 2011 and 2010).
2011 2010
JPY Php
Equivalent* US$ Php Equivalent* (In Thousands) Assets Cash and cash equivalents JPY24,802 P=13,889 JPY67,270 P=36,326 Accounts and notes receivable 137,928 77,240 219,487 118,523 Other noncurrent assets 2,392 1,340 2,325 1,256 Total assets 165,122 92,469 289,082 156,105 Liabilities Long-term debt 8,947,369 5,010,527 9,981,073 5,389,779 Service concession obligation 1,678,875 940,170 740,731 399,995 Total liabilities 10,626,244 5,950,697 10,721,804 5,789,774 Net foreign currency denominated
liabilities (JPY10,461,122) (P=5,858,228) (JPY10,432,722) (P=5,633,669) *Translated using the exchange rate at the reporting date (JPY1:P=0.56 in 2011 and JPY1:P=0.54 in 2010).

FinancialStatements 179
2011 2010
SGD Php
Equivalent* SGD Php Equivalent* (In Thousands) Assets Cash and cash equivalents SGD4,465 P=151,140 SGD1,301 P=44,169 Accounts and notes receivables 16 542 244 8,284 Other current assets 102 3,453 – – Investments – – 198 6,722 Other noncurrent assets 10,169 344,221 10,384 352,537 Total assets 14,752 499,356 12,127 411,712 Liabilities Accounts payable and accrued
expenses 1,802 60,998 5,042 171,176 Other current liabilities 1,294 43,802 1,295 43,965 Short-term debt 1,633 55,277 1,682 57,104 Other noncurrent liabilities 262 8,869 143 4,855 Total liabilities 4,991 168,946 8,162 277,100 Net foreign currency denominated
assets SGD9,761 P=330,410 SGD3,965 P=134,612 *Translated using the exchange rate at the reporting date SGD1:P=33.85 in 2011, SGD1:P=33.95 in 2010).
2011 2010
HKD Php
Equivalent* HKD Php Equivalent* (In Thousands) Assets Cash and cash equivalents HKD988 P=5,582 HKD1,118 P=6,306 Accounts and notes receivables 78,479 443,406 97,779 551,474 Investments 149 842 13,890 78,340 Other current assets 9,630 54,410 – – Total assets 89,246 504,240 112,787 636,120 Liabilities Accounts payable and accrued
expenses 3,436 19,413 6,293 35,493 Net foreign currency denominated
assets HKD85,810 P=484,827 HKD106,494 P=600,627 *Translated using the exchange rate at the reporting date (HKD1: P=5.65 in 2011, HKD1: P=5.64 in 2010).
2011 2010
RMB Php
Equivalent* RMB Php Equivalent* (In Thousands) Assets Cash and cash equivalents RMB42,525 P=295,549 RMB31,304 P=207,546 Accounts and notes receivables 271,962 1,890,136 255,384 1,693,196 Other current assets 17,377 120,770 – – Total assets 331,864 2,306,455 286,688 1,900,742 Liabilities Accounts payable and accrued
expenses 186,654 1,297,245 153,864 1,020,118 Other current liabilities 38 264 – – Total liabilities 186,692 1,297,509 153,864 1,020,118 Net foreign currency denominated
assets RMB145,172 P=1,008,946 RMB132,824 P=880,624 *Translated using the exchange rate at the reporting date (RMB1: P=6.95 in 2011, RMB1: P=6.63 in 2010).

Ayala Corporation and Subsidiariesnotes to Consolidated financial statements
FinancialStatements180
2011 2010
INR Php
Equivalent* INR Php Equivalent (In Thousands) Assets Cash and cash equivalents INR15,552 P=12,924 INR6,307 P=6,156 Other current assets 38,723 32,179 10,680 10,424 Other noncurrent asset – – 5,602 5,468 Total assets 54,275 45,103 22,589 22,048 Liabilities Accounts payable and accrued
expenses 71,368 59,307 33,522 32,717 Short term debt – – 2,000 1,952 Long-term debt 14,951 12,424 8,335 8,135 Other noncurrent liabilities 15,105 12,552 4,217 4,116 Total liabilities 101,424 84,283 48,074 46,920 Net foreign currency denominated
liabilities (INR47,149) (P=39,180) (INR25,485) (P=24,872) *Translated using the exchange rate at the reporting date (INR1: P=0.831 in 2011, INR1: P=0.976 in 2010).
2011 2010
THB Php
Equivalent* THB Php Equivalent* (In Thousands) Assets Cash and cash equivalents THB226 P=314 THB1,840 P=2,686 Accounts and notes receivables – – (1,591) (2,323) Investments – – 9,120 13,315 Other current assets 41 57 – – Other noncurrent assets 100,875 140,216 120,042 175,261 Total assets 101,142 140,587 129,411 188,939 Liabilities Accounts payable and accrued
expenses – – 712 1,040 Net foreign currency denominated
assets THB101,142 P=140,587 THB128,699 P=187,899 *Translated using the exchange rate at the reporting date (THB1: P=1.39 in 2011, THB1: P=1.46 in 2010).
2011 2010
MYR Php
Equivalent* MYR Php Equivalent* (In Thousands) Assets Cash and cash equivalents MYR4,674 P=64,875 MYR4,676 P=66,446 Short term investments – – 30 426 Investments 321 4,455 – – Other noncurrent assets 6,785 94,176 4,410 62,666 Total assets 11,780 163,506 9,116 129,538 Liabilities Accounts payable and accrued
expenses 49 680 89 1,265 Other noncurrent liabilities 26 361 26 369 Total liabilities 75 1,041 115 1,634 Net foreign currency denominated
assets MYR11,705 P=162,465 MYR9,001 P=127,904 *Translated using the exchange rate at the reporting date (MYR1: P=13.88 in 2011, MYR1: P=14.21 in 2010).
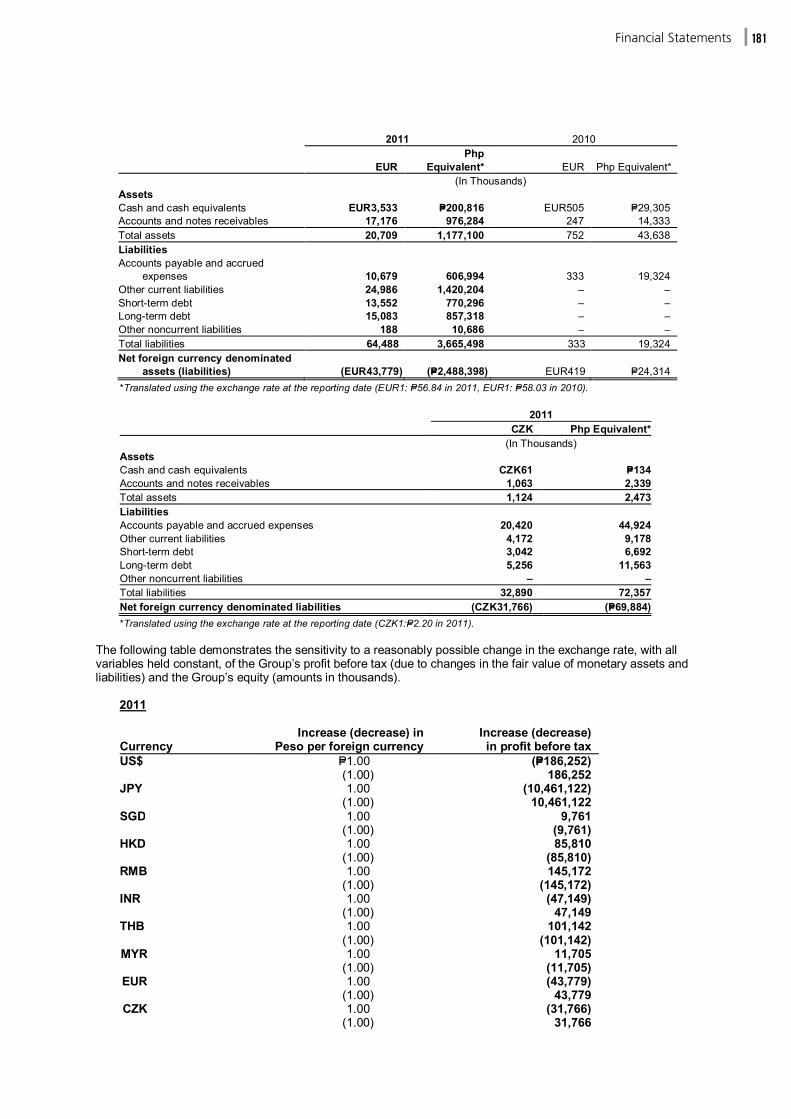
FinancialStatements 181
2011 2010
EUR Php
Equivalent* EUR Php Equivalent* (In Thousands) Assets Cash and cash equivalents EUR3,533 P=200,816 EUR505 P=29,305 Accounts and notes receivables 17,176 976,284 247 14,333 Total assets 20,709 1,177,100 752 43,638 Liabilities Accounts payable and accrued
expenses 10,679 606,994 333 19,324 Other current liabilities 24,986 1,420,204 – – Short-term debt 13,552 770,296 – – Long-term debt 15,083 857,318 – – Other noncurrent liabilities 188 10,686 – – Total liabilities 64,488 3,665,498 333 19,324 Net foreign currency denominated
assets (liabilities) (EUR43,779) (P=2,488,398) EUR419 P=24,314 *Translated using the exchange rate at the reporting date (EUR1: P=56.84 in 2011, EUR1: P=58.03 in 2010).
2011 CZK Php Equivalent* (In Thousands) Assets Cash and cash equivalents CZK61 P=134Accounts and notes receivables 1,063 2,339Total assets 1,124 2,473Liabilities Accounts payable and accrued expenses 20,420 44,924Other current liabilities 4,172 9,178Short-term debt 3,042 6,692Long-term debt 5,256 11,563Other noncurrent liabilities – –Total liabilities 32,890 72,357Net foreign currency denominated liabilities (CZK31,766) (P=69,884)*Translated using the exchange rate at the reporting date (CZK1:P=2.20 in 2011).
The following table demonstrates the sensitivity to a reasonably possible change in the exchange rate, with all variables held constant, of the Group’s profit before tax (due to changes in the fair value of monetary assets and liabilities) and the Group’s equity (amounts in thousands).
2011
Currency Increase (decrease) in
Peso per foreign currency Increase (decrease) in profit before tax
US$ P=1.00 (P=186,252) (1.00) 186,252
JPY 1.00 (10,461,122) (1.00) 10,461,122
SGD 1.00 9,761 (1.00) (9,761)
HKD 1.00 85,810 (1.00) (85,810)
RMB 1.00 145,172 (1.00) (145,172)
INR 1.00 (47,149) (1.00) 47,149
THB 1.00 101,142 (1.00) (101,142)
MYR 1.00 11,705 (1.00) (11,705)
EUR 1.00 (43,779) (1.00) 43,779
CZK 1.00 (31,766) (1.00) 31,766
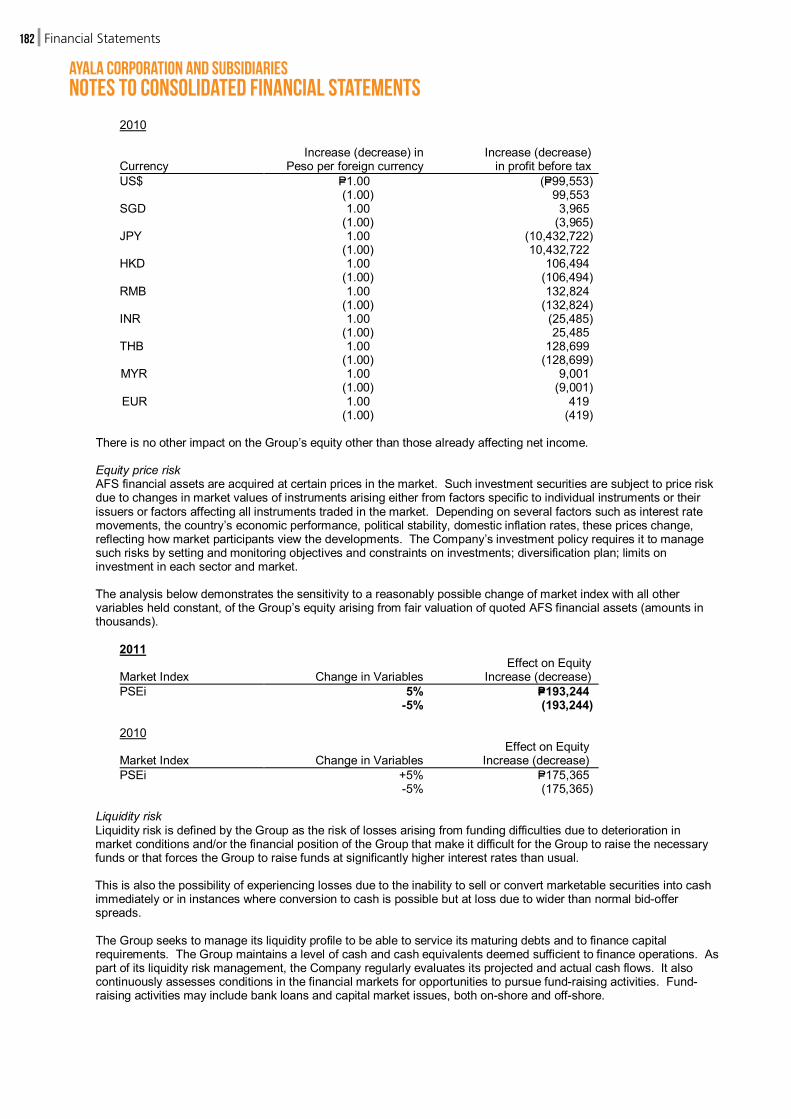
Ayala Corporation and Subsidiariesnotes to Consolidated financial statements
FinancialStatements182
2010
Currency Increase (decrease) in
Peso per foreign currency Increase (decrease)
in profit before tax US$ P=1.00 (P=99,553)
(1.00) 99,553 SGD 1.00 3,965
(1.00) (3,965) JPY 1.00 (10,432,722) (1.00) 10,432,722 HKD 1.00 106,494
(1.00) (106,494) RMB 1.00 132,824
(1.00) (132,824) INR 1.00 (25,485)
(1.00) 25,485 THB 1.00 128,699
(1.00) (128,699) MYR 1.00 9,001
(1.00) (9,001) EUR 1.00 419
(1.00) (419)
There is no other impact on the Group’s equity other than those already affecting net income.
Equity price risk AFS financial assets are acquired at certain prices in the market. Such investment securities are subject to price risk due to changes in market values of instruments arising either from factors specific to individual instruments or their issuers or factors affecting all instruments traded in the market. Depending on several factors such as interest rate movements, the country’s economic performance, political stability, domestic inflation rates, these prices change, reflecting how market participants view the developments. The Company’s investment policy requires it to manage such risks by setting and monitoring objectives and constraints on investments; diversification plan; limits on investment in each sector and market.
The analysis below demonstrates the sensitivity to a reasonably possible change of market index with all other variables held constant, of the Group’s equity arising from fair valuation of quoted AFS financial assets (amounts in thousands).
2011
Market Index Change in Variables Effect on Equity
Increase (decrease) PSEi 5% P=193,244
-5% (193,244)
2010
Market Index Change in Variables Effect on Equity
Increase (decrease) PSEi +5% P=175,365
-5% (175,365) Liquidity risk
Liquidity risk is defined by the Group as the risk of losses arising from funding difficulties due to deterioration in market conditions and/or the financial position of the Group that make it difficult for the Group to raise the necessary funds or that forces the Group to raise funds at significantly higher interest rates than usual.
This is also the possibility of experiencing losses due to the inability to sell or convert marketable securities into cash immediately or in instances where conversion to cash is possible but at loss due to wider than normal bid-offer spreads.
The Group seeks to manage its liquidity profile to be able to service its maturing debts and to finance capital requirements. The Group maintains a level of cash and cash equivalents deemed sufficient to finance operations. As part of its liquidity risk management, the Company regularly evaluates its projected and actual cash flows. It also continuously assesses conditions in the financial markets for opportunities to pursue fund-raising activities. Fund-raising activities may include bank loans and capital market issues, both on-shore and off-shore.

FinancialStatements 183
ALI Group
ALI Group employs scenario analysis and contingency planning to actively manage its liquidity position and guarantee that all operating, investing and financing needs are met. ALI Group has come up with a three-layered approach to liquidity through the prudent management of sufficient cash and cash equivalents, the potential sale of accounts receivables and the maintenance of short-term revolving credit facilities.
Cash and cash equivalents are maintained at a level that will enable it to fund its general and administrative expenses as well as to have additional funds as buffer for any opportunities or emergencies that may arise. Management develops viable funding alternatives through a continuous program for the sale of its receivables and ensures the availability of ample unused short-term revolving credit facilities from both local and foreign banks as back-up liquidity.
MWC Group
MWC Group’s objective is to maintain a balance between continuity of funding and flexibility through the use of bank overdrafts, bank loans, debentures, preference shares, leases and hire purchase contracts. The Group’s policy is to maintain a level of cash that is sufficient to fund its monthly cash requirements, at least for the next four to six months. Capital expenditures are funded through long-term debt, while operating expenses and working capital requirements are sufficiently funded through cash collections.
The table summarizes the maturity profile of the Group’s financial liabilities as of December 31, 2011 and 2010 based on contractual undiscounted payments.
2011 < 1 year 1 to < 2 years 2 to < 3 years > 3 years Total (In Thousands) Accounts payable and accrued expenses Accounts payable P=29,432,808 P=– P=– P=– P=29,432,808 Accrued expenses 7,109,950 – – – 7,109,950 Accrued project costs 5,684,761 – – – 5,684,761 Dividends payable 1,831,318 – – – 1,831,318 Related parties 1,226,606 – – – 1,226,606 Retentions payable 1,174,760 – – – 1,174,760 Accrued personnel costs 814,432 – – – 814,432 Derivative liability 1,515 – – – 1,515 Service concession liability 980,620 946,375 979,431 4,991,192 7,897,618 Customers’ deposit 1,340,148 – – – 1,340,148 Short-term debt 6,665,841 – – – 6,665,841 Long-term debt (LTD) 7,421,861 19,329,254 9,781,964 64,403,934 100,937,013 Other noncurrent liabilities – 7,299,133 455,701 1,518,993 9,273,827 P=63,684,620 P=27,574,762 P=11,217,096 P=70,914,119 P=173,390,597
< 1 year 1 to < 2 years 2 to < 3 years > 3 years Total Interest payable on LTD P=5,054,350 P=4,870,537 P=4,002,544 P=14,027,950 P=27,955,381
2010 < 1 year 1 to < 2 years 2 to < 3 years > 3 years Total (In Thousands) Accounts payable and accrued expenses Accounts payable P=17,995,363 P=– P=– P=– P=17,995,363 Accrued expenses 9,846,614 – – – 9,846,614 Accrued project costs 2,808,045 – – – 2,808,045 Dividends payable 2,226,117 – – – 2,226,117 Related parties 1,399,199 – – – 1,399,199 Accrued personnel costs 557,589 – – – 557,589 Retentions payable 119,151 – – – 119,151 Derivative liability 168,016 – – – 168,016 Service concession liability 794,473 911,529 934,713 5,179,509 7,820,224 Customers’ deposit 2,204,010 – – – 2,204,010 Short-term debt 4,519,287 – – – 4,519,287 Long-term debt (LTD) 11,237,343 11,110,988 18,098,406 37,870,554 78,317,291 Other noncurrent liabilities – 4,924,193 1,090,429 3,053,086 9,067,708 P=53,875,207 P=16,946,710 P=20,123,548 P=46,103,149 P=137,048,614
< 1 year 1 to < 2 years 2 to < 3 years > 3 years Total Interest payable on LTD P=4,193,819 P=4,063,511 P=3,391,864 P=5,214,882 P=16,864,076
Ayala Corporation and Subsidiariesnotes to Consolidated financial statements
FinancialStatements184
Cash and cash equivalents, short-term investments, financial assets at FVPL and AFS debt investments are used for the Group’s liquidity requirements. Please refer to the terms and maturity profile of these financial assets under the maturity profile of the interest-bearing financial assets and liabilities disclosed in the interest rate risk section. AFS unquoted debt investments with maturity of more than a year from December 31 are marketable securities and could be sold as and when needed prior to its maturity in order to meet the Group’s short-term liquidity needs.
Credit risk Credit risk is the risk that the Group’s counterparties to its financial assets will fail to discharge their contractual obligations. The Group’s holding of cash and short-term investments and receivables from customers and other third parties exposes the Group to credit risk of the counterparty. Credit risk management involves dealing with institutions for which credit limits have been established. The treasury policy sets credit limits for each counterparty. The Group trades only with recognized, creditworthy third parties. The Group has a well-defined credit policy and established credit procedures.
ALI Group For installments receivable from the sale of properties, credit risk is managed primarily through credit reviews and an analysis of receivables on a continuous basis. The Group also undertakes supplemental credit review procedures for certain installment payment structures. The Group’s stringent customer requirements and policies in place contribute to lower customer default than its competitors. Customer payments are facilitated through various collection modes including the use of postdated checks and auto-debit arrangements. Exposure to bad debts is not significant as titles to real estate properties are not transferred to the buyers until full payment has been made and the requirement for remedial procedures is minimal given the profile of buyers. Credit risk arising from rental income from leasing properties is primarily managed through a tenant selection process. Prospective tenants are evaluated on the basis of payment track record and other credit information. In accordance with the provisions of the lease contracts, the lessees are required to deposit with the Group security deposits and advance rentals which helps reduce the Group’s credit risk exposure in case of defaults by the tenants. For existing tenants, the Group has put in place a monitoring and follow-up system. Receivables are aged and analyzed on a continuous basis to minimize credit risk associated with these receivables. Regular meetings with tenants are also undertaken to provide opportunities for counseling and further assessment of paying capacity.
IMI Group
The credit evaluation reflects the customer’s overall credit strength based on key financial and credit characteristics such as financial stability, operations, focus market and trade references. All customers who wish to trade on credit terms are subject to credit verification procedures. In addition, receivable balances are monitored on an ongoing basis with the result that the Group’s exposure to bad debts is not significant.
MWC Group It is the Group’s policy that except for connection fees and other highly meritorious cases, the Group does not offer credit terms to its customers. Credit risk is managed primarily through credit reviews and an analysis of receivables on a continuous basis. Customer payments are facilitated through various collection modes including the use of postdated checks and auto-debit arrangements.
With respect to credit risk arising from other financial assets of the Group, which comprise cash and cash equivalents and short-term investments and AFS financial assets, the Group’s exposure to credit risk arises from default of the counterparty, with a maximum exposure equal to the carrying amount of the investments.
Given the Group’s diverse base of counterparties, it is not exposed to large concentrations of credit risk.

FinancialStatements 185
The table below shows the maximum exposure to credit risk for the components of the consolidated statement of financial position. The maximum exposure is shown at gross, before the effect of mitigation through the use of master netting arrangements or collateral agreements.
2011 2010 (In Thousands) Cash and cash equivalents P=53,524,835 P=53,125,220 Short-term investments 1,613,058 3,993,533 Financial assets at FVPL 1,470,829 872,080 Derivative assets 122,704 288,836 Accounts and notes receivables Trade Real estate 18,674,261 13,653,812 Electronics manufacturing 5,535,763 4,186,876 Water utilities 667,121 526,558 Automotive 498,972 833,041 Information technology and BPO 88,286 59,897 International and others 2,426 2,703 Advances to other companies 2,966,508 3,506,446 Related parties 2,700,637 2,076,515 Dividend receivable 815,220 318,279
Receivable from BWC 599,342 – Investment in bonds classified as loans and receivables 200,000 200,000 Other receivables 1,627,326 1,036,842 AFS financial assets Quoted equity investments 992,612 1,702,552 Unquoted equity investments 1,439,324 2,692,960 Quoted debt investments 874,161 288,007 Unquoted debt investments 439,071 527,947 Total credit risk exposure P=94,852,456 P=89,892,104
The aging analysis of accounts and notes receivables that are past due but not impaired follows:
December 31, 2011
Neither Past Past Due but not Impaired
Due nor
Impaired <30 days 30-60 days
60-90 days
90-120 days >120 days Total
Individually Impaired Total
(In Thousands) Trade: Real estate P=16,118,809 P=718,215 P=466,170 P=285,440 P=187,830 P=867,490 P=2,525,145 P=277,731 P=18,921,685 Electronics manufacturing 4,646,243 492,454 168,404 53,159 27,377 148,126 889,520 92,797 5,628,560 Water utilities 309,182 347,096 55,170 82,763 75,914 173,272 734,215 42,992 1,086,389 Automotive 233,644 109,822 77,627 37,640 15,829 24,410 265,328 36,003 534,975 Information technology and BPO 34,482 47,824 5,276 2,535 2,040 – 57,675 25,148 117,305 International and others 1,950 – 476 – – – 476 67 2,493 Advances to other companies 2,834,066 66,537 36,916 37,146 54,960 77,021 272,580 140,516 3,247,162 Related parties 2,425,677 40,218 18,149 12,150 10,717 171,398 252,632 22,456 2,700,765 Dividend receivable 815,220 – – – – – – – 815,220 Receivable from officers and employees 646,786 51,627 8,030 1,667 1,132 15,087 77,543 14,220 738,549 Receivable from BWC 599,342 – – – – – – – 599,342 Investment in bonds classified as loans and receivables 200,000 – – – – – – – 200,000 Others 1,594,147 733 – – – 32,446 33,179 – 1,627,326 Total P=30,459,548 P=1,874,526 P=836,218 P=512,500 P=375,799 P=1,509,250 P=5,108,293 P=651,930 P=36,219,770
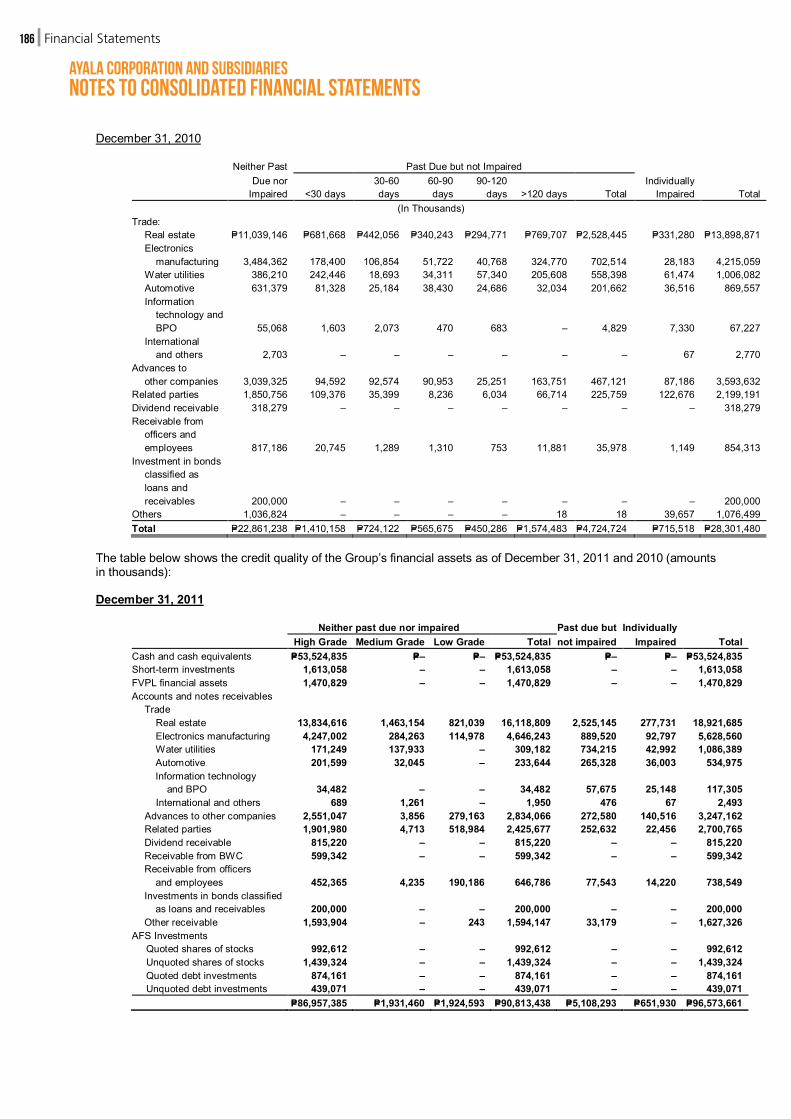
Ayala Corporation and Subsidiariesnotes to Consolidated financial statements
FinancialStatements186
December 31, 2010
Neither Past Past Due but not Impaired
Due nor
Impaired <30 days 30-60 days
60-90 days
90-120 days >120 days Total
Individually Impaired Total
(In Thousands) Trade: Real estate P=11,039,146 P=681,668 P=442,056 P=340,243 P=294,771 P=769,707 P=2,528,445 P=331,280 P=13,898,871 Electronics manufacturing 3,484,362 178,400 106,854 51,722 40,768 324,770 702,514 28,183 4,215,059 Water utilities 386,210 242,446 18,693 34,311 57,340 205,608 558,398 61,474 1,006,082 Automotive 631,379 81,328 25,184 38,430 24,686 32,034 201,662 36,516 869,557 Information technology and BPO 55,068 1,603 2,073 470 683 – 4,829 7,330 67,227 International and others 2,703 – – – – – – 67 2,770 Advances to other companies 3,039,325 94,592 92,574 90,953 25,251 163,751 467,121 87,186 3,593,632 Related parties 1,850,756 109,376 35,399 8,236 6,034 66,714 225,759 122,676 2,199,191 Dividend receivable 318,279 – – – – – – – 318,279 Receivable from officers and employees 817,186 20,745 1,289 1,310 753 11,881 35,978 1,149 854,313 Investment in bonds classified as loans and receivables 200,000 – – – – – – – 200,000 Others 1,036,824 – – – – 18 18 39,657 1,076,499 Total P=22,861,238 P=1,410,158 P=724,122 P=565,675 P=450,286 P=1,574,483 P=4,724,724 P=715,518 P=28,301,480
The table below shows the credit quality of the Group’s financial assets as of December 31, 2011 and 2010 (amounts in thousands):
December 31, 2011
Neither past due nor impaired Past due but Individually High Grade Medium Grade Low Grade Total not impaired Impaired Total Cash and cash equivalents P=53,524,835 P=– P=– P=53,524,835 P=– P=– P=53,524,835 Short-term investments 1,613,058 – – 1,613,058 – – 1,613,058 FVPL financial assets 1,470,829 – – 1,470,829 – – 1,470,829 Accounts and notes receivables Trade Real estate 13,834,616 1,463,154 821,039 16,118,809 2,525,145 277,731 18,921,685 Electronics manufacturing 4,247,002 284,263 114,978 4,646,243 889,520 92,797 5,628,560 Water utilities 171,249 137,933 – 309,182 734,215 42,992 1,086,389 Automotive 201,599 32,045 – 233,644 265,328 36,003 534,975 Information technology
and BPO 34,482 – – 34,482 57,675 25,148 117,305 International and others 689 1,261 – 1,950 476 67 2,493 Advances to other companies 2,551,047 3,856 279,163 2,834,066 272,580 140,516 3,247,162 Related parties 1,901,980 4,713 518,984 2,425,677 252,632 22,456 2,700,765 Dividend receivable 815,220 – – 815,220 – – 815,220
Receivable from BWC 599,342 – – 599,342 – – 599,342 Receivable from officers
and employees 452,365 4,235 190,186 646,786 77,543 14,220 738,549 Investments in bonds classified
as loans and receivables 200,000 – – 200,000 – – 200,000 Other receivable 1,593,904 – 243 1,594,147 33,179 – 1,627,326 AFS Investments Quoted shares of stocks 992,612 – – 992,612 – – 992,612 Unquoted shares of stocks 1,439,324 – – 1,439,324 – – 1,439,324 Quoted debt investments 874,161 – – 874,161 – – 874,161 Unquoted debt investments 439,071 – – 439,071 – – 439,071 P=86,957,385 P=1,931,460 P=1,924,593 P=90,813,438 P=5,108,293 P=651,930 P=96,573,661

FinancialStatements 187
December 31, 2010
Neither past due nor impaired Past due but Individually High Grade Medium Grade Low Grade Total not impaired Impaired Total Cash and cash equivalents P=53,125,220 P=– P=– P=53,125,220 P=– P=– P=53,125,220 Short-term investments 3,993,533 – – 3,993,533 – – 3,993,533 FVPL financial assets 872,080 – – 872,080 – – 872,080 Accounts and notes receivables Trade Real estate 8,049,691 1,577,103 1,412,352 11,039,146 2,528,445 331,280 13,898,871 Electronics manufacturing 3,248,723 199,593 36,046 3,484,362 702,514 28,183 4,215,059 Water utilities 264,449 121,761 – 386,210 558,398 61,474 1,006,082 Automotive 602,645 – 28,734 631,379 201,662 36,516 869,557 Information technology
and BPO 55,068 – – 55,068 4,829 7,330 67,227 International and others 2,449 254 – 2,703 – 67 2,770 Advances to other companies 2,301,575 717,437 20,313 3,039,325 467,121 87,186 3,593,632 Related parties 1,696,047 150,193 4,516 1,850,756 225,759 122,676 2,199,191 Receivable from officers and
employees 757,005 3,103 57,078 817,186 35,978 1,149 854,313 Dividend receivable 318,279 – – 318,279 – – 318,279 Investments in bonds classified
as loans and receivables 200,000 – – 200,000 – – 200,000 Other receivable 1,028,675 8,149 – 1,036,824 18 39,657 1,076,499 AFS Investments Quoted shares of stocks 1,702,552 – – 1,702,552 – – 1,702,552 Unquoted shares of stocks 2,692,960 – – 2,692,960 – – 2,692,960 Quoted debt investments 288,007 – – 288,007 – – 288,007 Unquoted debt investments 527,947 – – 527,947 – – 527,947 P=81,726,905 P=2,777,593 P=1,559,039 P=86,063,537 P=4,724,724 P=715,518 P=91,503,779
The credit quality of the financial assets was determined as follows:
Cash and cash equivalents, short-term investments, FVPL financial assets, quoted AFS financial assets,investment in bonds classified as loans and receivable,advances to other companies and related party receivables High grade pertains to cash and cash equivalents and short-term investments, quoted financial assets, investment in bonds classified as loans and receivable, related party transactions and receivables with high probability of collection.
Medium grade pertains to unquoted financial assets other than cash and cash equivalents and short-term investments with nonrelated counterparties and receivables from counterparties with average capacity to meet their obligation.
Low grade pertains to financial assets with the probability to be impaired based on the nature of the counterparty.
Trade receivables
Real estate, information technology and BPO and international and others - high grade pertains to receivables with no default in payment; medium grade pertains to receivables with up to 3 defaults in payment in the past; and low grade pertains to receivables with more than 3 defaults in payment.
Electronics manufacturing - high grade pertains to receivable with favorable credit terms and can be offered with a credit term of 15 to 45 days; medium grade pertains to receivable with normal credit terms and can be offered with a credit term of 15 to 30 days; and low grade pertains to receivables under advance payment or confirmed irrevocable Stand-by Letter of Credit and subjected to semi-annual or quarterly review for possible upgrade or transaction should be under advance payment or confirmed and irrevocable Stand-By Letters of credit; subject to quarterly review for possible upgrade after one year.
Water utilities - high grade pertains to receivables that are collectible within 7 days from bill delivery; medium grade pertains to receivables that are collectible from 11 to 30 days from bill delivery.
Automotive - high grade pertains to receivables from corporate accounts and medium grade for receivables from noncorporate accounts.
Unquoted AFS financial assets - the unquoted investments are unrated.

Ayala Corporation and Subsidiariesnotes to Consolidated financial statements
FinancialStatements188
32. Registration with the Philippine Export Zone Authority (PEZA) and Board of Investments (BOI) Incentives
Some activities of certain subsidiaries are registered with the PEZA. Under the registration, these subsidiaries are entitled to certain tax and nontax incentives, which include, but are not limited to, income tax holiday (ITH) and duty-free importation of inventories and capital equipment. Upon the expiration of the ITH, the subsidiaries will be liable for payment of a five percent (5%) tax on gross income earned from sources within the PEZA economic zone in lieu of payment of national and local taxes.
On February 9, 2010, the BOI issued in favor of a subsidiary a Certificate of Registration as an Expanding Developer of Low-Cost Mass Housing Project for its Celadon Park Tower 2, Felix Huertas Street, Manila in accordance with the Omnibus Investment Code of 1987. Pursuant thereto, the project has been granted an Income Tax Holiday for a period of three (3) years commencing from February 2010.
On March 23, 2011, the BOI issued in favor of a subsidiary a Certificate of Registration as New Developer of Low-Cost Mass Housing Project for its Amaia Scapes Laguna, Brgy. Barandal, Calamba City, Laguna. Pursuant thereto, the project has been granted an Income Tax Holiday for a period of four (4) years commencing from March 2011.
On December 13, 2011, the BOI issued in favor of a subsidiary a Certificate of Registration as a New Developer of Low-Cost Mass Housing Project for its Avida Towers Cebu Tower 1, Asiatown I.T. Park, Lahug, Cebu City. The project has been granted an Income Tax Holiday for a period of four (4) years commencing from December 2011.
On December 14, 2011, the BOI issued in favor of a subsidiary a Certificate of Registration as an Expanding Developer of Low-Cost Mass Housing Project for its Avida Towers San Lazaro Tower 5, Lot 5 E Block 50 C Pista St., Brgy. 350, Zone 035 Sta. Cruz, Manila, Avida Towers Cebu Tower 2, Asiatown I.T. Park, Lahug, Cebu City and Avida Towers Sucat Tower 7, Dr. A. Santos Ave., Brgy. San Dionisio, Parañaque City. The projects have been granted an Income Tax Holiday for a period of three (3) years commencing from December 2011.
33. Note to Consolidated Statements of Cash Flows
The Group’s major noncash investing activities in 2011 are as follows: Exchange of interest in ARCH Capital for additional interest in TRG shares (see Note 11). Recognition of contingent consideration arising from the acquisition of wind power companies amounting to
P=397.0 million (see Note 23). Issuance of 200 million of IMI Philippines’ shares in exchange for EPIQ shares (see Note 23). Declaration of a 20% stock dividend on all common stockholders of the Company. Conversion of notes receivable amounting to P=47.5 million into Series G Preferred shares of stock of an investee
company classified as investments in bonds and other securities. Certain investment properties with an aggregate carrying value of P=15.1 million were donated by the Group to
various organizations. Details of the decrease in consolidated net assets resulting from the deconsolidation of Integreon in 2010 follows:
In US$ In Php* (In Thousands) Assets Cash and cash equivalents US$1,262 P=58,691 Accounts receivable - net 17,182 798,947 Other current assets 3,905 181,573 Intangible assets 43,348 2,015,689 Property, plant and equipment 6,572 305,601 Other noncurrent assets 4,328 201,283 Total 76,597 3,561,784 Liabilities Accounts payable and accrued expenses 12,976 603,369 Short-term debt 33,326 1,549,661 Long-term debt 2,672 124,258 Other current liabilities 3,057 142,158 Total 52,031 2,419,446 Net assets US$24,566 P=1,142,338
*Translated using the exchange rate at the transaction date (US$1:P=46.50).

FinancialStatements 189
The Group’s noncash investing activity in 2009 pertains to the loans receivable from EGS Corp. that were transferred to Stream as part of the Agreement amounting to P=1,699.6 million (US$35.8 million).
34. Interest in a Joint Venture
MDC has a 51% interest in MDC-First BalFour, Inc. JV (the Joint Venture), a jointly controlled operation whose purpose is to design and build St. Luke’s Medical Center (the Project) in Fort Bonifacio Global City, Taguig.
The Project, which started on January 31, 2007, is a world-class medical facility comprising, more or less, of a 611-bed hospital and a 378-unit medical office building, with an approximate gross floor area of 154,000 square meters, which meets international standards, and all standards and guidelines of applicable regulatory codes of the Philippines and complies with the criteria of the Environment of Care of the Joint Commission International Accreditation. The project was completed on October 30, 2009. Activities in 2011 and 2010 mainly pertain to winding down operations and punch listing works.
The share in the assets, liabilities, income and expenses of the Joint Venture at December 31, 2011 and 2010 and for the years then ended, which are included in the consolidated financial statements follow:
2011 2010 (In Thousands) Current assets
Cash and cash equivalents P=24,622 P=30,384 Receivables – 130,928 Amounts due from customers for contract work 10,582 8,415 Other current assets 54,809 53,780
Property and equipment - net – 1 Total assets P=90,013 P=223,508 Total liabilities P=66,968 P=109,349
The following is the share of the MDC on the net income (loss) of the Joint Venture:
2011 2010 (In Thousands) Revenue from construction contracts P=2,069 P=20,841 Contract costs (9,687) (31,702) Interest and other income 2,490 4,833 Income (loss) before income tax (5,128) (6,028) Provision for income tax (148) (115) Net income (loss) (P=5,276) (P=6,143)
The Joint Venture’s Management Board declared and paid cash dividends amounting to P=185.3 million in 2010. Based on 51% share, MDC received P=94.5 million cash dividends in 2010.
Provision for income tax pertains to the final tax on interest income.
35. Commitments
The Company On November 21, 2006, the Company acted as guarantor to a US$150.0 million transferable term loan facility between AYCFL as borrower and several lenders. The facility has an outstanding balance of US$105.0 million as of December 31, 2010 and was fully paid by AYCFL on November 21, 2011.
On April 15, 2008, the Company acted as guarantor to a US$50.0 million transferable term loan facility between AYCFL as borrower and several lenders. The facility was fully drawn and with outstanding balance of US$45.0 million and US$50.0 million as of December 31, 2011 and 2010.
On August 14, 2009, the Company acted as guarantor to a US$20.0 million revolving credit facility between AYCFL as borrower and a foreign bank. As of December 31, 2011, AYCFL has not made any drawdown from the credit facility with the foreign bank.
On February 2, 2010, the Company acted as guarantor to a US$150.0 million transferable term loan facility between AYCFL as borrower and a foreign bank. As of December 31, 2010, AYCFL has not made any drawdown from the term loan facility with the foreign bank. AYCFL’s commitment to the facility was terminated on Februrary 2, 2011.
Ayala Corporation and Subsidiariesnotes to Consolidated financial statements
FinancialStatements190
On December 16, 2010, the Company acted as guarantor to a US$260.0 million transferable term loan facility between AYCFL as borrower and several lenders. As of December 31, 2011, AYCFL has made a drawdown amounting to US$100.0 million from the term loan facility with the foreign bank.
On March 28, 2011, the Company acted as guarantor to a US$150.0 million transferable term loan facility between AYCFL as borrower and several lenders. As of December 31, 2011, AYCFL has not made any drawdown from the term loan facility with the foreign bank. ALI On January 28, 2011, a notice was given to the ALI for the P=4.0 billion development of a 7.4-hectare lot at the University of the Philippines’ Diliman East Campus, also known as the UP Integrated School, along Katipunan Avenue, Quezon City. ALI signed a 25-year lease contract for the property last June 22, 2011, with an option to renew for a 58,000 square meters another 25 years by mutual agreement. The project involves the construction of a retail establishment with 63,000 square meters of available gross leasable area and a combination of Headquarter-and-BPO- type buildings with an estimated 8,000 square meters of office space. ALI has signed a 50-year lease agreement with the Subic Bay Metropolitan Authority (SBMA), for the development of a 7.5-hectare property along Rizal Highway within the Subic Bay Freeport Zone, located between the two main gates linking the Freeport Zone to Olongapo City.
On October 27, 2006, an ALI subsidiary entered into a land lease agreement with a third party for a term of 25 years. The lease generally provides for a monthly rent based on a certain percentage of gross revenue.
ALI has an existing contract with Bases Conversion and Development Authority (BCDA) to develop, under a lease agreement a mall with an estimated gross leasable area of 152,000 square meters on a 9.8-hectare lot inside Fort Bonifacio. The lease agreement covers 25 years, renewable for another 25 years subject to reappraisal of the lot at market value. The annual fixed lease rental amounts to P=106.5 million while the variable rent ranges from 5% to 20% of gross revenues. Subsequently, ALI transferred its rights and obligations granted to or imposed under the lease agreement to a subsidiary, in exchange for equity.
As part of the bid requirement, ALI procured a performance bond in 2003 from the Government Service Insurance System in favor of BCDA amounting to P=3.9 billion to guarantee the committed capital to BCDA. Moreover, the subsidiary obtained standby letters of credit to guarantee the payment of the fixed and variable rent as prescribed in the lease agreement.
MDC, in the normal course of business, furnishes performance bonds in connection with its construction projects. These bonds shall guarantee MDC’s execution and completion of the work indicated in the respective construction contracts.
NTDCC was assigned development rights over certain areas of the MRT Depot in Quezon City by MRT Development Co. to construct and operate a commercial center under certain terms and conditions until the end of a 50-year development period renewable for another 25 years. NTDCC was primarily organized to own and operate the commercial center atop the MRT Depot. NTDCC officially started the construction of the shopping center, now known as TriNoma, in 2005 and became operational on May 16, 2007.
On October 18, 2010, ALI undertook to cause the planning, developing and construction of Anvaya Golf and Sports Club, Inc.’s leisure and recreational facilities. ALI shall ensure the development and construction by second quarter of the year 2013 for an estimated total development cost of P=920.0 million.
MWC
MWC’s Concession Agreement (Agreement) The significant commitments of MWC under the Agreement and Extension are as follows:
a. To pay MWSS concession fees;
b. To post a performance bond, bank guarantee or other security acceptable to MWSS amounting to US$70.0
million in favor of MWSS as a bond for the full and prompt performance of MWC’s obligations under the Agreement. The aggregate amounts drawable in one or more installments under such performance bond during the Rate Rebasing Period to which it relates are set out below.
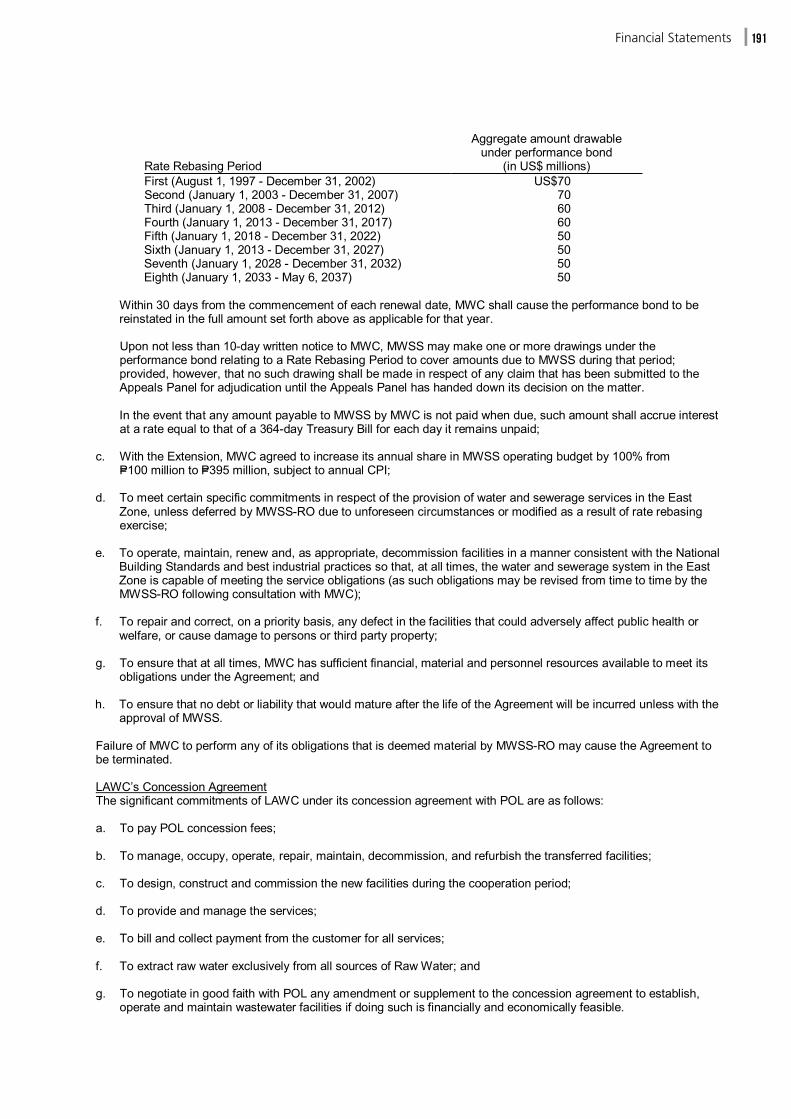
FinancialStatements 191
Aggregate amount drawable under performance bond Rate Rebasing Period (in US$ millions) First (August 1, 1997 - December 31, 2002) US$70 Second (January 1, 2003 - December 31, 2007) 70 Third (January 1, 2008 - December 31, 2012) 60 Fourth (January 1, 2013 - December 31, 2017) 60 Fifth (January 1, 2018 - December 31, 2022) 50 Sixth (January 1, 2013 - December 31, 2027) 50 Seventh (January 1, 2028 - December 31, 2032) 50 Eighth (January 1, 2033 - May 6, 2037) 50
Within 30 days from the commencement of each renewal date, MWC shall cause the performance bond to be reinstated in the full amount set forth above as applicable for that year.
Upon not less than 10-day written notice to MWC, MWSS may make one or more drawings under the performance bond relating to a Rate Rebasing Period to cover amounts due to MWSS during that period; provided, however, that no such drawing shall be made in respect of any claim that has been submitted to the Appeals Panel for adjudication until the Appeals Panel has handed down its decision on the matter.
In the event that any amount payable to MWSS by MWC is not paid when due, such amount shall accrue interest at a rate equal to that of a 364-day Treasury Bill for each day it remains unpaid;
c. With the Extension, MWC agreed to increase its annual share in MWSS operating budget by 100% from
P=100 million to P=395 million, subject to annual CPI;
d. To meet certain specific commitments in respect of the provision of water and sewerage services in the East Zone, unless deferred by MWSS-RO due to unforeseen circumstances or modified as a result of rate rebasing exercise;
e. To operate, maintain, renew and, as appropriate, decommission facilities in a manner consistent with the National
Building Standards and best industrial practices so that, at all times, the water and sewerage system in the East Zone is capable of meeting the service obligations (as such obligations may be revised from time to time by the MWSS-RO following consultation with MWC);
f. To repair and correct, on a priority basis, any defect in the facilities that could adversely affect public health or
welfare, or cause damage to persons or third party property;
g. To ensure that at all times, MWC has sufficient financial, material and personnel resources available to meet its obligations under the Agreement; and
h. To ensure that no debt or liability that would mature after the life of the Agreement will be incurred unless with the
approval of MWSS.
Failure of MWC to perform any of its obligations that is deemed material by MWSS-RO may cause the Agreement to be terminated.
LAWC’s Concession Agreement The significant commitments of LAWC under its concession agreement with POL are as follows:
a. To pay POL concession fees;
b. To manage, occupy, operate, repair, maintain, decommission, and refurbish the transferred facilities;
c. To design, construct and commission the new facilities during the cooperation period;
d. To provide and manage the services;
e. To bill and collect payment from the customer for all services;
f. To extract raw water exclusively from all sources of Raw Water; and
g. To negotiate in good faith with POL any amendment or supplement to the concession agreement to establish, operate and maintain wastewater facilities if doing such is financially and economically feasible.
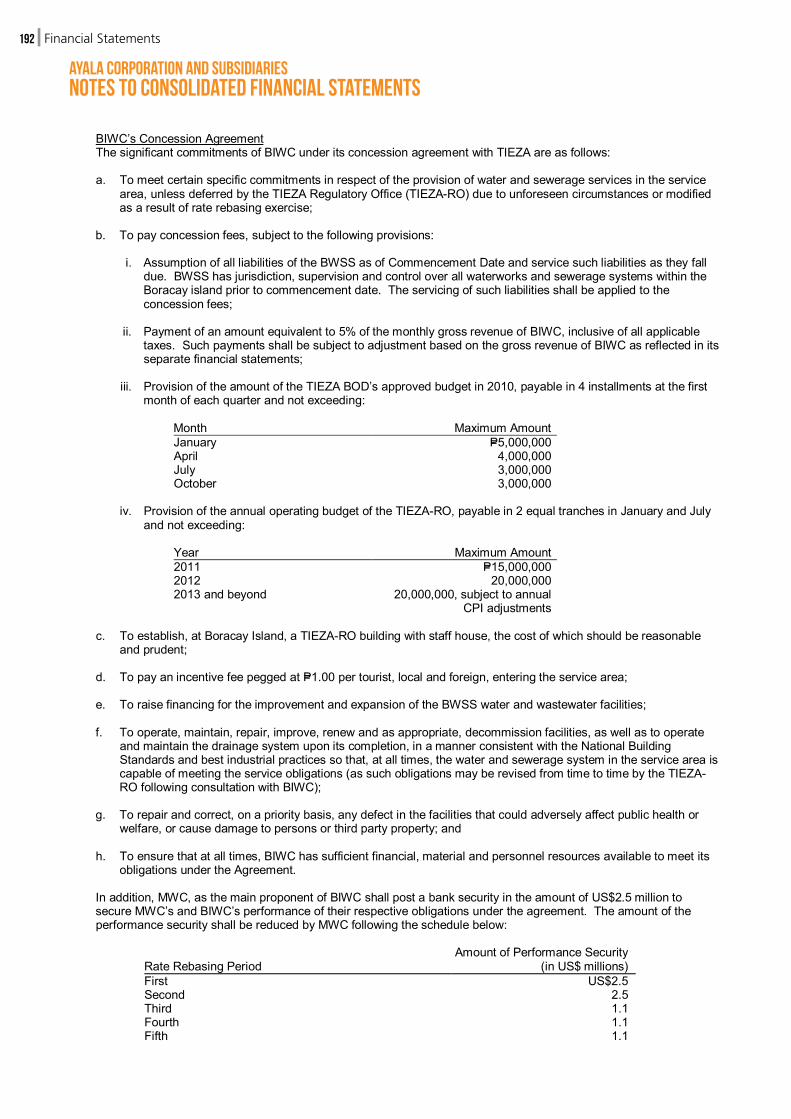
Ayala Corporation and Subsidiariesnotes to Consolidated financial statements
FinancialStatements192
BIWC’s Concession Agreement
The significant commitments of BIWC under its concession agreement with TIEZA are as follows:
a. To meet certain specific commitments in respect of the provision of water and sewerage services in the service area, unless deferred by the TIEZA Regulatory Office (TIEZA-RO) due to unforeseen circumstances or modified as a result of rate rebasing exercise;
b. To pay concession fees, subject to the following provisions:
i. Assumption of all liabilities of the BWSS as of Commencement Date and service such liabilities as they fall
due. BWSS has jurisdiction, supervision and control over all waterworks and sewerage systems within the Boracay island prior to commencement date. The servicing of such liabilities shall be applied to the concession fees;
ii. Payment of an amount equivalent to 5% of the monthly gross revenue of BIWC, inclusive of all applicable
taxes. Such payments shall be subject to adjustment based on the gross revenue of BIWC as reflected in its separate financial statements;
iii. Provision of the amount of the TIEZA BOD’s approved budget in 2010, payable in 4 installments at the first
month of each quarter and not exceeding:
Month Maximum Amount January P=5,000,000 April 4,000,000 July 3,000,000 October 3,000,000
iv. Provision of the annual operating budget of the TIEZA-RO, payable in 2 equal tranches in January and July
and not exceeding:
Year Maximum Amount 2011 P=15,000,000 2012 20,000,000 2013 and beyond 20,000,000, subject to annual
CPI adjustments
c. To establish, at Boracay Island, a TIEZA-RO building with staff house, the cost of which should be reasonable and prudent;
d. To pay an incentive fee pegged at P=1.00 per tourist, local and foreign, entering the service area;
e. To raise financing for the improvement and expansion of the BWSS water and wastewater facilities;
f. To operate, maintain, repair, improve, renew and as appropriate, decommission facilities, as well as to operate
and maintain the drainage system upon its completion, in a manner consistent with the National Building Standards and best industrial practices so that, at all times, the water and sewerage system in the service area is capable of meeting the service obligations (as such obligations may be revised from time to time by the TIEZA-RO following consultation with BIWC);
g. To repair and correct, on a priority basis, any defect in the facilities that could adversely affect public health or
welfare, or cause damage to persons or third party property; and
h. To ensure that at all times, BIWC has sufficient financial, material and personnel resources available to meet its obligations under the Agreement.
In addition, MWC, as the main proponent of BIWC shall post a bank security in the amount of US$2.5 million to secure MWC’s and BIWC’s performance of their respective obligations under the agreement. The amount of the performance security shall be reduced by MWC following the schedule below:
Amount of Performance Security Rate Rebasing Period (in US$ millions) First US$2.5 Second 2.5 Third 1.1 Fourth 1.1 Fifth 1.1

FinancialStatements 193
On or before the start of each year, BIWC shall cause the performance security to be reinstated in the full amount set forth as applicable for that year.
Upon not less than 10 days written notice to BIWC, TIEZA may take one or more drawings under the performance security relating to a Rate Rebasing Period to cover amounts due to TIEZA during that period; provided, however, that no such drawing shall be made in respect of any claim that has been submitted to the Arbitration Panel for adjudication until the Arbitration Panel has handed its decision on the matter.
In the event that any amount payable to TIEZA by BIWC is not paid when due, such amount shall accrue interest at a rate equal to that of a 364-day Treasury Bill for each day it remains unpaid.
Failure of BIWC to perform any of its obligations that is deemed material by TIEZA-RO may cause the concession agreement to be terminated.
CWC’s Concession Agreement The significant commitments of CWC under its concession agreement with CDC are follows: a. To pay franchise and rental fees of CDC;
b. Finance, design, and construct the New Facilities - defined as any improvement and extension works to (i) all
Existing Facilities - defined as all fixed and movable assets specifically listed in the Concession Agreement; (ii) the Construction Work - defined as the scope of construction work set out in the Concession Agreement; and (iii) other new works that do not constitute refurbishment or repair of Existing Facilities undertaken after the Commencement Date;
c. Manage, exclusively possess, occupy, operate, repair, maintain, decommission and refurbish the Existing Facilities, except for the private deep wells set out in the Concession Agreement, the negotiations for the acquisition and control of which shall be the sole responsibility and for the account of the Company; and manage, own, operate, repair, maintain, decommission and refurbish the New Facilities;
d. Treat raw water and wastewater in CFZ;
e. Provide and manage all water and wastewater related services (the Services) like assisting locator of relocating of pipes and assess internal leaks;
f. Bill and collect payment from all persons residing in CFZ (with the exception of SM City Clark) for the Services. SM City Clark has been carved out by virtue of Republic Act 9400 effective 2007 even if it is located within the franchise area; and
g. Extract raw water exclusively from all sources of raw water including all catchment areas, watersheds, springs, wells and reservoirs in CFZ free of charge by CDC.
MWC Management Contracts
Vietnam Project On July 22, 2008, MWC entered into a Performance-Based Leakage Reduction and Management Services Contract with Saigon Water Corporation. The contract involves the following components:
a. General requirements; b. District Metering Area establishment; c. Leakage reduction and management services; d. System expansion work; d. Emergency and unforseen works; and e. Daywork schedule
In 2011 and 2010, total revenue from the Vietnam Project amounted to P=162.5 million and P=72.8 million, respectively. Total costs related to the Vietnam Project amounted to P=171.7 million and P=93.9 million in 2011 and 2010, respectively.
India Project On May 25, 2007, MWC entered into a Secondment Agreement with Mahindra Water Utilities Limited relating to water management. Total revenue and costs related to the India Project in 2010 amounted to P=2.1 million and P=4.2 million, respectively.

Ayala Corporation and Subsidiariesnotes to Consolidated financial statements
FinancialStatements194
Cebu Project Following the execution of the Memorandum of Understanding on January 29, 2009, the Governor of Cebu Province has accepted the unsolicited proposal of the consortium of the MWC and Stateland, Inc. for a joint venture or investment with the Provincial Government of Cebu for the development of a treated bulk water supply project in the province of Cebu. On February 3, 2012, Provincial Government of Cebu awarded the project. The project aims to deliver in bulk to the province of Cebu treated surface water extracted from the Luyang River in the town of Carmen (see Note 38).
MWC contracts with the Maynilad Water Services, Inc. (Maynilad)
In relation to the Concession Agreement with MWSS, MWC entered into the following contracts with Maynilad:
a. Interconnection Agreement wherein the two Concessionaires shall form an unincorporated joint venture that will
manage, operate, and maintain interconnection facilities. The terms of the agreement provide, among others, the cost and the volume of water to be transferred between zones.
b. Joint Venture Arrangement that will operate, maintain, renew, and as appropriate, decommission common
purpose facilities, and perform other functions pursuant to and in accordance with the provisions of the Agreement and perform such other functions relating to the concession (and the concession of the West Zone Concessionaire) as the Concessionaires may choose to delegate to the joint venture, subject to the approval of MWSS.
c. In March 2010, MWSS entered into a loan agreement with The Export-Import Bank of China to finance the Angat
Water Utilization and Aqueduct Improvement Project Phase II (the Project). Total loan facility is US$116,602,000 with maturity of 20 years including 5 years grace period. Interest rate is 3% per annum. MWSS then entered into a Memorandum of Agreement with MWC and Maynilad for MWC and Maynilad to shoulder equally the repayment of the loan, to be part of the concession fees.
36. Contingencies The Group has various contingent liabilities arising in the ordinary conduct of business which are either pending
decision by the courts or being contested, the outcome of which are not presently determinable.
In the opinion of management and its legal counsel, the eventual liability under these lawsuits or claims, if any, will not have a material or adverse effect on the Group’s financial position and results of operations.
MWC On October 13, 2005, the Municipality of Norzagaray, Bulacan jointly assessed the MWC and Maynilad Water Services, Inc. (the “Concessionaires”) for real property taxes on certain common purpose facilities purportedly due from 1998 to 2005 amounting to P=357.1 million. It is the position of the Concessionaires that these properties are owned by the Republic of the Philippines and that the same are exempt from taxation.
Total provisions for real property taxes arising from the property in Bulacan and other municipalities, based on the delinquency notice received, amounted to P=570.0 million for the year 2011.
The Group is contingently liable for lawsuits or claims filed by third parties (substantially labor-related and civil cases) which are either pending decision by the courts or are under negotiation, the outcomes of which are not presently determinable. The Group has been advised by its internal and outside counsels that it is possible, but not probable, that the actions will succeed and accordingly, no provision for probable losses on these cases was recognized.
37. Assets Held in Trust
MWSS MWC is granted the right to operate, maintain in good working order, repair, decommission and refurbish the movable property required to provide the water and sewerage services under the Agreement. The legal title to all movable property in existence at the Commencement Date, however, shall be retained by MWSS and upon expiration of the useful life of any such movable property as may be determined by MWC, such movable property shall be returned to MWSS in its then-current condition at no charge to MWSS or MWC.

FinancialStatements 195
The Agreement also provides for the Concessionaires to have equal access to MWSS facilities involved in the provision of water supply and sewerage services in both East and West Zones including, but not limited to, the MWSS management information system, billing system, telemetry system, central control room and central records.
The net book value of the facilities transferred to MWC on Commencement Date based on MWSS’ closing audit report amounted to P=4.6 billion with a sound value of P=10.4 billion.
A re-appraisal of the MWSS facilities mentioned above as of December 31, 2004 was conducted by Cuervo Appraisers. The final appraisal report was submitted last November 2006 showing a total reproduction cost of P=27.0 billion with a sound value of P=17.2 billion.
In 2009, MWC engaged the services of Cuervo Appraisers to conduct a re-appraisal of the MWSS assets on record as of December 31, 2008. Total reproduction cost as of December 31, 2008 amounted to P=37.7 billion with a sound value of P=22.9 billion.
MWSS’ corporate headquarters is made available to the Concessionaires starting August 1, 1997, subject to periodic renewal by mutual agreement of the parties. On October 27, 2006, MWC has renewed the lease for 5 years, with expiry of October 27, 2011. Rent expense amounted to P=16.8 million in 2010. These are included under “Rental and utilities” in the consolidated statement of income.
POL LAWC is granted the right to manage, occupy, operate, repair, maintain, decommission and refurbish the property required to provide water services under its concession agreement with POL. The legal title of all property in existence at the commencement date shall be retained by POL. Upon expiration of the useful life of any such property as may be determined by LAWC, such property shall be returned to POL in its then condition at no charge to POL or LAWC.
TIEZA BIWC is granted the right to operate, maintain in good working order, repair, decommission and refurbish the movable property required to provide the water and sewerage services under the Agreement. The legal title to all movable property in existence at the commencement date, however, shall be retained by TIEZA and upon expiration of the useful life of any such movable property as may be determined by MWC, such movable property shall be returned to TIEZA in its then-current condition at no charge to TIEZA or MWC.
The net book value of the facilities transferred to MWC on commencement date based on TIEZA’s closing audit report amounted to P=618.3 million.
38. Renewable Energy Act of 2008
Republic Act No. 9513, An Act Promoting the Development, Utilization and Commercialization of Renewable Energy Resources and for Other Purposes, which shall be known as the “Renewable Energy Act of 2008” (the Act), became effective on January 30, 2009. The Act aims to: (a) accelerate the exploration and development of renewable energy resources such as, but not limited to, biomass, solar, wind, hydro, geothermal and ocean energy sources, including hybrid systems, to achieve energy self-reliance, through the adoption of sustainable energy development strategies to reduce the country’s dependence on fossil fuels and thereby minimize the country’s exposure to price fluctuations in the international markets, the effects of which spiral down to almost all sectors of the economy; (b) increase the utilization of renewable energy by institutionalizing the development of national and local capabilities in the use of renewable energy systems,and promoting its efficient and cost-effective commercial application by providing fiscal and non-fiscal incentives; (c) encourage the development and utilization of renewable energy resources as tools to effectively prevent or reduce harmful emissions and thereby balance the goals of economic growth and development with the protection of health and environment; (d) establish the necessary infrastructure and mechanism to carry out mandates specified in the Act and other laws.
As provided for in the Act, Renewable Energy (RE) developers of RE facilities, including hybrid systems, in proportion to and to the extent of the RE component, for both power and non-power applications, as duly certified by the Department of Energy (DOE), in consultation with the Board of Investments, shall be entitled to the following incentives, among others:
i. Income Tax Holiday (ITH) - For the first seven (7) years of its commercial operations, the duly registered RE
developer shall be exempt from income taxes levied by the National Government; ii. Duty-free Importation of RE Machinery, Equipment and Materials - Within the first ten (10) years upon issuance
of a certification of an RE developer, the importation of machinery and equipment, and materials and parts thereof, including control and communication equipment, shall not be subject to tariff duties;

Ayala Corporation and Subsidiariesnotes to Consolidated financial statements
FinancialStatements196
iii. Special Realty Tax Rates on Equipment and Machinery - Any law to the contrary notwithstanding, realty and
other taxes on civil works, equipment, machinery, and other improvements of a registered RE developer actually and exclusively used for RE facilities shall not exceed one and a half percent (1.5%) of their original cost less accumulated normal depreciation or net book value;
iv. NOLCO - the NOLCO of the RE developer during the first three (3) years from the start of commercial operation which had not been previously offset as deduction from gross income shall be carried over as deduction from gross income for the next seven (7) consecutive taxable years immediately following the year of such loss;
v. Corporate Tax Rate - After seven (7) years of ITH, all RE developers shall pay a corporate tax of ten percent (10%) on its net taxable income as defined in the National Internal Revenue Code of 1997, as amended by Republic Act No. 9337;
vi. Accelerated Depreciation - If, and only if, an RE project fails to receive an ITH before full operation, it may apply for accelerated depreciation in its tax books and be taxed based on such;
vii. Zero Percent VAT Rate - The sale of fuel or power generated from renewable sources of energy shall be subject to zero percent (0%) VAT;
viii. Cash Incentive of RE Developers for Missionary Electrification - An RE developer, established after the effectivity of the Act, shall be entitled to a cash generation-based incentive per kilowatt-hour rate generated, equivalent to fifty percent (50%) of the universal charge for power needed to service missionary areas where it operates the same;
ix. Tax Exemption of Carbon Credits - All proceeds from the sale of carbon emission credits shall be exempt from any and all taxes; and
x. Tax Credit on Domestic Capital Equipment and Services - A tax credit equivalent to one hundred percent (100%) of the value of the value-added tax and customs duties that would have been paid on the RE machinery, equipment, materials and parts had these items been imported shall be given to an RE operating contract holder who purchases machinery, equipment, materials, and parts from a domestic manufacturer for purposes set forth in the Act.
In addition, to accelerate the development of emerging renewable energy resources, a feed-in tariff system for electricity produced from wind, solar, ocean, run-of-river hydropower and biomass will be promulgated which shall include, but not limited to, the following:
a. Priority connections to the grid for electricity generated from emerging renewable energy resources; b. The priority purchase and transmission of, and payment for, such electricity by the grid system operators; and c. Determine the fixed tariff to be paid to electricity produced from each type of emerging renewable energy and the
mandated number of years for the application of these rates, which shall not be less than twelve (12) years.
The feed-in tariff to be set shall be applied to the emerging renewable energy to be used in compliance with the renewable portfolio standard as provided for in the Act and in accordance with the rules to be promulgated by ERC in consultation with the National Renewable Energy Board.
RE developers and local manufacturers, fabricators and suppliers of locally-produced RE equipment shall register with the DOE, through the Renewable Energy Management Bureau (REMB). Upon registration, a certification shall be issued to each RE developer and local manufacturer, fabricator and supplier of locally-produced renewable energy equipment to serve as the basis of their entitlement to the incentives provided for in the Act. All certifications required to qualify RE developers to avail of the incentives provided for under the Act shall be issued by the DOE through the REMB.
Within six (6) months from the effectivity of the Act, the DOE shall, in consultation with the Senate and House of Representatives Committee on Energy, relevant government agencies and RE stakeholders, promulgate the Implementing Rules and Regulations of the Act. On May 25, 2009, the DOE issued the Implementing Rules and Regulations of the Act which became effective on June 12, 2009.
ACEHI and its subsidiaries expect that the Act will impact their future operations and financial results. The impact of the Act will be disclosed as the need arises.
Northwind On January 18, 2010, Northwind filed its intent with the REMB for the conversion of its Negotiated Commercial Contract into Wind Energy Service Contract and Registration as RE Developer as provided for under the Act. On November 9, 2010, the DOE issued a Provisional Certificate of Registration as an RE Developer in favor of Northwind, subject to negotiation and execution of a Wind Energy Service Contract to replace the Negotiated Commercial Contract. On April 6, 2011, Northwind filed with the ERC an application for a FiT. The FiT will provide for a fixed rate per kilowatt of electricity produced over a period of fifteen years. On June 6, 2011, the ERC granted Northwind a provisional FiT rate of P=9.30 per kilowatt hour which shall be effective and collected only upon the final approval of the FiT for emerging renewable energy technologies, specifically for wind energy.

FinancialStatements 197
39. Events after the Reporting Period
a. On January 4, 2012, MWC received a letter from JMWD stating that JMWD requires infusion of additional funding of INR5 million for meeting its existing liabilities. It was agreed that the further funding requirement shall be met through infusion of additional equity of INR2.5 million each by MWC and JITF Water. On January 6 and 18, 2012, MWC infused additional equity to JMWD amounting to P=2.04 million and P=0.98 million, respectively.
b. On February 3, 2012, the Provincial Government of Cebu has awarded to Manila Consortium (composed of MWC, Vicsal Development Corporation and Stateland, Inc.) the development, operation, and maintenance of a bulk water system (“Project”) in the Province of Cebu.
With the issuance of the award, the Provincial Government of Cebu and Manila Water Consortium shall negotiate and execute a joint investment agreement with 49% - 51% equity participation, respectively. The Project shall supply 35 million liters per day of potable bulk water sourced from the Luyang River in the Municipality of Carmen. The Project will partly provide for the water demands in the northern and central portions of the province. The Project is not more than 10% of the total assets of the MWC.
c. On February 20, 2012, the ALI’s BOD approved the following restructuring exercise in order to comply with the regulatory requirement on Filipino-ownership following the Supreme Court’s ruling that nonvoting shares do not count as equity when computing for a company’s Filipino-ownership level:
i. Redemption and retirement of the 13.0 billion outstanding preferred shares. ii. Reclassification of the 1.97 billion unissued preferred shares to voting preferred shares through an
amendment of Article Seventh of the Articles of Incorporation. iii. Increase in authorized capital stock by P=1.3 billion through additional voting preferred shares and stock
rights offer of 13.0 billion voting preferred share from the increase in the authorized capital stock.
ALI’s BOD also approved the issuance of bonds in the amount of up to P=15.0 billion which are to be registered with the SEC. It will have tenors of seven and ten years. Net proceeds will be used to partially finance the Group’s planned capital expenditure for 2012.
d. On March 14, 2012, the Company’s BOD approved the offer and issuance of Fixed Rate Bonds with the principal
amount of P=8.0 billion up to P=10.0 billion subject to the registration requirements of the SEC.

corporate directory
REAL ESTATE
AYALA LAND, INC.30F Tower One and Exchange PlazaAyala Triangle Ayala AvenueMakati City1226 PhilippinesTel (632) 908 3000Fax (632) 750 6790www.ayalaland.com.ph
FINANCIAL SERVICES
BANK OF THE PHILIPPINE ISLANDS6768 Ayala AvenueMakati City1226 PhilippinesTel (632) 818 5541Express Phone Banking (632) 89 100Fax (632) 845 5267www.bpiexpressonline.com
TELECOMMUNICATIONS
GLOBE TELECOM, INC.5F Globe Telecom Plaza IPioneer corner Madison StreetsMandaluyong City1552 PhilippinesTel (632) 730 2000Hotline (632) 730 1000Fax (632) 739 2000www.globe.com.phwww.myglobe.com.ph
WATER AND WASTEWATER SERVICES
MANILA WATER COMPANY, INC.MWSS Administration Building489 Katipunan RoadBalara Quezon City1105 PhilippinesTel (632) 917 5900Hotline (632) 1627Fax (632) 928 2450www.manilawater.com
ELECTRONICS AND INFORMATION
TECHNOLOGY
INTEGRATED MICRO-ELECTRONICS, INC.North Science AvenueSpecial Export Processing ZoneLaguna TechnoparkBiñan Laguna4024 PhilippinesTel (632) 756 6840Fax (6349) 544 0311www.global-imi.com
BUSINESS PROCESS OUTSOURCING
LIVEIT INVESTMENTS, LTD.32F Tower One Ayala TriangleAyala Avenue Makati City1226 PhilippinesTel (632) 908 3455Fax (632) 759 4274
AUTOMOTIVE
Ayala Automotive Holdings Corporation
HONDA CARS MAKATI, INC.Magallanes Commercial CenterMakati City1232 PhilippinesTel (632) 902 9393Fax (632) 852 6593www.hondamakati.com.ph
ISUZU AUTOMOTIVE DEALERSHIP, INC.Alabang-Zapote Road corner Acacia AvenueAyala Alabang Muntinlupa City1780 PhilippinesTel (632) 807 1788Fax (632) 807 6011www.isuzuautodealer.com.ph
INTERNATIONAL
AG HOLDINGS LIMITED250 North Bridge Road#32-03A Raffles City TowerSingapore 179101Tel (65) 6311 5155Fax (65) 6311 5168
SOCIAL COMMITMENT
AYALA FOUNDATION, INC.10F BPI Building6768 Ayala Avenue corner Makati City1226 PhilippinesTel (632) 752 1101Fax (632) 813 4488www.ayalafoundation.org

CORPORATE INFORMATION
34F Tower One Ayala TriangleAyala Avenue Makati City1226 PhilippinesTel (632) 908 3442Fax (632) 848 [email protected]
Institutional Investor Inquiries
Ayala Corporation welcomes inquiries from analysts, the financial community, and institutional investors. Please write or call:
Ayala Corporation - Investor Relations34F Tower One Ayala TriangleAyala Avenue Makati City 1226 PhilippinesTel (632) 908 3459 and 3446Fax (632) 848 [email protected]/investor_relations.php
Shareholder Services and Assistance
For inquiries regarding dividend payments, change of address and account status, and lost or damaged stock certificates, please write or call:
BPI Stock Transfer Services16F BPI Building6768 Ayala Avenue Makati City 1226 PhilippinesTel (632) 816 9067 and 68 (632) 816 9321 (632) 816 9898Fax (632) 845 [email protected]@bpi.com.ph
CORPORATE information
Concept, Content Design and Layout: K2 Interactive (Asia), Inc. Photography: Tom Epperson (Portraits) Cesar Caina (Operational) Additional Photography: Ayala Foundation, Ayala Land, Bank of the Philippine Islands, Globe Telecom, IMI, Manila Water, LiveIt, Amiel Lapuebla