2011 10 黃金gap detect of afl
TRANSCRIPT
How to Identify the Conduction How to Identify the Conduction Gaps in the Atrial Flutter using Gaps in the Atrial Flutter using
Non-Contact MappingNon-Contact Mapping
Jin-Long Huang, MD, Ph D.
Cardiovascular Center, Taichung-Veterans General Hospital
National Yang-Ming University, Taipei, Taiwan

Right Atrial Flutters (AFL)
• Typical AFL
• Atypical AFL
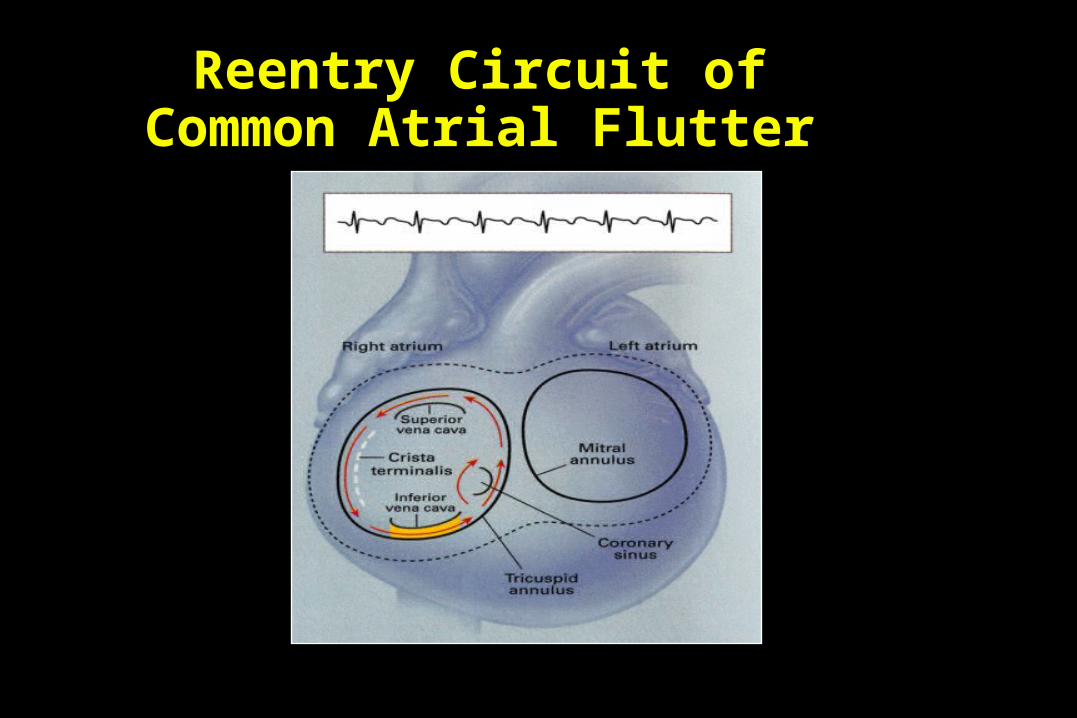
Reentry Circuit of Common Atrial Flutter
Morady F. N Engl J of Med. 1999;340:534-544.

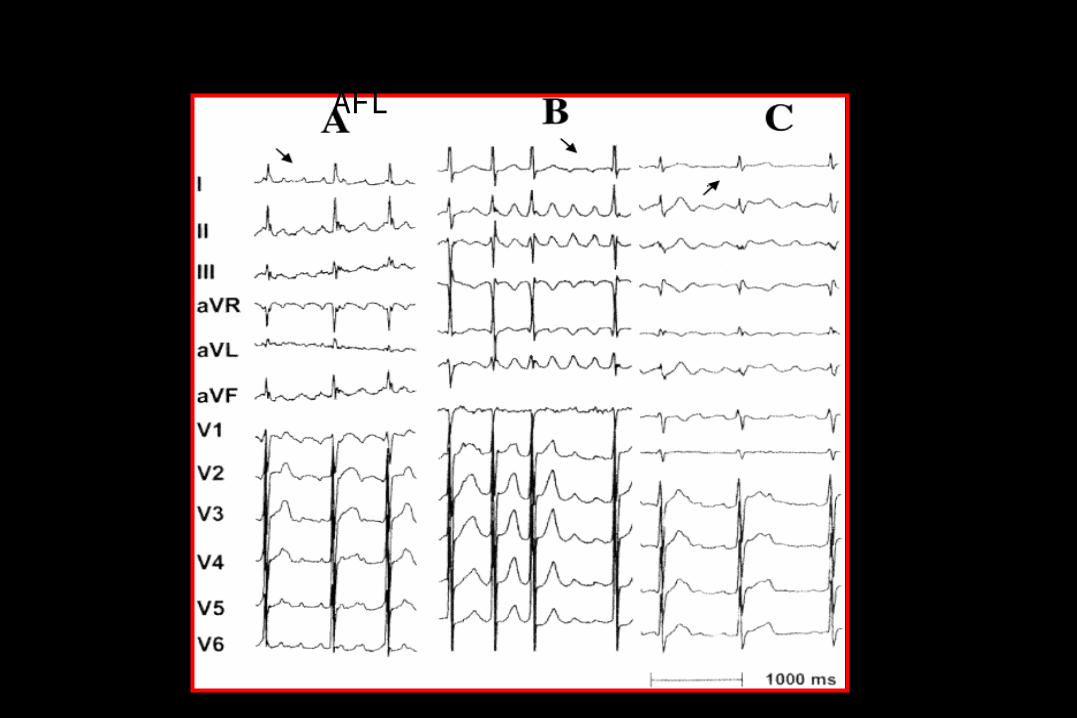
ECG Comparison
Counterclockwise Clockwise
Singer: Interventional Electrophysiology. Williams & Wilkins 1997; 356.
positive inferiorly and in V6, and negative in lead V1.

A new electrocardiographic algorithm to differentiate upper loop re-entry from reverse typical atrial flutter
Yuniadi Y, Tai CT,Huang JL,Chen SA.
J Am Coll Cardiol. 2005 Aug 2;46(3):524-8
Reverse typical AFL
Upper Loop AFL

Typical AFL (CCW)

Typical AFL (CW)
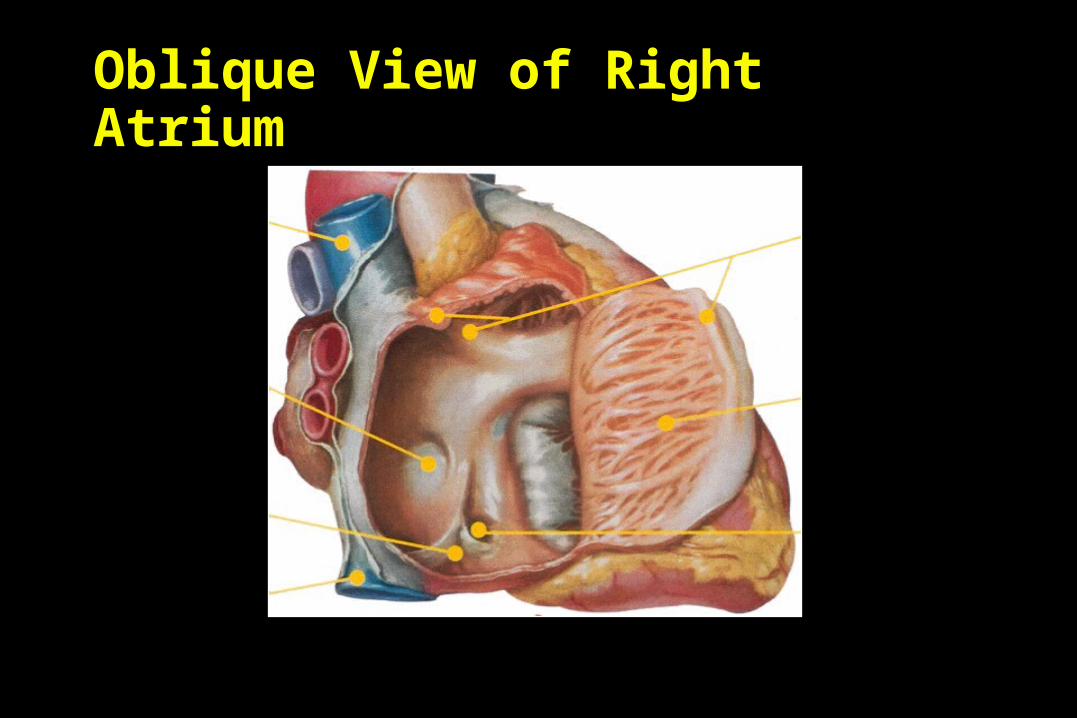
Oblique View of Right Atrium
Crista Terminalis
Pectinate Muscle
Orifice of Coronary Sinus
Superior Vena Cava
Fossa Ovalis
Eustachian Ridge
Inferior Vena Cava
Netter F. Atlas of Human Anatomy. 1989;Plate 208.
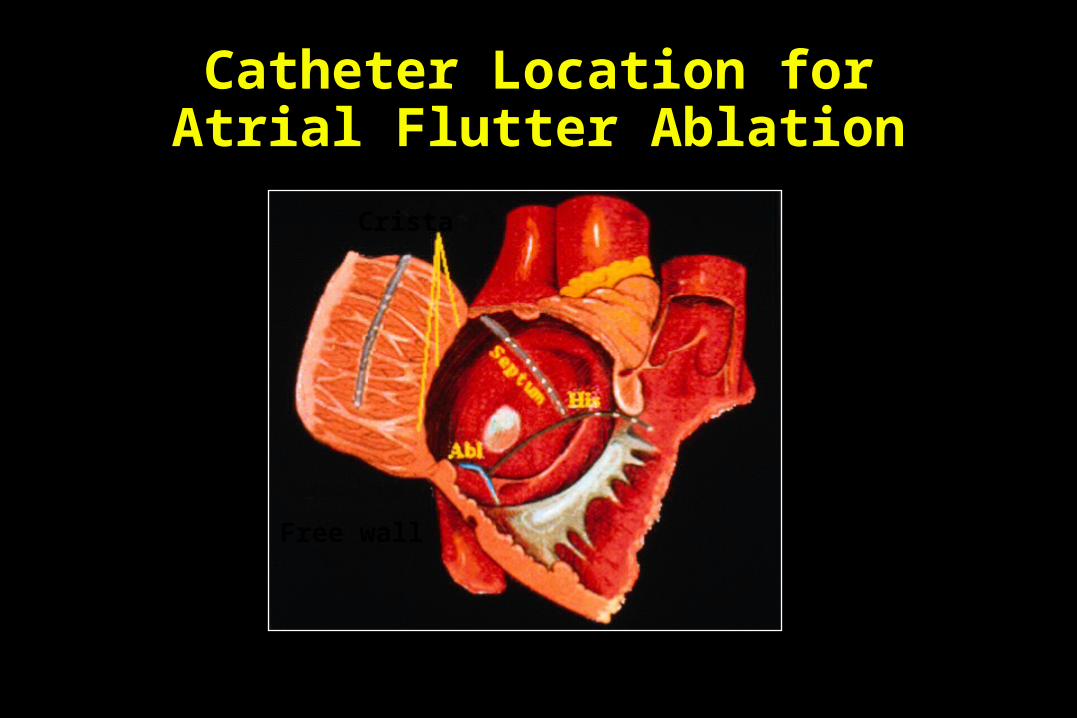
Catheter Location for Atrial Flutter Ablation
Free wall
Crista
Used with permission of Dr. Brian Olshansky.

Cosio FG. Am J Cardiol. 1993; 71:705-709.
Atrial Flutter Ablation
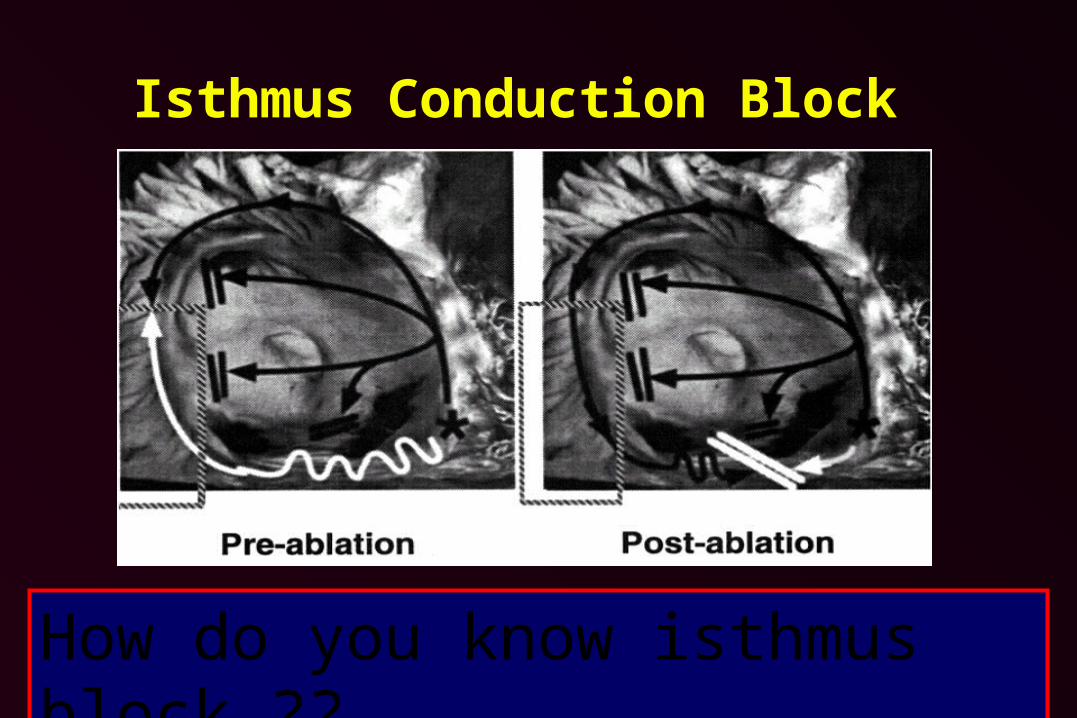
Isthmus Conduction Block
Singer: Interventional Electrophysiology. Williams & Wilkins 1997; 367.How do you know isthmus block ??
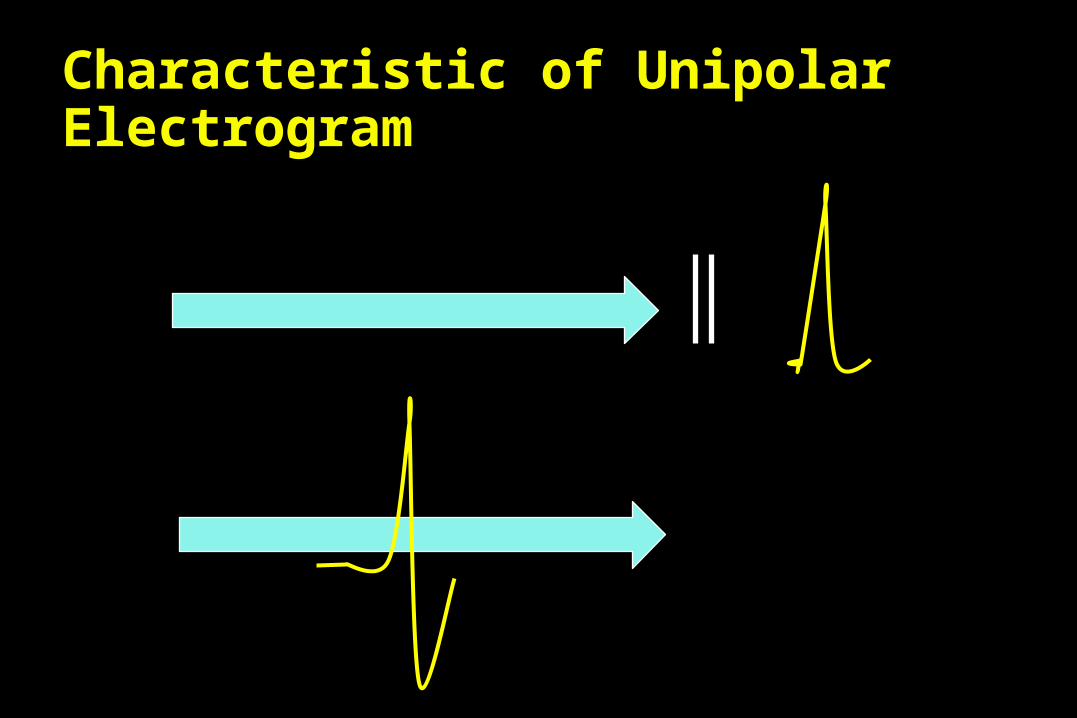
Characteristic of Unipolar Electrogram

Characteristics of Virtual Unipolar Electrograms for Detecting Isthmus Block
During RF Ablation of Typical AFL Lin YJ et al. J Am Coll Cardiol 2004;43:2300–4.
• The 2nd component of unipolar electrograms represents the approaching wavefront in the RA opposite the pacing site.
• We hypothesized that the morphologic characteristics of the second component of double potentials would be useful in detecting complete CTI block.

Group I (n=37):complete bidirectional CTI blockDuring CS pacing, the second component of unipolar electrograms showed an R or Rs pattern.
A
B
C
D
A
B
C
D
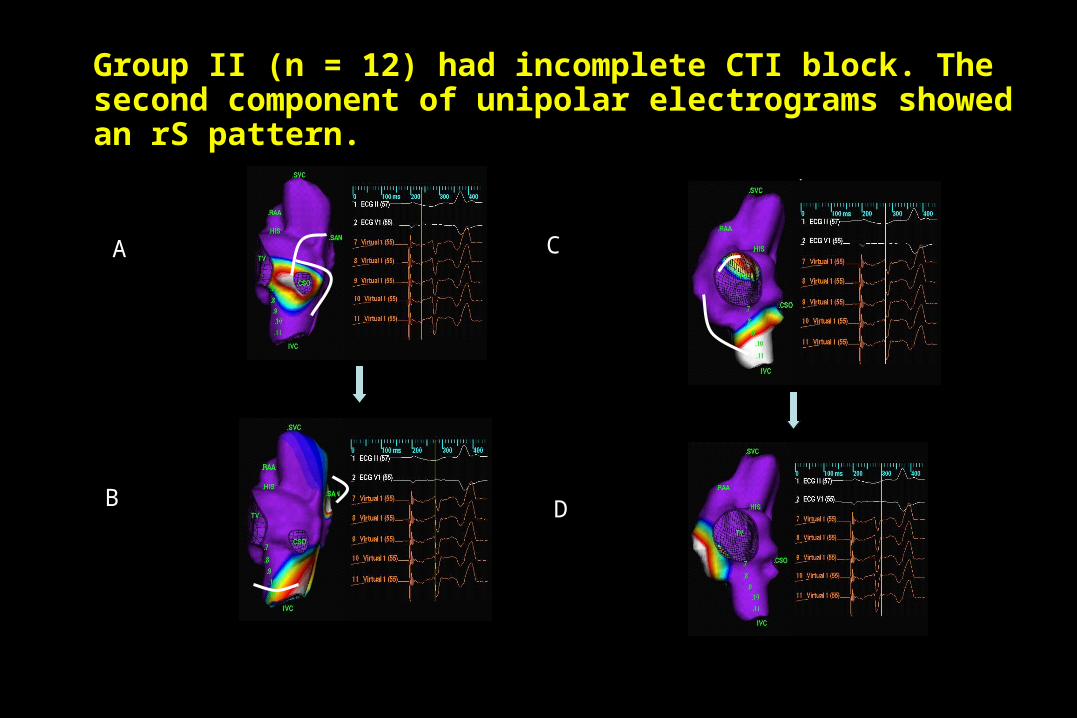
Group II (n = 12) had incomplete CTI block. The second component of unipolar electrograms showed an rS pattern.
A
D
C
B
A
D
C
B
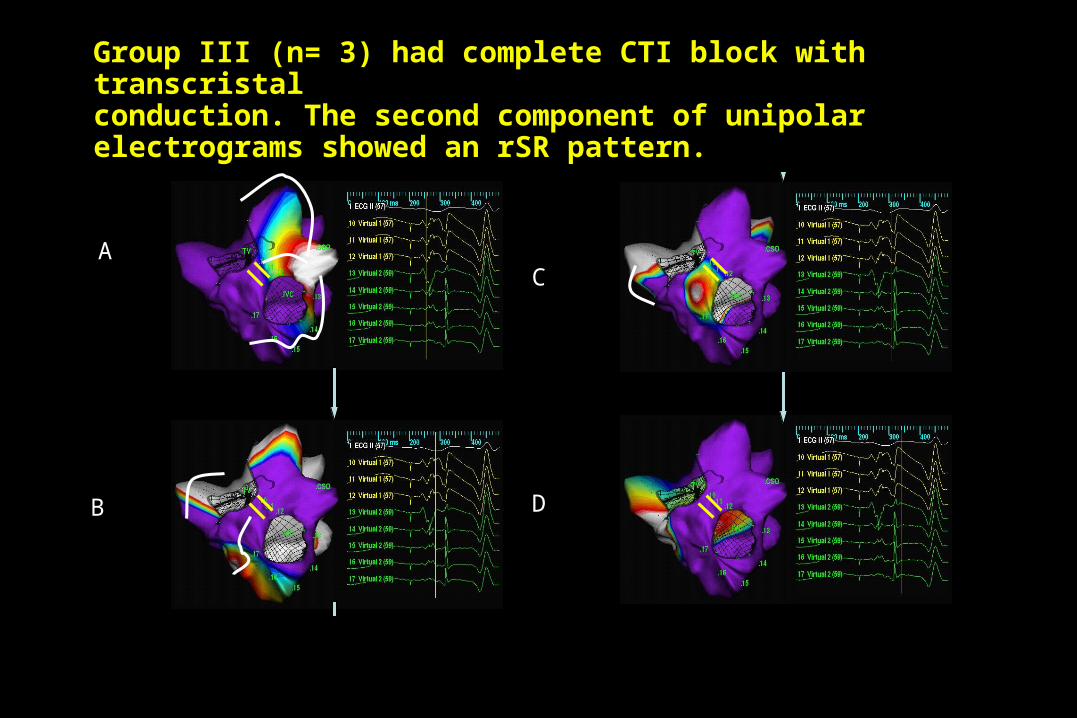
Group III (n= 3) had complete CTI block with transcristalconduction. The second component of unipolar electrograms showed an rSR pattern.
A
C
D
B
A
C
D
B
Conclusions
A predominant R-wave pattern in the secondcomponent of unipolar double potentials at the ablation line indicates complete CTI block, even in the presence of transcristal conduction.
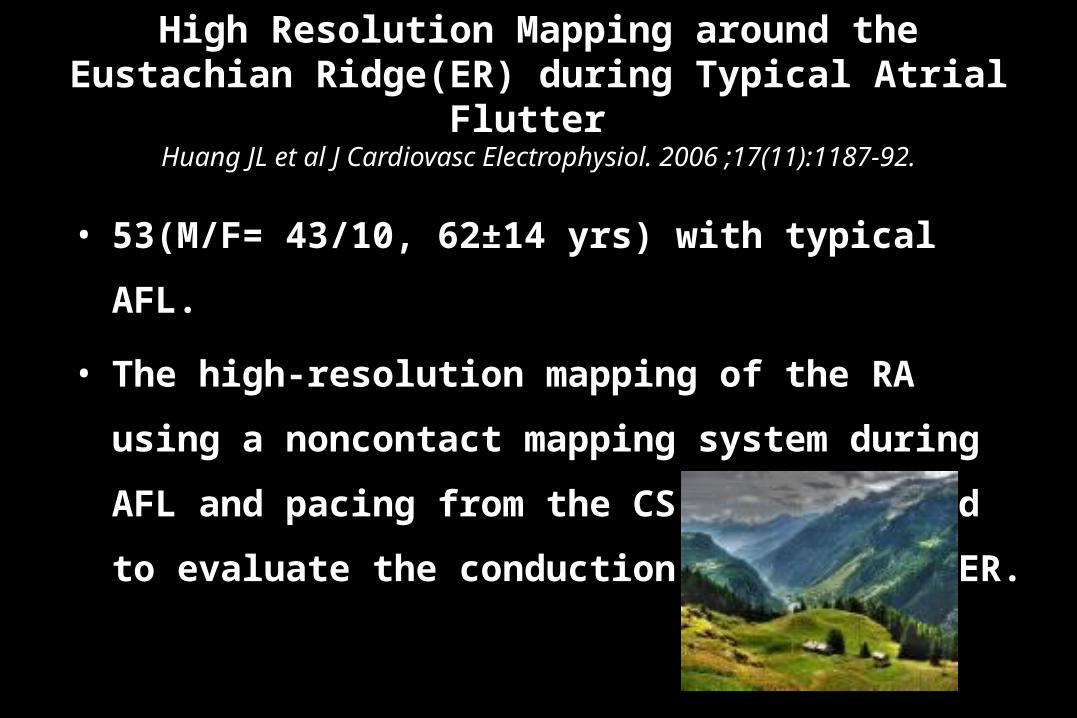
High Resolution Mapping around the Eustachian Ridge(ER) during Typical Atrial Flutter
Huang JL et al J Cardiovasc Electrophysiol. 2006 ;17(11):1187-92.
• 53(M/F= 43/10, 62±14 yrs) with typical AFL.
• The high-resolution mapping of the RA using a
noncontact mapping system during AFL and
pacing from the CS was performed to evaluate the
conduction through the ER.

A (AFL)
a b c
a b c
B(CS Pacing)
Type I pattern: ER block
A (AFL)
a b c
abc
B(CS Pacing)
abc
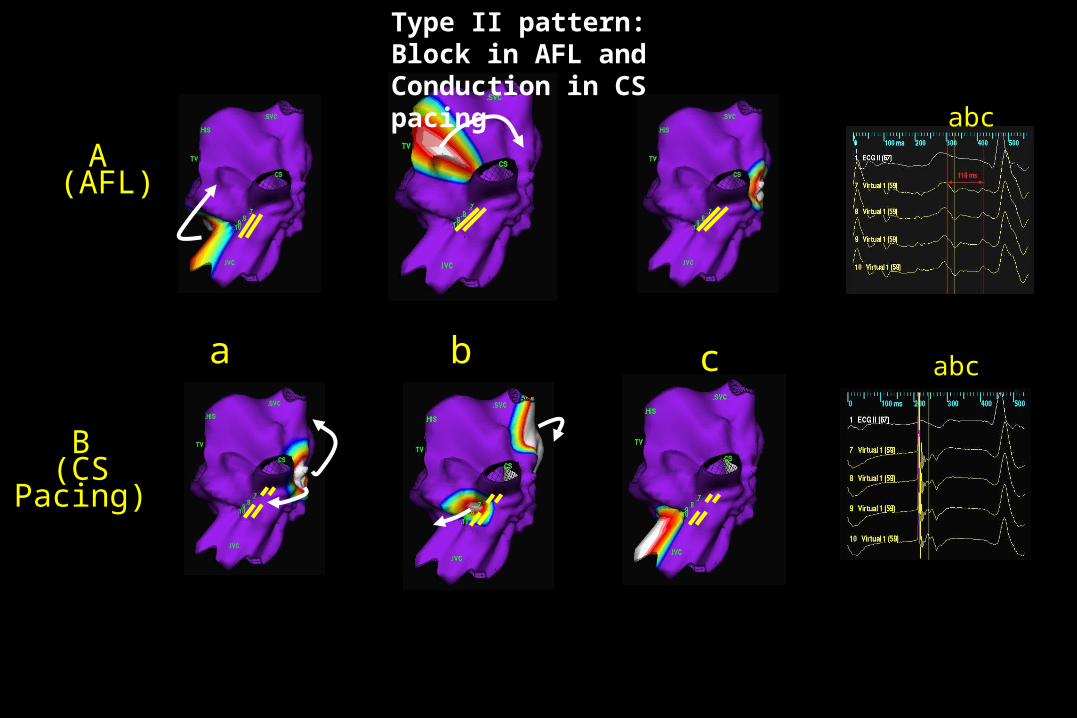
Type II pattern: Block in AFL and Conduction in CS pacing

A (AFL)
a
SV
b
SV
c
abc
SV
B(CS Pacing)
SV
SVSV
abc
Type III pattern
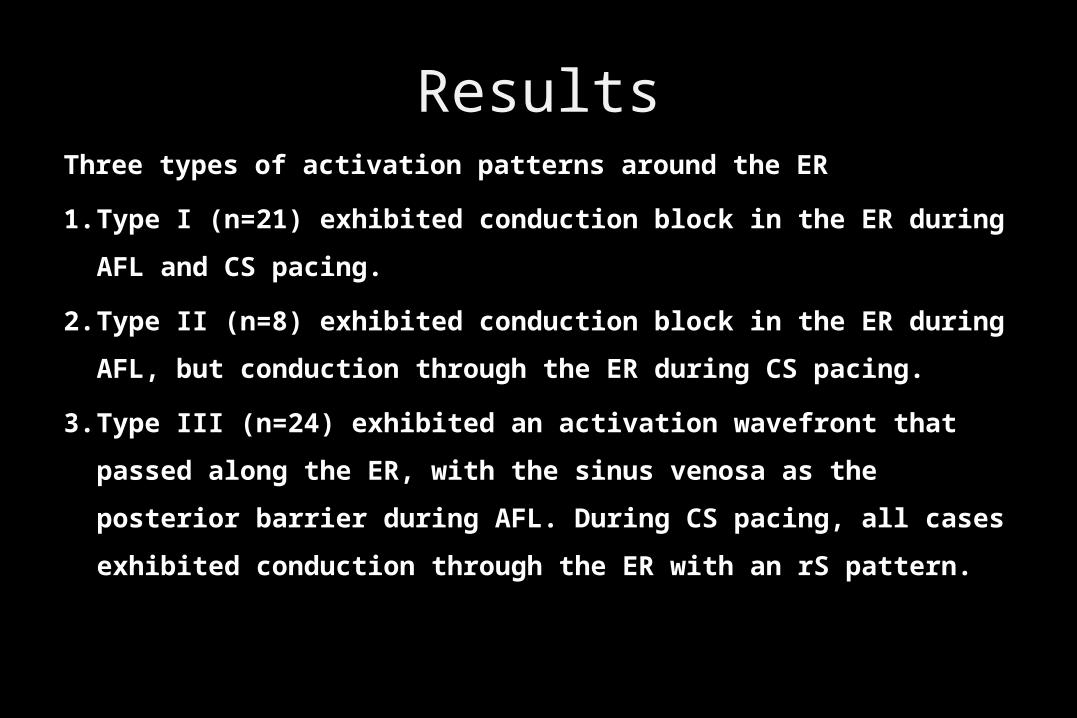
ResultsThree types of activation patterns around the ER
1. Type I (n=21) exhibited conduction block in the ER during AFL and
CS pacing.
2. Type II (n=8) exhibited conduction block in the ER during AFL, but
conduction through the ER during CS pacing.
3. Type III (n=24) exhibited an activation wavefront that passed along
the ER, with the sinus venosa as the posterior barrier during AFL.
During CS pacing, all cases exhibited conduction through the ER
with an rS pattern.
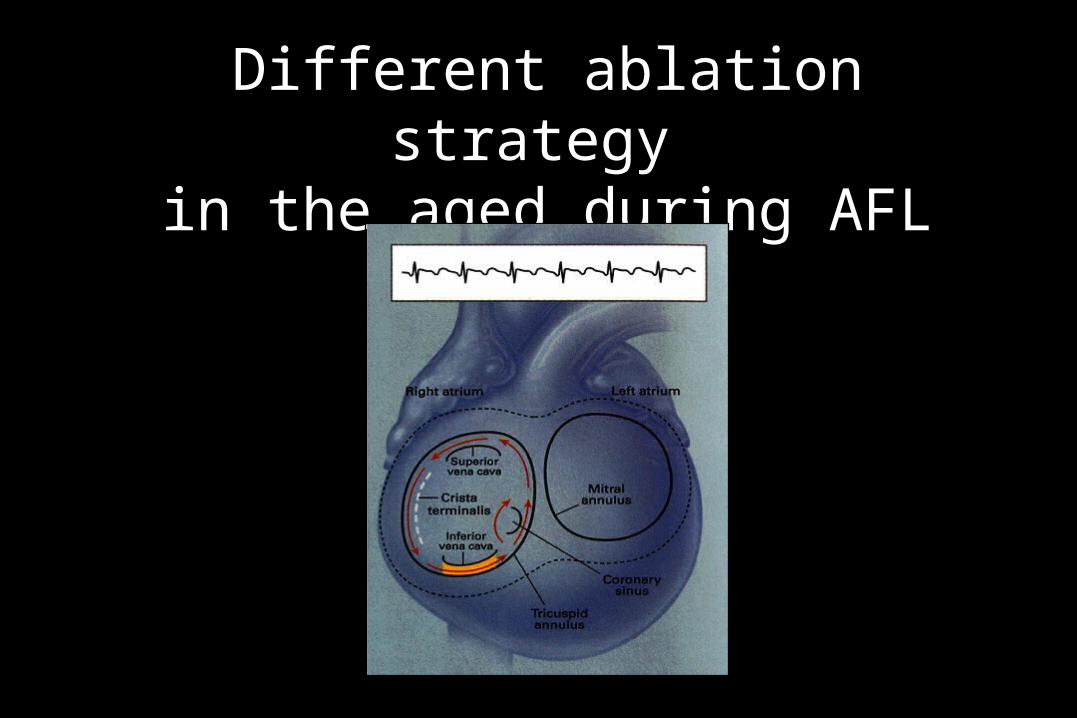
Different ablation strategy in the aged during AFL

RA substrate properties associated with age in patients with typical AFL
Huang JL et al. Heart Rhythm. 2008;5(8):1144-51
• OBJECTIVE: to characterize the difference in the right
atrial (RA) substrate related to aging using noncontact
mapping of the right atrium.
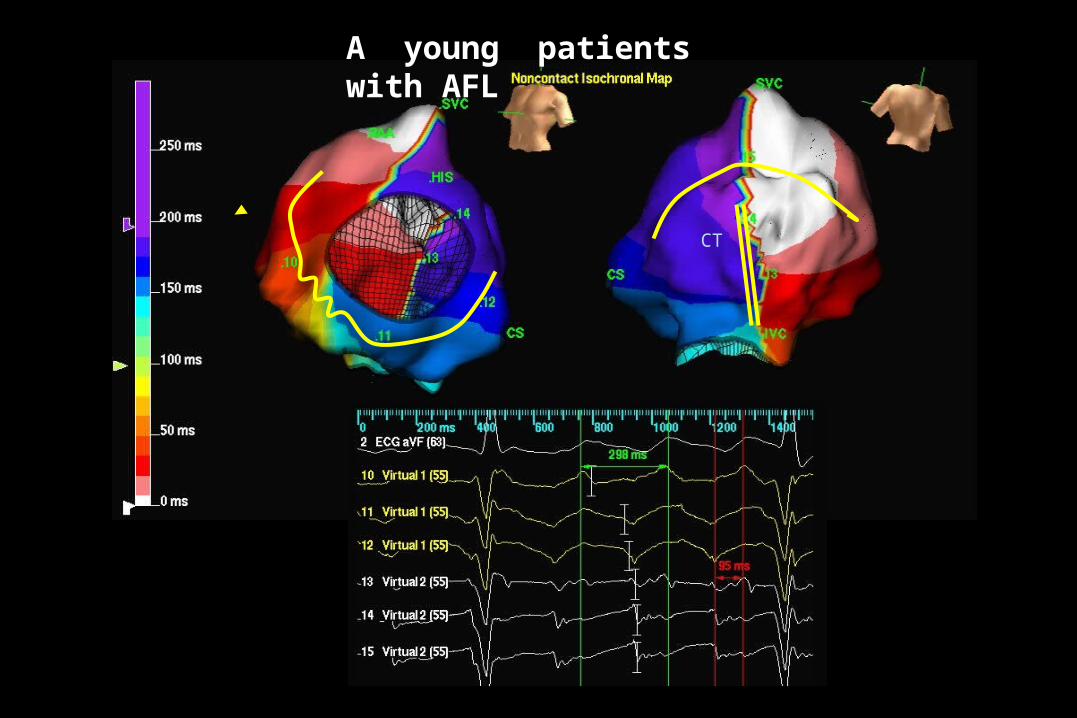
Fig 2
CT
A young patients with AFL

Fig 3
SV
CT
An old patients with AFL

Methods
• A total of 54 patients (23 young [<60 years] and 31 old [ 60 ≧
years]) with typical AFL who underwent 3-D noncontact mapping
of typical AFL were enrolled in the study.
• The atrial substrate was characterized according to
(1) regional wavefront activation mapping,
(2) regional conduction velocity
(3) regional voltage distribution by dynamic substrate mapping.
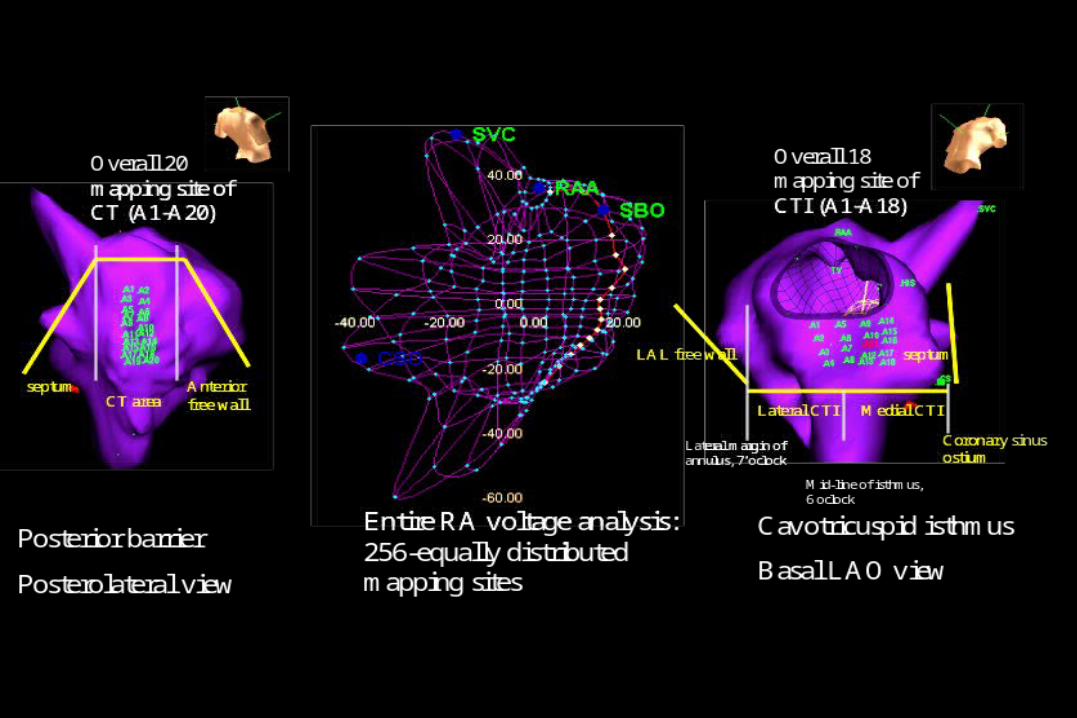
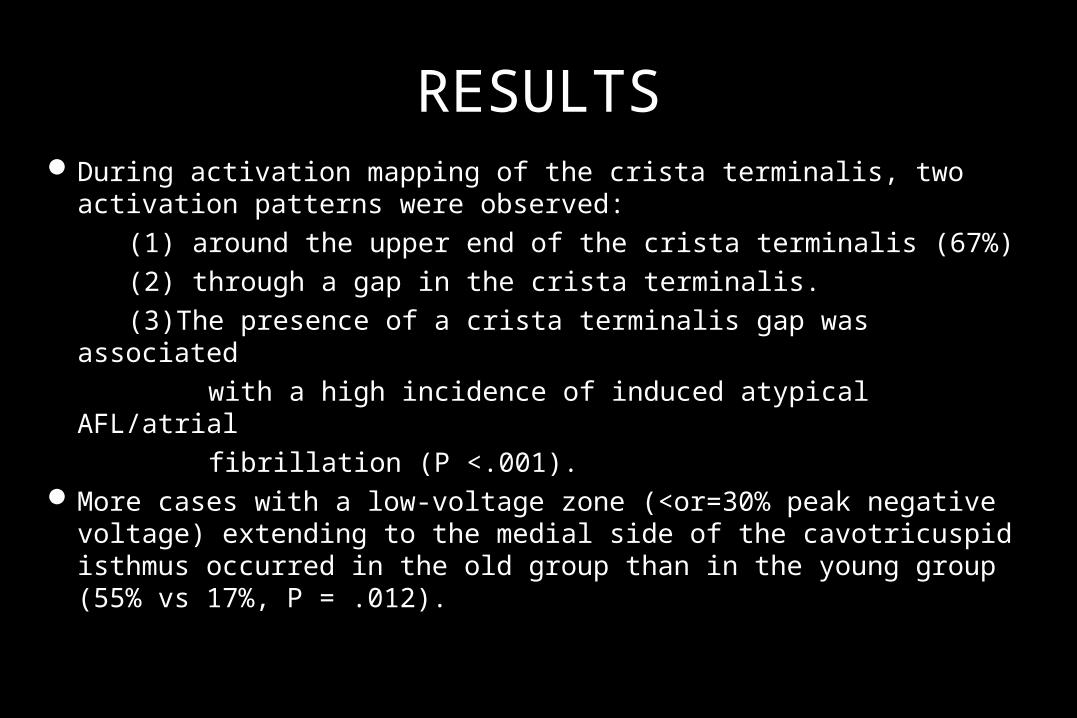
RESULTSDuring activation mapping of the crista terminalis, two activation
patterns were observed:
(1) around the upper end of the crista terminalis (67%)
(2) through a gap in the crista terminalis.
(3)The presence of a crista terminalis gap was associated
with a high incidence of induced atypical AFL/atrial
fibrillation (P <.001). More cases with a low-voltage zone (<or=30% peak negative
voltage) extending to the medial side of the cavotricuspid isthmus occurred in the old group than in the young group (55% vs 17%, P = .012).
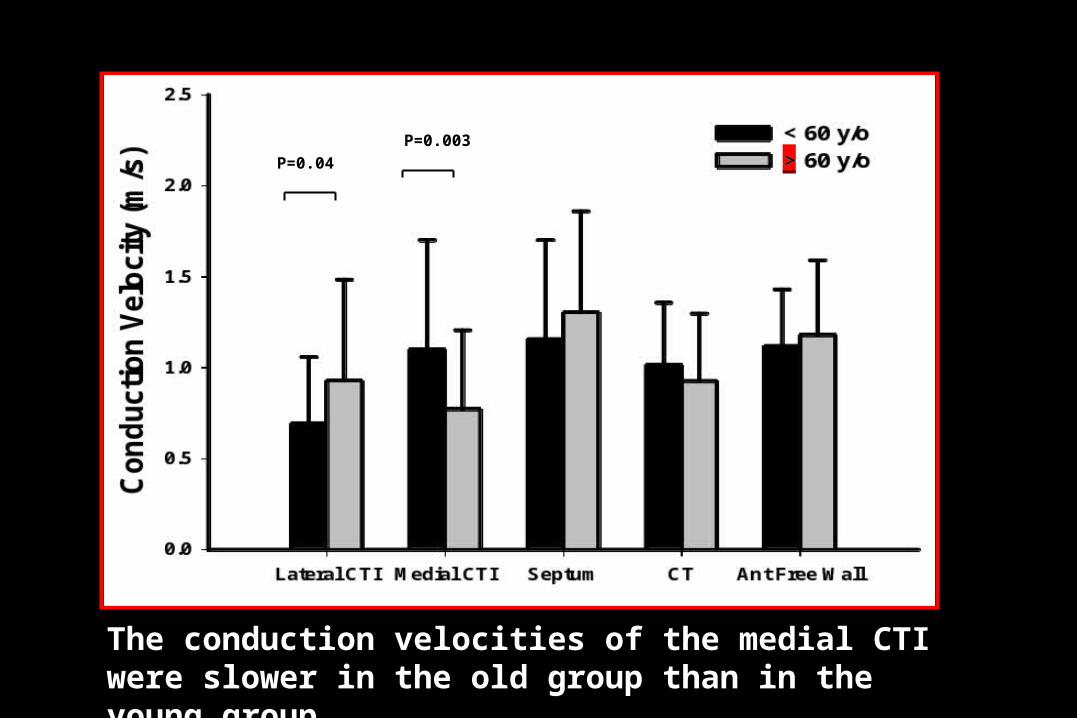
P=0.003
P=0.04
The conduction velocities of the medial CTI were slower in the old group than in the young group.
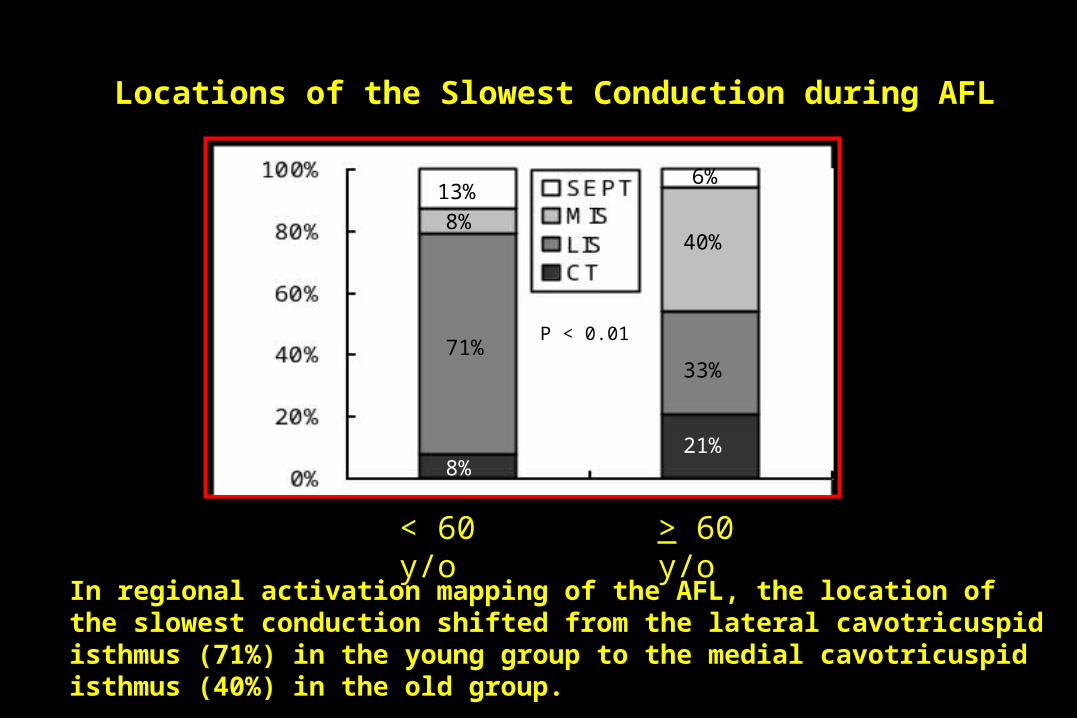
Locations of the Slowest Conduction during AFL
6%
40%
33%
21%
13%
8%
71%
8%
< 60 y/o > 60 y/o
P < 0.01
In regional activation mapping of the AFL, the location of the slowest conduction shifted from the lateral cavotricuspid isthmus (71%) in the young group to the medial cavotricuspid isthmus (40%) in the old group.

A: 43 yr malePNV= -4.2 mV
B: 79 yr malePNV= -3.9 mV
SVC
IVC
SVC
IVC
CT
SVC
IVC
SVC
IVC
CT
Conclusions
• Three-dimensional mapping showed the different patterns of
activation in the Eustachian during AFL.
• Analysis of atrial substrate could show the information of
protected isthmus during atypical atrial flutter, which could
provide important strategy for ablation.
• Different atrial substrate in the young and old patients with
AFL and strategy of ablation should be adjusted in the
clinical practice for these two groups.

What else? Besides activation mapping!!
Substrate analysis!!
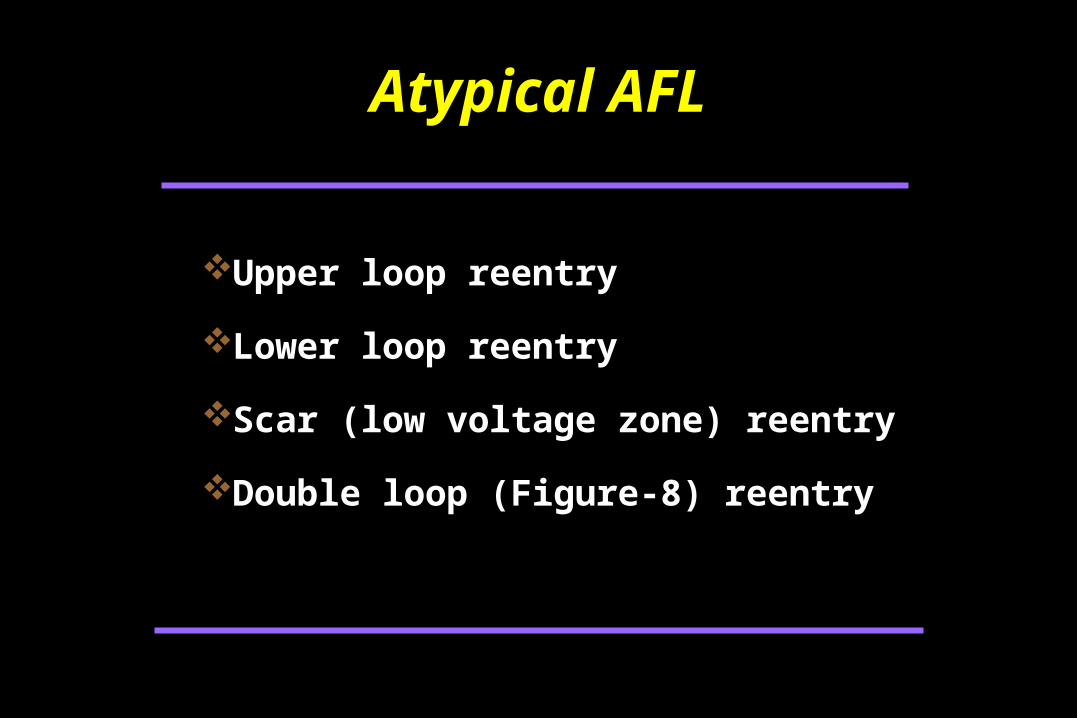
Atypical AFLAtypical AFL
Upper loop reentryUpper loop reentry
Lower loop reentryLower loop reentry
Scar (low voltage zone) reentryScar (low voltage zone) reentry
Double loop (Figure-8) reentryDouble loop (Figure-8) reentry

Upper Loop Reentry

Where is the target ?

IV1
6789
1011
˙
9
LVZ
LVZAblation line
Figure 3-B
Atypical AFL (Upper loop reentry)
Septum
LVZ
CT
Voltage map Virtual electrograms
ActivationIsochronal map
LVZ
LVZ
IVC
IVC
SVC
1 cm
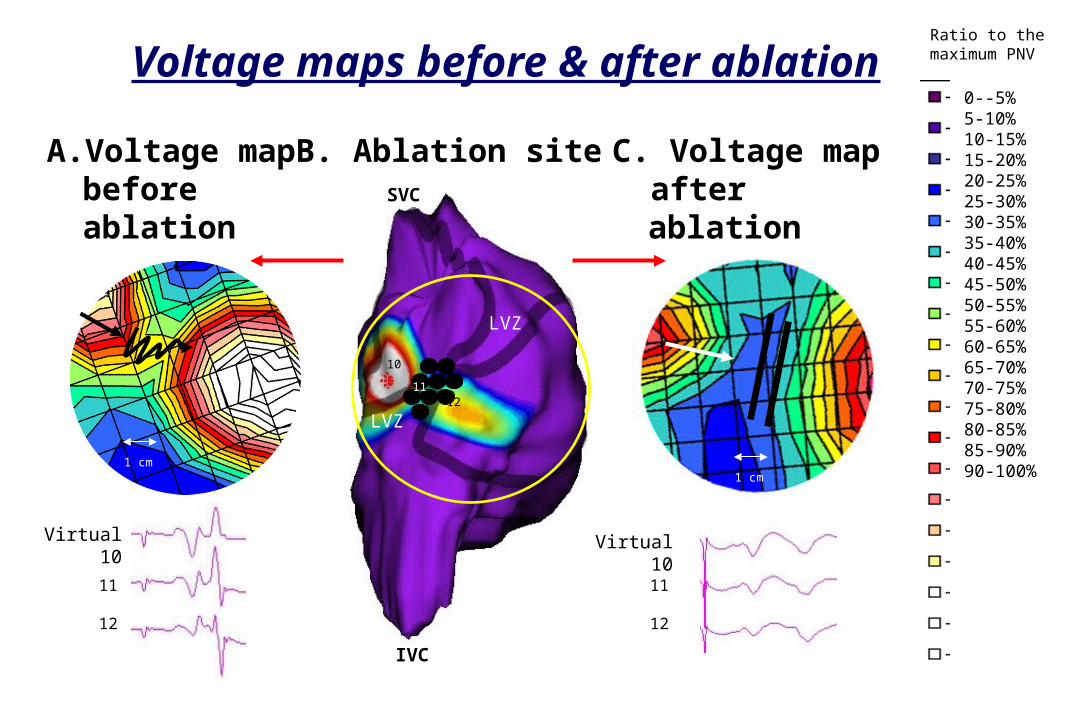
B. Ablation siteA. Voltage map before ablation
C. Voltage map after ablation
Virtual 10 Virtual 10
11
12
11
12
10
1112
1 cm
0--5%5-10%10-15%15-20%20-25%25-30%30-35%35-40%40-45%45-50%50-55%55-60%60-65%65-70%70-75%75-80%80-85%85-90%90-100%
Ratio to themaximum PNVVoltage maps before & after ablation

A: SR
C: LAL pacing
B: CSO pacing
D: Atypical flutter
% of global maximum PNV
Septum
Lateral wallCT
IVC
SVC
1
23
1
23
Voltage map: Normalized to Global Maximal PNV
1.5 mV
2.1 mV
3.4 mV
1.2 mV
0.2 mV
0.8 mV
LVZ
LVZ
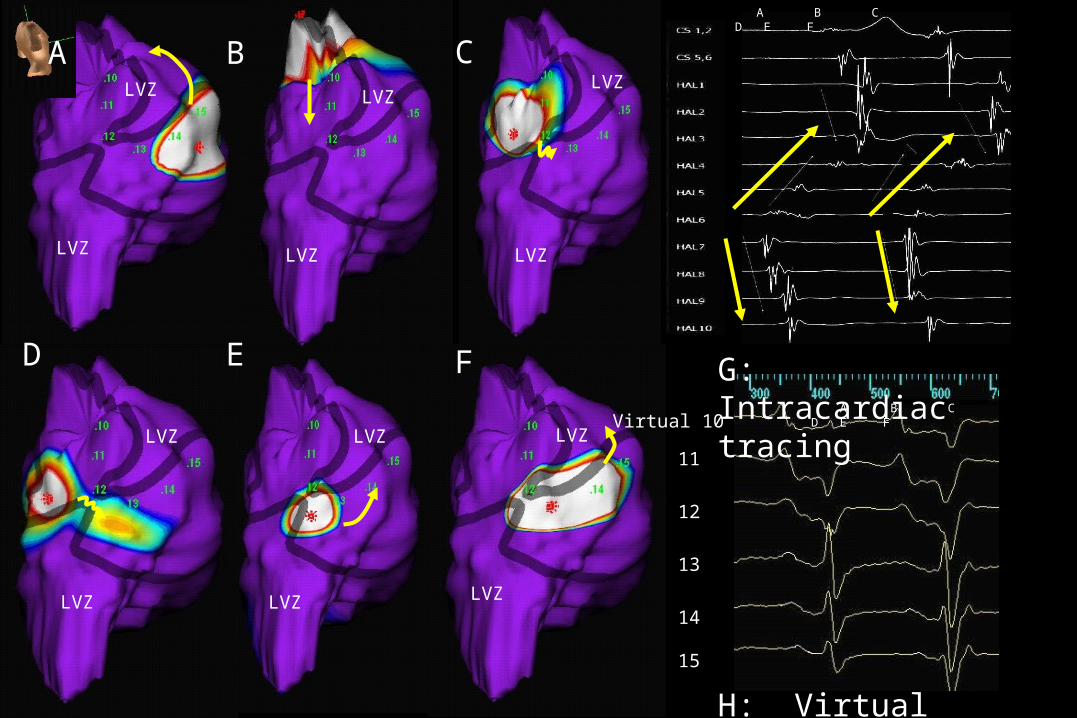
B C
F
LVZ LVZ
LVZ
LVZ
LVZ LVZ LVZ
LVZ
LVZ LVZ
A B C D E FVirtual 10
11
12
13
14
15
H: Virtual electrograms
A
G: Intracardiac tracing
A B C D E F
ED

LVZ
LVZ
IVC
SVC
Virtual 1
2
3
1
LVZ
Voltage mapping before ablation Voltage mapping after ablation
% of global maximum PNV
Virtual 1
2
3
12
3
IVC
32Pacing from
CSOPacing from CSO

Substrate Mapping to Detect Abnormal Atrial Endocardium with Slow Conduction in Patients with Atypical Right AFL
Huang JL et al. J Am Coll Cardiol 2006 ;48(3):492-8
• Atypical RA AFL was induced by atrial pacing in 12 patients,
• The protected isthmuses were near the crista terminalis.
• The conduction velocities within these paths were
significantly slower than outside the path (0.30±0.18 m/s vs.
1.14±0.41 m/s, respectively, p=0.004).

A: PNV voltage map
B: Isopotential activation maps
C: Unipolar Eg
1
2
3
4
5
LVZ
LVZ
Isthmus 1234
5
(1) (2) (3)
(4) (6)(5)
SVC
IVC
CT
54
3 2 1123
45
CT123
45
CT
1234
5
CT1234
5123
45
% o
f gl
obal
max
imum
PN
V

Ratio to the maximal peak negative voltage
Maximal peak negative voltage of a selected beat
Normalized Negative Unipolar Voltage

Identify the Protected Isthmus:
bordered by the low voltage zones
Isthmus
LVZ
Convergence of voltage lines
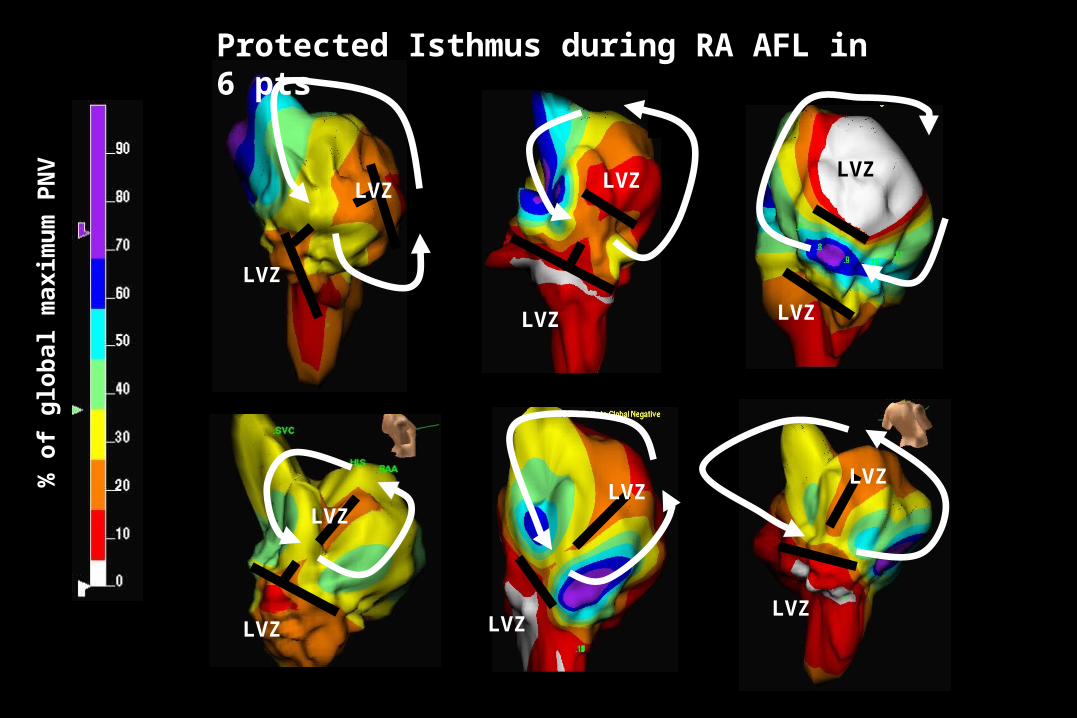
LVZ
LVZ LVZ
LVZLVZ
LVZ
LVZLVZ
LVZ
LVZ LVZ LVZ
% o
f g
lob
al m
axim
um
PN
VProtected Isthmus during RA AFL in 6 pts
Isthmus
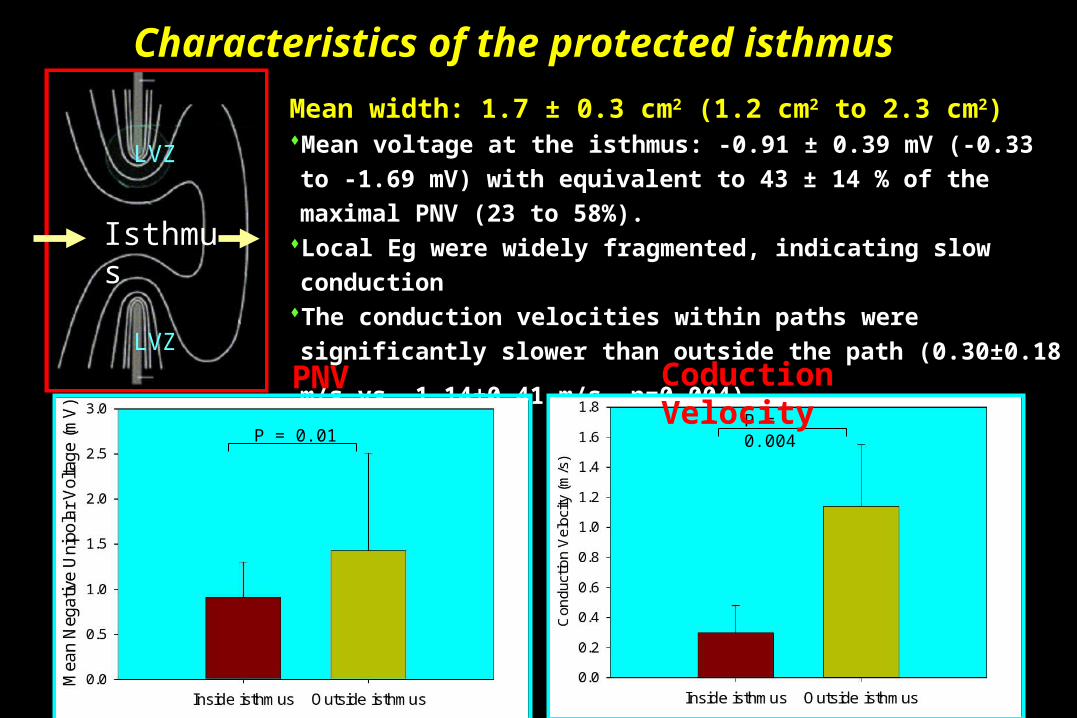
Mean width: 1.7 ± 0.3 cm2 (1.2 cm2 to 2.3 cm2) Mean voltage at the isthmus: -0.91 ± 0.39 mV (-0.33 to -1.69 mV)
with equivalent to 43 ± 14 % of the maximal PNV (23 to 58%).Local Eg were widely fragmented, indicating slow conductionThe conduction velocities within paths were significantly slower
than outside the path (0.30±0.18 m/s vs. 1.14±0.41 m/s, p=0.004).
LVZ
LVZ
Characteristics of the protected isthmus
P = 0.01P = 0.004
PNV Coduction Velocity

Result (I)Result (I)Prediction of slow conduction of the protected isthmusPrediction of slow conduction of the protected isthmus
Fixed voltage: -0.54 mV was the best cut-off value by local Eg voltage
(sensitivity=61.5% and specificity=85.7%, CI=95%).
Ratiometric voltage: 37.6% to the maximal PNV was the best cut-off value
(sensitivity=92.3% and specificity=85.7%, CI=95%).
0 20 40 60 80 100
100-Specificity (%)
100
80
60
40
20
0
Se
ns
itiv
ity
(%
)
0.8
0.7
0.6
0.5
0.4
0.3
0.2
0.1
Inside isthmus
A: ROC Curve Analysis B: Ratiometric voltage
Ra
tio
me
tric
Vo
lta
ge
Outside isthmus

Result (II)Result (II)
Radiofrequency ablationRadiofrequency ablation Delivery of ablation energy across the path was successful
(8.8 ± 2.6 pulses), suggesting it represented the critical isthmus of the reentrant circuit.
After ablation, voltage mapping showed significant reduction of unipolar negative voltage at the protected isthmus and double potentials appeared, which indicated conduction block. The activation propagated around the upper end of CT, instead of conducted through the protected isthmus.

ConclusionsConclusions
NCM in patients with atypical RA AFL consistently demonstrated slow conduction within LVZ’s in and around the CT.
Characterization of the RA substrate in terms of unipolar PNV is an effective predictor of the slow conduction path within the critical isthmus of the reentrant circuit.
A ratiometric threshold, normalized by the maximum PNV, improves the diagnostic accuracy over a fixed amplitude threshold.

謝謝