2010 mn sentencing guidelines comm drug report - minnesota
TRANSCRIPT

MINNESOTA SENTENCING GUIDELINES COMMISSION
Sentencing Practices Controlled Substance Offenses
Sentenced in 2010
Published April 2012
This document is made available electronically by the Minnesota Legislative Reference Library as part of an ongoing digital archiving project. http://www.leg.state.mn.us/lrl/lrl.asp

Sentencing Practices 2010
2 MSGC: Controlled Substance Offenses
MEMBERS
Jeffrey Edblad, Chair, Isanti County Attorney Jason Anderson, Probation Representative, Department of Corrections Paul Ford, Peace Officer Representative, Washington County Connie Larson, Citizen Member Caroline Lennon, Judge, First Judicial District Helen Meyer, Justice, Minnesota Supreme Court Tom Roy, Commissioner of Corrections Heidi Schellhas, Judge, Court of Appeals John Stuart, State Public Defender Yamy Vang, Citizen Member Sarah Walker, Citizen Member
STAFF Kelly Lyn Mitchell, Executive Director Kathleen Madland, Research Analyst Linda McBrayer, Management Analyst 4 Jill Payne, Research Analysis Specialist, Senior Anne Wall, Research Analysis Specialist, Senior
Minnesota Sentencing Guidelines Commission 309 Administration Building
50 Sherburne Avenue St. Paul, MN 55155
Voice: 651.296.0144 Fax: 651.297.5757
TTY: 1-800-627-3529, ask for 651.296.0144
Website: http://www.msgc.state.mn.us
E-mail: [email protected] Reports are available in alternative formats upon request.

Sentencing Practices 2010
3 MSGC: Controlled Substance Offenses
Table of Contents
Summary of 2010 Data .................................................................................................. 4
Case Volume & Distribution ......................................................................................... 5
Volume of Cases ...................................................................................................... 5
Drug Type, Region, Race & Prior Drug Convictions ................................................. 8
Sentencing Practices .................................................................................................. 13
Incarceration in State Prison ................................................................................... 13
Probation Cases ..................................................................................................... 15
Departure Rates .......................................................................................................... 17
Role & Definition of Departures in Sentencing Guidelines System ......................... 17
Description of Departure Types .............................................................................. 17
Departure Rates for Drug Offenses and Non-Drug Offenses ................................. 18
Trends in Departure Rates for Drug Cases ............................................................ 22
Departure Rates for Drug Offenses by Region ....................................................... 23
Departure Rates for Drug Offenses by Race .......................................................... 25
Departure Rates for Drug Offenses by Drug Degree & Judicial District .................. 27
Departure Rates for Subsequent Drug Offenses .................................................... 31
How the Guidelines Work ........................................................................................... 32
Minnesota Judicial District Map ................................................................................. 33
Sentencing Guidelines Grid ....................................................................................... 34

Sentencing Practices 2010
4 MSGC: Controlled Substance Offenses
Summary of 2010 Data This report gives statistics concerning drug felonies and how they were sentenced in 2010, as well as outlining trends in sentencing drug offenses since the implementation of the Guidelines. In 2010, there were 3,326 offenders sentenced for drug offenses, a decrease of approximately seven percent over the number sentenced in 2009 (Figures 1 and 2). For the last four years, the number of drug offenses sentenced has decreased by seven or eight percent each year. The number of first-degree offenses sentenced declined in almost every year since 2003, due in part to the decline in the number of manufacture of methamphetamine “Meth” offenses (10 offenders were sentenced in 2010, compared to 310 in 2003 – Figures 3 and 4). The number of cocaine cases was also down by twenty-three percent (Figure 5). The total incarceration rate for drug offenders sentenced was 86 percent, with 25 percent receiving a prison sentence and 62 percent having local jail time imposed as a condition of probation (Table 1). Departure rates for drug offenses declined slightly from the departure rates observed in 2009, and have now reached the lowest level seen in the last decade. However, mitigated (downward) dispositional departures still remain higher than those for most other felony offenses (Table 5). The total departure rate for drug offenses was 22 percent in 2010, and 26 percent for other offenses (Table 5). Among drug offenders recommended prison by the guidelines, 35 percent received a mitigated dispositional departure and were placed on probation (Figure 14). Departure rates among offenders recommended a prison sentence under the sentencing guidelines are so high that a greater number of offenders receive departures than receive the recommended sentence. Only 49 percent of drug offenders recommended a prison sentence received the recommended sentence or longer; 35 percent received a probationary sentence and 16 percent received a prison sentence that reflected less time than designated for under the Guidelines (Figure 22).

Sentencing Practices 2010
5 MSGC: Controlled Substance Offenses
Case Volume & Distribution1
Volume of Cases The number of felony offenders sentenced in 2010 totaled 14,311, a decrease of approximately four percent from the number of offenders sentenced from 2009. An illustration of the total number of felony offenders sentenced since 1981 can be found in MSGC’s full Sentencing Practices data report (available online at http://www.msgc.state.mn.us). There were 3,326 felony offenders sentenced for drug offenses in 2010, a decrease of seven percent over the number of drug offenders sentenced in 2009 (Figure 1). Figure 2 illustrates the percent change in the number of drug offenders sentenced over time. For the last four years, the number of drug offenders sentenced has decreased by seven or eight percent each year.
1 Minnesota Sentencing Guidelines Commission (MSGC) monitoring data are offender-based, meaning cases
represent offenders rather than individual charges. Offenders sentenced within the same county in a one-month period are generally counted only once, based on their most serious offense.
1,6
93
1,8
30
1,8
00
1,6
92
1,7
19
1,6
95
2,1
27
2,5
42
2,3
91
2,5
96
2,5
96
3,4
24 3,8
96
4,0
38
4,3
66
4,4
85
4,1
67
3,8
78
3,5
78
3,3
26
0
500
1,000
1,500
2,000
2,500
3,000
3,500
4,000
4,500
5,000
199
1
199
2
199
3
199
4
199
5
199
6
199
7
199
8
199
9
200
0
200
1
200
2
200
3
200
4
200
5
200
6
200
7
200
8
200
9
201
0
Nu
mb
er
of
Dru
g O
ffen
ders
Sen
ten
ced
Figure 1. Number of Offenders Sentenced for Felony Drug Convictions: 1991-2010

Sentencing Practices 2010
6 MSGC: Controlled Substance Offenses
Volume of Cases: First-Degree Figure 3 shows the distribution of drug offenders among the various degrees. After significantly increasing in the early 2000s, the number of offenders sentenced for first-degree offenses has declined. The number of first-degree offenders sentenced declined in each year between 2003 and 2008, due in part to the decline in the number of offenders sentenced for manufacture of methamphetamine (10 offenders in 2010, compared with 310 in 2003 – Figure 4). In 2010, the number of first-degree offenders continued to experience a general decline, falling to the lowest level seen in over a decade (194). Figure 4 shows the number of offenders sentenced for manufacture of methamphetamine from 2003 to 2010. In 2005, the offense of manufacture of methamphetamine; possession of precursors (Minn. Stat. § 152.021, subd. 2a(b)) was reclassified, and is no longer a first-degree offense. This statutory change contributed to the decline in the total number of first-degree offenders. These “precursor offenses” are now reported in the “Other” category.
8.1%
-1.6%
-6.0%
1.6%
-1.4%
25.5%
19.5%
-5.9%
8.6%
0.0%
31.9%
13.8%
3.5%
8.1%
2.7%
-7.1% -6.9%
-7.7%
-7.0%
-10.0%
-5.0%
0.0%
5.0%
10.0%
15.0%
20.0%
25.0%
30.0%
35.0%1
99
2
199
3
199
4
199
5
199
6
199
7
199
8
199
9
200
0
200
1
200
2
200
3
200
4
200
5
200
6
200
7
200
8
200
9
201
0
Perc
en
t C
han
ge
Figure 2. Percent Change in Number of Offenders Sentenced for Felony Drug Convictions: 1992-2010

Sentencing Practices 2010
7 MSGC: Controlled Substance Offenses
* In 2010, the “Other“ category includes three offenders sentenced for tampering with anhydrous ammonia, 17 offenders sentenced for possession of precursors with intent to manufacture methamphetamines, 21 offenders sentenced for sale of a simulated controlled substance, one offender sentenced for importing controlled substances across state borders, and 20 offenders sentenced for methamphetamine crimes involving children, which went into effect August 1, 2005.
29
6
25
7 44
0
13
2
1,4
42
25
654
397 579
118
2,0
60
88
459
390 6
56
143
2,5
85
133 351
429
579
130
2,5
93
85
306
458
558
104
2,3
66
86
307
376
507
133
2,1
90
65 194 350 521
144
2,0
56
61
0
500
1,000
1,500
2,000
2,500
3,000
1st 2nd 3rd 4th 5th Other*
Nu
mb
er
of
Off
en
ders
Sen
ten
ced
Figure 3. Distribution of Drug Offenders by Drug Degree: 2001-2010
2001 2003 2005 2007 2008 2009 2010
310
272
189
88
40 31 24 10
0
50
100
150
200
250
300
350
2003 2004 2005 2006 2007 2008 2009 2010
Perc
en
t
Figure 4. Number of Offenders Sentenced for Manufacture of Methamphetamine (Meth)

Sentencing Practices 2010
8 MSGC: Controlled Substance Offenses
Drug Type, Region, Race & Prior Drug Convictions Drug Type In 2010, the number of offenders sentenced for cocaine, methamphetamine and marijuana declined. The number of offenders sentenced for methamphetamine offenses declined by 5.5 percent while the number of offenders sentenced for cocaine offenses decreased by 23 percent and the number of offenders sentenced for marijuana offenses decreased by eight percent. In contrast, the number of offenders sentenced for offenses involving other or unknown drugs increased by 20 percent (Figure 5). Distribution of Cases over Time (Drug Types) The distribution of cases among drug types has changed over time. In 1996, 48 percent of the cases sentenced involved cocaine, 24 percent involved marijuana, 14 percent were unknown or of some other type and 14 percent involved amphetamines. In 2002, cocaine still represented the largest number of drug cases (40%), but the amphetamine/methamphetamine category had grown to 38 percent, marijuana had decreased to 13 percent, and 10 percent involved other drug types or were unknown. By 2004, over half (51%) of the drug cases sentenced involved methamphetamine. By 2010, the share of cases involving methamphetamines had returned to the 2002-level, approximately 38 percent while 26 percent of the cases involved cocaine, 15 percent involved marijuana and 22 percent were for other or unknown substances.
1,3
53
1,3
16
428
327
1,2
43
2,0
44
338
413
1,4
71
2,0
76
424
514
1,2
56 1,5
30
532
560
1,1
12
1,3
28
540
598 8
55
1,2
55
497 7
19
0
500
1,000
1,500
2,000
2,500
Cocaine Meth MJ Other/Unknown
Nu
mb
er
of
Off
en
ders
Sen
ten
ced
Figure 5. Distribution of Drug Offenders Sentenced in 2001-2010 by Drug Type
2002 2004 2006 2008 2009 2010

Sentencing Practices 2010
9 MSGC: Controlled Substance Offenses
Distribution of Cases over Time (Region) The number of drug cases outside of the metro area has increased more than the number of drug cases sentenced in the metro counties. In 1996, 35 percent of all drug cases were sentenced in Greater Minnesota (Figure 6). By 2004, that percentage had grown to 51 percent, and it has remained above 50 percent in almost every year since. In 2010, the percent of drug offenders sentenced in Greater Minnesota rose to an all-time high of 54 percent.
1996 1997 1998 1999 2000 2001 2002 2003 2004 2005 2006 2007 2008 2009 2010
Hennepin 26% 32% 27% 26% 28% 24% 23% 20% 19% 17% 22% 20% 21% 19% 17%
Ramsey 26% 24% 27% 24% 21% 20% 17% 14% 13% 13% 10% 11% 14% 15% 11%
Other Metro 14% 13% 12% 17% 15% 16% 16% 17% 18% 19% 19% 17% 17% 17% 18%
Greater MN 35% 31% 33% 33% 37% 40% 45% 50% 51% 51% 49% 51% 50% 50% 54%
0%
10%
20%
30%
40%
50%
60%
Pe
rce
nt
Figure 6. Distribution of Drug Cases by Region: 1995-2010

Sentencing Practices 2010
10 MSGC: Controlled Substance Offenses
2010 Distribution of Cases (Drug Types and Region)
There was a difference in the distribution of drug types among regions as well (Figure 7). Cocaine was still the drug type found most frequently in Hennepin and Ramsey counties in 2010, while methamphetamine remained the most common drug type in both Greater Minnesota and the other metro counties.
53%
37%
22%
16%
11%
30%
48% 45%
16% 16%
11%
16%
20% 17%
19%
24%
0%
10%
20%
30%
40%
50%
60%
Hennepin Ramsey Other Metro Greater MN
Perc
en
t
Figure 7. Distribution of Drug Offenders by Drug Type in Each Region
Cocaine Meth MJ Other/Unknown
Sentencing Practices 2010
11 MSGC: Controlled Substance Offenses
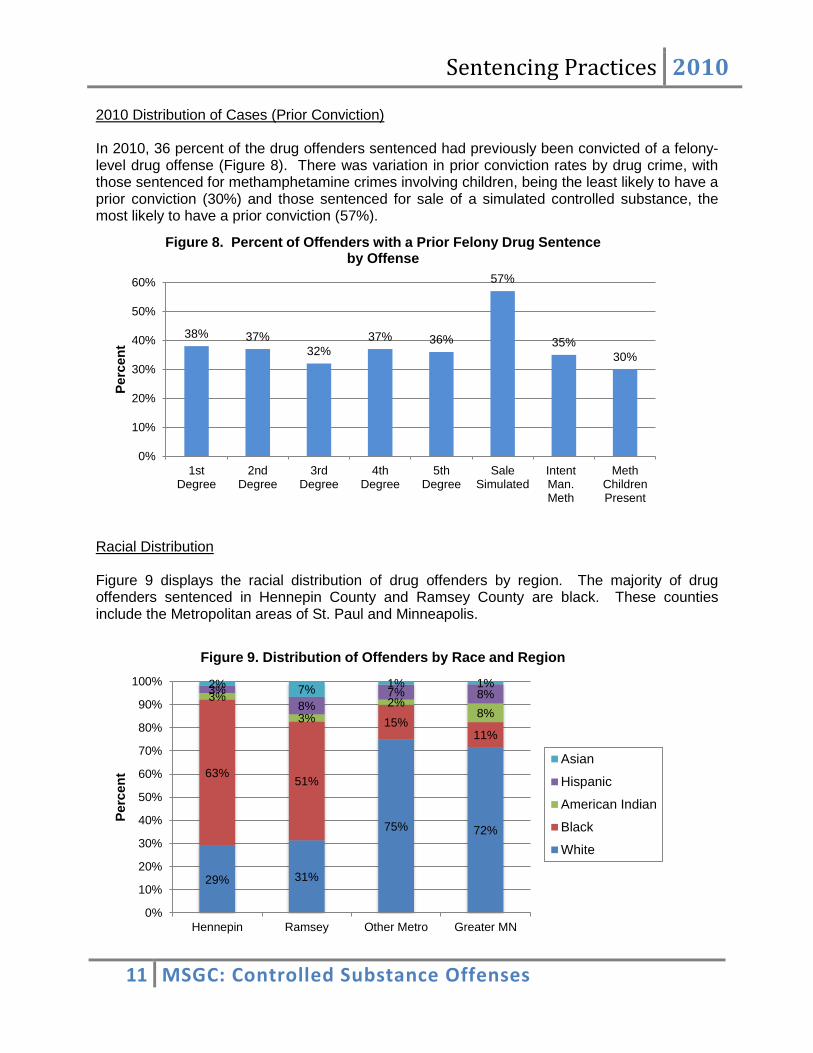
2010 Distribution of Cases (Prior Conviction) In 2010, 36 percent of the drug offenders sentenced had previously been convicted of a felony-level drug offense (Figure 8). There was variation in prior conviction rates by drug crime, with those sentenced for methamphetamine crimes involving children, being the least likely to have a prior conviction (30%) and those sentenced for sale of a simulated controlled substance, the most likely to have a prior conviction (57%).
Racial Distribution Figure 9 displays the racial distribution of drug offenders by region. The majority of drug offenders sentenced in Hennepin County and Ramsey County are black. These counties include the Metropolitan areas of St. Paul and Minneapolis.
38% 37%
32%
37% 36%
57%
35%
30%
0%
10%
20%
30%
40%
50%
60%
1stDegree
2ndDegree
3rdDegree
4thDegree
5thDegree
SaleSimulated
IntentMan.Meth
MethChildrenPresent
Perc
en
t
Figure 8. Percent of Offenders with a Prior Felony Drug Sentence by Offense
29% 31%
75% 72%
63% 51%
15% 11%
3%
3%
2% 8%
3%
8% 7% 8%
2% 7% 1% 1%
0%
10%
20%
30%
40%
50%
60%
70%
80%
90%
100%
Hennepin Ramsey Other Metro Greater MN
Perc
en
t
Figure 9. Distribution of Offenders by Race and Region
Asian
Hispanic
American Indian
Black
White

Sentencing Practices 2010
12 MSGC: Controlled Substance Offenses
Before the growth of methamphetamine, non-whites were over-represented among drug offenses when compared to other offense types. In 2010, the racial composition of drug offenders is similar to the composition of other felony offenders (Figure 10). In 1999, 51 percent of drug offenders were white and 36 percent were black, whereas in 2010, 61 percent of the drug offenders were white and 25 percent were black. Sentencing data reveal that methamphetamine is predominantly a drug of choice for white offenders and is directly impacting the racial make-up of drug offenders in Minnesota. Figure 11 displays the racial composition of offenders sentenced for methamphetamine, cocaine and marijuana offenses in 2010.
61%
56%
25% 29%
6% 7% 7% 7% 2% 2%
0%
10%
20%
30%
40%
50%
60%
70%
Drug Offenders Other Offenders
Perc
en
t
Figure 10. Distribution of Offenders by Race: Drug Offenders vs. Other Offenders
White Black American Indian Hispanic Asian
82%
26%
62%
2%
58%
29%
4% 5% 2%
8% 10% 5% 4%
1% 1%
0%
10%
20%
30%
40%
50%
60%
70%
80%
90%
Methamphetamine Cocaine Marijuana
Perc
en
t
Figure 11. Distribution of Offenders by Race: Most Common Drug Types
White Black American Indian Hispanic Asian

Sentencing Practices 2010
13 MSGC: Controlled Substance Offenses
Sentencing Practices Eighty-six percent of convicted drug offenders in Minnesota were incarcerated in 2010, with 25 percent receiving state prison sentences and 62 percent serving sentences in local correctional facilities (Table 1). The remaining 14 percent received non-jail sanctions such as treatment, with incarceration as a possible consequence of failing to comply with court orders.
Table 1. 2010 Total Incarceration
Incarceration Type Number Percent
State Prison 823 25
Local Jail 2,051 62
Total Incarceration 2,874 86
Incarceration in State Prison Since the controlled substance statutes were revised in 1989, the number of drug offenders sentenced has increased dramatically, as have imprisonment rates and average pronounced sentences. While the number of offenders sentenced for other crimes has also increased during this same time period, the increase has not been as dramatic; and the imprisonment rates and average pronounced sentences in those cases have remained relatively stable (Table 2). Incarceration of felony drug offenders at the state level has increased significantly over the past fifteen years, at a higher rate than for any other offense category. The reason for this increase is two-fold: a larger total number of drug offenders are being sentenced and a higher percentage of them are receiving prison sentences. The imprisonment rate for drug offenders was highest in 2003, at 28 percent, and has decreased slightly to 25 percent in recent years (Table 2). This decrease reflects the change in the distribution of cases, with a larger proportion of offenses now at the lower severity levels. This is due, in part, to the decrease in the number of offenders sentenced for manufacture of methamphetamine. However, despite the lower imprisonment rate trend in recent years, it is still true that more drug offenders are being sentenced to prison for longer periods of time than fifteen years ago, which directly impacts the amount of correctional resources required to accommodate this offender population. In 1991, 217 drug offenders received executed prison sentences with an average pronounced sentence of 35 months. In 2003, this number jumped to 1,107 offenders with an average sentence of 52 months. However, since 2003, both the total number of drug offenders sentenced and the proportion of drug offenders sentenced for the most serious offenses has decreased, resulting in a decrease in both the imprisonment rate and average sentence duration. In 2010, 823 drug offenders received an executed prison sentence with an average sentence of 43 months.

Sentencing Practices 2010
14 MSGC: Controlled Substance Offenses
Table 2. Imprisonment Rates and Average Pronounced Durations: Drug and Non-Drug Offenders
Year Sentenced
Drug Offenders Non-Drug Offenders
Total # Cases Prison Rate
Avg. Duration
Total #
Cases Prison Rate Avg.
Duration
1991 1,693 13% 35 months 7,468 21% 46 months
1992 1,830 14% 38 months 7,495 22% 49 months
1993 1,800 19% 42 months 7,837 22% 47 months
1994 1,692 17% 44 months 8,095 22% 51 months
1995 1,719 19% 41 months 7,702 24% 46 months
1996 1,695 17% 42 months 7,785 24% 47 months
1997 2,127 16% 42 months 7,720 24% 44 months
1998 2,542 22% 40 months 8,345 24% 47 months
1999 2,391 22% 42 months 8,243 23% 48 months
2000 2,596 24% 47 months 7,799 23% 49 months
2001 2,596 24% 47 months 8,200 22% 48 months
2002 3,424 27% 50 months 9,554 22% 46 months
2003 3,896 28% 52 months 10,596 23% 50 months
2004 4,038 25% 46 months 10,713 23% 45 months
2005 4,366 23% 44 months 11,096 23% 46 months
2006 4,485 20% 42 months 11,961 22% 45 months
2007 4,167 24% 42 months 12,001 23% 46 months
2008 3,878 25% 43 months 11,516 25% 46 months
2009 3,578 25% 42 months 11,262 25% 43 months
2010 3,326 25% 43 months 10,985 26% 47 months

Sentencing Practices 2010
15 MSGC: Controlled Substance Offenses
Probation Cases
The rise in the number of drug cases has resulted in an increase in the number of drug offenders sentenced to probation, as well as an increase in the number of drug offenders serving time in local jails and workhouses as a condition of probation. In 2010, 2,503 offenders received probation sentences for drug offenses – a 70 percent increase over the number receiving probation sentences in 1991 (Table 3). In comparison, the number of non-drug offenders serving probation sentences increased by about 38 percent during this same time period. The increase in the number of drug offenders placed on probation expands the size of the pool of offenders who could eventually end up in prison through probation revocations. This has directly impacted prison populations.
Offenders placed on probation for a felony offense can receive up to one year of local jail or workhouse time as a condition of probation. The vast majority of offenders placed on felony probation serve conditional jail time. Since 1991, more than 80 percent of felony probationers have had jail time imposed as a condition of probation and drug offenders have had jail time imposed at a slightly higher rate than non-drug offenders. In 2010, the jail rate declined to 82 percent from 90 percent in 2009. Non-drug offenders have had slightly lower rates of imposed jail time. For both groups, the average jail time pronounced has been close to, or slightly greater than, 100 days. In 2010, the average pronounced jail time for drug offenders increased to 120 days (Table 3).

Sentencing Practices 2010
16 MSGC: Controlled Substance Offenses
Table 3. Jail Rates and Avg. Pronounced Conditional Confinement: Drug and Non-Drug Offenses
Year Sentenced
Drug Offenders Non-Drug Offenders
# Stayed Cases
Jail Rate
Avg. Pronounced Duration
# Stayed Cases
Jail Rate
Avg. Pronounced Duration
1991 1,476 86% 90 days 5,908 80% 110 days
1992 1,575 87% 101 days 5,825 83% 111 days
1993 1,459 86% 116 days 6,114 81% 112 days
1994 1,412 87% 98 days 6,332 80% 117 days
1995 1,398 87% 101 days 5,887 82% 110 days
1996 1,404 83% 104 days 5,887 81% 108 days
1997 1,781 87% 105 days 5,877 82% 107 days
1998 1,192 88% 99 days 6,334 83% 110 days
1999 1,872 88% 99 days 6,311 84% 104 days
2000 1,982 90% 101 days 5,985 85% 106 days
2001 1,973 91% 108 days 6,374 84% 104 days
2002 2,486 90% 114 days 7,435 86% 103 days
2003 2,789 91% 115 days 8,167 86% 109 days
2004 3,015 91% 117 days 8,290 88% 110 days
2005 3,353 91% 118 days 8,526 89% 99 days
2006 3,573 91% 118 days 9,278 89% 96 days
2007 3,165 90% 118 days 9,243 88% 106 days
2008 2,914 88% 117 days 8,628 87% 106 days
2009 2,696 90% 113 days 8,421 87% 105 days
2010 2,503 82% 120 days 8,168 80% 107 days

Sentencing Practices 2010
17 MSGC: Controlled Substance Offenses
Departure Rates
Role and Definition of Departures in the Sentencing Guidelines System The sentencing guidelines establish a presumptive sentence for felony offenses based on the severity of the offense and the offender’s criminal history score. The presumptive sentence is based on “the typical case.” Judges may depart from the sentencing guidelines when substantial and compelling circumstances exist. The judge is required to state the reasons for departure on the record and either the prosecution or the defense may appeal the pronounced sentence. Since the presumptive sentence is based on “the typical case,” the appropriate use of departures by the courts when substantial and compelling circumstances exist can actually enhance proportionality by varying the sanction in an atypical case. It is also important to recognize that while the judge ultimately makes the sentencing decision, other criminal justice professionals and victims participate in the decision-making process. Probation officers make recommendations to the judge regarding whether a departure from the presumptive sentence is appropriate, and prosecutors and defense attorneys arrive at agreements regarding acceptable sentences for which an appeal will not be pursued. Victims are provided an opportunity to comment regarding the appropriate sentence as well. Therefore, these departure statistics should be reviewed with an understanding that, when a judge pronounces a particular sentence, there is typically agreement or acceptance among the other actors that the sentence is appropriate. Only a small percent of cases (1% to 2%) result in an appeal of the sentence pronounced by the court. Description of Departure Types Disposition refers to the decision to send an offender to state prison or to place the offender on probation (usually with a period of time in a local jail pronounced as a condition of that probation). An aggravated dispositional departure occurs when the sentencing guidelines recommend a stayed (probationary) sentence and the judge decides to sentence the offender to prison. This type of departure happens relatively infrequently compared to other types of departures (in only 7.5% of the drug cases in 2010 where a stayed sentence was the presumptive sentence) (Table 4). Most aggravated dispositional departures occur when an offender requests an executed prison sentence or agrees to the departure as part of a plea agreement. Offender requests accounted for 70 percent of the aggravated dispositional departures, excluding cases where the departure reason was “unknown.” This request is usually made to allow the offender to serve the sentence concurrently (at the same time) with another prison sentence (Table 4). The aggravated dispositional departure rate for drug offenses was higher than for non-drug offenses.

Sentencing Practices 2010
18 MSGC: Controlled Substance Offenses
Table 4. Aggravated Dispositional Departure Rates: Drug Offenders and Non-Drug Offenders
Drug
Offenders Other
Offenders
Number Presumptive Stays 2,332 7,036
Aggravated Dispositions 174
(7.5%) 270
(3.7%)
Cases with Departure Reasons 172 262
Request for Prison 121
(70%) 238
(91%)
A mitigated dispositional departure occurs when the sentencing guidelines recommend prison and the judge instead imposes intermediate sanctions (e.g.: probation, local incarceration, community work, treatment, financial sanctions). The mitigated dispositional departure rates discussed in this report are based on the percent of offenders for whom a prison sentence was recommended by the guidelines. These offenders are termed presumptive commits. Duration refers to the length of the sentence imposed. The sentencing guidelines recommend an appropriate length of incarceration for those offenders who receive an executed prison sentence. Like the presumptive disposition, the recommended duration of a sentence is determined by the severity of the offense and the offender’s criminal history. The guidelines provide both a presumptive duration and a narrow range of months around the presumptive duration that a judge may pronounce and still remain within the guidelines. If the judge pronounces a prison sentence that is greater or less than the upper and lower ranges, it constitutes a departure and the sentencing judge must cite the substantial and compelling circumstances that warrant the durational departure. If the judge pronounces a prison sentence that is greater than the upper end of the range, an aggravated durational departure results; a sentence less than the lower end of the range is a mitigated durational departure. The durational departure rates discussed in this report are for offenders who receive executed prison sentences. Departure Rates for Drug Offenders and Non-Drug Offenders Total Departure Rates The total departure rate for drug cases was 22 percent, compared to 26 percent for non-drug cases. The downward departure rate was 16 percent for drug cases and 22 percent for non-drug cases (Table 5).

Sentencing Practices 2010
19 MSGC: Controlled Substance Offenses
Table 5. Total Departure Rates: Drug and Non-Drug Offenders
Departure Type Drug Offenders
Other Offenders
None 2,587 (78%)
8,106 (74%)
Mitigated 543 (16%)
2,421 (22%)
Aggravated 164 (5%)
362 (3%)
Mixed 32 (1%)
96 (1%)
Total 3,326 (100%)
10,985 (100%)
Total Departures 739 (22%)
2,879 (26%)
Mitigated Dispositional Departures: Drug Offenses vs. Other Offense Types Figure 12 shows that 35 percent of drug offenders who were recommended prison under the guidelines instead received a non-prison sentence. In contrast, the mitigated dispositional departure rate for non-drug offenses that were presumptive prison cases was 31 percent. Departure rates vary greatly by general offense type and specific offense. Among offenses for which more than a handful of offenders had presumptive prison sentences, the offenses with mitigated dispositional departure rates equal to or higher than 35 percent were: second-degree assault (52%), failure to register as a predatory offender (46% in the “other” offenses category), criminal vehicular homicide (46%), first-degree burglary ranked at severity level 8 (42%), first-degree aggravated robbery (37%), felon in possession of a firearm (36%), and third-degree assault (36%).

Sentencing Practices 2010
20 MSGC: Controlled Substance Offenses
* “Other Person” includes all person offenses beyond second-degree assault and CSC offenses.
Dispositional Departures: Frequently Cited Reasons for Departure Amenability to treatment and probation were the most frequently-cited departure reasons for the mitigated dispositions in drug cases. In a large percentage of these cases, the court noted either that there was a plea agreement for the departure or that the prosecutor recommended or did not object to the departure. Plea agreements or prosecutor recommendations occurred more frequently in non-drug than in drug cases (64% and 61%, respectively). Information provided by the court revealed that the prosecutor was more likely to object to the mitigated disposition in drug cases than in non-drug cases (17% and 12%, respectively). Durational Departures: Prison Cases The mitigated durational departure rate for both drug and non-drug offenders who received executed prison sentences was 23 percent (Figure 13). The aggravated durational departure rate was under one-half of one percent for drug offenders and approximately four percent for non-drug cases. Figure 14 shows that these rates also vary by general offense type; the mitigated durational departure rate for drug offenses was higher than for most other offense types, and the aggravated durational departure rate was lower than for any other offense type.
31%
25%
35%
27% 25%
38%
0%
5%
10%
15%
20%
25%
30%
35%
40%
All Non-Drug CriminalSexual
Conduct
Drug Other Person* Property OtherOffenses
Perc
en
t Figure 12. Mitigated Dispositional Departure Rates by Offense
Presumptive Commits Only
# Presumptive Prison 267 296 940 1,267 940 909

Sentencing Practices 2010
21 MSGC: Controlled Substance Offenses
* “Other Person” includes all person offenses beyond murder/manslaughter, assault, and CSC offenses.
“Plea Agreement” was the most frequently-cited reason for mitigated durational departures in drug cases. The court stated either that there was a plea agreement for the departure or that the prosecutor recommended or did not object to the departure in a larger portion of the mitigated durations than the mitigated dispositions, particularly in drug cases. The court indicated that there was a plea agreement for the departure or that the prosecutor recommended or did not object to the mitigated durational departure in 74 percent of the drug cases and 76 percent of the non-drug cases. The court reported that the prosecutor objected to the mitigated duration in about seven percent of the drug cases and three percent of non-drug cases.
Drugs Non-Drug Offenses
Less Time 23% 23%
More Time 0% 4%
0%
5%
10%
15%
20%
25%
30%P
erc
en
t
Figure 13. Durational Departure Rates Drug vs Non-Drug Cases
Murder/Mansltr
AssaultCriminalSexual
Conduct
OtherPerson*
Drugs PropertyOther
Offenses
Less Time 13% 22% 19% 25% 23% 20% 30%
More Time 8% 7% 5% 3% 0% 4% 2%
0%
5%
10%
15%
20%
25%
30%
35%
Perc
en
t
Figure 14. Durational Departure Rates by General Offense Type

Sentencing Practices 2010
22 MSGC: Controlled Substance Offenses
Trends in Departure Rates for Drug Cases The total mitigated departure rates have increased since the early 1990s. Figure 15 shows that, between 1999 and 2003, the mitigated dispositional rate had stabilized. At 46 percent, the 2006 rate was the highest since 1997. In 2007, this rate returned to under 40 percent and has remained there since. The 2010 rate of 35 percent is the lowest rate seen in the last decade.
Figure 16 shows that the mitigated durational departure rate continued to increase through the 1990s, peaking in 2000 at 44 percent. Since 2000, however, this rate has been steadily declining, to a low of 23 percent in 2010. Aggravated durational departure rates have consistently been very low and in 2010 reached a new low of 0.4 percent.
41%
47%
55%
41% 38%
35% 37% 37% 36% 41% 42%
46%
38% 39% 37% 35%
0%
10%
20%
30%
40%
50%
60%
70%
80%
90%
100%
1995 1996 1997 1998 1999 2000 2001 2002 2003 2004 2005 2006 2007 2008 2009 2010
Figure 15. Mitigated Dispositional Departure Rates: 1995-2010 Presumptive Commits Only
1995 1996 1997 1998 1999 2000 2001 2002 2003 2004 2005 2006 2007 2008 2009 2010
More Time 4% 5% 6% 4% 6% 5% 5% 5% 4% 3% 3% 2% 2% 1% 1% 0%
Less Time 32% 31% 36% 32% 40% 44% 43% 40% 36% 34% 35% 29% 24% 26% 25% 23%
Overall 36% 37% 42% 38% 46% 49% 48% 45% 40% 37% 38% 31% 26% 27% 26% 23%
0%
10%
20%
30%
40%
50%
60%
Pe
rce
nt
Figure 16. Durational Departure Rates for Cases Receiving Prison Sentences: 1995-2010

Sentencing Practices 2010
23 MSGC: Controlled Substance Offenses
Departure Rates for Drug Offenders by Region While departure rates fluctuate from year to year and vary by region, they are fairly high across the state (Figure 17). Mitigated dispositional departure rates for 2010 decreased in all regions of the state except Ramsey County (which includes the city of St. Paul). In previous years, Hennepin County (which includes the city of Minneapolis) often had the highest mitigated dispositional departure rate and Greater Minnesota had the lowest. However, in the last three years, the other metro counties had the highest rates and Ramsey County or Greater Minnesota had the lowest. In 2007, the mitigated dispositional departure rate in Hennepin County plummeted to 39 percent, and continued to drop in 2009 and 2010. Part of this large drop may be the result of significant changes in how Hennepin County runs its Drug Court, changes that took effect in 2007. The decrease in departures may also have been due to a change in sentencing practices as a result of State v. Turck, 728 N.W.2d 544 (Minn. App. 2007) (holding that the mandatory minimum sentencing provision for a repeat offender under Minn. Stat. § 152.023, subd. 3(b) prohibits the court from staying execution).
1995 1996 1997 1998 1999 2000 2001 2002 2003 2004 2005 2006 2007 2008 2009 2010
Hennepin 51% 65% 70% 55% 51% 52% 56% 51% 46% 55% 53% 61% 39% 41% 35% 32%
Ramsey 39% 36% 40% 29% 32% 26% 32% 41% 26% 29% 45% 39% 32% 31% 25% 36%
Other Metro 42% 40% 56% 57% 48% 40% 44% 46% 51% 55% 54% 55% 58% 55% 51% 48%
Greater MN 24% 25% 35% 24% 22% 22% 28% 27% 30% 34% 34% 37% 33% 35% 36% 32%
0%
10%
20%
30%
40%
50%
60%
70%
80%
Pe
rce
nt
Figure 17. Mitigated Dispositional Departure Rates by Region Presumptive Prison Cases: 1995-2010

Sentencing Practices 2010
24 MSGC: Controlled Substance Offenses
Figure 18 shows that in 2010, the mitigated durational departure rate for executed sentences decreased from the rates observed in 2009 in all regions except Greater Minnesota. Mitigated durational departure rates have declined in all areas since the early years of this decade. Since the mandatory minimum sentence length for subsequent first- and second-degree drug offenses is less than the duration recommended on the guidelines grid, judges can give mitigated durational departures and still be at or above the mandatory minimum prison sentence.
1995 1996 1997 1998 1999 2000 2001 2002 2003 2004 2005 2006 2007 2008 2009 2010
Hennepin 30% 31% 52% 49% 67% 60% 57% 58% 53% 55% 51% 39% 40% 43% 47% 42%
Ramsey 36% 36% 32% 27% 35% 59% 69% 66% 62% 59% 53% 29% 29% 28% 35% 24%
Other Metro 23% 27% 47% 36% 53% 44% 53% 51% 53% 28% 35% 40% 30% 30% 25% 23%
Greater MN 32% 25% 20% 17% 14% 26% 23% 25% 22% 23% 26% 23% 16% 18% 14% 14%
0%
10%
20%
30%
40%
50%
60%
70%
80%
Pe
rce
nt
Figure 18. Mitigated Durational Departure Rates by Region for Cases Receiving Executed Prison Sentences: 1995-2010

Sentencing Practices 2010
25 MSGC: Controlled Substance Offenses
Departure Rates for Drug Offenders by Race Departure rates vary by race, with white offenders receiving mitigated dispositional departures at higher rates than blacks (Figure 19). Mitigated dispositional departure rates are typically lowest for Hispanics. The differences in departure rate may be related to criminal history scores. When offenders with a criminal history score of zero are isolated, every race category other than Hispanic has a departure rate of 50 percent or more. Hispanics have the lowest departure rate at a criminal history score of zero at only 38 percent.
39%
30%
44%
27%
35%
69% 67%
50%
38%
71%
0%
10%
20%
30%
40%
50%
60%
70%
80%
White Black American Indian Hispanic Asian
Perc
en
t
Figure 19. Mitigated Dispositional Departures by Race
All Offenders Criminal History Score = 0

Sentencing Practices 2010
26 MSGC: Controlled Substance Offenses
Mitigated durational departure rates are higher for blacks than for whites (Figure 20). This difference remains for offenders with a criminal history of zero. Criminal history may play a larger role in determining if an offender is amenable to probation than if a mitigated duration is warranted. Mitigated durational departures declined for every group except Asians. While the rates for white offenders and black offenders are only slightly lower than the 2009 rates, the rate for Hispanics declined from 27 percent to 17 percent and the rate for American Indians declined from 22 percent to 8 percent. The differences in mitigated durational departure rates may be related to differences in where the offenders are sentenced. A larger proportion of black offenders than offenders in other racial groups are sentenced in Hennepin County, where mitigated durational departure rates are highest. (See figure 9 for an illustration of the racial distribution of drug offenders by region.)
18%
34%
8%
17% 17%
0%
5%
10%
15%
20%
25%
30%
35%
40%
45%
50%
White Black AmericanIndian
Hispanic Asian
Perc
en
t
Figure 20. Mitigated Durational Departures by Race (for those receiving executed prison sentences)

Sentencing Practices 2010
27 MSGC: Controlled Substance Offenses
Departure Rates for Drug Cases by Drug Degree and Judicial District
Figure 21 shows the mitigated dispositional departure rates by drug degree. Mitigated dispositional departure rates for first-degree offenses decreased from 43 percent in 2009 to 41 percent in 2010, following a five-year rate increase (from 36% in 2003 to 50% in 2008). For second-degree offenses, the rate was 39 percent, a decrease over the rate observed in 2009 (44%). The rate for third-degree offenses remained almost the same as in 2009 (23%), while the rates for fourth and fifth-degree offenses increased from 17 and 31 percent in 2009. Among offenders with a criminal history score of 0, the overall mitigated dispositional departure rate was 63 percent.
* There were only three offenders sentenced for a fourth-degree offense that were both presumptive commits and had criminal history scores of zero. All three received a mitigated dispositional departure, making the departure rate for this category 100 percent.
41% 39%
22%
32%
37%
62% 62%
30%
100%
82%
0%
10%
20%
30%
40%
50%
60%
70%
80%
90%
100%
1st Deg. 2nd Deg. 3rd Deg. 4th Deg.* 5th Deg.
Perc
en
t
Figure 21. Mitigated Dispositional Departure Rates by Degree
All Offenders Criminal History Score = 0

Sentencing Practices 2010
28 MSGC: Controlled Substance Offenses
Figure 22 shows that mitigated durational departure rates were 29 percent for first-degree offenses and 21 percent for second-degree offenses. Both rates are decreases from the 2009 rates of 39 percent for first-degree and 24 percent for second-degree. The mitigated durational departure rates for third-, fourth-, and fifth-degree offenders are close to or identical to the 2009 rates. The average reduction in sentence length from the presumptive sentence was 46 months for first-degree cases, 28 months for second-degree cases, and 15 months for third-degree cases. The average sentence reduction was higher for first- and third-degree offenses in 2010 compared to 2009.
1st Deg. 2nd Deg. 3rd Deg. 4th Deg. 5th Deg.
Less Time 29% 21% 30% 7% 16%
More Time 0% 0% 1% 0% 1%
0%
5%
10%
15%
20%
25%
30%
35%
Perc
en
t
Figure 22. Durational Departure Rates by Degree (for those receiving executed sentences)

Sentencing Practices 2010
29 MSGC: Controlled Substance Offenses
Presumptive Prison Cases by Degree Of the 3,326 offenders sentenced for drug offenses in 2010, thirty percent (994) had presumptive prison sentences under the Guidelines. Departure rates are so high that, among offenders recommended a prison sentence, a greater number of offenders receive departures than receive the recommended sentence. Only 49 percent of drug offenders recommended a prison sentence received the recommended sentence or longer; 35 percent received a probationary sentence and 16 percent received a prison sentence that reflected less time than designated for under the guidelines. Figure 23 shows that just over 40 percent of first-degree cases received the recommended sentence. The percent of offenders who got the presumptive sentence in 2010 increased from that observed 2009 for first- and second-degree offenders (from 35% and 43%). A similar percentage of third- and fifth-degree offenders in 2010 and 2009 received the presumptive sentences. The percent receiving the presumptive sentence decreased from 79 percent to 65 percent for fourth-degree offenses.
1st Deg. 2nd Deg. 3rd Deg. 4th Deg. 5th Deg. Overall
Presumptive 42% 48% 54% 65% 52% 49%
Prison - Less Time 17% 13% 25% 3% 11% 16%
Probation 41% 39% 22% 32% 37% 35%
0%
10%
20%
30%
40%
50%
60%
70%
80%
90%
100%
Perc
en
t
Figure 23. Sentence Imposed by Drug Degree: Presumptive Prison Cases

Sentencing Practices 2010
30 MSGC: Controlled Substance Offenses
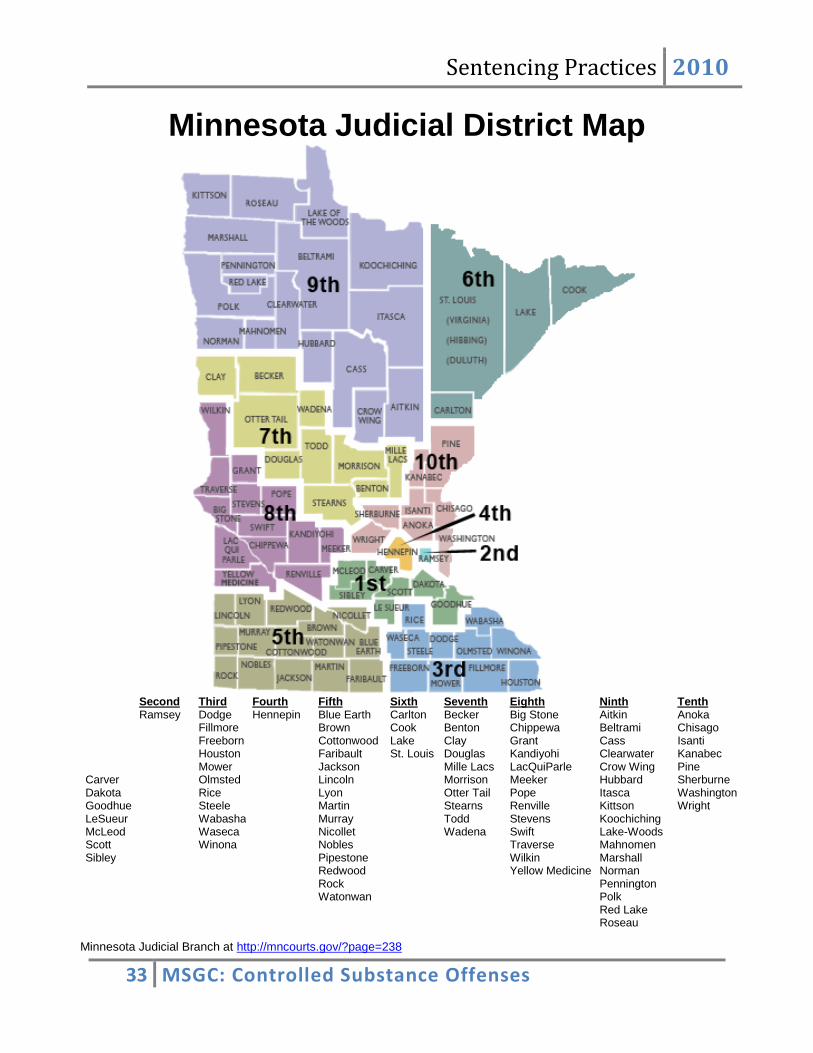
Presumptive Prison Cases by Judicial District The likelihood of an offender receiving the presumptive sentences varies widely across the state. Figure 24 shows the percent of offenders with presumptive prison sentences who received the recommended sentence by Judicial District. The portion who received a presumptive sentence ranged from 35 percent in the First District (includes Dakota County) to 85 percent in the Eighth District (includes western Minnesota). See p. 33 for a map of Minnesota’s Ten Judicial Districts. Because departure rates have decreased somewhat from 2009, the percent of offenders receiving the presumptive sentence increased in all districts except the Sixth District, Eighth District and Ninth District.
1st 2nd 3rd 4th 5th 6th 7th 8th 9th 10th
Presumptive 35% 48% 70% 37% 41% 36% 59% 85% 58% 52%
Prison - Less Time 17% 16% 12% 31% 9% 13% 17% 2% 3% 7%
Probation 48% 36% 18% 32% 50% 51% 24% 12% 40% 41%
0%
10%
20%
30%
40%
50%
60%
70%
80%
90%
100%
Perc
en
t
Figure 24. Sentence Imposed by Judicial District: Presumptive Prison Cases

Sentencing Practices 2010
31 MSGC: Controlled Substance Offenses
Departure Rates for Subsequent Drug Offenses Minnesota Statutes specify mandatory minimum prison terms for second or subsequent first- through third-degree drug offenses (Minn. Stats. §§ 152.021; 022; 023). When such a statutory mandatory minimum exists, the presumptive guidelines disposition is imprisonment. The mandatory minimums are as follows: 48 months for first-degree offenses, 36 months for second-degree offenses, and 24 months for third-degree offenses. Since the presumptive guidelines sentence is greater than the mandatory minimum for first- and second-degree offenses, the mandatory minimum usually affects only third-degree cases. In 2010, 371 drug offenders were sentenced for offenses involving a second or subsequent drug offense that was subject to mandatory minimum provisions. Of this total, 72 offenders (19%) received a mitigated dispositional departure from the guidelines. This is a slight decrease from the rate observed in 2009 (20%). The rate did not vary much between the three offenses (Figure 25). The court indicated that the prosecutor agreed to, recommended or did not object to the mitigated disposition in 58 percent of the mitigated dispositions for subsequent drug offenses. As discussed earlier in this report, it is believed that the Minnesota Court of Appeals’ ruling in State v. Turck, 728 N.W.2d 544 (Minn. App. 2007), has been a factor in the reduction of mitigated dispositional departures for subsequent drug offenses.
Of the 299 second or subsequent drug offenders who received executed prison sentences, all but 13 (4%) had a pronounced sentence equal to, or longer than, the mandatory minimum. One of the offenders receiving less time was a first-degree offender, one was a second-degree offender and eleven were third-degree offenders.
25
%
25
% 3
3%
40
%
24
%
28
%
22
% 29
%
21
%
19
%
29
%
22
% 3
2%
20
% 2
9%
31
%
19
%
22
%
17
% 20
%
39
%
50
%
40
%
31
% 37
%
37
%
23
%
22
%
23
%
19
%
0%
10%
20%
30%
40%
50%
60%
2001 2002 2003 2004 2005 2006 2007 2008 2009 2010
Figure 25. Mitigated Dispositional Departure Rate for Subsequent Drug Offenses by Offense: 2001-2010
First-Degree Second-Degree Third-Degree

Sentencing Practices 2010
32 MSGC: Controlled Substance Offenses
How the Guidelines Work Minnesota’s guidelines are based on a grid structure. The vertical axis of the grid represents the severity of the offense for which the offender was convicted. The horizontal axis represents a measure of the offender’s criminal history. The Commission has ranked felony level offenses into eleven severity levels. Offenses included in each severity level are listed in the Severity Reference Table in the Minnesota Sentencing Guidelines and Commentary. The criminal history index measures the offender’s prior record and consists of four measures of prior criminal behavior: (1) a weighted measure of prior felony sentences; (2) a limited measure of prior misdemeanor/gross misdemeanor sentences; (3) a limited measure of the prior serious juvenile record; and (4) a “custody status” measure which indicates if the offender was on probation or parole when the current offense was committed. The recommended (presumptive) guideline sentence is found in the cell of the sentencing grid in which the offender’s criminal history score and severity level intersect. The guidelines recommend imprisonment in a state prison in the non-shaded cells of the grid. The guidelines generally recommend a stayed sentence for cells in the shaded area of the grid. When a sentence is stayed, the court typically places the offender on probation and may require up to a year of conditional confinement in a local facility (jail or workhouse). Other conditions such as fines, restitution, community work service, treatment, house arrest, etc. may also be applied to an offender’s sentence. There are, however, a number of offenses that carry a presumptive prison sentence regardless of where the offender is on the guidelines grid (e.g., offenses involving dangerous weapons which carry mandatory minimum prison terms, and drug and burglary offenses). The number in the cell is the recommended length of the prison sentence in months. As explained above, sentences in shaded boxes are generally stayed probationary sentences. For cases in the non-shaded cells of the grid, the guidelines also provide a narrow range of months around the presumptive duration that a judge may pronounce and still be within the guidelines. It is not possible to fully explain all of the policies in this brief summary. Additional information on the sentencing guidelines is available by contacting the Commission’s office. The Minnesota Sentencing Guidelines and Commentary is available online at http://www.msgc.state.mn.us.
Sentencing Practices 2010
33 MSGC: Controlled Substance Offenses
Carver Dakota Goodhue LeSueur McLeod Scott Sibley
Second Ramsey
Third Dodge Fillmore Freeborn Houston Mower Olmsted Rice Steele Wabasha Waseca Winona
Fourth Hennepin
Fifth Blue Earth Brown Cottonwood Faribault Jackson Lincoln Lyon Martin Murray Nicollet Nobles Pipestone Redwood Rock Watonwan
Sixth Carlton Cook Lake St. Louis
Seventh Becker Benton Clay Douglas Mille Lacs Morrison Otter Tail Stearns Todd Wadena
Eighth Big Stone Chippewa Grant Kandiyohi LacQuiParle Meeker Pope Renville Stevens Swift Traverse Wilkin Yellow Medicine
Ninth Aitkin Beltrami Cass Clearwater Crow Wing Hubbard Itasca Kittson Koochiching Lake-Woods Mahnomen Marshall Norman Pennington Polk Red Lake Roseau
Tenth Anoka Chisago Isanti Kanabec Pine Sherburne Washington Wright
Source: Minnesota Judicial Branch at http://mncourts.gov/?page=238
Minnesota Judicial District Map

SENTENCING GUIDELINES GRID Presumptive Sentence Lengths in Months
Effective August 1, 2010
Italicized numbers within the grid denote the range within which a judge may sentence without the sentence being deemed a departure. Offenders with non-imprisonment felony sentences are subject to jail time according to law.
SEVERITY LEVEL OF CONVICTION OFFENSE (Common offenses listed in italics)
CRIMINAL HISTORY SCORE
0 1 2 3 4 5 6 or
more
Murder, 2nd Degree (intentional murder; drive-by- shootings)
XI 306
261-367 326
278-391 346
295-415 366
312-439 386
329-463 406
346-4803 M.S. § 244.09 requires the Sentencing Guidelines to provide a range of 15% downward and 20% upward from the presumptive sentence. However, because the statutory maximum sentence for these offenses is no more than 40 years, the range is capped at that number.
426 363-480
3 M.S. § 244.09 requires the Sentencing Guidelines to provide a range of 15% downward and 20% upward from the presumptive sentence. However, because the statutory maximum sentence for these offenses is no more than 40 years, the range is capped at that number.
Murder, 3rd Degree Murder, 2nd Degree (unintentional murder)
X 150
128-180 165
141-198 180
153-216 195
166-234 210
179-252 225
192-270 240
204-288
Assault, 1st Degree Controlled Substance Crime, 1
st Degree
IX 86
74-103 98
84-117 110
94-132 122
104-146 134
114-160 146
125-175 158
135-189
Aggravated Robbery 1st Degree Controlled Substance Crime, 2
nd Degree
VIII 48
41-57 58
50-69 68
58-81 78
67-93 88
75-105 98
84-117 108
92-129
Felony DWI VII 36 42 48 54
46-64 60
51-72 66
57-79 72
62-86
Assault, 2nd
Degree Felon in Possession of a Firearm
VI 21 27 33 39
34-46 45
39-54 51
44-61 57
49-68
Residential Burglary Simple Robbery
V 18 23 28 33
29-39 38
33-45 43
37-51 48
41-57
Nonresidential Burglary
IV
121 15 18 21
24 21-28
27 23-32
30 26-36
Theft Crimes (Over $2,500) III 121 13 15 17
19 17-22
21 18-25
23 20-27
Theft Crimes ($2,500 or less) Check Forgery ($200-$2,500)
II 121 12
1 13 15 17 19
21 18-25
Sale of Simulated Controlled Substance
I 121 12
1 12
1 13 15 17
19 17-22
Presumptive commitment to state imprisonment. First Degree Murder is excluded from the guidelines by law and continues to have a mandatory life sentence. See section II.E. Mandatory Sentences for policy regarding those sentences controlled by law.
Presumptive stayed sentence; at the discretion of the judge, up to a year in jail and/or other non-jail sanctions can be imposed as conditions of probation. However, certain offenses in this section of the grid always carry a presumptive commitment to state prison. See sections II.C. Presumptive Sentence and II.E. Mandatory Sentences.
1 One year and one day
2 M.S. § 244.09 requires the Sentencing Guidelines to provide a range of 15% downward and 20% upward from the presumptive
sentence. However, because the statutory maximum sentence for these offenses is no more than 40 years, the range is capped at that number