2010 guidelines to defra / decc's ghg conversion factors ... · what are greenhouse gas...
TRANSCRIPT

2010 Guidelines to Defra / DECC's GHG Conversion Factors for Company Reporting
Produced by AEA for the Department of Energy and Climate Change (DECC)
and the Department for Environment, Food and Rural Affairs (Defra)
Version 1.2.1 FINAL
Updated: 06/10/2010
Key: Data fields:
light blue = Data entry field
purple = Fixed factors used in calculations
yellow = Calculation results
Reporting Scope:
Scope 1 =
Scope 2 =
Scope 3 =
All Scopes =
Outside of Scopes =
Scope 1 OR Scope 3 =
Scope 2, 3 = Includes emissions resulting from electricity supplied to the consumer that are counted in both
Scope 2 (electricity GENERATED and supplied to the national grid) and Scope 3 (due to
LOSSES in transmission and distribution of electricity through the national grid to the
consumer), as defined by the GHG Protocol
Emissions can fall into either Scope 1 or Scope 3 as defined by the GHG Protocol (e.g.
depends on ownership of vehicle stock for transport)
Emissions fall into Scope 1 as defined by the GHG Protocol
Emissions fall into Scope 2 as defined by the GHG Protocol
Emissions fall into Scope 3 as defined by the GHG Protocol
All emissions from Scope 1 or 2 and Scope 3 as defined by the GHG Protocol
Emissions fall outside of the Scopes 1/2/3 as defined by the GHG Protocol (e.g. direct
emissions of CO2 from burning biomass/biofuels)
Page 1 of 49

2010 Guidelines to Defra / DECC's GHG Conversion Factors for Company Reporting
IntroductionLast updated: Oct-10
Major changes and updates from the September 2009 version are as follows:
i. In previous years, emissions factors have only been provided for direct emissions of CO2, with the other
greenhouse gases methane (CH4) and nitrous oxide (N2O) added in 2009.
ii. Lifecycle emissions factors and calculations for waste, biofuels and biomass have been expanded (as
well as updated /amended) and include both direct and indirect emissions. For example in the case of
biofuels, these emission factors incorporate emissions associated with the production and transportation
of the fuel, as well as the direct emissions from fuel combustion. In addition to indirect emissions, the
direct/Scope 1 emissions of CH4 and N2O resulting from combustion of these fuels have also been
separated out.
iii. The single table for water, biofuel and biomass emission factors from 2009 has been split into three.
Emission factors for pure biofuels are provided separately (based on UK averages from the Renewable
Fuels Agency for 2009) as well as assistance in calculating the emission factors for different blends with
conventional petrol, diesel or compressed natural gas (CNG) fuels.
General Introduction
Greenhouse Gases can be measured by recording emissions at source by continuous emissions monitoring
or by estimating the amount emitted using activity data (such as the amount of fuel used) and applying
relevant conversion factors (e.g. calorific values, emission factors, oxidation factors).
What are Greenhouse Gas Conversion Factors?
These conversion factors allow organisations and individuals to calculate greenhouse gas (GHG) emissions
from a range of activities, including energy use, water consumption, waste disposal, recycling and transport
activities. For instance, a conversion factor can be used to calculate the amount of greenhouse gases
emitted as a result of burning a particular quantity of oil in a heating boiler.
iv. An entirely new table of emission factors for maritime shipping freight transport has been produced for
Annex 7, based on information from the International Maritime Organisation's 2009 report on GHG
emissions.
For the first time in this 2010 update, indirect emission factors (also known as fuel cycle or Well-To-Tank
emission factors) associated with the production of fuels have been added for all activities allowing the
provision of life-cycle emission factors. Emissions from the production of vehicles or infrastructure are not
considered.
Values for CH4 and N2O are presented as CO2 equivalents (CO2e) using Global Warming Potential
(GWP) factors*, consistent with reporting under the Kyoto Protocol and the second assessment report of
the Intergovernmental Panel on Climate Change (IPCC).
v. A supporting methodological paper to explain how all of the emission factors have been derived is
being produced. This methodological paper is expected to be available by end August 2010 and will be
made available here: http://www.defra.gov.uk/environment/business/reporting/methodology-papers.htm
These conversion factors will enable you to convert activity data (e.g. litres of fuel used, number of miles
driven, tonnes of waste sent to landfill) into kilograms of carbon dioxide equivalent (CO2e). Carbon dioxide
equivalent is a universal unit of measurement used to indicate the global warming potential of one unit of
carbon dioxide. It is used to evaluate the releasing of different greenhouse gases against a common basis.
What are the major changes and updates from the September 2009 version?
* GWP for CH4 = 21, GWP for N2O = 310. See Annex 5 for more information on GWP
Page 2 of 49

2010 Guidelines to Defra / DECC's GHG Conversion Factors for Company Reporting
(a) Emission factors provided in a time-series (e.g. Annex 3 - Electricity Factors): These should be
updated for historical reporting with each annual update - i.e. you should recalculate emissions from
previous years using the latest time-series dataset. This is because there can be revisions to earlier
emission factor data due to improvements in the calculation methodology or UK GHG inventory datasets
they are based upon. For example in this 2010 update:
These factors are not for use with mandatory or legal reporting.
Do I need to update all my calculations using the new conversion factors each year?
Policymakers in National, Regional and Local Government should consult the document Greenhouse Gas
Policy Evaluation and Appraisal in Government Departments.
For reporting emissions under Climate Change Agreements, please refer to:
http://www.decc.gov.uk/en/content/cms/what_we_do/change_energy/tackling_clima/ccas/ccas.aspx
What should I not use the factors for?
Only in certain cases will you need to update previous calculations due to the release of the annual update
to the GHG conversion factors. The conversion factors provided in these annexes provide broadly two
types of data:
For reporting emissions under the EU Emissions Trading Scheme, please refer to: http://www.environment-
agency.gov.uk/business/topics/pollution/32232.aspx
For reporting emissions under the new CRC Energy Efficiency Scheme (CRC), please refer to:
http://www.environment-agency.gov.uk/business/topics/pollution/116626.aspx
3. Other reasons such as project planning and greenhouse gas emission reductions projects.
2. Your personal carbon footprint - Individuals who wish to calculate their carbon footprint from their day-
to-day activity may be interested in the Government's Act on CO2 Calculator,
(http://carboncalculator.direct.gov.uk/index.html).
Who should use these factors?
These factors are publicly available for use by organisations and individuals within the UK. We do not
recommend that they are used by organisations or individuals overseas as the emission factors are
specific to the UK and many will vary to a very significant degree for other countries. For example, the
electricity emission factors are based on the UK grid average mix of different types of generation and
average factors for transport are based on the composition of the UK fleet and UK-specific
occupancy/loading factors where relevant.
What should I use these factors for?
These conversion factors should be used to measure and report GHG emissions for:
1. Your organisation - Organisations that wish to calculate the greenhouse gas emissions they are
responsible for should make use of these conversion factors. Refer to Defra's website for guidance on
how to measure and report GHG emissions in a clear and consistent manner:
http://www.defra.gov.uk/environment/business/reporting/index.htm
Note: Care should be taken to use emission factors consistent with each other for comparability
of results - i.e. DO NOT mix the use of direct and indirect emission factors or emission factors for
different GHG Protocol Scopes (see 'What is the difference between direct and indirect
emissions?' below for more information).
EF used in 2009 reporting:
2007*
EF to use reporting in 2010:
new 2008*
2008
2007
2007*
2007
new 2008
new 2007
Electricity consumption year:
2009
2010 new 2008* N/A
etc.
new 2006
2005 new 2005
* This is the most recent year for which an emission factor is available for the reporting year
etc.
2005
etc.
2006 2006
Page 3 of 49

2010 Guidelines to Defra / DECC's GHG Conversion Factors for Company Reporting
Units
A. When calculating emissions from use of electricity or water (both of which are time series emission
factors). In this case the updated emission factor time series should be checked to see if they have
changed for relevant previous years and time series data updated as necessary in reporting.
(b) Other emission factors: The other factors provided in the annexes are figures produced generally for
the most recent year available . In the majority of cases this is 2 years behind the update year (i.e. based on
2008 data for the current 2010 update). A company should not generally recalculate their emissions for all
previous years using the newer factors. The most recent factors should only be applied for reporting on
years up to 2 years prior to the most recent dataset.
In most cases (except for natural gas, and perhaps bioenergy due to changing sources) the fuel emission
factors in general are unlikely to vary very significantly between different years. However, specific transport
factors generally do change on an annual basis and the new factors should only be used for the most
relevant/recent year of reporting. Earlier versions of the conversion factors from previous updates may
therefore be used for older data as necessary/appropriate.
In summary, you should only recalculate previous year's emissions using the new factors in the following
cases:
● To convert between common units of energy, volume, mass and distance, see Annex 12
● To calculate emissions associated with Passenger Transport, see Annex 6
● To convert greenhouse gases into carbon dioxide equivalents, see Annex 5
● To calculate emissions associated with Freight Transport, see Annex 7
● To calculate emissions from the use of Refrigeration and Air Conditioning Equipment, see Annex 8
● To estimate emissions from your supply chain, see Annex 13
● To calculate life-cycle emissions from the use of Water, Biomass and Biofuels, and from Waste
Disposal, see Annex 9
B. When recalculating emissions for a year consistent with the data basis of the new update (other than
electricity or water emission factor data). For example, if you are now reporting emissions for 2009-10, you
should also recalculate the 2008-9 emissions using the 2010 update data, as these are for the most part
based on 2008 datasets. Figures reported for 2007 should use emission factors from the 2009 update,
which are mostly based on 2007 data.
All emissions factors are given in units of kg (kilograms) of carbon dioxide (CO2) equivalent. GHG
emissions are sometimes quoted in figures of mass of Carbon equivalent , rather than Carbon Dioxide
equivalent . To convert carbon equivalents into carbon dioxide equivalents (CO2e), multiply by 44/12.
● To calculate emissions from the use of Overseas Electricity, see Annex 10
● For the typical Calorific Values and Densities of UK Fuels, see Annex 11
● To understand which industrial processes lead to GHG emissions, see Annex 4
Which Conversion Factors should I use?
● To calculate emissions from the use of Fuels, see Annex 1
● To calculate emissions from Combined Heat and Power (CHP), see Annex 2
● To calculate emissions from the use of Electricity, see Annex 3
To convert emissions of greenhouse gases to carbon dioxide equivalent units, see Annex 5. For other unit
conversions see Annexes 11 and 12.
Page 4 of 49

2010 Guidelines to Defra / DECC's GHG Conversion Factors for Company Reporting
What is the difference between direct and indirect emissions?
What are the GHG Protocol Scopes 1, 2 and 3
In the transport sector, ‘open book accounts’ provide a very good illustration of the financial and operational
control methods. In the case of an open book account, a transport operator provides vehicles to a
customer, but the customer pays the fuel bill for those vehicles directly, rather than simply paying the
transport operator for the logistics service.
In the open book situation, the customer has financial control, but the transport operator has operational
control. The customer and the transport operator will have to decide whether the emissions resulting from
these transport operations are the customer’s or the transport operator’s Scope 1. Whichever method is
used, it is very important that it is clearly stated in all reporting, and that it is consistently applied by both
organisations.
Direct GHG emissions are emissions from sources that are owned or controlled by the reporting entity.
The GHG Protocol further categorizes direct and indirect emissions into three broad scopes:
Direct GHG emissions are those emissions emitted at the point of use of a fuel/energy carrier (or in the
case of electricity, at the point of generation).
Indirect GHG emissions are those emissions emitted prior to the use of a fuel/energy carrier (or in the
case of electricity, prior to the point of generation), i.e. as a result of extracting and transforming the primary
energy source (e.g. crude oil) into the energy carrier (e.g. petrol). Emissions from the production of vehicles
or infrastructure are not considered.
Outside of Scopes: Emissions data for direct CO2 emissions from biologically sequestered carbon (e.g.
CO2 from burning biomass/biofuels) are reported separately from the scopes.
The diagram below summarises the main types of emissions sources under each scope. In some cases
direct emissions from transport can fall into either Scope 1 or Scope 3, depending on the ownership/level of
control.
In general it is recommended that the 'control' approach is used in order to decide whether to report
emissions as Scope 1 or Scope 3. The control approach is itself divided into two methods – financial and
operational (where the financial control approach is recommended).
- A company has financial control over an operation if the company has the ability to direct the financial and
operating policies of the operation with a view to gaining economic benefits from its activities.
- A company has operational control over an operation if the company or one of its subsidiaries has the full
authority to introduce and implement its operating policies at the operation.
Scope 1: Direct GHG emissions emitted at the point of combustion of fuels.
Where applicable, each Annex has a section called Scopes & Boundaries which gives a brief outline of
what the different emissions factors include. Where possible, links to more detailed source information are
also provided in each Annex.
Indirect GHG emissions are emissions that are a consequence of the activities of the reporting entity, but
occur at sources owned or controlled by another entity.
Scope 2: Indirect GHG emissions from consumption of purchased electricity, heat or steam.
(= Direct GHG emissions from the production of electricity, heat or steam.)
Scope 3: Indirect emissions, such as the extraction and production of purchased materials and fuels,
transport-related activities in vehicles not owned or controlled by the reporting entity, electricity-
related activities (e.g. T&D losses) not covered in Scope 2, outsourced activities, waste
disposal, etc.
The GHG Protocol defines direct and indirect emissions slightly differently as follows:
The definition used in used in the GHG Protocol for direct and indirect emissions is slightly different than
for these Annexes (which are consistent also with the Government's Act on CO2 Calculator and Carbon
Offsetting Accreditation Scheme). In these Annexes direct and indirect emissions are defined as follows:
Page 5 of 49

2010 Guidelines to Defra / DECC's GHG Conversion Factors for Company Reporting
* From / to point of ownership transfer
A further consideration is the treatment of leased assets, which depends on the organisational boundaries
set and the control approach.
http://www.ghgprotocol.org/standards/corporate-standard
The Publicly Available Specification (PAS): 2050 provides a method for measuring the lifecycle greenhouse
gas emissions from goods and services. It is available at http://www.bsigroup.com/en/Standards-and-
Publications/Industry-Sectors/Energy/PAS-2050/
Useful links:
The Government's Act on CO2 Calculator may be used to calculate individual's personal carbon footprint
from their day-to-day activity. It is available at: http://carboncalculator.direct.gov.uk/index.html
http://www.defra.gov.uk/environment/business/reporting/index.htm
OR from the Greenhouse Gas Protocol's website at:
Summary of the main types of emissions to be reported under each scope
Further information on scopes, control and leasing is available from Defra's website in the guidance on
reporting at:
Missing factors and additional guidance
The Carbon Trust also provides information about carbon footprinting for companies including a carbon
footprint calculator available at www.carbontrust.co.uk/footprinting.
If you require GHG conversion factors that you cannot find here, or this guidance is unclear, or you have
additional questions, please send us an email at [email protected]. We cannot undertake to
provide all the conversion factors.
Defra publishes guidance for businesses on how to measure and report their GHG emissions:
http://www.defra.gov.uk/environment/business/reporting/index.htm
Page 6 of 49

2010 Guidelines to Defra / DECC's GHG Conversion Factors for Company Reporting
Changes since Version 1.0 (03/08/10):
Version 1.1:
(06/08/10)
Version 1.2:
(16/09/10)
Version 1.2.1:
(06/10/10)
Annex 9 - corrected 'Outside of Scopes' emission factors (in kgCO2e per litre) for biodiesel
and bioethanol.
Annex 1 - added missing calculation formulae for LNG in Table 1b.
Annex 3 - added missing calculation formulae for year 2008 in Tables 3a-c.
Annex 10 - footnotes updated to be more consistent with Annex 3.
Annex 6 - coach CO2 emission factor corrected in Table 6k.
Annex 6 - corrected Table 6k footnote (6) on the source of the CO2 emission factor for
national passenger rail.
Annex 7 - corrected average load factor for all HGVs (from 56% to 58%) in Table 7d and
7e. No impact on emission factors.
Annex 9 - ammended Tables 9a and 9c and their footnotes to more clearly indicate there
are zero Scope 1 /Direct emissions for water, biomass and biogas.
Page 7 of 49
2010 Guidelines to Defra / DECC's GHG Conversion Factors for Company Reporting
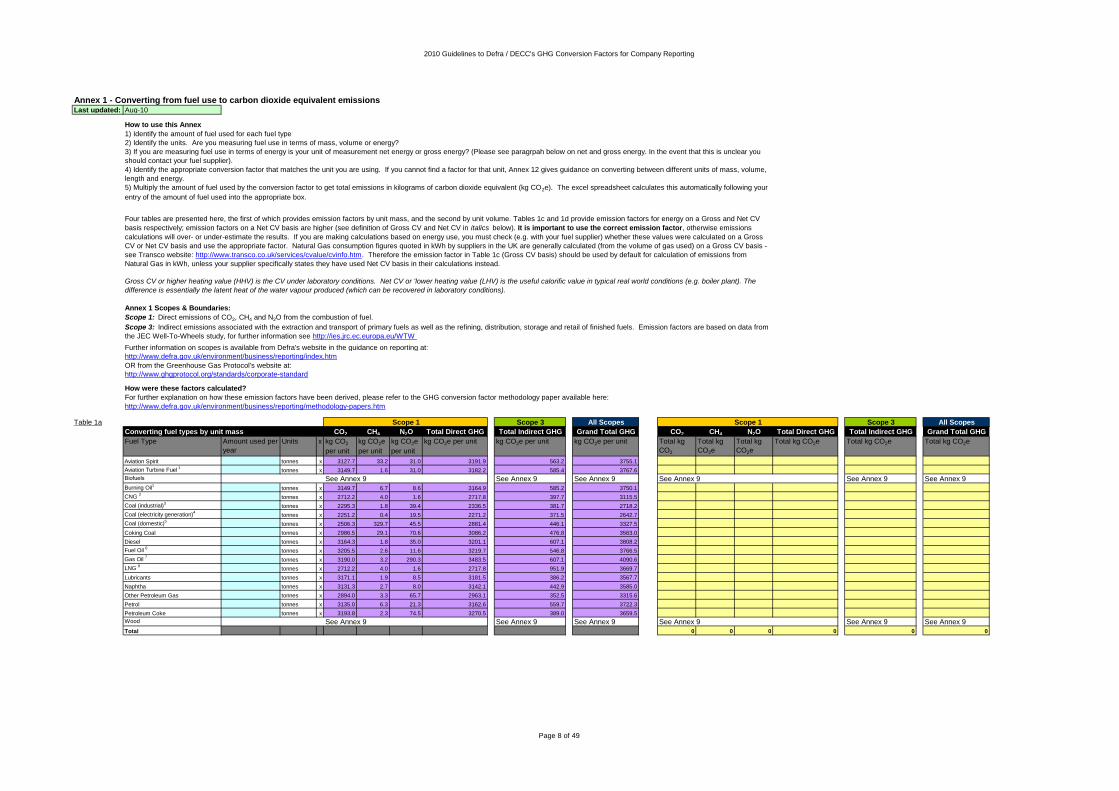
Annex 1 - Converting from fuel use to carbon dioxide equivalent emissionsLast updated: Aug-10
How to use this Annex
Table 1a Scope 3 All Scopes Scope 3 All Scopes
CO2 CH4 N2O Total Direct GHG Total Indirect GHG Grand Total GHG CO2 CH4 N2O Total Direct GHG Total Indirect GHG Grand Total GHG
Fuel Type Amount used per
year
Units x kg CO2
per unit
kg CO2e
per unit
kg CO2e
per unit
kg CO2e per unit kg CO2e per unit kg CO2e per unit Total kg
CO2
Total kg
CO2e
Total kg
CO2e
Total kg CO2e Total kg CO2e Total kg CO2e
Aviation Spirit tonnes x 3127.7 33.2 31.0 3191.9 563.2 3755.1
Aviation Turbine Fuel 1
tonnes x 3149.7 1.6 31.0 3182.2 585.4 3767.6
Biofuels See Annex 9 See Annex 9 See Annex 9 See Annex 9 See Annex 9 See Annex 9
Burning Oil1
tonnes x 3149.7 6.7 8.6 3164.9 585.2 3750.1
CNG 2
tonnes x 2712.2 4.0 1.6 2717.8 397.7 3115.5
Coal (industrial)3
tonnes x 2295.3 1.8 39.4 2336.5 381.7 2718.2
Coal (electricity generation)4
tonnes x 2251.2 0.4 19.5 2271.2 371.5 2642.7
Coal (domestic)5
tonnes x 2506.3 329.7 45.5 2881.4 446.1 3327.5
Coking Coal tonnes x 2986.5 29.1 70.6 3086.2 476.8 3563.0
Diesel tonnes x 3164.3 1.8 35.0 3201.1 607.1 3808.2
Fuel Oil 6
tonnes x 3205.5 2.6 11.6 3219.7 546.8 3766.5
Gas Oil 7
tonnes x 3190.0 3.2 290.3 3483.5 607.1 4090.6
LNG 8
tonnes x 2712.2 4.0 1.6 2717.8 951.9 3669.7
Lubricants tonnes x 3171.1 1.9 8.5 3181.5 386.2 3567.7
Naphtha tonnes x 3131.3 2.7 8.0 3142.1 442.9 3585.0
Other Petroleum Gas tonnes x 2894.0 3.3 65.7 2963.1 352.5 3315.6
Petrol tonnes x 3135.0 6.3 21.3 3162.6 559.7 3722.3
Petroleum Coke tonnes x 3193.8 2.3 74.5 3270.5 389.0 3659.5
Wood See Annex 9 See Annex 9 See Annex 9 See Annex 9 See Annex 9 See Annex 9
Total 0 0 0 0 0 0
Gross CV or higher heating value (HHV) is the CV under laboratory conditions. Net CV or 'lower heating value (LHV) is the useful calorific value in typical real world conditions (e.g. boiler plant). The
difference is essentially the latent heat of the water vapour produced (which can be recovered in laboratory conditions).
Scope 1
How were these factors calculated?
For further explanation on how these emission factors have been derived, please refer to the GHG conversion factor methodology paper available here:
http://www.defra.gov.uk/environment/business/reporting/methodology-papers.htm
Scope 1: Direct emissions of CO2, CH4 and N2O from the combustion of fuel.
Scope 3: Indirect emissions associated with the extraction and transport of primary fuels as well as the refining, distribution, storage and retail of finished fuels. Emission factors are based on data from
the JEC Well-To-Wheels study, for further information see http://ies.jrc.ec.europa.eu/WTW
1) Identify the amount of fuel used for each fuel type
2) Identify the units. Are you measuring fuel use in terms of mass, volume or energy?
3) If you are measuring fuel use in terms of energy is your unit of measurement net energy or gross energy? (Please see paragrpah below on net and gross energy. In the event that this is unclear you
should contact your fuel supplier).
4) Identify the appropriate conversion factor that matches the unit you are using. If you cannot find a factor for that unit, Annex 12 gives guidance on converting between different units of mass, volume,
length and energy.
5) Multiply the amount of fuel used by the conversion factor to get total emissions in kilograms of carbon dioxide equivalent (kg CO2e). The excel spreadsheet calculates this automatically following your
entry of the amount of fuel used into the appropriate box.
Four tables are presented here, the first of which provides emission factors by unit mass, and the second by unit volume. Tables 1c and 1d provide emission factors for energy on a Gross and Net CV
basis respectively; emission factors on a Net CV basis are higher (see definition of Gross CV and Net CV in italics below). It is important to use the correct emission factor, otherwise emissions
calculations will over- or under-estimate the results. If you are making calculations based on energy use, you must check (e.g. with your fuel supplier) whether these values were calculated on a Gross
CV or Net CV basis and use the appropriate factor. Natural Gas consumption figures quoted in kWh by suppliers in the UK are generally calculated (from the volume of gas used) on a Gross CV basis -
see Transco website: http://www.transco.co.uk/services/cvalue/cvinfo.htm. Therefore the emission factor in Table 1c (Gross CV basis) should be used by default for calculation of emissions from
Natural Gas in kWh, unless your supplier specifically states they have used Net CV basis in their calculations instead.
Converting fuel types by unit mass
Scope 1
Annex 1 Scopes & Boundaries:
Further information on scopes is available from Defra's website in the guidance on reporting at:
http://www.defra.gov.uk/environment/business/reporting/index.htm
OR from the Greenhouse Gas Protocol's website at:
http://www.ghgprotocol.org/standards/corporate-standard
Page 8 of 49

2010 Guidelines to Defra / DECC's GHG Conversion Factors for Company Reporting
Annex 1 - Converting from fuel use to carbon dioxide equivalent emissionsLast updated: Aug-10
Table 1b Scope 3 All Scopes Scope 3 All Scopes
CO2 CH4 N2O Total Direct GHG Total Indirect GHG Grand Total GHG CO2 CH4 N2O Total Direct GHG Total Indirect GHG Grand Total GHG
Fuel Type Amount used per
year
Units x kg CO2
per unit
kg CO2e
per unit
kg CO2e
per unit
kg CO2e per unit kg CO2e per unit kg CO2e per unit Total kg
CO2
Total kg
CO2e
Total kg
CO2e
Total kg CO2e Total kg CO2e Total kg CO2e
Aviation Spirit litres x 2.2119 0.0235 0.0219 2.2574 0.3983 2.6557
Aviation Turbine Fuel 1
litres x 2.5218 0.0012 0.0248 2.5478 0.4687 3.0165
Biofuels See Annex 9 See Annex 9 See Annex 9 See Annex 9 See Annex 9 See Annex 9
Burning Oil1
litres x 2.5299 0.0054 0.0069 2.5421 0.4700 3.0121
CNG 2
litres x 0.4746 0.0007 0.0003 0.4756 0.0696 0.5452
Diesel litres x 2.6413 0.0015 0.0292 2.6720 0.5067 3.1787
Gas Oil 7
litres x 2.7667 0.0028 0.2517 3.0212 0.5265 3.5477
LNG 8
litres x 1.2272 0.0018 0.0007 1.2297 0.4307 1.6604
LPG litres x 1.4902 0.0006 0.0012 1.4920 0.1866 1.6786
Natural Gas cubic metre x 2.0230 0.0030 0.0012 2.0272 0.1968 2.2240
Petrol litres x 2.3018 0.0046 0.0156 2.3220 0.4109 2.7329
Wood See Annex 9 See Annex 9 See Annex 9 See Annex 9 See Annex 9 See Annex 9
Total 0 0 0 0 0 0
Table 1c Scope 3 All Scopes Scope 3 All Scopes
CO2 CH4 N2O Total Direct GHG Total Indirect GHG Grand Total GHG CO2 CH4 N2O Total Direct GHG Total Indirect GHG Grand Total GHG
Fuel Type Amount used per
year
Units x kg CO2
per unit
kg CO2e
per unit
kg CO2e
per unit
kg CO2e per unit kg CO2e per unit kg CO2e per unit Total kg
CO2
Total kg
CO2e
Total kg
CO2e
Total kg CO2e Total kg CO2e Total kg CO2e
Aviation Spirit kWh x 0.23762 0.00253 0.00236 0.24250 0.04279 0.28529
Aviation Turbine Fuel 1
kWh x 0.24555 0.00012 0.00242 0.24808 0.04564 0.29372
Biofuels See Annex 9 See Annex 9 See Annex 9 See Annex 9 See Annex 9 See Annex 9
Burning Oil1
kWh x 0.24564 0.00052 0.00067 0.24683 0.04564 0.29247
CNG 2
kWh x 0.18485 0.00027 0.00011 0.18523 0.02710 0.21233
Coal (industrial)3
kWh x 0.31659 0.00025 0.00543 0.32227 0.05265 0.37492
Coal (electricity generation)4
kWh x 0.31907 0.00006 0.00277 0.32190 0.05265 0.37455
Coal (domestic)5
kWh x 0.29582 0.03892 0.00537 0.34010 0.05265 0.39275
Coking Coal kWh x 0.32979 0.00321 0.00780 0.34081 0.05265 0.39346
Diesel kWh x 0.25011 0.00014 0.00277 0.25301 0.04798 0.30099
Electricity See Annex 3 See Annex 3 See Annex 3 See Annex 3 See Annex 3 See Annex 3
Fuel Oil 6
kWh x 0.26475 0.00021 0.00096 0.26592 0.04516 0.31108
Gas Oil 7
kWh x 0.25214 0.00025 0.02294 0.27533 0.04798 0.32331
LNG 8
kWh x 0.18485 0.00027 0.00011 0.18523 0.06488 0.25011
LPG kWh x 0.21419 0.00009 0.00017 0.21445 0.02682 0.24127
therms x 6.2773 0.0026 0.0049 6.2848 0.7861 7.07086
Lubricants kWh x 0.26190 0.00016 0.00070 0.26276 0.03190 0.29466
Naphtha kWh x 0.23654 0.00021 0.00061 0.23735 0.03346 0.27081
Natural Gas kWh x 0.18485 0.00027 0.00011 0.18523 0.01799 0.20322
therms x 5.4174 0.0080 0.0033 5.4286 0.5271 5.9557
Other Petroleum Gas kWh x 0.20568 0.00024 0.00467 0.21059 0.02505 0.23564
Petrol kWh x 0.23965 0.00048 0.00163 0.24176 0.04279 0.28455
Petroleum Coke kWh x 0.32152 0.00023 0.00750 0.32925 0.03916 0.36841
Refinery Miscellaneous kWh x 0.24512 0.00023 0.00067 0.24602 0.02986 0.27588
therms x 7.1839 0.0066 0.0196 7.2102 0.8750 8.0852
Wood See Annex 9 See Annex 9 See Annex 9 See Annex 9 See Annex 9 See Annex 9
Total 0 0 0 0 0 0
Converting fuel types on an energy, Gross CV basis 9
Scope 1
Scope 1
Scope 1
Scope 1
Converting fuel types by unit volume
Page 9 of 49

2010 Guidelines to Defra / DECC's GHG Conversion Factors for Company Reporting
Annex 1 - Converting from fuel use to carbon dioxide equivalent emissionsLast updated: Aug-10
Table 1d Scope 3 All Scopes Scope 3 All Scopes
CO2 CH4 N2O Total Direct GHG Total Indirect GHG Grand Total GHG CO2 CH4 N2O Total Direct GHG Total Indirect GHG Grand Total GHG
Fuel Type Amount used per
year
Units x kg CO2
per unit
kg CO2e
per unit
kg CO2e
per unit
kg CO2e per unit kg CO2e per unit kg CO2e per unit Total kg
CO2
Total kg
CO2e
Total kg
CO2e
Total kg CO2e Total kg CO2e Total kg CO2e
Aviation Spirit kWh x 0.25012 0.00266 0.00248 0.25526 0.04504 0.30030
Aviation Turbine Fuel 1
kWh x 0.25847 0.00013 0.00254 0.26114 0.04804 0.30918
Biofuels See Annex 9 See Annex 9 See Annex 9 See Annex 9 See Annex 9 See Annex 9
Burning Oil1
kWh x 0.25857 0.00055 0.00071 0.25982 0.04804 0.30786
CNG 2
kWh x 0.20515 0.00030 0.00012 0.20558 0.03008 0.23566
Coal (industrial)3
kWh x 0.33325 0.00026 0.00572 0.33923 0.05542 0.39465
Coal (electricity generation)4
kWh x 0.33587 0.00006 0.00291 0.33884 0.05542 0.39426
Coal (domestic)5
kWh x 0.31139 0.04096 0.00565 0.35800 0.05542 0.41342
Coking Coal kWh x 0.34715 0.00338 0.00821 0.35874 0.05542 0.41416
Diesel kWh x 0.26607 0.00015 0.00294 0.26916 0.05105 0.32021
Electricity See Annex 3 See Annex 3 See Annex 3 See Annex 3 See Annex 3 See Annex 3
Fuel Oil 6
kWh x 0.28164 0.00023 0.00102 0.28289 0.04804 0.33093
Gas Oil 7
kWh x 0.26823 0.00027 0.02441 0.29291 0.05105 0.34396
LNG 8
kWh x 0.20515 0.00030 0.00012 0.20558 0.07200 0.27758
LPG kWh x 0.22999 0.00010 0.00018 0.23027 0.02880 0.25907
therms x 6.7404 0.0028 0.0052 6.7485 0.8441 7.59255
Lubricants kWh x 0.27862 0.00017 0.00074 0.27953 0.03394 0.31347
Naphtha kWh x 0.24899 0.00022 0.00064 0.24984 0.03522 0.28506
Natural Gas kWh x 0.20515 0.00030 0.00012 0.20558 0.01996 0.22554
therms x 6.0125 0.0089 0.0036 6.0250 0.5850 6.61004
Other Petroleum Gas kWh x 0.22357 0.00026 0.00508 0.22890 0.02723 0.25613
Petrol kWh x 0.25227 0.00051 0.00171 0.25449 0.04504 0.29953
Petroleum Coke kWh x 0.33845 0.00024 0.00789 0.34658 0.04122 0.38780
Refinery Miscellaneous kWh x 0.25802 0.00024 0.00071 0.25897 0.03143 0.29040
therms x 7.5620 0.0070 0.0207 7.5896 0.9211 8.51067
Wood See Annex 9 See Annex 9 See Annex 9 See Annex 9 See Annex 9 See Annex 9
Total 0 0 0 0 0 0
Sources
Notes1
2
3
4
5
6
7
8
9
10 Emission factors calculated on a Net Calorific Value basis.
Emission factors calculated on a Gross Calorific Value basis
UK Greenhouse Gas Inventory for 2008 (AEA)
Digest of UK Energy Statistics 2009 (DECC), available at:
http://www.decc.gov.uk/en/content/cms/statistics/publications/dukes/dukes.aspx
Burning oil is also known as kerosene or paraffin used for heating systems. Aviation Turbine fuel is a similar kerosene fuel specifically
refined to a higher quality for aviation.
Average emission factor for coal used in sources other than power stations and domestic, i.e. industry sources including collieries, Iron &
Steel, Autogeneration, Cement production, Lime production, Other industry, Miscellaneous, Public Sector, Stationary combustion -
railways and Agriculture. Users who wish to use coal factors for types of coal used in specific industry applications should use the factors
given in the UK ETS.
Converting fuel types on an energy, Net CV basis 10
Fuel oil is used for stationary power generation. Also use these emission factors for similar marine fuel oils.
LNG = Liquefied Natural Gas, usually shipped into the UK by tankers. LNG is usually used within the UK gas grid, however it can also be
used as an alternative transport fuel.
CNG = Compressed Natural Gas is usually stored at 200 bar in the UK for use as an alternative transport fuel.
Gas oil is used for stationary power generation and 'diesel' rail in the UK. Also use these emission factors for similar marine diesel oil
and marine gas oil fuels.
This emission factor should only be used for coal supplied for electricity generation (power stations). Coal supplied for domestic or
industrial purposes have different emission factors.
This emission factor should only be used for coal supplied for domestic purposes. Coal supplied to power stations or for industrial
purposes have different emission factors.
Scope 1Scope 1
Page 10 of 49

2010 Guidelines to Defra / DECC's GHG Conversion Factors for Company Reporting
Annex 2 - Combined Heat and Power - Imports and ExportsLast updated: Jun-09
How to use this Annex
Table 2a
Total emissions
(kg CO2e)
Total electricity
produced
Total heat
produced
kg CO2e/kWh
electricity
Table 2b
Total emissions
(kg CO2e)
Total electricity
produced
Total heat
produced
kgCO2e/kWh
heat
I buy my electricity from a producer/plant that I know is CHP. Which factor should I use?
If you purchase electricity for own consumption from a CHP plant, you should use the 'Grid Rolling Average' factor in Annex 3.
How were these factors calculated?
For further explanation on how these emission factors have been derived, please refer to the GHG conversion factor methodology paper available here:
http://www.defra.gov.uk/environment/business/reporting/conversion-factors.htm
total emissions (in kgCO2e)
If you use all the output of a Combined Heat and Power (CHP) plant to meet the energy needs of your business (i.e. you are not exporting any of the
electricity or heat for others to use), there is no need for you to attribute the emissions from the CHP plant between the electricity and heat output in your
reporting. This is because you are in this case responsible for the full emissions resulting from the fuel used for CHP. You can calculate the total CHP
plant emissions from the fuel used with the standard conversion factors at Annex 1.
If the heat user and the electricity user are different individuals/installations, greenhouse gas emissions should be calculated as per Annex 1 (i.e.
calculate fuel consumption then apply the appropriate conversion factor for that fuel) and then divided between the heat user and the electricity user .
It is typically roughly twice as efficient to generate heat from fossil fuels as it is to generate electricity. Therefore you can attribute the greenhouse gas
emissions from the CHP plant in the ratio 1:2 respectively per kWh of heat and electricity generated. Emissions per kWh of heat or electricity produced by
the CHP plant may be calculated in this way using the appropriate formula below:
Calculate emissions per kWh electricity
Calculate emissions per kWh heat
2 x total electricity produced + total heat produced (in kWh)Emissions (in kgCO2e) per kWh heat =
Emissions (in kgCO2e) per kWh electricity = 2 x total electricity produced + total heat produced (in kWh)
2 x total emissions (in kgCO2e)
Page 11 of 49

2010 Guidelines to Defra / DECC's GHG Conversion Factors for Company Reporting
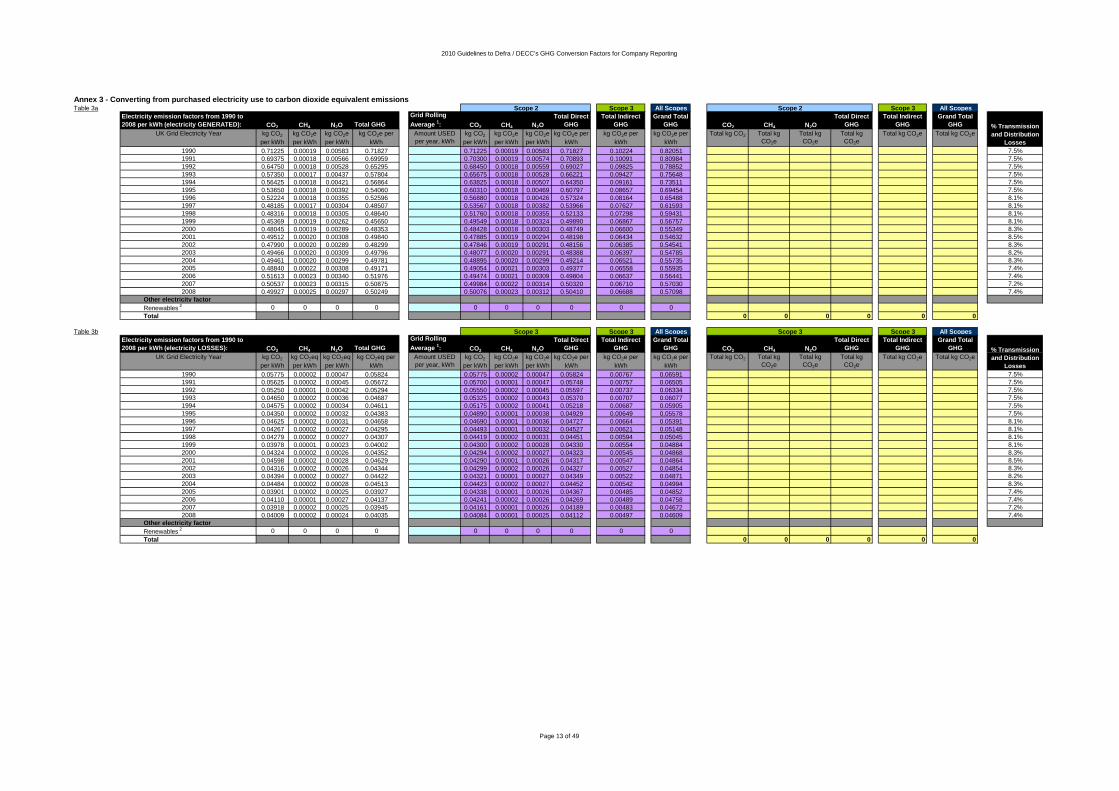
Annex 3 - Converting from purchased electricity use to carbon dioxide equivalent emissionsLast updated: Aug-10
How to use this Annex
To calculate emissions of carbon dioxide associated with use of UK grid electricity :
1) Identify the amount electricity used, in units of kWh;
Annex 3 Scopes & Boundaries:
How are the factors calculated?
I generate my electricity onsite. How do I calculate emissions from this?
How should I report the carbon emissions from my use of green tariffs?
How should I report the carbon emissions from my use of CHP-backed tariff?
You should account for all electricity purchased for own consumption from the national grid or a third party using the 'Grid Rolling Average' factor
(irrespective of the source of the electricity).
Do I need to update all my calculations using the new conversion factors each year?
How were these factors calculated?
The factors presented in the three tables below are a timeseries of electricity CO2 emission factors per kWh GENERATED (Table 3a, i.e. before
losses in transmission/distribution), electricity CO2 emission factors per kWh LOSSES in transmission/distribution (Table 3b) and per kWh
CONSUMED (Table 3c, i.e. for the final consumer, including transmission/distribution losses).
2) Multiply this value by the conversion factor for UK Grid Rolling Average electricity. Use Table 3c for calculating GHG emissions resulting from electricity
provided from the national/local grid.
The electricity conversion factors given in Table 3c represent the average carbon dioxide emission from the UK national grid per kWh of
electricity used at the point of final consumption (i.e. electricity grid transmission and distribution losses are included). This represents a
combination of the emissions directly resulting from electricity generation (Table 3a) and from electricity grid losses (Table 3b). The Direct GHG
emission factors include only carbon dioxide, methane and nitrous oxide emissions at UK power stations, with the Indirect GHG emission factors
including the emissions resulting from production and delivery of fuel to these power stations (i.e. from gas rigs, refineries and collieries, etc).
If you generate electricity from 'owned or controlled' renewable sources backed by Renewable Energy Guarantee of Origin (REGOs) within the
UK, you should account for these emissions using the 'Renewables' factor. Please see Annex G in Defra's Guidance on how to measure and
report your GHG emissions for an explanation of how to report on-site generated renewable energy:
http://www.defra.gov.uk/environment/business/reporting/index.htm
Scope 2 : Direct emissions of CO2, CH4 and N2O from the combustion of fuel in power stations to generate electricity (Table 3a Direct GHG, i.e.
excludes losses in transmission and distribution).
Further information on scopes is available from Defra's website in the guidance on reporting at:
http://www.defra.gov.uk/environment/business/reporting/index.htm
OR from the Greenhouse Gas Protocol's website at:
http://www.ghgprotocol.org/standards/corporate-standard
This factor changes from year to year, as the fuel mix consumed in UK power stations changes. Because these annual changes can be large
(the factor depends very heavily on the relative prices of coal and natural gas), and to assist companies with year to year comparability, a 'grid
rolling average' factor is presented which is the average of the grid Conversion factor over the last 5 years. This factor is updated annually.
Direct GHG emissions given in Table 3c are a combination of (Scope 2) Direct GHG emissions from Table 3a and (Scope 3) Direct GHG emissions from
Table 3b.
Scope 3: In electricity generation, this includes indirect GHG emissions associated with the extraction and transport of primary fuels as well as the refining,
distribution and storage of finished fuels (Table 3a, 3b and 3c). The Greenhouse Gas Protocol also attributes direct GHG emissions associated with losses
from electricity transmission and distribution (Table 3b) to Scope 3.
You should account for all electricity purchased for own consumption from the national grid or a third party using the 'Grid Rolling Average' factor
(irrespective of the source of the electricity). Please refer to Annex G of the Defra Guidance for further guidance on reporting green tariffs:
http://www.defra.gov.uk/environment/business/reporting/index.htm
Emission factors for electricity are provided in time-series (e.g. for grid electricity) and should be updated for historical reporting with the annual update.
This is because there can be revisions for earlier data due to the improvements in the calculation methodology or UK GHG inventory datasets they are
based upon. Please refer to the general introduction for further details.
For further explanation on how these emission factors have been derived, please refer to the GHG conversion factor methodology paper
available here: http://www.defra.gov.uk/environment/business/reporting/methodology-papers.htm
NOTE: Please use EITHER Table 3a + Table 3b, OR Table 3c to calculate emmissions to avoid double-counting.
(More information is also provided on the use of these tables in the introduction to the Annex.)
Page 12 of 49
2010 Guidelines to Defra / DECC's GHG Conversion Factors for Company Reporting
Annex 3 - Converting from purchased electricity use to carbon dioxide equivalent emissionsTable 3a Scope 3 All Scopes Scope 3 All Scopes
Electricity emission factors from 1990 to
2008 per kWh (electricity GENERATED): CO2 CH4 N2O Total GHG
Grid Rolling
Average 1: CO2 CH4 N2O
Total Direct
GHG
Total Indirect
GHG
Grand Total
GHG CO2 CH4 N2O
Total Direct
GHG
Total Indirect
GHG
Grand Total
GHG
UK Grid Electricity Year kg CO2
per kWh
kg CO2e
per kWh
kg CO2e
per kWh
kg CO2e per
kWh
Amount USED
per year, kWh
kg CO2
per kWh
kg CO2e
per kWh
kg CO2e
per kWh
kg CO2e per
kWh
kg CO2e per
kWh
kg CO2e per
kWh
Total kg CO2 Total kg
CO2e
Total kg
CO2e
Total kg
CO2e
Total kg CO2e Total kg CO2e
1990 0.71225 0.00019 0.00583 0.71827 0.71225 0.00019 0.00583 0.71827 0.10224 0.82051 7.5%
1991 0.69375 0.00018 0.00566 0.69959 0.70300 0.00019 0.00574 0.70893 0.10091 0.80984 7.5%
1992 0.64750 0.00018 0.00528 0.65295 0.68450 0.00018 0.00559 0.69027 0.09825 0.78852 7.5%
1993 0.57350 0.00017 0.00437 0.57804 0.65675 0.00018 0.00528 0.66221 0.09427 0.75648 7.5%
1994 0.56425 0.00018 0.00421 0.56864 0.63825 0.00018 0.00507 0.64350 0.09161 0.73511 7.5%
1995 0.53650 0.00018 0.00392 0.54060 0.60310 0.00018 0.00469 0.60797 0.08657 0.69454 7.5%
1996 0.52224 0.00018 0.00355 0.52596 0.56880 0.00018 0.00426 0.57324 0.08164 0.65488 8.1%
1997 0.48185 0.00017 0.00304 0.48507 0.53567 0.00018 0.00382 0.53966 0.07627 0.61593 8.1%
1998 0.48316 0.00018 0.00305 0.48640 0.51760 0.00018 0.00355 0.52133 0.07298 0.59431 8.1%
1999 0.45369 0.00019 0.00262 0.45650 0.49549 0.00018 0.00324 0.49890 0.06867 0.56757 8.1%
2000 0.48045 0.00019 0.00289 0.48353 0.48428 0.00018 0.00303 0.48749 0.06600 0.55349 8.3%
2001 0.49512 0.00020 0.00308 0.49840 0.47885 0.00019 0.00294 0.48198 0.06434 0.54632 8.5%
2002 0.47990 0.00020 0.00289 0.48299 0.47846 0.00019 0.00291 0.48156 0.06385 0.54541 8.3%
2003 0.49466 0.00020 0.00309 0.49796 0.48077 0.00020 0.00291 0.48388 0.06397 0.54785 8.2%
2004 0.49461 0.00020 0.00299 0.49781 0.48895 0.00020 0.00299 0.49214 0.06521 0.55735 8.3%
2005 0.48840 0.00022 0.00308 0.49171 0.49054 0.00021 0.00303 0.49377 0.06558 0.55935 7.4%
2006 0.51613 0.00023 0.00340 0.51976 0.49474 0.00021 0.00309 0.49804 0.06637 0.56441 7.4%
2007 0.50537 0.00023 0.00315 0.50875 0.49984 0.00022 0.00314 0.50320 0.06710 0.57030 7.2%
2008 0.49927 0.00025 0.00297 0.50249 0.50076 0.00023 0.00312 0.50410 0.06688 0.57098 7.4%
Other electricity factor
Renewables 2 0 0 0 0 0 0 0 0 0 0
Total 0 0 0 0 0 0
Table 3b Scope 3 All Scopes Scope 3 All Scopes
Electricity emission factors from 1990 to
2008 per kWh (electricity LOSSES): CO2 CH4 N2O Total GHG
Grid Rolling
Average 1: CO2 CH4 N2O
Total Direct
GHG
Total Indirect
GHG
Grand Total
GHG CO2 CH4 N2O
Total Direct
GHG
Total Indirect
GHG
Grand Total
GHG
UK Grid Electricity Year kg CO2
per kWh
kg CO2eq
per kWh
kg CO2eq
per kWh
kg CO2eq per
kWh
Amount USED
per year, kWh
kg CO2
per kWh
kg CO2e
per kWh
kg CO2e
per kWh
kg CO2e per
kWh
kg CO2e per
kWh
kg CO2e per
kWh
Total kg CO2 Total kg
CO2e
Total kg
CO2e
Total kg
CO2e
Total kg CO2e Total kg CO2e
1990 0.05775 0.00002 0.00047 0.05824 0.05775 0.00002 0.00047 0.05824 0.00767 0.06591 7.5%
1991 0.05625 0.00002 0.00045 0.05672 0.05700 0.00001 0.00047 0.05748 0.00757 0.06505 7.5%
1992 0.05250 0.00001 0.00042 0.05294 0.05550 0.00002 0.00045 0.05597 0.00737 0.06334 7.5%
1993 0.04650 0.00002 0.00036 0.04687 0.05325 0.00002 0.00043 0.05370 0.00707 0.06077 7.5%
1994 0.04575 0.00002 0.00034 0.04611 0.05175 0.00002 0.00041 0.05218 0.00687 0.05905 7.5%
1995 0.04350 0.00002 0.00032 0.04383 0.04890 0.00001 0.00038 0.04929 0.00649 0.05578 7.5%
1996 0.04625 0.00002 0.00031 0.04658 0.04690 0.00001 0.00036 0.04727 0.00664 0.05391 8.1%
1997 0.04267 0.00002 0.00027 0.04295 0.04493 0.00001 0.00032 0.04527 0.00621 0.05148 8.1%
1998 0.04279 0.00002 0.00027 0.04307 0.04419 0.00002 0.00031 0.04451 0.00594 0.05045 8.1%
1999 0.03978 0.00001 0.00023 0.04002 0.04300 0.00002 0.00028 0.04330 0.00554 0.04884 8.1%
2000 0.04324 0.00002 0.00026 0.04352 0.04294 0.00002 0.00027 0.04323 0.00545 0.04868 8.3%
2001 0.04598 0.00002 0.00028 0.04629 0.04290 0.00001 0.00026 0.04317 0.00547 0.04864 8.5%
2002 0.04316 0.00002 0.00026 0.04344 0.04299 0.00002 0.00026 0.04327 0.00527 0.04854 8.3%
2003 0.04394 0.00002 0.00027 0.04422 0.04321 0.00001 0.00027 0.04349 0.00522 0.04871 8.2%
2004 0.04484 0.00002 0.00028 0.04513 0.04423 0.00002 0.00027 0.04452 0.00542 0.04994 8.3%
2005 0.03901 0.00002 0.00025 0.03927 0.04338 0.00001 0.00026 0.04367 0.00485 0.04852 7.4%
2006 0.04110 0.00001 0.00027 0.04137 0.04241 0.00002 0.00026 0.04269 0.00489 0.04758 7.4%
2007 0.03918 0.00002 0.00025 0.03945 0.04161 0.00001 0.00026 0.04189 0.00483 0.04672 7.2%
2008 0.04009 0.00002 0.00024 0.04035 0.04084 0.00001 0.00025 0.04112 0.00497 0.04609 7.4%
Other electricity factor
Renewables 2 0 0 0 0 0 0 0 0 0 0
Total 0 0 0 0 0 0
% Transmission
and Distribution
Losses
Scope 3
Scope 2
Scope 3
Scope 2
% Transmission
and Distribution
Losses
Page 13 of 49

2010 Guidelines to Defra / DECC's GHG Conversion Factors for Company Reporting
Annex 3 - Converting from purchased electricity use to carbon dioxide equivalent emissions
Table 3c Scope 2, 33
Scope 3 All Scopes Scope 3 All Scopes
Electricity emission factors from 1990 to
2008 per kWh (electricity CONSUMED): CO2 CH4 N2O Total GHG
Grid Rolling
Average 1: CO2 CH4 N2O
Total Direct
GHG
Total Indirect
GHG
Grand Total
GHG CO2 CH4 N2O
Total Direct
GHG
Total Indirect
GHG
Grand Total
GHG
UK Grid Electricity Year kg CO2
per kWh
kg CO2eq
per kWh
kg CO2eq
per kWh
kg CO2eq per
kWh
Amount USED
per year, kWh
kg CO2
per kWh
kg CO2e
per kWh
kg CO2e
per kWh
kg CO2e per
kWh
kg CO2e per
kWh
kg CO2e per
kWh
Total kg CO2 Total kg
CO2e
Total kg
CO2e
Total kg
CO2e
Total kg CO2e Total kg CO2e
1990 0.77000 0.00021 0.00630 0.77651 0.77000 0.00021 0.00630 0.77651 0.10991 0.88642 7.5%
1991 0.75000 0.00020 0.00611 0.75631 0.76000 0.00020 0.00621 0.76641 0.10848 0.87489 7.5%
1992 0.70000 0.00019 0.00570 0.70589 0.74000 0.00020 0.00604 0.74624 0.10562 0.85186 7.5%
1993 0.62000 0.00019 0.00473 0.62491 0.71000 0.00020 0.00571 0.71591 0.10134 0.81725 7.5%
1994 0.61000 0.00020 0.00455 0.61475 0.69000 0.00020 0.00548 0.69568 0.09848 0.79416 7.5%
1995 0.58000 0.00020 0.00424 0.58443 0.65200 0.00019 0.00507 0.65726 0.09306 0.75032 7.5%
1996 0.56849 0.00020 0.00386 0.57254 0.61570 0.00019 0.00462 0.62051 0.08828 0.70879 8.1%
1997 0.52452 0.00019 0.00331 0.52802 0.58060 0.00019 0.00414 0.58493 0.08248 0.66741 8.1%
1998 0.52595 0.00020 0.00332 0.52947 0.56179 0.00020 0.00386 0.56584 0.07892 0.64476 8.1%
1999 0.49347 0.00020 0.00285 0.49652 0.53849 0.00020 0.00352 0.54220 0.07421 0.61641 8.1%
2000 0.52369 0.00021 0.00315 0.52705 0.52722 0.00020 0.00330 0.53072 0.07145 0.60217 8.3%
2001 0.54110 0.00022 0.00336 0.54469 0.52175 0.00020 0.00320 0.52515 0.06981 0.59496 8.5%
2002 0.52306 0.00022 0.00315 0.52643 0.52145 0.00021 0.00317 0.52483 0.06912 0.59395 8.3%
2003 0.53860 0.00022 0.00336 0.54218 0.52398 0.00021 0.00318 0.52737 0.06919 0.59656 8.2%
2004 0.53945 0.00022 0.00327 0.54294 0.53318 0.00022 0.00326 0.53666 0.07063 0.60729 8.3%
2005 0.52741 0.00024 0.00333 0.53098 0.53392 0.00022 0.00329 0.53744 0.07043 0.60787 7.4%
2006 0.55723 0.00024 0.00367 0.56113 0.53715 0.00023 0.00335 0.54073 0.07126 0.61199 7.4%
2007 0.54455 0.00025 0.00340 0.54820 0.54145 0.00023 0.00340 0.54509 0.07193 0.61702 7.2%
2008 0.53936 0.00027 0.00321 0.54284 0.54160 0.00024 0.00337 0.54522 0.07185 0.61707 7.4%
Other electricity factor
Renewables 2 0 0 0 0 0 0 0 0 0 0
Total 0 0 0 0 0 0
Sources
Notes
1
2
3
% Transmission
and Distribution
Losses
Based on UK Greenhouse Gas Inventory for 2008 (AEA) according to the amount of CO2, CH4 and N2O emitted from major power stations
Scope 2, 33
This factor changes from year to year, as the fuel mix consumed in UK power stations changes. Because these annual changes can be large
(the factor depends very heavily on the relative prices of coal and natural gas), and to assist companies with year to year comparability, the
factor presented is the grid rolling average of the grid conversion factor over the previous 5 years. This factor is updated annually.
The electricity conversion factors given represent the average carbon dioxide emission from the UK national grid per kWh of electricity generated
(supplied to grid) in Table 3a, and in Table 3c for kWh electricity used at the point of final consumption (i.e. transmission and distribution losses
are included, from Table 3b). These factors include only direct carbon dioxide (CO2), methane (CH4) and nitrous oxide (N2O) emissions at UK
power stations and do not include emissions resulting from production and delivery of fuel to these power stations (i.e. from gas rigs, refineries
and collieries, etc.).
Includes both Direct GHG emissions per kWh (electricity GENERATED), which are counted as Scope 2, as well as Direct GHG emissions per
kWh (electricity LOSSES), which are counted as Scope 3. This does not include indirect GHG emissions, which are different and accounted
separately, but also fall into Scope 3 for reporting.
Organisations should only use the 'Renewables' factor for reporting emissions from electricity generated from owned or controlled renewable sources
backed by Renewable Energy Guarantee of Origin (REGOs) certificates. Please refer to Annex G of the Defra Guidance for further guidance on reporting
renewable energy:
http://www.defra.gov.uk/environment/business/reporting/index.htm
per unit of electricity consumed from the DECC's Digest of UK Energy Statistics (DUKES) 2009 Table 5.6, available at:
http://www.decc.gov.uk/en/content/cms/statistics/publications/dukes/dukes.aspx
Emission Factor (Electricity CONSUMED) = Emission Factor (Electricity GENERATED) + Emission Factor (Electricity LOSSES)
Page 14 of 49

2010 Guidelines to Defra / DECC's GHG Conversion Factors for Company Reporting
Annex 4 - Typical Process EmissionsLast updated: Jun-09
Carbon Dioxide CO2
Methane CH4
Nitrous oxide N2O
Perfluorocarbons PFC
Sulphur Hexafluoride SF6
Hydrofluorocarbons HFC
Table 4
1
CO2 CH4 N2O PFC SF6 HFC
Cement Production
Lime Production
Limestone Use 2
Soda Ash Production and Use
Fletton Brick Manufacture 3
Ammonia
Nitric Acid
Adpic Acid
Urea
Carbides
Caprolactam
Petrochemicals
Iron, Steel and Ferroalloys
Aluminium
Magnesium
Other Metals
Coal mining
Solid fuel transformation
Oil production
Gas production and distribution
Venting and flaring from oil/gas production
Production of Halocarbons
Use of Halocarbons and SF6
Organic waste management
Sources
Notes1
2
3 This is specific to Fletton brick manufacture at the mineral processing stage, a
process that uses clay with high organic content. Other types of brick manufacturing in
the UK do not release Greenhouse Gases during the processing stage.
adapted for UK processes by AEA
Other
Greenhouse Gas Inventory Reference Manual, Revised 1996 IPCC Guidelines for
National Greenhouse Gas Inventories (IPCC, 1997)
These process related emissions refer to the types of processes that are used
specifically in the UK. Process emissions might be slightly different for processes
operated in other countries.
If you have identified process emissions of greenhouse gases other than those
covered in this Annex these may be converted to carbon dioxide equivalents by using
the factors provided in Annex 5.
For use of limestone in Flue Gas Desulphurisation (FGD) and processes such as
those in the glass industry. Not all uses of limestone release CO2.
Energy
Industry
Process
How to use this Annex
Process related emissions 1
Mineral
Products
Emission
Chemical
Industry
Metal
Production
Below is a table that highlights the gases that are likely to be produced by a variety of
the industries in the UK that are most likely to have a significant impact on climate
change. The dark areas represent the gases that are likely to be produced.
The Kyoto protocol seeks to reduce emissions of the following six greenhouse gases.
Page 15 of 49

2010 Guidelines to Defra / DECC's GHG Conversion Factors for Company Reporting
Last updated: May-10
How to use this Annex
CFCs and HCFCs
Mixed/Blended gases
How were these factors calculated?
Table 5a
2
Emission Chemical formula Amount
Emitted per
Year in tonnes
x Conversion
Factor
(GWP)
x Unit
conversion
tonnes to kg
Total kg CO2
equivalent
Carbon Dioxide CO2 x 1 x 1,000
Methane CH4 x 21 x 1,000
Nitrous Oxide N2O x 310 x 1,000
HFC-23 CHF3 x 11,700 x 1,000
HFC-32 CH2F2 x 650 x 1,000
HFC-41 CH3F x 150 x 1,000
HFC-125 CHF2CF3 x 2,800 x 1,000
HFC-134 CHF2CHF2 x 1,000 x 1,000
HFC-134a CH2FCF3 x 1,300 x 1,000
HFC-143 CH3CF3 x 300 x 1,000
HFC-143a CH3CHF2 x 3,800 x 1,000
HFC-152a CF3CHFCF3 x 140 x 1,000
HFC-227ea CF3CH2CF3 x 2,900 x 1,000
HFC-236fa CHF2CH2CF3 x 6,300 x 1,000
HFC-245fa CH3CF2CH2CF3 x 560 x 1,000
HFC-43-I0mee CF3CHFCHFCF2CF3 x 1,300 x 1,000
Perfluoromethane (PFC-14) CF4 x 6,500 x 1,000
Perfluoroethane (PFC-116) C2F6 x 9,200 x 1,000
Perfluoropropane (PFC-218) C3F8 x 7,000 x 1,000
Perfluorocyclobutane (PFC-318) c-C4F8 x 8,700 x 1,000
Perfluorobutane (PFC-3-1-10) C4F10 x 7,000 x 1,000
Perfluoropentane (PFC-4-1-12) C5F12 x 7,500 x 1,000
Perfluorohexane (PFC-5-1-14) C6F14 x 7,400 x 1,000
Sulphur hexafluoride SF6 x 23,900 x 1,000
Blends
R404A 52:44:4 blend of HFC-143a, -125 and -134a x 3,260 x 1,000
R407C 23:25:52 blend of HFC-32, -125 and -134a x 1,526 x 1,000
R408A 47:7:46 blend HCFC-22, HFC-125 and HFC-143a x 2,795 x 1,000
R410A 50:50 blend of HFC-32 and -125 x 1,725 x 1,000
R507 50:50 blend of HFC-125 and HFC-143a x 3,300 x 1,000
R508B 46:54 blend of HFC-23 and PFC-116 x 10,350 x 1,000
Total 0
Revised GWP values have since been published by the IPCC in the Fourth Assessment Report (2007) but current UNFCCC Guidelines on
Reporting and Review, adopted before the publication of the Fourth Assessment Report, require emission estimates to be based on the GWPs
in the IPCC Second Assessment Report. A second table, Table 5b, includes other greenhouse gases not listed in the Kyoto protocol or
covered by reporting under UNFCCC. These GWP conversion factors have been taken from the IPCC's Fourth Assessment Report (2007).
Not all refrigerants in use are classified as greenhouse gases for the purposes of the UNFCCC and Kyoto Protocol (e.g. CFCs, HCFCs).
These gases are controlled under the Montreal Protocol and as such GWP values are listed in Table 5b
GWP values for refrigerant blends should be calculated on the basis of the percentage blend composition (e.g. the GWP for R404a that
comprises is 44% HFC125, 52% HFC143a and 4% HFC134a is [2800 x 0.44] + [3800 x 0.52] + [1300 x 0.04] = 3260). A limited selection of
common blends is presented in Tables 5a and 5b.
For further explanation on how these emission factors have been derived, please refer to the GHG conversion factor methodology paper
available here: http://www.defra.gov.uk/environment/business/reporting/methodology-papers.htm
Annex 5 - Emission Factors for converting Greenhouse Gas Emissions into Carbon Dioxide Equivalents
(including emissions from refrigerants and air conditioning systems)
Global Warming Potentials (GWPs) are used to compare the impact of the emission of equivalent masses of different GHGs relative to carbon
dioxide. For example, it is estimated that the emission of 1 kilogram of methane will have the same warming impact 1 as 21 kilograms of carbon
dioxide. Therefore the GWP of methane is 21. The GWP of carbon dioxide is, by definition, 1.
The conversion factors in Table 5a incorporate (GWP) values relevant to reporting under UNFCCC, as published by the IPCC in its Second
Assessment Report, Climate Change 1995. The Science of Climate Change. Contribution of Working Group I to the Second Assessment
Report of the Intergovernmental Panel on Climate Change. (Eds. J. T Houghton et al, 1996) .
Factors for Process Emissions - Greenhouse Gases Listed in the Kyoto Protocol
1 Over the period of one century. The length of time a GWP is referenced to is important. 100 year GWPs were adopted for use under the UNFCCC and Kyoto
Protocol.
Page 16 of 49

2010 Guidelines to Defra / DECC's GHG Conversion Factors for Company Reporting
Last updated: May-10
Annex 5 - Emission Factors for converting Greenhouse Gas Emissions into Carbon Dioxide Equivalents
(including emissions from refrigerants and air conditioning systems)
Table 5b
Emission Amount
Emitted per
Year in tonnes
x Conversion
Factor
(GWP)
x Unit
conversion
tonnes to kg
Total kg CO2
equivalent
CFC-11/R11 = Trichlorofluoromethane CCl3F x 4,750 x 1,000
CFC-12/R12 = Dichlorodifluoromethane CCl2F2 x 10,900 x 1,000
CFC-13 CClF3 x 14,400 x 1,000
CFC-113 CCl2FCClF2 x 6,130 x 1,000
CFC-114 CClF2CClF2 x 10,000 x 1,000
CFC-115 CClF2CF3 x 7,370 x 1,000
Halon-1211 CBrClF2 x 1,890 x 1,000
Halon-1301 CBrF3 x 7,140 x 1,000
Halon-2402 CBrF2CBrF2 x 1,640 x 1,000
Carbon tetrachloride CCl4 x 1,400 x 1,000
Methyl bromide CH3Br x 5 x 1,000
Methyl chloroform CH3CCl3 x 146 x 1,000
HCFC-22/R22 = Chlorodifluoromethane CHClF2 x 1,810 x 1,000
HCFC-123 CHCl2CF3 x 77 x 1,000
HCFC-124 CHClFCF3 x 609 x 1,000
HCFC-141b CH3CCl2F x 725 x 1,000
HCFC-142b CH3CClF2 x 2,310 x 1,000
HCFC-225ca CHCl2CF2CF3 x 122 x 1,000
HCFC-225cb CHClFCF2CClF2 x 595 x 1,000
Nitrogen trifluoride NF3 x 17,200 x 1,000
PFC-4-1-12 C5F12 x 9,160 x 1,000
PFC-9-1-18 C10F18 x 7,500 x 1,000
trifluoromethyl sulphur pentafluoride SF5CF3 x 17,700 x 1,000
HFE-125 CHF2OCF3 x 14,900 x 1,000
HFE-134 CHF2OCHF2 x 6,320 x 1,000
HFE-143a CH3OCF3 x 756 x 1,000
HCFE-235da2 CHF2OCHClCF3 x 350 x 1,000
HFE-245cb2 CH3OCF2CHF2 x 708 x 1,000
HFE-245fa2 CHF2OCH2CF3 x 659 x 1,000
HFE-254cb2 CH3OCF2CHF2 x 359 x 1,000
HFE-347mcc3 CH3OCF2CF2CF3 x 575 x 1,000
HFE-347pcf2 CHF2CF2OCH2CF3 x 580 x 1,000
HFE-356pcc3 CH3OCF2CF2CHF2 x 110 x 1,000
HFE-449sl (HFE-7100) C4F9OCH3 x 297 x 1,000
HFE-569sf2 (HFE-7200) C4F9OC2H5 x 59 x 1,000
HFE-43-10pccc124 (H-Galden1040x) CHF2OCF2OC2F4OCHF2 x 1,870 x 1,000
HFE-236ca12 (HG-10) CHF2OCF2OCHF2 x 2,800 x 1,000
HFE-338pcc13 (HG-01) CHF2OCF2CF2OCHF2 x 1,500 x 1,000
PFPMIE CF3OCF(CF3)CF2OCF2OCF3 x 10,300 x 1,000
Dimethylether CH3OCH3 x 1 x 1,000
Methylene chloride CH2Cl2 x 8.7 x 1,000
Methyl chloride CH3Cl x 13 x 1,000
R290 = Propane C3H8 x 3.3 x 1,000
R600A = Isobutane C4H10 x 0.001 x 1,000
R406A 55:41:4 blend of HCFC-22, HCFC-142b and R600A x 1,943 x 1,000
R409A 60:25:15 blend of HCFC-22, HCFC-124 and HCFC-142b x 1,585 x 1,000
R502 48.8:51.2 blend of HCFC-22 and CFC-115 x 4,657 x 1,000
Total 0
Sources
Notes
The conversion factors in Table 4a above incorporate global warming potential (GWP) values published by the IPCC in its Second Assessment Report (Climate
Change 1995. The Science of Climate Change. Contribution of Working Group I to the Second Assessment Report of the Intergovernmental Panel on Climate
Change. (Eds. J.T Houghton et al). Published for the Intergovernmental Panel on Climate Change by Cambridge University Press 1996). Revised GWP values
have since been published by the IPCC in the Third Assessment Report (2001) and Fourth Assessment Report (2007) but current UNFCCC Guidelines on
Reporting and Review, adopted before the publication of the Third and Fourth Assessment Report, require emission estimates to be based on the GWPs in the
IPCC Second Assessment Report.
Factors for Process Emissions - Other Greenhouse Gases (e.g. other refrigerants)
Substances controlled by the Montreal Protocol
Other Perfluorinated compounds
Others
The conversion factors in Table 5b above incorporate (GWP) values published by the IPCC in its Fourth Assessment Report (Working Group I Report "The
Physical Science Basis", 2007, available at: http://www.ipcc.ch/ipccreports/ar4-wg1.htm).
Not all refrigerants in use are classified as greenhouse gases for the purposes of the Climate Change Programme (e.g. CFCs, HCFCs, other substances listed in
Table 5b). GWP values for refrigerant HFC blends should be calculated on the basis of the percentage blend composition. For example, the GWP for R404A
that comprises is 44% HFC125, 52% HFC143a and 4% HFC134a is 2800 x 0.44 + 3800 x 0.52 + 1300 x 0.04 = 3260. Similarly R407C is a blend of 23% of R32,
25% of R125 and 52% of R134a = 650 x 0.23 + 2800 x 0.25 + 1300 x 0.52 = 1526. Information on blends is based largely on information from the UK Institute of
Refrigeration website: http://www.ior.org.uk/index.php
Fluorinated ethers
Blends
Page 17 of 49

2010 Guidelines to Defra / DECC's GHG Conversion Factors for Company Reporting
Annex 6 - Passenger Transport Conversion TablesLast updated: Oct-10
How to use this Annex
Annex 6 Scopes & Boundaries:
How do I determine UK rail travel distances (in miles) where start and destination stations are known?
1. Click on web link: http://www.networkrail.co.uk/aspx/3828.aspx
2. Select the Route Index under Train Timetables
4. In the timetable, refer to the 'Miles' columns on the left to determine mileage between your starting and destination stations.
How were these factors calculated?
Table 6a Scope 3 All Scopes Scope 3 All Scopes
3 CO2 CH4 N2O
Total Direct
GHG
Total Indirect
GHG
Grand Total
GHG CO2 CH4 N2O
Total Direct
GHG
Total Indirect
GHG
Grand Total
GHG
Total units used x kg CO2
per unit
kg CO2e
per unit
kg CO2e
per unit
kg CO2e per
unit
kg CO2e per
unit
kg CO2e per
unit
Total kg CO2 Total kg
CO2e
Total kg
CO2e
Total kg CO2e Total kg CO2e Total kg CO2e
2.3018 0.0046 0.0156 2.3220 0.4109 2.7329
2.6413 0.0015 0.0292 2.6720 0.5067 3.1787
2.7122 0.0040 0.0016 2.7178 0.3977 3.1155
1.4902 0.0006 0.0012 1.4920 0.1866 1.6786
0 0 0 0 0 0
Further information on scopes, control and leased assets is available in the Introduction to these Annexes, and from Defra's website in the guidance on
reporting at:
Scope 1 OR Scope 3: Direct emissions from transport can fall into either Scope 1 or Scope 3, depending on the vehicle ownership/level of control. For
vehicles owned or directly controlled by a reporting company, direct emissions should be reported under Scope 1. However, emissions resulting from
transport-related activities in vehicles not owned or controlled by the reporting entity should be reported under Scope 3. Examples of direct emissions from
passenger transport that would be reported under Scope 3 include:
- Employees commuting to and from work;
A further consideration is the treatment of leased assets (e.g. vehicles), which depends on the organisational boundaries set and the control approach.
In general it is recommended that the 'control' approach is used in order to decide whether to report emissions as Scope 1 or Scope 3. The control approach
is itself divided into two methods – financial and operational ( where the financial control approach is the one most commonly recommended).
- A company has financial control over an operation if the company has the ability to direct the financial and operating policies of the operation with a view to
gaining economic benefits from its activities.
- A company has operational control over an operation if the company or one of its subsidiaries has the full authority to introduce and implement its operating
policies at the operation.
In the transport sector, ‘open book accounts’ provide a very good illustration of the financial and operational control methods. In the case of an open book
account, a transport operator provides vehicles to a customer, but the customer pays the fuel bill for those vehicles directly, rather than simply paying the
transport operator for the logistics service.
In the open book situation, the customer has financial control, but the transport operator has operational control. The customer and the transport operator will
have to decide whether the emissions resulting from these transport operations are the customer’s or the transport operator’s Scope 1. Whichever method is
used, it is very important that it is clearly stated in all reporting, and that it is consistently applied by both organisations.
- Employee business travel by non-owned means, i.e. public transport such as: bus, rail, ferry and taxi and air travel (except for the companies actually
owning/controlling the fleet / operating the services);
Scope 1: Direct emissions of CO2, CH4 and N2O from the combustion of fuel from owned/controlled transport.
Scope 3: Indirect emissions associated with the extraction and transport of primary fuels as well as the refining, distribution, storage and retail of finished
fuels. Emission factors are based on data from the JEC Well-To-Wheels study, for further information see: http://ies.jrc.ec.europa.eu/WTW
Emissions can be calculated either from fuel use (see Table 6a), which is the most accurate method of calculation, or estimated from distance travelled
using UK average emission factors for different modes of transport (other Tables 6b - 6j). For public transport (Tables 6k and 6l) emissions are presented per
passenger, rather than per vehicle. Therefore enter passenger kilometres travelled to calculate emissions (e.g. if one person travels 500km, then passenger
kilometres travelled are 500. If three people travel the same distance passenger kilometres travelled are 1500).
3. Use your mouse cursor to click on the appropriate train route in the 'Table' column that matches your starting and destination stations. This should open a
corresponding timetable with rail distances.
Simply multiply activity (either fuel used, kilometres travelled or passenger kilometres travelled) by the appropriate conversion factor. An excel spreadsheet is
provided for ease of use.
For further explanation on how these emission factors have been derived, please refer to the GHG conversion factor methodology paper available here:
http://www.defra.gov.uk/environment/business/reporting/methodology-papers.htm
Fuel used
Petrol
Diesel
Compressed Natural Gas (CNG)
Liquid Petroleum Gas (LPG)
Total
Scope 1 OR Scope 3
Units
litres
litres
kg
litres
Scope 1 OR Scope 3
Standard Road Transport Fuel Conversion Factors
http://www.defra.gov.uk/environment/business/reporting/index.htm
OR from the Greenhouse Gas Protocol's website at:
http://www.ghgprotocol.org/standards/corporate-standard
Page 18 of 49

2010 Guidelines to Defra / DECC's GHG Conversion Factors for Company Reporting
Annex 6 - Passenger Transport Conversion TablesLast updated: Oct-10
Sources
Notes
Table 6b Scope 3 All Scopes Scope 3 All Scopes
4 CO2 CH4 N2O
Total Direct
GHG
Total Indirect
GHG
Grand Total
GHG CO2 CH4 N2O
Total Direct
GHG
Total Indirect
GHG
Grand Total
GHG
Total units travelled x kg CO2
per unit
kg CO2e
per unit
kg CO2e
per unit
kg CO2e per
unit
kg CO2e per
unit
kg CO2e per
unit
Total kg CO2 Total kg
CO2e
Total kg
CO2e
Total kg CO2e Total kg CO2e Total kg CO2e
x 0.27837 0.00029 0.00154 0.28020 0.04970 0.32990
x 0.17297 0.00018 0.00096 0.17411 0.03088 0.20499
x 0.34578 0.00029 0.00154 0.34762 0.06173 0.40935
x 0.21486 0.00018 0.00096 0.21600 0.03836 0.25436
x 0.48179 0.00029 0.00154 0.48362 0.08602 0.56964
x 0.29937 0.00018 0.00096 0.30051 0.05345 0.35396
x 0.33910 0.00029 0.00154 0.34094 0.06054 0.40148
x 0.21071 0.00018 0.00096 0.21185 0.03762 0.24947
0 0 0 0 0 0
Table 6c Scope 3 All Scopes Scope 3 All Scopes
4 CO2 CH4 N2O
Total Direct
GHG
Total Indirect
GHG
Grand Total
GHG CO2 CH4 N2O
Total Direct
GHG
Total Indirect
GHG
Grand Total
GHG
Total units travelled x kg CO2
per unit
kg CO2e
per unit
kg CO2e
per unit
kg CO2e per
unit
kg CO2e per
unit
kg CO2e per
unit
Total kg CO2 Total kg
CO2e
Total kg
CO2e
Total kg CO2e Total kg CO2e Total kg CO2e
x 0.23364 0.00008 0.00267 0.23640 0.04482 0.28122
x 0.14518 0.00005 0.00166 0.14689 0.02785 0.17474
x 0.29124 0.00008 0.00267 0.29399 0.05588 0.34987
x 0.18097 0.00005 0.00166 0.18268 0.03472 0.21740
x 0.39503 0.00008 0.00267 0.39778 0.07578 0.47356
x 0.24546 0.00005 0.00166 0.24717 0.04709 0.29426
x 0.31374 0.00008 0.00267 0.31649 0.06019 0.37668
x 0.19495 0.00005 0.00166 0.19666 0.03740 0.23406
0 0 0 0 0 0
Table 6d Scope 3 All Scopes Scope 3 All Scopes
4 CO2 CH4 N2O
Total Direct
GHG
Total Indirect
GHG
Grand Total
GHG CO2 CH4 N2O
Total Direct
GHG
Total Indirect
GHG
Grand Total
GHG
Total units travelled x kg CO2
per unit
kg CO2e
per unit
kg CO2e
per unit
kg CO2e per
unit
kg CO2e per
unit
kg CO2e per
unit
Total kg CO2 Total kg
CO2e
Total kg
CO2e
Total kg CO2e Total kg CO2e Total kg CO2e
x 0.19174 0.00016 0.00154 0.19344 0.03423 0.22767
x 0.11914 0.00010 0.00096 0.12020 0.02127 0.14147
x 0.34965 0.00021 0.00154 0.35140 0.06243 0.41383
x 0.21726 0.00013 0.00096 0.21835 0.03879 0.25714
x 0.26506 0.00023 0.00154 0.26683 0.04731 0.31414
x 0.16470 0.00014 0.00096 0.16580 0.02940 0.19520
x 0.31120 0.00060 0.00198 0.31377 0.03896 0.35274
x 0.19337 0.00037 0.00123 0.19497 0.02421 0.21918
x 0.43361 0.00060 0.00198 0.43618 0.05430 0.49048
x 0.26943 0.00037 0.00123 0.27103 0.03374 0.30477
x 0.34471 0.00060 0.00198 0.34728 0.04316 0.39044
x 0.21419 0.00037 0.00123 0.21579 0.02682 0.24261
x 0.27663 0.00145 0.00198 0.28006 0.04056 0.32061
x 0.17189 0.00090 0.00123 0.17402 0.02520 0.19922
x 0.38542 0.00145 0.00198 0.38885 0.05650 0.44535
x 0.23949 0.00090 0.00123 0.24162 0.03511 0.27673
x 0.30640 0.00145 0.00198 0.30983 0.04492 0.35475
x 0.19039 0.00090 0.00123 0.19252 0.02791 0.22043
0 0 0 0 0 0
miles
Average LPG or CNG car km
Total for petrol cars
miles
km
miles
km
miles
km
Scope 1 OR Scope 3
Total for diesel cars
Units
miles
km
miles
km
miles
Units
miles
km
miles
km
Average petrol hybrid car
Passenger Road Transport Conversion Factors: Alternative Fuel Cars
Average petrol hybrid car
Medium CNG car
Medium LPG car miles
Medium LPG or CNG car km
Large LPG car miles
km
Units
miles
miles
km
miles
Average petrol car
Type of alternative fuel car
Size of car
Large petrol hybrid car
Average LPG or CNG car
Medium LPG or CNG car
Large CNG car
Average diesel car
miles
km
Large LPG or CNG car km
Average LPG car
Size of car
Digest of UK Energy Statistics 2009 (DECC), available at:
http://www.decc.gov.uk/en/content/cms/statistics/publications/dukes/dukes.aspx
Carbon factors for fuels (UKPIA, 2004)
km
Small petrol car, up to 1.4 litre engine
Passenger Road Transport Conversion Factors: Petrol Cars
Large petrol cars, above 2.0 litres
Medium petrol car, from 1.4 - 2.0 litres
1 imperial gallon (UK) = 4.546 litres
Large petrol hybrid car
miles
Medium petrol hybrid car
km
Large LPG or CNG car
km
Scope 1 OR Scope 3
km
Medium petrol hybrid car
miles
Small diesel car, up to 1.7 litre or under
Scope 1 OR Scope 3
Medium diesel car, from 1.7 to 2.0 litre
Large diesel car, over 2.0 litre
Scope 1 OR Scope 3
Passenger Road Transport Conversion Factors: Diesel Cars
Total for alternative fuel cars
Average CNG car
Scope 1 OR Scope 3 Scope 1 OR Scope 3
UK Greenhouse Gas Inventory for 2008 (AEA, 2010)
Page 19 of 49

2010 Guidelines to Defra / DECC's GHG Conversion Factors for Company Reporting
Annex 6 - Passenger Transport Conversion TablesLast updated: Oct-10
Table 6e Scope 3 All Scopes Scope 3 All Scopes
4 CO2 CH4 N2O
Total Direct
GHG
Total Indirect
GHG
Grand Total
GHG CO2 CH4 N2O
Total Direct
GHG
Total Indirect
GHG
Grand Total
GHG
Total units travelled x kg CO2
per unit
kg CO2e
per unit
kg CO2e
per unit
kg CO2e per
unit
kg CO2e per
unit
kg CO2e per
unit
Total kg CO2 Total kg
CO2e
Total kg
CO2e
Total kg CO2e Total kg CO2e Total kg CO2e
x 0.27220 0.00026 0.00177 0.27423 0.04875 0.32298
x 0.16914 0.00016 0.00110 0.17040 0.03029 0.20069
x 0.32790 0.00021 0.00196 0.33008 0.05955 0.38963
x 0.20375 0.00013 0.00122 0.20510 0.03700 0.24210
x 0.43842 0.00018 0.00216 0.44075 0.08042 0.52117
x 0.27242 0.00011 0.00134 0.27387 0.04997 0.32384
x 0.33297 0.00023 0.00195 0.33515 0.06041 0.39556
x 0.20690 0.00014 0.00121 0.20825 0.03754 0.24579
0 0 0 0 0 0
Sources
Notes
Table 6f Scope 3 All Scopes Scope 3 All Scopes
5 CO2 CH4 N2O
Total Direct
GHG
Total Indirect
GHG
Grand Total
GHG CO2 CH4 N2O
Total Direct
GHG
Total Indirect
GHG
Grand Total
GHG
Total units travelled x kg CO2
per unit
kg CO2e
per unit
kg CO2e
per unit
kg CO2e per
unit
kg CO2e per
unit
kg CO2e per
unit
Total kg CO2 Total kg
CO2e
Total kg
CO2e
Total kg CO2e Total kg CO2e Total kg CO2e
x 0.25727 0.00029 0.00154 0.25910 0.04593 0.30503
x 0.15986 0.00018 0.00096 0.16100 0.02854 0.18954
x 0.27755 0.00029 0.00154 0.27938 0.04955 0.32893
x 0.17246 0.00018 0.00096 0.17360 0.03079 0.20439
x 0.32589 0.00029 0.00154 0.32773 0.05818 0.38591
x 0.20250 0.00018 0.00096 0.20364 0.03615 0.23979
x 0.37017 0.00029 0.00154 0.37200 0.06608 0.43808
x 0.23001 0.00018 0.00096 0.23115 0.04106 0.27221
x 0.43884 0.00029 0.00154 0.44067 0.07834 0.51901
x 0.27268 0.00018 0.00096 0.27382 0.04868 0.32250
x 0.55921 0.00029 0.00154 0.56105 0.09984 0.66089
x 0.34748 0.00018 0.00096 0.34862 0.06204 0.41066
x 0.41013 0.00029 0.00154 0.41196 0.07323 0.48519
x 0.25484 0.00018 0.00096 0.25598 0.04550 0.30148
x 0.46660 0.00029 0.00154 0.46843 0.08330 0.55173
x 0.28993 0.00018 0.00096 0.29107 0.05176 0.34283
x 0.38006 0.00029 0.00154 0.38190 0.06785 0.44975
x 0.23616 0.00018 0.00096 0.23730 0.04216 0.27946
0 0 0 0 0 0
km
These factors are estimated average values for the UK car fleet in 2009 travelling on average trips in the UK. They are calculated based on data from SMMT
on new car CO2 emissions from 1997 to 2009 combined with factors from TRL as functions of average speed of vehicle derived from test data under real
world testing cycles and an uplift of 15% agreed with DfT to take into account further real-world driving effects on emissions relative to test-cycle based data.
Further work is ongoing to understand this figure in more detail and revise it if necessary in the future.
The hybrid car factors are calculated based on data new car CO2 emissions averaged across the main 4 hybrid vehicles currently available on the market
and an uplift of 15% agreed with DfT to take into account real-world driving effects on emissions relative to test-cycle based data.
New emission factors for CH4 and N2O are based on UK Greenhouse Gas Inventory default values for 2008 (AEA, 2010)
Average car (unknown fuel)
Real world effects not covered in regular test cycles include use of accessories (air con, lights, heaters, etc), vehicle payload (only driver +25kg is considered
in tests, no passengers or further luggage), poor maintenance (tyre under inflation, maladjusted tracking, etc), gradients (tests effectively assume a level
road), weather, harsher driving style, etc.
B. Supermini
Market segment of car
A. Mini
B. Supermini
A. Mini
F. Luxury
C. Lower Medium
C. Lower Medium
D. Upper Medium
D. Upper Medium
km
miles
Average medium car (unknown fuel)
Average large car (unknown fuel)
Total for average cars
miles
E. Executive
Units
miles
km
miles
km
miles
Factors developed by AEA and agreed with Department for Transport (2010)
According to the Energy Savings Trust (EST ), LPG and CNG cars results in 10-15% reduction in CO2 relative to petrol cars, similar to diesel vehicles. New
factors for LPG and CNG cars were calculated based on an average 12.5% reduction in CO2 emissions relative to the emission factors for petrol cars from
Table 6b. Due to the significant size and weight of the LPG and CNG fuel tanks only medium and large sized vehicles are available.
miles
km
Size of car
Scope 1 OR Scope 3 Scope 1 OR Scope 3
Scope 1 OR Scope 3 Scope 1 OR Scope 3
More accurate calculation of emissions can be made using the actual fuel consumed, where available, and the emission factors in Table 6a. Alternatively if a
figure for a specific car's fuel consumption (e.g. in miles per gallon, mpg) is known, then the CO2 can be calculated from the total mileage and the Table 6a
factors.
Units
miles
Passenger Road Transport Conversion Factors: Cars (unknown fuel)
km
miles
km
Average small car (unknown fuel)
H. Duel Purpose 4x4
I. MPV
F. Luxury
G. Sports
G. Sports
H. Duel Purpose 4x4
km
miles
km
miles
km
miles
I. MPV
Total for petrol cars
E. Executive
km
miles
km
miles
km
Passenger Road Transport Conversion Factors: Petrol Cars by Market Segment
Page 20 of 49

2010 Guidelines to Defra / DECC's GHG Conversion Factors for Company Reporting
Annex 6 - Passenger Transport Conversion TablesLast updated: Oct-10
Table 6g Scope 3 All Scopes Scope 3 All Scopes
5 CO2 CH4 N2O
Total Direct
GHG
Total Indirect
GHG
Grand Total
GHG CO2 CH4 N2O
Total Direct
GHG
Total Indirect
GHG
Grand Total
GHG
Total units travelled x kg CO2
per unit
kg
CO2eq
per unit
kg
CO2eq
per unit
kg CO2eq
per unit
kg CO2eq per
unit
kg CO2eq
per unit
Total kg CO2 Total kg
CO2eq
Total kg
CO2eq
Total kg
CO2eq
Total kg
CO2eq
Total kg
CO2eq
x 0.16626 0.00008 0.00267 0.16901 0.03190 0.20091
x 0.10331 0.00005 0.00166 0.10502 0.01982 0.12484
x 0.23348 0.00008 0.00267 0.23624 0.04479 0.28103
x 0.14508 0.00005 0.00166 0.14679 0.02783 0.17462
x 0.26763 0.00008 0.00267 0.27039 0.05134 0.32173
x 0.16630 0.00005 0.00166 0.16801 0.03190 0.19991
x 0.29208 0.00008 0.00267 0.29483 0.05604 0.35087
x 0.18149 0.00005 0.00166 0.18320 0.03482 0.21802
x 0.34599 0.00008 0.00267 0.34874 0.06639 0.41513
x 0.21499 0.00005 0.00166 0.21670 0.04125 0.25795
x 0.40770 0.00008 0.00267 0.41045 0.07821 0.48866
x 0.25333 0.00005 0.00166 0.25504 0.04860 0.30364
x 0.28748 0.00008 0.00267 0.29023 0.05515 0.34538
x 0.17863 0.00005 0.00166 0.18034 0.03427 0.21461
x 0.43562 0.00008 0.00267 0.43837 0.08357 0.52194
x 0.27068 0.00005 0.00166 0.27239 0.05193 0.32432
x 0.33561 0.00008 0.00267 0.33836 0.06439 0.40275
x 0.20854 0.00005 0.00166 0.21025 0.04001 0.25026
0 0 0 0 0 0
Table 6h Scope 3 All Scopes Scope 3 All Scopes
5 CO2 CH4 N2O
Total Direct
GHG
Total Indirect
GHG
Grand Total
GHG CO2 CH4 N2O
Total Direct
GHG
Total Indirect
GHG
Grand Total
GHG
Total units travelled x kg CO2
per unit
kg CO2e
per unit
kg CO2e
per unit
kg CO2e per
unit
kg CO2e per
unit
kg CO2e per
unit
Total kg CO2 Total kg
CO2e
Total kg
CO2e
Total kg CO2e Total kg CO2e Total kg CO2e
x 0.25637 0.00029 0.00163 0.25828 0.04497 0.30325
x 0.15930 0.00018 0.00101 0.16049 0.02794 0.18843
x 0.27309 0.00026 0.00177 0.27512 0.04862 0.32374
x 0.16969 0.00016 0.00110 0.17095 0.03021 0.20116
x 0.30920 0.00024 0.00187 0.31131 0.05625 0.36756
x 0.19213 0.00015 0.00116 0.19344 0.03495 0.22839
x 0.33717 0.00021 0.00196 0.33935 0.06235 0.40170
x 0.20951 0.00013 0.00122 0.21086 0.03874 0.24960
x 0.39910 0.00018 0.00216 0.40143 0.07179 0.47322
x 0.24799 0.00011 0.00134 0.24944 0.04461 0.29405
x 0.52468 0.00018 0.00216 0.52701 0.08800 0.61501
x 0.32602 0.00011 0.00134 0.32747 0.05468 0.38215
x 0.40729 0.00018 0.00216 0.40963 0.06333 0.47296
x 0.25308 0.00011 0.00134 0.25453 0.03935 0.29388
x 0.44807 0.00018 0.00216 0.45041 0.08344 0.53385
x 0.27842 0.00011 0.00134 0.27987 0.05185 0.33172
x 0.35697 0.00019 0.00206 0.35922 0.06626 0.42548
x 0.22181 0.00012 0.00128 0.22321 0.04117 0.26438
0 0 0 0 0 0
Sources
Notes
H. Duel Purpose 4x4
A. Mini
G. Sports
G. Sports
Market segment of car
A. Mini
Scope 1 OR Scope 3
A. Mini
B. Supermini
Scope 1 OR Scope 3
Scope 1 OR Scope 3
Scope 1 OR Scope 3
Factors developed by AEA and agreed with Department for Transport (2010)
The market segment categories are the standard segments as defined by SMMT (UK Society of Motor Manufacturers and Traders). These factors are
estimated average values for the UK car fleet in 2009 travelling on average trips in the UK. They are calculated based on data from SMMT on new car CO2
emissions from 1997 to 2009 by SMMT. An uplift of 15% agreed with DfT to take into account further real-world driving effects on emissions relative to test-
cycle based data (as under Tables 6b-6e). Further work is ongoing to understand this figure in more detail and revise it if necessary in the future.
There is a substantial variation in emission factors across market classes due to significant variations in engine size and vehicle weight. The Department for
Transport consider the emission factors by fuel and engine size to often be a closer match to actual emissions. It is preferable to use the emission factors by
engine size provided in Tables 6b and 6c over the market class based factors where possible.
km
miles
Market segment of car
A. Mini
Units
miles
Passenger Road Transport Conversion Factors: Diesel Cars by Market Segment
E. Executive
F. Luxury
B. Supermini
C. Lower Medium
C. Lower Medium
D. Upper Medium
D. Upper Medium
E. Executive
km
miles
km
miles
km
miles
km
miles
km
miles
H. Duel Purpose 4x4
I. MPV
F. Luxury
G. Sports
G. Sports
H. Duel Purpose 4x4
km
miles
km
miles
I. MPV
Total for diesel cars
km
E. Executive
F. Luxury
B. Supermini
C. Lower Medium
C. Lower Medium
D. Upper Medium
D. Upper Medium
E. Executive
Units
miles
km
miles
F. Luxury
B. Supermini
km
miles
km
miles
km
miles
km
miles
Total for cars (unknown fuel)
miles
H. Duel Purpose 4x4
I. MPV
km
I. MPV
km
miles
Passenger Road Transport Conversion Factors: Cars (unknown fuel) by Market
Segment
km
km
miles
Page 21 of 49

2010 Guidelines to Defra / DECC's GHG Conversion Factors for Company Reporting
Annex 6 - Passenger Transport Conversion TablesLast updated: Oct-10
Table 6i Scope 3 All Scopes Scope 3 All Scopes
6 CO2 CH4 N2O
Total Direct
GHG
Total Indirect
GHG
Grand Total
GHG CO2 CH4 N2O
Total Direct
GHG
Total Indirect
GHG
Grand Total
GHG
Total units travelled x kg CO2
per unit
kg CO2e
per unit
kg CO2e
per unit
kg CO2e per
unit
kg CO2e per
unit
kg CO2e per
unit
Total kg CO2 Total kg
CO2e
Total kg
CO2e
Total kg CO2e Total kg CO2e Total kg CO2e
x 0.31233 0.00039 0.00134 0.31406 0.06025 0.37431
x 0.19407 0.00024 0.00084 0.19515 0.03744 0.23259
x 0.33975 0.00039 0.00134 0.34148 0.06552 0.40700
x 0.21111 0.00024 0.00084 0.21218 0.04071 0.25289
x 0.41160 0.00041 0.00294 0.41495 0.07961 0.49456
x 0.25575 0.00026 0.00183 0.25784 0.04947 0.30731
x 0.38697 0.00040 0.00243 0.38981 0.07479 0.46460
x 0.24045 0.00025 0.00151 0.24222 0.04647 0.28869
x 0.25271 0.00010 0.00172 0.25453 0.04883 0.30336
x 0.15703 0.00006 0.00107 0.15816 0.03034 0.18850
x 0.36178 0.00010 0.00246 0.36434 0.06989 0.43423
x 0.22480 0.00006 0.00153 0.22639 0.04343 0.26982
x 0.43314 0.00010 0.00295 0.43619 0.08369 0.51988
x 0.26914 0.00006 0.00183 0.27103 0.05200 0.32303
x 0.40363 0.00010 0.00275 0.40647 0.07799 0.48446
x 0.25080 0.00006 0.00171 0.25257 0.04846 0.30103
x 0.42381 0.00083 0.00312 0.42776 0.05356 0.48132
x 0.26334 0.00052 0.00194 0.26580 0.03328 0.29908
x 0.38345 0.00202 0.00312 0.38859 0.05697 0.44556
x 0.23826 0.00126 0.00194 0.24146 0.03540 0.27686
x 0.40259 0.00012 0.00273 0.40544 0.07778 0.48322
x 0.25016 0.00007 0.00169 0.25193 0.04833 0.30026
0 0 0 0 0 0
Sources
Notes
Table 6j Scope 3 All Scopes Scope 3 All Scopes
7 CO2 CH4 N2O
Total Direct
GHG
Total Indirect
GHG
Grand Total
GHG CO2 CH4 N2O
Total Direct
GHG
Total Indirect
GHG
Grand Total
GHG
Total units travelled x kg CO2
per unit
kg CO2e
per unit
kg CO2e
per unit
kg CO2e per
unit
kg CO2e per
unit
kg CO2e per
unit
Total kg CO2 Total kg
CO2e
Total kg
CO2e
Total kg CO2e Total kg CO2e Total kg CO2e
x 0.13678 0.00412 0.00056 0.14146 0.02441 0.16587
x 0.08499 0.00256 0.00035 0.08790 0.01517 0.10307
x 0.16602 0.00465 0.00100 0.17167 0.02964 0.20131
x 0.10316 0.00289 0.00062 0.10667 0.01842 0.12509
x 0.22087 0.00360 0.00100 0.22547 0.03943 0.26490
x 0.13724 0.00224 0.00062 0.14010 0.02450 0.16460
x 0.18678 0.00425 0.00097 0.19199 0.03335 0.22534
x 0.11606 0.00264 0.00060 0.11930 0.02072 0.14002
0 0 0 0 0 0
Sources
Notes
LPG van up to 3.5 tonne miles
LPG or CNG van up to 3.5 tonne km
Scope 1 OR Scope 3
These factors are based on calculations of average emissions data by size category, based data provided by Clear (http://www.clear-offset.com/) of almost
1200 datapoints, over 300 different bikes from 50-1500cc, and from 25 manufacturers from a mix of magazine road test reports and user reported data.
Factors developed by AEA and agreed with Department for Transport (2010)
Factors developed by AEA and agreed with Department for Transport (2010)
Emission factors for petrol and diesel light good vehicles (vans up to 3.5 tonnes) were calculated based on the new emission factors used in the National
Atmospheric Emissions Inventory (NAEI) and Greenhouse Gas Inventory for 2008 (AEA, 2010). These test cycle based emission factors were then uplifted
by 15% to represent ‘real-world’ emissions, consistent with the approach used for cars agreed with DfT. Emission factors for LPG and CNG vans were
estimated to be similar to diesel vehicles, as indicated by EST for cars. The average van emission factor was calculated on the basis of the relative NAEI
vehicle km for petrol and diesel LGVs for 2008.
Scope 1 OR Scope 3 Scope 1 OR Scope 3
Scope 1 OR Scope 3
New emission factors for CH4 and N2O are based on UK Greenhouse Gas Inventory default values for 2008 (AEA, 2010)
New emission factors for CH4 and N2O are based on UK Greenhouse Gas Inventory default values for 2008 (AEA,
More accurate calculation of emissions can be made using the actual fuel consumed, where available, and the emission factors in Table 6a. Alternatively if a
figure for a specific car's fuel consumption (e.g. in miles per gallon, mpg) is known, then the CO2 can be calculated from the total mileage and the Table 6a
factors.
Petrol van (Class II), 1.305 to 1.74 tonne
Units
miles
Diesel van (Class II), 1.305 to 1.74 tonne
Average van up to 3.5 tonne
Total for vans
Diesel van up to 3.5 tonne
CNG van up to 3.5 tonne
Diesel van (Class III), 1.74 to 3.5 tonne
LPG or CNG van up to 3.5 tonne
Average van up to 3.5 tonne
Diesel van up to 3.5 tonne
km
km
miles
Type of van
Petrol van (Class I), up to 1.305 tonne
Petrol van up to 3.5 tonne
Diesel van (Class I), up to 1.305 tonne
Petrol van (Class III), 1.74 to 3.5 tonne
Petrol van up to 3.5 tonne
Average petrol motorbike
(unknown engine size)
More accurate calculation of emissions can be made using the actual fuel consumed, where available, and the emission factors in Table 5a. Alternatively if a
figure for a specific motorbike's fuel consumption (e.g. in miles per gallon, mpg) is known, then the CO2 can be calculated from the total mileage and the
Table 6a factors.
miles
km
miles
km
miles
km
miles
km
miles
km
miles
Size of motorcycle
km
miles
km
miles
km
Passenger Road Transport Conversion Factors: Motorcycles
Units
miles
km
miles
Total for motorcycles
km
Small petrol motorbike
(mopeds/scooters up to 125cc)
Medium petrol motorbike
(125-500cc)
Large petrol motorbike
(over 500cc)
Passenger Road Transport Conversion Factors: Vans (Light Commercial Vehicles)
miles
km
miles
km
New emission factors for CH4 and N2O are based on UK Greenhouse Gas Inventory default values for 2008 (AEA, 2010)
Page 22 of 49

2010 Guidelines to Defra / DECC's GHG Conversion Factors for Company Reporting
Annex 6 - Passenger Transport Conversion TablesLast updated: Oct-10
Table 6k Scope 3 All Scopes Scope 3 All Scopes
8 CO2 CH4 N2O
Total Direct
GHG
Total Indirect
GHG
Grand Total
GHG CO2 CH4 N2O
Total Direct
GHG
Total Indirect
GHG
Grand Total
GHG
Method of travel Vehicle kms
travelled (vkm)1
x kg CO2
per vkm1
kg CO2e
per vkm1
kg CO2e
per vkm1
kg CO2e per
vkm1
kg CO2e per
vkm1
kg CO2e per
vkm1
Total kg CO2 Total kg
CO2e
Total kg
CO2e
Total kg CO2e Total kg CO2e Total kg CO2e
x 0.21322 0.00005 0.00166 0.21493 0.02473 0.23966
x 0.24546 0.00005 0.00166 0.24717 0.04709 0.29426
Method of travel Passenger kms
travelled (pkm)
x kg CO2
per pkm
kg CO2e
per pkm
kg CO2e
per pkm
kg CO2e per
pkm
kg CO2e per
pkm
kg CO2e per
pkm
Total kg CO2 Total kg
CO2e
Total kg
CO2e
Total kg CO2e Total kg CO2e Total kg CO2e
x 0.15230 0.00004 0.00119 0.15352 0.02922 0.18274
x 0.19958 0.00012 0.00064 0.20034 0.03563 0.23597
x 0.15726 0.00020 0.00128 0.15874 0.03017 0.18891
x 0.08847 0.00009 0.00056 0.08912 0.01697 0.10609
x 0.13394 0.00016 0.00104 0.13514 0.02570 0.16084
x 0.03000 0.00008 0.00057 0.03065 0.00576 0.03641
x 0.05340 0.00006 0.00305 0.05651 0.00859 0.06510
x 0.01502 0.00001 0.00009 0.01512 0.00202 0.01714
x 0.07680 0.00004 0.00046 0.07730 0.01031 0.08761
x 0.07414 0.00004 0.00044 0.07462 0.00995 0.08457
x 0.01912 0.00001 0.00015 0.01928 0.00326 0.02254
x 0.13216 0.00004 0.00102 0.13322 0.02254 0.15576
x 0.11516 0.00004 0.00088 0.11608 0.01964 0.13572
0 0 0 0 0 0
Sources
Notes1
2
3
4
5
6
7
8
9
10
All:
Department for Transport, Transport for London and AEA (2010)
Scope 3
Taxi 2
The emission factor for international rail is based on figures provided by Eurostar in kgCO2/pkm based on electricity grid average emission factors. Eurostar's
published figure is 0.00771 kgCO2/pkm. This differs from the figure quoted in the table above as it is calculated using the individual conversion factors
as specified by each electricity supplier across each network section upon which they operate. For further information please visit:
http://www.eurostar.com/UK/uk/leisure/about_eurostar/environment/greener_than_flying.jsp
The London Underground rail factor is recalculated using the updated 2008 grid rolling average from figures in the Transport for London 2009 environmental
report available at: http://www.tfl.gov.uk/corporate/about-tfl/publications/1478.aspx
The factor for local buses was calculated based on actual fuel consumption data submitted by bus operators to the DfT as part of their Bus Service
Operators Grant (BSOG) claims and DfT bus statistics.
The national rail factor refers to an average emission per passenger kilometre for diesel and electric trains in 2007. The CO2 value for passenger rail is based
on currently available information on CO2 emissions by diesel and electric passenger trains in the UK in 2007 produced by ORR (Office of the Rail Regulator)
and is available at the link below. Emission factors for freight rail (from the same source) are provided in Annex 7, Table 7f.
The factors for RoPax ferries (Roll-on Roll-off ferries with additional passenger capacity) are based on data provided by Best Foot Forward from work for the
Passenger Shipping Association (PSA) carried out in 2007/8. The calculated figure is based on ferry service operator provided data on fuel consumption and
passengers transported, but does not include any data for passenger only ferry services, which would be expected to have significantly higher emission
factors per passenger km.
The emission factor for coach transport is the figure from the National Express Group's Corporate Responsibility Report, available at:
http://www.nationalexpressgroup.com/nx1/corporate/environment/climate/. National Express are responsible for the majority of long-distance coach services
in the UK, so this figure is expected to be broadly representative of the overall average.
Emission factors for CH4 and N2O are based on UK Greenhouse Gas Inventory default values for 2008 (AEA, 2010)
The light rail and tram factors were based on an average of factors for the Docklands Light Rail (DLR) service, the Manchester Metrolink, Tyne and Wear
Metro, Glasgow Underground, Supertram, Midland Metro and the Croydon Tramlink. The factors for the Tyne and Wear, Glasgow, Midland, Supertram and
Manchester tram and light rail systems were based on annual electricity consumption and passenger km data provided by the network operators in 2008
(referring mostly to consumption in 2007/08) and a CO2 emission factor for grid rolling average electricity from Table 3c. DLR and Croydon Tramlink figures
were recalculated using the updated 2008 grid rolling average from those available in the Transport for London 2009 environmental report available at:
http://www.tfl.gov.uk/corporate/about-tfl/publications/1478.aspx
The London bus factor is calculated using the same methodology as for other local busses using DfT's BSOG dataset and statistics.
Emission factors for taxis were estimated on the basis of an average of the emission factors of medium and large cars from Table 6c and occupancy of 1.4
(CfIT, 2002). The emission factors for black cabs are based on the large car emission factor (consistent with the VCA dataset for London Taxis International
vehicles) and an average passenger occupancy of 1.5 (average 2.5 people per cab from LTI website, 2008).
vkm (vehicle-km) is a measure of vehicle activity, representing the movement of a vehicle over a distance; pkm (passenger-km) is a measure of the total
distance travelled by passengers on a vehicle and is calculated by multiplying the number of passengers by the vehicle-km.
Scope 3
Coach 5
Regular taxi
Black cab
Rail
Local London bus 4
Taxi 2
Bus Local bus (not London) 3
Black cab
http://www.rail-reg.gov.uk/upload/pdf/rolling-c9-environ.pdf
Regular taxi
Taxi, Bus, Rail and Ferry Passenger Transport Conversion Factors
Average (all passengers)
Car passengers
Average local bus
National rail 6
International rail (Eurostar) 7
Light rail and tram 8
London Underground 9
Ferry (Large RoPax) 10
Foot passengers
Total
Page 23 of 49

2010 Guidelines to Defra / DECC's GHG Conversion Factors for Company Reporting
Annex 6 - Passenger Transport Conversion TablesLast updated: Oct-10
Table 6l Scope 3 All Scopes Scope 3 All Scopes
9 CO2 CH4 N2O
Total Direct
GHG
Total Indirect
GHG
Grand Total
GHG CO2 CH4 N2O
Total Direct
GHG
Total Indirect
GHG
Grand Total
GHG
Method of travel Passenger kms
travelled (pkm)
x km uplift factor 12 x kg CO2
per pkm 13
kg CO2e
per pkm
kg CO2e
per pkm
kg CO2e per
pkm
kg CO2e per
pkm
kg CO2e per
pkm
Total kg CO2 Total kg
CO2e
Total kg
CO2e
Total kg CO2e Total kg CO2e Total kg CO2e
Flight type14 Cabin class
11
Domestic14
Average x 109% x 0.17147 0.00013 0.00169 0.17328 0.03187 0.20515
Short-haul international14
Average x 109% x 0.09700 0.00001 0.00095 0.09797 0.01803 0.11600
Economy class x 109% x 0.09245 0.00001 0.00091 0.09336 0.01718 0.11054
Business class x 109% x 0.13867 0.00001 0.00136 0.14004 0.02577 0.16581
Long-haul international14
Average x 109% x 0.11319 0.00001 0.00111 0.11431 0.02104 0.13535
Economy class x 109% x 0.08263 0.00000 0.00081 0.08345 0.01536 0.09881
Premium economy class x 109% x 0.13221 0.00001 0.00130 0.13352 0.02457 0.15809
Business class x 109% x 0.23963 0.00001 0.00236 0.24200 0.04454 0.28654
First class x 109% x 0.33052 0.00002 0.00325 0.33380 0.06143 0.39523
0 0 0 0 0 0
Source
Notes
10
11
12
13
14
Air Passenger Transport Conversion Factors10
Scope 3
Civil Aviation Authority (2010)
Developed by AEA (2010) using the methodology developed in discussion with the Department for Transport and the airline industry, 2008.
EMEP/CORINAIR Emissions Inventory Guidebook (EIG), EEA (2009)
Total
The 9% uplift factor comes from the IPCC Aviation and the global Atmosphere 8.2.2.3 , which states that 9-10% should be added to take into account non-
direct routes (i.e. not along the straight line great circle distances between destinations) and delays/circling. Airline industry representatives have indicated
that the percentage uplift for short-haul flights will be higher and for long-haul flights will be lower, however specific data is not currently available to provide
separate factors. This is under investigation for future versions of these guidelines.
The emissions factors are based on typical aircraft fuel burn over illustrative trip distances listed in the EMEP/CORINAIR Emissions Inventory Guidebook
(EIG 2007) – available at the EEA website at: http://reports.eea.europa.eu/EMEPCORINAIR5/en/B851vs2.4.pdf and
http://reports.eea.europa.eu/EMEPCORINAIR5/en/B851_annex.zip. This information is combined with data from the Civil Aviation Authority (CAA) on
average aircraft seating capacity, loading factors, and annual passenger-km and aircraft-km for 2007 (most recent full-year data available). The provisional
evidence to date suggests an uplift in the region of 10-12% to climb/cruise/descent factors derived by the CORINAIR approach is appropriate in order to
ensure consistency with estimated UK aviation emissions as reported in line with the UN Framework on Climate Change, covering UK domestic flights and
departing international flights. This uplift has already been included in these emissions factors.
These emissions are based on bunker fuel consumption and are closely related to fuel on departing flights. This uplift is therefore based on comparisons of
national aviation fuel consumption from this reported inventory, with detailed bottom up calculations in DfT modelling along with the similar NAEI approach,
which both use detailed UK activity data (by aircraft and route) from CAA, and the CORINAIR fuel consumption approach. Therefore for this version of the
Defra CO2 emission factors an uplift of 10% is applied to the emissions from the Cruise, Climb and Decent of the aircraft based on provisional evidence. The
CORINAIR uplift is in addition to the assumption that Great Circle Distances are increased by 9% to allow for sub-optimal routing and stacking at airports
during periods of heavy congestion. It should be noted that work will continue to determine a more robust reconciliation and this will be accounted for in
future versions of these factors.
The long haul estimate is based on a flight length from the Guidebook of 6482 km, short haul 1108km and domestic 463km. Actual flight distances do
however vary significantly, as demonstrated in the examples in the following tables. Domestic flights are between UK airports, short haul international flights
are typically to Europe (up to 3700km distance), and long haul international flights are typically to non-European destinations (or all other international flights
over 3700km distance).
The emission factors refer to aviation's direct carbon dioxide (CO2), methane (CH4) and nitrous oxide (N2O) emissions only. There is currently uncertainty
over the other non-CO2 climate change effects of aviation (including water vapour, contrails, NOx etc) which may indicatively be accounted for by applying a
multiplier. The appropriate factor to apply is subject to uncertainty but was estimated by the IPCC in 1999 to be in the range 2-4, with current best scientific
evidence suggesting a factor of 1.9.
If used, this factor would be applied to the emissions factors set out here.
The indicative emissions factors by passenger seating class have been produced to allow passengers to build an understanding of how emissions per
passenger km are affected by load factors and seat configurations. This is in response to feedback on the previous version of the Act on CO 2 calculator.
Emission factors by passenger seating class were developed on the basis of detailed analysis of the seating configurations of 24 aircraft model variants from
16 major airlines providing services within/to/from the UK. Indicative emission factors were calculated via the relative area on the aircraft occupied by
different seating classes compared to an economy class equivalent per passenger. Figures are only indicative averages and will vary considerably between
different specific airline and aircraft configurations.
Scope 3
These indicative factors will be updated as further evidence comes to light on how these factors could more accurately be estimated. There are several ways
in which these factors could be estimated, which will be kept under review.
These emissions factors are intended to be an aggregate representation of the typical emissions per passenger km from illustrative types of aircraft for the 3
types of air services. Actual emissions will vary significantly according to the type of aircraft in use, the load, cabin class, specific conditions of the flight route,
etc.
Page 24 of 49

2010 Guidelines to Defra / DECC's GHG Conversion Factors for Company Reporting
Annex 6 - Passenger Transport Conversion TablesLast updated: Oct-10
Illustrative long haul flight distances
Area
North Africa
Southern Africa
Middle East
North America
North America
South America
Indian sub-continent
Far East
Australasia
Source
Illustrative short haul flight distances
Area
Europe
Europe
Europe
Europe
Source
Abu Simbel/Sharm El Sheikh, Egypt 3300
Airport
From London to:
Sao Paulo, Brazil
Bombay/Mumbai, India
Dubai, UAE
Malaga, Spain 1700
5500
5600
400
8900Los Angeles California, USA
Distance (km)
New emission factors for CH4 and N2O are based on the UK Greenhouse Gas Inventory for 2008 (AEA, 2010)
Distances based on International Passenger Survey (Office for National Statistics) calculations using airport geographic information.
Distances based on International Passenger Survey (Office for National Statistics) calculations using airport geographic information.
7200
9000
Hong Kong
Johannesburg/Pretoria, South Africa
1500
From London to:
9700
17000
Athens, Greece
Amsterdam, Netherlands
1000Prague (Ruzyne), Czech Rep
Distance (km)
Sydney, Australia
New York (JFK), USA
9400
Airport
Page 25 of 49

2010 Guidelines to Defra / DECC's GHG Conversion Factors for Company Reporting
Annex 7 - Freight Transport Conversion TablesLast updated: Oct-10
How to use this Annex
If you know how much of a particular fuel type is consumed, emissions can be calculated using Table 7a. This is the most accurate way to calculate emissions.
Table 7b gives emissions for distance travelled for vans and small trucks
Annex 7 Scopes & Boundaries:
How do I determine UK rail travel distances (in miles) where start and destination stations are known?
1. Click on web link: http://www.networkrail.co.uk/aspx/3828.aspx
2. Select the Route Index under Train Timetables
Table 7a Scope 3 All Scopes Scope 3 All Scopes
3 CO2 CH4 N2O
Total Direct
GHG
Total Indirect
GHG
Grand Total
GHG CO2 CH4 N2O
Total Direct
GHG
Total Indirect
GHG
Grand Total
GHG
Total units used Units
x
kg CO2 per
unit
kg CO2e per
unit
kg CO2e per
unit
kg CO2e per
unit
kg CO2e per
unit
kg CO2e per
unit
Total kg CO2 Total kg CO2e Total kg CO2e Total kg CO2e Total kg CO2e Total kg CO2e
litres x 2.3018 0.00460 0.01560 2.32200 0.41090 2.7329 `
litres x 2.6413 0.00150 0.02920 2.67200 0.50670 3.1787
kg x 2.7122 0.00400 0.00160 2.71780 0.39770 3.1155
litres x 1.4902 0.00060 0.00120 1.49200 0.18660 1.6786
0 0 0 0 0 0
Sources
Carbon factors for fuels (UKPIA, 2004)
Notes 1 imperial gallon (UK) = 4.546 litres
A tonne-km is a measure of transported goods representing the movement of one tonne over one km. To use the tables below you will need to multiply the weight of goods (in tonnes) by
the distance travelled by that mode (in km).
In general it is recommended that the 'control' approach is used in order to decide whether to report emissions as Scope 1 or Scope 3. The control approach is itself divided into two
methods – financial and operational ( where the financial control approach is the one most commonly recommended).
- A company has financial control over an operation if the company has the ability to direct the financial and operating policies of the operation with a view to gaining economic benefits
from its activities.
- A company has operational control over an operation if the company or one of its subsidiaries has the full authority to introduce and implement its operating policies at the operation.
In the transport sector, ‘open book accounts’ provide a very good illustration of the financial and operational control methods. In the case of an open book account, a transport operator
provides vehicles to a customer, but the customer pays the fuel bill for those vehicles directly, rather than simply paying the transport operator for the logistics service.
In the open book situation, the customer has financial control, but the transport operator has operational control. The customer and the transport operator will have to decide whether the
emissions resulting from these transport operations are the customer’s or the transport operator’s Scope 1. Whichever method is used, it is very important that it is clearly stated in all
reporting, and that it is consistently applied by both organisations.
A further consideration is the treatment of leased assets (e.g. vehicles), which depends on the organisational boundaries set and the control approach.
3. Use your mouse cursor to click on the appropriate train route in the 'Table' column that matches your starting and destination stations. This should open a corresponding timetable with
rail distances.
Table 7e gives emissions per tonne kilometre travelled for a range of HGV sizes with a range of different loads. Use this table if you know the distance the freight has travelled and
what the mass (in tonnes) of the freight was.
Table 7d gives emissions per vehicle kilometre travelled for a range of HGV sizes with a range of different loads. Use this table if you know the distance the vehicle has travelled. If you
do not know the load capacity of your vehicle, apply the UK average load which is given for a range of vehicle classes.
Table 7c gives emissions per tonne freight carried for vans and small trucks. Emission factors for vans in tonne km were calculated from the emission factors per vehicle km provided in
Table 6i (Annex 6) and an average load factor of 40%. The average cargo capacity was taken to be 0.6 tonnes for vans up to 1.305 tonnes gross vehicle weight, 1 tonne for vans
between 1.305-1.740 tonnes gross vehicle weight and 2 tonnes for vans up to 3.5 tonnes gross vehicle weight.
Table 7g gives emissions factors for tonne kilometres of freight for shipping
Table 7f gives emissions factors for tonne kilometres of freight for rail , and air freight
Scope 1: Direct emissions of CO2, CH4 and N2O from the combustion of fuel from owned/controlled transport.
Scope 3: Indirect emissions associated with the extraction and transport of primary fuels as well as the refining, distribution, storage and retail of finished fuels. Emission factors are
based on data from the JEC Well-To-Wheels study, for further information see: http://ies.jrc.ec.europa.eu/WTW
Further information on scopes, control and leased assets is available from Defra's website in the guidance on reporting at:
http://www.defra.gov.uk/environment/business/reporting/index.htm
OR from the Greenhouse Gas Protocol's website at:
http://www.ghgprotocol.org/standards/corporate-standard
Scope 1 OR Scope 3: Direct emissions from transport can fall into either Scope 1 or Scope 3, depending on the vehicle ownership/level of control. For vehicles owned or directly
controlled by a reporting company, direct emissions should be reported under Scope 1. However, emissions resulting from transport-related activities in vehicles not owned or controlled
by the reporting entity should be reported under Scope 3.
Compressed Natural Gas (CNG)
4. In the timetable, refer to the 'Miles' columns on the left to determine mileage between your starting and destination stations.
Scope 1 OR Scope 3
How were these factors calculated?
For further explanation on how these emission factors have been derived, please refer to the GHG conversion factor methodology paper available here:
http://www.defra.gov.uk/environment/business/reporting/methodology-papers.htm
Standard Road Transport Fuel Conversion Factors
Fuel used
Diesel
Petrol
Scope 1 OR Scope 3
UK Greenhouse Gas Inventory for 2008 (AEA, 2010)Digest of UK Energy Statistics 2009 (DECC), available at:
http://www.decc.gov.uk/en/content/cms/statistics/publications/dukes/dukes.aspx
Liquid Petroleum Gas (LPG)
Total
Page 26 of 49
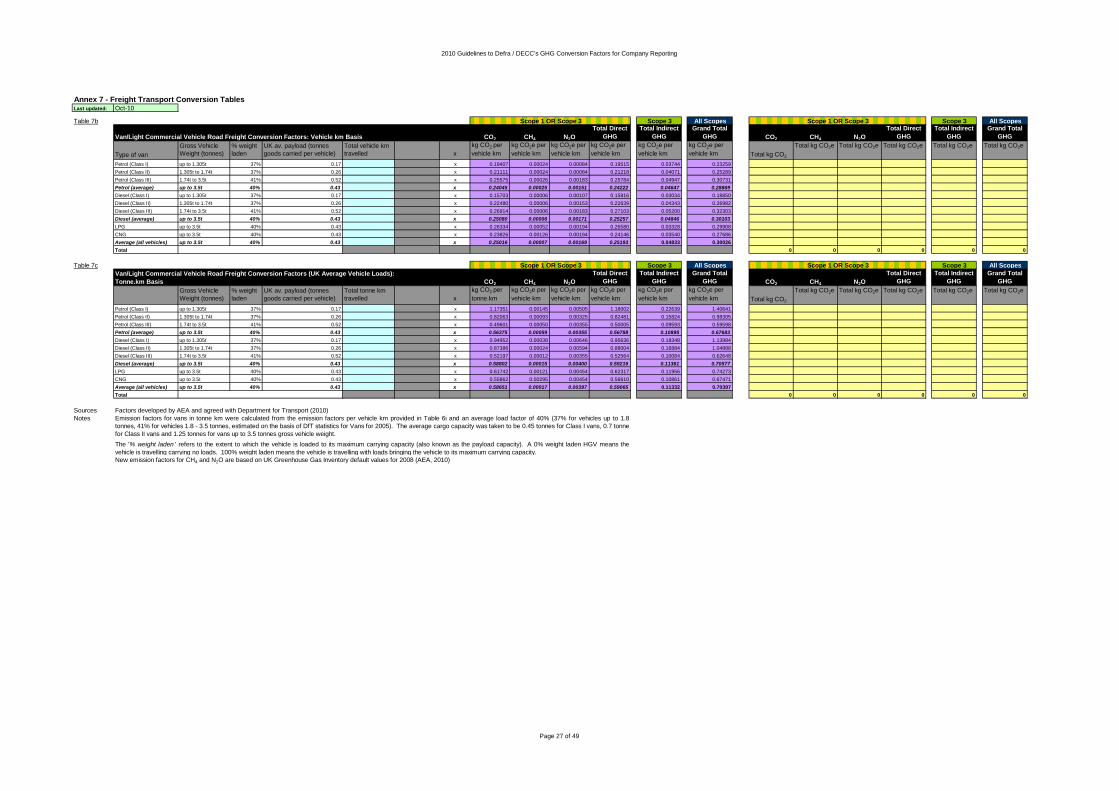
2010 Guidelines to Defra / DECC's GHG Conversion Factors for Company Reporting
Annex 7 - Freight Transport Conversion TablesLast updated: Oct-10
Table 7b Scope 3 All Scopes Scope 3 All Scopes
10 CO2 CH4 N2O
Total Direct
GHG
Total Indirect
GHG
Grand Total
GHG CO2 CH4 N2O
Total Direct
GHG
Total Indirect
GHG
Grand Total
GHG
Type of van
Gross Vehicle
Weight (tonnes)
% weight
laden
UK av. payload (tonnes
goods carried per vehicle)
Total vehicle km
travelled x
kg CO2 per
vehicle km
kg CO2e per
vehicle km
kg CO2e per
vehicle km
kg CO2e per
vehicle km
kg CO2e per
vehicle km
kg CO2e per
vehicle km Total kg CO2
Total kg CO2e Total kg CO2e Total kg CO2e Total kg CO2e Total kg CO2e
Petrol (Class I) up to 1.305t 37% 0.17 x 0.19407 0.00024 0.00084 0.19515 0.03744 0.23259
Petrol (Class II) 1.305t to 1.74t 37% 0.26 x 0.21111 0.00024 0.00084 0.21218 0.04071 0.25289
Petrol (Class III) 1.74t to 3.5t 41% 0.52 x 0.25575 0.00026 0.00183 0.25784 0.04947 0.30731
Petrol (average) up to 3.5t 40% 0.43 x 0.24045 0.00025 0.00151 0.24222 0.04647 0.28869
Diesel (Class I) up to 1.305t 37% 0.17 x 0.15703 0.00006 0.00107 0.15816 0.03034 0.18850
Diesel (Class II) 1.305t to 1.74t 37% 0.26 x 0.22480 0.00006 0.00153 0.22639 0.04343 0.26982
Diesel (Class III) 1.74t to 3.5t 41% 0.52 x 0.26914 0.00006 0.00183 0.27103 0.05200 0.32303
Diesel (average) up to 3.5t 40% 0.43 x 0.25080 0.00006 0.00171 0.25257 0.04846 0.30103
LPG up to 3.5t 40% 0.43 x 0.26334 0.00052 0.00194 0.26580 0.03328 0.29908
CNG up to 3.5t 40% 0.43 x 0.23826 0.00126 0.00194 0.24146 0.03540 0.27686
Average (all vehicles) up to 3.5t 40% 0.43 x 0.25016 0.00007 0.00169 0.25193 0.04833 0.30026
Total 0 0 0 0 0 0
Table 7c Scope 3 All Scopes Scope 3 All Scopes
10 CO2 CH4 N2O
Total Direct
GHG
Total Indirect
GHG
Grand Total
GHG CO2 CH4 N2O
Total Direct
GHG
Total Indirect
GHG
Grand Total
GHG
Gross Vehicle
Weight (tonnes)
% weight
laden
UK av. payload (tonnes
goods carried per vehicle)
Total tonne km
travelled x
kg CO2 per
tonne.km
kg CO2e per
vehicle km
kg CO2e per
vehicle km
kg CO2e per
vehicle km
kg CO2e per
vehicle km
kg CO2e per
vehicle km Total kg CO2
Total kg CO2e Total kg CO2e Total kg CO2e Total kg CO2e Total kg CO2e
Petrol (Class I) up to 1.305t 37% 0.17 x 1.17351 0.00145 0.00505 1.18002 0.22639 1.40641
Petrol (Class II) 1.305t to 1.74t 37% 0.26 x 0.82063 0.00093 0.00325 0.82481 0.15824 0.98305
Petrol (Class III) 1.74t to 3.5t 41% 0.52 x 0.49601 0.00050 0.00355 0.50005 0.09593 0.59598
Petrol (average) up to 3.5t 40% 0.43 x 0.56375 0.00059 0.00355 0.56788 0.10895 0.67683
Diesel (Class I) up to 1.305t 37% 0.17 x 0.94952 0.00038 0.00646 0.95636 0.18348 1.13984
Diesel (Class II) 1.305t to 1.74t 37% 0.26 x 0.87386 0.00024 0.00594 0.88004 0.16884 1.04888
Diesel (Class III) 1.74t to 3.5t 41% 0.52 x 0.52197 0.00012 0.00355 0.52564 0.10084 0.62648
Diesel (average) up to 3.5t 40% 0.43 x 0.58802 0.00015 0.00400 0.59216 0.11361 0.70577
LPG up to 3.5t 40% 0.43 x 0.61742 0.00121 0.00454 0.62317 0.11956 0.74273
CNG up to 3.5t 40% 0.43 x 0.55862 0.00295 0.00454 0.56610 0.10861 0.67471
Average (all vehicles) up to 3.5t 40% 0.43 x 0.58651 0.00017 0.00397 0.59065 0.11332 0.70397
Total 0 0 0 0 0 0
Sources
Notes
Van/Light Commercial Vehicle Road Freight Conversion Factors: Vehicle km Basis
Van/Light Commercial Vehicle Road Freight Conversion Factors (UK Average Vehicle Loads):
Tonne.km Basis
Factors developed by AEA and agreed with Department for Transport (2010)
Scope 1 OR Scope 3 Scope 1 OR Scope 3
Scope 1 OR Scope 3 Scope 1 OR Scope 3
New emission factors for CH4 and N2O are based on UK Greenhouse Gas Inventory default values for 2008 (AEA, 2010)
Emission factors for vans in tonne km were calculated from the emission factors per vehicle km provided in Table 6i and an average load factor of 40% (37% for vehicles up to 1.8
tonnes, 41% for vehicles 1.8 - 3.5 tonnes, estimated on the basis of DfT statistics for Vans for 2005). The average cargo capacity was taken to be 0.45 tonnes for Class I vans, 0.7 tonne
for Class II vans and 1.25 tonnes for vans up to 3.5 tonnes gross vehicle weight.
The '% weight laden ' refers to the extent to which the vehicle is loaded to its maximum carrying capacity (also known as the payload capacity). A 0% weight laden HGV means the
vehicle is travelling carrying no loads. 100% weight laden means the vehicle is travelling with loads bringing the vehicle to its maximum carrying capacity.
Page 27 of 49

2010 Guidelines to Defra / DECC's GHG Conversion Factors for Company Reporting
Annex 7 - Freight Transport Conversion TablesLast updated: Oct-10
Table 7d Scope 3 All Scopes Scope 3 All Scopes
11 CO2 CH4 N2O
Total Direct
GHG
Total Indirect
GHG
Grand Total
GHG CO2 CH4 N2O
Total Direct
GHG
Total Indirect
GHG
Grand Total
GHG
Gross Vehicle
Weight (tonnes)
% weight
laden
Total vehicle km
travelled x
kg CO2 per
vehicle km
kg CO2e per
vehicle km
kg CO2e per
vehicle km
kg CO2e per
vehicle km
kg CO2e per
vehicle km
kg CO2e per
vehicle km Total kg CO2
Total kg CO2e Total kg CO2e Total kg CO2e Total kg CO2e Total kg CO2e
Rigid >3.5-7.5t 0% x 0.52763 0.00030 0.00587 0.53380 0.10241 0.63621
50% x 0.57351 0.00030 0.00587 0.57968 0.11121 0.69089
100% x 0.61939 0.00030 0.00587 0.62556 0.12001 0.74557
41% (UK average load) x 0.56525 0.00030 0.00587 0.57142 0.10963 0.68105
Rigid >7.5-17t 0% x 0.67125 0.00040 0.00779 0.67944 0.13035 0.80979
50% x 0.76714 0.00040 0.00779 0.77533 0.14875 0.92408
100% x 0.86303 0.00040 0.00779 0.87122 0.16714 1.03836
41% (UK average load) x 0.74988 0.00040 0.00779 0.75807 0.14543 0.90350
Rigid >17t 0% x 0.79814 0.00052 0.01022 0.80888 0.15518 0.96406
50% x 0.97334 0.00052 0.01022 0.98408 0.18880 1.17288
100% x 1.14854 0.00052 0.01022 1.15928 0.22241 1.38169
53% (UK average load) x 0.98379 0.00052 0.01022 0.99453 0.19080 1.18533
All rigids UK average x 0.82903 0.00044 0.00861 0.83808 0.16079 0.99887
Articulated >3.5-33t 0% x 0.69214 0.00095 0.00881 0.70189 0.13466 0.83655
50% x 0.86518 0.00095 0.00881 0.87493 0.16786 1.04279
100% x 1.03822 0.00095 0.00881 1.04797 0.20105 1.24902
45% (UK average load) x 0.84788 0.00095 0.00881 0.85763 0.16454 1.02217
Articulated >33t 0% x 0.69793 0.00109 0.01020 0.70922 0.13606 0.84528
50% x 0.93057 0.00109 0.01020 0.94186 0.18070 1.12256
100% x 1.16321 0.00109 0.01020 1.17450 0.22533 1.39983
61% (UK average load) x 0.98175 0.00109 0.01020 0.99304 0.19051 1.18355
All artics UK average 60% x 0.96900 0.00108 0.01007 0.98015 0.18804 1.16819
ALL HGVs UK average 58% x 0.89522 0.00077 0.00930 0.90529 0.17368 1.07897
Total 0 0 0 0 0 0
Sources
Notes Factors are provided in kgCO2/vehicle.km for 3 different gross vehicle weight ranges of rigid-axled HGVs and 2 different gross vehicle weight ranges of articulated HGVs. A vehicle km is the distance
travelled by the HGV.
Transport Statistics Bulletin: Road Freight Statistics 2007, DfT SB (06) 27 (DfT, 2008)
Factors developed by AEA and agreed with Department for Transport (2010)
UK Greenhouse Gas Inventory for 2008 (AEA, 2010)
http://www.dft.gov.uk/pgr/statistics/datatablespublications/freight/goodsbyroad/roadfreightstatistics2008
Diesel HGV Road Freight Conversion Factors: Vehicle km Basis
Factors are based on road freight statistics from the Department for Transport (DfT, 2008), from a survey on the average miles per gallon and average loading factor for different sizes of rigid and artic
HGVs in the 2007 fleet, combined with test data from the European ARTEMIS project showing how fuel efficiency, and hence CO2 emissions, varies with vehicle load.
New emission factors for CH4 and N2O are based on UK Greenhouse Gas Inventory default values for 2008 (AEA, 2010)
The '% weight laden ' refers to the extent to which the vehicle is loaded to its maximum carrying capacity (also known as the payload capacity). A 0% weight laden HGV means the vehicle is travelling
carrying no loads. 100% weight laden means the vehicle is travelling with loads bringing the vehicle to its maximum carrying capacity.
UK average factors for all rigid and articulated HGVs are also provided in Table 7d if the user requires aggregate factors for these main classes of HGVs, perhaps because the weight class of the HGV is
not known. Again, these factors represent averages for the UK HGV fleet in 2005. These are derived directly from the average mpg values for all rigid and articulated HGVs in Table 1.9 of DfT (2008).
At a more aggregated level still are factors for all HGVs representing the average mpg for all rigid and articulated HGV classes in Table 1.9 of DfT (2008). This factor should be used if the user has no
knowledge of or requirement for different classes of HGV and may be suitable for analysis of HGV CO2 emissions in, for example, inter-modal freight transport comparisons.
The miles per gallon figures in Table 1.9 of DfT (2008) were converted into CO2 factors using the diesel fuel conversion factors. Then using the ARTEMIS data, these were corrected to CO2 factors
corresponding to 0%, 50% and 100% loading in Table 7d. The correction was based on the current percent lading for different sizes of HGVs in the national fleet in 2007 given in Table 1.16 of DfT (2008).
As well as CO2 factors for 0, 50 and 100% loading, CO2 factors are shown for the average loading of each weight class of HGV in the UK fleet in 2005. These should be used as default values if the user
does not know the loading factor to use and are based on the actual laden factors and mpg figures from tables 1.16 and 1.9 in DfT (2008).
Scope 1 OR Scope 3 Scope 1 OR Scope 3
Page 28 of 49

2010 Guidelines to Defra / DECC's GHG Conversion Factors for Company Reporting
Annex 7 - Freight Transport Conversion TablesLast updated: Oct-10
Table 7e Scope 3 All Scopes Scope 3 All Scopes
11 CO2 CH4 N2O
Total Direct
GHG
Total Indirect
GHG
Grand Total
GHG CO2 CH4 N2O
Total Direct
GHG
Total Indirect
GHG
Grand Total
GHG
Gross Vehicle
Weight (tonnes)
% weight
laden
UK av. payload (tonnes
goods carried per vehicle)
Total tonne km
travelled x
kg CO2 per
tonne.km
kg CO2e per
tonne.km
kg CO2e per
tonne.km
kg CO2e per
tonne.km
kg CO2e per
tonne.km
kg CO2e per
tonne.km Total kg CO2
Total kg CO2e Total kg CO2e Total kg CO2e Total kg CO2e Total kg CO2e
Rigid >3.5-7.5t 41% 0.86 x 0.65946 0.00035 0.00685 0.66666 0.12790 0.79456
Rigid >7.5-17t 41% 1.82 x 0.41243 0.00022 0.00428 0.41693 0.07999 0.49692
Rigid >17t 53% 4.91 x 0.20027 0.00011 0.00208 0.20246 0.03884 0.24130
All rigids UK average 52% 3.30 x 0.25115 0.00013 0.00261 0.25389 0.04871 0.30260
Articulated >3.5-33t 45% 5.56 x 0.15262 0.00017 0.00159 0.15438 0.02962 0.18400
Articulated >33t 61% 11.31 x 0.08678 0.00010 0.00090 0.08778 0.01684 0.10462
All articulateds UK average 60% 10.93 x 0.08869 0.00010 0.00092 0.08971 0.01721 0.10692
ALL HGVs UK average 58% 7.20 x 0.12427 0.00013 0.00191 0.12631 0.02423 0.15054
Total 0 0 0 0 0 0
Sources
Notes
Table 7f Scope 3 All Scopes Scope 3 All Scopes
12 CO2 CH4 N2O
Total Direct
GHG
Total Indirect
GHG
Grand Total
GHG CO2 CH4 N2O
Total Direct
GHG
Total Indirect
GHG
Grand Total
GHG
Mode Detail
Total tonne km
travelled
x kg CO2 per
tonne.km
kg CO2e per
tonne.km
kg CO2e per
tonne.km
kg CO2e per
tonne.km
kg CO2e per
tonne.km
kg CO2e per
tonne.km Total kg CO2
Total kg CO2e Total kg CO2e Total kg CO2e Total kg CO2e Total kg CO2e
Rail Diesel / Electric x 0.02850 0.00003 0.00306 0.03159 0.00533 0.03692
Mode Detail
Total tonne km
travelled
x km uplift
factor 1
x
kg CO2 per
tonne.km
kg CO2eq
per tonne.km
kg CO2eq
per tonne.km
kg CO2eq per
tonne.km
kg CO2eq per
tonne.km
kg CO2eq per
tonne.km Total kg CO2 Total kg CO2 Total kg CO2 Total kg CO2 Total kg CO2 Total kg CO2
Air Domestic x 109% x 1.96073 0.00145 0.01930 1.98149 0.36444 2.34593
Short-haul international x 109% x 1.47389 0.00008 0.01451 1.48848 0.27395 1.76243
Long-haul international x 109% x 0.61324 0.00004 0.00604 0.61931 0.11398 0.73329
Total 0 0 0 0 0 0
Sources
Notes Rail:
Air:
The factors are derived from the 2005 fleet average kgCO2 per vehicle km factors in Table 7d and the average tonne freight per vehicle lifted by each HGV weight class. The average tonne freight lifted
figures are derived from the tonne.km and vehicle.km figures given for each class of HGV in Tables 1.12 and 1.13, respectively, in DfT (2008). Dividing the tonne.km by the vehicle.km figures gives the
average tonnes freight lifted by each HGV class.
Tables 7d and 7e are provided as alternative methods for calculating CO2 emissions from movement of freight by HGVs. The factors in g/vehicle.km (Table 7d) are sufficient (and with the ability to take into
account different loading factors are preferential) for an operator who simply wants to calculate and compare CO2 emissions for different ways of transporting goods around by optimising freight logistics.
Factors in Table 7e may be better to use when comparing road freight with other modes for transporting a given weight of freight a given distance. To avoid double-counting, it is important that calculations
DO NOT USE BOTH methods.
Civil Aviation Authority (2010)
Factors developed by AEA and agreed with Department for Transport (2010)
Scope 1 OR Scope 3
Scope 3
Scope 1 OR Scope 3
The user may want to use factors in kgCO2/tonne.km for calculating the emissions due to transporting a given weight of freight a given distance for comparison with other modes of freight transport, e.g. for
comparing road vs rail using tonne.km factors for other modes in Table 7f. A tonne.km is the distance travelled multiplied by the weight of freight carried by the HGV. So, for example, an HGV carrying 5
tonnes freight over 100 km has a tonne.km value of 500 tonne.km. As different users may require CO2 factors for HGVs in different levels of detail of HGV type, factors are provided in kgCO2 /tonne.km
for: 3 different gross vehicle weight ranges of rigid-axled HGVs (most amount of detail possible) and 2 different gross vehicle weight ranges of articulated HGVs; fleet averaged factors for all types of rigids
and articulated HGVs; factor averaged for all types of HGVs (least amount of detail).
Diesel HGV Road Freight Conversion Factors (UK Average Vehicle Loads): Tonne.km Basis
Scope 3
The gCO2/tonne.km factors in Table 7e have been calculated on the basis that a lorry will run empty for part of the time in the overall transporting of the freight. Thus the user does not need to double the
distance of their freight tonne km for parts of a trip done empty loaded, as this has already been considered in the calculations. The distance should refer to the overall distance that the goods are moved.
Factors developed by AEA and agreed with Department for Transport (2010)
The '% weight laden ' refers to the extent to which the vehicle is loaded to its maximum carrying capacity (also known as the payload capacity). A 0% weight laden HGV means the vehicle is travelling
carrying no loads. 100% weight laden means the vehicle is travelling with loads bringing the vehicle to its maximum carrying capacity.
New emission factors for CH4 and N2O are based on UK Greenhouse Gas Inventory default values for 2008 (AEA, 2010)
EMEP/CORINAIR Emissions Inventory Guidebook (EIG), EEA (2009)
The CO2 value for rail freight is based on currently available information on CO2 emissions by diesel and electric freight trains in the UK in 2007 produced by ORR (Office of the Rail
Regulator) and is available at:
Office of Rail Regulation (ORR), 2009.
Rail and Air Freight Mileage Conversion Factors: Tonne.km Basis
http://www.rail-reg.gov.uk/upload/pdf/rolling-c9-environ.pdf
The rail freight CH4 and N2O factors are based on those used in the UK Greenhouse Gas Inventory for diesel rail for 2008 (AEA, 2010).
Freight is transported by two types of aircraft - dedicated cargo aircraft which carry freight only, and passenger aircraft which carry both passengers and their luggage, as well as freight.
Statistics from the CAA for 2008 suggest a large proportion of long haul air freight is transported on passenger aircraft. While it is possible to estimate freight CO2 factors per tonne.km for
dedicated cargo aircraft in much the same way as the passenger.km factors for passengers, it is more difficult to generate freight CO2 factors for aircraft that are also carrying passengers
without double-counting.
Page 29 of 49

2010 Guidelines to Defra / DECC's GHG Conversion Factors for Company Reporting
Annex 7 - Freight Transport Conversion TablesLast updated: Oct-10
1
Table 7g Scope 3 All Scopes Scope 3 All Scopes
CO2 CH4 N2O
Total Direct
GHG
Total Indirect
GHG
Grand Total
GHG CO2 CH4 N2O
Total Direct
GHG
Total Indirect
GHG
Grand Total
GHG
Mode Detail
Total tonne km
travelled
x kg CO2 per
tonne.km
kg CO2e per
tonne.km
kg CO2e per
tonne.km
kg CO2e per
tonne.km
kg CO2e per
tonne.km
kg CO2e per
tonne.km Total kg CO2
Total kg CO2e Total kg CO2e Total kg CO2e Total kg CO2e Total kg CO2e
Ship Type Size* Av. Loading
Crude tanker (oil) 200,000+ dwt 48% x 0.00290 0.00000 0.00002 0.00292 0.00049 0.00341
Crude tanker (oil) 120,000–199,999 dwt 48% x 0.00440 0.00000 0.00003 0.00443 0.00075 0.00518
Crude tanker (oil) 80,000–119,999 dwt 48% x 0.00590 0.00000 0.00005 0.00595 0.00101 0.00696
Crude tanker (oil) 60,000–79,999 dwt 48% x 0.00750 0.00000 0.00006 0.00756 0.00128 0.00884
Crude tanker (oil) 10,000–59,999 dwt 48% x 0.00910 0.00000 0.00007 0.00917 0.00155 0.01072
Crude tanker (oil) 0–9999 dwt 48% x 0.03330 0.00001 0.00026 0.03357 0.00568 0.03925
Crude tanker (oil) Average 48% x 0.00451 0.00000 0.00003 0.00454 0.00077 0.00531
Products tanker 60,000+ dwt 55% x 0.00570 0.00000 0.00004 0.00574 0.00097 0.00671
Products tanker 20,000–59,999 dwt 55% x 0.01030 0.00000 0.00008 0.01038 0.00176 0.01214
Products tanker 10,000–19,999 dwt 50% x 0.01870 0.00001 0.00014 0.01885 0.00319 0.02204
Products tanker 5000–9999 dwt 45% x 0.02920 0.00001 0.00022 0.02943 0.00498 0.03441
Products tanker 0–4999 dwt 45% x 0.04500 0.00001 0.00035 0.04536 0.00768 0.05304
Products tanker Average 54% x 0.00891 0.00000 0.00007 0.00898 0.00152 0.01050
Chemical tanker 20,000+ dwt 64% x 0.00840 0.00000 0.00006 0.00846 0.00143 0.00989
Chemical tanker 10,000–19,999 dwt 64% x 0.01080 0.00000 0.00008 0.01088 0.00184 0.01272
Chemical tanker 5000–9999 dwt 64% x 0.01510 0.00000 0.00012 0.01522 0.00258 0.01780
Chemical tanker 0–4999 dwt 64% x 0.02220 0.00001 0.00017 0.02238 0.00379 0.02617
Chemical tanker Average 64% x 0.01018 0.00000 0.00008 0.01026 0.00174 0.01200
LPG tanker 50,000+ m3 48% x 0.00900 0.00000 0.00007 0.00907 0.00154 0.01061
LPG tanker 0–49,999 m3 48% x 0.04350 0.00001 0.00033 0.04384 0.00742 0.05126
LNG tanker 200,000+ m3 48% x 0.00930 0.00000 0.00007 0.00937 0.00159 0.01096
LNG tanker 0–199,999 m3 48% x 0.01450 0.00000 0.00011 0.01461 0.00247 0.01708
LNG tanker Average 48% x 0.01139 0.00000 0.00009 0.01148 0.00194 0.01342
Bulk carrier 200,000+ dwt 50% x 0.00250 0.00000 0.00002 0.00252 0.00043 0.00295
Bulk carrier 100,000–199,999 dwt 50% x 0.00300 0.00000 0.00002 0.00302 0.00051 0.00353
Bulk carrier 60,000–99,999 dwt 55% x 0.00410 0.00000 0.00003 0.00413 0.00070 0.00483
Bulk carrier 35,000–59,999 dwt 55% x 0.00570 0.00000 0.00004 0.00574 0.00097 0.00671
Bulk carrier 10,000–34,999 dwt 55% x 0.00790 0.00000 0.00006 0.00796 0.00135 0.00931
Bulk carrier 0–9999 dwt 60% x 0.02920 0.00001 0.00022 0.02943 0.00498 0.03441
Bulk carrier Average 51% x 0.00349 0.00000 0.00003 0.00352 0.00060 0.00412
General cargo 10,000+ dwt 60% x 0.01190 0.00000 0.00009 0.01199 0.00203 0.01402
General cargo 5000–9999 dwt 60% x 0.01580 0.00001 0.00012 0.01593 0.00270 0.01863
General cargo 0–4999 dwt 60% x 0.01390 0.00000 0.00011 0.01401 0.00237 0.01638
General cargo 10,000+ dwt 100+ TEU 60% x 0.01100 0.00000 0.00008 0.01108 0.00188 0.01296
General cargo 5000–9999 dwt 100+ TEU 60% x 0.01750 0.00001 0.00013 0.01764 0.00299 0.02063
General cargo 0–4999 dwt 100+ TEU 60% x 0.01980 0.00001 0.00015 0.01996 0.00338 0.02334
General cargo Average 60% x 0.01305 0.00000 0.00010 0.01315 0.00223 0.01538
Refrigerated cargo All dwt 50% x 0.01290 0.00000 0.00010 0.01300 0.00220 0.01520
Container 8000+ TEU 70% x 0.01250 0.00000 0.00010 0.01260 0.00213 0.01473
Container 5000–7999 TEU 70% x 0.01660 0.00001 0.00013 0.01674 0.00283 0.01957
Container 3000–4999 TEU 70% x 0.01660 0.00001 0.00013 0.01674 0.00283 0.01957
Container 2000–2999 TEU 70% x 0.02000 0.00001 0.00015 0.02016 0.00341 0.02357
Container 1000–1999 TEU 70% x 0.03210 0.00001 0.00025 0.03236 0.00548 0.03784
Container 0–999 TEU 70% x 0.03630 0.00001 0.00028 0.03659 0.00619 0.04278
Container Average 70% x 0.01592 0.00001 0.00012 0.01605 0.00272 0.01877
Vehicle transport 4000+ CEU 70% x 0.03200 0.00001 0.00025 0.03226 0.00546 0.03772
Vehicle transport 0–3999 CEU 70% x 0.05760 0.00002 0.00044 0.05806 0.00983 0.06789
Vehicle transport Average 70% x 0.03805 0.00001 0.00029 0.03835 0.00649 0.04484
Ro–Ro ferry 2000+ LM 70% x 0.04950 0.00002 0.00038 0.04990 0.00844 0.05834
Ro–Ro ferry 0–1999 LM 70% x 0.06030 0.00002 0.00046 0.06078 0.01029 0.07107
Ro–Ro ferry Average 70% x 0.05095 0.00002 0.00039 0.05136 0.00869 0.06005
Large RoPax ferry - x 0.38434 0.00012 0.00295 0.38741 0.06556 0.45297
Total 0 0 0 0 0 0
New emission factors for CH4 and N2O are based on the UK Greenhouse Gas Inventory for 2008 (AEA, 2010)
Scope 3 Scope 3
Notes 10-12 from the passenger flights emission factors (Annex 6) also apply to the air freight emission factors.
The allocation of aircraft CO2 emissions between passengers and freight on these aircraft is complex and for the purposes of these emission factors the allocation is carried out by treating
freight carried on cargo or passenger services as equivalent. This is done by assuming the incorporation of the lost cargo capacity of passenger aircraft relative cargo-only equivalents into
the passenger weighting. It is assumed this difference in freight cargo capacity is due to passenger-service specific equipment (such as seating, galley, toilets, food) and air frame
modifications. The reference aircraft used in this calculation is the Boeing 747, as the freight configuration equivalent is used for over 90% of long-haul dedicated cargo transport from the
UK.
The 9% uplift factor comes from the IPCC Aviation and the global Atmosphere 8.2.2.3, which states that 9-10% should be added to take into account non-direct routes (i.e. not along the
straight line great circle distances between destinations) and delays/circling. Airline industry representatives have indicated that the percentage uplift for short-haul flights will be higher and
for long-haul flights will be lower, however specific data is not currently available to provide separate factors. This is under investigation for future versions of these guidelines.
Maritime Shipping Freight Distance Conversion Factors: Tonne.km Basis
Page 30 of 49

2010 Guidelines to Defra / DECC's GHG Conversion Factors for Company Reporting
Annex 7 - Freight Transport Conversion TablesLast updated: Oct-10
Sources
Notes dwt = deadweight, tonnes
TEU = Twenty-Foot Equivalent Units (intermodal shipping container)
CEU = Car Equivalent Units
LM = Lane Meters
m3 = volume in cubic meters
The freight CO2 emission factor for RoPax Ferries was derived from data provided by Best Foot Forward based on work for the Passenger Shipping Association (PSA) carried out in
2007/8. The calculated figure assumes an average HGV load factor of 13.6 tonnes, based on information in Table 2.6 of Road Transport Statistics 2005 (from the Department for
Transport). RoPax Ferries are Roll-on Roll-off ferries that carry both road vehicles and their passengers as well as having additional passenger-only capacity.
IMO (2009). "PREVENTION OF AIR POLLUTION FROM SHIPS, Second IMO GHG Study 2009. Update of the 2000 IMO GHG Study, Final report covering Phase 1". This report is
available from the IMO's website at:
Factors developed by AEA and agreed with Department for Transport (2010). These factors are international averages and load factors may not be the same as for average for ships
arriving at/leaving UK ports.
Only the weight of the cargo being transported should be used when calculating emissions from shipping. The weight of the ship (as incorporated into deadweight tonnage) should not be
included in the emissions calculation
New emission factors for CH4 and N2O are based on the UK Greenhouse Gas Inventory for 2008 (AEA, 2010)
Factors for the other representative ships are derived from information from Table 9.1 of the International Maritime Organisation's report on GHG emissions (IMO, 2009).
http://www.imo.org/includes/blastDataOnly.asp/data_id%3D26046/4-7.pdf
Page 31 of 49

2010 Guidelines to Defra / DECC's GHG Conversion Factors for Company Reporting
Last updated: Jul-10
How to use this Annex
A. Screening Method
To complete these tables you will need to:
1)
2)
3)
4)
5)
Annex 8 Scopes & Boundaries:
How were these factors calculated?
Determine disposal emissions: Identify any pieces of equipment that were disposed of on-site during the reporting period. Emissions from equipment that was sent offsite for third party recycling,
reclamation or disposal are not the responsibility of your organisation. For each piece disposed equipment, use Table 8c to estimate emissions.
Calculate total emissions: Add the emissions from each piece of equipment for each of emission - installation, operation and disposal - to get total emissions. Calculate separate totals for each type of
refrigerant used.
Scope 1: Direct emissions from leakage of refrigerants. Data on indirect emissions from production of refrigeration not currently available.
Further information on scopes is available from Defra's website in the guidance on reporting at:
http://www.defra.gov.uk/environment/business/reporting/index.htm
OR from the Greenhouse Gas Protocol's website at:
http://www.ghgprotocol.org/standards/corporate-standard
Annex 8 - Direct GHG Emissions from Use of Refrigeration and Air Conditioning Equipment
There are two methods presented here for the estimation of emissions from the use of refrigeration and air conditioning equipment. For smaller users the simple A. Screening Method will likely be the
easiest way to calculate their emissions. For some larger users of refrigerant and they should have the information necessary to perform a more accurate estimation using a B. Simplified Material
Balance Method.
This Screening Method will help organisations to estimate emissions from refrigeration and air conditioning based on the type of equipment used and emissions factors. This approach requires relatively
little actual data collection however there is a high degree of uncertainty with these emission factors. Therefore if emissions from this equipment are determined to be significant when compared to your
organisation's other emissions sources, then you should apply a better estimation method (e.g. a Material Balance Method). Please note, there are extensive regulatory requirements governing the
operation of stationary equipment using fluorinated greenhouse gases, including record keeping requirements for stationary refrigeration and air-conditioning equipment, heat pumps and
fire protection equipment with a charge of 3kg or more. Guidance is available at:
http://www.defra.gov.uk/environment/quality/air/fgas/index.htm
Carry out an inventory of equipment to find out:
Determine operating emissions: This step estimates losses from equipment leaks and service losses over the life of the equipment. For all pieces of equipment, use Table 8b to estimate emissions.
You will need to determine the length of time (in years) that each piece of equipment has be used.
(i) the number and types of each refrigeration unit;
(iii) the total charge capacity of each piece of equipment (charge capacity is the mass of refrigerant used in a refrigerator or other cooling equipment);
(ii) the type of refrigerant used (e.g. HFC 134a, R404a, R407a, R407b, R407c, R410A, etc);
(b) Refrigeration units : visual readings on the equipment
Once you know the refrigerant type, please refer to Annex 5 to identify its Global Warming Potential (GWP). Alternatively, defaults are currently filled out automatically from selected refrigerants in the
Excel spreadsheet. For further guidance on typical charge capacity, please refer to Table 8d.
Information on refrigerant type and kilograms (kg) of charge capacity can be sourced from:
(iv) the time in years used during the reporting period (e.g. 0.5 if used only during half of the reporting period then disposed)
(a) Air conditioning chillers and modular units : visual readings on the equipment, equipment manuals or maintenance records;
Determine installation emissions: Identify any new equipment that was installed during the reporting period and was charged (filled) on-site. Emissions from equipment that was charged at the
manufacturer are not the responsibility of your organisation. For each new piece of equipment charged on-site use Table 8a to estimate emissions.
For further explanation on how these emission factors have been derived, please refer to the GHG conversion factor methodology paper available here:
http://www.defra.gov.uk/environment/business/reporting/methodology-papers.htm
Page 32 of 49

2010 Guidelines to Defra / DECC's GHG Conversion Factors for Company Reporting
Last updated: Jul-10
Annex 8 - Direct GHG Emissions from Use of Refrigeration and Air Conditioning Equipment
Table 8a Scope 1
13
Type of Equipment
Number of
Units x
Equipment
Charge Capacity
(kg) x
Installation
Emission Factor x
Refrigerant type
(select from list from Annex 5)
Global Warming
Potential (GWP) x
Total kg CO2
equivalent
Domestic Refrigeration x x 1.0% x x
Stand-alone Commercial Applications x x 1.5% x x
Medium & Large Commercial Applications x x 2.0% x x
Transport Refrigeration x x 1.0% x x
Industrial Refrigeration (inc. food processing and cold storage) x x 1.0% x x
Chillers x x 1.0% x x
Residential and Commercial A/C including Heat Pumps x x 1.0% x x
Mobile Air Conditioning x x 1.0% x x
Total 0
Table 8b Scope 1
13
Type of Equipment
Number of
Units x
Equipment
Charge Capacity
(kg) x
Time used
during reporting
period (years) x
Annual Leak
Rate x
Refrigerant type
(select from list from Annex 5)
Global Warming
Potential (GWP) x
Total kg CO2
equivalent
Domestic Refrigeration x x x 0.3% x x
Stand-alone Commercial Applications x x x 2.0% x x
Medium & Large Commercial Applications x x x 11.0% x x
Transport Refrigeration x x x 8.0% x x
Industrial Refrigeration (inc. food processing and cold storage) x x x 8.0% x x
Chillers x x x 3.0% x x
Residential and Commercial A/C including Heat Pumps x x x 8.5% x x
Mobile Air Conditioning x x x 7.5% x x
Total 0
Table 8c Scope 1
13
Refrigerant Type
Number of
Units x
Equipment
Charge Capacity
(kg) x
Capacity
remaining at
disposal (%) x
Refrigerant
recovered (%) x
Refrigerant type
(select from list from Annex 5)
Global Warming
Potential (GWP) x
Total kg CO2
equivalent
Domestic Refrigeration x x 80% x 99.0% x x
Stand-alone Commercial Applications x x 80% x 94.5% x x
Medium & Large Commercial Applications x x 100% x 95.0% x x
Transport Refrigeration x x 50% x 94.0% x x
Industrial Refrigeration (inc. food processing and cold storage) x x 100% x 95.0% x x
Chillers x x 100% x 95.0% x x
Residential and Commercial A/C including Heat Pumps x x 80% x 95.0% x x
Mobile Air Conditioning x x 50% x 88.0% x x
Total 0
Table 8d
13
Typical Range in
Charge Capacity
(kg)
0.05 - 0.5
0.2 - 6
50 - 2,000
3 to 8
10 - 10,000
10 - 2,000
0.5 - 100
0.5 - 1.5
Emissions from operation of Refrigeration and Air-conditioning Equipment
Emissions from Disposal of Refrigeration and Air-conditioning Equipment
Transport Refrigeration
Emissions from Installation of Refrigeration and Air-conditioning Equipment
Industrial Refrigeration (inc. food processing and cold storage)
Chillers
Residential and Commercial A/C including Heat Pumps
Mobile Air Conditioning
Stand-alone Commercial Applications
Domestic Refrigeration
Type of Equipment
Typical Charge Capacity for Equipment
Medium & Large Commercial Applications
Page 33 of 49

2010 Guidelines to Defra / DECC's GHG Conversion Factors for Company Reporting
Last updated: Jul-10
Annex 8 - Direct GHG Emissions from Use of Refrigeration and Air Conditioning Equipment
Sources
B. Simplified Material Balance Method
1) Calculate installation emissions.
2) Determine equipment servicing emissions
3) Calculate disposal emissions
4) Calculate emissions
Scope 1
Table 8e Estimating Refrigerant Emissions with Simplified Material Balance Method
-
Total full capacity
of the new
equipment (kg) +
Quantity of
refrigerant used
to service
equipment (kg) +
Total full
capacity of
retiring
equipment (kg) - x
Refrigerant type
(select from list
from Annex 5)
Global
Warming
Potential
(GWP) =
Total kg CO2
equivalent
Refrigerant 1 - + + - x =
Refrigerant 2 - + + - x =
Refrigerant 3 - + + - x =
Refrigerant 4 - + + - x =
Refrigerant 5 - + + - x =
Refrigerant 6 - + + - x =
Refrigerant 7 - + + - x =
Refrigerant 8 - + + - x =
Refrigerant 9 - + + - x =
Refrigerant 10 - + + - x =
Total 0
Sources
US EPA Climate Leaders Greenhouse Gas Inventory Protocol Core Module Guidance - Direct HFC and PFC Emissions from use of Refrigeration and Air Conditioning Equipment (see:
http://www.epa.gov/stateply/documents/resources/mfgrfg.pdf)
2006 IPCC Guidelines for National Greenhouse Inventories (http://www.ipcc-nggip.iges.or.jp/public/2006gl/pdf/3_Volume3/V3_7_Ch7_ODS_Substitutes.pdf)
2006 IPCC Guidelines for National Greenhouse Inventories (http://www.ipcc-nggip.iges.or.jp/public/2006gl/pdf/3_Volume3/V3_7_Ch7_ODS_Substitutes.pdf)
US EPA Climate Leaders Greenhouse Gas Inventory Protocol Core Module Guidance - Direct HFC and PFC Emissions from use of Refrigeration and Air Conditioning Equipment
(see: http://www.epa.gov/stateply/documents/resources/mfgrfg.pdf)
c) Total full capacity of new equipment using this refrigerant (set to 0 if the equipment has been pre-charged by the manufacturer);
Equipment servicing emissions result from the refrigerant that is used to service operating equipment. It is assumed that the servicing refrigerant is replacing the same amount that was lost to the
environment.
UK Greenhouse Gas Inventory for 2007 (AEA)
Refrigerant recovered from retiring equipment
(kg)
f) Total full capacity of retiring equipment;
g) Total full capacity of equipment that is retrofitted away from this refrigerant to a different refrigerant;
Purchases of refrigerant used to charge new equipment (kg)
i) Refrigerant recovered from equipment that is retrofitted away from this refrigerant to a different refrigerant.
h) Refrigerant recovered from retiring equipment;
d) Total full capacity of equipment that is retrofitted to use this refrigerant (set to 0 if the equipment has been pre-charged by the manufacturer);
e) Refrigerant used to service equipment;
This step is only necessary if your organisation disposed of equipment during the reporting period. Emissions are calculated by taking the difference between the total capacity of the equipment disposed
and the amount of refrigerant recovered. The difference is assumed to be released to the environment.
Emissions are calculated by summing the results of the first three steps.
a) Refrigerant used to fill new equipment (set to 0 if the equipment has been pre-charged by the manufacturer);
This approach should be used for each type of refrigerant and blend.
This method requires the following information:
b) Refrigerant used to fill equipment retrofitted to use this refrigerant (set to 0 if the equipment has been pre-charged by the manufacturer);
This step is only necessary if your organisation installed any new equipment during the reporting period that was not pre-charged by the equipment supplier. Emissions are calculated by taking the
difference between the amount of refrigerant used to charge the equipment and the total capacity of the equipment. The difference is assumed to be released into the environment.
This is a simplified material balance method. This will enable more accurate estimation of refrigerant leakage than the Screening Method (Table 8a - d).
To complete Table 8e, you will need to:
Page 34 of 49

2010 Guidelines to Defra / DECC's GHG Conversion Factors for Company Reporting
Annex 9 - Other UK Conversion Factor TablesLast updated: Oct-10
How to use this Annex
http://www.biomassenergycentre.org.uk/portal/page?_pageid=75,163182&_dad=portal&_schema=PORTAL
2) Speak to your waste contractor(s). Your waste contractor will be able to advise you to which location your wastes have subsequently been delivered (i.e. landfill
site, recycling operation, compositing, or energy recovery facility).
1) Check for existing data. Data on waste arisings will be contained in waste transfer/consignment notes or receipts provided for individual waste transfers. All waste
producers are legally required to retain these notes for a specified period. These may identify the quantity of waste arising and the company collecting the waste.
Has your organisation carried out a waste audit recently? This may provide further useful information, such as the composition of mixed waste sent for proposal.
Tables 9a-c provide life-cycle conversion factors for water, biofuels and biomass:
1) Identify the amount of substance used
2) Identify the units. Are you measuring your fuel use in terms of mass, volume or energy?
(ii) If you are measuring fuel use in terms of energy, is your unit of measurement net energy or gross energy (in the event that this is unclear you should contact
your fuel supplier)? Annex 11 gives typical/average net/gross calorific values and the densities.
The emission factors presented in this Annex incorporate emissions from the full life-cycle and include net CO2, CH4 and N2O emissions. Care should be taken to use
equivalent emission factors (EFs) for different activities - i.e. combine only direct EFs, OR indirect EFs OR total lifecycle EFs, or emissions factors for the same Scope (as
defined by the GHG Protocol).
4) If you are using a biofuel blend EITHER:
(i) Use the total amount of pure biofuel used to calculate the emissions together with Table 9b, Part (i) and the total amount of pure conventional fuel together with
Table 9b, Part (ii); OR
(ii) Use the total amount of blended fuel in the calculation together with Table 9b, Part (iii). The combined emission factor (EF) is calculated by the excel
spreadsheet automatically following your entry of the % biofuel blended with conventional fuel and entry of the the total amount of biofuel/conventional fuel blend.
For an X% blend of biofuel with conventional fuel the combined emission factor is calculated as follows:
Total EF for X% biofuel/conventional fuel blend = X% x biofuel EF + (1-X%) x conventional fuel EF
(ii) The waste composition (in tonnes) for each waste treatment method. This can be done through sampling, sorting, and weighing your waste to determine its
percentage composition in tonnes. If you choose to do this, please wear the appropriate protective clothing and do not attempt to sample any
hazardous, toxic or radioactive waste.
3) Convert to the appropriate unit of volume or mass for the table:
(i) If you cannot find a factor for that unit, Annex 12 gives guidance on converting between different units of mass, volume, length and energy.
If you do not have detailed waste data from your waste contractors, you should carry out a waste inventory to determine:
5) Multiply the amount of fuel used by the conversion factor to get total emissions in kilograms of carbon dioxide equivalent (kg CO2e). The excel spreadsheet does this
automatically following your entry of the amount of fuel used into the appropriate box.
Table 9d provides life-cycle conversion factors for waste disposal:
Please note that these emission factors do not enable you to calculate direct emissions of carbon dioxide for the combustion of biomass and biofuels. Further updates to
these Guidelines will seek to address this issue. In the interim, please refer to the following weblink for direct CO2 emissions from combustion:
(i) The total waste sent to landfill, recycled or composted. This can be done through sampling your waste in order to approximate total waste for each different
waste treatment method
To complete this table, you will need to:
Depending on the level of information that your waste contractor can provide, you will need to carry out step 3.
(iii) If known, the proportion of recycled material contained in each waste fraction (e.g. the disposed of paper might contain 10% recycled material)
3) Carry out a waste audit
Page 35 of 49

2010 Guidelines to Defra / DECC's GHG Conversion Factors for Company Reporting
Annex 9 - Other UK Conversion Factor TablesLast updated: Oct-10
Key information:
Table 9a Scope 1 Scope 3 All Scopes Scope 1 Scope 3 All ScopesTotal Direct
GHG
Total Indirect
GHG
Grand Total
GHG
Total Direct
GHG
Total Indirect
GHG
Grand Total
GHG
Fuel used Year for emission factor Total units used Units x kg CO2e per
unit
kg CO2e per
unit
kg CO2e per
unit
Total kg CO2e Total kg CO2e Total kg CO2e
Water supply 2007/08 million litres x - 276 276
2008/09 million litres x - 300 300
2007/08 cubic metres x - 0.2760 0.2760
2008/09 cubic metres x - 0.3000 0.3000
Water treatment 2007/08 million litres x - 693 693
2008/09 million litres x - 750 750
2007/08 cubic metres x - 0.6930 0.6930
2008/09 cubic metres x - 0.7500 0.7500
0 0 0
Sources
How were these factors calculated?
Life-Cycle Conversion Factors for water
Total
For further explanation on how these emission factors have been derived, please refer to the GHG conversion factor methodology paper available here:
http://www.defra.gov.uk/environment/business/reporting/methodology-papers.htm
The tonnes of waste prevented column should be used if you want to determine the reduction in emissions associated with reduced procurement of materials.
For further assistance, please see Envirowise Guide GG414 Measuring to manage: the key to reducing waste costs, available free of charge from the Envirowise website.
Water UK Sustainability Indicators 2008/09, available at:
http://www.water.org.uk/home/policy/reports/sustainability/2008-09-sustainability-indicators
4) Enter the data in the table. Enter the weight (in tonnes) for each waste fraction (e.g. paper and card, textiles, etc) into the appropriate treatment method column along
with the recycled material content of disposed waste (if known). The total net kgCO2e emissions resulting from the waste will be automatically calculated as the sum of
kgCO2e emissions from the total tonnes of waste produced and the kgCO2e emissions per tonne of waste for each waste treatment method.
Water
Scope 3: Emissions of greenhouse gases associated with the supply and treatment of water and the industry’s buildings and transport.
Biofuels
Scope 1 : Direct emissions of CH4 and N2O from the combustion of fuel (CO2 emissions are set to 0 for biofuels, and reported separately)
Scope 3: Indirect emissions associated with the production and transport of primary fuels as well as the refining, distribution, storage and retail of finished fuels.
For further information see http://ies.jrc.ec.europa.eu/WTW
Outside of Scopes: Emissions data for direct CO2 emissions from biologically sequestered carbon (e.g. CO2 from burning biomass/biofuels) are reported separately
from the scopes.
Waste
Scope 3:
Further information on scopes is available from Defra's website in the guidance on reporting at:
http://www.defra.gov.uk/environment/business/reporting/index.htm
OR from the Greenhouse Gas Protocol's website at:
http://www.ghgprotocol.org/standards/corporate-standard
Annex 9 Scopes & Boundaries:
Further additional information is also available below Table 9d.
Emission factors for waste treatment processes: The emission factors are based on a life cycle assessment and include not only the carbon costs of treating and
transporting waste, but also the potential benefits where primary resource extraction or electricity generation are offset with energy recovery. The impact of waste prevention
is calculated based on the embodied energy in primary material, and therefore inherently assumes the offsetting of virgin production.
Page 36 of 49
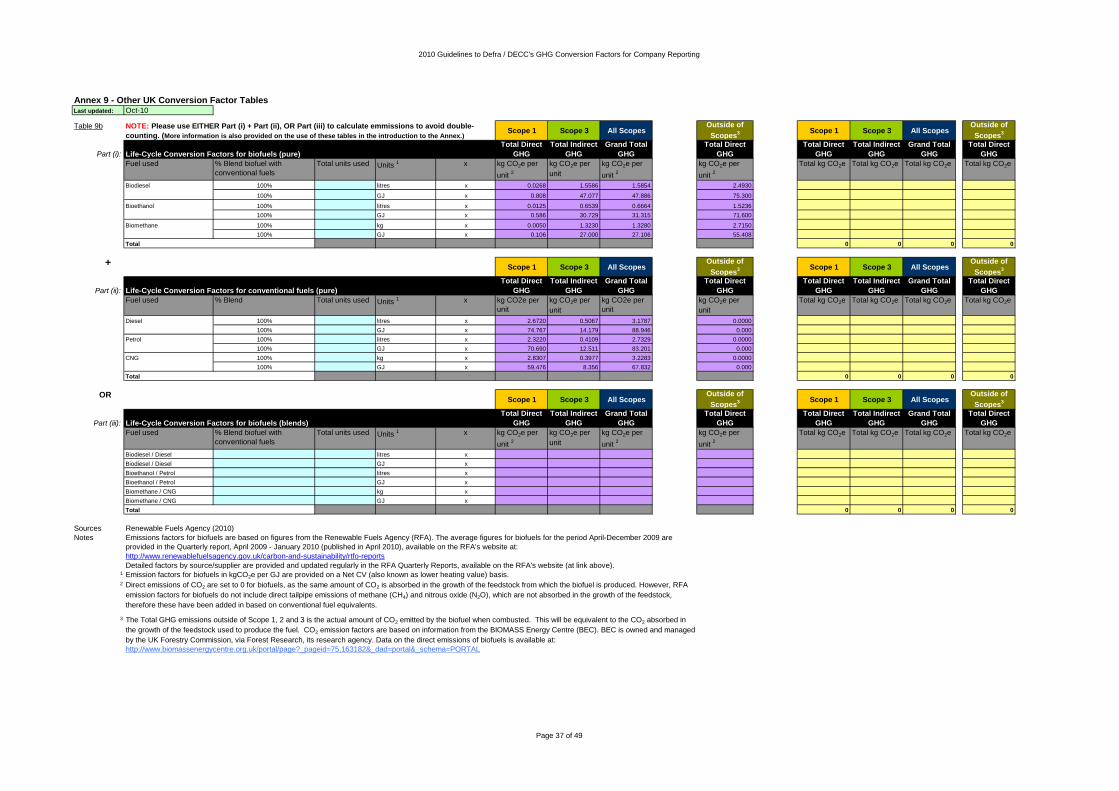
2010 Guidelines to Defra / DECC's GHG Conversion Factors for Company Reporting
Annex 9 - Other UK Conversion Factor TablesLast updated: Oct-10
Table 9bScope 1 Scope 3 All Scopes
Outside of
Scopes3 Scope 1 Scope 3 All Scopes
Outside of
Scopes3
Part (i):
Total Direct
GHG
Total Indirect
GHG
Grand Total
GHG
Total Direct
GHG
Total Direct
GHG
Total Indirect
GHG
Grand Total
GHG
Total Direct
GHG
Fuel used % Blend biofuel with
conventional fuels
Total units used Units 1 x kg CO2e per
unit 2
kg CO2e per
unit
kg CO2e per
unit 2
kg CO2e per
unit 2
Total kg CO2e Total kg CO2e Total kg CO2e Total kg CO2e
Biodiesel 100% litres x 0.0268 1.5586 1.5854 2.4930
100% GJ x 0.808 47.077 47.886 75.300
Bioethanol 100% litres x 0.0125 0.6539 0.6664 1.5236
100% GJ x 0.586 30.729 31.315 71.600
Biomethane 100% kg x 0.0050 1.3230 1.3280 2.7150
100% GJ x 0.106 27.000 27.106 55.408
Total 0 0 0 0
Scope 1 Scope 3 All ScopesOutside of
Scopes3 Scope 1 Scope 3 All Scopes
Outside of
Scopes3
Part (ii):
Total Direct
GHG
Total Indirect
GHG
Grand Total
GHG
Total Direct
GHG
Total Direct
GHG
Total Indirect
GHG
Grand Total
GHG
Total Direct
GHG
Fuel used % Blend Total units used Units 1 x kg CO2e per
unit
kg CO2e per
unit
kg CO2e per
unit
kg CO2e per
unit
Total kg CO2e Total kg CO2e Total kg CO2e Total kg CO2e
Diesel 100% litres x 2.6720 0.5067 3.1787 0.0000
100% GJ x 74.767 14.179 88.946 0.000
Petrol 100% litres x 2.3220 0.4109 2.7329 0.0000
100% GJ x 70.690 12.511 83.201 0.000
CNG 100% kg x 2.8307 0.3977 3.2283 0.0000
100% GJ x 59.476 8.356 67.832 0.000
Total 0 0 0 0
Scope 1 Scope 3 All ScopesOutside of
Scopes3 Scope 1 Scope 3 All Scopes
Outside of
Scopes3
Part (iii):
Total Direct
GHG
Total Indirect
GHG
Grand Total
GHG
Total Direct
GHG
Total Direct
GHG
Total Indirect
GHG
Grand Total
GHG
Total Direct
GHG
Fuel used % Blend biofuel with
conventional fuels
Total units used Units 1 x kg CO2e per
unit 2
kg CO2e per
unit
kg CO2e per
unit 2
kg CO2e per
unit 2
Total kg CO2e Total kg CO2e Total kg CO2e Total kg CO2e
Biodiesel / Diesel litres x
Biodiesel / Diesel GJ x
Bioethanol / Petrol litres x
Bioethanol / Petrol GJ x
Biomethane / CNG kg x
Biomethane / CNG GJ x
Total 0 0 0 0
Sources
Notes
1
2
3
Emission factors for biofuels in kgCO2e per GJ are provided on a Net CV (also known as lower heating value) basis.
Detailed factors by source/supplier are provided and updated regularly in the RFA Quarterly Reports, available on the RFA's website (at link above).
Emissions factors for biofuels are based on figures from the Renewable Fuels Agency (RFA). The average figures for biofuels for the period April-December 2009 are
provided in the Quarterly report, April 2009 - January 2010 (published in April 2010), available on the RFA's website at:
Direct emissions of CO2 are set to 0 for biofuels, as the same amount of CO2 is absorbed in the growth of the feedstock from which the biofuel is produced. However, RFA
emission factors for biofuels do not include direct tailpipe emissions of methane (CH4) and nitrous oxide (N2O), which are not absorbed in the growth of the feedstock,
therefore these have been added in based on conventional fuel equivalents.
Life-Cycle Conversion Factors for conventional fuels (pure)
Life-Cycle Conversion Factors for biofuels (pure)
Renewable Fuels Agency (2010)
http://www.renewablefuelsagency.gov.uk/carbon-and-sustainability/rtfo-reports
The Total GHG emissions outside of Scope 1, 2 and 3 is the actual amount of CO2 emitted by the biofuel when combusted. This will be equivalent to the CO2 absorbed in
the growth of the feedstock used to produce the fuel. CO2 emission factors are based on information from the BIOMASS Energy Centre (BEC). BEC is owned and managed
by the UK Forestry Commission, via Forest Research, its research agency. Data on the direct emissions of biofuels is available at:
http://www.biomassenergycentre.org.uk/portal/page?_pageid=75,163182&_dad=portal&_schema=PORTAL
Life-Cycle Conversion Factors for biofuels (blends)
+
OR
NOTE: Please use EITHER Part (i) + Part (ii), OR Part (iii) to calculate emmissions to avoid double-
counting. (More information is also provided on the use of these tables in the introduction to the Annex.)
Page 37 of 49
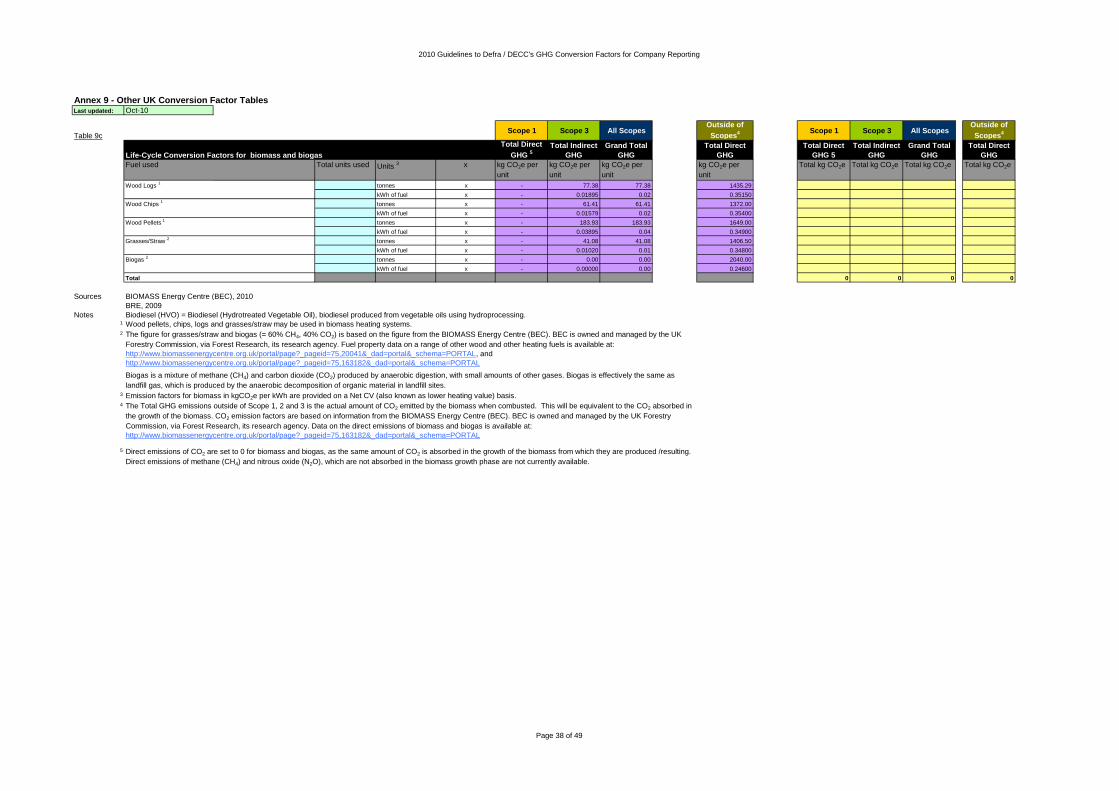
2010 Guidelines to Defra / DECC's GHG Conversion Factors for Company Reporting
Annex 9 - Other UK Conversion Factor TablesLast updated: Oct-10
Table 9cScope 1 Scope 3 All Scopes
Outside of
Scopes4 Scope 1 Scope 3 All Scopes
Outside of
Scopes4
Total Direct
GHG 5
Total Indirect
GHG
Grand Total
GHG
Total Direct
GHG
Total Direct
GHG 5
Total Indirect
GHG
Grand Total
GHG
Total Direct
GHG
Total units used Units 3 x kg CO2e per
unit
kg CO2e per
unit
kg CO2e per
unit
kg CO2e per
unit
Total kg CO2e Total kg CO2e Total kg CO2e Total kg CO2e
Wood Logs 1
tonnes x - 77.38 77.38 1435.29
kWh of fuel x - 0.01895 0.02 0.35150
Wood Chips 1
tonnes x - 61.41 61.41 1372.00
kWh of fuel x - 0.01579 0.02 0.35400
Wood Pellets 1
tonnes x - 183.93 183.93 1649.00
kWh of fuel x - 0.03895 0.04 0.34900
Grasses/Straw 2
tonnes x - 41.08 41.08 1406.50
kWh of fuel x - 0.01020 0.01 0.34800
Biogas 2
tonnes x - 0.00 0.00 2040.00
kWh of fuel x - 0.00000 0.00 0.24600
0 0 0 0
Sources
Notes1
2
3
4
5
Fuel used
Biodiesel (HVO) = Biodiesel (Hydrotreated Vegetable Oil), biodiesel produced from vegetable oils using hydroprocessing.
Direct emissions of CO2 are set to 0 for biomass and biogas, as the same amount of CO2 is absorbed in the growth of the biomass from which they are produced /resulting.
Direct emissions of methane (CH4) and nitrous oxide (N2O), which are not absorbed in the biomass growth phase are not currently available.
Emission factors for biomass in kgCO2e per kWh are provided on a Net CV (also known as lower heating value) basis.
Total
BIOMASS Energy Centre (BEC), 2010
BRE, 2009
The figure for grasses/straw and biogas (= 60% CH4, 40% CO2) is based on the figure from the BIOMASS Energy Centre (BEC). BEC is owned and managed by the UK
Forestry Commission, via Forest Research, its research agency. Fuel property data on a range of other wood and other heating fuels is available at:
http://www.biomassenergycentre.org.uk/portal/page?_pageid=75,20041&_dad=portal&_schema=PORTAL, and
http://www.biomassenergycentre.org.uk/portal/page?_pageid=75,163182&_dad=portal&_schema=PORTAL
Life-Cycle Conversion Factors for biomass and biogas
The Total GHG emissions outside of Scope 1, 2 and 3 is the actual amount of CO2 emitted by the biomass when combusted. This will be equivalent to the CO2 absorbed in
the growth of the biomass. CO2 emission factors are based on information from the BIOMASS Energy Centre (BEC). BEC is owned and managed by the UK Forestry
Commission, via Forest Research, its research agency. Data on the direct emissions of biomass and biogas is available at:
http://www.biomassenergycentre.org.uk/portal/page?_pageid=75,163182&_dad=portal&_schema=PORTAL
Wood pellets, chips, logs and grasses/straw may be used in biomass heating systems.
Biogas is a mixture of methane (CH4) and carbon dioxide (CO2) produced by anaerobic digestion, with small amounts of other gases. Biogas is effectively the same as
landfill gas, which is produced by the anaerobic decomposition of organic material in landfill sites.
Page 38 of 49

2010 Guidelines to Defra / DECC's GHG Conversion Factors for Company Reporting
Annex 9 - Other UK Conversion Factor TablesLast updated: Oct-10
Table 9d
Waste fraction
Open Loop7
Closed Loop7
Power only
moving grate
Anaerobic
Digestion950 -713 -500 -121 57 550
4,000 -89 -100 30 365
89 -121 -100 57 210
0 44 -271 -330 34 230
256 -6 -700 250 930
19,294 -3,800 600 300
3,100 -1,500 1,800 40
2,500 -1,000 1,800 35
3,100 -1,300 -786 10
11,000 -9,000 23 10
4 16 35 10
8 -4 35 10
102 58 242 305
840 2 -315 5 10
Tyres 3,410 -20 -2,900 -1,500
2,860 -259 97 -13 7 81
Waste fraction
Open Loop3
Closed Loop3
Power only
moving grate
Anaerobic
Digestion
0
0
0
0
0
0
0
0
0
0
0
0
0
0
0
0
0 0 0 0 0 0 0
0
Sources
Notes
1
2
3 Open loop recycling is the process of recycling material into other products. Closed loop recycling is the process of recycling material back into the same product. 4
There are essentially zero Scope 1 emissions for waste.
Tonnes of waste treated /disposed of by 4:
Non-ferrous metal
Plastic (dense)
Plastic (film)
Net kg CO2e emitted per tonne of waste treated / disposed of by 1:
Energy from wasteRecycling
Tonnes of waste
PRODUCED
Textiles
Plastic (film)
More information on WRAP can be found at: http://www.wrap.org.uk/
Garden/plant waste
Other organic
Recycling
Estimated impact of other materials (municipal and C&I)
Total Net kgCO2e emissions by category
Silt/soil
Aggregate materials
Misc combustibles
Glass
Tyres
The data summarised in the table covers the life cycle stages highlighted below. It excludes use of the product as this will be variable. For example, plastic may be used as automotive parts
or as drinks packaging amongst other things. If it is used as drinks packaging it will require filling. As it is not known what the final use of the material is, this section of the life cycle is
excluded for all materials. For some products forming is also excluded. Metals may be made into various products by different methods, excluded from these figures.
http://www.defra.gov.uk/ENVIRONMENT/waste/strategy/strategy07/documents/waste07-annex-a.pdf
Composting
Paper and Card
kg CO2e emitted
per tonne virgin
material 2
Kitchen/food waste
Aggregate materials
Misc combustibles
Ferrous metal
Plastic (dense)
Life-Cycle Conversion Factors for Waste Disposal
Paper and Card
Grand Total Net kgCO2e emissions
Total Net kg
CO2e
emissions by
waste fraction
On average in the UK 88% of non-recycled waste goes to landfill and 12% goes to energy from waste (power only moving grate).
Textiles
Wood
Ferrous metal
Garden/plant waste
Other organic
Landfill
Wood
Savings from embodied fossil energy resulting from avoiding waste are the negative of these figures.
The waste production figure for textiles currently does not account for the split of material types on the UK market. Improvements will be made to this figure in future updates.
Updated and new figures in BOLD provided by WRAP, 2009 and 2010.
Impact of other treatments as in pRIA – http://www.defra.gov.uk/ENVIRONMENT/waste/strategy/review/documents/partialRIA.pdf – p.58.
Kitchen/food waste
Scope 3
Landfill Composting
Defra Waste Strategy, Table A.28: Emission factors for waste treatment processes (kg carbon dioxide equivalents/tonne of waste processed)
Estimated impact of other materials (municipal and C&I)
Glass
Non-ferrous metal
Silt/soil
Energy from waste
Page 39 of 49

2010 Guidelines to Defra / DECC's GHG Conversion Factors for Company Reporting
Annex 9 - Other UK Conversion Factor TablesLast updated: Oct-10
Further additional information on Life Cycle Conversion Factors for Waste Disposal:
Figure 1:
A high level overview of the life cycle of materials and products is shown in figure 1 below.
The table is split into two halves. The top half contains all the emissions factors which are used to calculate the emissions which are calculated in the bottom half of the table. The (yellow)
box in the bottom right corner gives the total net CO2 emissions which can be reported in your GHG emissions report.
The first column of figures include emissions related to the materials purchased by an organisation that are subsequently transferred to the waste stream for treatment or disposal. This
includes the emissions from the following life cycle stages: extraction, primary processing, manufacturing and transportation. It excludes the use phase. The first column (yellow) will
automatically total the tonnes of material sent through for waste treatment or disposal and is used to calculate the emissions associated with the production of the original materials. The rest
of the blue columns deal with the emissions from different waste disposal routes. Enter the tonnes of waste sent to each waste disposal stream in the relevant blue boxes. The totals are
calculated in the yellow boxes.
By quantifying both material use and emissions from waste management, the benefits of waste prevention and more effective management may be estimated. If only waste management
emissions are calculated, the benefit of waste prevention will not be adequately covered.
Some of the figures in table 9d are negative numbers. This is because the recycling or energy recovery process avoids the production of primary materials and combustion of fossil fuels.
The figures do not include avoided emissions from alternative waste management.
These figures should be used for site based reporting only. They should not be added together along a supply chain, as material use would be counted several times along a supply chain.
The data provided for recycling, energy recovery and landfill are based on absolute emissions for these options. Therefore, to identify the benefit of one option versus another (e.g. recycling
versus landfill), the benefit is the difference between the two columns.
For further information on the factors in table 9d, please refer to the methodology paper for the 2010 update, which will be made available from:
http://www.defra.gov.uk/environment/business/reporting/conversion-factors.htm
It is essential that, where possible, data is used to cover both the production of the materials used by an organisation, and the waste generated by an organisation. See diagram below for the
life cycle stages covered.
Table 9d provides emissions factors for reporting on emissions from waste disposal. These emissions would fall into the Scope 3 emissions of a reporting company. As with all Scope 3
emissions, these are life-cycle emissions factors and therefore cannot be directly compared to Scope1 or 2 /direct emissions factors in other annexes. These figures are estimates to be
used in the absence of data specific to your goods and services. If you have more accurate information for your products, then please refer to the more accurate data for reporting your
emissions.
Page 40 of 49
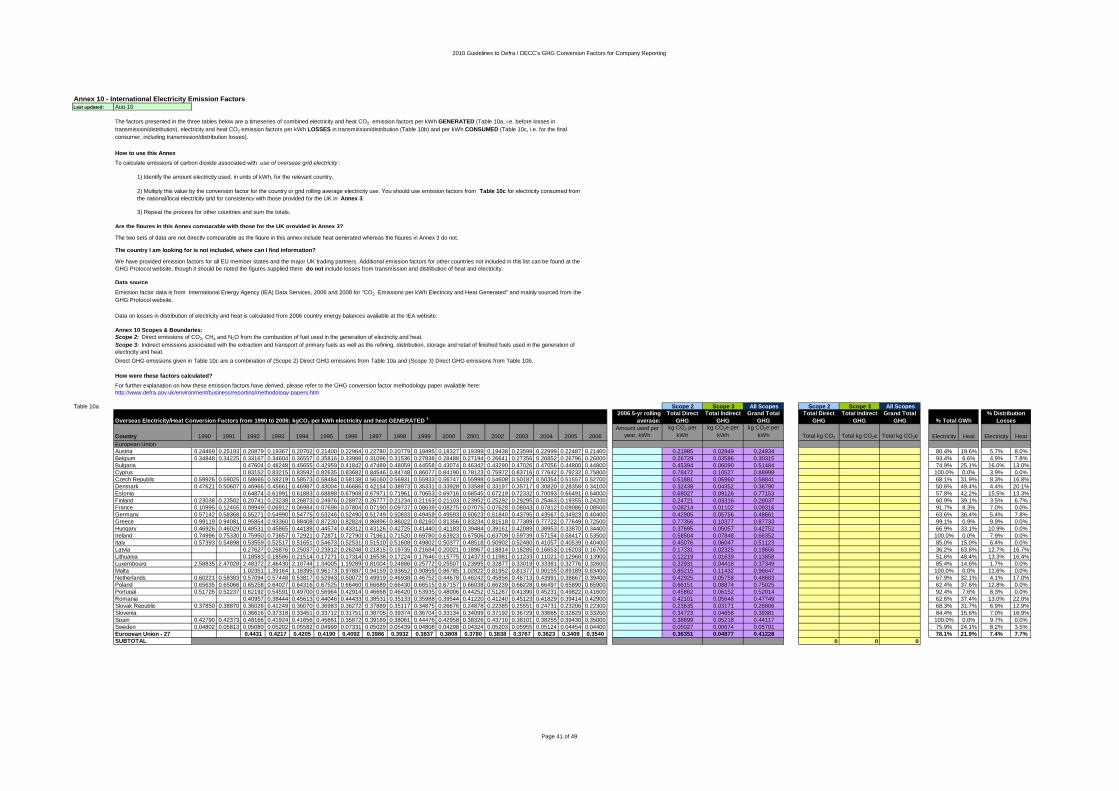
2010 Guidelines to Defra / DECC's GHG Conversion Factors for Company Reporting
Annex 10 - International Electricity Emission FactorsLast updated: Aug-10
Are the figures in this Annex comparable with those for the UK provided in Annex 3?
The two sets of data are not directly comparable as the figure in this annex include heat generated whereas the figures in Annex 3 do not.
Data source
Table 10a Scope 2 Scope 3 All Scopes Scope 2 Scope 3 All Scopes
1
2006 5-yr rolling
average:
Total Direct
GHG
Total Indirect
GHG
Grand Total
GHG
Total Direct
GHG
Total Indirect
GHG
Grand Total
GHG
Country 1990 1991 1992 1993 1994 1995 1996 1997 1998 1999 2000 2001 2002 2003 2004 2005 2006
Amount used per
year, kWh
kg CO2 per
kWh
kg CO2e per
kWh
kg CO2e per
kWh Total kg CO2 Total kg CO2e Total kg CO2e Electricity Heat Electricity Heat
Austria 0.24469 0.25193 0.20879 0.19367 0.20702 0.21400 0.22964 0.22780 0.20779 0.19495 0.18327 0.19399 0.19438 0.23599 0.22999 0.22487 0.21400 0.21985 0.02949 0.24934 80.4% 19.6% 5.7% 8.0%
Belgium 0.34848 0.34225 0.33167 0.34604 0.36557 0.35816 0.33988 0.31096 0.31536 0.27838 0.28488 0.27194 0.26641 0.27356 0.26852 0.26796 0.26000 0.26729 0.03586 0.30315 93.4% 6.6% 4.9% 7.8%
Bulgaria 0.47604 0.48248 0.45655 0.42959 0.41842 0.47489 0.48059 0.44558 0.43074 0.46342 0.43290 0.47026 0.47056 0.44800 0.44800 0.45394 0.06090 0.51484 74.9% 25.1% 16.0% 13.0%
Cyprus 0.83152 0.83215 0.83592 0.82635 0.83682 0.84546 0.84748 0.86077 0.84190 0.78123 0.75972 0.83716 0.77642 0.79232 0.75800 0.78472 0.10527 0.88999 100.0% 0.0% 3.9% 0.0%
Czech Republic 0.59926 0.59025 0.58666 0.58219 0.58573 0.58484 0.58138 0.56160 0.56931 0.55933 0.56747 0.55998 0.54608 0.50187 0.50354 0.51557 0.52700 0.51881 0.06960 0.58841 68.1% 31.9% 8.3% 16.8%
Denmark 0.47621 0.50607 0.46966 0.45661 0.46987 0.43004 0.46686 0.42154 0.38973 0.36331 0.33928 0.33588 0.33197 0.35717 0.30820 0.28358 0.34100 0.32438 0.04352 0.36790 50.6% 49.4% 4.4% 20.1%
Estonia 0.64874 0.61991 0.61883 0.68898 0.67908 0.67971 0.71961 0.70653 0.69716 0.68545 0.67219 0.72332 0.70093 0.66491 0.64000 0.68027 0.09126 0.77153 57.8% 42.2% 15.5% 13.3%
Finland 0.23038 0.23502 0.20741 0.23238 0.26873 0.24976 0.28972 0.26777 0.21234 0.21163 0.21103 0.23952 0.25292 0.29295 0.25463 0.19355 0.24200 0.24721 0.03316 0.28037 60.9% 39.1% 3.5% 6.7%
France 0.10995 0.12455 0.09949 0.06912 0.06984 0.07698 0.07804 0.07190 0.09737 0.08639 0.08275 0.07075 0.07628 0.08043 0.07812 0.09086 0.08500 0.08214 0.01102 0.09316 91.7% 8.3% 7.0% 0.0%
Germany 0.57142 0.58368 0.55271 0.54990 0.54775 0.53246 0.52490 0.51749 0.50833 0.49459 0.49593 0.50623 0.51840 0.43795 0.43567 0.34923 0.40400 0.42905 0.05756 0.48661 63.6% 36.4% 5.4% 7.8%
Greece 0.99119 0.94081 0.95854 0.93360 0.88408 0.87230 0.82824 0.86896 0.86022 0.82160 0.81356 0.83234 0.81518 0.77389 0.77722 0.77649 0.72500 0.77356 0.10377 0.87733 99.1% 0.9% 9.9% 0.0%
Hungary 0.46926 0.46029 0.48531 0.45865 0.44188 0.44574 0.43312 0.43126 0.42725 0.41440 0.41183 0.39484 0.39161 0.42089 0.38953 0.33870 0.34400 0.37695 0.05057 0.42752 66.9% 33.1% 10.9% 0.0%
Ireland 0.74996 0.75330 0.75950 0.73657 0.72921 0.72871 0.72790 0.71961 0.71520 0.69780 0.63923 0.67506 0.63709 0.59739 0.57154 0.58417 0.53500 0.58504 0.07848 0.66352 100.0% 0.0% 7.9% 0.0%
Italy 0.57393 0.54898 0.53559 0.52517 0.51651 0.54673 0.52531 0.51510 0.51608 0.49802 0.50377 0.48518 0.50902 0.52480 0.41057 0.40539 0.40400 0.45076 0.06047 0.51123 85.0% 15.0% 6.4% 0.0%
Latvia 0.27627 0.26876 0.25037 0.23812 0.26248 0.21815 0.19735 0.21684 0.20021 0.18967 0.18814 0.18285 0.16653 0.16203 0.16700 0.17331 0.02325 0.19656 36.2% 63.8% 12.7% 16.7%
Lithuania 0.18583 0.18586 0.21514 0.17271 0.17314 0.16538 0.17224 0.17646 0.15775 0.14373 0.11981 0.11233 0.11021 0.12960 0.13900 0.12219 0.01639 0.13858 51.6% 48.4% 13.3% 16.4%
Luxembourg 2.58835 2.47028 2.48372 2.46430 2.10744 1.34005 1.19289 0.81004 0.24886 0.25772 0.25507 0.23995 0.32877 0.33019 0.33381 0.32776 0.32600 0.32931 0.04418 0.37349 85.4% 14.6% 1.7% 0.0%
Malta 1.02351 1.39164 1.16395 0.96173 0.97887 0.94159 0.93652 0.90859 0.86785 1.02822 0.81952 0.81377 0.90155 0.89189 0.83400 0.85215 0.11432 0.96647 100.0% 0.0% 11.6% 0.0%
Netherlands 0.60221 0.58383 0.57094 0.57448 0.53817 0.52943 0.50072 0.49919 0.46938 0.46752 0.44678 0.46242 0.45856 0.46713 0.43991 0.38667 0.39400 0.42925 0.05758 0.48683 67.9% 32.1% 4.1% 17.0%
Poland 0.65635 0.65066 0.65258 0.64027 0.64316 0.67525 0.66460 0.66689 0.66430 0.66515 0.67157 0.66038 0.66239 0.66228 0.66497 0.65890 0.65900 0.66151 0.08874 0.75025 62.4% 37.6% 12.8% 0.0%
Portugal 0.51726 0.52237 0.62192 0.54591 0.49700 0.56964 0.42914 0.46668 0.46420 0.53935 0.48006 0.44252 0.51267 0.41390 0.45231 0.49822 0.41600 0.45862 0.06152 0.52014 92.4% 7.6% 8.3% 0.0%
Romania 0.40957 0.38444 0.45613 0.44046 0.44433 0.38531 0.35133 0.35988 0.39544 0.41220 0.41240 0.45123 0.41829 0.39414 0.42900 0.42101 0.05648 0.47749 62.6% 37.4% 13.0% 22.0%
Slovak Republic 0.37850 0.38870 0.36026 0.41249 0.36070 0.36983 0.36272 0.37889 0.35117 0.34875 0.26676 0.24878 0.22385 0.25551 0.24731 0.23206 0.22300 0.23635 0.03171 0.26806 68.3% 31.7% 6.9% 12.9%
Slovenia 0.36616 0.37318 0.33451 0.33712 0.31751 0.38705 0.39374 0.36704 0.33134 0.34099 0.37192 0.36729 0.33665 0.32829 0.33200 0.34723 0.04658 0.39381 84.4% 15.6% 7.0% 16.9%
Spain 0.42790 0.42373 0.48166 0.41924 0.41656 0.45661 0.35872 0.39189 0.38061 0.44476 0.42958 0.38326 0.43710 0.38101 0.38255 0.39430 0.35000 0.38899 0.05218 0.44117 100.0% 0.0% 9.7% 0.0%
Sweden 0.04802 0.05813 0.05080 0.05202 0.05582 0.04999 0.07331 0.05029 0.05439 0.04808 0.04208 0.04324 0.05203 0.05955 0.05124 0.04454 0.04400 0.05027 0.00674 0.05701 75.9% 24.1% 8.2% 3.5%
European Union - 27 0.4431 0.4217 0.4205 0.4190 0.4092 0.3986 0.3932 0.3837 0.3808 0.3780 0.3838 0.3767 0.3623 0.3409 0.3540 0.36351 0.04877 0.41228 78.1% 21.9% 7.4% 7.7%
SUBTOTAL 0 0 0
Scope 2: Direct emissions of CO2, CH4 and N2O from the combustion of fuel used in the generation of electricity and heat.
Scope 3: Indirect emissions associated with the extraction and transport of primary fuels as well as the refining, distribution, storage and retail of finished fuels used in the generation of
electricity and heat.
Direct GHG emissions given in Table 10c are a combination of (Scope 2) Direct GHG emissions from Table 10a and (Scope 3) Direct GHG emissions from Table 10b.
% Total GWh
% Distribution
Losses
European Union
2) Multiply this value by the conversion factor for the country or grid rolling average electricity use. You should use emission factors from Table 10c for electricity consumed from
the national/local electricity grid for consistency with those provided for the UK in Annex 3.
We have provided emission factors for all EU member states and the major UK trading partners. Additional emission factors for other countries not included in this list can be found at the
GHG Protocol website, though it should be noted the figures supplied there do not include losses from transmission and distribution of heat and electricity.
Emission factor data is from International Energy Agency (IEA) Data Services, 2006 and 2008 for "CO2 Emissions per kWh Electricity and Heat Generated" and mainly sourced from the
GHG Protocol website.
The country I am looking for is not included, where can I find information?
How were these factors calculated?
For further explanation on how these emission factors have derived, please refer to the GHG conversion factor methodology paper available here:
http://www.defra.gov.uk/environment/business/reporting/methodology-papers.htm
The factors presented in the three tables below are a timeseries of combined electricity and heat CO2 emission factors per kWh GENERATED (Table 10a, i.e. before losses in
transmission/distribution), electricity and heat CO2 emission factors per kWh LOSSES in transmission/distribution (Table 10b) and per kWh CONSUMED (Table 10c, i.e. for the final
consumer, including transmission/distribution losses).
Overseas Electricity/Heat Conversion Factors from 1990 to 2006: kgCO2 per kWh electricity and heat GENERATED 1
Annex 10 Scopes & Boundaries:
Data on losses in distribution of electricity and heat is calculated from 2006 country energy balances available at the IEA website.
3) Repeat the process for other countries and sum the totals.
How to use this Annex
To calculate emissions of carbon dioxide associated with use of overseas grid electricity :
1) Identify the amount electricity used, in units of kWh, for the relevant country.
Page 41 of 49
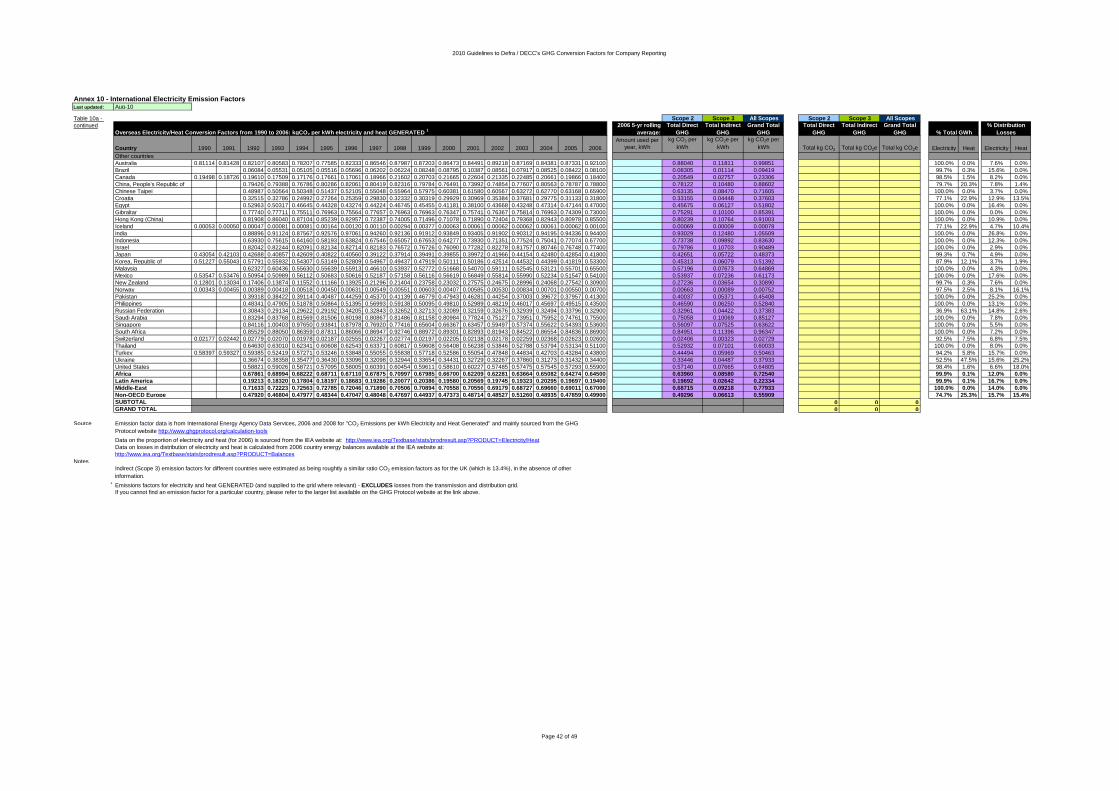
2010 Guidelines to Defra / DECC's GHG Conversion Factors for Company Reporting
Annex 10 - International Electricity Emission FactorsLast updated: Aug-10
Scope 2 Scope 3 All Scopes Scope 2 Scope 3 All Scopes
2006 5-yr rolling
average:
Total Direct
GHG
Total Indirect
GHG
Grand Total
GHG
Total Direct
GHG
Total Indirect
GHG
Grand Total
GHG
Country 1990 1991 1992 1993 1994 1995 1996 1997 1998 1999 2000 2001 2002 2003 2004 2005 2006
Amount used per
year, kWh
kg CO2 per
kWh
kg CO2e per
kWh
kg CO2e per
kWh Total kg CO2 Total kg CO2e Total kg CO2e Electricity Heat Electricity Heat
Australia 0.81114 0.81428 0.82107 0.80583 0.78207 0.77585 0.82333 0.86546 0.87987 0.87203 0.86473 0.84491 0.89218 0.87169 0.84381 0.87331 0.92100 0.88040 0.11811 0.99851 100.0% 0.0% 7.6% 0.0%
Brazil 0.06084 0.05531 0.05105 0.05516 0.05696 0.06202 0.06224 0.08248 0.08795 0.10387 0.08561 0.07917 0.08525 0.08422 0.08100 0.08305 0.01114 0.09419 99.7% 0.3% 15.6% 0.0%
Canada 0.19498 0.18726 0.19610 0.17509 0.17176 0.17661 0.17061 0.18966 0.21602 0.20703 0.21665 0.22604 0.21335 0.22485 0.20661 0.19866 0.18400 0.20549 0.02757 0.23306 98.5% 1.5% 8.2% 0.0%
China, People's Republic of 0.79426 0.79388 0.76786 0.80286 0.82061 0.80419 0.82316 0.79784 0.76491 0.73992 0.74854 0.77607 0.80563 0.78787 0.78800 0.78122 0.10480 0.88602 79.7% 20.3% 7.8% 1.4%
Chinese Taipei 0.48987 0.50564 0.50348 0.51437 0.52105 0.55048 0.55964 0.57975 0.60381 0.61580 0.60567 0.63272 0.62770 0.63168 0.65900 0.63135 0.08470 0.71605 100.0% 0.0% 3.7% 0.0%
Croatia 0.32515 0.32786 0.24992 0.27264 0.25359 0.29830 0.32332 0.30319 0.29929 0.30969 0.35384 0.37681 0.29775 0.31133 0.31800 0.33155 0.04448 0.37603 77.1% 22.9% 12.9% 13.5%
Egypt 0.52963 0.50317 0.46645 0.44328 0.43274 0.44224 0.46745 0.45455 0.41181 0.38100 0.43668 0.43248 0.47314 0.47144 0.47000 0.45675 0.06127 0.51802 100.0% 0.0% 16.4% 0.0%
Gibraltar 0.77740 0.77711 0.75511 0.76963 0.75564 0.77657 0.76963 0.76963 0.76347 0.75741 0.76367 0.75814 0.76963 0.74309 0.73000 0.75291 0.10100 0.85391 100.0% 0.0% 0.0% 0.0%
Hong Kong (China) 0.81908 0.86040 0.87104 0.85239 0.82957 0.72387 0.74005 0.71496 0.71078 0.71890 0.72404 0.79368 0.82943 0.80978 0.85500 0.80239 0.10764 0.91003 100.0% 0.0% 10.9% 0.0%
Iceland 0.00053 0.00050 0.00047 0.00081 0.00081 0.00164 0.00120 0.00110 0.00294 0.00377 0.00063 0.00061 0.00062 0.00062 0.00061 0.00062 0.00100 0.00069 0.00009 0.00078 77.1% 22.9% 4.7% 10.4%
India 0.88896 0.91124 0.87567 0.92576 0.97061 0.94260 0.92136 0.91912 0.93849 0.93405 0.91902 0.90312 0.94195 0.94336 0.94400 0.93029 0.12480 1.05509 100.0% 0.0% 26.8% 0.0%
Indonesia 0.63930 0.75615 0.64160 0.58193 0.63824 0.67546 0.65057 0.67653 0.64277 0.73930 0.71351 0.77524 0.75041 0.77074 0.67700 0.73738 0.09892 0.83630 100.0% 0.0% 12.3% 0.0%
Israel 0.82042 0.82244 0.82091 0.82134 0.82714 0.82183 0.76572 0.76726 0.76090 0.77282 0.82278 0.81757 0.80746 0.76748 0.77400 0.79786 0.10703 0.90489 100.0% 0.0% 2.9% 0.0%
Japan 0.43054 0.42103 0.42688 0.40857 0.42609 0.40822 0.40560 0.39122 0.37914 0.39491 0.39855 0.39972 0.41966 0.44154 0.42480 0.42854 0.41800 0.42651 0.05722 0.48373 99.3% 0.7% 4.9% 0.0%
Korea, Republic of 0.51227 0.55043 0.57791 0.55932 0.54307 0.53149 0.52809 0.54967 0.49437 0.47919 0.50111 0.50186 0.42514 0.44532 0.44399 0.41819 0.53300 0.45313 0.06079 0.51392 87.9% 12.1% 3.7% 1.9%
Malaysia 0.62327 0.60436 0.55630 0.55639 0.55913 0.46610 0.53937 0.52772 0.51668 0.54070 0.59111 0.52545 0.53121 0.55701 0.65500 0.57196 0.07673 0.64869 100.0% 0.0% 4.3% 0.0%
Mexico 0.53547 0.53476 0.50954 0.50989 0.56112 0.50683 0.50616 0.52187 0.57158 0.56116 0.56619 0.56849 0.55814 0.55990 0.52234 0.51547 0.54100 0.53937 0.07236 0.61173 100.0% 0.0% 17.6% 0.0%
New Zealand 0.12801 0.13034 0.17406 0.13874 0.11552 0.11166 0.13925 0.21296 0.21404 0.23758 0.23032 0.27575 0.24675 0.28996 0.24068 0.27542 0.30900 0.27236 0.03654 0.30890 99.7% 0.3% 7.6% 0.0%
Norway 0.00343 0.00455 0.00389 0.00418 0.00518 0.00450 0.00631 0.00549 0.00551 0.00603 0.00407 0.00585 0.00530 0.00834 0.00701 0.00550 0.00700 0.00663 0.00089 0.00752 97.5% 2.5% 8.1% 16.1%
Pakistan 0.39318 0.38422 0.39114 0.40487 0.44259 0.45370 0.41139 0.46779 0.47943 0.46281 0.44254 0.37003 0.39672 0.37957 0.41300 0.40037 0.05371 0.45408 100.0% 0.0% 25.2% 0.0%
Philippines 0.48341 0.47905 0.51878 0.50864 0.51395 0.56993 0.59138 0.50095 0.49810 0.52989 0.48219 0.46017 0.45697 0.49515 0.43500 0.46590 0.06250 0.52840 100.0% 0.0% 13.1% 0.0%
Russian Federation 0.30843 0.29134 0.29622 0.29192 0.34205 0.32843 0.32652 0.32713 0.32089 0.32159 0.32676 0.32939 0.32494 0.33796 0.32900 0.32961 0.04422 0.37383 36.9% 63.1% 14.8% 2.6%
Saudi Arabia 0.83294 0.83768 0.81569 0.81506 0.80198 0.80867 0.81486 0.81158 0.80984 0.77824 0.75127 0.73951 0.75952 0.74761 0.75500 0.75058 0.10069 0.85127 100.0% 0.0% 7.8% 0.0%
Singapore 0.84116 1.00403 0.97650 0.93841 0.87978 0.76920 0.77416 0.65604 0.66367 0.63457 0.59497 0.57374 0.55622 0.54393 0.53600 0.56097 0.07525 0.63622 100.0% 0.0% 5.5% 0.0%
South Africa 0.85529 0.88050 0.86359 0.87811 0.86066 0.86947 0.92746 0.88972 0.89301 0.82893 0.81943 0.84522 0.86554 0.84836 0.86900 0.84951 0.11396 0.96347 100.0% 0.0% 7.2% 0.0%
Switzerland 0.02177 0.02442 0.02779 0.02070 0.01978 0.02187 0.02555 0.02267 0.02774 0.02197 0.02205 0.02138 0.02178 0.02259 0.02368 0.02623 0.02600 0.02406 0.00323 0.02729 92.5% 7.5% 6.8% 7.5%
Thailand 0.64630 0.63010 0.62341 0.60608 0.62543 0.63371 0.60817 0.59608 0.56408 0.56238 0.53846 0.52788 0.53794 0.53134 0.51100 0.52932 0.07101 0.60033 100.0% 0.0% 8.0% 0.0%
Turkey 0.58397 0.59327 0.59385 0.52419 0.57271 0.53246 0.53848 0.55055 0.55838 0.57718 0.52586 0.55054 0.47848 0.44834 0.42703 0.43284 0.43800 0.44494 0.05969 0.50463 94.2% 5.8% 15.7% 0.0%
Ukraine 0.36674 0.38358 0.35477 0.36430 0.33096 0.32098 0.32944 0.33654 0.34431 0.32729 0.32267 0.37860 0.31273 0.31432 0.34400 0.33446 0.04487 0.37933 52.5% 47.5% 15.6% 25.2%
United States 0.58821 0.59026 0.58721 0.57095 0.58005 0.60391 0.60454 0.59611 0.58610 0.60227 0.57485 0.57475 0.57545 0.57293 0.55900 0.57140 0.07665 0.64805 98.4% 1.6% 6.6% 18.0%
Africa 0.67861 0.68994 0.68222 0.68711 0.67110 0.67875 0.70997 0.67985 0.66700 0.62209 0.62281 0.63664 0.65082 0.64274 0.64500 0.63960 0.08580 0.72540 99.9% 0.1% 12.0% 0.0%
Latin America 0.19213 0.18320 0.17804 0.18197 0.18683 0.19286 0.20077 0.20386 0.19580 0.20569 0.19745 0.19323 0.20295 0.19697 0.19400 0.19692 0.02642 0.22334 99.9% 0.1% 16.7% 0.0%
Middle-East 0.71633 0.72223 0.72563 0.72785 0.72046 0.71890 0.70506 0.70894 0.70558 0.70556 0.69179 0.68727 0.69660 0.69011 0.67000 0.68715 0.09218 0.77933 100.0% 0.0% 14.0% 0.0%
Non-OECD Europe 0.47920 0.46804 0.47977 0.48344 0.47047 0.48048 0.47697 0.44937 0.47373 0.48714 0.48527 0.51260 0.48935 0.47859 0.49900 0.49296 0.06613 0.55909 74.7% 25.3% 15.7% 15.4%
SUBTOTAL 0 0 0GRAND TOTAL 0 0 0
Source
Notes
1
Overseas Electricity/Heat Conversion Factors from 1990 to 2006: kgCO2 per kWh electricity and heat GENERATED 1
% Total GWh
Data on the proportion of electricity and heat (for 2006) is sourced from the IEA website at: http://www.iea.org/Textbase/stats/prodresult.asp?PRODUCT=Electricity/Heat
% Distribution
Losses
Data on losses in distribution of electricity and heat is calculated from 2006 country energy balances available at the IEA website at:
http://www.iea.org/Textbase/stats/prodresult.asp?PRODUCT=Balances
Indirect (Scope 3) emission factors for different countries were estimated as being roughtly a similar ratio CO2 emission factors as for the UK (which is 13.4%), in the absence of other
information.
Emission factor data is from International Energy Agency Data Services, 2006 and 2008 for "CO2 Emissions per kWh Electricity and Heat Generated" and mainly sourced from the GHG
Protocol website http://www.ghgprotocol.org/calculation-tools
If you cannot find an emission factor for a particular country, please refer to the larger list available on the GHG Protocol website at the link above.
Other countries
Emissions factors for electricity and heat GENERATED (and supplied to the grid where relevant) - EXCLUDES losses from the transmission and distribution grid.
Table 10a -
continued
Page 42 of 49

2010 Guidelines to Defra / DECC's GHG Conversion Factors for Company Reporting
Annex 10 - International Electricity Emission FactorsLast updated: Aug-10
Table 10b Scope 2 Scope 3 All Scopes Scope 2 Scope 3 All Scopes
#REF!
2006 5-yr rolling
average:
Total Direct
GHG
Total Indirect
GHG
Grand Total
GHG
Total Direct
GHG
Total Indirect
GHG
Grand Total
GHG
Country 1990 1991 1992 1993 1994 1995 1996 1997 1998 1999 2000 2001 2002 2003 2004 2005 2006
Amount used per
year, kWh
kg CO2 per
kWh
kg CO2e per
kWh
kg CO2e per
kWh Total kg CO2 Total kg CO2e Total kg CO2e Electricity Heat Electricity Heat
Austria 0.01607 0.01654 0.01371 0.01271 0.01359 0.01404 0.01508 0.01495 0.01364 0.01280 0.01203 0.01273 0.01277 0.01549 0.01510 0.01476 0.01400 0.01442 0.00194 0.01636 79.5% 20.5% 5.7% 8.0%
Belgium 0.01868 0.01835 0.01778 0.01855 0.01959 0.01920 0.01822 0.01667 0.01691 0.01492 0.01527 0.01458 0.01428 0.01466 0.01440 0.01436 0.01400 0.01434 0.00192 0.01626 94.2% 5.8% 4.9% 7.8%
Bulgaria 0.08445 0.08560 0.08100 0.07621 0.07423 0.08425 0.08527 0.07905 0.07642 0.08222 0.07681 0.08343 0.08348 0.07949 0.08036 0.08072 0.01083 0.09155 70.2% 29.8% 16.0% 13.0%
Cyprus 0.03414 0.03416 0.03432 0.03393 0.03436 0.03471 0.03479 0.03533 0.03456 0.03207 0.03119 0.03437 0.03187 0.03253 0.03112 0.03222 0.00432 0.03654 100.0% 0.0% 3.9% 0.0%
Czech Republic 0.07588 0.07474 0.07428 0.07372 0.07417 0.07405 0.07361 0.07111 0.07208 0.07082 0.07185 0.07090 0.06915 0.06355 0.06376 0.06529 0.06539 0.06543 0.00878 0.07421 65.7% 34.3% 8.3% 16.8%
Denmark 0.06218 0.06608 0.06132 0.05962 0.06135 0.05616 0.06096 0.05504 0.05088 0.04744 0.04430 0.04386 0.04335 0.04664 0.04024 0.03703 0.04719 0.04289 0.00575 0.04864 54.5% 45.5% 4.4% 20.1%
Estonia 0.10891 0.10407 0.10389 0.11567 0.11400 0.11410 0.12081 0.11861 0.11704 0.11507 0.11285 0.12143 0.11767 0.11162 0.10921 0.11456 0.01537 0.12993 48.6% 51.4% 15.5% 13.3%
Finland 0.01118 0.01140 0.01006 0.01128 0.01304 0.01212 0.01406 0.01300 0.01030 0.01027 0.01024 0.01163 0.01228 0.01421 0.01236 0.00939 0.01217 0.01208 0.00162 0.01370 65.9% 34.1% 3.5% 6.7%
France 0.00731 0.00828 0.00661 0.00459 0.00465 0.00512 0.00519 0.00478 0.00648 0.00574 0.00550 0.00470 0.00507 0.00535 0.00519 0.00604 0.00583 0.00549 0.00074 0.00623 89.0% 11.0% 7.0% 0.0%
Germany 0.03846 0.03929 0.03720 0.03701 0.03687 0.03584 0.03533 0.03483 0.03422 0.03329 0.03338 0.03408 0.03490 0.02948 0.02932 0.02351 0.02693 0.02883 0.00387 0.03270 61.3% 38.7% 5.4% 7.8%
Greece 0.10757 0.10210 0.10402 0.10131 0.09594 0.09466 0.08988 0.09430 0.09335 0.08916 0.08829 0.09032 0.08846 0.08398 0.08435 0.08427 0.07882 0.08397 0.01127 0.09524 98.9% 1.1% 9.9% 0.0%
Hungary 0.03744 0.03672 0.03872 0.03659 0.03525 0.03557 0.03456 0.03441 0.03409 0.03306 0.03286 0.03150 0.03124 0.03358 0.03107 0.02703 0.02698 0.02998 0.00402 0.03400 68.0% 32.0% 10.9% 0.0%
Ireland 0.06446 0.06475 0.06529 0.06332 0.06268 0.06264 0.06257 0.06186 0.06148 0.05998 0.05494 0.05803 0.05476 0.05136 0.04913 0.05022 0.04599 0.05029 0.00675 0.05704 100.0% 0.0% 7.9% 0.0%
Italy 0.03305 0.03161 0.03085 0.03025 0.02975 0.03148 0.03025 0.02967 0.02972 0.02868 0.02901 0.02794 0.02931 0.03022 0.02365 0.02335 0.02330 0.02596 0.00348 0.02944 84.9% 15.1% 6.4% 0.0%
Latvia 0.04849 0.04718 0.04395 0.04180 0.04608 0.03830 0.03464 0.03807 0.03515 0.03329 0.03303 0.03210 0.02923 0.02845 0.03015 0.03059 0.00410 0.03469 45.2% 54.8% 12.7% 16.7%
Lithuania 0.03298 0.03299 0.03819 0.03065 0.03073 0.02935 0.03057 0.03132 0.02800 0.02551 0.02127 0.01993 0.01956 0.02300 0.02415 0.02158 0.00290 0.02448 43.1% 56.9% 13.3% 16.4%
Luxembourg 0.03936 0.03757 0.03777 0.03747 0.03205 0.02038 0.01814 0.01231 0.00378 0.00391 0.00388 0.00365 0.00500 0.00502 0.00508 0.00498 0.00472 0.00496 0.00066 0.00562 89.7% 10.3% 1.7% 0.0%
Malta 0.13403 0.18224 0.15243 0.12594 0.12818 0.12330 0.12264 0.11899 0.11365 0.13465 0.10732 0.10656 0.11806 0.11680 0.10921 0.11159 0.01497 0.12656 100.0% 0.0% 11.6% 0.0%
Netherlands 0.04762 0.04617 0.04515 0.04543 0.04255 0.04186 0.03960 0.03948 0.03712 0.03697 0.03533 0.03657 0.03626 0.03694 0.03478 0.03057 0.03549 0.03481 0.00467 0.03948 75.1% 24.9% 4.1% 17.0%
Poland 0.04941 0.04899 0.04913 0.04820 0.04843 0.05084 0.05004 0.05021 0.05001 0.05008 0.05057 0.04973 0.04987 0.04987 0.05006 0.04961 0.05714 0.05131 0.00689 0.05820 54.7% 45.3% 12.8% 0.0%
Portugal 0.04314 0.04356 0.05186 0.04552 0.04144 0.04750 0.03578 0.03891 0.03871 0.04497 0.04003 0.03690 0.04275 0.03451 0.03771 0.04155 0.03470 0.03824 0.00513 0.04337 92.4% 7.6% 8.3% 0.0%
Romania 0.08088 0.07592 0.09008 0.08698 0.08775 0.07609 0.06938 0.07107 0.07809 0.08140 0.08144 0.08911 0.08261 0.07783 0.08391 0.08298 0.01113 0.09411 61.2% 38.8% 13.0% 22.0%
Slovak Republic 0.03672 0.03771 0.03494 0.04002 0.03499 0.03587 0.03518 0.03675 0.03406 0.03383 0.02587 0.02414 0.02171 0.02478 0.02399 0.02251 0.02148 0.02289 0.00307 0.02596 67.4% 32.6% 6.9% 12.9%
Slovenia 0.03390 0.03455 0.03098 0.03121 0.02940 0.03583 0.03646 0.03398 0.03068 0.03158 0.03444 0.03401 0.03117 0.03040 0.03093 0.03219 0.00432 0.03651 84.8% 15.2% 7.0% 16.9%
Spain 0.04587 0.04543 0.05163 0.04494 0.04465 0.04895 0.03845 0.04201 0.04080 0.04768 0.04605 0.04108 0.04686 0.04084 0.04101 0.04227 0.03752 0.04170 0.00560 0.04730 100.0% 0.0% 9.7% 0.0%
Sweden 0.00358 0.00434 0.00379 0.00388 0.00416 0.00372 0.00547 0.00375 0.00406 0.00359 0.00314 0.00322 0.00388 0.00444 0.00382 0.00332 0.00335 0.00376 0.00051 0.00427 72.9% 27.1% 8.2% 3.5%
European Union - 27 0.03588 0.03416 0.03406 0.03393 0.03314 0.03229 0.03184 0.03108 0.03085 0.03061 0.03108 0.03051 0.02934 0.02761 0.02865 0.02944 0.00394 0.03338 77.0% 23.0% 7.4% 7.7%
SUBTOTAL 0 0 0
Scope 3 Scope 3 All Scopes Scope 3 Scope 3 All Scopes
2006 5-yr rolling
average:
Total Direct
GHG
Total Indirect
GHG
Grand Total
GHG
Total Direct
GHG
Total Indirect
GHG
Grand Total
GHG
Country 1990 1991 1992 1993 1994 1995 1996 1997 1998 1999 2000 2001 2002 2003 2004 2005 2006
Amount used per
year, kWh
kg CO2 per
kWh
kg CO2e per
kWh
kg CO2e per
kWh Total kg CO2 Total kg CO2e Total kg CO2e Electricity Heat Electricity Heat
Australia 0.06645 0.06671 0.06727 0.06602 0.06408 0.06356 0.06745 0.07091 0.07209 0.07145 0.07085 0.06922 0.07309 0.07141 0.06913 0.07155 0.07546 0.07213 0.00967 0.08180 100.0% 0.0% 7.6% 0.0%
Brazil 0.01125 0.01023 0.00944 0.01020 0.01054 0.01147 0.01151 0.01526 0.01626 0.01921 0.01584 0.01464 0.01577 0.01557 0.01493 0.01535 0.00206 0.01741 100.0% 0.0% 15.6% 0.0%
Canada 0.01714 0.01646 0.01725 0.01540 0.01511 0.01553 0.01501 0.01668 0.01900 0.01821 0.01905 0.01987 0.01876 0.01977 0.01817 0.01747 0.01624 0.01809 0.00242 0.02051 98.2% 1.8% 8.2% 0.0%
China, People's Republic of 0.05533 0.05530 0.05348 0.05593 0.05717 0.05602 0.05734 0.05558 0.05329 0.05154 0.05214 0.05406 0.05612 0.05488 0.05484 0.05441 0.00730 0.06171 79.8% 20.2% 7.8% 1.4%
Chinese Taipei 0.01877 0.01938 0.01930 0.01971 0.01997 0.02109 0.02144 0.02221 0.02314 0.02359 0.02321 0.02424 0.02405 0.02420 0.02525 0.02419 0.00324 0.02743 100.0% 0.0% 3.7% 0.0%
Croatia 0.04853 0.04893 0.03731 0.04069 0.03785 0.04453 0.04826 0.04525 0.04467 0.04622 0.05282 0.05624 0.04445 0.04646 0.04760 0.04951 0.00664 0.05615 82.8% 17.2% 12.9% 13.5%
Egypt 0.10403 0.09883 0.09162 0.08707 0.08500 0.08686 0.09181 0.08928 0.08089 0.07483 0.08577 0.08494 0.09293 0.09260 0.09231 0.08971 0.01204 0.10175 100.0% 0.0% 16.4% 0.0%
Gibraltar 0.00000 0.00000 0.00000 0.00000 0.00000 0.00000 0.00000 0.00000 0.00000 0.00000 0.00000 0.00000 0.00000 0.00000 0.00000 0.00000 0.00000 0.00000 100.0% 0.0% 0.0% 0.0%
Hong Kong (China) 0.10036 0.10542 0.10673 0.10445 0.10165 0.08869 0.09068 0.08760 0.08709 0.08808 0.08872 0.09725 0.10163 0.09922 0.10476 0.09831 0.01319 0.11150 100.0% 0.0% 10.9% 0.0%
Iceland 0.00004 0.00003 0.00003 0.00005 0.00005 0.00010 0.00007 0.00007 0.00018 0.00024 0.00004 0.00004 0.00003 0.00004 0.00004 0.00004 0.00006 0.00005 0.00001 0.00006 77.2% 22.8% 4.7% 10.4%
India 0.32513 0.33327 0.32027 0.33859 0.35499 0.34475 0.33698 0.33616 0.34325 0.34162 0.33612 0.33030 0.34451 0.34503 0.34526 0.34024 0.04564 0.38588 100.0% 0.0% 26.8% 0.0%
Indonesia 0.08973 0.10613 0.09005 0.08168 0.08958 0.09481 0.09132 0.09495 0.09022 0.10376 0.10015 0.10882 0.10533 0.10818 0.09502 0.10350 0.01389 0.11739 100.0% 0.0% 12.3% 0.0%
Israel 0.02468 0.02473 0.02468 0.02470 0.02487 0.02472 0.02302 0.02307 0.02289 0.02324 0.02474 0.02459 0.02428 0.02308 0.02328 0.02399 0.00322 0.02721 100.0% 0.0% 2.9% 0.0%
Japan 0.02189 0.02141 0.02171 0.02077 0.02167 0.02076 0.02062 0.01990 0.01928 0.02009 0.02027 0.02032 0.02135 0.02246 0.02161 0.02179 0.02127 0.02169 0.00291 0.02460 99.3% 0.7% 4.9% 0.0%
Korea, Republic of 0.01845 0.01982 0.02082 0.02014 0.01956 0.01914 0.01902 0.01979 0.01780 0.01725 0.01805 0.01807 0.01531 0.01604 0.01598 0.01506 0.01927 0.01633 0.00219 0.01852 87.2% 12.8% 3.7% 1.9%
Malaysia 0.02812 0.02725 0.02509 0.02509 0.02521 0.02102 0.02433 0.02380 0.02330 0.02438 0.02666 0.02370 0.02396 0.02512 0.02954 0.02579 0.00346 0.02925 100.0% 0.0% 4.3% 0.0%
Mexico 0.11466 0.11451 0.10911 0.10918 0.12015 0.10853 0.10838 0.11175 0.12239 0.12016 0.12124 0.12172 0.11951 0.11989 0.11185 0.11038 0.11584 0.11549 0.01549 0.13098 100.0% 0.0% 17.6% 0.0%
New Zealand 0.01048 0.01068 0.01425 0.01136 0.00946 0.00915 0.01140 0.01744 0.01753 0.01946 0.01887 0.02259 0.02021 0.02374 0.01971 0.02256 0.02522 0.02229 0.00299 0.02528 100.0% 0.0% 7.6% 0.0%
Norway 0.00031 0.00041 0.00035 0.00037 0.00047 0.00041 0.00057 0.00049 0.00049 0.00055 0.00036 0.00052 0.00047 0.00075 0.00063 0.00050 0.00063 0.00060 0.00008 0.00068 97.9% 2.1% 8.1% 16.1%
Pakistan 0.13242 0.12940 0.13173 0.13635 0.14905 0.15280 0.13854 0.15754 0.16145 0.15587 0.14904 0.12462 0.13361 0.12783 0.13909 0.13484 0.01809 0.15293 100.0% 0.0% 25.2% 0.0%
Philippines 0.07280 0.07214 0.07813 0.07660 0.07741 0.08583 0.08906 0.07544 0.07502 0.07981 0.07262 0.06930 0.06882 0.07457 0.06551 0.07016 0.00941 0.07957 100.0% 0.0% 13.1% 0.0%
Russian Federation 0.02138 0.02021 0.02054 0.02025 0.02372 0.02278 0.02264 0.02268 0.02225 0.02230 0.02266 0.02284 0.02253 0.02344 0.02519 0.02333 0.00313 0.02646 31.7% 68.3% 14.8% 2.6%
Saudi Arabia 0.07054 0.07094 0.06908 0.06903 0.06792 0.06848 0.06901 0.06873 0.06858 0.06591 0.06363 0.06263 0.06432 0.06332 0.06394 0.06357 0.00853 0.07210 100.0% 0.0% 7.8% 0.0%
Singapore 0.04857 0.05798 0.05639 0.05419 0.05080 0.04442 0.04470 0.03788 0.03832 0.03664 0.03436 0.03313 0.03211 0.03141 0.03095 0.03239 0.00435 0.03674 100.0% 0.0% 5.5% 0.0%
South Africa 0.06590 0.06785 0.06654 0.06766 0.06631 0.06700 0.07146 0.06855 0.06881 0.06387 0.06314 0.06513 0.06668 0.06536 0.06696 0.06545 0.00878 0.07423 100.0% 0.0% 7.2% 0.0%
Switzerland 0.00160 0.00180 0.00205 0.00152 0.00146 0.00161 0.00188 0.00167 0.00204 0.00162 0.00163 0.00158 0.00161 0.00166 0.00175 0.00194 0.00192 0.00177 0.00024 0.00201 92.8% 7.2% 6.8% 7.5%
Thailand 0.05650 0.05508 0.05450 0.05299 0.05468 0.05540 0.05317 0.05211 0.04932 0.04917 0.04707 0.04615 0.04703 0.04645 0.04468 0.04628 0.00621 0.05249 100.0% 0.0% 8.0% 0.0%
Turkey 0.10003 0.10163 0.10172 0.08980 0.09810 0.09121 0.09224 0.09431 0.09565 0.09887 0.09009 0.09430 0.08196 0.07680 0.07316 0.07415 0.07634 0.07648 0.01026 0.08674 92.9% 7.1% 15.7% 0.0%
Ukraine 0.09382 0.09813 0.09076 0.09320 0.08466 0.08212 0.08428 0.08609 0.08809 0.08373 0.08254 0.09686 0.08000 0.08040 0.08666 0.08530 0.01144 0.09674 49.9% 50.1% 15.6% 25.2%
United States 0.04259 0.04274 0.04252 0.04134 0.04200 0.04372 0.04378 0.04316 0.04243 0.04361 0.04162 0.04162 0.04166 0.04149 0.04090 0.04145 0.00556 0.04701 99.0% 1.0% 6.6% 18.0%
Africa 0.09295 0.09450 0.09343 0.09411 0.09192 0.09297 0.09724 0.09312 0.09135 0.08520 0.08530 0.08720 0.08913 0.08803 0.08826 0.08759 0.01175 0.09934 100.0% 0.0% 12.0% 0.0%
Latin America 0.03844 0.03665 0.03562 0.03640 0.03737 0.03858 0.04016 0.04078 0.03917 0.04115 0.03950 0.03865 0.04059 0.03940 0.03875 0.03938 0.00528 0.04466 100.0% 0.0% 16.7% 0.0%
Middle-East 0.11689 0.11784 0.11840 0.11877 0.11755 0.11730 0.11505 0.11568 0.11513 0.11513 0.11288 0.11214 0.11366 0.11261 0.10932 0.11213 0.01504 0.12717 100.0% 0.0% 14.0% 0.0%
Non-OECD Europe 0.08861 0.08655 0.08872 0.08939 0.08699 0.08884 0.08819 0.08309 0.08760 0.09008 0.08973 0.09479 0.09049 0.08850 0.09230 0.09116 0.01223 0.10339 73.5% 26.5% 15.7% 15.4%
SUBTOTAL 0 0 0GRAND TOTAL 0 0 0
Source
% Distribution
Losses
European Union
Emission factor data is from International Energy Agency Data Services, 2006 and 2008 for "CO2 Emissions per kWh Electricity and Heat Generated" and mainly sourced from the GHG
Protocol website http://www.ghgprotocol.org/calculation-tools
% Total GWh
Other countries
% Total GWh
% Distribution
Losses
Data on the proportion of electricity and heat (for 2006) is sourced from the IEA website at: http://www.iea.org/Textbase/stats/prodresult.asp?PRODUCT=Electricity/Heat
Table 10b -
continued
Overseas Electricity/Heat Conversion Factors from 1990 to 2006: kgCO2 per kWh electricity and heat LOSSES in transmission and distribution 2
Overseas Electricity/Heat Conversion Factors from 1990 to 2006: kgCO2 per kWh electricity and heat LOSSES in transmission and distribution 2
Data on losses in distribution of electricity and heat is calculated from 2006 country energy balances available at the IEA website at:
http://www.iea.org/Textbase/stats/prodresult.asp?PRODUCT=Balances
Page 43 of 49

2010 Guidelines to Defra / DECC's GHG Conversion Factors for Company Reporting
Annex 10 - International Electricity Emission FactorsLast updated: Aug-10
Notes
2
Table 10c Scope 2, 34
Scope 3 All Scopes Scope 2, 34
Scope 3 All Scopes
2
2006 5-yr rolling
average:
Total Direct
GHG
Total Indirect
GHG
Grand Total
GHG
Total Direct
GHG
Total Indirect
GHG
Grand Total
GHG
Country 1990 1991 1992 1993 1994 1995 1996 1997 1998 1999 2000 2001 2002 2003 2004 2005 2006
Amount used per
year, kWh
kg CO2 per
kWh
kg CO2e per
kWh
kg CO2e per
kWh Total kg CO2 Total kg CO2e Total kg CO2e Electricity Heat Electricity Heat
Austria 0.26076 0.26847 0.22250 0.20638 0.22061 0.22804 0.24472 0.24275 0.22143 0.20775 0.19530 0.20672 0.20715 0.25148 0.24509 0.23963 0.22800 0.23427 0.03143 0.26570 79.5% 20.5% 5.7% 8.0%
Belgium 0.36716 0.36060 0.34945 0.36459 0.38516 0.37736 0.35810 0.32763 0.33227 0.29330 0.30015 0.28652 0.28069 0.28822 0.28292 0.28232 0.27400 0.28163 0.03778 0.31941 94.2% 5.8% 4.9% 7.8%
Bulgaria 0.56049 0.56808 0.53755 0.50580 0.49265 0.55914 0.56586 0.52463 0.50716 0.54564 0.50971 0.55369 0.55404 0.52749 0.52836 0.53466 0.07173 0.60639 70.2% 29.8% 16.0% 13.0%
Cyprus 0.86566 0.86631 0.87024 0.86028 0.87118 0.88017 0.88227 0.89610 0.87646 0.81330 0.79091 0.87153 0.80829 0.82485 0.78912 0.81694 0.10959 0.92653 100.0% 0.0% 3.9% 0.0%
Czech Republic 0.67514 0.66499 0.66094 0.65591 0.65990 0.65889 0.65499 0.63271 0.64139 0.63015 0.63932 0.63088 0.61523 0.56542 0.56730 0.58086 0.59239 0.58424 0.07838 0.66262 65.7% 34.3% 8.3% 16.8%
Denmark 0.53839 0.57215 0.53098 0.51623 0.53122 0.48620 0.52782 0.47658 0.44061 0.41075 0.38358 0.37974 0.37532 0.40381 0.34844 0.32061 0.38819 0.36727 0.04927 0.41654 54.5% 45.5% 4.4% 20.1%
Estonia 0.75765 0.72398 0.72272 0.80465 0.79308 0.79381 0.84042 0.82514 0.81420 0.80052 0.78504 0.84475 0.81860 0.77653 0.74921 0.79483 0.10663 0.90146 48.6% 51.4% 15.5% 13.3%
Finland 0.24156 0.24642 0.21747 0.24366 0.28177 0.26188 0.30378 0.28077 0.22264 0.22190 0.22127 0.25115 0.26520 0.30716 0.26699 0.20294 0.25417 0.25929 0.03478 0.29407 65.9% 34.1% 3.5% 6.7%
France 0.11726 0.13283 0.10610 0.07371 0.07449 0.08210 0.08323 0.07668 0.10385 0.09213 0.08825 0.07545 0.08135 0.08578 0.08331 0.09690 0.09083 0.08763 0.01176 0.09939 89.0% 11.0% 7.0% 0.0%
Germany 0.60988 0.62297 0.58991 0.58691 0.58462 0.56830 0.56023 0.55232 0.54255 0.52788 0.52931 0.54031 0.55330 0.46743 0.46499 0.37274 0.43093 0.45788 0.06143 0.51931 61.3% 38.7% 5.4% 7.8%
Greece 1.09876 1.04291 1.06256 1.03491 0.98002 0.96696 0.91812 0.96326 0.95357 0.91076 0.90185 0.92266 0.90364 0.85787 0.86157 0.86076 0.80382 0.85753 0.11504 0.97257 98.9% 1.1% 9.9% 0.0%
Hungary 0.50670 0.49701 0.52403 0.49524 0.47713 0.48131 0.46768 0.46567 0.46134 0.44746 0.44469 0.42634 0.42285 0.45447 0.42060 0.36573 0.37098 0.40693 0.05459 0.46152 68.0% 32.0% 10.9% 0.0%
Ireland 0.81442 0.81805 0.82479 0.79989 0.79189 0.79135 0.79047 0.78147 0.77668 0.75778 0.69417 0.73309 0.69185 0.64875 0.62067 0.63439 0.58099 0.63533 0.08523 0.72056 100.0% 0.0% 7.9% 0.0%
Italy 0.60698 0.58059 0.56644 0.55542 0.54626 0.57821 0.55556 0.54477 0.54580 0.52670 0.53278 0.51312 0.53833 0.55502 0.43422 0.42874 0.42730 0.47672 0.06395 0.54067 84.9% 15.1% 6.4% 0.0%
Latvia 0.32476 0.31594 0.29432 0.27992 0.30856 0.25645 0.23199 0.25491 0.23536 0.22296 0.22117 0.21495 0.19576 0.19048 0.19715 0.20390 0.02735 0.23125 45.2% 54.8% 12.7% 16.7%
Lithuania 0.21881 0.21885 0.25333 0.20336 0.20387 0.19473 0.20281 0.20778 0.18575 0.16924 0.14108 0.13226 0.12977 0.15260 0.16315 0.14377 0.01929 0.16306 43.1% 56.9% 13.3% 16.4%
Luxembourg 2.62771 2.50785 2.52149 2.50177 2.13949 1.36043 1.21103 0.82235 0.25264 0.26163 0.25895 0.24360 0.33377 0.33521 0.33889 0.33274 0.33072 0.33427 0.04484 0.37911 89.7% 10.3% 1.7% 0.0%
Malta 1.15754 1.57388 1.31638 1.08767 1.10705 1.06489 1.05916 1.02758 0.98150 1.16287 0.92684 0.92033 1.01961 1.00869 0.94321 0.96374 0.12929 1.09303 100.0% 0.0% 11.6% 0.0%
Netherlands 0.64983 0.63000 0.61609 0.61991 0.58072 0.57129 0.54032 0.53867 0.50650 0.50449 0.48211 0.49899 0.49482 0.50407 0.47469 0.41724 0.42949 0.46406 0.06225 0.52631 75.1% 24.9% 4.1% 17.0%
Poland 0.70576 0.69965 0.70171 0.68847 0.69159 0.72609 0.71464 0.71710 0.71431 0.71523 0.72214 0.71011 0.71226 0.71215 0.71503 0.70851 0.71614 0.71282 0.09563 0.80845 54.7% 45.3% 12.8% 0.0%
Portugal 0.56040 0.56593 0.67378 0.59143 0.53844 0.61714 0.46492 0.50559 0.50291 0.58432 0.52009 0.47942 0.55542 0.44841 0.49002 0.53977 0.45070 0.49686 0.06665 0.56351 92.4% 7.6% 8.3% 0.0%
Romania 0.49045 0.46036 0.54621 0.52744 0.53208 0.46140 0.42071 0.43095 0.47353 0.49360 0.49384 0.54034 0.50090 0.47197 0.51291 0.50399 0.06761 0.57160 61.2% 38.8% 13.0% 22.0%
Slovak Republic 0.41522 0.42641 0.39520 0.45251 0.39569 0.40570 0.39790 0.41564 0.38523 0.38258 0.29263 0.27292 0.24556 0.28029 0.27130 0.25457 0.24448 0.25924 0.03478 0.29402 67.4% 32.6% 6.9% 12.9%
Slovenia 0.40006 0.40773 0.36549 0.36833 0.34691 0.42288 0.43020 0.40102 0.36202 0.37257 0.40636 0.40130 0.36782 0.35869 0.36293 0.37942 0.05090 0.43032 84.8% 15.2% 7.0% 16.9%
Spain 0.47377 0.46916 0.53329 0.46418 0.46121 0.50556 0.39717 0.43390 0.42141 0.49244 0.47563 0.42434 0.48396 0.42185 0.42356 0.43657 0.38752 0.43069 0.05778 0.48847 100.0% 0.0% 9.7% 0.0%
Sweden 0.05160 0.06247 0.05459 0.05590 0.05998 0.05371 0.07878 0.05404 0.05845 0.05167 0.04522 0.04646 0.05591 0.06399 0.05506 0.04786 0.04735 0.05403 0.00725 0.06128 72.9% 27.1% 8.2% 3.5%
European Union - 27 0.47899 0.45590 0.45458 0.45297 0.44236 0.43092 0.42501 0.41480 0.41169 0.40861 0.41484 0.40717 0.39160 0.36847 0.38265 0.39295 0.05271 0.44566 77.0% 23.0% 7.4% 7.7%
SUBTOTAL 0 0 0
Scope 2, 34
Scope 3 All Scopes Scope 2, 34
Scope 3 All Scopes
2006 5-yr rolling
average:
Total Direct
GHG
Total Indirect
GHG
Grand Total
GHG
Total Direct
GHG
Total Indirect
GHG
Grand Total
GHG
Country 1990 1991 1992 1993 1994 1995 1996 1997 1998 1999 2000 2001 2002 2003 2004 2005 2006
Amount used per
year, kWh
kg CO2 per
kWh
kg CO2e per
kWh
kg CO2e per
kWh Total kg CO2 Total kg CO2e Total kg CO2e Electricity Heat Electricity Heat
Australia 0.87759 0.88099 0.88834 0.87185 0.84615 0.83941 0.89078 0.93637 0.95196 0.94348 0.93558 0.91413 0.96527 0.94310 0.91294 0.94486 0.99646 0.95253 0.12778 1.08031 100.0% 0.0% 7.6% 0.0%
Brazil 0.07209 0.06554 0.06049 0.06536 0.06750 0.07349 0.07375 0.09774 0.10421 0.12308 0.10145 0.09381 0.10102 0.09979 0.09593 0.09840 0.01320 0.11160 100.0% 0.0% 15.6% 0.0%
Canada 0.21212 0.20372 0.21335 0.19049 0.18687 0.19214 0.18562 0.20634 0.23502 0.22524 0.23570 0.24591 0.23211 0.24462 0.22478 0.21613 0.20024 0.22358 0.02999 0.25357 98.2% 1.8% 8.2% 0.0%
China, People's Republic of 0.84959 0.84918 0.82134 0.85879 0.87778 0.86021 0.88050 0.85342 0.81820 0.79146 0.80068 0.83013 0.86175 0.84275 0.84284 0.83563 0.11210 0.94773 79.8% 20.2% 7.8% 1.4%
Chinese Taipei 0.50864 0.52502 0.52278 0.53408 0.54102 0.57157 0.58108 0.60196 0.62695 0.63939 0.62888 0.65696 0.65175 0.65588 0.68425 0.65554 0.08794 0.74348 100.0% 0.0% 3.7% 0.0%
Croatia 0.37368 0.37679 0.28723 0.31333 0.29144 0.34283 0.37158 0.34844 0.34396 0.35591 0.40666 0.43305 0.34220 0.35779 0.36560 0.38106 0.05112 0.43218 82.8% 17.2% 12.9% 13.5%
Egypt 0.63366 0.60200 0.55807 0.53035 0.51774 0.52910 0.55926 0.54383 0.49270 0.45583 0.52245 0.51742 0.56607 0.56404 0.56231 0.54646 0.07331 0.61977 100.0% 0.0% 16.4% 0.0%
Gibraltar 0.77740 0.77711 0.75511 0.76963 0.75564 0.77657 0.76963 0.76963 0.76347 0.75741 0.76367 0.75814 0.76963 0.74309 0.73000 0.75291 0.10100 0.85391 100.0% 0.0% 0.0% 0.0%
Hong Kong (China) 0.91944 0.96582 0.97777 0.95684 0.93122 0.81256 0.83073 0.80256 0.79787 0.80698 0.81276 0.89093 0.93106 0.90900 0.95976 0.90070 0.12083 1.02153 100.0% 0.0% 10.9% 0.0%
Iceland 0.00057 0.00053 0.00050 0.00086 0.00086 0.00174 0.00127 0.00117 0.00312 0.00401 0.00067 0.00065 0.00065 0.00066 0.00065 0.00066 0.00106 0.00074 0.00010 0.00084 77.2% 22.8% 4.7% 10.4%
India 1.21409 1.24451 1.19594 1.26435 1.32560 1.28735 1.25834 1.25528 1.28174 1.27567 1.25514 1.23342 1.28646 1.28839 1.28926 1.27053 0.17044 1.44097 100.0% 0.0% 26.8% 0.0%
Indonesia 0.72903 0.86228 0.73165 0.66361 0.72782 0.77027 0.74189 0.77148 0.73299 0.84306 0.81366 0.88406 0.85574 0.87892 0.77202 0.84088 0.11281 0.95369 100.0% 0.0% 12.3% 0.0%
Israel 0.84510 0.84717 0.84559 0.84604 0.85201 0.84655 0.78874 0.79033 0.78379 0.79606 0.84752 0.84216 0.83174 0.79056 0.79728 0.82185 0.11025 0.93210 100.0% 0.0% 2.9% 0.0%
Japan 0.45243 0.44244 0.44859 0.42934 0.44776 0.42898 0.42622 0.41112 0.39842 0.41500 0.41882 0.42004 0.44101 0.46400 0.44641 0.45033 0.43927 0.44820 0.06013 0.50833 99.3% 0.7% 4.9% 0.0%
Korea, Republic of 0.53072 0.57025 0.59873 0.57946 0.56263 0.55063 0.54711 0.56946 0.51217 0.49644 0.51916 0.51993 0.44045 0.46136 0.45997 0.43325 0.55227 0.46946 0.06298 0.53244 87.2% 12.8% 3.7% 1.9%
Malaysia 0.65139 0.63161 0.58139 0.58148 0.58434 0.48712 0.56370 0.55152 0.53998 0.56508 0.61777 0.54915 0.55517 0.58213 0.68454 0.59775 0.08019 0.67794 100.0% 0.0% 4.3% 0.0%
Mexico 0.65013 0.64927 0.61865 0.61907 0.68127 0.61536 0.61454 0.63362 0.69397 0.68132 0.68743 0.69021 0.67765 0.67979 0.63419 0.62585 0.65684 0.65486 0.08785 0.74271 100.0% 0.0% 17.6% 0.0%
New Zealand 0.13849 0.14102 0.18831 0.15010 0.12498 0.12081 0.15065 0.23040 0.23157 0.25704 0.24919 0.29834 0.26696 0.31370 0.26039 0.29798 0.33422 0.29465 0.03953 0.33418 100.0% 0.0% 7.6% 0.0%
Norway 0.00374 0.00496 0.00424 0.00455 0.00565 0.00491 0.00688 0.00598 0.00600 0.00658 0.00443 0.00637 0.00577 0.00909 0.00764 0.00600 0.00763 0.00723 0.00097 0.00820 97.9% 2.1% 8.1% 16.1%
Pakistan 0.52560 0.51362 0.52287 0.54122 0.59164 0.60650 0.54993 0.62533 0.64088 0.61868 0.59158 0.49465 0.53033 0.50740 0.55209 0.53521 0.07180 0.60701 100.0% 0.0% 25.2% 0.0%
Philippines 0.55621 0.55119 0.59691 0.58524 0.59136 0.65576 0.68044 0.57639 0.57312 0.60970 0.55481 0.52947 0.52579 0.56972 0.50051 0.53606 0.07191 0.60797 100.0% 0.0% 13.1% 0.0%
Russian Federation 0.32981 0.31155 0.31676 0.31217 0.36577 0.35121 0.34916 0.34981 0.34314 0.34389 0.34942 0.35223 0.34747 0.36140 0.35419 0.35294 0.04735 0.40029 31.7% 68.3% 14.8% 2.6%
Saudi Arabia 0.90348 0.90862 0.88477 0.88409 0.86990 0.87715 0.88387 0.88031 0.87842 0.84415 0.81490 0.80214 0.82384 0.81093 0.81894 0.81415 0.10922 0.92337 100.0% 0.0% 7.8% 0.0%
Singapore 0.88973 1.06201 1.03289 0.99260 0.93058 0.81362 0.81886 0.69392 0.70199 0.67121 0.62933 0.60687 0.58833 0.57534 0.56695 0.59336 0.07960 0.67296 100.0% 0.0% 5.5% 0.0%
South Africa 0.92119 0.94835 0.93013 0.94577 0.92697 0.93647 0.99892 0.95827 0.96182 0.89280 0.88257 0.91035 0.93222 0.91372 0.93596 0.91496 0.12274 1.03770 100.0% 0.0% 7.2% 0.0%
Switzerland 0.02337 0.02622 0.02984 0.02222 0.02124 0.02348 0.02743 0.02434 0.02978 0.02359 0.02368 0.02296 0.02339 0.02425 0.02543 0.02817 0.02792 0.02583 0.00347 0.02930 92.8% 7.2% 6.8% 7.5%
Thailand 0.70280 0.68518 0.67791 0.65907 0.68011 0.68911 0.66134 0.64819 0.61340 0.61155 0.58553 0.57403 0.58497 0.57779 0.55568 0.57560 0.07722 0.65282 100.0% 0.0% 8.0% 0.0%
Turkey 0.68400 0.69490 0.69557 0.61399 0.67081 0.62367 0.63072 0.64486 0.65403 0.67605 0.61595 0.64484 0.56044 0.52514 0.50019 0.50699 0.51434 0.52142 0.06995 0.59137 92.9% 7.1% 15.7% 0.0%
Ukraine 0.46056 0.48171 0.44553 0.45750 0.41562 0.40310 0.41372 0.42263 0.43240 0.41102 0.40521 0.47546 0.39273 0.39472 0.43066 0.41976 0.05631 0.47607 49.9% 50.1% 15.6% 25.2%
United States 0.63080 0.63300 0.62973 0.61229 0.62205 0.64763 0.64832 0.63927 0.62853 0.64588 0.61647 0.61637 0.61711 0.61442 0.59990 0.61285 0.08221 0.69506 99.0% 1.0% 6.6% 18.0%
Africa 0.77156 0.78444 0.77565 0.78122 0.76302 0.77172 0.80721 0.77297 0.75835 0.70729 0.70811 0.72384 0.73995 0.73077 0.73326 0.72719 0.09755 0.82474 100.0% 0.0% 12.0% 0.0%
Latin America 0.23057 0.21985 0.21366 0.21837 0.22420 0.23144 0.24093 0.24464 0.23497 0.24684 0.23695 0.23188 0.24354 0.23637 0.23275 0.23630 0.03170 0.26800 100.0% 0.0% 16.7% 0.0%
Middle-East 0.83322 0.84007 0.84403 0.84662 0.83801 0.83620 0.82011 0.82462 0.82071 0.82069 0.80467 0.79941 0.81026 0.80272 0.77932 0.79928 0.10722 0.90650 100.0% 0.0% 14.0% 0.0%
Non-OECD Europe 0.56781 0.55459 0.56849 0.57283 0.55746 0.56932 0.56516 0.53246 0.56133 0.57722 0.57500 0.60739 0.57984 0.56709 0.59130 0.58412 0.07836 0.66248 73.5% 26.5% 15.7% 15.4%
SUBTOTAL 0 0 0GRAND TOTAL 0 0 0
% Distribution
Losses
European Union
Overseas Electricity/Heat Conversion Factors from 1990 to 2006: kgCO2 per kWh electricity and heat CONSUMED 3
% Total GWh
Overseas Electricity/Heat Conversion Factors from 1990 to 2006: kgCO2 per kWh electricity and heat CONSUMED 3
% Distribution
Losses% Total GWh
Emission factors per kWh energy LOSSES in trasmission and distribution are calculated using % distribution losses for 2006.
Emissions factors for electricity and heat LOSSES from the transmission and distribution grid.
If you cannot find an emission factor for a particular country, please refer to the larger list available on the GHG Protocol website at the link above.
Table 10c -
continued
Indirect (Scope 3) emission factors for different countries were estimated as being roughtly a similar ratio CO2 emission factors as for the UK (which is 13.4%), in the absence of other
information.
Other countries
Page 44 of 49

2010 Guidelines to Defra / DECC's GHG Conversion Factors for Company Reporting
Annex 10 - International Electricity Emission FactorsLast updated: Aug-10
Source
Notes
3
Emission factors per kWh energy consumed are calculated using % distribution losses for 2006.
Data on the proportion of electricity and heat (for 2006) is sourced from the IEA website at: http://www.iea.org/Textbase/stats/prodresult.asp?PRODUCT=Electricity/Heat
If you cannot find an emission factor for a particular country, please refer to the larger list available on the GHG Protocol website at the link above.
Emissions factors for electricity and heat generated (and supplied to the grid where relevant) - INCLUDES losses from the transmission and distribution grid, i.e.
Emission Factor (Electricity/Heat CONSUMED) = Emission Factor (Electricity/Heat GENERATED) + Emission Factor (Electricity/Heat LOSSES)
Emission factor data is from International Energy Agency Data Services, 2006 and 2008 for "CO2 Emissions per kWh Electricity and Heat Generated" and mainly sourced from the GHG
Protocol website http://www.ghgprotocol.org/calculation-tools
Data on losses in distribution of electricity and heat is calculated from 2006 country energy balances available at the IEA website at:
http://www.iea.org/Textbase/stats/prodresult.asp?PRODUCT=Balances
Indirect (Scope 3) emission factors for different countries were estimated as being roughtly a similar ratio CO2 emission factors as for the UK (which is 13.4%), in the absence of other
information.
Page 45 of 49
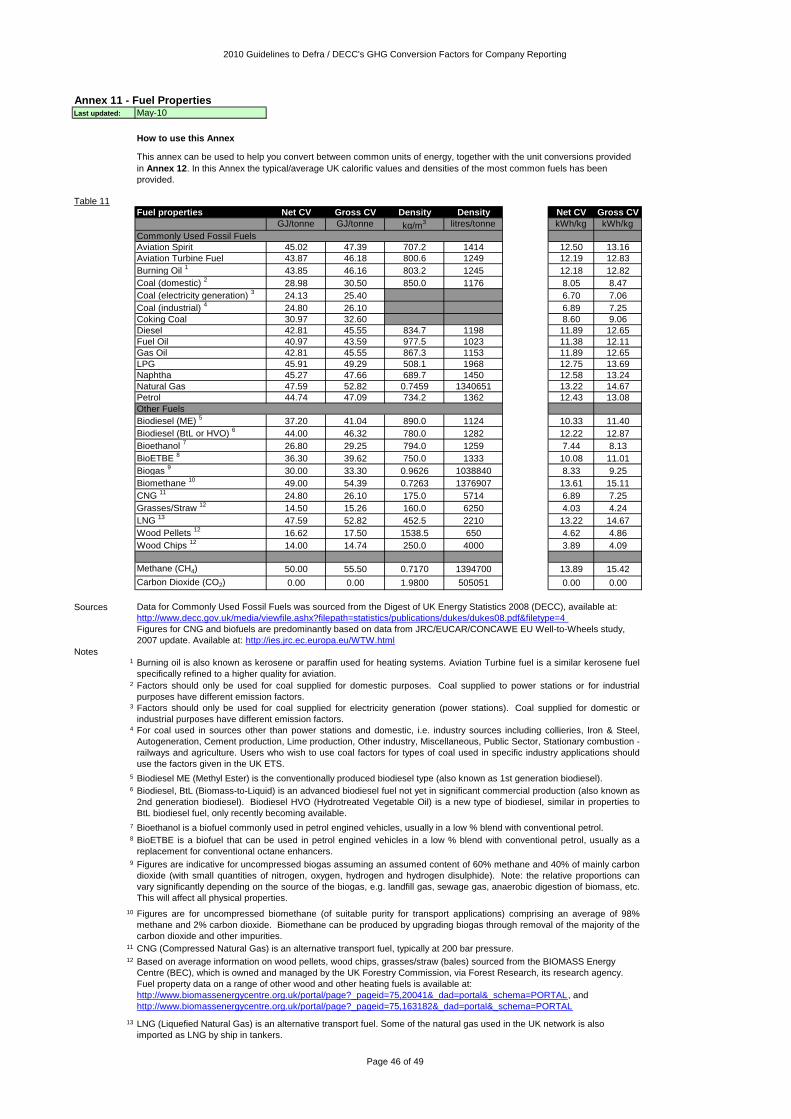
2010 Guidelines to Defra / DECC's GHG Conversion Factors for Company Reporting
Annex 11 - Fuel PropertiesLast updated: May-10
How to use this Annex
Table 11
#REF! Fuel properties Net CV Gross CV Density Density Net CV Gross CV
GJ/tonne GJ/tonne kg/m3 litres/tonne kWh/kg kWh/kg
Aviation Spirit 45.02 47.39 707.2 1414 12.50 13.16
Aviation Turbine Fuel 43.87 46.18 800.6 1249 12.19 12.83
Burning Oil 1
43.85 46.16 803.2 1245 12.18 12.82
Coal (domestic) 2
28.98 30.50 850.0 1176 8.05 8.47
Coal (electricity generation) 3
24.13 25.40 6.70 7.06
Coal (industrial) 4
24.80 26.10 6.89 7.25
Coking Coal 30.97 32.60 8.60 9.06
Diesel 42.81 45.55 834.7 1198 11.89 12.65
Fuel Oil 40.97 43.59 977.5 1023 11.38 12.11
Gas Oil 42.81 45.55 867.3 1153 11.89 12.65
LPG 45.91 49.29 508.1 1968 12.75 13.69
Naphtha 45.27 47.66 689.7 1450 12.58 13.24
Natural Gas 47.59 52.82 0.7459 1340651 13.22 14.67
Petrol 44.74 47.09 734.2 1362 12.43 13.08
Biodiesel (ME) 5
37.20 41.04 890.0 1124 10.33 11.40
Biodiesel (BtL or HVO) 6
44.00 46.32 780.0 1282 12.22 12.87
Bioethanol 7
26.80 29.25 794.0 1259 7.44 8.13
BioETBE 8
36.30 39.62 750.0 1333 10.08 11.01
Biogas 9
30.00 33.30 0.9626 1038840 8.33 9.25
Biomethane 10
49.00 54.39 0.7263 1376907 13.61 15.11
CNG 11
24.80 26.10 175.0 5714 6.89 7.25
Grasses/Straw 12
14.50 15.26 160.0 6250 4.03 4.24
LNG 13
47.59 52.82 452.5 2210 13.22 14.67
Wood Pellets 12
16.62 17.50 1538.5 650 4.62 4.86
Wood Chips 12
14.00 14.74 250.0 4000 3.89 4.09
Methane (CH4) 50.00 55.50 0.7170 1394700 13.89 15.42
Carbon Dioxide (CO2) 0.00 0.00 1.9800 505051 0.00 0.00
Sources
Notes1
2
3
4
5
6
7
8
9
10
11
12
13
BioETBE is a biofuel that can be used in petrol engined vehicles in a low % blend with conventional petrol, usually as a
replacement for conventional octane enhancers.
Figures are indicative for uncompressed biogas assuming an assumed content of 60% methane and 40% of mainly carbon
dioxide (with small quantities of nitrogen, oxygen, hydrogen and hydrogen disulphide). Note: the relative proportions can
vary significantly depending on the source of the biogas, e.g. landfill gas, sewage gas, anaerobic digestion of biomass, etc.
This will affect all physical properties.
LNG (Liquefied Natural Gas) is an alternative transport fuel. Some of the natural gas used in the UK network is also
imported as LNG by ship in tankers.
This annex can be used to help you convert between common units of energy, together with the unit conversions provided
in Annex 12. In this Annex the typical/average UK calorific values and densities of the most common fuels has been
provided.
Commonly Used Fossil Fuels
Other Fuels
Factors should only be used for coal supplied for electricity generation (power stations). Coal supplied for domestic or
industrial purposes have different emission factors.
Data for Commonly Used Fossil Fuels was sourced from the Digest of UK Energy Statistics 2008 (DECC), available at:
http://www.decc.gov.uk/media/viewfile.ashx?filepath=statistics/publications/dukes/dukes08.pdf&filetype=4
Figures for CNG and biofuels are predominantly based on data from JRC/EUCAR/CONCAWE EU Well-to-Wheels study,
2007 update. Available at: http://ies.jrc.ec.europa.eu/WTW.html
Burning oil is also known as kerosene or paraffin used for heating systems. Aviation Turbine fuel is a similar kerosene fuel
specifically refined to a higher quality for aviation.
Factors should only be used for coal supplied for domestic purposes. Coal supplied to power stations or for industrial
purposes have different emission factors.
For coal used in sources other than power stations and domestic, i.e. industry sources including collieries, Iron & Steel,
Autogeneration, Cement production, Lime production, Other industry, Miscellaneous, Public Sector, Stationary combustion -
railways and agriculture. Users who wish to use coal factors for types of coal used in specific industry applications should
use the factors given in the UK ETS.
Based on average information on wood pellets, wood chips, grasses/straw (bales) sourced from the BIOMASS Energy
Centre (BEC), which is owned and managed by the UK Forestry Commission, via Forest Research, its research agency.
Fuel property data on a range of other wood and other heating fuels is available at:
http://www.biomassenergycentre.org.uk/portal/page?_pageid=75,20041&_dad=portal&_schema=PORTAL, and
http://www.biomassenergycentre.org.uk/portal/page?_pageid=75,163182&_dad=portal&_schema=PORTAL
Biodiesel ME (Methyl Ester) is the conventionally produced biodiesel type (also known as 1st generation biodiesel).
Figures are for uncompressed biomethane (of suitable purity for transport applications) comprising an average of 98%
methane and 2% carbon dioxide. Biomethane can be produced by upgrading biogas through removal of the majority of the
carbon dioxide and other impurities.
CNG (Compressed Natural Gas) is an alternative transport fuel, typically at 200 bar pressure.
Biodiesel, BtL (Biomass-to-Liquid) is an advanced biodiesel fuel not yet in significant commercial production (also known as
2nd generation biodiesel). Biodiesel HVO (Hydrotreated Vegetable Oil) is a new type of biodiesel, similar in properties to
BtL biodiesel fuel, only recently becoming available.
Bioethanol is a biofuel commonly used in petrol engined vehicles, usually in a low % blend with conventional petrol.
Page 46 of 49

2010 Guidelines to Defra / DECC's GHG Conversion Factors for Company Reporting
Annex 12 - Unit ConversionsLast updated: Jun-09
How to use this Annex
Common unit abbreviations:
kilo (k) = 1,000 or 103
mega (M) = 1,000,000 or 106
giga (G) = 1,000,000,000 or 109
tera (T) = 1,000,000,000,000 or 1012
peta (P) = 1,000,000,000,000,000 or 1015
Table 12a Energy
#REF! From/To - multiply by GJ kWh therm toe kcal
Gigajoule, GJ 1 277.78 9.47817 0.02388 238,903
Kilowatthour, kWh 0.0036 1 0.03412 0.00009 860.05
Therm 0.10551 29.307 1 0.00252 25,206
Tonne oil equivalent, toe 41.868 11,630 396.83 1 10,002,389
Kilocalorie, kcal 0.000004186 0.0011627 0.000039674 0.000000100 1
Table 12b Volume
#REF! From/To - multiply by L m3
cu ft Imp. gallon US gallon Bbl (US,P)
Litres, L 1 0.001 0.03531 0.21997 0.26417 0.0062898
Cubic metres, m3
1000 1 35.315 219.97 264.17 6.2898
Cubic feet, cu ft 28.317 0.02832 1 6.2288 7.48052 0.17811
Imperial gallon 4.5461 0.00455 0.16054 1 1.20095 0.028594
US gallon 3.7854 0.0037854 0.13368 0.83267 1 0.023810
Barrel (US, petroleum), bbl 158.99 0.15899 5.6146 34.972 42 1
Table 12c Weight/Mass
#REF! From/To - multiply by kg tonne ton (UK) ton (US) lb
Kilogram, kg 1 0.001 0.00098 0.00110 2.20462
tonne, t (metric ton) 1000 1 0.98421 1.10231 2204.62368
ton (UK, long ton) 1016.04642 1.01605 1 1.12000 2240
ton (US, short ton) 907.18 0.90718 0.89286 1 2000
Pound, lb 0.45359 0.00045359 0.00044643 0.00050 1
Table 12d Length/Distance
#REF! From/To - multiply by m ft mi km nmi
Metre, m 1 3.2808 0.00062137 0.001 0.00053996
Feet, ft 0.30480 1 0.000 0.0003048 0.00016458
Miles, mi 1609.34 5280 1 1.60934 0.86898
Kilometres, km 1000 3280.8 0.62137 1 0.53996
Nautical miles, nmi or NM 1852 6076.1 1.15078 1.852 1
From/To - multiply by m ft in cm yd
Metre, m 1 3.28084 39.37008 100 1.09361
Feet, ft 0.30480 1 12 30.48000 0.33333
Inch, in 0.02540 0.08333 1 2.54000 0.02778
Centimetres, cm 0.01 0.03281 0.39370 1 0.01094
Yard, yd 0.91440 3 36 91.44000 1
If this annex does not have the conversion factor you are looking for, a more complete list of conversions
is available here: http://www.onlineconversion.com/
This Annex can be used to help you convert between common units of energy, volume, mass or distance.
Table 12a provides conversions from common units of Energy
Table 12b provides conversions from common units of Volume
Table 12c provides conversions from common units of Weight/Mass
Table 12d provides conversions from common units of Length/Distance
Page 47 of 49

2010 Guidelines to Defra / DECC's GHG Conversion Factors for Company Reporting
Annex 13 - Indirect emissions from the supply chainSep-09
Key information:
http://www.censa.org.uk
Table 13 Total GHG
SIC code
(SIC 2003)
Product category Carbon
Dioxide (CO2)
Methane
(CH4)
Nitrous Oxide
(N2O)
HFCs PFCs SF6 Amount spent by
product category (£)
x Total kg
CO2e per £
Total kg CO2e
01 Agriculture products1 0.82 1.20 1.71 0.01 0.00 0.00 x 3.76
02 Forestry products 0.63 0.07 0.03 0.04 0.00 0.00 x 0.77
05 Fish products1 1.35 0.17 0.05 0.02 0.00 0.00 x 1.59
10 Coal, lignite, peat2 0.99 5.99 0.02 0.03 0.00 0.00 x 7.04
11 Crude petroleum, natural gas2 1.18 0.14 0.02 0.00 0.00 0.00 x 1.35
13 Metal ores 17.35 0.40 0.31 13.33 0.00 0.00 x 31.40
14 Stone, sand and clay, other minerals 1.55 0.28 0.04 0.01 0.00 0.00 x 1.89
15 Food and drink products1 0.71 0.42 0.45 0.01 0.00 0.00 x 1.59
16 Tobacco products 0.38 0.25 0.28 0.01 0.00 0.00 x 0.93
17 Textiles 0.80 0.08 0.04 0.02 0.00 0.00 x 0.95
18 Wearing apparel 0.57 0.08 0.04 0.01 0.00 0.00 x 0.71
19 Leather products, footwear 0.41 0.02 0.01 0.02 0.00 0.00 x 0.46
20 Wood and wood products 0.90 0.06 0.02 0.01 0.00 0.00 x 1.00
21 Pulp and paper, paper products 1.15 0.10 0.03 0.01 0.00 0.00 x 1.30
22 Printing matter and related services 0.45 0.05 0.02 0.01 0.00 0.00 x 0.53
23 Refined petroleum, coke and other fuels3 2.22 0.59 0.03 0.01 0.00 0.00 x 2.85
24.11,24.12 Industrial gases and dyes 1.88 0.19 0.04 0.03 0.01 0.01 x 2.16
24.13 Inorganic chemicals 2.11 0.18 0.05 0.04 0.01 0.01 x 2.41
2) Multiply the amount of spending by the conversion factor to get total emissions in kilograms of carbon dioxide equivalent (kg CO2eq). The excel spreadsheet does this
automatically following your entry of the amount of spending into the appropriate box.
For example, if £1000 is spent on ‘ceramic goods’, then the table calculates that 1,309 kilograms of CO2eq were released during all stages of the production of these
goods, including raw material extraction, processing, manufacturing, transportation, packaging etc. As a result, these emissions factors are different from the emission
factors shown in the other annexes. They are similar to life-cycle emissions, but do not account for direct emissions which are included in life-cycle estimates (e.g. from the
actual combustion of the fuel).
What are the factors for each of the individual Greenhouse Gases?
The factors for each of the six gases included in the overall calculation are included for information in Table 13.
Do the factors take into account emissions relating to imported goods, and those relating to the formation of capital assets used in making the products?
Are these factors directly comparable to those in the other annexes?
No. The emission factors provided in this annex are for the supply chain emissions of GHG resulting from the production and transportation of broad categories of goods
and services. They express Scope 2 and 3 emissions as defined by the GHG Protocol. Because they encompass all the supply chain impacts (i.e. indirect emissions),
these emission factors are not directly comparable with those from other annexes, which generally only include emissions from the point of use (generation for electricity;
life cycle in the case of Annex 9).
Which products are included in which categories?
Some guidance is available in the comment boxes in the Table. The categories are based upon the Standard Industrial Classification (SIC 2003): further information on the
SIC 2003 is available here:
http://www.statistics.gov.uk/statbase/Product.asp?vlnk=14012
Please use this annex in conjunction with Annex F in the Defra Guidance on measuring emissions from your supply chain which is available at
http://www.defra.gov.uk/environment/business/reporting/index.htm
1) Identify the amount spent on different product groups, excluding VAT, in £s
Last updated:
How to use this Annex
This annex is intended to be used primarily as a high level diagnostic tool/for initial scoping/estimating. If you have more specific information about the supply chain
emissions of any particular product then that source should be used instead. Such adjustments should be clearly documented.
The table below provides emission factors for spending on different groups of products:
Unlike most of the emission factors provided in the annexes, the emission factors presented in this Annex only cover indirect emissions from the supply chain and include
CO2, CH4, N2O and F-gas emissions. Indirect emissions are those which are generated by other organisations as part of the process of providing goods and services to
your company.
This annex also includes a number of activities that are also covered in other annexes, such as coal, fuels refined from crude oil, mains electricity, gas, water and for
various modes of transport. If you have more specific/detailed information for such activities that will enable you to make calculations of emissions using the
emission factors in the other annexes these should be used in perference to the factors in this annex as they will be much more accurate. However, the
information in this annex may still be useful for a rough initial calculation of the relative importance of these activities in the first instance.
The data in this annex has not been updated since the 2009 release, since more recent information was not available.
For more detail on the methodology used, contact the Centre for Sustainability Accounting: [email protected]
This Annex can be used to produce indicative estimates of the Greenhouse Gas emissions relating to the production of goods and services purchased by your company.
The estimates can only be indicative as they represent the average emissions relating to each product group, and the emission factors relating to specific products within
the group may be quite different. If you have specific information about the supply chain emissions of any particular product then this source should be used instead.
The information derived from this table can be combined with data on direct emissions, i.e. those relating to actual fuel use (e.g. litres of fuel used, or derived from mileage
estimates). The footnotes to the table give more information about what the factors shown in the table mean in terms of purchases of energy products and transport
services.
Supply chain emission factors for spending on products: kgCO2eq per £
Scope 3
The factors are derived from a multi-region model and hence take some account of the emissions relating to the production of imports. However, the estimates do not
incorporate any allowance for emissions relating to the formation of capital assets, whether in the UK or overseas.
The input-output tables used for this exercise are in 2004 basic prices (i.e. net of taxes on products and distributors' margins). It may be advisable to take subsequent
price changes into account when using the factors shown below. It should also be noted that emissions in more recent years may have changed because of subsequent
changes in the structure and emissions intensity of the supply chain since 2004.
Annex 13 Scopes & Boundaries:
Scope 3. For boundaries, see How were these factors calculated?
How were these factors calculated?
The factors are based on a model of the economy, known as the input-output model, which describes in monetary terms how the goods and services produced by different
sectors of the economy are used by other sectors to produce their own output. These monetary accounts are linked to information about the greenhouse gas emissions of
different sectors of the economy. By using the input-output model, these emissions are then attributed to the monetary transactions taking place in the economy. The
result is an estimate of the total upstream emissions associated with the supply of a particular product group.
Page 48 of 49
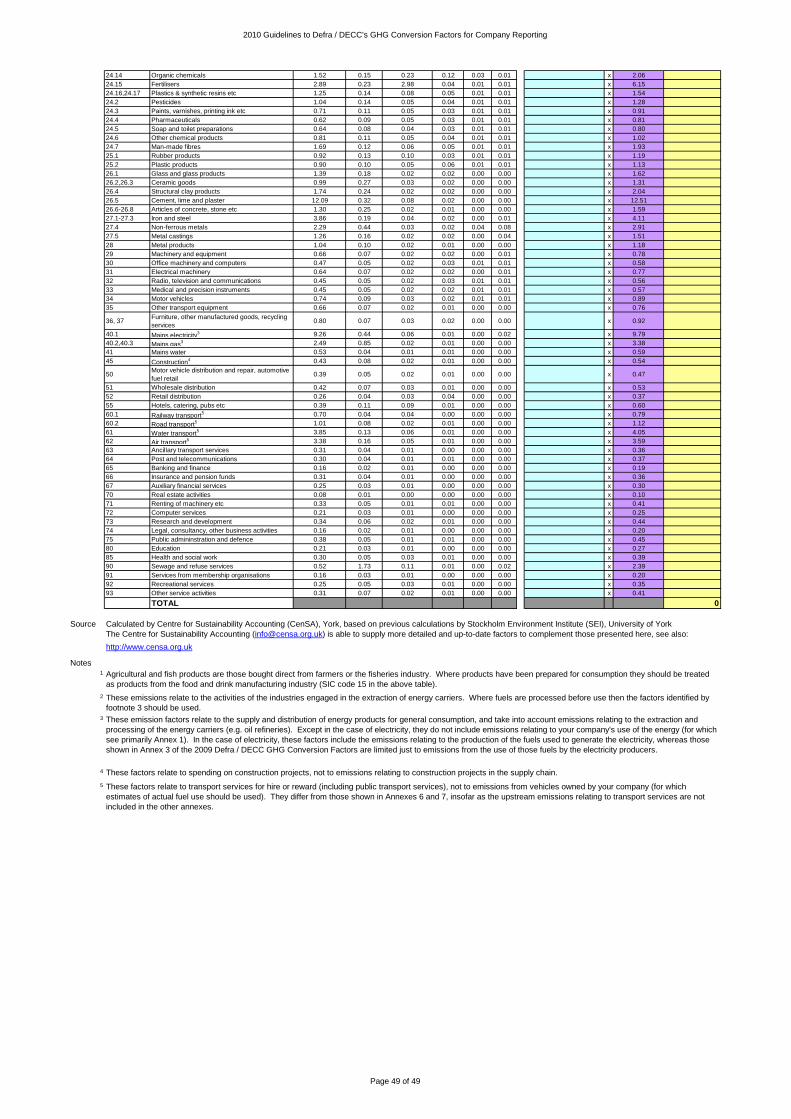
2010 Guidelines to Defra / DECC's GHG Conversion Factors for Company Reporting
24.14 Organic chemicals 1.52 0.15 0.23 0.12 0.03 0.01 x 2.06
24.15 Fertilisers 2.89 0.23 2.98 0.04 0.01 0.01 x 6.15
24.16,24.17 Plastics & synthetic resins etc 1.25 0.14 0.08 0.05 0.01 0.01 x 1.54
24.2 Pesticides 1.04 0.14 0.05 0.04 0.01 0.01 x 1.28
24.3 Paints, varnishes, printing ink etc 0.71 0.11 0.05 0.03 0.01 0.01 x 0.91
24.4 Pharmaceuticals 0.62 0.09 0.05 0.03 0.01 0.01 x 0.81
24.5 Soap and toilet preparations 0.64 0.08 0.04 0.03 0.01 0.01 x 0.80
24.6 Other chemical products 0.81 0.11 0.05 0.04 0.01 0.01 x 1.02
24.7 Man-made fibres 1.69 0.12 0.06 0.05 0.01 0.01 x 1.93
25.1 Rubber products 0.92 0.13 0.10 0.03 0.01 0.01 x 1.19
25.2 Plastic products 0.90 0.10 0.05 0.06 0.01 0.01 x 1.13
26.1 Glass and glass products 1.39 0.18 0.02 0.02 0.00 0.00 x 1.62
26.2,26.3 Ceramic goods 0.99 0.27 0.03 0.02 0.00 0.00 x 1.31
26.4 Structural clay products 1.74 0.24 0.02 0.02 0.00 0.00 x 2.04
26.5 Cement, lime and plaster 12.09 0.32 0.08 0.02 0.00 0.00 x 12.51
26.6-26.8 Articles of concrete, stone etc 1.30 0.25 0.02 0.01 0.00 0.00 x 1.59
27.1-27.3 Iron and steel 3.86 0.19 0.04 0.02 0.00 0.01 x 4.11
27.4 Non-ferrous metals 2.29 0.44 0.03 0.02 0.04 0.08 x 2.91
27.5 Metal castings 1.26 0.16 0.02 0.02 0.00 0.04 x 1.51
28 Metal products 1.04 0.10 0.02 0.01 0.00 0.00 x 1.18
29 Machinery and equipment 0.66 0.07 0.02 0.02 0.00 0.01 x 0.78
30 Office machinery and computers 0.47 0.05 0.02 0.03 0.01 0.01 x 0.58
31 Electrical machinery 0.64 0.07 0.02 0.02 0.00 0.01 x 0.77
32 Radio, television and communications 0.45 0.05 0.02 0.03 0.01 0.01 x 0.56
33 Medical and precision instruments 0.45 0.05 0.02 0.02 0.01 0.01 x 0.57
34 Motor vehicles 0.74 0.09 0.03 0.02 0.01 0.01 x 0.89
35 Other transport equipment 0.66 0.07 0.02 0.01 0.00 0.00 x 0.76
36, 37Furniture, other manufactured goods, recycling
services0.80 0.07 0.03 0.02 0.00 0.00 x 0.92
40.1 Mains electricity3 9.26 0.44 0.06 0.01 0.00 0.02 x 9.79
40.2,40.3 Mains gas3 2.49 0.85 0.02 0.01 0.00 0.00 x 3.38
41 Mains water 0.53 0.04 0.01 0.01 0.00 0.00 x 0.59
45 Construction4 0.43 0.08 0.02 0.01 0.00 0.00 x 0.54
50Motor vehicle distribution and repair, automotive
fuel retail0.39 0.05 0.02 0.01 0.00 0.00 x 0.47
51 Wholesale distribution 0.42 0.07 0.03 0.01 0.00 0.00 x 0.53
52 Retail distribution 0.26 0.04 0.03 0.04 0.00 0.00 x 0.37
55 Hotels, catering, pubs etc 0.39 0.11 0.09 0.01 0.00 0.00 x 0.60
60.1 Railway transport5 0.70 0.04 0.04 0.00 0.00 0.00 x 0.79
60.2 Road transport5 1.01 0.08 0.02 0.01 0.00 0.00 x 1.12
61 Water transport5 3.85 0.13 0.06 0.01 0.00 0.00 x 4.05
62 Air transport5 3.38 0.16 0.05 0.01 0.00 0.00 x 3.59
63 Ancillary transport services 0.31 0.04 0.01 0.00 0.00 0.00 x 0.36
64 Post and telecommunications 0.30 0.04 0.01 0.01 0.00 0.00 x 0.37
65 Banking and finance 0.16 0.02 0.01 0.00 0.00 0.00 x 0.19
66 Insurance and pension funds 0.31 0.04 0.01 0.00 0.00 0.00 x 0.36
67 Auxiliary financial services 0.25 0.03 0.01 0.00 0.00 0.00 x 0.30
70 Real estate activities 0.08 0.01 0.00 0.00 0.00 0.00 x 0.10
71 Renting of machinery etc 0.33 0.05 0.01 0.01 0.00 0.00 x 0.41
72 Computer services 0.21 0.03 0.01 0.00 0.00 0.00 x 0.25
73 Research and development 0.34 0.06 0.02 0.01 0.00 0.00 x 0.44
74 Legal, consultancy, other business activities 0.16 0.02 0.01 0.00 0.00 0.00 x 0.20
75 Public admininstration and defence 0.38 0.05 0.01 0.01 0.00 0.00 x 0.45
80 Education 0.21 0.03 0.01 0.00 0.00 0.00 x 0.27
85 Health and social work 0.30 0.05 0.03 0.01 0.00 0.00 x 0.39
90 Sewage and refuse services 0.52 1.73 0.11 0.01 0.00 0.02 x 2.39
91 Services from membership organisations 0.16 0.03 0.01 0.00 0.00 0.00 x 0.20
92 Recreational services 0.25 0.05 0.03 0.01 0.00 0.00 x 0.35
93 Other service activities 0.31 0.07 0.02 0.01 0.00 0.00 x 0.41
TOTAL 0
Source
Notes1
2
3
4
5
These factors relate to spending on construction projects, not to emissions relating to construction projects in the supply chain.
These factors relate to transport services for hire or reward (including public transport services), not to emissions from vehicles owned by your company (for which
estimates of actual fuel use should be used). They differ from those shown in Annexes 6 and 7, insofar as the upstream emissions relating to transport services are not
included in the other annexes.
http://www.censa.org.uk
Agricultural and fish products are those bought direct from farmers or the fisheries industry. Where products have been prepared for consumption they should be treated
as products from the food and drink manufacturing industry (SIC code 15 in the above table).
These emissions relate to the activities of the industries engaged in the extraction of energy carriers. Where fuels are processed before use then the factors identified by
footnote 3 should be used.
These emission factors relate to the supply and distribution of energy products for general consumption, and take into account emissions relating to the extraction and
processing of the energy carriers (e.g. oil refineries). Except in the case of electricity, they do not include emissions relating to your company's use of the energy (for which
see primarily Annex 1). In the case of electricity, these factors include the emissions relating to the production of the fuels used to generate the electricity, whereas those
shown in Annex 3 of the 2009 Defra / DECC GHG Conversion Factors are limited just to emissions from the use of those fuels by the electricity producers.
Calculated by Centre for Sustainability Accounting (CenSA), York, based on previous calculations by Stockholm Environment Institute (SEI), University of York
The Centre for Sustainability Accounting ([email protected]) is able to supply more detailed and up-to-date factors to complement those presented here, see also:
Page 49 of 49