2010-03-19 chart 1 why intermodal traffic volume in germany (more than) doubled within 10 years!...
TRANSCRIPT

2010-03-19Chart 1
Why Intermodal Traffic Volume in Germany
(More Than) Doubled Within 10 Years!
Rainer Mertel
KombiConsult GmbH, Frankfurt am Main
Email: [email protected]
MINISTRY OF TRANSPORT, POSTS AND TELECOMMUNICATIONS
Conference on „Infrastructure Of Intermodal Transport“
Bratislava – 19 March 2010

2010-03-19Chart 2
Budapest
BucurestiBeograd
Sofia
Istanbul
Bratislava
Ljubljana
Wien
Rotterdam
Duisburg
München
Nürnberg
Hannover
HamburgBremen
Thessaloniki
A
H
RO
GR
BG
TR
IT
D
NL
Köln
Praha
TriestSLO
HR
Zagreb
SCG
MK
Antwerp
B
Skopje
Project corridor
CREAM Project
FP6 project, co-financed by European Commissionwww.cream-project.eu

2010-03-19Chart 3
Project objectives
Achieve competitive rail freight and intermodal rail/road
services on CREAM corridor by: Catching new freight markets such as temperature-controlled
cargo for intermodal services by applying innovate technology Improving border crossing processes and enabling
interoperable operations Developing quality management system(s) Enhancing data exchange and information flow Implementing efficient and customer-oriented rail operation
schemes such as gateway/hub systems Upgrade intermodal terminals and management
CREAM Project

2010-03-19Chart 4
Unaccompanied intermodal rail/road traffic 1998-2008
Intermodal Traffic In Germany
-
10
20
30
40
50
60
70
80
1998 2005 2008
Million gross tonnes
Source: Statistisches Bundesamt; KombiConsult calculations

2010-03-19Chart 5
Unaccompanied intermodal barge/road traffic 1998-2008
Intermodal Traffic In Germany
Source: Statistisches Bundesamt; KombiConsult calculations
-
5
10
15
20
25
1998 2005 2008
Million gross tonnes

2010-03-19Chart 6
Why doubled intermodal traffic volume?
Domestic traffic in Germany: implementation of block train
systems shifting responsibility for service profiling and
economic risks from railways to intermodal operators International traffic: extension of block train systems to
virtually all corridors: Catching new European markets Faster, road-competitive services Cost-effective rail production: shuttle and gateway services Synchronized time-schedules Multiple daily departures Building European networks
Improvement in rail infrastructure: loading gauge etc.
Intermodal Traffic In Germany

2010-03-19Chart 7
Why doubled intermodal traffic volume?
Competition on rail traction services on domestic network
since 2000, and on important international lanes such as the
Brenner as of 2001: Cost control Service quality improvement
Competition on intermodal operator level: Innovations in services, technologies and business models Tapping new freight market potentials
Booming economy
Growth of global container flows
Intermodal Traffic In Germany
2010-03-19Chart 8
Why doubled intermodal traffic volume?
EU enlargement driving especially marine container traffic
Improved cost competitiveness with road: Fuel cost increase Saturated truck capacities Limitations on truck drivers Restrictions on truck drivers’ working hours
Massive enlargement of intermodal terminal capacities
(not only) in Germany
Intermodal Traffic In Germany

2010-03-19Chart 9
4 categories of intermodal terminal investments
Intermodal Terminal Investment Programme In Germany
OwnershipFinancial sources /
state subsidy
2007 share of total handling capacity
(estimated)
DB NetzFederal state (BSchwAG):100% of eligible cost
24 %
Private companies
Federal state (FKV):up to 85% of eligible cost
56 %
Private companies
Various (regional funds, EU): 30-50 % of investment
15 %
Private companies
100% privately financed 5 %
Source: KombiConsult
Since 1998 the overwhelming majority of investments has been implemented under the FKV funding regime.

2010-03-19Chart 10
General information on Directive “FKV”
First coming into effect: March 1998
Currently, the 4th edition is being applied due to expire on
31 Dec 2011.
Prerequisites for every renewal: Evaluation study (carried out by Hacon and KombiConsult) Notification by European Commission
Germany is committed to promoting intermodal traffic only
through the funding of the construction of terminals. There
are no other instruments such as operational subsidies;
discounts on fuel or infrastructure access fees; funding of
intermodal equipment or information technology.
Directive For Funding Intermodal Terminals

2010-03-19Chart 11
Principles of funding
Eligible beneficiaries: only private companies
Terminal categories: rail/road; barge/road; trimodal facilities
Measures: new terminals and enlargement measures
Purpose: ensuring handling rate in line with market
What’s funded: all items and facilities required for enabling
the transhipment of intermodal units.
Max. funding rate: 85% of eligible costs
Directive For Funding Intermodal Terminals

2010-03-19Chart 12
Principles of funding
Prerequisites for funding: Private capital doesn’t ensure viability (10y business plan) Ensuring non-discriminatory access (public terminal) No cannibalization of existing terminals, also cross-border Public tendering of terminal management (investor may not hold
more than 50% of shares of operating company) Public tendering of all investments Bank guarantee corresponding to funding amount Commitment to operate facility for 10/20 years
Procedure: Application at any time (no call!) Formal application to federal authorities
Directive For Funding Intermodal Terminals
2010-03-19Chart 13
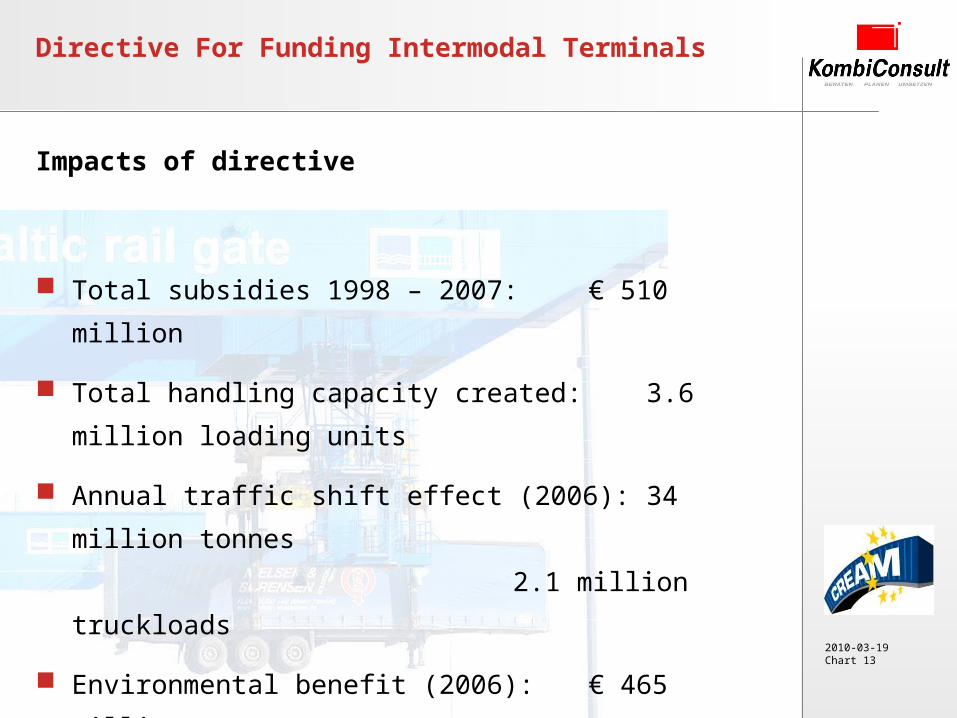
Impacts of directive
Directive For Funding Intermodal Terminals
Total subsidies 1998 – 2007: € 510 million
Total handling capacity created: 3.6 million loading units
Annual traffic shift effect (2006): 34 million tonnes
2.1 million truckloads
Environmental benefit (2006): € 465 million
2010-03-19Chart 14
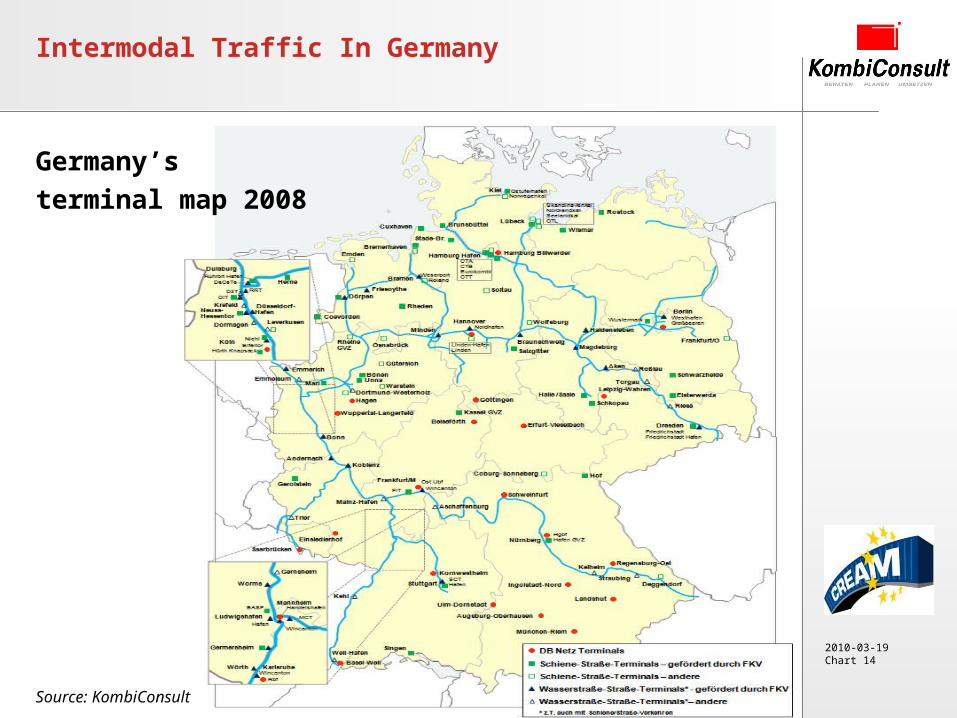
Intermodal Traffic In Germany
Germany’s terminal
map 2008
Source: KombiConsult
2010-03-19Chart 15
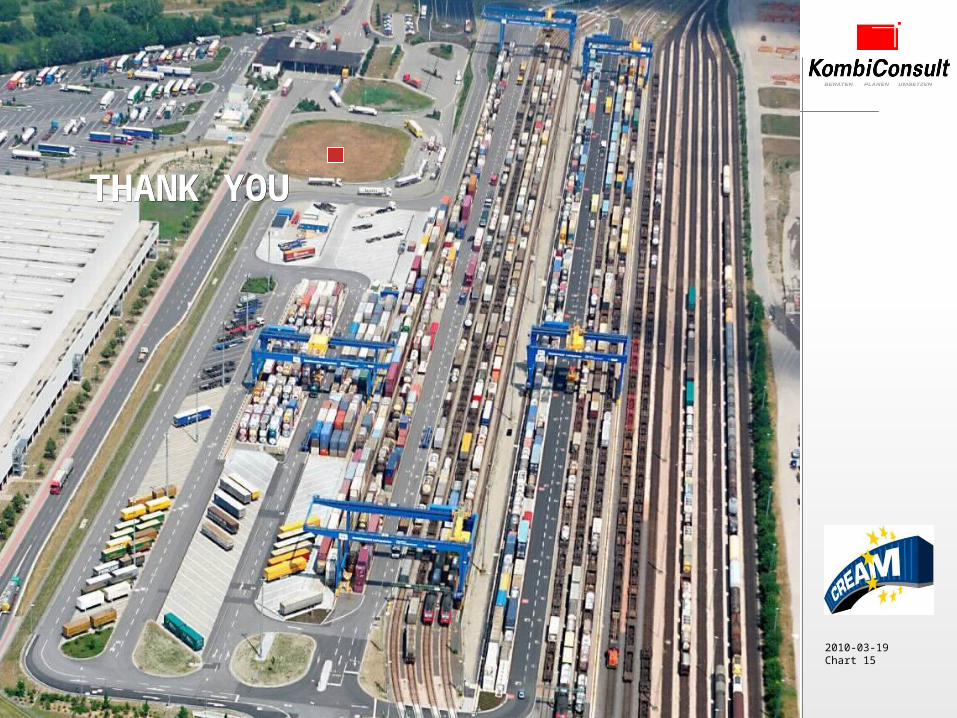
Intermodal Traffic In Germany
THANK YOUTHANK YOU