2009_aom_money matters on corruption
TRANSCRIPT

7/30/2019 2009_AoM_MONEY MATTERS on Corruption
http://slidepdf.com/reader/full/2009aommoney-matters-on-corruption 1/28
A Cross-Level Study 1
Effects of Managers’ Money Attitude,
Pay Satisfaction, and Geopolitical Entity’s Affluence
on Corrupt Intent: A Cross-Level Study of
30 Geopolitical EntitiesThomas Li-Ping Tang, U.S.A.; Jian Liang, China; Toto Sutarso, U.S.A.; Mahfooz A. Ansari,
Canada; Adebowale Akande, South Africa; Michael W. Allen, Australia; Abdulgawi Salim
Alzubaidi, Oman; Fernando Arias-Galicia, Mexico; Mark G. Borg, Malta; Brigitte Charles-
Pauvers, France; Bor-Shiuan Cheng, Taiwan; Randy K. Chiu, Hong Kong; Linzhi Du, China;Ilya Garber, Russia; Consuelo Garcia De La Torre, Mexico; Rosario Correia Higgs, Portugal;Abdul Hamid Safwat Ibrahim, Saudi Arabia; Chin-Kang Jen, Taiwan; Ali Mahdi Kazem, Oman;
Kilsun Kim, South Korea; Vivien Kim Geok Lim, Singapore; Roberto Luna-Arocas, Spain; Eva Malovics, Hungary; Alice S. Moreira, Brazil; Richard T. Mpoyi, U.S.A.; Anthony
Ugochukwu Obiajulu Nnedum, Nigeria; Johnsto E. Osagie, USA; AAhad M. Osman-Gani,
Singapore; Francisco Costa Pereira, Portugal; Ruja Pholsward, Thailand; Horia D. Pitariu,Romania; Marko Polic, Slovenia; Elisaveta Gjorgji Sardžoska, Macedonia; Petar Skobic, U.S.A.;Allen F. Stembridge, U.S.A.; Theresa Li-Na Tang, U.S.A.; Thompson Sian Hin Teo, Singapore;Martina Trontelj, Slovenia; Caroline Urbain, France; Peter Vlerick, Belgium.
The final version of this paper was presented at the Academy of Management Annual Meeting
August 7-11, 2009, Chicago, IL, USA. Published in Academy of Management Index on
International Management, 68, 296 .
ABSTRACT
This study tests the three-way interaction effect involving managers’ money attitude, paysatisfaction (Level 1), and geopolitical entity’s affluence (Level 2) on managers’ corrupt intent.We collected data from managers in 30 geopolitical entities across six continents around theworld ( N = 5,272). Our cross-level analyses revealed a significant three-way interaction effect.We explicated the above findings, identified the high GDP (+1 SD) and the low GDP groups (-1SD) based on GDP per capita, and found that for managers in the most affluent entities (GDP per capita > $20,000), the relationship between love of money and corrupt intent was significantand positive for those with low pay satisfaction, but non-significant for those with high paysatisfaction. Managers with low pay satisfaction had significantly higher corrupt intent thanthose with high pay satisfaction. For managers in the least affluent entities (GDP per capita <$2,000), as the love of money increased from low to high, their corrupt intent increased
significantly, regardless of pay satisfaction. Results are discussed in light of the effects of love of money, pay dissatisfaction and geopolitical entity’s affluence on corrupt intent around the world.
------------Key words: the Love of Money, Pay Satisfaction, GDP per capita, Corrupt intent, Cross-levelanalysis, Cross-Cultural, International Corruption
7/30/2019 2009_AoM_MONEY MATTERS on Corruption
http://slidepdf.com/reader/full/2009aommoney-matters-on-corruption 2/28
A Cross-Level Study 2
Effects of Managers’ Money Attitude, Pay Satisfaction, and Geopolitical Entity’s Affluence
on Corrupt Intent: A Cross-Level Study of 30 Geopolitical Entities
According to Ashforth, Gioia, Robinson, and Treviño (2008), corruption is both a state
and a process. It reflects not only the corrupt behavior of an individual — defined as the illicit useof one’s position or power for perceived personal or collective gain — but also the dangerous,viruslike infection of a group, organization, industry, or geopolitical entity. Most managementissues (e.g., corruption) are multilevel management phenomena, yet most management researchin the literature uses a single level of analysis (applying a micro or a macro lens alone) thatyields incomplete understanding at either level (Hitt, Beamish, Jackson, & Mathieu, 2007).Ashforth et al. (2008: 673) posited that “we need a considerably more holistic or dynamic
understanding regarding the interplay of environmental, organizational, and individual forces —
that is, a more macro view —to help us understand the etiology and evolution of corruption”.Despite the Foreign Corruption Practices Act that prohibits US corporations from paying
bribes to officials overseas and other initiatives — Organization for Economic Co-operation and
Development (OECD) and the United Nations Convention Against Corruption, corruption iscommonly practiced in almost all geopolitical entities around the world. A plethora of variablesat the individual, group, organizational, industry, and geopolitical entity levels may influencecorruption (Ashforth et al., 2008). Researchers need to apply multilevel designs to existingmodels, consider bottom-up effects, collaborating across disciplines on multidisciplinary topics,and address major real-world problems via multilevel approaches (Hitt et al., 2007). Institutionalanomie theory suggests that pecuniary materialism and firm-level pressures encourage bribery inorganizations (Cullen, Parboteeah, & Hoegl, 2004; Martin, Cullen, Johnson, & Parboteeah,2007). Researchers seek understanding through deep contextualization (Tsui, 2007).
In response, we answer the call and explore only a very limited aspect of “corruption” from several different perspectives of “money”, applying not only a micro but also a macro lens.More specifically, the major purpose of the present investigation is to ascertain the interactioneffect of love of money, pay satisfaction at the individual level (Level 1), and affluence oreconomic development (Gross Domestic Product (GDP) per capita) at the geopolitical entitylevel (Level 2) on managers’ corrupt intent involving data collected from managers in 30geopolitical entities around the world. We present the rationale of our study below.
Corruption is an interesting “real-world” phenomenon. Although people around the worldhave unique histories, cultures, beliefs, and values as well as economic, legal, political, andsocial infrastructures in their respective geopolitical entities (nation-states), they all speak onelanguage that everyone understands: money. Money is the instrument of commerce and measureof value (Smith, 1937). We argue that money (income), the love of money, and pay satisfactionare all related to corruption. We incorporate people’s general secular attitude toward money, thelove of money, because the meaning of money is in the eye of beholder (Mickel & Barron, 2008;Mitchell & Mickel, 1999) and is used as a “frame of reference” (Tang, 1992) to evaluate paysatisfaction and is a potential driver for corruption. De Tocqueville (1805-1859, a Frenchpolitical thinker and historian) traced love of wealth to the root of all that Americans do.Following an oft-cited proposition that “the love of money is a root of all kinds of evil” (e.g.,Vitell, Singh, & Paolillo, 2007), we attempt to focus on only one aspect of “evil”: “corruption”
and test a modified proposition that “the love of money is a root of corruption” across cultures.

7/30/2019 2009_AoM_MONEY MATTERS on Corruption
http://slidepdf.com/reader/full/2009aommoney-matters-on-corruption 3/28
A Cross-Level Study 3
Whoever loves money wants to get rich (Vitell, Paolillo, & Singh, 2006), falls into temptation(Ariely, 2008), and engages in corruption (Peterson, 2002; Tang & Chen, 2008).
Pay dissatisfaction has many negative consequences in organizations, e.g., lowcommitment, high turnover, corruption, and counterproductive behavior (Anand, Ashforth, &Joshi, 2004; Heneman & Judge, 2000; Rynes & Gerhart, 2000; Tang, Kim, & Tang, 2000). Due
to a strong feeling of injustice (Cohen-Charash & Spector, 2001), underpaid employees maysteal “in the name of justice” (Greenberg, 1993, 2002), get even, and engage in corruption.“Whoever loves money never has money enough; whoever loves wealth is never satisfied withhis income”. People with high love of money have low pay satisfaction, regardless of income.The relationship between the love of money and corrupt intent is much stronger for those withhigh pay dissatisfaction than for those without. Thus, pay satisfaction is moderator.
We turn to geopolitical entity (nation-states) (Level 2). Since individuals are nested in thecontext of national cultures, attitudes and behavior depend on both individual dispositions and onthe situation (Ashforth et al., 2008; Greenberg, 2002; Hofstede, Bond, & Luk, 1993). A skillfuluse of multilevel study allows researchers to disentangle processes at the individual- and theentity levels and to gain insights which research at one level can not produce. According to
Ariely (2008), getting students to contemplate their own ethical values (e.g., recalling the TenCommandments or signing an honor code) eliminates cheating completely; while offering pokerchips to redeem for cash doubles the level of cheating. Individuals, embedded in larger contextsof ethical cultures and values at the entity level, are su bject to “temptation” (Vohs, Mead, &Goode, 2006), and may behave in both positive (ethical) and negative (unethical) directions.
Research suggests that entities with a high level of economic development (GDP per
capita), long-established liberal democracy, free and widely read press, power sharing and highrepresentation of women in government, history of openness to trade, high level of informationtransparency, high level of socio-political stability, and tradition of law abidance and nationalculture are less corrupt (Treisman, 2007; Park, 2003). Managers in affluent societies at the top(bottom) of the income pyramid (Prahalad & Hammond, 2002) have the lowest (highest) level of corruption (Sorensen, 2002). People in the poorest entities have very little wealth, see corruptionas a way of life, and are susceptible to temptation. Through the processes of institutionalization,rationalization, and socialization (Ashforth & Anand, 2003), they take corruption for granted,regardless of pay satisfaction. Pay satisfaction matters less in the least (the poorest) than in themost affluent (the richest) entities. We posit: The moderating effect of pay satisfaction on therelationship between love of money and corrupt intent is stronger for managers in developedeconomies than for those in underdeveloped ones. Entity’s affluence matters.
Recent developments in analytic tools and measurement theories enable researchers totest management theories across cultures (Vandenberg & Lance, 2000). Most cross-culturalresearch studies (64%) have focused on only two countries and only a few (23%) examined morethan two countries (Sin, Cheung, & Lee, 1999). Only 28 percent of studies reported measurementinvariance across cultures (He, Merz, & Alden, 2008). Studies with only a few countries andwithout a documentation of measurement invariance across cultures may have limited usefulnessfor theory development and practice. However, empirical research on individuals’ money
attitude, income, pay satisfaction, and corruption across the three-tier income pyramid (Prahalad& Hammond, 2002) is rare and remains silent, at the bottom of the income pyramid in particular.Very little research has examined these aforementioned issues comprehensively in themanagement literature. This study fills the void and may be useful for theory and practice and to
7/30/2019 2009_AoM_MONEY MATTERS on Corruption
http://slidepdf.com/reader/full/2009aommoney-matters-on-corruption 4/28
A Cross-Level Study 4
make relevant contributions to the literature (Colquitt & Zapata-Phelan, 2007; Sutton & Staw,1995). We examine these money-related constructs in a cross-level model (see Figure 1).
------------Insert Figure 1 about here------------
THEORY AND HYPOTHESES
Love of Money and Corrupt Intent Love of Money. According to the theory of planned behavior (TPB, Ajzen & Fishbein,
1980), attitudes will predict behavior effectively only when there is a high correspondencebetween the attitude object and the behavioral option. The attitude must be about the samespecific object involved in the behavioral decision, or else the attitude will not predict behavioreffectively. There are many money-related attitudinal constructs (e.g., Furnham & Argyle, 1998; Furnham, Kirkcaldy, & Lynn, 1994; Mitchell & Mickel, 1999; Srivastava, Locke, & Bartol,2001; Wernimont & Fitzpatrick, 1972; Yamauchi & Templer, 1982). In this study, we
specifically select (affective, behavioral, and cognitive) constructs/attitudes that allow us tocapture the aspiration for money that in turn, may help us maximize the relationship betweenlove of money (attitude) and corrupt intent (behavioral intention).
The affective component of money attitude deals with the love/hate (good/evil)relationship toward money (Gorbacheva & Kupreychenko, 2006; Lefebvre, 2001). We take thepositive approach--most people love money, want to have a lot of money, and want to be rich, rather than the negative approach — some people hate money and consider money as evil. Theconstruct “rich” captures one’s aspiration for money which is negatively related to subjectivewell-being and happiness (Easterlin, 2001; Michalos, 1985). The rising desire to be rich lifts theabsolute levels of income to a higher level. We argue that people with a high love-of-moneyorientation are more likely to have foolish and harmful desires to get rich that lead them to fallinto temptation (Ariely, 2008) and engage in corruption than those without.
According to Herzberg (1987), money is a hygiene factor because money leads tomovements, but not to intrinsic motivation. For most people, money is a motivator (Harpaz,1990; Jenkins, Mitra, Gupta, & Shaw, 1998). On the positive side, among four motivationaltechniques (participation, job design, goal setting, and money) of performance improvement,nothing comes even close to money (Locke, Feren, McCaleb, Shaw, & Denny, 1980). On thenegative side, when people are rewarded for finding insect parts in a food process plant,innovative employees brought insect parts from home to add to the food just before theyremoved them and collected the bonus (Milkovich & Newman, 2008). When people considermoney as a motivator, money may lead to their movements or intent to engage in corruption.
The cognitive component examines different meanings of money. The most consistentthread of money attitude in the literature is the emphasis on its importance (Mitchell & Mickel,1999). To some, money is the most important thing in life. In America, money is how we keepscore, and income is used to judge success (Rubenstein, 1980). Thus, money is important. Othersconsider it only secondary in importance. However, some are obsessed with money because in anaffluent society, there is an increasing emphasis on money, material success, and possessions(Belk, 1985; Kasser, 2002; Richins & Rudmin, 1994) that may lead to ethical problems forbusiness (Kasser, Vansteenkiste, & Deckop, 2006). Money represents power because moneytalks and is highly related to power. Power tends to corrupt, and absolute power corrupts

7/30/2019 2009_AoM_MONEY MATTERS on Corruption
http://slidepdf.com/reader/full/2009aommoney-matters-on-corruption 5/28
A Cross-Level Study 5
absolutely (Lord Acton, Letter to Bishop Mandell Creighton , 1887). People may use money tobuy freedom or to bribe, control, or corrupt others. In summary, the love of money reflects one’s
frame of reference, strong desire to be rich, and aspiration for money.Corrupt intent. It is very difficult and almost impossible to directly observe or measure
managers’ actual unethical behavior such as corruption because most unethical behaviors are
performed in private or behind closed doors. There are measures of workplace deviance(Robinson & Bennett, 2000), counterproductive behavior (Cohen-Charash & Spector, 2001),corruption (Anand, Ashforth, & Joshi, 2004; Dozier & Miceli, 1985), and misbehavior(Ivancevich, Konopaske, & Matteson, 2005; Vardi & Weitz, 2004). We do not intend to study allaspects of unethical behavior (or evil); instead, we focus on corruption only. Corruption is themisuse of organizational position or authority for personal or organizational gain (bribery,kickbacks) and may include acts committed against (sabotaging) or on behalf of the organization(laying off employees for personal gain) (Anand et al., 2004).
Relationship between love of money and corrupt intent. Research suggests that theinstrumental climate (looking out for one’s own self -interest) of the Ethical ClimateQuestionnaire is related to unethical behavior (Peterson, 2002; Wimbush, Shepard, & Markham,
1997). In Swaziland, public sector employees’ money attitude (as measured by the Money EthicScale, Tang, 1992) is related to their moral conduct (Gbadamosi & Joubert, 2005). Americanadult consumers who desire to be rich condone questionable consumer activities (Vitell et al.,2006, 2007). Peo ple’s love of money is positively related to high propensity to engage inunethical behavior among Hong Kong professionals (Tang & Chiu, 2003) and among businessstudents in the US (Tang & Chen, 2008). On the basis of these studies with different constructs,measures, and samples, we argue that those with a high level of love of money cannot resist theflow of money, power, and success in their lives (Badaracco, 2006), fall into temptation and intomany foolish and harmful desires, and are likely to have a high level of corrupt intent.
H1: Love of money is positively related to corrupt intent.
Pay Satisfaction as a Moderator
Pay satisfaction. Pay satisfaction is a component of job satisfaction. The high (low)income to high (low) pay satisfaction relationship is the most robust and consist findingregarding pay satisfaction (Heneman & Judge, 2000; Heneman & Schwab, 1985; Williams,McDaniel, & Nguyen, 2006). Pay satisfaction can be explained by equity model that focuses onthe comparison of one’s and other’s outcome-input ratio (Adam, 1963) and the discrepancymodel that examines the difference between “expectation” and “reality” in pay (Lawler, 1971).According to Plato (427-347 BC), “poverty consists, not in the decrease of one’s possessions, but
in the increase of one’s greed”. Pay satisfaction depends more on relative deprivation (the gaps between the individual’s income and the incomes of all individuals richer than him/her) than on
absolute levels of income (D’Ambrosio & Frick, 2007; Sweeney, McFarlin, & Inderrieden,1990). It is not the absolute levels of income, but one’s motive or love of money and how onecompares one’s pay that causes pay (Srivastava et al., 2001) or life dissatisfaction (Tang, 2007).
Borrowing the literature of motivation theories, Maslow’s (1954) hierarchy of needs
theory suggests that a satisfied need is not a motivator of behavior. People are expected to act inways that satisfy deprived needs. Money can be used to satisfy many human needs at differentlevels. People with low pay satisfaction may have a strong motive to take actions and seek thesatisfaction of needs. People with the perception of underpayment may steal “in the name of justice” (Greenberg, 1993, 2002). Low salaries force public servants to supplement their incomes
7/30/2019 2009_AoM_MONEY MATTERS on Corruption
http://slidepdf.com/reader/full/2009aommoney-matters-on-corruption 6/28
A Cross-Level Study 6
illicitly (Lambsdorff, 1999). People with high love of money have high pay dissatisfaction (Lim& Sng, 2006; Tang & Chiu, 2003). Mental health workers with high love of money change jobsin order to increase income or to maximize perceived economic gains (Hsee, Zhang, Yu, & Xi,2003; Tang et al., 2000).
Pay satisfaction as a moderator. We posit that pay satisfaction is a moderator of
Hypothesis 1 for the following rationale. Since an unsatisfied need is a motivator of behavior(Maslow, 1954), people with a high level of pay dissatisfaction have a strong desire to satisfydeprived needs and are very vulnerable to “temptation” in the environment. Therefore, first, paydissatisfaction triggers people to engage in corruption. Second, following Hypothesis 1 (love of money is positively related to corrupt intent), among people with high love of money, those withhigh pay dissatisfaction are more likely to fall into temptation (Ariely, 2008), look foropportunities that allow them to take action, satisfy their needs, financial gains (Maslow, 1954),self-interests (Peterson, 2002), and engage in corruption than those without (Tang & Chiu,2003). We predict that the relationship between love of money and corruption is much strongerfor those with higher pay dissatisfaction than those without.
H2. Pay satisfaction moderates the relationship between love of money and corrupt intent
in that the relationship is stronger for managers with higher pay dissatisfaction.
Entity’s Affluence or Level of Economic Development (GDP per Capita)
“Whenever research traverses levels of analysis, it becomes more complex, and scholars
must be vigilant about carefully articulating the theoretical bases of their work” (Hitt et al., 2007:1387). Researchers must consider the levels of theory, measurement, and analysis for theconstructs included in their research studies. Individuals are nested in national environments. Weinvestigate the effect of entity’s affluence (Level 2) on the moderating role of pay satisfaction forthe love of money to corruption relationship (Level 1). Entity’s affluence can be best measuredby GDP per capita (an objective measure of economic development) and is a continuousvariable. The richest (poorest) countries with the highest (lowest) GDP per capita have very low(high) perceived corruption (Organization for Economic Co-operation and Development).
At the macro level, the richest, highly developed entities have well-established economic,legal, political, and social infrastructures, dominant economies in the tertiary (service) andquaternary (intellectual services, e.g., health, education, culture, research, and entertainment)sectors of industry, and a more stable environment than those in developing or emergingeconomies (Treisman, 2007). With abundant wealth or resources, entities have a strong culture topromote socially responsible practices (Campbell, 2007) and ethical behavior through rewardand punishment (Hunt, Wood, & Chonko, 1989), treat their citizens decently, abide by the law,and maintain standards of honesty and integrity (Gomez-Mejia, Wiseman, & Dykes, 2005).Ethical values or culture may deter unethical behavior (Baker, Hunt, & Andrews, 2006; Victor &Cullen, 1987) because most people do look to the social context or culture to determine what isethically right and wrong (Bandura, 1977; Thomas, Schermerhorn, & Dienhart, 2004), obeyauthority figures (Litzky, Eddleston, & Kidder, 2006; Milgram, 1974), and do what is rewarded(Skinner, 1972; Treviño & Brown, 2004). We assert that with high pay satisfaction at theindividual level, as managers’ love of money increases, their corruption does not increasesignificantly because ethical cultures and legal infrastructures at the entity level may stronglydeter unethical behavior intention. The cost of corruption (loss of reputation, freedom, andliberty) is too high for the benefit (Gomez-Mejia et al. 2005). These context factors offer“positive” temptation in rich entities; people behave ethically and do not engage in corruption,

7/30/2019 2009_AoM_MONEY MATTERS on Corruption
http://slidepdf.com/reader/full/2009aommoney-matters-on-corruption 7/28
A Cross-Level Study 7
when they have high pay satisfaction. On the other hand, managers with pay dissatisfaction havea high desire or aspiration to get rich in order to satisfy their needs, high feeling of injustice, andare more susceptible to external temptation (Ariely, 2008) that may lead them to ignore the socialnorms, carrots and sticks, take risks, and engage in counterproductive behavior, or corruption(Cohen-Charash & Spector, 2001; Skinner, 1972; Tang & Chiu, 2003).
Entities in transition economies (China, Russia) have changed from a planned/controlledeconomy to a market economy; solid economic, legal, political, and social infrastructures do not exist (McCarthy & Puffer, 2008; Vynoslavaska, McKinney, Moore, & Longenecker, 2005).Managers at the bottom of the income pyramid (e.g., China) experience scarce resources,extreme competition for survival (Drori, Jang, & Meyer, 2006), a strong sense of relativedeprivation (D’Ambrosio & Frick, 2007; Sweeney, McFarlin, & Inderrieden, 1990), and a veryweak ethical culture (entity level) and infrastructures, therefore, they have nothing to lose, noconcern for reputation and liberty (Gomez-Mejia et al., 2005), and high incentive to cut corners,compromise product safety and quality, and cheat customers (Campbell, 2007). Corruption is away of life (diffusion of responsibility, Bandura, 1986). Managers with high love of money takeactions and ascend to the top of the echelon to obtain power. Because power tends to corrupt;
and absolute power corrupts absolutely, managers with power can not resist the opportunities andtemptation in that corrupt context, their love of money triggers corruption regardless of their paysatisfaction, allowing them to be the first ones to enjoy a taste of what is like to be well off.
In Ukraine, public sector employees received 24 to 32 percent less wages than theirprivate sector counterparts but both sectors had essentially identical level of consumerexpenditures. Bribery accounted for at least 20 percent of the total wage compensation in thepublic sector which was equivalent to US$460-580 million, or 0.9-1.2 percent of Ukraine’s GDP
in 2003 (Gorodnichenko & Peter, 2007). According to the World Bank, in the last four decades,Nigeria lost about N3.5 trillion to corruption. In some of the poorest countries (Congo, Nigeria),political and/or public office has become a viable means to extend personal wealth and politicalpower of the ruling class (collectively, kleptocrates; kleptocracy--rule by thieves) at the expenseof the population (Grossman, 1999). The rule of man (not law) exists; self-interest (not justice)prevails (e.g., Peterson, 2002). In the poorest entities, the “positive” temptation in rich entities,mentioned above (e.g., Bandura, 1977; Skinner, 1972; Treviño & Brown, 2004), may not exist;rather, the abundant “negative” temptation in a corrupt environment reinforces people to behaveunethically and engage in corruption (Ariely, 2008). Due to these cultural, ethical, and contextualfactors in the poorest entities, managers’ pay satisfaction does not matter and may play a veryminor role in their corrupt intent.
Taken together, we posit strongly that using the most affluent (the richest) and the leastaffluent (the poorest) (Level 2) entities as examples, their respective contexts foster differentcultural and ethical environments under which managers at the individual level (Level 1) operate(Hitt et al., 2007; Tsui, 2007). We posit that Hypothesis 2 varies at different levels of economicdevelopment and is stronger for managers in the most affluent entities than those in the leastaffluent entities. Entity’s affluence is a moderator. We test Hypothesis 3 on an exploratory basis.
H3. There is a three-way interaction effect involving the love of money, pay satisfaction(Level 1), and entity’s affluence (Level 2) on corruption. More specifically, therelationship between love of money and corruption is positive and significant formanagers with low pay satisfaction; but non-significant for those with high paysatisfaction in the most affluent (the richest) entities. The same relationship between love

7/30/2019 2009_AoM_MONEY MATTERS on Corruption
http://slidepdf.com/reader/full/2009aommoney-matters-on-corruption 8/28
A Cross-Level Study 8
of money and corruption is positive and significant regardless of pay satisfaction forthose in the least affluent (the poorest) entities.
METHOD
Procedures and SamplesScholars in multilevel research suggest that higher levels of power (1 – β) are achievedwith larger samples at Level 2 (group/entity) than at Level 1 (individual). Researchers need toemploy a minimum of 30 groups with 30 individuals in those groups, i.e., a rule of thumb of 30/30 (Scherbaum & Ferreter, 2009). Following Hitt et al. (2007), we contacted collaboratorsfrom multiple disciplines (e.g., management, economics, human resource development, andpsychology) in about 50 geopolitical entities. Researchers adopted the English version, ortranslated it to their native language using the multistage translation/back-translation procedure(Brislin, 1980), and distributed survey to people in various organizations across one or multiplecities. Participants completed the survey voluntarily, anonymously and received no reward(response rate = 45% to 100%). We collected data from managers in 31 geopolitical entities
across six continents around the world (Asia, Africa, Australia/Oceania, Europe, North America,and South America; there is no country in Antarctica), mostly between 2002 and 2005 withadditional data collected in 2007 and 2008. Most of these entities are nation-states. We treatedChina, Hong Kong, and Taiwan as separate geopolitical entities and dropped one entity (Italy)due to missing data. In this study, we employed 30 geopolitical entities (Level 2) with 87 to 538managers in these 30 entities (Level 1, N = 6,171). Our sample size at Level 2 ( N = 30) andLevel 1 (n = 206/entity) was better than the requirements (30 x 30 = 900) suggested inScherbaum and Ferreter (2009). See Table 1 for the name and sample size of these 30 entities.
Participants were executive, senior manager, logistics coordinator, accountant, financialdirector, product manager, sales manager, architect, director of communication, engineer, R&Dsupervisor, HR manager, purchasing officer, health care worker, assistant marketing manager,designer, etc. We used the term manager in this paper. Managers were 34.80 years old (SD =9.83), 50.6 percent male (male = 1, female = 0), and had 15.41 years of education (SD = 2.61).The correlation between managers’ self -reported income ($14,359) and GDP 2005 ($14,099)was significant ( N = 6,171, r = .50, p < .01). At the entity level, the self-reported average income($13,060) was significantly correlated to GDP per capita 2005 ($12,405) ( N = 30, r = .68, p <.01) and Corruption Perceptions Index (CPI) 2005 (r = .66, p < .01). GDP per capita was alsorelated to CPI (r = .85, p < .01). Our samples were reasonable representations of the respectivegeopolitical entities. Table 1 shows the entity name, sample size, GDP, and mean and standarddeviation of demographic variables for each of the 30 geopolitical entities in this study.
------------Insert Table 1 about here------------
Measures Love of Money. We selected the Love of Money Scale (Tang, 1992; Tang & Chiu, 2003)
to measure managers’ attitude toward money. This scale has been widely applied in empiricalstudies (e.g., Gbadamosi & Joubert, 2005; Vitell et al., 2006, 2007) and cited in influentialreviews (e.g., Furnham & Argyle, 1998; McShane & Von Glinow, 2008; Milkovich & Newman,2008; Mitchell & Mickel, 1999; Rynes & Gerhart, 2000). We used four specific factors in this

7/30/2019 2009_AoM_MONEY MATTERS on Corruption
http://slidepdf.com/reader/full/2009aommoney-matters-on-corruption 9/28
A Cross-Level Study 9
study: Factors Rich (4 items, Cronbach’s alpha, α = .83), Motivator (4 items, α = .85),Importance (5 items, α = .77), and Power (4 items, α = .71) (see Appendix for items).
Pay satisfaction. We measured managers’ pay satisfaction using Heneman and Schwab’s (1985) 18-item Pay Satisfaction Questionnaire (PSQ). It has good measurement properties(Judge & Welbourne, 1994) and has been used widely in the pay satisfaction literature (Rynes &
Gerhart, 2000; Williams et al., 2006).Corrupt intent. We measured managers’ propensity to engage in corruption (Robinson &Bennett, 2000). Participants were asked: If you were in that situation, what is the probability thatyou will engage in these activities (i.e., reveal company secrets for several million dollars; acceptmoney, gifts, and kickbacks from others; sabotage the company to get even due to unfairtreatment; lay off 500 managers to save the company money and increase my personal bonus(Anand et al., 2004; Tang & Chiu, 2003)? This self-prediction measure predicts intention.
We used five-point Likert scales with the following anchors: (a) the Love of Money scale(LOM): strongly disagree (1), neutral (3), and strongly agree (5); (b) Pay SatisfactionQuestionnaire (PSQ): strongly dissatisfied (1), neutral (3), and strongly satisfied (5); and (c)Corruption: very low probability (1), neutral (3), and very high probability (5). Using different
anchors creates a psychological separation and reduces the common method variance bias(Podsakoff, MacKenzie, Lee, & Podsakoff, 2003).GDP per capita. The Gross Domestic Product (GDP) per capita for each of the 30
geopolitical entities was obtained from the 2005 report of International Monetary Fund, IMF(http://www. imf.org, see also World Bank’s Top GDP 2005, http://siteresources.worldbank.org, and United Nations’ Human Development Report 2006). The GDP per capita 2005 was assignedto all managers of each entity to calculate the individual-level correlations. We employed alogarithm to transform this statistic in subsequent analyses.
Control variables. Young individuals and males tend to be less ethical than their olderand female counterparts (Collins, 2000). We controlled age, gender (dummy coded: male = 1,female = 0), education, and income (the Z score for participants in each geopolitical entity).
Analysis strategy. Due to the nature of our cross-cultural data, we adopted StructuralEquation Modeling (SEM) technique (using SPSS and Amos, 16.0) and examined measurementinvariance. Ideally, a statistically non-significant chi-square value should be obtained to infersupport for a well-fitting model. Since chi-square statistic is highly sensitive to sample size,researchers need to select a variety of practical fit indices to supplement the chi-square test. Inthis study, we used the following criteria for configural invariance (passing 5 out of 6 criteria):(1) χ 2 / df < 5, (2) incremental fit index, IFI > .90, (3) Tucker-Lewis Index, TLI > .90, (4)comparative fit index, CFI > .90, (5) standardized root mean square residual, SRMSR < .10, and(6) root mean square error of approximation, RMSEA < .10 (Vandenberg & Lance, 2000).Metric invariance is achieved when the differences between unconstrained and constrainedmulti-group confirmatory factor analyses (MGCFAs) are non-significant. Cheung and Rensvold(2002) recommended using changes in CFI as a rule of thumb for metric invariance (if ΔCFI <.01: differences between models do not exist).
Our theoretical model is multilevel in nature, consisting of constructs spanning both theindividual (Level 1) and geopolitical entity levels (Level 2) of analysis. Multilevel randomcoefficient models were estimated for testing hypotheses using the NLME package for S-PLUSand R written by Pinheiro and Bates (2000). The predictors of Level 1 were grand-mean centeredto reduce the potential for multicollinearity in Level 2 estimation and to reduce the correlationbetween the Level 2 intercept and the slope estimates (Hofmann & Gavin, 1998). Any cases with
7/30/2019 2009_AoM_MONEY MATTERS on Corruption
http://slidepdf.com/reader/full/2009aommoney-matters-on-corruption 10/28
A Cross-Level Study 10
incomplete information were dropped in the analyses to increase the representativeness of anaggregated measure.
RESULTS
Confirmatory Factor Analysis (CFA) ResultsWe conducted confirmatory factor analysis (CFA) for each of the three measures usingthe whole sample. First, for the 17-item, four-factor Love of Money Scale, results showed a goodfit ( χ 2 = 2,033.61, df = 115, p = .0001, χ 2 /df = 17.68, IFI = .95, TLI = .95 , CFI = .95 , SRMSR=
.05, RMSEA = .05). With a large sample ( N = 6,171) in this study, minor misspecifications maylead to a poor model fit (Vandenberg & Lance, 2000) and an inflated χ
2 value causing the χ 2 / df
value to be greater than 5. Factor loadings for the first-order latent factors were as follows: Rich(.85), Motivator (.71), Importance (.70), and Power (.55). These results revealed strongmeasurement properties of this scale. We combined all items into an overall index in subsequentdata analyses (α = .85). Second, for the 18-item, four-factor Pay Satisfaction Questionnaire(PSQ), CFA results revealed a good fit ( χ 2 = 5,572.92, df = 131, p = .0001, χ 2 /df = 42.54, IFI =
.92, TLI = .91 , CFI = .92 , SRMSR= .04, RMSEA = .08) with first-order latent factor’s factor loadings as follows: Pay Level (.84), Raises (.97), Benefits (.83), and Pay Administration (.88).We combined all items into an overall index (α = .94). Finally, there was a good fit for the 4-itemCorruption Scale ( χ 2 = 45.17, df = 2, p = .0001, χ 2 /df = 22.58, IFI = .99, TLI = .98 , CFI = .98 ,SRMSR= .01, RMSEA = .06). The Cronbach’s alpha for this 4-item scale was .94. All thesefindings revealed a good fit between the measurement model and our data.
Measurement Invariance We examined the measurement invariance by dividing the 30 geopolitical entities into
three groups according to their GDP per capita. Since the logarithm of GDP per capita was closeto a normal distribution, following Akien and West’s (1991) suggestion, we identified three GDP per capita groups (high GDP per capita group = +1 SD and the low GDP per capita group = -1SD): the high group (7 entities, GDP per capita > $20,000), the medium group (18 entities,$20,000 > GDP per capita > $2,000); and the low group (5 entities, GDP per capita < $2,000).This classification was exactly the same as Prahalad and Hammond’s (2002) three-tier “income pyramid”. The USA, Belgium, Australia, France, Spain, Singapore, and Hong Kong were in theHigh GDP per capita group. In the low GDP per capita group, we had a much smaller samplebased on data from only five (5) entities out of 30 (China, Egypt, the Philippines, DemocraticRepublic of Congo, and Nigeria, see Table 1).
We achieved configural invariance (factor structure equivalence) of all three measureswith first- and second-order latent constructs for (1) the whole sample ( χ 2 = 10,185.67, df = 694, p = .0001, χ 2 /df = 14.68, IFI = .9228, TLI = .9175 , CFI = .9228 , SRMSR= .0476, RMSEA =
.0471), (2) the high GDP per capita ( χ 2
= 3,060.75, df = 694, p = .0001, χ 2 /df = 4.40, IFI = .9370,
TLI = .9326 , CFI = .9369 , SRMSR= .0586, RMSEA = .0441), and (3) the medium GDP per
capita groups ( χ 2 = 5,279.67, df = 694, p = .0001, χ 2 /df = 7.61, IFI = .9289, TLI = .9250 , CFI =
.9297 , SRMSR= .0496, RMSEA = .0433). Our findings for the low GDP per capita group ( χ 2 = 5,367.89, df = 694, p = .0001, χ
2 /df = 7.73, IFI = .8073, TLI = .7939 , CFI = .8069 , SRMSR=
.1296, RMSEA = .0868) can be explained by the smaller sample size, managers’ limitedexperiences in answering survey questionnaires, and different values across cultures, comparedto their counterparts in the high and medium GDP per capita groups.

7/30/2019 2009_AoM_MONEY MATTERS on Corruption
http://slidepdf.com/reader/full/2009aommoney-matters-on-corruption 11/28
A Cross-Level Study 11
We achieved metric invariance (factor loading equivalence) because the differences werenon-significant (ΔCFI = .0068, ΔRMSEA = .0007) when we compared two measurement models
across three GDP per capita groups simultaneously: (1) unconstrained multi-group confirmatoryfactor analysis, MGCFA ( χ 2 = 13,711.08, df = 2082, p = .0001, χ 2 /df = 6.59, IFI = .9085, TLI =.9022 , CFI = .9084 , SRMSR= .0586, RMSEA = .0301) and (2) constrained MGCFA (set all
factor loadings to be equal across three groups) ( χ 2
= 14,626.99, df = 2,129, p = .0001, χ 2
/df =6.87, IFI = .9017, TLI = .8972 , CFI = .9016 , SRMSR= .0587, RMSEA = .0308). Taken together,our results supported measurement invariance across the three-tier income pyramid.
Common Method Variance Bias (CMV) The common method variance (CMV) problem may have been overstated and reached
the status of urban legend in the literature (Spector, 2006). It should be noted that commonmethod variance may be a concern for cross-sectional studies that focus on the linearrelationships among variables, but this is not the case for the interaction effect in this studyinvolving data from managers (Level 1) in 30 different geopolitical entities (Level 2). Interactioncan attenuate, but cannot create CMV bias (Evans, 1985). In order to address possible concerns,
we examined this issue in two steps (Podsakoff et al., 2003). Harman’s single-factor test. First, we conducted Harman’s single-factor test andexamined the unrotated factor solution involving all items of interest in an exploratory factoranalysis (EFA). We found eight factors with Eigen values greater than one and listed the scaleand the amount of variance explained (64.23%) as follows: PSQ (24.07%), LOM (15.38%),Corruption (6.83%), and items with cross loading (4.17%, 4.02%, 3.85%, 3.13%, and 2.77%).There were three independent factors for our predictor and criterion variables.
Latent common method variance (CMV) factor. Second, the measurement model withall three measures and items of interest with the addition of an unmeasured latent commonmethod variance (CMV) factor ( χ 2 = 6,700.75, df = 655, p = .0001, χ 2 /df = 10.23, IFI = .9508,TLI = .9443 , CFI = .9508 , SRMSR= .0421, RMSEA = .0387) did not improve the fit over ourmeasurement model without a CMV factor ( χ 2 = 10,185.67, df = 694, p = .0001, χ 2 /df = 14.68, IFI = .9228, TLI = .9175 , CFI = .9228 , SRMSR= .0476, RMSEA = .0471) because changes of CFI and RMSEA were relatively small (ΔCFI = .9508 - .9228 = .028; ΔRMSEA = .0471 - .0387= .0084). CMV effect was not a major concern in this study.
Descriptive Statistics Table 2 shows the mean, standard deviation, and correlations of major variables. Corrupt
intent was positively correlated with love of money (.13, p < .01) and negatively correlated withpay satisfaction (-.07, p < .01). Consistent with our intuition, income was related to corrupt intent(-.03, p < .05), pay satisfaction (.18, p < .01), but not related to love of money (-.01), suggestingincome (money) and love of money are conceptually distinct constructs.
------------Insert Table 2 about here------------
Testing of the Hypotheses
Employing random coefficient modeling (RCM), we tested Hypothesis 1 by regressingcorrupt intent on love of money while controlling for age, gender, education, and income. Weinvestigated Hypotheses 2 to 3, concerning the moderating effects of pay satisfaction and GDP
per capita, using the three-step procedures suggested by Aiken and West (1991). Table 3

7/30/2019 2009_AoM_MONEY MATTERS on Corruption
http://slidepdf.com/reader/full/2009aommoney-matters-on-corruption 12/28
A Cross-Level Study 12
summarizes the results of the regression analyses, including the Gamma coefficients, the robuststandard errors, and the overall model deviance for the estimation of fixed effects.
------------Insert Table 3 about here------------
Null models. We predict that both individual- and entity-level variables are significantlyrelated to managers’ corrupt intent. In order to further test these hypotheses, significant between-entity variance needs to exist in corrupt intent. Thus, we first estimate null models in which nopredictors are specified to test the significance level of the Level 2 residual variance of theintercept. Results indicated that the within-entity variance of corrupt intent was .08 and thebetween-entity variance component was .41. The intra-class correlation (ICC) associated withcorrupt intent was .84, reflecting that 84 percent of its variance resided between entities.Therefore, results provided a basis for examining both entity- and individual-level predictors of intention to engage in corruption.
Main effect of love of money (Hypothesis 1). Love of money had a significant, positiveeffect on corrupt intent (γ =. 15, p < .01; see Model 1 of Table 3). Results supported H1. In
addition, our control variables showed that younger (γ = -. 01, p < .01) and male (γ =. 15, p < .01)managers tended to have higher corrupt intent than their older and female counterparts. Moderating effect of pay satisfaction (Hypothesis 2). Table 3 shows a significant
moderating effect of pay satisfaction on the relationship between love of money and corruptintent (see model 3 of Table 3). Specifically, the Gamma coefficient for the interaction term(love of money x pay satisfaction) was statistically significant (γ = -.05, p < .01). The negativesign before the Gamma weight of the interaction term for the corrupt intent supported Hypothesis2 (that relationship between love of money and intention to engage in corruption is stronger formanagers with low pay satisfaction than those with high pay satisfaction).
Moderating effect of entity’s affluence (GDP per capita) (Hypothesis 3). Model 4 inTable 3 showed that the cross-level three-way interaction effect of love of money, paysatisfaction, and entity’s affluence (GDP per capita) on corrupt intent (Hypothesis 3) wassignificant (γ = -.07, p < .05), controlling for their main effects and the corresponding two-wayinteraction terms. Since the three-way interaction effect was significant, we turned our attentionto Hypothesis 3 rather than Hypotheses 1 and 2. The negative sign before the Gamma weights of the three-way interaction term was consistent with H3 (that relationship between love of moneyand intention to engage in corruption is stronger for managers with low pay satisfaction thanthose with high pay satisfaction and the impact is stronger for managers in affluent entities thanthose in less affluent entities).
To explicate the above findings, we probed the three-way interaction among love of money, pay satisfaction, and GDP per capita on intention to engage in corruption, followingprocedures recommended by Aiken and West (1991). We classified the high GDP per capita group (+1 SD) and the low GDP per capita group (-1 SD) and plotted results in Figure 2.Consistent with Hypothesis 2, results illustrated that compared with those with high paysatisfaction, the relationship between love of money and corrupt intent was positive andsignificant for managers with low pay satisfaction. This relationship pattern existed in both highand low GDP per capita groups.
A close examination of the single slopes suggested that for managers in the most affluententities (GDP per capita > $20,000), the relationship between love of money and corruption waspositive and significant for those with low pay satisfaction (β = .17, p < .01); but non-significant

7/30/2019 2009_AoM_MONEY MATTERS on Corruption
http://slidepdf.com/reader/full/2009aommoney-matters-on-corruption 13/28
A Cross-Level Study 13
for those with high pay satisfaction (β = .03, n.s.). Managers with low pay satisfaction hadsignificantly higher corrupt intent than those with high pay satisfaction. Therefore, there was asignificant difference in the pattern of the relationship between those with high and low paysatisfaction. For managers with high pay satisfaction, as their love of money increased from lowto high, their corrupt intent did not increase accordingly. For those with low pay satisfaction, as
their love of money increased from low to high, their corrupt intent increased significantly.For managers in the least affluent entities (GDP per capita < $2,000), the relationshipbetween love of money and corrupt intent was significant and positive for people with both high(β = .09, p <.05) and low pay satisfaction (β =.17, p < .01). Relatively speaking, managers withlow pay satisfaction had higher corrupt intent than those with high pay satisfaction. However, formanagers in the least affluent entities, the relationships between love of money and corrupt intentwere similar: as the love of money increased from low to high, their corrupt intent increasedsignificantly, regardless of pay satisfaction. Consistent with Hypothesis 3, as shown in Table 4,the simple slope was non-significant, only when both pay satisfaction and GDP per capita werehigh. Taken together, these results provided support for our interaction hypothesis.
------------Insert Figure 2 and Table 4 about here------------
DISCUSSION
We summarize our theoretical, empirical, and practical contributions of this paper below.First, we craft a very simply multilevel theory, and test three constructs using a multilevel model.Second, this study provides strong, significant empirical contributions by adopting rigorousmultilevel measures, collecting a large sample of 6,171 managers in 30 geopolitical entities indifferent parts of the world, and selecting highly rigorous quantitative research methods such asStructural Equation Modeling technique (SEM, SPSS and Amos 16.0) to conduct exploratoryand confirmatory factor analysis, measurement invariance and Random Coefficient Modelingtechnique (RCM, R and S-PLUS) to conduct cross-level analyses. Our large sample size at Level1 and Level 2 provides interesting, unique, and counterintuitive results and makes significantempirical contributions to the literature. Third, results of our cross-level model provide practical implications and demonstrate a significant three-way interaction effect of pay satisfaction, loveof money (Level 1), and entity’s affluence (Level 2) on corrupt intent.
In order to detect the interaction effect, we divide our sample into three levels of economic development reflecting the tree-tier income pyramid (Prahalad & Hammond, 2002).Our cross-level results suggest that for managers in the most affluent entities (GDP > $20,000),the relationship between love of money and corrupt intent is much stronger for managers withlow pay satisfaction than those without; whereas in the least affluent entities (GDP < $2,000), therelationship exists regardless of managers’ pay satisfaction.
Due to pervasive corruption, lack of resources, and the processes of institutionalization,rationalization, and socialization (Ashforth & Anand, 2003), people at the bottom of the incomepyramid take corruption for granted. As their love of money increases, their corrupt intent alsoincreases. Our counterintuitive insights suggest that pay satisfaction has little impact on people’scorruption in the poorest economies. We look at this strategic and economic perspective andconclude that entities in the most affluent (the richest) and the least affluent (the poorest) (Level2) contexts foster different cultural and ethical environments under which managers at theindividual level (Level 1) operate (Hitt et al., 2007; Tsui, 2007). The effect of pay satisfaction on

7/30/2019 2009_AoM_MONEY MATTERS on Corruption
http://slidepdf.com/reader/full/2009aommoney-matters-on-corruption 14/28
A Cross-Level Study 14
the relationship between love of money and corrupt intent varies across levels of economicdevelopment.
For managers in affluent societies, pay dissatisfaction enhances the importance of money(e.g., Anand et al., 2004; Cohen-Charash & Spector, 2001; Lim & Sng, 2006; Tang, Luna, &Sutarso, 2005). Money is related to the satisfaction of many needs (Maslow, 1953; Oleson,
2004). Salary has more potency as a job dissatisfier than a job satisfier (Herzberg, 1987). Theimpact of money (salary) on pay dissatisfaction is much stronger and lasts three times longerthan the impact of money on pay satisfaction. Most people are happy with their pay raises atfirst. But the immediate thought after that is they deserved the pay raise because they haveworked so hard for it. The pay raise is not enough and they deserve more than what they receive.Pay satisfaction does not last very long. Almost all people look for the next pay raise some or allof the time. Pay satisfaction depends more on relative deprivation (D’Ambrosio & Frick, 2007;Sweeney, McFarlin, & Inderrieden, 1990) than on absolute levels of income. It depends on loveof money and how they compare their pay with others (Tang et al., 2005). “The rising tide liftsall boats”. When people have higher income, they raise the standard (aspiration) and want moremoney. Most people compare themselves with the rich. The rising aspirations for money lead to
pay dissatisfaction. It is not the money, but the motive (Srivastava et al., 2001) or the love of money (Tang et al., 2005) that causes pay dissatisfaction. Our findings offer support for classicmotivation theories and reveal a critical new insight that pay dissatisfaction serves as a triggerthat enhances the relationship between the love of money and corrupt intent for managers ingeneral and those in the richest entities in particular.
In summary, entity’s affluence, the love money, and pay satisfaction have impacts onmanagers’ corruption in this cross-level study. We clearly demonstrate that pay dissatisfaction isa driver that triggers managers’ love of money toward corruption differently across three tiers of the income pyramid. We reveal not only the important combined effects of entity’s affluence,love of money, and pay satisfaction on corrupt intent but also boundaries of classic motivationand compensation theories. This makes significant theoretical contributions to the literature(Colquitt & Zapata-Phelan, 2007).
Practical implications. In the wake of global competition, multinational corporations(MNCs) are increasingly interested in reducing labor costs, increasing worker productivity andprofits, and managing human resource effectively across borders. From 2000 to 2005, US MNCscut more than 2 million jobs at home, but their expansion has been mainly in high-quality andlow-cost areas overseas (Mandel, 2008), e.g., China, India, Indonesia, and Vietnam. Manyresearchers as well as MNC executives have a great interest in understanding the differences andsimilarities of doing business in different parts of the world and achieving business goals. Due torecent economic down turn, high unemployment, and mass layoffs, organizational trust (Gilbert& Tang, 1998) goes down and dishonesty is on the rise (http://www.management-issues.com/2009/3/6/research/its-a-jungle-out-there.asp). The processes of institutionalization,rationalization, and socialization (Ashforth & Anand, 2003) and the harsh economic environmentcause some desperate, angry, and disgruntled people to engage in corruption. Results of thisstudy may help MNC executives and expatriates understand and manage stakeholders (e.g.,stockholders, managers, employees, suppliers, and customers) across the three-tier incomepyramid (Prahalad & Hammond, 2002) effectively and efficiently and avoid corruption.
To prevent or reduce corruption, we need to consider the following: First, it is difficult tomanage the compensation systems in organizations and managers’ love of money. Executivesmust pay managers fairly and well for the following reasons. People bring dispositional values to

7/30/2019 2009_AoM_MONEY MATTERS on Corruption
http://slidepdf.com/reader/full/2009aommoney-matters-on-corruption 15/28
A Cross-Level Study 15
organizations (Staw, Bell, & Clausen, 1986). Individuals with financial hardship are obsessedwith money (Lim & Teo, 1997). For relatively underpaid managers, high income leads to a highlove of money: The more money they have, the more they want. Salary is a hygiene factor;people need money continuously to maintain their lives. It is impossible to satisfy employees’
desires for money. Research suggests that high income is related to low love of money for high-
income professionals (Tang & Chiu, 2003). When people are satisfied with their compensation,they are likely to have a sense of self-sufficiency and justice, take their minds off money (Kohn,1993), elevate their virtue and wisdom, inculcate their stewardship behaviors, and supplantopportunism and self-interest (Gomez-Mejia et al., 2005). Doubling the civil servants’ wage will
improve the corruption index by two points on the CPI index (Rijekeghem & Weder, 1997).Since income (money), pay satisfaction, and love of money are not mutually exclusive,
but intertwined in a proverbial Gordian knot. Executives need to adopt measures such as theLove of Money and Pay Satisfaction Questionnaire in their (annual) attitude survey, monitormanagers’ aspiration for money, income, needs satisfaction in general (Maslow, 1953), and paysatisfaction in particular, and investigate the relationships among these variables overtime. Theyneed to manage compensation systems in organizations effectively and efficiently (Milkovich &
Newman, 2008) to foster a high sense of justice, a high level of pay satisfaction, and a healthylevel of the love of money.Second, MNC executives should valorize corporate ethical values (carrots and sticks),
create a strong legal environment, and inspire personal integrity, character, and calling inmanagers’ lives to curb corrupt intent at the organizational level. Executives must consider (1)prevention (identifying and rejecting job applicants and managers who are prone to makeunethical decisions); (2) control (the use of normative force--code of ethics, internal controlsystems, role models, and social norms and instrumental force--proper checks and balances,electronic surveillance devices, and rewards and punishment); and (3) deterrence (dismissingmanagers in business organizations or providing a strong response to harmful misbehavior) (Ivancevich et al., 2005). It is important that they do not discriminate against managers who mayscore high (the Love of Money and corrupt intent) or low (pay satisfaction) on self-reportedmeasures employed in this study.
Third, entities with high GDP per capita, liberal democracy and solid economic, social,political, and legal infrastructures have high ethical cultures and low corruption (Treisman,2007). Without these infrastructures in entities, a vicious cycle of poverty and corruption exists.MNC executives and expatriates need to understand these environmental contexts. There is asurprising amount of agreement throughout the world that bribery/corruption is unethical andwill damage economic efficiency. Business ethics is seldom black and white. Managers mustmaintain their ethical values, respect the rights of other cultures, and raise the bar constantly.
The President of the USA signed the Sarbanes-Oxley Act into law on July 30, 2002.Other entities may or may not have such laws. Corruption varies across cultures and isnotoriously high at the bottom of the income pyramid. The correlation between economicdevelopment and perceived corruption is extremely robust (Treisman, 2007). It takes time tochange ethical values or cultures at the individual, organizational, and geopolitical entity level.Perhaps due to pervasive corruption in transition, emerging economies, some managers lose theirsense of self-sufficiency (Vohs et al., 2006) and interest in reputation and liberty (Gomez-Mejiaet al., 2005); deactivate their moral self-regulatory processes (moral disengagement, Bandura,1986); ignore all the laws, orders, and values in the poorest barrels; become corrupt in the name
7/30/2019 2009_AoM_MONEY MATTERS on Corruption
http://slidepdf.com/reader/full/2009aommoney-matters-on-corruption 16/28
A Cross-Level Study 16
of justice (Greenberg, 1993); and do whatever it takes to survive or succeed. Due to the absenceof carrots and the failure of sticks; self-interest is the most salient factor in driving behaviors.
Due to globalization, outsourcing, and foreign direct investment (FDI), China is one of the most volatile markets in the world with an eight percent increase of GDP per capita for thepast several years (10.1% in 2004, 9.9% in 2005, 8.6% in 2006, and 11.4% in 2007). China is in
the low GDP per capita group (the bottom of the income pyramid) in the present study and willmove to the medium or high GDP groups quickly (2007/2008 GDP per capita = $6,757). It is thethird largest economy in the world. Without a stable institutional framework, the uncertaintyassociated with economic transactions imposes a heavy risk premium on investments thatdiscourages foreign investment in particular. Researchers need to investigate the impact of change in GDP per capita and self-reported income on unethical intentions over time.
Limitations. We measured the propensity to engage in corruption, not the actualbehavior. Only a small part of unethical behavior such as actual theft (amount of money taken)or cheating can be measured in laboratory experiments and field studies (Ariely, 2008;Greenberg, 1993, 2002). However, people are more willing to provide accurate information in ananonymous paper-and-pencil survey or computer-administered questionnaire than a face-to-face
interview (Richman, Kiesler, Weisband, & Drasgow, 1999). The good news is that theincumbent’s self -report and the coworker’s peer -report converged significantly oncounterproductive work behavior toward other persons and work stressors (Fox, Spector, Goh, &Bruursema, 2007). People respond honestly when answering a survey tend to report a higherlevel of cheating behavior (Bernardi & Adamaitis, 2006). Martin et al. (2007) have used self-reported multiple-item measure of bribery to assess firm bribery activity and its frequency.Therefore, these findings suggest that self-reported behavior intention is arguably adequatesurrogate measures of actual unethical behavior (Jones & Kavanagh, 1996).
We did not select 30 geopolitical entities from all entities in the world or the sample fromeach entity randomly. We had a relatively small sample in underdeveloped economies (GDP per
capita < $2,000). Our sample did not represent equally the population in the three-tiered incomepyramid (Prahalad & Hammond, 2002). We did not examine the economy, unemployment rate,moral development, and religion of each entity which may have an impact on results of thisstudy. However, due to our large sample from 30 entities, these variables may be distributedrandomly. People’s love of money and pay satisfaction may be best addressed by mono-methodself reports. Our control variables, age and gender, are significantly related to corrupt intent.Researchers may incorporate additional entities, variables/constructs, e.g., economy,unemployment rate, moral development, religion/religiosity, norm, and control (Ajzen &Fishbein, 1980), character, virtue (Wright & Goodstein, 2007), qualitative data at individual,organizational, and entity levels, and longitudinal data from multiple sources in future research.
Conclusion. The love of money, pay satisfaction, and entity’s affluence have an effect oncorruption. Executives should be aware of the benefits and risks involved in doing businessacross the three-tier income pyramid around the world. They shall not spurn the poor at thebottom of income pyramid because they may become new sources of growth in the earliest stageof rapid economic development. “People do work for money— but they work even more formeaning in their lives” (Pfeffer, 1998: 112). The combination of “head” and “heart” is thecompetitive advantage in the world market (Ashmos & Duchon, 2000; Wright & Goodstein,2007). We hope this cross-level research is useful for theory and practice, relates to theglobalization of the economy, and will move to further research and improved practice.

7/30/2019 2009_AoM_MONEY MATTERS on Corruption
http://slidepdf.com/reader/full/2009aommoney-matters-on-corruption 17/28
A Cross-Level Study 17
REFERENCESAdams, J. 1963. Toward an understanding of inequity. Journal of Abnormal Social Psychology , 67: 422-436.Akien, L. S., & West, S. G. 1991. Multiple regression: Testing and interpreting interactions. Newbury Park,
CA: Sage.Ajzen, I., & Fishbein, M. 1980. Understanding attitudes and predicting social behavior. Englewood Cliffs,
NJ: Prentice Hall.
Anand, V., Ashforth, B. E., & Joshi, M. 2004. Business as usual: The acceptance and perpetuation of corruption in organizations. Academy of Management Executive, 18: 39-53.
Ariely, D. 2008, February. How honest people cheat. Harvard Business Review, 86: 24.Ashforth, B. E., & Anand, V. 2003. The normalization of corruption in organizations. Research in
organizational behavior, 25: 1-52.Ashforth, B. E., Gioia, D. A., Robinson, S. L., & Treviño, L. K. 2008. Introduction to special topic forum:
Re-viewing organizational corruption. Academy of Management Review, 33: 670-684.Ashmos, D. P., & Duchon, D. 2000. Spirituality at work: A conceptualization and measure. Journal of
Management Inquiry, 9: 134-145.Badaracco, J. L. 2006, March. Leadership in literature: A conversation with business ethicist Joseph L.
Badaracco, Jr. Harvard Business Review, 47-55.Baker, T. L., Hunt, T. G., & Andrews, M. C. 2006. Promoting ethical behavior and organizational citizenship
behaviors: The influence of corporate ethical values. Journal of Business Research, 59: 849-857.Bandura, A. 1977. Social learning theory. Englewood Cliffs, NJ: Prentice-Hall.Bandura, A. 1986. Social foundations of thought and action: A social cognitive theory . Englewood Cliffs,
NJ: Prentice Hall.Bernardi, R. A., & Adamaitis, K. L. 2006. Data contamination by social desirability response bias: An
international study of students’ cheating behavior. Research on Professional Responsibility and Ethics in Accounting, 11: 157-184.
Belk, R. W. 1985. Materialism: Trait aspects of living in the material world. Journal of Consumer Research,12: 265-280.
Brislin, R. W. 1980. Translation and content analysis of oral and written materials. In H. C. Triandis, & J. W.Berry (Eds.) Handbook of cross-cultural psychology, Vol. 2: Methodology. Boston, MA: Allyn andBacon, 349-444.
Campbell, J. L. 2007. Why would corporations behave in socially responsible ways? An institutional theoryof corporate social responsibility. Academy of Management Review, 32: 946-967.
Cheung, G. W., & Rensvold, R. B. 2002. Evaluating goodness-of-fit indexes for testing measurementinvariance. Structural Equation Modeling, 9: 233-255.
Cohen-Charash, Y., & Spector, P. E. 2001. The role of justice in organizations: A meta-analysis.Organizational Behavior and Human Decision Processes, 86: 278-321.
Collins, D. 2000. The quest to improve the human condition: The first 1,500 articles published in the Journal
of Business Ethics. Journal of Business Ethics, 21: 1-73.Colquitt, J. A., & Zapata-Phelan, C. P. 2007. Trends in theory building and theory testing: A five-decade
study of the Academy of Management Journal. Academy of Management Journal , 50: 1281-1303.Cullen, J. B., Parboteeah, K. P., & Hoegl, M. 2004. Cross-national differences in managers’ willingness to
justify ethically suspect behaviors: A test of institutional anomie theory. Academy of Management
Journal , 47: 411-421.D’Ambrosio, C., & Frick, J. R. 2007. Income satisfaction and relative deprivation: An empirical link. Social
Indicators Research, 81: 497-519.Dozier, J. B., & Miceli, M. P. 1985. Potential predictors of whistle-blowing: A pro-social behavior
perspective, Academy of Management Review, 10: 823-836.Drori, G. S., Jang, Y. S., & Meyer, J. W. 2006. Sources of rationalized governance: Cross-national
longitudinal analyses 1985-2002. Administrative Science Quarterly, 51: 205-229.Easterlin, R. A. 2001. Income and happiness: Towards a unified theory. The Economic Journal , 111: 465-
484.

7/30/2019 2009_AoM_MONEY MATTERS on Corruption
http://slidepdf.com/reader/full/2009aommoney-matters-on-corruption 18/28
A Cross-Level Study 18
Evans, M. G. 1985. A Monte Carlo study of the effects of correlated method variance in moderated multipleregression analysis. Organizational Behavior and Human Decision Processes, 36: 305-323.
Fox, S., Spector, P. E., Goh, A., & Bruursema, K. 2007. Does your cowork er know what you’re doing?Convergence of self- and peer-reports of counterproductive work behavior. International Journal of
Stress Management, 14: 41-60.Furnham, A., & Argyle, M. 1998. The psychology of money. London: Routledge.
Furnham, A., Kirkcaldy, B. D., & Lynn R. 1994. National attitude to competitiveness, money, and work among young people: First, second, and third world differences, Human Relations, 47: 119-132.
Gbadamosi, G., & Joubert, P. 2005. Money ethic, moral conduct and work related attitudes: Field study fromthe public sector in Swaziland. Journal of Management Development, 24: 754-763.
Gilbert, J. A., & Tang, T. L. P. 1998. An examination of organizational trust antecedents. Public Personnel Management, 27: 321-338.
Gomez-Mejia, L., Wiseman, R. M., & Dykes, B. J. 2005. Agency problems in diverse contexts: A globalperspective. Journal of Management Studies, 42: 1507-1517.
Gorbacheva, E. I., & Kupreychenko, A. B. 2006. The attitude of the person to money: Moral contradictions inestimations and associations. Psikhologicheskii Zhurnal , 27: 26-37.
Gorodnichenko, Y., & Peter, K. S. 2007. Public sector pay and corruption: Measuring bribery from microdata. Journal of Public Economics, 91: 963-991.
Greenberg, J. 1993. Stealing in the name of justice: Informational and interpersonal moderators of theftreactions to underpayment inequity. Organizational Behavior and Human Decision Processes, 54:81-103.
Greenberg, J. 2002. Who stole the money, and when? Individual and situational determinants of managertheft. Organizational Behavior and Human Decision Processes, 89: 985-1003.
Grossman, H. I. 1999. Kleptocracy and revolutions. Oxford Economic Papers, 51: 267-283.Harpaz, I. 1990. The importance of work goals: An international perspective. Journal of International
Business Studies, 21: 79-93.He, Y., Merz, M. A., & Alden, D. L. 2008. Diffusion of measurement invariance assessment in cross-national
marketing empirical research: Perspectives from the literature and a survey of researchers. Journal of International Marketing, 16: 64-83.
Heneman, H. G. & Judge, T. A. 2000. Compensation attitudes. In S. L. Rynes & B. Gerhart (Eds.)
Compensation in Organizations: Current Research and Practice. San Francisco: Jossey-Bass.Heneman, H. G. & Schwab, D. 1985. Pay satisfaction: Its multidimensional nature and measurement.
International Journal of Psychology , 20: 129-141.Herzberg, F. 1987, September-October. One more time: How do you motivate employees? Harvard Business
Review, 109-120.Hitt, M. A., Beamish, P. W., Jackson, S. E., & Mathieu, J. E. 2007. Building theoretical and empirical bridges
across levels: Multilevel research in management. Academy of Management Journal , 50: 1385-1399.
Hofmann, D. A., & Gavin, M. B. 1998. Centering decisions in hierarchical linear models: Implications forresearch in organizations. Journal of Management , 24: 623-641.
Hofstede, G., Bond, M. H., & Luk, C. L. 1993. Individual perceptions of organizational cultures: Amethodological treatise on levels of analyses. Organization Sciences, 14: 483-503.
Hsee, C. K., Zhang, F., Yu, F., & Xi, Y. 2003. Lay rationalism and inconsistency between predictedexperience and decision. Journal of Behavioral Decision Making, 16: 257-272.
Hunt, S. D., Wood, V. R., & Chonko, L. B. 1989. Corporate ethical values and organizational commitment inmarketing. Journal of Marketing, 53: 79-90.
Ivancevich, J. M., Konopaske, R., & Matteson, M. T. 2005. Organizational behavior and management (7th ed.). Boston: McGraw-Hill Irwin.
Jenkins, G. D., Mitra, A., Gupta, N., & Shaw, D. 1998. Are financial incentives related to performance? Ameta-analytic review of empirical research. Journal of Applied Psychology, 83: 777-787.
Jones, G. E., & Kavanagh, M. J. 1996. An experimental examination of the effects of individual and
7/30/2019 2009_AoM_MONEY MATTERS on Corruption
http://slidepdf.com/reader/full/2009aommoney-matters-on-corruption 19/28
A Cross-Level Study 19
situational factors on unethical behavioral intentions in the workplace. Journal of Business Ethics, 15: 511-523.
Judge, T. A., & Welbourne, T. M. 1994. A confirmatory investigation of the dimensionality of the paysatisfaction questionnaire. Journal of Applied Psychology, 79: 461-466.
Kasser, T. 2002. The high price of materialism. Cambridge, MA: MIT Press.Kasser, T., Vansteenkiste, M., & Deckop, J. R. 2006. The ethical problems of a materialistic value orientation
for business (and some suggestions for alternatives). In J. R. Deckop (Ed.) Human resource management ethics, Greenwich, CT: Information Age Publishers.
Kohn, A. 1993, September/October. Why incentive plans cannot work. Harvard Business Review: 54-63.Lambsdorff, J. G. 1999, November. Corruption in empirical research: A review. Transparency International
Working Paper, 1-17.Lawler, E. E. 1971. Pay and organizational effectiveness: A psychological view. New York: McGraw-Hill.Lefebvre, V. A. 2001. Algebra of conscience. Kluwer Academic Publishers.Lim, V. K. G., & Teo, T. S. H. 1997. Sex, money and financial hardship: An empirical study of attitudes
towards money among undergraduates in Singapore. Journal of Economic Psychology, 18: 369-386.Lim, V. K. G., & Sng, Q. S. 2006. Does parental job insecurity matter? Money anxiety, money motives, and
work motivation. Journal of Applied Psychology, 91: 1078-1087.Litzky, B. E., Eddleston, K. A., & Kidder, D. L. 2006. The good, the bad, and the misguided: How managers
inadvertently encourage deviant behaviors. Academy of Management Perspectives, 20: 91-103.Locke, E. A., Feren, D. B., McCaleb, V. M., Shaw, K. N., & Denny, A. T. 1980. The relative effectiveness of
four methods of motivating manager performance. In K. D. Duncan, M. M., Gruneberg, and D.Wallis (Eds.), Changes in working life (pp. 363-388). New York: Wiley.
Mandel, M. 2008, March 10. Multinationals: Are they good for America? Business Week, 41-46.Martin, K. D., Cullen, J. B., Johnson, J. L., & Parboteeah, K. P. 2007. Decide to bribe: A cross-level analysis
of firm and home country influences on bribery activity. Academy of Management Journal , 50:1401-1422.
Maslow, A. H. 1954. Motivation and personality. New York: Harper.McCarthy, D. J., & Puffer, S. M. 2008. Interpreting the ethicality of corporate governance decisions in
Russia: Utilizing integrative social contracts theory to evaluate the relevance of agency theory norms. Academy of Management Review, 33: 11-31.
McShane, S. L., & Von Glinow, M. A. 2008. Organizational behavior (4th
ed.). Boston: McGraw-Hill Irwin.Michalos, A. 1985. Multiple discrepancy theory. Social Indicators Research, 16: 347-413.Mickel, A. E., & Barron, L. A. 2008. Getting “More Bang for the Buck”: Symbolic value of monetary
rewards in organizations. Journal of Management Inquiry, 17: 329-338.Milgram, S. 1974. Obedience to authority: An experimental view. New York: Harper and Row.Milkovich, G. T., & Newman, J. M. 2008. Compensation (9th ed.). Boston: Irwin/McGraw-Hill.Mitchell, T. R., & Mickel, A. E. 1999. The meaning of money: An individual difference perspective.
Academy of Management Review, 24: 568-578.Oleson, M. 2004. Exploring the relationship between money attitudes and Maslow’s hierarchy of needs.
International Journal of Consumer Studies, 28: 83-92.Park, H. 2003. Determinants of corruption: A cross-national analysis. Multinational Business Review, 11:
29-48.
Peterson, D. 2002. The relationship between unethical behaviour and the dimensions of the Ethical ClimateQuestionnaire. Journal of Business Ethics, 41: 313-326.
Pfeffer, J. 1998, May/June. Six dangerous myths about pay. Harvard Business Review, 108-119.Podsakoff, P. M., MacKenzie, S. B., Lee, J. Y., & Podsakoff, N. P. 2003. Common method biases in
behavioral research: A critical review of the literature and recommended remedies. Journal of Applied Psychology, 88: 879-903.
Prahalad, C. K., & Hammond, A. 2002. Serving the world’s poor profitably. Harvard Business Review, 80:48-57.
Richins, M. L., & Rudmin, F. W. 1994. Materialism and economic psychology. Journal of Economic

7/30/2019 2009_AoM_MONEY MATTERS on Corruption
http://slidepdf.com/reader/full/2009aommoney-matters-on-corruption 20/28
A Cross-Level Study 20
Psychology, 15: 217-231.Richman, W. L., Kiesler, S., Weisband, S., & Drasgow, F. 1999. A meta-analytic study of social desirability
distortion in computer-administered questionnaires, traditional questionnaires, and interviews. Journal of Applied Psychology, 84: 754-775.
Rijekeghem, C. V., & Weder, B. 1997. Corruption and the rate of temptation: Do low wages in the civilservice cause corruption? International Monetary Fund Working Paper, 97/73.
Robinson, S. L., & Bennett, R. J. 2000. Development of a measure of workplace deviance. Journal of Applied Psychology, 85: 349-360.
Rubenstein, C. 1980. Your money and your life. Psychology Today, 12: 47-58.Rynes, S. L., & Gerhart, B. 2000. Compensation in organizations: Current research and practice. San
Francisco: Jossey-Bass.Scherbaum, C. A., & Ferreter, J. M. 2009. Estimating statistical power and required sample sizes for
organizational research using multilevel modeling; Organizational Research Methods, 12: 347-367.Sin, L. Y. M., Cheung, G. W. H., & Lee, R. 1999. Methodology in cross-cultural consumer research: A
review and critical assessment. Journal of International Consumer Marketing, 11: 75-96.Skinner, B. F. 1972. Beyond freedom and dignity. New York: Bantam Books.Smith, A. 1937. An inquiry into the nature and causes of the wealth of nations. New York: Modern Library
(Original work published 1776).
Sorensen, J. B. 2002. The strength of corporate culture and the reliability of firm performance. AdministrativeScience Quarterly, 47: 70-91.
Spector, P. E. 2006. Method variance in organizational research: Truth or urban legend? Organizational
Research Methods, 9: 221-232.Srivastava, A., Locke, E. A., & Bartol. K. M. 2001. Money and subjective well- being: It’s not the money, it’s
the motives. Journal of Personality and Social Psychology, 80: 959-971.Staw, B. M., Bell, N. E., & Clausen, J. A. 1986. The dispositional approach to job attitudes: A lifetime
longitudinal test. Administrative Science Quarterly, 31: 56-77.Sutton, R. I., & Staw, B. M. 1995. What theory is not. Administrative Science Quarterly, 40: 371-384.Sweeney, P. D., McFarlin, D. B., & Inderrieden, E. J. 1990. Using relative deprivation theory to explain
satisfaction with income and pay level: A multistudy examination. Academy of Management Journal , 33: 423-436.
Tang, T. L. P. 1992. The meaning of money revisited. Journal of Organizational Behavior, 13: 197-202.Tang, T. L. P. 2007. Income and quality of life: Does the love of money make a difference? Journal of
Business Ethics, 72: 375-393.Tang, T. L. P., & Chen, Y. J. 2008. Intelligence vs. wisdom: The love of money, Machiavellianism, and
unethical behavior across college major and gender. Journal of Business Ethics, 82: 1-26.Tang, T. L. P., & Chiu, R. K. 2003. Income, Money Ethic, pay satisfaction, commitment, and unethical
behavior: Is the love of money the root of evil for Hong Kong managers? Journal of Business
Ethics, 46: 13-30.Tang, T. L. P., Luna-Arocas, R., & Sutarso, T. 2005. From income to pay satisfaction: The love of money and
pay equity comparison as mediators and culture (the United States and Spain) and gender asmoderators. Management Research: The Journal of the Iberoamerican Academy of Management,3: 7-26.
Tang, T. L. P., Kim, J. K., & Tang, D. S. H. 2000. Does attitude toward money moderate the relationshipbetween intrinsic job satisfaction and voluntary turnover? Human Relations, 53: 213-245.
Thomas, T., Schermerhorn, J. R., & Dienhart, J. W. 2004. Strategic leadership of ethical behavior in business. Academy of Management Executive, 18, 56-66.
Treisman, D. 2007. What have we learned about the causes of corruption from ten years of cross-nationalempirical research? Annual Review of Political Science, 10: 211-244.
Treviño, L. K., & Brown, M. E. 2004. Managing to be ethical: Debunking five business ethics myths. Academy of Management Executive, 18: 69-81.
Tsui, A. S. 2007. From homogenization to pluralism: International management research in the academy and

7/30/2019 2009_AoM_MONEY MATTERS on Corruption
http://slidepdf.com/reader/full/2009aommoney-matters-on-corruption 21/28
A Cross-Level Study 21
beyond. Academy of Management Journal , 50: 1353-1364.Vandenberg, R. J., & Lance, C. E. 2000. A review and synthesis of the measurement invariance literature:
Suggestions, practices, and recommendations for organizational research. Organizational Research Methods, 3: 4-69.
Vardi, Y., & Weitz, E. 2004. Misbehavior in organizations. Mahwah, NY: Lawrence Erlbaum.Victor, B., & Cullen, J. B. 1988. The organizational bases of ethical work climates. Administrative Science
Quarterly, 33: 101-125.Vitell, S. J., Paolillo, J. G. P., & Singh, J. J. 2006. The role of money and religiosity in determining
consumers’ ethical beliefs. Journal of Business Ethics, 64: 117-124.Vitell, S. J., Singh, J. J., & Paolillo, J. G. P. 2007. Consumers’ ethical beliefs: The role of money, religiosity,
and attitude toward business. Journal of Business Ethics, 73: 369-379.Vohs, K. D., Mead, N. L., & Goode, M. 2006. The psychological consequences of money. Science, 314:
1154-1156.Vynoslavaska, O., McKinney, J. A., Moore, C. W., & Longenecker, J. G. 2005. Transition ethics: A
comparison of Ukrainian and United States business professionals. Journal of Business Ethics, 61:283-299.
Wernimont, P. F., & Fitzpatrick, S. 1972. The meaning of money. Journal of Applied Psychology , 56: 218-226.
Williams, M. L., McDaniel, M. A. & Nguyen, N. T. 2006. A meta-analysis of the antecedents andconsequences of pay level satisfaction. Journal of Applied Psychology, 91: 392-413.
Wimbush, J., Shepard, J., & Markham, S. 1997. An empirical examination of the relationship between ethicalclimate and ethical behaviour from multiple levels of analysis. Journal of Business Ethics, 16: 1705-1716.
Wright, T. A., & Goodstein, J. 2007. Character is not “dead” in management r esearch: A review of individualcharacter and organizational-level virtue. Journal of Management, 33: 928-958.
Yamauchi, K. T., & Templer, D. J. 1982. The development of a money attitude scale. Journal of Personality
Assessment, 46: 522-528.

7/30/2019 2009_AoM_MONEY MATTERS on Corruption
http://slidepdf.com/reader/full/2009aommoney-matters-on-corruption 22/28
A Cross-Level Study 22
TABLE 1
Demographic Statistics across 30 Geopolitical Entities
Geopolitical Entity N GDP per
capita (2005)
Age Gender Education Annual Income
Mean SD Mean SD Mean SD Mean SD
1. Australia 262 34740 26.50 13.13 0.29 0.46 12.74 1.58 12008.99 15372.01
2. Belgium 201 35712 38.85 10.79 0.57 0.50 14.83 2.35 20269.40 10027.85
3. Brazil 201 4320 37.50 7.46 0.45 0.50 16.87 1.38 5006.64 2527.00
4. Bulgaria 162 3459 27.48 5.89 0.43 0.50 16.76 1.44 2169.59 2057.29
5. China 204 1709 31.86 6.85 0.60 0.49 15.38 1.58 2553.40 5447.41
6. Croatia 165 8675 37.48 11.46 0.42 0.49 14.73 3.08 14336.47 12441.14
7. Congo 90 710 42.37 9.73 0.83 0.35 14.61 1.62 3064.57 5172.00
8. Egypt 200 1265 40.41 9.12 0.50 0.50 14.88 2.71 7181.00 6785.73
9. France 87 33918 36.63 6.92 0.63 0.49 15.74 1.49 16753.70 14766.25
10. Hong Kong 211 25943 30.79 7.82 0.49 0.50 15.66 3.11 47509.06 45159.45
11. Hungary 100 10814 34.06 10.59 0.55 0.50 15.96 2.11 2700.29 1517.48
12. Macedonia 204 2810 41.60 9.69 0.44 0.50 13.31 1.67 2176.48 989.65
13. Malaysia 200 5042 31.80 6.56 0.53 0.50 15.23 3.31 10180.21 7690.56
14. Malta 200 13803 36.91 11.28 0.51 0.50 16.47 2.12 14922.60 6919.88
15. Mexico 295 7298 30.95 9.30 0.55 0.50 14.32 2.43 7416.59 6048.72
16. Nigeria 200 678 34.80 9.93 0.60 0.49 15.73 3.72 1909.35 1152.69
17. Oman 204 12664 29.91 5.86 0.64 0.48 14.68 2.51 5816.32 2585.15
18. Peru 183 2841 31.98 5.29 0.68 0.47 16.93 2.27 13270.95 14105.74
19. Philippines 200 1168 33.45 7.93 0.60 0.49 16.96 1.63 4027.27 1791.11
20. Portugal 200 17456 35.16 8.49 0.39 0.49 15.44 3.61 3386.70 2111.52
21. Romania 200 4539 38.02 9.29 0.27 0.45 16.69 1.56 1723.19 916.16
22. Russia 200 5349 35.92 9.59 0.42 0.49 17.58 1.20 2901.83 3587.91
23. Singapore 538 26836 33.41 7.78 0.55 0.50 15.06 1.99 30243.69 11820.20
24. Slovenia 200 16986 38.68 10.94 0.44 0.50 13.68 2.38 7025.55 3024.50
25. South Africa 203 5106 43.32 7.13 0.50 0.50 15.61 2.23 5247.93 3102.07
26. South Korea 203 16308 37.15 6.08 0.73 0.45 15.90 1.03 45647.02 22292.12
27. Spain 183 27226 33.82 9.81 0.58 0.49 14.20 3.26 4142.85 1940.82
28. Taiwan 201 15203 34.94 7.31 0.51 0.50 16.50 2.19 22567.04 11781.73
29. Thailand 200 2659 33.32 7.05 0.55 0.50 16.84 1.12 10985.04 10340.37
30. The USA 274 42000 35.03 10.04 0.45 0.50 15.08 2.01 35357.08 16676.79
Note: Data ( N = 6171) were collected in 30 entities across 6 continents around the world (i.e., Asia, Africa,Australia/Oceania, Europe, North America, and South America). Both GDP per capita and annual income wereexpressed in US$.

7/30/2019 2009_AoM_MONEY MATTERS on Corruption
http://slidepdf.com/reader/full/2009aommoney-matters-on-corruption 23/28
A Cross-Level Study 23
TABLE 2
Means, Standard Deviations, Cronbach’s Alphas, and Correlations among Variables
Variable Mean SD 1 2 3 4 5 6 7
1. Corrupt intent 1.55 0.71 (.81)
2. Love of Money 3.70 0.60 .13** (.85)
3. Pay satisfaction 2.93 0.73 -.07** -.01 (.94)
4. Log GDP per capita 3.91 0.51 .00 -.05** -.06** ---
5. Age 34.79 9.67 -.10** -.02 -.03* -.09** ---
6. Gender (0 female; 1 male) 0.51 0.50 .10** .10** .05** -.05** .13** ---
7. Education 15.40 2.55 .03* .03* .02 -.16** .02 .04** ---
8. Income 0.00 1.00 -.03* -.02 .18** .00 .27** .15** .18**
Notes: N varied between 6102 and 6171. GDP per capita was assigned to all participants of the same geopolitical entity. Thecorrelations and significance tests associated with Log GDP per capita should be interpreted with caution. Z Income was calculatedfor all managers in each entity. Numbers in parentheses are alpha coefficients. * p < .05, ** p < .01 (two-tailed).

7/30/2019 2009_AoM_MONEY MATTERS on Corruption
http://slidepdf.com/reader/full/2009aommoney-matters-on-corruption 24/28
A Cross-Level Study 24
TABLE 3
Results of Random Coefficient Modeling Analysis with Corrupt Intent
Note. Level 1: N = 5272, Level 2: N = 30. Gamma coefficients corresponding to thepredicting variables are estimations of the fixed effects with robust standard errors.† p < .10. * p < .05. ** p < .01.
Propensity to Engage in Corruption
Level/Variable Model 1 Model 2 Model 3 Model 4
Level 1
Intercept 1.80** (.09) 1.80**(.09) 1.79** (.09) 1.80** (.09)
Age -.01**(.00) -.008**(.001) -.01** (.00) -.01** (.00)
Gender .15** (.02) .15**(.02) .15** (.02) .15** (.02)
Education .00 (.00) .00 (.00) .00 (.00) .00 (.00)
Income -.02† (.01) -.02 (.01) -.02 (.01) -.01 (.01)
Love of money (LOM) .15** (.02) .14** (.02) .14** (.03) .13** (.03) Pay satisfaction -.04** (.01) -.03* (.01) -.03** (.01)
LOM*Satisfaction -.05** (.02) -.06** (.02)
Level 2
Log GDP .05 (.10)
Cross-level
LOM*Log GDP .05(.06)
Satisfaction*Log GDP -.10**(.02)
LOM*Satisfaction*Log GDP -.07*(.03)
Model deviance 10214.82 10212.08 10167.36 10158.10

7/30/2019 2009_AoM_MONEY MATTERS on Corruption
http://slidepdf.com/reader/full/2009aommoney-matters-on-corruption 25/28
A Cross-Level Study 25
TABLE 4
Standard Error and t Tests for Simple Slopes of Regression of
Corrupt Intent on Love of Money
Level of GDP per capita Level of pay satisfaction Simple slope SE t
High High .03 .04 .69
High Low .17 .04 4.60**
Low High .09 .04 2.07*
Low Low .17 .05 3.37**
Note. * p < .05, ** p < .01.

7/30/2019 2009_AoM_MONEY MATTERS on Corruption
http://slidepdf.com/reader/full/2009aommoney-matters-on-corruption 26/28
A Cross-Level Study 26
FIGURE 1
Hypothesized Theoretical Model
Entity Level
Individual Level
The Love of Money
Rich, Motivator
Importance, Power
Pay Satisfaction (PSQ)
Level, Raises
Benefits, Administration
Propensity to Engage
in Corruption
Entity's Affluence
GDP per Capita
H1
H2
H3
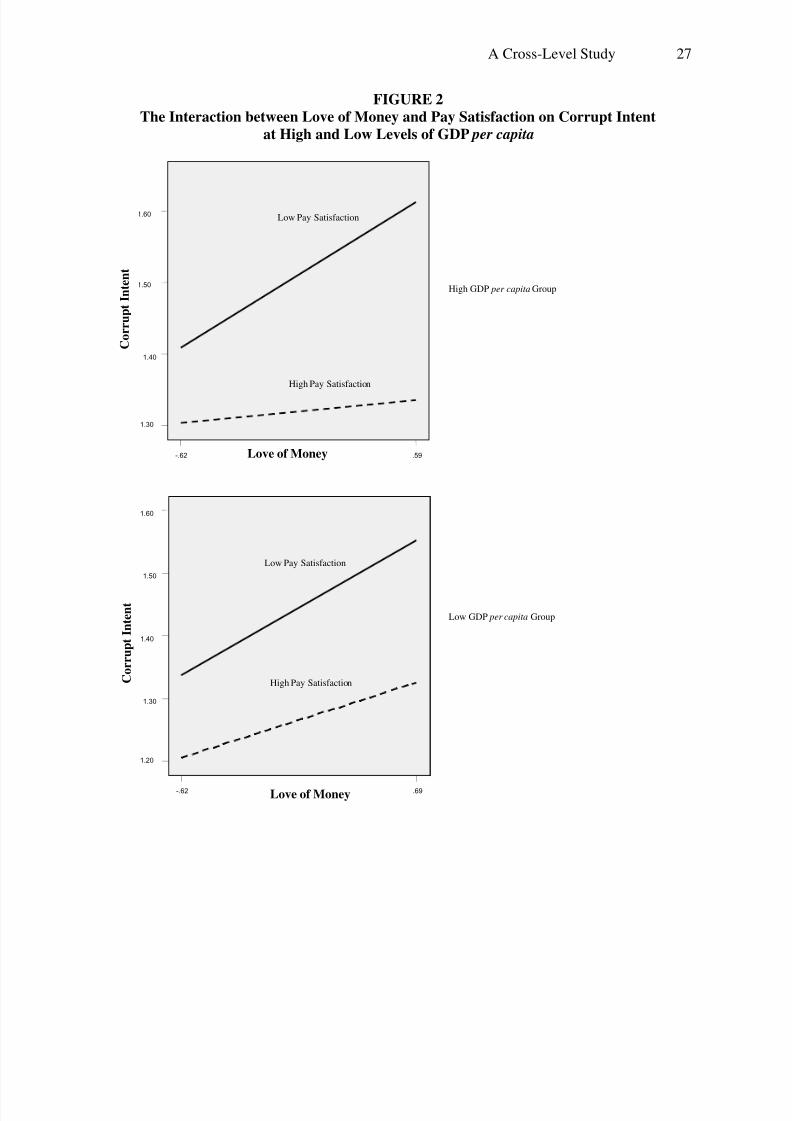
7/30/2019 2009_AoM_MONEY MATTERS on Corruption
http://slidepdf.com/reader/full/2009aommoney-matters-on-corruption 27/28
A Cross-Level Study 27
FIGURE 2
The Interaction between Love of Money and Pay Satisfaction on Corrupt Intent
at High and Low Levels of GDP per capita
.59 -.62 Love of Money
1.60
1.50
1.40
1.30
High Pay Satisfaction
Low Pay Satisfaction
High GDP per capita Group
.69 -.62 Love of Money
1.60
1.50
1.40
1.30
1.20
C o r r u p t I n t e n t
High Pay Satisfaction
Low Pay Satisfaction
Low GDP per capita Group
C o r r u p t I n t e n t

7/30/2019 2009_AoM_MONEY MATTERS on Corruption
http://slidepdf.com/reader/full/2009aommoney-matters-on-corruption 28/28
A Cross-Level Study 28
Appendix 1: Items of The Love of Money Scale
Factor Rich
1. I want to be rich.2. It would be nice to be rich.
3. Having a lot of money (being rich) is good.4. My life will be more enjoyable, if I am rich and have more money. Factor Motivator
5. Money is a motivator.6. I am motivated to work hard for money.7. Money reinforces me to work harder.8. I am highly motivated by money.
Factor Importance
9. Money is an important factor in the lives of all of us.10. Money is good.11. Money is important.
12. Money is valuable.13. Money is attractive.Factor Power
14. Money is power.15. Money gives one considerable power.16. Money can buy the best products and services.17. Money controls and manipulates your behavior, when you are paid.
Response scale: (1) strongly disagree, (3) neutral, and (5) strongly agree.