2009. pere suau-sanchez*, guillaume burghouwt** & …
TRANSCRIPT

1
REINTERPRETING EU AIR TRANSPORT DEREGULATION: A
DISAGGREGATED ANALYSIS OF THE SPATIAL DISTRIBUTION OF TRAFFIC
IN EUROPE, 1990–2009.
PERE SUAU-SANCHEZ*, GUILLAUME BURGHOUWT** & XAVIER
FAGEDA***
*Centre for Air Transport Management, Cranfield University, Martell House,
University Way, Cranfield, Bedfordshire MK43 0TR, UK. E-mail:
**Airneth, SEO Economic Research, Roetersstraat 29, 1018 WB Amsterdam, the
Netherlands. E-mail: [email protected]
***Department of Economic Policy, Universitat de Barcelona, Av.Diagonal 690, 08034
Barcelona, Spain. E-mail: [email protected]
Abstract: This paper analyzes the spatial distribution of seat capacity in the EU from
1990 to 2009 and tries to shed some light on the contrasting results in the literature. It
contributes to the debate on the deregulation and inequality of the market and whether
the rise of hub-and-spoke networks and the success of low-cost carriers lead to
concentration or deconcentration. We use the Gini index and compute its
decomposition, which allows identifying the contribution of airport subgroups and
particular airline networks to the overall concentration of seat capacity. From our
analysis, we conclude that, overall, seat capacity follows a deconcentration pattern.
While intra-EU seat capacity deconcentrated, extra-EU seat capacity concentrated.
However, our results do not support the general view that network carriers tend to
increase concentration levels and low-cost carriers to decrease them, leading us to a
reinterpretation of the impacts of air traffic deregulation. Also, the results show the
increasing importance of foreign carriers and new strategies such as hub-bypassing.
NOTE: Figures and tables are submitted in separated files

2
1. Introduction
A city’s air traffic is one of the factors that influences its position in the world
city hierarchy (Derudder & Witlox 2008). The literature reports, for example, that
higher volumes of air passenger and cargo flows correlate with urban growth (Goetz
1992), the city’s position in the knowledge economy (Zook & Brunn 2006) and the
extent to which it is integrated in the dynamics of globalisation (Goetz & Graham 2004;
Cidell 2006; Otiso et al. 2011). Other studies find causality between the provision of air
services and trade relations (Van de Vijver et al. 2014).
Air transport is key to our understanding of the way in which information moves to
facilitate face-to-face communication (Hall 2009), and over long distances complex and
personalised (tacit) information continues to move by air via the main international
airports (Shin & Timberlake 2000). In this regard, the location choices of multinational
firms and knowledge intensive activities, which present a high degree of spatial
concentration (Dicken 2011), are highly influenced by the availability of direct air
services in the urban area (Bel & Fageda 2008). And yet the costs of moving people
remain high (Glaeser 1998), depending mainly on the opportunity cost of passenger
travel time, which increases with income. However, the impact of advances in
information technologies has not replaced the need for face-to-face contact, and while
electronic and face-to-face interaction can complement one another, the latter continues
to offer unique advantages as means of communication, coordination and motivation
(Gaspar & Glaeser 1998; Storper & Venables 2004; Wickham & Vecchi 2008; Bentlage
et al. 2013). In short, urban areas still need direct air services to maintain their strong
position in the global hierarchy of cities and regions.

3
In Europe, the deregulation of air transport, through the establishment of a single
intra-European market, was the product of three interlinked deregulation packages
implemented in 1987, 1990 and 1993 and which came into full effect in 1997.
Internationally, the EU-US Open Skies Agreement of 2008 ushered in a new phase in
bilateral air service agreements allowing all EU- and US-registered carriers to operate
services between any point in the EU and the US.
Following deregulation the airlines were free to configure their own route
networks, to choose the airports out of which they wished to operate, and to determine
flight frequencies, seating capacities and fares. Although such a situation might have
generated contradictory forces, most airlines chose to concentrate their traffic at a few
airports to exploit economies of density through a hub-and-spoke network, cutting their
average costs by increasing traffic at the route level. But while network carriers, on the
whole, took advantage of economies of density by concentrating traffic at their hub
airports, some low-cost carriers (LCCs) preferred to deploy their operations at a number
of airport bases to avoid additional fixed costs incurred when operating in more airports
(scale economies).
Although airlines have incentives to concentrate their traffic in just a few
airports, this does not necessarily mean that there has been a general tendency towards
traffic concentration at certain leading airports, as the airlines have been able to use
different airports in the hierarchy. Some LCCs, for example, have tended to configure
their networks around secondary airports, while full-service network carriers seeking
market niches have also based their aircraft at smaller airports. In short, the exact
manner in which European deregulation has affected the spatial
concentration/deconcentration of airline traffic is unclear.

4
The regional economic impact of air services and the freedom of airlines to open
up and shut down services at will have long attracted the attention of research scholars,
concerned with determining whether it is the regions with big hubs or those with
smaller airports that benefit most from the dynamics of deregulated air traffic markets.
Although most studies describe a general aggregated network dynamic –in which,
network carriers contribute to the concentration of capacity supply in major airports and
LCCs contribute to its deconcentration by supplying capacity to smaller secondary
airports–, a more detailed review of the literature suggests that the debate is far from
settled, in part because some of the contradictory results can be traced back to the use of
different methodologies and contrasting sample sizes.
In this paper we aim, first and foremost, to undertake a comprehensive seat
capacity allocation analysis in order to shed some light on the contradictory results
reported in studies examining spatial concentration/deconcentration patterns in the
deregulated EU market. Our sample covers all EU airports with scheduled services over
the 20-year period 1990 to 2009 and includes intra- and extra-market traffic. We use the
well-known Gini index and compute its decomposition to identify the contribution of
airport subgroups and specific airline networks to the overall concentration of seat
capacity.
Second, by analysing which airlines and airports are responsible for the trends
observed, we are able to detect evidence of the influence of deregulation on seat
capacity allocation. This may point to the need for a reinterpretation of the impact of air
traffic deregulation and allow us to identify new strategic and economic policy
opportunities for second-tier cities.
The rest of the paper is organised as follows. In the second section, we review
previous literature examining air traffic concentration patterns in deregulated markets.

5
In the third section, we describe the data and the methodology used in conducting our
empirical analysis. In the fourth and fifth sections, we report the concentration/
deconcentration patterns observed and the contribution to these of the different airport
and airline types. The last section summarises and discusses the main results of the
analysis.
2. Network concentration or deconcentration?
The literature analysing the evolution of airline networks in terms of their level
of concentration is substantial, and, as discussed above, presents a general consensus
regarding the patterns of seat capacity allocation, with any differences being attributable
to different methodologies and sample sizes (Table 1).
[TABLE 1 ABOUT HERE]
From a global perspective, O’Connor (2003) observes the presence of a dispersal
pattern for the period 1990-2000, when traditional airport hubs lost out to slightly
smaller large cities. However, for the period 1986-1996, Bowen (2002) reports a
different picture: while overall more cities made marked gains in accessibility to
international airline networks, the relative access of the world’s poorest countries
deteriorated. Similarly, O’Connor and Fuellhart (2013) conclude that in 2010 Alpha
cities1 presented a concentration of fast growth airlines, suggesting that their role in air
transportation was likely to continue to expand and grow, while the gap between them
and other cities was set to be maintained or widened.
In Europe, some studies identified a deconcentration in intra-EU seat capacity
between 1990 and 2003 due to the growth of regional and low-cost airlines, which make
use of smaller airports in the hierarchy, and an increasing concentration in extra-EU seat
1 See Loughborough University’s “Global and World City Project” for a classification of world cities.

6
capacity at a limited number of large hub airports because of the network strategies
adopted by global airline alliances (Burghouwt & Hakfoort 2001; Burghouwt et al.
2003; Burghouwt 2007).2 Similarly, Redondi et al. (2011) identify several airports that
were de-hubbed between 1997 and 2009 and which did not recover their hub activity,
resulting in even higher levels of concentration. However, for the shorter period 2004-
2008, Bel & Fageda (2010) observed a deconcentration of intercontinental flights, in a
set of large European urban areas, due to hub-bypassing strategies of selected network
airlines. Finally, Huber (2009), in his cross-sectional analysis for 2005, found a higher
concentration of intercontinental seat capacity in Europe than in the US, although US
intercontinental traffic also remained concentrated in a few airports.3
The above literature review therefore reveals the simultaneous presence of
forces of concentration and deconcentration acting over the airport population.
However, these analyses are conducted over limited time periods and with limited
numbers of airports, and do not attempt to identify the airlines or airports responsible
for the de/concentration dynamics.
3. Data and methodology
3.1 Data
For our analysis we drew on data from the Official Airline Guide (OAG) for the
years 1990, 1995, 1999, 2001, 2003, 2005, 2007 and 2009. The specific variables
included in our analysis are departure airport, destination airport, airline and weekly
seat capacity. For the years 1990, 1995 and 1999 we chose the 3rd week of July as our
sample week, while for 2001, 2003, 2005, 2007 and 2009 we chose the 3rd week of
June. Our data set contains only scheduled direct flights; seat capacity provided on
2 See also Dobruszkes (2006) for a geography of the networks of low-cost airlines.
3 For studies on the US, see Chou (1993), Goetz & Sutton (1997), Reynolds-Feighan (1998, 2001, 2007a)
and Goetz & Vowels (2009).

7
indirect connecting services with a transfer at a hub is not included in the OAG database
and has not been considered in our analysis. Note that had we included passengers’
onward travel options, our analysis would have produced different results, inflating the
values for intercontinental travel and giving rise to double-counting issues, since a seat
could feasibly be considered for different destination markets depending on the
passenger’s final destination. For this reason, our analysis focuses solely on the spatial
characteristics of the airport and airline networks and does not consider their temporal
dimensions or connectivity. This is especially relevant in terms of regional economics
as the most valuable air services are direct non-stop flights (Bel & Fageda, 2008).
Finally, it should be noted that OAG does not provide details of actual passenger
demand or supply, which can vary in relation to such variables as load factor, weather
and congestion.
Our data set covers the EU-27 countries (with the exception of Malta) plus
Croatia, Norway and Switzerland.
In order to analyse changes in the network configurations of different types of
carrier, we categorised airlines into the following groups: (a) Network airlines, that is,
those that form part of an alliance (Oneworld, Star, SkyTeam, Wings); (b) Low-cost
carriers, distinguished by the fact that they offer a single fare class, although it is
becoming increasingly difficult to separate these two categories, given the hybrid nature
of LCCs; (c) Other carriers, including former flag carriers that do not form part of an
international alliance and regional carriers that are independent of network carriers.4
To analyse the contributions of the various airport types to overall seat capacity
concentration, we categorised the full list of EU airports into five groups using the
natural breaks method with Jenks’ optimisation (Jenks, 1967). This method calculates
4 The complete list of airlines included in each group is available upon request from the authors.

8
the best grouping based on data distribution, seeking to reduce within-group and
maximize between-group variances. We used the number of seats in 2009 to categorize
the airport hierarchy (Table 2).
[TABLE 2 ABOUT HERE]
3.2 Methodology for measuring network concentration
Various concentration and dispersion indices can be used to measure the spatial
distribution of seat capacity within an airport population, including the concentration
ratio (CR) and the Herfindahl-Hirschman index (HHI) (see, for example, Wojahn 2001;
Reynolds-Feighan 1998; Suau-Sanchez & Burghouwt 2011), the coefficient of
variation, Theil’s entropy measure and the Gini index (e.g., Reynolds-Feighan 2001;
Burghouwt et al. 2003). The relative advantages and disadvantages of these measures
have been frequently addressed in the literature (Reynolds-Feighan, 1998) and, recently,
alternatives to these standards have been used to “decode” the spatiality and complexity
of air transport networks (see, among others, Limtanakool et al. 2007 art n & Voltes-
Dorta 2008; Derudder & Witlox 2009; Paleari et al. 2010).
In this paper, we apply the Gini index, which has the advantages of not being
sensitive to the distribution of the population and of responding well to changes in all
parts of a given population. The Gini index can be calculated with the matrix
computation (in line with Reynolds-Feighan, 1998, 2001; Burghouwt et al. 2003;
Burghouwt 2007) or with the covariance computation (in line with Lerman & Yitzhaki
1984, 1985; Yitzhaki 2002; Wodon & Yitzhaki 2002, 2003; Burghouwt 2007). We opt
for the second method as it allows for the subsequent decomposition of the index.5
The Gini index is useful for gaining insights into the level of spatial
concentration of a particular aviation network at the aggregate level. However, as we
5 Given that the Gini index is sensitive to the number of airports (n), when comparing networks with a
different number of airports we use the corrected Gini (Gc), which is the result of dividing the observed
Gini index by the maximum Gini index given the number of airports in the network.

9
seek a clear picture of the determinants of seat capacity concentration/deconcentration
(i.e., the contribution of a particular airline or airport category), we conduct an
additional analysis that involves decomposing the Gini index by airport size subgroup
and airline type. The former enables us to determine the contribution of different
population subgroups to the overall seat capacity concentration; the latter allows us to
measure the contribution of a particular airline network configuration to the overall
concentration of seat capacity. To decompose the Gini index we follow Lerman &
Yitzhaki (1984, 1985), Yitzhaki (2002), Wodon & Yitzhaki (2002, 2003), Burghouwt
(2007) and Reynolds-Feighan (2007b) (See Appendix 2).
4. General overview
The EU constitutes a vast air traffic market. In the third week of June 2009, more
than 18 million seats were offered at EU airports on scheduled departures. Between
1990 and 2009 seat capacity increased by 157% with the overall market becoming more
deconcentrated (Figure 1). Indeed, the EU has always presented a relatively
deconcentrated pattern of seat capacity distribution due to the historical importance of
the national flag carriers of the Member States, which used to base their operations at
the nation’s main airport.
[FIGURE 1. Evolution of the corrected Gini index by market, 1990-2009. Source:
OAG.]
If we break down the analysis by airline type (Figure 2), we observe that the
networks of both network and low-cost carriers have increased in concentration during
the period of analysis. The network carriers achieved this by entering into strategic
alliances, which fostered higher concentrations of traffic at hub airports and the
configuration of “dog-bone” networks internationally (Button, 2009). The LCCs
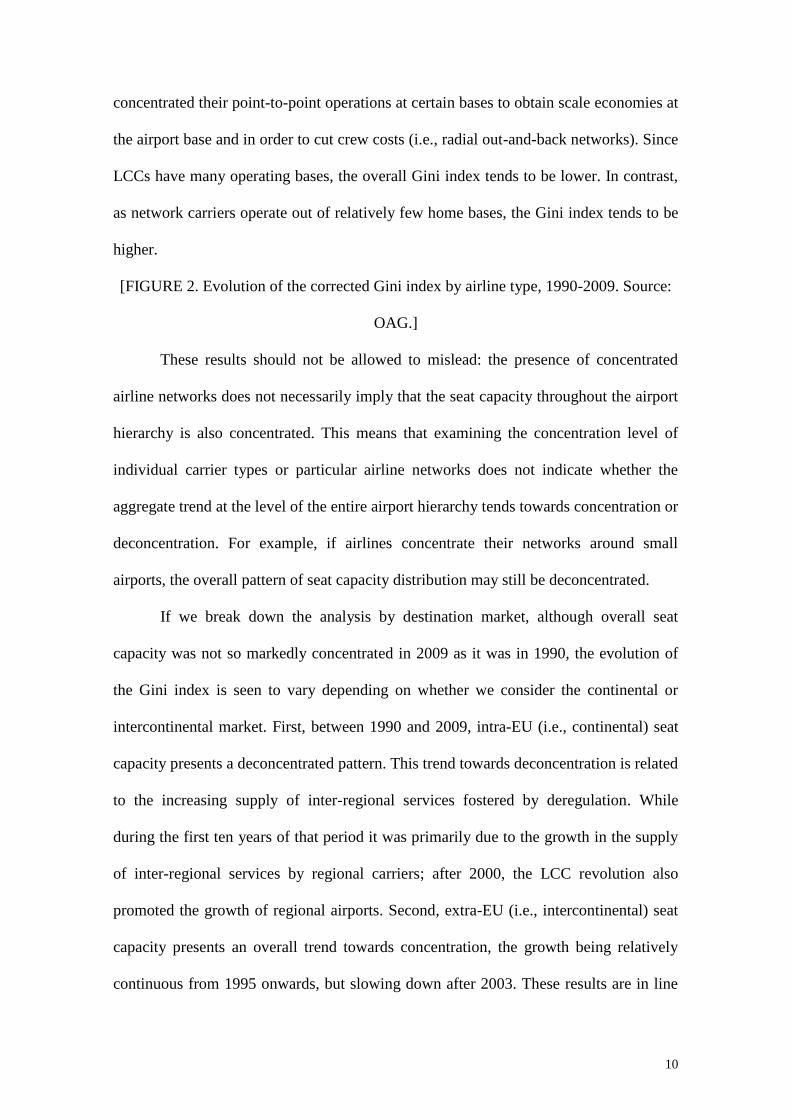
10
concentrated their point-to-point operations at certain bases to obtain scale economies at
the airport base and in order to cut crew costs (i.e., radial out-and-back networks). Since
LCCs have many operating bases, the overall Gini index tends to be lower. In contrast,
as network carriers operate out of relatively few home bases, the Gini index tends to be
higher.
[FIGURE 2. Evolution of the corrected Gini index by airline type, 1990-2009. Source:
OAG.]
These results should not be allowed to mislead: the presence of concentrated
airline networks does not necessarily imply that the seat capacity throughout the airport
hierarchy is also concentrated. This means that examining the concentration level of
individual carrier types or particular airline networks does not indicate whether the
aggregate trend at the level of the entire airport hierarchy tends towards concentration or
deconcentration. For example, if airlines concentrate their networks around small
airports, the overall pattern of seat capacity distribution may still be deconcentrated.
If we break down the analysis by destination market, although overall seat
capacity was not so markedly concentrated in 2009 as it was in 1990, the evolution of
the Gini index is seen to vary depending on whether we consider the continental or
intercontinental market. First, between 1990 and 2009, intra-EU (i.e., continental) seat
capacity presents a deconcentrated pattern. This trend towards deconcentration is related
to the increasing supply of inter-regional services fostered by deregulation. While
during the first ten years of that period it was primarily due to the growth in the supply
of inter-regional services by regional carriers; after 2000, the LCC revolution also
promoted the growth of regional airports. Second, extra-EU (i.e., intercontinental) seat
capacity presents an overall trend towards concentration, the growth being relatively
continuous from 1995 onwards, but slowing down after 2003. These results are in line

11
with previous findings reported by Burghouwt & Hakfoort (2001), Burghouwt et al.
(2003), Burghouwt (2007), Huber (2009) and Suau-Sanchez & Burghouwt (2011).
5. Determinants of market concentration/deconcentration in the airport
population
The results reported above indicate that airlines have tended to configure their
networks into more concentrated structures and that intra-EU seat capacity has
deconcentrated at the same time as extra-EU distribution has become more
concentrated. However, this analysis does not allow us to determine which airports are
gaining or losing seats or to identify the airlines that are playing the largest part in these
changes. In this section, therefore, we decompose the Gini index.
5.1 The effect of airline network strategies on the airport hierarchy
The deconcentration in intra-EU seat capacity was the result of a decrease in
within-group inequality6 of the 1
st to 4
th tier airports and a decrease in between-group
inequality.7 This was more important than the increase in within-group inequality of the
5th
tier airports. Note some airports, including Weeze and Verona, experienced a
substantial increase in traffic, while in many others passenger numbers remained very
low (Table 3). Additionally, the share of 1st to 4
th tier airports in the overall Gini index
decreased, while the share of 5th
tier airports increased slightly (Table 4). In other
words, intra-EU seat capacity did deconcentrate to smaller airports, but this process of
deconcentration did not benefit all 5th
tier airports in the same way. Some smaller
6 Within-group inequality measures the distribution of seat capacity within a particular airport-tier group.
High within-group inequality means that seat capacity is concentrated in just a few airports in that
particular airport-tier group. In contrast, low within-group inequality means that seat capacity is more
equally spread across the airports in that particular airport-tier group. 7 Between-group inequality measures the level of inequality in the seat capacity distribution between the
airport tier groups. High between-group inequality means that seat capacity is more concentrated in one
airport tier group than in the others. In contrast, low between-group inequality means that seat capacity is
equally allocated among all the airport tier groups.

12
airports benefitted greatly from deregulation, while in others traffic levels remained
low.
[TABLE 3 ABOUT HERE]
[TABLE 4 ABOUT HERE]
Decomposition by airport group confirmed the concentration of extra-EU seat
capacity: both within-group inequality and its share in the overall Gini index decreased;
whereas, between-group inequality and its share increased. Given the increase in market
share of 1st tier airports (Table 5), the increase in between-group inequality and the
between-group share in the Gini index can be attributed to the above-average growth of
the 1st tier airports in relation to that of the other tiers. However, deconcentration forces
were also active, as shown by the increase in the market share of 4th
tier airports in the
Gini index, reflecting the impact of the hub-bypassing strategies of such airlines as
Delta and Emirates. This strategy provides direct long-haul services from hubs to both
small and medium-sized airports (such as, Manchester, Birmingham, Hamburg,
Valencia and Nice), and explains why within-group inequality grew. This finding is in
line with Bel and Fageda (2010), who likewise report evidence of the deconcentration
effects of hub-bypassing strategies.8 Yet, the economic reasons underpinning the
benefits of these strategies to a limited number of airports are not readily decoded. As
O’Connor and Fuellhart (2013) point out, the shifts in the global economy brought more
regions into global trade and production networks, but the change in seat capacity is
very uneven and does not necessarily impact on the rank of the cities in the world city
hierarchy. As such, a city’s rank may not be a sufficient condition to explain seat
capacity concentration, with other factors, such as aircraft technology (Bowen, 2010),
airport capacity, bilateral air service agreements (Button, 2009) and airport marketing
8 These strategies to avoid airport congestion take advantage of the economic growth of non-hub regions
and the introduction of smaller and more efficient long-haul airliners.

13
incentives, having to be taken into consideration. Certainly, deregulation has not only
allowed for greater intra-EU competition, but it has also given rise to a scenario in
which foreign carriers exert a growing influence on the availability of air services,
especially following the EU-US Open Skies agreement9 and the liberalisation of
bilateral air service agreements.
In short, our finding resolves the apparently contradictory results for
intercontinental seat capacity allocation in Europe, with Burghouwt (2007) observing a
pattern of concentration and Bel and Fageda (2010) observing deconcentration.
5.2 Which airlines are responsible for concentration/deconcentration?
The potential regional, regulatory and technological drivers of the changing
hierarchy of airports are difficult to isolate because of the particularities of individual
cities and regions. Ultimately, seat capacity allocation is dictated by an airline’s
network strategy and the perceived feasibility of individual routes. Thus, we now turn to
examine the impact of individual airline network configurations on the overall seat
capacity concentration, which is the result of the net effect of the various airline
network dynamics. The level of concentration of a particular airline will have a
differentiated impact on the overall Gini index depending on its network magnitude and
the size of the airport tier groups in which the airline operates.
The consequences of the EU’s three deregulation packages, which became fully
effective at the end of the 1990s, are quite remarkable (See Figures 3 and 4). These
results are in line with the commonly accepted belief that network carriers fostered seat
capacity concentration in both intra- and extra-EU markets by building hub-and-spoke
networks, while LCCs and other regional airlines exploited particular market niches
9 From 2007 to 2009 the corrected Gini index of seat capacity for flights from the US to the EU fell from
0.710 to 0.695 and for flights from EU to US from 0.767 to 0.761. These could be the first noticeable
effects of the EU-US Open Skies agreement, although more time is needed to evaluate the mid- and long-
term consequences.

14
resulting in seat capacity deconcentration at the intra-EU level. While Figure 2 above
showed that LCCs have tended to concentrate their networks (since operating out of a
few central home bases has left them almost as concentrated as the network carriers),
the low-cost carriers have fostered the deconcentration of intra-EU traffic because, in
general, they allocate most of their seat capacity at secondary airports so as to avoid the
high airport charges and costs associated with congestion. Thus, while LCC networks
might in themselves be concentrated, overall these carriers have had a deconcentrating
impact on the EU airport hierarchy.
[FIGURE 3. Change in the intra-EU Gini index (ΔG) by airline type, 1990-2009.
Source: OAG.] Note: The value shows the estimated absolute change in the overall Gini
index following a 1% change in the seat capacity of the airline type.
[FIGURE 4. Change in the extra-EU Gini Index (ΔG) by airline type, 1990-2009.
Source: OAG.] Note: The value shows the estimated absolute change in the overall Gini
index following a 1% change in the seat capacity of the airline type.
Yet, as mentioned above, individual airline strategies and decisions are
fundamental in explaining the existence of a certain service. When we repeated the
analysis for individual airlines (Figure 5), it became clear that not all LCCs had an equal
impact on the overall concentration. Ryanair was the main generator of deconcentration
in the EU since it serves primarily the smaller 4th
and 5th
tier airports. On average,
between 1990 and 2009, a 1% growth in Ryanair’s seat capacity resulted in a decrease
in the overall Gini index of 0.000051. The airlines’ maximum impact was recorded in
2009 when the index fell by 0.000106. Other leading LCCs, such as Wizz, AirOne,

15
Hapag Lloyd/TUIfly and BMIbaby, were also responsible for the deconcentration in the
intra-EU market, but the magnitude of their impact is not comparable to Ryanair’s. In
contrast, a significant number of LCCs that adopted a different market strategy and
operated out of larger airports (e.g., easyJet, Vueling and Germanwings) were
responsible for market concentration, as they have tended to focus their network
operations on larger economic centres. Likewise all the major network carriers were
responsible for greater market concentration. However, the impact of former flag
carriers that had not joined an alliance differed depending on the characteristics of their
national geography. Thus, while Olympic Air has fostered deconcentration by serving
several small airports in the Greek islands, Aer Lingus operates flights to the main EU
destinations from its base in Dublin.
This difference between network carriers is also present in their extra-EU seat
capacity. The inequality impact of Alitalia, Swiss, Iberia and SAS was because they
based their hubs or secondary hubs at airports that were not in the 1st tier.
Our results therefore contradict the commonly held belief that network carriers
have fostered seat capacity concentration while the LCCs have fostered
deconcentration, which suggests a need to reinterpret the impact of the EU’s air
transport deregulation policy.
A point worth mentioning is the increasing influence of third-party or non-EU
carriers in the EU market (Figure 5). Most have fostered concentration since they use
the major hubs as continental gateways via which their alliance partners offer onward
connections. Yet, some other airlines have fostered the deconcentration of
intercontinental seat capacity by adopting hub-bypassing strategies that serve smaller
EU airports directly from their hub. Several airlines, including Delta, Continental and
Emirates, serve primary and secondary European destinations from their hubs. The 2008

16
EU-US Open Skies Agreement ushered in a new period in which all EU- and US-
registered carriers can operate services between any point in the EU and the US.
Although it is still too early to analyse the impact of the agreement, it seems that new
strategies leading to deconcentration might become more significant.
[FIGURE 5. Average change in the Gini index (ΔG) by airline, 1990-2009, for a
selection of airlines. Source: OAG.] Note: The value shows the estimated absolute
change in the overall Gini index following a 1% change in the seat capacity of the
airline.
6. Discussion and conclusions: Reinterpreting EU air transport deregulation
In this paper we have discussed the changes in the spatial distribution of seat
capacity at the level of the EU’s airports and the contribution made to this by different
airport and airline categories. At the aggregate level, intra-EU seat capacity
deconcentrated, while extra-EU seat capacity concentrated. These results support earlier
findings by Burghouwt & Hakfoort (2001), Burghouwt et al. (2003), Burghouwt
(2007), Huber (2009) and Suau-Sanchez & Burghouwt (2011).
There are two possible explanations for the different dynamics found in intra-EU
and extra-EU markets. First, while intra-EU markets have been completely liberalized
since 1997, extra-EU markets have been subject to the restrictions imposed by bilateral
air service agreements (with the exception of the EU-US market since 2008). Hence, in
markets where deregulation has been much more modest, as is the case of extra-EU
markets, the dispersal of air services to a higher number of airports has not taken place.
Second, long-haul services require strong hubs to concentrate traffic in the trunk route
and thus achieve density economies. However, LCCs have been able to exploit some of

17
their competitive advantages over network carriers on short-haul routes, but not on
long-haul routes. At the aggregate level, our results suggest that the benefits of
deregulation in terms of the increasing connectivity of smaller airports are strongly
associated with the success of LCCs on intra-EU routes and with the provision of more
regional services in the 1990s by regional carriers.
In this regard, deregulation fostered a quantitative decrease in inequality (that is,
seat capacity deconcentration), since more air services are now available from more
airports in the intra-EU market. However, our analysis shows a qualitative increase in
inequality (that is, seat capacity concentration), since the most valuable air services in
terms of facilitating the exchange of face-to-face information and strengthening supply
chains, i.e., intercontinental air services, have tended to concentrate in fewer airports.
The study has also shown that individual airline networks, especially those of
the network and low-cost carriers, became more concentrated, indicative of the essential
nature of economies of density for airlines. Yet, when we decomposed the Gini index
we found that the increasing concentration of airline networks does foster concentration
in the airport hierarchy as a whole. In other words, the impact of each airline would
seem to be best explained by the rank of airports served and not by the airline’s network
configuration. Indeed, our analysis at the disaggregate level shows the existence of
simultaneous forces of concentration and deconcentration, which helps resolve the
contradictions in the literature concerning extra-EU seat capacity, with Burghouwt
(2007) observing a pattern of concentration and Bel and Fageda (2010) observing
deconcentration.
Additionally, our results identify the increasing importance of foreign carriers
and of new strategies, such as hub-bypassing. Here, our findings are in line with other
studies that note the increased use of hub-bypassing in response to the growth in

18
demand (Burghouwt, 2014), the rising cost efficiency of new aircraft technology
(O’Connor, 1995 Bowen, 2010 Tembleque-Vilalta, 2013), and the importance of other
factors including infrastructure traits and regional economic power and industrial
structure (Bel & Fageda, 2008; Maertens, 2010).
All in all, our results seem to point to the need for a reinterpretation of the
impact of deregulation on the provision of air services. First, the deconcentration of seat
capacity for intra-EU travel can be attributed to the behaviour of a small number of
airlines, headed by Ryanair. However, LCC growth has not been as widespread as it is
generally thought, which is line with the findings of Ramos-Pérez & Sánchez-
Hernández (2013) who show how prevailing patterns of interaction within the EU
following air transport market liberalisation have in fact been strengthened. Thus, a
change in Ryanair’s behaviour would limit the dynamics of deconcentration
considerably. Indeed, announcements made by Ryanair during the last quarter of 2013
point towards an upmarket movement in which, among other steps, the carrier will open
up a new Brussels base and increase its operations out of Rome, by concentrating its
domestic services at Rome-Fiumicino Airport and its international flights at Rome-
Ciampino Airport.10
Thus, in order to decode and explain seat capacity patterns in the
deregulated market, a more detailed study is required of the evolution of low-cost
airline business models11
in addition to a greater concern for such factors as the city
hierarchy, global production networks, the local market, aircraft technology and the
intensity of the deregulation process.
Second, although intercontinental seat capacity is highly concentrated at just a
few airports, our results suggest that in the near future we could see a tendency towards
the deconcentration of extra-EU seat capacity. Such a trend is in line with Bowen
10
Ryanair recently announced that it intends cutting excess baggage fees by 50%, launching allocated
seating on all flights, and stepping up operations at several larger airports. 11
See Mason and Morrison (2008) for a comparison of low-cost airline business models.

19
(2002) and O’Connor (2003), who detect a general tendency towards the global
deconcentration of seat capacity. On the one hand, we have observed that some airline
dual-hub systems served to disperse the overall concentration. Although dual-hub
systems lost momentum during the second half of the decade 2000-2010 (Redondi et
al., 2011), this type of strategy has begun to reappear because of the limited capacity of
the major European hub airports (see Burghouwt, 2014, for a thorough analysis of
multi-hub strategies). On the other hand, hub-bypassing is a network strategy that has
long been present in certain markets. Figure 6, for example, shows the evolution in the
number of airports served in the North American-European market. It reveals a pattern
that clearly favours European airports, suggesting that more and more European regions
enjoy access to non-stop travel to North America. Hub-bypassing has also been used by
iddle East carriers (O’Connell, 2011), but the strategy has not been used in other
markets and, so far, has benefitted only a small number of European airports. However,
the advent of a global fleet renewal with new aircraft technology –i.e., Boeing 787 and
Airbus A350– will make thinner routes that were not profitable using previous
technology more feasible.12
[FIGURE 6. Number of airports served in the North America-European market. Source:
OAG.]
Such a reconfiguration of airline networks has significant repercussions for the
“positionality” of cities (see Zook & Brunn 2006) and the possible long-term
implications of the role of aviation in shaping the hierarchical organisation of the global
city network. It should be borne in mind that, although technological advances open up
12
See, for example, Tembleque-Vilalta (2013) for a detailed case study of the capacity of the Boeing 787
to turnaround routes.

20
new windows for development, the viability of long-haul travel –especially for non-hub
airports– relies heavily on maintaining high levels of demand for business travel and
cargo transport, both of which depend on specific economic potential at the regional
level and are subject to local path dependencies. In this respect, economic growth in
Europe is increasingly being driven by second-tier urban regions, which outperform
larger urban areas in terms of GDP per capita growth (Dijstra et al., 2012). This seems
to have been the trend since the year 2000, while the 1990s were dominated by the large
core cities (OECD, 2009a). The latter remain crucial for growth, but increasing negative
externalities (e.g., congestion costs and pollution) and rising costs of living, among
other factors, can hamper the economic development of these large cities. In contrast,
second-tier cities face fewer growth constraints and, on occasions, enjoy better access to
certain services (OECD, 2009b, Dijkstra et al., 2012). Hence, a smooth urban hierarchy
offering a wide range of city sizes can provide stronger agglomeration economies and
lower agglomeration diseconomies, which should allow people and firms alike to select
an optimal city size to match their changing preferences, which in turn increases the
utility of these people and firms (Dijkstra, 2013).
In light of these factors, and because air traffic services have a strong influence
on firms’ location choices –to the extent that the amount of traffic and the number and
range of non-stop destinations associated with an airport are determinants of the
attractiveness of an urban area (Brueckner, 2003; Green, 2007; Bel and Fageda, 2008;
Bilotkach, 2013)–, our study has shown that secondary airports could take increasing
advantage of current developments in the air transport market and contribute to the
economic growth in second-tier urban regions across Europe and, so, help create a
smoother urban hierarchy.
21
The critical importance of economies of density in airline economics means that
today only hub airports can offer an extensive range of flights to non-European
destinations, thus giving them a competitive advantage in attracting business and
knowledge-intensive activities in which the face-to-face exchange of information is
vital. However, improvements to aircraft technology and changing airline business
models are creating new opportunities for second-tier cities. To take advantage of this,
government policies have to recognize and embrace the polycentric nature of the
European city network and seek to level the playing field between the big airports and
the rest. For example, only a few second-tier airports currently enjoy fifth freedom
rights13
or are listed in bilateral air service agreements, while most infrastructure
investment remains centered on capital cities. There is a pressing need here for further
research.
Acknowledgments
The authors would like to thank the editor and three anonymous referees for their
valuable insights and comments.
13
The right of an airline from a third country to carry traffic between two foreign countries.