2009 half-year financial report - cegedim
TRANSCRIPT
-1-
2009 Half-year Financial Report
At the heart of decision-making and performance

-2-
Contents
1/. /. 2009 Half-year report
• Main lines of business ……………………………………………… • Comments regarding half-year-results ……………………………. • Significant events in H1 2009 ………………................................ • Significant events after the closing date ………………………..… • Main transactions between related parties ……………………..... • Outlook………………………………………………………............. • Principal risks and uncertainties …………………………………..
2/. Reports
• Statement of the person responsible for the 2009 half-year financial report ……………………………………………………….
• Statutory auditors’ review report on half-year condensed financial statements for the period ended 30 June 2009……………………………………………………………………
3/. 2009 Half-year consolidated results ……………………………………………
4 4 8 9 9 9 9
11
12
14
At the heart of decision-making and performance
Cegedim GroupCegedim Group
Cegedim Group
Founded in 1969, Cegedim is a global technology and services company specializing in the healthcare field.Cegedim offers services, IT tools, specialized software, and information flow and database managementservices. Its offers target industries such as health, pharmaceutical, health professionals and insurancecompanies.
The Cegedim Group’s expertise is broken down into three sectors:
CRM and strategic dataHealthcare professionalsInsurances and services
The world leader for pharmaceutical CRM, its historical core business, Cegedim assists the largestpharmaceutical companies with their CRM (Customer Relationship Management) projects and measures theeffectiveness of their marketing and sales activities. The Group’s CRM tools, whose value is enhanced bythe strategic databases, provide customers with an informed view of their market and their targets so thatthey can optimize their strategies and their return on investment.
Cegedim has also positioned itself as one of Europe's leading producers of medical and paramedicalmanagement software. Structured, scalable, and communicative, this software adapts to the needs ofhealthcare professionals while meeting the latest technical and regulatory requirements.
Capitalizing on its skills in the publishing of professional software and the processing of complex information,the Group also offers solutions dedicated to health insurance players as well as high value-addedmanagement solutions to its many clients concerned with issues related to outsourcing and computerizedexchanges.
Cegedim is involved in an ongoing process of developing and synergizing its activities, with the aim ofbecoming one of the chief intermediaries for healthcare sector partners and positioning itself at the heart oftheir information needs.

At the heart of decision-making and performance
HistoryHistory
1969 Jean-Claude Labrune founds Cegedim(for Centre de Gestion, deDocumentation, d’Information et deMarketing) with initial vocation to poolpharmaceutical companies ITresources and document researchexpertise. Launch of first databases.
1979 Launch of CRM activities in France.
1990 International expansion begins.
1991 Launch of the first platform of electronic
2000 Acquisition of a 10% stake in theAlliance Healthcare France Groupe (exAlliance Unichem, became AllianceBoots), which, in exchange, contributesto Cegedim its pharmacy computerizingactivities and medication databases forboth pharmacies and medical practices.
2001 Establishment in the United States thenacquisition of Target Software in 2005,allowing the Cegedim Group tostrengthen its presence in the UnitedStates.
2006 Cegedim revenue exceeds €5001991 Launch of the first platform of electronicdata interchange.
1994 Start of doctors’ computerization inFrance and promotional activitiesdedicated to doctors and pharmacistsand human resources managementactivities.
1995 Cegedim has been listed on the Parissecond market and is now listed onNYSE Euronext Paris, compartment B.
1999 Computerization of health insuranceand mutual companies.
2006 Cegedim revenue exceeds €500million.
2007 Cegedim announces the acquisition ofthe American company DendriteInternational, listed on the Nasdaq, andbecomes the world leader inPharmaceutical CRM. With thebroadest and best R&D structurededicated to this highly specific sector,Cegedim shows a unique ability tooptimize promotional investments for itscustomers.
2009 Cegedim employs 8 239 people in morethan 80 countries. Internationalactivities represent more than 50% offull-year revenue. The database ofchoice for healthcare professionalsaround the world (OneKey) is availablein 73 countries.

At the heart of decision-making and performance
Group ActivitiesGroup Activities

At the heart of decision-making and performance
Key figuresKey figures
Employees
S1 09 Revenues by geographical zone
Shareholders

At the heart of decision-making and performance
Financial informationFinancial information
Selected financial information
30/06/09 31/12/08 30/06/08
Revenue (million €) 434 849 414
Income from operations before non-recurringitems (million €)
54 97 43
Net earnings (million €) 17 33 9
Group share net earnings(million €) 17 34 8
Cash flow (million €) 52 98 42
Total balance sheet (million €) 1,265 1,297 1,194
Goodwill on acquisition (million €) 616 617 569
Net financial debt (million €) 606 603 629
Group share shareholders’ equity (million €) 258 242 169
Number of shares outstanding 9,331,449 9,331,449 9,331,449Number of shares outstanding 9,331,449 9,331,449 9,331,449
Number of shares excluding treasury shares 9,331,449 9,331,449 9,331,449
Net profit by share (€) 1.8 3.6 0.9
Revenue and operating profit by sector
(In millions of euros)S1 09
TO
S1 09 operating
profit beforenon-
recurringitems
S1 09 restated
operating profit
S1 09 operating marginbeforenon-
recurringitems
S1 09 restated
operating margin
CRM and strategic data 235 22 23 9.4% 10.0%
Healthcare professionals 141 24 24 16.8% 16.9%
Insurances and services 58 8 9 14.3% 14.9%
Total 434 54 56 12.5% 12.9%
-3-
2009 Half-year report
-4-
Main lines of business Cegedim develops exclusive databases and high value-added software solutions. The Group has three major operating divisions:
• “CRM and Strategic Data” solutions specifically designed for pharmaceutical companies. The Cegedim Group provides the world’s largest pharmaceutical companies with vital support for successful Customer Relationship Management (CRM). Using the Group’s strategic databases on the world drug market, Cegedim also helps pharmaceutical companies optimise the effectiveness of sales & marketing. Cegedim is the world leader in CRM for the pharmaceuticals industry.
• Services for “Healthcare sector Professionals”, notably management software designed for physicians and pharmacists.
• Products for “Insurance and services” and related service providers, with integrated healthcare flow management applications.
Comments regarding half-year-results
Margins improved substantially and net profit doubled
• Revenue of €434 million for H1 09, up 4.8% compared to H1 08 • Operating profit from ordinary activities of €54.1 million for H1 09, up 26%
compared to H1 08 • Operating margin of 12.5%
Vigorous sales and marketing efforts by Cegedim teams and the launch of new solutions enabled the Group to garner several new contracts in the first half of 2009. This factor, combined with the success of the Group’s first two integration and restructuring plans, explains the sharp increase in profit margin.
Because a majority of its clients operate in the healthcare field, Cegedim is not experiencing significant repercussions from the global economic slowdown.

-5-
€ thousands 1HY 2009 1HY 2008
Revenues 433.9 414.0
Operating profit 49.4 37.5
Operating margin 11.4% 9.1%
Exceptional operating revenues/(expenses) under IFRS 4.7 5.5
Operating profit from ordinary activities 54.1 43.1
Operating margin from ordinary activities 12.5% 10.4%
Other non-IFRS reorganization and integration costs 1.8 4.5
Revenues up by nearly 5%
Consolidated first-half 2009 revenues came to €434 million, a 4.9% like-for-like* increase over the previous year and a 4.8% increase on a reported basis.
Operating profit up 32%
Operating profit of €49.4 million represents a strong increase over the year-earlier period; operating margin amounted to 11.4% versus 9.1% in the first half of 2008. Operating profit from ordinary activities also rose, to €54.1 million. The margin came to 12.5%, compared with 10.4% in the first half of 2008.
For the first six months of 2009, the total amount of income and charges linked to restructuring and integrations (IFRS and non-IFRS) came to €6.5 million. As a result, restated operating profit was €55.9 million, or a margin of 12.9% versus 11.5%, representing a noticeable improvement over the year-earlier period.

-6-
Consolidated margins by sector (in thousands of euros)
From ordinary activities Restated(**)
Margin in % 1HY 2009 1HY 2008 1HY 2009 1HY 2008
CRM and strategic data 9.4% 9.2% 10.0% 10.9%
Healthcare professionals 16.8% 14.5% 16.9% 14.9%
Insurances and services 14.3% 5.9% 14.9% 6.0%
Cegedim Group 12.5% 10.4% 12.9% 11.5%
CRM and strategic data
First-half 2009 revenues came to €235 million.
Operating result from ordinary activities for the first six months came to €22.2 million, unchanged compared with the first half of 2008. The operating margin from ordinary activities came up to 9.4%, compared with 9.2% in the first half of 2008. Restated(**) margin amounted to 10.0%.
The increase in the CRM and strategic data sector margin is the result of a drop at the strategic data division, where orders were postponed that the Group expects to make up in the second half, and a strong improvement in CRM margins.
The increase in first-half margins is proof that the initial integration and restructuring plans have been a complete success, and that there is strong demand for the Mobile Intelligence (MI) solutions, particularly in mature countries. For example, margins rose substantially in France, the UK and the US.
Among the contract wins of the first half, the highlights were:
• A three-year global agreement with Sanofi-Aventis for the Mobile Intelligence solution.
• A 32-country agreement for SaaS delivery of Mobile Intelligence with one of the world’s leading biotech companies.
• A European customer-data hosting agreement combined with the OneKey database for a global food group, and numerous promising contracts in OTC, one of the pharmaceutical sector’s most dynamic fields.

-7-
• In the US, Mobile Intelligence solutions for a division of Bristol Myers Squibb and SaaS delivery to a number of companies, including Auxilium Pharmaceuticals. In addition, the Group also signed numerous marketing solution and compliance contracts in the first half.
With the release of MI version 5.0 in early September, the Group is confident that the strong sales trend of the first half will continue. Also noteworthy was the US launch of a new activity monitoring counterfeit pharmaceutical products.
Healthcare professionals
First-half 2009 revenues came to €141 million.
Operating profit from ordinary activities came to €23.6 million, up 31 %. The operating margin from ordinary activities was 16.8% versus 14.5% in the first half of 2008.
The more than 230bp increase was the result of the positive impact of rationalization and resource optimization policies adopted after the doctor, paramedic and pharmacist software activities were folded into a single unit: Cegedim Healthcare Software (CHS).
The launch of new solutions also helped boost margins. Noteworthy launches included offerings aimed at cardiologists and physical therapists in France, mid-sized pharmacies in France and general practitioners in the UK.
Lastly, the successful integration of various acquisitions helped improve margins.
The restated(**) margin came to 16.9% compared with 14.9% in the first six months of 2008.
Assurances and services
Le chiffre d’affaires du premier semestre 2009 s’établit à 58 millions d’euros.
Le résultat opérationnel courant s’établit à 8,3 millions d’euros en très forte hausse de 169% par rapport au premier semestre 2008. La marge courante ressort à 14,3% comparé à 5.9% sur la même période de l’an passé. Cette amélioration de 840 points de marge s’explique par la pertinence des investissements réalisés en particulier pour la plateforme de gestion des flux qui a franchit son point d’équilibre, et des succès commerciaux des progiciels pour le monde de l’assurance et des mutuelles.
Il est à noter que, après un an d’activité, la filiale marocaine du Groupe est à l’équilibre.
La marge retraitée(**) s’établit à 14,9% contre 6,0% au premier semestre 2008.

-8-
Net profit doubled
The Group share of net profit rose to € 17.2 million, an increase of 101% over H1 2008, which means that profits grew 21 times faster than revenues. This result incorporates an increase in the cost of debt, offset by a lower tax charge.
As a result, EPS rose to €1.8, compared with €0.9 a year ago based on 9.3 million existing shares over the past 12 months.
Financial situation under control, in total compliance with bank covenants
Net Group financial debt amounted to €597 million at June 30, 2009.
Key financial ratios (no audited) show a well-managed financial position. As of June 30, 2009 Cegedim was in full compliance with the covenants set by its loan agreement, with a net debt to contractual EBITDA ratio of 2.996 compared with an upper limit of 3.25, and a contractual EBITDA to interest expense ratio of 4.65 compared with a lower limit of 3.75.
Cegedim’s financial model continues to generate ample cash flow: net cash flows from operations amounted to €73.2 million.
The €8.5 million decrease in the net cash position over the period reflects notably the €42 million paid to banks, €26 million invested in development, €3 million of net external growth and €5 million spent on expanding the Cegelease business.
At June 30, 2009 Cegedim had positive net cash at hand of €69 million.
* at constant scope and exchange rates ** restated according to the loan documentation
Significant events in H1 2009 On February 16, 2009, Cegedim Belgium, a subsidiary of Cegedim S.A., acquired the Belgian company, Fichier Medical Central SPRL (FMC) which specializes in databases of healthcare professionals. March 2, 2009, the Cegedim Group acquired the Tunisian company Next Software, editor of the "Pharma2000" software.
-9-
Significant events after the closing date In July 2009, the Cegedim Group acquired the NOMI Group, a leading provider of business intelligence and sales force optimization solutions for the pharmaceutics industry in the Nordic region. Late July 2009, Cegedim Strategic Data UK, a Cegedim Group subsidiary, acquired Hospital Marketing Services Ltd (HMSL) which specializes in the analysis of patient and in-hospital promotion data.
Main transactions between related parties Transactions between related parties continued under the same conditions as before. No major changes have occurred during the first semester.
Outlook Cegedim remains right on tract, is meeting its repayment deadlines and developing new products suited to market needs. As a result, we confirm our 2009 revenue growth target of approximately 6%. Furthermore, all of the cost-cutting measures adopted in 2008 are expected to continue to boost margins, all other things being equal.
Principal risks and uncertainties Ordinary activities do not merit any specific remarks.
-10-
Reports

-11-
Statement of the person responsible for the 2008 ha lf-year financial report I hereby certify that, to the best of my knowledge, the half-year financial statements have been established in accordance with applicable accounting standards and give a true and fair view of the assets, financial position and earnings of the Company and all of the companies included in the consolidation scope. I hereby certify that, to the best of my knowledge, the half-year financial report included in this document presents a true image of the changes during the six first month of the year, earnings and financial position of the company and of all the companies included in the scope of consolidation as well as a description of the main risks and uncertainties that they are faced with. Done in Boulogne-Billancourt, September 25, 2009. Jean-Claude Labrune Président Directeur Général Cegedim S.A. e

-12-
Statutory auditors’ review report on half-year cond ensed financial statements for the period ended 30 June 2009
This is a free translation into English of the statutory auditor’s review report issued in French and is provided solely for the convenience of English speaking readers. This report should be read in conjunction with, and construed in accordance with, French law and professional auditing standards applicable in France.
To the Shareholders,
In compliance with the assignment entrusted to us by your General Meeting and in accordance with the requirements of article L. 451-1-2 III of the French Monetary and Financial Code (“Code monétaire et financier”), we hereby report to you on:
- the review of the accompanying condensed half-year consolidated financial statements of CEGEDIM, for the period January 1 to June 30, 2009,
- the verification of information contained in the interim management report.
These condensed half-year consolidated financial statements are the responsibility of the Board of Directors. Our role is to express a conclusion on these financial statements based on our review.
1. Conclusions on the financial statements
We conducted our review in accordance with professional standards applicable in France. A review of interim financial information consists of making inquiries, primarily of persons responsible for financial and accounting matters, and applying analytical and other review procedures. A review is substantially less in scope than an audit conducted in accordance with professional standards applicable in France and consequently does not enable us to obtain assurance that we would become aware of all significant matters that might be identified in an audit. Accordingly, we do not express an audit opinion.
Based on our review, nothing has come to our attention that causes us to believe that the accompanying condensed half-year consolidated financial statements are not prepared,

-13-
in all material respects, in accordance with IAS 34 – the standard of the IFRS as adopted by the European Union applicable to interim financial information.
2. Specific verification
We have also verified the information given in the interim management report commenting the condensed half-year consolidated financial statements subject to our review.
We have no matters to report as to its fair presentation and consistency with the condensed half-year consolidated financial statements.
Courbevoie and Paris, September 25th 2009
Statutory Auditors
Grant Thornton Membre Français de Grant Thornton
International
Mazars
Michel COHEN
Jean-Paul STEVENARD

-14-
2009 Half-year consolidated results

-15-
Consolidated financial statements at June 30, 2009
Assets In K€
06/30/2009 12/31/2008K Euros K Euros
Net Net
Uncalled subscribed capitalGOODWILL ON ACQUISITION 616 256 616 952
Development costs 48 551 44 446Concessions, patents, trademarks 107 199 109 519Other intangible fixed assets 62 647 55 611
INTANGIBLE FIXED ASSETS 218 397 209 576
Property 507 507Buildings 3 566 3 547Plant, machinery and equipment 26 039 28 477Other tangible fixed assets 16 787 19 340Construction work in progress 3 180 2 830
TANGIBLE FIXED ASSETS 50 079 54 701
Equity investments 191 225Equity shares in equity method companies 3 971 4 057Loans 830 858Other long-term investments 7 810 6 069
FINANCIAL ASSETS 12 802 11 209
Government - Deferred taxes 36 009 36 603
Accounts receivable: long-term portion 12 092 9 175
Other receivables: long-term portion 1 518 2 760
NON-CURRENT ASSETS 947 153 940 976
Services in progress 1 035 958Goods 11 364 11 358
Advances, deposits on orders 2 620 1 142Accounts receivable: short-term portion 195 464 198 950
Unpaid, called capital 0 0
Other receivables: short-term portion 19 101 30 733
Cash equivalents 5 149 22 433Cash 63 912 71 068
Prepaid expenses 19 189 18 998
CURRENT ASSETS 317 834 355 640
GRAND TOTAL 1 264 987 1 296 616

-16-
Liabilities In K€
06/30/2009 12/31/2008K Euros K Euros
Net Net
Share capital 8 891 8 891
Issue premium 14 981 14 981
Group reserves 244 382 213 570
Group translation reserves -238 -238
Group translation gains / losses -27 718 -29 698
GROUP EARNINGS 17 237 33 661
Investment subsidies
Regulated provisions
EQUITY CAPITAL, GROUP SHARE 257 535 241 167
Minority interests (reserves) 639 1 056
Minority interests (earnings) 3 -174
MINORITY INTERESTS 642 882
SHAREHOLDERS’ EQUITY 258 177 242 049
Long-term financial liabilities 582 474 585 327
Long-term financial instrument 27 484 22 525
Deferred tax credits 52 285 55 946
Provisions 18 761 18 753
Other non-current liabilities 13 372 19 822
NON-CURRENT LIABILITIES 694 376 702 373
Short-term financial liabilities 92 445 111 296
Short-term financial instrument 0 1 706
Accounts payable and related accounts 61 580 63 131
Tax and social liabilities 103 195 115 762
Provisions 6 183 6 234
Other current liabilities 49 031 54 065
CURRENT LIABILITIES 312 434 352 194
GRAND TOTAL 1 264 987 1 296 616
-17-
Income statement In K€
Note 06/30/2009 06/30/2008K Euros K Euros
Net Net
Sale of goods 45 725 36 549Production sold - goods 7 004 2 870Production sold - services 381 177 374 569
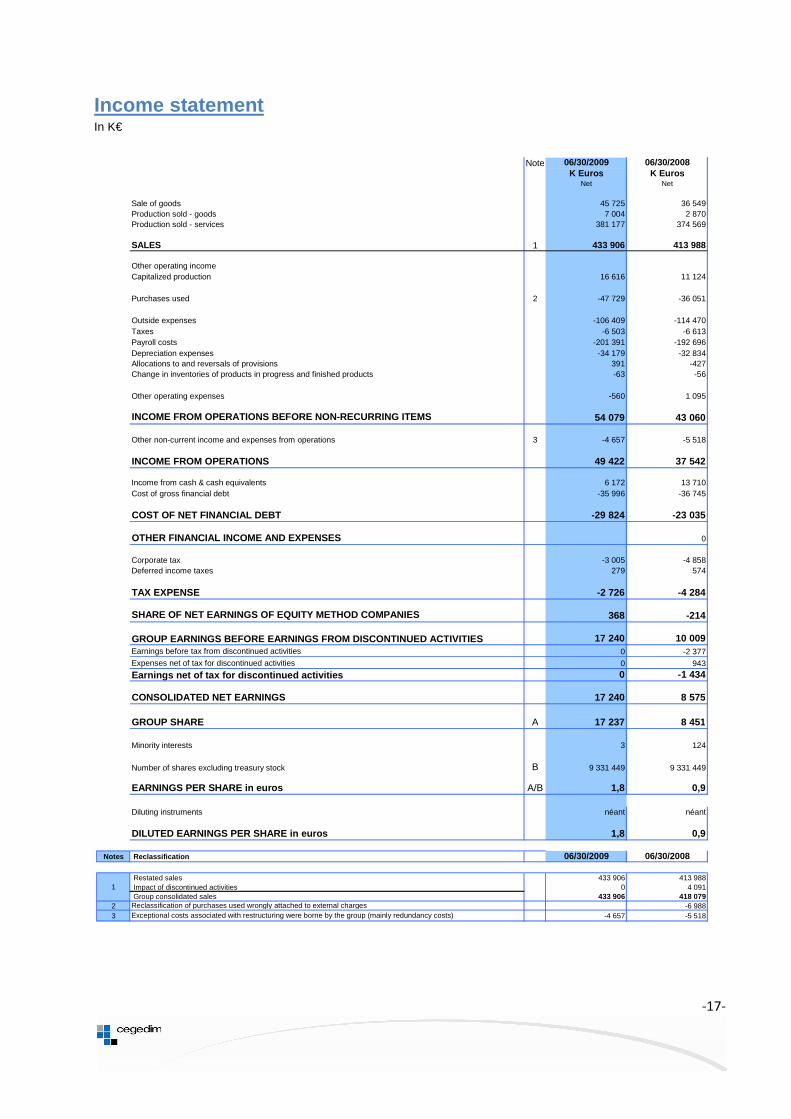
SALES 1 433 906 413 988
Other operating incomeCapitalized production 16 616 11 124
Purchases used 2 -47 729 -36 051
Outside expenses -106 409 -114 470Taxes -6 503 -6 613Payroll costs -201 391 -192 696Depreciation expenses -34 179 -32 834Allocations to and reversals of provisions 391 -427Change in inventories of products in progress and finished products -63 -56
Other operating expenses -560 1 095
INCOME FROM OPERATIONS BEFORE NON-RECURRING ITEMS 54 079 43 060
Other non-current income and expenses from operations 3 -4 657 -5 518
INCOME FROM OPERATIONS 49 422 37 542
Income from cash & cash equivalents 6 172 13 710Cost of gross financial debt -35 996 -36 745
COST OF NET FINANCIAL DEBT -29 824 -23 035
OTHER FINANCIAL INCOME AND EXPENSES 0
Corporate tax -3 005 -4 858Deferred income taxes 279 574
TAX EXPENSE -2 726 -4 284
SHARE OF NET EARNINGS OF EQUITY METHOD COMPANIES 368 -214
GROUP EARNINGS BEFORE EARNINGS FROM DISCONTINUED AC TIVITIES 17 240 10 009Earnings before tax from discontinued activities 0 -2 377Expenses net of tax for discontinued activities 0 943
Earnings net of tax for discontinued activities 0 -1 434
CONSOLIDATED NET EARNINGS 17 240 8 575
GROUP SHARE A 17 237 8 451
Minority interests 3 124
Number of shares excluding treasury stock B 9 331 449 9 331 449
EARNINGS PER SHARE in euros A/B 1,8 0,9
Diluting instruments néant néant
DILUTED EARNINGS PER SHARE in euros 1,8 0,9
Notes Reclassification 06/30/2009 06/30/2008
Restated sales 433 906 413 988 Impact of discontinued activities 0 4 091 Group consolidated sales 433 906 418 079
2 Reclassification of purchases used wrongly attached to external charges -6 9883 Exceptional costs associated with restructuring were borne by the group (mainly redundancy costs) -4 657 -5 518
1
-18-
Global result In K€
06/30/2009 06/30/2008K Euros K Euros
Net Net
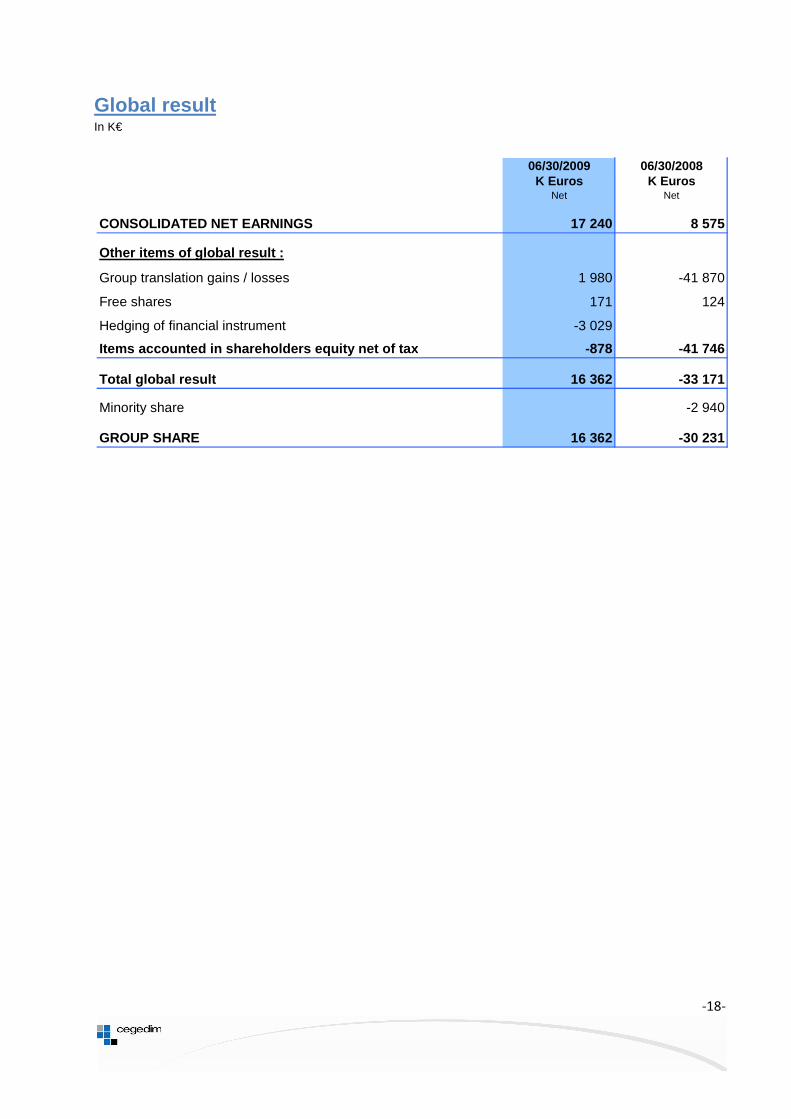
CONSOLIDATED NET EARNINGS 17 240 8 575
Other items of global result :
Group translation gains / losses 1 980 -41 870
Free shares 171 124
Hedging of financial instrument -3 029
Items accounted in shareholders equity net of tax -878 -41 746
Total global result 16 362 -33 171
Minority share -2 940
GROUP SHARE 16 362 -30 231
-19-
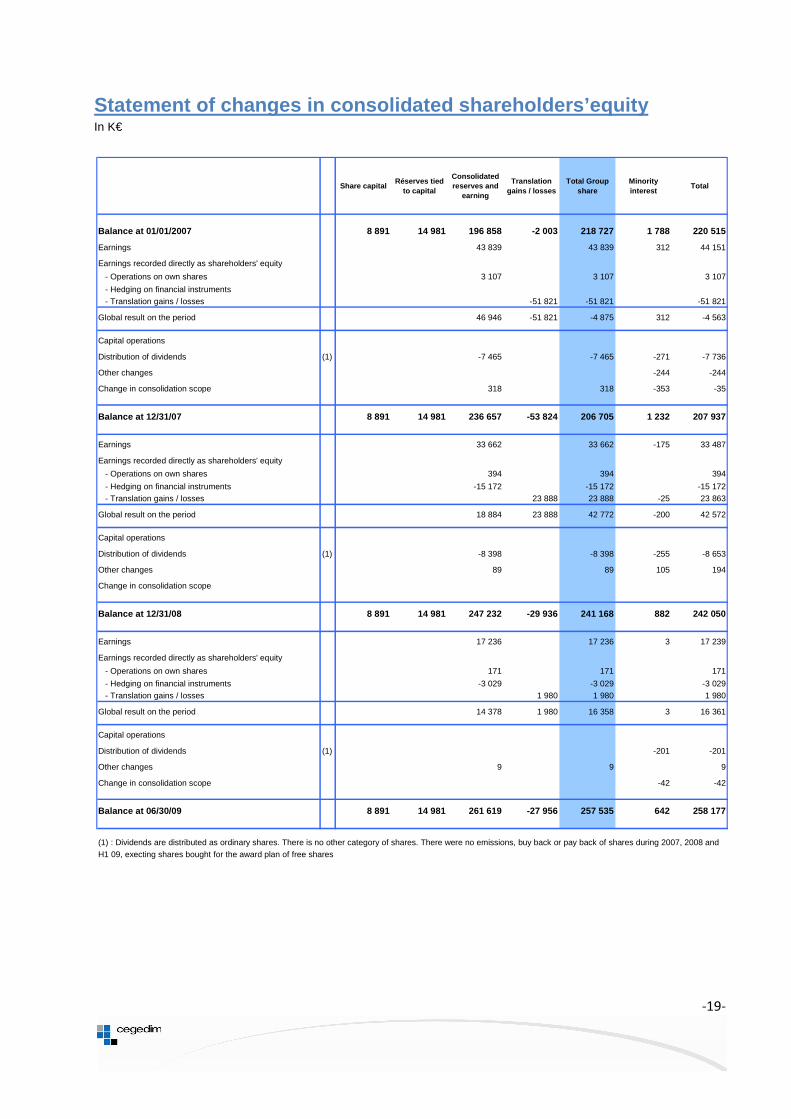
Statement of changes in consolidated shareholders’e quity In K€
Share capitalRéserves tied
to capital
Consolidated reserves and
earning
Translation gains / losses
Total Group share
Minority interest
Total
Balance at 01/01/2007 8 891 14 981 196 858 -2 003 218 727 1 788 220 515
Earnings 43 839 43 839 312 44 151
Earnings recorded directly as shareholders' equity
- Operations on own shares 3 107 3 107 3 107
- Hedging on financial instruments - Translation gains / losses -51 821 -51 821 -51 821
Global result on the period 46 946 -51 821 -4 875 312 -4 563
Capital operations
Distribution of dividends (1) -7 465 -7 465 -271 -7 736
Other changes -244 -244
Change in consolidation scope 318 318 -353 -35
Balance at 12/31/07 8 891 14 981 236 657 -53 824 206 705 1 232 207 937
Earnings 33 662 33 662 -175 33 487
Earnings recorded directly as shareholders' equity
- Operations on own shares 394 394 394
- Hedging on financial instruments -15 172 -15 172 -15 172 - Translation gains / losses 23 888 23 888 -25 23 863
Global result on the period 18 884 23 888 42 772 -200 42 572
Capital operations
Distribution of dividends (1) -8 398 -8 398 -255 -8 653
Other changes 89 89 105 194
Change in consolidation scope
Balance at 12/31/08 8 891 14 981 247 232 -29 936 241 168 882 242 050
Earnings 17 236 17 236 3 17 239
Earnings recorded directly as shareholders' equity
- Operations on own shares 171 171 171
- Hedging on financial instruments -3 029 -3 029 -3 029 - Translation gains / losses 1 980 1 980 1 980
Global result on the period 14 378 1 980 16 358 3 16 361
Capital operations
Distribution of dividends (1) -201 -201
Other changes 9 9 9
Change in consolidation scope -42 -42
Balance at 06/30/09 8 891 14 981 261 619 -27 956 257 535 642 258 177
(1) : Dividends are distributed as ordinary shares. There is no other category of shares. There were no emissions, buy back or pay back of shares during 2007, 2008 and H1 09, execting shares bought for the award plan of free shares

-20-
Cash flow earning of consolidated companies In K€
06/30/2009 12/31/2008 06/30/2008
K Euros K Euros K Euros
Consolidated net earnings........................…….....……...…………………...…………………………..…………..........................……………17 240 33 487 10 009
Share of earnings from equity method companies…..…...……………….……………………………………..………….. .....................368 - 60 214
. Depreciation expenses and provisions...............................................................................................................................................34 411 70 334 31 949
. Capital gains or losses on disposal ...........................................................………………………………………….............................................275 5 924 - 19 -
Cash flow after net financial debt expense and taxe s 51 558 97 957 42 153
. Cost of financial debt ..................................………...………...................…………...…………….……………………........................…29 824 43 618 28 689
. Tax expense ...........................................................................................………………...………………………...........................................2 726 12 994 4 283
Operating cash flow before net financial debt expen se and taxes 84 108 154 569 75 125
. Taxes paid.....….......……..………….…………………….…....................................................................................... 245 7 823 - 2 852 -
Plus: change in working capital requirement for operations...................……………….….………………………………………. 11 179 - 20 132 1 492
Net cash flows generated by business activities (A) ................................................................................. 73 174 166 878 73 765
Acquisitions of intangible fixed assets ...............................................................................................................................................20 044 - 49 408 - 16 346 -
Acquisitions of tangible fixed assets ...............................................................................................................................................12 098 - 51 026 - 22 588 -
Acquisitions of financial assets .............................................................................................................................................. 1 454 - 1 763 - 3 187 -
Disposals of tangible and intangible fixed assets............................................................................................................... 2 263 7 348 6 038
Disposals of financial assets ......................................................................................................................................................................363 1 338 398
Impact of changes in the consolidation scope ..........................................................................................................................................2 691 - 8 164 - 10 341 -
Dividends received from equity method companies............................................................................................................................. - 383 339
Net cash flows generated by capital investment tran sactions (B)....................................... ...............................33 661 - 101 292 - 45 687 -
Dividends paid to shareholders of the parent company..........................................................................................................................................- 8 398 - 8 398 -
Dividends paid to the minority interests of consolidated companies...........................................................................................................................- 255 - 255 -
Capital increase in cash ......................................................................................................................................................................... - - -
Loans floated........................................................................................................................................................................................62 240 2 901 3 012
Loans repaid......................................................................................................................................................................................................86 091 - 14 721 - 6 670 -
Financial interest paid …………………………………..………………...……………..………………………….…………………………………….……….……………..……………24 110 - 32 354 - 21 448 -
Net cash flows generated by financing transactions (C)....................................................................... 47 961 - 52 827 - 33 759 -
Net cash flows generated from discontinued activiti es (D)................................................................... - - 3 400 -
CHANGE IN CASH POSITION (A+B+C+D)……................ ...................................................................................................8 448 - 12 759 9 081 -
Opening cash position ..........................................................................................................................................................................................70 254 57 772 57 772
Closing cash position ............................................................................................................................................................................61 539 70 254 46 445
Impact of changes in foreign currency exchange rates...........................................................................................................................267 277 2 246

-21-
Segmental reporting - P&L items as at June 30, 2009 In K€
CRM and strategic data
Healthcare professionals
Insurance and services
TOTALTOTAL France
TOTAL Rest of world
SECTOR REVENUE
A Outside Group sales 235 147 140 762 57 998 433 906 232 116 201 790 (*)
B Sales to other Group sectors 21 286 2 700 2 587 26 573 25 913 660C=A+B Total sector sales 256 433 143 461 60 585 460 479 258 029 202 451
SECTOR EARNINGS
D Income from operations before non-recurring items f or the sector22 162 23 607 8 311 54 079
OPERATING MARGIN (as a %)
D/A Operating margin outside Group 9,4% 16,8% 14,3% 12,5%
D/C Sector operating margin 8,6% 16,5% 13,7% 11,7%
SECTOR DEPRECIATION AND AMORTIZATION 12 482 18 160 3 537 34 179
(*)June 2009 consolidated sales France
Euro areaexcluding
Pound Sterling Area
US Dollar area
Rest of world
Total
Geographic breakdown 227 795 58 919 38 512 60 704 47 976 433 906% 52% 14% 9% 14% 11% 100%
Primary Sectors Secondary Sectors
-22-
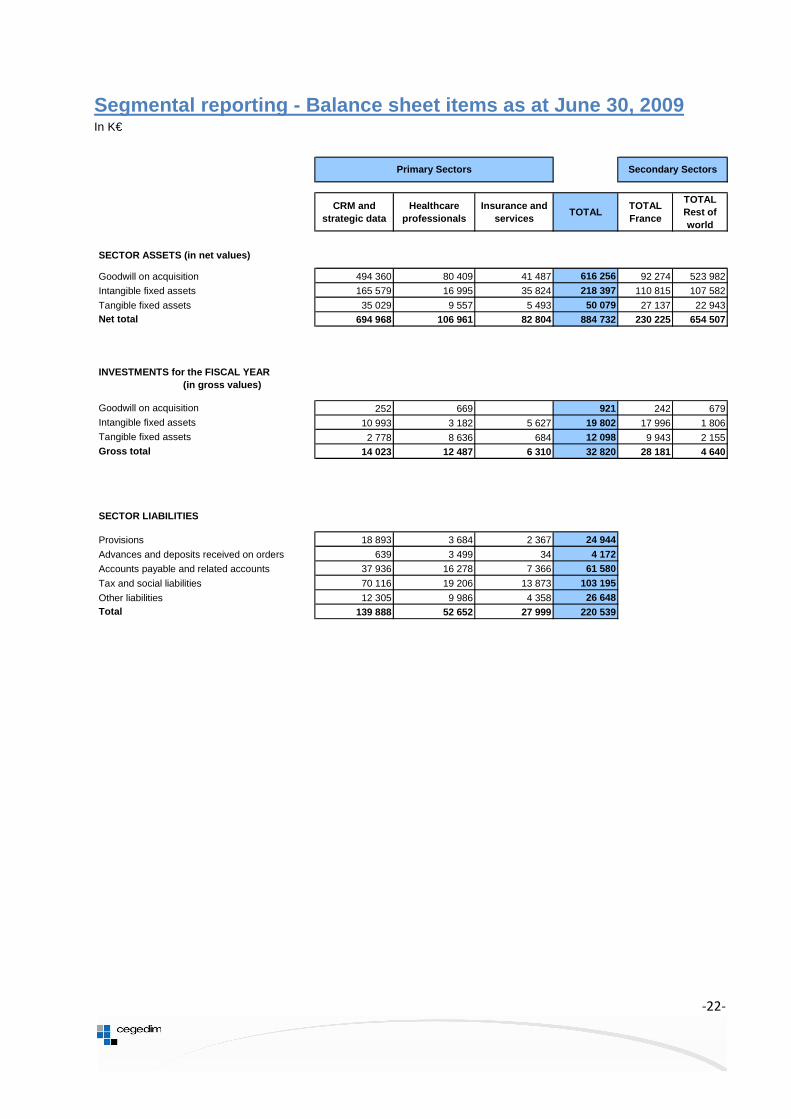
Segmental reporting - Balance sheet items as at Jun e 30, 2009 In K€
CRM and strategic data
Healthcare professionals
Insurance and services
TOTALTOTAL France
TOTAL Rest of world
SECTOR ASSETS (in net values)
Goodwill on acquisition 494 360 80 409 41 487 616 256 92 274 523 982
Intangible fixed assets 165 579 16 995 35 824 218 397 110 815 107 582
Tangible fixed assets 35 029 9 557 5 493 50 079 27 137 22 943Net total 694 968 106 961 82 804 884 732 230 225 654 507
INVESTMENTS for the FISCAL YEAR (in gross values)
Goodwill on acquisition 252 669 921 242 679Intangible fixed assets 10 993 3 182 5 627 19 802 17 996 1 806Tangible fixed assets 2 778 8 636 684 12 098 9 943 2 155Gross total 14 023 12 487 6 310 32 820 28 181 4 640
SECTOR LIABILITIES
Provisions 18 893 3 684 2 367 24 944
Advances and deposits received on orders 639 3 499 34 4 172Accounts payable and related accounts 37 936 16 278 7 366 61 580
Tax and social liabilities 70 116 19 206 13 873 103 195
Other liabilities 12 305 9 986 4 358 26 648Total 139 888 52 652 27 999 220 539
Primary Sectors Secondary Sectors

-23-
Segmental reporting - P&L items as at June 30, 2008 In K€
CRM and strategic data
Healthcare professionals
Insurance and services
TOTALTOTAL France
TOTAL Rest of world
SECTOR REVENUE
A Outside Group sales 236 580 124 795 52 613 413 988 209 110 204 878 (*)
B Sales to other Group sectors 13 649 1 806 2 778 18 233 17 814 418C=A+B Total sector sales 250 229 126 601 55 391 432 221 226 924 205 297
SECTOR EARNINGS
D Income from operations before non-recurring items f or the sector21 882 18 089 3 089 43 060
OPERATING MARGIN (as a %)
D/A Operating margin outside Group 9,2% 14,5% 5,9% 10,4%
D/C Sector operating margin 8,7% 14,3% 5,6% 10,0%
SECTOR DEPRECIATION AND AMORTIZATION 12 396 17 515 2 923 32 834
Discontinued activities
Sales 4 092 4 092Income from operations for the sector -2 376 -2 376
Amortization 217 217
(*)June 2008 consolidated sales France
Euro areaexcluding
Pound Sterling Area
Rest of world
Total
Geographic breakdown 209 110 57 692 40 872 106 314 413 988% 51% 14% 10% 26% 100%
Primary Sectors Secondary Sectors

-24-
Segmental reporting - Balance sheet items as at Dec ember 31, 2008 In K€
CRM and strategic data
Healthcare professionals
Insurance and services
TOTALTOTAL France
TOTAL Rest of world
SECTOR ASSETS (in net values)
Goodwill on acquisition 499 954 75 127 41 871 616 952 92 433 524 519
Intangible fixed assets 165 335 14 276 29 965 209 576 77 648 131 928
Tangible fixed assets 38 961 9 616 6 124 54 701 29 393 25 308Net total 704 250 99 019 77 960 881 229 199 474 681 755
INVESTMENTS for the FISCAL YEAR (in gross v alues)
Goodwill on acquisition 2 165 1 055 10 480 13 700 11 535 2 165Intangible fixed assets 34 227 6 056 8 427 48 710 40 325 8 385Tangible fixed assets 14 624 34 345 2 056 51 025 41 793 9 232Gross total 51 016 41 456 20 963 113 435 93 653 19 782
SECTOR LIABILITIES
19 063 3 544 2 380 24 987Provisions 669 3 024 41 3 734
Advances and deposits received on orders 39 037 14 176 9 918 63 131
Accounts payable and related accounts 78 412 19 801 17 548 115 761Tax and social liabilities 20 055 12 258 2 694 35 007
Other liabilities 157 236 52 803 32 581 242 620Total
Operations are done at market share price
Primary Sectors Secondary Sectors

-25-
1/. Accounting standards
The Group's half-yearly consolidated financial statements as of June 30, 2009, have been prepared in accordance with standard IAS 34 - Interim Financial Reporting. They correspond to condensed interim financial statements and do not include all of the information required for annual financial statements. The consolidated financial statements as of June 30, 2009, should therefore be read in conjunction with the Group's published consolidated financial statements as of December 31, 2008. The accounting principles applied by the Group for the preparation of the interim consolidated financial statements at June 30, 2009, are the same as those applied by the Group at December 31, 2008 and comply with international accounting standards IFRS (International Financial Reporting Standards) as endorsed by the European Union. These accounting principles are described in the section entitled "Accounting Principles" applicable to the consolidated financial statements in the 2008 reference document to the exclusion of amendments to IFRS standards and mandatory interpretations as of January 1, 2009 set out below:
• Revised IAS 1 - Presentation of Financial Statements; the Group has chosen the option of presenting performance in two statements: a separate income statement and a statement detailing other elements of global income.
• IFRS 8 - Operating Segments: segments previously presented under IAS 14 meet the definition of operating segments that have been identified and grouped together in accordance with sections 5 and 12 of IFRS 8. The Group presented its segment information on the basis of the activity sectors "CRM and strategic data", "Healthcare Professionals" and "Insurance Services" as detailed in internal reports and shows elements of reconciliation with the summary statements. Furthermore, it was deemed appropriate to continue to represent geographical data for certain indicators considered relevant.
• IFRIC 14 - Defined Benefit Assets and Minimum Funding Requirements. • Revised IAS 23 - Borrowing Costs. Mandatory capitalization of borrowing costs.
The Group did not implement early application of the following standards and interpretations with mandatory application after January 1, 2009
• IFRIC 12 - Service Concession Arrangements; • IFRIC 16 - Hedges of a Net Investment in a Foreign Operation; • Revised IFRS 3 - Business Combinations; • Amendments to IAS 27 - Consolidated and Separate Financial Statements; • IFRIC 15 - Agreements for the Construction of Real Estate.
-26-
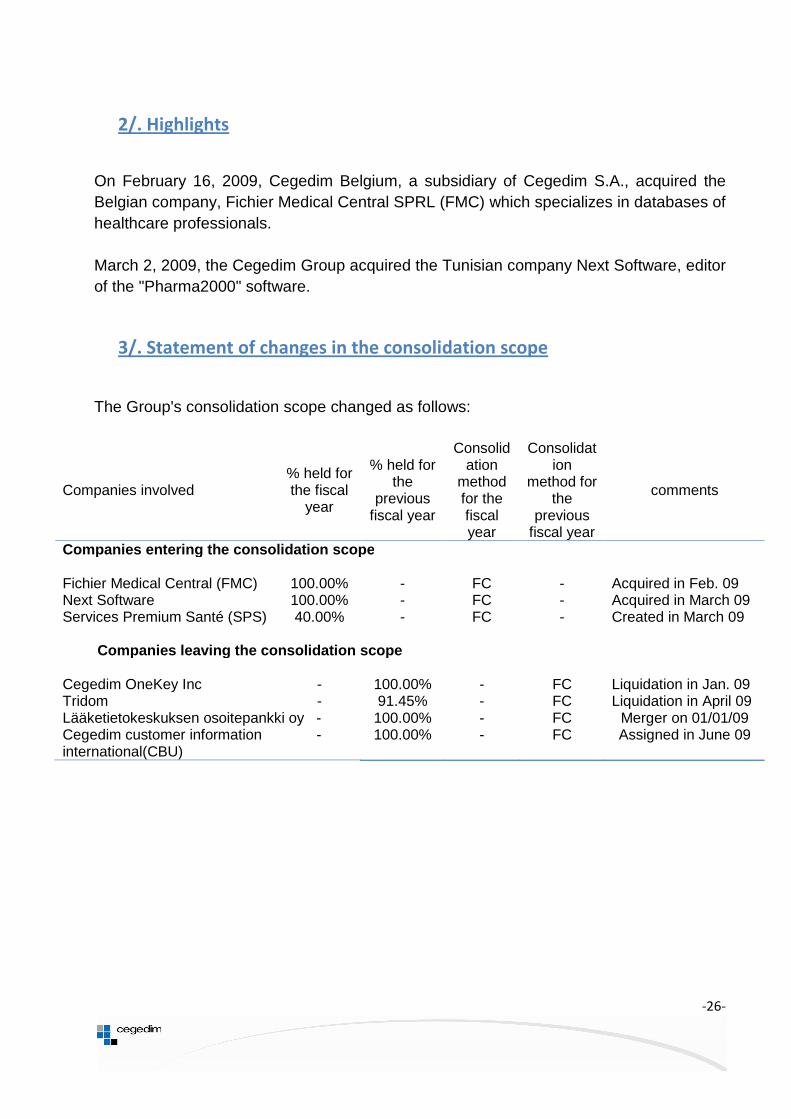
2/. Highlights
On February 16, 2009, Cegedim Belgium, a subsidiary of Cegedim S.A., acquired the Belgian company, Fichier Medical Central SPRL (FMC) which specializes in databases of healthcare professionals. March 2, 2009, the Cegedim Group acquired the Tunisian company Next Software, editor of the "Pharma2000" software.
3/. Statement of changes in the consolidation scope
The Group's consolidation scope changed as follows:
Companies involved % held for the fiscal
year
% held for the
previous fiscal year
Consolidation
method for the fiscal year
Consolidation
method for the
previous fiscal year
comments
Companies entering the consolidation scope Fichier Medical Central (FMC) 100.00% - FC - Acquired in Feb. 09 Next Software 100.00% - FC - Acquired in March 09 Services Premium Santé (SPS) 40.00% - FC - Created in March 09
Companies leaving the consolidation scope Cegedim OneKey Inc - 100.00% - FC Liquidation in Jan. 09 Tridom - 91.45% - FC Liquidation in April 09 Lääketietokeskuksen osoitepankki oy - 100.00% - FC Merger on 01/01/09 Cegedim customer information -international(CBU)
100.00% - FC Assigned in June 09
-27-
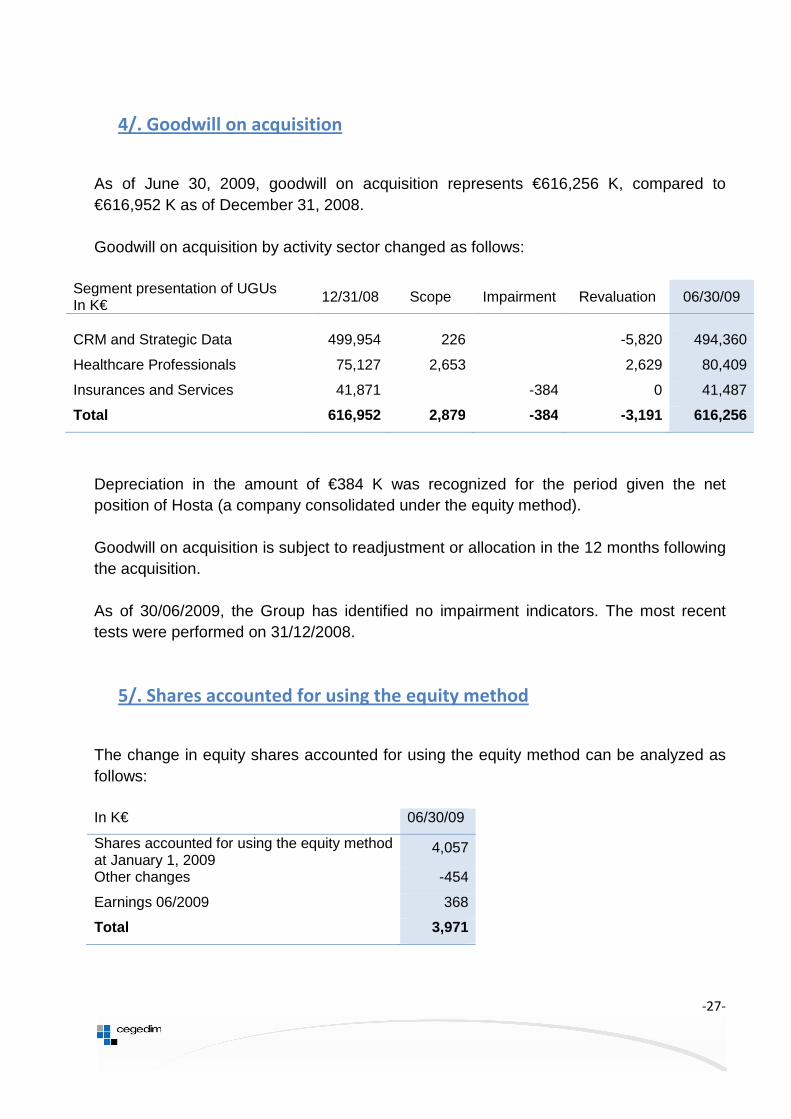
4/. Goodwill on acquisition
As of June 30, 2009, goodwill on acquisition represents €616,256 K, compared to €616,952 K as of December 31, 2008. Goodwill on acquisition by activity sector changed as follows:
Segment presentation of UGUs In K€ 12/31/08 Scope Impairment Revaluation 06/30/09
CRM and Strategic Data 499,954 226 -5,820 494,360
Healthcare Professionals 75,127 2,653 2,629 80,409
Insurances and Services 41,871 -384 0 41,487
Total 616,952 2,879 -384 -3,191 616,256
Depreciation in the amount of €384 K was recognized for the period given the net position of Hosta (a company consolidated under the equity method). Goodwill on acquisition is subject to readjustment or allocation in the 12 months following the acquisition. As of 30/06/2009, the Group has identified no impairment indicators. The most recent tests were performed on 31/12/2008.
5/. Shares accounted for using the equity method
The change in equity shares accounted for using the equity method can be analyzed as follows: In K€ 06/30/09
Shares accounted for using the equity method at January 1, 2009
4,057
Other changes -454
Earnings 06/2009 368
Total 3,971

-28-
6/. Accounts receivable
In K€ Current Non current 06/30/09 12/31/08
French companies 118,741 12,092 (1) 130,833 125,392
Foreign companies 83,208 - 83,208 88,527
Total gross values 201,949 12,092 214,041 213,919
Provisions 6,485 - 6,485 5,794
Total net values 195,464 12,092 207,556 208,125
(1) Receivables corresponding to financial leases granted by Cegelease and due for payment in more than one year.
Receivables are valued at their face value. A provision for impairment is recognized if the inventory value, based on the probability of collection, is less than the recorded value. Thus, doubtful clients are routinely impaired at 100% and receivables outstanding for more than six months are monitored on a case-by-case basis and, if necessary, impaired in the amount of the estimated risk of non-collection. The share of past-due receivables, gross amount, is 51.4 million euros at June 30, 2009.
Aging schedule
In K€ Total past-due receivables
Receivables < 1 month
Receivables 1 to 2 months
Receivables 2 to 3 months
Receivables 3 to 4 months
Receivables > 4 months
French companies 14,568 5,361 2,110 1,708 2,647 2,742
Foreign companies 36,820 17,730 5,590 5,026 2,970 5,504
Total 51,388 23,091 7,700 6,734 5,617 8,246

-29-
7/. Net financial debt
In K€ Financial Miscellane
ous 06/30/09 12/31/08
Long-term financial borrowing and liabilities (> 5 years)
- - - -
Medium- and long-term financial borrowing and liabilities (> 1 yr, < 5 yrs)
575,360 7,114 582,474 585,327
Short-term financial borrowing and liabilities (< 1 year)
83,253 1,671 84,924 88,050
Current bank loans 7,521 - 7,521 23,246
Total financial liabilities 666,134 8,785 (1) 674,919 696,623
Total positive cash flow 69,061 - 69,061 93,500
Net financial debt 597,073 8,785 605,858 603,123
(1) Including €206 K for financial leases and €8,176 K for employee equity plans.
Statement of change in net debt
In K€ 06/30/09 12/31/08
Net debt at the beginning of the fiscal year (a) 603,123 621,014
Impact of discontinued activities 0 0
Operating cash flow before net financial debt expense and taxes
84,108 154,569
Tax paid 245 -7,823
Change in working capital requirement -11,179 20,132
Net cash flow generated by operating activities 73,174 166,878
Change resulting from investment transactions -30,970 -93,511
Impact of changes in consolidation scope -2,691 -8,164
Dividends 0 -8,270
Increase in cash capital 0 0
Impact of changes in foreign currency exchange rates
-267 -277
Interest paid -24,110 -32,354
Other changes -17,871 -6,411
Total net change for the year (b) -2,735 17,891
Net debt at year end (a - b) 605,858 603,123
-30-
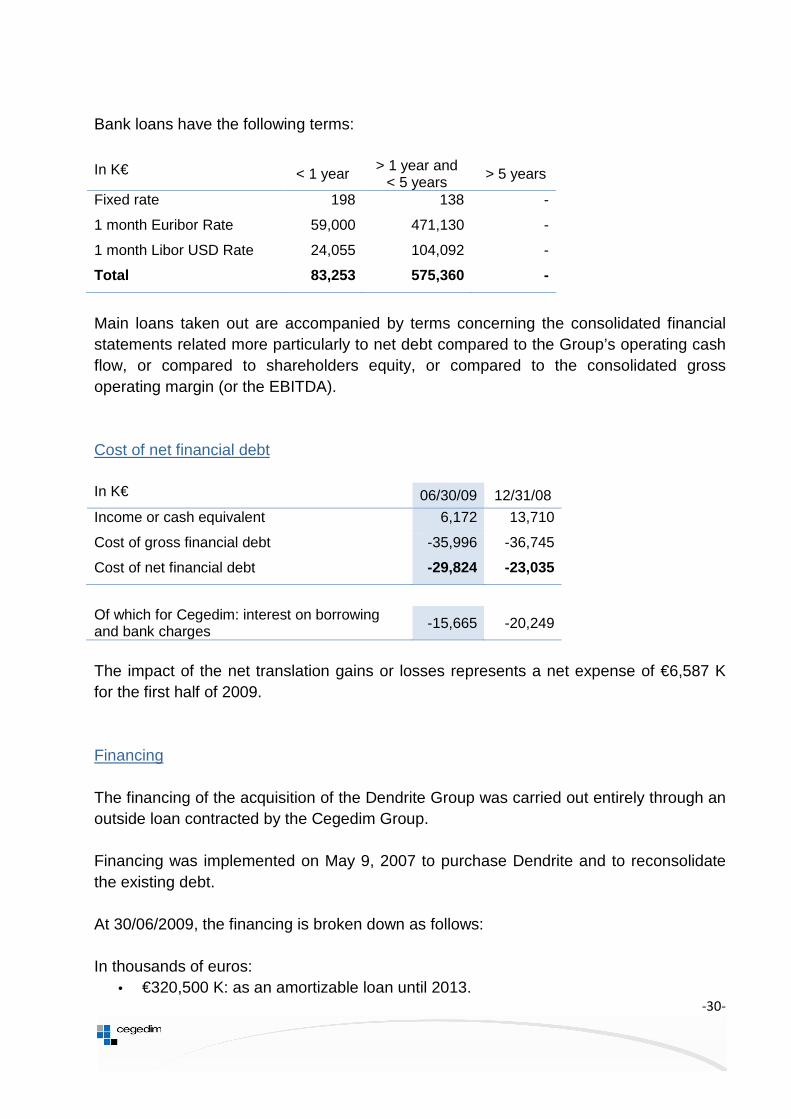
Bank loans have the following terms:
In K€ < 1 year > 1 year and < 5 years > 5 years
Fixed rate 198 138 -
1 month Euribor Rate 59,000 471,130 -
1 month Libor USD Rate 24,055 104,092 -
Total 83,253 575,360 -
Main loans taken out are accompanied by terms concerning the consolidated financial statements related more particularly to net debt compared to the Group’s operating cash flow, or compared to shareholders equity, or compared to the consolidated gross operating margin (or the EBITDA). Cost of net financial debt In K€ 06/30/09 12/31/08
Income or cash equivalent 6,172 13,710
Cost of gross financial debt -35,996 -36,745
Cost of net financial debt -29,824 -23,035
Of which for Cegedim: interest on borrowing and bank charges -15,665 -20,249
The impact of the net translation gains or losses represents a net expense of €6,587 K for the first half of 2009. Financing The financing of the acquisition of the Dendrite Group was carried out entirely through an outside loan contracted by the Cegedim Group. Financing was implemented on May 9, 2007 to purchase Dendrite and to reconsolidate the existing debt. At 30/06/2009, the financing is broken down as follows: In thousands of euros:
• €320,500 K: as an amortizable loan until 2013.

-31-
• €165,000 K: as revolver credit facilities renewable every three months (amount used out of a total available line of €165,000 K).
In thousands of US dollars:
• $183,000 K: as an amortizable loan until 2013..
The loan of €320,500 K and the revolver credit facilities of €72,000 K subscribed at a variable rate have been hedged by derivatives offering the following rates. A fixed-rate swap. Cegedim receiver of the 3-month Euribor against the 3-month Euribor post-fixed rate +2.62% base 360 with a cap at 5.58% and a floor at 4.25%. The interest expense resulting from these loans amounts to €15,474 K for 2009. The change in fair value of these derivatives was recognized under equity for the effective part of those qualified as cash flow hedges (- €18,201 K) and in the income statement for their ineffective part and for those not qualified as hedges under IFRS standards (- €1.348 K).
-32-
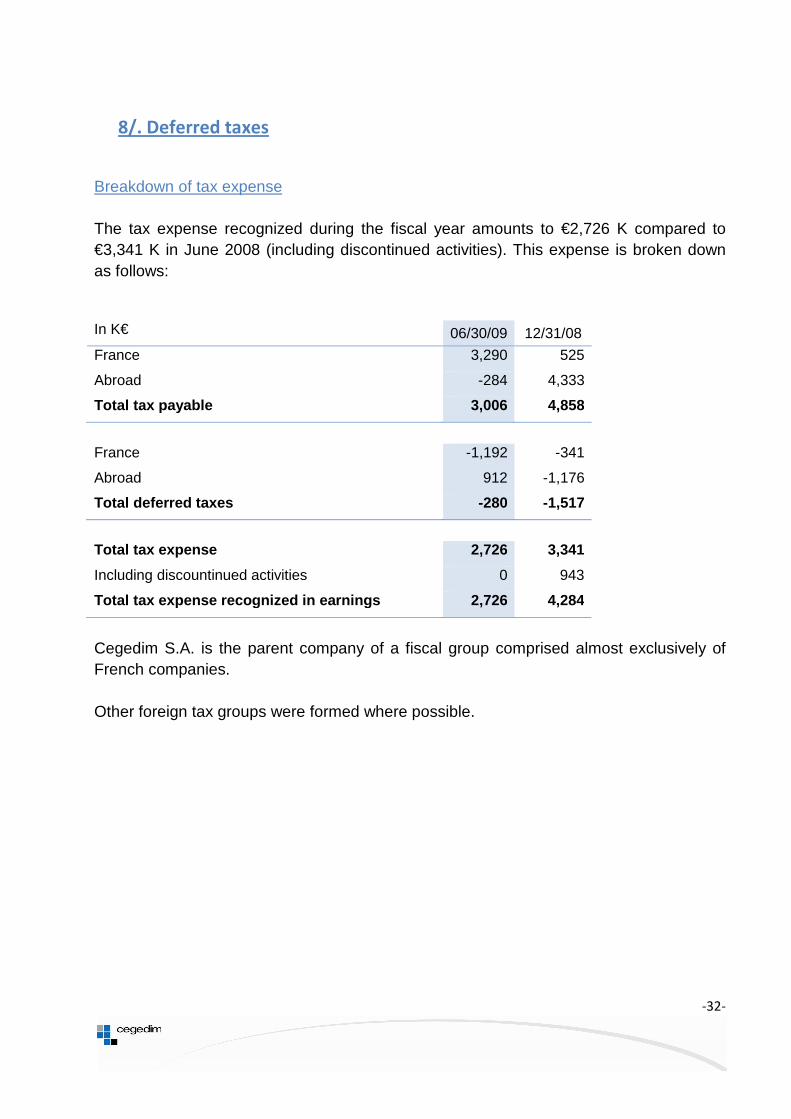
8/. Deferred taxes
Breakdown of tax expense The tax expense recognized during the fiscal year amounts to €2,726 K compared to €3,341 K in June 2008 (including discontinued activities). This expense is broken down as follows: In K€ 06/30/09 12/31/08
France 3,290 525
Abroad -284 4,333
Total tax payable 3,006 4,858
France -1,192 -341
Abroad 912 -1,176
Total deferred taxes -280 -1,517
Total tax expense 2,726 3,341
Including discountinued activities 0 943
Total tax expense recognized in earnings 2,726 4,284
Cegedim S.A. is the parent company of a fiscal group comprised almost exclusively of French companies. Other foreign tax groups were formed where possible.

-33-
Theoretical tax expense and recognized tax expense The reconciliation between the theoretical tax expense for the Group and the tax expense effectively recognized is presented in the following table:
In K€ 30/06/09 31/12/08
Net income 17,240 8,575
Net earnings of companies held for sale 1,434
Group share of EM companies -368 214
Income taxes 2,726 4,284
Earnings before tax from consolidated companies (a) 19,598 14,507
for which French consolidated companies -3,975 -9,296
for which foreign consolidated companies 23,573 23,803
Normal tax rate in France (b) 34,45% 34,45%
Theoretical tax expense (c) = (a) x (b) 6,752 4,998
Impact of income and expenses ultimately not deductible or not taxable 860 858
Impact of differences in tax rates on profits -7,520 -2,239
Impact of differences in tax rates on capitalized losses -1,312 -1,745
Uncapitalized tax on losses 3,946 1,540
Impact of tax credit 748
Impact of exit of companies sold 124
Tax expenses recognized in the Income Statement 2,726 4,284
Effective tax rate 13.91% 29.53%

-34-
Deferred tax assets and liabilities Analysis by category of the temporal difference for the net deferred tax position recognized in the balance sheet (before compensation by fiscal entities for deferred tax assets and liabilities)
Deferred tax assets :
In K€ Total
12/31/08 Earnings Change in
conso. scope
Other changes in
equity
Change in exchange
rate
Total 06/30/09
Tax loss carry forwards and tax credits 26,033 -9,166 -46 -415 16,406
Retirement obligations 2,304 323 2,627 Non-deductible provisions 1,554 -997 557 Adjustment to fair value of financial instruments 7,753 123 1,592 9,468
Cancellation of margin on inventory 187 33 220
Cancellation of internal capital gain 894 5,967 6,861
Restatement of preliminary expenses 14 -4 10
Restatement of R&D margin 511 217 728 Restatement of allowance for the assignment of intangible assets
0 86 86
Other 1,677 1,495 3,172 Total 40,927 -1,922 -46 1,592 -415 40,136
Deferred tax liabilities :
In K€ Total
12/31/08 Earnings Change in
conso. scope
Other changes in
equity
Change in exchange
rate
Total 06/30/09
Translation adjustments -5,687 2,265 188 -3,234 Cancellation of accelerated depreciation -2,122 91 -2,031
Cegelease unrealized capital gain -3,171 213 -2,958
Cancellation of depreciation on goodwill -1,021 -54 -1,075
Cancellation of depreciation internal capital gains 0 -139 -139
Leasing -110 -6 -116 R&D capitalization -2,829 -1,171 -4,000 Restatement of the allowance for the R&D margin 0 -14 -14
Adjustment to fair value of financial instruments -1,211 974 -237
Allocation DIL brands -43,866 0 1,467 -42,399 Other -253 42 -211 Total -60,270 2,201 0 0 1,655 -56,414
Net deferred taxes -19,343 280 -46 1,592 1,240 -16,277

-35-
The change in deferred taxes recognized in the consolidated balance sheet after compensation by fiscal entities for the deferred tax assets and liabilities can be verified as follows: In K€ Assets Liabilities Net
At Decemb er 31, 2008 40,927 -60,270 -19,343
Impact on earnings for the period -1,922 2,201 280
Impact on shareholders' equity 1,131 1,655 2,786
Impact of net presentation by fiscal entity -4,129 4,129 0
At June 30, 2009 36,009 -52,285 -16,276
The amount of uncapitalized tax as of June 30, 2009 amounts to €11,089 K.
9/. Off-balance-sheet commitments
Bonds existing at December 31, 2008 have not evolved significantly during the 1st half of 2009.
10/. Capital
As of June 30, 2008, the share capital is made up of 9,331,449 shares each with a nominal value of 0.9528 euros, i.e. total capital of 8,891,004.61 euros.
Award of free shares:
On March 21, 2008, the Board of Directors was authorized by the extraordinary shareholders' meeting of February 22, 2008, to award a total number of free shares not to exceed 10% of the total number of shares making up the capital to the directors and employees of the Cegedim Group. The main characteristics are the following:
- The free shares awarded will grant the right to dividends. Their distribution will be decided at the award date. The plan of March 21, 2008 granted a total of 28,900 free shares.
- The award of said shares to their beneficiaries will become final at the end of an acquisition period of two years for beneficiaries whose residence for tax purposes is in

-36-
France as of the award date and four years for beneficiaries whose residence for tax purposes is not in France as of the award date.
- The shares will be permanently awarded to their beneficiaries on a single condition: the absence of resignation, dismissal or layoff.
- As from the final award date, beneficiaries whose residence for tax purposes is in France as at the award date must keep their shares for a term of two years.
In application of standard IFRS 2, the expense measuring "the benefit" offered to employees is spread out linearly over the period of acquisition of the rights by the beneficiaries. The amount recognized for the 1st half year is €171 K.
February 22, 2008
March 21, 2008
March 21, 2008
43,410 shares
€52.00
France March 21, 2010Abroad March 21, 2012
39,190 shares
10,290 shares
France €48.77Abroad €41.24
Total number of shares left to be acquired after recorded exercising of options and cancelled options
Adjusted acquisition price of free share awards
Date of free disposal of free shares
Position of plans as of June 30, 2009
Total number of shares acquired
Initial subscription price
The main characteristics of the plan are the following:
2008 free share award plan
Date of the shareholders' meeting
Date of plan opening
Total number of shares than can be acquired
Date of the Board of Directors meeting

-37-
11/. Treasury shares
There were no transactions for the acquisition or sale of treasury shares during the 1st half year of 2009 to the exclusion of shares acquired under the free share award plan.
12/. Dividends
The following dividend was approved and paid for 2008, in compliance with the decision made during the Ordinary General Shareholders' Meeting held on May 27, 2009.
13/. Employees
06/30/09
France 3,521
International 5,124
Total 8,645
14/. Post-closing events
In July 2009, the Cegedim Group acquired the NOMI Group, a leading provider of business intelligence and sales force optimization solutions for the pharmaceutics industry in the Nordic region. Late July 2009, Cegedim Strategic Data UK, a Cegedim Group subsidiary, acquired Hospital Marketing Services Ltd (HMSL) which specializes in the analysis of patient and in-hospital promotion data.
15/. Seasonality
The Cegedim Group's interim closing on June 30, 2009, has no significant seasonality effect on continued activities.