2009 bridge to excellence master plan update review
TRANSCRIPT

2009 Bridge to Excellence Master Plan Annual Update Review
The Bridge to Excellence in Public Schools Act, 2002
The Education Fiscal Accountability and Oversight Act, 2004
Maryland State Department of Education Division of Student, Family, and School Support
Division of Business Services
December 2009

i
Maryland State Board of Education
James H. DeGraffenreidt, Jr. President
Baltimore City (Term Ends 2012) Charlene M. Dukes Vice President Glenn Dale Silver Spring (Term Ends 2010) Nancy S. Grasmick Secretary‐Treasurer of the Board State Superintendent of Schools
Mary Kay Finan Cumberland (Term Ends 2011) S. James Gates, Jr. Mitchellville (Term Ends 2013) Madhu Sidhu Chestertown (Term Ends 2013) Guffrie M. Smith, Jr. St. Leonard (Term Ends 2013) Martin O’Malley Governor
Donna Hill Staton, Esq. Clarksville (Term Ends 2010) Ivan C. A. Walks Potomac (Term Ends 2012) Kate Walsh Catonsville (Term Ends 2012)
David H. Murray Student Member Salisbury (Term Ends 2010)

2009 Master Plan Annual Update Review
Table of Contents
Contents Page A Message from the State Superintendent i Section 1.0 Introduction 1 Section 2.0 Background 2 Section 3.0 Annual Review Process 4 Section 4.0 Finance Section 6 Section 5.0 Performance Results 12 Section 6.0 Review Process Outcomes 14 Section 7.0 Local School System Master Plan Goal Progress 16 Section 8.0 What the Master Plan Updates Reveal: How LSSs Use Data to Drive Instruction 57 Section 8.0 Program, Technical, and Budget Reviews 68 Section 9.0 Conclusion 71 Attachments 73 A Core Academic Subject Classes Taught by Highly Qualified Teachers 74 B Budget Summaries by Local School System (separate attachments) 75 Executive Summaries of LSS Annual Updates (available online) http://www.marylandpublicschools.org/MSDE/programs/Bridge_to_Excellence/


2009 Master Plan Annual Update Review
A Message from the State Superintendent It is hard to overestimate the significance of the master planning process. The process is one of the most salient strategies that the Maryland State Department of Education utilizes for improving student achievement and closing the achievement gap. Until recently, many local school systems (LSSs) treated planning as a local endeavor that merely acknowledged federal and State expectations. Now, however, nearly every LSS must understand the importance of the master planning process and how it can create alignment of federal, State, and local expectations and sustainable advantages. The authors of this report summarize the strategic significance of the master planning process. They show how this year’s master plan review process reveals the way LSSs operate internally, and may alter the relationships between LSSs and the State Department. They outline nine sections (introduction, background, review process, finance section, performance results, annual review results, goal progress, how LSSs use data to drive instruction, conclusion) to help stakeholders assess the impact that the master planning process is having in our public schools. Are local master plans and plan updates producing the intended effect of improving student achievement for all students and groups of students? To answer this question, the Maryland State Department of Education (MSDE) conducts an annual review of school system performance data contained in the master plan updates. The review is based on a deficiency analysis and requires that LSSs respond sufficiently to any data deficiency by articulating the adjustments they are making in their master plans. Driving these planning efforts are the No Child Left Behind (NCLB) annual performance targets which set the pace for the growth required for LSSs to attain the 2014 goal of 100% proficiency. What we know. We know that the programmatic and fiscal decisions made have a deep and profound impact on the academic success that children have in our public schools and school systems. While school systems across the State have demonstrated improvements for overall student achievement for six consecutive years, some school systems are demonstrating performance breakthroughs. This year, several school systems distinguished themselves in the following ways:
• One school system (Baltimore City Schools) exited School System in Corrective Action status; and
• Six other school systems (Allegany, Calvert, Carroll, Garrett, Washington, and Worcester) met district AYP and schools in improvement thresholds that resulted in less intense scrutiny being applied to the plan updates submitted to the State Department.

2009 Master Plan Annual Update Review
What the fiscal data tell us. The fiscal data presented in this report provide a snapshot of how LSSs are identifying their priorities and targeting their resources. Overall, the fiscal news is of concern, though with some areas of hope. While twenty‐one local school systems met maintenance of effort, three school systems requested a waiver from the State Board of Education. At least one of these school systems is continuing to call for a review of their waiver request. All school systems received new federal funding that resulted from the enactment of the American Recovery and Reinvestment Act of 2009 (ARRA). The funding is being used to back fill gaps in local budgets and to advance the reform efforts of the current administration, including improving data systems. What the plan updates tell us. More students are reaching Maryland’s proficiency standards in both reading and mathematics across all grade bands and most subgroups. Despite an overall increase in academic performance, there is an achievement gap between our African American and Hispanic students and our white and Asian students. While many Limited English Proficient (LEP) students are making AYP, a number of LSSs failed to meet the LEP targets for English proficiency. Regarding the target that 100% of core academic subject (CAS) classes are taught by highly qualified teachers (HQTs), the percentage of CAS classes taught by HQTs rose to all time high of 88.5%. Once again, only one LSS had any persistently dangerous schools as defined by NCLB. The graduation rate of 85.24% fell just short of the State target of 85.5%. How LSSs use data to inform instruction. We want all school systems to use data to inform the decisions that are made to improve student and school performance. We encourage LSSs to improve their data systems and reveal to stakeholders the areas in need of attention. Together, we must continue to measure progress over time in order to address the issue of greatest challenge: that every child has the opportunity to achieve at high levels. What is the strategic significance of the master planning process? This report aims to illustrate how local school systems respond to the challenges of the current school year. How will LSSs adjust the instructional program to improve student outcomes in reading, mathematics, and science? What are the implications of the High School Assessment graduation requirement? How are LSSs supporting struggling schools? What strategies should a LSS pursue to support LEP students in attaining English proficiency? Of the many opportunities that LSSs have for investing in data systems, which are the most urgent?
The master planning process is affecting LSSs in three vital ways:
• It sharpens the focus in each school system in developing the structures needed to support high levels of learning.
• It is a mechanism that gives LSSs a way to convey to various stakeholders the strategies in place to improve performance.
• It spawns whole new ways of thinking, often building on the LSS successes.

2009 Master Plan Annual Update Review
We discuss how the master planning process acquires strategic significance. We then describe how local school systems are targeting their resources. Finally, we outline Strategies in Practice and Strategies in Brief that illustrate how LSS are turning their efforts into sustained continuous improvement.
Sincerely, Nancy S. Grasmick State Superintendent of Schools


1
Section 1: Introduction This is the annual report on the results of the Maryland State Department of Education’s review of the Bridge to Excellence Master Plan Annual Updates. The focus of the review is on local school systems’ progress toward meeting their master plan goals, the plans that they have for improving student achievement and closing achievement gaps, and the alignment of local school system priorities with their annual budgets as reported in the master plans and plan updates. In addition to informing the Maryland State Board of Education of the results of this year’s review, the report is also intended to satisfy the statutory reporting requirement included in the Education Fiscal Accountability and Oversight Act of 2004. This report is not intended to convey the progress that each LSS is making toward meeting the No Child Left Behind (NCLB) Goals. While these data are critical to local school systems when they assess student progress and to reviewers as they review the plan updates, these data are not the focus of this report. More specifically, this report does not include data that can be found on the MSDE Website, nor reported by MSDE staff to the State Board of Education in previous reports. This year’s review revealed that all 24 local school system Master Plan Annual Updates were in compliance with the requirements contained in State and federal law, and, as applicable, additional requirements established by MSDE.
Recommendation:
All 24 school system Master Plan Annual Updates are recommended as approvable.

2009 Master Plan Annual Update Review
2
Section 2: Background
The Bridge to Excellence in Public Schools Act of 2002
In 2002, the General Assembly enacted the Bridge to Excellence in Public Schools Act which restructured Maryland’s public school finance system and increased State Aid to public schools by an estimated $1.3 billion over six fiscal years (FY 2003‐2008). As a result of this landmark legislation, Maryland adopted a standards‐based approach to public school financing based on the premise that when students have access to rigorous curriculum, highly qualified teachers, and programs that employ proven strategies and methods for student learning, all students, regardless of race, ethnicity, gender, disability, or socioeconomic background, can achieve. Under this approach, and consistent with the federal No Child Left Behind Act, the State established benchmark academic content and student achievement standards, ensures that schools and students have sufficient resources to meet those standards, and holds schools and school systems accountable for student performance. In 2003, local school systems were required under BTE to develop a 5‐year Master Plan that outlined strategies for improving student achievement and eliminating achievement gaps. Each year, an update to the plans is submitted to the Maryland State Department of Education and reviewed for sufficiency and to determine if progress is being made by individual school systems. During the 2007 session of the Maryland General Assembly lawmakers amended Bridge to Excellence, requiring that local boards of education continue submitting updates to their comprehensive master plans in October 2008 and 2009 and to submit new 5‐year comprehensive plans by October 15, 2010. The Education Fiscal Accountability and Oversight Act of 2004
The unrestricted nature of increased financial support to local school systems creates the need for unique accountability measures. In addition to the academic accountability standards, the State must ensure that school systems have the mechanisms in place to guarantee that funds are being spent appropriately. As such, the General Assembly enacted the Education Fiscal Accountability and Oversight Act of 2004, that prohibits local school systems from carrying a deficit, provides specific remedial actions for systems that carry a deficit, affirms recourse should a school system not comply with the Act, and provides for an audit of each local school system by the Office of Legislative Audits. Local school systems must illustrate alignment between their annual budget and their plans for improving student achievement. Additionally, the State Superintendent is

2009 Master Plan Annual Update Review
3
required to file an annual report on the alignment of school system master plan and budget priorities.1 Within the Master Plans and Annual Updates, school systems illustrate the connection between resources and priorities in several ways.
The Executive Summary includes a budget narrative that is intended to convey overview‐level information on the current status and the changes occurring in school system demographics, student performance, and fiscal resources.
School systems submit budget‐level data for the current and prior years in
variance tables detailing revenue by source and planned expenditures by local master plan goals. In these documents, school systems discuss the budgetary changes in addition to the use of new funds.
In separate attachments, school systems provide revenue, expenditure and FTE
data based on revenue source and State expenditure categories.
Finally, school systems are asked to discuss resource allocations within the content portion of the Annual Updates.
Bridge to Excellence Website
The Maryland State Department of Education (MSDE) has prepared several public documents to assist local school systems in preparing the Master Plans and Annual Updates, to guide reviewers in reviewing Master Plans and Annual Updates, and to inform the public on the process for the preparation, review, and approval of local Master Plans and Annual Updates. The following items are available at http://www.marylandpublicschools.org/MSDE/programs/Bridge_to_Excellence/:
Maryland’s Framework for the Preparation, Review, and Approval of Local
Master Plans and Annual Updates; and
Bridge to Excellence Toolbox: Guidance to Local School Systems on Preparing the Master Plan Annual Updates, Reviewers Guide, Facilitators Guide, and links to the Master Plans and Annual Updates.
1 Section 5‐401 (h) (1) and (2), Comprehensive Master Plans, of the Education Article of the Annotated Code.

2009 Master Plan Annual Update Review
4
Section 3: Annual Review Process
The annual review process is divided into three separate reviews, each of which addresses a section of the annual update: Content Section, Attachment Section, and American Recovery and Reinvestment Act (ARRA) Supplement. The Content Section is reviewed through a peer review process. The Attachment Section and specific program area components (within the Content Section) are reviewed by MSDE managers for compliance with federal or State requirements. The ARRA Supplements are reviewed by the Division of Business Services, the Division of Certification and Accreditation, and the Division of Student, Family, and School Support for compliance with federal requirements.
Content Review In 2009, a total of 101 reviewers served on seven panels that evaluated the Annual Updates. Panelists and panel facilitators received training on the tools that were used in the review process. The review involves an examination of school system analyses of and responses to performance data for each of the NCLB Goal Areas. The analyses and the LSS narrative are intended to address the following prompts:
1. Describe where progress is evident. In your response, please identify progress in terms of grade bands and subgroups.
2. Identify the practices, programs, or strategies and the related resource
allocations that appear related to the progress.
3. Describe where challenges are evident. In your response, please identify challenges in terms of grade bands and subgroups.
4. Describe the changes or adjustments that will be made along with the related
resource allocations to ensure progress. Include timelines where appropriate.
The Content Review was completed in these phases – the Initial Review, the Clarification Review, and the Meeting Review. During the Initial Review, facilitators worked with panel members to reach consensus on the approvability of the Annual Update. The panels had the option of recommending approval, or deferring a recommendation pending their assessment of the sufficiency of the local school system’s responses to the clarifying questions asked by panel members.

2009 Master Plan Annual Update Review
5
Compliance Reviews
Program Review
MSDE program managers review the components of school system Annual Updates related to specific student groups (early learning, gifted and talented students) and cross‐program themes ( multicultural education,2 educational technology) for compliance and for sufficiency of the plans toward meeting the program goals. MSDE program managers work with their counterparts to resolve any issues of concern that emerge during the Program Review. In certain cases, the program reviewer (Special Education, Highly Qualified Staff and Career and Technology Education) may provide a report to the panel to inform their discussion.
Technical Review
The Technical Review involves the examination of State and federal grant applications and supporting budget documents to ensure compliance with State and federal requirements. MSDE program managers work closely with their counterparts in the LSSs to resolve any issues that arise throughout the Technical Review.
Budget Review
Financial specialists conduct a technical compliance review of the Budget Documents (current and prior year variance tables). While the Panel Review examines the alignment between local school system priorities and the budget, the Budget Review focuses on the accuracy of the individual budget documents. Financial specialists work with their local school system counterparts to resolve any compliance issues. A summary report is provided to the Panel Facilitators and the Office of Comprehensive Planning and School Support. The summary report is included in the Final Review.
2 Code of Maryland Regulations 13A.04.05.06 requires that each school system report in their master plans and annual updates the district’s progress toward meeting the goals of Education that is Multicultural (ETM) programs. The Equity and Assurances Branch at the Maryland State Department of Education conducted a program review of each Annual Update and found that all 24 local school systems have reported on the progress toward meeting the goals and objectives in this area.

2009 Master Plan Annual Update Review
6
Section 4: Finance Section
Resources Local school systems illustrate the connection between annual budgets and master plan priorities through the budget narrative in the executive summary, a current year variance table (how new funds are being allocated to local goals), and a prior year variance table (a comparative analysis of the prior year plan). Additionally, school systems submit three attachments in support of the budget; a total revenue statement, a total expenditures statement; and, a total FTE statement. Local school systems incorporate a discussion of their use of resources throughout the annual update – particularly where they are allocating new funds. Including the narrative throughout the document provides the reader with a complete picture of a school system’s plan for the current year. A budget summary for each school system is included in the appendix.
In fiscal year 2008, with the exception of the Geographic Cost of Education Index (GCEI), the State finance structure was fully phased‐in, effectively starting the funding level envisioned by the Thornton Commission. Therefore, unlike the large incremental changes in State Aid seen in previous fiscal years, fiscal year 2009 reflect a much more limited State Aid increase. In fiscal year 2010, local school systems faced the potential for decreases in State Aid. In response to the world‐wide financial crisis, the President signed the American Recovery and Reinvestment Act of 2009 (ARRA) into law in February of 2009. Maryland applied and received stimulus funds through ARRA, which in turn were passed onto local school systems. Local school systems received additional funds through the ARRA State Fiscal Stabilization Program, Title I, IDEA, and the National School Lunch programs. For the 2009 annual update, local school systems were asked to focus on budgetary changes in addition to new funds. Local school systems were also asked to provide information on ARRA funding and that analysis begins on page 4. The following is an analysis of available revenue.
Reported Changes in Revenue
Revenue Description
FY 2009 Original Budget
(in millions)
FY 2010 Original Budget
(in millions)
FY 2010 New Funds (in millions)
Local Appropriation $5,325 $5,371 $47 State Revenue 4,600 4,497 (104) Federal Revenue 523 675 152Other Resources/Transfers 90 89 (1)Other Local Revenue 87 118 32Federal ARRA Funds ‐ 223 223Total $10,625 $10,973 $348
2009 Master Plan Annual Update Review
7
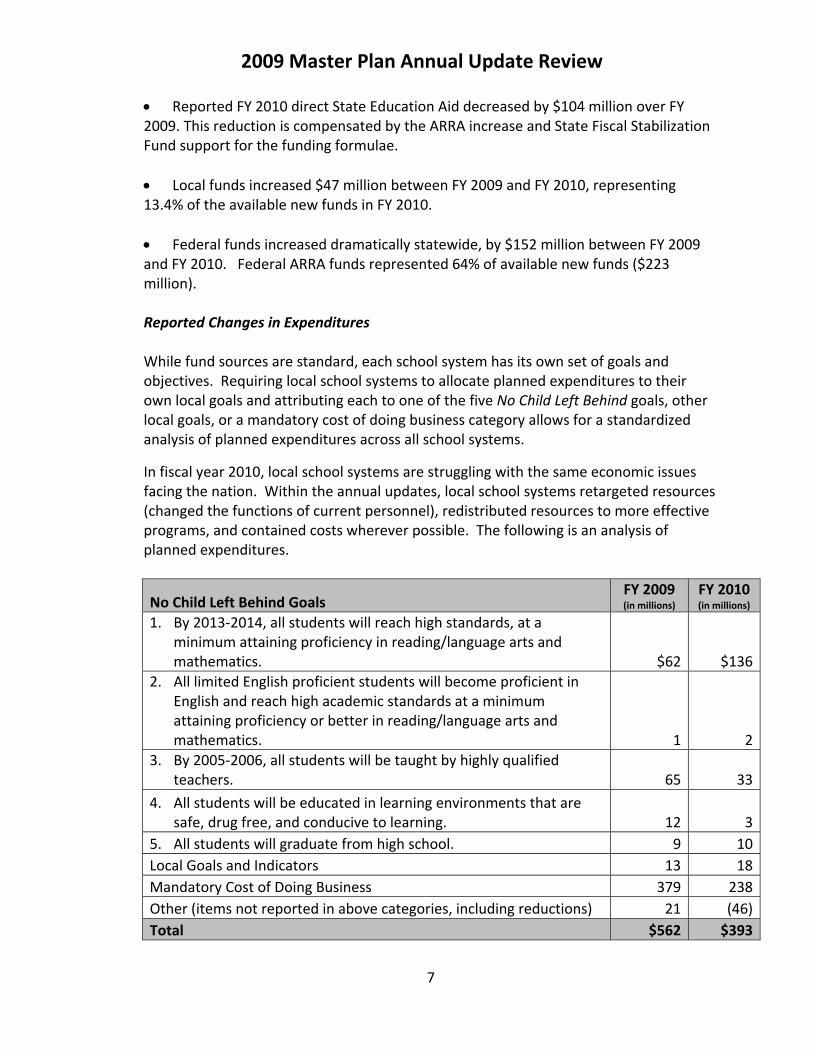
• Reported FY 2010 direct State Education Aid decreased by $104 million over FY 2009. This reduction is compensated by the ARRA increase and State Fiscal Stabilization Fund support for the funding formulae. • Local funds increased $47 million between FY 2009 and FY 2010, representing 13.4% of the available new funds in FY 2010. • Federal funds increased dramatically statewide, by $152 million between FY 2009 and FY 2010. Federal ARRA funds represented 64% of available new funds ($223 million). Reported Changes in Expenditures While fund sources are standard, each school system has its own set of goals and objectives. Requiring local school systems to allocate planned expenditures to their own local goals and attributing each to one of the five No Child Left Behind goals, other local goals, or a mandatory cost of doing business category allows for a standardized analysis of planned expenditures across all school systems.
In fiscal year 2010, local school systems are struggling with the same economic issues facing the nation. Within the annual updates, local school systems retargeted resources (changed the functions of current personnel), redistributed resources to more effective programs, and contained costs wherever possible. The following is an analysis of planned expenditures.
No Child Left Behind Goals FY 2009 (in millions)
FY 2010 (in millions)
1. By 2013‐2014, all students will reach high standards, at a minimum attaining proficiency in reading/language arts and mathematics. $62 $136
2. All limited English proficient students will become proficient in English and reach high academic standards at a minimum attaining proficiency or better in reading/language arts and mathematics. 1 2
3. By 2005‐2006, all students will be taught by highly qualified teachers. 65 33
4. All students will be educated in learning environments that are safe, drug free, and conducive to learning. 12 3
5. All students will graduate from high school. 9 10Local Goals and Indicators 13 18Mandatory Cost of Doing Business 379 238Other (items not reported in above categories, including reductions) 21 (46)Total $562 $393

2009 Master Plan Annual Update Review
8
• No Child Left Behind Goal 1 was established to ensure that all students are proficient in reading and mathematics. Examples of planned expenditures school systems include in this goal area consist of funds for intervention programs for lower performing students, inclusion programs for special education students, and content and/or grade band‐specific professional development activities. Local school systems attributed $136 million to this goal area in FY 2010. • In FY 2010, local school systems allocated $13 million in new funds to reading and math programs at the elementary and middle school levels. Additionally, $30.5 million and 168 additional FTEs can be attributed to the needs of special education students. • Funds for programs designed to meet the unique challenges facing limited English proficient students can be included in either Goal 1 or Goal 2. In FY 2009, over $2 million is attributed to Goal 2. In total, $2.25 million in new funds and 33 FTEs are allocated to programs for English Language Learners. • Goal 3 addresses the requirement that all teachers be highly qualified. Systems included $3 million in funds for professional development and recruitment and retention of highly qualified staff within the $33 million in new funds attributed to this goal. Some local school systems included increases in expenditures for teacher salaries and benefits within this goal area. • Goal 4 encompasses programs aimed at providing students with safe learning environments. Local school systems included funding for character education programs, positive behavioral interventions and supports programs, health‐related services, and extra‐curricular activities within the $3 million in new funds attributed to this goal area. • Within the $10 million in new funds attributed to Goal 5 (all students will graduate from high school) are professional development opportunities, interscholastic athletic programs, career and technology education programs, and drop‐out prevention programs. • Beginning with the graduating class of 2009, students must pass the four high school assessments in order to receive a Maryland diploma. A total of $5.9 million in new resources and 37 FTE are allocated to interventions planned to assist all students in passing the high school assessments.
• Many local school systems have goals associated with improved service delivery and parent involvement. Funds included in these goal areas are collapsed into one category – local goals and indicators. For FY 2010, local school systems have attributed $18 million in new funds to this area.

2009 Master Plan Annual Update Review
9
• The Mandatory cost of doing business category includes increases in expenditures for transportation, nonpublic special education placements and negotiated agreements. Of the $238 million in new funds attributed to this category, $149 million can be tied to increases in negotiated agreements (salary and benefits), $8 million for transportation costs, and $13 million for utilities. • Additional resources (approximately $169 million) are allocated to 1,148 new staff (teachers, paraprofessionals, school administrators, central office‐level program managers, etc.). • In FY 2010, technology continues to be a critical driver of education reform. Local school systems allocated $6 million in new resources to upgrade and enhance technology programs. Additional resources are allocated to improve service delivery at the system level, specifically to improve strategic planning, data management systems, and parent and community involvement initiatives.
• To fund current year priorities, local school systems made $175 million in reductions to other programs and services. Local school systems cut central office positions, redirected responsibilities, re‐allocated funds for critical programs, cut ineffective programs, and engaged in cost containment operations in preparation for future fiscal challenges.
Analysis: American Recovery and Reinvestment Act of 2009 In February 2009, President Obama signed the American Recovery and Reinvestment Act into law. The purpose of the legislation was to stimulate the economy by providing jobs in the short term with wise investments destined to support long‐term economic growth. The education portion of this stimulus package was designed to strengthen education and improve results for students. In Maryland, Governor O’Malley reiterated his commitment to public education by using ARRA State Fiscal Stabilization Funds to fully fund the Bridge to Excellence in Public Schools Act; the State’s education finance formulae. Further, substantial new funding is available in restricted programs such as Title I and Individuals with Disabilities Education Act (IDEA). The education portion of the ARRA funding focuses on four guiding principles: Spend funds quickly to save and create jobs; Improve student achievement through school improvement and reform; Ensure transparency, reporting and accountability; and, Invest one‐time ARRA funds thoughtfully as these funds are intended to be temporary. The State Fiscal Stabilization Fund further clarifies the second principle by requiring states and local school systems to adhere to the following assurances:

2009 Master Plan Annual Update Review
10
1. Increase teacher effectiveness and address inequities in the distribution of highly qualified teachers (recruiting, developing, and retaining effective teachers and principals).
2. Establish and use a pre‐K through college and career data system to track progress and foster continuous improvement (building data systems that measure student success and inform teachers and principals how they can improve their practices).
3. Make progress towards rigorous college and career‐ready standards and high quality assessments that are valid and reliable for all students, including limited English proficient students and students with disabilities (adopting internationally benchmarked standards and assessments that prepare students for success in college and the workplace).
4. Provide targeted, intensive support and effective interventions to turn around schools identified for corrective action and restructuring (turning around lowest performing schools).
The following analysis displays reported ARRA revenue by source.
Funds by Grant FY 2009 (in millions)
FY 2010 (in millions)
Total ARRA Funds
(in millions)
National School Lunch ‐ Equipment Assistance $0.25 $0.85 $1.11Homeless Children and Youth 0 .85 .85Title I ‐ Grants to LEAs, Neglected and Delinquent 0 130.26 130.26IDEA Part B ‐ Grants to States‐Pass‐Through 13.22 188.86 202.08IDEA Part B ‐ Preschool Grants .52 6.15 6.67IDEA Part C ‐ Infants and Families 0 8.85 8.85State Fiscal Stabilization Fund Education Program 0 159.95 159.98Head Start ARRA COLA Quality Improvement Grant 0 1.48 1.48Total $13.99 $497.28 $511.28 The following analysis displays reported planned ARRA expenditures across the four assurances.
2009 Master Plan Annual Update Review
11
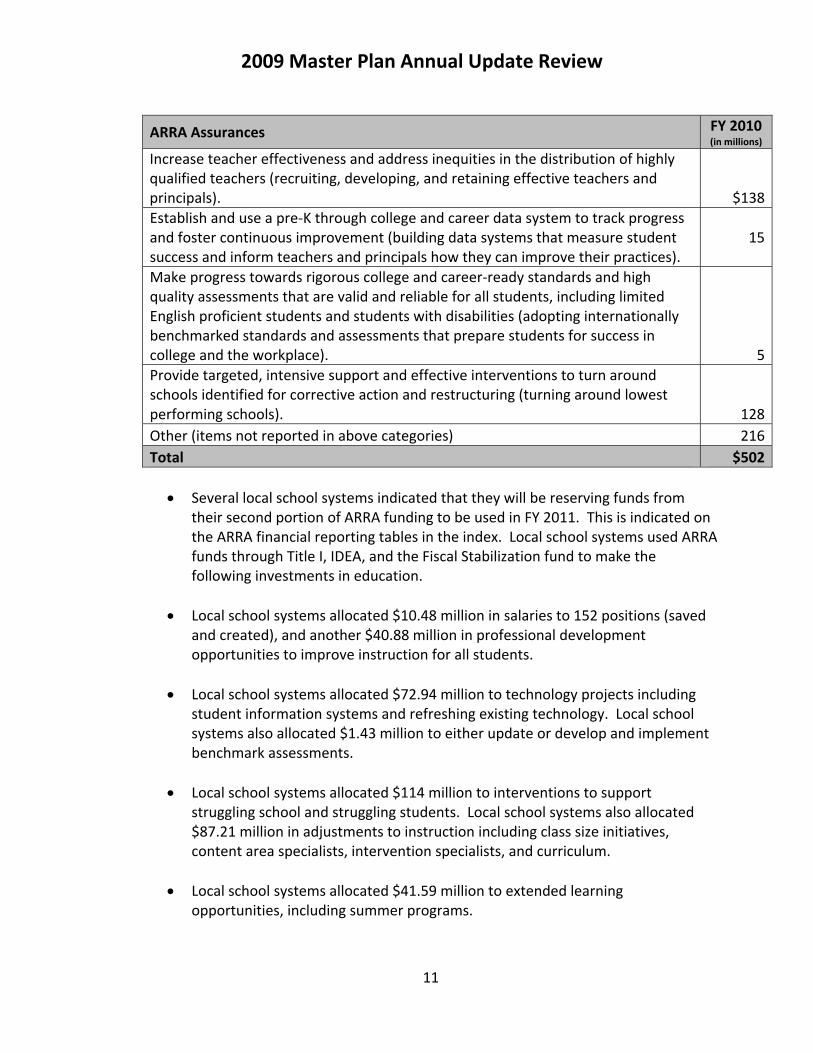
ARRA Assurances FY 2010 (in millions)
Increase teacher effectiveness and address inequities in the distribution of highly qualified teachers (recruiting, developing, and retaining effective teachers and principals). $138Establish and use a pre‐K through college and career data system to track progress and foster continuous improvement (building data systems that measure student success and inform teachers and principals how they can improve their practices).
15
Make progress towards rigorous college and career‐ready standards and high quality assessments that are valid and reliable for all students, including limited English proficient students and students with disabilities (adopting internationally benchmarked standards and assessments that prepare students for success in college and the workplace). 5Provide targeted, intensive support and effective interventions to turn around schools identified for corrective action and restructuring (turning around lowest performing schools). 128Other (items not reported in above categories) 216Total $502
• Several local school systems indicated that they will be reserving funds from
their second portion of ARRA funding to be used in FY 2011. This is indicated on the ARRA financial reporting tables in the index. Local school systems used ARRA funds through Title I, IDEA, and the Fiscal Stabilization fund to make the following investments in education.
• Local school systems allocated $10.48 million in salaries to 152 positions (saved
and created), and another $40.88 million in professional development opportunities to improve instruction for all students.
• Local school systems allocated $72.94 million to technology projects including
student information systems and refreshing existing technology. Local school systems also allocated $1.43 million to either update or develop and implement benchmark assessments.
• Local school systems allocated $114 million to interventions to support
struggling school and struggling students. Local school systems also allocated $87.21 million in adjustments to instruction including class size initiatives, content area specialists, intervention specialists, and curriculum.
• Local school systems allocated $41.59 million to extended learning
opportunities, including summer programs.
2009 Master Plan Annual Update Review
12
Section 5: Performance Results 2009 Statewide Results The ultimate goal of the master planning process is for LSSs to create a school system master plan that focuses on student achievement and is consistent with the performance targets established by the Maryland State Department of Education for each NCLB Goal Area. Regarding this goal, a summary of statewide progress is listed below.
1. 87.1% of all students are at or above the proficient level in reading/language arts at the elementary school level(2009 AMO = 76.5%); additionally, all subgroups made Adequate Yearly Progress (AYP), including the subgroup of students receiving special education services, who made AYP with Safe Harbor.
2. 85.1% of all students are at or above the proficient level in mathematics at the
elementary school level (2009 AMO = 74.2%); additionally, all subgroups made AYP, except the subgroup of students receiving special education services.
3. At the middle school level, 81.8% of all students are at or above the proficient
level in reading/language arts (2009 AMO = 75.9%); in addition, all subgroups made AYP, with African American, Hispanic, Free/Reduced Meals, Special Education, and LEP subgroups making AYP with Safe Harbor.
4. Additionally, at the middle school level, 71.4% of all students are at or above
the proficient level in mathematics (2009 AMO = 64.3%); also, all subgroups, except African American, Hispanic, and students receiving special education services, made AYP. Among the subgroups that made AYP, the Free/Reduced Meals and LEP subgroups made AYP with Safe Harbor.
5. At the high school level, 83.9% of all students are at or above the proficient
level on the English 2 assessment (2009 AMO = 65.8%); additionally, all subgroups of students except students receiving special education services, made AYP.
6. In addition, at the high school level, 85.7% of all students are at or above the proficient level on the Algebra/Data Analysis assessment (2009 AMO = 56.1%); moreover, all subgroups made AYP.
7. Slightly over 86% percent of Maryland elementary and middle schools made Adequate Yearly Progress (AYP).

2009 Master Plan Annual Update Review
13
8. One school system (Baltimore City Public Schools) exited School System in Corrective Action.
9. Of the LSSs that have ELL students enrolled, all LSSs but 4 LSSs (Kent, Saint Mary’s, Washington, and Wicomico) met the target for the percentage of children making progress in learning English this school year (AMAO I = 56%); twelve LSSs met the target for the number or percentage of children attaining English proficiency by the end of the school year (AMAO II = 15%); and all LSSs except Prince George’s County and Baltimore City Schools made adequate yearly progress for limited English proficient children (AMAO III).
10. The percentage of Core Academic Subject Classes (CAS) taught by Highly
Qualified Teachers (HQT) improved from 66.8% in 2003‐2004 to 88.5% in 2008‐2009, but still falls short of the HQT target of 100%.
11. Only one school system (Baltimore City Schools) had any schools identified by
the State as persistently dangerous, and there were 4 of them.3 12. The graduation rate of 85.24% for the State of Maryland is slightly under the
2009 AMO of 85.5%; yet, the dropout rate of 2.80% meets the State satisfactory standard of 3.00% or less.
3 Although eight schools were named, four of them were closed, and four more continue to count as “persistently dangerous” for school year 2009‐2010.
2009 Master Plan Annual Update Review
14
Section 6: Review Process Outcomes Panel Reviews
Maryland’s annual review of local school system Master Plan Annual Updates involves a peer review process. Using this process, educators from MSDE and the local school systems are assigned to review panels.
In 2009, members of each of seven panels evaluated the Annual Updates individually (Initial Review). Then panel members participated in caucuses to arrive at a consensus decision on the approvable status of the Annual Updates. During the panel discussion, panelists identified areas of the Annual Update that needed further work, as well as areas of commendable achievements that the school system demonstrated in meeting or exceeding State standards. Each panel forwarded the commendations and, if necessary, requests that they had for additional information from the local school system. In turn, local school system staff responded in writing to the requests (Clarification Review) that they received for additional information. Differentiated Review This year, several school systems were recognized for attaining performance thresholds for district‐level AYP and schools in improvement for a three‐year period. As a result of attaining such high performance levels, these school systems were able to forego a panel review; however, the plans submitted were still reviewed for compliance with federal and State requirements (Compliance Review). Certain school systems are required to have more intensive reviews and, as a result, are invited to a face‐to‐face meeting review (Meeting Review). The meeting review is required of any local school system that has been designated with the status of School System in Improvement or Corrective Action. Representatives from the school systems may be asked to share additional information about their plans for improving student achievement and closing achievement gaps.
Peer Review Results
The results of the content review are listed below:
Compliance Review, without a Panel Review
− Six local school systems (Allegany, Calvert, Carroll, Garrett, Washington, and Worcester) were informed that, as a result of attaining district AYP and schools in improvement thresholds for three consecutive years, their plan updates would be reviewed by MSDE staff for compliance only.

2009 Master Plan Annual Update Review
15
Initial Review (October 15‐ 30)
− Eighteen school systems had their plans reviewed by panels.
− Each panel had from twelve and fifteen reviewers. Each reviewer was assigned two or three plans to read. There were seven panels. Each panel reached consensus on the approvability of the plan update based on adequate progress and sufficient responses to data deficiencies.
− 18 LSSs received requests for clarifications.
Clarification Review (November 10 & 12)
− All clarifications provided by the LSSs were deemed by the panels to be sufficient.
Meeting Review (November 16)
− Prince George’s County was required to attend a Meeting Review since it continues to be designated as a School System in Corrective Action.
− Although Dorchester County was not required to attend a Meeting Review, the
panel reviewers had concerns about some of the clarifications that the school system provided. These concerns were conveyed to the school systems, and will be addressed as part of a collaborative agreement between the MSDE Breakthrough Center and Dorchester County Public Schools.
Final Review
For the Final Review, each local school system was required to submit a final Annual Update to MSDE no later than November 23, 2009. The reviewers (panel reviewers and MSDE program managers) then reviewed the final submissions to ensure that all corrections and additions were incorporated.
2009 Master Plan Annual Update Review
16
Section 7: Local School System Master Plan Goal Progress
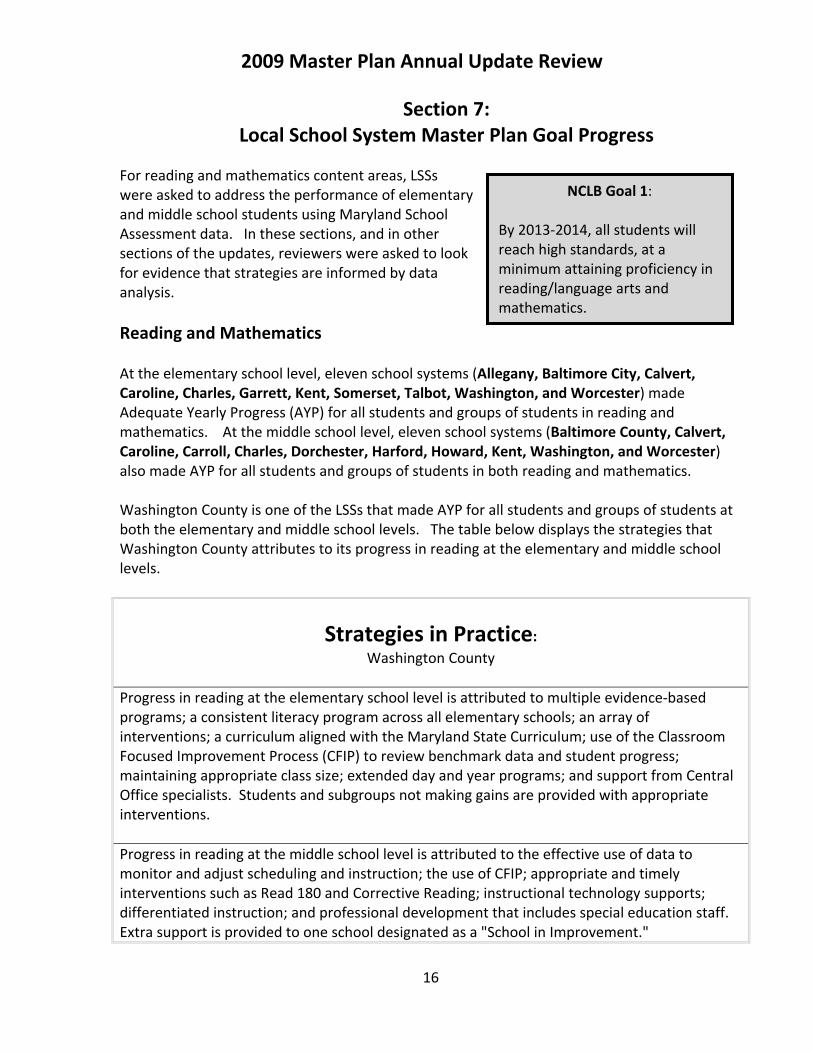
For reading and mathematics content areas, LSSs were asked to address the performance of elementary and middle school students using Maryland School Assessment data. In these sections, and in other sections of the updates, reviewers were asked to look for evidence that strategies are informed by data analysis.
Reading and Mathematics At the elementary school level, eleven school systems (Allegany, Baltimore City, Calvert, Caroline, Charles, Garrett, Kent, Somerset, Talbot, Washington, and Worcester) made Adequate Yearly Progress (AYP) for all students and groups of students in reading and mathematics. At the middle school level, eleven school systems (Baltimore County, Calvert, Caroline, Carroll, Charles, Dorchester, Harford, Howard, Kent, Washington, and Worcester) also made AYP for all students and groups of students in both reading and mathematics. Washington County is one of the LSSs that made AYP for all students and groups of students at both the elementary and middle school levels. The table below displays the strategies that Washington County attributes to its progress in reading at the elementary and middle school levels.
Strategies in Practice: Washington County
Progress in reading at the elementary school level is attributed to multiple evidence‐based programs; a consistent literacy program across all elementary schools; an array of interventions; a curriculum aligned with the Maryland State Curriculum; use of the Classroom Focused Improvement Process (CFIP) to review benchmark data and student progress; maintaining appropriate class size; extended day and year programs; and support from Central Office specialists. Students and subgroups not making gains are provided with appropriate interventions. Progress in reading at the middle school level is attributed to the effective use of data to monitor and adjust scheduling and instruction; the use of CFIP; appropriate and timely interventions such as Read 180 and Corrective Reading; instructional technology supports; differentiated instruction; and professional development that includes special education staff. Extra support is provided to one school designated as a "School in Improvement."
NCLB Goal 1: By 2013‐2014, all students will reach high standards, at a minimum attaining proficiency in reading/language arts and mathematics.

2009 Master Plan Annual Update Review
17
The next table displays the strategies that Washington County attributes to its progress in mathematics at the elementary and middle school levels.
Strategies in Practice: Washington County
Progress in mathematics at the elementary school is attributed to: a comprehensive math program from pre‐K to 12; end of unit benchmark assessments that mirror the Maryland State Curriculum and the Maryland School Assessment; additional planning time for teachers; appropriate class size; the use of the Classroom Focused Improvement Process; focused professional development; classroom inter‐visitations; inclusion of special education staff in professional development and teaming; appropriate interventions and materials; and extended day and extended year programs. Gains in math at the middle school level are attributed to: intensive professional development; benchmark assessments aligned with MSC; differentiated instruction; use of National Council of Teachers of Mathematics (NCTM) standards; Mathematics Improvement Plans for struggling students; inclusion of special education staff in teaming; adjustment of instructional materials; use of Voyager Math program; incorporating literature, reading, and writing skills with math instruction; and the use of multiple interventions. The next section reports some examples of how local school systems are adjusting their instructional programs to improve student outcomes in the content areas of reading and mathematics, as well as science. Some similarities in these adjustments include the following:
• Refining the district curriculum for better alignment with State standards and assessments (Washington, Garrett, Carroll, St. Mary's, and Dorchester);
• Making instructional decisions based on assessment data (Washington, Howard, Garrett, Calvert, Somerset, Allegany, Carroll, and Dorchester); and
• Utilizing research‐based practices and differentiated instruction (Garrett, Queen Anne's, and St. Mary's) so that more students and groups of students learn at high levels.
2009 Master Plan Annual Update Review
18
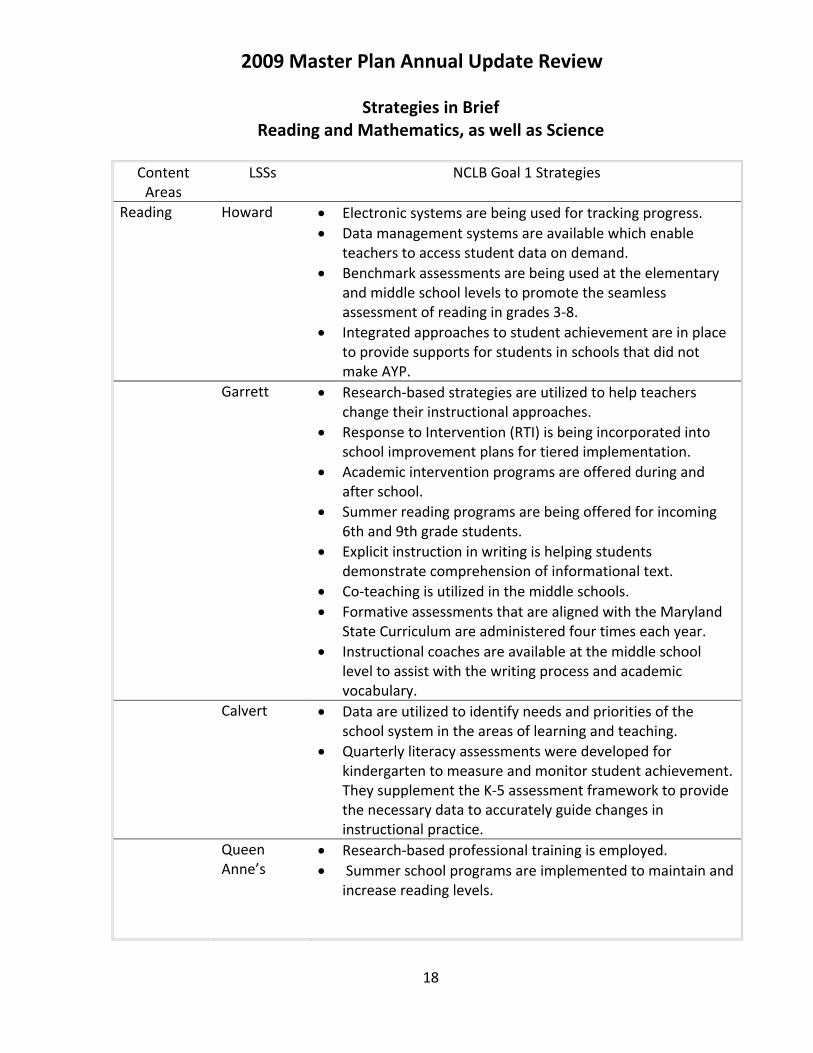
Strategies in Brief Reading and Mathematics, as well as Science
Content Areas
LSSs NCLB Goal 1 Strategies
Reading
Howard
• Electronic systems are being used for tracking progress. • Data management systems are available which enable
teachers to access student data on demand. • Benchmark assessments are being used at the elementary
and middle school levels to promote the seamless assessment of reading in grades 3‐8.
• Integrated approaches to student achievement are in place to provide supports for students in schools that did not make AYP.
Garrett
• Research‐based strategies are utilized to help teachers change their instructional approaches.
• Response to Intervention (RTI) is being incorporated into school improvement plans for tiered implementation.
• Academic intervention programs are offered during and after school.
• Summer reading programs are being offered for incoming 6th and 9th grade students.
• Explicit instruction in writing is helping students demonstrate comprehension of informational text.
• Co‐teaching is utilized in the middle schools. • Formative assessments that are aligned with the Maryland
State Curriculum are administered four times each year. • Instructional coaches are available at the middle school
level to assist with the writing process and academic vocabulary.
Calvert
• Data are utilized to identify needs and priorities of the school system in the areas of learning and teaching.
• Quarterly literacy assessments were developed for kindergarten to measure and monitor student achievement. They supplement the K‐5 assessment framework to provide the necessary data to accurately guide changes in instructional practice.
Queen Anne’s
• Research‐based professional training is employed. • Summer school programs are implemented to maintain and
increase reading levels.
2009 Master Plan Annual Update Review
19
Content Areas
LSSs NCLB Goal 1 Strategies
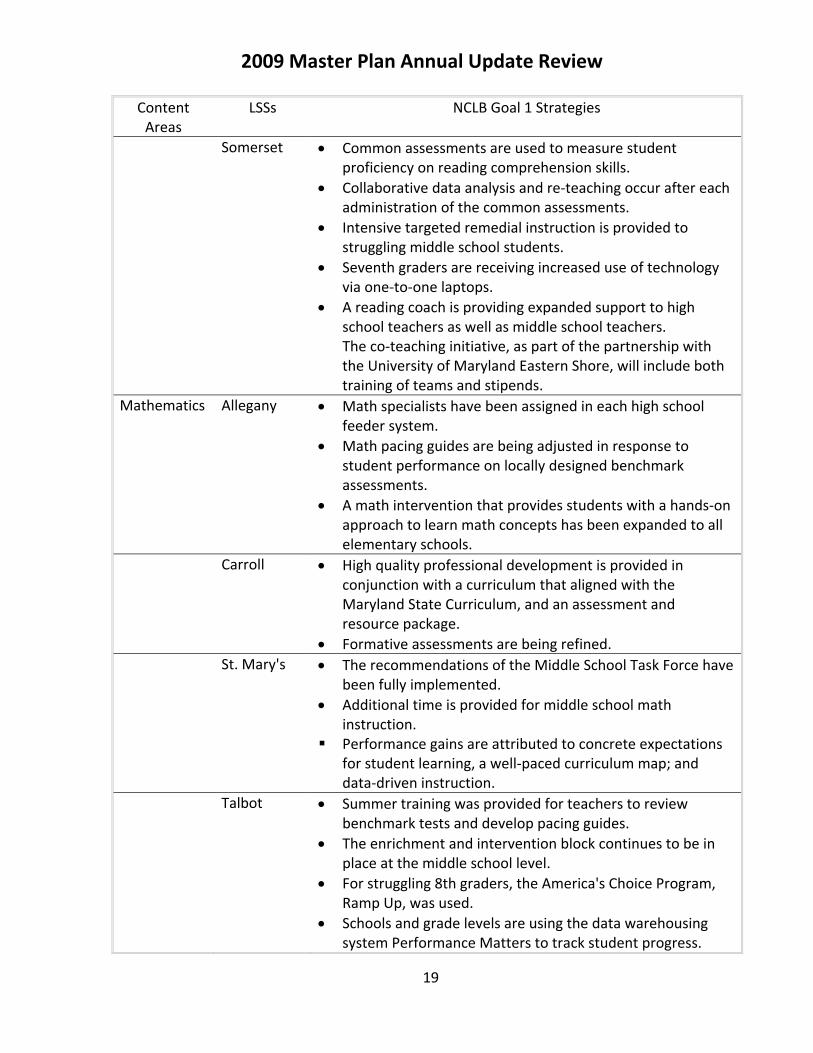
Somerset
• Common assessments are used to measure student proficiency on reading comprehension skills.
• Collaborative data analysis and re‐teaching occur after each administration of the common assessments.
• Intensive targeted remedial instruction is provided to struggling middle school students.
• Seventh graders are receiving increased use of technology via one‐to‐one laptops.
• A reading coach is providing expanded support to high school teachers as well as middle school teachers. The co‐teaching initiative, as part of the partnership with the University of Maryland Eastern Shore, will include both training of teams and stipends.
Mathematics
Allegany
• Math specialists have been assigned in each high school feeder system.
• Math pacing guides are being adjusted in response to student performance on locally designed benchmark assessments.
• A math intervention that provides students with a hands‐on approach to learn math concepts has been expanded to all elementary schools.
Carroll
• High quality professional development is provided in conjunction with a curriculum that aligned with the Maryland State Curriculum, and an assessment and resource package.
• Formative assessments are being refined. St. Mary's
• The recommendations of the Middle School Task Force have been fully implemented.
• Additional time is provided for middle school math instruction.
Performance gains are attributed to concrete expectations for student learning, a well‐paced curriculum map; and data‐driven instruction.
Talbot
• Summer training was provided for teachers to review benchmark tests and develop pacing guides.
• The enrichment and intervention block continues to be in place at the middle school level.
• For struggling 8th graders, the America's Choice Program, Ramp Up, was used.
• Schools and grade levels are using the data warehousing system Performance Matters to track student progress.
2009 Master Plan Annual Update Review
20
Content Areas
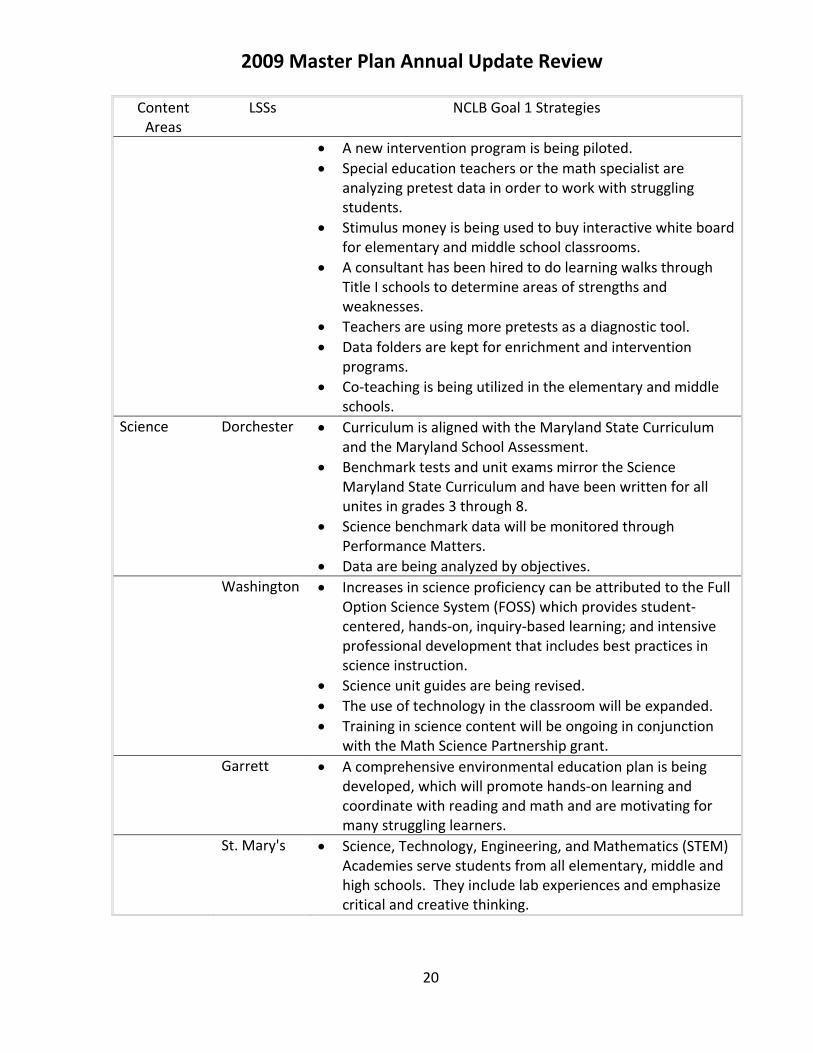
LSSs NCLB Goal 1 Strategies
• A new intervention program is being piloted. • Special education teachers or the math specialist are
analyzing pretest data in order to work with struggling students.
• Stimulus money is being used to buy interactive white board for elementary and middle school classrooms.
• A consultant has been hired to do learning walks through Title I schools to determine areas of strengths and weaknesses.
• Teachers are using more pretests as a diagnostic tool. • Data folders are kept for enrichment and intervention
programs. • Co‐teaching is being utilized in the elementary and middle
schools. Science
Dorchester
• Curriculum is aligned with the Maryland State Curriculum and the Maryland School Assessment.
• Benchmark tests and unit exams mirror the Science Maryland State Curriculum and have been written for all unites in grades 3 through 8.
• Science benchmark data will be monitored through Performance Matters.
• Data are being analyzed by objectives. Washington
• Increases in science proficiency can be attributed to the Full
Option Science System (FOSS) which provides student‐centered, hands‐on, inquiry‐based learning; and intensive professional development that includes best practices in science instruction.
• Science unit guides are being revised. • The use of technology in the classroom will be expanded. • Training in science content will be ongoing in conjunction
with the Math Science Partnership grant. Garrett
• A comprehensive environmental education plan is being
developed, which will promote hands‐on learning and coordinate with reading and math and are motivating for many struggling learners.
St. Mary's
• Science, Technology, Engineering, and Mathematics (STEM) Academies serve students from all elementary, middle and high schools. They include lab experiences and emphasize critical and creative thinking.
2009 Master Plan Annual Update Review
21
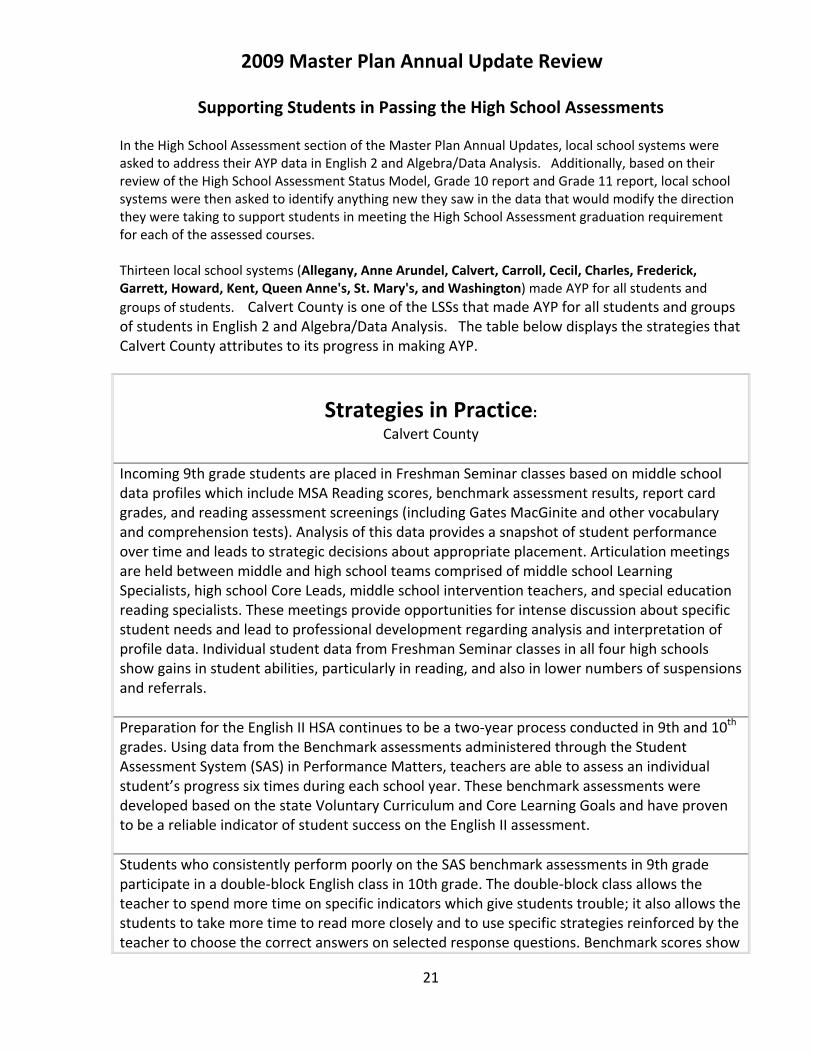
Supporting Students in Passing the High School Assessments In the High School Assessment section of the Master Plan Annual Updates, local school systems were asked to address their AYP data in English 2 and Algebra/Data Analysis. Additionally, based on their review of the High School Assessment Status Model, Grade 10 report and Grade 11 report, local school systems were then asked to identify anything new they saw in the data that would modify the direction they were taking to support students in meeting the High School Assessment graduation requirement for each of the assessed courses. Thirteen local school systems (Allegany, Anne Arundel, Calvert, Carroll, Cecil, Charles, Frederick, Garrett, Howard, Kent, Queen Anne's, St. Mary's, and Washington) made AYP for all students and groups of students. Calvert County is one of the LSSs that made AYP for all students and groups of students in English 2 and Algebra/Data Analysis. The table below displays the strategies that Calvert County attributes to its progress in making AYP.
Strategies in Practice: Calvert County
Incoming 9th grade students are placed in Freshman Seminar classes based on middle school data profiles which include MSA Reading scores, benchmark assessment results, report card grades, and reading assessment screenings (including Gates MacGinite and other vocabulary and comprehension tests). Analysis of this data provides a snapshot of student performance over time and leads to strategic decisions about appropriate placement. Articulation meetings are held between middle and high school teams comprised of middle school Learning Specialists, high school Core Leads, middle school intervention teachers, and special education reading specialists. These meetings provide opportunities for intense discussion about specific student needs and lead to professional development regarding analysis and interpretation of profile data. Individual student data from Freshman Seminar classes in all four high schools show gains in student abilities, particularly in reading, and also in lower numbers of suspensions and referrals. Preparation for the English II HSA continues to be a two‐year process conducted in 9th and 10th grades. Using data from the Benchmark assessments administered through the Student Assessment System (SAS) in Performance Matters, teachers are able to assess an individual student’s progress six times during each school year. These benchmark assessments were developed based on the state Voluntary Curriculum and Core Learning Goals and have proven to be a reliable indicator of student success on the English II assessment. Students who consistently perform poorly on the SAS benchmark assessments in 9th grade participate in a double‐block English class in 10th grade. The double‐block class allows the teacher to spend more time on specific indicators which give students trouble; it also allows the students to take more time to read more closely and to use specific strategies reinforced by the teacher to choose the correct answers on selected response questions. Benchmark scores show
2009 Master Plan Annual Update Review
22
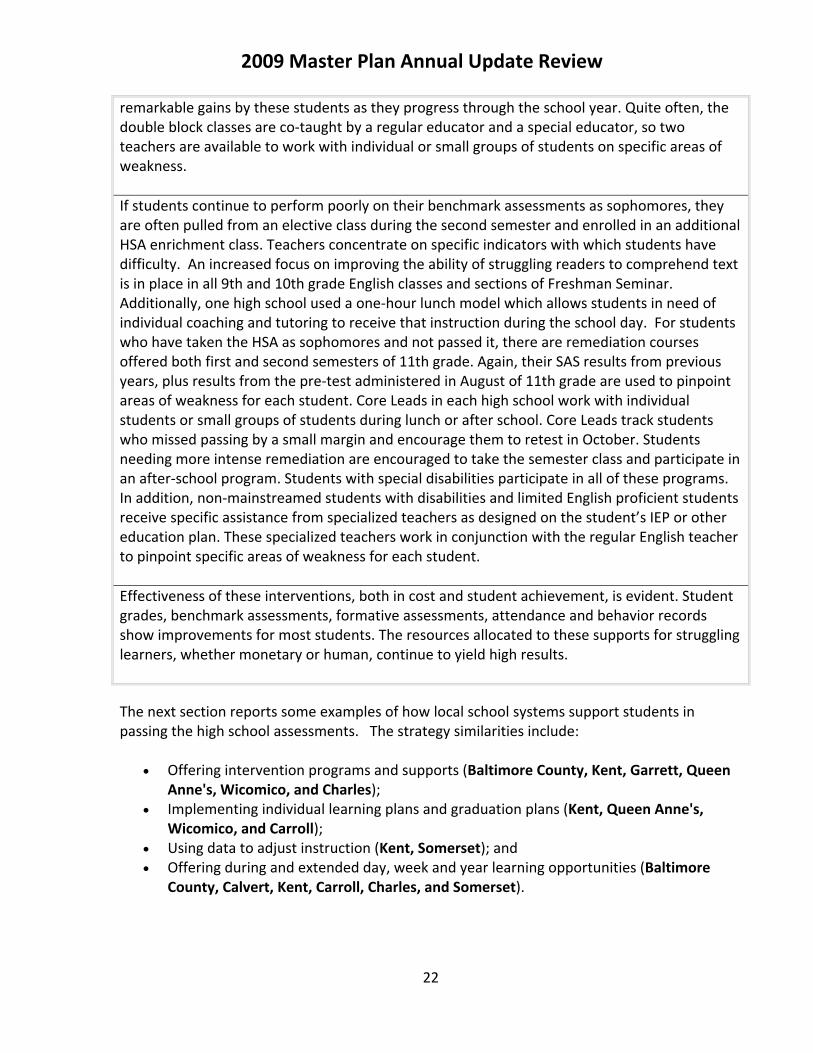
remarkable gains by these students as they progress through the school year. Quite often, the double block classes are co‐taught by a regular educator and a special educator, so two teachers are available to work with individual or small groups of students on specific areas of weakness. If students continue to perform poorly on their benchmark assessments as sophomores, they are often pulled from an elective class during the second semester and enrolled in an additional HSA enrichment class. Teachers concentrate on specific indicators with which students have difficulty. An increased focus on improving the ability of struggling readers to comprehend text is in place in all 9th and 10th grade English classes and sections of Freshman Seminar. Additionally, one high school used a one‐hour lunch model which allows students in need of individual coaching and tutoring to receive that instruction during the school day. For students who have taken the HSA as sophomores and not passed it, there are remediation courses offered both first and second semesters of 11th grade. Again, their SAS results from previous years, plus results from the pre‐test administered in August of 11th grade are used to pinpoint areas of weakness for each student. Core Leads in each high school work with individual students or small groups of students during lunch or after school. Core Leads track students who missed passing by a small margin and encourage them to retest in October. Students needing more intense remediation are encouraged to take the semester class and participate in an after‐school program. Students with special disabilities participate in all of these programs. In addition, non‐mainstreamed students with disabilities and limited English proficient students receive specific assistance from specialized teachers as designed on the student’s IEP or other education plan. These specialized teachers work in conjunction with the regular English teacher to pinpoint specific areas of weakness for each student. Effectiveness of these interventions, both in cost and student achievement, is evident. Student grades, benchmark assessments, formative assessments, attendance and behavior records show improvements for most students. The resources allocated to these supports for struggling learners, whether monetary or human, continue to yield high results. The next section reports some examples of how local school systems support students in passing the high school assessments. The strategy similarities include:
• Offering intervention programs and supports (Baltimore County, Kent, Garrett, Queen Anne's, Wicomico, and Charles);
• Implementing individual learning plans and graduation plans (Kent, Queen Anne's, Wicomico, and Carroll);
• Using data to adjust instruction (Kent, Somerset); and • Offering during and extended day, week and year learning opportunities (Baltimore
County, Calvert, Kent, Carroll, Charles, and Somerset).

2009 Master Plan Annual Update Review
23
Strategies in Brief High School Assessments
LSSs How LSSs Support Students in Passing the High School Assessments
Baltimore County
• A course has been designed for students who have not passed the test as first‐time takers.
• Remediation classes are held after school and on Saturdays. Calvert
• A co‐teaching specialist has been hired for the purpose of refining the
co‐teaching model in the high schools. • A three‐phase summer school program was held. Phase One was a
one‐week program for students who were close to passing; Phase Two was a four‐week program for students with greater need; and Phase Three was a Bridge Camp for students to complete projects in the summer rather than during the school year.
• Each high school has set aside one hour during the day for every high school student to eat lunch for 30 minutes and participate in instructional activities for 30 minutes. During the instructional time, teachers can provide additional remediation and tutoring.
Kent
• Teachers were trained on how to use data to adjust instruction. • Individual student plans were developed, and then monitored
throughout the year. • A database of High School Assessments scores was created and used to
help monitor student progress. • A High School Assessment seminar period was instituted at the high
school and used to provide remediation in the four assessed content areas and to provide support for the completion of Bridge projects.
Montgomery
• Data warehouse High School Assessment reports are sent to district offices and all high schools each month. Student performance and attendance data can be filtered to identify students who are underperforming or in danger of underperforming.
• Ninth and Tenth‐Grade Literacy Reports are accessed through myMCPS portal and include student performance data on most recent MSA, PSAT and Measures of Academic Progress‐ Reading (MAP‐R) scores, and grades and exam scores for English 9 and English 10. Teachers and administrators use these reports to identify students who are underperforming and who may benefit from intervention.
• The Achievement Series reporting tool contains student performance data on English exams, English formative assessments, and High School Assessment practice tests. Student data can be disaggregated and analyzed to determine specific areas of need and to make instructional decisions, including matching appropriate interventions to address student needs.
2009 Master Plan Annual Update Review
24
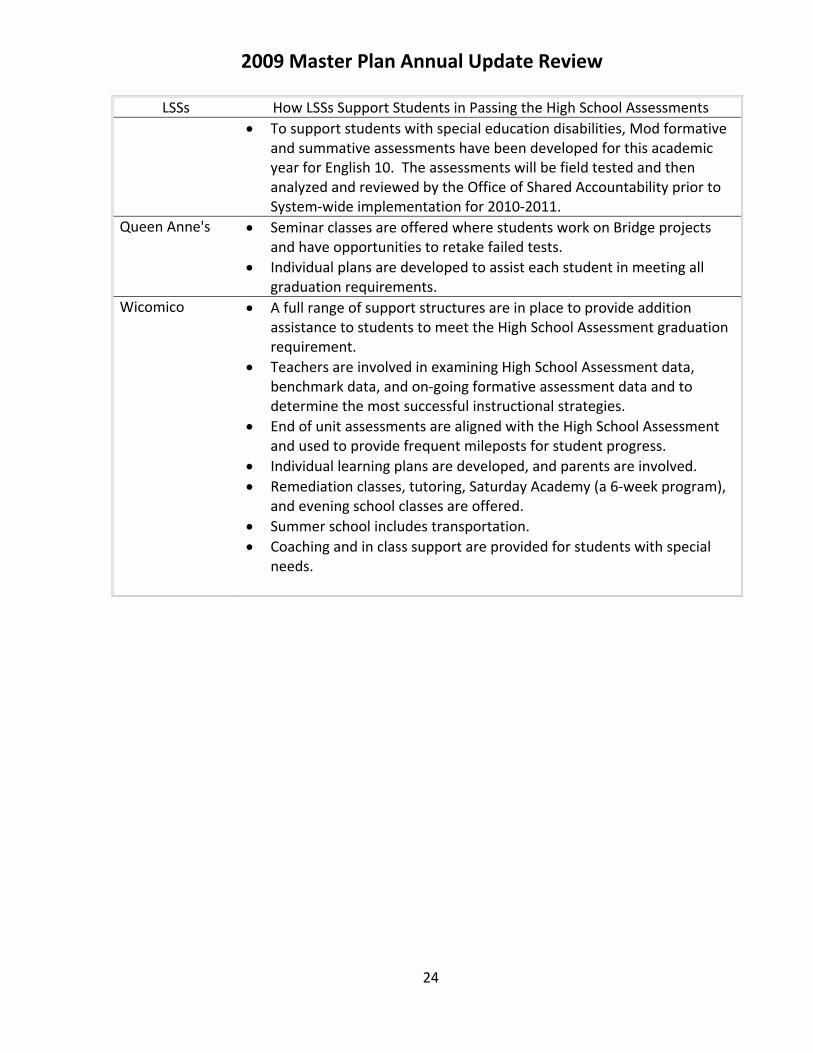
LSSs How LSSs Support Students in Passing the High School Assessments • To support students with special education disabilities, Mod formative
and summative assessments have been developed for this academic year for English 10. The assessments will be field tested and then analyzed and reviewed by the Office of Shared Accountability prior to System‐wide implementation for 2010‐2011.
Queen Anne's
• Seminar classes are offered where students work on Bridge projects and have opportunities to retake failed tests.
• Individual plans are developed to assist each student in meeting all graduation requirements.
Wicomico
• A full range of support structures are in place to provide addition assistance to students to meet the High School Assessment graduation requirement.
• Teachers are involved in examining High School Assessment data, benchmark data, and on‐going formative assessment data and to determine the most successful instructional strategies.
• End of unit assessments are aligned with the High School Assessment and used to provide frequent mileposts for student progress.
• Individual learning plans are developed, and parents are involved. • Remediation classes, tutoring, Saturday Academy (a 6‐week program),
and evening school classes are offered. • Summer school includes transportation. • Coaching and in class support are provided for students with special
needs.

2009 Master Plan Annual Update Review
25
Strategies in Brief High School Assessment Graduation Requirement
LSSs How LSSs Support Rising Seniors in Meeting the HSA Graduation Requirement Carroll
• Academic facilitators at each high school track the progress of students in meeting the High School Assessment requirement for graduation.
• Individual graduation plans are developed, and intervention and remediation (pull‐out programs, after‐school tutoring, test preparation sessions, Bridge Plan for Academic Validation, on‐line options) are discussed.
• 1.0 FTE has been provided to each high school to provide remediation services for the High School Assessments.
• Schedules at four of eight high schools will be changed ruing the 2009‐2010 school year to provide time for student access to any of their teachers to receive extra assistance.
Charles
• A Bridge class period will continue to be promoted as the second academic intervention class a student takes in order to meet the HSA graduation requirement.
• ARRA funds will be used to cover the costs of teacher stipends (review panels), materials of Instruction for the different projects, professional Development for the Bridge teachers, and development of parallel assignments and teacher resources.
Garrett
• Schools have created essentials' courses (year long courses) for students who have not passed the High School Assessment subject test after the second attempt.
Kent
• Individual plans will be developed, in collaboration with parents, and then monitored and adjusted as necessary.
• Algebra teachers work with the research‐based Mobius materials, the MSDE online algebra course, the released practice tests for both MOD and regular HSAs, and online practice HSAs. Students track their own data and put extra time into their own areas of weakness. Instruction is highly individualized.
• A special education position at the high school has been restructured in order to provide a focus on mathematics instruction. This special education teacher works for most of his day with students at risk of not passing the HSA in Algebra/Data Analysis, most of whom are special education, African American, or both.
• With a focus on African American and special education student needs, students who have been identified as at‐risk in mathematics through teacher recommendations, test scores, and class grades, who are in their first or second years at Kent County High School have been enrolled in the year‐long, research‐based, Carnegie Algebra program. This program is both computer and classroom based and is co‐taught be a regular and a special educator, in order to provide these students both with an alternative method of learning the material and the individualized attention necessary to ensure their success.

2009 Master Plan Annual Update Review
26
LSSs How LSSs Support Rising Seniors in Meeting the HSA Graduation Requirement Somerset
• One high school has added a 30 minute “Access” period for all students.
Students needing tutoring or time to complete Bridge projects will utilize this period. This period is the result of restructuring the school day to include a “One Hour” lunch period.
• A Bridge monitor has been assigned to work with students individually. • Inservice sessions are being offered for high school teachers on analyzing
data to help focus instruction for High School Assessment success. Wicomico
• High school schedules were been adjusted to accommodate HSA intervention
and Bridge classes. • Juniors were strongly encouraged to take advantage of summer opportunities
to prepare to retake the HSAs and/or complete Bridge projects. • Four Facilitating Teachers were hired. T hey will maintain a close working
relationship with students not having passed one or more HSA's. • The school system is looking at incentives that could be attractive to high
school students to encourage them to pass the HSA rather than rely on Bridge projects to fulfill the requirement (e.g., being allowed to have a study hall, preferred parking locations).
• Certain "senior bonuses" were removed from schedules (i.e. late arrival, early dismissal) in order to provide additional time for instruction/remediation/support for students in the HSA‐assessed areas.
2009 Master Plan Annual Update Review
27
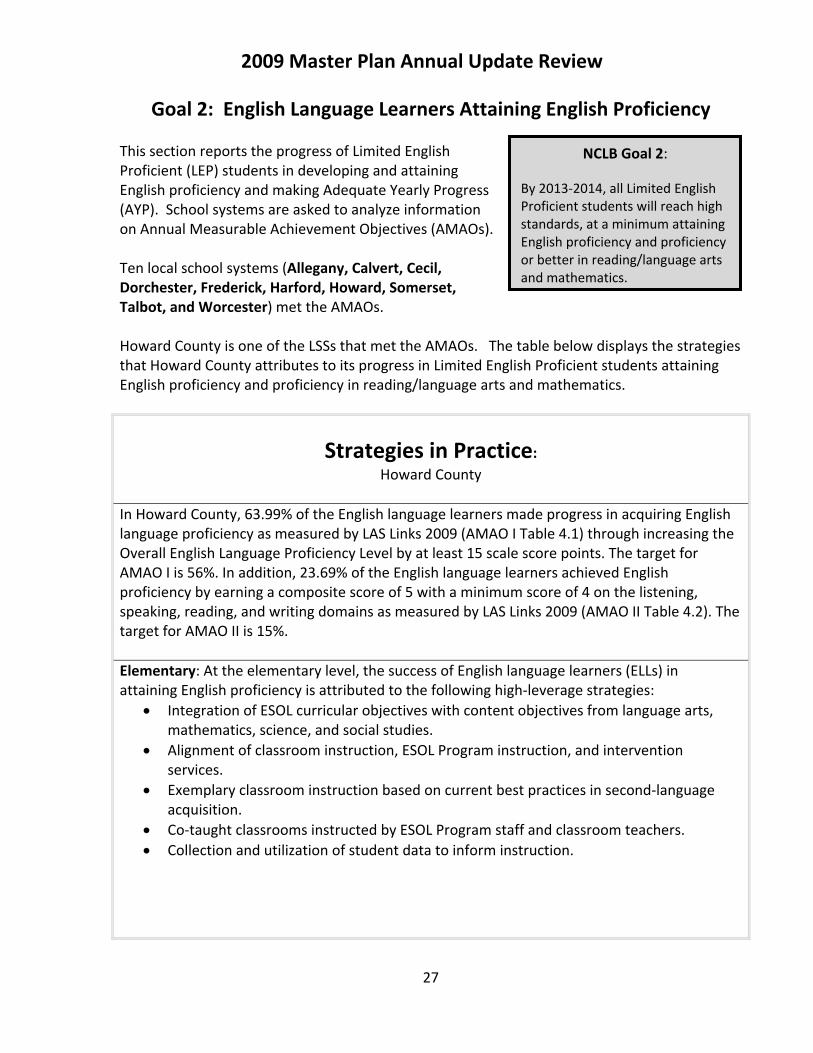
NCLB Goal 2: By 2013‐2014, all Limited English Proficient students will reach high standards, at a minimum attaining English proficiency and proficiency or better in reading/language arts and mathematics.
Goal 2: English Language Learners Attaining English Proficiency This section reports the progress of Limited English Proficient (LEP) students in developing and attaining English proficiency and making Adequate Yearly Progress (AYP). School systems are asked to analyze information on Annual Measurable Achievement Objectives (AMAOs). Ten local school systems (Allegany, Calvert, Cecil, Dorchester, Frederick, Harford, Howard, Somerset, Talbot, and Worcester) met the AMAOs. Howard County is one of the LSSs that met the AMAOs. The table below displays the strategies that Howard County attributes to its progress in Limited English Proficient students attaining English proficiency and proficiency in reading/language arts and mathematics.
Strategies in Practice: Howard County
In Howard County, 63.99% of the English language learners made progress in acquiring English language proficiency as measured by LAS Links 2009 (AMAO I Table 4.1) through increasing the Overall English Language Proficiency Level by at least 15 scale score points. The target for AMAO I is 56%. In addition, 23.69% of the English language learners achieved English proficiency by earning a composite score of 5 with a minimum score of 4 on the listening, speaking, reading, and writing domains as measured by LAS Links 2009 (AMAO II Table 4.2). The target for AMAO II is 15%. Elementary: At the elementary level, the success of English language learners (ELLs) in attaining English proficiency is attributed to the following high‐leverage strategies:
• Integration of ESOL curricular objectives with content objectives from language arts, mathematics, science, and social studies.
• Alignment of classroom instruction, ESOL Program instruction, and intervention services.
• Exemplary classroom instruction based on current best practices in second‐language acquisition.
• Co‐taught classrooms instructed by ESOL Program staff and classroom teachers. • Collection and utilization of student data to inform instruction.

2009 Master Plan Annual Update Review
28
Strategies in Practice: Howard County
Middle: At the middle school level, the success of ELLs in attaining English proficiency is attributed to the following high‐leverage strategies:
• Alignment of ESOL curriculum to both the State Curriculum English proficiency and content standards.
• Provision of sheltered language arts instruction that integrates ESOL curricular objectives with content objectives from language arts, science, and social studies.
• Exemplary classroom instruction based on current best practices in second‐language acquisition.
• Collection and utilization of student data to inform instruction.
High: At the high school level, the success of ELLs in attaining English proficiency is attributed to the following high‐leverage strategies:
• Alignment of ESOL curriculum to both the State Curriculum English proficiency and content standards.
• Provision of a series of sheltered language arts courses that integrate ESOL curricular objectives with content objectives from language arts, science, and social studies.
• Provision of a series of US History courses to provide focused preparation for the American Government High School Assessment (HSA).
• Co‐taught classrooms instructed by ESOL Program staff and teachers in the HSA‐assessed courses.
• Implementation of a Newcomer ELL Program that includes English language development through a content‐based approach and intense instruction in mathematics.
The next section reports some examples of how local school systems are adjusting their instructional programs to provide extra assistance to English Language Learners (ELLs) in attaining English proficiency and proficiency in reading and mathematics. Some similarities in the strategies in place include the following:
• Utilizing district curriculum that is aligned with State standards and assessments (Howard, Allegany, Frederick);
• Making instructional decisions based on assessment data (Howard, Allegany, Frederick, Calvert, Somerset); and
• Utilizing research‐based practices and differentiated instruction (Howard, Allegany, Frederic, Somerset, Queen Anne’s) in regular classrooms.
• Collaboration among ELL teachers, classroom teachers, and other staff members in order to provide the research‐based strategies necessary to accelerate English language acquisition among ELL children (Frederick, Calvert) .
2009 Master Plan Annual Update Review
29
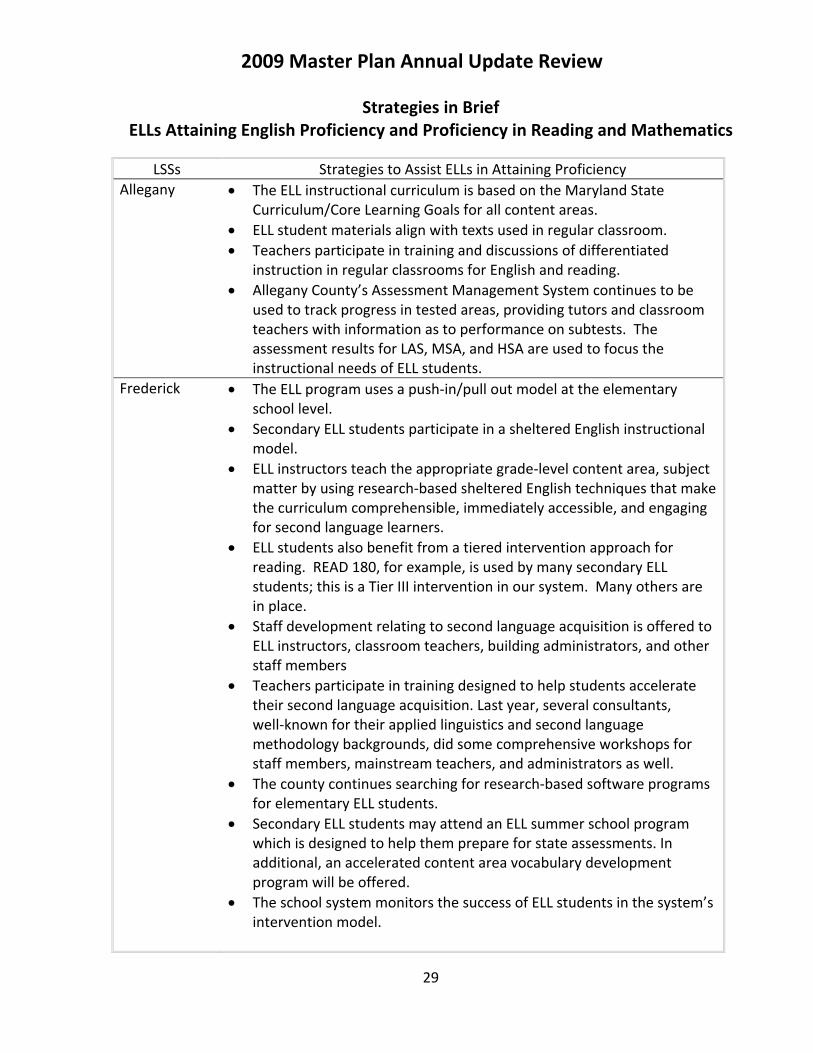
Strategies in Brief ELLs Attaining English Proficiency and Proficiency in Reading and Mathematics
LSSs Strategies to Assist ELLs in Attaining Proficiency Allegany
• The ELL instructional curriculum is based on the Maryland State
Curriculum/Core Learning Goals for all content areas. • ELL student materials align with texts used in regular classroom. • Teachers participate in training and discussions of differentiated
instruction in regular classrooms for English and reading. • Allegany County’s Assessment Management System continues to be
used to track progress in tested areas, providing tutors and classroom teachers with information as to performance on subtests. The assessment results for LAS, MSA, and HSA are used to focus the instructional needs of ELL students.
Frederick
• The ELL program uses a push‐in/pull out model at the elementary school level.
• Secondary ELL students participate in a sheltered English instructional model.
• ELL instructors teach the appropriate grade‐level content area, subject matter by using research‐based sheltered English techniques that make the curriculum comprehensible, immediately accessible, and engaging for second language learners.
• ELL students also benefit from a tiered intervention approach for reading. READ 180, for example, is used by many secondary ELL students; this is a Tier III intervention in our system. Many others are in place.
• Staff development relating to second language acquisition is offered to ELL instructors, classroom teachers, building administrators, and other staff members
• Teachers participate in training designed to help students accelerate their second language acquisition. Last year, several consultants, well‐known for their applied linguistics and second language methodology backgrounds, did some comprehensive workshops for staff members, mainstream teachers, and administrators as well.
• The county continues searching for research‐based software programs for elementary ELL students.
• Secondary ELL students may attend an ELL summer school program which is designed to help them prepare for state assessments. In additional, an accelerated content area vocabulary development program will be offered.
• The school system monitors the success of ELL students in the system’s intervention model.
2009 Master Plan Annual Update Review
30
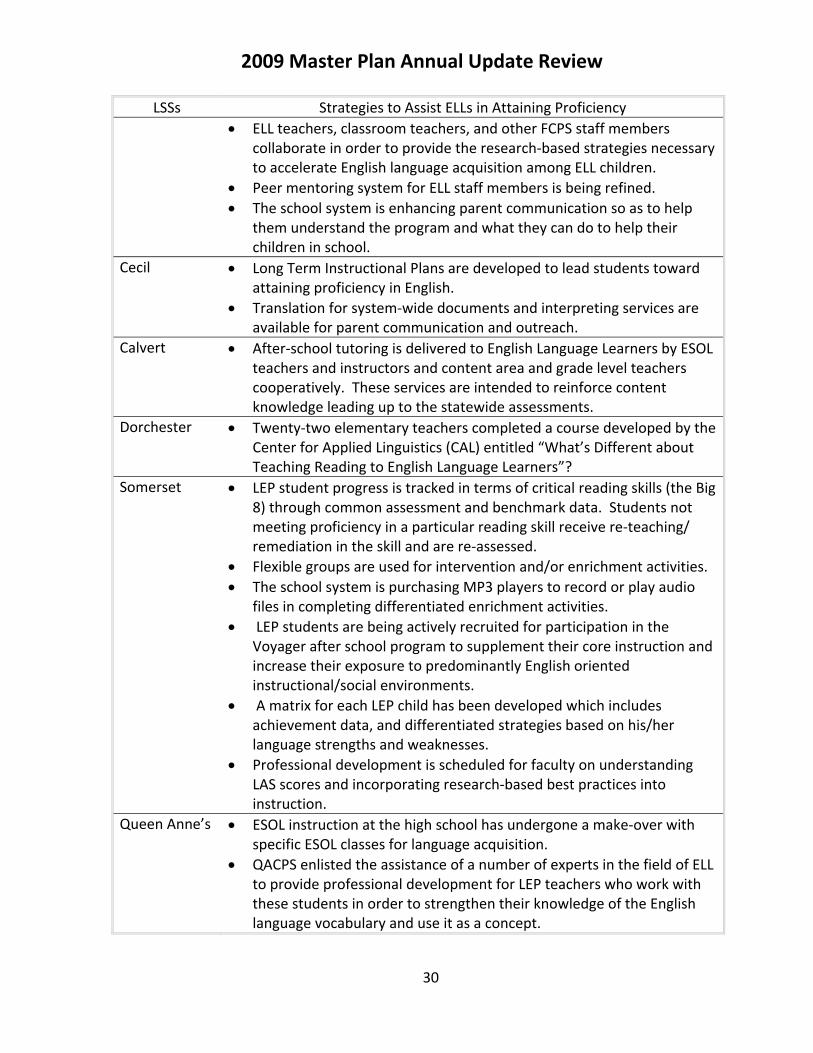
LSSs Strategies to Assist ELLs in Attaining Proficiency • ELL teachers, classroom teachers, and other FCPS staff members
collaborate in order to provide the research‐based strategies necessary to accelerate English language acquisition among ELL children.
• Peer mentoring system for ELL staff members is being refined. • The school system is enhancing parent communication so as to help
them understand the program and what they can do to help their children in school.
Cecil
• Long Term Instructional Plans are developed to lead students toward attaining proficiency in English.
• Translation for system‐wide documents and interpreting services are available for parent communication and outreach.
Calvert
• After‐school tutoring is delivered to English Language Learners by ESOL teachers and instructors and content area and grade level teachers cooperatively. These services are intended to reinforce content knowledge leading up to the statewide assessments.
Dorchester
• Twenty‐two elementary teachers completed a course developed by the Center for Applied Linguistics (CAL) entitled “What’s Different about Teaching Reading to English Language Learners”?
Somerset
• LEP student progress is tracked in terms of critical reading skills (the Big 8) through common assessment and benchmark data. Students not meeting proficiency in a particular reading skill receive re‐teaching/ remediation in the skill and are re‐assessed.
• Flexible groups are used for intervention and/or enrichment activities. • The school system is purchasing MP3 players to record or play audio
files in completing differentiated enrichment activities. • LEP students are being actively recruited for participation in the
Voyager after school program to supplement their core instruction and increase their exposure to predominantly English oriented instructional/social environments.
• A matrix for each LEP child has been developed which includes achievement data, and differentiated strategies based on his/her language strengths and weaknesses.
• Professional development is scheduled for faculty on understanding LAS scores and incorporating research‐based best practices into instruction.
Queen Anne’s
• ESOL instruction at the high school has undergone a make‐over with specific ESOL classes for language acquisition.
• QACPS enlisted the assistance of a number of experts in the field of ELL to provide professional development for LEP teachers who work with these students in order to strengthen their knowledge of the English language vocabulary and use it as a concept.
2009 Master Plan Annual Update Review
31
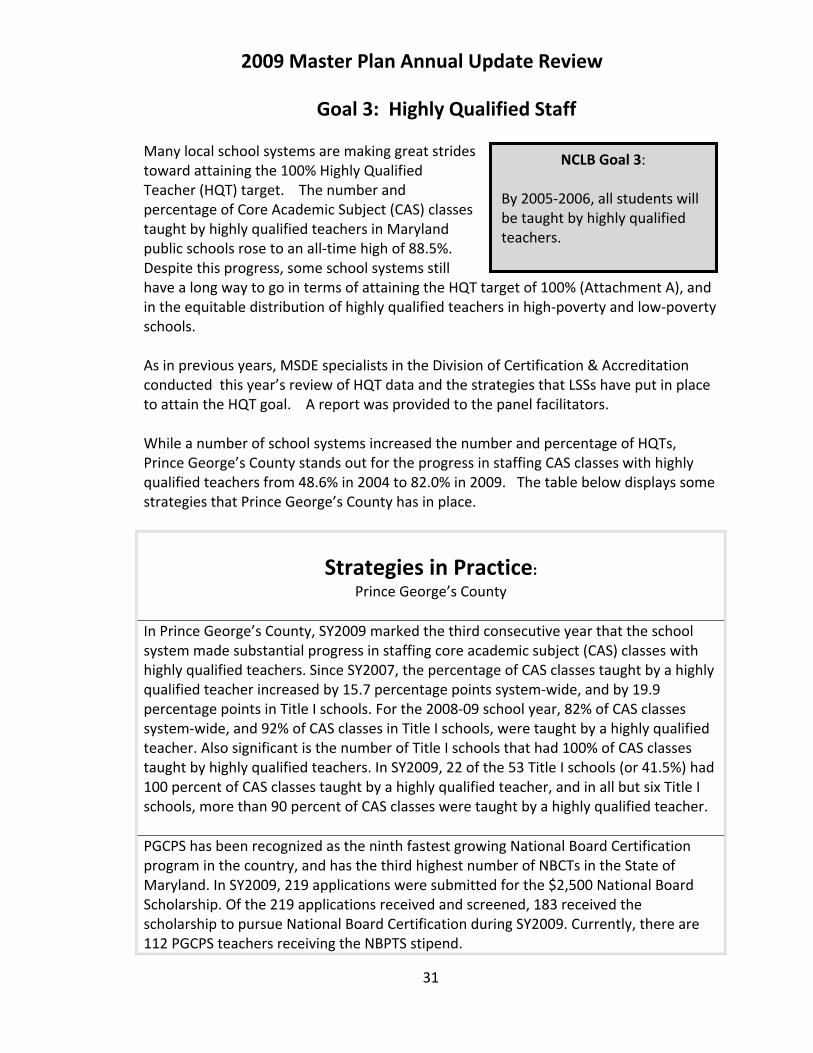
Goal 3: Highly Qualified Staff Many local school systems are making great strides toward attaining the 100% Highly Qualified Teacher (HQT) target. The number and percentage of Core Academic Subject (CAS) classes taught by highly qualified teachers in Maryland public schools rose to an all‐time high of 88.5%. Despite this progress, some school systems still have a long way to go in terms of attaining the HQT target of 100% (Attachment A), and in the equitable distribution of highly qualified teachers in high‐poverty and low‐poverty schools. As in previous years, MSDE specialists in the Division of Certification & Accreditation conducted this year’s review of HQT data and the strategies that LSSs have put in place to attain the HQT goal. A report was provided to the panel facilitators. While a number of school systems increased the number and percentage of HQTs, Prince George’s County stands out for the progress in staffing CAS classes with highly qualified teachers from 48.6% in 2004 to 82.0% in 2009. The table below displays some strategies that Prince George’s County has in place.
Strategies in Practice: Prince George’s County
In Prince George’s County, SY2009 marked the third consecutive year that the school system made substantial progress in staffing core academic subject (CAS) classes with highly qualified teachers. Since SY2007, the percentage of CAS classes taught by a highly qualified teacher increased by 15.7 percentage points system‐wide, and by 19.9 percentage points in Title I schools. For the 2008‐09 school year, 82% of CAS classes system‐wide, and 92% of CAS classes in Title I schools, were taught by a highly qualified teacher. Also significant is the number of Title I schools that had 100% of CAS classes taught by highly qualified teachers. In SY2009, 22 of the 53 Title I schools (or 41.5%) had 100 percent of CAS classes taught by a highly qualified teacher, and in all but six Title I schools, more than 90 percent of CAS classes were taught by a highly qualified teacher. PGCPS has been recognized as the ninth fastest growing National Board Certification program in the country, and has the third highest number of NBCTs in the State of Maryland. In SY2009, 219 applications were submitted for the $2,500 National Board Scholarship. Of the 219 applications received and screened, 183 received the scholarship to pursue National Board Certification during SY2009. Currently, there are 112 PGCPS teachers receiving the NBPTS stipend.
NCLB Goal 3: By 2005‐2006, all students will be taught by highly qualified teachers.

2009 Master Plan Annual Update Review
32
Strategies in Practice: Prince George’s County
Alternative Certification Programs. The system continued its partnership with several state‐approved alternative route certification programs that enable individuals to accelerate the process of becoming certified and highly qualified teachers. For SY2009, PGCPS partnered with the following Maryland Approved Alternative Preparation (MAAPP) Programs: Prince Georges County Resident Teacher Program (internal program); The New Teacher Project Teaching Fellows; the College of Notre Dame (Dual/Special Education) Certification Program; Teach for America; and the University of Maryland Master’s Certification Program. In addition, through Troops to Teach – a recruitment support program/partnership between all United States military service branches, the Maryland State Department of Education, and local school systems – PGCPS is able to identify and directly hire highly qualified teachers or admit transitioning armed service members into the existing alternative preparation programs. In SY2009, PGCPS hired 98 additional candidates to pursue alternative certification than it did during the previous school year. Almost all (98.8%) of the 259 alternatively‐ certified, highly qualified teachers were assigned to teach in hard‐to‐staff and/or high poverty schools. Three alternatively prepared teachers were placed in non‐priority schools due to the lack of vacancies in high needs schools. The school system intends to expand the programs in SY2009‐ Alternative Certification programs allow the school system to focus on selecting and hiring a cadre of teachers that will fill state‐and district‐identified, hard‐to‐staff areas in priority schools. An additional benefit to this approach to producing certified and highly qualified teachers is the relatively high retention rate among program participants. Since SY2001, the retention rate for teachers who were selected, trained, and hired through alternative preparation programs has averaged 82% district‐wide. This retention rate is consistent with the school system’s overall teacher retention rate which has averaged 84.7% over the past three years. As the system refines its internal transfer process and works towards increasing teacher effectiveness support programs, it is anticipated that the retention of alternatively‐prepared teachers in high needs schools will exceed well beyond the required three years of service.
PGCPS has become increasingly dependent on alternative teacher certification programs to meet the NCLB requirement that all CAS classes are taught by highly qualified teachers. In 2007‐08, two studies were conducted to assess the current state of alternative certification programs in PGCPS. The first was designed to review how PGCPS translated MSDE alternative teacher preparation polices into programs, and the second was a comparison of training program components of the current alternative certification programs in PGCPS with the literature on effective teacher preparation for the purpose of providing recommendations to guide future program development.
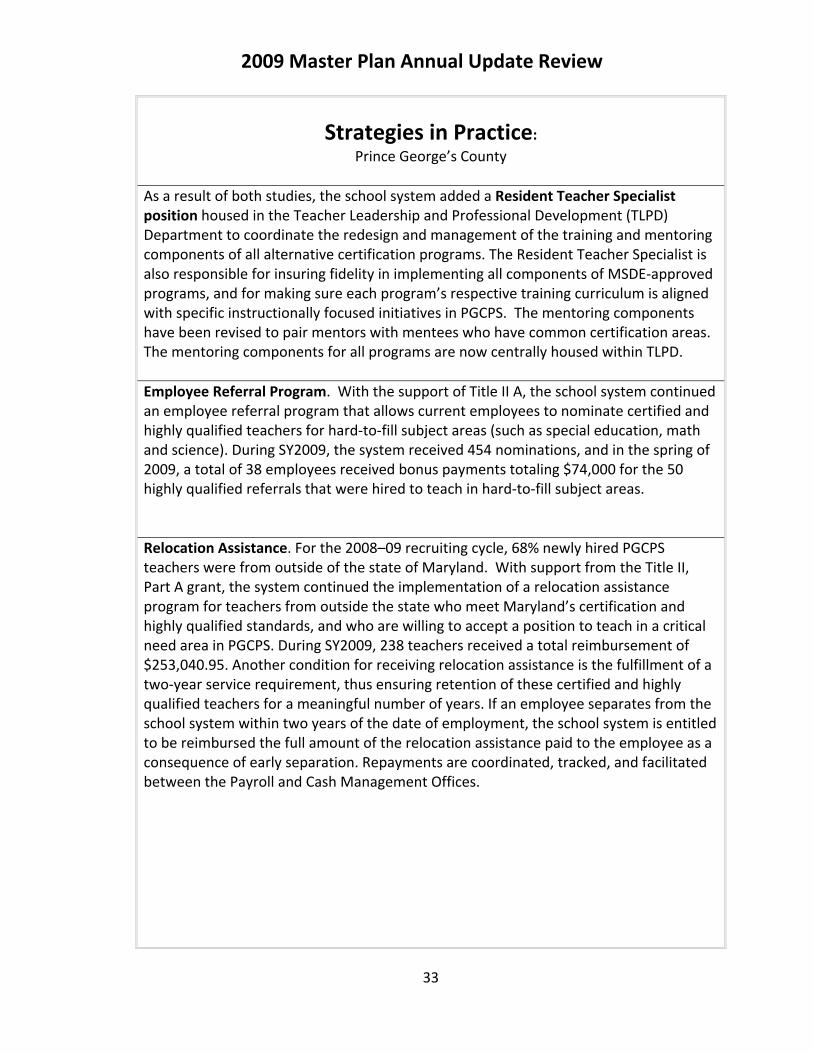
2009 Master Plan Annual Update Review
33
Strategies in Practice: Prince George’s County
As a result of both studies, the school system added a Resident Teacher Specialist position housed in the Teacher Leadership and Professional Development (TLPD) Department to coordinate the redesign and management of the training and mentoring components of all alternative certification programs. The Resident Teacher Specialist is also responsible for insuring fidelity in implementing all components of MSDE‐approved programs, and for making sure each program’s respective training curriculum is aligned with specific instructionally focused initiatives in PGCPS. The mentoring components have been revised to pair mentors with mentees who have common certification areas. The mentoring components for all programs are now centrally housed within TLPD.
Employee Referral Program. With the support of Title II A, the school system continued an employee referral program that allows current employees to nominate certified and highly qualified teachers for hard‐to‐fill subject areas (such as special education, math and science). During SY2009, the system received 454 nominations, and in the spring of 2009, a total of 38 employees received bonus payments totaling $74,000 for the 50 highly qualified referrals that were hired to teach in hard‐to‐fill subject areas.
Relocation Assistance. For the 2008–09 recruiting cycle, 68% newly hired PGCPS teachers were from outside of the state of Maryland. With support from the Title II, Part A grant, the system continued the implementation of a relocation assistance program for teachers from outside the state who meet Maryland’s certification and highly qualified standards, and who are willing to accept a position to teach in a critical need area in PGCPS. During SY2009, 238 teachers received a total reimbursement of $253,040.95. Another condition for receiving relocation assistance is the fulfillment of a two‐year service requirement, thus ensuring retention of these certified and highly qualified teachers for a meaningful number of years. If an employee separates from the school system within two years of the date of employment, the school system is entitled to be reimbursed the full amount of the relocation assistance paid to the employee as a consequence of early separation. Repayments are coordinated, tracked, and facilitated between the Payroll and Cash Management Offices.

2009 Master Plan Annual Update Review
34
Strategies in Practice: Prince George’s County
International Teacher Recruitment. Title II, Part A funding also allowed the school system to continue its International Teacher Recruitment Program, which includes providing legal support services to highly qualified teachers to help them manage the complex immigration process. For SY2009, a total of 212 fully certified, highly qualified teachers were hired to teach in hard‐to‐ fill subject areas. Since the program’s inception in SY2005, 978 international teachers have been hired under this program, and 92% of these teachers continue to teach in the school system. While the international recruitment option has allowed for the school system to increase the numbers of highly qualified and certified teachers in all classrooms, it is anticipated that due to increased availability of certified and highly qualified teachers in the mid‐ Atlantic region and across the United States, the reliance upon international recruitment will decrease in future years.
The Division of Human Resources. The Department of Teacher Staffing and Certification within the Division of Human Resources continues to partner with staff in the Division of Information Technology to generate reports for each school that identify individual teacher certification information. This information will assist principals and master schedulers in making informed decisions about the assignment of teachers to core academic subject (CAS) areas. The reports are provided to both schools and to individual teachers during the fall and spring semesters so that every effort can be made to arrange appropriate professional development that will assist teachers in gaining the knowledge and skill needed to teach, as effectively as possible, courses for which they are not certified or highly qualified. With the implementation of the data warehouse scheduled for the fall of 2009, Human Resources staff and principals will be in a position to ensure greater accuracy with teacher placements.
Compensation. During SY2008, Prince George’s County Public Schools was awarded a $17.1 million Teacher Incentive Fund grant to launch the Financial Incentives Rewards for Supervisors and Teachers (FIRST) program in 12 high needs schools. The grant will provide for the planning and implementation of a voluntary, performance‐based, financial incentive compensation system for teachers and administrators who work in hard‐to‐staff schools and who assist students in meeting achievement standards in tested areas, participate in professional development, and undergo a rigorous evaluation process. Data from the first year’s implementation will be available during late fall 2009. As a result of these efforts, for the 2008‐09 school year, the percentage of core academic subject classes taught by a highly qualified teacher was 10 percentage points higher in Title I schools (92%) than for the school system as a whole (82%).
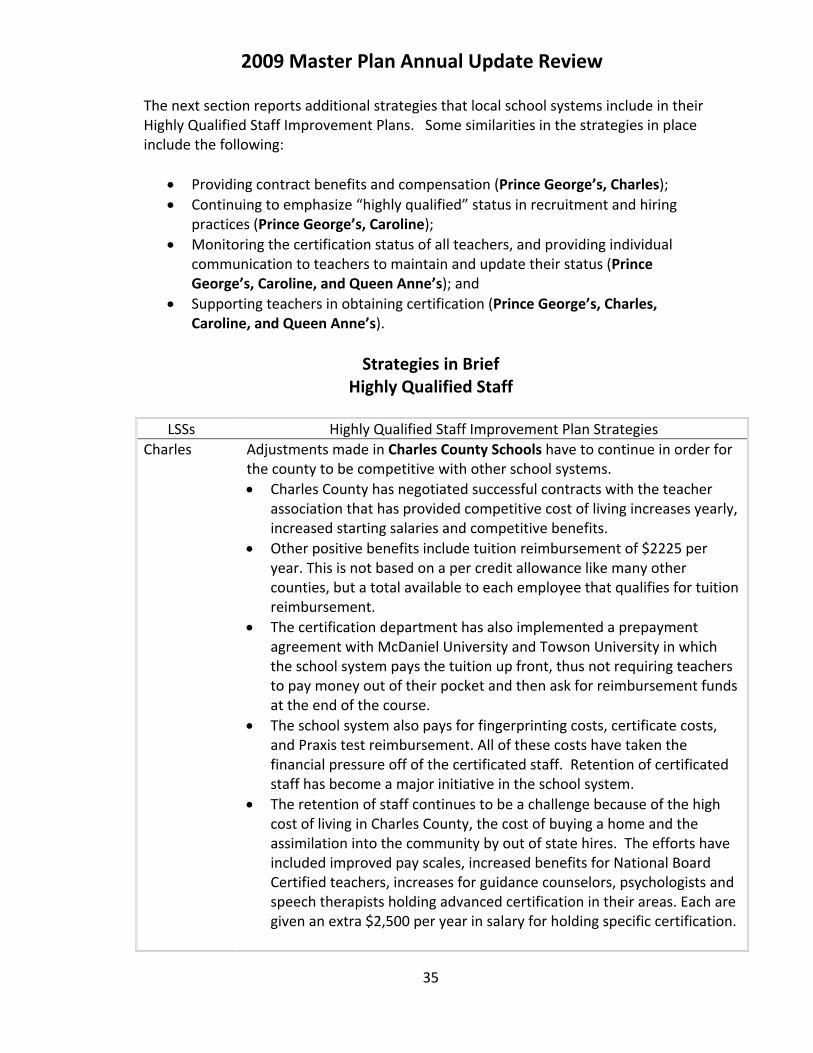
2009 Master Plan Annual Update Review
35
The next section reports additional strategies that local school systems include in their Highly Qualified Staff Improvement Plans. Some similarities in the strategies in place include the following:
• Providing contract benefits and compensation (Prince George’s, Charles); • Continuing to emphasize “highly qualified” status in recruitment and hiring
practices (Prince George’s, Caroline); • Monitoring the certification status of all teachers, and providing individual
communication to teachers to maintain and update their status (Prince George’s, Caroline, and Queen Anne’s); and
• Supporting teachers in obtaining certification (Prince George’s, Charles, Caroline, and Queen Anne’s).
Strategies in Brief
Highly Qualified Staff
LSSs Highly Qualified Staff Improvement Plan Strategies Charles Adjustments made in Charles County Schools have to continue in order for
the county to be competitive with other school systems. • Charles County has negotiated successful contracts with the teacher
association that has provided competitive cost of living increases yearly, increased starting salaries and competitive benefits.
• Other positive benefits include tuition reimbursement of $2225 per year. This is not based on a per credit allowance like many other counties, but a total available to each employee that qualifies for tuition reimbursement.
• The certification department has also implemented a prepayment agreement with McDaniel University and Towson University in which the school system pays the tuition up front, thus not requiring teachers to pay money out of their pocket and then ask for reimbursement funds at the end of the course.
• The school system also pays for fingerprinting costs, certificate costs, and Praxis test reimbursement. All of these costs have taken the financial pressure off of the certificated staff. Retention of certificated staff has become a major initiative in the school system.
• The retention of staff continues to be a challenge because of the high cost of living in Charles County, the cost of buying a home and the assimilation into the community by out of state hires. The efforts have included improved pay scales, increased benefits for National Board Certified teachers, increases for guidance counselors, psychologists and speech therapists holding advanced certification in their areas. Each are given an extra $2,500 per year in salary for holding specific certification.

2009 Master Plan Annual Update Review
36
LSSs Highly Qualified Staff Improvement Plan Strategies • Housing has become a major area that has restricted retention efforts.
Housing in Charles County is one of the most expensive in Maryland. A partnership with the Charles County Government has been formed to offer House Keys for Employees to eligible employees. This includes support and certificated staff. A $5,000 down payment plus another $5,000 match is available through county and state government to eligible employees. This is not to be paid back until the house is sold and is given interest free until that time. This program is approaching the 14th employee purchasing a home in the county.
Caroline Caroline County Public Schools has made significant progress in the area of highly qualified staff. The school system has experienced a 22.5% increase in the number of Core Academic Subject classes taught by highly qualified teachers from the 2003‐2009 school years. Also 100% of our teachers assigned to Title I schools are highly qualified. This progress is attributed to three reasons. First, the school system has developed a systematic and highly effective
recruiting program to obtain teachers who are already Highly Qualified in their respective areas. Significant resources are allotted to these recruiting efforts. In fact, during the 08‐09 recruiting season, over $85,000 was spent on recruiting efforts. This includes: subscribing to online recruiting web sites, buying print ads in newspapers and professional journals, paying incentives and signing bonuses to new hires, designing and purchasing all new recruiting print and display materials, and conducting 19 recruiting trips
Additionally, the schools system was able to produce an entirely new Human Resources section on our school system’s web site, making it easier to apply online. Since the inception of our online application database, we have received over 3,000 applications in just a few years.
In addition to these recruitment efforts, the system has taken great strides in being able to offset or even eliminate total travel expenses for candidates who are certified in critical shortage areas and who agree to travel to Caroline County for an interview.
The school system identifies critical shortage areas as those that are defined and declared as such by MSDE each year. The system also pays for moving expenses, provides additional classroom supplies and materials for new teachers, and provides assistance in finding suitable housing. It is evident that our recruiting plan is working as evidenced by the increasing number of highly qualified teachers we are finding and hiring. Since there are only 10 schools in our system, Caroline County Public Schools does not differentiate its hiring practices between schools regardless of the school’s identified status.
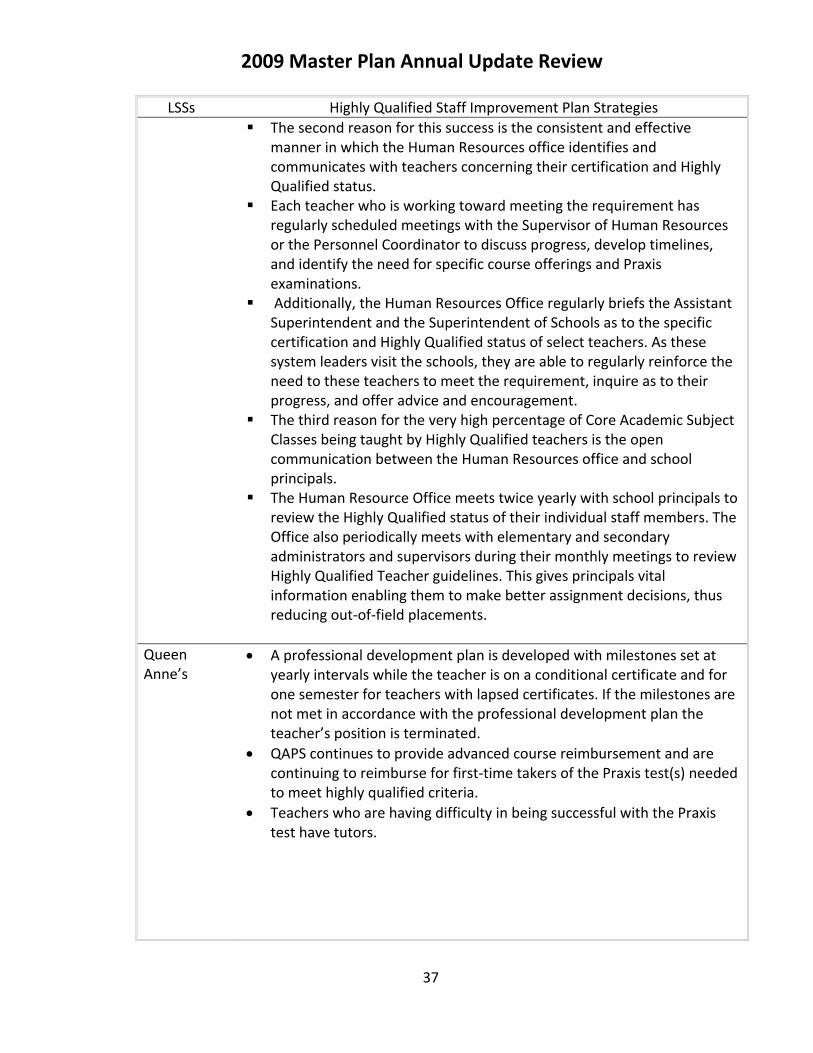
2009 Master Plan Annual Update Review
37
LSSs Highly Qualified Staff Improvement Plan Strategies The second reason for this success is the consistent and effective
manner in which the Human Resources office identifies and communicates with teachers concerning their certification and Highly Qualified status.
Each teacher who is working toward meeting the requirement has regularly scheduled meetings with the Supervisor of Human Resources or the Personnel Coordinator to discuss progress, develop timelines, and identify the need for specific course offerings and Praxis examinations.
Additionally, the Human Resources Office regularly briefs the Assistant Superintendent and the Superintendent of Schools as to the specific certification and Highly Qualified status of select teachers. As these system leaders visit the schools, they are able to regularly reinforce the need to these teachers to meet the requirement, inquire as to their progress, and offer advice and encouragement.
The third reason for the very high percentage of Core Academic Subject Classes being taught by Highly Qualified teachers is the open communication between the Human Resources office and school principals.
The Human Resource Office meets twice yearly with school principals to review the Highly Qualified status of their individual staff members. The Office also periodically meets with elementary and secondary administrators and supervisors during their monthly meetings to review Highly Qualified Teacher guidelines. This gives principals vital information enabling them to make better assignment decisions, thus reducing out‐of‐field placements.
Queen Anne’s
• A professional development plan is developed with milestones set at yearly intervals while the teacher is on a conditional certificate and for one semester for teachers with lapsed certificates. If the milestones are not met in accordance with the professional development plan the teacher’s position is terminated.
• QAPS continues to provide advanced course reimbursement and are continuing to reimburse for first‐time takers of the Praxis test(s) needed to meet highly qualified criteria.
• Teachers who are having difficulty in being successful with the Praxis test have tutors.

2009 Master Plan Annual Update Review
38
LSSs Highly Qualified Staff Improvement Plan Strategies • To ensure that we do not have teachers who lose their highly qualified
status due to failing to complete state certification requirements in a timely manner, we have established a process where the human resources director and the certification specialist meet with teachers who will have their certification due for renewal within two years. At this meeting, a professional development plan is developed with milestones set at the one year and six month mark.
• Two ongoing masters programs are located in the County to provide an additional avenue for teachers to renew their certification.
• In middle schools and high schools, the director of resources, the certification specialist and principal are meeting with our teachers who are teaching out of field. They are counseling the teachers on the appropriate test they need to take in order to meet the highly qualified criteria. If necessary, funds for coursework and/or study guides are provided through our course reimbursement program. Where possible, teachers are reassigned to areas where they meet the highly qualified criteria.

2009 Master Plan Annual Update Review
39
Strategies in Practice: Equitable Distribution of Highly Qualified Teachers in
High‐Poverty and Low‐Poverty Schools Under NCLB, LSSs must also address the equitable distribution of highly qualified teachers in high‐poverty and low‐poverty schools. In Dorchester County during the 2008‐2009 school year, the number of classes in high poverty secondary schools taught by experienced highly qualified teachers increased from 80.2% to 82.4%. Strategies that Dorchester County put in place to support the equitable distribution of Highly Qualified Teachers in high‐poverty and low‐poverty schools include the following:
Strategies in Practice: Dorchester County
• Budgeted funds allowed for a continuation of signing bonuses, recruitment
incentives, and relocation reimbursements to attract highly qualified teachers. • Staff were notified of openings in high poverty schools and given the opportunity to
transfer into those positions. • Funding was maintained for professional development in the high poverty
elementary and secondary schools.

2009 Master Plan Annual Update Review
40
High Quality Teacher Professional Development No Child Left Behind requires that districts address teacher participation in high quality professional development. In 2008, districts submitted plans for (Option 1) district‐wide professional development initiatives that meet the Maryland Teacher Professional Development Standards or (Option 2) fostering high‐quality school‐based professional development activities by integrating the six components of the Maryland Teacher Professional Development Planning Guide. Twelve districts submitted plans for activities under the first option, and twelve districts submitted plans under the second option. This year, districts have updated their professional development initiatives described in the 2008 Master Plan Annual Updates. In the 2009 Master Plan Annual Update Guidance Document: • LSSs were asked to report on Option 1 activities in one of two ways: for initiatives
early in implementation, districts were required to submit a detailed evaluation plan. For activities that are well –underway, districts were required to submit either an interim or a final evaluation report.
• Districts that submitted plans for integrating a teacher professional development
planning framework into their school improvement process were required to report their progress on four specific tasks that are included in the guidance.
The following is an analysis of the professional development plans that were included in this year's updates: 1. The professional development submissions were significantly improved over the
2008 submissions.
2. The Maryland State Department of Education's review process was refined to include two reviewers for each district submission. Additionally, reviewers partnered with at least two different reviewers to foster inter‐rater reliability.
3. The reviewers found that 10 school systems submitted plans for Option 1, and 14
school systems submitted plans under Option 2. There was one professional development plans submitted under Option 1 that was far enough along that the school system was able to submit an evaluation plan.
4. Seven (7) school systems received no clarifying questions.
2009 Master Plan Annual Update Review
41
5. For the 10 Option 1 submissions, the following clarifications were most frequently identified:
a. The outcomes and indicators identified in the evaluation plan were not
measurable, causing problems with data collection, analysis and reporting. b. Some evaluation plans did not include data collection strategies or artifacts
that would measure the outcomes and indicators. c. Details regarding who is collecting the data; who is analyzing the data; and
who is completing the evaluation report were missing.
6. Regarding the professional development plans submitted under Option 2, the following clarifications were most frequently identified:
a. Explicitly including the six components of the professional development
planning framework into local school improvement guidance was missing or incomplete.
b. Training for school based leadership teams on how to address the 6 PD planning components had not been completed or a plan for completing the training was missing.
c. Plans to complete reviews of school‐based professional development plans, including training of staff to complete those reviews, was incomplete or missing.
d. Monitoring school level implementation of their professional development plans was not adequately planned or institutionalized in the local school system processes.
7. As a result of these clarifying questions submitted under Option 2, several school systems were asked to:
a. Revise their local school improvement guidance and submit with their final
2009 Master Plan Annual Update. b. Explain how the school system training process on the 6 components of the
planning framework and the school‐based professional development plan review processes would be ramped up.
In summary, the LSS progress in the implementation of the Maryland Teacher Professional Development Standards through the explicit use of the Maryland Teacher Professional Development Planning Guide is evident and can be attributed to a three year commitment to technical assistance and inclusion in the master planning process. Holding these sections of the master plan review process to full compliance in 2009 (as opposed to a “no fault” status during the 2007 and 2008 master plan submissions), facilitated serious attention to ensuring quality in teacher professional development initiatives in all 24 local school systems.
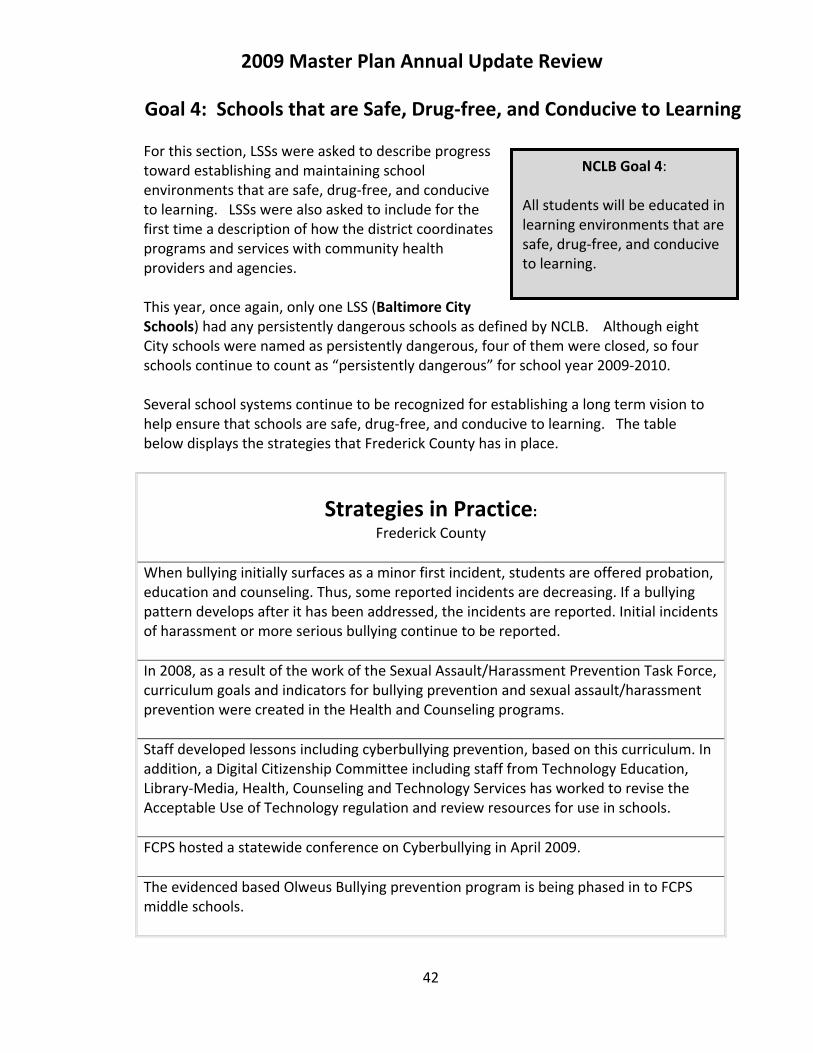
2009 Master Plan Annual Update Review
42
Goal 4: Schools that are Safe, Drug‐free, and Conducive to Learning For this section, LSSs were asked to describe progress toward establishing and maintaining school environments that are safe, drug‐free, and conducive to learning. LSSs were also asked to include for the first time a description of how the district coordinates programs and services with community health providers and agencies. This year, once again, only one LSS (Baltimore City Schools) had any persistently dangerous schools as defined by NCLB. Although eight City schools were named as persistently dangerous, four of them were closed, so four schools continue to count as “persistently dangerous” for school year 2009‐2010. Several school systems continue to be recognized for establishing a long term vision to help ensure that schools are safe, drug‐free, and conducive to learning. The table below displays the strategies that Frederick County has in place.
Strategies in Practice: Frederick County
When bullying initially surfaces as a minor first incident, students are offered probation, education and counseling. Thus, some reported incidents are decreasing. If a bullying pattern develops after it has been addressed, the incidents are reported. Initial incidents of harassment or more serious bullying continue to be reported.
In 2008, as a result of the work of the Sexual Assault/Harassment Prevention Task Force, curriculum goals and indicators for bullying prevention and sexual assault/harassment prevention were created in the Health and Counseling programs. Staff developed lessons including cyberbullying prevention, based on this curriculum. In addition, a Digital Citizenship Committee including staff from Technology Education, Library‐Media, Health, Counseling and Technology Services has worked to revise the Acceptable Use of Technology regulation and review resources for use in schools. FCPS hosted a statewide conference on Cyberbullying in April 2009.
The evidenced based Olweus Bullying prevention program is being phased in to FCPS middle schools.
NCLB Goal 4: All students will be educated in learning environments that are safe, drug‐free, and conducive to learning.
2009 Master Plan Annual Update Review
43
Strategies in Practice: Frederick County
FCPS has recognized the disproportionate number of African American students and students with disabilities who are suspended from school. To address the large number of students with disabilities who had been suspended prior to three years ago, the Director of Student Services and the Director of Special Education created a process requiring schools to receive prior approval when proposing to suspend special education students beyond 10 days. This approval process has significantly reduced the number of such suspensions over the past three years, primarily by encouraging school administrators to consider alternatives to suspension.
Two years ago the FCPS Special Education Department reconvened a committee to address the disproportionate representation of African‐American students in special education. In addition, this committee has examined the suspension data for special education and African American students. Using funding from the Disproportionality Grant ($13,000), the committee worked closely with Dr. James Patton, national consultant, to review suspension data, and conduct study‐groups and workshops with staff. The culmination of their work was the creation of a model Student Services Team guide to be used in all schools. Included in this guide is an effort toward creating “culturally competent” Student Services Teams in order to effectively address minority student suspensions. The next table displays additional strategies that local school systems utilize in establishing and maintaining schools that are safe, drug‐free, and conducive to learning. Some similarities in these strategies in place include the following:
• Focusing on school safety (Frederick, St. Mary’s); • Providing professional development to address bullying, harassment, and
intimidation in schools (Frederick, Baltimore County); • Redefining or creating model Student Services Teams (Frederick, Charles); • Offering programs to support positive behaviors (Frederick, Baltimore County,
and Charles).

2009 Master Plan Annual Update Review
44
Strategies in Brief Schools that are Safe, Drug free, and Conducive to Learning
LSSs Strategies for Establishing and Maintaining
Schools that are Safe, Drug‐free, and Conducive to Learning Baltimore County
• Staff participated in professional development to address bullying, harassment, and intimidation in schools. Workshop sessions on the topic have been included at the Annual Safe Schools Conference, Character Education Conference, as well as at faculty meetings and system wide professional development days.
• The Department of Student Support Services provided staff training on restorative practices (i.e. Community Conferencing, Daily Rap, and Peace Circles) which assist staff to work with students who may be victims, offenders, or bystanders.
• Schools are provided the How To Establish a Character Education Program in your School: A Handbook for School Administrators and other resources to develop and implement a character building process as an integral component of the school improvement plan and extra‐curricular programs.
• All middle schools have been given the booklet Bullying in Schools: What you Need to Know, which encourages discussion about bullying with students and adults.
• The Baltimore County Public Schools’ Education Channel has produced two video scenarios on bullying utilizing students, which air around the clock on the cable channel as well as is a part of the health education curriculum.
• All middle schools and many elementary schools will be provided the Second Step Program, a violence prevention program with a bullying and harassment component. The Positive Behavior Planning Guide is a resource for staff.
Charles Charles County has instituted several strategies that have resulted in reduced suspensions. • One of the most positive factors is the increased importance and impact of
the school‐level student support team (SSTs). These teams are designed and staffed to encourage consideration of other alternatives to suspensions.
• PBIS has positively influenced the culture of participating schools. The measured reduction in class and school disruptions is reflected in falling suspension numbers.
• We have begun to provide training to improve the staff skills of individuals that are responsible for administering our in‐school suspension programs. Our goal is that the in‐school suspension experience is a behavioral change program, not just a “time‐out” period.
2009 Master Plan Annual Update Review
45
LSSs Strategies for Establishing and Maintaining Schools that are Safe, Drug‐free, and Conducive to Learning
Saint Mary’s
Saint Mary’s County Public Schools believes that one of our greatest responsibilities is to provide for the safety and security of students, staff, and visitors. • Establishing a safe and orderly environment ensures the greatest
opportunity for positive individual development and success in student learning. We constantly strive to enhance our safety and security initiatives through open communication, strong community partnerships, progressive policies and procedures, and proactive action by our staff.
• The Department of Safety and Security is responsible for the development and implementation of system wide safety and security programs and initiatives that enhance the overall safety and security of all SMCPS school campuses and supporting office sites. The department collaborates with staff, many departments, and supporting community partners to develop, refine, and implement safety and security initiatives to include emergency preparedness and response, daily school security measures, school visitor management, school employee and volunteer background screening, new facility development, and existing facility enhancements. The Supervisor of Safety and Security maintains a strategic plan prioritizing existing safety and security initiatives and enhancements. Maintaining and improving safety and security within all schools greatly increases the efficiency and effectiveness of each school. The current safety and security strategic plan has identified many primary focus areas and functions for the department.
• Main Functions of the Department of Safety and Security a. Manage employee and volunteer identification badges b. Manage employee school access control cards c. Oversee automated school visitor registration management d. Ensure school based notification of known sex offenders e. Manage background screenings for all school employees and
volunteers f. Oversee mandatory daily security checks and screenings of all facilities g. Identify and implement needed physical security enhancements to
include security vestibules, electronic locking systems, surveillance camera systems, campus security vehicles, campus radio communication system, and alarms
h. Coordinate the daily activities of campus based Safety and Security Assistants
i. Oversee the Superintendent’s Young Driver Safety Program j. Oversee the SMCPS Focus on Cyber Use and Safety Program k. Oversee the SMCPS Secure Your Gear Program l. Assist in the implementation of School Safety Patrols (elementary
schools) m. Conduct bi‐annual school safety and security site visits identifying
current concerns and ensuring compliance with policies and procedures

2009 Master Plan Annual Update Review
46
LSSs Strategies for Establishing and Maintaining Schools that are Safe, Drug‐free, and Conducive to Learning
n. Conduct formal annual safety and security audits of all SMCPS sites to include follow up and after action meetings with site based management
o. Monitor attendance, discipline, and arrest data at schools p. Oversee implementation of the Student Crime Solvers Program q. Oversee implementation of the Confidential School Reporting Hotline r. Oversee and monitor site based drills of emergency response
protocols s. Coordinate site based professional development staff training on
safety and security procedures and current trends in youth crime t. Oversee the annual review and revision of all school crisis and
emergency response plans, procedures, protocols, and corresponding manuals Provide assistance to staff with safety and security procedures and coordination of other activities with law enforcement authorities to include site‐based investigations conducted in cooperation with law enforcement authorities and other events requiring a level of emergency response
The next table displays how several school systems coordinate mental health needs and services with community health providers and agencies.
Strategies in Brief Coordinated Services
LSSs Coordinated Mental Health Needs and Services
Frederick
• FCPS has a close working relationship with the Frederick County Health Department, the Mental Health Association of Frederick County and the Mental Health Management Agency (core service agency), as well as many private providers. The Supervisor of Counseling is on the board of the MHMA and the Frederick County Mental Health Advisory Board. This close collaboration allows FCPS to access needed resources for students.
• Community Agency School Services (CASS) coordinators are school social workers who link families to mental health services. Several providers are contracted to work directly in schools. CASS coordinators can help families determine which providers accept their health insurance to provide a smooth access to services.
• School counselors provide brief solution focused counseling. • FCPS has student support teachers who provide crisis intervention and
behavior management programs. FCPS employs school therapists in programs for students with emotional disabilities and conduct disorders.

2009 Master Plan Annual Update Review
47
LSSs Coordinated Mental Health Needs and Services Prince George’s
• In coordination with the University of Maryland, PGCPS continues to participate in the Prince George’s School Mental Health Initiative (PGSMHI). The purpose of the PGSMHI is to provide an integrated model of mental health services in the least restrictive setting, by developing a cost effective model that utilizes evidenced‐based practices to provide a continuum of services to students with emotional/behavioral disorders who are at risk of attending nonpublic special education programs. In addition, an important goal for the school system to enhance the competency of school staff by providing emergency mental health services, on‐going training, mentoring, and education on evidence‐based practices and Individualized Education Program (IEP) team decision‐making.
• The system strongly encourages its high schools and middle schools to implement a Student Assistance Program (SAP). SAP is a school‐based substance abuse intervention program designed to identify adolescents whose behavior, attendance, grades or other indicators identify them as being at‐risk and/or have problems related to substance abuse. During SY2009, 18 secondary schools were trained to implement the SAP prevention/intervention initiative. Through the SAP process, at‐risk students and their parents are referred to appropriate services and resources within the community that can provide the necessary assistance. Additionally, the SAP initiative is a partnership with the county health department, which provides assessments and counseling for identified students and also assists school‐based teams with their program implementation.
• The district also sustains five Walk‐In Student Counseling and Family Support Centers that provide students and their parents with interventions such as: anger management, short term counseling, decision‐making, alcohol/drug assessments and alcohol, tobacco and other drug prevention/intervention services. When necessary, students and parents are referred to appropriate community agencies for services and treatment. In SY2009, there were 1,089 student clients seen by the Walk‐In Student Counseling and Family Support Centers, as compared with 883 student clients in SY2008.
• The Office of School Health Services collaborates with the Prince George’s Health Department to provide a coordinated response to health‐related issues and conducted PPW trainings on the resources to be utilized for student referrals that may impact a student’s full participation in instructional programs. The Office of Health Services has increased linkages between the school and other community organizations through the Prince George’s County School Health Council. This is an umbrella advisory organization serving the

2009 Master Plan Annual Update Review
48
LSSs Coordinated Mental Health Needs and Services Superintendent of Schools and the Health Officer of the Health Department.
• The Office of Pupil Personnel Services works collaboratively with the Department of Social Services, the Commission of Children Youth and Families, Youth Services, Psychiatric Institute of Washington and the Mobile Crisis Unit to both provide instruction to staff on social and emotionally related issues, while also serving as a resource for student referrals.
• The Department of Social Services and the Commission of Children, Youth and Families often provide classes to parents and other interventions on site or at the home of our constituents. The Office of Pupil Personnel Services serves as an intermediary to convey available resources as well as referrals through the Interagency Council, especially in cases where school attendance has been identified as the result, but where emotional and/or social issues serve as the root cause.
• The Psychiatric Institute of Washington has often received county students and conducted full evaluations in cases of attempted suicide or ideations. The Mobile Crisis Unit provides on site assistance to schools with students in immediate crisis and also provides a one‐time psychiatric evaluation.
Washington Over the past year, our Local Management Board and the Department of Social Services conducted separate surveys. Both surveys identified mental health needs and services as a major concern for residents of Washington County. WCPS has provided space for our Washington County Health Department (WCHD) to operate Wellness Centers within three WCPS schools. • A licensed clinical social worker is assigned to the centers to provide
mental health services to students. Due to the demand, WCHD has increased their staffing to meet the expanding mental health case loads at these centers.
• WCPS has entered into a partnership with the Mental Health Authority to reduce teen suicide. This partnership includes training for staff and the distribution of suicide prevention brochures for students and parents.
• WCPS hired its first licensed clinical social worker three years ago to address the mental health needs of our students in our alternative school setting. This year, through a USDE grant, WCPS hired three additional licensed clinical social workers to address the mental health needs in our elementary Title I schools. Additionally, we have increased our school psychology staff this year with the inclusion of a supervisor.
2009 Master Plan Annual Update Review
49
LSSs Coordinated Mental Health Needs and Services Worcester
• The Board of Education coordinates community programs and services
with other county agencies through the Office of Student Services. • Pupil Personnel Workers or Student Services Specialists are permanent
members of the community agencies listed below. They meet monthly with each agency. At each meeting the names of students or families in need of assistance are placed on the agenda for discussion and solutions. Since all county service agencies are represented at each meeting, cases are assigned to the appropriate agency. Generally, all students are assessed or evaluated by the Alternative Directions Team to help determine the appropriate level of care. Students in need of mental health or health services are referred to the Worcester County Health Department.
• Students with addiction issues or in need of counseling services are referred to Worcester County Health Department Addiction Unit, Worcester Youth and Family Counseling or the Worcester County Drug Court Program. Students in need of services beyond the scope of our school system are discussed at Local Coordinating Council (LCC) or the Multi Disciplinary Team meetings and referred to out‐of‐county facilities.
2009 Master Plan Annual Update Review
50
NCLB Goal 5 All students will graduate from high school.
Goal 5: Graduation from High School In this section of the annual updates, local school systems provided more information than they did in previous year’s updates on their efforts to improve graduation rates and prevent students from dropping out. Thirteen school systems (Carroll, Worcester, Frederick, Howard, Calvert, Washington, Anne Arundel, Garrett, Charles, Montgomery, Harford, St. Mary’s, and Allegany) have graduation rates above the State standard of 85.5%. St. Mary’s plan to improve the graduation rate is highlighted in the table below as a comprehensive approach.
Strategies in Practice:
St. Mary’s
St. Mary’s will continue the implementation of a new model for school improvement plans that focuses the work of school staff on strategies that have proven successful in our schools and in other systems. Schools will choose from several approved options for climate setting: PBIS, Asset Development and/or Character Education initiatives. Initial funding for asset development has been provided by the Local Management Board (LMB). The school system will continue working with the LMB to continue providing funding and training for the asset development process. We will continue to provide training and support for those schools who have piloted the asset development program. We are also working with the national PBIS office to provide ongoing training for our PBIS schools as well. High school‐based pupil services teams also meet regularly to identify students who are at risk in the areas of attendance, discipline infractions, and retention or dropping out. Individualized plans will be developed and implemented for these students that include mentoring, parent involvement, referral to school and community resources, and creative scheduling. As we continue our focus on the transition year of ninth grade, Fairlead Academy opened last fall with 60 incoming 9th grade students who were identified as needing intervention in reading and mathematics in order to be successful at high school. That number has increased to 72 students for the 2009‐2010 school year. We have also expanded this program to the tenth grade year for 30 students who need the ongoing support of Fairlead Academy for an additional year. This ninth grade academy continues to draw students from all three attendance areas and additional slots will continue to be assigned to Great Mills High School, as that school continues to experience the greatest challenge in terms of potential dropouts and graduation rate concerns.

2009 Master Plan Annual Update Review
51
Strategies in Practice:
St. Mary’s
The Tech Connect program will also continue to serve approximately 75 ninth graders in the partial day program, with a focus on reengagement to encourage on time graduation in four years. We will continue to support and monitor the academic progress of these students beyond the ninth grade year. These students will have a mentor at the Forrest Center, will complete an informal vocational evaluation, and will have opportunities to explore courses available at the center. This year the new position of transition coordinator will provide ongoing support and monitoring for students leaving ninth grade programs‐Fairlead Academy and Tech Connect‐as they re‐enter their home high schools for their 10th through 12th grade years. The transition coordinator will meet with administrators, counselors, teachers, and other school system personnel on behalf of students’ academic needs, and the coordinator will meet with students and their families to provide them with individualized support as needed. The transition coordinator will monitor students’ progress, collect and maintain performance data, provide monthly updates, and collaborate with all stakeholders on educational decisions that affect transitioning students.
We are in the second year of our Academy of Finance program. This program, which is being offered at Chopticon High School, is designed to provide interested students with a focused career pathway in the financial services industry. Students learn about careers in finance, such as banking, insurance, financial planning, business administration, sales, contract oversight, budget analysis, and advertising. The program provides field and internship opportunities to apply classroom learning. The program also incorporates extracurricular programs related to the career interests of students, such as the Future Business Leaders of America. Students from Great Mills High School and Leonardtown High School are able to transfer to Chopticon High School for enrollment in the Academy. To provide additional opportunities for our students to meet academic success, we will continue allocating four additional instructional positions at the high school level to coordinate the High School Assessment Bridge Plan for students who find themselves unable to pass the tests individually or through a combined score option. These teachers have mutually convenient schedules with co‐planning time built in to share data and work with students. They will continue to work closely with the building level HSA remediation teachers as well as the content supervisors and instructors from other schools. The SMCPS school calendar has built in early dismissal days each marking period to allow teachers to meet with colleagues beyond their home school.
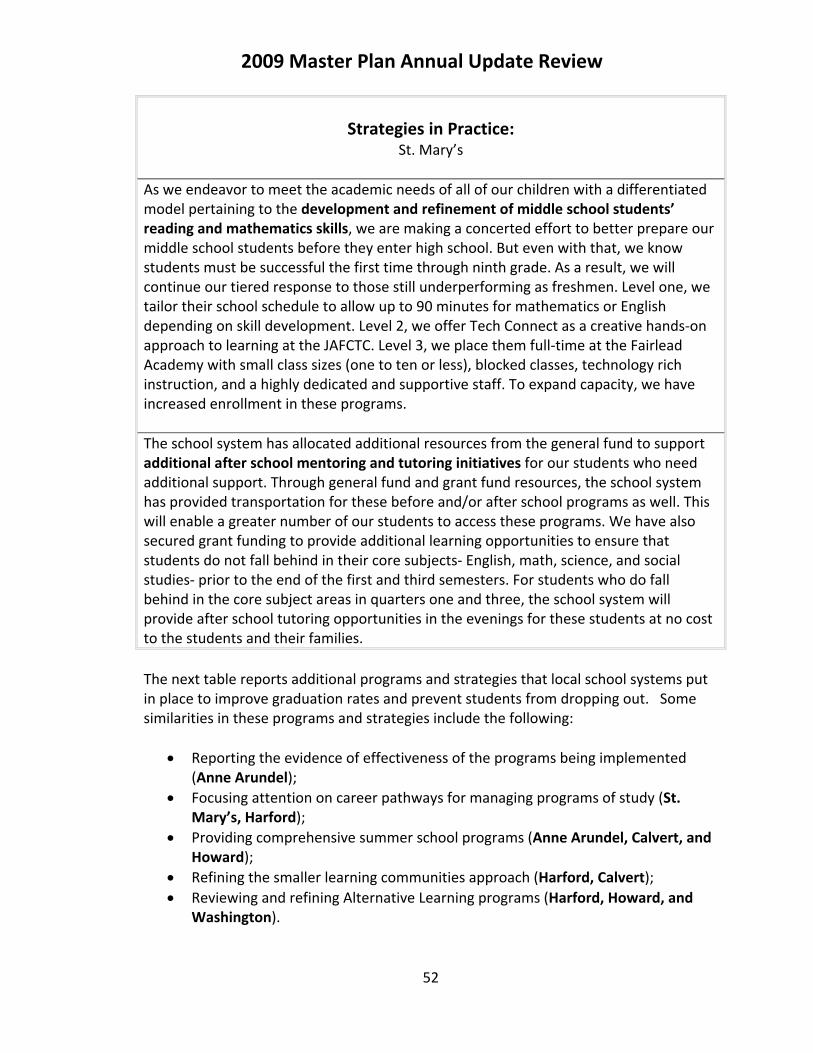
2009 Master Plan Annual Update Review
52
Strategies in Practice:
St. Mary’s
As we endeavor to meet the academic needs of all of our children with a differentiated model pertaining to the development and refinement of middle school students’ reading and mathematics skills, we are making a concerted effort to better prepare our middle school students before they enter high school. But even with that, we know students must be successful the first time through ninth grade. As a result, we will continue our tiered response to those still underperforming as freshmen. Level one, we tailor their school schedule to allow up to 90 minutes for mathematics or English depending on skill development. Level 2, we offer Tech Connect as a creative hands‐on approach to learning at the JAFCTC. Level 3, we place them full‐time at the Fairlead Academy with small class sizes (one to ten or less), blocked classes, technology rich instruction, and a highly dedicated and supportive staff. To expand capacity, we have increased enrollment in these programs. The school system has allocated additional resources from the general fund to support additional after school mentoring and tutoring initiatives for our students who need additional support. Through general fund and grant fund resources, the school system has provided transportation for these before and/or after school programs as well. This will enable a greater number of our students to access these programs. We have also secured grant funding to provide additional learning opportunities to ensure that students do not fall behind in their core subjects‐ English, math, science, and social studies‐ prior to the end of the first and third semesters. For students who do fall behind in the core subject areas in quarters one and three, the school system will provide after school tutoring opportunities in the evenings for these students at no cost to the students and their families. The next table reports additional programs and strategies that local school systems put in place to improve graduation rates and prevent students from dropping out. Some similarities in these programs and strategies include the following:
• Reporting the evidence of effectiveness of the programs being implemented (Anne Arundel);
• Focusing attention on career pathways for managing programs of study (St. Mary’s, Harford);
• Providing comprehensive summer school programs (Anne Arundel, Calvert, and Howard);
• Refining the smaller learning communities approach (Harford, Calvert); • Reviewing and refining Alternative Learning programs (Harford, Howard, and
Washington).
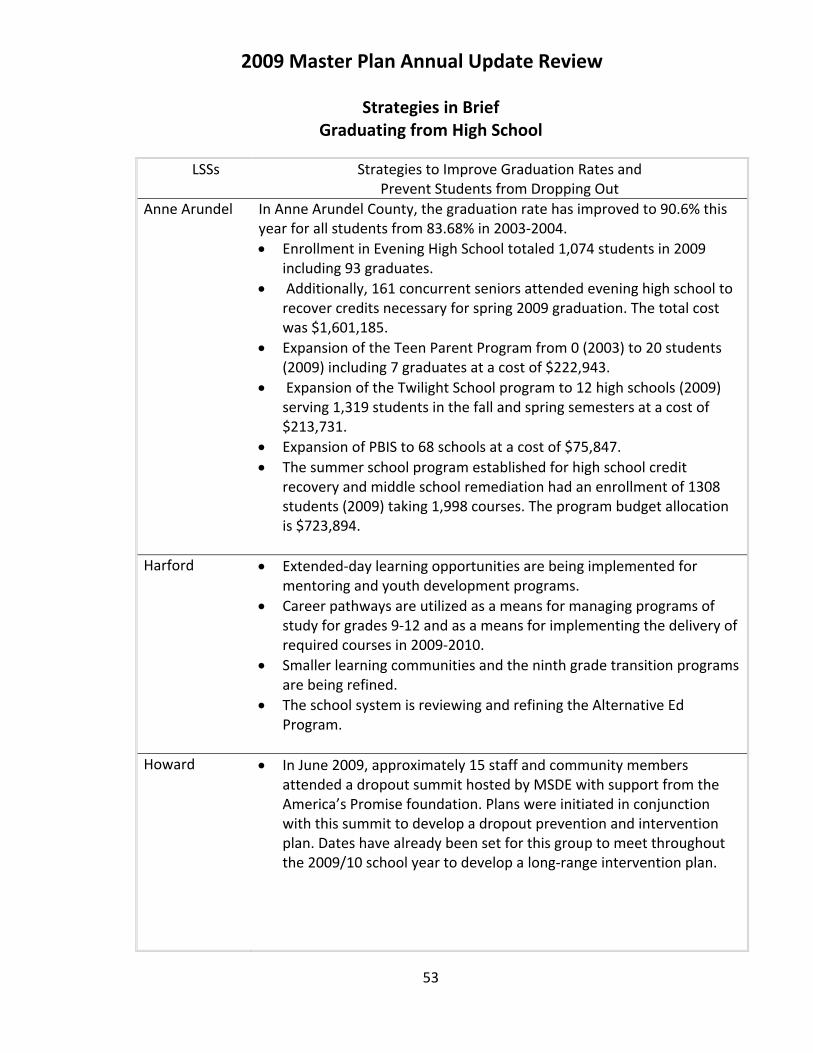
2009 Master Plan Annual Update Review
53
Strategies in Brief Graduating from High School
LSSs Strategies to Improve Graduation Rates and Prevent Students from Dropping Out
Anne Arundel In Anne Arundel County, the graduation rate has improved to 90.6% this year for all students from 83.68% in 2003‐2004. • Enrollment in Evening High School totaled 1,074 students in 2009
including 93 graduates. • Additionally, 161 concurrent seniors attended evening high school to
recover credits necessary for spring 2009 graduation. The total cost was $1,601,185.
• Expansion of the Teen Parent Program from 0 (2003) to 20 students (2009) including 7 graduates at a cost of $222,943.
• Expansion of the Twilight School program to 12 high schools (2009) serving 1,319 students in the fall and spring semesters at a cost of $213,731.
• Expansion of PBIS to 68 schools at a cost of $75,847. • The summer school program established for high school credit
recovery and middle school remediation had an enrollment of 1308 students (2009) taking 1,998 courses. The program budget allocation is $723,894.
Harford
• Extended‐day learning opportunities are being implemented for mentoring and youth development programs.
• Career pathways are utilized as a means for managing programs of study for grades 9‐12 and as a means for implementing the delivery of required courses in 2009‐2010.
• Smaller learning communities and the ninth grade transition programs are being refined.
• The school system is reviewing and refining the Alternative Ed Program.
Howard
• In June 2009, approximately 15 staff and community members attended a dropout summit hosted by MSDE with support from the America’s Promise foundation. Plans were initiated in conjunction with this summit to develop a dropout prevention and intervention plan. Dates have already been set for this group to meet throughout the 2009/10 school year to develop a long‐range intervention plan.

2009 Master Plan Annual Update Review
54
LSSs Strategies to Improve Graduation Rates and Prevent Students from Dropping Out
• Students who are having difficulty passing the required high school assessments continue to need attention. During the summer of 2009, the HCPSS comprehensive summer school program provided the opportunity for eligible students to enroll in HSA mastery classes and to complete Bridge plans. The Homewood Center also provided a summer school opportunity for its students with a focus on HSA mastery and Bridge Plan completion.
• Funds have been allotted to continue the expansion of HCPSS evening programs and to provide assistance to students who struggle to meet the HSA requirement.
• The Homewood Center will continue its partnership with the Woodstock Job Corps Center. This partnership allows students to attend classes for part of the day at Homewood and part of the day at the Job Corp Center. As a result, participating students may graduate with a high school diploma and a certificate in the vocational area of their choosing.
• Meetings will be held with each HCPSS high school to study and review the students who dropped out of school in 2008/09. The Director of Student Services and the Coordinator of Alternative Programs will facilitate these meetings with appropriate school staff. The information gathered in each of these school meetings will be used to plan dropout prevention and intervention efforts specifically designed to meet the needs of students in each school and to help develop system wide strategies.
• In addition, for the 2009/10 school year, all high schools will be provided with a list of the names of their rising 8th grade students who meet specific risk factors for school disengagement and dropping out. These students will be referred to the 9th grade team at each high school so that plans for academic and behavioral support can be put into place early in their freshman year.
Calvert Calvert County Public Schools’ dropout rate improved from 2.00% in 2007‐2008 to 1.60% in 2008‐2009 and continues to exceed the state satisfactory standard of 3.00%. A strong instructional program prekindergarten through grade 12 is the foundation of student success. The instructional strategies discussed throughout this plan are the first steps in ensuring that students are well positioned to graduate. Some of these strategies, which are reported on in more detail in other sections of this Master Plan, include:

2009 Master Plan Annual Update Review
55
LSSs Strategies to Improve Graduation Rates and Prevent Students from Dropping Out
• Tiered research‐based interventions and a single core reading program at elementary, middle and high levels which are delivered in accordance with IEPs for students with disabilities.
• The implementation of smaller learning communities in 6th and 9th grades. These enable the provision of targeted learning support.
• The use of Professional Learning Communities (PLCs) in all schools which include regular and special education teachers, administrators, and teacher specialists.
• PLCs meet on a regular basis to review student benchmark and classroom data to direct instructional planning. Interventions such as fluid flex groupings and modified instruction are implemented to meet the needs of individual students. A range of instructional activities during and outside of the regular instructional day for students who are at‐risk of not passing or have not passed one or more HSA.
• New in 2008‐ 2009 was a Bridge Camp at one high school where Core Leads from all four high schools worked with students who needed to complete Bridge projects to complete their HAS graduation requirement.
• High school credit recovery programs offered during the summer. (See the HSA sections of this Master Plan) One‐hour lunch programs in two of the four high schools which allowed students more access to remediation, interventions, compensatory services, social skill training, mentoring, and credit recovery.
• Articulation meetings between middle and high school teams which focus on specific students and their instructional needs.
Washington
Overall, the WCPS high graduation rate and low dropout rate can be attributed to the implementation and continuation of system‐wide initiatives designed to meet the needs of all students and the systematic development and application of strategies designed to provide all students with an opportunity to succeed. WCPS has implemented and continued to refine numerous initiatives designed to ensure that students graduate and discourage students from dropping out of school including: • Provided dropout prevention/student intervention specialists at all
high schools to serve as "graduation coaches" by providing intervention and relationship‐focused case management for students identified as potential dropouts.
• Placed dropout prevention/student intervention specialists at all middle schools to provide proactive intervention for students who may be at‐risk for not achieving long‐term school success.

2009 Master Plan Annual Update Review
56
LSSs Strategies to Improve Graduation Rates and Prevent Students from Dropping Out
• Increased the use of data to capture key information about current students who withdrew from school to inform dropout prevention efforts.
• Employed a range of school‐based and systemic “alternative” educational options including Antietam Academy, WC Evening High School, the WC Family Center, and School Within a School alternative to suspension programs.
• Promoted the adoption of the revised Student Support Team process in order to assist schools in identifying and addressing student concerns and issues that may affect school success.
• Reorganized High School Summer School to include numerous site‐based options to provide opportunities for students to repeat or recover credit.
• Implemented the use of APEX computer/web based instructional programs, at Evening High School, The WC Family Center, Antietam Academy Alternative Learning Center, and Summer School in order to provide an alternative method for students to obtain “recovery” credit.
• Increased classroom interventions to assist students experiencing academic difficulties to successfully pass high school assessments and complete Bridge projects
• Implemented a Summer High School Transition Program at six high schools throughout the county for at‐risk rising ninth grade students to build relationships, enhance reading skills, and provide targeted intervention designed to ensure a smooth adjustment to high school.
• Placed mathematics and reading student achievement specialists at high schools to work with students experiencing academic difficulties and provide teachers with research‐based strategies to ensure effective instruction is occurring in all classes.
• Continued professional development on meeting the needs of all students for various staff in order boost to student achievement and to help determine the need for strategic academic interventions.
• Implemented the Link Crew and WEB (We Belong Together) 6th and 9th grade transition programs that utilize trained student leaders to create a more inviting and welcoming atmosphere at 13 middle and high schools throughout the system.
• Increased technological support at the WC Family Center (alternative learning center for pregnant and parenting teens) in order to expand academic programming.
• Added another Pupil Personnel Worker (6 total) to reduce the student/PPW ratio and help ensure that the needs of at‐risk students are addressed.

57
Section 8: What Master Plan Updates Reveal‐ How LSSs Use Data Systems to Drive Instruction
Several Maryland school systems are pioneers in their use of data management systems to inform instruction. These LSSs are the ones that are providing detailed discussions in their master plan updates not only on how they use data management systems in measuring school and student progress, but also on how they are used to drive instruction. While nearly every Maryland LSS makes a claim in their master plan updates to be data‐driven, what are the pioneers doing? How do all LSSs use their data systems to inform instruction?
To answer these questions, we started a research project into the data‐driven practices that LSSs reported in their 2009 Master Plan Annual Updates. We began by conducting a search of the annual update submissions (October 15, 2009 and November 23, 2009). The 24 update submissions formed the research sample. We discovered some similarities in the ways that the pioneers are data‐driven. Their approaches have five main elements. First, they are committed to the use of data to drive instructional decisions. Second, as a result of professional development, they create a broad learning community that is receptive to the changes that are proposed. Third, they provide technological tools and resources that enhance the data‐driven approach. Fourth, they are moving toward the integration of multiple data systems into a single data system. Last, they are willing to evaluate the effectiveness of their data‐driven processes. To begin, we describe how some LSSs, whether they are pioneers or not, communicate their commitment to use data in instructional decisions.
A Commitment to Use Data to Drive Instruction
Recently, we have all learned a great deal about assessment and formative assessment in particular. At the center of improving schools and school districts are data management systems to gather data and provide feedback to educators, and others, in order to improve student and teacher performance continuously. Through the 2000s, administrators and teachers embarked on data management systems as a strategy. Throughout this period, pioneers were kicking off their data management systems and beginning to make a public commitment to use data to drive instructional decisions. In this year’s master plan annual updates, this commitment is evidenced in the following statements extracted from several school system master plan updates. They are as follows:
The Impact of Commitment
A commitment to use data to inform instruction should have a high impact on student performance.

2009 Master Plan Annual Update Review
58
• Montgomery: “The district has implemented a Strategic Monitoring Plan to support schools to engage in ongoing student monitoring. It is the expectation that all teachers, grade‐level teams, and course teams will use this data to make instructional decisions to drive student achievement and improve teaching and learning.”
• Kent: “Kent County Public Schools uses an improvement model process that is data driven and implemented at all levels.”
• Calvert: “Consistent use of student data to drive instructional decisions is made possible through Performance Matters data reports in the Student Assessment System (SAS).”
• Worcester: “We use Edusoft a web‐based assessment data management system to provide objective level data to teachers to drive instruction.”
More specific examples of how LSSs are using data to inform instruction are listed below:
LSS Use of Data to Inform Instruction Washington The capability of real‐time access of data through Performance Matters, Inc.
further enhances district‐wide and school‐wide opportunities to manipulate various information sources in an expeditious way in order to analyze student performance. Administrators, teachers, and student achievement specialists (job‐embedded staff developers) are able to make important instructional decisions without any delay.
Talbot Schools administer benchmark assessments. This data is stored in Performance Matters, a data warehouse. Teachers and administrators use the information to make instructional decisions, plan for interventions/ acceleration and enrichment programs. Special emphasis is placed on programming for minority students. Schools maintain flexible grouping so that adjustments can be made as assessments are analyzed.
Caroline Data driven instructional decisions are being utilized to form flexible groups and to differentiate instruction. Improvements are needed to address the needs of our subgroups, even through growth has occurred each year in this area.
Talbot In addition to making data driven instructional decisions for placing students into appropriate reading programs, central office and building based administrators worked to provide differentiated staff development for teachers.
Dorchester Refine benchmarking initiatives and the use of Performance Matters to inform both short and long range instructional planning.
Montgomery Student data can be disaggregated and analyzed to determine specific areas of need and to make instructional decisions, including matching appropriate interventions to address student needs.
St. Mary’s PLCs develop “quick‐checks” which are assessments of learning. They consist of four drafted selected response items consisting of current learning targets as well as poor performing items. This type of assessment allows the PLCs to make data‐driven instructional decisions.
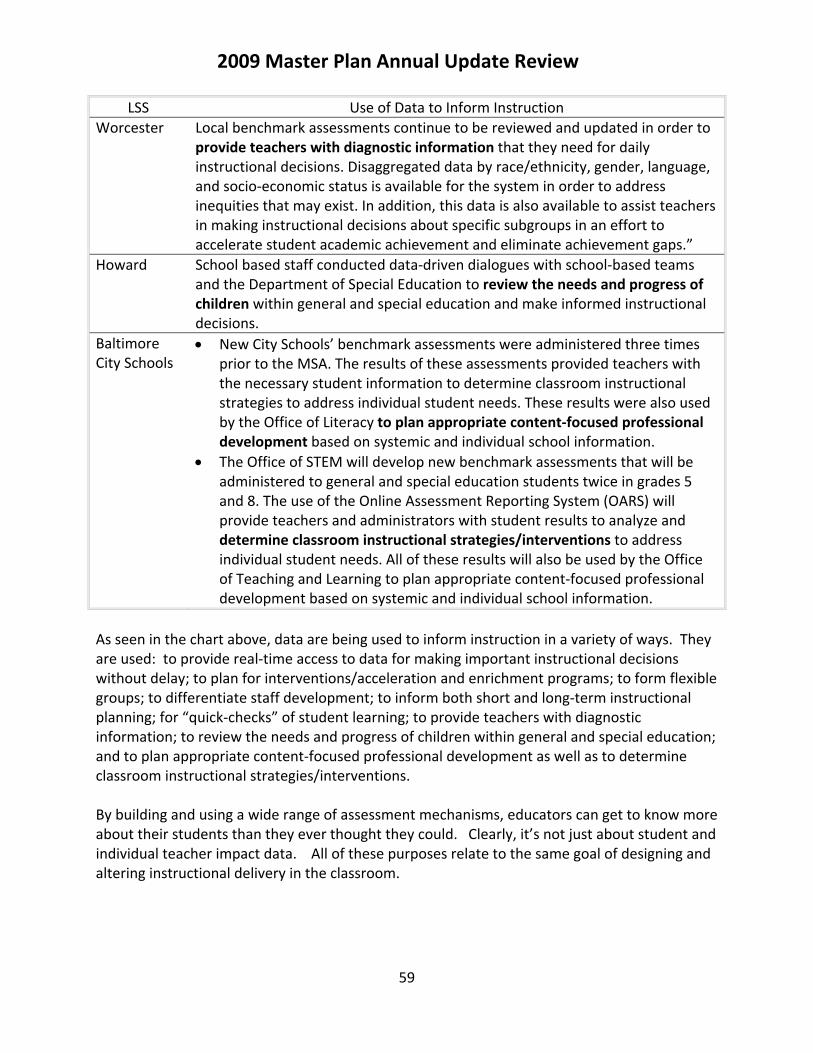
2009 Master Plan Annual Update Review
59
LSS Use of Data to Inform Instruction Worcester Local benchmark assessments continue to be reviewed and updated in order to
provide teachers with diagnostic information that they need for daily instructional decisions. Disaggregated data by race/ethnicity, gender, language, and socio‐economic status is available for the system in order to address inequities that may exist. In addition, this data is also available to assist teachers in making instructional decisions about specific subgroups in an effort to accelerate student academic achievement and eliminate achievement gaps.”
Howard School based staff conducted data‐driven dialogues with school‐based teams and the Department of Special Education to review the needs and progress of children within general and special education and make informed instructional decisions.
Baltimore City Schools
• New City Schools’ benchmark assessments were administered three times prior to the MSA. The results of these assessments provided teachers with the necessary student information to determine classroom instructional strategies to address individual student needs. These results were also used by the Office of Literacy to plan appropriate content‐focused professional development based on systemic and individual school information.
• The Office of STEM will develop new benchmark assessments that will be administered to general and special education students twice in grades 5 and 8. The use of the Online Assessment Reporting System (OARS) will provide teachers and administrators with student results to analyze and determine classroom instructional strategies/interventions to address individual student needs. All of these results will also be used by the Office of Teaching and Learning to plan appropriate content‐focused professional development based on systemic and individual school information.
As seen in the chart above, data are being used to inform instruction in a variety of ways. They are used: to provide real‐time access to data for making important instructional decisions without delay; to plan for interventions/acceleration and enrichment programs; to form flexible groups; to differentiate staff development; to inform both short and long‐term instructional planning; for “quick‐checks” of student learning; to provide teachers with diagnostic information; to review the needs and progress of children within general and special education; and to plan appropriate content‐focused professional development as well as to determine classroom instructional strategies/interventions. By building and using a wide range of assessment mechanisms, educators can get to know more about their students than they ever thought they could. Clearly, it’s not just about student and individual teacher impact data. All of these purposes relate to the same goal of designing and altering instructional delivery in the classroom.

2009 Master Plan Annual Update Review
60
The Impact of TrainingPioneers train a large portion of the workforce on how to be data‐driven.
Intensive Training
LSSs are investing a great deal of time and effort into training for a large number of their employees. Local master plan updates suggest that training is provided for principals, teachers, guidance counselors, and other staff to use data to identify the specific help students need to succeed, to adjust classroom instruction to better address student strengths and weaknesses, and to target professional development and other resources on student and teacher needs.
• Montgomery: “Through the M‐Stat process, MCPS will continue to monitor disciple/suspension data at the system and school level in its effort to reduce the incidences of out‐of‐school suspensions and to reduce the disproportionate use of suspension for identified student groups. The M‐Stat team will continue to offer professional development training for all school administrators. Throughout the school year, community superintendents will discuss and analyze school discipline/suspension data monthly for the schools under their supervision.”
• St. Mary’s: First and foremost, the implementation of the data warehouse across the system provided a means for content area supervisors to be able to analyze data down to the individual student level in order to make data driven decisions about students and instruction/pacing. Supervisors provided differentiated professional development about the data analysis of county‐wide formative assessments in order to impact instruction in a timely manner.”
• Washington: “Adjustments will need to be made to the Master Plan to address gap deficiencies noted in the Maryland Technology Survey on the part of the principal and administrators sub group. In particular, data‐driven decision making, management and operations, and professional practice and productivity, (Standards III, IV, and V), will be the focus of future training in order to close gap analysis data.”
• Wicomico: “Edusoft implementation teams which include the Principal, Instructional Leadership Team (school improvement team) Chair, Technology Resource Teacher and Reading and Math Professional Development Coaches from each school continued to receive extensive professional development on the use of the system and how to generate customized reports to track student performance in the aggregate, disaggregated by subgroup (African American, Hispanic, FARM, Special Education, ELL), and individually. Every teacher was trained on the use of Edusoft and processes were put in place to ensure all teachers new to the school system in future years will also be trained.”
• Baltimore City Schools: “DREAA conducted training sessions for test coordinators for MSA, alt‐MSA, online mod‐MSA, MSA science, and HSA assessments on the correct procedures and administration of these assessments. All required monitoring activities for these assessments have been conducted and all test security violations identified by MSDE were addressed and resolved.”

2009 Master Plan Annual Update Review
61
The table below displays some professional development offerings. They include the following:
LSS Professional Development Allegany Teachers have been trained to review data for individual students, subgroups,
whole grade levels, and all test takers; to disaggregate data and adjust instruction through differentiation to meet the needs of underachieving students.
Carroll Members from the Research and Accountability Department provide training and professional development to classroom teachers and administrators on data‐driven decision making and related strategies to improve student achievement.
Garrett • Garrett County HSA content teachers have been trained and use portions of the online HSA courses for formative assessments and remediation to prepare students for the high school assessments.
• Staff development opportunities including professional learning communities, vertical teaming where teachers analyze student performance and develop strategies for improvement, instructional consultation team development, professional collaboration, a course for new teachers to the county, data driven instruction, differentiated instruction, content mentoring for special education teachers and content area teacher sharing expertise, co‐teaching and mentoring for all first and second year teachers.
Harford Professional development will also be provided to middle school teachers focusing on the utilization of data to inform instruction. With regard to resources, curriculum and assessment teams have been fully funded to accomplish these goals which are intended to ensure progress.
Howard All elementary reading specialists as well as representatives from every school team at each grade level received materials and training on the Fountas and Pinnell Benchmark Assessment System. This assessment system is designed to bring out a common understanding of instructional needs and will be used by middle schools in the upcoming school year. Each intermediate team will receive the Benchmark Assessment System, designed to enable teachers to more closely link assessment to instruction. Ongoing support will be provided through reading support teachers and reading specialists. Special education teachers and Title 1 teachers will participate in this endeavor. The amount of materials and number of teachers trained will continue to increase.
Washington Fountas and Pinnell Benchmark Assessment System: The curriculum and instruction staff will train all student achievement specialist and classroom and specialist teachers across the county in grades k‐5 in the use of the Fountas and Pinnell Benchmark Assessment System. All classroom teachers will be required to use the assessment system to conduct running records and assessment conferencing quarterly to all children reading below level and biannually to all students reading on level. The data collected will be entered into the Performance Matters data warehouse to monitor reading progress and to use the data to support CFIP conversations.
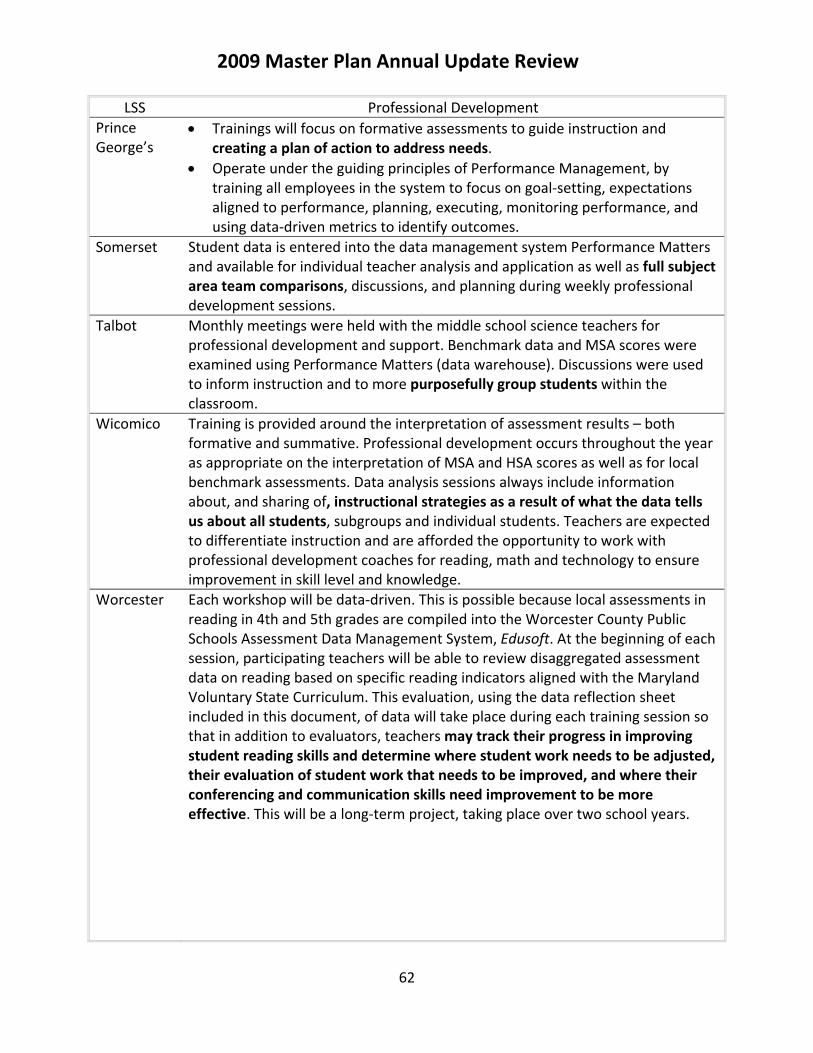
2009 Master Plan Annual Update Review
62
LSS Professional Development Prince George’s
• Trainings will focus on formative assessments to guide instruction and creating a plan of action to address needs.
• Operate under the guiding principles of Performance Management, by training all employees in the system to focus on goal‐setting, expectations aligned to performance, planning, executing, monitoring performance, and using data‐driven metrics to identify outcomes.
Somerset Student data is entered into the data management system Performance Matters and available for individual teacher analysis and application as well as full subject area team comparisons, discussions, and planning during weekly professional development sessions.
Talbot Monthly meetings were held with the middle school science teachers for professional development and support. Benchmark data and MSA scores were examined using Performance Matters (data warehouse). Discussions were used to inform instruction and to more purposefully group students within the classroom.
Wicomico Training is provided around the interpretation of assessment results – both formative and summative. Professional development occurs throughout the year as appropriate on the interpretation of MSA and HSA scores as well as for local benchmark assessments. Data analysis sessions always include information about, and sharing of, instructional strategies as a result of what the data tells us about all students, subgroups and individual students. Teachers are expected to differentiate instruction and are afforded the opportunity to work with professional development coaches for reading, math and technology to ensure improvement in skill level and knowledge.
Worcester Each workshop will be data‐driven. This is possible because local assessments in reading in 4th and 5th grades are compiled into the Worcester County Public Schools Assessment Data Management System, Edusoft. At the beginning of each session, participating teachers will be able to review disaggregated assessment data on reading based on specific reading indicators aligned with the Maryland Voluntary State Curriculum. This evaluation, using the data reflection sheet included in this document, of data will take place during each training session so that in addition to evaluators, teachers may track their progress in improving student reading skills and determine where student work needs to be adjusted, their evaluation of student work that needs to be improved, and where their conferencing and communication skills need improvement to be more effective. This will be a long‐term project, taking place over two school years.

2009 Master Plan Annual Update Review
63
LSS Professional Development Baltimore City Schools
• Professional development activities will focus on data‐driven decision making.• Professional development in the area of special education strategies to close
the gap between general education student performances on the MSA was a topic throughout all professional development sessions that addressed differentiation of instruction. Other topics included error analysis to inform instruction using formative assessments, IEP writing in mathematics (in collaboration with the Special Education Office), and intervention strategies. Teachers participated in professional development activities using the Online Assessment Reporting System (OARS) to input student benchmark data and analyze it.
Local school systems recognize the value of ongoing training on data‐driven decision‐making as a way to attain maximum student and teacher performance. Effective coaches and administrators are data‐savvy; they understand the nuances of formative assessments and how analyzing student work samples (including pre‐assessments, portfolios, surveys, and performance‐based assessments) can lead to greater rates of student learning and more precision in teaching approaches.
Instructional Technology
Pioneers that are data‐driven also use technology to improve teaching and learning. More specifically, school systems are purchasing, and training teachers to use, instructional software, technology‐enabled white boards, and other interactive technologies that have been shown to be effective aids for instruction, particularly for English Language learners, students with disabilities, and both struggling and advanced learners. They are also creating web‐enabled repositories of instructional resources for teachers to use in meeting the needs of different learners. For example:
• Allegany: “An electronic curriculum repository has been developed to house web and software based resources in a framework that is aligned with the VSC and easily accessed by teachers. This repository features instructional resources and a mechanism whereby teachers can recommend additional resources to other teachers.”
• Calvert: “All of our high school math classrooms continue to utilize SMART Boards which are interactive whiteboards. Training has been offered during the summer and at several staff development days. In 2009‐10, teachers have begun to use hand‐held student response tools (SENTEO). SENTEO has helped gain student interest and has allowed for immediate feedback to guide teachers’ instruction through data‐driven decision‐making.”
The Impact of Instructional Technology
The more widespread the use of technology‐enabled teaching aids, the greater the chances of student success among all learners.
2009 Master Plan Annual Update Review
64
The Impact of Linking Data Systems
Several school systems are moving toward the integration of multiple systems into a single data system.
• Talbot: “Prior to freshman entering high school, their middle school MSA reading data is analyzed to identify which students present as those in need of interventions. Built into these students’ schedules is a literacy support class. Depending upon progress made during the year, as measured by benchmark assessments, they may or may not continue with this intervention their sophomore year. Students also receive individualized reading and writing skill remediation/development using PLATO software on their student laptops.”
• Washington: “Some identified students receive sufficient HSA preparation during the year‐long, 90‐minute daily Introduction to Algebra and Algebra 1 course sequence for successful performance. Some identified students exhibit concerns after the first benchmark in six weeks or any of the other five benchmarks during the year. Identified students with targeted areas of weakness participate in interventions as planned and documented in the student’s Mathematics Improvement Plan (MIP). The Algebra teacher, Special Education or ELL teacher, and mathematics Student Achievement Specialist collaborate to create an MIP with planned target remedial areas and documented interventions specifically for the identified student. The MIP includes an analysis of student strengths and weaknesses on MSA and county‐created HSA benchmarks, error patterns, missing pre‐requisite skills, instructional strategies and interventions. The primary intervention programs available for the cohort populating Table 2.6 AYP included Cognitive Tutor Algebra software by Carnegie Learning and HSA FinishLine workbooks by Continental Press. Students are offered interventions during non‐assessed courses, after‐school programs, and summer school.”
In addition, local school systems use or purchase high‐quality online courseware in core high school content areas.
Linking Data Systems
School systems are exploring the integration of multiple data systems that could assist teachers in data collection so that assessment information can be readily available for them to use to make meaningful, data‐driven, instructional decisions. Districts’ might link student, financial, and personnel systems, and use resulting information for analyses and reports that enable community, district, and school leaders to better understand the educational and cost effectiveness of district programs and strategies and allocate resources accordingly. They might develop or enhance existing data systems to provide teachers access to (1) student data in such areas as attendance, grades, course schedules, and disability or English language learner statistics, and (2) data that show academic performance and growth, how those compare to state averages for similar students and schools, and whether students are on track to meet standards and graduate from high school. The next page includes some descriptive information about LSSs that are linking their data systems.
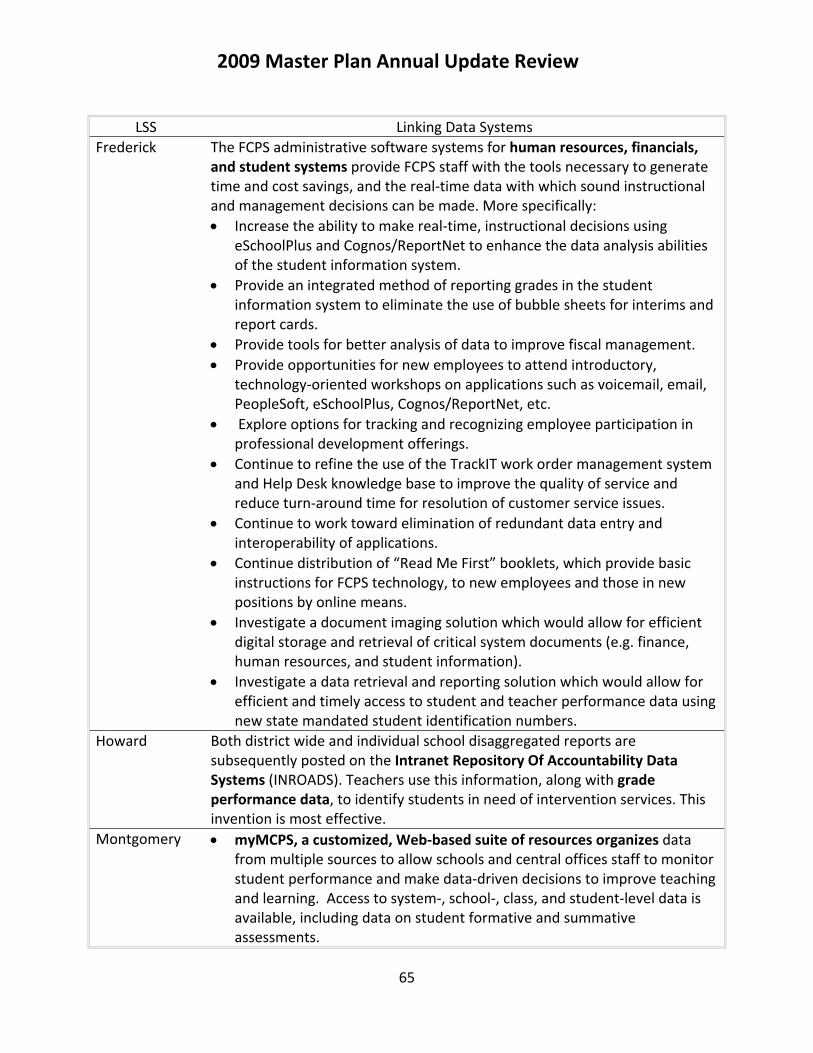
2009 Master Plan Annual Update Review
65
LSS Linking Data Systems
Frederick The FCPS administrative software systems for human resources, financials, and student systems provide FCPS staff with the tools necessary to generate time and cost savings, and the real‐time data with which sound instructional and management decisions can be made. More specifically: • Increase the ability to make real‐time, instructional decisions using
eSchoolPlus and Cognos/ReportNet to enhance the data analysis abilities of the student information system.
• Provide an integrated method of reporting grades in the student information system to eliminate the use of bubble sheets for interims and report cards.
• Provide tools for better analysis of data to improve fiscal management. • Provide opportunities for new employees to attend introductory,
technology‐oriented workshops on applications such as voicemail, email, PeopleSoft, eSchoolPlus, Cognos/ReportNet, etc.
• Explore options for tracking and recognizing employee participation in professional development offerings.
• Continue to refine the use of the TrackIT work order management system and Help Desk knowledge base to improve the quality of service and reduce turn‐around time for resolution of customer service issues.
• Continue to work toward elimination of redundant data entry and interoperability of applications.
• Continue distribution of “Read Me First” booklets, which provide basic instructions for FCPS technology, to new employees and those in new positions by online means.
• Investigate a document imaging solution which would allow for efficient digital storage and retrieval of critical system documents (e.g. finance, human resources, and student information).
• Investigate a data retrieval and reporting solution which would allow for efficient and timely access to student and teacher performance data using new state mandated student identification numbers.
Howard Both district wide and individual school disaggregated reports are subsequently posted on the Intranet Repository Of Accountability Data Systems (INROADS). Teachers use this information, along with grade performance data, to identify students in need of intervention services. This invention is most effective.
Montgomery • myMCPS, a customized, Web‐based suite of resources organizes data from multiple sources to allow schools and central offices staff to monitor student performance and make data‐driven decisions to improve teaching and learning. Access to system‐, school‐, class, and student‐level data is available, including data on student formative and summative assessments.

2009 Master Plan Annual Update Review
66
LSS Linking Data Systems • A quarterly Performance Management Analysis and Planning Process
(PMAPP) will monitor student achievement data (formative assessments, attendance, suspensions) as they align with specific activities and strategies identified and supported by the professional development plans.
Washington A data management system for individual student data, Performance Matters, Incl (PMI), includes periodic benchmark assessment results and is maintained for all schools. The ability to cross‐reference this data management system with the general student information system has enabled greater access to detailed student information in order to present a comprehensive picture that informs classroom decisions and identifies significant implications leading to new learning.
Worcester • In addition to LAS Links scores, assessment data from county benchmark assessments, CTBS, and MSA is readily available through the Edusoft Program to provide staff with diagnostic information that is used to create individualized ELL plans and drive instructional decision making.
• Additionally, teachers use information derived from another technology, Edusoft data management software to identify problematic areas in mathematics content so they can design differentiated learning experiences for their underperforming students based on data derived from local benchmark assessments. This software is designed so teachers are able to target all students, with special attention given to the African‐American, Hispanic, FARMS, Special Education and ELL populations. The use of data to inform instructional decisions leading to differentiated learning opportunities is an expectation of all Worcester County teachers in a variety of instructional settings, including during the school day, and in extended‐day and extended‐year instructional programs as well.
Additionally, school systems are beginning to make this information available to the public. More specifically, Baltimore City Schools is providing school profiles that include disaggregation of Stanford, MSA, HSA by all NCLB subgroups, along with enrollment, attendance, over‐age, suspension, graduation, dropout, and highly qualified teacher data were posted on the website for school and public access.
2009 Master Plan Annual Update Review
67
Evaluation of Data‐Driven Processes Local school systems are beginning to assess how effective their data systems are in solving particular problems and thus contributing to long‐term changes in teaching and learning effectiveness. In their 2009 Master Plan Annual Updates, LSSs attribute gains in student performance, as least in part, to the following:
• Talbot: “We believe the significant gains between our 2007 and 2008 data can be attributed to several factors: the alignment of instruction with the English VSC, administrators and teachers using benchmark testing to inform instruction, the use of technology as an instructional tool, and staff development that incorporated technology and instruction.”
• Washington: “WCPS continues to meet AYP targets and exceed Maryland targets in the area. Less than 4% of students did not pass the HSA and instead used the Bridge Plan to meet graduation requirements. Success can be attributed to the establishment of a unified Pre‐K through 12 math program; use of national math standards; 90 minutes of daily math instruction; use of benchmark data for instructional decisions and early identification of struggling students...”
Or, school systems may report benefits of the use of their data systems, as Worcester County did, in this way: “Implementation of a new system, Edusoft (assessment data management system), has begun to assist teachers in the management of assessment data. This system serves a two‐fold need for teachers: 1) it scores local benchmark assessments that are aligned to the MD VSC; 2) it provides a vehicle for the manipulation of the local benchmark, MSA, HSA, and CTBS/5 data. The system will give teachers information to the objective level. This system will assist teachers by eliminating the labor intensive work of scoring and creating charts and graphs to view data that will be used in instructional decision making.”
Impact of Effectiveness School systems must continually evaluate: • Benchmark exams to ensure their
use for improving student learning. • Reports designed to be user‐
friendly and provide guidance on how to appropriately interpret and use the results.

2009 Master Plan Annual Update Review
68
Section 8: Program, Technical, and Budget Reviews
This section reports on the results of the Program Reviews, Technical Reviews, and Budget Reviews. Program Reviews
The Program Reviews focused on progress that local school systems were making toward meeting program goals. As a result of the Program Reviews, all program areas (e.g., early learning, gifted and talented students, education technology, and multicultural education) were found to be in compliance with requirements contained in State law, and, as applicable, additional requirements established by MSDE. This report highlight the results of the program review regarding gifted and talented programs.
Gifted and Talented Programs
1. Local school systems differ in their interpretation of the BTE statute requirement to include in the Master Plan “goals, objectives, and strategies regarding the performance of gifted and talented students.” An exemplary approach from one school system was to create a separate performance objective for gifted and talented students as a subgroup: “By 2011, 95% of students participating in GT program offerings will have achieved exemplary status as defined by state and local assessments.” (Howard)
2. School systems differ in the quality and quantity of services offered, which range from a
once a week 50 minute pullout class to a full time magnet school program for gifted students. This range is not always directly correlated with the economic status. Currently Maryland does not have consistent program standards for gifted and talented programs (COMAR).
3. Most school systems include in their updates the numbers/percentages of students
participating in gifted and talented programs and typically disaggregate the data by NCLB student subgroup. Exemplary plans include goals and strategies for the participation of underrepresented groups.
4. Commendations were given for exemplary 2009 Master Plan Updates
• Calvert County Public Schools Master Plan Update on the Gifted and Talented
Program presents an innovative approach to improving opportunities for gifted and talented students through a comprehensive discussion of services offered at all levels and an identification process which includes Primary Talent Development and a census aptitude test (CogAT) for the identification of high cognitive potential.

2009 Master Plan Annual Update Review
69
• The Cecil County Public Schools Master Plan Update on the Gifted and
Talented Program presents an innovative approach to improving opportunities for gifted and talented students through a comprehensive discussion of the resources and strategies, including professional development and instructional differentiation, which are allocated to support LSS priorities.
• Charles County Public Schools is commended for a Master Plan update on the
Gifted and Talented Program that presents data‐driven practices designed to ensure success for gifted student identification and services that leverage local and federal resources, including ARRA, to support system priorities.
• Frederick County Public Schools is commended for a Master Plan Update on
the Gifted and Talented Program that provides a comprehensive discussion of the resources and services.
Technical Reviews
As a result of the Technical Review, the NCLB grant programs (Title I‐A, Title I‐D, Title II‐A, Title II‐D, Title III‐A, Title IV‐A), the State Fine Arts Grant, facilities plans for kindergarten and pre‐kindergarten for disadvantaged students, and other State reporting areas, were found to be in compliance with requirements contained in State and federal law, and, as applicable, additional requirements established by MSDE. This report highlights the results of the program review regarding the State Fine Arts grants.
State Fine Arts Grants
1. The Maryland State Department of Education (MSDE) supported strategic planning at the local level prior to No Child Left Behind legislation (NCLB). In 2000, a series of technical assistance workshops were conducted for local school system teams in effective ways for developing long‐range, strategic planning documents that would support local initiatives to improve fine arts education programs. Having acquired core curricula status in NCLB, strategic planning became a required component of Maryland’s Bridge to Excellence master planning process in school year 2003‐2004.
2. All of the work that has been accomplished during the strategic planning years is
characterized by four principles: a) It is collaborative; b) Professional development is woven throughout; c) The discourse is open and inclusive and the evaluation process iterative and thorough, and d) All products developed are of the highest quality.
3. Baltimore, Carroll, Harford, and Howard counties are setting the pace in strategic
planning. Annually they have provided comprehensive discussions of their goals,
2009 Master Plan Annual Update Review
70
strategies, and activities and the application of fiscal and human resources required for success.
4. Most school system have developed end of course assessments and are developing
system‐wide grade level assessments to measure student achievement. Based on years of experience in developing and implementing a system‐wide assessment program, Frederick County Public Schools has shared extensive information about its arts assessments with other school systems and is currently integrating portfolio components into the system. Wicomico County has revised its entire curriculum in music and the visual arts and has developed an assessment system to evaluate student progress and improve instruction, and Howard County is piloting e‐portfolio assessment at the elementary level in collaboration with the University of Maryland, Baltimore County.
5. Working with local arts and cultural organizations, Cecil County expanded its elementary‐
level offerings to include dance and theatre and has established an exemplary format for reporting program growth.
6. All aspects of the strategic planning work reflect collaboration between MSDE and local
school systems or other partners. Embedded in all of these activities are a variety of opportunities for teacher and administrator growth.
Budget Reviews
All Budget Documents were found to be in compliance with requirements established by MSDE.

2009 Master Plan Annual Update Review
71
Section 9: Conclusion This annual review revealed that all 24 local school system Annual Updates were substantially in compliance with the requirements contained in State and federal law, and, as applicable, additional requirements established by MSDE.


72
Attachments


73
Attachment A
Annual Update PercentagesOf Core Academic Subject Classes Taught by HQT
Local School System
2003‐2004
2004‐2005
2005‐2006
2006‐2007
2007‐2008
2008‐2009
Allegany 85.0% 93.6% 97.2% 97.5% 97.8% 98.4%Anne Arundel 82.2% 84.0% 84.5% 84.1% 87.4% 90.4%Baltimore City 34.3% 42.1% 46.8% 53.0% 51.0% 69.0%Baltimore 62.5% 77.7% 83.3% 87.5% 88.7% 89.8%Calvert 77.7% 85.6% 86.5% 87.3% 86.3% 92.5%Caroline 74.5% 87.0% 89.5% 95% 96% 96.7%Carroll NA 87.9% 89.8% 90.2% 91.7% 92.5%Cecil 77.7% 86.9% 89.5% 90.2% 93.1% 94.0%Charles 51.0% 60.0% 73.0% 82.0% 91.0% 87.1%Dorchester 67.3% 56.5% 66.9% 61.7% 79.8% 79.8%Frederick 79.4% 86.4% 89.0% 90.4% 91.9% 92.7%Garrett 85.0% 90.1% 93.3% 94.8% 95.0% 93.6%Harford 80.1% 88.9% 89.3% 88.2% 88.7% 91.1%Howard 81.7% 84.2% 89.0% 88.4% 90% 92.5%Kent 73.0% 75.1% 82.9% 82.7% 90% 93.7%Montgomery 74.5% 80.3% 85.5% 90.5% 92.5% 93.9%Prince George’s 48.6% 62.0% 62.1% 66.3% 78.0% 82.0%Queen Anne’s 62.1% 72.1% 81.1% 83.7% 82.6% 83.9%St. Mary’s 70.9% 89.6% 93.3% 94.2% 92.9% 93.5%Somerset 53.4% 75.8% 69.0% 71.4% 83.3% 90.7%Talbot NA 87.8% 91.9% 91.2% 96.4% 94.6%Washington 69.7% 84.4% 89.2% 90.2% 90.1% 91.5%Wicomico 78.2% 80.5% 74.5% 86.9% 88% 93.4%Worcester 79.3% 86.2% 89.2% 91.6% 95% 97.3%Statewide % HQT 66.8% 75.4% 79.5% 82.2% 84.6% 88.5%

2009 Master Plan Annual Update Review
74
Attachment B: Master Plan Annual Update Budget Summaries
• Current Year Variance Table • Prior Year Variance Table • ARRA Financial Table

Allegany County Public Schools
Revenue
Original Budget 7/1/2009
Original Budget 7/1/2010 Change
Current Year Variance Report (Allocation of Available Resources)
Local Appropriation $28,450,000 $28,165,000 ($285,000)
State Revenue $86,676,000 $85,013,000 ($1,663,000)
Federal Revenue $8,565,000 $8,372,000 ($193,000)
Other Resources/Transfers $0 $0 $0
Other Local Revenue $564,000 $526,000 ($38,000)
Federal ARRA Funds $0 $3,810,000 $3,810,000
$124,255,000 $125,886,000 $1,631,000Total
Planned Expenditures by federal NCLB Goals
1. By 2013‐2014, all students will reach high standards, at a minimum attaining proficiency in reading/language arts and mathematics.
$2,256,800
3. By 2005‐2006, all students will be taught by highly qualified teachers. ($542,900)4. All students will be educated in learning environments that are safe, drug free, and conducive to learning.
$202,800
* Mandatory Cost of Doing Business ($285,700)
Planned Expenditures Examples
ARRA ‐ OT/PT $700,000ARRA ‐ Special Educaiton $1,258,900ARRA ‐ Title 1 $1,338,800Grants shortfall ($521,800)Purchase of library books ($748,000)Change in regular instruction ($432,300)ARRA ‐ School health nurse funding $415,900Decrease in local costs for school health nurses ($393,400)Decrease in GASB 45 contribution ($436,000)Eliminate FY09 one‐time projects ($610,000)Fiber Requirements , BOE, Mtn Ridge, Braddock $325,000Increases in contractual agreements ‐ salaries $1,377,700Net decrease in contribution to retiree insurance ($1,214,000)Nonpublic Special Education Placements $300,000
Note: Each school system's goals may or may not directly correlate to one of the federal NCLB goals. Expenditures are illustrative of those reported in the Master Plan Update Budget Alignment and are not intended to sum to the total.
Allegany County Public Schools
B-1
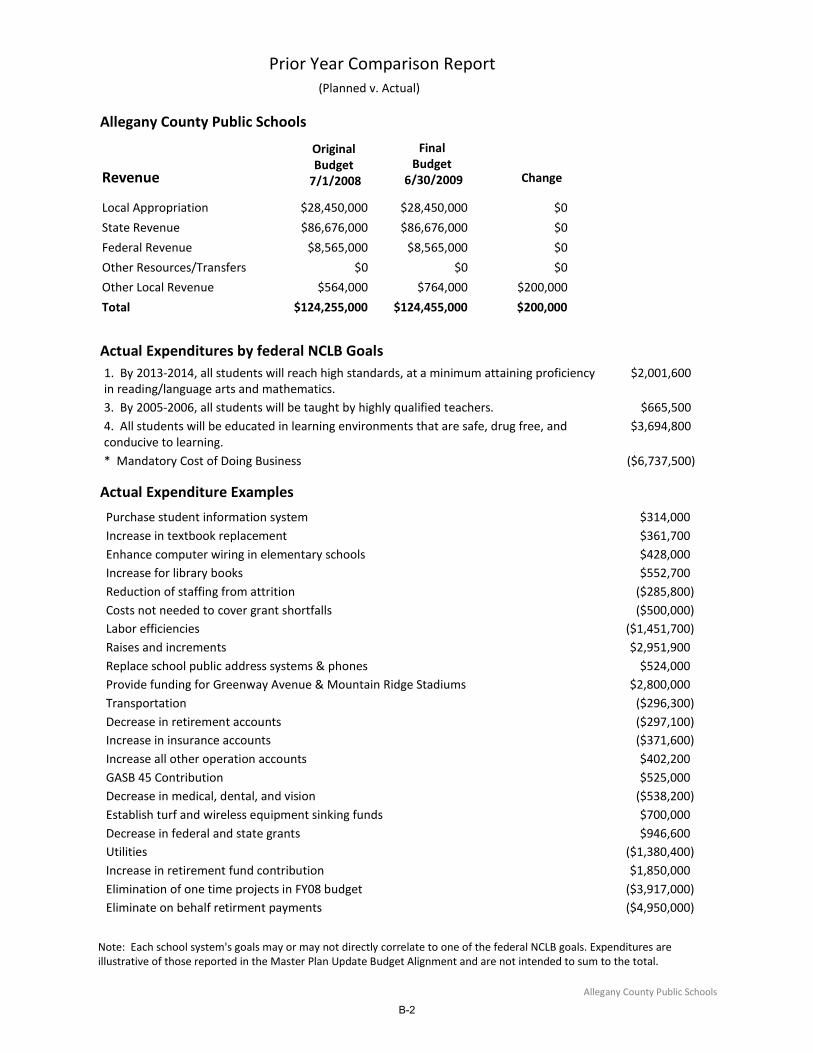
Allegany County Public Schools
Prior Year Comparison Report (Planned v. Actual)
Original Budget 7/1/2008
Final Budget
6/30/2009 ChangeRevenue
Local Appropriation $28,450,000 $28,450,000 $0
State Revenue $86,676,000 $86,676,000 $0
Federal Revenue $8,565,000 $8,565,000 $0
Other Resources/Transfers $0 $0 $0
Other Local Revenue $564,000 $764,000 $200,000
$124,255,000 $124,455,000 $200,000Total
Actual Expenditures by federal NCLB Goals1. By 2013‐2014, all students will reach high standards, at a minimum attaining proficiency in reading/language arts and mathematics.
$2,001,600
3. By 2005‐2006, all students will be taught by highly qualified teachers. $665,5004. All students will be educated in learning environments that are safe, drug free, and conducive to learning.
$3,694,800
* Mandatory Cost of Doing Business ($6,737,500)
Actual Expenditure Examples
Purchase student information system $314,000Increase in textbook replacement $361,700Enhance computer wiring in elementary schools $428,000Increase for library books $552,700Reduction of staffing from attrition ($285,800)Costs not needed to cover grant shortfalls ($500,000)Labor efficiencies ($1,451,700)Raises and increments $2,951,900Replace school public address systems & phones $524,000Provide funding for Greenway Avenue & Mountain Ridge Stadiums $2,800,000Transportation ($296,300)Decrease in retirement accounts ($297,100)Increase in insurance accounts ($371,600)Increase all other operation accounts $402,200GASB 45 Contribution $525,000Decrease in medical, dental, and vision ($538,200)Establish turf and wireless equipment sinking funds $700,000Decrease in federal and state grants $946,600Utilities ($1,380,400)Increase in retirement fund contribution $1,850,000Elimination of one time projects in FY08 budget ($3,917,000)Eliminate on behalf retirment payments ($4,950,000)
Note: Each school system's goals may or may not directly correlate to one of the federal NCLB goals. Expenditures are illustrative of those reported in the Master Plan Update Budget Alignment and are not intended to sum to the total.
Allegany County Public Schools
B-2

Allegany County Public Schools
American Recovery and Reinvestment Act of 2009Financial Reporting Table
FY 2009 FY 2010 TotalGrant Name
National School Lunch ‐ Equipment Assistance 0 95,800 95,800
Homeless Children and Youth 0 0 0
Title I ‐ Grants to LEAs, Neglected and Delinquent 0 1,338,768 1,338,768
IDEA Part B ‐ Grants to States‐Pass‐Through 0 2,547,730 2,547,730
IDEA Part B ‐ Preschool Grants 0 101,138 101,138
IDEA Part C ‐ Infants and Families 0 103,874 103,874
State Fiscal Stabilization Fund Education Program 0 1,114,828 1,114,828
$0 $5,302,138 $5,302,138Total
Expenditures by ARRA Assurances1. Increase teacher effectiveness and address inequities in the distribution of highly qualified teachers (recruiting, developing, and retaining effective teachers and principals).
128,258.00
* Other 797,509.00
Note: The above figures do not include funds which will be deferred until FY2011
Planned Expenditures Examples
Special Education Teachers $276,000
Title I Summer School $280,284
OT/PT Service $700,000
School Health $414,828
Special Education Contracted Related Services $366,233
Technology Initiative – Title I schoolwide programs Laptops/Carts $290,100
Note: Each school system's goals may or may not directly correlate to one of the federal NCLB goals. Expenditures are illustrative of those reported in the Master Plan Update Budget Alignment and are not intended to sum to the total.
Allegany County Public Schools
B-3

B-4

Anne Arundel County Public Schools
Revenue
Original Budget 7/1/2009
Original Budget 7/1/2010 Change
Current Year Variance Report (Allocation of Available Resources)
Local Appropriation $551,206,500 $554,026,500 $2,820,000
State Revenue $281,021,909 $275,775,600 ($5,246,309)
Federal Revenue $33,031,000 $33,175,400 $144,400
Other Resources/Transfers $0 $0 $0
Other Local Revenue $10,606,991 $9,957,000 ($649,991)
$875,866,400 $872,934,500 ($2,931,900)Total
Planned Expenditures by federal NCLB Goals
1. By 2013‐2014, all students will reach high standards, at a minimum attaining proficiency in reading/language arts and mathematics.
$1,673,121
3. By 2005‐2006, all students will be taught by highly qualified teachers. ($825,000)5. All students will graduate from high school. $900,039* Mandatory Cost of Doing Business $2,468,464* Other ($7,148,524)
Planned Expenditures Examples
Performing & Visual Arts Program ‐ Bates Middle School $800,000STEM Magnet program at North County High School‐Continuation $253,943STEM Magnet program at South River High School $619,178Signing Bonuses for Teachers ($400,000)Replacement of Student Information System $900,039Charter School allocations $2,476,640Increases in contractual agreements ‐ benefits (if itemized separately) $8,845,638Increases in contractual agreements ‐ salaries (FURLOUGHS) ($7,660,000)Reduction in Grants ($1,776,900)Transportation ($300,000)Utilities $883,086Budget Balancing Reductions ‐ Non‐Position Cuts (Prof Dev.,Training, Supplies, Equipment, Technology)
($3,794,153)
Budget Balancing Reductions ‐ Vacant Position Cuts ($675,000)Reduction of Reserve Accounts ($2,214,622)Reduction of Textbooks ($310,628)
Note: Each school system's goals may or may not directly correlate to one of the federal NCLB goals. Expenditures are illustrative of those reported in the Master Plan Update Budget Alignment and are not intended to sum to the total.
Anne Arundel County Public Schools
B-5

B-6

Anne Arundel County Public Schools
Prior Year Comparison Report (Planned v. Actual)
Original Budget 7/1/2008
Final Budget
6/30/2009 ChangeRevenue
Local Appropriation $551,206,500 $551,340,800 $134,300
State Revenue $281,021,909 $280,483,169 ($538,740)
Federal Revenue $33,031,000 $37,822,540 $4,791,540
Other Resources/Transfers $0 $0 $0
Other Local Revenue $10,606,991 $10,918,291 $311,300
$875,866,400 $880,564,800 $4,698,400Total
Actual Expenditures by federal NCLB Goals1. By 2013‐2014, all students will reach high standards, at a minimum attaining proficiency in reading/language arts and mathematics.
$12,797,757
2. All limited English proficient students will become proficient in English and reach high academic standards at a minimum attaining proficiency or better in reading/language arts and mathematics.
$257,020
3. By 2005‐2006, all students will be taught by highly qualified teachers. $708,5504. All students will be educated in learning environments that are safe, drug free, and conducive to learning.
$1,128,411
5. All students will graduate from high school. $2,813,611* Mandatory Cost of Doing Business $45,677,141* Other $231,710
Actual Expenditure Examples
Homeland Security Signature program at Meade High School $326,166Middle School Math ‐ Textbooks $600,000STEM Magnet program at North County High School $665,416Federal IDEA increase ‐ Grant $1,160,390Title I increase ‐ Grant $2,018,700Restricted Grant Increases $2,358,510Special Education support $5,285,265ESOL Teachers and cluster program $266,620Restricted Grant Increases $566,150School Based Custodians ‐ staffing increase $438,156Maintenance Supplies ‐ upkeep of buildings $690,255Technology Education COMAR requirement $524,103High School Test Coordinators $1,137,609Pupil Personnel Workers ‐ staffing increase $1,151,899Transportation ($289,780)Copier and Printer contracts $406,782Additional Positions for Enrollment Growth or Class Size reduction� ‐ School Secretary ‐ staffing increase
$525,123
Note: Each school system's goals may or may not directly correlate to one of the federal NCLB goals. Expenditures are illustrative of those reported in the Master Plan Update Budget Alignment and are not intended to sum to the total.
Anne Arundel County Public Schools
B-7

Nonpublic Special Education Placements $756,624Costs associated with opening a new school or newly renovated school � ‐ Nantucket Elementary School
$910,056
Other items deemed necessary by the local board of education ‐ � ‐ Enhancing Technology $1,125,307Charter Schools $2,275,262Utilities $2,784,278Budget Balancing Reductions ‐ Position Cuts ($4,400,876)Budget Balancing Reductions ‐ Non‐position cuts ($4,856,779)Reserve Increase for FY09 State Aid overpayment $5,154,362Increases in negotiated contractual agreements ‐ benefits $5,759,092Increases in negotiated contractual agreements ‐ salaries $35,527,690
Note: Each school system's goals may or may not directly correlate to one of the federal NCLB goals. Expenditures are illustrative of those reported in the Master Plan Update Budget Alignment and are not intended to sum to the total.
Anne Arundel County Public Schools
B-8

Anne Arundel County Public Schools
American Recovery and Reinvestment Act of 2009Financial Reporting Table
FY 2009 FY 2010 TotalGrant Name
National School Lunch ‐ Equipment Assistance 0 64,808 64,808
Homeless Children and Youth 0 90,000 90,000
Title I ‐ Grants to LEAs, Neglected and Delinquent 0 6,061,822 6,061,822
IDEA Part B ‐ Grants to States‐Pass‐Through 257,500 17,173,902 17,431,402
IDEA Part B ‐ Preschool Grants 0 296,298 296,298
IDEA Part C ‐ Infants and Families 0 2,171,650 2,171,650
State Fiscal Stabilization Fund Education Program 0 8,748,926 8,748,926
$257,500 $34,607,406 $34,864,906Total
Expenditures by ARRA Assurances1. Increase teacher effectiveness and address inequities in the distribution of highly qualified teachers (recruiting, developing, and retaining effective teachers and principals).
029,760.00
* Other 729,901.00
Note: The above figures do not include funds which will be deferred until FY2011
Planned Expenditures Examples
AYP assignment & performance stipend $5,520,000
Differentiated Instruction Conference $310,626
National Board Certification stipend $450,000
Professional Development supported from School Per Pupil Allocation $388,827
Teacher Recruitment ‐ cohort program $288,626
Tuition Allowance ‐ cohorts to grow our own $2,053,926
Tuition Reimbursement $725,000
Additional reading and math interventions for eligible students and parent involvement supported from School Per Pupil Allocation
$4,289,253
Curriculum Writing, HSA Bridge Support, Mental Health Contract, Intervention programs to support student achievement ‐ ARRA I
$629,308
Curriculum Writing, HSA Bridge Support, Mental Health Contract, Intervention programs to support student achievement ‐ ARRA II
$793,759
Extended Learning Opportunities for eligible students supported from District Wide and Administrative Allocation
$806,742
Infants and Toddlers program will provide support to ensure families and children receive appropriate early interventions
$450,284
Materials of Instruction/Supplies & Equipment ‐ ARRA I $901,958
Materials of Instruction/Supplies & Equipment ‐ ARRA II $756,667
Non‐Public Tuition ‐ FY09 $257,500
Non‐Public Tuition ‐ FY10 $600,000
Smart classrooms and technology $1,827,868
Staffing to support schools $270,182
Note: Each school system's goals may or may not directly correlate to one of the federal NCLB goals. Expenditures are illustrative of those reported in the Master Plan Update Budget Alignment and are not intended to sum to the total.
Anne Arundel County Public Schools
B-9

Staffing to support schools $3,037,201
Temporary Support Assistants $382,620
Note: Each school system's goals may or may not directly correlate to one of the federal NCLB goals. Expenditures are illustrative of those reported in the Master Plan Update Budget Alignment and are not intended to sum to the total.
Anne Arundel County Public Schools
B-10

Baltimore City Public Schools
Revenue
Original Budget 7/1/2009
Original Budget 7/1/2010 Change
Current Year Variance Report (Allocation of Available Resources)
Local Appropriation $207,940,795 $210,018,415 $2,077,620
State Revenue $829,339,422 $803,083,201 ($26,256,221)
Federal Revenue $113,261,025 $170,980,140 $57,719,115
Other Resources/Transfers $15,941,381 $13,370,000 ($2,571,381)
Other Local Revenue $4,397,668 $4,637,000 $239,332
Federal ARRA Funds $0 $33,061,904 $33,061,904
$1,170,880,291 $1,235,150,660 $64,270,369Total
Planned Expenditures by federal NCLB Goals
1. By 2013‐2014, all students will reach high standards, at a minimum attaining proficiency in reading/language arts and mathematics.
$29,467,000
3. By 2005‐2006, all students will be taught by highly qualified teachers. $7,639,0004. All students will be educated in learning environments that are safe, drug free, and conducive to learning.
$912,000
5. All students will graduate from high school. $2,000,000* Local Goals and Indicators $13,858,000* Mandatory Cost of Doing Business $91,341,738* Other ($39,800,000)
Planned Expenditures Examples
Additional Title I School Based Allocations $4,994,000Expand Pre‐K by 40 classrooms (800 full day students) $15,550,000Math Extended Week $5,723,000Private School Title I Support $1,200,000School based early intervention $2,000,000Leadership Development $7,639,00020 extra police officers $912,000City‐wide disbursement of Special Ed classes $2,000,000Data Warehouse $6,000,000Increased parent and community engagement $1,658,000Launch School Support Networks $5,300,000Transition Services/School to Work+ enhanced school Special Ed support $900,000ARRA grant administrative/indirect costs $2,750,000Increases in contractual agreements ‐ benefits (if itemized separately) $17,100,000Increases in contractual agreements ‐ salaries $15,015,369Other items deemed necessary by the local board of education $53,656,369Transportation $2,560,000Utilities $260,000Central Office Administrative Cost Reductions ($39,800,000)
Note: Each school system's goals may or may not directly correlate to one of the federal NCLB goals. Expenditures are illustrative of those reported in the Master Plan Update Budget Alignment and are not intended to sum to the total.
Baltimore City Public Schools
B-11

Baltimore City Public Schools
Prior Year Comparison Report (Planned v. Actual)
Original Budget 7/1/2008
Final Budget
6/30/2009 ChangeRevenue
Local Appropriation $207,940,795 $207,940,795 $0
State Revenue $829,339,422 $829,339,422 $0
Federal Revenue $113,261,025 $113,261,025 $0
Other Resources/Transfers $15,941,381 $21,382,317 $5,440,936
Other Local Revenue $4,397,668 $4,397,668 $0
$1,170,880,291 $1,176,321,227 $5,440,936Total
Actual Expenditures by federal NCLB Goals1. By 2013‐2014, all students will reach high standards, at a minimum attaining proficiency in reading/language arts and mathematics.
$3,657,000
3. By 2005‐2006, all students will be taught by highly qualified teachers. ($4,125,000)4. All students will be educated in learning environments that are safe, drug free, and conducive to learning.
$840,000
5. All students will graduate from high school. $3,500,000* Local Goals and Indicators $1,199,000* Mandatory Cost of Doing Business $27,410,936
Actual Expenditure Examples
Increased Special Education contractual services $483,00016 additional pre‐kindergarten classes $3,174,000Recruitment Initiatives ($725,000)Recruitment/Retention Initiatives ‐ laptops ($3,400,000)Increased overtime for police $840,000Launch a multi‐year Secondary Transformation Schools Initiative $3,500,000 Increased maintenance contracts $1,000,000 Increased overtime for custodians ($1,026,000) Increased parent and community engagement $1,225,000Decrease in CAROI $690,936Utilities $734,000Transportation $2,041,000Other $3,092,000Nonpublic Special Education Placements $4,937,000Decrease in Contribution to Contingency Reserve ($5,000,000)Risk Management $6,000,000Increases in contractual agreements ‐ benefits (if itemized separately) $8,000,000Central office budget cuts as anticipated state revenue increases were scaled back ($27,084,000)Increases in contractual agreements ‐ salaries $34,000,000
Note: Each school system's goals may or may not directly correlate to one of the federal NCLB goals. Expenditures are illustrative of those reported in the Master Plan Update Budget Alignment and are not intended to sum to the total.
Baltimore City Public Schools
B-12

Baltimore City Public Schools
American Recovery and Reinvestment Act of 2009Financial Reporting Table
FY 2009 FY 2010 TotalGrant Name
National School Lunch ‐ Equipment Assistance 0 0 0
Homeless Children and Youth 0 88,640 88,640
Title I ‐ Grants to LEAs, Neglected and Delinquent 0 51,980,244 51,980,244
IDEA Part B ‐ Grants to States‐Pass‐Through 0 26,418,668 26,418,668
IDEA Part B ‐ Preschool Grants 0 1,068,732 1,068,732
IDEA Part C ‐ Infants and Families 0 332,000 332,000
State Fiscal Stabilization Fund Education Program 0 33,061,904 33,061,904
$0 $112,950,188 $112,950,188Total
Expenditures by ARRA Assurances1. Increase teacher effectiveness and address inequities in the distribution of highly qualified teachers (recruiting, developing, and retaining effective teachers and principals).
514,492.00
2. Establish and use a pre-K through college and career data system to track progress and foster continuous improvement (building data systems that measure student success and ifnorm teachers and prinicpals how they can improve their practices).
771,112.00
4. Provide targeted, intensive support and effective interventions to turn around schools identified for corrective action and restructuring (turnign around lowest performing schools).
957,704.50
* Other 863,948.00
Planned Expenditures Examples
Decrease teacher/administrator reduction in force $2,343,000
Leadership Development and Teacher Leaders (Urban Leadership Acad/Teacher Residency School)
$3,231,492
Provide Court‐mandated PD to school staff on FBA/ $1,940,000
Create a data warehouse $2,250,000
Purchase state‐of‐the‐art business systems $10,521,112
Establish additional city‐wide SPED classes, Develop/implement co‐teaching model, Fund competetive proposals for Early Intervention Services (Grades K‐3)
$8,240,812
Hire special education co‐teachers $534,366
Hire teachers and paraprofessionals for Pre‐K expansion $14,196,853
Parent Involvement $975,644
Private Schools Title I support $1,194,910
Provide special education related services $332,000
School Based Allocations $4,994,000
Supplemental Educational services (SES) $5,202,688
Turnaround strategies for low performing schools $20,197,792
Admin Support/Indirects $571,817
Admin Support/Indirects $2,292,131
Note: Each school system's goals may or may not directly correlate to one of the federal NCLB goals. Expenditures are illustrative of those reported in the Master Plan Update Budget Alignment and are not intended to sum to the total.
Baltimore City Public Schools
B-13

B-14
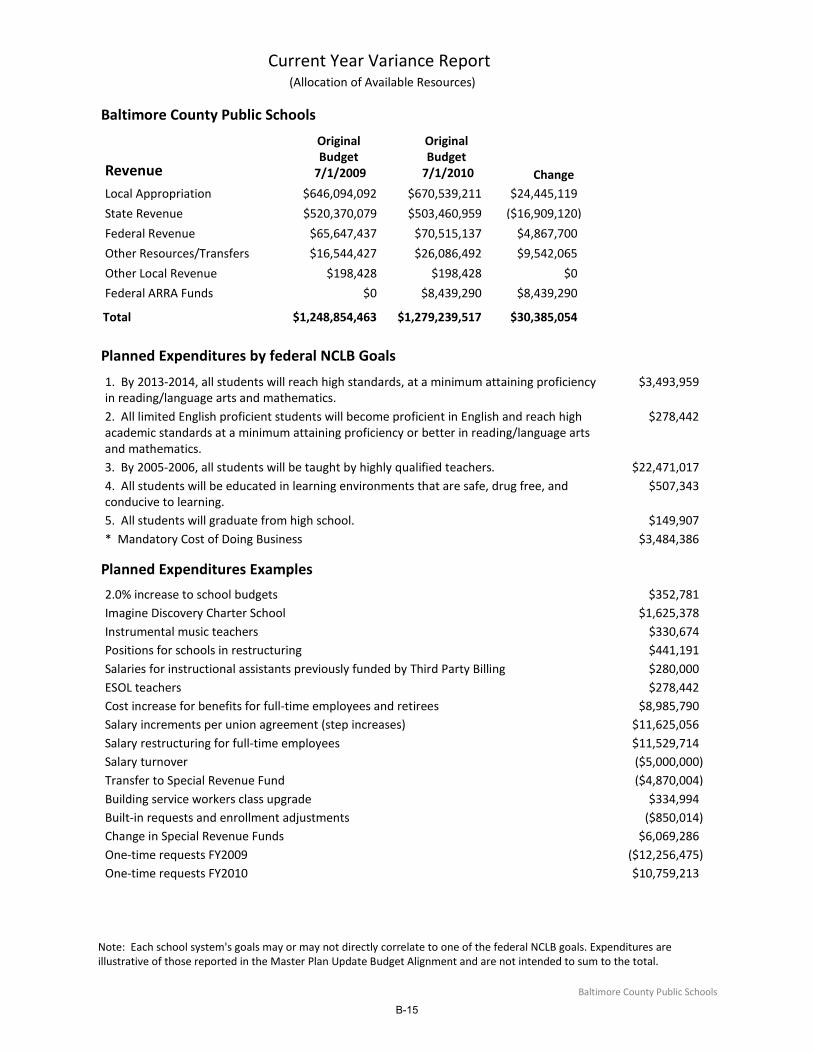
Baltimore County Public Schools
Revenue
Original Budget 7/1/2009
Original Budget 7/1/2010 Change
Current Year Variance Report (Allocation of Available Resources)
Local Appropriation $646,094,092 $670,539,211 $24,445,119
State Revenue $520,370,079 $503,460,959 ($16,909,120)
Federal Revenue $65,647,437 $70,515,137 $4,867,700
Other Resources/Transfers $16,544,427 $26,086,492 $9,542,065
Other Local Revenue $198,428 $198,428 $0
Federal ARRA Funds $0 $8,439,290 $8,439,290
$1,248,854,463 $1,279,239,517 $30,385,054Total
Planned Expenditures by federal NCLB Goals
1. By 2013‐2014, all students will reach high standards, at a minimum attaining proficiency in reading/language arts and mathematics.
$3,493,959
2. All limited English proficient students will become proficient in English and reach high academic standards at a minimum attaining proficiency or better in reading/language arts and mathematics.
$278,442
3. By 2005‐2006, all students will be taught by highly qualified teachers. $22,471,0174. All students will be educated in learning environments that are safe, drug free, and conducive to learning.
$507,343
5. All students will graduate from high school. $149,907* Mandatory Cost of Doing Business $3,484,386
Planned Expenditures Examples
2.0% increase to school budgets $352,781Imagine Discovery Charter School $1,625,378Instrumental music teachers $330,674Positions for schools in restructuring $441,191Salaries for instructional assistants previously funded by Third Party Billing $280,000ESOL teachers $278,442Cost increase for benefits for full‐time employees and retirees $8,985,790Salary increments per union agreement (step increases) $11,625,056Salary restructuring for full‐time employees $11,529,714Salary turnover ($5,000,000)Transfer to Special Revenue Fund ($4,870,004)Building service workers class upgrade $334,994Built‐in requests and enrollment adjustments ($850,014)Change in Special Revenue Funds $6,069,286One‐time requests FY2009 ($12,256,475)One‐time requests FY2010 $10,759,213
Note: Each school system's goals may or may not directly correlate to one of the federal NCLB goals. Expenditures are illustrative of those reported in the Master Plan Update Budget Alignment and are not intended to sum to the total.
Baltimore County Public Schools
B-15

B-16

Baltimore County Public Schools
Prior Year Comparison Report (Planned v. Actual)
Original Budget 7/1/2008
Final Budget
6/30/2009 ChangeRevenue
Local Appropriation $646,094,092 $646,094,092 $0
State Revenue $520,370,079 $520,370,079 $0
Federal Revenue $65,647,437 $65,647,437 $0
Other Resources/Transfers $16,544,427 $16,544,427 $0
Other Local Revenue $198,428 $198,428 $0
$1,248,854,463 $1,248,854,463 $0Total
Actual Expenditures by federal NCLB Goals1. By 2013‐2014, all students will reach high standards, at a minimum attaining proficiency in reading/language arts and mathematics.
$7,301,616
2. All limited English proficient students will become proficient in English and reach high academic standards at a minimum attaining proficiency or better in reading/language arts and mathematics.
$20,000
3. By 2005‐2006, all students will be taught by highly qualified teachers. $25,426,8824. All students will be educated in learning environments that are safe, drug free, and conducive to learning.
$2,014,909
* Local Goals and Indicators $1,574,765* Mandatory Cost of Doing Business ($8,045,172)
Actual Expenditure Examples
Base budget increase for extra duty activities $364,508Old Court and Woodlawn Middle Schools $26,000 redirected funds $390,000100 Book Challenge program expansion $514,002AVID expansion ‐ middle (4) and high (4) schools $517,001Four percent increase to non‐salary school budgets $150,000 redirected funds $746,210Request for contracted services to be transferred from the Pass‐through grant $782,526Restructuring ‐ Lansdowne Middle, Southwest Academy, and Woodlawn High School $1,701,587Imagine Schools, Inc. charter school $1,869,160Base budget increase for substitute salaries $1,390,738Reclassifications effective January 2008 (half‐year) $1,874,149Cost increases for benefits for full‐time employees $9,598,741Salary increments per union agreements (step increases) $12,453,955Utilities $825,573Staffing for opening of Vincent Farm Elementary School $901,135Director, specialist, and coordinator‐Dept. of Research, Accountability, and Assessment $571,764Base budget increase for summer school transportation $999,646Mid‐year additions $745,981Enrollment adjustments/Redirected Funds ($1,252,073)Built in requests and other adjustments ($2,738,938)
Note: Each school system's goals may or may not directly correlate to one of the federal NCLB goals. Expenditures are illustrative of those reported in the Master Plan Update Budget Alignment and are not intended to sum to the total.
Baltimore County Public Schools
B-17

One‐time requests FY2008 ($7,461,930)Reduction in Special Revenue Funds ($8,820,787)One‐time requests FY2009 $11,482,575
Note: Each school system's goals may or may not directly correlate to one of the federal NCLB goals. Expenditures are illustrative of those reported in the Master Plan Update Budget Alignment and are not intended to sum to the total.
Baltimore County Public Schools
B-18

Baltimore County Public Schools
American Recovery and Reinvestment Act of 2009Financial Reporting Table
FY 2009 FY 2010 TotalGrant Name
National School Lunch ‐ Equipment Assistance 82,079 0 82,079
Homeless Children and Youth 0 110,000 110,000
Title I ‐ Grants to LEAs, Neglected and Delinquent 0 16,419,290 16,419,290
IDEA Part B ‐ Grants to States‐Pass‐Through 12,620,188 12,620,188 25,240,376
IDEA Part B ‐ Preschool Grants 519,252 519,252 1,038,504
IDEA Part C ‐ Infants and Families 0 2,776,326 2,776,326
State Fiscal Stabilization Fund Education Program 0 8,438,126 8,438,126
$13,221,519 $40,883,182 $54,104,701Total
Expenditures by ARRA Assurances1. Increase teacher effectiveness and address inequities in the distribution of highly qualified teachers (recruiting, developing, and retaining effective teachers and principals).
624,860.00
* Other 612,818.75
Note: The above figures do not include funds which will be deferred until FY2011
Planned Expenditures Examples
ASCD Title I Principals' Leadership Academy $539,968
Hired Academic Behavior Facilitators (ABF) $3,786,056
Hired and retained higly qualified general education teachers to co‐teach in self contained classrooms
$1,920,000
Math Solutions $1,602,386
Reading Research Labs $1,740,100
Retention of highly qualified special education staff $13,621,248
School‐Level Expenditures on Professional Development $415,102
Administration $825,173
Equtiable Services to Private Schools $267,591
Extended Day/Year Program $2,000,000
Funding for increase in local share of nonpublic placement costs. $4,327,150
Hire contractual related services providers and teachers to provide services to children when service needs exceed staffing resources and to implement the Extended IFSP option.
$451,415
Hired contractual related service personnel to improve compliance and achievement data for preschool and prekindergarten children.
$510,079
Purchase of Assistive Technology to enhance current related services to support academic progress.
$1,005,774
Purchase of Promethean Boards. $380,000
School Allocations ‐ Instructional Resources $8,131,648
Transfor Option $584,739
Note: Each school system's goals may or may not directly correlate to one of the federal NCLB goals. Expenditures are illustrative of those reported in the Master Plan Update Budget Alignment and are not intended to sum to the total.
Baltimore County Public Schools
B-19

B-20

Calvert County Public Schools
Revenue
Original Budget 7/1/2009
Original Budget 7/1/2010 Change
Current Year Variance Report (Allocation of Available Resources)
Local Appropriation $100,656,137 $103,615,515 $2,959,378
State Revenue $86,646,126 $84,596,079 ($2,050,047)
Federal Revenue $7,056,919 $6,832,291 ($224,628)
Other Resources/Transfers $1,920,900 $1,659,631 ($261,269)
Other Local Revenue $1,916,853 $1,029,218 ($887,635)
Federal ARRA Funds $4,850,927 $4,850,927
$198,196,935 $202,583,661 $4,386,726Total
Planned Expenditures by federal NCLB Goals
1. By 2013‐2014, all students will reach high standards, at a minimum attaining proficiency in reading/language arts and mathematics.
$556,583
2. All limited English proficient students will become proficient in English and reach high academic standards at a minimum attaining proficiency or better in reading/language arts and mathematics.
$0
4. All students will be educated in learning environments that are safe, drug free, and conducive to learning.
$16,000
5. All students will graduate from high school. $477,130* Mandatory Cost of Doing Business $3,253,228* Other $83,785
Planned Expenditures Examples
Smart Boards $472,500Increases in contractual agreements ‐ benefits (if itemized separately) $1,878,345Nonpublic Special Education Placements $333,640Pupil Transportation $550,730Utilities $528,726
Note: Each school system's goals may or may not directly correlate to one of the federal NCLB goals. Expenditures are illustrative of those reported in the Master Plan Update Budget Alignment and are not intended to sum to the total.
Calvert County Public Schools
B-21
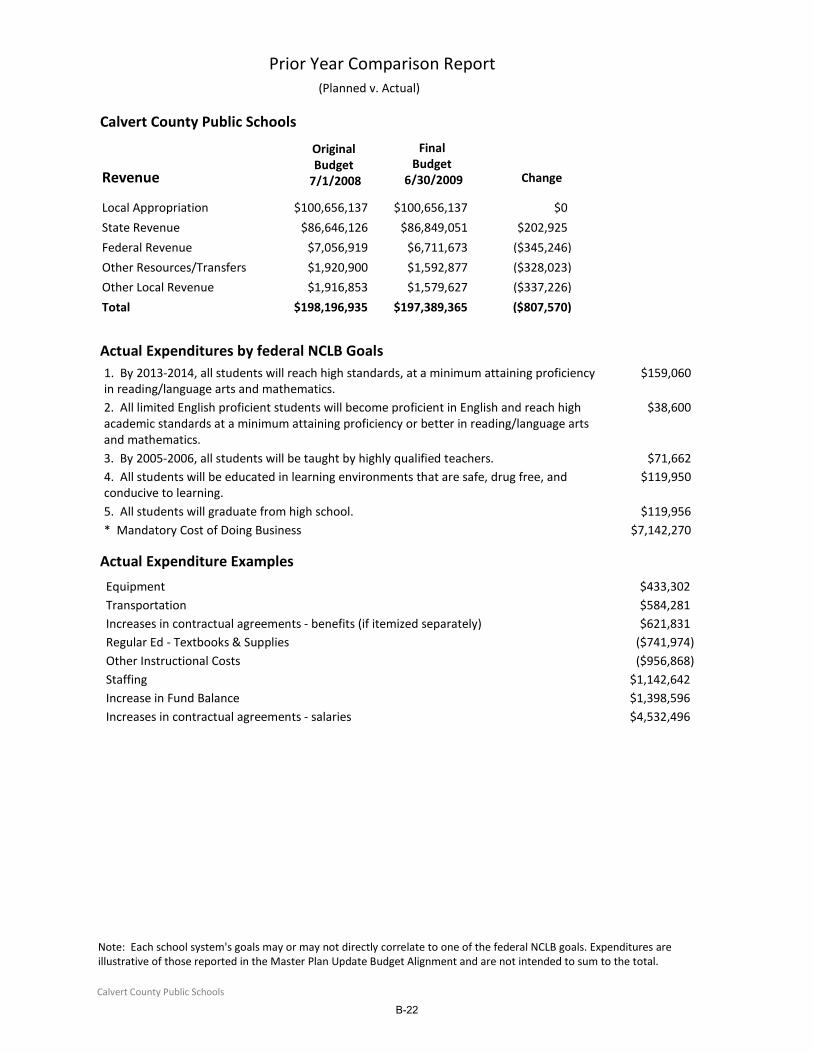
Calvert County Public Schools
Prior Year Comparison Report (Planned v. Actual)
Original Budget 7/1/2008
Final Budget
6/30/2009 ChangeRevenue
Local Appropriation $100,656,137 $100,656,137 $0
State Revenue $86,646,126 $86,849,051 $202,925
Federal Revenue $7,056,919 $6,711,673 ($345,246)
Other Resources/Transfers $1,920,900 $1,592,877 ($328,023)
Other Local Revenue $1,916,853 $1,579,627 ($337,226)
$198,196,935 $197,389,365 ($807,570)Total
Actual Expenditures by federal NCLB Goals1. By 2013‐2014, all students will reach high standards, at a minimum attaining proficiency in reading/language arts and mathematics.
$159,060
2. All limited English proficient students will become proficient in English and reach high academic standards at a minimum attaining proficiency or better in reading/language arts and mathematics.
$38,600
3. By 2005‐2006, all students will be taught by highly qualified teachers. $71,6624. All students will be educated in learning environments that are safe, drug free, and conducive to learning.
$119,950
5. All students will graduate from high school. $119,956* Mandatory Cost of Doing Business $7,142,270
Actual Expenditure Examples
Equipment $433,302Transportation $584,281Increases in contractual agreements ‐ benefits (if itemized separately) $621,831Regular Ed ‐ Textbooks & Supplies ($741,974)Other Instructional Costs ($956,868)Staffing $1,142,642Increase in Fund Balance $1,398,596Increases in contractual agreements ‐ salaries $4,532,496
Note: Each school system's goals may or may not directly correlate to one of the federal NCLB goals. Expenditures are illustrative of those reported in the Master Plan Update Budget Alignment and are not intended to sum to the total.
Calvert County Public Schools
B-22

Calvert County Public Schools
American Recovery and Reinvestment Act of 2009Financial Reporting Table
FY 2009 FY 2010 TotalGrant Name
National School Lunch ‐ Equipment Assistance 0 0 0
Homeless Children and Youth 0 0 0
Title I ‐ Grants to LEAs, Neglected and Delinquent 0 681,609 681,609
IDEA Part B ‐ Grants to States‐Pass‐Through 36,234 3,494,938 3,531,172
IDEA Part B ‐ Preschool Grants 0 98,958 98,958
IDEA Part C ‐ Infants and Families 0 105,504 105,504
State Fiscal Stabilization Fund Education Program 0 2,248,622 2,248,622
$36,234 $6,629,631 $6,665,865Total
Expenditures by ARRA Assurances1. Increase teacher effectiveness and address inequities in the distribution of highly qualified teachers (recruiting, developing, and retaining effective teachers and principals).
035,277.00
2. Establish and use a pre-K through college and career data system to track progress and foster continuous improvement (building data systems that measure student success and ifnorm teachers and prinicpals how they can improve their practices).
149,108.00
3. Make progress towards rigorous college and career-ready standards and high quality assessments that are valid and reliable for all students, including limited English proficient students and students with disabilities (adopting internationally benchma
100,294.00
4. Provide targeted, intensive support and effective interventions to turn around schools identified for corrective action and restructuring (turnign around lowest performing schools).
650,669.00
* Other 730,517.00
Planned Expenditures Examples
Educational Allowance $1,000,000
Equipment/Materials $886,060
Staff Development $1,478,836
Extended Day Interventions $1,072,165
Extended Year Employment $275,729
Textbooks & Other Instructional Supplies $614,747
Note: Each school system's goals may or may not directly correlate to one of the federal NCLB goals. Expenditures are illustrative of those reported in the Master Plan Update Budget Alignment and are not intended to sum to the total.
Calvert County Public Schools
B-23

B-24

Caroline County Public Schools
Revenue
Original Budget 7/1/2009
Original Budget 7/1/2010 Change
Current Year Variance Report (Allocation of Available Resources)
Local Appropriation $12,367,678 $12,484,826 $117,148
State Revenue $42,388,784 $40,966,633 ($1,422,151)
Federal Revenue $2,951,709 $5,376,905 $2,425,196
Other Resources/Transfers $0 $0 $0
Other Local Revenue $405,320 $455,320 $50,000
Federal ARRA Funds $0 $1,116,658 $1,116,658
$58,113,491 $60,400,342 $2,286,851Total
Planned Expenditures by federal NCLB Goals
1. By 2013‐2014, all students will reach high standards, at a minimum attaining proficiency in reading/language arts and mathematics.
($592,833)
3. By 2005‐2006, all students will be taught by highly qualified teachers. $30,0004. All students will be educated in learning environments that are safe, drug free, and conducive to learning.
$6,200
5. All students will graduate from high school. ($30,000)* Local Goals and Indicators ($9,000)* Mandatory Cost of Doing Business $533,125* Other $2,414,359
Planned Expenditures Examples
Increases in contractual agreements ‐ salaries and benefits $687,125Increase in restricted federal revenues $2,425,196
Note: Each school system's goals may or may not directly correlate to one of the federal NCLB goals. Expenditures are illustrative of those reported in the Master Plan Update Budget Alignment and are not intended to sum to the total.
Caroline County Public Schools
B-25
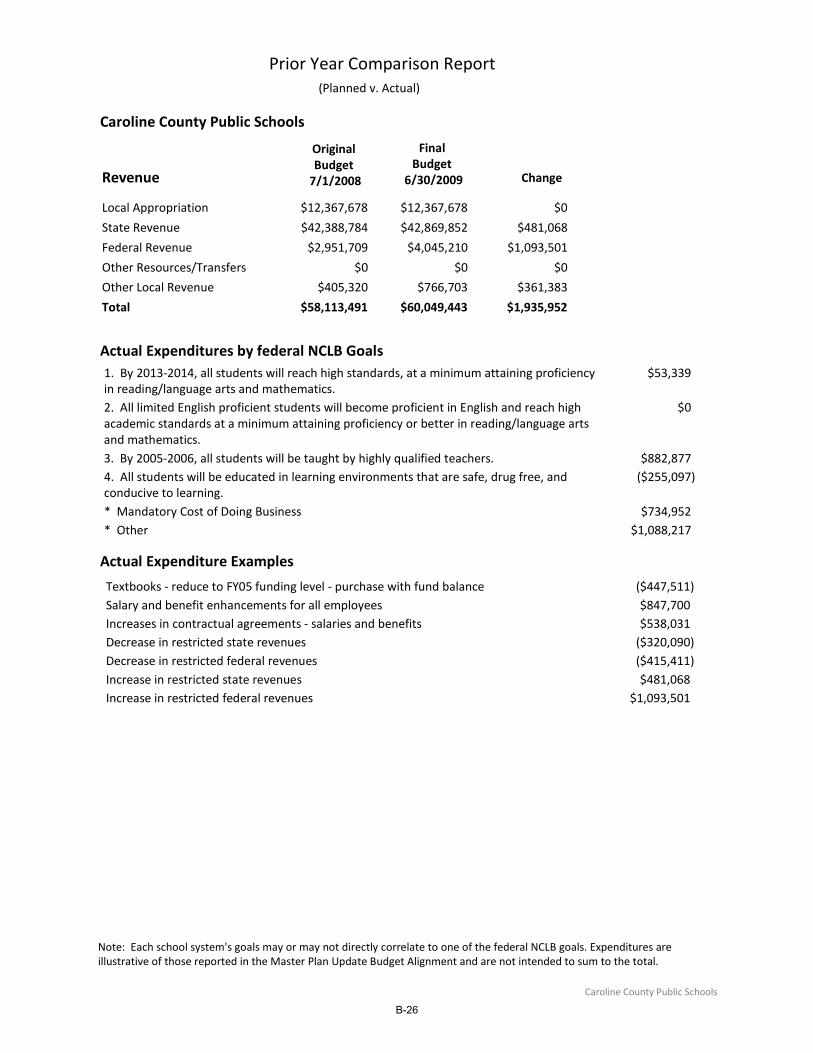
Caroline County Public Schools
Prior Year Comparison Report (Planned v. Actual)
Original Budget 7/1/2008
Final Budget
6/30/2009 ChangeRevenue
Local Appropriation $12,367,678 $12,367,678 $0
State Revenue $42,388,784 $42,869,852 $481,068
Federal Revenue $2,951,709 $4,045,210 $1,093,501
Other Resources/Transfers $0 $0 $0
Other Local Revenue $405,320 $766,703 $361,383
$58,113,491 $60,049,443 $1,935,952Total
Actual Expenditures by federal NCLB Goals1. By 2013‐2014, all students will reach high standards, at a minimum attaining proficiency in reading/language arts and mathematics.
$53,339
2. All limited English proficient students will become proficient in English and reach high academic standards at a minimum attaining proficiency or better in reading/language arts and mathematics.
$0
3. By 2005‐2006, all students will be taught by highly qualified teachers. $882,8774. All students will be educated in learning environments that are safe, drug free, and conducive to learning.
($255,097)
* Mandatory Cost of Doing Business $734,952* Other $1,088,217
Actual Expenditure Examples
Textbooks ‐ reduce to FY05 funding level ‐ purchase with fund balance ($447,511)Salary and benefit enhancements for all employees $847,700Increases in contractual agreements ‐ salaries and benefits $538,031Decrease in restricted state revenues ($320,090)Decrease in restricted federal revenues ($415,411)Increase in restricted state revenues $481,068Increase in restricted federal revenues $1,093,501
Note: Each school system's goals may or may not directly correlate to one of the federal NCLB goals. Expenditures are illustrative of those reported in the Master Plan Update Budget Alignment and are not intended to sum to the total.
Caroline County Public Schools
B-26
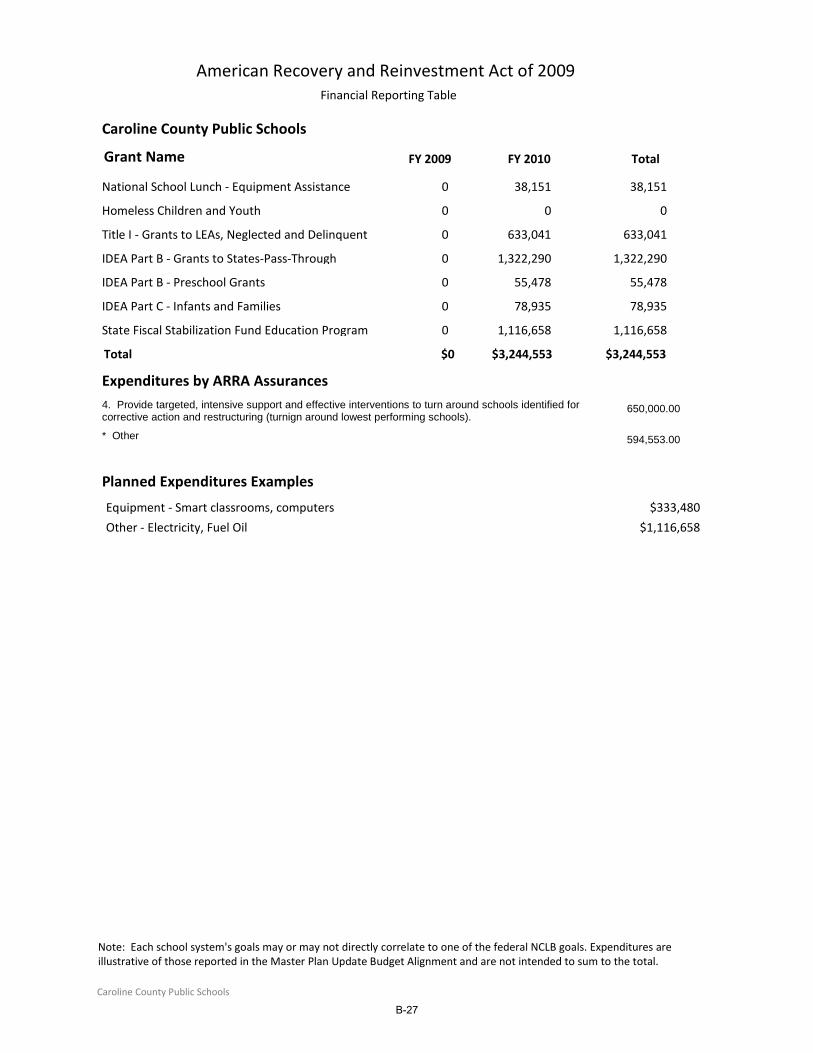
Caroline County Public Schools
American Recovery and Reinvestment Act of 2009Financial Reporting Table
FY 2009 FY 2010 TotalGrant Name
National School Lunch ‐ Equipment Assistance 0 38,151 38,151
Homeless Children and Youth 0 0 0
Title I ‐ Grants to LEAs, Neglected and Delinquent 0 633,041 633,041
IDEA Part B ‐ Grants to States‐Pass‐Through 0 1,322,290 1,322,290
IDEA Part B ‐ Preschool Grants 0 55,478 55,478
IDEA Part C ‐ Infants and Families 0 78,935 78,935
State Fiscal Stabilization Fund Education Program 0 1,116,658 1,116,658
$0 $3,244,553 $3,244,553Total
Expenditures by ARRA Assurances4. Provide targeted, intensive support and effective interventions to turn around schools identified for corrective action and restructuring (turnign around lowest performing schools).
650,000.00
* Other 594,553.00
Planned Expenditures Examples
Equipment ‐ Smart classrooms, computers $333,480
Other ‐ Electricity, Fuel Oil $1,116,658
Note: Each school system's goals may or may not directly correlate to one of the federal NCLB goals. Expenditures are illustrative of those reported in the Master Plan Update Budget Alignment and are not intended to sum to the total.
Caroline County Public Schools
B-27

B-28
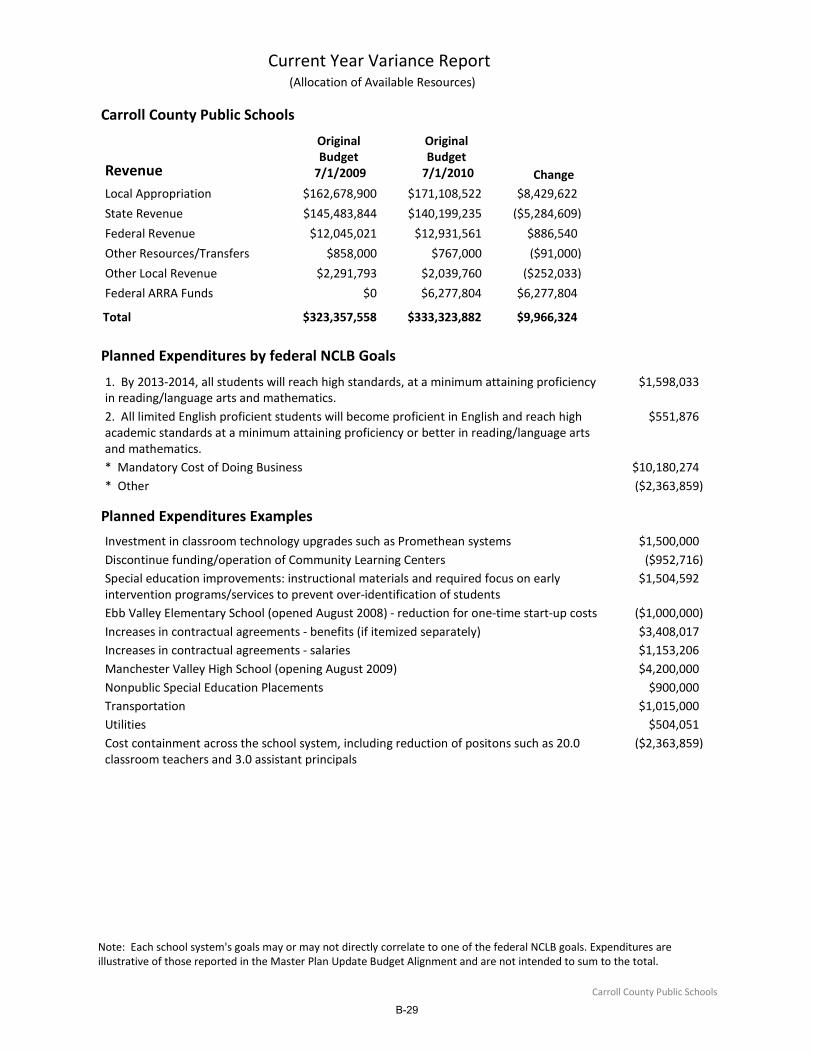
Carroll County Public Schools
Revenue
Original Budget 7/1/2009
Original Budget 7/1/2010 Change
Current Year Variance Report (Allocation of Available Resources)
Local Appropriation $162,678,900 $171,108,522 $8,429,622
State Revenue $145,483,844 $140,199,235 ($5,284,609)
Federal Revenue $12,045,021 $12,931,561 $886,540
Other Resources/Transfers $858,000 $767,000 ($91,000)
Other Local Revenue $2,291,793 $2,039,760 ($252,033)
Federal ARRA Funds $0 $6,277,804 $6,277,804
$323,357,558 $333,323,882 $9,966,324Total
Planned Expenditures by federal NCLB Goals
1. By 2013‐2014, all students will reach high standards, at a minimum attaining proficiency in reading/language arts and mathematics.
$1,598,033
2. All limited English proficient students will become proficient in English and reach high academic standards at a minimum attaining proficiency or better in reading/language arts and mathematics.
$551,876
* Mandatory Cost of Doing Business $10,180,274* Other ($2,363,859)
Planned Expenditures Examples
Investment in classroom technology upgrades such as Promethean systems $1,500,000Discontinue funding/operation of Community Learning Centers ($952,716)Special education improvements: instructional materials and required focus on early intervention programs/services to prevent over‐identification of students
$1,504,592
Ebb Valley Elementary School (opened August 2008) ‐ reduction for one‐time start‐up costs ($1,000,000)Increases in contractual agreements ‐ benefits (if itemized separately) $3,408,017Increases in contractual agreements ‐ salaries $1,153,206Manchester Valley High School (opening August 2009) $4,200,000Nonpublic Special Education Placements $900,000Transportation $1,015,000Utilities $504,051Cost containment across the school system, including reduction of positons such as 20.0 classroom teachers and 3.0 assistant principals
($2,363,859)
Note: Each school system's goals may or may not directly correlate to one of the federal NCLB goals. Expenditures are illustrative of those reported in the Master Plan Update Budget Alignment and are not intended to sum to the total.
Carroll County Public Schools
B-29

Carroll County Public Schools
Prior Year Comparison Report (Planned v. Actual)
Original Budget 7/1/2008
Final Budget
6/30/2009 ChangeRevenue
Local Appropriation $162,678,900 $162,664,876 ($14,024)
State Revenue $145,483,844 $145,595,933 $112,089
Federal Revenue $12,045,021 $12,551,701 $506,680
Other Resources/Transfers $858,000 $858,000 $0
Other Local Revenue $2,291,793 $2,609,551 $317,758
$323,357,558 $324,280,061 $922,503Total
Actual Expenditures by federal NCLB Goals1. By 2013‐2014, all students will reach high standards, at a minimum attaining proficiency in reading/language arts and mathematics.
$34,533
2. All limited English proficient students will become proficient in English and reach high academic standards at a minimum attaining proficiency or better in reading/language arts and mathematics.
($59,383)
3. By 2005‐2006, all students will be taught by highly qualified teachers. $135,1254. All students will be educated in learning environments that are safe, drug free, and conducive to learning.
$43,200
* Local Goals and Indicators $14,481* Mandatory Cost of Doing Business $10,768,748
Actual Expenditure Examples
English Language Learners ‐ new costs1 $258,133Discontinue local funding of Community Learning Centers in the northwest region and other scattered sites1
($430,614)
Increase in Budget for Loaned Employees1 $280,713Manchester Valley High School (opening August 2009)1 $284,500Decrease in restricted programs grants for Title I‐A and Community Learning Centers ($364,849)Budget for FY 2008 grants to be carried forward was underused ($1,109,246)Miscellaneous Cuts / Savings Across the School System ($1,570,840)Special Education costs $2,131,841Ebb Valley Elementary School (opening August 2008)1 $2,671,974Increases in contractual agreements ‐ benefits (if itemized separately)1 $2,796,440Increases in contractual agreements ‐ salaries and hourly wages1 $5,405,003
Note: Each school system's goals may or may not directly correlate to one of the federal NCLB goals. Expenditures are illustrative of those reported in the Master Plan Update Budget Alignment and are not intended to sum to the total.
Carroll County Public Schools
B-30
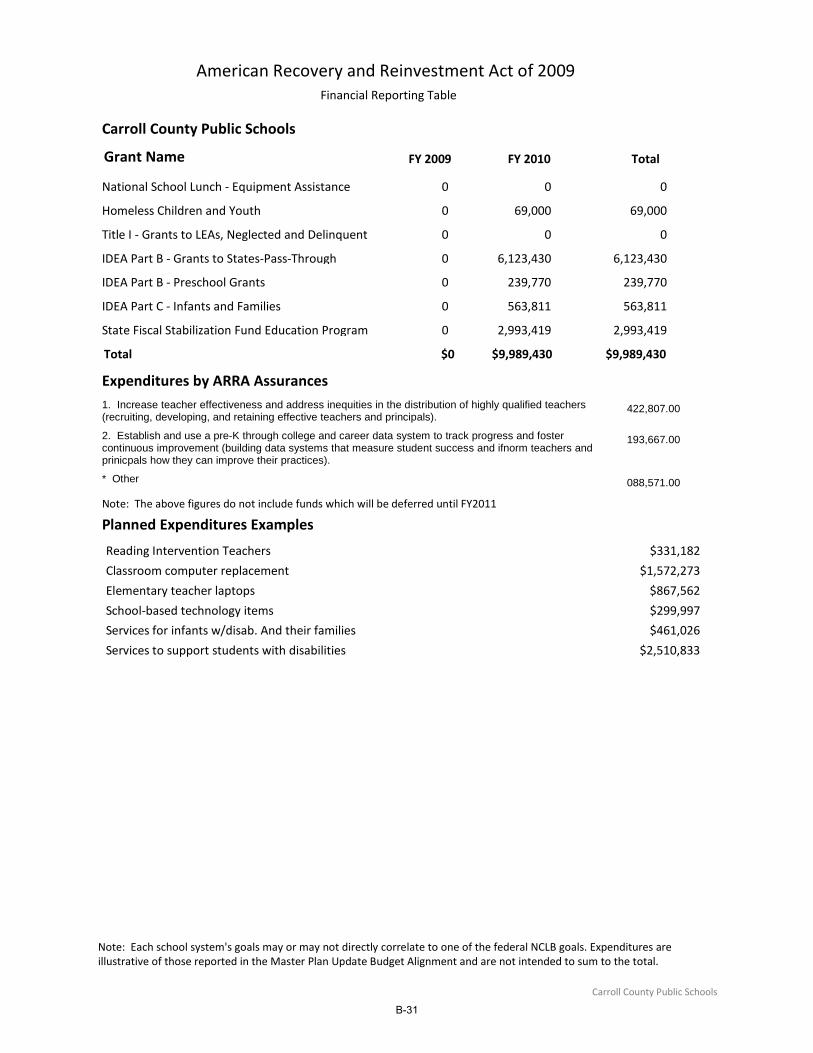
Carroll County Public Schools
American Recovery and Reinvestment Act of 2009Financial Reporting Table
FY 2009 FY 2010 TotalGrant Name
National School Lunch ‐ Equipment Assistance 0 0 0
Homeless Children and Youth 0 69,000 69,000
Title I ‐ Grants to LEAs, Neglected and Delinquent 0 0 0
IDEA Part B ‐ Grants to States‐Pass‐Through 0 6,123,430 6,123,430
IDEA Part B ‐ Preschool Grants 0 239,770 239,770
IDEA Part C ‐ Infants and Families 0 563,811 563,811
State Fiscal Stabilization Fund Education Program 0 2,993,419 2,993,419
$0 $9,989,430 $9,989,430Total
Expenditures by ARRA Assurances1. Increase teacher effectiveness and address inequities in the distribution of highly qualified teachers (recruiting, developing, and retaining effective teachers and principals).
422,807.00
2. Establish and use a pre-K through college and career data system to track progress and foster continuous improvement (building data systems that measure student success and ifnorm teachers and prinicpals how they can improve their practices).
193,667.00
* Other 088,571.00
Note: The above figures do not include funds which will be deferred until FY2011
Planned Expenditures Examples
Reading Intervention Teachers $331,182
Classroom computer replacement $1,572,273
Elementary teacher laptops $867,562
School‐based technology items $299,997
Services for infants w/disab. And their families $461,026
Services to support students with disabilities $2,510,833
Note: Each school system's goals may or may not directly correlate to one of the federal NCLB goals. Expenditures are illustrative of those reported in the Master Plan Update Budget Alignment and are not intended to sum to the total.
Carroll County Public Schools
B-31

B-32

Cecil County Public Schools
Revenue
Original Budget 7/1/2009
Original Budget 7/1/2010 Change
Current Year Variance Report (Allocation of Available Resources)
Local Appropriation $69,915,162 $68,385,625 ($1,529,537)
State Revenue $98,716,390 $95,921,788 ($2,794,602)
Federal Revenue $8,421,734 $8,487,846 $66,112
Other Resources/Transfers $0 $0 $0
Other Local Revenue $2,130,794 $4,000,000 $1,869,206
Federal ARRA Funds $0 $4,010,731 $4,010,731
$179,184,080 $180,805,990 $1,621,910Total
Planned Expenditures by federal NCLB Goals
1. By 2013‐2014, all students will reach high standards, at a minimum attaining proficiency in reading/language arts and mathematics.
($237,000)
2. All limited English proficient students will become proficient in English and reach high academic standards at a minimum attaining proficiency or better in reading/language arts and mathematics.
($93,000)
3. By 2005‐2006, all students will be taught by highly qualified teachers. ($309,000)* Mandatory Cost of Doing Business $2,261,000
Planned Expenditures Examples
Increases in contractual agreements ‐ benefits (if itemized separately) ($291,000)Increases in contractual agreements ‐ salaries $1,478,000Transportation $385,000Utilities $672,000
Note: Each school system's goals may or may not directly correlate to one of the federal NCLB goals. Expenditures are illustrative of those reported in the Master Plan Update Budget Alignment and are not intended to sum to the total.
Cecil County Public Schools
B-33
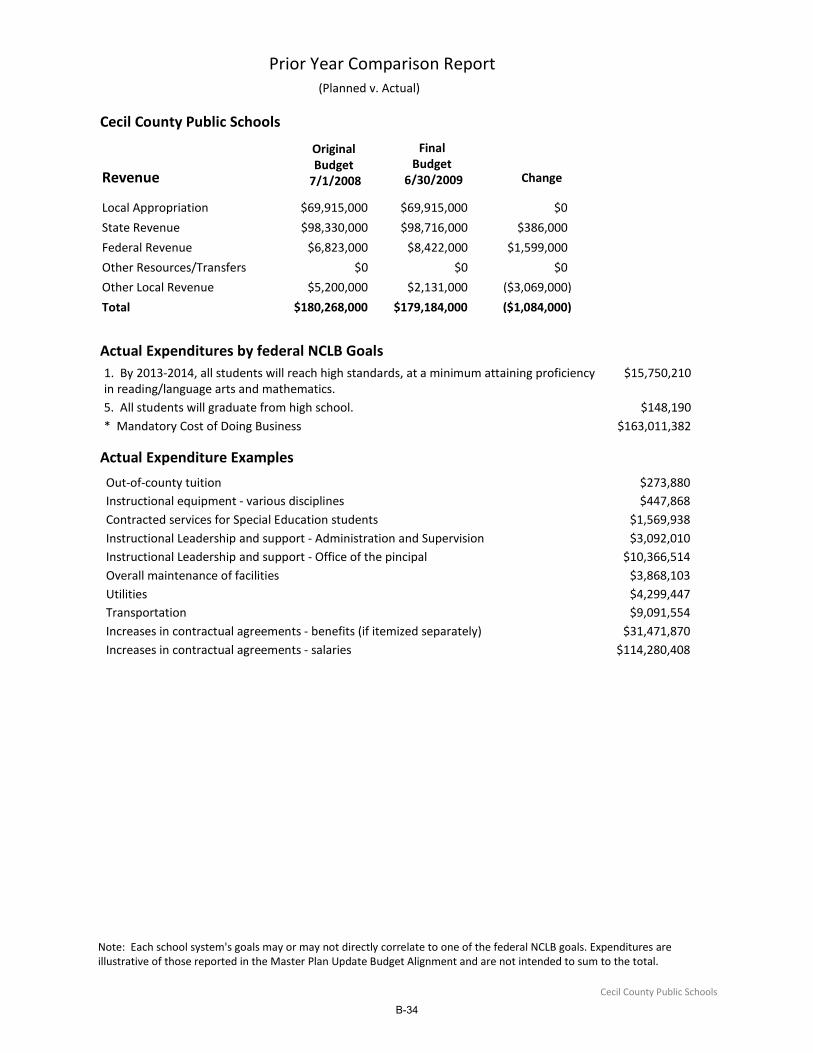
Cecil County Public Schools
Prior Year Comparison Report (Planned v. Actual)
Original Budget 7/1/2008
Final Budget
6/30/2009 ChangeRevenue
Local Appropriation $69,915,000 $69,915,000 $0
State Revenue $98,330,000 $98,716,000 $386,000
Federal Revenue $6,823,000 $8,422,000 $1,599,000
Other Resources/Transfers $0 $0 $0
Other Local Revenue $5,200,000 $2,131,000 ($3,069,000)
$180,268,000 $179,184,000 ($1,084,000)Total
Actual Expenditures by federal NCLB Goals1. By 2013‐2014, all students will reach high standards, at a minimum attaining proficiency in reading/language arts and mathematics.
$15,750,210
5. All students will graduate from high school. $148,190* Mandatory Cost of Doing Business $163,011,382
Actual Expenditure Examples
Out‐of‐county tuition $273,880Instructional equipment ‐ various disciplines $447,868Contracted services for Special Education students $1,569,938Instructional Leadership and support ‐ Administration and Supervision $3,092,010Instructional Leadership and support ‐ Office of the pincipal $10,366,514Overall maintenance of facilities $3,868,103Utilities $4,299,447Transportation $9,091,554Increases in contractual agreements ‐ benefits (if itemized separately) $31,471,870Increases in contractual agreements ‐ salaries $114,280,408
Note: Each school system's goals may or may not directly correlate to one of the federal NCLB goals. Expenditures are illustrative of those reported in the Master Plan Update Budget Alignment and are not intended to sum to the total.
Cecil County Public Schools
B-34
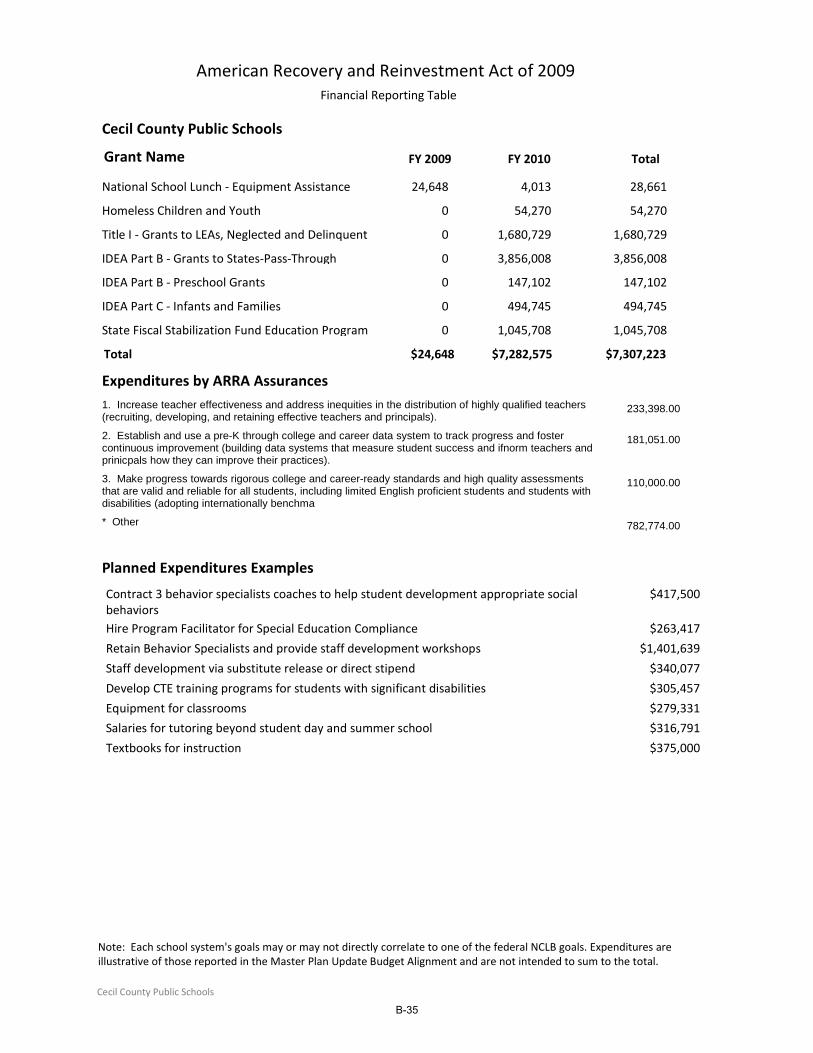
Cecil County Public Schools
American Recovery and Reinvestment Act of 2009Financial Reporting Table
FY 2009 FY 2010 TotalGrant Name
National School Lunch ‐ Equipment Assistance 24,648 4,013 28,661
Homeless Children and Youth 0 54,270 54,270
Title I ‐ Grants to LEAs, Neglected and Delinquent 0 1,680,729 1,680,729
IDEA Part B ‐ Grants to States‐Pass‐Through 0 3,856,008 3,856,008
IDEA Part B ‐ Preschool Grants 0 147,102 147,102
IDEA Part C ‐ Infants and Families 0 494,745 494,745
State Fiscal Stabilization Fund Education Program 0 1,045,708 1,045,708
$24,648 $7,282,575 $7,307,223Total
Expenditures by ARRA Assurances1. Increase teacher effectiveness and address inequities in the distribution of highly qualified teachers (recruiting, developing, and retaining effective teachers and principals).
233,398.00
2. Establish and use a pre-K through college and career data system to track progress and foster continuous improvement (building data systems that measure student success and ifnorm teachers and prinicpals how they can improve their practices).
181,051.00
3. Make progress towards rigorous college and career-ready standards and high quality assessments that are valid and reliable for all students, including limited English proficient students and students with disabilities (adopting internationally benchma
110,000.00
* Other 782,774.00
Planned Expenditures Examples
Contract 3 behavior specialists coaches to help student development appropriate social behaviors
$417,500
Hire Program Facilitator for Special Education Compliance $263,417
Retain Behavior Specialists and provide staff development workshops $1,401,639
Staff development via substitute release or direct stipend $340,077
Develop CTE training programs for students with significant disabilities $305,457
Equipment for classrooms $279,331
Salaries for tutoring beyond student day and summer school $316,791
Textbooks for instruction $375,000
Note: Each school system's goals may or may not directly correlate to one of the federal NCLB goals. Expenditures are illustrative of those reported in the Master Plan Update Budget Alignment and are not intended to sum to the total.
Cecil County Public Schools
B-35

B-36

Charles County Public Schools
Revenue
Original Budget 7/1/2009
Original Budget 7/1/2010 Change
Current Year Variance Report (Allocation of Available Resources)
Local Appropriation $146,609,227 $146,786,932 $177,705
State Revenue $152,927,022 $146,217,494 ($6,709,528)
Federal Revenue $12,797,295 $13,548,144 $750,849
Other Resources/Transfers $0 $2,600,000 $2,600,000
Other Local Revenue $2,596,300 $2,045,300 ($551,000)
Federal ARRA Funds $0 $11,152,441 $11,152,441
$314,929,844 $322,350,311 $7,420,467Total
Planned Expenditures by federal NCLB Goals
1. By 2013‐2014, all students will reach high standards, at a minimum attaining proficiency in reading/language arts and mathematics.
$3,376,357
3. By 2005‐2006, all students will be taught by highly qualified teachers. $1,875,9415. All students will graduate from high school. $5,807,836* Mandatory Cost of Doing Business ($574,297)* Other $626,133
Planned Expenditures Examples
ARRA ‐ State Fiscal Stabilization fund ‐ Extended Learning Opportunities $2,206,180ARRA ‐ Title I, Part A ‐ Instructional Technology $676,367ARRA ‐ Title I, Part A ‐ School Support, Extended Learning Opportunities $299,395ARRA ‐ State Fiscal Stabilization fund ‐ Professional Development $1,326,620ARRA ‐ Title I, Part A ‐ Professional Development $549,321ARRA ‐ IDEA Part B ‐ 2nd allocation not distributed to line items yet $2,826,149ARRA ‐ IDEA Part B ‐ Compensation $2,049,041ARRA ‐ IDEA Part B ‐ Instructional Technology and Instructional Programs $281,116ARRA ‐ IDEA Part B ‐ Professional Development $268,992Capital Outlay Maintenance ($650,000)Central Office Positions ($1,600,297)Health/Life Insurance & Retirement $3,735,000Materials ‐ Of ‐ Instruction (MOI) ($976,000)Technology Debt Service ($1,200,000)Technology Upgrades & Replacements ($425,000)Utilities/Contractual Obligations $792,000IDEA Part B ‐ Competitive funding $850,849Restricted miscellaneous revenues ($317,023)
Note: Each school system's goals may or may not directly correlate to one of the federal NCLB goals. Expenditures are illustrative of those reported in the Master Plan Update Budget Alignment and are not intended to sum to the total.
Charles County Public Schools
B-37

Charles County Public Schools
Prior Year Comparison Report (Planned v. Actual)
Original Budget 7/1/2008
Final Budget
6/30/2009 ChangeRevenue
Local Appropriation $146,609,227 $139,477,743 ($7,131,484)
State Revenue $152,927,022 $152,937,297 $10,275
Federal Revenue $12,797,295 $12,747,832 ($49,463)
Other Resources/Transfers $0 $2,375,000 $2,375,000
Other Local Revenue $2,596,300 $2,174,558 ($421,742)
$314,929,844 $309,712,430 ($5,217,414)Total
Actual Expenditures by federal NCLB Goals1. By 2013‐2014, all students will reach high standards, at a minimum attaining proficiency in reading/language arts and mathematics.
$0
3. By 2005‐2006, all students will be taught by highly qualified teachers. $6,111,100* Mandatory Cost of Doing Business $3,753,040* Other ($634,568)
Actual Expenditure Examples
EACC COLA $6,111,100NURSES' CONTRACT $259,000TRANSFER OF ADMINISTRATIVE STAFF ($315,700)NORTH POINT HIGH SCHOOL PHASE IV (FINAL) $413,800NORTH POINT HIGH SCHOOL TRANSFER POSITIONS ($413,800)NEAL ELEMENTARY SCHOOL OPERATING COSTS $448,000TRANSPORTATION $636,600UTILITY PRICE INCREASE $686,160AFSCME COLA $1,254,600REALLOCATION OF BASE GASB45 OPEB FUNDING ($1,300,000)TRANSFER OF STAFF POSITIONS ($1,325,600)HEALTH INSURANCE $1,338,000Budget Reduction Maintenance Of Effort (MOE) ($2,500,000)DEPARTMENT BUDGET REDUCTIONS ($2,602,320)MAINTENANCE PROJECTS (Safety, Learning environment) $3,200,000NEAL ELEMENTARY SCHOOL ‐ (TOTAL STAFF) $3,850,30010 Budget Reduction ($4,350,000)NEGOTIAITED CONTRACT CHANGES $4,582,000Restricted program expenditures were less than expected and revenue was deferred to FY10 (IDEA, Title II, Erate, Cell Tower Lease)
($634,568)
Note: Each school system's goals may or may not directly correlate to one of the federal NCLB goals. Expenditures are illustrative of those reported in the Master Plan Update Budget Alignment and are not intended to sum to the total.
Charles County Public Schools
B-38
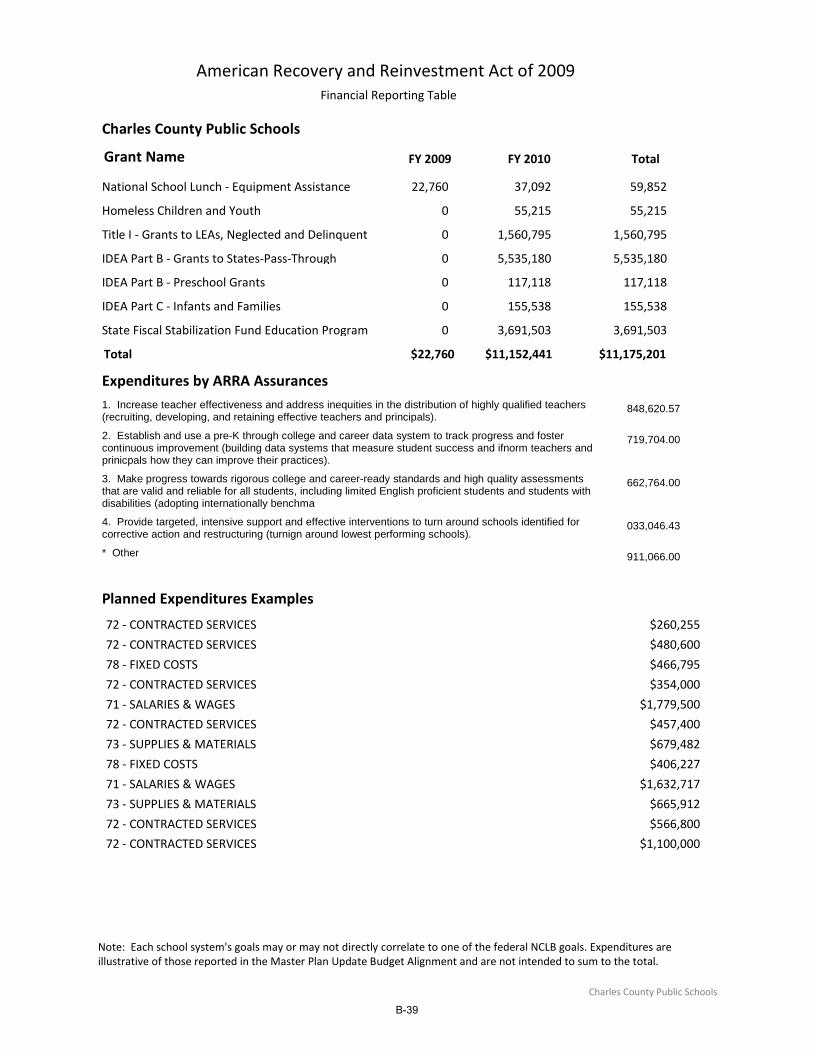
Charles County Public Schools
American Recovery and Reinvestment Act of 2009Financial Reporting Table
FY 2009 FY 2010 TotalGrant Name
National School Lunch ‐ Equipment Assistance 22,760 37,092 59,852
Homeless Children and Youth 0 55,215 55,215
Title I ‐ Grants to LEAs, Neglected and Delinquent 0 1,560,795 1,560,795
IDEA Part B ‐ Grants to States‐Pass‐Through 0 5,535,180 5,535,180
IDEA Part B ‐ Preschool Grants 0 117,118 117,118
IDEA Part C ‐ Infants and Families 0 155,538 155,538
State Fiscal Stabilization Fund Education Program 0 3,691,503 3,691,503
$22,760 $11,152,441 $11,175,201Total
Expenditures by ARRA Assurances1. Increase teacher effectiveness and address inequities in the distribution of highly qualified teachers (recruiting, developing, and retaining effective teachers and principals).
848,620.57
2. Establish and use a pre-K through college and career data system to track progress and foster continuous improvement (building data systems that measure student success and ifnorm teachers and prinicpals how they can improve their practices).
719,704.00
3. Make progress towards rigorous college and career-ready standards and high quality assessments that are valid and reliable for all students, including limited English proficient students and students with disabilities (adopting internationally benchma
662,764.00
4. Provide targeted, intensive support and effective interventions to turn around schools identified for corrective action and restructuring (turnign around lowest performing schools).
033,046.43
* Other 911,066.00
Planned Expenditures Examples
72 ‐ CONTRACTED SERVICES $260,255
72 ‐ CONTRACTED SERVICES $480,600
78 ‐ FIXED COSTS $466,795
72 ‐ CONTRACTED SERVICES $354,000
71 ‐ SALARIES & WAGES $1,779,500
72 ‐ CONTRACTED SERVICES $457,400
73 ‐ SUPPLIES & MATERIALS $679,482
78 ‐ FIXED COSTS $406,227
71 ‐ SALARIES & WAGES $1,632,717
73 ‐ SUPPLIES & MATERIALS $665,912
72 ‐ CONTRACTED SERVICES $566,800
72 ‐ CONTRACTED SERVICES $1,100,000
Note: Each school system's goals may or may not directly correlate to one of the federal NCLB goals. Expenditures are illustrative of those reported in the Master Plan Update Budget Alignment and are not intended to sum to the total.
Charles County Public Schools
B-39

B-40

Dorchester County Public Schools
Revenue
Original Budget 7/1/2009
Original Budget 7/1/2010 Change
Current Year Variance Report (Allocation of Available Resources)
Local Appropriation $17,473,300 $17,034,817 ($438,483)
State Revenue $30,582,025 $28,968,418 ($1,613,607)
Federal Revenue $3,446,157 $3,378,933 ($67,224)
Other Resources/Transfers $432,068 $205,617 ($226,451)
Other Local Revenue $645,700 $797,700 $152,000
Federal ARRA Funds $0 $1,880,438 $1,880,438
$52,579,250 $52,265,923 ($313,327)Total
Planned Expenditures by federal NCLB Goals
* Mandatory Cost of Doing Business $918,711* Other ($38,498)
Planned Expenditures Examples
Maintaining/enhancing education services in Title I schools: salaries, contracted services, MOI
$679,625
Maintaining/enhancing special education services with ARRA funds: salaries, contracted services, moi
$1,172,087
Net increase in employee benefits: health care premiums, tuition reimbursement, unemployment insurance, workers compensation and social security taxes
$272,000
Reduction in staff and related benefits over all categories ($821,181)Reduction in textbooks and materials of instruction ($290,928)
Note: Each school system's goals may or may not directly correlate to one of the federal NCLB goals. Expenditures are illustrative of those reported in the Master Plan Update Budget Alignment and are not intended to sum to the total.
Dorchester County Public Schools
B-41
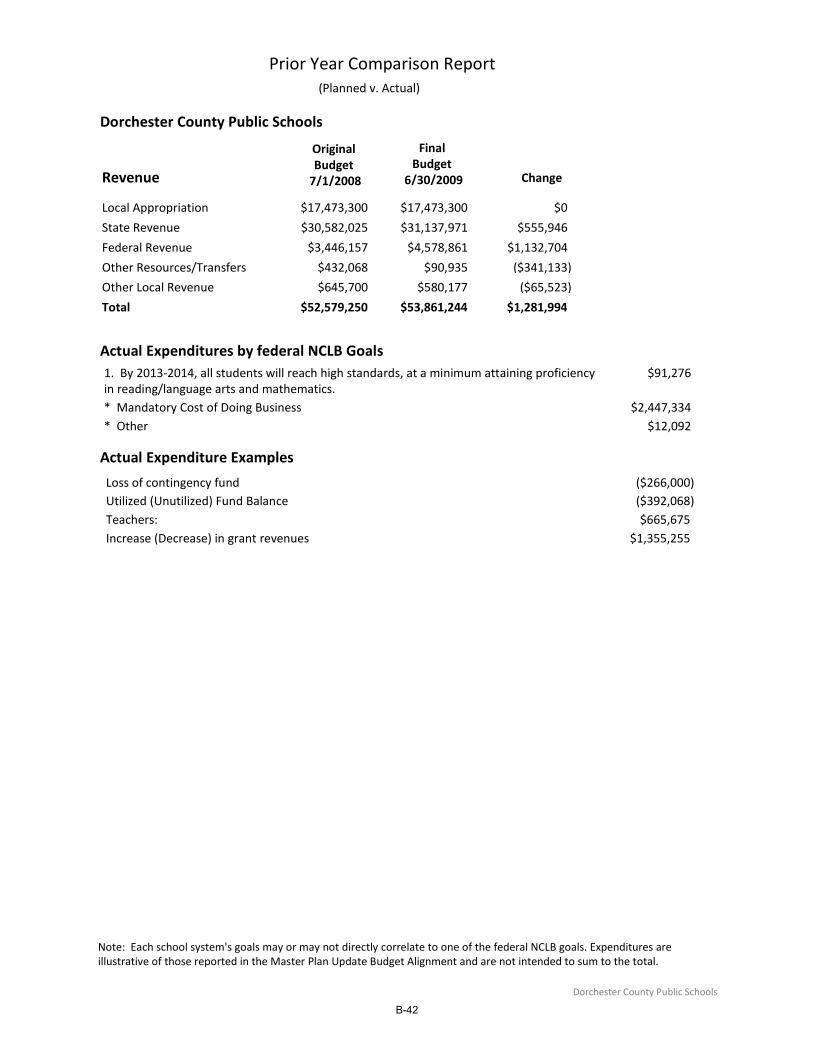
Dorchester County Public Schools
Prior Year Comparison Report (Planned v. Actual)
Original Budget 7/1/2008
Final Budget
6/30/2009 ChangeRevenue
Local Appropriation $17,473,300 $17,473,300 $0
State Revenue $30,582,025 $31,137,971 $555,946
Federal Revenue $3,446,157 $4,578,861 $1,132,704
Other Resources/Transfers $432,068 $90,935 ($341,133)
Other Local Revenue $645,700 $580,177 ($65,523)
$52,579,250 $53,861,244 $1,281,994Total
Actual Expenditures by federal NCLB Goals1. By 2013‐2014, all students will reach high standards, at a minimum attaining proficiency in reading/language arts and mathematics.
$91,276
* Mandatory Cost of Doing Business $2,447,334* Other $12,092
Actual Expenditure Examples
Loss of contingency fund ($266,000)Utilized (Unutilized) Fund Balance ($392,068)Teachers: $665,675Increase (Decrease) in grant revenues $1,355,255
Note: Each school system's goals may or may not directly correlate to one of the federal NCLB goals. Expenditures are illustrative of those reported in the Master Plan Update Budget Alignment and are not intended to sum to the total.
Dorchester County Public Schools
B-42

Dorchester County Public Schools
American Recovery and Reinvestment Act of 2009Financial Reporting Table
FY 2009 FY 2010 TotalGrant Name
National School Lunch ‐ Equipment Assistance 0 28,726 28,726
Homeless Children and Youth 0 0 0
Title I ‐ Grants to LEAs, Neglected and Delinquent 0 679,625 679,625
IDEA Part B ‐ Grants to States‐Pass‐Through 197,025 905,181 1,102,206
IDEA Part B ‐ Preschool Grants 0 41,562 41,562
IDEA Part C ‐ Infants and Families 0 78,935 78,935
State Fiscal Stabilization Fund Education Program 0 1,150,544 1,150,544
$197,025 $2,884,573 $3,081,598Total
Expenditures by ARRA Assurances1. Increase teacher effectiveness and address inequities in the distribution of highly qualified teachers (recruiting, developing, and retaining effective teachers and principals).
849,598.00
4. Provide targeted, intensive support and effective interventions to turn around schools identified for corrective action and restructuring (turnign around lowest performing schools).
401,293.00
* Other 830,707.00
Planned Expenditures Examples
Retained teaching positions $646,961
Retained teaching positions $1,150,544
Contracted Services ‐ Related Services $299,495
Note: Each school system's goals may or may not directly correlate to one of the federal NCLB goals. Expenditures are illustrative of those reported in the Master Plan Update Budget Alignment and are not intended to sum to the total.
Dorchester County Public Schools
B-43

B-44

Frederick County Public Schools
Revenue
Original Budget 7/1/2009
Original Budget 7/1/2010 Change
Current Year Variance Report (Allocation of Available Resources)
Local Appropriation $237,631,000 $228,943,000 ($8,688,000)
State Revenue $205,877,000 $198,789,000 ($7,088,000)
Federal Revenue $17,482,000 $17,482,000 $0
Other Resources/Transfers $800,000 $1,949,000 $1,149,000
Other Local Revenue $4,455,000 $4,617,000 $162,000
Federal ARRA Funds $0 $12,382,000 $12,382,000
$466,245,000 $464,162,000 ($2,083,000)Total
Planned Expenditures by federal NCLB Goals
1. By 2013‐2014, all students will reach high standards, at a minimum attaining proficiency in reading/language arts and mathematics.
$5,914,960
3. By 2005‐2006, all students will be taught by highly qualified teachers. $564,776* Mandatory Cost of Doing Business $234,714* Other ($8,797,450)
Planned Expenditures Examples
Curriculum and materials to support interventions $293,386 Staffing Changes $733,620 Technology support, supplies, equipment and software $3,186,880 Staffing $1,161,395 Technology suppport, supplies, equipment and software $288,730ARRA ‐ Title I Professional Development $414,776Additional non‐benefited Special Education Assistants $400,000Additional staffing for English Language Learners (ELL) $396,640Increases in contractual agreements ‐ benefits (if itemized separately) $1,936,177Nonpublic Special Education Placements $837,662Reduced positions due to enrollment decline ($2,161,413)Savings in Worker Compensation costs ($570,316)Transportation ($969,749) Funding for Substitutes $2,264,174 Funding for Teacher Workshops $1,738,036 Funding for Textbook Replacement $1,900,000 Reduce Warehouse operations ($312,228) Reduce funding for Substitutes ($2,264,174) Reduce funding for Teacher Workshops ($1,738,036) Reduce funding for Textbook Replacement ($1,900,000) Reduce funding support for Food Services ($449,233) Reduce work year of central office and school‐based staff ($974,017) Reversal of FY 2009 one‐time funding ($868,959)
Note: Each school system's goals may or may not directly correlate to one of the federal NCLB goals. Expenditures are illustrative of those reported in the Master Plan Update Budget Alignment and are not intended to sum to the total.
Frederick County Public Schools
B-45

Salary reductions due to turnover, reducing FTE positions and reducing overtime ($1,322,044) Transportation policy change ($965,069)County OPEB funding reduction ($7,159,200)FCPS OPEB funding $3,645,607
Note: Each school system's goals may or may not directly correlate to one of the federal NCLB goals. Expenditures are illustrative of those reported in the Master Plan Update Budget Alignment and are not intended to sum to the total.
Frederick County Public Schools
B-46

Frederick County Public Schools
Prior Year Comparison Report (Planned v. Actual)
Original Budget 7/1/2008
Final Budget
6/30/2009 ChangeRevenue
Local Appropriation $237,631,000 $237,451,000 ($180,000)
State Revenue $205,877,000 $206,248,000 $371,000
Federal Revenue $17,482,000 $14,920,000 ($2,562,000)
Other Resources/Transfers $800,000 $800,000 $0
Other Local Revenue $4,455,000 $3,752,000 ($703,000)
$466,245,000 $463,171,000 ($3,074,000)Total
Actual Expenditures by federal NCLB Goals3. By 2005‐2006, all students will be taught by highly qualified teachers. $5,575,104* Mandatory Cost of Doing Business $10,492,678* Other ($1,672,782)
Actual Expenditure Examples
Salary Resource Pool $5,575,104 Additional staffing for English Language Learners (ELL) $275,000Utilities $275,341 Additional Pre‐kindergarten classrooms $304,104Cost associated with opeining a new school or newly renovated school $607,631Transportations $793,547Nonpublic Special Education Placements $1,150,000Additional Positions for Enrollment Growth of Class Size reduction initiatives ($1,153,199)Increases in contractual agreements ‐ benefits (if itemized separately) $2,697,399 Reversal of FY 2008 County one‐time funding ($3,582,878)Increases in contractual agreements ‐ salaries $9,283,995County OPEB Contribution $1,069,218Federal grants ($2,562,000)
Note: Each school system's goals may or may not directly correlate to one of the federal NCLB goals. Expenditures are illustrative of those reported in the Master Plan Update Budget Alignment and are not intended to sum to the total.
Frederick County Public Schools
B-47

Frederick County Public Schools
American Recovery and Reinvestment Act of 2009Financial Reporting Table
FY 2009 FY 2010 TotalGrant Name
National School Lunch ‐ Equipment Assistance 0 113,182 113,182
Homeless Children and Youth 0 42,729 42,729
Title I ‐ Grants to LEAs, Neglected and Delinquent 0 2,187,850 2,187,850
IDEA Part B ‐ Grants to States‐Pass‐Through 0 8,387,056 8,387,056
IDEA Part B ‐ Preschool Grants 0 196,716 196,716
IDEA Part C ‐ Infants and Families 0 0 0
State Fiscal Stabilization Fund Education Program 0 5,902,210 5,902,210
$0 $16,829,743 $16,829,743Total
Expenditures by ARRA Assurances1. Increase teacher effectiveness and address inequities in the distribution of highly qualified teachers (recruiting, developing, and retaining effective teachers and principals).
385,667.00
* Other 444,076.00
Planned Expenditures Examples
Professional Development $315,000
Professional Development $332,631
Professional Development $1,738,036
Regular education instructional assistants $430,863
Special Education ARRA II $4,193,528
Staffing for extended learning programs $471,468
Staffing for extended learning programs $662,000
Substitute teachers $2,264,174
Technology support, supplies, equipment, software $303,553
Technology support, supplies,equipment, software $2,797,142
Textbook replacement $1,900,000
Note: Each school system's goals may or may not directly correlate to one of the federal NCLB goals. Expenditures are illustrative of those reported in the Master Plan Update Budget Alignment and are not intended to sum to the total.
Frederick County Public Schools
B-48

Garrett County Public Schools
Revenue
Original Budget 7/1/2009
Original Budget 7/1/2010 Change
Current Year Variance Report (Allocation of Available Resources)
Local Appropriation $23,159,000 $23,159,000 $0
State Revenue $25,353,656 $24,339,306 ($1,014,350)
Federal Revenue $3,712,936 $3,478,867 ($234,069)
Other Resources/Transfers $0 $693,628 $693,628
Other Local Revenue $283,428 $38,428 ($245,000)
Federal ARRA Funds $0 $1,773,445 $1,773,445
$52,509,020 $53,482,674 $973,654Total
Planned Expenditures by federal NCLB Goals
1. By 2013‐2014, all students will reach high standards, at a minimum attaining proficiency in reading/language arts and mathematics.
$325,340
2. All limited English proficient students will become proficient in English and reach high academic standards at a minimum attaining proficiency or better in reading/language arts and mathematics.
$105,000
* Mandatory Cost of Doing Business $428,314
Planned Expenditures Examples
Increases in contractual agreements ‐ benefits $696,341
Note: Each school system's goals may or may not directly correlate to one of the federal NCLB goals. Expenditures are illustrative of those reported in the Master Plan Update Budget Alignment and are not intended to sum to the total.
Garrett County Public Schools
B-49

Garrett County Public Schools
Prior Year Comparison Report (Planned v. Actual)
Original Budget 7/1/2008
Final Budget
6/30/2009 ChangeRevenue
Local Appropriation $23,159,000 $23,159,000 $0
State Revenue $25,353,656 $25,500,847 $147,191
Federal Revenue $3,712,936 $4,452,013 $739,077
Other Resources/Transfers $0
Other Local Revenue $283,428 $296,647 $13,219
$52,509,020 $53,408,507 $899,487Total
Actual Expenditures by federal NCLB Goals1. By 2013‐2014, all students will reach high standards, at a minimum attaining proficiency in reading/language arts and mathematics.
$90,402
2. All limited English proficient students will become proficient in English and reach high academic standards at a minimum attaining proficiency or better in reading/language arts and mathematics.
$66,790
* Mandatory Cost of Doing Business $1,592,460
Actual Expenditure Examples
Transportation $415,133Increases in contractual agreements ‐ salaries $755,624
Note: Each school system's goals may or may not directly correlate to one of the federal NCLB goals. Expenditures are illustrative of those reported in the Master Plan Update Budget Alignment and are not intended to sum to the total.
Garrett County Public Schools
B-50
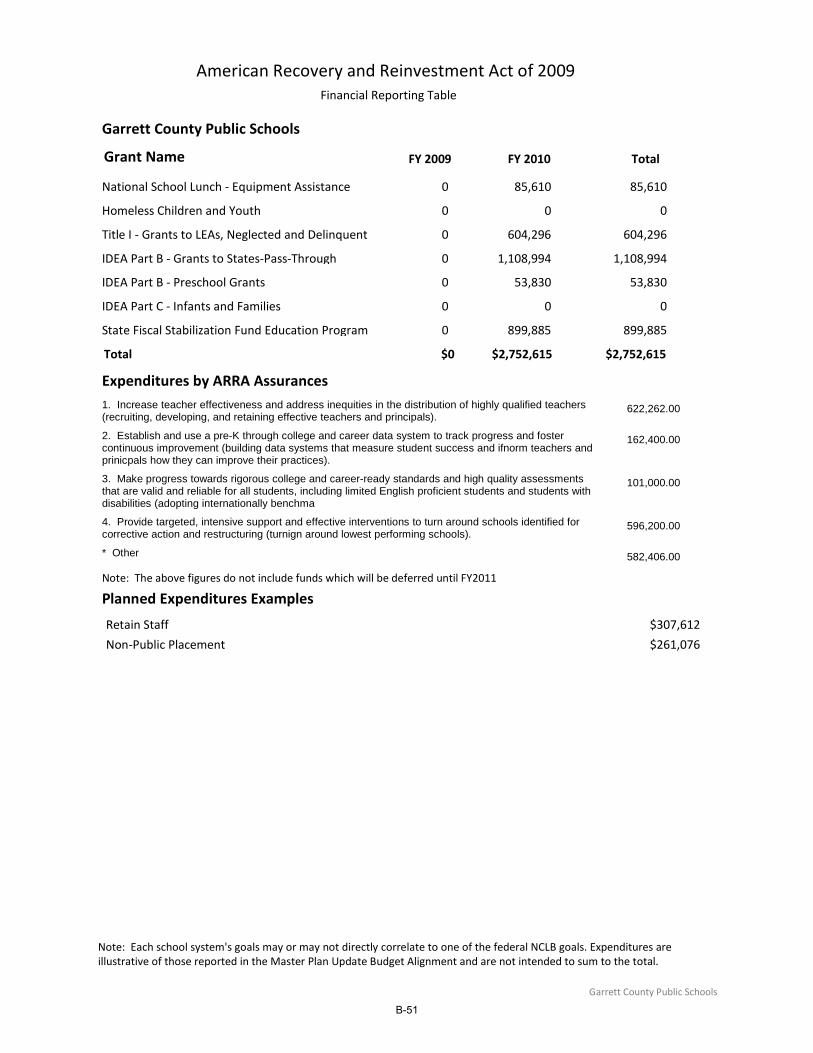
Garrett County Public Schools
American Recovery and Reinvestment Act of 2009Financial Reporting Table
FY 2009 FY 2010 TotalGrant Name
National School Lunch ‐ Equipment Assistance 0 85,610 85,610
Homeless Children and Youth 0 0 0
Title I ‐ Grants to LEAs, Neglected and Delinquent 0 604,296 604,296
IDEA Part B ‐ Grants to States‐Pass‐Through 0 1,108,994 1,108,994
IDEA Part B ‐ Preschool Grants 0 53,830 53,830
IDEA Part C ‐ Infants and Families 0 0 0
State Fiscal Stabilization Fund Education Program 0 899,885 899,885
$0 $2,752,615 $2,752,615Total
Expenditures by ARRA Assurances1. Increase teacher effectiveness and address inequities in the distribution of highly qualified teachers (recruiting, developing, and retaining effective teachers and principals).
622,262.00
2. Establish and use a pre-K through college and career data system to track progress and foster continuous improvement (building data systems that measure student success and ifnorm teachers and prinicpals how they can improve their practices).
162,400.00
3. Make progress towards rigorous college and career-ready standards and high quality assessments that are valid and reliable for all students, including limited English proficient students and students with disabilities (adopting internationally benchma
101,000.00
4. Provide targeted, intensive support and effective interventions to turn around schools identified for corrective action and restructuring (turnign around lowest performing schools).
596,200.00
* Other 582,406.00
Note: The above figures do not include funds which will be deferred until FY2011
Planned Expenditures Examples
Retain Staff $307,612
Non‐Public Placement $261,076
Note: Each school system's goals may or may not directly correlate to one of the federal NCLB goals. Expenditures are illustrative of those reported in the Master Plan Update Budget Alignment and are not intended to sum to the total.
Garrett County Public Schools
B-51

B-52
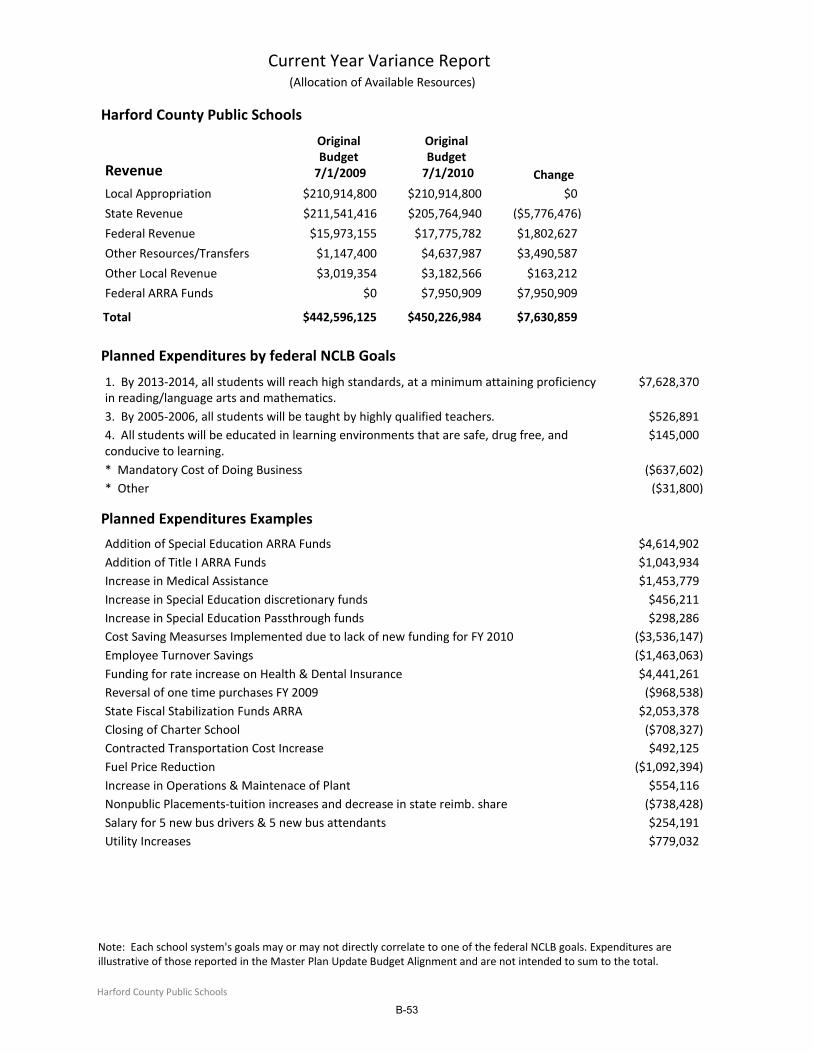
Harford County Public Schools
Revenue
Original Budget 7/1/2009
Original Budget 7/1/2010 Change
Current Year Variance Report (Allocation of Available Resources)
Local Appropriation $210,914,800 $210,914,800 $0
State Revenue $211,541,416 $205,764,940 ($5,776,476)
Federal Revenue $15,973,155 $17,775,782 $1,802,627
Other Resources/Transfers $1,147,400 $4,637,987 $3,490,587
Other Local Revenue $3,019,354 $3,182,566 $163,212
Federal ARRA Funds $0 $7,950,909 $7,950,909
$442,596,125 $450,226,984 $7,630,859Total
Planned Expenditures by federal NCLB Goals
1. By 2013‐2014, all students will reach high standards, at a minimum attaining proficiency in reading/language arts and mathematics.
$7,628,370
3. By 2005‐2006, all students will be taught by highly qualified teachers. $526,8914. All students will be educated in learning environments that are safe, drug free, and conducive to learning.
$145,000
* Mandatory Cost of Doing Business ($637,602)* Other ($31,800)
Planned Expenditures Examples
Addition of Special Education ARRA Funds $4,614,902Addition of Title I ARRA Funds $1,043,934Increase in Medical Assistance $1,453,779Increase in Special Education discretionary funds $456,211Increase in Special Education Passthrough funds $298,286Cost Saving Measurses Implemented due to lack of new funding for FY 2010 ($3,536,147)Employee Turnover Savings ($1,463,063)Funding for rate increase on Health & Dental Insurance $4,441,261Reversal of one time purchases FY 2009 ($968,538)State Fiscal Stabilization Funds ARRA $2,053,378Closing of Charter School ($708,327)Contracted Transportation Cost Increase $492,125Fuel Price Reduction ($1,092,394)Increase in Operations & Maintenace of Plant $554,116Nonpublic Placements‐tuition increases and decrease in state reimb. share ($738,428)Salary for 5 new bus drivers & 5 new bus attendants $254,191Utility Increases $779,032
Note: Each school system's goals may or may not directly correlate to one of the federal NCLB goals. Expenditures are illustrative of those reported in the Master Plan Update Budget Alignment and are not intended to sum to the total.
Harford County Public Schools
B-53

Harford County Public Schools
Prior Year Comparison Report (Planned v. Actual)
Original Budget 7/1/2008
Final Budget
6/30/2009 ChangeRevenue
Local Appropriation $210,914,800 $210,914,800 $0
State Revenue $211,541,416 $212,232,092 $690,676
Federal Revenue $15,973,155 $17,096,932 $1,123,777
Other Resources/Transfers $1,147,400 $1,147,400 $0
Other Local Revenue $3,019,354 $2,987,141 ($32,213)
$442,596,125 $444,378,365 $1,782,240Total
Actual Expenditures by federal NCLB Goals1. By 2013‐2014, all students will reach high standards, at a minimum attaining proficiency in reading/language arts and mathematics.
$4,151,866
3. By 2005‐2006, all students will be taught by highly qualified teachers. $3,017,0654. All students will be educated in learning environments that are safe, drug free, and conducive to learning.
($1,803,137)
* Mandatory Cost of Doing Business $6,837,532* Other $146,369
Actual Expenditure Examples
Transfer of Special Education positions from grants $322,331Summer School Program for Middle School Students $347,450Increase in Magnet & Special Programs $425,180Intervention Funding for Edgewood Middle School $490,715Equipment & Supplies for Schools $510,000Decrease in Medical Assistance $1,100,318Decrease of 56 Regular Program Teaching Positions to fund Wage/Salary Increases ($3,319,636)Negotiated Wage and Salary Increases $6,336,701Decrease in Security Area Initiative ($275,000)Reversal of One Time Purchases FY 2008 ($1,634,999)Costs associated with opening a new school or newly renovated school $695,039Nonpublic Special Education Placements $1,374,823Transportation $2,256,435Increases in Health and Dental Insurance ‐ benefits (if itemized separately) $2,444,765
Note: Each school system's goals may or may not directly correlate to one of the federal NCLB goals. Expenditures are illustrative of those reported in the Master Plan Update Budget Alignment and are not intended to sum to the total.
Harford County Public Schools
B-54
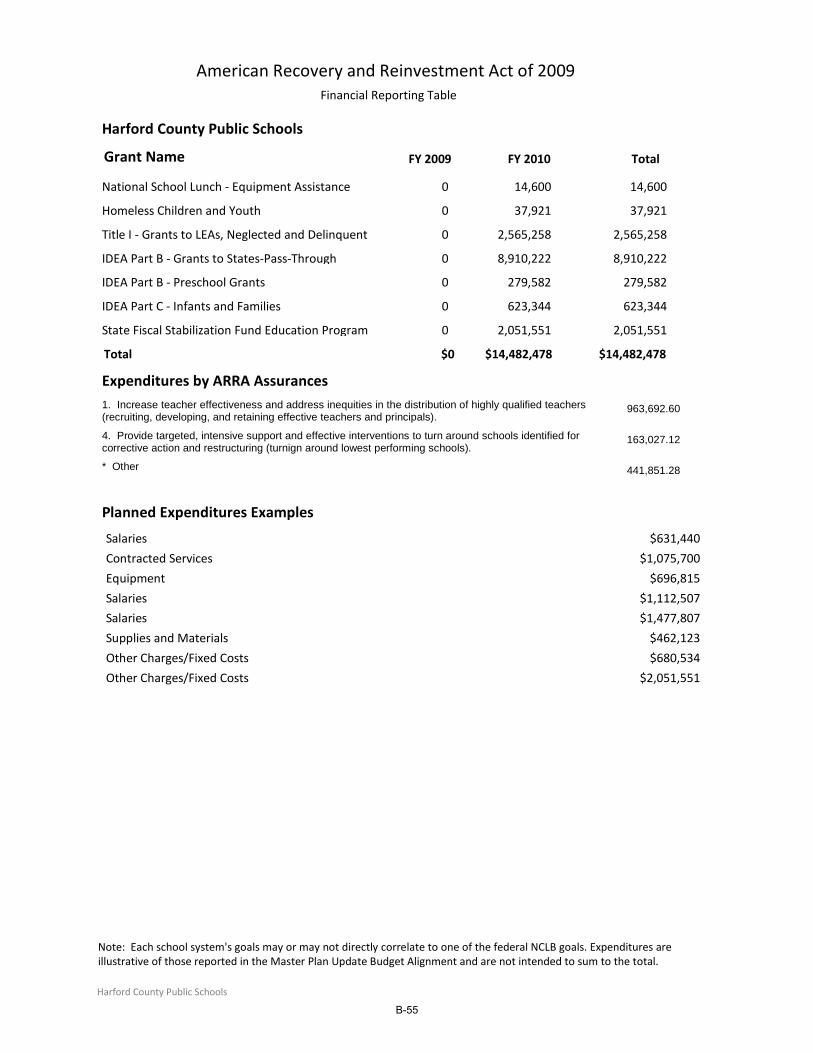
Harford County Public Schools
American Recovery and Reinvestment Act of 2009Financial Reporting Table
FY 2009 FY 2010 TotalGrant Name
National School Lunch ‐ Equipment Assistance 0 14,600 14,600
Homeless Children and Youth 0 37,921 37,921
Title I ‐ Grants to LEAs, Neglected and Delinquent 0 2,565,258 2,565,258
IDEA Part B ‐ Grants to States‐Pass‐Through 0 8,910,222 8,910,222
IDEA Part B ‐ Preschool Grants 0 279,582 279,582
IDEA Part C ‐ Infants and Families 0 623,344 623,344
State Fiscal Stabilization Fund Education Program 0 2,051,551 2,051,551
$0 $14,482,478 $14,482,478Total
Expenditures by ARRA Assurances1. Increase teacher effectiveness and address inequities in the distribution of highly qualified teachers (recruiting, developing, and retaining effective teachers and principals).
963,692.60
4. Provide targeted, intensive support and effective interventions to turn around schools identified for corrective action and restructuring (turnign around lowest performing schools).
163,027.12
* Other 441,851.28
Planned Expenditures Examples
Salaries $631,440
Contracted Services $1,075,700
Equipment $696,815
Salaries $1,112,507
Salaries $1,477,807
Supplies and Materials $462,123
Other Charges/Fixed Costs $680,534
Other Charges/Fixed Costs $2,051,551
Note: Each school system's goals may or may not directly correlate to one of the federal NCLB goals. Expenditures are illustrative of those reported in the Master Plan Update Budget Alignment and are not intended to sum to the total.
Harford County Public Schools
B-55

B-56

Howard County Public Schools
Revenue
Original Budget 7/1/2009
Original Budget 7/1/2010 Change
Current Year Variance Report (Allocation of Available Resources)
Local Appropriation $454,794,610 $457,560,424 $2,765,814
State Revenue $196,407,120 $191,285,963 ($5,121,157)
Federal Revenue $15,840,610 $33,103,271 $17,262,661
Other Resources/Transfers $4,004,300 $416,350 ($3,587,950)
Other Local Revenue $11,041,380 $14,428,102 $3,386,722
Federal ARRA Funds $0 $10,117,446 $10,117,446
$682,088,020 $706,911,556 $24,823,536Total
Planned Expenditures by federal NCLB Goals
1. By 2013‐2014, all students will reach high standards, at a minimum attaining proficiency in reading/language arts and mathematics.
$782,250
2. All limited English proficient students will become proficient in English and reach high academic standards at a minimum attaining proficiency or better in reading/language arts and mathematics.
$766,690
4. All students will be educated in learning environments that are safe, drug free, and conducive to learning.
$93,360
5. All students will graduate from high school. $72,220* Mandatory Cost of Doing Business $9,396,510* Other $3,595,060
Planned Expenditures Examples
Adds staff and benefits ( 9.0 teachers and 5.5 paraeducators) $745,190Additional Positions for Enrollment Growth (to include salary and benefits) $1,895,260Central Office positions cut in order to maintain class size ($551,090)Increases in contractual agreements ‐ salaries $5,500,000Nonpublic Special Education Placements $819,580Utilities $1,699,850Other Grant contingent revenues for anticipated ARRA funds and competitive incentive and innovation grants
$3,595,060
Note: Each school system's goals may or may not directly correlate to one of the federal NCLB goals. Expenditures are illustrative of those reported in the Master Plan Update Budget Alignment and are not intended to sum to the total.
Howard County Public Schools
B-57
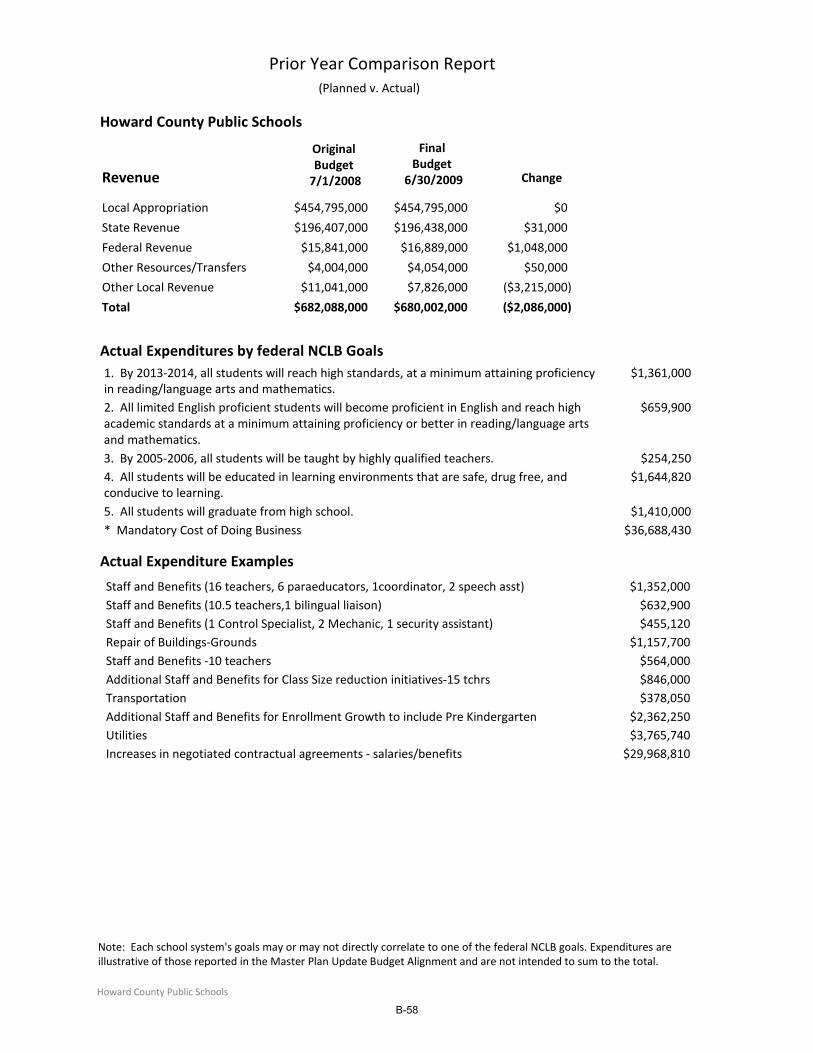
Howard County Public Schools
Prior Year Comparison Report (Planned v. Actual)
Original Budget 7/1/2008
Final Budget
6/30/2009 ChangeRevenue
Local Appropriation $454,795,000 $454,795,000 $0
State Revenue $196,407,000 $196,438,000 $31,000
Federal Revenue $15,841,000 $16,889,000 $1,048,000
Other Resources/Transfers $4,004,000 $4,054,000 $50,000
Other Local Revenue $11,041,000 $7,826,000 ($3,215,000)
$682,088,000 $680,002,000 ($2,086,000)Total
Actual Expenditures by federal NCLB Goals1. By 2013‐2014, all students will reach high standards, at a minimum attaining proficiency in reading/language arts and mathematics.
$1,361,000
2. All limited English proficient students will become proficient in English and reach high academic standards at a minimum attaining proficiency or better in reading/language arts and mathematics.
$659,900
3. By 2005‐2006, all students will be taught by highly qualified teachers. $254,2504. All students will be educated in learning environments that are safe, drug free, and conducive to learning.
$1,644,820
5. All students will graduate from high school. $1,410,000* Mandatory Cost of Doing Business $36,688,430
Actual Expenditure Examples
Staff and Benefits (16 teachers, 6 paraeducators, 1coordinator, 2 speech asst) $1,352,000Staff and Benefits (10.5 teachers,1 bilingual liaison) $632,900Staff and Benefits (1 Control Specialist, 2 Mechanic, 1 security assistant) $455,120Repair of Buildings‐Grounds $1,157,700Staff and Benefits ‐10 teachers $564,000Additional Staff and Benefits for Class Size reduction initiatives‐15 tchrs $846,000Transportation $378,050Additional Staff and Benefits for Enrollment Growth to include Pre Kindergarten $2,362,250Utilities $3,765,740Increases in negotiated contractual agreements ‐ salaries/benefits $29,968,810
Note: Each school system's goals may or may not directly correlate to one of the federal NCLB goals. Expenditures are illustrative of those reported in the Master Plan Update Budget Alignment and are not intended to sum to the total.
Howard County Public Schools
B-58
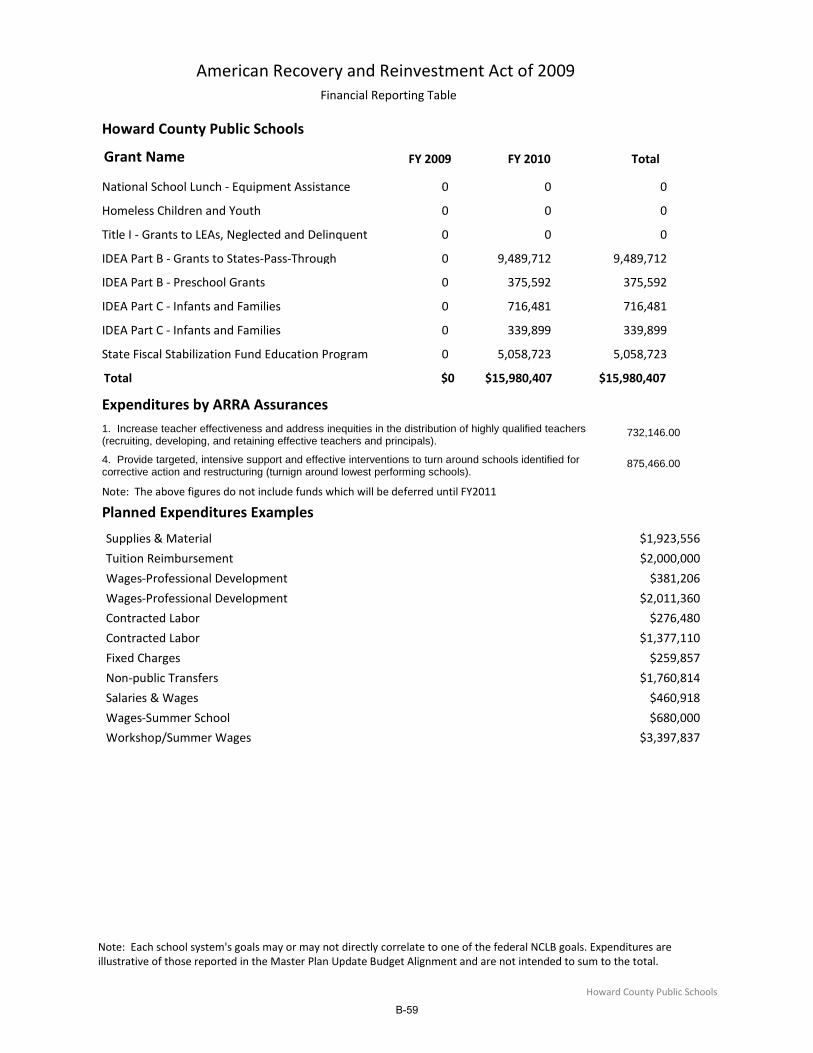
Howard County Public Schools
American Recovery and Reinvestment Act of 2009Financial Reporting Table
FY 2009 FY 2010 TotalGrant Name
National School Lunch ‐ Equipment Assistance 0 0 0
Homeless Children and Youth 0 0 0
Title I ‐ Grants to LEAs, Neglected and Delinquent 0 0 0
IDEA Part B ‐ Grants to States‐Pass‐Through 0 9,489,712 9,489,712
IDEA Part B ‐ Preschool Grants 0 375,592 375,592
IDEA Part C ‐ Infants and Families 0 716,481 716,481
IDEA Part C ‐ Infants and Families 0 339,899 339,899
State Fiscal Stabilization Fund Education Program 0 5,058,723 5,058,723
$0 $15,980,407 $15,980,407Total
Expenditures by ARRA Assurances1. Increase teacher effectiveness and address inequities in the distribution of highly qualified teachers (recruiting, developing, and retaining effective teachers and principals).
732,146.00
4. Provide targeted, intensive support and effective interventions to turn around schools identified for corrective action and restructuring (turnign around lowest performing schools).
875,466.00
Note: The above figures do not include funds which will be deferred until FY2011
Planned Expenditures Examples
Supplies & Material $1,923,556
Tuition Reimbursement $2,000,000
Wages‐Professional Development $381,206
Wages‐Professional Development $2,011,360
Contracted Labor $276,480
Contracted Labor $1,377,110
Fixed Charges $259,857
Non‐public Transfers $1,760,814
Salaries & Wages $460,918
Wages‐Summer School $680,000
Workshop/Summer Wages $3,397,837
Note: Each school system's goals may or may not directly correlate to one of the federal NCLB goals. Expenditures are illustrative of those reported in the Master Plan Update Budget Alignment and are not intended to sum to the total.
Howard County Public Schools
B-59

B-60
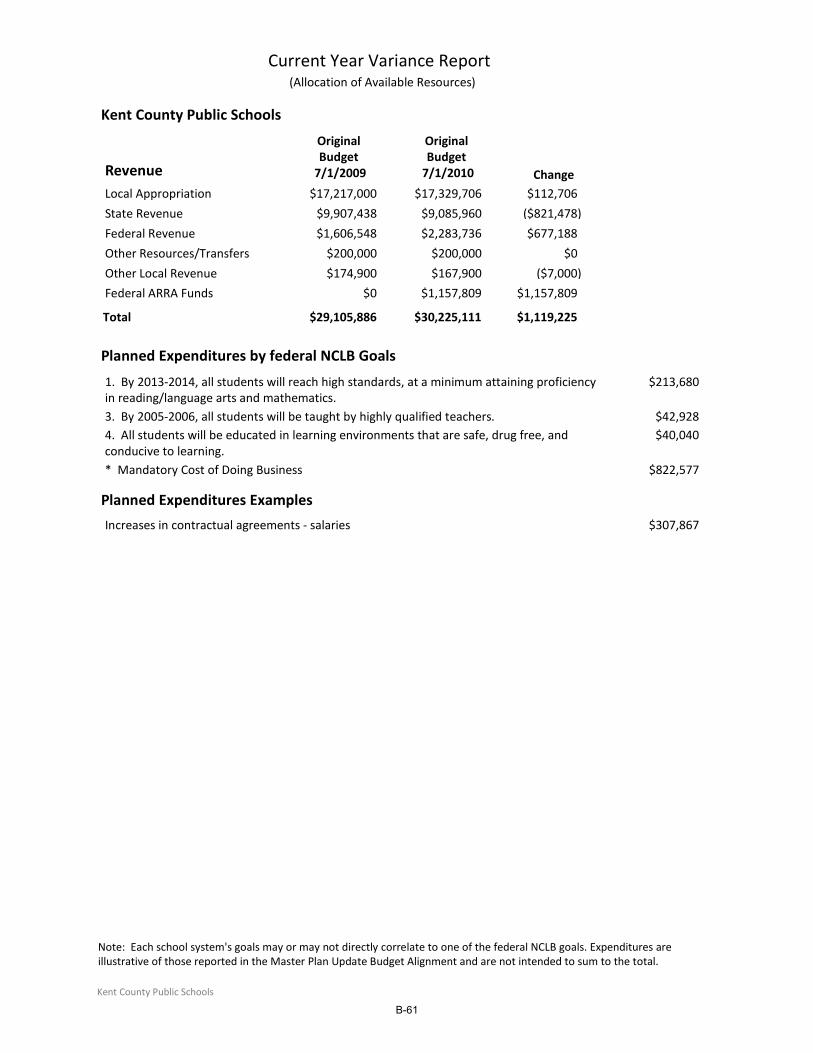
Kent County Public Schools
Revenue
Original Budget 7/1/2009
Original Budget 7/1/2010 Change
Current Year Variance Report (Allocation of Available Resources)
Local Appropriation $17,217,000 $17,329,706 $112,706
State Revenue $9,907,438 $9,085,960 ($821,478)
Federal Revenue $1,606,548 $2,283,736 $677,188
Other Resources/Transfers $200,000 $200,000 $0
Other Local Revenue $174,900 $167,900 ($7,000)
Federal ARRA Funds $0 $1,157,809 $1,157,809
$29,105,886 $30,225,111 $1,119,225Total
Planned Expenditures by federal NCLB Goals
1. By 2013‐2014, all students will reach high standards, at a minimum attaining proficiency in reading/language arts and mathematics.
$213,680
3. By 2005‐2006, all students will be taught by highly qualified teachers. $42,9284. All students will be educated in learning environments that are safe, drug free, and conducive to learning.
$40,040
* Mandatory Cost of Doing Business $822,577
Planned Expenditures Examples
Increases in contractual agreements ‐ salaries $307,867
Note: Each school system's goals may or may not directly correlate to one of the federal NCLB goals. Expenditures are illustrative of those reported in the Master Plan Update Budget Alignment and are not intended to sum to the total.
Kent County Public Schools
B-61
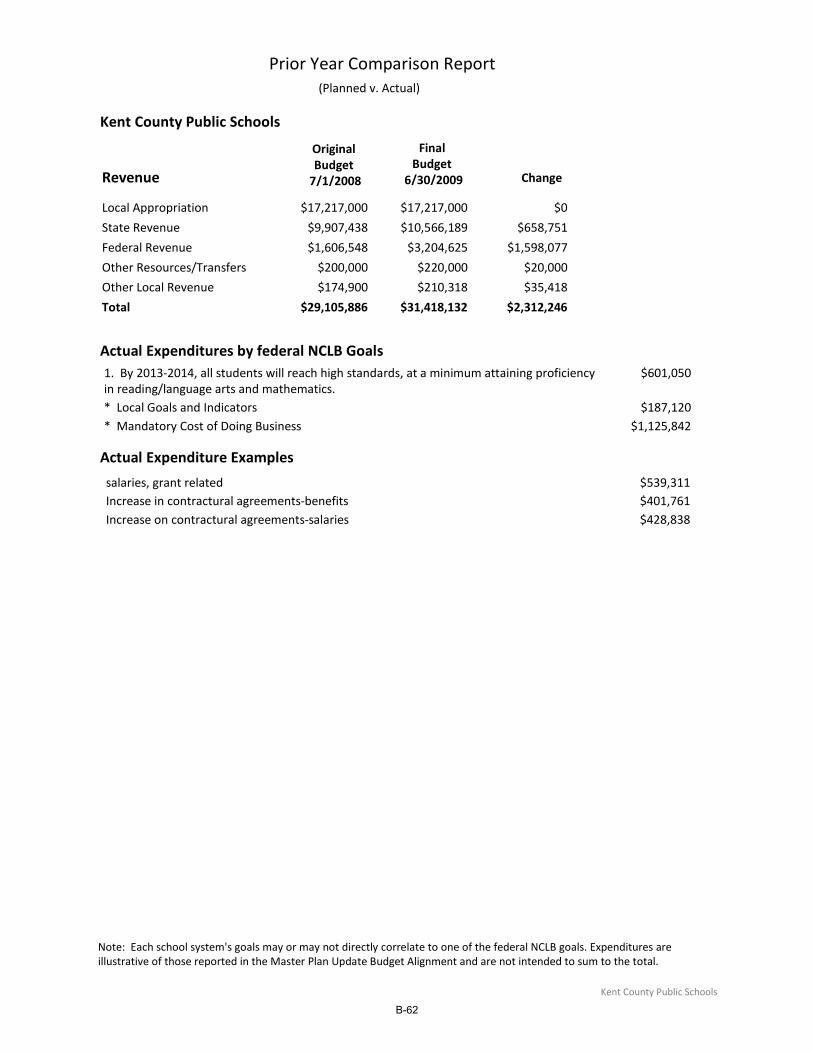
Kent County Public Schools
Prior Year Comparison Report (Planned v. Actual)
Original Budget 7/1/2008
Final Budget
6/30/2009 ChangeRevenue
Local Appropriation $17,217,000 $17,217,000 $0
State Revenue $9,907,438 $10,566,189 $658,751
Federal Revenue $1,606,548 $3,204,625 $1,598,077
Other Resources/Transfers $200,000 $220,000 $20,000
Other Local Revenue $174,900 $210,318 $35,418
$29,105,886 $31,418,132 $2,312,246Total
Actual Expenditures by federal NCLB Goals1. By 2013‐2014, all students will reach high standards, at a minimum attaining proficiency in reading/language arts and mathematics.
$601,050
* Local Goals and Indicators $187,120* Mandatory Cost of Doing Business $1,125,842
Actual Expenditure Examples
salaries, grant related $539,311Increase in contractural agreements‐benefits $401,761Increase on contractural agreements‐salaries $428,838
Note: Each school system's goals may or may not directly correlate to one of the federal NCLB goals. Expenditures are illustrative of those reported in the Master Plan Update Budget Alignment and are not intended to sum to the total.
Kent County Public Schools
B-62

Kent County Public Schools
American Recovery and Reinvestment Act of 2009Financial Reporting Table
FY 2009 FY 2010 TotalGrant Name
National School Lunch ‐ Equipment Assistance 0 72,390 72,390
Homeless Children and Youth 0 0 0
Title I ‐ Grants to LEAs, Neglected and Delinquent 0 258,370 258,370
IDEA Part B ‐ Grants to States‐Pass‐Through 109,334 432,454 541,788
IDEA Part B ‐ Preschool Grants 0 25,906 25,906
IDEA Part C ‐ Infants and Families 0 11,964 11,964
State Fiscal Stabilization Fund Education Program 0 744,657 744,657
$109,334 $1,545,741 $1,655,075Total
Expenditures by ARRA Assurances1. Increase teacher effectiveness and address inequities in the distribution of highly qualified teachers (recruiting, developing, and retaining effective teachers and principals).
314,749.97
* Other 340,326.03
Planned Expenditures Examples
staff $252,318
Additional staff, Instructional Support, Equipment for interactive classrooms $479,357
Testing Support, Computer Lease Payment, Rental Copiers, Textbook/Materials of Instruction, Energy Management Contract, Utilities, ESL Hourly Tutor, Technology support, Studetn Transportation, Maintenance Agreements
$744,657
Note: Each school system's goals may or may not directly correlate to one of the federal NCLB goals. Expenditures are illustrative of those reported in the Master Plan Update Budget Alignment and are not intended to sum to the total.
Kent County Public Schools
B-63

B-64

Montgomery County Public Schools
Revenue
Original Budget 7/1/2009
Original Budget 7/1/2010 Change
Current Year Variance Report (Allocation of Available Resources)
Local Appropriation $1,513,555,147 1,529,554,447 $15,999,300
State Revenue $400,323,324 $440,089,248 $39,765,924
Federal Revenue $65,115,337 $115,609,261 $50,493,924
Other Resources/Transfers $15,028,218 $14,980,651 ($47,567)
Other Local Revenue $17,927,455 $44,200,000 $26,272,545
$2,011,949,481 $2,144,433,607 $132,484,126Total
Planned Expenditures by federal NCLB Goals
* Mandatory Cost of Doing Business $132,554,413* Other ($70,287)
Planned Expenditures Examples
Elementary/Secondary Schools $12,372,436 ESOL $1,269,434 Relocatable Classrooms/Utilities/Building Services $615,651 Special Education (excluding students in non‐public placements) $1,954,503 Add 9.075 New Positions for New School Opened in FY 2009 (salaries and benefits) $1,217,533 Add Funds for Building Services, and Utilities for New School $475,683 Add Hours‐based Staffing Special Education, Employee Benefits, Technology, Professsional Development, Substitutes, Equipment, Other Resources
$10,443,993
Continuing Salary Costs ‐ Including Benefits $18,509,783 Debt Service Payment $79,537,322 Employee Benefits ‐ Base $25,597,832 Head Start Benefits $277,712 Increase Class Size from 15‐17 in Kindergarten ($1,070,898) Inflation for Supplies and Materials $1,809,571 Maintenance/Facilities Costs $781,313 Pre‐funding of Retiree Benefits ($6,300,000) Reduce Aging Schools Program ($1,023,000) Reduce Elementary Positions: Special Program Teachers, Media Assistants, Immersion/Special Prog. Teachers, Staff Development and Reading Teachers, Academic Intervention Teachers
($1,757,020)
Reduce High School Positions: Media Specialist, Media Tech., Teacher Assistants, English Composition Assistants, Media Assistants, IT Systems Spec., Staff for County‐wide Progs., Academic Intervention Teachers, Literacy Coaches, Signature Prog. Teach
($3,005,045)
Reduce Middle Schools Positions: Magnet, Immersion, Magnet Consortium, Counselor, Teacher Assistant, Academic Intervention Teachers, Alternative Teachers, Staff Development Teachers
($2,469,712)
Reduce Other Elementary Funds: Summer Employment, Consultants, School Improvement funds, Textbooks and Materials, Furniture/Equipment, Travel
($1,395,241)
Note: Each school system's goals may or may not directly correlate to one of the federal NCLB goals. Expenditures are illustrative of those reported in the Master Plan Update Budget Alignment and are not intended to sum to the total.
Montgomery County Public Schools
B-65
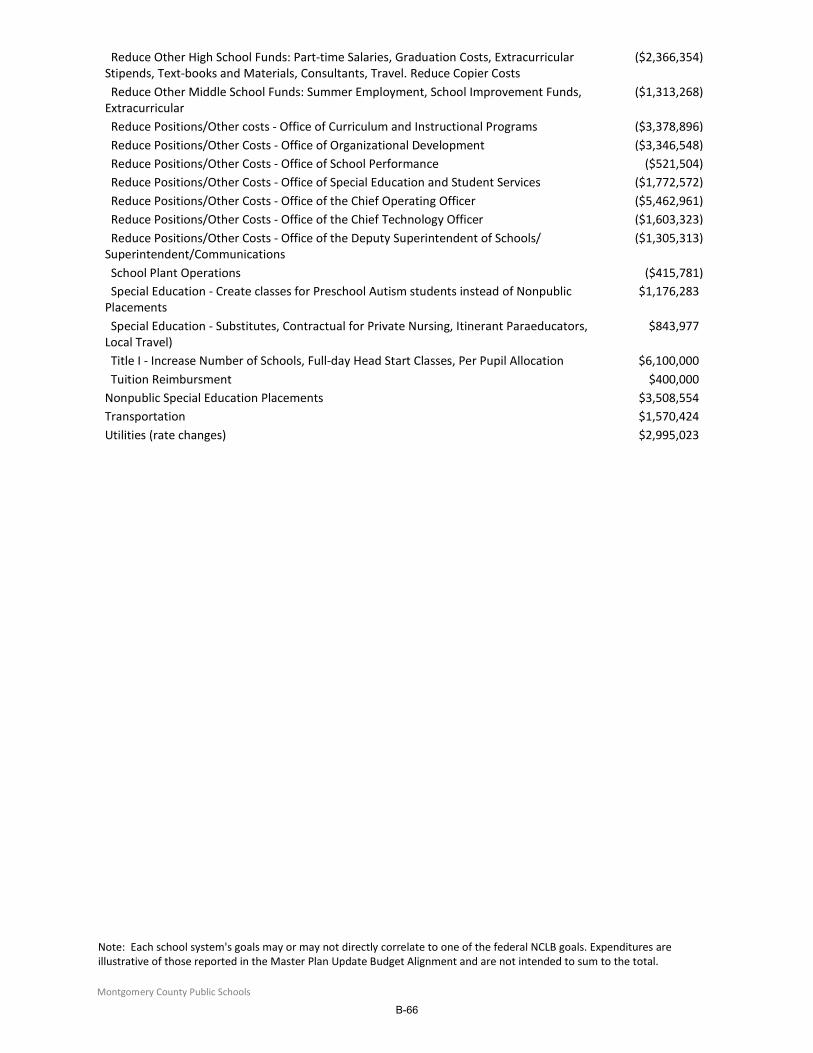
Reduce Other High School Funds: Part‐time Salaries, Graduation Costs, Extracurricular Stipends, Text‐books and Materials, Consultants, Travel. Reduce Copier Costs
($2,366,354)
Reduce Other Middle School Funds: Summer Employment, School Improvement Funds, Extracurricular
($1,313,268)
Reduce Positions/Other costs ‐ Office of Curriculum and Instructional Programs ($3,378,896) Reduce Positions/Other Costs ‐ Office of Organizational Development ($3,346,548) Reduce Positions/Other Costs ‐ Office of School Performance ($521,504) Reduce Positions/Other Costs ‐ Office of Special Education and Student Services ($1,772,572) Reduce Positions/Other Costs ‐ Office of the Chief Operating Officer ($5,462,961) Reduce Positions/Other Costs ‐ Office of the Chief Technology Officer ($1,603,323) Reduce Positions/Other Costs ‐ Office of the Deputy Superintendent of Schools/ Superintendent/Communications
($1,305,313)
School Plant Operations ($415,781) Special Education ‐ Create classes for Preschool Autism students instead of Nonpublic Placements
$1,176,283
Special Education ‐ Substitutes, Contractual for Private Nursing, Itinerant Paraeducators, Local Travel)
$843,977
Title I ‐ Increase Number of Schools, Full‐day Head Start Classes, Per Pupil Allocation $6,100,000 Tuition Reimbursment $400,000Nonpublic Special Education Placements $3,508,554Transportation $1,570,424Utilities (rate changes) $2,995,023
Note: Each school system's goals may or may not directly correlate to one of the federal NCLB goals. Expenditures are illustrative of those reported in the Master Plan Update Budget Alignment and are not intended to sum to the total.
Montgomery County Public Schools
B-66
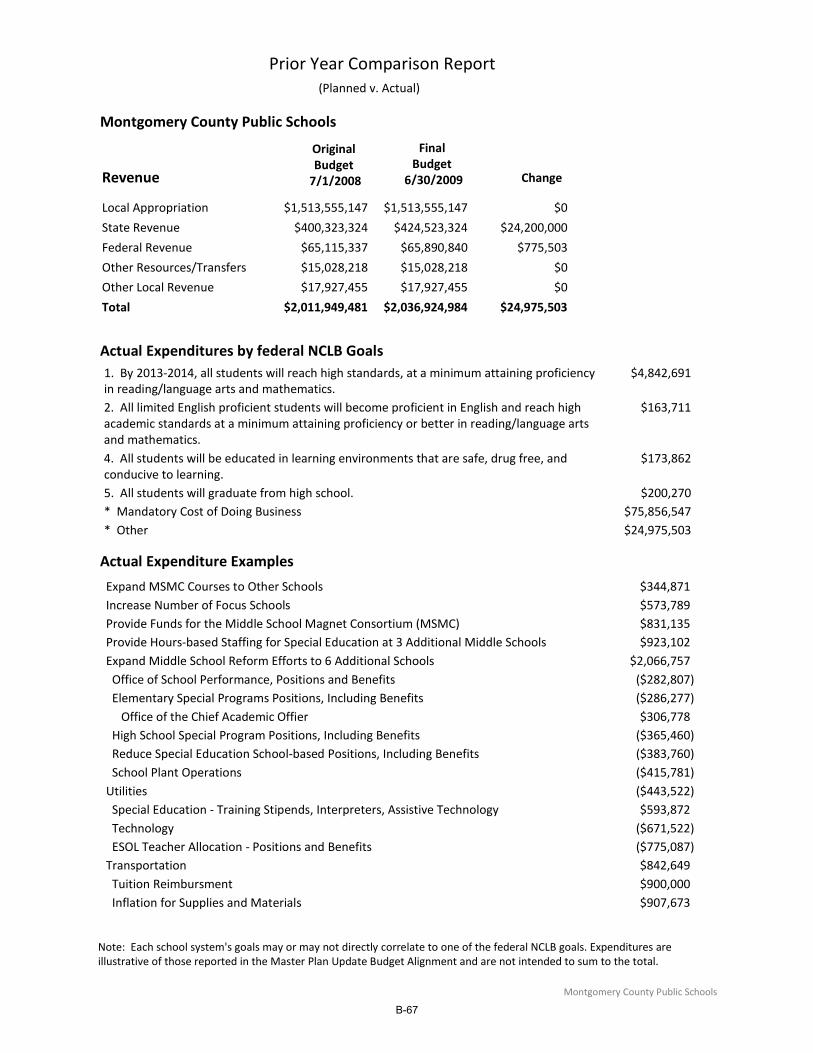
Montgomery County Public Schools
Prior Year Comparison Report (Planned v. Actual)
Original Budget 7/1/2008
Final Budget
6/30/2009 ChangeRevenue
Local Appropriation $1,513,555,147 $1,513,555,147 $0
State Revenue $400,323,324 $424,523,324 $24,200,000
Federal Revenue $65,115,337 $65,890,840 $775,503
Other Resources/Transfers $15,028,218 $15,028,218 $0
Other Local Revenue $17,927,455 $17,927,455 $0
$2,011,949,481 $2,036,924,984 $24,975,503Total
Actual Expenditures by federal NCLB Goals1. By 2013‐2014, all students will reach high standards, at a minimum attaining proficiency in reading/language arts and mathematics.
$4,842,691
2. All limited English proficient students will become proficient in English and reach high academic standards at a minimum attaining proficiency or better in reading/language arts and mathematics.
$163,711
4. All students will be educated in learning environments that are safe, drug free, and conducive to learning.
$173,862
5. All students will graduate from high school. $200,270* Mandatory Cost of Doing Business $75,856,547* Other $24,975,503
Actual Expenditure Examples
Expand MSMC Courses to Other Schools $344,871Increase Number of Focus Schools $573,789Provide Funds for the Middle School Magnet Consortium (MSMC) $831,135Provide Hours‐based Staffing for Special Education at 3 Additional Middle Schools $923,102Expand Middle School Reform Efforts to 6 Additional Schools $2,066,757 Office of School Performance, Positions and Benefits ($282,807) Elementary Special Programs Positions, Including Benefits ($286,277) Office of the Chief Academic Offier $306,778 High School Special Program Positions, Including Benefits ($365,460) Reduce Special Education School‐based Positions, Including Benefits ($383,760) School Plant Operations ($415,781)Utilities ($443,522) Special Education ‐ Training Stipends, Interpreters, Assistive Technology $593,872 Technology ($671,522) ESOL Teacher Allocation ‐ Positions and Benefits ($775,087)Transportation $842,649 Tuition Reimbursment $900,000 Inflation for Supplies and Materials $907,673
Note: Each school system's goals may or may not directly correlate to one of the federal NCLB goals. Expenditures are illustrative of those reported in the Master Plan Update Budget Alignment and are not intended to sum to the total.
Montgomery County Public Schools
B-67

Office of Curriculum and Instructional Programs ‐ Positions, Benefits, Part‐time Salaries, Contractual, Supplies
($1,273,726)
Staff Development Project Funds and Positions, Including Benefits ($1,918,362) Pre‐funding of Retiree Health Benefits $2,160,000 Close Mark Twain School ‐ Positions, Benefits, Other Costs ($2,208,291) Reduce School‐based Funds for Consultants, Materials, Equipment ($2,230,893) Reduce Start‐up Funding Budgeted in FY 2008 for new schools opening in FY 2008 ($2,536,721) Reduce Central Office Positions, Including Benefits ($2,954,218) Reduce Grant Project Funds to Meet Final Revenue Figures ($3,304,015) Reduce School‐based Part‐time Salaries, Including Benefits ($4,249,274) Employee Benefits ‐ Base $4,442,049Nonpublic Special Education Placements $4,522,678Additional Positions for Enrollment Growth or Class Size reduction initiatives ‐ may include in a specific local goal
$7,423,309
Increases in contractual agreements ‐ benefits (if itemized separately) $8,065,949 Reduce Regular Education School‐based Positions, Including Benefits ($9,705,685) Continuing Salary Costs ‐ Including Benefits $14,166,335Increases in contractual agreements ‐ salaries $65,905,589 Supplemental appropriation for federal grants for bus retrofit and tobacco prevention $775,503 Additional state Foundation aid $24,200,000
Note: Each school system's goals may or may not directly correlate to one of the federal NCLB goals. Expenditures are illustrative of those reported in the Master Plan Update Budget Alignment and are not intended to sum to the total.
Montgomery County Public Schools
B-68

Montgomery County Public Schools
American Recovery and Reinvestment Act of 2009Financial Reporting Table
FY 2009 FY 2010 TotalGrant Name
National School Lunch ‐ Equipment Assistance 0 72,305 72,305
Homeless Children and Youth 0 85,000 85,000
Title I ‐ Grants to LEAs, Neglected and Delinquent 0 11,812,010 11,812,010
Title I ‐ Grants to LEAs, Neglected and Delinquent 0 58,594 58,594
IDEA Part B ‐ Grants to States‐Pass‐Through 0 31,897,994 31,897,994
IDEA Part B ‐ Preschool Grants 0 1,079,680 1,079,680
IDEA Part C ‐ Infants and Families 0 0 0
State Fiscal Stabilization Fund Education Program 0 27,844,286 27,844,286
$0 $72,849,869 $72,849,869Total
Expenditures by ARRA Assurances1. Increase teacher effectiveness and address inequities in the distribution of highly qualified teachers (recruiting, developing, and retaining effective teachers and principals).
821,960.00
4. Provide targeted, intensive support and effective interventions to turn around schools identified for corrective action and restructuring (turnign around lowest performing schools).
870,604.00
* Other 478,725.00
Note: The above figures do not include funds which will be deferred until FY2011
Planned Expenditures Examples
ARRA Preschool Pass‐through grant funds will be used to hire 1.2 FTE occupational therapists to provide IEP related services to students in six new comprehensive autism preschool programs. Funds also will be used to hire 1.2 FTEs speech language patholog
$1,079,680
Funds from the ARRA IDEA grant to support Early Intervention services will be used to preserve 24 FTE kindergarten teacher positions. These teachers will provide instruction to struggling students who otherwise may be considered for special education ser
$4,784,700
Grant funds were used to create 28.8 new teacher positions, 43.25 paraeducator positions, and to reinstate 25.5 teaching positions that previously had been eliminated in the MCPS FY10 Operating budget. The new positions enable MCPS to expand hours‐based
$27,113,294
MCPS used Fiscal Stabilization ARRA funds to pay electricity and natural gas costs for the district's 200 schools and educational centers. In this way, MCPS was able to save 442 FTEs (approximately 2 positions per school) and maintain an equitable distr
$27,844,286
MCPS has no schools that have been identified for corrective action or restructuring. ARRA Title I Part A funds will be used to provide academic supports that will increase the achievement of low‐income students and prevent the schools they attend from f
$11,812,010
Funds are supporting district‐wide utility costs. $46,542,234
Funds are supporting the enhancement of the quality of services delivered to children and families in center based settings that will also be used for training to address obesity and diversity, career development opportunities for staff and the creation o
$427,269
Funds are supporting the expansion of Head Start services to 60 additional children and families in center based settings that will also include support for training and technical assistance and 8 newly created teacher and paraprofessional positions.
$1,057,655
Note: Each school system's goals may or may not directly correlate to one of the federal NCLB goals. Expenditures are illustrative of those reported in the Master Plan Update Budget Alignment and are not intended to sum to the total.
Montgomery County Public Schools
B-69

Funds to support activities and programs that provide technology support and interventions that are designed to reduce referrals to Special Education for students without disabilities and outreach to support families of students with disabilities..
$15,246,838
Funds to support the improvement of service delivery and resource utilization. $843,600
Note: Each school system's goals may or may not directly correlate to one of the federal NCLB goals. Expenditures are illustrative of those reported in the Master Plan Update Budget Alignment and are not intended to sum to the total.
Montgomery County Public Schools
B-70
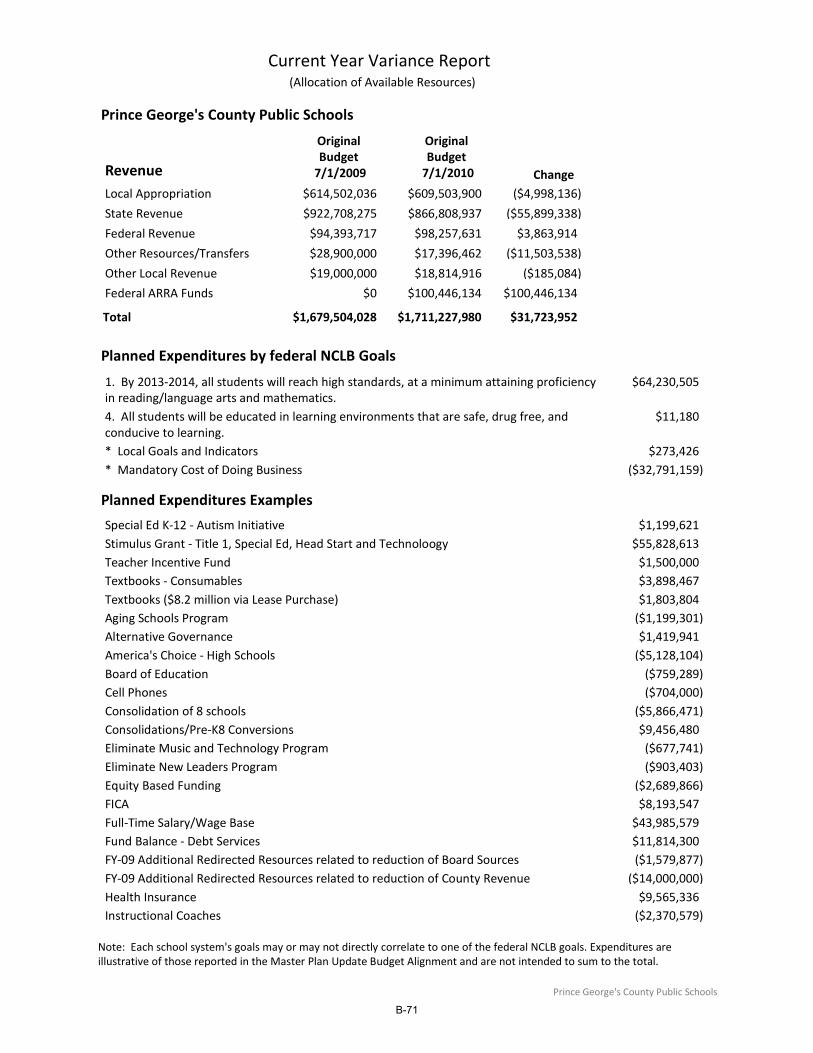
Prince George's County Public Schools
Revenue
Original Budget 7/1/2009
Original Budget 7/1/2010 Change
Current Year Variance Report (Allocation of Available Resources)
Local Appropriation $614,502,036 $609,503,900 ($4,998,136)
State Revenue $922,708,275 $866,808,937 ($55,899,338)
Federal Revenue $94,393,717 $98,257,631 $3,863,914
Other Resources/Transfers $28,900,000 $17,396,462 ($11,503,538)
Other Local Revenue $19,000,000 $18,814,916 ($185,084)
Federal ARRA Funds $0 $100,446,134 $100,446,134
$1,679,504,028 $1,711,227,980 $31,723,952Total
Planned Expenditures by federal NCLB Goals
1. By 2013‐2014, all students will reach high standards, at a minimum attaining proficiency in reading/language arts and mathematics.
$64,230,505
4. All students will be educated in learning environments that are safe, drug free, and conducive to learning.
$11,180
* Local Goals and Indicators $273,426* Mandatory Cost of Doing Business ($32,791,159)
Planned Expenditures Examples
Special Ed K‐12 ‐ Autism Initiative $1,199,621Stimulus Grant ‐ Title 1, Special Ed, Head Start and Technoloogy $55,828,613Teacher Incentive Fund $1,500,000Textbooks ‐ Consumables $3,898,467Textbooks ($8.2 million via Lease Purchase) $1,803,804Aging Schools Program ($1,199,301)Alternative Governance $1,419,941America's Choice ‐ High Schools ($5,128,104)Board of Education ($759,289)Cell Phones ($704,000)Consolidation of 8 schools ($5,866,471)Consolidations/Pre‐K8 Conversions $9,456,480Eliminate Music and Technology Program ($677,741)Eliminate New Leaders Program ($903,403)Equity Based Funding ($2,689,866)FICA $8,193,547Full‐Time Salary/Wage Base $43,985,579Fund Balance ‐ Debt Services $11,814,300FY‐09 Additional Redirected Resources related to reduction of Board Sources ($1,579,877)FY‐09 Additional Redirected Resources related to reduction of County Revenue ($14,000,000)Health Insurance $9,565,336Instructional Coaches ($2,370,579)
Note: Each school system's goals may or may not directly correlate to one of the federal NCLB goals. Expenditures are illustrative of those reported in the Master Plan Update Budget Alignment and are not intended to sum to the total.
Prince George's County Public Schools
B-71

Lease Purchase ($5,343,839)New Schools and Enrollment Changes $785,573Non‐Classroom Support Positions ($9,726,210)Parent and Community Engagement ‐ Parent Liaisons ($7,593,826)Part‐Time Salary/Wage Base $14,700,000Prior Year Program Corrections ($1,558,205)Reduce Assistant Principals at small schools ($2,780,700)Reduction of AVID Program ($2,058,542)Reduction of non‐grant related travel and food expenses. ($2,093,785)Reorganization of Zones ($2,946,864)Retirement ($2,245,309)Salary Lapse / Workforce Turnover ($10,222,291)School Operating Resources ($2,977,065)Staffing Formula Adjustment "Pool" ($15,716,600)Student Services / Special Educations Middle School Means Expansion ($683,206)Superintendent's Office ($391,000)System Wide reductions ($35,819,008)Transportation $2,390,193Unemployment Insurance $1,200,000Utilities $3,498,034Violence Free Zones ($497,486)Washington Plaza Rent ($5,910,126)Workers' Compensation Insurance $4,531,204
Note: Each school system's goals may or may not directly correlate to one of the federal NCLB goals. Expenditures are illustrative of those reported in the Master Plan Update Budget Alignment and are not intended to sum to the total.
Prince George's County Public Schools
B-72

Prince George's County Public Schools
Prior Year Comparison Report (Planned v. Actual)
Original Budget 7/1/2008
Final Budget
6/30/2009 ChangeRevenue
Local Appropriation $614,502,036 $0 $614,502,036)
State Revenue $922,708,275 $0 $922,708,275)
Federal Revenue $94,393,717 $0 ($94,393,717)
Other Resources/Transfers $28,900,000 $42,900,000 $14,000,000
Other Local Revenue $19,000,000 $0 ($19,000,000)
$1,679,504,028 $42,900,000 $1,636,604,028)Total
Actual Expenditures by federal NCLB Goals1. By 2013‐2014, all students will reach high standards, at a minimum attaining proficiency in reading/language arts and mathematics.
$5,823,783
3. By 2005‐2006, all students will be taught by highly qualified teachers. $21,684,2474. All students will be educated in learning environments that are safe, drug free, and conducive to learning.
$2,628,019
* Local Goals and Indicators $8,752,629* Mandatory Cost of Doing Business ($28,395,224)
Actual Expenditure Examples
Special Education ‐ Program Services $384,291Textbooks ($10.2 million via Lease Purchase) $1,662,904Special Education ‐ Limited MEANS Expansion $3,736,884Reserve for Negotiations $21,634,447School Nurses $607,630School Security $794,282Transportation ‐ Bus Drivers/Ridgely Bus Lot $1,226,107Lease & Relocation of Administrative Facilities $8,735,629Lease Purchase $385,351Reduce Extended Learning Contracts / Supplies ($400,000)Lease Agreement ‐ Amendale $412,654Recruitment & Retention ($500,000)Travel Related Expenditures ($500,000)Partially Restore Maintenance Reductions $533,430Reduce Employer Estimates for FICA ($556,877)Nonpublic Placements $632,830Partially Restore Media Specialist Reductions $640,673Maintain Even Start Family Literacy Program Previously Grant Funded $693,522Delay Expansion of IB Middle Years Program ($780,000)Charter School Increase in Enrollment $791,495Agency Contracted Nurses $808,071
Note: Each school system's goals may or may not directly correlate to one of the federal NCLB goals. Expenditures are illustrative of those reported in the Master Plan Update Budget Alignment and are not intended to sum to the total.
Prince George's County Public Schools
B-73
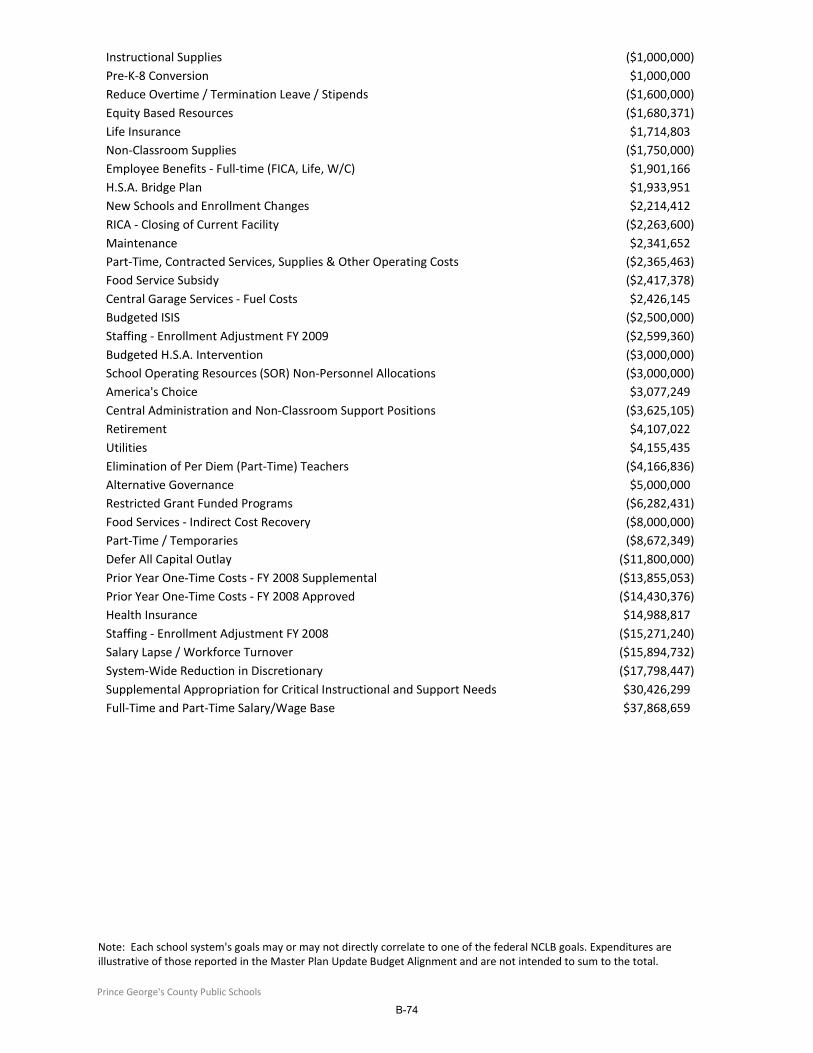
Instructional Supplies ($1,000,000)Pre‐K‐8 Conversion $1,000,000Reduce Overtime / Termination Leave / Stipends ($1,600,000)Equity Based Resources ($1,680,371)Life Insurance $1,714,803Non‐Classroom Supplies ($1,750,000)Employee Benefits ‐ Full‐time (FICA, Life, W/C) $1,901,166H.S.A. Bridge Plan $1,933,951New Schools and Enrollment Changes $2,214,412RICA ‐ Closing of Current Facility ($2,263,600)Maintenance $2,341,652Part‐Time, Contracted Services, Supplies & Other Operating Costs ($2,365,463)Food Service Subsidy ($2,417,378)Central Garage Services ‐ Fuel Costs $2,426,145Budgeted ISIS ($2,500,000)Staffing ‐ Enrollment Adjustment FY 2009 ($2,599,360)Budgeted H.S.A. Intervention ($3,000,000)School Operating Resources (SOR) Non‐Personnel Allocations ($3,000,000)America's Choice $3,077,249Central Administration and Non‐Classroom Support Positions ($3,625,105)Retirement $4,107,022Utilities $4,155,435Elimination of Per Diem (Part‐Time) Teachers ($4,166,836)Alternative Governance $5,000,000Restricted Grant Funded Programs ($6,282,431)Food Services ‐ Indirect Cost Recovery ($8,000,000)Part‐Time / Temporaries ($8,672,349)Defer All Capital Outlay ($11,800,000)Prior Year One‐Time Costs ‐ FY 2008 Supplemental ($13,855,053)Prior Year One‐Time Costs ‐ FY 2008 Approved ($14,430,376)Health Insurance $14,988,817Staffing ‐ Enrollment Adjustment FY 2008 ($15,271,240)Salary Lapse / Workforce Turnover ($15,894,732)System‐Wide Reduction in Discretionary ($17,798,447)Supplemental Appropriation for Critical Instructional and Support Needs $30,426,299Full‐Time and Part‐Time Salary/Wage Base $37,868,659
Note: Each school system's goals may or may not directly correlate to one of the federal NCLB goals. Expenditures are illustrative of those reported in the Master Plan Update Budget Alignment and are not intended to sum to the total.
Prince George's County Public Schools
B-74
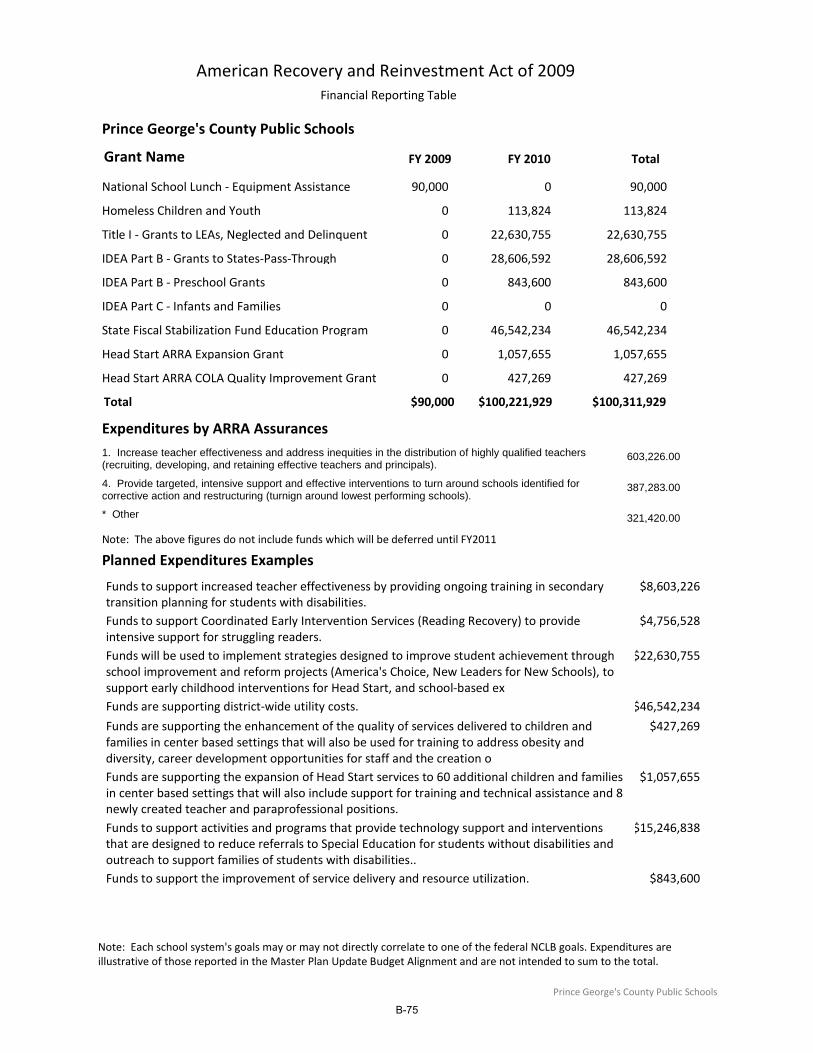
Prince George's County Public Schools
American Recovery and Reinvestment Act of 2009Financial Reporting Table
FY 2009 FY 2010 TotalGrant Name
National School Lunch ‐ Equipment Assistance 90,000 0 90,000
Homeless Children and Youth 0 113,824 113,824
Title I ‐ Grants to LEAs, Neglected and Delinquent 0 22,630,755 22,630,755
IDEA Part B ‐ Grants to States‐Pass‐Through 0 28,606,592 28,606,592
IDEA Part B ‐ Preschool Grants 0 843,600 843,600
IDEA Part C ‐ Infants and Families 0 0 0
State Fiscal Stabilization Fund Education Program 0 46,542,234 46,542,234
Head Start ARRA Expansion Grant 0 1,057,655 1,057,655
Head Start ARRA COLA Quality Improvement Grant 0 427,269 427,269
$90,000 $100,221,929 $100,311,929Total
Expenditures by ARRA Assurances1. Increase teacher effectiveness and address inequities in the distribution of highly qualified teachers (recruiting, developing, and retaining effective teachers and principals).
603,226.00
4. Provide targeted, intensive support and effective interventions to turn around schools identified for corrective action and restructuring (turnign around lowest performing schools).
387,283.00
* Other 321,420.00
Note: The above figures do not include funds which will be deferred until FY2011
Planned Expenditures Examples
Funds to support increased teacher effectiveness by providing ongoing training in secondary transition planning for students with disabilities.
$8,603,226
Funds to support Coordinated Early Intervention Services (Reading Recovery) to provide intensive support for struggling readers.
$4,756,528
Funds will be used to implement strategies designed to improve student achievement through school improvement and reform projects (America's Choice, New Leaders for New Schools), to support early childhood interventions for Head Start, and school‐based ex
$22,630,755
Funds are supporting district‐wide utility costs. $46,542,234
Funds are supporting the enhancement of the quality of services delivered to children and families in center based settings that will also be used for training to address obesity and diversity, career development opportunities for staff and the creation o
$427,269
Funds are supporting the expansion of Head Start services to 60 additional children and families in center based settings that will also include support for training and technical assistance and 8 newly created teacher and paraprofessional positions.
$1,057,655
Funds to support activities and programs that provide technology support and interventions that are designed to reduce referrals to Special Education for students without disabilities and outreach to support families of students with disabilities..
$15,246,838
Funds to support the improvement of service delivery and resource utilization. $843,600
Note: Each school system's goals may or may not directly correlate to one of the federal NCLB goals. Expenditures are illustrative of those reported in the Master Plan Update Budget Alignment and are not intended to sum to the total.
Prince George's County Public Schools
B-75

B-76
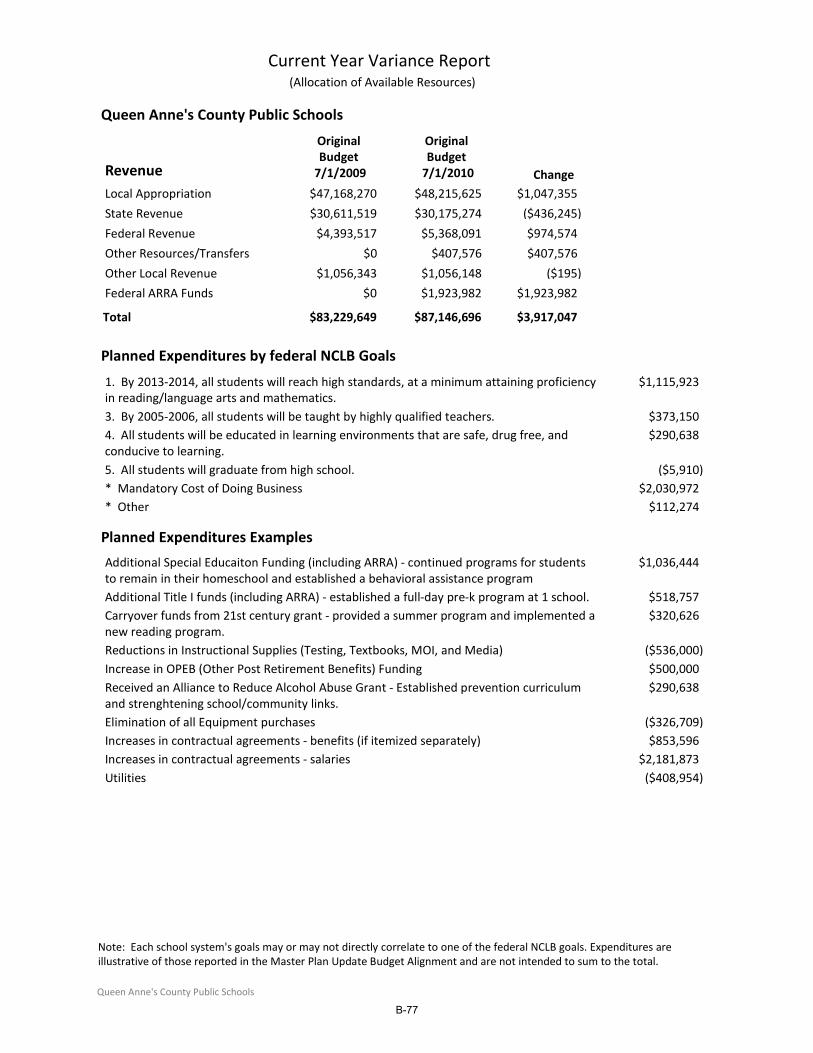
Queen Anne's County Public Schools
Revenue
Original Budget 7/1/2009
Original Budget 7/1/2010 Change
Current Year Variance Report (Allocation of Available Resources)
Local Appropriation $47,168,270 $48,215,625 $1,047,355
State Revenue $30,611,519 $30,175,274 ($436,245)
Federal Revenue $4,393,517 $5,368,091 $974,574
Other Resources/Transfers $0 $407,576 $407,576
Other Local Revenue $1,056,343 $1,056,148 ($195)
Federal ARRA Funds $0 $1,923,982 $1,923,982
$83,229,649 $87,146,696 $3,917,047Total
Planned Expenditures by federal NCLB Goals
1. By 2013‐2014, all students will reach high standards, at a minimum attaining proficiency in reading/language arts and mathematics.
$1,115,923
3. By 2005‐2006, all students will be taught by highly qualified teachers. $373,1504. All students will be educated in learning environments that are safe, drug free, and conducive to learning.
$290,638
5. All students will graduate from high school. ($5,910)* Mandatory Cost of Doing Business $2,030,972* Other $112,274
Planned Expenditures Examples
Additional Special Educaiton Funding (including ARRA) ‐ continued programs for students to remain in their homeschool and established a behavioral assistance program
$1,036,444
Additional Title I funds (including ARRA) ‐ established a full‐day pre‐k program at 1 school. $518,757Carryover funds from 21st century grant ‐ provided a summer program and implemented a new reading program.
$320,626
Reductions in Instructional Supplies (Testing, Textbooks, MOI, and Media) ($536,000)Increase in OPEB (Other Post Retirement Benefits) Funding $500,000Received an Alliance to Reduce Alcohol Abuse Grant ‐ Established prevention curriculum and strenghtening school/community links.
$290,638
Elimination of all Equipment purchases ($326,709)Increases in contractual agreements ‐ benefits (if itemized separately) $853,596Increases in contractual agreements ‐ salaries $2,181,873Utilities ($408,954)
Note: Each school system's goals may or may not directly correlate to one of the federal NCLB goals. Expenditures are illustrative of those reported in the Master Plan Update Budget Alignment and are not intended to sum to the total.
Queen Anne's County Public Schools
B-77
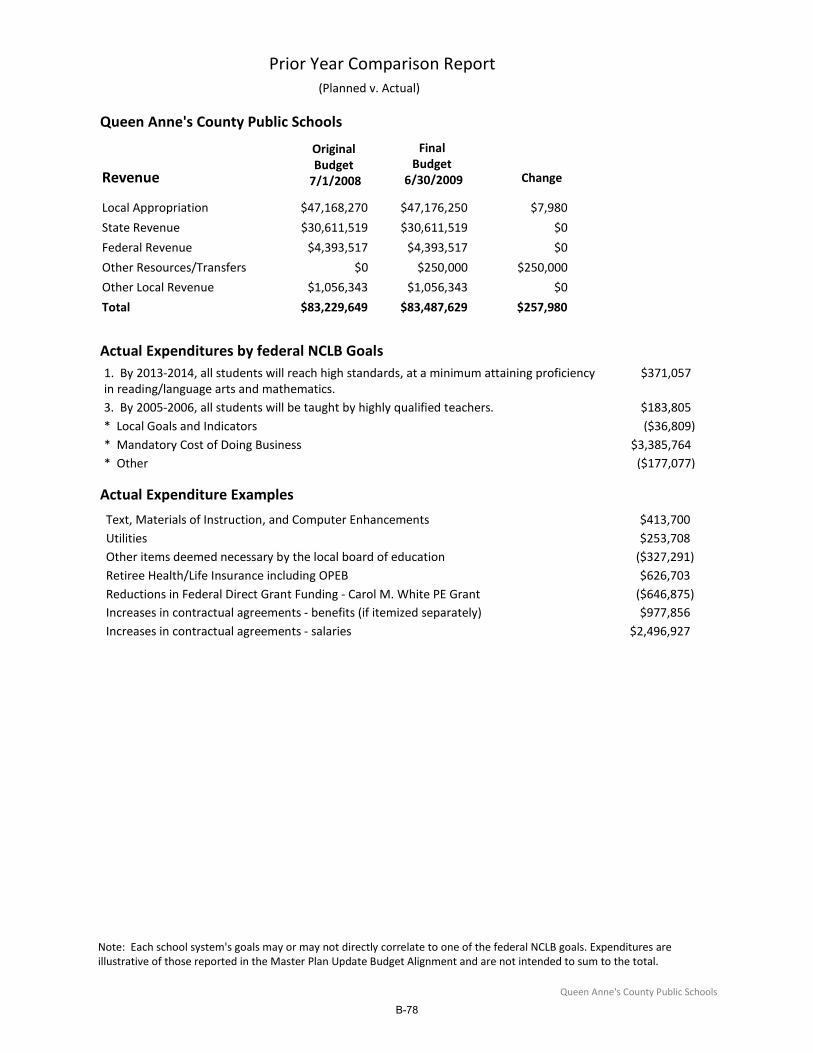
Queen Anne's County Public Schools
Prior Year Comparison Report (Planned v. Actual)
Original Budget 7/1/2008
Final Budget
6/30/2009 ChangeRevenue
Local Appropriation $47,168,270 $47,176,250 $7,980
State Revenue $30,611,519 $30,611,519 $0
Federal Revenue $4,393,517 $4,393,517 $0
Other Resources/Transfers $0 $250,000 $250,000
Other Local Revenue $1,056,343 $1,056,343 $0
$83,229,649 $83,487,629 $257,980Total
Actual Expenditures by federal NCLB Goals1. By 2013‐2014, all students will reach high standards, at a minimum attaining proficiency in reading/language arts and mathematics.
$371,057
3. By 2005‐2006, all students will be taught by highly qualified teachers. $183,805* Local Goals and Indicators ($36,809)* Mandatory Cost of Doing Business $3,385,764* Other ($177,077)
Actual Expenditure Examples
Text, Materials of Instruction, and Computer Enhancements $413,700Utilities $253,708Other items deemed necessary by the local board of education ($327,291)Retiree Health/Life Insurance including OPEB $626,703Reductions in Federal Direct Grant Funding ‐ Carol M. White PE Grant ($646,875)Increases in contractual agreements ‐ benefits (if itemized separately) $977,856Increases in contractual agreements ‐ salaries $2,496,927
Note: Each school system's goals may or may not directly correlate to one of the federal NCLB goals. Expenditures are illustrative of those reported in the Master Plan Update Budget Alignment and are not intended to sum to the total.
Queen Anne's County Public Schools
B-78

Queen Anne's County Public Schools
American Recovery and Reinvestment Act of 2009Financial Reporting Table
FY 2009 FY 2010 TotalGrant Name
National School Lunch ‐ Equipment Assistance 0 0 0
Homeless Children and Youth 0 0 0
Title I ‐ Grants to LEAs, Neglected and Delinquent 0 370,045 370,045
IDEA Part B ‐ Grants to States‐Pass‐Through 0 1,661,938 1,661,938
IDEA Part B ‐ Preschool Grants 0 46,254 46,254
IDEA Part C ‐ Infants and Families 0 160,279 160,279
State Fiscal Stabilization Fund Education Program 0 699,776 699,776
$0 $2,938,292 $2,938,292Total
Expenditures by ARRA Assurances1. Increase teacher effectiveness and address inequities in the distribution of highly qualified teachers (recruiting, developing, and retaining effective teachers and principals).
282,823.00
2. Establish and use a pre-K through college and career data system to track progress and foster continuous improvement (building data systems that measure student success and ifnorm teachers and prinicpals how they can improve their practices).
132,971.00
3. Make progress towards rigorous college and career-ready standards and high quality assessments that are valid and reliable for all students, including limited English proficient students and students with disabilities (adopting internationally benchma
200,549.00
4. Provide targeted, intensive support and effective interventions to turn around schools identified for corrective action and restructuring (turnign around lowest performing schools).
079,083.00
* Other 358,043.00
Note: The above figures do not include funds which will be deferred until FY2011
Planned Expenditures Examples
Special Education ‐ Instructional Staff $790,111
Note: Each school system's goals may or may not directly correlate to one of the federal NCLB goals. Expenditures are illustrative of those reported in the Master Plan Update Budget Alignment and are not intended to sum to the total.
Queen Anne's County Public Schools
B-79

B-80

St. Mary's County Public Schools
Revenue
Original Budget 7/1/2009
Original Budget 7/1/2010 Change
Current Year Variance Report (Allocation of Available Resources)
Local Appropriation $8,994,324 $8,743,774 ($250,550)
State Revenue $23,279,631 $23,070,614 ($209,017)
Federal Revenue $3,800,000 $3,800,000 $0
Other Resources/Transfers $1,223,633 $261,905 ($961,728)
Other Local Revenue $314,218 $265,000 ($49,218)
Federal ARRA Funds $1,539,184 $1,539,184
$37,611,806 $37,680,477 $68,671Total
Planned Expenditures by federal NCLB Goals
1. By 2013‐2014, all students will reach high standards, at a minimum attaining proficiency in reading/language arts and mathematics.
$603,409
3. By 2005‐2006, all students will be taught by highly qualified teachers. $147,7504. All students will be educated in learning environments that are safe, drug free, and conducive to learning.
$52,146
5. All students will graduate from high school. $176,932* Mandatory Cost of Doing Business $6,532,184* Other ($1,688,923)
Planned Expenditures Examples
Mathematics Initiative $300,000 Materials of Instruction, Other Costs, Health, Operation of Plant ‐ Evergreen Elementary School
$933,372
New Positions: Evergreen Elementary School $836,342Charter School $651,441Increases in contractual agreements ‐ benefits (if itemized separately) ($1,914,398)Increases in contractual agreements ‐ salaries $3,216,210Other items deemed necessary by the local board of education $2,287,400Transportation $550,570 Aggregate change to funding and utilization of fund balance ($1,688,923)
Note: Each school system's goals may or may not directly correlate to one of the federal NCLB goals. Expenditures are illustrative of those reported in the Master Plan Update Budget Alignment and are not intended to sum to the total.
St. Mary's County Public Schools
B-81
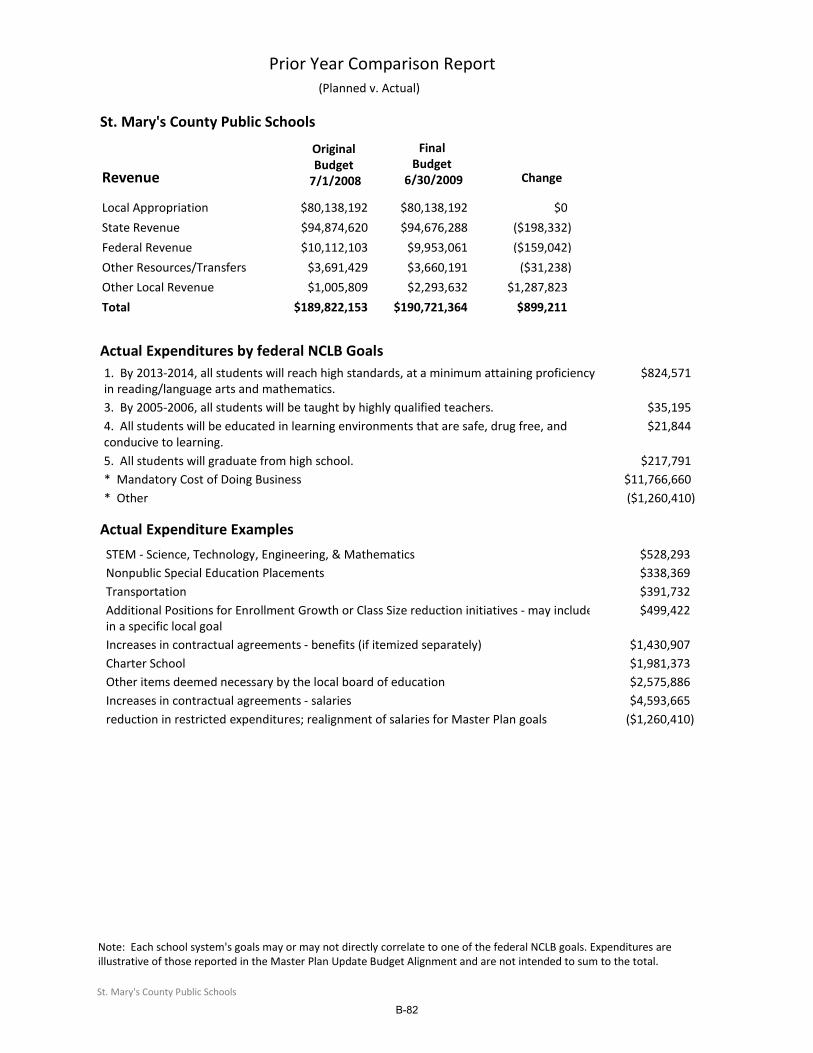
St. Mary's County Public Schools
Prior Year Comparison Report (Planned v. Actual)
Original Budget 7/1/2008
Final Budget
6/30/2009 ChangeRevenue
Local Appropriation $80,138,192 $80,138,192 $0
State Revenue $94,874,620 $94,676,288 ($198,332)
Federal Revenue $10,112,103 $9,953,061 ($159,042)
Other Resources/Transfers $3,691,429 $3,660,191 ($31,238)
Other Local Revenue $1,005,809 $2,293,632 $1,287,823
$189,822,153 $190,721,364 $899,211Total
Actual Expenditures by federal NCLB Goals1. By 2013‐2014, all students will reach high standards, at a minimum attaining proficiency in reading/language arts and mathematics.
$824,571
3. By 2005‐2006, all students will be taught by highly qualified teachers. $35,1954. All students will be educated in learning environments that are safe, drug free, and conducive to learning.
$21,844
5. All students will graduate from high school. $217,791* Mandatory Cost of Doing Business $11,766,660* Other ($1,260,410)
Actual Expenditure Examples
STEM ‐ Science, Technology, Engineering, & Mathematics $528,293Nonpublic Special Education Placements $338,369Transportation $391,732Additional Positions for Enrollment Growth or Class Size reduction initiatives ‐ may include in a specific local goal
$499,422
Increases in contractual agreements ‐ benefits (if itemized separately) $1,430,907Charter School $1,981,373Other items deemed necessary by the local board of education $2,575,886Increases in contractual agreements ‐ salaries $4,593,665reduction in restricted expenditures; realignment of salaries for Master Plan goals ($1,260,410)
Note: Each school system's goals may or may not directly correlate to one of the federal NCLB goals. Expenditures are illustrative of those reported in the Master Plan Update Budget Alignment and are not intended to sum to the total.
St. Mary's County Public Schools
B-82

St. Mary's County Public Schools
American Recovery and Reinvestment Act of 2009Financial Reporting Table
FY 2009 FY 2010 TotalGrant Name
National School Lunch ‐ Equipment Assistance 14,029 0 14,029
Homeless Children and Youth 0 0 0
Title I ‐ Grants to LEAs, Neglected and Delinquent 0 1,352,959 1,352,959
IDEA Part B ‐ Grants to States‐Pass‐Through 0 1,856,744 1,856,744
IDEA Part B ‐ Preschool Grants 0 79,407 79,407
IDEA Part C ‐ Infants and Families 0 0 0
State Fiscal Stabilization Fund Education Program 0 3,171,948 3,171,948
$14,029 $6,461,058 $6,475,087Total
Expenditures by ARRA Assurances1. Increase teacher effectiveness and address inequities in the distribution of highly qualified teachers (recruiting, developing, and retaining effective teachers and principals).
204,801.00
2. Establish and use a pre-K through college and career data system to track progress and foster continuous improvement (building data systems that measure student success and ifnorm teachers and prinicpals how they can improve their practices).
$45,100.00
3. Make progress towards rigorous college and career-ready standards and high quality assessments that are valid and reliable for all students, including limited English proficient students and students with disabilities (adopting internationally benchma
212,848.00
4. Provide targeted, intensive support and effective interventions to turn around schools identified for corrective action and restructuring (turnign around lowest performing schools).
312,685.00
* Other 699,653.00
Note: The above figures do not include funds which will be deferred until FY2011
Planned Expenditures Examples
Tuition Reimbursement $538,880
SMART Technology and intervention software $995,709
SMART Technology to support interventions $800,000
Curriculum Related Field Trips $417,977
Reg Prog MOI $1,101,018
Utilities (Oil & Electricity) $427,374
Note: Each school system's goals may or may not directly correlate to one of the federal NCLB goals. Expenditures are illustrative of those reported in the Master Plan Update Budget Alignment and are not intended to sum to the total.
St. Mary's County Public Schools
B-83

B-84

Somerset County Public Schools
Revenue
Original Budget 7/1/2009
Original Budget 7/1/2010 Change
Current Year Variance Report (Allocation of Available Resources)
Local Appropriation $8,994,324 $8,743,774 ($250,550)
State Revenue $23,279,631 $23,070,614 ($209,017)
Federal Revenue $3,800,000 $3,800,000 $0
Other Local Revenue $314,218 $265,000 ($49,218)
Federal ARRA Funds $1,539,184 $1,539,184
$36,388,173 $37,418,572 $1,030,399Total
Planned Expenditures by federal NCLB Goals
1. By 2013‐2014, all students will reach high standards, at a minimum attaining proficiency in reading/language arts and mathematics.
$98,284
3. By 2005‐2006, all students will be taught by highly qualified teachers. $250,9354. All students will be educated in learning environments that are safe, drug free, and conducive to learning.
($215,822)
* Local Goals and Indicators $157,443* Mandatory Cost of Doing Business ($222,169)
Planned Expenditures Examples
ARRA Funds ‐ saved positions (2 years) $317,626Redistributed Funds ‐ Decrease in Technology Equipment ($329,900)Negotiated Increase for Staff $260,302Positions Eliminated (Learning Support and Behavior Intervention Specialists) due to loss of grant funding
($267,518)
Other items deemed necessary by the local board of education: Redistributed Funds ‐ Reduction in capital outlay budget line
($300,000)
Note: Each school system's goals may or may not directly correlate to one of the federal NCLB goals. Expenditures are illustrative of those reported in the Master Plan Update Budget Alignment and are not intended to sum to the total.
Somerset County Public Schools
B-85

Somerset County Public Schools
Prior Year Comparison Report (Planned v. Actual)
Original Budget 7/1/2008
Final Budget
6/30/2009 ChangeRevenue
Local Appropriation $8,994,324 $8,994,324 $0
State Revenue $23,279,631 $23,329,631 $50,000
Federal Revenue $3,800,000 $5,746,397 $1,946,397
Other Resources/Transfers $1,223,633 $1,223,633 $0
Other Local Revenue $314,218 $294,355 ($19,863)
$37,611,806 $39,588,340 $1,976,534Total
Actual Expenditures by federal NCLB Goals1. By 2013‐2014, all students will reach high standards, at a minimum attaining proficiency in reading/language arts and mathematics.
($596,288)
3. By 2005‐2006, all students will be taught by highly qualified teachers. $636,0244. All students will be educated in learning environments that are safe, drug free, and conducive to learning.
$1,010,409
* Mandatory Cost of Doing Business $325,006
Actual Expenditure Examples
Redistributed $$ ‐ positions eliminated to meet negotiated increase ($506,988)Salary increases PreK ‐ 12 (includes Special Education, ROTC) $709,524Safe Schools Healthy Students grant ‐ no longer funded $926,528
Note: Each school system's goals may or may not directly correlate to one of the federal NCLB goals. Expenditures are illustrative of those reported in the Master Plan Update Budget Alignment and are not intended to sum to the total.
Somerset County Public Schools
B-86
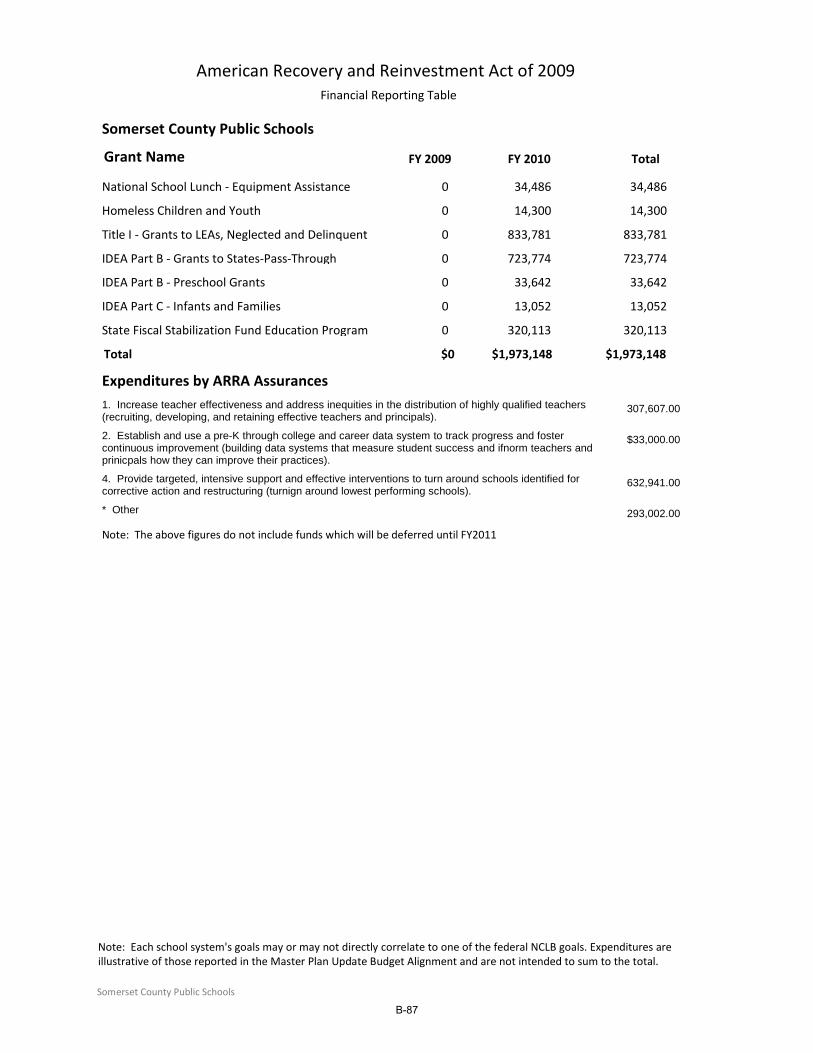
Somerset County Public Schools
American Recovery and Reinvestment Act of 2009Financial Reporting Table
FY 2009 FY 2010 TotalGrant Name
National School Lunch ‐ Equipment Assistance 0 34,486 34,486
Homeless Children and Youth 0 14,300 14,300
Title I ‐ Grants to LEAs, Neglected and Delinquent 0 833,781 833,781
IDEA Part B ‐ Grants to States‐Pass‐Through 0 723,774 723,774
IDEA Part B ‐ Preschool Grants 0 33,642 33,642
IDEA Part C ‐ Infants and Families 0 13,052 13,052
State Fiscal Stabilization Fund Education Program 0 320,113 320,113
$0 $1,973,148 $1,973,148Total
Expenditures by ARRA Assurances1. Increase teacher effectiveness and address inequities in the distribution of highly qualified teachers (recruiting, developing, and retaining effective teachers and principals).
307,607.00
2. Establish and use a pre-K through college and career data system to track progress and foster continuous improvement (building data systems that measure student success and ifnorm teachers and prinicpals how they can improve their practices).
$33,000.00
4. Provide targeted, intensive support and effective interventions to turn around schools identified for corrective action and restructuring (turnign around lowest performing schools).
632,941.00
* Other 293,002.00
Note: The above figures do not include funds which will be deferred until FY2011
Note: Each school system's goals may or may not directly correlate to one of the federal NCLB goals. Expenditures are illustrative of those reported in the Master Plan Update Budget Alignment and are not intended to sum to the total.
Somerset County Public Schools
B-87

B-88
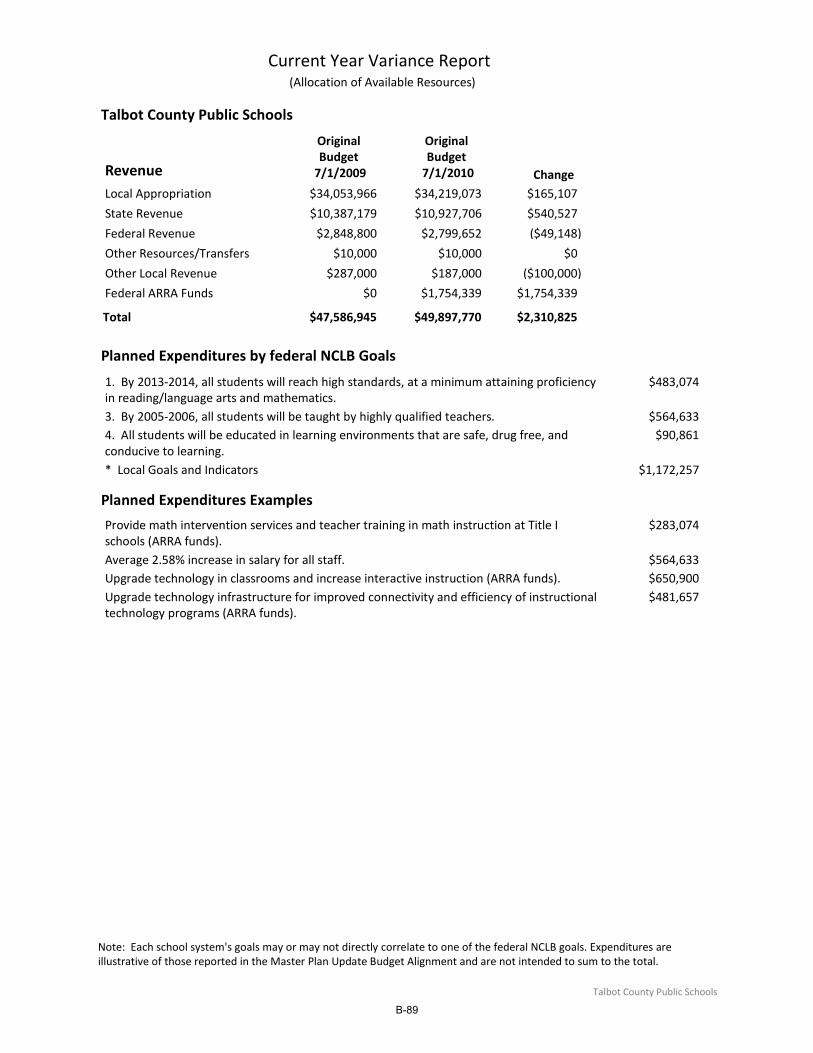
Talbot County Public Schools
Revenue
Original Budget 7/1/2009
Original Budget 7/1/2010 Change
Current Year Variance Report (Allocation of Available Resources)
Local Appropriation $34,053,966 $34,219,073 $165,107
State Revenue $10,387,179 $10,927,706 $540,527
Federal Revenue $2,848,800 $2,799,652 ($49,148)
Other Resources/Transfers $10,000 $10,000 $0
Other Local Revenue $287,000 $187,000 ($100,000)
Federal ARRA Funds $0 $1,754,339 $1,754,339
$47,586,945 $49,897,770 $2,310,825Total
Planned Expenditures by federal NCLB Goals
1. By 2013‐2014, all students will reach high standards, at a minimum attaining proficiency in reading/language arts and mathematics.
$483,074
3. By 2005‐2006, all students will be taught by highly qualified teachers. $564,6334. All students will be educated in learning environments that are safe, drug free, and conducive to learning.
$90,861
* Local Goals and Indicators $1,172,257
Planned Expenditures Examples
Provide math intervention services and teacher training in math instruction at Title I schools (ARRA funds).
$283,074
Average 2.58% increase in salary for all staff. $564,633Upgrade technology in classrooms and increase interactive instruction (ARRA funds). $650,900Upgrade technology infrastructure for improved connectivity and efficiency of instructional technology programs (ARRA funds).
$481,657
Note: Each school system's goals may or may not directly correlate to one of the federal NCLB goals. Expenditures are illustrative of those reported in the Master Plan Update Budget Alignment and are not intended to sum to the total.
Talbot County Public Schools
B-89
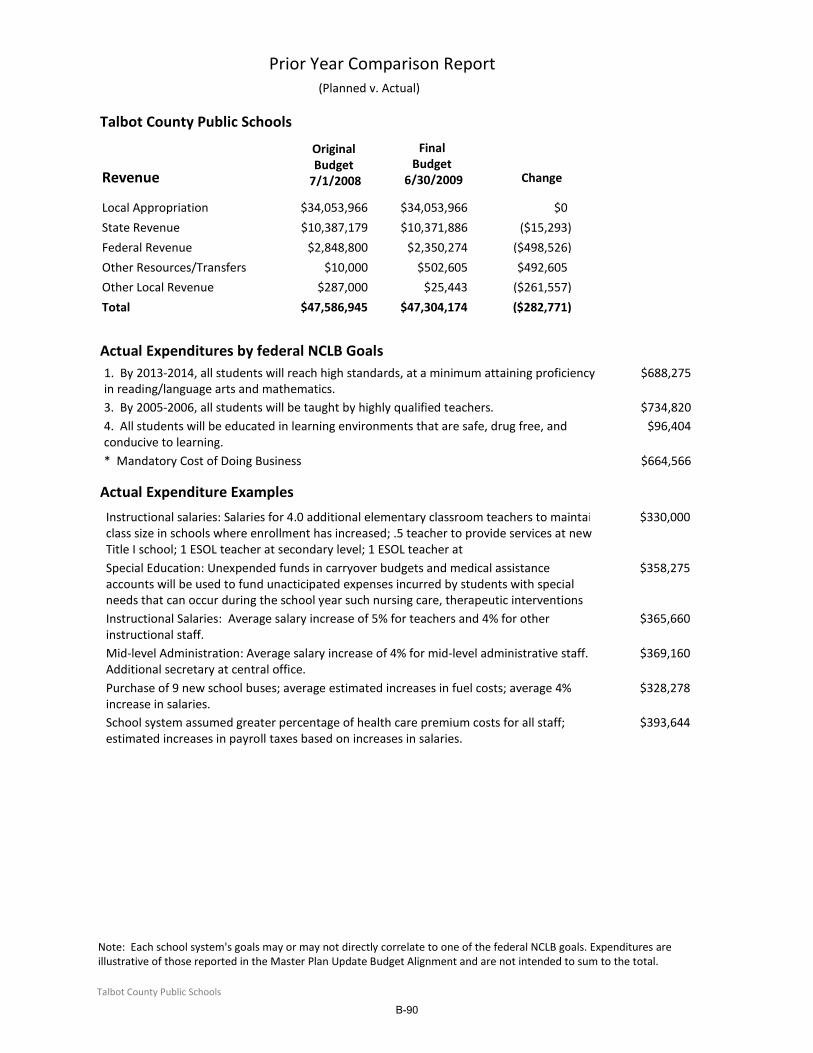
Talbot County Public Schools
Prior Year Comparison Report (Planned v. Actual)
Original Budget 7/1/2008
Final Budget
6/30/2009 ChangeRevenue
Local Appropriation $34,053,966 $34,053,966 $0
State Revenue $10,387,179 $10,371,886 ($15,293)
Federal Revenue $2,848,800 $2,350,274 ($498,526)
Other Resources/Transfers $10,000 $502,605 $492,605
Other Local Revenue $287,000 $25,443 ($261,557)
$47,586,945 $47,304,174 ($282,771)Total
Actual Expenditures by federal NCLB Goals1. By 2013‐2014, all students will reach high standards, at a minimum attaining proficiency in reading/language arts and mathematics.
$688,275
3. By 2005‐2006, all students will be taught by highly qualified teachers. $734,8204. All students will be educated in learning environments that are safe, drug free, and conducive to learning.
$96,404
* Mandatory Cost of Doing Business $664,566
Actual Expenditure Examples
Instructional salaries: Salaries for 4.0 additional elementary classroom teachers to maintain class size in schools where enrollment has increased; .5 teacher to provide services at new Title I school; 1 ESOL teacher at secondary level; 1 ESOL teacher at
$330,000
Special Education: Unexpended funds in carryover budgets and medical assistance accounts will be used to fund unacticipated expenses incurred by students with special needs that can occur during the school year such nursing care, therapeutic interventions
$358,275
Instructional Salaries: Average salary increase of 5% for teachers and 4% for other instructional staff.
$365,660
Mid‐level Administration: Average salary increase of 4% for mid‐level administrative staff. Additional secretary at central office.
$369,160
Purchase of 9 new school buses; average estimated increases in fuel costs; average 4% increase in salaries.
$328,278
School system assumed greater percentage of health care premium costs for all staff; estimated increases in payroll taxes based on increases in salaries.
$393,644
Note: Each school system's goals may or may not directly correlate to one of the federal NCLB goals. Expenditures are illustrative of those reported in the Master Plan Update Budget Alignment and are not intended to sum to the total.
Talbot County Public Schools
B-90

Talbot County Public Schools
American Recovery and Reinvestment Act of 2009Financial Reporting Table
FY 2009 FY 2010 TotalGrant Name
National School Lunch ‐ Equipment Assistance 0 0 0
Homeless Children and Youth 0 0 0
Title I ‐ Grants to LEAs, Neglected and Delinquent 0 377,974 377,974
IDEA Part B ‐ Grants to States‐Pass‐Through 0 1,101,232 1,101,232
IDEA Part B ‐ Preschool Grants 0 27,286 27,286
IDEA Part C ‐ Infants and Families 0 39,700 39,700
State Fiscal Stabilization Fund Education Program 0 208,147 208,147
$0 $1,754,339 $1,754,339Total
Expenditures by ARRA Assurances1. Increase teacher effectiveness and address inequities in the distribution of highly qualified teachers (recruiting, developing, and retaining effective teachers and principals).
546,192.00
* Other 208,147.00
Planned Expenditures Examples
Contract services for materials and installation of technology upgrades. $1,101,232
Contract services for math intervention services and professional development consultants. $283,074
Note: Each school system's goals may or may not directly correlate to one of the federal NCLB goals. Expenditures are illustrative of those reported in the Master Plan Update Budget Alignment and are not intended to sum to the total.
Talbot County Public Schools
B-91

B-92
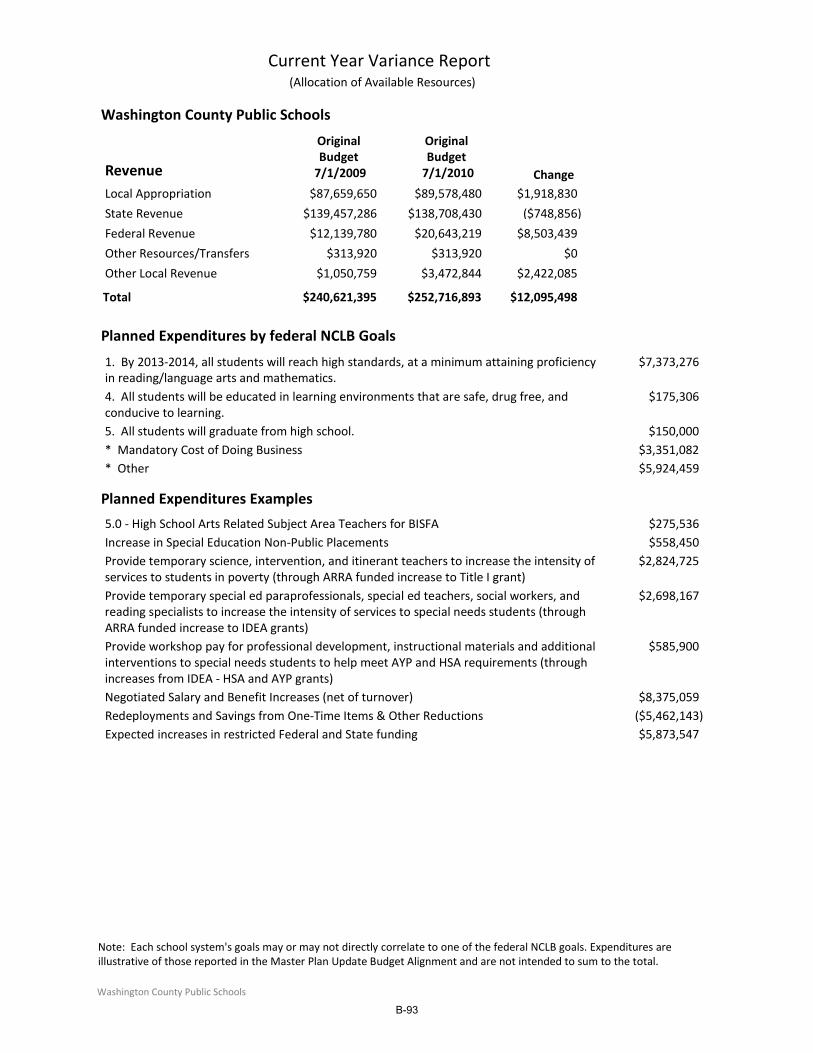
Washington County Public Schools
Revenue
Original Budget 7/1/2009
Original Budget 7/1/2010 Change
Current Year Variance Report (Allocation of Available Resources)
Local Appropriation $87,659,650 $89,578,480 $1,918,830
State Revenue $139,457,286 $138,708,430 ($748,856)
Federal Revenue $12,139,780 $20,643,219 $8,503,439
Other Resources/Transfers $313,920 $313,920 $0
Other Local Revenue $1,050,759 $3,472,844 $2,422,085
$240,621,395 $252,716,893 $12,095,498Total
Planned Expenditures by federal NCLB Goals
1. By 2013‐2014, all students will reach high standards, at a minimum attaining proficiency in reading/language arts and mathematics.
$7,373,276
4. All students will be educated in learning environments that are safe, drug free, and conducive to learning.
$175,306
5. All students will graduate from high school. $150,000* Mandatory Cost of Doing Business $3,351,082* Other $5,924,459
Planned Expenditures Examples
5.0 ‐ High School Arts Related Subject Area Teachers for BISFA $275,536Increase in Special Education Non‐Public Placements $558,450Provide temporary science, intervention, and itinerant teachers to increase the intensity of services to students in poverty (through ARRA funded increase to Title I grant)
$2,824,725
Provide temporary special ed paraprofessionals, special ed teachers, social workers, and reading specialists to increase the intensity of services to special needs students (through ARRA funded increase to IDEA grants)
$2,698,167
Provide workshop pay for professional development, instructional materials and additional interventions to special needs students to help meet AYP and HSA requirements (through increases from IDEA ‐ HSA and AYP grants)
$585,900
Negotiated Salary and Benefit Increases (net of turnover) $8,375,059Redeployments and Savings from One‐Time Items & Other Reductions ($5,462,143)Expected increases in restricted Federal and State funding $5,873,547
Note: Each school system's goals may or may not directly correlate to one of the federal NCLB goals. Expenditures are illustrative of those reported in the Master Plan Update Budget Alignment and are not intended to sum to the total.
Washington County Public Schools
B-93

Washington County Public Schools
Prior Year Comparison Report (Planned v. Actual)
Original Budget 7/1/2008
Final Budget
6/30/2009 ChangeRevenue
Local Appropriation $87,659,650 $87,659,650 $0
State Revenue $139,457,286 $140,217,924 $760,638
Federal Revenue $12,139,780 $12,304,154 $164,374
Other Resources/Transfers $313,920 $381,637 $67,717
Other Local Revenue $1,050,759 $1,111,262 $60,503
$240,621,395 $241,674,627 $1,053,232Total
Actual Expenditures by federal NCLB Goals1. By 2013‐2014, all students will reach high standards, at a minimum attaining proficiency in reading/language arts and mathematics.
$936,284
2. All limited English proficient students will become proficient in English and reach high academic standards at a minimum attaining proficiency or better in reading/language arts and mathematics.
$60,117
3. By 2005‐2006, all students will be taught by highly qualified teachers. $126,9285. All students will graduate from high school. $551,073* Mandatory Cost of Doing Business $2,993,063* Other $716,601
Actual Expenditure Examples
Annual Lease Payment associated w/ Barbara Ingram School for the Arts $634,704OPEB Funding (Health Insurance liability for retirees) $750,000Redeployments and Savings from One‐Time Items ($3,503,304)Negotiated Salary and Benefit Increases (net of turnover) $4,923,274Misc. increases in restricted County funding (maintenance projects, Judy Center, crossing guards)
$330,500
Expected increases in restricted Federal and State funding $354,985
Note: Each school system's goals may or may not directly correlate to one of the federal NCLB goals. Expenditures are illustrative of those reported in the Master Plan Update Budget Alignment and are not intended to sum to the total.
Washington County Public Schools
B-94

Washington County Public Schools
American Recovery and Reinvestment Act of 2009Financial Reporting Table
FY 2009 FY 2010 TotalGrant Name
National School Lunch ‐ Equipment Assistance 0 86,850 86,850
Homeless Children and Youth 0 0 0
Title I ‐ Grants to LEAs, Neglected and Delinquent 0 2,779,007 2,779,007
IDEA Part B ‐ Grants to States‐Pass‐Through 0 2,637,462 2,637,462
IDEA Part B ‐ Preschool Grants 0 60,705 60,705
IDEA Part C ‐ Infants and Families 0 70,971 70,971
State Fiscal Stabilization Fund Education Program 0 1,342,121 1,342,121
$0 $6,977,116 $6,977,116Total
Expenditures by ARRA Assurances4. Provide targeted, intensive support and effective interventions to turn around schools identified for corrective action and restructuring (turnign around lowest performing schools).
977,116.00
Note: The above figures do not include funds which will be deferred until FY2011
Planned Expenditures Examples
Provide temporary science, intervention, and itinerant teachers to increase the intensity of services to students in poverty (through ARRA funded increase to Title I‐A and Title I‐D grants).
$2,779,007
Provide temporary special ed paraprofessionals, special ed teachers, social workers, and reading specialists to increase the intensity of services to the special needs subgroup, thereby supporting school‐by‐school efforts to maintain AYP (through ARRA fu
$1,349,084
SFSF ‐ ARRA ‐ Non‐Public Placements (These funds were provided by the Governor to supplant legislatively mandated funding that had been received in the prior year under BTE in Education Act. Therefore, no new programs or positions were funded with the SF
$1,342,121
Note: Each school system's goals may or may not directly correlate to one of the federal NCLB goals. Expenditures are illustrative of those reported in the Master Plan Update Budget Alignment and are not intended to sum to the total.
Washington County Public Schools
B-95

B-96

Wicomico County Public Schools
Revenue
Original Budget 7/1/2009
Original Budget 7/1/2010 Change
Current Year Variance Report (Allocation of Available Resources)
Local Appropriation $50,204,655 $50,781,711 $577,056
State Revenue $110,164,941 $113,596,663 $3,431,722
Federal Revenue $9,486,292 $11,227,094 $1,740,802
Other Resources/Transfers $1,439,528 $1,516,735 $77,207
Other Local Revenue $1,718,000 $1,694,500 ($23,500)
Federal ARRA Funds $0 $5,600,142 $5,600,142
$173,013,416 $184,416,845 $11,403,429Total
Planned Expenditures by federal NCLB Goals
1. By 2013‐2014, all students will reach high standards, at a minimum attaining proficiency in reading/language arts and mathematics.
$5,459,991
4. All students will be educated in learning environments that are safe, drug free, and conducive to learning.
$277,441
5. All students will graduate from high school. $391,541* Local Goals and Indicators $1,639,032* Mandatory Cost of Doing Business $2,906,701* Other $728,723
Planned Expenditures Examples
Implement the Title I program, providing supplemental reading and math services to identified students.
$3,070,820
Provide services to identify students with disabilities, develop and ensure implementation of individual education plans, monitor compliance of case management tasks, and provide professional development on differentiated instruction, curriculum and accom
$2,438,894
Support schools in the early identification of at‐risk students and use of suitable interventions.
$340,696
Provide for the acquisition, construction, and renovation of land, buildings and equipment to support student learning.
$1,624,766
Increases in contractual agreements ‐ benefits (if itemized separately) 11.002 $1,497,764Increases in contractual agreements ‐ salaries 11.002 and 16.034 $1,931,140Transportation 10.001 ($529,003)Additional grant funding $728,723
Note: Each school system's goals may or may not directly correlate to one of the federal NCLB goals. Expenditures are illustrative of those reported in the Master Plan Update Budget Alignment and are not intended to sum to the total.
Wicomico County Public Schools
B-97
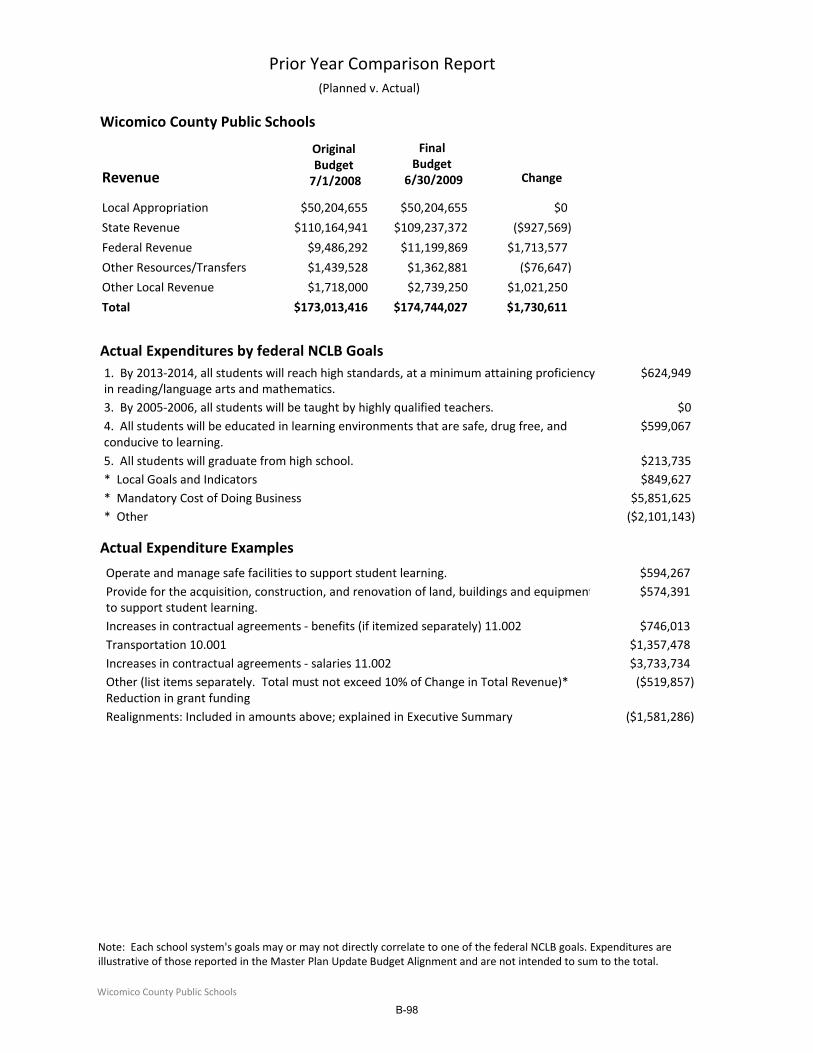
Wicomico County Public Schools
Prior Year Comparison Report (Planned v. Actual)
Original Budget 7/1/2008
Final Budget
6/30/2009 ChangeRevenue
Local Appropriation $50,204,655 $50,204,655 $0
State Revenue $110,164,941 $109,237,372 ($927,569)
Federal Revenue $9,486,292 $11,199,869 $1,713,577
Other Resources/Transfers $1,439,528 $1,362,881 ($76,647)
Other Local Revenue $1,718,000 $2,739,250 $1,021,250
$173,013,416 $174,744,027 $1,730,611Total
Actual Expenditures by federal NCLB Goals1. By 2013‐2014, all students will reach high standards, at a minimum attaining proficiency in reading/language arts and mathematics.
$624,949
3. By 2005‐2006, all students will be taught by highly qualified teachers. $04. All students will be educated in learning environments that are safe, drug free, and conducive to learning.
$599,067
5. All students will graduate from high school. $213,735* Local Goals and Indicators $849,627* Mandatory Cost of Doing Business $5,851,625* Other ($2,101,143)
Actual Expenditure Examples
Operate and manage safe facilities to support student learning. $594,267Provide for the acquisition, construction, and renovation of land, buildings and equipment to support student learning.
$574,391
Increases in contractual agreements ‐ benefits (if itemized separately) 11.002 $746,013Transportation 10.001 $1,357,478Increases in contractual agreements ‐ salaries 11.002 $3,733,734Other (list items separately. Total must not exceed 10% of Change in Total Revenue)* Reduction in grant funding
($519,857)
Realignments: Included in amounts above; explained in Executive Summary ($1,581,286)
Note: Each school system's goals may or may not directly correlate to one of the federal NCLB goals. Expenditures are illustrative of those reported in the Master Plan Update Budget Alignment and are not intended to sum to the total.
Wicomico County Public Schools
B-98

Wicomico County Public Schools
American Recovery and Reinvestment Act of 2009Financial Reporting Table
FY 2009 FY 2010 TotalGrant Name
National School Lunch ‐ Equipment Assistance 0 105,604 105,604
Homeless Children and Youth 0 48,030 48,030
Title I ‐ Grants to LEAs, Neglected and Delinquent 0 2,554,763 2,554,763
IDEA Part B ‐ Grants to States‐Pass‐Through 0 1,691,557 1,691,557
IDEA Part B ‐ Preschool Grants 0 40,625 40,625
IDEA Part C ‐ Infants and Families 0 0 0
State Fiscal Stabilization Fund Education Program 0 1,219,385 1,219,385
$0 $5,659,964 $5,659,964Total
Expenditures by ARRA Assurances1. Increase teacher effectiveness and address inequities in the distribution of highly qualified teachers (recruiting, developing, and retaining effective teachers and principals).
175,048.00
2. Establish and use a pre-K through college and career data system to track progress and foster continuous improvement (building data systems that measure student success and ifnorm teachers and prinicpals how they can improve their practices).
271,750.00
3. Make progress towards rigorous college and career-ready standards and high quality assessments that are valid and reliable for all students, including limited English proficient students and students with disabilities (adopting internationally benchma
162,761.00
* Other 051,151.33
Note: The above figures do not include funds which will be deferred until FY2011
Planned Expenditures Examples
Capital Outlay $1,219,385
Regular Program ‐ Contract Services $521,988
Regular Program ‐ Salaries & Wages $582,817
Regular Program ‐ Supplies & Materials $730,446
Special Education ‐ Public Sch Instr. Prog. ‐ Contract Services $304,805
Special Education ‐ Public Sch Instr. Prog. ‐ Equipment $302,264
Special Education ‐ Public Sch Instr. Prog. ‐ Salaries & Wages $307,519
Special Education ‐ Public Sch Instr. Prog. ‐ Supplies & Materials $329,768
Note: Each school system's goals may or may not directly correlate to one of the federal NCLB goals. Expenditures are illustrative of those reported in the Master Plan Update Budget Alignment and are not intended to sum to the total.
Wicomico County Public Schools
B-99

B-100
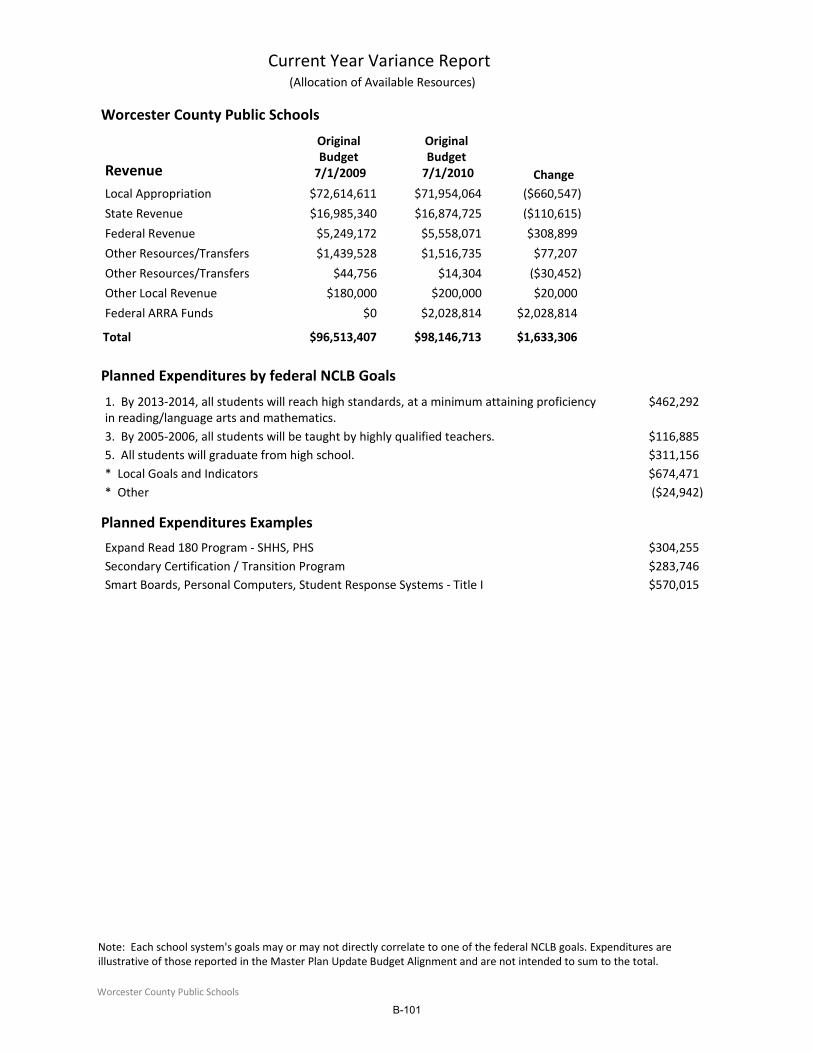
Worcester County Public Schools
Revenue
Original Budget 7/1/2009
Original Budget 7/1/2010 Change
Current Year Variance Report (Allocation of Available Resources)
Local Appropriation $72,614,611 $71,954,064 ($660,547)
State Revenue $16,985,340 $16,874,725 ($110,615)
Federal Revenue $5,249,172 $5,558,071 $308,899
Other Resources/Transfers $1,439,528 $1,516,735 $77,207
Other Resources/Transfers $44,756 $14,304 ($30,452)
Other Local Revenue $180,000 $200,000 $20,000
Federal ARRA Funds $0 $2,028,814 $2,028,814
$96,513,407 $98,146,713 $1,633,306Total
Planned Expenditures by federal NCLB Goals
1. By 2013‐2014, all students will reach high standards, at a minimum attaining proficiency in reading/language arts and mathematics.
$462,292
3. By 2005‐2006, all students will be taught by highly qualified teachers. $116,8855. All students will graduate from high school. $311,156* Local Goals and Indicators $674,471* Other ($24,942)
Planned Expenditures Examples
Expand Read 180 Program ‐ SHHS, PHS $304,255Secondary Certification / Transition Program $283,746Smart Boards, Personal Computers, Student Response Systems ‐ Title I $570,015
Note: Each school system's goals may or may not directly correlate to one of the federal NCLB goals. Expenditures are illustrative of those reported in the Master Plan Update Budget Alignment and are not intended to sum to the total.
Worcester County Public Schools
B-101
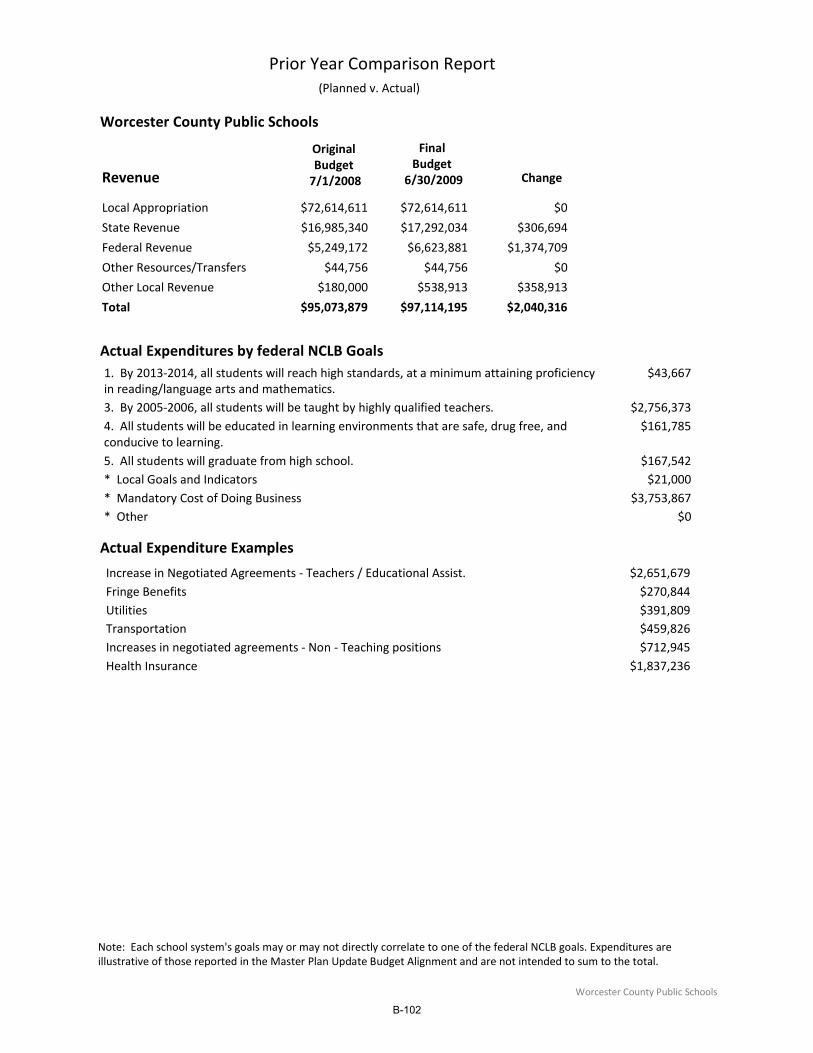
Worcester County Public Schools
Prior Year Comparison Report (Planned v. Actual)
Original Budget 7/1/2008
Final Budget
6/30/2009 ChangeRevenue
Local Appropriation $72,614,611 $72,614,611 $0
State Revenue $16,985,340 $17,292,034 $306,694
Federal Revenue $5,249,172 $6,623,881 $1,374,709
Other Resources/Transfers $44,756 $44,756 $0
Other Local Revenue $180,000 $538,913 $358,913
$95,073,879 $97,114,195 $2,040,316Total
Actual Expenditures by federal NCLB Goals1. By 2013‐2014, all students will reach high standards, at a minimum attaining proficiency in reading/language arts and mathematics.
$43,667
3. By 2005‐2006, all students will be taught by highly qualified teachers. $2,756,3734. All students will be educated in learning environments that are safe, drug free, and conducive to learning.
$161,785
5. All students will graduate from high school. $167,542* Local Goals and Indicators $21,000* Mandatory Cost of Doing Business $3,753,867* Other $0
Actual Expenditure Examples
Increase in Negotiated Agreements ‐ Teachers / Educational Assist. $2,651,679Fringe Benefits $270,844Utilities $391,809Transportation $459,826Increases in negotiated agreements ‐ Non ‐ Teaching positions $712,945Health Insurance $1,837,236
Note: Each school system's goals may or may not directly correlate to one of the federal NCLB goals. Expenditures are illustrative of those reported in the Master Plan Update Budget Alignment and are not intended to sum to the total.
Worcester County Public Schools
B-102

Worcester County Public Schools
American Recovery and Reinvestment Act of 2009Financial Reporting Table
FY 2009 FY 2010 TotalGrant Name
National School Lunch ‐ Equipment Assistance 18,600 0 18,600
Homeless Children and Youth 0 37,000 37,000
Title I ‐ Grants to LEAs, Neglected and Delinquent 0 838,217 838,217
IDEA Part B ‐ Grants to States‐Pass‐Through 0 786,098 786,098
IDEA Part B ‐ Preschool Grants 0 23,113 23,113
IDEA Part C ‐ Infants and Families 0 15,771 15,771
State Fiscal Stabilization Fund Education Program 0 365,615 365,615
$18,600 $2,065,814 $2,084,414Total
Expenditures by ARRA Assurances2. Establish and use a pre-K through college and career data system to track progress and foster continuous improvement (building data systems that measure student success and ifnorm teachers and prinicpals how they can improve their practices).
$77,410.00
3. Make progress towards rigorous college and career-ready standards and high quality assessments that are valid and reliable for all students, including limited English proficient students and students with disabilities (adopting internationally benchma
283,746.00
4. Provide targeted, intensive support and effective interventions to turn around schools identified for corrective action and restructuring (turnign around lowest performing schools).
035,892.00
* Other 687,366.00
Note: The above figures do not include funds which will be deferred until FY2011
Planned Expenditures Examples
Secondary Certification / Transition Program $283,746
Expand Read 180 Program $304,255
Smart Boards, Personal Computers, Student Response Systems $570,015
Sustain Existing Student Programs & Services $365,615
Note: Each school system's goals may or may not directly correlate to one of the federal NCLB goals. Expenditures are illustrative of those reported in the Master Plan Update Budget Alignment and are not intended to sum to the total.
Worcester County Public Schools
B-103