2009 annual report of child deaths in clark county… · 2 2009 annual report of child deaths in...
TRANSCRIPT

2009 Annual Report of Child Deaths in Clark County, Nevada
A Report from the Child Death Review Team in Clark County August 2010
Report Prepared by: Nevada Institute for Children’s Research and Policy
This report was commissioned by the Clark County Manager’s Office

2 2009 Annual Report of Child Deaths in Clark County
This report was prepared by the Nevada Institute for Children’s Research and Policy
through a contract with Clark County Manager’s Office.
NICRP Authors:
Tara Phebus, M.A. Senior Research Analyst
Denise Tanata Ashby, J.D.
Executive Director
Special Thanks to: The Child Death Review Team in Clark County
Karen Silcott, MSW ‐ Research Assistant, NICRP
Jennifer Waddoups, MPH – Research Assistant, NICRP
Marissa Marano – Research Assistant, NICRP
About the Nevada Institute for Children’s Research and Policy The Nevada Institute for Children’s Research and Policy (NICRP) is a not‐for‐profit, non‐partisan organization whose primary goal is to advance the well‐being of children in Nevada. As a research center in the School of Community Health Sciences at the University of Nevada Las Vegas, NICRP is dedicated to conducting academic and community‐based research that helps guide the development of policies, practices, and programs which serve to enhance the health and well‐being of children and their families. For more information about NICRP, please contact us or visit our website at http://nic.unlv.edu.
Nevada Institute for Children’s Research and Policy School of Community Health Sciences, UNLV
4505 S. Maryland Parkway, Box 453030, Las Vegas, NV 89154‐3030 Phone: (702) 895‐1040
Email: [email protected] Web: http://nic.unlv.edu

3 2009 Annual Report of Child Deaths in Clark County
TABLE OF CONTENTS CHILD DEATH REVIEW IN CLARK COUNTY ......................................................................................................................................... 4 METHODOLOGY................................................................................................................................................................................................ 7 LIMITATIONS ..................................................................................................................................................................................................... 9 CONFIDENTIALITY ...................................................................................................................................................................................... 10 FINDINGS .......................................................................................................................................................................................................... 11
SECTION I: SUMMARY STATISTICS ..................................................................................................................................................... 11 OVERALL DEMOGRAPHICS ..................................................................................................................................................................... 16 CHILD WELFARE INVOLVEMENT .......................................................................................................................................................... 18 SECTION II: NATURAL DEATHS .......................................................................................................................................................... 22 CHRONIC ILLNESS .................................................................................................................................................................................... 25 PREMATURITY .......................................................................................................................................................................................... 27 SUDDEN INFANT DEATH SYNDROME (SIDS) ..................................................................................................................................... 29 NATURAL DEATHS: RECOMMENDATIONS FOR PREVENTION .......................................................................................................... 32 SECTION III: ACCIDENTAL DEATHS ................................................................................................................................................... 33 MOTOR VEHICLE ACCIDENTS ................................................................................................................................................................ 36 DROWNING ............................................................................................................................................................................................... 40 SUFFOCATION ........................................................................................................................................................................................... 46 POISONING/OVERDOSE .......................................................................................................................................................................... 49 ACCIDENTAL DEATHS: RECOMMENDATIONS FOR PREVENTION ..................................................................................................... 50 SECTION IV: SUICIDE DEATHS ........................................................................................................................................................... 51 SITUATIONAL FACTORS OF SUICIDE ..................................................................................................................................................... 53 METHOD OF SUICIDE ............................................................................................................................................................................... 54 CIRCUMSTANCES OF SUICIDE ................................................................................................................................................................. 55 SUICIDE DEATHS: RECOMMENDATIONS FOR PREVENTION .............................................................................................................. 58 SECTION V: HOMICIDE DEATHS ......................................................................................................................................................... 59 FIREARM HOMICIDE ................................................................................................................................................................................ 61 NON‐FIREARM HOMICIDES .................................................................................................................................................................... 66 HOMICIDE DEATHS: RECOMMENDATIONS FOR PREVENTION .......................................................................................................... 71 SECTION VI: UNDETERMINED DEATHS ............................................................................................................................................. 72 UNDETERMINED DEATH – LESS THAN ONE YEAR OF AGE ............................................................................................................... 75 UNDETERMINED DEATHS – OVER ONE YEAR OF AGE ...................................................................................................................... 76 MANNER NOT APPLICABLE ................................................................................................................................................................... 76
LOCAL PREVENTION EFFORTS .............................................................................................................................................................. 77 2009 RECOMMENDATIONS TO THE STATE ADMINISTRATIVE TEAM ................................................................................ 78 APPENDIX A: 2009 CDRT MEMBERSHIP LIST .................................................................................................................................. 81 APPENDIX B: NEVADA REVISED STATUTES ..................................................................................................................................... 82

4 2009 Annual Report of Child Deaths in Clark County
CHILD DEATH REVIEW IN CLARK COUNTY In an effort to identify risk factors and prevent future child deaths, in 1992 the State of Nevada joined many other states in mandating Child Death Review Teams. Since that time, both the law and the regional teams throughout Nevada have evolved to facilitate the growing need for collaborative efforts to identify interventions necessary to reduce the rate of child deaths in Nevada. While the primary legislative focus of Nevada Child Death Review Teams has been on addressing fatalities related to child maltreatment and/or involvement with the child welfare system, the teams have expanded their focus to address risk factors and preventability in a wide variety of cases. As the largest county in the State, containing approximately 72% of the state’s population under 19 years of age (Nevada State Demographer 2009 Population Estimates, Retrieved August 2010), the Child Death Review team in Clark County has been, and will continue to be, a crucial part of identifying risk factors as well as recommending and implementing policies and procedures to minimize preventable child deaths in the State. Starting in 2007 the Clark County Manger’s Office has contracted with the Nevada Institute for Children’s Research and Policy in the School of Community Health Sciences at the University of Nevada Las Vegas to collect case specific data from case reviews and compile an annual report of child deaths in Clark County. This report is a result of Clark County’s commitment to make this information more visible and available to the public. While this report is commissioned by the Clark County Manger’s Office, the Child Death Review Team serving Clark County is a multidisciplinary team that conducts independent reviews of cases of child deaths. This team does not report to any county officials and the information found in this report is a result of those independent reviews.
Goals & Purpose for Teams The primary goal of all Child Death Review Teams is to prevent future child deaths. The child death review process enables jurisdictions to come together in a collaborative, multidisciplinary forum to openly discuss detailed circumstances in an effort to gain a better understanding of child deaths. The team provides a venue for representatives from a variety of both public and private agencies as well as community organizations to share information in a confidential and non‐threatening environment. The National Center for Child Death Review (hereinafter, National Center), which is supported by the Maternal and Child Health Bureau of the U.S. Department of Health and Human Services, has developed a “Program Manual for Child Death Review” (hereinafter, Program Manual) to assist States in developing and conducting Child Death Review Teams. Many of the recommendations provided in that document have been adopted by both the State and local Child Death Review Teams in Nevada.
Through a comprehensive and multidisciplinary
review of child deaths, we will better understand
how and why children die and use our findings to
take action to prevent other deaths and improve the
health and safety of our children.
National Center for Child Death Review

5 2009 Annual Report of Child Deaths in Clark County
The Purpose The Nevada State Legislature has defined the purpose of organizing local child death review teams in NRS 432B.403 as a means to:
Review records of selected cases of deaths of children in Nevada;
Review the records of selected cases of deaths of children who are residents of Nevada, but die in another state;
Assess and analyze such cases;
Make recommendations for improvements to laws, policies and practice;
Support the safety of children; and
Prevent future deaths of children.
The Operating Principles of Child Death Review The National Center has established the following operating principles for conducting reviews, which have been adopted by the Nevada Child Death Review teams:
The death of a child is a community responsibility.
A child’s death is a sentinel event that should urge communities to identify other children at risk for illness or injury.
A death review requires multidisciplinary participation from the community.
A review of case information should be comprehensive and broad.
A review should lead to an understanding of risk factors.
A review should focus on prevention and should lead to effective recommendations and actions to prevent deaths and to keep children healthy, safe and protected.
The Objectives As provided in the Program Manual, the National Center has identified ten primary objectives of the child death review process, which are provided below. These objectives should serve as guidelines for all regional child death review teams in Nevada. It is important to note that all ten objectives are designed to prevent future child deaths. Each regional child death review team should:
1. Ensure the accurate identification and uniform, consistent reporting of the cause and manner of every child death.
2. Improve communication and linkages among local and state agencies and enhance coordination of efforts. 3. Improve agency responses in the investigation of child deaths. 4. Improve agency response to protect siblings and other children in the homes of deceased children. 5. Improve criminal investigations and the prosecution of child homicides. 6. Improve delivery of services to children, families, providers and community members. 7. Identify specific barriers and system issues involved in the deaths of children. 8. Identify significant risk factors and trends in child deaths. 9. Identify and advocate for needed changes in legislation, policy and practices and expanded efforts in child health
and safety to prevent child deaths. 10. Increase public awareness and advocacy for the issues that affect the health and safety of children.
Composition of Child Death Review Teams In an effort to gain a holistic perspective of risk factors that may have contributed to the death of a child, Child Death Review Teams are organized to include representatives from a variety of both public and private entities that may have information or insight on a particular child or family. The collaborative nature of this process allows the team to

6 2009 Annual Report of Child Deaths in Clark County
understand the child and family in a more global perspective, providing more insight into circumstances which may have lead to the fatality and, ultimately, to preventative measures that may be implemented to prevent future child deaths. The Nevada State Legislature has mandated participation in local child death review teams in NRS 432B.406, which provides that local team membership, should include, but may not be limited to:
1) A representative of any law enforcement agency involved with the case under review, 2) Medical personnel, 3) A representative of the local district attorney’s office, 4) A representative of any school that is involved with the case under review, 5) A representative of any child welfare agency that is involved with the case under review, and 6) A representative of the coroner’s office.
The Child Death Review Team in Clark County includes members representing all of the mandatory categories, as well as additional members from other public and private organizations including the Department of Juvenile Justice, Safe Kids Coalition, the Office of Suicide Prevention and many others. A complete list of local Child Death Review Team members for 2009 is located in Appendix A.
The Review Process Regional child death review teams are charged with the periodic review of child deaths which occur in the area represented by the team. Regional teams may review the death of any child who either resides in or died in the State of Nevada, within their respective regions. The Child Death Review Team for Clark County meets once a month at the Coroner’s Office for a period of three hours to conduct reviews. The team reviewed an average of 24 new cases per month. At the beginning of each meeting, the chairs of the team remind members of the confidential nature of the review process and ask any new members to sign a confidentiality statement. All attendees in the meeting are required to sign an annual confidentiality agreement stating that all information shared in the meetings may not be discussed or shared outside of the child death review meeting (see page 10 for a full description of measures taken to preserve the confidentiality of information shared during meetings). The monthly agenda is organized first according to status and all cases that were brought back from the previous month are listed first. After that all cases are organized by manner of death and by cause of death within each manner. Only cases that have been officially signed out by the Coroner’s Office are placed on the monthly agenda. The first few pages of the agenda contain summary information for all cases that month organized by cause and manner of death. This section allows the team to see any trends at first glance. In addition the front page of the agenda contains summary information for each manner of death year to date. For example, this section displays the total number of accidental deaths the team has reviewed for that year. For each individual case, a summary sheet is created that contains basic demographic information about the child and also a short description regarding the circumstances of the child’s death. This full agenda with all information is provided to the team to review one week prior to the meeting. In 2008 the agendas were only available during the meeting, and in an effort to protect the confidential nature of the information, it was returned to NICRP staff at the end of the meeting. Due to budgetary constraints, in 2009 all team members were sent the agenda one week prior to the meeting and expected to print and bring their own agenda to the meeting. During the review meeting cases are reviewed in groups based on their cause of death. Agencies with additional information are asked to present their case information. All team members are then given the opportunity to ask questions regarding the case. After the case assessment, team members have the opportunity to make and discuss improvements to laws, policies and practices which will support the safety of children and prevent future child deaths. Each quarter, the Child Death Review Team for Clark County submits a report to the Nevada Division of Child and Family Services, on behalf of the Administrative Team, which identifies statistical information regarding the cases that were reviewed and recommendations made based on those reviews.

7 2009 Annual Report of Child Deaths in Clark County
Team Changes in 2009 In 2009 the team worked to solidify existing team protocols and procedures. The team worked to more consistently report the ages of parents through an agreement with the Southern Nevada Health District to screen birth records for decedents and provide the ages of the parents. In addition, the local fire departments were invited to participate in child death review by becoming at‐large members. The team now has representation from the Henderson Fire Department and the North Las Vegas Fire Department. Additionally the team has taken extra care to discuss the contribution of child abuse or neglect in each case. For each case reviewed the team makes a determination about whether they feel that child abuse or neglect either caused or contributed to the child’s death. This information is not based solely on any one agencies regulations or policies but rather the determination of the team as a multidisciplinary group.
METHODOLOGY In 2009, Clark County continued to collect and maintain a county‐level database to manage the review information on child fatalities. The Nevada Institute for Children’s Research and Policy (NICRP) continues to collect the data and maintain a database of information as well as produce the annual report. The data were collected using a form that was modeled after the collection tool developed by the National Center for Child Death Review. The data collection tool collects as much information as possible through specific questions about the demographics of the child, the supervisor, caregiver, and the family. It also captures detailed information regarding the circumstances surrounding the child’s death. In addition, efforts were made to improve the data collection tool for the 2009 data based on lessons learned in collection from 2006 to 2008. Data presented in this report is drawn from information gathered at each of the monthly child death review meetings. The Clark County Office of the Coroner/Medical Examiner forwards information for all fetal and child deaths to NICRP for review by the child death review team on a monthly basis. In 2009 the Child Death Review Team in Clark County continued to review 100% of the child deaths referred to the team by the Clark County Coroner/Medical Examiner’s
Office; this included all natural deaths, as well as all accidents, homicides, suicides and undetermined cases. The team also reviewed all fetal deaths over 20 weeks gestation. If a case was referred to the team that was less than 20 weeks gestation at the time of death and the manner was natural the case was screened out and not reviewed by the team. The team made the decision to use 20 weeks as a conservative cut off point for potential viability of a fetus. In all cases where these fetal deaths were due to natural causes the manner “natural” was assigned. In these cases it is often the choice of the family if a fetal death certificate is issued. Although fetal death certificates do not indicate a manner of death, for the purposes of child death review and this report, these cases were classified as natural deaths. 2009 is the second year where the Child Death Review Team in Clark County chose to review all deaths referred to the team by the Coroner/Medical Examiner’s Office. This process will allow the team to monitor trends in all fetal and child deaths.
It is important to note this change when reviewing the total number of child deaths starting in 2008, which due to the change in methodology looks substantially larger than 2006 and 2007. This is because the team reviewed ALL deaths and not just a selection of the natural deaths. Because the methodology is the same it is more representative to compare 2008 and 2009 data when reviewing natural deaths.
“Again in 2009 the Child Death Review
Team in Clark County reviewed 100% of the
child deaths referred to the team by the
Clark County Coroner/Medical Examiner’s
Office; this included all natural deaths, as
well as all accidents, homicides, suicides
and undetermined cases.”

8 2009 Annual Report of Child Deaths in Clark County
During the review meeting representatives from various agencies provide information on the case that is then used to complete the data tool. If agencies are unable to attend the meetings requests are made to the agency for the pertinent information on the case. Information that was unavailable at the meeting or unknown by agencies at the meeting is listed as “unknown” in the database. The Clark County Office of the Coroner/Medical Examiner provides copies of death certificates as well as investigation summaries for each case for data collection purposes when it is available to them. Clark County Department of Family Services also screens each case for prior history with the child welfare agency and if there is history, then that agency completes a form containing the pertinent facts of their involvement with the child and the family. Data forms were completed by NICRP staff, numerically coded and then entered into a statistical data analysis software package. The data was cleaned, or checked for errors using a process of generating frequencies and identifying outliers, then verifying their accuracy. At this time no additional case information was requested, if the information did not exist in the file, it was simply listed as “unknown”. This dataset was then used to produce the statistics that appear in this report. Descriptive statistics are used in this report to present summary information about all cases as well as the leading causes under each manner of death. Frequencies and cross‐tabulations were used, however due to the small sample size, tests for statistical significance were not completed. In many cases the subset of cases being discussed is too small to make accurate statements about a number’s statistical significance. In addition to simple descriptive statistics, comparative data for 2006, 2007, 2008 and 2009 are also presented in this report. The goal is to be able to track the major causes of child death to identify trends and improve the ability to design prevention strategies in Clark County. This report is organized in terms of manner of death. The different causes of death under these manners are reported as well as some general demographic information on the cases is presented in each section. Determinations of the official cause and manner of death are made by the Clark County Office of the Coroner/Medical Examiner for all coroner cases. According to the National Association of Medical Examiners (NAME), "medical examiners and coroners have the sole legal authority to investigate deaths that are sudden, unexpected, unexplained, and potentially due to external causes such as injury." For natural deaths that are not deemed to be coroner cases the attending physician at the time of death will make the determination regarding cause and manner and sign the death certificate. The cause of death is indicated by the actual physiological event that caused the person to die and is generally determined through autopsy. Manner is a ruling about intent and is determined by the investigation and circumstances surrounding the death. Therefore, the exact same physiological cause of death could have five possible manners of death. There are five standard manners used: 1) Natural, 2) Accidental, 3) Suicide, 4) Homicide, and 5) Undetermined. The coroner may rule a death “undetermined” when sufficient evidence or information cannot be adduced, usually about intent, to assign a manner of death. For example, a youth may die of a gunshot wound, which would be the actual cause of death. Assigning the manner depends on how the individual was shot. If the youth shot himself, that would be suicide. If he was shot by someone else on purpose, that is homicide. If he discharged a weapon while cleaning it and was hit, that is an accident (although it is important to note that this scenario also presents an element of neglect which the team may identify at review). It is important to pay attention not only to cause of death, but manner as well, because understanding the manner of death can provide reviewers a greater understanding of the circumstances surrounding the death, which increases the potential for preventing future child fatalities.
9 2009 Annual Report of Child Deaths in Clark County
LIMITATIONS As with any research there are limitations associated with this dataset. As we are in the fourth year of data collection there have been changes made to the data collection tool as well as some of the methods for collection to improve the data presented in this report. However certain limitations could not be avoided. Again this year not all information could be gathered regarding every case reviewed. This missing information can be due to a variety of circumstances including differences among investigating agencies, as information that is important for tracking and prevention may not be pertinent to a coroner or law enforcement investigation and is therefore not available. In other instances a child may not be a resident of this state and therefore the team did not have access to all of the family’s background information. This limits the level of detail provided for each case in this report. Additionally, there are many sections where the total number of cases discussed is so small that statistical generalizations cannot be made. Finally, to ensure consistency in data reporting, the Child Death Review Team’s database was compared with records from the Clark County Office of the Coroner/Medical Examiner. The cases matched with a few exceptions. There were several cases of fetal deaths that the team reviewed, but the coroner’s office did not count as a child death in their statistics. According to the coroner’s office, fetuses that die in‐utero and never take a breath are often issued a fetal death certificate which does not assign a manner of death, while a fetus that is delivered and takes a breath is considered a child and will be issued a death certificate. In an effort to further ensure the accuracy of the data presented in this report, NICRP obtains a list of all child deaths for the current year and compares total numbers in the child death review database and the coroner’s office statistics. Any differences in total numbers are then reviewed and explanations are provided. In 2009 there were two categories of death where the total number of deaths reported from the coroner’s office did not match the total number of deaths in the Child Death Review (CDR) database. First, there were more natural deaths listed in the child death review database than in the coroner’s database. This is because the CDR team reviewed all deaths of those people under 18 years of age including fetal deaths. If the fetal death was due to natural causes it was assigned a manner of “natural” even though fetal death certificates do not list a manner of death. The second manner of death with a discrepancy between reported coroner numbers and CDR team numbers was the accident category. There were two more accident case in the coroner’s database than in the CDR database. This year there were 2 cases of children that died in Clark county but were residents of another Nevada county and therefore the information was forwarded to that team. This resulted in the total number of accidental deaths reviewed and entered into the CDR database to be 57, while in the coroner data there were 59. In 2009, data collection processes have become even more firm and routine. This year the child death review team was able to gain access to more pieces of information including hospital records, school records, and police investigation reports. In addition in 2009, the ages of the parents were more readily available as a system of information sharing was developed with the Southern Nevada Health District. This information was used to complete the review and later the data collection tool. Agencies have become more familiar with the team and its purpose and, upon request, are sharing the information for these purposes. However, the team was still unable to obtain all information for all cases. Therefore, this information was listed as unknown. The team anticipates that this information will be more readily available in the future as relationships for data sharing are developed between the team and the relevant agencies.

10 2009 Annual Report of Child Deaths in Clark County
CONFIDENTIALITY All cases reviewed by the Child Death Review Team are kept completely confidential. Information shared in the meetings is protected under NRS 432B.407 and cannot be shared with anyone outside the meeting. All records kept by NICRP are also kept confidential and are securely stored in a locked cabinet in a locked office. In addition, only team members are sent the full agenda with case details prior to the meeting. Because this information is confidential, every effort was made in this report to discuss cases in general terms and not make reference to any specific details of one case. Therefore, in instances where only one case fits specific criteria, details are not provided in this report. This report is intended to provide summary statistics about all child fatalities in Clark County, offer a comparison between 2006, 2007, 2008, and 2009 fatalities where appropriate, as well as provide descriptive statistics regarding specific circumstances surrounding causes and manners of death to assist in generating data driven prevention initiatives. This report does not represent all data collected regarding 2009 child fatalities, because some variables presented too few cases to provide information that is not identifiable.

11 2009 Annual Report of Child Deaths in Clark County
FINDINGS
SECTION I: SUMMARY STATISTICS Again in 2009, the Child Death Review Team in Clark County reviewed ALL child deaths and all fetal deaths over 20 weeks gestation. This resulted in the large difference in the total number of cases reviewed in 2008 and 2009 when compared with 2006 or 2007 (See Table 1 below).
Table 1: Total Child Deaths Reviewed by Year
Year 2006 2007 2008 2009
Count 148 155 311 283
The table indicates an increase from 2007 to 2008, but this is due to the change in the methodology starting in 2008 when all cases of child and fetal deaths (over 20 weeks gestation) were reviewed by the team, not a drastic increase in the number of children that died in 2008 and 2009 compared to 2006 and 2007. The 283 cases in 2009 and 311 cases in 2008 represent 100% of all child and fetal deaths referred to the team from the Clark County Office of the Coroner/Medical Examiner (Comparison to Clark County Office of the Coroner/Medical Examiner Data, June 2009 and
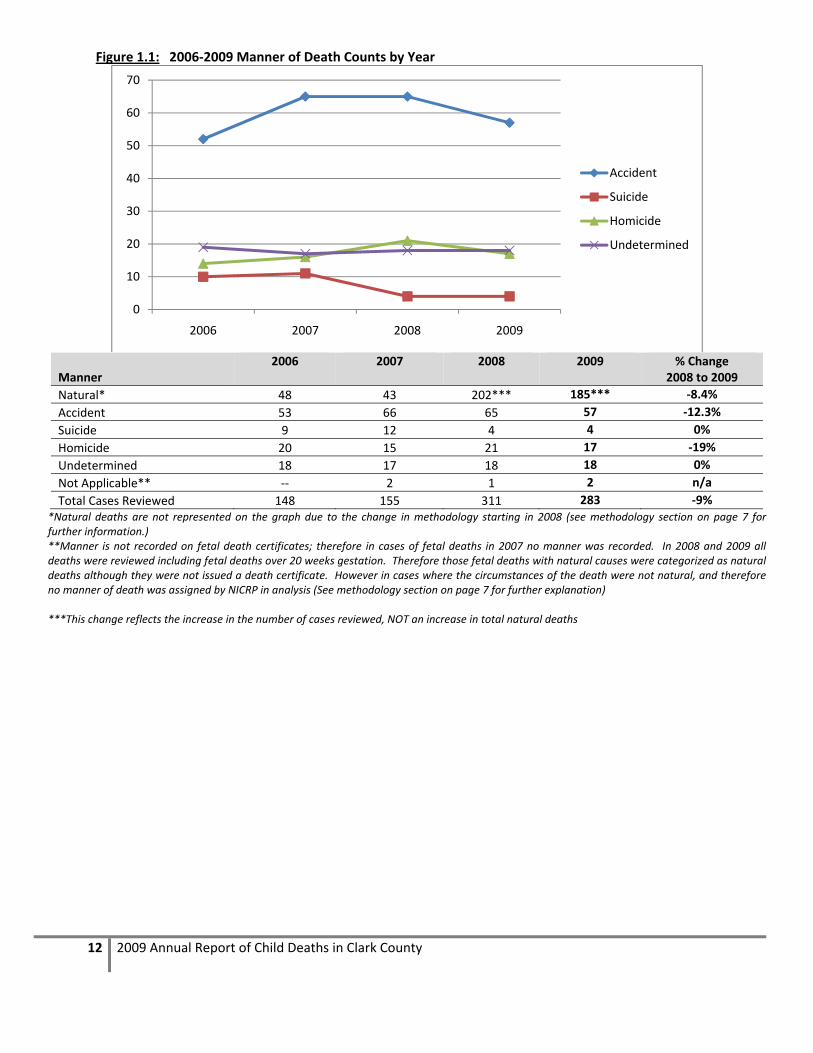
June 2010). Because the same methodology was used to select cases for review in both years this represents a 9% decrease in Child Deaths in Clark County in 2009. Deaths are categorized based on the official manner of death and can be placed in one of five categories: natural, accidental, suicide, homicide, or undetermined. These classifications are determined by the coroner’s office during an investigation or by a physician signing the death certificate in the hospital, if it is not a coroner’s case. “Coroner’s case” refers to the cases that the coroner’s office investigates in order to assign manners of death and sign the death certificate. If hospital physicians sign the death certificate, it is because they do not feel the death needs to be investigated. Since all deaths were reviewed in 2009 it is not surprising that the majority of all deaths reviewed were natural deaths at 65% (185 cases). The next most frequent category was accidental deaths at 20.1% or 57 cases. This is around the same number of cases as in 2008 and 2007 and slightly more than in 2006. There were slightly fewer homicides in 2009 compared to 2008 and suicides remained consistent in 2009 with the decrease seen in 2008. These overall counts are important to understanding the general trends in child deaths in Clark County. As expected there are far more Natural deaths in 2008 and in 2009 than in previous years. This is due to the fact that starting in 2008 all deaths were reviewed, while in previous years natural deaths were screened for review and only selected cases were reviewed by the team. This is important to remember when comparing percentages of all deaths over the past three years. This is especially clear when looking at the overall causes of death. The majority are Natural causes where in the past the majority of these causes have been Accidental. This is due to the fact that all deaths (including fetal deaths) were reviewed and Natural deaths are the most frequently occurring among children less than one year of age, which is also the most frequently occurring age category. To further illustrate this, overall statistics regarding cause of death have been broken out to display those that are due to medical causes and those that are due to external injuries.
12 2009 Annual Report of Child Deaths in Clark County
Figure 1.1: 2006‐2009 Manner of Death Counts by Year
Manner 2006 2007 2008 2009 % Change
2008 to 2009
Natural* 48 43 202*** 185*** ‐8.4%
Accident 53 66 65 57 ‐12.3%
Suicide 9 12 4 4 0%
Homicide 20 15 21 17 ‐19%
Undetermined 18 17 18 18 0%
Not Applicable** ‐‐ 2 1 2 n/a
Total Cases Reviewed 148 155 311 283 ‐9%*Natural deaths are not represented on the graph due to the change in methodology starting in 2008 (see methodology section on page 7 for further information.) **Manner is not recorded on fetal death certificates; therefore in cases of fetal deaths in 2007 no manner was recorded. In 2008 and 2009 all deaths were reviewed including fetal deaths over 20 weeks gestation. Therefore those fetal deaths with natural causes were categorized as natural deaths although they were not issued a death certificate. However in cases where the circumstances of the death were not natural, and therefore no manner of death was assigned by NICRP in analysis (See methodology section on page 7 for further explanation) ***This change reflects the increase in the number of cases reviewed, NOT an increase in total natural deaths
0
10
20
30
40
50
60
70
2006 2007 2008 2009
Accident
Suicide
Homicide
Undetermined

13 2009 Annual Report of Child Deaths in Clark County
Cause of death is displayed in two different graphs on the following pages. Figure 1.2a below represents those cases where the primary cause of death was a medical cause for all child deaths reviewed from 2007 to 2009. The leading medical cause of death for children in Clark County was prematurity (n=75) second was congenital defects (n=49), and third chronic illness (n=25). Figure 1.2a: 2007‐2009 Primary Medical Causes of Death (Counts)
2007* 2008 2009
Medical Causes
Acute Illness 15 20 23
Chronic Illness 4 38 24
Congenital Defect 5 40 50
Other perinatal condition 0 0 15
Prematurity 13 106 75
SIDS 6 3 2
*Data for2006 are not presented in the table or graph because of changes in classification categories from 2006 to 2007. 2007 are not presented in the graph above because data on all natural deaths were not collected until 2008.
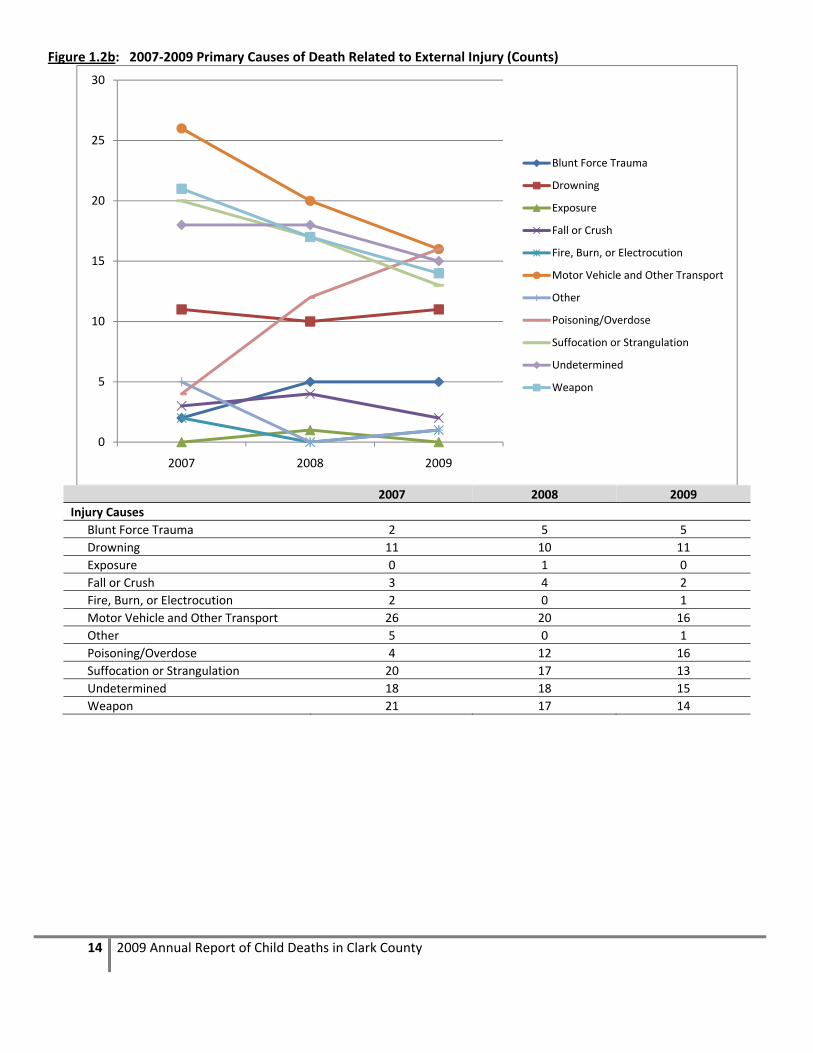
Figure 1.2b displays those cases from 2007 to 2009 where the primary cause of death was due to some type of external injury. Among these cases we can see that while on the decline from 2007 to 2009, motor vehicle incidents are still the leading cause of death for children (n=16). However, in 2009 we see another increase in the number of number of children dying from poisoning/overdose and for the first time this number equals the number of cases due to a motor vehicle incident. The second leading overall cause of death in 2009 were those undetermined deaths (n=15) which are described in Section VI Undetermined Deaths. The third leading cause of death in 2009 were those related to weapons (n=14).
0
20
40
60
80
100
120
Acute Illness Chronic Illness
Congenital Defect
Other perinatal condition
Prematurity SIDS
20
38 40
0
106
3
23 24
50
15
75
2
2008
2009
NOTE: ALL natural deaths were NOT reviewed in 2006 and in 2007 therefore they are NOT presented in the graph.
14 2009 Annual Report of Child Deaths in Clark County
Figure 1.2b: 2007‐2009 Primary Causes of Death Related to External Injury (Counts)
2007 2008 2009
Injury Causes
Blunt Force Trauma 2 5 5
Drowning 11 10 11
Exposure 0 1 0
Fall or Crush 3 4 2
Fire, Burn, or Electrocution 2 0 1
Motor Vehicle and Other Transport 26 20 16
Other 5 0 1
Poisoning/Overdose 4 12 16
Suffocation or Strangulation 20 17 13
Undetermined 18 18 15
Weapon 21 17 14
0
5
10
15
20
25
30
2007 2008 2009
Blunt Force Trauma
Drowning
Exposure
Fall or Crush
Fire, Burn, or Electrocution
Motor Vehicle and Other Transport
Other
Poisoning/Overdose
Suffocation or Strangulation
Undetermined
Weapon

15 2009 Annual Report of Child Deaths in Clark County
Figure 1.2c displays the crude death rates for children (ages 0‐17 years) in Clark County for 2008 and 2009 as well as the change in the rates from 2008 to 2009. Causes of death with an increase in the rate are highlighted in pink on the chart. Figure 1.2c: Crude Child Death Rates for Clark County population under 18 years (per 100,000)
Medical Cause 2008 2009 Change % Change
Prematurity 20.53 14.66 ‐5.87 ‐28.6%
Congenital Defect 7.75 9.58 1.83 23.6%
Chronic Illness 7.36 4.89 ‐2.47 ‐33.6%
Acute Illness 3.87 4.5 0.62 16.0%
Other perinatal condition 0 2.93 2.93 n/a
External Injury 2008 2009 Change % Change
Motor Vehicle and Other Transport 3.87 3.13 ‐0.75 ‐19.4%
Poisoning/Overdose 2.32 3.13 0.8 34.5%
Undetermined 3.49 2.93 ‐0.55 ‐15.8%
Weapon 3.29 2.74 ‐0.56 ‐17.0%
Suffocation or Strangulation 3.29 2.54 ‐0.75 ‐22.8%
Drowning 1.94 2.15 0.21 10.8%
Blunt Force Trauma 0.97 0.98 0.01 1.0%
Fall or Crush 0.77 0.39 ‐0.38 ‐49.4%
SIDS 0.58 0.39 ‐0.19 ‐32.8%
Fire, Burn, or Electrocution 0 0.2 0.2 n/a
Exposure 0.19 0 ‐0.19 ‐100.0%
Total population of Clark County under 18* 516398 511619 ‐4779 ‐0.9%
*Total population estimates for Clark County come from the Las Vegas Perspective 2009, 2010
Figure 1.2d below displays the overall child death rates for all deaths, all unintentional injuries, suicides and homicides and provides a comparison to national rates. In Clark County, our overall death rate and unintentional injury rate is lower than the national rate, but the homicide rate is higher than the national rate.
Figure 1.2d: Overall Crude Child Death Rates 2008 to 2009
2008 2009 Change National Rate*
All Deaths under 18 60.22 55.31 ‐4.91 62.4
All Unintentional Injuries (Accidents) 12.59 11.14 ‐1.45 11.2
Suicide 0.77 0.78 0.01 1.3
Homicide 4.07 3.32 ‐0.74 2.6
*National rates come from CDC estimates of crude child death rates from 2004‐2006

16 2009 Annual Report of Child Deaths in Clark County
OVERALL DEMOGRAPHICS The Clark County team reviews the deaths of children from birth to 17 years of age. In 2009 again the vast majority of deaths are those children less than one year of age (62%). However, starting in 2008 we see an increase in the total number of deaths in the 1 to 4 year old category, the 5‐9 year old category and 15‐17 year old category. Figure 1.3: 2006‐2009 Age (2006 n=148, 2007 n=155, 2008 n=311, 2009 n=283)
Data regarding race and ethnicity are collected from the child’s death certificate, and presented in Figure 1.4 below. The data indicate that White Non‐Hispanic children consistently have the highest number of deaths, followed by White Hispanic children, then Black children. Interestingly it seems that starting in 2008 we see a decrease in the percentage of Black children overall. This may be due to the change in methodology to review all child deaths. These statistics are presented in Figure 1.4 below.
2006 2007 2008 2009
<1 42.6% 40.6% 65.6% 61.8%
1‐4 17.6% 18.7% 10.6% 15.2%
5‐9 5.4% 5.2% 3.2% 4.9%
10‐14 9.5% 14.8% 7.4% 3.9%
15‐17 25.0% 20.6% 13.2% 14.1%
0.0%
10.0%
20.0%
30.0%
40.0%
50.0%
60.0%
70.0%
Percent
Note: All Natural deaths were NOT reviewed in
2006 and 2007 and the majority of these deaths
are children less than 1 year of age, which may
account for the sharp increase from 2007 to 2008

17 2009 Annual Report of Child Deaths in Clark County
Figure 1.4: 2006‐2009 Race/Ethnicity (2006 n=148, 2007 n=155, 2008 n=311, 2009 n=283)
White
(Non Hispanic) White
(Hispanic) Black Native
Hawaiian/Pacific Islander
Asian American Indian
Other/Multiple Race
Unknown
2006 33.8% (50) 26.4% (39) 25.7% (38) 2.7% (4) 3.4% (5) .7% (1) 7.4% (11) ‐‐
2007 34.8% (54) 34.2% (53) 27.1% (42) .6% (1) 1.9% (3) 0 1.3% (2) ‐‐
2008 37.3% (116) 31.8% (99) 20.9% (65) 1.2% (4) 3.5% (11) 1% (3) 3.2% (10) 1% (3)
2009 39.6% (112) 33.2% (94) 17.7% (50) 1.8% (5) 2.5% (7) .4% (1) 4.9% (14) ‐‐
* Not shown in the graph are the 3 cases in 2008 where race/ethnicity was unknown. These were fetal deaths where little information was collected. ** “Other” includes all decedents with a mixed race, or a race other than those listed on the data collection tool
The distribution of males and females is very similar for all four years. While we seem to be seeing a decrease in male child deaths from 2006 to 2009, there also seems to be an increase in female deaths. This will be an important trend to watch in the coming years as female deaths are moving to meet and even exceed male deaths over time. Additionally, in 2006 and in 2009 there was one case in each year that at the time of death sex was unable to be determined; those cases are listed as unknown in Figure 1.5 below.
0.0%
5.0%
10.0%
15.0%
20.0%
25.0%
30.0%
35.0%
40.0%
45.0%
2006 2007 2008 2009
White (Non‐Hispanic)
White (Hispanic)
Black
Pacific Islander
Asian
American Indian
Other*

18 2009 Annual Report of Child Deaths in Clark County
Figure 1.5: 2006‐2009 Sex of Decedent (2006 n=148, 2007 n=155, 2008 n=311, 2009 n=283)
* In 2006 and in 2009 there was one case where the child’s sex could not be identified at the time of the investigation.
2006* 2007 2008 2009*
Male 64.2% (95) 60.6% (94) 59.2% (184) 58% (164)
Female 35.1% (52) 39.4% (61) 40.8% (127) 41.7% (118)
Unknown 0.7% (1) 0 0 0.4% (1)
CHILD WELFARE INVOLVEMENT Information was also collected regarding the child or family’s history with child welfare. The table below illustrates the comparison of child welfare involvement from 2006 to 2009. All categories in the table below are NOT mutually exclusive meaning that the same child may fall into multiple categories. Additionally, the reader should note that in 2007 and in 2009 there was one case in each year with unknown child welfare history. This information could not be collected because verification data regarding the birth date of the mother could not be obtained in either case. Figure 1.6 illustrates that there was a steady increase in the number of cases that had an open CPS case at the child’s time of death from 2006 through 2008 but in 2009 there were only seven cases with an open case at the time of death which is less than half of the total in 2008. The numbers presented in Figure 1.6 below represent total counts in each of the categories.
Figure 1.6: 2006‐2009 Type of Child Welfare Involvement (2006 n=148, 2007 n=155, 2008 n=311, 2009, n=283)
* Starting in 2007 data were collected on whether or not the child was in foster or shelter care at the time of death, not ever in their life as it was collected in 2006. Therefore that information is not available for 2006 cases.
0.0%
20.0%
40.0%
60.0%
80.0%
2006* 2007 2008 2009*
Male Female
020406080
Open CPS Case at TOD Any CPS History with Family
Child in Foster/Shelter Care at TOD*
1734
19
56
420
50
48
63
1
2006 2007 2008 2009
19 2009 Annual Report of Child Deaths in Clark County
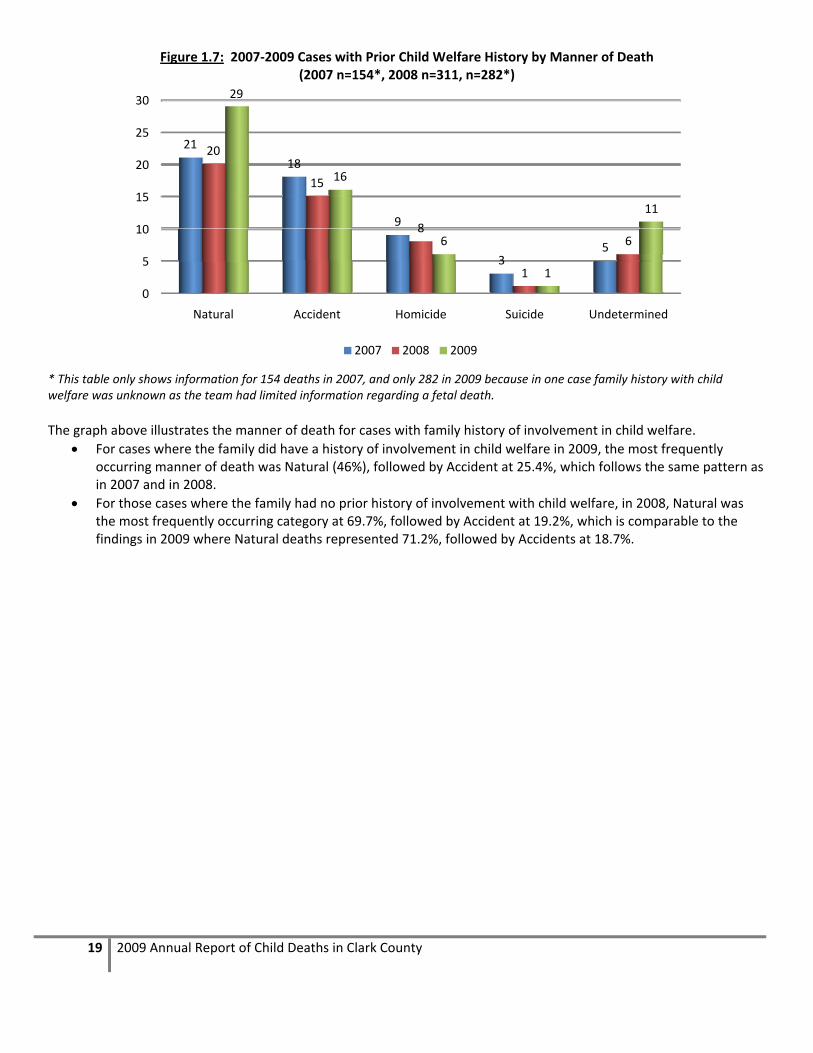
Figure 1.7: 2007‐2009 Cases with Prior Child Welfare History by Manner of Death (2007 n=154*, 2008 n=311, n=282*)
* This table only shows information for 154 deaths in 2007, and only 282 in 2009 because in one case family history with child welfare was unknown as the team had limited information regarding a fetal death.
The graph above illustrates the manner of death for cases with family history of involvement in child welfare.
For cases where the family did have a history of involvement in child welfare in 2009, the most frequently occurring manner of death was Natural (46%), followed by Accident at 25.4%, which follows the same pattern as in 2007 and in 2008.
For those cases where the family had no prior history of involvement with child welfare, in 2008, Natural was the most frequently occurring category at 69.7%, followed by Accident at 19.2%, which is comparable to the findings in 2009 where Natural deaths represented 71.2%, followed by Accidents at 18.7%.
0
5
10
15
20
25
30
Natural Accident Homicide Suicide Undetermined
21
18
9
35
20
15
8
1
6
29
16
6
1
11
2007 2008 2009

20 2009 Annual Report of Child Deaths in Clark County
SUBSTANTIATED ABUSE/NEGLECT DEATHS In addition to these statistics, which are collected at each CDR team meeting, the Clark County Department of Family Services (CCDFS) provided NICRP statistics regarding the 2009 child fatalities where their office received a death allegation of child abuse or neglect, and this allegation was substantiated. A report of abuse or neglect is “substantiated” when credible evidence of abuse/neglect has been found in accordance with criteria established in Nevada Revised Statutes and the Nevada Administrative Code 432B. In 2009, there were 18 substantiated death allegations of child abuse or neglect, this represents 6.4% of all child deaths in 2009. This is an increase from 2008 when only 3.9% of all child deaths had substantiated death allegations. Additional information regarding these cases is presented in the figures below.
Figure 1.8a: 2008 Manner of Death for Substantiated Death Allegations (2008 n=12)
Figure 1.8b: 2009 Manner of Death for Substantiated Death Allegations (2009 n=18)
In 2009 there was one undetermined death with a substantiated death allegation of abuse. All substantiated allegations for accidental deaths were due to nelgect in both 2008 and 2009. Similarly, all substantiated allegations for homicide deaths were due to abuse in 2008, however in 2009 two of the homicide cases had substantiated allegations of both abuse and neglect.
0
5
10
Natural Accident Homicide Undetermined
0 0
4
00
7
1 0
2008 Abuse 2008 Neglect
0
1
2
3
4
5
6
7
8
Natural Accident Homicide Undetermined
1
0
4
1
2
8
0 0
2
2009 Abuse 2009 Neglect 2009 Abuse and Neglect

21 2009 Annual Report of Child Deaths in Clark County
Figure 1.9: Counts by Type of Prior Family History with Child Protective Services (CPS) (2008 n=12, 2009 n=18)
In 2009 the distribution of cases looks very similar to that in 2008. In 2009 nearly half of these cases (8 of 18)did not have prior history with CPS. In two cases the history was regarding the decedent, and in another 6 cases the history was on the decedent and their sibling(s).
0
1
2
3
4
5
6
7
8
Child Sibling Child and Sibling
No Prior CPS History
1 1
3
7
2 2
6
8
2008
2009

22 2009 Annual Report of Child Deaths in Clark County
SECTION II: NATURAL DEATHS Natural deaths are those deaths that result from natural causes, which include; chronic or acute diseases, congenital defects, or genetic disorders. Major risk factors for natural deaths among children under one year include prematurity and low birth weight. For children over one year, the National Center for Child Death Review reports that natural causes are the second leading cause of death behind unintentional injuries. According to the National Center for Child Death Review, children under one year of age who die from causes other than SIDS usually die within the first 28 days of life. In 2006 and 2007 not all natural deaths were reviewed by the team. Only cases selected for review by a physician were reviewed. However, in 2007 some limited data, including basic demographic information and cause and manner, were
collected for those cases that were not selected for review. Beginning in 2008, all natural deaths were reviewed, including fetal deaths over 20 weeks gestation. This information is reflected in this section and accounts for the dramatic increase in the total number of natural deaths starting in 2008. Comparisons in data for Natural deaths are most useful between 2008 and 2009 data when all deaths were reviewed. This difference in data collection should be noted when reviewing this section. In 2009 the top three causes of natural deaths reviewed included:
Prematurity
Congenital Anomalies
Chronic Illness.
The focus of child death review is prevention, and therefore this section of the report will focus on Chronic Illness, Prematurity and SIDS, because although SIDS was not one of the leading causes of natural deaths, SIDS is a category of death for which a review is mandatory under Nevada Revised Statutes. Additionally, the majority of Natural deaths (77.8%) were among children less than one year old, which is just slightly less than in 2008. The following graph presents all the causes of natural deaths among cases reviewed in 2008 and 2009. As illustrated, the category “Prematurity” is again the leading cause of natural death in children at 40% which is a slight decrease compared to the 51% in 2008. Data for 2006 and 2007 are not presented in this section because only selected natural deaths were reviewed in those years. Starting in 2008 all child and fetal deaths over 20 weeks gestation were reviewed by the team, and therefore 2008 is a comparable year to 2009 for this manner of death.
23 2009 Annual Report of Child Deaths in Clark County
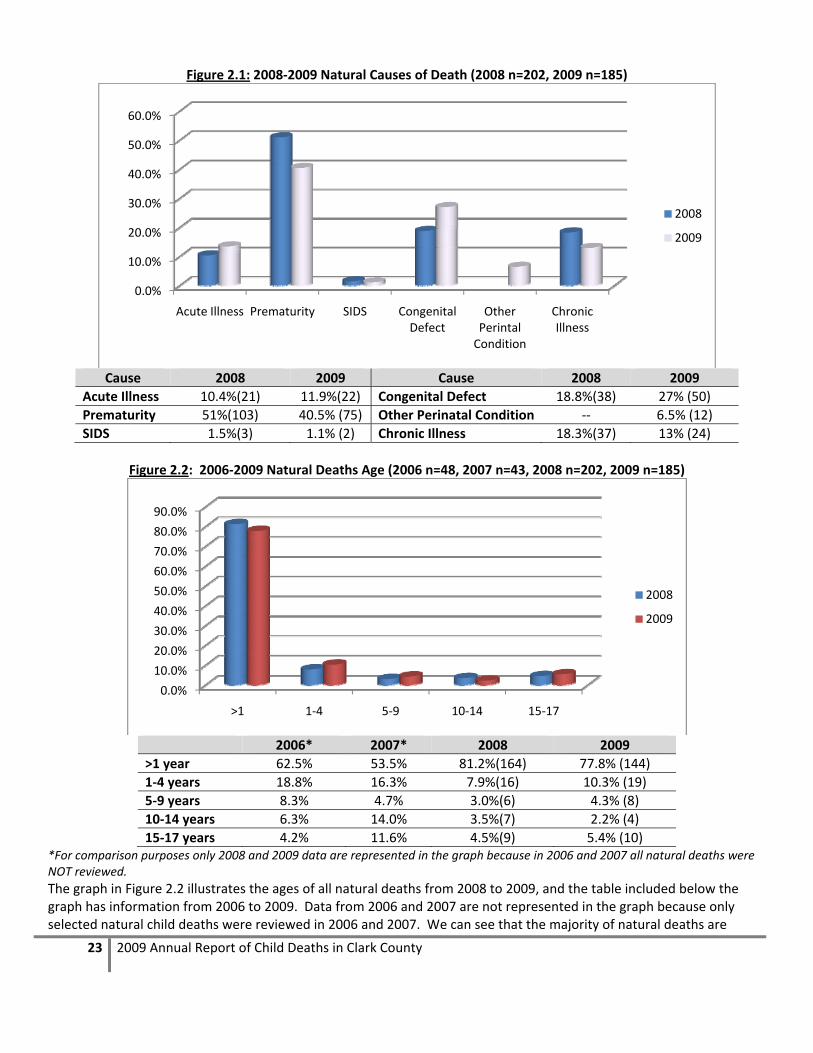
Figure 2.1: 2008‐2009 Natural Causes of Death (2008 n=202, 2009 n=185)
Cause 2008 2009 Cause 2008 2009
Acute Illness 10.4%(21) 11.9%(22) Congenital Defect 18.8%(38) 27% (50)
Prematurity 51%(103) 40.5% (75) Other Perinatal Condition ‐‐ 6.5% (12)
SIDS 1.5%(3) 1.1% (2) Chronic Illness 18.3%(37) 13% (24)
Figure 2.2: 2006‐2009 Natural Deaths Age (2006 n=48, 2007 n=43, 2008 n=202, 2009 n=185)
2006* 2007* 2008 2009
>1 year 62.5% 53.5% 81.2%(164) 77.8% (144)
1‐4 years 18.8% 16.3% 7.9%(16) 10.3% (19)
5‐9 years 8.3% 4.7% 3.0%(6) 4.3% (8)
10‐14 years 6.3% 14.0% 3.5%(7) 2.2% (4)
15‐17 years 4.2% 11.6% 4.5%(9) 5.4% (10) *For comparison purposes only 2008 and 2009 data are represented in the graph because in 2006 and 2007 all natural deaths were NOT reviewed.
The graph in Figure 2.2 illustrates the ages of all natural deaths from 2008 to 2009, and the table included below the graph has information from 2006 to 2009. Data from 2006 and 2007 are not represented in the graph because only selected natural child deaths were reviewed in 2006 and 2007. We can see that the majority of natural deaths are
0.0%
10.0%
20.0%
30.0%
40.0%
50.0%
60.0%
Acute Illness Prematurity SIDS Congenital Defect
Other Perintal Condition
Chronic Illness
2008
2009
0.0%
10.0%
20.0%
30.0%
40.0%
50.0%
60.0%
70.0%
80.0%
90.0%
>1 1‐4 5‐9 10‐14 15‐17
2008
2009

24 2009 Annual Report of Child Deaths in Clark County
among children less than one year of age from 2006 through 2009. However, we do see a slight decrease in the number of children under one year from 2008 to 2009 (81.2%in 2008 compared to 77.8% in 2009) and a slight increase in the number of young children between the ages of 1 and 4 years (7.9% in 2008 compared to 10.3% in 2009).
Figure 2.3: Natural Deaths ‐ Sex (2006 n=48, 2007 n=43, 2008 n=202, 2009 n=185)
Figure 2.3 shows that in both 2008 and 2009 more males than females died from natural causes with the distribution being very similar from year to year. The graph in Figure 2.4 below shows the racial and ethnic breakdown of the Natural deaths for 2008 and 2009. This table contains information for 2006 through 2009. Data from 2008 and 2009 are represented in the graph because all natural deaths were reviewed during both of these years and therefore can be compared. In 2009, 38.9% of natural deaths were White non‐Hispanic children, followed by 35% White Hispanic children and 16% Black children. This is an increase in the number of White Non‐Hispanic children, but a decrease in Hispanic and Black children who died from natural causes.
0.0%
10.0%
20.0%
30.0%
40.0%
50.0%
60.0%
2008 2009
57.4% 56.2%
42.6% 43.2%
Male
Female

25 2009 Annual Report of Child Deaths in Clark County
Figure 2.4: Natural Deaths – Race/Ethnicity (2006 n=48, 2007 n=43, 2008 n=202, 2009 n=185))
2006 2007 2008* 2009
White (Non‐Hispanic) 31.3%(15) 16.3%(7) 31.7% (64) 38.9% (72)
White (Hispanic) 20.8%(10) 37.2%(16) 36.6% (74) 35.1% (65)
Black 35.4%(17) 37.2%(16) 20.8% (42) 16.2% (30)
Native Hawaiian/Pacific Islander 4.2%(2) 0.0%(0) 2.0% (4) 1.6% (3)
Asian 4.2%(2) 4.7%(2) 4.5%(9) 2.7% (5)
Multiple Races/Other 5.7%(2) 4.7%(2) 3.0% (6) 5.4% (10) *In 2008 there were 3 cases of fetal deaths where race could not be identified, these cases are NOT represented in Figure 2.4
CHRONIC ILLNESS Less than one sixth (12.9%) of natural deaths reviewed were attributed to complications associated with some kind of chronic illness. The category of chronic illness includes many different illnesses, such as:
Anemia Cardiac Arrhythmia Leukemia
Asthma Cerebral Palsy Renal Failure
Brain Tumor Cystic Fibrosis
In 2009 twice as many males (66.7%) compared to females (33.3%) died from complications associated with chronic illness. The most frequent age category for chronic illness was 15 to 17 years (33.3%) followed by 1‐4 years (29.2%).
0.0%
10.0%
20.0%
30.0%
40.0%
2008 2009
31.7%
38.9%36.6% 35.1%
20.8%16.2%
2.0% 1.6%4.5% 2.7%3.0%5.4%
White (Non‐Hispanic) White (Hispanic)
Black Native Hawaiian/Pacific Islander
Asian Multiple Races/Other

26 2009 Annual Report of Child Deaths in Clark County
Figure 2.5: 2008‐2009 Natural Deaths ‐ Chronic Illness – Age in Years (2008 n=37, 2009 n=24)
Figure 2.6 displays the racial and ethnic breakdown for deaths associated with chronic illnesses in 2009. Nearly half of these cases were White Non Hispanic children (45.8%). This is fairly representative as overall 38.9% of all natural deaths reviewed were White Non Hispanic children.
Figure 2.6: 2008 Natural Deaths – Chronic Illness Race/Ethnicity (2008 n=37, 2009 n=24)
In more than one third of the cases (37.5%) the child had the condition since birth, while another 25% had the illness for a number of years. In 66.7% (16) of the cases death was expected as a result of the condition. 95.8% were receiving medical care for the chronic condition and a slightly smaller proportion of families were following the doctors’ prescribed care plan (87.5%). In only one case there was a known issue with accessing appropriate health care or following through with prescribed care plans. In this case the team determined that the caregiver was unskilled in giving the appropriate care.
0.0%
5.0%
10.0%
15.0%
20.0%
25.0%
30.0%
35.0%
< 1 1‐4 5‐9 10‐14 15‐17
29.7%
21.6%
13.5% 13.5%
21.6%
8.3%
29.2%
16.7%
12.5%
33.3%
2008
2009
0.0%
5.0%
10.0%
15.0%
20.0%
25.0%
30.0%
35.0%
40.0%
45.0%
50.0%
White Non‐Hispanic
White Hispanic Black Pacific Islander Asian Other/Multiple Races
35.1%
27.0%
21.6%
5.4% 5.4% 5.4%
45.8%
37.5%
8.3%
0.0% 0.0%
8.3%
2008
2009

27 2009 Annual Report of Child Deaths in Clark County
PREMATURITY About 40.5% of all natural deaths reviewed in 2009 were caused by complications of prematurity, a decrease from 51% in 2008. As expected, all children in this category were less than one year of age at the time of their death. Again in 2009 there were slightly more males (53.3%) than females (46.7%) which was similar to the distributions in 2007 and in 2008. The most frequently occurring racial/ethnic category was White Non Hispanic infants (40%), followed by White Hispanic infants (34.7%). This still indicates a slight disparity among White Hispanic children because they represent only 33.2% of all child deaths. In 2009 13.3% of all deaths due to prematurity were Black children, which is slightly less than the previous year. This is a slight deviation from national statistics that indicate that both Black and Hispanic infants are more likely than White infants to be born premature (March of Dimes, 2008).
Figure 2.7: 2008‐2009 Natural Deaths – Prematurity (2008 n=103, 2009 n=75)
Gestational age was known in 65.3% of cases (n=49) where the cause was listed as prematurity, ranging from 20 to 37 weeks. Only 34.7% (n=28) of the cases indicated that the mother received prenatal care. In 24% (n‐18) of the cases the mother had known medical complications or infections. In only 2.7% (n=2) the mother admitted to smoking tobacco during the pregnancy, and in only 1 case there was a known history of illicit drug use by the mother. In 2009 the age of the mother was known in 92% of cases (n=69), and ranged from 14 to 40 years. Since maternal age is a factor that influences the likelihood of complications and premature birth this is an important variable to track. The graph below illustrates the age categories of mothers of infants who died from complications associated with prematurity in 2008 and 2009. Note that in 2008 mother’s age was only known in 58% of these cases and this year it is known in nearly all cases (92%).
0.0%
5.0%
10.0%
15.0%
20.0%
25.0%
30.0%
35.0%
40.0%
White Non‐Hispanic
White Hispanic Black Asian Other/Multiple Races
Unknown
30.1%
35.0%
24.3%
5.8%3.9%
1.0%
40.0%
34.7%
13.3%
5.3% 5.4%
0.0%
2008
2009

28 2009 Annual Report of Child Deaths in Clark County
Figure 2.8: 2008‐2009 Natural Deaths – Prematurity – Mother’s Age in Years (2008 n=103, 2009 n=75)
Figure 2.9: 2006‐2009 Prematurity – Child Welfare Involvement (2006 n=7, 2007 n=13, 2008 n=103, 2009 n=75)
2006 2007 2008 2009
Count % Count % Count % Count %
Open Case at Time of Death 2 28.6% 6 46.2% 2 1.9% 1 1.3%
History of Child Welfare Involvement 5 71.4% 9 69.2% 5 4.9% 11 14.7
In previous years only certain natural deaths were selected to be reviewed, this included all cases with a history of child welfare involvement. In 2008 all child deaths were reviewed so when looking at child welfare involvement across the past three years it is important to look at the counts and not just the percentages. Percentages are calculated out of total reviewed deaths due to prematurity, since in 2006 and 2007 only selected cases were reviewed (and all cases with child welfare history were reviewed) those cases would represent a greater proportion of the total. In 2008 and 2009 all natural deaths were reviewed and therefore we can see that of all natural deaths due to prematurity 14.7% (compared
0.0%
5.0%
10.0%
15.0%
20.0%
25.0%
30.0%
35.0%
40.0%
45.0%
< 15 15‐20 21‐26 27‐32 33‐38 39‐44 Unknown
0.0%
17.5%
8.7%
17.5%
8.7%5.8%
41.7%
4.0%
17.3%
24.0%
28.0%
17.3%
1.3%
8.0%
2008
2009
0
2
4
6
8
10
12
Open Case at Time of Death History of Child Welfare Involvement
2
56
9
2
5
1
11
2006 2007 2008 2009

29 2009 Annual Report of Child Deaths in Clark County
to 4.9% in 2008) had any family history of involvement with child welfare and an even smaller percentage (1.3% in 2009 and 1.9% in 2008) had an open case at the time of their death.
SUDDEN INFANT DEATH SYNDROME (SIDS) In 2008 and in 2009, all child deaths were reviewed and so SIDS was no longer one of the top three leading natural causes of death for children less than one year of age. In addition, in 2009 SIDS was at its lowest in the past three years.
Figure 2.10: 2006‐2009 Natural Deaths – SIDS Cases (counts)
According to the National Center for Child Death Review:
“Sudden Infant Death Syndrome (SIDS) is the sudden death of an infant under one year of age which remains unexplained after completion of a full autopsy, examination of the death scene and review of the baby’s health history. If any of these three steps are not conducted, a SIDS diagnosis should not be made. A diagnosis of SIDS reflects the clear admission by medical examiners that an infant’s death remains completely unexplained.” (http://www.childdeathreview.org/causesSI.htm, 2008).
In 2009 there were only 2 deaths due to SIDS, and one was a male, the other female. This represents the first time in four years that there have been equal proportions of males and females.
Figure 2.11: 2006‐2009 Natural Deaths due to SIDS – Sex (2006 n=7, 2007 n=6, 2008 n=3, 2009 n=2)
Figure 2.12 illustrates the race and ethnicity of child deaths due to SIDS. Because there were so few SIDS deaths in both 2008 and 2009 it is difficult to make any definitive statements regarding race and ethnicity. In 2009 there were only two cases of SIDS and both of those were Black children resulting in the 100% in the graph below. According to national statistics Black male children are most frequently victims of SIDS, therefore with such small numbers it is not surprising that both cases were Black children.
0
2
4
6
8
2006 2007 2008 2009
76
32
0.0%
20.0%
40.0%
60.0%
80.0%
Male Female
71.4%
28.6%
66.7%
33.3%
66.7%
33.3%50.0% 50.0% 2006
2007
2008
2009

30 2009 Annual Report of Child Deaths in Clark County
Figure 2.12: 2006‐2008 Natural Deaths Due to SIDS – Race/Ethnicity (2006 n=7, 2007 n=6, 2008 n=3, 2009 n=2)
2006 2007 2008 2009
White 42.9% (3) ‐‐ ‐‐ ‐‐
Hispanic 14.3% (1) ‐‐ ‐‐ ‐‐
White (Non‐Hispanic) ‐‐ 16.7% (1) 66.7% (2) 0%
White (Hispanic) ‐‐ 33.3% (2) 0% 0%
Black 42.9% (3) 50.0% (3) 33.3% (1) 100%(2) NOTE: Dashed lines (‐‐) indicate that these data were not collected in that year.
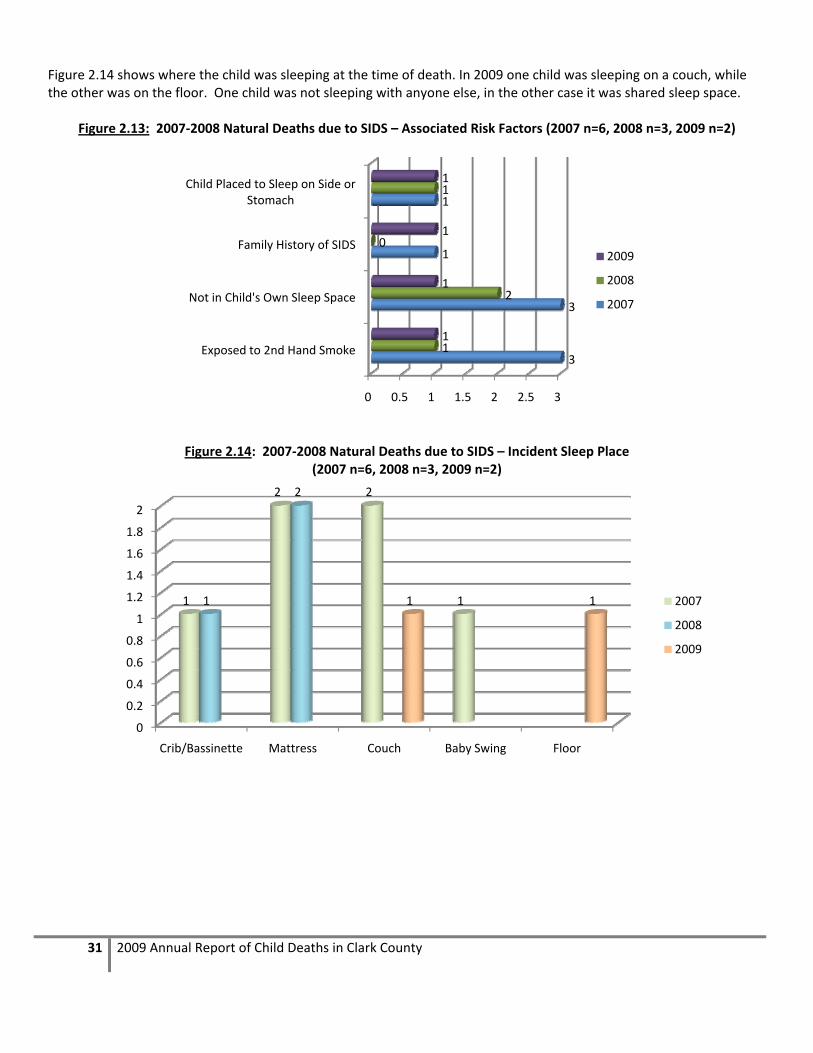
Figure 2.13 illustrates associated risk factors for SIDS. In both cases in 2009 the child was in a sleeping space. In one case the child was placed to sleep on the stomach, and in one case the child was not in his/her own sleep space.
0
1
1
2
2
3
3
4
2006 2007 2008 2009
3
0 0
1
0 0
1
2
0
2
0 0
3 3
1
2
White Hispanic White (Non‐Hispanic) White (Hispanic) Black
31 2009 Annual Report of Child Deaths in Clark County
Figure 2.14 shows where the child was sleeping at the time of death. In 2009 one child was sleeping on a couch, while the other was on the floor. One child was not sleeping with anyone else, in the other case it was shared sleep space.
Figure 2.13: 2007‐2008 Natural Deaths due to SIDS – Associated Risk Factors (2007 n=6, 2008 n=3, 2009 n=2)
Figure 2.14: 2007‐2008 Natural Deaths due to SIDS – Incident Sleep Place (2007 n=6, 2008 n=3, 2009 n=2)
0 0.5 1 1.5 2 2.5 3
Exposed to 2nd Hand Smoke
Not in Child's Own Sleep Space
Family History of SIDS
Child Placed to Sleep on Side or Stomach
3
3
1
1
1
2
0
1
1
1
1
1
2009
2008
2007
0
0.2
0.4
0.6
0.8
1
1.2
1.4
1.6
1.8
2
Crib/Bassinette Mattress Couch Baby Swing Floor
1
2 2
11
2
1 1 2007
2008
2009

32 2009 Annual Report of Child Deaths in Clark County
NATURAL DEATHS: RECOMMENDATIONS FOR PREVENTION Natural deaths are some of the most difficult cases in which to identify preventative factors that could lead to recommendations for change to prevent future child deaths. By definition, natural deaths are those that occur from natural causes, leaving little room for prevention. The data does present, however, several areas that warrant some attention in regard to prevention efforts.
1. CONTINUE TO IMPROVE DATA COLLECTION AND RESEARCH ON CHILD DEATHS RELATED TO PREMATURITY. Again in 2009 the majority (77.8%) of natural deaths occurred among children less than one year of age. This represents a slight decrease from the 81.2% in 2008. Again this year there were a high proportion of deaths attributed to complications of prematurity (40.5%) which again provides support for improvements and continued research and tracking regarding prenatal care, parental substance abuse, exposure to environmental pollutants, etc.
2. IMPROVE ACCESS AND OUTREACH FOR ADEQUATE PRENATAL CARE, PARTICULARLY FOR YOUNG WOMEN. In 2009 the team worked with the Southern Nevada Health District to screen birth records for all cases reviewed to collect data on the ages of decedent’s parents. Age of the mother was known in 92% (n=69) of prematurity cases, which is marked improvement from 58% in 2008. 22% of these mothers were 20 years old or younger and another 26% were between the ages of 21 and 26 years. Because nearly half of all of these mothers were 26 years or younger, this may point to a need to focus health education regarding prenatal care on younger mothers. Statistically, teenage mothers have a much higher proportion of low birth weight babies and this again points to the importance of prenatal care, as it is a key factor in preventing preterm births and low birth weight babies. Prenatal care is also important in identifying problems and lifestyles that can increase the risk of preterm labor and birth.
3. IMPROVE PARENT EDUCATION ABOUT PROPER MANAGEMENT OF COMMON CHRONIC ILLNESSES IN CHILDREN. This year one of the leading causes of natural deaths was chronic illness (13%). This category included those children who suffered from asthma, diabetes and cerebral palsy. These chronic conditions, while dangerous, can be managed with proper medical care. For the fourth year in a row we continue to see children die from complications associated with these conditions. Simple monitoring and maintaining regimented medication administration can allow children with both asthma and diabetes to live long and healthy lives. Increased educational campaigns should be created and directed toward parents to remind them of the severity of these illnesses if not carefully monitored.
33 2009 Annual Report of Child Deaths in Clark County
SECTION III: ACCIDENTAL DEATHS
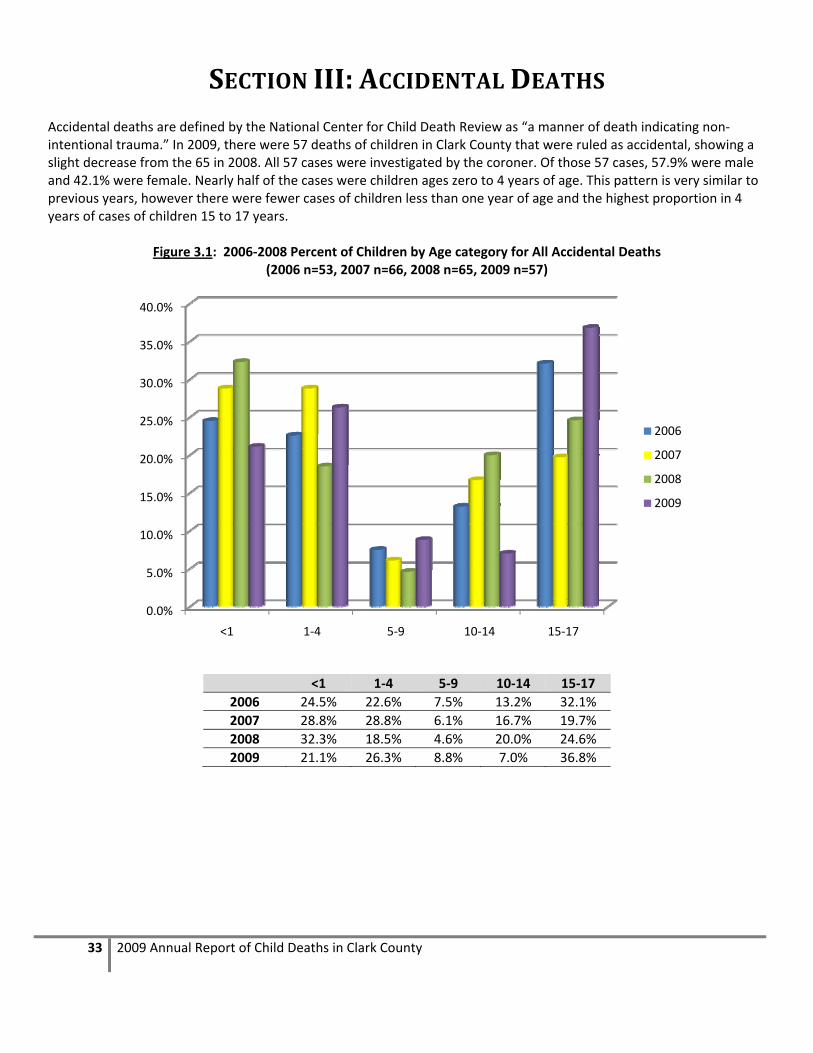
Accidental deaths are defined by the National Center for Child Death Review as “a manner of death indicating non‐intentional trauma.” In 2009, there were 57 deaths of children in Clark County that were ruled as accidental, showing a slight decrease from the 65 in 2008. All 57 cases were investigated by the coroner. Of those 57 cases, 57.9% were male and 42.1% were female. Nearly half of the cases were children ages zero to 4 years of age. This pattern is very similar to previous years, however there were fewer cases of children less than one year of age and the highest proportion in 4 years of cases of children 15 to 17 years.
Figure 3.1: 2006‐2008 Percent of Children by Age category for All Accidental Deaths (2006 n=53, 2007 n=66, 2008 n=65, 2009 n=57)
<1 1‐4 5‐9 10‐14 15‐17
2006 24.5% 22.6% 7.5% 13.2% 32.1%
2007 28.8% 28.8% 6.1% 16.7% 19.7%
2008 32.3% 18.5% 4.6% 20.0% 24.6%
2009 21.1% 26.3% 8.8% 7.0% 36.8%
0.0%
5.0%
10.0%
15.0%
20.0%
25.0%
30.0%
35.0%
40.0%
<1 1‐4 5‐9 10‐14 15‐17
2006
2007
2008
2009

34 2009 Annual Report of Child Deaths in Clark County
Nearly half of all accident victims were White Non Hispanic (45.6%), nearly one third were White Hispanic, followed by another 12.3% that were Black. The remaining cases were children who were multiracial, American Indian and Asian. This distribution is very similar to those seen in previous years. In more than one quarter (28.7%) of accidental cases the child’s family had some history with the child welfare system, making these cases mandatory reviews. In 19.3% of accidents, the child welfare history was regarding the decedent. In 3.5% of all accidents there was a child welfare case open at the time of the child’s death. In 68.4% (n=39) of cases supervision was needed, but in 38% of those cases the child was not supervised at the time of death. For the majority of cases (49.1%) the child’s biological parent was the person responsible for supervision at the time of the child’s death. Other responsible supervisors included grandparents, friends, or adoptive parents. In 10.5% of all accidents reviewed, the supervisor was 23 years of age or younger. The majority of accidental deaths in 2008 occurred either in the child’s home (47.4%) or in a roadway, driveway or sidewalk (28%). Additionally, there were five accidental deaths where children from out of state (or country) died while in Clark County. These children were from Idaho, Utah, Arizona, and one from France. For the fourth year in a row the leading cause of accidental deaths were motor vehicle accidents (MVA) at 26.3% of all accidental deaths, however by a smaller margin than the last three years. Following MVAs were accidental poisoning/overdose cases at 22.8%, then suffocations (choking or infant rollover deaths) and drowning tied at 19.3% of the all accidental deaths. This is the second time that accidental poisoning has been one of the leading causes of accidental child deaths, and the first time that it out ranks suffocation as a leading cause of accidental death. The percentage of deaths related to accidental poisoning is more than four times as high as 2007 and an increase of 7.4% from 2008. These cases were primarily accidental drug overdoses in youth age 15 to 17 years. These will be examined in more detail in the following sections. A graph illustrating the comparison of all causes of accidental deaths from 2006 to 2009 is displayed in Figure 3.2 below.

35 2009 Annual Report of Child Deaths in Clark County
Figure 3.2: 2006‐2009 Percent of Accidental Injury Deaths by Cause (2006 n=53, 2007 n=66, 2008 n=65, 2009 n=57)
2006 2007 2008 2009
Motor Vehicle and Other Transport 46.0% 41.9% 29.2% (19) 26.3% (15)
Suffocation or Strangulation 18.0% 22.6% 23.1% (15) 19.3% (11)
Drowning 18.0% 17.7% 15.4% (10) 19.3% (11)
Fall or Crush 8.0% 4.8% 6.2% (4) 3.5% (2)
Poisoning 6.0% 4.8% 15.4% (10) 22.8% (13)
Weapon 2.0% 4.8% 1.5% (1) 5.3% (3)
Fire, Burn or Electrocution 2.0% 3.2% 0% 0%
Complications of Maternal Drug Use 0% 0% 4.6% (3) 0%
Acute Illness* 0% 0% 1.5% (1) 3.5% (2)
Blunt Force Trauma** 0% 0% 3.1% (2) 0% *There was one case in 2008 ruled an accident where a child went into cardiac arrest while on a roller coaster. In 2009, one case was a child with cerebral palsy who died from acute pneumonia; the other case was due to an infection from a misplaced gastronomy tube. ** There were 2 cases in 2008 coded as “blunt force trauma” due to fatal attacks by dogs.
Prosecution was pending at the time of review in 24.6% of cases (n=14). In just over one quarter of the cases (28.1% or 16 cases), CPS took action as a result of the death. Of those 16 cases, CPS substantiated abuse or neglect in eight of them and in five cases the surviving children were removed from the home as a result of the death.
0.0%
5.0%
10.0%
15.0%
20.0%
25.0%
30.0%
35.0%
40.0%
45.0%
50.0%
2006 2007 2008 2009
Motor Vehicle and Other Transport
Suffocation or Strangulation
Drowning
Fall or Crush
Poisoning
Weapon
Fire, Burn or Electrocution
Complications of Maternal Drug Use

36 2009 Annual Report of Child Deaths in Clark County
MOTOR VEHICLE ACCIDENTS There were 15 accidental deaths due to motor vehicle accidents1 (MVAs) in Clark County in 2009, a nearly 39% decrease from the high of 26 cases in 2007. In 2009 more males (60%) died in MVAs than females (40%), which is a similar trend to 2006 and 2007 where nearly equal numbers of males and females died in MVAs. The majority (53.3% or n=8) of decedents were White Non Hispanic and 26.7% (n=4) were White Hispanic. This year none of victims’ families had a prior history with the child welfare system and only one decedent had a juvenile justice history. About two thirds (66.7%) were between the ages of 15‐17, and nearly three quarters (73.4%) were over the age of 10. In 2009 there was one case of a child less than one year old, two cases between one and four years and only one case of a child between the ages of 5 and 9 years. The most dramatic increase in 2009 was among those victims between 15 and 17 years old, which for the first time represented more than half (66.7%) of all MVAs.
Figure 3.3: 2006‐2008 Percent of Motor Vehicle Accident Victims by Age Category
(2006 n=23, 2007 n=26, 2008 n=19, 2009 n=15))
<1 year 1‐4 years 5‐9 years 10‐14 years 15‐17 years
2006 17.4% (4) 8.7% (2) 8.7% (2) 21.7% (5) 43.5% (10)
2007 3.8% (1) 19.2% (5) 11.5%(3) 26.9% (7) 38.5% (10)
2008 5.3% (1) 0% (0) 10.5% (2) 47.4% (9) 36.8% (7)
2009 6.7% (1) 13.3% (2) 6.7% (1) 6.7% (1) 66.7% (10)
In all accidents, there were either one or two vehicles (vehicles include golf carts, bicycles, and watercrafts) involved. Approximately 80% of cases involved only one vehicle. The majority of accidents occurred on a highway (60%) which is similar to 2007, but differs from 2008 when the majority occurred on city or residential streets. Primary causes of accidents included poor tires (20%), recklessness (13.3%), driver inexperience (13.3%), and driver distraction (13.3%).At the time of the accident, 13.3% (n=2) of drivers were alcohol or drug impaired, and this was listed as a secondary cause of the accident.
1 In 2009 there were a total of 16 motor vehicle incidents, however only 15 were deemed accidental, in one case it was determined
to be a homicide. Therefore in this section on the 15 accidental deaths are described and the remaining case will be discussed in the
homicide section of this report.
0.0%
10.0%
20.0%
30.0%
40.0%
50.0%
60.0%
70.0%
<1 1‐4 5‐9 10‐14 15‐17
2006
2007
2008
2009

37 2009 Annual Report of Child Deaths in Clark County
Figure 3.4: Primary Cause of Motor Vehicle Accidents (2006 n=23, 2007 n=26, 2008 n=19, 2009 n=15)
2006 2007 2008 2009
Speeding Over the Limit 4.3% 26.9% 10.5% (2) 13.3% (2)
Recklessness 9.0% 11.5% 15.8% (3) 13.3% (2)
Driver Inexperience ‐‐ 7.7% 0% (0) 13.3% (2)
Poor Sight Line 9.0% 7.7% 0% (0) 0% (0)
Drug & Alcohol Use 13.0% 3.8% 5.3% (1) 6.7% (1)
Unsafe Speed for Conditions 9.0% 0% (0) 0% (0) 6.7% (1)
Ran Stop Sign or Red Light ‐‐ ‐‐ 15.8% (3) 0% (0)
Back Over ‐‐ ‐‐ 10.5% (2) 6.7% (1)
Fatigue ‐‐ ‐‐ 10.5% (2) 6.7% (1)
Driver Distraction ‐‐ ‐‐ 10.5% (2) 13.3% (2)
Other* ‐‐ ‐‐ 11.1% (4) 20% (3) *Other causes included poor tires, other driver error, and pedestrian running into the street
In nearly all (73.3%) of cases, the child’s vehicle was a car, van, SUV or truck. 13.3% of cases involved an RV, and in another 13.3% (n=2) of cases the child was not in a vehicle (one was riding a bicycle, the other walking on the street). In 80% of cases, the child’s vehicle was at fault for the incident. In two cases, the decedent was the driver of the vehicle involved in the accident, and in both cases the decedents did have a valid driver’s license, and one driver was under the influence at the time of the accident. For all other MVAs, 80% of the drivers had valid licenses, and only one of those drivers were under the influence at the time of the accident. Nearly three fourths of decedents (73.3%, n=11) were passengers. Of those passengers killed, 27% were younger than age 10, and the majority (72.7%) were between the ages of 15‐17. In the passenger fatalities, 72.7% of these accidents
0.0% 5.0% 10.0% 15.0% 20.0% 25.0% 30.0%
Unsafe Speed for Conditions
Speeding Over the Limit
Recklessness
Ran Stop Sign or Red Light
Poor Sight Line
Other*
Fatigue
Drug & Alcohol Use
Driver Inexperience
Driver Distraction
Backover
2009
2008
2007
2006

38 2009 Annual Report of Child Deaths in Clark County
were single car accidents, and the other 27.3% were two‐car accidents. In 91% of these cases, the child’s vehicle was at fault for the accident. Primary causes of accidents were attributed to poor tires (27.3%) and driver inexperience (18.2%), driver distraction (18.2%), and recklessness (18.2%). Other causes included drug/alcohol use and fatigue/sleeping. In 27.3% of cases, the driver responsible was under age 21, and in one of the cases the age of the responsible driver was unknown to the team at the time of the review. In nearly half of these cases (45.5%) the decedent was not wearing a seatbelt. The driver was under the influence in only one case. Again in 2009 there were no MVA fatalities where children under the age of ten were sitting in the front seat, which is a continued improvement from 2007 where 25% of those fatalities involved children ages 5‐9 in the front seat. In 2009 there was only one infant (less than one year) that died in a MVA and the decedent was properly restrained in a car seat.
Figure 3.5: 2007‐2009 Circumstances of MVA Passenger Fatalities (2007 n=15, 2008 n=8, 2009 n=11)
2007 2008 2009 2007 2008 2009
Infants/Toddlers Birth‐4 Without Car seat 100.0% 0%
9.1% (1)
Percent of Single Car Accidents 60.0%
50.0% (4) 72.7% (8)
Decedents Age 5‐17 Without Seatbelt 92.0%
50.0% (4)
45.5% (5)
Driver Under the Influence 26.7%
37.5% (3) 9.1% (1)
Responsible Driver Under Age 21 86.7%
50.0% (4)
27.3% (3)
Children Age 5‐9 in Front Seat 25.0% 0% 0%
Child's Vehicle at Fault for Accident 73.3%
75.0% (6)
90.9% (10)
* This percentage represents the total number of all MVA fatalities (n=11 of 15) where the child was the passenger.
In only two cases (13.3%) of motor vehicle accident cases, the decedent was a pedestrian. One of the pedestrian fatalities was a child between one and four years, while the other was a child between the ages of 10 and 14 years. One child was on a bicycle, and the other was walking. In both cases the child was not at fault for the incident. One case occurred on a residential street while the other was in a driveway. Regarding the case where the child was on a bicycle the child was wearing a helmet. Primary causes of these accidents included a driver speeding over the limit and hitting a child on a bicycle, and the other incident was a child who was backed over by a vehicle.
0.0% 20.0% 40.0% 60.0% 80.0% 100.0%
Infants/Toddlers Birth‐4 Without Carseat
Decedents Age 5‐17 Without Seatbelt
Responsible Driver Under Age 21
Child's Vehicle at Fault for Accident
Percent of Single Car Accidents
% of All MVA Decedents*
Driver Under the Influence
Children Age 5‐9 in Front Seat
2009
2008
2007

39 2009 Annual Report of Child Deaths in Clark County
Figure 3.6: 2007‐2009 Circumstances of MVA Pedestrian Fatalities (2007 n=8, 2008 n=7, 2009 n=2))
2007 2008 2009
Helmet Needed but Not Worn 2 4 0
Decedent Walking with Other People 5 1 0
Occurred on City/Residential Street 5 5 1
Other Vehicle Responsible for Accident 3 2
2
Decedent Riding Bicycle 2 4 1
Child at fault for Accident 1 5 0
0 1 2 3 4 5 6
Helmet Needed but Not Worn
Decedent Walking with Other People
Occurred on City/Residential Street
Other Driver Responsible for Accident
Decedent Riding Bicycle
Child at Fault for Accident
2009
2008
2007

40 2009 Annual Report of Child Deaths in Clark County
DROWNING In 2009, drowning tied with accidental suffocation as the third leading cause of accidental deaths among children in Clark County, with 11 deaths in this category. This is still higher than the low in 2006 of 9 drowning deaths; however it is the same number as in 2007, and one more than in 2008. Again this year, the vast majority (72.7%) of these children were ages 1 to 4, indicating that prevention efforts should focus on those children under 5 years of age.
Figure 3.7: 2006‐2009 Accidental Drowning – Age (2006 n=9, 2007 n=11, 2008 n=10, 2009 n=11)
2006 2007 2008 2009
< 1 year 0.0% 9.1% 20.0% (2) 9.1% (1)
1‐4 years 55.6% 81.8% 80.0% (8) 72.7% (8)
5‐9 years 22.2% 0.0% 0.0% 9.1% (1)
15‐17 years 22.2% 9.1% 0.0% 9.1% (1)
Similar to previous years, in 2009 nearly all drowning cases occurred in a pool, hot tub or spa (72.7%), while the remaining 18.2% of cases were in a bathtub, and one case was in a bucket (9.1%).
Figure 3.8: 2006‐2009 Accidental Drowning Type of Water (2007 n=11, 2008 n=10, 2009 n=11)
In 2009 the distribution of male and female drowning victims is nearly an even split, with 45.5% male and 54.5% female, which is consistent with most prior years.
0.0%
10.0%
20.0%
30.0%
40.0%
50.0%
60.0%
70.0%
80.0%
90.0%
< 1 1‐4 5‐9 15‐17
2006
2007
2008
2009
0.0%
20.0%
40.0%
60.0%
80.0%
100.0%
Pool, Hot Tub, Spa Bathtub Other
90.9%
9.1%0.0%
80%
20%
0.0%
72.7%
18.2%
9.1%
2007
2008
2009

41 2009 Annual Report of Child Deaths in Clark County
Figure 3.9: 2006‐2009 Accidental Drowning – Sex (2006 n=9, 2007 n=11, 2008 n=10, 2009 n=11)
The race/ethnicity data for drowning victims in 2009 looks very similar to the distribution of that in 2007 and 2008. However, there were no Black children who drown in 2007, but 10% of the drowning cases in 2008, and 18.2% in 2009 were Black children. This distribution is displayed in Figure 3.10.
Figure 3.10: 2006‐2009 Accidental Drowning – Race/Ethnicity (2006 n=9, 2007 n=11, 2008 n=10, 2009 n=11)
In 2009 the majority (63.3%, n=7) of drowning cases occurred at the child’s home. The remaining drowning fatalities occurred at a friend’s home (27.3%). One case in 2009 occurred at a public or apartment pool (9.1% n=1).
0.0%
10.0%
20.0%
30.0%
40.0%
50.0%
60.0%
70.0%
80.0%
90.0%
Male Female
55.6%
44.4%
81.8%
18.2%
50.0% 50.0%45.5%
54.5%2006
2007
2008
2009
0.0%
10.0%
20.0%
30.0%
40.0%
50.0%
60.0%
70.0%
White (Non‐Hispanic)
White (Hispanic) Black Asian
63.6%
36.4%
60.0%
30.0%
10.0%
45.5%
27.3%
18.2%
9.1%
2007
2008
2009

42 2009 Annual Report of Child Deaths in Clark County
Figure 3.11: 2007‐2009 Accidental Drowning – Drowning Location (2007 n=11, 2008 n=10, 2009 n=11)
In three of the pool drowning deaths the child had been supervised swimming in the pool within the previous 24 hours. Most frequently (72.7%) the biological parent was the supervisor at the time of the incident, followed by “grandparent” at 18.2%. In 36.4% of cases the child was last seen in the house and was subsequently left unsupervised between three and thirty minutes. The average period of elapsed time was around 12 minutes since the child was last seen. In all cases the child was not wearing a floatation device and in two cases there was a gathering or event going on at the same time as the incident. Figure 3.12 below shows that in 50% of cases occurring in either a pool or spa (4 of the 8 cases), no barrier existed to prevent access to the pool or spa. In the remaining 4 cases, 2 had a gate and 2 cases had either a fence or a door blocking entrance to the pool.
0.0%
10.0%
20.0%
30.0%
40.0%
50.0%
60.0%
70.0%
80.0%
Child's Home Relative's Home Friend's Home Public/Apartment Pool
54.5%
27.3%
18.2%
0.0%
80%
20%
0% 0%
63.3%
0.0%
27.3%
9.1%
2007
2008
2009

43 2009 Annual Report of Child Deaths in Clark County
Figure 3.12: 2007‐2009 Accidental Drowning – Barriers to Pool/Spa* (2007 n=10, 2008 n=8, 2009 n=8)
*This table represents only those cases where the drowning occurred in a pool/spa
2007 2008 2009
No Barriers Existed 60% (6) 37.5% (3) 50% (4)
Fence 10% (1) 12.5% (1) 12.5% (1)
Gate 20% (2) 12.5% (1) 25% (2)
Door 10% (1) 37.5% (3) 12.5%(1)
None of these pools had alarms or covers as a barrier to entrance. Children were able to breach existing barriers to the pools in all of the cases where barriers existed. In all of these cases barriers were working properly, however they were either left open or unlocked. Two of the families of the drowning victims had a history of involvement in the child welfare system.
0%
10%
20%
30%
40%
50%
60%
70%
No Barriers Existed Fence Gate Door
60%
10%
20%
10%
37.5%
12.5% 12.5%
37.5%
50.0%
12.5%
25.0%
12.5%
2007
2008
2009

44 2009 Annual Report of Child Deaths in Clark County
Figure 3.13: Items Relative to Drowning Prevention (2006 n=9, 2007 n=11, 2008 n=10, 2009 n=11)
2006 2007 2008 2009
No Barriers in Place Around Pool* 33.3% 60.0% 62.5% (5) 50% (4)
Incident at Child's Home 33.3% 54.5% 80.0% (8) 63.6% (7)
Incident at Friend/Relative's Home 44.4% 45.5% 20.0% (2) 27.3% (3)
Child Knew How to Swim 33.3% 9.1% 0.0% 0.0%
Child Wearing a Floatation Device 11.1% 0.0% 0.0% 0.0% *This percentage is calculated out of the total number of drowning cases that occurred in a pool or spa
Figure 3.13 above illustrates the comparison between 2006, 2007, 2008, and 2009 in terms of some of the items relative to drowning prevention. Note in interpreting this figure that categories are NOT mutually exclusive, meaning that one child can fall into more than one category. In 2007, compared to 2006, there were nearly twice as many drowning fatalities where no barriers to the pool existed, and there were slightly more in 2008 (62.5%), and we see a slight decrease in 2009 at 50%. Additionally, the number of incidents occurring at the child’s home has increased from 2006 to 2009, but we see a decrease (n=1) from 2008 to 2009. This supports the prevention recommendation to promote pool safety for families with pools or spas at their homes.
0.0% 10.0% 20.0% 30.0% 40.0% 50.0% 60.0% 70.0% 80.0% 90.0%
No Barriers in Place Around Pool
Incident at Child's Home
Incident at Friend/Relative's Home
Child Knew How to Swim
Child Wearing a Floatation Device
2009
2008
2007
2006

45 2009 Annual Report of Child Deaths in Clark County
The following map illustrates that most drowning incidents occurred in the north central zip codes in Clark County (shown in blue on the map). As was the case in 2006 through 2008, most drowning cases occurred in the older areas of Las Vegas and Henderson, showing support for the movement to improve safety barriers for existing pools that were not required to install fences, alarms, or other safety barriers due to county regulations for new pools which began in 2002.
Child Death Review Team in Clark County 2009 Incidents of Drowning by Zipcode with
Drowning Victims’ Zipcode of Residence
Created: August 4, 2010

46 2009 Annual Report of Child Deaths in Clark County
SUFFOCATION In 2008, there were 11 accidental suffocations in Clark County, an increase from the nine that occurred in 2006, and decrease from 2007 (n=14) and 2008 (n=15). All but one of the cases involved infants less than one year old. Two thirds of the decedents (63.6%) were female, and 36.4% were male, which is consistent with 2008 data. Slightly less than half (45.5%) were White Hispanic, with 36.4% listed as White Non‐Hispanic. In Figure 3.13 below we see a sharp decrease in the number of accidental suffocation deaths for Black children from 40% in 2008 to less than 10% in 2009.
Figure 3.13: Percentage of Accidental Suffocations by Race/Ethnicity (2006 n=9, 2007 n=14, 2008 n=15, 2009 n=11)
** Race/Ethnicity data were collected differently in 2006 and 2007. In 2006, data did not differentiate between White (Non‐Hispanic) and White (Hispanic).
2006 2007 2008 2009 2006 2007 2008 2009
White 11.1% ‐‐ ‐‐ ‐‐ Pacific Islander 11.1% 0% 0% 0%
White (Non‐Hispanic) ‐‐ 28.6% 26.7% (4) 36.4%(4) Asian 22.2% 0% 0% 0%
White (Hispanic) ‐‐ 28.6% 13.3% (2) 45.5%(5) Multi‐Racial 0% 20% (3) 9.1% (1)
Black 55.6% 42.9% 40.0% (6) 9.1% (1)
None of these decedents suffered from a disability, none had a chronic illness, and none were acutely ill in the two weeks preceding their death. In 72.7% of cases, the primary caregiver at the time of the incident was a parent. In all but one case, the mother had no prior child deaths. Mother’s ages ranged between 16 and 42 years, with the most frequently occurring age being 28 years. Fathers ranged in age from 20 to 37 years and the most frequently occurring age was 28 years. In 2 of these cases the child’s mother had a known history of substance abuse. In 45.5% of cases the infant had been carried to full‐term (37‐40 weeks). The mother was known to have received prenatal care in 63.6% of cases. In one case the decedent’s mother had a history of misusing prescription drugs during her pregnancy and in another case the mother reported medical complications during her pregnancy.
0.0%
10.0%
20.0%
30.0%
40.0%
50.0%
60.0%
White White (Non‐Hispanic)
White (Hispanic) Black Pacific Islander Asian Multi‐Racial
2006
2007
2008
2009

47 2009 Annual Report of Child Deaths in Clark County
The majority (72.7%) of children had supervision at the time of their deaths, and all of those children were being supervised by their biological parent. In less than one third of cases (27.3%) the child was in the sight of the supervisor, and in 36.4% of cases it had been hours since the supervisor had seen the child. The minimum number of hours listed was one, and the maximum was 9, with 5 hours as the average number of hours since the supervisor had seen the child. In more than half of cases (54.5%), the supervisor was asleep at the time.
Figure 3.14: 2007‐2009 Supervisor Circumstances (2007 n=14, 2008 n=15, 2009 n=11)
Supervisor Circumstances 2007 2008 2009 2007 2008 2009
Asleep 78.6% 80.0% (12) 54.5 (6) Absent 7.1% 6.7% (1) 0% (0)
Alcohol Impaired 21.4% 0% (0) 0% (0) Victim of Domestic Violence 7.1% 13.3% (2) 0% (0)
Under age 22 14.3% 33.3% (5) 18.2% (2) Criminal History 7.1% 6.7% (1) 0% (0)
Drug Impaired 7.1% 13.3% (2) ‐‐
Nearly all incidents (72.7%) occurred in the child’s home, and of the remaining cases one was in a hospital, one in a licensed child care facility and one in a foster home. 911 was called in all but one case. CPS action was taken as a result of the death in 18.2% of cases, and there was no prosecution pending at time of review in any of these cases. Slightly more than one third (36.4%, n=4) of families had a prior child welfare history. In two of the four cases, there was CPS history on the decedent, and two cases, there was some CPS history regarding a sibling. One of the cases had an open child welfare case at the time of death, and that child was in foster care at the time of death. For all four cases with prior history allegations were for neglect, not abuse. Perpetrators listed in these allegations included both the mother and the child’s grandmother. Two of these allegations were substantiated at the time of their investigation. The majority of accidental suffocation deaths involved children less than one year of age (n=10). All of the decedents under one year were in a sleeping environment at the time of their death; the other case of accidental suffocation was a child between 1 and 4 years of age who was suffocated by a plastic bag.
0.0% 10.0% 20.0% 30.0% 40.0% 50.0% 60.0% 70.0% 80.0% 90.0%
Asleep
Alcohol Impaired
Under age 22
Drug Impaired
Absent
Victim of Domestic Violence
Criminal History
2009
2008
2007

48 2009 Annual Report of Child Deaths in Clark County
Figure 3.15: 2007‐2008 Type of Accidental Suffocation (2007 n=14, 2008 n=15, 2009 n=11)
Of those decedents who died in a sleeping environment, in six of the cases the infant was sleeping on an adult mattress, couch, or the floor, while the remaining four were in an age appropriate sleeping environment such as a crib or bassinette. In three of these cases, this was a new sleep location for the child. In four of these cases, the infant was sleeping with a parent. 50% of all decedents were placed to sleep on either their stomach (30%) or sides (20%). None of the infants were found on their backs – 80% were found on their stomachs. In 7 cases the child was suffocated by bedding (blankets, pillows, etc), in two cases the child was suffocated due to overlay of another person and in the remaining case the child was suffocated due to wedging in a couch.
0.0%
20.0%
40.0%
60.0%
80.0%
100.0%
Sleeping Environment Choked on Food Asphyxiated on External Object
85.7%
7.1% 7.1%
100.0%
0.0% 0.0%
90.9%
0.0%9.1%
2007 2008 2009

49 2009 Annual Report of Child Deaths in Clark County
POISONING/OVERDOSE For the first time in four years the number of overdose cases equals that of motor vehicle incidents. The majority of these incidents were accidental (n=13), however one was a suicide, one a homicide and the other undetermined. This section will detail those accidental overdose cases. In 2009 there were 13 cases of accidental overdose which accounts for 23% of all accidental deaths. The majority of these deaths (69.2%) were youth between the ages of 15 and 17 years, 15.4% were children ages 10 to 14 years and the remaining two cases were under 10 years of age. Decedents in this category were primarily male (69.2%) and White Non‐Hispanic (61.5%). There were a variety of substances involved in these accidental overdose cases, however the majority were prescription drugs (69.2% n=9). Figure 3.15 illustrates the different substances used.
Figure 3.15: Substances Used in Accidental Overdose (2008 n=10, 2009 n=13)
*Categories are NOT mutually exclusive, one person could be represented in more than one category.
In those cases where overdose was caused by prescription medications, none of the prescriptions were for the decedent. In 46.2% of cases the child had a history with juvenile justice, and in 69.2% (n=9) of all cases the child had a history of substance abuse which included alcohol, cocaine, marijuana, methamphetamines and prescription drugs. In one third of those cases the child did receive substance abuse treatment, and none received mental health treatment. Additionally, in 58.5% of all accidental overdose cases the decadent’s family had a history with a child welfare agency.
0%
5%
10%
15%
20%
25%
30%
35%
40%
45%
50%
Psychotropic Medication
(Rx)
Pain Killer (opiate) (Rx)
Methadone (Rx)
Cleaning Solution
Alcohol Street Drugs Carbon Monoxide
10%
50%
30%
20%
7.70%
46.10%
23.10%
7.70%
15.40%
7.70%
2008
2009

50 2009 Annual Report of Child Deaths in Clark County
ACCIDENTAL DEATHS: RECOMMENDATIONS FOR PREVENTION Accidental deaths are defined by the National Center for Child Death Review as “a manner of death indicating non‐intentional trauma.” Nearly all accidental deaths of children in Clark County in 2009 were due to motor vehicle accidents, suffocation/strangulation, drowning and overdose. By their nature, all accidental deaths are preventable and thus provide ample data to make recommendations aimed at preventing future child deaths.
1. CONTINUE PREVENTION EFFORTS AIMED AT IMPROVING MOTOR VEHICLE SAFETY, ESPECIALLY MESSAGING ABOUT PROPER RESTRAINTS FOR CHILDREN AND YOUTH. For the fourth year in a row the leading cause of accidental death was motor vehicle accidents, accounting for 26.3% of all accidental deaths in 2009. While this proportion is a decline of more than 10% from 2006 and 2007 and 3% decrease from 2008, it is still an important area to continue prevention efforts. In 2008 the majority of MVA victims were between the ages of 15 and 17 years (66.7%), and although these are youth of driving age, the majority of these youth were not the drivers of the vehicles involved in the accidents. 73.3% of MVA victims were passengers in 2009. However, this does provide additional support for motor vehicle safety messages, because nearly half of these decedents (45.5%) were not wearing seatbelts.
2. FOCUS ON CHANGING REGULATIONS TO BRING OLDER POOLS UP TO CURRENT STANDARDS FOR BARRIERS TO ACCESSING THE POOL INCLUDING, FENCES, GATES, ALARMS, ETC. Nearly all (82%) of drowning victims in 2009 were between the ages of one and four. Also 72.7% of drowning fatalities occurred in a pool or spa. In 50% of these cases, there was no barrier in place to prevent access to the pool/spa. In 2009 the majority of pool drowning incidents took place in older areas of Las Vegas, Henderson and North Las Vegas, which may account for the lack of appropriate barrier devices which are mandated by the County for newer pools. In addition we see another increase in the number of Black children who are victims of drowning from 10% in 2008 to 18% in 2009; this may point to the need for targeted outreach.
3. IMPROVE/EXPAND CULTURALLY SENSITIVE OUTREACH AND EDUCATION EFFORTS REGARDING SAFE SLEEP ENVIRONMENTS FOR INFANTS. In 2009 nearly all cases of accidental suffocation were children less than one year of age (n=10 of 11) (one case was an older child) and all cases involving children less than one year occurred while the child was in a sleeping environment. A 2009 study in Pediatrics found that infant mortality rates attributable to accidental suffocation in bed have quadrupled since 1984 (Shapiro‐Medoza, et.al, 2009). These national findings along with our local data support the need for targeted health education focused on creating safe sleep environments for infants. In addition in 2009 nearly half 45.5% of these cases involved Hispanic infants, pointing to the need for more culturally specific outreach.
4. FOCUS OUTREACH AND EDUCATION EFFORTS ABOUT THE DANGER OF RECREATIONAL USE OF PRESCRIPTION DRUGS AND WELL AS INVESTIGATE POSSIBLE POLICY CHANGES TO BETTER CONTROL THESE MEDICATIONS AND PREVENT THEIR RECREATIONAL USE BY CHILDREN. For the second time in the last four years accidental overdose was one of the leading causes of accidental deaths, claiming the same number of lives as drowning and nearly the same number as motor vehicle accidents. The majority (69.2%) of these deaths were children ages 15 to 17 years, with another 15.4% of children ages 10 to 14 years. 69.2% of these deaths were due to an overdose of a prescription medication. Public education campaigns should focus on providing information on the danger of recreational use of prescription medications and regulatory officials should look for ways to better control the dissemination of these prescription medications.
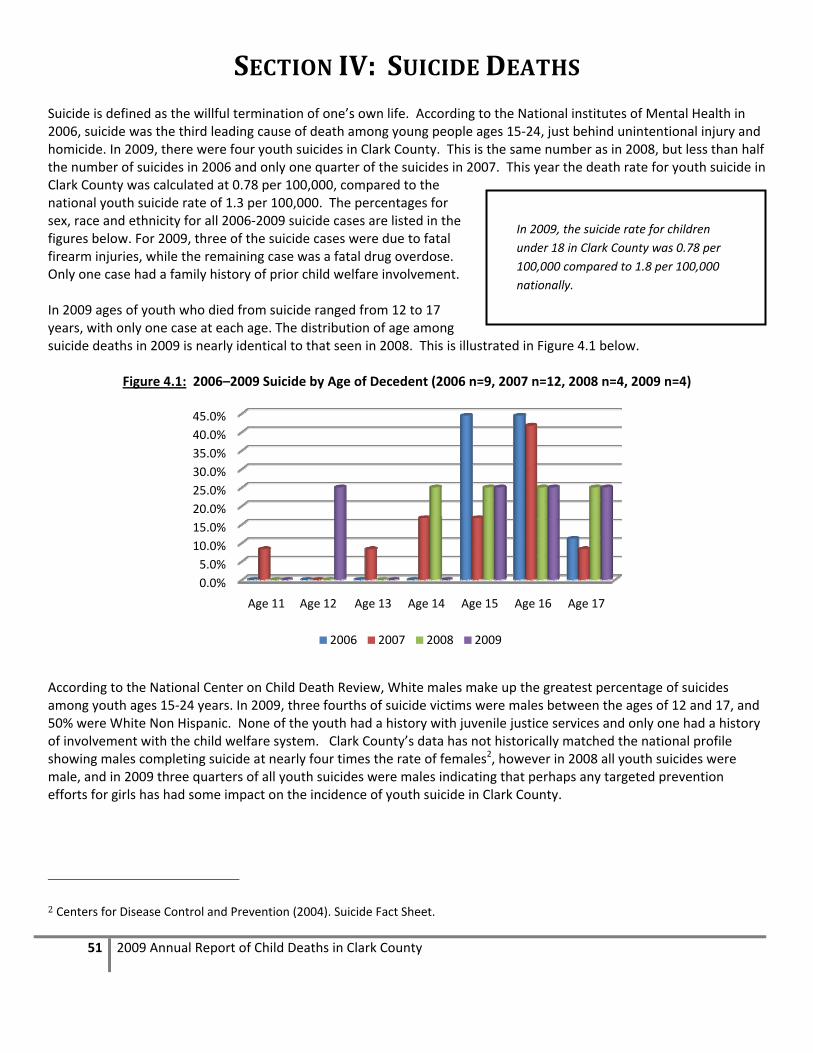
51 2009 Annual Report of Child Deaths in Clark County
SECTION IV: SUICIDE DEATHS Suicide is defined as the willful termination of one’s own life. According to the National institutes of Mental Health in 2006, suicide was the third leading cause of death among young people ages 15‐24, just behind unintentional injury and homicide. In 2009, there were four youth suicides in Clark County. This is the same number as in 2008, but less than half the number of suicides in 2006 and only one quarter of the suicides in 2007. This year the death rate for youth suicide in Clark County was calculated at 0.78 per 100,000, compared to the national youth suicide rate of 1.3 per 100,000. The percentages for sex, race and ethnicity for all 2006‐2009 suicide cases are listed in the figures below. For 2009, three of the suicide cases were due to fatal firearm injuries, while the remaining case was a fatal drug overdose. Only one case had a family history of prior child welfare involvement. In 2009 ages of youth who died from suicide ranged from 12 to 17 years, with only one case at each age. The distribution of age among suicide deaths in 2009 is nearly identical to that seen in 2008. This is illustrated in Figure 4.1 below.
Figure 4.1: 2006–2009 Suicide by Age of Decedent (2006 n=9, 2007 n=12, 2008 n=4, 2009 n=4)
According to the National Center on Child Death Review, White males make up the greatest percentage of suicides among youth ages 15‐24 years. In 2009, three fourths of suicide victims were males between the ages of 12 and 17, and 50% were White Non Hispanic. None of the youth had a history with juvenile justice services and only one had a history of involvement with the child welfare system. Clark County’s data has not historically matched the national profile showing males completing suicide at nearly four times the rate of females2, however in 2008 all youth suicides were male, and in 2009 three quarters of all youth suicides were males indicating that perhaps any targeted prevention efforts for girls has had some impact on the incidence of youth suicide in Clark County.
2 Centers for Disease Control and Prevention (2004). Suicide Fact Sheet.
0.0%
5.0%
10.0%
15.0%
20.0%
25.0%
30.0%
35.0%
40.0%
45.0%
Age 11 Age 12 Age 13 Age 14 Age 15 Age 16 Age 17
2006 2007 2008 2009
In 2009, the suicide rate for children
under 18 in Clark County was 0.78 per
100,000 compared to 1.8 per 100,000
nationally.

52 2009 Annual Report of Child Deaths in Clark County
Figure 4.2: 2006–2009 Suicide by Sex of Decedent (2006 n=9, 2007 n=12, 2008 n=4, 2009 n=4)
Figure 4.3: 2006–2008 Suicide by Race/Ethnicity (2006 n=9, 2007 n=12, 2008 n=4, 2009 n=4)
* The “Other” race in the 2006 data was a person who did not list a race, but listed ethnicity as Hispanic ** Race/Ethnicity data were collected differently in 2006. In 2006, data did not differentiate between White (Non‐Hispanic) and White (Hispanic).
Over the past three years we have seen a decline in the number of Hispanic youth who complete suicide, while conversely we see an increase in Non Hispanic youth completing suicide. This is more in line with national statistics indicating that White youth have the highest incidence of suicide completions.
0.0%
20.0%
40.0%
60.0%
80.0%
100.0%
Male Female
2006
2007
2008
2009
0.0%10.0%20.0%30.0%40.0%50.0%60.0%70.0%80.0%90.0%
White White (Non‐Hispanic)
White (Hispanic)
Black Asian Other*
88.9%
11.1%
50.0%
25.0%16.7%
8.3%
75%
25%
50%
25% 25%
2006 2007 2008 2009

53 2009 Annual Report of Child Deaths in Clark County
Figure 4.4: 2006–2009 Suicide by Ethnicity (2006 n=9, 2007 n=12, 2008 n=4, 2009 n=4)
SITUATIONAL FACTORS OF SUICIDE In half of the suicide cases in 2009 the child had a history of substance abuse and none of the youth were involved in the juvenile justice system. None of these youth had been diagnosed with a mental illness; however in one case a prior suicide attempt had been made. In three cases, the suicide occurred in the child’s home, the other case occurred in a relative’s home. 911 were called in all cases. In all cases, the child was attending school at the time of death. However, in one case the child was experiencing school failure and in two cases a note was left.
Figure 4.5: 2007–2009 Situational Factors of Suicide (2007 n=12, 2008 n=4, 2009 n=4)
2007 2008 2009
Suicide Occurred in Child's Home 100.0% 50.0% (2) 75% (3)
Positive Toxicology Screen 64.0% 75.0%(3) 25% (1)
Child Welfare History 25.0% 25.0%(1) 25% (1)
Juvenile Justice History 25.0% 25.0%(1) 0% (0)
A toxicology screen was conducted in only one of the suicide cases (an overdose), and an autopsy was conducted in all but one case. Sexual orientation was known in two of the cases and unknown in the other two.
0.0%
20.0%
40.0%
60.0%
80.0%
Hispanic Non‐Hispanic
44.4%
55.6%
33.3%
66.7%
25%
75.0%
25%
75%
2006
2007
2008
2009
0.0%20.0%40.0%60.0%80.0%100.0%
Suicide occurred in child's home
Positive Toxicology Screen
Child Welfare History
Juvenile Justice History
2007 2008 2009

54 2009 Annual Report of Child Deaths in Clark County
METHOD OF SUICIDE An article authored by the Suicide Prevention Research Center and the Harvard Injury Control Research Center suggests that 44% of teen suicides were suffocation deaths (primarily by hanging), followed by 43% of suicides committed using a firearm3. This pattern is replicated in Clark County for 2006 through 2009. For Clark County teens in 2009, firearms were the most common method of suicide, a shift from hanging in 2006 and 2007.
Figure 4.6: 2006–2009 Method of Suicide (2006 n=9, 2007 n=12, 2008 n=4, 2009 n=4)
In three of the four cases in 2009 the youth used a firearm, and one case was an intentional overdose. For the first time Clark County reviewed no cases of suffocation/strangulation as a method of suicide. In two of the firearm suicides a handgun was used and in the other a shotgun was used. In none of these cases was the firearm stored in a locked cabinet, and in all cases the firearm was owned by a family member of the decedent. In one case the youth had made prior attempts, and in two cases a note was left.
3 http://www.sprc.org/library/YouthSuicideFactSheet.pdf
0.0%
10.0%
20.0%
30.0%
40.0%
50.0%
60.0%
70.0%
80.0%
Suffocation or Strangulation
Gunshot Wound Poisoning/Overdose Other
66.7%
22.2%
11.1%
50.0%41.7%
8.3%
25.0%
50.0%
25.0%
75.0%
25.0%
2006 2007 2008 2009

55 2009 Annual Report of Child Deaths in Clark County
CIRCUMSTANCES OF SUICIDE There are several factors that have been identified as risk factors for suicide. The circumstances that were present in the 4 cases reviewed in 2009 are listed in Figure 4.7 below.
Figure 4.7: 2006‐2009 Circumstances of Suicide (2006 n=9, 2007 n=12, 2008 n=4, 2009 n=4)
In the 2009 cases, clearly identified risk factors are more difficult to identify. All youth were regularly attending school and only one had made a prior attempt. However in 75% of cases in 2009 the decedent had talked about suicide in the past. According to literature on risk factors associated with suicide, prior attempts are one of the best predictors of future attempts of suicide4. In 2006, over half (55.6%) of suicide victims had prior attempts, while from 2007 to 2009 only one quarter (25%) of decedents had a prior attempt. National literature clearly shows that adolescent males of all races are four times more likely to complete suicide than females, but adolescent females are twice as likely as adolescent males to attempt suicide. However, among suicide fatalities in Clark County, starting in 2007 we see that the
4 www.KidsHealth.org, Retrieved June 25, 2007
0.0% 20.0% 40.0% 60.0% 80.0% 100.0%
History of Substance Abuse
History of Self‐Mutilation
Diagnosed with a Mental Illness
Decedent Attending School Regularly
Child on Medication for MH
Child Currently received MH Services
2009
2008
2007
2006
0.0% 10.0% 20.0% 30.0% 40.0% 50.0% 60.0% 70.0% 80.0%
Youth Talked about Suicide
Prior Threats Made
Prior MH Services Received
Prior Attempts Made
Known Family History of Suicide
Involvement with Juvenile Justice
2009
2008
2007
2006

56 2009 Annual Report of Child Deaths in Clark County
number of males and females with prior attempts is evenly split, then in 2008 and 2009 only male decedents had a history of prior attempts.
Figure 4.8: 2006–2009 Prior Attempts Made by Sex (2006 n=9, 2007 n=12, 2008 n=4, 2009 n=4)
In taking a look at these cases and the decedent’s history of any acute or cumulative crisis, several factors were shown to be present in these cases. One of the victims had recently had a fight with their parent, and one had recently fought with their boyfriend or girlfriend. Another decedent had been involved with drugs or alcohol.
0.0%
10.0%
20.0%
30.0%
40.0%
50.0%
60.0%
70.0%
80.0%
Male Female
40.0%
75.0%
28.5%
20.0%25.0%
33.3%
Prior Attempts 2006 Prior Attempts 2007 Prior Attempts 2008 Prior Attempts 2009

57 2009 Annual Report of Child Deaths in Clark County
Figure 4.9: 2006–2009 History of Acute or Cumulative Crisis
(2006 n=9, 2007 n=12, 2008 n=4, 2009 n=4)
* Other Crisis includes alleged sexual abuse, and anger management issues ** School Problems includes “School Failure”, “Move/New School”, and “Other Serious School Problems”
2006 2007 2008 2009
Argument with Parent/Caregiver 11.1% 58.3% 75.0%(3) 25% (1)
Family Discord 0.0% 41.7% 75.0% (3) 0.0%
School Problems** 0.0% 41.6% 25.0% (1) 25% (1)
Involvement with the Internet 0.0% 25.0% 0.0% 0.0%
Argument with Boyfriend/Girlfriend 44.4% 16.7% 25.0% (1) 0.0%
Drugs/Alcohol 33.3% 16.7% 50.0% (2) 25% (1)
Other Crisis* 22.2% 16.7% 0.0% 25% (1)
Suicide of Friend or Relative 11.1% 8.3% 0.0% 0.0%
Rape/Sexual Abuse 22.2% 8.3% 0.0% 0.0%
Pregnancy/Possible Pregnancy 11.1% 0.0% 0.0% 0.0%
Problems with the law 22.2% 0.0% 25.0% (1) 0.0%
Sexual Orientation 11.1% 0.0% 0.0% 0.0%
0 0.1 0.2 0.3 0.4 0.5 0.6 0.7 0.8
School Problems**
Involvement with the Internet
Family Discord
Drugs/Alcohol
Argument with Parent/Caregiver
Argument with Boyfriend/Girlfriend
2009 2008 2007 2006
0.0% 5.0% 10.0% 15.0% 20.0% 25.0%
Suicide of Friend or Relative
Sexual Orientation
Rape/Sexual Abuse
Problems with the law
Pregnancy/Possible Pregnancy
Other Crisis*
2009 2008 2007 2006

58 2009 Annual Report of Child Deaths in Clark County
SUICIDE DEATHS: RECOMMENDATIONS FOR PREVENTION Youth suicide is preventable if appropriate measures are taken to educate parents, youth, friends and family regarding the risks and signs of suicidal ideation. The primary prevention recommendation for youth suicide is to raise awareness of the signs and risk factors among parents and peers from elementary school through high school. However, there are particular areas in which targeted efforts may be needed.
1. EXPAND SUICIDE PREVENTION EFFORTS IN ELEMENTARY SCHOOLS TO AND CONTINUE EDUCATION TO TEACHER, PARENTS AND OTHERS ABOUT SUICIDE PREVENTION. In 2009 there were only four youth suicide deaths. While this is a marked decreased from the 2006 and 2007, even one youth suicide in our community is too many. All deaths were among youth ages 12 to 17 years of age indicating that middle and high schools are still the most appropriate place to target prevention interventions, but since we are seeing cases as young as 12 years old, we may want to increase efforts in elementary schools as well. It is essential that mental health screenings occur in children that are school aged, and that teachers and other non‐family members are educated about the signs and risk factors for suicide.
2. EXPAND EXISTING FIREARM SAFETY CAMPAIGNS TO INCLUDE SPECIFIC MESSAGES ABOUT PREVENTING MEANS FOR SUICIDE, ESPECIALLY IF CHILDREN HAVE A HISTORY OF MENTAL HEALTH ISSUES, OR PRIOR ATTEMPTS. In 2009 we saw a greater proportion of suicide victims using firearms. This year 3 of the four cases committed suicide using a firearm. This is one of the means of suicide that should be most difficult for children and youth to get a hold of. Families that choose to have firearms in their homes must be especially careful about ensuring that they are store in a locked secured location where children and youth do not have access, especially if that child has a history of mental health issues or substance abuse.
3. EXPAND AND PROMOTE GATEKEEPER TRAINING FOR ANYONE WORKING WITH YOUTH TO RECOGNIZE SIGNS OF SUICIDE AS WELL AS TECHNIQUES FOR HOW TO INTERVENE IF SUICIDAL IDEATION IS SUSPECTED. In all but one of the youth suicides in 2009 the youth had talked about suicide prior to their death, and in one of the four cases the youth had actually attempted suicide in the past. Verbalizing suicidal ideation should always be taken seriously. However many parents, teachers, friends, etc. do not take action to get professional help until after an attempt. Prevention efforts including suicide gatekeeper training should attempt to include other youth in recognizing the signs of suicide, as well as measures that can and should be taken to intervene. The Nevada Office of Suicide Prevention currently offers gatekeeper training designed to help people recognize the signs and symptoms of suicidal ideation and provides information on what to do to help. The training also provides information about suicide risk to reduce some of the stigma attached to mental illness and suicide.

59 2009 Annual Report of Child Deaths in Clark County
SECTION V: HOMICIDE DEATHS Homicide is legally defined as the killing of one human being by another human being. The Center for Disease Control lists youth homicide as the second leading cause of death for the 10‐24 age group5, and further states that “among 10‐24 year olds, 86% of homicide victims were male, and 82% were killed with a firearm.”6 Further, “among 10 to 24 year‐olds, homicide is the leading cause of death for African Americans; the second leading cause of death for Hispanics and Asian/Pacific Islanders; and the third leading cause of death for American Indians and Alaska Natives.”7 In 2009, there were 17 homicides of children and youth, which is a decrease from the 21 in 2008. The 2009 homicides fell into two categories – those that were committed using a firearm (35.3%) and those that were committed without a firearm (64.7%). Overall, victims were more than four times as likely to be male (82.4%) than female (17.6%). This year we saw a large proportion of homicide victims less than four years of age (52.9%), which is a very different trend when compared to previous years where the majority of homicide victims are between 15 and 17 years of age
Figure 5.1: 2006 – 2009 Homicide Deaths by Sex and Type (2006 n=20, 2007 n=15, 2008 n=21, 2009 n=17)
5 http://www.cdc.gov/ncipc/pub‐res/YVFactSheet.pdf 6 http://www.cdc.gov/ncipc/dvp/YV_DataSheet.pdf 7 http://www.cdc.gov/ncipc/dvp/YV_DataSheet.pdf
0.0%
10.0%
20.0%
30.0%
40.0%
50.0%
60.0%
70.0%
80.0%
90.0%
100.0%
2006 Firearm
2007 Firearm
2008 Firearm
2009 Firearm
2006 Non‐Firearm
2007 Non‐Firearm
2008 Non‐Firearm
2009 Non‐Firearm
Male Female

60 2009 Annual Report of Child Deaths in Clark County
Nearly one third of homicide deaths were White Non Hispanic (29.4%) children and another third (29.3%) were White Hispanic children. The remaining 41.2% of cases (n=7) were Black children in 2009. These data indicate that Black and Hispanic teens are disproportionately victimized by homicide, and that these disparities are increasing from 2007 to 2009. Figure 5.2: 2007‐2009 Homicide Deaths by Race/Ethnicity (2007 n=15, 2008 n=21, 2009 n=17)
It is also interesting to note the bimodality of the age distribution in 2006 through 2009. The oldest group (ages 15‐17) and the youngest group (infants <1 year) demonstrated the highest percentages of victims in all four years. Also in 2009 we see a sharp increase in the percentage of children ages 1 to 4 years, going from only 14.3% in 2008 to 35.3% in 2009.
Figure 5.3: 2006–2009 Homicide Deaths by Age (2006 n=20, 2007 n=15, 2008 n=21, 2009 n=17)
0.0%
10.0%
20.0%
30.0%
40.0%
50.0%
2007 2008 2009
White (Non‐Hispanic)
White (Hispanic)
Black
Asian/Pacific Islander
American Indian/Alaskan Native
0.0%
10.0%
20.0%
30.0%
40.0%
50.0%
60.0%
>1 1 ‐ 4 5 ‐ 9 10 ‐ 14 15 ‐ 17
25.0%
15.0%
0.0%
20.0%
40.0%
20.0%
20.0%
6.7%
13.3%
40.0%
19.0%
14.3%4.8% 9.5%
52.4%
17.6%
35.3%
5.9% 5.9%
35.3%
2006 2007 2008 2009
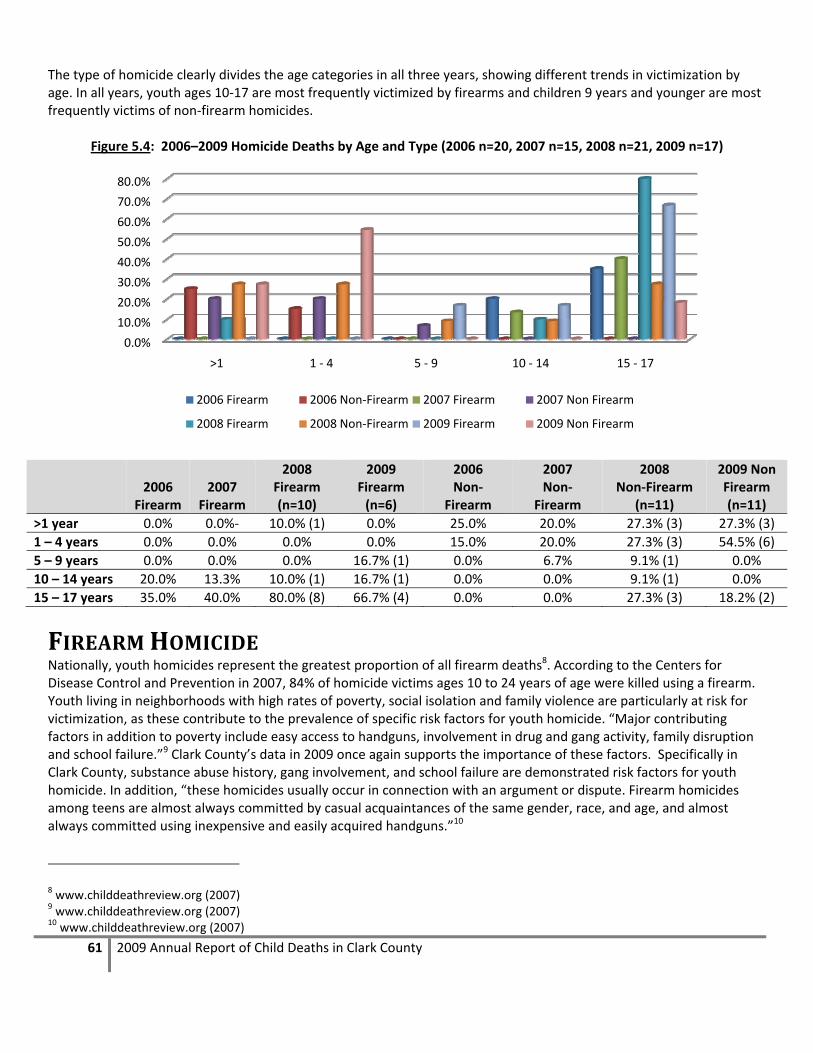
61 2009 Annual Report of Child Deaths in Clark County
The type of homicide clearly divides the age categories in all three years, showing different trends in victimization by age. In all years, youth ages 10‐17 are most frequently victimized by firearms and children 9 years and younger are most frequently victims of non‐firearm homicides.
Figure 5.4: 2006–2009 Homicide Deaths by Age and Type (2006 n=20, 2007 n=15, 2008 n=21, 2009 n=17)
2006
Firearm 2007
Firearm
2008 Firearm (n=10)
2009 Firearm (n=6)
2006 Non‐
Firearm
2007 Non‐
Firearm
2008 Non‐Firearm
(n=11)
2009 Non Firearm (n=11)
>1 year 0.0% 0.0%‐ 10.0% (1) 0.0% 25.0% 20.0% 27.3% (3) 27.3% (3)
1 – 4 years 0.0% 0.0% 0.0% 0.0% 15.0% 20.0% 27.3% (3) 54.5% (6)
5 – 9 years 0.0% 0.0% 0.0% 16.7% (1) 0.0% 6.7% 9.1% (1) 0.0%
10 – 14 years 20.0% 13.3% 10.0% (1) 16.7% (1) 0.0% 0.0% 9.1% (1) 0.0%
15 – 17 years 35.0% 40.0% 80.0% (8) 66.7% (4) 0.0% 0.0% 27.3% (3) 18.2% (2)
FIREARM HOMICIDE Nationally, youth homicides represent the greatest proportion of all firearm deaths8. According to the Centers for Disease Control and Prevention in 2007, 84% of homicide victims ages 10 to 24 years of age were killed using a firearm. Youth living in neighborhoods with high rates of poverty, social isolation and family violence are particularly at risk for victimization, as these contribute to the prevalence of specific risk factors for youth homicide. “Major contributing factors in addition to poverty include easy access to handguns, involvement in drug and gang activity, family disruption and school failure.”9 Clark County’s data in 2009 once again supports the importance of these factors. Specifically in Clark County, substance abuse history, gang involvement, and school failure are demonstrated risk factors for youth homicide. In addition, “these homicides usually occur in connection with an argument or dispute. Firearm homicides among teens are almost always committed by casual acquaintances of the same gender, race, and age, and almost always committed using inexpensive and easily acquired handguns.”10
8 www.childdeathreview.org (2007) 9 www.childdeathreview.org (2007) 10 www.childdeathreview.org (2007)
0.0%
10.0%
20.0%
30.0%
40.0%
50.0%
60.0%
70.0%
80.0%
>1 1 ‐ 4 5 ‐ 9 10 ‐ 14 15 ‐ 17
2006 Firearm 2006 Non‐Firearm 2007 Firearm 2007 Non Firearm
2008 Firearm 2008 Non‐Firearm 2009 Firearm 2009 Non Firearm

62 2009 Annual Report of Child Deaths in Clark County
In 2009 we see a shift in the type of homicide cases, firearm homicides represent only 35.3% (n=6) while non‐firearm homicides represent 64.7% (n=11) of all homicides. Historically this proportion has been more evenly split. This likely explains the higher proportion of younger victims of homicide in 2009 as younger children are more likely to be victims of non‐firearm homicide (see Figure 5.4 above). 83.3% of firearm homicide victims in 2009 were male. In 2009, half of victims were White Non Hispanic while the other half was either Black (33.3%) or White Hispanic (16.7%). Again this year the percentage of Black victims of firearm homicide is disproportionate to the population distribution in Southern Nevada and represents a clear area for intervention and prevention.
Figure 5.5: 2006–2009 Race of Victim in Firearm Homicide (2006 n=11, 2007 n=8, 2008 n=10, 2009 n=6)
* Race/Ethnicity data were collected differently in 2006 and 2007. In 2006, data did not differentiate between White (Non‐Hispanic) and White (Hispanic).
Nearly all victims (83.3%) were regularly attending school at the time of their death. None of the victims had a chronic illness or disability; however in two cases the victim had a known history of substance abuse (one had a history of alcohol abuse, the other marijuana) and neither had received any substance abuse treatment. None of the victims tested positive for drugs at the time of their death. In half of these cases prosecution was pending at the time of the review.
0.0%10.0%20.0%30.0%40.0%50.0%60.0%70.0%80.0%
White White (Non‐Hispanic)
White (Hispanic)
Black Pacific Islander American Indian/Alaska
Native
73.0%
27.0%25.0%
62.5%
12.5%20.0% 20.0%
40.0%
20.0%
50%
16.70%
33.30%
2006 2007 2008 2009

63 2009 Annual Report of Child Deaths in Clark County
Figure 5.6: 2006–2009 Characteristics of Firearm Homicides (2006 n=11, 2007 n=8, 2008 n=10, 2009 n=6)
*NOTE: These questions were not asked in both 2006 and 2007 and therefore data does not exist for both years for the variables; “History of Truancy” or “CPS Involvement Past 12 Months.”
Families of firearm homicide victims had a history with child welfare in 50% of the cases in 2009. No CPS action was taken as a result of any of these deaths. There were various circumstances surrounding these fatalities. In two of the cases (33.3%) there was some kind of argument that preceded the homicide, and in only one case gang involvement was either known or suspected.
Figure 5.7: 2007–2009 Child Welfare Involvement for Firearm Homicide Victims (2007 n=8, 2008 n=10, 2009 n=6)
One half of firearm homicide victims (50%) had a known juvenile justice history, which is a reduction of approximately 25% from 2006, when approximately three quarters had a known juvenile justice history. Charges included: battery, larceny, solicitation, truancy, drug possession and weapons. In 2009 none of the youth had been incarcerated in a juvenile correctional facility. The map on the following page illustrates the incident location as well as the location of the child’s residence by zip code. Zip codes colored in peach indicate the location of the incident leading to the child’s death, while the diagonal stripes indicate the zip code of the child’s residence. Some zip codes are both colored peach and have diagonal stripes. This indicates zip codes where children were residents as well as those where incidents occurred. You can see that many of the incidents occurred in neighboring zip codes in the north central part of the County, but this year it seems that incidents were less likely to occur in the zip code of residence for the youth.
0.0% 10.0% 20.0% 30.0% 40.0% 50.0% 60.0% 70.0% 80.0%
Juvenile Justice History
Time in Detention/Corrections
CPS Involvement Past 12 months*
Drug/Alcohol Impaired at TOD
History of Substance Abuse
Open CPS Case at TOD
History of Truancy*
2009 2008 2007 2006
0.0% 10.0% 20.0% 30.0% 40.0% 50.0%
History with Decedent
History with Sibling
Prior History of CPS
CPS Involvement Past 12 months
Substantiated Incidents
Open CPS Case at TOD
2009
2008
2007
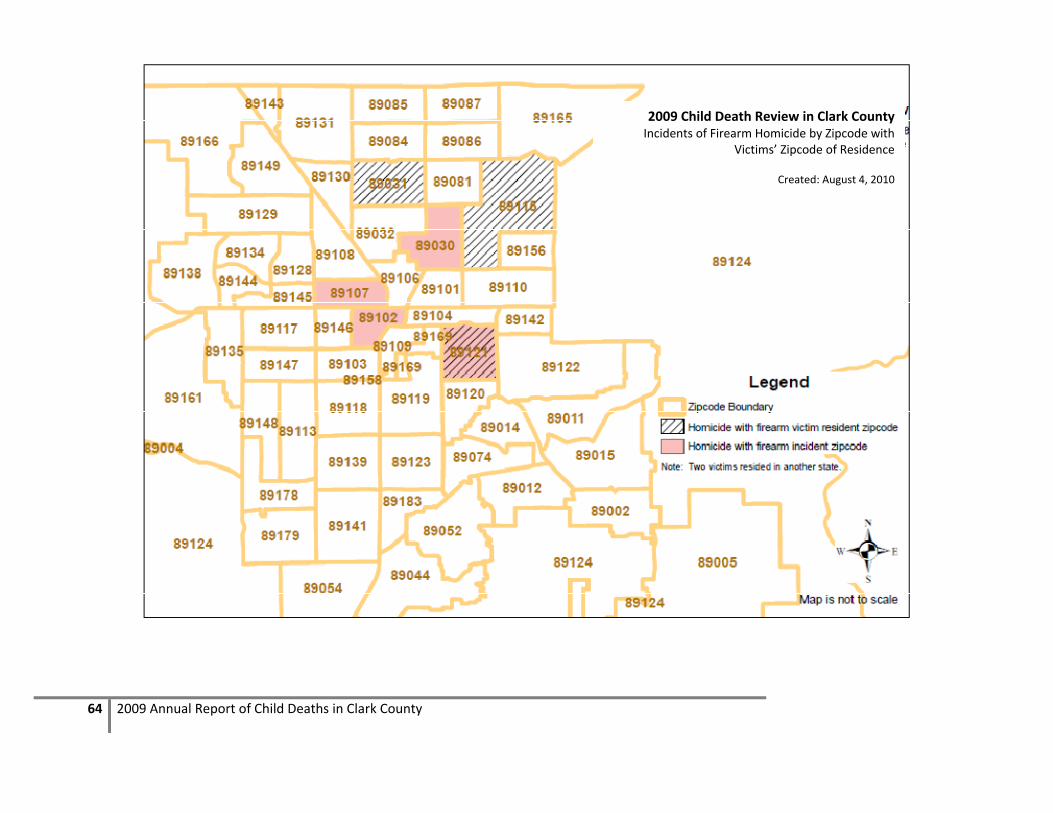
64 2009 Annual Report of Child Deaths in Clark County
2009 Child Death Review in Clark County Incidents of Firearm Homicide by Zipcode with
Victims’ Zipcode of Residence
Created: August 4, 2010

65 2009 Annual Report of Child Deaths in Clark County‐ DRAFT
In 83.3% of cases (n=5) the incident occurred either at the child’s residence or the residence of a friend or other family member. The remaining incident occurred on a sidewalk. The majority (50%) of incidents involved a handgun, one involved an assault rifle and in two cases the type of firearm was unknown at the time of the review. In the majority of cases, the firearms were not owned by family or friends of the decedent. In three cases the firearm was owned by a gang member and in one case the firearm was owned by the decedent. Another was a law enforcement officer involved shooting and in one case the firearm was not recovered and therefore the owner was unknown at the time of review. One incident occurred during the commission of a crime and in one incident the child was a bystander. There was suspected gang involvement in one third of the cases (33.3%) which is the highest proportion since 2006. This may be a product of better data collection methods and not necessarily an increase in gang involved youth homicides. In only one case the victim was known or suspected to be in a gang, and in three cases, the perpetrator was known or suspected to be in a gang. One third of incidents (n=2) occurred at a party, and 33.3% of incidents occurred during an argument.
Figure 5.8: 2006–2009 Incident Information for Firearm Homicides (2006 n=11, 2007 n=8, 2008 n=10, 2009 n=6)
0 0.1 0.2 0.3 0.4 0.5 0.6 0.7 0.8 0.9
Perpetrator was a Stranger
Weapon was a Handgun
Incident Occurred on Sidewalk
Weapon Owned by Gang Member
Gang Involvement
Occurred at a Party
Victim Known Gang Member
Occurred during an Argument
45.0%
44.0%
87.5%
71.4%
62.5%
50.0%
25.0%
12.5%
12.5%
12.5%
4.8%
60.0%
10.0%
10.0%
30.0%
10.0%
10.0%
33.3%
50.0%
16.7%
50.0%
33.3%
33.3%
16.7%
33.3%
2009
2008
2007
2006

66 2009 Annual Report of Child Deaths in Clark County‐ DRAFT
NONFIREARM HOMICIDES In 2009 there were 11 non‐firearm homicides. These cases display an entirely different set of characteristics than the firearm homicides. This year 54.5% (n=6) of non‐firearm homicide victims were between the ages of 1 and 4 years, 27.3% (n=3) were less than one year of age, and 18.2% (n=2) were between 15 and 17 years of age. This year minority children were disproportionately represented in non‐firearm homicides. 45.5% (n=5) of victims were Black, 36.4% (n=4) were White Hispanic, and the remaining 18.2% (n=2) were White Non Hispanic. The majority of non‐firearm homicide victims were male (81.8%) and none of these children had a chronic illness or disability.
Figure 5.9: 2006–2009 Race of Non‐Firearm Victims (2006 n=9, 2007 n=7, 2008 n=11, 2009 n=11)
* Race/Ethnicity data were collected differently in 2006. In 2006, data did not differentiate between White (Non‐Hispanic) and White (Hispanic).
There were only two non‐firearm homicide victims in 2009 that were school aged and both were attending school regularly at the time of their death. In 36.4% of cases (n=4) the victim’s primary supervisor at the time of the incident was a biological parent, in another 45.5% of cases (n=5) the supervisor was the victim’s mother’s boyfriend, and in the remaining two cases the child was of an age that they did not require direct supervision. None of the parents of these children had any prior child deaths, and in two cases the decedent’s mother had a history of substance abuse. In 2009, 81.8% of non‐firearm homicides (n=9) were a result of child abuse. In more than half of these 9 cases (n=5) the perpetrator was the decedent’s biological mother’s boyfriend, and in three of the cases the perpetrator was a biological parent (in one case the mother, and in 2 cases the father), in one case the perpetrator was unknown at the time of the review. In eight of the eleven cases (72.7%) the child was beaten or burned, in one case a motor vehicle was used as the weapon, one case was an intentional drug overdose, an in another case the exact information on what act caused the child’s death was unknown at the time of review. In 90.9% of cases prosecution was pending at the time of the review.
0.0%10.0%20.0%30.0%40.0%50.0%60.0%70.0%80.0%
White White (Non‐Hispanic)
White (Hispanic)
Black Asian American Indian/Alaskan
Native
2006 2007 2008 2009

67 2009 Annual Report of Child Deaths in Clark County‐ DRAFT
Figure 5.10: 2006–2009 Incident Information for Non‐Firearm Homicides
(2006 n=9, 2007 n=7, 2008 n=11, 2009 n=11)
In ten of the eleven cases 911 was called. CPS action was taken as a result of the death in six of the eleven cases. Action included, removal of remaining children, and in three cases the allegations were substantiated by CPS. In the other five cases CPS did not take action for a variety of reasons. Primarily CPS did not take action because in many cases the deceased child was the only child in the home, or the child’s death was a result of an injury inflicted by someone other than a family member.
0.0% 10.0% 20.0% 30.0% 40.0% 50.0% 60.0% 70.0% 80.0% 90.0% 100.0%
CPS Action As a Result
Suspect Apprehended
Prevention Services Provided
Children Removed as a Result
Parents Prosecuted
911 Called
Parent's Partner Prosecuted
Substantiated CPS Investigation
Relative Prosecuted
85.7%
71.4%
50.0%
50.0%
50.0%
42.9%
33.3%
16.7%
16.7%
54.5%
81.0%
33.3%
66.7%
30.0%
54.5%
10.0%
50.0%
0.0%
54.5%
91.0%
27.3%
45.5%
91.0%
18.2%
27.3%
2009
2008
2007

68 2009 Annual Report of Child Deaths in Clark County‐ DRAFT
2009 Child Death Review in Clark CountyIncidents of Non‐Firearm Homicide by Zipcode with
Victims’ Zipcode of Residence
Created: August 4, 2010

69 2009 Annual Report of Child Deaths in Clark County‐ DRAFT
The map above illustrates the zip codes for the incident location that led to the child’s death as well as the zip code for the child’s residence for all 2009 non‐firearm homicides. Because the local team reviews deaths of all children that die in Clark County, unless they reside in another Nevada county, there were some cases that are not represented on this map. There were three cases where the child was a resident of another state and the incident occurred in another state, also there was one case where the zip code of the incident was unknown at the time of the review. In all but one case the decedent had proper supervision at the time of death, 81.8% (n=9) required direct supervision due to their age and the remaining two victims were of an age that they did not need direct supervision. In eight of the nine cases the supervisor was also responsible for inflicting fatal injuries and in the remaining case the perpetrator was unknown at the time of review.
Figure 5.11: 2006–2008 Primary Supervisor at Time of Incident (2006 n=9, 2007 n=7, 2008 n=11, 2009 n=11)
0.0% 10.0% 20.0% 30.0% 40.0% 50.0% 60.0%
Biological Parent
Mother's Partner
Father's Partner
Grandparent
Other Relative
Step Parent
Foster Parent
No Supervision Needed
2009
2008
2007
2006
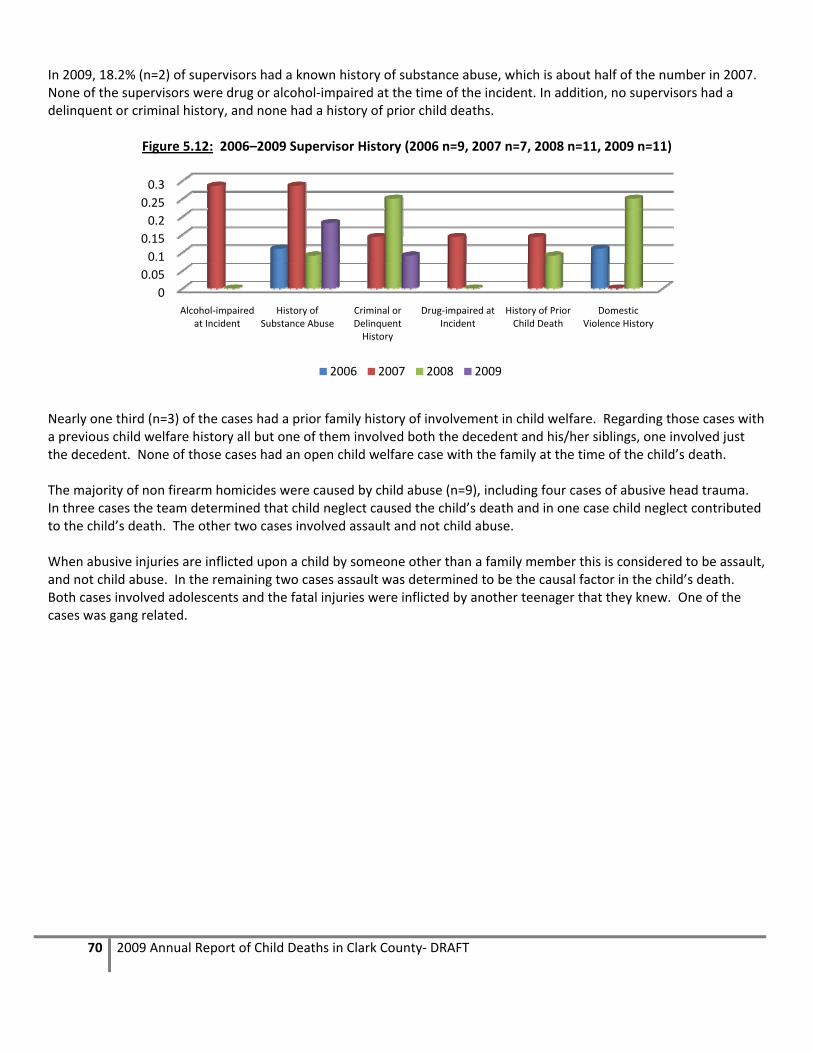
70 2009 Annual Report of Child Deaths in Clark County‐ DRAFT
In 2009, 18.2% (n=2) of supervisors had a known history of substance abuse, which is about half of the number in 2007. None of the supervisors were drug or alcohol‐impaired at the time of the incident. In addition, no supervisors had a delinquent or criminal history, and none had a history of prior child deaths.
Figure 5.12: 2006–2009 Supervisor History (2006 n=9, 2007 n=7, 2008 n=11, 2009 n=11)
Nearly one third (n=3) of the cases had a prior family history of involvement in child welfare. Regarding those cases with a previous child welfare history all but one of them involved both the decedent and his/her siblings, one involved just the decedent. None of those cases had an open child welfare case with the family at the time of the child’s death. The majority of non firearm homicides were caused by child abuse (n=9), including four cases of abusive head trauma. In three cases the team determined that child neglect caused the child’s death and in one case child neglect contributed to the child’s death. The other two cases involved assault and not child abuse. When abusive injuries are inflicted upon a child by someone other than a family member this is considered to be assault, and not child abuse. In the remaining two cases assault was determined to be the causal factor in the child’s death. Both cases involved adolescents and the fatal injuries were inflicted by another teenager that they knew. One of the cases was gang related.
0
0.05
0.1
0.15
0.2
0.25
0.3
Alcohol‐impaired at Incident
History of Substance Abuse
Criminal or Delinquent History
Drug‐impaired at Incident
History of Prior Child Death
Domestic Violence History
2006 2007 2008 2009

71 2009 Annual Report of Child Deaths in Clark County‐ DRAFT
Fatal child abuse or neglect is the fatal physical injury or negligent treatment of a child by a person who is responsible for the child’s welfare. Most child maltreatment deaths result from physical abuse, especially children receiving injuries to their heads. Known as abusive head trauma, these injuries occur when a child’s head is slammed against a surface, is severely struck or when a child is violently shaken. The next most common cause of physical abuse deaths is punches or kicks to the abdomen, leading to internal bleeding. Young children are the most vulnerable victims. National statistics show that children under six years of age account for 86% of all maltreatment deaths and infants account for 43% of these deaths. Fathers and mothers’ boyfriends are most often the perpetrators in the abuse deaths; mothers are more often at fault in the neglect fatalities. Fatal abuse is interrelated with poverty, domestic violence and substance abuse.
www.childdeathreview.org, 2007
HOMICIDE DEATHS: RECOMMENDATIONS FOR PREVENTION Homicide, by definition, is the intentional killing of another human being. Seventeen children and youth were the victims of homicide in Clark County in 2009. The data indicates two distinct categories for child homicides: firearm related and non‐firearm related, and each category has a distinct pattern of circumstances.
FIREARM HOMICIDES: 1. FOCUS ON ADDRESSING THE NEEDS OF MINORITY YOUTH
THROUGH COMMUNITY BASED OUTREACH AND GANG
PREVENTION ACTIVITIES. Nearly all firearm homicides occurred among youth ages 10‐17 (83.4%), primarily among 15‐17 year olds (66.7%), and 83% of victims were male. The data indicates that half of victims were minorities, split between Black (33.3%) and White Hispanic (16.7%) male youth. Again the percentage of Black victims is disproportionate to the population distribution in Southern Nevada and identifies a specific target population for intervention efforts. The data also shows that 50% of the victims had a prior juvenile justice history, and that approximately 33.3% of the incidents were suspected to be gang related. Prevention efforts aimed at reducing firearm related youth homicides should focus on addressing the needs of these youth through community based outreach programs and gang prevention activities. All efforts should take into consideration the language and cultural needs of the populations most at risk.
NONFIREARM HOMICIDES: 1. DEVELOP AND PROMOTE NETWORKS OF SERVICES TO HELP FAMILIES MOST AT RISK TO PREVENT INCIDENTS BEFORE
THEY START. PARENTING/STRESS MANAGEMENT TRAINING SHOULD ALSO BE TARGETED TOWARD ADULTS LIVING IN THE HOME WITH CHILDREN WHO ARE NOT THEIR BIOLOGICAL PARENTS, BUT ARE RESPONSIBLE FOR CARE GIVING. In 2009 non‐firearm homicides represented over half (64.7%) of all youth homicides, an increase of 12% from 2008. The majority of non‐firearm homicide victims were less than four years of age (n=9), the remaining victims were between 15 to 17 years (n=2). In 2009, 82% of non‐firearm homicides were a result of child abuse (n=9). In 5 cases the perpetrator was the mother’s boyfriend, in three cases it was a biological parent (in one case the mother, in the other two the perpetrator was the father) and in one case the perpetrator was unknown. Prevention efforts should focus on developing networks of services in the community to reach out to these at‐risk families. Providing services and resources to parents of young children that educate parents and new partners who are willing to participate on basic parenting skills and ways to cope with stress and anger may also reduce the potential for child abuse related homicides.
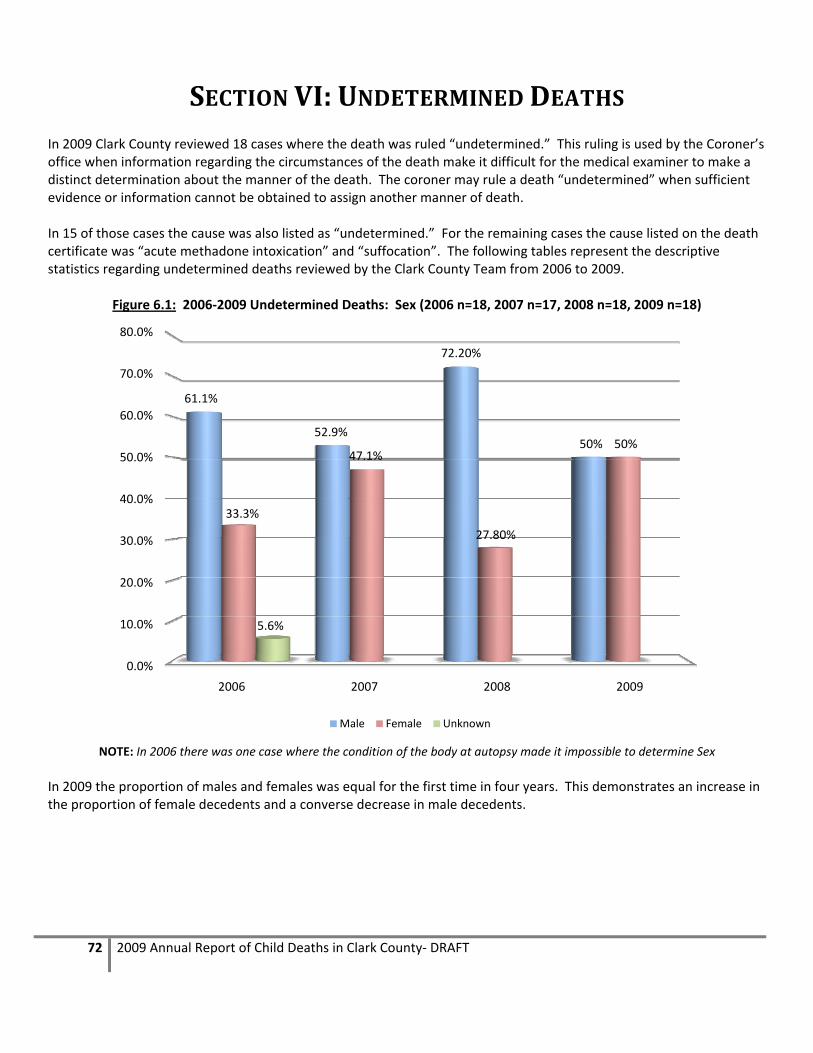
72 2009 Annual Report of Child Deaths in Clark County‐ DRAFT
SECTION VI: UNDETERMINED DEATHS In 2009 Clark County reviewed 18 cases where the death was ruled “undetermined.” This ruling is used by the Coroner’s office when information regarding the circumstances of the death make it difficult for the medical examiner to make a distinct determination about the manner of the death. The coroner may rule a death “undetermined” when sufficient evidence or information cannot be obtained to assign another manner of death. In 15 of those cases the cause was also listed as “undetermined.” For the remaining cases the cause listed on the death certificate was “acute methadone intoxication” and “suffocation”. The following tables represent the descriptive statistics regarding undetermined deaths reviewed by the Clark County Team from 2006 to 2009.
Figure 6.1: 2006‐2009 Undetermined Deaths: Sex (2006 n=18, 2007 n=17, 2008 n=18, 2009 n=18)
NOTE: In 2006 there was one case where the condition of the body at autopsy made it impossible to determine Sex
In 2009 the proportion of males and females was equal for the first time in four years. This demonstrates an increase in the proportion of female decedents and a converse decrease in male decedents.
0.0%
10.0%
20.0%
30.0%
40.0%
50.0%
60.0%
70.0%
80.0%
2006 2007 2008 2009
61.1%
52.9%
72.20%
50%
33.3%
47.1%
27.80%
50%
5.6%
Male Female Unknown

73 2009 Annual Report of Child Deaths in Clark County‐ DRAFT
Figure 6.2: 2006‐2009 Undetermined Deaths: Age (2006 n=18, 2007 n=17, 2008 n=18, 2009 n=18)
Less than 1 year 1 to 4 years 10‐14 years 15 to 17 years
2006 83.3% (15) 11.1% (2) 0% 5.6% (1)
2007 94.1% (16) 5.9% (1) 0% 0%
2008 77.8% (14) 11.1% (2) 0% 11.1% (2)
2009 77.8% (14) 16.7% (3) 5.6% (1) 0%
Again in 2009 the majority of undetermined child deaths were those less than one year of age (77.8% or 14 cases). For the first time there is an undetermined case in the 10 to 14 year old category, and the highest proportion in four years in the one to four year old category (16.7%)
0
2
4
6
8
10
12
14
16
2006 2007 2008 2009
15
16
14 14
2
1
2
3
0 0 0
11
0
2
0
<1
1‐4
10‐14
15‐17

74 2009 Annual Report of Child Deaths in Clark County‐ DRAFT
Figure 6.3: 2006‐2009 Undetermined Deaths: Race (2006 n=18, 2007 n=17, 2008 n=18, 2009 n=18)
White White
(Non‐Hispanic) White
(Hispanic)Hispanic Black American
Indian Other
2006 44.4% ‐‐ ‐‐ 27.8% 33.3% 5.6% 16.7%
2007 ‐‐ 35.3% 35.3% ‐‐ 29.4% 0% 0%
2008 ‐‐ 55.6% (10) 22.2% (4) ‐‐ 22.2% (4) 0% 0%
2009 ‐‐ 38.9% (7) 22.2 (4) ‐‐ 27.8% (5) 0% 11.1% (2) * Race/Ethnicity data were collected differently in 2006 and 2007. Dashed lines (‐‐) indicate where this separate data was not collected in that year.
In 2009 there were slightly more undetermined deaths of White Non‐Hispanic children than in 2007, but fewer than in 2008. In 2009 we see a slight increase in the percentage of Black children with undetermined deaths at 27.8% overall. For undetermined deaths the majority of families had prior history with child protective services, 61.1% (11 cases) had a history of child welfare involvement, and in 11.1% (2 cases) of all undetermined cases was the history on the decedent. Additionally, there were no cases where the child was in foster care at the time of death.
0 0.1 0.2 0.3 0.4 0.5 0.6
White (Non Hispanic)
White (Hispanic)
White
Other*
Hispanic
Black
American Indian
2009
2008
2007
2006

75 2009 Annual Report of Child Deaths in Clark County‐ DRAFT
UNDETERMINED DEATH – LESS THAN ONE YEAR OF AGE The majority of undetermined deaths in 2009 were again those children under one year of age (77.8% or 14 cases). In all but one case the child’s death occurred while the child was in a sleeping environment. In 57.1% of these cases (8 cases) the child was sleeping on a mattress at the time of their death. In all of these cases the child was sleeping with another person, most frequently a parent or a sibling or both. Figure 6.4 illustrates the various sleep locations for these children. Most notable we see a continued increase from 2006 to 2009 of children less than one year of age sleeping on adult mattresses, increasing from 30.8% in 2006 to 61.5% in 2009.
Figure 6.4: 2006‐2009 Children <1 year old: Sleep Location (2006 n=15, 2007 n=16, 2008 n=13, 2009 n=13)
Incident Sleep
Place 2006 (n=15)
2007 (n=16)
2008 (n=13)
2009 (n=13)
Incident Sleep Place
2006 (n=15)
2007 (n=16)
2008 (n=13)
2009 (n=13)
Unknown 0.0% 0.0% 7.7% (1) 0.0% Couch/Chair 7.7% 17.6% 15.4% (2) 0.0%
Cot 0.0% 5.9% 0.0% 0.0% Mattress 30.8% 41.2% 53.8% (7) 61.5% (8)
Floor 0.0% 5.9% 0.0% 7.1% (1) Bassinette 23.1% 0.0% 7.7% (1) 7.1% (1)
Playpen 0.0% 5.9% 0.0% 7.1% (1) Crib 30.8% 17.6% 7.7% (1) 15.4% (2)
Carseat/Stroller 7.7% 0.0% 7.7% (1) 0.0%
Among the deaths of children less than one year of age that were in sleeping environments, 46.2% (6 cases) of these children were placed to sleep on either their side or stomach, while another 46.2% (6 cases) the child was placed to sleep on his/her back (placement was unknown in one case). When found, most children were on their stomach or side (52.8%), followed by 30.8% of all cases where the child was found on his/her back. These infants were found in a variety of positions, ranging from face down in blankets or pillows, to having a sheet wrapped around the face, face down in a couch or chair cushion, or next to a co‐sleeping parent. In 2009 most undetermined deaths of children under one year of age occurred while the child was in a sleeping environment. There was only one case where the death did not occur in a sleeping environment and this child had just been delivered in a bathtub when (s)he became unresponsive.
0.0% 10.0% 20.0% 30.0% 40.0% 50.0% 60.0% 70.0%
Unknown
Playpen
Mattress
Floor
Crib
Couch/Chair
Cot
Carseat/Stroller
Bassinette
2009
2008
2007
2006

76 2009 Annual Report of Child Deaths in Clark County‐ DRAFT
UNDETERMINED DEATHS – OVER ONE YEAR OF AGE The remaining four undetermined deaths were children over one year of age. This included three cases of children between one and four years of age and one case of a child between the ages of ten and fourteen. In three of the cases the cause of death was also undetermined, and in the remaining case the cause was strangulation. . In each of these cases the circumstances surrounding the child’s death were not clear, and therefore were ruled undetermined
MANNER NOT APPLICABLE In 2009 there were two cases referred to the team for review that were categorized as “manner not applicable.” Both of these cases were fetal deaths (one at 23 weeks and the other at 39 weeks) and therefore manner was not assigned. In most cases these deaths would be assigned a manner of “natural” for the purposes of review. However in these two cases the circumstances were such that both deaths included maternal substance use which ultimately led to the fetal death. In one case the mother admitted to using methamphetamine, smoking cigarettes and drinking alcohol through the 23rd week of pregnancy. In the other case the mother reported several falls and smoking crack cocaine through the 7th month of pregnancy.

77 2009 Annual Report of Child Deaths in Clark County‐ DRAFT
LOCAL PREVENTION EFFORTS
The Child Death Review Team in Clark County makes an effort to act locally to prevent child deaths. There were several primary activities highlighted below. Some initiatives were carried out by the team itself, but others are local agency initiatives that were influenced by team members participation in Child Death Reviews. These are examples of how the local annual report, as well as multidisciplinary participation in the review meetings can have an impact in the community through improved policy and practice as well as prevention activities.
TEAM STRUCTURE In 2009 the team continues to use the protocols created in 2008 to support team function. A new co‐chair was elected in 2009 and accepted new at large members using application protocols. In 2009 the team added members from the Henderson Fire Department and North Las Vegas Fire Department as well as the UMC Pediatric Trauma Program. All of these new members add a fresh perspective on case reviews and help to facilitate prevention recommendations.
TEAM EDUCATION AND INVITED PRESENTATIONS In 2009 the team was approached by a local non‐profit organization that provides supplies to new mothers that need things for their baby. The team invited the organizations’ president and founder to attend the meeting to discuss their program. Following that discussion the team was able to provide them with safe sleep brochures to be included in all diaper bags they supply to new mothers.
INFORMATION DISSEMINATION The NICRP is contracted to coordinate the Child Death Review Team in Clark County, collect data from reviews and complete the annual report. In addition to these duties, in 2009 NICRP also presented the findings to the Clark County Commission, Henderson City Council, and a councilwoman with the City of North Las Vegas. Zip code specific data were also provided to the City of Las Vegas for review.
DROWNING PREVENTION Clark Team coordinator was invited to attend a one day CDC Appleseed Project Workshop on Drowning Prevention. At this meeting key agencies discussed some of the barriers and challenges in drowning prevention and tried to strategize for ways to overcome those barriers. As a result of this meeting representatives from the Southern Nevada Health District’s Drowning Prevention Program were invited to talk to the CDR team about the data that they track on fatal and non‐fatal drowning incidents to help improve agency collaboration and data collection.
OVERALL CHILD SAFETY The NICRP used information from the review meetings and its 2008 Child Death Report to create a “Child Safety Booklet” for parents in Clark County. This booklet is organized by age group and provides prevention information and statistics for parents to keep their children safe from accidental injuries. The booklet is currently under review and may possibly be used as a part of other County wide injury prevention efforts.

78 2009 Annual Report of Child Deaths in Clark County‐ DRAFT
2009 RECOMMENDATIONS TO THE STATE ADMINISTRATIVE TEAM
Summary of Recommendations Reported to the State Administrative Team for 2009 Child Deaths Every quarter the Child Death Review Team in Clark County provides a set of recommendations to the state Administrative Team to Review the Death of Children. These recommendations are reviewed and some action or response is generated. These responses are summarized in reports that are forwarded to the local representatives that serve on the Executive Committee. Listed below are all recommendations that were made by the Child Death Review Team in Clark County to the Administrative Team to Review the Death of Children in 2009. “Action” listed under each recommendation represents the response from the Administrative Team. 2009‐01: Pesticides should be included on the SUIDI list for investigators to consider and collect information about.
Action: Both Washoe and Clark County Coroner’s Offices include questions about the presence or absence of fumes, insects and other environmental concerns at the scene of death in their SUIDI checklists.
2009‐02: Safety tethers on the back of furniture should be used to secure furniture to walls to prevent it from falling over and crushing or injuring children and other people in the home. Agencies that are already doing home visits – assessing the safety of the home should be trained about this issue and this should be added to the safety checklists used by the local child welfare investigators. Action: Safety information researched and posted on CAN Prevent website. ( 2009‐03: Enact legislation to create a graduated licensing system for new drivers. Currently there are no restrictions for new teen drivers. Action: Nevada does have graduated licensing requirements under NRS 483. 2009‐04: Create a letter from Nevada Child Death Review that recommends that business owners require that all ride operators be first aid and CPR certified. Action: Letter drafted and sent to Clark County Chief of Code Enforcement from State Administrative Team. 2009‐05: Informational brochures or DVDs could be provided to all families purchasing homes in Las Vegas with swimming pools. This information could be provided to new homeowners by the realtors after closing to make new homeowners aware of the dangers swimming pools pose to children and educate them about safety precautions they can take.
Action: Recommendation was referred to the state Executive Committee’s Public Awareness subcommittee and drowning prevention was included as part of the 2010 public awareness campaign. Under this campaign information will be disseminated through pool supply companies to ensure that new homeowners as well as existing homeowners receive the information.

79 2009 Annual Report of Child Deaths in Clark County‐ DRAFT
2009‐06: Improve mandated reporter training for medical specialists by working with state licensing boards to mandate that this training is required for licensure. Action: A letter was sent to the president of the Nevada Board of Medical Examiners. 2009‐07: Review/update child care licensing regulations to ensure that they clearly state that child care centers must have appropriate and adequate space for as many children as they are licensed for.
Action: This issue was researched and determined that the language already exists under Nevada Administrative Code. Further under NRS, the Division of Child and Family Services (DCFS) conducts two unannounced site visits each year to licensed child care centers.
2009‐08: Provide education materials to be distributed to local trash collection agencies regarding the safety hazards of placing large objects out on the curb prior to their designated pick up day.
Action: The Administrative Team determined that this could not be addressed by the Administrative Team because it is a parental supervision matter.
2009‐09: Promote a public education campaign about the safety hazards associated with using plastic bags for storage of toys for small children, including information about risks associated with these bags to parenting classes and other parent/caregiver groups. These messages should not be limited to hazards associated with re‐sealable bags, but also other types of plastic bags including grocery bags and dry cleaning bags.
Action: Information was researched from the Consumer Product Safety Commission, but this recommendation is still currently under review by the Administrative Team.
2009‐10: Provide public education in as many venues as possible about the importance of maintaining barriers to access (including, fences, self latching gates, locks, and alarms) as well as the vital importance of constant adult supervision.
Action: The Administrative Team discussed existing efforts in Clark County through the Southern Nevada Health District as well as the inclusion of drowning prevention in the 2010 public awareness campaign.
2009‐11: Improve public education about children’s eligibility for health care coverage under Medicaid or Nevada Check Up to increase enrollment and decrease the number of children who are uninsured in Nevada.
Action: The Administrative Team initially declined to provide further education about these programs due to cuts in program funding, however state representatives for Medicaid and Nevada Check Up were invited to attend the next quarterly meeting. The recommendation is currently still under review

80 2009 Annual Report of Child Deaths in Clark County‐ DRAFT
2009‐12: Send an informational letter to all major professional organizations for medical providers that may treat asthma in children. This letter should include information on appropriate care plans, access to good medical care and the importance of compliance with the prescribed care plans. Action: This recommendation is currently still under review. 2009‐13: Provide additional education and promotion for “safe haven laws” protecting mothers who need a safe place to give up their newborn child. Action: This recommendation is currently still under review.

81 2009 Annual Report of Child Deaths in Clark County‐ DRAFT
APPENDIX A: 2009 CDRT MEMBERSHIP LIST
2009 Core Members
Vicki Monroe 2009 Team Chair Alane Olson Clark County Office of the Coroner/Medical Examiner
Dr. Andrew Eisen 2009 Team Vice Chair Gwendolyn Osburn Southern Nevada Health District
Sally Jost Clark County School District Mark Reeping Mesquite Police Department
Dave McKenna Henderson Police Department Joseph Smith Nevada Highway Patrol/Department of Public Safety
Ricky Crosby Clark County Department of Juvenile Justice Services Robert Sullivan North Las Vegas Police Department
Tom Morton Clark County Department of Family Services Lisa Teele
Las Vegas Metropolitan Police Department – Abuse/Neglect Detail
2009 At Large Members
Sue Battaglia Las Vegas Metropolitan Police Department – Abuse/Neglect Detail Paula Haynes‐Green
Clark County Department of Family Services
Marion Biron Clark County Department of Family Services Tracy Kingera Department of Juvenile Justice Services
Mary Brown District Attorney’s Office Doug Koch University Medical Center
Catherine Coleman University Medical Center Dr. Neha Mehta Sunrise Hospital
Ron Cordes District Attorney’s Office Liza Morris University Medical Center
Jeanne Cosgrove SAFE Kids Todd Peters Henderson Police Department
Daphne Dwitt North Vista Hospital Tara Phebus Nevada Institute for Children’s Research and Policy
Thomas Finn Boulder City Police Department Lisa Popovsky Area Health Education Center ‐ Prevent Child Abuse Nevada
Mark Fitzgerald Clark County Department of Family Services Peggy Rowe
Clark County Department of Family Services
Linda Flatt Nevada Office of Suicide Prevention Gregory Schultz Las Vegas Metropolitan Police Department
Deborah Flowers Nevada Department of Child and Family Services Karen Silcott
Nevada Institute for Children’s Research and Policy
Dr. Tony Fredrick Southern Nevada Health District James Sweetin District Attorney’s Office
John Fudenberg Clark County Office of the Coroner/Medical Examiner
Denise Tanata Ashby
Nevada Institute for Children’s Research and Policy
Paula Hammack Clark County Department of Family Services Rosemary Virtuoso Clark County School District
Marion Hancock Sunrise Hospital

82 2009 Annual Report of Child Deaths in Clark County‐ DRAFT
APPENDIX B: NEVADA REVISED STATUTES RELATING TO CHILD DEATH REVIEW
NRS 432B.403 Purpose of organizing child death review teams. The purpose of organizing multidisciplinary teams to review the deaths of children pursuant to NRS 432B.403 to 432B.409, inclusive, is to: 1. Review the records of selected cases of deaths of children under 18 years of age in this state; 2. Review the records of selected cases of deaths of children under 18 years of age who are residents of Nevada and who die in another state; 3. Assess and analyze such cases; 4. Make recommendations for improvements to laws, policies and practice; 5. Support the safety of children; and 6. Prevent future deaths of children. (Added to NRS by 2003, 863) NRS 432B.405 Organization of child death review teams. 1. An agency which provides child welfare services: (a) May organize one or more multidisciplinary teams to review the death of a child; and (b) Shall organize one or more multidisciplinary teams to review the death of a child under any of the following circumstances: (1) Upon receiving a written request from an adult related to the child within the third degree of consanguinity, if the request is received by the agency within 1 year after the date of death of the child; (2) If the child dies while in the custody of or involved with an agency which provides child welfare services, or if the child’s family previously received services from such an agency; (3) If the death is alleged to be from abuse or neglect of the child; (4) If a sibling, household member or daycare provider has been the subject of a child abuse and neglect investigation within the previous 12 months, including cases in which the report was unsubstantiated or the investigation is currently pending; (5) If the child was adopted through an agency which provides child welfare services; or (6) If the child died of Sudden Infant Death Syndrome. 2. A review conducted pursuant to subparagraph (2) of paragraph (b) of subsection 1 must occur within 3 months after the issuance of a certificate of death. (Added to NRS by 1993, 2051; A 2001 Special Session, 47; 2003, 864) NRS 432B.406 Composition of child death review teams. 1. A multidisciplinary team to review the death of a child that is organized by an agency which provides child welfare services pursuant to NRS 432B.405 must include, insofar as possible: (a) A representative of any law enforcement agency that is involved with the case under review; (b) Medical personnel; (c) A representative of the district attorney’s office in the county where the case is under review; (d) A representative of any school that is involved with the case under review; (e) A representative of any agency which provides child welfare services that is involved with the case under review; and (f) A representative of the coroner’s office. 2. A multidisciplinary team may include such other representatives of other organizations concerned with the death of the child as the agency which provides child welfare services deems appropriate for the review. (Added to NRS by 2003, 863) NRS 432B.407 Information available to child death review teams; sharing of certain information; subpoena to obtain information; confidentiality of information. 1. A multidisciplinary team to review the death of a child is entitled to access to:
83 2009 Annual Report of Child Deaths in Clark County‐ DRAFT
(a) All investigative information of law enforcement agencies regarding the death; (b) Any autopsy and coroner’s investigative records relating to the death; (c) Any medical or mental health records of the child; and (d) Any records of social and rehabilitative services or of any other social service agency which has provided services to the child or the child’s family. 2. Each organization represented on a multidisciplinary team to review the death of a child shall share with other members of the team information in its possession concerning the child who is the subject of the review, any siblings of the child, any person who was responsible for the welfare of the child and any other information deemed by the organization to be pertinent to the review. 3. A multidisciplinary team to review the death of a child may petition the district court for the issuance of, and the district court may issue, a subpoena to compel the production of any books, records or papers relevant to the cause of any death being investigated by the team. Any books, records or papers received by the team pursuant to the subpoena shall be deemed confidential and privileged and not subject to disclosure. 4. Information acquired by, and the records of, a multidisciplinary team to review the death of a child are confidential, must not be disclosed, and are not subject to subpoena, discovery or introduction into evidence in any civil or criminal proceeding. (Added to NRS by 2003, 863) NRS 432B.408 Administrative team to review report of child death review team. 1. The report and recommendations of a multidisciplinary team to review the death of a child must be transmitted to an administrative team for review. 2. An administrative team must consist of administrators of agencies which provide child welfare services, and agencies responsible for vital statistics, public health, mental health and public safety. 3. The administrative team shall review the report and recommendations and respond in writing to the multidisciplinary team within 90 days after receiving the report. (Added to NRS by 2003, 864) NRS 432B.409 Establishment, composition and duties of Executive Committee to Review the Death of Children; creation of and use of money in Review of Death of Children Account. 1. The Administrator of the Division of Child and Family Services shall establish an Executive Committee to Review the Death of Children, consisting of representatives from multidisciplinary teams formed pursuant to NRS 432B.405 and 432B.406, vital statistics, law enforcement, public health and the Office of the Attorney General. 2. The Executive Committee shall: (a) Adopt statewide protocols for the review of the death of a child; (b) Designate the members of an administrative team for the purposes of NRS 432B.408; (c) Oversee training and development of multidisciplinary teams to review the death of children; and (d) Compile and distribute a statewide annual report, including statistics and recommendations for regulatory and policy changes. 3. The Review of Death of Children Account is hereby created in the State General Fund. The Executive Committee may use money in the Account to carry out the provisions of NRS 432B.403 to 432B.409, inclusive. (Added to NRS by 2003, 864)