2008 semi annual report russell investment company ii plc
TRANSCRIPT
2008 SEMI ANNUAL REPORT
30 September, 2008 (Unaudited)
Russell Investment Company II plcan umbrella fund with segregated liability between sub-funds
The Euro Fixed Income Fund
The Global Bond (Euro Hedged) Fund
The Pan European Equity Fund
The U.K. Equity Plus Fund
The U.S. Growth Fund
The U.S. Quant Fund
The U.S. Value Fund
The World Equity Fund

Russell Investment Company II plc Contents
Contents
Administration of the Company ......................................................................................................................... 2 Background to the Company ............................................................................................................................ 5 Combined Statements ...................................................................................................................................... 6 The Euro Fixed Income Fund ........................................................................................................................... 10 The Global Bond (Euro Hedged) Fund ............................................................................................................. 36 The Pan European Equity Fund ....................................................................................................................... 86 The U.K. Equity Plus Fund ............................................................................................................................... 112 The U.S. Growth Fund ...................................................................................................................................... 125 The U.S. Quant Fund ........................................................................................................................................ 137 The U.S. Value Fund ........................................................................................................................................ 166 The World Equity Fund ..................................................................................................................................... 179 Notes to the Financial Statements .................................................................................................................... 211 Total Expense Ratio .......................................................................................................................................... 239
Russell Investment Company II plc Administration of the Company
2 Administration of the Company
Board of Directors of the Company Promoter Mr. James Firn (Chairman) Frank Russell Company Mr. James Beveridge 909 A Street Mr. Karl Ege Tacoma, WA 98402 - 5120 Mr. Neil Jenkins (Alternate Director for Mr. Randall P. Lert) United States of America Mr. Randall P. Lert Mr. Paul McNaughton Secretary Ms. Anna Nye Bradwell Limited Mr. William Roberts Arthur Cox Building Mr. David Shubotham Earlsfort Centre, Earlsfort Terrace Mr. Hal Strong Dublin 2 Ireland Audit Committee Members Mr. David Shubotham (Chairman) Principal Money Manager, Adviser and Distributor Mr. Paul McNaughton Russell Investments Limited Mr. William Roberts Rex House 10 Regent Street Registered Office London SW1Y 4PE Guild House, Guild Street England International Financial Services Centre Dublin 1 Money Managers for The Euro Fixed Income Fund Ireland Fidelity Investments International Limited Oakhill House Manager 130 Tonbridge Road Russell Investments Ireland Limited Hildenborough Guild House, Guild Street Tonbridge International Financial Services Centre Kent TN11 9DZ Dublin 1 England Ireland Robeco Institutional Asset Management BV Independent Auditors Coolsingel 120 NL PricewaterhouseCoopers 3011 AG Rotterdam Chartered Accountants and Registered Auditors The Netherlands One Spencer Dock North Wall Quay Western Asset Management Dublin 1 155 Bishopsgate Ireland London EC2M 3XG England Legal Advisers Arthur Cox Money Managers for The Global Bond (Euro Hedged) Earlsfort Centre Fund Earlsfort Terrace Colchester Global Investors Limited Dublin 2 Heathcoat House Ireland 20 Savile Row London WIS 3PR Administrator England State Street Fund Services (Ireland) Limited Guild House, Guild Street Drake Capital Management LLC International Financial Services Centre 660 Madison Avenue, 16th Floor Dublin 1 New York, NY 10065 Ireland United States of America Custodian and Trustee Loomis, Sayles & Company, L.P. State Street Custodial Services (Ireland) Limited One Financial Center Guild House, Guild Street Boston, MA 02111 International Financial Services Centre United States of America Dublin 1 Ireland
Russell Investment Company II plc Administration of the Company - continued
Administration of the Company 3
Pacific Investment Management Company LLC River and Mercantile Asset Management LLP 840 Newport Centre Drive, Suite 360 30 Coleman Street Newport Beach, CA 92658-6430 London, EC2R 5AL United States of America England Money Managers for The Pan European Equity Fund Standard Life Investments AQR Capital Management 1 George Street Two Greenwich Plaza, 3rd Floor Edinburgh EH2 2LL Greenwich, CT 06830 Scotland United States of America TT International BlackRock International Limited Martin House 40 Torphichen Street 5 Martin Lane Edinburgh EH3 8JB London EC4R 0DP Scotland England Numeric Investors L.P. Money Managers for The U.S. Growth Fund 1 Memorial Drive Marisco Capital Management, LLC Cambridge, MA 02142 1200 17th Street, Suite 1300 United States of America Denver, CO 80202 United States of America Pzena Investment Management, LLC 120 West 45th Street, 20th Floor Suffolk Capital Management, LLC New York, NY 10036 1633 Broadway, 40th Floor United States of America New York, NY 10019 United States of America RCM (U.K.) Ltd 155 Bishopsgate Sustainable Growth Advisers, L.P. London, EC2M 3AD 310 Tresser Boulevard, Ste. 1310 England Stamford, CT 06901 United States of America Sourcecap International LLP Block D, The Old Truman Brewery Turner Investment Partners Inc. 91 Brick Lane 1205 Westlakes Drive, Suite 100 London, E1 6QL Berwyn, PA 19312 England United States of America TT International Wells Capital Management Martin House 525 Market Street, 10th Floor 5 Martin Lane San Francisco, CA 94105 London EC4R 0DP United States of America England Money Managers for The U.S. Quant Fund Taube Hodson Stonex Partners Ltd. Aronson and Johnson and Ortiz L.P. Cassini House, 1st Floor 230 South Broad Street, 20th Floor 57-59, St. James’ Street Philadelphia, PA 19102 London SW1A 1LD United States of America England Enhanced Investment Technologies, LLC Money Managers for The U.K. Equity Plus Fund 2401 PGA Boulevard, Suite 100 Liontrust Investment Services Limited Palm Beach Gardens, FL 33410 2 Savoy Court United States of America London WC2R 0EZ England Frank Russell Company 909 A Street Resolution Asset Management Limited Tacoma, WA 98402 Resolution House United States of America 50 Bothwell Street Glasgow G2 6HR Scotland
Russell Investment Company II plc Administration of the Company - continued
4 Administration of the Company
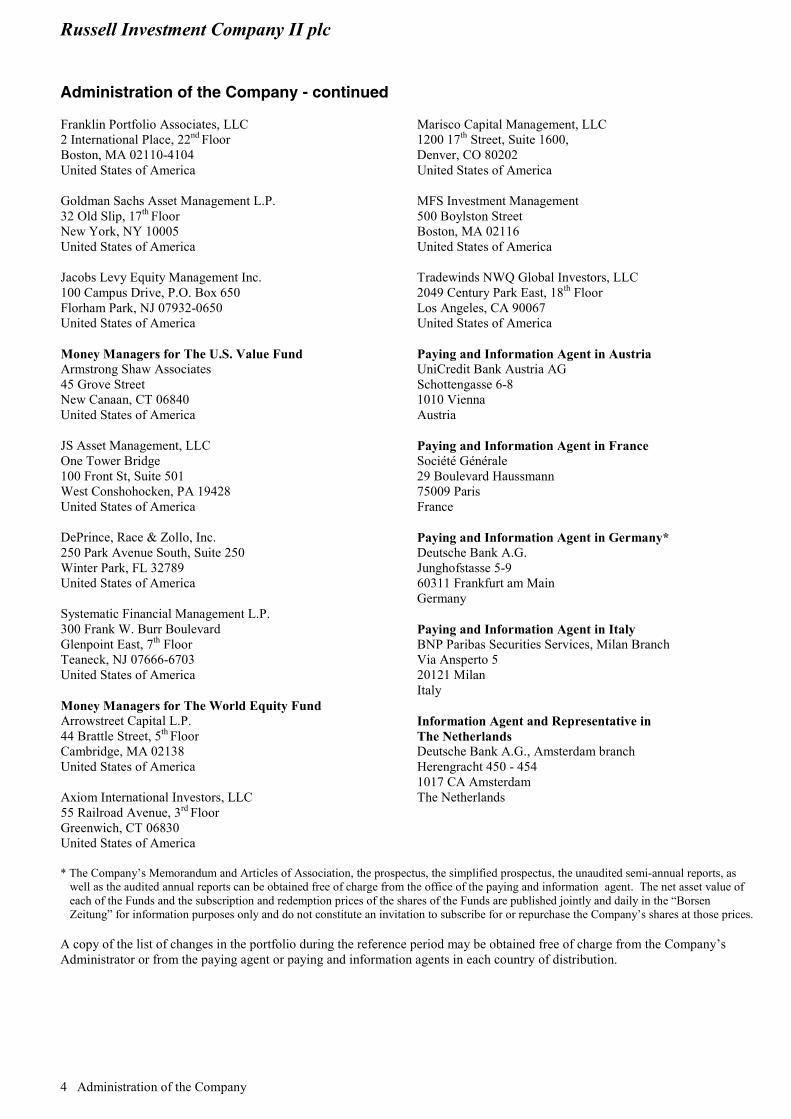
Franklin Portfolio Associates, LLC Marisco Capital Management, LLC 2 International Place, 22nd Floor 1200 17th Street, Suite 1600, Boston, MA 02110-4104 Denver, CO 80202 United States of America United States of America Goldman Sachs Asset Management L.P. MFS Investment Management 32 Old Slip, 17th Floor 500 Boylston Street New York, NY 10005 Boston, MA 02116 United States of America United States of America Jacobs Levy Equity Management Inc. Tradewinds NWQ Global Investors, LLC 100 Campus Drive, P.O. Box 650 2049 Century Park East, 18th Floor Florham Park, NJ 07932-0650 Los Angeles, CA 90067 United States of America United States of America Money Managers for The U.S. Value Fund Paying and Information Agent in Austria Armstrong Shaw Associates UniCredit Bank Austria AG 45 Grove Street Schottengasse 6-8 New Canaan, CT 06840 1010 Vienna United States of America Austria JS Asset Management, LLC Paying and Information Agent in France One Tower Bridge Société Générale 100 Front St, Suite 501 29 Boulevard Haussmann West Conshohocken, PA 19428 75009 Paris United States of America France DePrince, Race & Zollo, Inc. Paying and Information Agent in Germany* 250 Park Avenue South, Suite 250 Deutsche Bank A.G. Winter Park, FL 32789 Junghofstasse 5-9 United States of America 60311 Frankfurt am Main Germany Systematic Financial Management L.P. 300 Frank W. Burr Boulevard Paying and Information Agent in Italy Glenpoint East, 7th Floor BNP Paribas Securities Services, Milan Branch Teaneck, NJ 07666-6703 Via Ansperto 5 United States of America 20121 Milan Italy Money Managers for The World Equity Fund Arrowstreet Capital L.P. Information Agent and Representative in 44 Brattle Street, 5th Floor The Netherlands Cambridge, MA 02138 Deutsche Bank A.G., Amsterdam branch United States of America Herengracht 450 - 454 1017 CA Amsterdam Axiom International Investors, LLC The Netherlands 55 Railroad Avenue, 3rd Floor Greenwich, CT 06830 United States of America * The Company’s Memorandum and Articles of Association, the prospectus, the simplified prospectus, the unaudited semi-annual reports, as
well as the audited annual reports can be obtained free of charge from the office of the paying and information agent. The net asset value of each of the Funds and the subscription and redemption prices of the shares of the Funds are published jointly and daily in the “Borsen Zeitung” for information purposes only and do not constitute an invitation to subscribe for or repurchase the Company’s shares at those prices.
A copy of the list of changes in the portfolio during the reference period may be obtained free of charge from the Company’s Administrator or from the paying agent or paying and information agents in each country of distribution.
Russell Investment Company II plc Background to the Company
Background to the Company 5
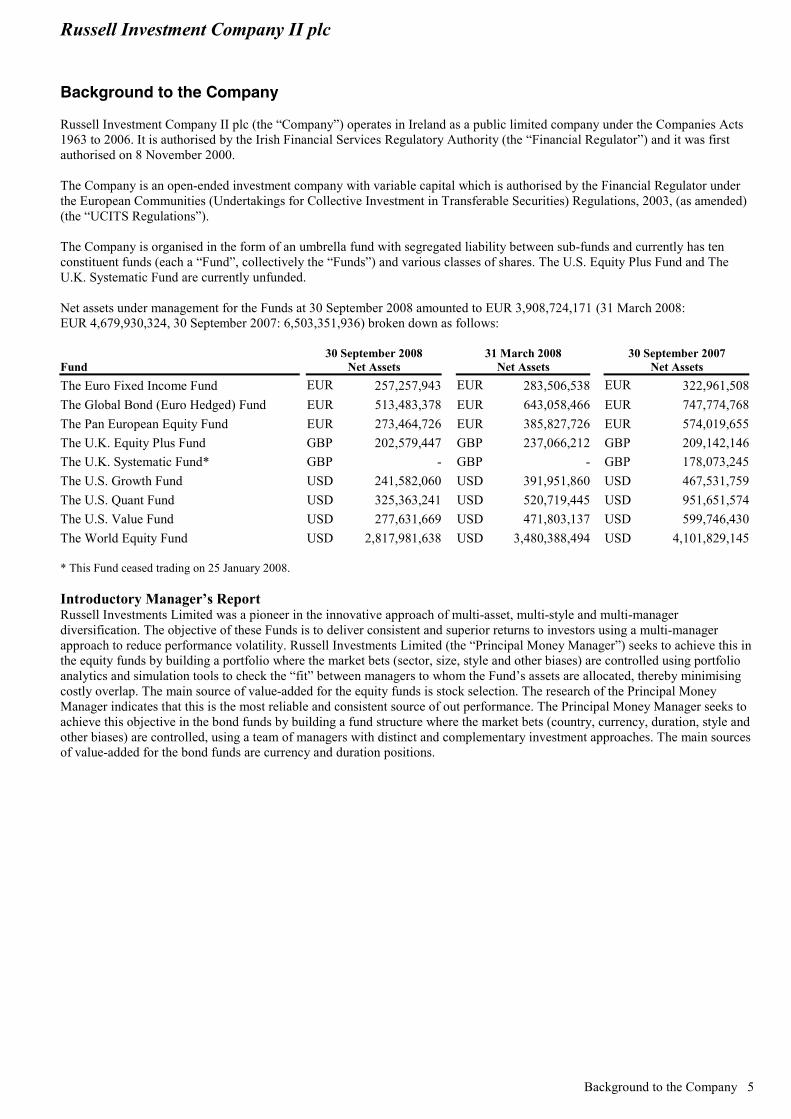
Russell Investment Company II plc (the “Company”) operates in Ireland as a public limited company under the Companies Acts 1963 to 2006. It is authorised by the Irish Financial Services Regulatory Authority (the “Financial Regulator”) and it was first authorised on 8 November 2000. The Company is an open-ended investment company with variable capital which is authorised by the Financial Regulator under the European Communities (Undertakings for Collective Investment in Transferable Securities) Regulations, 2003, (as amended) (the “UCITS Regulations”). The Company is organised in the form of an umbrella fund with segregated liability between sub-funds and currently has ten constituent funds (each a “Fund”, collectively the “Funds”) and various classes of shares. The U.S. Equity Plus Fund and The U.K. Systematic Fund are currently unfunded. Net assets under management for the Funds at 30 September 2008 amounted to EUR 3,908,724,171 (31 March 2008: EUR 4,679,930,324, 30 September 2007: 6,503,351,936) broken down as follows:
Fund 30 September 2008
Net Assets 31 March 2008
Net Assets 30 September 2007
Net Assets The Euro Fixed Income Fund EUR 257,257,943 EUR 283,506,538 EUR 322,961,508The Global Bond (Euro Hedged) Fund EUR 513,483,378 EUR 643,058,466 EUR 747,774,768The Pan European Equity Fund EUR 273,464,726 EUR 385,827,726 EUR 574,019,655The U.K. Equity Plus Fund GBP 202,579,447 GBP 237,066,212 GBP 209,142,146The U.K. Systematic Fund* GBP - GBP - GBP 178,073,245The U.S. Growth Fund USD 241,582,060 USD 391,951,860 USD 467,531,759The U.S. Quant Fund USD 325,363,241 USD 520,719,445 USD 951,651,574The U.S. Value Fund USD 277,631,669 USD 471,803,137 USD 599,746,430The World Equity Fund USD 2,817,981,638 USD 3,480,388,494 USD 4,101,829,145 * This Fund ceased trading on 25 January 2008. Introductory Manager’s Report Russell Investments Limited was a pioneer in the innovative approach of multi-asset, multi-style and multi-manager diversification. The objective of these Funds is to deliver consistent and superior returns to investors using a multi-manager approach to reduce performance volatility. Russell Investments Limited (the “Principal Money Manager”) seeks to achieve this in the equity funds by building a portfolio where the market bets (sector, size, style and other biases) are controlled using portfolio analytics and simulation tools to check the “fit” between managers to whom the Fund’s assets are allocated, thereby minimising costly overlap. The main source of value-added for the equity funds is stock selection. The research of the Principal Money Manager indicates that this is the most reliable and consistent source of out performance. The Principal Money Manager seeks to achieve this objective in the bond funds by building a fund structure where the market bets (country, currency, duration, style and other biases) are controlled, using a team of managers with distinct and complementary investment approaches. The main sources of value-added for the bond funds are currency and duration positions.

Russell Investment Company II plc Combined Balance Sheet As at 30 September 2008
The accompanying notes are an integral part of the financial statements. 6 Combined Balance Sheet
Total 30 September 2008
EUR
Total 31 March 2008
(Audited) EUR
Total 30 September 2007
EUR Assets Financial assets at fair value through profit or loss:
Investments at fair value .............................................................. 4,011,668,832 4,662,536,538 6,498,810,153Unrealised gain on open futures contracts ................................... 1,373,275 5,347,344 3,719,272Unrealised gain on forward foreign currency exchange contracts........................................................................................
28,603,928 43,191,355 49,821,447
Options purchased at fair value ................................................... 827,405 1,077,593 1,588,426Interest rate swaps at fair value ................................................... 1,744,680 4,922,891 2,944,963Credit default swaps at fair value ................................................ 904,413 565,943 356,278Swaptions purchased at fair value ............................................... 123,408 243,996 629,876
4,045,245,941 4,717,886,660 6,557,870,415
Cash at bank ..................................................................................... 27,986,998 125,315,729 108,708,849Cash held with brokers for open futures contracts .......................... 8,554,149 4,167,311 12,862,385Cash held with brokers for options .................................................. 50 - 49Cash held with counterparties for swap contracts ........................... 2,756,701 2,369,187 -Debtors:
Receivable for investments sold .................................................. 101,874,301 89,177,556 81,735,171Receivable for fund shares issued ................................................ 1,566,311 1,586,802 259,659Dividends receivable ................................................................... 6,408,703 9,579,776 8,977,921Interest receivable ........................................................................ 16,100,643 15,232,488 18,100,087
4,210,493,797 4,965,314,509 6,788,514,536Liabilities Financial liabilities at fair value through profit or loss:
Unrealised loss on open futures contracts .................................... (8,603,618) (3,240,868) (1,858,935)Unrealised loss on forward foreign currency exchange contracts .......................................................................................
(44,880,939) (36,050,536) (31,062,702)
Options written at fair value ........................................................ (153,005) (494,050) (526)Interest rate swaps at fair value ................................................... (6,535,919) (9,725,762) (4,420,738)Credit default swaps at fair value ................................................. (666,626) (570,885) (109,012)Swaptions written at fair value .................................................... (481,480) (279,199) (559,715)
(61,321,587) (50,361,300) (38,011,628)Creditors – amounts falling due within one year:
Bank overdraft ............................................................................. - (212) (192)Cash due to brokers for open futures contracts ............................ - (2,479,962) (1,291,786)Cash due to brokers for options contracts .................................... (1,134,191) (1,148,630) (74,365)Payable for investments purchased .............................................. (236,744,193) (227,220,471) (241,220,870)Payable for fund shares redeemed ............................................... (4,682,636) (4,990,164) (4,626,796)Management fees payable ........................................................... (3,406,040) (3,772,550) (5,817,749)Performance fees payable ............................................................ (739,905) (1,873,435) -Custodian and Trustee fees payable ............................................. (45,610) (50,214) (110,897)Sub-custodian fees payable ......................................................... (249,281) (381,067) (170,126)Administration fees payable ........................................................ (84,093) (95,714) (183,916)Interest payable ............................................................................ (122,321) (17,068) (29,082)Distributions Payable ................................................................... (254) 98,782 -Payable to Shareholders ............................................................... - (74,081) -Miscellaneous fees payable ......................................................... (222,531) (286,118) (603,896)
(308,752,642) (292,652,204) (292,141,303)

Russell Investment Company II plc Combined Balance Sheet - continued As at 30 September 2008
The accompanying notes are an integral part of the financial statements.
Combined Balance Sheet 7
On behalf of the Board Director Director 21 November 2008
Total 30 September 2008
EUR
Total 31 March 2008
(Audited) EUR
Total 30 September 2007
EUR Net assets attributable to redeemable participating shareholders (at bid market prices) ..........................................
3,901,741,155 4,672,662,305 6,496,373,233
Adjustment from bid market prices to last traded market prices ...............................................................................................
6,983,016 7,268,019 6,978,703
Net assets attributable to redeemable participating shareholders (at last traded market prices) ............................
3,908,724,171 4,679,930,324 6,503,351,936

Russell Investment Company II plc Combined Profit and Loss Account For the period ended 30 September 2008
The accompanying notes are an integral part of the financial statements. 8 Combined Profit and Loss Account
Total Six months ended
30 September 2008 EUR
Total Year ended
31 March 2008 EUR
Income Dividends .................................................................................................................... 54,492,413 115,011,864Bond income ............................................................................................................... 19,169,510 47,999,600Bank interest ............................................................................................................... 234,974 2,180,672Short term interest income........................................................................................... 463,871 4,160,941Securities lending income ........................................................................................... 3,662,630 12,721,115Miscellaneous income ................................................................................................ 155,368 646,803
78,178,766 182,720,995 Net gain (loss) on investment activities ......................................................................... (723,193,230) (321,038,871) Total investment income ............................................................................................ (645,014,464) (138,317,876) Expenses
Management fees ........................................................................................................ (21,566,204) (60,052,293)Performance fees ........................................................................................................ 496,397 (1,471,384)Custodian and Trustee fees ......................................................................................... (286,873) (1,063,753)Sub-custodian fees ...................................................................................................... (483,192) (1,024,142)Administration fees ..................................................................................................... (527,725) (1,234,409)Audit fees ................................................................................................................... (105,580) (172,305)Professional fees ......................................................................................................... (117,290) (489,810)Registration fees ......................................................................................................... (53,756) (154,030)Marketing fees ............................................................................................................ (264,863) (768,447)Miscellaneous fees ...................................................................................................... (458,849) (515,367)
Total operating expenses ........................................................................................... (23,367,935) (66,945,940) Net income (expense) .................................................................................................. (668,382,399) (205,263,816) Finance costs
Distributions ............................................................................................................... (48,820,890) (111,343,818)Bank interest paid ........................................................................................................ (85,594) -
Profit (loss) for the financial period/ year before withholding tax ..................... (717,288,883) (316,607,634) Withholding tax............................................................................................................... (8,109,406) (17,709,744) Profit (loss) for the financial period/year after withholding tax ......................... (725,398,289) (334,317,378) Movement in adjustment from bid market prices to last traded market prices ............................................................................................................................
(285,003) 2,782,541
Increase (decrease) in net assets attributable to redeemable participating shareholders resulting from operations ..................................................................
(725,683,292) (331,534,837)
All amounts arose solely from continuing operations. There are no gains or losses other than those dealt with in the Profit and Loss Account. On behalf of the Board Director Director 21 November 2008
Russell Investment Company II plc Combined Statement of Changes in Net Assets Attributable to Redeemable Participating Shareholders For the period ended 30 September 2008
The accompanying notes are an integral part of the financial statements.
Combined Statement of Net Assets Attributable to Redeemable Participating Shareholders 9
Total Six months ended
30 September 2008 EUR
Total Year ended
31 March 2008 EUR
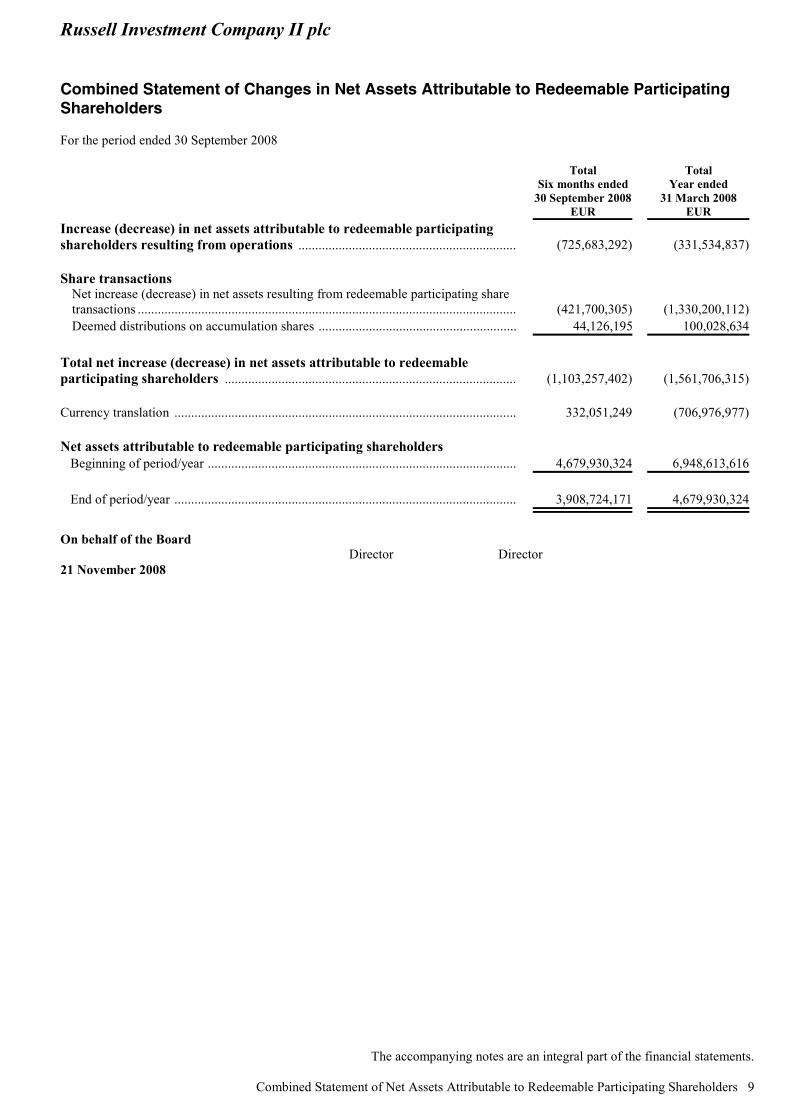
Increase (decrease) in net assets attributable to redeemable participating shareholders resulting from operations ................................................................. (725,683,292) (331,534,837) Share transactions
Net increase (decrease) in net assets resulting from redeemable participating share transactions ................................................................................................................. (421,700,305) (1,330,200,112)Deemed distributions on accumulation shares ........................................................... 44,126,195 100,028,634
Total net increase (decrease) in net assets attributable to redeemable participating shareholders ....................................................................................... (1,103,257,402) (1,561,706,315) Currency translation ...................................................................................................... 332,051,249 (706,976,977) Net assets attributable to redeemable participating shareholders Beginning of period/year ............................................................................................ 4,679,930,324 6,948,613,616 End of period/year ...................................................................................................... 3,908,724,171 4,679,930,324
On behalf of the Board Director Director 21 November 2008

Russell Investment Company II plc The Euro Fixed Income Fund Manager’s Report
10 The Euro Fixed Income Fund
Money Managers Fidelity Investments International Limited Robeco Institutional Asset Management BV Western Asset Management Investment Objective The investment objective of the Euro Fixed Income Fund (the “Fund”) is to provide income and capital growth by investing primarily in Euro denominated transferable debt instruments, which include but are not limited to, municipal and government bonds, agency debt (being that issued by local authorities or public international bodies of which one or more states is a member), mortgage related debt and corporate debt that are listed, traded or dealt in on a regulated market in the OECD and which may have fixed or floating rates. Fund Performance The Fund returned -2.9 per cent during the period on a gross-of-fees basis verses a benchmark return of 0.1 per cent.* Market Comment During the first half of the period, the economy showed signs of a slow down and European bond yields rose on inflation concerns and hawkish comments on monetary policy by Central Banks. The unprecedented rise in commodity prices earlier this year was a major benefactor to rising inflation. Corporate bonds recovered some of the ground lost during a difficult first quarter of the year and outperformed U.S. treasuries. However, concerns that liquidity problems at some of the biggest financial institutions might not yet have concluded weighed on investor sentiment. The third quarter of 2008 was one of the most turbulent in history. The unprecedented market events began with the nationalisation of mortgage facilitators Fannie Mae and Freddie Mac. This was followed by Lehman Brothers filing for bankruptcy, throwing the market into further turmoil. This led to a merger between Bank of America and Merrill Lynch and the rescue of AIG by the U.S. Federal Reserve. The quarter ended on further bad news as the U.S. bailout plan designed to clean up banks’ toxic debt was rejected and a temporary ban on short-selling of financials was imposed; the combination of the two was detrimental to investor confidence and saw most of the world’s major indices fall sharply. European bond yields declined during a difficult quarter. The U.S. Dollar strengthened towards the end of the quarter as commodity prices retreated resulting in a sell off of weaker currencies. Furthermore, commodity-related and emerging market currencies also weakened due to accelerated inflation and high commodity prices. Credit and high yield spreads again widened, reflecting the more vigilant overall outlook. Financials was the worst performing sector as banks continued to struggle with house-related losses. General Comment on Manager/Performance The Fund has lagged the benchmark mainly due to its overweight to credit and high yields that the managers have in the Fund. Fidelity Investments International Limited underperformed the benchmark given its overweight to financials. Although Robeco Institutional Asset Management BV posted absolute positive returns performance, it also underperformed the benchmark over the period. The manager’s small overweight to industrials was detrimental to performance. Western Asset Management was the worst-performing manager over the period as it continues to be a difficult market environment for the manager given its credit biased investment style. The overweight to financials and other off-benchmark positions, such as high yields, detracted from performance. Outlook The Fund remains well positioned to benefit from diverse returns in the coming quarter given its broad allocation of assets. Past performance is no indication of current or future performance. * Benchmark Source: Citigroup EuroBig Index
Russell Investment Company II plc The Euro Fixed Income Fund Balance Sheet As at 30 September 2008
The accompanying notes are an integral part of the financial statements.
The Euro Fixed Income Fund 11
30 September 2008
EUR
31 March 2008 (Audited)
EUR 30 September 2007
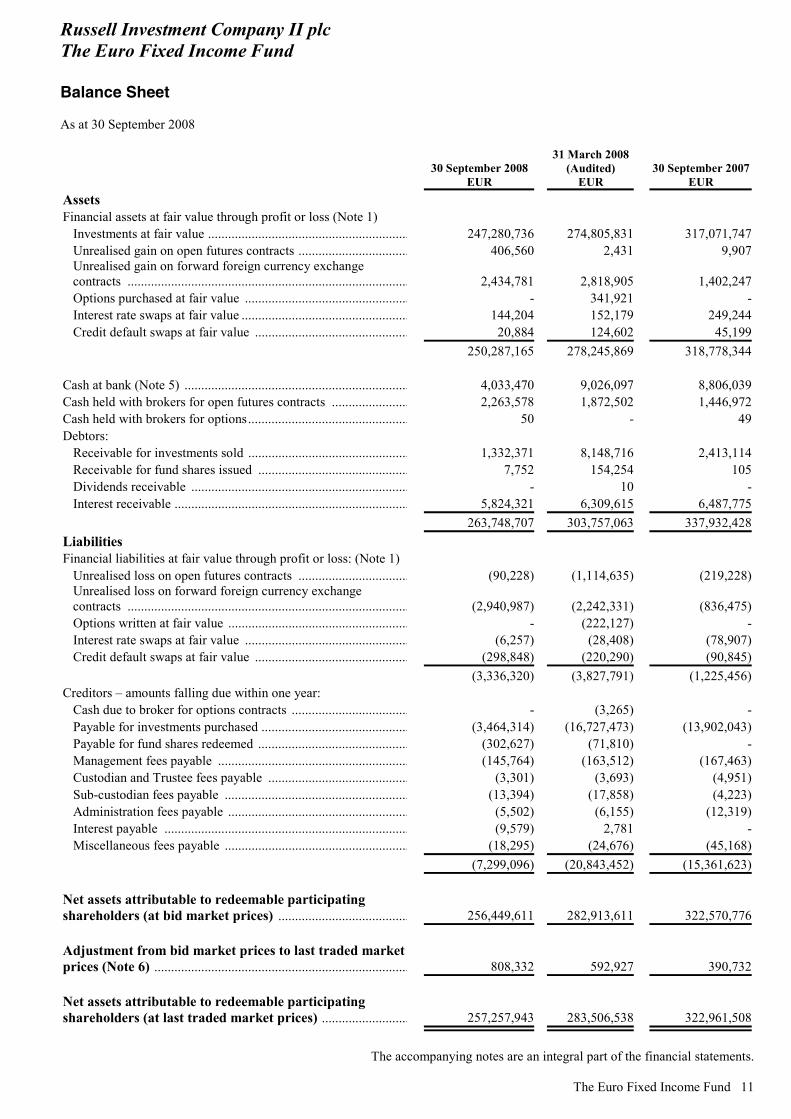
EUR Assets Financial assets at fair value through profit or loss (Note 1)
Investments at fair value ............................................................ 247,280,736 274,805,831 317,071,747Unrealised gain on open futures contracts ................................. 406,560 2,431 9,907Unrealised gain on forward foreign currency exchange contracts .................................................................................... 2,434,781 2,818,905 1,402,247Options purchased at fair value ................................................. - 341,921 -Interest rate swaps at fair value .................................................. 144,204 152,179 249,244Credit default swaps at fair value .............................................. 20,884 124,602 45,199
250,287,165 278,245,869 318,778,344 Cash at bank (Note 5) ................................................................... 4,033,470 9,026,097 8,806,039Cash held with brokers for open futures contracts ....................... 2,263,578 1,872,502 1,446,972Cash held with brokers for options................................................ 50 - 49Debtors:
Receivable for investments sold ................................................ 1,332,371 8,148,716 2,413,114Receivable for fund shares issued ............................................. 7,752 154,254 105Dividends receivable ................................................................. - 10 -Interest receivable ...................................................................... 5,824,321 6,309,615 6,487,775
263,748,707 303,757,063 337,932,428Liabilities Financial liabilities at fair value through profit or loss: (Note 1)
Unrealised loss on open futures contracts ................................. (90,228) (1,114,635) (219,228)Unrealised loss on forward foreign currency exchange contracts .................................................................................... (2,940,987) (2,242,331) (836,475)Options written at fair value ...................................................... - (222,127) -Interest rate swaps at fair value ................................................. (6,257) (28,408) (78,907)Credit default swaps at fair value .............................................. (298,848) (220,290) (90,845)
(3,336,320) (3,827,791) (1,225,456)Creditors – amounts falling due within one year:
Cash due to broker for options contracts ................................... - (3,265) -Payable for investments purchased ............................................ (3,464,314) (16,727,473) (13,902,043)Payable for fund shares redeemed ............................................. (302,627) (71,810) -Management fees payable ......................................................... (145,764) (163,512) (167,463)Custodian and Trustee fees payable .......................................... (3,301) (3,693) (4,951)Sub-custodian fees payable ....................................................... (13,394) (17,858) (4,223)Administration fees payable ...................................................... (5,502) (6,155) (12,319)Interest payable ......................................................................... (9,579) 2,781 -Miscellaneous fees payable ....................................................... (18,295) (24,676) (45,168)
(7,299,096) (20,843,452) (15,361,623) Net assets attributable to redeemable participating shareholders (at bid market prices) ....................................... 256,449,611 282,913,611 322,570,776 Adjustment from bid market prices to last traded market prices (Note 6) ............................................................................ 808,332 592,927 390,732 Net assets attributable to redeemable participating shareholders (at last traded market prices) .......................... 257,257,943 283,506,538 322,961,508
Russell Investment Company II plc The Euro Fixed Income Fund Balance Sheet - continued As at 30 September 2008
The accompanying notes are an integral part of the financial statements. 12 The Euro Fixed Income Fund
30 September 2008
EUR
31 March 2008 (Audited)
EUR 30 September 2007
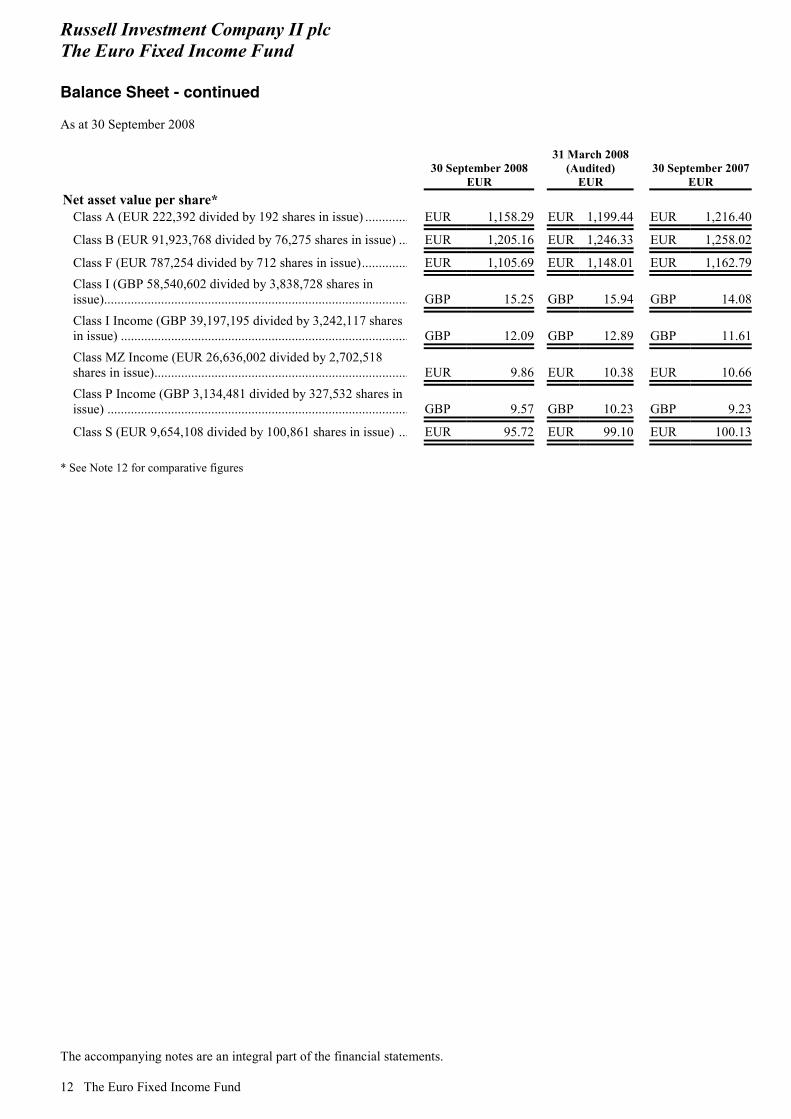
EUR Net asset value per share*
Class A (EUR 222,392 divided by 192 shares in issue) ............. EUR 1,158.29 EUR 1,199.44 EUR 1,216.40
Class B (EUR 91,923,768 divided by 76,275 shares in issue) ... EUR 1,205.16 EUR 1,246.33 EUR 1,258.02
Class F (EUR 787,254 divided by 712 shares in issue).............. EUR 1,105.69 EUR 1,148.01 EUR 1,162.79Class I (GBP 58,540,602 divided by 3,838,728 shares in issue)........................................................................................... GBP 15.25 GBP 15.94 GBP 14.08Class I Income (GBP 39,197,195 divided by 3,242,117 shares in issue) ...................................................................................... GBP 12.09 GBP 12.89 GBP 11.61Class MZ Income (EUR 26,636,002 divided by 2,702,518 shares in issue)............................................................................ EUR 9.86 EUR 10.38 EUR 10.66Class P Income (GBP 3,134,481 divided by 327,532 shares in issue) .......................................................................................... GBP 9.57 GBP 10.23 GBP 9.23
Class S (EUR 9,654,108 divided by 100,861 shares in issue) ... EUR 95.72 EUR 99.10 EUR 100.13 * See Note 12 for comparative figures
Russell Investment Company II plc The Euro Fixed Income Fund Profit and Loss Account For the period ended 30 September 2008
The accompanying notes are an integral part of the financial statements.
The Euro Fixed Income Fund 13
Six months ended 30 September 2008
EUR
Year ended 31 March 2008
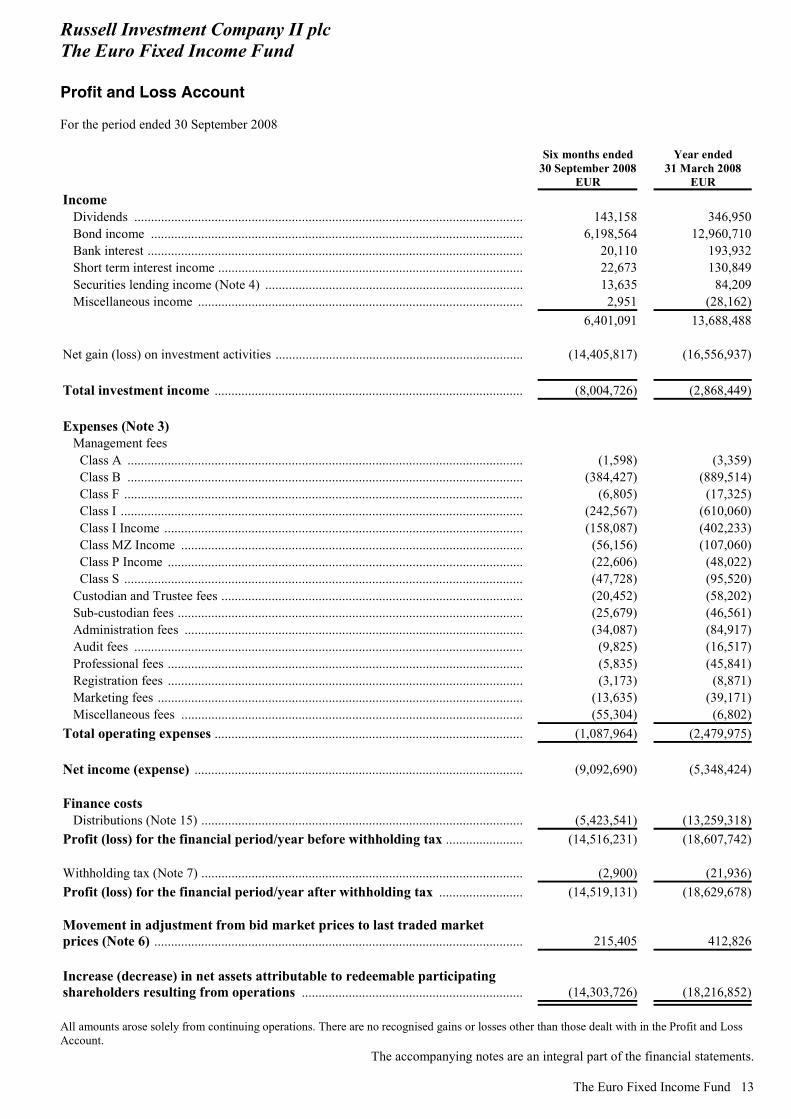
EUR Income
Dividends .................................................................................................................... 143,158 346,950Bond income ............................................................................................................... 6,198,564 12,960,710Bank interest ................................................................................................................ 20,110 193,932Short term interest income ........................................................................................... 22,673 130,849Securities lending income (Note 4) ............................................................................. 13,635 84,209Miscellaneous income ................................................................................................. 2,951 (28,162)
6,401,091 13,688,488 Net gain (loss) on investment activities .......................................................................... (14,405,817) (16,556,937) Total investment income ............................................................................................ (8,004,726) (2,868,449) Expenses (Note 3)
Management fees Class A ...................................................................................................................... (1,598) (3,359)Class B ...................................................................................................................... (384,427) (889,514)Class F ....................................................................................................................... (6,805) (17,325)Class I ........................................................................................................................ (242,567) (610,060)Class I Income ........................................................................................................... (158,087) (402,233)Class MZ Income ...................................................................................................... (56,156) (107,060)Class P Income .......................................................................................................... (22,606) (48,022)Class S ....................................................................................................................... (47,728) (95,520)
Custodian and Trustee fees .......................................................................................... (20,452) (58,202)Sub-custodian fees ....................................................................................................... (25,679) (46,561)Administration fees ..................................................................................................... (34,087) (84,917)Audit fees .................................................................................................................... (9,825) (16,517)Professional fees .......................................................................................................... (5,835) (45,841)Registration fees .......................................................................................................... (3,173) (8,871)Marketing fees ............................................................................................................. (13,635) (39,171)Miscellaneous fees ...................................................................................................... (55,304) (6,802)
Total operating expenses ............................................................................................ (1,087,964) (2,479,975) Net income (expense) .................................................................................................. (9,092,690) (5,348,424) Finance costs
Distributions (Note 15) ................................................................................................ (5,423,541) (13,259,318)Profit (loss) for the financial period/year before withholding tax ....................... (14,516,231) (18,607,742) Withholding tax (Note 7) ................................................................................................ (2,900) (21,936)Profit (loss) for the financial period/year after withholding tax ......................... (14,519,131) (18,629,678) Movement in adjustment from bid market prices to last traded market prices (Note 6) .............................................................................................................. 215,405 412,826 Increase (decrease) in net assets attributable to redeemable participating shareholders resulting from operations .................................................................. (14,303,726) (18,216,852) All amounts arose solely from continuing operations. There are no recognised gains or losses other than those dealt with in the Profit and Loss Account.

Russell Investment Company II plc The Euro Fixed Income Fund Statement of Changes in Net Assets Attributable to Redeemable Participating Shareholders For the period ended 30 September 2008
The accompanying notes are an integral part of the financial statements. 14 The Euro Fixed Income Fund
Six months ended 30 September 2008
EUR
Year ended 31 March 2008
EUR Increase (decrease) in net assets attributable to redeemable participating shareholders resulting from operations .................................................................. (14,303,726) (18,216,852) Share transactions
Net increase (decrease) in net assets resulting from redeemable participating share transactions (Note 6) ................................................................................................... (15,685,428) (78,687,936)Deemed distributions on accumulation shares (Note 15) ........................................... 3,740,559 9,165,098
Total net increase (decrease) in net assets attributable to redeemable participating shareholders ......................................................................................... (26,248,595) (87,739,690) Net assets attributable to redeemable participating shareholders
Beginning of period/year ............................................................................................. 283,506,538 371,246,228 End of period/year ........................................................................................................ 257,257,943 283,506,538
Russell Investment Company II plc The Euro Fixed Income Fund Schedule of Investments 30 September 2008
The accompanying notes are an integral part of the financial statements.
The Euro Fixed Income Fund 15
Principal Amount
Fair Value EUR
Fund %
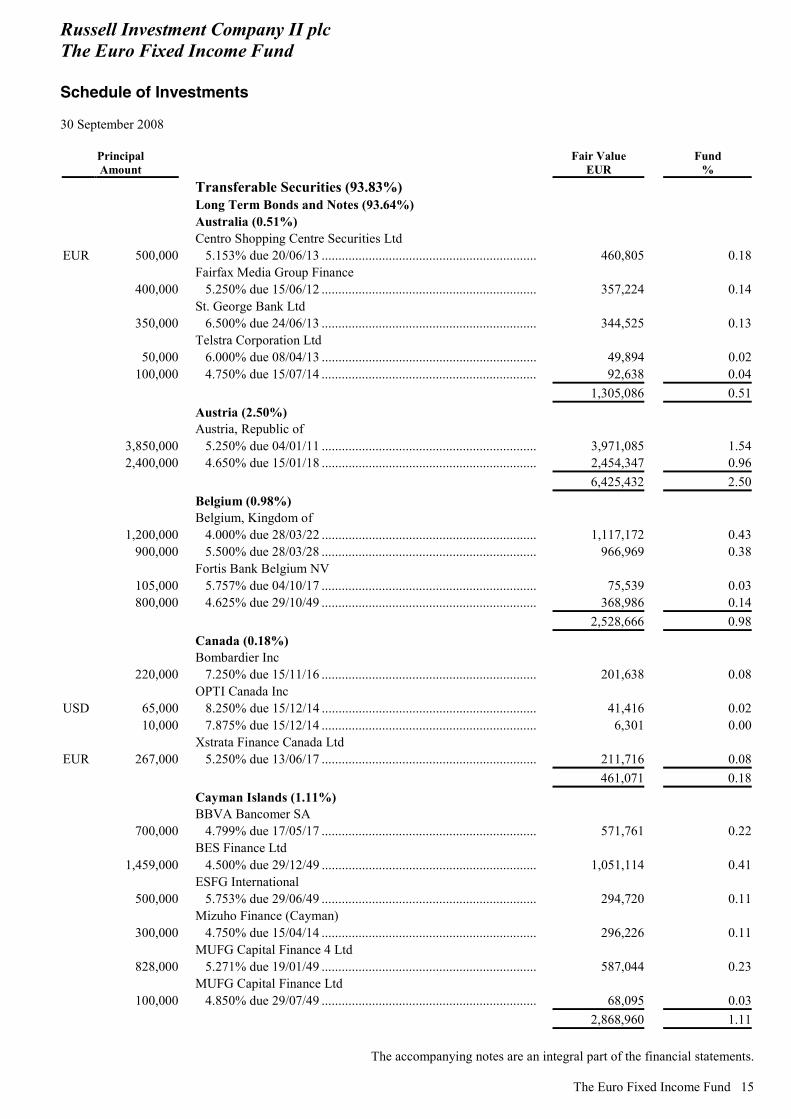
Transferable Securities (93.83%) Long Term Bonds and Notes (93.64%) Australia (0.51%) Centro Shopping Centre Securities Ltd
EUR 500,000 5.153% due 20/06/13 ................................................................ 460,805 0.18 Fairfax Media Group Finance
400,000 5.250% due 15/06/12 ................................................................ 357,224 0.14 St. George Bank Ltd
350,000 6.500% due 24/06/13 ................................................................ 344,525 0.13 Telstra Corporation Ltd
50,000 6.000% due 08/04/13 ................................................................ 49,894 0.02 100,000 4.750% due 15/07/14 ................................................................ 92,638 0.04
1,305,086 0.51 Austria (2.50%) Austria, Republic of
3,850,000 5.250% due 04/01/11 ................................................................ 3,971,085 1.54 2,400,000 4.650% due 15/01/18 ................................................................ 2,454,347 0.96
6,425,432 2.50 Belgium (0.98%) Belgium, Kingdom of
1,200,000 4.000% due 28/03/22 ................................................................ 1,117,172 0.43 900,000 5.500% due 28/03/28 ................................................................ 966,969 0.38
Fortis Bank Belgium NV 105,000 5.757% due 04/10/17 ................................................................ 75,539 0.03 800,000 4.625% due 29/10/49 ................................................................ 368,986 0.14
2,528,666 0.98 Canada (0.18%) Bombardier Inc
220,000 7.250% due 15/11/16 ................................................................ 201,638 0.08 OPTI Canada Inc
USD 65,000 8.250% due 15/12/14 ................................................................ 41,416 0.02 10,000 7.875% due 15/12/14 ................................................................ 6,301 0.00
Xstrata Finance Canada Ltd EUR 267,000 5.250% due 13/06/17 ................................................................ 211,716 0.08
461,071 0.18 Cayman Islands (1.11%) BBVA Bancomer SA
700,000 4.799% due 17/05/17 ................................................................ 571,761 0.22 BES Finance Ltd
1,459,000 4.500% due 29/12/49 ................................................................ 1,051,114 0.41 ESFG International
500,000 5.753% due 29/06/49 ................................................................ 294,720 0.11 Mizuho Finance (Cayman)
300,000 4.750% due 15/04/14 ................................................................ 296,226 0.11 MUFG Capital Finance 4 Ltd
828,000 5.271% due 19/01/49 ................................................................ 587,044 0.23 MUFG Capital Finance Ltd
100,000 4.850% due 29/07/49 ................................................................ 68,095 0.03 2,868,960 1.11
Russell Investment Company II plc The Euro Fixed Income Fund Schedule of Investments - continued 30 September 2008
The accompanying notes are an integral part of the financial statements. 16 The Euro Fixed Income Fund
Principal Amount
Fair Value EUR
Fund %
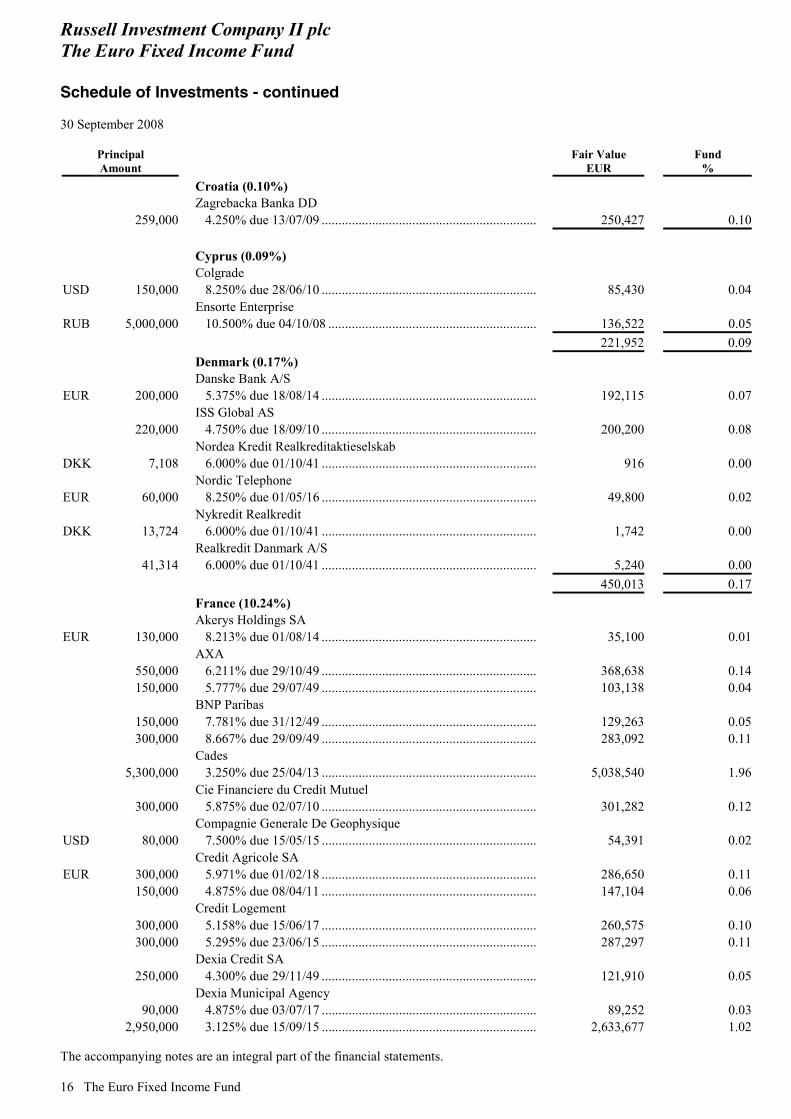
Croatia (0.10%) Zagrebacka Banka DD
259,000 4.250% due 13/07/09 ................................................................ 250,427 0.10 Cyprus (0.09%) Colgrade
USD 150,000 8.250% due 28/06/10 ................................................................ 85,430 0.04 Ensorte Enterprise
RUB 5,000,000 10.500% due 04/10/08 .............................................................. 136,522 0.05 221,952 0.09 Denmark (0.17%) Danske Bank A/S
EUR 200,000 5.375% due 18/08/14 ................................................................ 192,115 0.07 ISS Global AS
220,000 4.750% due 18/09/10 ................................................................ 200,200 0.08 Nordea Kredit Realkreditaktieselskab
DKK 7,108 6.000% due 01/10/41 ................................................................ 916 0.00 Nordic Telephone
EUR 60,000 8.250% due 01/05/16 ................................................................ 49,800 0.02 Nykredit Realkredit
DKK 13,724 6.000% due 01/10/41 ................................................................ 1,742 0.00 Realkredit Danmark A/S
41,314 6.000% due 01/10/41 ................................................................ 5,240 0.00 450,013 0.17 France (10.24%) Akerys Holdings SA
EUR 130,000 8.213% due 01/08/14 ................................................................ 35,100 0.01 AXA
550,000 6.211% due 29/10/49 ................................................................ 368,638 0.14 150,000 5.777% due 29/07/49 ................................................................ 103,138 0.04
BNP Paribas 150,000 7.781% due 31/12/49 ................................................................ 129,263 0.05 300,000 8.667% due 29/09/49 ................................................................ 283,092 0.11
Cades 5,300,000 3.250% due 25/04/13 ................................................................ 5,038,540 1.96
Cie Financiere du Credit Mutuel 300,000 5.875% due 02/07/10 ................................................................ 301,282 0.12
Compagnie Generale De Geophysique USD 80,000 7.500% due 15/05/15 ................................................................ 54,391 0.02
Credit Agricole SA EUR 300,000 5.971% due 01/02/18 ................................................................ 286,650 0.11 150,000 4.875% due 08/04/11 ................................................................ 147,104 0.06
Credit Logement 300,000 5.158% due 15/06/17 ................................................................ 260,575 0.10 300,000 5.295% due 23/06/15 ................................................................ 287,297 0.11
Dexia Credit SA 250,000 4.300% due 29/11/49 ................................................................ 121,910 0.05
Dexia Municipal Agency 90,000 4.875% due 03/07/17 ................................................................ 89,252 0.03 2,950,000 3.125% due 15/09/15 ................................................................ 2,633,677 1.02

Russell Investment Company II plc The Euro Fixed Income Fund Schedule of Investments - continued 30 September 2008
The accompanying notes are an integral part of the financial statements.
The Euro Fixed Income Fund 17
Principal Amount
Fair Value EUR
Fund %
Europcar Groupe 104,000 8.465% due 15/05/13 ................................................................ 60,320 0.02
Faurecia 200,000 3.625% due 05/10/10 ................................................................ 182,850 0.07
FCC Paris Prime Commercial Real Estate 504,762 5.207% due 22/04/14 ................................................................ 454,493 0.18
FCC Proudreed Properties 200,000 5.485% due 18/08/17 ................................................................ 149,160 0.06
FCC SPARC 300,000 4.987% due 15/07/11 ................................................................ 291,750 0.11
FCC Sparc Europe 100,000 5.750% due 15/07/13 ................................................................ 78,566 0.03
France OAT 600,000 3.000% due 25/10/15 ................................................................ 557,555 0.22
France, Republic of 4,070,000 4.000% due 25/04/55 ................................................................ 3,524,383 1.37 150,000 3.000% due 12/01/10 ................................................................ 148,934 0.06 2,846,000 4.750% due 25/10/12 ................................................................ 2,927,689 1.14 4,940,000 4.750% due 25/04/35 ................................................................ 4,935,316 1.92 256,000 5.000% due 25/04/12 ................................................................ 264,970 0.10
Groupama SA 800,000 6.298% due 29/10/49 ................................................................ 537,665 0.21
Groupe Danone 250,000 5.500% due 06/05/15 ................................................................ 246,114 0.10
HSBC France 150,000 5.750% due 19/06/13 ................................................................ 149,300 0.06
Natixis 300,000 5.212% due 26/01/17 ................................................................ 272,316 0.11USD 200,000 10.000% due 29/04/49 .............................................................. 88,812 0.03
Societe Generale EUR 200,000 5.250% due 28/03/13 ................................................................ 193,188 0.08 300,000 5.308% due 15/03/16 ................................................................ 287,607 0.11 550,000 7.756% due 22/05/49 ................................................................ 474,259 0.18 400,000 6.125% due 20/08/18 ................................................................ 375,947 0.15
26,341,103 10.24 Germany (36.43%) Bayer
200,000 4.375% due 11/04/11 ................................................................ 197,054 0.08 Bayerische Landesbank
250,000 4.500% due 07/02/19 ................................................................ 210,650 0.08 400,000 5.750% due 23/10/17 ................................................................ 349,444 0.14
Bundesobligation Inflation Linked 233,333 2.250% due 15/04/13 ................................................................ 237,386 0.09
Bundesrepublik Deutschland 3,200,000 4.250% due 04/07/18 ................................................................ 3,258,592 1.27
Commerzbank AG 600,000 4.125% due 13/09/16 ................................................................ 534,182 0.21
Deutsche Boerse AG 150,000 7.500% due 13/06/38 ................................................................ 123,245 0.05
Eurohypo AG 3,300,000 3.000% due 18/01/12 ................................................................ 3,117,202 1.21

Russell Investment Company II plc The Euro Fixed Income Fund Schedule of Investments - continued 30 September 2008
The accompanying notes are an integral part of the financial statements. 18 The Euro Fixed Income Fund
Principal Amount
Fair Value EUR
Fund %
Germany, Federal Republic of 11,160,000 3.500% due 12/04/13 ................................................................ 11,026,165 4.29 4,750,000 4.250% due 04/07/17 ................................................................ 4,838,234 1.88 1,390,000 5.625% due 04/01/28 ................................................................ 1,558,454 0.61 200,000 5.500% due 04/01/31 ................................................................ 222,152 0.09 1,210,000 4.000% due 04/01/37 ................................................................ 1,094,731 0.42 4,070,000 4.750% due 04/07/28 ................................................................ 4,131,009 1.60 10,067,000 4.750% due 04/07/34 ................................................................ 10,204,415 3.97 1,360,000 4.250% due 04/07/39 ................................................................ 1,282,208 0.50
Germany, Republic of 3,760,000 4.250% due 04/07/14 ................................................................ 3,836,245 1.49 6,800,000 4.250% due 12/10/12 ................................................................ 6,923,610 2.69 3,650,000 3.500% due 08/04/11 ................................................................ 3,645,896 1.42 3,150,000 4.000% due 04/01/18 ................................................................ 3,154,927 1.23 2,235,000 5.375% due 04/01/10 ................................................................ 2,286,850 0.89 400,000 5.000% due 04/01/12 ................................................................ 415,959 0.16 2,700,000 3.500% due 04/01/16 ................................................................ 2,625,416 1.02 2,600,000 4.500% due 04/01/13 ................................................................ 2,670,434 1.04 500,000 4.500% due 04/07/09 ................................................................ 502,685 0.19 11,900,000 4.250% due 04/01/14 ................................................................ 12,149,888 4.72 3,444,000 3.750% due 04/01/15 ................................................................ 3,417,309 1.33 2,875,000 5.250% due 04/01/11 ................................................................ 2,979,017 1.16 3,448,000 3.500% due 09/10/09 ................................................................ 3,451,035 1.34
Henkel AG & Co KGaA 100,000 5.375% due 25/11/04 ................................................................ 79,533 0.03
HSH Nordbank AG 600,000 5.266% due 14/02/17 ................................................................ 466,726 0.18
Kabel Deutschland 65,000 10.750% due 01/07/14 .............................................................. 61,750 0.02
Kreditanstalt Fur Wiederaufbau 1,700,000 3.500% due 04/07/15 ................................................................ 1,605,782 0.62
Munchener Hypothekenbank 80,000 5.000% due 16/01/12 ................................................................ 80,702 0.03
Munich Re Finance 700,000 5.767% due 29/06/49 ................................................................ 481,785 0.19
Prime Bricks 50,000 5.462% due 30/01/40 ................................................................ 41,206 0.02 100,000 5.262% due 30/01/40 ................................................................ 89,073 0.03
Promise plc 400,000 5.629% due 10/03/17 ................................................................ 322,520 0.12
Volkswagen Leasing GmbH 50,000 4.875% due 18/10/12 ................................................................ 47,616 0.02
93,721,087 36.43 Greece (2.81%) Greece,Republic of
4,100,000 4.600% due 20/05/13 ................................................................ 4,097,313 1.59 Hellenic Republic Government Bond
2,350,000 4.600% due 20/07/18 ................................................................ 2,286,011 0.89 900,000 4.700% due 20/03/24 ................................................................ 840,435 0.33
7,223,759 2.81
Russell Investment Company II plc The Euro Fixed Income Fund Schedule of Investments - continued 30 September 2008
The accompanying notes are an integral part of the financial statements.
The Euro Fixed Income Fund 19
Principal Amount
Fair Value EUR
Fund %
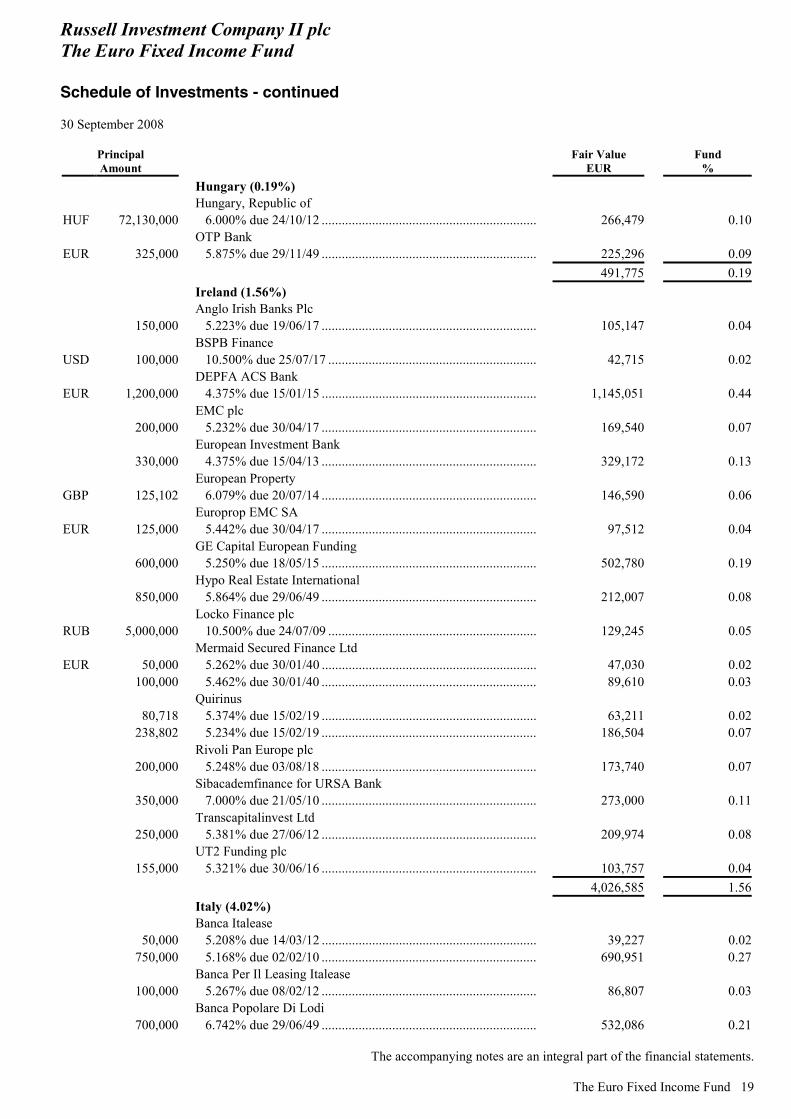
Hungary (0.19%) Hungary, Republic of
HUF 72,130,000 6.000% due 24/10/12 ................................................................ 266,479 0.10 OTP Bank
EUR 325,000 5.875% due 29/11/49 ................................................................ 225,296 0.09 491,775 0.19 Ireland (1.56%) Anglo Irish Banks Plc
150,000 5.223% due 19/06/17 ................................................................ 105,147 0.04 BSPB Finance
USD 100,000 10.500% due 25/07/17 .............................................................. 42,715 0.02 DEPFA ACS Bank
EUR 1,200,000 4.375% due 15/01/15 ................................................................ 1,145,051 0.44 EMC plc
200,000 5.232% due 30/04/17 ................................................................ 169,540 0.07 European Investment Bank
330,000 4.375% due 15/04/13 ................................................................ 329,172 0.13 European Property
GBP 125,102 6.079% due 20/07/14 ................................................................ 146,590 0.06 Europrop EMC SA
EUR 125,000 5.442% due 30/04/17 ................................................................ 97,512 0.04 GE Capital European Funding
600,000 5.250% due 18/05/15 ................................................................ 502,780 0.19 Hypo Real Estate International
850,000 5.864% due 29/06/49 ................................................................ 212,007 0.08 Locko Finance plc
RUB 5,000,000 10.500% due 24/07/09 .............................................................. 129,245 0.05 Mermaid Secured Finance Ltd
EUR 50,000 5.262% due 30/01/40 ................................................................ 47,030 0.02 100,000 5.462% due 30/01/40 ................................................................ 89,610 0.03
Quirinus 80,718 5.374% due 15/02/19 ................................................................ 63,211 0.02 238,802 5.234% due 15/02/19 ................................................................ 186,504 0.07
Rivoli Pan Europe plc 200,000 5.248% due 03/08/18 ................................................................ 173,740 0.07
Sibacademfinance for URSA Bank 350,000 7.000% due 21/05/10 ................................................................ 273,000 0.11
Transcapitalinvest Ltd 250,000 5.381% due 27/06/12 ................................................................ 209,974 0.08
UT2 Funding plc 155,000 5.321% due 30/06/16 ................................................................ 103,757 0.04
4,026,585 1.56 Italy (4.02%) Banca Italease
50,000 5.208% due 14/03/12 ................................................................ 39,227 0.02 750,000 5.168% due 02/02/10 ................................................................ 690,951 0.27
Banca Per Il Leasing Italease 100,000 5.267% due 08/02/12 ................................................................ 86,807 0.03
Banca Popolare Di Lodi 700,000 6.742% due 29/06/49 ................................................................ 532,086 0.21
Russell Investment Company II plc The Euro Fixed Income Fund Schedule of Investments - continued 30 September 2008
The accompanying notes are an integral part of the financial statements. 20 The Euro Fixed Income Fund
Principal Amount
Fair Value EUR
Fund %
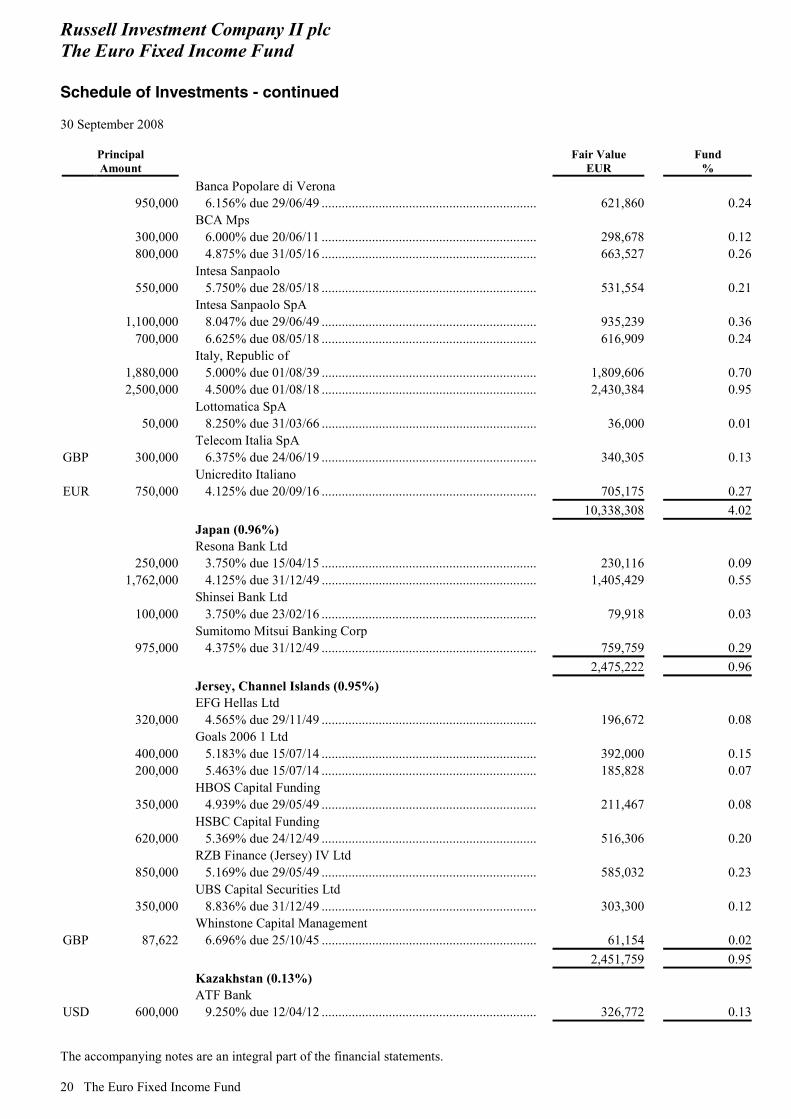
Banca Popolare di Verona 950,000 6.156% due 29/06/49 ................................................................ 621,860 0.24
BCA Mps 300,000 6.000% due 20/06/11 ................................................................ 298,678 0.12 800,000 4.875% due 31/05/16 ................................................................ 663,527 0.26
Intesa Sanpaolo 550,000 5.750% due 28/05/18 ................................................................ 531,554 0.21
Intesa Sanpaolo SpA 1,100,000 8.047% due 29/06/49 ................................................................ 935,239 0.36 700,000 6.625% due 08/05/18 ................................................................ 616,909 0.24
Italy, Republic of 1,880,000 5.000% due 01/08/39 ................................................................ 1,809,606 0.70 2,500,000 4.500% due 01/08/18 ................................................................ 2,430,384 0.95
Lottomatica SpA 50,000 8.250% due 31/03/66 ................................................................ 36,000 0.01
Telecom Italia SpA GBP 300,000 6.375% due 24/06/19 ................................................................ 340,305 0.13
Unicredito Italiano EUR 750,000 4.125% due 20/09/16 ................................................................ 705,175 0.27
10,338,308 4.02 Japan (0.96%) Resona Bank Ltd
250,000 3.750% due 15/04/15 ................................................................ 230,116 0.09 1,762,000 4.125% due 31/12/49 ................................................................ 1,405,429 0.55
Shinsei Bank Ltd 100,000 3.750% due 23/02/16 ................................................................ 79,918 0.03
Sumitomo Mitsui Banking Corp 975,000 4.375% due 31/12/49 ................................................................ 759,759 0.29
2,475,222 0.96 Jersey, Channel Islands (0.95%) EFG Hellas Ltd
320,000 4.565% due 29/11/49 ................................................................ 196,672 0.08 Goals 2006 1 Ltd
400,000 5.183% due 15/07/14 ................................................................ 392,000 0.15 200,000 5.463% due 15/07/14 ................................................................ 185,828 0.07
HBOS Capital Funding 350,000 4.939% due 29/05/49 ................................................................ 211,467 0.08
HSBC Capital Funding 620,000 5.369% due 24/12/49 ................................................................ 516,306 0.20
RZB Finance (Jersey) IV Ltd 850,000 5.169% due 29/05/49 ................................................................ 585,032 0.23
UBS Capital Securities Ltd 350,000 8.836% due 31/12/49 ................................................................ 303,300 0.12
Whinstone Capital Management GBP 87,622 6.696% due 25/10/45 ................................................................ 61,154 0.02
2,451,759 0.95 Kazakhstan (0.13%) ATF Bank
USD 600,000 9.250% due 12/04/12 ................................................................ 326,772 0.13
Russell Investment Company II plc The Euro Fixed Income Fund Schedule of Investments - continued 30 September 2008
The accompanying notes are an integral part of the financial statements.
The Euro Fixed Income Fund 21
Principal Amount
Fair Value EUR
Fund %
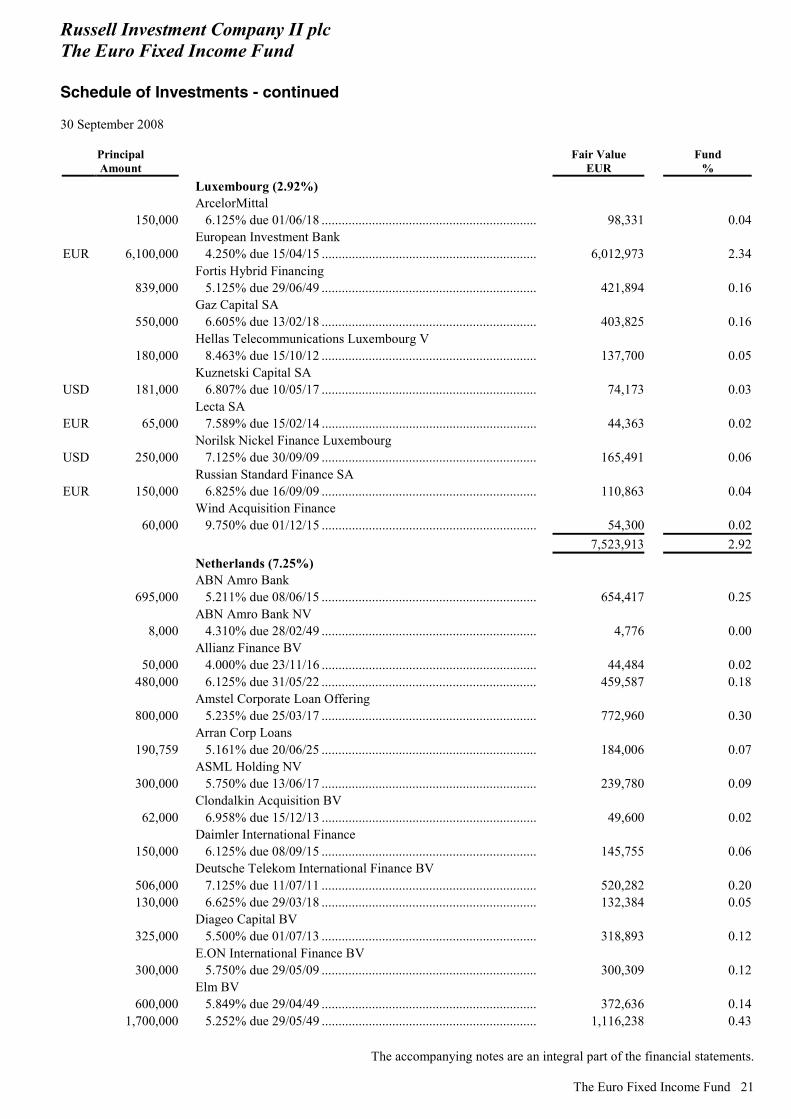
Luxembourg (2.92%) ArcelorMittal
150,000 6.125% due 01/06/18 ................................................................ 98,331 0.04 European Investment Bank
EUR 6,100,000 4.250% due 15/04/15 ................................................................ 6,012,973 2.34 Fortis Hybrid Financing
839,000 5.125% due 29/06/49 ................................................................ 421,894 0.16 Gaz Capital SA
550,000 6.605% due 13/02/18 ................................................................ 403,825 0.16 Hellas Telecommunications Luxembourg V
180,000 8.463% due 15/10/12 ................................................................ 137,700 0.05 Kuznetski Capital SA
USD 181,000 6.807% due 10/05/17 ................................................................ 74,173 0.03 Lecta SA
EUR 65,000 7.589% due 15/02/14 ................................................................ 44,363 0.02 Norilsk Nickel Finance Luxembourg
USD 250,000 7.125% due 30/09/09 ................................................................ 165,491 0.06 Russian Standard Finance SA
EUR 150,000 6.825% due 16/09/09 ................................................................ 110,863 0.04 Wind Acquisition Finance
60,000 9.750% due 01/12/15 ................................................................ 54,300 0.02 7,523,913 2.92 Netherlands (7.25%) ABN Amro Bank
695,000 5.211% due 08/06/15 ................................................................ 654,417 0.25 ABN Amro Bank NV
8,000 4.310% due 28/02/49 ................................................................ 4,776 0.00 Allianz Finance BV
50,000 4.000% due 23/11/16 ................................................................ 44,484 0.02 480,000 6.125% due 31/05/22 ................................................................ 459,587 0.18
Amstel Corporate Loan Offering 800,000 5.235% due 25/03/17 ................................................................ 772,960 0.30
Arran Corp Loans 190,759 5.161% due 20/06/25 ................................................................ 184,006 0.07
ASML Holding NV 300,000 5.750% due 13/06/17 ................................................................ 239,780 0.09
Clondalkin Acquisition BV 62,000 6.958% due 15/12/13 ................................................................ 49,600 0.02
Daimler International Finance 150,000 6.125% due 08/09/15 ................................................................ 145,755 0.06
Deutsche Telekom International Finance BV 506,000 7.125% due 11/07/11 ................................................................ 520,282 0.20 130,000 6.625% due 29/03/18 ................................................................ 132,384 0.05
Diageo Capital BV 325,000 5.500% due 01/07/13 ................................................................ 318,893 0.12
E.ON International Finance BV 300,000 5.750% due 29/05/09 ................................................................ 300,309 0.12
Elm BV 600,000 5.849% due 29/04/49 ................................................................ 372,636 0.14 1,700,000 5.252% due 29/05/49 ................................................................ 1,116,238 0.43
Russell Investment Company II plc The Euro Fixed Income Fund Schedule of Investments - continued 30 September 2008
The accompanying notes are an integral part of the financial statements. 22 The Euro Fixed Income Fund
Principal Amount
Fair Value EUR
Fund %
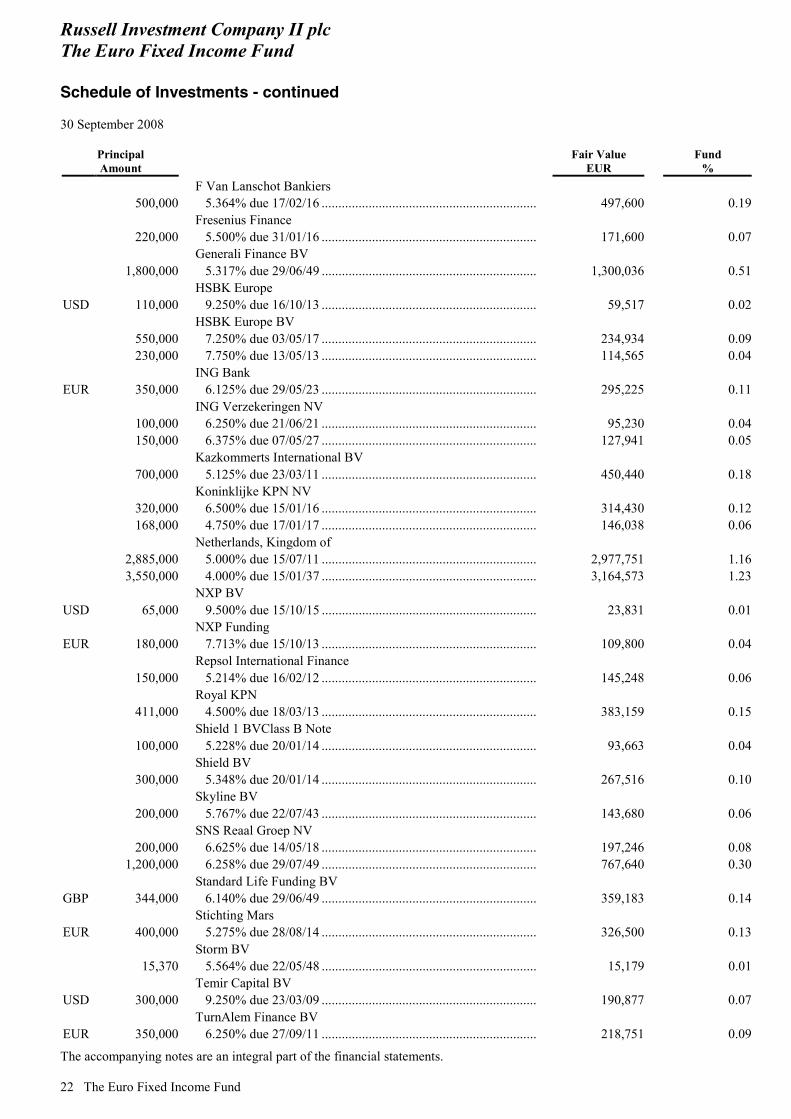
F Van Lanschot Bankiers 500,000 5.364% due 17/02/16 ................................................................ 497,600 0.19
Fresenius Finance 220,000 5.500% due 31/01/16 ................................................................ 171,600 0.07
Generali Finance BV 1,800,000 5.317% due 29/06/49 ................................................................ 1,300,036 0.51
HSBK Europe USD 110,000 9.250% due 16/10/13 ................................................................ 59,517 0.02
HSBK Europe BV 550,000 7.250% due 03/05/17 ................................................................ 234,934 0.09 230,000 7.750% due 13/05/13 ................................................................ 114,565 0.04
ING Bank EUR 350,000 6.125% due 29/05/23 ................................................................ 295,225 0.11
ING Verzekeringen NV 100,000 6.250% due 21/06/21 ................................................................ 95,230 0.04 150,000 6.375% due 07/05/27 ................................................................ 127,941 0.05
Kazkommerts International BV 700,000 5.125% due 23/03/11 ................................................................ 450,440 0.18
Koninklijke KPN NV 320,000 6.500% due 15/01/16 ................................................................ 314,430 0.12 168,000 4.750% due 17/01/17 ................................................................ 146,038 0.06
Netherlands, Kingdom of 2,885,000 5.000% due 15/07/11 ................................................................ 2,977,751 1.16 3,550,000 4.000% due 15/01/37 ................................................................ 3,164,573 1.23
NXP BV USD 65,000 9.500% due 15/10/15 ................................................................ 23,831 0.01
NXP Funding EUR 180,000 7.713% due 15/10/13 ................................................................ 109,800 0.04
Repsol International Finance 150,000 5.214% due 16/02/12 ................................................................ 145,248 0.06
Royal KPN 411,000 4.500% due 18/03/13 ................................................................ 383,159 0.15
Shield 1 BVClass B Note 100,000 5.228% due 20/01/14 ................................................................ 93,663 0.04
Shield BV 300,000 5.348% due 20/01/14 ................................................................ 267,516 0.10
Skyline BV 200,000 5.767% due 22/07/43 ................................................................ 143,680 0.06
SNS Reaal Groep NV 200,000 6.625% due 14/05/18 ................................................................ 197,246 0.08 1,200,000 6.258% due 29/07/49 ................................................................ 767,640 0.30
Standard Life Funding BV GBP 344,000 6.140% due 29/06/49 ................................................................ 359,183 0.14
Stichting Mars EUR 400,000 5.275% due 28/08/14 ................................................................ 326,500 0.13
Storm BV 15,370 5.564% due 22/05/48 ................................................................ 15,179 0.01
Temir Capital BV USD 300,000 9.250% due 23/03/09 ................................................................ 190,877 0.07
TurnAlem Finance BV EUR 350,000 6.250% due 27/09/11 ................................................................ 218,751 0.09
Russell Investment Company II plc The Euro Fixed Income Fund Schedule of Investments - continued 30 September 2008
The accompanying notes are an integral part of the financial statements.
The Euro Fixed Income Fund 23
Principal Amount
Fair Value EUR
Fund %
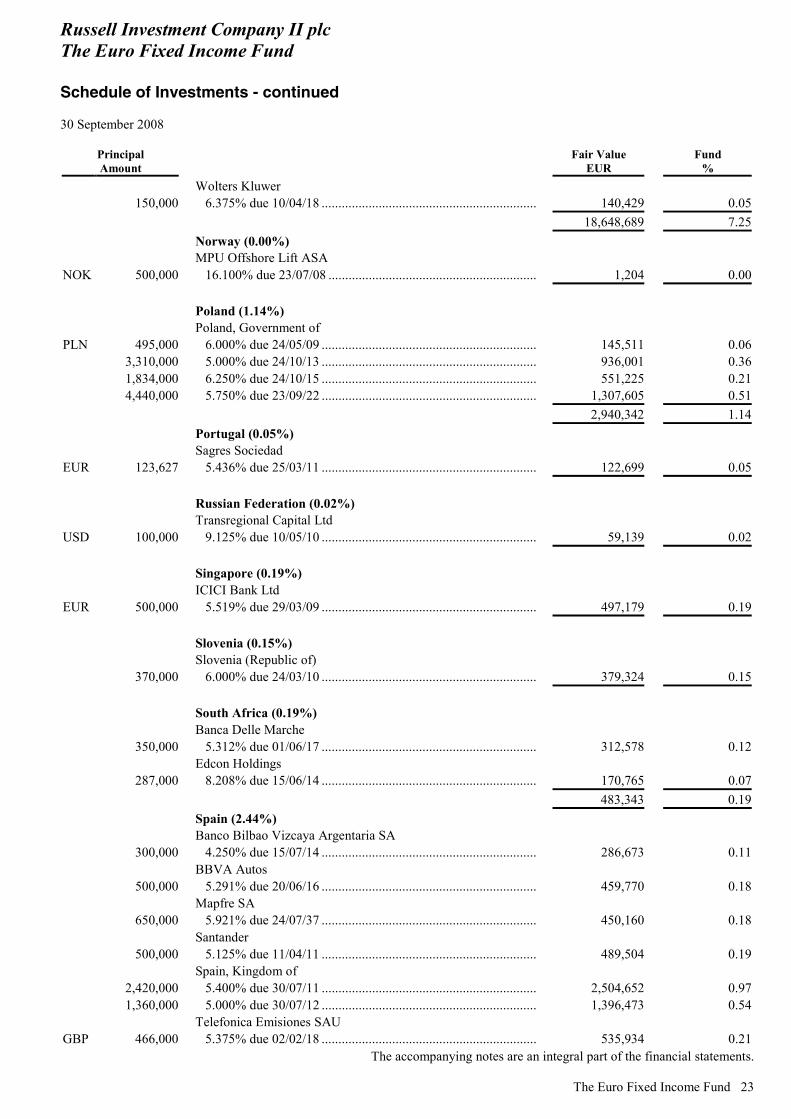
Wolters Kluwer 150,000 6.375% due 10/04/18 ................................................................ 140,429 0.05
18,648,689 7.25 Norway (0.00%) MPU Offshore Lift ASA
NOK 500,000 16.100% due 23/07/08 .............................................................. 1,204 0.00 Poland (1.14%) Poland, Government of
PLN 495,000 6.000% due 24/05/09 ................................................................ 145,511 0.06 3,310,000 5.000% due 24/10/13 ................................................................ 936,001 0.36 1,834,000 6.250% due 24/10/15 ................................................................ 551,225 0.21 4,440,000 5.750% due 23/09/22 ................................................................ 1,307,605 0.51
2,940,342 1.14 Portugal (0.05%) Sagres Sociedad
EUR 123,627 5.436% due 25/03/11 ................................................................ 122,699 0.05 Russian Federation (0.02%) Transregional Capital Ltd
USD 100,000 9.125% due 10/05/10 ................................................................ 59,139 0.02 Singapore (0.19%) ICICI Bank Ltd
EUR 500,000 5.519% due 29/03/09 ................................................................ 497,179 0.19 Slovenia (0.15%) Slovenia (Republic of)
370,000 6.000% due 24/03/10 ................................................................ 379,324 0.15 South Africa (0.19%) Banca Delle Marche
350,000 5.312% due 01/06/17 ................................................................ 312,578 0.12 Edcon Holdings
287,000 8.208% due 15/06/14 ................................................................ 170,765 0.07 483,343 0.19 Spain (2.44%) Banco Bilbao Vizcaya Argentaria SA
300,000 4.250% due 15/07/14 ................................................................ 286,673 0.11 BBVA Autos
500,000 5.291% due 20/06/16 ................................................................ 459,770 0.18 Mapfre SA
650,000 5.921% due 24/07/37 ................................................................ 450,160 0.18 Santander
500,000 5.125% due 11/04/11 ................................................................ 489,504 0.19 Spain, Kingdom of
2,420,000 5.400% due 30/07/11 ................................................................ 2,504,652 0.97 1,360,000 5.000% due 30/07/12 ................................................................ 1,396,473 0.54
Telefonica Emisiones SAU GBP 466,000 5.375% due 02/02/18 ................................................................ 535,934 0.21
Russell Investment Company II plc The Euro Fixed Income Fund Schedule of Investments - continued 30 September 2008
The accompanying notes are an integral part of the financial statements. 24 The Euro Fixed Income Fund
Principal Amount
Fair Value EUR
Fund %
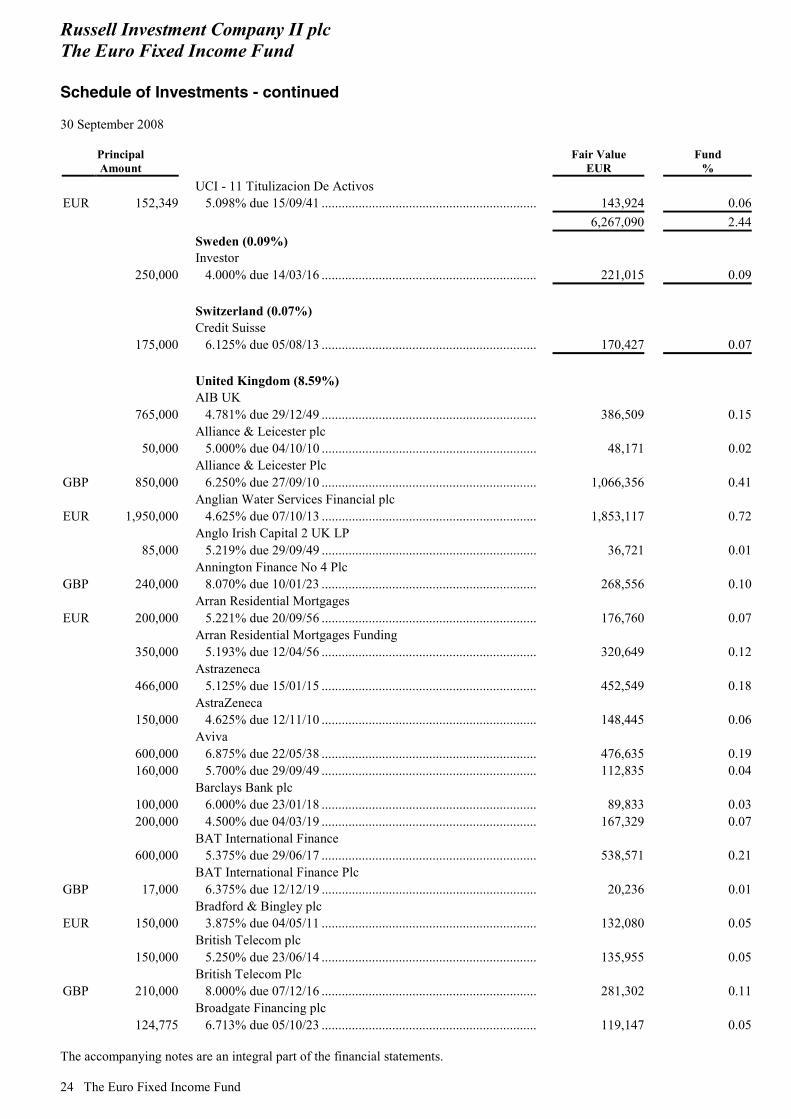
UCI - 11 Titulizacion De Activos EUR 152,349 5.098% due 15/09/41 ................................................................ 143,924 0.06
6,267,090 2.44 Sweden (0.09%) Investor
250,000 4.000% due 14/03/16 ................................................................ 221,015 0.09 Switzerland (0.07%) Credit Suisse
175,000 6.125% due 05/08/13 ................................................................ 170,427 0.07 United Kingdom (8.59%) AIB UK
765,000 4.781% due 29/12/49 ................................................................ 386,509 0.15 Alliance & Leicester plc
50,000 5.000% due 04/10/10 ................................................................ 48,171 0.02 Alliance & Leicester Plc
GBP 850,000 6.250% due 27/09/10 ................................................................ 1,066,356 0.41 Anglian Water Services Financial plc
EUR 1,950,000 4.625% due 07/10/13 ................................................................ 1,853,117 0.72 Anglo Irish Capital 2 UK LP
85,000 5.219% due 29/09/49 ................................................................ 36,721 0.01 Annington Finance No 4 Plc
GBP 240,000 8.070% due 10/01/23 ................................................................ 268,556 0.10 Arran Residential Mortgages
EUR 200,000 5.221% due 20/09/56 ................................................................ 176,760 0.07 Arran Residential Mortgages Funding
350,000 5.193% due 12/04/56 ................................................................ 320,649 0.12 Astrazeneca
466,000 5.125% due 15/01/15 ................................................................ 452,549 0.18 AstraZeneca
150,000 4.625% due 12/11/10 ................................................................ 148,445 0.06 Aviva 600,000 6.875% due 22/05/38 ................................................................ 476,635 0.19 160,000 5.700% due 29/09/49 ................................................................ 112,835 0.04
Barclays Bank plc 100,000 6.000% due 23/01/18 ................................................................ 89,833 0.03 200,000 4.500% due 04/03/19 ................................................................ 167,329 0.07
BAT International Finance 600,000 5.375% due 29/06/17 ................................................................ 538,571 0.21
BAT International Finance Plc GBP 17,000 6.375% due 12/12/19 ................................................................ 20,236 0.01
Bradford & Bingley plc EUR 150,000 3.875% due 04/05/11 ................................................................ 132,080 0.05
British Telecom plc 150,000 5.250% due 23/06/14 ................................................................ 135,955 0.05
British Telecom Plc GBP 210,000 8.000% due 07/12/16 ................................................................ 281,302 0.11
Broadgate Financing plc 124,775 6.713% due 05/10/23 ................................................................ 119,147 0.05
Russell Investment Company II plc The Euro Fixed Income Fund Schedule of Investments - continued 30 September 2008
The accompanying notes are an integral part of the financial statements.
The Euro Fixed Income Fund 25
Principal Amount
Fair Value EUR
Fund %
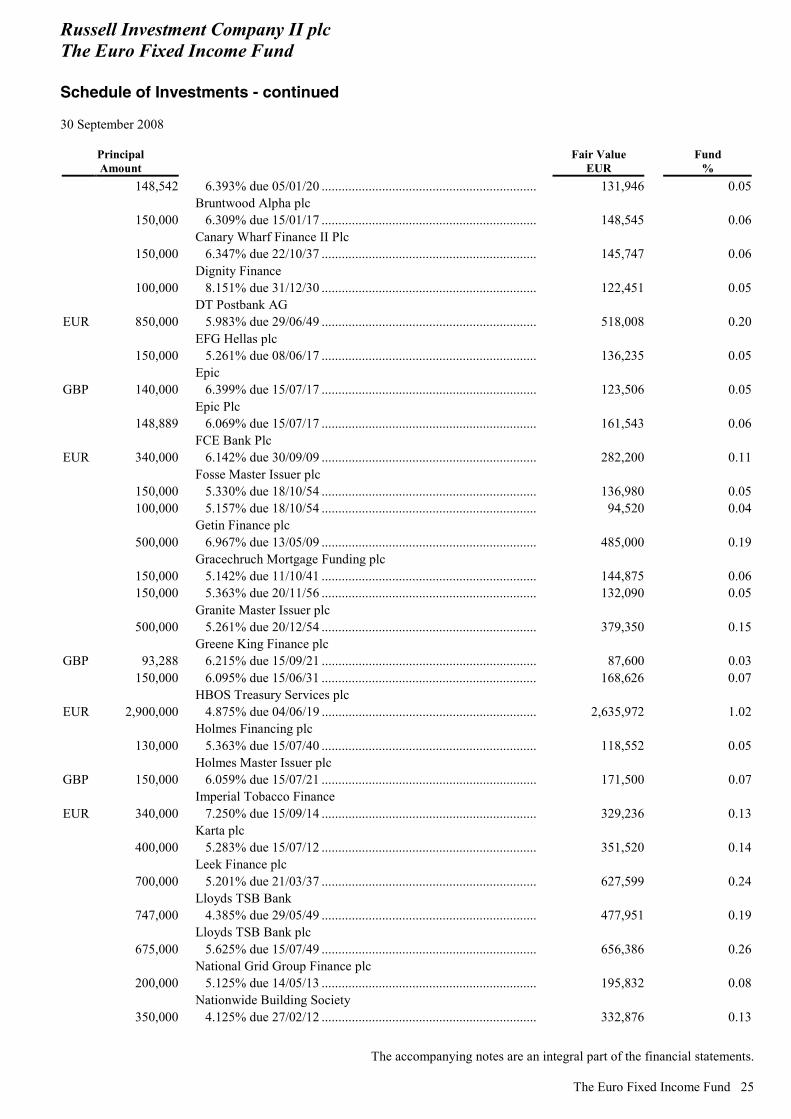
148,542 6.393% due 05/01/20 ................................................................ 131,946 0.05 Bruntwood Alpha plc
150,000 6.309% due 15/01/17 ................................................................ 148,545 0.06 Canary Wharf Finance II Plc
150,000 6.347% due 22/10/37 ................................................................ 145,747 0.06 Dignity Finance
100,000 8.151% due 31/12/30 ................................................................ 122,451 0.05 DT Postbank AG
EUR 850,000 5.983% due 29/06/49 ................................................................ 518,008 0.20 EFG Hellas plc
150,000 5.261% due 08/06/17 ................................................................ 136,235 0.05 Epic
GBP 140,000 6.399% due 15/07/17 ................................................................ 123,506 0.05 Epic Plc
148,889 6.069% due 15/07/17 ................................................................ 161,543 0.06 FCE Bank Plc
EUR 340,000 6.142% due 30/09/09 ................................................................ 282,200 0.11 Fosse Master Issuer plc
150,000 5.330% due 18/10/54 ................................................................ 136,980 0.05 100,000 5.157% due 18/10/54 ................................................................ 94,520 0.04
Getin Finance plc 500,000 6.967% due 13/05/09 ................................................................ 485,000 0.19
Gracechruch Mortgage Funding plc 150,000 5.142% due 11/10/41 ................................................................ 144,875 0.06
150,000 5.363% due 20/11/56 ................................................................ 132,090 0.05 Granite Master Issuer plc
500,000 5.261% due 20/12/54 ................................................................ 379,350 0.15 Greene King Finance plc
GBP 93,288 6.215% due 15/09/21 ................................................................ 87,600 0.03 150,000 6.095% due 15/06/31 ................................................................ 168,626 0.07
HBOS Treasury Services plc EUR 2,900,000 4.875% due 04/06/19 ................................................................ 2,635,972 1.02
Holmes Financing plc 130,000 5.363% due 15/07/40 ................................................................ 118,552 0.05
Holmes Master Issuer plc GBP 150,000 6.059% due 15/07/21 ................................................................ 171,500 0.07
Imperial Tobacco Finance EUR 340,000 7.250% due 15/09/14 ................................................................ 329,236 0.13
Karta plc 400,000 5.283% due 15/07/12 ................................................................ 351,520 0.14
Leek Finance plc 700,000 5.201% due 21/03/37 ................................................................ 627,599 0.24
Lloyds TSB Bank 747,000 4.385% due 29/05/49 ................................................................ 477,951 0.19
Lloyds TSB Bank plc 675,000 5.625% due 15/07/49 ................................................................ 656,386 0.26
National Grid Group Finance plc 200,000 5.125% due 14/05/13 ................................................................ 195,832 0.08
Nationwide Building Society 350,000 4.125% due 27/02/12 ................................................................ 332,876 0.13

Russell Investment Company II plc The Euro Fixed Income Fund Schedule of Investments - continued 30 September 2008
The accompanying notes are an integral part of the financial statements. 26 The Euro Fixed Income Fund
Principal Amount
Fair Value EUR
Fund %
Northern Rock plc GBP 25,000 5.625% due 13/01/15 ................................................................ 25,425 0.01
OTE plc EUR 220,000 5.375% due 14/02/11 ................................................................ 216,401 0.08
Permanent Master Issuer plc USD 200,000 3.191% due 15/07/42 ................................................................ 129,205 0.05
Pipe Holdings plc GBP 140,000 7.750% due 01/11/11 ................................................................ 126,135 0.05
Rec Plantation Place 198,882 6.116% due 25/07/16 ................................................................ 214,290 0.08
RMAC plc 93,360 6.234% due 12/12/43 ................................................................ 92,761 0.04
RMAC Securities No 1 plc EUR 210,000 5.199% due 12/06/44 ................................................................ 157,132 0.06GBP 250,000 5.974% due 12/06/44 ................................................................ 214,917 0.08
Royal Bank of Scotland EUR 50,000 4.350% due 23/01/17 ................................................................ 41,052 0.02 300,000 6.934% due 09/04/18 ................................................................ 277,469 0.11 200,000 7.092% due 29/10/49 ................................................................ 138,590 0.05 750,000 5.250% due 15/05/13 ................................................................ 677,137 0.26
Royal Bank of Scotland plc 350,000 5.625% due 23/05/13 ................................................................ 310,919 0.12
Standard Chartered Bank 500,000 4.875% due 11/03/11 ................................................................ 487,710 0.19 1,550,000 5.875% due 26/09/17 ................................................................ 1,362,817 0.53
Standard Life 530,000 5.314% due 29/01/49 ................................................................ 391,552 0.15
Tesco Plc 200,000 5.875% due 12/09/16 ................................................................ 191,138 0.07
Theatre Hospitals Plc GBP 148,902 6.519% due 15/10/31 ................................................................ 149,328 0.06
U.K., Government of 50,000 4.750% due 07/03/20 ................................................................ 64,186 0.02
United Utilities Water EUR 50,000 4.250% due 24/01/20 ................................................................ 42,786 0.02
Vedanta Resources Plc USD 311,000 8.750% due 15/01/14 ................................................................ 188,492 0.07
Vodafone Group EUR 200,000 3.625% due 29/11/12 ................................................................ 183,364 0.07
W & DB Issuer plc GBP 257,142 6.369% due 15/07/20 ................................................................ 241,465 0.09
WPP Group EUR 50,000 6.625% due 12/05/16 ................................................................ 46,080 0.02
22,098,753 8.59 United States (7.61%) AES Corp
GBP 140,000 8.375% due 01/03/11 ................................................................ 174,990 0.07 AIG
EUR 150,000 5.000% due 26/06/17 ................................................................ 78,649 0.03 400,000 8.000% due 22/05/38 ................................................................ 60,000 0.02 150,000 4.000% due 20/09/11 ................................................................ 82,500 0.03
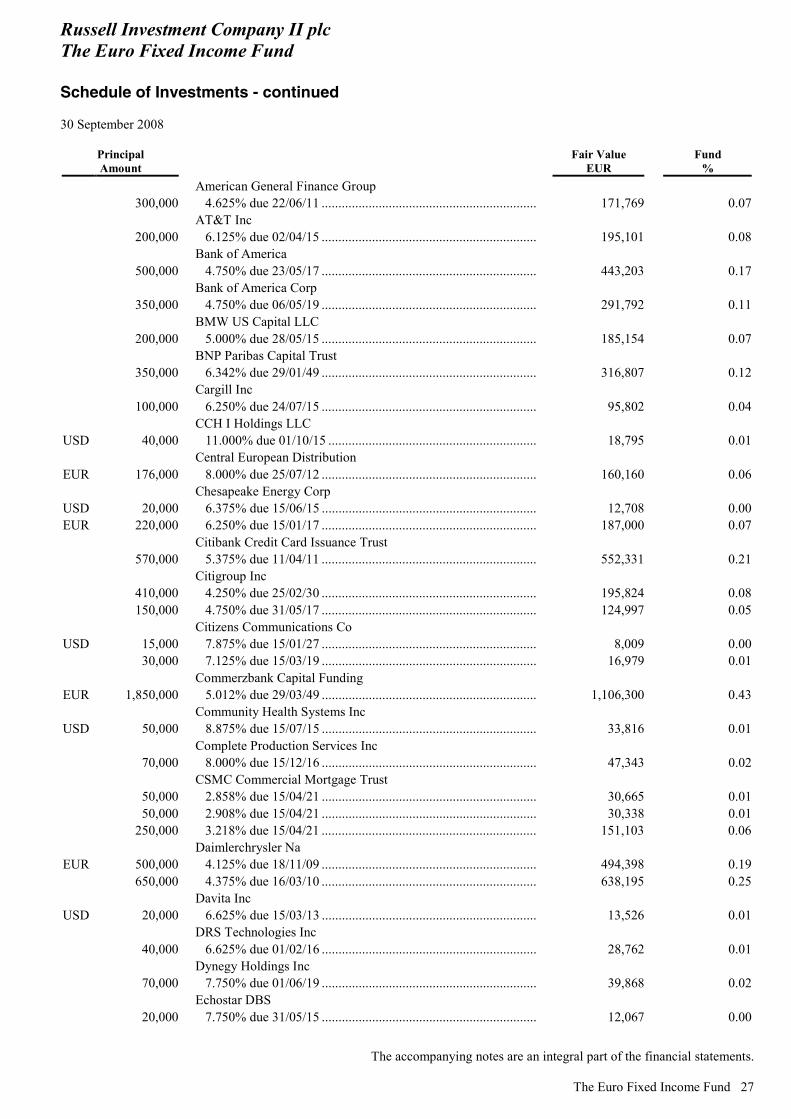
Russell Investment Company II plc The Euro Fixed Income Fund Schedule of Investments - continued 30 September 2008
The accompanying notes are an integral part of the financial statements.
The Euro Fixed Income Fund 27
Principal Amount
Fair Value EUR
Fund %
American General Finance Group 300,000 4.625% due 22/06/11 ................................................................ 171,769 0.07
AT&T Inc 200,000 6.125% due 02/04/15 ................................................................ 195,101 0.08
Bank of America 500,000 4.750% due 23/05/17 ................................................................ 443,203 0.17
Bank of America Corp 350,000 4.750% due 06/05/19 ................................................................ 291,792 0.11
BMW US Capital LLC 200,000 5.000% due 28/05/15 ................................................................ 185,154 0.07
BNP Paribas Capital Trust 350,000 6.342% due 29/01/49 ................................................................ 316,807 0.12
Cargill Inc 100,000 6.250% due 24/07/15 ................................................................ 95,802 0.04
CCH I Holdings LLC USD 40,000 11.000% due 01/10/15 .............................................................. 18,795 0.01
Central European Distribution EUR 176,000 8.000% due 25/07/12 ................................................................ 160,160 0.06
Chesapeake Energy Corp USD 20,000 6.375% due 15/06/15 ................................................................ 12,708 0.00EUR 220,000 6.250% due 15/01/17 ................................................................ 187,000 0.07
Citibank Credit Card Issuance Trust 570,000 5.375% due 11/04/11 ................................................................ 552,331 0.21
Citigroup Inc 410,000 4.250% due 25/02/30 ................................................................ 195,824 0.08 150,000 4.750% due 31/05/17 ................................................................ 124,997 0.05
Citizens Communications Co USD 15,000 7.875% due 15/01/27 ................................................................ 8,009 0.00 30,000 7.125% due 15/03/19 ................................................................ 16,979 0.01
Commerzbank Capital Funding EUR 1,850,000 5.012% due 29/03/49 ................................................................ 1,106,300 0.43
Community Health Systems Inc USD 50,000 8.875% due 15/07/15 ................................................................ 33,816 0.01
Complete Production Services Inc 70,000 8.000% due 15/12/16 ................................................................ 47,343 0.02
CSMC Commercial Mortgage Trust 50,000 2.858% due 15/04/21 ................................................................ 30,665 0.01 50,000 2.908% due 15/04/21 ................................................................ 30,338 0.01 250,000 3.218% due 15/04/21 ................................................................ 151,103 0.06
Daimlerchrysler Na EUR 500,000 4.125% due 18/11/09 ................................................................ 494,398 0.19 650,000 4.375% due 16/03/10 ................................................................ 638,195 0.25
Davita Inc USD 20,000 6.625% due 15/03/13 ................................................................ 13,526 0.01
DRS Technologies Inc 40,000 6.625% due 01/02/16 ................................................................ 28,762 0.01
Dynegy Holdings Inc 70,000 7.750% due 01/06/19 ................................................................ 39,868 0.02
Echostar DBS 20,000 7.750% due 31/05/15 ................................................................ 12,067 0.00

Russell Investment Company II plc The Euro Fixed Income Fund Schedule of Investments - continued 30 September 2008
The accompanying notes are an integral part of the financial statements. 28 The Euro Fixed Income Fund
Principal Amount
Fair Value EUR
Fund %
Echostar DBS Corp 50,000 7.000% due 01/10/13 ................................................................ 30,702 0.01
Edison Mission Energy 50,000 7.200% due 15/05/19 ................................................................ 31,324 0.01
Energy Future Holdings Corp 1,320,000 11.250% due 01/11/17 .............................................................. 794,077 0.31 10,000 10.875% due 01/11/17 .............................................................. 6,425 0.00
Eurohypo Capital Funding Trust EUR 166,000 6.445% due 23/05/33 ................................................................ 117,362 0.05
Fannie Mae Pool USD 1,019,115 5.500% due 01/02/36 ................................................................ 724,179 0.28 299,999 4.500% due 01/09/38 ................................................................ 202,076 0.08 1,000,000 4.500% due 01/03/38 ................................................................ 673,588 0.26
FHLMC TBA Oct 30 Gold Single 300,000 5.500% due 01/12/99 ................................................................ 212,442 0.08
FNMA TBA Oct 30 Single Family 2,700,000 5.500% due 01/12/99 ................................................................ 1,916,781 0.75
Fortune Brands EUR 100,000 3.500% due 30/01/09 ................................................................ 99,339 0.04
Freeport-McMoRan Copper & Gold Inc USD 120,000 8.375% due 01/04/17 ................................................................ 84,149 0.03
Freescale Semiconductor Inc 15,000 8.875% due 15/12/14 ................................................................ 7,368 0.00
General Motors Acceptance Corp 1,630,000 8.000% due 01/11/31 ................................................................ 437,804 0.17
Georgia Gulf Corp 20,000 9.500% due 15/10/14 ................................................................ 8,757 0.00
Goldman Sachs Group EUR 100,000 3.750% due 04/02/13 ................................................................ 77,588 0.03 1,650,000 4.750% due 12/10/21 ................................................................ 917,966 0.36
Graham Packaging Co USD 30,000 8.500% due 15/10/12 ................................................................ 19,756 0.01 15,000 9.875% due 15/10/14 ................................................................ 9,291 0.00
HCA Inc 40,000 6.500% due 15/02/16 ................................................................ 22,568 0.01 80,000 9.625% due 15/11/16 ................................................................ 54,106 0.02
Hertz Corp 20,000 8.875% due 01/01/14 ................................................................ 12,281 0.00 15,000 10.500% due 01/01/16 .............................................................. 8,917 0.00
HSBC Home Equity Loan Trust 123,565 2.781% due 20/01/35 ................................................................ 72,387 0.03
HVB Funding Trust EUR 400,000 7.055% due 29/03/49 ................................................................ 341,563 0.13
Idearc Inc USD 75,000 8.000% due 15/11/16 ................................................................ 14,550 0.01
JP Morgan Chase & Co EUR 300,000 3.875% due 31/03/18 ................................................................ 244,665 0.10
JP Morgan Chase Bank 300,000 5.250% due 08/05/13 ................................................................ 282,012 0.11
Kraft Foods Inc 350,000 5.750% due 20/03/12 ................................................................ 341,450 0.13
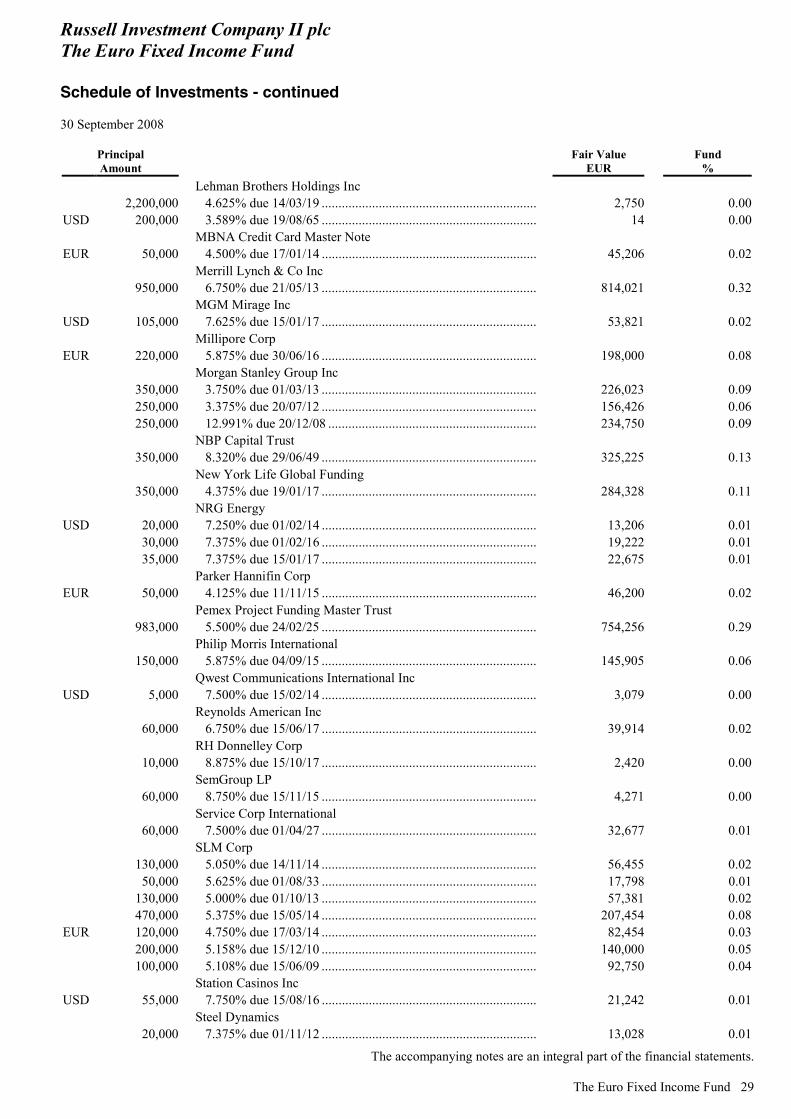
Russell Investment Company II plc The Euro Fixed Income Fund Schedule of Investments - continued 30 September 2008
The accompanying notes are an integral part of the financial statements.
The Euro Fixed Income Fund 29
Principal Amount
Fair Value EUR
Fund %
Lehman Brothers Holdings Inc 2,200,000 4.625% due 14/03/19 ................................................................ 2,750 0.00USD 200,000 3.589% due 19/08/65 ................................................................ 14 0.00
MBNA Credit Card Master Note EUR 50,000 4.500% due 17/01/14 ................................................................ 45,206 0.02
Merrill Lynch & Co Inc 950,000 6.750% due 21/05/13 ................................................................ 814,021 0.32
MGM Mirage Inc USD 105,000 7.625% due 15/01/17 ................................................................ 53,821 0.02
Millipore Corp EUR 220,000 5.875% due 30/06/16 ................................................................ 198,000 0.08
Morgan Stanley Group Inc 350,000 3.750% due 01/03/13 ................................................................ 226,023 0.09 250,000 3.375% due 20/07/12 ................................................................ 156,426 0.06 250,000 12.991% due 20/12/08 .............................................................. 234,750 0.09
NBP Capital Trust 350,000 8.320% due 29/06/49 ................................................................ 325,225 0.13
New York Life Global Funding 350,000 4.375% due 19/01/17 ................................................................ 284,328 0.11
NRG Energy USD 20,000 7.250% due 01/02/14 ................................................................ 13,206 0.01 30,000 7.375% due 01/02/16 ................................................................ 19,222 0.01 35,000 7.375% due 15/01/17 ................................................................ 22,675 0.01
Parker Hannifin Corp EUR 50,000 4.125% due 11/11/15 ................................................................ 46,200 0.02
Pemex Project Funding Master Trust 983,000 5.500% due 24/02/25 ................................................................ 754,256 0.29
Philip Morris International 150,000 5.875% due 04/09/15 ................................................................ 145,905 0.06
Qwest Communications International Inc USD 5,000 7.500% due 15/02/14 ................................................................ 3,079 0.00
Reynolds American Inc 60,000 6.750% due 15/06/17 ................................................................ 39,914 0.02
RH Donnelley Corp 10,000 8.875% due 15/10/17 ................................................................ 2,420 0.00
SemGroup LP 60,000 8.750% due 15/11/15 ................................................................ 4,271 0.00
Service Corp International 60,000 7.500% due 01/04/27 ................................................................ 32,677 0.01
SLM Corp 130,000 5.050% due 14/11/14 ................................................................ 56,455 0.02 50,000 5.625% due 01/08/33 ................................................................ 17,798 0.01 130,000 5.000% due 01/10/13 ................................................................ 57,381 0.02 470,000 5.375% due 15/05/14 ................................................................ 207,454 0.08EUR 120,000 4.750% due 17/03/14 ................................................................ 82,454 0.03 200,000 5.158% due 15/12/10 ................................................................ 140,000 0.05 100,000 5.108% due 15/06/09 ................................................................ 92,750 0.04
Station Casinos Inc USD 55,000 7.750% due 15/08/16 ................................................................ 21,242 0.01
Steel Dynamics 20,000 7.375% due 01/11/12 ................................................................ 13,028 0.01

Russell Investment Company II plc The Euro Fixed Income Fund Schedule of Investments - continued 30 September 2008
The accompanying notes are an integral part of the financial statements. 30 The Euro Fixed Income Fund
Principal Amount
Fair Value EUR
Fund %
Steel Dynamics Inc 40,000 6.750% due 01/04/15 ................................................................ 24,490 0.01
Sungard Data Systems Inc 50,000 10.250% due 15/08/15 .............................................................. 30,880 0.01
Tenet Healthcare Corp 80,000 7.375% due 01/02/13 ................................................................ 51,828 0.02
Terex Corp 20,000 7.375% due 15/01/14 ................................................................ 12,957 0.01
TI Acquisitions Inc 20,000 10.500% due 15/01/15 .............................................................. 11,248 0.00
TRW Automotive Inc EUR 101,000 6.375% due 15/03/14 ................................................................ 77,517 0.03
TXU Corp USD 10,000 5.550% due 15/11/14 ................................................................ 5,313 0.00 40,000 6.500% due 15/11/24 ................................................................ 18,136 0.01 515,000 6.550% due 15/11/34 ................................................................ 225,279 0.09
U.S. Bank National Association EUR 150,000 4.375% due 28/02/17 ................................................................ 129,000 0.05
U.S. West Communications Inc USD 60,000 6.875% due 15/09/33 ................................................................ 28,726 0.01
UniCredito Italian Capital Trust EUR 1,120,000 4.028% due 29/10/49 ................................................................ 774,609 0.30
Visteon Corp USD 34,000 12.250% due 31/12/16 .............................................................. 14,523 0.01 13,000 8.250% due 01/08/10 ................................................................ 7,682 0.00
Windstream Corp 60,000 8.625% due 01/08/16 ................................................................ 39,405 0.02
ZFS Finance USA Trust I - Pref - 500,000 5.875% due 09/05/32 ................................................................ 242,801 0.09
19,571,769 7.61 Total Long Term Bonds and Notes ................................... 240,892,863 93.64 Short Term Investments (0.19%) France (0.19%) France, Republic of
EUR 500,000 0.000% due 18/12/08 ................................................................ 495,550 0.19
Total Transferable Securities .............................................. 241,388,413 93.83
Number of Shares
Fair Value EUR
Fund %
Collective Investment Schemes (2.29%) Ireland (2.29%)
5,890 Russell Investment Company III plc The Euro Cash Fund - Class A Shares ..................................... 5,890,183 2.29
3 Russell Investment Company III plc The U.S. Dollar Cash Plus Fund - Class A Shares .................. 2,140 0.00
Total Collective Investment Schemes ............................... 5,892,323 2.29
Total Investments excluding Financial Derivative Instruments ............................................................................. 247,280,736 96.12
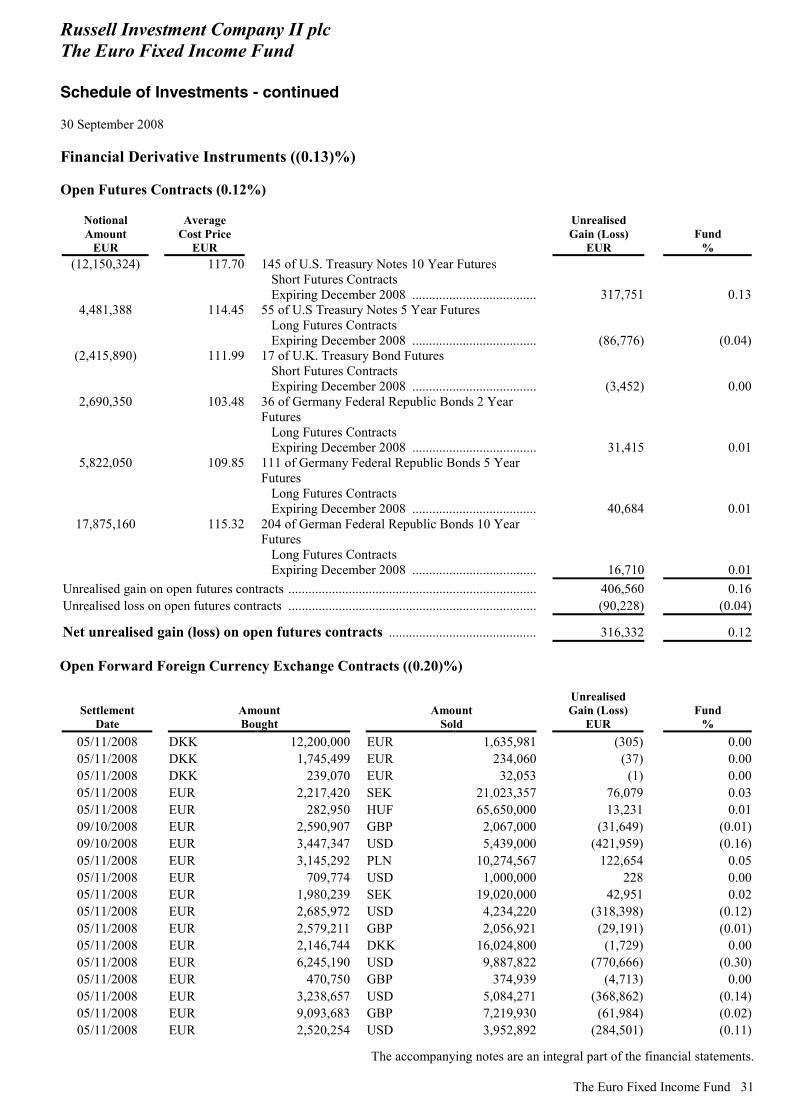
Russell Investment Company II plc The Euro Fixed Income Fund Schedule of Investments - continued 30 September 2008
The accompanying notes are an integral part of the financial statements.
The Euro Fixed Income Fund 31
Financial Derivative Instruments ((0.13)%) Open Futures Contracts (0.12%)
Notional Amount
EUR
Average Cost Price
EUR
Unrealised Gain (Loss)
EUR Fund
% (12,150,324) 117.70 145 of U.S. Treasury Notes 10 Year Futures
Short Futures Contracts Expiring December 2008 ..................................... 317,751 0.13
4,481,388 114.45 55 of U.S Treasury Notes 5 Year Futures Long Futures Contracts Expiring December 2008 ..................................... (86,776) (0.04)
(2,415,890) 111.99 17 of U.K. Treasury Bond Futures Short Futures Contracts Expiring December 2008 ..................................... (3,452) 0.00
2,690,350 103.48 36 of Germany Federal Republic Bonds 2 Year Futures Long Futures Contracts Expiring December 2008 ..................................... 31,415 0.01
5,822,050 109.85 111 of Germany Federal Republic Bonds 5 Year Futures Long Futures Contracts Expiring December 2008 ..................................... 40,684 0.01
17,875,160 115.32 204 of German Federal Republic Bonds 10 Year Futures Long Futures Contracts Expiring December 2008 ..................................... 16,710 0.01
Unrealised gain on open futures contracts .......................................................................... 406,560 0.16Unrealised loss on open futures contracts .......................................................................... (90,228) (0.04)
Net unrealised gain (loss) on open futures contracts ............................................ 316,332 0.12 Open Forward Foreign Currency Exchange Contracts ((0.20)%)
Settlement Date
Amount Bought
Amount Sold
Unrealised Gain (Loss)
EUR Fund
% 05/11/2008 DKK 12,200,000 EUR 1,635,981 (305) 0.0005/11/2008 DKK 1,745,499 EUR 234,060 (37) 0.0005/11/2008 DKK 239,070 EUR 32,053 (1) 0.0005/11/2008 EUR 2,217,420 SEK 21,023,357 76,079 0.0305/11/2008 EUR 282,950 HUF 65,650,000 13,231 0.0109/10/2008 EUR 2,590,907 GBP 2,067,000 (31,649) (0.01)09/10/2008 EUR 3,447,347 USD 5,439,000 (421,959) (0.16)05/11/2008 EUR 3,145,292 PLN 10,274,567 122,654 0.0505/11/2008 EUR 709,774 USD 1,000,000 228 0.0005/11/2008 EUR 1,980,239 SEK 19,020,000 42,951 0.0205/11/2008 EUR 2,685,972 USD 4,234,220 (318,398) (0.12)05/11/2008 EUR 2,579,211 GBP 2,056,921 (29,191) (0.01)05/11/2008 EUR 2,146,744 DKK 16,024,800 (1,729) 0.0005/11/2008 EUR 6,245,190 USD 9,887,822 (770,666) (0.30)05/11/2008 EUR 470,750 GBP 374,939 (4,713) 0.0005/11/2008 EUR 3,238,657 USD 5,084,271 (368,862) (0.14)05/11/2008 EUR 9,093,683 GBP 7,219,930 (61,984) (0.02)05/11/2008 EUR 2,520,254 USD 3,952,892 (284,501) (0.11)

Russell Investment Company II plc The Euro Fixed Income Fund Schedule of Investments - continued 30 September 2008
The accompanying notes are an integral part of the financial statements. 32 The Euro Fixed Income Fund
Settlement Date
Amount Bought
Amount Sold
Unrealised Gain (Loss)
EUR Fund
% 05/11/2008 EUR 318,394 USD 500,000 (36,378) (0.02)05/11/2008 EUR 629,089 GBP 500,000 (4,966) 0.0005/11/2008 EUR 910,501 USD 1,350,000 (47,385) (0.02)05/11/2008 EUR 1,022,481 USD 1,510,000 (48,932) (0.02)05/11/2008 EUR 986,214 USD 1,420,000 (21,340) (0.01)05/11/2008 EUR 610,000 USD 868,762 (6,426) 0.0005/11/2008 EUR 140,845 USD 200,000 (1,064) 0.0005/11/2008 EUR 1,990,000 USD 2,898,037 (66,288) (0.03)05/11/2008 EUR 2,944,179 USD 4,240,000 (64,293) (0.03)09/10/2008 EUR 537,537 USD 774,000 (13,086) (0.01)05/11/2008 EUR 2,082,434 USD 3,040,000 (74,583) (0.03)09/10/2008 EUR 3,774,096 USD 5,439,000 (95,211) (0.04)05/11/2008 EUR 126,080 GBP 100,000 (731) 0.0005/11/2008 EUR 149,573 GBP 119,054 (1,401) 0.0005/11/2008 EUR 204,499 USD 300,000 (8,365) 0.0005/11/2008 EUR 208,398 USD 300,000 (4,465) 0.0009/10/2008 GBP 48,000 EUR 60,181 721 0.0005/11/2008 GBP 3,735,291 EUR 4,688,513 48,248 0.0205/11/2008 GBP 1,112,007 EUR 1,397,380 12,768 0.0005/11/2008 GBP 1,980,000 EUR 2,498,171 12,688 0.0009/10/2008 GBP 54,000 EUR 68,110 403 0.0009/10/2008 GBP 43,000 EUR 54,179 378 0.0005/11/2008 GBP 270,836 EUR 339,841 3,609 0.0005/11/2008 SEK 18,070,000 EUR 1,908,413 (67,888) (0.03)05/11/2008 SEK 19,748,815 EUR 2,087,063 (75,542) (0.03)05/11/2008 SEK 2,240,000 EUR 236,804 (8,648) 0.0009/10/2008 USD 774,000 EUR 513,363 37,260 0.0209/10/2008 USD 99,000 EUR 67,877 2,552 0.0005/11/2008 USD 2,967,129 EUR 2,050,000 55,312 0.0205/11/2008 USD 1,460,000 EUR 1,031,146 4,790 0.0009/10/2008 USD 105,000 EUR 66,351 8,346 0.0005/11/2008 USD 2,813,761 EUR 1,990,000 6,490 0.0009/10/2008 USD 5,439,000 EUR 3,777,346 91,961 0.0305/11/2008 USD 420,000 EUR 284,187 13,822 0.0109/10/2008 USD 774,000 EUR 537,075 13,549 0.0109/10/2008 USD 132,000 EUR 83,512 10,393 0.0005/11/2008 USD 3,389,052 EUR 2,138,304 266,381 0.1005/11/2008 USD 19,966,294 EUR 12,601,006 1,565,980 0.6109/10/2008 USD 340,000 EUR 218,811 23,065 0.0109/10/2008 USD 123,000 EUR 87,243 259 0.0009/10/2008 USD 141,000 EUR 99,643 664 0.00
Unrealised gain on open forward foreign currency exchange contracts ............................. 2,434,781 0.94Unrealised loss on open forward foreign currency exchange contracts .............................. (2,940,987) (1.14)
Net unrealised gain (loss) on open forward foreign currency exchange contracts (506,206) (0.20)
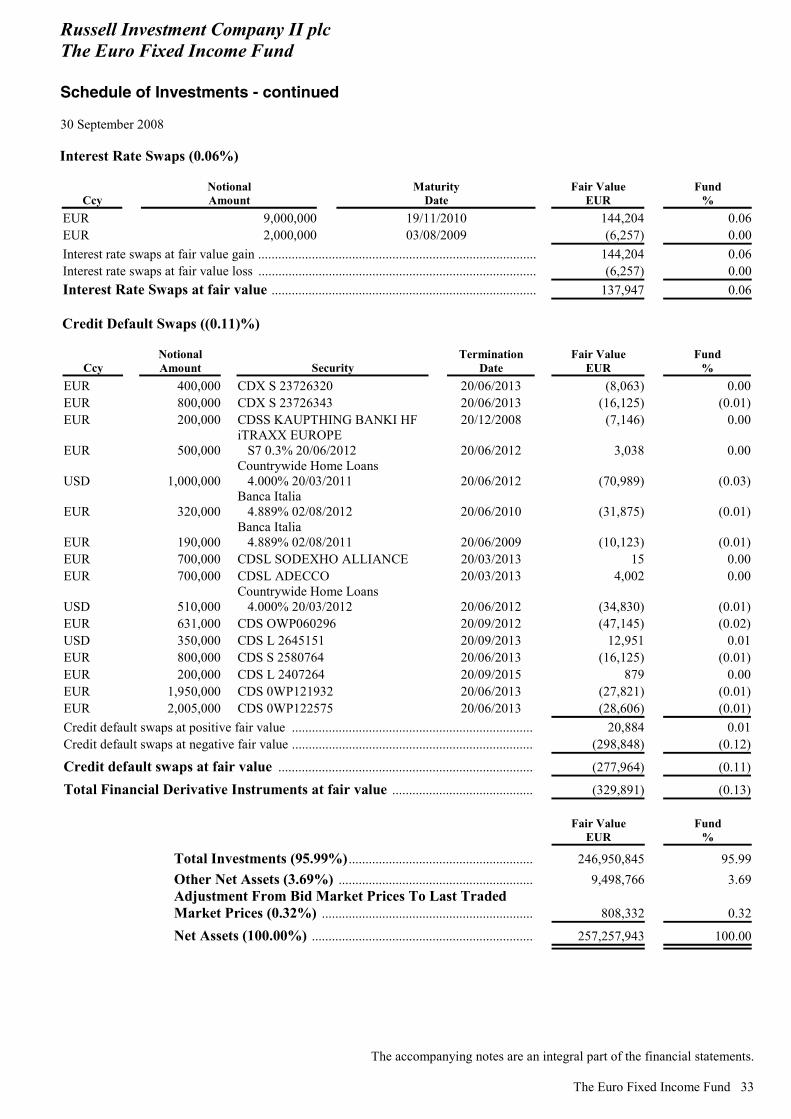
Russell Investment Company II plc The Euro Fixed Income Fund Schedule of Investments - continued 30 September 2008
The accompanying notes are an integral part of the financial statements.
The Euro Fixed Income Fund 33
Interest Rate Swaps (0.06%)
Ccy Notional Amount
Maturity Date
Fair Value EUR
Fund %
EUR 9,000,000 19/11/2010 144,204 0.06EUR 2,000,000 03/08/2009 (6,257) 0.00Interest rate swaps at fair value gain ................................................................................... 144,204 0.06Interest rate swaps at fair value loss ................................................................................... (6,257) 0.00Interest Rate Swaps at fair value ............................................................................... 137,947 0.06 Credit Default Swaps ((0.11)%)
Ccy Notional Amount Security
TerminationDate
Fair Value EUR
Fund %
EUR 400,000 CDX S 23726320 20/06/2013 (8,063) 0.00EUR 800,000 CDX S 23726343 20/06/2013 (16,125) (0.01)EUR 200,000 CDSS KAUPTHING BANKI HF 20/12/2008 (7,146) 0.00
EUR 500,000iTRAXX EUROPE S7 0.3% 20/06/2012 20/06/2012 3,038 0.00
USD 1,000,000Countrywide Home Loans 4.000% 20/03/2011 20/06/2012 (70,989) (0.03)
EUR 320,000Banca Italia 4.889% 02/08/2012 20/06/2010 (31,875) (0.01)
EUR 190,000Banca Italia 4.889% 02/08/2011 20/06/2009 (10,123) (0.01)
EUR 700,000 CDSL SODEXHO ALLIANCE 20/03/2013 15 0.00EUR 700,000 CDSL ADECCO 20/03/2013 4,002 0.00
USD 510,000Countrywide Home Loans 4.000% 20/03/2012 20/06/2012 (34,830) (0.01)
EUR 631,000 CDS OWP060296 20/09/2012 (47,145) (0.02)USD 350,000 CDS L 2645151 20/09/2013 12,951 0.01EUR 800,000 CDS S 2580764 20/06/2013 (16,125) (0.01)EUR 200,000 CDS L 2407264 20/09/2015 879 0.00EUR 1,950,000 CDS 0WP121932 20/06/2013 (27,821) (0.01)EUR 2,005,000 CDS 0WP122575 20/06/2013 (28,606) (0.01)Credit default swaps at positive fair value ......................................................................... 20,884 0.01Credit default swaps at negative fair value ......................................................................... (298,848) (0.12)
Credit default swaps at fair value ............................................................................. (277,964) (0.11)
Total Financial Derivative Instruments at fair value ........................................... (329,891) (0.13)
Fair Value
EUR Fund
%
Total Investments (95.99%) ........................................................ 246,950,845 95.99 Other Net Assets (3.69%) ........................................................... 9,498,766 3.69
Adjustment From Bid Market Prices To Last Traded Market Prices (0.32%) ................................................................ 808,332 0.32
Net Assets (100.00%) ................................................................... 257,257,943 100.00
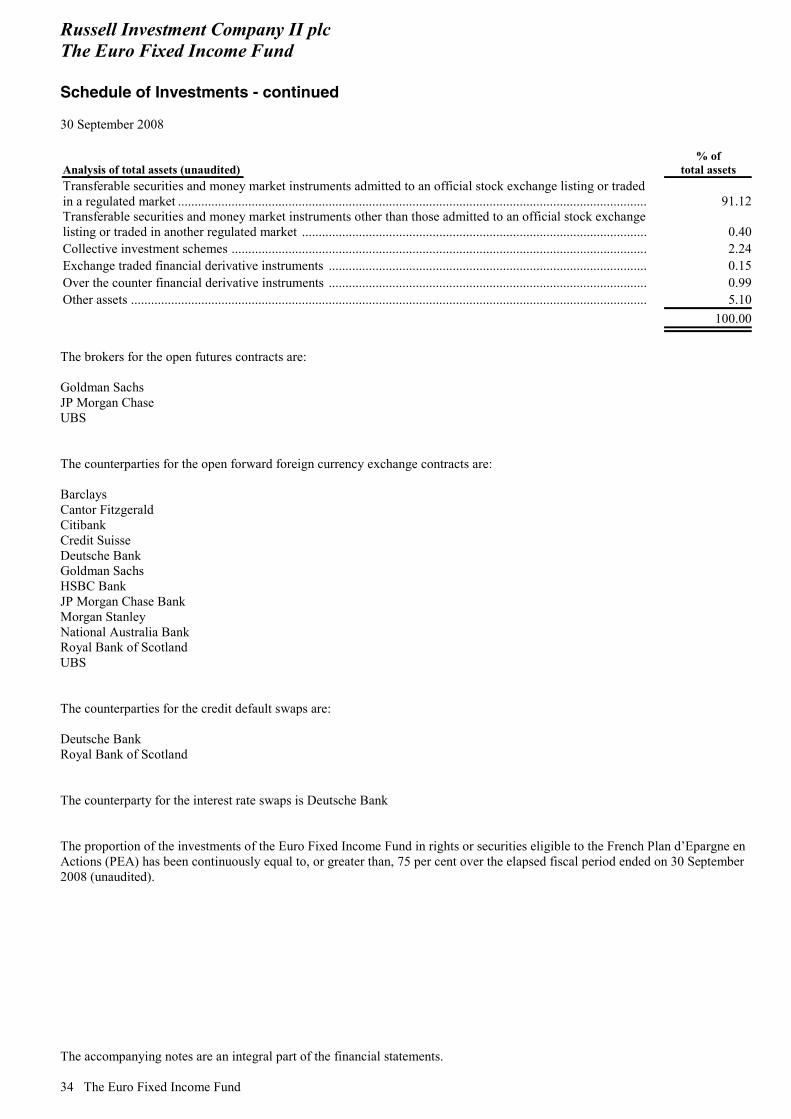
Russell Investment Company II plc The Euro Fixed Income Fund Schedule of Investments - continued 30 September 2008
The accompanying notes are an integral part of the financial statements. 34 The Euro Fixed Income Fund
Analysis of total assets (unaudited) % of
total assets Transferable securities and money market instruments admitted to an official stock exchange listing or traded in a regulated market ............................................................................................................................................ 91.12Transferable securities and money market instruments other than those admitted to an official stock exchange listing or traded in another regulated market ....................................................................................................... 0.40Collective investment schemes ............................................................................................................................ 2.24Exchange traded financial derivative instruments ............................................................................................... 0.15Over the counter financial derivative instruments ............................................................................................... 0.99Other assets .......................................................................................................................................................... 5.10
100.00
The brokers for the open futures contracts are: Goldman Sachs JP Morgan Chase UBS
The counterparties for the open forward foreign currency exchange contracts are: Barclays Cantor Fitzgerald Citibank Credit Suisse Deutsche Bank Goldman Sachs HSBC Bank JP Morgan Chase Bank Morgan Stanley National Australia Bank Royal Bank of Scotland UBS The counterparties for the credit default swaps are: Deutsche Bank Royal Bank of Scotland The counterparty for the interest rate swaps is Deutsche Bank The proportion of the investments of the Euro Fixed Income Fund in rights or securities eligible to the French Plan d’Epargne en Actions (PEA) has been continuously equal to, or greater than, 75 per cent over the elapsed fiscal period ended on 30 September 2008 (unaudited).

Russell Investment Company II plc The Euro Fixed Income Fund Statement of Changes in Composition of Portfolio Listed below are the 20 largest cumulative investment purchases and sales during the period ended 30 September 2008
A copy of the list of changes in the portfolio during the reference period may be obtained free of charge from the Company’s administrator or from the paying agent or paying and information agents in each country of distribution.
The Euro Fixed Income Fund 35
Portfolio Securities Acquisition Cost
EUR Portfolio Securities Disposal Proceeds
EUR Russell Investment Company III plc Russell Investment Company III plc
The Euro Cash Fund The Euro Cash Fund Class A Income Shares 28,027,155 Class A Shares 30,953,000
Germany, Republic of Bundesrepublik Deutschland 3.500% due 12/04/13 22,201,565 4.250% due 12/10/12 13,319,792
Germany, Republic of Germany, Republic of 4.250% due 04/01/14 11,697,514 4.000% due 04/01/18 12,498,588
Germany, Republic of Germany, Republic of 4.000% due 04/01/18 11,283,894 3.500% due 12/04/13 11,383,086 Germany, Republic of Germany, Republic of 3.750% due 04/01/15 11,280,410 5.375% due 04/01/10 11,332,799
FNMA TBA Jul 30 Single Family FNMA TBA Jul 30 Single Family 5.500% due 01/12/99 9,691,019 5.500% due 01/12/99 9,705,855
Bundesrepublik Deutschland Germany, Republic of 4.250% due 12/10/12 9,434,437 3.500% due 10/10/08 8,740,362
Germany, Republic of Germany, Republic of 4.250% due 04/07/14 7,176,627 3.750% due 04/01/15 8,154,068
Austria, Republic of Netherlands, Government of 5.250% due 04/01/11 6,546,960 4.500% due 15/07/17 6,684,830
FNMA TBA Jun 30 Single Family FNMA TBA May 30 Single Family 5.500% due 01/12/99 6,318,643 5.500% due 01/12/99 6,334,581
FNMA TBA May 30 Single Family France, Government of 5.500% due 01/12/99 6,209,618 4.750% due 25/10/12 6,263,446
France, Government of FNMA TBA Apr 30 Single Family 3.000% due 12/07/08 5,986,380 5.500% due 01/12/99 6,222,570
Germany, Republic of FNMA TBA Jun 30 Single Family 4.250% due 04/07/18 5,893,616 5.500% due 01/12/99 6,182,502
France, Government of Germany, Republic of 4.000% due 25/04/18 5,892,060 4.500% due 04/07/09 5,995,920
Bundesrepublik Deutschland France, Government of 1.500% due 15/04/16 5,502,927 3.000% due 12/07/08 5,991,300
Bundesrepublik Deutschland Austria, Republic of 4.250% due 04/07/17 5,009,095 5.250% due 04/01/11 5,849,352
Netherlands, Kingdom of France, Government of 2.750% due 15/01/09 4,958,150 4.000% due 25/04/18 5,611,173
Germany, Republic of Bundesrepublik Deutschland 4.250% due 04/07/39 4,735,853 1.500% due 15/04/16 5,563,146
Germany, Republic of Germany, Republic of 5.250% due 04/01/11 4,118,540 3.750% due 04/01/17 5,242,664
Germany, Republic of Germany, Republic of 4.750% due 04/07/34 3,362,829 5.250% due 04/01/11 5,050,303
Russell Investment Company II plc The Global Bond (Euro Hedged) Fund Manager’s Report
36 The Global Bond (Euro Hedged) Fund
Money Managers Colchester Global Investors Limited Drake Capital Management LLC Loomis, Sayles & Company L.P. Pacific Investment Management Company LLC Investment Objective The investment objective of the Global Bond (Euro Hedged) Fund (the “Fund”) is to provide income and capital growth by investing primarily in transferable debt instruments denominated in a variety of currencies, which include but are not limited to, municipal and government bonds, agency debt (being that issued by local authorities or public international bodies of which one or more states is a member), mortgage related debt and corporate debt that are listed, traded or dealt in on a regulated market in the OECD and which may have fixed or floating rates. Fund Performance The Fund returned -1.7 per cent during the period on a gross-of-fees basis verses a benchmark return of -0.1 per cent.* Market Comment During the first half of the period, the economy showed signs of a slow down and yields rose on inflation concerns and hawkish comments on monetary policy by Central Banks. The unprecedented rise in commodity prices earlier this year was a major benefactor to rising inflation and the U.S. Dollar continued to weaken against most of the major currencies due to the poor U.S. economic outlook. Corporate bonds recovered some of the ground lost during a difficult first quarter of the year and outperformed U.S. treasuries. However, concerns that liquidity problems at some of the biggest financial institutions might not yet have concluded weighed on investor sentiment. The third quarter of 2008 was one of the most turbulent in history. The unprecedented market events began with the nationalisation of mortgage facilitators Fannie Mae and Freddie Mac. This was followed by Lehman Brothers filing for bankruptcy, throwing the market into further turmoil. This led to a merger between Bank of America and Merrill Lynch and the rescue of AIG by the U.S. Federal Reserve. The quarter ended on further bad news as the U.S. bailout plan designed to clean up banks toxic debt was rejected and a temporary ban on short-selling of financials was imposed; the combination of the two was detrimental to investor confidence and saw most of the world’s major indices fall sharply. The U.S. Dollar strengthened towards the end of the quarter as commodity prices retreated resulting in a sell off of weaker currencies. Furthermore, commodity-related and emerging market currencies also weakened due to accelerated inflation and high commodity prices. Credit and high yield spreads again widened, reflecting the more vigilant overall outlook. Financials was the worst performing sector as banks continued to struggle with house-related losses. General Comment on Managers/Performance The Fund underperformed the benchmark during the period as the majority of managers struggled in the volatile market conditions. Colchester Global Investors Limited was by the far the best-performing manager, delivering stellar performance over the period. Its investment style, that inherently has a bias to governments vs. credit, did very well in this market environment. Moreover, its currency strategy also contributed positively to performance, in particular the overweight to the Yen (which outperformed all major currencies over the quarter as risk aversion drove the Yen higher). Pacific Investment Management Company LLC was the worst-performing manager as its swap spread exposure provided a headwind to performance as short-dated swaps saw significant widening. The position in AIG, was a significant hit to performance. Also diversified exposure to financials in general has detracted from performance as spreads widened in the sector. Furthermore, the managers asset backed securities and collateralised mortgage obligations overweight came under pressure given liquidity issues in the market.
Russell Investment Company II plc The Global Bond (Euro Hedged) Fund Manager’s Report - continued
The Global Bond (Euro Hedged) Fund 37
Outlook The Fund remains well positioned to benefit from diverse returns in the coming quarter given its broad allocation of assets. Past performance is no indication of current or future performance. * Benchmark Source: Lehman Brothers Global Aggregate Euro Hedged Index
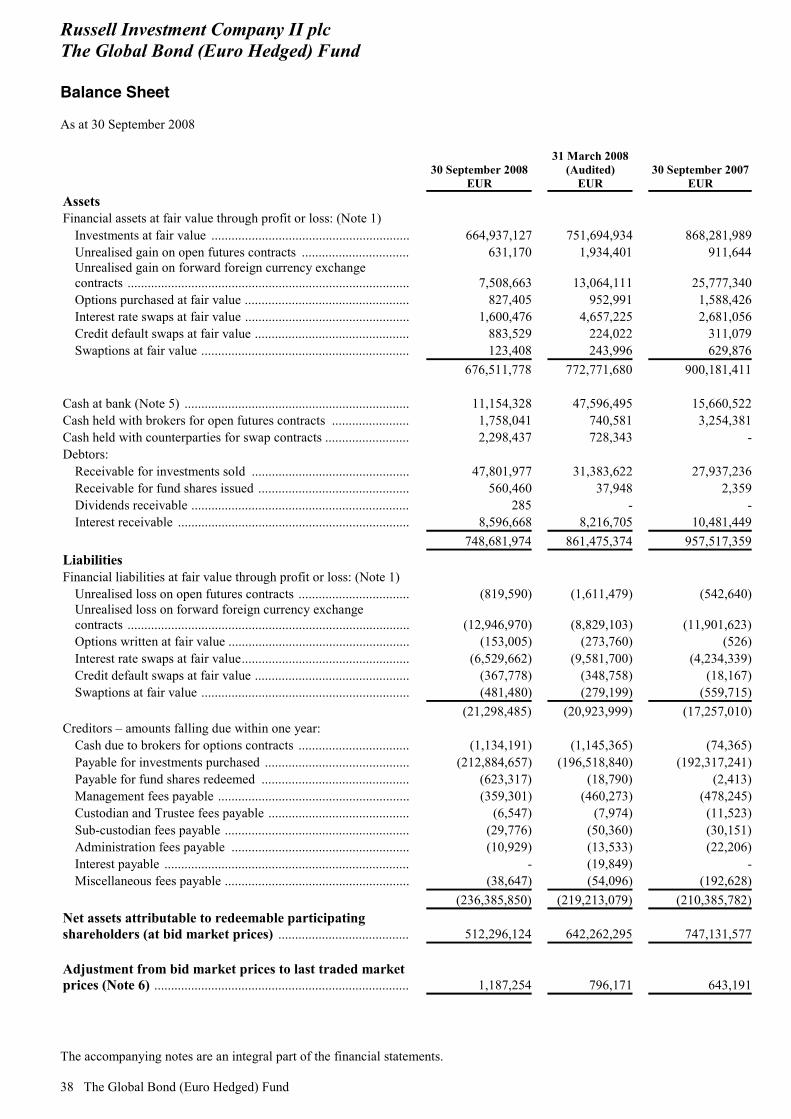
Russell Investment Company II plc The Global Bond (Euro Hedged) Fund Balance Sheet As at 30 September 2008
The accompanying notes are an integral part of the financial statements. 38 The Global Bond (Euro Hedged) Fund
30 September 2008
EUR
31 March 2008 (Audited)
EUR 30 September 2007
EUR Assets Financial assets at fair value through profit or loss: (Note 1)
Investments at fair value ........................................................... 664,937,127 751,694,934 868,281,989Unrealised gain on open futures contracts ................................ 631,170 1,934,401 911,644Unrealised gain on forward foreign currency exchange contracts .................................................................................... 7,508,663 13,064,111 25,777,340Options purchased at fair value ................................................. 827,405 952,991 1,588,426Interest rate swaps at fair value ................................................. 1,600,476 4,657,225 2,681,056Credit default swaps at fair value .............................................. 883,529 224,022 311,079Swaptions at fair value .............................................................. 123,408 243,996 629,876
676,511,778 772,771,680 900,181,411 Cash at bank (Note 5) ................................................................... 11,154,328 47,596,495 15,660,522Cash held with brokers for open futures contracts ....................... 1,758,041 740,581 3,254,381Cash held with counterparties for swap contracts ......................... 2,298,437 728,343 -Debtors:
Receivable for investments sold ............................................... 47,801,977 31,383,622 27,937,236Receivable for fund shares issued ............................................. 560,460 37,948 2,359Dividends receivable ................................................................. 285 - -Interest receivable ..................................................................... 8,596,668 8,216,705 10,481,449
748,681,974 861,475,374 957,517,359Liabilities Financial liabilities at fair value through profit or loss: (Note 1)
Unrealised loss on open futures contracts ................................. (819,590) (1,611,479) (542,640)Unrealised loss on forward foreign currency exchange contracts .................................................................................... (12,946,970) (8,829,103) (11,901,623)Options written at fair value ...................................................... (153,005) (273,760) (526)Interest rate swaps at fair value.................................................. (6,529,662) (9,581,700) (4,234,339)Credit default swaps at fair value .............................................. (367,778) (348,758) (18,167)Swaptions at fair value .............................................................. (481,480) (279,199) (559,715)
(21,298,485) (20,923,999) (17,257,010) Creditors – amounts falling due within one year:
Cash due to brokers for options contracts ................................. (1,134,191) (1,145,365) (74,365)Payable for investments purchased ........................................... (212,884,657) (196,518,840) (192,317,241)Payable for fund shares redeemed ............................................ (623,317) (18,790) (2,413)Management fees payable ......................................................... (359,301) (460,273) (478,245)Custodian and Trustee fees payable .......................................... (6,547) (7,974) (11,523)Sub-custodian fees payable ....................................................... (29,776) (50,360) (30,151)Administration fees payable ..................................................... (10,929) (13,533) (22,206)Interest payable ......................................................................... - (19,849) -Miscellaneous fees payable ....................................................... (38,647) (54,096) (192,628)
(236,385,850) (219,213,079) (210,385,782)Net assets attributable to redeemable participating shareholders (at bid market prices) ....................................... 512,296,124 642,262,295 747,131,577 Adjustment from bid market prices to last traded market prices (Note 6) ............................................................................ 1,187,254 796,171 643,191

Russell Investment Company II plc The Global Bond (Euro Hedged) Fund Balance Sheet - continued As at 30 September 2008
The accompanying notes are an integral part of the financial statements.
The Global Bond (Euro Hedged) Fund 39
30 September 2008
EUR
31 March 2008 (Audited)
EUR 30 September 2007
EUR Net assets attributable to redeemable participating shareholders (at last traded market prices) .......................... 513,483,378 643,058,466 747,774,768
Net asset value per share* Class A (EUR 1,302,767 divided by 1,054 shares in issue) .......................................................................................... EUR 1,236.02 EUR 1,268.17 EUR 1,258.90Class B (EUR 322,494,263 divided by 249,064 shares in issue) .......................................................................................... EUR 1,294.82 EUR 1,323.50 EUR 1,310.42Class DH-B (USD 56,082,462 divided by 5,178,436 shares in issue) .......................................................................................... USD 10.83 USD 11.17 USD 7.78
Class F (EUR 1,757,074 divided by 1,590 shares in issue) ....... EUR 1,105.08 EUR 1,134.27 EUR 1,128.78Class I (GBP 57,272,792 divided by 3,687,881 shares in issue) .......................................................................................... GBP 15.53 GBP 16.04 GBP 19.89Class I Income (GBP 38,358,470 divided by 3,105,949 shares in issue) ...................................................................................... GBP 12.35 GBP 13.03 GBP 16.52Class MZ Income (EUR 26,645,470 divided by 2,612,441 shares in issue) ........................................................................... EUR 10.20 EUR 10.62 EUR 10.73
* See Note 12 for comparative figures
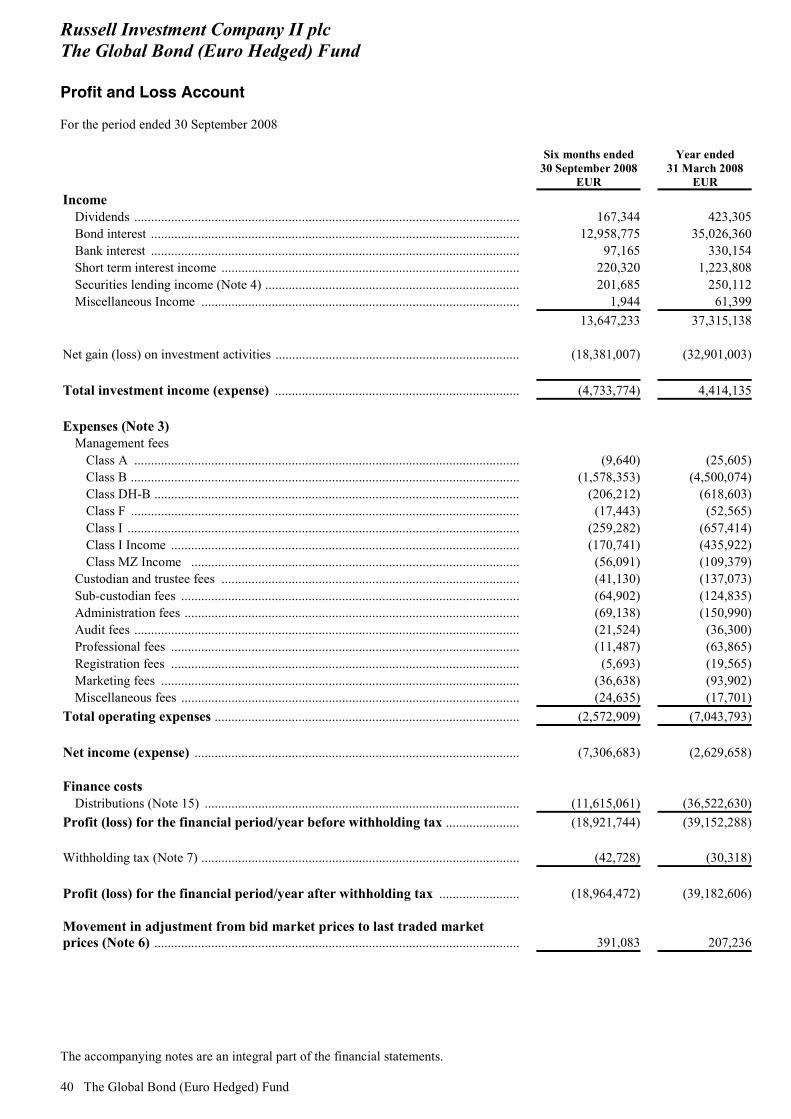
Russell Investment Company II plc The Global Bond (Euro Hedged) Fund Profit and Loss Account For the period ended 30 September 2008
The accompanying notes are an integral part of the financial statements. 40 The Global Bond (Euro Hedged) Fund
Six months ended 30 September 2008
EUR
Year ended 31 March 2008
EUR Income
Dividends .................................................................................................................... 167,344 423,305Bond interest ............................................................................................................... 12,958,775 35,026,360Bank interest ............................................................................................................... 97,165 330,154Short term interest income .......................................................................................... 220,320 1,223,808Securities lending income (Note 4) ............................................................................. 201,685 250,112Miscellaneous Income ................................................................................................ 1,944 61,399
13,647,233 37,315,138 Net gain (loss) on investment activities .......................................................................... (18,381,007) (32,901,003) Total investment income (expense) .......................................................................... (4,733,774) 4,414,135 Expenses (Note 3)
Management fees Class A .................................................................................................................... (9,640) (25,605)Class B ..................................................................................................................... (1,578,353) (4,500,074)Class DH-B .............................................................................................................. (206,212) (618,603)Class F ..................................................................................................................... (17,443) (52,565)Class I ...................................................................................................................... (259,282) (657,414)Class I Income ......................................................................................................... (170,741) (435,922)Class MZ Income ................................................................................................... (56,091) (109,379)
Custodian and trustee fees .......................................................................................... (41,130) (137,073)Sub-custodian fees ...................................................................................................... (64,902) (124,835)Administration fees ..................................................................................................... (69,138) (150,990)Audit fees .................................................................................................................... (21,524) (36,300)Professional fees ......................................................................................................... (11,487) (63,865)Registration fees ......................................................................................................... (5,693) (19,565)Marketing fees ............................................................................................................ (36,638) (93,902)Miscellaneous fees ...................................................................................................... (24,635) (17,701)
Total operating expenses ............................................................................................ (2,572,909) (7,043,793) Net income (expense) .................................................................................................. (7,306,683) (2,629,658) Finance costs
Distributions (Note 15) ............................................................................................... (11,615,061) (36,522,630)Profit (loss) for the financial period/year before withholding tax ....................... (18,921,744) (39,152,288) Withholding tax (Note 7) ................................................................................................ (42,728) (30,318) Profit (loss) for the financial period/year after withholding tax ......................... (18,964,472) (39,182,606) Movement in adjustment from bid market prices to last traded market prices (Note 6) .............................................................................................................. 391,083 207,236

Russell Investment Company II plc The Global Bond (Euro Hedged) Fund Profit and Loss Account - continued For the period ended 30 September 2008
The accompanying notes are an integral part of the financial statements.
The Global Bond (Euro Hedged) Fund 41
Six months ended 30 September 2008
EUR
Year ended 31 March 2008
EUR Increase (decrease) in net assets attributable to redeemable participating shareholders resulting from operations .................................................................. (18,573,389) (38,975,370) All amounts arose solely from continuing operations. There are no recognised gains or losses other than those dealt with in the Profit and Loss Account.
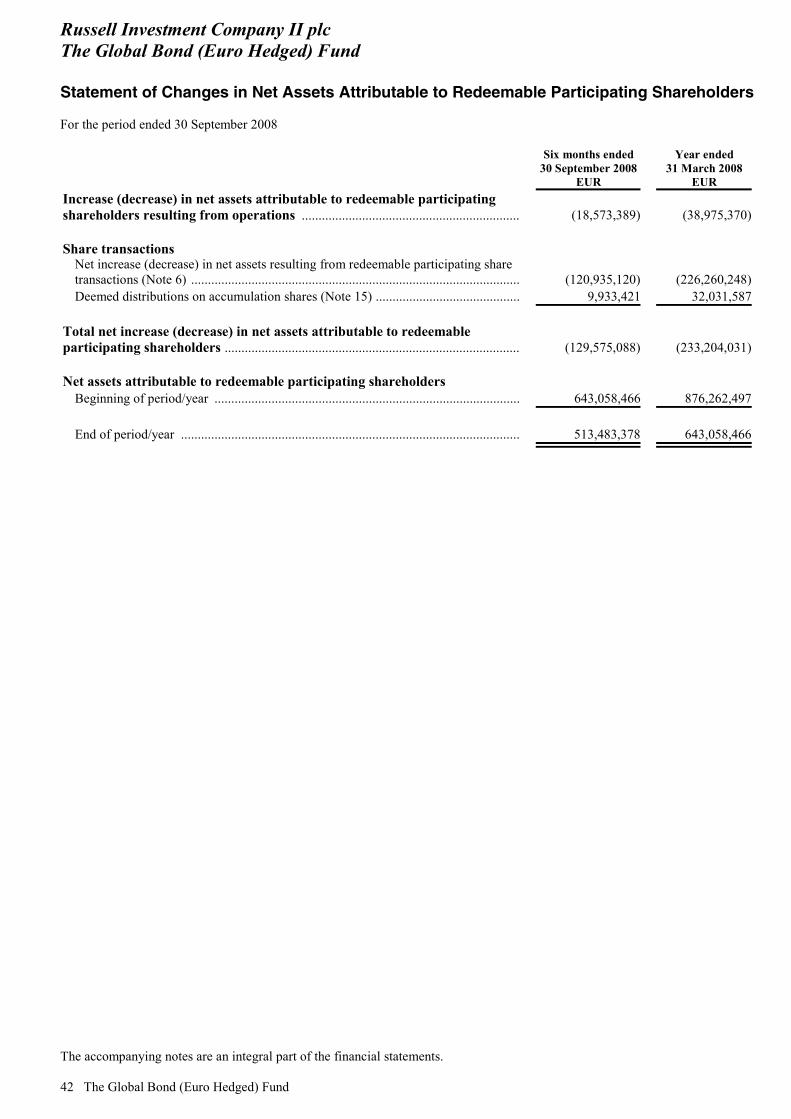
Russell Investment Company II plc The Global Bond (Euro Hedged) Fund Statement of Changes in Net Assets Attributable to Redeemable Participating Shareholders For the period ended 30 September 2008
The accompanying notes are an integral part of the financial statements. 42 The Global Bond (Euro Hedged) Fund
Six months ended 30 September 2008
EUR
Year ended 31 March 2008
EUR Increase (decrease) in net assets attributable to redeemable participating shareholders resulting from operations ................................................................. (18,573,389) (38,975,370) Share transactions
Net increase (decrease) in net assets resulting from redeemable participating share transactions (Note 6) .................................................................................................. (120,935,120) (226,260,248)Deemed distributions on accumulation shares (Note 15) ........................................... 9,933,421 32,031,587
Total net increase (decrease) in net assets attributable to redeemable participating shareholders ........................................................................................ (129,575,088) (233,204,031) Net assets attributable to redeemable participating shareholders
Beginning of period/year ........................................................................................... 643,058,466 876,262,497 End of period/year ..................................................................................................... 513,483,378 643,058,466
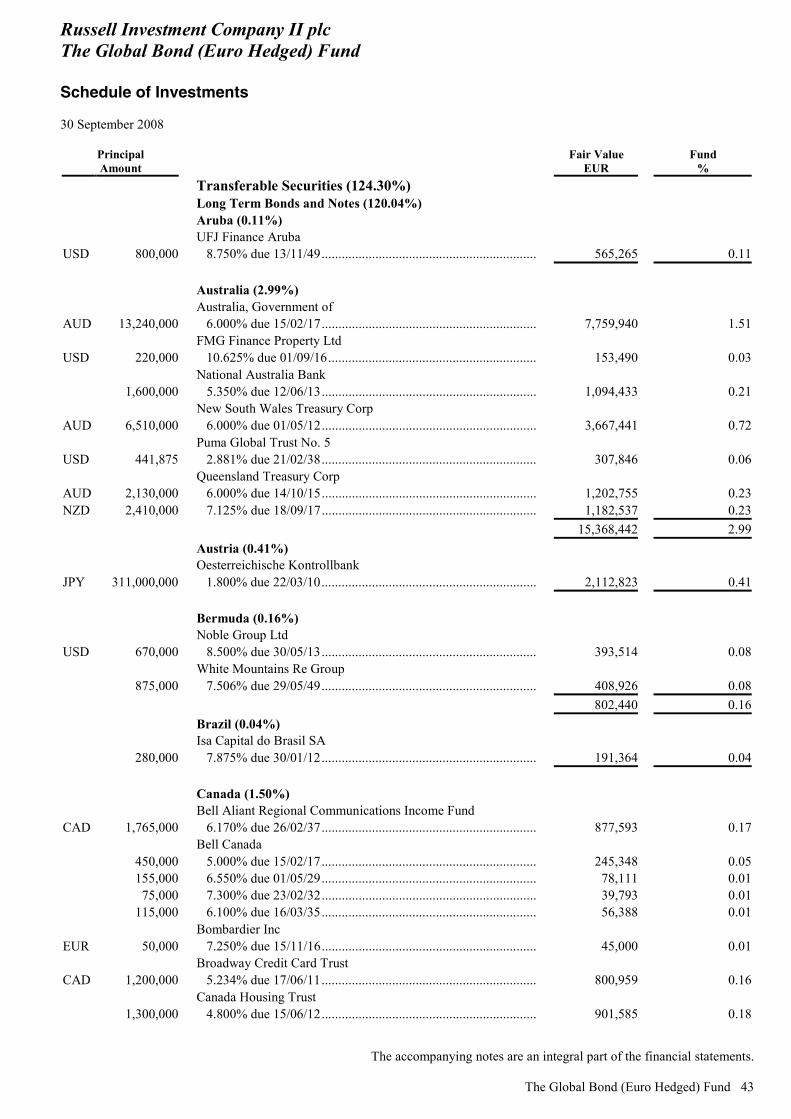
Russell Investment Company II plc The Global Bond (Euro Hedged) Fund Schedule of Investments 30 September 2008
The accompanying notes are an integral part of the financial statements.
The Global Bond (Euro Hedged) Fund 43
Principal Amount
Fair Value EUR
Fund %
Transferable Securities (124.30%) Long Term Bonds and Notes (120.04%) Aruba (0.11%) UFJ Finance Aruba
USD 800,000 8.750% due 13/11/49................................................................ 565,265 0.11 Australia (2.99%) Australia, Government of
AUD 13,240,000 6.000% due 15/02/17................................................................ 7,759,940 1.51 FMG Finance Property Ltd
USD 220,000 10.625% due 01/09/16.............................................................. 153,490 0.03 National Australia Bank
1,600,000 5.350% due 12/06/13................................................................ 1,094,433 0.21 New South Wales Treasury Corp
AUD 6,510,000 6.000% due 01/05/12................................................................ 3,667,441 0.72 Puma Global Trust No. 5
USD 441,875 2.881% due 21/02/38................................................................ 307,846 0.06 Queensland Treasury Corp
AUD 2,130,000 6.000% due 14/10/15................................................................ 1,202,755 0.23NZD 2,410,000 7.125% due 18/09/17................................................................ 1,182,537 0.23
15,368,442 2.99 Austria (0.41%) Oesterreichische Kontrollbank
JPY 311,000,000 1.800% due 22/03/10................................................................ 2,112,823 0.41 Bermuda (0.16%) Noble Group Ltd
USD 670,000 8.500% due 30/05/13................................................................ 393,514 0.08 White Mountains Re Group
875,000 7.506% due 29/05/49................................................................ 408,926 0.08 802,440 0.16 Brazil (0.04%) Isa Capital do Brasil SA
280,000 7.875% due 30/01/12................................................................ 191,364 0.04 Canada (1.50%) Bell Aliant Regional Communications Income Fund
CAD 1,765,000 6.170% due 26/02/37................................................................ 877,593 0.17 Bell Canada
450,000 5.000% due 15/02/17................................................................ 245,348 0.05 155,000 6.550% due 01/05/29................................................................ 78,111 0.01 75,000 7.300% due 23/02/32................................................................ 39,793 0.01 115,000 6.100% due 16/03/35................................................................ 56,388 0.01
Bombardier Inc EUR 50,000 7.250% due 15/11/16................................................................ 45,000 0.01
Broadway Credit Card Trust CAD 1,200,000 5.234% due 17/06/11................................................................ 800,959 0.16
Canada Housing Trust 1,300,000 4.800% due 15/06/12................................................................ 901,585 0.18
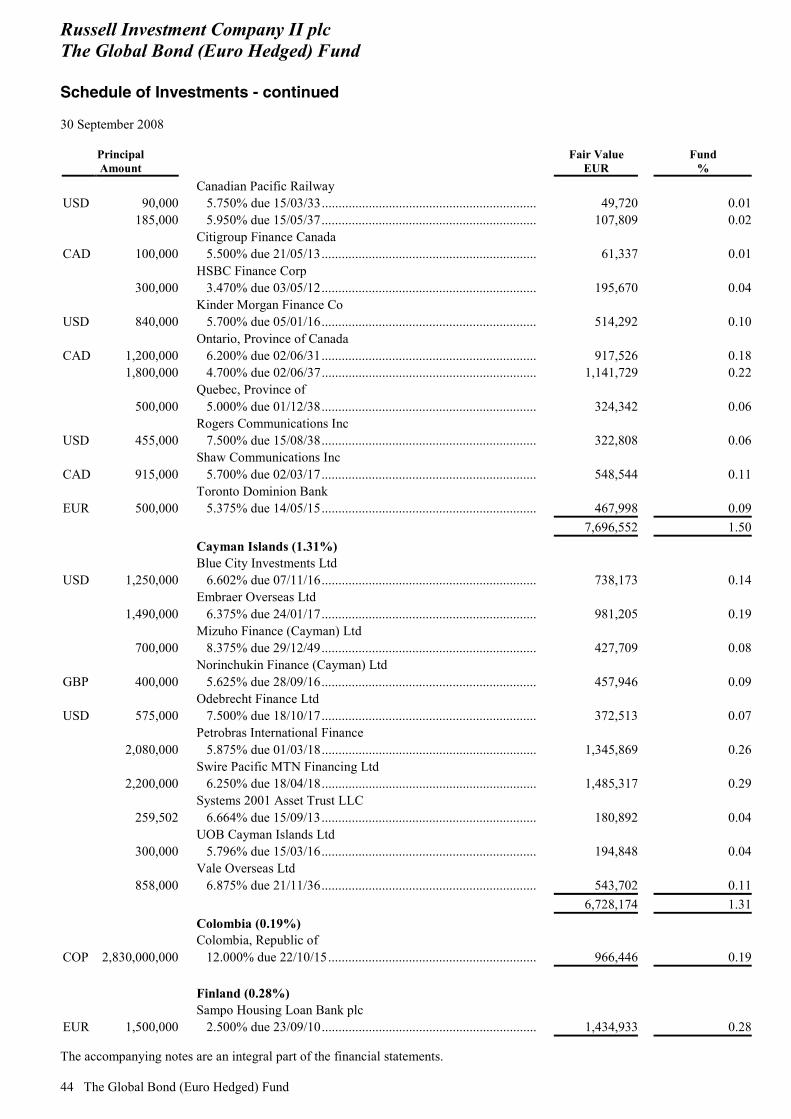
Russell Investment Company II plc The Global Bond (Euro Hedged) Fund Schedule of Investments - continued 30 September 2008
The accompanying notes are an integral part of the financial statements. 44 The Global Bond (Euro Hedged) Fund
Principal Amount
Fair Value EUR
Fund %
Canadian Pacific Railway USD 90,000 5.750% due 15/03/33................................................................ 49,720 0.01 185,000 5.950% due 15/05/37................................................................ 107,809 0.02
Citigroup Finance Canada CAD 100,000 5.500% due 21/05/13................................................................ 61,337 0.01
HSBC Finance Corp 300,000 3.470% due 03/05/12................................................................ 195,670 0.04
Kinder Morgan Finance Co USD 840,000 5.700% due 05/01/16................................................................ 514,292 0.10
Ontario, Province of Canada CAD 1,200,000 6.200% due 02/06/31................................................................ 917,526 0.18 1,800,000 4.700% due 02/06/37................................................................ 1,141,729 0.22
Quebec, Province of 500,000 5.000% due 01/12/38................................................................ 324,342 0.06
Rogers Communications Inc USD 455,000 7.500% due 15/08/38................................................................ 322,808 0.06
Shaw Communications Inc CAD 915,000 5.700% due 02/03/17................................................................ 548,544 0.11
Toronto Dominion Bank EUR 500,000 5.375% due 14/05/15................................................................ 467,998 0.09
7,696,552 1.50 Cayman Islands (1.31%) Blue City Investments Ltd
USD 1,250,000 6.602% due 07/11/16................................................................ 738,173 0.14 Embraer Overseas Ltd
1,490,000 6.375% due 24/01/17................................................................ 981,205 0.19 Mizuho Finance (Cayman) Ltd
700,000 8.375% due 29/12/49................................................................ 427,709 0.08 Norinchukin Finance (Cayman) Ltd
GBP 400,000 5.625% due 28/09/16................................................................ 457,946 0.09 Odebrecht Finance Ltd
USD 575,000 7.500% due 18/10/17................................................................ 372,513 0.07 Petrobras International Finance
2,080,000 5.875% due 01/03/18................................................................ 1,345,869 0.26 Swire Pacific MTN Financing Ltd
2,200,000 6.250% due 18/04/18................................................................ 1,485,317 0.29 Systems 2001 Asset Trust LLC
259,502 6.664% due 15/09/13................................................................ 180,892 0.04 UOB Cayman Islands Ltd
300,000 5.796% due 15/03/16................................................................ 194,848 0.04 Vale Overseas Ltd
858,000 6.875% due 21/11/36................................................................ 543,702 0.11 6,728,174 1.31 Colombia (0.19%) Colombia, Republic of
COP 2,830,000,000 12.000% due 22/10/15.............................................................. 966,446 0.19 Finland (0.28%) Sampo Housing Loan Bank plc
EUR 1,500,000 2.500% due 23/09/10................................................................ 1,434,933 0.28

Russell Investment Company II plc The Global Bond (Euro Hedged) Fund Schedule of Investments - continued 30 September 2008
The accompanying notes are an integral part of the financial statements.
The Global Bond (Euro Hedged) Fund 45
Principal Amount
Fair Value EUR
Fund %
France (2.56%) Alcatel
110,000 6.375% due 07/04/14................................................................ 88,550 0.02 ASF
200,000 5.625% due 04/07/22................................................................ 180,610 0.04 BNP Paribas Covered Bonds
500,000 4.750% due 28/05/13................................................................ 492,941 0.10 Bouygues
GBP 450,000 5.500% due 06/10/26................................................................ 454,805 0.09 France Telecom
EUR 1,100,000 7.250% due 28/01/13................................................................ 1,144,049 0.22 750,000 3.625% due 14/10/15................................................................ 638,691 0.12USD 700,000 8.500% due 01/03/31................................................................ 540,653 0.11
France, Republic of EUR 1,067,787 3.150% due 25/07/32................................................................ 1,224,004 0.24 1,900,000 5.750% due 25/10/32................................................................ 2,161,017 0.42 500,000 4.750% due 25/04/35................................................................ 499,526 0.10 200,000 4.000% due 25/04/55................................................................ 173,188 0.03
GCE Covered Bonds 1,000,000 5.250% due 17/09/10................................................................ 999,730 0.20
Lafarge SA 400,000 5.375% due 26/06/17................................................................ 332,369 0.06 570,000 4.750% due 23/03/20................................................................ 428,591 0.08
PPR 550,000 4.000% due 29/01/13................................................................ 500,669 0.10
Société Générale USD 700,000 5.922% due 29/04/49................................................................ 409,119 0.08
Veolia Environnement EUR 85,000 4.000% due 12/02/16................................................................ 75,274 0.01USD 100,000 6.000% due 01/06/18................................................................ 68,266 0.01EUR 620,000 5.125% due 24/05/22................................................................ 543,369 0.11
Vivendi SA 300,000 3.875% due 15/02/12................................................................ 277,246 0.05USD 1,200,000 5.750% due 04/04/13................................................................ 835,280 0.16 100,000 6.625% due 04/04/18................................................................ 68,527 0.01
Wendel Investissement EUR 400,000 4.875% due 26/05/16................................................................ 279,679 0.05 750,000 4.375% due 09/08/17................................................................ 489,129 0.10
WPP Finance SA 300,000 5.250% due 30/01/15................................................................ 266,235 0.05
13,171,517 2.56 Germany (8.95%) Bertelsmann
1,515,000 3.625% due 06/10/15................................................................ 1,285,071 0.25 Deutsche Bank AG
USD 500,000 6.000% due 01/09/17................................................................ 336,300 0.07 Germany, Federal Republic of
EUR 3,620,000 4.000% due 13/04/12................................................................ 3,653,103 0.71 631,000 3.750% due 04/01/17................................................................ 620,721 0.12 6,110,000 6.250% due 04/01/24................................................................ 7,262,981 1.41 4,300,000 5.625% due 04/01/28................................................................ 4,821,118 0.94
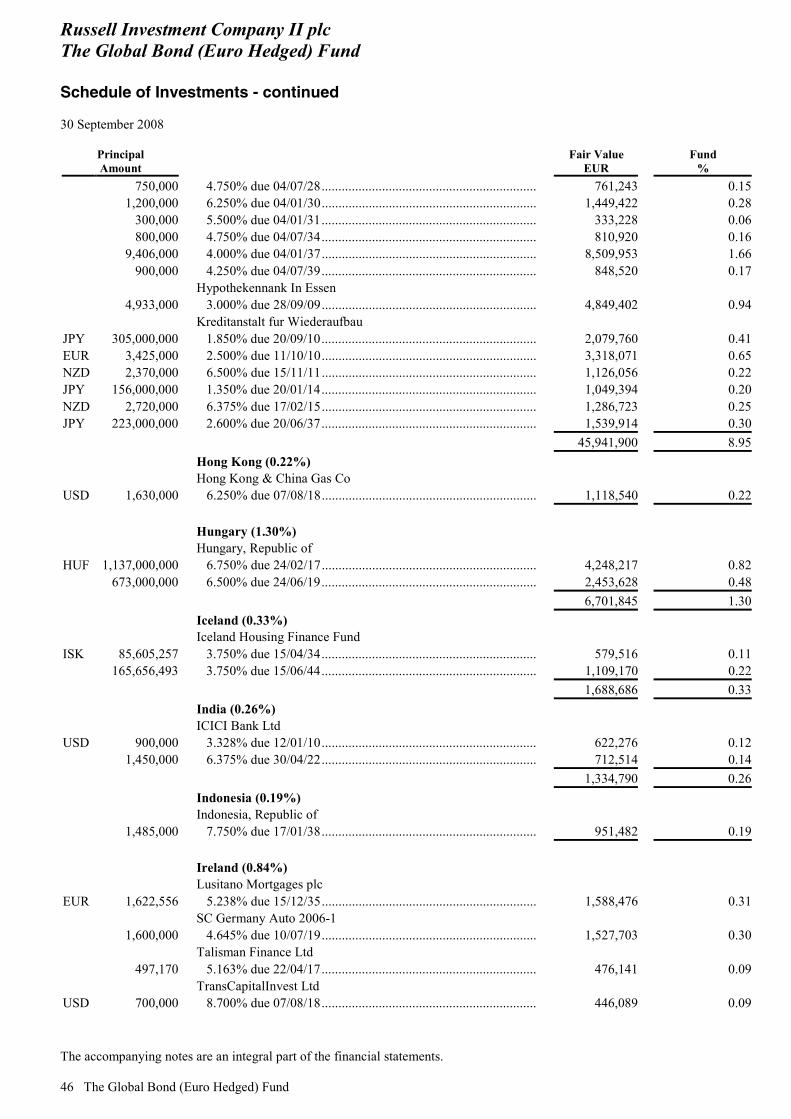
Russell Investment Company II plc The Global Bond (Euro Hedged) Fund Schedule of Investments - continued 30 September 2008
The accompanying notes are an integral part of the financial statements. 46 The Global Bond (Euro Hedged) Fund
Principal Amount
Fair Value EUR
Fund %
750,000 4.750% due 04/07/28................................................................ 761,243 0.15 1,200,000 6.250% due 04/01/30................................................................ 1,449,422 0.28 300,000 5.500% due 04/01/31................................................................ 333,228 0.06 800,000 4.750% due 04/07/34................................................................ 810,920 0.16 9,406,000 4.000% due 04/01/37................................................................ 8,509,953 1.66 900,000 4.250% due 04/07/39................................................................ 848,520 0.17
Hypothekennank In Essen 4,933,000 3.000% due 28/09/09................................................................ 4,849,402 0.94
Kreditanstalt fur Wiederaufbau JPY 305,000,000 1.850% due 20/09/10................................................................ 2,079,760 0.41EUR 3,425,000 2.500% due 11/10/10................................................................ 3,318,071 0.65NZD 2,370,000 6.500% due 15/11/11................................................................ 1,126,056 0.22JPY 156,000,000 1.350% due 20/01/14................................................................ 1,049,394 0.20NZD 2,720,000 6.375% due 17/02/15................................................................ 1,286,723 0.25JPY 223,000,000 2.600% due 20/06/37................................................................ 1,539,914 0.30
45,941,900 8.95 Hong Kong (0.22%) Hong Kong & China Gas Co
USD 1,630,000 6.250% due 07/08/18................................................................ 1,118,540 0.22 Hungary (1.30%) Hungary, Republic of
HUF 1,137,000,000 6.750% due 24/02/17................................................................ 4,248,217 0.82 673,000,000 6.500% due 24/06/19................................................................ 2,453,628 0.48
6,701,845 1.30 Iceland (0.33%) Iceland Housing Finance Fund
ISK 85,605,257 3.750% due 15/04/34................................................................ 579,516 0.11 165,656,493 3.750% due 15/06/44................................................................ 1,109,170 0.22
1,688,686 0.33 India (0.26%) ICICI Bank Ltd
USD 900,000 3.328% due 12/01/10................................................................ 622,276 0.12 1,450,000 6.375% due 30/04/22................................................................ 712,514 0.14
1,334,790 0.26 Indonesia (0.19%) Indonesia, Republic of
1,485,000 7.750% due 17/01/38................................................................ 951,482 0.19 Ireland (0.84%) Lusitano Mortgages plc
EUR 1,622,556 5.238% due 15/12/35................................................................ 1,588,476 0.31 SC Germany Auto 2006-1
1,600,000 4.645% due 10/07/19................................................................ 1,527,703 0.30 Talisman Finance Ltd
497,170 5.163% due 22/04/17................................................................ 476,141 0.09 TransCapitalInvest Ltd
USD 700,000 8.700% due 07/08/18................................................................ 446,089 0.09
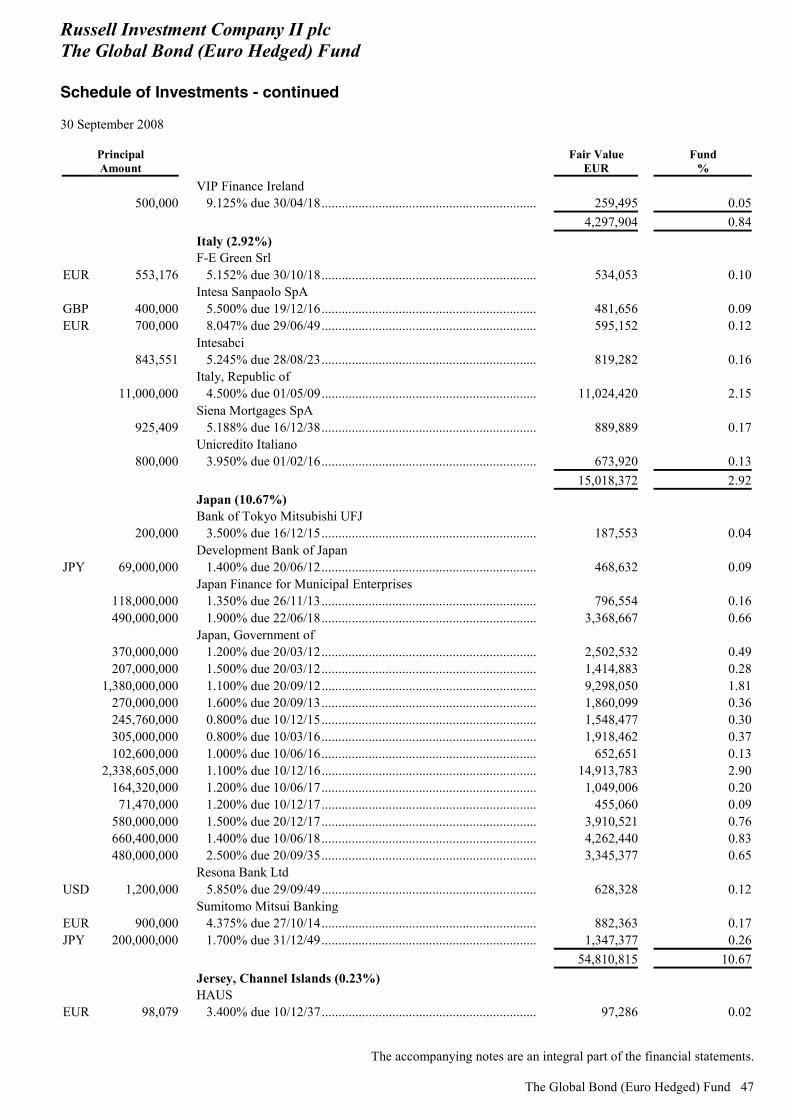
Russell Investment Company II plc The Global Bond (Euro Hedged) Fund Schedule of Investments - continued 30 September 2008
The accompanying notes are an integral part of the financial statements.
The Global Bond (Euro Hedged) Fund 47
Principal Amount
Fair Value EUR
Fund %
VIP Finance Ireland 500,000 9.125% due 30/04/18................................................................ 259,495 0.05
4,297,904 0.84 Italy (2.92%) F-E Green Srl
EUR 553,176 5.152% due 30/10/18................................................................ 534,053 0.10 Intesa Sanpaolo SpA
GBP 400,000 5.500% due 19/12/16................................................................ 481,656 0.09EUR 700,000 8.047% due 29/06/49................................................................ 595,152 0.12
Intesabci 843,551 5.245% due 28/08/23................................................................ 819,282 0.16
Italy, Republic of 11,000,000 4.500% due 01/05/09................................................................ 11,024,420 2.15
Siena Mortgages SpA 925,409 5.188% due 16/12/38................................................................ 889,889 0.17
Unicredito Italiano 800,000 3.950% due 01/02/16................................................................ 673,920 0.13
15,018,372 2.92 Japan (10.67%) Bank of Tokyo Mitsubishi UFJ
200,000 3.500% due 16/12/15................................................................ 187,553 0.04 Development Bank of Japan
JPY 69,000,000 1.400% due 20/06/12................................................................ 468,632 0.09 Japan Finance for Municipal Enterprises
118,000,000 1.350% due 26/11/13................................................................ 796,554 0.16 490,000,000 1.900% due 22/06/18................................................................ 3,368,667 0.66
Japan, Government of 370,000,000 1.200% due 20/03/12................................................................ 2,502,532 0.49 207,000,000 1.500% due 20/03/12................................................................ 1,414,883 0.28 1,380,000,000 1.100% due 20/09/12................................................................ 9,298,050 1.81 270,000,000 1.600% due 20/09/13................................................................ 1,860,099 0.36 245,760,000 0.800% due 10/12/15................................................................ 1,548,477 0.30 305,000,000 0.800% due 10/03/16................................................................ 1,918,462 0.37 102,600,000 1.000% due 10/06/16................................................................ 652,651 0.13 2,338,605,000 1.100% due 10/12/16................................................................ 14,913,783 2.90 164,320,000 1.200% due 10/06/17................................................................ 1,049,006 0.20 71,470,000 1.200% due 10/12/17................................................................ 455,060 0.09 580,000,000 1.500% due 20/12/17................................................................ 3,910,521 0.76 660,400,000 1.400% due 10/06/18................................................................ 4,262,440 0.83 480,000,000 2.500% due 20/09/35................................................................ 3,345,377 0.65
Resona Bank Ltd USD 1,200,000 5.850% due 29/09/49................................................................ 628,328 0.12
Sumitomo Mitsui Banking EUR 900,000 4.375% due 27/10/14................................................................ 882,363 0.17JPY 200,000,000 1.700% due 31/12/49................................................................ 1,347,377 0.26
54,810,815 10.67 Jersey, Channel Islands (0.23%) HAUS
EUR 98,079 3.400% due 10/12/37................................................................ 97,286 0.02
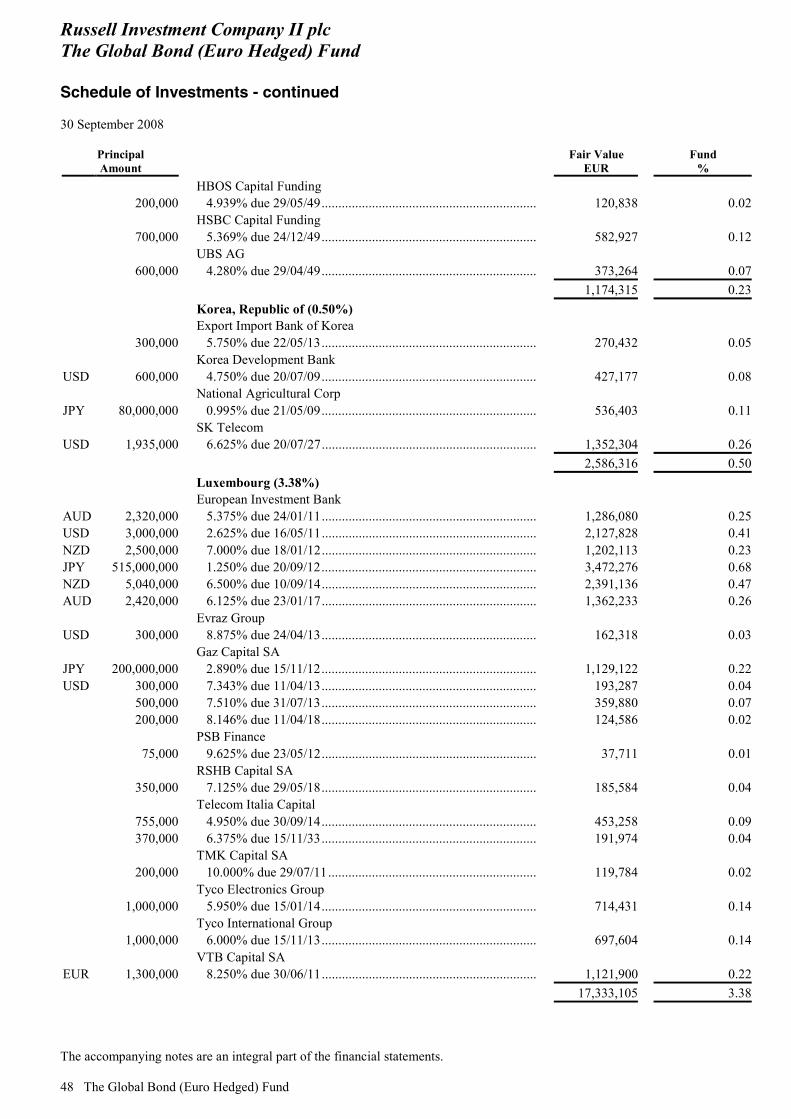
Russell Investment Company II plc The Global Bond (Euro Hedged) Fund Schedule of Investments - continued 30 September 2008
The accompanying notes are an integral part of the financial statements. 48 The Global Bond (Euro Hedged) Fund
Principal Amount
Fair Value EUR
Fund %
HBOS Capital Funding 200,000 4.939% due 29/05/49................................................................ 120,838 0.02
HSBC Capital Funding 700,000 5.369% due 24/12/49................................................................ 582,927 0.12
UBS AG 600,000 4.280% due 29/04/49................................................................ 373,264 0.07
1,174,315 0.23 Korea, Republic of (0.50%) Export Import Bank of Korea
300,000 5.750% due 22/05/13................................................................ 270,432 0.05 Korea Development Bank
USD 600,000 4.750% due 20/07/09................................................................ 427,177 0.08 National Agricultural Corp
JPY 80,000,000 0.995% due 21/05/09................................................................ 536,403 0.11 SK Telecom
USD 1,935,000 6.625% due 20/07/27................................................................ 1,352,304 0.26 2,586,316 0.50 Luxembourg (3.38%) European Investment Bank
AUD 2,320,000 5.375% due 24/01/11................................................................ 1,286,080 0.25USD 3,000,000 2.625% due 16/05/11................................................................ 2,127,828 0.41NZD 2,500,000 7.000% due 18/01/12................................................................ 1,202,113 0.23JPY 515,000,000 1.250% due 20/09/12................................................................ 3,472,276 0.68NZD 5,040,000 6.500% due 10/09/14................................................................ 2,391,136 0.47AUD 2,420,000 6.125% due 23/01/17................................................................ 1,362,233 0.26
Evraz Group USD 300,000 8.875% due 24/04/13................................................................ 162,318 0.03
Gaz Capital SA JPY 200,000,000 2.890% due 15/11/12................................................................ 1,129,122 0.22USD 300,000 7.343% due 11/04/13................................................................ 193,287 0.04 500,000 7.510% due 31/07/13................................................................ 359,880 0.07 200,000 8.146% due 11/04/18................................................................ 124,586 0.02
PSB Finance 75,000 9.625% due 23/05/12................................................................ 37,711 0.01
RSHB Capital SA 350,000 7.125% due 29/05/18................................................................ 185,584 0.04
Telecom Italia Capital 755,000 4.950% due 30/09/14................................................................ 453,258 0.09 370,000 6.375% due 15/11/33................................................................ 191,974 0.04
TMK Capital SA 200,000 10.000% due 29/07/11.............................................................. 119,784 0.02
Tyco Electronics Group 1,000,000 5.950% due 15/01/14................................................................ 714,431 0.14
Tyco International Group 1,000,000 6.000% due 15/11/13................................................................ 697,604 0.14
VTB Capital SA EUR 1,300,000 8.250% due 30/06/11................................................................ 1,121,900 0.22
17,333,105 3.38
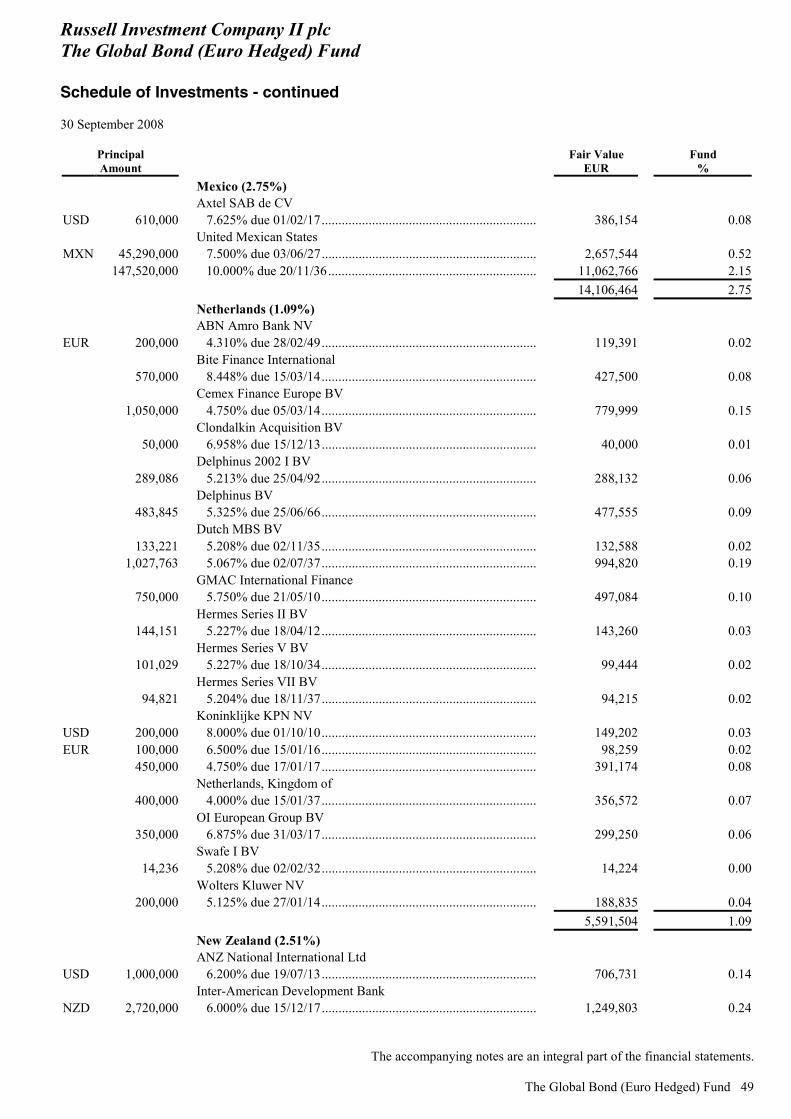
Russell Investment Company II plc The Global Bond (Euro Hedged) Fund Schedule of Investments - continued 30 September 2008
The accompanying notes are an integral part of the financial statements.
The Global Bond (Euro Hedged) Fund 49
Principal Amount
Fair Value EUR
Fund %
Mexico (2.75%) Axtel SAB de CV
USD 610,000 7.625% due 01/02/17................................................................ 386,154 0.08 United Mexican States
MXN 45,290,000 7.500% due 03/06/27................................................................ 2,657,544 0.52 147,520,000 10.000% due 20/11/36.............................................................. 11,062,766 2.15
14,106,464 2.75 Netherlands (1.09%) ABN Amro Bank NV
EUR 200,000 4.310% due 28/02/49................................................................ 119,391 0.02 Bite Finance International
570,000 8.448% due 15/03/14................................................................ 427,500 0.08 Cemex Finance Europe BV
1,050,000 4.750% due 05/03/14................................................................ 779,999 0.15 Clondalkin Acquisition BV
50,000 6.958% due 15/12/13................................................................ 40,000 0.01 Delphinus 2002 I BV
289,086 5.213% due 25/04/92................................................................ 288,132 0.06 Delphinus BV
483,845 5.325% due 25/06/66................................................................ 477,555 0.09 Dutch MBS BV
133,221 5.208% due 02/11/35................................................................ 132,588 0.02 1,027,763 5.067% due 02/07/37................................................................ 994,820 0.19
GMAC International Finance 750,000 5.750% due 21/05/10................................................................ 497,084 0.10
Hermes Series II BV 144,151 5.227% due 18/04/12................................................................ 143,260 0.03
Hermes Series V BV 101,029 5.227% due 18/10/34................................................................ 99,444 0.02
Hermes Series VII BV 94,821 5.204% due 18/11/37................................................................ 94,215 0.02
Koninklijke KPN NV USD 200,000 8.000% due 01/10/10................................................................ 149,202 0.03EUR 100,000 6.500% due 15/01/16................................................................ 98,259 0.02 450,000 4.750% due 17/01/17................................................................ 391,174 0.08
Netherlands, Kingdom of 400,000 4.000% due 15/01/37................................................................ 356,572 0.07
OI European Group BV 350,000 6.875% due 31/03/17................................................................ 299,250 0.06
Swafe I BV 14,236 5.208% due 02/02/32................................................................ 14,224 0.00
Wolters Kluwer NV 200,000 5.125% due 27/01/14................................................................ 188,835 0.04
5,591,504 1.09 New Zealand (2.51%) ANZ National International Ltd
USD 1,000,000 6.200% due 19/07/13................................................................ 706,731 0.14 Inter-American Development Bank
NZD 2,720,000 6.000% due 15/12/17................................................................ 1,249,803 0.24
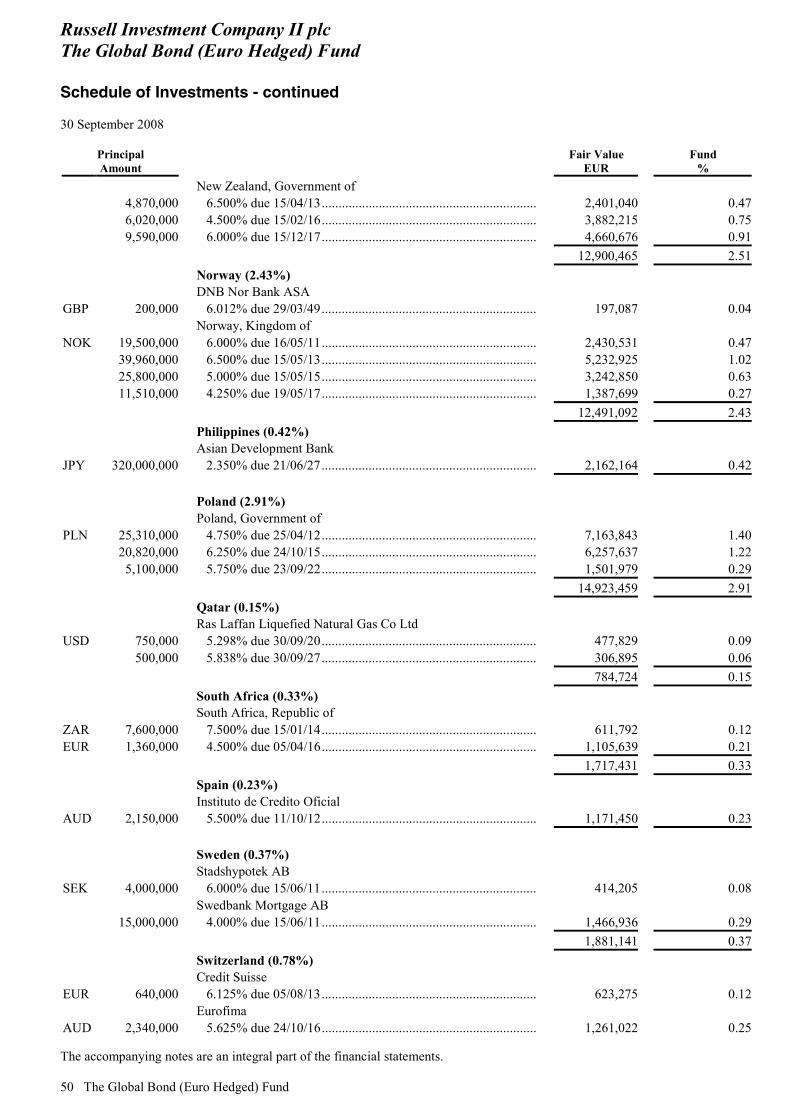
Russell Investment Company II plc The Global Bond (Euro Hedged) Fund Schedule of Investments - continued 30 September 2008
The accompanying notes are an integral part of the financial statements. 50 The Global Bond (Euro Hedged) Fund
Principal Amount
Fair Value EUR
Fund %
New Zealand, Government of 4,870,000 6.500% due 15/04/13................................................................ 2,401,040 0.47 6,020,000 4.500% due 15/02/16................................................................ 3,882,215 0.75 9,590,000 6.000% due 15/12/17................................................................ 4,660,676 0.91
12,900,465 2.51 Norway (2.43%) DNB Nor Bank ASA
GBP 200,000 6.012% due 29/03/49................................................................ 197,087 0.04 Norway, Kingdom of
NOK 19,500,000 6.000% due 16/05/11................................................................ 2,430,531 0.47 39,960,000 6.500% due 15/05/13................................................................ 5,232,925 1.02 25,800,000 5.000% due 15/05/15................................................................ 3,242,850 0.63 11,510,000 4.250% due 19/05/17................................................................ 1,387,699 0.27
12,491,092 2.43 Philippines (0.42%) Asian Development Bank
JPY 320,000,000 2.350% due 21/06/27................................................................ 2,162,164 0.42 Poland (2.91%) Poland, Government of
PLN 25,310,000 4.750% due 25/04/12................................................................ 7,163,843 1.40 20,820,000 6.250% due 24/10/15................................................................ 6,257,637 1.22 5,100,000 5.750% due 23/09/22................................................................ 1,501,979 0.29
14,923,459 2.91 Qatar (0.15%) Ras Laffan Liquefied Natural Gas Co Ltd
USD 750,000 5.298% due 30/09/20................................................................ 477,829 0.09 500,000 5.838% due 30/09/27................................................................ 306,895 0.06
784,724 0.15 South Africa (0.33%) South Africa, Republic of
ZAR 7,600,000 7.500% due 15/01/14................................................................ 611,792 0.12EUR 1,360,000 4.500% due 05/04/16................................................................ 1,105,639 0.21
1,717,431 0.33 Spain (0.23%) Instituto de Credito Oficial
AUD 2,150,000 5.500% due 11/10/12................................................................ 1,171,450 0.23 Sweden (0.37%) Stadshypotek AB
SEK 4,000,000 6.000% due 15/06/11................................................................ 414,205 0.08 Swedbank Mortgage AB
15,000,000 4.000% due 15/06/11................................................................ 1,466,936 0.29 1,881,141 0.37 Switzerland (0.78%) Credit Suisse
EUR 640,000 6.125% due 05/08/13................................................................ 623,275 0.12 Eurofima
AUD 2,340,000 5.625% due 24/10/16................................................................ 1,261,022 0.25
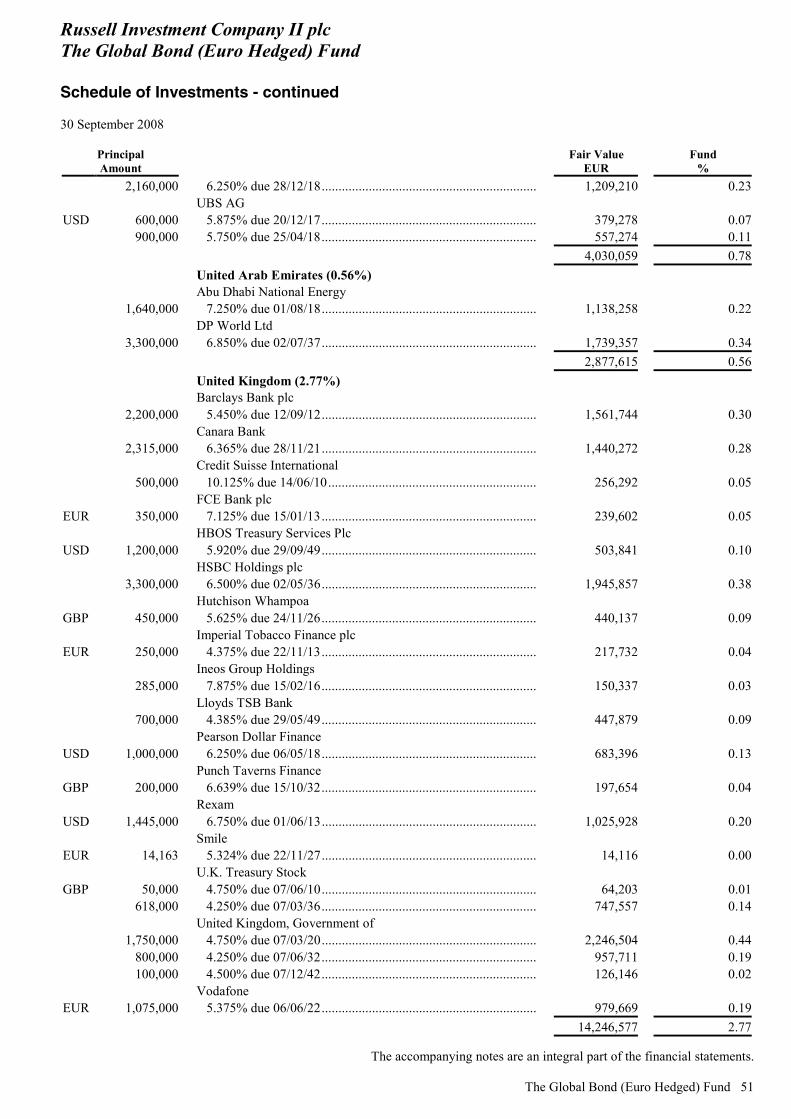
Russell Investment Company II plc The Global Bond (Euro Hedged) Fund Schedule of Investments - continued 30 September 2008
The accompanying notes are an integral part of the financial statements.
The Global Bond (Euro Hedged) Fund 51
Principal Amount
Fair Value EUR
Fund %
2,160,000 6.250% due 28/12/18................................................................ 1,209,210 0.23 UBS AG
USD 600,000 5.875% due 20/12/17................................................................ 379,278 0.07 900,000 5.750% due 25/04/18................................................................ 557,274 0.11
4,030,059 0.78 United Arab Emirates (0.56%) Abu Dhabi National Energy
1,640,000 7.250% due 01/08/18................................................................ 1,138,258 0.22 DP World Ltd
3,300,000 6.850% due 02/07/37................................................................ 1,739,357 0.34 2,877,615 0.56 United Kingdom (2.77%) Barclays Bank plc
2,200,000 5.450% due 12/09/12................................................................ 1,561,744 0.30 Canara Bank
2,315,000 6.365% due 28/11/21................................................................ 1,440,272 0.28 Credit Suisse International
500,000 10.125% due 14/06/10.............................................................. 256,292 0.05 FCE Bank plc
EUR 350,000 7.125% due 15/01/13................................................................ 239,602 0.05 HBOS Treasury Services Plc
USD 1,200,000 5.920% due 29/09/49................................................................ 503,841 0.10 HSBC Holdings plc
3,300,000 6.500% due 02/05/36................................................................ 1,945,857 0.38 Hutchison Whampoa
GBP 450,000 5.625% due 24/11/26................................................................ 440,137 0.09 Imperial Tobacco Finance plc
EUR 250,000 4.375% due 22/11/13................................................................ 217,732 0.04 Ineos Group Holdings
285,000 7.875% due 15/02/16................................................................ 150,337 0.03 Lloyds TSB Bank
700,000 4.385% due 29/05/49................................................................ 447,879 0.09 Pearson Dollar Finance
USD 1,000,000 6.250% due 06/05/18................................................................ 683,396 0.13 Punch Taverns Finance
GBP 200,000 6.639% due 15/10/32................................................................ 197,654 0.04 Rexam
USD 1,445,000 6.750% due 01/06/13................................................................ 1,025,928 0.20 Smile
EUR 14,163 5.324% due 22/11/27................................................................ 14,116 0.00 U.K. Treasury Stock
GBP 50,000 4.750% due 07/06/10................................................................ 64,203 0.01 618,000 4.250% due 07/03/36................................................................ 747,557 0.14
United Kingdom, Government of 1,750,000 4.750% due 07/03/20................................................................ 2,246,504 0.44 800,000 4.250% due 07/06/32................................................................ 957,711 0.19 100,000 4.500% due 07/12/42................................................................ 126,146 0.02
Vodafone EUR 1,075,000 5.375% due 06/06/22................................................................ 979,669 0.19
14,246,577 2.77
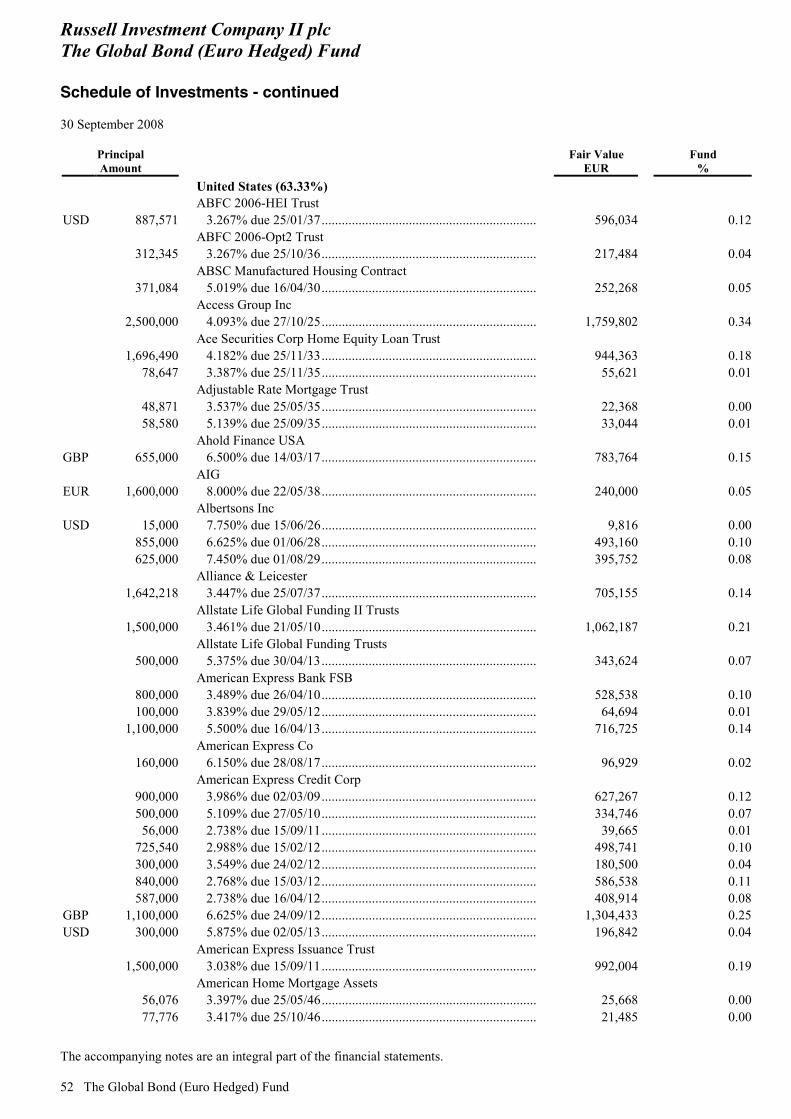
Russell Investment Company II plc The Global Bond (Euro Hedged) Fund Schedule of Investments - continued 30 September 2008
The accompanying notes are an integral part of the financial statements. 52 The Global Bond (Euro Hedged) Fund
Principal Amount
Fair Value EUR
Fund %
United States (63.33%) ABFC 2006-HEI Trust
USD 887,571 3.267% due 25/01/37................................................................ 596,034 0.12 ABFC 2006-Opt2 Trust
312,345 3.267% due 25/10/36................................................................ 217,484 0.04 ABSC Manufactured Housing Contract
371,084 5.019% due 16/04/30................................................................ 252,268 0.05 Access Group Inc
2,500,000 4.093% due 27/10/25................................................................ 1,759,802 0.34 Ace Securities Corp Home Equity Loan Trust
1,696,490 4.182% due 25/11/33................................................................ 944,363 0.18 78,647 3.387% due 25/11/35................................................................ 55,621 0.01
Adjustable Rate Mortgage Trust 48,871 3.537% due 25/05/35................................................................ 22,368 0.00 58,580 5.139% due 25/09/35................................................................ 33,044 0.01
Ahold Finance USA GBP 655,000 6.500% due 14/03/17................................................................ 783,764 0.15
AIG EUR 1,600,000 8.000% due 22/05/38................................................................ 240,000 0.05
Albertsons Inc USD 15,000 7.750% due 15/06/26................................................................ 9,816 0.00 855,000 6.625% due 01/06/28................................................................ 493,160 0.10 625,000 7.450% due 01/08/29................................................................ 395,752 0.08
Alliance & Leicester 1,642,218 3.447% due 25/07/37................................................................ 705,155 0.14
Allstate Life Global Funding II Trusts 1,500,000 3.461% due 21/05/10................................................................ 1,062,187 0.21
Allstate Life Global Funding Trusts 500,000 5.375% due 30/04/13................................................................ 343,624 0.07
American Express Bank FSB 800,000 3.489% due 26/04/10................................................................ 528,538 0.10 100,000 3.839% due 29/05/12................................................................ 64,694 0.01 1,100,000 5.500% due 16/04/13................................................................ 716,725 0.14
American Express Co 160,000 6.150% due 28/08/17................................................................ 96,929 0.02
American Express Credit Corp 900,000 3.986% due 02/03/09................................................................ 627,267 0.12 500,000 5.109% due 27/05/10................................................................ 334,746 0.07 56,000 2.738% due 15/09/11................................................................ 39,665 0.01 725,540 2.988% due 15/02/12................................................................ 498,741 0.10 300,000 3.549% due 24/02/12................................................................ 180,500 0.04 840,000 2.768% due 15/03/12................................................................ 586,538 0.11 587,000 2.738% due 16/04/12................................................................ 408,914 0.08GBP 1,100,000 6.625% due 24/09/12................................................................ 1,304,433 0.25USD 300,000 5.875% due 02/05/13................................................................ 196,842 0.04
American Express Issuance Trust 1,500,000 3.038% due 15/09/11................................................................ 992,004 0.19
American Home Mortgage Assets 56,076 3.397% due 25/05/46................................................................ 25,668 0.00 77,776 3.417% due 25/10/46................................................................ 21,485 0.00
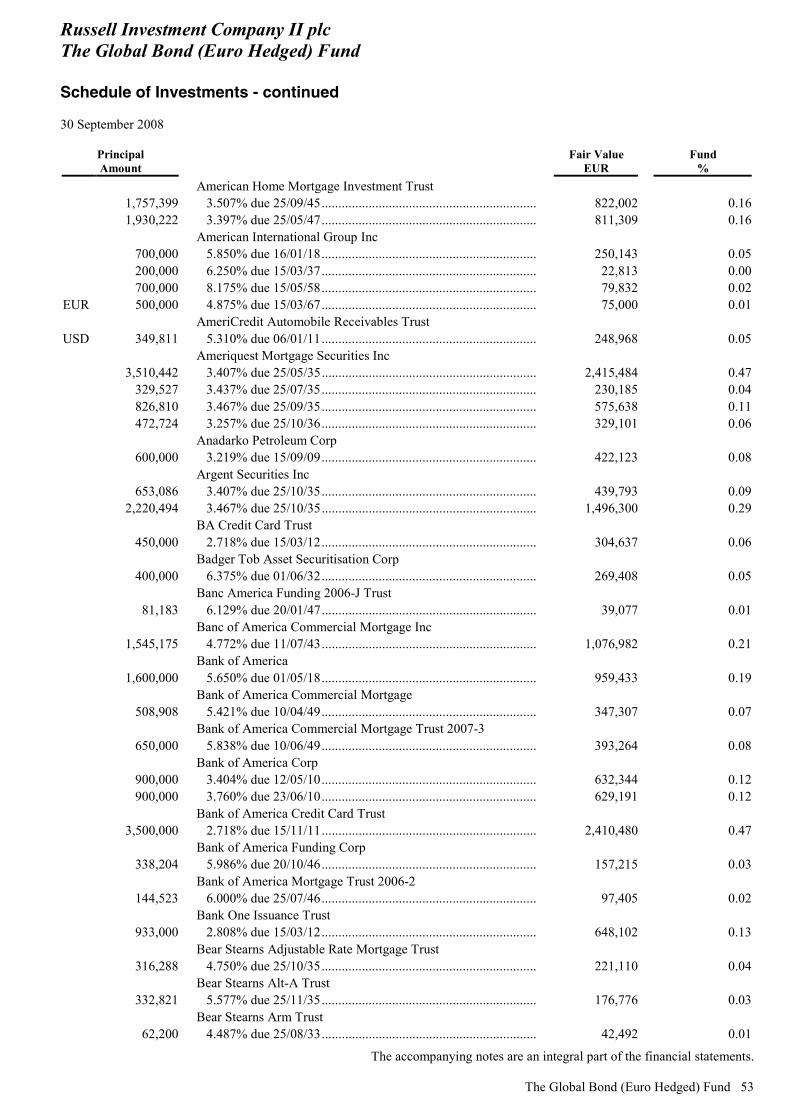
Russell Investment Company II plc The Global Bond (Euro Hedged) Fund Schedule of Investments - continued 30 September 2008
The accompanying notes are an integral part of the financial statements.
The Global Bond (Euro Hedged) Fund 53
Principal Amount
Fair Value EUR
Fund %
American Home Mortgage Investment Trust 1,757,399 3.507% due 25/09/45................................................................ 822,002 0.16 1,930,222 3.397% due 25/05/47................................................................ 811,309 0.16
American International Group Inc 700,000 5.850% due 16/01/18................................................................ 250,143 0.05 200,000 6.250% due 15/03/37................................................................ 22,813 0.00 700,000 8.175% due 15/05/58................................................................ 79,832 0.02EUR 500,000 4.875% due 15/03/67................................................................ 75,000 0.01
AmeriCredit Automobile Receivables Trust USD 349,811 5.310% due 06/01/11................................................................ 248,968 0.05
Ameriquest Mortgage Securities Inc 3,510,442 3.407% due 25/05/35................................................................ 2,415,484 0.47 329,527 3.437% due 25/07/35................................................................ 230,185 0.04 826,810 3.467% due 25/09/35................................................................ 575,638 0.11 472,724 3.257% due 25/10/36................................................................ 329,101 0.06
Anadarko Petroleum Corp 600,000 3.219% due 15/09/09................................................................ 422,123 0.08
Argent Securities Inc 653,086 3.407% due 25/10/35................................................................ 439,793 0.09 2,220,494 3.467% due 25/10/35................................................................ 1,496,300 0.29
BA Credit Card Trust 450,000 2.718% due 15/03/12................................................................ 304,637 0.06
Badger Tob Asset Securitisation Corp 400,000 6.375% due 01/06/32................................................................ 269,408 0.05
Banc America Funding 2006-J Trust 81,183 6.129% due 20/01/47................................................................ 39,077 0.01
Banc of America Commercial Mortgage Inc 1,545,175 4.772% due 11/07/43................................................................ 1,076,982 0.21
Bank of America 1,600,000 5.650% due 01/05/18................................................................ 959,433 0.19
Bank of America Commercial Mortgage 508,908 5.421% due 10/04/49................................................................ 347,307 0.07
Bank of America Commercial Mortgage Trust 2007-3 650,000 5.838% due 10/06/49................................................................ 393,264 0.08
Bank of America Corp 900,000 3.404% due 12/05/10................................................................ 632,344 0.12 900,000 3.760% due 23/06/10................................................................ 629,191 0.12
Bank of America Credit Card Trust 3,500,000 2.718% due 15/11/11................................................................ 2,410,480 0.47
Bank of America Funding Corp 338,204 5.986% due 20/10/46................................................................ 157,215 0.03
Bank of America Mortgage Trust 2006-2 144,523 6.000% due 25/07/46................................................................ 97,405 0.02
Bank One Issuance Trust 933,000 2.808% due 15/03/12................................................................ 648,102 0.13
Bear Stearns Adjustable Rate Mortgage Trust 316,288 4.750% due 25/10/35................................................................ 221,110 0.04
Bear Stearns Alt-A Trust 332,821 5.577% due 25/11/35................................................................ 176,776 0.03
Bear Stearns Arm Trust 62,200 4.487% due 25/08/33................................................................ 42,492 0.01
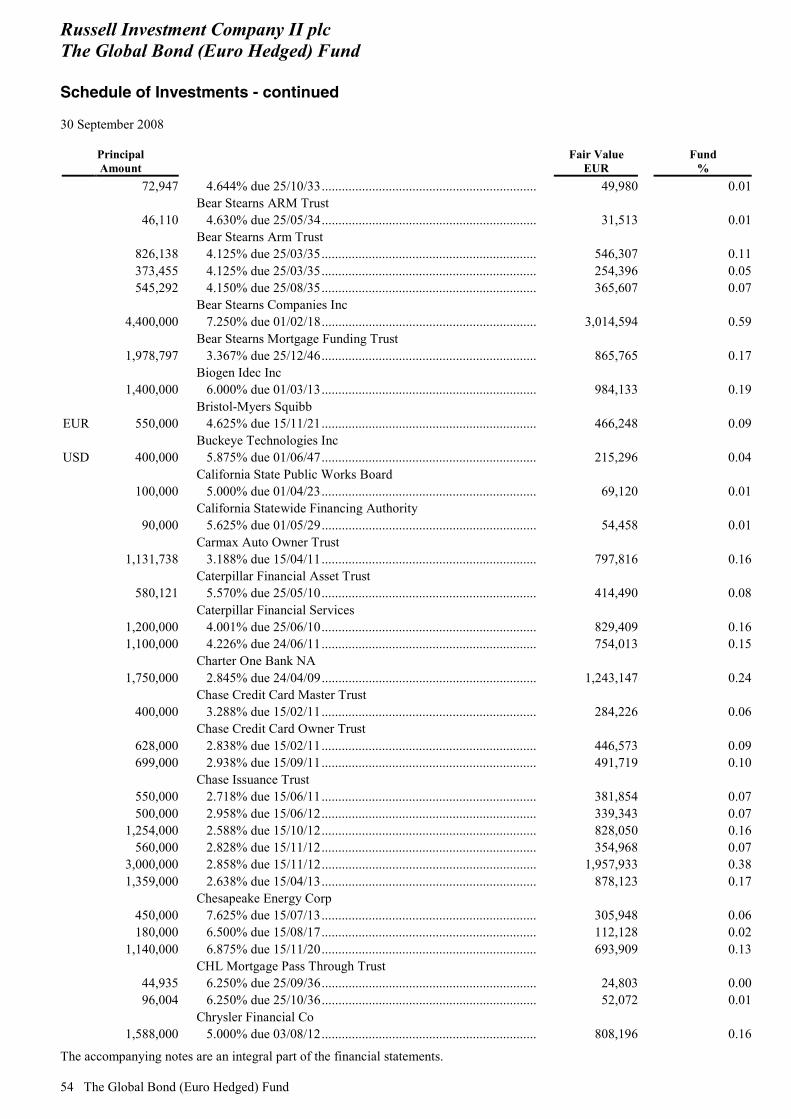
Russell Investment Company II plc The Global Bond (Euro Hedged) Fund Schedule of Investments - continued 30 September 2008
The accompanying notes are an integral part of the financial statements. 54 The Global Bond (Euro Hedged) Fund
Principal Amount
Fair Value EUR
Fund %
72,947 4.644% due 25/10/33................................................................ 49,980 0.01 Bear Stearns ARM Trust
46,110 4.630% due 25/05/34................................................................ 31,513 0.01 Bear Stearns Arm Trust
826,138 4.125% due 25/03/35................................................................ 546,307 0.11 373,455 4.125% due 25/03/35................................................................ 254,396 0.05 545,292 4.150% due 25/08/35................................................................ 365,607 0.07
Bear Stearns Companies Inc 4,400,000 7.250% due 01/02/18................................................................ 3,014,594 0.59
Bear Stearns Mortgage Funding Trust 1,978,797 3.367% due 25/12/46................................................................ 865,765 0.17
Biogen Idec Inc 1,400,000 6.000% due 01/03/13................................................................ 984,133 0.19
Bristol-Myers Squibb EUR 550,000 4.625% due 15/11/21................................................................ 466,248 0.09
Buckeye Technologies Inc USD 400,000 5.875% due 01/06/47................................................................ 215,296 0.04
California State Public Works Board 100,000 5.000% due 01/04/23................................................................ 69,120 0.01
California Statewide Financing Authority 90,000 5.625% due 01/05/29................................................................ 54,458 0.01
Carmax Auto Owner Trust 1,131,738 3.188% due 15/04/11................................................................ 797,816 0.16
Caterpillar Financial Asset Trust 580,121 5.570% due 25/05/10................................................................ 414,490 0.08
Caterpillar Financial Services 1,200,000 4.001% due 25/06/10................................................................ 829,409 0.16 1,100,000 4.226% due 24/06/11................................................................ 754,013 0.15
Charter One Bank NA 1,750,000 2.845% due 24/04/09................................................................ 1,243,147 0.24
Chase Credit Card Master Trust 400,000 3.288% due 15/02/11................................................................ 284,226 0.06
Chase Credit Card Owner Trust 628,000 2.838% due 15/02/11................................................................ 446,573 0.09 699,000 2.938% due 15/09/11................................................................ 491,719 0.10
Chase Issuance Trust 550,000 2.718% due 15/06/11................................................................ 381,854 0.07 500,000 2.958% due 15/06/12................................................................ 339,343 0.07 1,254,000 2.588% due 15/10/12................................................................ 828,050 0.16 560,000 2.828% due 15/11/12................................................................ 354,968 0.07 3,000,000 2.858% due 15/11/12................................................................ 1,957,933 0.38 1,359,000 2.638% due 15/04/13................................................................ 878,123 0.17
Chesapeake Energy Corp 450,000 7.625% due 15/07/13................................................................ 305,948 0.06 180,000 6.500% due 15/08/17................................................................ 112,128 0.02 1,140,000 6.875% due 15/11/20................................................................ 693,909 0.13
CHL Mortgage Pass Through Trust 44,935 6.250% due 25/09/36................................................................ 24,803 0.00 96,004 6.250% due 25/10/36................................................................ 52,072 0.01
Chrysler Financial Co 1,588,000 5.000% due 03/08/12................................................................ 808,196 0.16

Russell Investment Company II plc The Global Bond (Euro Hedged) Fund Schedule of Investments - continued 30 September 2008
The accompanying notes are an integral part of the financial statements.
The Global Bond (Euro Hedged) Fund 55
Principal Amount
Fair Value EUR
Fund %
CIT Equipment Collateral Trust 770,562 5.070% due 20/02/10................................................................ 549,095 0.11
CIT Group EUR 300,000 4.250% due 22/09/11................................................................ 169,107 0.03 150,000 3.800% due 14/11/12................................................................ 82,299 0.02GBP 1,200,000 5.500% due 01/12/14................................................................ 857,141 0.17EUR 150,000 4.250% due 17/03/15................................................................ 79,368 0.02 150,000 4.650% due 19/09/16................................................................ 78,035 0.02GBP 550,000 5.500% due 20/12/16................................................................ 381,701 0.07
Citibank Credit Card Issuance Trust EUR 1,000,000 5.375% due 11/04/11................................................................ 969,001 0.19USD 2,800,000 2.707% due 09/01/12................................................................ 1,867,774 0.36
Citicorp Mortgage Securities Trust 93,458 6.000% due 25/06/36................................................................ 60,982 0.01
Citigroup Commercial Mortgage Trust 300,000 5.889% due 10/12/49................................................................ 182,051 0.04
Citigroup Funding 1,400,000 3.852% due 07/05/10................................................................ 939,856 0.18
Citigroup Inc 3,200,000 5.500% due 11/04/13................................................................ 1,988,506 0.39 3,030,000 5.000% due 15/09/14................................................................ 1,653,890 0.32 1,000,000 6.125% due 15/05/18................................................................ 589,473 0.11
Citigroup Mortgage Loan Trust 163,339 4.663% due 25/03/34................................................................ 110,375 0.02 352,809 4.248% due 25/08/35................................................................ 239,225 0.05 290,912 4.748% due 25/08/35................................................................ 196,798 0.04 711,542 3.247% due 25/09/36................................................................ 499,185 0.10 90,372 6.014% due 25/09/37................................................................ 44,863 0.01
Citizens Communications Co 250,000 6.250% due 15/01/13................................................................ 166,634 0.03USD 365,000 6.625% due 15/03/15................................................................ 215,676 0.04 695,000 7.125% due 15/03/19................................................................ 393,354 0.08 80,000 9.000% due 15/08/31................................................................ 43,570 0.01
City of San Antonio TX 800,000 4.500% due 15/05/32................................................................ 468,097 0.09
CMS Energy Corp 800,000 3.741% due 15/01/13................................................................ 501,192 0.10
CNH Equipment Trust 335,636 5.200% due 15/06/10................................................................ 239,581 0.05
Comcast Cable Communications 255,000 6.750% due 30/01/11................................................................ 184,135 0.04
Comcast Corp 500,000 5.300% due 15/01/14................................................................ 326,263 0.06 800,000 5.875% due 15/02/18................................................................ 507,817 0.10
Community Health Systems Inc 600,000 8.875% due 15/07/15................................................................ 405,795 0.08
Consolidated Edison of New York 400,000 5.850% due 01/04/18................................................................ 270,356 0.05
Corning Inc 1,710,000 7.250% due 15/08/36................................................................ 1,079,174 0.21
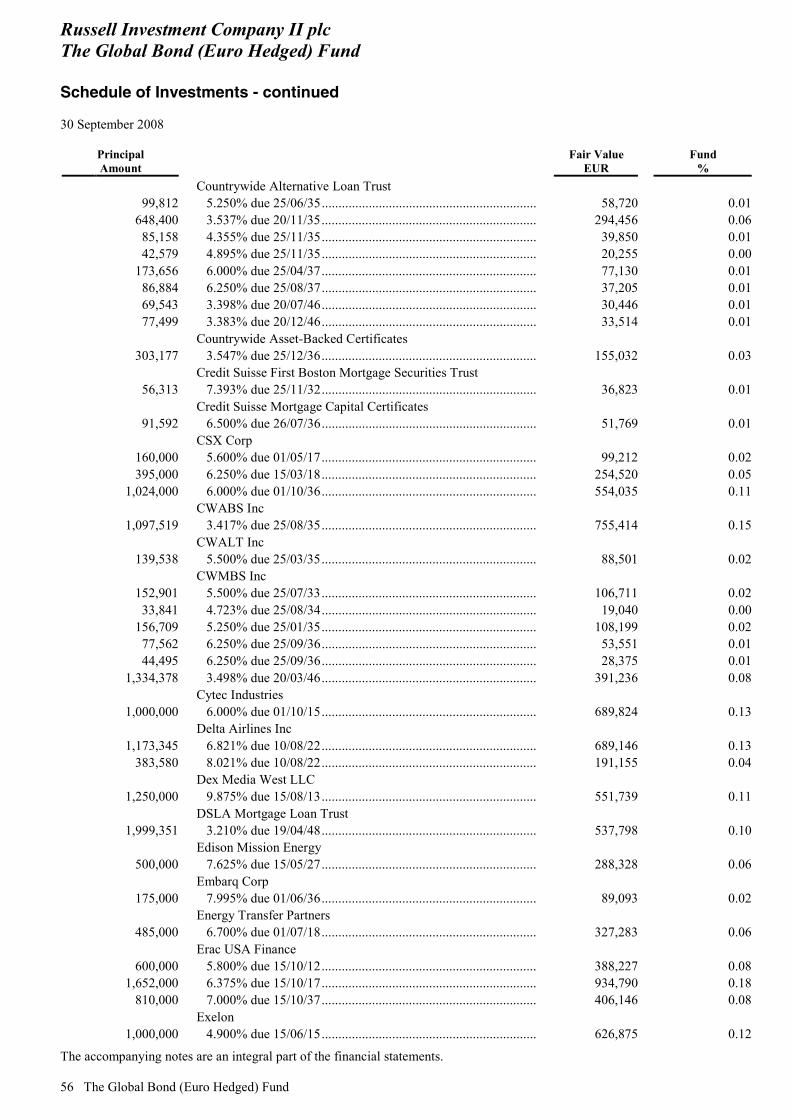
Russell Investment Company II plc The Global Bond (Euro Hedged) Fund Schedule of Investments - continued 30 September 2008
The accompanying notes are an integral part of the financial statements. 56 The Global Bond (Euro Hedged) Fund
Principal Amount
Fair Value EUR
Fund %
Countrywide Alternative Loan Trust 99,812 5.250% due 25/06/35................................................................ 58,720 0.01 648,400 3.537% due 20/11/35................................................................ 294,456 0.06 85,158 4.355% due 25/11/35................................................................ 39,850 0.01 42,579 4.895% due 25/11/35................................................................ 20,255 0.00 173,656 6.000% due 25/04/37................................................................ 77,130 0.01 86,884 6.250% due 25/08/37................................................................ 37,205 0.01 69,543 3.398% due 20/07/46................................................................ 30,446 0.01 77,499 3.383% due 20/12/46................................................................ 33,514 0.01
Countrywide Asset-Backed Certificates 303,177 3.547% due 25/12/36................................................................ 155,032 0.03
Credit Suisse First Boston Mortgage Securities Trust 56,313 7.393% due 25/11/32................................................................ 36,823 0.01
Credit Suisse Mortgage Capital Certificates 91,592 6.500% due 26/07/36................................................................ 51,769 0.01
CSX Corp 160,000 5.600% due 01/05/17................................................................ 99,212 0.02 395,000 6.250% due 15/03/18................................................................ 254,520 0.05 1,024,000 6.000% due 01/10/36................................................................ 554,035 0.11
CWABS Inc 1,097,519 3.417% due 25/08/35................................................................ 755,414 0.15
CWALT Inc 139,538 5.500% due 25/03/35................................................................ 88,501 0.02
CWMBS Inc 152,901 5.500% due 25/07/33................................................................ 106,711 0.02 33,841 4.723% due 25/08/34................................................................ 19,040 0.00 156,709 5.250% due 25/01/35................................................................ 108,199 0.02 77,562 6.250% due 25/09/36................................................................ 53,551 0.01 44,495 6.250% due 25/09/36................................................................ 28,375 0.01 1,334,378 3.498% due 20/03/46................................................................ 391,236 0.08
Cytec Industries 1,000,000 6.000% due 01/10/15................................................................ 689,824 0.13
Delta Airlines Inc 1,173,345 6.821% due 10/08/22................................................................ 689,146 0.13 383,580 8.021% due 10/08/22................................................................ 191,155 0.04
Dex Media West LLC 1,250,000 9.875% due 15/08/13................................................................ 551,739 0.11
DSLA Mortgage Loan Trust 1,999,351 3.210% due 19/04/48................................................................ 537,798 0.10
Edison Mission Energy 500,000 7.625% due 15/05/27................................................................ 288,328 0.06
Embarq Corp 175,000 7.995% due 01/06/36................................................................ 89,093 0.02
Energy Transfer Partners 485,000 6.700% due 01/07/18................................................................ 327,283 0.06
Erac USA Finance 600,000 5.800% due 15/10/12................................................................ 388,227 0.08 1,652,000 6.375% due 15/10/17................................................................ 934,790 0.18 810,000 7.000% due 15/10/37................................................................ 406,146 0.08
Exelon 1,000,000 4.900% due 15/06/15................................................................ 626,875 0.12
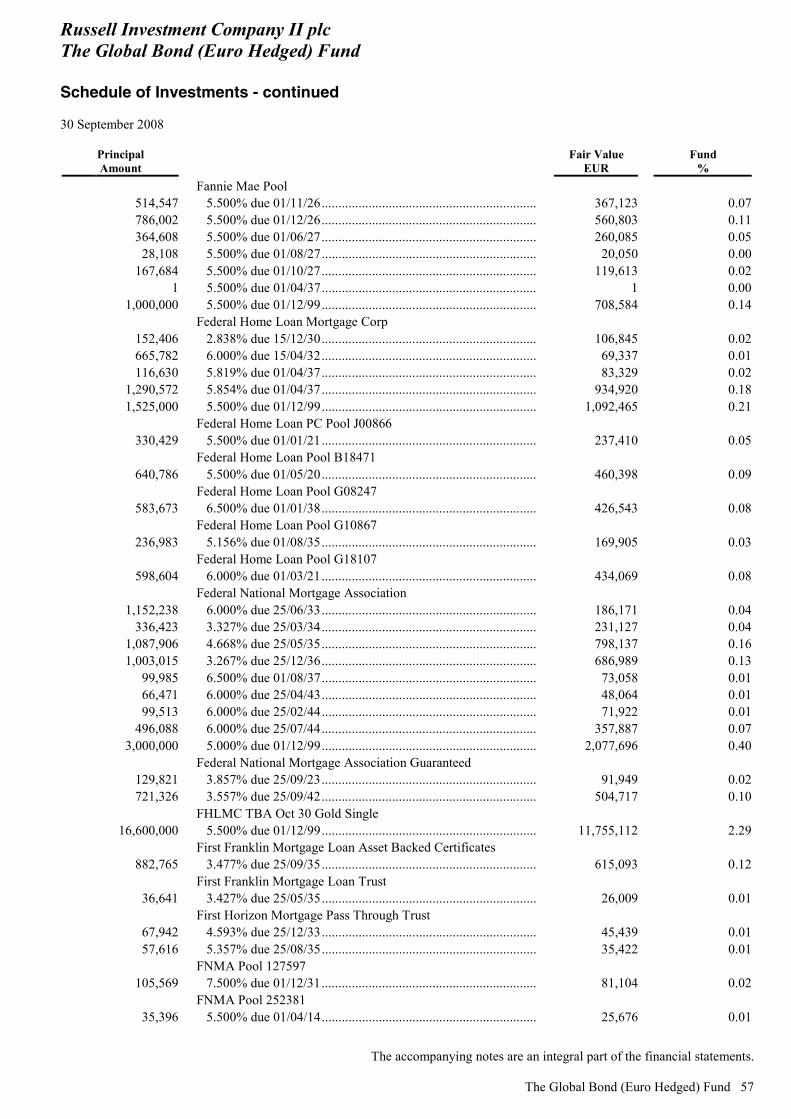
Russell Investment Company II plc The Global Bond (Euro Hedged) Fund Schedule of Investments - continued 30 September 2008
The accompanying notes are an integral part of the financial statements.
The Global Bond (Euro Hedged) Fund 57
Principal Amount
Fair Value EUR
Fund %
Fannie Mae Pool 514,547 5.500% due 01/11/26................................................................ 367,123 0.07 786,002 5.500% due 01/12/26................................................................ 560,803 0.11 364,608 5.500% due 01/06/27................................................................ 260,085 0.05 28,108 5.500% due 01/08/27................................................................ 20,050 0.00 167,684 5.500% due 01/10/27................................................................ 119,613 0.02 1 5.500% due 01/04/37................................................................ 1 0.00 1,000,000 5.500% due 01/12/99................................................................ 708,584 0.14
Federal Home Loan Mortgage Corp 152,406 2.838% due 15/12/30................................................................ 106,845 0.02 665,782 6.000% due 15/04/32................................................................ 69,337 0.01 116,630 5.819% due 01/04/37................................................................ 83,329 0.02 1,290,572 5.854% due 01/04/37................................................................ 934,920 0.18 1,525,000 5.500% due 01/12/99................................................................ 1,092,465 0.21
Federal Home Loan PC Pool J00866 330,429 5.500% due 01/01/21................................................................ 237,410 0.05
Federal Home Loan Pool B18471 640,786 5.500% due 01/05/20................................................................ 460,398 0.09
Federal Home Loan Pool G08247 583,673 6.500% due 01/01/38................................................................ 426,543 0.08
Federal Home Loan Pool G10867 236,983 5.156% due 01/08/35................................................................ 169,905 0.03
Federal Home Loan Pool G18107 598,604 6.000% due 01/03/21................................................................ 434,069 0.08
Federal National Mortgage Association 1,152,238 6.000% due 25/06/33................................................................ 186,171 0.04 336,423 3.327% due 25/03/34................................................................ 231,127 0.04 1,087,906 4.668% due 25/05/35................................................................ 798,137 0.16 1,003,015 3.267% due 25/12/36................................................................ 686,989 0.13 99,985 6.500% due 01/08/37................................................................ 73,058 0.01 66,471 6.000% due 25/04/43................................................................ 48,064 0.01 99,513 6.000% due 25/02/44................................................................ 71,922 0.01 496,088 6.000% due 25/07/44................................................................ 357,887 0.07 3,000,000 5.000% due 01/12/99................................................................ 2,077,696 0.40
Federal National Mortgage Association Guaranteed 129,821 3.857% due 25/09/23................................................................ 91,949 0.02 721,326 3.557% due 25/09/42................................................................ 504,717 0.10
FHLMC TBA Oct 30 Gold Single 16,600,000 5.500% due 01/12/99................................................................ 11,755,112 2.29
First Franklin Mortgage Loan Asset Backed Certificates 882,765 3.477% due 25/09/35................................................................ 615,093 0.12
First Franklin Mortgage Loan Trust 36,641 3.427% due 25/05/35................................................................ 26,009 0.01
First Horizon Mortgage Pass Through Trust 67,942 4.593% due 25/12/33................................................................ 45,439 0.01 57,616 5.357% due 25/08/35................................................................ 35,422 0.01
FNMA Pool 127597 105,569 7.500% due 01/12/31................................................................ 81,104 0.02
FNMA Pool 252381 35,396 5.500% due 01/04/14................................................................ 25,676 0.01
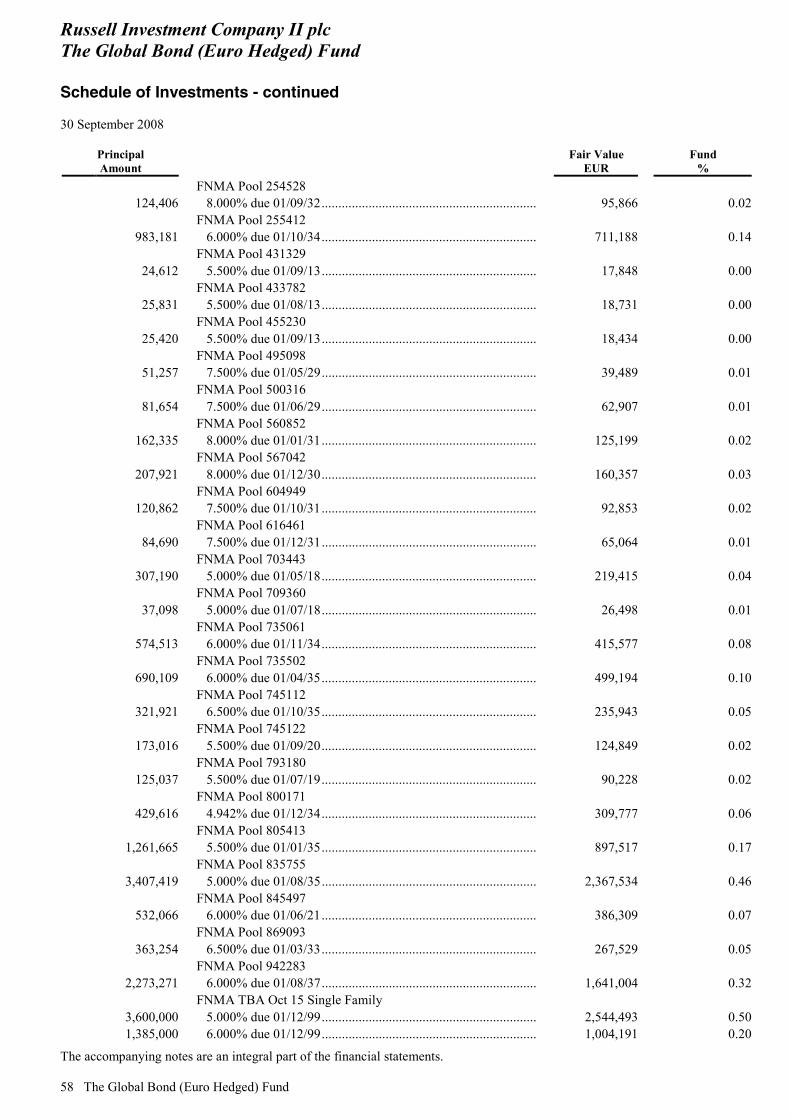
Russell Investment Company II plc The Global Bond (Euro Hedged) Fund Schedule of Investments - continued 30 September 2008
The accompanying notes are an integral part of the financial statements. 58 The Global Bond (Euro Hedged) Fund
Principal Amount
Fair Value EUR
Fund %
FNMA Pool 254528 124,406 8.000% due 01/09/32................................................................ 95,866 0.02
FNMA Pool 255412 983,181 6.000% due 01/10/34................................................................ 711,188 0.14
FNMA Pool 431329 24,612 5.500% due 01/09/13................................................................ 17,848 0.00
FNMA Pool 433782 25,831 5.500% due 01/08/13................................................................ 18,731 0.00
FNMA Pool 455230 25,420 5.500% due 01/09/13................................................................ 18,434 0.00
FNMA Pool 495098 51,257 7.500% due 01/05/29................................................................ 39,489 0.01
FNMA Pool 500316 81,654 7.500% due 01/06/29................................................................ 62,907 0.01
FNMA Pool 560852 162,335 8.000% due 01/01/31................................................................ 125,199 0.02
FNMA Pool 567042 207,921 8.000% due 01/12/30................................................................ 160,357 0.03
FNMA Pool 604949 120,862 7.500% due 01/10/31................................................................ 92,853 0.02
FNMA Pool 616461 84,690 7.500% due 01/12/31................................................................ 65,064 0.01
FNMA Pool 703443 307,190 5.000% due 01/05/18................................................................ 219,415 0.04
FNMA Pool 709360 37,098 5.000% due 01/07/18................................................................ 26,498 0.01
FNMA Pool 735061 574,513 6.000% due 01/11/34................................................................ 415,577 0.08
FNMA Pool 735502 690,109 6.000% due 01/04/35................................................................ 499,194 0.10
FNMA Pool 745112 321,921 6.500% due 01/10/35................................................................ 235,943 0.05
FNMA Pool 745122 173,016 5.500% due 01/09/20................................................................ 124,849 0.02
FNMA Pool 793180 125,037 5.500% due 01/07/19................................................................ 90,228 0.02
FNMA Pool 800171 429,616 4.942% due 01/12/34................................................................ 309,777 0.06
FNMA Pool 805413 1,261,665 5.500% due 01/01/35................................................................ 897,517 0.17
FNMA Pool 835755 3,407,419 5.000% due 01/08/35................................................................ 2,367,534 0.46
FNMA Pool 845497 532,066 6.000% due 01/06/21................................................................ 386,309 0.07
FNMA Pool 869093 363,254 6.500% due 01/03/33................................................................ 267,529 0.05
FNMA Pool 942283 2,273,271 6.000% due 01/08/37................................................................ 1,641,004 0.32
FNMA TBA Oct 15 Single Family 3,600,000 5.000% due 01/12/99................................................................ 2,544,493 0.50 1,385,000 6.000% due 01/12/99................................................................ 1,004,191 0.20

Russell Investment Company II plc The Global Bond (Euro Hedged) Fund Schedule of Investments - continued 30 September 2008
The accompanying notes are an integral part of the financial statements.
The Global Bond (Euro Hedged) Fund 59
Principal Amount
Fair Value EUR
Fund %
USD 20,000,000 6.500% due 01/12/99................................................................ 14,598,823 2.84 FNMA TBA Oct 30 Single Family
9,000,000 5.000% due 01/12/99................................................................ 6,243,102 1.22 35,165,000 5.500% due 01/12/99................................................................ 24,964,304 4.86 37,250,000 6.000% due 01/12/99................................................................ 26,858,819 5.23
FNMA, Pool 735228 2,038,273 5.500% due 01/02/35................................................................ 1,449,976 0.28
FNMA, Pool 745093 4,594,888 5.500% due 01/12/35................................................................ 3,266,644 0.64
FNMA, Pool 745418 1,940,579 5.500% due 01/04/36................................................................ 1,379,616 0.27
FNMA, Pool 823358 1,004,991 6.061% due 01/02/35................................................................ 719,493 0.14
FNMA, Pool 841068 1,255,060 1.000% due 01/11/34................................................................ 900,435 0.18
FNMA, Pool 928381 1,432,941 5.500% due 01/06/37................................................................ 1,018,185 0.20
Ford Credit Auto Owner Trust 1,000,000 3.388% due 15/01/11................................................................ 704,353 0.14 800,000 3.908% due 15/06/12................................................................ 554,769 0.11
Ford Motor Co 985,000 1.000% due 29/11/13................................................................ 485,506 0.09
FPL Group Capital 400,000 3.696% due 17/06/11................................................................ 289,874 0.06
Freddie Mac Gold Pool 748,229 4.500% due 01/02/18................................................................ 525,284 0.10
Freddie Mac REMICS 1,025,844 4.500% due 15/02/17................................................................ 732,596 0.14
GE Capital Commercial Mortgage Corp 2,165,722 4.229% due 10/12/37................................................................ 1,506,516 0.29
GE Capital Credit Card Master Note Trust 504,000 2.788% due 15/06/13................................................................ 329,702 0.06
General Electric Capital 250,000 6.750% due 15/03/32................................................................ 148,558 0.03
General Electric Capital Corp JPY 87,000,000 1.450% due 10/11/11................................................................ 524,131 0.10 149,100,000 1.000% due 21/03/12................................................................ 906,549 0.18USD 1,300,000 5.875% due 14/01/38................................................................ 682,323 0.13
General Mills 1,900,000 2.921% due 22/01/10................................................................ 1,334,075 0.26
General Motors Acceptance Corp 500,000 6.875% due 15/09/11................................................................ 158,825 0.03
Georgia Pacific Corp 1,540,000 7.125% due 15/01/17................................................................ 978,500 0.19
GNMA I TBA Oct 30 Single Family 26,500,000 6.000% due 01/12/99................................................................ 19,143,009 3.73
GNMA I Pool TBA OCT 30 Single Family 5,000,000 6.500% due 01/12/99................................................................ 3,643,035 0.71
GNMA II Pool 003556 160,641 5.500% due 20/05/34................................................................ 114,264 0.02
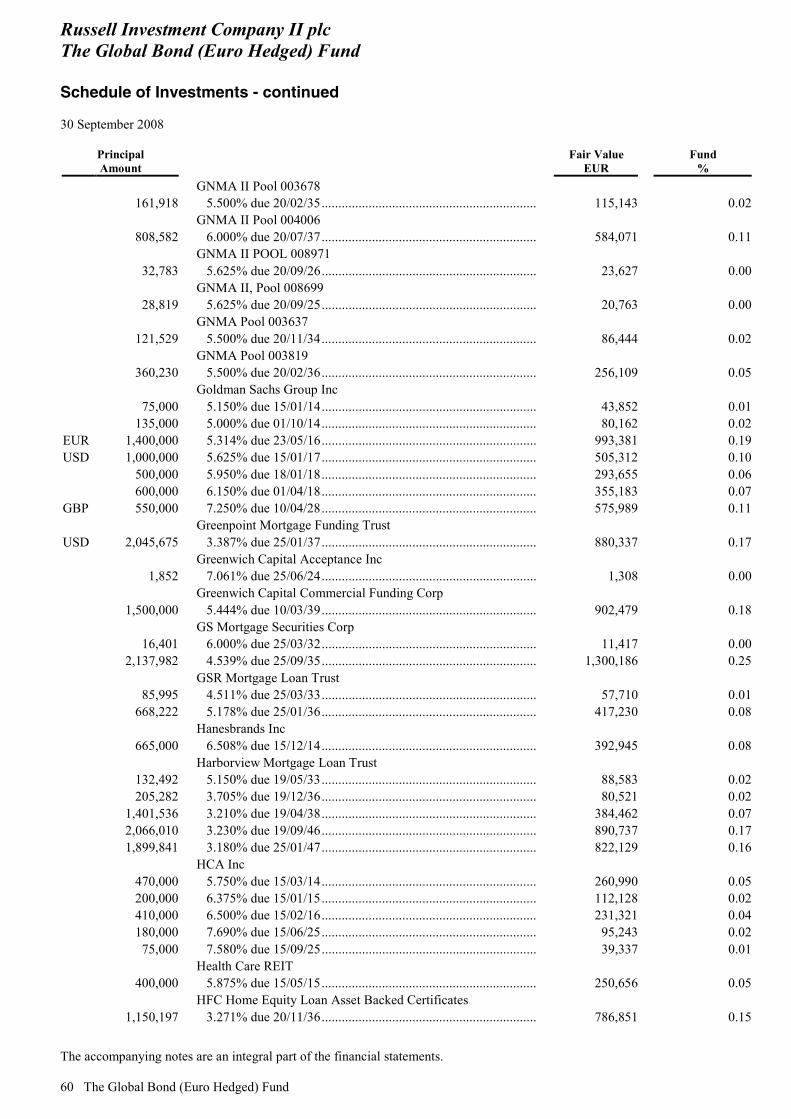
Russell Investment Company II plc The Global Bond (Euro Hedged) Fund Schedule of Investments - continued 30 September 2008
The accompanying notes are an integral part of the financial statements. 60 The Global Bond (Euro Hedged) Fund
Principal Amount
Fair Value EUR
Fund %
GNMA II Pool 003678 161,918 5.500% due 20/02/35................................................................ 115,143 0.02
GNMA II Pool 004006 808,582 6.000% due 20/07/37................................................................ 584,071 0.11
GNMA II POOL 008971 32,783 5.625% due 20/09/26................................................................ 23,627 0.00
GNMA II, Pool 008699 28,819 5.625% due 20/09/25................................................................ 20,763 0.00
GNMA Pool 003637 121,529 5.500% due 20/11/34................................................................ 86,444 0.02
GNMA Pool 003819 360,230 5.500% due 20/02/36................................................................ 256,109 0.05
Goldman Sachs Group Inc 75,000 5.150% due 15/01/14................................................................ 43,852 0.01 135,000 5.000% due 01/10/14................................................................ 80,162 0.02EUR 1,400,000 5.314% due 23/05/16................................................................ 993,381 0.19USD 1,000,000 5.625% due 15/01/17................................................................ 505,312 0.10 500,000 5.950% due 18/01/18................................................................ 293,655 0.06 600,000 6.150% due 01/04/18................................................................ 355,183 0.07GBP 550,000 7.250% due 10/04/28................................................................ 575,989 0.11
Greenpoint Mortgage Funding Trust USD 2,045,675 3.387% due 25/01/37................................................................ 880,337 0.17
Greenwich Capital Acceptance Inc 1,852 7.061% due 25/06/24................................................................ 1,308 0.00
Greenwich Capital Commercial Funding Corp 1,500,000 5.444% due 10/03/39................................................................ 902,479 0.18
GS Mortgage Securities Corp 16,401 6.000% due 25/03/32................................................................ 11,417 0.00 2,137,982 4.539% due 25/09/35................................................................ 1,300,186 0.25
GSR Mortgage Loan Trust 85,995 4.511% due 25/03/33................................................................ 57,710 0.01 668,222 5.178% due 25/01/36................................................................ 417,230 0.08
Hanesbrands Inc 665,000 6.508% due 15/12/14................................................................ 392,945 0.08
Harborview Mortgage Loan Trust 132,492 5.150% due 19/05/33................................................................ 88,583 0.02 205,282 3.705% due 19/12/36................................................................ 80,521 0.02 1,401,536 3.210% due 19/04/38................................................................ 384,462 0.07 2,066,010 3.230% due 19/09/46................................................................ 890,737 0.17 1,899,841 3.180% due 25/01/47................................................................ 822,129 0.16
HCA Inc 470,000 5.750% due 15/03/14................................................................ 260,990 0.05 200,000 6.375% due 15/01/15................................................................ 112,128 0.02 410,000 6.500% due 15/02/16................................................................ 231,321 0.04 180,000 7.690% due 15/06/25................................................................ 95,243 0.02 75,000 7.580% due 15/09/25................................................................ 39,337 0.01
Health Care REIT 400,000 5.875% due 15/05/15................................................................ 250,656 0.05
HFC Home Equity Loan Asset Backed Certificates 1,150,197 3.271% due 20/11/36................................................................ 786,851 0.15
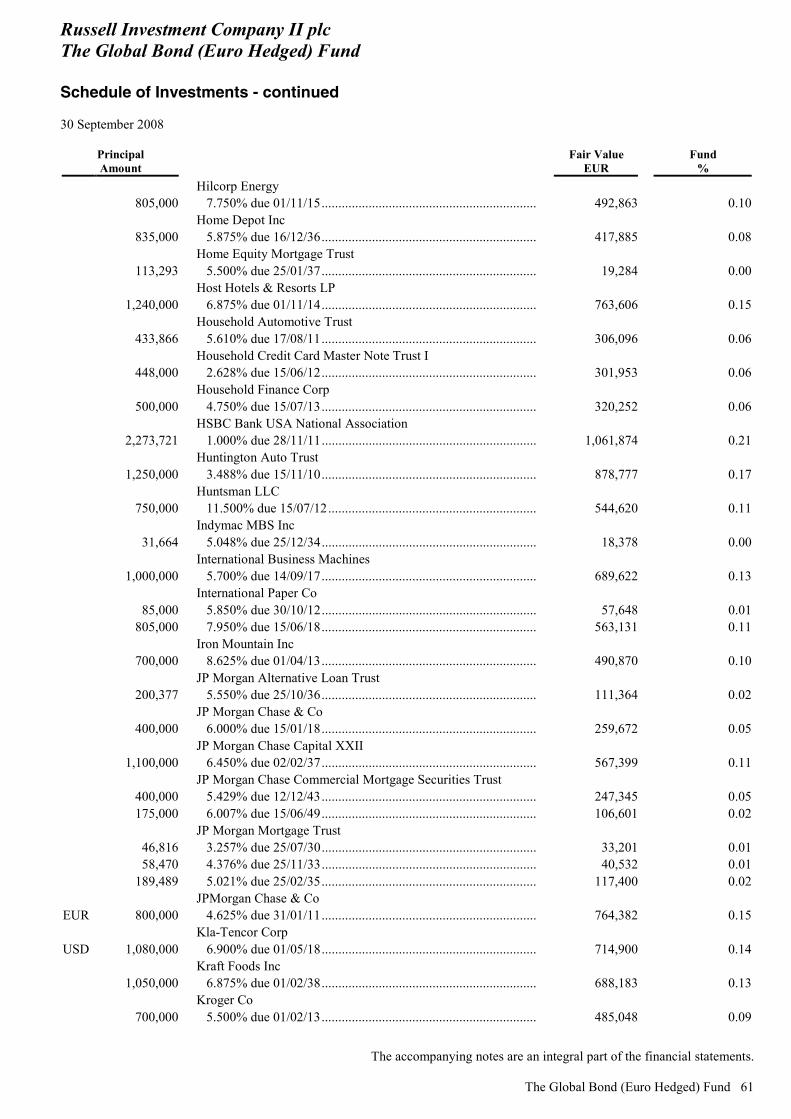
Russell Investment Company II plc The Global Bond (Euro Hedged) Fund Schedule of Investments - continued 30 September 2008
The accompanying notes are an integral part of the financial statements.
The Global Bond (Euro Hedged) Fund 61
Principal Amount
Fair Value EUR
Fund %
Hilcorp Energy 805,000 7.750% due 01/11/15................................................................ 492,863 0.10
Home Depot Inc 835,000 5.875% due 16/12/36................................................................ 417,885 0.08
Home Equity Mortgage Trust 113,293 5.500% due 25/01/37................................................................ 19,284 0.00
Host Hotels & Resorts LP 1,240,000 6.875% due 01/11/14................................................................ 763,606 0.15
Household Automotive Trust 433,866 5.610% due 17/08/11................................................................ 306,096 0.06
Household Credit Card Master Note Trust I 448,000 2.628% due 15/06/12................................................................ 301,953 0.06
Household Finance Corp 500,000 4.750% due 15/07/13................................................................ 320,252 0.06
HSBC Bank USA National Association 2,273,721 1.000% due 28/11/11................................................................ 1,061,874 0.21
Huntington Auto Trust 1,250,000 3.488% due 15/11/10................................................................ 878,777 0.17
Huntsman LLC 750,000 11.500% due 15/07/12.............................................................. 544,620 0.11
Indymac MBS Inc 31,664 5.048% due 25/12/34................................................................ 18,378 0.00
International Business Machines 1,000,000 5.700% due 14/09/17................................................................ 689,622 0.13
International Paper Co 85,000 5.850% due 30/10/12................................................................ 57,648 0.01 805,000 7.950% due 15/06/18................................................................ 563,131 0.11
Iron Mountain Inc 700,000 8.625% due 01/04/13................................................................ 490,870 0.10
JP Morgan Alternative Loan Trust 200,377 5.550% due 25/10/36................................................................ 111,364 0.02
JP Morgan Chase & Co 400,000 6.000% due 15/01/18................................................................ 259,672 0.05
JP Morgan Chase Capital XXII 1,100,000 6.450% due 02/02/37................................................................ 567,399 0.11
JP Morgan Chase Commercial Mortgage Securities Trust 400,000 5.429% due 12/12/43................................................................ 247,345 0.05 175,000 6.007% due 15/06/49................................................................ 106,601 0.02
JP Morgan Mortgage Trust 46,816 3.257% due 25/07/30................................................................ 33,201 0.01 58,470 4.376% due 25/11/33................................................................ 40,532 0.01 189,489 5.021% due 25/02/35................................................................ 117,400 0.02
JPMorgan Chase & Co EUR 800,000 4.625% due 31/01/11................................................................ 764,382 0.15
Kla-Tencor Corp USD 1,080,000 6.900% due 01/05/18................................................................ 714,900 0.14
Kraft Foods Inc 1,050,000 6.875% due 01/02/38................................................................ 688,183 0.13
Kroger Co 700,000 5.500% due 01/02/13................................................................ 485,048 0.09
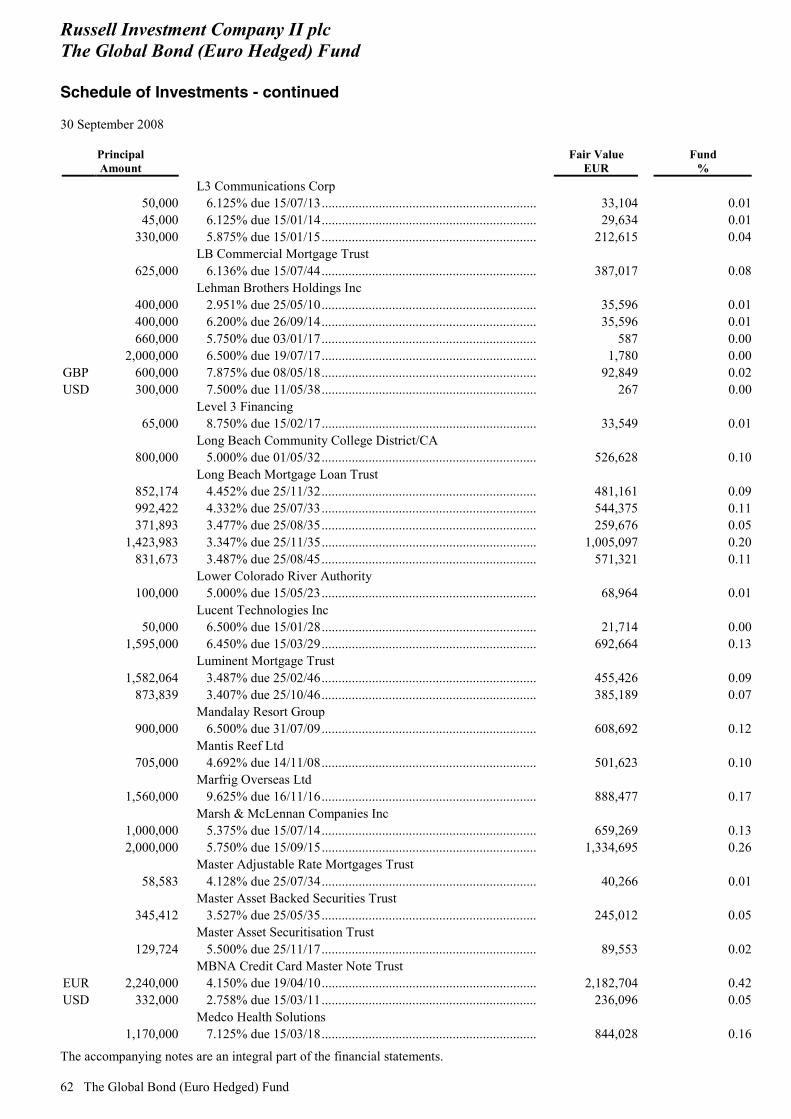
Russell Investment Company II plc The Global Bond (Euro Hedged) Fund Schedule of Investments - continued 30 September 2008
The accompanying notes are an integral part of the financial statements. 62 The Global Bond (Euro Hedged) Fund
Principal Amount
Fair Value EUR
Fund %
L3 Communications Corp 50,000 6.125% due 15/07/13................................................................ 33,104 0.01 45,000 6.125% due 15/01/14................................................................ 29,634 0.01 330,000 5.875% due 15/01/15................................................................ 212,615 0.04
LB Commercial Mortgage Trust 625,000 6.136% due 15/07/44................................................................ 387,017 0.08
Lehman Brothers Holdings Inc 400,000 2.951% due 25/05/10................................................................ 35,596 0.01 400,000 6.200% due 26/09/14................................................................ 35,596 0.01 660,000 5.750% due 03/01/17................................................................ 587 0.00 2,000,000 6.500% due 19/07/17................................................................ 1,780 0.00GBP 600,000 7.875% due 08/05/18................................................................ 92,849 0.02USD 300,000 7.500% due 11/05/38................................................................ 267 0.00
Level 3 Financing 65,000 8.750% due 15/02/17................................................................ 33,549 0.01
Long Beach Community College District/CA 800,000 5.000% due 01/05/32................................................................ 526,628 0.10
Long Beach Mortgage Loan Trust 852,174 4.452% due 25/11/32................................................................ 481,161 0.09 992,422 4.332% due 25/07/33................................................................ 544,375 0.11 371,893 3.477% due 25/08/35................................................................ 259,676 0.05 1,423,983 3.347% due 25/11/35................................................................ 1,005,097 0.20 831,673 3.487% due 25/08/45................................................................ 571,321 0.11
Lower Colorado River Authority 100,000 5.000% due 15/05/23................................................................ 68,964 0.01
Lucent Technologies Inc 50,000 6.500% due 15/01/28................................................................ 21,714 0.00 1,595,000 6.450% due 15/03/29................................................................ 692,664 0.13
Luminent Mortgage Trust 1,582,064 3.487% due 25/02/46................................................................ 455,426 0.09 873,839 3.407% due 25/10/46................................................................ 385,189 0.07
Mandalay Resort Group 900,000 6.500% due 31/07/09................................................................ 608,692 0.12
Mantis Reef Ltd 705,000 4.692% due 14/11/08................................................................ 501,623 0.10
Marfrig Overseas Ltd 1,560,000 9.625% due 16/11/16................................................................ 888,477 0.17
Marsh & McLennan Companies Inc 1,000,000 5.375% due 15/07/14................................................................ 659,269 0.13 2,000,000 5.750% due 15/09/15................................................................ 1,334,695 0.26
Master Adjustable Rate Mortgages Trust 58,583 4.128% due 25/07/34................................................................ 40,266 0.01
Master Asset Backed Securities Trust 345,412 3.527% due 25/05/35................................................................ 245,012 0.05
Master Asset Securitisation Trust 129,724 5.500% due 25/11/17................................................................ 89,553 0.02
MBNA Credit Card Master Note Trust EUR 2,240,000 4.150% due 19/04/10................................................................ 2,182,704 0.42USD 332,000 2.758% due 15/03/11................................................................ 236,096 0.05
Medco Health Solutions 1,170,000 7.125% due 15/03/18................................................................ 844,028 0.16
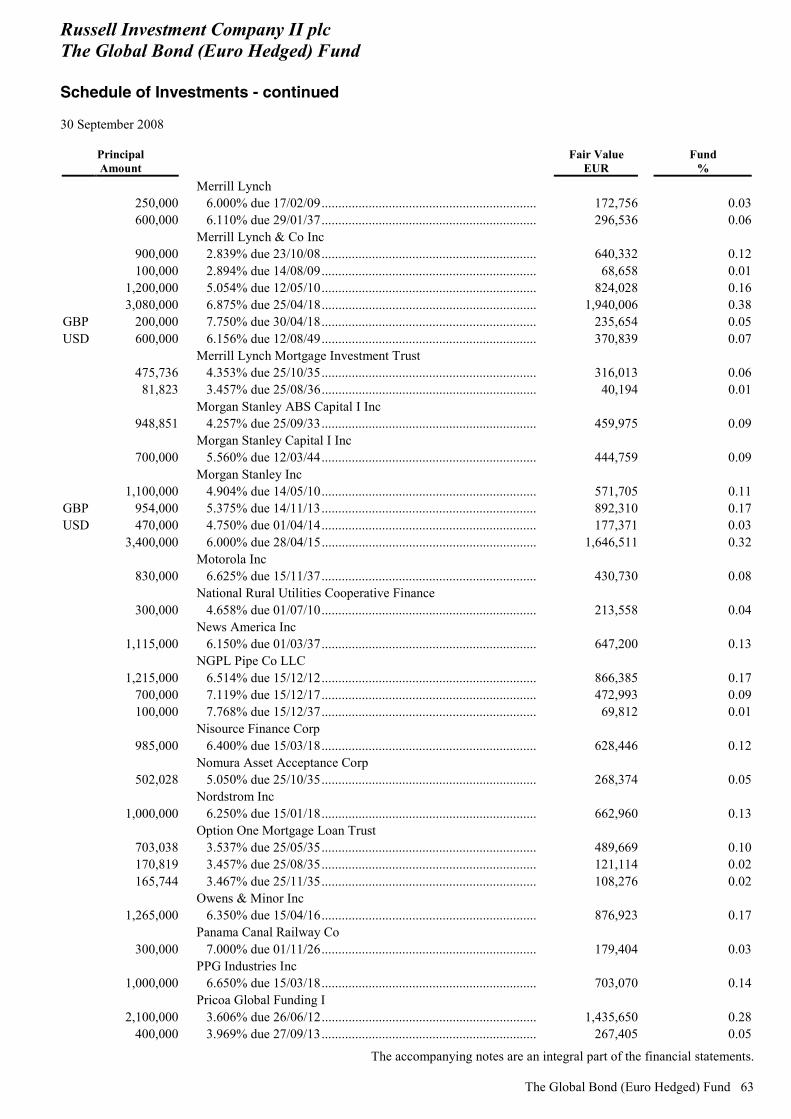
Russell Investment Company II plc The Global Bond (Euro Hedged) Fund Schedule of Investments - continued 30 September 2008
The accompanying notes are an integral part of the financial statements.
The Global Bond (Euro Hedged) Fund 63
Principal Amount
Fair Value EUR
Fund %
Merrill Lynch 250,000 6.000% due 17/02/09................................................................ 172,756 0.03 600,000 6.110% due 29/01/37................................................................ 296,536 0.06
Merrill Lynch & Co Inc 900,000 2.839% due 23/10/08................................................................ 640,332 0.12 100,000 2.894% due 14/08/09................................................................ 68,658 0.01 1,200,000 5.054% due 12/05/10................................................................ 824,028 0.16 3,080,000 6.875% due 25/04/18................................................................ 1,940,006 0.38GBP 200,000 7.750% due 30/04/18................................................................ 235,654 0.05USD 600,000 6.156% due 12/08/49................................................................ 370,839 0.07
Merrill Lynch Mortgage Investment Trust 475,736 4.353% due 25/10/35................................................................ 316,013 0.06 81,823 3.457% due 25/08/36................................................................ 40,194 0.01
Morgan Stanley ABS Capital I Inc 948,851 4.257% due 25/09/33................................................................ 459,975 0.09
Morgan Stanley Capital I Inc 700,000 5.560% due 12/03/44................................................................ 444,759 0.09
Morgan Stanley Inc 1,100,000 4.904% due 14/05/10................................................................ 571,705 0.11GBP 954,000 5.375% due 14/11/13................................................................ 892,310 0.17USD 470,000 4.750% due 01/04/14................................................................ 177,371 0.03 3,400,000 6.000% due 28/04/15................................................................ 1,646,511 0.32
Motorola Inc 830,000 6.625% due 15/11/37................................................................ 430,730 0.08
National Rural Utilities Cooperative Finance 300,000 4.658% due 01/07/10................................................................ 213,558 0.04
News America Inc 1,115,000 6.150% due 01/03/37................................................................ 647,200 0.13
NGPL Pipe Co LLC 1,215,000 6.514% due 15/12/12................................................................ 866,385 0.17 700,000 7.119% due 15/12/17................................................................ 472,993 0.09 100,000 7.768% due 15/12/37................................................................ 69,812 0.01
Nisource Finance Corp 985,000 6.400% due 15/03/18................................................................ 628,446 0.12
Nomura Asset Acceptance Corp 502,028 5.050% due 25/10/35................................................................ 268,374 0.05
Nordstrom Inc 1,000,000 6.250% due 15/01/18................................................................ 662,960 0.13
Option One Mortgage Loan Trust 703,038 3.537% due 25/05/35................................................................ 489,669 0.10 170,819 3.457% due 25/08/35................................................................ 121,114 0.02 165,744 3.467% due 25/11/35................................................................ 108,276 0.02
Owens & Minor Inc 1,265,000 6.350% due 15/04/16................................................................ 876,923 0.17
Panama Canal Railway Co 300,000 7.000% due 01/11/26................................................................ 179,404 0.03
PPG Industries Inc 1,000,000 6.650% due 15/03/18................................................................ 703,070 0.14
Pricoa Global Funding I 2,100,000 3.606% due 26/06/12................................................................ 1,435,650 0.28 400,000 3.969% due 27/09/13................................................................ 267,405 0.05
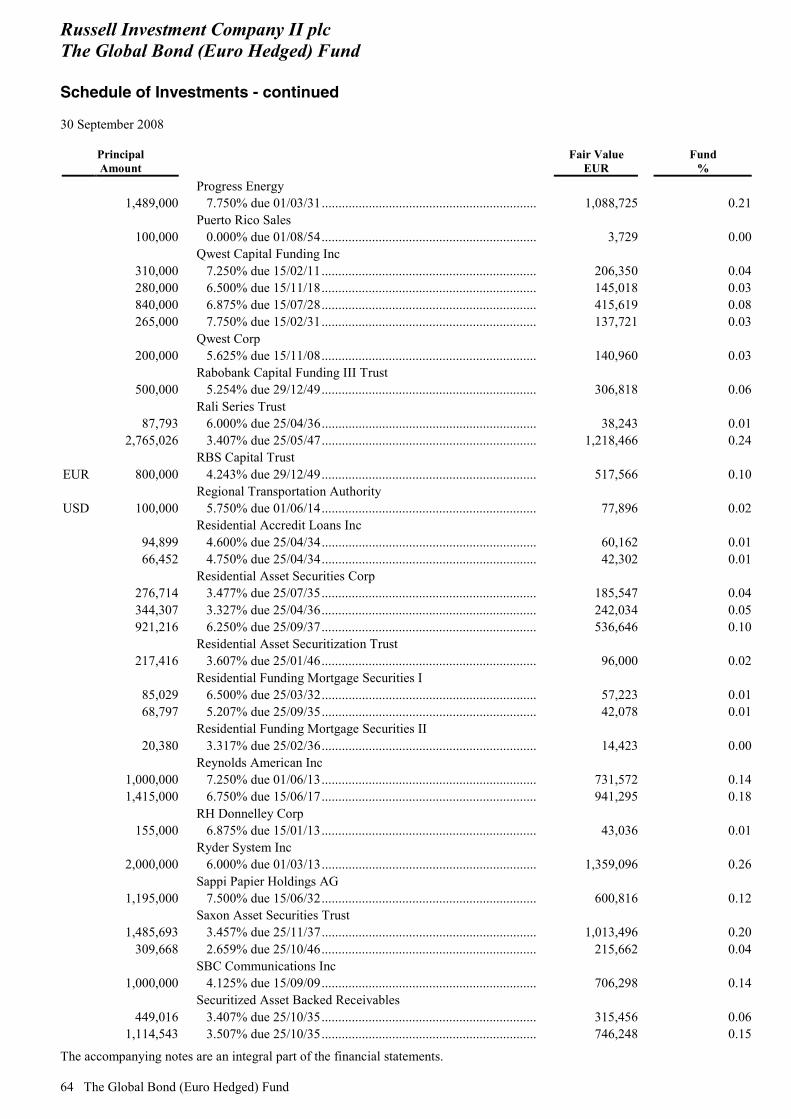
Russell Investment Company II plc The Global Bond (Euro Hedged) Fund Schedule of Investments - continued 30 September 2008
The accompanying notes are an integral part of the financial statements. 64 The Global Bond (Euro Hedged) Fund
Principal Amount
Fair Value EUR
Fund %
Progress Energy 1,489,000 7.750% due 01/03/31................................................................ 1,088,725 0.21
Puerto Rico Sales 100,000 0.000% due 01/08/54................................................................ 3,729 0.00
Qwest Capital Funding Inc 310,000 7.250% due 15/02/11................................................................ 206,350 0.04 280,000 6.500% due 15/11/18................................................................ 145,018 0.03 840,000 6.875% due 15/07/28................................................................ 415,619 0.08 265,000 7.750% due 15/02/31................................................................ 137,721 0.03
Qwest Corp 200,000 5.625% due 15/11/08................................................................ 140,960 0.03
Rabobank Capital Funding III Trust 500,000 5.254% due 29/12/49................................................................ 306,818 0.06
Rali Series Trust 87,793 6.000% due 25/04/36................................................................ 38,243 0.01 2,765,026 3.407% due 25/05/47................................................................ 1,218,466 0.24
RBS Capital Trust EUR 800,000 4.243% due 29/12/49................................................................ 517,566 0.10
Regional Transportation Authority USD 100,000 5.750% due 01/06/14................................................................ 77,896 0.02
Residential Accredit Loans Inc 94,899 4.600% due 25/04/34................................................................ 60,162 0.01 66,452 4.750% due 25/04/34................................................................ 42,302 0.01
Residential Asset Securities Corp 276,714 3.477% due 25/07/35................................................................ 185,547 0.04 344,307 3.327% due 25/04/36................................................................ 242,034 0.05 921,216 6.250% due 25/09/37................................................................ 536,646 0.10
Residential Asset Securitization Trust 217,416 3.607% due 25/01/46................................................................ 96,000 0.02
Residential Funding Mortgage Securities I 85,029 6.500% due 25/03/32................................................................ 57,223 0.01 68,797 5.207% due 25/09/35................................................................ 42,078 0.01
Residential Funding Mortgage Securities II 20,380 3.317% due 25/02/36................................................................ 14,423 0.00
Reynolds American Inc 1,000,000 7.250% due 01/06/13................................................................ 731,572 0.14 1,415,000 6.750% due 15/06/17................................................................ 941,295 0.18
RH Donnelley Corp 155,000 6.875% due 15/01/13................................................................ 43,036 0.01
Ryder System Inc 2,000,000 6.000% due 01/03/13................................................................ 1,359,096 0.26
Sappi Papier Holdings AG 1,195,000 7.500% due 15/06/32................................................................ 600,816 0.12
Saxon Asset Securities Trust 1,485,693 3.457% due 25/11/37................................................................ 1,013,496 0.20 309,668 2.659% due 25/10/46................................................................ 215,662 0.04
SBC Communications Inc 1,000,000 4.125% due 15/09/09................................................................ 706,298 0.14
Securitized Asset Backed Receivables 449,016 3.407% due 25/10/35................................................................ 315,456 0.06 1,114,543 3.507% due 25/10/35................................................................ 746,248 0.15
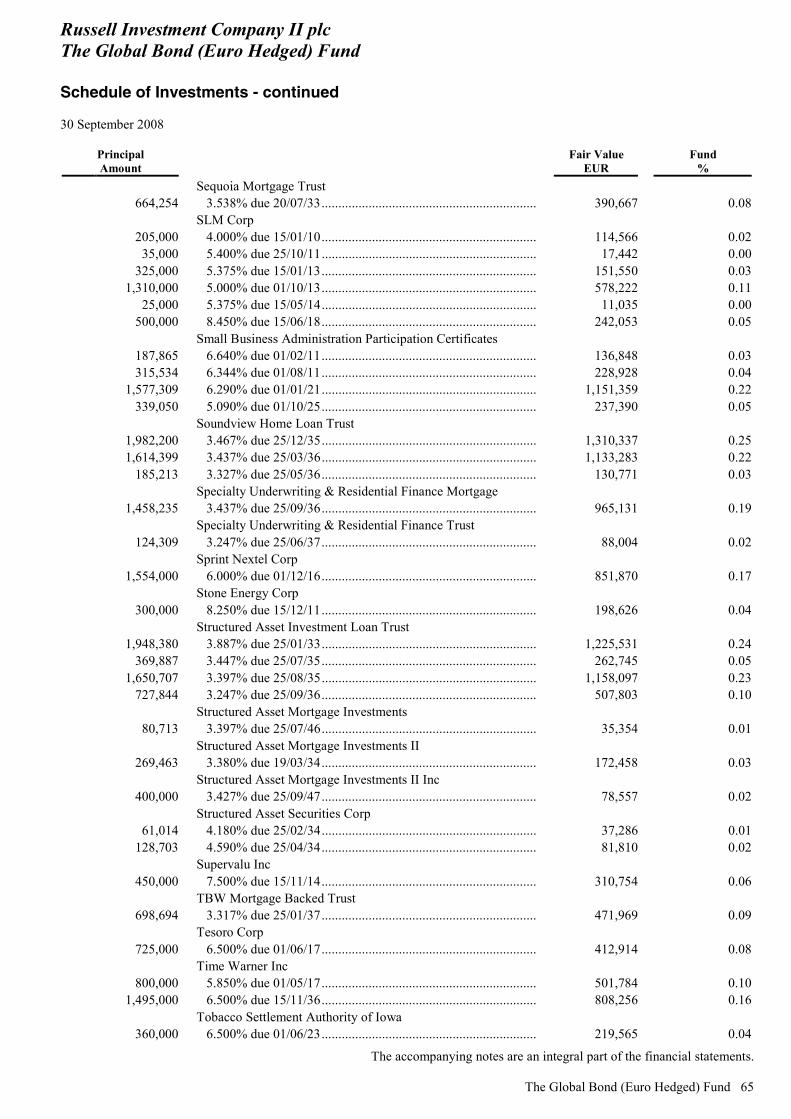
Russell Investment Company II plc The Global Bond (Euro Hedged) Fund Schedule of Investments - continued 30 September 2008
The accompanying notes are an integral part of the financial statements.
The Global Bond (Euro Hedged) Fund 65
Principal Amount
Fair Value EUR
Fund %
Sequoia Mortgage Trust 664,254 3.538% due 20/07/33................................................................ 390,667 0.08
SLM Corp 205,000 4.000% due 15/01/10................................................................ 114,566 0.02 35,000 5.400% due 25/10/11................................................................ 17,442 0.00 325,000 5.375% due 15/01/13................................................................ 151,550 0.03 1,310,000 5.000% due 01/10/13................................................................ 578,222 0.11 25,000 5.375% due 15/05/14................................................................ 11,035 0.00 500,000 8.450% due 15/06/18................................................................ 242,053 0.05
Small Business Administration Participation Certificates 187,865 6.640% due 01/02/11................................................................ 136,848 0.03 315,534 6.344% due 01/08/11................................................................ 228,928 0.04 1,577,309 6.290% due 01/01/21................................................................ 1,151,359 0.22 339,050 5.090% due 01/10/25................................................................ 237,390 0.05
Soundview Home Loan Trust 1,982,200 3.467% due 25/12/35................................................................ 1,310,337 0.25 1,614,399 3.437% due 25/03/36................................................................ 1,133,283 0.22 185,213 3.327% due 25/05/36................................................................ 130,771 0.03
Specialty Underwriting & Residential Finance Mortgage 1,458,235 3.437% due 25/09/36................................................................ 965,131 0.19
Specialty Underwriting & Residential Finance Trust 124,309 3.247% due 25/06/37................................................................ 88,004 0.02
Sprint Nextel Corp 1,554,000 6.000% due 01/12/16................................................................ 851,870 0.17
Stone Energy Corp 300,000 8.250% due 15/12/11................................................................ 198,626 0.04
Structured Asset Investment Loan Trust 1,948,380 3.887% due 25/01/33................................................................ 1,225,531 0.24 369,887 3.447% due 25/07/35................................................................ 262,745 0.05 1,650,707 3.397% due 25/08/35................................................................ 1,158,097 0.23 727,844 3.247% due 25/09/36................................................................ 507,803 0.10
Structured Asset Mortgage Investments 80,713 3.397% due 25/07/46................................................................ 35,354 0.01
Structured Asset Mortgage Investments II 269,463 3.380% due 19/03/34................................................................ 172,458 0.03
Structured Asset Mortgage Investments II Inc 400,000 3.427% due 25/09/47................................................................ 78,557 0.02
Structured Asset Securities Corp 61,014 4.180% due 25/02/34................................................................ 37,286 0.01 128,703 4.590% due 25/04/34................................................................ 81,810 0.02
Supervalu Inc 450,000 7.500% due 15/11/14................................................................ 310,754 0.06
TBW Mortgage Backed Trust 698,694 3.317% due 25/01/37................................................................ 471,969 0.09
Tesoro Corp 725,000 6.500% due 01/06/17................................................................ 412,914 0.08
Time Warner Inc 800,000 5.850% due 01/05/17................................................................ 501,784 0.10 1,495,000 6.500% due 15/11/36................................................................ 808,256 0.16
Tobacco Settlement Authority of Iowa 360,000 6.500% due 01/06/23................................................................ 219,565 0.04
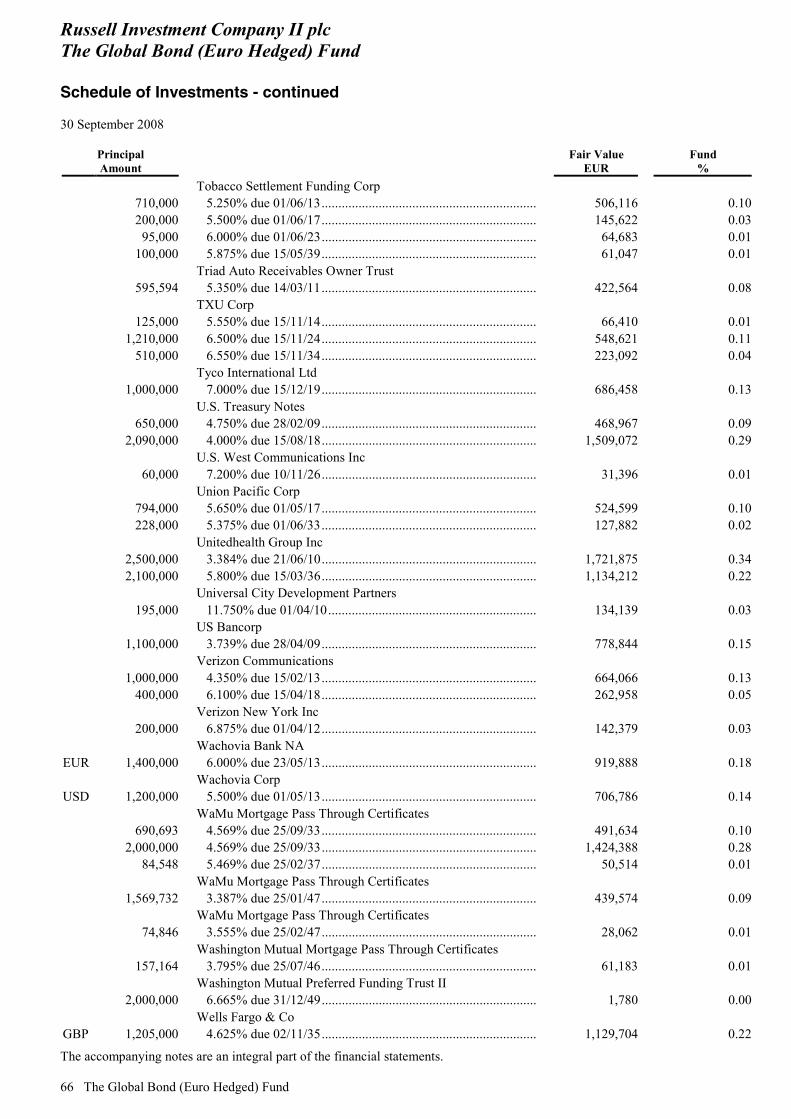
Russell Investment Company II plc The Global Bond (Euro Hedged) Fund Schedule of Investments - continued 30 September 2008
The accompanying notes are an integral part of the financial statements. 66 The Global Bond (Euro Hedged) Fund
Principal Amount
Fair Value EUR
Fund %
Tobacco Settlement Funding Corp 710,000 5.250% due 01/06/13................................................................ 506,116 0.10 200,000 5.500% due 01/06/17................................................................ 145,622 0.03 95,000 6.000% due 01/06/23................................................................ 64,683 0.01 100,000 5.875% due 15/05/39................................................................ 61,047 0.01
Triad Auto Receivables Owner Trust 595,594 5.350% due 14/03/11................................................................ 422,564 0.08
TXU Corp 125,000 5.550% due 15/11/14................................................................ 66,410 0.01 1,210,000 6.500% due 15/11/24................................................................ 548,621 0.11 510,000 6.550% due 15/11/34................................................................ 223,092 0.04
Tyco International Ltd 1,000,000 7.000% due 15/12/19................................................................ 686,458 0.13
U.S. Treasury Notes 650,000 4.750% due 28/02/09................................................................ 468,967 0.09 2,090,000 4.000% due 15/08/18................................................................ 1,509,072 0.29
U.S. West Communications Inc 60,000 7.200% due 10/11/26................................................................ 31,396 0.01
Union Pacific Corp 794,000 5.650% due 01/05/17................................................................ 524,599 0.10 228,000 5.375% due 01/06/33................................................................ 127,882 0.02
Unitedhealth Group Inc 2,500,000 3.384% due 21/06/10................................................................ 1,721,875 0.34 2,100,000 5.800% due 15/03/36................................................................ 1,134,212 0.22
Universal City Development Partners 195,000 11.750% due 01/04/10.............................................................. 134,139 0.03
US Bancorp 1,100,000 3.739% due 28/04/09................................................................ 778,844 0.15
Verizon Communications 1,000,000 4.350% due 15/02/13................................................................ 664,066 0.13 400,000 6.100% due 15/04/18................................................................ 262,958 0.05
Verizon New York Inc 200,000 6.875% due 01/04/12................................................................ 142,379 0.03
Wachovia Bank NA EUR 1,400,000 6.000% due 23/05/13................................................................ 919,888 0.18
Wachovia Corp USD 1,200,000 5.500% due 01/05/13................................................................ 706,786 0.14
WaMu Mortgage Pass Through Certificates 690,693 4.569% due 25/09/33................................................................ 491,634 0.10 2,000,000 4.569% due 25/09/33................................................................ 1,424,388 0.28 84,548 5.469% due 25/02/37................................................................ 50,514 0.01
WaMu Mortgage Pass Through Certificates 1,569,732 3.387% due 25/01/47................................................................ 439,574 0.09
WaMu Mortgage Pass Through Certificates 74,846 3.555% due 25/02/47................................................................ 28,062 0.01
Washington Mutual Mortgage Pass Through Certificates 157,164 3.795% due 25/07/46................................................................ 61,183 0.01
Washington Mutual Preferred Funding Trust II 2,000,000 6.665% due 31/12/49................................................................ 1,780 0.00
Wells Fargo & Co GBP 1,205,000 4.625% due 02/11/35................................................................ 1,129,704 0.22
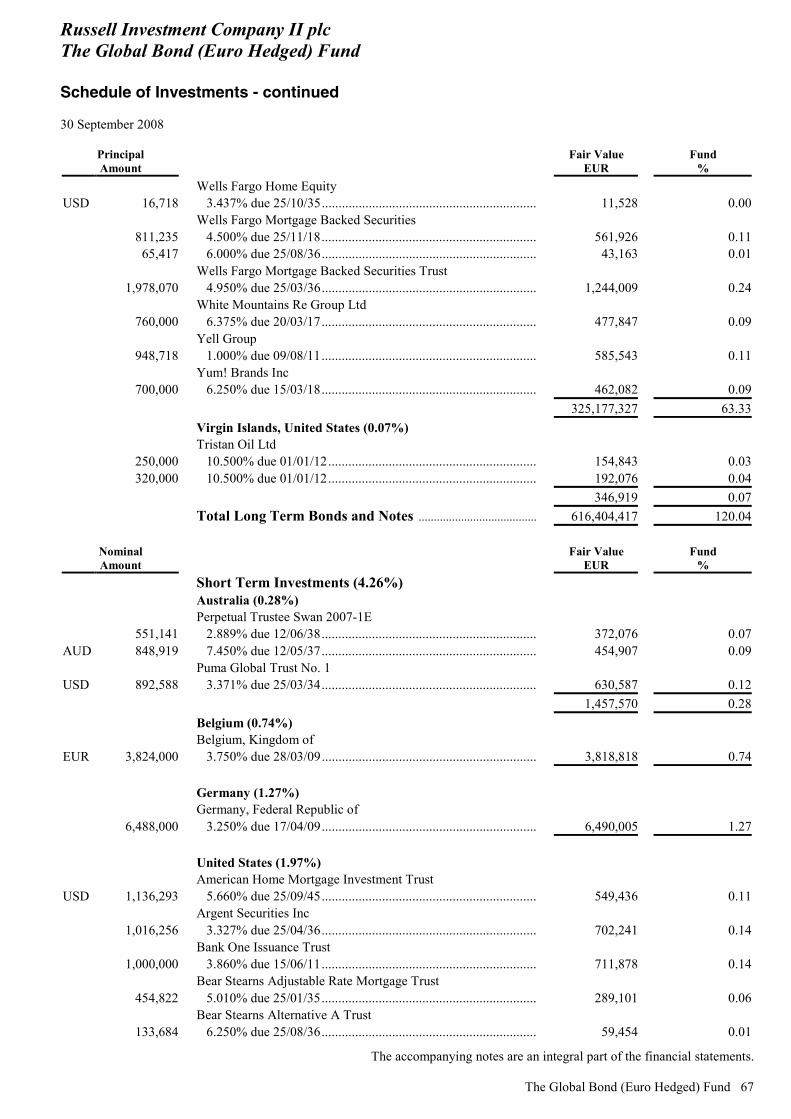
Russell Investment Company II plc The Global Bond (Euro Hedged) Fund Schedule of Investments - continued 30 September 2008
The accompanying notes are an integral part of the financial statements.
The Global Bond (Euro Hedged) Fund 67
Principal Amount
Fair Value EUR
Fund %
Wells Fargo Home Equity USD 16,718 3.437% due 25/10/35................................................................ 11,528 0.00
Wells Fargo Mortgage Backed Securities 811,235 4.500% due 25/11/18................................................................ 561,926 0.11 65,417 6.000% due 25/08/36................................................................ 43,163 0.01
Wells Fargo Mortgage Backed Securities Trust 1,978,070 4.950% due 25/03/36................................................................ 1,244,009 0.24
White Mountains Re Group Ltd 760,000 6.375% due 20/03/17................................................................ 477,847 0.09
Yell Group 948,718 1.000% due 09/08/11................................................................ 585,543 0.11
Yum! Brands Inc 700,000 6.250% due 15/03/18................................................................ 462,082 0.09
325,177,327 63.33 Virgin Islands, United States (0.07%) Tristan Oil Ltd
250,000 10.500% due 01/01/12.............................................................. 154,843 0.03 320,000 10.500% due 01/01/12.............................................................. 192,076 0.04
346,919 0.07 Total Long Term Bonds and Notes ....................................... 616,404,417 120.04
Nominal Amount
Fair Value EUR
Fund %
Short Term Investments (4.26%) Australia (0.28%) Perpetual Trustee Swan 2007-1E
551,141 2.889% due 12/06/38................................................................ 372,076 0.07AUD 848,919 7.450% due 12/05/37................................................................ 454,907 0.09
Puma Global Trust No. 1 USD 892,588 3.371% due 25/03/34................................................................ 630,587 0.12
1,457,570 0.28 Belgium (0.74%) Belgium, Kingdom of
EUR 3,824,000 3.750% due 28/03/09................................................................ 3,818,818 0.74 Germany (1.27%) Germany, Federal Republic of
6,488,000 3.250% due 17/04/09................................................................ 6,490,005 1.27 United States (1.97%) American Home Mortgage Investment Trust
USD 1,136,293 5.660% due 25/09/45................................................................ 549,436 0.11 Argent Securities Inc
1,016,256 3.327% due 25/04/36................................................................ 702,241 0.14 Bank One Issuance Trust
1,000,000 3.860% due 15/06/11................................................................ 711,878 0.14 Bear Stearns Adjustable Rate Mortgage Trust
454,822 5.010% due 25/01/35................................................................ 289,101 0.06 Bear Stearns Alternative A Trust
133,684 6.250% due 25/08/36................................................................ 59,454 0.01
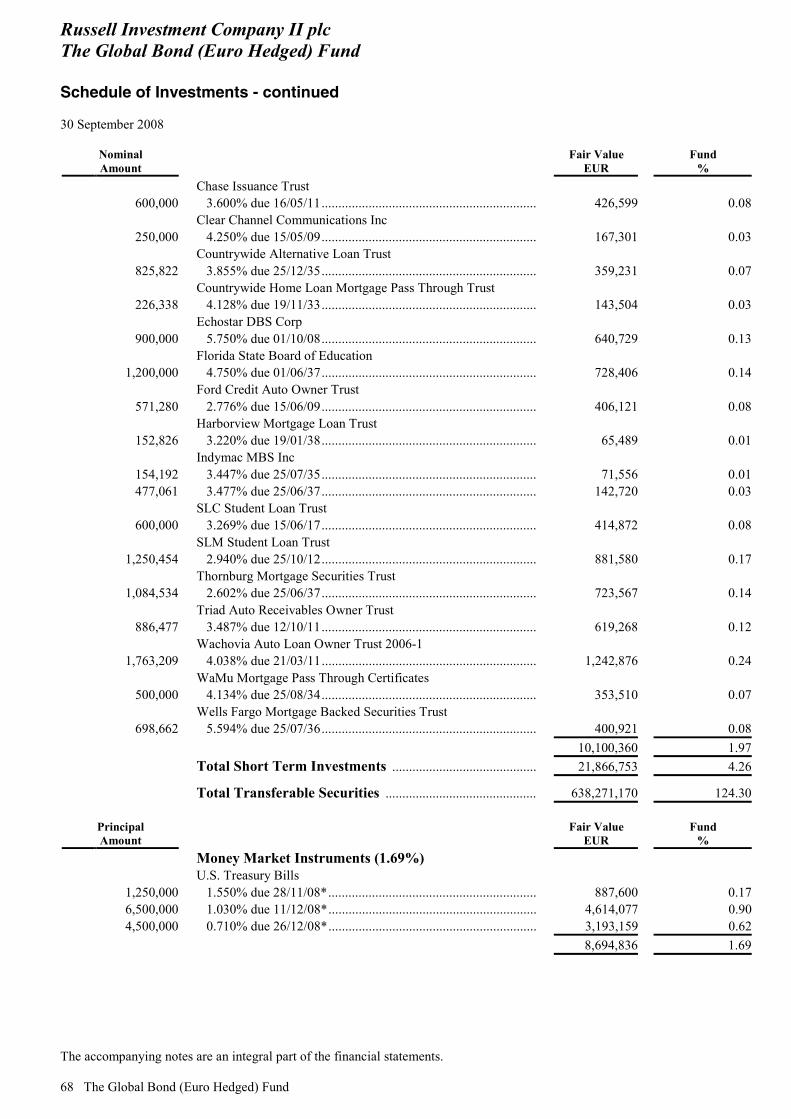
Russell Investment Company II plc The Global Bond (Euro Hedged) Fund Schedule of Investments - continued 30 September 2008
The accompanying notes are an integral part of the financial statements. 68 The Global Bond (Euro Hedged) Fund
Nominal Amount
Fair Value EUR
Fund %
Chase Issuance Trust 600,000 3.600% due 16/05/11................................................................ 426,599 0.08
Clear Channel Communications Inc 250,000 4.250% due 15/05/09................................................................ 167,301 0.03
Countrywide Alternative Loan Trust 825,822 3.855% due 25/12/35................................................................ 359,231 0.07
Countrywide Home Loan Mortgage Pass Through Trust 226,338 4.128% due 19/11/33................................................................ 143,504 0.03
Echostar DBS Corp 900,000 5.750% due 01/10/08................................................................ 640,729 0.13
Florida State Board of Education 1,200,000 4.750% due 01/06/37................................................................ 728,406 0.14
Ford Credit Auto Owner Trust 571,280 2.776% due 15/06/09................................................................ 406,121 0.08
Harborview Mortgage Loan Trust 152,826 3.220% due 19/01/38................................................................ 65,489 0.01
Indymac MBS Inc 154,192 3.447% due 25/07/35................................................................ 71,556 0.01 477,061 3.477% due 25/06/37................................................................ 142,720 0.03
SLC Student Loan Trust 600,000 3.269% due 15/06/17................................................................ 414,872 0.08
SLM Student Loan Trust 1,250,454 2.940% due 25/10/12................................................................ 881,580 0.17
Thornburg Mortgage Securities Trust 1,084,534 2.602% due 25/06/37................................................................ 723,567 0.14
Triad Auto Receivables Owner Trust 886,477 3.487% due 12/10/11................................................................ 619,268 0.12
Wachovia Auto Loan Owner Trust 2006-1 1,763,209 4.038% due 21/03/11................................................................ 1,242,876 0.24
WaMu Mortgage Pass Through Certificates 500,000 4.134% due 25/08/34................................................................ 353,510 0.07
Wells Fargo Mortgage Backed Securities Trust 698,662 5.594% due 25/07/36................................................................ 400,921 0.08
10,100,360 1.97 Total Short Term Investments ........................................... 21,866,753 4.26
Total Transferable Securities ............................................. 638,271,170 124.30
Principal Amount
Fair Value EUR
Fund %
Money Market Instruments (1.69%) U.S. Treasury Bills
1,250,000 1.550% due 28/11/08*.............................................................. 887,600 0.17 6,500,000 1.030% due 11/12/08*.............................................................. 4,614,077 0.90 4,500,000 0.710% due 26/12/08*.............................................................. 3,193,159 0.62
8,694,836 1.69
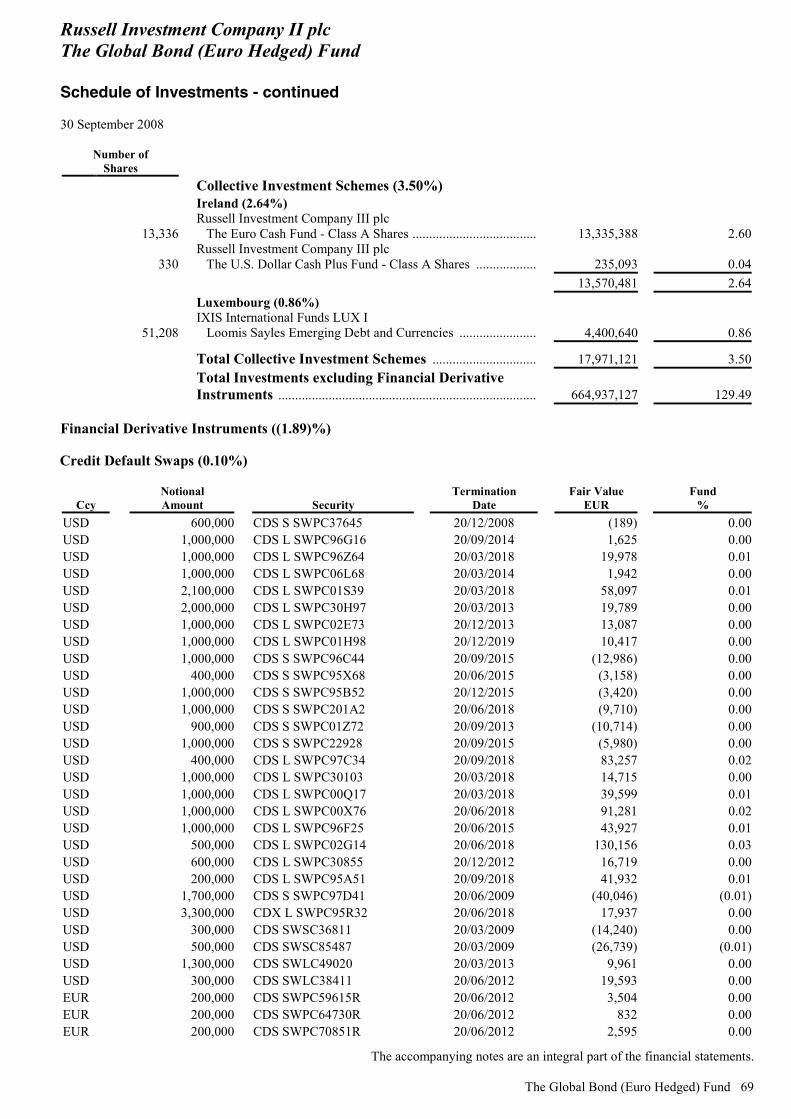
Russell Investment Company II plc The Global Bond (Euro Hedged) Fund Schedule of Investments - continued 30 September 2008
The accompanying notes are an integral part of the financial statements.
The Global Bond (Euro Hedged) Fund 69
Number of Shares
Collective Investment Schemes (3.50%) Ireland (2.64%)
13,336 Russell Investment Company III plc The Euro Cash Fund - Class A Shares ..................................... 13,335,388 2.60
330 Russell Investment Company III plc The U.S. Dollar Cash Plus Fund - Class A Shares .................. 235,093 0.04
13,570,481 2.64 Luxembourg (0.86%)
51,208 IXIS International Funds LUX I Loomis Sayles Emerging Debt and Currencies ....................... 4,400,640 0.86
Total Collective Investment Schemes ............................... 17,971,121 3.50
Total Investments excluding Financial Derivative Instruments ............................................................................. 664,937,127 129.49
Financial Derivative Instruments ((1.89)%) Credit Default Swaps (0.10%)
Ccy Notional Amount Security
Termination Date
Fair Value EUR
Fund %
USD 600,000 CDS S SWPC37645 20/12/2008 (189) 0.00USD 1,000,000 CDS L SWPC96G16 20/09/2014 1,625 0.00USD 1,000,000 CDS L SWPC96Z64 20/03/2018 19,978 0.01USD 1,000,000 CDS L SWPC06L68 20/03/2014 1,942 0.00USD 2,100,000 CDS L SWPC01S39 20/03/2018 58,097 0.01USD 2,000,000 CDS L SWPC30H97 20/03/2013 19,789 0.00USD 1,000,000 CDS L SWPC02E73 20/12/2013 13,087 0.00USD 1,000,000 CDS L SWPC01H98 20/12/2019 10,417 0.00USD 1,000,000 CDS S SWPC96C44 20/09/2015 (12,986) 0.00USD 400,000 CDS S SWPC95X68 20/06/2015 (3,158) 0.00USD 1,000,000 CDS S SWPC95B52 20/12/2015 (3,420) 0.00USD 1,000,000 CDS S SWPC201A2 20/06/2018 (9,710) 0.00USD 900,000 CDS S SWPC01Z72 20/09/2013 (10,714) 0.00USD 1,000,000 CDS S SWPC22928 20/09/2015 (5,980) 0.00USD 400,000 CDS L SWPC97C34 20/09/2018 83,257 0.02USD 1,000,000 CDS L SWPC30103 20/03/2018 14,715 0.00USD 1,000,000 CDS L SWPC00Q17 20/03/2018 39,599 0.01USD 1,000,000 CDS L SWPC00X76 20/06/2018 91,281 0.02USD 1,000,000 CDS L SWPC96F25 20/06/2015 43,927 0.01USD 500,000 CDS L SWPC02G14 20/06/2018 130,156 0.03USD 600,000 CDS L SWPC30855 20/12/2012 16,719 0.00USD 200,000 CDS L SWPC95A51 20/09/2018 41,932 0.01USD 1,700,000 CDS S SWPC97D41 20/06/2009 (40,046) (0.01)USD 3,300,000 CDX L SWPC95R32 20/06/2018 17,937 0.00USD 300,000 CDS SWSC36811 20/03/2009 (14,240) 0.00USD 500,000 CDS SWSC85487 20/03/2009 (26,739) (0.01)USD 1,300,000 CDS SWLC49020 20/03/2013 9,961 0.00USD 300,000 CDS SWLC38411 20/06/2012 19,593 0.00EUR 200,000 CDS SWPC59615R 20/06/2012 3,504 0.00EUR 200,000 CDS SWPC64730R 20/06/2012 832 0.00EUR 200,000 CDS SWPC70851R 20/06/2012 2,595 0.00

Russell Investment Company II plc The Global Bond (Euro Hedged) Fund Schedule of Investments - continued 30 September 2008
The accompanying notes are an integral part of the financial statements. 70 The Global Bond (Euro Hedged) Fund
Ccy Notional Amount Security
Termination Date
Fair Value EUR
Fund %
EUR 200,000 CDS SWPC59631R 20/06/2012 1,842 0.00EUR 200,000 CDS L SWPC59656 20/06/2012 10,088 0.00USD 400,000 CDS SWLC50507 20/06/2012 431 0.00JPY 900,000 CDS L SWPC59193 20/06/2012 72,210 0.02JPY 200,000 CDS S SWPC70687 20/06/2012 (400) 0.00USD 1,200,000 CDS L SWPC30G98 20/09/2013 35,118 0.01USD 500,000 CDS L SWPC96G24 20/06/2013 1,077 0.00USD 500,000 CDS L SWPC06N58 20/06/2018 16,782 0.00USD 400,000 CDS L SWPC30H89 20/09/2013 18,079 0.00USD 500,000 CDS L SWPC97S29 20/08/2013 31,135 0.01USD 100,000 CDS S SWPC00G42 20/06/2018 (75) 0.00USD 1,600,000 CDS S SWPC01L28 20/12/2008 (568) 0.00USD 700,000 CDS L SWPC00W51 20/06/2013 5,688 0.00USD 1,000,000 CDS L SWPC30F99 20/06/2013 10,216 0.00EUR 2,500,000 CDX S SWPCN6041 20/06/2018 (94,506) (0.02)USD 3,100,000 CDX L SWPC95N28 20/06/2013 21,853 0.01USD 2,100,000 CDX L SWPC95N77 20/06/2013 14,847 0.00USD 300,000 CMBX S SWPC46570 25/07/2045 (89,657) (0.02)USD 100,000 CDS L SWPC59185 20/06/2012 1,013 0.00USD 2,000,000 CDS 1571657P 20/09/2012 (24,431) 0.00USD 1,000,000 CDS 1572008P 20/09/2012 (30,959) (0.01)USD 100,000 CDS SWLC59128 20/06/2017 2,207 0.00Credit default swaps at fair value gain ................................................................................ 883,529 0.17Credit default swaps at fair value loss ................................................................................. (367,778) (0.07)Total Credit Default Swaps .......................................................................................... 515,751 0.10
Interest Rate Swaps ((0.96)%)
Ccy Notional Amount
Maturity Date
Fair Value EUR
Fund %
GBP 4,000,000 17/09/2013 (32,591) (0.01)USD 600,000 20/03/2009 (78,714) (0.01)EUR 17,300,000 17/09/2013 (448,881) (0.09)EUR 6,200,000 15/12/2014 (186,056) (0.04)EUR 2,000,000 20/03/2018 2,794 0.00EUR 9,500,000 15/09/2009 19,445 0.00EUR 8,800,000 16/12/2011 74,143 0.01USD 1,600,000 20/12/2017 73,020 0.01AUD 6,700,000 15/03/2010 43,799 0.01AUD 6,700,000 15/03/2010 43,333 0.01EUR 300,000 20/12/2016 18,000 0.00EUR 1,300,000 20/12/2016 78,000 0.02JPY 460,000,000 20/03/2012 47,949 0.01EUR 300,000 20/12/2016 19,635 0.00JPY 1,080,000,000 20/06/2016 (244,995) (0.05)JPY 810,000,000 20/06/2016 (182,514) (0.03)JPY 560,000,000 20/12/2027 (224,778) (0.04)JPY 180,000,000 20/06/2027 31,116 0.01JPY 180,000,000 20/06/2027 30,573 0.01GBP 100,000 15/12/2035 1,741 0.00EUR 3,100,000 18/06/2034 65,868 0.01
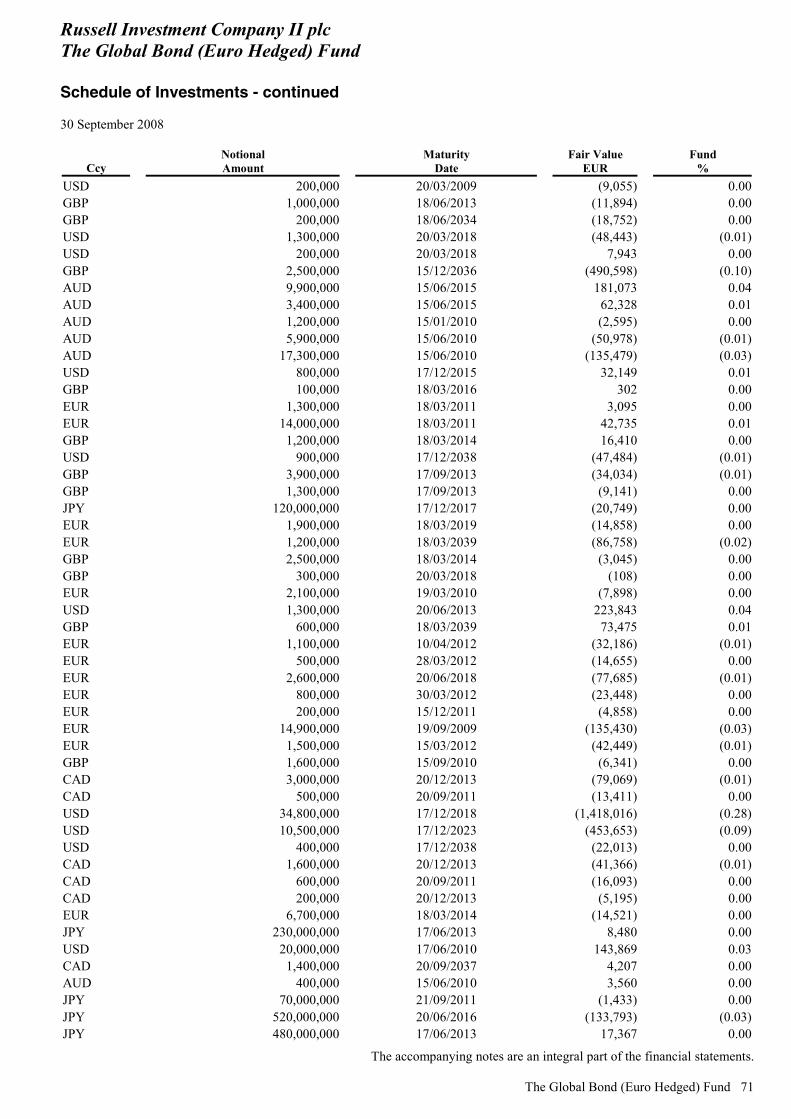
Russell Investment Company II plc The Global Bond (Euro Hedged) Fund Schedule of Investments - continued 30 September 2008
The accompanying notes are an integral part of the financial statements.
The Global Bond (Euro Hedged) Fund 71
Ccy Notional Amount
Maturity Date
Fair Value EUR
Fund %
USD 200,000 20/03/2009 (9,055) 0.00GBP 1,000,000 18/06/2013 (11,894) 0.00GBP 200,000 18/06/2034 (18,752) 0.00USD 1,300,000 20/03/2018 (48,443) (0.01)USD 200,000 20/03/2018 7,943 0.00GBP 2,500,000 15/12/2036 (490,598) (0.10)AUD 9,900,000 15/06/2015 181,073 0.04AUD 3,400,000 15/06/2015 62,328 0.01AUD 1,200,000 15/01/2010 (2,595) 0.00AUD 5,900,000 15/06/2010 (50,978) (0.01)AUD 17,300,000 15/06/2010 (135,479) (0.03)USD 800,000 17/12/2015 32,149 0.01GBP 100,000 18/03/2016 302 0.00EUR 1,300,000 18/03/2011 3,095 0.00EUR 14,000,000 18/03/2011 42,735 0.01GBP 1,200,000 18/03/2014 16,410 0.00USD 900,000 17/12/2038 (47,484) (0.01)GBP 3,900,000 17/09/2013 (34,034) (0.01)GBP 1,300,000 17/09/2013 (9,141) 0.00JPY 120,000,000 17/12/2017 (20,749) 0.00EUR 1,900,000 18/03/2019 (14,858) 0.00EUR 1,200,000 18/03/2039 (86,758) (0.02)GBP 2,500,000 18/03/2014 (3,045) 0.00GBP 300,000 20/03/2018 (108) 0.00EUR 2,100,000 19/03/2010 (7,898) 0.00USD 1,300,000 20/06/2013 223,843 0.04GBP 600,000 18/03/2039 73,475 0.01EUR 1,100,000 10/04/2012 (32,186) (0.01)EUR 500,000 28/03/2012 (14,655) 0.00EUR 2,600,000 20/06/2018 (77,685) (0.01)EUR 800,000 30/03/2012 (23,448) 0.00EUR 200,000 15/12/2011 (4,858) 0.00EUR 14,900,000 19/09/2009 (135,430) (0.03)EUR 1,500,000 15/03/2012 (42,449) (0.01)GBP 1,600,000 15/09/2010 (6,341) 0.00CAD 3,000,000 20/12/2013 (79,069) (0.01)CAD 500,000 20/09/2011 (13,411) 0.00USD 34,800,000 17/12/2018 (1,418,016) (0.28)USD 10,500,000 17/12/2023 (453,653) (0.09)USD 400,000 17/12/2038 (22,013) 0.00CAD 1,600,000 20/12/2013 (41,366) (0.01)CAD 600,000 20/09/2011 (16,093) 0.00CAD 200,000 20/12/2013 (5,195) 0.00EUR 6,700,000 18/03/2014 (14,521) 0.00JPY 230,000,000 17/06/2013 8,480 0.00USD 20,000,000 17/06/2010 143,869 0.03CAD 1,400,000 20/09/2037 4,207 0.00AUD 400,000 15/06/2010 3,560 0.00JPY 70,000,000 21/09/2011 (1,433) 0.00JPY 520,000,000 20/06/2016 (133,793) (0.03)JPY 480,000,000 17/06/2013 17,367 0.00

Russell Investment Company II plc The Global Bond (Euro Hedged) Fund Schedule of Investments - continued 30 September 2008
The accompanying notes are an integral part of the financial statements. 72 The Global Bond (Euro Hedged) Fund
Ccy Notional Amount
Maturity Date
Fair Value EUR
Fund %
AUD 2,600,000 15/06/2014 22,070 0.00EUR 500,000 18/03/2039 (35,215) (0.01)USD 10,100,000 17/12/2018 (414,964) (0.08)USD 6,800,000 17/12/2038 (376,984) (0.07)JPY 540,000,000 17/12/2017 (92,418) (0.02)USD 1,300,000 17/12/2018 (51,544) (0.01)JPY 170,000,000 17/12/2017 (29,489) (0.01)GBP 900,000 17/09/2013 (6,442) 0.00GBP 2,800,000 18/03/2014 (1,134) 0.00SEK 1,000,000 18/03/2014 (301) 0.00EUR 2,300,000 18/03/2014 (9,359) 0.00GBP 2,400,000 18/03/2014 (927) 0.00EUR 4,900,000 18/03/2039 (341,471) (0.07)EUR 4,600,000 18/03/2014 (8,860) 0.00GBP 6,000,000 18/03/2014 (7,308) 0.00GBP 800,000 18/03/2039 (18,690) 0.00EUR 6,700,000 18/03/2014 (17,484) 0.00GBP 700,000 18/03/2012 (434) 0.00JPY 1,160,000,000 17/12/2015 101,920 0.02JPY 1,070,000,000 17/06/2013 37,091 0.01JPY 320,000,000 17/06/2013 11,491 0.00USD 13,500,000 05/02/2009 (97,520) (0.02)USD 4,500,000 05/02/2009 (32,443) (0.01)USD 1,000,000 21/05/2009 (16,759) 0.00USD 900,000 20/03/2009 (43,903) (0.01)USD 700,000 20/03/2018 27,195 0.01USD 700,000 20/03/2018 12,568 0.00USD 500,000 20/03/2018 17,890 0.00Interest rate swaps at fair value gain ................................................................................... 1,600,476 0.29Interest rate swaps at fair value loss ................................................................................... (6,529,662) (1.25)Interest rate swaps at fair value ................................................................................. (4,929,186) (0.96) Open Forward Foreign Currency Exchange Contracts ((1.06)%)
Settlement Date
Amount Bought
Amount Sold
Unrealised Gain (Loss)
EUR Fund
% 04/12/2008 AED 7,700,000 USD 2,120,336 (16,889) 0.0016/04/2009 AED 2,705,778 USD 751,000 (9,942) 0.0030/10/2008 AUD 90,000 USD 72,075 (808) 0.0009/10/2008 AUD 406,000 USD 323,302 (2,213) 0.0009/10/2008 AUD 371,000 USD 295,349 (1,965) 0.0003/10/2008 AUD 166,000 USD 140,751 (6,986) 0.0030/10/2008 AUD 96,000 USD 79,776 (2,917) 0.0002/12/2008 BRL 5,184,758 USD 2,789,754 (94,715) (0.02)02/12/2008 BRL 1,185,040 USD 696,263 (63,248) (0.01)02/12/2008 BRL 341,443 USD 179,000 (2,889) 0.0002/12/2008 BRL 360,612 USD 189,000 (3,016) 0.0002/10/2008 BRL 682,590 USD 366,000 (8,638) 0.0002/12/2008 BRL 682,590 USD 373,817 (17,108) 0.0002/12/2008 BRL 29,440 USD 15,961 (623) 0.00
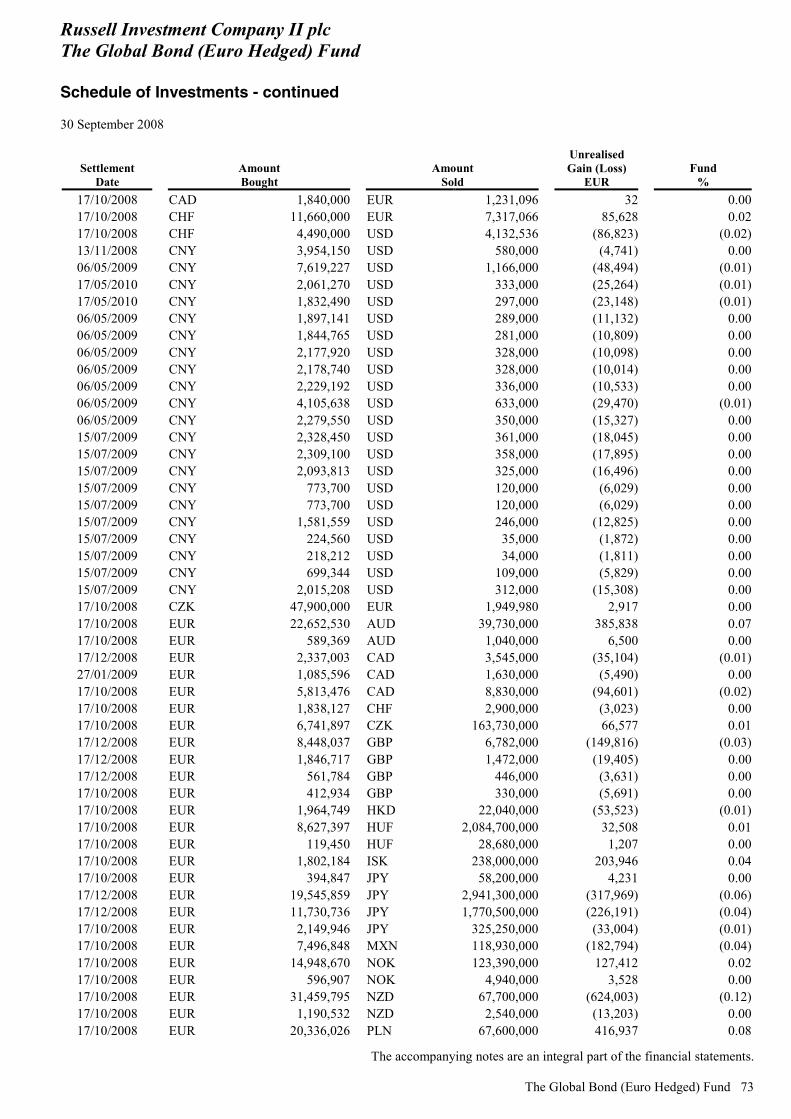
Russell Investment Company II plc The Global Bond (Euro Hedged) Fund Schedule of Investments - continued 30 September 2008
The accompanying notes are an integral part of the financial statements.
The Global Bond (Euro Hedged) Fund 73
Settlement Date
Amount Bought
Amount Sold
Unrealised Gain (Loss)
EUR Fund
% 17/10/2008 CAD 1,840,000 EUR 1,231,096 32 0.0017/10/2008 CHF 11,660,000 EUR 7,317,066 85,628 0.0217/10/2008 CHF 4,490,000 USD 4,132,536 (86,823) (0.02)13/11/2008 CNY 3,954,150 USD 580,000 (4,741) 0.0006/05/2009 CNY 7,619,227 USD 1,166,000 (48,494) (0.01)17/05/2010 CNY 2,061,270 USD 333,000 (25,264) (0.01)17/05/2010 CNY 1,832,490 USD 297,000 (23,148) (0.01)06/05/2009 CNY 1,897,141 USD 289,000 (11,132) 0.0006/05/2009 CNY 1,844,765 USD 281,000 (10,809) 0.0006/05/2009 CNY 2,177,920 USD 328,000 (10,098) 0.0006/05/2009 CNY 2,178,740 USD 328,000 (10,014) 0.0006/05/2009 CNY 2,229,192 USD 336,000 (10,533) 0.0006/05/2009 CNY 4,105,638 USD 633,000 (29,470) (0.01)06/05/2009 CNY 2,279,550 USD 350,000 (15,327) 0.0015/07/2009 CNY 2,328,450 USD 361,000 (18,045) 0.0015/07/2009 CNY 2,309,100 USD 358,000 (17,895) 0.0015/07/2009 CNY 2,093,813 USD 325,000 (16,496) 0.0015/07/2009 CNY 773,700 USD 120,000 (6,029) 0.0015/07/2009 CNY 773,700 USD 120,000 (6,029) 0.0015/07/2009 CNY 1,581,559 USD 246,000 (12,825) 0.0015/07/2009 CNY 224,560 USD 35,000 (1,872) 0.0015/07/2009 CNY 218,212 USD 34,000 (1,811) 0.0015/07/2009 CNY 699,344 USD 109,000 (5,829) 0.0015/07/2009 CNY 2,015,208 USD 312,000 (15,308) 0.0017/10/2008 CZK 47,900,000 EUR 1,949,980 2,917 0.0017/10/2008 EUR 22,652,530 AUD 39,730,000 385,838 0.0717/10/2008 EUR 589,369 AUD 1,040,000 6,500 0.0017/12/2008 EUR 2,337,003 CAD 3,545,000 (35,104) (0.01)27/01/2009 EUR 1,085,596 CAD 1,630,000 (5,490) 0.0017/10/2008 EUR 5,813,476 CAD 8,830,000 (94,601) (0.02)17/10/2008 EUR 1,838,127 CHF 2,900,000 (3,023) 0.0017/10/2008 EUR 6,741,897 CZK 163,730,000 66,577 0.0117/12/2008 EUR 8,448,037 GBP 6,782,000 (149,816) (0.03)17/12/2008 EUR 1,846,717 GBP 1,472,000 (19,405) 0.0017/12/2008 EUR 561,784 GBP 446,000 (3,631) 0.0017/10/2008 EUR 412,934 GBP 330,000 (5,691) 0.0017/10/2008 EUR 1,964,749 HKD 22,040,000 (53,523) (0.01)17/10/2008 EUR 8,627,397 HUF 2,084,700,000 32,508 0.0117/10/2008 EUR 119,450 HUF 28,680,000 1,207 0.0017/10/2008 EUR 1,802,184 ISK 238,000,000 203,946 0.0417/10/2008 EUR 394,847 JPY 58,200,000 4,231 0.0017/12/2008 EUR 19,545,859 JPY 2,941,300,000 (317,969) (0.06)17/12/2008 EUR 11,730,736 JPY 1,770,500,000 (226,191) (0.04)17/10/2008 EUR 2,149,946 JPY 325,250,000 (33,004) (0.01)17/10/2008 EUR 7,496,848 MXN 118,930,000 (182,794) (0.04)17/10/2008 EUR 14,948,670 NOK 123,390,000 127,412 0.0217/10/2008 EUR 596,907 NOK 4,940,000 3,528 0.0017/10/2008 EUR 31,459,795 NZD 67,700,000 (624,003) (0.12)17/10/2008 EUR 1,190,532 NZD 2,540,000 (13,203) 0.0017/10/2008 EUR 20,336,026 PLN 67,600,000 416,937 0.08
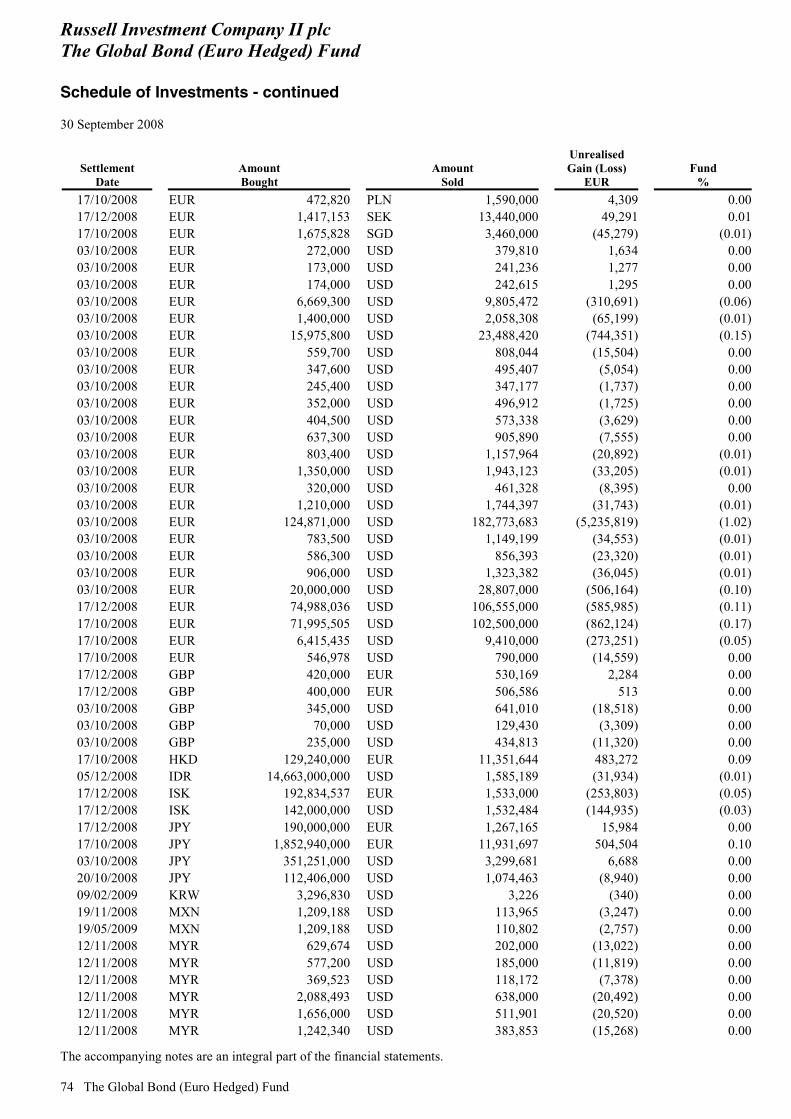
Russell Investment Company II plc The Global Bond (Euro Hedged) Fund Schedule of Investments - continued 30 September 2008
The accompanying notes are an integral part of the financial statements. 74 The Global Bond (Euro Hedged) Fund
Settlement Date
Amount Bought
Amount Sold
Unrealised Gain (Loss)
EUR Fund
% 17/10/2008 EUR 472,820 PLN 1,590,000 4,309 0.0017/12/2008 EUR 1,417,153 SEK 13,440,000 49,291 0.0117/10/2008 EUR 1,675,828 SGD 3,460,000 (45,279) (0.01)03/10/2008 EUR 272,000 USD 379,810 1,634 0.0003/10/2008 EUR 173,000 USD 241,236 1,277 0.0003/10/2008 EUR 174,000 USD 242,615 1,295 0.0003/10/2008 EUR 6,669,300 USD 9,805,472 (310,691) (0.06)03/10/2008 EUR 1,400,000 USD 2,058,308 (65,199) (0.01)03/10/2008 EUR 15,975,800 USD 23,488,420 (744,351) (0.15)03/10/2008 EUR 559,700 USD 808,044 (15,504) 0.0003/10/2008 EUR 347,600 USD 495,407 (5,054) 0.0003/10/2008 EUR 245,400 USD 347,177 (1,737) 0.0003/10/2008 EUR 352,000 USD 496,912 (1,725) 0.0003/10/2008 EUR 404,500 USD 573,338 (3,629) 0.0003/10/2008 EUR 637,300 USD 905,890 (7,555) 0.0003/10/2008 EUR 803,400 USD 1,157,964 (20,892) (0.01)03/10/2008 EUR 1,350,000 USD 1,943,123 (33,205) (0.01)03/10/2008 EUR 320,000 USD 461,328 (8,395) 0.0003/10/2008 EUR 1,210,000 USD 1,744,397 (31,743) (0.01)03/10/2008 EUR 124,871,000 USD 182,773,683 (5,235,819) (1.02)03/10/2008 EUR 783,500 USD 1,149,199 (34,553) (0.01)03/10/2008 EUR 586,300 USD 856,393 (23,320) (0.01)03/10/2008 EUR 906,000 USD 1,323,382 (36,045) (0.01)03/10/2008 EUR 20,000,000 USD 28,807,000 (506,164) (0.10)17/12/2008 EUR 74,988,036 USD 106,555,000 (585,985) (0.11)17/10/2008 EUR 71,995,505 USD 102,500,000 (862,124) (0.17)17/10/2008 EUR 6,415,435 USD 9,410,000 (273,251) (0.05)17/10/2008 EUR 546,978 USD 790,000 (14,559) 0.0017/12/2008 GBP 420,000 EUR 530,169 2,284 0.0017/12/2008 GBP 400,000 EUR 506,586 513 0.0003/10/2008 GBP 345,000 USD 641,010 (18,518) 0.0003/10/2008 GBP 70,000 USD 129,430 (3,309) 0.0003/10/2008 GBP 235,000 USD 434,813 (11,320) 0.0017/10/2008 HKD 129,240,000 EUR 11,351,644 483,272 0.0905/12/2008 IDR 14,663,000,000 USD 1,585,189 (31,934) (0.01)17/12/2008 ISK 192,834,537 EUR 1,533,000 (253,803) (0.05)17/12/2008 ISK 142,000,000 USD 1,532,484 (144,935) (0.03)17/12/2008 JPY 190,000,000 EUR 1,267,165 15,984 0.0017/10/2008 JPY 1,852,940,000 EUR 11,931,697 504,504 0.1003/10/2008 JPY 351,251,000 USD 3,299,681 6,688 0.0020/10/2008 JPY 112,406,000 USD 1,074,463 (8,940) 0.0009/02/2009 KRW 3,296,830 USD 3,226 (340) 0.0019/11/2008 MXN 1,209,188 USD 113,965 (3,247) 0.0019/05/2009 MXN 1,209,188 USD 110,802 (2,757) 0.0012/11/2008 MYR 629,674 USD 202,000 (13,022) 0.0012/11/2008 MYR 577,200 USD 185,000 (11,819) 0.0012/11/2008 MYR 369,523 USD 118,172 (7,378) 0.0012/11/2008 MYR 2,088,493 USD 638,000 (20,492) 0.0012/11/2008 MYR 1,656,000 USD 511,901 (20,520) 0.0012/11/2008 MYR 1,242,340 USD 383,853 (15,268) 0.00
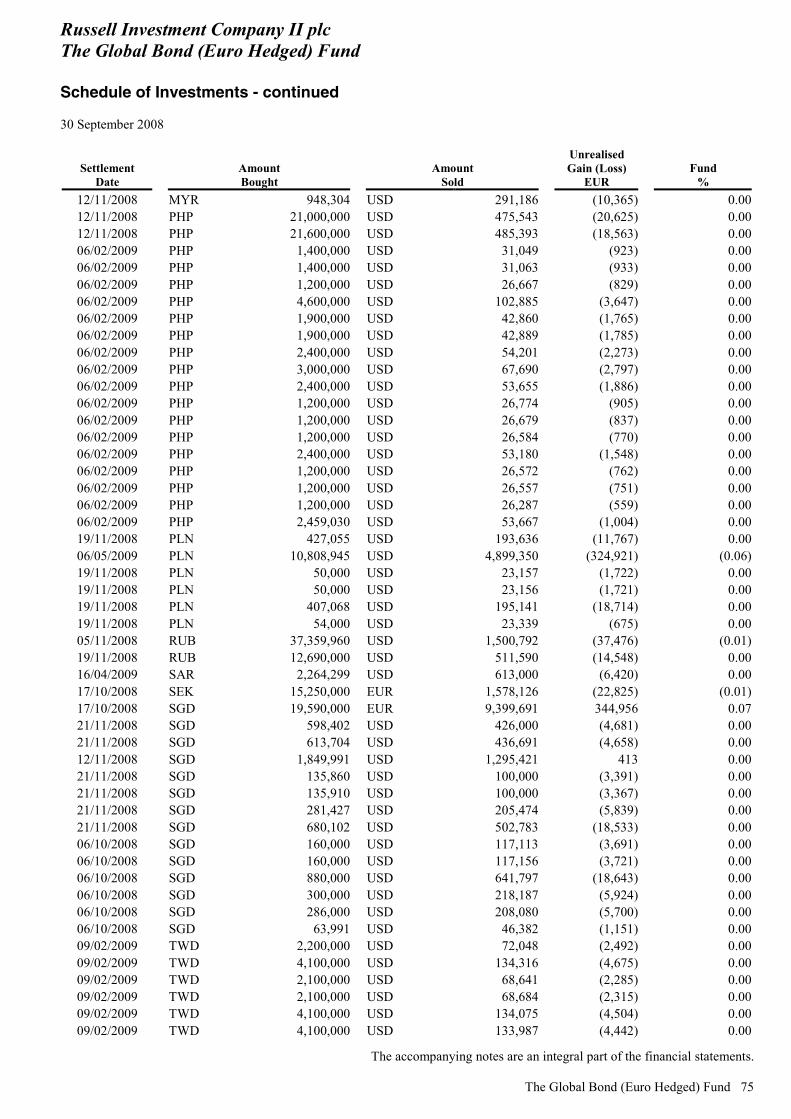
Russell Investment Company II plc The Global Bond (Euro Hedged) Fund Schedule of Investments - continued 30 September 2008
The accompanying notes are an integral part of the financial statements.
The Global Bond (Euro Hedged) Fund 75
Settlement Date
Amount Bought
Amount Sold
Unrealised Gain (Loss)
EUR Fund
% 12/11/2008 MYR 948,304 USD 291,186 (10,365) 0.0012/11/2008 PHP 21,000,000 USD 475,543 (20,625) 0.0012/11/2008 PHP 21,600,000 USD 485,393 (18,563) 0.0006/02/2009 PHP 1,400,000 USD 31,049 (923) 0.0006/02/2009 PHP 1,400,000 USD 31,063 (933) 0.0006/02/2009 PHP 1,200,000 USD 26,667 (829) 0.0006/02/2009 PHP 4,600,000 USD 102,885 (3,647) 0.0006/02/2009 PHP 1,900,000 USD 42,860 (1,765) 0.0006/02/2009 PHP 1,900,000 USD 42,889 (1,785) 0.0006/02/2009 PHP 2,400,000 USD 54,201 (2,273) 0.0006/02/2009 PHP 3,000,000 USD 67,690 (2,797) 0.0006/02/2009 PHP 2,400,000 USD 53,655 (1,886) 0.0006/02/2009 PHP 1,200,000 USD 26,774 (905) 0.0006/02/2009 PHP 1,200,000 USD 26,679 (837) 0.0006/02/2009 PHP 1,200,000 USD 26,584 (770) 0.0006/02/2009 PHP 2,400,000 USD 53,180 (1,548) 0.0006/02/2009 PHP 1,200,000 USD 26,572 (762) 0.0006/02/2009 PHP 1,200,000 USD 26,557 (751) 0.0006/02/2009 PHP 1,200,000 USD 26,287 (559) 0.0006/02/2009 PHP 2,459,030 USD 53,667 (1,004) 0.0019/11/2008 PLN 427,055 USD 193,636 (11,767) 0.0006/05/2009 PLN 10,808,945 USD 4,899,350 (324,921) (0.06)19/11/2008 PLN 50,000 USD 23,157 (1,722) 0.0019/11/2008 PLN 50,000 USD 23,156 (1,721) 0.0019/11/2008 PLN 407,068 USD 195,141 (18,714) 0.0019/11/2008 PLN 54,000 USD 23,339 (675) 0.0005/11/2008 RUB 37,359,960 USD 1,500,792 (37,476) (0.01)19/11/2008 RUB 12,690,000 USD 511,590 (14,548) 0.0016/04/2009 SAR 2,264,299 USD 613,000 (6,420) 0.0017/10/2008 SEK 15,250,000 EUR 1,578,126 (22,825) (0.01)17/10/2008 SGD 19,590,000 EUR 9,399,691 344,956 0.0721/11/2008 SGD 598,402 USD 426,000 (4,681) 0.0021/11/2008 SGD 613,704 USD 436,691 (4,658) 0.0012/11/2008 SGD 1,849,991 USD 1,295,421 413 0.0021/11/2008 SGD 135,860 USD 100,000 (3,391) 0.0021/11/2008 SGD 135,910 USD 100,000 (3,367) 0.0021/11/2008 SGD 281,427 USD 205,474 (5,839) 0.0021/11/2008 SGD 680,102 USD 502,783 (18,533) 0.0006/10/2008 SGD 160,000 USD 117,113 (3,691) 0.0006/10/2008 SGD 160,000 USD 117,156 (3,721) 0.0006/10/2008 SGD 880,000 USD 641,797 (18,643) 0.0006/10/2008 SGD 300,000 USD 218,187 (5,924) 0.0006/10/2008 SGD 286,000 USD 208,080 (5,700) 0.0006/10/2008 SGD 63,991 USD 46,382 (1,151) 0.0009/02/2009 TWD 2,200,000 USD 72,048 (2,492) 0.0009/02/2009 TWD 4,100,000 USD 134,316 (4,675) 0.0009/02/2009 TWD 2,100,000 USD 68,641 (2,285) 0.0009/02/2009 TWD 2,100,000 USD 68,684 (2,315) 0.0009/02/2009 TWD 4,100,000 USD 134,075 (4,504) 0.0009/02/2009 TWD 4,100,000 USD 133,987 (4,442) 0.00
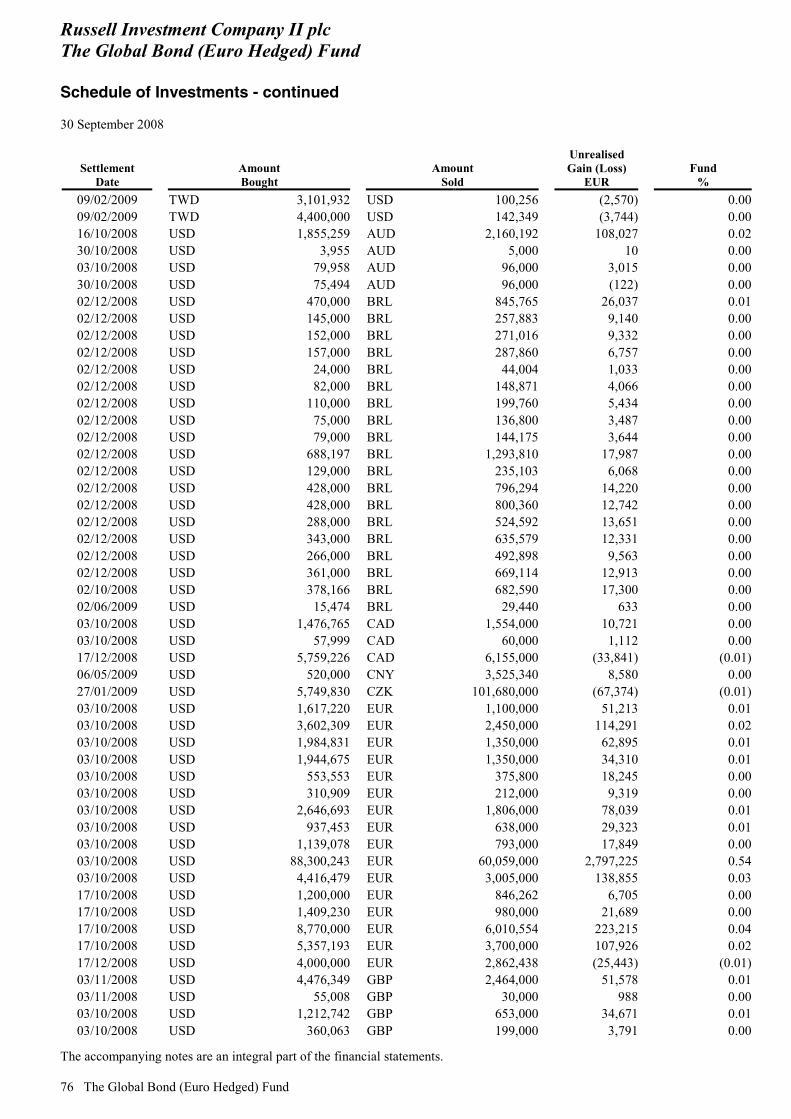
Russell Investment Company II plc The Global Bond (Euro Hedged) Fund Schedule of Investments - continued 30 September 2008
The accompanying notes are an integral part of the financial statements. 76 The Global Bond (Euro Hedged) Fund
Settlement Date
Amount Bought
Amount Sold
Unrealised Gain (Loss)
EUR Fund
% 09/02/2009 TWD 3,101,932 USD 100,256 (2,570) 0.0009/02/2009 TWD 4,400,000 USD 142,349 (3,744) 0.0016/10/2008 USD 1,855,259 AUD 2,160,192 108,027 0.0230/10/2008 USD 3,955 AUD 5,000 10 0.0003/10/2008 USD 79,958 AUD 96,000 3,015 0.0030/10/2008 USD 75,494 AUD 96,000 (122) 0.0002/12/2008 USD 470,000 BRL 845,765 26,037 0.0102/12/2008 USD 145,000 BRL 257,883 9,140 0.0002/12/2008 USD 152,000 BRL 271,016 9,332 0.0002/12/2008 USD 157,000 BRL 287,860 6,757 0.0002/12/2008 USD 24,000 BRL 44,004 1,033 0.0002/12/2008 USD 82,000 BRL 148,871 4,066 0.0002/12/2008 USD 110,000 BRL 199,760 5,434 0.0002/12/2008 USD 75,000 BRL 136,800 3,487 0.0002/12/2008 USD 79,000 BRL 144,175 3,644 0.0002/12/2008 USD 688,197 BRL 1,293,810 17,987 0.0002/12/2008 USD 129,000 BRL 235,103 6,068 0.0002/12/2008 USD 428,000 BRL 796,294 14,220 0.0002/12/2008 USD 428,000 BRL 800,360 12,742 0.0002/12/2008 USD 288,000 BRL 524,592 13,651 0.0002/12/2008 USD 343,000 BRL 635,579 12,331 0.0002/12/2008 USD 266,000 BRL 492,898 9,563 0.0002/12/2008 USD 361,000 BRL 669,114 12,913 0.0002/10/2008 USD 378,166 BRL 682,590 17,300 0.0002/06/2009 USD 15,474 BRL 29,440 633 0.0003/10/2008 USD 1,476,765 CAD 1,554,000 10,721 0.0003/10/2008 USD 57,999 CAD 60,000 1,112 0.0017/12/2008 USD 5,759,226 CAD 6,155,000 (33,841) (0.01)06/05/2009 USD 520,000 CNY 3,525,340 8,580 0.0027/01/2009 USD 5,749,830 CZK 101,680,000 (67,374) (0.01)03/10/2008 USD 1,617,220 EUR 1,100,000 51,213 0.0103/10/2008 USD 3,602,309 EUR 2,450,000 114,291 0.0203/10/2008 USD 1,984,831 EUR 1,350,000 62,895 0.0103/10/2008 USD 1,944,675 EUR 1,350,000 34,310 0.0103/10/2008 USD 553,553 EUR 375,800 18,245 0.0003/10/2008 USD 310,909 EUR 212,000 9,319 0.0003/10/2008 USD 2,646,693 EUR 1,806,000 78,039 0.0103/10/2008 USD 937,453 EUR 638,000 29,323 0.0103/10/2008 USD 1,139,078 EUR 793,000 17,849 0.0003/10/2008 USD 88,300,243 EUR 60,059,000 2,797,225 0.5403/10/2008 USD 4,416,479 EUR 3,005,000 138,855 0.0317/10/2008 USD 1,200,000 EUR 846,262 6,705 0.0017/10/2008 USD 1,409,230 EUR 980,000 21,689 0.0017/10/2008 USD 8,770,000 EUR 6,010,554 223,215 0.0417/10/2008 USD 5,357,193 EUR 3,700,000 107,926 0.0217/12/2008 USD 4,000,000 EUR 2,862,438 (25,443) (0.01)03/11/2008 USD 4,476,349 GBP 2,464,000 51,578 0.0103/11/2008 USD 55,008 GBP 30,000 988 0.0003/10/2008 USD 1,212,742 GBP 653,000 34,671 0.0103/10/2008 USD 360,063 GBP 199,000 3,791 0.00

Russell Investment Company II plc The Global Bond (Euro Hedged) Fund Schedule of Investments - continued 30 September 2008
The accompanying notes are an integral part of the financial statements.
The Global Bond (Euro Hedged) Fund 77
Settlement Date
Amount Bought
Amount Sold
Unrealised Gain (Loss)
EUR Fund
% 17/10/2008 USD 489,186 HKD 3,800,000 (261) 0.0003/10/2008 USD 485,303 JPY 51,140,000 2,507 0.0020/10/2008 USD 11,439,809 JPY 1,236,609,000 (172,128) (0.03)20/10/2008 USD 165,118 JPY 17,631,000 (1,022) 0.0017/12/2008 USD 2,138,242 JPY 230,000,000 (36,740) (0.01)19/11/2008 USD 113,454 MXN 1,209,188 2,884 0.0012/11/2008 USD 431,000 MYR 1,472,943 1,000 0.0012/11/2008 USD 690,000 MYR 2,376,360 (2,184) 0.0009/10/2008 USD 333,014 NZD 476,000 10,924 0.0012/11/2008 USD 795,000 PHP 36,307,650 16,371 0.0012/11/2008 USD 167,000 PHP 7,690,350 2,482 0.0006/05/2009 USD 4,978,731 PLN 11,236,000 256,599 0.0519/11/2008 USD 2,510,000 PLN 5,712,509 100,508 0.0227/01/2009 USD 3,120,847 PLN 7,750,000 (58,651) (0.01)06/05/2009 USD 415,985 RUB 10,103,653 22,893 0.0005/11/2008 USD 1,201,000 RUB 29,772,790 33,409 0.0119/11/2008 USD 404,000 RUB 9,990,920 12,320 0.0006/10/2008 USD 2,826,868 SEK 18,728,000 100,095 0.0221/11/2008 USD 1,266,000 SGD 1,783,288 11,457 0.0021/11/2008 USD 553,000 SGD 781,389 3,794 0.0012/11/2008 USD 695,000 SGD 995,032 (1,465) 0.0006/10/2008 USD 1,292,678 SGD 1,849,991 (1,048) 0.0009/02/2009 USD 300,000 TWD 9,333,000 6,564 0.0009/02/2009 USD 420,000 TWD 13,078,800 8,911 0.0027/01/2009 USD 4,030,823 ZAR 33,740,000 42,334 0.0127/01/2009 ZAR 33,740,000 USD 4,118,150 (104,271) (0.02)
Unrealised gain on open forward foreign currency exchange contracts .............................. 7,508,663 1.38Unrealised loss on open forward foreign currency exchange contracts ............................... (12,946,970) (2.44)Net unrealised gain (loss) on open forward foreign currency exchange contracts ...... (5,438,307) (1.06) Open Futures Contracts ((0.04)%)
Notional Amount
EUR
Average Cost Price
EUR
Unrealised Gain (Loss)
EUR Fund
% 2,054,070 96.18 12 of Eurodollar Futures
Long Futures Contracts Expiring March 2010 ............................................ 4,805 0.00
28,682,439 96.50 167 of Eurodollar Futures Long Futures Contracts Expiring December 2009 ...................................... 17,807 0.00
1,662,325 94.99 7 of Euribor Futures Long Futures Contracts Expiring December 2008 ...................................... - 0.00
42,154,370 95.26 177 of Euribor Futures Long Futures Contracts Expiring March 2009 ............................................ 139,780 0.03
9,534,928 95.35 40 of Euribor Futures Long Futures Contracts Expiring June 2009 ................................................ 48,572 0.01
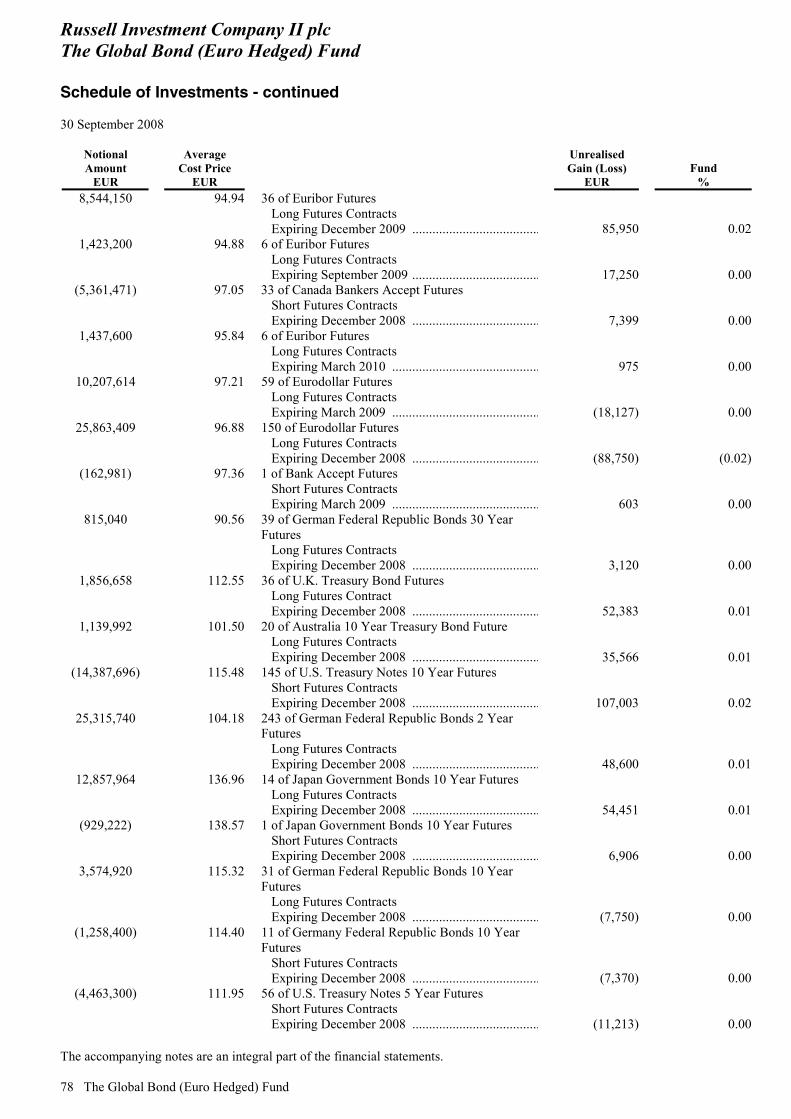
Russell Investment Company II plc The Global Bond (Euro Hedged) Fund Schedule of Investments - continued 30 September 2008
The accompanying notes are an integral part of the financial statements. 78 The Global Bond (Euro Hedged) Fund
Notional Amount
EUR
Average Cost Price
EUR
Unrealised Gain (Loss)
EUR Fund
% 8,544,150 94.94 36 of Euribor Futures
Long Futures Contracts Expiring December 2009 ...................................... 85,950 0.02
1,423,200 94.88 6 of Euribor Futures Long Futures Contracts Expiring September 2009 ...................................... 17,250 0.00
(5,361,471) 97.05 33 of Canada Bankers Accept Futures Short Futures Contracts Expiring December 2008 ...................................... 7,399 0.00
1,437,600 95.84 6 of Euribor Futures Long Futures Contracts Expiring March 2010 ............................................ 975 0.00
10,207,614 97.21 59 of Eurodollar Futures Long Futures Contracts Expiring March 2009 ............................................ (18,127) 0.00
25,863,409 96.88 150 of Eurodollar Futures Long Futures Contracts Expiring December 2008 ...................................... (88,750) (0.02)
(162,981) 97.36 1 of Bank Accept Futures Short Futures Contracts Expiring March 2009 ............................................ 603 0.00
815,040 90.56 39 of German Federal Republic Bonds 30 Year Futures Long Futures Contracts Expiring December 2008 ...................................... 3,120 0.00
1,856,658 112.55 36 of U.K. Treasury Bond Futures Long Futures Contract Expiring December 2008 ...................................... 52,383 0.01
1,139,992 101.50 20 of Australia 10 Year Treasury Bond Future Long Futures Contracts Expiring December 2008 ...................................... 35,566 0.01
(14,387,696) 115.48 145 of U.S. Treasury Notes 10 Year Futures Short Futures Contracts Expiring December 2008 ...................................... 107,003 0.02
25,315,740 104.18 243 of German Federal Republic Bonds 2 Year Futures Long Futures Contracts Expiring December 2008 ...................................... 48,600 0.01
12,857,964 136.96 14 of Japan Government Bonds 10 Year Futures Long Futures Contracts Expiring December 2008 ...................................... 54,451 0.01
(929,222) 138.57 1 of Japan Government Bonds 10 Year Futures Short Futures Contracts Expiring December 2008 ...................................... 6,906 0.00
3,574,920 115.32 31 of German Federal Republic Bonds 10 Year Futures Long Futures Contracts Expiring December 2008 ...................................... (7,750) 0.00
(1,258,400) 114.40 11 of Germany Federal Republic Bonds 10 Year Futures Short Futures Contracts Expiring December 2008 ...................................... (7,370) 0.00
(4,463,300) 111.95 56 of U.S. Treasury Notes 5 Year Futures Short Futures Contracts Expiring December 2008 ...................................... (11,213) 0.00
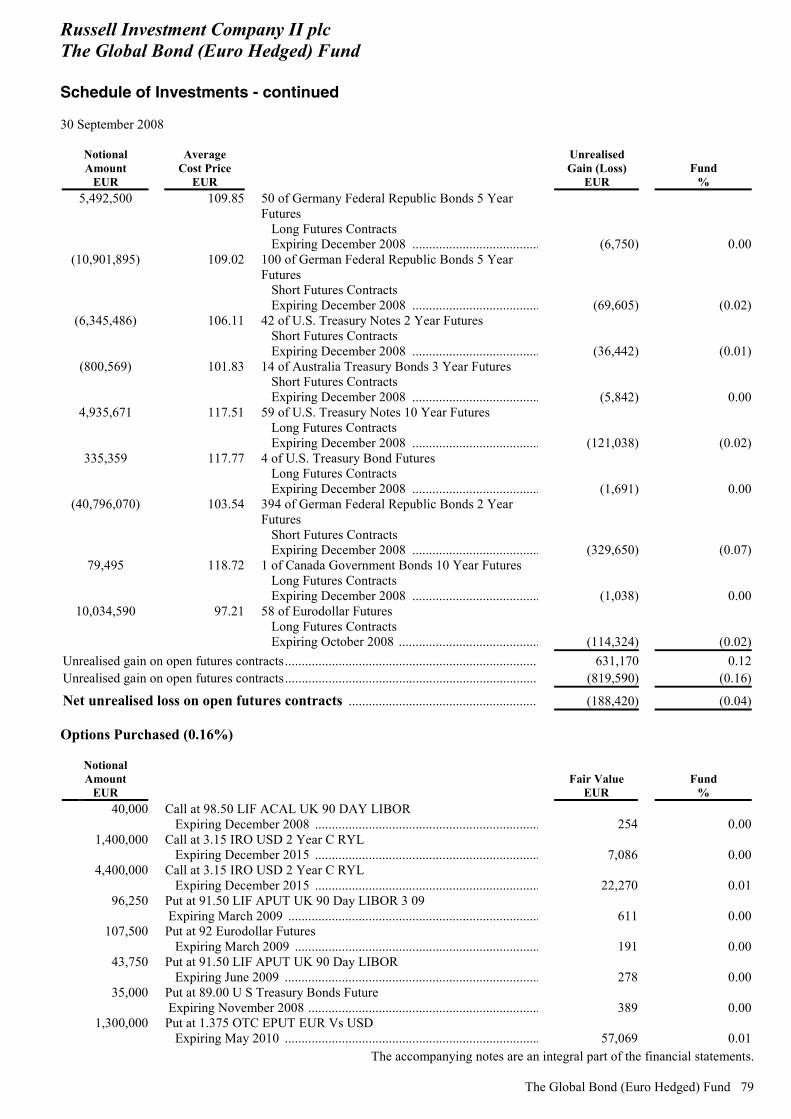
Russell Investment Company II plc The Global Bond (Euro Hedged) Fund Schedule of Investments - continued 30 September 2008
The accompanying notes are an integral part of the financial statements.
The Global Bond (Euro Hedged) Fund 79
Notional Amount
EUR
Average Cost Price
EUR
Unrealised Gain (Loss)
EUR Fund
% 5,492,500 109.85 50 of Germany Federal Republic Bonds 5 Year
Futures Long Futures Contracts Expiring December 2008 ...................................... (6,750) 0.00
(10,901,895) 109.02 100 of German Federal Republic Bonds 5 Year Futures Short Futures Contracts Expiring December 2008 ...................................... (69,605) (0.02)
(6,345,486) 106.11 42 of U.S. Treasury Notes 2 Year Futures Short Futures Contracts Expiring December 2008 ...................................... (36,442) (0.01)
(800,569) 101.83 14 of Australia Treasury Bonds 3 Year Futures Short Futures Contracts Expiring December 2008 ...................................... (5,842) 0.00
4,935,671 117.51 59 of U.S. Treasury Notes 10 Year Futures Long Futures Contracts Expiring December 2008 ...................................... (121,038) (0.02)
335,359 117.77 4 of U.S. Treasury Bond Futures Long Futures Contracts Expiring December 2008 ...................................... (1,691) 0.00
(40,796,070) 103.54 394 of German Federal Republic Bonds 2 Year Futures Short Futures Contracts Expiring December 2008 ...................................... (329,650) (0.07)
79,495 118.72 1 of Canada Government Bonds 10 Year Futures Long Futures Contracts Expiring December 2008 ...................................... (1,038) 0.00
10,034,590 97.21 58 of Eurodollar Futures Long Futures Contracts Expiring October 2008 .......................................... (114,324) (0.02)
Unrealised gain on open futures contracts........................................................................... 631,170 0.12Unrealised gain on open futures contracts........................................................................... (819,590) (0.16)
Net unrealised loss on open futures contracts ........................................................ (188,420) (0.04) Options Purchased (0.16%)
Notional Amount
EUR Fair Value
EUR Fund
%
40,000 Call at 98.50 LIF ACAL UK 90 DAY LIBOR
Expiring December 2008 ................................................................... 254 0.00
1,400,000 Call at 3.15 IRO USD 2 Year C RYL
Expiring December 2015 ................................................................... 7,086 0.00
4,400,000 Call at 3.15 IRO USD 2 Year C RYL
Expiring December 2015 ................................................................... 22,270 0.01
96,250 Put at 91.50 LIF APUT UK 90 Day LIBOR 3 09
Expiring March 2009 ........................................................................... 611 0.00
107,500 Put at 92 Eurodollar Futures
Expiring March 2009 ......................................................................... 191 0.00
43,750 Put at 91.50 LIF APUT UK 90 Day LIBOR
Expiring June 2009 ............................................................................ 278 0.00
35,000 Put at 89.00 U S Treasury Bonds Future
Expiring November 2008 ..................................................................... 389 0.00
1,300,000 Put at 1.375 OTC EPUT EUR Vs USD
Expiring May 2010 ............................................................................ 57,069 0.01
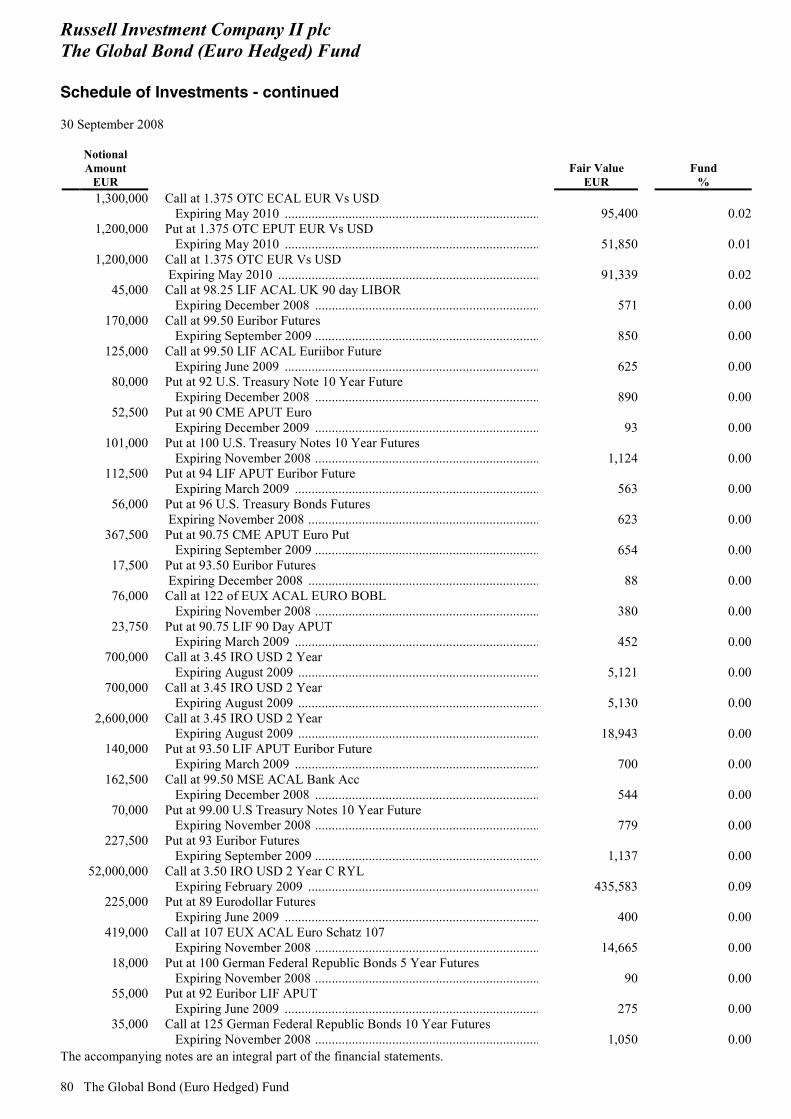
Russell Investment Company II plc The Global Bond (Euro Hedged) Fund Schedule of Investments - continued 30 September 2008
The accompanying notes are an integral part of the financial statements. 80 The Global Bond (Euro Hedged) Fund
Notional Amount
EUR Fair Value
EUR Fund
%
1,300,000 Call at 1.375 OTC ECAL EUR Vs USD
Expiring May 2010 ............................................................................ 95,400 0.02
1,200,000 Put at 1.375 OTC EPUT EUR Vs USD
Expiring May 2010 ............................................................................ 51,850 0.01
1,200,000 Call at 1.375 OTC EUR Vs USD
Expiring May 2010 .............................................................................. 91,339 0.02
45,000 Call at 98.25 LIF ACAL UK 90 day LIBOR
Expiring December 2008 ................................................................... 571 0.00
170,000 Call at 99.50 Euribor Futures
Expiring September 2009 ................................................................... 850 0.00
125,000 Call at 99.50 LIF ACAL Euriibor Future
Expiring June 2009 ............................................................................ 625 0.00
80,000 Put at 92 U.S. Treasury Note 10 Year Future
Expiring December 2008 ................................................................... 890 0.00
52,500 Put at 90 CME APUT Euro
Expiring December 2009 ................................................................... 93 0.00
101,000 Put at 100 U.S. Treasury Notes 10 Year Futures
Expiring November 2008 ................................................................... 1,124 0.00
112,500 Put at 94 LIF APUT Euribor Future
Expiring March 2009 ......................................................................... 563 0.00
56,000 Put at 96 U.S. Treasury Bonds Futures
Expiring November 2008 ..................................................................... 623 0.00
367,500 Put at 90.75 CME APUT Euro Put
Expiring September 2009 ................................................................... 654 0.00
17,500 Put at 93.50 Euribor Futures
Expiring December 2008 ..................................................................... 88 0.00
76,000 Call at 122 of EUX ACAL EURO BOBL
Expiring November 2008 ................................................................... 380 0.00
23,750 Put at 90.75 LIF 90 Day APUT
Expiring March 2009 ......................................................................... 452 0.00
700,000 Call at 3.45 IRO USD 2 Year
Expiring August 2009 ........................................................................ 5,121 0.00
700,000 Call at 3.45 IRO USD 2 Year
Expiring August 2009 ........................................................................ 5,130 0.00
2,600,000 Call at 3.45 IRO USD 2 Year
Expiring August 2009 ........................................................................ 18,943 0.00
140,000 Put at 93.50 LIF APUT Euribor Future
Expiring March 2009 ......................................................................... 700 0.00
162,500 Call at 99.50 MSE ACAL Bank Acc
Expiring December 2008 ................................................................... 544 0.00
70,000 Put at 99.00 U.S Treasury Notes 10 Year Future
Expiring November 2008 ................................................................... 779 0.00
227,500 Put at 93 Euribor Futures
Expiring September 2009 ................................................................... 1,137 0.00
52,000,000 Call at 3.50 IRO USD 2 Year C RYL
Expiring February 2009 ..................................................................... 435,583 0.09
225,000 Put at 89 Eurodollar Futures
Expiring June 2009 ............................................................................ 400 0.00
419,000 Call at 107 EUX ACAL Euro Schatz 107
Expiring November 2008 ................................................................... 14,665 0.00
18,000 Put at 100 German Federal Republic Bonds 5 Year Futures
Expiring November 2008 ................................................................... 90 0.00
55,000 Put at 92 Euribor LIF APUT
Expiring June 2009 ............................................................................ 275 0.00
35,000 Call at 125 German Federal Republic Bonds 10 Year Futures
Expiring November 2008 ................................................................... 1,050 0.00
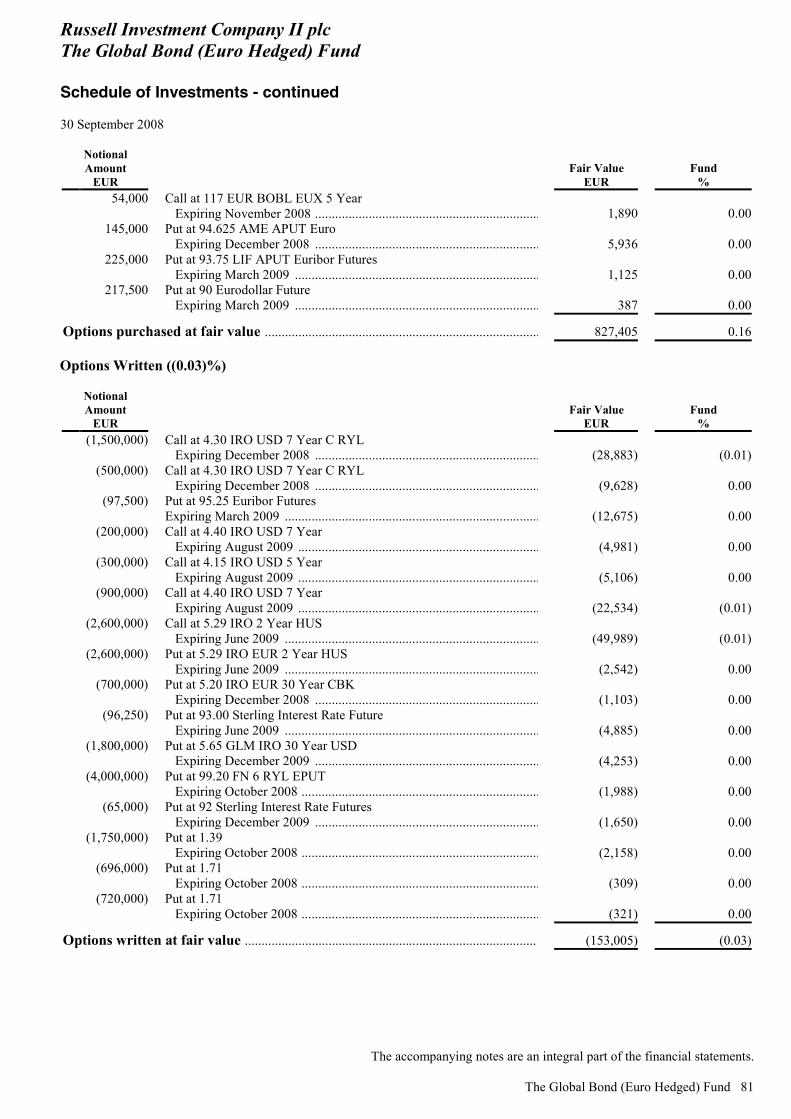
Russell Investment Company II plc The Global Bond (Euro Hedged) Fund Schedule of Investments - continued 30 September 2008
The accompanying notes are an integral part of the financial statements.
The Global Bond (Euro Hedged) Fund 81
Notional Amount
EUR Fair Value
EUR Fund
%
54,000 Call at 117 EUR BOBL EUX 5 Year
Expiring November 2008 ................................................................... 1,890 0.00
145,000 Put at 94.625 AME APUT Euro
Expiring December 2008 ................................................................... 5,936 0.00
225,000 Put at 93.75 LIF APUT Euribor Futures
Expiring March 2009 ......................................................................... 1,125 0.00
217,500 Put at 90 Eurodollar Future
Expiring March 2009 ......................................................................... 387 0.00
Options purchased at fair value .................................................................................. 827,405 0.16 Options Written ((0.03)%)
Notional Amount
EUR Fair Value
EUR Fund
%
(1,500,000) Call at 4.30 IRO USD 7 Year C RYL
Expiring December 2008 ................................................................... (28,883) (0.01)
(500,000) Call at 4.30 IRO USD 7 Year C RYL
Expiring December 2008 ................................................................... (9,628) 0.00
(97,500) Put at 95.25 Euribor Futures
Expiring March 2009 ............................................................................ (12,675) 0.00
(200,000) Call at 4.40 IRO USD 7 Year
Expiring August 2009 ........................................................................ (4,981) 0.00
(300,000) Call at 4.15 IRO USD 5 Year
Expiring August 2009 ........................................................................ (5,106) 0.00
(900,000) Call at 4.40 IRO USD 7 Year
Expiring August 2009 ........................................................................ (22,534) (0.01)
(2,600,000) Call at 5.29 IRO 2 Year HUS
Expiring June 2009 ............................................................................ (49,989) (0.01)
(2,600,000) Put at 5.29 IRO EUR 2 Year HUS
Expiring June 2009 ............................................................................ (2,542) 0.00
(700,000) Put at 5.20 IRO EUR 30 Year CBK
Expiring December 2008 ................................................................... (1,103) 0.00
(96,250) Put at 93.00 Sterling Interest Rate Future
Expiring June 2009 ............................................................................ (4,885) 0.00
(1,800,000) Put at 5.65 GLM IRO 30 Year USD
Expiring December 2009 ................................................................... (4,253) 0.00
(4,000,000) Put at 99.20 FN 6 RYL EPUT
Expiring October 2008 ....................................................................... (1,988) 0.00
(65,000) Put at 92 Sterling Interest Rate Futures
Expiring December 2009 ................................................................... (1,650) 0.00
(1,750,000) Put at 1.39
Expiring October 2008 ....................................................................... (2,158) 0.00
(696,000) Put at 1.71
Expiring October 2008 ....................................................................... (309) 0.00
(720,000) Put at 1.71
Expiring October 2008 ....................................................................... (321) 0.00
Options written at fair value ........................................................................................ (153,005) (0.03)
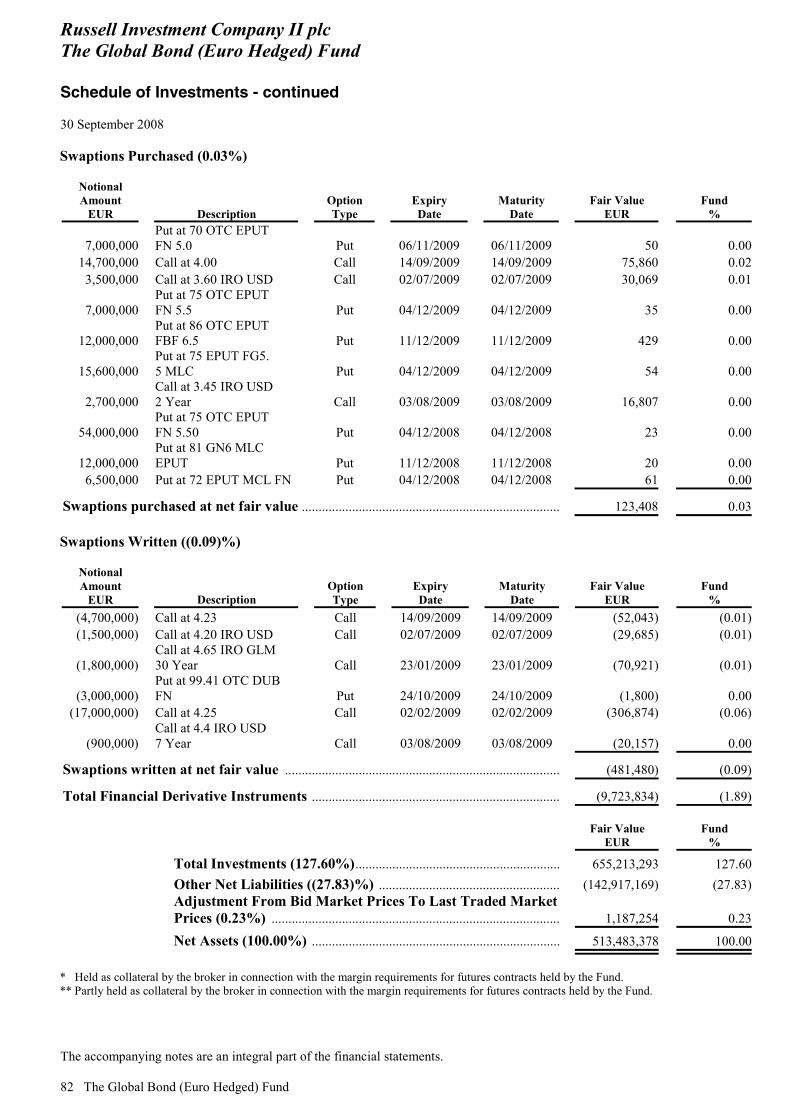
Russell Investment Company II plc The Global Bond (Euro Hedged) Fund Schedule of Investments - continued 30 September 2008
The accompanying notes are an integral part of the financial statements. 82 The Global Bond (Euro Hedged) Fund
Swaptions Purchased (0.03%)
Notional Amount
EUR Description OptionType
Expiry Date
Maturity Date
Fair Value EUR
Fund %
7,000,000Put at 70 OTC EPUT FN 5.0 Put 06/11/2009 06/11/2009 50 0.00
14,700,000 Call at 4.00 Call 14/09/2009 14/09/2009 75,860 0.023,500,000 Call at 3.60 IRO USD Call 02/07/2009 02/07/2009 30,069 0.01
7,000,000Put at 75 OTC EPUT FN 5.5 Put 04/12/2009 04/12/2009 35 0.00
12,000,000Put at 86 OTC EPUT FBF 6.5 Put 11/12/2009 11/12/2009 429 0.00
15,600,000Put at 75 EPUT FG5. 5 MLC Put 04/12/2009 04/12/2009 54 0.00
2,700,000Call at 3.45 IRO USD 2 Year Call 03/08/2009 03/08/2009 16,807 0.00
54,000,000Put at 75 OTC EPUT FN 5.50 Put 04/12/2008 04/12/2008 23 0.00
12,000,000Put at 81 GN6 MLC EPUT Put 11/12/2008 11/12/2008 20 0.00
6,500,000 Put at 72 EPUT MCL FN Put 04/12/2008 04/12/2008 61 0.00
Swaptions purchased at net fair value ............................................................................. 123,408 0.03 Swaptions Written ((0.09)%)
Notional Amount
EUR Description Option Type
Expiry Date
Maturity Date
Fair Value EUR
Fund %
(4,700,000) Call at 4.23 Call 14/09/2009 14/09/2009 (52,043) (0.01)(1,500,000) Call at 4.20 IRO USD Call 02/07/2009 02/07/2009 (29,685) (0.01)
(1,800,000)Call at 4.65 IRO GLM 30 Year Call 23/01/2009 23/01/2009 (70,921) (0.01)
(3,000,000)Put at 99.41 OTC DUB FN Put 24/10/2009 24/10/2009 (1,800) 0.00
(17,000,000) Call at 4.25 Call 02/02/2009 02/02/2009 (306,874) (0.06)
(900,000)Call at 4.4 IRO USD 7 Year Call 03/08/2009 03/08/2009 (20,157) 0.00
Swaptions written at net fair value .................................................................................. (481,480) (0.09)
Total Financial Derivative Instruments .......................................................................... (9,723,834) (1.89)
Fair Value
EUR Fund
%
Total Investments (127.60%)............................................................. 655,213,293 127.60Other Net Liabilities ((27.83)%) ...................................................... (142,917,169) (27.83)Adjustment From Bid Market Prices To Last Traded Market Prices (0.23%) ...................................................................................... 1,187,254 0.23
Net Assets (100.00%) .......................................................................... 513,483,378 100.00 * Held as collateral by the broker in connection with the margin requirements for futures contracts held by the Fund. ** Partly held as collateral by the broker in connection with the margin requirements for futures contracts held by the Fund.
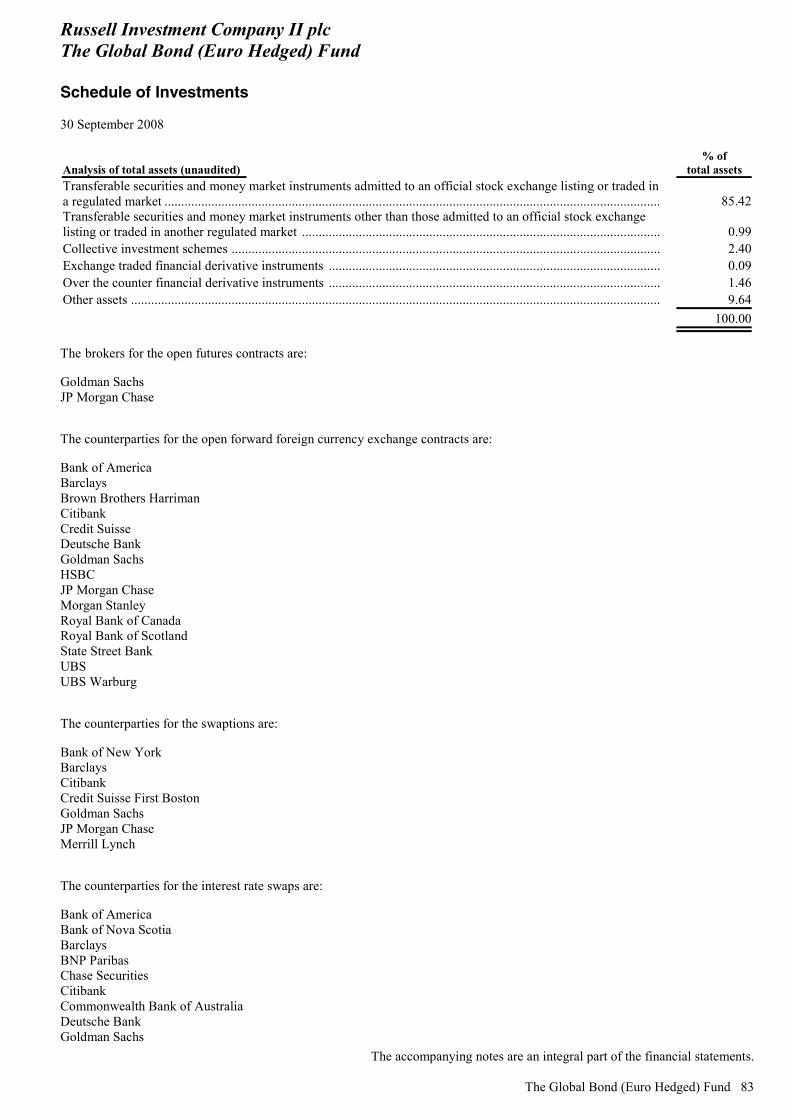
Russell Investment Company II plc The Global Bond (Euro Hedged) Fund Schedule of Investments 30 September 2008
The accompanying notes are an integral part of the financial statements.
The Global Bond (Euro Hedged) Fund 83
Analysis of total assets (unaudited) % of
total assets Transferable securities and money market instruments admitted to an official stock exchange listing or traded in a regulated market .................................................................................................................................................... 85.42Transferable securities and money market instruments other than those admitted to an official stock exchange listing or traded in another regulated market ........................................................................................................... 0.99Collective investment schemes ................................................................................................................................ 2.40Exchange traded financial derivative instruments ................................................................................................... 0.09Over the counter financial derivative instruments ................................................................................................... 1.46Other assets .............................................................................................................................................................. 9.64
100.00 The brokers for the open futures contracts are: Goldman Sachs JP Morgan Chase The counterparties for the open forward foreign currency exchange contracts are: Bank of America Barclays Brown Brothers Harriman Citibank Credit Suisse Deutsche Bank Goldman Sachs HSBC JP Morgan Chase Morgan Stanley Royal Bank of Canada Royal Bank of Scotland State Street Bank UBS UBS Warburg The counterparties for the swaptions are: Bank of New York Barclays Citibank Credit Suisse First Boston Goldman Sachs JP Morgan Chase Merrill Lynch The counterparties for the interest rate swaps are: Bank of America Bank of Nova Scotia Barclays BNP Paribas Chase Securities Citibank Commonwealth Bank of Australia Deutsche Bank Goldman Sachs
Russell Investment Company II plc The Global Bond (Euro Hedged) Fund Schedule of Investments - continued 30 September 2008
The accompanying notes are an integral part of the financial statements. 84 The Global Bond (Euro Hedged) Fund
HSBC JP Morgan Chase Merrill Lynch Morgan Stanley Royal Bank of Canada Royal Bank of Scotland UBS Union Bank of Switzerland Useden Securities The counterparties for the options are: Barclays Chase Securities Citibank Citigroup Credit Suisse Deutsche Bank Goldman Sachs HSBC JP Morgan Chase Merrill Lynch Royal Bank of Scotland The counterparties for the credit default swaps are: Bank of America Barclays Bear Stearns Chase Securities Citibank Citigroup Credit Suisse Deutsche Bank Goldman Sachs HSBC JP Morgan Chase Merrill Lynch Royal Bank of Scotland Société Générale UBS Union Bank of Switzerland Wachovia The proportion of the investments of The Global Bond (Euro Hedged) Fund in rights or securities eligible to the French Plan d’Epargne en Actions (PEA) has been continuously equal to, or greater than, 75 per cent over the elapsed fiscal period ended on 30 September 2008 (unaudited).
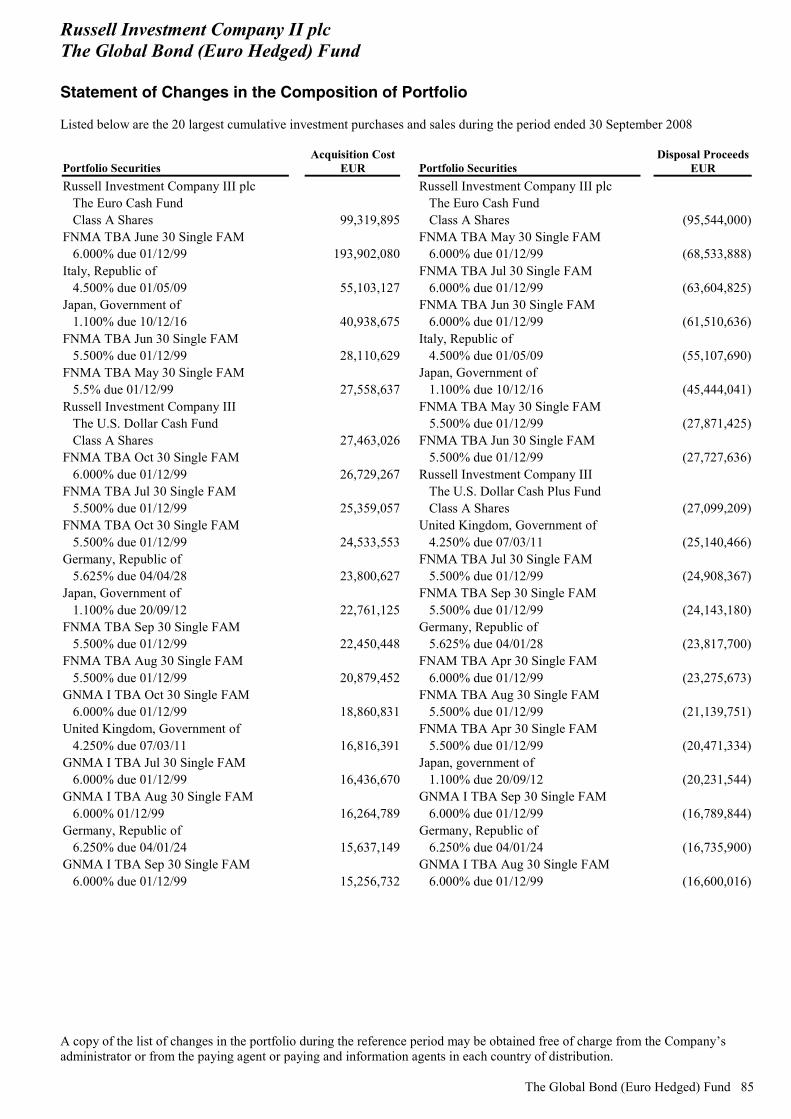
Russell Investment Company II plc The Global Bond (Euro Hedged) Fund Statement of Changes in the Composition of Portfolio Listed below are the 20 largest cumulative investment purchases and sales during the period ended 30 September 2008
A copy of the list of changes in the portfolio during the reference period may be obtained free of charge from the Company’s administrator or from the paying agent or paying and information agents in each country of distribution.
The Global Bond (Euro Hedged) Fund 85
Portfolio Securities Acquisition Cost
EUR Portfolio Securities Disposal Proceeds
EUR Russell Investment Company III plc Russell Investment Company III plc The Euro Cash Fund The Euro Cash Fund Class A Shares 99,319,895 Class A Shares (95,544,000)FNMA TBA June 30 Single FAM FNMA TBA May 30 Single FAM 6.000% due 01/12/99 193,902,080 6.000% due 01/12/99 (68,533,888)Italy, Republic of FNMA TBA Jul 30 Single FAM 4.500% due 01/05/09 55,103,127 6.000% due 01/12/99 (63,604,825)Japan, Government of FNMA TBA Jun 30 Single FAM 1.100% due 10/12/16 40,938,675 6.000% due 01/12/99 (61,510,636)FNMA TBA Jun 30 Single FAM Italy, Republic of 5.500% due 01/12/99 28,110,629 4.500% due 01/05/09 (55,107,690)FNMA TBA May 30 Single FAM Japan, Government of 5.5% due 01/12/99 27,558,637 1.100% due 10/12/16 (45,444,041)Russell Investment Company III FNMA TBA May 30 Single FAM The U.S. Dollar Cash Fund 5.500% due 01/12/99 (27,871,425) Class A Shares 27,463,026 FNMA TBA Jun 30 Single FAM FNMA TBA Oct 30 Single FAM 5.500% due 01/12/99 (27,727,636) 6.000% due 01/12/99 26,729,267 Russell Investment Company III FNMA TBA Jul 30 Single FAM The U.S. Dollar Cash Plus Fund 5.500% due 01/12/99 25,359,057 Class A Shares (27,099,209)FNMA TBA Oct 30 Single FAM United Kingdom, Government of 5.500% due 01/12/99 24,533,553 4.250% due 07/03/11 (25,140,466)Germany, Republic of FNMA TBA Jul 30 Single FAM 5.625% due 04/04/28 23,800,627 5.500% due 01/12/99 (24,908,367)Japan, Government of FNMA TBA Sep 30 Single FAM 1.100% due 20/09/12 22,761,125 5.500% due 01/12/99 (24,143,180)FNMA TBA Sep 30 Single FAM Germany, Republic of 5.500% due 01/12/99 22,450,448 5.625% due 04/01/28 (23,817,700)FNMA TBA Aug 30 Single FAM FNAM TBA Apr 30 Single FAM 5.500% due 01/12/99 20,879,452 6.000% due 01/12/99 (23,275,673)GNMA I TBA Oct 30 Single FAM FNMA TBA Aug 30 Single FAM 6.000% due 01/12/99 18,860,831 5.500% due 01/12/99 (21,139,751)United Kingdom, Government of FNMA TBA Apr 30 Single FAM 4.250% due 07/03/11 16,816,391 5.500% due 01/12/99 (20,471,334)GNMA I TBA Jul 30 Single FAM Japan, government of 6.000% due 01/12/99 16,436,670 1.100% due 20/09/12 (20,231,544)GNMA I TBA Aug 30 Single FAM GNMA I TBA Sep 30 Single FAM 6.000% 01/12/99 16,264,789 6.000% due 01/12/99 (16,789,844)Germany, Republic of Germany, Republic of 6.250% due 04/01/24 15,637,149 6.250% due 04/01/24 (16,735,900)GNMA I TBA Sep 30 Single FAM GNMA I TBA Aug 30 Single FAM 6.000% due 01/12/99 15,256,732 6.000% due 01/12/99 (16,600,016)
Russell Investment Company II plc The Pan European Equity Fund Manager’s Report
86 The Pan European Equity Fund
Money Managers AQR Capital Management Blackrock International Limited Numeric Investors L.P. Pzena Investment Management, LLC RCM (U.K.) Ltd. Sourcecap International, LLC TT International Taube Hodson Stonex Partners Ltd. Investment Objective The Pan European Equity Fund (the “Fund”) will seek to achieve capital appreciation by investing principally in equity securities listed on regulated markets in Europe. At least 75 per cent of the Fund’s net assets will be invested in issuers based in the E.U., Norway and Iceland. The Fund may hold such securities listed or traded on regulated markets worldwide of companies that are not incorporated, listed or traded in Europe, but which receive the majority of their total revenue from European countries. The Fund will not be concentrating on any specific industry sector but will pursue a policy of active stock selection and active country allocation on the regulated markets in which it invests. Fund Performance The Fund returned -16.1 per cent during the period on a gross-of-fees basis verses a benchmark return of -13.9 per cent.* Market Comment The period under review was a difficult period for equity markets globally as the credit crunch maintained its grip on markets. Equity markets fell in the second quarter of 2008 as strong gains in the first half of the quarter evaporated when negative investor sentiment returned. Banks continued to report asset write-downs, which drove the market lower. Bleak economic updates also highlighted the dilemma facing the European Central Bank, which indicated that it may raise rates to combat rising inflation but must also consider the effect that this would have on economic growth. Inflation continued to be driven by the rising price of foodstuffs and commodities, the latter of which benefited the performance of energy and materials stocks. The third quarter of 2008 was an unprecedented period for world equity markets. Following modest gains in August 2008, markets plummeted in September 2008. This was due to a number of extraordinary and historic events such as the bankruptcy of Lehman Brothers, AIG’s rescue by the U.S. government, the part-nationalisation of the banking group Fortis and U.S. congress’s rejection of a USD 700 billion financials bailout plan. Evidently, several financial stocks endured severe sell-offs. However, the financials sector outperformed as it benefited from gains earlier in the quarter. The resilience of stocks believed to be well positioned to weather the market turmoil, such as the French bank BNP Paribas, also positively contributed. The more cyclical sectors, in particular materials and energy, were amongst the worst-performing due to a fall in commodity prices brought on by weakening demand and slowing economic growth. The defensively positioned consumer staples and health care sectors performed well as investors sought protection from the turbulent market. General Comment on Managers The Fund underperformed its benchmark as Numeric Investors L.P. (“Numeric”) and Taube Hodson Stonex Partners Ltd. (“THS”) led returns lower. Quant manager Numeric’s stock selection in the financials and materials sectors was the key driver of underperformance. Notably, an overweight to the U.K. bank HBOS was negative as the stock continued to feel the effects of the subprime crisis and falling house prices. THS’s stock selection in the financials sector hindered performance. In particular, its exposure to Deutsche Postbank was particularly negative for performance as Deutsche Bank abandoned its bid for the company. THS favours specific German financial companies, such as Deutsche Postbank, as it believes they offer good value and growth prospects based on an investment theme which anticipates consumer credit growth in continental Europe. Outlook The Fund remains well positioned to benefit from diverse returns in the coming quarter given its broad allocation of assets. Past performance is no indication of current or future performance. * Benchmark source: MSCI Europe Index

Russell Investment Company II plc The Pan European Equity Fund Balance Sheet As at 30 September 2008
The accompanying notes are an integral part of the financial statements.
The Pan European Equity Fund 87
30 September 2008
EUR
31 March 2008 (Audited)
EUR 30 September 2007
EUR Assets Financial assets at fair value through profit or loss: (Note 1)
Investments at fair value ............................................................ 269,948,398 366,252,910 529,272,172Unrealised gain on open futures contracts ................................. 194,227 1,530,316 1,155,067Unrealised gain on forward foreign currency exchange contracts ..................................................................................... 2,056,473 2,259,416 3,766,176Interest rate swaps at fair value .................................................. - 113,487 14,663
272,199,098 370,156,129 534,208,078 Cash at bank (Note 5) .................................................................... 1,319,825 14,675,211 19,783,985Cash held with brokers for open futures contracts ........................ 2,180,242 367,415 8,087,402Cash held with counterparty for equity swaps ............................... 458,264 1,640,844 -Debtors:
Receivable for investments sold ................................................ 2,018,123 4,151,784 20,180,282Receivable for fund shares issued .............................................. 1 156,632 16,315Dividends receivable .................................................................. 614,062 1,375,646 1,233,863Interest receivable ...................................................................... - 118,590 -
278,789,615 392,642,251 583,509,925Liabilities Financial liabilities at fair value through profit or loss: (Note 1)
Unrealised loss on open futures contracts .................................. (613,634) (430,948) (1,009,970)Unrealised loss on forward foreign currency exchange contracts ..................................................................................... (2,189,734) (2,861,320) (3,467,745)Interest rate swaps at fair value .................................................. - (115,653) (107,492)
(2,803,368) (3,407,921) (4,585,207)Creditors – amounts falling due within one year:
Payable for investments purchased ............................................ (1,446,978) (2,823,807) (2,931,413)Payable for fund shares redeemed ............................................. (834,839) (693,291) (1,864,346)Management fees payable .......................................................... (292,855) (385,419) (516,950)Custodian and Trustee fees payable ........................................... (3,814) (5,039) (8,720)Sub-custodian fees payable ........................................................ (76,865) (91,672) (46,962)Administration fees payable ...................................................... (6,356) (8,398) (19,801)Miscellaneous fees payable ........................................................ (19,835) (34,260) (181,855)Interest payable .......................................................................... (73,636) (2,024) -
(5,558,546) (7,451,831) (10,155,255)Net assets attributable to redeemable participating shareholders (at bid market prices) ........................................ 273,231,069 385,190,420 573,354,669 Adjustment from bid market prices to last traded market prices (Note 6) ............................................................................. 233,657 637,306 664,986 Net assets attributable to redeemable participating shareholders (at last traded market prices) ........................... 273,464,726 385,827,726 574,019,655
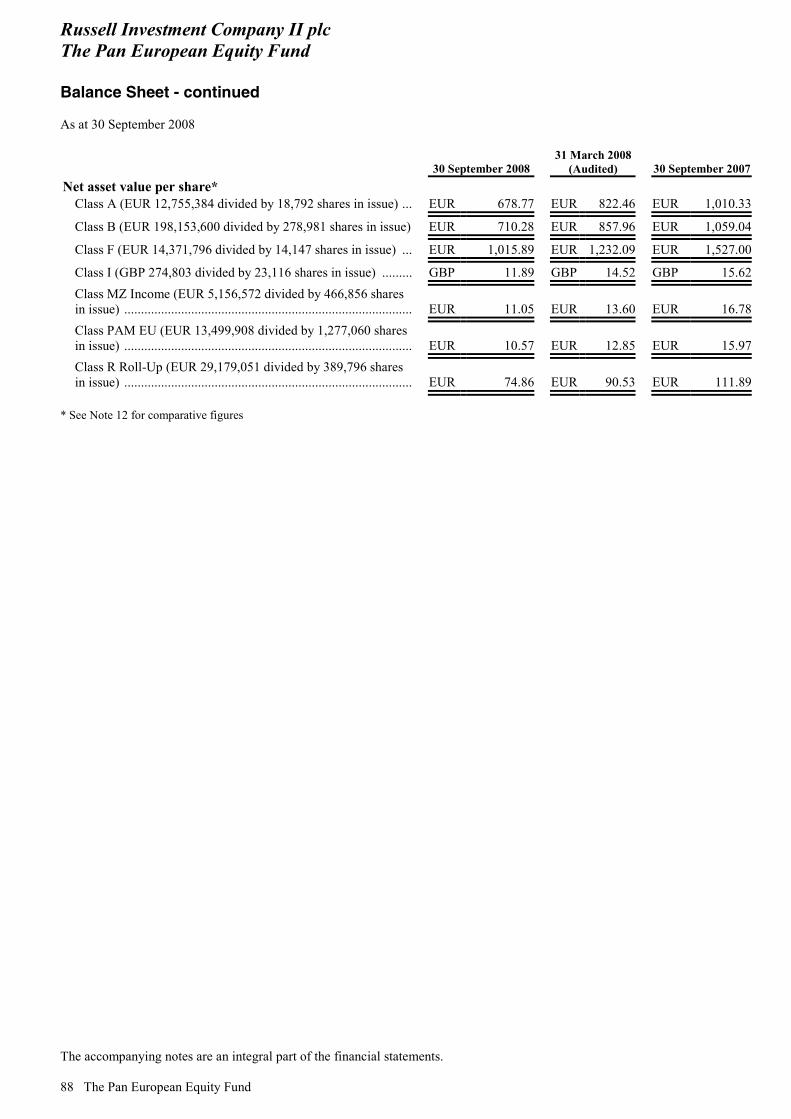
Russell Investment Company II plc The Pan European Equity Fund Balance Sheet - continued As at 30 September 2008
The accompanying notes are an integral part of the financial statements. 88 The Pan European Equity Fund
30 September 2008 31 March 2008
(Audited) 30 September 2007Net asset value per share*
Class A (EUR 12,755,384 divided by 18,792 shares in issue) ... EUR 678.77 EUR 822.46 EUR 1,010.33
Class B (EUR 198,153,600 divided by 278,981 shares in issue) EUR 710.28 EUR 857.96 EUR 1,059.04
Class F (EUR 14,371,796 divided by 14,147 shares in issue) ... EUR 1,015.89 EUR 1,232.09 EUR 1,527.00
Class I (GBP 274,803 divided by 23,116 shares in issue) ......... GBP 11.89 GBP 14.52 GBP 15.62Class MZ Income (EUR 5,156,572 divided by 466,856 shares in issue) ...................................................................................... EUR 11.05 EUR 13.60 EUR 16.78Class PAM EU (EUR 13,499,908 divided by 1,277,060 shares in issue) ...................................................................................... EUR 10.57 EUR 12.85 EUR 15.97Class R Roll-Up (EUR 29,179,051 divided by 389,796 shares in issue) ...................................................................................... EUR 74.86 EUR 90.53 EUR 111.89
* See Note 12 for comparative figures

Russell Investment Company II plc The Pan European Equity Fund Profit and Loss Account For the period ended 30 September 2008
The accompanying notes are an integral part of the financial statements.
The Pan European Equity Fund 89
Six months ended 30 September 2008
EUR
Year ended 31 March 2008
EUR Income
Dividends ..................................................................................................................... 9,653,160 16,339,090Short term interest income ............................................................................................ 50,887 108,705Bank interest ................................................................................................................ 74,014 825,901Securities lending income (Note 4) .............................................................................. 257,917 1,085,226Miscellaneous income .................................................................................................. (6,906) 9,058
10,029,072 18,367,980 Net gain (loss) on investment activities............................................................................ (64,620,061) (102,324,422) Total investment expense ............................................................................................ (54,590,989) (83,956,442) Expenses (Note 3)
Management fees Class A ..................................................................................................................... (121,502) (422,399)Class B ..................................................................................................................... (1,258,459) (4,101,150)Class F ...................................................................................................................... (163,885) (397,248)Class I ....................................................................................................................... (1,823) (39,894)Class MZ Income ...................................................................................................... (11,937) (27,386)Class PAM EU ......................................................................................................... (219,685) (1,132,193)Class R Roll-Up ....................................................................................................... (208,277) (444,162)
Custodian and Trustee fees .......................................................................................... (25,792) (100,975)Sub-custodian fees ....................................................................................................... (151,416) (233,648)Administration fees ...................................................................................................... (42,986) (118,704)Audit fees ..................................................................................................................... (14,241) (24,200)Professional fees .......................................................................................................... (7,390) (43,213)Registration fees .......................................................................................................... (4,460) (15,256)Marketing fees ............................................................................................................. (17,194) (72,421)Miscellaneous fees ....................................................................................................... (56,369) (3,244)
Total operating expenses ............................................................................................. (2,305,416) (7,176,093) Net income (expense) ................................................................................................... (56,896,405) (91,132,535) Finance costs
Distributions (Note 15) ................................................................................................ (6,521,348) (9,335,492)Profit (loss) for the financial period/year before withholding tax ........................ (63,417,753) (100,468,027) Withholding tax (Note 7) ................................................................................................. (1,221,178) (1,769,202) Profit (loss) for the financial period/year after withholding tax .......................... (64,638,931) (102,237,229) Movement in adjustment from bid market prices to last traded market prices (Note 6) ............................................................................................................... (403,649) 415,320 Increase (decrease) in net assets attributable to redeemable participating shareholders resulting from operations ................................................................... (65,042,580) (101,821,909) All amounts arose solely from continuing operations. There are no recognised gains or losses other than those dealt with in the Profit and Loss Account.

Russell Investment Company II plc The Pan European Equity Fund Statement of Changes in Net Assets Attributable to Redeemable Participating Shareholders For the period ended 30 September 2008
The accompanying notes are an integral part of the financial statements. 90 The Pan European Equity Fund
Six months ended 30 September 2008
EUR
Year ended 31 March 2008
EUR Increase (decrease) in net assets attributable to redeemable participating shareholders resulting from operations ................................................................... (65,042,580) (101,821,909) Share transactions
Net increase (decrease) in net assets resulting from redeemable participating share transactions (Note 6) .................................................................................................... (53,713,391) (121,617,709)Deemed distributions on accumulation shares (Note 15) ............................................. 6,392,971 9,215,354
Total net increase (decrease) in net assets attributable to redeemable participating shareholders .......................................................................................... (112,363,000) (214,224,264) Net assets attributable to redeemable participating shareholders
Beginning of period/year ............................................................................................. 385,827,726 600,051,990 End of period/year ....................................................................................................... 273,464,726 385,827,726
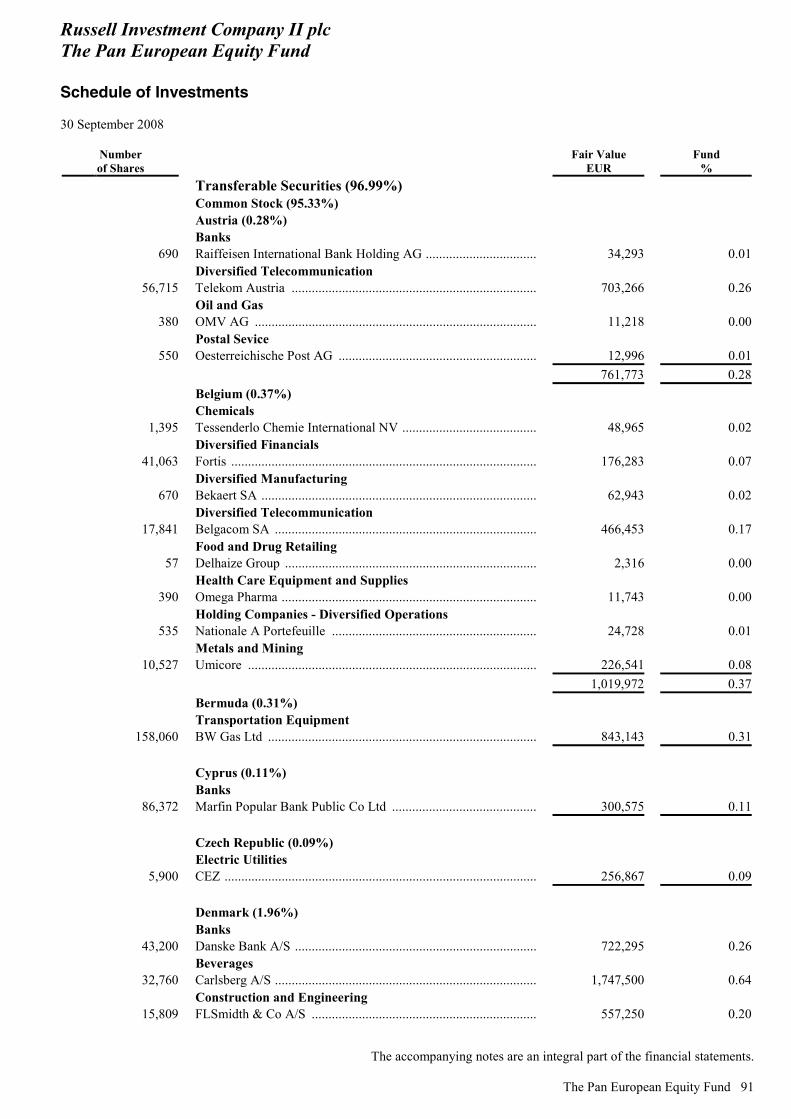
Russell Investment Company II plc The Pan European Equity Fund Schedule of Investments 30 September 2008
The accompanying notes are an integral part of the financial statements.
The Pan European Equity Fund 91
Number of Shares
Fair Value EUR
Fund %
Transferable Securities (96.99%) Common Stock (95.33%) Austria (0.28%) Banks
690 Raiffeisen International Bank Holding AG ................................. 34,293 0.01 Diversified Telecommunication
56,715 Telekom Austria ......................................................................... 703,266 0.26 Oil and Gas
380 OMV AG .................................................................................... 11,218 0.00 Postal Sevice
550 Oesterreichische Post AG ........................................................... 12,996 0.01 761,773 0.28 Belgium (0.37%) Chemicals
1,395 Tessenderlo Chemie International NV ........................................ 48,965 0.02 Diversified Financials
41,063 Fortis ........................................................................................... 176,283 0.07 Diversified Manufacturing
670 Bekaert SA .................................................................................. 62,943 0.02 Diversified Telecommunication
17,841 Belgacom SA .............................................................................. 466,453 0.17 Food and Drug Retailing
57 Delhaize Group ........................................................................... 2,316 0.00 Health Care Equipment and Supplies
390 Omega Pharma ............................................................................ 11,743 0.00 Holding Companies - Diversified Operations
535 Nationale A Portefeuille ............................................................. 24,728 0.01 Metals and Mining
10,527 Umicore ...................................................................................... 226,541 0.08 1,019,972 0.37 Bermuda (0.31%) Transportation Equipment
158,060 BW Gas Ltd ................................................................................ 843,143 0.31 Cyprus (0.11%) Banks
86,372 Marfin Popular Bank Public Co Ltd ........................................... 300,575 0.11 Czech Republic (0.09%) Electric Utilities
5,900 CEZ ............................................................................................. 256,867 0.09 Denmark (1.96%) Banks
43,200 Danske Bank A/S ........................................................................ 722,295 0.26 Beverages
32,760 Carlsberg A/S .............................................................................. 1,747,500 0.64 Construction and Engineering
15,809 FLSmidth & Co A/S ................................................................... 557,250 0.20
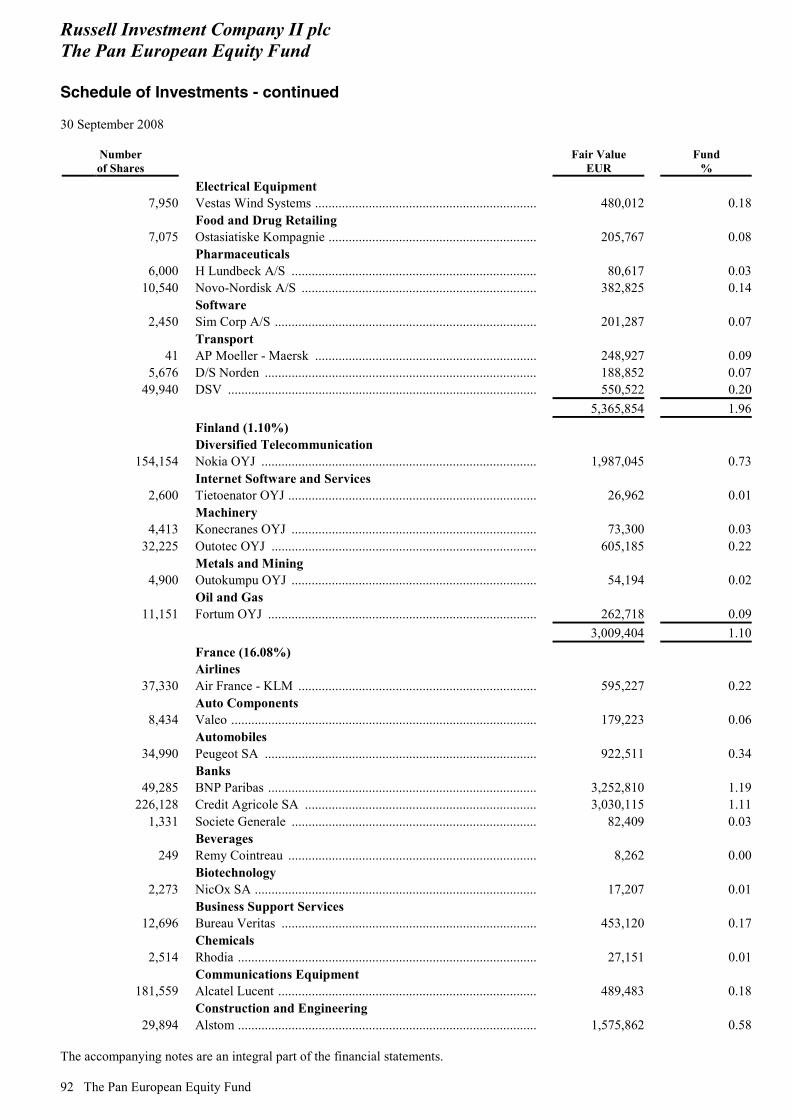
Russell Investment Company II plc The Pan European Equity Fund Schedule of Investments - continued 30 September 2008
The accompanying notes are an integral part of the financial statements. 92 The Pan European Equity Fund
Number of Shares
Fair Value EUR
Fund %
Electrical Equipment 7,950 Vestas Wind Systems .................................................................. 480,012 0.18
Food and Drug Retailing 7,075 Ostasiatiske Kompagnie .............................................................. 205,767 0.08
Pharmaceuticals 6,000 H Lundbeck A/S ......................................................................... 80,617 0.03
10,540 Novo-Nordisk A/S ...................................................................... 382,825 0.14 Software
2,450 Sim Corp A/S .............................................................................. 201,287 0.07 Transport
41 AP Moeller - Maersk .................................................................. 248,927 0.095,676 D/S Norden ................................................................................. 188,852 0.07
49,940 DSV ............................................................................................ 550,522 0.20 5,365,854 1.96 Finland (1.10%) Diversified Telecommunication
154,154 Nokia OYJ .................................................................................. 1,987,045 0.73 Internet Software and Services
2,600 Tietoenator OYJ .......................................................................... 26,962 0.01 Machinery
4,413 Konecranes OYJ ......................................................................... 73,300 0.0332,225 Outotec OYJ ............................................................................... 605,185 0.22
Metals and Mining 4,900 Outokumpu OYJ ......................................................................... 54,194 0.02
Oil and Gas 11,151 Fortum OYJ ................................................................................ 262,718 0.09
3,009,404 1.10 France (16.08%) Airlines
37,330 Air France - KLM ....................................................................... 595,227 0.22 Auto Components
8,434 Valeo ........................................................................................... 179,223 0.06 Automobiles
34,990 Peugeot SA ................................................................................. 922,511 0.34 Banks
49,285 BNP Paribas ................................................................................ 3,252,810 1.19226,128 Credit Agricole SA ..................................................................... 3,030,115 1.11
1,331 Societe Generale ......................................................................... 82,409 0.03 Beverages
249 Remy Cointreau .......................................................................... 8,262 0.00 Biotechnology
2,273 NicOx SA .................................................................................... 17,207 0.01 Business Support Services
12,696 Bureau Veritas ............................................................................ 453,120 0.17 Chemicals
2,514 Rhodia ......................................................................................... 27,151 0.01 Communications Equipment
181,559 Alcatel Lucent ............................................................................. 489,483 0.18 Construction and Engineering
29,894 Alstom ......................................................................................... 1,575,862 0.58

Russell Investment Company II plc The Pan European Equity Fund Schedule of Investments - continued 30 September 2008
The accompanying notes are an integral part of the financial statements.
The Pan European Equity Fund 93
Number of Shares
Fair Value EUR
Fund %
Construction Material 315 Lafarge SA .................................................................................. 23,241 0.01
Containers and Packaging 6,030 Belvedere SA .............................................................................. 361,860 0.13
Diversified Financials 15,008 Eurazeo ....................................................................................... 885,622 0.325,822 Sechilienne-Sidec ........................................................................ 232,938 0.09
Diversified Telecommunication 111,227 France Telecom SA ..................................................................... 2,201,182 0.80
Electric Utilities 48,364 Electricite de France ................................................................... 2,463,420 0.90
Electrical Equipment 6,190 Gemalto ....................................................................................... 155,926 0.062,468 Nexans ........................................................................................ 152,769 0.05
21,480 Saft Groupe SA ........................................................................... 600,581 0.22 Electronic Equipment and Instruments
30,024 Ingenico ...................................................................................... 530,224 0.19 Energy Equipment and Services
40 Areva ........................................................................................... 21,781 0.01810 Technip SA ................................................................................. 31,809 0.01
Food and Drug Retailing 60,098 Carrefour SA ............................................................................... 1,989,244 0.73
Food Products 16,146 Groupe Danone ........................................................................... 806,977 0.29
Health Care Equipment and Supplies 188 Biomerieux .................................................................................. 11,318 0.00
29,253 Essilor International .................................................................... 1,024,001 0.38 Hotels, Restaurants and Leisure
12,143 Sodexho Alliance ........................................................................ 502,720 0.18 Household Durables
47,221 Thomson SA ............................................................................... 118,525 0.04 Insurance
5,810 CNP Assurances ......................................................................... 461,256 0.17 IT Consulting and Services
5,782 Atos Origin ................................................................................. 178,259 0.0619,715 Cap Gemini SA ........................................................................... 654,538 0.24
Media 13,402 JC Decaux SA ............................................................................. 203,576 0.0732,050 Lagardere SCA ........................................................................... 1,013,742 0.3724,284 Publicis Groupe SA .................................................................... 535,219 0.205,860 Teleperformance ......................................................................... 114,622 0.04
118,560 Vivendi Universal ....................................................................... 2,610,098 0.96 Metals and Mining
479 Eramet SA ................................................................................... 127,500 0.04875 Vallourec ..................................................................................... 132,169 0.05
Multi-Line Retail 8,206 PPR ............................................................................................. 514,393 0.19
Multi-Utilities 11 Suez SA ...................................................................................... 380 0.00
38,817 Veolia Environnement ................................................................ 1,120,065 0.41
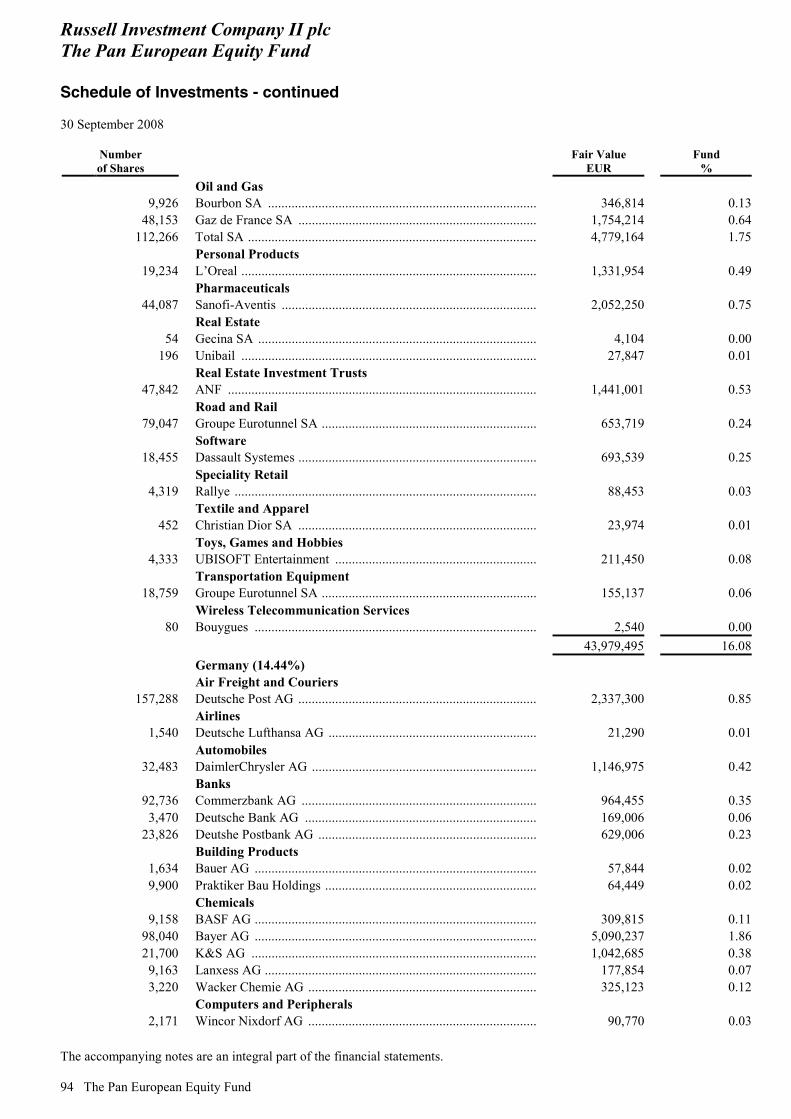
Russell Investment Company II plc The Pan European Equity Fund Schedule of Investments - continued 30 September 2008
The accompanying notes are an integral part of the financial statements. 94 The Pan European Equity Fund
Number of Shares
Fair Value EUR
Fund %
Oil and Gas 9,926 Bourbon SA ................................................................................ 346,814 0.13
48,153 Gaz de France SA ....................................................................... 1,754,214 0.64112,266 Total SA ...................................................................................... 4,779,164 1.75
Personal Products 19,234 L’Oreal ........................................................................................ 1,331,954 0.49
Pharmaceuticals 44,087 Sanofi-Aventis ............................................................................ 2,052,250 0.75
Real Estate 54 Gecina SA ................................................................................... 4,104 0.00
196 Unibail ........................................................................................ 27,847 0.01 Real Estate Investment Trusts
47,842 ANF ............................................................................................ 1,441,001 0.53 Road and Rail
79,047 Groupe Eurotunnel SA ................................................................ 653,719 0.24 Software
18,455 Dassault Systemes ....................................................................... 693,539 0.25 Speciality Retail
4,319 Rallye .......................................................................................... 88,453 0.03 Textile and Apparel
452 Christian Dior SA ....................................................................... 23,974 0.01 Toys, Games and Hobbies
4,333 UBISOFT Entertainment ............................................................ 211,450 0.08 Transportation Equipment
18,759 Groupe Eurotunnel SA ................................................................ 155,137 0.06 Wireless Telecommunication Services
80 Bouygues .................................................................................... 2,540 0.00 43,979,495 16.08 Germany (14.44%) Air Freight and Couriers
157,288 Deutsche Post AG ....................................................................... 2,337,300 0.85 Airlines
1,540 Deutsche Lufthansa AG .............................................................. 21,290 0.01 Automobiles
32,483 DaimlerChrysler AG ................................................................... 1,146,975 0.42 Banks
92,736 Commerzbank AG ...................................................................... 964,455 0.353,470 Deutsche Bank AG ..................................................................... 169,006 0.06
23,826 Deutshe Postbank AG ................................................................. 629,006 0.23 Building Products
1,634 Bauer AG .................................................................................... 57,844 0.029,900 Praktiker Bau Holdings ............................................................... 64,449 0.02
Chemicals 9,158 BASF AG .................................................................................... 309,815 0.11
98,040 Bayer AG .................................................................................... 5,090,237 1.8621,700 K&S AG ..................................................................................... 1,042,685 0.389,163 Lanxess AG ................................................................................. 177,854 0.073,220 Wacker Chemie AG .................................................................... 325,123 0.12
Computers and Peripherals 2,171 Wincor Nixdorf AG .................................................................... 90,770 0.03
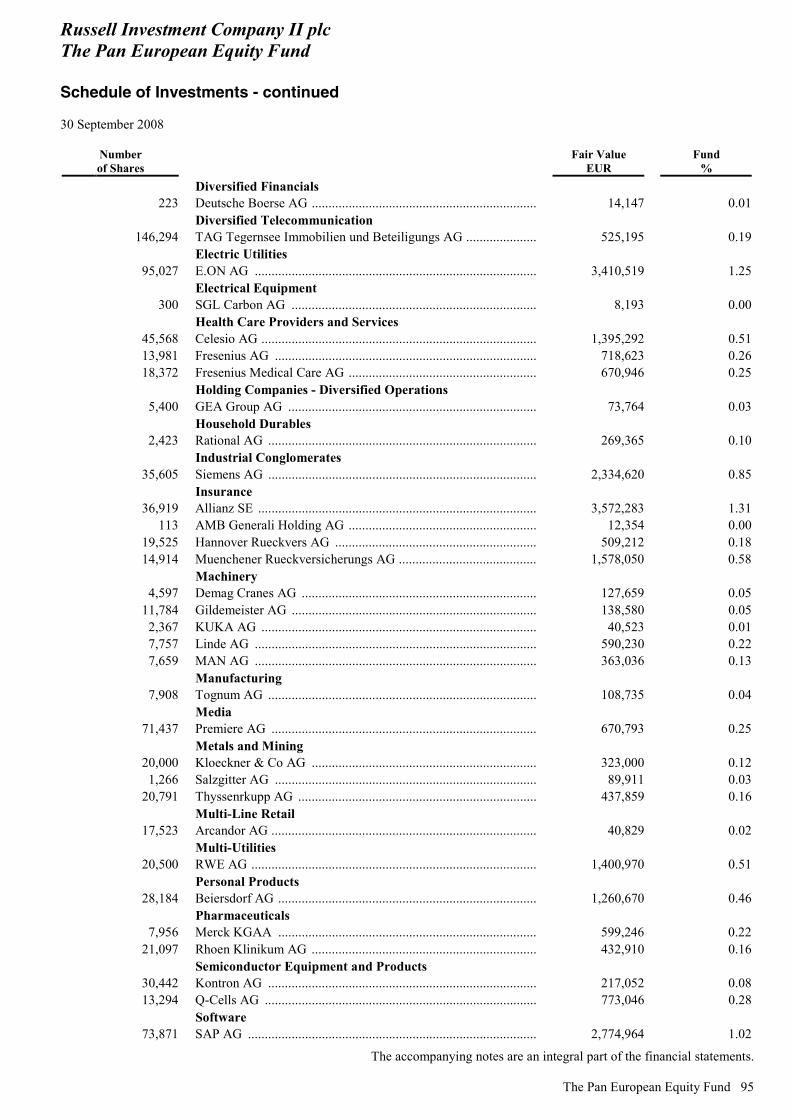
Russell Investment Company II plc The Pan European Equity Fund Schedule of Investments - continued 30 September 2008
The accompanying notes are an integral part of the financial statements.
The Pan European Equity Fund 95
Number of Shares
Fair Value EUR
Fund %
Diversified Financials 223 Deutsche Boerse AG ................................................................... 14,147 0.01
Diversified Telecommunication 146,294 TAG Tegernsee Immobilien und Beteiligungs AG ..................... 525,195 0.19
Electric Utilities 95,027 E.ON AG .................................................................................... 3,410,519 1.25
Electrical Equipment 300 SGL Carbon AG ......................................................................... 8,193 0.00
Health Care Providers and Services 45,568 Celesio AG .................................................................................. 1,395,292 0.5113,981 Fresenius AG .............................................................................. 718,623 0.2618,372 Fresenius Medical Care AG ........................................................ 670,946 0.25
Holding Companies - Diversified Operations 5,400 GEA Group AG .......................................................................... 73,764 0.03
Household Durables 2,423 Rational AG ................................................................................ 269,365 0.10
Industrial Conglomerates 35,605 Siemens AG ................................................................................ 2,334,620 0.85
Insurance 36,919 Allianz SE ................................................................................... 3,572,283 1.31
113 AMB Generali Holding AG ........................................................ 12,354 0.0019,525 Hannover Rueckvers AG ............................................................ 509,212 0.1814,914 Muenchener Rueckversicherungs AG ......................................... 1,578,050 0.58
Machinery 4,597 Demag Cranes AG ...................................................................... 127,659 0.05
11,784 Gildemeister AG ......................................................................... 138,580 0.052,367 KUKA AG .................................................................................. 40,523 0.017,757 Linde AG .................................................................................... 590,230 0.227,659 MAN AG .................................................................................... 363,036 0.13
Manufacturing 7,908 Tognum AG ................................................................................ 108,735 0.04
Media 71,437 Premiere AG ............................................................................... 670,793 0.25
Metals and Mining 20,000 Kloeckner & Co AG ................................................................... 323,000 0.121,266 Salzgitter AG .............................................................................. 89,911 0.03
20,791 Thyssenrkupp AG ....................................................................... 437,859 0.16 Multi-Line Retail
17,523 Arcandor AG ............................................................................... 40,829 0.02 Multi-Utilities
20,500 RWE AG ..................................................................................... 1,400,970 0.51 Personal Products
28,184 Beiersdorf AG ............................................................................. 1,260,670 0.46 Pharmaceuticals
7,956 Merck KGAA ............................................................................. 599,246 0.2221,097 Rhoen Klinikum AG ................................................................... 432,910 0.16
Semiconductor Equipment and Products 30,442 Kontron AG ................................................................................ 217,052 0.0813,294 Q-Cells AG ................................................................................. 773,046 0.28
Software 73,871 SAP AG ...................................................................................... 2,774,964 1.02
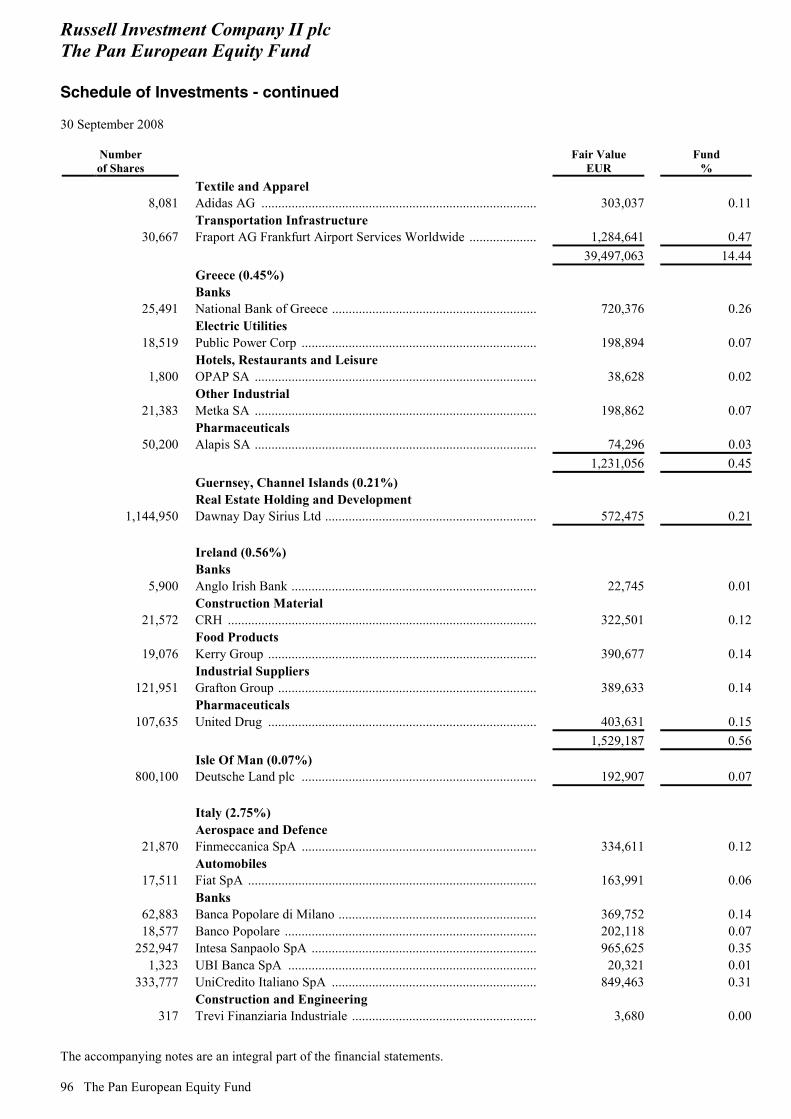
Russell Investment Company II plc The Pan European Equity Fund Schedule of Investments - continued 30 September 2008
The accompanying notes are an integral part of the financial statements. 96 The Pan European Equity Fund
Number of Shares
Fair Value EUR
Fund %
Textile and Apparel 8,081 Adidas AG .................................................................................. 303,037 0.11
Transportation Infrastructure 30,667 Fraport AG Frankfurt Airport Services Worldwide .................... 1,284,641 0.47
39,497,063 14.44 Greece (0.45%) Banks
25,491 National Bank of Greece ............................................................. 720,376 0.26 Electric Utilities
18,519 Public Power Corp ...................................................................... 198,894 0.07 Hotels, Restaurants and Leisure
1,800 OPAP SA .................................................................................... 38,628 0.02 Other Industrial
21,383 Metka SA .................................................................................... 198,862 0.07 Pharmaceuticals
50,200 Alapis SA .................................................................................... 74,296 0.03 1,231,056 0.45 Guernsey, Channel Islands (0.21%) Real Estate Holding and Development
1,144,950 Dawnay Day Sirius Ltd ............................................................... 572,475 0.21 Ireland (0.56%) Banks
5,900 Anglo Irish Bank ......................................................................... 22,745 0.01 Construction Material
21,572 CRH ............................................................................................ 322,501 0.12 Food Products
19,076 Kerry Group ................................................................................ 390,677 0.14 Industrial Suppliers
121,951 Grafton Group ............................................................................. 389,633 0.14 Pharmaceuticals
107,635 United Drug ................................................................................ 403,631 0.15 1,529,187 0.56 Isle Of Man (0.07%)
800,100 Deutsche Land plc ...................................................................... 192,907 0.07 Italy (2.75%) Aerospace and Defence
21,870 Finmeccanica SpA ...................................................................... 334,611 0.12 Automobiles
17,511 Fiat SpA ...................................................................................... 163,991 0.06 Banks
62,883 Banca Popolare di Milano ........................................................... 369,752 0.1418,577 Banco Popolare ........................................................................... 202,118 0.07
252,947 Intesa Sanpaolo SpA ................................................................... 965,625 0.351,323 UBI Banca SpA .......................................................................... 20,321 0.01
333,777 UniCredito Italiano SpA ............................................................. 849,463 0.31 Construction and Engineering
317 Trevi Finanziaria Industriale ....................................................... 3,680 0.00
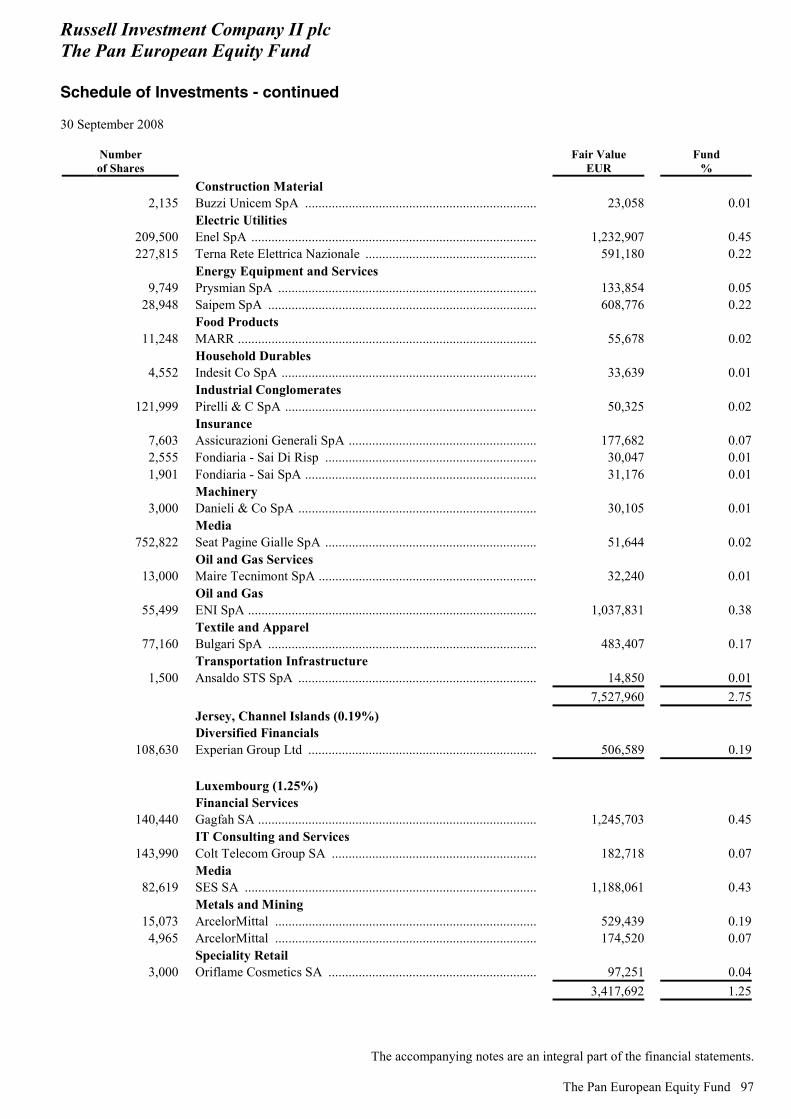
Russell Investment Company II plc The Pan European Equity Fund Schedule of Investments - continued 30 September 2008
The accompanying notes are an integral part of the financial statements.
The Pan European Equity Fund 97
Number of Shares
Fair Value EUR
Fund %
Construction Material 2,135 Buzzi Unicem SpA ..................................................................... 23,058 0.01
Electric Utilities 209,500 Enel SpA ..................................................................................... 1,232,907 0.45227,815 Terna Rete Elettrica Nazionale ................................................... 591,180 0.22
Energy Equipment and Services 9,749 Prysmian SpA ............................................................................. 133,854 0.05
28,948 Saipem SpA ................................................................................ 608,776 0.22 Food Products
11,248 MARR ......................................................................................... 55,678 0.02 Household Durables
4,552 Indesit Co SpA ............................................................................ 33,639 0.01 Industrial Conglomerates
121,999 Pirelli & C SpA ........................................................................... 50,325 0.02 Insurance
7,603 Assicurazioni Generali SpA ........................................................ 177,682 0.072,555 Fondiaria - Sai Di Risp ............................................................... 30,047 0.011,901 Fondiaria - Sai SpA ..................................................................... 31,176 0.01
Machinery 3,000 Danieli & Co SpA ....................................................................... 30,105 0.01
Media 752,822 Seat Pagine Gialle SpA ............................................................... 51,644 0.02
Oil and Gas Services 13,000 Maire Tecnimont SpA ................................................................. 32,240 0.01
Oil and Gas 55,499 ENI SpA ...................................................................................... 1,037,831 0.38
Textile and Apparel 77,160 Bulgari SpA ................................................................................ 483,407 0.17
Transportation Infrastructure 1,500 Ansaldo STS SpA ....................................................................... 14,850 0.01
7,527,960 2.75 Jersey, Channel Islands (0.19%) Diversified Financials
108,630 Experian Group Ltd .................................................................... 506,589 0.19 Luxembourg (1.25%) Financial Services
140,440 Gagfah SA ................................................................................... 1,245,703 0.45 IT Consulting and Services
143,990 Colt Telecom Group SA ............................................................. 182,718 0.07 Media
82,619 SES SA ....................................................................................... 1,188,061 0.43 Metals and Mining
15,073 ArcelorMittal .............................................................................. 529,439 0.194,965 ArcelorMittal .............................................................................. 174,520 0.07
Speciality Retail 3,000 Oriflame Cosmetics SA .............................................................. 97,251 0.04
3,417,692 1.25

Russell Investment Company II plc The Pan European Equity Fund Schedule of Investments - continued 30 September 2008
The accompanying notes are an integral part of the financial statements. 98 The Pan European Equity Fund
Number of Shares
Fair Value EUR
Fund %
Netherlands (5.01%) Aerospace and Defence
15,625 European Aeronautic Defence and Space Co NV ....................... 187,422 0.07 Air Freight and Couriers
31,603 TNT NV ...................................................................................... 616,258 0.23 Banks
45,581 SNS Reaal Groep NV ................................................................. 362,825 0.13 Beverages
5,240 EFES Breweries International NV .............................................. 65,283 0.02 Chemicals
2,387 Akzo Nobel NV .......................................................................... 80,227 0.039,970 Koninklijke DSM NV ................................................................. 332,151 0.12
Commercial Services and Supplies 19,141 Randstad Holding NV ................................................................. 353,151 0.13
Diversified Financials 158,066 ING Groep NV ............................................................................ 2,358,345 0.86
Diversified Telecommunication 87,317 Koninklijke KPN NV .................................................................. 889,935 0.32
Food and Drug Retailing 196,770 Koninklijke Ahold NV ................................................................ 1,599,150 0.59
48,461 OPG Groep NV ........................................................................... 468,618 0.17 Food Products
4,818 CSM ............................................................................................ 85,953 0.03105,952 Unilever NV ................................................................................ 2,101,558 0.77
Health Care Equipment and Supplies 1,100 Qiagen NV .................................................................................. 15,202 0.01
Household Durables 667 Hunter Douglas NV .................................................................... 18,322 0.01
27,279 Koninklijke Philips Electronics NV ............................................ 519,938 0.19 Insurance
158,993 Aegon NV ................................................................................... 985,757 0.36 Marine
600 Royal Vopak NV ........................................................................ 19,800 0.01 Media
75,334 Reed Elsevier NV ....................................................................... 792,740 0.29 Metals and Mining
200 Advanced Metallurgical Group NV ............................................ 5,844 0.00 Semiconductor Equipment and Products
134,414 ASML Holding NV .................................................................... 1,666,733 0.61 Software
13,298 TomTom NV ............................................................................... 170,081 0.06 13,695,293 5.01 Norway (2.61%) Banks
25,700 DNB NOR Bank ASA ................................................................ 137,401 0.05 Chemicals
30,640 Yara International ....................................................................... 745,273 0.27 Construction and Engineering
224,900 Tomra Systems ASA ................................................................... 809,722 0.30 Electronic Equipment and Instruments
19,285 Tandberg ASA ............................................................................ 181,362 0.07
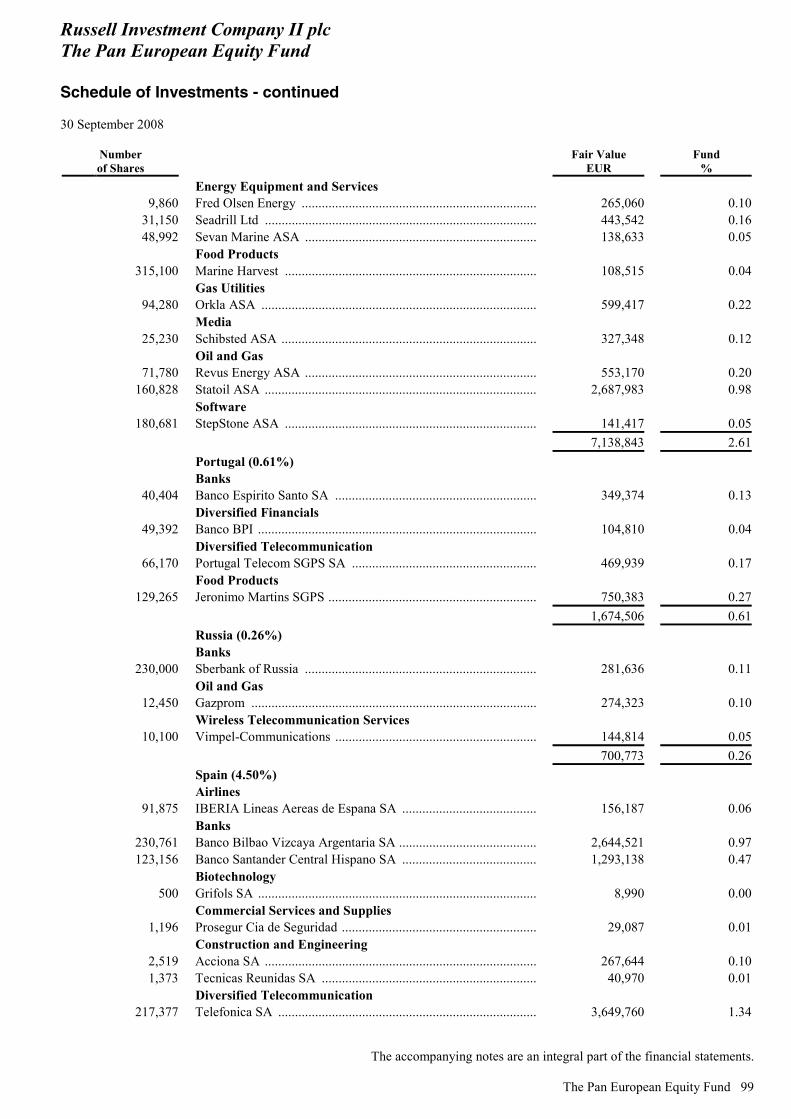
Russell Investment Company II plc The Pan European Equity Fund Schedule of Investments - continued 30 September 2008
The accompanying notes are an integral part of the financial statements.
The Pan European Equity Fund 99
Number of Shares
Fair Value EUR
Fund %
Energy Equipment and Services 9,860 Fred Olsen Energy ...................................................................... 265,060 0.10
31,150 Seadrill Ltd ................................................................................. 443,542 0.1648,992 Sevan Marine ASA ..................................................................... 138,633 0.05
Food Products 315,100 Marine Harvest ........................................................................... 108,515 0.04
Gas Utilities 94,280 Orkla ASA .................................................................................. 599,417 0.22
Media 25,230 Schibsted ASA ............................................................................ 327,348 0.12
Oil and Gas 71,780 Revus Energy ASA ..................................................................... 553,170 0.20
160,828 Statoil ASA ................................................................................. 2,687,983 0.98 Software
180,681 StepStone ASA ........................................................................... 141,417 0.05 7,138,843 2.61 Portugal (0.61%) Banks
40,404 Banco Espirito Santo SA ............................................................ 349,374 0.13 Diversified Financials
49,392 Banco BPI ................................................................................... 104,810 0.04 Diversified Telecommunication
66,170 Portugal Telecom SGPS SA ....................................................... 469,939 0.17 Food Products
129,265 Jeronimo Martins SGPS .............................................................. 750,383 0.27 1,674,506 0.61 Russia (0.26%) Banks
230,000 Sberbank of Russia ..................................................................... 281,636 0.11 Oil and Gas
12,450 Gazprom ..................................................................................... 274,323 0.10 Wireless Telecommunication Services
10,100 Vimpel-Communications ............................................................ 144,814 0.05 700,773 0.26 Spain (4.50%) Airlines
91,875 IBERIA Lineas Aereas de Espana SA ........................................ 156,187 0.06 Banks
230,761 Banco Bilbao Vizcaya Argentaria SA ......................................... 2,644,521 0.97123,156 Banco Santander Central Hispano SA ........................................ 1,293,138 0.47
Biotechnology 500 Grifols SA ................................................................................... 8,990 0.00
Commercial Services and Supplies 1,196 Prosegur Cia de Seguridad .......................................................... 29,087 0.01
Construction and Engineering 2,519 Acciona SA ................................................................................. 267,644 0.101,373 Tecnicas Reunidas SA ................................................................ 40,970 0.01
Diversified Telecommunication 217,377 Telefonica SA ............................................................................. 3,649,760 1.34
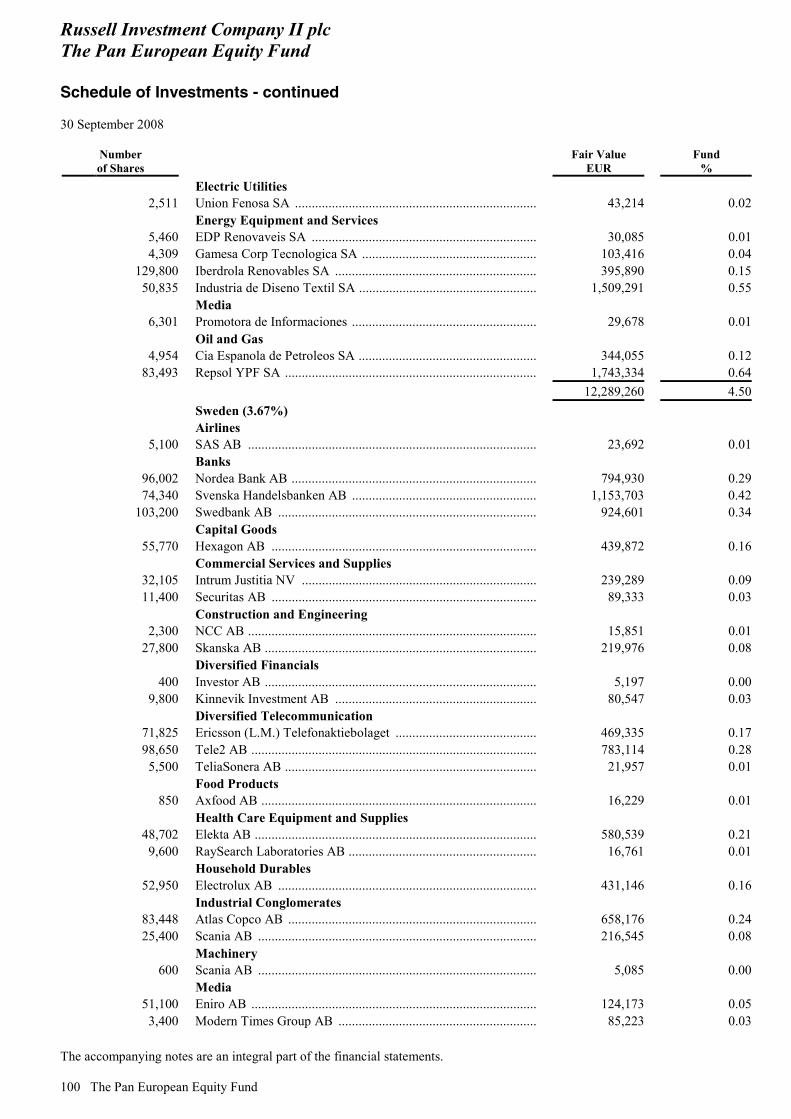
Russell Investment Company II plc The Pan European Equity Fund Schedule of Investments - continued 30 September 2008
The accompanying notes are an integral part of the financial statements. 100 The Pan European Equity Fund
Number of Shares
Fair Value EUR
Fund %
Electric Utilities 2,511 Union Fenosa SA ........................................................................ 43,214 0.02
Energy Equipment and Services 5,460 EDP Renovaveis SA ................................................................... 30,085 0.014,309 Gamesa Corp Tecnologica SA .................................................... 103,416 0.04
129,800 Iberdrola Renovables SA ............................................................ 395,890 0.1550,835 Industria de Diseno Textil SA ..................................................... 1,509,291 0.55
Media 6,301 Promotora de Informaciones ....................................................... 29,678 0.01
Oil and Gas 4,954 Cia Espanola de Petroleos SA ..................................................... 344,055 0.12
83,493 Repsol YPF SA ........................................................................... 1,743,334 0.64 12,289,260 4.50 Sweden (3.67%) Airlines
5,100 SAS AB ...................................................................................... 23,692 0.01 Banks
96,002 Nordea Bank AB ......................................................................... 794,930 0.2974,340 Svenska Handelsbanken AB ....................................................... 1,153,703 0.42
103,200 Swedbank AB ............................................................................. 924,601 0.34 Capital Goods
55,770 Hexagon AB ............................................................................... 439,872 0.16 Commercial Services and Supplies
32,105 Intrum Justitia NV ...................................................................... 239,289 0.0911,400 Securitas AB ............................................................................... 89,333 0.03
Construction and Engineering 2,300 NCC AB ...................................................................................... 15,851 0.01
27,800 Skanska AB ................................................................................. 219,976 0.08 Diversified Financials
400 Investor AB ................................................................................. 5,197 0.009,800 Kinnevik Investment AB ............................................................ 80,547 0.03
Diversified Telecommunication 71,825 Ericsson (L.M.) Telefonaktiebolaget .......................................... 469,335 0.1798,650 Tele2 AB ..................................................................................... 783,114 0.285,500 TeliaSonera AB ........................................................................... 21,957 0.01
Food Products 850 Axfood AB .................................................................................. 16,229 0.01
Health Care Equipment and Supplies 48,702 Elekta AB .................................................................................... 580,539 0.219,600 RaySearch Laboratories AB ........................................................ 16,761 0.01
Household Durables 52,950 Electrolux AB ............................................................................. 431,146 0.16
Industrial Conglomerates 83,448 Atlas Copco AB .......................................................................... 658,176 0.2425,400 Scania AB ................................................................................... 216,545 0.08
Machinery 600 Scania AB ................................................................................... 5,085 0.00
Media 51,100 Eniro AB ..................................................................................... 124,173 0.053,400 Modern Times Group AB ........................................................... 85,223 0.03

Russell Investment Company II plc The Pan European Equity Fund Schedule of Investments - continued 30 September 2008
The accompanying notes are an integral part of the financial statements.
The Pan European Equity Fund 101
Number of Shares
Fair Value EUR
Fund %
Retail Trade 13,000 Mekonomen AB .......................................................................... 102,203 0.04
Speciality Retail 78,400 Hennes & Mauritz AB ................................................................ 2,225,300 0.81
Tobacco 24,700 Swedish Match AB ..................................................................... 301,995 0.11
10,024,772 3.67 Switzerland (11.26%) Agriculture
9,801 Syngenta AG ............................................................................... 1,466,138 0.54 Banks
11,735 Bank Sarasin & Cie AG .............................................................. 314,058 0.1177,830 Credit Suisse Group .................................................................... 2,490,617 0.91
Chemicals 89,683 Clariant AG ................................................................................. 613,275 0.22
414 Sika Ltd ....................................................................................... 330,682 0.12 Commercial Services and Supplies
583 SGS SA ....................................................................................... 481,217 0.18 Diversified Financials
38 Banque Cantonale Vaudoise ....................................................... 8,029 0.0067 Julius Baer Holdings Ltd ............................................................ 2,278 0.00
281,218 UBS AG ...................................................................................... 3,285,415 1.20 Diversified Telecommunication
989 Swisscom AG ............................................................................. 208,480 0.08 Electrical Equipment
304,580 ABB Ltd ...................................................................................... 4,095,969 1.50 Food Products
57 Barry Callebaut AG .................................................................... 24,248 0.01319 Lindt & Spruengli AG ................................................................ 743,338 0.27
134,034 Nestle SA .................................................................................... 4,098,555 1.50 Health Care Equipment and Supplies
110 Straumann Holding ..................................................................... 21,512 0.01 Health Care Providers and Services
1,193 Galenica AG ............................................................................... 301,287 0.11 Insurance
4,421 Baloise Holdings ......................................................................... 217,687 0.08474 Helvetia Holding AG .................................................................. 83,968 0.03
3,032 Swiss Life Holding ..................................................................... 305,324 0.1130,440 Swiss Reinsurance ...................................................................... 1,163,511 0.43
29 Zurich Financial Services Group ................................................ 5,634 0.008,291 Zurich Financial Services Group ................................................ 1,616,124 0.59
Machinery 173 Bucher Industries AG ................................................................. 16,235 0.01160 Sulzer AG ................................................................................... 11,957 0.00
Oil and Gas 940 Petroplus Holdings AG ............................................................... 25,246 0.01
Pharmaceuticals 41,452 Actelion Ltd ................................................................................ 1,512,045 0.5567,323 Novartis AG ................................................................................ 2,500,626 0.9231,942 Roche Holdings AG .................................................................... 3,565,417 1.30
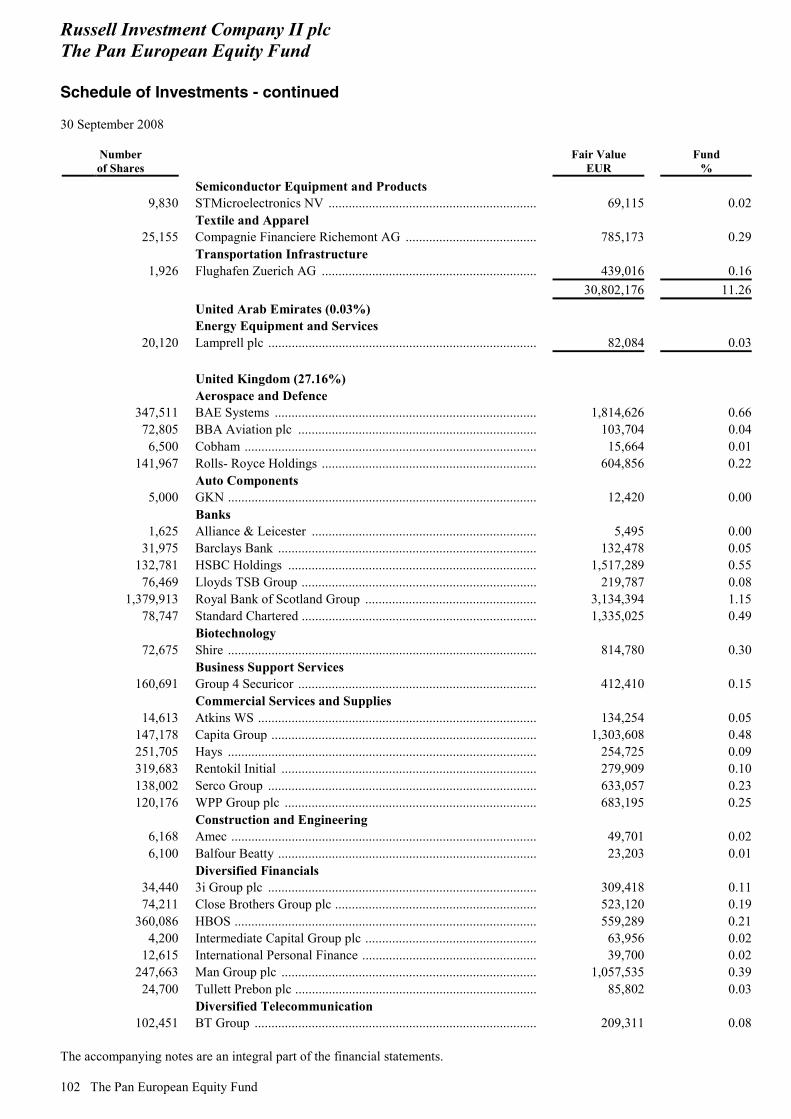
Russell Investment Company II plc The Pan European Equity Fund Schedule of Investments - continued 30 September 2008
The accompanying notes are an integral part of the financial statements. 102 The Pan European Equity Fund
Number of Shares
Fair Value EUR
Fund %
Semiconductor Equipment and Products 9,830 STMicroelectronics NV .............................................................. 69,115 0.02
Textile and Apparel 25,155 Compagnie Financiere Richemont AG ....................................... 785,173 0.29
Transportation Infrastructure 1,926 Flughafen Zuerich AG ................................................................ 439,016 0.16
30,802,176 11.26 United Arab Emirates (0.03%) Energy Equipment and Services
20,120 Lamprell plc ................................................................................ 82,084 0.03 United Kingdom (27.16%) Aerospace and Defence
347,511 BAE Systems .............................................................................. 1,814,626 0.6672,805 BBA Aviation plc ....................................................................... 103,704 0.046,500 Cobham ....................................................................................... 15,664 0.01
141,967 Rolls- Royce Holdings ................................................................ 604,856 0.22 Auto Components
5,000 GKN ............................................................................................ 12,420 0.00 Banks
1,625 Alliance & Leicester ................................................................... 5,495 0.0031,975 Barclays Bank ............................................................................. 132,478 0.05
132,781 HSBC Holdings .......................................................................... 1,517,289 0.5576,469 Lloyds TSB Group ...................................................................... 219,787 0.08
1,379,913 Royal Bank of Scotland Group ................................................... 3,134,394 1.1578,747 Standard Chartered ...................................................................... 1,335,025 0.49
Biotechnology 72,675 Shire ............................................................................................ 814,780 0.30
Business Support Services 160,691 Group 4 Securicor ....................................................................... 412,410 0.15
Commercial Services and Supplies 14,613 Atkins WS ................................................................................... 134,254 0.05
147,178 Capita Group ............................................................................... 1,303,608 0.48251,705 Hays ............................................................................................ 254,725 0.09319,683 Rentokil Initial ............................................................................ 279,909 0.10138,002 Serco Group ................................................................................ 633,057 0.23120,176 WPP Group plc ........................................................................... 683,195 0.25
Construction and Engineering 6,168 Amec ........................................................................................... 49,701 0.026,100 Balfour Beatty ............................................................................. 23,203 0.01
Diversified Financials 34,440 3i Group plc ................................................................................ 309,418 0.1174,211 Close Brothers Group plc ............................................................ 523,120 0.19
360,086 HBOS .......................................................................................... 559,289 0.214,200 Intermediate Capital Group plc ................................................... 63,956 0.02
12,615 International Personal Finance .................................................... 39,700 0.02247,663 Man Group plc ............................................................................ 1,057,535 0.39
24,700 Tullett Prebon plc ........................................................................ 85,802 0.03 Diversified Telecommunication
102,451 BT Group .................................................................................... 209,311 0.08
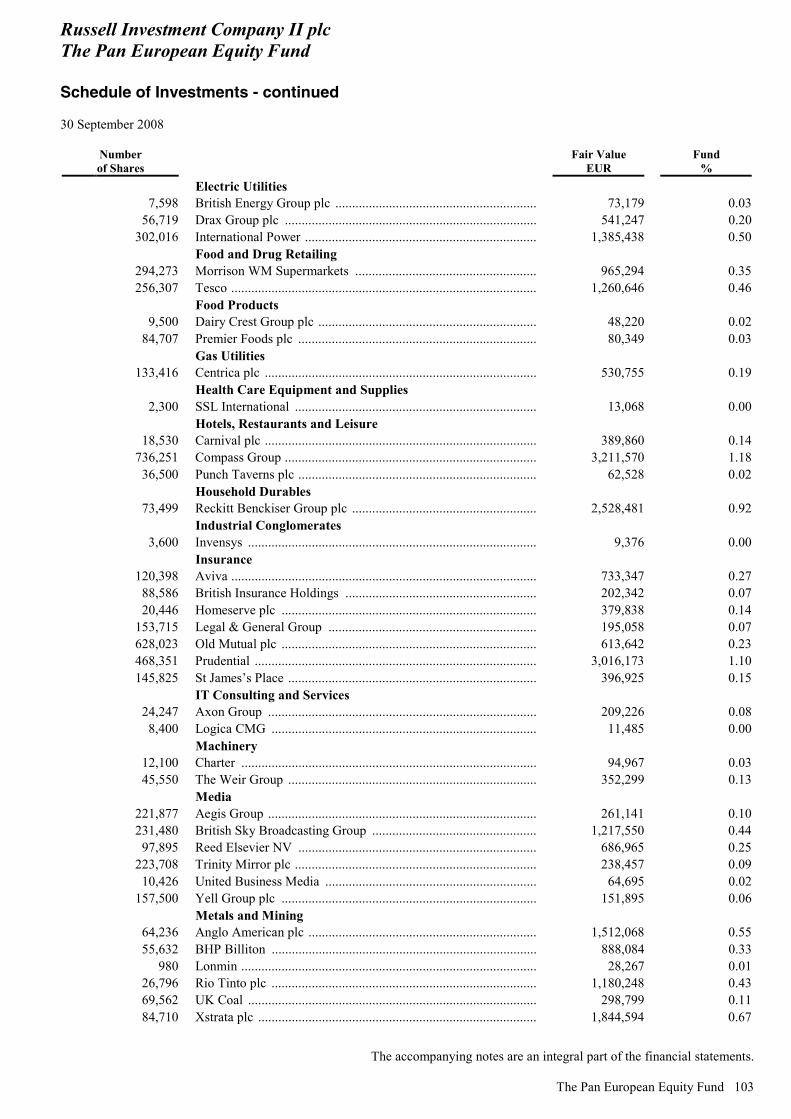
Russell Investment Company II plc The Pan European Equity Fund Schedule of Investments - continued 30 September 2008
The accompanying notes are an integral part of the financial statements.
The Pan European Equity Fund 103
Number of Shares
Fair Value EUR
Fund %
Electric Utilities 7,598 British Energy Group plc ............................................................ 73,179 0.03
56,719 Drax Group plc ........................................................................... 541,247 0.20302,016 International Power ..................................................................... 1,385,438 0.50
Food and Drug Retailing 294,273 Morrison WM Supermarkets ...................................................... 965,294 0.35256,307 Tesco ........................................................................................... 1,260,646 0.46
Food Products 9,500 Dairy Crest Group plc ................................................................. 48,220 0.02
84,707 Premier Foods plc ....................................................................... 80,349 0.03 Gas Utilities
133,416 Centrica plc ................................................................................. 530,755 0.19 Health Care Equipment and Supplies
2,300 SSL International ........................................................................ 13,068 0.00 Hotels, Restaurants and Leisure
18,530 Carnival plc ................................................................................. 389,860 0.14736,251 Compass Group ........................................................................... 3,211,570 1.18
36,500 Punch Taverns plc ....................................................................... 62,528 0.02 Household Durables
73,499 Reckitt Benckiser Group plc ....................................................... 2,528,481 0.92 Industrial Conglomerates
3,600 Invensys ...................................................................................... 9,376 0.00 Insurance
120,398 Aviva ........................................................................................... 733,347 0.2788,586 British Insurance Holdings ......................................................... 202,342 0.0720,446 Homeserve plc ............................................................................ 379,838 0.14
153,715 Legal & General Group .............................................................. 195,058 0.07628,023 Old Mutual plc ............................................................................ 613,642 0.23468,351 Prudential .................................................................................... 3,016,173 1.10145,825 St James’s Place .......................................................................... 396,925 0.15
IT Consulting and Services 24,247 Axon Group ................................................................................ 209,226 0.088,400 Logica CMG ............................................................................... 11,485 0.00
Machinery 12,100 Charter ........................................................................................ 94,967 0.0345,550 The Weir Group .......................................................................... 352,299 0.13
Media 221,877 Aegis Group ................................................................................ 261,141 0.10231,480 British Sky Broadcasting Group ................................................. 1,217,550 0.44
97,895 Reed Elsevier NV ....................................................................... 686,965 0.25223,708 Trinity Mirror plc ........................................................................ 238,457 0.09
10,426 United Business Media ............................................................... 64,695 0.02157,500 Yell Group plc ............................................................................ 151,895 0.06
Metals and Mining 64,236 Anglo American plc .................................................................... 1,512,068 0.5555,632 BHP Billiton ............................................................................... 888,084 0.33
980 Lonmin ........................................................................................ 28,267 0.0126,796 Rio Tinto plc ............................................................................... 1,180,248 0.4369,562 UK Coal ...................................................................................... 298,799 0.1184,710 Xstrata plc ................................................................................... 1,844,594 0.67
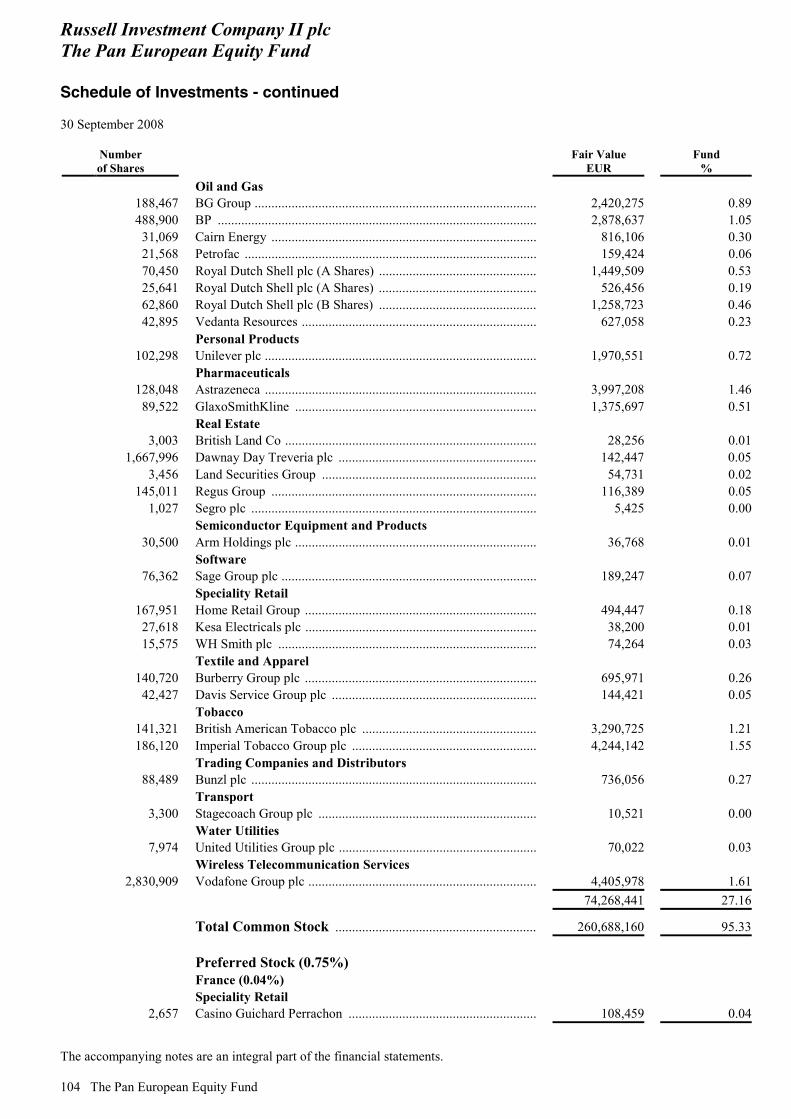
Russell Investment Company II plc The Pan European Equity Fund Schedule of Investments - continued 30 September 2008
The accompanying notes are an integral part of the financial statements. 104 The Pan European Equity Fund
Number of Shares
Fair Value EUR
Fund %
Oil and Gas 188,467 BG Group .................................................................................... 2,420,275 0.89488,900 BP ............................................................................................... 2,878,637 1.05
31,069 Cairn Energy ............................................................................... 816,106 0.3021,568 Petrofac ....................................................................................... 159,424 0.0670,450 Royal Dutch Shell plc (A Shares) ............................................... 1,449,509 0.5325,641 Royal Dutch Shell plc (A Shares) ............................................... 526,456 0.1962,860 Royal Dutch Shell plc (B Shares) ............................................... 1,258,723 0.4642,895 Vedanta Resources ...................................................................... 627,058 0.23
Personal Products 102,298 Unilever plc ................................................................................. 1,970,551 0.72
Pharmaceuticals 128,048 Astrazeneca ................................................................................. 3,997,208 1.46
89,522 GlaxoSmithKline ........................................................................ 1,375,697 0.51 Real Estate
3,003 British Land Co ........................................................................... 28,256 0.011,667,996 Dawnay Day Treveria plc ........................................................... 142,447 0.05
3,456 Land Securities Group ................................................................ 54,731 0.02145,011 Regus Group ............................................................................... 116,389 0.05
1,027 Segro plc ..................................................................................... 5,425 0.00 Semiconductor Equipment and Products
30,500 Arm Holdings plc ........................................................................ 36,768 0.01 Software
76,362 Sage Group plc ............................................................................ 189,247 0.07 Speciality Retail
167,951 Home Retail Group ..................................................................... 494,447 0.1827,618 Kesa Electricals plc ..................................................................... 38,200 0.0115,575 WH Smith plc ............................................................................. 74,264 0.03
Textile and Apparel 140,720 Burberry Group plc ..................................................................... 695,971 0.26
42,427 Davis Service Group plc ............................................................. 144,421 0.05 Tobacco
141,321 British American Tobacco plc .................................................... 3,290,725 1.21186,120 Imperial Tobacco Group plc ....................................................... 4,244,142 1.55
Trading Companies and Distributors 88,489 Bunzl plc ..................................................................................... 736,056 0.27
Transport 3,300 Stagecoach Group plc ................................................................. 10,521 0.00
Water Utilities 7,974 United Utilities Group plc ........................................................... 70,022 0.03
Wireless Telecommunication Services 2,830,909 Vodafone Group plc .................................................................... 4,405,978 1.61
74,268,441 27.16
Total Common Stock ............................................................ 260,688,160 95.33 Preferred Stock (0.75%) France (0.04%) Speciality Retail
2,657 Casino Guichard Perrachon ........................................................ 108,459 0.04
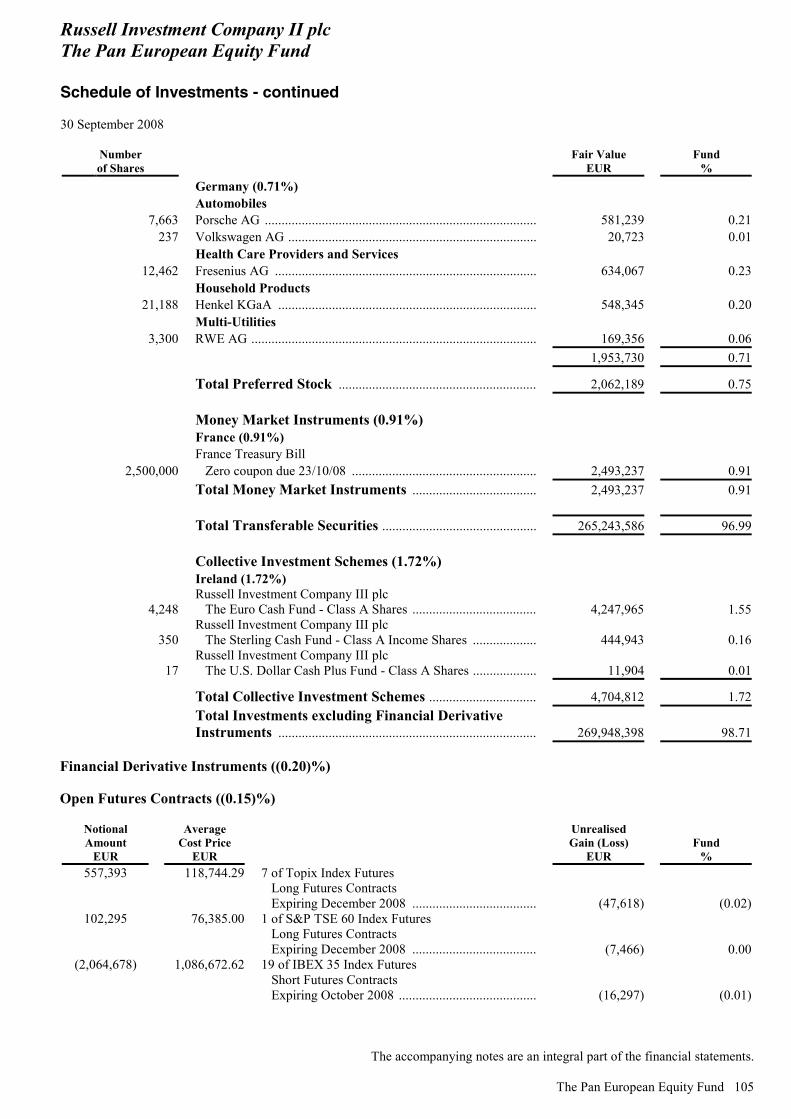
Russell Investment Company II plc The Pan European Equity Fund Schedule of Investments - continued 30 September 2008
The accompanying notes are an integral part of the financial statements.
The Pan European Equity Fund 105
Number of Shares
Fair Value EUR
Fund %
Germany (0.71%) Automobiles
7,663 Porsche AG ................................................................................. 581,239 0.21237 Volkswagen AG .......................................................................... 20,723 0.01
Health Care Providers and Services 12,462 Fresenius AG .............................................................................. 634,067 0.23
Household Products 21,188 Henkel KGaA ............................................................................. 548,345 0.20
Multi-Utilities 3,300 RWE AG ..................................................................................... 169,356 0.06
1,953,730 0.71
Total Preferred Stock ........................................................... 2,062,189 0.75 Money Market Instruments (0.91%) France (0.91%) France Treasury Bill
2,500,000 Zero coupon due 23/10/08 ....................................................... 2,493,237 0.91 Total Money Market Instruments ..................................... 2,493,237 0.91 Total Transferable Securities .............................................. 265,243,586 96.99 Collective Investment Schemes (1.72%) Ireland (1.72%)
4,248 Russell Investment Company III plc The Euro Cash Fund - Class A Shares ..................................... 4,247,965 1.55
350 Russell Investment Company III plc The Sterling Cash Fund - Class A Income Shares ................... 444,943 0.16
17 Russell Investment Company III plc The U.S. Dollar Cash Plus Fund - Class A Shares ................... 11,904 0.01
Total Collective Investment Schemes ................................ 4,704,812 1.72
Total Investments excluding Financial Derivative Instruments ............................................................................. 269,948,398 98.71
Financial Derivative Instruments ((0.20)%) Open Futures Contracts ((0.15)%)
Notional Amount
EUR
Average Cost Price
EUR
Unrealised Gain (Loss)
EUR Fund
% 557,393 118,744.29 7 of Topix Index Futures
Long Futures Contracts Expiring December 2008 ..................................... (47,618) (0.02)
102,295 76,385.00 1 of S&P TSE 60 Index Futures Long Futures Contracts Expiring December 2008 ..................................... (7,466) 0.00
(2,064,678) 1,086,672.62 19 of IBEX 35 Index Futures Short Futures Contracts Expiring October 2008 ......................................... (16,297) (0.01)
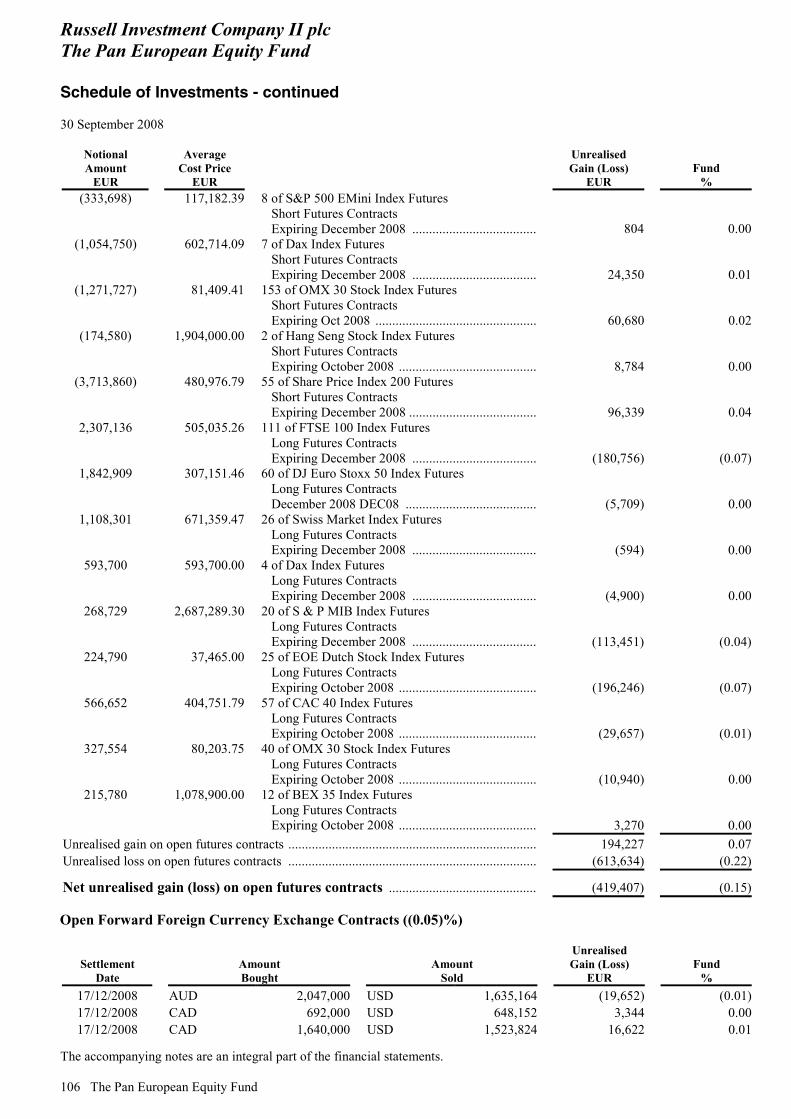
Russell Investment Company II plc The Pan European Equity Fund Schedule of Investments - continued 30 September 2008
The accompanying notes are an integral part of the financial statements. 106 The Pan European Equity Fund
Notional Amount
EUR
Average Cost Price
EUR
Unrealised Gain (Loss)
EUR Fund
% (333,698) 117,182.39 8 of S&P 500 EMini Index Futures
Short Futures Contracts Expiring December 2008 ..................................... 804 0.00
(1,054,750) 602,714.09 7 of Dax Index Futures Short Futures Contracts Expiring December 2008 ..................................... 24,350 0.01
(1,271,727) 81,409.41 153 of OMX 30 Stock Index Futures Short Futures Contracts Expiring Oct 2008 ................................................ 60,680 0.02
(174,580) 1,904,000.00 2 of Hang Seng Stock Index Futures Short Futures Contracts Expiring October 2008 ......................................... 8,784 0.00
(3,713,860) 480,976.79 55 of Share Price Index 200 Futures Short Futures Contracts Expiring December 2008 ...................................... 96,339 0.04
2,307,136 505,035.26 111 of FTSE 100 Index Futures Long Futures Contracts Expiring December 2008 ..................................... (180,756) (0.07)
1,842,909 307,151.46 60 of DJ Euro Stoxx 50 Index Futures Long Futures Contracts December 2008 DEC08 ....................................... (5,709) 0.00
1,108,301 671,359.47 26 of Swiss Market Index Futures Long Futures Contracts Expiring December 2008 ..................................... (594) 0.00
593,700 593,700.00 4 of Dax Index Futures Long Futures Contracts Expiring December 2008 ..................................... (4,900) 0.00
268,729 2,687,289.30 20 of S & P MIB Index Futures Long Futures Contracts Expiring December 2008 ..................................... (113,451) (0.04)
224,790 37,465.00 25 of EOE Dutch Stock Index Futures Long Futures Contracts Expiring October 2008 ......................................... (196,246) (0.07)
566,652 404,751.79 57 of CAC 40 Index Futures Long Futures Contracts Expiring October 2008 ......................................... (29,657) (0.01)
327,554 80,203.75 40 of OMX 30 Stock Index Futures Long Futures Contracts Expiring October 2008 ......................................... (10,940) 0.00
215,780 1,078,900.00 12 of BEX 35 Index Futures Long Futures Contracts Expiring October 2008 ......................................... 3,270 0.00
Unrealised gain on open futures contracts .......................................................................... 194,227 0.07Unrealised loss on open futures contracts .......................................................................... (613,634) (0.22)
Net unrealised gain (loss) on open futures contracts ............................................ (419,407) (0.15) Open Forward Foreign Currency Exchange Contracts ((0.05)%)
Settlement Date
Amount Bought
Amount Sold
Unrealised Gain (Loss)
EUR Fund
% 17/12/2008 AUD 2,047,000 USD 1,635,164 (19,652) (0.01)17/12/2008 CAD 692,000 USD 648,152 3,344 0.0017/12/2008 CAD 1,640,000 USD 1,523,824 16,622 0.01
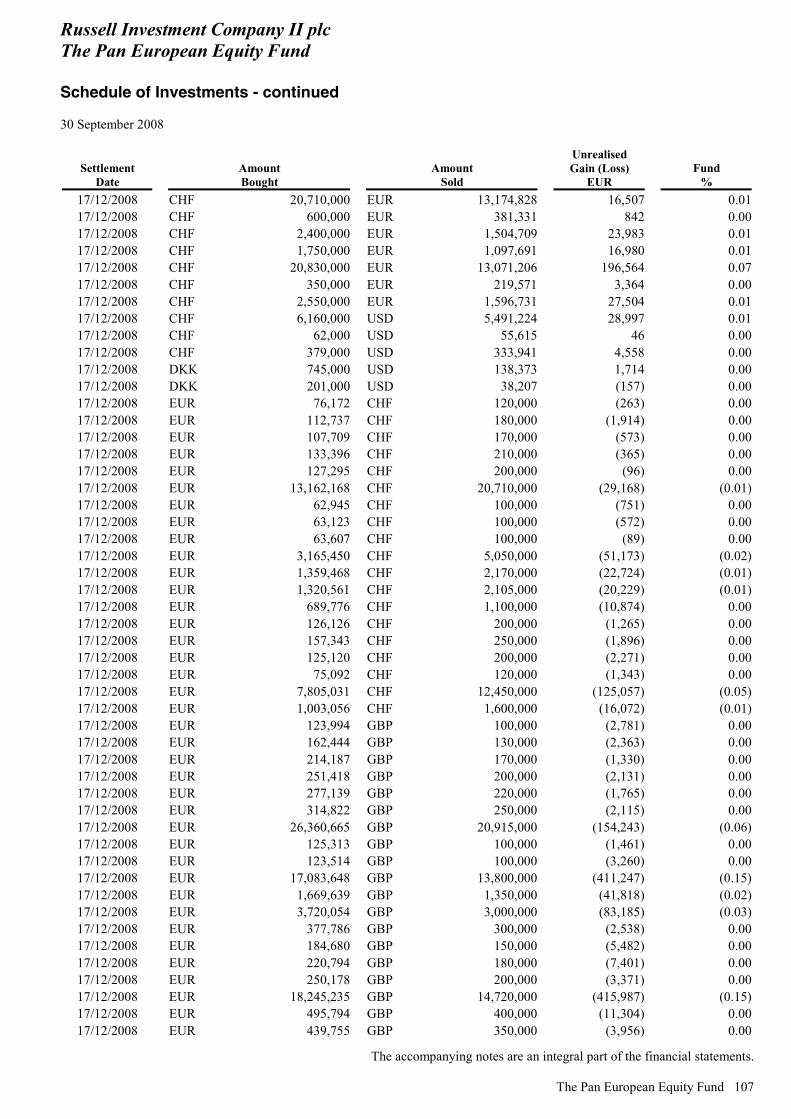
Russell Investment Company II plc The Pan European Equity Fund Schedule of Investments - continued 30 September 2008
The accompanying notes are an integral part of the financial statements.
The Pan European Equity Fund 107
Settlement Date
Amount Bought
Amount Sold
Unrealised Gain (Loss)
EUR Fund
% 17/12/2008 CHF 20,710,000 EUR 13,174,828 16,507 0.0117/12/2008 CHF 600,000 EUR 381,331 842 0.0017/12/2008 CHF 2,400,000 EUR 1,504,709 23,983 0.0117/12/2008 CHF 1,750,000 EUR 1,097,691 16,980 0.0117/12/2008 CHF 20,830,000 EUR 13,071,206 196,564 0.0717/12/2008 CHF 350,000 EUR 219,571 3,364 0.0017/12/2008 CHF 2,550,000 EUR 1,596,731 27,504 0.0117/12/2008 CHF 6,160,000 USD 5,491,224 28,997 0.0117/12/2008 CHF 62,000 USD 55,615 46 0.0017/12/2008 CHF 379,000 USD 333,941 4,558 0.0017/12/2008 DKK 745,000 USD 138,373 1,714 0.0017/12/2008 DKK 201,000 USD 38,207 (157) 0.0017/12/2008 EUR 76,172 CHF 120,000 (263) 0.0017/12/2008 EUR 112,737 CHF 180,000 (1,914) 0.0017/12/2008 EUR 107,709 CHF 170,000 (573) 0.0017/12/2008 EUR 133,396 CHF 210,000 (365) 0.0017/12/2008 EUR 127,295 CHF 200,000 (96) 0.0017/12/2008 EUR 13,162,168 CHF 20,710,000 (29,168) (0.01)17/12/2008 EUR 62,945 CHF 100,000 (751) 0.0017/12/2008 EUR 63,123 CHF 100,000 (572) 0.0017/12/2008 EUR 63,607 CHF 100,000 (89) 0.0017/12/2008 EUR 3,165,450 CHF 5,050,000 (51,173) (0.02)17/12/2008 EUR 1,359,468 CHF 2,170,000 (22,724) (0.01)17/12/2008 EUR 1,320,561 CHF 2,105,000 (20,229) (0.01)17/12/2008 EUR 689,776 CHF 1,100,000 (10,874) 0.0017/12/2008 EUR 126,126 CHF 200,000 (1,265) 0.0017/12/2008 EUR 157,343 CHF 250,000 (1,896) 0.0017/12/2008 EUR 125,120 CHF 200,000 (2,271) 0.0017/12/2008 EUR 75,092 CHF 120,000 (1,343) 0.0017/12/2008 EUR 7,805,031 CHF 12,450,000 (125,057) (0.05)17/12/2008 EUR 1,003,056 CHF 1,600,000 (16,072) (0.01)17/12/2008 EUR 123,994 GBP 100,000 (2,781) 0.0017/12/2008 EUR 162,444 GBP 130,000 (2,363) 0.0017/12/2008 EUR 214,187 GBP 170,000 (1,330) 0.0017/12/2008 EUR 251,418 GBP 200,000 (2,131) 0.0017/12/2008 EUR 277,139 GBP 220,000 (1,765) 0.0017/12/2008 EUR 314,822 GBP 250,000 (2,115) 0.0017/12/2008 EUR 26,360,665 GBP 20,915,000 (154,243) (0.06)17/12/2008 EUR 125,313 GBP 100,000 (1,461) 0.0017/12/2008 EUR 123,514 GBP 100,000 (3,260) 0.0017/12/2008 EUR 17,083,648 GBP 13,800,000 (411,247) (0.15)17/12/2008 EUR 1,669,639 GBP 1,350,000 (41,818) (0.02)17/12/2008 EUR 3,720,054 GBP 3,000,000 (83,185) (0.03)17/12/2008 EUR 377,786 GBP 300,000 (2,538) 0.0017/12/2008 EUR 184,680 GBP 150,000 (5,482) 0.0017/12/2008 EUR 220,794 GBP 180,000 (7,401) 0.0017/12/2008 EUR 250,178 GBP 200,000 (3,371) 0.0017/12/2008 EUR 18,245,235 GBP 14,720,000 (415,987) (0.15)17/12/2008 EUR 495,794 GBP 400,000 (11,304) 0.0017/12/2008 EUR 439,755 GBP 350,000 (3,956) 0.00
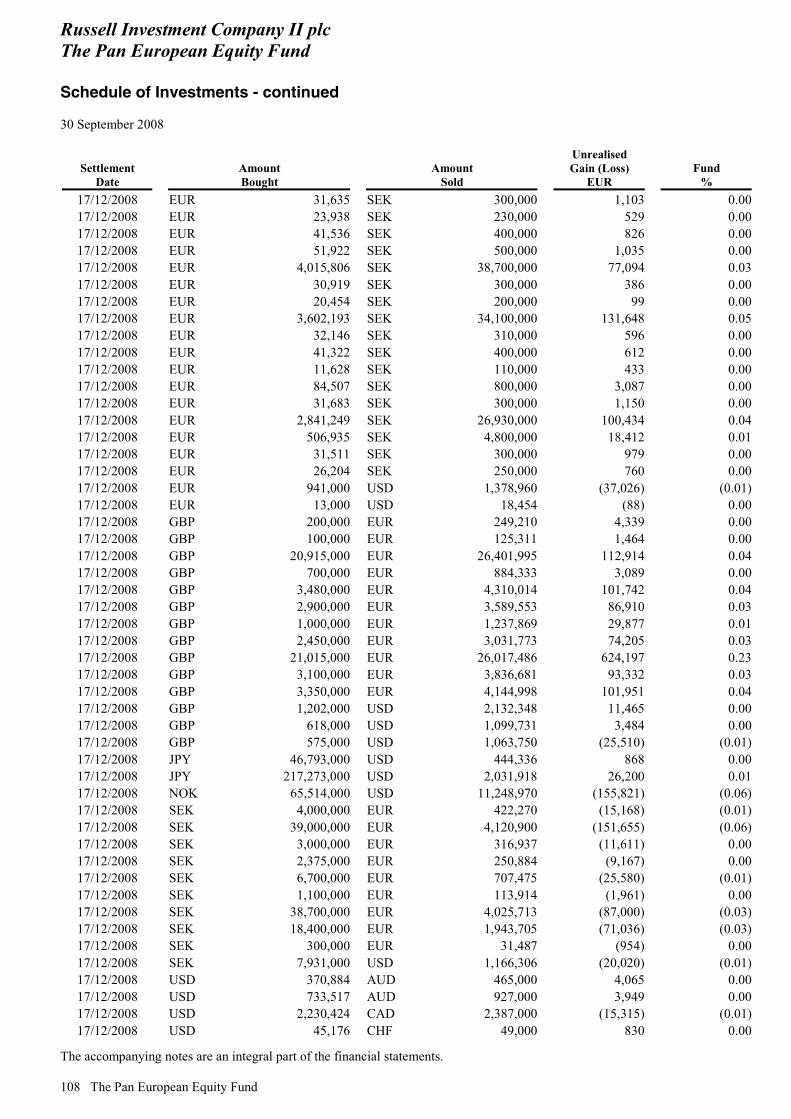
Russell Investment Company II plc The Pan European Equity Fund Schedule of Investments - continued 30 September 2008
The accompanying notes are an integral part of the financial statements. 108 The Pan European Equity Fund
Settlement Date
Amount Bought
Amount Sold
Unrealised Gain (Loss)
EUR Fund
% 17/12/2008 EUR 31,635 SEK 300,000 1,103 0.0017/12/2008 EUR 23,938 SEK 230,000 529 0.0017/12/2008 EUR 41,536 SEK 400,000 826 0.0017/12/2008 EUR 51,922 SEK 500,000 1,035 0.0017/12/2008 EUR 4,015,806 SEK 38,700,000 77,094 0.0317/12/2008 EUR 30,919 SEK 300,000 386 0.0017/12/2008 EUR 20,454 SEK 200,000 99 0.0017/12/2008 EUR 3,602,193 SEK 34,100,000 131,648 0.0517/12/2008 EUR 32,146 SEK 310,000 596 0.0017/12/2008 EUR 41,322 SEK 400,000 612 0.0017/12/2008 EUR 11,628 SEK 110,000 433 0.0017/12/2008 EUR 84,507 SEK 800,000 3,087 0.0017/12/2008 EUR 31,683 SEK 300,000 1,150 0.0017/12/2008 EUR 2,841,249 SEK 26,930,000 100,434 0.0417/12/2008 EUR 506,935 SEK 4,800,000 18,412 0.0117/12/2008 EUR 31,511 SEK 300,000 979 0.0017/12/2008 EUR 26,204 SEK 250,000 760 0.0017/12/2008 EUR 941,000 USD 1,378,960 (37,026) (0.01)17/12/2008 EUR 13,000 USD 18,454 (88) 0.0017/12/2008 GBP 200,000 EUR 249,210 4,339 0.0017/12/2008 GBP 100,000 EUR 125,311 1,464 0.0017/12/2008 GBP 20,915,000 EUR 26,401,995 112,914 0.0417/12/2008 GBP 700,000 EUR 884,333 3,089 0.0017/12/2008 GBP 3,480,000 EUR 4,310,014 101,742 0.0417/12/2008 GBP 2,900,000 EUR 3,589,553 86,910 0.0317/12/2008 GBP 1,000,000 EUR 1,237,869 29,877 0.0117/12/2008 GBP 2,450,000 EUR 3,031,773 74,205 0.0317/12/2008 GBP 21,015,000 EUR 26,017,486 624,197 0.2317/12/2008 GBP 3,100,000 EUR 3,836,681 93,332 0.0317/12/2008 GBP 3,350,000 EUR 4,144,998 101,951 0.0417/12/2008 GBP 1,202,000 USD 2,132,348 11,465 0.0017/12/2008 GBP 618,000 USD 1,099,731 3,484 0.0017/12/2008 GBP 575,000 USD 1,063,750 (25,510) (0.01)17/12/2008 JPY 46,793,000 USD 444,336 868 0.0017/12/2008 JPY 217,273,000 USD 2,031,918 26,200 0.0117/12/2008 NOK 65,514,000 USD 11,248,970 (155,821) (0.06)17/12/2008 SEK 4,000,000 EUR 422,270 (15,168) (0.01)17/12/2008 SEK 39,000,000 EUR 4,120,900 (151,655) (0.06)17/12/2008 SEK 3,000,000 EUR 316,937 (11,611) 0.0017/12/2008 SEK 2,375,000 EUR 250,884 (9,167) 0.0017/12/2008 SEK 6,700,000 EUR 707,475 (25,580) (0.01)17/12/2008 SEK 1,100,000 EUR 113,914 (1,961) 0.0017/12/2008 SEK 38,700,000 EUR 4,025,713 (87,000) (0.03)17/12/2008 SEK 18,400,000 EUR 1,943,705 (71,036) (0.03)17/12/2008 SEK 300,000 EUR 31,487 (954) 0.0017/12/2008 SEK 7,931,000 USD 1,166,306 (20,020) (0.01)17/12/2008 USD 370,884 AUD 465,000 4,065 0.0017/12/2008 USD 733,517 AUD 927,000 3,949 0.0017/12/2008 USD 2,230,424 CAD 2,387,000 (15,315) (0.01)17/12/2008 USD 45,176 CHF 49,000 830 0.00

Russell Investment Company II plc The Pan European Equity Fund Schedule of Investments - continued 30 September 2008
The accompanying notes are an integral part of the financial statements.
The Pan European Equity Fund 109
Settlement Date
Amount Bought
Amount Sold
Unrealised Gain (Loss)
EUR Fund
% 17/12/2008 USD 27,317 DKK 139,000 744 0.0017/12/2008 USD 1,121,224 DKK 5,938,000 (663) 0.0017/12/2008 USD 3,393,254 EUR 2,443,000 (36,338) (0.01)17/12/2008 USD 3,245,057 EUR 2,304,024 (2,471) 0.0017/12/2008 USD 1,124,841 GBP 646,000 (21,172) (0.01)17/12/2008 USD 3,497,692 JPY 367,520,000 (1,282) 0.0017/12/2008 USD 3,898,362 NOK 22,780,000 44,933 0.0217/12/2008 USD 679,810 NOK 3,962,000 9,084 0.0017/12/2008 USD 3,488,296 NZD 5,344,000 (35,050) (0.01)17/12/2008 USD 89,842 NZD 137,000 (604) 0.0017/12/2008 USD 983,512 SEK 6,502,000 35,811 0.0117/12/2008 USD 73,037 SEK 501,000 812 0.00
Unrealised gain on open forward foreign currency exchange contracts .............................. 2,056,473 0.75Unrealised loss on open forward foreign currency exchange contracts ............................... (2,189,734) (0.80)Net unrealised gain (loss) on open forward foreign currency exchange contracts. (133,261) (0.05)Total Financial Derivatives ............................................................................................. (522,668) (0.20)
Fair Value
EUR Fund
%
Total Investments (98.51%) .......................................................... 269,395,730 98.51 Other Net Liabilities (1.40%) ....................................................... 3,835,339 1.40
Adjustment From Bid Market Prices To Last Traded Market Prices (0.09%) ................................................................... 233,657 0.09
Net Assets (100.00%) ..................................................................... 273,464,726 100.00
Analysis of total assets (unaudited) % of
total assets Transferable securities and money market instruments admitted to an official stock exchange listing or traded in a regulated market ............................................................................................................................................ 94.91Transferable securities and money market instruments other than those admitted to an official stock exchange listing or traded in another regulated market ....................................................................................................... 0.23Collective investment schemes ........................................................................................................................... 1.69Exchange traded financial derivative instruments ............................................................................................... 0.07Over the counter financial derivative instruments ............................................................................................... 0.74Other assets ......................................................................................................................................................... 2.36
100.00 The brokers for the open futures contracts are: Barclays Morgan Stanley The counterparties for the open forward foreign currency exchange contracts are: Bank of America Brown Brothers Harriman Citibank Credit Suisse First Boston Deutsche Bank
Russell Investment Company II plc The Pan European Equity Fund Schedule of Investments - continued 30 September 2008
The accompanying notes are an integral part of the financial statements. 110 The Pan European Equity Fund
Goldman Sachs HSBC Morgan Stanley Royal Bank of Scotland State Street Bank UBS Warburg The proportion of the investments of the Pan European Equity Fund in rights or securities eligible to the French Plan d’Epargne en Actions (PEA) has been continuously equal to or greater than, 75 per cent over the elapsed fiscal period ended on 30 September 2008 (unaudited).
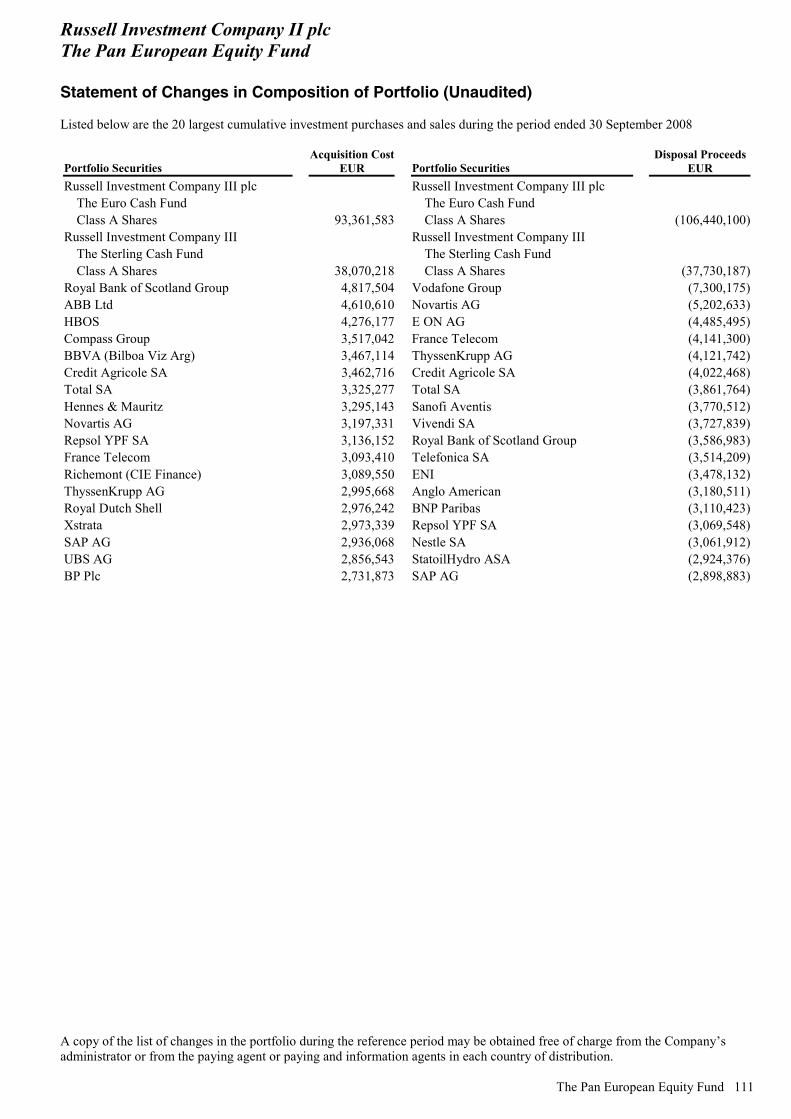
Russell Investment Company II plc The Pan European Equity Fund Statement of Changes in Composition of Portfolio (Unaudited) Listed below are the 20 largest cumulative investment purchases and sales during the period ended 30 September 2008
A copy of the list of changes in the portfolio during the reference period may be obtained free of charge from the Company’s administrator or from the paying agent or paying and information agents in each country of distribution.
The Pan European Equity Fund 111
Portfolio Securities Acquisition Cost
EUR Portfolio Securities Disposal Proceeds
EUR Russell Investment Company III plc Russell Investment Company III plc
The Euro Cash Fund The Euro Cash Fund Class A Shares 93,361,583 Class A Shares (106,440,100)
Russell Investment Company III Russell Investment Company III The Sterling Cash Fund The Sterling Cash Fund Class A Shares 38,070,218 Class A Shares (37,730,187)
Royal Bank of Scotland Group 4,817,504 Vodafone Group (7,300,175)ABB Ltd 4,610,610 Novartis AG (5,202,633)HBOS 4,276,177 E ON AG (4,485,495)Compass Group 3,517,042 France Telecom (4,141,300)BBVA (Bilboa Viz Arg) 3,467,114 ThyssenKrupp AG (4,121,742)Credit Agricole SA 3,462,716 Credit Agricole SA (4,022,468)Total SA 3,325,277 Total SA (3,861,764)Hennes & Mauritz 3,295,143 Sanofi Aventis (3,770,512)Novartis AG 3,197,331 Vivendi SA (3,727,839)Repsol YPF SA 3,136,152 Royal Bank of Scotland Group (3,586,983)France Telecom 3,093,410 Telefonica SA (3,514,209)Richemont (CIE Finance) 3,089,550 ENI (3,478,132)ThyssenKrupp AG 2,995,668 Anglo American (3,180,511)Royal Dutch Shell 2,976,242 BNP Paribas (3,110,423)Xstrata 2,973,339 Repsol YPF SA (3,069,548)SAP AG 2,936,068 Nestle SA (3,061,912)UBS AG 2,856,543 StatoilHydro ASA (2,924,376)BP Plc 2,731,873 SAP AG (2,898,883)
Russell Investment Company II plc The U.K. Equity Plus Fund Manager’s Report
112 The U.K. Equity Plus Fund
Money Managers Liontrust Investment Services Limited Resolution Asset Management Limited River and Mercantile Asset Management LLP Standard Life Investments TT International Investment Objective The U.K. Equity Plus Fund (the “Fund”) aims to provide total returns by investing in a portfolio of predominantly U.K. equities traded on U.K. stock exchanges, including convertibles, warrants, money market instruments, deposits and collective investment schemes. The U.K. Equity Plus Fund will seek to achieve its investment objective by investing in derivative instruments that have as their underlying exposure the foregoing (e.g. swaps and contracts for differences) and may implement bought (long) and synthetic short (sold) positions through the use of derivatives. Money market instruments may include but are not limited to commercial paper issued by corporate entities; certificates of deposit; bankers’ acceptances; Treasury bills; short corporate bonds (securities with less than one year to maturity); money market funds. The investments will be selected with a view to achieving the Fund’s objective of providing total returns and focussed stock selection. In addition to investing in the foregoing instruments, the Fund may also invest up to 30 per cent of its net assets in non-U.K. equities. The Fund may also invest in new issues for which application for listing on a regulated market will be sought. Investment in money market instruments will not exceed 20 per cent of the net assets of the Fund. Investment in collective investment schemes will not exceed 10 per cent of the net assets of the Fund. At all times, at least two thirds of the Fund’s net assets will be invested in the foregoing instruments (excluding convertibles) of issuers domiciled in the U.K.. Fund Performance The Fund returned -16.2 per cent during the period on a gross-of-fees basis verses a benchmark return of -13.4 per cent.* Market Comment The FTSE All-Share Index fell 13.4 per cent during the period as a crisis in global credit markets unfolded. Despite interest rate cuts in the U.K. and U.S. and injections of liquidity into the market, banks’ ability to raise capital remained at the forefront of investor concerns. Weak economic data put further pressure on the Bank of England, which had to weigh up the rise of interest rates to stem inflation against the effects of higher borrowing costs on an already contracting economy. Following a brief rally in August, markets plummeted in September following the bankruptcy of Lehman Brothers, the bailout of AIG and the rescue of HBOS by Lloyds TSB. This culminated in the U.S. Federal Reserve announcing plans for a USD 700 billion bailout of the banking sector. However, this was later rejected and markets once again sold off, resulting in a number of financial institutions around the world needing to be rescued. In particular, Bradford & Bingley were nationalised and became the latest victim of the credit crunch in the U.K.. Elsewhere, oil and mining stocks struggled as falls in the underlying commodity prices were brought on by weakening consumer demand and signs of slowing economic growth. General Comment on Managers/Performance In June, RCM (U.K.) Ltd. was removed from the Fund’s line up and replaced with River and Mercantile Asset Management LLP (“River & Mercantile”). River & Mercantile use a quantitative screen to rank stocks that is then followed by a qualitative verification process to form a powerful ’best ideas’ stock picking process. Resolution Asset Management Limited, benefited from a minimal position in mining stocks as it believes they are overvalued and earnings are at the peak of the cycle. However, it finished in line with the benchmark due to weak stock selection in the financials sector. TT International’s underperformance was driven by stock selection in the financials sector. Its position in HBOS, which was bought based on its good discount to book value, was the one of the main detractors. Outlook The Fund remains well positioned to benefit from the stock-picking abilities of the managers in the Fund, and Russell currently remain confident in the manager line-up. Past performance is no indication of current or future performance. * Benchmark source: FTSE All-Share Index
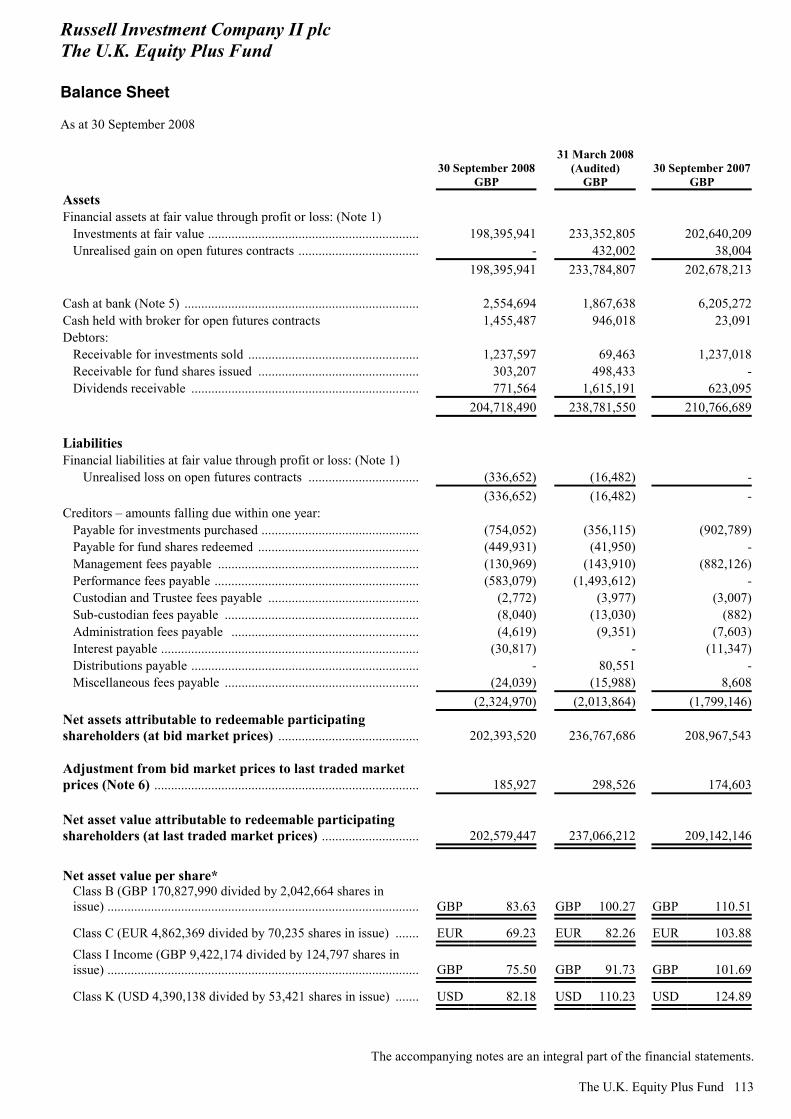
Russell Investment Company II plc The U.K. Equity Plus Fund Balance Sheet As at 30 September 2008
The accompanying notes are an integral part of the financial statements.
The U.K. Equity Plus Fund 113
30 September 2008
GBP
31 March 2008 (Audited)
GBP 30 September 2007
GBP Assets Financial assets at fair value through profit or loss: (Note 1)
Investments at fair value ................................................................ 198,395,941 233,352,805 202,640,209Unrealised gain on open futures contracts ..................................... - 432,002 38,004 198,395,941 233,784,807 202,678,213
Cash at bank (Note 5) ....................................................................... 2,554,694 1,867,638 6,205,272Cash held with broker for open futures contracts 1,455,487 946,018 23,091Debtors:
Receivable for investments sold .................................................... 1,237,597 69,463 1,237,018Receivable for fund shares issued ................................................. 303,207 498,433 -Dividends receivable ..................................................................... 771,564 1,615,191 623,095
204,718,490 238,781,550 210,766,689 Liabilities Financial liabilities at fair value through profit or loss: (Note 1)
Unrealised loss on open futures contracts .................................. (336,652) (16,482) - (336,652) (16,482) -Creditors – amounts falling due within one year:
Payable for investments purchased ................................................ (754,052) (356,115) (902,789)Payable for fund shares redeemed ................................................. (449,931) (41,950) -Management fees payable ............................................................. (130,969) (143,910) (882,126)Performance fees payable .............................................................. (583,079) (1,493,612) -Custodian and Trustee fees payable .............................................. (2,772) (3,977) (3,007)Sub-custodian fees payable ........................................................... (8,040) (13,030) (882)Administration fees payable ......................................................... (4,619) (9,351) (7,603)Interest payable .............................................................................. (30,817) - (11,347)Distributions payable ..................................................................... - 80,551 -Miscellaneous fees payable ........................................................... (24,039) (15,988) 8,608
(2,324,970) (2,013,864) (1,799,146)Net assets attributable to redeemable participating shareholders (at bid market prices) ...........................................
202,393,520 236,767,686 208,967,543
Adjustment from bid market prices to last traded market prices (Note 6) ................................................................................
185,927 298,526 174,603
Net asset value attributable to redeemable participating shareholders (at last traded market prices) ..............................
202,579,447 237,066,212 209,142,146
Net asset value per share*
Class B (GBP 170,827,990 divided by 2,042,664 shares in issue) ..............................................................................................
GBP 83.63 GBP 100.27 GBP 110.51
Class C (EUR 4,862,369 divided by 70,235 shares in issue) ........ EUR 69.23 EUR 82.26 EUR 103.88Class I Income (GBP 9,422,174 divided by 124,797 shares in issue) ..............................................................................................
GBP 75.50 GBP 91.73 GBP 101.69
Class K (USD 4,390,138 divided by 53,421 shares in issue) ........ USD 82.18 USD 110.23 USD 124.89
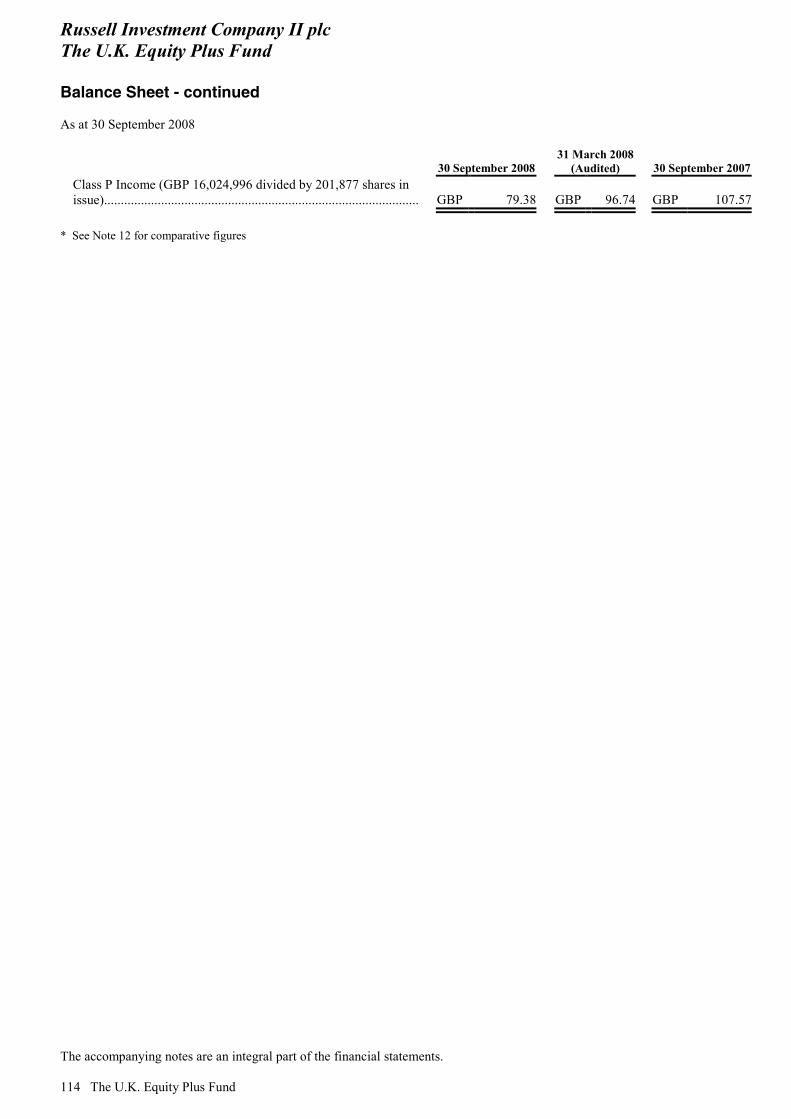
Russell Investment Company II plc The U.K. Equity Plus Fund Balance Sheet - continued As at 30 September 2008
The accompanying notes are an integral part of the financial statements. 114 The U.K. Equity Plus Fund
30 September 2008 31 March 2008
(Audited) 30 September 2007Class P Income (GBP 16,024,996 divided by 201,877 shares in issue)...............................................................................................
GBP 79.38 GBP 96.74 GBP 107.57
* See Note 12 for comparative figures
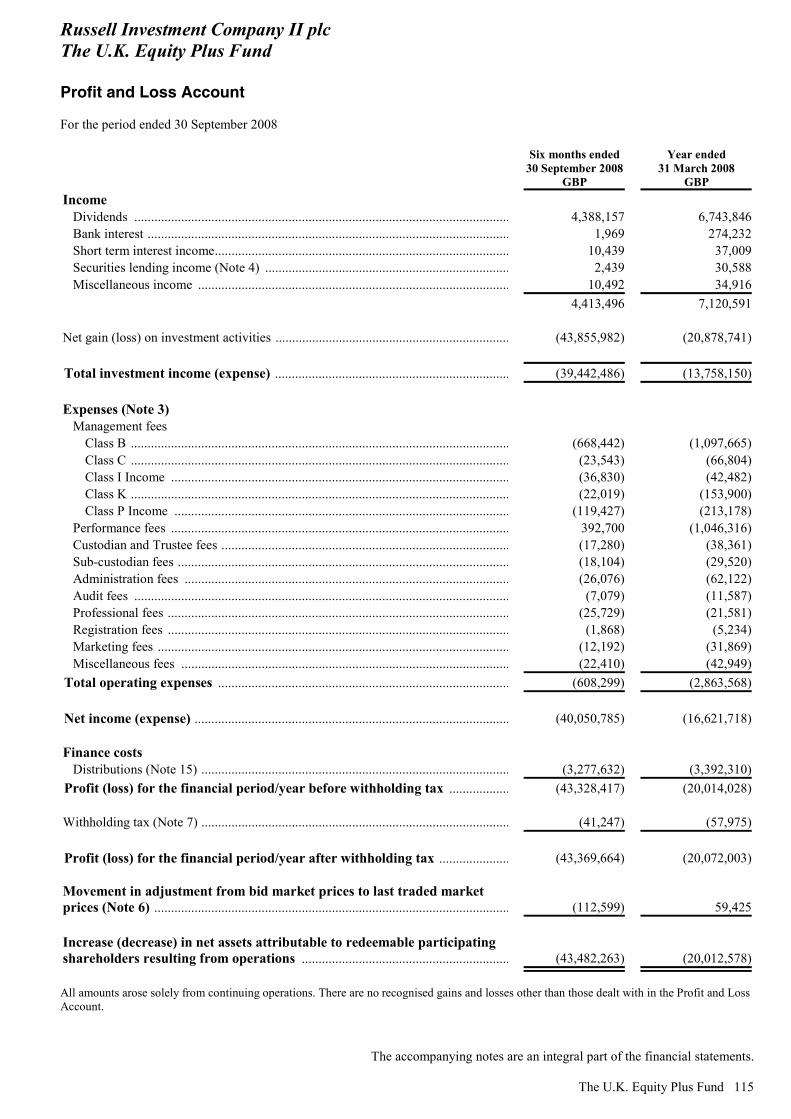
Russell Investment Company II plc The U.K. Equity Plus Fund Profit and Loss Account For the period ended 30 September 2008
The accompanying notes are an integral part of the financial statements.
The U.K. Equity Plus Fund 115
Six months ended
30 September 2008 GBP
Year ended 31 March 2008
GBP Income
Dividends ................................................................................................................ 4,388,157 6,743,846Bank interest ............................................................................................................ 1,969 274,232Short term interest income........................................................................................ 10,439 37,009Securities lending income (Note 4) ......................................................................... 2,439 30,588Miscellaneous income ............................................................................................. 10,492 34,916
4,413,496 7,120,591 Net gain (loss) on investment activities ...................................................................... (43,855,982) (20,878,741) Total investment income (expense) ...................................................................... (39,442,486) (13,758,150) Expenses (Note 3)
Management fees Class B ................................................................................................................. (668,442) (1,097,665)Class C ................................................................................................................. (23,543) (66,804)Class I Income ..................................................................................................... (36,830) (42,482)Class K ................................................................................................................. (22,019) (153,900)Class P Income .................................................................................................... (119,427) (213,178)
Performance fees ..................................................................................................... 392,700 (1,046,316)Custodian and Trustee fees ...................................................................................... (17,280) (38,361)Sub-custodian fees ................................................................................................... (18,104) (29,520)Administration fees ................................................................................................. (26,076) (62,122)Audit fees ................................................................................................................ (7,079) (11,587)Professional fees ...................................................................................................... (25,729) (21,581)Registration fees ...................................................................................................... (1,868) (5,234)Marketing fees ......................................................................................................... (12,192) (31,869)Miscellaneous fees .................................................................................................. (22,410) (42,949)
Total operating expenses ....................................................................................... (608,299) (2,863,568) Net income (expense) .............................................................................................. (40,050,785) (16,621,718) Finance costs
Distributions (Note 15) ............................................................................................ (3,277,632) (3,392,310)Profit (loss) for the financial period/year before withholding tax .................. (43,328,417) (20,014,028) Withholding tax (Note 7) ............................................................................................ (41,247) (57,975) Profit (loss) for the financial period/year after withholding tax ..................... (43,369,664) (20,072,003) Movement in adjustment from bid market prices to last traded market prices (Note 6) ..........................................................................................................
(112,599) 59,425
Increase (decrease) in net assets attributable to redeemable participating shareholders resulting from operations ..............................................................
(43,482,263) (20,012,578)
All amounts arose solely from continuing operations. There are no recognised gains and losses other than those dealt with in the Profit and Loss Account.
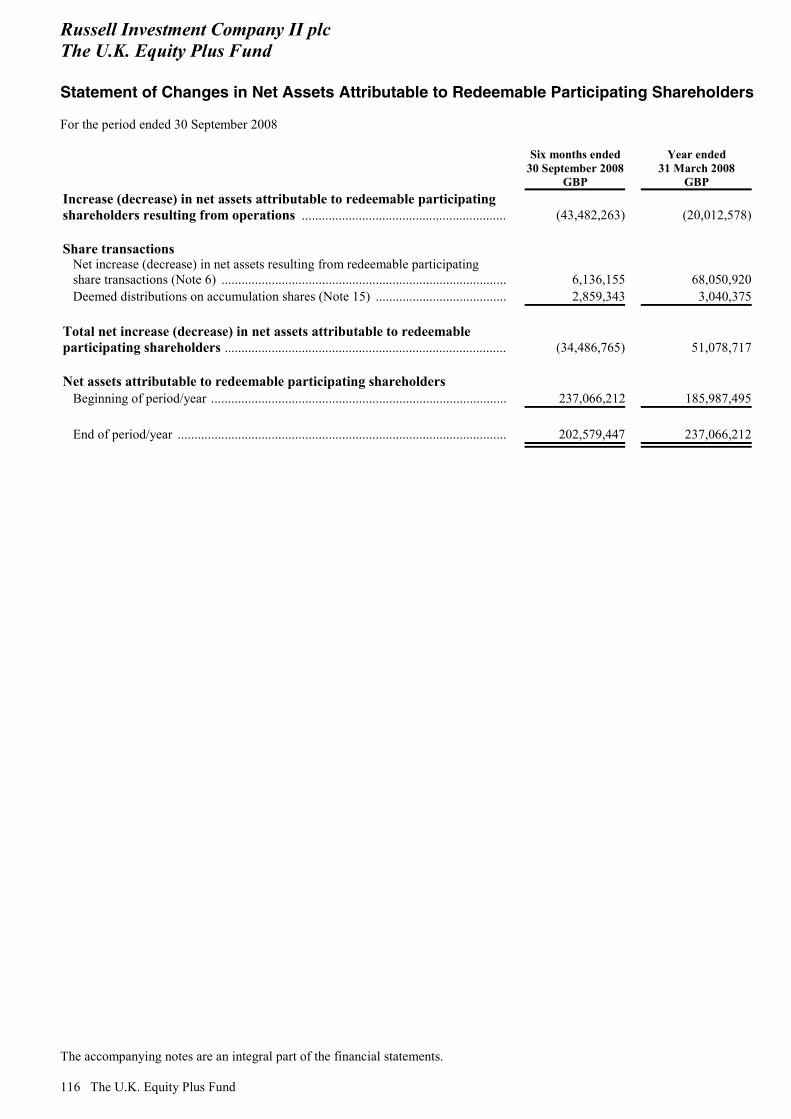
Russell Investment Company II plc The U.K. Equity Plus Fund Statement of Changes in Net Assets Attributable to Redeemable Participating Shareholders For the period ended 30 September 2008
The accompanying notes are an integral part of the financial statements. 116 The U.K. Equity Plus Fund
Six months ended 30 September 2008
GBP
Year ended 31 March 2008
GBP Increase (decrease) in net assets attributable to redeemable participating shareholders resulting from operations ............................................................. (43,482,263) (20,012,578) Share transactions
Net increase (decrease) in net assets resulting from redeemable participating share transactions (Note 6) ..................................................................................... 6,136,155 68,050,920Deemed distributions on accumulation shares (Note 15) ....................................... 2,859,343 3,040,375
Total net increase (decrease) in net assets attributable to redeemable participating shareholders .................................................................................... (34,486,765) 51,078,717 Net assets attributable to redeemable participating shareholders
Beginning of period/year ........................................................................................ 237,066,212 185,987,495 End of period/year .................................................................................................. 202,579,447 237,066,212
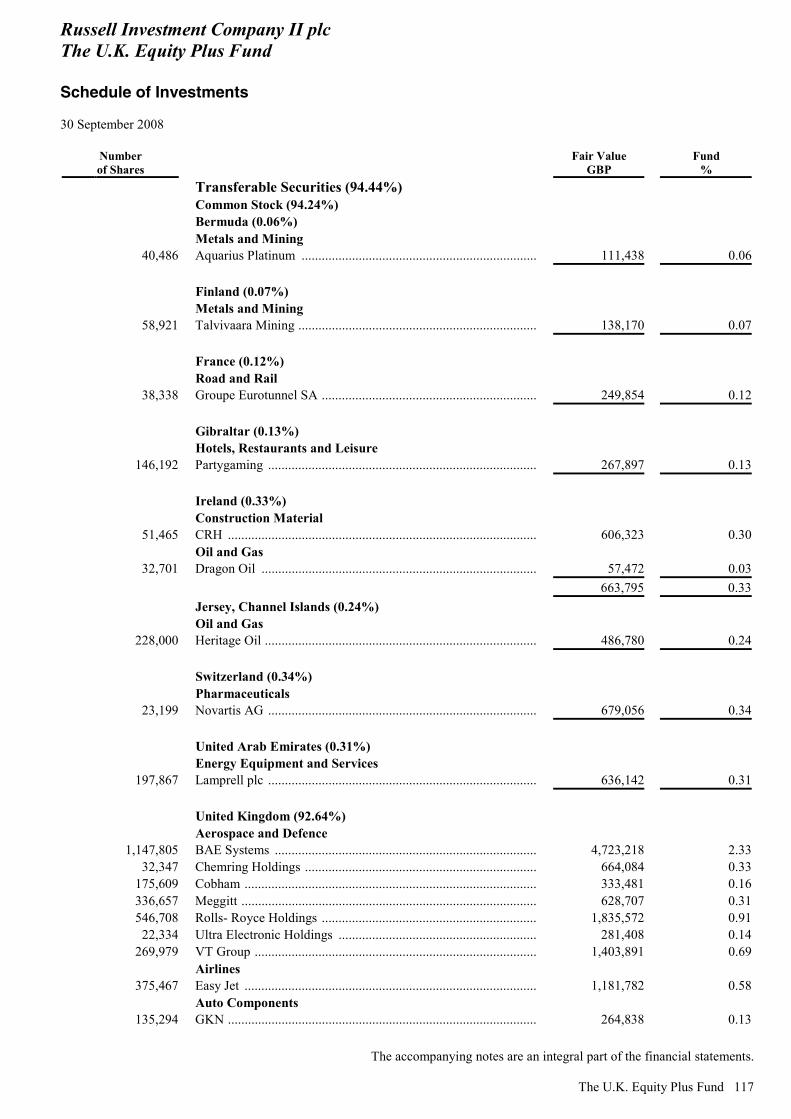
Russell Investment Company II plc The U.K. Equity Plus Fund Schedule of Investments 30 September 2008
The accompanying notes are an integral part of the financial statements.
The U.K. Equity Plus Fund 117
Number of Shares
Fair Value GBP
Fund %
Transferable Securities (94.44%) Common Stock (94.24%) Bermuda (0.06%) Metals and Mining
40,486 Aquarius Platinum ...................................................................... 111,438 0.06 Finland (0.07%) Metals and Mining
58,921 Talvivaara Mining ....................................................................... 138,170 0.07 France (0.12%) Road and Rail
38,338 Groupe Eurotunnel SA ................................................................ 249,854 0.12 Gibraltar (0.13%) Hotels, Restaurants and Leisure
146,192 Partygaming ................................................................................ 267,897 0.13 Ireland (0.33%) Construction Material
51,465 CRH ............................................................................................ 606,323 0.30 Oil and Gas
32,701 Dragon Oil .................................................................................. 57,472 0.03 663,795 0.33 Jersey, Channel Islands (0.24%) Oil and Gas
228,000 Heritage Oil ................................................................................. 486,780 0.24 Switzerland (0.34%) Pharmaceuticals
23,199 Novartis AG ................................................................................ 679,056 0.34 United Arab Emirates (0.31%) Energy Equipment and Services
197,867 Lamprell plc ................................................................................ 636,142 0.31 United Kingdom (92.64%) Aerospace and Defence
1,147,805 BAE Systems .............................................................................. 4,723,218 2.3332,347 Chemring Holdings ..................................................................... 664,084 0.33
175,609 Cobham ....................................................................................... 333,481 0.16336,657 Meggitt ........................................................................................ 628,707 0.31546,708 Rolls- Royce Holdings ................................................................ 1,835,572 0.91
22,334 Ultra Electronic Holdings ........................................................... 281,408 0.14269,979 VT Group .................................................................................... 1,403,891 0.69
Airlines 375,467 Easy Jet ....................................................................................... 1,181,782 0.58
Auto Components 135,294 GKN ............................................................................................ 264,838 0.13

Russell Investment Company II plc The U.K. Equity Plus Fund Schedule of Investments - continued 30 September 2008
The accompanying notes are an integral part of the financial statements. 118 The U.K. Equity Plus Fund
Number of Shares
Fair Value GBP
Fund %
Banks 442,737 Barclays Bank ............................................................................. 1,445,536 0.71708,449 HSBC Holdings .......................................................................... 6,379,583 3.15
1,367,891 Lloyds TSB Group ...................................................................... 3,098,273 1.532,644,032 Royal Bank of Scotland Group ................................................... 4,732,817 2.34
99,168 Standard Chartered ...................................................................... 1,324,885 0.65 Beverages
87,886 Diageo plc ................................................................................... 830,083 0.41 Biotechnology
139,762 Shire ............................................................................................ 1,234,797 0.61 Commercial Services and Supplies
117,586 Aggreko ...................................................................................... 638,492 0.32325,000 Ashtead Group ............................................................................ 216,938 0.11155,048 Atkins WS ................................................................................... 1,122,547 0.55
7,683 BPP Holdings .............................................................................. 35,111 0.0255,610 Capita Group ............................................................................... 388,158 0.19
177,154 De La Rue ................................................................................... 1,591,729 0.7927,268 Dignity ........................................................................................ 187,195 0.09
189,057 ITE Group ................................................................................... 228,285 0.1169,835 Mears Group ............................................................................... 198,681 0.10
127,163 Michael Page International ......................................................... 292,157 0.1473,176 Mitie Group ................................................................................. 150,011 0.0751,342 PayPoint ...................................................................................... 271,086 0.13
793,935 Rentokil Initial ............................................................................ 547,815 0.27161,393 RPS Group .................................................................................. 392,992 0.19242,699 Scott Wilson Group .................................................................... 422,903 0.21434,858 Serco Group ................................................................................ 1,572,011 0.78112,698 SThree plc ................................................................................... 201,448 0.10201,572 Wincanton ................................................................................... 374,924 0.19
Construction and Engineering 96,891 Amec ........................................................................................... 615,258 0.30
540,589 Balfour Beatty ............................................................................. 1,620,415 0.80483,143 Carillion ...................................................................................... 1,248,925 0.62973,398 Galliford Try plc ......................................................................... 425,862 0.21
58,868 Kier Group .................................................................................. 457,993 0.2382,399 Morgan Sindall ........................................................................... 364,615 0.1848,981 WSP Group ................................................................................. 161,025 0.08
Diversified Financials 112,334 Ashmore Group ........................................................................... 218,490 0.11444,069 Cattles plc ................................................................................... 338,603 0.17933,210 HBOS .......................................................................................... 1,142,249 0.56152,383 Icap ............................................................................................. 540,197 0.27158,437 IG Group Holdings ..................................................................... 496,700 0.25109,184 Intermediate Capital Group plc ................................................... 1,310,208 0.65
99,552 International Personal Finance .................................................... 246,889 0.12567,641 Man Group plc ............................................................................ 1,910,112 0.94475,000 Paragon Group of ........................................................................ 308,750 0.15
19,871 Provident Financial Plc ............................................................... 166,916 0.08244,816 Savills ......................................................................................... 634,686 0.31
83,583 Tullett Prebon plc ........................................................................ 228,808 0.11
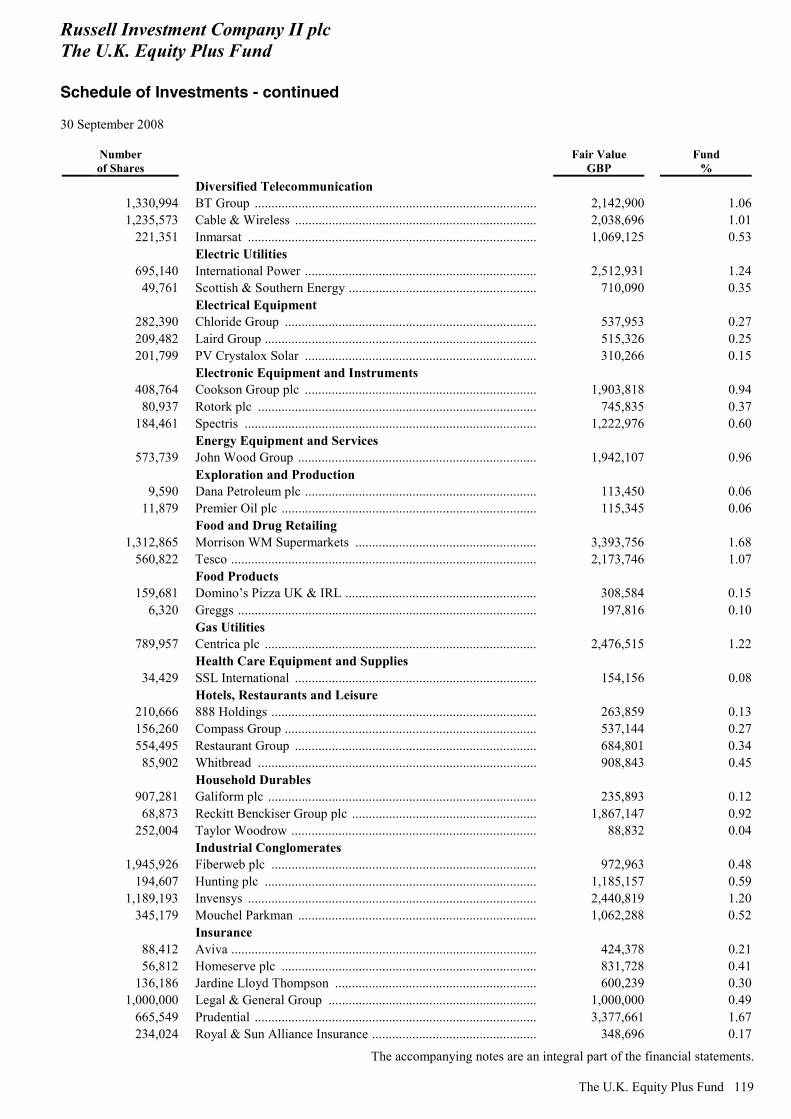
Russell Investment Company II plc The U.K. Equity Plus Fund Schedule of Investments - continued 30 September 2008
The accompanying notes are an integral part of the financial statements.
The U.K. Equity Plus Fund 119
Number of Shares
Fair Value GBP
Fund %
Diversified Telecommunication 1,330,994 BT Group .................................................................................... 2,142,900 1.061,235,573 Cable & Wireless ........................................................................ 2,038,696 1.01
221,351 Inmarsat ...................................................................................... 1,069,125 0.53 Electric Utilities
695,140 International Power ..................................................................... 2,512,931 1.2449,761 Scottish & Southern Energy ........................................................ 710,090 0.35
Electrical Equipment 282,390 Chloride Group ........................................................................... 537,953 0.27209,482 Laird Group ................................................................................. 515,326 0.25201,799 PV Crystalox Solar ..................................................................... 310,266 0.15
Electronic Equipment and Instruments 408,764 Cookson Group plc ..................................................................... 1,903,818 0.94
80,937 Rotork plc ................................................................................... 745,835 0.37184,461 Spectris ....................................................................................... 1,222,976 0.60
Energy Equipment and Services 573,739 John Wood Group ....................................................................... 1,942,107 0.96
Exploration and Production 9,590 Dana Petroleum plc ..................................................................... 113,450 0.06
11,879 Premier Oil plc ............................................................................ 115,345 0.06 Food and Drug Retailing
1,312,865 Morrison WM Supermarkets ...................................................... 3,393,756 1.68560,822 Tesco ........................................................................................... 2,173,746 1.07
Food Products 159,681 Domino’s Pizza UK & IRL ......................................................... 308,584 0.15
6,320 Greggs ......................................................................................... 197,816 0.10 Gas Utilities
789,957 Centrica plc ................................................................................. 2,476,515 1.22 Health Care Equipment and Supplies
34,429 SSL International ........................................................................ 154,156 0.08 Hotels, Restaurants and Leisure
210,666 888 Holdings ............................................................................... 263,859 0.13156,260 Compass Group ........................................................................... 537,144 0.27554,495 Restaurant Group ........................................................................ 684,801 0.34
85,902 Whitbread ................................................................................... 908,843 0.45 Household Durables
907,281 Galiform plc ................................................................................ 235,893 0.1268,873 Reckitt Benckiser Group plc ....................................................... 1,867,147 0.92
252,004 Taylor Woodrow ......................................................................... 88,832 0.04 Industrial Conglomerates
1,945,926 Fiberweb plc ............................................................................... 972,963 0.48194,607 Hunting plc ................................................................................. 1,185,157 0.59
1,189,193 Invensys ...................................................................................... 2,440,819 1.20345,179 Mouchel Parkman ....................................................................... 1,062,288 0.52
Insurance 88,412 Aviva ........................................................................................... 424,378 0.2156,812 Homeserve plc ............................................................................ 831,728 0.41
136,186 Jardine Lloyd Thompson ............................................................ 600,239 0.301,000,000 Legal & General Group .............................................................. 1,000,000 0.49
665,549 Prudential .................................................................................... 3,377,661 1.67234,024 Royal & Sun Alliance Insurance ................................................. 348,696 0.17
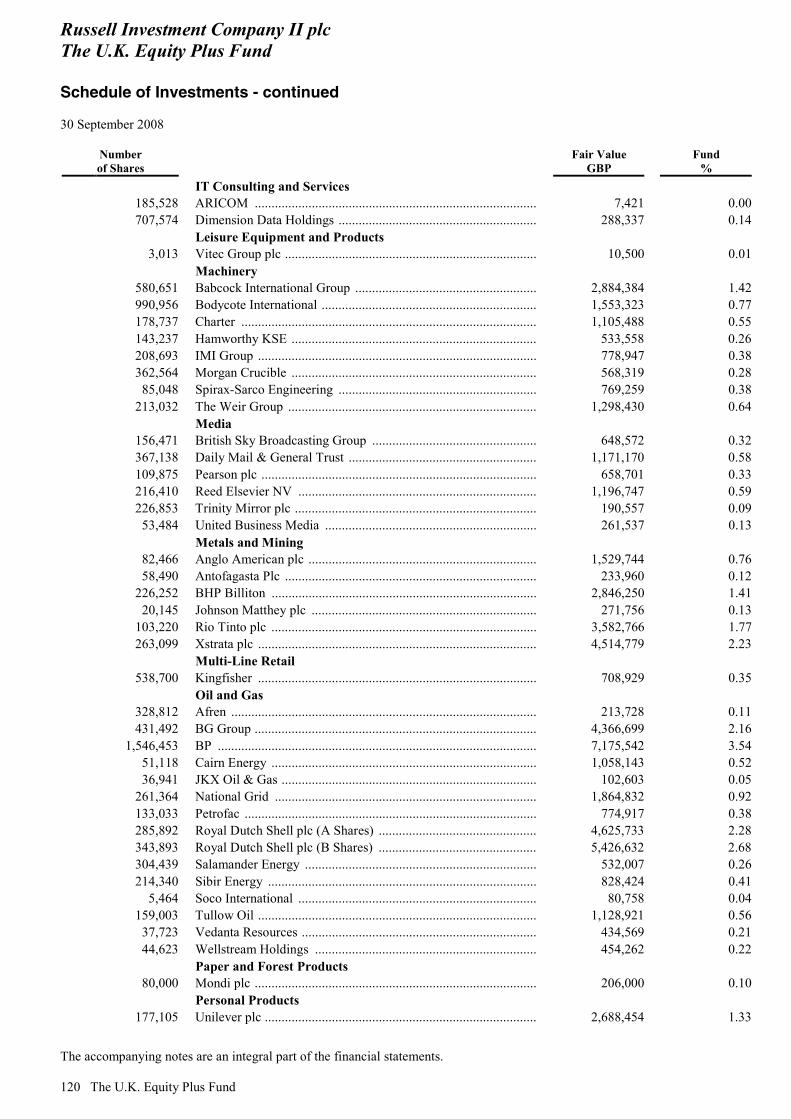
Russell Investment Company II plc The U.K. Equity Plus Fund Schedule of Investments - continued 30 September 2008
The accompanying notes are an integral part of the financial statements. 120 The U.K. Equity Plus Fund
Number of Shares
Fair Value GBP
Fund %
IT Consulting and Services 185,528 ARICOM .................................................................................... 7,421 0.00707,574 Dimension Data Holdings ........................................................... 288,337 0.14
Leisure Equipment and Products 3,013 Vitec Group plc ........................................................................... 10,500 0.01
Machinery 580,651 Babcock International Group ...................................................... 2,884,384 1.42990,956 Bodycote International ................................................................ 1,553,323 0.77178,737 Charter ........................................................................................ 1,105,488 0.55143,237 Hamworthy KSE ......................................................................... 533,558 0.26208,693 IMI Group ................................................................................... 778,947 0.38362,564 Morgan Crucible ......................................................................... 568,319 0.28
85,048 Spirax-Sarco Engineering ........................................................... 769,259 0.38213,032 The Weir Group .......................................................................... 1,298,430 0.64
Media 156,471 British Sky Broadcasting Group ................................................. 648,572 0.32367,138 Daily Mail & General Trust ........................................................ 1,171,170 0.58109,875 Pearson plc .................................................................................. 658,701 0.33216,410 Reed Elsevier NV ....................................................................... 1,196,747 0.59226,853 Trinity Mirror plc ........................................................................ 190,557 0.09
53,484 United Business Media ............................................................... 261,537 0.13 Metals and Mining
82,466 Anglo American plc .................................................................... 1,529,744 0.7658,490 Antofagasta Plc ........................................................................... 233,960 0.12
226,252 BHP Billiton ............................................................................... 2,846,250 1.4120,145 Johnson Matthey plc ................................................................... 271,756 0.13
103,220 Rio Tinto plc ............................................................................... 3,582,766 1.77263,099 Xstrata plc ................................................................................... 4,514,779 2.23
Multi-Line Retail 538,700 Kingfisher ................................................................................... 708,929 0.35
Oil and Gas 328,812 Afren ........................................................................................... 213,728 0.11431,492 BG Group .................................................................................... 4,366,699 2.16
1,546,453 BP ............................................................................................... 7,175,542 3.5451,118 Cairn Energy ............................................................................... 1,058,143 0.5236,941 JKX Oil & Gas ............................................................................ 102,603 0.05
261,364 National Grid .............................................................................. 1,864,832 0.92133,033 Petrofac ....................................................................................... 774,917 0.38285,892 Royal Dutch Shell plc (A Shares) ............................................... 4,625,733 2.28343,893 Royal Dutch Shell plc (B Shares) ............................................... 5,426,632 2.68304,439 Salamander Energy ..................................................................... 532,007 0.26214,340 Sibir Energy ................................................................................ 828,424 0.41
5,464 Soco International ....................................................................... 80,758 0.04159,003 Tullow Oil ................................................................................... 1,128,921 0.56
37,723 Vedanta Resources ...................................................................... 434,569 0.2144,623 Wellstream Holdings .................................................................. 454,262 0.22
Paper and Forest Products 80,000 Mondi plc .................................................................................... 206,000 0.10
Personal Products 177,105 Unilever plc ................................................................................. 2,688,454 1.33
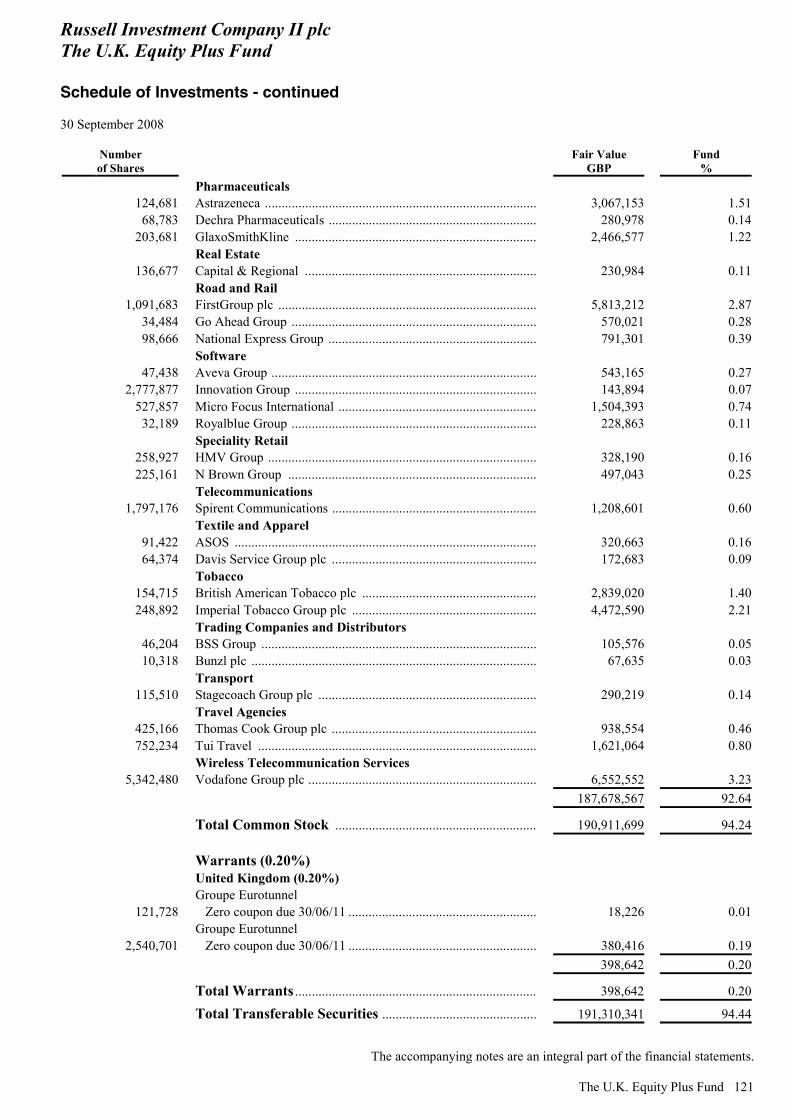
Russell Investment Company II plc The U.K. Equity Plus Fund Schedule of Investments - continued 30 September 2008
The accompanying notes are an integral part of the financial statements.
The U.K. Equity Plus Fund 121
Number of Shares
Fair Value GBP
Fund %
Pharmaceuticals 124,681 Astrazeneca ................................................................................. 3,067,153 1.51
68,783 Dechra Pharmaceuticals .............................................................. 280,978 0.14203,681 GlaxoSmithKline ........................................................................ 2,466,577 1.22
Real Estate 136,677 Capital & Regional ..................................................................... 230,984 0.11
Road and Rail 1,091,683 FirstGroup plc ............................................................................. 5,813,212 2.87
34,484 Go Ahead Group ......................................................................... 570,021 0.2898,666 National Express Group .............................................................. 791,301 0.39
Software 47,438 Aveva Group ............................................................................... 543,165 0.27
2,777,877 Innovation Group ........................................................................ 143,894 0.07527,857 Micro Focus International ........................................................... 1,504,393 0.74
32,189 Royalblue Group ......................................................................... 228,863 0.11 Speciality Retail
258,927 HMV Group ................................................................................ 328,190 0.16225,161 N Brown Group .......................................................................... 497,043 0.25
Telecommunications 1,797,176 Spirent Communications ............................................................. 1,208,601 0.60
Textile and Apparel 91,422 ASOS .......................................................................................... 320,663 0.1664,374 Davis Service Group plc ............................................................. 172,683 0.09
Tobacco 154,715 British American Tobacco plc .................................................... 2,839,020 1.40248,892 Imperial Tobacco Group plc ....................................................... 4,472,590 2.21
Trading Companies and Distributors 46,204 BSS Group .................................................................................. 105,576 0.0510,318 Bunzl plc ..................................................................................... 67,635 0.03
Transport 115,510 Stagecoach Group plc ................................................................. 290,219 0.14
Travel Agencies 425,166 Thomas Cook Group plc ............................................................. 938,554 0.46752,234 Tui Travel ................................................................................... 1,621,064 0.80
Wireless Telecommunication Services 5,342,480 Vodafone Group plc .................................................................... 6,552,552 3.23
187,678,567 92.64
Total Common Stock ............................................................ 190,911,699 94.24 Warrants (0.20%) United Kingdom (0.20%) Groupe Eurotunnel
121,728 Zero coupon due 30/06/11 ........................................................ 18,226 0.01 Groupe Eurotunnel
2,540,701 Zero coupon due 30/06/11 ........................................................ 380,416 0.19 398,642 0.20
Total Warrants ........................................................................ 398,642 0.20
Total Transferable Securities .............................................. 191,310,341 94.44
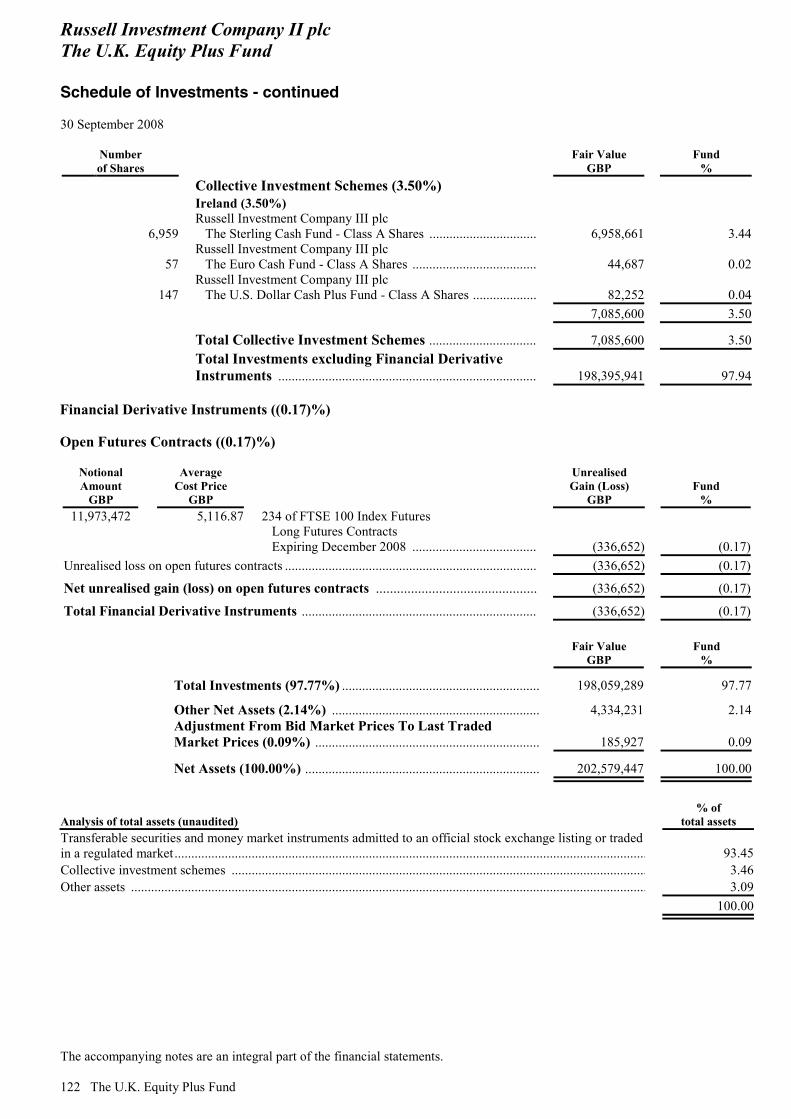
Russell Investment Company II plc The U.K. Equity Plus Fund Schedule of Investments - continued 30 September 2008
The accompanying notes are an integral part of the financial statements. 122 The U.K. Equity Plus Fund
Number of Shares
Fair Value GBP
Fund %
Collective Investment Schemes (3.50%) Ireland (3.50%)
6,959 Russell Investment Company III plc The Sterling Cash Fund - Class A Shares ................................ 6,958,661 3.44
57 Russell Investment Company III plc The Euro Cash Fund - Class A Shares ..................................... 44,687 0.02
147 Russell Investment Company III plc The U.S. Dollar Cash Plus Fund - Class A Shares ................... 82,252 0.04
7,085,600 3.50
Total Collective Investment Schemes ................................ 7,085,600 3.50
Total Investments excluding Financial Derivative Instruments ............................................................................. 198,395,941 97.94
Financial Derivative Instruments ((0.17)%) Open Futures Contracts ((0.17)%)
Notional Amount
GBP
Average Cost Price
GBP
Unrealised Gain (Loss)
GBP Fund
% 11,973,472 5,116.87 234 of FTSE 100 Index Futures
Long Futures Contracts Expiring December 2008 ...................................... (336,652) (0.17)
Unrealised loss on open futures contracts ........................................................................... (336,652) (0.17)
Net unrealised gain (loss) on open futures contracts .............................................. (336,652) (0.17)
Total Financial Derivative Instruments ...................................................................... (336,652) (0.17)
Fair Value
GBP Fund
%
Total Investments (97.77%) ........................................................... 198,059,289 97.77
Other Net Assets (2.14%) .............................................................. 4,334,231 2.14
Adjustment From Bid Market Prices To Last Traded Market Prices (0.09%) ................................................................... 185,927 0.09
Net Assets (100.00%) ...................................................................... 202,579,447 100.00
Analysis of total assets (unaudited) % of
total assets Transferable securities and money market instruments admitted to an official stock exchange listing or traded in a regulated market ............................................................................................................................................. 93.45Collective investment schemes ............................................................................................................................ 3.46Other assets .......................................................................................................................................................... 3.09
100.00
Russell Investment Company II plc The U.K. Equity Plus Fund Schedule of Investments - continued 30 September 2008
The accompanying notes are an integral part of the financial statements.
The U.K. Equity Plus Fund 123
The broker for the open futures contract is Morgan Stanley. The proportion of the investments of the U.K. Equity Plus Fund in rights or securities eligible to the French Plan d’Epargne en actions (PEA) has been continuously equal to, or greater than, 75 per cent over the elapsed fiscal period ended on 30 September 2008 (unaudited).
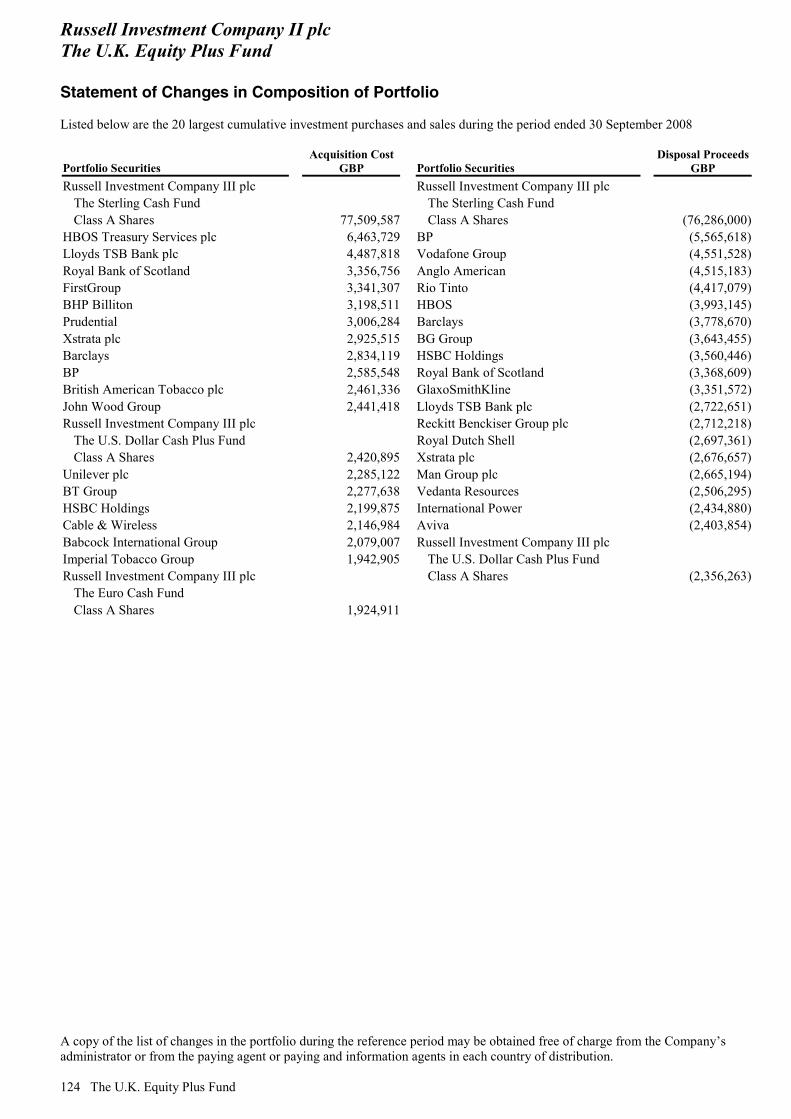
Russell Investment Company II plc The U.K. Equity Plus Fund Statement of Changes in Composition of Portfolio Listed below are the 20 largest cumulative investment purchases and sales during the period ended 30 September 2008
A copy of the list of changes in the portfolio during the reference period may be obtained free of charge from the Company’s administrator or from the paying agent or paying and information agents in each country of distribution. 124 The U.K. Equity Plus Fund
Portfolio Securities Acquisition Cost
GBP Portfolio Securities Disposal Proceeds
GBP Russell Investment Company III plc Russell Investment Company III plc
The Sterling Cash Fund The Sterling Cash Fund Class A Shares 77,509,587 Class A Shares (76,286,000)
HBOS Treasury Services plc 6,463,729 BP (5,565,618)Lloyds TSB Bank plc 4,487,818 Vodafone Group (4,551,528)Royal Bank of Scotland 3,356,756 Anglo American (4,515,183)FirstGroup 3,341,307 Rio Tinto (4,417,079)BHP Billiton 3,198,511 HBOS (3,993,145)Prudential 3,006,284 Barclays (3,778,670)Xstrata plc 2,925,515 BG Group (3,643,455)Barclays 2,834,119 HSBC Holdings (3,560,446)BP 2,585,548 Royal Bank of Scotland (3,368,609)British American Tobacco plc 2,461,336 GlaxoSmithKline (3,351,572)John Wood Group 2,441,418 Lloyds TSB Bank plc (2,722,651)Russell Investment Company III plc Reckitt Benckiser Group plc (2,712,218)
The U.S. Dollar Cash Plus Fund Royal Dutch Shell (2,697,361)Class A Shares 2,420,895 Xstrata plc (2,676,657)
Unilever plc 2,285,122 Man Group plc (2,665,194)BT Group 2,277,638 Vedanta Resources (2,506,295)HSBC Holdings 2,199,875 International Power (2,434,880)Cable & Wireless 2,146,984 Aviva (2,403,854)Babcock International Group 2,079,007 Russell Investment Company III plc Imperial Tobacco Group 1,942,905 The U.S. Dollar Cash Plus Fund Russell Investment Company III plc Class A Shares (2,356,263)
The Euro Cash Fund Class A Shares 1,924,911

Russell Investment Company II plc The U.S. Growth Fund Manager’s Report
The U.S. Growth Fund 125
Money Managers Marisco Capital Management, LLC Suffolk Capital Management, LLC Sustainable Growth Advisers, L.P. Turner Investment Partners Inc. Wells Capital Management Investment Objective The U.S. Growth Fund (the “Fund”) will seek to achieve capital appreciation by investing primarily in U.S. equity securities, including common stock, American depository receipts, global depository receipts, convertibles and warrants listed, traded or dealt in on a regulated market in the U.S. Fund Performance The Fund returned -10.1 per cent during the period on a gross-of-fees basis verses a benchmark return of -11.3 per cent.* Market Comment U.S. markets declined by 11.3 per cent during the period. During the second quarter of 2008, a rate cut by the Federal Reserve (“Fed”) improved investor sentiment and equities rose during the first six weeks, to peak mid-May 2008. This was led primarily by the strong performance of oil stocks and healthy corporate data. However, investor sentiment was diminished by concerns over the potential impact of the high oil price on consumer spending. Further write-downs and profit warnings from major financial institutions alongside weak economic data fuelled a sell-off which continued throughout June 2008. Key economic data such as housing, manufacturing and employment was weak during the period which underlined Fed comments that further rate cuts were unlikely in the short term due to inflation. Following volatility related to the oil sector in July and August 2008, September’s market performance defined the third quarter as global markets suffered historic losses. A steep decline in mid-September, the greatest since the 9/11 terrorist attacks, was marked by a flurry of buy-outs and government intervention not witnessed since the Great Depression. The collapse of Lehman Brothers and Bank of America’s purchase of Merrill Lynch caused an anxious cascade of sell-offs. The Fed’s rescue of AIG and its announcement of a rescue package restored some investor confidence. However, U.S. Congress rejected the initial Bill prompting another decline towards the end of the month. Investors moved defensively towards the consumer staples sector while cyclical sectors such as technology performed poorly. General Comment on Managers/Performance The Fund outperformed the benchmark. This outperformance was driven particularly by a strong second quarter performance. This was due primarily to strong stock selection in the financial services and consumer discretionary sectors. Growth significantly outperformed value during the period and this was evident in performance. An overweight to stocks with high momentum, high earnings yield and low dividend yield drove returns. In addition, a greater exposure to mid-cap stocks contributed to the outperformance. However, in the third quarter performance was detracted largely by negative stock selection in the technology sector. Investors who were fearful of an economic downturn fled and high growth stocks, where the potential for earnings growth below market expectations was higher. The Fund’s most aggressive growth manager was the worst performer overall, with stock selection in technology being the largest detractor. Investors’ risk appetite fell sharply to avoided momentum and higher growth stocks and this particularly affected the manager’s position in Apple Inc. Outlook The Fund remains well positioned to benefit from the stock-picking abilities of the managers in the Fund, and we currently remain confident in the manager line-up. Past performance is no indication of current or future performance. * Benchmark Source: Russell 1000 Growth Index (Net of 30 per cent Withholding Tax)

Russell Investment Company II plc The U.S. Growth Fund Balance Sheet As at 30 September 2008
The accompanying notes are an integral part of the financial statements. 126 The U.S. Growth Fund
30 September 2008
USD
31 March 2008 (Audited)
USD 30 September 2007
USD Assets Financial assets at fair value through profit or loss: (Note 1)
Investments at fair value ............................................................. 240,573,721 380,247,411 461,997,600Unrealised gain on open futures contracts .................................. - 291,072 247,130
240,573,721 380,538,483 462,244,730 Cash at bank (Note 5) ..................................................................... 710,290 10,768,023 6,678,114Cash held with broker for open futures contracts ........................... 161,978 - - Debtors:
Receivable for investments sold .................................................. 3,369,042 2,185,017 2,064,015Receivable for fund shares issued ............................................... 78,399 800,001 32,121Dividends receivable ................................................................... 156,727 265,967 246,285Interest receivable ....................................................................... 90,177 109,617 141,955
245,140,334 394,667,108 471,407,220Liabilities Financial liabilities at fair value through profit or loss: (Note 1)
Unrealised loss on open futures contracts ................................... (540,264) - (24,960) (540,264) - (24,960)
Creditors – amounts falling due within one year:
Cash due to brokers for open futures contracts ........................... - (1,241,835) (196,484)Payable for investments purchased ............................................. (2,480,692) (1,226,865) (1,697,858)Payable for fund shares redeemed ............................................... (526,532) (257,209) (1,735,472)Management fees payable ........................................................... (240,946) (365,071) (395,920)Custodian and Trustee fees payable ............................................ (3,258) (4,933) (7,786)Sub-custodian fees payable ......................................................... (21,856) (30,258) (24,182)Administration fees payable ........................................................ (5,430) (8,222) (16,470)Miscellaneous fees payable ......................................................... (30,656) (28,875) (38,645)
(3,849,634) (3,163,268) (4,137,777) Net assets attributable to redeemable participating shareholders (at bid market prices) .........................................
241,290,700 391,503,840 467,269,443
Adjustment from bid market prices to last traded market prices (Note 6) ..............................................................................
291,360 448,020 262,316
Net assets attributable to redeemable participating shareholders (at last traded market prices) ...........................
241,582,060 391,951,860 467,531,759
Net asset value per share*
Class A Income (USD 615,572 divided by 67,636 shares in issue) ...........................................................................................
USD 9.10 USD 10.62 USD 12.22
Class B (USD 185,859,255 divided by 18,762,873 shares in issue) ...........................................................................................
USD 9.91 USD 11.52 USD 13.21
Class C (EUR 31,218,420 divided by 33,817 shares in issue) .... EUR 923.16 EUR 954.82 EUR 1,224.08
Class I (GBP 4,738,992 divided by 614,719 shares in issue) ...... GBP 7.71 GBP 8.04 GBP 9.00

Russell Investment Company II plc The U.S. Growth Fund Balance Sheet - continued As at 30 September 2008
The accompanying notes are an integral part of the financial statements.
The U.S. Growth Fund 127
30 September 2008 31 March 2008 30 September 2007Class I Income (GBP 1,576,069 divided by 204,498 shares in issue) ........................................................................................... GBP 7.71 GBP 8.04 GBP 9.00
* See Note 12 for comparative net assets
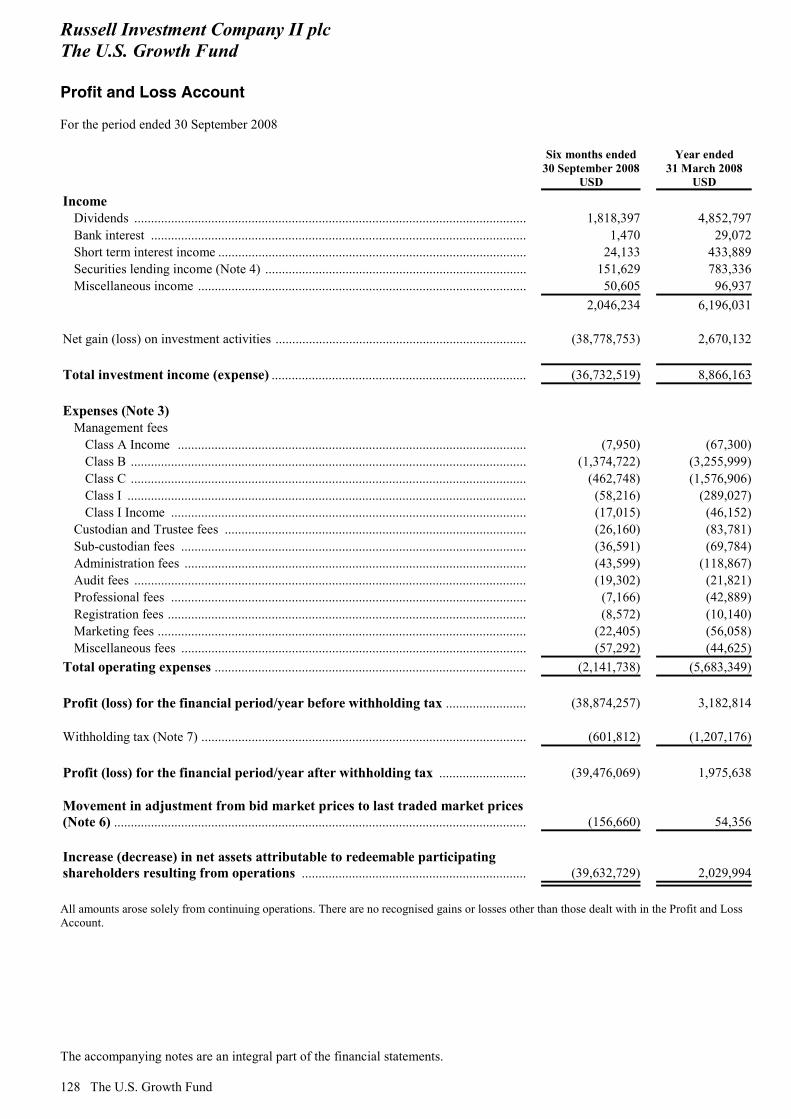
Russell Investment Company II plc The U.S. Growth Fund Profit and Loss Account For the period ended 30 September 2008
The accompanying notes are an integral part of the financial statements. 128 The U.S. Growth Fund
Six months ended 30 September 2008
USD
Year ended 31 March 2008
USD Income
Dividends ..................................................................................................................... 1,818,397 4,852,797Bank interest ................................................................................................................ 1,470 29,072Short term interest income ............................................................................................ 24,133 433,889Securities lending income (Note 4) .............................................................................. 151,629 783,336Miscellaneous income .................................................................................................. 50,605 96,937
2,046,234 6,196,031 Net gain (loss) on investment activities ........................................................................... (38,778,753) 2,670,132 Total investment income (expense) ............................................................................ (36,732,519) 8,866,163 Expenses (Note 3)
Management fees Class A Income ........................................................................................................ (7,950) (67,300)Class B ...................................................................................................................... (1,374,722) (3,255,999)Class C ...................................................................................................................... (462,748) (1,576,906)Class I ....................................................................................................................... (58,216) (289,027)Class I Income .......................................................................................................... (17,015) (46,152)
Custodian and Trustee fees .......................................................................................... (26,160) (83,781)Sub-custodian fees ....................................................................................................... (36,591) (69,784)Administration fees ...................................................................................................... (43,599) (118,867)Audit fees ..................................................................................................................... (19,302) (21,821)Professional fees .......................................................................................................... (7,166) (42,889)Registration fees ........................................................................................................... (8,572) (10,140)Marketing fees .............................................................................................................. (22,405) (56,058)Miscellaneous fees ....................................................................................................... (57,292) (44,625)
Total operating expenses ............................................................................................. (2,141,738) (5,683,349) Profit (loss) for the financial period/year before withholding tax ........................ (38,874,257) 3,182,814 Withholding tax (Note 7) ................................................................................................. (601,812) (1,207,176) Profit (loss) for the financial period/year after withholding tax .......................... (39,476,069) 1,975,638 Movement in adjustment from bid market prices to last traded market prices (Note 6) ........................................................................................................................... (156,660) 54,356 Increase (decrease) in net assets attributable to redeemable participating shareholders resulting from operations ................................................................... (39,632,729) 2,029,994 All amounts arose solely from continuing operations. There are no recognised gains or losses other than those dealt with in the Profit and Loss Account.

Russell Investment Company II plc The U.S. Growth Fund Statement of Changes in Net Assets Attributable to Redeemable Participating Shareholders For the period ended 30 September 2008
The accompanying notes are an integral part of the financial statements.
The U.S. Growth Fund 129
Six months ended 30 September 2008
USD
Year ended 31 March 2008
USD Increase (decrease) in net assets attributable to redeemable participating shareholders resulting from operations ................................................................... (39,632,729) 2,029,994 Share transactions
Net increase (decrease) in net assets resulting from redeemable participating share transactions (Note 6) .................................................................................................... (110,737,071) (110,335,530)
Total net increase (decrease) in net assets attributable to redeemable participating shareholders .......................................................................................... (150,369,800) (108,305,536) Net assets attributable to redeemable participating shareholders
Beginning of period/year .............................................................................................. 391,951,860 500,257,396 End of period/year ........................................................................................................ 241,582,060 391,951,860
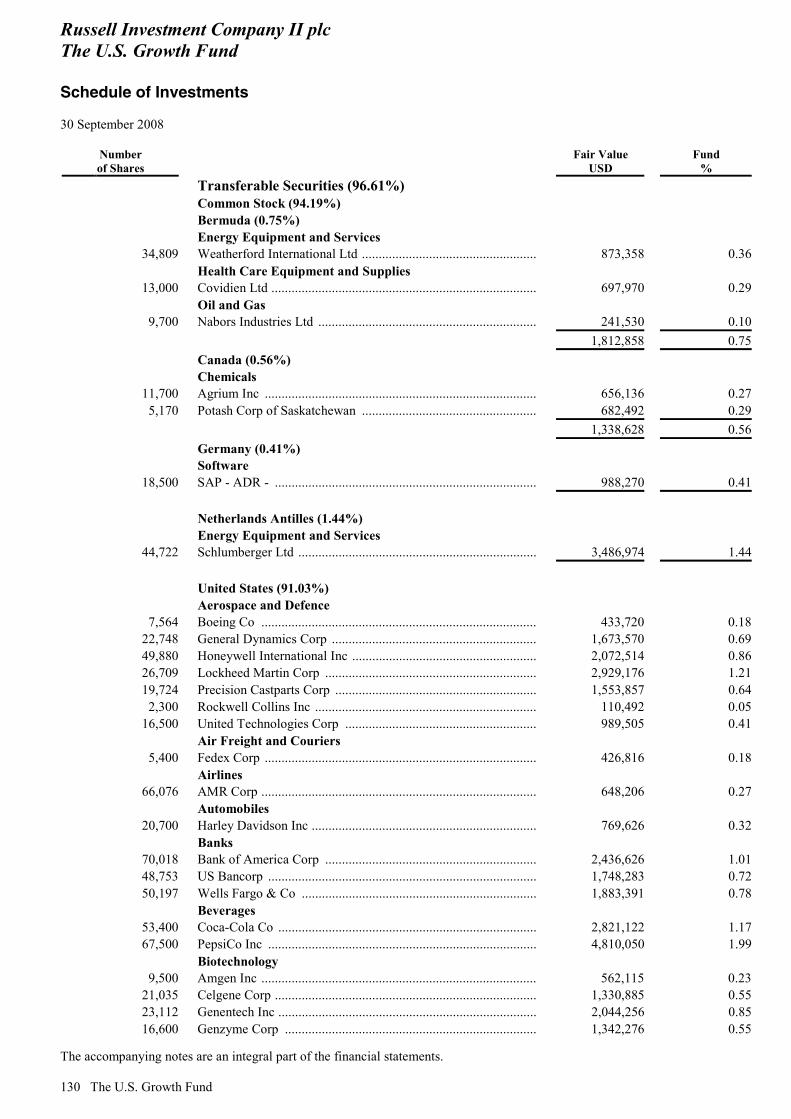
Russell Investment Company II plc The U.S. Growth Fund Schedule of Investments 30 September 2008
The accompanying notes are an integral part of the financial statements. 130 The U.S. Growth Fund
Number of Shares
Fair Value USD
Fund %
Transferable Securities (96.61%) Common Stock (94.19%) Bermuda (0.75%) Energy Equipment and Services
34,809 Weatherford International Ltd .................................................... 873,358 0.36 Health Care Equipment and Supplies
13,000 Covidien Ltd ............................................................................... 697,970 0.29 Oil and Gas
9,700 Nabors Industries Ltd ................................................................. 241,530 0.10 1,812,858 0.75 Canada (0.56%) Chemicals
11,700 Agrium Inc ................................................................................. 656,136 0.275,170 Potash Corp of Saskatchewan .................................................... 682,492 0.29
1,338,628 0.56 Germany (0.41%) Software
18,500 SAP - ADR - .............................................................................. 988,270 0.41 Netherlands Antilles (1.44%) Energy Equipment and Services
44,722 Schlumberger Ltd ....................................................................... 3,486,974 1.44 United States (91.03%) Aerospace and Defence
7,564 Boeing Co .................................................................................. 433,720 0.1822,748 General Dynamics Corp ............................................................. 1,673,570 0.6949,880 Honeywell International Inc ....................................................... 2,072,514 0.8626,709 Lockheed Martin Corp ............................................................... 2,929,176 1.2119,724 Precision Castparts Corp ............................................................ 1,553,857 0.642,300 Rockwell Collins Inc .................................................................. 110,492 0.05
16,500 United Technologies Corp ......................................................... 989,505 0.41 Air Freight and Couriers
5,400 Fedex Corp ................................................................................. 426,816 0.18 Airlines
66,076 AMR Corp .................................................................................. 648,206 0.27 Automobiles
20,700 Harley Davidson Inc ................................................................... 769,626 0.32 Banks
70,018 Bank of America Corp ............................................................... 2,436,626 1.0148,753 US Bancorp ................................................................................ 1,748,283 0.7250,197 Wells Fargo & Co ...................................................................... 1,883,391 0.78
Beverages 53,400 Coca-Cola Co ............................................................................. 2,821,122 1.1767,500 PepsiCo Inc ................................................................................ 4,810,050 1.99
Biotechnology 9,500 Amgen Inc .................................................................................. 562,115 0.23
21,035 Celgene Corp .............................................................................. 1,330,885 0.5523,112 Genentech Inc ............................................................................. 2,044,256 0.8516,600 Genzyme Corp ........................................................................... 1,342,276 0.55
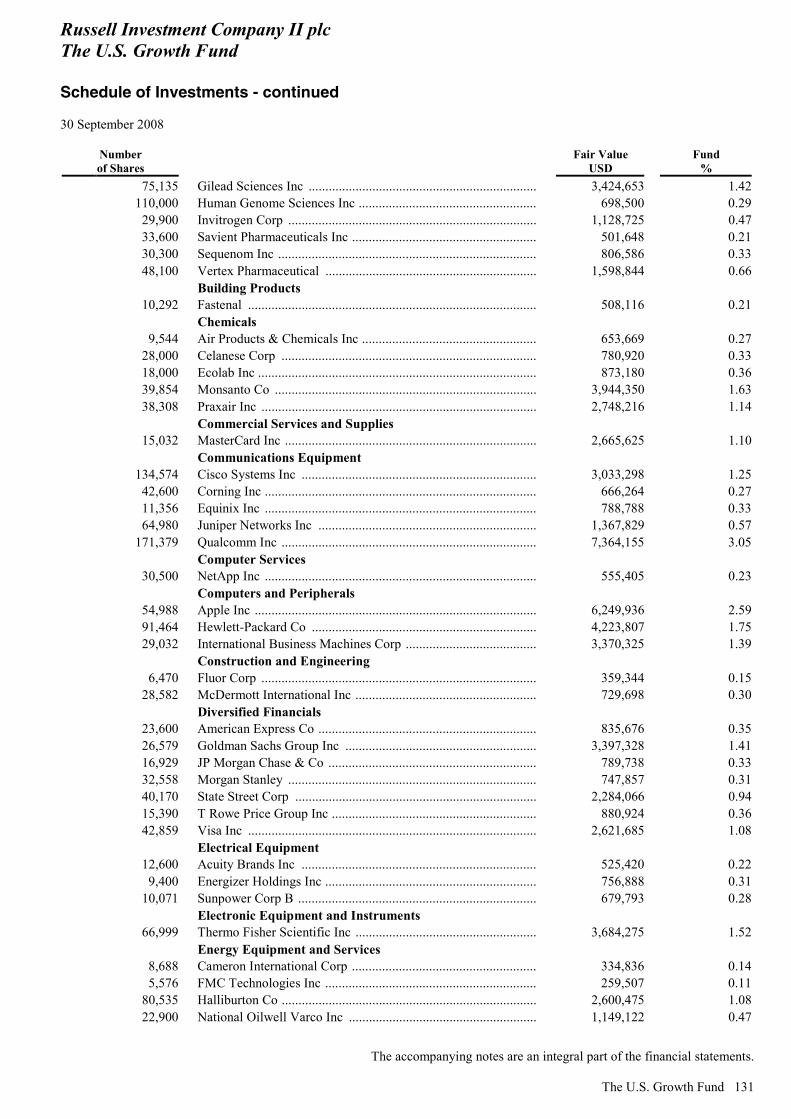
Russell Investment Company II plc The U.S. Growth Fund Schedule of Investments - continued 30 September 2008
The accompanying notes are an integral part of the financial statements.
The U.S. Growth Fund 131
Number of Shares
Fair Value USD
Fund %
75,135 Gilead Sciences Inc .................................................................... 3,424,653 1.42110,000 Human Genome Sciences Inc ..................................................... 698,500 0.29
29,900 Invitrogen Corp .......................................................................... 1,128,725 0.4733,600 Savient Pharmaceuticals Inc ....................................................... 501,648 0.2130,300 Sequenom Inc ............................................................................. 806,586 0.3348,100 Vertex Pharmaceutical ............................................................... 1,598,844 0.66
Building Products 10,292 Fastenal ...................................................................................... 508,116 0.21
Chemicals 9,544 Air Products & Chemicals Inc .................................................... 653,669 0.27
28,000 Celanese Corp ............................................................................ 780,920 0.3318,000 Ecolab Inc ................................................................................... 873,180 0.3639,854 Monsanto Co .............................................................................. 3,944,350 1.6338,308 Praxair Inc .................................................................................. 2,748,216 1.14
Commercial Services and Supplies 15,032 MasterCard Inc ........................................................................... 2,665,625 1.10
Communications Equipment 134,574 Cisco Systems Inc ...................................................................... 3,033,298 1.25
42,600 Corning Inc ................................................................................. 666,264 0.2711,356 Equinix Inc ................................................................................. 788,788 0.3364,980 Juniper Networks Inc ................................................................. 1,367,829 0.57
171,379 Qualcomm Inc ............................................................................ 7,364,155 3.05 Computer Services
30,500 NetApp Inc ................................................................................. 555,405 0.23 Computers and Peripherals
54,988 Apple Inc .................................................................................... 6,249,936 2.5991,464 Hewlett-Packard Co ................................................................... 4,223,807 1.7529,032 International Business Machines Corp ....................................... 3,370,325 1.39
Construction and Engineering 6,470 Fluor Corp .................................................................................. 359,344 0.15
28,582 McDermott International Inc ...................................................... 729,698 0.30 Diversified Financials
23,600 American Express Co ................................................................. 835,676 0.3526,579 Goldman Sachs Group Inc ......................................................... 3,397,328 1.4116,929 JP Morgan Chase & Co .............................................................. 789,738 0.3332,558 Morgan Stanley .......................................................................... 747,857 0.3140,170 State Street Corp ........................................................................ 2,284,066 0.9415,390 T Rowe Price Group Inc ............................................................. 880,924 0.3642,859 Visa Inc ...................................................................................... 2,621,685 1.08
Electrical Equipment 12,600 Acuity Brands Inc ...................................................................... 525,420 0.229,400 Energizer Holdings Inc ............................................................... 756,888 0.31
10,071 Sunpower Corp B ....................................................................... 679,793 0.28 Electronic Equipment and Instruments
66,999 Thermo Fisher Scientific Inc ...................................................... 3,684,275 1.52 Energy Equipment and Services
8,688 Cameron International Corp ....................................................... 334,836 0.145,576 FMC Technologies Inc ............................................................... 259,507 0.11
80,535 Halliburton Co ............................................................................ 2,600,475 1.0822,900 National Oilwell Varco Inc ........................................................ 1,149,122 0.47
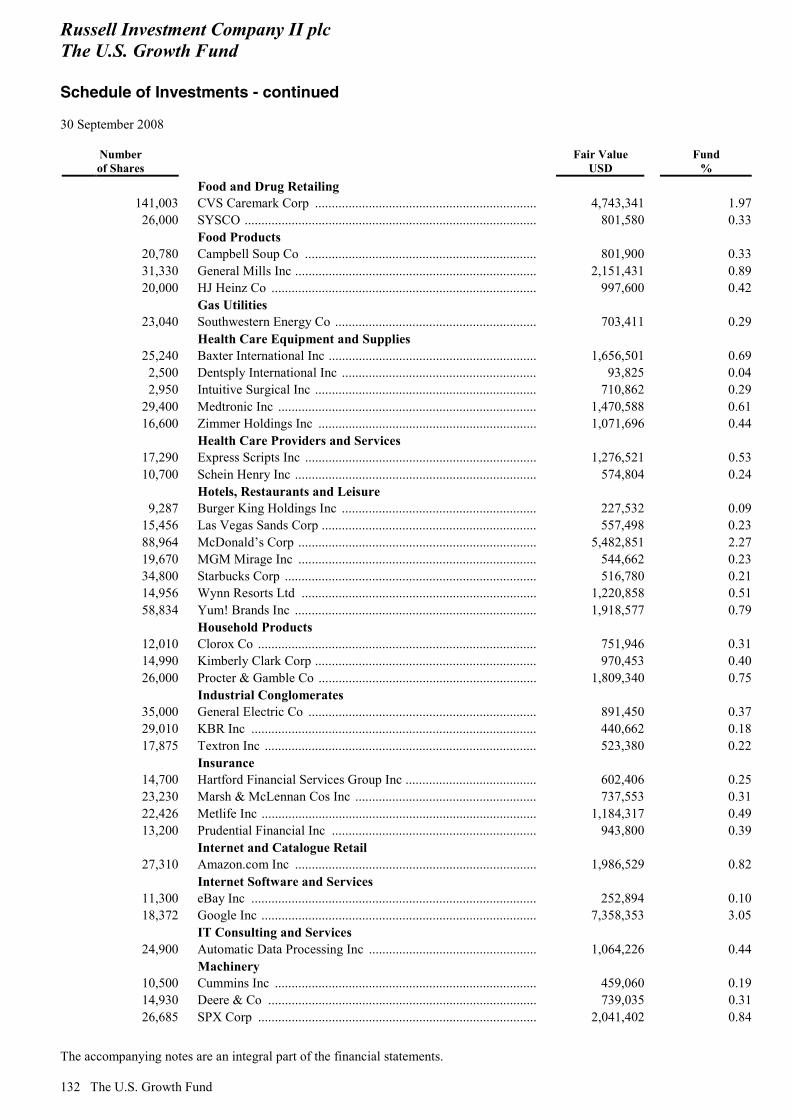
Russell Investment Company II plc The U.S. Growth Fund Schedule of Investments - continued 30 September 2008
The accompanying notes are an integral part of the financial statements. 132 The U.S. Growth Fund
Number of Shares
Fair Value USD
Fund %
Food and Drug Retailing 141,003 CVS Caremark Corp .................................................................. 4,743,341 1.97
26,000 SYSCO ....................................................................................... 801,580 0.33 Food Products
20,780 Campbell Soup Co ..................................................................... 801,900 0.3331,330 General Mills Inc ........................................................................ 2,151,431 0.8920,000 HJ Heinz Co ............................................................................... 997,600 0.42
Gas Utilities 23,040 Southwestern Energy Co ............................................................ 703,411 0.29
Health Care Equipment and Supplies 25,240 Baxter International Inc .............................................................. 1,656,501 0.692,500 Dentsply International Inc .......................................................... 93,825 0.042,950 Intuitive Surgical Inc .................................................................. 710,862 0.29
29,400 Medtronic Inc ............................................................................. 1,470,588 0.6116,600 Zimmer Holdings Inc ................................................................. 1,071,696 0.44
Health Care Providers and Services 17,290 Express Scripts Inc ..................................................................... 1,276,521 0.5310,700 Schein Henry Inc ........................................................................ 574,804 0.24
Hotels, Restaurants and Leisure 9,287 Burger King Holdings Inc .......................................................... 227,532 0.09
15,456 Las Vegas Sands Corp ................................................................ 557,498 0.2388,964 McDonald’s Corp ....................................................................... 5,482,851 2.2719,670 MGM Mirage Inc ....................................................................... 544,662 0.2334,800 Starbucks Corp ........................................................................... 516,780 0.2114,956 Wynn Resorts Ltd ...................................................................... 1,220,858 0.5158,834 Yum! Brands Inc ........................................................................ 1,918,577 0.79
Household Products 12,010 Clorox Co ................................................................................... 751,946 0.3114,990 Kimberly Clark Corp .................................................................. 970,453 0.4026,000 Procter & Gamble Co ................................................................. 1,809,340 0.75
Industrial Conglomerates 35,000 General Electric Co .................................................................... 891,450 0.3729,010 KBR Inc ..................................................................................... 440,662 0.1817,875 Textron Inc ................................................................................. 523,380 0.22
Insurance 14,700 Hartford Financial Services Group Inc ....................................... 602,406 0.2523,230 Marsh & McLennan Cos Inc ...................................................... 737,553 0.3122,426 Metlife Inc .................................................................................. 1,184,317 0.4913,200 Prudential Financial Inc ............................................................. 943,800 0.39
Internet and Catalogue Retail 27,310 Amazon.com Inc ........................................................................ 1,986,529 0.82
Internet Software and Services 11,300 eBay Inc ..................................................................................... 252,894 0.1018,372 Google Inc .................................................................................. 7,358,353 3.05
IT Consulting and Services 24,900 Automatic Data Processing Inc .................................................. 1,064,226 0.44
Machinery 10,500 Cummins Inc .............................................................................. 459,060 0.1914,930 Deere & Co ................................................................................ 739,035 0.3126,685 SPX Corp ................................................................................... 2,041,402 0.84
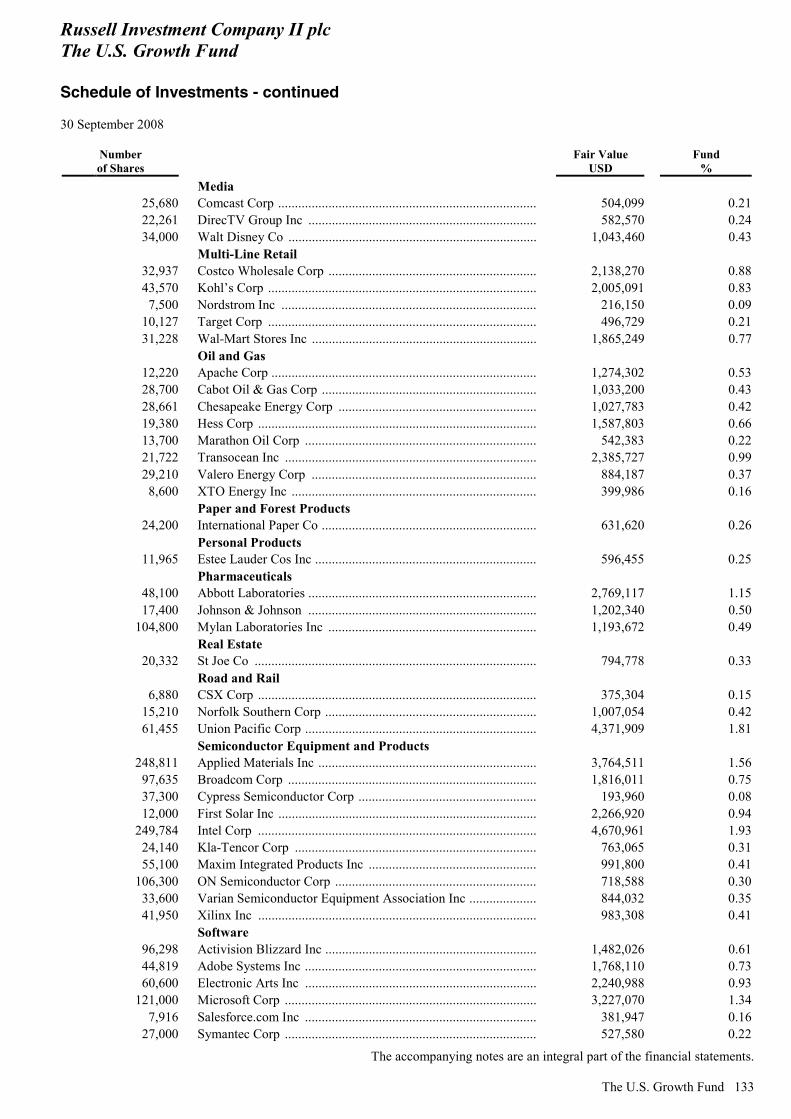
Russell Investment Company II plc The U.S. Growth Fund Schedule of Investments - continued 30 September 2008
The accompanying notes are an integral part of the financial statements.
The U.S. Growth Fund 133
Number of Shares
Fair Value USD
Fund %
Media 25,680 Comcast Corp ............................................................................. 504,099 0.2122,261 DirecTV Group Inc .................................................................... 582,570 0.2434,000 Walt Disney Co .......................................................................... 1,043,460 0.43
Multi-Line Retail 32,937 Costco Wholesale Corp .............................................................. 2,138,270 0.8843,570 Kohl’s Corp ................................................................................ 2,005,091 0.837,500 Nordstrom Inc ............................................................................ 216,150 0.09
10,127 Target Corp ................................................................................ 496,729 0.2131,228 Wal-Mart Stores Inc ................................................................... 1,865,249 0.77
Oil and Gas 12,220 Apache Corp ............................................................................... 1,274,302 0.5328,700 Cabot Oil & Gas Corp ................................................................ 1,033,200 0.4328,661 Chesapeake Energy Corp ........................................................... 1,027,783 0.4219,380 Hess Corp ................................................................................... 1,587,803 0.6613,700 Marathon Oil Corp ..................................................................... 542,383 0.2221,722 Transocean Inc ........................................................................... 2,385,727 0.9929,210 Valero Energy Corp ................................................................... 884,187 0.378,600 XTO Energy Inc ......................................................................... 399,986 0.16
Paper and Forest Products 24,200 International Paper Co ................................................................ 631,620 0.26
Personal Products 11,965 Estee Lauder Cos Inc .................................................................. 596,455 0.25
Pharmaceuticals 48,100 Abbott Laboratories .................................................................... 2,769,117 1.1517,400 Johnson & Johnson .................................................................... 1,202,340 0.50
104,800 Mylan Laboratories Inc .............................................................. 1,193,672 0.49 Real Estate
20,332 St Joe Co .................................................................................... 794,778 0.33 Road and Rail
6,880 CSX Corp ................................................................................... 375,304 0.1515,210 Norfolk Southern Corp ............................................................... 1,007,054 0.4261,455 Union Pacific Corp ..................................................................... 4,371,909 1.81
Semiconductor Equipment and Products 248,811 Applied Materials Inc ................................................................. 3,764,511 1.56
97,635 Broadcom Corp .......................................................................... 1,816,011 0.7537,300 Cypress Semiconductor Corp ..................................................... 193,960 0.0812,000 First Solar Inc ............................................................................. 2,266,920 0.94
249,784 Intel Corp ................................................................................... 4,670,961 1.9324,140 Kla-Tencor Corp ........................................................................ 763,065 0.3155,100 Maxim Integrated Products Inc .................................................. 991,800 0.41
106,300 ON Semiconductor Corp ............................................................ 718,588 0.3033,600 Varian Semiconductor Equipment Association Inc .................... 844,032 0.3541,950 Xilinx Inc ................................................................................... 983,308 0.41
Software 96,298 Activision Blizzard Inc ............................................................... 1,482,026 0.6144,819 Adobe Systems Inc ..................................................................... 1,768,110 0.7360,600 Electronic Arts Inc ..................................................................... 2,240,988 0.93
121,000 Microsoft Corp ........................................................................... 3,227,070 1.347,916 Salesforce.com Inc ..................................................................... 381,947 0.16
27,000 Symantec Corp ........................................................................... 527,580 0.22

Russell Investment Company II plc The U.S. Growth Fund Schedule of Investments - continued 30 September 2008
The accompanying notes are an integral part of the financial statements. 134 The U.S. Growth Fund
Number of Shares
Fair Value USD
Fund %
Speciality Retail 26,010 GameStop Corp .......................................................................... 886,161 0.37
133,980 Lowe’s Cos Inc .......................................................................... 3,172,646 1.31114,155 Staples Inc .................................................................................. 2,567,346 1.06
3,800 Tiffany & Co .............................................................................. 134,900 0.06 Textile and Apparel
10,426 Nike Inc ...................................................................................... 697,395 0.29 Trading Companies and Distributors
12,500 Pioneer Natural Resources Co .................................................... 650,875 0.27 Wireless Telecommunication Services
31,519 American Tower Corp ................................................................ 1,129,010 0.4743,620 NII Holdings Inc ........................................................................ 1,652,762 0.68
219,916,791 91.03
Total Common Stock ............................................................ 227,543,521 94.19 Preferred Stock (1.59%) Brazil (0.56%) Oil and Gas
30,672 Petroleo Brasileiro SA 1,341,900 0.56 Hong Kong (0.21%) Wireless Telecommunication Services
10,280 China Mobile Ltd ....................................................................... 514,822 0.21 Israel (0.44%) Pharmaceuticals
23,100 Teva Pharmaceutical Industries Ltd ........................................... 1,057,518 0.44 Mexico (0.38%) Wireless Telecommunication Services
19,876 America Movil SAB de CV ....................................................... 921,253 0.38
Total Preferred Stock ........................................................... 3,835,493 1.59 Money Market Instruments (0.83%) United States (0.83%)
2,000,000 United States Treasury Bill* Zero coupon due 18/12/08 ........................................................ 1,999,827 0.83
Total Money Market Instruments...................................... 1,999,827 0.83
Total Transferable Securities ............................................. 233,378,841 96.61 Collective Investment Schemes (2.98%) Ireland (2.98%)
7,195 Russell Investment Company III plc
The U.S. Dollar Cash Plus Fund - Class A Shares ................. 7,194,880 2.98 Total Collective Investment Schemes ............................... 7,194,880 2.98
Total Investments excluding Financial Derivative Instruments ............................................................................. 240,573,721 99.59
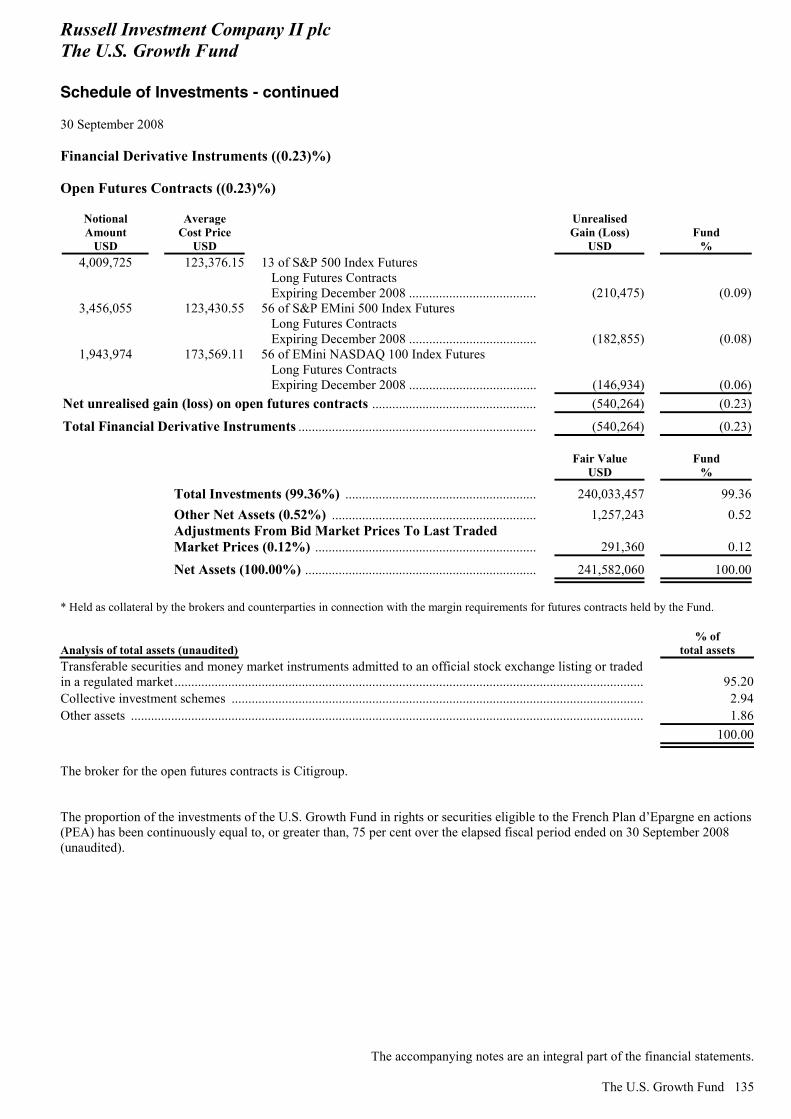
Russell Investment Company II plc The U.S. Growth Fund Schedule of Investments - continued 30 September 2008
The accompanying notes are an integral part of the financial statements.
The U.S. Growth Fund 135
Financial Derivative Instruments ((0.23)%) Open Futures Contracts ((0.23)%)
Notional Amount
USD
Average Cost Price
USD
Unrealised Gain (Loss)
USD Fund
% 4,009,725 123,376.15 13 of S&P 500 Index Futures
Long Futures Contracts Expiring December 2008 ...................................... (210,475) (0.09)
3,456,055 123,430.55 56 of S&P EMini 500 Index Futures Long Futures Contracts Expiring December 2008 ...................................... (182,855) (0.08)
1,943,974 173,569.11 56 of EMini NASDAQ 100 Index Futures Long Futures Contracts Expiring December 2008 ...................................... (146,934) (0.06)
Net unrealised gain (loss) on open futures contracts ................................................. (540,264) (0.23)
Total Financial Derivative Instruments ....................................................................... (540,264) (0.23)
Fair Value
USD Fund
%
Total Investments (99.36%) ......................................................... 240,033,457 99.36 Other Net Assets (0.52%) ............................................................. 1,257,243 0.52
Adjustments From Bid Market Prices To Last Traded Market Prices (0.12%) .................................................................. 291,360 0.12
Net Assets (100.00%) ..................................................................... 241,582,060 100.00
* Held as collateral by the brokers and counterparties in connection with the margin requirements for futures contracts held by the Fund.
Analysis of total assets (unaudited) % of
total assets Transferable securities and money market instruments admitted to an official stock exchange listing or traded in a regulated market ............................................................................................................................................. 95.20Collective investment schemes ............................................................................................................................ 2.94Other assets .......................................................................................................................................................... 1.86
100.00 The broker for the open futures contracts is Citigroup. The proportion of the investments of the U.S. Growth Fund in rights or securities eligible to the French Plan d’Epargne en actions (PEA) has been continuously equal to, or greater than, 75 per cent over the elapsed fiscal period ended on 30 September 2008 (unaudited).
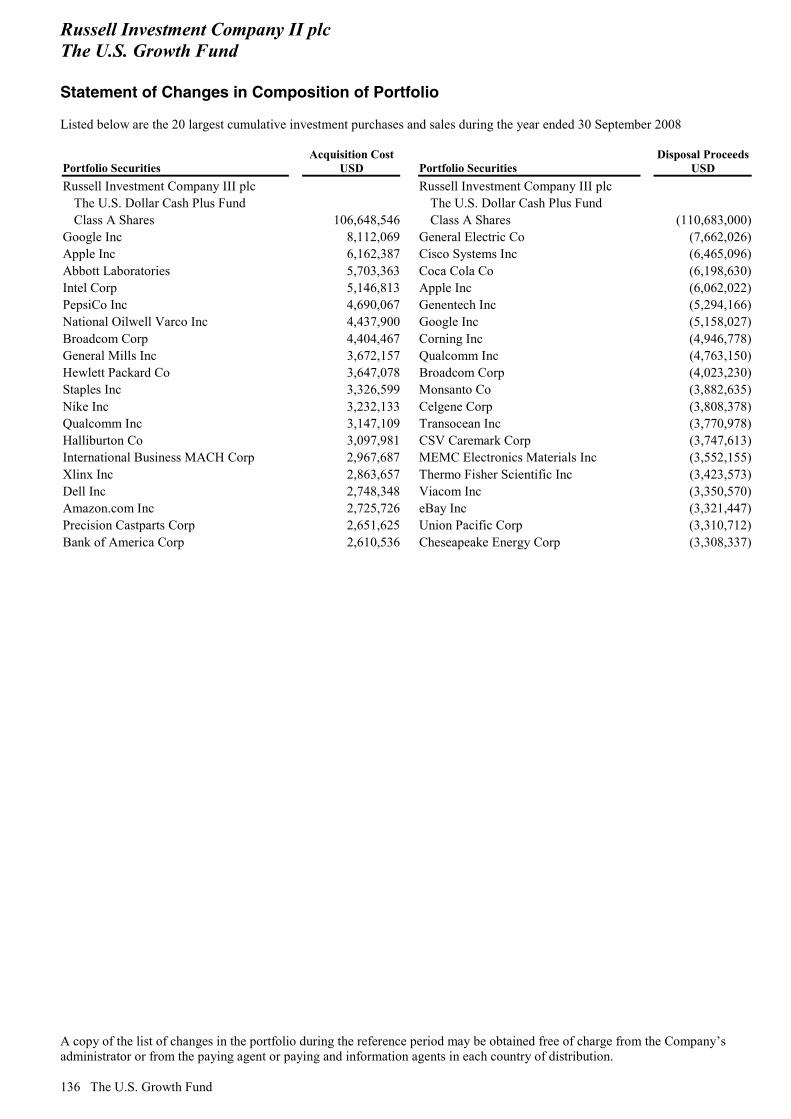
Russell Investment Company II plc The U.S. Growth Fund Statement of Changes in Composition of Portfolio Listed below are the 20 largest cumulative investment purchases and sales during the year ended 30 September 2008
A copy of the list of changes in the portfolio during the reference period may be obtained free of charge from the Company’s administrator or from the paying agent or paying and information agents in each country of distribution. 136 The U.S. Growth Fund
Portfolio Securities Acquisition Cost
USD Portfolio Securities Disposal Proceeds
USD Russell Investment Company III plc Russell Investment Company III plc
The U.S. Dollar Cash Plus Fund The U.S. Dollar Cash Plus Fund Class A Shares 106,648,546 Class A Shares (110,683,000)
Google Inc 8,112,069 General Electric Co (7,662,026)Apple Inc 6,162,387 Cisco Systems Inc (6,465,096)Abbott Laboratories 5,703,363 Coca Cola Co (6,198,630)Intel Corp 5,146,813 Apple Inc (6,062,022)PepsiCo Inc 4,690,067 Genentech Inc (5,294,166)National Oilwell Varco Inc 4,437,900 Google Inc (5,158,027)Broadcom Corp 4,404,467 Corning Inc (4,946,778)General Mills Inc 3,672,157 Qualcomm Inc (4,763,150)Hewlett Packard Co 3,647,078 Broadcom Corp (4,023,230)Staples Inc 3,326,599 Monsanto Co (3,882,635)Nike Inc 3,232,133 Celgene Corp (3,808,378)Qualcomm Inc 3,147,109 Transocean Inc (3,770,978)Halliburton Co 3,097,981 CSV Caremark Corp (3,747,613)International Business MACH Corp 2,967,687 MEMC Electronics Materials Inc (3,552,155)Xlinx Inc 2,863,657 Thermo Fisher Scientific Inc (3,423,573)Dell Inc 2,748,348 Viacom Inc (3,350,570)Amazon.com Inc 2,725,726 eBay Inc (3,321,447)Precision Castparts Corp 2,651,625 Union Pacific Corp (3,310,712)Bank of America Corp 2,610,536 Cheseapeake Energy Corp (3,308,337)

Russell Investment Company II plc The U.S. Quant Fund Manager’s Report
The U.S. Quant Fund 137
Money Managers Aronson and Johnson and Ortiz L.P. Enhanced Investment Technologies, LLC (INTEC) Frank Russell Company Franklin Portfolio Associates LLC Goldman Sachs Asset Management L.P. Jacobs Levy Equity Management Inc. Investment Objective The U.S. Quant Fund (the “Fund”) will seek to achieve capital appreciation by investing primarily in U.S. equity securities, including common stock, American depository receipts, global depository receipts, convertibles and warrants listed, traded or dealt in on a regulated market in the U.S. Fund Performance The Fund returned -10.1 per cent during the period on a gross-of-fees basis verses a benchmark* return of -11.3 per cent.* Market Comment U.S. markets declined by 11.3 per cent during the period. During the second quarter of 2008, a rate cut by the Federal Reserve (“Fed”) early in the quarter had improved investor sentiment and equities rose during the first six weeks, to peak in mid-May 2008. This was led primarily by the strong performance of oil stocks and healthy corporate data. However, investor sentiment was diminished by concerns over the potential impact of the high oil price on consumer spending. Further write-downs and profit warnings from major financial institutions alongside weak economic data fuelled a sell-off which continued throughout June 2008. Key economic data such as housing, manufacturing and employment was weak during the period which underlined Fed comments that further rate cuts were unlikely in the short term due to inflation. Following volatility related to the oil sector in July and August 2008, September’s market performance defined the third quarter as global markets suffered historic losses. A steep decline in mid-September, the greatest since the 9/11 terrorist attacks, was marked by flurry of buy-outs and government intervention not witnessed since the Great Depression. The collapse of Lehman Brothers and Bank of America’s purchase of Merrill Lynch caused an anxious cascade of sell-offs. The Fed’s rescue of AIG and its announcement of a rescue package restored some investor confidence. However, U.S. Congress rejected the initial Bill prompting another decline towards the end of the month. Investors moved defensively towards the consumer staples sector while cyclical sectors such as technology performed poorly. General Comment on Managers/Performance The Fund outperformed the benchmark. This outperformance was driven particularly by a strong second quarter performance. This was due primarily to strong stock selection in the financial services and consumer discretionary sectors. Growth significantly outperformed value during the period and this was evident in performance. An overweight to stocks with high momentum, high earnings yield and low dividend yield drove returns. In addition, a greater exposure to mid-cap stocks contributed to the outperformance. INTEC was added to the manager line up in the second quarter of 2008. INTEC implements a unique quantitative approach which the firm refers to as a ‘volatility capture’ process. The manager prefers securities with a higher volatility, which they believe provide managers with greater opportunities to add value. Outlook The Fund remains well positioned to benefit from the stock-picking abilities of the managers in the Fund, and we currently remain confident in the manager line-up. Past performance is no indication of current or future performance. * Benchmark Source: Russell 1000 Index (Net of 30 per cent Withholding Tax)
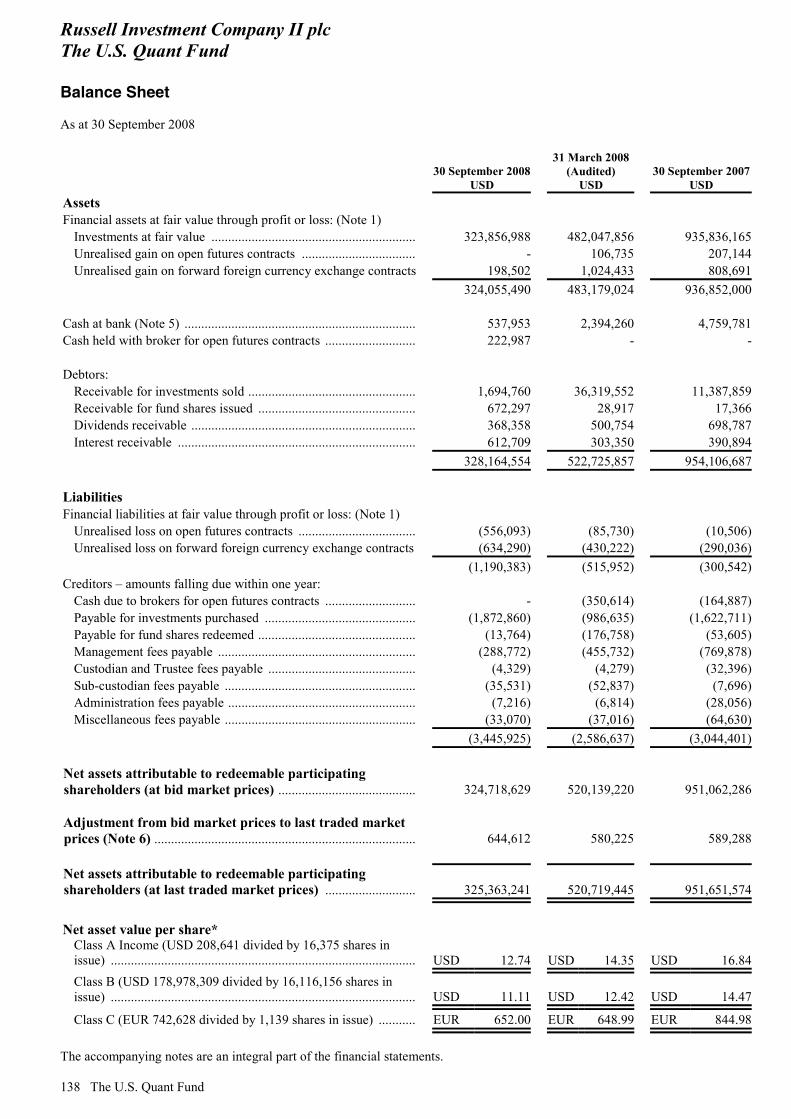
Russell Investment Company II plc The U.S. Quant Fund Balance Sheet As at 30 September 2008
The accompanying notes are an integral part of the financial statements. 138 The U.S. Quant Fund
30 September 2008
USD
31 March 2008 (Audited)
USD 30 September 2007
USD Assets Financial assets at fair value through profit or loss: (Note 1)
Investments at fair value .............................................................. 323,856,988 482,047,856 935,836,165Unrealised gain on open futures contracts ................................... - 106,735 207,144Unrealised gain on forward foreign currency exchange contracts 198,502 1,024,433 808,691
324,055,490 483,179,024 936,852,000 Cash at bank (Note 5) ...................................................................... 537,953 2,394,260 4,759,781Cash held with broker for open futures contracts ............................ 222,987 - - Debtors:
Receivable for investments sold ................................................... 1,694,760 36,319,552 11,387,859Receivable for fund shares issued ................................................ 672,297 28,917 17,366Dividends receivable .................................................................... 368,358 500,754 698,787Interest receivable ........................................................................ 612,709 303,350 390,894
328,164,554 522,725,857 954,106,687 Liabilities Financial liabilities at fair value through profit or loss: (Note 1)
Unrealised loss on open futures contracts .................................... (556,093) (85,730) (10,506)Unrealised loss on forward foreign currency exchange contracts (634,290) (430,222) (290,036)
(1,190,383) (515,952) (300,542)Creditors – amounts falling due within one year:
Cash due to brokers for open futures contracts ............................ - (350,614) (164,887)Payable for investments purchased .............................................. (1,872,860) (986,635) (1,622,711)Payable for fund shares redeemed ................................................ (13,764) (176,758) (53,605)Management fees payable ............................................................ (288,772) (455,732) (769,878)Custodian and Trustee fees payable ............................................. (4,329) (4,279) (32,396)Sub-custodian fees payable .......................................................... (35,531) (52,837) (7,696)Administration fees payable ......................................................... (7,216) (6,814) (28,056)Miscellaneous fees payable .......................................................... (33,070) (37,016) (64,630)
(3,445,925) (2,586,637) (3,044,401) Net assets attributable to redeemable participating shareholders (at bid market prices) ..........................................
324,718,629 520,139,220 951,062,286
Adjustment from bid market prices to last traded market prices (Note 6) ...............................................................................
644,612 580,225 589,288
Net assets attributable to redeemable participating shareholders (at last traded market prices) ............................
325,363,241 520,719,445 951,651,574
Net asset value per share*
Class A Income (USD 208,641 divided by 16,375 shares in issue) ............................................................................................
USD 12.74 USD 14.35 USD 16.84
Class B (USD 178,978,309 divided by 16,116,156 shares in issue) ............................................................................................
USD 11.11 USD 12.42 USD 14.47
Class C (EUR 742,628 divided by 1,139 shares in issue) ............ EUR 652.00 EUR 648.99 EUR 844.98
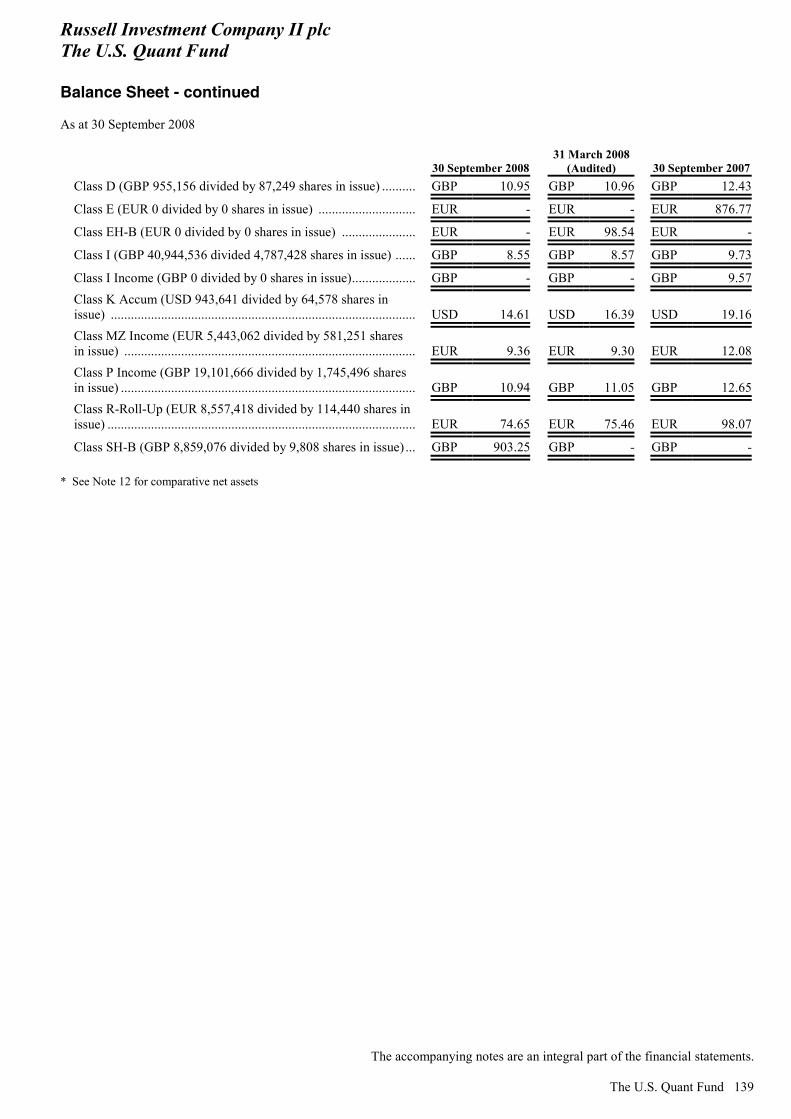
Russell Investment Company II plc The U.S. Quant Fund Balance Sheet - continued As at 30 September 2008
The accompanying notes are an integral part of the financial statements.
The U.S. Quant Fund 139
30 September 2008 31 March 2008
(Audited) 30 September 2007Class D (GBP 955,156 divided by 87,249 shares in issue) .......... GBP 10.95 GBP 10.96 GBP 12.43
Class E (EUR 0 divided by 0 shares in issue) ............................. EUR - EUR - EUR 876.77
Class EH-B (EUR 0 divided by 0 shares in issue) ...................... EUR - EUR 98.54 EUR -
Class I (GBP 40,944,536 divided 4,787,428 shares in issue) ...... GBP 8.55 GBP 8.57 GBP 9.73
Class I Income (GBP 0 divided by 0 shares in issue)................... GBP - GBP - GBP 9.57Class K Accum (USD 943,641 divided by 64,578 shares in issue) ...........................................................................................
USD 14.61 USD 16.39 USD 19.16
Class MZ Income (EUR 5,443,062 divided by 581,251 shares in issue) .......................................................................................
EUR 9.36 EUR 9.30 EUR 12.08
Class P Income (GBP 19,101,666 divided by 1,745,496 shares in issue) ........................................................................................
GBP 10.94 GBP 11.05 GBP 12.65
Class R-Roll-Up (EUR 8,557,418 divided by 114,440 shares in issue) ............................................................................................
EUR 74.65 EUR 75.46 EUR 98.07
Class SH-B (GBP 8,859,076 divided by 9,808 shares in issue) ... GBP 903.25 GBP - GBP - * See Note 12 for comparative net assets
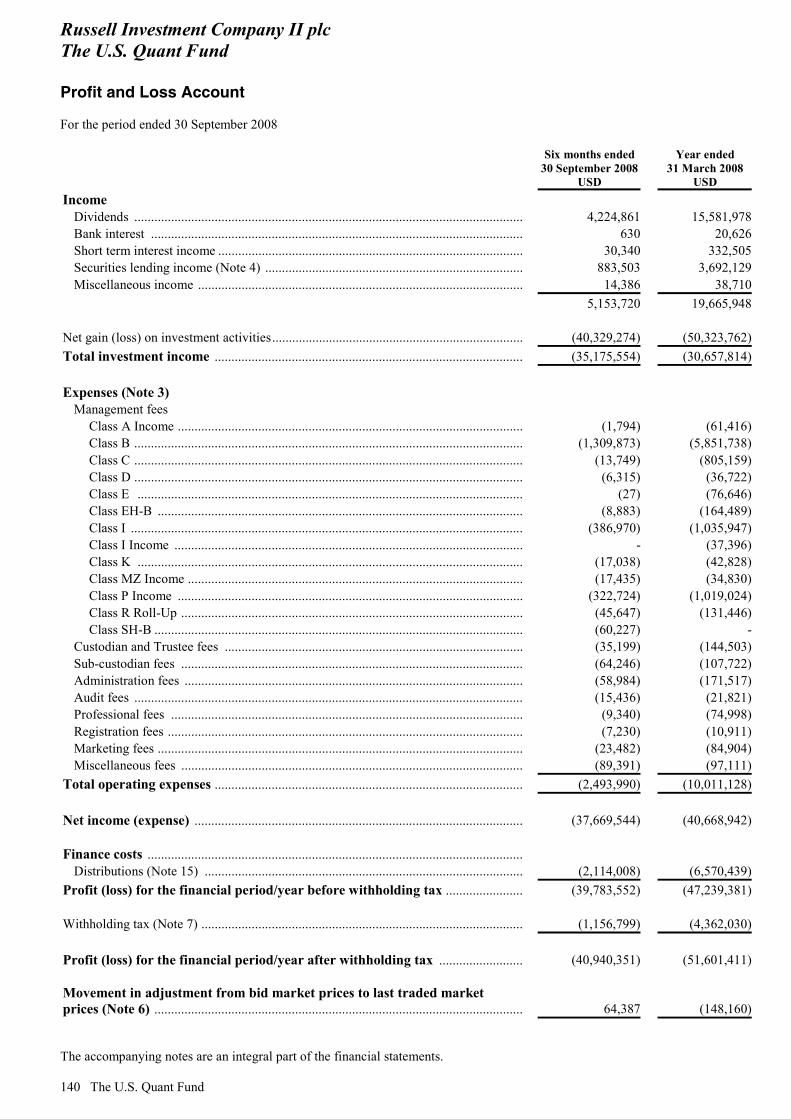
Russell Investment Company II plc The U.S. Quant Fund Profit and Loss Account For the period ended 30 September 2008
The accompanying notes are an integral part of the financial statements. 140 The U.S. Quant Fund
Six months ended 30 September 2008
USD
Year ended 31 March 2008
USD Income
Dividends .................................................................................................................... 4,224,861 15,581,978Bank interest ............................................................................................................... 630 20,626Short term interest income ........................................................................................... 30,340 332,505Securities lending income (Note 4) ............................................................................. 883,503 3,692,129Miscellaneous income ................................................................................................. 14,386 38,710
5,153,720 19,665,948 Net gain (loss) on investment activities........................................................................... (40,329,274) (50,323,762)Total investment income ............................................................................................ (35,175,554) (30,657,814) Expenses (Note 3)
Management fees Class A Income ....................................................................................................... (1,794) (61,416)Class B .................................................................................................................... (1,309,873) (5,851,738)Class C .................................................................................................................... (13,749) (805,159)Class D .................................................................................................................... (6,315) (36,722)Class E ................................................................................................................... (27) (76,646)Class EH-B ............................................................................................................. (8,883) (164,489)Class I ..................................................................................................................... (386,970) (1,035,947)Class I Income ........................................................................................................ - (37,396)Class K ................................................................................................................... (17,038) (42,828)Class MZ Income .................................................................................................... (17,435) (34,830)Class P Income ....................................................................................................... (322,724) (1,019,024)Class R Roll-Up ...................................................................................................... (45,647) (131,446)Class SH-B .............................................................................................................. (60,227) -
Custodian and Trustee fees ......................................................................................... (35,199) (144,503)Sub-custodian fees ...................................................................................................... (64,246) (107,722)Administration fees ..................................................................................................... (58,984) (171,517)Audit fees .................................................................................................................... (15,436) (21,821)Professional fees ......................................................................................................... (9,340) (74,998)Registration fees .......................................................................................................... (7,230) (10,911)Marketing fees ............................................................................................................. (23,482) (84,904)Miscellaneous fees ...................................................................................................... (89,391) (97,111)
Total operating expenses ............................................................................................ (2,493,990) (10,011,128) Net income (expense) .................................................................................................. (37,669,544) (40,668,942) Finance costs ................................................................................................................
Distributions (Note 15) ............................................................................................... (2,114,008) (6,570,439)Profit (loss) for the financial period/year before withholding tax ....................... (39,783,552) (47,239,381) Withholding tax (Note 7) ................................................................................................ (1,156,799) (4,362,030) Profit (loss) for the financial period/year after withholding tax ......................... (40,940,351) (51,601,411) Movement in adjustment from bid market prices to last traded market prices (Note 6) .............................................................................................................. 64,387 (148,160)
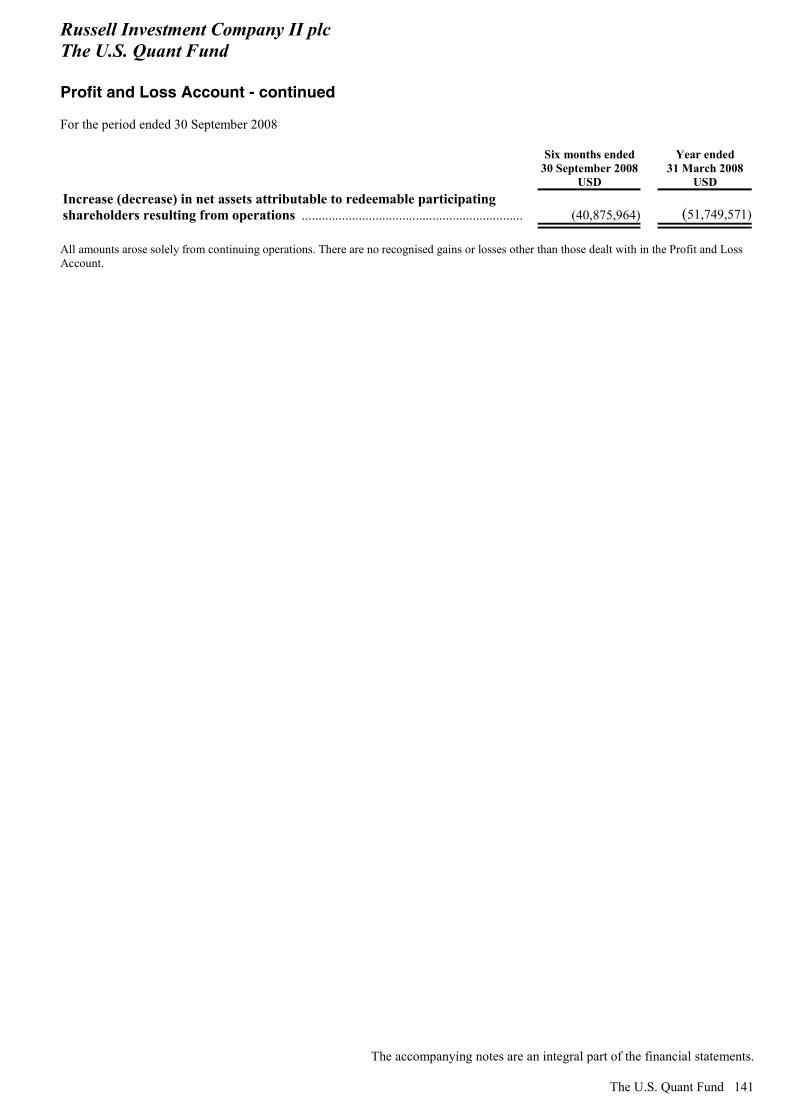
Russell Investment Company II plc The U.S. Quant Fund Profit and Loss Account - continued For the period ended 30 September 2008
The accompanying notes are an integral part of the financial statements.
The U.S. Quant Fund 141
Six months ended 30 September 2008
USD
Year ended 31 March 2008
USD Increase (decrease) in net assets attributable to redeemable participating shareholders resulting from operations .................................................................. (40,875,964) (51,749,571) All amounts arose solely from continuing operations. There are no recognised gains or losses other than those dealt with in the Profit and Loss Account.
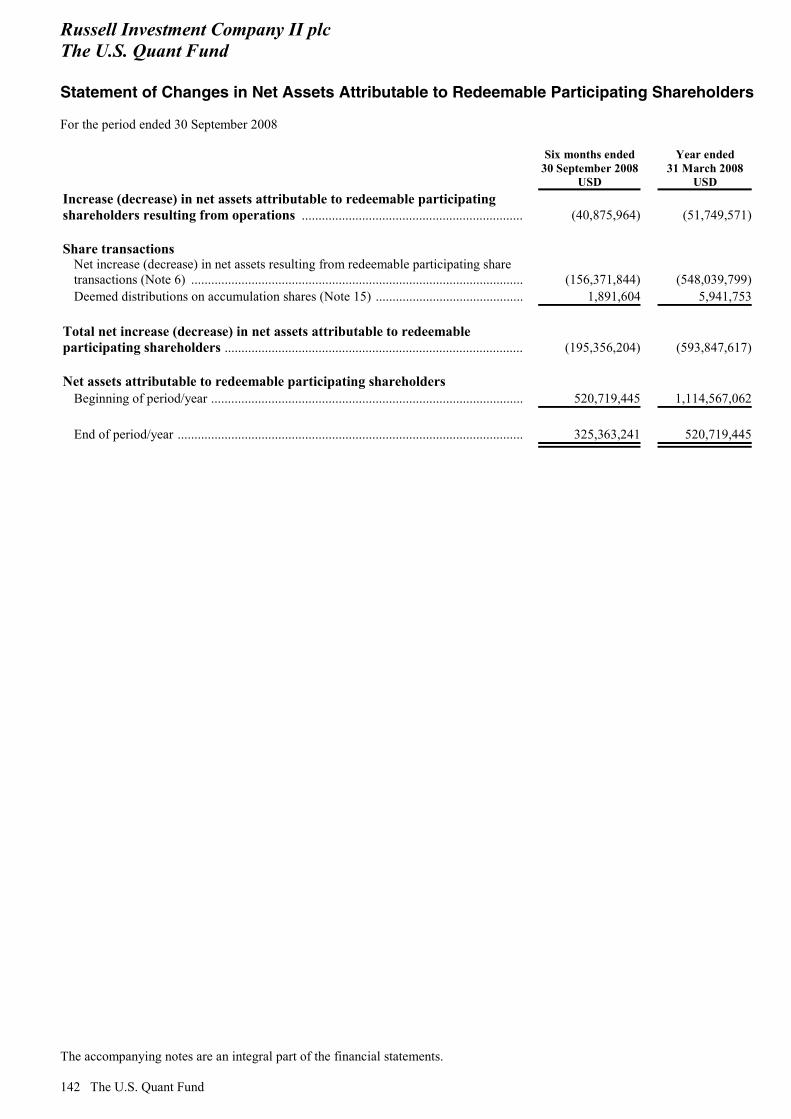
Russell Investment Company II plc The U.S. Quant Fund Statement of Changes in Net Assets Attributable to Redeemable Participating Shareholders For the period ended 30 September 2008
The accompanying notes are an integral part of the financial statements. 142 The U.S. Quant Fund
Six months ended 30 September 2008
USD
Year ended 31 March 2008
USD Increase (decrease) in net assets attributable to redeemable participating shareholders resulting from operations .................................................................. (40,875,964) (51,749,571) Share transactions
Net increase (decrease) in net assets resulting from redeemable participating sharetransactions (Note 6) ................................................................................................... (156,371,844) (548,039,799)Deemed distributions on accumulation shares (Note 15) ............................................ 1,891,604 5,941,753
Total net increase (decrease) in net assets attributable to redeemable participating shareholders ......................................................................................... (195,356,204) (593,847,617) Net assets attributable to redeemable participating shareholders
Beginning of period/year ............................................................................................. 520,719,445 1,114,567,062 End of period/year ....................................................................................................... 325,363,241 520,719,445
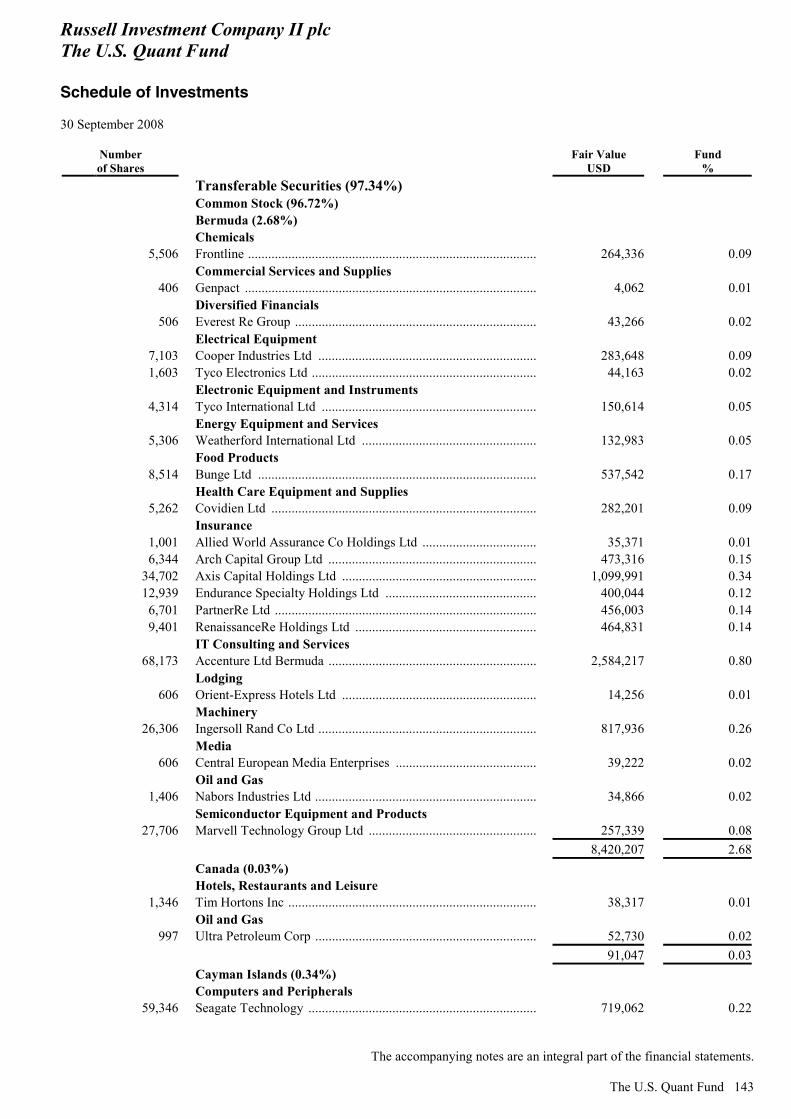
Russell Investment Company II plc The U.S. Quant Fund Schedule of Investments 30 September 2008
The accompanying notes are an integral part of the financial statements.
The U.S. Quant Fund 143
Number of Shares
Fair Value USD
Fund %
Transferable Securities (97.34%) Common Stock (96.72%) Bermuda (2.68%) Chemicals
5,506 Frontline ...................................................................................... 264,336 0.09 Commercial Services and Supplies
406 Genpact ....................................................................................... 4,062 0.01 Diversified Financials
506 Everest Re Group ........................................................................ 43,266 0.02 Electrical Equipment
7,103 Cooper Industries Ltd ................................................................. 283,648 0.091,603 Tyco Electronics Ltd ................................................................... 44,163 0.02
Electronic Equipment and Instruments 4,314 Tyco International Ltd ................................................................ 150,614 0.05
Energy Equipment and Services 5,306 Weatherford International Ltd .................................................... 132,983 0.05
Food Products 8,514 Bunge Ltd ................................................................................... 537,542 0.17
Health Care Equipment and Supplies 5,262 Covidien Ltd ............................................................................... 282,201 0.09
Insurance 1,001 Allied World Assurance Co Holdings Ltd .................................. 35,371 0.016,344 Arch Capital Group Ltd .............................................................. 473,316 0.15
34,702 Axis Capital Holdings Ltd .......................................................... 1,099,991 0.3412,939 Endurance Specialty Holdings Ltd ............................................. 400,044 0.126,701 PartnerRe Ltd .............................................................................. 456,003 0.149,401 RenaissanceRe Holdings Ltd ...................................................... 464,831 0.14
IT Consulting and Services 68,173 Accenture Ltd Bermuda .............................................................. 2,584,217 0.80
Lodging 606 Orient-Express Hotels Ltd .......................................................... 14,256 0.01
Machinery 26,306 Ingersoll Rand Co Ltd ................................................................. 817,936 0.26
Media 606 Central European Media Enterprises .......................................... 39,222 0.02
Oil and Gas 1,406 Nabors Industries Ltd .................................................................. 34,866 0.02
Semiconductor Equipment and Products 27,706 Marvell Technology Group Ltd .................................................. 257,339 0.08
8,420,207 2.68 Canada (0.03%) Hotels, Restaurants and Leisure
1,346 Tim Hortons Inc .......................................................................... 38,317 0.01 Oil and Gas
997 Ultra Petroleum Corp .................................................................. 52,730 0.02 91,047 0.03 Cayman Islands (0.34%) Computers and Peripherals
59,346 Seagate Technology .................................................................... 719,062 0.22
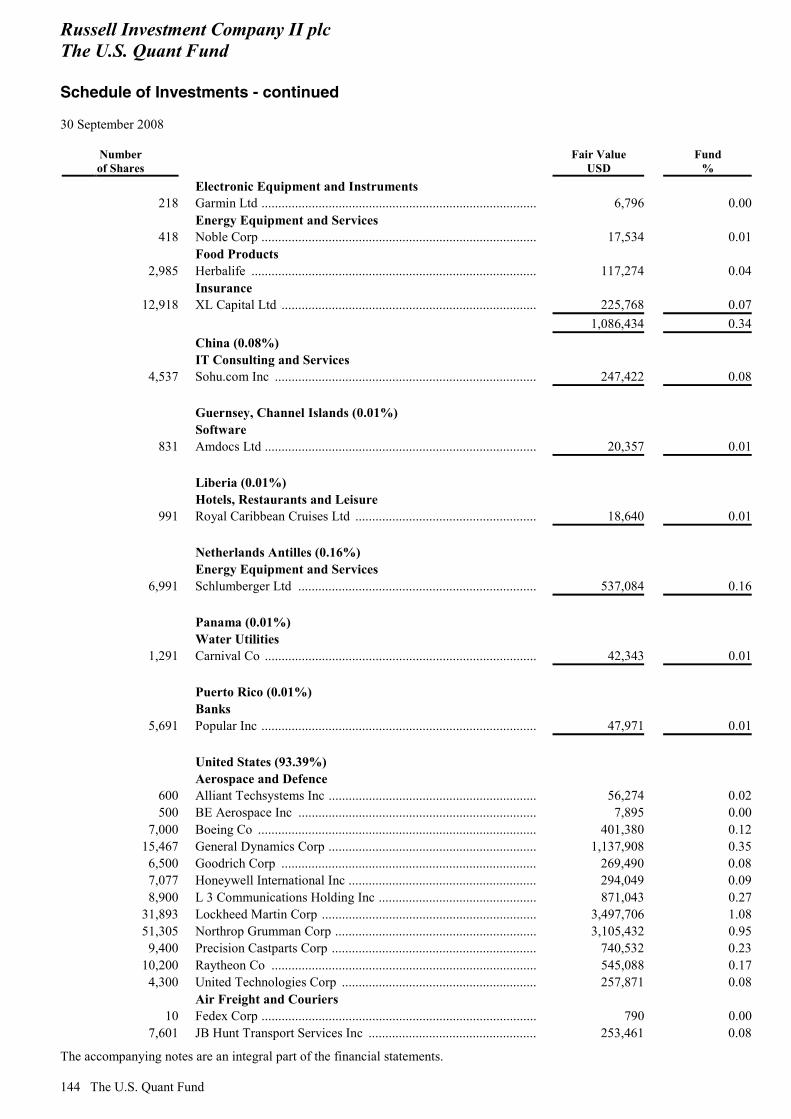
Russell Investment Company II plc The U.S. Quant Fund Schedule of Investments - continued 30 September 2008
The accompanying notes are an integral part of the financial statements. 144 The U.S. Quant Fund
Number of Shares
Fair Value USD
Fund %
Electronic Equipment and Instruments 218 Garmin Ltd .................................................................................. 6,796 0.00
Energy Equipment and Services 418 Noble Corp .................................................................................. 17,534 0.01
Food Products 2,985 Herbalife ..................................................................................... 117,274 0.04
Insurance 12,918 XL Capital Ltd ............................................................................ 225,768 0.07
1,086,434 0.34 China (0.08%) IT Consulting and Services
4,537 Sohu.com Inc .............................................................................. 247,422 0.08 Guernsey, Channel Islands (0.01%) Software
831 Amdocs Ltd ................................................................................. 20,357 0.01 Liberia (0.01%) Hotels, Restaurants and Leisure
991 Royal Caribbean Cruises Ltd ...................................................... 18,640 0.01 Netherlands Antilles (0.16%) Energy Equipment and Services
6,991 Schlumberger Ltd ....................................................................... 537,084 0.16 Panama (0.01%) Water Utilities
1,291 Carnival Co ................................................................................. 42,343 0.01 Puerto Rico (0.01%) Banks
5,691 Popular Inc .................................................................................. 47,971 0.01 United States (93.39%) Aerospace and Defence
600 Alliant Techsystems Inc .............................................................. 56,274 0.02500 BE Aerospace Inc ....................................................................... 7,895 0.00
7,000 Boeing Co ................................................................................... 401,380 0.1215,467 General Dynamics Corp .............................................................. 1,137,908 0.356,500 Goodrich Corp ............................................................................ 269,490 0.087,077 Honeywell International Inc ........................................................ 294,049 0.098,900 L 3 Communications Holding Inc ............................................... 871,043 0.27
31,893 Lockheed Martin Corp ................................................................ 3,497,706 1.0851,305 Northrop Grumman Corp ............................................................ 3,105,432 0.959,400 Precision Castparts Corp ............................................................. 740,532 0.23
10,200 Raytheon Co ............................................................................... 545,088 0.174,300 United Technologies Corp .......................................................... 257,871 0.08
Air Freight and Couriers 10 Fedex Corp .................................................................................. 790 0.00
7,601 JB Hunt Transport Services Inc .................................................. 253,461 0.08
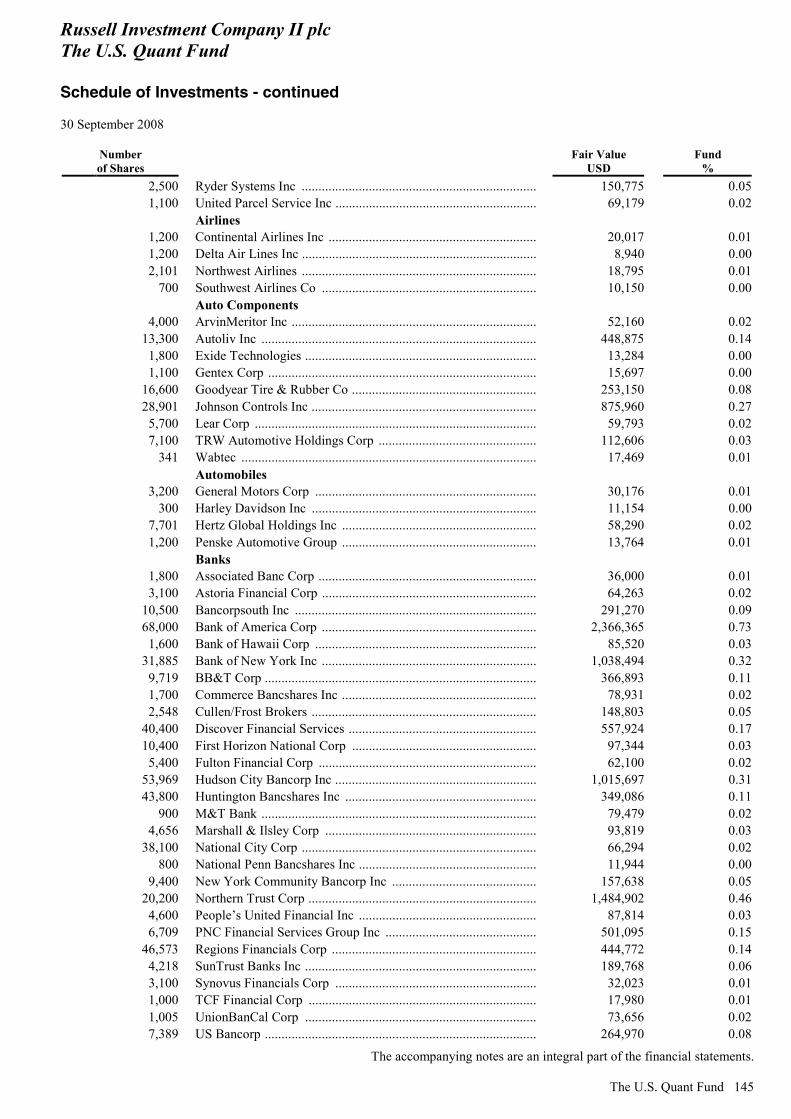
Russell Investment Company II plc The U.S. Quant Fund Schedule of Investments - continued 30 September 2008
The accompanying notes are an integral part of the financial statements.
The U.S. Quant Fund 145
Number of Shares
Fair Value USD
Fund %
2,500 Ryder Systems Inc ...................................................................... 150,775 0.051,100 United Parcel Service Inc ............................................................ 69,179 0.02
Airlines 1,200 Continental Airlines Inc .............................................................. 20,017 0.011,200 Delta Air Lines Inc ...................................................................... 8,940 0.002,101 Northwest Airlines ...................................................................... 18,795 0.01
700 Southwest Airlines Co ................................................................ 10,150 0.00 Auto Components
4,000 ArvinMeritor Inc ......................................................................... 52,160 0.0213,300 Autoliv Inc .................................................................................. 448,875 0.141,800 Exide Technologies ..................................................................... 13,284 0.001,100 Gentex Corp ................................................................................ 15,697 0.00
16,600 Goodyear Tire & Rubber Co ....................................................... 253,150 0.0828,901 Johnson Controls Inc ................................................................... 875,960 0.275,700 Lear Corp .................................................................................... 59,793 0.027,100 TRW Automotive Holdings Corp ............................................... 112,606 0.03
341 Wabtec ........................................................................................ 17,469 0.01 Automobiles
3,200 General Motors Corp .................................................................. 30,176 0.01300 Harley Davidson Inc ................................................................... 11,154 0.00
7,701 Hertz Global Holdings Inc .......................................................... 58,290 0.021,200 Penske Automotive Group .......................................................... 13,764 0.01
Banks 1,800 Associated Banc Corp ................................................................. 36,000 0.013,100 Astoria Financial Corp ................................................................ 64,263 0.02
10,500 Bancorpsouth Inc ........................................................................ 291,270 0.0968,000 Bank of America Corp ................................................................ 2,366,365 0.731,600 Bank of Hawaii Corp .................................................................. 85,520 0.03
31,885 Bank of New York Inc ................................................................ 1,038,494 0.329,719 BB&T Corp ................................................................................. 366,893 0.111,700 Commerce Bancshares Inc .......................................................... 78,931 0.022,548 Cullen/Frost Brokers ................................................................... 148,803 0.05
40,400 Discover Financial Services ........................................................ 557,924 0.1710,400 First Horizon National Corp ....................................................... 97,344 0.035,400 Fulton Financial Corp ................................................................. 62,100 0.02
53,969 Hudson City Bancorp Inc ............................................................ 1,015,697 0.3143,800 Huntington Bancshares Inc ......................................................... 349,086 0.11
900 M&T Bank .................................................................................. 79,479 0.024,656 Marshall & Ilsley Corp ............................................................... 93,819 0.03
38,100 National City Corp ...................................................................... 66,294 0.02800 National Penn Bancshares Inc ..................................................... 11,944 0.00
9,400 New York Community Bancorp Inc ........................................... 157,638 0.0520,200 Northern Trust Corp .................................................................... 1,484,902 0.464,600 People’s United Financial Inc ..................................................... 87,814 0.036,709 PNC Financial Services Group Inc ............................................. 501,095 0.15
46,573 Regions Financials Corp ............................................................. 444,772 0.144,218 SunTrust Banks Inc ..................................................................... 189,768 0.063,100 Synovus Financials Corp ............................................................ 32,023 0.011,000 TCF Financial Corp .................................................................... 17,980 0.011,005 UnionBanCal Corp ..................................................................... 73,656 0.027,389 US Bancorp ................................................................................. 264,970 0.08
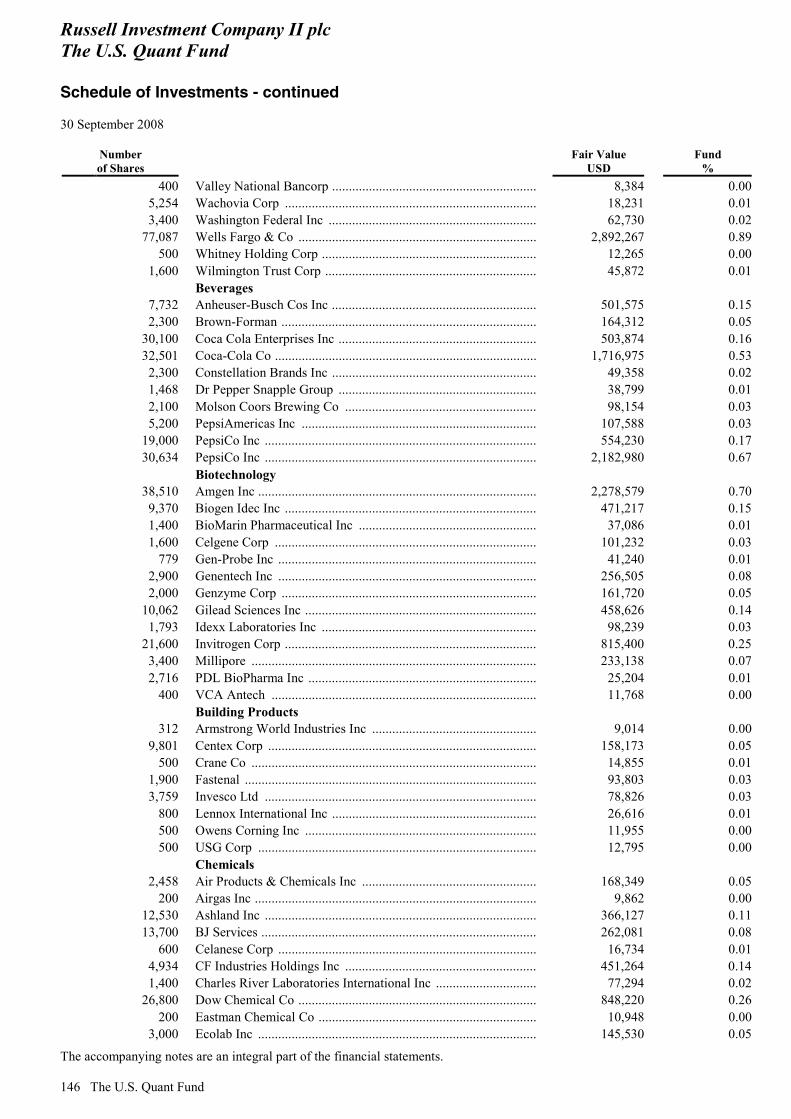
Russell Investment Company II plc The U.S. Quant Fund Schedule of Investments - continued 30 September 2008
The accompanying notes are an integral part of the financial statements. 146 The U.S. Quant Fund
Number of Shares
Fair Value USD
Fund %
400 Valley National Bancorp ............................................................. 8,384 0.005,254 Wachovia Corp ........................................................................... 18,231 0.013,400 Washington Federal Inc .............................................................. 62,730 0.02
77,087 Wells Fargo & Co ....................................................................... 2,892,267 0.89500 Whitney Holding Corp ................................................................ 12,265 0.00
1,600 Wilmington Trust Corp ............................................................... 45,872 0.01 Beverages
7,732 Anheuser-Busch Cos Inc ............................................................. 501,575 0.152,300 Brown-Forman ............................................................................ 164,312 0.05
30,100 Coca Cola Enterprises Inc ........................................................... 503,874 0.1632,501 Coca-Cola Co .............................................................................. 1,716,975 0.532,300 Constellation Brands Inc ............................................................. 49,358 0.021,468 Dr Pepper Snapple Group ........................................................... 38,799 0.012,100 Molson Coors Brewing Co ......................................................... 98,154 0.035,200 PepsiAmericas Inc ...................................................................... 107,588 0.03
19,000 PepsiCo Inc ................................................................................. 554,230 0.1730,634 PepsiCo Inc ................................................................................. 2,182,980 0.67
Biotechnology 38,510 Amgen Inc ................................................................................... 2,278,579 0.709,370 Biogen Idec Inc ........................................................................... 471,217 0.151,400 BioMarin Pharmaceutical Inc ..................................................... 37,086 0.011,600 Celgene Corp .............................................................................. 101,232 0.03
779 Gen-Probe Inc ............................................................................. 41,240 0.012,900 Genentech Inc ............................................................................. 256,505 0.082,000 Genzyme Corp ............................................................................ 161,720 0.05
10,062 Gilead Sciences Inc ..................................................................... 458,626 0.141,793 Idexx Laboratories Inc ................................................................ 98,239 0.03
21,600 Invitrogen Corp ........................................................................... 815,400 0.253,400 Millipore ..................................................................................... 233,138 0.072,716 PDL BioPharma Inc .................................................................... 25,204 0.01
400 VCA Antech ............................................................................... 11,768 0.00 Building Products
312 Armstrong World Industries Inc ................................................. 9,014 0.009,801 Centex Corp ................................................................................ 158,173 0.05
500 Crane Co ..................................................................................... 14,855 0.011,900 Fastenal ....................................................................................... 93,803 0.033,759 Invesco Ltd ................................................................................. 78,826 0.03
800 Lennox International Inc ............................................................. 26,616 0.01500 Owens Corning Inc ..................................................................... 11,955 0.00500 USG Corp ................................................................................... 12,795 0.00
Chemicals 2,458 Air Products & Chemicals Inc .................................................... 168,349 0.05
200 Airgas Inc .................................................................................... 9,862 0.0012,530 Ashland Inc ................................................................................. 366,127 0.1113,700 BJ Services .................................................................................. 262,081 0.08
600 Celanese Corp ............................................................................. 16,734 0.014,934 CF Industries Holdings Inc ......................................................... 451,264 0.141,400 Charles River Laboratories International Inc .............................. 77,294 0.02
26,800 Dow Chemical Co ....................................................................... 848,220 0.26200 Eastman Chemical Co ................................................................. 10,948 0.00
3,000 Ecolab Inc ................................................................................... 145,530 0.05
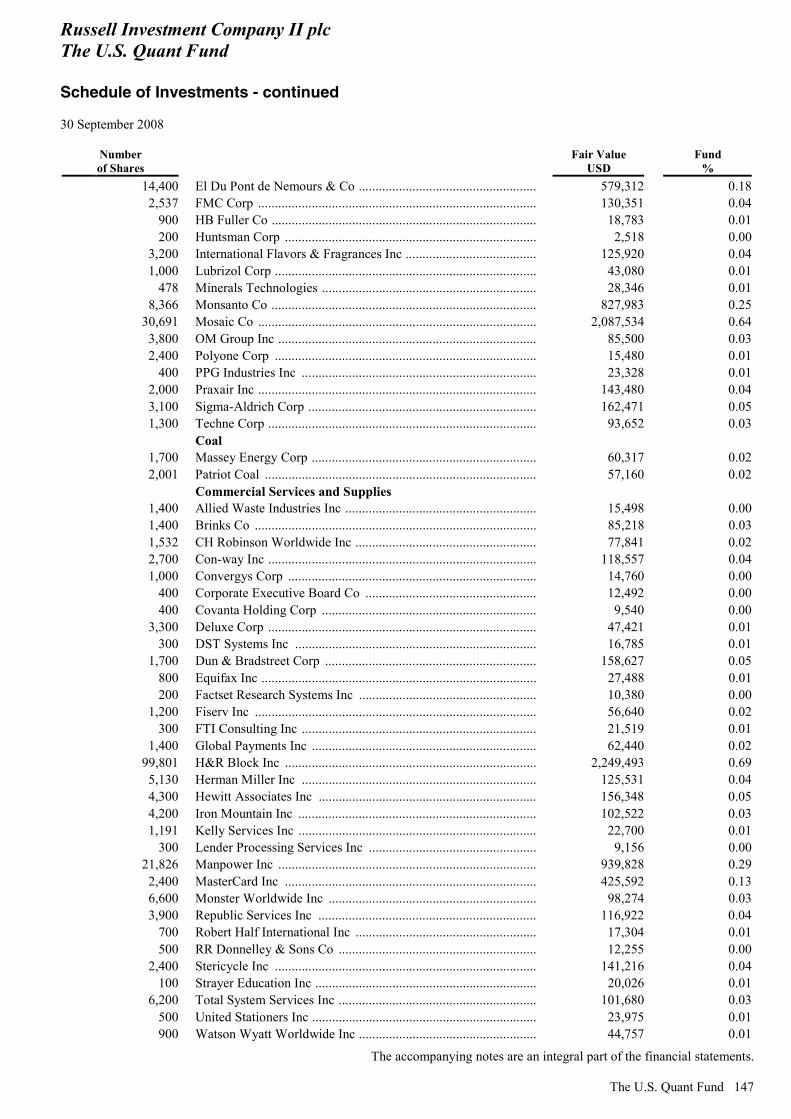
Russell Investment Company II plc The U.S. Quant Fund Schedule of Investments - continued 30 September 2008
The accompanying notes are an integral part of the financial statements.
The U.S. Quant Fund 147
Number of Shares
Fair Value USD
Fund %
14,400 El Du Pont de Nemours & Co ..................................................... 579,312 0.182,537 FMC Corp ................................................................................... 130,351 0.04
900 HB Fuller Co ............................................................................... 18,783 0.01200 Huntsman Corp ........................................................................... 2,518 0.00
3,200 International Flavors & Fragrances Inc ....................................... 125,920 0.041,000 Lubrizol Corp .............................................................................. 43,080 0.01
478 Minerals Technologies ................................................................ 28,346 0.018,366 Monsanto Co ............................................................................... 827,983 0.25
30,691 Mosaic Co ................................................................................... 2,087,534 0.643,800 OM Group Inc ............................................................................. 85,500 0.032,400 Polyone Corp .............................................................................. 15,480 0.01
400 PPG Industries Inc ...................................................................... 23,328 0.012,000 Praxair Inc ................................................................................... 143,480 0.043,100 Sigma-Aldrich Corp .................................................................... 162,471 0.051,300 Techne Corp ................................................................................ 93,652 0.03
Coal 1,700 Massey Energy Corp ................................................................... 60,317 0.022,001 Patriot Coal ................................................................................. 57,160 0.02
Commercial Services and Supplies 1,400 Allied Waste Industries Inc ......................................................... 15,498 0.001,400 Brinks Co .................................................................................... 85,218 0.031,532 CH Robinson Worldwide Inc ...................................................... 77,841 0.022,700 Con-way Inc ................................................................................ 118,557 0.041,000 Convergys Corp .......................................................................... 14,760 0.00
400 Corporate Executive Board Co ................................................... 12,492 0.00400 Covanta Holding Corp ................................................................ 9,540 0.00
3,300 Deluxe Corp ................................................................................ 47,421 0.01300 DST Systems Inc ........................................................................ 16,785 0.01
1,700 Dun & Bradstreet Corp ............................................................... 158,627 0.05800 Equifax Inc .................................................................................. 27,488 0.01200 Factset Research Systems Inc ..................................................... 10,380 0.00
1,200 Fiserv Inc .................................................................................... 56,640 0.02300 FTI Consulting Inc ...................................................................... 21,519 0.01
1,400 Global Payments Inc ................................................................... 62,440 0.0299,801 H&R Block Inc ........................................................................... 2,249,493 0.695,130 Herman Miller Inc ...................................................................... 125,531 0.044,300 Hewitt Associates Inc ................................................................. 156,348 0.054,200 Iron Mountain Inc ....................................................................... 102,522 0.031,191 Kelly Services Inc ....................................................................... 22,700 0.01
300 Lender Processing Services Inc .................................................. 9,156 0.0021,826 Manpower Inc ............................................................................. 939,828 0.292,400 MasterCard Inc ........................................................................... 425,592 0.136,600 Monster Worldwide Inc .............................................................. 98,274 0.033,900 Republic Services Inc ................................................................. 116,922 0.04
700 Robert Half International Inc ...................................................... 17,304 0.01500 RR Donnelley & Sons Co ........................................................... 12,255 0.00
2,400 Stericycle Inc .............................................................................. 141,216 0.04100 Strayer Education Inc .................................................................. 20,026 0.01
6,200 Total System Services Inc ........................................................... 101,680 0.03500 United Stationers Inc ................................................................... 23,975 0.01900 Watson Wyatt Worldwide Inc ..................................................... 44,757 0.01

Russell Investment Company II plc The U.S. Quant Fund Schedule of Investments - continued 30 September 2008
The accompanying notes are an integral part of the financial statements. 148 The U.S. Quant Fund
Number of Shares
Fair Value USD
Fund %
Communications Equipment 22,300 3Com Corp .................................................................................. 51,959 0.0212,400 ADC Telecommunications Inc .................................................... 104,656 0.034,100 Adtran Inc ................................................................................... 79,909 0.037,900 Ciena Corp .................................................................................. 79,237 0.02
100,297 Cisco Systems Inc ....................................................................... 2,260,673 0.70900 Commscope Inc .......................................................................... 31,167 0.01
47,700 Corning Inc ................................................................................. 746,028 0.235,400 Emulex Corp ............................................................................... 57,618 0.021,700 Frontier Communications Corp .................................................. 19,499 0.014,300 Harris Corp ................................................................................. 198,660 0.066,200 Juniper Networks Inc .................................................................. 130,510 0.04
15,600 Motorola Inc ............................................................................... 111,384 0.0322,868 Qualcomm Inc ............................................................................. 982,638 0.3058,953 TelLaboratories Inc ..................................................................... 238,755 0.07
Computer Services 5,689 NetApp Inc .................................................................................. 103,579 0.03
Computers and Peripherals 12,690 Apple Inc .................................................................................... 1,442,345 0.4458,097 Dell Inc ....................................................................................... 955,679 0.29
108,786 Hewlett-Packard Co .................................................................... 5,023,692 1.54300 IHS Inc ........................................................................................ 14,238 0.00
14,900 International Business Machines Corp ........................................ 1,729,743 0.537,441 Lexmark International Inc ........................................................... 241,981 0.07
36,329 Western Digital Corp .................................................................. 771,628 0.24 Construction and Engineering
800 Aecom Technology ..................................................................... 19,424 0.0112,400 EMCOR Group Inc ..................................................................... 326,368 0.107,649 Fluor Corp ................................................................................... 424,825 0.13
13,001 Foster Wheeler Ltd ..................................................................... 469,430 0.143,800 Jacobs Engineering Group Inc .................................................... 206,378 0.061,100 McDermott International Inc ...................................................... 28,083 0.01
400 Pride International ....................................................................... 11,844 0.001,900 Quanta Services Inc .................................................................... 51,015 0.02
500 Shaw Group Inc .......................................................................... 15,360 0.0012,900 URS Corp .................................................................................... 473,044 0.15
Containers and Packaging 1,434 Aptar Group Inc .......................................................................... 55,869 0.028,800 Crown Holdings Inc .................................................................... 195,184 0.061,240 Expeditors International Washington .......................................... 43,202 0.01
603 Greif Inc ...................................................................................... 39,201 0.011,700 Jarden Corp ................................................................................. 39,831 0.01
21,201 Owens-Illinois Inc ....................................................................... 621,161 0.19200 Packaging Corp of America ........................................................ 4,628 0.00
6,100 Pactiv Corp ................................................................................. 151,219 0.053,400 Sealed Air ................................................................................... 74,766 0.021,291 Sonoco Products Co .................................................................... 38,097 0.01
Diversified Financials 24,700 American Express Co ................................................................. 874,627 0.2718,344 Ameriprise Financials Inc ........................................................... 700,007 0.212,847 Apollo Investment Corp .............................................................. 168,827 0.05
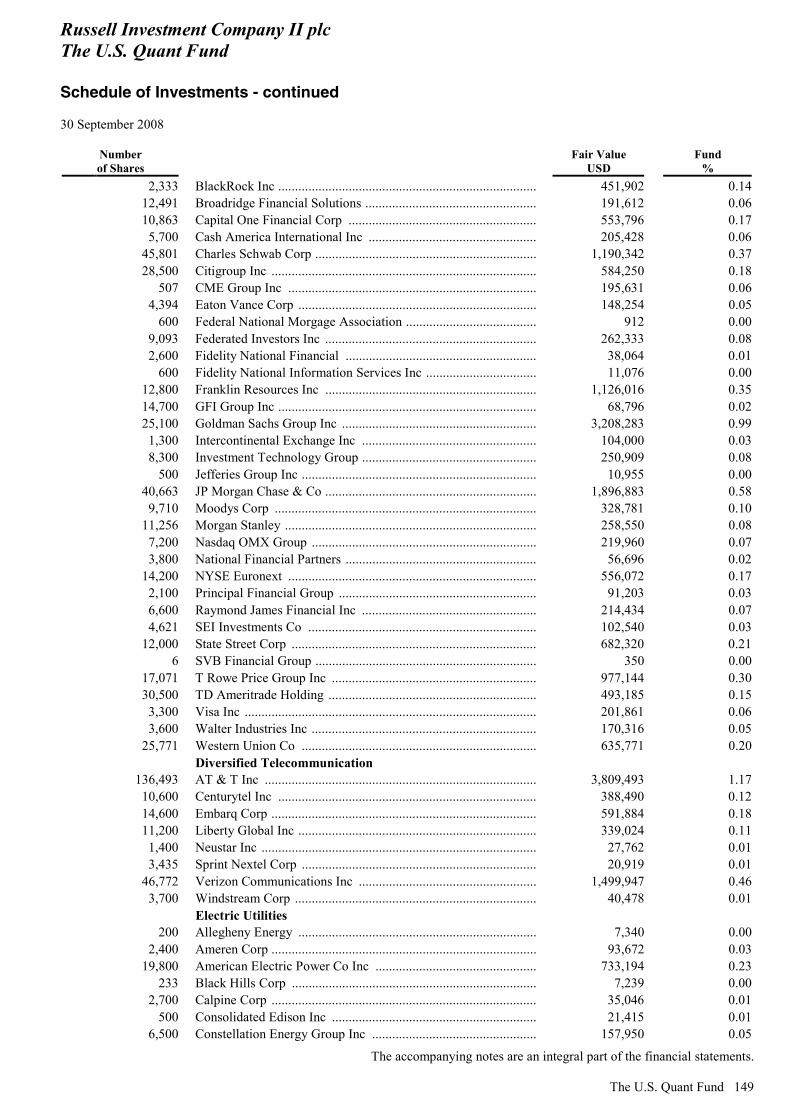
Russell Investment Company II plc The U.S. Quant Fund Schedule of Investments - continued 30 September 2008
The accompanying notes are an integral part of the financial statements.
The U.S. Quant Fund 149
Number of Shares
Fair Value USD
Fund %
2,333 BlackRock Inc ............................................................................. 451,902 0.1412,491 Broadridge Financial Solutions ................................................... 191,612 0.0610,863 Capital One Financial Corp ........................................................ 553,796 0.175,700 Cash America International Inc .................................................. 205,428 0.06
45,801 Charles Schwab Corp .................................................................. 1,190,342 0.3728,500 Citigroup Inc ............................................................................... 584,250 0.18
507 CME Group Inc .......................................................................... 195,631 0.064,394 Eaton Vance Corp ....................................................................... 148,254 0.05
600 Federal National Morgage Association ....................................... 912 0.009,093 Federated Investors Inc ............................................................... 262,333 0.082,600 Fidelity National Financial ......................................................... 38,064 0.01
600 Fidelity National Information Services Inc ................................. 11,076 0.0012,800 Franklin Resources Inc ............................................................... 1,126,016 0.3514,700 GFI Group Inc ............................................................................. 68,796 0.0225,100 Goldman Sachs Group Inc .......................................................... 3,208,283 0.991,300 Intercontinental Exchange Inc .................................................... 104,000 0.038,300 Investment Technology Group .................................................... 250,909 0.08
500 Jefferies Group Inc ...................................................................... 10,955 0.0040,663 JP Morgan Chase & Co ............................................................... 1,896,883 0.589,710 Moodys Corp .............................................................................. 328,781 0.10
11,256 Morgan Stanley ........................................................................... 258,550 0.087,200 Nasdaq OMX Group ................................................................... 219,960 0.073,800 National Financial Partners ......................................................... 56,696 0.02
14,200 NYSE Euronext .......................................................................... 556,072 0.172,100 Principal Financial Group ........................................................... 91,203 0.036,600 Raymond James Financial Inc .................................................... 214,434 0.074,621 SEI Investments Co .................................................................... 102,540 0.03
12,000 State Street Corp ......................................................................... 682,320 0.216 SVB Financial Group .................................................................. 350 0.00
17,071 T Rowe Price Group Inc ............................................................. 977,144 0.3030,500 TD Ameritrade Holding .............................................................. 493,185 0.153,300 Visa Inc ....................................................................................... 201,861 0.063,600 Walter Industries Inc ................................................................... 170,316 0.05
25,771 Western Union Co ...................................................................... 635,771 0.20 Diversified Telecommunication
136,493 AT & T Inc ................................................................................. 3,809,493 1.1710,600 Centurytel Inc ............................................................................. 388,490 0.1214,600 Embarq Corp ............................................................................... 591,884 0.1811,200 Liberty Global Inc ....................................................................... 339,024 0.111,400 Neustar Inc .................................................................................. 27,762 0.013,435 Sprint Nextel Corp ...................................................................... 20,919 0.01
46,772 Verizon Communications Inc ..................................................... 1,499,947 0.463,700 Windstream Corp ........................................................................ 40,478 0.01
Electric Utilities 200 Allegheny Energy ....................................................................... 7,340 0.00
2,400 Ameren Corp ............................................................................... 93,672 0.0319,800 American Electric Power Co Inc ................................................ 733,194 0.23
233 Black Hills Corp ......................................................................... 7,239 0.002,700 Calpine Corp ............................................................................... 35,046 0.01
500 Consolidated Edison Inc ............................................................. 21,415 0.016,500 Constellation Energy Group Inc ................................................. 157,950 0.05
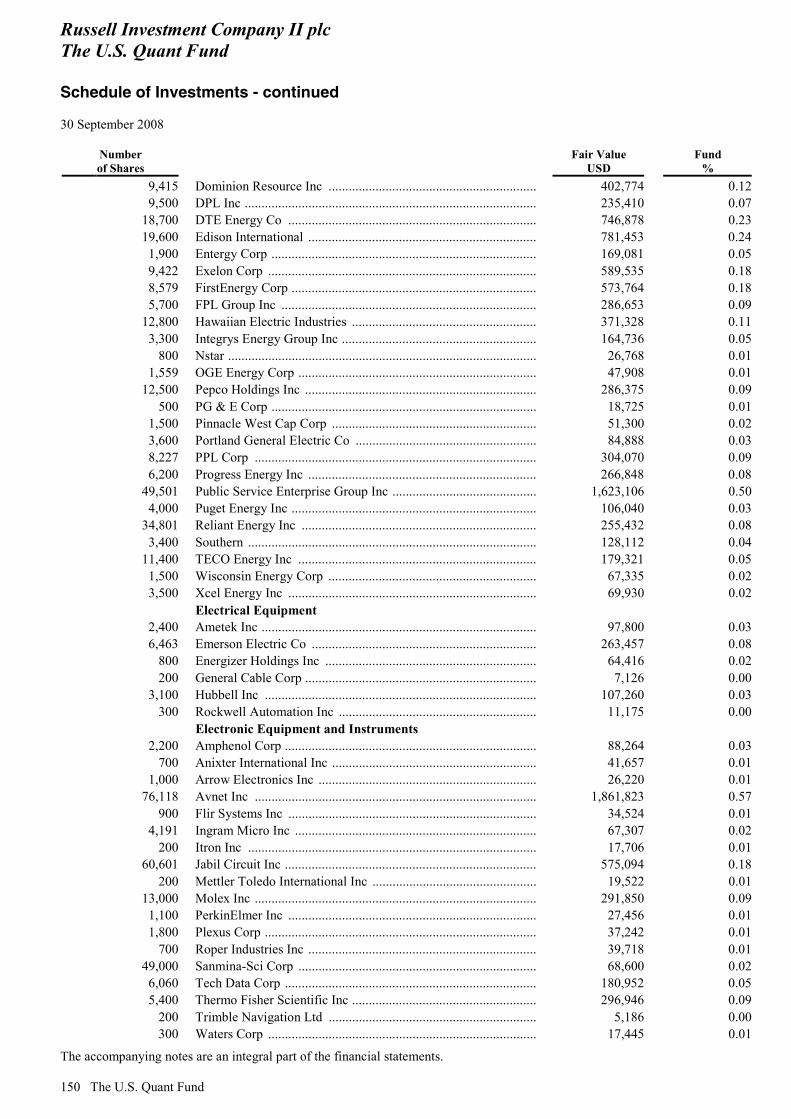
Russell Investment Company II plc The U.S. Quant Fund Schedule of Investments - continued 30 September 2008
The accompanying notes are an integral part of the financial statements. 150 The U.S. Quant Fund
Number of Shares
Fair Value USD
Fund %
9,415 Dominion Resource Inc .............................................................. 402,774 0.129,500 DPL Inc ....................................................................................... 235,410 0.07
18,700 DTE Energy Co .......................................................................... 746,878 0.2319,600 Edison International .................................................................... 781,453 0.241,900 Entergy Corp ............................................................................... 169,081 0.059,422 Exelon Corp ................................................................................ 589,535 0.188,579 FirstEnergy Corp ......................................................................... 573,764 0.185,700 FPL Group Inc ............................................................................ 286,653 0.09
12,800 Hawaiian Electric Industries ....................................................... 371,328 0.113,300 Integrys Energy Group Inc .......................................................... 164,736 0.05
800 Nstar ............................................................................................ 26,768 0.011,559 OGE Energy Corp ....................................................................... 47,908 0.01
12,500 Pepco Holdings Inc ..................................................................... 286,375 0.09500 PG & E Corp ............................................................................... 18,725 0.01
1,500 Pinnacle West Cap Corp ............................................................. 51,300 0.023,600 Portland General Electric Co ...................................................... 84,888 0.038,227 PPL Corp .................................................................................... 304,070 0.096,200 Progress Energy Inc .................................................................... 266,848 0.08
49,501 Public Service Enterprise Group Inc ........................................... 1,623,106 0.504,000 Puget Energy Inc ......................................................................... 106,040 0.03
34,801 Reliant Energy Inc ...................................................................... 255,432 0.083,400 Southern ...................................................................................... 128,112 0.04
11,400 TECO Energy Inc ....................................................................... 179,321 0.051,500 Wisconsin Energy Corp .............................................................. 67,335 0.023,500 Xcel Energy Inc .......................................................................... 69,930 0.02
Electrical Equipment 2,400 Ametek Inc .................................................................................. 97,800 0.036,463 Emerson Electric Co ................................................................... 263,457 0.08
800 Energizer Holdings Inc ............................................................... 64,416 0.02200 General Cable Corp ..................................................................... 7,126 0.00
3,100 Hubbell Inc ................................................................................. 107,260 0.03300 Rockwell Automation Inc ........................................................... 11,175 0.00
Electronic Equipment and Instruments 2,200 Amphenol Corp ........................................................................... 88,264 0.03
700 Anixter International Inc ............................................................. 41,657 0.011,000 Arrow Electronics Inc ................................................................. 26,220 0.01
76,118 Avnet Inc .................................................................................... 1,861,823 0.57900 Flir Systems Inc .......................................................................... 34,524 0.01
4,191 Ingram Micro Inc ........................................................................ 67,307 0.02200 Itron Inc ...................................................................................... 17,706 0.01
60,601 Jabil Circuit Inc ........................................................................... 575,094 0.18200 Mettler Toledo International Inc ................................................. 19,522 0.01
13,000 Molex Inc .................................................................................... 291,850 0.091,100 PerkinElmer Inc .......................................................................... 27,456 0.011,800 Plexus Corp ................................................................................. 37,242 0.01
700 Roper Industries Inc .................................................................... 39,718 0.0149,000 Sanmina-Sci Corp ....................................................................... 68,600 0.026,060 Tech Data Corp ........................................................................... 180,952 0.055,400 Thermo Fisher Scientific Inc ....................................................... 296,946 0.09
200 Trimble Navigation Ltd .............................................................. 5,186 0.00300 Waters Corp ................................................................................ 17,445 0.01
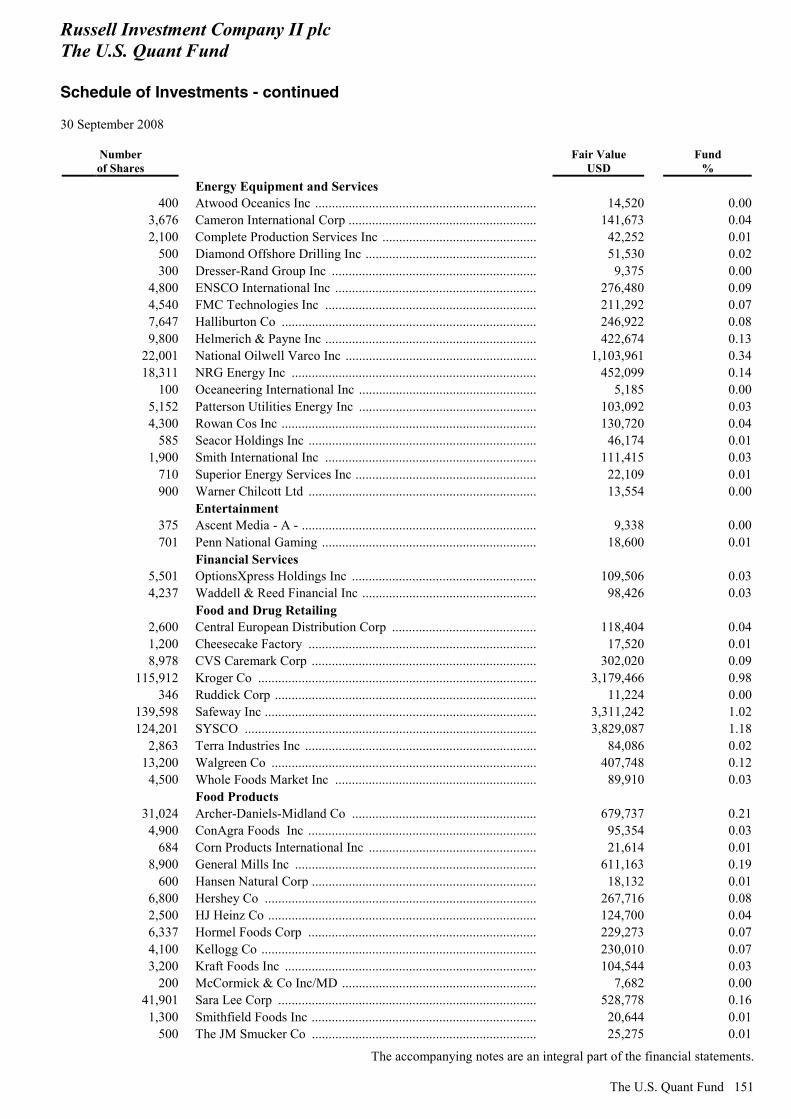
Russell Investment Company II plc The U.S. Quant Fund Schedule of Investments - continued 30 September 2008
The accompanying notes are an integral part of the financial statements.
The U.S. Quant Fund 151
Number of Shares
Fair Value USD
Fund %
Energy Equipment and Services 400 Atwood Oceanics Inc .................................................................. 14,520 0.00
3,676 Cameron International Corp ........................................................ 141,673 0.042,100 Complete Production Services Inc .............................................. 42,252 0.01
500 Diamond Offshore Drilling Inc ................................................... 51,530 0.02300 Dresser-Rand Group Inc ............................................................. 9,375 0.00
4,800 ENSCO International Inc ............................................................ 276,480 0.094,540 FMC Technologies Inc ............................................................... 211,292 0.077,647 Halliburton Co ............................................................................ 246,922 0.089,800 Helmerich & Payne Inc ............................................................... 422,674 0.13
22,001 National Oilwell Varco Inc ......................................................... 1,103,961 0.3418,311 NRG Energy Inc ......................................................................... 452,099 0.14
100 Oceaneering International Inc ..................................................... 5,185 0.005,152 Patterson Utilities Energy Inc ..................................................... 103,092 0.034,300 Rowan Cos Inc ............................................................................ 130,720 0.04
585 Seacor Holdings Inc .................................................................... 46,174 0.011,900 Smith International Inc ............................................................... 111,415 0.03
710 Superior Energy Services Inc ...................................................... 22,109 0.01900 Warner Chilcott Ltd .................................................................... 13,554 0.00
Entertainment 375 Ascent Media - A - ...................................................................... 9,338 0.00701 Penn National Gaming ................................................................ 18,600 0.01
Financial Services 5,501 OptionsXpress Holdings Inc ....................................................... 109,506 0.034,237 Waddell & Reed Financial Inc .................................................... 98,426 0.03
Food and Drug Retailing 2,600 Central European Distribution Corp ........................................... 118,404 0.041,200 Cheesecake Factory .................................................................... 17,520 0.018,978 CVS Caremark Corp ................................................................... 302,020 0.09
115,912 Kroger Co ................................................................................... 3,179,466 0.98346 Ruddick Corp .............................................................................. 11,224 0.00
139,598 Safeway Inc ................................................................................. 3,311,242 1.02124,201 SYSCO ....................................................................................... 3,829,087 1.18
2,863 Terra Industries Inc ..................................................................... 84,086 0.0213,200 Walgreen Co ............................................................................... 407,748 0.124,500 Whole Foods Market Inc ............................................................ 89,910 0.03
Food Products 31,024 Archer-Daniels-Midland Co ....................................................... 679,737 0.214,900 ConAgra Foods Inc .................................................................... 95,354 0.03
684 Corn Products International Inc .................................................. 21,614 0.018,900 General Mills Inc ........................................................................ 611,163 0.19
600 Hansen Natural Corp ................................................................... 18,132 0.016,800 Hershey Co ................................................................................. 267,716 0.082,500 HJ Heinz Co ................................................................................ 124,700 0.046,337 Hormel Foods Corp .................................................................... 229,273 0.074,100 Kellogg Co .................................................................................. 230,010 0.073,200 Kraft Foods Inc ........................................................................... 104,544 0.03
200 McCormick & Co Inc/MD .......................................................... 7,682 0.0041,901 Sara Lee Corp ............................................................................. 528,778 0.161,300 Smithfield Foods Inc ................................................................... 20,644 0.01
500 The JM Smucker Co ................................................................... 25,275 0.01

Russell Investment Company II plc The U.S. Quant Fund Schedule of Investments - continued 30 September 2008
The accompanying notes are an integral part of the financial statements. 152 The U.S. Quant Fund
Number of Shares
Fair Value USD
Fund %
36,008 Tyson Foods Inc .......................................................................... 429,575 0.132,700 Wrigley William Jr Co ................................................................ 214,380 0.06
Gaming 2,501 International Game Technology .................................................. 42,901 0.01
Gas Utilities 1,400 Atmos Energy Corp .................................................................... 37,268 0.012,200 Energen Corp .............................................................................. 99,616 0.031,000 Laclede Group Inc ...................................................................... 48,490 0.012,700 New Jersey Resources Corp ........................................................ 96,876 0.031,100 NiSource Inc ............................................................................... 16,236 0.012,700 Oneok Inc .................................................................................... 92,745 0.03
400 Sempra Energy ............................................................................ 20,188 0.0118,301 Southwestern Energy Co ............................................................. 558,700 0.179,800 UGI Corp .................................................................................... 252,252 0.08
Health Care Equipment and Supplies 8,100 Applied Biosystems Inc .............................................................. 276,939 0.094,000 Baxter International Inc .............................................................. 262,520 0.081,787 Becton Dickinson & Co .............................................................. 143,246 0.04
84,416 Boston Scientific Corp ................................................................ 1,034,085 0.321,150 CR Bard ...................................................................................... 109,089 0.035,886 Dentsply International Inc ........................................................... 220,902 0.07
500 Edwards Lifesciences Corp ......................................................... 28,800 0.01412 Hill-Rom Holdings Inc ............................................................... 12,467 0.00
1,000 Hologic Inc ................................................................................. 19,190 0.011,200 Illumina Inc ................................................................................. 48,540 0.01
300 Intuitive Surgical Inc ................................................................... 72,291 0.028,750 Medtronic Inc .............................................................................. 437,675 0.131,600 Pediatrix Medical Group ............................................................. 86,176 0.03
400 Resmed Inc ................................................................................. 17,168 0.0116,413 St Jude Medical Inc ..................................................................... 711,504 0.228,000 Stryker Corp ................................................................................ 498,320 0.152,557 Varian Medical Systems Inc ....................................................... 146,055 0.059,400 Zimmer Holdings Inc .................................................................. 606,864 0.19
Health Care Providers and Services 8,800 Aetna Inc ..................................................................................... 317,768 0.108,600 AmeriGroup Corp ....................................................................... 217,064 0.07
72,667 Amerisourcebergen Corp ............................................................ 2,735,876 0.8426,100 Cardinal Health Inc ..................................................................... 1,286,208 0.391,700 Centene Corp .............................................................................. 34,867 0.01
26,500 CIGNA Corp ............................................................................... 899,675 0.28400 Community Health Systems Inc ................................................. 11,724 0.00
2,100 Covance Inc ................................................................................ 185,241 0.0611,247 Express Scripts Inc ...................................................................... 830,366 0.252,600 Health Management Associates Inc ............................................ 10,816 0.009,700 Health Net Inc ............................................................................. 225,137 0.07
23,500 Humana Inc ................................................................................. 962,560 0.301,961 Kindred Healthcare Inc ............................................................... 53,928 0.02
400 Laboratory Corp of America Holdings ....................................... 27,800 0.017,200 Lincare Holdings Inc ................................................................... 216,720 0.072,700 Magellan Health Services Inc ..................................................... 110,862 0.03
28,294 McKesson Corp .......................................................................... 1,522,500 0.47
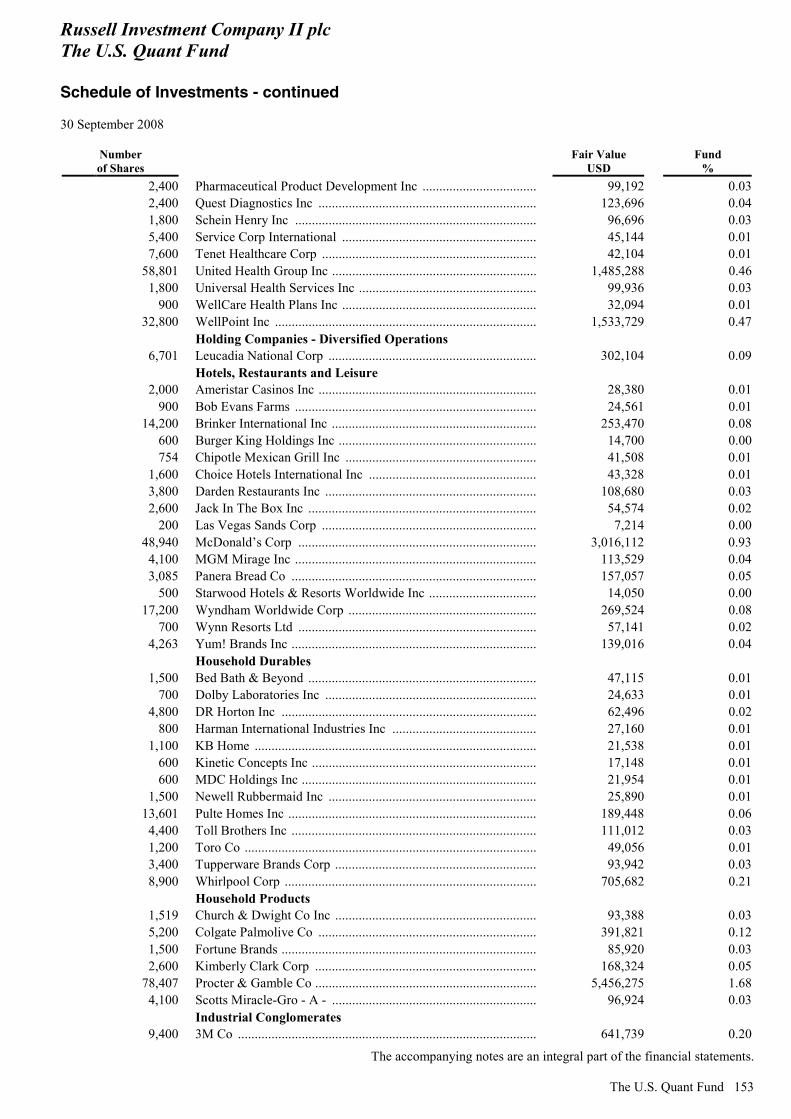
Russell Investment Company II plc The U.S. Quant Fund Schedule of Investments - continued 30 September 2008
The accompanying notes are an integral part of the financial statements.
The U.S. Quant Fund 153
Number of Shares
Fair Value USD
Fund %
2,400 Pharmaceutical Product Development Inc .................................. 99,192 0.032,400 Quest Diagnostics Inc ................................................................. 123,696 0.041,800 Schein Henry Inc ........................................................................ 96,696 0.035,400 Service Corp International .......................................................... 45,144 0.017,600 Tenet Healthcare Corp ................................................................ 42,104 0.01
58,801 United Health Group Inc ............................................................. 1,485,288 0.461,800 Universal Health Services Inc ..................................................... 99,936 0.03
900 WellCare Health Plans Inc .......................................................... 32,094 0.0132,800 WellPoint Inc .............................................................................. 1,533,729 0.47
Holding Companies - Diversified Operations 6,701 Leucadia National Corp .............................................................. 302,104 0.09
Hotels, Restaurants and Leisure 2,000 Ameristar Casinos Inc ................................................................. 28,380 0.01
900 Bob Evans Farms ........................................................................ 24,561 0.0114,200 Brinker International Inc ............................................................. 253,470 0.08
600 Burger King Holdings Inc ........................................................... 14,700 0.00754 Chipotle Mexican Grill Inc ......................................................... 41,508 0.01
1,600 Choice Hotels International Inc .................................................. 43,328 0.013,800 Darden Restaurants Inc ............................................................... 108,680 0.032,600 Jack In The Box Inc .................................................................... 54,574 0.02
200 Las Vegas Sands Corp ................................................................ 7,214 0.0048,940 McDonald’s Corp ....................................................................... 3,016,112 0.934,100 MGM Mirage Inc ........................................................................ 113,529 0.043,085 Panera Bread Co ......................................................................... 157,057 0.05
500 Starwood Hotels & Resorts Worldwide Inc ................................ 14,050 0.0017,200 Wyndham Worldwide Corp ........................................................ 269,524 0.08
700 Wynn Resorts Ltd ....................................................................... 57,141 0.024,263 Yum! Brands Inc ......................................................................... 139,016 0.04
Household Durables 1,500 Bed Bath & Beyond .................................................................... 47,115 0.01
700 Dolby Laboratories Inc ............................................................... 24,633 0.014,800 DR Horton Inc ............................................................................ 62,496 0.02
800 Harman International Industries Inc ........................................... 27,160 0.011,100 KB Home .................................................................................... 21,538 0.01
600 Kinetic Concepts Inc ................................................................... 17,148 0.01600 MDC Holdings Inc ...................................................................... 21,954 0.01
1,500 Newell Rubbermaid Inc .............................................................. 25,890 0.0113,601 Pulte Homes Inc .......................................................................... 189,448 0.064,400 Toll Brothers Inc ......................................................................... 111,012 0.031,200 Toro Co ....................................................................................... 49,056 0.013,400 Tupperware Brands Corp ............................................................ 93,942 0.038,900 Whirlpool Corp ........................................................................... 705,682 0.21
Household Products 1,519 Church & Dwight Co Inc ............................................................ 93,388 0.035,200 Colgate Palmolive Co ................................................................. 391,821 0.121,500 Fortune Brands ............................................................................ 85,920 0.032,600 Kimberly Clark Corp .................................................................. 168,324 0.05
78,407 Procter & Gamble Co .................................................................. 5,456,275 1.684,100 Scotts Miracle-Gro - A - ............................................................. 96,924 0.03
Industrial Conglomerates 9,400 3M Co ......................................................................................... 641,739 0.20

Russell Investment Company II plc The U.S. Quant Fund Schedule of Investments - continued 30 September 2008
The accompanying notes are an integral part of the financial statements. 154 The U.S. Quant Fund
Number of Shares
Fair Value USD
Fund %
215,830 General Electric Co ..................................................................... 5,497,166 1.6916,900 KBR Inc ...................................................................................... 256,711 0.0810,300 Reynolds Amern Inc ................................................................... 500,477 0.1519,101 SAIC Inc ..................................................................................... 385,629 0.123,800 Textron Inc .................................................................................. 111,264 0.03
Insurance 14,200 Aflac Inc ..................................................................................... 833,682 0.2620,505 Allstate Corp ............................................................................... 945,486 0.29
700 American Financial Group Inc .................................................... 19,936 0.0111,100 American International Group Inc .............................................. 36,852 0.016,700 AON Corp ................................................................................... 300,428 0.09
14,900 Assurant Inc ................................................................................ 804,153 0.255,100 Brown & Brown Inc .................................................................... 110,211 0.03
15,619 Chubb Corp ................................................................................. 856,702 0.261,300 Cincinnati Financials Corp ......................................................... 38,662 0.019,500 Conseco Inc ................................................................................. 33,345 0.01
100 Erie Indemnity Co ....................................................................... 4,068 0.00255 First American Corp ................................................................... 7,520 0.00600 Hanover Insurance Group Inc ..................................................... 27,228 0.01
13,800 Hartford Financial Services Group Inc ....................................... 565,524 0.1711,000 HCC Insurance Holdings Inc ...................................................... 287,650 0.09
600 Infinity Property & Casualty ....................................................... 24,972 0.016,500 Lincoln National Corp ................................................................ 277,615 0.09
11,100 Loews Corp ................................................................................. 438,339 0.142,700 Marsh & McLennan Cos Inc ....................................................... 85,725 0.03
46,381 Metlife Inc ................................................................................... 2,449,329 0.75200 Navigators Group Inc .................................................................. 10,684 0.00341 OneBeacon Insurance Group ...................................................... 7,099 0.00500 Philadelphia Consolidated Holdings Co ..................................... 29,245 0.01
1,500 Progressive Corp/Ohio ................................................................ 25,875 0.01500 Protective Life Corp .................................................................... 14,250 0.00
10,509 Prudential Financial Inc .............................................................. 751,394 0.2310,800 Reinsurance Group of America Inc ............................................ 551,664 0.173,800 Stancorp Financial Group Inc ..................................................... 188,784 0.061,100 Torchmark Inc ............................................................................. 66,066 0.02
75,406 Travelers Cos Inc ........................................................................ 3,364,572 1.032,200 Unum Group ............................................................................... 55,154 0.02
19,300 WR Berkley Corp ....................................................................... 453,743 0.14 Internet and Catalogue Retail
3,488 Amazon.com Inc ......................................................................... 253,718 0.074,101 Expedia Inc ................................................................................. 61,910 0.02
300 Priceline com Inc ........................................................................ 20,520 0.01 Internet Software and Services
1,600 Akamai Technologies Inc ........................................................... 27,856 0.01400 DeVry Inc ................................................................................... 19,776 0.01
13,500 Earthlink Inc ............................................................................... 114,345 0.0334,360 eBay Inc ...................................................................................... 768,955 0.242,056 Google Inc ................................................................................... 823,470 0.25
16,800 HLTH .......................................................................................... 192,024 0.063,700 McAfee Inc ................................................................................. 125,541 0.04
22,400 Sun Microsystems ....................................................................... 170,240 0.05
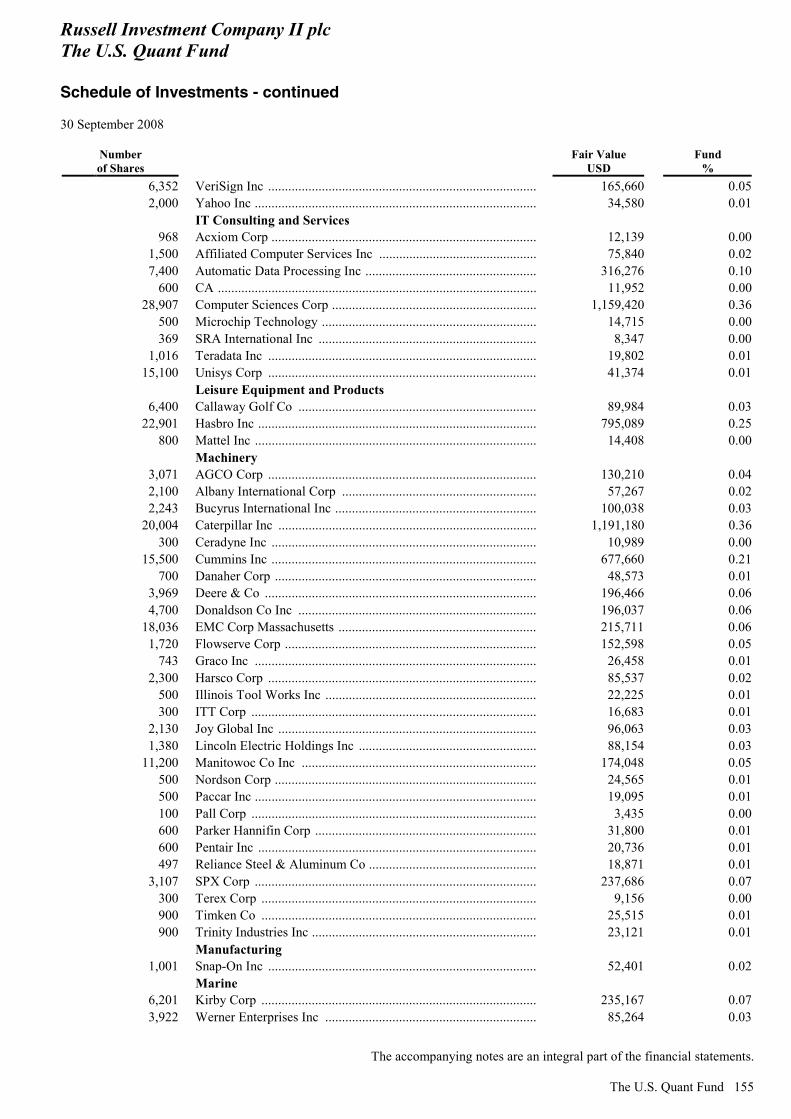
Russell Investment Company II plc The U.S. Quant Fund Schedule of Investments - continued 30 September 2008
The accompanying notes are an integral part of the financial statements.
The U.S. Quant Fund 155
Number of Shares
Fair Value USD
Fund %
6,352 VeriSign Inc ................................................................................ 165,660 0.052,000 Yahoo Inc .................................................................................... 34,580 0.01
IT Consulting and Services 968 Acxiom Corp ............................................................................... 12,139 0.00
1,500 Affiliated Computer Services Inc ............................................... 75,840 0.027,400 Automatic Data Processing Inc ................................................... 316,276 0.10
600 CA ............................................................................................... 11,952 0.0028,907 Computer Sciences Corp ............................................................. 1,159,420 0.36
500 Microchip Technology ................................................................ 14,715 0.00369 SRA International Inc ................................................................. 8,347 0.00
1,016 Teradata Inc ................................................................................ 19,802 0.0115,100 Unisys Corp ................................................................................ 41,374 0.01
Leisure Equipment and Products 6,400 Callaway Golf Co ....................................................................... 89,984 0.03
22,901 Hasbro Inc ................................................................................... 795,089 0.25800 Mattel Inc .................................................................................... 14,408 0.00
Machinery 3,071 AGCO Corp ................................................................................ 130,210 0.042,100 Albany International Corp .......................................................... 57,267 0.022,243 Bucyrus International Inc ............................................................ 100,038 0.03
20,004 Caterpillar Inc ............................................................................. 1,191,180 0.36300 Ceradyne Inc ............................................................................... 10,989 0.00
15,500 Cummins Inc ............................................................................... 677,660 0.21700 Danaher Corp .............................................................................. 48,573 0.01
3,969 Deere & Co ................................................................................. 196,466 0.064,700 Donaldson Co Inc ....................................................................... 196,037 0.06
18,036 EMC Corp Massachusetts ........................................................... 215,711 0.061,720 Flowserve Corp ........................................................................... 152,598 0.05
743 Graco Inc .................................................................................... 26,458 0.012,300 Harsco Corp ................................................................................ 85,537 0.02
500 Illinois Tool Works Inc ............................................................... 22,225 0.01300 ITT Corp ..................................................................................... 16,683 0.01
2,130 Joy Global Inc ............................................................................. 96,063 0.031,380 Lincoln Electric Holdings Inc ..................................................... 88,154 0.03
11,200 Manitowoc Co Inc ...................................................................... 174,048 0.05500 Nordson Corp .............................................................................. 24,565 0.01500 Paccar Inc .................................................................................... 19,095 0.01100 Pall Corp ..................................................................................... 3,435 0.00600 Parker Hannifin Corp .................................................................. 31,800 0.01600 Pentair Inc ................................................................................... 20,736 0.01497 Reliance Steel & Aluminum Co .................................................. 18,871 0.01
3,107 SPX Corp .................................................................................... 237,686 0.07300 Terex Corp .................................................................................. 9,156 0.00900 Timken Co .................................................................................. 25,515 0.01900 Trinity Industries Inc ................................................................... 23,121 0.01
Manufacturing 1,001 Snap-On Inc ................................................................................ 52,401 0.02
Marine 6,201 Kirby Corp .................................................................................. 235,167 0.073,922 Werner Enterprises Inc ............................................................... 85,264 0.03
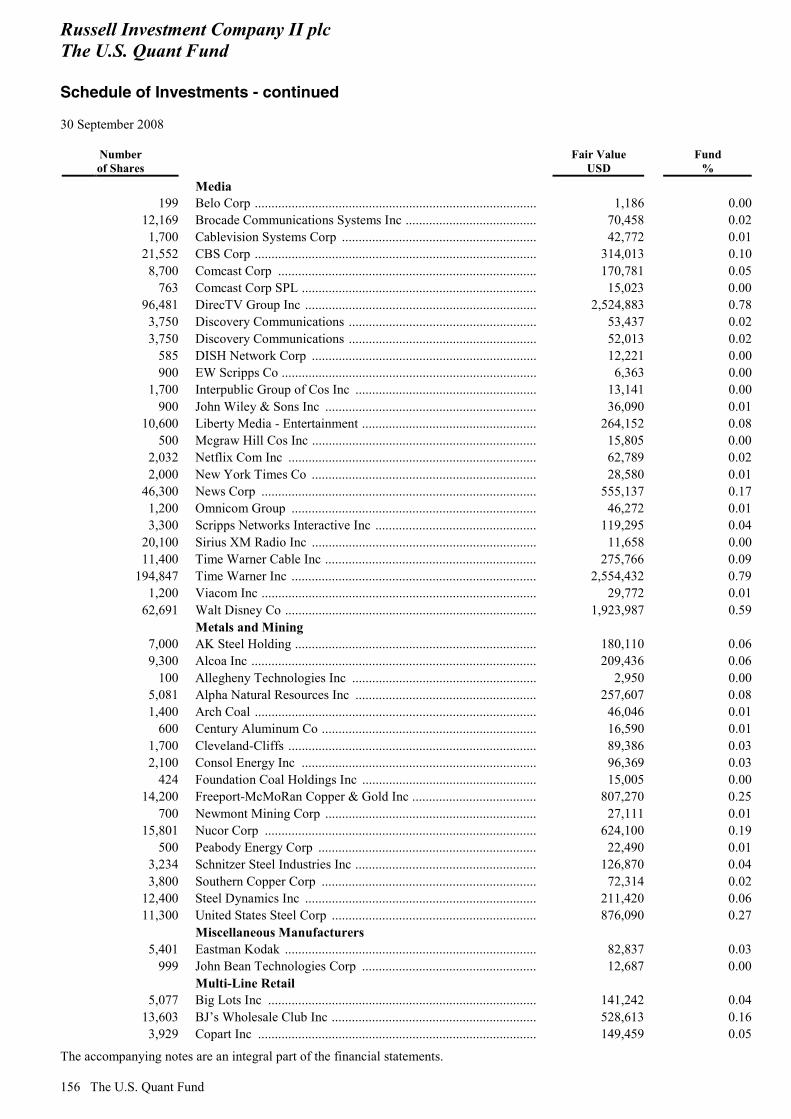
Russell Investment Company II plc The U.S. Quant Fund Schedule of Investments - continued 30 September 2008
The accompanying notes are an integral part of the financial statements. 156 The U.S. Quant Fund
Number of Shares
Fair Value USD
Fund %
Media 199 Belo Corp .................................................................................... 1,186 0.00
12,169 Brocade Communications Systems Inc ....................................... 70,458 0.021,700 Cablevision Systems Corp .......................................................... 42,772 0.01
21,552 CBS Corp .................................................................................... 314,013 0.108,700 Comcast Corp ............................................................................. 170,781 0.05
763 Comcast Corp SPL ...................................................................... 15,023 0.0096,481 DirecTV Group Inc ..................................................................... 2,524,883 0.783,750 Discovery Communications ........................................................ 53,437 0.023,750 Discovery Communications ........................................................ 52,013 0.02
585 DISH Network Corp ................................................................... 12,221 0.00900 EW Scripps Co ............................................................................ 6,363 0.00
1,700 Interpublic Group of Cos Inc ...................................................... 13,141 0.00900 John Wiley & Sons Inc ............................................................... 36,090 0.01
10,600 Liberty Media - Entertainment .................................................... 264,152 0.08500 Mcgraw Hill Cos Inc ................................................................... 15,805 0.00
2,032 Netflix Com Inc .......................................................................... 62,789 0.022,000 New York Times Co ................................................................... 28,580 0.01
46,300 News Corp .................................................................................. 555,137 0.171,200 Omnicom Group ......................................................................... 46,272 0.013,300 Scripps Networks Interactive Inc ................................................ 119,295 0.04
20,100 Sirius XM Radio Inc ................................................................... 11,658 0.0011,400 Time Warner Cable Inc ............................................................... 275,766 0.09
194,847 Time Warner Inc ......................................................................... 2,554,432 0.791,200 Viacom Inc .................................................................................. 29,772 0.01
62,691 Walt Disney Co ........................................................................... 1,923,987 0.59 Metals and Mining
7,000 AK Steel Holding ........................................................................ 180,110 0.069,300 Alcoa Inc ..................................................................................... 209,436 0.06
100 Allegheny Technologies Inc ....................................................... 2,950 0.005,081 Alpha Natural Resources Inc ...................................................... 257,607 0.081,400 Arch Coal .................................................................................... 46,046 0.01
600 Century Aluminum Co ................................................................ 16,590 0.011,700 Cleveland-Cliffs .......................................................................... 89,386 0.032,100 Consol Energy Inc ...................................................................... 96,369 0.03
424 Foundation Coal Holdings Inc .................................................... 15,005 0.0014,200 Freeport-McMoRan Copper & Gold Inc ..................................... 807,270 0.25
700 Newmont Mining Corp ............................................................... 27,111 0.0115,801 Nucor Corp ................................................................................. 624,100 0.19
500 Peabody Energy Corp ................................................................. 22,490 0.013,234 Schnitzer Steel Industries Inc ...................................................... 126,870 0.043,800 Southern Copper Corp ................................................................ 72,314 0.02
12,400 Steel Dynamics Inc ..................................................................... 211,420 0.0611,300 United States Steel Corp ............................................................. 876,090 0.27
Miscellaneous Manufacturers 5,401 Eastman Kodak ........................................................................... 82,837 0.03
999 John Bean Technologies Corp .................................................... 12,687 0.00 Multi-Line Retail
5,077 Big Lots Inc ................................................................................ 141,242 0.0413,603 BJ’s Wholesale Club Inc ............................................................. 528,613 0.163,929 Copart Inc ................................................................................... 149,459 0.05
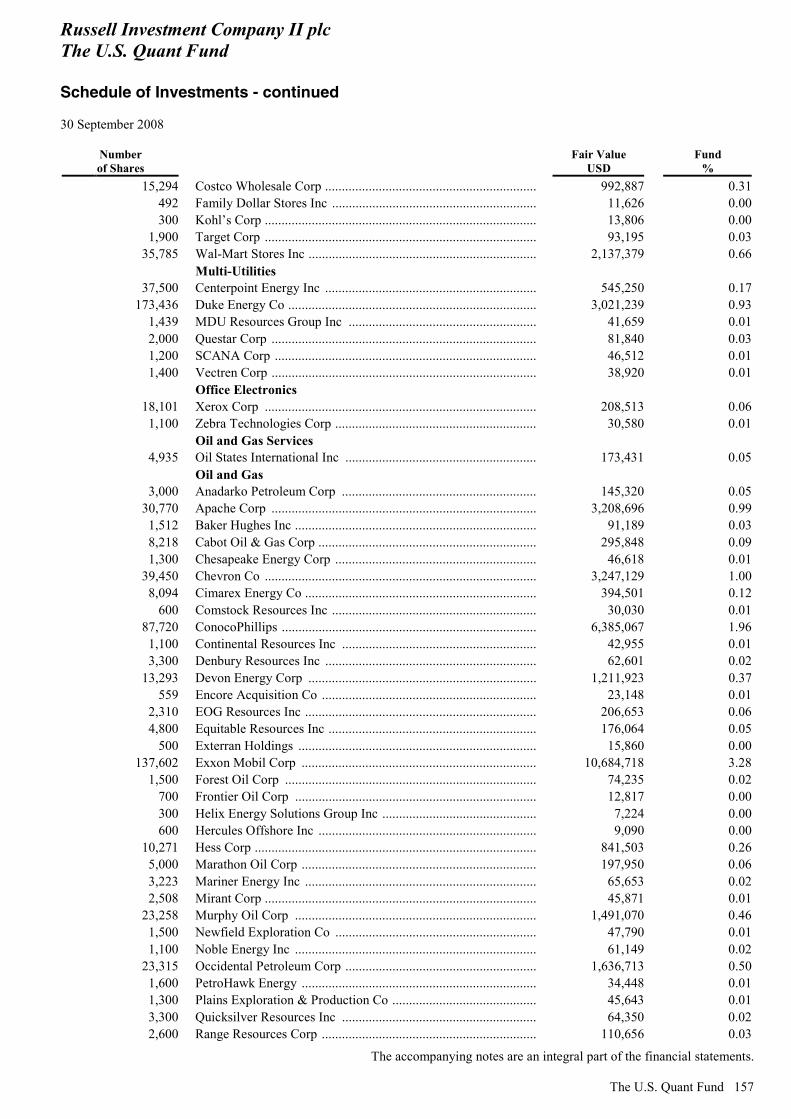
Russell Investment Company II plc The U.S. Quant Fund Schedule of Investments - continued 30 September 2008
The accompanying notes are an integral part of the financial statements.
The U.S. Quant Fund 157
Number of Shares
Fair Value USD
Fund %
15,294 Costco Wholesale Corp ............................................................... 992,887 0.31492 Family Dollar Stores Inc ............................................................. 11,626 0.00300 Kohl’s Corp ................................................................................. 13,806 0.00
1,900 Target Corp ................................................................................. 93,195 0.0335,785 Wal-Mart Stores Inc .................................................................... 2,137,379 0.66
Multi-Utilities 37,500 Centerpoint Energy Inc ............................................................... 545,250 0.17
173,436 Duke Energy Co .......................................................................... 3,021,239 0.931,439 MDU Resources Group Inc ........................................................ 41,659 0.012,000 Questar Corp ............................................................................... 81,840 0.031,200 SCANA Corp .............................................................................. 46,512 0.011,400 Vectren Corp ............................................................................... 38,920 0.01
Office Electronics 18,101 Xerox Corp ................................................................................. 208,513 0.061,100 Zebra Technologies Corp ............................................................ 30,580 0.01
Oil and Gas Services 4,935 Oil States International Inc ......................................................... 173,431 0.05
Oil and Gas 3,000 Anadarko Petroleum Corp .......................................................... 145,320 0.05
30,770 Apache Corp ............................................................................... 3,208,696 0.991,512 Baker Hughes Inc ........................................................................ 91,189 0.038,218 Cabot Oil & Gas Corp ................................................................. 295,848 0.091,300 Chesapeake Energy Corp ............................................................ 46,618 0.01
39,450 Chevron Co ................................................................................. 3,247,129 1.008,094 Cimarex Energy Co ..................................................................... 394,501 0.12
600 Comstock Resources Inc ............................................................. 30,030 0.0187,720 ConocoPhillips ............................................................................ 6,385,067 1.961,100 Continental Resources Inc .......................................................... 42,955 0.013,300 Denbury Resources Inc ............................................................... 62,601 0.02
13,293 Devon Energy Corp .................................................................... 1,211,923 0.37559 Encore Acquisition Co ................................................................ 23,148 0.01
2,310 EOG Resources Inc ..................................................................... 206,653 0.064,800 Equitable Resources Inc .............................................................. 176,064 0.05
500 Exterran Holdings ....................................................................... 15,860 0.00137,602 Exxon Mobil Corp ...................................................................... 10,684,718 3.28
1,500 Forest Oil Corp ........................................................................... 74,235 0.02700 Frontier Oil Corp ........................................................................ 12,817 0.00300 Helix Energy Solutions Group Inc .............................................. 7,224 0.00600 Hercules Offshore Inc ................................................................. 9,090 0.00
10,271 Hess Corp .................................................................................... 841,503 0.265,000 Marathon Oil Corp ...................................................................... 197,950 0.063,223 Mariner Energy Inc ..................................................................... 65,653 0.022,508 Mirant Corp ................................................................................. 45,871 0.01
23,258 Murphy Oil Corp ........................................................................ 1,491,070 0.461,500 Newfield Exploration Co ............................................................ 47,790 0.011,100 Noble Energy Inc ........................................................................ 61,149 0.02
23,315 Occidental Petroleum Corp ......................................................... 1,636,713 0.501,600 PetroHawk Energy ...................................................................... 34,448 0.011,300 Plains Exploration & Production Co ........................................... 45,643 0.013,300 Quicksilver Resources Inc .......................................................... 64,350 0.022,600 Range Resources Corp ................................................................ 110,656 0.03
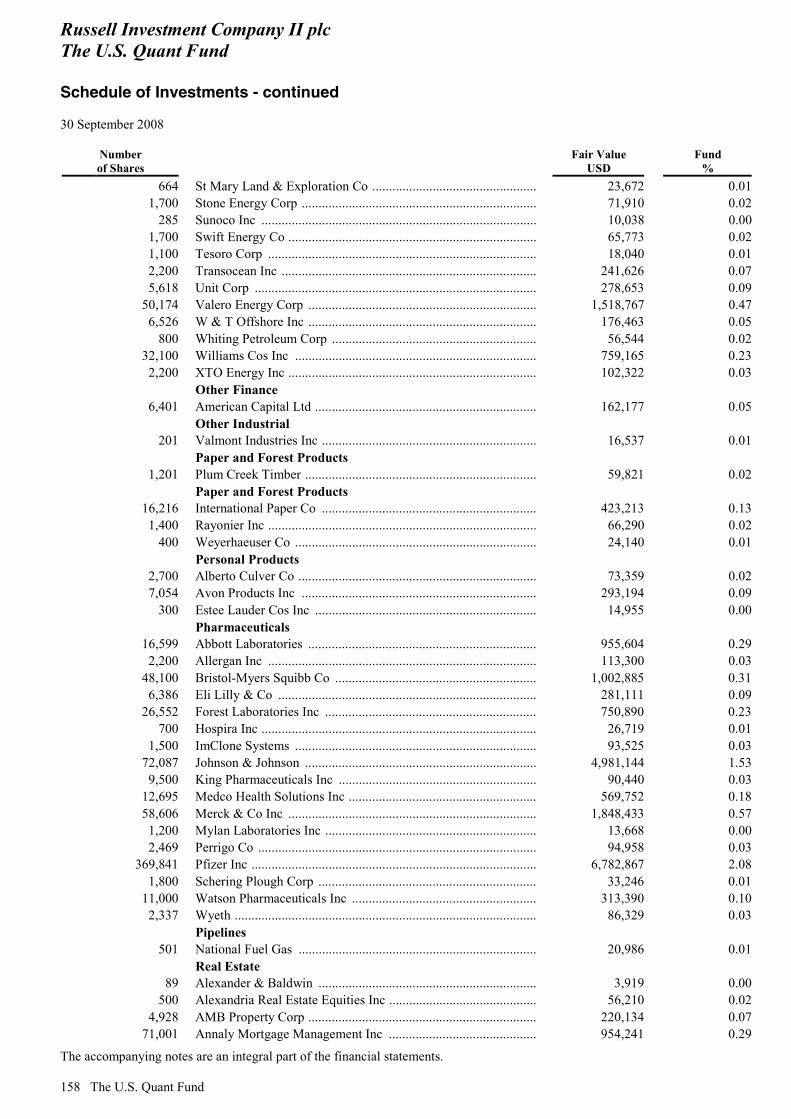
Russell Investment Company II plc The U.S. Quant Fund Schedule of Investments - continued 30 September 2008
The accompanying notes are an integral part of the financial statements. 158 The U.S. Quant Fund
Number of Shares
Fair Value USD
Fund %
664 St Mary Land & Exploration Co ................................................. 23,672 0.011,700 Stone Energy Corp ...................................................................... 71,910 0.02
285 Sunoco Inc .................................................................................. 10,038 0.001,700 Swift Energy Co .......................................................................... 65,773 0.021,100 Tesoro Corp ................................................................................ 18,040 0.012,200 Transocean Inc ............................................................................ 241,626 0.075,618 Unit Corp .................................................................................... 278,653 0.09
50,174 Valero Energy Corp .................................................................... 1,518,767 0.476,526 W & T Offshore Inc .................................................................... 176,463 0.05
800 Whiting Petroleum Corp ............................................................. 56,544 0.0232,100 Williams Cos Inc ........................................................................ 759,165 0.232,200 XTO Energy Inc .......................................................................... 102,322 0.03
Other Finance 6,401 American Capital Ltd .................................................................. 162,177 0.05
Other Industrial 201 Valmont Industries Inc ................................................................ 16,537 0.01
Paper and Forest Products 1,201 Plum Creek Timber ..................................................................... 59,821 0.02
Paper and Forest Products 16,216 International Paper Co ................................................................ 423,213 0.131,400 Rayonier Inc ................................................................................ 66,290 0.02
400 Weyerhaeuser Co ........................................................................ 24,140 0.01 Personal Products
2,700 Alberto Culver Co ....................................................................... 73,359 0.027,054 Avon Products Inc ...................................................................... 293,194 0.09
300 Estee Lauder Cos Inc .................................................................. 14,955 0.00 Pharmaceuticals
16,599 Abbott Laboratories .................................................................... 955,604 0.292,200 Allergan Inc ................................................................................ 113,300 0.03
48,100 Bristol-Myers Squibb Co ............................................................ 1,002,885 0.316,386 Eli Lilly & Co ............................................................................. 281,111 0.09
26,552 Forest Laboratories Inc ............................................................... 750,890 0.23700 Hospira Inc .................................................................................. 26,719 0.01
1,500 ImClone Systems ........................................................................ 93,525 0.0372,087 Johnson & Johnson ..................................................................... 4,981,144 1.539,500 King Pharmaceuticals Inc ........................................................... 90,440 0.03
12,695 Medco Health Solutions Inc ........................................................ 569,752 0.1858,606 Merck & Co Inc .......................................................................... 1,848,433 0.571,200 Mylan Laboratories Inc ............................................................... 13,668 0.002,469 Perrigo Co ................................................................................... 94,958 0.03
369,841 Pfizer Inc ..................................................................................... 6,782,867 2.081,800 Schering Plough Corp ................................................................. 33,246 0.01
11,000 Watson Pharmaceuticals Inc ....................................................... 313,390 0.102,337 Wyeth .......................................................................................... 86,329 0.03
Pipelines 501 National Fuel Gas ....................................................................... 20,986 0.01
Real Estate 89 Alexander & Baldwin ................................................................. 3,919 0.00
500 Alexandria Real Estate Equities Inc ............................................ 56,210 0.024,928 AMB Property Corp .................................................................... 220,134 0.07
71,001 Annaly Mortgage Management Inc ............................................ 954,241 0.29
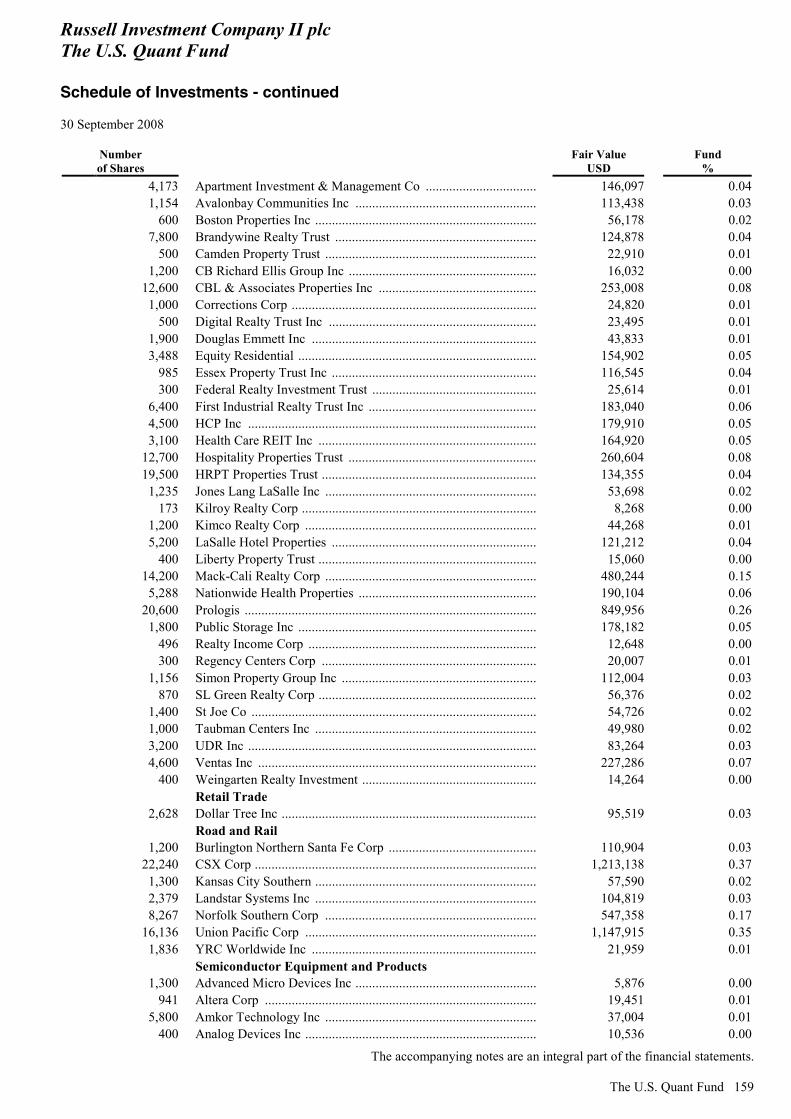
Russell Investment Company II plc The U.S. Quant Fund Schedule of Investments - continued 30 September 2008
The accompanying notes are an integral part of the financial statements.
The U.S. Quant Fund 159
Number of Shares
Fair Value USD
Fund %
4,173 Apartment Investment & Management Co ................................. 146,097 0.041,154 Avalonbay Communities Inc ...................................................... 113,438 0.03
600 Boston Properties Inc .................................................................. 56,178 0.027,800 Brandywine Realty Trust ............................................................ 124,878 0.04
500 Camden Property Trust ............................................................... 22,910 0.011,200 CB Richard Ellis Group Inc ........................................................ 16,032 0.00
12,600 CBL & Associates Properties Inc ............................................... 253,008 0.081,000 Corrections Corp ......................................................................... 24,820 0.01
500 Digital Realty Trust Inc .............................................................. 23,495 0.011,900 Douglas Emmett Inc ................................................................... 43,833 0.013,488 Equity Residential ....................................................................... 154,902 0.05
985 Essex Property Trust Inc ............................................................. 116,545 0.04300 Federal Realty Investment Trust ................................................. 25,614 0.01
6,400 First Industrial Realty Trust Inc .................................................. 183,040 0.064,500 HCP Inc ...................................................................................... 179,910 0.053,100 Health Care REIT Inc ................................................................. 164,920 0.05
12,700 Hospitality Properties Trust ........................................................ 260,604 0.0819,500 HRPT Properties Trust ................................................................ 134,355 0.041,235 Jones Lang LaSalle Inc ............................................................... 53,698 0.02
173 Kilroy Realty Corp ...................................................................... 8,268 0.001,200 Kimco Realty Corp ..................................................................... 44,268 0.015,200 LaSalle Hotel Properties ............................................................. 121,212 0.04
400 Liberty Property Trust ................................................................. 15,060 0.0014,200 Mack-Cali Realty Corp ............................................................... 480,244 0.155,288 Nationwide Health Properties ..................................................... 190,104 0.06
20,600 Prologis ....................................................................................... 849,956 0.261,800 Public Storage Inc ....................................................................... 178,182 0.05
496 Realty Income Corp .................................................................... 12,648 0.00300 Regency Centers Corp ................................................................ 20,007 0.01
1,156 Simon Property Group Inc .......................................................... 112,004 0.03870 SL Green Realty Corp ................................................................. 56,376 0.02
1,400 St Joe Co ..................................................................................... 54,726 0.021,000 Taubman Centers Inc .................................................................. 49,980 0.023,200 UDR Inc ...................................................................................... 83,264 0.034,600 Ventas Inc ................................................................................... 227,286 0.07
400 Weingarten Realty Investment .................................................... 14,264 0.00 Retail Trade
2,628 Dollar Tree Inc ............................................................................ 95,519 0.03 Road and Rail
1,200 Burlington Northern Santa Fe Corp ............................................ 110,904 0.0322,240 CSX Corp .................................................................................... 1,213,138 0.371,300 Kansas City Southern .................................................................. 57,590 0.022,379 Landstar Systems Inc .................................................................. 104,819 0.038,267 Norfolk Southern Corp ............................................................... 547,358 0.17
16,136 Union Pacific Corp ..................................................................... 1,147,915 0.351,836 YRC Worldwide Inc ................................................................... 21,959 0.01
Semiconductor Equipment and Products 1,300 Advanced Micro Devices Inc ...................................................... 5,876 0.00
941 Altera Corp ................................................................................. 19,451 0.015,800 Amkor Technology Inc ............................................................... 37,004 0.01
400 Analog Devices Inc ..................................................................... 10,536 0.00
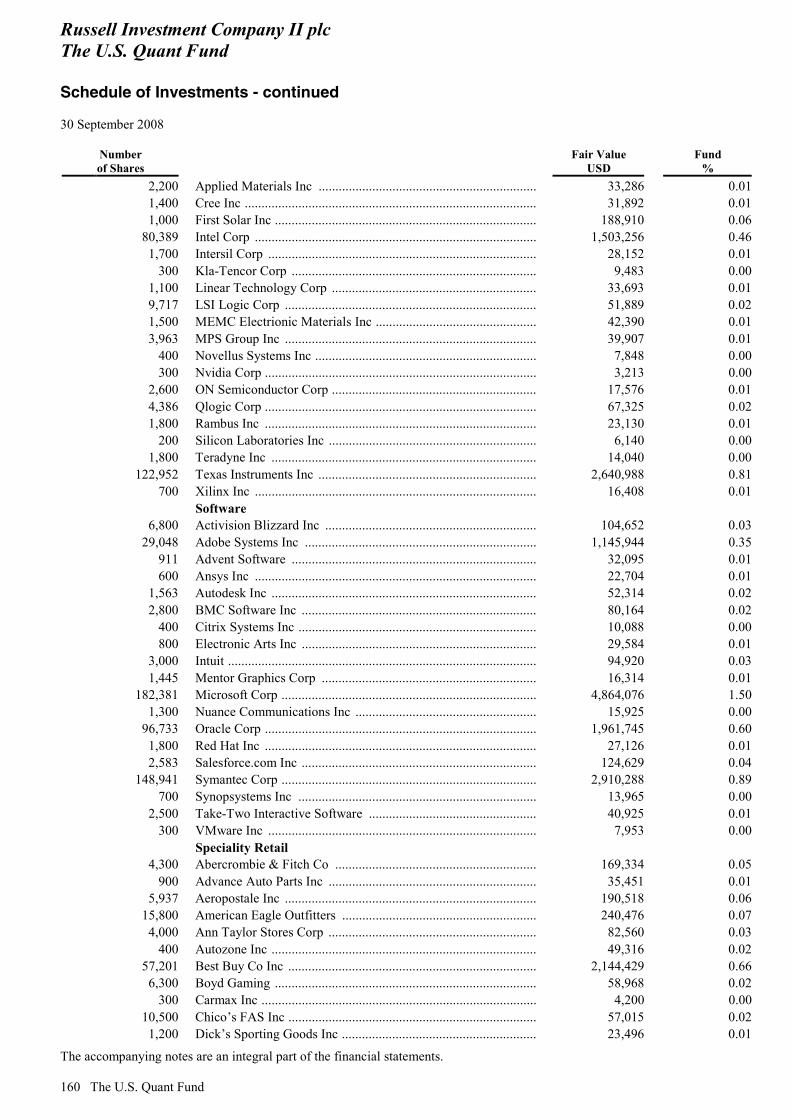
Russell Investment Company II plc The U.S. Quant Fund Schedule of Investments - continued 30 September 2008
The accompanying notes are an integral part of the financial statements. 160 The U.S. Quant Fund
Number of Shares
Fair Value USD
Fund %
2,200 Applied Materials Inc ................................................................. 33,286 0.011,400 Cree Inc ....................................................................................... 31,892 0.011,000 First Solar Inc .............................................................................. 188,910 0.06
80,389 Intel Corp .................................................................................... 1,503,256 0.461,700 Intersil Corp ................................................................................ 28,152 0.01
300 Kla-Tencor Corp ......................................................................... 9,483 0.001,100 Linear Technology Corp ............................................................. 33,693 0.019,717 LSI Logic Corp ........................................................................... 51,889 0.021,500 MEMC Electrionic Materials Inc ................................................ 42,390 0.013,963 MPS Group Inc ........................................................................... 39,907 0.01
400 Novellus Systems Inc .................................................................. 7,848 0.00300 Nvidia Corp ................................................................................. 3,213 0.00
2,600 ON Semiconductor Corp ............................................................. 17,576 0.014,386 Qlogic Corp ................................................................................. 67,325 0.021,800 Rambus Inc ................................................................................. 23,130 0.01
200 Silicon Laboratories Inc .............................................................. 6,140 0.001,800 Teradyne Inc ............................................................................... 14,040 0.00
122,952 Texas Instruments Inc ................................................................. 2,640,988 0.81700 Xilinx Inc .................................................................................... 16,408 0.01
Software 6,800 Activision Blizzard Inc ............................................................... 104,652 0.03
29,048 Adobe Systems Inc ..................................................................... 1,145,944 0.35911 Advent Software ......................................................................... 32,095 0.01600 Ansys Inc .................................................................................... 22,704 0.01
1,563 Autodesk Inc ............................................................................... 52,314 0.022,800 BMC Software Inc ...................................................................... 80,164 0.02
400 Citrix Systems Inc ....................................................................... 10,088 0.00800 Electronic Arts Inc ...................................................................... 29,584 0.01
3,000 Intuit ............................................................................................ 94,920 0.031,445 Mentor Graphics Corp ................................................................ 16,314 0.01
182,381 Microsoft Corp ............................................................................ 4,864,076 1.501,300 Nuance Communications Inc ...................................................... 15,925 0.00
96,733 Oracle Corp ................................................................................. 1,961,745 0.601,800 Red Hat Inc ................................................................................. 27,126 0.012,583 Salesforce.com Inc ...................................................................... 124,629 0.04
148,941 Symantec Corp ............................................................................ 2,910,288 0.89700 Synopsystems Inc ....................................................................... 13,965 0.00
2,500 Take-Two Interactive Software .................................................. 40,925 0.01300 VMware Inc ................................................................................ 7,953 0.00
Speciality Retail 4,300 Abercrombie & Fitch Co ............................................................ 169,334 0.05
900 Advance Auto Parts Inc .............................................................. 35,451 0.015,937 Aeropostale Inc ........................................................................... 190,518 0.06
15,800 American Eagle Outfitters .......................................................... 240,476 0.074,000 Ann Taylor Stores Corp .............................................................. 82,560 0.03
400 Autozone Inc ............................................................................... 49,316 0.0257,201 Best Buy Co Inc .......................................................................... 2,144,429 0.666,300 Boyd Gaming .............................................................................. 58,968 0.02
300 Carmax Inc .................................................................................. 4,200 0.0010,500 Chico’s FAS Inc .......................................................................... 57,015 0.021,200 Dick’s Sporting Goods Inc .......................................................... 23,496 0.01

Russell Investment Company II plc The U.S. Quant Fund Schedule of Investments - continued 30 September 2008
The accompanying notes are an integral part of the financial statements.
The U.S. Quant Fund 161
Number of Shares
Fair Value USD
Fund %
50,098 GameStop Corp ........................................................................... 1,706,840 0.5355,501 Gap Inc ........................................................................................ 986,790 0.302,200 Hanesbrands Inc .......................................................................... 47,828 0.01
24,800 Home Depot Inc .......................................................................... 641,080 0.201,200 Lowe’s Cos Inc ........................................................................... 28,416 0.015,900 Ltd Brands Inc ............................................................................ 102,188 0.032,000 Mens Wearhouse Inc ................................................................... 42,480 0.01
20,000 Office Depot Inc ......................................................................... 116,200 0.0412,000 OfficeMax Inc ............................................................................. 106,680 0.039,800 RadioShack Corp ........................................................................ 169,344 0.054,933 Ross Stores Inc ............................................................................ 181,584 0.06
900 Scansource Inc ............................................................................ 25,911 0.01600 Sherwin Williams Co .................................................................. 34,296 0.01
3,100 Staples Inc ................................................................................... 69,719 0.0226,035 Supervalu Inc .............................................................................. 564,960 0.1711,400 Tiffany & Co ............................................................................... 404,700 0.1225,627 TJX Cos Inc ................................................................................ 782,136 0.232,600 Tractor Supply Co ....................................................................... 109,434 0.036,172 United Rentals Inc ...................................................................... 94,061 0.03
15,726 Urban Outfitters Inc .................................................................... 501,030 0.15800 Williams-Sonoma Inc ................................................................. 12,912 0.00
Technology Hardware and Equipment 1,001 DRS Technologies Inc ................................................................ 76,701 0.02
Textile and Apparel 27,027 Coach Inc .................................................................................... 675,675 0.213,800 Columbia Sportswear Co ............................................................ 158,802 0.051,400 Guess Inc .................................................................................... 48,692 0.02
39,401 Jones Apparel Group Inc ............................................................ 727,719 0.2212,700 Liz Claiborne Inc ........................................................................ 208,661 0.0610,400 Nike Inc ...................................................................................... 695,656 0.218,600 Polo Ralph Lauren Corp ............................................................. 573,104 0.18
10,100 Quiksilver Inc ............................................................................. 57,974 0.022,100 VF Corp ...................................................................................... 162,309 0.05
Tobacco 25,719 Altria Group Inc .......................................................................... 510,265 0.154,066 Lorillard Inc ................................................................................ 289,296 0.09
30,488 Philip Morris International Inc .................................................... 1,465,816 0.45501 Universal Corp ............................................................................ 24,589 0.01840 UST Inc ....................................................................................... 55,894 0.02
Trading Companies and Distributors 1,459 Pioneer Natural Resources Co .................................................... 75,919 0.02
6 W W Grainger Inc ....................................................................... 521 0.00 Transportation Equipment
2,000 Arkansas Best Corp ..................................................................... 67,380 0.024,201 Borg Warner Inc ......................................................................... 137,593 0.04
Transportation Services 701 GATX Corp ................................................................................ 27,630 0.01
Water Utilities 701 Nalco Holdings Co ...................................................................... 12,972 0.00
Wholesale Trade 1,100 Genuine Parts Co ........................................................................ 44,231 0.01
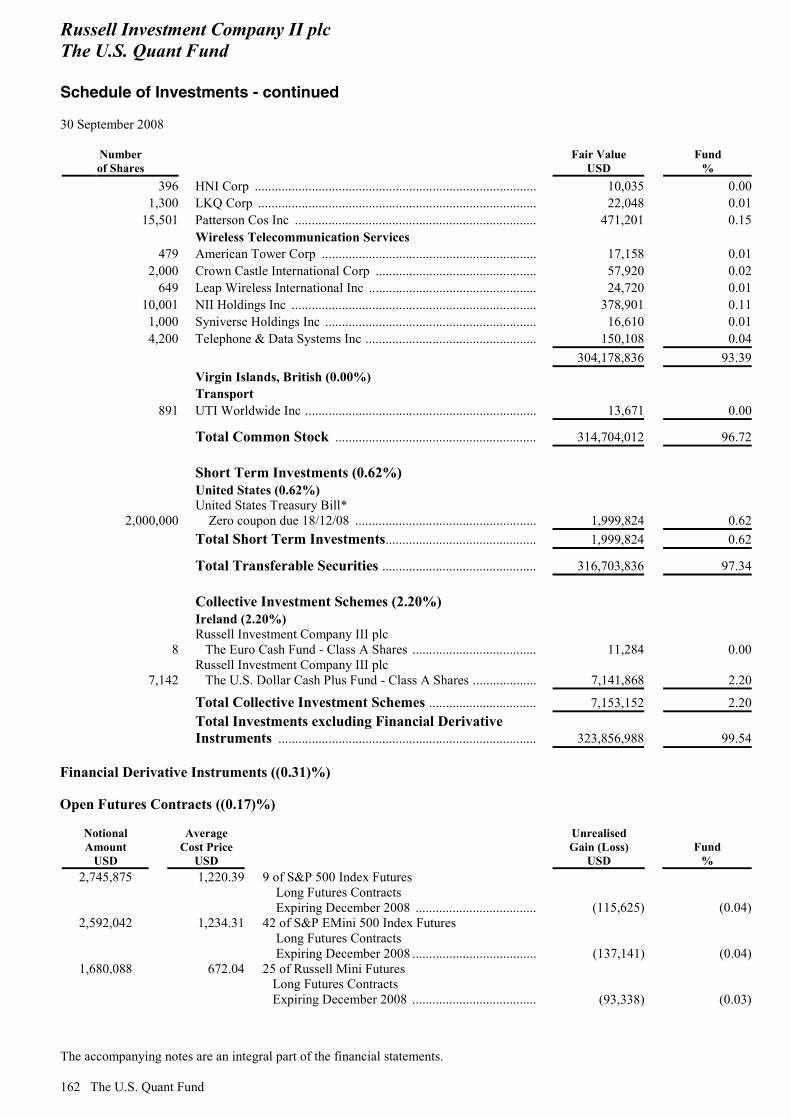
Russell Investment Company II plc The U.S. Quant Fund Schedule of Investments - continued 30 September 2008
The accompanying notes are an integral part of the financial statements. 162 The U.S. Quant Fund
Number of Shares
Fair Value USD
Fund %
396 HNI Corp .................................................................................... 10,035 0.001,300 LKQ Corp ................................................................................... 22,048 0.01
15,501 Patterson Cos Inc ........................................................................ 471,201 0.15 Wireless Telecommunication Services
479 American Tower Corp ................................................................ 17,158 0.012,000 Crown Castle International Corp ................................................ 57,920 0.02
649 Leap Wireless International Inc .................................................. 24,720 0.0110,001 NII Holdings Inc ......................................................................... 378,901 0.111,000 Syniverse Holdings Inc ............................................................... 16,610 0.014,200 Telephone & Data Systems Inc ................................................... 150,108 0.04
304,178,836 93.39 Virgin Islands, British (0.00%) Transport
891 UTI Worldwide Inc ..................................................................... 13,671 0.00
Total Common Stock ............................................................ 314,704,012 96.72 Short Term Investments (0.62%)
United States (0.62%)
2,000,000 United States Treasury Bill* Zero coupon due 18/12/08 ...................................................... 1,999,824 0.62 Total Short Term Investments............................................. 1,999,824 0.62
Total Transferable Securities .............................................. 316,703,836 97.34
Collective Investment Schemes (2.20%) Ireland (2.20%)
8 Russell Investment Company III plc The Euro Cash Fund - Class A Shares ..................................... 11,284 0.00
7,142 Russell Investment Company III plc The U.S. Dollar Cash Plus Fund - Class A Shares ................... 7,141,868 2.20
Total Collective Investment Schemes ................................ 7,153,152 2.20
Total Investments excluding Financial Derivative Instruments ............................................................................. 323,856,988 99.54
Financial Derivative Instruments ((0.31)%) Open Futures Contracts ((0.17)%)
Notional Amount
USD
Average Cost Price
USD
Unrealised Gain (Loss)
USD Fund
% 2,745,875 1,220.39 9 of S&P 500 Index Futures
Long Futures Contracts Expiring December 2008 .................................... (115,625) (0.04)
2,592,042 1,234.31 42 of S&P EMini 500 Index Futures Long Futures Contracts Expiring December 2008 ..................................... (137,141) (0.04)
1,680,088 672.04 25 of Russell Mini Futures Long Futures Contracts Expiring December 2008 ..................................... (93,338) (0.03)

Russell Investment Company II plc The U.S. Quant Fund Schedule of Investments - continued 30 September 2008
The accompanying notes are an integral part of the financial statements.
The U.S. Quant Fund 163
Notional Amount
USD
Average Cost Price
USD
Unrealised Gain (Loss)
USD Fund
% 4,080,579 769.92 53 of S&P Mid 400 EMini Index Futures
Long Futures Contracts Expiring December 2008 ...................................... (209,989) (0.06)
Unrealised loss on open futures contracts .......................................................................... (556,093) (0.17)
Net unrealised gain (loss) on open futures contracts ................................................. (556,093) (0.17) Open Forward Foreign Currency Exchange Contracts ((0.14)%)
Settlement Date
Amount Bought
Amount Sold
Unrealised Gain (Loss)
USD Fund
% 03/10/2008 GBP 14,719,746 USD 26,858,238 (618,867) (0.19)03/10/2008 GBP 367,204 USD 670,000 (15,423) 0.0003/10/2008 USD 6,171,800 GBP 3,382,531 142,112 0.0403/10/2008 USD 378,900 GBP 208,622 7,010 0.0003/10/2008 USD 1,039,500 GBP 578,469 8,323 0.0003/10/2008 USD 282,000 GBP 155,124 5,476 0.0003/10/2008 USD 1,752,000 GBP 962,875 35,581 0.01
Unrealised gain on open forward foreign currency exchange contracts ............................. 198,502 0.05Unrealised loss on open forward foreign currency exchange contracts .............................. (634,290) (0.19)Net unrealised gain (loss) on open forward foreign currency exchange contracts (435,788) (0.14)Total Financial Derivative Instruments ................................................................... (991,881) (0.31)
Fair Value
USD Fund
%
Total Investments (99.23%) ......................................................... 322,865,107 99.23 Other Net Assets (0.57%) ............................................................. 1,853,522 0.57
Adjustments From Bid Market Prices To Last Traded Market Prices (0.20%) .................................................................. 644,612 0.20
Net Assets (100.00%) ..................................................................... 325,363,241 100.00 * Held as collateral by the brokers and counterparties in connection with the margin requirements for futures contracts held by the Fund.
Analysis of total assets (unaudited) % of
total assets Transferable securities and money market instruments admitted to an official stock exchange listing or traded in a regulated market ................................................................................................................................ 96.51Collective investment schemes ........................................................................................................................... 2.18Over the counter financial derivative instruments .............................................................................................. 0.06Other assets ......................................................................................................................................................... 1.25
100.00
The broker for the open futures contracts is Citigroup. The counterparties for the open forward foreign currency exchange contracts are: Brown Brothers Harriman Citibank State Street Bank

Russell Investment Company II plc The U.S. Quant Fund Schedule of Investments - continued 30 September 2008
The accompanying notes are an integral part of the financial statements. 164 The U.S. Quant Fund
The proportion of the investments of The U.S. Quant Fund in rights or securities eligible to the French Plan d’Epargne en Actions (PEA) has been continuously equal to, or greater than, 75 per cent over the elapsed fiscal period ended on 30 September 2008 (unaudited).

Russell Investment Company II plc The U.S. Quant Fund Statement of Changes in Composition of Portfolio Listed below are the 20 largest cumulative investment purchases and sales during the year ended 30 September 2008
A copy of the list of changes in the portfolio during the reference period may be obtained free of charge from the Company’s administrator or from the paying agent or paying and information agents in each country of distribution.
The U.S. Quant Fund 165
Portfolio Securities Acquisition Cost
USD Portfolio Securities Disposal Proceeds
USD Russell Investment Company III plc Russell Investment Company III plc
The U.S. Dollar Cash Plus Fund The U.S. Dollar Cash Plus Fund Class A Shares 121,126,263 Class A Shares (115,566,000)
Hewlett-Packard Co 5,365,429 Exxon Mobil Corp (9,219,237)Best Buy Co Inc 4,271,052 JPMorgan Chase & Co (7,519,635)Safeway Inc 4,196,365 Boeing Co (7,363,825)MetLife Inc 3,547,585 Chevron Corp (6,286,704)Johnson & Johnson 3,519,203 Nike Inc (5,129,218)ConocoPhillips 3,303,557 Oracle Corp (5,018,033)Accenture Ltd Bermuda 3,241,898 Pfizer Inc (4,758,870)McDonald’s Corp 3,122,238 Medco Health Solutions (4,652,027)Apache Corp 3,028,839 Apple Inc (4,617,186)General Electric Co 2,904,900 Express Scripts Inc (4,597,364)Procter & Gamble Co 2,849,880 National Oilwell Varco Inc (4,478,925)Amgen Inc 2,846,186 Kroger Co (4,453,247)Wells Fargo & Co 2,784,952 Microsoft Corp (4,237,800)Mosaic Co 2,774,692 Bank of America Corp (4,130,948)GameStop Corp 2,716,085 Anadarko Petroleum Corp (4,089,747)H&R Block Inc 2,672,094 Procter & Gamble Co (4,024,262)Nike Inc 2,605,541 Hewlett-Packard Co (3,957,114)AT&T Inc 2,306,731 ProLogis (3,925,761)Occidental Petroleum Corp 2,279,212 Time Warner Inc (3,729,706)
Russell Investment Company II plc The U.S. Value Fund Manager’s Report
166 The U.S. Value Fund
Money Managers Armstrong Shaw Associates JS Asset Management, LLC DePrince, Race & Zollo, Inc. Systematic Financial Management L.P. Investment Objective The U.S. Value Fund (the “Fund”) will seek to achieve capital appreciation by investing primarily in U.S. equity securities, including common stock, American depository receipts, global depository receipts, convertibles and warrants listed, traded or dealt in on a regulated market in the U.S. Fund Performance The Fund returned -19.2 per cent during the period on a gross-of-fees basis verses a benchmark return of -11.5 per cent.* Market Comment U.S. markets declined by 11.5 per cent during the period. During the second quarter of 2008 a rate cut by the Federal Reserve (“Fed”) had improved investor sentiment and equities rose during the first six weeks, to peak in mid-May 2008. This was led primarily by the strong performance of oil stocks and healthy corporate data. However, investor sentiment was diminished by concerns over the potential impact of the high oil price on consumer spending. Further write-downs and profit warnings from major financial institutions alongside weak economic data fuelled a sell-off which continued throughout June 2008. Key economic data such as housing, manufacturing and employment was weak during the period which underlined Fed comments that further rate cuts were unlikely in the short term due to inflation. Following volatility related to the oil sector in July and August 2008, September’s market performance defined the third quarter as global markets suffered historic losses. A steep decline in mid-September, the greatest since the 9/11 terrorist attacks, was marked by flurry of buy-outs and government intervention not witnessed since the Great Depression. The collapse of Lehman Brothers and Bank of America’s purchase of Merrill Lynch caused an anxious cascade of sell-offs. The Fed’s rescue of AIG and its announcement of a rescue package restored some investor confidence. However, U.S. Congress rejected the initial Bill prompting another decline towards the end of the month. Investors moved defensively towards the consumer staples sector while cyclical sectors such as technology performed poorly. General Comment on Managers/Performance The Fund underperformed the benchmark. Underperformance was led by the deep value manager JS Asset Management, LLC (“JS”). In a market environment where investors become highly risk averse, deep value processes will be significantly affected and the noted third quarter of 2008 turned into an exceptionally difficult period. Investor fears primarily related to the financial services sector materialised as major institutions failed causing further sell-offs within the sector. In a scenario where there is such an unprecedented level of contagion this caused JS to underperform significantly during the quarter. Outlook The Fund remains well positioned to benefit from the stock-picking abilities of the managers in the Fund, and we currently remain confident in the manager line-up. Past performance is no indication of current or future performance. * Benchmark Source: Russell 1000 Value Index (Net of 30 per cent Withholding Tax)
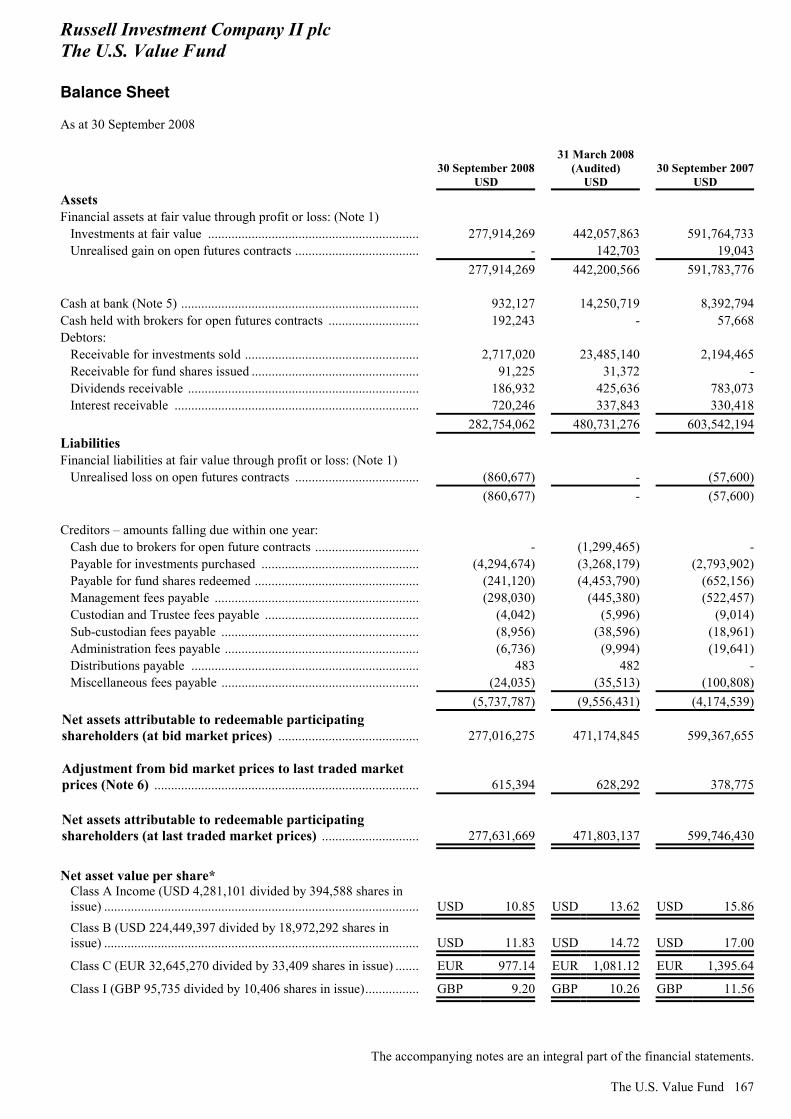
Russell Investment Company II plc The U.S. Value Fund Balance Sheet As at 30 September 2008
The accompanying notes are an integral part of the financial statements.
The U.S. Value Fund 167
30 September 2008
USD
31 March 2008 (Audited)
USD 30 September 2007
USD Assets Financial assets at fair value through profit or loss: (Note 1)
Investments at fair value ................................................................ 277,914,269 442,057,863 591,764,733 Unrealised gain on open futures contracts ...................................... - 142,703 19,043 277,914,269 442,200,566 591,783,776 Cash at bank (Note 5) ........................................................................ 932,127 14,250,719 8,392,794Cash held with brokers for open futures contracts ............................ 192,243 - 57,668Debtors:
Receivable for investments sold ..................................................... 2,717,020 23,485,140 2,194,465Receivable for fund shares issued ................................................... 91,225 31,372 -Dividends receivable ...................................................................... 186,932 425,636 783,073Interest receivable .......................................................................... 720,246 337,843 330,418
282,754,062 480,731,276 603,542,194Liabilities Financial liabilities at fair value through profit or loss: (Note 1)
Unrealised loss on open futures contracts ...................................... (860,677) - (57,600) (860,677) - (57,600) Creditors – amounts falling due within one year:
Cash due to brokers for open future contracts ................................ - (1,299,465) -Payable for investments purchased ................................................ (4,294,674) (3,268,179) (2,793,902)Payable for fund shares redeemed .................................................. (241,120) (4,453,790) (652,156)Management fees payable .............................................................. (298,030) (445,380) (522,457)Custodian and Trustee fees payable ............................................... (4,042) (5,996) (9,014)Sub-custodian fees payable ............................................................ (8,956) (38,596) (18,961)Administration fees payable ........................................................... (6,736) (9,994) (19,641)Distributions payable ..................................................................... 483 482 -Miscellaneous fees payable ............................................................ (24,035) (35,513) (100,808)
(5,737,787) (9,556,431) (4,174,539)Net assets attributable to redeemable participating shareholders (at bid market prices) ...........................................
277,016,275 471,174,845 599,367,655
Adjustment from bid market prices to last traded market prices (Note 6) ................................................................................
615,394 628,292 378,775
Net assets attributable to redeemable participating shareholders (at last traded market prices) ..............................
277,631,669 471,803,137 599,746,430
Net asset value per share*
Class A Income (USD 4,281,101 divided by 394,588 shares in issue) ............................................................................................... USD 10.85 USD 13.62 USD 15.86Class B (USD 224,449,397 divided by 18,972,292 shares in issue) ............................................................................................... USD 11.83 USD 14.72 USD 17.00
Class C (EUR 32,645,270 divided by 33,409 shares in issue) ........ EUR 977.14 EUR 1,081.12 EUR 1,395.64
Class I (GBP 95,735 divided by 10,406 shares in issue)................. GBP 9.20 GBP 10.26 GBP 11.56

Russell Investment Company II plc The U.S. Value Fund Balance Sheet - continued As at 30 September 2008
The accompanying notes are an integral part of the financial statements. 168 The U.S. Value Fund
30 September 200831 March 2008
(Audited) 30 September 2007Class I Income (GBP 1,613,646 divided by 180,902 shares in issue) ...............................................................................................
GBP 8.92 GBP 10.01 GBP 11.33
* See Note 12 for comparative net assets
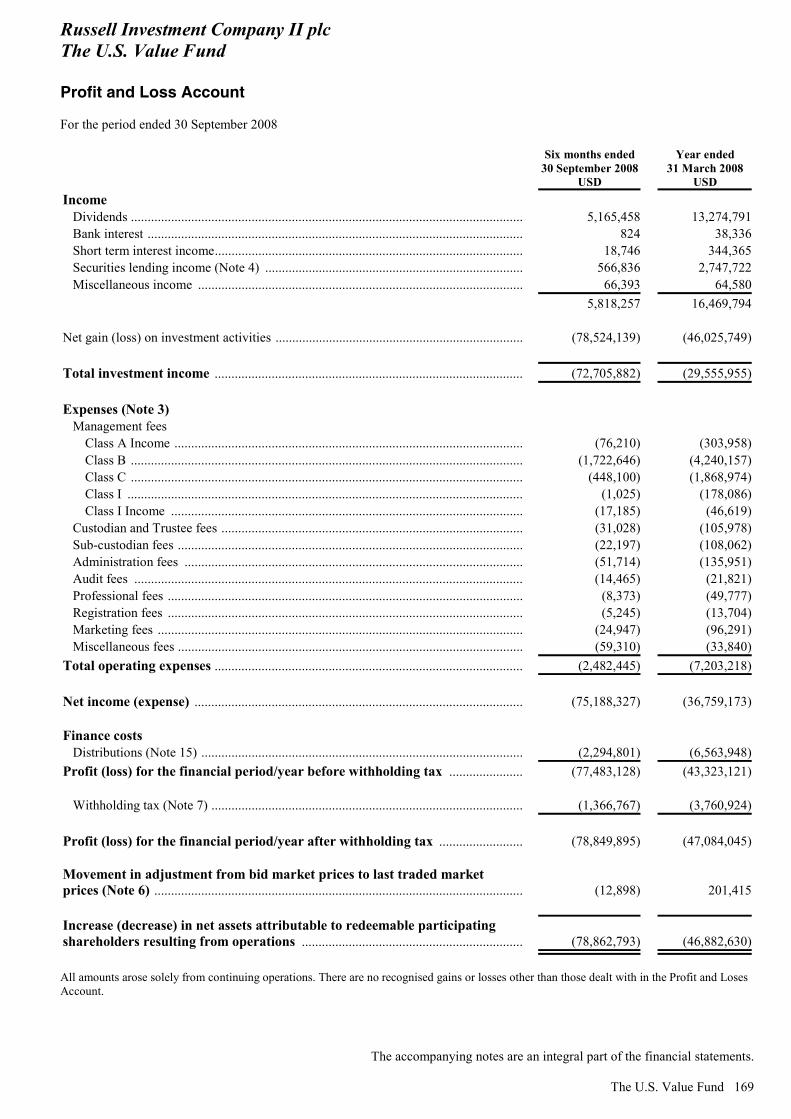
Russell Investment Company II plc The U.S. Value Fund Profit and Loss Account For the period ended 30 September 2008
The accompanying notes are an integral part of the financial statements.
The U.S. Value Fund 169
Six months ended 30 September 2008
USD
Year ended 31 March 2008
USD Income
Dividends ..................................................................................................................... 5,165,458 13,274,791Bank interest ................................................................................................................ 824 38,336Short term interest income............................................................................................ 18,746 344,365Securities lending income (Note 4) ............................................................................. 566,836 2,747,722Miscellaneous income ................................................................................................. 66,393 64,580
5,818,257 16,469,794 Net gain (loss) on investment activities .......................................................................... (78,524,139) (46,025,749) Total investment income ............................................................................................ (72,705,882) (29,555,955) Expenses (Note 3)
Management fees Class A Income ........................................................................................................ (76,210) (303,958)Class B ..................................................................................................................... (1,722,646) (4,240,157)Class C ..................................................................................................................... (448,100) (1,868,974)Class I ...................................................................................................................... (1,025) (178,086)Class I Income ......................................................................................................... (17,185) (46,619)
Custodian and Trustee fees .......................................................................................... (31,028) (105,978)Sub-custodian fees ....................................................................................................... (22,197) (108,062)Administration fees ..................................................................................................... (51,714) (135,951)Audit fees .................................................................................................................... (14,465) (21,821)Professional fees .......................................................................................................... (8,373) (49,777)Registration fees .......................................................................................................... (5,245) (13,704)Marketing fees ............................................................................................................. (24,947) (96,291)Miscellaneous fees ....................................................................................................... (59,310) (33,840)
Total operating expenses ............................................................................................ (2,482,445) (7,203,218) Net income (expense) .................................................................................................. (75,188,327) (36,759,173) Finance costs
Distributions (Note 15) ................................................................................................ (2,294,801) (6,563,948)Profit (loss) for the financial period/year before withholding tax ...................... (77,483,128) (43,323,121)
Withholding tax (Note 7) ............................................................................................. (1,366,767) (3,760,924) Profit (loss) for the financial period/year after withholding tax ......................... (78,849,895) (47,084,045) Movement in adjustment from bid market prices to last traded market prices (Note 6) .............................................................................................................. (12,898) 201,415 Increase (decrease) in net assets attributable to redeemable participating shareholders resulting from operations .................................................................. (78,862,793) (46,882,630) All amounts arose solely from continuing operations. There are no recognised gains or losses other than those dealt with in the Profit and Loses Account.

Russell Investment Company II plc The U.S. Value Fund Statement of Changes in Net Assets Attributable to Redeemable Participating Shareholders For the period ended 30 September 2008
The accompanying notes are an integral part of the financial statements. 170 The U.S. Value Fund
Six months ended 30 September 2008
USD
Year ended 31 March 2008
USD Net increase (decrease) in net assets attributable to redeemable participating shareholders resulting from operations .................................................................. (78,862,793) (46,882,630) Share transactions
Net increase (decrease) in net assets resulting from redeemable participating share transactions (Note 6)..................................................................................................... (117,536,543) (166,948,707)Deemed distributions on accumulation shares (Note 15) ............................................ 2,227,868 6,296,956
Total net increase (decrease) in net assets attributable to redeemable participating shareholders ......................................................................................... (194,171,468) (207,534,381) Net assets attributable to redeemable participating shareholders
Beginning of period/year ............................................................................................. 471,803,137 679,337,518 End of period/year ....................................................................................................... 277,631,669 471,803,137

Russell Investment Company II plc The U.S. Value Fund Schedule of Investments 30 September 2008
The accompanying notes are an integral part of the financial statements.
The U.S. Value Fund 171
Number of Shares
Fair Value USD
Fund %
Transferable Securities (95.65%) Common Stock (93.80%) Bermuda (1.68%) Electrical Equipment
25,600 Tyco Electronics Ltd .................................................................. 706,560 0.25 Food Products
9,600 Bunge Ltd ................................................................................... 606,528 0.22 Health Care Equipment and Supplies
51,300 Covidien Ltd ............................................................................... 2,754,297 0.99 Insurance
8,000 Arch Capital Group Ltd .............................................................. 596,960 0.22 4,664,345 1.68 Canada (0.35%) Internet Software and Services
154,400 Nortel Networks ......................................................................... 345,856 0.13 Paper and Forest Products
160,300 AbitibiBowater Inc ..................................................................... 618,758 0.22 964,614 0.35 Cayman Islands (1.25%) Computers and Peripherals
52,500 Seagate Technology .................................................................... 636,300 0.23 Electronic Equipment and Instruments
30,000 Garmin Ltd ................................................................................. 1,016,700 0.37 Energy Equipment and Services
24,100 Noble Corp ................................................................................. 1,055,339 0.38 Oil and Gas Services
42,900 Aqua America Inc ....................................................................... 759,330 0.27 3,467,669 1.25 France (1.28%) Pharmaceuticals
43,400 Sanofi-Aventis ............................................................................ 1,426,558 0.51 Telecommunications
552,700 Alcatel-Lucent - Sp. ADR - ........................................................ 2,122,368 0.77 3,548,926 1.28 Israel (0.29%) Internet Software and Services
35,100 Check Point Software Technologies ........................................... 795,015 0.29 Mexico (0.62%) Building Products
101,016 Cemex ......................................................................................... 1,738,485 0.62 Netherlands (0.15%) Machinery
19,000 CNH Global NV ......................................................................... 418,190 0.15 Switzerland (0.77%) Insurance
39,600 ACE Ltd ..................................................................................... 2,142,756 0.77
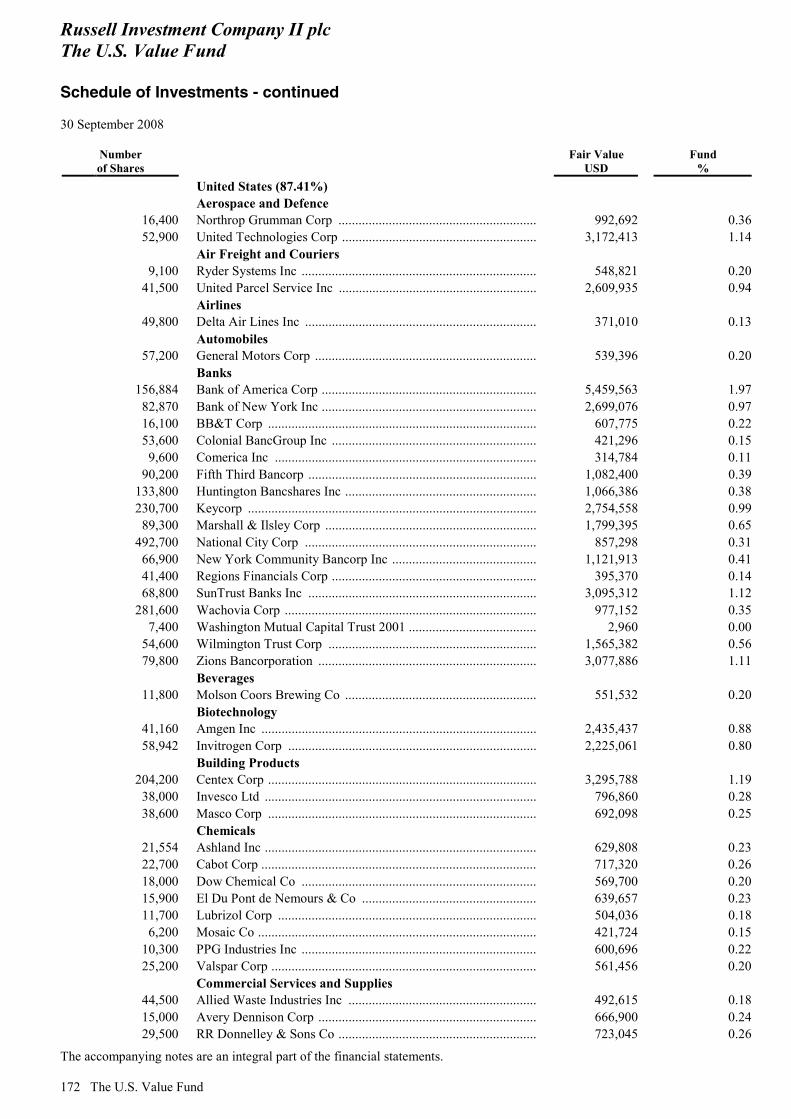
Russell Investment Company II plc The U.S. Value Fund Schedule of Investments - continued 30 September 2008
The accompanying notes are an integral part of the financial statements. 172 The U.S. Value Fund
Number of Shares
Fair Value USD
Fund %
United States (87.41%) Aerospace and Defence
16,400 Northrop Grumman Corp ........................................................... 992,692 0.3652,900 United Technologies Corp .......................................................... 3,172,413 1.14
Air Freight and Couriers 9,100 Ryder Systems Inc ...................................................................... 548,821 0.20
41,500 United Parcel Service Inc ........................................................... 2,609,935 0.94 Airlines
49,800 Delta Air Lines Inc ..................................................................... 371,010 0.13 Automobiles
57,200 General Motors Corp .................................................................. 539,396 0.20 Banks
156,884 Bank of America Corp ................................................................ 5,459,563 1.9782,870 Bank of New York Inc ................................................................ 2,699,076 0.9716,100 BB&T Corp ................................................................................ 607,775 0.2253,600 Colonial BancGroup Inc ............................................................. 421,296 0.159,600 Comerica Inc .............................................................................. 314,784 0.11
90,200 Fifth Third Bancorp .................................................................... 1,082,400 0.39133,800 Huntington Bancshares Inc ......................................................... 1,066,386 0.38230,700 Keycorp ...................................................................................... 2,754,558 0.99
89,300 Marshall & Ilsley Corp ............................................................... 1,799,395 0.65492,700 National City Corp ..................................................................... 857,298 0.31
66,900 New York Community Bancorp Inc ........................................... 1,121,913 0.4141,400 Regions Financials Corp ............................................................. 395,370 0.1468,800 SunTrust Banks Inc .................................................................... 3,095,312 1.12
281,600 Wachovia Corp ........................................................................... 977,152 0.357,400 Washington Mutual Capital Trust 2001 ...................................... 2,960 0.00
54,600 Wilmington Trust Corp .............................................................. 1,565,382 0.5679,800 Zions Bancorporation ................................................................. 3,077,886 1.11
Beverages 11,800 Molson Coors Brewing Co ......................................................... 551,532 0.20
Biotechnology 41,160 Amgen Inc .................................................................................. 2,435,437 0.8858,942 Invitrogen Corp .......................................................................... 2,225,061 0.80
Building Products 204,200 Centex Corp ................................................................................ 3,295,788 1.19
38,000 Invesco Ltd ................................................................................. 796,860 0.2838,600 Masco Corp ................................................................................ 692,098 0.25
Chemicals 21,554 Ashland Inc ................................................................................. 629,808 0.2322,700 Cabot Corp .................................................................................. 717,320 0.2618,000 Dow Chemical Co ...................................................................... 569,700 0.2015,900 El Du Pont de Nemours & Co .................................................... 639,657 0.2311,700 Lubrizol Corp ............................................................................. 504,036 0.186,200 Mosaic Co ................................................................................... 421,724 0.15
10,300 PPG Industries Inc ...................................................................... 600,696 0.2225,200 Valspar Corp ............................................................................... 561,456 0.20
Commercial Services and Supplies 44,500 Allied Waste Industries Inc ........................................................ 492,615 0.1815,000 Avery Dennison Corp ................................................................. 666,900 0.2429,500 RR Donnelley & Sons Co ........................................................... 723,045 0.26
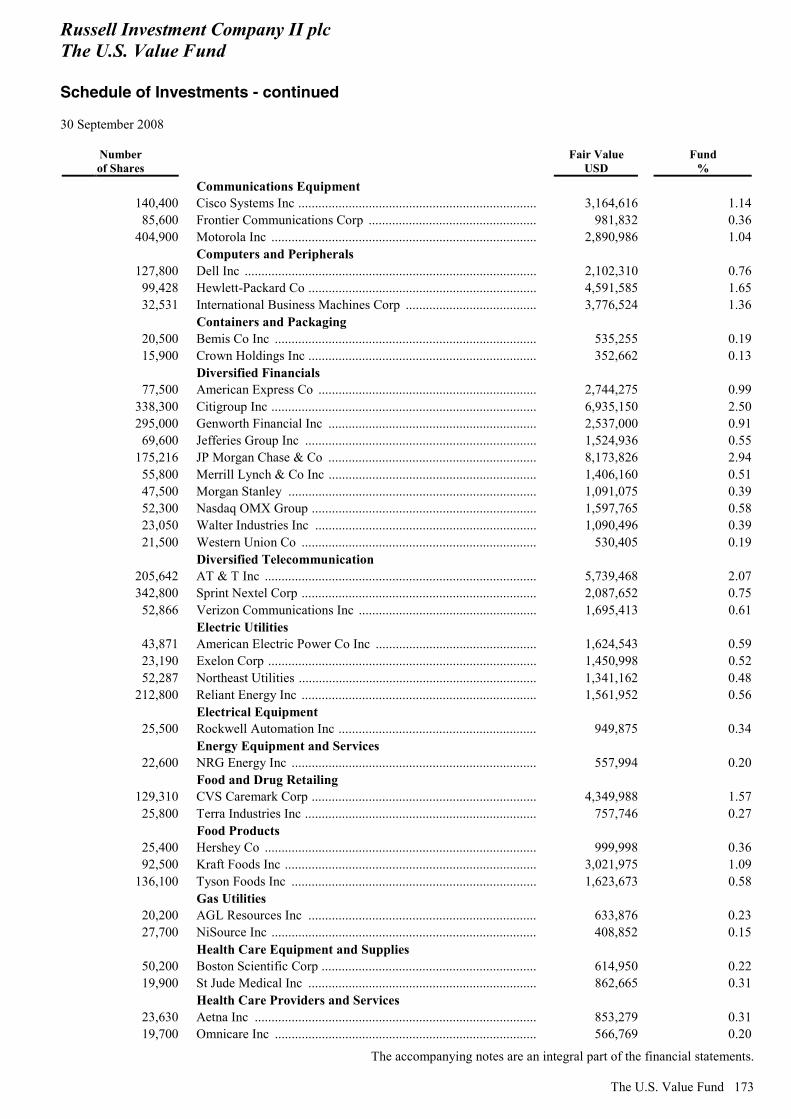
Russell Investment Company II plc The U.S. Value Fund Schedule of Investments - continued 30 September 2008
The accompanying notes are an integral part of the financial statements.
The U.S. Value Fund 173
Number of Shares
Fair Value USD
Fund %
Communications Equipment 140,400 Cisco Systems Inc ....................................................................... 3,164,616 1.14
85,600 Frontier Communications Corp .................................................. 981,832 0.36404,900 Motorola Inc ............................................................................... 2,890,986 1.04
Computers and Peripherals 127,800 Dell Inc ....................................................................................... 2,102,310 0.76
99,428 Hewlett-Packard Co .................................................................... 4,591,585 1.6532,531 International Business Machines Corp ....................................... 3,776,524 1.36
Containers and Packaging 20,500 Bemis Co Inc .............................................................................. 535,255 0.1915,900 Crown Holdings Inc .................................................................... 352,662 0.13
Diversified Financials 77,500 American Express Co ................................................................. 2,744,275 0.99
338,300 Citigroup Inc ............................................................................... 6,935,150 2.50295,000 Genworth Financial Inc .............................................................. 2,537,000 0.91
69,600 Jefferies Group Inc ..................................................................... 1,524,936 0.55175,216 JP Morgan Chase & Co .............................................................. 8,173,826 2.94
55,800 Merrill Lynch & Co Inc .............................................................. 1,406,160 0.5147,500 Morgan Stanley .......................................................................... 1,091,075 0.3952,300 Nasdaq OMX Group ................................................................... 1,597,765 0.5823,050 Walter Industries Inc .................................................................. 1,090,496 0.3921,500 Western Union Co ...................................................................... 530,405 0.19
Diversified Telecommunication 205,642 AT & T Inc ................................................................................. 5,739,468 2.07342,800 Sprint Nextel Corp ...................................................................... 2,087,652 0.75
52,866 Verizon Communications Inc ..................................................... 1,695,413 0.61 Electric Utilities
43,871 American Electric Power Co Inc ................................................ 1,624,543 0.5923,190 Exelon Corp ................................................................................ 1,450,998 0.5252,287 Northeast Utilities ....................................................................... 1,341,162 0.48
212,800 Reliant Energy Inc ...................................................................... 1,561,952 0.56 Electrical Equipment
25,500 Rockwell Automation Inc ........................................................... 949,875 0.34 Energy Equipment and Services
22,600 NRG Energy Inc ......................................................................... 557,994 0.20 Food and Drug Retailing
129,310 CVS Caremark Corp ................................................................... 4,349,988 1.5725,800 Terra Industries Inc ..................................................................... 757,746 0.27
Food Products 25,400 Hershey Co ................................................................................. 999,998 0.3692,500 Kraft Foods Inc ........................................................................... 3,021,975 1.09
136,100 Tyson Foods Inc ......................................................................... 1,623,673 0.58 Gas Utilities
20,200 AGL Resources Inc .................................................................... 633,876 0.2327,700 NiSource Inc ............................................................................... 408,852 0.15
Health Care Equipment and Supplies 50,200 Boston Scientific Corp ................................................................ 614,950 0.2219,900 St Jude Medical Inc .................................................................... 862,665 0.31
Health Care Providers and Services 23,630 Aetna Inc .................................................................................... 853,279 0.3119,700 Omnicare Inc .............................................................................. 566,769 0.20
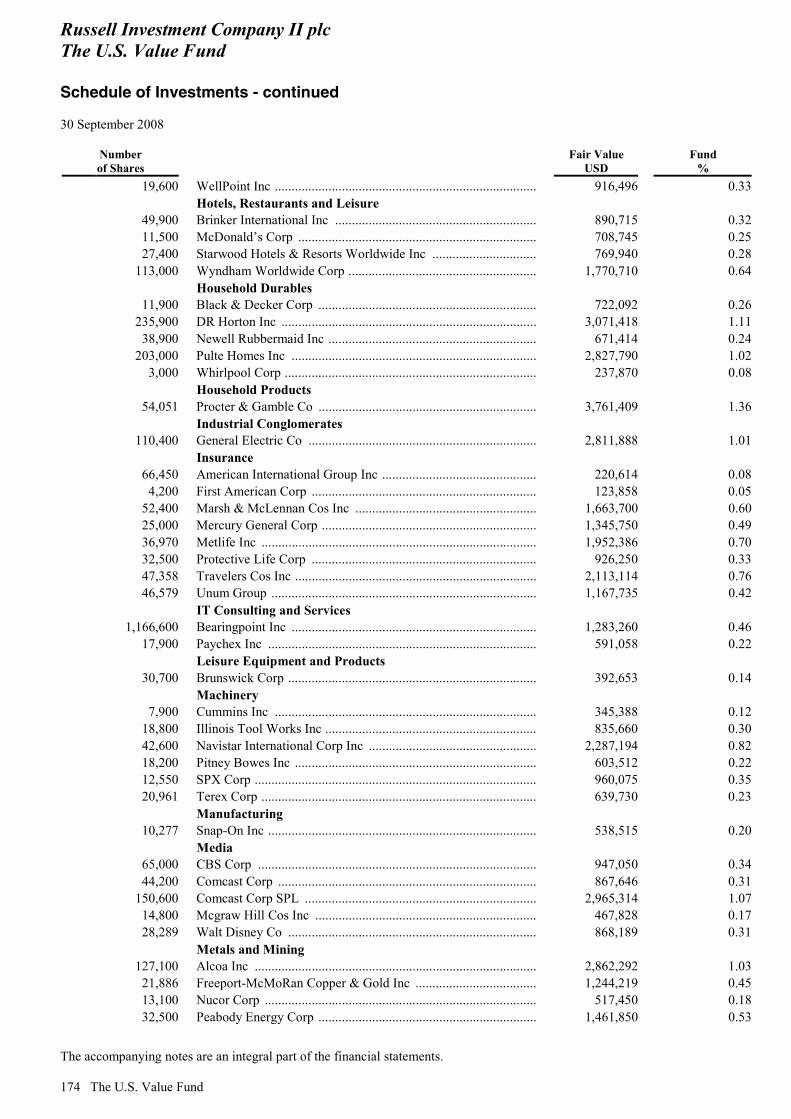
Russell Investment Company II plc The U.S. Value Fund Schedule of Investments - continued 30 September 2008
The accompanying notes are an integral part of the financial statements. 174 The U.S. Value Fund
Number of Shares
Fair Value USD
Fund %
19,600 WellPoint Inc .............................................................................. 916,496 0.33 Hotels, Restaurants and Leisure
49,900 Brinker International Inc ............................................................ 890,715 0.3211,500 McDonald’s Corp ....................................................................... 708,745 0.2527,400 Starwood Hotels & Resorts Worldwide Inc ............................... 769,940 0.28
113,000 Wyndham Worldwide Corp ........................................................ 1,770,710 0.64 Household Durables
11,900 Black & Decker Corp ................................................................. 722,092 0.26235,900 DR Horton Inc ............................................................................ 3,071,418 1.11
38,900 Newell Rubbermaid Inc .............................................................. 671,414 0.24203,000 Pulte Homes Inc ......................................................................... 2,827,790 1.02
3,000 Whirlpool Corp ........................................................................... 237,870 0.08 Household Products
54,051 Procter & Gamble Co ................................................................. 3,761,409 1.36 Industrial Conglomerates
110,400 General Electric Co .................................................................... 2,811,888 1.01 Insurance
66,450 American International Group Inc .............................................. 220,614 0.084,200 First American Corp ................................................................... 123,858 0.05
52,400 Marsh & McLennan Cos Inc ...................................................... 1,663,700 0.6025,000 Mercury General Corp ................................................................ 1,345,750 0.4936,970 Metlife Inc .................................................................................. 1,952,386 0.7032,500 Protective Life Corp ................................................................... 926,250 0.3347,358 Travelers Cos Inc ........................................................................ 2,113,114 0.7646,579 Unum Group ............................................................................... 1,167,735 0.42
IT Consulting and Services 1,166,600 Bearingpoint Inc ......................................................................... 1,283,260 0.46
17,900 Paychex Inc ................................................................................ 591,058 0.22 Leisure Equipment and Products
30,700 Brunswick Corp .......................................................................... 392,653 0.14 Machinery
7,900 Cummins Inc .............................................................................. 345,388 0.1218,800 Illinois Tool Works Inc ............................................................... 835,660 0.3042,600 Navistar International Corp Inc .................................................. 2,287,194 0.8218,200 Pitney Bowes Inc ........................................................................ 603,512 0.2212,550 SPX Corp .................................................................................... 960,075 0.3520,961 Terex Corp .................................................................................. 639,730 0.23
Manufacturing 10,277 Snap-On Inc ................................................................................ 538,515 0.20
Media 65,000 CBS Corp ................................................................................... 947,050 0.3444,200 Comcast Corp ............................................................................. 867,646 0.31
150,600 Comcast Corp SPL ..................................................................... 2,965,314 1.0714,800 Mcgraw Hill Cos Inc .................................................................. 467,828 0.1728,289 Walt Disney Co .......................................................................... 868,189 0.31
Metals and Mining 127,100 Alcoa Inc .................................................................................... 2,862,292 1.03
21,886 Freeport-McMoRan Copper & Gold Inc .................................... 1,244,219 0.4513,100 Nucor Corp ................................................................................. 517,450 0.1832,500 Peabody Energy Corp ................................................................. 1,461,850 0.53
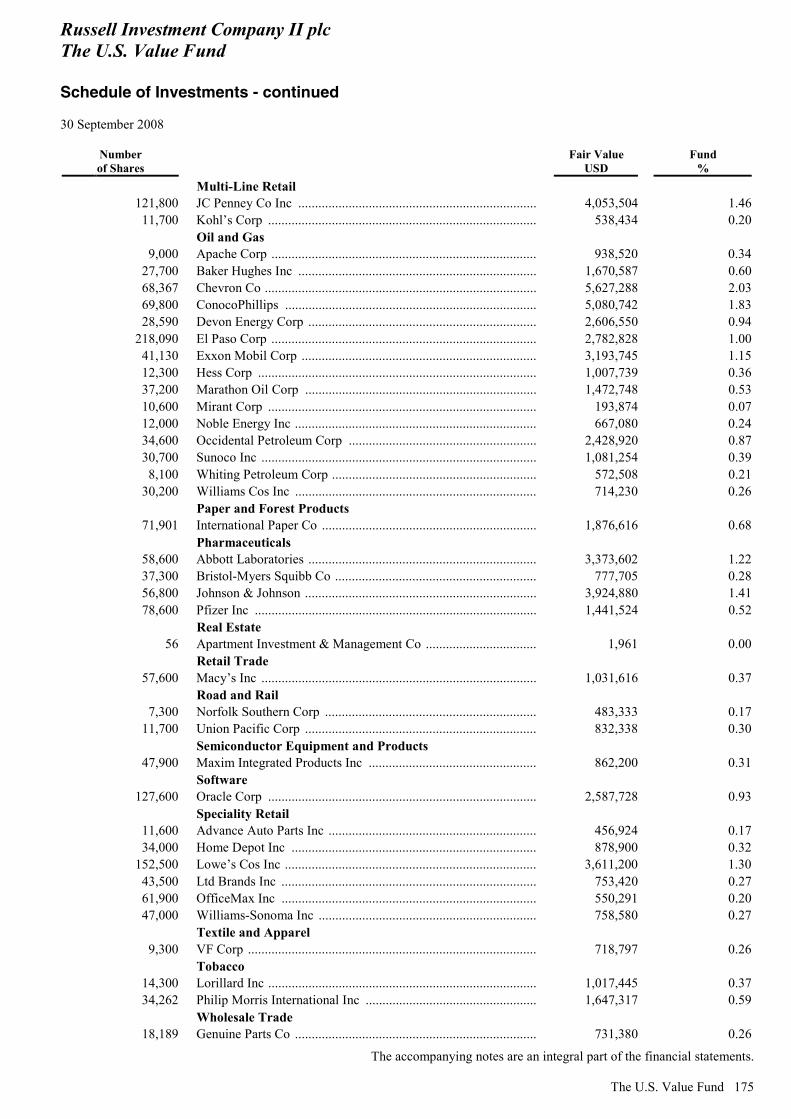
Russell Investment Company II plc The U.S. Value Fund Schedule of Investments - continued 30 September 2008
The accompanying notes are an integral part of the financial statements.
The U.S. Value Fund 175
Number of Shares
Fair Value USD
Fund %
Multi-Line Retail 121,800 JC Penney Co Inc ....................................................................... 4,053,504 1.46
11,700 Kohl’s Corp ................................................................................ 538,434 0.20 Oil and Gas
9,000 Apache Corp ............................................................................... 938,520 0.3427,700 Baker Hughes Inc ....................................................................... 1,670,587 0.6068,367 Chevron Co ................................................................................. 5,627,288 2.0369,800 ConocoPhillips ........................................................................... 5,080,742 1.8328,590 Devon Energy Corp .................................................................... 2,606,550 0.94
218,090 El Paso Corp ............................................................................... 2,782,828 1.0041,130 Exxon Mobil Corp ...................................................................... 3,193,745 1.1512,300 Hess Corp ................................................................................... 1,007,739 0.3637,200 Marathon Oil Corp ..................................................................... 1,472,748 0.5310,600 Mirant Corp ................................................................................ 193,874 0.0712,000 Noble Energy Inc ........................................................................ 667,080 0.2434,600 Occidental Petroleum Corp ........................................................ 2,428,920 0.8730,700 Sunoco Inc .................................................................................. 1,081,254 0.398,100 Whiting Petroleum Corp ............................................................. 572,508 0.21
30,200 Williams Cos Inc ........................................................................ 714,230 0.26 Paper and Forest Products
71,901 International Paper Co ................................................................ 1,876,616 0.68 Pharmaceuticals
58,600 Abbott Laboratories .................................................................... 3,373,602 1.2237,300 Bristol-Myers Squibb Co ............................................................ 777,705 0.2856,800 Johnson & Johnson ..................................................................... 3,924,880 1.4178,600 Pfizer Inc .................................................................................... 1,441,524 0.52
Real Estate 56 Apartment Investment & Management Co ................................. 1,961 0.00
Retail Trade 57,600 Macy’s Inc .................................................................................. 1,031,616 0.37
Road and Rail 7,300 Norfolk Southern Corp ............................................................... 483,333 0.17
11,700 Union Pacific Corp ..................................................................... 832,338 0.30 Semiconductor Equipment and Products
47,900 Maxim Integrated Products Inc .................................................. 862,200 0.31 Software
127,600 Oracle Corp ................................................................................ 2,587,728 0.93 Speciality Retail
11,600 Advance Auto Parts Inc .............................................................. 456,924 0.1734,000 Home Depot Inc ......................................................................... 878,900 0.32
152,500 Lowe’s Cos Inc ........................................................................... 3,611,200 1.3043,500 Ltd Brands Inc ............................................................................ 753,420 0.2761,900 OfficeMax Inc ............................................................................ 550,291 0.2047,000 Williams-Sonoma Inc ................................................................. 758,580 0.27
Textile and Apparel 9,300 VF Corp ...................................................................................... 718,797 0.26
Tobacco 14,300 Lorillard Inc ................................................................................ 1,017,445 0.3734,262 Philip Morris International Inc ................................................... 1,647,317 0.59
Wholesale Trade 18,189 Genuine Parts Co ........................................................................ 731,380 0.26
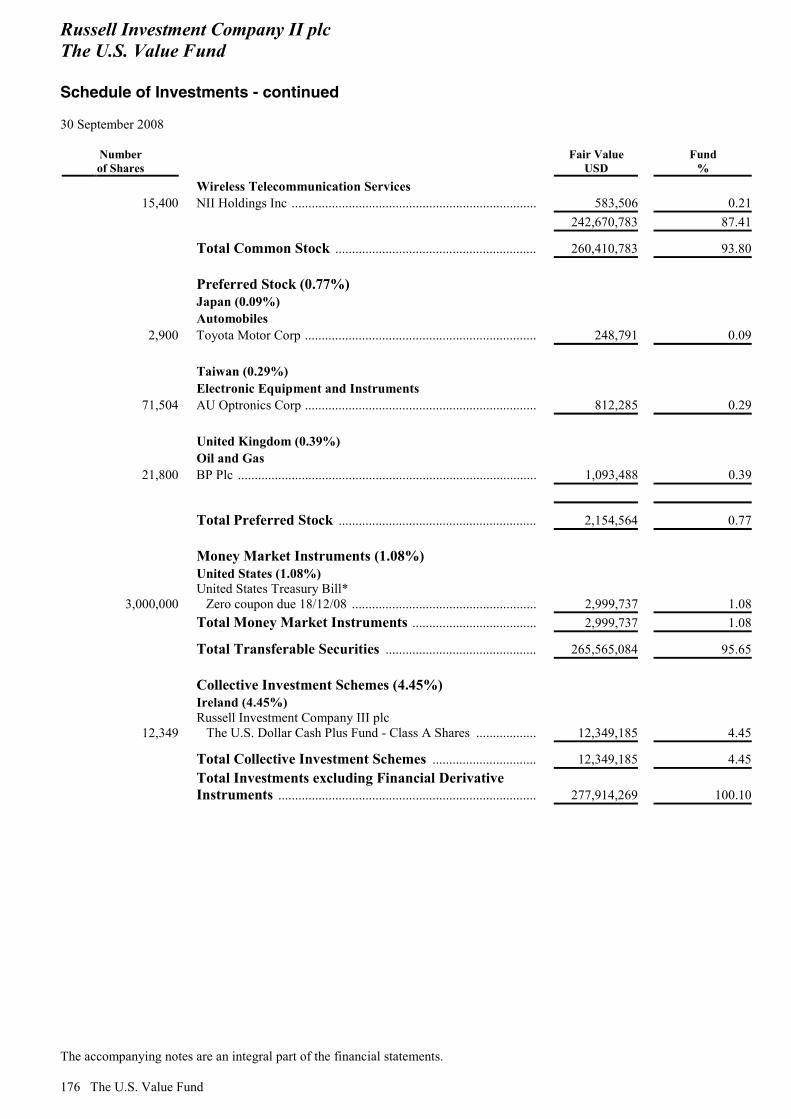
Russell Investment Company II plc The U.S. Value Fund Schedule of Investments - continued 30 September 2008
The accompanying notes are an integral part of the financial statements. 176 The U.S. Value Fund
Number of Shares
Fair Value USD
Fund %
Wireless Telecommunication Services 15,400 NII Holdings Inc ......................................................................... 583,506 0.21
242,670,783 87.41
Total Common Stock ............................................................ 260,410,783 93.80 Preferred Stock (0.77%) Japan (0.09%) Automobiles
2,900 Toyota Motor Corp ..................................................................... 248,791 0.09 Taiwan (0.29%) Electronic Equipment and Instruments
71,504 AU Optronics Corp ..................................................................... 812,285 0.29 United Kingdom (0.39%) Oil and Gas
21,800 BP Plc ......................................................................................... 1,093,488 0.39
Total Preferred Stock ........................................................... 2,154,564 0.77 Money Market Instruments (1.08%) United States (1.08%)
3,000,000 United States Treasury Bill*
Zero coupon due 18/12/08 ....................................................... 2,999,737 1.08 Total Money Market Instruments ..................................... 2,999,737 1.08
Total Transferable Securities ............................................. 265,565,084 95.65 Collective Investment Schemes (4.45%) Ireland (4.45%)
12,349 Russell Investment Company III plc The U.S. Dollar Cash Plus Fund - Class A Shares .................. 12,349,185 4.45
Total Collective Investment Schemes ............................... 12,349,185 4.45
Total Investments excluding Financial Derivative Instruments ............................................................................. 277,914,269 100.10
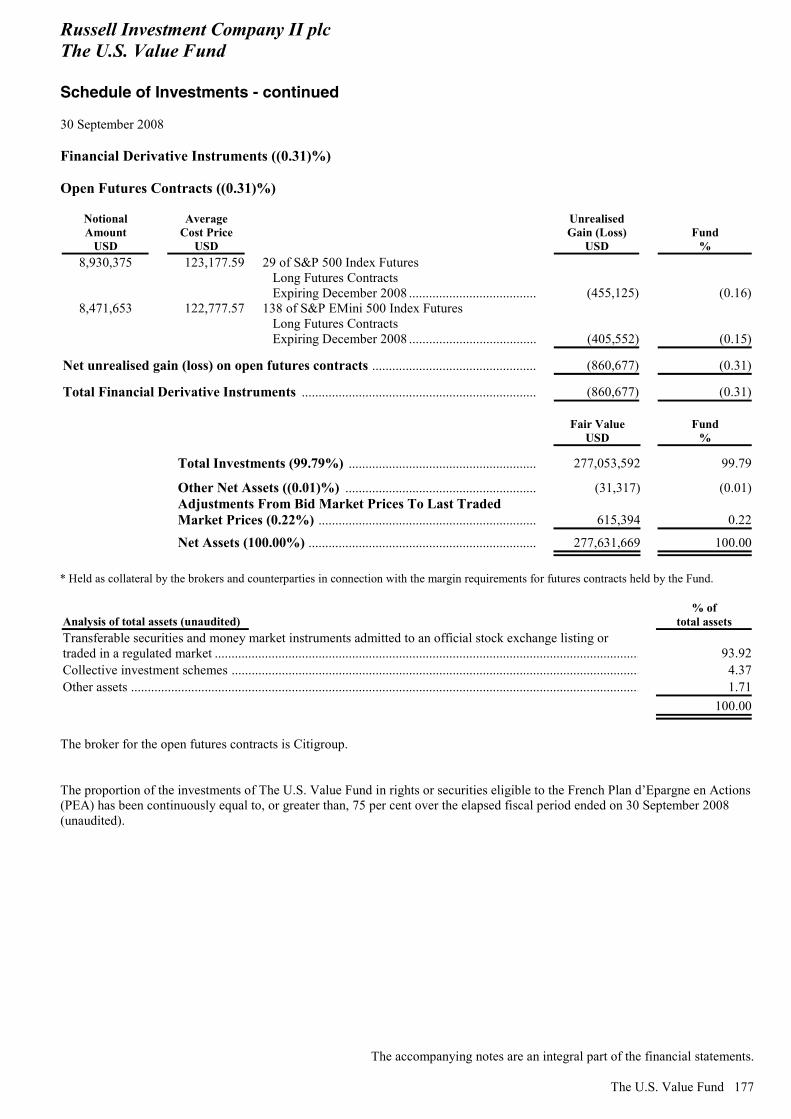
Russell Investment Company II plc The U.S. Value Fund Schedule of Investments - continued 30 September 2008
The accompanying notes are an integral part of the financial statements.
The U.S. Value Fund 177
Financial Derivative Instruments ((0.31)%) Open Futures Contracts ((0.31)%)
Notional Amount
USD
Average Cost Price
USD
Unrealised Gain (Loss)
USD Fund
% 8,930,375 123,177.59 29 of S&P 500 Index Futures
Long Futures Contracts Expiring December 2008 ...................................... (455,125) (0.16)
8,471,653 122,777.57 138 of S&P EMini 500 Index Futures Long Futures Contracts Expiring December 2008 ...................................... (405,552) (0.15)
Net unrealised gain (loss) on open futures contracts ................................................. (860,677) (0.31)
Total Financial Derivative Instruments ...................................................................... (860,677) (0.31)
Fair Value
USD Fund
%
Total Investments (99.79%) ........................................................ 277,053,592 99.79
Other Net Assets ((0.01)%) ......................................................... (31,317) (0.01)
Adjustments From Bid Market Prices To Last Traded Market Prices (0.22%) ................................................................. 615,394 0.22
Net Assets (100.00%) .................................................................... 277,631,669 100.00 * Held as collateral by the brokers and counterparties in connection with the margin requirements for futures contracts held by the Fund.
Analysis of total assets (unaudited) % of
total assets Transferable securities and money market instruments admitted to an official stock exchange listing or traded in a regulated market ............................................................................................................................... 93.92Collective investment schemes .......................................................................................................................... 4.37Other assets ........................................................................................................................................................ 1.71
100.00
The broker for the open futures contracts is Citigroup. The proportion of the investments of The U.S. Value Fund in rights or securities eligible to the French Plan d’Epargne en Actions (PEA) has been continuously equal to, or greater than, 75 per cent over the elapsed fiscal period ended on 30 September 2008 (unaudited).

Russell Investment Company II plc The U.S. Value Fund Statement of Changes in Composition of Portfolio Listed below are the 20 largest cumulative investment purchases and sales during the year ended 30 September 2008
A copy of the list of changes in the portfolio during the reference period may be obtained free of charge from the Company’s administrator or from the paying agent or paying and information agents in each country of distribution. 178 The U.S. Value Fund
Portfolio Securities Acquisition Cost
USD Portfolio Securities Disposal Proceeds
USD Russell Investment Company III plc Russell Investment Company III plc
The U.S. Dollar Cash Plus Fund The U.S. Dollar Cash Plus Fund Class A Shares 113,399,399 Class A Shares (119,783,900)
Federal National Mortgage Association 7,053,510 Bank of America Corp (5,627,563)Citigroup Inc 5,228,502 BB&T Corp (4,891,033)Wachovia Corp 4,361,375 General Electric Co (4,044,204)Bank of America Corp 3,976,844 Celanese Corp De (3,985,050)Suntrust Banks Inc 3,802,549 Citigroup (3,958,063)American International Group Inc 3,582,367 Northern Trust Corp (3,878,836)National City Corp 3,565,400 Pulte Homes Inc (3,832,122)Keycorp 3,547,624 CVS Caremark Corp (3,697,108)Federal Home Loan Mortgage Corp 3,486,494 International Business Machs (3,287,759)Walter Industries Inc 3,090,422 Wachiovia Corp (3,140,792)Zions Bancorp 3,076,082 JP Morgan Chase & Co (3,133,439)Bank New York Mellon Corp 2,777,068 DR Horton Inc (3,011,685)International Paper Co 2,740,611 Peabody Energy Corp (3,009,306)Amgan Inc 2,688,393 AT&T Inc (2,940,310)Washington Mutual Inc 2,548,655 Washington Mutual Inc (2,837,707)Macys Inc 2,530,903 Merrill Lynch & Co Inc (2,652,478)BT&T Corp 2,502,587 Federal Home Loan Mortgage Corp (2,535,739)Lehman Brothers Holdings Inc 2,430,053 Exxon Mobil Corp (2,457,864)Ace Limited 2,377,699 Wells Fargo & Co (2,412,996)
Russell Investment Company II plc The World Equity Fund Manager’s Report
The World Equity Fund 179
Money Managers Arrowstreet Capital L.P. Axiom International Investors, LLC Marisco Capital Management, LLC MFS Investment Management Tradewinds NWQ Global Investors, LLC Investment Objective The World Equity Fund (the “Fund”) will seek to achieve capital appreciation by investing principally in equity securities, including common stock, convertibles and warrants, listed, traded or dealt in on the regulated markets within the MSCI World Index. Fund Performance The Fund returned -18.0 per cent during the period on a gross-of-fees basis verses a benchmark return of -16.4 per cent.* Market Comment The period under review was a difficult period for equity markets globally as the credit crunch maintained its grip on markets and evolved into a global financial markets crisis. The MSCI World Index declined by 16.4 per cent in the period. Global equities rose during the first half of the second quarter of 2008 only to reverse their gains on concerns over increasing inflation, record high oil prices and slowing global growth. The financial sector was the worst performing as concerns of earnings downgrades combined with news of further credit-related losses from banks globally, weakened returns. The historic third quarter of 2008 saw the rescue, bankruptcy or nationalisation of many financial institutions in both the United States and Europe along with a U.S. government bail out plan, the Troubled Asset Relief Program, which was rejected by Congress. Equities tumbled across the globe as the crisis heightened fears over slower world growth and caused liquidity to dry up in credit markets. Declines in commodity-related stocks led to materials being the worst-performing sector. North America was the best-performing region, whereas, emerging markets declined sharply as investors rotated out of riskier assets. General Comment on Managers/Performance The Fund underperformed its benchmark. Axiom International Investors, LLC (“Axiom”) and Arrowstreet Capital L.P. (“Arrowstreet”) were the worst-performing managers. Aggressive growth and momentum manager Axiom had a positive second quarter of the year but struggled in the volatile environment of the third quarter. With emerging markets underperforming, the manager’s performance was impacted negatively by its holdings in the emerging market countries, especially in Russia. Its rotation over the third quarter into more defensive sectors did assist somewhat in limiting further performance downside. Arrowstreet had flat performance over the second quarter of 2008, but found the third quarter difficult. Stock selection in financials was the key detractor for the value bias manager as the market turmoil in September 2008 saw many stocks in this sector decline sharply. Marisco Capital Management, LLC was added to the Fund in August 2008. The manager pursues a thematic aggressive growth style and will give the Fund a broader exposure to the global growth opportunity set. Outlook The Fund remains well positioned to benefit from diverse returns in the coming quarter given its broad allocation of assets. Past performance is no indication of current or future performance * Benchmark source: MSCI World Index
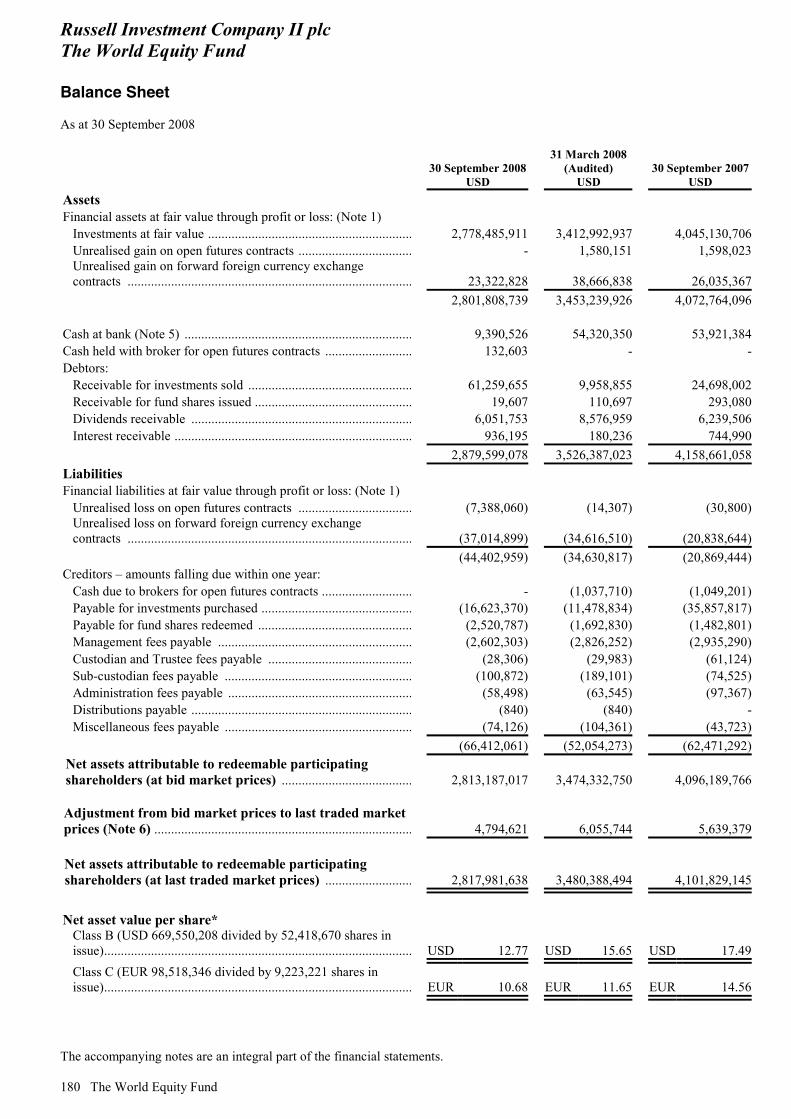
Russell Investment Company II plc The World Equity Fund Balance Sheet As at 30 September 2008
The accompanying notes are an integral part of the financial statements. 180 The World Equity Fund
30 September 2008
USD
31 March 2008 (Audited)
USD 30 September 2007
USD Assets Financial assets at fair value through profit or loss: (Note 1)
Investments at fair value ............................................................. 2,778,485,911 3,412,992,937 4,045,130,706Unrealised gain on open futures contracts .................................. - 1,580,151 1,598,023Unrealised gain on forward foreign currency exchange contracts .....................................................................................
23,322,828 38,666,838 26,035,367
2,801,808,739 3,453,239,926 4,072,764,096 Cash at bank (Note 5) .................................................................... 9,390,526 54,320,350 53,921,384Cash held with broker for open futures contracts .......................... 132,603 - -Debtors: Receivable for investments sold ................................................. 61,259,655 9,958,855 24,698,002 Receivable for fund shares issued ............................................... 19,607 110,697 293,080 Dividends receivable .................................................................. 6,051,753 8,576,959 6,239,506 Interest receivable ....................................................................... 936,195 180,236 744,990 2,879,599,078 3,526,387,023 4,158,661,058Liabilities Financial liabilities at fair value through profit or loss: (Note 1)
Unrealised loss on open futures contracts .................................. (7,388,060) (14,307) (30,800)Unrealised loss on forward foreign currency exchange contracts .....................................................................................
(37,014,899) (34,616,510) (20,838,644)
(44,402,959) (34,630,817) (20,869,444)Creditors – amounts falling due within one year:
Cash due to brokers for open futures contracts ........................... - (1,037,710) (1,049,201)Payable for investments purchased ............................................. (16,623,370) (11,478,834) (35,857,817)Payable for fund shares redeemed .............................................. (2,520,787) (1,692,830) (1,482,801)Management fees payable .......................................................... (2,602,303) (2,826,252) (2,935,290)Custodian and Trustee fees payable ........................................... (28,306) (29,983) (61,124)Sub-custodian fees payable ........................................................ (100,872) (189,101) (74,525)Administration fees payable ....................................................... (58,498) (63,545) (97,367)Distributions payable .................................................................. (840) (840) -Miscellaneous fees payable ........................................................ (74,126) (104,361) (43,723)
(66,412,061) (52,054,273) (62,471,292)Net assets attributable to redeemable participating shareholders (at bid market prices) .......................................
2,813,187,017 3,474,332,750 4,096,189,766
Adjustment from bid market prices to last traded market prices (Note 6) .............................................................................
4,794,621 6,055,744 5,639,379
Net assets attributable to redeemable participating shareholders (at last traded market prices) ..........................
2,817,981,638 3,480,388,494 4,101,829,145
Net asset value per share*
Class B (USD 669,550,208 divided by 52,418,670 shares in issue)............................................................................................
USD 12.77 USD 15.65 USD 17.49
Class C (EUR 98,518,346 divided by 9,223,221 shares in issue)............................................................................................
EUR 10.68 EUR 11.65 EUR 14.56
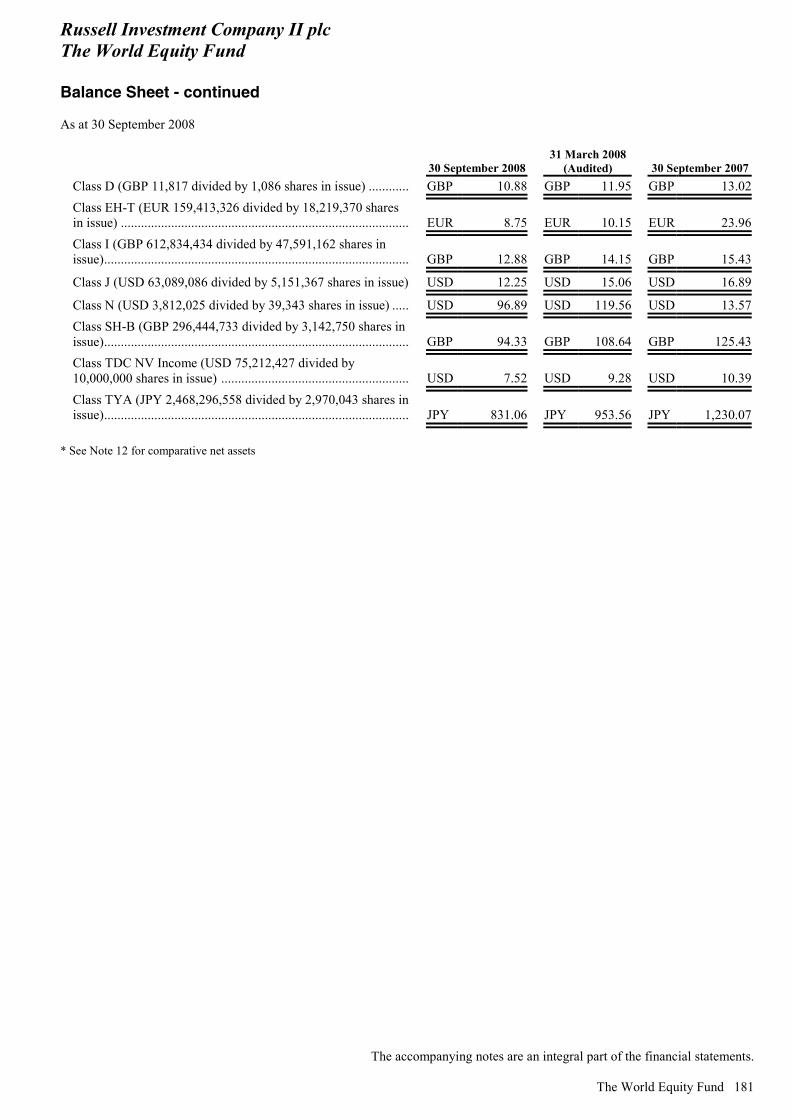
Russell Investment Company II plc The World Equity Fund Balance Sheet - continued As at 30 September 2008
The accompanying notes are an integral part of the financial statements.
The World Equity Fund 181
30 September 2008 31 March 2008
(Audited) 30 September 2007Class D (GBP 11,817 divided by 1,086 shares in issue) ............. GBP 10.88 GBP 11.95 GBP 13.02Class EH-T (EUR 159,413,326 divided by 18,219,370 shares in issue) .......................................................................................
EUR 8.75 EUR 10.15 EUR 23.96
Class I (GBP 612,834,434 divided by 47,591,162 shares in issue)............................................................................................
GBP 12.88 GBP 14.15 GBP 15.43
Class J (USD 63,089,086 divided by 5,151,367 shares in issue). USD 12.25 USD 15.06 USD 16.89
Class N (USD 3,812,025 divided by 39,343 shares in issue) ...... USD 96.89 USD 119.56 USD 13.57Class SH-B (GBP 296,444,733 divided by 3,142,750 shares in issue)............................................................................................
GBP 94.33 GBP 108.64 GBP 125.43
Class TDC NV Income (USD 75,212,427 divided by 10,000,000 shares in issue) .........................................................
USD 7.52 USD 9.28 USD 10.39
Class TYA (JPY 2,468,296,558 divided by 2,970,043 shares in issue)............................................................................................
JPY 831.06 JPY 953.56 JPY 1,230.07
* See Note 12 for comparative net assets
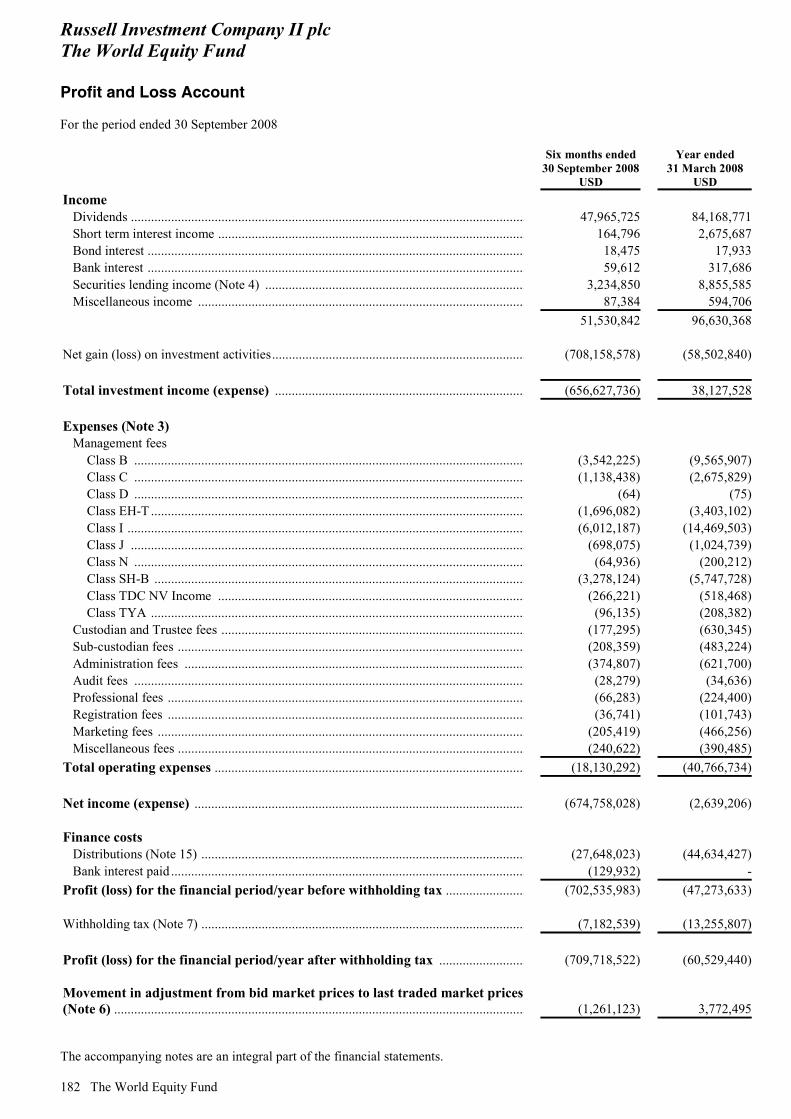
Russell Investment Company II plc The World Equity Fund Profit and Loss Account For the period ended 30 September 2008
The accompanying notes are an integral part of the financial statements. 182 The World Equity Fund
Six months ended 30 September 2008
USD
Year ended 31 March 2008
USD Income
Dividends ...................................................................................................................... 47,965,725 84,168,771Short term interest income ............................................................................................ 164,796 2,675,687Bond interest ................................................................................................................. 18,475 17,933Bank interest ................................................................................................................. 59,612 317,686Securities lending income (Note 4) .............................................................................. 3,234,850 8,855,585Miscellaneous income .................................................................................................. 87,384 594,706
51,530,842 96,630,368 Net gain (loss) on investment activities............................................................................ (708,158,578) (58,502,840) Total investment income (expense) ........................................................................... (656,627,736) 38,127,528 Expenses (Note 3)
Management fees Class B ..................................................................................................................... (3,542,225) (9,565,907)Class C ..................................................................................................................... (1,138,438) (2,675,829)Class D ..................................................................................................................... (64) (75)Class EH-T ................................................................................................................ (1,696,082) (3,403,102)Class I ....................................................................................................................... (6,012,187) (14,469,503)Class J ...................................................................................................................... (698,075) (1,024,739)Class N ..................................................................................................................... (64,936) (200,212)Class SH-B ............................................................................................................... (3,278,124) (5,747,728)Class TDC NV Income ............................................................................................ (266,221) (518,468)Class TYA ................................................................................................................ (96,135) (208,382)
Custodian and Trustee fees ........................................................................................... (177,295) (630,345)Sub-custodian fees ........................................................................................................ (208,359) (483,224)Administration fees ...................................................................................................... (374,807) (621,700)Audit fees ..................................................................................................................... (28,279) (34,636)Professional fees ........................................................................................................... (66,283) (224,400)Registration fees ........................................................................................................... (36,741) (101,743)Marketing fees .............................................................................................................. (205,419) (466,256)Miscellaneous fees ........................................................................................................ (240,622) (390,485)
Total operating expenses ............................................................................................. (18,130,292) (40,766,734) Net income (expense) ................................................................................................... (674,758,028) (2,639,206) Finance costs
Distributions (Note 15) ................................................................................................. (27,648,023) (44,634,427)Bank interest paid .......................................................................................................... (129,932) -
Profit (loss) for the financial period/year before withholding tax ........................ (702,535,983) (47,273,633) Withholding tax (Note 7) ................................................................................................. (7,182,539) (13,255,807) Profit (loss) for the financial period/year after withholding tax .......................... (709,718,522) (60,529,440) Movement in adjustment from bid market prices to last traded market prices (Note 6) ........................................................................................................................... (1,261,123) 3,772,495
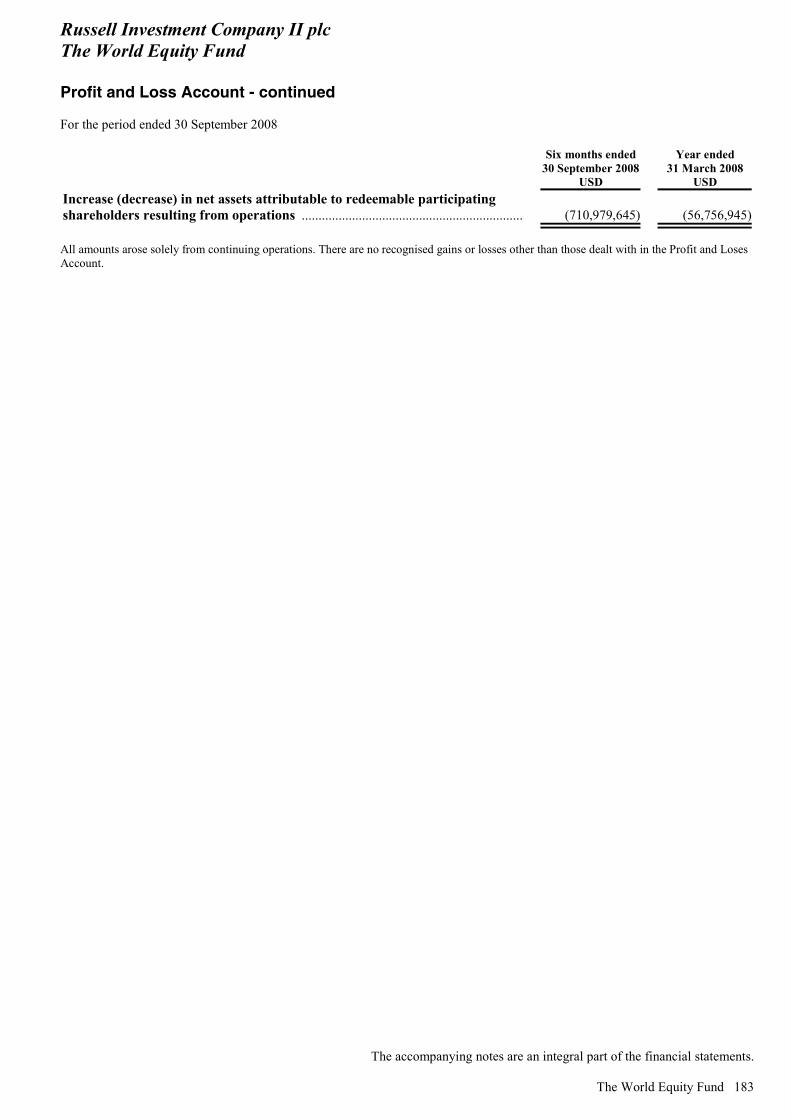
Russell Investment Company II plc The World Equity Fund Profit and Loss Account - continued For the period ended 30 September 2008
The accompanying notes are an integral part of the financial statements.
The World Equity Fund 183
Six months ended 30 September 2008
USD
Year ended 31 March 2008
USD Increase (decrease) in net assets attributable to redeemable participating shareholders resulting from operations ................................................................... (710,979,645) (56,756,945) All amounts arose solely from continuing operations. There are no recognised gains or losses other than those dealt with in the Profit and Loses Account.

Russell Investment Company II plc The World Equity Fund Statement of Changes in Net Assets Attributable to Redeemable Participating Shareholders For the period ended 30 September 2008
The accompanying notes are an integral part of the financial statements. 184 The World Equity Fund
Six months ended 30 September 2008
USD
Year ended 31 March 2008
USD Increase (decrease) in net assets attributable to redeemable participating shareholders resulting from operations ................................................................... (710,979,645) (56,756,945) Share transactions
Net increase (decrease) in net assets resulting from redeemable participating share transactions (Note 6) ..................................................................................................... 21,656,971 (244,608,962)Deemed distributions on accumulation shares (Note 15) ............................................. 26,915,818 43,506,631
Total net increase (decrease) in net assets attributable to redeemable participating shareholders .......................................................................................... (662,406,856) (257,859,276) Net assets attributable to redeemable participating shareholders
Beginning of period/year .............................................................................................. 3,480,388,494 3,738,247,770 End of period/year ........................................................................................................ 2,817,981,638 3,480,388,494
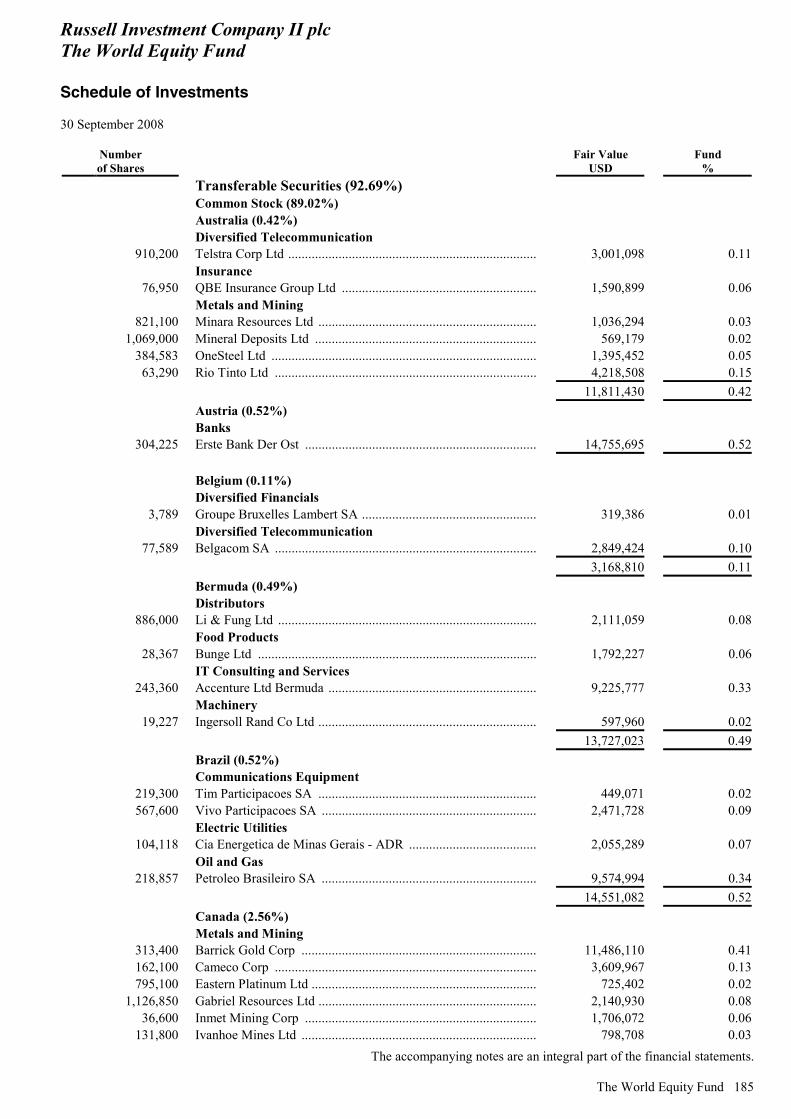
Russell Investment Company II plc The World Equity Fund Schedule of Investments 30 September 2008
The accompanying notes are an integral part of the financial statements.
The World Equity Fund 185
Number of Shares
Fair Value USD
Fund %
Transferable Securities (92.69%) Common Stock (89.02%) Australia (0.42%) Diversified Telecommunication
910,200 Telstra Corp Ltd .......................................................................... 3,001,098 0.11 Insurance
76,950 QBE Insurance Group Ltd .......................................................... 1,590,899 0.06 Metals and Mining
821,100 Minara Resources Ltd ................................................................. 1,036,294 0.031,069,000 Mineral Deposits Ltd .................................................................. 569,179 0.02
384,583 OneSteel Ltd ............................................................................... 1,395,452 0.0563,290 Rio Tinto Ltd .............................................................................. 4,218,508 0.15
11,811,430 0.42 Austria (0.52%) Banks
304,225 Erste Bank Der Ost ..................................................................... 14,755,695 0.52 Belgium (0.11%) Diversified Financials
3,789 Groupe Bruxelles Lambert SA .................................................... 319,386 0.01 Diversified Telecommunication
77,589 Belgacom SA .............................................................................. 2,849,424 0.10 3,168,810 0.11 Bermuda (0.49%) Distributors
886,000 Li & Fung Ltd ............................................................................. 2,111,059 0.08 Food Products
28,367 Bunge Ltd ................................................................................... 1,792,227 0.06 IT Consulting and Services
243,360 Accenture Ltd Bermuda .............................................................. 9,225,777 0.33 Machinery
19,227 Ingersoll Rand Co Ltd ................................................................. 597,960 0.02 13,727,023 0.49 Brazil (0.52%) Communications Equipment
219,300 Tim Participacoes SA ................................................................. 449,071 0.02567,600 Vivo Participacoes SA ................................................................ 2,471,728 0.09
Electric Utilities 104,118 Cia Energetica de Minas Gerais - ADR ...................................... 2,055,289 0.07
Oil and Gas 218,857 Petroleo Brasileiro SA ................................................................ 9,574,994 0.34
14,551,082 0.52 Canada (2.56%) Metals and Mining
313,400 Barrick Gold Corp ...................................................................... 11,486,110 0.41162,100 Cameco Corp .............................................................................. 3,609,967 0.13795,100 Eastern Platinum Ltd ................................................................... 725,402 0.02
1,126,850 Gabriel Resources Ltd ................................................................. 2,140,930 0.0836,600 Inmet Mining Corp ..................................................................... 1,706,072 0.06
131,800 Ivanhoe Mines Ltd ...................................................................... 798,708 0.03

Russell Investment Company II plc The World Equity Fund Schedule of Investments - continued 30 September 2008
The accompanying notes are an integral part of the financial statements.
186 The World Equity Fund
Number of Shares
Fair Value USD
Fund %
578,000 Moto Goldmines Ltd ................................................................... 1,114,466 0.04514,100 Uranium One Inc ........................................................................ 1,112,142 0.04680,930 Yamana Gold .............................................................................. 5,672,147 0.20
Oil and Gas Services 60,800 Imperial Oil Ltd .......................................................................... 2,606,531 0.09
Oil and Gas 188,300 Encana Corp ................................................................................ 12,025,555 0.42
59,500 Husky Energy Inc ....................................................................... 2,462,110 0.0924,404 Petro-Canada ............................................................................... 813,873 0.03
175,800 Petro-Canada ............................................................................... 5,853,386 0.21 Paper and Forest Products
154,249 AbitibiBowater Inc ..................................................................... 595,401 0.02 Pharmaceuticals
410,500 Patheon Inc ................................................................................. 1,343,623 0.05 Real Estate
189,704 Brookfield Asset Management Inc ............................................. 5,205,478 0.18 Road and Rail
268,460 Canadian National Railway Co ................................................... 12,840,442 0.46 72,112,343 2.56 Cayman Islands (0.05%) Insurance
36,364 XL Capital Ltd ............................................................................ 636,370 0.02 Metals and Mining
444,400 Apex Silver Mines Ltd ................................................................ 764,368 0.03 1,400,738 0.05 China (0.65%) Banks
6,566,000 China Construction Bank Corp ................................................... 4,262,126 0.159,583,000 Industrial & Commercial Bank ................................................... 5,640,435 0.20
Oil and Gas 3,796,000 China Petroleum & Chemical Corp ............................................ 2,948,074 0.11
19,720 Petrochina Co .............................................................................. 2,025,836 0.073,238,000 Petrochina Co .............................................................................. 3,332,104 0.12
18,208,575 0.65 Czech Republic (0.13%) Banks
16,470 Komercni Banka ......................................................................... 3,597,436 0.13 Denmark (0.58%) Electrical Equipment
194,030 Vestas Wind Systems .................................................................. 16,455,912 0.58 Finland (0.46%) Diversified Telecommunication
284,775 Nokia OYJ .................................................................................. 5,156,119 0.18 Oil and Gas
125,060 Fortum OYJ ................................................................................ 4,138,681 0.15 Paper and Forest Products
238,700 UPM Kymmene OYJ .................................................................. 3,668,073 0.13 12,962,873 0.46
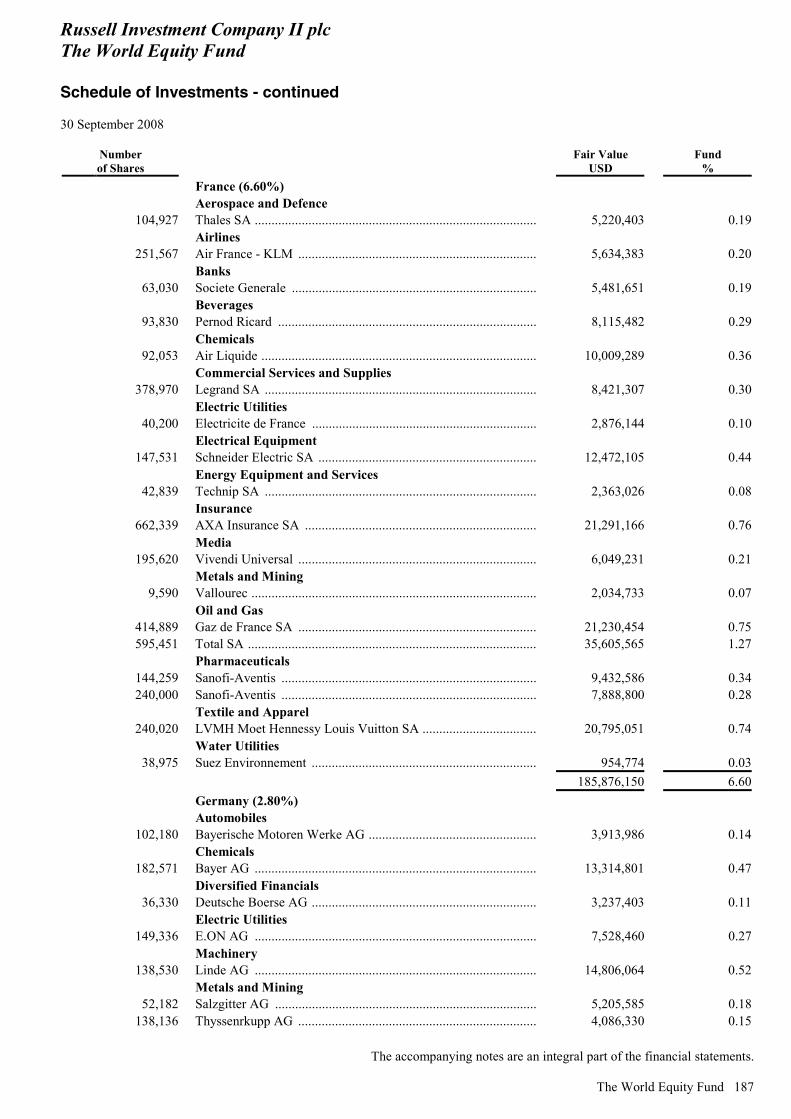
Russell Investment Company II plc The World Equity Fund Schedule of Investments - continued 30 September 2008
The accompanying notes are an integral part of the financial statements.
The World Equity Fund 187
Number of Shares
Fair Value USD
Fund %
France (6.60%) Aerospace and Defence
104,927 Thales SA .................................................................................... 5,220,403 0.19 Airlines
251,567 Air France - KLM ....................................................................... 5,634,383 0.20 Banks
63,030 Societe Generale ......................................................................... 5,481,651 0.19 Beverages
93,830 Pernod Ricard ............................................................................. 8,115,482 0.29 Chemicals
92,053 Air Liquide .................................................................................. 10,009,289 0.36 Commercial Services and Supplies
378,970 Legrand SA ................................................................................. 8,421,307 0.30 Electric Utilities
40,200 Electricite de France ................................................................... 2,876,144 0.10 Electrical Equipment
147,531 Schneider Electric SA ................................................................. 12,472,105 0.44 Energy Equipment and Services
42,839 Technip SA ................................................................................. 2,363,026 0.08 Insurance
662,339 AXA Insurance SA ..................................................................... 21,291,166 0.76 Media
195,620 Vivendi Universal ....................................................................... 6,049,231 0.21 Metals and Mining
9,590 Vallourec ..................................................................................... 2,034,733 0.07 Oil and Gas
414,889 Gaz de France SA ....................................................................... 21,230,454 0.75595,451 Total SA ...................................................................................... 35,605,565 1.27
Pharmaceuticals 144,259 Sanofi-Aventis ............................................................................ 9,432,586 0.34240,000 Sanofi-Aventis ............................................................................ 7,888,800 0.28
Textile and Apparel 240,020 LVMH Moet Hennessy Louis Vuitton SA .................................. 20,795,051 0.74
Water Utilities 38,975 Suez Environnement ................................................................... 954,774 0.03
185,876,150 6.60 Germany (2.80%) Automobiles
102,180 Bayerische Motoren Werke AG .................................................. 3,913,986 0.14 Chemicals
182,571 Bayer AG .................................................................................... 13,314,801 0.47 Diversified Financials
36,330 Deutsche Boerse AG ................................................................... 3,237,403 0.11 Electric Utilities
149,336 E.ON AG .................................................................................... 7,528,460 0.27 Machinery
138,530 Linde AG .................................................................................... 14,806,064 0.52 Metals and Mining
52,182 Salzgitter AG .............................................................................. 5,205,585 0.18138,136 Thyssenrkupp AG ....................................................................... 4,086,330 0.15

Russell Investment Company II plc The World Equity Fund Schedule of Investments - continued 30 September 2008
The accompanying notes are an integral part of the financial statements.
188 The World Equity Fund
Number of Shares
Fair Value USD
Fund %
Pharmaceuticals 127,440 Merck KGAA ............................................................................. 13,482,930 0.48
Software 125,720 SAP AG ...................................................................................... 6,633,702 0.24
Textile and Apparel 129,830 Adidas AG .................................................................................. 6,838,715 0.24
79,047,976 2.80 Greece (0.23%) Banks
164,820 National Bank of Greece ............................................................. 6,542,598 0.23 Hong Kong (0.50%) Electric Utilities
279,000 CLP Holdings Ltd ....................................................................... 2,240,452 0.08 Oil and Gas
11,900 Cnooc Ltd ................................................................................... 1,362,669 0.054,287,000 Cnooc Ltd ................................................................................... 4,880,908 0.17
Wireless Telecommunication Services 570,500 China Mobile Hong Kong Ltd .................................................... 5,646,696 0.20
14,130,725 0.50 India (0.09%) Automobiles
349,500 Tata Motors Ltd .......................................................................... 2,677,170 0.09 Ireland (0.15%) Airlines
167,700 Ryanair Holdings ........................................................................ 3,759,834 0.14 Banks
42,459 Allied Irish Banks ....................................................................... 345,912 0.01 4,105,746 0.15 Italy (1.16%) Banks
816,182 Intesa Sanpaolo SpA ................................................................... 4,376,574 0.16 Diversified Telecommunication
1,962,700 Telecom Italia SpA ..................................................................... 2,211,039 0.08 Electric Utilities
677,171 Terna Rete Elettrica Nazionale ................................................... 2,468,334 0.09 Energy Equipment and Services
52,647 Saipem SpA ................................................................................ 1,555,182 0.05 Oil and Gas
770,275 ENI SpA ...................................................................................... 20,232,782 0.72107,300 ERG SpA .................................................................................... 1,739,297 0.06
32,583,208 1.16 Japan (8.45%) Auto Components
610,300 Bridgestone Corp ........................................................................ 11,267,254 0.4069,000 Denso Corp ................................................................................. 1,650,826 0.06
Automobiles 221,300 Honda Motor Co Ltd ................................................................... 6,420,233 0.23
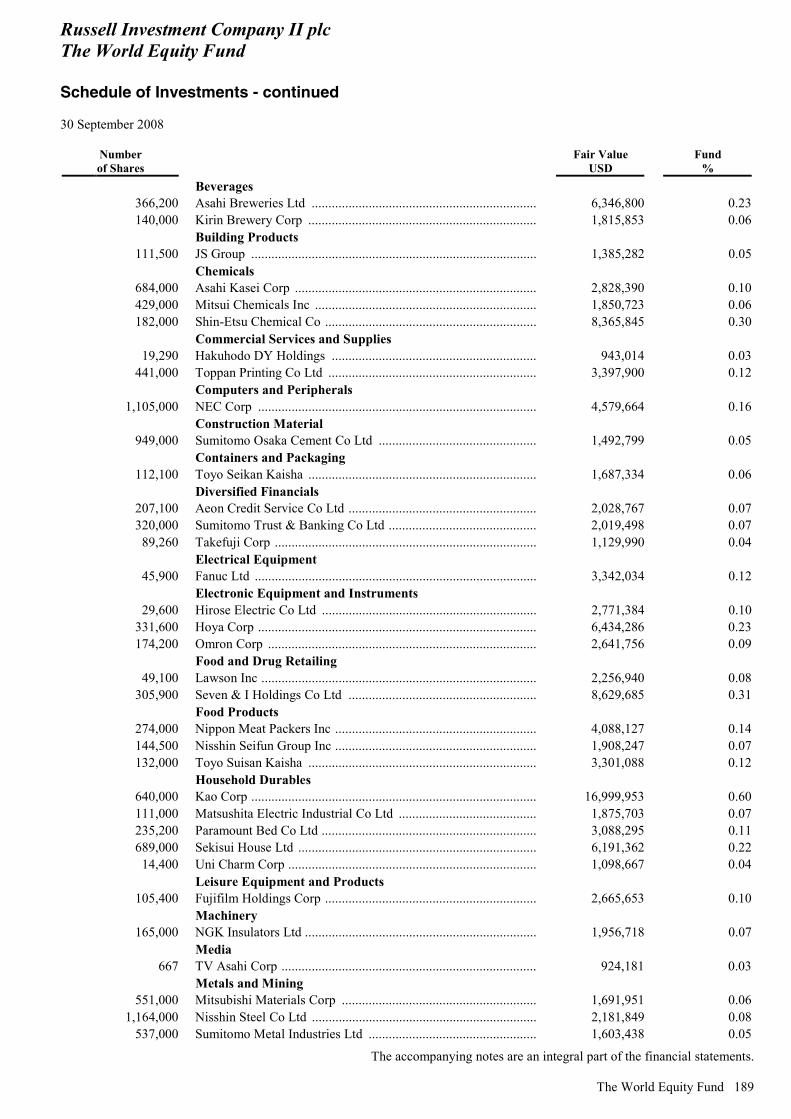
Russell Investment Company II plc The World Equity Fund Schedule of Investments - continued 30 September 2008
The accompanying notes are an integral part of the financial statements.
The World Equity Fund 189
Number of Shares
Fair Value USD
Fund %
Beverages 366,200 Asahi Breweries Ltd ................................................................... 6,346,800 0.23140,000 Kirin Brewery Corp .................................................................... 1,815,853 0.06
Building Products 111,500 JS Group ..................................................................................... 1,385,282 0.05
Chemicals 684,000 Asahi Kasei Corp ........................................................................ 2,828,390 0.10429,000 Mitsui Chemicals Inc .................................................................. 1,850,723 0.06182,000 Shin-Etsu Chemical Co ............................................................... 8,365,845 0.30
Commercial Services and Supplies 19,290 Hakuhodo DY Holdings ............................................................. 943,014 0.03
441,000 Toppan Printing Co Ltd .............................................................. 3,397,900 0.12 Computers and Peripherals
1,105,000 NEC Corp ................................................................................... 4,579,664 0.16 Construction Material
949,000 Sumitomo Osaka Cement Co Ltd ............................................... 1,492,799 0.05 Containers and Packaging
112,100 Toyo Seikan Kaisha .................................................................... 1,687,334 0.06 Diversified Financials
207,100 Aeon Credit Service Co Ltd ........................................................ 2,028,767 0.07320,000 Sumitomo Trust & Banking Co Ltd ............................................ 2,019,498 0.07
89,260 Takefuji Corp .............................................................................. 1,129,990 0.04 Electrical Equipment
45,900 Fanuc Ltd .................................................................................... 3,342,034 0.12 Electronic Equipment and Instruments
29,600 Hirose Electric Co Ltd ................................................................ 2,771,384 0.10331,600 Hoya Corp ................................................................................... 6,434,286 0.23174,200 Omron Corp ................................................................................ 2,641,756 0.09
Food and Drug Retailing 49,100 Lawson Inc .................................................................................. 2,256,940 0.08
305,900 Seven & I Holdings Co Ltd ........................................................ 8,629,685 0.31 Food Products
274,000 Nippon Meat Packers Inc ............................................................ 4,088,127 0.14144,500 Nisshin Seifun Group Inc ............................................................ 1,908,247 0.07132,000 Toyo Suisan Kaisha .................................................................... 3,301,088 0.12
Household Durables 640,000 Kao Corp ..................................................................................... 16,999,953 0.60111,000 Matsushita Electric Industrial Co Ltd ......................................... 1,875,703 0.07235,200 Paramount Bed Co Ltd ................................................................ 3,088,295 0.11689,000 Sekisui House Ltd ....................................................................... 6,191,362 0.22
14,400 Uni Charm Corp .......................................................................... 1,098,667 0.04 Leisure Equipment and Products
105,400 Fujifilm Holdings Corp ............................................................... 2,665,653 0.10 Machinery
165,000 NGK Insulators Ltd ..................................................................... 1,956,718 0.07 Media
667 TV Asahi Corp ............................................................................ 924,181 0.03 Metals and Mining
551,000 Mitsubishi Materials Corp .......................................................... 1,691,951 0.061,164,000 Nisshin Steel Co Ltd ................................................................... 2,181,849 0.08
537,000 Sumitomo Metal Industries Ltd .................................................. 1,603,438 0.05

Russell Investment Company II plc The World Equity Fund Schedule of Investments - continued 30 September 2008
The accompanying notes are an integral part of the financial statements.
190 The World Equity Fund
Number of Shares
Fair Value USD
Fund %
Office Electronics 409,200 Canon Inc .................................................................................... 14,723,722 0.52188,000 Ricoh Co Ltd ............................................................................... 2,562,389 0.09
Oil and Gas 855 Inpex Holdings Inc ...................................................................... 7,207,884 0.26
651,000 Nippon Oil Corp ......................................................................... 3,219,281 0.11 Personal Products
93,000 Shiseido Co Ltd .......................................................................... 2,054,208 0.07 Pharmaceuticals
209,400 Astellas Pharma Inc .................................................................... 8,599,670 0.31246,100 Chugai Pharmaceutical Co Ltd ................................................... 3,943,071 0.14205,200 Daiichi Sankyo Co Ltd ................................................................ 5,209,005 0.19
77,100 FamilyMart Co Ltd ..................................................................... 3,224,453 0.11109,000 Kissei Pharmaceutical Co Ltd ..................................................... 2,356,285 0.08183,000 Shionogi & Co Ltd ...................................................................... 3,654,312 0.13161,000 Taisho Pharmaceutical Co Ltd .................................................... 3,139,170 0.11393,300 Takeda Pharmaceutical Co Ltd ................................................... 19,449,206 0.69198,000 Tanabe Seiyaku Co Ltd ............................................................... 2,717,336 0.10
Retail Trade 198,000 UNY Co Ltd ................................................................................ 1,969,463 0.07
Semiconductor Equipment and Products 78,300 Advantest Corp ........................................................................... 1,604,130 0.06
Software 37,900 Nintendo Co Ltd ......................................................................... 15,475,580 0.55
Trading Companies and Distributors 1,200 Fields Corp .................................................................................. 2,204,116 0.08
238,174,770 8.45 Korea, Republic of (0.30%) Electronic Equipment and Instruments
19,080 Samsung Electronic .................................................................... 8,520,751 0.30 Luxembourg (0.22%) Marine
424,200 Stolt Offshore SA ........................................................................ 4,914,788 0.18 Metals and Mining
23,826 ArcelorMittal .............................................................................. 1,176,372 0.04 6,091,160 0.22 Mexico (0.11%) Beverages
731,600 Grupo Modelo Sa de CV ............................................................. 3,083,568 0.11 Netherlands (2.73%) Air Freight and Couriers
411,270 TNT NV ...................................................................................... 11,264,965 0.40 Beverages
290,382 Heineken Holding NV ................................................................ 11,269,867 0.40554,710 Heineken Holdings NV ............................................................... 22,077,882 0.78
Chemicals 54,075 Akzo Nobel NV .......................................................................... 2,552,896 0.09
229,252 Koninklijke DSM NV ................................................................. 10,728,059 0.38
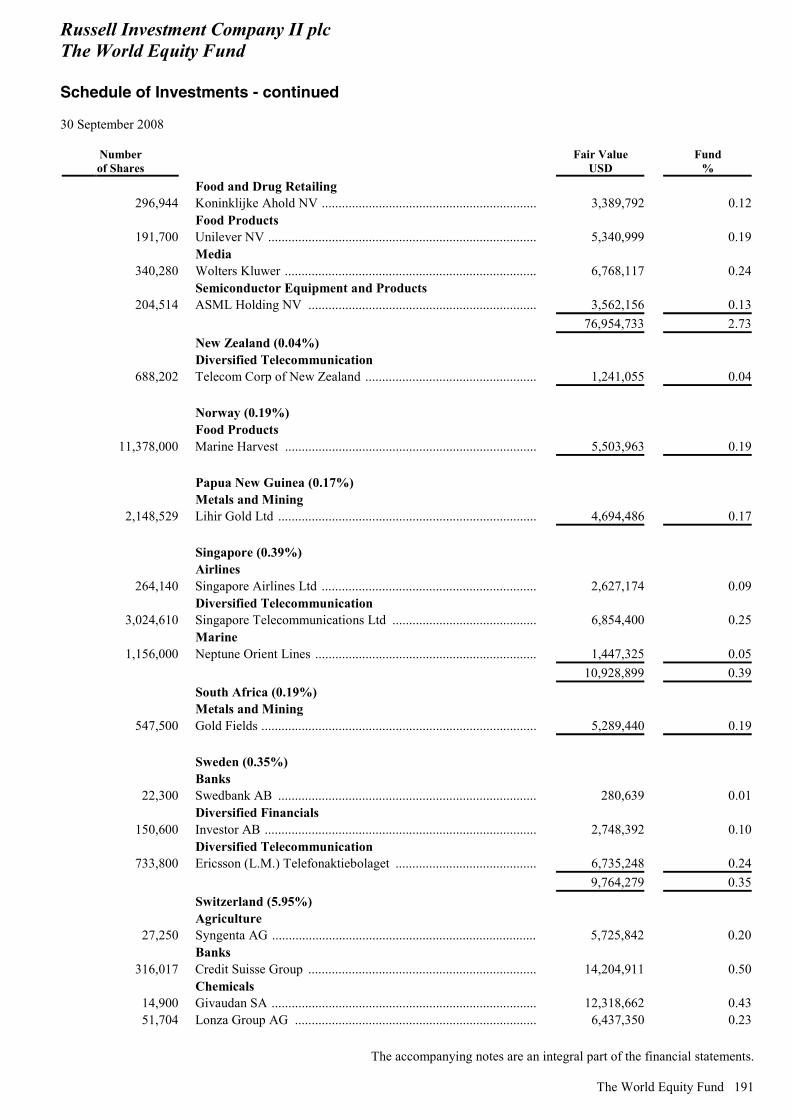
Russell Investment Company II plc The World Equity Fund Schedule of Investments - continued 30 September 2008
The accompanying notes are an integral part of the financial statements.
The World Equity Fund 191
Number of Shares
Fair Value USD
Fund %
Food and Drug Retailing 296,944 Koninklijke Ahold NV ................................................................ 3,389,792 0.12
Food Products 191,700 Unilever NV ................................................................................ 5,340,999 0.19
Media 340,280 Wolters Kluwer ........................................................................... 6,768,117 0.24
Semiconductor Equipment and Products 204,514 ASML Holding NV .................................................................... 3,562,156 0.13
76,954,733 2.73 New Zealand (0.04%) Diversified Telecommunication
688,202 Telecom Corp of New Zealand ................................................... 1,241,055 0.04 Norway (0.19%) Food Products
11,378,000 Marine Harvest ........................................................................... 5,503,963 0.19 Papua New Guinea (0.17%) Metals and Mining
2,148,529 Lihir Gold Ltd ............................................................................. 4,694,486 0.17 Singapore (0.39%) Airlines
264,140 Singapore Airlines Ltd ................................................................ 2,627,174 0.09 Diversified Telecommunication
3,024,610 Singapore Telecommunications Ltd ........................................... 6,854,400 0.25 Marine
1,156,000 Neptune Orient Lines .................................................................. 1,447,325 0.05 10,928,899 0.39 South Africa (0.19%) Metals and Mining
547,500 Gold Fields .................................................................................. 5,289,440 0.19 Sweden (0.35%) Banks
22,300 Swedbank AB ............................................................................. 280,639 0.01 Diversified Financials
150,600 Investor AB ................................................................................. 2,748,392 0.10 Diversified Telecommunication
733,800 Ericsson (L.M.) Telefonaktiebolaget .......................................... 6,735,248 0.24 9,764,279 0.35 Switzerland (5.95%) Agriculture
27,250 Syngenta AG ............................................................................... 5,725,842 0.20 Banks
316,017 Credit Suisse Group .................................................................... 14,204,911 0.50 Chemicals
14,900 Givaudan SA ............................................................................... 12,318,662 0.4351,704 Lonza Group AG ........................................................................ 6,437,350 0.23
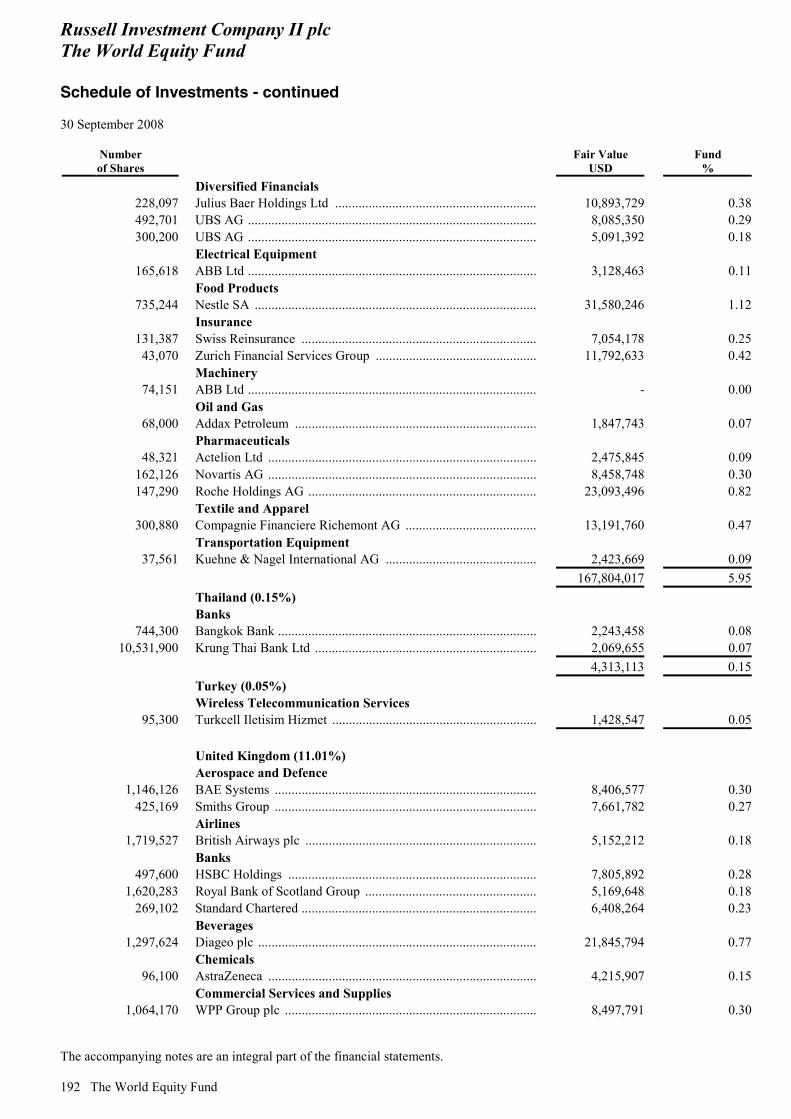
Russell Investment Company II plc The World Equity Fund Schedule of Investments - continued 30 September 2008
The accompanying notes are an integral part of the financial statements.
192 The World Equity Fund
Number of Shares
Fair Value USD
Fund %
Diversified Financials 228,097 Julius Baer Holdings Ltd ............................................................ 10,893,729 0.38492,701 UBS AG ...................................................................................... 8,085,350 0.29300,200 UBS AG ...................................................................................... 5,091,392 0.18
Electrical Equipment 165,618 ABB Ltd ...................................................................................... 3,128,463 0.11
Food Products 735,244 Nestle SA .................................................................................... 31,580,246 1.12
Insurance 131,387 Swiss Reinsurance ...................................................................... 7,054,178 0.25
43,070 Zurich Financial Services Group ................................................ 11,792,633 0.42 Machinery
74,151 ABB Ltd ...................................................................................... - 0.00 Oil and Gas
68,000 Addax Petroleum ........................................................................ 1,847,743 0.07 Pharmaceuticals
48,321 Actelion Ltd ................................................................................ 2,475,845 0.09162,126 Novartis AG ................................................................................ 8,458,748 0.30147,290 Roche Holdings AG .................................................................... 23,093,496 0.82
Textile and Apparel 300,880 Compagnie Financiere Richemont AG ....................................... 13,191,760 0.47
Transportation Equipment 37,561 Kuehne & Nagel International AG ............................................. 2,423,669 0.09
167,804,017 5.95 Thailand (0.15%) Banks
744,300 Bangkok Bank ............................................................................. 2,243,458 0.0810,531,900 Krung Thai Bank Ltd .................................................................. 2,069,655 0.07
4,313,113 0.15 Turkey (0.05%) Wireless Telecommunication Services
95,300 Turkcell Iletisim Hizmet ............................................................. 1,428,547 0.05 United Kingdom (11.01%) Aerospace and Defence
1,146,126 BAE Systems .............................................................................. 8,406,577 0.30425,169 Smiths Group .............................................................................. 7,661,782 0.27
Airlines 1,719,527 British Airways plc ..................................................................... 5,152,212 0.18
Banks 497,600 HSBC Holdings .......................................................................... 7,805,892 0.28
1,620,283 Royal Bank of Scotland Group ................................................... 5,169,648 0.18269,102 Standard Chartered ...................................................................... 6,408,264 0.23
Beverages 1,297,624 Diageo plc ................................................................................... 21,845,794 0.77
Chemicals 96,100 AstraZeneca ................................................................................ 4,215,907 0.15
Commercial Services and Supplies 1,064,170 WPP Group plc ........................................................................... 8,497,791 0.30
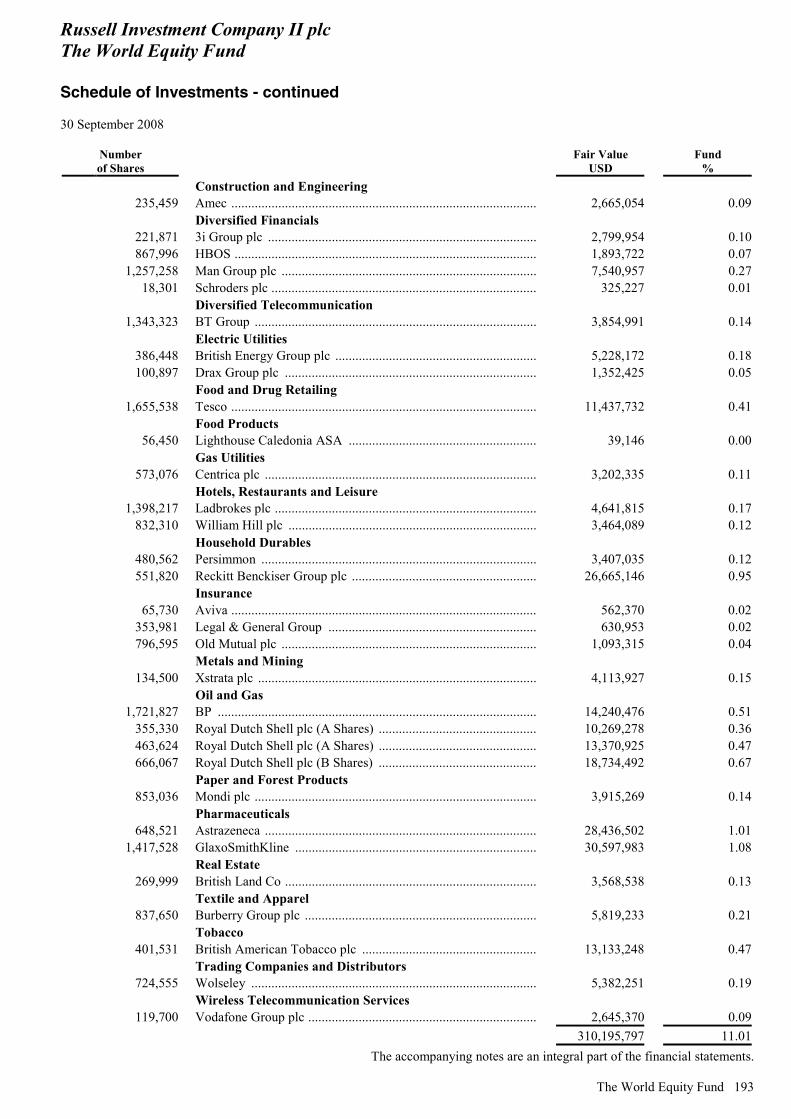
Russell Investment Company II plc The World Equity Fund Schedule of Investments - continued 30 September 2008
The accompanying notes are an integral part of the financial statements.
The World Equity Fund 193
Number of Shares
Fair Value USD
Fund %
Construction and Engineering 235,459 Amec ........................................................................................... 2,665,054 0.09
Diversified Financials 221,871 3i Group plc ................................................................................ 2,799,954 0.10867,996 HBOS .......................................................................................... 1,893,722 0.07
1,257,258 Man Group plc ............................................................................ 7,540,957 0.2718,301 Schroders plc ............................................................................... 325,227 0.01
Diversified Telecommunication 1,343,323 BT Group .................................................................................... 3,854,991 0.14
Electric Utilities 386,448 British Energy Group plc ............................................................ 5,228,172 0.18100,897 Drax Group plc ........................................................................... 1,352,425 0.05
Food and Drug Retailing 1,655,538 Tesco ........................................................................................... 11,437,732 0.41
Food Products 56,450 Lighthouse Caledonia ASA ........................................................ 39,146 0.00
Gas Utilities 573,076 Centrica plc ................................................................................. 3,202,335 0.11
Hotels, Restaurants and Leisure 1,398,217 Ladbrokes plc .............................................................................. 4,641,815 0.17
832,310 William Hill plc .......................................................................... 3,464,089 0.12 Household Durables
480,562 Persimmon .................................................................................. 3,407,035 0.12551,820 Reckitt Benckiser Group plc ....................................................... 26,665,146 0.95
Insurance 65,730 Aviva ........................................................................................... 562,370 0.02
353,981 Legal & General Group .............................................................. 630,953 0.02796,595 Old Mutual plc ............................................................................ 1,093,315 0.04
Metals and Mining 134,500 Xstrata plc ................................................................................... 4,113,927 0.15
Oil and Gas 1,721,827 BP ............................................................................................... 14,240,476 0.51
355,330 Royal Dutch Shell plc (A Shares) ............................................... 10,269,278 0.36463,624 Royal Dutch Shell plc (A Shares) ............................................... 13,370,925 0.47666,067 Royal Dutch Shell plc (B Shares) ............................................... 18,734,492 0.67
Paper and Forest Products 853,036 Mondi plc .................................................................................... 3,915,269 0.14
Pharmaceuticals 648,521 Astrazeneca ................................................................................. 28,436,502 1.01
1,417,528 GlaxoSmithKline ........................................................................ 30,597,983 1.08 Real Estate
269,999 British Land Co ........................................................................... 3,568,538 0.13 Textile and Apparel
837,650 Burberry Group plc ..................................................................... 5,819,233 0.21 Tobacco
401,531 British American Tobacco plc .................................................... 13,133,248 0.47 Trading Companies and Distributors
724,555 Wolseley ..................................................................................... 5,382,251 0.19 Wireless Telecommunication Services
119,700 Vodafone Group plc .................................................................... 2,645,370 0.09 310,195,797 11.01
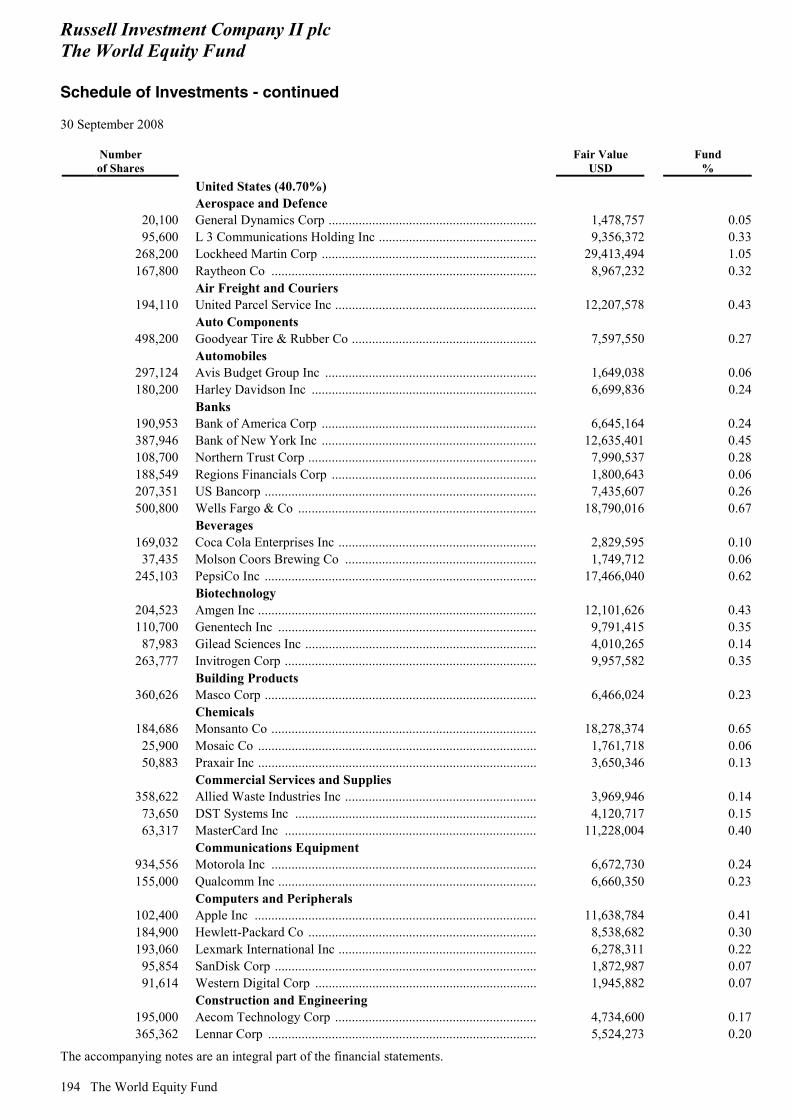
Russell Investment Company II plc The World Equity Fund Schedule of Investments - continued 30 September 2008
The accompanying notes are an integral part of the financial statements.
194 The World Equity Fund
Number of Shares
Fair Value USD
Fund %
United States (40.70%) Aerospace and Defence
20,100 General Dynamics Corp .............................................................. 1,478,757 0.0595,600 L 3 Communications Holding Inc ............................................... 9,356,372 0.33
268,200 Lockheed Martin Corp ................................................................ 29,413,494 1.05167,800 Raytheon Co ............................................................................... 8,967,232 0.32
Air Freight and Couriers 194,110 United Parcel Service Inc ............................................................ 12,207,578 0.43
Auto Components 498,200 Goodyear Tire & Rubber Co ....................................................... 7,597,550 0.27
Automobiles 297,124 Avis Budget Group Inc ............................................................... 1,649,038 0.06180,200 Harley Davidson Inc ................................................................... 6,699,836 0.24
Banks 190,953 Bank of America Corp ................................................................ 6,645,164 0.24387,946 Bank of New York Inc ................................................................ 12,635,401 0.45108,700 Northern Trust Corp .................................................................... 7,990,537 0.28188,549 Regions Financials Corp ............................................................. 1,800,643 0.06207,351 US Bancorp ................................................................................. 7,435,607 0.26500,800 Wells Fargo & Co ....................................................................... 18,790,016 0.67
Beverages 169,032 Coca Cola Enterprises Inc ........................................................... 2,829,595 0.10
37,435 Molson Coors Brewing Co ......................................................... 1,749,712 0.06245,103 PepsiCo Inc ................................................................................. 17,466,040 0.62
Biotechnology 204,523 Amgen Inc ................................................................................... 12,101,626 0.43110,700 Genentech Inc ............................................................................. 9,791,415 0.35
87,983 Gilead Sciences Inc ..................................................................... 4,010,265 0.14263,777 Invitrogen Corp ........................................................................... 9,957,582 0.35
Building Products 360,626 Masco Corp ................................................................................. 6,466,024 0.23
Chemicals 184,686 Monsanto Co ............................................................................... 18,278,374 0.65
25,900 Mosaic Co ................................................................................... 1,761,718 0.0650,883 Praxair Inc ................................................................................... 3,650,346 0.13
Commercial Services and Supplies 358,622 Allied Waste Industries Inc ......................................................... 3,969,946 0.14
73,650 DST Systems Inc ........................................................................ 4,120,717 0.1563,317 MasterCard Inc ........................................................................... 11,228,004 0.40
Communications Equipment 934,556 Motorola Inc ............................................................................... 6,672,730 0.24155,000 Qualcomm Inc ............................................................................. 6,660,350 0.23
Computers and Peripherals 102,400 Apple Inc .................................................................................... 11,638,784 0.41184,900 Hewlett-Packard Co .................................................................... 8,538,682 0.30193,060 Lexmark International Inc ........................................................... 6,278,311 0.22
95,854 SanDisk Corp .............................................................................. 1,872,987 0.0791,614 Western Digital Corp .................................................................. 1,945,882 0.07
Construction and Engineering 195,000 Aecom Technology Corp ............................................................ 4,734,600 0.17365,362 Lennar Corp ................................................................................ 5,524,273 0.20
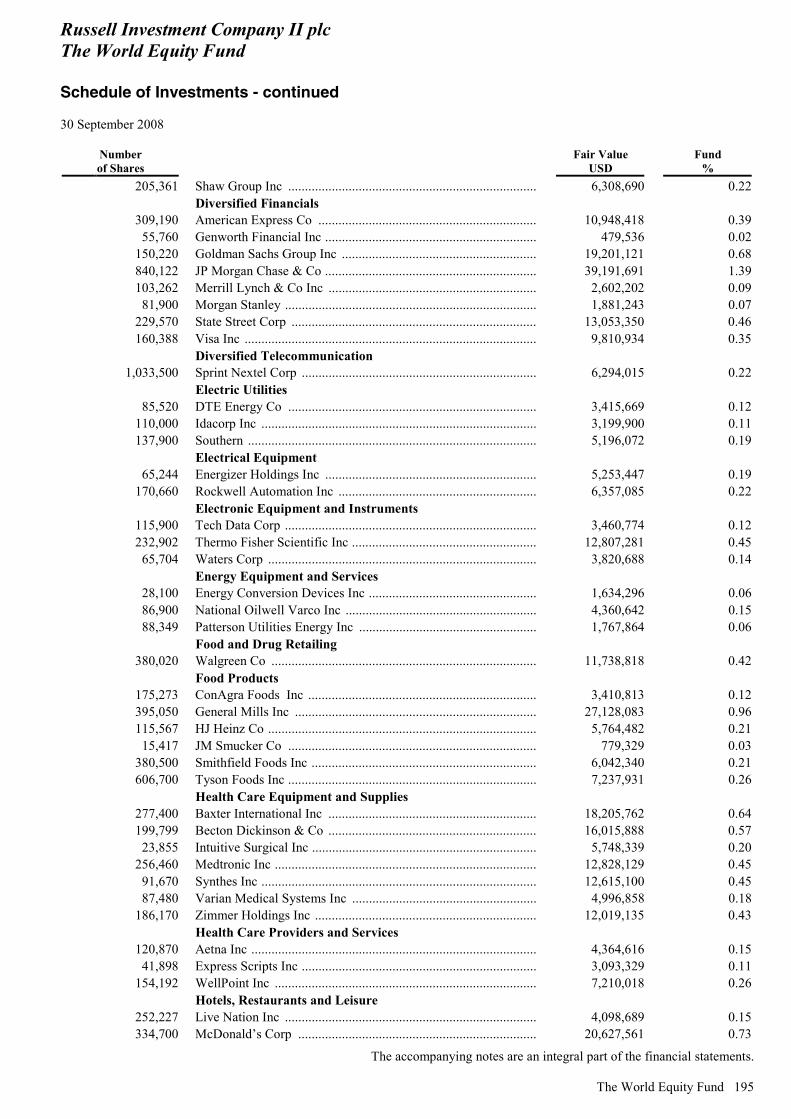
Russell Investment Company II plc The World Equity Fund Schedule of Investments - continued 30 September 2008
The accompanying notes are an integral part of the financial statements.
The World Equity Fund 195
Number of Shares
Fair Value USD
Fund %
205,361 Shaw Group Inc .......................................................................... 6,308,690 0.22 Diversified Financials
309,190 American Express Co ................................................................. 10,948,418 0.3955,760 Genworth Financial Inc ............................................................... 479,536 0.02
150,220 Goldman Sachs Group Inc .......................................................... 19,201,121 0.68840,122 JP Morgan Chase & Co ............................................................... 39,191,691 1.39103,262 Merrill Lynch & Co Inc .............................................................. 2,602,202 0.09
81,900 Morgan Stanley ........................................................................... 1,881,243 0.07229,570 State Street Corp ......................................................................... 13,053,350 0.46160,388 Visa Inc ....................................................................................... 9,810,934 0.35
Diversified Telecommunication 1,033,500 Sprint Nextel Corp ...................................................................... 6,294,015 0.22
Electric Utilities 85,520 DTE Energy Co .......................................................................... 3,415,669 0.12
110,000 Idacorp Inc .................................................................................. 3,199,900 0.11137,900 Southern ...................................................................................... 5,196,072 0.19
Electrical Equipment 65,244 Energizer Holdings Inc ............................................................... 5,253,447 0.19
170,660 Rockwell Automation Inc ........................................................... 6,357,085 0.22 Electronic Equipment and Instruments
115,900 Tech Data Corp ........................................................................... 3,460,774 0.12232,902 Thermo Fisher Scientific Inc ....................................................... 12,807,281 0.45
65,704 Waters Corp ................................................................................ 3,820,688 0.14 Energy Equipment and Services
28,100 Energy Conversion Devices Inc .................................................. 1,634,296 0.0686,900 National Oilwell Varco Inc ......................................................... 4,360,642 0.1588,349 Patterson Utilities Energy Inc ..................................................... 1,767,864 0.06
Food and Drug Retailing 380,020 Walgreen Co ............................................................................... 11,738,818 0.42
Food Products 175,273 ConAgra Foods Inc .................................................................... 3,410,813 0.12395,050 General Mills Inc ........................................................................ 27,128,083 0.96115,567 HJ Heinz Co ................................................................................ 5,764,482 0.21
15,417 JM Smucker Co .......................................................................... 779,329 0.03380,500 Smithfield Foods Inc ................................................................... 6,042,340 0.21606,700 Tyson Foods Inc .......................................................................... 7,237,931 0.26
Health Care Equipment and Supplies 277,400 Baxter International Inc .............................................................. 18,205,762 0.64199,799 Becton Dickinson & Co .............................................................. 16,015,888 0.57
23,855 Intuitive Surgical Inc ................................................................... 5,748,339 0.20256,460 Medtronic Inc .............................................................................. 12,828,129 0.45
91,670 Synthes Inc .................................................................................. 12,615,100 0.4587,480 Varian Medical Systems Inc ....................................................... 4,996,858 0.18
186,170 Zimmer Holdings Inc .................................................................. 12,019,135 0.43 Health Care Providers and Services
120,870 Aetna Inc ..................................................................................... 4,364,616 0.1541,898 Express Scripts Inc ...................................................................... 3,093,329 0.11
154,192 WellPoint Inc .............................................................................. 7,210,018 0.26 Hotels, Restaurants and Leisure
252,227 Live Nation Inc ........................................................................... 4,098,689 0.15334,700 McDonald’s Corp ....................................................................... 20,627,561 0.73
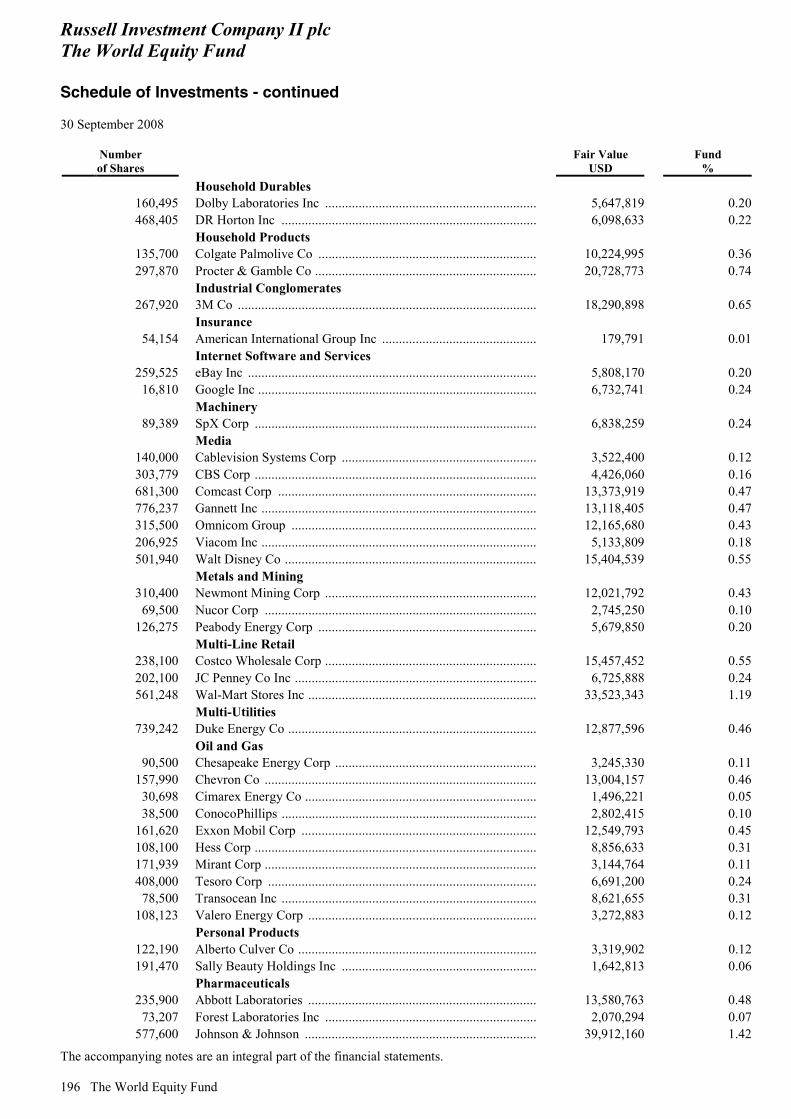
Russell Investment Company II plc The World Equity Fund Schedule of Investments - continued 30 September 2008
The accompanying notes are an integral part of the financial statements.
196 The World Equity Fund
Number of Shares
Fair Value USD
Fund %
Household Durables 160,495 Dolby Laboratories Inc ............................................................... 5,647,819 0.20468,405 DR Horton Inc ............................................................................ 6,098,633 0.22
Household Products 135,700 Colgate Palmolive Co ................................................................. 10,224,995 0.36297,870 Procter & Gamble Co .................................................................. 20,728,773 0.74
Industrial Conglomerates 267,920 3M Co ......................................................................................... 18,290,898 0.65
Insurance 54,154 American International Group Inc .............................................. 179,791 0.01
Internet Software and Services 259,525 eBay Inc ...................................................................................... 5,808,170 0.20
16,810 Google Inc ................................................................................... 6,732,741 0.24 Machinery
89,389 SpX Corp .................................................................................... 6,838,259 0.24 Media
140,000 Cablevision Systems Corp .......................................................... 3,522,400 0.12303,779 CBS Corp .................................................................................... 4,426,060 0.16681,300 Comcast Corp ............................................................................. 13,373,919 0.47776,237 Gannett Inc .................................................................................. 13,118,405 0.47315,500 Omnicom Group ......................................................................... 12,165,680 0.43206,925 Viacom Inc .................................................................................. 5,133,809 0.18501,940 Walt Disney Co ........................................................................... 15,404,539 0.55
Metals and Mining 310,400 Newmont Mining Corp ............................................................... 12,021,792 0.43
69,500 Nucor Corp ................................................................................. 2,745,250 0.10126,275 Peabody Energy Corp ................................................................. 5,679,850 0.20
Multi-Line Retail 238,100 Costco Wholesale Corp ............................................................... 15,457,452 0.55202,100 JC Penney Co Inc ........................................................................ 6,725,888 0.24561,248 Wal-Mart Stores Inc .................................................................... 33,523,343 1.19
Multi-Utilities 739,242 Duke Energy Co .......................................................................... 12,877,596 0.46
Oil and Gas 90,500 Chesapeake Energy Corp ............................................................ 3,245,330 0.11
157,990 Chevron Co ................................................................................. 13,004,157 0.4630,698 Cimarex Energy Co ..................................................................... 1,496,221 0.0538,500 ConocoPhillips ............................................................................ 2,802,415 0.10
161,620 Exxon Mobil Corp ...................................................................... 12,549,793 0.45108,100 Hess Corp .................................................................................... 8,856,633 0.31171,939 Mirant Corp ................................................................................. 3,144,764 0.11408,000 Tesoro Corp ................................................................................ 6,691,200 0.24
78,500 Transocean Inc ............................................................................ 8,621,655 0.31108,123 Valero Energy Corp .................................................................... 3,272,883 0.12
Personal Products 122,190 Alberto Culver Co ....................................................................... 3,319,902 0.12191,470 Sally Beauty Holdings Inc .......................................................... 1,642,813 0.06
Pharmaceuticals 235,900 Abbott Laboratories .................................................................... 13,580,763 0.48
73,207 Forest Laboratories Inc ............................................................... 2,070,294 0.07577,600 Johnson & Johnson ..................................................................... 39,912,160 1.42

Russell Investment Company II plc The World Equity Fund Schedule of Investments - continued 30 September 2008
The accompanying notes are an integral part of the financial statements.
The World Equity Fund 197
Number of Shares
Fair Value USD
Fund %
812,332 Pfizer Inc ..................................................................................... 14,898,169 0.53146,890 Wyeth .......................................................................................... 5,426,116 0.19
Road and Rail 70,300 CSX Corp .................................................................................... 3,834,865 0.14
Semiconductor Equipment and Products 6,900 First Solar Inc .............................................................................. 1,303,479 0.05
780,650 Intel Corp .................................................................................... 14,598,155 0.5258,087 Lam Research Corp ..................................................................... 1,829,160 0.06
314,697 Teradyne Inc ............................................................................... 2,454,636 0.09 Software
100,500 Ansys Inc .................................................................................... 3,802,920 0.14312,142 Cadence Design Systems Inc ...................................................... 2,103,837 0.07
10,761 Citrix Systems Inc ....................................................................... 271,393 0.01156,200 Microsoft Corp ............................................................................ 4,165,854 0.15728,940 Oracle Corp ................................................................................. 14,782,903 0.52447,900 Symantec Corp ............................................................................ 8,751,966 0.31
Speciality Retail 281,800 GameStop Corp ........................................................................... 9,600,926 0.34256,667 Home Depot Inc .......................................................................... 6,634,842 0.24404,268 Office Depot Inc ......................................................................... 2,348,797 0.08
Textile and Apparel 290,080 Nike Inc ...................................................................................... 19,403,451 0.69
Tobacco 338,215 Altria Group Inc .......................................................................... 6,710,185 0.24500,409 Philip Morris International Inc .................................................... 24,059,665 0.85
1,146,803,690 40.70
Total Common Stock ............................................................ 2,508,507,758 89.02 Preferred Stock (3.10%) Australia (0.05%) Metals and Mining
143,100 Alumina Ltd ................................................................................ 1,436,724 0.05 Brazil (0.90%) Banks
350,180 Banco Bradesco SA .................................................................... 5,588,873 0.20 Industrial Conglomerates
73,300 Cia de Saneamento Basico do Estado de Sao Paulo ................... 2,069,259 0.07 Diversified Telecommunication
64,540 Brasil Telecom Participacoes ...................................................... 3,114,700 0.11292,000 Tele Norte Leste Participacoes SA ............................................. 5,072,040 0.18
Electric Utilities 486,600 Centrais Eletricas Brasileiras SA ................................................ 5,741,880 0.20
Preferred Stock 575,024 All America Latina Logistica SA ................................................ 3,848,498 0.14
25,435,250 0.90 Colombia (0.01%) Banks
7,620 Bancolombia SA ......................................................................... 215,722 0.01
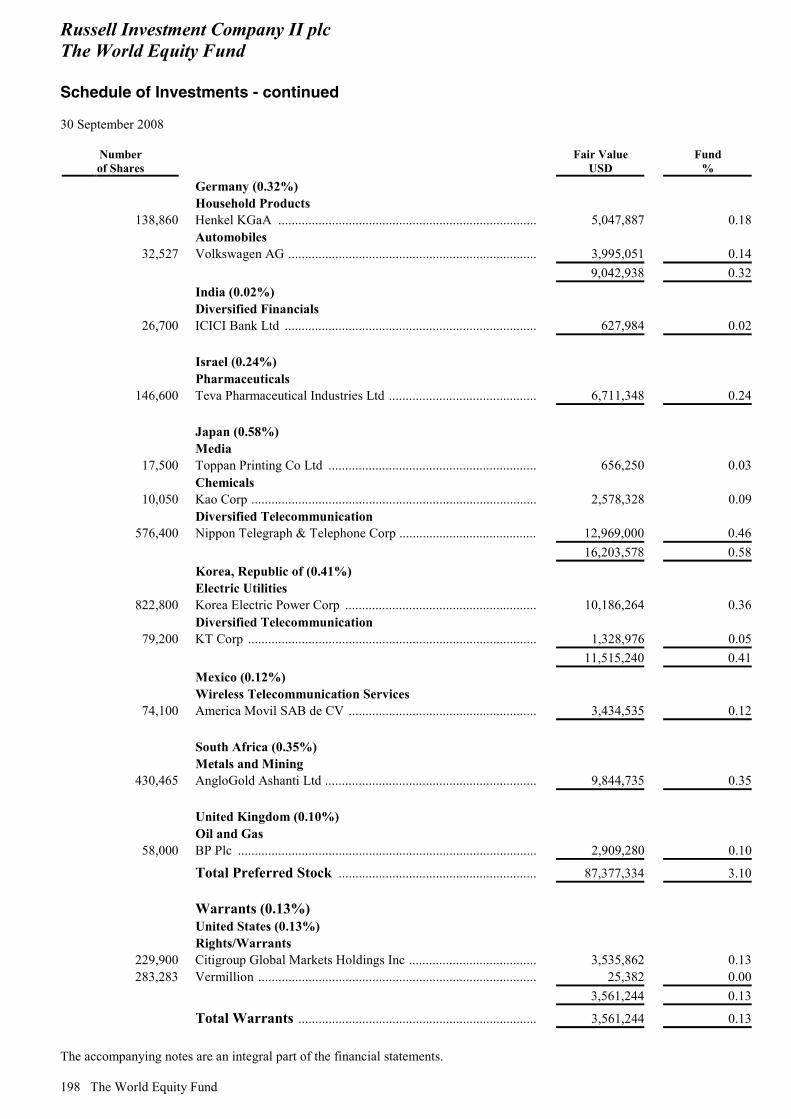
Russell Investment Company II plc The World Equity Fund Schedule of Investments - continued 30 September 2008
The accompanying notes are an integral part of the financial statements.
198 The World Equity Fund
Number of Shares
Fair Value USD
Fund %
Germany (0.32%) Household Products
138,860 Henkel KGaA ............................................................................. 5,047,887 0.18 Automobiles
32,527 Volkswagen AG .......................................................................... 3,995,051 0.14 9,042,938 0.32 India (0.02%) Diversified Financials
26,700 ICICI Bank Ltd ........................................................................... 627,984 0.02 Israel (0.24%) Pharmaceuticals
146,600 Teva Pharmaceutical Industries Ltd ............................................ 6,711,348 0.24 Japan (0.58%) Media
17,500 Toppan Printing Co Ltd .............................................................. 656,250 0.03 Chemicals
10,050 Kao Corp ..................................................................................... 2,578,328 0.09 Diversified Telecommunication
576,400 Nippon Telegraph & Telephone Corp ......................................... 12,969,000 0.46 16,203,578 0.58 Korea, Republic of (0.41%) Electric Utilities
822,800 Korea Electric Power Corp ......................................................... 10,186,264 0.36 Diversified Telecommunication
79,200 KT Corp ...................................................................................... 1,328,976 0.05 11,515,240 0.41 Mexico (0.12%) Wireless Telecommunication Services
74,100 America Movil SAB de CV ........................................................ 3,434,535 0.12 South Africa (0.35%) Metals and Mining
430,465 AngloGold Ashanti Ltd ............................................................... 9,844,735 0.35 United Kingdom (0.10%) Oil and Gas
58,000 BP Plc ......................................................................................... 2,909,280 0.10
Total Preferred Stock ........................................................... 87,377,334 3.10 Warrants (0.13%) United States (0.13%) Rights/Warrants
229,900 Citigroup Global Markets Holdings Inc ...................................... 3,535,862 0.13283,283 Vermillion ................................................................................... 25,382 0.00
3,561,244 0.13
Total Warrants ....................................................................... 3,561,244 0.13
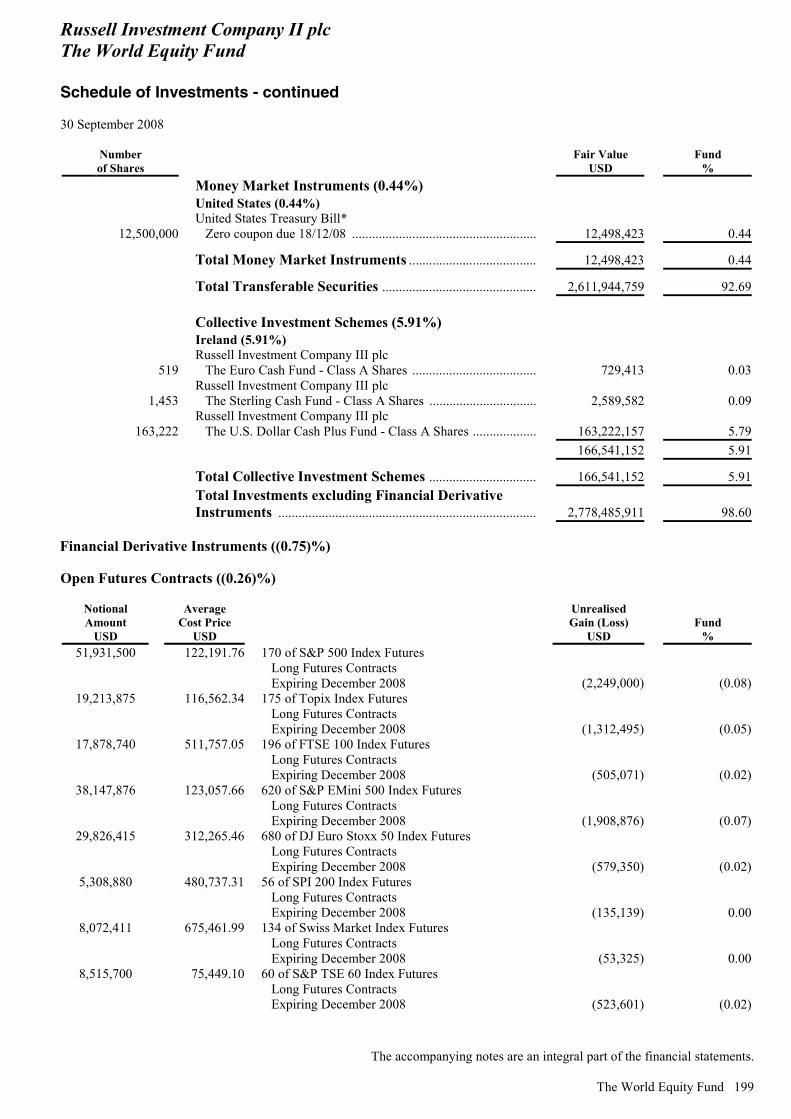
Russell Investment Company II plc The World Equity Fund Schedule of Investments - continued 30 September 2008
The accompanying notes are an integral part of the financial statements.
The World Equity Fund 199
Number of Shares
Fair Value USD
Fund %
Money Market Instruments (0.44%) United States (0.44%)
12,500,000 United States Treasury Bill* Zero coupon due 18/12/08 ....................................................... 12,498,423 0.44
Total Money Market Instruments ...................................... 12,498,423 0.44
Total Transferable Securities .............................................. 2,611,944,759 92.69 Collective Investment Schemes (5.91%) Ireland (5.91%)
519 Russell Investment Company III plc The Euro Cash Fund - Class A Shares ..................................... 729,413 0.03
1,453 Russell Investment Company III plc The Sterling Cash Fund - Class A Shares ................................ 2,589,582 0.09
163,222 Russell Investment Company III plc The U.S. Dollar Cash Plus Fund - Class A Shares ................... 163,222,157 5.79
166,541,152 5.91
Total Collective Investment Schemes ................................ 166,541,152 5.91
Total Investments excluding Financial Derivative Instruments ............................................................................. 2,778,485,911 98.60
Financial Derivative Instruments ((0.75)%) Open Futures Contracts ((0.26)%)
Notional Amount
USD
Average Cost Price
USD
Unrealised Gain (Loss)
USD Fund
% 51,931,500 122,191.76 170 of S&P 500 Index Futures
Long Futures Contracts Expiring December 2008 (2,249,000) (0.08)
19,213,875 116,562.34 175 of Topix Index Futures Long Futures Contracts Expiring December 2008 (1,312,495) (0.05)
17,878,740 511,757.05 196 of FTSE 100 Index Futures Long Futures Contracts Expiring December 2008 (505,071) (0.02)
38,147,876 123,057.66 620 of S&P EMini 500 Index Futures Long Futures Contracts Expiring December 2008 (1,908,876) (0.07)
29,826,415 312,265.46 680 of DJ Euro Stoxx 50 Index Futures Long Futures Contracts Expiring December 2008 (579,350) (0.02)
5,308,880 480,737.31 56 of SPI 200 Index Futures Long Futures Contracts Expiring December 2008 (135,139) 0.00
8,072,411 675,461.99 134 of Swiss Market Index Futures Long Futures Contracts Expiring December 2008 (53,325) 0.00
8,515,700 75,449.10 60 of S&P TSE 60 Index Futures Long Futures Contracts Expiring December 2008 (523,601) (0.02)
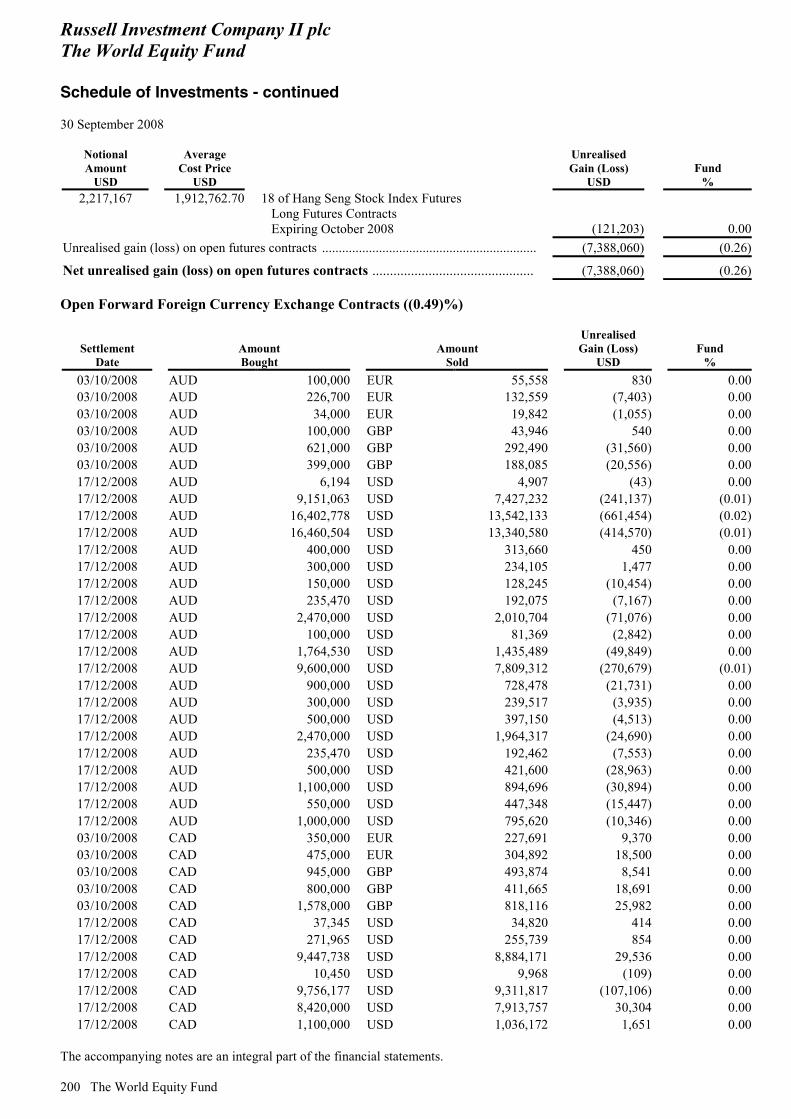
Russell Investment Company II plc The World Equity Fund Schedule of Investments - continued 30 September 2008
The accompanying notes are an integral part of the financial statements.
200 The World Equity Fund
Notional Amount
USD
Average Cost Price
USD
Unrealised Gain (Loss)
USD Fund
% 2,217,167 1,912,762.70 18 of Hang Seng Stock Index Futures
Long Futures Contracts Expiring October 2008 (121,203) 0.00
Unrealised gain (loss) on open futures contracts ................................................................ (7,388,060) (0.26)
Net unrealised gain (loss) on open futures contracts .............................................. (7,388,060) (0.26) Open Forward Foreign Currency Exchange Contracts ((0.49)%)
Settlement Date
Amount Bought
Amount Sold
Unrealised Gain (Loss)
USD Fund
% 03/10/2008 AUD 100,000 EUR 55,558 830 0.0003/10/2008 AUD 226,700 EUR 132,559 (7,403) 0.0003/10/2008 AUD 34,000 EUR 19,842 (1,055) 0.0003/10/2008 AUD 100,000 GBP 43,946 540 0.0003/10/2008 AUD 621,000 GBP 292,490 (31,560) 0.0003/10/2008 AUD 399,000 GBP 188,085 (20,556) 0.0017/12/2008 AUD 6,194 USD 4,907 (43) 0.0017/12/2008 AUD 9,151,063 USD 7,427,232 (241,137) (0.01)17/12/2008 AUD 16,402,778 USD 13,542,133 (661,454) (0.02)17/12/2008 AUD 16,460,504 USD 13,340,580 (414,570) (0.01)17/12/2008 AUD 400,000 USD 313,660 450 0.0017/12/2008 AUD 300,000 USD 234,105 1,477 0.0017/12/2008 AUD 150,000 USD 128,245 (10,454) 0.0017/12/2008 AUD 235,470 USD 192,075 (7,167) 0.0017/12/2008 AUD 2,470,000 USD 2,010,704 (71,076) 0.0017/12/2008 AUD 100,000 USD 81,369 (2,842) 0.0017/12/2008 AUD 1,764,530 USD 1,435,489 (49,849) 0.0017/12/2008 AUD 9,600,000 USD 7,809,312 (270,679) (0.01)17/12/2008 AUD 900,000 USD 728,478 (21,731) 0.0017/12/2008 AUD 300,000 USD 239,517 (3,935) 0.0017/12/2008 AUD 500,000 USD 397,150 (4,513) 0.0017/12/2008 AUD 2,470,000 USD 1,964,317 (24,690) 0.0017/12/2008 AUD 235,470 USD 192,462 (7,553) 0.0017/12/2008 AUD 500,000 USD 421,600 (28,963) 0.0017/12/2008 AUD 1,100,000 USD 894,696 (30,894) 0.0017/12/2008 AUD 550,000 USD 447,348 (15,447) 0.0017/12/2008 AUD 1,000,000 USD 795,620 (10,346) 0.0003/10/2008 CAD 350,000 EUR 227,691 9,370 0.0003/10/2008 CAD 475,000 EUR 304,892 18,500 0.0003/10/2008 CAD 945,000 GBP 493,874 8,541 0.0003/10/2008 CAD 800,000 GBP 411,665 18,691 0.0003/10/2008 CAD 1,578,000 GBP 818,116 25,982 0.0017/12/2008 CAD 37,345 USD 34,820 414 0.0017/12/2008 CAD 271,965 USD 255,739 854 0.0017/12/2008 CAD 9,447,738 USD 8,884,171 29,536 0.0017/12/2008 CAD 10,450 USD 9,968 (109) 0.0017/12/2008 CAD 9,756,177 USD 9,311,817 (107,106) 0.0017/12/2008 CAD 8,420,000 USD 7,913,757 30,304 0.0017/12/2008 CAD 1,100,000 USD 1,036,172 1,651 0.00
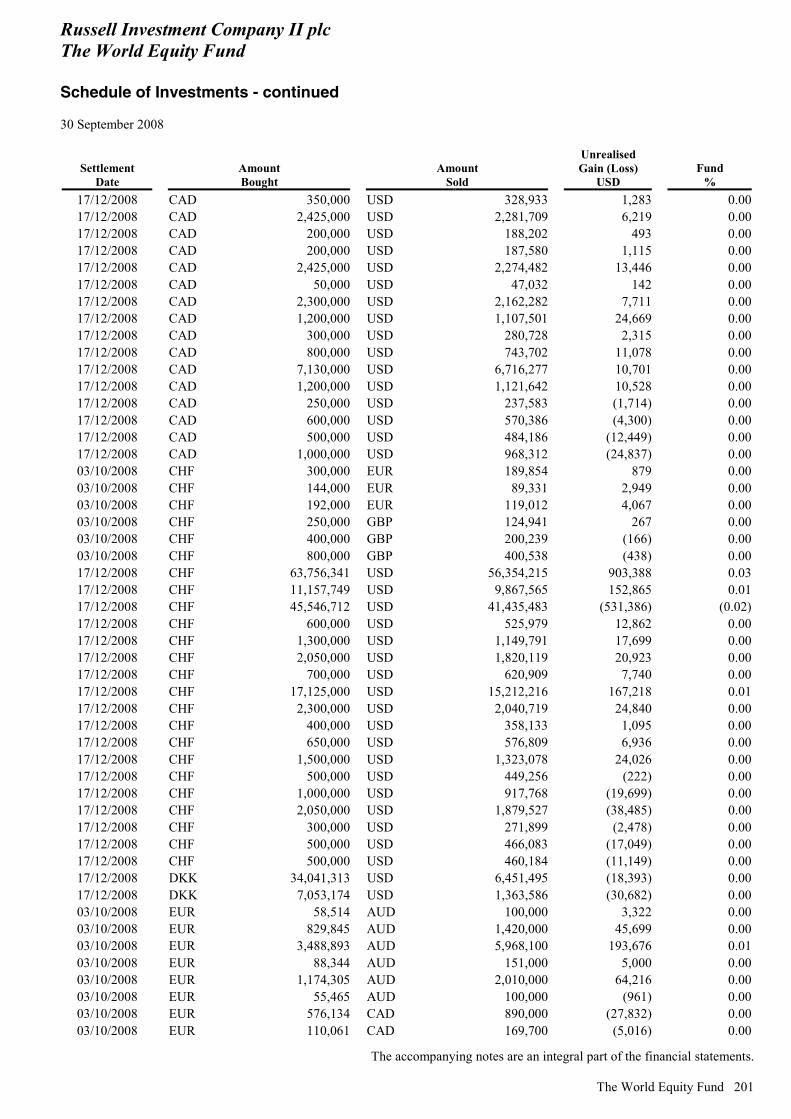
Russell Investment Company II plc The World Equity Fund Schedule of Investments - continued 30 September 2008
The accompanying notes are an integral part of the financial statements.
The World Equity Fund 201
Settlement Date
Amount Bought
Amount Sold
Unrealised Gain (Loss)
USD Fund
% 17/12/2008 CAD 350,000 USD 328,933 1,283 0.0017/12/2008 CAD 2,425,000 USD 2,281,709 6,219 0.0017/12/2008 CAD 200,000 USD 188,202 493 0.0017/12/2008 CAD 200,000 USD 187,580 1,115 0.0017/12/2008 CAD 2,425,000 USD 2,274,482 13,446 0.0017/12/2008 CAD 50,000 USD 47,032 142 0.0017/12/2008 CAD 2,300,000 USD 2,162,282 7,711 0.0017/12/2008 CAD 1,200,000 USD 1,107,501 24,669 0.0017/12/2008 CAD 300,000 USD 280,728 2,315 0.0017/12/2008 CAD 800,000 USD 743,702 11,078 0.0017/12/2008 CAD 7,130,000 USD 6,716,277 10,701 0.0017/12/2008 CAD 1,200,000 USD 1,121,642 10,528 0.0017/12/2008 CAD 250,000 USD 237,583 (1,714) 0.0017/12/2008 CAD 600,000 USD 570,386 (4,300) 0.0017/12/2008 CAD 500,000 USD 484,186 (12,449) 0.0017/12/2008 CAD 1,000,000 USD 968,312 (24,837) 0.0003/10/2008 CHF 300,000 EUR 189,854 879 0.0003/10/2008 CHF 144,000 EUR 89,331 2,949 0.0003/10/2008 CHF 192,000 EUR 119,012 4,067 0.0003/10/2008 CHF 250,000 GBP 124,941 267 0.0003/10/2008 CHF 400,000 GBP 200,239 (166) 0.0003/10/2008 CHF 800,000 GBP 400,538 (438) 0.0017/12/2008 CHF 63,756,341 USD 56,354,215 903,388 0.0317/12/2008 CHF 11,157,749 USD 9,867,565 152,865 0.0117/12/2008 CHF 45,546,712 USD 41,435,483 (531,386) (0.02)17/12/2008 CHF 600,000 USD 525,979 12,862 0.0017/12/2008 CHF 1,300,000 USD 1,149,791 17,699 0.0017/12/2008 CHF 2,050,000 USD 1,820,119 20,923 0.0017/12/2008 CHF 700,000 USD 620,909 7,740 0.0017/12/2008 CHF 17,125,000 USD 15,212,216 167,218 0.0117/12/2008 CHF 2,300,000 USD 2,040,719 24,840 0.0017/12/2008 CHF 400,000 USD 358,133 1,095 0.0017/12/2008 CHF 650,000 USD 576,809 6,936 0.0017/12/2008 CHF 1,500,000 USD 1,323,078 24,026 0.0017/12/2008 CHF 500,000 USD 449,256 (222) 0.0017/12/2008 CHF 1,000,000 USD 917,768 (19,699) 0.0017/12/2008 CHF 2,050,000 USD 1,879,527 (38,485) 0.0017/12/2008 CHF 300,000 USD 271,899 (2,478) 0.0017/12/2008 CHF 500,000 USD 466,083 (17,049) 0.0017/12/2008 CHF 500,000 USD 460,184 (11,149) 0.0017/12/2008 DKK 34,041,313 USD 6,451,495 (18,393) 0.0017/12/2008 DKK 7,053,174 USD 1,363,586 (30,682) 0.0003/10/2008 EUR 58,514 AUD 100,000 3,322 0.0003/10/2008 EUR 829,845 AUD 1,420,000 45,699 0.0003/10/2008 EUR 3,488,893 AUD 5,968,100 193,676 0.0103/10/2008 EUR 88,344 AUD 151,000 5,000 0.0003/10/2008 EUR 1,174,305 AUD 2,010,000 64,216 0.0003/10/2008 EUR 55,465 AUD 100,000 (961) 0.0003/10/2008 EUR 576,134 CAD 890,000 (27,832) 0.0003/10/2008 EUR 110,061 CAD 169,700 (5,016) 0.00
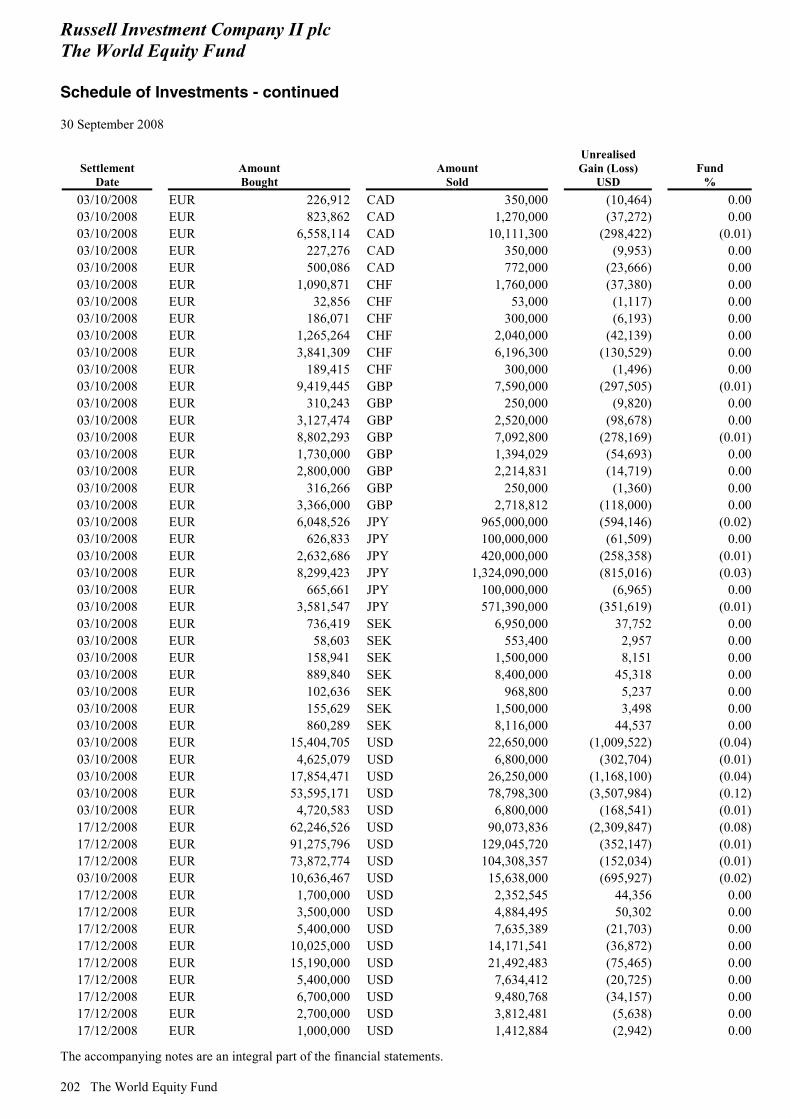
Russell Investment Company II plc The World Equity Fund Schedule of Investments - continued 30 September 2008
The accompanying notes are an integral part of the financial statements.
202 The World Equity Fund
Settlement Date
Amount Bought
Amount Sold
Unrealised Gain (Loss)
USD Fund
% 03/10/2008 EUR 226,912 CAD 350,000 (10,464) 0.0003/10/2008 EUR 823,862 CAD 1,270,000 (37,272) 0.0003/10/2008 EUR 6,558,114 CAD 10,111,300 (298,422) (0.01)03/10/2008 EUR 227,276 CAD 350,000 (9,953) 0.0003/10/2008 EUR 500,086 CAD 772,000 (23,666) 0.0003/10/2008 EUR 1,090,871 CHF 1,760,000 (37,380) 0.0003/10/2008 EUR 32,856 CHF 53,000 (1,117) 0.0003/10/2008 EUR 186,071 CHF 300,000 (6,193) 0.0003/10/2008 EUR 1,265,264 CHF 2,040,000 (42,139) 0.0003/10/2008 EUR 3,841,309 CHF 6,196,300 (130,529) 0.0003/10/2008 EUR 189,415 CHF 300,000 (1,496) 0.0003/10/2008 EUR 9,419,445 GBP 7,590,000 (297,505) (0.01)03/10/2008 EUR 310,243 GBP 250,000 (9,820) 0.0003/10/2008 EUR 3,127,474 GBP 2,520,000 (98,678) 0.0003/10/2008 EUR 8,802,293 GBP 7,092,800 (278,169) (0.01)03/10/2008 EUR 1,730,000 GBP 1,394,029 (54,693) 0.0003/10/2008 EUR 2,800,000 GBP 2,214,831 (14,719) 0.0003/10/2008 EUR 316,266 GBP 250,000 (1,360) 0.0003/10/2008 EUR 3,366,000 GBP 2,718,812 (118,000) 0.0003/10/2008 EUR 6,048,526 JPY 965,000,000 (594,146) (0.02)03/10/2008 EUR 626,833 JPY 100,000,000 (61,509) 0.0003/10/2008 EUR 2,632,686 JPY 420,000,000 (258,358) (0.01)03/10/2008 EUR 8,299,423 JPY 1,324,090,000 (815,016) (0.03)03/10/2008 EUR 665,661 JPY 100,000,000 (6,965) 0.0003/10/2008 EUR 3,581,547 JPY 571,390,000 (351,619) (0.01)03/10/2008 EUR 736,419 SEK 6,950,000 37,752 0.0003/10/2008 EUR 58,603 SEK 553,400 2,957 0.0003/10/2008 EUR 158,941 SEK 1,500,000 8,151 0.0003/10/2008 EUR 889,840 SEK 8,400,000 45,318 0.0003/10/2008 EUR 102,636 SEK 968,800 5,237 0.0003/10/2008 EUR 155,629 SEK 1,500,000 3,498 0.0003/10/2008 EUR 860,289 SEK 8,116,000 44,537 0.0003/10/2008 EUR 15,404,705 USD 22,650,000 (1,009,522) (0.04)03/10/2008 EUR 4,625,079 USD 6,800,000 (302,704) (0.01)03/10/2008 EUR 17,854,471 USD 26,250,000 (1,168,100) (0.04)03/10/2008 EUR 53,595,171 USD 78,798,300 (3,507,984) (0.12)03/10/2008 EUR 4,720,583 USD 6,800,000 (168,541) (0.01)17/12/2008 EUR 62,246,526 USD 90,073,836 (2,309,847) (0.08)17/12/2008 EUR 91,275,796 USD 129,045,720 (352,147) (0.01)17/12/2008 EUR 73,872,774 USD 104,308,357 (152,034) (0.01)03/10/2008 EUR 10,636,467 USD 15,638,000 (695,927) (0.02)17/12/2008 EUR 1,700,000 USD 2,352,545 44,356 0.0017/12/2008 EUR 3,500,000 USD 4,884,495 50,302 0.0017/12/2008 EUR 5,400,000 USD 7,635,389 (21,703) 0.0017/12/2008 EUR 10,025,000 USD 14,171,541 (36,872) 0.0017/12/2008 EUR 15,190,000 USD 21,492,483 (75,465) 0.0017/12/2008 EUR 5,400,000 USD 7,634,412 (20,725) 0.0017/12/2008 EUR 6,700,000 USD 9,480,768 (34,157) 0.0017/12/2008 EUR 2,700,000 USD 3,812,481 (5,638) 0.0017/12/2008 EUR 1,000,000 USD 1,412,884 (2,942) 0.00
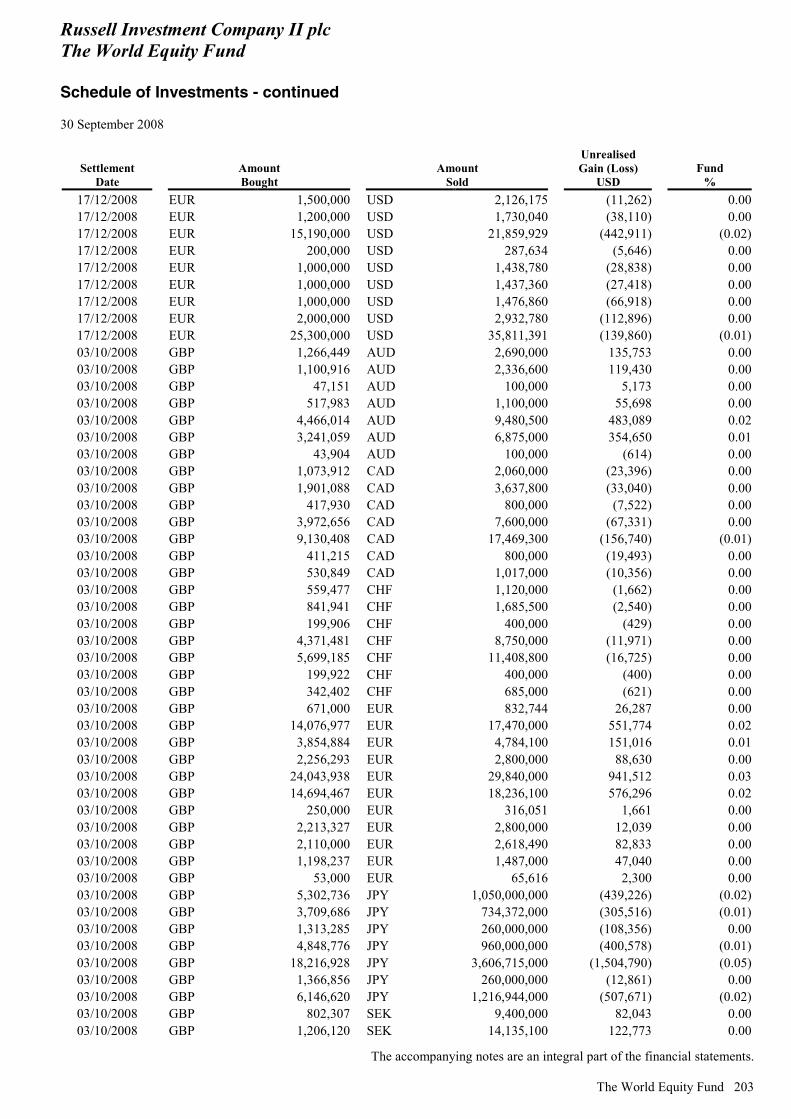
Russell Investment Company II plc The World Equity Fund Schedule of Investments - continued 30 September 2008
The accompanying notes are an integral part of the financial statements.
The World Equity Fund 203
Settlement Date
Amount Bought
Amount Sold
Unrealised Gain (Loss)
USD Fund
% 17/12/2008 EUR 1,500,000 USD 2,126,175 (11,262) 0.0017/12/2008 EUR 1,200,000 USD 1,730,040 (38,110) 0.0017/12/2008 EUR 15,190,000 USD 21,859,929 (442,911) (0.02)17/12/2008 EUR 200,000 USD 287,634 (5,646) 0.0017/12/2008 EUR 1,000,000 USD 1,438,780 (28,838) 0.0017/12/2008 EUR 1,000,000 USD 1,437,360 (27,418) 0.0017/12/2008 EUR 1,000,000 USD 1,476,860 (66,918) 0.0017/12/2008 EUR 2,000,000 USD 2,932,780 (112,896) 0.0017/12/2008 EUR 25,300,000 USD 35,811,391 (139,860) (0.01)03/10/2008 GBP 1,266,449 AUD 2,690,000 135,753 0.0003/10/2008 GBP 1,100,916 AUD 2,336,600 119,430 0.0003/10/2008 GBP 47,151 AUD 100,000 5,173 0.0003/10/2008 GBP 517,983 AUD 1,100,000 55,698 0.0003/10/2008 GBP 4,466,014 AUD 9,480,500 483,089 0.0203/10/2008 GBP 3,241,059 AUD 6,875,000 354,650 0.0103/10/2008 GBP 43,904 AUD 100,000 (614) 0.0003/10/2008 GBP 1,073,912 CAD 2,060,000 (23,396) 0.0003/10/2008 GBP 1,901,088 CAD 3,637,800 (33,040) 0.0003/10/2008 GBP 417,930 CAD 800,000 (7,522) 0.0003/10/2008 GBP 3,972,656 CAD 7,600,000 (67,331) 0.0003/10/2008 GBP 9,130,408 CAD 17,469,300 (156,740) (0.01)03/10/2008 GBP 411,215 CAD 800,000 (19,493) 0.0003/10/2008 GBP 530,849 CAD 1,017,000 (10,356) 0.0003/10/2008 GBP 559,477 CHF 1,120,000 (1,662) 0.0003/10/2008 GBP 841,941 CHF 1,685,500 (2,540) 0.0003/10/2008 GBP 199,906 CHF 400,000 (429) 0.0003/10/2008 GBP 4,371,481 CHF 8,750,000 (11,971) 0.0003/10/2008 GBP 5,699,185 CHF 11,408,800 (16,725) 0.0003/10/2008 GBP 199,922 CHF 400,000 (400) 0.0003/10/2008 GBP 342,402 CHF 685,000 (621) 0.0003/10/2008 GBP 671,000 EUR 832,744 26,287 0.0003/10/2008 GBP 14,076,977 EUR 17,470,000 551,774 0.0203/10/2008 GBP 3,854,884 EUR 4,784,100 151,016 0.0103/10/2008 GBP 2,256,293 EUR 2,800,000 88,630 0.0003/10/2008 GBP 24,043,938 EUR 29,840,000 941,512 0.0303/10/2008 GBP 14,694,467 EUR 18,236,100 576,296 0.0203/10/2008 GBP 250,000 EUR 316,051 1,661 0.0003/10/2008 GBP 2,213,327 EUR 2,800,000 12,039 0.0003/10/2008 GBP 2,110,000 EUR 2,618,490 82,833 0.0003/10/2008 GBP 1,198,237 EUR 1,487,000 47,040 0.0003/10/2008 GBP 53,000 EUR 65,616 2,300 0.0003/10/2008 GBP 5,302,736 JPY 1,050,000,000 (439,226) (0.02)03/10/2008 GBP 3,709,686 JPY 734,372,000 (305,516) (0.01)03/10/2008 GBP 1,313,285 JPY 260,000,000 (108,356) 0.0003/10/2008 GBP 4,848,776 JPY 960,000,000 (400,578) (0.01)03/10/2008 GBP 18,216,928 JPY 3,606,715,000 (1,504,790) (0.05)03/10/2008 GBP 1,366,856 JPY 260,000,000 (12,861) 0.0003/10/2008 GBP 6,146,620 JPY 1,216,944,000 (507,671) (0.02)03/10/2008 GBP 802,307 SEK 9,400,000 82,043 0.0003/10/2008 GBP 1,206,120 SEK 14,135,100 122,773 0.00
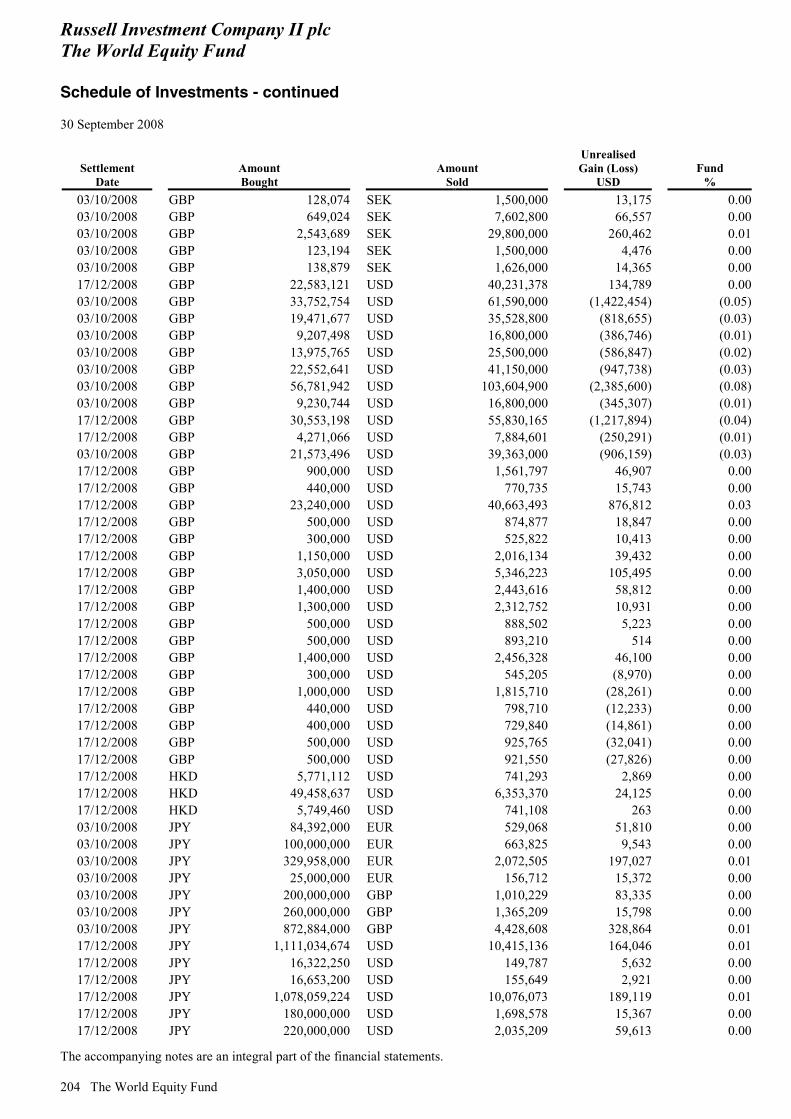
Russell Investment Company II plc The World Equity Fund Schedule of Investments - continued 30 September 2008
The accompanying notes are an integral part of the financial statements.
204 The World Equity Fund
Settlement Date
Amount Bought
Amount Sold
Unrealised Gain (Loss)
USD Fund
% 03/10/2008 GBP 128,074 SEK 1,500,000 13,175 0.0003/10/2008 GBP 649,024 SEK 7,602,800 66,557 0.0003/10/2008 GBP 2,543,689 SEK 29,800,000 260,462 0.0103/10/2008 GBP 123,194 SEK 1,500,000 4,476 0.0003/10/2008 GBP 138,879 SEK 1,626,000 14,365 0.0017/12/2008 GBP 22,583,121 USD 40,231,378 134,789 0.0003/10/2008 GBP 33,752,754 USD 61,590,000 (1,422,454) (0.05)03/10/2008 GBP 19,471,677 USD 35,528,800 (818,655) (0.03)03/10/2008 GBP 9,207,498 USD 16,800,000 (386,746) (0.01)03/10/2008 GBP 13,975,765 USD 25,500,000 (586,847) (0.02)03/10/2008 GBP 22,552,641 USD 41,150,000 (947,738) (0.03)03/10/2008 GBP 56,781,942 USD 103,604,900 (2,385,600) (0.08)03/10/2008 GBP 9,230,744 USD 16,800,000 (345,307) (0.01)17/12/2008 GBP 30,553,198 USD 55,830,165 (1,217,894) (0.04)17/12/2008 GBP 4,271,066 USD 7,884,601 (250,291) (0.01)03/10/2008 GBP 21,573,496 USD 39,363,000 (906,159) (0.03)17/12/2008 GBP 900,000 USD 1,561,797 46,907 0.0017/12/2008 GBP 440,000 USD 770,735 15,743 0.0017/12/2008 GBP 23,240,000 USD 40,663,493 876,812 0.0317/12/2008 GBP 500,000 USD 874,877 18,847 0.0017/12/2008 GBP 300,000 USD 525,822 10,413 0.0017/12/2008 GBP 1,150,000 USD 2,016,134 39,432 0.0017/12/2008 GBP 3,050,000 USD 5,346,223 105,495 0.0017/12/2008 GBP 1,400,000 USD 2,443,616 58,812 0.0017/12/2008 GBP 1,300,000 USD 2,312,752 10,931 0.0017/12/2008 GBP 500,000 USD 888,502 5,223 0.0017/12/2008 GBP 500,000 USD 893,210 514 0.0017/12/2008 GBP 1,400,000 USD 2,456,328 46,100 0.0017/12/2008 GBP 300,000 USD 545,205 (8,970) 0.0017/12/2008 GBP 1,000,000 USD 1,815,710 (28,261) 0.0017/12/2008 GBP 440,000 USD 798,710 (12,233) 0.0017/12/2008 GBP 400,000 USD 729,840 (14,861) 0.0017/12/2008 GBP 500,000 USD 925,765 (32,041) 0.0017/12/2008 GBP 500,000 USD 921,550 (27,826) 0.0017/12/2008 HKD 5,771,112 USD 741,293 2,869 0.0017/12/2008 HKD 49,458,637 USD 6,353,370 24,125 0.0017/12/2008 HKD 5,749,460 USD 741,108 263 0.0003/10/2008 JPY 84,392,000 EUR 529,068 51,810 0.0003/10/2008 JPY 100,000,000 EUR 663,825 9,543 0.0003/10/2008 JPY 329,958,000 EUR 2,072,505 197,027 0.0103/10/2008 JPY 25,000,000 EUR 156,712 15,372 0.0003/10/2008 JPY 200,000,000 GBP 1,010,229 83,335 0.0003/10/2008 JPY 260,000,000 GBP 1,365,209 15,798 0.0003/10/2008 JPY 872,884,000 GBP 4,428,608 328,864 0.0117/12/2008 JPY 1,111,034,674 USD 10,415,136 164,046 0.0117/12/2008 JPY 16,322,250 USD 149,787 5,632 0.0017/12/2008 JPY 16,653,200 USD 155,649 2,921 0.0017/12/2008 JPY 1,078,059,224 USD 10,076,073 189,119 0.0117/12/2008 JPY 180,000,000 USD 1,698,578 15,367 0.0017/12/2008 JPY 220,000,000 USD 2,035,209 59,613 0.00

Russell Investment Company II plc The World Equity Fund Schedule of Investments - continued 30 September 2008
The accompanying notes are an integral part of the financial statements.
The World Equity Fund 205
Settlement Date
Amount Bought
Amount Sold
Unrealised Gain (Loss)
USD Fund
% 17/12/2008 JPY 1,669,000,000 USD 15,445,981 446,102 0.0217/12/2008 JPY 100,000,000 USD 944,394 7,798 0.0017/12/2008 JPY 80,000,000 USD 741,125 20,628 0.0017/12/2008 JPY 50,000,000 USD 460,256 15,840 0.0017/12/2008 JPY 920,000,000 USD 8,522,140 238,025 0.0117/12/2008 JPY 220,000,000 USD 2,058,749 36,073 0.0017/12/2008 JPY 100,000,000 USD 951,318 874 0.0017/12/2008 JPY 2,440,000,000 USD 22,628,211 605,271 0.0217/12/2008 JPY 250,000,000 USD 2,416,159 (35,680) 0.0017/12/2008 JPY 220,000,000 USD 2,128,353 (33,531) 0.0017/12/2008 JPY 100,000,000 USD 954,927 (2,736) 0.0017/12/2008 JPY 300,000,000 USD 2,798,847 57,729 0.0017/12/2008 NOK 457,432 USD 84,216 (7,207) 0.0017/12/2008 NOK 29,541,947 USD 5,180,389 (207,006) (0.01)17/12/2008 NOK 51,077,307 USD 8,858,821 (259,962) (0.01)17/12/2008 NZD 503,059 USD 331,415 1,609 0.0017/12/2008 NZD 1,200,597 USD 789,272 5,520 0.0017/12/2008 NZD 1,200,597 USD 819,407 (24,615) 0.0003/10/2008 SEK 1,500,000 EUR 155,916 (3,900) 0.0003/10/2008 SEK 458,000 EUR 48,440 (2,362) 0.0003/10/2008 SEK 2,300,000 GBP 196,278 (20,020) 0.0003/10/2008 SEK 1,500,000 GBP 123,331 (4,720) 0.0003/10/2008 SEK 1,978,000 GBP 168,978 (17,535) 0.0017/12/2008 SEK 63,727 USD 9,900 (755) 0.0017/12/2008 SEK 70,923,569 USD 10,525,440 (348,078) (0.01)17/12/2008 SEK 185,495,442 USD 28,069,433 (1,451,281) (0.05)17/12/2008 SEK 99,959,014 USD 14,824,006 (480,128) (0.02)17/12/2008 SGD 283,550 USD 200,667 (1,624) 0.0017/12/2008 SGD 39,684,176 USD 27,960,386 (103,385) 0.0017/12/2008 SGD 17,974,490 USD 12,637,622 (20,115) 0.0017/12/2008 SGD 39,684,176 USD 27,883,766 (26,765) 0.0017/12/2008 USD 54,098 AUD 63,920 3,903 0.0017/12/2008 USD 20,757,744 AUD 25,552,395 692,106 0.0217/12/2008 USD 13,509,164 AUD 16,402,778 628,485 0.0217/12/2008 USD 293,509 AUD 350,000 18,663 0.0017/12/2008 USD 586,673 AUD 710,000 29,128 0.0017/12/2008 USD 123,422 AUD 150,000 5,630 0.0017/12/2008 USD 3,212,550 AUD 3,960,000 102,864 0.0017/12/2008 USD 1,402,208 AUD 1,730,000 43,684 0.0017/12/2008 USD 2,120,222 AUD 2,600,000 78,509 0.0017/12/2008 USD 1,584,668 AUD 1,950,000 53,383 0.0017/12/2008 USD 1,960,439 AUD 2,470,000 20,812 0.0017/12/2008 USD 192,462 AUD 235,470 7,553 0.0017/12/2008 USD 412,081 AUD 500,000 19,443 0.0017/12/2008 USD 79,774 AUD 100,000 1,247 0.0017/12/2008 USD 333,260 AUD 400,000 19,150 0.0017/12/2008 USD 9,293,633 CAD 9,756,177 88,922 0.0017/12/2008 USD 40,078 CAD 41,426 993 0.0017/12/2008 USD 9,176,671 CAD 9,756,177 (28,041) 0.0017/12/2008 USD 628,198 CAD 650,000 14,939 0.00

Russell Investment Company II plc The World Equity Fund Schedule of Investments - continued 30 September 2008
The accompanying notes are an integral part of the financial statements.
206 The World Equity Fund
Settlement Date
Amount Bought
Amount Sold
Unrealised Gain (Loss)
USD Fund
% 17/12/2008 USD 1,547,149 CAD 1,600,000 37,589 0.0017/12/2008 USD 282,776 CAD 300,000 (266) 0.0017/12/2008 USD 327,069 CAD 350,000 (3,147) 0.0017/12/2008 USD 839,075 CAD 900,000 (10,053) 0.0017/12/2008 USD 5,628,051 CAD 5,995,000 (28,083) 0.0017/12/2008 USD 2,827,685 CAD 3,010,000 (12,175) 0.0017/12/2008 USD 2,071,895 CAD 2,200,000 (3,751) 0.0017/12/2008 USD 232,623 CAD 250,000 (3,246) 0.0017/12/2008 USD 2,270,599 CAD 2,425,000 (17,328) 0.0017/12/2008 USD 1,931,047 CAD 2,050,000 (3,077) 0.0017/12/2008 USD 561,267 CAD 600,000 (4,818) 0.0017/12/2008 USD 39,901 CHF 43,776 587 0.0017/12/2008 USD 41,314,084 CHF 45,546,712 409,987 0.0117/12/2008 USD 3,129,880 CHF 3,399,050 77,298 0.0017/12/2008 USD 7,745,977 CHF 8,790,600 (148,589) (0.01)17/12/2008 USD 40,247,344 CHF 45,546,712 (656,753) (0.02)17/12/2008 USD 317,894 CHF 350,000 3,570 0.0017/12/2008 USD 813,957 CHF 900,000 5,694 0.0017/12/2008 USD 1,874,029 CHF 2,050,000 32,987 0.0017/12/2008 USD 92,277 CHF 100,000 2,470 0.0017/12/2008 USD 1,484,547 CHF 1,600,000 47,636 0.0017/12/2008 USD 2,449,135 CHF 2,765,000 (34,026) 0.0017/12/2008 USD 1,541,979 CHF 1,740,000 (20,661) 0.0017/12/2008 USD 2,930,208 CHF 3,300,000 (33,420) 0.0017/12/2008 USD 532,111 CHF 600,000 (6,731) 0.0017/12/2008 USD 88,733 CHF 100,000 (1,074) 0.0017/12/2008 USD 268,420 CHF 300,000 (1,000) 0.0017/12/2008 USD 6,522,376 CHF 7,350,000 (78,433) 0.0017/12/2008 USD 398,855 CHF 450,000 (5,276) 0.0017/12/2008 USD 1,335,525 DKK 7,053,174 2,621 0.0017/12/2008 USD 1,567,210 DKK 8,268,130 4,705 0.0017/12/2008 USD 1,367,265 DKK 7,053,174 34,361 0.0017/12/2008 USD 269,010 DKK 1,370,453 10,022 0.0017/12/2008 USD 103,307 DKK 553,250 (1,246) 0.0017/12/2008 USD 16,996,412 EUR 11,626,248 604,077 0.0203/10/2008 USD 10,022,600 EUR 6,816,982 446,126 0.0217/12/2008 USD 203,029,160 EUR 143,608,846 549,024 0.0203/10/2008 USD 4,508,000 EUR 3,132,296 107,761 0.0003/10/2008 USD 6,800,000 EUR 4,724,355 163,242 0.0117/12/2008 USD 89,865,310 EUR 62,246,526 2,101,321 0.0717/12/2008 USD 7,275,891 EUR 4,963,429 277,744 0.0103/10/2008 USD 4,307,000 EUR 2,930,510 190,229 0.0103/10/2008 USD 1,500,000 EUR 1,020,269 66,729 0.0017/12/2008 USD 1,306,527 EUR 900,000 37,580 0.0017/12/2008 USD 3,177,592 EUR 2,200,000 75,720 0.0017/12/2008 USD 715,565 EUR 500,000 10,594 0.0017/12/2008 USD 18,221,538 EUR 12,895,000 40,336 0.0017/12/2008 USD 3,960,754 EUR 2,800,000 12,917 0.0017/12/2008 USD 283,314 EUR 200,000 1,326 0.0017/12/2008 USD 13,019,748 EUR 9,200,000 48,282 0.00
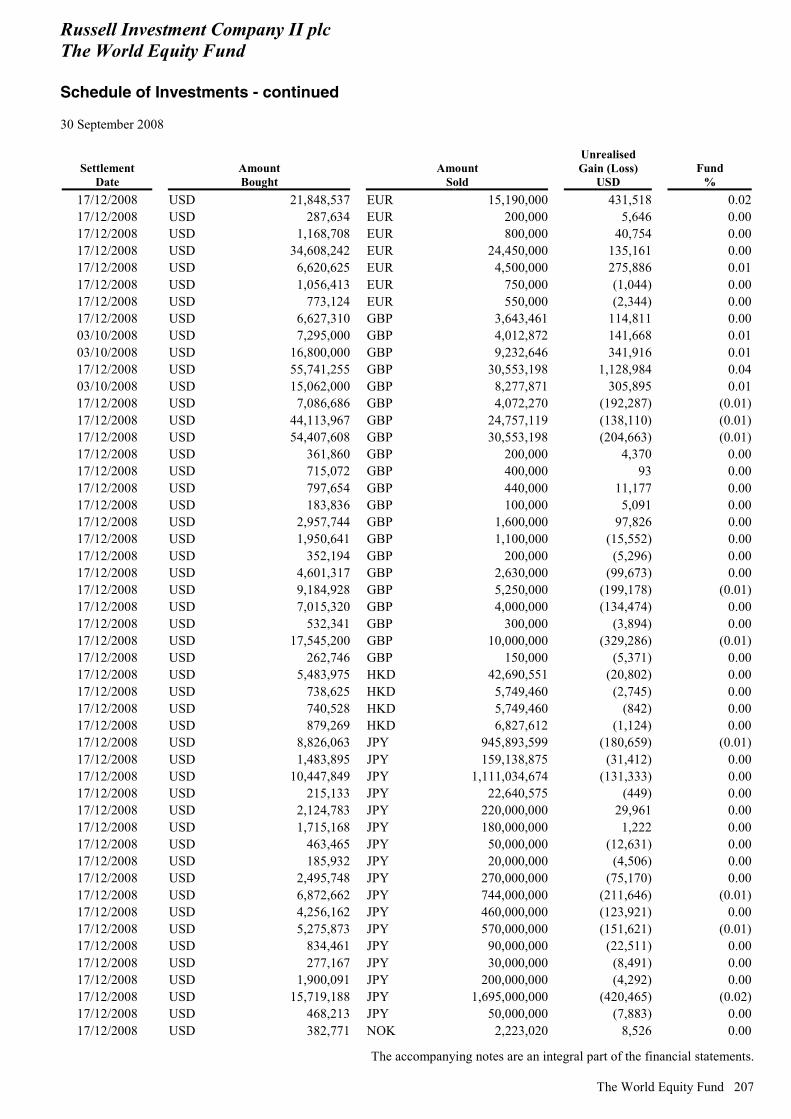
Russell Investment Company II plc The World Equity Fund Schedule of Investments - continued 30 September 2008
The accompanying notes are an integral part of the financial statements.
The World Equity Fund 207
Settlement Date
Amount Bought
Amount Sold
Unrealised Gain (Loss)
USD Fund
% 17/12/2008 USD 21,848,537 EUR 15,190,000 431,518 0.0217/12/2008 USD 287,634 EUR 200,000 5,646 0.0017/12/2008 USD 1,168,708 EUR 800,000 40,754 0.0017/12/2008 USD 34,608,242 EUR 24,450,000 135,161 0.0017/12/2008 USD 6,620,625 EUR 4,500,000 275,886 0.0117/12/2008 USD 1,056,413 EUR 750,000 (1,044) 0.0017/12/2008 USD 773,124 EUR 550,000 (2,344) 0.0017/12/2008 USD 6,627,310 GBP 3,643,461 114,811 0.0003/10/2008 USD 7,295,000 GBP 4,012,872 141,668 0.0103/10/2008 USD 16,800,000 GBP 9,232,646 341,916 0.0117/12/2008 USD 55,741,255 GBP 30,553,198 1,128,984 0.0403/10/2008 USD 15,062,000 GBP 8,277,871 305,895 0.0117/12/2008 USD 7,086,686 GBP 4,072,270 (192,287) (0.01)17/12/2008 USD 44,113,967 GBP 24,757,119 (138,110) (0.01)17/12/2008 USD 54,407,608 GBP 30,553,198 (204,663) (0.01)17/12/2008 USD 361,860 GBP 200,000 4,370 0.0017/12/2008 USD 715,072 GBP 400,000 93 0.0017/12/2008 USD 797,654 GBP 440,000 11,177 0.0017/12/2008 USD 183,836 GBP 100,000 5,091 0.0017/12/2008 USD 2,957,744 GBP 1,600,000 97,826 0.0017/12/2008 USD 1,950,641 GBP 1,100,000 (15,552) 0.0017/12/2008 USD 352,194 GBP 200,000 (5,296) 0.0017/12/2008 USD 4,601,317 GBP 2,630,000 (99,673) 0.0017/12/2008 USD 9,184,928 GBP 5,250,000 (199,178) (0.01)17/12/2008 USD 7,015,320 GBP 4,000,000 (134,474) 0.0017/12/2008 USD 532,341 GBP 300,000 (3,894) 0.0017/12/2008 USD 17,545,200 GBP 10,000,000 (329,286) (0.01)17/12/2008 USD 262,746 GBP 150,000 (5,371) 0.0017/12/2008 USD 5,483,975 HKD 42,690,551 (20,802) 0.0017/12/2008 USD 738,625 HKD 5,749,460 (2,745) 0.0017/12/2008 USD 740,528 HKD 5,749,460 (842) 0.0017/12/2008 USD 879,269 HKD 6,827,612 (1,124) 0.0017/12/2008 USD 8,826,063 JPY 945,893,599 (180,659) (0.01)17/12/2008 USD 1,483,895 JPY 159,138,875 (31,412) 0.0017/12/2008 USD 10,447,849 JPY 1,111,034,674 (131,333) 0.0017/12/2008 USD 215,133 JPY 22,640,575 (449) 0.0017/12/2008 USD 2,124,783 JPY 220,000,000 29,961 0.0017/12/2008 USD 1,715,168 JPY 180,000,000 1,222 0.0017/12/2008 USD 463,465 JPY 50,000,000 (12,631) 0.0017/12/2008 USD 185,932 JPY 20,000,000 (4,506) 0.0017/12/2008 USD 2,495,748 JPY 270,000,000 (75,170) 0.0017/12/2008 USD 6,872,662 JPY 744,000,000 (211,646) (0.01)17/12/2008 USD 4,256,162 JPY 460,000,000 (123,921) 0.0017/12/2008 USD 5,275,873 JPY 570,000,000 (151,621) (0.01)17/12/2008 USD 834,461 JPY 90,000,000 (22,511) 0.0017/12/2008 USD 277,167 JPY 30,000,000 (8,491) 0.0017/12/2008 USD 1,900,091 JPY 200,000,000 (4,292) 0.0017/12/2008 USD 15,719,188 JPY 1,695,000,000 (420,465) (0.02)17/12/2008 USD 468,213 JPY 50,000,000 (7,883) 0.0017/12/2008 USD 382,771 NOK 2,223,020 8,526 0.00
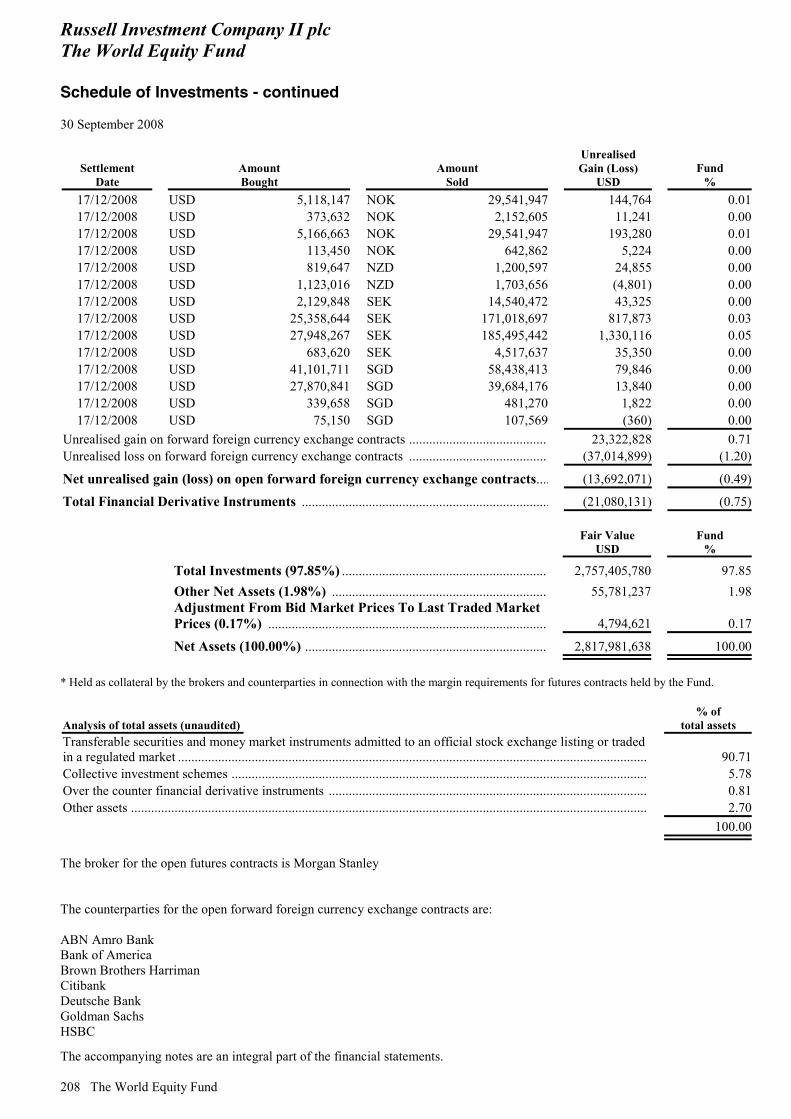
Russell Investment Company II plc The World Equity Fund Schedule of Investments - continued 30 September 2008
The accompanying notes are an integral part of the financial statements.
208 The World Equity Fund
Settlement Date
Amount Bought
Amount Sold
Unrealised Gain (Loss)
USD Fund
% 17/12/2008 USD 5,118,147 NOK 29,541,947 144,764 0.0117/12/2008 USD 373,632 NOK 2,152,605 11,241 0.0017/12/2008 USD 5,166,663 NOK 29,541,947 193,280 0.0117/12/2008 USD 113,450 NOK 642,862 5,224 0.0017/12/2008 USD 819,647 NZD 1,200,597 24,855 0.0017/12/2008 USD 1,123,016 NZD 1,703,656 (4,801) 0.0017/12/2008 USD 2,129,848 SEK 14,540,472 43,325 0.0017/12/2008 USD 25,358,644 SEK 171,018,697 817,873 0.0317/12/2008 USD 27,948,267 SEK 185,495,442 1,330,116 0.0517/12/2008 USD 683,620 SEK 4,517,637 35,350 0.0017/12/2008 USD 41,101,711 SGD 58,438,413 79,846 0.0017/12/2008 USD 27,870,841 SGD 39,684,176 13,840 0.0017/12/2008 USD 339,658 SGD 481,270 1,822 0.0017/12/2008 USD 75,150 SGD 107,569 (360) 0.00
Unrealised gain on forward foreign currency exchange contracts ......................................... 23,322,828 0.71Unrealised loss on forward foreign currency exchange contracts ......................................... (37,014,899) (1.20)
Net unrealised gain (loss) on open forward foreign currency exchange contracts.... (13,692,071) (0.49)
Total Financial Derivative Instruments .......................................................................... (21,080,131) (0.75)
Fair Value
USD Fund
%
Total Investments (97.85%) ............................................................. 2,757,405,780 97.85 Other Net Assets (1.98%) ................................................................ 55,781,237 1.98
Adjustment From Bid Market Prices To Last Traded Market Prices (0.17%) ................................................................................... 4,794,621 0.17
Net Assets (100.00%) ........................................................................ 2,817,981,638 100.00 * Held as collateral by the brokers and counterparties in connection with the margin requirements for futures contracts held by the Fund.
Analysis of total assets (unaudited) % of
total assets Transferable securities and money market instruments admitted to an official stock exchange listing or traded in a regulated market ............................................................................................................................................ 90.71Collective investment schemes ............................................................................................................................ 5.78Over the counter financial derivative instruments ............................................................................................... 0.81Other assets .......................................................................................................................................................... 2.70
100.00 The broker for the open futures contracts is Morgan Stanley The counterparties for the open forward foreign currency exchange contracts are: ABN Amro Bank Bank of America Brown Brothers Harriman Citibank Deutsche Bank Goldman Sachs HSBC
Russell Investment Company II plc The World Equity Fund Schedule of Investments - continued 30 September 2008
The accompanying notes are an integral part of the financial statements.
The World Equity Fund 209
Mellon Bank Morgan Stanley Royal Bank of Scotland State Street Bank UBS The proportion of the investments of The World Equity Fund in rights or securities eligible to the French Plan d’Epargne en Actions (PEA) has been continuously equal to, or greater than, 75 per cent over the elapsed fiscal period ended on 30 September 2008 (unaudited).
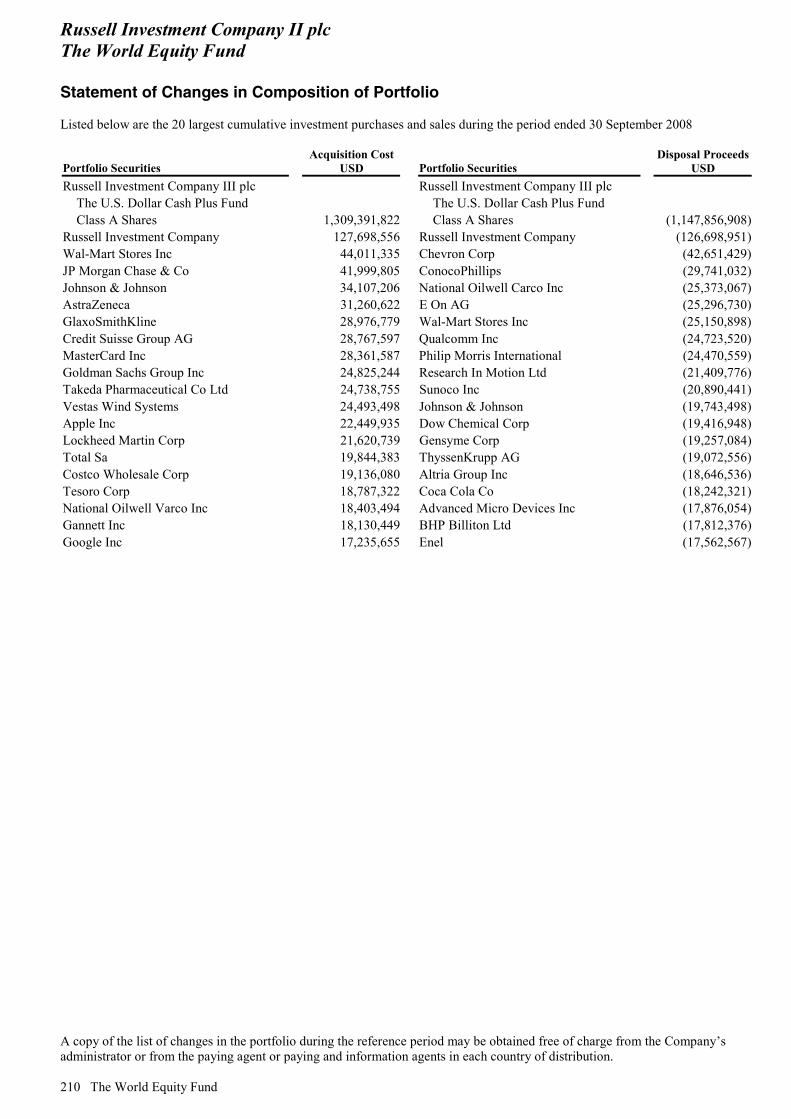
Russell Investment Company II plc The World Equity Fund Statement of Changes in Composition of Portfolio Listed below are the 20 largest cumulative investment purchases and sales during the period ended 30 September 2008
A copy of the list of changes in the portfolio during the reference period may be obtained free of charge from the Company’s administrator or from the paying agent or paying and information agents in each country of distribution. 210 The World Equity Fund
Portfolio Securities Acquisition Cost
USD Portfolio Securities Disposal Proceeds
USD Russell Investment Company III plc Russell Investment Company III plc
The U.S. Dollar Cash Plus Fund The U.S. Dollar Cash Plus Fund Class A Shares 1,309,391,822 Class A Shares (1,147,856,908)
Russell Investment Company 127,698,556 Russell Investment Company (126,698,951)Wal-Mart Stores Inc 44,011,335 Chevron Corp (42,651,429)JP Morgan Chase & Co 41,999,805 ConocoPhillips (29,741,032)Johnson & Johnson 34,107,206 National Oilwell Carco Inc (25,373,067)AstraZeneca 31,260,622 E On AG (25,296,730)GlaxoSmithKline 28,976,779 Wal-Mart Stores Inc (25,150,898)Credit Suisse Group AG 28,767,597 Qualcomm Inc (24,723,520)MasterCard Inc 28,361,587 Philip Morris International (24,470,559)Goldman Sachs Group Inc 24,825,244 Research In Motion Ltd (21,409,776)Takeda Pharmaceutical Co Ltd 24,738,755 Sunoco Inc (20,890,441)Vestas Wind Systems 24,493,498 Johnson & Johnson (19,743,498)Apple Inc 22,449,935 Dow Chemical Corp (19,416,948)Lockheed Martin Corp 21,620,739 Gensyme Corp (19,257,084)Total Sa 19,844,383 ThyssenKrupp AG (19,072,556)Costco Wholesale Corp 19,136,080 Altria Group Inc (18,646,536)Tesoro Corp 18,787,322 Coca Cola Co (18,242,321)National Oilwell Varco Inc 18,403,494 Advanced Micro Devices Inc (17,876,054)Gannett Inc 18,130,449 BHP Billiton Ltd (17,812,376)Google Inc 17,235,655 Enel (17,562,567)
Russell Investment Company II plc Notes to the Financial Statements 30 September 2008
Notes to the Financial Statements 211
1. Accounting Policies The significant accounting policies adopted by the Company for the period ended 30 September 2008 are as follows: Basis of Accounting The financial statements are prepared under the historical cost convention as modified by the revaluation of financial assets and financial liabilities held at fair value through profit or loss. The financial statements are prepared in accordance with the European Communities (Undertakings for Collective Investment in Transferable Securities) Regulations, 2003 (as amended) (the “UCITS Regulations”) and in accordance with Irish statute comprising the Companies Acts, 1963 to 2006. The Company has adopted the ASB "Statement on half-yearly reports" which was issued in July 2007. The statement has been fully applied with the exception of inserting comparative figures to the last interim for the Profit and Loss Account and Statement of Changes in Net Assets attributable to redeemable participating shareholders. This is due to the fact that these primary statements were not prepared for the interim period ended 30 September 2007. All references to “net assets” throughout this document refer to net assets attributable to holders of redeemable participating shares unless otherwise stated. Financial Instruments at Fair Value through Profit or Loss This category has two sub-categories: financial assets and liabilities held for trading, and those designated by Directors at fair value through profit and loss at inception. All instruments on each Fund’s Schedule of Investments are classified at fair value through profit or loss. Subsequent to initial recognition, all instruments classified at fair value through profit or loss are measured at fair value. Investments Securities listed on a recognised stock exchange or traded on any other organised market are valued at the last traded price as at close of business on the stock exchange or market which constitutes the principal market for such securities. If for specific assets the last traded price as at close of business do not, in the opinion of the Directors, reflect their fair value or are not available, the price of the most recent transaction provides evidence of the current fair value as long as there has not been a significant change in economic circumstances since the time of the transaction. In the case of any security not listed, quoted or dealt in on a regulated market or for which no quotation or value is available which would provide a fair valuation, or in respect of which the price is unrepresentative, the fair value of such security is determined on the basis of the probable realisation value as at the close of business and is determined by the Manager, a stockbroker or other competent person appointed by the Manager and approved for the purpose by the Custodian and Trustee, using valuation techniques. The Company uses a variety of methods and makes assumptions that are based on market conditions existing at each Balance Sheet date. Valuation techniques used include the use of comparable recent arm’s length transactions, discounted cash flow analysis and option pricing models. If there is a valuation technique commonly used by market participants to price the instrument and that technique has been demonstrated to provide reliable estimates of prices obtained in actual market transactions, the Fund uses that technique. Estimation methods and valuation models may be used to calculate fair value. Due to the dynamic nature of assumptions used in estimating market value and market volatility, the values reflected in the financial statements for these investments may differ from the values that would be determined by negotiations held between parties in a near term sales transaction, and those differences could be material. Commercial paper is valued on an amortised basis with reference to the maturity date of the instruments. Certificates of deposit and deposits with credit institutions are valued at par. Investments in open-ended collective investment schemes are valued at fair value at the latest available unaudited net asset value for the shares or units, obtained from the relevant administrator. Forwards and Spot Foreign Currency Exchange Contracts The fair value of open forward foreign currency exchange contracts, and open foreign currency exchange spot contracts, is calculated as the difference between the contracted rate and the current forward rate that would close out the contract on the Balance Sheet date. For each relevant Fund, gains or losses on open foreign currency exchange spot contracts are included in cash at bank in the Balance Sheet and gains or losses on open forward foreign currency exchange contracts are included in the unrealised gain (loss) on forward foreign currency exchange contracts in the Balance Sheet and are shown in the Schedule of Investments of each relevant Fund.
Russell Investment Company II plc Notes to the Financial Statements - continued 30 September 2008
212 Notes to the Financial Statements
Futures Contracts Initial margin deposits are made upon entering into futures contracts and are generally made in cash or cash equivalents. The fair value of futures contracts is based upon their quoted daily settlement prices. Changes in the value of open futures contracts are recognised as unrealised gains or losses on futures contracts until the contracts are terminated, at which time realised gains and losses are recognised. Gains or losses on open futures contracts are shown in the Schedule of Investments of each relevant Fund and as unrealised gain (loss) on open futures contracts in the Balance Sheet. Options The Fund may purchase and sell (write) call and put options on securities, securities indices and foreign currencies traded on a national securities exchange or in an over-the-counter market. When a Fund writes a covered call or a put option a premium is received by the Fund. An amount equal to the premium is subsequently marked-to-market to reflect the fair value of the option written, which is reported as a liability on the Balance Sheet for each relevant Fund. The difference between the premium amount and the fair value reported on the Balance Sheet gives rise to an unrealised gain (loss). When a Fund purchases a call or a put option a premium is paid by the Fund. The premium on purchased put options exercised is subtracted from the proceeds of the sale of the underlying security or foreign currency in determining the realized gain or loss. The premium on purchased call options exercised is included in determining initial fair value of the securities or foreign currency purchased. Premiums paid from the purchase of options which expire unexercised are treated as realized losses. The premium is subsequently marked-to-market to reflect the fair value of the option purchased, which is reported as an asset on the Balance Sheet for each relevant Fund. If an option which a Fund has written either expires on its stipulated expiration date or a Fund enters into a closing purchase transaction, a Fund realises a gain (or loss, if the cost of a closing purchase transaction exceeds the premium received when the option was sold) without regard to any unrealised gain or loss on the underlying security, and the liability related to such option is extinguished. If a call option which a Fund has written is exercised, a Fund realises a capital gain or loss from the sale of the underlying security, and the proceeds from such sale are increased by the premium originally received. When a put option which a Fund has written is exercised, the amount of the premium originally received will reduce the cost of the security which a Fund purchases upon exercise of the option. Options are valued at close of business on the dealing day at the settlement price as provided by the counterparty/broker and the values are independently valued, at a minimum, weekly. In the event of it being impossible or incorrect to carry out a valuation of a specific investment in accordance with the valuation rules, or if such valuation is not representative of a security’s fair market value, the Directors are entitled to use other generally recognised valuation methods in order to reach a proper valuation of that specific instrument, provided that such method of valuation has been approved by the Custodian and Trustee.
Interest Rate Swaps and Credit Default Swaps Interest rate swaps are valued using standard net present value methodologies whereby all future cash flows of the interest rate swaps are discounted to their present value using the appropriate interest rate. Credit default swaps are valued using standard net present value methodologies whereby all future cashflows of the fixed side of the swap are discounted to their present value using the appropriate interest rate and whereby all futures cashflows of the default side of the swap are discounted to their present value based on the cost of default to the default payer. This cost is determined by the recovery rate, notional amount of the contract, and default probability among other factors. The notional amount of swap contracts is subsequently marked-to-market to reflect the fair value of the swap which is reported as an asset or liability as appropriate on the Balance Sheet for each relevant Fund. The net amounts of interest payments and receipts on swaps are accrued in swap income or expense as appropriate in the Profit and Loss account. Swaptions This instrument combines the features of two other financial instruments, namely an option and a swap. A swaption involves writing/purchasing options to enter into a swap. Swaptions are priced using standard Black Scholes pricing model where the inputs required are the term of the option, the price and volatility of the underlying instrument (the swap), the strike price of the option and the risk free rate of return (yield curve).
Russell Investment Company II plc Notes to the Financial Statements - continued 30 September 2008
Notes to the Financial Statements 213
A Fund records an unrealised gain (loss) for the amount expected to be received or paid under the swaption agreement if the agreement was terminated on the Balance Sheet date and is recorded as swaptions at fair value on the Fund’s Balance Sheet and Schedule of Investments. When a Fund writes a swaption a premium is received by the Fund and the swaption is initially recognised at the amount of the premium. The premium is subsequently marked-to-market to reflect the fair value of the swaption written, which is reported as a liability on the Fund’s Balance Sheet. The difference between the premium received and the fair value reported on the Balance Sheet gives rise to an unrealised gain (loss). When a swaption which the Fund has written is exercised, the amount of the premium originally received will offset the cost of the swap upon exercise of the option in arriving at the movement in unrealised gain or loss to be included in the Profit and Loss Account. Premiums received on swaptions written which expire unexercised are treated as realised gains. When a Fund purchases a swaption, a premium is paid by the Fund and the swaption is initially recognised at the amount of the premium. The premium is subsequently marked-to-market to reflect the fair value of the swaption purchased, which is reported as an asset on the Fund’s Balance Sheet. When a swaption which a Fund holds is exercised, the amount of the premium originally paid will offset the cost of the swap upon exercise of the option in arriving at the movement in unrealized gain or loss to be included in the Profit and Loss Account. Premiums paid from the purchase of swaptions which expire unexercised are treated as realised losses. Foreign Currency Transactions In accordance with FRS 23, items included in the individual Fund’s financial statements are measured using the currency of the primary economic environment in which it operates (functional currency). The Directors’ selection of the functional currency is attributable to the functional currency being: a) the major component of the Funds’ benchmarks; b) the common currency of monies received on subscriptions and paid out on redemptions of shares for most clients in the Funds’ varied client base. The functional currency assessment was done at a Fund level. All Funds’ base currencies equated to their respective functional currencies when assessed under FRS 23. The functional currency of the Company is the Euro. Each individual Fund has also adopted its functional currency as the presentation currency. Foreign currency transactions are translated to the functional currency of the relevant Fund at the rate of exchange ruling on the date of the transaction. For each relevant Fund, monetary assets and liabilities denominated in currencies other than the Fund’s functional currency are translated at the rate of exchange ruling at the close of business on the relevant reporting date. Redeemable Participating Shares Redeemable shares are redeemable at the shareholder’s option and are classified as financial liabilities. The redeemable shares can be put back to the Company at any time for cash equal to a proportionate share of the Company’s net asset value. The redeemable share is carried at the redemption amount that is payable at the Balance Sheet date if the shareholder exercised its right to put the share back to the Company. In accordance with the prospectus the Company is contractually obliged to redeem shares at dealing prices and the liability to redeemable participating shareholders has been adjusted to reflect this. Distributions Distributions on income share classes and deemed distributions on accumulating share classes are disclosed as a finance cost in the Profit and Loss Account and the deemed distribution on the accumulated share classes is disclosed as a share transaction in the Statement of Changes in Net Assets Attributable to Redeemable Participating Shareholders. Distributions are calculated on a quarterly basis and all distributions with an ex-date during the financial year are included in these financial statements.
2. Basis of Preparation The Company has availed of the exemption available to open-ended investment funds under FRS 1 (revised) not to prepare a cash flow statement. The financial statements of the individual Funds are prepared in the functional currency of the respective Fund. The functional currency of The Euro Fixed Income Fund, the Global Bond (Euro Hedged) Fund and the Pan European Equity Fund is Euro. The functional currency of the U.K. Equity Plus Fund is Sterling and the functional currency of The U.S. Growth Fund, The U.S. Quant Fund, The U.S. Value Fund and The World Equity Fund is U.S. Dollar. Details as to the functional currency of Funds unfunded as of 30 September 2008 are omitted. The combined Balance Sheet of the Company is measured using the currency of the primary economic environment in which it operates, i.e. Euro. The Company has also adopted Euro as the presentation currency. The accounts of the individual Funds
Russell Investment Company II plc Notes to the Financial Statements - continued 30 September 2008
214 Notes to the Financial Statements
are translated into Euros using exchange rates as at 30 September 2008 and 31 March 2008 respectively, and accumulated for preparation of the combined Balance Sheet. Estimates and judgments The preparation of financial statements in conformity with Irish GAAP requires the use of certain critical accounting estimates. It also requires the Board of Directors, based on the advice of the Principal Money Manager, to exercise its judgement in the process of applying the Fund’s accounting policies. The areas involving a higher degree of judgment or complexity, or areas where assumptions and estimates are significant to the financial statements, are disclosed below. Critical accounting estimates and assumptions Management makes estimates and assumptions concerning the future. The resulting accounting estimates will, by definition, seldom equal the related actual results. The estimates and assumptions that have a significant risk of causing a material adjustment to the carrying amounts of assets and liabilities within the next financial year are outlined below: a) Fair value of derivative financial instruments
The Fund may, from time to time, hold financial instruments that are not quoted in active markets, such as over-the-counter derivatives. Fair values of such instruments are determined by using valuation techniques. Where valuation techniques (for example, models) are used to determine fair values, they are validated and periodically reviewed by experienced personnel at the Administrator, independent of the party that created them. Models are calibrated by back-testing to actual transactions to ensure that outputs are reliable.
Models use observable data, to the extent practicable. However, areas such as credit risk (both own and counterparty), volatilities and correlations require management to make estimates. Changes in assumptions about these factors could affect the reported fair value of financial instruments. Each Fund’s financial assets and financial liabilities are held for the purpose of being traded or are expected to be realised within one year.
b) Critical judgments – functional currency
The Board of Directors has selected the Euro as the currency in which to present the combined financial statements. The Euro is the currency in which the Company measures its performance and reports its results. This determination also considers the competitive environment in which the Fund is compared to other European investment products.
3. Significant Agreements and Transactions with Related Parties
Manager Russell Investments Ireland Limited, a wholly-owned subsidiary of Russell Investments Limited, which in turn is a subsidiary of The Northwestern Mutual Life Insurance Company, is the Manager of the Company. The Manager is engaged in the business of providing investment management and administrative services to collective investment schemes. The Manager has: (a) appointed the Principal Money Manager (Russell Investments Limited) to advise it on the Funds’ investments; (b) authorised the Principal Money Manager and the Manager to select and appoint the money managers; (c) delegated the administration of the Company to the Administrator, State Street Fund Services (Ireland) Limited, and; (d) appointed the Principal Money Manager to market and promote the shares of the Funds. For services rendered under the management agreement, the Company pays the Manager a fee, accrued daily and paid monthly in arrears, at the following annual rates based on the respective average daily net asset values of each class of shares.
The Euro Fixed Income Fund The Global Bond (Euro Hedged) Fund The Pan European Equity Fund Class A 1.40% Class A 1.50% Class A 1.60%Class B 0.80% Class B 0.90% Class B 1.00%Class F 1.60% Class DH-B 0.90% Class F 1.80%Class I 0.60% Class F 1.80% Class I 0.90%Class I Income 0.60% Class I 0.65% Class MZ Income 0.40%Class MZ Income 0.40% Class I Income 0.65% Class PAM EU 2.30%Class P Income 1.00% Class MZ Income 0.40% Class R Roll-Up 1.25%Class S 1.02%
The U.K. Equity Plus Fund The U.S. Growth Fund
Class B 0.65% Class A Income 1.60% Class C 1.25% Class B 1.00% Class I Income 0.65% Class C 1.60% Class K 1.25% Class I 1.00% Class P Income 1.25% Class I Income 1.00%
Russell Investment Company II plc Notes to the Financial Statements - continued 30 September 2008
Notes to the Financial Statements 215
The U.S. Quant Fund The U.S. Value Fund The World Equity Fund Class A Income 1.50% Class A Income 1.60% Class B 0.90%Class B 1.00% Class B 1.00% Class C 1.60%Class C 1.60% Class C 1.60% Class D 0.75%Class D 0.65% Class I 1.00% Class EH-T 1.15%Class I Income 0.80% Class I Income 1.00% Class I 0.90%Class K 1.60% Class J 1.60%Class MZ Income 0.40% Class N 2.30%Class P Income 1.50% Class SH-B 0.95%Class R Roll-Up 1.20% Class TYA 0.68%Class SH-B 1.05% Class TDC NV 0.58% Rates for classes of shares not yet funded are not listed. The Manager discharges all fees payable to the Principal Money Manager. All share classes are Accumulation Class Shares unless otherwise indicated in the name of the share class. All of the Directors of the Company hold directorships in the Manager except Ms. Anna Nye. All of the Directors of the Company are also directors of Russell Investment Company III plc. The following Directors of the Company are directors of the Principal Money Manager: Mr. James Firn, Mr. James Beveridge, Mr. Neil Jenkins and Ms. Anna Nye. The following Directors of the Company are employed by Frank Russell Company in Tacoma: Mr. Karl Ege, Mr. Randall P. Lert and Mr. Hal Strong. Mr. Lert and Mr. Jenkins (as alternate for Mr. Lert) resigned from the Board of Directors of the Company with effect from 17 October 2008. Russell Implementation Services Inc is engaged by the Company to carry out currency trading for which a fee of 0.02 per cent per trade will be charged. For the period ended 30 September 2008 and the year ended 31 March 2008 no such fees have been charged to the Company. Directed Transactions Under the terms of their agreements with the Principal Money Manager, each of the money managers is obliged, subject to the requirement of best execution, to direct a portion of its portfolio transactions through the broker network operated by Russell Implementation Services, Inc, a related party of the Manager. Upon the completion of such directed transactions, up to 70 per cent of the commissions generated by a Fund are available for use in a soft commission arrangement as described below. The gross amount of commission traded through the broker network operated by LJR Recapture Services (LJR), on behalf of the commission recapture program for the period ended 30 September 2008 amounted to USD 436,067 (31 March 2008: USD 665,104) and is directed to the underlying Funds. Soft Commission Arrangements The Principal Money Manager has the right under the terms of its agreements with the money managers to request that the money manager, subject to a requirement of best execution, executes transactions that enable it or its advisers to purchase brokerage and research services that assist in the provision of investment services to the Company and are in the best interests of the Company’s shareholders. Brokerage and research services include: (1) advice either directly or indirectly through publications or writings as to the value of securities, the advisability of investing in, purchasing or selling securities and the availability of securities or of purchasers or sellers of securities; (2) analysis and reports concerning issuers, industries, securities, economic factors and trends, portfolio strategy and the performance of accounts; and/or (3) effecting securities transactions and performing functions incidental thereto (such as clearance and settlement) or that are required in connection therewith. The Principal Money Manager has received the following goods and services from brokers and dealers over the period covered by these accounts: written and oral research reports from brokers or dealers; computer based financial systems together with their associated software and servicing support; and statistical analyses relating to markets, companies, industries, business and economic factors, market trends and portfolio strategies. All goods and services received comply with the Financial Services Authority’s requirements.
Russell Investment Company II plc Notes to the Financial Statements - continued 30 September 2008
216 Notes to the Financial Statements
Investment in Russell Investment Company III plc Funds of the Company may invest in sub-funds of Russell Investment Company III plc (“RIC III plc”) which is also managed by the Manager. RIC III plc is an umbrella structure with segregated liability between sub-funds and consisted of four sub-funds as at 30 September 2008.. The investment objective of The Euro Cash Fund, The Sterling Cash Fund and the U.S. Dollar Cash Fund is to provide the maximum current income that is consistent with the preservation of capital and liquidity by investing in short term, high-grade debt and debt-related instruments. The investment objective of The Active Currency Fund is to generate capital appreciation and income from actively managed currency positions, with a positive return above a USD 3 month LIBOR benchmark. Uninvested cash in the Funds is swept daily to RIC III plc, as appropriate, to maximise the earnings of cash held. A management fee which varies from 0.05 per cent to 1.80 per cent of the underlying net asset value is incurred depending on the sub-fund/share class of RIC III plc in which a Fund invests. Principal Money Manager and Money Managers The Principal Money Manager and the Manager may invest a Fund’s assets or may appoint money managers to do so. Some of the money managers selected may be related parties to the Fund. Subject to the supervision and guidance of the Principal Money Manager and the Manager, the money managers determine the investments to be purchased and sold by a Fund. The Principal Money Manager and the Manager discharges all fees payable to the money managers, which are based on the value of the assets within the Fund managed by the money managers. Custodian and Trustee State Street Custodial Services (Ireland) Limited is the Custodian and Trustee (the “Custodian”). The Custodian has delegated its function to a global sub-custodian. Sub-custodian fees are paid at annual rates based on the total assets held in each individual country in which the Funds invest plus applicable transaction charges. The total rate varies between 0.004 per cent and 0.35 per cent. The Custodian and Administrator may, on aggregate, charge a maximum fee and a maximum fee of up to 0.20 per cent of the Net Asset Value per Fund. Administrator State Street Fund Services (Ireland) Limited is the Administrator. The Manager on behalf of the Company has entered into an administration agreement with the Administrator. The Administrator is responsible for the daily determination of the net asset value, maintaining the books and records of the Funds in respect of the Company and other administrative services. Pursuant to the administration agreement the Manager shall pay to the Administrator out of the assets of the Funds a fee of 0.025 per cent per annum on the average monthly net asset value of the Funds up to USD 750 million and a fee of 0.025 per cent per annum on all the average monthly net asset value of the Funds for the next USD 750 million and a fee of 0.02 percent per annum on all the average monthly net asset value of the Funds in excess of USD 1.5 billion. Such fees will accrue and be paid monthly in arrears. The Manager shall discharge reasonable out of pocket expenses payable to the Administrator out of the Funds’ assets. All administration fees will accrue and be paid monthly in arrears. The fees are stated net of discount, when the assets of funds promoted or co-promoted by Russell Investment Group and administered by the Administrator exceed a total value of USD 70 billion. The standard discount rate applicable here is 0.01 per cent. Rates increase thereafter as follows:
In excess of USD 100 billion: 0.0015%;
4. Securities Lending At 30 September 2008, the aggregate value of securities on loan by the Company amounted to USD 471,425,978 (31 March 2008: USD 1,614,353,554) and the value of collateral held by the Company in respect of these securities amounted to USD 487,927,623 (31 March 2008: USD 1,660,953,634). The Company participates in two securities lending programs, one with State Street Bank and Trust Company and one with Securities Finance Trust Company. Income generated from the investment of cash collateral, less negotiated rebate fees paid to participating brokers, is divided between the Fund and the relevant securities lending agent and is recorded as securities lending income for the Fund. This is reported as securities lending income in the financial statements. To the extent that a loan is secured by non-cash collateral, brokers pay the Fund negotiated lenders’ fees which are divided between the Fund and the relevant securities lending agent and are recorded as security lending income for the Fund. As at the period end date the loans are secured by cash collateral only. The securities on loan are included in the investments at fair value of each Fund and have been valued in accordance with the accounting policies as outlined in Note 1.

Russell Investment Company II plc Notes to the Financial Statements - continued 30 September 2008
Notes to the Financial Statements 217
As of 30 September 2008, the value of outstanding securities on loan and the value of collateral recorded by the Funds were the following:
Fund
Functional
currency of Fund
Value of Outstanding Securities on Loan
USD Value of Collateral
USD The Euro Fixed Income Fund EUR 146,017,015 147,812,427The Global Bond (Euro Hedged) Fund EUR 85,396,653 86,707,860The Pan European Equity Fund EUR 77,921,666 81,880,851The U.K. Equity Plus Fund GBP 37,496,422 39,647,910The U.S. Growth Fund USD 1,123,628 1,146,101The U.S. Quant Fund USD - -The U.S. Value Fund USD - -The World Equity Fund USD 123,470,593 130,732,475 As of 31 March 2008, the value of outstanding securities on loan and the value of collateral recorded by the Funds were the following:
Fund
Functional
currency of Fund
Value of Outstanding Securities on Loan
USD Value of Collateral
USD The Euro Fixed Income Fund EUR 163,178,972 164,574,816 The Global Bond (Euro Hedged) Fund EUR 199,751,961 202,701,592 The Pan European Equity Fund EUR 93,942,729 98,850,155 The U.K. Equity Plus Fund GBP 55,838,468 58,970,775 The U.S. Growth Fund USD 93,070,872 94,940,150 The U.S. Quant Fund USD 133,474,818 136,158,108 The U.S. Value Fund USD 33,192,480 33,860,266 The World Equity Fund USD 841,903,254 870,897,772
5. Cash at Bank and Bank Overdrafts All cash balances and bank overdrafts are held by State Street Bank and Trust Company, with the exception of amounts on overnight deposit.
6. Number of Shares in Issue and Net Assets Attributable to Holders of Redeemable Participating Shares Nature of Redeemable Share Each share will represent an individual beneficial interest in the Company. The shares are not debt obligations or guaranteed by the Company. The return on an investment in the Company will depend solely upon the investment performance of the assets in the Company and the increase or decrease (as the case may be) in the net asset value of the shares. The amount payable to a shareholder in respect of each share upon liquidation of the Company will equal the net asset value per share. Listed investments and investments with prices quoted in over the counter markets or by market makers are stated at the last traded price on the valuation day for the purpose of determining net asset value per share for subscriptions and redemptions and for various fee calculations. However, as stated in Note 1 the accounting policy of the Company for the purpose of compliance with FRS 26 and for reporting purpose is to value its investments at the relevant bid market prices on the Balance Sheet date. As at 30 September 2008, the difference between the valuation methods stated in the financial statements of investments and the valuation methodology indicated in the Company’s prospectus, results in a decrease in value of investments by EUR 6,983,016 (31 March 2008: EUR7,268,019). Net assets attributable to shareholders represent a liability in the Balance Sheet, carried at the redemption amount that would be payable at the Balance Sheet date if the shareholder exercised the right to redeem the shares in the Company. Consequently, the differences described above adjust the carrying amount of the net assets attributable to the shareholders. The cumulative adjustment is included as “Adjustment from bid market prices to last traded market prices” on the Balance Sheet. Authorised The authorised share capital of the Company is 39,000 subscriber shares of no par value and 500 billion participating shares of no par value. Subscriber shares do not form part of the net asset value of the Company. They are disclosed in the financial statements by way of this note only. Holders of subscriber shares are not entitled to dividends or any surplus of assets over liabilities upon the winding up of the Company.
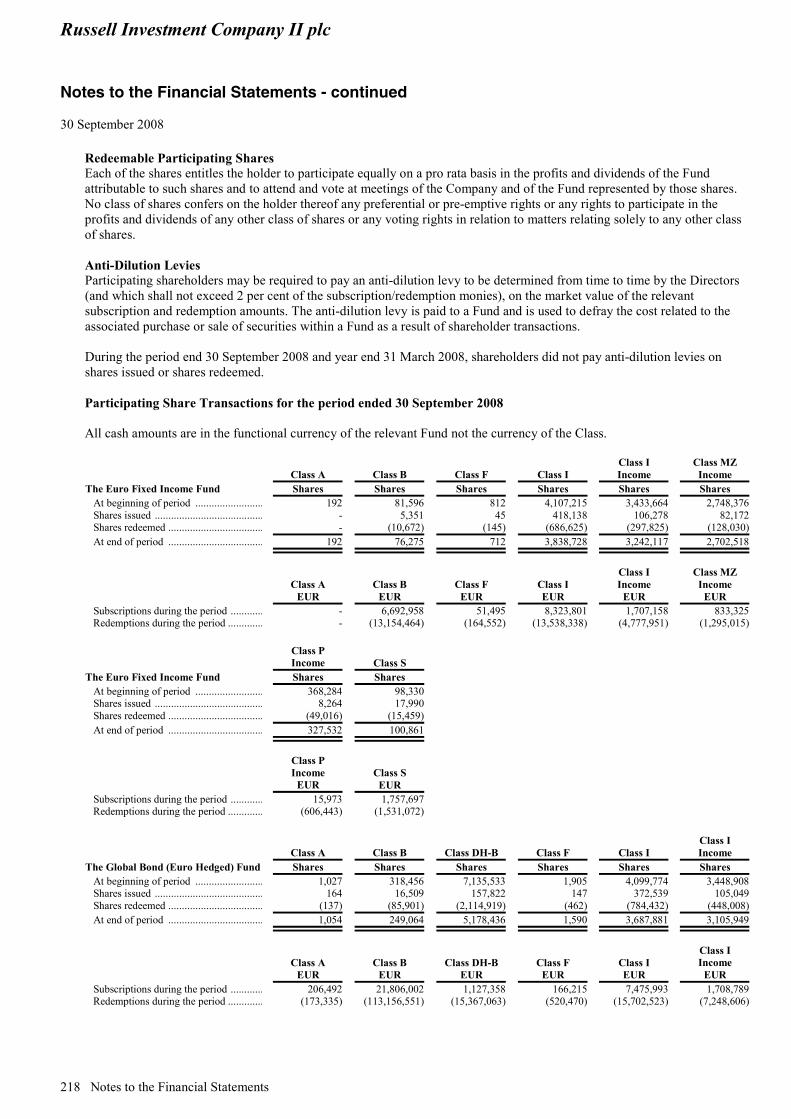
Russell Investment Company II plc Notes to the Financial Statements - continued 30 September 2008
218 Notes to the Financial Statements
Redeemable Participating Shares Each of the shares entitles the holder to participate equally on a pro rata basis in the profits and dividends of the Fund attributable to such shares and to attend and vote at meetings of the Company and of the Fund represented by those shares. No class of shares confers on the holder thereof any preferential or pre-emptive rights or any rights to participate in the profits and dividends of any other class of shares or any voting rights in relation to matters relating solely to any other class of shares. Anti-Dilution Levies Participating shareholders may be required to pay an anti-dilution levy to be determined from time to time by the Directors (and which shall not exceed 2 per cent of the subscription/redemption monies), on the market value of the relevant subscription and redemption amounts. The anti-dilution levy is paid to a Fund and is used to defray the cost related to the associated purchase or sale of securities within a Fund as a result of shareholder transactions. During the period end 30 September 2008 and year end 31 March 2008, shareholders did not pay anti-dilution levies on shares issued or shares redeemed. Participating Share Transactions for the period ended 30 September 2008 All cash amounts are in the functional currency of the relevant Fund not the currency of the Class.
Class A Class B Class F Class I
Class I Income
Class MZ Income
The Euro Fixed Income Fund Shares Shares Shares Shares Shares Shares At beginning of period ......................... 192 81,596 812 4,107,215 3,433,664 2,748,376 Shares issued ........................................ - 5,351 45 418,138 106,278 82,172 Shares redeemed ................................... - (10,672) (145) (686,625) (297,825) (128,030) At end of period ................................... 192 76,275 712 3,838,728 3,242,117 2,702,518
Class A EUR
Class B EUR
Class F EUR
Class I EUR
Class I Income
EUR
Class MZ Income
EUR Subscriptions during the period ............ - 6,692,958 51,495 8,323,801 1,707,158 833,325 Redemptions during the period ............. - (13,154,464) (164,552) (13,538,338) (4,777,951) (1,295,015)
Class P
Income Class S The Euro Fixed Income Fund Shares Shares At beginning of period ......................... 368,284 98,330 Shares issued ........................................ 8,264 17,990 Shares redeemed ................................... (49,016) (15,459) At end of period ................................... 327,532 100,861
Class P
Income EUR
Class S EUR
Subscriptions during the period ............ 15,973 1,757,697 Redemptions during the period ............. (606,443) (1,531,072)
Class A Class B Class DH-B Class F Class I
Class I Income
The Global Bond (Euro Hedged) Fund Shares Shares Shares Shares Shares Shares At beginning of period ......................... 1,027 318,456 7,135,533 1,905 4,099,774 3,448,908 Shares issued ........................................ 164 16,509 157,822 147 372,539 105,049 Shares redeemed ................................... (137) (85,901) (2,114,919) (462) (784,432) (448,008) At end of period ................................... 1,054 249,064 5,178,436 1,590 3,687,881 3,105,949
Class A EUR
Class B EUR
Class DH-BEUR
Class F EUR
Class I EUR
Class I Income
EUR Subscriptions during the period ............ 206,492 21,806,002 1,127,358 166,215 7,475,993 1,708,789 Redemptions during the period ............. (173,335) (113,156,551) (15,367,063) (520,470) (15,702,523) (7,248,606)
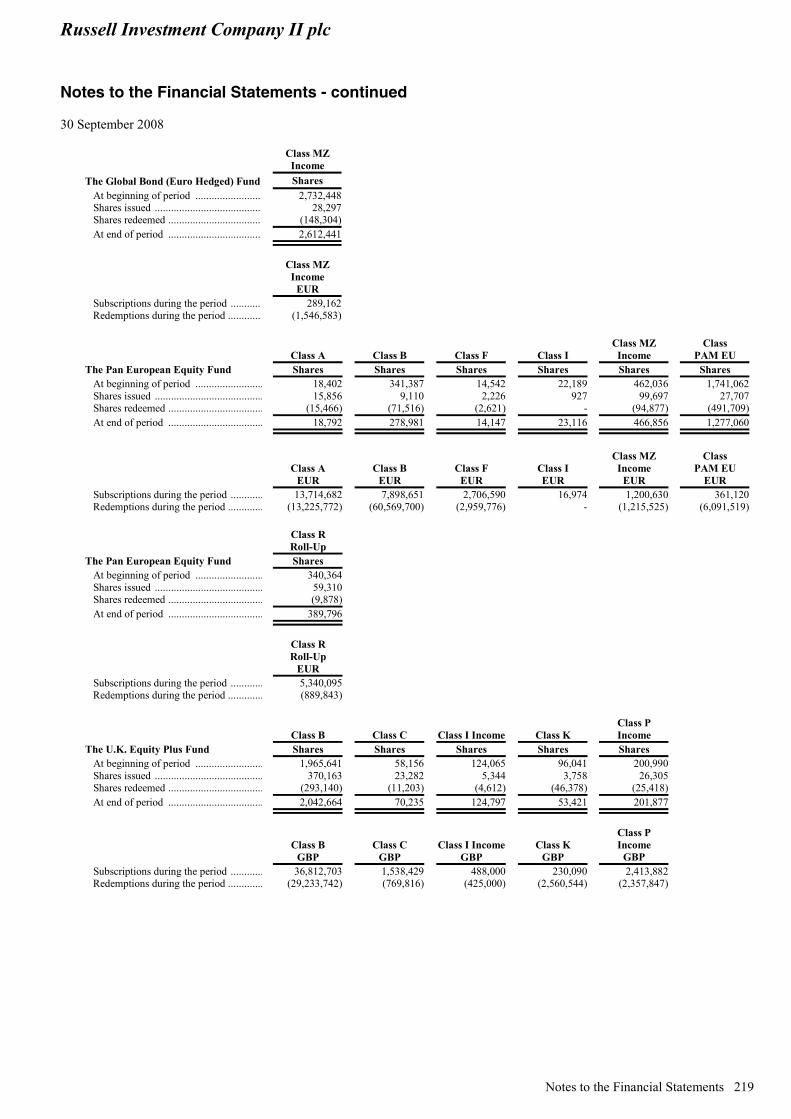
Russell Investment Company II plc Notes to the Financial Statements - continued 30 September 2008
Notes to the Financial Statements 219
Class MZ Income
The Global Bond (Euro Hedged) Fund Shares At beginning of period ......................... 2,732,448 Shares issued ........................................ 28,297 Shares redeemed ................................... (148,304) At end of period ................................... 2,612,441
Class MZ
Income EUR
Subscriptions during the period ............ 289,162 Redemptions during the period ............. (1,546,583)
Class A Class B Class F Class I
Class MZ Income
Class PAM EU
The Pan European Equity Fund Shares Shares Shares Shares Shares Shares At beginning of period ......................... 18,402 341,387 14,542 22,189 462,036 1,741,062 Shares issued ........................................ 15,856 9,110 2,226 927 99,697 27,707 Shares redeemed ................................... (15,466) (71,516) (2,621) - (94,877) (491,709) At end of period ................................... 18,792 278,981 14,147 23,116 466,856 1,277,060
Class A EUR
Class B EUR
Class F EUR
Class I EUR
Class MZ Income
EUR
Class PAM EU
EUR Subscriptions during the period ............ 13,714,682 7,898,651 2,706,590 16,974 1,200,630 361,120 Redemptions during the period ............. (13,225,772) (60,569,700) (2,959,776) - (1,215,525) (6,091,519)
Class R Roll-Up
The Pan European Equity Fund Shares At beginning of period ......................... 340,364 Shares issued ........................................ 59,310 Shares redeemed ................................... (9,878) At end of period ................................... 389,796
Class R
Roll-Up EUR
Subscriptions during the period ............ 5,340,095 Redemptions during the period ............. (889,843)
Class B Class C Class I Income Class K
Class P Income
The U.K. Equity Plus Fund Shares Shares Shares Shares Shares At beginning of period ......................... 1,965,641 58,156 124,065 96,041 200,990 Shares issued ........................................ 370,163 23,282 5,344 3,758 26,305 Shares redeemed ................................... (293,140) (11,203) (4,612) (46,378) (25,418) At end of period ................................... 2,042,664 70,235 124,797 53,421 201,877
Class B GBP
Class C GBP
Class I IncomeGBP
Class K GBP
Class P Income
GBP Subscriptions during the period ............ 36,812,703 1,538,429 488,000 230,090 2,413,882 Redemptions during the period ............. (29,233,742) (769,816) (425,000) (2,560,544) (2,357,847)
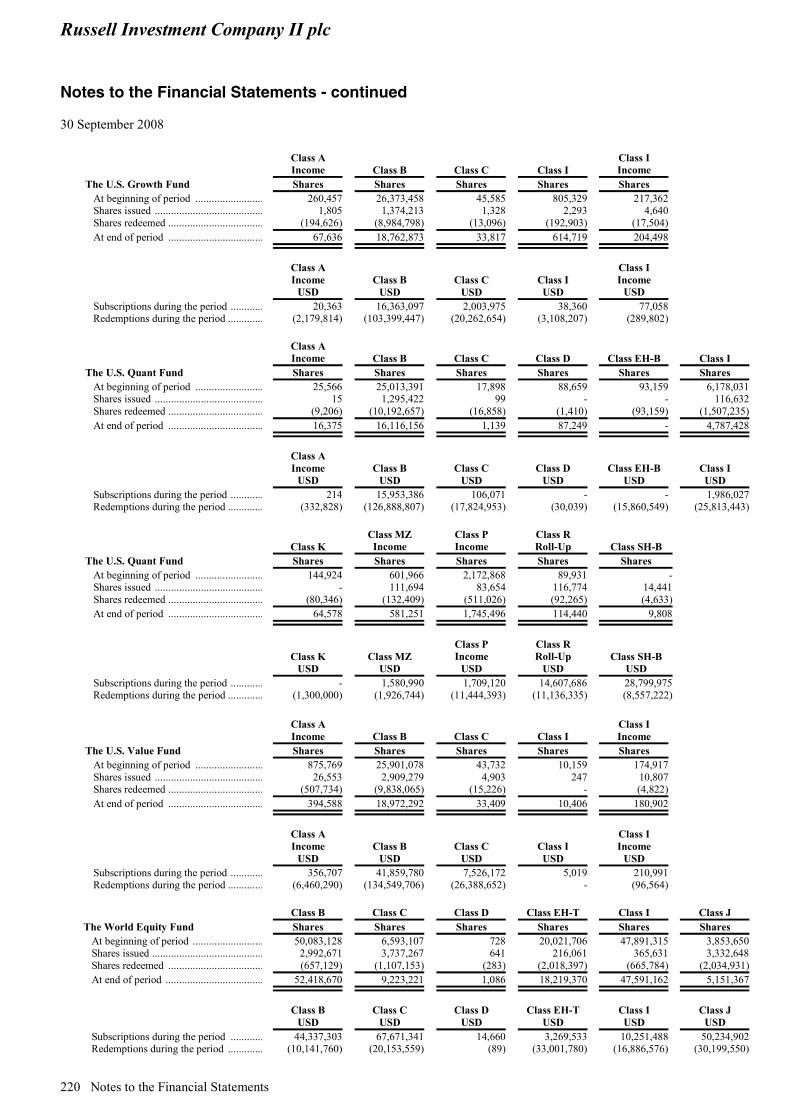
Russell Investment Company II plc Notes to the Financial Statements - continued 30 September 2008
220 Notes to the Financial Statements
Class A
Income Class B Class C Class I Class I Income
The U.S. Growth Fund Shares Shares Shares Shares Shares At beginning of period ......................... 260,457 26,373,458 45,585 805,329 217,362 Shares issued ........................................ 1,805 1,374,213 1,328 2,293 4,640 Shares redeemed ................................... (194,626) (8,984,798) (13,096) (192,903) (17,504) At end of period ................................... 67,636 18,762,873 33,817 614,719 204,498
Class A
Income USD
Class B USD
Class C USD
Class I USD
Class I Income
USD Subscriptions during the period ............ 20,363 16,363,097 2,003,975 38,360 77,058 Redemptions during the period ............. (2,179,814) (103,399,447) (20,262,654) (3,108,207) (289,802)
Class A
Income Class B Class C Class D Class EH-B Class I The U.S. Quant Fund Shares Shares Shares Shares Shares Shares At beginning of period ......................... 25,566 25,013,391 17,898 88,659 93,159 6,178,031 Shares issued ........................................ 15 1,295,422 99 - - 116,632 Shares redeemed ................................... (9,206) (10,192,657) (16,858) (1,410) (93,159) (1,507,235) At end of period ................................... 16,375 16,116,156 1,139 87,249 - 4,787,428
Class A
Income USD
Class B USD
Class C USD
Class D USD
Class EH-BUSD
Class I USD
Subscriptions during the period ............ 214 15,953,386 106,071 - - 1,986,027 Redemptions during the period ............. (332,828) (126,888,807) (17,824,953) (30,039) (15,860,549) (25,813,443)
Class K
Class MZ Income
Class P Income
Class R Roll-Up
Class SH-B
The U.S. Quant Fund Shares Shares Shares Shares Shares At beginning of period ......................... 144,924 601,966 2,172,868 89,931 - Shares issued ........................................ - 111,694 83,654 116,774 14,441 Shares redeemed ................................... (80,346) (132,409) (511,026) (92,265) (4,633) At end of period ................................... 64,578 581,251 1,745,496 114,440 9,808
Class K USD
Class MZ USD
Class P Income
USD
Class R Roll-Up
USD
Class SH-B
USD Subscriptions during the period ............ - 1,580,990 1,709,120 14,607,686 28,799,975 Redemptions during the period ............. (1,300,000) (1,926,744) (11,444,393) (11,136,335) (8,557,222)
Class A Income Class B Class C Class I
Class I Income
The U.S. Value Fund Shares Shares Shares Shares Shares At beginning of period ......................... 875,769 25,901,078 43,732 10,159 174,917 Shares issued ........................................ 26,553 2,909,279 4,903 247 10,807 Shares redeemed ................................... (507,734) (9,838,065) (15,226) - (4,822) At end of period ................................... 394,588 18,972,292 33,409 10,406 180,902
Class A
Income USD
Class B USD
Class C USD
Class I USD
Class I Income
USD Subscriptions during the period ............ 356,707 41,859,780 7,526,172 5,019 210,991 Redemptions during the period ............. (6,460,290) (134,549,706) (26,388,652) - (96,564)
Class B Class C Class D Class EH-T Class I Class J The World Equity Fund Shares Shares Shares Shares Shares Shares At beginning of period .......................... 50,083,128 6,593,107 728 20,021,706 47,891,315 3,853,650 Shares issued ......................................... 2,992,671 3,737,267 641 216,061 365,631 3,332,648 Shares redeemed ................................... (657,129) (1,107,153) (283) (2,018,397) (665,784) (2,034,931) At end of period .................................... 52,418,670 9,223,221 1,086 18,219,370 47,591,162 5,151,367
Class B
USD Class C
USD Class D
USD Class EH-T
USD Class I USD
Class J USD
Subscriptions during the period ............ 44,337,303 67,671,341 14,660 3,269,533 10,251,488 50,234,902 Redemptions during the period ............. (10,141,760) (20,153,559) (89) (33,001,780) (16,886,576) (30,199,550)

Russell Investment Company II plc Notes to the Financial Statements - continued 30 September 2008
Notes to the Financial Statements 221
Class N Class SH-B Class TDC NV Class TYA The World Equity Fund Shares Shares Shares Shares At beginning of period .......................... 53,459 3,336,069 10,000,000 2,975,785 Shares issued ......................................... 8,597 71,861 - - Shares redeemed ................................... (22,713) (265,180) - (5,742) At end of period .................................... 39,343 3,142,750 10,000,000 2,970,043
Class N
USD Class SH-B
USD Class TDC-NV
USD Class TYA
USD
Subscriptions during the period ............. 1,006,237 14,883,199 - - Redemptions during the period ............. (2,599,130) (56,982,082) - (47,167) Participating Share Transactions for the period ended 30 September 2007 All cash amounts are in the functional currency of the relevant Fund not the currency of the Class.
Class A Class B Class F Class I
Class I Income Class MZ
The Euro Fixed Income Fund Shares Shares Shares Shares Shares Shares At beginning of period .......................... 231 117,096 781 5,290,157 4,294,967 2,395,672 Shares issued ......................................... 49 12,378 412 242,626 87,881 70,886 Shares redeemed ................................... (87) (42,634) (238) (422,819) (322,495) (23,548) At end of period .................................... 192 86,840 955 5,109,964 4,060,352 2,443,010
Class A EUR
Class B EUR
Class F EUR
Class I EUR
Class I Income
EUR Class MZ
EUR Subscriptions during the period ............. 57,144 18,872,780 494,203 5,042,591 1,523,849 70,208 Redemptions during the period ............. (148,021) (55,182,933) (295,312) (8,515,061) (5,336,357) (254,859)
Class P Income Class S
The Euro Fixed Income Fund Shares Shares At beginning of period ........................... 136,967 121,768 Shares issued .......................................... 436,581 10,534 Shares redeemed ..................................... (70,694) (41,323) At end of period ..................................... 502,854 90,979
Class P
Income EUR
Class S EUR
Subscriptions during the period .............. 5,938,935 1,578 Redemptions during the period ............... (980,309) (4,142,640)
Class A Class B Class DH-B Class F Class I Class I Income
The Global Bond (Euro Hedged) Fund Shares Shares Shares Shares Shares Shares At beginning of period ........................... 2,250 446,817 8,931,714 2,031 5,399,835 4,378,102 Shares issued .......................................... 99 25,262 1,344,544 1,609 227,481 61,956 Shares redeemed .................................... (1,368) (106,778) (1,420,836) (866) (480,478) (369,109) At end of period ..................................... 981 365,302 8,855,421 2,775 5,146,838 4,070,949
Class A EUR
Class B EUR
Class DH-BEUR
Class F EUR
Class I EUR
Class I Income
EUR Subscriptions during the period .............. 123,483 32,779,099 10,868,343 1,813,860 4,496,279 1,032,765 Redemptions during the period .............. (14,962,782) (138,682,566) (11,431,825) (1,070,411) (9,548,098) (6,165,770)

Russell Investment Company II plc Notes to the Financial Statements - continued 30 September 2008
222 Notes to the Financial Statements
Class MZ The Global Bond (Euro Hedged) Fund Shares At beginning of period ........................... 2,856,597 Shares issued .......................................... 76,296 Shares redeemed .................................... (491,329) At end of period ..................................... 2,441,564
Class MZ
EUR Subscriptions during the period .............. 816,552 Redemptions during the period .............. (5,409,190)
Class A Class B Class F Class I Class MZ Class PAMEU
The Pan European Equity Fund Shares Shares Shares Shares Shares Shares At beginning of period .......................... 30,837 418,843 14,452 231,439 419,432 3,779,822 Shares issued ......................................... 2,025 75,114 28,144 3,615 6,138 1,185,416 Shares redeemed ................................... (3,748) (96,960) (1,282) (15,917) (20,913) (1,656,253) At end of period .................................... 29,114 396,997 15,984 219,127 404,657 3,308,985
Class A
EUR Class B
EUR Class F
EUR Class I EUR
Class MZ EUR
Class PAMEUEUR
Subscriptions during the period ............ 2,042,223 79,951,561 4,343,346 80,655 102,560 19,166,298 Redemptions during the period ............. (3,921,913) (102,578,925) (1,922,717) (353,725) (360,817) (27,297,067)
Class R Roll-Up
The Pan European Equity Fund Shares At beginning of period .......................... 356,547 Shares issued ......................................... 39,839 Shares redeemed ................................... (83,738) At end of period .................................... 312,648
Class R
Roll-Up EUR
Subscriptions during the period ............ 4,557,426 Redemptions during the period ............. (9,460,353)
Class B Class C
Class I Income Class K
Class P Income
The U.K. Equity Fund Shares Shares Shares Shares Shares At beginning of period .......................... 1,455,245 88,000 - 135,831 137,943 Shares issued ......................................... 77,689 - 115,562 161,895 39,277 Shares redeemed ................................... (105,867) (10,200) - (29,259) (13,755) At end of period .................................... 1,427,067 77,800 115,562 268,467 163,465
Class B GBP
Class C GBP
Class I Income
GBP Class K
GBP
Class P Income
GBP Subscriptions during the period ............ 8,666,123 - 11,556,238 10,217,052 4,185,599 Redemptions during the period ............. (11,862,637) (748,412) - (1,794,124) (1,492,309)
Class B Class C Class I
Class I Income
Class P Income
The U.K. Systematic Fund Shares Shares Shares Shares Shares At beginning of period .......................... 3,442,523 7,260 8,090,178 1,403,147 3,68,316 Shares issued ......................................... 133,936 12 158,413 140,411 6,862 Shares redeemed ................................... (399,260) (1,024) (558,812) (990,540) (108,247) At end of period .................................... 3,177,199 6,248 7,689,779 553,017 266,931
Class B GBP
Class C GBP
Class I GBP
Class I Income
GBP
Class P Income
GBP Subscriptions during the period ............ 1,919,891 15,761 2,275,254 1,799,138 107,615 Redemptions during the period ............. (6,013,844) (1,356,835) (8,152,391) (12,536,815) (1,707,691)
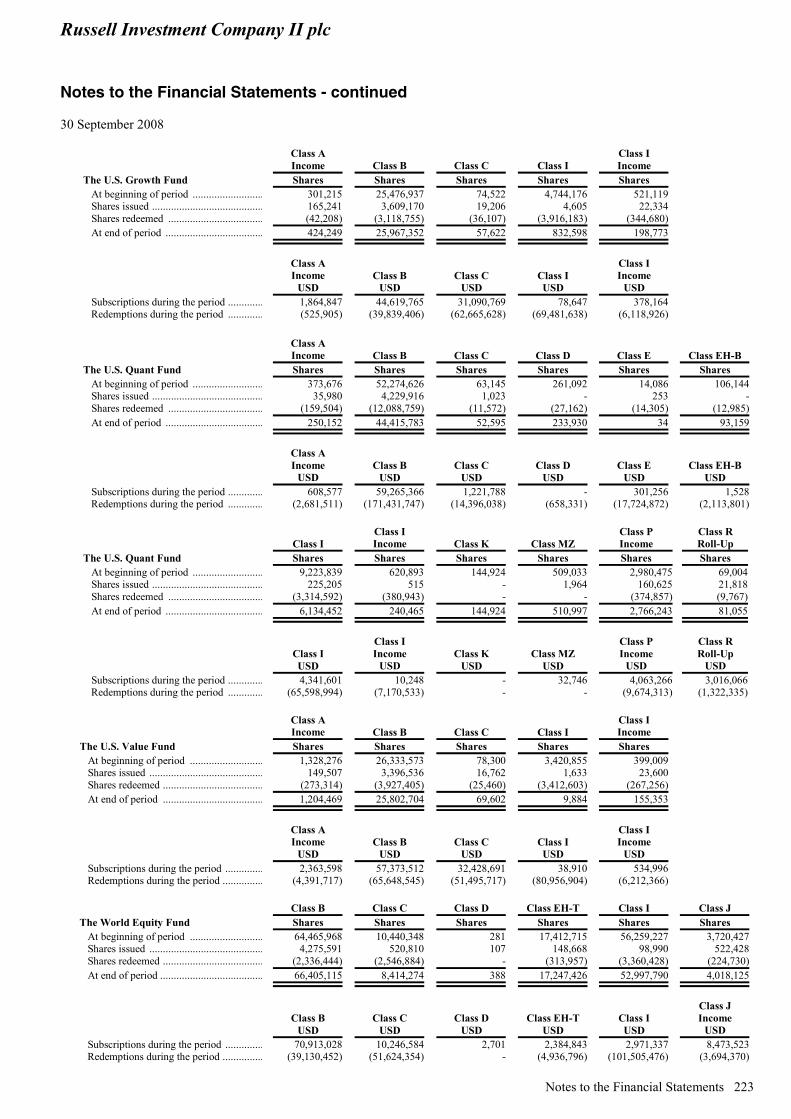
Russell Investment Company II plc Notes to the Financial Statements - continued 30 September 2008
Notes to the Financial Statements 223
Class A Income Class B Class C Class I
Class I Income
The U.S. Growth Fund Shares Shares Shares Shares Shares At beginning of period .......................... 301,215 25,476,937 74,522 4,744,176 521,119 Shares issued ......................................... 165,241 3,609,170 19,206 4,605 22,334 Shares redeemed ................................... (42,208) (3,118,755) (36,107) (3,916,183) (344,680) At end of period .................................... 424,249 25,967,352 57,622 832,598 198,773
Class A
Income USD
Class B USD
Class C USD
Class I USD
Class I Income
USD Subscriptions during the period ............. 1,864,847 44,619,765 31,090,769 78,647 378,164 Redemptions during the period ............. (525,905) (39,839,406) (62,665,628) (69,481,638) (6,118,926)
Class A
Income Class B Class C Class D Class E Class EH-B The U.S. Quant Fund Shares Shares Shares Shares Shares Shares At beginning of period .......................... 373,676 52,274,626 63,145 261,092 14,086 106,144 Shares issued ......................................... 35,980 4,229,916 1,023 - 253 - Shares redeemed ................................... (159,504) (12,088,759) (11,572) (27,162) (14,305) (12,985) At end of period .................................... 250,152 44,415,783 52,595 233,930 34 93,159
Class A
Income USD
Class B USD
Class C USD
Class D USD
Class E USD
Class EH-B USD
Subscriptions during the period ............. 608,577 59,265,366 1,221,788 - 301,256 1,528 Redemptions during the period ............. (2,681,511) (171,431,747) (14,396,038) (658,331) (17,724,872) (2,113,801)
Class I Class I Income Class K Class MZ
Class P Income
Class R Roll-Up
The U.S. Quant Fund Shares Shares Shares Shares Shares Shares At beginning of period .......................... 9,223,839 620,893 144,924 509,033 2,980,475 69,004 Shares issued ......................................... 225,205 515 - 1,964 160,625 21,818 Shares redeemed ................................... (3,314,592) (380,943) - - (374,857) (9,767) At end of period .................................... 6,134,452 240,465 144,924 510,997 2,766,243 81,055
Class I USD
Class I Income
USD Class K
USD Class MZ
USD
Class P Income
USD
Class R Roll-Up
USD Subscriptions during the period ............. 4,341,601 10,248 - 32,746 4,063,266 3,016,066 Redemptions during the period ............. (65,598,994) (7,170,533) - - (9,674,313) (1,322,335)
Class A
Income Class B Class C Class I Class I Income
The U.S. Value Fund Shares Shares Shares Shares Shares At beginning of period ........................... 1,328,276 26,333,573 78,300 3,420,855 399,009 Shares issued .......................................... 149,507 3,396,536 16,762 1,633 23,600 Shares redeemed ..................................... (273,314) (3,927,405) (25,460) (3,412,603) (267,256) At end of period ..................................... 1,204,469 25,802,704 69,602 9,884 155,353
Class A
Income USD
Class B USD
Class C USD
Class I USD
Class I Income
USD Subscriptions during the period .............. 2,363,598 57,373,512 32,428,691 38,910 534,996 Redemptions during the period ............... (4,391,717) (65,648,545) (51,495,717) (80,956,904) (6,212,366)
Class B Class C Class D Class EH-T Class I Class J
The World Equity Fund Shares Shares Shares Shares Shares Shares At beginning of period ........................... 64,465,968 10,440,348 281 17,412,715 56,259,227 3,720,427 Shares issued .......................................... 4,275,591 520,810 107 148,668 98,990 522,428 Shares redeemed ..................................... (2,336,444) (2,546,884) - (313,957) (3,360,428) (224,730) At end of period ...................................... 66,405,115 8,414,274 388 17,247,426 52,997,790 4,018,125
Class B USD
Class C USD
Class D USD
Class EH-T USD
Class I USD
Class J Income
USD Subscriptions during the period .............. 70,913,028 10,246,584 2,701 2,384,843 2,971,337 8,473,523 Redemptions during the period ............... (39,130,452) (51,624,354) - (4,936,796) (101,505,476) (3,694,370)
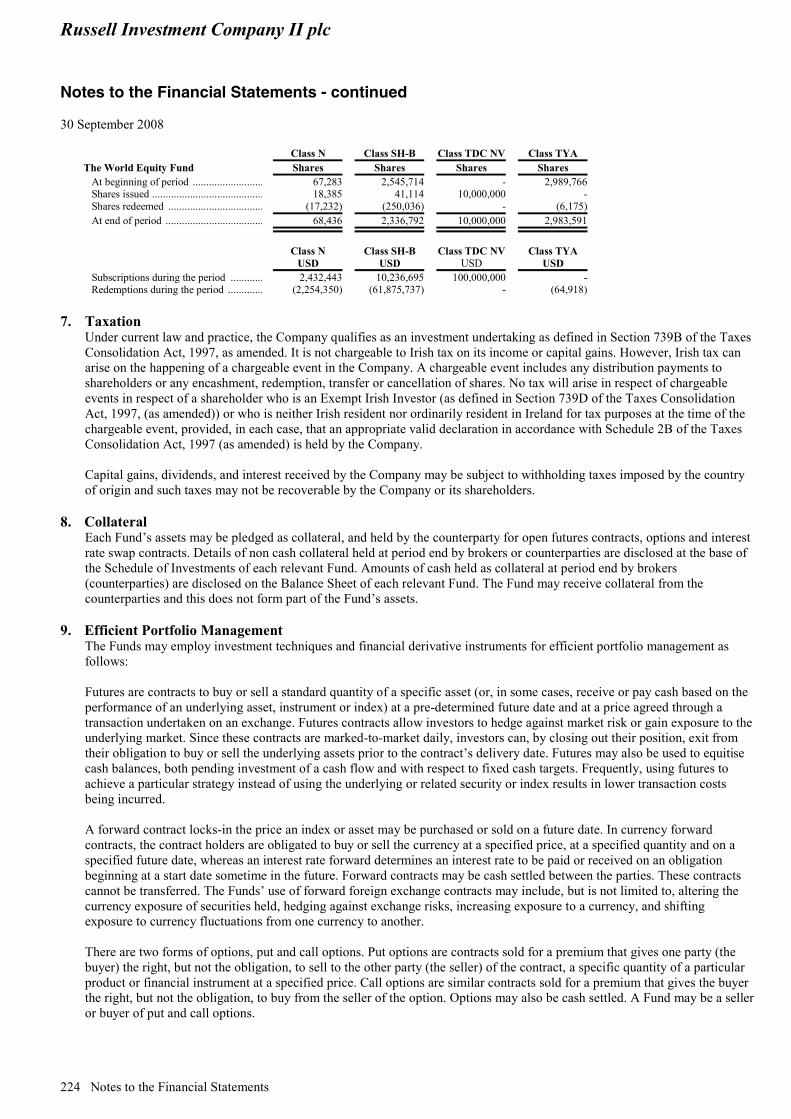
Russell Investment Company II plc Notes to the Financial Statements - continued 30 September 2008
224 Notes to the Financial Statements
Class N Class SH-B Class TDC NV Class TYA The World Equity Fund Shares Shares Shares Shares At beginning of period .......................... 67,283 2,545,714 - 2,989,766 Shares issued ......................................... 18,385 41,114 10,000,000 - Shares redeemed ................................... (17,232) (250,036) - (6,175) At end of period .................................... 68,436 2,336,792 10,000,000 2,983,591
Class N
USD Class SH-B
USD Class TDC NV
USD Class TYA
USD Subscriptions during the period ............ 2,432,443 10,236,695 100,000,000 - Redemptions during the period ............. (2,254,350) (61,875,737) - (64,918)
7. Taxation Under current law and practice, the Company qualifies as an investment undertaking as defined in Section 739B of the Taxes Consolidation Act, 1997, as amended. It is not chargeable to Irish tax on its income or capital gains. However, Irish tax can arise on the happening of a chargeable event in the Company. A chargeable event includes any distribution payments to shareholders or any encashment, redemption, transfer or cancellation of shares. No tax will arise in respect of chargeable events in respect of a shareholder who is an Exempt Irish Investor (as defined in Section 739D of the Taxes Consolidation Act, 1997, (as amended)) or who is neither Irish resident nor ordinarily resident in Ireland for tax purposes at the time of the chargeable event, provided, in each case, that an appropriate valid declaration in accordance with Schedule 2B of the Taxes Consolidation Act, 1997 (as amended) is held by the Company. Capital gains, dividends, and interest received by the Company may be subject to withholding taxes imposed by the country of origin and such taxes may not be recoverable by the Company or its shareholders.
8. Collateral Each Fund’s assets may be pledged as collateral, and held by the counterparty for open futures contracts, options and interest rate swap contracts. Details of non cash collateral held at period end by brokers or counterparties are disclosed at the base of the Schedule of Investments of each relevant Fund. Amounts of cash held as collateral at period end by brokers (counterparties) are disclosed on the Balance Sheet of each relevant Fund. The Fund may receive collateral from the counterparties and this does not form part of the Fund’s assets.
9. Efficient Portfolio Management The Funds may employ investment techniques and financial derivative instruments for efficient portfolio management as follows: Futures are contracts to buy or sell a standard quantity of a specific asset (or, in some cases, receive or pay cash based on the performance of an underlying asset, instrument or index) at a pre-determined future date and at a price agreed through a transaction undertaken on an exchange. Futures contracts allow investors to hedge against market risk or gain exposure to the underlying market. Since these contracts are marked-to-market daily, investors can, by closing out their position, exit from their obligation to buy or sell the underlying assets prior to the contract’s delivery date. Futures may also be used to equitise cash balances, both pending investment of a cash flow and with respect to fixed cash targets. Frequently, using futures to achieve a particular strategy instead of using the underlying or related security or index results in lower transaction costs being incurred. A forward contract locks-in the price an index or asset may be purchased or sold on a future date. In currency forward contracts, the contract holders are obligated to buy or sell the currency at a specified price, at a specified quantity and on a specified future date, whereas an interest rate forward determines an interest rate to be paid or received on an obligation beginning at a start date sometime in the future. Forward contracts may be cash settled between the parties. These contracts cannot be transferred. The Funds’ use of forward foreign exchange contracts may include, but is not limited to, altering the currency exposure of securities held, hedging against exchange risks, increasing exposure to a currency, and shifting exposure to currency fluctuations from one currency to another. There are two forms of options, put and call options. Put options are contracts sold for a premium that gives one party (the buyer) the right, but not the obligation, to sell to the other party (the seller) of the contract, a specific quantity of a particular product or financial instrument at a specified price. Call options are similar contracts sold for a premium that gives the buyer the right, but not the obligation, to buy from the seller of the option. Options may also be cash settled. A Fund may be a seller or buyer of put and call options.
Russell Investment Company II plc Notes to the Financial Statements - continued 30 September 2008
Notes to the Financial Statements 225
A standard swap is an agreement between two counterparties in which the cash flows from two assets are exchanged over a fixed time period, with the terms initially set so that the present value of the swap is zero. The Funds may enter into swaps, including, but not limited to, equity swaps, swaptions, interest rate swaps or currency swaps and other derivative instruments both as independent profit opportunities and to hedge existing long positions. Swaps may extend over substantial periods of time, and typically call for the making of payments on a periodic basis. Swaptions are contracts whereby one party receives a fee in return for agreeing to enter into a forward swap at a predetermined fixed rate if some contingency event occurs (normally where future rates are set in relation to a fixed benchmark). Interest rate swaps involve the exchange by a Fund with another party of their respective commitments to make or receive interest payments (e.g. an exchange of fixed rate payments for floating rate payments). On each payment date under an interest rate swap, the net payments owed by each party, and only the net amount, is paid by one party to the other. Currency swaps are agreements between two parties to exchange future payments in one currency for payments in another currency. These agreements are used to transform the currency denomination of assets and liabilities. Unlike interest rate swaps, currency swaps must include an exchange of principal at maturity. The Funds may enter into spot foreign exchange transactions which involve the purchase of one currency with another, a fixed amount of the first currency being paid to receive a fixed amount of the second currency. “Spot” settlement means that delivery of the currency amounts normally takes place two business days in both relevant centres after the trade is executed. The Funds may enter into caps and floors which are agreements under which the seller agrees to compensate the buyer if interest rates rise above a pre-agreed strike rate on pre-agreed dates during the life of the agreement. In return the buyer pays the seller a premium up front. A floor is similar to a cap except that the seller compensates the buyer if interest rates fall below a pre-agreed strike rate on pre-agreed dates during the life of the agreement. As with a cap, the buyer pays the seller a premium up front. The Funds may enter into contracts for differences which allow a direct exposure to the market, a sector or an individual security. Unlike a forward contract, there is no final maturity, the position being closed out at the discretion of the position taker. Contracts for differences (“CFD”) are used to gain exposure to share price movements without buying the shares themselves. A CFD on a company’s shares will specify the price of the shares when the contract was started. The contract is an agreement to pay out cash on the difference between the starting share and when the contract is closed. The Funds may enter into credit derivatives to isolate and transfer the credit risk associated with a particular reference asset. Credit default swaps provide a measure of protection against defaults of debt issuers. The Funds’ use of credit default swaps does not assure their use will be effective or will have the desired result. A Fund may either be the buyer or seller in a credit default swap transaction. Credit default swaps are transactions under which the parties’ obligations depend on whether a credit event has occurred in relation to the reference asset. The credit events are specified in the contract and are intended to identify the occurrence of a significant deterioration in the creditworthiness of the reference asset. On settlement, credit default products may be cash settled or involve the physical delivery of an obligation of the reference entity following a default. The buyer in a credit default swap contract is obligated to pay the seller a periodic stream of payments over the term of the contract provided that no event of default on an underlying reference asset has occurred. If a credit event occurs, the seller must pay the buyer the full notional value of the reference asset that may have little or no value. If the Fund is a buyer and no credit event occurs the Fund’s losses will be limited to the periodic stream of payments over the term of the contract. As a seller, the Funds will receive a fixed rate of income throughout the term of the contract, provided that there is no credit event. If a credit event occurs, the seller must pay the buyer the full notional value of the reference obligation.
10. Launch of New Funds and Classes of Shares During the financial period under review the following Fund and classes of shares were funded for the first time. Classes of Shares
Launch Date Launch Price per
share The U.S. Quant Fund Class SH-B 10/07/2008 USD 1,994.51
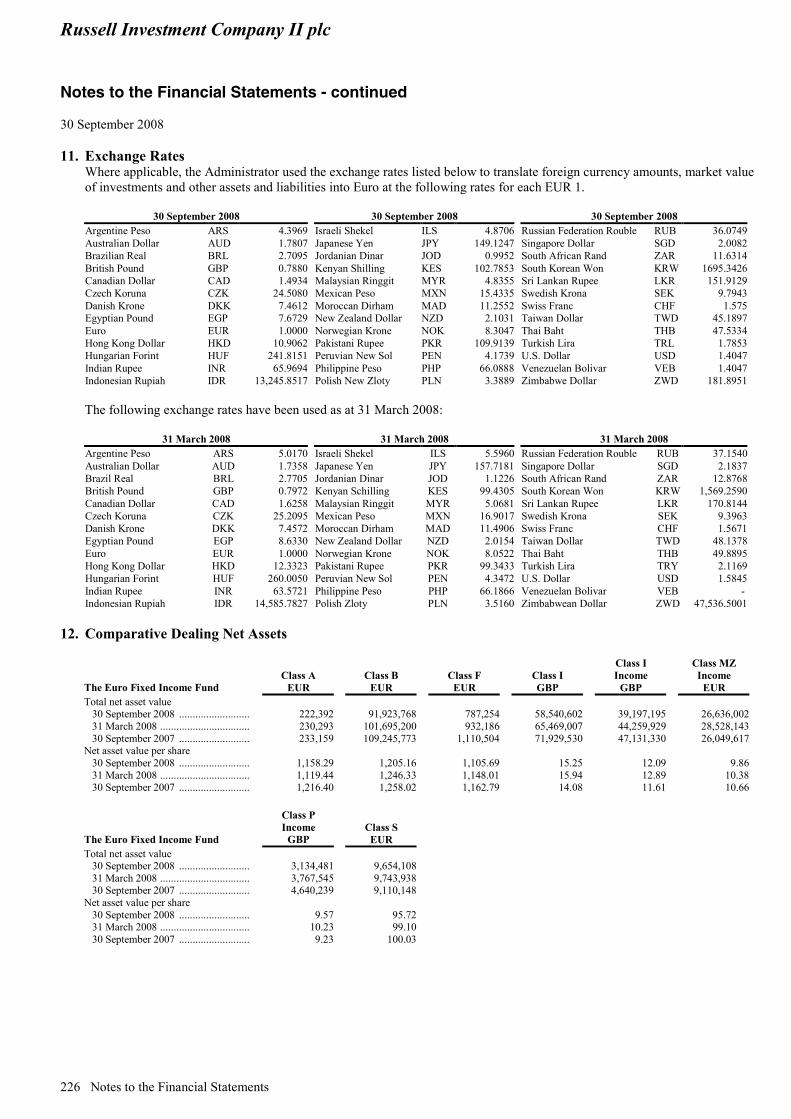
Russell Investment Company II plc Notes to the Financial Statements - continued 30 September 2008
226 Notes to the Financial Statements
11. Exchange Rates Where applicable, the Administrator used the exchange rates listed below to translate foreign currency amounts, market value of investments and other assets and liabilities into Euro at the following rates for each EUR 1.
30 September 2008 30 September 2008 30 September 2008 Argentine Peso ARS 4.3969 Israeli Shekel ILS 4.8706 Russian Federation Rouble RUB 36.0749Australian Dollar AUD 1.7807 Japanese Yen JPY 149.1247 Singapore Dollar SGD 2.0082Brazilian Real BRL 2.7095 Jordanian Dinar JOD 0.9952 South African Rand ZAR 11.6314British Pound GBP 0.7880 Kenyan Shilling KES 102.7853 South Korean Won KRW 1695.3426Canadian Dollar CAD 1.4934 Malaysian Ringgit MYR 4.8355 Sri Lankan Rupee LKR 151.9129Czech Koruna CZK 24.5080 Mexican Peso MXN 15.4335 Swedish Krona SEK 9.7943Danish Krone DKK 7.4612 Moroccan Dirham MAD 11.2552 Swiss Franc CHF 1.575Egyptian Pound EGP 7.6729 New Zealand Dollar NZD 2.1031 Taiwan Dollar TWD 45.1897Euro EUR 1.0000 Norwegian Krone NOK 8.3047 Thai Baht THB 47.5334Hong Kong Dollar HKD 10.9062 Pakistani Rupee PKR 109.9139 Turkish Lira TRL 1.7853Hungarian Forint HUF 241.8151 Peruvian New Sol PEN 4.1739 U.S. Dollar USD 1.4047Indian Rupee INR 65.9694 Philippine Peso PHP 66.0888 Venezuelan Bolivar VEB 1.4047Indonesian Rupiah IDR 13,245.8517 Polish New Zloty PLN 3.3889 Zimbabwe Dollar ZWD 181.8951 The following exchange rates have been used as at 31 March 2008:
31 March 2008 31 March 2008 31 March 2008 Argentine Peso ARS 5.0170 Israeli Shekel ILS 5.5960 Russian Federation Rouble RUB 37.1540 Australian Dollar AUD 1.7358 Japanese Yen JPY 157.7181 Singapore Dollar SGD 2.1837 Brazil Real BRL 2.7705 Jordanian Dinar JOD 1.1226 South African Rand ZAR 12.8768 British Pound GBP 0.7972 Kenyan Schilling KES 99.4305 South Korean Won KRW 1,569.2590 Canadian Dollar CAD 1.6258 Malaysian Ringgit MYR 5.0681 Sri Lankan Rupee LKR 170.8144 Czech Koruna CZK 25.2095 Mexican Peso MXN 16.9017 Swedish Krona SEK 9.3963 Danish Krone DKK 7.4572 Moroccan Dirham MAD 11.4906 Swiss Franc CHF 1.5671 Egyptian Pound EGP 8.6330 New Zealand Dollar NZD 2.0154 Taiwan Dollar TWD 48.1378 Euro EUR 1.0000 Norwegian Krone NOK 8.0522 Thai Baht THB 49.8895 Hong Kong Dollar HKD 12.3323 Pakistani Rupee PKR 99.3433 Turkish Lira TRY 2.1169 Hungarian Forint HUF 260.0050 Peruvian New Sol PEN 4.3472 U.S. Dollar USD 1.5845 Indian Rupee INR 63.5721 Philippine Peso PHP 66.1866 Venezuelan Bolivar VEB - Indonesian Rupiah IDR 14,585.7827 Polish Zloty PLN 3.5160 Zimbabwean Dollar ZWD 47,536.5001
12. Comparative Dealing Net Assets
The Euro Fixed Income Fund
Class A
EUR Class B
EUR Class F
EUR Class I GBP
Class I Income
GBP
Class MZ Income
EUR Total net asset value 30 September 2008 ........................... 222,392 91,923,768 787,254 58,540,602 39,197,195 26,636,002 31 March 2008 .................................. 230,293 101,695,200 932,186 65,469,007 44,259,929 28,528,143 30 September 2007 ........................... 233,159 109,245,773 1,110,504 71,929,530 47,131,330 26,049,617Net asset value per share 30 September 2008 ........................... 1,158.29 1,205.16 1,105.69 15.25 12.09 9.86 31 March 2008 .................................. 1,119.44 1,246.33 1,148.01 15.94 12.89 10.38 30 September 2007 ........................... 1,216.40 1,258.02 1,162.79 14.08 11.61 10.66
The Euro Fixed Income Fund
Class P Income
GBP Class S EUR
Total net asset value 30 September 2008 ........................... 3,134,481 9,654,108 31 March 2008 .................................. 3,767,545 9,743,938 30 September 2007 ........................... 4,640,239 9,110,148 Net asset value per share 30 September 2008 ........................... 9.57 95.72 31 March 2008 .................................. 10.23 99.10 30 September 2007 ........................... 9.23 100.03
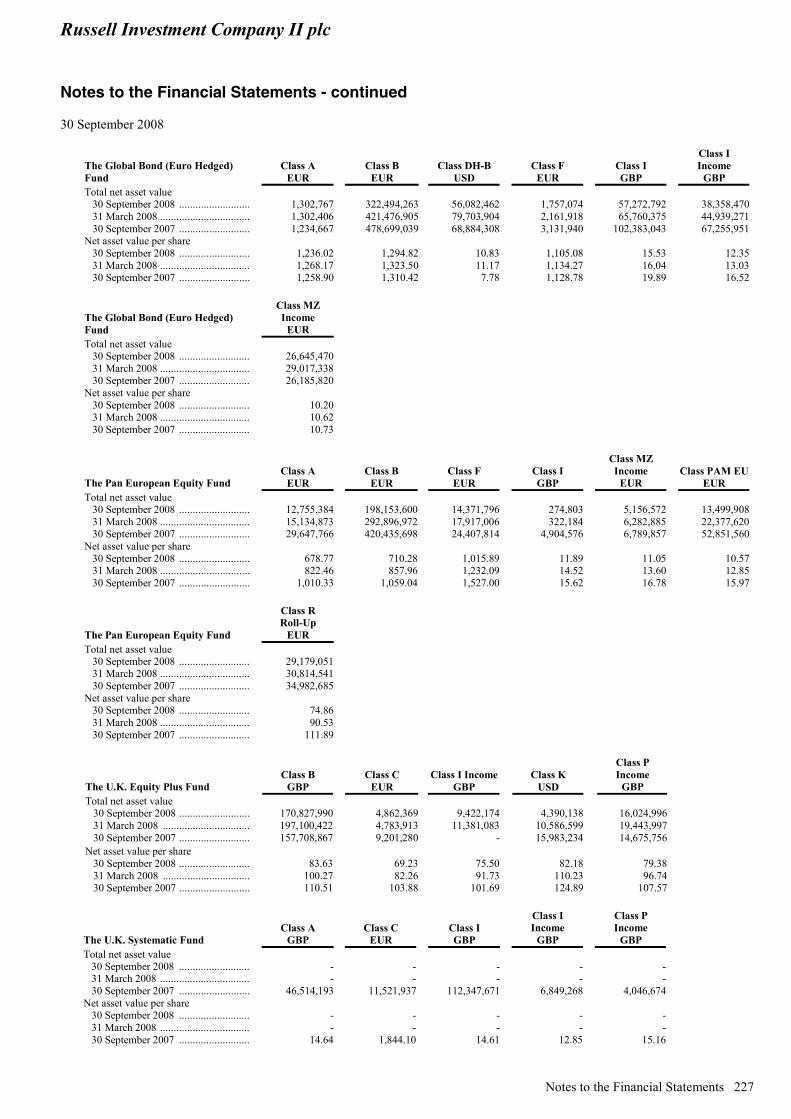
Russell Investment Company II plc Notes to the Financial Statements - continued 30 September 2008
Notes to the Financial Statements 227
The Global Bond (Euro Hedged) Fund
Class A
EUR Class B
EUR Class DH-B
USD Class F
EUR Class I GBP
Class I Income
GBP Total net asset value 30 September 2008 .......................... 1,302,767 322,494,263 56,082,462 1,757,074 57,272,792 38,358,470 31 March 2008 ................................. 1,302,406 421,476,905 79,703,904 2,161,918 65,760,375 44,939,271 30 September 2007 .......................... 1,234,667 478,699,039 68,884,308 3,131,940 102,383,043 67,255,951Net asset value per share 30 September 2008 .......................... 1,236.02 1,294.82 10.83 1,105.08 15.53 12.35 31 March 2008 ................................. 1,268.17 1,323.50 11.17 1,134.27 16.04 13.03 30 September 2007 .......................... 1,258.90 1,310.42 7.78 1,128.78 19.89 16.52
The Global Bond (Euro Hedged) Fund
Class MZ Income
EUR Total net asset value 30 September 2008 .......................... 26,645,470 31 March 2008 ................................. 29,017,338 30 September 2007 .......................... 26,185,820Net asset value per share 30 September 2008 .......................... 10.20 31 March 2008 ................................. 10.62 30 September 2007 .......................... 10.73
The Pan European Equity Fund
Class A
EUR Class B
EUR Class F
EUR Class I GBP
Class MZ Income
EUR
Class PAM EU
EUR Total net asset value 30 September 2008 .......................... 12,755,384 198,153,600 14,371,796 274,803 5,156,572 13,499,908 31 March 2008 ................................. 15,134,873 292,896,972 17,917,006 322,184 6,282,885 22,377,620 30 September 2007 .......................... 29,647,766 420,435,698 24,407,814 4,904,576 6,789,857 52,851,560Net asset value per share 30 September 2008 .......................... 678.77 710.28 1,015.89 11.89 11.05 10.57 31 March 2008 ................................. 822.46 857.96 1,232.09 14.52 13.60 12.85 30 September 2007 .......................... 1,010.33 1,059.04 1,527.00 15.62 16.78 15.97
The Pan European Equity Fund
Class R Roll-Up
EUR Total net asset value 30 September 2008 .......................... 29,179,051 31 March 2008 ................................. 30,814,541 30 September 2007 .......................... 34,982,685Net asset value per share 30 September 2008 .......................... 74.86 31 March 2008 ................................. 90.53 30 September 2007 .......................... 111.89
The U.K. Equity Plus Fund
Class B
GBP Class C
EUR Class I Income
GBP Class K
USD
Class P Income
GBP Total net asset value 30 September 2008 .......................... 170,827,990 4,862,369 9,422,174 4,390,138 16,024,996 31 March 2008 ................................ 197,100,422 4,783,913 11,381,083 10,586,599 19,443,997 30 September 2007 .......................... 157,708,867 9,201,280 - 15,983,234 14,675,756 Net asset value per share 30 September 2008 .......................... 83.63 69.23 75.50 82.18 79.38 31 March 2008 ................................ 100.27 82.26 91.73 110.23 96.74 30 September 2007 .......................... 110.51 103.88 101.69 124.89 107.57
The U.K. Systematic Fund
Class A
GBP Class C
EUR Class I GBP
Class I Income
GBP
Class P Income
GBP Total net asset value 30 September 2008 .......................... - - - - - 31 March 2008 ................................. - - - - - 30 September 2007 .......................... 46,514,193 11,521,937 112,347,671 6,849,268 4,046,674Net asset value per share 30 September 2008 .......................... - - - - - 31 March 2008 ................................. - - - - - 30 September 2007 .......................... 14.64 1,844.10 14.61 12.85 15.16
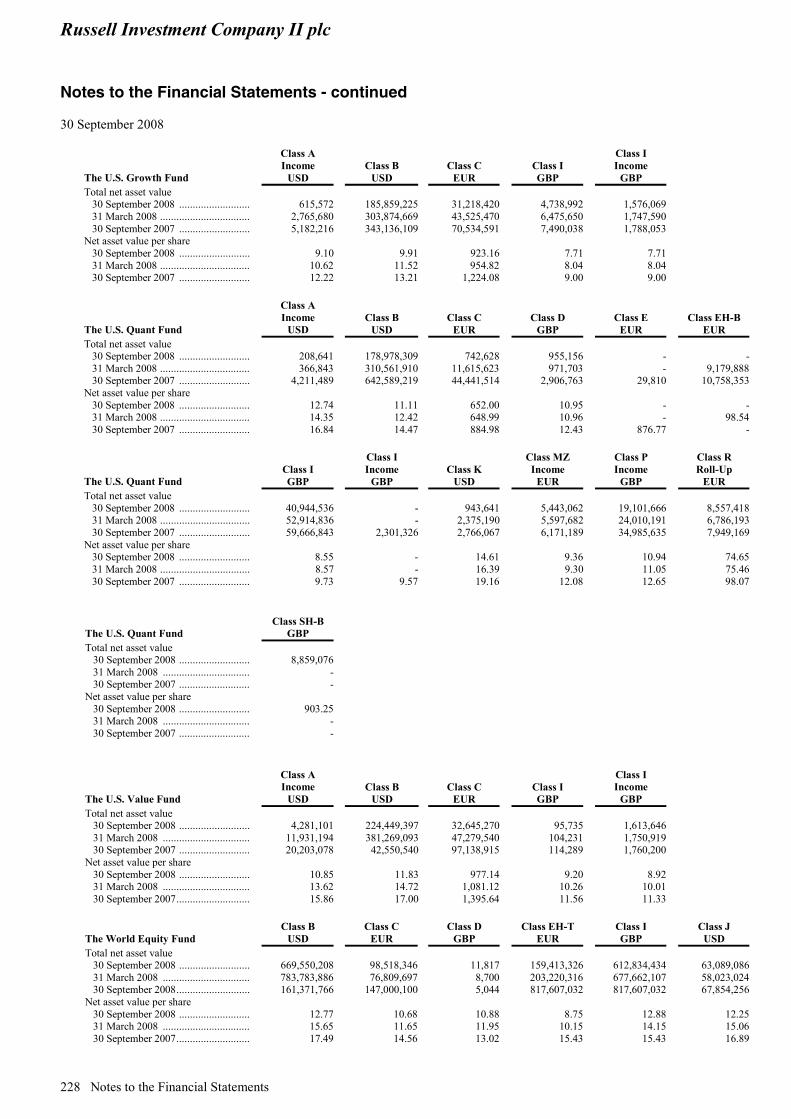
Russell Investment Company II plc Notes to the Financial Statements - continued 30 September 2008
228 Notes to the Financial Statements
The U.S. Growth Fund
Class A Income
USD
Class B
USD Class C
EUR Class I GBP
Class I Income
GBP Total net asset value 30 September 2008 .......................... 615,572 185,859,225 31,218,420 4,738,992 1,576,069 31 March 2008 ................................. 2,765,680 303,874,669 43,525,470 6,475,650 1,747,590 30 September 2007 .......................... 5,182,216 343,136,109 70,534,591 7,490,038 1,788,053Net asset value per share 30 September 2008 .......................... 9.10 9.91 923.16 7.71 7.71 31 March 2008 ................................. 10.62 11.52 954.82 8.04 8.04 30 September 2007 .......................... 12.22 13.21 1,224.08 9.00 9.00
The U.S. Quant Fund
Class A Income
USD Class B
USD Class C
EUR Class D
GBP Class E
EUR Class EH-B
EUR Total net asset value 30 September 2008 .......................... 208,641 178,978,309 742,628 955,156 - - 31 March 2008 ................................. 366,843 310,561,910 11,615,623 971,703 - 9,179,888 30 September 2007 .......................... 4,211,489 642,589,219 44,441,514 2,906,763 29,810 10,758,353Net asset value per share 30 September 2008 .......................... 12.74 11.11 652.00 10.95 - - 31 March 2008 ................................. 14.35 12.42 648.99 10.96 - 98.54 30 September 2007 .......................... 16.84 14.47 884.98 12.43 876.77 -
The U.S. Quant Fund
Class I GBP
Class I Income
GBP
Class K
USD
Class MZ Income
EUR
Class P Income
GBP
Class R Roll-Up
EUR Total net asset value 30 September 2008 .......................... 40,944,536 - 943,641 5,443,062 19,101,666 8,557,418 31 March 2008 ................................. 52,914,836 - 2,375,190 5,597,682 24,010,191 6,786,193 30 September 2007 .......................... 59,666,843 2,301,326 2,766,067 6,171,189 34,985,635 7,949,169Net asset value per share 30 September 2008 .......................... 8.55 - 14.61 9.36 10.94 74.65 31 March 2008 ................................. 8.57 - 16.39 9.30 11.05 75.46 30 September 2007 .......................... 9.73 9.57 19.16 12.08 12.65 98.07
The U.S. Quant Fund
Class SH-B
GBP
Total net asset value 30 September 2008 .......................... 8,859,076 31 March 2008 ................................ - 30 September 2007 .......................... -Net asset value per share 30 September 2008 .......................... 903.25 31 March 2008 ................................ - 30 September 2007 .......................... -
The U.S. Value Fund
Class A Income
USD
Class B
USD Class C
EUR Class I GBP
Class I Income
GBP Total net asset value 30 September 2008 .......................... 4,281,101 224,449,397 32,645,270 95,735 1,613,646 31 March 2008 ................................ 11,931,194 381,269,093 47,279,540 104,231 1,750,919 30 September 2007 .......................... 20,203,078 42,550,540 97,138,915 114,289 1,760,200Net asset value per share 30 September 2008 .......................... 10.85 11.83 977.14 9.20 8.92 31 March 2008 ................................ 13.62 14.72 1,081.12 10.26 10.01 30 September 2007........................... 15.86 17.00 1,395.64 11.56 11.33
The World Equity Fund Class B
USD Class C
EUR Class D
GBP Class EH-T
EUR Class I
GBP Class J
USD Total net asset value 30 September 2008 .......................... 669,550,208 98,518,346 11,817 159,413,326 612,834,434 63,089,086 31 March 2008 ................................ 783,783,886 76,809,697 8,700 203,220,316 677,662,107 58,023,024 30 September 2008........................... 161,371,766 147,000,100 5,044 817,607,032 817,607,032 67,854,256Net asset value per share 30 September 2008 .......................... 12.77 10.68 10.88 8.75 12.88 12.25 31 March 2008 ................................ 15.65 11.65 11.95 10.15 14.15 15.06 30 September 2007........................... 17.49 14.56 13.02 15.43 15.43 16.89
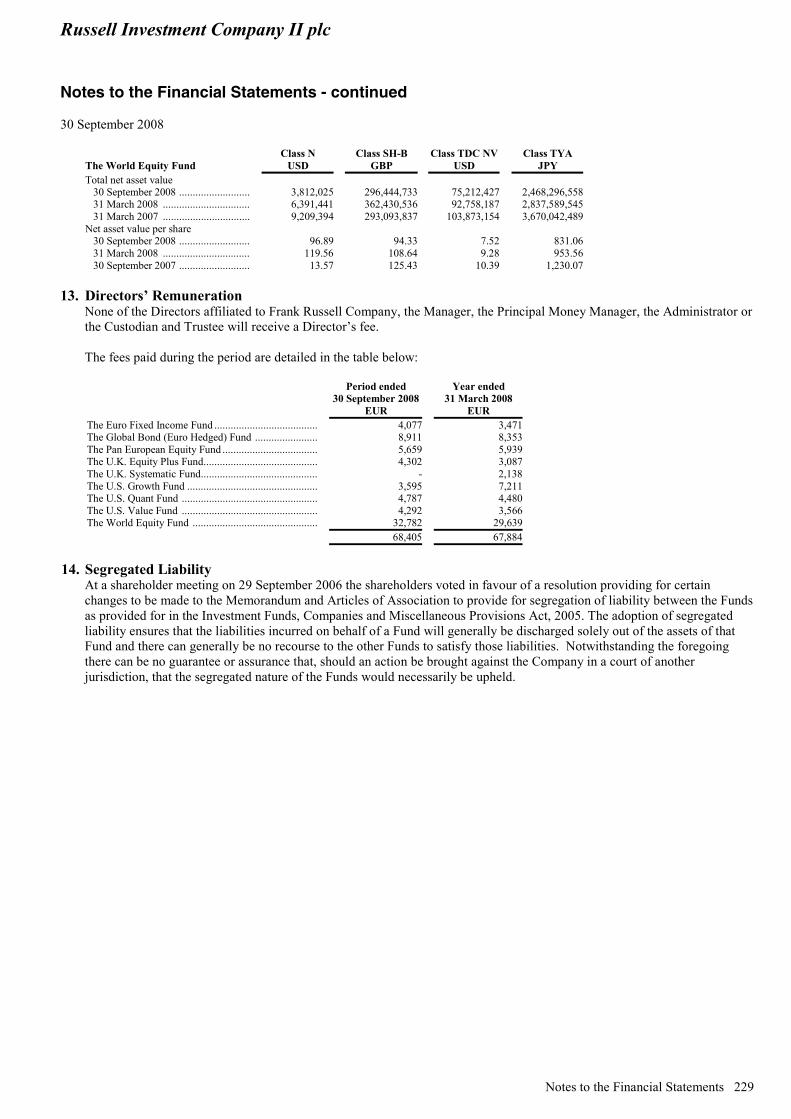
Russell Investment Company II plc Notes to the Financial Statements - continued 30 September 2008
Notes to the Financial Statements 229
The World Equity Fund Class N
USD Class SH-B
GBP Class TDC NV
USD Class TYA
JPY
Total net asset value 30 September 2008 .......................... 3,812,025 296,444,733 75,212,427 2,468,296,558 31 March 2008 ................................ 6,391,441 362,430,536 92,758,187 2,837,589,545 31 March 2007 ................................ 9,209,394 293,093,837 103,873,154 3,670,042,489Net asset value per share 30 September 2008 .......................... 96.89 94.33 7.52 831.06 31 March 2008 ................................ 119.56 108.64 9.28 953.56 30 September 2007 .......................... 13.57 125.43 10.39 1,230.07
13. Directors’ Remuneration None of the Directors affiliated to Frank Russell Company, the Manager, the Principal Money Manager, the Administrator or the Custodian and Trustee will receive a Director’s fee. The fees paid during the period are detailed in the table below:
Period ended 30 September 2008
EUR
Year ended 31 March 2008
EUR The Euro Fixed Income Fund ...................................... 4,077 3,471The Global Bond (Euro Hedged) Fund ....................... 8,911 8,353The Pan European Equity Fund ................................... 5,659 5,939The U.K. Equity Plus Fund.......................................... 4,302 3,087The U.K. Systematic Fund........................................... - 2,138The U.S. Growth Fund ................................................ 3,595 7,211The U.S. Quant Fund .................................................. 4,787 4,480The U.S. Value Fund .................................................. 4,292 3,566The World Equity Fund .............................................. 32,782 29,639 68,405 67,884
14. Segregated Liability
At a shareholder meeting on 29 September 2006 the shareholders voted in favour of a resolution providing for certain changes to be made to the Memorandum and Articles of Association to provide for segregation of liability between the Funds as provided for in the Investment Funds, Companies and Miscellaneous Provisions Act, 2005. The adoption of segregated liability ensures that the liabilities incurred on behalf of a Fund will generally be discharged solely out of the assets of that Fund and there can generally be no recourse to the other Funds to satisfy those liabilities. Notwithstanding the foregoing there can be no guarantee or assurance that, should an action be brought against the Company in a court of another jurisdiction, that the segregated nature of the Funds would necessarily be upheld.

Russell Investment Company II plc Notes to the Financial Statements - continued 30 September 2008
230 Notes to the Financial Statements
15. Distributions (Finance Costs) Total finance costs/distributions declared for the period ended 30 September 2008 were:
The Euro Fixed Income
Fund EUR
The Global Bond (Euro
Hedged) Fund EUR
The Pan European
Equity Fund EUR
The U.K. Equity Plus
Fund GBP
The U.S. Quant Fund
USD
The U.S. Value Fund
USD
The World Equity Fund
USD Class A ...................................................... (4,541) (27,036) (328,398) - - - -Class A Income ......................................... - - - - (1,201) (47,184) -Class B ...................................................... - (7,206,040) (5,280,994) (2,758,002) (1,301,239) (1,907,885) (6,391,966)Class C ...................................................... - - - (53,183) (6,760) (318,773) (1,195,636)Class D ...................................................... - - - - (9,848) - (161)Class DH-B ............................................... - (969,334) - - - - -Class E ...................................................... - - - - - - -Class EH-B ................................................ - - - - - - -Class EH-T ................................................ - - - - - - (2,303,588)Class F ....................................................... (16,860) (40,726) (395,061) - - - -Class I Accumulation ................................ (1,615,496) (1,690,285) (8,877) - (524,868) (1,210) (10,731,774)Class I Income ........................................... (1,035,680) (1,092,424) - (155,677) - (19,749) -Class J ....................................................... - - - - - - (681,622)Class K ...................................................... - - - (48,158) (9,444) - -Class MZ ................................................... (557,756) (589,216) (128,377) - (43,971) - -Class N ...................................................... - - - - - - (42,430)Class PAM EU .......................................... - - (379,641) - - - -Class P Accumulation ................................ - - - - - - -Class P Income .......................................... (89,546) - - (262,612) (177,232) - -Class R Roll-Up ........................................ - - - - - - -Class S ....................................................... (186,608) - - - - - -Class SH-B ................................................ - - - - (39,445) - (5,342,184)Class TDCNV Income ............................... - - - - - - (732,205)Class TYA ................................................. - - - - - - (226,457)
Distributions paid on income shares .......... (1,682,982) (1,681,640) (128,377) (418,289) (222,404) (66,933) (732,205)Distributions deemed on accumulation shares ......................................................... (3,740,559) (9,933,421) (6,392,971) (2,859,343) (1,891,604) (2,227,868) (26,915,818)Total (5,423,541) (11,615,061) (6,521,348) (3,277,632) (2,114,008) (2,294,801) (27,648,023)
The Euro Fixed Income
Fund EUR
The Global Bond (Euro
Hedged) Fund EUR
The Pan European
Equity Fund EUR
The U.K. Equity Plus
Fund GBP
The U.S. Quant Fund
USD
The U.S. Value Fund
USD
The World Equity Fund
USD Dividend rate per share Class A ...................................................... 11.8449 13.2413 8.6847 - - - -Class A Income ......................................... - - - 0.0367 0.0389 -Class B ...................................................... 12.3086 13.8478 9.0807 0.7250 0.0318 0.0422 0.0622 Class C ...................................................... - - - 0.4504 2.6308 4.9063 0.0732 Class D ...................................................... - - - - 0.0559 - 0.0944 Class DH-B ............................................... - 0.0768 - - - - -Class E ...................................................... - - - - - - -Class EH-B ................................................ - - - - - - -Class EH-T ................................................ - - - - - - 0.0625 Class F ....................................................... 11.3047 11.8437 13.0017 - - - -Class I Accumulation ................................ 0.1976 0.2106 0.1928 - 0.0437 0.0585 0.1118 Class I Income ........................................... 0.1590 0.1702 - 0.6290 - 0.0569 -Class J ....................................................... - - - - - - 0.0597 Class K ...................................................... - - - 0.3807 0.0420 - -Class MZ ................................................... 0.1021 0.1107 0.1438 - 0.0378 - -Class N ...................................................... - - - - - - 0.4732 Class PAM EU .......................................... - - 0.1354 - - - -Class P Accumulation ................................ - - - - - - -Class P Income .......................................... 0.1259 - - 0.6622 0.0562 - -Class R Roll-Up ........................................ - - - - - - -Class S ....................................................... 0.9780 - - - - - -Class SH-B ................................................ - - - - 1.9006 - 0.8391 Class TDCNV Income ............................... - - - - - - 0.0368 Class TYA ................................................. - - - - - - 0.0381
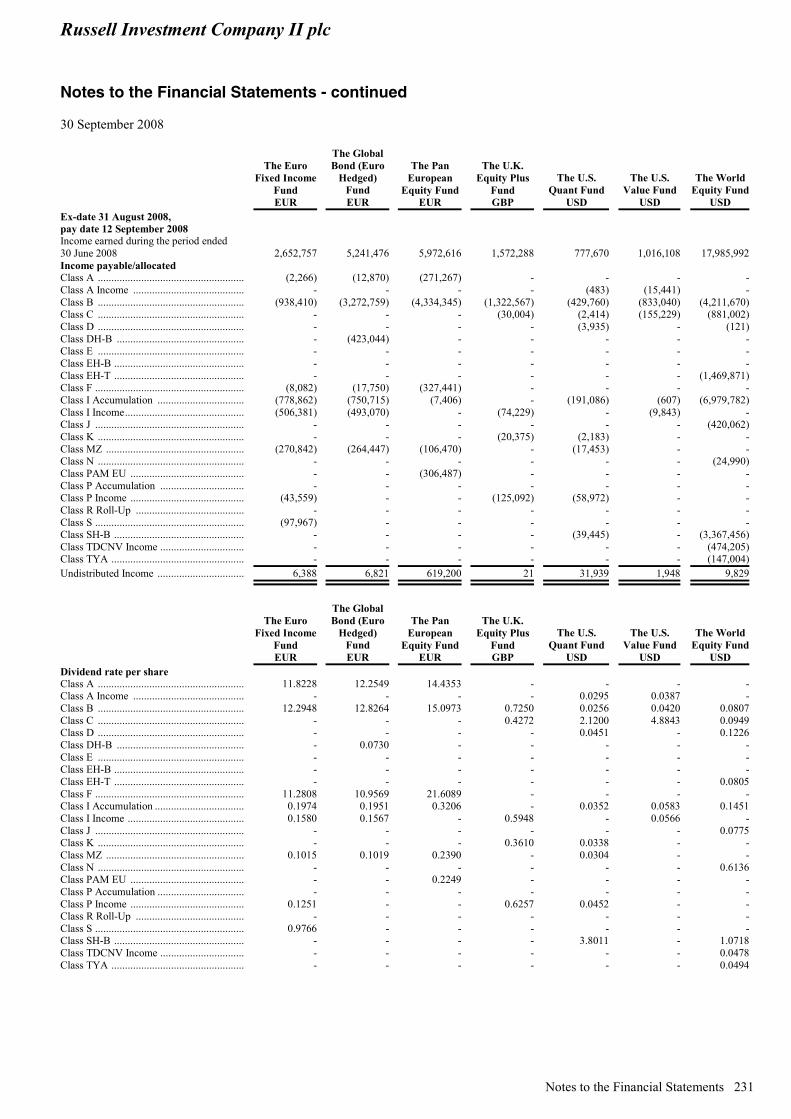
Russell Investment Company II plc Notes to the Financial Statements - continued 30 September 2008
Notes to the Financial Statements 231
The Euro Fixed Income
Fund EUR
The Global Bond (Euro
Hedged) Fund EUR
The Pan European
Equity Fund EUR
The U.K. Equity Plus
Fund GBP
The U.S. Quant Fund
USD
The U.S. Value Fund
USD
The World Equity Fund
USD Ex-date 31 August 2008, pay date 12 September 2008
Income earned during the period ended 30 June 2008 2,652,757 5,241,476 5,972,616 1,572,288 777,670 1,016,108 17,985,992 Income payable/allocated Class A ....................................................... (2,266) (12,870) (271,267) - - - -Class A Income .......................................... - - - - (483) (15,441) -Class B ....................................................... (938,410) (3,272,759) (4,334,345) (1,322,567) (429,760) (833,040) (4,211,670)Class C ....................................................... - - - (30,004) (2,414) (155,229) (881,002)Class D ....................................................... - - - - (3,935) - (121)Class DH-B ................................................ - (423,044) - - - - -Class E ....................................................... - - - - - - -Class EH-B ................................................. - - - - - - -Class EH-T ................................................. - - - - - - (1,469,871)Class F ........................................................ (8,082) (17,750) (327,441) - - - -Class I Accumulation ................................. (778,862) (750,715) (7,406) - (191,086) (607) (6,979,782)Class I Income............................................. (506,381) (493,070) - (74,229) - (9,843) -Class J ........................................................ - - - - - - (420,062)Class K ....................................................... - - - (20,375) (2,183) - -Class MZ .................................................... (270,842) (264,447) (106,470) - (17,453) - -Class N ....................................................... - - - - - - (24,990)Class PAM EU ........................................... - - (306,487) - - - -Class P Accumulation ................................ - - - - - - -Class P Income ........................................... (43,559) - - (125,092) (58,972) - -Class R Roll-Up ......................................... - - - - - - -Class S ........................................................ (97,967) - - - - - -Class SH-B ................................................. - - - - (39,445) - (3,367,456)Class TDCNV Income ................................ - - - - - - (474,205)Class TYA .................................................. - - - - - - (147,004)Undistributed Income ................................. 6,388 6,821 619,200 21 31,939 1,948 9,829
The Euro Fixed Income
Fund EUR
The Global Bond (Euro
Hedged) Fund EUR
The Pan European
Equity Fund EUR
The U.K. Equity Plus
Fund GBP
The U.S. Quant Fund
USD
The U.S. Value Fund
USD
The World Equity Fund
USD Dividend rate per share Class A ....................................................... 11.8228 12.2549 14.4353 - - - -Class A Income .......................................... - - - - 0.0295 0.0387 -Class B ....................................................... 12.2948 12.8264 15.0973 0.7250 0.0256 0.0420 0.0807 Class C ....................................................... - - - 0.4272 2.1200 4.8843 0.0949 Class D ....................................................... - - - - 0.0451 - 0.1226 Class DH-B ................................................ - 0.0730 - - - - -Class E ....................................................... - - - - - - -Class EH-B ................................................. - - - - - - -Class EH-T ................................................. - - - - - - 0.0805 Class F ........................................................ 11.2808 10.9569 21.6089 - - - -Class I Accumulation .................................. 0.1974 0.1951 0.3206 - 0.0352 0.0583 0.1451 Class I Income ............................................ 0.1580 0.1567 - 0.5948 - 0.0566 -Class J ........................................................ - - - - - - 0.0775 Class K ....................................................... - - - 0.3610 0.0338 - -Class MZ .................................................... 0.1015 0.1019 0.2390 - 0.0304 - -Class N ....................................................... - - - - - - 0.6136 Class PAM EU ........................................... - - 0.2249 - - - -Class P Accumulation ................................. - - - - - - -Class P Income ........................................... 0.1251 - - 0.6257 0.0452 - -Class R Roll-Up ......................................... - - - - - - -Class S ........................................................ 0.9766 - - - - - -Class SH-B ................................................. - - - - 3.8011 - 1.0718 Class TDCNV Income ................................ - - - - - - 0.0478 Class TYA .................................................. - - - - - - 0.0494
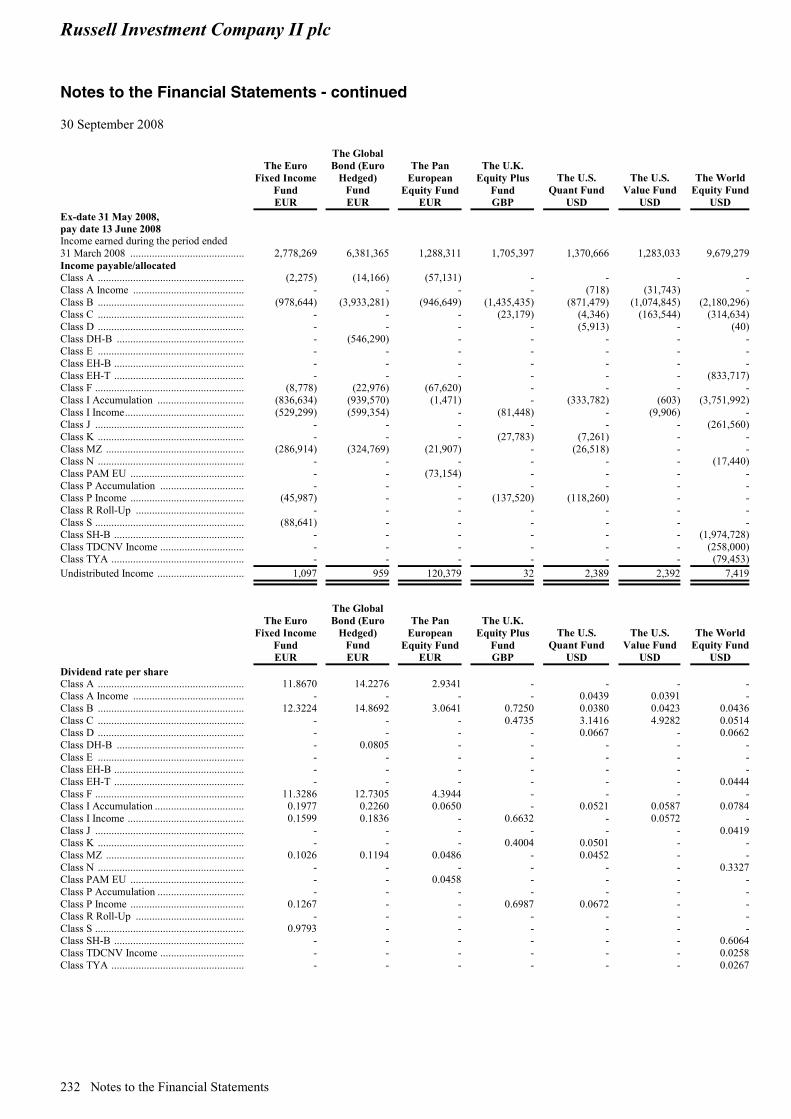
Russell Investment Company II plc Notes to the Financial Statements - continued 30 September 2008
232 Notes to the Financial Statements
The Euro Fixed Income
Fund EUR
The Global Bond (Euro
Hedged) Fund EUR
The Pan European
Equity Fund EUR
The U.K. Equity Plus
Fund GBP
The U.S. Quant Fund
USD
The U.S. Value Fund
USD
The World Equity Fund
USD Ex-date 31 May 2008, pay date 13 June 2008
Income earned during the period ended 31 March 2008 ........................................... 2,778,269 6,381,365 1,288,311 1,705,397 1,370,666 1,283,033 9,679,279 Income payable/allocated Class A ....................................................... (2,275) (14,166) (57,131) - - - -Class A Income .......................................... - - - - (718) (31,743) -Class B ....................................................... (978,644) (3,933,281) (946,649) (1,435,435) (871,479) (1,074,845) (2,180,296)Class C ....................................................... - - - (23,179) (4,346) (163,544) (314,634)Class D ....................................................... - - - - (5,913) - (40)Class DH-B ................................................ - (546,290) - - - - -Class E ....................................................... - - - - - - -Class EH-B ................................................. - - - - - - -Class EH-T ................................................. - - - - - - (833,717)Class F ........................................................ (8,778) (22,976) (67,620) - - - -Class I Accumulation ................................. (836,634) (939,570) (1,471) - (333,782) (603) (3,751,992)Class I Income............................................. (529,299) (599,354) - (81,448) - (9,906) -Class J ........................................................ - - - - - - (261,560)Class K ....................................................... - - - (27,783) (7,261) - -Class MZ .................................................... (286,914) (324,769) (21,907) - (26,518) - -Class N ....................................................... - - - - - - (17,440)Class PAM EU ........................................... - - (73,154) - - - -Class P Accumulation ................................ - - - - - - -Class P Income ........................................... (45,987) - - (137,520) (118,260) - -Class R Roll-Up ......................................... - - - - - - -Class S ........................................................ (88,641) - - - - - -Class SH-B ................................................. - - - - - - (1,974,728)Class TDCNV Income ................................ - - - - - - (258,000)Class TYA .................................................. - - - - - - (79,453)Undistributed Income ................................. 1,097 959 120,379 32 2,389 2,392 7,419
The Euro Fixed Income
Fund EUR
The Global Bond (Euro
Hedged) Fund EUR
The Pan European
Equity Fund EUR
The U.K. Equity Plus
Fund GBP
The U.S. Quant Fund
USD
The U.S. Value Fund
USD
The World Equity Fund
USD Dividend rate per share Class A ....................................................... 11.8670 14.2276 2.9341 - - - -Class A Income .......................................... - - - - 0.0439 0.0391 -Class B ....................................................... 12.3224 14.8692 3.0641 0.7250 0.0380 0.0423 0.0436 Class C ....................................................... - - - 0.4735 3.1416 4.9282 0.0514 Class D ....................................................... - - - - 0.0667 - 0.0662 Class DH-B ................................................ - 0.0805 - - - - -Class E ....................................................... - - - - - - -Class EH-B ................................................. - - - - - - -Class EH-T ................................................. - - - - - - 0.0444 Class F ........................................................ 11.3286 12.7305 4.3944 - - - -Class I Accumulation .................................. 0.1977 0.2260 0.0650 - 0.0521 0.0587 0.0784 Class I Income ............................................ 0.1599 0.1836 - 0.6632 - 0.0572 -Class J ........................................................ - - - - - - 0.0419 Class K ....................................................... - - - 0.4004 0.0501 - -Class MZ .................................................... 0.1026 0.1194 0.0486 - 0.0452 - -Class N ....................................................... - - - - - - 0.3327 Class PAM EU ........................................... - - 0.0458 - - - -Class P Accumulation ................................. - - - - - - -Class P Income ........................................... 0.1267 - - 0.6987 0.0672 - -Class R Roll-Up ......................................... - - - - - - -Class S ........................................................ 0.9793 - - - - - -Class SH-B ................................................. - - - - - - 0.6064 Class TDCNV Income ................................ - - - - - - 0.0258 Class TYA .................................................. - - - - - - 0.0267
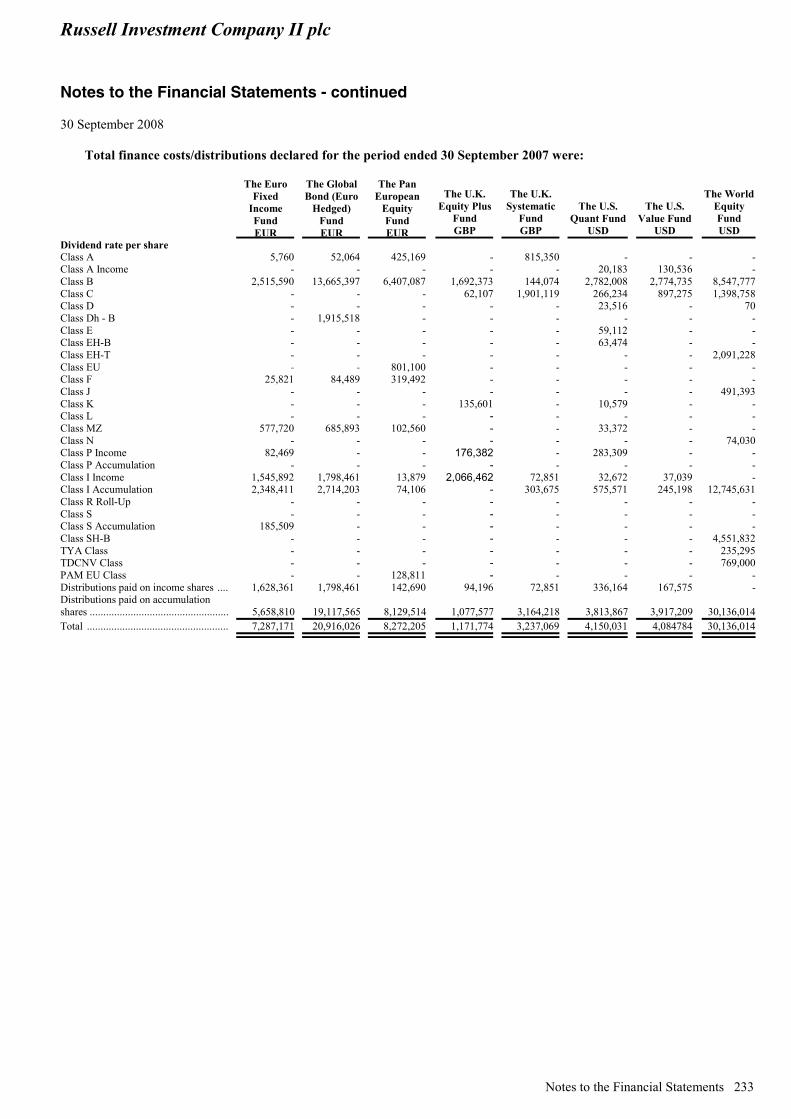
Russell Investment Company II plc Notes to the Financial Statements - continued 30 September 2008
Notes to the Financial Statements 233
Total finance costs/distributions declared for the period ended 30 September 2007 were:
The Euro Fixed
Income Fund EUR
The Global Bond (Euro
Hedged) Fund EUR
The Pan European
Equity Fund EUR
The U.K. Equity Plus
Fund GBP
The U.K. Systematic
Fund GBP
The U.S. Quant Fund
USD
The U.S. Value Fund
USD
The World Equity Fund USD
Dividend rate per share Class A 5,760 52,064 425,169 - 815,350 - - -Class A Income - - - - - 20,183 130,536 -Class B 2,515,590 13,665,397 6,407,087 1,692,373 144,074 2,782,008 2,774,735 8,547,777Class C - - - 62,107 1,901,119 266,234 897,275 1,398,758Class D - - - - - 23,516 - 70Class Dh - B - 1,915,518 - - - - - -Class E - - - - - 59,112 - -Class EH-B - - - - - 63,474 - -Class EH-T - - - - - - - 2,091,228Class EU - - 801,100 - - - - -Class F 25,821 84,489 319,492 - - - - -Class J - - - - - - - 491,393Class K - - - 135,601 - 10,579 - -Class L - - - - - - - -Class MZ 577,720 685,893 102,560 - - 33,372 - -Class N - - - - - - - 74,030Class P Income 82,469 - - 176,382 - 283,309 - -Class P Accumulation - - - - - - - -Class I Income 1,545,892 1,798,461 13,879 2,066,462 72,851 32,672 37,039 -Class I Accumulation 2,348,411 2,714,203 74,106 - 303,675 575,571 245,198 12,745,631Class R Roll-Up - - - - - - - -Class S - - - - - - - -Class S Accumulation 185,509 - - - - - - -Class SH-B - - - - - - - 4,551,832TYA Class - - - - - - - 235,295TDCNV Class - - - - - - - 769,000PAM EU Class - - 128,811 - - - - -Distributions paid on income shares .... 1,628,361 1,798,461 142,690 94,196 72,851 336,164 167,575 -Distributions paid on accumulation shares ................................................... 5,658,810 19,117,565 8,129,514 1,077,577 3,164,218 3,813,867 3,917,209 30,136,014Total .................................................... 7,287,171 20,916,026 8,272,205 1,171,774 3,237,069 4,150,031 4,084784 30,136,014
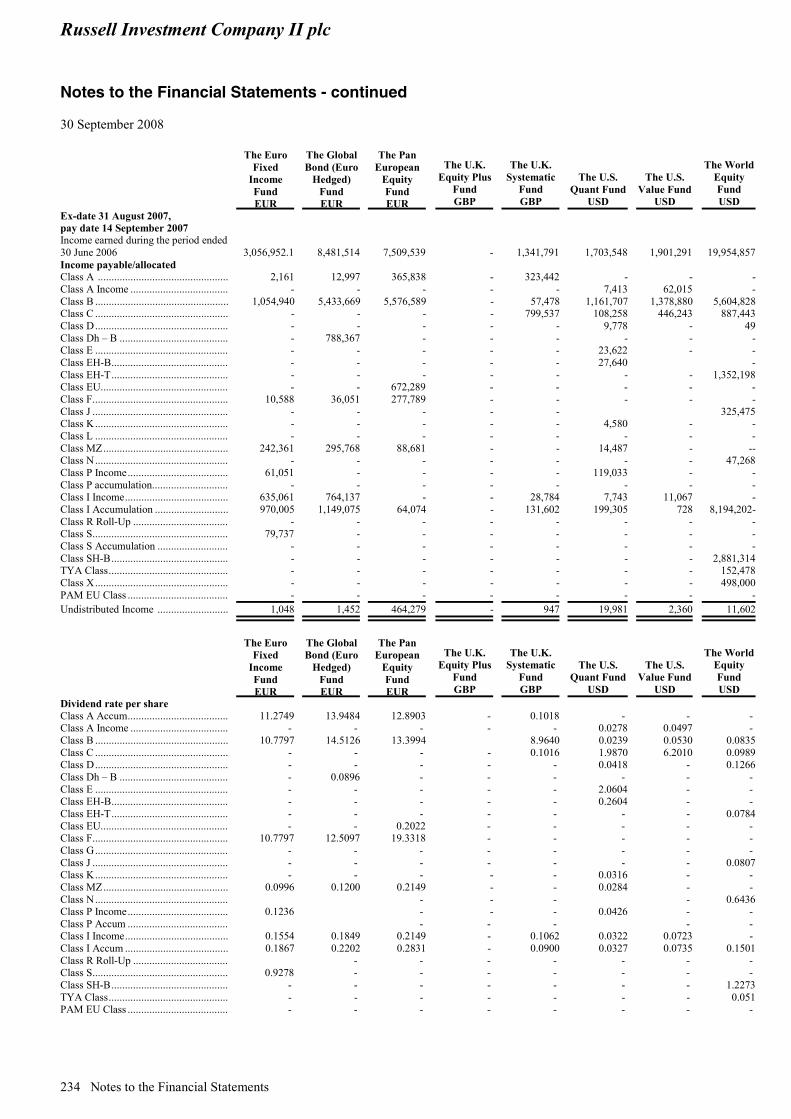
Russell Investment Company II plc Notes to the Financial Statements - continued 30 September 2008
234 Notes to the Financial Statements
The Euro Fixed
Income Fund EUR
The Global Bond (Euro
Hedged) Fund EUR
The Pan European
Equity Fund EUR
The U.K. Equity Plus
Fund GBP
The U.K. Systematic
Fund GBP
The U.S. Quant Fund
USD
The U.S. Value Fund
USD
The World Equity Fund USD
Ex-date 31 August 2007, pay date 14 September 2007 Income earned during the period ended 30 June 2006 3,056,952.1 8,481,514 7,509,539 - 1,341,791 1,703,548 1,901,291 19,954,857Income payable/allocated Class A ................................................ 2,161 12,997 365,838 - 323,442 - - -Class A Income .................................... - - - - - 7,413 62,015 -Class B ................................................. 1,054,940 5,433,669 5,576,589 - 57,478 1,161,707 1,378,880 5,604,828Class C ................................................. - - - - 799,537 108,258 446,243 887,443Class D................................................. - - - - - 9,778 - 49Class Dh – B ........................................ - 788,367 - - - - - -Class E ................................................. - - - - - 23,622 - -Class EH-B........................................... - - - - - 27,640 -Class EH-T........................................... - - - - - - - 1,352,198Class EU............................................... - - 672,289 - - - - -Class F.................................................. 10,588 36,051 277,789 - - - - -Class J .................................................. - - - - - 325,475Class K................................................. - - - - - 4,580 - -Class L ................................................. - - - - - - - -Class MZ.............................................. 242,361 295,768 88,681 - - 14,487 - --Class N................................................. - - - - - - - 47,268Class P Income..................................... 61,051 - - - - 119,033 - -Class P accumulation............................ - - - - - - - -Class I Income...................................... 635,061 764,137 - - 28,784 7,743 11,067 -Class I Accumulation ........................... 970,005 1,149,075 64,074 - 131,602 199,305 728 8,194,202-Class R Roll-Up ................................... - - - - - - - -Class S.................................................. 79,737 - - - - - - -Class S Accumulation .......................... - - - - - - - -Class SH-B........................................... - - - - - - - 2,881,314TYA Class............................................ - - - - - - - 152,478Class X................................................. - - - - - - - 498,000PAM EU Class ..................................... - - - - - - - -Undistributed Income .......................... 1,048 1,452 464,279 - 947 19,981 2,360 11,602
The Euro Fixed
Income Fund EUR
The Global Bond (Euro
Hedged) Fund EUR
The Pan European
Equity Fund EUR
The U.K. Equity Plus
Fund GBP
The U.K. Systematic
Fund GBP
The U.S. Quant Fund
USD
The U.S. Value Fund
USD
The World Equity Fund USD
Dividend rate per share Class A Accum..................................... 11.2749 13.9484 12.8903 - 0.1018 - - - Class A Income .................................... - - - - - 0.0278 0.0497 - Class B ................................................. 10.7797 14.5126 13.3994 8.9640 0.0239 0.0530 0.0835Class C ................................................. - - - - 0.1016 1.9870 6.2010 0.0989Class D................................................. - - - - - 0.0418 - 0.1266Class Dh – B ........................................ - 0.0896 - - - - - - Class E ................................................. - - - - - 2.0604 - - Class EH-B........................................... - - - - - 0.2604 - - Class EH-T........................................... - - - - - - - 0.0784Class EU............................................... - - 0.2022 - - - - - Class F.................................................. 10.7797 12.5097 19.3318 - - - - - Class G................................................. - - - - - - - - Class J .................................................. - - - - - - - 0.0807Class K................................................. - - - - - 0.0316 - - Class MZ.............................................. 0.0996 0.1200 0.2149 - - 0.0284 - - Class N................................................. - - - - 0.6436Class P Income..................................... 0.1236 - - - 0.0426 - - Class P Accum ..................................... - - - - - Class I Income...................................... 0.1554 0.1849 0.2149 - 0.1062 0.0322 0.0723 - Class I Accum ...................................... 0.1867 0.2202 0.2831 - 0.0900 0.0327 0.0735 0.1501Class R Roll-Up ................................... - - - - - - - Class S.................................................. 0.9278 - - - - - - - Class SH-B........................................... - - - - - - - 1.2273TYA Class............................................ - - - - - - - 0.051PAM EU Class ..................................... - - - - - - - -
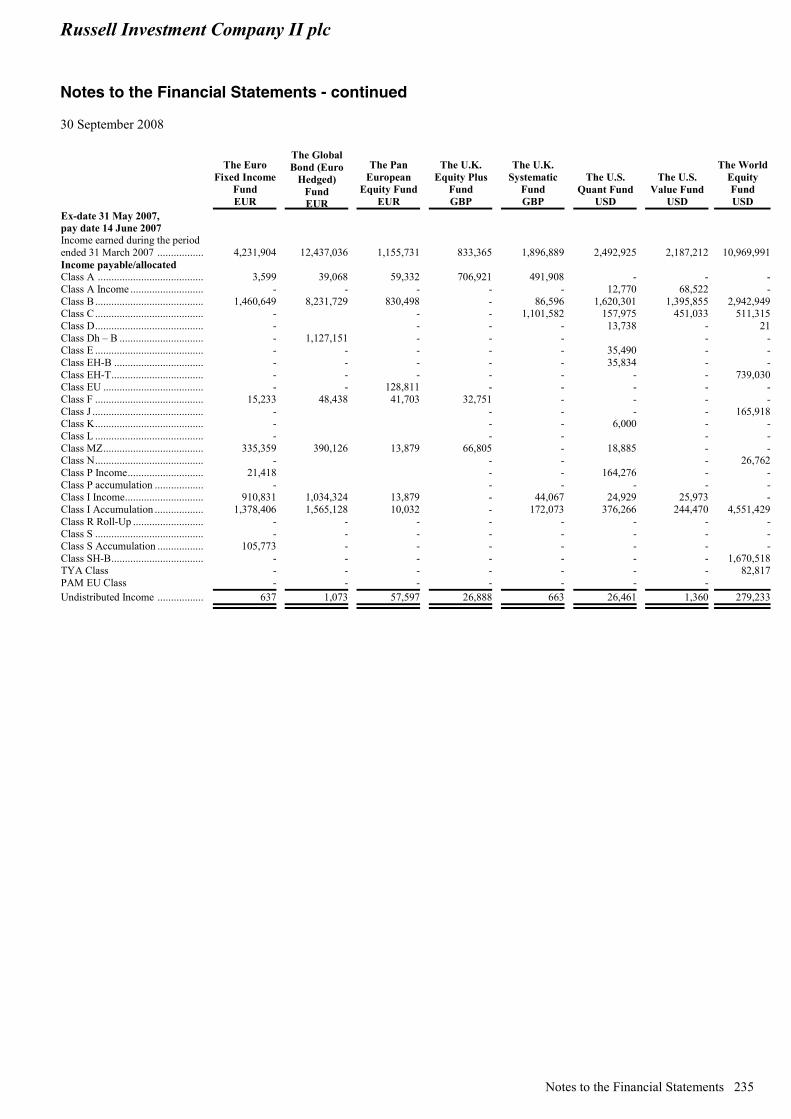
Russell Investment Company II plc Notes to the Financial Statements - continued 30 September 2008
Notes to the Financial Statements 235
The Euro Fixed Income
Fund EUR
The Global Bond (Euro
Hedged) Fund EUR
The Pan European
Equity Fund EUR
The U.K. Equity Plus
Fund GBP
The U.K. Systematic
Fund GBP
The U.S. Quant Fund
USD
The U.S. Value Fund
USD
The World Equity Fund USD
Ex-date 31 May 2007, pay date 14 June 2007 Income earned during the period ended 31 March 2007 .................. 4,231,904 12,437,036 1,155,731 833,365 1,896,889 2,492,925 2,187,212 10,969,991Income payable/allocated Class A ........................................ 3,599 39,068 59,332 706,921 491,908 - - -Class A Income ............................ - - - - - 12,770 68,522 -Class B......................................... 1,460,649 8,231,729 830,498 - 86,596 1,620,301 1,395,855 2,942,949 Class C......................................... - - - 1,101,582 157,975 451,033 511,315 Class D......................................... - - - - 13,738 - 21 Class Dh – B ................................ - 1,127,151 - - - - -Class E ......................................... - - - - - 35,490 - -Class EH-B .................................. - - - - - 35,834 - -Class EH-T................................... - - - - - - - 739,030 Class EU ...................................... - - 128,811 - - - - -Class F ......................................... 15,233 48,438 41,703 32,751 - - - -Class J .......................................... - - - - - 165,918 Class K......................................... - - - 6,000 - -Class L ......................................... - - - - -Class MZ...................................... 335,359 390,126 13,879 66,805 - 18,885 - -Class N......................................... - - - - 26,762 Class P Income............................. 21,418 - - 164,276 - -Class P accumulation ................... - - - - - -Class I Income.............................. 910,831 1,034,324 13,879 - 44,067 24,929 25,973 -Class I Accumulation ................... 1,378,406 1,565,128 10,032 - 172,073 376,266 244,470 4,551,429 Class R Roll-Up ........................... - - - - - - - -Class S ......................................... - - - - - - - -Class S Accumulation .................. 105,773 - - - - - - -Class SH-B................................... - - - - - - - 1,670,518 TYA Class - - - - - - - 82,817 PAM EU Class - - - - - - -Undistributed Income .................. 637 1,073 57,597 26,888 663 26,461 1,360 279,233
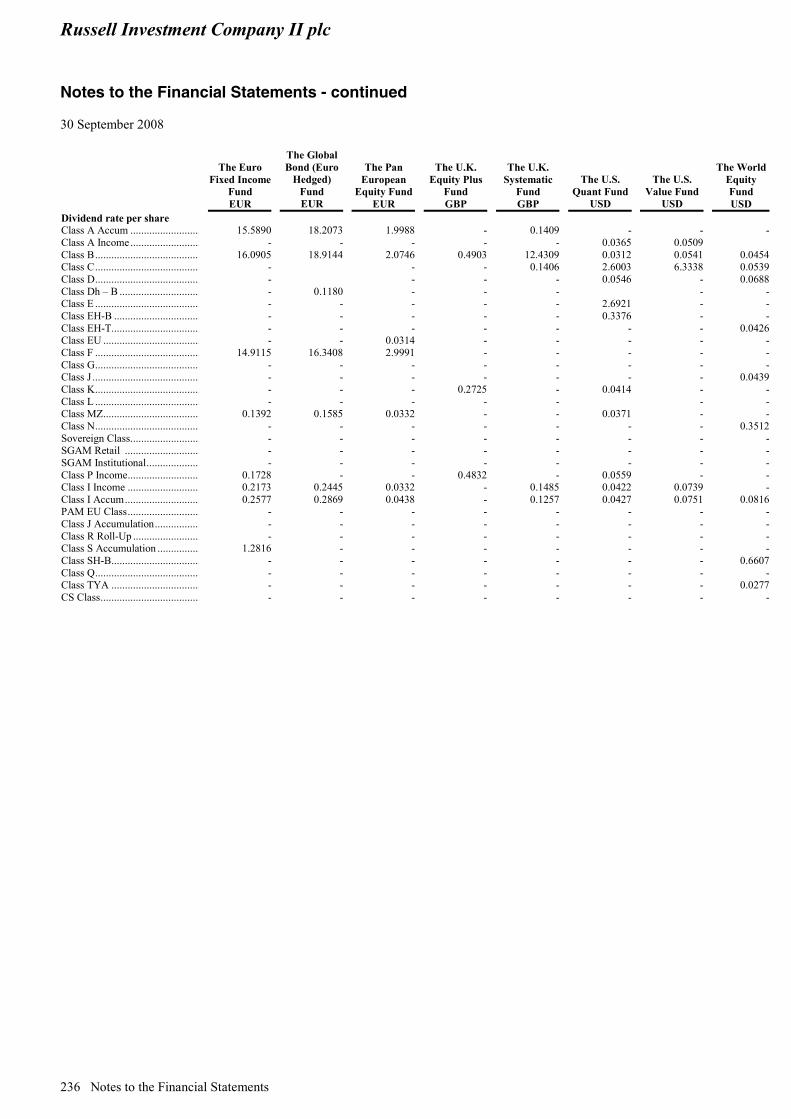
Russell Investment Company II plc Notes to the Financial Statements - continued 30 September 2008
236 Notes to the Financial Statements
The Euro Fixed Income
Fund EUR
The Global Bond (Euro
Hedged) Fund EUR
The Pan European
Equity Fund EUR
The U.K. Equity Plus
Fund GBP
The U.K. Systematic
Fund GBP
The U.S. Quant Fund
USD
The U.S. Value Fund
USD
The World Equity Fund USD
Dividend rate per share Class A Accum .......................... 15.5890 18.2073 1.9988 - 0.1409 - - -Class A Income.......................... - - - - - 0.0365 0.0509Class B....................................... 16.0905 18.9144 2.0746 0.4903 12.4309 0.0312 0.0541 0.0454Class C....................................... - - - 0.1406 2.6003 6.3338 0.0539Class D....................................... - - - - 0.0546 - 0.0688Class Dh – B .............................. - 0.1180 - - - - -Class E ....................................... - - - - - 2.6921 - -Class EH-B ................................ - - - - - 0.3376 - -Class EH-T................................. - - - - - - - 0.0426Class EU .................................... - - 0.0314 - - - - -Class F ....................................... 14.9115 16.3408 2.9991 - - - - -Class G....................................... - - - - - - - -Class J ........................................ - - - - - - - 0.0439Class K....................................... - - - 0.2725 - 0.0414 - -Class L ....................................... - - - - - - -Class MZ.................................... 0.1392 0.1585 0.0332 - - 0.0371 - -Class N....................................... - - - - - - - 0.3512Sovereign Class.......................... - - - - - - - -SGAM Retail ............................ - - - - - - - -SGAM Institutional.................... - - - - - - - -Class P Income........................... 0.1728 - - 0.4832 - 0.0559 - -Class I Income ........................... 0.2173 0.2445 0.0332 - 0.1485 0.0422 0.0739 -Class I Accum............................ 0.2577 0.2869 0.0438 - 0.1257 0.0427 0.0751 0.0816PAM EU Class........................... - - - - - - - -Class J Accumulation................. - - - - - - - -Class R Roll-Up ......................... - - - - - - - -Class S Accumulation ................ 1.2816 - - - - - - -Class SH-B................................. - - - - - - - 0.6607Class Q....................................... - - - - - - - -Class TYA ................................. - - - - - - - 0.0277CS Class..................................... - - - - - - - -
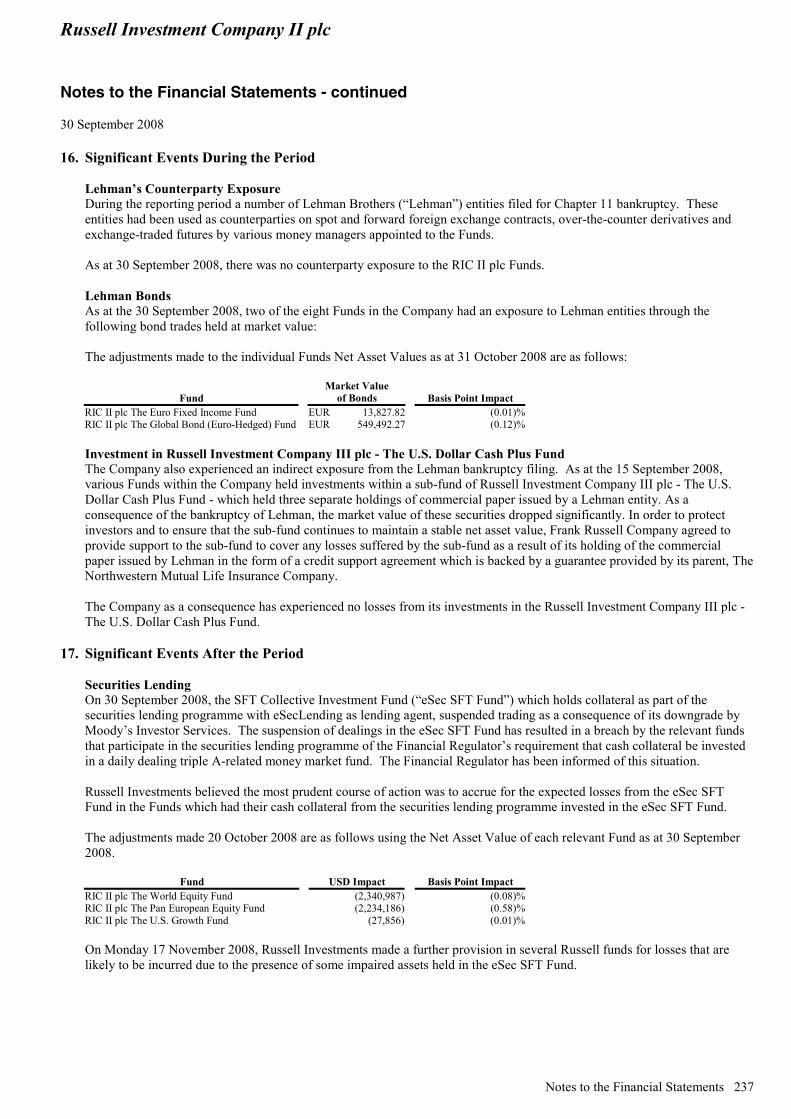
Russell Investment Company II plc Notes to the Financial Statements - continued 30 September 2008
Notes to the Financial Statements 237
16. Significant Events During the Period Lehman’s Counterparty Exposure During the reporting period a number of Lehman Brothers (“Lehman”) entities filed for Chapter 11 bankruptcy. These entities had been used as counterparties on spot and forward foreign exchange contracts, over-the-counter derivatives and exchange-traded futures by various money managers appointed to the Funds. As at 30 September 2008, there was no counterparty exposure to the RIC II plc Funds. Lehman Bonds As at the 30 September 2008, two of the eight Funds in the Company had an exposure to Lehman entities through the following bond trades held at market value: The adjustments made to the individual Funds Net Asset Values as at 31 October 2008 are as follows:
Fund Market Value
of Bonds Basis Point Impact RIC II plc The Euro Fixed Income Fund EUR 13,827.82 (0.01)%RIC II plc The Global Bond (Euro-Hedged) Fund EUR 549,492.27 (0.12)% Investment in Russell Investment Company III plc - The U.S. Dollar Cash Plus Fund The Company also experienced an indirect exposure from the Lehman bankruptcy filing. As at the 15 September 2008, various Funds within the Company held investments within a sub-fund of Russell Investment Company III plc - The U.S. Dollar Cash Plus Fund - which held three separate holdings of commercial paper issued by a Lehman entity. As a consequence of the bankruptcy of Lehman, the market value of these securities dropped significantly. In order to protect investors and to ensure that the sub-fund continues to maintain a stable net asset value, Frank Russell Company agreed to provide support to the sub-fund to cover any losses suffered by the sub-fund as a result of its holding of the commercial paper issued by Lehman in the form of a credit support agreement which is backed by a guarantee provided by its parent, The Northwestern Mutual Life Insurance Company. The Company as a consequence has experienced no losses from its investments in the Russell Investment Company III plc - The U.S. Dollar Cash Plus Fund.
17. Significant Events After the Period Securities Lending On 30 September 2008, the SFT Collective Investment Fund (“eSec SFT Fund”) which holds collateral as part of the securities lending programme with eSecLending as lending agent, suspended trading as a consequence of its downgrade by Moody’s Investor Services. The suspension of dealings in the eSec SFT Fund has resulted in a breach by the relevant funds that participate in the securities lending programme of the Financial Regulator’s requirement that cash collateral be invested in a daily dealing triple A-related money market fund. The Financial Regulator has been informed of this situation. Russell Investments believed the most prudent course of action was to accrue for the expected losses from the eSec SFT Fund in the Funds which had their cash collateral from the securities lending programme invested in the eSec SFT Fund. The adjustments made 20 October 2008 are as follows using the Net Asset Value of each relevant Fund as at 30 September 2008.
Fund USD Impact Basis Point Impact RIC II plc The World Equity Fund (2,340,987) (0.08)%RIC II plc The Pan European Equity Fund (2,234,186) (0.58)%RIC II plc The U.S. Growth Fund (27,856) (0.01)% On Monday 17 November 2008, Russell Investments made a further provision in several Russell funds for losses that are likely to be incurred due to the presence of some impaired assets held in the eSec SFT Fund.
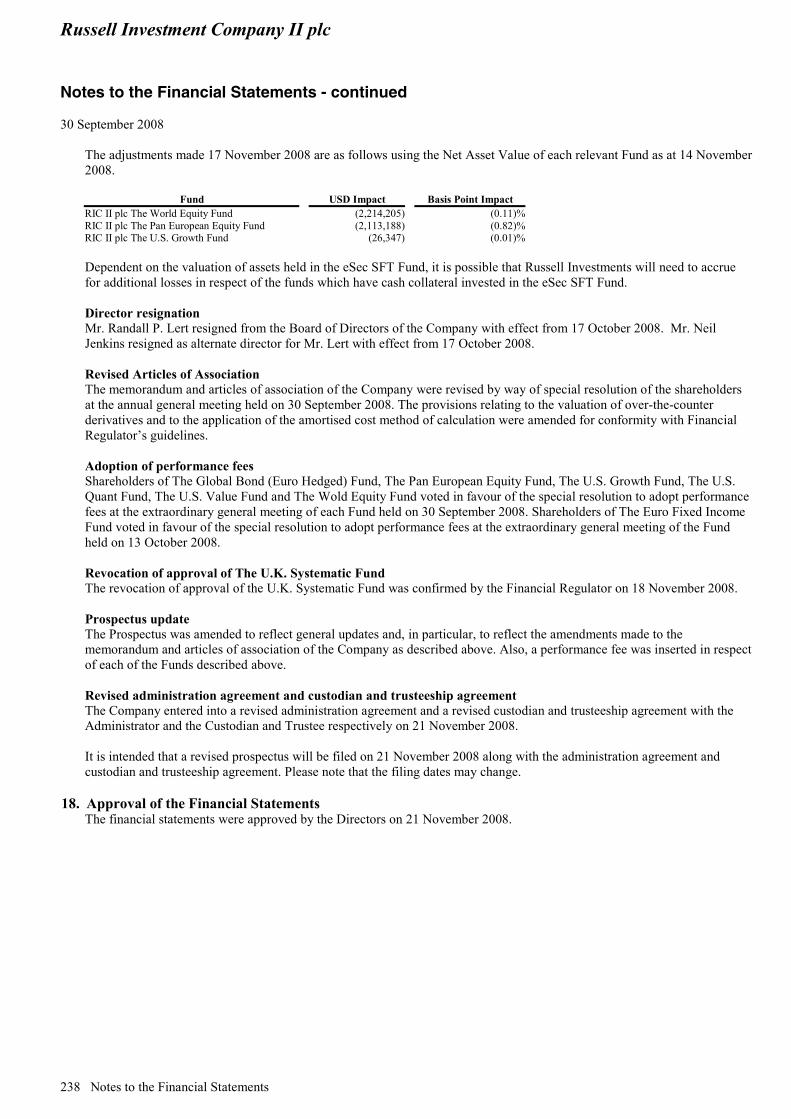
Russell Investment Company II plc Notes to the Financial Statements - continued 30 September 2008
238 Notes to the Financial Statements
The adjustments made 17 November 2008 are as follows using the Net Asset Value of each relevant Fund as at 14 November 2008.
Fund USD Impact Basis Point Impact RIC II plc The World Equity Fund (2,214,205) (0.11)%RIC II plc The Pan European Equity Fund (2,113,188) (0.82)%RIC II plc The U.S. Growth Fund (26,347) (0.01)% Dependent on the valuation of assets held in the eSec SFT Fund, it is possible that Russell Investments will need to accrue for additional losses in respect of the funds which have cash collateral invested in the eSec SFT Fund. Director resignation Mr. Randall P. Lert resigned from the Board of Directors of the Company with effect from 17 October 2008. Mr. Neil Jenkins resigned as alternate director for Mr. Lert with effect from 17 October 2008. Revised Articles of Association The memorandum and articles of association of the Company were revised by way of special resolution of the shareholders at the annual general meeting held on 30 September 2008. The provisions relating to the valuation of over-the-counter derivatives and to the application of the amortised cost method of calculation were amended for conformity with Financial Regulator’s guidelines. Adoption of performance fees Shareholders of The Global Bond (Euro Hedged) Fund, The Pan European Equity Fund, The U.S. Growth Fund, The U.S. Quant Fund, The U.S. Value Fund and The Wold Equity Fund voted in favour of the special resolution to adopt performance fees at the extraordinary general meeting of each Fund held on 30 September 2008. Shareholders of The Euro Fixed Income Fund voted in favour of the special resolution to adopt performance fees at the extraordinary general meeting of the Fund held on 13 October 2008. Revocation of approval of The U.K. Systematic Fund The revocation of approval of the U.K. Systematic Fund was confirmed by the Financial Regulator on 18 November 2008. Prospectus update The Prospectus was amended to reflect general updates and, in particular, to reflect the amendments made to the memorandum and articles of association of the Company as described above. Also, a performance fee was inserted in respect of each of the Funds described above. Revised administration agreement and custodian and trusteeship agreement The Company entered into a revised administration agreement and a revised custodian and trusteeship agreement with the Administrator and the Custodian and Trustee respectively on 21 November 2008. It is intended that a revised prospectus will be filed on 21 November 2008 along with the administration agreement and custodian and trusteeship agreement. Please note that the filing dates may change.
18. Approval of the Financial Statements The financial statements were approved by the Directors on 21 November 2008.
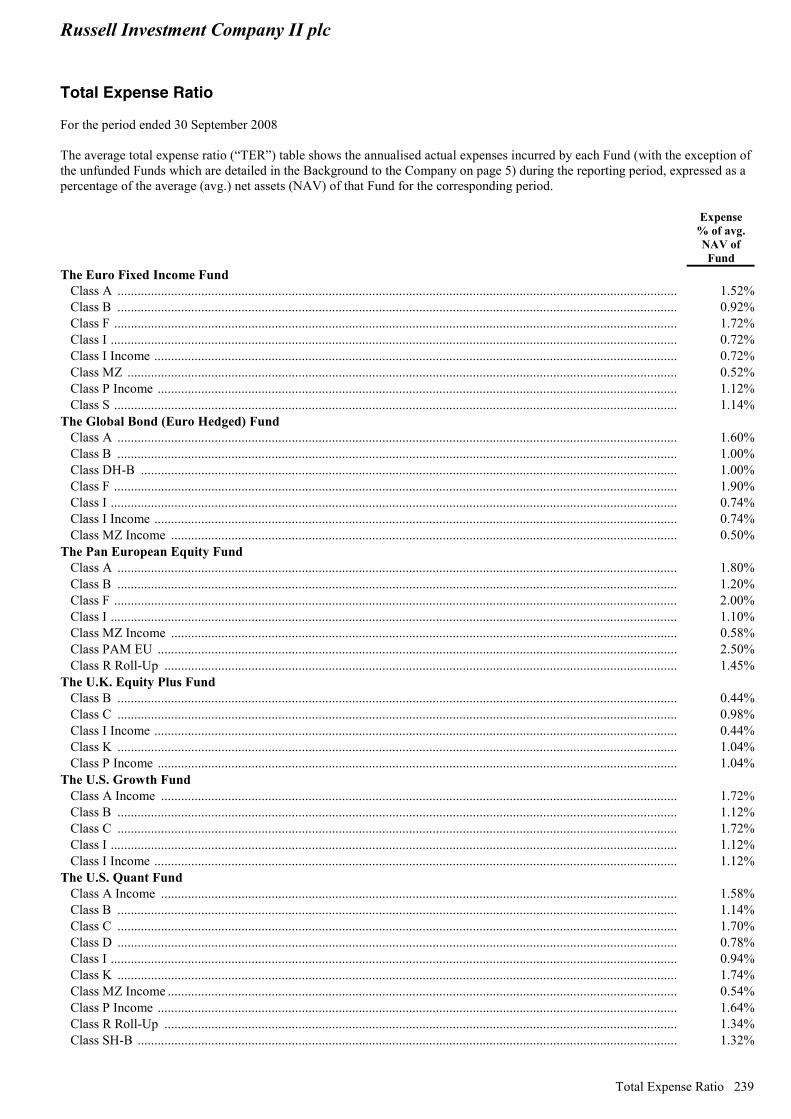
Russell Investment Company II plc Total Expense Ratio For the period ended 30 September 2008
Total Expense Ratio 239
The average total expense ratio (“TER”) table shows the annualised actual expenses incurred by each Fund (with the exception of the unfunded Funds which are detailed in the Background to the Company on page 5) during the reporting period, expressed as a percentage of the average (avg.) net assets (NAV) of that Fund for the corresponding period.
Expense % of avg. NAV of Fund
The Euro Fixed Income Fund Class A ....................................................................................................................................................................... 1.52% Class B ....................................................................................................................................................................... 0.92% Class F ........................................................................................................................................................................ 1.72% Class I ......................................................................................................................................................................... 0.72% Class I Income ............................................................................................................................................................ 0.72% Class MZ .................................................................................................................................................................... 0.52% Class P Income ........................................................................................................................................................... 1.12% Class S ........................................................................................................................................................................ 1.14%The Global Bond (Euro Hedged) Fund Class A ....................................................................................................................................................................... 1.60% Class B ....................................................................................................................................................................... 1.00% Class DH-B ................................................................................................................................................................ 1.00% Class F ........................................................................................................................................................................ 1.90% Class I ......................................................................................................................................................................... 0.74% Class I Income ............................................................................................................................................................ 0.74% Class MZ Income ....................................................................................................................................................... 0.50%The Pan European Equity Fund Class A ....................................................................................................................................................................... 1.80% Class B ....................................................................................................................................................................... 1.20% Class F ........................................................................................................................................................................ 2.00% Class I ......................................................................................................................................................................... 1.10% Class MZ Income ....................................................................................................................................................... 0.58% Class PAM EU ........................................................................................................................................................... 2.50% Class R Roll-Up ......................................................................................................................................................... 1.45%The U.K. Equity Plus Fund Class B ....................................................................................................................................................................... 0.44% Class C ....................................................................................................................................................................... 0.98% Class I Income ............................................................................................................................................................ 0.44% Class K ....................................................................................................................................................................... 1.04% Class P Income ........................................................................................................................................................... 1.04%The U.S. Growth Fund Class A Income .......................................................................................................................................................... 1.72% Class B ....................................................................................................................................................................... 1.12% Class C ....................................................................................................................................................................... 1.72% Class I ......................................................................................................................................................................... 1.12% Class I Income ............................................................................................................................................................ 1.12%The U.S. Quant Fund Class A Income .......................................................................................................................................................... 1.58% Class B ....................................................................................................................................................................... 1.14% Class C ....................................................................................................................................................................... 1.70% Class D ....................................................................................................................................................................... 0.78% Class I ......................................................................................................................................................................... 0.94% Class K ....................................................................................................................................................................... 1.74% Class MZ Income ........................................................................................................................................................ 0.54% Class P Income ........................................................................................................................................................... 1.64% Class R Roll-Up ......................................................................................................................................................... 1.34% Class SH-B ................................................................................................................................................................. 1.32%
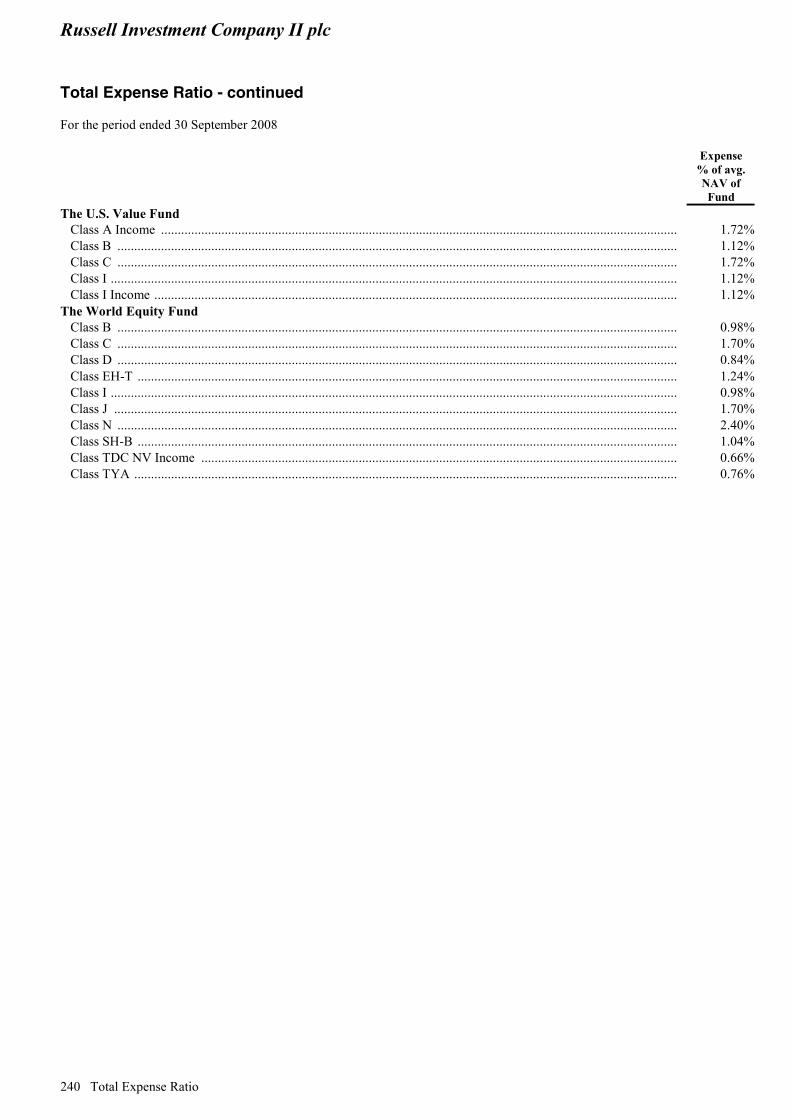
Russell Investment Company II plc Total Expense Ratio - continued For the period ended 30 September 2008
240 Total Expense Ratio
Expense % of avg. NAV of Fund
The U.S. Value Fund Class A Income .......................................................................................................................................................... 1.72% Class B ....................................................................................................................................................................... 1.12% Class C ....................................................................................................................................................................... 1.72% Class I ......................................................................................................................................................................... 1.12% Class I Income ............................................................................................................................................................ 1.12%The World Equity Fund Class B ....................................................................................................................................................................... 0.98% Class C ....................................................................................................................................................................... 1.70% Class D ....................................................................................................................................................................... 0.84% Class EH-T ................................................................................................................................................................. 1.24% Class I ......................................................................................................................................................................... 0.98% Class J ........................................................................................................................................................................ 1.70% Class N ....................................................................................................................................................................... 2.40% Class SH-B ................................................................................................................................................................. 1.04% Class TDC NV Income .............................................................................................................................................. 0.66% Class TYA .................................................................................................................................................................. 0.76%

Russell Investments Rex House10 Lower Regent StreetLondon, SW1Y 4PE
tel +44(0) 20 7024 6000fax +44 (0) 20 7024 6001www.russell.com