2008 black bear management report of survey …...if this report is used in its entirety, please...
TRANSCRIPT

Black Bear Management Report
of survey-inventory activities 1 July 2004–30 June 2007
Patricia Harper, Editor
Alaska Department of Fish and Game Division of Wildlife Conservation
Photo by Rich Lowell, ADF&G
Funded through Federal Aid in Wildlife Restoration
Grants W-33-3, W-33-4, and W-33-5

STATE OF ALASKA Sarah Palin, Governor
DEPARTMENT OF FISH AND GAME
Denby Lloyd, Commissioner
DIVISION OF WILDLIFE CONSERVATION Doug Larsen, Director
For a hard copy of this report please direct requests to our publications specialist:
Publications Specialist ADF&G, Wildlife Conservation
P.O. Box 115526 Juneau, AK 99811-5526
(907) 465-4176 [email protected]
Please note that population and harvest data in this report are estimates and may be refined at a later date.
The Alaska Department of Fish and Game (ADF&G) administers all programs and activities free from discrimination based on race, color, national origin, age, sex, religion, marital status, pregnancy, parenthood, or disability. The department administers all programs and activities in compliance with Title VI of the Civil Rights Act of 1964, Section 504 of the Rehabilitation Act of 1973, Title II of the Americans with Disabilities Act of 1990, the Age Discrimination Act of 1975, and Title IX of the Education Amendments of 1972. If you believe you have been discriminated against in any program, activity, or facility please write:
• ADF&G ADA Coordinator, P.O. Box 115526, Juneau, AK 99811-5526 • U.S. Fish and Wildlife Service, 4401 N. Fairfax Drive, MS 2042, Arlington, VA 22203 • Office of Equal Opportunity, U.S. Department of the Interior, 1849 C Street NW MS 5230,
Washington DC 20240. The department’s ADA Coordinator can be reached via phone at the following numbers: (VOICE) 907-465-6077; (Statewide Telecommunication Device for the Deaf) 1-800-478-3648; (Juneau TDD) 907-465-3646; (FAX) 907-465-6078. For information on alternative formats and questions on this publication, please contact the following: Publications Specialist, ADF&G/Division of Wildlife Conservation, P.O. Box 115526, Juneau, AK 99811-5526, or call 907-465-4176. Cover Photo: A black bear cub in a garbage can in Petersburg. Photo by Rich Lowell.

Black Bear Management Report
of survey-inventory activities 1 July 2004–30 June 2007
Patricia Harper, Editor
Alaska Department of Fish and Game Division of Wildlife Conservation
Funded through Federal Aid in Wildlife Restoration
Grants W-33-3. W-33-4, and W-33-5
Any information taken from this report should be cited with credit given to authors and the Alaska Department of Fish and Game. Authors are identified at the end of each unit section.
If this report is used in its entirety, please reference as: Alaska Department of Fish and Game. 2008. Black Bear management report of survey-inventory activities 1 July 2004–30 June 2007. P. Harper, editor. Juneau, Alaska.


BLACK BEAR MANAGEMENT REPORT
TABLE OF CONTENTS
Unit Map .......................................................................................................................................... i
Unit 1A – Unit 1 south of Lemesurier Point, including drainages into Behm Canal and excluding drainages into Ernest Sound ...........................................................................................1 Unit 1B – Southeast Alaska mainland from Cape Fanshaw to Lemesurier Point ........................19
Unit 1C – Southeast Alaska mainland between Cape Fanshaw and the latitude of Eldred Rock, including Berners Bay and Sullivan Island, excluding drainages into Faragut Bay ..........30 Unit 1D – Southeast Alaska mainland north of Eldred Rock, excluding Sullivan Island and the drainages of Berners Bay .................................................................................................48 Unit 2 – Prince of Wales Island and adjacent islands south of Sumner Strait and west of Kashevarof Passage ......................................................................................................................66 Unit 3 – Islands of the Petersburg, Kake, and Wrangell area .......................................................92
Unit 5 – Cape Fairweather to Icy Bay, eastern Gulf of Alaska Coast ........................................112
Unit 6 – Prince William Sound and the northern Gulf of Alaska Coast .....................................124
Units 7 and 15 – Kenai Peninsula ...............................................................................................143
Unit 11 – Wrangell Mountains ...................................................................................................149
Unit 12 – Upper Tanana and White River drainages, including the northern Alaska Range east of the Robertson River, and the Mentasta, Nutzotin, and northern Wrangell Mountains ....155 Unit 13 – Nelchina Basin ............................................................................................................167
Unit 14 – Upper Cook Inlet ........................................................................................................175
Unit 16 – West side of Cook Inlet ..............................................................................................187
Unit 17 – Northern Bristol Bay ...................................................................................................199
Unit 19, 21A, and 21E – All drainages of the Kuskokwim River upstream from the village of Lower Kalskag; Yukon River drainage from Paimiut upstream to, but not including, the Blackburn Creek drainage; the entire Innoko River drainage; and the Nowitna River drainage upstream from the confluence of the Little Mud and Nowitna Rivers. ......................................208
Units 20A, 20B, 20C, and 20F – Central–Lower Tanana and middle Yukon River drainages ..217
Unit 20D – Central Tanana Valley near Delta Junction .............................................................234
Unit 20E – Fortymile, Charley, and Ladue River drainages, including the Tanana Uplands and all drainages into the south bank of the Yukon River upstream from and including the Charley River drainage ...............................................................................................................242

i

1
WILDLIFE Alaska Department of Fish and Game
Division of Wildlife Conservation
MANAGEMENT REPORT (907) 465-4190 P.O. BOX 115526 JUNEAU, AK 99811-5526
BLACK BEAR MANAGEMENT REPORT
From: 1 July 2004 To: 30 June 2007
LOCATION GAME MANAGEMENT UNIT: Unit 1A (5300 mi2) GEOGRAPHICAL DESCRIPTION: That portion of Unit 1 lying south of Lemesurier Point,
including all drainages into Behm Canal and excluding all drainages into Ernest Sound.
BACKGROUND HABITAT DESCRIPTION Unit 1A includes portions of the Cleveland Peninsula and Misty Fjords National Monument on the mainland, and Revillagigedo (Revilla), Gravina, Annette, and Duke Islands. Most high quality mainland black bear habitat in Unit 1A is confined to a relatively narrow band of forested landscapes between saltwater and the high elevation peaks and ice fields of the coastal mountains. An exception is the broader bays and lower peaks of southern Cleveland Peninsula. Revilla Island has many productive salmon streams, large tracts of young age clear cut stands, and productive forest that provides high quality habitat. Gravina, Annette, and Duke Islands generally have lower-quality black bear habitat. A few large mainland river valleys, such as the Unuk, Chickamin, Blossom, Wilson, Keta, and Marten, as well as many Revilla Island stream systems, support salmon and other anadromous fish. Black bears compete with coastal brown bears for foraging opportunities along most of the productive salmon streams in the area.
Portions of Revilla, Gravina, and Annette Islands have been logged and have clear-cuts with habitats in various stages of regeneration. As is the case elsewhere in Southeast Alaska, habitat changes continue to occur from clear-cut logging. Although early successional stages (3–20 years after logging) provide black bears with an abundance of plant foods, later stages result in the disappearance of understory plants as conifer canopies close and sunlight does not penetrate to the forest floor. Second-growth stands lack large hollow trees and root masses used for denning habitat. Although logging may create food for bears in the short term, the long-term result of logging will likely be a decline in bear numbers (Suring et al. 1988).
ADF&G has estimated approximately 890 square miles of forested habitat on the Unit 1A mainland and 1600 additional square miles of forested habitat on the Unit 1A islands and a

2
portion of the lower Cleveland Peninsula within Unit 1A. Large portions of Unit 1A are designated wilderness within the Misty Fjords National Monument.
Bear distribution near Ketchikan is significantly influenced by human garbage. Although bears have probably always been numerous locally, the availability of this attractive alternative food source promotes high bear densities. Additionally, restrictions against firearm discharge within urban areas provide a refugium from harvest near the city, allowing the bear population to sustain the high densities in this area. At the same time, the high human density in the area and differing attitudes toward responsible garbage-handling promote a high level of human–bear conflict.
HUMAN USE HISTORY Black bears have long been hunted in Unit 1A for trophies and food. Sealing of black bears was first required in 1973. Resident bear hunters are not required to have a permit, so information on the effort of unsuccessful hunters has never been available. We collect information from a mandatory sealing requirement for all successful hunters.
Regulatory history Since statehood black bear hunting season has extended from 1 September through 30 June, and the bag limit for residents has remained 2 bears annually, only 1 of which can be a blue or glacier bear. Nonresident bag limits were the same as resident limits until 1990, when the nonresident limit was reduced from 2 to 1 black bear per regulatory year.
Historical harvest patterns
Annual harvest in Unit 1A increased from about 25 bears in the 1970s and early 1980s to 60 bears by the late 1980s. During the 1990s the mean annual hunter harvest was 64 bears/year, with a range of 33 to 97 bears. During 2000-2006 the mean annual harvest increased to 78 bears/year, with a range of 55 to 103 bears (Table 1).
Fluctuations in annual harvest are probably linked more with human activity and weather during hunting season than to changes in bear numbers. Earlier harvest cycles may have been linked to the amount of logging and road building activity in the unit. The harvest increase in the 1990s may have been linked to an increase in hunting effort by residents and nonresidents alike and may also be associated with renewed logging in some areas. Logging activity not only opened up more areas to hunting by providing good access, it also brought more humans in contact with bears. During some of the peak logging years in the mid 1980s and early 1990s, highway vehicles provided more than 25% of the hunter transport. During the past 3 years, vehicles accounted for only 7 percent of the hunter transport, slightly higher than the 10-year average of 5 percent.
Boats historically have been the favored mode of transport by Unit 1A bear hunters, with airplanes ranking a distant second. Many bears frequent the beaches in search of grasses and sedges during the early spring, making them visible and accessible to hunters. The majority of hunters target male bears. By using the spot-and-stalk technique along the many miles of

3
beaches in the spring, hunters are able to observe multiple animals and be selective. Consequently, over 70% of the Unit 1A annual bear harvest occurs during spring (April–June).
By state regulation, starting in 1996 the edible meat from spring bears needed to be salvaged for human consumption, but the meat from fall bears has not required salvage. Many hunters find meat from spring bears very tasty, while fall bears taken in Southeast Alaska are rarely considered edible by hunters because of the salmon component in the bears’ diet.
Resident hunters historically accounted for about 75% of the Unit 1A harvest until the late 1990s when nonresidents began harvesting around 50% of the 1A bears. This nonresident pattern has remained similar over the years since 2000 with only slight fluctuation between 43 and 57 percent. There is no guide requirement for nonresident hunters, and most out-of-state hunters have historically hunted without a registered guide in this unit. Nonresident hunters must purchase locking tags and must affix them on a bear immediately after it is harvested. The costs of hunting for nonresidents, including a hunting license ($85), tags ($225–$300), and expensive transportation do not seem to limit the number of nonresident hunters who pursue black bears in Unit 1A.
Some logging roads historically open to hunters will soon be closed as part of a statewide effort by the U.S. Forest Service (USFS) to reduce road maintenance costs and liability. The net effect will reduce the number of drivable road miles available to hunters by over one third. That will mean going from more than 300 miles of drivable roads currently available in the Ketchikan area to about 100 miles of roads that will remain open to motorized vehicles. Many of the roads slated to be closed are not connected to the main Ketchikan road system and require the use of a boat to offload a truck or 4-wheeler to the roads.
Historical harvest locations Hunters harvest bears throughout the unit, although the highest harvests continue to come from Wildlife Analysis Areas (WAAs) 405 (Thorne Arm), 406 (Carroll Inlet), 407 (George Inlet and the Ward Cove–Harriet Hunt Lake road), and 510 (northwest Revilla Island). On the mainland, WAAs 822 (Boca De Quadra) and 823 (Nakat Bay) also contribute substantially to the harvest. Because of its proximity to Ketchikan, WAA 406 is a popular recreational area for Ketchikan residents. U.S. Coast Guard personnel stationed at the Shoal Cove Loran Station along Carroll Inlet regularly harvest bears in that area. WAA 407 is also easily accessed by Ketchikan residents, by boat via George Inlet and by vehicle up the Ward Cove–Harriet Hunt Lake road system. Ketchikan residents and personnel from the Neets Bay fish hatchery account for several bears taken in WAA 510 each season. WAA 822 is accessible by boat from Ketchikan and remains a very popular place to hunt.
History of urban bear management in Ketchikan Responding to “bear calls” in Ketchikan continues to consume large amounts of staff time. Tasks include responding to complaints, explaining proper garbage handling and providing public safety precautions. We continue to work with the Ketchikan Police Department and Alaska Bureau of Wildlife Enforcement (ABWE) troopers to reduce bear–human conflicts. We use all of the available media sources to promote public service messages, and we also conduct several local education programs geared toward awareness and prevention. The combination of these

4
efforts and good cooperation with the other agencies seems to be making a positive change, with fewer nuisance calls and fewer bears being killed each season.
In 2006 ADF&G and the Ketchikan City Council formed a working group to develop a city ordinance to require residents to secure garbage. During late 2007 the Ketchikan City Council passed an ordinance and is currently working through a warning and citation schedule to track and cite offenders and to make it usable between multiple agencies. This should help a great deal with situations where residents refuse to secure garbage and continue to create irresistible food attractions within the community.
MANAGEMENT DIRECTION
MANAGEMENT OBJECTIVES • Maintain a male:female ratio of 3:1 in the harvest.
• Maintain an average male spring skull size of at least 17.5 inches.
• Minimize human–bear conflicts by providing information and assistance to the public and to other agencies.
• Maintain a harvest of at least 65% males in the combined harvest during the most recent 3 years.
Age, genetics, and environmental factors such as habitat and forage quality combine to influence black bear skull size. Sealing records indicate that mature Unit 1A black bears generally have smaller skulls than bears from the nearby Unit 2. The skull size management objective of 17.5 inches for males harvested in the spring was established in the early 1990s after harvest data analysis showed this to be the long-term average.
Skull size is used as a management tool because we believe that a change in mean skull size may indicate changes in population size and composition and provide some measure of the sustainability of the harvest levels. A decreasing average skull size may indicate a decline in that segment of the population composed of large, older bears and could indicate an overall population decline. An increasing average skull size could indicate a reduction in the proportion of younger bears in the population. Probably the most important and safest use of skull size data at this time is as an indicator of some change in the population or in hunter effort. We use skull size in conjunction with other harvest data to make our best assessment of current bear population trends.
Harvest sex ratio is the second most common parameter for monitoring black bear populations. It is relied upon as a primary means of assessing population status in 19 states and provinces and as supporting information for population assessment in another 8 areas (Garshelis 1990). A changing sex ratio in harvest is thought by some bear biologists to reflect changes in the population. As a measure of harvest intensity, we expect the sex ratio to change with cohort age. In the younger age classes, males will outnumber females in the harvest. However, the higher harvest mortality of males causes their numbers to decline more rapidly with age. Males remain

5
more vulnerable and the ratio of males to females in the harvest declines with age because of the progressive depletion of males (Bunnell and Tait 1980). A 3:1 sex ratio in favor of more males in the harvest has been suggested (Miller, S. personal communication) to be a sustainable yield from a healthy bear population.
METHODS
Black bear hides and skulls taken by successful hunters were sealed by ADF&G staff, public safety staff, and designated sealers. Biological and hunt information collected at the time of sealing included sex, skull size (length and width), pelage color, date and location of kill, number of days hunted, transportation method, guide use, and hunter use of commercial services. A premolar was collected from most bears and sent to Matson’s Laboratory for age determination.
RESULTS AND DISCUSSION
POPULATION STATUS AND TREND Black bear population estimates are not available. Information obtained during sealing cannot be used directly to measure population trends. While harvest information gained from sealing records, such as average skull sizes, average ages, and sex ratios, may provide some indication of black bear population trends, in the absence of accompanying demographic data, correlations between these measures and harvest sustainability will continue to elude us. Research is needed to identify population parameters, so that we might better assess population trends and harvest sustainability.
Population Size
No black bear population studies have been conducted in Unit 1A. Estimates of population size or density are difficult and expensive to obtain. The species generally inhabits forested areas, where aerial surveys are impractical. Vast, remote areas in the unit also make studies difficult and expensive to undertake. Conservative black bear density estimates for Unit 1A are based on studies in similar habitats in western Washington state in the 1960s (Poelker and Hartwell 1973) where they estimated 1.4 bears/mi2. Wood (1990) and Larsen (1990) calculated a slightly higher density of 1.5 bears/mi2 for most of the forested islands and mainland, and lower densities for the more barren portions of the mainland and unproductive island habitats. In 1990, they made the following assumptions about bear density and derived a population estimate for all of Unit 1A. • Revilla Island – 1176 mi2 x 1.5 bears per mi2 = 1764 bears • Gravina Island – 96 mi2 X 0.50 bears per mi2 = 48 bears • Cleveland Peninsula south of Yes Bay – 203 mi2 X 1.0 bears per mi2 = 203 bears • Duke and Annette Islands – 140 mi2 X 0.10 bears per mi2 = 14 bears • Remainder of Unit 1A – 890 forested mi2 X 1.5 bears per mi2 = 1344 bears for a total
estimated Unit 1A population of 3520 black bears (Larsen 1990)

6
Population Composition Our management objective of a 3:1 male-to-female harvest ratio is aimed at assuring a minimal harvest of female bears. We lack reliable information on the composition of the bear population, but use the harvest sex ratio for insight into the availability of male bears in the population. On a very gross scale, if the harvest of females increases, we may interpret that to suggest there are fewer large male bears available to hunters. This is more difficult recently because our hunter population seems to be changing. Recently we have more nonresident hunters anxiously harvesting the first bear they see rather than waiting for a good trophy male or even a representative specimen.
Distribution and Movements Black bears are thought to be more numerous on the islands of Unit 1A than on the mainland; however, population estimates or quantitative information about home ranges and movement patterns of Unit 1A black bears are not available. Black colored pelage is most common and occurs throughout the bears’ range. The cinnamon color phase occurs mostly in mainland portions of the unit and occasionally on Revilla Island. Black bears with glacier (blue) pelage are also found in Unit 1A. Kermode bears, or those with pure white pelage, have been reported in extreme southern mainland portions of the unit along the Portland Canal.
MORTALITY Harvest Season Bag Limit 1 Sep–30 Jun Resident hunters: 2 bears, not more than 1 of
which may be a blue or glacier bear
1 Sep–30 Jun Nonresident hunters: 1 bear Game Board Action and Emergency Orders: No Board of Game actions took place, and no emergency orders were issued during this report period.
Hunter harvest. Hunters harvested 51, 87, and 103 bears during 2004, 2005, and 2006 seasons respectively. The most recent 3-year average was the same as the 10-year mean ( x = 80 bears) and higher than the previous 3-year average of 70 bears. The 2006 harvest of 103 bears from Unit 1A was the highest on record (Table 1).
Miller (1990) suggested it would be more important to monitor the number of females in the harvest than percentage of males. Taylor (1986) noted the effect of hunting pressure on breeding females was critical in sustained yield management. Males typically compose over 75% of the bears killed in Unit 1A, and during the past 10 years 78% (range 71–89%) of the kill has been male. The 3-year male average is slightly lower at 76% (range 74–85%) (Table 1).
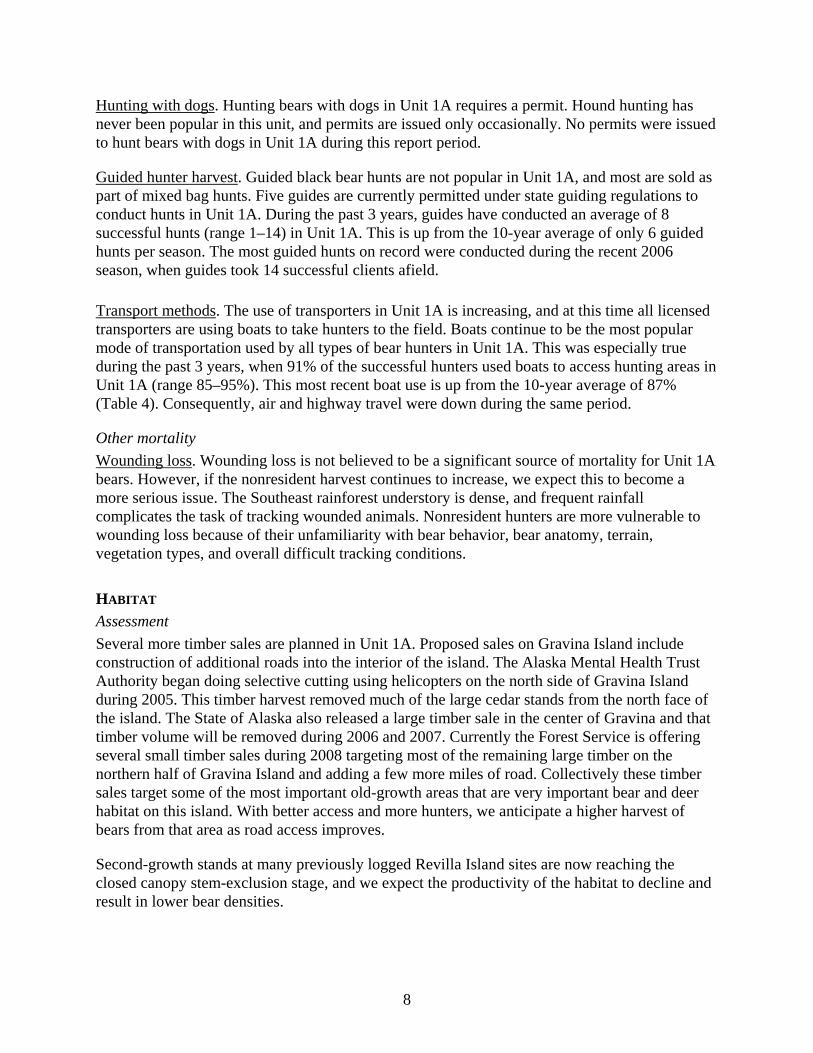
The average male skull size during this report period ( x = 18.2 inches, range 17.7–18.7) was slightly higher than the past 10-year average ( x = 18.1 inches, range 17.7–18.7). We continue to

7
meet our management objective of 17.5-inch average for male spring bears. These data show only slight variation between yearly and spring-only male skull size. Female skull size average for the past 10-year period was 16.1 inches (range 15.7–16.7 inches) (Table 5).
The annual average number of hunters during this report period (81) was higher than the 10-year average of 73 (range 52–103). The number of successful hunters peaked in 2006 at 103. The 2006 season also saw the most total days hunted (248) since 2000, when successful hunters spent 265 days afield. The spring 2005 season saw the fewest hunter days since 1997 while the spring of 2007 had the second highest days hunted in the last 20 years. Days in the field per successful hunter remained similar at 2.5 days (Table 5).
Hunter residency and success. Nonresident participation in Unit 1A black bear hunting has varied during the past 20 years, averaging 34% of the kill (15–58%). This nonresident pattern has increased during the past 3 years to a combined average of 52%. During the 2004, 2005 and 2006 seasons, 55%, 53% and 48% respectfully, of successful hunters were nonresidents. The high of 58% in 2002 was the highest nonresident participation on record for this unit. Alaska residents not living in Unit 1A (nonlocal) historically harvest only 5–10% of the bears in this area. This past 3-year period had the least participation by nonlocal residents on record which was (2%) down from the long-term average of 9% (Table 2).
Harvest chronology during report period. Unit 1A bears are most visible and accessible during the spring, when they are near the coast feeding on sedges and grasses. The hides are also most prime and full during this same period. During this report period, May continued to be the most popular month for Unit 1A harvest (49%), followed by September (27%) and June (16%). The May trend during the past 3 years (49%), was similar to the 10-year average of 47% (range 34–58) (Table 3).
Harvest in particular areas (WAAs). Hunters harvest bears throughout the unit. However, more than 60% of the Unit 1A harvest has historically been taken from Wildlife Analysis Areas 0406 (Carroll Inlet), 407 (George Inlet and the Ward Cove–Harriet Hunt Lake road), 0822 (Boca De Quadra), and 0510 (northwest Revilla Island), listed in order. On the mainland, WAAs 822 and 823 (Nakat Bay) also contribute substantially to the harvest. Because of its proximity to Ketchikan, WAA 406 is a popular recreational area for Ketchikan residents. U.S. Coast Guard personnel at the Shoal Cove Loran station in Carroll Inlet regularly harvest bears in this WAA. WAA 407 is also easily accessed by Ketchikan residents, by boat via George Inlet and by highway vehicle up the Ward Cove–Harriet Hunt Lake road system. Ketchikan residents and personnel from the Neets Bay fish hatchery account for several bears taken in WAA 510 each season. Most defense of life or property (DLP) and reported vehicle collisions occur in WAA 408 along the Ketchikan road system (Table 6).
Bait stations. Bear baiting has never been popular in Unit 1A. Only 2–5 bait permits are issued annually and bears are occasionally harvested using this method. During the three years of this report period 1, 3, and 2 bears were reported killed in Unit 1A using bait (Table 1).
8
Hunting with dogs. Hunting bears with dogs in Unit 1A requires a permit. Hound hunting has never been popular in this unit, and permits are issued only occasionally. No permits were issued to hunt bears with dogs in Unit 1A during this report period.
Guided hunter harvest. Guided black bear hunts are not popular in Unit 1A, and most are sold as part of mixed bag hunts. Five guides are currently permitted under state guiding regulations to conduct hunts in Unit 1A. During the past 3 years, guides have conducted an average of 8 successful hunts (range 1–14) in Unit 1A. This is up from the 10-year average of only 6 guided hunts per season. The most guided hunts on record were conducted during the recent 2006 season, when guides took 14 successful clients afield.
Transport methods. The use of transporters in Unit 1A is increasing, and at this time all licensed transporters are using boats to take hunters to the field. Boats continue to be the most popular mode of transportation used by all types of bear hunters in Unit 1A. This was especially true during the past 3 years, when 91% of the successful hunters used boats to access hunting areas in Unit 1A (range 85–95%). This most recent boat use is up from the 10-year average of 87% (Table 4). Consequently, air and highway travel were down during the same period.
Other mortality Wounding loss. Wounding loss is not believed to be a significant source of mortality for Unit 1A bears. However, if the nonresident harvest continues to increase, we expect this to become a more serious issue. The Southeast rainforest understory is dense, and frequent rainfall complicates the task of tracking wounded animals. Nonresident hunters are more vulnerable to wounding loss because of their unfamiliarity with bear behavior, bear anatomy, terrain, vegetation types, and overall difficult tracking conditions.
HABITAT Assessment Several more timber sales are planned in Unit 1A. Proposed sales on Gravina Island include construction of additional roads into the interior of the island. The Alaska Mental Health Trust Authority began doing selective cutting using helicopters on the north side of Gravina Island during 2005. This timber harvest removed much of the large cedar stands from the north face of the island. The State of Alaska also released a large timber sale in the center of Gravina and that timber volume will be removed during 2006 and 2007. Currently the Forest Service is offering several small timber sales during 2008 targeting most of the remaining large timber on the northern half of Gravina Island and adding a few more miles of road. Collectively these timber sales target some of the most important old-growth areas that are very important bear and deer habitat on this island. With better access and more hunters, we anticipate a higher harvest of bears from that area as road access improves.
Second-growth stands at many previously logged Revilla Island sites are now reaching the closed canopy stem-exclusion stage, and we expect the productivity of the habitat to decline and result in lower bear densities.

9
Enhancement No habitat enhancement projects specifically to benefit black bears have been attempted in the unit. Although intended as a silviculture practice, precommercial thinning and pruning has been performed in some young second-growth stands. Although not the primary intent, this effort provides a benefit to wildlife by improving and extending habitat suitability in the short-term by permitting sunlight to reach the forest floor and increase understory production. These benefits are short-lived (20–25 years), after which time canopy closure again results in loss of understory vegetation. The long-term effects of clearcut logging will be detrimental to black bear populations.
NONREGULATORY MANAGEMENT PROBLEMS AND NEEDS Nonhunting issues. Margaret Creek, located on Revilla Island approximately 20 miles north of Ketchikan, is a contentious area. The U.S. Forest Service recently improved a trail to an existing fish weir, providing better access for bear viewing. Several air charter services now provide bear viewing trips from Ketchikan for visiting cruise ship passengers. There have been several clashes with hunters and bear viewers during the past several years. Signs are now posted and the immediate area around the bear viewing platform and access trail are closed to all firearm discharge by Forest Supervisor Order.
Neets Bay, also on Revilla Island, has recently developed into a substantial bear viewing site. Southern Southeast Regional Aquaculture Association (SSRAA) operates a salmon hatchery at this site and contracts with air charter services to transport cruise ship passengers to the site for bear viewing. SSRAA provides a natural history bear guide from the dock to the viewing site. SSRAA employees have reported observing up to 40 or more bears in one evening feeding in the salmon stream and estuary near this viewing site.
Nuisance bear problems/urban bear management activities. Household garbage, bird feeders, and pet foods continue to attract bears to urban locations. We are working with the police departments, city managers, and ABWE to provide educational material on how to reduce bear encounters by residents of Unit 1A. Combined, ABWE, Ketchikan Police Department, and the Ketchikan ADF&G office receive 200–600 calls annually from residents asking for help with food-conditioned bears. While responding to these calls, we inform the public about their responsibilities and options. The City of Ketchikan has distributed approximately 2000, 90-gallon roller-cans to residents in an attempt to reduce the availability of garbage to bears. Fish and Game staff also spent time talking to school classes about bear safety and bear awareness. All of these efforts seem to be paying off recently. Nuisance bear calls are down by about 25%, and the number of bears killed under defense of life or property is also down during this report period.
The Ketchikan landfill site was closed in 1994, and many food-conditioned bears were either relocated or killed. Prior to that closure an average of 2–8 bears per year were killed in Ketchikan; since 1997 an average of 10 bears (range 5–20) have been killed annually, some of which could be bears (or their offspring) that frequented the dump prior to 1994. Residents continue to provide opportunities for bears to access human foods and are likely educating new bears. Consequently, bears are common around town in the summer and fall, and are periodically killed either by ADF&G, enforcement officers, or local residents. A total of 7 bears were killed

10
under DLP situations across the entire unit during this report period, which is down from the last report period, when 9 were listed as DLP kills (Table 1). We continue to educate the public about proper garbage handling to prevent bears from becoming food-conditioned and the resulting public safety issues and needless killing of bears.
In 2006 ADF&G and the Ketchikan City Council formed a working group to develop a city ordinance to require residents to secure garbage. During late 2007 the Ketchikan City Council passed an ordinance and currently we are working through a warning and citation schedule to track and cite offenders and to make it usable between multiple agencies. This should help a great deal with situations where residents refuse to secure garbage and continue to create irresistible food attractions within the community.
CONCLUSIONS AND RECOMMENDATIONS
Black bears are an important big game species in Southeast Alaska, and the Unit 1A harvest continues to increase because of a long hunting season, liberal bag limit, and an attractive meat source to hunters.
The 2006 season recorded the most days hunted, most successful hunters, and consequently the most bears harvested on record for Unit 1A. We expect this increasing harvest trend to continue as long as tourism is strong, and Alaska is selected as a popular and safe tourism destination.
The current harvest ratio, proportion of females, average skull size, and age structure of the harvest all suggest a stable bear population. Harvest records indicate the annual kill remains low relative to our crude population estimate. Harvest records also indicate a healthy male component and have not shown any discernible changes in skull size, age, or sex parameters. We continue to see increasing numbers of nonresident hunters, some unguided nonresidents renting boats and vehicles, and other nonresidents employing transporters or licensed big game guides.
As local bear viewing interest continues to grow with tourism, we will undoubtedly be faced with allocation issues related to both human safety and bear preservation, requiring compromise by hunters and wildlife watchers. Town bears continue to occupy staff time, although we are making some headway in this arena, and public education efforts continue. The real town bear problem will be resolved now that city decision makers are taking some responsibility for garbage problems.
As logging continues, and large tracts of previously logged habitat rapidly convert to second-growth forest, we anticipate reductions in Unit 1A bear numbers, less visibility, and that consequently fewer bears will be harvested by hunters. Research is needed to better identify and understand the dynamics of Unit 1A black bears.
LITERATURE CITED
BUNNEL, F. L. AND D. TAIT. 1980. Bears in models and in reality–implications to management. Pages 15–25 in C.J. Martinka, editor. Bears–their biology and management. U.S. Government Printing Office, Washington, DC.

11
GARSHELIS, D. L. 1990. Monitoring effects of harvest on black bear populations in North
America: a review and evaluations of techniques. Pages 120–144 in Clark, J.D., and K.G. Smith, editors. Proceedings of the Tenth Eastern Workshop on Black Bear Research and Management.
LARSEN, D. N. 1990. Unpublished memo to David Johnson in ADF&G files, Oct. 16, 1990. 6 pp. MILLER, S. D. 1990. Population management of bears in North America. International
Conference on Bear Research and Management. 8:357–373. POELKER, R. J. AND H. D. HARTWELL. 1973. Black bear of Washington. Biol. Bull. No. 14.
Federal Aid Project W-71-R. Olympia, Washington. 180pp. SURING, L. H., E. J. DEGAYNER, R. W. FLYNN, T. MCCARTHY, M. L. ORME, R. E. WOOD, AND E.
L. YOUNG. 1988. Habitat capability model for black bear in southeast Alaska. USDA Forest Service, Tongass National Forest. 27pp.
TAYLOR, M. 1986. Risk analysis for black bear populations. Eastern Workshop Black Bear
Research and Management. 8:174–184. WOOD, R. E. 1990. Black bear survey-inventory progress report. Pages 1–6 in S. O. Morgan,
editor. Annual report of survey-inventory activities. Part IV. Black bear. Vol. XX. Alaska Department of Fish and Game Federal Aid in Wildlife Restoration Progress Report. Project. W-23-2, Study 17.0. Juneau. 117pp.
Prepared by: Submitted by: Boyd Porter Neil Barten Wildlife Biologist III Regional Management Coordinator Please cite information taken from this section, and reference as: PORTER B. 2008. Subunit 1A black bear management report. Pages 1–18 in P. Harper, editor. Black bear management report of survey and inventory activities 1 July 2004–30 June 2007. Alaska Department of Fish and Game. Project 17.0. Juneau, Alaska.

12
TABLE 1 Unit 1A black bear harvest, regulatory years 1997 through 2006 Reported
Regulatory Hunter kill Nonhunting killa Estimated kill Total estimated kill year M F Unk Total Baitedb M F Unk Total Unrep Illegal M (%) F (%) Unk Total
1997 Fall 1997 13 3 0 16 0 1 0 1 0 0 13 (76) 4 (24) 0 17 Spring 1998 52 5 0 57 0 0 0 0 0 0 52 (91) 5 (9) 0 57 Total 65 8 0 73 1 0 1 0 1 0 0 65 (88) 9 (12) 0 74 1998 Fall 1998 19 11 0 30 0 0 0 0 0 0 19 (63) 11 (37) 0 30 Spring 1999 48 5 1 54 2 2 0 4 0 0 50 (88 7 (12) 1 58 Total 67 16 1 84 1 2 2 0 4 0 0 69 (79) 18 (20) 1 88 1999 Fall 1999 15 21 0 36 4 0 0 4 0 0 19 (48) 21 (52) 0 40 Spring 2000 54 5 0 59 1 0 0 1 0 0 55 (92) 5 (8) 0 60 Total 69 26 0 95 2 5 0 0 5 0 0 74 (74) 26 (26) 0 100 2000 Fall 2000 18 11 0 29 2 1 0 3 0 0 20 (63) 12 (37) 0 32 Spring 2001 57 11 0 68 1 1 0 2 0 0 58 (83) 12 (17) 0 70 Total 75 22 0 97 2 3 2 0 5 0 0 78 (76) 24 (24) 0 102 2001 Fall 2001 13 14 0 27 0 5 1 0 6c 0 0 18 (55) 15 (47) 0 34 Spring 2002 50 5 0 55 0 0 0 0 0 0 0 50 (91) 5 (9) 0 55 Total 63 19 0 82 0 5 1 0 6d 0 0 68 (77) 20 (22) 0 88 2002 Fall 2002 14 13 0 27 0 1 0 0 1 0 0 15 (54) 13 (46) 0 28 Spring 2003 40 7 0 47 0 0 0 0 0 0 0 40 (85) 7 (15) 0 47 Total 54 20 0 74 0 1 0 0 1e 0 0 55 (73) 20 (27) 0 75 2003 Fall 2003 6 7 0 13 1 2 0 0 2 0 0 8 (53) 7 (47) 0 15 Spring 2004 34 8 0 42 1 1 0 0 1 0 0 35 (81) 8 (19) 0 43 Total 40 15 0 55 2 3 0 0 3f 0 0 43 (74) 15 (26) 0 58 2004 Fall 2004 13 8 0 21 0 1 0 0 1 0 0 14 (64) 8 (36) 0 22 Spring 2005 25 5 0 30 1 2 0 0 2 0 0 27 (84) 5 (16) 0 32 Total 38 13 0 51 1 3 0 0 3 0 0 41 (76) 13 (24) 0 54 2005 Fall 2005 13 13 0 26 2 2 0 0 2 0 0 15 (54) 13 (46) 0 28 Spring 2006 53 8 0 61 3 1 1 0 2 0 0 54 (89) 9 (11) 0 63 Total 66 21 0 87 3 3 1 0 4 0 0 69 (76) 22 (24) 0 91

13
TABLE 1 continued Reported
Regulatory Hunter kill Nonhunting killa Estimated kill Total estimated kill year M F Unk Total Baitedb M F Unk Total Unrep Illegal M (%) F (%) Unk Total
2006 Fall 2006 17 8 0 25 0 0 1 0 1 0 0 17 (65) 9 (45) 0 26 Spring 2007 71 7 0 78 2 0 1 0 1 0 0 71 (90) 8 (10) 0 79 Total 88 15 0 103 2 0 2 0 2 0 0 88 (84) 17 (16) 0 105 a Includes defense of life or property kills, research mortalities, and other known human-caused mortality. b Bears reported harvested over bait. c One female bear killed by vehicle d Includes 5 DLP and one killed by vehicle. e Includes 1 DLP. f Includes 3 DLP.

14
TABLE 2 Unit 1A successful black bear hunter residency, regulatory years 1997 through 2006 Regulatory
year Locala
resident
(%) Nonlocal resident
(%)
Nonresident
(%)
Unknown residencyb
(%)
Total
1997–1998 38 (51) 11 (15) 24 (32) 1 (2) 74 1998–1999 51 (58) 14 (16) 19 (22) 4 (4) 88 1999–2000 48 (48) 8 (8) 39 (30) 5 (5) 100 2000–2001 45 (44) 2 (2) 50 (49) 5 (5) 102 2001–2002 41 (49) 5 (6) 36 (43) 1 (1) 83 2002–2003 28 (38) 4 (5) 42 (57) 0 (0) 74 2003–2004 25 (45) 5 (9) 25 (46) 0 (0) 55 2004–2005 21 (41) 3 (5) 28 (55) 0 (0) 52 2005–2006 39 (45) 2 (2) 46 (53) 0 (0) 87 2006–2007 50 (49) 3 (3) 50 (48) 0 (0) 103
Average 38 (54) 6 (8) 25 (35) 2 (3) 71 a Local hunters are those hunters that reside in Unit 1A. b Includes DLP kills, research mortalities, and other known human-caused mortality.

15
TABLE 3 Unit 1A black bear harvest chronology by montha, regulatory years 1997 through 2006 Regulatory Month
year Sep (%) Oct (%) Nov (%) Apr (%) May (%) Jun (%) n 1997–1998 10b (14) 7 (9) 0 (0) 11 (15) 43 (58) 3 (4) 74 1998–1999 26 (30) 4 (4) 0 (0) 3 (3) 35b (40) 20c (23) 88 1999–2000 21 (21) 14b (14) 1 (1) 4 (4) 46 (46) 10b (10) 96 2000–2001 22 (22) 7 (7) 1b (1) 8b (8) 42 (43) 19 (19) 99 2001–2002 26 (29) 6 (7) 0 (0) 0 (0) 37 (42) 19 (21) 88 2002–2003 24 (32) 4 (5) 7 (0) 0 (0) 25 (33) 21 (28) 81 2003–2004 13 (24) 1 (1) 0 (0) 0 (0) 34 (61) 9 (16) 57 2004–2005 17 b (33) 4 (8) 0 (0) 1 (2) 24 (47) 5 (10) 51 2005–2006 23 (26) 3 (3) 0 (0) 2 (2) 39 (45) 21 (24) 88 2006–2007 22 b (22) 2 (2) 1 (1) 1 (1) 55 (53) 22 b (21) 103
Average 16 (22) 5 (7) 1 (1) 3 (4) 35 (51) 11 (15) 70 a Does not include bears killed during closed season b Includes 1 DLP c Includes 3 DLPs TABLE 4 Unit 1A black bear harvest percent by transport method, regulatory years 1997 through 2006
Transport Regulatory Highway
year Air (%) Boat (%) vehicle (%) Walk (%) Othera (%) Unkb (%) n 1997–1998 4 (6) 61 (82) 5 (7) 3 (4) 0 (0) 1 (1) 74 1998–1999 0 (0) 66 (75) 11 (12) 7 (8) 0 (0) 4 (5) 88 1999–2000 4 (4) 79 (79) 5 (5) 5 (5) 2 (2) 5 (5) 100 2000–2001 0 (0) 86 (84) 6 (6) 2 (2) 2 (2) 6 (6) 102 2001–2002 7 (8) 73 (82) 2 (2) 0 (0) 0 (0) 7 (8) 89 2002–2003 0 (0) 73 (97) 0 (0) 1 (1) 0 (0) 1 (1) 75 2003–2004 1 (1) 51 (88) 0 (0) 3 (5) 0 (0) 3 (6) 58 2004–2005 0 (0) 48 (95) 2 (4) 1 (1) 0 (0) 0 (0) 51 2005–2006 0 (0) 80 (94 5 (6) 0 (0) 0 (0) 0 (0) 5 2006–2007 0 (0) 88 (88) 12 (12) 0 (0) 0 (0) 0 (0) 100
Average 2 (2) 71 (85) 5 (6) 2 (2) 1 (1) 3 (4) 84 a Includes 3- or 4-wheelers or other ORV b Includes DLP and vehicle collisions
16
TABLE 5 Unit 1A successful black bear hunter effort, mean skull size, and mean age, regulatory years 1997 through 2006 Hunter effort Mean skull sizea (inches) Average age (years)
Regulatory Total Nr Mean days year days hunters per hunter Male nb Female nb Male n Female n
1997–1998 Fall 1997 47 17 2.8 17.2 12 15.6 4 Spring 1998 139 56 2.5 17.9 52 15.9 3 Total/ x 186 73 2.5 x =17.8 64 x =15.7 7 x =9.0 65 x =10.0 8 1998–1999 Fall 1998 62 30 2.1 17.1 19 16.3 11 Spring 1999 172 54 3.2 17.9 50 15.1 7 Total/ x 234 84 2.8 x =17.7 69 x =15.8 18 x =7.8 64 x =10.0 16 1999–2000 Fall 1999 71 37 1.9 17.5 15 16.0 21 Spring 2000 154 58 2.7 18.1 54 16.6 5 Total/ x 225 95 2.3 x =17.9 69 x =16.1 26 x =8.1 69 x =9.9 26 2000–2001 Fall 2000 64 29 2.2 17.7 18 15.8 11 Spring 2001 201 66 3.0 18.5 53 16.0 10 Total/ x 265 85 3.1 x =18.3 71 x =15.9 21 x =9.0 72 x =9.8 24 2001-2002 Fall 2001 57 25 2.3 18.9 9 16.1 11 10.0 9 11.9 12 Spring 2002 135 53 2.6 18.1 50 16.0 5 9.5 46 9.8 5 Total/ x 192 78 2.7 x =18.5 59 x =16.1 16 x =9.8 52 x =10.9 17 2002–2003 Fall 2002 74 26 2.9 17.7 13 16.3 13 9.7 12 10.1 11 Spring 2003 130 43 3.0 18.3 38 17.0 7 9.0 40 10.1 7 Total/ x 204 69 3.0 x =18.0 51 x =16.7 20 x =9.4 52 x =10.1 18 2003–2004 Fall 2003 32 14 2.3 18.4 6 16.2 8 9.8 6 5.1 8 Spring 2004 105 42 2.5 18.4 34 15.8 8 9.8 34 5.1 8 Total/ x 137 56 2.4 x =18.5 59 x =16.1 16 x =9.8 55 x =10.9 17

17
TABLE 5 continued Hunter effort Mean skull sizea (inches) Average age (years)
Regulatory Total Nr Mean days year days hunters per hunter Male nb Female nb Male n Female n
2004–2005 Fall 2004 61 22 2.8 18.4 14 15.6 8 8.5 11 5.1 7 Spring 2005 73 30 2.4 18.9 24 16.2 4 11.6 25 11.3 4 Total/ x 134 52 2.6 x =18.7 38 x =15.9 12 x =10.0 36 x =8.2 11
2005–2006 Fall 2005 45 28 1.6 17.4 13 15.7 13 7.5 13 7.9 13 Spring 2006 162 59 2.7 18.7 52 16.5 8 10.3 51 11.1 8 Total/ x 207 87 2.4 x =18.1 65 x =16.1 21 x =8.9 64 x =9.0 21
2006–2007 Fall 2006 50 25 2.0 16.9 17 15.9 9 7.2 17 11.3 7 Spring 2007 198 78 2.5 18.5 67 16.7 7 10.7 68 15.3 14 Total/ x 248 103 2.4 x =17.7 84 x =16.3 16 x =9.0 85 x =13.3 14 a Skull sizes equal length plus zygomatic width. b n represents sample size. Not all skulls sealed can be measured.

18
TABLE 6 Unit 1A black bear harvesta by Wildlife Analysis Area (WAA), regulatory years 1997–2006 WAA 1997 1998 1999 2000 2001 2002 2003 2004 2005 2006 0101 1 1 1 1 2 1 0303 1 2 2 0404 1 4 6 8 5 6 3 1 0405 2 4 1 1 9 18 10 0406 20 25 22 22 11 12 8 8 12 13 0407 5 13 15 12 13 15 7 6 0408 8 5 7 16 4 4 4 7 3 0509 3 1 4 4 1 1 4 4 7 3 0510 12 12 10 13 15 11 10 9 25 10 0511 1 1 1 4 1 0612 1 1 1 0613 1 3 3 2 2 1 1 2 0614 1 1 1 1 0715 2 3 3 1 1 2 5 0716 2 1 1 1 3 2 0717 1 2 2 0718 0719 1 2 2 1 1 1 0820 4 2 4 1 2 4 3 2 2 0822 12 2 18 14 19 13 2 7 13 20 0823 8 5 2 2 1 3 0824 1 4 3 3 1 2 1 6 0825 1 1 2 0826 2 1 1 1 1 1209 1 1210 1 1319 1 1526 1 a Includes DLP and road kills

19
WILDLIFE Alaska Department of Fish and GameDivision of Wildlife Conservation
MANAGEMENT REPORT (907) 465-4190 P.O. BOX 115526 JUNEAU, AK 99811-5526
BLACK BEAR MANAGEMENT REPORT
From: 1 July 2004 To: 30 June 2007
LOCATION
GAME MANAGEMENT UNIT: Unit 1B (3000 mi2) GEOGRAPHIC DESCRIPTION: Southeast Alaska mainland, Cape Fanshaw to Lemesurier Point.
BACKGROUND
HABITAT DESCRIPTION Most high quality black bear habitat in Unit 1B is confined to a relatively narrow band of forested landscape between saltwater and the coastal mountains. A large portion of the unit encompasses high elevation peaks and ice fields. The Alaska Department of Fish and Game (ADF&G) has estimated that of the 3000 square miles in Unit 1B, only about 850 square miles are forested habitat. A few large river valleys, such as the Farragut, Stikine, Bradfield, Harding, Eagle, and Thomas Bay drainages, support salmon and other anadromous fish. The Anan Creek drainage also supports large, accessible salmon runs and attracts many bears, as well as humans who view them. Portions of the unit have been logged and have clearcuts in various stages of seral habitats and some logging roads.
Small openings and disturbed areas, such as wetlands, avalanche chutes, clearcuts, and subalpine meadows, are important black bear foraging areas. Black bear diets may range from mostly vegetarian to mostly carnivorous, and the species may subsist by scavenging or by predation on large and small mammals or fish. In Unit 1B, black bears primarily eat vegetation during early spring. Major foods include grasses and sedges, Equisetum spp., and berries that have persisted through the winter. Later in spring, black bears may be efficient predators of moose calves and/or Sitka black-tailed deer fawns. During summer and fall, when bears accumulate fat reserves for winter hibernation, those bears with access to salmon streams eat large quantities of fish. Berries are also important during the summer and fall months. Poor fish runs or berry crops are thought to result in low cub production and survival the following spring. In most areas of the mainland, black bears share habitats with brown bears.
Over 16,000 acres of forested habitat in Unit 1B have been logged to date. As a result, timber harvest poses the most serious threat to black bear habitat in the unit over the long term. Black bears appear able to exploit increases in forage in early-successional plant communities immediately after logging and may temporarily benefit from clearcutting. However, this food source is lost approximately 20–25 years postlogging with canopy closure, and second-growth forests provide little habitat for bears. Precommercial thinning and pruning of second-growth
20
stands can extend the short-term benefits to bears, but the long-term effects of logging will be detrimental.
HUMAN USE HISTORY Black bears are indigenous to Unit 1B and have traditionally been hunted for food and trophies. Information about black bears in the unit is limited to sealing records, anecdotal public reports, and observations by our staff. Although we lack quantitative demographic information on black bears in the unit, we believe the population is stable.
Regulatory history Statewide sealing of black bears began in 1973. Hunters have not been required to obtain a hunt registration permit for black bear; thus, effort data for unsuccessful hunters have never been available. We have information on hunt effort only for successful hunters.
For most years since statehood the black bear hunting season extended from 1 September through 30 June with a resident bag limit of 2 bears annually, only 1 of which could be a blue or glacier bear. From 1980 through 1983 the season closed on 15 June, and the bag limit for residents and nonresidents was only 1 bear. In 1984, the limit increased to 2 bears. In 1990, the nonresident bag limit was reduced from 2 bears to 1 per year. In 1982 it became legal to use bait to hunt black bears year-round. In 1988 the Board of Game limited baiting in Southeast Alaska to the spring period 15 April–15 June. The use of dogs for hunting black bears has been allowed since 1966. Hunting with dogs requires a permit issued by ADF&G. No permit requests to hunt bears with dogs have been received for the unit. Since 1996, hunters have been required to salvage the edible meat of all black bears killed in Southeast Alaska during the period 1 January–31 May.
Historical harvest patterns Because of difficult access to most areas and a low human population, the annual harvest in the unit has remained low, averaging 8 bears per year from 1973 to 1979, 15 bears per year in the 1980s, and 17 bears per year in the 1990s. The 30 bears killed during the 2001–2002 regulatory year represent the highest recorded annual harvest. While there is no clear explanation for this harvest spike, there was a relatively high take by guided nonresident hunters (57%) and local resident hunters (16%) that year, but we do not know if total hunter effort was higher than normal. Approximately 70–100% of the annual harvest occurs during the spring season. Since 1973, males have outnumbered females in the harvest by about 7 to 1. Beginning in 1993, the nonresident harvest began to exceed the resident harvest, with nonresidents accounting for 69% of the harvest since 1995. Most nonresidents hunt with a guide in the unit. Nonresident hunters must purchase a tag to affix to each bear harvested. The cost of these tags ($225 for nonresidents and $300 for nonresident aliens) may limit the number of nonresident hunters who pursue black bears. Nonresidents willing to purchase a tag are more likely to hunt the adjacent Unit 3 islands, which are better known for producing trophy-sized bears.
Historical harvest locations
Between 1973 and 2003 black bear harvest was documented in 15 Wildlife Analysis Areas (WAAs) in Unit 1B. These include WAAs in the Cape Fanshaw, Farragut Bay, Thomas Bay, LeConte Bay, Stikine River, Eastern Passage, Bradfield Canal, Frosty Bay, and Cleveland

21
Peninsula areas. WAA 1603, the Dry Bay/Thomas Bay area, accounted for a disproportionately high percentage (20%) of the total harvest. Proximity to and accessibility from the communities of Petersburg and Wrangell probably influence harvest areas. Most harvest areas are associated with river drainages that support anadromous fish runs. Roads associated with logging at Thomas Bay and the Bradfield River valley provide easy access to hunters previously restricted to airplanes or boats.
Anan Creek management Anan Creek, on the upper Cleveland Peninsula, has long been a popular black bear viewing area. Since statehood, the Anan Creek drainage has been closed to black bear hunting. In October 1996, the Board of Game changed the boundaries of the Anan Creek Closed Area. Effective July 1, 1997, the Anan Creek drainage within 1 mile of Anan Creek downstream from the mouth of Anan Lake, including the area within a 1-mile radius from the mouth of Anan Creek Lagoon, was closed to taking black and brown bear. The rationale for this regulatory change was a desire to protect bears that had become vulnerable to harvest due to human habituation as a result of bear viewing at Anan Creek.
MANAGEMENT DIRECTION
MANAGEMENT OBJECTIVES • Maintain an average spring skull size and an average annual male skull size of at least
17.5 inches.
• Maintain a male to female ratio of 3:1 in the harvest.
We have been using skull size as a management objective since the late 1980s because we believe that year-to-year trends in average skull size may indicate changes in population size and composition and provide some measure of the sustainability of harvest levels. A decreasing average skull size may indicate a decline in that segment of the population composed of large, older bears and could indicate an overall population decline. However, an increasing average skull size could also indicate a reduction in the proportion of younger bears in the population. Probably the most appropriate use of skull size data at this time is as an indicator of some change in the population or in hunter effort. We do not have a technique to tell us precisely what such a change might indicate, but use it in conjunction with other data to make our best assessment of the current population.
Age, genetics, and environmental factors such as habitat and forage quality all combine to influence black bear skull size. Sealing records and anecdotal evidence indicate that mature mainland black bears generally have smaller skull sizes compared to those found on Southeast Alaska islands. The skull size management objective of 17.5 inches was established after analysis of previous years’ data showed this to be the long-term average. We wanted to maintain skull size in the harvest at the long-term high, and we have looked at any reduction in this mean as a possible indication of changes in the population’s age structure.

22
METHODS
Staff of the Alaska departments of Fish and Game and Public Safety and state-appointed sealing agents sealed hides and skulls of black bears. Hunters are required to submit bear skulls and hides for sealing within 30 days of the kill. Biological and hunt information collected included pelage color, sex, skull size (length and width), date and location of kill, number of days hunted, transportation method, guide use, and hunter use of commercial services. A premolar was collected from most bears and sent to Matson’s Laboratory (Milltown, Montana) for age determination. We also seal any bear that is killed under defense of life or property (DLP) provisions, as a road kill, an illegal kill, or during research efforts. During this report period, tissue samples were opportunistically collected from some bears harvested in the unit for DNA and stable isotope analysis. Comparison of current and historical data indicates harvest trends and may offer indirect evidence of population trends.
RESULTS AND DISCUSSION POPULATION STATUS AND TREND Population estimates are not currently available for black bears in this unit. Information obtained during sealing cannot be used to measure population trends. While harvest information gained from sealing records, such as average skull sizes, average ages, and sex ratios, may provide some indication of black bear population trends, in the absence of accompanying demographic data, correlations between these measures and harvest sustainability will continue to elude us. Research is needed to identify population parameters so we might better assess population trends and harvest sustainability.
Population Size No black bear population studies have been conducted in Unit 1B. Estimates of population size or density are difficult to obtain, as the species generally inhabits forested areas, and aerial surveys are impossible. The vast, remote areas in the unit also make studies difficult and expensive to undertake. Black bear density estimates for Unit 1B are based on studies in similar habitats in western Washington state in the 1960s. We believe minimum densities in mainland Southeast Alaska are slightly higher than the 1.4 bears per square mile found in the Washington study (Poelker and Hartwell 1973). Assuming a density of approximately 1.5 bears per square mile of forested habitat, ADF&G estimated 1230 black bears in Unit 1B in 1990. Densities of black bears are probably similar in Unit 1B to other Southeast Alaska mainland areas.
Black bears with cinnamon-colored pelage occur primarily in a few isolated pockets in Unit 1B. A relatively high proportion of bears taken by hunters from the Farragut Bay, Stikine River, and Eastern Passage areas have cinnamon pelage. Although there exist few unverified reports of glacier bear sightings in the unit, no glacier bears have been noted in the harvest. No Kermody bears (those with white pelage) have been reported in the unit.
Population Composition We lack quantitative information with which to estimate the sex and age composition of the Unit 1B black bear population. The male-to-female ratio in the harvest may provide a better indicator of harvest sustainability and population status than does average skull size. Considering their

23
high reproductive potential, survival of breeding females is critical to sustained yield management. Prolonged overharvest of females is likely to result in population declines. A decreasing trend in the male-to-female harvest ratio could signal a decline in that segment of the population composed of older, larger males. Region I staff established the 3:1 male-to-female guideline in the late 1980s, based on work done on black bears elsewhere. Distribution and Movements Black bears are thought to be evenly distributed throughout the forested habitats in Unit 1B. Unlike black bears on most Southeast Alaska islands, Unit 1B black bears share mainland habitat with brown bears. Quantitative information about home ranges and movement patterns of Unit 1B black bears is not available. The only quantitative information on black bear movement patterns in Southeast Alaska comes from a single denning study conducted on Mitkof Island in Unit 3 during 1980–1981 (Erickson et al. 1982). Black bear movement patterns are influenced to a large degree by seasonal changes and annual differences in the occurrence, abundance, and quality of preferred food items. Reproductive activities also influence bear movement patterns, particularly for males. As a result, males typically have larger home ranges than do females.
Black bears typically emerge from winter dens in March and April. Following emergence from dens, bears typically occupy low elevation habitats, where they feed on greening vegetation. As spring proceeds into summer, bears typically disperse throughout forested and alpine habitats, where they continue to feed on grasses, sedges, forbs, and berry-producing shrubs. In the late summer and early fall bears typically congregate near anadromous fish streams, where they feed on spawning salmon. As fish runs decline in the late summer and fall, bears disperse from salmon streams and feed primarily on berries and alpine vegetation before denning again in October and November.
MORTALITY Harvest Season Bag Limit 1 Sep–30 Jun Resident hunters: 2 bears, not more than 1 of
which may be a blue or glacier bear
1 Sep–30 Jun Bag Limit Nonresident hunters: 1 bear
Board of Game Action and Emergency Orders. No Board of Game actions took place, and no emergency orders were issued during this report period.
Hunter Harvest. The Unit 1B black bear harvest has remained relatively stable at low levels since about 1980. However, the level of harvest during the most recent 5-year period decreased 38% over the preceding 5-year period. The harvest decrease was primarily due to an unusually low harvest in 2003–04. The harvest of just 8 bears in 2005–06 represents the second lowest annual harvest in the unit since 1981. In the absence of a mandatory reporting requirement for unsuccessful black bear hunters we are currently unable to determine if the unusually low

24
harvests in 2003–2004 and 2005–2006 were simply the result of reduced hunter effort or success, or if other environmental factors were responsible.
Hunter harvest in Unit 1B ranged from 8 to 18 bears annually during this report period and during all 3 years was below the average harvest of 19 bears annually during the preceding 10 year period (Table 1).
Males made up 82%, 88%, and 100% of the kill in regulatory years 2004, 2005, and 2006, respectively. During this report period the average male skull size ranged from 18.4 to 18.5 inches, well above the management objective of 17.5 inches, during all 3 years (Table 2). The male-to-female harvest ratio during this report period was 11:1, well above the management goal of 3:1.
Hunter Residency and Success. Although the ratio varies annually, during this report period nonresident hunters took approximately 68% of the total annual harvest, local residents took about 30%, and nonlocal Alaska hunters took 3% of the bears harvested in the unit (Table 3). During the report period the number of bears harvested by nonresident hunters decreased, while the number taken by local residents increased slightly compared to the previous report period. It is therefore possible that reduced effort by both local residents, and guided and unguided nonresidents contributed to the low harvest in 2005–2006.
Harvest Chronology. Most black bears are taken in the spring, with 55–100% of bears killed in May this report period (Table 4).
Harvest in Particular Areas (WAAs). During this report period black bear harvest occurred in 12 WAAs in Unit 1B. These include WAAs in the Cape Fanshaw, Farragut Bay, Dry Bay, Thomas Bay, LeConte Bay, Stikine River, Eastern Passage, Bradfield Canal, and Cleveland Peninsula areas. WAAs in the Farragut Bay, Bradfield Canal, Dry Bay and Thomas Bay areas produce 59 percent of the unitwide harvest.
Bait Stations. No permits were applied for or issued for the operation of bait stations in the unit.
Hunting with Dogs. No permit requests have been made to hunt bears with dogs in the unit.
Guided Hunter Harvest. Over the last ten years, the percentage of the unitwide harvest taken by guided nonresidents has averaged 45%. During the most recent 5-year period, guided hunters accounted for 73% of the unitwide harvest, compared to 46% during the preceding 5-year period. During this report period a little more than half of the successful nonresident hunters used a guide (52%), while 23% used commercial services for transportation to and from the field.
Transport Methods. During the report period 100% of successful hunters reported using boats to access black bear hunting areas (Table 5). There are no communities in Unit 1B, and with the exception of Thomas Bay and Bradfield Canal, there are very few roads.
Other Mortality There were no reports of nonhunting mortality in Unit 1B during the report period (Table 1). No DLPs or illegal harvests were reported. Nonetheless, we continue to receive unconfirmed reports of bears being shot and left in the field by individuals believing that bears are detrimental to deer

25
and moose populations. While possibly significant, no information is currently available on the amount of wounding loss that occurs in the unit.
HABITAT Assessment Timber harvest continues to pose the most serious threat to black bear habitat in the unit. Postlogging increases in berry production, primarily Vaccinium sp., may contribute to short-term bear population growth. This forage source will be lost as the canopy closes, as will habitat diversity associated with old-growth forests, accompanied by a loss of denning trees. The long-term effects of logging will be detrimental to black bears. Roads associated with logging increase human access and can make bears increasingly vulnerable to harvest. Although no new logging activity occurred during this report period, several proposed timber sales are in planning stages. Two timber sale offerings, one at Crystal Creek near Thomas Bay and another at Bradfield Canal, were sold, but the purchasers later defaulted on the sales. The U.S. Forest Service is currently in the planning stages for future timber sales at Farragut Bay, Upper Muddy River, Madan Bay, Frosty Bay, and Emerald Bay. Enhancement No habitat enhancement projects specifically intended to benefit black bears have been attempted in the unit. Although primarily intended as a silvicultural practice, habitat manipulation in the form of precommercial thinning and pruning has been performed in some young second-growth stands in the Thomas Bay area. While not the primary intent, this effort does provide a secondary benefit to wildlife by improving and extending habitat suitability in the short-term, by reducing canopy cover, permitting sunlight to reach the forest floor, and increasing the production and availability of understory forage plants and berries. These benefits are relatively short-lived, approximately 20–25 years, after which time canopy closure again results in loss of understory vegetation. In the absence of additional thinning the long-term effects of clearcut logging will be detrimental to black bear populations.
NONREGULATORY MANAGEMENT PROBLEMS AND NEEDS Nuisance Bear Problems. There are no established communities on the Unit 1B mainland. We have, however, received occasional reports of bears breaking into cabins and campers in the Thomas Bay area.
CONCLUSIONS AND RECOMMENDATIONS
The Unit 1B black bear harvest has remained relatively stable at low levels. The harvest level during the most recent 5-year period decreased 38% from that of the preceding 5-year period. The harvest of 8 bears in 2005–06 represents the second lowest annual harvest since 1981. The reasons for the unusually low harvests in 2003–2004 and 2005–2006 remain unknown. There is currently no mandatory hunt reporting requirement for unsuccessful black bear hunters. In the absence of information from this group of hunters we are currently unable to evaluate whether the unusually low harvests those years were simply the result of reduced effort or low hunter success, or if they resulted from environmental factors such as atypical winter or spring weather

26
conditions. The black bear harvest in neighboring Unit 3 experienced a similar harvest decline in 2003–2004, implying that regional environmental factors may have contributed to the harvest reduction that year.
In order to ensure that black bears are managed on a sustained yield basis, research is needed to estimate the black bear population in the unit. Research is also needed to identify possible correlations between sealing data and population trends. A better understanding of the short- and long-term impacts of clearcut logging on black bear populations is also needed. The percentage of males in the harvest and average male skull size were well above the management objectives during this 3-year period and indicate that black bear populations are stable in Unit 1B. No management or regulatory changes are recommended at this time. Timber harvest continues to pose the most serious threat to black bear habitat in the unit. Roads associated with logging increase human access and can make bears increasingly vulnerable to harvest. The long-term effects of logging will be detrimental to black bears.
LITERATURE CITED
ERICKSON A.W., B.M. HANSON, J.J. BRUEGGEMAN. 1982. Black bear denning study, Mitkof Island, Alaska. University of Washington School of Fisheries. Seattle. 86pp.
POELKER R.J. AND H.D. HARTWELL. 1973. Black bear of Washington. Biol. Bull. No. 14. Federal Aid Project W-71-R. Olympia, Washington. 180pp.
PREPARED BY: SUBMITTED BY: Richard E. Lowell Neil Barten Wildlife Biologist III Regional Management Coordinator Please cite any information taken from this section, and reference as: LOWELL R.E. 2008. Unit 1B black bear management report. Pages 19–29 in P. Harper, editor. Black bear management report of survey and inventory activities 1 July 2004–30 June 2007. Alaska Department of Fish and Game. Project 17.0. Juneau, Alaska.

27
TABLE 1 Unit 1B black bear harvest, 1999–2006 Regulatory
year
Hunter kill
Nonhunting kill a
Total estimated kill M F (%) Unk. Total Over bait M F Unk. M (%) F (%) Unk. Total
Fall 99 4 0 0 0 4 NA 0 0 0 4 100 0 0 0 4 Spring 00 8 1 11 0 9 0 0 0 0 8 89 1 11 0 9
Total 12 1 8 0 13 0 0 0 0 12 92 1 8 0 13 Fall 00 4 1 20 0 5 NA 0 0 0 4 80 1 20 0 5
Spring 01 16 1 6 0 17 0 0 0 0 16 94 1 6 0 17 Total 20 2 10 0 22 0 0 0 0 20 91 2 9 0 22
Fall 01 5 2 29 0 7 NA 0 0 0 5 71 2 29 0 7 Spring 02 19 4 17 0 23 0 0 0 0 19 83 4 17 0 23
Total 24 6 20 0 30 0 0 0 0 24 80 6 20 0 30 Fall 02 2 1 33 0 3 NA 0 0 0 2 67 1 33 0 3
Spring 03 13 2 13 0 15 0 0 0 0 13 87 2 13 0 15 Total 15 3 17 0 18 0 0 0 0 15 83 3 17 0 18
Fall 03 1 0 0 0 1 NA 0 0 0 1 100 0 0 0 1 Spring 04 6 0 0 0 6 0 0 0 0 6 100 0 0 0 6
Total 7 0 0 0 7 0 0 0 0 7 100 0 0 0 7 Fall 04 1 1 50 0 2 NA 0 0 0 1 50 1 50 0 2
Spring 05 8 1 11 0 9 0 0 0 0 8 89 1 11 0 9 Total 9 2 18 0 11 0 0 0 0 9 82 2 18 0 11
Fall 05 0 0 0 0 0 NA 0 0 0 0 0 0 0 0 0 Spring 06 7 1 13 0 8 0 0 0 0 7 88 1 13 0 8
Total 7 1 13 0 8 0 0 0 0 7 88 1 13 0 8 Fall 06 1 0 0 0 1 NA 0 0 0 1 100 0 0 0 1
Spring 07 17 0 0 0 17 0 0 0 0 17 100 0 0 0 17 Total 18 0 0 0 18 0 0 0 0 18 100 0 0 0 18
a Includes DLP kills, research mortalities, and other known human-caused accidental mortality.

28
TABLE 2 Unit 1B black bear mean skull sizea, 1995–2006 Regulatory
year Males n Females n
1995–1996 18.1 28 17.2 1 1996–1997 18.6 19 18.7 1 1997–1998 17.4 9 16.0 1 1998–1999 17.7 23 N/A 0 1999–2000 18.7 12 N/A 0 2000–2001 18.5 19 15.7 2 2001–2002 18.1 24 16.2 6 2002–2003 18.4 15 16.1 3 2003–2004 18.1 7 N/A 0 2004–2005 18.4 9 16.3 2 2005–2006 18.5 7 17.4 1 2006–2007 18.5 18 NA 0
a Skull size = total length + zygomatic width in inches. TABLE 3 Unit 1B successful black bear hunter residency, 1995–2006 Regulatory Local Nonlocal Total
year resident a (%) resident (%) Nonresident (%) successful hunters1995–1996 8 28 1 3 20 69 29 1996–1997 7 32 0 0 15 68 22 1997–1998 3 27 1 9 7 64 11 1998–1999 8 33 1 4 15 62 24 1999–2000 2 15 1 8 10 77 13 2000–2001 7 32 1 4 14 64 22 2001–2002 4 16 1 1 25 83 30 2002–2003 4 22 0 0 14 78 18 2003–2004 3 43 1 14 3 43 7 2004–2005 5 45 0 0 6 55 11 2005–2006 1 13 0 0 7 88 8 2006–2007 5 28 1 6 12 67 18 a Local residents are those that reside in Petersburg, Wrangell, or Kake.

29
TABLE 4 Unit 1B black bear harvest chronology by percent, 1995–2006 Regulatory Month
year September October November April May June n 1995–1996 17 0 0 3 76 4 29 1996–1997 18 9 4 0 55 14 22 1997–1998 0 0 0 27 55 18 11 1998–1999 4 0 0 13 70 13 24 1999–2000 31 0 0 7 46 16 13 2000–2001 22 0 0 14 50 14 22 2001–2002 23 0 0 10 54 13 30 2002–2003 11 0 6 6 71 6 18 2003–2004 14 0 0 29 57 0 7 2004–2005 9 9 0 18 55 9 11 2005–2006 0 0 0 0 100 0 8 2006–2007 6 0 0 6 89 0 18 TABLE 5 Unit 1B black bear harvest in percent by transport method, 1995–2006 Regulatory
year Airplane Boat Highway
vehicle Foot Unknown n
1995–1996 7 93 0 0 0 29 1996–1997 14 82 0 4 0 22 1997–1998 0 100 0 0 0 11 1998–1999 0 100 0 0 0 24 1999–2000 0 100 0 0 0 13 2000–2001 0 100 0 0 0 22 2001–2002 0 100 0 0 0 30 2002–2003 0 100 0 0 0 18 2003–2004 0 86 0 14 0 7 2004–2005 0 100 0 0 0 11 2005–2006 0 100 0 0 0 8 2006–2007 0 100 0 0 0 18

30
WILDLIFE Alaska Department of Fish and GameDivision of Wildlife Conservation
MANAGEMENT REPORT (907) 465-4190 P.O. BOX 115526 JUNEAU, AK 99811-5526
BLACK BEAR MANAGEMENT REPORT
From: 1 July 2004 To: 30 June 2007
LOCATION GAME MANAGEMENT UNIT: 1C (7600 mi2)
GEOGRAPHICAL DESCRIPTION: The Southeast Alaska mainland and the islands of Lynn Canal and Stephens Passage lying between Cape Fanshaw and the latitude of Eldred Rock, including Sullivan Island and the drainages of Berners Bay
BACKGROUND
HABITAT DESCRIPTION Most high-quality Unit 1C black bear habitat is confined to a relatively narrow band of forest between saltwater and the coastal mountains. A large portion of the unit encompasses high elevation peaks and ice fields. A few large river valleys, such as the Taku, Speel, Endicott, Chuck, Port Houghton, and Berners Bay, have streams that support salmon and other anadromous fish. Portions of the unit have been logged and contain clearcuts that are in various seral stages. As elsewhere in Southeast Alaska, habitat changes continue to occur from clearcut logging. Although early successional stages (3–20 years postlogging) provide black bears with an abundance of forage, later stages result in the disappearance of understory plant species as conifer canopies close and light does not penetrate to the forest floor. Second-growth stands also lack large hollow trees and root masses that are used for dens. Therefore, although logging may result in an increase in black bear forage in the short term, the long-term result of logging will be a decline in bear numbers due to the disappearance of a productive understory (Suring et al. 1988). The Alaska Department of Fish and Game (ADF&G) has estimated approximately 1300 square miles of forested habitat in Unit 1C with approximately 38–50 mi2 having been logged by clearcutting. These logging operations occurred from the time of World War II in Excursion Inlet to 1999 near Echo Cove. Several proposed logging operations could take place over the next few years, including 2 at Pt. Couverden and Hobart Bay.
Unit 1C black bears primarily eat vegetation during early spring, although they likely prey on moose calves and Sitka black-tailed deer fawns where available. Important foraging areas are beach lines, estuaries, small forest openings, subalpine meadows, and disturbed areas such as wetlands, avalanche chutes, and clearcuts. Major vegetative foods include grasses and sedges, skunk cabbage, devil’s club, Equisetum, and berries that have persisted through the winter. During summer and fall bears accumulate fat for hibernation, and their diets may change from mostly vegetative to largely fish for individuals with access to salmon streams. Berries are also

31
important during summer and fall. Poor fish runs or berry crops are thought to result in low cub production and survival in the following spring because of low fat accumulation prior to den-up. Mainland black bears share ranges with brown bears, especially in major river valleys. Brown bears are rare to nonexistent on the Unit 1C islands and are seen only occasionally in the immediate Juneau area.
Bear habitat near Juneau is currently affected by one significant nonnatural factor, human garbage. Although bears are numerous locally due to productive natural habitat, the availability of garbage as an attractive alternative or additional food source promotes high bear densities. With restrictions against firearms discharge within the City and Borough of Juneau (CBJ), these urban areas provide a “refuge,” where bears are not subjected to hunter harvest. This absence of a harvest, along with the high human density in the area, ensures a high level of conflict with bears.
HUMAN USE HISTORY Black bears have been hunted for many years in Unit 1C, although harvest information was not collected until 1973, when sealing was first required. Since then, all successful hunters have been required to take hides and skulls to a sealing agent, allowing ADF&G to acquire information on harvested bears and hunter effort. Because permits or harvest tickets are not required for black bear hunting, we have no way of gathering effort data from unsuccessful hunters.
Regulatory history For most years since statehood the black bear hunting season has been from 1 September through 15 June or 30 June, and the bag limit for residents has been 1–3 bears annually, only 1 of which could be a blue or glacier bear. Since 1990, the bag limit has been 2 bears per year for residents (not more than 1 glacier bear) and 1 bear per year for nonresidents.
Historical harvest patterns The harvest percentage by residency status has not changed significantly during the past 30 years. Alaska resident hunters historically accounted for 60–70% of the annual harvest. Approximately half of nonresidents hunt without a guide in the unit. Nonresident hunters must purchase tags to affix to each bear harvested. The fact that black bear hunting opportunities exist in most other states, along with the cost of these tags ($225 for nonresident citizens and $300 for nonresident aliens), probably reduces the number of nonresidents who hunt black bears in Unit 1C.
The Unit 1C annual harvest has risen steadily over the past 30 years, with a mean of 47 in the 1970s, 73 in the 1980s, and 96 bears in the 1990s. Approximately 80% of the harvest has occurred in the spring season, with males outnumbering females in the harvest about 3 to 1. There are differences in the sex ratio of the harvest in spring vs. fall, with the fall harvest having a higher percent of female bears. This is probably due to females kicking out yearling cubs by the fall season, and thereby being single and legal for harvest. During this two-year period 34% (22) of the 64 bears hunters harvested in fall were female compared with only 7% (15) females among the 226 bears harvested in spring.

32
From 1990 through 1993, black bear movement, disease, and toxicology studies were conducted in the areas of 2 proposed gold mines. Through cooperative agreements between the mining companies and ADF&G, black bears were captured and radiocollared at each mine site, hair and blood samples were collected, and data on bear movements were recorded. The studies were designed to provide baseline data prior to the mines’ development. Since then, 1 of the 2 projects was abandoned, leaving the Kensington Mine north of Berners Bay as the sole prospect for large mine development in the near term. Due partly to the limited resources devoted to the studies, results were inconclusive. Findings suggested that bears in the study area have smaller home range sizes than reported elsewhere, and the sites are rich environments for bears, capable of supporting higher densities than other study sites (Robus and Carney 1995, Robus and Carney 1996). We believe roads, settlements, and development nodes associated with mine development have the potential for changes in disturbance levels, access, and availability of refuse which could adversely affect bears.
Historical harvest locations The black bear harvest in Unit 1C is fairly well distributed. The areas with the most harvest are the west side of Lynn Canal and the area south of the Taku River (Table 6). WAA 2304 is the St. James Bay area that attracts mostly local residents of Unit 1C. It contains several good anchorages for boaters, and the estuary provides bear hunters with ample opportunity to spot and stalk bears. WAAs 2305 and 2306 are at the southern end of the Chilkat Range and have been partially logged. The road system in this area provides opportunities for hunters to use ATVs to hunt bears. This is a very popular area for Hoonah residents because of its proximity to their community, and because it is the nearest area to Hoonah where black bears are present. WAAs 2823–2927 (Table 6) are located between Snettisham and Cape Fanshaw in the southern portion of the subunit. Nonresidents who are on combination hunts for brown and black bears harvest many of the bears taken in this area. A typical hunt begins in Unit 4 for brown bears, and then finishes in this area for black bears.
Urban bear management The tendency for black bears to take advantage of human food or garbage as alternative foods has been the greatest management problem regarding black bears within this unit. Bears that have become conditioned to human food are difficult to discourage, and it has often been necessary to move or destroy such animals. In 1986 the number of complaints involving nuisance bears received by the Juneau Police Department (JPD) and ADF&G far exceeded those of previous years. In an effort to reduce the bear population around Juneau, the Unit 1C bag limit, lowered to 1 bear per year from 1980 to 1986, was increased to 2 bears per year in 1987. In spite of the liberalized bag limit, 17 bears were killed in 1987 because of public safety concerns over aggressive behavior of garbage-conditioned bears. Despite enforcement and public education efforts, the number of bear–human conflicts and resulting complaints to ADF&G and public safety agencies required a significant and growing expenditure of effort and resources. A weak municipal ordinance requiring garbage cans to have tight-fitting lids was passed in 1987, but garbage conditioning and conflicts with residents continued. Studies to determine the usefulness of aversive conditioning to discourage bears were conducted in 1989 and 1990, but little success was seen with garbage-conditioned bears, and intensive and repeated treatment of bears was not practical (McCarthy and Seavoy 1992).

33
In 1991, 21 garbage-conditioned bears were killed. In subsequent years, bear kills related to garbage were low (4 during 1992–1994), due more to the high 1991 harvest than an active refuse management program. We speculate that the bear population grew, and in 1995 five bears were killed; that number doubled to 10 in 1996. In 1997, as expected, the kill declined to just 1 bear. It became increasingly apparent that killing or removing urban bears was nothing but a short-term fix to the so-called “bear problem” in Juneau.
During 1999 problems associated with urban bears accessing garbage brought the real problem (refuse management) to the forefront once again. During the fall mayoral election, the newly elected mayor promised to address the refuse/bear concern in Juneau and began by appointing an Ad Hoc Bear Committee. This committee consisted of representatives from ADF&G, CBJ, JPD, Arrow Refuse, and several private citizens. The charge of this committee was to identify problems and solutions related to refuse and bears. This eventually led to the passage of several key city ordinances that addressed the management and handling of refuse by residents within the city and borough of Juneau. Most notably were the requirements for people to keep their refuse in a bear resistant container, a prohibition on putting garbage cans out before 4 am on the morning of pickup, and the requirement that all dumpsters have a metal locking lid (CBJ 2004).
Along with the sporadic killing of urban bears, Douglas area staff also trapped and moved bears throughout the 1990s, in spite of the general ADF&G policy to not move bears (ADF&G 1990). In many cases a combination of public sentiment and staff incentive made moving bears a less onerous option than destroying them, especially after a single incident for an animal. In some cases bears were simply hauled to the end of the Juneau road system, while at other times they were transported to a more remote mainland location by boat. As one would expect, translocation of bears is not effective, as many problem animals returned to former urban neighborhoods and habits. In addition, moving bears is expensive in terms of transportation costs and staff time. Altogether, from 1986 through 1997 ADF&G staff captured and relocated 90 bears.
MANAGEMENT DIRECTION
MANAGEMENT OBJECTIVES • Maintain a mean annual male skull size (length plus width) of at least 17.5 inches.
• Maintain a 3:1 male to female ratio in the harvest.
It is difficult to obtain direct population information on black bears (such as aerial surveys for population size and composition), so we collect sealing data as an indirect method of monitoring the populations. Skull measurements and sex ratios are indices we have historically used in this effort. Hunters will generally select the largest bear they encounter on a hunt, and these large bears tend to be males. If the availability of larger male bears decreases, then hunters are likely to shoot smaller bears, male and female.
The 3:1 male to female objective in the harvest was arrived at by consensus among ADF&G biologists as a means to manage the harvest in a conservative manner. The reasoning is that there is a 50:50 sex ratio at birth, and ½ of the breeding-age sows are legal for harvest each year (sows with cubs are protected). Because of the relative low productivity of black bears, it is imperative to protect the female portion of the population as much as possible. By monitoring the female

34
portion of the harvest, we can also gain insight into the availability of male bears in the population.
The objective of maintaining a 17.5-inch mean male skull size is based on the long-term average for male bears harvested in Unit 1C. If skull size or age of harvested bears changes over time significantly, this could be an indication that the population parameters have changed. If the mean skull size declines, this may mean that availability of larger bears has declined as well.
As black bear managers, we use the above indices as trend indicators more than decision trigger points. We continually look for ways to interpret these data in a meaningful manner, and measures such as hunter effort and guided hunters vs. unguided hunters can affect the size and sex of bears harvested. Harvest data, collected during sealing, may or may not reflect any real changes in the population as a whole. Management biologists take these variables into consideration when interpreting the above indices, as well as changes to habitat, weather, and access patterns. We stress that skull size and age of harvested bears is at best a general, indirect measure of what is happening with a portion of the population. Whether these indices can measure real changes to populations and can be of management use has not yet been demonstrated.
There was much discussion about black bear management and management objectives in Region 1 during this report period, focusing on the value and rationale of using skull sizes and ages to measure population change. Characteristics of harvested bears are not representative of the population as a whole, but rather provide a measure of hunter selectivity. Thus, hunter demographics and selectivity may have more to do with changes in skull size and age than do changes in the population structure. Also, there could be several scenarios that lead to changes in these indices, and without population information we have no way of determining what is causing the change. If the average age of bears declines, this could be due to fewer older bears being available, or due to a productive bear population where younger bears are more prevalent and more likely to be taken. Based on Sterling Miller’s work (Miller and Miller 1990), skull size and age are not sensitive enough to show changes in a population until major changes have already taken place. Therefore, managers need to be careful when interpreting the meaning behind any such changes.
METHODS
Staff of the Departments of Fish and Game and Public Safety sealed black bear hides and skulls taken by successful hunters. Hunters were legally required to seal bears within 30 days of the date of kill. Biological and hunt information collected at the time of sealing included pelage color, sex, skull size (length and width), date and location of kill, number of days hunted, transportation method, and use of commercial services, including guides. All bears were checked for tattoos or ear tags, an indication that ADF&G personnel captured the bear previously. A premolar was collected from each bear and sent to Matson’s Laboratory in Montana for age determination.

35
RESULTS AND DISCUSSION
POPULATION STATUS AND TREND Population estimates are not available for Unit 1C black bears. Information obtained during sealing cannot be used to measure population trends. While harvest information gained from sealing records, such as skull size, age, and sex ratios, may provide some indication of population trends, correlations between these measures and harvest sustainability will continue to elude us in the absence of accompanying demographic data. Research is needed to identify population parameters so we might better assess population trends and harvest sustainability.
Population size There have been no black bear population studies in Unit 1C. Estimates of population size or density are difficult to obtain. The species generally inhabits forested areas, where aerial surveys are impractical. Vast remote areas in the unit also make studies difficult and expensive to undertake. Density estimates for Unit 1C are based on studies conducted in similar habitats in western Washington State in the 1960s (Poelker and Hartwell 1973). We believe minimum densities in mainland Southeast Alaska are slightly higher than the 1.4 bears per mi2 found in the Washington study area. Assuming a density of 1.5 bears per mi2 of forested habitat, ADF&G estimates 1950 black bears in Unit 1C. Black bear densities are probably similar in Unit 1C to other Southeast mainland areas, and we have assumed density to be consistent throughout the forested areas of the unit. Depending on the availability of human food to bears, mainly garbage, and the tolerance of the human population, bear density near communities may differ from elsewhere in the unit. For example, in comparing bear densities near Juneau with Gustavus, because of conditions noted above, the bear density near Juneau is probably higher than the extended natural habitat. In Gustavus, where there are no restrictions on firearms discharge and most bears that frequent residential areas are killed, there is undoubtedly a lower bear density near the community than away from it.
All black bears harvested in Unit 1C must be sealed, at which time data on skull size and age are collected as two of the main sets of biological data. These data are used by the department as 2 sets of indices of the status of the black bear populations. Our reasoning is that if the skull sizes and ages of harvested bears are relatively stable, then this may be a reflection of the population being stable as well. On the other hand, if these indices decline significantly, that would be an indication to the department that the population, and therefore availability of bears to hunters, had changed as well. There have been no significant changes in skull size and age data we have collected over the past 3 report periods, so based on these data, we don’t have reason to suspect that the population has changed significantly, at least on the Unit 1C level. The harvest during this report period has varied substantially between the first year and the next two. The low harvest in 2004 may have been due to weather factors during the spring of the year. Because most hunters take bears on the tide flats, the timing of green-up can have a major impact on hunter success.
The number of bears near the city of Juneau appears to be increasing, based on the number of nuisance bear calls to the JPD and ADF&G. This is likely the result of learned behavior in which bears are more persistent and visible, thus giving the impression of an increase in bear numbers.

36
If this is the case, it may result from female bears teaching their cubs to feed on refuse, resulting in a generational increase of nuisance bears.
Population composition Our management objective of a 3:1 male-to-female harvest ratio is aimed at assuring a minimal harvest of female bears. We lack reliable information on the composition of the bear population, but use the indirect index of the harvest sex ratio for insight into the availability of male bears in the population. On a very gross scale, if the harvest of females increases, we interpret that as meaning fewer large male bears are available to hunters.
Distribution and movements Bears are present throughout the mainland and on most islands in Unit 1C. The larger mainland river drainages harbor brown bears that likely displace black bears from some locations. The distances black bears move in and around the unit is generally unknown, except in the areas adjacent to 2 proposed mining sites (in the early 1990s), the Alaska Juneau Mine (AJ Mine) in the Sheep Creek valley just southeast of Juneau and the Kensington mine just north of Berners Bay. Home ranges for black bears were estimated at both of these sites using radiocollared animals (n=7 and n=12 respectively). Average home range sizes were 6 km2 and 8 km2, respectively, at the 2 sites (Robus and Carney 1995, Robus and Carney 1996). These compare similarly to home ranges of bears in Washington state (Poelker and Hartwell 1973), giving some credibility to our rationale of using black bear density data from the Washington state study for Southeast Alaska.
Unit 1C black bears exhibit a wide range of colors, including black, cinnamon, and blue (glacier) color. We have received one report of a white bear in the Petersen Creek drainage from ADF&G fisheries staff. Glacier bears are more likely to be found from the Taku River north, and reports of them seem to be increasing. In recent years at least 4 glacier bears were seen from Juneau north to Petersen Creek. A relatively high proportion of bears between the Taku River and Tracy Arm have an amber tint, and are often referred to as cinnamon bears by hunters. However, ADF&G records them as black during sealing.
MORTALITY Harvest Season Bag Limit
1 Sep–30 Jun Resident hunters: 2 bears, not more than 1 of which may be a blue or glacier bear
1 Sep–30 Jun Nonresident hunters: 1 bear
Game Board Action and Emergency Orders. No Board of Game actions were taken pertaining to this unit, nor were any emergency orders issued.
Hunter Harvest. Hunters reported killing 63, 111, and 116 bears in regulatory years 2004, 2005, and 2006, respectively (Table 1). The mean annual harvest of 97 bears is a 13% decrease over the mean harvest of 111 during the previous 3-year reporting period. Males composed 94, 86,

37
and 85% of the harvest, exceeding the management objective of 75%. Average skull size for male bears was 18.5 inches, during the first 2 years of the report period, and slightly lower at 17.9 inches during the final year. The mean age of male bears increased, going from a mean of 8.0 years of age during the previous report period to 9.7 years in 2004–2006 (Table 5). The majority of bears harvested had black pelage, although 1 glacier bear was killed by JPD in 2006 as a nuisance kill. Successful hunters spent an average of 3.1 days afield (Table 5), similar to the 3.2 days of effort expended per successful hunter during the previous reporting period.
Hunter Residency and Success. Nonlocal Alaskans took 8% of all black bears harvested during the reporting period, while local residents harvested 34%. Nonresident hunters took 58% of the harvest, ranging from 56% to 59%. This is a significant increase when compared to the previous 2 report periods, when the nonresident take ranged from 25% to 51%.
Harvest Chronology. During the reporting period, 78% of the bears taken were killed in the spring season, ranging from 75% in 2005 and 2006 to 86% in 2004 (Table 3). This compares to the previous 3-year mean of 87% of the harvest occurring in the spring.
Harvest in Particular Areas (WAAs). The harvest during this reporting period was again concentrated in the handful of WAAs that produced most of the bears in the preceding 2 reporting periods. These areas were again centered on the south end of the Chilkat Range and the area between Snettisham and Cape Fanshaw (Table 6).
Transport Methods. Boats continued to dominate means of transport to the field, used by 84% of successful hunters during the report period (Table 4). Other methods included foot, highway vehicles, airplanes, and off-road vehicles. The reason boat access is so prevalent is that, during the spring, black bears can be found on nearly any uninhabited beach as they forage for newly emergent sedges. By using a boat, hunters can cover a lot of area with relative ease and likely will have opportunity to pursue one or more bears.
Other Mortality. During this reporting period, ADF&G, JPD, and private citizens killed 5, 11, and 12 bears during 2004, 2005, and 2006 respectively. The bears were killed either in defense of life or property, or because they were garbage conditioned and considered to be a public safety concern.
HABITAT Assessment The most critical impacts to habitat in this unit have been associated with logging operations in Hobart Bay, Port Houghton, and Pt. Couverden. Clearcutting at Pt. Couverden began in 1975 and continued into the mid 1980s. There is currently a proposal to continue logging in this area. Hobart Bay and Port Houghton logging operations took place in the late 1980s, and there is additional logging proposed for Port Houghton. A 1999 clearcut of about 300–400 acres borders the north side of Cowee Creek near Echo Cove. There has also been some helicopter logging on the southwest side of Douglas Island near Pt. Hilda. Helicopter operations are much less destructive to forest habitat and will probably not have the long-term negative effect on bears that traditional clearcuts have. These areas could benefit bears in the short term, but older clearcuts will soon become less valuable to bears as second growth takes over.

38
A number of proposed developments in Unit 1C could have local impacts on bear populations. A proposed 400-acre golf course on north Douglas Island will likely lead to additional development by private homeowners as lands become available. This area is attractive to bears because of the salmon in Petersen Creek, as well as abundant skunk cabbage and blueberries in the area. Undoubtedly, this development will affect bears more from a human–bear interaction standpoint than from the footprint of the golf course itself. Another potential area of development is the mainland coast from Echo Cove to Cascade Point. Plans are in the making to build a road between these areas, along with additional development that includes a store, dock, and fuel storage. This could affect the bear population in that area due to increased highway traffic, increased access to the area by recreational users, and interactions between bears and refuse at the newly developed area.
Enhancement No habitat enhancement projects specifically intended to benefit black bears have been attempted in the unit. Although primarily intended as a silvicultural practice, precommercial thinning and pruning has been performed in some young second-growth stands in the unit. While not the primary intent, this effort does provide a secondary benefit to wildlife by improving and extending habitat suitability in the short-term by reducing canopy cover, which permits sunlight to reach the forest floor and increase the production of understory forage plants. These benefits are relatively short-lived, approximately 20–25 years, after which time canopy closure again results in loss of understory vegetation. The long-term effects of clearcut logging will be detrimental to black bear populations. Enhancement of habitat for black bears in Southeast Alaska is not worth considering because the highly productive state of the natural habitat provides for an abundant population of bears. The best way to provide good habitat for black bears is to limit development within productive natural habitat.
NONREGULATORY MANAGEMENT PROBLEMS/NEEDS Urban Bear Management Activities. During the report period staff continued a substantial effort to shift ADF&G involvement away from instant response to nuisance bear reports to advising callers on how to reduce the attraction for bears in the hopes that the animals would return to wild habitats. Only in the case of an intractable bear that repeatedly caused problems did we make an effort to trap and remove or relocate an animal.
We continued to work to provide the public with bear and refuse information through public service announcements via the daily newspaper, a weekly newspaper, radio, television, and signs on city buses. In addition, ADF&G staff took part in a local radio program each year to reinforce the message that bears are only a symptom of a refuse problem. Throughout the report period ADF&G staff presented information to local groups and interested parties such as the Rotary Club, the U.S. Forest Service and University of Alaska Southeast housing personnel about bears and refuse and the need for a comprehensive refuse plan led by CBJ.
CONCLUSIONS AND RECOMMENDATIONS
The Unit 1C bear harvest that had declined substantially during the last year of the previous report period was lower still during 2004. However the harvest rebounded somewhat during 2005 and 2006, reversing the downward trend. Hunters began voicing their concerns and

39
observations of seeing fewer bears, at least in the southern portion of Unit 1C. Whether this is a trend we are seeing will likely be evident in the next few years. The increase in harvest during the last 2 years of the report period over 2005 and 2006 was promising. Two of our indices of population health (skull size and age) were similar throughout the report period, as were days hunted per bear. These measurements were also similar to those of the means of the previous report period. The stable skull size and age structure of the harvest gives us some comfort as managers that the black bear population may not have changed significantly.
We should continue to monitor the bear harvest through sealing requirements, while gathering more specific information on kill locations. Eventually, we will need more detailed information on kill and effort location to anticipate areas of concern with black bear harvest. Work should continue toward a strategy for refuse management in the CBJ, and success in this issue should be made available to other ADF&G offices.
LITERATURE CITED
CITY AND BOROUGH OF JUNEAU. 2004. Ordinance No. 2004-11. Juneau, Alaska.
ALASKA Department OF FISH AND GAME. 1990. Policy for Managing Bear/Human Conflicts in Alaska. Juneau, Alaska.
MCCARTHY T.M. AND R.J. SEAVOY. 1992. Reducing non-sport losses attributable to food conditioning – human and bear behavior modification in an urban environment. Unpublished report. Alaska Department of Fish and Game, Division of Wildlife Conservation, Douglas, Alaska. 29pp.
MILLER S.D. AND S.M. MILLER. 1990. Interpretation of Bear Harvest Data. Final Report. Alaska Department of Fish and Game, Federal Aid in Wildlife Restoration Projects W-22-6 through W-23-3, Job 4.18. 90pp.
POELKER R.J. AND H.D. HARTWELL. 1973. Black bear of Washington. Biological Bulletin Nr 14. Federal Aid Project W-71-R. Olympia, Washington. 180pp.
ROBUS M.H. AND B.L. CARNEY. 1995. Effects of A-J mine development on black bears and mountain goats. Wildlife baseline studies and monitoring plan final report. Unpublished report. Alaska Department of Fish and Game, Division of Wildlife Conservation, Douglas, Alaska. 32 pp.
_______ AND ______. 1996. Effects of Kensington mine development on black bears and mountain goats. Wildlife baseline studies and monitoring plan 1996 final report. Unpublished report. Alaska Department. of Fish and Game, Division of Wildlife Conservation, Douglas, Alaska. 36 pp.
SURING L.H., E.J. DEGAYNER, R.W. FLYNN, T. MCCARTHY, M.L. ORME, R.E. WOOD, AND E.L. YOUNG. 1988. Habitat capability model for black bear in southeast Alaska. U.S. Forest Service, Tongass National Forest. 27pp.

40
PREPARED AND SUBMITTED BY:
Neil Barten___________________ Regional Management Coordinator Please cite any information taken from this section, and reference as: BARTEN N. 2008. Unit 1C black bear management report. Pages 30–47 in P. Harper, editor. Black bear management report of survey and inventory activities 1 July 2004–30 June 2007. Alaska Department of Fish and Game. 17.0. Juneau, Alaska.

41
TABLE 1 Unit 1C black bear harvest and other mortality, regulatory years 1997 through 2006
Reported Regulatory Hunter kill Nonhunting kill Total estimated kill
year M F Unk Total Baited M F Unk Total M (%) F (%) Unk Total
1997–1998 Fall 1997 8 0 0 8 NA 0 0 0 0 8 (100) 0 (0) 0 8 Spring 1998 67 12 0 79 NA 1 1 0 2 68 (84) 13 (16) 0 81 Total 75 12 0 87 NA 1 1 0 2 76 (85) 13 (15) 0 89 1998–1999 Fall 1998 9 1 0 10 NA 4 0 0 4 13 (93) 1 (7) 0 14 Spring 1999 136 5 1 142 NA 0 0 0 136 (96) 5 (4) 1 142
Total 145 6 1 152 NA 4 0 0 4 149 (96) 6 (4) 1 156 1999–2000 Fall 1999 22 4 0 26 NA 0 2 0 2 22 (79) 6 (21) 0 28 Spring 2000 94 16 0 110 NA 1 1 0 2 95 (85) 17 (15) 0 112
Total 116 20 0 136 NA 1 3 0 4 117 (84) 23 (16) 0 140 2000–2001 Fall 2000 8 8 0 16 NA 10 4 0 14 18 (60) 12 (40) 0 30 Spring 2001 112 24 2 138 NA 0 1 0 1 112 (82) 25 (18) 2 139
Total 120 32 2 154 NA 10 5 0 15 130 (78) 37 (22) 2 169 2001–2002 Fall 2001 18 12 0 30 NA 2 4 0 6 20 (56) 16 (44) 0 36 Spring 2002 96 16 0 112 NA 1 0 1 2 97 (85) 16 (14) 1 114
Total 114 28 0 142 NA 3 4 1 8 117 (78) 32 (22) 1 150 2002–2003
Fall 2002 30 8 0 38 NA 10 7 4 21 40 (73) 15 (27) 4 59 Spring 2003 64 17 0 81 NA 0 0 1 1 64 (79) 17 (21) 1 82
Total 94 25 0 119 NA 10 7 5 22 104 (76) 32 (24) 5 141

42
TABLE 1 continued Reported
Regulatory Hunter kill Nonhunting kill Total estimated kill year M F Unk Total Baited M F Unk Total M (%) F (%) Unk (%) Total
2003–2004
Fall 2003 7 6 0 13 NA 5 1 0 6 12 (63) 7 (37) 0 19 Spring 2004 51 8 0 59 NA 1 0 0 1 52 (87) 8 (13) 0 60
Total 58 14 0 72 NA 6 1 0 7 64 (81) 15 (19) 0 79 2004-2005 Fall 2004 7 2 0 9 NA 0 4 0 4 7 (54) 6 (46) 0 13 Spring 2005 52 2 0 54 NA 0 1 0 1 52 (95) 3 (5) 0 55 Total 59 4 0 63 NA 0 5 0 5 59 (87) 9 (13) 0 68 2005-2006 Fall 2005 16 11 0 27 NA 5 2 2 9 21 (62) 13 (38) 2 36 Spring 2006 79 5 0 84 NA 0 2 0 2 79 (92) 7 (8) 0 86 Total 95 16 0 111 NA 5 4 2 11 100 (83) 20 (17) 2 122 2006-2007 Fall 2006 19 9 0 28 NA 5 5 2 12 24 (63) 14 (37) 2 40 Spring 2007 80 8 0 88 NA 0 0 0 0 80 (91) 8 (9) 0 88 Total 99 17 0 116 NA 5 5 2 12 104 (83) 22 (17) 2 128

43
TABLE 2 Unit 1C black bear successful hunter residency, regulatory years 1997 through 2006 Regulatory
year Local
resident
(%) Nonlocal resident
(%)
Nonresident
(%)
Unknownresidency
(%)
Total
1997–1998 47 (55) 7 (8) 32 (37) 0 (0) 86 1998–1999 86 (57) 27 (18) 38 (25) 1 (0) 152 1999–2000 68 (50) 24 (18) 44 (32) 0 (0) 136 2000–2001 73 (47) 20 (13) 62 (40) 0 (0) 155 2001–2002 60 (42) 19 (13) 63 (45) 0 (0) 142 2002–2003 43 (36) 15 (13) 61 (51) 0 (0) 119 2003–2004 37 (52) 6 (8) 29 (40) 0 (0) 72 2004-2005 19 (30) 8 (13) 36 (57) 0 (0) 63 2005-2006 34 (31) 11 (10) 66 (59) 0 (0) 111 2006-2007 46 (40) 5 (4) 65 (56) 0 (0) 116
TABLE 3 Unit 1C black bear harvest chronology by month, regulatory years 1997 through 2006 Regulatory Harvest periods
year Sep (%) Oct (%) Nov (%) Apr (%) May (%) Jun (%) n 1997–1998 6 (7) 2 (2) 0 (0) 3 (3) 71 (80) 7 (8) 89 1998–1999 8 (5) 2 (1) 0 (0) 4 (3) 106 (70) 31 (21) 151 1999–2000 21 (15.5) 4 (3) 1 (.5) 3 (2) 89 (66) 18 (13) 136 2000–2001 14 (9) 2 (1) 1 (.5) 12 (8) 101 (66) 24 (15.5) 154 2001–2002 20 (14) 10 (7) 0 (0) 2 (1) 83 (59) 27 (19) 142 2002–2003 27 (23) 8 (7) 3 (3) 2 (2) 69 (58) 10 (8) 119 2003–2004 10 (14) 3 (4) 0 (0) 2 (3) 52 (72) 5 (7) 72 2004-2005 7 (11) 2 (3) 0 (0) 2 (3) 50 (80) 2 (3) 63 2005-2006 22 (20) 5 (4.5) 0 (0) 7 (6) 72 (65) 5 (4.5) 111 2006-2007 24 (21) 3 (2) 1 (1) 7 (6) 60 (52) 21 (18) 116

44
TABLE 4 Unit 1C black bear harvest percent by transport method, regulatory years 1997 through 2006 Transport
Highway
Regulatory year Air (%) Boat (%) vehicle (%) Walk (%) Other (%) Unk (%) n
1997–1998 5 (6) 71 (82) 6 (7) 4 (5) 0 (0) 0 (0) 86 1998–1999 2 (1) 125 (83) 16 (10.5) 7 (5) 1 (.5) 0 (0) 151 1999–2000 7 (5) 106 (78) 11 (8) 9 (7) 3 (2) 0 (0) 136 2000–2001 5 (3) 117 (76) 16 (10) 7 (5) 8 (5) 2 (1) 155 2001–2002 4 (3) 112 (79) 16 (11) 7 (5) 3 (2) 0 (0) 142 2002–2003 3 (3) 86 (72) 16 (13) 4 (3) 10 (8) 0 (0) 119 2003–2004 0 (0) 55 (76) 10 (14) 0 (0) 7 (10) 0 (0) 72 2004-2005 0 (0) 56 (89) 4 (6) 2 (3) 1 (2) 0 (0) 63 2005-2006 1 (1) 94 (85) 7 (6) 3 (3) 6 (5) 0 (0) 111 2006-2007 1 (1) 94 (81) 14 (12) 6 (5) 1 (1) 0 (0) 116

45
TABLE 5 Unit 1C successful black bear hunter effort, mean skull size, and mean age, regulatory years 1997 through 2006 Successful hunter effort Mean skull sizea (inches) Average age (years)
Regulatory Total Nr Mean days year days hunters per hunter Male nc Female n Male n Female n
1997–1998 Fall 1997 15 8 1.9 17.5 8 --- --- Spring 1998 228 79 2.9 17.7 64 15.7 12 Total 243 87 2.8 17.7 72 15.7 12 7.3 64 7.0 10 1998–1999 Fall 1998 21 10 2.1 18.2 8 17.4 1 4.5 9 19 1 Spring 1999 385 141 2.7 17.7 133 15.6 5 7.9 126 6.2 5 Total 406 151 2.7 17.7 141 15.9 6 7.7 135 8.3 6 1999–2000 Fall 1999 49 26 1.9 16.9 21 16.8 4 6.5 21 12.0 4 Spring 2000 292 110 2.7 18.0 90 15.3 16 7.9 84 6.2 15 Total 341 136 2.5 17.7 111 15.6 20 7.6 105 7.5 19 2000–2001 Fall 2000 36 15 2.4 17.9 8 16.3 9 6.3 8 10.0 9 Spring 2001 377 139 2.8 17.9 111 16.1 23 7.9 104 12.0 23 Total 413 154 2.7 17.9 119 16.2 32 7.6 112 11.5 32 2001–2002 Fall 2001 116 30 3.9 17.4 17 15.5 12 6.0 20 7.6 15 Spring 2002 345 112 3.1 17.8 94 16.1 15 8.4 93 9.8 16 Total 461 142 3.2 17.8 111 15.8 27 7.9 113 8.7 31 Table continued next page

46
TABLE 5 continued Successful hunter effort Mean skull sizea (inches) Average age (years)
Regulatory Total Nr Mean days year days hunters per hunter Male nc Female n Male n Female n
2002–2003 Fall 2002 91 38 2.4 17.1 28 16.0 8 7.8 36 7.3 9 Spring 2003 294 81 3.6 17.9 58 16.3 17 8.3 62 11.2 16 Total 385 119 3.2 17.6 86 16.2 25 8.1 98 9.8 25
2003–2004 Fall 2003 33 13 2.5 17.5 6 15.9 6 5.1 11 9.0 7 Spring 2004 187 59 3.2 17.8 50 15.9 8 8.7 52 8.3 8 Total 220 72 3.1 17.8 56 15.9 14 8.1 63 8.6 15
2004-2005 Fall 2004 13 9 1.4 18.4 6 16.2 2 8.8 6 9.0 2 Spring 2005 176 54 3.3 18.5 52 16.7 2 9.9 49 7.0 2 Total 189 63 3.0 18.5 58 16.5 4 9.8 55 8.0 4 2005-2006 Fall 2005 88 27 3.3 18.9 16 16.4 11 9.9 14 9.7 11 Spring 2006 261 84 3.1 18.5 79 16.4 5 10.1 75 8.0 5 Total 349 111 3.1 18.5 95 16.4 16 10.1 89 9.2 16 2006-2007 Fall 2006 59 28 2.1 16.3 19 16.1 8 5.5 19 11.8 8 Spring 2007 284 88 3.2 18.3 78 16.0 8 10.1 79 9.0 8 Total 343 116 3.0 17.9 97 16.0 16 9.2 98 10.4 16

47
TABLE 6 Unit 1C black bear mortality from all Wildlife Analysis Areas (WAA), regulatory years 1997 through 2006 Regulatory year
WAA 1997 1998 1999 2000 2001 2002 2003 2004 2005 2006 Total 2202 1 4 4 2 2 1 0 1 0 2 17 2203 4 0 3 0 3 2 1 1 2 1 17 2304 2 10 12 15 11 7 6 3 7 9 82 2305 4 14 7 8 5 8 6 1 3 9 65 2306 8 14 15 22 10 17 13 8 12 11 130 2307 1 5 7 8 5 14 3 0 4 7 54 2408 2 6 1 4 0 1 0 1 0 0 15 2409 2 4 1 3 1 3 1 0 0 1 16 2410 0 0 0 0 1 1 3 1 0 2 8 2411 0 1 1 0 1 1 0 0 1 0 5 2412 0 0 0 0 0 0 0 0 1 0 1 2413 0 0 0 0 0 0 0 0 0 0 0 2514 4 11 5 6 6 5 5 0 2 10 54 2515 4 10 7 7 11 10 6 5 9 5 74 2516 0 0 0 0 0 0 0 0 0 0 0 2517 2 6 5 14 7 12 5 3 6 11 71 2518 2 2 5 7 5 1 0 1 5 2 30 2519 2 1 1 2 1 2 2 0 2 2 15 2722 0 2 2 4 7 6 1 3 1 0 26 2823 13 32 25 17 20 12 11 8 12 11 161 2824 4 4 11 6 3 4 6 3 2 4 47 2825 10 7 6 19 14 9 5 7 6 6 89 2926 14 14 17 18 26 15 3 15 31 20 173 2927 9 10 5 8 10 10 2 7 16 15 92
Total
88
157
140
170
149
141
79
68
122
128
1242

48
WILDLIFE Alaska Department of Fish and GameDivision of Wildlife Conservation
MANAGEMENT REPORT (907) 465-4190 P.O. BOX 115526 JUNEAU, AK 99811-5526
BLACK BEAR MANAGEMENT REPORT
From: 1 July 2004 To: 30 June 2007
LOCATION GAME MANAGEMENT UNIT: 1D (2700 mi2) GEOGRAPHICAL DESCRIPTION: That portion of the Southeast Alaska lying north of the
latitude of Eldred Rock, excluding Sullivan Island and the drainages of Berners Bay.
BACKGROUND HABITAT DESCRIPTION Unit 1D contains approximately 210 mi2 of forested habitat. About 160 mi2 is owned by the state (Alaska Department of Natural Resources 1979), and the remainder is in federal ownership, including the Tongass National Forest (37 mi2) and Klondike Gold Rush National Historic Park (13 mi2). The Alaska Chilkat Bald Eagle Preserve consists of 75 mi2 along the Chilkat River. Many large river systems with abundant fish populations, notably salmon, are in the southern portion of Unit 1D. These include the Chilkat River and its major tributaries, the Klehini, Tsirku, Little Salmon, Kelsall, and Takhin Rivers. Two other rivers, the Chilkoot and Ferebee, also have important anadromous fish runs, as does the Katzehin River on the east side of Lynn Canal. In the Skagway area, the Taiya and Skagway Rivers also support anadromous fish runs.
Small openings and disturbed areas, such as wetlands, avalanche chutes, clearcuts, and subalpine meadows, are important foraging areas. In some areas during some seasons, black bear diets may range from mostly vegetarian to mostly carnivorous, and the species may subsist by scavenging or by predation on small mammals or fish. In Unit 1D, black bears primarily eat vegetation during early spring. Major foods include grasses, sedges and horsetail (Equisetum spp.) in estuarine areas, cow parsnip (Heracleum lanatum), skunk cabbage (Lysichiton americanum), and berries (Vaccinium spp. and Viburnum edule) that have persisted through the winter. Later in spring, Unit 1D black bears may also prey on moose calves. During summer and fall, when bears accumulate fat reserves for winter hibernation, bears with access to salmon streams eat large quantities of fish. Berries are also important during summer and fall. Poor fish runs or berry crops are thought to result in low cub production and survival the following spring. Unit 1D black bears share habitat with brown bears and, in some areas, such as the Chilkoot River valley, may have been displaced by them.
Large areas of the Klehini, Kelsall, and Chilkat River valleys are encompassed by the Haines State Forest, and portions of the forest have been subjected to clearcut logging in the past. More

49
areas will be cut in the future, as the forest is generally on a 125-year cutting rotation. Similar to elsewhere in Southeast Alaska, habitat changes continue to occur as a result of timber harvest. Although early succession stages (3–20 years) provide black bears with an abundance of plant foods, later stages result in the disappearance of understory as conifer canopies close and light cannot penetrate to the forest floor. Second-growth stands lack large hollow trees and root masses important for denning. An increase in the number of logging roads in Unit 1D has resulted in more human access to areas that formerly experienced lighter use. We believe that although logging may create food for bears in the short term, the long-term result will be a decline in bear numbers (Suring et al. 1988), at least partly due to increased access and decreased forage.
HUMAN USE HISTORY Black bears have a long history of being hunted in Unit 1D. Sealing of black bears was first required in 1973. Because hunters are not required to have hunting permits, information about unsuccessful hunter effort is not available. We have information only for successful hunts, gathered during sealing of black bear hides and skulls.
Regulatory history Since statehood, the black bear hunting season has extended from 1 September through 30 June, and the annual bag limit for residents has been 2 bears, only 1 of which can be a blue or glacier bear. Nonresident bag limits were the same as those for residents until 1990, when the nonresident limit was reduced to 1 bear per year. The use of dogs for hunting black bears has been allowed since 1966; hunting with dogs requires a permit issued by ADF&G. No permits to hunt with dogs have been issued in Unit 1D, nor has there been any interest expressed in this pursuit. Following a regulatory change in 1996, hunters must salvage the edible meat and the hide and skull of all black bears killed in Southeast Alaska during the period 1 January–31 May. In 1982 using bait to hunt black bears became legal year-round. However, in 1988 the Board of Game limited baiting in Southeast Alaska to the spring period 15 April–15 June.
Historical harvest patterns The Unit 1D average annual harvest has increased steadily over the last 3 decades. During the 1970s, average annual harvest was around 18 bears, in the 1980s it increased by nearly 50 percent to around 26 bears, and in the 1990s it continued to increase to an average of 33 bears per year. Within each decade, no other clear trends have been apparent, as harvest varies greatly from year to year. For the periods 1998–2001 and 2001–2003 the average numbers of bears harvested were 42 and 26 bears, respectively (Hessing 2005). The mean harvest for this reporting period (2004–2006) was 35 black bears. The information provided above illustrates the variability in the Unit 1D black bear harvest.
Local residents have typically accounted for about three-quarters of the annual harvest. However, this reporting period has shown an increase in successful nonresident hunters, especially in regulatory year (RY) 2005 (Table 2). This increase is possibly due to guided hunters participating in multispecies hunts. Many hunters use highway vehicles for transport, probably because of the abundance of logging roads in the most heavily hunted Wildlife Analysis Areas (WAAs) in the unit. During the last decade more than half of the successful black bear hunters used highway vehicles and approximately one-third used boats. During this

50
reporting period, an increasing number of bears were taken by hunters using boats (39%) as their primary transportation. The use of off-road vehicles increased form 8% to 18% of successful hunters. Only 9% of hunters reported "by foot" as their means of transportation; a decrease from 11% during the last reporting period (2001–2003). However, this may be misleading, as "transportation" can be interpreted in different ways.
Male bears constituted an overall average of 77% of the harvest during the 14-year period 1990–2003; the 2004–2006 male harvest was 81%. Overall, nonresident hunters killed 18% females in this period, versus 2% by local residents and 2% by nonlocal residents. The low percentage of female bears harvested by resident hunters reversed itself during 2004–2006; of the resident harvest, 85% were female bears.
A relatively high percentage of bears harvested in Unit 1D have been killed over bait in recent years. During 1992–1994, 19% of the harvest was killed over bait. That percentage increased to 39% during 1995–1997 (Barten 1999). During this report period, the percentage of black bears taken over bait was 38%, indicating that bear baiting remains a popular and successful method of taking Unit 1D black bears. During the 7-year period 1986–1992, an average of 64% of the harvest occurred in the spring. However, during 1993–1997 (5 years), spring harvest averaged 86% of the annual hunter kill. In the last reporting period, spring harvest decreased slightly to 79% (Hessing 2005). During this reporting period the spring havest increased to previous levels of approximately 88% of the overall black bear harvest. As reported here in 1999, a regulatory change restricting bait stations from within a 1-mile corridor of the main roads in the Haines area took effect beginning in spring 2003, but it does not appear to have impacted the long-term seasonal black bear harvest.
Historical harvest locations The majority of the Unit 1D black bear harvest has been confined to 2 WAAs, 4302 (along the Haines Highway and Chilkat and Klehini Rivers) and 4303 (the Kelsall River drainage) (Table 6). To a lesser extent, WAA 4405, which includes Taiya Inlet and the immediate area west of Skagway, is also used. Because 4302 and 4303 are relatively accessible by highway vehicles and boats, most hunters use these areas, as well as establish bait stations there in the spring.
MANAGEMENT DIRECTION MANAGEMENT OBJECTIVES
• Maintain a mean annual male skull size of at least 17.0 inches
• Maintain a 3:1 male to female ratio in the harvest
Because population information, either estimate or census, is costly and difficult to obtain, we collect data on other biological parameters, such as skull size and sex of harvested bears, as a means of monitoring the status of the population over time. Theoretically, a change in the sex ratio or in skull size over time might reflect a change in population structure that would need to be addressed through some regulatory change. In reality, changes in skull size or sex ratio are likely subtle and would need to be extreme in order for us to recognize the need for a regulatory change. However, we will continue to collect the information and to pursue other ways of

51
examining these data that will be more perceptive to change over time, and thus more useful for managers.
Using a 3:1 ratio of males to females is one way of managing relatively conservatively. Assuming a 1:1 male to female ratio at birth, half the animals in the population are females. Theoretically, the breeding interval is typically 2 years, so half the adult females are accompanied by young in a given year. It is illegal to shoot a female accompanied by young; thus, half the females are protected annually. However, breeding intervals may be longer than 2 years (Garshelis 1994), and we have no data on age at first reproduction, which might also result in a higher number of females in unprotected status each year.
The 17.0-inch skull size objective is based on long-term data from this unit. A significant change could reflect a change in age composition of this population, possibly signifying overharvest. However, population changes resulting in such a change would likely need to be extreme for such a change to be evident and not simply an artifact of small sample size.
METHODS Staff of the Alaska Departments of Fish and Game (ADF&G) and Public Safety sealed black bear hides and skulls taken by successful hunters. Biological and hunt information collected at the time of sealing included pelage color, sex, skull size (length and width), date and location of kill, number of days hunted, transportation method, and hunter use of commercial services. A premolar was collected from most bears and sent to Matson’s Laboratory for age determination. All black bear hunters using bait stations were required to register with ADF&G. Bait station registration has recently been changed to a statewide, computer-based system. Hunters desiring a bait station permit are registered in the statewide database at the time of permit issuance.
RESULTS AND DISCUSSION POPULATION STATUS AND TREND No black bear population studies have been conducted in Unit 1D. Estimates of population size or density are difficult to obtain. The species generally inhabits forested areas, where aerial surveys are impractical. Vast, remote areas in the unit also make studies difficult and expensive to undertake.
Population size Black bear densities are probably lower in Unit 1D than in any other Southeast Alaska mainland area. Brown bear numbers, on the other hand, appear to be high compared to black bears. ADF&G estimated 275 black bears in Unit 1D in 1990, an average of 1.3 bears per forested mi2. However, if we use estimates based on work by Linzey et al. (1986) that estimated an average of 3.8 black bears per mi2, there might be 1357 bears in forested habitat in the unit. Without having more direct estimates of black bear numbers, it is virtually impossible to have a sense of the population size in this unit. Numbers may be higher because of productive salmon streams in the area. Conversely, black bear populations may be affected by brown bears and perhaps suppressed by them. A relatively high proportion of black bears harvested in Unit 1D exhibit

52
cinnamon pelage. One glacier (blue) pelage bear has been reported in the harvest during this reporting period.
Population composition The majority of black bears sealed in Unit 1D during 2004–2006 exhibited the common black pelage color; approximately 27% of the black bears harvested in Unit 1D exhibit cinnamon pelage, although this designation is somewhat subjective and may depend on the experience of the sealing agent. In fall 2006 a guided nonresident hunter took the only sealed glacier bear in Unit 1D. Reports of a glacier bear cub were received in the summer of 2006. This bear appears to accompany a sow and black colored sibling near the city limits of Skagway, Alaska..
During this report period (2004–2006), 19% of the harvested bears were females, meeting our management objective of a 3:1 (75% to 25%) male to female bear harvest ratio.
Distribution and movement We have little information about black bear distribution in this unit. Human population growth is resulting in increasing interactions between bears and rural dwellers.
MORTALITY Harvest Season Bag Limit
1 Sep–30 Jun Resident hunters: 2 bears, not more than 1 of which may be a blue or glacier bear
1 Sep–30 Jun Nonresident hunters: 1 bear
Board of Game Action and Emergency Orders. No Board of Game action occurred during the report period. No Emergency Orders were issued for Unit 1D black bear seasons.
Hunter Harvest. Hunters reported killing 24, 43 and 35 black bears in 2004, 2005 and 2006, respectively. This was slightly higher than the previous 3 years’ harvest; 26 bears per year for the previous report period (Hessing 2005) versus 34 bears per year during this report period. regulatory year (RY)2005 represents the highest black bear harvest since 2000, and is the third highest harvest in the last 10 years (Table 1). The ratio of males to females (3:1) was within management objectives (Table 1) for 2004 & 2005, and only slightly below the objective in 2006 (2.9:1)
Hunter Residency and Success. Local resident hunters take the majority of black bears in Unit 1D (range 57%-76%), who primarily use bears for meat. There was a substantial increase in the percentage of bears taken by nonresidents; approximately 25% of bears were taken by nonresidents during the reporting period (Table 2). RY2005 represented a substantial increase in the total harvest of bears; the nonresident harvest in 2005 (15 bears) is the highest nonresident harvest in the previous 10 years.
Hunter Effort. Data indicate that 4.6 days per hunter were required to harvest a black bear during this reporting period (Table 5). This would suggest that more effort is now required, compared to

53
earlier periods, to harvest a black bear and that the trend is toward increasing effort required. Perhaps this reflects a decreasing availability of bears, but it would be premature to draw this conclusion from this data alone. To more accurately gauge the availability of black bear we would need to obtain effort data from unsuccessful hunters. We have no such data because unsuccessful hunters are not required to report.
Harvest Chronology. Spring months account for most Unit 1D harvest, with May and June accounting for 60% and 29% of the report period kill. September accounted for about 6% of the most recent 3-year harvest (Table 3). As noted above, most local bear hunters, who take up to 75% of the annual harvest, hunt for meat. Spring bears are preferred over fall bears because they are believed to be more palatable.
Harvest in Particular Areas (WAAs). Approximately 51% of the black bear harvest came from along the Haines Highway and the lower Chilkat River, WAA 4302 (Table 7). Another 32% came from the upper Chilkat, and about 12% originated from the Chilkoot and Ferebee watersheds. This reporting period’s harvest locations are consistent with long-term trends. Both the Haines Highway and Kelsall River Road provide extensive access to hunting locations and both have hunters with histories of hunting the same areas over the years.
Bait Stations. Data on percentages of bears taken over bait in earlier years is not readily available. The increasing popularity of black bear baiting in this unit prior to this reporting period raised several management concerns; the harvest of black bears over bait continued to increase to a total of 39 bears during this period (Table 1) up from 32 and 21 bears from the two previous reports, respectively (Hessing 2005). The increase in harvest over the past 2 report periods is largely the result of successful baiting operations and may reach a nonsustainable level if the trend continues. There is some concern from local Alaska Wildlife Troopers and other unit residents that the harvest of brown bears at or near black bear bait stations may be occurring. Furthermore, some residents are highly concerned that black and particularly brown bears may become food conditioned at bait stations, and thus, have a higher likelihood of becoming nuisance bears.
Hunting with Dogs. No permit requests have been made to hunt bears with dogs in the unit.
Guided Hunter Harvest. Nonresident hunters took 25% of black bears during the report period (Table 2), an increase of approximately 44% over the last report, and the largest increase in any of the 3 black bear hunter demographics (local resident, nonlocal resident, and nonresident). Nonresident hunters are not required to have a registered guide while hunting black bears in Alaska but many have chosen to pursue black bears in combined species hunts (i.e., brown bear, mountain goats). Also, black bears hunting locations are readily accessible due to the extensive road system in the unit, making it fairly easy to conduct hunts, without guides, for black bears.
Transport Methods. Most successful black bear hunters used boats (39%) or highway vehicles (31%) during the report period (Table 4).
Other Mortality During 2004–2006, 2 black bears were killed in Defense of Life and Property (DLP). The same numbers of bears were taken DLP in the last reporting period; 3 bears were killed in DLP during

54
1998–2000. Since 1990, a total of 12 DLP bears have been reported. Between 1971 and 1989, only 10 bears were taken under DLP regulations (Hessing 2005); this slight increase in the number of DLP harvests supports department statements concerning people moving into traditional black bear habitat. During the current reporting period, no bears were reported killed in vehicle collisions, and 1 bear was reported to be caught in a trap but was not confirmed.
HABITAT Assessment Urban sprawl is the single most important habitat consideration for Unit 1D black bears. Even in small communities, people move into traditional black bear habitat. This will displace bears and increase the number of human/bear conflicts. Logging and subsequent forest succession continue to have an effect on black bear habitat in Unit 1D, and it appears that in some areas isostatic rebound is raising riparian habitat and possibly decreasing available moose browse, which could result in a decreased prey base for black and brown bears. The extent to which these factors impact unit black bears is unknown.
Enhancement We performed no habitat enhancement work during this reporting period.
NONREGULATORY MANAGEMENT PROBLEMS/NEEDS
Nuisance Bear Problems/Urban Bear Management Activities. The Haines dump was closed in 1999 and collected garbage is now sorted for recycling, compost, and burial. Garbage disposal in Unit 1D has historically been problematic. Rather than pay the fees for refuse disposal, some residents have constructed garbage sheds on their property. They accumulate garbage over time, and then haul it to the baling facility. These stockpiles attract bears. Also, several landowners in Haines grow fruit trees, particularly apples and cherries. Fruit bearing trees and shrubs attract bears.
A toll-free number is now available to allow unit residents to make direct contact with the area Wildlife Conservation office in Douglas. The amount of information about black (and brown) bears that we dispense to the public has increased, and has elicited positive responses. Wildlife staff have suggested bear deterrent techniques and deterrent devices (Critter Gitter© & electric fences) have been fielded in Haines. Wildlife staff will continue to work with Unit 1D residents to alleviate bear/human conflicts.
CONCLUSIONS AND RECOMMENDATIONS During the report period, regulatory years 2004–2006, the black bear harvest was composed of 81% male and 19% female bears, meeting the management objective of a 3:1 male to female harvest ratio. The 3-year mean male skull size of 16.8 inches was slightly below the management objective of 17.0 inches. We will continue to evaluate this parameter to determine if the declining trend continues. The increase in harvest will be scrutinized for the next report in an attempt to determine if there is a specific mechanism providing for the additional harvest, or if the harvest is simply displaying its variable nature. As noted, regulatory year 2005 represents a substantial increase in harvest compared with the other 2 years of the reporting period,

55
increasing the mean report period harvest. While the number of bears taken over bait stabilized in this report period, these harvests need to be further examined for possible long-term effects. We continue to collect teeth for aging bears, and we will assess reproductive history of females using tooth analysis by Matson’s Laboratory (Milltown, MT). High brown bear numbers and habitat changes may cause a decline in black bear numbers and harvest in the future.
Black bear hunting is becoming more popular in Southeast Alaska, resulting in concerns of overharvest in a limited number of locations. We anticipate an increase in the total number of hunters in unit 1D and will monitor the overall harvest, considering management objectives and hunter demographics, to evaluate the need for regulatory action.
Several research projects are ongoing in Southeast Alaska using hair snare techniques to collect bear DNA. DNA can used to estimate bear populations and densities in the project areas. Consideration should be given to using these techniques to estimate black bear populations and densities in specific locations within Unit 1D.
Continued public education and outreach will be used to reduce the number of black bears taken DLP and to provide Unit 1D residents with nonlethal options to address black bear concerns.
LITERATURE CITED ALASKA DEPARTMENT OF NATURAL RESOURCES. 1979. Haines-Skagway area draft land use plan.
Vol. III. Alaska Department of Natural Resources, Anchorage, AK. 131 pp.
BARTEN N.L. 1999. Unit 1D black bear management report. Pages 26–31 in M. Hicks, editor. Federal Aid in Wildlife Restoration, Management Report of Survey-Inventory Activities, Grants W-24-4, W24-5, and W-27-1, Study 17.0, Juneau, 175 pp.
GARSHELIS D.L. 1994. Density-dependent population regulation of black bears. Pages 3–14 in M. Taylor, editor. Density-dependent population regulation in black, brown, and polar bears. International Conference on Bear Research and Management Monograph Series No. 3. 43 pp.
Hessing P. 2005. Unit 1D black bear management report. Pages 56-70 in C. Brown, editor. Black bear management report in survey and inventory 1 July 2001-30 June 2004. Alaska Department of Fish and Game. Project 17.0. Juneau, Alaska.
LINZEY F.G., K.R. BARBER, R.D. PETERS, AND E.C. MESLOW. 1986. Responses of a black bear population to a changing environment. International Conference on Bear Research and Management. 6:57–63.
SURING L.H., E.J. DEGAYNER, R.W. FLYNN, T. MCCARTHY, M.L. ORME, R.E. WOOD, AND E.L. YOUNG. 1988. Habitat capability model for black bear in southeast Alaska. USDA Forest Service, Tongass National Forest. 27pp.

56
PREPARED BY: SUBMITTED BY: Ryan Scott Neil Barten Wildlife Biologist II Regional Management Coordinator
Please cite any information taken from this section, and reference as:
SCOTT R. 2007. Unit 1D black bear management report. Pages 48–65 in P. Harper, editor. Black bear management report of survey and inventory activities 1 July 2004–30 June 2007. Alaska Department of Fish and Game. Project 17.0. Juneau, Alaska.

57
TABLE 1 Unit 1D black bear harvest, regulatory years 1997 through 2006 Regulatory Hunter kill Nonhunting killa Total reported kill
year M F Unk Total Baited M F Unk Total Illegal
kill M (%) F (%) Unk (%) Total 1997 Fall 1997 6 5 0 11 0 1 0 0 1 0 7 (58) 5 (42) 0 (0) 12 Spring 1998 23 6 1 30 18 0 0 0 0 0 23 (79) 6 (21) 1 (3) 30 Total 29 11 1 41 18 1 0 0 1 0 30 (73) 11 (27) 1 (2) 42 1998 Fall 1998 4 1 0 5 0 0 0 0 0 0 4 (80) 1 (20) 0 (0) 5 Spring 1999 23 8 0 31 12 0 0 0 0 0 23 (74) 8 (26) 0 (0) 31 Total 27 9 0 36 12 0 0 0 0 0 27 (75) 9 (25) 0 (0) 36 1999 Fall 1999 9 3 0 12 0 0 1 0 1 0 9 (69) 4 (31) 0 (0) 13 Spring 2000 26 6 0 32 2 0 0 0 0 0 26 (81) 6 (19) 0 (0) 32 Total 35 9 0 44 2 0 1 0 1 0 35 (78) 10 (22) 0 (0) 45 2000 Fall 2000 6 0 0 6 0 0 0 0 0 0 8 (100) 0 (0) 0 (0) 8 Spring 2001 30 9 0 39 18 0 0 0 0 0 30 (77) 9 (23) 0 (0) 39 Total 36 9 0 45 18 0 0 0 0 0 38 (81) 9 (19) 0 (0) 47 2001 Fall 2001 2 3 0 5 0 0 1 0 1 0 2 (33) 4 (67) 0 (0) 6 Spring 2002 26 5 0 31 10 0 2 0 2 0 26 (79) 7 (21) 0 (0) 33 Total 28 8 0 36 10 0 3 0 3 0 28 (72) 11 (28) 0 (0) 39 2002 Fall 2002 4 4 0 8 0 1 0 0 1 0 5 (56) 4 (44) 0 (0) 9 Spring 2003 9 4 0 13 5 1 0 0 1 0 10 (71) 4 (29) 0 (0) 14 Total 13 8 0 21 5 2 0 0 2 0 15 (65) 8 (35) 0 (0) 23 2003 Fall 2003 2 2 0 4 0 0 0 0 0 0 2 (50) 2 (50) 0 (0) 4 Spring 2004 14 2 0 16 6 0 0 0 0 0 14 (88) 2 (12) 0 (0) 16 Total 16 4 0 20 6 0 0 0 0 0 16 (80) 4 (20) 0 (0) 20 Table continues next page

58
TABLE 1 continued Regulatory Hunter kill Nonhunting killa Total reported kill
year M F Unk Total Baited M F Unk Total Illegal
kill M (%) F (%) Unk (%) Total 2004 Fall 2004 1 0 0 1 0 0 0 0 0 0 1 (100) 0 (0) 0 (0) 1 Spring 2005 20 3 0 23 11 1 0 0 1 0 21 (88) 3 (12) 0 (0) 24 Total 21 3 0 24 11 1 0 0 1 0 22 (88) 3 (12) 0 (0) 25 2005 Fall 2005 5 1 0 6 0 1 0 0 1 0 6 (86) 1 (14) 0 (0) 7 Spring 2006 30 7 0 37 17 0 0 0 0 0 30 (81) 7 (19) 0 (0) 37 Total 35 8 0 43 17 1 0 0 1 0 36 (82) 8 (18) 0 (0) 44 2006 Fall 2006 4 1 0 5 0 0 0 0 0 0 4 (80) 1 (20) 0 (0) 5 Spring 2007 22 8 0 30 11 0 0 0 0 0 22 (73) 8 (27) 0 (0) 30 Total 26 9 0 35 11 0 0 0 0 0 26 (74) 9 (26) 0 (0) 35
a Includes DLP kills, research mortalities, and other known human-caused mortality.

59
TABLE 2 Unit 1D black bear successful hunter residency, regulatory years 1997 through 2006 Regulatory
year Locala
resident
(%) Nonlocal resident
(%)
Nonresident
(%)
Unknownb
residency
(%)
Total 1997 31 (74) 3 (7) 7 (17) 1 (2) 42 1998 27 (75) 3 (8) 6 (17) 0 (0) 36 1999 32 (71) 9 (20) 3 (7) 1 (2) 45 2000 33 (70) 5 (11) 7 (15) 2 (4) 47 2001 27 (69) 1 (2) 8 (21) 3 (8) 39 2002 13 (57) 2 (8.5) 6 (26) 2 (8.5) 23 2003 15 (75) 1 (5) 4 (20) 0 (0) 20 2004 19 (76) 2 (8) 4 (16) 0 (0) 25 2005 25 (57) 4 (9) 15 (34) 0 (0) 44 2006 26 (74) 2 (6) 7 (20) 0 (0) 35
a Local hunters are those hunters that reside in Unit 1D. b Includes DLP kills, research mortalities, and other known human-caused mortality.
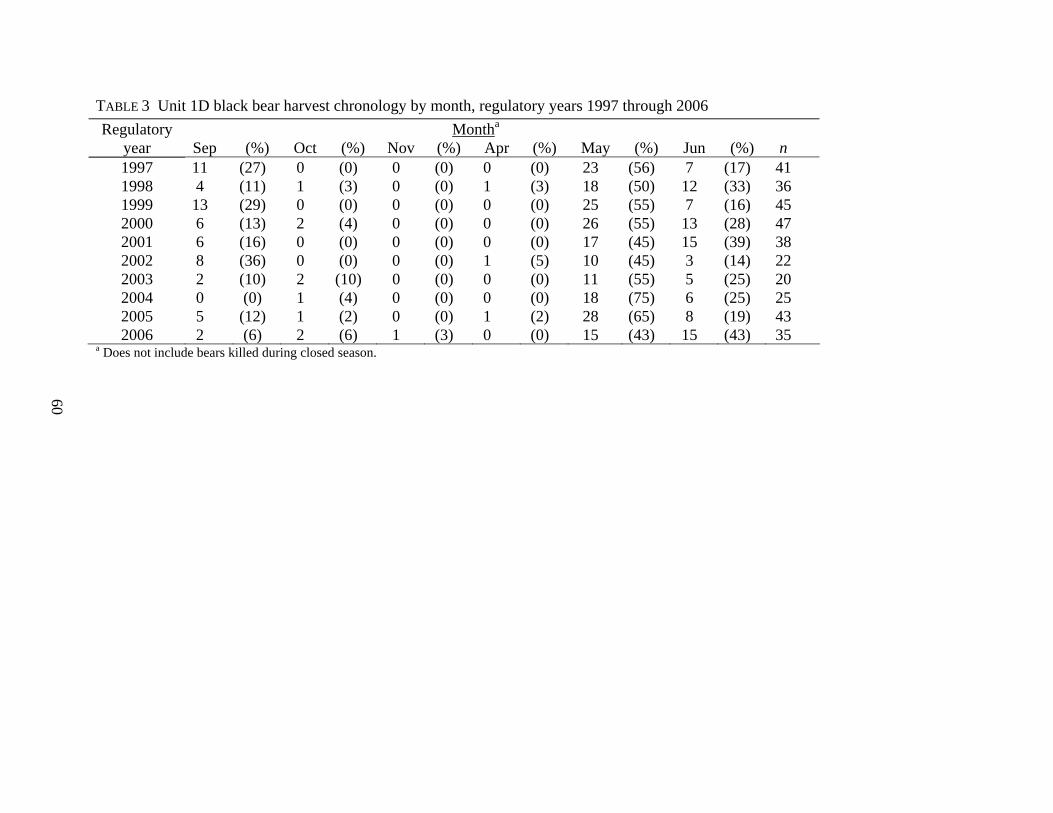
60
TABLE 3 Unit 1D black bear harvest chronology by month, regulatory years 1997 through 2006 Regulatory Montha
year Sep (%) Oct (%) Nov (%) Apr (%) May (%) Jun (%) n 1997 11 (27) 0 (0) 0 (0) 0 (0) 23 (56) 7 (17) 41 1998 4 (11) 1 (3) 0 (0) 1 (3) 18 (50) 12 (33) 36 1999 13 (29) 0 (0) 0 (0) 0 (0) 25 (55) 7 (16) 45 2000 6 (13) 2 (4) 0 (0) 0 (0) 26 (55) 13 (28) 47 2001 6 (16) 0 (0) 0 (0) 0 (0) 17 (45) 15 (39) 38 2002 8 (36) 0 (0) 0 (0) 1 (5) 10 (45) 3 (14) 22 2003 2 (10) 2 (10) 0 (0) 0 (0) 11 (55) 5 (25) 20 2004 0 (0) 1 (4) 0 (0) 0 (0) 18 (75) 6 (25) 25 2005 5 (12) 1 (2) 0 (0) 1 (2) 28 (65) 8 (19) 43 2006 2 (6) 2 (6) 1 (3) 0 (0) 15 (43) 15 (43) 35
a Does not include bears killed during closed season.

61
TABLE 4 Unit 1D black bear harvest percent by transport method, regulatory years 1997 through 2006 Transport
Regulatory Highway year vehicle (%) Boat (%) Walk (%) Plane (%) Othera (%) Unkb (%) n 1997 25 (59) 12 (29) 1 (2) 0 (0) 0 (0) 4 (9) 42 1998 18 (50) 11 (31) 5 (14) 0 (0) 2 (5) 0 (0) 36 1999 14 (31) 16 (35) 11 (24) 0 (0) 3 (7) 1 (2) 45 2000 20 (44) 14 (31) 10 (22) 1 (3) 0 (0) 0 (0) 45 2001 15 (38) 15 (38) 4 (10) 2 (5) 0 (0) 3 (8) 39 2002 11 (48) 7 (30) 1 (4) 0 (0) 2 (9) 2 (9) 23 2003 6 (30) 6 (30) 4 (20) 1 (5) 3 (15) 0 (0) 20 2004 11 (44) 10 (40) 1 (4) 0 (0) 2 (8) 1 (4) 25 2005 8 (19) 20 (46) 5 (12) 1 (2) 8 (19) 2 (2) 43 2006 11 (31) 11 (31) 4 (11) 0 (0) 9 (26) 0 (0) 35
a Includes 3- or 4-wheelers or other ORV. b Includes DLP, or other known human-caused mortality.

62
TABLE 5 Unit 1D black bear hunter effort, mean skull size, and mean age, regulatory years 1994 through 2006. Days hunted over 30 are excluded from table. Ages not available for all bears or years. Mean skull size not available for all bears.
Hunter effort Mean skull sizea (inches) Average age (years)b Regulatory Total Nr Mean days
year days hunters per hunter Male nc Female n Male n Female n 1997 Fall 1997 20 11 1.8 14.8 6 16.5 5 Spring 1998 171 29 5.9 16.9 23 16.1 6 Total 191 40 4.8 16.5 29 16.3 11 6.2 24 6.3 8 1998 Fall 1998 10 5 2.0 16.7 4 16.0 1 Spring 1999 187 31 6.0 16.6 22 14.8 8 Total 197 36 5.5 16.6 27 14.9 9 5.5 28 10.0 7 1999 Fall 1999 28 12 2.3 16.7 9 16.2 3 Spring 2000 83 32 2.6 17.1 26 15.5 6 Total 111 44 2.5 17.0 35 15.7 9 6.8 22 9.7 6 2000 Fall 2000 8 6 1.3 16.2 6 Spring 2001 236 39 6.1 17.3 30 15.5 9 Total 244 45 5.4 17.1 36 15.5 9 7.0 37 9.6 9 2001 Fall 2001 14 5 2.8 16.5 2 14.8 3 Spring 2002 135 31 4.4 17.1 25 15.1 5 Total 149 36 4.1 17.1 27 15.0 8 7.9 28 6.5 10 Table continues next page

63
TABLE 5 (continued) Hunter effort Mean skull sizea (inches) Average age (years)b
Regulatory Total Nr Mean days year days hunters per hunter Male nc Female n Male n Female n
2002 Fall 2002 12 7 1.7 17.3 4 15.5 4 Spring 2003 79 12 6.6 17.9 9 15.7 4 Total 91 19 4.8 17.7 13 15.6 8 8.8 14 11.4 7 2003 Fall 2003 6 4 1.5 15.8 2 15.5 2 Spring 2004 58 14 4.1 17.8 15 15.8 2 Total 64 18 3.6 17.6 17 15.6 4 8.8 16 10.3 4 2004 Fall 2004 1 1 1 16.3 1 0.0 0 Spring 2005 110 23 4.8 17.7 21 16.3 3 Total 111 24 4.6 16.0 21 16.3 3 12.7 21 9.4 3 2005 Fall 2005 22 6 3.7 17.4 6 16.1 1 Spring 2006 170 37 4.6 17.6 30 15.7 7 Total 192 43 4.5 17.5 36 15.8 8 9.2 35 9.5 8 2006 Fall 2006 11 5 2.2 16.4 4 15.1 1 Spring 2007 160 30 5.3 17.3 22 15.5 8 Total 171 35 4.9 16.5 26 15.5 9 8.3 26 5.6 9
a Skull sizes equal length plus zygomatic width. b Ages not available for all bears. c n represents sample size..

64
TABLE 6 3-Year mean hunter effort, bear skull size and age comparison
Hunter effort Mean skull sizea (inches) Average age (years)b Regulatory Total Nr Mean days
year days hunters per hunter Male nc Female n Male n Female n 1998-2000 Total 355 125 2.8 16.9 99 15.4 27 6.9 82 8.7 23 2001-2003 Total 274 73 3.8 17.4 58 15.3 20 8.4 57 9.1 21 2004-2006 Total 474 102 4.6 16.8 81 15.7 20 8.9 82 8.2 20
a Skull sizes equal length plus zygomatic width. b Ages not available for all bears. c n represents sample size.

65
TABLE 7 Unit 1D black bear mortalitya by Wildlife Analysis Areas (WAA), regulatory years 1997 through 2006 WAA
Regulatory years 4302 4303 4304 4405 4406 4407 4408 Total 1997 19 16 0 4 0 1 1 41 1998 23 7 0 5 0 1 0 36 1999 28 5 1 3 1 2 5 47 2000 24 8 1 7 7 0 0 47 2001 21 10 1 5 0 0 2 39 2002 10 8 0 2 0 2 1 23 2003 7 12 0 0 0 1 0 20 2004 13 8 0 4 0 0 0 25 2005 25 13 2 1 1 1 1 44 2006 15 12 1 7 0 0 0 35
a Includes DLP kills, research mortalities, and other known human-caused mortality.

66
WILDLIFE Alaska Department of Fish and GameDivision of Wildlife Conservation
MANAGEMENT REPORT (907) 465-4190 P.O. BOX 115526 JUNEAU, AK 99811-5526
BLACK BEAR MANAGEMENT REPORT
From: 1 July 2004 To: 30 June 2007
LOCATION GAME MANAGEMENT UNIT: 2 (3600 mi2)
GEOGRAPHICAL DESCRIPTION: Prince of Wales Island and adjacent islands south of Sumner Strait and west of Kashevarof Passage.
BACKGROUND HABITAT DESCRIPTION Prince of Wales (POW) and adjacent islands have some of the best black bear habitat in Southeast Alaska. Unit 2 has abundant productive salmon streams, many large estuaries, and subalpine and alpine areas at lower, more hospitable elevations compared to mainland locations, thus supporting a large number of bears. The larger average skull sizes of Unit 2 bears compared to other Southeast Alaska bears also suggest that Unit 2 bears have access to extremely productive, healthy habitats.
Small openings and disturbed areas, such as wetlands, avalanche chutes, clearcuts, and subalpine meadows are important areas for foraging. Black bear diets range from mostly vegetarian to mostly carnivorous, and the species may subsist by scavenging or by predation on a variety of mammals or fish. Unit 2 black bears primarily eat vegetation during early spring. Major foods include grasses and sedges, Equisetum spp., skunk cabbage (Lysichiton americanum), and berries (Vaccinium and Rubus sp.). Later in spring, bears are efficient predators of Sitka black-tailed deer fawns during a short vulnerable period in May. During summer and fall, bears accumulate fat reserves necessary for winter hibernation. Bears with access to salmon streams consume large quantities of fish, and poor fish runs (or reduced berry crops) can result in low cub production and survival (Jonkel and Cowan 1971). If food supplies have been poor during the previous summer and the female has not accumulated adequate energy reserves, the fertilized egg may not implant and consequently will not produce cubs. Poor food availability may also cause losses after implantation or may result in the death of cubs that are born weak. In most years, cub survival is around 20% but may be as high as 50% during good food years. The most critical period is when a bear becomes independent at 16–17 months old (Jonkel and Cowan 1971). The age when females first produce cubs is also related to available food supply and ranges from 3 to 7 years of age, depending on their nutritional plane, a measure of habitat quality (Kolenosky and Strathearn 1987).

67
Though there are abundant healthy and productive habitats, it is also true that more clearcut logging has occurred in Unit 2 than in other Southeast Alaska (Southeast) black bear habitats. Counting national forest and private lands, the Alaska Department of Fish and Game (ADF&G) estimates about 470 mi2 of forested black bear habitat has been cut during the past 50 years, including over 40% of the old-growth forest once found in Unit 2. Logging-associated road building in Unit 2 has created the highest density of roads in Southeast, with more than 2500 miles of drivable roads on national forest land and additional large tracts of road on private Native corporation lands. Only a few roads have been closed after logging operations finished, as required by the 1997 Tongass Land Management Plan (TLMP, USFS 1997). As a result of more than 40 years of large scale clearcut logging, habitat changes continue to evolve. Although early seral stages (3–20 years postlogging) provide black bears with abundant plant foods, later stages result in the disappearance of understory as conifer canopies close and light does not penetrate to the forest floor. Second-growth stands also lack large hollow trees and root masses important for denning. We believe that, although logging may create food for bears in the short term, the long-term result will be a decline in bear numbers in Unit 2 (Suring et al. 1988).
The faunal history of Southeast Alaska is far more complex than previously thought. Recent discoveries in several limestone caves in Unit 2 show that prehistorically black bears (Ursus americanus) shared this range with brown bears (Ursus arctos). Brown bears are no longer present on POW or the surrounding archipelago. Radiocarbon dating methods on fossils found in the caves suggest both species of bears were present during the last glacial maximum, dating back to 35,000–45,000 years ago, and the range overlap existed during the Pleistocene until at least 7200 B.P. What finally drove U. arctos to extinction on the southern islands is unclear, but a likely factor is the dense forest habitat that developed during the Holocene, covering all but the highest mountain peaks (Banfield 1974; MacDonald and Cook 1996, 1999). Stable isotope analysis on both modern and fossil U. americanus from POW using δ13C values suggest this species has an almost exclusive terrestrial diet in spite of the fact that these bears are often seen catching salmon (Heaton 1995). Along with U. arctos, several other extirpated species have been identified from fossils found in the caves. They include red fox (Vulpes vulpes), arctic fox (Alopex logopus), wolverine (Gulo gulo), and barren ground caribou (Rangifer tarandus).
HUMAN USE HISTORY Black bears are indigenous to Unit 2 and have traditionally been hunted for food and trophies. Information about black bear abundance and distribution in the unit is limited to sealing records, anecdotal public reports, and observations by our staff.
Regulatory history. Statewide sealing of black bears began in 1973. Hunters have not been required to obtain a hunt registration permit for black bears; thus, effort data for unsuccessful hunters has never been available. Currently, we only have information on hunt effort for successful hunters from sealing data. Seasons and bag limits. Since statehood, the bear hunting season has extended from 1 September through 30 June, and the annual bag limit for residents has been 2 bears, only 1 of which can be a blue bear. Nonresident and resident bag limits were the same until 1990, when the nonresident limit was reduced to 1 bear per year. In 1982 it became legal to bait black bears year-round. However, in 1988, the Board of Game limited baiting in Southeast Alaska to the 15 April–15

68
June period. This was the same year that ADF&G records began to accurately document the number of bait permits issued. Beginning Fall 1996, hunters were required to salvage the edible meat of all spring black bears killed in Southeast Alaska during 1 January–31 May. The salvage rule continues to be a contentious issue with many big game guides and hunters.
Hunting with dogs. POW is the only place in Southeast Alaska with a history of hunting bears with dogs, and unlike other areas of the state, such hunters are primarily nonresidents. Many other states have eliminated the use of dogs for bear hunting, but the practice has been allowed since 1966 in Alaska. In the early 1990s, numerous complaints about this practice on POW prompted ADF&G to develop a policy for hunting bears with dogs in the region. That policy, adopted in 1992, restricts hunting bears with dogs to the fall, September–December, because deer fawns, bear cubs, and other young wildlife are most vulnerable to disruption during the spring. Currently, a maximum of 5 permits are issued in Unit 2 during any year, to keep this hunt within manageable limits and to minimize disruption to wildlife and other user groups. Prior to 1998, the annual 5-permit limit had never been reached. In 1994 the Board of Game adopted additional permit conditions into regulation, and Region I added additional conditions requiring a report of the number of bears treed and harvested and proof of health certificates for all dogs used. Many of the same hunters consistently apply for the permits each year. Approximately 2–4 bears are harvested with dogs each year, a small portion of the overall bear harvest. In contrast, outside of Alaska, dog-related hunting harvests have been increasing and have accounted for up to 15% of the annual take in other states. For example, hound hunters may take up to 50% of the bear harvest in a state that does not allow baiting or hunting during the deer season. In a state that allows baiting, hound hunters may be taking 20 percent or less of the harvest. However, in cases where an alternative hunting method is available that the general public can use effectively, the percentage of bears taken with hounds is usually low. This is true for Southeast Alaska. Most hunters find spot-and-stalk methods very effective, and they consequently rely less on other methods.
Historical harvest patterns After averaging 123 bears per year during 1980–1988 and 221 bears annually from 1989 to 1995, the Unit 2 black bear harvest increased to a yearly average of 353 bears during 1994–2002. Males have accounted for about 72% of the harvest during the past 13 years, exceeding our management objective. On average about 65–75% of the harvest occurs during the spring season. Black bear harvest by nonresidents in Unit 2 has steadily increased over the past decade and recently reached 89% during 2006. During the past 10-year period, Alaska residents living in Unit 2 accounted for 8% and nonlocal residents another 11% of the harvest (Table 2). Most nonresidents do not use a registered guide when black bear hunting in this unit, but guided hunts are increasing. Nonresident hunters must purchase a locking tag to affix to each bear harvested. Neither the cost of these tags ($250–$300) nor the cost of travel to the area appears to limit the number of nonresident hunters.
Until 1985 Unit 2 bear hunters used airplane, boat, and highway transportation in relatively equal amounts. However, logging-associated road construction peaked in the 1980s, and beginning in 1986, most hunters used the road system to access hunting areas. During the past 10 years, highway vehicles accounted for 51% of the transportation used by successful Unit 2 hunters (Table 4).
69
Historical harvest locations Wildlife Analysis Areas (WAAs) 1318 and 1422 accounted for about 21% of the harvest during 1991–2003 (Table 6). WAA 1318 encompasses the area around the communities of Craig and Klawock, POW’s primary population center, which affords hunters easy road access. WAA 1422, which includes Tuxekan and El Capitan passages on west POW, also offers easy road access. Additional WAAs that have received notable hunting pressure more recently include 1420 (Ratz Harbor to Coffman Cove on the east side of POW), 1317 (the area south and west of Hollis), and 1530 (Whale Pass and Exchange Cove on the northeast corner of the island). Many of these areas also offer good access from saltwater along protected bays and passages.
MANAGEMENT DIRECTION MANAGEMENT OBJECTIVES
• Maintain an average skull size of at least 19.1 inches for male bears harvested each spring (January–June) or 18.0 inches for all males taken during a regulatory year.
• Maintain a male-to-female sex ratio of 3:1 in the harvest.
• Minimize human–bear conflicts by providing information and assistance to the public and to other agencies.
• Maintain a harvest of at least 65% males in the combined harvest during the most recent 3 years.
Age, genetics, and environmental factors, such as habitat and forage quality, combine to influence black bear skull size. Sealing records indicate that harvested mature black bears in Unit 2 generally have larger skulls than bears from the nearby mainland. The skull size management objective of 19.1 inches for males harvested in the spring was established in the late 1980s after analysis of several previous years data showed this to be the long-term average. We wanted to maintain skull size in the harvest at the long-term high, and we have looked at any reduction in this mean as a possible indication of changes in the population’s age structure.
Skull size is used as a management tool because we believe that average skull size trends may indicate changes in population size and composition, and they provide some measure of the sustainability of the harvest. A decreasing average skull size may indicate a decline in that segment of the population composed of large, older bears and could indicate an overall population decline. However, an increasing average skull size could also indicate a reduction in the proportion of younger bears in the population. Probably the most important and safest use of skull size data is as an indicator of some change in the population or in hunter effort. We do not have a technique to tell us precisely what such a change might indicate, but use it in conjunction with other data to make our best assessment of the current population.
Sex ratio is another parameter commonly used when monitoring black bear harvests. It is relied on as a primary means of assessing population status in 19 states and provinces and as supporting information for population assessment in another 8 areas (Garshelis 1990). Harvest sex ratio is thought by some bear biologists to suggest changes in the population. A 3:1 male to

70
female sex ratio in the harvest has been suggested to be a sustainable yield from a healthy bear population (Sterling Miller, former ADF&G research biologist, personal communication).
METHODS Hunters are required to submit bear skulls and hides for sealing within 30 days of the kill. Fish and Game staff, designated sealers, or Alaska Bureau of Wildlife Enforcement troopers must seal black bear hides and skulls taken by successful hunters. Biological and hunt information collected at the time of sealing includes hide color, sex, skull length and width, date and location of kill, number of days hunted, transportation method, and any use of commercial services, including guides. A premolar is collected and sent to Matson’s Laboratory in Milltown, Montana for age determination. During this report period, tissue samples were collected from harvested bears for DNA and stable isotope analysis.
We currently are completing research on predator–prey relationships in Unit 2; this work is in the publication phase. We are hoping to be able to conduct research in the future on black bears in this unit. A pilot study in 2000, using radio collars on newborn Sitka black-tailed deer, confirmed bears are efficient predators of young deer. Adding bears to this predator prey research project will provide valuable data on hunting vulnerability due to road density and extensive shoreline habitat, and on wounding loss, recruitment, habitat selection, habitat use and home ranges.
RESULTS AND DISCUSSION POPULATION STATUS AND TREND Population estimates are not currently available for black bears in this unit. Information obtained during sealing cannot be used to measure population trends. While harvest information gained from sealing records, such as average skull size, average age, and sex ratio may provide some indication of black bear population trends, in the absence of accompanying demographic data, correlations between these measures and harvest sustainability will continue to elude us. Research is needed to identify population parameters so we might better assess population trends and harvest sustainability.
Population Size No black bear population studies have been conducted in Unit 2. Density estimates of North American black bears vary between 0.3 and 3.4 bears/mi2, depending on the region and habitat conditions. At the high end, a Washington state study in forested Sitka spruce habitat that included logged areas comparable to POW resulted in the 3.4 bears/mi2 estimate (Lindzey and Meslow 1977).
Elsewhere, Modafferi (1982) estimated 1 bear/mi2 in eastern Prince William Sound, Alaska. Density estimates from forested habitat in Minnesota using biomarker mark-recapture methods resulted in higher values than we estimate for Unit 2, ranging from 4–6 bears/mi2 (Garshelis 1989). The highest black bear density estimated in forested habitat outside of Alaska, Minnesota, or Washington was in Virginia and ranged from 0.96–1.49 bears/mi2 (Carney 1985).

71
Wood (1990) indicated that unlogged portions of Unit 2 contain some of the best black bear habitat in Southeast Alaska. Based on population estimates from other North America coastal areas (Poelker and Hartwell 1973), Wood estimated the Unit 2 black bear density at 1.5 bears/mi2. Using Wood’s density estimate, Larsen derived a population estimate of 5400 bears for the unit (Larsen 1995). In making this estimate, Larsen assumed some areas have more and some less bears than others. Bunnell and Tait (1985) developed a deterministic simulation model showing that maximum allowable annual hunting mortality on black bears over 1 year old is 14.2% of the estimated population.
In 2000, ADF&G supported a study on a 400-mi2 northern portion of Kuiu Island located in Unit 3 that used tetracycline biomarkers to estimate black bear density. This black bear research calculated a bear density estimate at 3.9 bears/mi2 (1.5 km2 ) (Peacock 2004). This higher density estimate is comparable with Lindzey and Meslow’s (1977) peak estimate of black bears on Long Island, Washington. Because the Kuiu effort was focused on an island adjacent to Unit 2 with similar logging patterns, its results may be more applicable to Unit 2 bear populations than studies done elsewhere. If we calculate a conservative estimate of Unit 2 bears using 3 bears/mi2, which is less than the results from the Kuiu study but higher than previous estimates calculated from the Washington state work, we would essentially double the overall estimate for Unit 2 from 5400 to 10,800 bears. The actual number of bears in Unit 2 likely is somewhere between these two density estimates because of the large area and varying habitat quality across the temperate forest landscape.
In 2007 we initiated a pilot study in the central portion of Prince of Wales Island. This study includes the use of noninvasive genetic mark–recapture techniques. We are using noninvasive breakaway single-capture noose snares equipped with barbed wire to capture hair from live bears (Beier et al. 2005). Bears are considered marked when we obtain a genetic signature from hair samples. The recaptures are obtained when bears are harvested during the subsequent hunting seasons. This field project will continue through 2009 and lab work and results should be complete by 2010.
Population Composition We lack quantitative information with which to estimate the sex and age composition of the Unit 2 black bear population. The male-to-female harvest ratio may provide a better indicator of harvest sustainability and population status than does average skull size. Considering their high reproductive potential, survival of breeding females is critical to sustained yield management. Prolonged overharvest of females is likely to result in population declines. A decreasing trend in the male-to-female harvest ratio could signal a decline in that segment of the population made up of older, larger males. Region I staff established the 3:1 male-to-female guideline in the late 1980s, based on work done on black bears elsewhere.
Distribution and Movements As stated above, Unit 2 black bears are probably not evenly distributed across the unit. For example, islands in the POW archipelago that lack productive salmon streams likely support fewer bears/mi2 than those with fish streams. Also, a high proportion of southern POW is characterized by muskeg and low volume timber and probably supports a lower density of bears than the more productive northern half of the island. Quantitative information about home ranges

72
and movement patterns of Unit 2 black bears are not yet available. Efforts are ongoing to secure funding for a comprehensive research project to determine home range sizes and look at habitat use and seasonal movements by Unit 2 bears.
Unlike mainland Southeast Alaska, Unit 2 black bears occur in the absence of brown bears. The cinnamon-colored black bear, which occurs in mainland populations, is absent from Unit 2, as are the glacier (blue) and Kermody (white) bears, which occur infrequently in nearby British Columbia and occasionally along the mainland of Southeast Alaska.
MORTALITY
Harvest Season Bag limit 1 Sep–30 Jun Resident hunters: 2 bears, not more than 1 of which may be a blue
or glacier bear
1 Sep–30 Jun Nonresident hunters: 1 bear Board of Game Action and Emergency Orders. No Board of Game actions or emergency orders were issued during the report period. However, a board action in fall 2000 regarding Unit 3 black bears has indirectly impacted Unit 2. This action placed an annual nonresident harvest cap of 120 bears for Kuiu Island. Currently, nonresidents account for 80% of the annual Kuiu bear harvest. The Kuiu harvest was within 10 bears of the cap by the end of the spring 2001 season, resulting in an emergency closure of the subsequent nonresident fall season. Similar closures are expected in the future. The access to and availability of black bears on Kuiu is similar to Unit 2, and consequently when the Kuui cap was initiated many licensed guides and transporters, and many unguided nonresident hunters shifted from Kuiu to POW. The harvest deflection issue has been discussed several times and will likely be an issue at future board meetings. The U.S. Forest Service (USFS) has experienced an increase in the number of guide and transporter requests for Unit 2 Special Use Permits, and we expect this trend to continue as registered guides and outfitter/transporters look for other areas to conduct black bear hunts.
Hunter Harvest. The 2004–2006 average of 450 bears per year indicates a continuing upward harvest trend. Bunnell and Tait (1985) developed a deterministic simulation model showing that maximum allowable annual hunting mortality on black bears over 1 year old is 14.2% of the estimated population. Using our population estimate of 5400 bears (Larsen 1995), this percentage would result in a maximum sustainable annual harvest of 767 bears. To date, the high 2005 harvest of 486 bears constituted only 9% of this conservative population estimate. This suggests the current harvest is within sustainable levels, according to this simulation model, as long as our density estimate is reasonably accurate. However, we feel it is important to evaluate watershed or site-specific harvests in order to track potential localized overharvest and to evaluate our population estimate, which is currently based entirely on available habitat in Unit 2.
A sex ratio of 3 males to 1 female bear in the harvest is thought to be sustainable over the long term, and we have maintained that level with a couple of exceptions during the past 10 years. Sex ratio of the harvest during the past 10 years has remained stable and even increased slightly

73
during 2003, to 4:1. The 2005 harvest was the highest harvest for Unit 2 on record (486 bears) and also the first time the harvest dropped to a 2:1 male to female ratio (Table 5).
We looked at Unit 2 harvest using smaller scale areas and found increasing female harvest in some Major Harvest Units (MHU). The MHU (the first two digits) is composed of several smaller units (second two digits) called Wildlife Analysis Areas (WAA). The increasing trends included MHUs 1100, 1200, and 1300. Also the proportion of females in the total harvest increased during the last decade in MHUs 1100, 1200, and 1500, but has not changed significantly in MHUs 1300 and 1400. MHUs 1300 and 1400 also have some of the highest road densities in the Unit and bears from these areas seem to be younger compared to ages in areas with less access (Figure 1).
We met our management objective of maintaining at least 65% male harvest during the past 3 years with males representing 72% overall 2004–2006. This male dominated harvest is consistent with the past 20 years as males have represented 72% over the long term harvest (Porter 2002).
The mean or median age of the harvest (or some ratio among age classes) is often assumed to directly reflect the level of exploitation. If mortality is age-biased, as bear hunting appears to be, changes in the age structure will lag well behind changes in population size (Garshelis 1990). The mean age of harvested Unit 2 bears has remained fairly constant during the past 10 years, with males averaging 6.4 years (range 5.0–7.5) and females 8.6 years (range 7.2– 10.3) (Table 5). Males harvested in the spring are always younger on average than bears harvested in the fall. Conversely, there is no age pattern in the female harvest between spring and fall. We will continue to evaluate the age trends of harvested male bears and the age structure of all harvested bears on a smaller landscape scale to look for trends.
Hunter Residency and Success. Nonresident hunters continue to harvest more bears in Unit 2 than local and nonlocal Alaska residents combined. Between 1980 and 1990, nonresidents represented less than 50% of the Unit 2 bear harvest. During this report period, nonresidents took 87% of the reported harvest. Unit 2 residents took only 5% of the harvest during the same period, down from an average of 13% during the past 20 years. Successful nonlocal Alaskans have declined from a 20-year average of 18% to an average of 8% during this report period. During the past 10 years, Alaska residents accounted for 19% of the harvest (range 11–29%). This is radically lower than the previous 10 years (1987–1996) when residents averaged 44% (range 35–55%) of the harvest (Table 2). Most strikingly, the Unit 2 human population has changed in the past 5 years with the closure of many logging camps and overall reductions in timber-related activities. During the past 30–40 years, the logging industry provided a steady flow of new hunters into the area. These were often new residents to Alaska, and a high proportion of them were avid hunters. The remote locations of the many operations allowed workers easy access to game populations, including bears. Since the decline of the timber industry, newer Unit 2 residents are more involved in tourism and charter fishing and less invested in a lifestyle that involves hunting. This latter fact may explain some of the reduced resident harvest.
A few years postcutting these clearcut areas provided additional forage; however, currently much of the habitat is changing and converting to closed canopy forest. This is making it much

74
more difficult to visually locate bears in the thick vegetation over much of the landscape. We also expect this less productive forage production will have a negative impact on carrying capacity for bears.
The abundance and accessibility of Unit 2 black bears for hunters, due in part to the ease of access along the extensive road system, is attractive and appealing to many. Recent releases of bear hunting videos and articles in popular hunting magazines also contribute to an increasing nonresident interest. POW has gained recognition for producing large bears, with regular entries into the Boone and Crockett, and Pope and Young, record books each year. A strong economy, with more hunters having disposable income during the past several years, may also be a factor driving nonresident hunter activity. Bear hunting closures and/or shorter seasons in other states and in Canada have likely contributed to the increased attraction of black bear hunting in Southeast Alaska.
Harvest Chronology. Harvest of black bears in Unit 2 increased from 1997–2007, however, all of the increase occurred during the spring season. Regression of harvest during autumn 1999–2004 indicated that the slope was not different from 0 (F= 0.047, P= 0.832) but was negative after 2004 (F= 109.15, P< 0.001) and a strong negative trend after 2004 (F = 22.08, P = 0.005). Total harvest steadily declined after 2005, but most of that was due to decline in the spring harvest.
The mean male skull size during the spring met our management objective of 19.0 inches during 2 of the 3 years, 2004 ( x =19.3), 2005 ( x = 18.8) and 2006 ( x = 19.0). During those same 3 years 125, 93, and 106 harvested male bears respectively had 20-inch or larger skulls in the spring. A few bear skulls each year exceed 21 inches and during this report period 2004 (24), 2005 (26) and 2006 (28) were included in that category. Occasionally Unit 2 male bears also exceed the total 21-inch skull measurements, qualifying them for Boone and Crocket and Pope and Young record books. The average age of these large male bears was 11 (range 4–28).
Most Unit 2 bears are taken in the spring (76%) with May consistently ranking as the peak harvest month. The May 2004 harvest represented 59% of the year’s total and was slightly higher than the past 10-year average ( x = 54%). May harvests during the 2005 and 2006 seasons were each 57% of total harvest. September consistently has the second highest harvest (27%) with only a few bears taken in October and November (Table 3). Spring 2006 had the most hunters (360) and the most hunter-days (1306) for a spring hunt on record (Table 5).
Harvest in particular Major Harvest Areas (MHU). As stated earlier, 2 MHUs on POW, 1300 and 1400, have accounted for a large portion of the total harvest in Unit 2. MHU 1400 showed the most obvious increase during recent years and reached an all-time high harvest peak during 2004. That increasing trend has slowed during the 2006 season, but MHU 1400 still ranks as the top harvest area in the unit.
Bait stations. Alaska faced a ballot initiative during November 2004 to ban bear baiting under state hunting regulations. Anti-hunters felt using bait to lure bears was unfair chase and unethical hunting practice, and they were able to get the required signatures to bring it to a statewide vote. The initiative brought about a great deal of news coverage on both sides, but in the end the initiative was defeated at the polls.

75
Bait permits are issued by registration permit, and each permit allows the hunter to establish 2 bait sites. Baiting is allowed only during the spring hunting season. During the past 10 years, we have issued an average of 100 permits each year (range 52–158). During the 2005 season we issued 158 permits, the most permits on record for a single year. Hunters normally choose to establish the maximum of 2 bait sites per registration permit, so in 2005 that meant more than 300 bait sites were likely set up across Unit 2. However, even with the number of registration permits issued in the unit the reported harvested over bait has historically accounted for only a small percentage of the Unit 2 bear harvest. During this report period 2004–2006, hunters reported taking 30, 46, and 37 bears over bait respectively (Table 1). With many other bear hunting options in this area hunters who obtain Unit 2 bait permits often report taking bears using spot and stalk methods during their hunt rather than over the established bait site.
Because additional hunters may hunt over the same site with permission of the owner we do not have good estimates of actual numbers of hunters using bait sites. In an attempt to gather some of that important harvest information we have asked hunters to mail their site permit at the end of the season. This site permit includes hunting license numbers from other visitors if they used another hunter’s registered bait site. More than 80% of the hunters harvesting bears each season in Unit 2 over bait are nonresidents. The majority of hunters using bait report taking bears with archery equipment (Table 1).
Hunting with Dogs. Hunting with dogs has been banned in most states, and those displaced houndsmen appear to be taking advantage of the many opportunities in Alaska. Many of the houndsmen who apply for permits each year are repeat hunters, mostly from Idaho and Montana. Currently, hunting with dogs in Unit 2 requires a permit issued by the Ketchikan area wildlife biologist. Hunting bears with dogs in Unit 2 is restricted to the fall, a maximum of 5 permits are issued per year, and permittees must report the number of bears treed and harvested at the end of the season. Good health certificates are also required for dogs before entering Alaska. The cost of gas and the declining economy has reduced the number of applicants wanting hound permits. Consequently, during the past 3 years we have not issued all 5 allowable hound hunting permits. Until 2003, all permits issued during the past 10 years had been to nonresident hunters. One resident of the unit now owns hounds and has obtained a permit each year since 2003. This hound hunter has also assisted several hunters to find and dispatch wounded and hard to locate bears.
Guided Hunter Harvest. Nonresidents accompanied by a licensed big game guide are allowed to harvest 1 bear. Historically, 2–4 licensed big game guides have operated in Unit 2 annually. Guides must first be licensed by the state for specific guide use areas and then be permitted by the U.S. Forest Service (USFS) under a special use permit. Guided hunters are not guaranteed success, although personal contact with several Southeast guides suggests 95–100% of guide-assisted hunters take bears. Successful guided hunts have increased recently and reached a high during 2005, when 72 guided hunters harvested bears. This is compared to an average of 5 guided kills from 1980 to 1999. During the 2004–2006 seasons 52, 72, and 57 successful hunters reported using licensed guides to harvest bears.
The use of transporters to access hunting areas, especially by nonresidents, is also increasing. Outfitters using boats as floating hotels and transportation are the most troublesome. This

76
increase is difficult to monitor or manage. Transporters must obtain a state transporter license, and those operating on marine waters must also have U.S. Coast Guard approval. Transporters are not legally allowed to influence where hunters go to hunt. They also cannot assist hunters in locating or stalking game, or helping clients care for trophies. These regulations are frequently abused, yet few cases are ever prosecuted due to the difficulty of gathering evidence and monitoring hunting activities. The USFS is currently evaluating these activities and may eventually change its special use permit system to provide better records across the Tongass National Forest. The Alaska Big Game Commercial Services Board is also clarifying existing guide language in State regulation and establishing new guidelines to reduce abuse of this system. One large Unit 2 transporter case was successfully prosecuted in court and several investigations are ongoing. The Forest Service is also looking at ways to bring transporters under the permit umbrella similar to guides and other users. Although the Forest Service use permit system is addressing crowding issues, this mandatory reporting will also provide a way to monitor changes across all of the Tongass National Forest.
Transport Methods. During this report period 50% of successful hunters used highway vehicles to reach Unit 2 hunting destinations. Another 48% reported using boats, and the remaining 2% went by air (Table 4). The shift to more boat reflects both more boat-based transporters offering hunts, and hunters using land vehicles less because bears are harder to find in the overgrown clearcut habitat along the extensive road network.
A new highway improvement and paving project was recently completed along a large tract of the main road from Klawock to Thorne Bay and east to Naukati. Another section of pavement will be complete along the main 30 Road from the Naukati Junction to Coffman Cove summer of 2009. Beginning in early 2002, a new interisland ferry started making daily runs from Ketchikan and POW during all months with 2 daily runs during the peak summer and fall seasons. In 2006 another seasonal ferry route was added from Petersburg to Coffman Cove, making the area more accessible. All of these access issues will increase the number of people using Unit 2 for hunting, fishing, and other recreational activities.
Other mortality Wounding loss is thought to be a significant source of mortality for Unit 2 bears, but this is based on anecdotal information with little documentation. Forest understory is dense, and frequent rainfall complicates the task of tracking wounded animals. At the time of sealing, hunters sometimes volunteer that they shot at or hit additional bears while hunting and were unable to find them. Hunters are unlikely to report such incidents. Nonresident hunters probably wound more animals than residents because of unfamiliarity with local conditions and vegetation, distance, and bear behavior.
In the past few years we have documented a few defense of life or property (DLP) kills, but prior to that, few cases were ever reported. Bears killed at logging camps and in the many small Unit 2 communities have historically gone unreported. Locals tend to avoid involving law enforcement or Fish and Game officials in these situations to avoid the subsequent investigation and paperwork. Even some law enforcement officers are slow to relay information about nuisance or DLP-killed bears. Fish and Game is making a greater effort to build relationships with enforcement officials to foster better documentation and data collection in the future. Since the

77
closure of the landfill in Craig, several bears have been killed under DLP regulations near Craig and Klawock. Several bears are also killed in vehicle collisions each year along the new stretch of paved highway. We expect vehicle collisions to increase with more miles of road being paved each year in the unit, grasses planted to stabilize hillsides will attract bears, and more drivers will spend additional time on the road at higher speeds.
HABITAT Assessment Timber harvest continues to pose the most serious threat to black bear habitat in the unit. Postlogging increases in berry production, primarily Vaccinium spp., may contribute to short-term bear population growth. This forage source will be lost as the canopy closes, as will habitat diversity associated with old-growth forests, accompanied by a loss of den trees. The long-term effects of logging will be detrimental to black bears. Roads associated with logging increase human access and can make bears increasingly vulnerable to harvest.
Enhancement No habitat enhancement projects specifically intended to benefit black bears have been attempted in the unit. Traditionally used as a silvicultural practice, precommercial thinning and pruning has been performed in some young second-growth stands in Unit 2. Recently there have been some attempts to add a wildlife component to the thinning prescriptions. The problem with most thinning prescriptions meant to benefit wildlife is the remaining slash. Because of additional cost to remove or reduce this material it is seldom treated and creates an impenetrable barrier to most animals for many years, approximately 20–25 years, after which time canopy closure again results in loss of understory. The long-term effects of extensive clearcut logging will be detrimental to black bear populations in this unit.
NONREGULATORY MANAGEMENT PROBLEMS/NEEDS
Nuisance Bear Problems. Historical records are inaccurate regarding the number of bears killed while getting into garbage in Unit 2. We receive only 1–2 DLP reports from POW each year, and anecdotal information suggests a number of bears are killed around logging camps and near communities each year; however, very few of these were ever reported or documented. Because most of these Unit 2 areas are not restricted by city ordinances, landowners are more likely to shoot and tag a nuisance bear under hunting regulations than surrender it to authorities.
Until recently there have been open landfills near many communities luring bears near people, and consequently, creating generations of food-conditioned bears. A recent effort by the Alaska Department of Environmental Conservation to bring landfill managers into compliance with state regulations will eventually result in fewer refuse attractions for Unit 2 bears. The city of Thorne Bay recently relocated and fenced its landfill. The city of Hydaburg was found to be out of compliance and is now shipping to the Craig/Klawock landfill. The shared Craig/Klawock barge transfer site is now operating and has removed the food attraction for bears.

78
CONCLUSIONS AND RECOMMENDATIONS The Unit 2 black bear harvest has been steadily increasing and is currently at a record level. Research is needed to estimate black bear density to determine if the harvest is sustainable and to better address future management needs. Research is also needed to ascertain the relationship between sealing data (such as skull size and age) and sustainability of the increasing harvest in Unit 2.
We initiated a pilot research project on central POW to provide some basic information regarding bear vulnerability to hunting in high use areas including the likelihood of a bear being taken during the legal bear seasons. Some additional research needs for Unit 2 include obtaining better information on wounding loss, basic demographics, and reproduction and survival rates.
The general age trend of male bears appears to be stable, but we are also seeing an older age class of female bears in the harvest along with slightly smaller male skull averages. This may suggest hunters are searching for the largest bear, but in some cases harvest an older female bear instead of a male because it was the largest animal they encountered. We will continue to monitor female age to see if the trend continues and whether it is areawide.
Unit 2 hunters would benefit from an educational video with information on identifying mature male bears in the field and at the same time outlining our concerns about wounding loss. Such a video would help hunters and managers by promoting more male-specific selective hunting and would help educate hunters about shot placement and shot distance.
We will continue to monitor specific harvest locations in order to track harvest and adjust future population estimates. This is especially important because harvests in 2 MHUs, both easily accessible along the road system, make up a large portion of the total bear harvest in the unit during the past 18 seasons. Based on available literature, data collected, and crude density estimates, we believe the existing harvest is within sustained yield limits.
As logging continues, and large tracts of previously logged habitat rapidly convert to second-growth forest, we anticipate reductions in Unit 2 bear numbers. Research is needed to better identify and understand the dynamics of Unit 2 black bears.
LITERATURE CITED BEIER L. R., S. B. LEWIS, R. W. FLYNN, G. PENDELTON, T. V. SCHUMACHER. 2005. A single-catch
snare to collect brown bear hair for genetic mark-recapture studies. Wild. Soc. Bull. Vol. 33, (2) pp. 766–773.
BUNNELL F.L. AND D. TAIT. 1985. Mortality rates of North American bears. Arctic 38:316–323. CARNEY D.W. 1985. Population dynamics and denning ecology of black bears in Shenandoah
National Park, Virginia. M.S. Thesis. Virginia Polytechnic Institute and State University, Blacksburg, VA. 84pp.
BANFIELD A.W.F. 1974. The mammals of Canada. Toronto: University of Toronto Press, 438 pp.

79
ELOWE, K. D. 1990. Bear hunting with hounds: techniques and effects on bears and the public. Eastern Workshop Black Bear Res. and Manage. 10:101–109.
GARSHELIS D.L. 1989. Bear Management and Research in the Great Lakes States. North Country
Bear Hunter 2(2):8–9. _____________ 1990. Monitoring effects of harvest on black bear populations in North
America: a review and evaluations of techniques. Pages 120–144. in Clark, J.D., and K.G. Smith, editors. Proceedings of the Tenth Eastern Workshop on Black Bear Research and Management.
HEATON T.H. 1995. Interpretation of values from vertebrate remains of the Alexander
Archipelago, Southeast Alaska. Current research in the Pleistocene 12:95–97. JONKEL C.J. AND I.M. COWAN. 1971. The black bear in the spruce-fir forest. Wildlife
Monographs 27. 57pp. KOLENOSKY G.B. AND STRATHEARN S.M. 1987. Black Bear. Pages 442-454 in M. Novak et al.,
editors. Wild Furbearer Management and Conservation in North America. MACDONALD S.O., AND J.A. COOK. 1996. The land mammal fauna of Southeast Alaska.
Canadian Field Naturalist 110(4):571–598. MACDONALD S.O., AND J.A. COOK. 1999. The mammal fauna of Southeast Alaska. Fairbanks:
University of Alaska Museum. MODAFFERI R. 1982. Black bear movements and home range study. Alaska Department of Fish
and Game Final Report. Federal Aid in Wildlife Restoration Project. W-17-10, W-17-11, W-21-1, and W-21-2. Job 17.2R.
LARSEN D.N. 1995. Black bear harvests and management, Prince of Wales and adjacent
islands. Unpublished report, Ketchikan. 18pp. LINDZEY F.G. AND E.C. MESLOW. 1977. Population Characteristics of black bears on an island in
Washington. Journal of Wildlife Management 41(3):408–412. PEACOCK L. AND J. BERGER. 2001. Kuiu Island black bears: pilot study progress report. Alaska
Department of Fish and Game. Juneau, Alaska. 9pp. PEACOCK L. 2004. Population, genetic and behavioral studies of black bears in southeast, Alaska.
Ph D Dissertation, University of Nevada Reno. 204pp. POELKER R.J. AND H.D. HARTWELL. 1973. Black bear of Washington. Biological Bulletin. No.
14. Federal Aid Project W-71-R. Olympia, Washington. 180pp.

80
PORTER, B. 2002. Unit 2 black bear management report. Pages 69-92 in C. Healy, editor. Black bear management report of survey and inventory activities 1 July 1998–30 June 2001. Alaska Department of Fish and Game. Proj. 17.0. Juneau, Alaska
SURING L.H., E.J. DEGAYNER, R.W. FLYNN, T. MCCARTHY, M.L. ORME, R.E. WOOD AND E.L. YOUNG. 1988. Habitat capability model for black bear in southeast Alaska. U.S. Forest Service, Tongass National Forest. 27pp.
U.S. FOREST SERVICE. 1997. Tongass Land Management Plan Revision. U.S. Forest Service
R10-MB-338b. WOOD R.E. 1990. Black bear survey-inventory progress report. Pages 1–6 in S.O. Morgan,
editor. Annual report of survey-inventory activities. Part IV. Black bear. Vol. XX. Alaska Department of Fish and Game Federal Aid in Wildlife Restoration Progress Report. Project W-23-2, Study 17.0. Juneau. 117 pp.
PREPARED BY: SUBMITTED BY: Boyd Porter Neil Barten Wildlife Biologist III Regional Management Coordinator Please cite any information taken from this section, and reference as: PORTER, B. 2008. Unit 2 black bear management report. Pages 66–91 in P. Harper, editor. Black bear management report of survey and inventory activities 1 July 2004–30 June 2007. Alaska Department of Fish and Game. Project 17.0. Juneau, Alaska.

81
TABLE 1 Unit 2 black bear harvest, regulatory years RY 1987–RY 2006 Reported
Regulatory Hunter kill Nonhunting killa Estimated kill Total estimated killc
year M F Unk Total Baitedb M F Unk Total Unrep Illegal M (%) F (%) Unk Total 1987 Fall 1987 27 12 1 40 0 0 0 0 0 0 27 (69) 12 (31) 1 40 Spring 1988 100 12 0 112 1 0 2 0 2 0 0 100 (88) 14 (12) 0 114 Total 127 24 1 152 1 0 2 0 2 0 0 127 (83) 26 (17) 1 154 1988 Fall 1988 63 28 1 92 2 0 1 3 0 0 65 (70) 28 (30) 2 95 Spring 1989 74 16 21 111 5 3 2 0 5 0 0 77 (81) 18 (19) 21 116 Total 137 44 22 203 5 5 2 1 8 0 0 142 (76) 46 (24) 23 211 1989 Fall 1989 27 17 27 71 1 1 2 4 0 0 28 (61) 18 (39) 29 75 Spring 1990 92 16 39 147 22 0 0 1 1 0 0 92 (85) 16 (15) 40 148 Total 119 33 66 218 22 1 1 3 5 0 0 120 (78) 34 (22) 69 223 1990 Fall 1990 44 21 16 81 4 3 2 9 0 0 48 (67) 24 (33) 18 90 Spring 1991 98 16 11 125 14 1 0 0 1 0 0 99 (86) 16 (14) 11 126 Total 142 37 27 206 14 5 3 2 10 0 0 147 (79) 40 (21) 29 216 1991 Fall 1991 34 26 5 65 0 2 0 2 0 0 34 (55) 28 (45) 5 67 Spring 1992 103 29 21 153 1 1 0 0 1 0 0 104 (78) 29 (22) 21 154 Total 137 55 26 218 1 1 2 0 3 0 0 138 (71) 57 (29) 26 221 1992 Fall 1992 42 26 12 80 0 0 1 1 0 0 42 (62) 26 (38) 13 81 Spring 1993 116 18 8 142 24 0 0 1 1 0 0 116 (87) 18 (13) 9 143 Total 158 44 20 222 24 0 0 2 2 0 0 158 (78) 44 (22) 22 224 1993 Fall 1993 52 35 3 90 0 0 0 0 0 0 52 (60) 35 (40) 3 90 Spring 1994 114 19 2 135 18 0 0 0 0 0 0 114 (86) 19 (14) 2 135 Total 166 51 5 225 18 0 0 0 0 0 0 166 (75) 54 (25) 5 225 Table continues next page

82
TABLE 1 continued Reported
Regulatory Hunter kill Nonhunting killa Estimated kill Total estimated killc
year M F Unk Total Baitedb M F Unk Total Unrep Illegal M (%) F (%) Unk Total 1996 Fall 1996 49 39 0 88 0 0 0 1 1 0 0 49 (56) 39 (44) 1 89 Spring 1997 106 20 0 126 8 1 0 0 1 0 0 107 (84) 20 (16) 0 127 Total 155 59 0 214 8 1 0 1 2 0 0 156 (73) 59 (27) 1 216 1997 Fall 1997 65 37 1 103 0 0 0 1 1 0 0 65 (64) 37 (36) 2 104 Spring 1998 154 35 1 190 3 0 0 0 0 0 0 154 (81) 35 (19) 1 190 Total 219 72 2 293 3 0 0 1 1 0 0 219 (75) 72 (25) 3 294 1998 Fall 1998 53 66 0 119 0 0 0 2 2 0 0 53 (45) 66 (55) 2 121 Spring 1999 170 26 1 197 1 0 0 0 0 0 0 170 (87) 26 (13) 1 197 Total 223 92 1 316 1 0 0 2 2 0 0 223 (71) 92 (29) 3 318 1999 Fall 1999 50 46 0 96 0 1 0 0 1 0 0 51 (53) 46 (47) 0 97 Spring 2000 196 31 1 228 15 0 1 0 1 0 0 196 (86) 32 (14) 1 229 Total 246 77 1 324 15 1 1 0 2 0 0 247 (76) 78 (24) 1 326 2000 Fall 2000 88 58 0 146 0 0 1 0 1 0 0 88 (60) 59 (40) 0 147 Spring 2001 195 40 0 235 12 3 0 1 4 0 0 198 (83) 40 (17) 1 239 Total 283 98 0 381 12 3 1 1 5 0 0 286 (74) 99 (26) 1 386 2001 Fall 2001 55 55 0 110 0 0 1 0 1 0 0 55 (50) 56 (50) 0 111 Spring 2002 204 40 0 244 8 0 0 0 0 0 0 204 (84) 40 (16) 0 244 Total 259 95 0 354 8 0 1 0 1 0 0 259 (73) 96 (27) 0 355 2002 Fall 2002 70 54 0 124 0 0 1 0 1 0 0 70 (56) 55 (44) 0 125 Spring 2003 235 45 0 280 29 0 0 0 0 0 0 235 (84) 45 (16) 0 280 Total 305 99 0 404 29 0 1 0 1 0 0 305 (75) 100 (25) 0 405 2003 Fall 2003 66 54 0 120 0 0 2 0 2 0 0 66 (54) 56 (46) 0 122 Spring 2004 276 46 0 322 35 3 0 0 3 0 0 279 (86) 46 (14) 0 325 Total 342 100 0 442 35 3 2 0 5 0 0 345 (77) 102 (23) 0 447
Table continues next page

83
TABLE 1 continued Reported
Regulatory Hunter kill Nonhunting killa Estimated kill Total estimated killc
year M F Unk Total Baitedb M F Unk Total Unrep Illegal M (%) F (%) Unk Total 2004 Fall 2004 48 66 0 114 0 48 (42) 66 (58) 0 114 Spring 2005 296 61 0 357 30 0 0 0 0 0 0 0 296 (83) 61 (17) 0 357 Total 344 127 0 471 30 0 0 0 0 0 0 0 344 (73) 127 (27) 0 471 2005 Fall 2005 71 53 0 124 0 0 0 0 0 0 0 0 71 (57) 53 (43) 0 124 Spring 2006 268 94 0 362 46 0 0 0 0 0 0 0 268 (74) 94 (26) 0 362 Total 339 147 0 486 46 0 0 0 0 0 0 0 339 (70) 147 (30) 0 486 2006 Fall 2006 44 37 0 81 0 0 0 0 0 0 0 0 44 (54) 37 (46) 0 81 Spring 2007 240 72 0 312 37 0 0 0 0 0 0 0 240 (77) 72 (23) 0 312 Total 284 109 0 393 37 0 0 0 0 0 0 0 284 (72) 109 (28) 0 393 a Includes DLP kills, research mortalities, and other known human-caused mortality. b Bears reported harvested over bait. c Percent by sex based only on known harvest totals

84
TABLE 2 Unit 2 black bear successful hunter residency, RY 1986–RY 2006 Regulatory
year Locala
resident
(%) Nonlocal resident
(%)
Nonresident
(%)
Unknownb residency
(%)
Total
1987–1988 38 (25) 46 (30) 62 (40) 8c (5) 154 1988–1989 33 (16) 47 (22) 123 (58) 8 (4) 211 1989–1990 39 (18) 52 (23) 127 (57) 5 (2) 223 1990–1991 46 (21) 71 (33) 89 (41) 10 (5) 216 1991–1992 40 (18) 72 (33) 106 (48) 3 (1) 221 1992–1993 24 (11) 73 (32) 125 (56) 2 (1) 224 1993–1994 35 (15) 58 (26) 132 (59) 0 (0) 225 1994–1995 29 (12) 55 (23) 151 (64) 3 (1) 238 1995–1996 62 (25) 45 (18) 143 (57) 1 (0) 251 1996–1997 35 (16) 40 (19) 139 (64) 2 (1) 216 1997–1998 46 (16) 38 (13) 209 (71) 1 (0) 294 1998–1999 35 (11) 55 (17) 226 (71) 2 (1) 318 1999–2000 26 (8) 44 (13) 254 (78) 2 (1) 326 2000–2001 29 (8) 53 (14) 299 (77) 5 (1) 386 2001–2002 25 (7) 48 (13) 284 (80) 0 (0) 357 2002–2003 27 (7) 47 (12) 330 (82) 0 (0) 404 2003–2004 31 (7) 23 (5) 388 (88) 0 (0) 442 2004–2005 28 (6) 42 (9) 401 (85) 0 (0) 471 2005–2006 20 (4) 41 (8) 425 (87) 0 (0) 486 2006–2007 18 (5) 26 (6) 349 (89) 0 (0) 393
Average 33 (13) 49 (18) 218 (68) 2 (1) 303 a Local hunters are those hunters that reside in Unit 2. b Includes DLP kills, research mortalities, and other known human-caused mortality. c Six unknown and 2 DLPs.

85
TABLE 3 Unit 2 black bear harvest chronology by montha, RY 1987–RY 2006 Regulatory Harvest periods
year Sep (%) Oct (%) Nov (%) Apr (%) May (%) Jun (%) n 1987–1988 24 (15) 14 (9) 1 (1) 21 (14) 80c (52) 14 (9) 154 1988–1989 72 (35) 21b (10) 1 (1) 9 (4) 92e (44) 13 (6) 208 1989–1990 55 (25) 14 (6) 2b (1) 14b (6) 115 (53) 19 (9) 219 1990–1991 63c (30) 17c (8) 7c (3) 16 (8) 88c (41) 22 (10) 213 1991–1992 38 (17) 17b (8) 8 (4) 28 (13) 107b (49) 19 (9) 217 1992–1993 56 (25) 23b (10) 2 (1) 19 (8) 116b (52) 8 (4) 224 1993–1994 67 (30) 14 (6) 9 (4) 15 (7) 94 (42) 26 (11) 225 1994–1995 62d (26) 20 (8) 6b (3) 12 (5) 119 (50) 18 (8) 237 1995–1996 67 (27) 12 (5) 5 (2) 16 (6) 137b (55) 13 (5) 250 1996–1997 75 (35) 9 (4) 4 (2) 14 (7) 100 (46) 13b (6) 215 1997–1998 82 (28) 21 (7) 0 (0) 30 (10) 152 (52) 9 (4) 294 1998–1999 96 (30) 22 (7) 2c (1) 25 (8) 149 (47) 23 (7) 317 1999–2000 82 (25) 10 (3) 4 (1) 18 (6) 187 (58) 23b (7) 324 2000–2001 129 (34) 17 (4) 0 (0) 27 (7) 176c (46) 36c (9) 385 2001–2002 113 (31) 10 (3) 3 (1) 20 (5) 194 (52) 30 (8) 370 2002–2003 97 (24) 18 (5) 9 (2) 36 (9) 205 (51) 36 (9) 401 2003–2004 104f (24) 13 (3) 2 (<1) 21 (5) 264b (60) 37g (8) 441 2004–2005 99 (21) 11 (2) 4 (1) 37 (8) 278 (59) 42 (9) 471 2005–2006 110 (23) 12 (2) 2 (<1) 18 (4) 276 (57) 68 (14) 486 2006–2007 95 (24) 11 (3) 4 (1) 3 (1) 223 (57) 57 (15) 393
Average 77 (27) 15 (6) 4 (2) 20 (7) 158 (51) 26 (8) 302 a Does not include bears killed during closed season. b Includes 1 DLP or other known human-caused mortality. c Includes 2 DLPs or other known human-caused mortality. d Includes 3 DLPs or other known human-caused mortality. e Includes 4 DLPs or other known human-caused mortality. f Includes 1 DLP and one roadkill. g Includes 2 roadkill.

86
TABLE 4 Unit 2 black bear harvest percent by transport method, RY 1987–RY 2006 Transport
Regulatory Highway year Air (%) Boat (%) vehicle (%) Walk (%) Othera (%) Unkb (%) n
1987–1988 14 (9) 39 (25) 99 (64) 0 (0) 0 (0) 2 (1) 154 1988–1989 30 (14) 68 (32) 102 (48) 0 (0) 3 (2) 8 (4) 211 1989–1990 18 (8) 70 (31) 118 (53) 0 (0) 6 (3) 11 (5) 223 1990–1991 7 (3) 69 (32) 118 (55) 0 (0) 12 (5) 10 (5) 216 1991–1992 11 (5) 64 (29) 126 (57) 5 (2) 5 (2) 10 (5) 221 1992–1993 18 (8) 59 (26) 135 (60) 10 (5) 0 (0) 2 (1) 224 1993–1994 15 (7) 63 (28) 124 (55) 23 (10) 0 (0) 0 (0) 225 1994–1995 13 (5) 53 (22) 159 (68) 10 (4) 0 (0) 3 (1) 238 1995–1996 19 (9) 69 (27) 134 (53) 27 (11) 1 (0) 1 (0) 251 1996–1997 11 (5) 56 (26) 114 (53) 32 (15) 1 (0) 2 (1) 216 1997–1998 19 (6) 82 (28) 170 (58) 22 (7) 0 (0) 1 (1) 294 1998–1999 8 (3) 98 (31) 175 (55) 33 (10) 0 (0) 4 (1) 318 1999–2000 13 (4) 107 (33) 196 (60) 8 (2) 0 (0) 2 (1) 326 2000–2001 13 (3) 146 (38) 197 (51) 21 (5) 4 (1) 5 (2) 386 2001–2002 0 (0) 169 (46) 198 (54) 0 (0) 0 (0) 0 (0) 367 2002–2003 2 (1) 201 (51) 195 (48) 0 (0) 0 (0) 0 (0) 398 2003–2004 6 (1) 236 (54) 187 (43) 0 (0) 0 (0) 0 (0) 429 2004–2005 6 (1) 235 (50) 228 (48) 0 (0) 0 (0) 3 (<1) 471 2005–2006 5 (1) 258 (53) 219 (45) 4 (1) 0 (0) 0 (0) 486 2006–2007 12 (3) 181 (46) 200 (51) 0 (0) 0 (0) 0 (0) 393 Average 12 (5) 116 (35) 160 (54) 10 (4) 2 (1) 3 (2) 302
a Includes 3- or 4-wheelers or other ORV b Includes DLP or other known human caused mortality

87
TABLE 5 Unit 2 black bear hunter effort, mean skull size, and mean age, RY 1986–RY 2006 Hunter effort Mean skull sizea (inches) Average age (years)b
Regulatory Total Nr Mean days year days hunters per hunter Male nc Female n Male n Female n
1987 Fall 1987 105 40 2.6 17.2 23 16.7 9 Spring 1988 293 113 2.6 19.5 94 17.2 12 Total/average 398 153 2.6 x =19.0 117 x =17.0 21 x =8.0 99 x =7.7 20
1988 Fall 1988 328 92 3.6 18.0 57 16.9 26 Spring 1989 414 114 3.6 19.4 70 16.7 18 Total/average 742 206 3.6 x =18.8 127 x =16.8 44 x =58 7.8 x =8.4 10
1989 Fall 1989 231 71 3.3 18.4 22 17.0 12 Spring 1990 442 147 3.0 19.5 89 16.9 16 Total/average 673 218 3.1 x =19.3 111 x =16.9 28 ---- ----
1990 Fall 1990 228 86 2.7 17.8 39 16.6 19 Spring 1991 448 124 3.6 19.1 93 16.5 16 Total/average 676 210 3.2 x =18.7 132 x =16.5 35 x =7.7 128 x =8.1 33
1991 Fall 1991 184 67 2.7 18.1 31 16.8 25 Spring 1992 653 154 4.2 19.4 103 17.0 28 Total/average 837 221 3.8 x =19.1 134 x =16.9 53 x =7.6 132 x =8.2 56
1992 Fall 1992 231 80 2.9 17.3 37 16.6 25 Spring 1993 774 141 5.5 19.0 115 16.7 18 Total/average 1005 221 4.5 x =18.6 152 x =16.6 43 x =7.1 153 x =8.4 42
1993 Fall 1993 295 90 3.3 17.6 52 16.9 35 Spring 1994 480 135 3.6 19.3 112 16.9 18 Total/average 775 225 3.4 x =18.8 164 x =16.9 53 x =7.1 161 x =7.2 49
Table continued next page

88
TABLE 5 continued Hunter effort Mean skull sizea (inches) Average age (years)b
Regulatory Total Nr Mean days year days hunters per hunter Male nc Female n Male n Female n
1994 Fall 1994 223 85 2.6 18.2 60 16.8 24 Spring 1995 601 149 4.0 19.2 112 17.3 27 Total/average 824 234 x =3.5 x =18.9 172 x =17.1 51 x =7.1 177 x =8.4 55
1995 Fall 1995 233 85 2.7 18.3 50 16.8 35 Spring 1996 588 166 3.5 19.2 135 17.0 26 Total/average 821 251 x =3.3 x =18.9 185 x =16.9 61 x =7.1 185 x =8.0 62
1996 Fall 1996 355 88 4.0 17.2 48 16.8 38 Spring 1997 543 127 4.3 19.5 102 16.6 19 Total/average 898 215 x =4.2 x =18.8 150 x =16.7 57 x =6.9 154 x =8.7 57
1997 Fall 1997 345 103 3.3 17.6 63 16.5 36 Spring 1998 704 187 3.8 19.2 151 17.0 34 Total/average 1049 290 x =3.6 x =18.8 214 x =16.8 70 x =6.5 215 x =8.2 71
1998 Fall 1998 397 119 3.3 17.7 51 16.6 65 Spring 1999 709 189 3.8 19.1 163 17.3 25 Total/average 1106 308 x =3.6 x =18.8 214 x =16.8 90 x =7.1 215 x =7.8 89
1999 Fall 1999 281 96 2.9 17.0 48 16.5 44 Spring 2000 984 228 4.3 19.2 190 17.1 32 Total/average 1265 324 x =3.9 x =18.7 238 x =16.7 76 x =6.6 237 x =7.2 71 Table continued next page

89
TABLE 5 continued Hunter effort Mean skull sizea (inches) Average age (years)b
Regulatory Total Nr Mean days year days hunters per hunter Male nc Female n Male n Female n
2000 Fall 2000 557 143 3.9 17.4 88 16.6 57 Spring 2001 987 230 4.3 19.3 193 17.2 40 Total/average 1544 373 x = 4.1 x =18.7 281 x =16.8 97 x =6.5 276 x =8.8 94 2001 Fall 2001 391 112 3.5 17.8 52 16.7 57 4.5 53 8.9 53 Spring 2002 913 243 3.8 18.0 200 17.9 38 5.5 195 9.3 39 Total/average 1304 355 x =3.7 x =17.9 252 x =17.3 95 x =5.0 248 x =9.1 92 2002 Fall 2002 376 125 3.0 17.5 70 16.9 55 6.9 69 5.9 45 Spring 2003 1068 270 4.0 19.4 229 17.2 45 8.1 230 8.4 50 Total/average 1444 395 x =3.7 x =18.5 299 x =17.0 100 x =7.5 299 x =7.2 95 2003 Fall 2003 355 120 3.0 17.5 67 16.7 49 5.0 77 10.3 44 Spring 2004 1138 320 3.5 19.4 274 17.2 45 7.9 274 10.3 44 Total/average 1493 440 x =3.3 x =18.5 341 x =17.0 94 x =6.5 351 x =10.3 88 2004 Fall 2004 375 112 3.3 17.6 46 16.8 65 4.5 47 9.3 64 Spring 2005 1251 354 3.5 19.3 286 16.9 57 7.8 288 9.6 60 Total/average 1626 466 x =3.4 x =18.5 332 x =16.9 122 x =6.2 335 x =9.5 124 2005 Fall 2005 371 124 3.0 17.2 67 16.5 51 4.6 70 7.5 51 Spring 2006 1306 360 3.6 18.8 258 17.2 87 7.4 260 9.6 90 Total/average 1677 484 x =3.3 x =18.0 325 x =16.9 138 x =6.0 330 x =8.6 141 2006 Fall 2006 267 81 3.5 16.9 43 16.7 37 4.9 44 9.6 37 Spring 2007 1165 312 3.7 19.0 240 16.7 72 7.8 228 8.1 67 Total/average 1432 393 x =3.6 x =18.0 283 x =16.7 109 x =6.4 272 x =8.9 104 a Skull sizes equal length plus zygomatic width. b Bear ages not available for 1980–1981 and 1989–1990. c n represents sample size.

90
TABLE 6 Unit 2 black bear harvesta from the most heavily harvested Wildlife Analysis Areas (WAA), RY 1991–RY 2006 Regulatory years
WAA 1991 1992 1993 1994 1995 1996 1997 1998 1999 2000 2001 2002 2003 2004 2005 2006 x1107 7 11 8 14 8 8 12 12 16 21 18 44 16 37 35 23 181210 6 6 8 8 7 6 10 20 15 11 11 6 26 10 24 12 121211 4 2 12 6 8 8 7 9 11 24 21 29 20 35 32 28 161213 2 7 2 2 7 1 6 6 7 13 11 18 9 16 21 7 81214 18 15 15 10 18 11 36 28 31 13 30 40 37 38 55 21 261315 18 12 15 6 14 16 17 22 16 16 9 19 24 13 12 16 151316 3 4 0 4 10 1 2 1 3 3 1 2 3 3 1 3 31317 14 20 14 17 23 13 17 25 29 33 40 30 34 37 32 36 261318 16 17 19 21 18 19 15 22 16 16 16 11 25 11 13 16 171319 17 14 13 14 15 14 15 19 23 30 20 18 21 24 36 22 201332 9 9 8 6 8 12 6 9 10 13 0 0 0 15 14 19 91420 16 20 18 22 14 18 21 26 30 21 15 21 16 24 29 23 211421 6 6 9 9 5 6 8 14 14 16 3 12 11 10 8 11 91422 23 25 25 38 36 33 37 28 40 63 52 46 50 62 60 46 421526 2 1 12 1 6 7 20 12 15 19 16 16 26 22 12 19 131527 2 7 7 8 5 5 21 13 15 15 12 16 16 5 10 12 111529 12 13 10 15 9 9 23 14 7 24 18 9 10 19 19 21 151530 23 17 13 25 19 7 9 12 6 8 18 15 17 16 13 13 141531 0 1 6 7 5 2 4 7 3 17 6 4 4 9 6 4 5
a Includes DLP kills, research mortalities, and other known human-caused mortality.

91
FIGURE 1 Unit 2 Major Harvest Units (MHUs)

92
WILDLIFE Alaska Department of Fish and GameDivision of Wildlife Conservation
MANAGEMENT REPORT (907) 465-4190 P.O. BOX 115526 JUNEAU, AK 99811-5526
BLACK BEAR MANAGEMENT REPORT
From: 1 July 2004 To: 30 June 2007
LOCATION GAME MANAGEMENT UNIT: 3 (3000 mi2)
GEOGRAPHIC DESCRIPTION: Islands of the Petersburg, Kake, and Wrangell area.
BACKGROUND HABITAT DESCRIPTION Most high quality black bear habitat in Unit 3 is associated with low-elevation, old-growth forest with abundant and productive salmon streams. Small openings and disturbed areas, such as wetlands, avalanche chutes, clearcuts, and subalpine meadows are important black bear foraging areas. Black bear diets may range from mostly vegetarian to mostly carnivorous, and the species may subsist by scavenging or by predation on large and small mammals or fish. In Unit 1B, black bears primarily eat vegetation during early spring. Major foods include grasses and sedges, Equisetum spp., and berries, primarily Vaccinium sp., that persist through winter. Later in spring, black bears may be efficient predators of moose calves and/or Sitka black-tailed deer fawns. During summer and fall, when bears accumulate fat reserves for winter hibernation, those bears with access to salmon streams eat large quantities of fish. Berries are also important during the summer and fall months. Poor fish runs or berry crops are thought to result in low cub production and survival the following spring.
We remain concerned about the extensive habitat changes occurring throughout the unit due to logging. The Alaska Department of Fish and Game (ADF&G) has estimated that of the 3000 mi2 of terrestrial habitat in Unit 3, about 1500 mi2 is forested. More than 129,000 acres of forested habitat in Unit 3 have been logged to date. As a result, timber harvest poses the most serious threat to black bear habitat in the unit over the long term. Black bears are able to exploit increases in forage in early-successional plant communities immediately after logging and may temporarily benefit from clearcutting. However, this food source is lost approximately 20–25 years postlogging with canopy closure, and second-growth forests provide little bear habitat. Precommercial thinning and pruning of second-growth stands can extend the short-term benefits to bears, but the long-term effects of logging will be detrimental. Large clearcuts on Mitkof, Wrangell, and Kupreanof Islands will diminish in value as bear habitat over the next few decades (Suring et al. 1988). The proliferation of roads associated with logging is also of concern as roads increase human access and make bears increasingly vulnerable to harvest.

93
HUMAN-USE HISTORY Black bears are indigenous to Unit 3 and traditionally have been hunted for food and trophies. Information about black bears in the unit is limited to sealing records, anecdotal public reports, and staff observations. Although we lack quantitative demographic information on black bears in the unit, we believe the population is stable.
Regulation History Sealing of black bears was first required in 1973. Hunters are not required to obtain registration permits or harvest tickets prior to black bear hunting, so information on the effort of unsuccessful hunters has never been available.
For most years since statehood black bear hunting season extended from 1 September through 30 June, and the bag limit for residents has been 2 bears annually, only 1 of which could be a blue or glacier bear. From 1980 through 1983 the season closed on 15 June, and the resident bag limit was only 1 bear. Nonresident bag limits were the same as for residents until 1990, when the nonresident bag limit was reduced from 2 bears to 1 bear per year. In 1982 it became legal to use bait to hunt black bears year-round. In 1988 the Board of Game limited baiting in Southeast Alaska to 15 April–15 June. From 1989 to 1997 the department issued an average of 4 bear baiting permits per year in the unit. Each baiting permit allows the permittee to establish 2 individual bear baiting stations in the unit. The highest number of baiting permits issued was 11 in 2004. Hunting bears with dogs requires a permit issued by ADF&G. The use of dogs for black bear hunting has been allowed since 1966. No permit requests to hunt bears with dogs have been received for the unit. Since 1996 hunters have been required to salvage the edible meat of all black bears killed in Southeast Alaska from 1 January to 31 May.
In fall 2000, due to concerns over the steadily increasing harvest of black bears by nonresident hunters, the Board of Game established a harvest guideline of 120 bears annually for nonresidents on Kuiu Island. In 2001, the first year implemented, the new harvest guideline resulted in the emergency closure of the entire fall nonresident season on Kuiu after nonresidents harvested 110 bears, or 92 percent of the allowable quota, during the spring season. Since that time, no additional emergency closures have been necessary and the nonresident harvest on Kuiu has stabilized at an average of 112 bears annually.
At its statewide meeting in February 2004, the Board of Game passed a regulation allowing the sale of handicraft articles made from the fur of black bears.
Historical harvest patterns Annual harvests remained relatively stable from 1973 to 1980, averaging 43 bears per year. The harvest began to increase in the early 1980s, rising from 81 bears in 1981 to 166 bears in 1992. By the early 1990s the unit had gained worldwide recognition for producing trophy-sized black bears, and in 1993 the harvest increased to 232 bears. By 2000 the annual harvest had increased over ten-fold since 1973, when 29 bears were killed. In the 2000–01 regulatory year the Unit 3 harvest was 309 bears, with 165 (53 %) of those taken on Kuiu Island. Approximately 73–83% of the annual harvest occurs during the spring season. Since 1973, males have outnumbered females in the harvest about 4 to 1. The percentage of the harvest attributable to nonresident hunters has grown over the past 15 years, increasing from less than 50% in 1990 to 80% in 2000.

94
Since 1992, the majority of black bears taken in the unit by nonresidents have come from Kuiu Island. Most nonresidents hunt without a guide in the unit. Nonresident hunters must purchase tags to affix to each bear harvested. The cost of these tags ($225 for nonresident citizens and $300 for nonresident aliens) may limit the number of nonresident hunters who hunt black bears.
As a result of increasing interest by nonresident hunters, the Unit 3 black bear harvest grew at an annual rate of 7% between 1990 and 2000. The Kuiu Island harvest increased more rapidly, at 9% annually, during the same period. The increasing harvest by nonresident hunters, particularly on Kuiu Island, resulted in concerns about the sustainability of increasing harvest levels. In 2001 the department implemented a newly authorized harvest guideline for Kuiu limiting the nonresident harvest to 120 bears annually. Since that time the Unit 3 harvest distribution has changed slightly and the proportion of the unitwide harvest coming off Kuiu annually has been reduced.
Historical harvest locations Kuiu Island accounts for 25% of the Unit 3 land area and produced about 55% of the total black bear harvest from 1990 to 2000. Kuiu Island male skull sizes are larger on average than those from any other area of the state except Prince of Wales Island in Unit 2. Compared to other Unit 3 islands, Kuiu Island has a relatively high number of salmon streams and more shoreline miles per square mile of area than other islands. Roads associated with logging also provide easy access to the north end of Kuiu, where the highest harvest occurs. After increasing dramatically during the late 1990s, the percentage of successful hunters using motor vehicles on Kuiu has decreased in recent years. The decrease in motor vehicle use on Kuiu is primarily attributable to the departure of one transporter who had previously provided highway vehicles to his clients on the island. Kupreanof and Mitkof Islands produced annual black bear harvests averaging 33% and 8% of the Unit 3 bear harvest, respectively, throughout the 1990s. These percentages correspond closely to the percentage of Unit 3 land area on each island, 36% and 7%, respectively. Both islands have several highly productive salmon streams and extensive logging road networks, which aid hunter access. From 2001 and 2003 Kupreanof Island provided 45% of the unitwide harvest, Mitkof 5%, and the remainder of the Unit 3 islands 3%.
MANAGEMENT DIRECTION MANAGEMENT OBJECTIVES
• Maintain an average spring skull size and an average annual male skull size of at least 18.5 inches.
• Maintain a male to female ratio of 3:1 in the harvest.
We have been using skull size as a management objective since the late 1980s because we believe that year-to-year trends in average skull size may indicate changes in population size and composition and provide some measure of the sustainability of harvest levels. A decreasing average skull size may indicate a decline in that segment of the population composed of large, older bears and could indicate an overall population decline. However, an increasing average skull size could also indicate a reduction in the proportion of younger bears in the population. Probably the most appropriate use of skull size data at this time is as an indicator of some change in the population or in hunter effort. We do not have a technique to tell us precisely what such a

95
change might indicate, but use it in conjunction with other data to make our best assessment of the current population.
Age, genetics, and environmental factors, such as habitat and forage quality, all combine to influence black bear skull size. Sealing records and anecdotal evidence indicate that mature mainland black bears generally have smaller skull sizes compared to those found on Southeast Alaska islands. The skull size management objective of 18.5 inches was established in the late 1980s after analysis of data from previous years showed this to be the long-term average. We wanted to maintain skull size in the harvest at the long-term high, and we have looked at any reduction in this mean as a possible indication of changes in the population’s age structure.
METHODS Hunters are required to submit bear skulls and hides for sealing within 30 days of the kill. State-appointed sealing agents and staff from the departments of Fish and Game and Public Safety sealed hides and skulls of black bears. Biological and hunt information collected included pelage color, sex, skull size (length and width), date and location of kill, number of days hunted, transportation method, and hunter use of commercial services, including guide use. A premolar was collected from most bears and sent to Matson’s Laboratory (Milltown, Montana) for age determination. We also sealed any bear killed under defense of life or property provisions (DLP) or any that died as road kill, illegal kill, or during research efforts. Comparison of current and historical data indicates harvest trends and may offer indirect evidence of population trends. No effort data is collected from unsuccessful hunters.
KUIU ISLAND RESEARCH In May 2000, ADF&G entered into a cooperative agreement with the University of Nevada initiating a study using tetracycline biomarking and noninvasive DNA sampling as means of estimating the black bear population on northern Kuiu Island. In June of 2000 and 2002, Elizabeth Peacock (Peacock 2004) used tetracycline biomarking (Garshelis and Visser 1997) to estimate the size of the black bear population on Kuiu Island, north of the Bay of Pillars and Port Camden isthmus (673 km2). Baits were laced with the antibiotic tetracycline and distributed; when a bait was taken by a bear, the tetracycline was incorporated in the newly formed bone tissue (Johnson 1964). To recover samples, hunters were asked to submit toe bone (metatarsal) samples from bears harvested on Kuiu and neighboring Kupreanof Islands during the period from fall 2000 and spring 2003. The bone samples were examined later under an ultraviolet microscope for the presence of a tetracycline-induced fluorescent mark allowing researchers to determine a marked-to-unmarked ratio of bears. In June 2000 a total of 188 baits were deployed, resulting in 138 marked bears. Using recovery data from regulatory year 2000 Peacock estimated the population size on northern Kuiu was 1019 bears for a density estimate of 1.51 bears/km2. In June 2002, a total of 263 baits were deployed, resulting in 191–201 marked bears. Using 2002 marks and recovery data, population point estimates for northern Kuiu ranged from 983 bears (1.46 bears/km2) to 1013 bears (1.51 bears/km2). Based on the 2000 and 2002 baiting efforts, and after adjusting for double-marking, emigration and immigration, Peacock developed density point estimates ranging from 1.31 to

96
1.51 bears/km2 on northern Kuiu. The density estimate of 1.51 bears/km2 or 3.9 bears/mi2 is among the highest published black bear densities across the entire distribution of the species.
RESULTS AND DISCUSSION POPULATION STATUS AND TREND Information about Unit 3 black bears is limited to a Mitkof Island denning study (Erickson et al. 1982), the recently-completed population estimation study on Kuiu Island (Peacock 2004), harvest sealing records, anecdotal public reports, and observations by ADF&G staff.
Except for northern Kuiu, population estimates are not available for black bears in the unit. Information obtained during sealing cannot be used to measure population trends. Although harvest information gained from sealing records, such as average skull size, average age, and sex ratio, may provide some indication of black bear population trends, in the absence of accompanying demographic data, correlations between these measures and harvest sustainability will continue to elude us. Research is needed to identify population parameters so we might better assess population trends and harvest sustainability.
Population Size With the exception of northern Kuiu Island, precise population estimates are not available for black bears in most of the unit. Information collected during sealing cannot be used to measure population trends. Prior to the recently completed study on northern Kuiu Island, no black bear population studies had been conducted in Unit 3. Estimates of population size or density are difficult to obtain because the species generally inhabits forested areas, and aerial surveys are impossible. Vast, remote areas in the unit also make studies difficult and expensive to undertake. Past black bear density estimates for Unit 3 were based on studies in similar habitats in western Washington state in the 1960s (Poelker and Hartwell 1973). We believe minimum densities in most of Southeast Alaska are slightly higher than the 1.4 bears per mi2 found in the Washington study area. Assuming a density of approximately 1.5 bears per mi2 of forested habitat, ADF&G estimated 3340 black bears in Unit 3 in 1990 based on an estimate of 2220 forested mi2. Since then, it has been necessary to revise forested acreage estimates downward. Bear density is probably not consistent throughout the forested areas of the unit. For instance, until recently black bears were unknown on Zarembo Island. Within the past 5 years a few resident bears have become established on Zarembo, but numbers remain low. Bear densities are also relatively low on Etolin and other islands south of Sumner Strait. Density is much higher on Kuiu, Kupreanof, and Mitkof Islands, which have more abundant and productive salmon streams.
Black bears with cinnamon pelage occur on a few islands in Unit 3. A relatively high proportion of bears taken from Mitkof, Wrangell, and Kuiu Islands are cinnamon colored. Glacier bears are uncommon in the unit. Two records exist of glacier bears being harvested in the unit since 1973, both taken from Kuiu Island. We are aware of one anecdotal report of a glacier bear that was reportedly taken at Security Bay, Kuiu Island in the years prior to 1973, when sealing began. No Kermody bears (those with white pelage) have been reported in the unit.

97
Population Composition We lack quantitative information to estimate sex and age composition of the Unit 3 black bear population. The male to female ratio in the harvest may provide a better indicator of harvest sustainability and population status than average skull size. Considering their high reproductive potential, survival of breeding females is critical to sustained yield management. Prolonged overharvests of females will likely result in population declines. A decreasing trend in the male to female harvest ratio could signal a decline in that segment of the population composed of older, larger males. Region I staff established the 3:1 male to female guideline in the late 1980s, based on work done on black bears elsewhere.
Distribution and Movements Quantitative information about home ranges and movement patterns of Unit 3 black bears is not available. The only quantitative information on black bear movement patterns in Southeast comes from a single denning study conducted on Mitkof Island during 1980–1981 (Erickson et al. 1982). Black bear movement patterns are influenced to a large degree by seasonal changes and annual differences in the occurrence, abundance, and quality of preferred food items. Reproductive activities also influence bear movement patterns, particularly for males. As a result, males typically have larger home ranges than females.
Black bears typically emerge from winter dens in March and April. Following emergence from dens, bears typically occupy low elevation habitats, where they feed on greening vegetation. As spring proceeds into summer, bears typically disperse throughout forested and alpine habitats, where they continue to feed on grasses, sedges, forbs, and berry-producing shrubs. In the late summer and early fall, bears typically congregate near anadromous fish streams, where they feed on spawning salmon. As fish runs decline in the late summer and fall, bears disperse from salmon streams and feed primarily on berries and alpine vegetation before denning in October and November.
MORTALITY Harvest Season Bag Limit
1 Sep–30 Jun Resident hunters: 2 bears, not more than 1 of which may be a blue or glacier bear.
1 Sep–30 Jun Nonresident hunters: 1 bear.
Game Board Action and Emergency Orders. No Board of Game actions took place, and no emergency orders were issued regarding Unit 3 black bears during this report period.
Hunter Harvest. Unit 3 hunter harvests ranged from 198 to 232 bears annually during this report period (Table 1). The average annual harvest of 219 bears annually during this report period, was below the preceding ten-year average of 254 bears annually. The 198 bears killed in 2004–05 represent the lowest annual harvest since the 1992–93 season.

98
Males made up 75% of the Unit 3 harvest in both 2004, and 2005, and 81% in 2006. During this report period, the average male skull size ranged from 18.3 inches to 18.6 inches (Table 2). The male to female ratio during this report period was 3.4:1—slightly above the management objective of 3:1. Hunter Residency and Success. Although the percentage varies annually, from 2004 to 2006 nonresidents took approximately 85% of the bears harvested in the unit, nonlocal Alaskans took about 10%, and local residents about 5% (Table 7). Harvest Chronology. During this report period, 74–77% of the overall harvest occurred during the spring season, with 42–49% of all bears killed in May (Table 8).
Harvest in Particular Areas. Harvest occurred in 16 individual Unit 3 Wildlife Analysis Areas (WAAs) during this report period. Of the 658 bears harvested, over 50% were taken from 6 WAAs on Kuiu Island, and 44% were taken from 5 WAAs on Kupreanof Island. WAA 5012 alone, on northern Kuiu Island, accounted for 23% of the total unitwide harvest. Combined, the harvest from 5 other Unit 3 WAAs, including those on Mitkof, Wrangell, Etolin, and Woronkofski Islands, accounted for just 6% of the unitwide harvest (Table 5).
Bait Stations. A total of 13 individuals were issued bear baiting permits during the report period. Each bear baiting permit allows a hunter to establish up to 2 individual bait stations. Eleven permittees requested authorization to establish 2 bait stations, while 2 individuals requested a permit to establish a bait station at a single site.
A record number of permits were issued in 2004, when 11 individuals requested authorizations to establish up to 20 bait stations. In 2005, 4 individuals were authorized to establish 8 bait stations. In 2006 3 individuals were issued permits to establish 6 bait stations.
Hunting with Dogs. No permits were requested to hunt bears with dogs during this report period.
Guided Hunter Harvest. During the report period, harvest by guided nonresident hunters increased slightly as a percentage of the overall harvest. Guided nonresidents accounted for 46% of the harvest in 2004, 39% in 2005, and 34% in 2006.
Transport Methods. Hunter transportation is primarily by boat, highway vehicle and airplane, respectively (Table 9). During this report period the unitwide percentage of hunters using highway vehicles to access hunt areas decreased slightly from the previous report period. The percentage of Kuiu Island hunters using vehicles increased at a rate of 214% annually from 1995 to 2000 before peaking at 20% in 2000. Since 2003, however, the percentage of hunters using highway vehicles on the island has steadily decreased and was just 2% during this report period.
Other Mortality No DLPs were documented during the report period; however, some DLPs likely go unreported, particularly in the communities of Wrangell and Kake. We continue to receive unconfirmed reports of bears being shot and left in the field by individuals believing that bears are detrimental to deer and moose populations.

99
One registered guide reported that, despite the use of heavy caliber rifles and backup shots by professional guides, his clients failed to recover 13 (21%) of 63 black bears struck and wounded between spring 2001 and fall 2004. It is reasonable to assume that wounding loss rates for nonguided hunters are considerably higher than for guided hunters.
While possibly significant, little information is currently available on the amount of wounding loss that is occurring in the unit. Between 2001and 2003 a special permit was issued to a registered big game guide interested in experimenting with the use of a dog to track and aid in the recovery of black bears wounded by clients. During a 3 year period, the guide reported that his clients struck a total of 63 black bears, 13 (21%) of which were wounded and never recovered. Three wounded bears (5%) that might otherwise have been lost were successfully recovered with the aid of a tracking dog. Wounding loss experienced by nonguided hunters is likely much higher than that of guided hunters who have the benefit of expert advice on caliber selection, shot placement, shooting distance, back-up shots and tracking experience.
HABITAT ASSESSMENT Assessment Timber harvest continues to pose the most serious threat to black bear habitat in the unit. Clearcut logging reduces habitat diversity associated with old growth forests and eliminates denning trees. While postlogging increases in berry production, primarily Vaccinium sp., may contribute to short-term bear population growth, this forage source will be lost as second growth stands regenerate and the canopy closes. Roads associated with logging increase human access and can make bears increasingly vulnerable to harvest. The long-term effects of logging will be detrimental to black bears. Roads associated with logging increase human access and can make bears increasingly vulnerable to harvest. The long-term effects of logging will be detrimental to black bears.
During this report period, timber harvest occurred on Kuiu, Kupreanof, Mitkof, Etolin, Zarembo, Deer, and Wrangell Islands. Timber harvest is planned or already scheduled for additional sale areas on Etolin, Kupreanof, Kuiu, Mitkof, Zarembo, Woronkofski, and Wrangell Islands.
Enhancement No habitat enhancement projects specifically intended to benefit black bears have been attempted in the unit. Although primarily intended as a silvicultural practice, precommercial thinning and pruning has been performed in some young, second-growth stands in the unit. While not the primary intent, this effort does provide a secondary benefit to wildlife by improving and extending habitat suitability in the short-term by reducing canopy cover, which permits sunlight to reach the forest floor and increase the production of understory forage plants. These benefits are relatively short-lived, approximately 20–25 years, after which time canopy closure again results in loss of understory vegetation. The long-term effects of clearcut logging will be detrimental to black bear populations.
NONREGULATORY MANAGEMENT PROBLEMS/NEEDS Nuisance Bear Problems. Black bears in close proximity to human settlements quickly learn to seek out human-related food sources, including livestock, pet food, and improperly secured

100
garbage. During this report period there were no documented instances of a black bear being killed in the unit under defense of life and property (DLP) regulations. This represents a significant decline from the 23 bears killed under DLP regulations during the 1998–2000 report period. Historically, the majority of documented DLPs occur during late summer and early fall, when bears are drawn into communities as a result of improper waste management and the declining availability of natural food sources.
It is likely that additional DLPs in Wrangell and Kake went unreported. In 1998 ADF&G and the Petersburg Police Department (PPD) entered into a cooperative Black Bear Response Program. Under the terms of this agreement, PPD must report any bears destroyed due to public safety concerns. In the absence of similar agreements between ADF&G and the City of Wrangell and the Organized Village of Kake, DLPs in these communities have a higher likelihood of going unreported. For example, we continue to receive occasional reports of carcasses or remains of bears at the Kake landfill. While it is unclear if these mortalities are the result of DLPs or other legal or illegal harvests, the presence of unsealed skulls and hides with carcasses suggests that some of these mortalities were not the result of legal harvests.
CONCLUSIONS AND RECOMMENDATIONS The Unit 3 black bear harvest increased at a rate of 7% annually from 1990 to 2000 before peaking at 309 bears in 2000–01. During the same period, the Kuiu Island harvest increased at a rate of 9% annually peaking at 168 bears in 1999–00. In fall 2000, due to concerns over the steadily increasing harvest of black bears by nonresident hunters, the Board of Game established a nonresident harvest guideline of 120 bears per year on Kuiu Island. In 2001, the first year implemented, the new harvest guideline resulted in the emergency closure of the entire fall nonresident season on Kuiu. Since implementation of the 120-bear nonresident harvest guideline, the Kuiu harvest has stabilized and averaged 112 bears annually. In conjunction with the harvest guideline, in 2002 the USFS implemented a moratorium on increases in the number of guides permitted to operate on Kuiu and the number of hunts each was allowed to conduct. These actions also served to stabilize the annual black bear harvest on the island. In 2006, largely as a result of complaints from big game guides about hunt crowding issues, the USFS also froze the number of guide use authorizations for black bear hunting in all of Unit 3 at current levels pending completion of guide use capacity analysis.
The unitwide harvest of 198 bears in 2004–05 was the lowest since 1992–93, and the average annual harvest of 219 bears annually during this report period was below the preceding 10-year average of 254 bears annually. The reason for the unusually low harvests in 2004–05 remains unclear. There is currently no mandatory hunt reporting requirement for unsuccessful black bear hunters. In the absence of information from this group of hunters we are currently unable to evaluate whether the unusually low harvest that year was the result of reduced effort or low hunter success, or if other environmental factors such as atypical winter or spring weather conditions contributed to the low harvests.
In order to ensure that the bear population is managed on a sustained yield basis, additional research is needed to estimate the black bear population in the unit, particularly on Kupreanof Island. Research is also needed to identify possible correlations between sealing data and population trends. A better understanding of the short- and long-term impacts of clearcut logging
101
on black bear populations is needed. Some estimate of black bear mortality as a result of wounding loss is needed.
In the wake of steadily increasing harvest by nonresident hunters, ensuring that black bear populations are managed within sustainable harvest limits will remain a formidable challenge for wildlife managers. Although the Unit 3 black bear harvest dropped below the preceding 10 year average, the percentage of males in the harvest met the management objective. The average male skull size met the management objective in 2005–06 and 2006–07 and was only slightly below the objective in 2004–05. No management or regulatory changes are recommended at this time.
LITERATURE CITED ERICKSON A.W., B.M. HANSON, AND J.J. BRUEGGEMNAN. 1982. Black bear denning study,
Mitkof Island, Alaska. University of Washington School of Fisheries. Seattle. 86pp.
GARCHELIS, D.L. AND L.G. VISSER. 1997. Enumerating megapopulations of wild bears with an ingested biomarker. Journal of Wildlife Management 61:466–480.
JOHNSON, R.H. 1964. The tetracyclines: A review of the literature – 1948 through 1963. Journal of Oral Therapy and Pharmacology 1:190–217.
PEACOCK E. 2004. Population, genetic and behavioral studies of black bear (Ursus americanus) in Southeast Alaska. Ph.D. dissertation. University of Nevada, Reno.
POELKER R.J. AND H.D. HARTWELL. 1973. Black bear of Washington. Biol. Bull. No. 14. Federal Aid Project W-71-R. Olympia, Washington. 180pp.
SURING L.H., E.J. DEGAYNER, R.W. FLYNN, T. MCCARTHY, M.L. ORME, R.E. WOOD, AND E.L. YOUNG. 1988. Habitat capability model for black bear in southeast Alaska. U.S. Forest Service, Tongass National Forest. 27pp.
PREPARED BY: SUBMITTED BY: Richard E. Lowell Neil Barten Wildlife Biologist III Regional Management Coordinator Please cite any information taken from this section, and reference as: LOWELL R.E. 2008. Unit 3 black bear management report. Pages 92–111 in P. Harper, editor. Black bear management report of survey and inventory activities 1 July 2004–30 June 2007. Alaska Department of Fish and Game. Project 17.0. Juneau, Alaska.

102
TABLE 1 Unit 3 black bear harvest, 1999–2006
Hunter kill Nonhunting killa Total estimated kill
M F (%) Unk. Total Over bait M F Unk. M (%) F (%) Unk. Total
Fall 99 29 31 52 0 60 NA 0 4 3 29 45 35 55 3 67
Spring 00 195 32 14 0 227 2 0 0 0 195 86 32 14 0 227
Total 224 63 22 287 2 0 4 3 224 77 67 23 3 294
Fall 00 47 24 34 0 71 NA 1 2 2 48 65 26 35 2 76
Spring 01 203 35 15 0 238 2 0 0 0 203 85 35 15 0 238
Total 250 59 19 0 309 2 1 2 2 251 80 61 20 2 314
Fall 01 28 20 42 0 48 NA 0 0 0 28 58 20 42 0 48
Spring 02 201 37 16 0 238 1 0 0 1 201 84 37 16 1 239
Total 229 57 20 0 286 1 0 0 1 229 80 57 20 1 287
Fall 02 24 19 44 0 43 NA 0 0 2 24 56 19 44 2 45
Spring 03 147 38 21 0 185 2 0 0 0 147 79 38 21 0 185
Total 171 57 25 0 228 2 0 0 2 171 75 57 25 2 230 Table 1 continues next page

103
TABLE 1 continued Hunter kill Nonhunting killa Total estimated kill
M F (%) Unk. Total Over bait M F Unk. M (%) F (%) Unk. Total
Fall 03 25 13 34 0 38 NA 1 0 0 26 67 13 33 0 39
Spring 04 135 34 20 0 169 5 0 0 0 135 80 34 20 0 169
Total 160 47 23 0 207 5 1 0 0 161 77 47 23 0 208
Fall 04 34 17 33 0 51 NA 0 0 0 34 67 17 33 0 51
Spring 05 115 32 22 0 147 4 0 0 0 115 78 32 22 0 147
Total 149 49 25 0 198 4 0 0 0 149 75 49 25 0 198
Fall 05 34 28 45 0 62 NA 0 0 0 34 55 28 45 0 62
Spring 06 137 29 17 0 166 0 0 0 0 137 83 29 17 0 166
Total 171 57 25 0 228 0 0 0 0 171 75 57 25 0 228
Fall 06 35 17 33 0 52 NA 0 0 0 35 67 17 33 0 52
Spring 07 153 27 15 0 180 2 0 0 0 153 85 27 15 0 180
Total 188 44 19 0 232 2 0 0 0 188 81 44 19 0 232 a Includes DLP kills, research mortalities, and other known human-caused accidental mortality.

104
TABLE 2 Unit 3 harvested black bear mean skull sizea, 1995–2006
Regulatory year
Males n Females n
1995–1996 18.3 182 16.5 45
1996–1997 18.2 179 16.5 48
1997–1998 18.3 192 16.5 45
1998–1999 18.6 232 16.6 48
1999–2000 18.5 216 16.7 60
2000–2001 18.5 249 16.9 58
2001–2002 18.5 222 16.8 57
2002–2003 18.3 167 16.8 56
2003–2004 18.5 157 16.6 45
2004–2005 18.3 148 16.7 49
2005–2006 18.6 168 16.7 56
2006–2007 18.6 184 16.4 43 a Skull size = total length + zygomatic width in inches. TABLE 3 Unit 3 harvested black bear mean age, 1995–2006
Regulatory year
Males n Females N
1995–1996 7.2 179 9.7 46
1996–1997 7.2 180 8.2 49
1997–1998 6.8 181 8.5 42
1998–1999 7.3 222 8.5 46
1999–2000 7.4 217 9.4 59
2000–2001 7.2 245 9.3 58
2001–2002 7.3 228 9.3 57
2002–2003 7.4 171 9.1 57
2003–2004 N/A N/A
2004–2005 7.4 148 9.3 49
2005–2006 8.0 166 10.1 53
2006–2007 8.2 180 9.3 41

105
TABLE 4 Unit 3 harvested black bear mean days hunted per successful hunter, 1995–2006a
Regulatory year
Total days Total hunters Average days hunted
1995–1996 682 231 3.0
1996–1997 663 233 2.8
1997–1998 720 242 3.0
1998–1999 892 292 3.1
1999–2000 871 282 3.1
2000–2001 930 309 3.0
2001–2002 964 286 3.4
2002–2003 775 228 3.4
2003–2004 682 207 3.3
2004–2005 651 195 3.3
2005–2006 696 223 3.1
2006–2007 751 227 3.3 aTotals do not include DLP.

106
TABLE 5 Unit 3 black bear hunter harvest by island and density, 1995–2006
Kupreanof Kuiu Mitkof 1090 mi2 746 mi2 211 mi2
Regulatory Percent
of Average mi2/bear
kill Percent
of Average mi2/
bear kill Percent
of Average mi2/
bear kill year Kill Unit 3 Male Female Kill Unit 3 Male Female Kill Unit 3 Male Female 1995 91 39 16 50 124 53 7 36 9 4 35 70
1996 71 30 19 78 129 55 8 25 20 9 14 42
1997 74 30 18 73 151 62 6 26 8 3 30 211
1998 107 37 12 78 161 55 6 25 11 4 26 70
1999 104 38 13 52 168 59 6 19 5 2 42 No females
2000 124 40 11 40 165 53 6 25 10 3 26 106
2001 161 56 9 29 106 37 8 41 14 5 18 106
2002 97 43 15 42 111 49 9 26 11 5 19 No females
2003 69 33 21 64 121 58 8 31 13 6 26 42
2004 77 39 19 55 114 58 9 27 2 1 106 No females
2005 108 47 15 33 107 47 9 36 8 4 35 106
2006 104 45 14 39 110 47 8 57 11 5 26 70

107
TABLE 6 Unit 3 black bear mean male skull sizea and percent of harvest by major island and season, 2001–2006
2001 2002 2003 Island Season Nr
males (%) Average n Nr
males(%) Average n Nr
males(%) Average n
Kupreanof Fall 22 55 17.8 22 10 59 18.8 10 3 60 18.7 2
Spring 102 84 18.4 97 61 76 18.2 58 49 77 18.5 49
Total 124 77 18.3 119 71 73 18.3 68 52 75 18.5 51
Kuiu Fall 3 60 18.0 3 8 42 17.0 8 21 72 17.9 20
Spring 85 84 18.8 84 74 80 18.5 74 76 83 18.6 75
Total 88 83 18.8 87 82 74 18.4 82 97 80 18.5 95
Mitkof Fall 2 100 19.0 2 5 100 16.8 5 1 33 15.5 1
Spring 10 83 17.2 9 6 100 17.5 5 7 70 17.5 7
Total 12 86 17.5 11 11 100 17.1 10 8 62 17.2 8

108
TABLE 6 continued 2004 2005 2006
Island Season Nr males
(%) Average n Nr males
(%) Average n Nr males
(%) Average n
Kupreanof Fall 11 61 17.6 11 17 50 18.0 17 11 50 17.4 11
Spring 37 67 18.2 37 58 78 18.8 58 65 79 19.0 62
Total 48 71 18.1 48 75 69 18.6 75 76 73 18.7 73
Kuiu Fall 21 58 18.3 21 12 57 17.8 11 21 84 18.2 21
Spring 64 83 18.7 64 74 86 18.8 73 76 89 18.8 75
Total 85 75 18.6 85 86 81 18.7 84 97 88 18.7 96
Mitkof Fall 0 0 0 0 3 60 17.4 3 3 60 16.3 3
Spring 2 100 17.0 1 3 100 18.9 3 5 83 18.7 5
Total 2 100 17.0 1 6 75 18.2 6 8 73 17.8 8 aSkull size = total length + zygomatic width.

109
TABLE 7 Unit 3 black bear successful hunter residency, 1995–2006
Regulatory Local Nonlocal Total year residenta (%) resident (%) Nonresident (%) successful hunters
1995–1996 34 14 51 22 151 64 236
1996–1997 41 18 38 16 154 66 233
1997–1998 31 13 41 17 172 70 244
1998–1999 45 15 41 14 206 71 292
1999–2000 25 9 31 11 231 80 287
2000–2001 27 9 36 12 246 80 309
2001–2002 28 10 44 15 214 75 286
2002–2003 24 11 29 13 175 77 228
2003–2004 12 6 16 8 179 86 207
2004–2005 8 4 19 10 168 86 195
2005–2006 15 7 11 5 197 88 223
2006–2007 10 4 34 15 183 81 227 aLocal residents are those that reside in Petersburg, Wrangell, or Kake.

110
TABLE 8 Unit 3 black bear harvest chronology by percent, 1995–2006 Regulatory Month
year September October November December March April May June July n 1995–1996 17 2 0 0 0 10 57 13 1 236
1996–1997 22 1 1 0 0 9 57 10 0 233
1997–1998 22 3 1 0 1 14 49 10 0 244
1998–1999 22 3 1 0 0 10 49 15 0 292
1999–2000 19 2 0 0 1 9 50 19 0 287
2000–2001 20 3 0 0 0 16 49 12 0 309
2001–2002 15 1 0 0 0 8 56 20 0 286
2002–2003 16 1 0 0 0 11 51 21 0 228
2003–2004 18 0 0 0 0 12 56 14 0 207
2004–2005 24 2 1 0 0 14 42 18 0 198
2005–2006 25 2 0 0 0 10 43 21 0 228
2006–2007 20 2 0 0 0 3 49 25 0 232

111
TABLE 9 Unit 3 black bear harvest, in percent by transport method, 1995–2006 Regulatory
year Airplane Boat 3-4
wheelerSnowmachine Off-road
vehicle Highwayvehicle
Foot Unknown n
1995–1996 5 78 0 0 <1 15 <1 1 236
1996–1997 7 81 0 0 0 11 1 0 233
1997–1998 7 79 1 0 0 11 2 0 244
1998–1999 8 72 1 0 0 17 2 0 292
1999–2000 2 71 0 0 0 27 0 0 287
2000–2001 3 75 0 0 0 20 2 0 309
2001–2002 1 78 0 0 0 21 0 0 285
2002–2003 1 79 0 0 0 19 1 0 228
2003–2004 7 77 0 0 0 16 0 0 207
2004–2005 8 74 <1 0 <1 17 0 0 198
2005–2006 7 77 0 0 0 14 1 0 228
2006–2007 7 70 1 0 2 19 1 0 232

112
WILDLIFE Alaska Department of Fish and GameDivision of Wildlife Conservation
MANAGEMENT REPORT (907) 465-4190 P.O. BOX 115526 JUNEAU, AK 99811-5526
BLACK BEAR MANAGEMENT REPORT
From: 1 July 2004 To: 30 June 2007
LOCATION
GAME MANAGEMENT UNIT: 5 (5800 mi2)
GEOGRAPHICAL DESCRIPTION: Cape Fairweather to Icy Bay, Eastern Gulf Coast.
BACKGROUND
Within Game Management Unit 5, black bears are found almost exclusively in Unit 5A. Unit 5B, dominated by the Malaspina Glacier, has accounted for only a few harvested black bears since sealing records have been kept; all have been reported from the head of Disenchantment Bay, at the junction of the subunits 5A and B. “Glacier” (gray pelage color variant) bears occur more frequently in Unit 5 than in other management units, and usually several are harvested each year. The opportunity to harvest one of these unusual bears attracts hunters not only from other parts of Alaska, but also from throughout the world.
HABITAT DESCRIPTION The entire Yakutat Forelands between the coast and the ice fields is potentially good black bear habitat. The forelands contain a variety of habitats, including open sedge meadows, willow flats, mixed stands of spruce and cottonwood, thick stands of spruce and hemlock, riparian stream corridors, beach fringes, and mountainous regions. These habitats contain vegetative forages such as grasses, sedges, devil’s club, skunk cabbage, cow parsnip, blueberries, salmonberries, strawberries, and cranberries, to name a few. In addition, the forelands are rich in salmon, including sockeye, chum, pink, Chinook, and coho. Streams containing salmon are distributed throughout the forelands, and bears have widespread access to fish. There are also eulachon (Thaleichtys pacificus) present in some streams during the early spring. Calf moose might provide additional feeding opportunities in the spring; the forelands harbor an estimated 600–800 moose. In spite of this apparently productive habitat for black bears, they are common only near the mountainous regions due to the presence of numerous brown bears in the remainder of the area. We estimate there are approximately 522 brown bears in Unit 5A (based on a habitat capability model), and they likely displace black bears from lower elevations. Probably the biggest testament to the scarcity of black bears in the non-mountainous regions of the Yakutat Forelands is the near absence of black bears taken during the moose-hunting season. Generally there are moose hunters scattered throughout the forelands, but seldom is a black bear harvested.

113
Habitat alterations and concerns are mostly in the form of successional changes of logged areas. There are 9 townships of land near the town of Yakutat that have been largely logged by clearcutting. These areas are currently in a productive stage for bears in that they contain abundant berry bushes as well as other forage. Although these early successional stages (3–20 years postlogging) provide black bears with an abundance of forage, later stages result in the disappearance of understory forage species as conifer canopies close and light does not penetrate to the forest floor.
HUMAN USE HISTORY Black bears have long been hunted in Unit 5. Statewide black bear sealing began in 1973. Hunters have not needed hunting permits, thus information on the effort of unsuccessful hunters has never been available. We have information only for successful hunts.
Regulatory history Since statehood, black bear hunting season has extended from 1 September through 30 June, and the bag limit for residents has been 2 bears annually, only 1 of which can be a blue or glacier bear. Nonresident bag limits were the same as for residents until 1990, when the nonresident limit was reduced to 1 bear per year. Use of dogs for hunting black bears has been allowed since 1966, although this requires a permit issued by ADF&G. To date no one has ever applied for one of these permits. Since 1996, hunters have had to salvage the edible meat of any black bears they kill in Southeast Alaska during the period 1 January–31 May.
Historical harvest patterns Black bear harvest averaged 14 bears per year during the 1970s. During the 1980s, the average annual harvest increased to 24 bears. The highest harvest occurred in 1985, when hunters took 39 bears. That year was the first that subsistence moose hunting regulations were in place, and nonresidents and many nonlocal residents were prohibited from hunting moose. It may be that many nonlocals chose to hunt black bear rather than abandon their Yakutat area hunting trip entirely. Moose regulations in subsequent years reinstated a nonresident general season.
Annual harvests remained at about 24 black bears through the late 1980s then rose to 33 and 32 bears in 1990 and 1991, respectively; we have no explanation for this spike in harvest. Subsequent annual harvest during 1992–2006 averaged only 17 bears. More glacier bears are taken in the Unit 5 harvest, an average of 2–3 a year, than from other areas of Southeast Alaska. The harvest of glacier bears was 13% of all black bears killed by hunters during 1971–1989, 17% of bears killed during 1990–1997, and 11% of bears killed during 1998–2006.
The spring season often accounts for 100% of the annual harvest, and although baiting is legal in Unit 5, few bears are taken over bait. Nonresidents generally take 50% or more of the bears, with the goal of finding a glacier bear the impetus for hunting black bears in Unit 5. Aircraft and boats are the 2 predominant means of transport for Unit 5 black bear hunters, regularly accounting for more than 90% of reported hunts.
Historical harvest locations There have been no changes in the primary locations where black bears have been killed in Unit 5.

114
MANAGEMENT DIRECTION
MANAGEMENT OBJECTIVES • Maintain a 3:1 male to female ratio in the harvest.
• Maintain a mean annual male skull size (length plus width) of at least 17.0 inches.
METHODS
Staff members of the Departments of Fish and Game and Public Safety sealed black bear hides and skulls. Biological and hunt information collected at the time of sealing included pelage color, sex, skull size (length plus width), date and location of kill, transportation method, and the type of any commercial services used. A premolar was collected from most bears and sent to Matson’s Laboratory in Montana for age determination. Anecdotal information about conditions in the field was gathered at the same time.
RESULTS AND DISCUSSION
POPULATION STATUS AND TREND Population information is not available for Unit 5 black bears, and because only data from successful hunters are available (Tables 1 and 2), effort information is incomplete. Harvest decreased by 27% over the level of the previous reporting period (Table 3). This lower harvest reflects the low harvest in 2004, when only 8 bears were harvested. In 2005 and 2006 the harvest returned to more traditional levels of 20 and 21 respectively. Mean total skull size for male bears was slightly below the previous 3-year mean, but met the management goal of 17.0 inches for the report period. A 3:1 male to female harvest ratio continued to be maintained, with 94% males in the harvest during the report period. The mean age of male and female bears was 9.9 and 9.0 years, respectively. For male bears this represents an increase in age over the 2 previous reports periods of 8.6 and 7.8 years. The female mean age was based only on a sample of three animals, and was close to the two previous report periods of 9.6 and 9.3 years.
Population size No Unit 5 black bear population studies have been conducted. Population size or density estimates are difficult to obtain, and have never been attempted in Unit 5. The species generally inhabits forested areas, where aerial surveys are impractical, and vast remote areas also make studies difficult and expensive. Density estimates for Unit 5 are based on studies conducted in western Washington State in the 1960s (Poelker and Hartwell 1973). We believe minimum densities in mainland Southeast Alaska are slightly higher than the 1.4 bears per mi2 found in the Washington study area. This equates to about 600 black bears in Unit 5A. Although this density is used in Unit 1C, it probably overestimates the number of Unit 5 black bears due to their displacement from some habitats by brown bears.

115
Population composition Our management objective of a 3:1 male to female harvest ratio is aimed at assuring a minimal harvest of female bears. We lack reliable information on the composition of the bear population, but use the indirect index of the harvest sex ratio for insight into the availability of male bears in the population. On a very gross scale, if the female harvest increases, we interpret that as an indication of fewer large male bears available to hunters. Based on the nearly 100% male harvest during this report period, it appears that there is no shortage of male bears in the population.
Glacier bears occur more frequently in Unit 5 than in other management units and are regularly harvested in small numbers. No cinnamon or Kermode (white) pelage black bears have been reported in Unit 5.
Distribution and movements Our most reliable information on Unit 5 black bear distribution comes from hunter harvest. Unit 5B has few black bears, while Unit 5A has black bears distributed throughout. Brown bears are also abundant throughout the unit, and they displace black bears from many non-mountainous locales. Because of this displacement, most of the black bear harvest and observations are either along the coast or in foothills and mountainous areas within the subunit.
One human-caused factor that may affect the Unit 5 black bear distribution is the presence of an open landfill at the city of Yakutat. Black bears have occasionally been seen foraging at the landfill, and some harvest occurs in nearby areas.
MORTALITY Harvest Season Bag Limits
1 Sep–30 June Resident hunters: 2 bears, not more than 1 of which may be a blue or glacier bear.
1 Sep–30 Jun Nonresident hunters: 1 bear.
Game Board Actions and Emergency Orders. No emergency orders were issued relating to black bears in Unit 5 during this report period.
Hunter Effort and Harvest. Black bear harvests ranged from 8 to 21 from 2004 to 2006, averaging 16 per regulatory year (Table 3), a decrease of 6 bears annually over the previous report period. Only 3 female bears were harvested compared to 46 males during the report period, yielding 94% males. This is an extremely high male sex ration, and easily exceeds our management goal of a 3:1 male-to-female sex ratio. Three bears, or approximately 8% of the harvest during this reporting period, were glacier bears (Table 3).
Effort expended by successful hunters per bear killed was 4.3 days compared to 3.2 for the previous report period. Both nonresident and unit resident hunter effort dropped slightly, while other Alaska resident hunters increased slightly (Table 1). Although baiting is a legal method of

116
pursuing black bears during the spring season in Unit 5, our records indicate that there is very little interest in using this method.
Hunter Residency and Success. As with the previous report period, resident hunters took the majority of Unit 5 black bears. The percentage of successful black bear hunters who were nonresidents was 47%, compared to 42% during 2001–2003 (Table 1). Alaskans residing outside of Unit 5 harvested 17%, and Unit 5 residents harvested 37% of the bears taken.
Harvest Chronology. Historically, most Unit 5 black bears have been harvested during the spring. This trend continued through this report period, with all 49 bears harvested taken in spring. The reason for the concentrated spring harvest has to do with black bear accessibility. In spring black bears forage along beaches that hunters can access by boat, allowing them to effectively hunt large areas fairly easily. In the fall, however, bears are much harder to locate and access because they are foraging on fish streams bordered by dense vegetation or in mountainous terrain that is difficult to access.
Harvest in Particular Areas (WAAs). No changes stand out in analysis of the harvest distribution, although different WAAs were the big producers in different years (Table 4). The area near Yakutat Bay on the Puget Peninsula (WAA’s 4506 and 4508) always accounts for a large portion of the harvest and did again during this report period, with 57% of the harvest coming from that area. Hunters can easily access this area from small skiffs, and are never far from protected waters. By boating along, they can scan miles of shoreline or hillside, increasing their chances of locating a bear. Another area in which hunters consistently harvest black bears is the foothills of the Brabazon Mountains (WAA 4503). During the report period, 24% of the harvest came from this area. Although the access in this area isn’t nearly as easy as WAA 4506 and 4508, hunters still manage to get to bears using boats and in some cases small airplanes. Several hunting guides offer fly in hunting opportunities in this area.
Bait Stations. Although baiting is legal during the Unit 5 spring season, we did not issue any permits for this type of hunt.
Guided Hunter Harvest. Guided hunters accounted for 16 of 49 bears harvested, or 33% of the total during the report period. During the previous report period guided hunters took 26% of the harvest. Often, the hunters who hire a guide are searching for a glacier bear, and take a black colored bear only because they fail to find a blue colored animal.
Transport Methods and Commercial Services Used. Boats were the predominant transport means for Unit 5 black bear hunters (Table 1), with 63% of the hunters using this method of transport. Highway vehicles were the second most common, with 18% of the hunters using this method, and only 8% using aircraft. Commercial services were used by 17 (35%) of the 49 successful hunters, with 16 of these using a commercial guide, and 1 other using only transportation to the field (Table 2).
Other mortality We do not have records of any DLP kills, road kills, or illegal kills during the period.

117
HABITAT Assessment Habitat alterations and concerns are mostly in the form of successional changes of logged areas. Future logging on U.S. Forest Service lands is likely to be confined to the area at the southern end of Russell Fjord. Most private land in the Yakutat area has already been logged.
Enhancement
No habitat enhancement projects intended to benefit black bears have been attempted in the unit. Although primarily intended as a silvicultural practice, precommercial thinning and pruning has been performed in some young second growth stands in Unit 5. While not the primary intent, this effort does provide a secondary benefit to wildlife by improving and extending habitat suitability in the short-term by reducing canopy cover which permits sunlight to reach the forest floor and increase the production of understory forage plants. These benefits last only 20–25 years, after which time canopy closure again results in loss of understudy vegetation. The long-term effects of clearcut logging will be detrimental to black bear populations.
NONREGULATORY MANAGEMENT PROBLEMS In small communities, fish camps, and remote areas it is unusual to receive nuisance bear complaints because such issues are often dealt with locally without ADF&G being alerted. We do not believe that we have a significant issue with illegal harvest in Unit 5.
CONCLUSIONS AND RECOMMENDATIONS
The management objective of maintaining a 3:1 male to female harvest ratio was achieved in all three years of this report period. Our objective for male skull size was also met in each of the years. Although the number of black bears harvested from this unit is not large, the increase in local harvest during the last 2 report periods needs to be monitored. Trends in harvest parameters should be looked at critically to keep us abreast of possible conservation concerns.
One project of interest would be to collect DNA samples from black bears in Unit 5, and compare the glacier colored bears with the black colored animals as well as amongst themselves. Given the new advances in DNA analysis, some interesting information on color phases of these bears might be a result of this analysis. With all bears requiring sealing, the tissue collection would be an easy task.
LITERATURE CITED
POELKER R.J. AND H.D. HARTWELL. 1973. Black bear of Washington. Biological Bulletin No. 14. Federal Aid Project W-71-R. Olympia, Washington. 180pp.

118
PREPARED AND SUBMITTED BY: Neil L. Barten Please cite any information taken from this section, and reference as: BARTEN, N. L. 2008. Unit 5 black bear management report. Pages 112–123 in P. Harper, editor. Black bear management report of survey and inventory activities 1 July 2004–30 June 2007. Alaska Department of Fish and Game. Project 17.0. Juneau, Alaska.

119
TABLE 1 Unit 5 residency, mean days hunted, and transportation used by successful black bear hunters, 1997 through 2006
Regulatory year
Unit resident
hunters days
Other AK resident
hunters days
Nonresident hunters days
Total effort
hunters days
Plane
Boat
ORV
Hwy
vehicle
Foot
Unk 1997 5 2.6 0 0.0 9 4.8 14 4.0 2 10 0 1 1 0 1998 1 4.0 10 6.1 13 5.9 24 5.8 13 10 0 0 1 0 1999 6 2.8 2 5.5 12 3.6 20 3.6 5 12 1 0 1 1 2000 2 3.5 1 1.0 13 5.1 16 4.6 3 10 3 0 0 0 2001 13 2.3 4 4.0 10 2.6 27 2.7 4 22 1 0 0 0 2002 12 2.3 1 7.0 8 3.6 21 3.0 0 16 0 5 0 0 2003 8 1.9 1 1.0 10 5.9 19 3.9 3 12 2 2 0 0 2004 3 4.3 2 4.5 3 7.0 8 5.4 0 5 1 2 0 0 2005 10 3.1 3 7.7 7 3.6 20 4.0 2 10 2 6 0 0 2006 5 2.4 3 4.3 13 3.8 21 3.6 2 16 2 1 0 0
1998–2000
Mean
3.0
3.4
4.3
4.2
12.7
4.9
20
4.7
7.0
10.7
1.3
0
0.7
0.3 2001–2003
Mean
11.0
2.2
2.0
4.0
9.3
4.0
22.3
3.2
2.3
16.7
1.0
2.3
0
0 2004–2006
Mean
6.0
3.3
2.7
5.5
7.7
4.8
16.3
4.3
1.3
10.3
1.6
3.0
0
0

120
TABLE 2 Unit 5 commercial services used by successful black bear hunters, 1997 through 2006
Regulatory year
Unit residents
No Yes
Other AK residents
No Yes
Nonresidents
No Yes
Total use
No Yes
Transport Registered
guide 1997 5 0 0 0 2 7 7 7 7 7 1998 1 0 7 3 2 11 10 14 3 10 1999 6 0 1 1 1 11 8 12 2 10 2000 2 0 1 0 0 13 3 13 0 13 2001 13 0 3 1 2 8 18 9 2 7 2002 12 0 0 1 0 8 12 9 2 7 2003 8 0 1 0 0 10 9 10 6 4 2004 3 0 2 0 2 1 7 1 0 1 2005 10 0 3 0 0 7 13 7 0 7 2006 5 0 2 1 5 8 12 9 1 8
1998–2000
Mean
3.0 0
3.0
1.3
1.0
11.7
7.0
13.0
1.6
11.0
2001–2003 Mean
11.0
0
1.3
0.7
0.7
8.7
13.0
9.4
3.3
6.0
2004–2006 Mean
6
0
2.3
.3
2.3
5.3
10.6
5.6
.3
5.3

121
TABLE 3 Unit 5 black bear harvest, 1997 through 2006
Regulatory year
Harvest
Males
Females
Unk.
Male Mean Mean skull (n) age (n)
Female Mean Mean skull (n) age (n)
Color variant black blue
Total 1997 Fall Spring
14 2 12
11 1 10
3 1 2
0 0 0
15.9 13.6 16.1
10 1 9
5.3 6 15.516.914.8
3 1 2
3.0 3 12 2
Total 1998 Fall Spring
24 1 23
24 1 23
0 0 0
0 0 0
17.1 16.3 17.1
21 1 20
8.1 5.0 8.3
18 1 17
-- -- -- - 24 0
Total 1999 Fall Spring
20 0 20
16 0 16
4 0 4
0 0 0
17.6 --
17.6
15 0 15
7.6 15 15.8 3 10.3 3 15 5
Total 2000 Fall Spring
16 0 16
15 0 15
1 0 1
0 0 0
17.2 --
17.2
15
15
6.9 15 15.8 1 6.0 14 2
Total 2001 Fall Spring
27 0 27
24 0 24
3 0 3
0 0 0
17.1 --
17.1
21 0 21
7.7 18 15.9 3 6.0 1 24 3
Total 2002 Fall Spring
21 3 17
18 3 14
3 0 3
0 0 0
17.0 16.6 17.0
17 3 14
8.7 15 15.9 3 13.5 2 18 3
Total 2003 Fall Spring
19 2 17
17 2 15
2 0 2
0 0 0
17.7 16.1 17.9
17 2 15
10.0 12 16.0 2 7.5 2 15 4

122
TABLE 3 continued
Regulatory year
Harvest
Males
Females
Unk.
Male Mean Mean skull (n) age (n)
Female Mean Mean skull (n) age (n)
Color variantBlack Blue
Total 2004 Fall Spring
8 0 8
7 0 7
1 0 1
0 0 0
17.3--
17.3
5 0 5
8.3
4
--- --- ---
0 0 0
10.0
1
7
1
Total 2005 Fall Spring
20 0 20
20 0 20
0 0 0
0 0 0
18.2--
18.2
18 0 18
9.9
14
--- --
---
0 0 0
-- 0
19
1
Total 2006 Fall Spring
21 0 21
19 0 19
2 0 2
0 0 0
17.7--
17.7
18 0 18
10.3
16
16.2 --
16.2
1 0 1
8.5 2
20
1
1998–2000
60
55
5
0
17.3
52
7.8
42
16.3
5
9.3
4
53
7
2001–2003
67
59
8
0
17.2
55
8.6
45
15.9
8
9.6
5
57
10
2004–2006
49
46
3
0
17.9
41
9.9
34
16.2
1
9.0
3
46
3

123
TABLE 4 Unit 5A black bear harvest from all Wildlife Analysis Areas (WAA), regulatory years 1997 through 2006
Regulatory year WAA 1997 1998 1999 2000 2001 2002 2003 2004 2005 2006 Total 2101 0 0 4 0 0 0 2 0 1 0 7 2102 0 3 0 1 0 2 3 0 0 2 11 4503 5 7 4 5 5 4 5 3 8 1 47 4504 0 2 0 0 1 1 0 1 0 0 5 4505 4 1 3 3 4 2 5 0 2 3 27 4506 2 7 5 5 12 3 4 3 4 11 56 4508 4 4 4 1 5 9 0 1 5 4 37 4607 0 0 0 0 0 0 0 0 0 0 0
Unknown 1 0 0 2 0 0 0 0 0 0 3 TOTAL 16 24 20 17 27 21 19 8 20 21 193

124
WILDLIFE Alaska Department of Fish and GameDivision of Wildlife Conservation
MANAGEMENT REPORT (907) 465-4190 P.O. BOX 115526 JUNEAU, AK 99811-5526
BLACK BEAR MANAGEMENT REPORT
From: 1 July 2004 To: 30 June 2007
LOCATION
GAME MANAGEMENT UNIT: 6 (10,140 mi2)
GEOGRAPHIC DESCRIPTION: Prince William Sound and North Gulf of Alaska coast
BACKGROUND Black bears are common throughout most of Unit 6, with the exception of Montague, Hinchinbrook, several smaller islands in Prince William Sound (PWS), and Kayak and Middleton islands along the North Gulf of Alaska Coast (NGC). Density is highest in western PWS and lower in eastern PWS and along the NGC. Modafferi (1978) roughly estimated densities of 0.5, 0.23, and 0.3 bears/km2 in western PWS, eastern PWS, and along the NGC, respectively. Other density estimates for good habitat in PWS have ranged from 0.4 to 10 bears/km2 (Grauvogel 1967; McIlroy 1970; Modafferi 1982). None of these estimates, however, was obtained by methods considered reliable for estimating bear population size or density.
Hunting pressure may have occasionally affected local populations. McIlroy (1970) reported declining harvest and hunter success, and increasing hunter-days per harvested bear indicated a declining black bear population in Valdez Arm (Unit 6D) between 1966 and 1969. Relatively high hunter effort documented by Modafferi (1978) around Whittier in 1977 may also have indicated a reduced population in western Unit 6D. In Unit 6C average skull size of male bears decreased during the mid to late 1990s, coincident with an increase in hunter harvest and effort.
Food abundance and weather conditions can affect black bear populations in Unit 6. Harvest data and incidental observations by guides, charters, and local hunters indicated that distribution and general abundance increased throughout Unit 6 during the mid to late 1990s and was at a high level. High salmon escapement and relatively mild winters probably contributed to the increase. Competition and predation by brown bears also may influence black bear numbers locally. The highest density occurs in western PWS where very few brown bears are present.
Harvest monitoring began in 1973 with mandatory sealing of hides. Before this requirement, annual harvests ranged from “practically nil” (Robards 1954) to more than 100 during 1965 and 1966 (McIlroy 1970). Sealing records indicated an average annual take of 118 bears from 1973 to 1983, 232 from 1984 to 1994, and 294 from 1995 to 2000. The Anton Anderson Memorial Tunnel (Whittier road) opened to highway vehicles in June 2000, which has allowed easier access to bear hunters in Unit 6D. Although the increasing trend in harvest began 4 years before

125
the Whittier road opened, easier access has allowed the number of hunters to continue increasing in Unit 6D.
MANAGEMENT OBJECTIVES The management objective for Unit 6 black bear is to maintain a black bear population that will sustain a 3-year average annual harvest of 200 bears composed of at least 75% males with a minimum average skull size of 17 inches.
METHODS We sealed hides and skulls of all black bears in the reported harvest. Reported harvest included bears taken by licensed hunters and bears killed in defense of life or property. Staff checked each hide for sex identifiers and took skull measurements for total length and zygomatic width. We recorded harvest date, days hunted, transportation used, and location of harvest within Uniform Coding Units (UCUs). UCUs are small, defined areas within Unit 6 bounded by watersheds, islands, or island groups. We estimated unreported and illegal kills. Unreported harvest included wounding loss and bears taken by hunters and not sealed. Tooth samples were collected from bears harvested in Unit 6D to determine age and female reproductive histories (Coy and Garshelis 1992) and compared to age data collected during 1970s and early 1990s. Also in Unit 6D only, we interviewed returning bear hunters and parties in Whittier to determine hunter success.
I assessed population size of black bears in Unit 6D by examining harvest density within UCUs during the last decade. I subtracted alpine rock and ice from the total area of each UCU to obtain a measure of available habitat. Harvest from a given population is either sustainable or not, and hunting pressure is not decreasing in PWS. Therefore, for UCUs in which harvest density decreased during the last decade, I assumed that the population was being harvested at an unsustainable rate of about 20%. For UCUs with increasing or stable harvest density, I assigned density estimates that resulted in a harvest rate of 12% or less. Thus, the approximate lower limit for density assumed that 10 to 20% of the bear population was being harvested. The exceptions, those UCUs with limited hunter activity, were assigned a density of 0.3 – 0.5 bears/km2 (Modafferi 1982). Peacock (2004) estimated a black bear density of 1.51 bears/km2 on Kuiu Island in Southeast Alaska. Bears in PWS have similar food resources to those on Kuiu Island, but because of the more northerly latitude of PWS, I assumed that Kuiu Island density was an approximate upper limit for bear density within UCUs of Unit 6D. I grouped UCUs into Ecological Units (EUs) similar to those established by Modafferi (1982), calculated density estimates for each area, and compared my results to other regions in which reliable density estimates had been obtained.
RESULTS AND DISCUSSION POPULATION STATUS AND TREND Harvest assessment by UCU suggested that black bear densities ranged from 0.25 to 1.6 bears/km2 with an overall density of 0.59 bears/km2 in Unit 6D. Only five of 60 UCUs assessed produced bear densities of ≥ 1.0 bears/km2 in Unit 6D, 3 of which were over 1.5 bears/km2.

126
When pooled into EUs, bear densities ranged from 0.33 to 0.85 bears/km2 (Appendix 1, Table 1). Several UCUs sustained a harvest density greater than reported bear densities from various other populations (Appendix 1, Table 2). Population size indicated by this method was approximately 3,300 bears in Unit 6D.
MORTALITY Harvest Season and Bag Limit. The seasons for Unit 6 were as follows: 6A and B was 20 August–30 June, 6C was 1 September–30 June, and 6D was 1 September–10 June. The bag limit was 1 bear in Unit 6.
Board of Game Actions and Emergency Orders. The Board of Game changed the season closing date for black bears in Unit 6D from June 30 to June 10 beginning in regulatory year 2005. This was an incremental step to limit harvest to 350–400 bears, preceded by prohibiting the shooting of bears from boats (2002) and Alaska Department of Fish and Game (department; ADF&G) implementation of various bear baiting restrictions.
Hunter Harvest. Black bear harvest in Unit 6 is reported in Table 1. The majority of the harvest was male (75–85%), and most bears were taken in Unit 6D (82–86%). Hunter harvest reported during the past five regulatory years averaged 449 bears. The harvest in regulatory year 2006–07 was an all-time high.
Mean skull size among males harvested during the past 3 years was 17.2 inches (Table 2). The largest skulls (average = 18.2 inches) came from Unit 6A, and the smallest (average = 17.1 inches) were reported in Unit 6D. Over the past five years, no trends were obvious.
Unit 6D is of special concern because of high harvest during the last decade and easier access into Prince William Sound from the largest population center of Alaska. Hunter questionnaire surveys indicated a success rate of 45% in Unit 6D. Assessment of harvest by EU indicated a harvest rate of 12.9% of the population (Appendix 1, Table 1). Harvest continued to increase through the reporting period to record highs (Table 1). The proportion of females in the harvest exceeded the management objective of 25% during 2 of the last 5 years. This occurred in 2006 because of a record-high harvest during the fall (Table 1).
Assessing black bear populations using harvest data is fraught with biases (Garshelis 1993). Without a population estimate, however, harvest data must be searched for red flags that indicate possible overharvest, particularly in areas with high harvest pressure such as Unit 6D. The highest indicated harvest rates occurred in EUs 3, 5 and 6 (Appendix 1, Table 1). Harvest increased considerably in these EUs during the late 1990s through early 2000s because of their proximity to Whittier. Harvest has since stabilized at this high level. Average female skull size (an age indicator) in EUs 5, 2, and 7 increased by 0.8, 0.5, and 0.4 in., respectively, during the last decade. Proportion of females in the harvest exceeded the management objective of 25% in 5 of 8 EUs during 2006. These parameters indicated a possible harvest impact on the female population in these areas. Female skull size and percent females harvested showed little change in EU 3 despite high harvest density, suggesting that my bear density estimate was too low.

127
Although average skull size for males remained stable overall, Appendix 1, Figure 1 suggests a negative relationship between harvest density and average male skull size.
Median age of female bears harvested in Unit 6D was 5 years old during the late 1970s and early 1990s. By 2004 median female age had increased to 7 years. Median age dropped by 1 year for both males and females from 2004 to 2005 (Table 2; 2006 teeth still being processed). Median age for males was 6 years for each age-sampling period since the 1970s until 2005, when it dropped to 5 years. Female reproductive histories could be determined from cementum annuli in only 8 of 62 samples. These indicated that the most common age for first successful litter was 5 years (range 4 – 6) and breeding increment was 2 years (range 2 – 3).
Harvest distribution in Unit 6D has changed during the last 10 years. Much of the harvest was focused near Whittier and Valdez during the 1990s but is now distributed to the far reaches of PWS. An increasing number of transporters, fuel-efficient four-stroke engines, and inexpensive GPS (global positioning system) units have contributed to the longer range of bear hunters.
Hunter Residency. Nonresident hunters killed the majority of bears in Units 6A and 6B (Table 3). Nonlocal residents took most bears in Units 6C and 6D. Residency of successful hunters did not change significantly over the past 5 years in Units 6A–C. In Unit 6D the proportion of nonresident harvests was increasing (Table 3). This trend began during the early 1990s, when the proportion of nonresident hunters in Unit 6D was approximately 18%.
Harvest Chronology. Most bears were taken in May during this reporting period (Table 4) and during the past 5 years. Black bears exhibited sexual segregation during the spring (Modafferi 1982). Male black bears in Unit 6D tended to move down to beaches after emerging from winter dens to feed on new sedges and grasses, making them more vulnerable to harvest during this period. Females tended to remain away from beaches, instead favoring south-facing slopes and avalanche chutes that green up early in the season. Both in Alaska (Schwartz et. al. 1986) and Minnesota (Rogers 1987), den emergence was correlated with weather conditions. By the time the fall season opened, most bears were feeding on berries at higher elevations, where they were much less vulnerable to hunting, as indicated by the fall harvest in Table 4. Although fewer bears were harvested in the fall, a higher proportion of females were taken (Table 1). Most bears were in the den by mid October.
Transport Methods. Most successful hunters used boats and airplanes for transportation during the past 3 years (Table 5). Airplanes provided most of the transportation in Units 6A and 6B. Highway vehicles, boats and 4-wheelers were important in Unit 6C, and boats were used most in Unit 6D.
Other Mortality An unknown number of bears were wounded by hunters, not recovered and died (wounding loss). I arbitrarily set the rate of wounding loss at 10–15% of the harvest. This was recorded as part of the estimated unreported kill (Table 1).

128
CONCLUSIONS AND RECOMMENDATIONS Black bear populations and harvest in Units 6A–6C were at acceptable levels. I recommend no changes or management actions.
In unit 6D, where harvest may be impacting the population, I recommend delaying the fall season by 10 days to protect females and limit harvest. It is difficult to predict if the increasing harvest is sustainable because of the lack of a population estimate. We should continue to collect teeth from harvested bears to determine age structure in the harvest and female reproductive histories.
LITERATURE CITED COY, P.L. AND D.L. GARSHELIS. 1992. Reconstructing reproductive histories of black bears from
the incremental layering in dental cementum. Canadian Journal of Zoology 70: 2150–2160.
GARSHELIS, D.L. 1993. Monitoring black bear populations: pitfalls and recommendations. Pages 123-144 in J. A. Keay, Editor. Proceedings of the fourth western black bear workshop. Technical report MPS/NRWR/NRTR-93/12. United States Department of the Interior, National Park Service. Denver, Colorado.
GARSHELIS, D.L. AND L G. VISSER. 1997. Enumerating megapopulations of wild bears with an ingested biomarker. Journal of Wildlife Management 61(2):466–480.
GRAUVOGEL, C.A. 1967. Typewritten report in the files of Alaska Cooperative Wildlife Research Unit.
Kontio, B.D., D.L Garshelis, E.C. Birney, and D.E. Anderson. 1998. Resilience of a Minnesota black bear population to heavy hunting: self-sustaining population or population sink? Ursus 10:139-146.
MCILROY, C.W. 1970. Aspects of the ecology and hunter harvest of the black bear in Prince William Sound. M.S. thesis. University of Alaska, Fairbanks. 69pp.
MILLER, S.D., G.C. WHITE, R.A. SELLERS, H.V. REYNOLDS, J.W. SCHOEN, K. TITUS, V.G. BARNES, JR., R.R. SMITH, W.B. BALLARD, AND C.C. SCHWARATZ. 1997. Brown and black bear density estimation in Alaska using radiotelemetry and replicated mark - resight techniques. Wildlife Monographs No. 193.
MODAFFERI, R.D. 1978. Black bear management techniques development. Alaska Department of Fish and Game. Federal Aid in Wildlife Restoration Progress Report Project. W-17-8 and W-17-9. Juneau. 76pp.
———. 1982. Black bear movement and home range study. Alaska Department of Fish and Game. Federal Aid in Wildlife Restoration Progress Report Project. W-17-10, W-17-11, W-21-1, and W-21-2. Job 17.2R. Juneau. 73pp.

129
PEACOCK, E. 2004. Population, genetic and behavioral studies of black bears Ursus americanus in Southeast Alaska. Ph.D dissertation. University of Nevada, Reno. 216pp.
ROBARDS, F.C. 1954. Annual report: Game, fur and game fish; Cordova, 1953. Unpublished Report, Alaska Game Commission. 31pp.
ROGERS, L.L. 1987. Effects of food supply and kinship on social behavior, movements, and population growth of black bears in northeastern Minnesota. Wildlife Monographs. 97:1–72.
SCHWARTZ, C.C., S.D. MILLER, AND A.W. FRANZMANN. 1986. Denning ecology of three black bear populations in Alaska. International Conference on Bear Research and Management. 7:281–291.
SCHWARTZ, C.C. AND A.W. FRANZMANN. 1991. Interrelationship of black bears to moose and forest succession in the northern coniferous forest. Wildlife Monographs No. 113.
PREPARED BY: SUBMITTED BY: David W. Crowley Gino Del Frate Wildlife Biologist III Management Coordinator Please cite any information taken from this section, and reference as: CROWLEY, D.W. 2008. Unit 6 black bear management report. Pages 124–142 in P. Harper, editor. Black bear management report of survey and inventory activities 1 July 2004–30 June 2007. Alaska Department of Fish and Game. Project 17.0. Juneau, Alaska.

130
TABLE 1 Unit 6 black bear harvest, 2002–2006 Subunit/ Reported Regulatory Hunter kill Nonhunting kill Estimated kill Total estimated kill Year M F (%) Unk. Total Over bait M F Unk. Unreported Illegal M (%) F (%) Unk. Total 6A/2002 Fall 02 5 0 (0) 0 5 0 0 0 0 1 0 5 (100) 0 (0) 1 6 Spring 03 23 2 (8) 0 25 0 0 0 0 3 0 23 (92) 2 (8) 3 28 Total 28 2 (7) 0 30 0 0 0 0 4 0 28 (93) 2 (7) 4 34 6A/2003 Fall 03 4 2 (33) 0 6 0 0 0 0 1 4 (67) 2 (33) 1 7 Spring 04 23 1 (4) 0 24 0 0 0 1 3 23 (96) 1 (4) 4 28 Total 27 3 (10) 0 30 0 0 0 1 4 0 27 (90) 3 (10) 5 35 6A/2004 Fall 04 1 0 (0) 0 1 0 0 0 0 0 0 1 (100) 0 (0) 0 1 Spring 05 23 1 (4) 0 24 0 0 0 0 3 0 23 (96) 1 (4) 3 27 Total 24 1 (4) 0 25 0 0 0 0 3 0 24 (96) 1 (4) 3 28 6A/2005 Fall 05 9 1 (10) 0 10 0 0 0 0 1 0 9 (90) 1 (10) 1 11 Spring 06 30 1 (3) 0 31 12 0 0 0 4 0 30 (97) 1 (3) 4 35 Total 39 2 (5) 0 41 12 0 0 0 5 0 39 (95) 2 (5) 5 46 6A/2006 Fall 06 2 1 (33) 0 3 0 0 0 0 0 0 2 (67) 1 (33) 0 3 Spring 07 49 5 (9) 0 54 0 0 0 0 6 0 49 (91) 5 (9) 6 60 Total 51 6 (11) 0 57 0 0 0 0 7 0 51 (89) 6 (11) 7 64
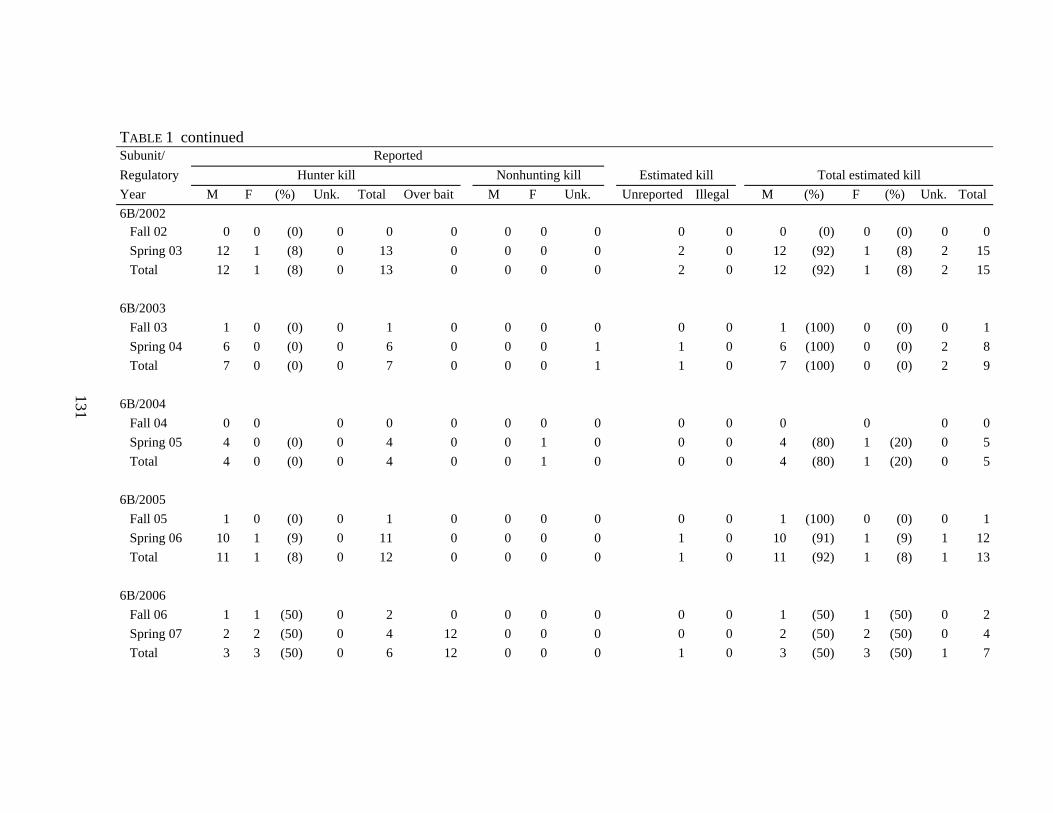
131
TABLE 1 continued Subunit/ Reported Regulatory Hunter kill Nonhunting kill Estimated kill Total estimated kill Year M F (%) Unk. Total Over bait M F Unk. Unreported Illegal M (%) F (%) Unk. Total 6B/2002 Fall 02 0 0 (0) 0 0 0 0 0 0 0 0 0 (0) 0 (0) 0 0 Spring 03 12 1 (8) 0 13 0 0 0 0 2 0 12 (92) 1 (8) 2 15 Total 12 1 (8) 0 13 0 0 0 0 2 0 12 (92) 1 (8) 2 15 6B/2003 Fall 03 1 0 (0) 0 1 0 0 0 0 0 0 1 (100) 0 (0) 0 1 Spring 04 6 0 (0) 0 6 0 0 0 1 1 0 6 (100) 0 (0) 2 8 Total 7 0 (0) 0 7 0 0 0 1 1 0 7 (100) 0 (0) 2 9 6B/2004 Fall 04 0 0 0 0 0 0 0 0 0 0 0 0 0 0 Spring 05 4 0 (0) 0 4 0 0 1 0 0 0 4 (80) 1 (20) 0 5 Total 4 0 (0) 0 4 0 0 1 0 0 0 4 (80) 1 (20) 0 5 6B/2005 Fall 05 1 0 (0) 0 1 0 0 0 0 0 0 1 (100) 0 (0) 0 1 Spring 06 10 1 (9) 0 11 0 0 0 0 1 0 10 (91) 1 (9) 1 12 Total 11 1 (8) 0 12 0 0 0 0 1 0 11 (92) 1 (8) 1 13 6B/2006 Fall 06 1 1 (50) 0 2 0 0 0 0 0 0 1 (50) 1 (50) 0 2 Spring 07 2 2 (50) 0 4 12 0 0 0 0 0 2 (50) 2 (50) 0 4 Total 3 3 (50) 0 6 12 0 0 0 1 0 3 (50) 3 (50) 1 7

132
TABLE 1 continued Subunit/ Reported Regulatory Hunter kill Nonhunting kill Estimated kill Total estimated kill Year M F (%) Unk. Total Over bait M F Unk. Unreported Illegal M (%) F (%) Unk. Total 6C/2002 Fall 02 4 4 (50) 0 8 0 0 0 1 1 0 4 (50) 4 (50) 2 10 Spring 03 12 2 (14) 0 14 1 0 0 0 2 0 12 (86) 2 (14) 2 16 Total 16 6 (27) 0 22 1 0 0 1 3 0 16 (73) 6 (27) 4 26 6C/2003 Fall 03 4 6 (60) 0 10 0 2 0 0 1 0 6 (50) 6 (50) 1 13 Spring 04 16 2 (11) 0 18 2 0 0 0 2 0 16 (89) 2 (11) 2 20 Total 20 8 (29) 0 28 2 2 0 0 3 0 22 (73) 8 (27) 3 33 6C/2004 Fall 04 4 0 (0) 0 4 0 0 0 2 0 0 4 (100) 0 (0) 2 6 Spring 05 16 2 (11) 0 18 4 0 0 0 2 0 16 (89) 2 (11) 2 20 Total 20 2 (9) 0 22 4 0 0 2 3 0 20 (91) 2 (9) 5 27 6C/2005 Fall 05 1 3 (75) 0 4 0 0 0 0 0 0 1 (25) 3 (75) 0 4 Spring 06 26 7 (21) 0 33 4 0 0 0 4 0 26 (79) 7 (21) 4 37 Total 27 10 (27) 0 37 4 0 0 0 4 0 27 (73) 10 (27) 4 41 6C/2006 Fall 06 5 4 (44) 0 9 0 5 2 1 1 0 10 (63) 6 (38) 2 18 Spring 07 21 6 (22) 0 27 4 0 1 0 3 0 21 (75) 7 (25) 3 31 Total 26 10 (28) 0 36 4 5 3 1 4 0 31 (70) 13 (30) 5 49

133
TABLE 1 continued Subunit/ Reported Regulatory Hunter kill Nonhunting kill Estimated kill Total estimated kill year M F (%) Unk. Total Over bait M F Unk. Unreported Illegal M (%) F (%) Unk. Total 6D/2002 Fall 02 46 27 (37) 0 73 0 0 0 0 9 10 46 (63) 27 (37) 19 92 Spring 03 182 69 (27) 0 251 27 0 0 0 30 0 182 (73) 69 (27) 30 281 Total 228 96 (30) 0 324 27 0 0 0 39 10 228 (70) 96 (30) 49 373 6D/2003 Fall 03 23 28 (55) 0 51 0 1 1 2 6 24 (45) 29 (55) 8 61 Spring 04 249 51 (17) 2 302 59 0 0 0 36 249 (83) 51 (17) 38 338 Total 272 79 (23) 2 353 59 1 1 2 42 0 273 (77) 80 (23) 46 399 6D/2004 Fall 04 17 8 (32) 0 25 0 0 0 0 3 0 17 (68) 8 (32) 3 28 Spring 05 247 45 (15) 0 292 53 1 0 0 35 0 248 (85) 45 (15) 35 328 Total 264 53 (17) 0 317 53 1 0 0 38 0 265 (83) 53 (17) 38 356 6D/2005 Fall 05 38 13 (25) 0 51 0 0 0 0 6 0 38 (75) 13 (25) 6 57 Spring 06 299 64 (18) 0 363 34 4 0 0 44 1 303 (83) 64 (17) 45 412 Total 337 77 (19) 0 414 34 4 0 0 50 1 341 (82) 77 (18) 51 469 6D/2006 Fall 06 59 46 (44) 0 105 0 2 1 0 13 0 61 (56) 47 (44) 13 121 Spring 07 283 78 (22) 1 362 52 0 0 0 43 1 283 (78) 78 (22) 45 406 Total 342 124 (27) 1 467 52 2 1 0 56 1 344 (73) 125 (27) 58 527

134
TABLE 1 continued Subunit/ Reported Regulatory Hunter kill Nonhunting kill Estimated kill Total estimated kill year M F (%) Unk. Total Over bait M F Unk. Unreported Illegal M (%) F (%) Unk. Total TOTAL 2002 Fall 02 55 31 (36) 0 86 0 0 0 0 10 10 56 (64) 31 (36) 20 107 Spring 03 229 74 (24) 0 303 28 0 0 0 36 0 229 (76) 74 (24) 36 339 Total 284 105 (27) 0 389 28 0 0 0 47 10 285 (73) 105 (27) 57 447 2003 Fall 03 32 36 (53) 0 68 0 3 1 0 8 0 35 (49) 37 (51) 8 80 Spring 04 294 54 (16) 2 350 61 0 0 2 42 0 294 (84) 54 (16) 46 394 Total 326 90 (22) 2 418 61 3 1 2 50 0 329 (78) 91 (22) 54 474 2004 Fall 04 22 8 (27) 0 30 0 0 0 0 4 0 22 (73) 8 (27) 4 34 Spring 05 290 48 (14) 0 338 57 1 1 0 41 0 291 (86) 49 (14) 41 381 Total 312 56 (15) 0 368 57 1 1 0 44 0 313 (85) 57 (15) 44 414 2005 Fall 05 49 17 (26) 0 66 0 0 0 0 8 0 49 (74) 17 (26) 8 74 Spring 06 365 73 (17) 0 438 50 4 0 0 53 1 369 (83) 73 (17) 54 496 Total 414 90 (18) 0 504 50 4 0 0 60 1 418 (82) 90 (18) 61 569 2006 Fall 06 67 52 (44) 0 119 0 7 3 1 14 0 74 (57) 55 (43) 15 144 Spring 07 355 91 (20) 1 447 68 0 1 0 54 1 355 (79) 92 (21) 56 503 Total 422 143 (25) 1 566 68 7 4 1 68 1 429 (74) 147 (26) 71 647

135
TABLE 2 Unit 6 black bear harvest mean skull size (length + width), 2002–2006, and median age (years) in Unit 6D only
Regulatory Males Females Subunit year Skull (in) n Age n Skull (in) n Age n 6A 2002–03 17.87 28 15.50 2 2003–04 17.97 25 16.73 3 2004–05 18.20 24 16.19 1 2005–06 18.26 37 15.69 2 2006–07 18.25 47 16.37 5 6B 2002–03 18.21 12 16.69 1 2003–04 17.84 7 0 2004–05 17.14 4 0 2005–06 18.39 11 15.38 1 2006–07 17.56 3 16.21 3 6C 2002–03 16.52 14 15.42 6 2003–04 17.19 22 15.48 7 2004–05 18.17 20 15.44 1 2005–06 17.15 26 15.13 10 2006–07 16.96 25 15.63 9 6D 2002–03 17.10 219 15.60 96 2003–04 17.01 262 15.59 78 2004–05 17.30 304 6 207 15.95 53 7 35 2005–06 16.90 324 5 84 15.53 74 6 27 2006–07 17.03 331 15.72 122 Unit 6 2002–03 17.12 273 15.59 105 Total 2003–04 17.12 316 15.54 88 2004–05 17.43 352 15.95 55 2005–06 17.09 398 15.48 87 2006–07 17.17 406 15.75 139

136
TABLE 3 Unit 6 black bear successful hunter residency, 2002–2006 Regulatory Local resident a Nonlocal resident Nonresident Total successfulSubunit year Nr. (%) Nr. (%) Nr. (%) hunters b 6A 2002–03 4 (13) 3 (10) 23 (77) 30 2003–04 1 (3) 7 (23) 22 (73) 30 2004–05 0 2 (8) 23 (92) 25 2005–06 2 (5) 4 (10) 35 (85) 41 2006–07 0 10 (18) 47 (82) 57 6B 2002–03 2 (15) 4 (31) 7 (54) 13 2003–04 2 (29) 2 (29) 3 (43) 7 2004–05 0 2 (50) 2 (50) 4 2005–06 0 3 (25) 9 (75) 12 2006–07 1 (17) 2 (33) 3 (50) 6 6C 2002–03 11 (50) 6 (27) 5 (23) 22 2003–04 6 (21) 13 (46) 9 (32) 28 2004–05 8 (36) 9 (41) 5 (23) 22 2005–06 8 (22) 21 (57) 8 (22) 37 2006–07 18 (50) 6 (17) 12 (33) 36 6D 2002–03 32 (10) 185 (57) 106 (33) 324 2003–04 36 (10) 186 (53) 127 (36) 353 2004–05 20 (6) 184 (58) 113 (36) 317 2005–06 21 (5) 228 (55) 165 (40) 414 2006–07 35 (7) 252 (54) 179 (38) 467 Unit 6 2002–03 49 (13) 198 (51) 141 (36) 389 Total 2003–04 45 (11) 208 (50) 161 (39) 418 2004–05 28 (8) 197 (54) 143 (39) 368 2005–06 31 (6) 256 (51) 217 (43) 504 2006–07 54 (10) 270 (48) 241 (43) 566 a Residents of Unit 6. b Total includes hunters with unknown residency and subunit.

137
TABLE 4 Unit 6 black bear harvest chronology percent by harvest period, 2002–2006 Harvest periods a Regulatory September October April May June Subunit year 1–15 16–30 1–15 16–31 1–15 16–30 1–15 16–31 1–15 16–30 n 6A 2002–03 10 3 3 0 0 3 43 33 3 0 30 2003–04 13 3 3 0 0 10 37 33 0 0 30 2004–05 0 0 0 0 0 16 36 44 0 0 25 2005–06 2 22 0 0 0 12 34 29 0 0 41 2006–07 0 4 0 0 0 9 25 33 21 7 57 6B 2002–03 0 0 0 0 0 15 54 31 0 0 13 2003–04 14 0 0 0 0 0 29 57 0 0 7 2004–05 0 0 0 0 0 25 25 50 0 0 4 2005–06 0 8 0 0 0 0 42 25 25 0 12 2006–07c 0 0 17 0 0 0 17 50 0 0 6 6C 2002–03 9 18 9 0 0 0 27 18 18 0 22 2003–04 25 7 4 0 4 0 36 11 7 7 28 2004–05 5 14 0 0 0 5 55 23 0 0 22 2005–06 8 0 3 0 0 0 16 62 3 8 37 2006–07 17 0 8 0 0 6 19 44 6 0 36 6D 2002–03 11 7 3 1 0 1 19 44 11 2 324 2003–04 9 3 2 0 0 0 17 46 19 3 353 2004–05 6 2 1 0 0 1 21 48 20 2 317 2005–06 8 3 0 0 0 0 15 59 13 0 414 2006–07 16 6 1 0 0 0 18 40 19 1 467 Unit 6 2002–03 11 7 3 1 0 2 22 42 10 2 389 Totalb 2003–04 11 3 2 0 0 1 20 43 16 3 418 2004–05 5 2 1 0 0 2 24 46 17 2 368 2005–06 8 5 1 0 0 1 17 56 12 1 504 2006–07 14 5 2 0 0 1 19 39 18 1 566 a Bears were not taken during November–March. b Total includes bears taken in unknown subunits. c 1 bear (17%)was taken during August 16-31.

138
TABLE 5 Unit 6 black bear harvest percent by transport method, 2002–2006 Percent of harvest Regulatory 3- or 4- Snow- Highway Subunit year Airplane Horse Boat wheeler machine ORV Vehicle Unknown n 6A 2002–03 93 0 0 0 0 0 3 3 29 2003–04 87 0 3 3 0 0 7 0 30 2004–05 88 0 12 0 0 0 0 0 25 2005–06 49 0 39 10 0 0 2 0 41 2006–07 33 0 47 11 0 0 0 9 57 6B 2002–03 46 0 8 15 0 0 31 0 13 2003–04 43 0 29 14 14 0 0 0 7 2004–05 25 0 0 25 0 0 50 0 4 2005–06 75 0 0 8 0 0 17 0 12 2006–07 20 0 0 0 0 0 80 0 5 6C 2002–03 0 0 18 23 0 0 55 5 22 2003–04 4 0 11 11 0 0 57 18 28 2004–05 5 0 5 32 0 0 55 5 22 2005–06 5 0 19 11 0 0 59 5 37 2006–07 0 0 28 19 0 0 50 3 36

139
TABLE 5 continued Percent of harvest Regulatory 3- or 4- Highway Subunit year Airplane Horse Boat Wheeler Snowmachine ORV Vehicle Unknown n 6D 2002–03 3 0 87 3 0 0 4 3 324 2003–04 3 0 89 3 0 0 4 1 353 2004–05 2 0 93 2 0 0 2 0 317 2005–06 3 0 92 2 0 0 2 1 414 2006–07 3 0 89 5 0 0 2 1 467 Unit 6 2002–03 11 0 74 5 0 0 7 3 388 Total a 2003–04 10 0 77 4 0 0 8 2 418 2004–05 8 0 82 4 0 0 6 0 368 2005–06 8 0 80 3 0 0 7 1 504 2006–07 6 0 80 6 0 0 5 2 565 a Total includes bears taken in unknown subunits.

140
APPENDIX 1 TABLE 1 Results of Unit 6D black bear density assessment. Bear density results are speculative and should not be considered actual estimates of population or density.
3-year average 2004–2006
Change in 3-year average harvests Density assessment, 3-year average
Ecological Unit
Hunter
kill
Harvest density
(kill/km2) a
1995–97
minus 1992–94
1998–00 minus
1995–97
2001–03 minus
1998–00
2004–06 minus
2001–03
Bear density (bears/km2)
Estimated population
size
Theoretical harvest rate (%)
1) Eastern PWS 35 0.04 +2 +15 +5 +1 0.37 398 9.7
2) Valdez Arm 56 0.06 +5 +16 +7 +3 0.47 466 13.3
3) Esther Is. – Columbia Gl. 101 0.09 +2 +25 +39 +4 0.60 745 15.0
4) Port Wells/ College Fiord 34 0.04 -5 +14 -6 +10 0.36 269 11.0
5) Passage Canal – Kings Bay 61 0.10 +1 +27 –1 +3 0.65 439 15.3
6) Southwest PWS Mainland 52 0.12 +10 +8 +18 +2 0.85 402 14.5
7) SW PWS Islands 45 0.06 +3 +6 +10 +12 0.63 450 8.9
8) Knight Island 14 0.05 -1 +2 +9 +1 0.33 111 13.9
Total PWS 398 0.07 +17 +113 +82 +35 0.59 3280 12.9 a Reported harvest plus 15% wounding loss

141
APPENDIX 1 (CONTINUED) TABLE 2 Various estimates of black bear density and harvest density. Source/location Bears/km2 Bears/mi2 Black bear density estimates
Prince William Sound, UCU analysisa 0.59 1.53
Modafferi 1982, western PWS a 0.50 1.30
Peacock 2004, Kuiu Island, Southeast Alaska 1.51 3.90
Schwartz and Franzmann (1991), Kenai 1947 burn 0.21 0.53
Schwartz and Franzmann (1991), Kenai 1969 burn 0.27 0.69
Kontio et al. 1998, central Minnesota 0.33 0.85
Miller et al. 1997, Mid Susitna River Basin 0.09 0.23
Sustained harvest densities (kills/km2), selected from western Prince William Soundb
Esther Is. and Passage: average 2004–2006 0.23 0.60
Cullross Island: average 2004–2006 0.18 0.47
Whale Bay: average 2004–2006 0.21 0.54
Average harvest density in Unit 6D 2004–2006 0.08 0.21
a Not a true estimate, based on unverified assumptions. b Reported harvest plus 15% wounding loss.
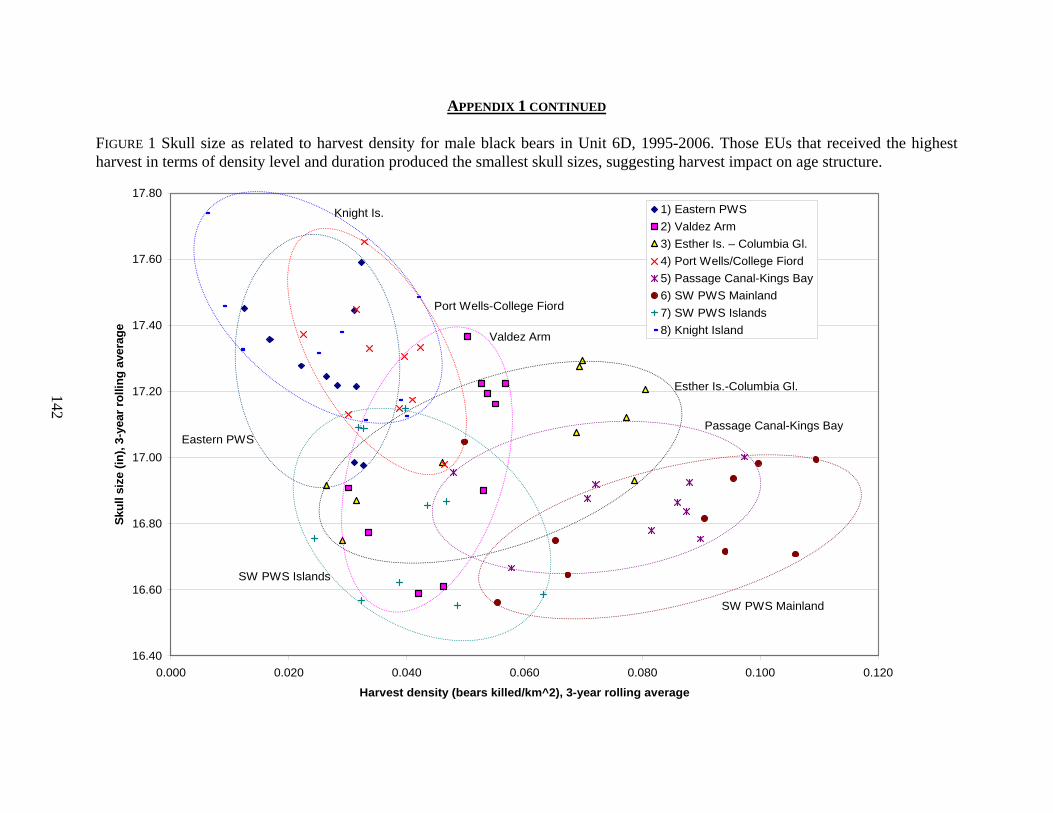
142
APPENDIX 1 CONTINUED FIGURE 1 Skull size as related to harvest density for male black bears in Unit 6D, 1995-2006. Those EUs that received the highest harvest in terms of density level and duration produced the smallest skull sizes, suggesting harvest impact on age structure.
16.40
16.60
16.80
17.00
17.20
17.40
17.60
17.80
0.000 0.020 0.040 0.060 0.080 0.100 0.120
Harvest density (bears killed/km^2), 3-year rolling average
Skul
l siz
e (in
), 3-
year
rolli
ng a
vera
ge
1) Eastern PWS2) Valdez Arm3) Esther Is. – Columbia Gl.4) Port Wells/College Fiord5) Passage Canal-Kings Bay6) SW PWS Mainland7) SW PWS Islands8) Knight Island
Knight Is.
Eastern PWS
Valdez Arm
Esther Is.-Columbia Gl.
SW PWS Islands
Passage Canal-Kings Bay
SW PWS Mainland
Port Wells-College Fiord

143
WILDLIFE Alaska Department of Fish and GameDivision of Wildlife Conservation
MANAGEMENT REPORT (907) 465-4190 PO BOX 115526 JUNEAU, AK 99811-5526
BLACK BEAR MANAGEMENT REPORT
From: 1 July 2004 To: 30 June 2007
LOCATION GAME MANAGEMENT UNITS: 7 and 15 (8397 mi2)
GEOGRAPHIC DESCRIPTION: Kenai Peninsula
BACKGROUND Black bear densities in Unit 15A were estimated at 205 bears/1000 km2 within the 1947 burn and 265/1000 km2 in the 1969 burn (Schwartz and Franzmann 1991). No other surveys to assess population size have been conducted. There have been several studies conducted on black bears on the Kenai Peninsula looking at predation (Franzmann and Schwartz 1986; Schwartz and Franzmann 1983 and 1989), food habits (Smith 1984), habitat (Schwartz and Franzmann 1991), dispersal (Schwartz and Franzmann 1992), and denning (Schwartz et al. 1987).
MANAGEMENT DIRECTION MANAGEMENT OBJECTIVES Provide the opportunity to hunt black bears, using seasons and bag limits to regulate the take so we do not exceed an average of 40% females in the harvest during the most recent 3-year period.
METHODS The department monitors the harvest of black bears through a mandatory sealing program established in 1973. Hides and skulls of all black bears reported killed are sealed with metal locking tags, and information is collected and entered on bear sealing forms. All of the harvest data is now kept at the department's Web-based database called WinfoNet. This report reflects updated tables using data from WinfoNet; therefore, data may differ slightly from past reports.
RESULTS AND DISCUSSION POPULATION STATUS AND TREND Population Size The black bear population on the Kenai Peninsula appears stable. Using Schwartz and Franzmann’s (1991) lower density estimate of 205 bears/1000 km2 from Unit 15A and assumed higher densities along the southern outer coast, we estimate about 3000–4000 black bears throughout Units 7 and 15.

144
Distribution and Movements The distribution and abundance of devil's club is an important factor affecting distribution and movements of black bears (Schwartz and Franzmann 1991). Devil’s club may be affected by spruce beetle infestation when more light penetrates to the forest floor after the removal of the canopy. Black bears appear in greater densities along the southern outer coast, probably due to healthy salmon runs coupled with low densities of competing brown bears.
MORTALITY Harvest Season and Bag Limit. Black bear hunting has been open year-round on the Kenai Peninsula since 1980. Since 1994, the bag limit has been 2 bears per regulatory year (1 bear 1 July–31 December and 1 bear 1 January–30 June). It is illegal to take cubs or females accompanied by cubs.
Bear baiting is allowed through a registration permit 15 April–15June, except in Resurrection Creek and its tributaries in Unit 7 or within 1/4 mile along the Kenai, Kasilof, and Swanson rivers in Units 7 and 15. Baiting is also restricted within the Kenai National Wildlife Refuge. Completion of a bear-baiting clinic is required by all bait permit holders in Units 7 and 15.
Board of Game Action and Emergency Orders. There have been no Board of Game actions for black bears during the reporting period.
Hunter Harvest. During the most recent 3-year period (regulatory years 2004–2006), the annual average for percent females in the harvest was 24%. The 5-year average annual harvest was 410 bears taken annually (Table 1). The 5-year average annual bait harvest was 86 bears taken per year (Table 2).
Hunter Residency and Success. The percentage of successful hunters who are nonresidents fluctuates annually, but overall appears to be increasing (Table 3).
Harvest Chronology. May is the month when most of the black bear harvest occurs (Table 4).
Transport Methods. Transport by boat was the top method used by successful bear hunters (Table 5), which is probably driven by the popularity of hunting black bears around the outer coast in the southern part of the Kenai Peninsula.
CONCLUSIONS AND RECOMMENDATIONS Black bears are an important big game species, leading all other big game species in the numbers of animals harvested annually for Units 7 and 15. Black bear hunting continues to increase in popularity because of a lengthy season, liberal bag limit, and an alternative meat source to other big game. The department will continue to assess the sustainability of the harvest by monitoring the percent females in the harvest, skull size trends, and anecdotal assessments while flying surveys for other species. We have been well within our management objective using the current seasons and bag limits.

145
We will continue to assess our current season and bag limits relative to our management goal, and consider recommending liberalizing the bag limit to 2 bears per year with no seasonal restrictions at the March 2009 Board of Game meeting
LITERATURE CITED FRANZMANN, A.W. AND C.C. SCHWARTZ. 1986. Black bear predation on moose calves in highly
productive versus marginal moose habitats on the Kenai Peninsula, Alaska. Alces 22:139–154.
SCHWARTZ, C.C. AND A.W. FRANZMANN. 1983. Effects of tree crushing on black bear predation on moose calves. International. Conference on Bear Research and Management 5:40–44.
———, AND ———. 1989. Bears, wolves, moose and forest succession: some management considerations on the Kenai Peninsula, Alaska. Alces 25:1–10.
———, AND ———. 1991. Interrelationship of black bears to moose and forest succession in the northern coniferous forest. Wildlife Monographs. 113. 58pp.
———, AND ———. 1992. Dispersal and survival of subadult black bears from the Kenai Peninsula, Alaska. Journal of Wildlife Management 56:426–431.
———, S.D. MILLER, AND A.W. FRANZMANN. 1987. Denning ecology of three black bear populations in Alaska. International Conference on Bear Research and Management. 7:281–292.
SMITH, P.A. 1984. Kenai black bears and cranberries: bear food habits and densities. MS. Thesis, University of Alaska, Fairbanks. 144pp.
PREPARED BY: SUBMITTED BY: Jeff Selinger Gino Del Frate Wildlife Biologist III Management Coordinator
Please cite any information taken from this section, and reference as:
SELINGER, J. 2008. Units 7 & 15 black bear management report. Pages 143–148 in P. Harper, editor. Black bear management report of survey and inventory activities 1 July 2004–30 June 2007. Alaska Department of Fish and Game. Project 17.0. Juneau, Alaska.
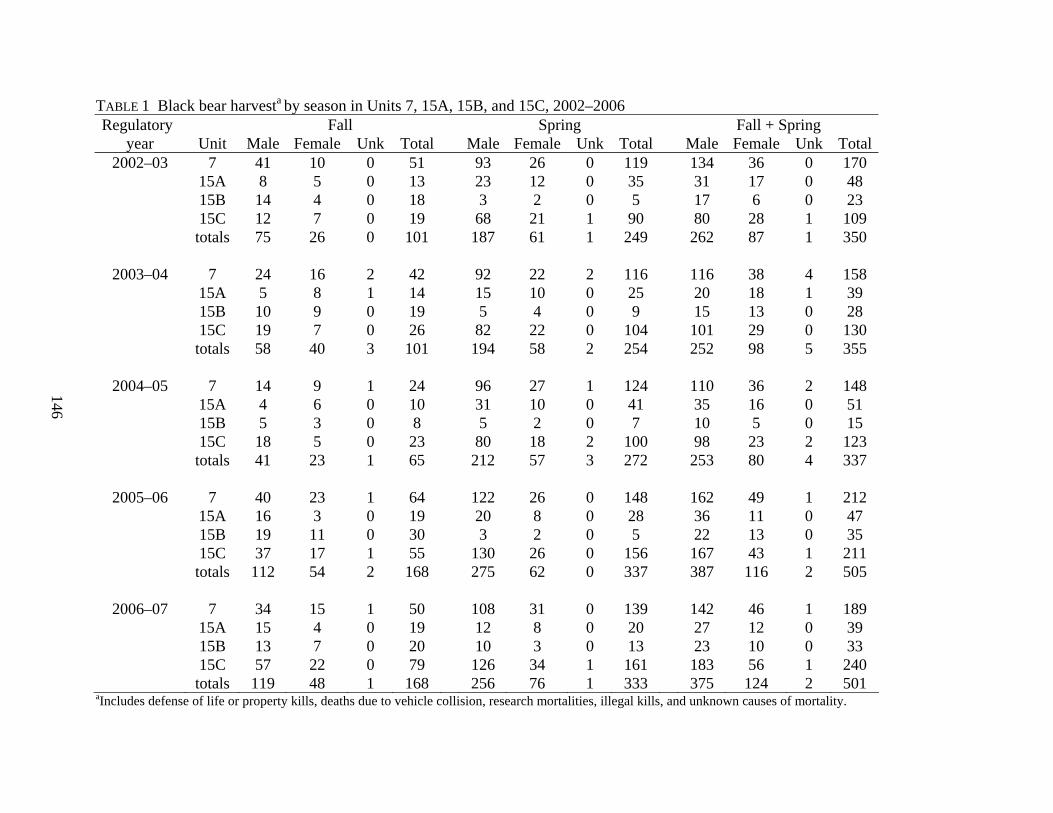
146
TABLE 1 Black bear harvesta by season in Units 7, 15A, 15B, and 15C, 2002–2006 Regulatory Fall Spring Fall + Spring
year Unit Male Female Unk Total Male Female Unk Total Male Female Unk Total2002–03 7 41 10 0 51 93 26 0 119 134 36 0 170
15A 8 5 0 13 23 12 0 35 31 17 0 48 15B 14 4 0 18 3 2 0 5 17 6 0 23 15C 12 7 0 19 68 21 1 90 80 28 1 109 totals 75 26 0 101 187 61 1 249 262 87 1 350
2003–04 7 24 16 2 42 92 22 2 116 116 38 4 158 15A 5 8 1 14 15 10 0 25 20 18 1 39 15B 10 9 0 19 5 4 0 9 15 13 0 28 15C 19 7 0 26 82 22 0 104 101 29 0 130 totals 58 40 3 101 194 58 2 254 252 98 5 355
2004–05 7 14 9 1 24 96 27 1 124 110 36 2 148 15A 4 6 0 10 31 10 0 41 35 16 0 51 15B 5 3 0 8 5 2 0 7 10 5 0 15 15C 18 5 0 23 80 18 2 100 98 23 2 123 totals 41 23 1 65 212 57 3 272 253 80 4 337
2005–06 7 40 23 1 64 122 26 0 148 162 49 1 212 15A 16 3 0 19 20 8 0 28 36 11 0 47 15B 19 11 0 30 3 2 0 5 22 13 0 35 15C 37 17 1 55 130 26 0 156 167 43 1 211 totals 112 54 2 168 275 62 0 337 387 116 2 505
2006–07 7 34 15 1 50 108 31 0 139 142 46 1 189 15A 15 4 0 19 12 8 0 20 27 12 0 39 15B 13 7 0 20 10 3 0 13 23 10 0 33 15C 57 22 0 79 126 34 1 161 183 56 1 240 totals 119 48 1 168 256 76 1 333 375 124 2 501
aIncludes defense of life or property kills, deaths due to vehicle collision, research mortalities, illegal kills, and unknown causes of mortality.

147
TABLE 2 Number of registered bait stations and baiting harvest in Units 7, 15A, 15B, and 15C, 2002–2006
Spring Unit 7 Unit 15A Unit 15B Unit 15C Units 7&15
Year #
stations Harvest #
stations Harvest #
stations Harvest #
stations Harvest #
stations Harvest2003 227 65 62 24 7 0 51 5 347 94 2004 194 67 72 14 8 2 21 4 295 87 2005 165 60 39 25 3 4 23 3 230 92 2006 159 51 38 15 8 2 17 1 222 69 2007 126 68 61 15 10 3 20 1 217 87
TABLE 3 Black bear harvest by residency in Units 7 and 15, 2002–2006
Regulatory Residents Total
successful year Locala (%) Nonlocal (%) Total (%) Nonresident (%) Unk hunters
2002–03 109 31 137 39 246 70 92 26 12 350 2003–04 115 32 125 35 240 68 106 30 9 355 2004–05 119 35 115 34 234 69 97 29 6 337 2005–06 150 30 155 31 305 60 187 37 13 505 2006–07 150 30 175 35 325 65 169 34 8 502
a Local residents are residents of the Kenai Peninsula

148
TABLE 4 Black bear harvest chronology in Units 7 and 15, 2002–2006
Regulatory Total year Jul (%) Aug. (%) Sep (%) Oct. (%) Nov (%) Apr (%) May (%) Jun (%) Unk (%) harvest
2002–03 11 (3) 16 (5) 42 (12) 25 (7) 0 (0) 9 (3) 175 (50) 61 (17) 11 (3) 350 2003–04 8 (2) 23 (6) 53 (15) 13 (4) 0 (0) 4 (1) 178 (50) 66 (19) 10 (3) 355 2004–05 0 (0) 6 (2) 42 (12) 15 (4) 0 (0) 13 (4) 188 (56) 68 (20) 5 (2) 337 2005–06 4 (1) 35 (7) 102 (20) 16 (3) 0 (0) 6 (1) 253 (50) 73 (14) 16 (3) 505 2006–07 18 (4) 30 (6) 89 (18) 23 (5) 1 (0) 5 (1) 218 (43) 110 (22) 8 (2) 502
TABLE 5 Black bear harvest by transportation method in Units 7 and 15, 2002–2006
Dog/ Snow- Other Highway Other
/ Total RY1 Airplane (%) Horse (%) Boat (%) ATV (%) machine (%) ORV (%) Vehicle (%) Walk (%) Unk (%) harvest 2002 21 (6) 8 (2) 125 (36) 33 (9) 0 (0) 1 (0) 87 (25) 61 (17) 14 (4) 350 2003 35 (10) 9 (3) 142 (40) 31 (9) 0 (0) 0 (0) 75 (21) 52 (15) 11 (3) 355 2004 20 (6) 8 (2) 148 (44) 47 (14) 0 (0) 1 (0) 76 (23) 30 (9) 7 (2) 337 2005 39 (8) 10 (2) 249 (49) 34 (7) 1 (0) 0 (0) 95 (19) 62 (12) 15 (3) 505 2006 30 (6) 8 (2) 257 (51) 37 (7) 0 (0) 0 (0) 96 (19) 62 (12) 12 (2) 502
1 RY = Regulatory year. A regulatory year runs from 1 July through 30 June (e.g., RY 2006 = 1 July 2006 through 30 June 2007.
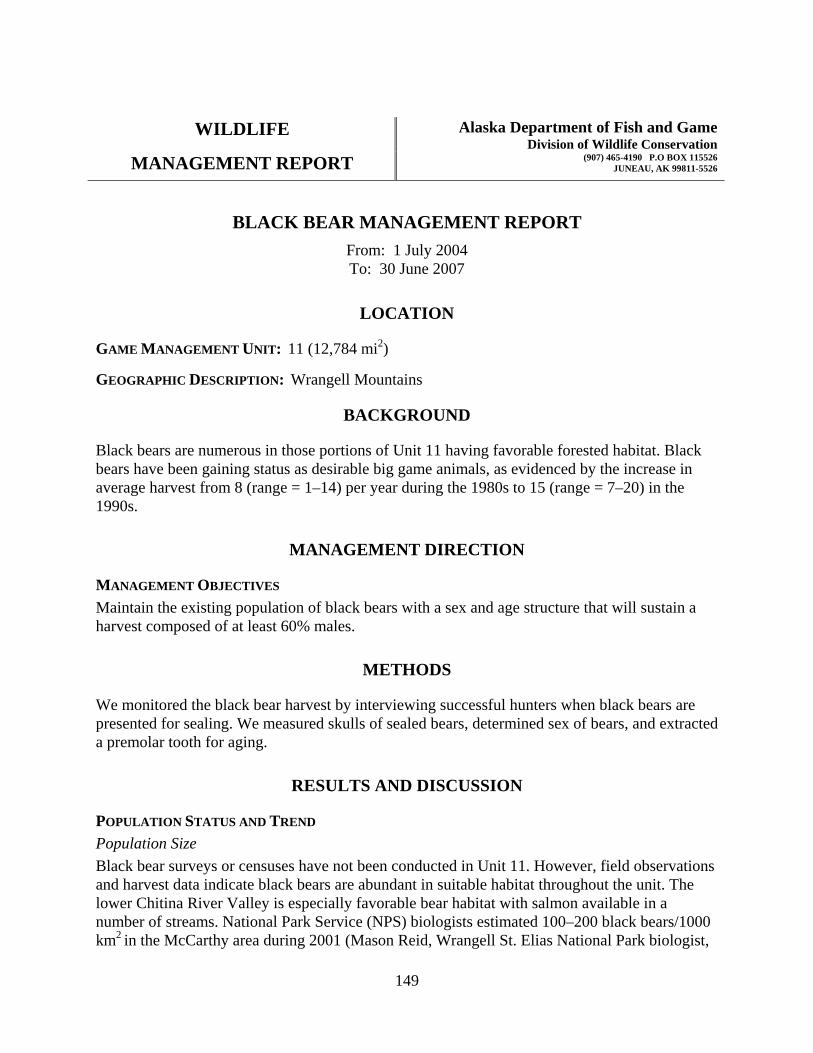
149
WILDLIFE Alaska Department of Fish and Game
Division of Wildlife Conservation
MANAGEMENT REPORT (907) 465-4190 P.O BOX 115526 JUNEAU, AK 99811-5526
BLACK BEAR MANAGEMENT REPORT
From: 1 July 2004 To: 30 June 2007
LOCATION
GAME MANAGEMENT UNIT: 11 (12,784 mi2)
GEOGRAPHIC DESCRIPTION: Wrangell Mountains
BACKGROUND
Black bears are numerous in those portions of Unit 11 having favorable forested habitat. Black bears have been gaining status as desirable big game animals, as evidenced by the increase in average harvest from 8 (range = 1–14) per year during the 1980s to 15 (range = 7–20) in the 1990s.
MANAGEMENT DIRECTION
MANAGEMENT OBJECTIVES Maintain the existing population of black bears with a sex and age structure that will sustain a harvest composed of at least 60% males.
METHODS
We monitored the black bear harvest by interviewing successful hunters when black bears are presented for sealing. We measured skulls of sealed bears, determined sex of bears, and extracted a premolar tooth for aging.
RESULTS AND DISCUSSION
POPULATION STATUS AND TREND Population Size Black bear surveys or censuses have not been conducted in Unit 11. However, field observations and harvest data indicate black bears are abundant in suitable habitat throughout the unit. The lower Chitina River Valley is especially favorable bear habitat with salmon available in a number of streams. National Park Service (NPS) biologists estimated 100–200 black bears/1000 km2 in the McCarthy area during 2001 (Mason Reid, Wrangell St. Elias National Park biologist,

150
personal communication). This figure approaches densities observed elsewhere in Southcentral Alaska.
MORTALITY Harvest Season and Bag Limit. There was no closed season for black bears in Unit 11, and the bag limit was 3 bears.
Board of Game Actions and Emergency Orders. The Board of Game passed a regulation that required the salvage of meat from black bears taken from 1 January—31 May, starting in the spring of 1997.
Hunter Harvest. Hunters reported taking 14 black bears during the 2006–07 season, identical to the average take for the prior 5 years (Table 1). Males have composed 79% of the harvest for the last six years (2001–2007). Since sealing of black bears started in 1973, males have composed 73% (range = 25–100%) of the Unit 11 bear harvest. The mean skull size for males taken in 2006 was 17.5 inches, slightly above the 30-year mean of 16.8 inches. The average skull size of females last year was 15.4, slightly below the 30-year average of 15.7.
Hunter Residency and Success. Nonresident hunters have taken 16% (range = 0–36) of the harvest (2.1 bears) during the last six years (Table 2). Between 1973 and 1998, nonresidents averaged 3–4 bears per year (range = 0–18), and 30% of the harvest in Unit 11. Most nonresidents reported using a guide and usually harvested a bear during the fall while hunting other big game species, such as sheep. The percentage of black bears in the harvest taken by local residents has varied between years but averaged 29% (4 bears) a year during the last 6 years (Table 2). Successful bear hunters spent an average of 2.5 days hunting during the 2006 season, similar to the 6-year average of 2.7 days.
Data from bear sealing certificates indicates 82% of successful hunters were specifically hunting black bears during this reporting period. The remainder reported taking a bear incidentally to other hunting activities. In the last 6 years, 83% of successful hunters salvaged some or all of the bear meat. There was only 1 black bear reported taken over bait each year from 1990 to 1992, but on average 2.8 (21%) have been reported annually during the last 6 years (Table 1). Bear-baiting activity fluctuates considerably between years.
Harvest Chronology. May and August are the most important months for harvesting black bears (Table 3). During the last 6 years, on average 8.0 (57%) bears have been taken in the fall and 6.0 (43%) bears have been taken in the spring. Since 1973, 60% of the black bear harvest occurred during the fall season. Harvest chronology data shows that between 1993 and 2002 spring harvests exceeded fall harvests due to the increased interest in bear baiting during the spring by nonlocal Alaska residents.
Transportation Methods. Boats, highway vehicles, aircraft, and walking were the methods of transportation most often reported by successful black bear hunters (Table 4). Aircraft use was primarily by nonresidents on mixed-bag hunts during the fall, and walking was common for locals.

151
Other Mortality Remote rural residents are a source of unreported harvests. These most likely involve defense of life or property (DLP) kills around remote cabins. Hunters taking a bear under DLP conditions are required to turn over the hide and skull to the Alaska Department of Fish and Game. Reporting is minimal, mostly because of the transportation difficulties from remote portions of the unit. Some DLP bears are claimed under the general season take because of the liberal bag limit and 12-month season.
CONCLUSIONS AND RECOMMENDATIONS
After increasing in the early 1990s, the Unit 11 black bear harvest has been relatively stable overall, although yearly fluctuations are observed. Much of the observed harvest increase since 1993 can be attributed to increased popularity of spring bear baiting. Considering access is so limited in Unit 11, the increase in baiting activities is not likely to affect the population, though it probably keeps problem bears away from communities and keeps DLP kills down. Males continue to predominate in the harvest, meeting management objectives for harvest composition. Even with the increased take in recent years, the harvest of black bears remains quite low for the amount of available habitat. Black bear numbers in Unit 11 are thought to be similar to other timbered areas in Southcentral Alaska, and current low harvest has little impact on unitwide bear numbers.
Because most of Unit 11 is included in Wrangell-St Elias Park and Preserve, the black bear population will always receive relatively light hunting pressure. NPS regulations prohibit hunting by nonlocal residents in portions of the unit designated as park. Subsistence hunting by local rural residents continues in these areas; however, aircraft cannot be used to access park areas, although they can be used in the preserve. This effectively closes most of the hard park to all hunting. As a result, most of the harvest is along the road system. No changes in season length or bag limits are recommended.
PREPARED BY: SUBMITTED BY: Bob Tobey Gino Del Frate Wildlife Biologist III Management Coordinator
Please cite any information taken from this section, and reference as: TOBEY B. 2008. Unit 11 black bear management report. Pages 149–154 in P. Harper, editor. Black bear management report of survey and inventory activities 1 July 2004–30 June 2007. Alaska Department of Fish and Game. Project 17.0. Juneau, Alaska.
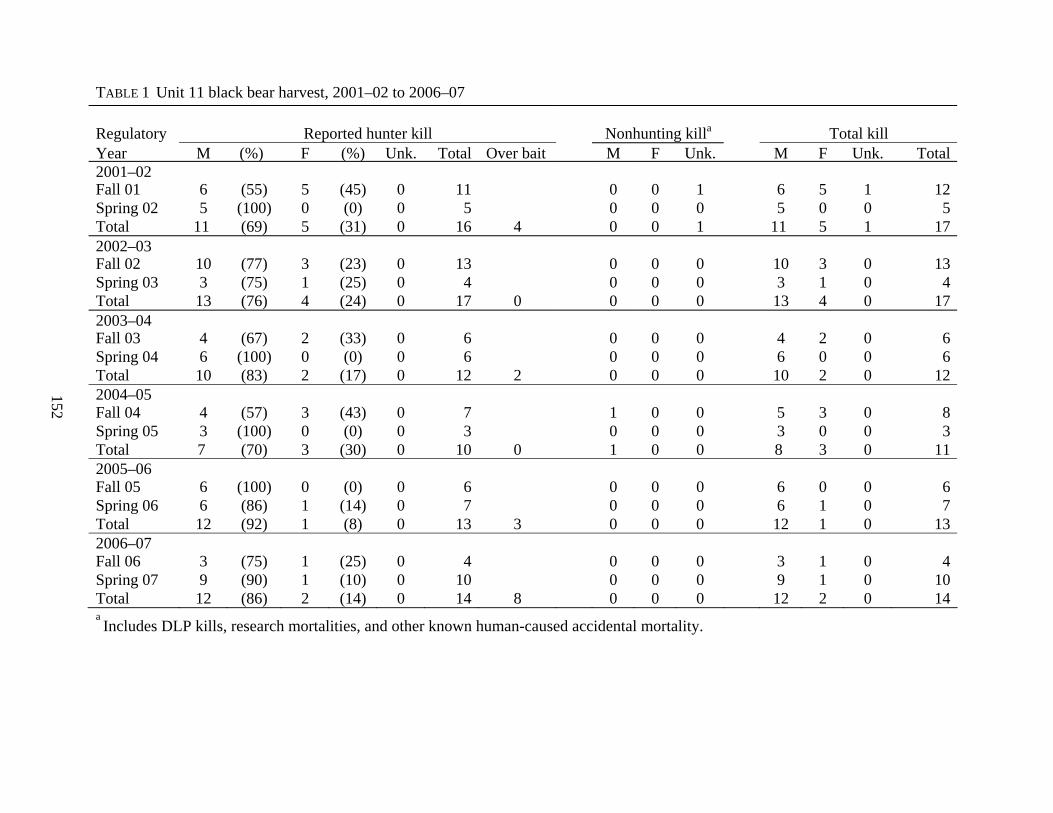
152
TABLE 1 Unit 11 black bear harvest, 2001–02 to 2006–07 Regulatory Reported hunter kill Nonhunting killa Total kill Year M (%) F (%) Unk. Total Over bait M F Unk. M F Unk. Total2001–02 Fall 01 6 (55) 5 (45) 0 11 0 0 1 6 5 1 12Spring 02 5 (100) 0 (0) 0 5 0 0 0 5 0 0 5Total 11 (69) 5 (31) 0 16 4 0 0 1 11 5 1 172002–03 Fall 02 10 (77) 3 (23) 0 13 0 0 0 10 3 0 13Spring 03 3 (75) 1 (25) 0 4 0 0 0 3 1 0 4Total 13 (76) 4 (24) 0 17 0 0 0 0 13 4 0 172003–04 Fall 03 4 (67) 2 (33) 0 6 0 0 0 4 2 0 6Spring 04 6 (100) 0 (0) 0 6 0 0 0 6 0 0 6Total 10 (83) 2 (17) 0 12 2 0 0 0 10 2 0 122004–05 Fall 04 4 (57) 3 (43) 0 7 1 0 0 5 3 0 8Spring 05 3 (100) 0 (0) 0 3 0 0 0 3 0 0 3Total 7 (70) 3 (30) 0 10 0 1 0 0 8 3 0 112005–06 Fall 05 6 (100) 0 (0) 0 6 0 0 0 6 0 0 6Spring 06 6 (86) 1 (14) 0 7 0 0 0 6 1 0 7Total 12 (92) 1 (8) 0 13 3 0 0 0 12 1 0 132006–07 Fall 06 3 (75) 1 (25) 0 4 0 0 0 3 1 0 4Spring 07 9 (90) 1 (10) 0 10 0 0 0 9 1 0 10Total 12 (86) 2 (14) 0 14 8 0 0 0 12 2 0 14a Includes DLP kills, research mortalities, and other known human-caused accidental mortality.

153
TABLE 2 Unit 11 black bear successful hunter residency, 2001–02 to 2006–07
Regulatory Locala Nonlocal
year resident (%) resident (%) Nonresident (%) Successful hunters 2001–02 1 (6) 13 (81) 2 (13) 16 2002–03 7 (41) 8 (47) 2 (12) 17 2003–04 5 (42) 7 (58) 0 (0) 12 2004–05 5 (50) 4 (40) 1 (10) 10 2005–06 2 (15) 8 (62) 3 (23) 13 2006–07 4 (29) 5 (36) 5 (36) 14 _____________________________________________________________________________________________________________________ a Resident of Unit 11 or NPS subsistence community for Wrangell-St. Elias National Park/Preserve.
TABLE 3 Unit 11 black bear harvest chronology percent by month, 2001–02 to 2006–07 Regulatory Harvest periods year July August September October April May June n 2001–02 1 (6) 4 (25) 6 (38) 0 (0) 0 (0) 5 (31) 0 (0) 16 2002–03 1 (6) 6 (38) 3 (19) 2 (12) 0 (0) 2 (12) 2 (12) 16 2003–04 0 (0) 4 (33) 2 (17) 0 (0) 0 (0) 3 (25) 3 (25) 12 2004–05 1 (10) 4 (40) 2 (20) 0 (0) 0 (0) 3 (30) 0 (0) 10 2005–06 1 (8) 3 (23) 2 (15) 0 (0) 0 (0) 5 (38) 2 (15) 13 2006–07 1 (7) 2 (14) 1 (7) 0 (0) 0 (0) 2 (14) 8 (57) 14

154
TABLE 4 Unit 11 black bear harvest percent by transport method, 2001–02 to 2006–07 Percent of harvest Regulatory 3- or Highway year Airplane Horse Boat 4-Wheeler Snowmachine vehicle Walk Unknown n
2001–02 5 (31) 0 (0) 0 (0) 0 (0) 0 (0) 10 (63) 1 (6) 0 (0) 16 2002–03 3 (18) 0 (0) 2 (12) 2 (12) 0 (0) 5 (29) 5 (29) 0 (0) 17 2003–04 2 (17) 1 (8) 1 (8) 3 (25) 0 (0) 3 (25) 2 (17) 0 (0) 12 2004–05 2 (20) 0 (0) 3 (30) 0 (0) 0 (0) 1 (10) 4 (40) 0 (0) 10 2005–06 2 (15) 0 (0) 4 (31) 1 (8) 1 (8) 3 (23) 2 (15) 0 (0) 13 2006–07 1 (7) 0 (0) 4 (29) 0 (0) 0 (0) 5 (36) 4 (29) 0 (0) 14

155
WILDLIFE Alaska Department of Fish and GameDivision of Wildlife Conservation
MANAGEMENT REPORT (907) 465-4190 P.O. Box 115526 Juneau, AK 99811-5526
BLACK BEAR MANAGEMENT REPORT
From: 1 July 2004 To: 30 June 20071
LOCATION GAME MANAGEMENT UNIT: 12 (9978 mi2)
GEOGRAPHIC DESCRIPTION: Upper Tanana and White River drainages, including the northern Alaska Range east of the Robertson River, and the Mentasta, Nutzotin, and northern Wrangell Mountains
BACKGROUND Historically, human use of black bears in Unit 12 was relatively low, despite liberal hunting regulations and moderate bear population levels. Most black bear hunting occurred along the highway system and the Tanana River.
In 1992 interest in black bear hunting increased, particularly at bait stations, and has remained high relative to previous levels. Most bears are taken by local residents in the spring and are an important meat source. Even before regulations were implemented requiring salvage of black bear meat from 1 January to 31 May, meat was salvaged from over 90% of all black bears harvested by local residents. In the fall most black bears were harvested incidentally during hunts for other species.
MANAGEMENT DIRECTION MANAGEMENT GOALS
Protect, maintain, and enhance the black bear population and its habitat in concert with other components of the ecosystem.
Provide the greatest sustained opportunity to participate in hunting black bears.
MANAGEMENT OBJECTIVE Manage for a harvest of black bears that maintains 55% or more males in the combined
harvests during the most recent 3 years.
1 At the discretion of the reporting biologist, this unit report may contain data collected outside the report period.

156
METHODS Annual harvest information was collected from hunters during the mandatory sealing process of hunter-killed bears and bears killed in defense of life or property. These reports provided data on harvest location and date, hunter residency and effort, sex of the bear, skull size, baiting, salvage of meat, incidental take, and defense of life or property. A premolar was extracted from most bears during the sealing process; however, black bear teeth have not been sectioned or aged for several years. Harvest data were summarized by regulatory year (RY), which begins 1 July and ends 30 June (e.g., RY06 = 1 Jul 2006–30 Jun 2007).
Starting in summer 2000, blueberry abundance has been monitored at 5 permanent blueberry sample areas in Unit 12 and 3 in adjacent Unit 20E. Sample sites were selected for the presence of blueberry plants in a variety of habitat types, aspects, elevations, and slopes. Each year rainfall and temperature has been monitored at each site to determine their effects on blossom and berry production. Berry production is estimated by counts of berries within 5 1-m2 plots in each area at the same time each year. Through continued monitoring it may be possible to compare berry production between years and sites, and to evaluate effects of berry abundance on bear harvest and problem bear incidents.
RESULTS AND DISCUSSION POPULATION STATUS AND TREND Population Size During RY04–RY06 no population surveys were conducted in Unit 12 to determine the black bear population size and trend. Based on limited radiotelemetry data collected in Unit 12 (Kelleyhouse 1990) and on more rigorous data collected in Unit 20A (Hechtel 1991), estimated black bear density in Unit 12 was 16–22 bears/100 mi2 of black bear habitat and the estimated population size was ~700–1000 bears.
In the adjacent upper Yukon–Tanana grizzly bear control area of Unit 20E, grizzly and black bear populations are being assessed. In 2006, the Alaska Department of Fish and Game (C. Gardner, ADF&G unpublished data, Fairbanks, 2007) conducted a DNA-based mark–recapture population estimate using barbed wire bear hair traps with scent lures. Although Unit 20E may have lower black bear densities than Unit 12, preliminary data from this study suggest black bear densities in Unit 12 may be significantly below previous estimates.
No major climatic anomalies or habitat alterations occurred in Unit 12. Black bear habitat that burned during the reporting period in Unit 12 was limited to 434 mi2 north of the Alaska Highway in 2004. Some bears were likely displaced from the burned areas but the overall population trend was likely stable.
Population Composition Few data were available on population composition in Unit 12. Sex ratios in the harvest were not representative of the population because females with cubs were protected by regulation.
During RY04–RY06, productivity of the black bear population in Unit 12 appeared adequate based on the animals harvested and on numerous sightings of sows with cubs. The reproductive

157
interval (length of time between parturition and weaning), determined by observations of radiocollared bears, was 2–3 years (Kelleyhouse 1990). This was similar to other black bear populations in Interior Alaska (Miller 1987).
Distribution and Movements Black bears are distributed throughout the forested areas that include approximately 4500 mi2 of Unit 12. In fall and spring, bears move into the shrub zones to feed on berries and succulent vegetation. In 1990 a forest fire burned approximately 156 mi2 of black bear habitat in the Tok River valley and observations from members of the public as well as information gathered incidentally to other fieldwork suggested black bear use of the area was reduced. By 1994 bears began using the edges of the burn for feeding. Beginning in 1997, incidental sightings indicated black bears were utilizing most areas of the burn. In 2004, wildfires burned 434 mi2 of black bear habitat in Unit 12. These fires initially reduced habitat availability, but likely will result in long-term positive effects on black bear habitat.
Kelleyhouse (1990) investigated black bear movements in a portion of Unit 12. He reported home ranges of 16 mi2 for an adult female, 3 mi2 for a subadult male, and 63 mi2 for an adult male.
MORTALITY Harvest Season and Bag Limit. There was no closed season for black bears in Unit 12, and the bag limit was 3 bears. Harvest of cubs (in first year of life) or females accompanied by cubs was prohibited.
Alaska Board of Game Actions and Emergency Orders. During their spring 2006 meeting, the Alaska Board of Game adopted regulations to allow the sale of black bear hides and skulls, and same day airborne hunting of black bears over bait in active predator control areas, including the Upper Yukon–Tanana Predator Control Area in Unit 12 north of the Alaska Highway. No emergency orders were issued during RY04–RY06.
Harvest by Hunters. During RY04–RY06, 39–50 ( x = 43) black bears were harvested annually in Unit 12 (Table 1). Estimated harvest rate was 3–7%, but without detailed population estimates the precise harvest rate is unknown. Annual average black bear harvest has increased from 25.1 bears during RY80–RY91 to 36.1 bears during RY92–RY03 and 43 bears during RY04–RY06. Males composed 51–78% of the harvest ( x = 69%) during RY04–RY06 (Table 1), meeting the harvest objective. The RY99–RY03 average was 65% males.
Mean skull size of males taken during RY04–RY06 was 16.4 inches (RY04 = 16.4, RY05 = 16.6, RY06 = 16.3). Increased harvest since RY92 has not affected male skull size. Average skull size of male black bears harvested in Unit 12 has remained consistent since RY80. During RY92–RY97 average skull size was 16.4 inches (σ = 0.326), compared to 16.4 inches (σ = 0.437) during RY80–RY91.
About 80% of black bear harvest in Unit 12 occurred along the road system within the Tok and Tanana River valleys. Few hunters accessed remote portions of Unit 12 to hunt black bear.

158
Circumstantial evidence indicates that berry abundance may affect bear harvest. During years of poor berry production (Gardner 2002), bears may travel more in search of berries and/or may be more attracted to hunter-killed moose or caribou or other human foods. These behaviors increase the vulnerability of bears to hunters. Low blueberry abundance in fall 2006 (Table 2) coincided with the highest fall harvest of black bears since fall 1996.
Hunter Residency and Success. During RY04–RY06 Alaska residents harvested 75–92% ( x = 86%) of the black bears taken in Unit 12 (Table 3). Of these, Unit 12 residents took 31–58% ( x = 44%). During the previous 5 years, the average annual percent harvest for Alaska residents was 85%. The average percent harvest by Unit 12 residents was 57%. Historically, nonresidents harvested few black bears in Unit 12. From RY90 through RY95, nonresidents took an average of 1 black bear/year, 3.3% of the annual harvest. Annual harvest by nonresidents increased to an average of 4.5 bears/year (14% of the harvest) between RY96 and RY03 and remained stable at 5.7 bears/year (13% of the harvest) in RY04–RY06. Guided nonresidents harvested about half of the bears killed by nonresidents.
No measure of hunter success was available because unsuccessful hunters were not required to report. During RY04–RY06 successful hunters spent an average of 4.3 and 4.9 days afield hunting black bears during the fall and spring, respectively. The yearly average time spent hunting black bears was 4.7 days in RY04–RY06 compared to 4.2 days in RY01–RY03. During RY90–RY94 the average number of days afield was 8.7 days. The differences among the periods probably reflect improved success at bait stations and increased satisfaction of hunters who harvested only 1 bear. During RY04–RY06 an average of only 10.3% of hunters took >1 bear compared to 15.5% during RY95–RY00, and 28.0% during RY90–RY94. The average number of hunters who took >1 bear per year declined from 4.0 in RY90–RY94 to 2.8 in RY95–RY00 but returned to 4.0 in RY04–RY06.
Harvest Chronology. During RY04–RY06 the average percent of the harvest taken during the spring was 70%. This harvest was similar to the mean of 72% seen in RY01–RY03, and 69% in RY96–RY00 (Table 4).
During RY04–RY06, hunters at bait stations accounted for an average of 75% (18–28 bears) of the spring harvest, compared to 85% of the spring harvest (11–27 bears) during RY01–RY03. The use of bait stations by successful hunters increased substantially in 1992. During RY89 and RY91, 45% of the spring harvest was taken over bait (5–8 bears). During RY04–RY06 most fall harvest (60–75%) was incidental to hunts for other species.
Transport Methods. Since RY01, 3- or 4-wheelers have been the most commonly used mode of transportation for successful black bear hunters, and hunters who used this transportation averaged 37% of the harvest during RY04–RY06 (Table 5). In previous years, highway vehicles were the most common mode of transportation. During RY98–RY00, hunters who used highway vehicles killed an annual average of 44% of the black bears reported taken. Most black bear baiting occurred in areas accessible by highway vehicles. Use of other transportation types will remain low unless the harvest success rate declines in areas where ATVs and highway vehicles can be used.

159
Other Mortality Most black bear mortality in Unit 12 is natural, rather than human-caused. There is no data on the mortality rate of cubs in this area; however, Miller (1987) found that cubs of the year in the Susitna Basin had a natural mortality rate of 35%.
HABITAT Assessment Approximately one-half of Unit 12 is suitable black bear habitat. Because grizzly bears are moderately abundant and have been documented as an important source of mortality for black bears of all age classes in other areas of Alaska (Miller 1987), they may limit black bear distribution to areas offering adequate escape cover. Berry species used by black bears in Unit 12 are generally available throughout the unit. Annual berry abundance is directly affected by climate. The Tok wildfire in 1990 burned approximately 156 mi2 of prime black bear habitat. Its initial impact on the local black bear population is unknown, but suitable black bear food sources are increasing annually, and based on incidental sightings more black bears are using the area. Similarly, wildfires consumed 434 mi2 in Unit 12 during 2004, which can be expected to result in improved habitat quality for black bears in the future.
Enhancement The implementation of the Alaska Interagency Wildland Fire Management Plan (Alaska Wildland Fire Coordinating Group 1998) and the 1990 and 2004 wildfires are expected to enhance black bear habitat over the long term in Unit 12. Extensive areas of climax black spruce forest exist in the unit that have understories nearly devoid of high-quality black bear food. A younger, more diverse habitat mosaic will provide more productive food plants preferred by black bears.
CONCLUSIONS AND RECOMMENDATIONS During the report period we met the management objective to manage for a harvest of black bears that maintains 55% or more males in the combined harvests during the most recent 3 years, with an average of 70% males. Average male skull size was 16.4 inches and has remained consistent since 1980. An average of 86% of the black bear harvest was by Alaska residents, of which 44% were local residents. During RY04-RY06 an average of 69% of hunter-killed bears were taken in spring over bait (75% of bears taken by hunters in spring). Black bear meat was an important food source for local residents, particularly in the spring. Based on hunter report data and bear sightings by the public and ADF&G staff, there was no indication that harvest was excessive. During RY04–RY06, harvest was estimated to be sustainable. I recommend no changes in the seasons and bag limits or management goals and objectives.
LITERATURE CITED ALASKA WILDLAND FIRE COORDINATING GROUP. 1998. Alaska interagency wildland fire
management plan. <http://forestry.alaska.gov/pdfs/98AIFMP.pdf> (Accessed 25 Mar 2008).

160
GARDNER, C. L. 2002. Unit 12 black bear. Pages 161–171 in C. Healy, editor. Black bear management report of survey and inventory activities 1 July 1998–30 June 2001. Alaska Department of Fish and Game. Project 17.0. Juneau, Alaska.
HECHTEL, J. L. 1991. Population dynamics of black bear populations, Fort Wainwright, Alaska. Final report to the U.S. Army.
KELLEYHOUSE, D. G. 1990. Unit 12 black bear. Pages 58–63 in S.O. Morgan, editor. Black bear management report of survey and inventory activities. Part IV. Volume XX. Alaska Department of Fish and Game. Study 17.0. Juneau, Alaska.
MILLER, S. D. 1987. Susitna hydroelectric project. Final report, big game studies, Volume VI. Black and Brown Bear. Alaska Department of Fish and Game. Juneau, Alaska.
PREPARED BY: SUBMITTED BY:
Torsten W. Bentzen Doreen I. Parker McNeill Wildlife Biologist II Assistant Management Coordinator
REVIEWED BY:
Mark A. Keech Wildlife Biologist III
Laura A. McCarthy Publications Technician II Please cite any information taken from this section, and reference as:
BENTZEN, T. W. 2008. Unit 12 black bear. Pages 155–166 in P. Harper, editor. Black bear management report of survey and inventory activities 1 July 2004 through 30 June 2007. Alaska Department of Fish and Game. Project 17.0. Juneau, Alaska.

TABLE 1 Unit 12 black bear harvest, regulatory years 1995–1996 through 2006–2007 Reported
Regulatory Hunter kill Nonhunting killa Estimated kill Total reported and estimated kill year M F Unk Total Baited M F Unk Unreported Illegal M (%) F (%) Unk Total
1995–1996 Fall 1995 5 3 0 8 0 0 0 0 0 0 5 (63) 3 (37) 0 8 Spring 1996 17 6 0 23 11 0 0 0 0 0 17 (74) 6 (26) 23
Total 22 9 0 31 11 0 0 0 0 0 22 (71) 9 (29) 0 31
1996–1997 Fall 1996 21 2 0 23 0 0 1 0 0 0 21 (88) 3 (12) 0 24 Spring 1997 14 6 0 20 16 0 0 0 0 0 14 (70) 6 (30) 0 20
Total 35 8 0 43 16 0 1 0 0 0 35 (80) 9 (20) 0 44
1997–1998 Fall 1997 2 2 0 4 0 0 0 0 0 0 2 (50) 2 (50) 0 4 Spring 1998 30 7 0 37 27 0 0 0 0 0 30 (81) 7 (19) 0 37
Total 32 9 0 41 27 0 0 0 0 0 32 (78) 9 (22) 0 41
1998–1999 Fall 1998 8 3 0 11 0 0 0 0 0 0 8 (73) 3 (27) 0 11 Spring 1999 19 10 0 29 18 0 0 0 0 0 19 (66) 10 (34) 0 29
Total 27 13 0 40 18 0 0 0 0 0 27 (68) 13 (32) 0 40
1999–2000 Fall 1999 7 2 0 9 0 0 0 0 0 0 7 (78) 2 (22) 0 9 Spring 2000 13 5 0 18 11 0 0 0 0 0 13 (72) 5 (28) 0 18
Total 20 7 0 27 11 0 0 0 0 0 20 (74) 7 (26) 0 27
2000–2001 Fall 2000 13 3 0 16 0 0 0 0 0 0 13 (81) 3 (19) 0 16 Spring 2001 18 13 0 31 21 0 1 0 0 0 18 (56) 14 (44) 0 32
Total 31 16 0 47 21 0 1 0 0 0 31 (65) 17 (35) 0 48
2001–2002 Fall 2001 4 5 0 9 0 0 0 0 0 0 4 (44) 5 (56) 0 9 Spring 2002 10 4 0 14 11 0 0 0 0 0 10 (71) 4 (29) 0 14
Total 14 9 0 23 11 0 0 0 0 0 14 (61) 9 (39) 0 23
161

Reported Regulatory Hunter kill Nonhunting killa Estimated kill Total reported and estimated kill
year M F Unk Total Baited M F Unk Unreported Illegal M (%) F (%) Unk Total 2002–2003
Fall 2002 7 2 0 9 0 0 1 0 0 0 7 (70) 3 (30) 0 10 Spring 2003 17 14 0 31 27 0 0 0 0 0 17 (55) 14 (45) 0 31
Total 24 16 0 40 27 0 1 0 0 0 24 (59) 17 (41) 0 41
2003–2004 Fall 2003 3 2 0 5 0 0 0 0 0 0 3 (60) 2 (40) 0 5 Spring 2004 13 4 0 17 15 0 0 0 0 0 13 (76) 4 (24) 0 17
Total 16 6 0 22 15 0 0 0 0 0 16 (73) 6 (27) 0 22
2004–2005 Fall 2004 6 3 0 9 0 2 0 0 0 0 8 (73) 3 (27) 0 11 Spring 2005 22 7 0 29 18 0 0 0 0 0 22 (76) 7 (24) 0 29
Total 28 10 0 38 18 2 0 0 0 0 30 (75) 10 (25) 0 40 2005–2006
Fall 2005 6 6 0 12 0 0 0 0 0 0 6 (50) 6 (50) 0 12 Spring 2006 14 13 0 27 20 0 0 0 0 0 14 (52) 13 (48) 0 27
Total 20 19 0 39 20 0 0 0 0 0 20 (51) 19 (49) 0 39
2006–2007 Fall 2006 13 4 1 18 0 0 0 0 0 0 13 (76) 4 (24) 1 18 Spring 2007 25 7 0 32 28 0 0 0 0 0 25 (78) 7 (22) 0 32
Total 38 11 1 50 28 0 0 0 0 0 38 (78) 11 (22) 1 50 a Includes defense of life or property kills, research mortalities, and other known human-caused accidental mortality.
162

TABLE 2 Total countsa of blueberries surveyed at 8 sites in Units 12 and 20E between 25 July and 1 August 2000–2007 Location/Unit Year
Latitude
Longitude
Clearwater (Unit 12)
7 mile (Unit 12)
Pipeline (Unit 12)
RCA (Unit 12)
4 mile (Unit 12)
9 mile (Unit 20E)
Fairplay 1 (Unit 20E)
Fairplay 2 (Unit 20E)
Total
2000 N63°09' W143°10' 137 3 19 7 55 51 124 46 442 2001 N63°12' W143° 04' 285 23 278 23 356 400 379 599 2343 2002b N63°15' W142°27' n/a n/a n/a n/a n/a n/a n/a n/a n/a 2003 N63°23' W143°47' 806 24 135 220 676 209 667 996 3733 2004 N63°21' W142°34' 164 19 67 6 burned 152 274 358 1040 2005 N63°24' W142°28' 630 55 490 238 0 205 199 292 2109 2006 N63°40' W142°15' 27 56 47 298 15 24 239 87 793 2007 N63°41' W142°15' 285 7 47 231 46 999 457 125 2197 a Sum of all blueberries counted on 5 plots at each sample site. b No surveys were conducted in 2002.
163

164
TABLE 3 Unit 12 successful black bear hunter residency, regulatory years 1990–1991 through 2006–2007 Regulatory
year
Unit resident (%) Other residents
(%)
Nonresident (%) Total successful
huntersa 1990–1991 15 (63) 7 (29) 2 (8) 24 1991–1992 10 (56) 8 (44) 0 (0) 18 1992–1993 26 (74) 8 (23) 1 (3) 35 1993–1994 21 (78) 5 (19) 1 (4) 27 1994–1995 24 (73) 8 (24) 1 (3) 33 1995–1996 20 (69) 8 (28) 1 (3) 29 1996–1997 32 (73) 7 (16) 5 (11) 44 1997–1998 27 (73) 5 (14) 5 (14) 37 1998–1999 25 (63) 12 (30) 3 (8) 40 1999–2000 18 (67) 6 (22) 3 (11) 27 2000–2001 30 (64) 12 (26) 5 (11) 47 2001–2002 12 (52) 4 (17) 7 (30) 23 2002–2003 23 (58) 11 (27) 6 (15) 40 2003–2004 10 (45) 10 (45) 2 (9) 22 2004–2005 22 (58) 13 (34) 3 (8) 38 2005–2006 12 (31) 17 (44) 10 (26) 39 2006–2007 21 (42) 25 (50) 4 (8) 50 a Total may include hunters who did not specify whether or not they were residents.

165
TABLE 4 Unit 12 black bear harvest chronology percent by month, regulatory years 1990–1991 through 2006–2007 Regulatory Harvest chronology percent by month
year Jul Aug Sep Oct Nov Apr May Jun n 1990–1991 0 4 21 0 0 0 54 21 24 1991–1992 0 6 6 0 0 0 41 47 17 1992–1993 3 11 20 0 0 3 46 17 35 1993–1994 0 7 7 0 0 0 41 44 27 1994–1995 7 7 10 0 0 0 33 43 34 1995–1996 7 10 10 0 0 0 38 34 29 1996–1997 9 7 36 0 0 0 39 9 44 1997–1998 5 0 5 0 0 0 71 20 41 1998–1999 0 8 20 0 0 0 58 15 40 1999–2000 0 15 19 0 0 0 33 33 27 2000–2001 4 11 19 0 0 2 43 21 47 2001–2002 9 9 17 4 0 0 35 26 23 2002–2003 0 5 18 0 0 2 48 27 40 2003–2004 0 14 9 0 0 0 54 23 22 2004–2005 3 8 13 0 0 3 53 21 38 2005–2006 0 13 18 0 0 0 36 33 39 2006–2007 2 6 26 0 0 0 44 20 50

TABLE 5 Unit 12 black bear harvest by transport method, regulatory years 1990–1991 through 2006–2007 Harvest by transport method (%)
Regulatory year
Airplane
Horse
Boat
3- or 4-wheeler
Snowmachine
ORV
Highway vehicle
Walking
Unknown
n
1990–1991 1 (4) 1 (4) 2 (8) 3 (13) 0 (0) 0 (0) 12 (50) 0 (0) 5 (21) 24 1991–1992 1 (6) 0 (0) 1 (6) 2 (11) 0 (0) 0 (0) 13 (71) 0 (0) 1 (6) 18 1992–1993 3 (9) 0 (0) 4 (11) 7 (20) 0 (0) 2 (6) 16 (46) 1 (3) 2 (6) 35 1993–1994 1 (4) 0 (0) 1 (4) 9 (36) 0 (0) 1 (4) 11 (44) 1 (4) 1 (4) 25 1994–1995 2 (6) 1 (3) 3 (9) 7 (21) 0 (0) 1 (3) 12 (35) 7 (21) 1 (3) 34 1995–1996 2 (7) 1 (3) 1 (3) 4 (14) 0 (0) 0 (0) 16 (55) 5 (17) 0 (0) 29 1996–1997 5 (11) 1 (2) 2 (5) 8 (18) 0 (0) 0 (0) 19 (43) 6 (14) 3 (7) 44 1997–1998 0 (0) 0 (0) 2 (5) 10 (24) 0 (0) 0 (0) 22 (54) 7 (17) 0 (0) 41 1998–1999 3 (8) 2 (5) 2 (5) 2 (5) 0 (0) 0 (0) 19 (48) 12 (30) 0 (0) 40 1999–2000 5 (19) 1 (4) 1 (4) 6 (22) 0 (0) 0 (0) 11 (41) 3 (11) 0 (0) 27 2000–2001 1 (2) 0 (0) 3 (6) 14 (30) 1 (2) 0 (0) 20 (43) 8 (17) 0 (0) 47 2001–2002 1 (4) 0 (0) 0 (0) 6 (26) 0 (0) 0 (0) 10 (43) 5 (22) 1 (4) 23 2002–2003 3 (7) 0 (0) 1 (2) 19 (46) 0 (0) 2 (5) 8 (20) 7 (17) 1 (2) 41 2003–2004 4 (18) 0 (0) 0 (0) 7 (32) 0 (0) 0 (0) 6 (27) 5 (23) 0 (0) 22 2004–2005 3 (8) 0 (0) 0 (0) 12 (32) 0 (0) 0 (0) 16 (42) 7 (18) 0 (0) 38 2005–2006 2 (5) 0 (0) 1 (3) 15 (38) 0 (0) 0 (0) 12 (31) 9 (23) 0 (0) 39 2006–2007 3 (6) 0 (0) 1 (3) 20 (40) 0 (0) 4 (8) 15 (30) 5 (10) 2 (4) 50
166

167
WILDLIFE Alaska Department of Fish and GameDivision of Wildlife Conservation
MANAGEMENT REPORT (907) 465-4190 P.O. BOX 115526 JUNEAU, AK 99811-5526
BLACK BEAR MANAGEMENT REPORT
From: 1 July 2004 To: 30 June 2007
LOCATION
GAME MANAGEMENT UNIT: 13 (23,000 mi2)
GEOGRAPHIC DESCRIPTION: Nelchina Basin
BACKGROUND Black bears are numerous in portions of Unit 13 with suitable forest habitat. Harvest data have been available since 1973, when the sealing of black bears became mandatory. Annual black bear harvests averaged 67 during the 1970s, 81 in the 1980s, and 93 in the 1990s. The increasing harvest trend shows black bears are gaining in status as a desirable big game animal, and black bear hunting is much more popular than in the past.
MANAGEMENT DIRECTION MANAGEMENT OBJECTIVES Maintain the existing population of black bears with a sex structure that will sustain a harvest of at least 60% males.
METHODS Department staff members monitor the black bear harvest by interviewing successful hunters when black bears are presented for sealing. Data obtained at sealing include skull measurements, sex of bears, and hunter methods, means, and effort.
RESULTS AND DISCUSSION POPULATION STATUS AND TREND Population Size A black bear population estimate was conducted in 1985 along a portion of the upper Susitna River in conjunction with the Susitna Hydroelectric Project Studies (Miller 1987). Results indicated a density estimate of 90 black bears/1000 km2. Females had an observed mean litter size of 2.1 (range = 1–4) cubs of the year, or 1.9 (range = 1–3) yearlings. However, Miller considered the study area to be marginal black bear habitat and not indicative of bear densities in more favorable forested habitat within the unit. Field observations and harvest data indicate

168
black bears are abundant in large portions of 13D and 13E. A population estimate for Unit 13 has not been attempted because density estimates for bears in more favorable or typical forested habitat within GMU 13 are not available. Black bear densities in the favorable habitats within Unit 13 are thought to be similar to densities in other portions of Southcentral Alaska. Trends in bear abundance have not been documented.
Distribution and Movements Black bears usually inhabit forested habitats except during the fall and occasionally in spring when they move into shrub zones to feed on berries and succulent vegetation (Miller 1987).
MORTALITY Harvest Season and Bag Limit. There is no closed season on black bears in Unit 13, and the bag limit is 3 bears per year.
Board of Game Actions and Emergency Orders. The Board of Game passed a regulation that liberalized hunting of black bear in areas with an active wolf control program, which includes 13A, 13D, 13C and 13E east of the Alaska Highway. Under this regulation hunters can sell untanned hides and skulls of black bears and take bears from a registered bait station the same day airborne provided they are more than 300 feet from the plane.
Hunter Harvest. The reported harvest of black bears during the 2006–07 season was 124 bears, similar to the prior 5-year average of 122 (range = 87–144) for this reporting period (Table 1). Black bear harvests began increasing in 1994; the 123 average harvest for this reporting period was 56% higher than the 79 bears a year reported between 1979 and 1993. Males composed 73% (n = 91) of the 2006–07 harvest and females 27% (n = 33). Overall, males composed 71% of the harvest during this reporting period. Black bear harvests consisting of 60% or more males meet current management objectives.
Mean skull size for males was 16.5 inches in 2006–07, slightly below the recent 5-year average of 16.8 inches. Mean skull size for females was 15.9 inches in the 2006–07 harvest, slightly above the 5-year mean of 15.5 inches. The average yearly skull size for males has been quite high and stable over the last 15 years (range = 16.5–17.0). This suggests larger males are being maintained in the population, and the increase in harvest is not just attributed to large cub cohorts.
Overall, bears killed in subunit 13D account for 45% of the total Unit 13 harvest, followed by 13E with 37%, 13A with 9%, 13C with 4%, 13B with only 3%, and 1% in unknown subunits.
The defense of life or property (DLP) kill averaged about 1 bear/year throughout this reporting period. Despite increased human settlement, reported DLP kills remain low because many DLP bears are likely sealed under general season take or remain unreported. With a 3-bear bag limit and no closed season, there is little incentive to report the take of black bears as DLP, which would require surrendering the hide and skull to the Alaska Department of Fish and Game (ADF&G).

169
Hunting of black bears over bait is allowed during the spring. Registration of bait stations is required, and hunters must follow special baiting regulations. In the 2006 season 38 bears were taken over bait, and the 6-year average for this reporting period was 40 (range = 26–51) bears (Table 1). Clearly, the popularity of bear baiting has increased since 2000, when only 12 were taken. During this report period, baiting accounted for 54% of the spring harvest and 69% of the bears taken over bait were males.
Successful hunters reported taking a bear incidentally while hunting other game only 30 percent of the time during this reporting period. Also, 79% of the successful hunters salvaged some or all of the meat.
Hunter Residency and Success. Nonresidents took 24 (19%) black bears during 2006–07 (Table 2). During the last six years, the black bear take by nonresidents has averaged 26 bears/year. This is an increase of 63% over the 1988–97 average of 16 bears/year. Local residents of Unit 13 harvested 33 (27%) black bears during 2006–07, the highest local harvest ever reported. Local hunters averaged 20 (16%) bears/year in the 5 prior years. The remaining 67 bears (54%) harvested during 2006–07 were taken by nonlocal Alaska residents, who have historically accounted for the largest portion of the Unit 13 black bear harvest, 60% during the past 6 years.
Successful black bear hunters spent an average of 4.2 days in the field both in 2006–07and on average during this report period. Data suggest successful hunters are now spending more time in the field to take a bear when compared to the 3.8-day average reported by all hunters since 1979. Hunters spent 4.7 days to take a black bear in the spring versus 3.4 in the fall. The increased popularity of hunting over a bait station probably accounts for the higher effort. If a hunter sets out a bait station, it is only logical he will spend more time in the field observing bears coming into the bait station, and perhaps waiting for a better trophy.
Harvest Chronology. During the 2006–07 season, the spring harvest was 81 bears (65%), compared to 43 (35%) in the fall. Harvest chronology is similar for the entire reporting period, on average 60% of the Unit 13 black bear harvest occurred during spring. The spring harvest has exceeded the fall harvest every year since 2000–01. June has had the highest spring harvest since 2005, while September is the most important month during the fall season (Table 3). Harvests in July and August have contributed quite a few bears to the harvest (Table 3). The bears killed during the summer usually have lesser quality hides, suggesting summer kills were either for meat or that a higher incidence of DLP bears were reported under general season regulations.
Transport Methods. Successful 2006–07 bear hunters reported that highway vehicles (25%) and 4-wheelers (19%) were the most popular methods of transportation (Table 4). Highway vehicles and 4-wheelers have been the most important methods of transportation throughout this reporting period. Aircraft use had declined after 1995 but was relatively stable during this reporting period. The combined importance of highway vehicles, 4-wheelers, and walking indicates roadside black bear populations received the greatest hunting pressure.
Other Mortality Miller (1987) observed 35% mortality among cubs of the year accompanying radiocollared females in the upper Susitna River study area. In this study, additional natural mortality also

170
occurred among radiocollared adult black bears. Miller believed predation by brown bears was an important source of natural mortality for black bears of all age classes in Unit 13. DLP reports and other human sources of mortality remain low with no trends evident (Table 1). Other than hunting, human influence on bear survival appears minimal.
HABITAT Assessment Black bears in Unit 13 use extensive tracts of spruce forest and, to a lesser degree, forested land bordering rivers, and upland shrub zones. Units 13D and 13E have more black bears than other subunits and also have the most extensive areas of heavily timbered mature spruce forests. Current fire management objectives specify a reduction in fire suppression activities in remote portions of Unit 13, supporting a return to a natural fire regime. This may eventually result in an interspersion of forest stands in different successional stages that could reduce prime black bear habitat. Seasonal availability of salmon can also influence numbers of black bears in subunits 13D and 13E; salmon provide an alternative source of nutrition unavailable in more interior subunits.
CONCLUSIONS AND RECOMMENDATIONS Black bear harvests over the last 5 years have been high. Interest in bear hunting and bear harvests increased in the late 1990s, primarily due to the growing popularity of spring bear baiting. Black bears have become a very important and primary game species, rather than being just an animal taken incidentally while hunting other more important game animals. This conclusion is supported by chronology data showing high harvests during periods when other big game hunting opportunities are limited.
Harvest levels currently reported on black bears in Unit 13 are considered sustainable. Unit 13 has extensive areas of forest habitat ideal for black bears, especially subunits D and E. Access is extremely limited, and harvests are low over much of the best black bear habitat. Both plotting black bear bait station locations and transportation data indicate most harvest occurs near the road system. Increased harvests along the road system have not resulted in a decline in the percent males or the average skull size of all bears in the harvest. These data suggest we are not overharvesting local populations. If bears were being overharvested along the road system, immigration by subadults from unharvested or lightly harvested areas would be expected. Also, the fact that taking cubs and sows with cubs is prohibited ensures that productive females are afforded protection and assures annual productivity and recruitment to offset hunting loss. Females would have to predominate in the harvest for a number of years before a population decline would be a concern.
Harvest data are not currently collected from unsuccessful black bear hunters; thus, we have no way of determining total hunting effort. Black bear hunting has become more popular and this trend is expected to continue as hunters seek alternative big game hunting opportunities because of increasing competition, shorter hunting seasons, and increased use of Tier II permit hunts for the more popular big game species. Data used to evaluate changes in hunting pressure and success rates are important in monitoring hunt conditions and, to some extent, bear abundance. Currently, this information is collected only from successful hunters. I recommend that a system

171
to collect these data from unsuccessful hunters be developed and implemented. Additional changes to season length or bag limits are not recommended at this time.
LITERATURE CITED MILLER, S.D. 1987. Big Game Studies. Vol. VI. Final Research Report. 1986 Susitna
Hydroelectric Project. Alaska Department of Fish and Game. Juneau.
PREPARED BY: SUBMITTED BY: Robert W. Tobey Gino Del Frate Wildlife Biologist III Management Coordinator Please cite any information taken from this section, and reference as:
TOBEY R.W. 2008. Unit 13 black bear management report. Pages 167–174 in P. Harper, editor. Black bear management report of survey and inventory activities 1 July 2004–30 June 2007. Alaska Department of Fish and Game. Project 17.0. Juneau, Alaska.

172
TABLE 1 Unit 13 black bear harvest, 2001–02 to 2006–07 Regulatory Reported hunter kill Nonhunting killa Total kill Year M (%) F (%) Unk. Total Over bait M F Unk. M F Unk. Total2001–02 Fall 01 26 (70) 11 (30) 2 39 0 0 0 26 11 2 39Spring 02 38 (79) 10 (21) 0 48 0 0 0 38 10 0 48Total 64 (75) 21 (25) 2 87 26 0 0 0 64 21 2 872002–03 Fall 02 37 (66) 19 (34) 0 56 1 1 0 38 20 0 58Spring 03 60 (68) 28 (32) 0 88 0 0 1 60 28 1 89Total 97 (67) 47 (33) 0 144 51 1 1 1 98 48 1 1472003–04 Fall 03 32 (63) 19 (37) 0 51 0 0 0 32 19 0 51Spring 04 53 (74) 19 (26) 0 72 0 0 0 53 19 0 72Total 85 (69) 38 (31) 0 123 46 0 0 0 85 38 0 1232004–05 Fall 04 35 (69) 16 (31) 0 51 1 1 0 36 17 0 53Spring 05 63 (74) 22 (26) 0 85 1 0 0 64 22 0 86Total 98 (72) 38 (28) 0 136 40 2 1 0 100 39 0 1392005–06 Fall 05 33 (66) 17 (34) 0 50 0 0 0 33 17 0 50Spring 06 50 (70) 21 (30) 0 71 0 0 0 50 21 0 71Total 83 (69) 38 (31) 0 121 38 0 0 0 83 38 0 1212006–07 Fall 06 30 (70) 13 (30) 0 43 0 0 1 30 13 1 44Spring 07 61 (75) 20 (25) 0 81 0 0 0 61 20 0 81Total 91 (73) 33 (27) 0 124 38 1 0 0 92 33 0 125a Includes DLP kills, research mortalities, and other known human-caused accidental mortality.

173
TABLE 2 Unit 13 black bear successful hunter residency, 2001–02 to 2006–07 Regulatory Local Other SuccessfulYear resident (%) resident (%) Nonresident (%) huntersa 2001–02 16 (18) 44 (51) 27 (31) 872002–03 19 (13) 101 (70) 24 (17) 144 2003–04 17 (14) 80 (65) 26 (21) 123 2004–05 25 (18) 85 (63) 26 (19) 136 2005–06 23 (19) 69 (57) 29 (24) 121 2006–07 33 (27) 67 (54) 24 (19) 124 a Includes residency unknown hunters. TABLE 3 Unit 13 black bear harvest chronology percent by month, 2001–02 to 2006–07 Harvest periodsRegulatory year July August September October April May June na 2001–02 5 (6) 11 (13) 18 (21) 4 (5) 0 (0) 23 (26) 25 (29) 872002–03 3 (2) 22 (15) 29 (20) 2 (1) 0 (0) 59 (41) 29 (20) 1442003–04 3 (2) 20 (16) 25 (20) 3 (2) 0 (0) 36 (29) 36 (29) 1232004–05 2 (1) 16 (12) 27 (20) 6 (4) 3 (2) 52 (38) 30 (22) 1362005–06 1 (1) 13 (11) 32 (26) 4 (3) 1 (1) 19 (16) 51 (42) 1212006–07 3 (2) 15 (12) 20 (16) 5 (4) 0 (0) 28 (23) 53 (43) 124a May include bears with unknown harvest date.

174
TABLE 4 Unit 13 black bear harvest (percent) by transport method, 2001–02 to 2006–07 Percent of harvest
Regulatory 3- or Highwayyear Airplane Horse Boat 4-wheeler Snowmachine ORV Vehicle Walk Othera n 2001–02 13 (15) 3 (3) 15 (17) 18 (21) 2 (2) 0 (0) 22 (25) 13 (15) 1 (1) 87 2002–03 13 (9) 5 (3) 33 (23) 41 (28) 0 (0) 1 (1) 36 (25) 13 (9) 2 (1) 144 2003–04 16 (13) 3 (2) 26 (21) 20 (16) 0 (0) 1 (1) 39 (32) 14 (11) 4 (3) 123 2004–05 18 (13) 2 (1) 32 (24) 32 (24) 2 (1) 4 (3) 34 (25) 8 (6) 3 (2) 135 2005–06 22 (18) 1 (1) 24 (20) 31 (26) 1 (1) 1 (1) 27 (22) 13 (11) 1 (1) 121 2006–07 19 (15) 0 (0) 20 (16) 24 (19) 1 (1) 1 (1) 31 (25) 24 (19) 4 (3) 124 a Other includes unknown

175
WILDLIFE Alaska Department of Fish and GameDivision of Wildlife Conservation
MANAGEMENT REPORT (907) 465-4190 P.O. BOX 115526 JUNEAU, AK 99811-5526
BLACK BEAR MANAGEMENT REPORT From: 1 July 2004 To: 30 June 2007
LOCATION
GAME MANAGEMENT UNIT: 14 (6625 mi2)
GEOGRAPHIC DESCRIPTION: Upper Cook Inlet
BACKGROUND
Griese (1999) evaluated total available habitat and harvest trends and projected the black bear population was near 700 with a maximum sustainable harvest of 24–30 sows. McDonough (2002) reported that the population likely remains between 500 and 1000 bears.
MANAGEMENT DIRECTION
MANAGEMENT GOALS Since 1976 the management goal in Units 14A and 14B has been to provide the greatest opportunity to participate in hunting black bears. Given the low numbers of moose in Unit 14B there was incentive to reduce the number of black bears to increase moose calf survival. The goals in Unit 14C were to provide an opportunity to hunt black bears under aesthetically pleasing conditions and to provide an opportunity to enjoy black bears by viewing and photography.
MANAGEMENT OBJECTIVES The management objective has been to maintain a population largely unaffected by human harvest. The human-use objective has been to provide liberal opportunities to hunt black bears with annual total harvests of less than 80 bears with the annual sow harvest not exceeding 30 (not to exceed 14 sows in Unit 14A or 8 sows in each of Units 14B and 14C).
METHODS
Department staff monitored black bear mortality by collecting harvest information through the sealing of skulls and hides of bears taken by hunters or killed for other reasons. During sealing skull measurements, sex identification, hunting effort, location, and date of kill were recorded. Bears taken over bait, incidental harvest, and meat salvage were noted on the sealing reports. To hunt bears over bait, hunters were required to have a permit from the Alaska Department of Fish

176
and Game (department) with no more than 2 bait stations allowed per permit. Baiting was not allowed in 14C.
RESULTS AND DISCUSSION
POPULATION STATUS AND TREND Population Size
The black bear population in Unit 14 was previously projected as between 530–1080 by Griese (1996). Earlier estimates by Harkness (1990) and Grauvogel (1990) reported a population size of 750–1050. Based on more recent information available from Earl Becker’s bear survey work in Unit 16 (unpublished data), we assumed this population was similar or increasing during the reporting period. Unit 14C, which includes the Anchorage area, has numerous black bear complaints from the public. Reports of bear-human conflicts remain low in both 14A and 14B. In Unit 14A it is likely bears previously taken in defense of life or property are being taken with a hunting license during the summer, when nuisance bear activity tends to occur. Increased harvest and recent trends in hunter activities indicate a healthy black bear population.
MORTALITY Harvest
Season and Bag Limit. In 2005, the Board of Game raised the black bear limit in Unit 14B from 1 to 3 bears per year. The bag limit remained 1 bear in Unit 14A and 14C. Baiting was allowed by registration permit between 15 April and 15 June in 14A and 14B. Bear hunters desiring to use bait in Unit 14A and 14B were required to successfully complete a bear bait hunting class in order to get a bear bait hunting registration permit from the department.
Board of Game Actions. The Board of Game raised the bag limit in Unit 14B from 1 bear to 3 bears in 2005.
Hunter Harvest. The bear harvest in Unit 14 increased during the 2004–2007 period, compared to previous years (Table 1). During 2004–2007, hunters reported an average annual kill of 166 bears, including an average of 60 (36%) sows. This was a substantial increase from the previous reporting period; however, there was little change in the percent females taken. Nonresident hunters reported an average harvest of 20 bears (Table 6). This was up from an average harvest of 17 reported from 2001–2003. During the last 3 year period, 173 of the black bears harvested in Units 14A and 14B were taken over bait (Tables 2–3). The harvest in Unit 14C averaged 39 during this period (Table 4), up from the average of 35 black bears during the 2001–2004 period.
Baiting Participation. The average number of hunters using bait to hunt bears in Unit 14 during the report period was 214. This was an increase from the previous 3-year average of 147 permit holders (Table 5).
Hunter Residency and Success. Unit 14 residents on average took 85% of the harvest during this reporting period (Table 6).

177
Harvest Chronology. May produced a lower percentage of the harvest in Unit 14 during the reporting period compared with the 2001–2003 period (40% vs. 46%), with that peak occurring during the second half of the month (Table 7). During late September, a smaller peak in harvest occurs when large numbers of moose and other big game hunters are in the field and there is opportunity for the incidental take of black bears (Table 7).
Transport Methods. The largest percentage of hunters in Unit 14 reported using ORV/ATVs as the preferred method to access hunting areas (Table 8). Highway vehicles were reported as the second and airplanes as the third most preferred methods.
Other Mortality
Nonhunting kills for all of Unit 14 totaled 16 bears for 2004–2007.
CONCLUSIONS AND RECOMMENDATIONS
Given current and historic harvest trends, the population of black bears in Unit 14 is likely at the upper end of a range between 500 and 1000 black bears. Budget and time constraints are likely to prevent surveys from being conducted any time soon. Recent black bear surveys in Unit 16 may provide some insight into the Unit 14 population based on similar habitat characteristics in some of the areas.
Human-use objectives were exceeded during this report period. The average annual harvest of 166 bears was higher than the management objective of 80 bears and the average sow harvest of 60 females was greater than the estimated allowable harvest of 30 females. During 2004–2007, the proportion of females in the harvest in Unit 14 was 36%. The trends in female harvest and total harvest did not show a problem with the bear population. These trends should be monitored for undesirable effects on the black bear population. It is possible that the increased harvest may have been a result of increased development and human activity in the unit. While the proportion of females harvested will need to be monitored closely for negative population trends, it is believed that the populations, especially in Unit 14B can withstand higher harvests and some decrease in bear densities.
The expanding human population and encroachment into bear habitat in the unit will likely result in increased conflicts and more bears being killed either in defense of life or property or as legal harvest. It is possible that the reduction in defense of life or property bear mortality was due in part to unit residents becoming more aware of potential bear problems through bear awareness programs promoted by the department, various federal agencies, and groups like the Bear Necessities Coalition of Talkeetna. Because of the potential for increased bear/human conflicts in Unit 14, the department must continue to provide information and education to the public about bears and how to avoid problems with them.

178
LITERATURE CITED
GRAUVOGEL, C.A.. 1990. Unit 14C black bear survey-inventory progress report. Pages 70–83 in S. O. Morgan, Ed. Annual report of survey-inventory activities. Part IV. Black bears. Vol. XX. Alaska Department of Fish and Game. Federal Aid in Wildlife Restoration Progress Report. Project W-23-2. Study 17.0. Juneau. 117pp.
GRIESE, H. J. 1996. Unit 14 black bear management report. Pages 113–122 in M. Hicks, Ed. Annual report of survey-inventory activities. Part IV. Black bears. Alaska Department of Fish and Game. Federal Aid in Wildlife Restoration Progress Report. Project W-24-1, W-24-2, W-24-3. Study 17.0. Juneau. 163pp.
———. 1999. Unit 14 black bear management report. Pages 124–136 in M. Hicks, Ed. Annual report of survey-inventory activities. Black bears. Alaska Department of Fish and Game. Federal Aid in Wildlife Restoration. Grants W-24-4, W-24-5, and W-27-1. Study 17.0. Juneau.
HARKNESS, D. 1990. Unit 14C black bear survey-inventory progress report. Pages 84–89 in S. O. Morgan, Ed. Annual report of survey-inventory activities. Part IV. Black bears. Vol. XX. Alaska Department of Fish and Game. Federal Aid in Wildlife Restoration Progress Report. Project W-23-2. Study 17.0. Juneau. 117pp.
KAVALOK, T. 2005. Unit 14 black bear management report. Pages 183–194 in C. Brown, editor. Black bear management report of survey and inventory activities 1 July 2001–30 June 2005. Alaska Department of Fish & Game. Project 17.0. Juneau, Alaska.
MCDONOUGH, T. 2002. Unit 14 black bear management report. Pages 180–190 in C. Healy, Ed. Black bear management report of survey and inventory activities 1 July 1998-30 June 2001. Alaska Department of Fish and Game. Proj. 17.0. Juneau.
PREPARED BY: SUBMITTED BY: Tim Peltier Gino Del Frate Wildlife Biologist II Management Coordinator PELTIER, T. 2008. Unit 14 black bear management report. Pages 175–186 in P. Harper, editor. Black bear management report of survey and inventory activities 1 July 2004–30 June 2007. Alaska Department of Fish and Game. 17.0 Juneau, Alaska

179
TABLE 1 Unit 14 black bear harvest composition, 1997–2006 Regulatory Reported Harvest
Year Male (%)a Female (%)a Unk Total 1997/98 66 68% 31 32% 0 97 1998/99 101 74% 35 26% 0 136 1999/00 68 74% 24 26% 2 94 2000/01 84 78% 24 22% 0 108 2001/02 63 67% 31 33% 0 94 2002/03 105 73% 38 27% 1 144 2003/04 100 68% 48 32% 1 149 2004/05 118 67% 57 33% 0 175 2005/06 103 62% 64 38% 3 170 2006/07 92 61% 60 39% 1 153
aIncludes bears of known sex only

180
TABLE 2 Unit 14A black bear harvest, 2002–2006 Reported
Hunter kill Nonhunting killb Total estimated kill Regulatory year M F (%) Unk. Total Baiteda M F Unk.
Estimated unreported
killc M (%) F (%) Unk. Total 2002 Fall 02 16 4 (20) 0 20 0 0 3 0 16 (70) 7 (30) 0 23 Spring 03 38 21 (36) 1 60 42 0 0 1 38 (64) 21 (35) 2 61 Total 54 25 (32) 0 79 38 0 3 0 8 54 (66) 28 (34) 8 90 2003 Fall 03 21 10 (32) 1 32 0 0 1 0 21 (66) 11 (34) 1 33 Spring 04 36 24 (40) 0 60 36 1 0 0 37 (61) 24 (39) 0 61 Total 57 34 (37) 1 92 30 1 1 0 9 58 (62) 35 (38) 10 103 2004 Fall 04 21 10 (32) 0 31 0 0 0 0 21 (68) 10 (32) 0 31 Spring 05 44 27 (38) 0 71 46 1 0 0 45 (63) 27 (37) 0 72 Total 65 37 (36) 0 102 46 1 0 0 10 66 (64) 37 (36) 10 113 2005 Fall 05 11 10 (48) 0 21 0 0 1 0 11 (50) 11 (50) 0 22 Spring 06 40 29 (42) 2 69 46 1 0 0 41 (59) 29 (41) 2 72 Total 51 39 (43) 2 92 46 1 1 0 9 52 (57) 40 (43) 11 103 2006 Fall 06 13 7 (35) 0 20 0 0 1 0 13 (62) 8 (38) 0 21 Spring 07 32 23 (42) 1 56 40 1 0 1 33 (59) 23 (41) 2 58 Total 45 30 (40) 1 76 40 1 1 1 8 46 (60) 31 (40) 10 97 a Bears reported taken over legally established bait stations b Includes defense of life or property kills, illegal kills, and other known human-caused accidental mortality c Assumes approximately 10% of reported harvest

181
TABLE 3 Unit 14B black bear harvest, 2002–2006 Reported
Hunter kill Nonhunting killb Total estimated kill Regulatory year M F (%) Unk. Total Baiteda M F Unk.
Estimated unreported
killc M (%) F (%) Unk. Total 2002 Fall 02 11 1 (8) 0 12 0 0 0 0 11 (92) 1 (8) 0 12 Spring 03 12 5 (29) 0 17 8 0 0 0 12 (71) 5 (29) 0 17 Total 23 6 (21) 0 29 8 0 0 0 3 23 (79) 6 (21) 3 32 2003 Fall 03 2 3 (60) 0 5 0 0 1 0 2 (33) 4 (67) 0 6 Spring 04 12 2 (14) 0 14 10 0 0 0 12 (86) 2 (14) 0 14 Total 14 4 (22) 0 18 10 0 1 0 2 14 (74) 5 (26) 2 21 2004 Fall 04 6 1 (14) 0 7 0 0 0 0 6 (86) 1 (14) 0 7 Spring 05 18 7 (28) 0 25 14 0 0 0 18 (72) 7 (28) 0 25 Total 24 8 (25) 0 32 14 0 0 0 3 24 (75) 8 (25) 3 35 2005 Fall 05 10 6 (38) 0 16 0 1 0 0 11 (65) 6 (35) 0 17 Spring 06 14 4 (22) 0 18 9 0 0 0 14 (78) 4 (22) 0 18 Total 24 10 (29) 0 34 9 1 0 0 3 25 (71) 10 (29) 3 39 2006 Fall 06 8 4 (33) 0 12 0 0 1 0 8 (62) 5 (38) 0 13 Spring 07 20 12 (38 0 32 18 0 0 0 20 (63) 12 (37) 0 32 Total 28 16 (36) 0 44 18 0 1 0 4 28 (62) 17 (38) 4 49 a Bears reported taken over legally established bait stations b Includes defense of life or property kills, illegal kills, and other known human-caused accidental mortality c Assumes approximately 10% of reported harvest

182
TABLE 4 Unit 14C black bear harvest, 2002–2006 Reported
Hunter kill Nonhunting killb Total estimated kill Regulatory year M F (%) Unk. Total Baiteda M F Unk.
Estimated unreported
killc M (%) F (%) Unk. Total 2002 Fall 02 7 1 (13) 0 8 0 1 0 0 8 (89) 1 (37) 0 9 Spring 03 20 5 (20) 0 25 2 1 0 0 21 (81) 5 (19) 0 26 Total 27 6 (18) 0 33 2 2 0 0 3 29 (83) 6 (17) 3 38 2003 Fall 03 13 5 (28) 0 18 0 2 1 0 15 (71) 6 (29) 0 21 Spring 04 16 4 (20) 0 20 0 0 0 0 16 (80) 4 (20) 0 20 Total 29 9 (24) 0 38 0 2 1 0 4 31 (74) 11 (26) 4 42 2004 Fall 04 13 3 (19) 0 16 0 0 0 0 13 (81) 3 (19) 0 16 Spring 05 15 9 (38) 0 24 0 2 0 0 17 (65) 9 (35) 0 26 Total 28 12 (30) 0 40 0 2 0 0 4 30 (71) 12 (29) 4 46 2005 Fall 05 8 7 (47) 1 16 0 1 2 0 9 (50) 9 (50) 1 19 Spring 06 20 8 (29) 0 28 0 0 0 0 20 (71) 8 (29) 0 28 Total 28 15 (35) 1 44 0 1 2 0 4 29 (63) 17 (37) 5 51 2006 Fall 06 4 4 (50) 0 8 0 1 0 0 5 (56) 4 (44) 0 9 Spring 07 15 10 (40) 0 25 0 2 0 0 17 (63) 10 (37) 0 27 Total 19 14 (42) 0 33 0 3 0 0 3 22 (61) 14 (39) 3 39 a Bears reported taken over legally established bait stations b Includes defense of life or property kills, illegal kills, and other known human-caused accidental mortality c Assumes approximately 10% of reported harvest

183
TABLE 5 Unit 14 black bear hunter baiting participation, 1997–2006 Number of stations registered Regulatory
year Number of permittees SU 14A SU 14B 1997/98 137 155 40 1998/99 153 162 40 1999/00 140 169 54 2000/01 141 159 43 2001/02 114 135 35 2002/03 158 183 40 2003/04 169 197 40 2004/05 194 201 55 2005/06 223 257 56 2006/07 225 234 83
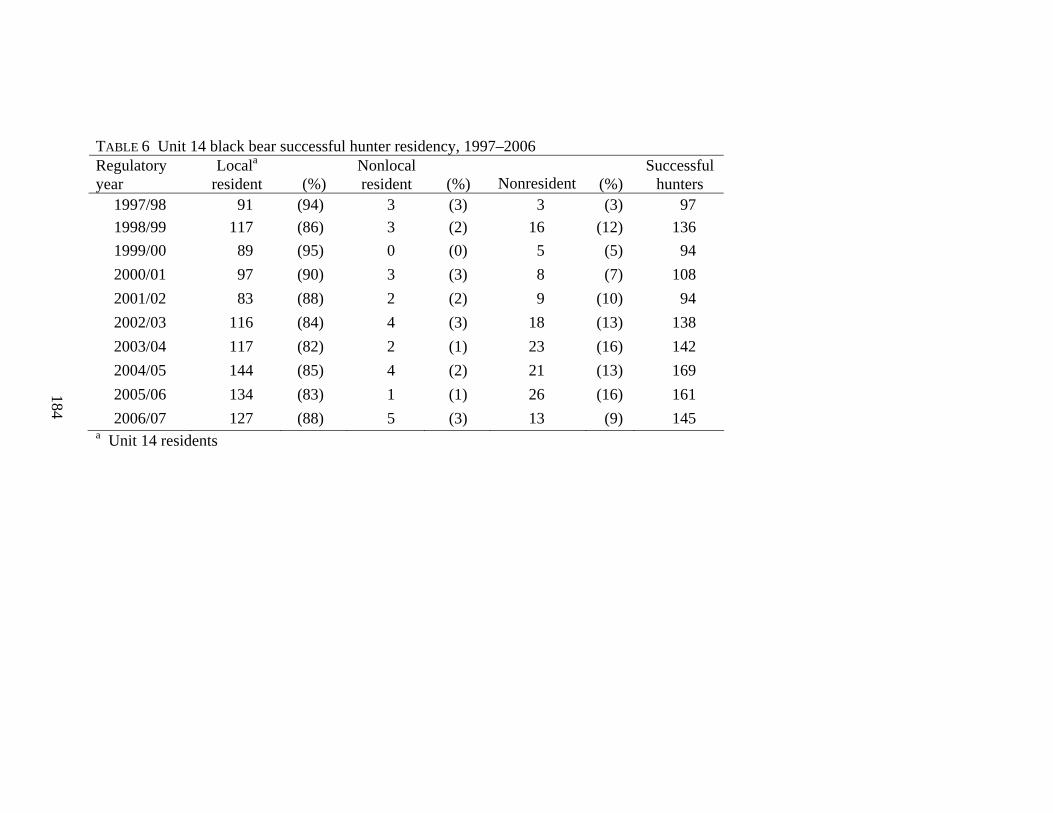
184
TABLE 6 Unit 14 black bear successful hunter residency, 1997–2006
Regulatory year
Locala resident (%)
Nonlocal resident (%) Nonresident (%)
Successful hunters
1997/98 91 (94) 3 (3) 3 (3) 97 1998/99 117 (86) 3 (2) 16 (12) 136 1999/00 89 (95) 0 (0) 5 (5) 94 2000/01 97 (90) 3 (3) 8 (7) 108 2001/02 83 (88) 2 (2) 9 (10) 94 2002/03 116 (84) 4 (3) 18 (13) 138 2003/04 117 (82) 2 (1) 23 (16) 142 2004/05 144 (85) 4 (2) 21 (13) 169 2005/06 134 (83) 1 (1) 26 (16) 161 2006/07 127 (88) 5 (3) 13 (9) 145
a Unit 14 residents
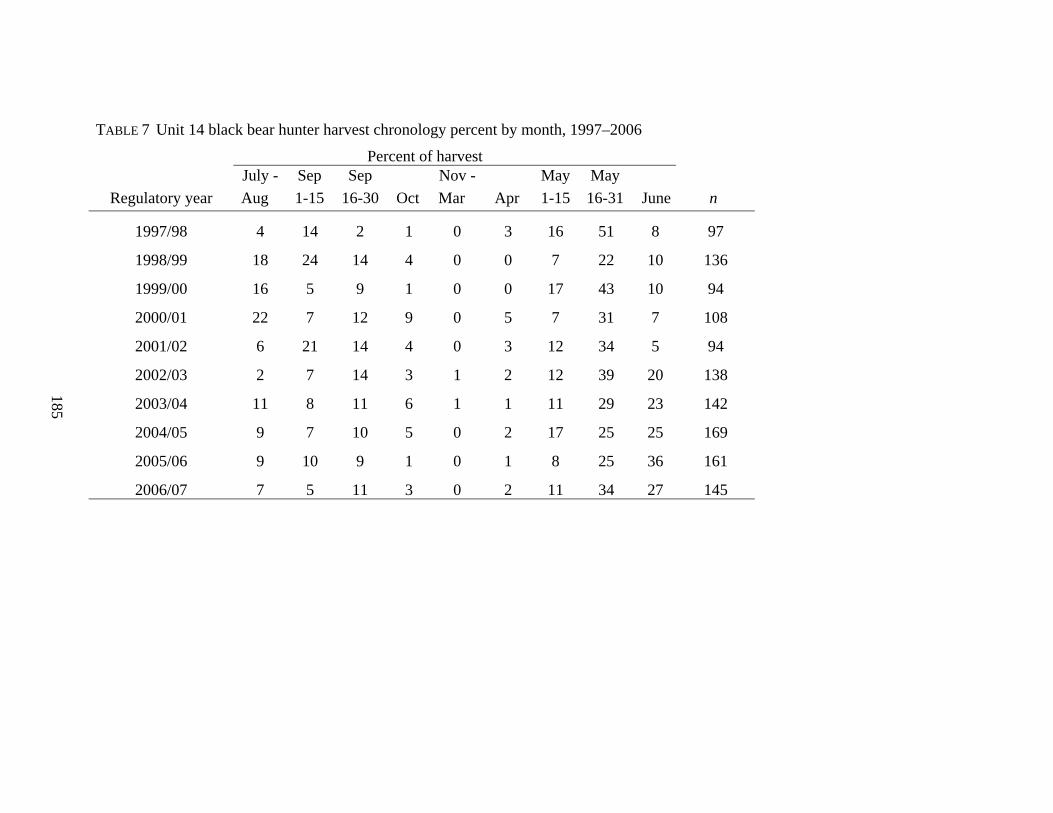
185
TABLE 7 Unit 14 black bear hunter harvest chronology percent by month, 1997–2006 Percent of harvest
Regulatory year July - Aug
Sep 1-15
Sep 16-30 Oct
Nov - Mar Apr
May 1-15
May 16-31 June n
1997/98 4 14 2 1 0 3 16 51 8 97
1998/99 18 24 14 4 0 0 7 22 10 136
1999/00 16 5 9 1 0 0 17 43 10 94
2000/01 22 7 12 9 0 5 7 31 7 108
2001/02 6 21 14 4 0 3 12 34 5 94
2002/03 2 7 14 3 1 2 12 39 20 138
2003/04 11 8 11 6 1 1 11 29 23 142
2004/05 9 7 10 5 0 2 17 25 25 169
2005/06 9 10 9 1 0 1 8 25 36 161
2006/07 7 5 11 3 0 2 11 34 27 145

186
TABLE 8 Unit 14 black bear harvest percent by transport method, 1997–2006 Percent of harvest
Regulatory year Airplane Horse Boat Snow
Machine ORV/ATV Highway Vehicle
Other / Unknown n
1997/98 14 0 6 0 35 27 18 97
1998/99 21 2 4 0 33 17 22 136
1999/00 19 3 2 0 28 21 27 94
2000/01 19 1 4 0 26 14 37 108
2001/02 19 3 10 0 26 20 22 94
2002/03 12 1 12 0 33 25 18 138
2003/04 14 2 9 1 35 17 23 142
2004/05 15 0 8 0 39 21 17 169
2005/06 14 0 13 0 34 22 18 141
2006/07 18 0 14 0 33 21 14 145

187
WILDLIFE Alaska Department of Fish and GameDivision of Wildlife Conservation
MANAGEMENT REPORT (907) 465-4190 P.O. BOX 115526 JUNEAU, AK 99811-5526
BLACK BEAR MANAGEMENT REPORT
From: 1 July 2004 To: 30 June 2007
LOCATION
GAME MANAGEMENT UNIT: 16 (12,445 mi2)
GEOGRAPHIC DESCRIPTION: West Side of Cook Inlet
BACKGROUND
Trends in black bear harvest in Unit 16 have been reported to vary with fluctuations in the fall berry crops (Faro 1990), the length of moose season, and access conditions during late spring (Harkness 1993). Reported harvest levels have fluctuated from 67 to 415 (this report) since sealing requirements began. During recent years, the bulk of the harvest has shifted from fall to spring, a product of baiting opportunity and increased interest in hunting black bears (Faro 1989).
Harkness (1993) expressed concern about the unknown level of nuisance bears killed and not reported. Based on work by Scott et al. (1993) regarding harvest rates per household in Unit 16B, McDonough (2002) concluded the reported harvest in Unit 16 over that last 15 years probably does not accurately reflect the actual harvest due to the ratio between the number of households in the unit and the number of bears that were reported as resident harvest. Reported harvest rates have been increasing for the last several years.
Recently there has been a desire to increase the harvest objective to reduce the bear population in order to support moose management.
MANAGEMENT DIRECTION
MANAGEMENT GOALS The management goal in Unit 16 is to provide the greatest opportunity to participate in hunting black bears. Beginning in July 2007, an additional management goal will be to reduce the overall population of black bears in the unit which should result in increased moose calf survival.
188
MANAGEMENT OBJECTIVES The population objective has been to maintain a population size that appears largely unaffected by human harvest. The human-use objective has been a 3-year average harvest of greater than 270 black bears (45 in 16A, >225 in 16B) with >30% female. Beginning in July 2007, the population objective in the Unit 16 Predator Control Area (16 PCA) will be to use liberalized harvest strategies and control methods to reduce the population to 600 to 800 bears and maintain it afterward at a level that would be largely unaffected by human harvest within the area.
METHODS
Earl Becker conducted a line-transect bear survey of Unit 16B in May of 2007. Department staff monitored the black bear harvest by sealing skulls and hides of bears taken by hunters or killed for other reasons. We measured skulls of sealed bears, determined sex, recorded date and location of kill, and the number of days hunted. Hunters were asked if the harvest was incidental, or if the bear was taken over bait, and if any meat was salvaged. Hunters who used bait were required to register with the department and get a permit (maximum of 2 bait stations were allowed per bait permit).
RESULTS AND DISCUSSION
POPULATION STATUS AND TREND Population Size
Results of Becker’s line-transect survey were 1887.8 black bears for Unit 16B. This is based on a density of 126.7 bears per 1000 km2 and a total area of 14,895 km2 of available habitat below 3500 feet elevation. Previous estimates were based on 25–50 black bears/100mi2 (Griese 1996) using available moose habitat to determine black bear habitat. These produced a similar mid-point estimate to the line transect survey result of 2700 bears for all of Unit 16 (Quang and Becker 1999). The previous range estimate of 1825–3650 black bears (Griese 1996, Griese 1999) covered the potential variation in the habitat quality throughout the unit.
Population Composition
No composition information is available for Unit 16 black bears.
Distribution and Movements
No information is available for movements of Unit 16 black bears.
MORTALITY Harvest
Season and Bag Limit. During this report period there was no closed season for black bear hunting in Unit 16. The bag limit was 3 bears, excluding cubs and sows accompanied by cubs. Baiting black bears was allowed by registration permit between 15 April and 15 June outside of Denali State Park in Unit 16A. The baiting season in Unit 16B was from 15 April–30 June. A

189
second bear baiting period, from 10 August–15 October, was added covering 16B and the portion of 16A within the liberalized hunting area.
Board of Game Actions and Emergency Orders. During its spring 2006 meeting the Board of Game (BOG) permitted the sale of black bear hides (with claws attached) and skulls from bears harvested in Unit 16B on nonfederal lands. In May of 2006 the BOG met in an emergency meeting to respond to a court judgment against the board and the Alaska Department of Fish and Game (ADF&G; department) in a lawsuit brought by Defenders of Wildlife. At that meeting the board expanded the predator control area to include a portion of 16A. In the new control area, effective 1 September 2006, hunters could sell black bear hides and skulls, a fall bear baiting season was established, and black bears could be taken the same day hunters flew, providing the hunters were at least 300 feet from an airplane when they attempted to take the animal. During the spring 2007 meeting the BOG created a Black Bear Predation Control program for Unit 16 within the 16 PCA. This program, which is set to begin in July 2007, will allow for licensed resident bear hunters to take black bears under a special Black Bear Control Permit issued by the department. With this permit, black bears can be taken over bait or by other methods on the same day the permittee has flown, provided that they are over 300 feet from the airplane. There will be no limit to the number of black bears that can be taken and cubs and sows accompanied by cubs may be taken. Control permittees will be able to have up to 4 registered Black Bear Bait Stations at the same time. They will have the option to sell tanned or untanned hides and skulls of black bears taken with a sale permit issued by the department.
Hunter Harvest. The average annual harvest of black bears during regulatory years (RY) 2004–2006 was 283 animals. This was much greater than the 2001–2003 average of 197. The harvest in RY 2006 was significantly greater than any previous year, with a total of 415 bears taken. Twenty-eight percent of the harvest was female. (Table 1). Most of the increase was from bears harvested in Unit 16B, where there has been an emphasis on reducing the number of bears.
Baiting Participation. The number of bear hunters using bait increased during this report period (Table 4). The proportion of the total harvest that came from spring bears taken over bait also increased in Unit 16A. The proportion of bears taken over bait in Unit 16B decreased during the reporting period (Tables 2 and 3).
Hunter Residency and Success. Compared to the previous report period, local resident success rates remained similar while nonlocal resident success rates increased slightly and nonresident success rates decreased slightly during this period (Table 5).
Harvest Chronology. Late May and June accounted for the majority of this harvest. This coincides with a switch that occurred during the late 1990s from more hunting pressure in the fall to more in the spring baiting season. During this reporting period an average of 65% of hunters took their bears during the late May and June period. (Table 6)
Transport Methods. Successful bear hunters in Unit 16 preferred aircraft and boats as their method of transportation although ATVs have become more popular where there is access (Table 7). Transportation methods have not changed substantially in the past 10 years (Table 7).

190
Other Mortality
Reported nonhunting kills represented a minor portion of the total reported mortality. However, we suspect that a number of nuisance black bears are killed and not reported due to inconvenience and time requirements for reporting. In addition, the 3-bear limit with no closed season probably results in a few bears being taken under the hunting regulations that would otherwise be considered defense of life and property kills. Estimates of nonreported harvested bears (Tables 2 and 3) were adjusted to reflect a higher portion in the total harvest, following the method set out by Griese (1996).
CONCLUSIONS AND RECOMMENDATIONS
McDonough (2002) reported the bear population in Unit 16 appeared to be largely unaffected by human harvest. During this report period the harvest was high and near record levels, yet the percentage of females in the average harvest has remained below 30% (Table 1). The human use objectives were met for 16A during this period. The human use objective for 16B met the goals as stated in the previous management report for 2006–2007 of >225 bears. The actual harvest could be higher due to unreported kills.
The black bear population and human use objectives were adjusted during the last report period to match moose management. In 2006 the Board of Game intended to reduce black bear numbers to aid in the moose population recovery. Since black bear harvests were not meeting management objectives the Board of Game implemented a black bear predation control program that will begin July 2007. Future management reports will discuss the effects of those changes.
LITERATURE CITED
FARO, J. 1989. Unit 16 black bear survey-inventory progress report. Pages 81–83 in S. O. Morgan, ed. Annual report of survey-inventory activities. Part IV. Black bears. Vol. XIX. Alaska Department of Fish and Game. Federal Aid in Wildlife Restoration. Progress Report Project W-23-1. Study 17.0. Juneau. 101pp.
FARO, J. 1990. Unit 16 black bear survey-inventory progress report. Pages 90–93 in S. O. Morgan, ed. Annual report of survey-inventory activities. Part IV. Black bears. Vol. XX. Alaska Department of Fish and Game. Federal Aid in Wildlife Restoration. Progress Report Project W-23-2. Study 17.0. Juneau. 117pp.
GRIESE, H. J. 1996. Unit 16 black bear management report. Pages 123–132 in M. Hicks, ed. Federal Aid in Wildlife Restoration, Management Report of Survey-Inventory Activities, 1 July 1992 – 30 June 1995. Black Bear. Alaska Department of Fish and Game. Grants W-24-1, W-24-2 and W-24-3. Study 17.0. Juneau. 163 pp.
GRIESE, H. J. 1999. Unit 16 black bear management report. Pages 124–136 in M. Hicks, ed. Federal Aid in Wildlife Restoration, Management Report of Survey-Inventory Activities, 1 July 1995 – 30 June 1998. Black Bear. Alaska Department of Fish and Game. Grants W-24-4, W-24-5 and W-27-1. Study 17.0. Juneau. 175 pp.

191
HARKNESS, D. 1993. Unit 16 black bear management report. Pages 112–120 in S. M. Abbott, ed. Management report of survey-inventory activities. Black bears. Alaska Department of Fish and Game. Federal Aid in Wildlife Restoration. Progress Report Project W-23-4/5. Study 17.0. Juneau. 159 pp.
MCDONOUGH, T. 2002. Unit 16 black bear management report. Pages 191–205 in C. Healy, ed. Black bear management report of survey and inventory activities, 1 July 1998 – 30 June 2001. Alaska Department of Fish and Game. Federal Aid in Wildlife Restoration Grants W-27-, W-27-3 and W-27-4. Proj. 17.0. Juneau, Alaska.
QUANG, P. X., AND E. F. BECKER. 1999. Aerial survey sampling of contour transects using double-count and covariate data. Pages. 87-97 in G. W. Garner, S. C. Amstrup, J. L. Laake, B. F. J. Manly, L. L. McDonald, and D. G. Robertson, A. A. Balkema eds. Marine Mammal Survey and Assessment Methods, Rotterdam. Netherlands.
SCOTT, C., A. PAIGE, G. JENNINGS, AND L. BROWN. 1993. Community profile database. Alaska Department of Fish and Game, Division of Subsistence. Juneau.
PREPARED BY: SUBMITTED BY: Tim Peltier Gino Del Frate Wildlife Biologist II Management Coordinator PELTIER, T. 2008. Unit 16 black bear management report. Pages 187–198 in P. Harper, editor. Black bear management report of survey and inventory activities 1 July 2004–30 June 2007. Alaska Department of Fish and Game. 17.0 Juneau, Alaska

192
TABLE 1 Unit 16 black bear harvest composition, 1997–2006 Regulatory Reported Harvest
Year Male (%)a Female (%)a Unk Total 1997/98 108 (73) 39 (27) 0 147 1998/99 156 (69) 69 (31) 0 225 1999/00 87 (74) 31 (26) 0 118 2000/01 125 (71) 50 (29) 1 176 2001/02 109 (65) 58 (35) 1 168 2002/03 143 (73) 53 (27) 1 197 2003/04 166 (73) 60 (27) 1 227 2004/05 152 (72) 59 (28) 1 213 2005/06 156 (72) 62 (28) 4 222 2006/07 298 (71) 120 (29) 2 420
aIncludes bears of known sex only

193
TABLE 2 Unit 16A black bear harvest, 2002–2006 Reported
Hunter kill Nonhunting killb Total estimated kill Regulatory year M F (%) Unk. Total Baiteda M F Unk.
Estimated unreported
killc M (%) F (%) Unk. Total 2002 Fall 02 14 12 (46) 0 26 0 1 0 0 15 (56) 12 (44) 0 27 Spring 03 28 14 (33) 0 42 29 0 0 0 28 (67) 14 (33) 0 42 Total 42 26 (38) 0 68 29 1 0 0 7 43 (62) 26 (37) 7 78 2003 Fall 03 12 8 (40) 0 20 0 1 0 0 13 (62) 8 (38) 0 21 Spring 04 38 15 (28) 0 53 39 0 0 0 38 (72) 15 (27) 0 53 Total 50 23 (32) 0 73 39 1 0 0 7 51 (69) 23 (31) 7 81 2004 Fall 04 17 5 (22) 0 22 0 1 0 0 18 (78) 5 (22) 0 23 Spring 05 34 20 (37) 0 54 33 0 0 0 34 (63) 20 (30) 0 54 Total 51 25 (33) 0 76 33 1 0 0 8 52 (68) 25 (32) 7 84 2005 Fall 05 12 5 (29) 1 18 0 0 0 0 12 (67) 5 (33) 1 18 Spring 06 28 12 (30) 0 40 33 0 0 0 28 (70) 12 (30) 0 40 Total 40 17 (30) 1 58 33 0 0 0 6 40 (63) 17 (37) 7 64 2006 Fall 06 12 9 (43) 0 21 0 0 0 0 12 (67) 9 (43) 0 21 Spring 07 49 23 (32) 0 72 53 0 0 0 49 (68) 23 (32) 0 72 Total 49 25 (34) 0 74 53 0 0 0 7 49 (69) 25 (33) 7 81 a Bears reported taken over legally established bait stations b Includes defense of life or property kills, illegal kills, and other known human-caused accidental mortality c Assumes approximately 10% of reported harvest

194
TABLE 3 Unit 16B black bear harvest, 2002–2006 Reported
Hunter kill Nonhunting killb Total estimated kill Regulatory year M F (%) Unk. Total Baiteda M F Unk.
Estimated unreported
killc M (%) F (%) Unk. Total 2002 Fall 02 22 6 (21) 0 28 0 0 0 0 22 (79) 6 (21) 0 29 Spring 03 79 21 (21) 0 100 47 3 0 0 82 (80) 21 (20) 0 103 Total 101 27 (21) 0 128 47 3 0 0 13 104 (79) 27 (21) 13 144 2003 Fall 03 21 6 (22) 0 27 0 1 0 0 22 (80) 6 (20) 0 30 Spring 04 95 31 (25) 0 126 85 0 0 0 95 (75) 31 (25) 0 126 Total 116 37 (24) 0 153 85 1 0 0 15 117 (76) 37 (24) 15 169 2004 Fall 04 17 8 (32) 0 25 0 1 0 0 18 (68) 8 (32) 0 26 Spring 05 84 26 (24) 1 111 73 0 0 0 84 (76) 26 (24) 1 111 Total 101 34 (25) 1 136 73 1 0 0 14 102 (67) 34 (23) 15 151 2005 Fall 05 37 13 (26) 2 52 0 0 0 0 37 (74) 13 (26) 2 52 Spring 06 79 32 (29) 1 112 62 0 0 0 79 (71) 32 (29) 1 112 Total 116 45 (28) 3 164 62 0 0 0 16 116 (66) 45 (25) 19 180 2006 Fall 06 58 17 (23) 0 75 4 0 0 0 58 (77) 17 (23) 0 75 Spring 07 179 70 (28) 2 251 115 0 0 0 179 (72) 70 (28) 2 251 Total 237 87 (27) 2 326 119 0 0 0 33 237 (73) 87 (27) 35 359 a Bears reported taken over legally established bait stations b Includes defense of life or property kills, illegal kills, and other known human-caused accidental mortality c Assumes approximately 10% of reported harvest

195
TABLE 4 Unit 16 black bear hunter baiting participation, 1988–2006 Number of stations registered Regulatory
year Number of permittees SU 16A SU 16B 1988/89 47 33 40 1989/90 52 38 35 1990/91 107 60 114 1991/92 112 79 93 1992/93 121 104 92 1993/94 118 91 99 1994/95 130 124 96 1995/96 123 114 86 1996/97 124 116 95 1997/98 97 89 67 1998/99 83 81 64 1999/00 98 85 66 2000/01 93 80 74 2001/02 124 107 101 2002/03 130 93 107 2003/04 124 99 90 2004/05 130 107 96 2005/06 141 89 117 2006/07 235 146 222

196
TABLE 5 Unit 16 black bear successful hunter residency, 1997–2006 Regulatory
year Locala
resident (%) Nonlocal resident (%) Nonresident (%)
Successful hunters
1997/98 3 (2) 100 (68) 44 (30) 147 1998/99 8 (4) 151 (67) 66 (29) 225 1999/00 4 (3) 83 (70) 31 (26) 118 2000/01 6 (3) 131 (75) 39 (22) 176 2001/02 8 (5) 96 (57) 64 (38) 168 2002/03 6 (3) 148 (76) 42 (21) 196 2003/04 6 (3) 143 (63) 78 (34) 227 2004/05 4 (2) 155 (73) 53 (25) 212 2005/06 7 (3) 156 (70) 59 (27) 222 2006/07 11 (3) 282 (68) 122 (29) 415 a Unit 16 residents

197
TABLE 6 Unit 16 black bear hunter harvest chronology percent by month, 1997–2006 Percent of harvest
Regulatory year
July - Aug
Sep 1-15
Sep 16-30 Oct
Nov - Mar Apr
May 1-15
May 16-31 June n
1997/98 12 11 16 1 1 1 2 32 26 146
1998/99 19 33 17 4 <1 0 <1 7 19 223
1999/00 8 13 7 2 <1 0 3 29 39 117
2000/01 18 10 13 <1 0 <1 5 23 30 173
2001/02 15 10 7 1 0 <1 2 19 46 166
2002/03 8 5 13 1 <1 1 8 25 38 191
2003/04 6 8 5 <1 0 2 4 32 42 225
2004/05 7 8 7 <1 0 3 3 35 37 211
2005/06 6 14 9 2 <1 2 8 26 32 222
2006/07 10 7 5 1 0 1 9 32 34 413

198
TABLE 7 Unit 16 black bear harvest percent by transport method, 1997–2006 Percent of harvest Regulatory year Airplane Horse Boat
Snow Machine ORV/ATV
Highway Vehicle
Other / Unknown n
1997/98 42 6 23 1 13 11 4 146
1998/99 42 5 19 0 15 12 6 219
1999/00 24 <1 38 2 15 11 9 117
2000/01 37 4 29 <1 11 13 7 174
2001/02 27 0 26 <1 20 20 6 166
2002/03 42 0 26 0 17 9 6 192
2003/04 34 0 32 1 20 5 6 221
2004/05 37 1 32 3 15 8 3 211
2005/06 41 1 28 2 15 11 2 221
2006/07 50 1 19 <1 14 11 4 415
199
WILDLIFE Alaska Department of Fish and GameDivision of Wildlife Conservation
MANAGEMENT REPORT (907) 465-4190 P.O. BOX 115526 JUNEAU, AK 99811-5526
BLACK BEAR MANAGEMENT REPORT
From: 1 July 2004 To: 30 June 2007
LOCATION
GAME MANAGEMENT UNIT: 17A, B, and C (18,800 mi2)
GEOGRAPHIC DESCRIPTION: Northern Bristol Bay
BACKGROUND
Black bears inhabit some of the forested areas of Game Management Unit 17 and are most visible during the fall while they forage on berries along open hillsides in Subunits 17B and 17C. Black bears are less common along salmon streams and near human settlements, primarily because of competition from and predation by brown bears. There have been no research activities conducted in Unit 17, so we do not have complete understanding of the density, key denning areas, and other aspects of this bear population.
Before 1994 hunters were not required to report or seal black bears harvested in Unit 17 and the Alaska Department of Fish and Game (the department) did not allocate funding specifically for black bear management. Consequently, we had no way of assessing the number of bears killed, the sex or age composition of the harvest, or the distribution of harvest. Incidental observations by biologists during caribou surveys and other flights during the past several years suggest black bears might be more common than during previous reporting periods.
MANAGEMENT DIRECTION
MANAGEMENT GOALS Protect, maintain, and enhance the black bear population and its habitat in concert with other
components of the ecosystem.
Provide the greatest sustained opportunity to participate in hunting black bears.
MANAGEMENT OBJECTIVES Maintain existing populations of black bears with a sex and age structure that will sustain a
harvest of at least 60% males.

200
Related Management Activities
Monitor the hunt by interviewing hunters and sealing all harvested black bears.
METHODS
Each black bear legally harvested or killed in defense of life or property (DLP) in the unit is sealed, the skull is measured, and sex is determined. At the time of sealing we record data on hunter residency, number of days hunted, date of kill, transportation used, and location of the kill. When possible, we investigate circumstances surrounding DLP and illegal kills. We collect subjective population data during caribou and moose surveys. Reports from fieldworkers are also used to estimate bear population trends.
RESULTS AND DISCUSSION
POPULATION STATUS AND TREND Population Size
No objective data are available on the population density of black bears in the unit.
Distribution and Movements
We know little about the overall distribution and movements of black bears in this unit. I suspect that the greatest densities are in the spruce forest habitats along the upper Mulchatna and Nushagak rivers and along the Chichitnok River. Black bears are also occasionally seen along the Kokwok and Nuyakuk rivers, and in the Muklung Hills. Black bears are most obvious when they feed along hillsides in the autumn where berries are abundant. We also occasionally see individual bears and family groups near postcalving aggregations of caribou in June and July. Areas important for denning remain unknown.
MORTALITY Harvest
Season and Bag Limit.
Unit 17
August 1–May 31 Residents: 2 bears per year
Nonresidents: 1 bear per year
Board of Game Actions and Emergency Orders. No Board of Game actions or Emergency Orders occurred during this reporting period.
Human-Induced Mortality. Before 1994 there were no sealing or reporting requirements for black bear hunters in Unit 17. Our incidental observations indicated that black bears were subject to the same increasing hunting pressure as other big game species in Unit 17B because more hunters came into the area to harvest caribou from the Mulchatna herd. Local residents also

201
expressed concerns of overharvest by hunters and sportfishers along the upper Nushagak River drainages.
During the 2004–05 season hunters in Unit 17 reported harvesting 21 black bears, including 13 males (62%) and eight females (38%). The average total skull size was 18.1" for males and 15.9" for females. Successful hunters spent an average of 3.6 days afield. No hunters killed more than 1 bear. At least some meat was salvaged from 4 bears (19%). Guided hunters took 3 of the 21 bears. Four of the successful nonresident hunters took black bears using big game tags from other species.
During the 2005–06 season hunters in Unit 17 reported harvesting seven black bears, including six males (86%) and one female (14%). The average total skull size was 18.3" for males and skull size for the lone female was 18.0". Successful hunters spent an average of 4.4 days afield. No hunters reported killing more than 1 bear. At least some meat was salvaged from 2 bears (29%). Guided hunters took 5 of the 7 bears. None of the successful nonresident hunters took black bears using big game tags from other species.
During the 2006–07 season hunters in Unit 17 reported harvesting 14 black bears, including 9 males (64%), and 5 females (36%). The average total skull size was 18.6" for males and 17.0" for females. Successful hunters spent an average of 5.9 days afield. No hunters reported killing more than 1 bear. At least some meat was salvaged from 2 bears (14%). Guided hunters took 8 of the 14 bears. At least 5 of the successful nonresident hunters took black bears using big game tags from other species.
Hunter Residency and Success. Nonresidents account for most of the reported black bear harvest in Unit 17. During the 2004–05 season, nonresidents took 95% of the harvested bears reported in the unit, Unit 17 residents didn’t report taking any bears, and other Alaska residents took 5%. During the 2005–06 season, nonresidents took 86% of the harvested bears reported in Unit 17, Unit 17 residents took 1 bear (14%), and other Alaska residents did not report killing any bears. During the 2006–07 season, nonresidents took 86% of the bears reported harvested in the unit, Unit 17 residents reported 1 bear (7%) and other Alaska residents reported 1 bear (7%) (Table 3).
Harvest Chronology. One black bear was reported killed in May 2006, and all other black bears reported harvested in Unit 17 during this reporting period were killed during the fall (Table 4).
Transport Methods. All successful black bear hunters during this reporting period used aircraft for access (Table 5).
Other Mortality
Although natural deaths associated with age, brown bears, and moose occur in the unit, we do not collect data on natural mortalities for black bears in Unit 17.

202
HABITAT Assessment
Black bear habitat in Unit 17 is virtually unaltered and in excellent condition. Salmon stocks are carefully managed and escapements are adequate for the needs of the current bear population. Ungulates and seasonally abundant berry crops provide an abundant food supply for bears. Human settlements are relatively small and unobtrusive.
NONREGULATORY PROBLEMS/NEEDS Black bears rarely occur near human settlements in Unit 17, and there have been few reports of adversarial encounters between humans and black bears in the backcountry. There are no nonregulatory problems or needs in the unit at this time.
CONCLUSIONS AND RECOMMENDATIONS
Initiation of mandatory sealing in 1994 and restricted seasons are indications of the importance the department places on this resource in Unit 17. Data derived from these actions, when coupled with continued information from hunters and local residents, enhance our ability to evaluate the status of the black bear population and allow us to make more informed management decisions. No changes in the present hunting regulations for black bears in Game Management Unit 17 are recommended at this time.
PREPARED BY: SUBMITTED BY: James D. Woolington Gino Del Frate Wildlife Biologist III Management Coordinator Please cite any information taken from this section, and reference as: WOOLINGTON, J. D. 2008. Unit 17 black bear management report. Pages 199–207 in P. Harper, editor. Black bear management report of survey and inventory activities 1 July 2004–30 June 2007. Alaska Department of Fish and Game. Project 17.0. Juneau, Alaska.

203
TABLE 1 Unit 17 black bear harvest, 1994/95–2006/07 Regulatory Hunter Kill Nonhunting Kill Total reported kill
Year Male Female Unk Total Male Female Unk Total Male Female Unk Total
1994–95 6 7 0 13 0 0 0 0 6 7 0 13
1995–96 13 5 0 18 0 0 0 0 13 5 0 18
1996–97 19 6 1 26 0 0 0 0 19 6 1 26
1997–98
1998–99
1999–00
2000–01
12
17
16
8
6
12
4
2
0
0
0
0
18
29
20
10
0
0
0
0
0
0
0
0
0
0
0
0
0
0
0
0
12
17
16
8
6
12
4
2
0
0
0
0
18
29
20
10
2001-02 8 1 1 10 0 0 0 0 8 1 1 10
2002-03 4 4 0 8 0 0 0 0 4 4 0 8
2003-04 7 6 0 13 0 0 0 0 7 6 0 13
2004-05 13 8 0 21 0 0 0 0 13 8 0 21
2005-06 6 1 0 7 0 0 0 0 6 1 0 7
2006-07 9 5 0 14 0 0 0 0 9 5 0 14

204
TABLE 2 Unit 17 black bear harvest by subunit, 1994/95–2003/04 ____________________________Subunit_____________________________
Regulatory 17A 17B 17C Unit 17 total Year M F Unk Total M F Unk Total M F Unk Total M F Unk Total
1994–95 0 0 0 0 6 7 0 13 0 0 0 0 6 7 0 13
1995–96 0 0 0 0 12 4 0 16 1 1 0 2 13 5 0 18
1996–97 0 0 0 0 18 6 1 25 1 0 0 1 19 6 1 26
1997–98 0 0 0 0 10 5 0 15 2 1 0 3 12 6 0 18
1998–99
1999–00
2000–01
0
0
0
0
0
0
0
0
0
0
0
0
16
14
8
12
4
2
0
0
0
18
18
10
1
2
0
0
0
0
0
0
0
1
2
0
17
16
8
12
4
2
0
0
0
29
20
10
2001-02 0 0 0 0 7 1 1 9 1 0 0 1 8 1 1 10
2002-03 0 0 0 0 4 4 0 8 0 0 0 0 4 4 0 8
2003-04 0 0 0 0 7 6 0 13 0 0 0 0 7 6 0 13
2004-05 0 0 0 0 11 8 0 19 0 0 0 0 13a 8 0 21a
2005-06 0 0 0 0 5 1 0 6 1 0 0 1 6 1 0 7
2006-07 0 0 0 0 7 4 0 11 2 1 0 3 9 5 0 14a Includes two male bears, location unknown.

205
TABLE 3 Unit 17 black bear successful hunter residency, 1994/95–2006/07 Regulatory Locala Nonlocal Total
Year resident (%) resident (%) Nonresident (%) successful huntersb
1994–95 0 (---) 2 (15%) 11 (85%) 13 1995–96 1 (6%) 4 (22%) 13 (72%) 18 1996–97 0 (---) 4 (15%) 22 (85%) 26 1997–98 1998–99 1999–00 2000–01
0 (---) 0 (---) 0 (---) 0 (---)
2 (11%) 3 (10%) 0 (---)
2 (20%)
16 (89%) 26 (90%) 20 (100%) 8 (80%)
18 29 20 10
2001-02 0 (---) 3 (30%) 7 (70%) 10 2002-03 0 (---) 1 (13%) 7 (87%) 8 2003-04 0 (---) 2 (15%) 11 (85%) 13 2004-05 0 (---) 1(5%) 20 (95%) 21 2005-06 1(14%) 0 (---) 6 (86%) 7 2006-07 1 (7%) 1 (7%) 12 (86%) 14
a Residents of Unit 17. b Total may be higher than the sum of the columns due to hunters of unknown residency

206
TABLE 4 Unit 17 black bear harvest chronology percentage by month, 1994/95–2006-07 Regulatory Month of harvest
Year Aug Sep Oct Nov Dec Jan Feb Mar Apr May Total
1994–95a 46% 39% 15% 0% 0% 0% 0% 0% 0% 0% 13 1995–96a 33% 67% 0% 0% 0% 0% 0% 0% 0% 0% 18 1996–97a 42% 58% 0% 0% 0% 0% 0% 0% 0% 0% 26 1997–98a
1998–99 1999–00 2000–01
33% 10% 15% 20%
67% 90% 85% 70%
0% 0% 0% 10%
0% 0% 0% 0%
0% 0% 0% 0%
0% 0% 0% 0%
0% 0% 0% 0%
0% 0% 0% 0%
0% 0% 0% 0%
0% 0% 0% 0%
18 29 20 10
2001-02 30% 70% 0% 0% 0% 0% 0% 0% 0% 0% 10 2002-03 38% 62% 0% 0% 0% 0% 0% 0% 0% 0% 8 2003-04 31% 69% 0% 0% 0% 0% 0% 0% 0% 0% 13 2004-05 19% 81% 0% 0% 0% 0% 0% 0% 0% 0% 21 2005-06 29% 57% 0% 0% 0% 0% 0% 0% 0% 14% 7 2006-07 14% 86% 0% 0% 0% 0% 0% 0% 0% 0% 14
a Season dates: August 1–May 31; 2 bears for residents, 1 bear for nonresidents

207
TABLE 5 Unit 17 black bear harvest percentage by transport method, 1994/95–2006/07 __________________________________Percent of harvest___________________________
Regulatory 3- or Highway Year Airplane Horse Boat 4-wheeler Snowmachine ORV vehicle Walk Unknown Total
1994–95 39% 0% 54% 0% 0% 0% 0% 8% 0% 13 1995–96 78% 22% 0% 0% 0% 0% 0% 0% 0% 18 1996–97 81% 19% 0% 0% 0% 0% 0% 0% 0% 26 1997–98 1998–99 1999–00 2000–01
89% 72% 85% 70%
0% 0% 0% 0%
0% 28% 10% 30%
0% 0% 5% 0%
0% 0% 0% 0%
0% 0% 0% 0%
0% 0% 0% 0%
11% 0% 0% 0%
0% 0% 0% 0%
18 29 20 10
2001-02 100% 0% 0% 0% 0% 0% 0% 0% 0% 10
2002-03 100% 0% 0% 0% 0% 0% 0% 0% 0% 8 2003-04 100% 0% 0% 0% 0% 0% 0% 0% 0% 13 2004-05 95% 0% 5% 0% 0% 0% 0% 0% 0% 21 2005-06 86% 0% 0% 0% 0% 0% 14% 0% 0% 7 2006-07 93% 0% 0% 0% 0% 0% 7% 0% 0% 14

208
WILDLIFE Alaska Department of Fish and GameDivision of Wildlife Conservation
MANAGEMENT REPORT (907) 465-4190 P.O. Box 115526 Juneau, AK 99811-5526
BLACK BEAR MANAGEMENT REPORT
From: 1 July 2004 To: 30 June 20071
LOCATION GAME MANAGEMENT UNITS: 19, 21A, and 21E (59,756 mi2 prior to 1 July 2006 and 55,278 mi2 after that date, when the upper Nowitna River drainage was excluded from Unit 21A).
GEOGRAPHIC DESCRIPTION: Unit 19, all drainages into the Kuskokwim River upstream from a straight line drawn between Lower Kalskag and Paimiut. Unit 21A, the Innoko River drainage upstream from and including the Iditarod River drainage; and the Nowitna River drainage upstream from the confluence of the Little Mud and Nowitna Rivers (beginning 1 July 2006, Unit 21A no longer included the upper Nowitna drainage). Unit 21E, the Yukon River drainage from Paimiut upstream to, but not including, the Blackburn Creek drainage, and the Innoko River drainage downstream from the Iditarod River drainage.
BACKGROUND Black bears are distributed throughout Units 19A, 19B, 19C, 19D, 21A, and 21E, and bear densities and hunter interest vary among units. Lower elevation areas associated with boreal forest and river floodplains (Units 19A, 19D, 21A, and 21E) provide good hunting opportunity; however, harvest pressure is low. Harvest pressure is also light in Units 19B and 19C. Overall, reported harvest is low not only because there is no sealing requirement in most of Units 19, 21A and 21E, but also because harvest is low.
In 2001 the department established the Experimental Micro Management Area (EMMA) within a 20-mile radius of McGrath (528 mi2; Fig. 1). The purpose of the EMMA was to focus predator management around McGrath to provide more moose for subsistence harvest opportunity. This area encompasses the highest density of moose in Unit 19D East (upstream from the Selatna and Black River drainages; Fig. 1) and was established as a treatment area where predator population manipulations and other management actions could be tested. This included capture and removal of black bears.
1 At the discretion of the reporting biologist, this unit report may contain data collected outside the report period.

209
The black bear intensive management program in Unit 19D is critical for compliance with the Intensive Management Law (AS 16.05.255[e]–[g]) and with regulations 5 AAC 92.106 and 5 AAC 92.108 which identify the Unit 19 moose populations as important for providing high levels of harvest for human consumptive use and set the moose population and harvest objectives. This designation means the Board of Game must consider intensive management of predators if a reduction in moose harvest becomes necessary because of dwindling moose numbers or productivity.
MANAGEMENT DIRECTION MANAGEMENT GOALS Unit 19D East (upstream from the Selatna and Black River drainages)
Provide for the increased harvest of black bears.
Units 19A, 19B, 19C, the remainder of 19D and 21A and 21E
Provide the opportunity to take black bears.
MANAGEMENT OBJECTIVE Maintain reported harvest of at least 30 black bears in Unit 19D East as part of the intensive
management program.
METHODS Harvest data for hunter residency, methods, harvest demographics, sex ratio of the harvest, and timing and location of harvest are usually provided from sealing certificates. However, sealing was required only in Unit 19D East. In the remainder of Unit 19D sealing is required only for bears taken between 1 January and 31 May if removed from Unit 19, or any untanned hide or skull removed from Alaska. In addition, beginning in regulatory year (RY) 2006 (RY06 = 1 Jul 2006 through 30 Jun 2007), black bear hides or skulls taken from Unit 19A that were intended for sale also needed to be sealed. In Units 21A and 21E sealing was not required unless the hide and/or skull are removed from Alaska. All available harvest data were summarized by regulatory year. Boudreau (2005) estimated black bear population densities based on research conducted by Miller et al. (1997) in other areas. In the EMMA the black bear population was measured using a mark–recapture technique (M. Keech, Alaska Department of Fish and Game [ADF&G], personal communication).
Methods for black bear population estimates are described by Boudreau (2005), and are based on known bear densities (Miller et al. 1997) in similar habitats in other game management units in Interior Alaska.
210
RESULTS AND DISCUSSION POPULATION STATUS AND TREND Population Size and Composition Based on Boudreau’s (2005) estimates, and subtracting the portion of Unit 21A transferred to Unit 21B, I estimate the black bear population for the entire 55,278-mi2 management area to be 8300–16,600 black bears, based on overall densities of 15–30 bears/100 mi2. The population has probably been stable or slowly increasing since 1995, based on local observations.
Population surveys have been conducted only in the EMMA portion of Unit 19D East. However, Boudreau (2005) estimated the entire Unit 19 black bear population to be 7700–9235 bears.
The habitat in Unit 19A is of moderate to high quality and could support approximately 2475–2970 black bears. Unit 19B contains about 5000 mi2 of good quality bear habitat, with an estimated 1250–1500 bears. Unit 19C has about 3000 mi2 of good habitat and about 1500 mi2 of moderate-quality habitat, supporting about 975–1165 bears. Unit 19D contains about 3000–6000 bears in 12,000 mi2 of high quality habitat.
One hundred two individual black bears were removed from the EMMA in 2003 (n = 75) and 2004 (n = 34 with 7 recaptures). No females with cubs were removed during these 2 years. The pre-removal population in 2003 was estimated at 130 and the post-removal estimate in 2004 was 28 black bears. This represents a 79% removal. A mark–recapture survey was conducted in May 2007 and the EMMA was estimated to have 72 black bears (M. Keech, ADF&G, unpublished data). This is an increase of 157% and the population is now at approximately 55% of the pre-removal estimate.
In Units 21A and 21E, the higher elevation areas are believed to include moderate quality bear habitat, and low elevation areas contain high quality habitat. Unit 21A, has about 7500 mi2 of high quality habitat and about 3000 mi2 of moderate quality habitat with a total population estimate of 2325–2775 bears. This is less than the estimate of 3550–4235 bears in the previous report due to the transfer of 4476 mi2 from Unit 21A to Unit 21B. Unit 21E consists of about 7000 mi2 of high quality habitat and about 1000 mi2 of moderate quality habitat, yielding a population estimate for Unit 21E of 1900–2275 black bears.
MORTALITY Harvest Hunting Seasons and Bag Limitsa.
Units and Bag Limits
Resident and Nonresident Open
Season
Resident and Nonresident
Baiting Season RY04–RY05 Units 19, 21A, and 21E, 3 bears
No closed season
15 Apr–30 Jun
Unit 19D East, 2 additional bears by registration permit RL338
No closed season
15 Apr–30 Jun 1 Sep–30 Sep

211
Units and Bag Limits
Resident and Nonresident Open
Season
Resident and Nonresident
Baiting Season RY06 Units 19B, 19C, 21A, and 21E, 3 bears
No closed season
15 Apr–30 Jun
Units 19A and 19D, remainder, 5 bears
No closed season
15 Apr–30 Jun
Unit 19D East, 5 bears
No closed season
15 Apr–30 Junb 1 Sep–30 Sepb
a Harvest of cubs (in first year of life) or females accompanied by cubs was prohibited in all seasons. b Same day airborne at bait stations was allowed, provided the hunter was at least 300 feet from the airplane.
Control Regulations and Bag Limitsa.
Residents only Baiting Season Residents Only
RY06 Unit 19D black bear control area (EMMA). No limit, but permit required.
1 Aug–30 Jun
1 Aug–30 Junb a Harvest of cubs (in first year of life) or females accompanied by cubs was prohibited in all seasons. b Same day airborne at bait stations was allowed, provided the permittee was at least 300 feet from the airplane.
Alaska Board of Game Actions and Emergency Orders. No regulations were changed for Units 19B, 19C, 21A, or 21E during the report period, and no emergency orders were issued for any units.
At the March 2006 meeting, the board eliminated registration hunt RL338 and increased the bag limit in Units 19A and 19D to 5 bears per year. Also at that meeting, the board legalized same day airborne at bait stations under hunting regulations in the active Unit 19D East wolf control area, provided the hunter was at least 300 feet from the airplane. In May 2006 the board updated the predator control implementation plan for Unit 19D and established a black bear control plan within the EMMA. Under this program, permittees can take an unlimited number of bears and register up to 10 bait stations. As under the hunting regulations, no sows with cubs or cubs are allowed to be taken and a permittee can access bait stations the same day airborne provided they are at least 300 feet from the airplane.
Harvest by Hunters. During RY02–RY06, 183 black bears were sealed from Units 19, 21A, and 21E (Table 1). On average 68% of these bears were males. Thirty-three of these bears were harvested in Unit 19D (where sealing was required for all black bears taken in a portion of the unit) and 70 were sealed in Unit 19B (Table 2) where sealing is not required unless the hide and skull are taken from Alaska. Unit 19B typically has a high percentage of nonresident hunters. Two defense of life or property kills and 3 research kills were reported in RY03, however it is likely that more nuisance bears were killed at fish camps or by local residents and not reported. No black bear control permits were issued in RY06 and no bears have been taken under the bear control regulations.

212
Hunter Residency and Success. It is difficult to assess hunter residency and success for black bear harvest in Unit 19, 21A, and 21E because in all units except Unit 19D East, sealing was required only for bears transported out of Alaska. However, of the bears that were sealed, 68% were harvested by nonresidents.
Harvest Chronology. There is likely unreported resident harvest of bears during spring and summer months, but overall harvest reporting was greatest in the fall (Table 3). This is primarily due to nonresident hunters who have their bears sealed in order to take the hides and skulls out of Alaska.
Transport Methods. During the past 5 years, 73% of hunters who had their black bears sealed used airplanes as their primary access method. This is consistent with the high number of black bears sealed from Unit 19B, which receives a large amount of nonlocal hunting pressure. Boats are also likely important and probably account for a substantial portion of the unreported harvest taken by local residents.
CONCLUSIONS AND RECOMMENDATIONS Black bears are common throughout most of the units managed by the McGrath area office. Studies recently completed in the EMMA have indicated that black bears are a significant source of moose calf mortality (M. Keech, ADF&G, personal communication). As a result, hunting regulations were liberalized in both Units 19A and 19D and a control program was established in the EMMA portion of Unit 19D. These actions were taken to increase the harvest of black bears with the intent of improving moose calf survival. Liberal hunting seasons have not resulted in higher harvest however, and there has been an increase in black bear predation on moose calves in recent years as the population of black bears increases within the EMMA. The bear control program has also been unsuccessful to date and no bears have been taken under this program. There is no biological reason to reduce the black bear bag limits in the area; however these liberal regulations have not had a positive effect on moose calf survival. No changes are needed in the regulations at this time; however, if the bear control program continues to be ineffective it should be eliminated to reduce unnecessary administrative burden.
During RY04–RY06, we did not meet our management objective to maintain an annual reported harvest of at least 30 black bears in Unit 19D East as part of the intensive management program. In fact, only 12 total bears were harvested during the entire 3-year reporting period. There are ample opportunities to harvest black bears, including same day airborne over bait, however interest among local hunters is extremely low. Gasoline prices are high ($5.73/gallon in McGrath as of 9 Sep 2007) which may influence hunting activities, but local interest in bear meat is also low. Raw black bear hides are worth approximately $100 and the ability to sell skins has not provided enough of an incentive to encourage higher harvest. Only 4 legal sale tags have been issued since they became available, and to our knowledge none of those hides were sold.
I recommend that sealing continue to be required in Unit 19D East, however the sealing requirement for the remainder of Unit 19D is unnecessary and only adds complexity to the regulations. During the next Board of Game cycle a proposal should be submitted to remove this requirement. It is also recommended that a black bear harvest ticket be created. We cannot provide sealing services throughout our management area, and therefore have no information for

213
most of the resident harvest. Black bears are an important management species and a harvest ticket would provide extremely valuable information, including effort data, which is currently unavailable.
The management goal for the entire area for the next reporting period will be to provide for the opportunity to harvest black bears. The management objective of 30 bears in Unit 19D East will remain in place while there is a bear control program, however when this program is terminated this high harvest objective should also end.
LITERATURE CITED BOUDREAU, T. A. 2005. Units 19, 21A, and 21E black bear. Pages 218–222 in C. Brown, editor.
Black bear management report of survey and inventory activities 1 July 2001–30 June 2004. Alaska Department of Fish and Game. Project 17.0. Juneau, Alaska.
MILLER, S., G. C. WHITE, R. A. SELLERS, H. V. REYNOLDS, J. W. SCHOEN, K. TITUS, V. G. BARNES, JR., R. B. SMITH, R. R. NELSON, W. B. BALLARD, AND C. C. SCHWARTZ. 1997. Brown and black bear density estimation in Alaska using radiotelemetry and replicated mark–resight techniques. Wildlife Monographs 133.
PREPARED BY: SUBMITTED BY:
Joshua M. Peirce Doreen I. Parker McNeill Wildlife Biologist III Assistant Management Coordinator
REVIEWED BY:
Mark A. Keech Wildlife Biologist III
Laura A. McCarthy Publications Technician II Please cite any information taken from this section, and reference as:
PEIRCE, J. M. 2008. Units 19, 21A, and 21E black bear. Pages 208–216 in P. Harper, editor. Black bear management report of survey and inventory activities 1 July 2004–30 June 2007. Alaska Department of Fish and Game. Project 17.0. Juneau, Alaska.

214
EMMA, 528 mi2
Unit 19D East, 8,513 mi2
Remainder of Unit 19D, 3,531 mi2
ALASKA RANGE MTNS
Takotna McGrath Nikolai
Minchumina
Telida
Medfra
Farewell
Kuskokwim
Rive
r
Riv
er
Rive
r
Rive
r
Yuko
n
Innoko
Susi
tna
Unit 19D, 12,044 mi2
FIGURE 1 Detail area map of Unit 19D

TABLE 1 Black bear harvest in Units 19, 21A and 21E by type of killa, regulatory years 2002–2003 through 2006–2007 Regulatory Hunter kill Nonhunting killb Total reported kill
year M F Unk Total M F Unk Total M (%) F (%) Total 2002–2003 25 9 0 34 0 0 0 0 25 (74) 9 (26) 34 2003–2004 28 6 0 34 3 1 0 4 31 (82) 7 (18) 38 2004–2005 29 16 0 45 0 0 0 0 29 (64) 16 (36) 45 2005–2006 21 9 0 30 0 0 0 0 21 (70) 9 (30) 30 2006–2007 18 18 0 36 0 0 0 0 18 (50) 18 (50) 36 a Sealing was only required in Unit 19D East and in the remainder of Unit 19D for bears taken between 1 January and 31 May if removed from Unit 19, or if the hide was going to be sold. b Includes defense of life or property and research mortalities.
TABLE 2 Reported black bear harvest by unita, regulatory years 2002–2003 through 2006–2007
Regulatory Unit year 19A 19B 19C 19D 19 Unknown 21A 21E Total
2002–2003 2 10 10 10 2 34 2003–2004 2 17 4 11 4 38 2004–2005 14 18 5 3 1 3 1 45 2005–2006 2 11 4 8 1 3 1 30 2006–2007 8 14 5 1 3 3 2 36 Total 28 70 28 33 9 9 6 183
a Reporting and sealing was only required in Unit 19D East and in the remainder of Unit 19D for bears taken between 1 January and 31 May if removed from Unit 19, or if the hide was going to be sold. Reporting and sealing was required for all bear hides and skulls removed from the state of Alaska.
215

TABLE 3 Units 19, 21A, and 21E black bear harvest chronologya 2002–2003 through 2006–2007 Regulatory Month
year Mar Apr May Jun Jul Aug Sep Oct Unknown Total 2002–2003 1 1 4 26 2 34 2003–2004 5 2 13 16 2 38 2004–2005 5 1 15 23 1 45 2005–2006 1 2 7 5 14 1 30 2006–2007 3 13 20 36 a Sealing was only required in Unit 19D East and in the remainder of Unit 19D for bears taken between 1 January and 31 May if removed from Unit 19, or if the hide was going to be sold.
216

217
WILDLIFE Alaska Department of Fish and GameDivision of Wildlife Conservation
MANAGEMENT REPORT (907) 465-4190 P.O. Box 115526 Juneau, AK 99811-5526
BLACK BEAR MANAGEMENT REPORT
From: 1 July 2004 To: 30 June 20071
LOCATION GAME MANAGEMENT UNITS: 20A, 20B, 20C, and 20F (34,079 mi2)
GEOGRAPHIC DESCRIPTION: Central–Lower Tanana and Middle Yukon River drainages
BACKGROUND Black bears live throughout Interior Alaska (we estimate there are 2000–4000 in the 4 units discussed in this report); however, only a few studies of black bear ecology or population dynamics have been completed. During 1988–1991 a cooperative project conducted by the Alaska Department of Fish and Game (ADF&G) with support from the U.S. Army yielded important information about black bear reproduction, mortality, and density on the Tanana Flats (Hechtel 1991). A portion of this project involved a study of black bear habitat use and denning ecology (Smith 1994). In 1967, Hatler completed a master's thesis on Interior Alaska black bear ecology (Hatler 1967). Johnson (1982) investigated production of offspring by female black bears in Units 20A and 20B.
Black bears provide an important source of meat, hides, and recreation for hunters in some areas. With growth of the Fairbanks human population, interest in hunting black bears is increasing, especially during spring. Information about black bear ecology and population dynamics has helped ADF&G ensure that the current year-round season and 3-bear bag limit is sustainable.
MANAGEMENT DIRECTION MANAGEMENT GOALS
Protect and maintain the black bear population and its habitat in concert with other components of the ecosystem.
Provide the greatest sustained opportunity to participate in hunting black bears.
Protect human life and property in human–bear interactions.
1 At the discretion of the reporting biologist, this unit report may contain data collected outside the report period.

218
MANAGEMENT OBJECTIVES Sex ratio of the harvest is a key indicator of appropriate levels of harvest used for management in these units; therefore, management objectives call for a minimum percentage of males in the harvest.
Maintain a black bear population that sustains a harvest of at least 55% males in the combined harvests for the most recent 3 years in all units.
Minimize human–bear conflicts by providing information and assistance to the public and to agencies.
METHODS We collected annual harvest data from sealing reports of black bears killed by hunters and in defense of life or property (DLP). Black bear sealing certificates included data on kill date and location, sex, skull size, amount of meat salvaged, DLP kills, hunter residency, incidental take, commercial services used, and baiting. We recorded the distribution of bears killed in the area using uniform coding units. During sealing, we collected premolars and sent them to Matson’s Laboratory (Milltown, Montana, USA) for sectioning and age determination.
Since 1989, hunters have been required to register bait stations before hunting black bears over bait in spring. We also prepared hunter information leaflets and free clinics to summarize black bear baiting regulations and encourage hunters to harvest males instead of females.
There are some differences between annual harvest data reported here and annual harvest data reported previously. Prior to 1988, data were summarized by calendar year. Since 1988, data have been summarized by regulatory year (RY), which begins 1 July and ends 30 June (e.g., RY06 = 1 Jul 2006 through 30 Jun 2007).
RESULTS AND DISCUSSION POPULATION STATUS AND TREND Population Size Densities of northern black bears are relatively low compared to other areas. Current estimates for the number of black bears in the area included 500–700 bears in the Tanana Flats in Unit 20A, 750–1200 bears in Unit 20B, 700–1000 in the portion of Unit 20C outside Denali National Park, and 400–700 in Unit 20F. Population estimates were calculated based on Hechtel’s (1991) density estimate of 12–18 black bears/100 mi2 (46–67/1000 km2), excluding cubs of the year, inhabiting the Tanana Flats study area in 1989. The density estimate was then applied to the estimated amount of suitable black bear habitat in each unit. This density is similar to the estimate of 17 bears/100 mi2 in the Susitna River area (Miller et al. 1987), but is much lower than the 39–52 bears/100 mi2 estimated to inhabit portions of the Kenai Peninsula (Schwartz and Franzmann 1991).

219
Population Composition No estimate of population composition is available for this black bear population. Sex ratios in the harvest were not representative of sex ratios in the population because females with cubs were protected by regulation. In addition, behavioral differences of male and female bears may have resulted in higher vulnerability of males, and many hunters try to select adult males.
Distribution and Movements The distribution of black bears shifts seasonally. During spring, bears use moist lowlands where early growing vegetation, especially Equisetum, makes up the bulk of their diet (Hatler 1967). Dispersal of young occurs in the spring usually before the breeding season. Immature males disperse longer distances from maternal home ranges than immature females. During fall, black bears feed primarily on berries in open meadows or alpine areas. Black bears usually den after freeze-up in autumn, and denning habitat can be found within most bear home ranges. Mean home range sizes of marked black bears in the Tanana Flats were 23 mi2 for adult females, 32 mi2 for subadult females, 230 mi2 for adult males, and 93 mi2 for subadult males (Hechtel 1991).
MORTALITY Harvest Season and Bag Limit. The black bear hunting season was open year-round in Unit 20 with a bag limit of 3 bears (baiting was restricted to 15 Apr–30 Jun). Since July 1972 the taking of cubs (first year of life) and females accompanied by cubs has been prohibited.
Alaska Board of Game Actions and Emergency Orders. In January 2000 the Alaska Board of Game adopted a regulation that required hunters who used bait stations registered by another hunter to obtain written permission from that hunter and to place their own hunting license number at the site. During January 1998 the board adopted a regulation that allowed the sale of handcrafted items made from black bear fur. In January 1996 the board passed a regulation that required salvage of meat, hides, and skulls from black bears harvested during 1 January–31 May in units where black bears are required to be sealed.
Harvest by Hunters. In Unit 20A the annual black bear harvest was relatively stable during RY01–RY03, averaging 43 bears with a range of 35–48 bears (Table 1). The annual harvest decreased during RY04–RY06, averaging 29 bears with a range of 24–34 bears and 53% males.
In Unit 20B the average annual harvest of black bears during RY01–RY03 was 158 bears with a range of 124–190 bears (Table 1). The annual harvest decreased during RY04–RY06, averaging 134 bears with a range of 120–141 bears and 59% males.
In Unit 20C the average annual harvest of black bears during RY01–RY03 was 26 bears with a range of 18–39 bears (Table 1). The annual harvest was similar during RY04–RY06, averaging 32 bears with a range of 24–41 bears and 54% males.
In Unit 20F the average annual harvest of black bears during RY01–RY03 was 31 bears with a range of 26–36 bears (Table 1). The annual harvest decreased during RY04–RY06, averaging 26 bears with a range of 16–40 bears and 69% males.

220
In all units, the average annual reported harvest from RY01 through RY03 was 258 bears, compared to an average annual reported harvest of 221 bears during RY04–RY06. The decrease in the 3-year mean harvest may be attributed to the low harvest of 189 in RY05, the lowest annual harvest since RY91 (Table 1). Several factors may have contributed to this decrease, including changes in military deployment, inclement weather that may have hampered hunters or use of transportation methods, and availability of alternative food sources, which may have made bears less vulnerable.
The estimated maximum sustainable exploitation rate for Interior black bear populations is approximately 12% (Hechtel 1991). Based on our population estimates for each of the units and the mean harvest during the last 3 regulatory years, we estimated the proportion of black bears harvested was approximately 4–6% in Unit 20A, 11–18% in Unit 20B, 3–5% in Units 20C, and 4–7% in Unit 20F. The harvest rate in Unit 20B has been sustained at the estimated maximum harvest rate of 12% or higher for 14 of the 18 years from RY89 through RY06. This suggests the estimates of maximum harvest rate or density may be inaccurate, or there is immigration into the area from lightly harvested areas.
To further investigate the possibility that black bears are being overharvested in Unit 20B, we investigated age and skull size when available from RY89 through RY06. During times of overharvest, older and larger animals are expected to become scarcer in populations, thus, we would expect skull size and average age to decrease during overexploitation of a population of black bears. On the contrary, in Unit 20B, skull size remained consistent for males (16.6 inches) and females (15.7 inches) from RY89 to RY06 (Table 2), suggesting that on average, hunters are harvesting adult size bears. Therefore, enough bears were making it to adulthood for a consistent harvest of adult sized bears. Similarly, the age data shows a gradual increase in mean age from RY89 through RY06 (Table 3). The mean age of harvested black bears during the 9-year period from RY89 through RY97 was 4.9. The mean age of harvested bears during RY98 through RY06 was 5.7. Bears were 16% older on average during those last 9 years. This is contrary to the expectation of overharvest.
Distribution of Harvest. Most black bear harvest was during the spring within the road-accessible portions of Unit 20B. Bait stations were more prevalent along the road system because of the difficulty of transporting heavy, bulky bait. The distribution of harvests reflected this trend. Other trends in harvest included hunters traveling farther away from the road system and from Fairbanks to hunt black bears, possibly to avoid crowding by other hunters.
Nonresident military hunters can hunt black bears without purchasing a big game tag or license if they hunt on military land. Therefore, military land such as the Yukon Maneuver Area in Unit 20B and the Fort Wainwright land in Unit 20A were hunted more intensively than some other areas of Units 20A, 20B, 20C, and 20F.
Registration of Bait Stations. Regulations for hunting black bears at bait stations changed several times during the past 20 years. Prior to RY81, black bear baiting was legal with minimal regulations. From mid 1982 through 1983, permits were required to hunt bears at bait stations. From RY84 through RY87, baiting was legal without permits or restrictions in season. Since RY88, baiting has been limited to the spring season, and hunters using baits have been required to register their bait stations prior to setting them up, have no more than 2 bait stations, and post

221
a sign at bait stations that includes their hunting license number. Other hunters using these bait stations were required to add their license number to the bait station sign. In addition, baiting was restricted to 15 April–15 June during RY89, but extended to 15 April–30 June during RY90–RY06 in response to the later emergence of bears from hibernation north of the Alaska Range.
The number of hunters who registered black bear bait stations increased from 220 hunters registering 314 bait stations in spring 1989, when registration became mandatory, to a peak of 615 hunters registering 1154 bait stations in RY91 (Table 4). Since RY91, those numbers have steadily decreased, to an average of 434 hunters registering an average of 664 bait stations during RY04–RY06.
Harvest at Bait Stations. The proportion of the harvest that was taken over bait has increased steadily since RY89. During RY89–RY91, 64% of the black bear harvest occurred at bait stations (Table 4). From RY04 through RY06, the average was 81%.
Hunter Residency and Success. During RY04–RY06, most black bear harvest (76%) was by residents of Alaska, and 72% was by local residents of Unit 20 (Table 5). In RY89 nonresidents took about 5% of the black bears taken in the Fairbanks area. Since then, there has been a steady increase in nonresident harvest, and in RY06 nearly 25% of the black harvest was attributed to nonresident hunters. Because only successful hunters were required to report, we have no data on the typical success rates as reported for other species. However, we do have baiting success, or the number of bears taken over bait compared to the number of bait stations registered. This is the best data we have to monitor take per unit effort (success). During the previous 18 years, there was an increasing trend in baiting success from 32% in RY89 to 43% in RY06. Several potential factors may contribute to baiting success. Those factors may include 1) increasing knowledge and experience of bear baiters through time and baiting clinics, 2) increasing number of guided nonresidents taking bears, and 3) an increasing bear population.
Harvest Chronology. From RY04 through RY06, 87% of the harvest occurred during May and June (Table 6), which coincides with den emergence and the baiting season. Factors that influenced harvest chronology for black bears included the opportunity to use bait, vulnerability of bears, hide quality, and seasonal activity of hunters.
Transport Methods. From RY04 through RY06, the most common methods of transportation used (listed in descending order) by successful black bear hunters were 4-wheelers, boats, highway vehicles, and airplanes (Table 7).
Defense of Life or Property. During RY04 through RY06, only 4 black bears were recorded as taken under DLP provisions of the hunting regulations. With a year-round season and a bag limit of 3 black bears, some black bears that might have otherwise been taken under the DLP regulations were taken under the general hunting regulations.
Other Mortality Causes of natural mortality of black bears include predation, food shortages that result in undernourished cubs and yearlings (Rogers 1977), and flooding of natal dens (Alt 1984). Hechtel (1991) reported several instances of natural mortality. During the spring 1996 recollaring effort,

222
a bear died after being immobilized, but necropsy results revealed the presence of extensive cancerous tissue in several internal organs.
Bear baiting has become an important issue for anti-hunting groups in the United States. Their efforts have succeeded in eliminating this black bear hunting method in some western states, especially during the spring. Such campaigns have sometimes been predicated on the likelihood of cubs being orphaned when their mothers are killed at bait stations or during spring hunts. Our records show little evidence of this, despite the fact that most harvest takes place during May and June (Table 6). A ballot initiative in November 2004 failed to outlaw bear baiting in Alaska. The practice in Alaska will probably continue to receive close scrutiny.
CONCLUSIONS AND RECOMMENDATIONS We met our management objective for sex ratio of the black bear harvests. The average percentage of males in the harvest during RY04–RY06 was 59%, which was above the minimum objective of 55%.
Based on the population estimates for individual units, the average annual harvest rates for RY04–RY06 were below the maximum sustainable exploitation rate of 12% in Units 20A (4–6%), 20C (3–5%), and 20F (4–7%). In Unit 20B the average annual harvest rate was 11–18% of the estimated population during RY04–RY06. The harvest rate in Unit 20B has been sustained at the estimated maximum harvest rate of 12% or higher for 14 of the 18 years from RY89 through RY06. This sustained high harvest rate suggests that either estimates of maximum harvest rate or density were inaccurate, or that immigration rates from adjacent units were high. The extrapolation of the density estimate in Unit 20A to Unit 20B may be a source of inaccuracy. It is also possible that black bear populations can sustain higher than 12% harvest in some areas when distribution of harvest is considered. For instance, Unit 20B harvest is concentrated along roads, and bears may be harvested above the level at which they can reproduce in these areas, making these roaded areas “sink” populations that are replenished by immigration of bears from populations farther from roads. When the surrounding inaccessible and essentially unhunted areas are considered as “source” populations, immigration into the roaded areas may allow a higher sustainable harvest than previously predicted. We investigated the theoretical overharvest of Unit 20B black bears through age and skull size analysis, and success rates at bait stations. Average skull size remained consistent, age increased slightly, and baiting success increased. Considering these factors, it is highly unlikely that black bears have been overharvested in Unit 20B during the last 18 years.
We met our objective of minimizing bear–human conflicts in the Fairbanks area. Relatively high black bear harvest in this area may be a factor in the reduction of potential problems. We also provided the public with information to reduce garbage availability to bears and worked to reduce the need for DLP kills. We should continue to closely monitor public interest in black bear hunting and subsequent harvest. As an important part of this monitoring, we recommend teeth from harvested black bears continue to be processed to provide age structure data. For the next report, we will change the objective of minimizing bear–human conflicts to “maintain a DLP take of less than 10% of the total bear take in Unit 20B.”

223
LITERATURE CITED ALT, G. L. 1984. Black bear cub mortality due to flooding of natal dens. Journal of Wildlife
Management 48:1432–1434.
HATLER, D. F. 1967. Some aspects in the ecology of the black bear (Ursus americanus) in Interior Alaska. Thesis, University of Alaska Fairbanks, Alaska, USA.
HECHTEL, J. L. 1991. Population dynamics of black bear populations, Fort Wainwright, Alaska. Final report to the U.S. Army.
JOHNSON, D. M. 1982. Reproductive characteristics of black bears in Interior Alaska. Alaska Department of Fish and Game. Federal Aid in Wildlife Restoration. Research Final Report. Grant W-21-2. Study 17.4R. Juneau, Alaska, USA.
MILLER, S. D., E. F. BECKER, AND W. B. BALLARD. 1987. Black and brown bear density estimates using modified capture–recapture techniques in Alaska. International Conference on Bear Research and Management 7:23–35.
ROGERS, L. L. 1977. Social relationships, movements, and population dynamics of black bears in northeastern Minnesota. Dissertation, University of Minnesota, Minneapolis, USA.
SCHWARTZ, C. C., AND A. W. FRANZMANN. 1991. Interrelationship of black bears to moose and forest succession in the northern coniferous forest. Wildlife Monographs 113:1–58.
SMITH, M. E. 1994. Black bear denning ecology and habitat selection in Interior Alaska. Thesis, University of Alaska Fairbanks, Alaska, USA.
PREPARED BY: SUBMITTED BY:
C. Tom Seaton Doreen I. Parker McNeill Wildlife Biologist II Assistant Management Coordinator
REVIEWED BY:
Mark A. Keech Wildlife Biologist III
Laura A. McCarthy Publications Technician II
Please cite any information taken from this section, and reference as:
SEATON, C. T. 2008. Units 20A, 20B, 20C, and 20F black bear. Pages 217–233 in P. Harper, editor. Black bear management report of survey and inventory activities 1 July 2004–30 June 2007. Alaska Department of Fish and Game. Project 17.0. Juneau, Alaska.

TABLE 1 Units 20A, 20B, 20C, and 20F black bear harvesta, regulatory years 1989–1990 through 2006–2007 Regulatory Fall Spring Annual total
year Area Male Female Unk Total Male Female Unk Total Male Female Unk Total 1989–1990 20A 7 3 1 11 8 6 0 14 15 9 1 25 20B 13 4 0 17 49 23 0 72 62 27 0 89 20C 6 3 0 9 3 1 0 4 9 4 0 13 20F 3 0 0 3 6 2 0 8 9 2 0 11 Total 29 10 1 40 66 32 0 98 95 42 1 138 (74%) (67%) (69%)
1990–1991 20A 7 3 0 10 19 11 0 30 26 14 0 40 20B 6 7 0 13 93 49 2 144 99 56 2 157 20C 4 1 0 5 14 5 2 21 18 6 2 26 20F 3 2 0 5 18 7 0 25 21 9 0 30 Total 20 13 0 33 144 72 4 220 164 85 4 253 (61%) (67%) (66%)
1991–1992 20A 9 5 1 15 13 5 0 18 22 10 1 33 20B 11 8 1 20 47 28 6 81 58 36 7 101 20C 3 2 0 5 12 3 2 17 15 5 2 22 20F 4 3 0 7 12 4 0 16 16 7 0 23 Total 27 18 2 47 84 40 8 132 111 58 10 179 (60%) (68%) (66%)
1992–1993 20A 13 8 0 21 27 16 0 43 40 24 0 64 20B 25 11 0 36 74 48 0 122 99 59 0 158 20C 12 2 0 14 6 1 1 8 18 3 1 22 20F 5 3 0 8 19 12 0 31 24 15 0 39 Total 55 24 0 79 126 77 1 204 181 101 1 283 (70%) (62%) (64%)
1993–1994 20A 6 9 0 15 21 10 1 32 27 19 1 47 20B 9 6 1 16 81 38 3 122 90 44 4 138 20C 3 0 0 3 12 4 1 17 15 4 1 20 20F 2 2 0 4 28 9 0 37 30 11 0 41 Total 20 17 1 38 142 61 5 208 162 78 6 246 (54%) (70%) (68%)
224

Regulatory Fall Spring Annual total year Area Male Female Unk Total Male Female Unk Total Male Female Unk Total
1994–1995 20A 6 1 0 7 31 5 0 36 37 6 0 43 20B 11 3 0 14 111 51 1 163 122 54 1 177 20C 3 2 0 5 13 3 0 16 16 5 0 21 20F 2 2 0 4 28 14 0 42 30 16 0 46 Total 22 8 0 30 183 73 1 257 205 81 1 287 (73%) (71%) (72%)
1995–1996 20A 9 1 1 11 24 15 1 40 33 16 2 51 20B 14 6 0 20 103 39 0 142 117 45 0 162 20C 5 0 0 5 5 2 0 7 10 2 0 12 20F 1 0 0 1 20 13 0 33 21 13 0 34 Total 29 7 1 37 152 69 1 222 181 76 2 259 (81%) (69%) (70%)
1996–1997 20A 15 16 0 31 17 10 0 27 32 26 0 58 20B 25 14 1 40 81 53 0 134 106 67 1 174 20C 12 7 0 19 18 4 0 22 30 11 0 41 20F 5 0 0 5 22 13 0 35 27 13 0 40 Total 57 37 1 95 138 80 0 218 195 117 1 313 (61%) (63%) (63%)
1997–1998 20A 9 8 0 17 30 12 1 43 39 20 1 60 20B 12 8 1 21 98 40 0 138 110 48 1 159 20C 3 3 0 6 15 13 1 29 18 16 1 35 20F 2 0 0 2 21 8 0 29 23 8 0 31 Total 26 19 1 46 164 73 2 239 190 92 3 285 (58%) (69%) (67%)
1998–1999 20A 9 6 0 15 27 15 0 42 36 21 0 57 20B 20 11 0 31 75 41 0 116 95 52 0 147 20C 3 5 0 8 30 10 0 40 33 15 0 48 20F 2 5 0 7 30 11 0 41 32 16 0 48 Total 34 27 0 61 162 77 0 239 196 104 0 300 (56%) (68%) (65%)
225

Regulatory Fall Spring Annual total year Area Male Female Unk Total Male Female Unk Total Male Female Unk Total
1999–2000 20A 10 6 0 16 17 17 0 34 27 23 0 50 20B 5 10 0 15 82 52 0 134 87 62 0 149 20C 2 2 0 4 29 13 0 42 31 15 0 46 20F 2 2 0 4 27 5 0 32 29 7 0 36 Total 19 20 0 39 155 87 0 242 174 107 0 281 (49%) (64%) (62%)
2000–2001 20A 11 10 0 21 23 14 0 37 34 24 0 58 20B 20 12 0 32 76 66 0 142 96 78 0 174 20C 8 0 0 8 19 19 0 38 27 19 0 46 20F 4 2 0 6 17 10 0 27 21 12 0 33 Total 43 24 0 67 135 109 0 244 178 133 0 311 (64%) (55%) (57%) 2001–2002 20A 10 10 0 20 19 9 0 28 29 19 0 48 20B 12 13 0 25 51 48 0 99 63 61 0 124 20C 3 2 0 5 8 8 0 16 11 10 0 21 20F 1 1 0 2 19 5 0 24 20 6 0 26 Total 26 26 0 52 97 70 0 167 123 96 0 219 (50%) (58%) (56%)
2002–2003 20A 5 8 0 13 16 17 0 33 21 25 0 46 20B 19 15 1 35 90 65 0 155 109 80 1 190 20C 3 5 0 8 20 11 0 31 23 16 0 39 20F 1 1 0 2 24 5 0 29 25 6 0 31 Total 28 29 1 58 150 98 0 248 178 127 1 306 (49%) (60%) (58%)
2003–2004 20A 8 6 0 14 18 3 0 21 26 9 0 35 20B 13 4 0 17 83 61 0 144 96 65 0 161 20C 0 1 0 1 9 8 0 17 9 9 0 18 20F 2 1 0 3 24 9 0 33 26 10 0 36 Total 23 12 0 35 134 81 0 215 157 93 0 250 (66%) (62%) (63%)
226

Regulatory Fall Spring Annual total year Area Male Female Unk Total Male Female Unk Total Male Female Unk Total
2004–2005 20A 3 7 0 10 9 11 0 20 12 18 0 30 20B 19 9 0 28 54 60 0 114 73 69 0 142 20C 3 2 0 5 16 20 0 36 19 22 0 41 20F 2 0 0 2 10 4 0 14 12 4 0 16 Total 27 18 0 45 89 95 0 184 116 113 0 229 (60%) (48%) (51%)
2005–2006 20A 0 3 0 3 15 6 0 21 15 9 0 24 20B 7 6 0 13 68 39 0 107 75 45 0 120 20C 0 0 0 0 17 7 0 24 17 7 0 24 20F 0 4 0 4 12 5 0 17 12 9 0 21 Total 7 13 0 20 112 57 0 169 119 70 0 189 (35%) (66%) (63%)
2006–2007 20A 2 2 0 4 18 12 0 30 20 14 0 34 20B 13 4 0 17 76 47 1 124 89 51 1 141 20C 0 1 0 1 16 14 0 30 16 15 0 31 20F 1 1 0 2 28 10 0 38 29 11 0 40 Total 16 8 0 24 138 83 1 222 154 91 1 246 (67%) (62%) (63%) a Includes DLP kills. Parentheses indicate percentage of bears of known sex that were male. Data for 1989–1992 from counts of sealing certificates.
227
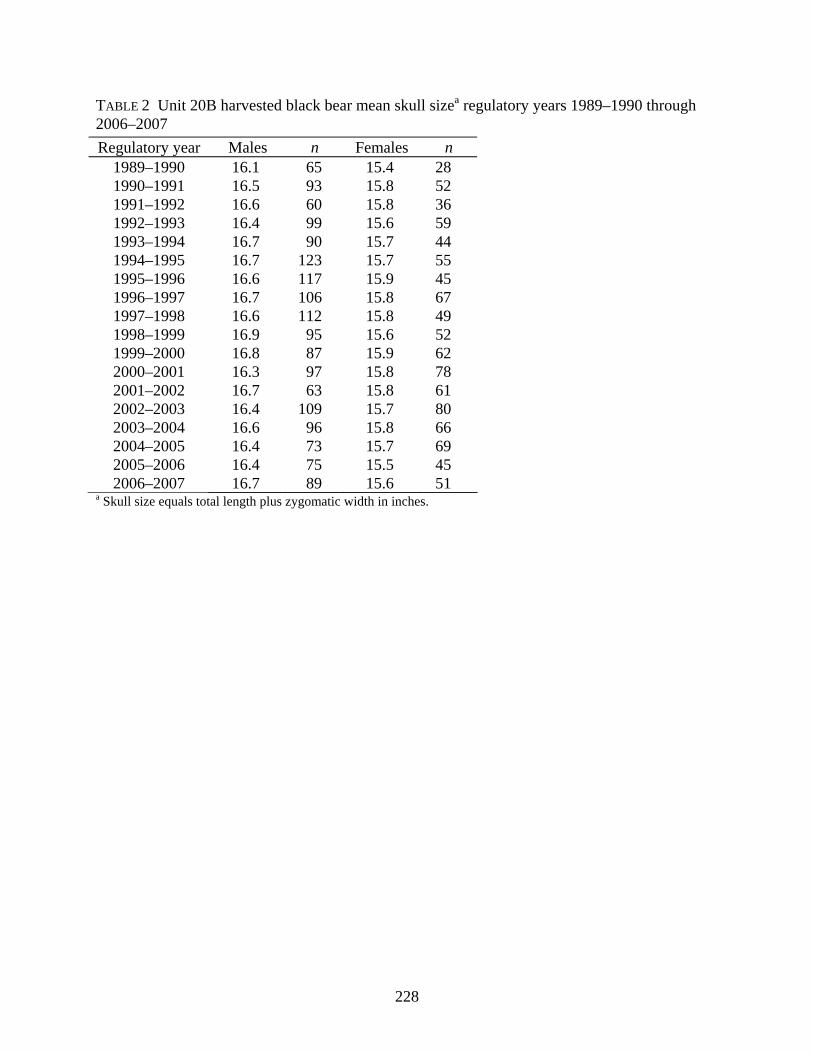
228
TABLE 2 Unit 20B harvested black bear mean skull sizea regulatory years 1989–1990 through 2006–2007 Regulatory year Males n Females n
1989–1990 16.1 65 15.4 28 1990–1991 16.5 93 15.8 52 1991–1992 16.6 60 15.8 36 1992–1993 16.4 99 15.6 59 1993–1994 16.7 90 15.7 44 1994–1995 16.7 123 15.7 55 1995–1996 16.6 117 15.9 45 1996–1997 16.7 106 15.8 67 1997–1998 16.6 112 15.8 49 1998–1999 16.9 95 15.6 52 1999–2000 16.8 87 15.9 62 2000–2001 16.3 97 15.8 78 2001–2002 16.7 63 15.8 61 2002–2003 16.4 109 15.7 80 2003–2004 16.6 96 15.8 66 2004–2005 16.4 73 15.7 69 2005–2006 16.4 75 15.5 45 2006–2007 16.7 89 15.6 51
a Skull size equals total length plus zygomatic width in inches.

229
TABLE 3 Units 20B harvested black bear mean ages, regulatory years 1989–1990 through 2006–2007 Regulatory year Mean age na
1989–1990 4.1 85 1990–1991 4.7 152 1991–1992 4.7 94 1992–1993 5.4 140 1993–1994 5.1 122 1994–1995 4.0 14 1995–1996 4.6 147 1996–1997 5.8 77 1997–1998 5.1 149 1998–1999 5.7 129 1999–2000 5.8 136 2000–2001 6.5 28 2001–2002 5.9 73 2002–2003 5.6 157 2003–2004 5.7 131 2004–2005 6.2 112 2005–2006 5.3 108 2006–2007 5.2 32
a Age data not available for some bears.

TABLE 4 Units 20A, 20B, 20C, and 20F black bear bait station registration and harvest, regulatory years 1989–1990 through 2006–2007
Baiting Harvest Success Regulatory
year Hunters registering
bait stations Bait
stations Taken over
bait (%) Not takena
over bait (%) Total
harvestb Taken over bait divided by hunters
registering bait stations (%) 1989–1990 220 314 71 (51) 67 (49) 138 (32) 1990–1991 450 767 175 (70) 76 (30) 251 (39) 1991–1992 615 1154 118 (66) 62 (34) 180 (19) 1992–1993 542 901 176 (64) 100 (36) 276 (32) 1993–1994 575 899 175 (73) 66 (27) 241 (30) 1994–1995 593 958 221 (79) 59 (21) 280 (37) 1995–1996 596 951 190 (73) 69 (27) 259 (32) 1996–1997 n/a n/a 197 (63) 116 (37) 313 n/a 1997–1998 544 831 217 (76) 68 (24) 285 (40) 1998–1999 597 863 217 (73) 80 (27) 297 (36) 1999–2000 562 798 224 (81) 51 (19) 275 (40) 2000–2001 550 1083 227 (73) 84 (27) 311 (41) 2001–2002 521 819 156 (71) 63 (29) 219 (30) 2002–2003 558 837 235 (77) 71 (23) 306 (42) 2003–2004 512 768 194 (78) 56 (22) 250 (38) 2004–2005 439 681 170 (76) 54 (24) 224 (39) 2005–2006 399 623 159 (85) 27 (15) 186 (40) 2006–2007 463 687 201 (82) 43 (18) 244 (43) a Not taken over bait harvest includes bears taken outside of the baiting season. b Total harvest does not include harvest for which it was not known if baits were used.
230

TABLE 5 Units 20A, 20B, 20C, and 20F successful hunter residency, regulatory years 1989–1990 through 2006–2007 Regulatory Residents Total successful
year Locala (%) Nonlocal (%) Total (%) Nonresident Unk huntersb 1989–1990 127 (91) 5 (4) 132 (95) 7 (5) 1 140 1990–1991 221 (89) 8 (3) 229 (93) 18 (7) 1 248 1991–1992 133 (76) 30 (17) 163 (93) 12 (7) 0 175 1992–1993 234 (85) 14 (5) 248 (90) 27 (9) 12 287 1993–1994 211 (87) 12 (5) 223 (92) 19 (8) 8 250 1994–1995 258 (91) 10 (4) 268 (94) 16 (6) 6 290 1995–1996 226 (87) 19 (7) 245 (95) 14 (5) 0 259 1996–1997 260 (83) 18 (6) 278 (89) 34 (11) 1 313 1997–1998 238 (84) 16 (6) 254 (89) 30 (11) 1 285 1998–1999 231 (78) 11 (4) 242 (82) 54 (18) 1 297 1999–2000 206 (75) 6 (2) 212 (77) 63 (23) 0 275 2000–2001 235 (76) 11 (4) 246 (79) 65 (21) 0 311 2001–2002 166 (76) 14 (6) 180 (82) 39 (18) 0 219 2002–2003 253 (83) 10 (3) 263 (87) 41 (13) 2 306 2003–2004 199 (80) 18 (7) 217 (87) 32 (13) 1 250 2004–2005 152 (68) 10 (4) 162 (72) 63 (28) 0 225 2005–2006 144 (76) 7 (4) 151 (80) 38 (20) 0 189 2006–2007 176 (72) 8 (3) 184 (76) 59 (24) 0 243 a Resident of Unit 20. b Excludes data from DLPs that were not taken as a legal harvest.
231

TABLE 6 Units 20A, 20B, 20C, and 20F black bear harvest chronology by month, regulatory years 2002–2003 through 2006–2007 Regulatory Harvest chronology by month (%)
Unit year Jul Aug Sep Oct–Apr May Jun 20A 2002–2003 2 (4) 1 (2) 10 (22) 0 (0) 24 (52) 9 (20)
2003–2004 3 (9) 5 (14) 6 (17) 0 (0) 10 (29) 11 (31) 2004–2005 0 (0) 3 (10) 6 (21) 0 (0) 13 (45) 7 (24) 2005–2006 0 (0) 0 (0) 3 (13) 0 (0) 12 (50) 9 (38) 2006–2007 1 (3) 0 (0) 3 (9) 0 (0) 15 (45) 14 (42)
20B 2002–2003 6 (3) 4 (2) 25 (13) 0 (0) 56 (29) 99 (52) 2003–2004 0 (0) 6 (4) 11 (7) 0 (0) 49 (30) 95 (59) 2004–2005 3 (2) 6 (4) 19 (13) 0 (0) 47 (33) 67 (47) 2005–2006 3 (3) 1 (1) 9 (8) 0 (0) 35 (29) 72 (60) 2006–2007 4 (3) 2 (1) 11 (8) 0 (0) 43 (30) 81 (57)
20C 2002–2003 0 (0) 5 (13) 3 (8) 1 (3) 10 (26) 20 (51) 2003–2004 0 (0) 0 (0) 1 (6) 0 (0) 8 (44) 9 (50) 2004–2005 0 (0) 0 (0) 5 (12) 0 (0) 11 (27) 25 (61) 2005–2006 0 (0) 0 (0) 0 (0) 0 (0) 6 (25) 18 (75) 2006–2007 0 (0) 0 (0) 1 (3) 0 (0) 4 (13) 26 (84)
20F 2002–2003 1 (3) 0 (0) 1 (3) 0 (0) 7 (23) 22 (71) 2003–2004 1 (3) 1 (3) 1 (3) 0 (0) 7 (19) 26 (72) 2004–2005 2 (13) 0 (0) 0 (0) 0 (0) 6 (38) 8 (50) 2005–2006 2 (10) 0 (0) 2 (10) 0 (0) 3 (14) 14 (67) 2006–2007 0 (0) 1 (3) 1 (3) 0 (0) 12 (30) 26 (65)
Total (%) 28 (2) 35 (3) 118 (10) 1 (0) 378 (31) 658 (54)
232
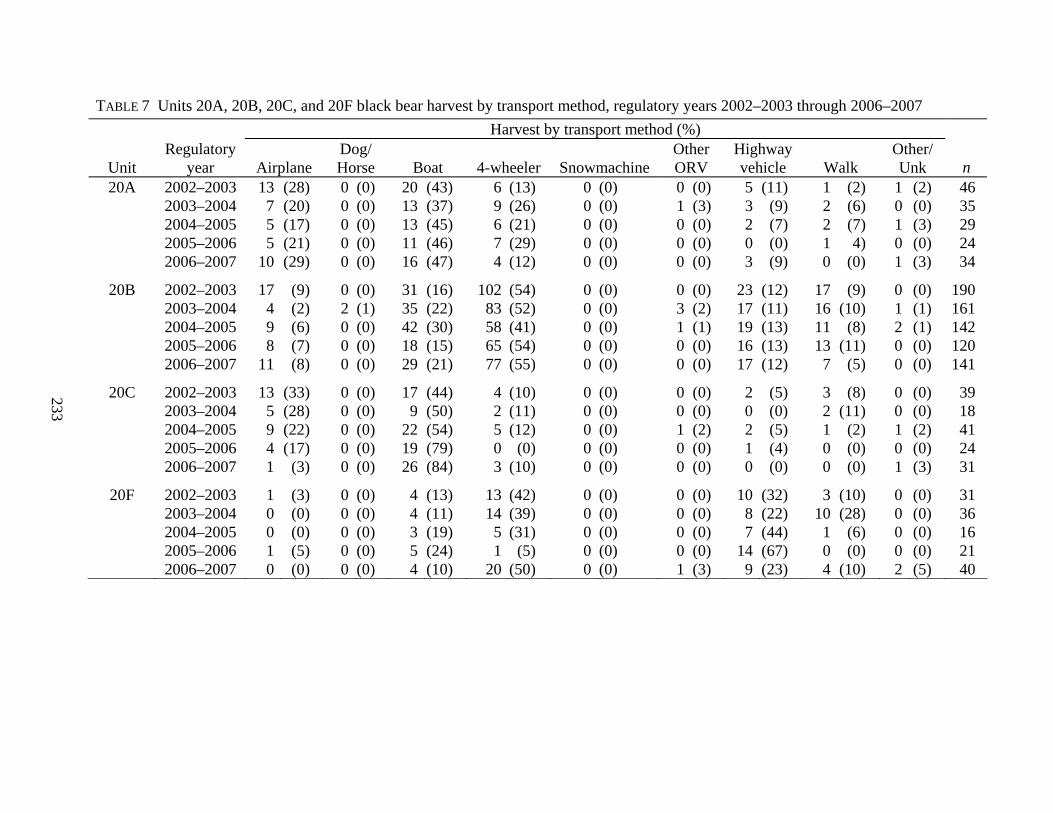
TABLE 7 Units 20A, 20B, 20C, and 20F black bear harvest by transport method, regulatory years 2002–2003 through 2006–2007 Harvest by transport method (%)
Unit
Regulatory year
Airplane
Dog/ Horse
Boat
4-wheeler
Snowmachine
Other ORV
Highway vehicle
Walk
Other/Unk
n
20A 2002–2003 13 (28) 0 (0) 20 (43) 6 (13) 0 (0) 0 (0) 5 (11) 1 (2) 1 (2) 46 2003–2004 7 (20) 0 (0) 13 (37) 9 (26) 0 (0) 1 (3) 3 (9) 2 (6) 0 (0) 35 2004–2005 5 (17) 0 (0) 13 (45) 6 (21) 0 (0) 0 (0) 2 (7) 2 (7) 1 (3) 29 2005–2006 5 (21) 0 (0) 11 (46) 7 (29) 0 (0) 0 (0) 0 (0) 1 4) 0 (0) 24 2006–2007 10 (29) 0 (0) 16 (47) 4 (12) 0 (0) 0 (0) 3 (9) 0 (0) 1 (3) 34
20B 2002–2003 17 (9) 0 (0) 31 (16) 102 (54) 0 (0) 0 (0) 23 (12) 17 (9) 0 (0) 190 2003–2004 4 (2) 2 (1) 35 (22) 83 (52) 0 (0) 3 (2) 17 (11) 16 (10) 1 (1) 161 2004–2005 9 (6) 0 (0) 42 (30) 58 (41) 0 (0) 1 (1) 19 (13) 11 (8) 2 (1) 142 2005–2006 8 (7) 0 (0) 18 (15) 65 (54) 0 (0) 0 (0) 16 (13) 13 (11) 0 (0) 120 2006–2007 11 (8) 0 (0) 29 (21) 77 (55) 0 (0) 0 (0) 17 (12) 7 (5) 0 (0) 141
20C 2002–2003 13 (33) 0 (0) 17 (44) 4 (10) 0 (0) 0 (0) 2 (5) 3 (8) 0 (0) 39 2003–2004 5 (28) 0 (0) 9 (50) 2 (11) 0 (0) 0 (0) 0 (0) 2 (11) 0 (0) 18 2004–2005 9 (22) 0 (0) 22 (54) 5 (12) 0 (0) 1 (2) 2 (5) 1 (2) 1 (2) 41 2005–2006 4 (17) 0 (0) 19 (79) 0 (0) 0 (0) 0 (0) 1 (4) 0 (0) 0 (0) 24 2006–2007 1 (3) 0 (0) 26 (84) 3 (10) 0 (0) 0 (0) 0 (0) 0 (0) 1 (3) 31
20F 2002–2003 1 (3) 0 (0) 4 (13) 13 (42) 0 (0) 0 (0) 10 (32) 3 (10) 0 (0) 31 2003–2004 0 (0) 0 (0) 4 (11) 14 (39) 0 (0) 0 (0) 8 (22) 10 (28) 0 (0) 36 2004–2005 0 (0) 0 (0) 3 (19) 5 (31) 0 (0) 0 (0) 7 (44) 1 (6) 0 (0) 16 2005–2006 1 (5) 0 (0) 5 (24) 1 (5) 0 (0) 0 (0) 14 (67) 0 (0) 0 (0) 21 2006–2007 0 (0) 0 (0) 4 (10) 20 (50) 0 (0) 1 (3) 9 (23) 4 (10) 2 (5) 40
233

234
WILDLIFE Alaska Department of Fish and GameDivision of Wildlife Conservation
MANAGEMENT REPORT (907) 465-4190 P.O. Box 115526 Juneau, AK 99811-5526
BLACK BEAR MANAGEMENT REPORT
From: 1 July 2004 To: 30 June 20071
LOCATION GAME MANAGEMENT UNIT: 20D (5637 mi2)
GEOGRAPHIC DESCRIPTION: Central Tanana Valley near Delta Junction
BACKGROUND Black bears are widely distributed in Unit 20D. Most black bear harvest in Unit 20D occurs near the road system south of the Tanana River, in the northwestern portion of the unit along the Richardson Highway, and along major river systems.
MANAGEMENT DIRECTION MANAGEMENT GOALS
Protect, maintain, and enhance the black bear population and its habitat in concert with other components of the ecosystem.
Provide the greatest sustained opportunity to participate in hunting black bears.
MANAGEMENT OBJECTIVE Manage for a sustained yield of black bears with harvest not to exceed 15 black bears south
of the Tanana River and 35 black bears north of the Tanana River.
METHODS I collected harvest data through mandatory sealing of bears killed by hunters, in defense of life or property, or for other reasons, such as road kill. Data collected from each black bear killed included color phase, sex, skull length and width, transportation used by the hunter, date of kill, number of days hunted, location of kill, hunter name and address, and whether the meat was salvaged. Data were summarized by regulatory year (RY), which begins 1 July and ends 30 June (e.g., RY06 = 1 July 2006–30 June 2007).
1 At the discretion of the reporting biologist, this unit report may contain data collected outside the report period.

235
RESULTS AND DISCUSSION POPULATION STATUS AND TREND Population Size An accurate estimate of black bear population size and trend was not available for Unit 20D. However, based on Hechtel’s (1991) estimate of 17.5 adult black bears/100 mi2 in adjacent Unit 20A, I estimated a population of approximately 750 adult black bears in Unit 20D. I also estimated that approximately 525 bears were present north of the Tanana River and 225 bears lived south of the Tanana River. Anecdotal information from residents and hunters in Unit 20D during RY04–RY06 indicated that black bears were numerous throughout the area.
Distribution and Movements Black bears are distributed throughout Unit 20D except in the most heavily populated areas and in treeless alpine habitat. No information was available concerning movements.
MORTALITY Harvest Season and Bag Limit. There was no closed season on black bears in Unit 20D during RY04–RY06. The bag limit was 3 per year. Cubs or females accompanied by cubs were not legal to harvest. Black bear baiting was allowed from 15 April through 30 June; however, hunters using bait could not establish more than 2 bait stations at a time and were required to first obtain a permit issued by the Alaska Department of Fish and Game.
Alaska Board of Game Actions and Emergency Orders. No regulatory changes were adopted during this reporting period.
Harvest by Hunters. Reported black bear harvest by hunters during RY04–RY06 ranged from a low of 19 in RY06 to a high of 29 in RY04 (Table 1) and did not exceed the Unit 20D combined harvest objective of 50 bears/year. Mean 3-year annual harvest by hunters was 24 bears/year. Most bears taken were males (70%).
Fifty-six percent of black bears killed by hunters during this report period were taken at bait stations, ranging from a low of 11 in RY06 to a high of 17 in RY05. A 3-year mean of 13 bears/year were taken with bait (Table 1).
Nonhunting Mortality. There were 2 defense of life or property nonhunting mortalities reported in RY04 (Table 1).
Harvest Locations. The Unit 20D harvest objective not to exceed 15 bears/year south of the Tanana River was met this reporting period (Table 2). The southern Unit 20D harvest ranged from 9 to 11 bears/year. The 3-year mean harvest south of the Tanana River was 10 bears/year. This take represented an estimated annual harvest of 4% of the estimated adult population south of the Tanana River.
The Unit 20D harvest objective not to exceed 35 bears/year north of the Tanana River was met this reporting period (Table 2). The reported harvest north of the Tanana River ranged from 8 to

236
18 bears/year. The 3-year mean harvest north of the Tanana River was 13 bears/year. This harvest represented an annual estimated take of 2% of the estimated adult population north of the Tanana River.
Hunter Residency. Most black bears killed in Unit 20D were taken by Alaska residents (Table 3).
Harvest Chronology. Most bears continued to be harvested in May–June and August–September (Table 4).
Transportation Methods. The most popular modes of transportation for black bear hunters in Unit 20D continued to be 3- or 4-wheelers, boats, and highway vehicles (Table 5). Other commonly used modes of transportation include airplanes and walking.
CONCLUSIONS AND RECOMMENDATIONS We monitored harvest of black bears to assure that hunting did not have negative effects on the population. Liberal seasons and bag limits provided hunters with maximum opportunity to hunt black bears in Unit 20D. Harvest levels met management objectives. No changes in regulations are recommended at this time.
LITERATURE CITED HECHTEL, J. L. 1991. Population dynamics of black bear populations, Fort Wainwright, Alaska.
Natural Resources Report 91-2, U.S. Army 6th Infantry Division (Light).
PREPARED BY: SUBMITTED BY:
Stephen D. DuBois Doreen I. Parker McNeill Wildlife Biologist III Assistant Management Coordinator
REVIEWED BY:
Mark A. Keech Wildlife Biologist III Laura A. McCarthy Publications Technician II Please cite any information taken from this section, and reference as: DUBOIS, S. D. 2008. Unit 20D black bear. Pages 234–241 in P. Harper, editor. Black bear management report of survey and inventory activities 1 July 2004–30 June 2007. Alaska Department of Fish and Game. Project 17.0. Juneau, Alaska.

TABLE 1 Unit 20D black bear harvest, regulatory years 1994–1995 through 2006–2007 Reported
Regulatory Hunter kill Nonhunting killa Estimated kill Total reported and estimated kill year M (%) F (%) Unk Total Baited M F Unk Unreported Illegal M (%) F (%) Unk Total
1994–1995 Fall 1994 3 (100) 0 (0) 0 3 0 0 0 0 0 0 3 (100) 0 (0) 0 3 Spring 1995 6 (55) 5 (46) 0 11 6 0 0 0 0 0 6 (55) 5 (46) 0 11
Total 9 (64) 5 (36) 0 14 6 0 0 0 0 0 9 (64) 5 (36) 0 14
1995–1996 Fall 1995 3 (75) 1 (25) 0 4 0 0 0 0 0 0 3 (75) 1 (25) 0 4 Spring 1996 10 (67) 5 (33) 0 15 7 1 0 0 0 0 11 (69) 5 (31) 0 16
Total 13 (68) 6 (32) 0 19 7 1 0 0 0 0 14 (70) 6 (30) 0 20
1996–1997 Fall 1996 9 (82) 2 (18) 0 11 0 0 0 0 0 0 9 (82) 2 (18) 0 11 Spring 1997 6 (50) 6 (50) 0 12 8 0 0 0 0 0 6 (50) 6 (50) 0 12
Total 15 (65) 8 (35) 0 23 8 0 0 0 0 0 15 (65) 8 (35) 0 23
1997–1998 Fall 1997 8 (73) 3 (27) 0 11 0 1 0 0 0 0 9 (75) 3 (25) 0 12 Spring 1998 17 (94) 1 (6) 1 19 15 1 0 0 0 0 18 (95) 1 (5) 1 20
Total 25 (86) 4 (14) 1 30 15 2 0 0 0 0 27 (84) 4 (13) 1 32
1998–1999 Fall 1998 7 (70) 3 (30) 0 10 0 0 0 0 0 0 7 (70) 3 (30) 0 10 Spring 1999 6 (50) 6 (50) 0 12 7 0 0 0 0 0 6 (50) 6 (50) 0 12
Total 13 (59) 9 (41) 0 22 7 0 0 0 0 0 13 (59) 9 (41) 0 22
1999–2000 Fall 1999 6 (60) 4 (40) 1 11 0 0 0 1 0 0 6 (60) 4 (40) 2 12 Spring 2000 4 (57) 3 (43) 0 7 4 0 0 0 0 0 4 (57) 3 (43) 0 7
Total 10 (59) 7 (41) 1 18 4 0 0 1 0 0 10 (59) 7 (41) 2 19
2000–2001 Fall 2000 14 (64) 8 (36) 0 22 0 1 1 0 0 0 15 (63) 9 (38) 0 24 Spring 2001 8 (53) 7 (47) 0 15 11 0 0 0 0 0 8 (53) 7 (47) 0 15
Total 22 (59) 15 (41) 0 37 11 1 1 0 0 0 23 (59) 16 (41) 0 39
2001–2002 Fall 2001 5 (63) 3 (38) 0 8 0 0 0 0 0 0 5 (63) 3 (38) 0 8 Spring 2002 8 (57) 6 (43) 0 14 14 0 0 0 0 0 8 (57) 6 (43) 0 14
Total 13 (59) 9 (41) 0 22 14 0 0 0 0 0 13 (59) 9 (41) 0 22
237

Reported Regulatory Hunter kill Nonhunting killa Estimated kill Total reported and estimated kill
year M (%) F (%) Unk Total Baited M F Unk Unreported Illegal M (%) F (%) Unk Total 2002–2003
Fall 2002 5 (71) 2 (29) 0 7 0 0 0 0 0 0 5 (71) 2 (29) 0 7 Spring 2003 9 (53) 8 (47) 0 17 14 0 0 0 0 0 9 (53) 8 (47) 0 17
Total 14 (58) 10 (42) 0 24 14 0 0 0 0 0 14 (58) 10 (42) 0 24
2003–2004 Fall 2003 3 (75) 1 (25) 0 4 0 0 0 0 0 0 3 (75) 1 (25) 0 4 Spring 2004 6 (50) 6 (50) 0 12 11 0 0 0 0 0 6 (50) 6 (50) 0 12
Total 9 (56) 7 (44) 0 16 11 0 0 0 0 0 9 (56) 7 (44) 0 16
2004–2005 Fall 2004 12 (86) 2 (14) 0 14 0 1 0 1 0 0 13 (87) 2 (13) 1 16 Spring 2005 10 (69) 5 (31) 0 15 12 0 0 0 0 0 10 (69) 5 (31) 0 15
Total 22 (76) 7 (24) 0 29 12 1 0 1 0 0 23 (80) 7 (20) 1 31
2005–2006 Fall 2005 1 (50) 1 (50) 0 2 0 0 0 0 0 0 1 (50) 1 (50) 0 2 Spring 2006 15 (71) 6 (29) 0 21 17 0 0 0 0 0 15 (71) 6 (29) 0 21
Total 16 (70) 7 (30) 0 23 17 0 0 0 0 0 16 (70) 7 (30) 0 23
2006–2007 Fall 2006 3 (43) 4 (57) 0 7 0 0 0 0 0 0 3 (43) 4 (57) 0 7 Spring 2007 9 (75) 3 (25) 0 12 11 0 0 0 0 0 9 (75) 3 (25) 0 12
Total 12 (63) 7 (37) 0 19 11 0 0 0 0 0 12 (63) 7 (37) 0 19 a Includes defense of life or property kills, research mortalities, and other known human-caused accidental mortality.
238

239
TABLE 2 Unit 20D black bear harvest location, regulatory years 1994–1995 through 2006–2007
Regulatory South of Tanana
River North of Tanana
River
year n (%) n (%) Unk n 1994–1995 10 (71) 4 (29) 14 1995–1996 13 (68) 6 (32) 19 1996–1997 12 (52) 11 (48) 23 1997–1998 22 (73) 8 (27) 30 1998–1999 16 (73) 6 (27) 22 1999–2000 11 (61) 7 (39) 1 19 2000–2001 15 (48) 16 (58) 1 32 2001–2002 11 (52) 10 (48) 1 22 2002–2003 9 (38) 15 (63) 0 24 2003–2004 9 (56) 7 (44) 0 16 2004–2005 11 (38) 18 (62) 0 29 2005–2006 9 (39) 14 (61) 0 23 2006–2007 11 (58) 8 (42) 0 19 TABLE 3 Unit 20D black bear successful hunter residency, regulatory years 1994–1995 through 2006–2007 Regulatory
year Locala
resident (%) Nonlocal
resident (%) Nonresident
(%)
Unk Total successful
hunters 1994–1995 7 (50) 7 (50) 0 (0) 14 1995–1996 9 (47) 10 (53) 0 (0) 19 1996–1997 12 (52) 10 (44) 1 (4) 23 1997–1998 18 (60) 12 (40) 0 (0) 30 1998–1999 19 (86) 3 (14) 0 (0) 22 1999–2000 12 (67) 5 (28) 1 (5) 1 19 2000–2001 26 (81) 3 (9) 3 (9) 32 2001–2002 19 (86) 1 (5) 2 (9) 22 2002–2003 22 (92) 1 (4) 1 (4) 24 2003–2004 15 (94) 1 (6) 0 (0) 16 2004–2005 15 (52) 12 (41) 2 (7) 29 2005–2006 7 (30) 16 (70) 0 (0) 23 2006–2007 11 (58) 8 (42) 0 (0) 19 a Local residents are residents of Unit 20D.
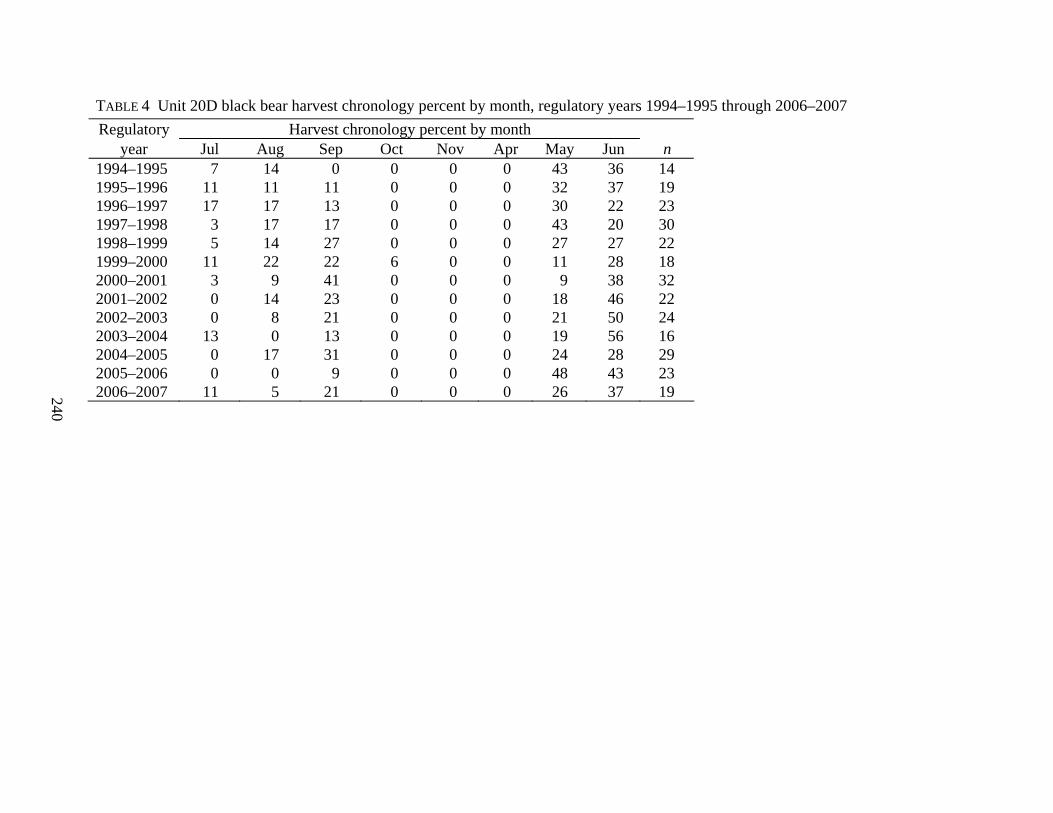
TABLE 4 Unit 20D black bear harvest chronology percent by month, regulatory years 1994–1995 through 2006–2007 Regulatory Harvest chronology percent by month
year Jul Aug Sep Oct Nov Apr May Jun n 1994–1995 7 14 0 0 0 0 43 36 14 1995–1996 11 11 11 0 0 0 32 37 19 1996–1997 17 17 13 0 0 0 30 22 23 1997–1998 3 17 17 0 0 0 43 20 30 1998–1999 5 14 27 0 0 0 27 27 22 1999–2000 11 22 22 6 0 0 11 28 18 2000–2001 3 9 41 0 0 0 9 38 32 2001–2002 0 14 23 0 0 0 18 46 22 2002–2003 0 8 21 0 0 0 21 50 24 2003–2004 13 0 13 0 0 0 19 56 16 2004–2005 0 17 31 0 0 0 24 28 29 2005–2006 0 0 9 0 0 0 48 43 23 2006–2007 11 5 21 0 0 0 26 37 19
240

TABLE 5 Unit 20D black bear harvest percent by transport method, regulatory years 1994–1995 through 2006–2007 Harvest percent by transport method
Regulatory year
Airplane
Horse
Boat
3- or 4-wheeler
Snowmachine
ORV
Highway vehicle
Walk
Other
Unk
n
1994–1995 0 0 14 29 0 0 29 29 0 0 14 1995–1996 16 0 5 47 0 0 16 11 5 0 19 1996–1997 9 0 26 30 0 4 17 13 0 0 23 1997–1998 10 0 10 30 0 0 47 3 0 0 30 1998–1999 14 0 9 36 0 5 23 10 5 0 22 1999–2000 16 0 21 32 0 0 16 5 11 0 19 2000–2001 6 3 31 25 0 3 16 16 0 0 32 2001–2002 5 0 23 41 0 0 14 18 0 0 22 2002–2003 8 0 29 42 0 0 4 13 0 4 24 2003–2004 0 0 38 44 0 0 13 0 0 6 16 2004–2005 10 0 24 31 0 0 24 0 0 10 29 2005–2006 4 4 13 53 0 0 22 4 0 0 23 2006–2007 11 0 21 31 0 0 16 21 0 0 19
241

242
WILDLIFE Alaska Department of Fish and GameDivision of Wildlife Conservation
MANAGEMENT REPORT (907) 465-4190 P.O. Box 115526 Juneau, AK 99811-5526
BLACK BEAR MANAGEMENT REPORT
From: 1 July 2004 To: 30 June 20071
LOCATION GAME MANAGEMENT UNIT: 20E (10,681 mi2)
GEOGRAPHIC DESCRIPTION: Fortymile, Charley, and Ladue River drainages, including the Tanana Uplands and all drainages into the south bank of the Yukon River upstream from and including the Charley River drainage
BACKGROUND Black bears live throughout forested habitat in Unit 20E. Observations by long-term area residents indicate that black bear numbers fluctuated during the past 50 years in relation to grizzly bear population trends. Black bear numbers were thought to be highest following federal predator control poisoning efforts during the 1950s that caused grizzly bear numbers to decline and remain depressed during the 1960s and early 1970s. As grizzly bear numbers recovered during the 1970s through the mid 1980s, black bear numbers appeared to decline. Grizzly bears have been known to kill black bears, but how important that mortality is to black bear population trend in Unit 20E is not known. Black bear abundance may also have declined due to poor habitat quality. Until the 1990s, fire suppression activities in Unit 20E allowed extensive areas of black spruce stands to reach climax stage, a stage that does not produce high quality black bear food.
During the 1990s and early 2000s, the black bear population in Unit 20E appeared stable. The highest densities are believed to occur in the hardwood habitats near the community of Chicken and along the Yukon River. Extensive fires in 2004 and 2005 will likely result in improved black bear habitat in the future. Historically, interest in black bear hunting in the unit has been low.
1 At the discretion of the reporting biologist, this unit report may contain data collected outside the report period.

243
MANAGEMENT DIRECTION MANAGEMENT GOALS
Protect, maintain, and enhance the black bear population and its habitat in concert with other components of the ecosystem.
Provide the greatest sustained opportunity to participate in hunting black bears.
MANAGEMENT OBJECTIVE Manage for a harvest of black bears that maintains 55% or more males in the combined
harvests of the most recent 3 years.
METHODS A recent bear population survey was conducted by the Alaska Department of Fish and Game (ADF&G) within a 2002-mi2 portion of southern Unit 20E using a DNA-based mark–recapture estimate technique (C. Gardner, ADF&G unpublished data, Fairbanks, 2007). Annual harvest information was collected from hunters during the mandatory process of sealing hunter-killed bears and bears killed in defense of life or property. Information collected included harvest date and location, sex of the bear, skull size, transportation mode, number of days hunted, salvage of meat, and bait use. Harvest data were summarized by regulatory year (RY), which begins 1 July and ends 30 June (e.g., RY06 = 1 Jul 2006–30 Jun 2007).
RESULTS AND DISCUSSION POPULATION STATUS AND TREND Population Size and Composition During RY04–RY05, no surveys were conducted to determine black bear population size or trend. Survey results from the summer 2006 bear survey are still being evaluated and will be presented during the next report cycle. The Unit 20E black bear population was estimated to be 1000–1500 bears based on population data collected in adjacent Unit 12 (Kelleyhouse 1990) during the early 1980s and in Unit 20A (Hechtel 1991). The composition of the Unit 20E black bear population is unknown. Several large fires burned in Unit 20E during summer 2004. The effect of wildfires on black bear population trend is not known.
Distribution and Movements Black bears inhabit all of the forested habitats within Unit 20E. Their movement patterns within the subunit are unknown.
MORTALITY Harvest Season and Bag Limit. There was no closed season for black bears in Unit 20E, and the bag limit was 3 bears. Harvest of cubs (first year of life) and females accompanied by cubs was prohibited.

244
Alaska Board of Game Actions and Emergency Orders. During the spring 2006 meeting, the Alaska Board of Game (board) adopted regulations to allow the sale of black bear hides and skulls, and same day airborne hunting of black bears over bait in active predator control areas, including the Upper Yukon–Tanana Predator Control Area in Unit 20E. Also during the spring 2006 meeting, the board expanded the Upper Yukon–Tanana Predator Control Area to include all of Unit 20E. No emergency orders were issued.
Harvest by Hunters. During RY04–RY06 the annual reported harvest ranged from 7 to 28 black bears ( x = 15 bears) in Unit 20E (Table 1). A total of 45 black bears, including 35 males were killed during this 3-year period. Males made up 78–86% of the harvest ( x = 81%) during RY04–RY06, meeting the harvest objective of >55% males for all 3 years combined. The previous 5-year average harvest during RY99–RY03 was 13 bears with annual harvests ranging from 50% to 93% males ( x = 69%).
Hunter Residency and Success. During RY04–RY06, Alaska residents harvested an average of 93% of the black bears taken in Unit 20E (Table 2). Of these, Unit 20E residents took an average of 36% of the harvest. The previous 5-year average for unit resident harvest was 37%. During RY04–RY06, 3 black bears were killed by nonresidents, 7% of the total harvest. From RY99 through RY03, nonresidents killed no black bears during 2 of the 5 years and only 1 bear each year during the other 3 years. No measure of hunter success was available because unsuccessful hunters were not required to report.
Harvest Chronology. During RY04–RY06, 50–71% ( x = 58%) of the black bear harvest occurred during July–September, primarily in August (Table 3). During the previous 5 years, 46–84% ( x = 61%) of the harvest took place in fall (Table 3).
Transport Methods. During RY04–RY06, 4-wheelers (52%) and highway vehicles (34%) were the most common modes of transportation used by successful black bear hunters (Table 4). I expect use of 4-wheelers will continue to be prevalent among Unit 20E black bear hunters because of the difficulty of access into the area.
HABITAT Assessment Black bear habitat is extensive in Unit 20E. Only treeless habitat, generally above elevations of 4000 feet, is not black bear habitat. Blueberries, crowberries, and cranberries are widely available, and bearberries are available in a few areas. Human-caused changes in the quantity and quality of black bear habitat are not expected because little development has occurred or is planned within black bear habitat in Unit 20E.
Enhancement The implementation of the Alaska Interagency Wildland Fire Management Plan (Alaska Wildland Fire Coordinating Group 1998) allowed wildfires to burn in more areas than before 1984. Also, 3 prescribed burns were ignited during 1997–1999, affecting about 95,000 acres of black bear habitat. Revegetation of preferred plant species in burned areas is expected to provide better forage for black bears than is available in mature forests of black or white spruce.

245
Similarly, in 2004 about 1700 mi2 of Unit 20E burned and can be expected to provide improvements in usable habitat for black bears in the future.
CONCLUSIONS AND RECOMMENDATIONS We met the objective of 55% or more males in the harvest ( x = 81% males) during RY04–RY06. Black bears in Unit 20E were lightly harvested and were hunted primarily during the fall by nonlocal Alaska residents. Highway vehicles and 4-wheelers were used by 86% of the successful hunters. Current harvest rate likely has little effect on the status and trend of the population. Males composed 80% of the harvest during the past 3 years and skull size remained relatively constant. For the next report period the objective will be clarified to read “Maintain at least 55% males in the harvest during the report period.” I recommend no changes in seasons or bag limits.
LITERATURE CITED ALASKA WILDLAND FIRE COORDINATING GROUP. 1998. Alaska interagency wildland fire
management plan. <http://forestry.alaska.gov/pdfs/98AIFMP.pdf> (Accessed 25 Mar 2008).
HECHTEL, J. L. 1991. Population dynamics of black bear populations, Fort Wainwright, Alaska. Final report to the U.S. Army.
KELLEYHOUSE, D. G. 1990. Unit 12 black bear. Pages 58–63 in S. O. Morgan, editor. Black bear management report of survey and inventory activities. Part IV. Volume XX. Alaska Department of Fish and Game. Study 17.0. Juneau, Alaska.
PREPARED BY: SUBMITTED BY:
Jeffrey A. Gross Doreen I. Parker McNeill Wildlife Biologist III Assistant Management Coordinator
REVIEWED BY:
Mark A. Keech Wildlife Biologist III
Laura A. McCarthy Publications Technician II Please cite any information taken from this section, and reference as:
GROSS, J. A. 2008. Unit 20E black bear. Pages 242–248 in P. Harper, editor. Black bear management report of survey and inventory activities 1 July 2004–30 June 2007. Alaska Department of Fish and Game. Project 17.0. Juneau, Alaska.

TABLE 1 Unit 20E black bear harvest, regulatory years 1999–2000 through 2006–2007 Reported
Regulatory Hunter kill Nonhunting killa Estimated kill Total reported and estimated kill year M F Unk Total Baited M F Unk Unreported Illegal M (%) F (%) Unk (%) Total
1999–2000 Fall 1999 4 2 0 6 0 0 0 0 0 0 4 (67) 2 (33) 0 6 Spring 2000 4 1 0 5 0 0 0 0 0 0 4 (80) 1 (20) 0 5
Total 8 3 0 11 0 0 0 0 0 0 8 (73) 3 (27) 0 11
2000–2001 Fall 2000 6 1 0 7 0 0 0 0 0 0 6 (86) 1 (14) 0 7 Spring 2001 7 0 0 7 2 0 0 0 0 0 7 (100) 0 (0) 0 7
Total 13 1 0 14 2 0 0 0 0 0 13 (93) 1 (7) 0 14
2001–2002 Fall 2001 3 2 1 6 0 0 0 0 0 0 3 (60) 2 (40) 1 6 Spring 2002 4 3 0 7 0 0 0 0 0 0 4 (57) 3 (43) 0 7
Total 7 5 1 13 0 0 0 0 0 0 7 (58) 5 (42) 1 13
2002–2003 Fall 2002 8 7 0 15 0 0 0 0 0 0 8 (53) 7 (47) 0 15 Spring 2003 1 2 0 3 0 0 0 0 0 0 1 (33) 2 (67) 0 3
Total 9 9 0 18 0 0 0 0 0 0 9 (50) 9 (50) 0 18
2003–2004 Fall 2003 3 2 0 5 0 0 0 0 0 0 3 (60) 2 (40) 0 5 Spring 2004 2 0 0 2 0 0 0 0 0 0 2 (100) 0 (0) 0 2
Total 5 2 0 7 0 0 0 0 0 0 5 (71) 2 (29) 0 7
2004–2005 Fall 2004 10 5 0 15 0 0 0 0 0 0 10 (67) 5 (33) 0 15 Spring 2005 12 1 0 13 7 0 0 0 0 0 12 (92) 1 (8) 0 13
Total 22 6 0 28 7 0 0 0 0 0 22 (79) 6 (21) 0 28 2005–2006
Fall 2005 4 0 1 5 0 0 0 0 0 0 4 (100) 0 (0) 1 5 Spring 2006 3 2 0 5 4 0 0 0 0 0 3 (60) 2 (40) 0 5
Total 7 2 1 10 4 0 0 0 0 0 7 (78) 2 (22) 1 10
2006–2007 Fall 2006 4 1 0 5 0 0 0 0 0 0 4 (80) 1 (20) 0 5 Spring 2007 2 0 0 2 0 0 0 0 0 0 2 (100) 0 (0) 0 2
Total 6 1 0 7 0 0 0 0 0 0 6 (86) 1 (14) 0 7 a Includes defense of life or property kills, research mortalities, and other known human-caused accidental mortality.
246

247
TABLE 2 Unit 20E successful black bear hunter residency, regulatory years 1999–2000 through 2006–2007
Regulatory year
Unit resident (%)
Other residents (%)
Nonresident (%)
Total successful hunters
1999–2000 5 (45) 6 (55) 0 (0) 11 2000–2001 6 (43) 8 (57) 0 (0) 14 2001–2002 6 (46) 6 (46) 1 (8) 13 2002–2003 6 (33) 11 (61) 1 (6) 18 2003–2004 0 (0) 6 (86) 1 (14) 7 2004–2005 11 (39) 15 (54) 2 (7) 28 2005–2006 3 (30) 6 (60) 1 (10) 10 2006–2007 2 (29) 5 (71) 0 (0) 7
TABLE 3 Unit 20E black bear harvest chronology percent by month, regulatory years 1999–2000 through 2006–2007 Regulatory Harvest chronology percent by month
year Jul Aug Sep Oct Nov Apr May Jun n 1999–2000 0 0 55 0 0 0 18 27 11 2000–2001 14 0 36 0 0 0 43 7 14 2001–2002 8 23 15 0 0 0 38 15 13 2002–2003 6 22 56 0 0 0 17 0 18 2003–2004 0 29 43 0 0 0 29 0 7 2004–2005 7 18 29 0 0 4 21 21 28 2005–2006 0 30 20 0 0 0 10 40 10 2006–2007 0 57 14 0 0 0 14 14 7

TABLE 4 Unit 20E black bear harvest (% harvest) by transport method, regulatory years 1999–2000 through 2006–2007 Transport method (%)
Regulatory year
Airplane
Horse
Boat
3- or 4-wheeler
Snowmachine
ORV
Highway vehicle
Walking
Unknown
n
1999–2000 0 (0) 0 (0) 5 (45) 2 (18) 0 (0) 0 (0) 3 (27) 1 (9) 0 (0) 112000–2001 0 (0) 0 (0) 3 (21) 6 (43) 0 (0) 0 (0) 4 (29) 1 (7) 0 (0) 142001–2002 0 (0) 0 (0) 2 (15) 5 (38) 0 (0) 0 (0) 5 (38) 1 (8) 0 (0) 132002–2003 1 (6) 0 (0) 0 (0) 5 (28) 0 (0) 0 (0) 10 (56) 2 (11) 0 (0) 182003–2004 0 (0) 0 (0) 1 (14) 5 (71) 0 (0) 0 (0) 1 (14) 0 (0) 0 (0) 72004–2005 0 (0) 0 (0) 5 (18) 11 (39) 0 (0) 0 (0) 9 (32) 3 (11) 0 (0) 282005–2006 0 (0) 0 (0) 0 (0) 6 (60) 0 (0) 0 (0) 4 (40) 0 (0) 0 (0) 102006–2007 0 (0) 0 (0) 0 (0) 4 (57) 0 (0) 0 (0) 2 (29) 1 (14) 0 (0) 7
248


The Federal Aid in Wildlife Restoration Program consists of funds from a 10% to 11% manufacturer’s excise tax collected from the sales of handguns, sporting rifles, shotguns, ammunition, and archery equipment. The Federal Aid program allots funds back to states through a formula based on each state’s geographic area and number of paid hunting license holders. Alaska receives a maximum 5% of revenues collected each year. The Alaska Department of Fish and Game uses federal aid funds to help restore, conserve and manage wild birds and mammals to benefit the public. These funds are also used to educate hunters to develop the skills, knowledge and attitudes for responsible hunting.
Photo by Rich Lowell, ADF&G