2008 annual report on form 10-k - snl · 2008 annual report on form 10-k virginia heritage bank...
TRANSCRIPT

2 0 0 8 A n n u a l R e p o r t O n F o r m 1 0 - K
VIRGINIA HERITAGE BANKBuilding Prosperity Together

Virginia Heritage Bank was founded in 2005 on the fundamental
belief that many local businesses and individuals in Northern
Virginia no longer felt they had a meaningful relationship with
their bank.
Headquartered in Fairfax, with two other branches and a fourth
planned, VHB is a full-service community bank that is locally
owned and managed and sees itself as a financial resource
center dedicated to helping customers achieve prosperity.
The bank’s Board of Directors and senior management live
and work in Northern Virginia and share with their customers
a personal interest in maintaining a strong, vibrant local
community.
The bank is optimized for the needs of individuals, families and
small businesses. Customers choose the bank because they
like the friendly, personalized service of a community bank
whose people are easy to work with, experienced, attuned
to the trends and issues of the region, empowered to make
fast, responsive decisions and accessible through strategically
located branches and online services.
The Bank supports its personal service approach with
advanced technologies. The Bank's Directors and employees
believe that building its brand based on delivery of friendly,
personalized banking services enables the Bank to develop
meaningful and long term customer relationships that, in turn,
create added value to these relationships and build market
differentiation.
w w w . v i r g i n i a h e r i t a g e b a n k . c o m
cORpORAte pROFile
VIRGINIA HERITAGE BANKBuilding Prosperity Together

VIRGINIA HERITAGE BANKBuilding Prosperity Together
Dear Shareholder:
On behalf of the Board of Directors and employees of Virginia Heritage Bank (VHB), it is my pleasure to provide the Bank’s 2008 shareholders’ meeting materials. Included with this letter is the Bank’s Annual Report which contains financial statements for the two year period ended December 31, 2008 as well as the proxy material which requires your immediate attention.
The operating environment for the banking industry experienced dramatic change during 2008. With the current recession having technically begun in late 2007, the economy’s deterioration gained speed as the year progressed. The forced sale of Bear Stearns to JPMorgan Chase took place in March, FNMA and FHLMC required emergency Federal Reserve funding in July, Merrill Lynch was sold to Bank of America in September, Lehman Brothers filed for bankruptcy, Wachovia Bank was sold to Citigroup in late September and in October nine of the largest banks in the U.S. were required to take $125 billion of capital from the U.S. Treasury. All of this against the backdrop of the Treasury and the Federal Reserve lending AIG $150 billion to provide that institution enough time to wind down without disrupting world markets.
Many of VHB’s local competitors felt the full impact of the recession during 2008. The quality of loan portfolios began to deteriorate, particularly in the consumer and commercial real estate sectors. With unemployment rates in Northern Virginia nearly doubling in the past year, many borrowers have had difficulty making mortgage, automobile and credit card payments. Home builders and land developers, in particular, were exceptionally hard hit as demand for new homes and new communities dried up. The contraction in economic activity in the region has impacted many businesses. A significant concern remaining after the vast government intervention is whether such actions will help in pulling us out of the economic doldrums. The health of the economy and, more specifically, the health of the banking industry, depend upon a return to more normalized lending and investing.
Despite the preponderance of gloomy economic news during 2008, VHB continued the positive trends begun in mid 2007. Fortunately, the Bank began operations late in this current economic cycle. Lending exposure to some of the more troubled sectors is modest while overall loan growth has been robust. The expansion of the loan portfolio has been managed with the goal of balanced diversification between consumer, commercial and industrial, and commercial real estate exposure. Within each sector we have attempted to manage concentration risk with appropriate credit monitoring. The results of our ability to limit risk within the loan portfolio have so far been very good. The length and severity of the current recession will certainly test the effectiveness of our underwriting and monitoring systems.
The attached Annual Report sets forth the progress we have made over the past year. I would like to highlight below some of the more notable accomplishments as follows:
Total assets at 12/31/2008 were $242.2 million compared to $128.8 million the previous year end. Total loans increased to $204.9 million at year end, an increase of $134.9 million from December 31, 2007. Total gross loan production, including our mortgage loan originations, exceeded $216 million for 2008.Total deposit growth during the past year was $75.5 million.

www.virginiaheritagebank.com
The Bank’s loss narrowed during 2008 to $(1.7) million and only a $(94,000) loss after factoring in the impact of the provision for loan losses which was driven by the robust growth in the loan portfolio.An increase in the net interest margin to 3.40% compared to the 2007 level of 2.98%. This was accomplished in spite of a 2% drop in short term interest rates during the 4th quarter of 2008.Asset quality ratios are all significantly better than our “peer” group of community banks.Capital ratios exceed all regulatory guidelines.
The Board of Directors, management and employees are very aware of the economic turmoil we are currently experiencing in the Northern Virginia market. We have adjusted our business plan as we attempt to react to the new economic climate. However, we see some unique opportunities for VHB going forward and will remain vigilant in our efforts to continue the expansion of the franchise. Significant progress has been made, and as always, there is much left for us to accomplish. Please take time to review the material included. Thank you for your continued support and we look forward to seeing you on June 18th at the shareholders meeting.
Sincerely,
David P. SummersChairman & CEO
Financial ServicesPersonal Banking Business Banking Online BankingFinancial ServicesPersonal Banking Business Banking Online Banking
VIRGINIA HERITAGE BANKBuilding Prosperity Together
BOARD OF GOVENORS OF THE FEDERAL RESERVE SYSTEM Washington, D.C. 20551
Form 10-K
(Mark One) ⌧ ANNUAL REPORT UNDER SECTION 13 OR 15(D) OF THE SECURITIES EXCHANGE ACT OF 1934
For the fiscal year ended December 31, 2008 OR
� TRANSITION REPORT UNDER SECTION 13 OR 15 (D) OF THE SECURITIES AND EXCHANGE ACT OF 1934
For the transition period from to
Federal Reserve System file number: N/A
Virginia Heritage Bank (Exact name of registrant as specified in its charter)
Virginia 30-0311709
(State or other jurisdiction of incorporation or organization)
(I.R.S. Employer Identification No.)
11166 Fairfax Boulevard, Fairfax, Virginia 22030
(Address of principal executive offices) (Zip Code)
Registrant’s telephone number, including area code (703) 359-4100
Securities registered under Section 12(b) of the Exchange Act:
Title of each class Name of each exchange on which registeredNone None
Securities registered under Section 12(g) of the Exchange Act:
Common Stock, $4.00 par value per share (Title of class)
Indicate by check mark if the registrant is a well known seasoned issuer, as defined in Rule 405 of the Securities Act. Yes � No ⌧
Indicate by check mark if the registrant is not required to file reports pursuant to Section 13 or 15(d) of the Exchange Act. Yes � No ⌧
Indicate by check mark whether the issuer (1) filed all reports required to be filed by Section 13 or 15(d) of the Securities Exchange Act during the past 12 months (or for such shorter period that the registrant was required to file such reports), and (2) has been subject to such filing requirements for the past 90 days. Yes ⌧ No �
Indicate by check mark if there is no disclosure of delinquent filers in response to Item 405 of Regulation S-K contained in this form, and no disclosure will be contained, to the best of registrant’s knowledge, in definitive proxy or information statements incorporated by reference in Part III of this Form 10-K or any amendment to this Form 10-K. ⌧
Indicate by check mark whether the registrant is a large accelerated filer, an accelerated filer, a non-accelerated filer, or a smaller reporting company. See the definitions of “large accelerated filer,” “accelerated filer,” and “smaller reporting company” in Rule 12b-2 of the Exchange Act. (Check one):
Large Accelerated Filer � Accelerated Filer � Non-accelerated Filer � Smaller reporting company ⌧ Indicate by check mark whether the registrant is a shell company (as defined in Rule 12b-2 of the Act). Yes � No ⌧ As of June 30, 2008, the aggregate value of the 3,632,055 shares of Common Stock of the Registrant issued and outstanding on such date, which excludes 159,578 shares held by directors and officers of the Registrant as a group, was approximately $38.1 million. This figure is based on the last sales price of $10.50 per share of the Registrant’s Common Stock on June 27, 2008. Number of shares of Common Stock outstanding as of March 27, 2009: 3,791,633
DOCUMENTS INCORPORATED BY REFERENCE List hereunder the following documents incorporated by reference and the Part of the Form 10-K into which the document is incorporated. Portions of the definitive proxy statement for the 2009 Annual Meeting of Stockholders are incorporated into Part III, Items 10 through 14 of the Form 10-K.

Virginia Heritage Bank Form 10-K
Index
PART I
Item 1 Business .............................................................................................................................................. 1
Item 1A Risk Factors ........................................................................................................................................ 9
Item 1B Unresolved Staff Comments ............................................................................................................. 12
Item 2 Property ............................................................................................................................................ 12
Item 3 Legal Proceedings............................................................................................................................. 13
Item 4 Submission of Matters to a Vote of Security Holders ...................................................................... 13
PART II
Item 5 Market for Registrant’s Common Equity, Related Stockholder Matters and Issuer Purchases of Equity Securities .......................................................................................................................... 13
Item 6 Selected Financial Data .................................................................................................................... 15
Item 7 Management’s Discussion and Analysis of Financial Condition and Results of Operations ........................................................................................................................ 16
Item 7A Quantitative and Qualitative Disclosures About Market Risk .......................................................... 28
Item 8 Financial Statements and Supplementary Data ................................................................................. 30
Item 9 Changes In and Disagreements with Accountants on Accounting and Financial Disclosure ........... 53
Item 9A(T) Controls and Procedures ................................................................................................................... 53
Item 9B Other Information ............................................................................................................................. 54
PART III
Item 10 Directors, Executive Officers and Corporate Governance ................................................................ 54
Item 11 Executive Compensation .................................................................................................................. 54
Item 12 Security Ownership of Certain Beneficial Owners and Management and Related Stockholder Matters .......................................................................................................................... 54
Item 13 Certain Relationships and Related Transactions, and Director Independence .................................. 54
Item 14 Principal Accountant Fees and Services ........................................................................................... 54
PART IV
Item 15 Exhibits and Financial Statement Schedules .................................................................................... 54
11
PART I
Item 1. Description of Business
General
Virginia Heritage Bank is a commercial bank incorporated in and chartered by the Commonwealth of Virginia. We are a member of the Federal Reserve System and our deposits are insured by the FDIC. We opened for business on November 21, 2005 and are headquartered in the city of Fairfax, Virginia.
We serve the greater Washington, D.C. metropolitan area with an emphasis on Northern Virginia. Our goal has been to deliver a customized and targeted mix of products and services that meets or exceeds customer expectations. To accomplish this goal, we have deployed a premium operating system that gives customers access to the most up-to-date banking technology.
We offer a full range of banking services through traditional and electronic delivery. Services include: free business and consumer checking, premium interest-bearing checking, business account analysis, savings, certificates of deposit and other depository services, as well as a broad array of commercial, real estate and consumer loans. Free internet account access is available for all personal and business accounts, free internet bill payment services are available on most accounts, and a robust online cash management system is available for business customers.
During the last year, the Bank placed an emphasis on developing its customer relationships and focused on deposit and loan growth. Total assets at December 31, 2007 were $128.8 million and total gross loans were $69.4 million. Total assets increased to $242.2 million at December 31, 2008, a $113.4 million, or 88.04% increase over total assets at December 31, 2007. Total gross loans were $198.0 million at December 31, 2008, a $128.6 million, or 185.30%, increase over total gross loans at December 31, 2007. Total deposits were $171.3 million at December 31, 2008, which represents a 78.81% increase from $95.8 million of total deposits at December 31, 2007. Noninterest bearing deposits totaled $26.2 million or 15.29% of total deposits as of December 31, 2008 compared to $19.9 million, or 20.77% of total deposits at December 31, 2007.
The Bank’s headquarters address is 11166 Fairfax Boulevard, Fairfax, Virginia 22030. The telephone number is (703) 359-4100, and the website address is www.virginiaheritagebank.com.
Forward Looking Statements
Discussions of certain matters in this Form 10-K and other related year end documents may constitute forward-looking statements within the meaning of Section 27A of the Securities Act of 1933, as amended, and Section 21E of Securities Exchange Act of 1934, as amended (the “Exchange Act”), and as such, may involve risks and uncertainties. Forward-looking statements, which are based on certain assumptions and describe future plans, strategies, and expectations, are generally identifiable by the use of words or phrases such as “believe”, “plan”, “expect”, “intend”, “anticipate”, “estimate”, “project”, “forecast”, “may increase”, “may fluctuate”, “may improve” and similar expressions of future or conditional verbs such as “will”, “should”, “would”, and “could”. These forward-looking statements relate to, among other things, expectations of the business environment in which the Bank operates, projections of future performance, potential future credit experience, perceived opportunities in the market and statements regarding the Bank’s mission and vision. The Bank’s actual results, performance and achievements may differ materially from the results, performance, and achievements expressed or implied in such forward-looking statements due to a wide range of factors. These factors include, but are not limited to, changes in interest rates, general economic conditions, the local economy, the demand for the Bank’s products and services, accounting principles or guidelines, legislative and regulatory changes, monetary and fiscal policies of the U.S. Government, U.S. Treasury, and Federal Reserve, real estate markets, competition in the financial services industry, attracting and retaining key personnel, performance of new employees, regulatory actions, changes in and utilization of new technologies and other risks detailed in the Bank’s reports filed with the Board of Governors of the Federal Reserve System from time to time. These factors and those discussed under “Risk Factors” should be considered in evaluating the forward-looking statements, and undue reliance should not be placed on such statements. The Bank
22
does not undertake, and specifically disclaims any obligation, to update any forward-looking statements to reflect occurrences or unanticipated events or circumstances after the date of such statements.
Market Area
We consider our target market to be the greater Washington, D.C. metropolitan area with an emphasis on Northern Virginia, which consists of the counties of Arlington, Fairfax, Fauquier, Loudoun and Prince William, and the cities of Alexandria, Fairfax, Falls Church, Manassas and Manassas Park. Our main office is located approximately 12 miles west of Washington, D.C. in Fairfax, Virginia. We also have full service branches in Chantilly, Virginia, and Gainesville, Virginia, and a mortgage division headquartered in Chantilly, Virginia. With the banking experience of our management team in the Washington, D.C. metropolitan area, we will focus our efforts locally as we build the Virginia Heritage loan and deposit portfolios.
Fairfax County, Virginia, is one of the premier centers of commerce and technology in the United States. The county’s strategic mid-Atlantic location provides international companies a unique setting to conduct business with direct links to world markets from Washington Dulles International Airport and a state-of-the-art technology infrastructure. The county is home to one of the world’s largest clusters of technology firms, services and workers.
The county’s proximity to key institutions such as the FDA, NIH, EPA, IMF, the World Bank and the Overseas Private Investment Corporation, as well as the diplomatic community—all located within a 15 mile radius of our headquarters—gives businesses, including our Bank, an added advantage.
According to a recent research report, Fairfax County’s 2007 population is approximately 1.04 million people. The 2007 median household income figures reported in the research report is approximately $104,509 for Fairfax County, as compared to Virginia’s median household income of $59,797 and a national median household income of approximately $53,154. Based on estimates released by the Bureau of Labor Statistics of the U.S. Department of Labor for July 2007, the unemployment rate was 2.3% for Fairfax County, as compared to a national unemployment rate of 4.6%. As of June 30, 2007, total bank and thrift deposits in Fairfax County were approximately $22.7 billion.
According to the same research report, the current 2007 population of the Washington, D.C. metropolitan area is approximately 5.5 million people. The 2007 median household income figures reported in the research report is approximately $80,082 for the area, as compared to a national median household income of approximately $53,154. Based on estimates released by the Bureau of Labor Statistics of the U.S. Department of Labor for July 2007, the unemployment rate was 3.3% for the area, as compared to a national unemployment rate of 4.6%. As of June 30, 2007, total bank and thrift deposits in the Washington, D.C. metropolitan area were approximately $108.7 billion.
Lending Activities
The Bank’s primary market focus is on making loans to small businesses, professionals and other consumers in its local market area, along with various aspects of real estate finance. Commercial real estate loans represent the largest segment of the Bank’s loan portfolio. At December 31, 2008, approximately 34% of the total loan portfolio was devoted to commercial real estate loans. The Bank’s primary lending activities are principally directed to its defined market area in the greater Washington, D.C. metropolitan area with an emphasis on Northern Virginia.
The Bank’s lending strategy is to maintain a loan portfolio that is adequately diversified between commercial and consumer activities. We feel this approach allows management to modify production goals and react to changing economic and pricing environments. For a bank our size, we feel this gives us another competitive advantage over other community focused financial institutions.
Commercial Business Lending. Commercial loans are written for a variety of business purposes, including government contract receivables, plant and equipment, general working capital, contract administration and acquisition lending. Our client base is diverse and we do not have a concentration of commercial business loans in any specific industry segment.

33
Commercial Real Estate Lending. We finance owner occupied and investment commercial real estate. Our underwriting policies and processes focus on the client’s ability to repay the loan as well as assessment of the underlying real estate. Risks inherent in managing a commercial real estate portfolio relate to sudden or gradual drops in property values as well as changes in the economic climate. We attempt to mitigate those risks by carefully underwriting loans of this type and by following appropriate loan-to-value standards. The Bank has a concentration in loans secured by commercial real estate. At December 31, 2008 and 2007, our loan portfolio consisted of 34% and 36.5%, respectively of commercial real estate loans.
Real Estate Construction Lending. This segment of our portfolio is predominately residential in nature and composed of loans with short durations. We offer real estate construction financing to customers that have in place a permanent loan “take-out,” either by the Bank or another institution. Our approach to this type of lending reduces our credit risk, yet offers a competitive product in the marketplace.
Residential Real Estate Lending. The Bank offers a variety of consumer-oriented residential real estate loans both for purchase and refinancing, most of which are sold in the secondary market. The bulk of our current residential portfolio is made up of home equity loans to individuals. Our home equity portfolio gives the Bank a diverse client base. Although most of the loans are in the Northern Virginia area, the diversity of the individual loans in the portfolio reduces our potential risk. Our residential real estate lending products are available through all of our banking facilities and our mortgage division in Chantilly, Virginia.
Consumer Installment Lending. We offer a broad array of consumer loans including car loans, term loans, and overdraft protection. In late 2007, we established an indirect consumer lending department which acquires automobile loans from selected dealers in the local market. This unit employs seasoned managers and support staff that worked with the Chief Executive Officer at previous financial institutions and focuses primarily on higher credit quality loans. At December 31, 2008 and 2007, total loans outstanding for this unit was approximately $47.0 million and $4.5 million, respectively and represented approximately 23.74% and 6.5% of the Bank’s total loan portfolio.
Credit Policies and Administration. The Bank has adopted a comprehensive lending policy, which includes stringent underwriting standards for all types of loans. The lending staff follows pricing guidelines established periodically by the management team. In an effort to manage risk, all credit decisions in excess of the officer’s lending authority must be approved prior to funding by a management loan committee and/or a Board of Directors loan committee. Any loans or loan relationships in excess of $1 million require director loan committee approval. Management believes that it employs experienced lending officers, secures appropriate collateral and carefully monitors the financial conditions of its borrowers.
In addition to the normal repayment risks, all loans in the Bank’s portfolio are subject to economic conditions and the related effects on the borrower and/or the real estate market. Generally, longer-term loans have periodic interest rate adjustments and/or call provisions. Senior management monitors the loan portfolio closely to ensure that past due loans are minimized and that potential problem loans are addressed swiftly. In addition to the internal business processes employed in the credit administration area, the Bank has engaged an outside or independent credit review firm to review the loan portfolio. Results of the credit review will be used to validate our internal loan ratings and to review independent commentary on specific loans and loan administration activities.
Lending Limit. As of December 31, 2008, our legal lending limit for loans to one borrower was approximately $4.8 million. We may voluntarily choose to impose a policy limit on loans to a single borrower that is less than the legal lending limit. Loans greater than the legal or voluntary lending limit are participated to other banks in the area so that we may retain the customer relationship.
Investments and Funding
The Bank balances its liquidity needs based on loan and deposit growth through the investment portfolio and borrowed funds. It is the Bank’s goal to provide adequate liquidity to meet depositors withdrawals and to support the loan growth of the Bank. In the event the Bank has excess liquidity, investments are used to generate positive earnings. In the event deposit growth does not fully support this goal, a combination of sales of investment securities, federal funds and other borrowed funds will be used to augment the Bank’s funding position.
44
The investment portfolio is actively managed and to date, has been classified as “Available For Sale.” Under such a classification, investment instruments may be sold as deemed appropriate by management. On a monthly basis, the investment portfolio is marked to market as required by SFAS 115. Additionally, the investment portfolio is used to balance the Bank’s asset and liability position. The Bank invests in fixed rate or floating rate instruments as necessary to reduce interest rate risk exposure.
Deposit Activities
Deposits are the major source of funding for the Bank. The Bank offers a broad array of deposit products that include demand, NOW, money market and savings accounts as well as certificates of deposit. The Bank typically pays a competitive rate on the interest-bearing deposits. As a relationship-oriented organization, we seek generally to obtain deposit relationships with our loan clients. We will also focus deposit gathering activities on low cost sources of deposits, such as real estate escrow and title company accounts. The management team has dealt with these type of clients over the years and will focus development activities on these prospects.
As the Bank’s overall balance sheet positions dictate, we may become more or less competitive in our interest rate structure as our liquidity position changes. Additionally, we may use brokered deposits to augment our funding position.
We can also arrange for FDIC insurance for deposits up to $50 million through CDARS -- the Certificate of Deposit Account Registry Service, which is the most convenient way to enjoy full FDIC insurance on deposits up to $50 million through a single banking relationship.
Competition
The banking business is highly competitive. We compete with other commercial banks, savings associations, credit unions, mortgage banking firms, consumer finance companies, securities brokerage firms, insurance companies, money market mutual funds and other financial institutions operating in our primary service area and elsewhere.
The Bank is based in Fairfax, Virginia, in the heart of the Northern Virginia region. We have been able to effectively leverage our talents, contacts and location to achieve a strong financial position for a relatively new organization. However, our primary service area is highly competitive and heavily branched. Competition in our primary service area for loans to small and medium-sized businesses, individual and professional, is intense, and pricing is important. Our bank competitors have greater lending limits and offer established branch networks and other services that we do not expect to provide in the near future. Deposit competition is also strong. As a result, it is possible that, to remain competitive, we may pay above-market rates for deposits. Despite strong competition, the Bank is experiencing success in its primary service area because the area is reacting favorably to our community focus and our emphasis on service to the small and medium-sized business community, individuals and professionals.
The mergers of Mercantile Bank into PNC Bank, James Monroe Bank into Mercantile Bank, Community Bank of Northern Virginia into Mercantile Bank, Tysons National Bank and Bank of Northern Virginia into One Valley Bank and subsequently into BB&T Corporation, F&M National Corporation into BB&T Corporation and Southern Financial into Provident Bankshares Corporation have increased the presence of large regional bank holding companies in our already competitive marketplace. We believe these mergers have created opportunities for community-focused, prudently managed, small and medium-sized business-oriented banks. Our Board believes that our position as a community owned and operated bank interested exclusively in small and medium-sized businesses, individuals and professionals in the greater Washington, D.C. metropolitan area and adjacent counties, with an emphasis on Northern Virginia, offers us an important competitive opportunity.

55
Expansion Strategy
Our headquarters is a leased full service banking and office facility located in Fairfax City, Virginia. Our Board and management believe the natural evolution of a community-focused bank involves expanding the delivery channels. We also have full service branches in Chantilly, Virginia, and Gainesville, Virginia. Our mortgage division is headquartered in Chantilly, Virginia.
The Board intends to evaluate branching opportunities in the Tysons Corner, Leesburg, Herndon, Reston, Falls Church and Arlington markets. Branching has become more costly in recent years with intense competition for good locations, driven mostly by out of market institutions. Management and the Board are aware of these costs and will expand the franchise deliberately, balancing geographic coverage with the appropriate cost analysis.
We will use technology to augment the Bank’s growth plans within our business customer base. The Bank currently delivers online account access, bill payment and commercial cash management services through the Bank’s internet website at www.virginiaheritagebank.com. Certain loan and deposit products may also be offered from time to time on our website. We view the internet as a significant product delivery channel that meets the time and convenience needs of many of our current and future clients.
We may also take advantage of the strategic opportunities presented to the Bank as a result of mergers occurring in our marketplace. Although physical expansion is not a primary goal at present, we may purchase or lease branches that are being closed or otherwise pursue key market locations for new branch facilities.
Employees
As of December 31, 2008, the Bank had 70 full-time and 4 part-time employees. None of our employees are represented by any collective bargaining unit, and we believe that relations with our employees are good.
Supervision and Regulation
The Bank is a Virginia chartered commercial bank and a member of the Federal Reserve System (a “state member bank”) whose accounts are insured by the Deposit Insurance Fund of the FDIC up to the maximum legal limits of the FDIC. The Bank is subject to regulation, supervision and regular examination by the Virginia Bureau of Financial Institutions and the Federal Reserve Board. The regulations of these various agencies govern most aspects of the Bank’s business, including required reserves against deposits, loans, investments, mergers and acquisitions, borrowing, dividends and location and number of branch offices. The laws and regulations governing the Bank generally have been promulgated to protect depositors and the deposit insurance funds, and not for the purpose of protecting shareholders. The summary of laws, regulations and policies set forth below is qualified in its entirety by reference to the full text of such laws, regulations and policies.
Competition among commercial banks, savings and loan associations, and credit unions has increased following enactment of legislation that greatly expanded the ability of banks and bank holding companies to engage in interstate banking or acquisition activities. As a result of federal and state legislation, banks in the greater Washington, D.C. metropolitan area can, subject to limited restrictions, acquire or merge with a bank in another of the jurisdictions, and can branch de novo in any of the jurisdictions. The Graham Leach Bliley Act of 1999 (the “GLB Act”) allowed a wider array of companies to own banks, which could result in companies with resources substantially in excess of those of the Bank entering into competition with the Bank.
Banking is a business that depends on interest rate differentials. In general, the differences between the interest paid by a bank on its deposits and its other borrowings and the interest received by a bank on loans extended to its customers and securities held in its investment portfolio constitute the major portion of the Bank’s earnings. Thus, the earnings and growth of the Bank will be subject to the influence of economic conditions generally, both domestic and foreign, and also to the monetary and fiscal policies of the United States and its agencies, particularly, as it relates to monetary policy, the Federal Reserve Board, which regulates the supply of money through various means including open market dealings in United States government securities. The nature and timing of changes in such policies and their impact on the Bank cannot be predicted.

66
Insurance of Accounts. Substantially all of the deposits of the Bank are insured up to applicable limits by the Deposit Insurance Fund (“DIF”) of the FDIC and are subject to deposit insurance assessments to maintain the DIF. The FDIC utilizes a risk-based assessment system that imposes insurance premiums based upon a risk matrix that takes into account a bank’s capital level and supervisory rating (“CAMELS rating”).
The deposits of the Bank are insured to the maximum extent permitted by the DIF, which is administered by the FDIC, and are backed by the full faith and credit of the U.S. Government. As insurer, the FDIC is authorized to conduct examinations of, and to require reporting by, FDIC-insured institutions. It also may prohibit any FDIC-insured institution from engaging in any activity the FDIC determines by regulation or order to pose a serious threat to the FDIC. The FDIC also has the authority to initiate enforcement actions against savings institutions, after giving the OTS an opportunity to take such action.
The FDIC may terminate the deposit insurance of any insured depository institution, including the Bank, if it determines after a hearing that the institution has engaged or is engaging in unsafe or unsound practices, is in an unsafe or unsound condition to continue operations, or has violated any applicable law, regulation, order or any condition imposed by an agreement with the FDIC. It also may suspend deposit insurance temporarily during the hearing process for the permanent termination of insurance, if the institution has no tangible capital. If insurance of accounts is terminated, the accounts at the institution at the time of the termination, less subsequent withdrawals, shall continue to be insured for a period of six months to two years, as determined by the FDIC. Management is aware of no existing circumstances that would result in termination of the Bank’s deposit insurance.
Increases in the FDIC’s Assessment Rates. On December 16, 2008, the FDIC approved the final rule to raise the risk-based deposit insurance assessment rates uniformly by seven basis points for the first quarter of 2009 assessment period beginning on January 1, 2009. On February 26, 2009, the FDIC approved the final rule to raise the assessment rates for the assessment period beginning on April 1, 2009 and subsequent assessment periods. The new assessment scheme will differentiate between risk profiles and will require riskier institutions to pay higher assessment rates based on classification into one of four risk categories. Initial base assessment rates will increase to between 12 and 45 basis points, depending on the risk category. Such initial base assessment rates are subject to adjustment such that the total assessment rate could range from 7 to 77.5 basis points on an annual basis.
On February 26, 2009, the FDIC adopted an interim rule, with request for comment, to impose a one-time 20 basis point emergency special assessment effective on June 30, 2009 and to be collected on September 30, 2009. Based on our most recent FDIC deposit insurance assessment base, the emergency special assessment of 20 basis points, if implemented, would increase our FDIC deposit insurance premiums by approximately $343,000 in 2009. The FDIC has indicated in recent press reports that it may consider reducing the emergency special assessment by half to 10 basis points if, among other factors, Congress enacts legislation to expand the FDIC’s line of credit with the Department of Treasury to $100 billion.
On February 26, 2009, the FDIC adopted another interim rule, with request for comment, to have the option to impose a further special assessment of up to 10 basis points on an institution’s assessment base on the last day of any calendar quarter after June 30, 2009 to be collected at the same time the risk-based assessments are collected. The assessment will be imposed if the FDIC determines the Deposit Insurance Fund reserve ratio will fall to a level that would adversely affect public confidence or to a level close to zero or negative, among other factors. The ultimate goal of the increase in assessment rates and the proposed special assessments is to restore the DIF ratio to a minimum of 1.15 percent within the next seven years. However, the interim rules are be subject to change and may or may not be enacted.
Given the enacted and proposed increases in assessments for insured financial institutions in 2009, the Bank anticipates that FDIC assessments on deposits will have a significantly greater impact upon operating expenses in 2009 compared to 2008 and could materially affect our reported earnings, liquidity and capital.
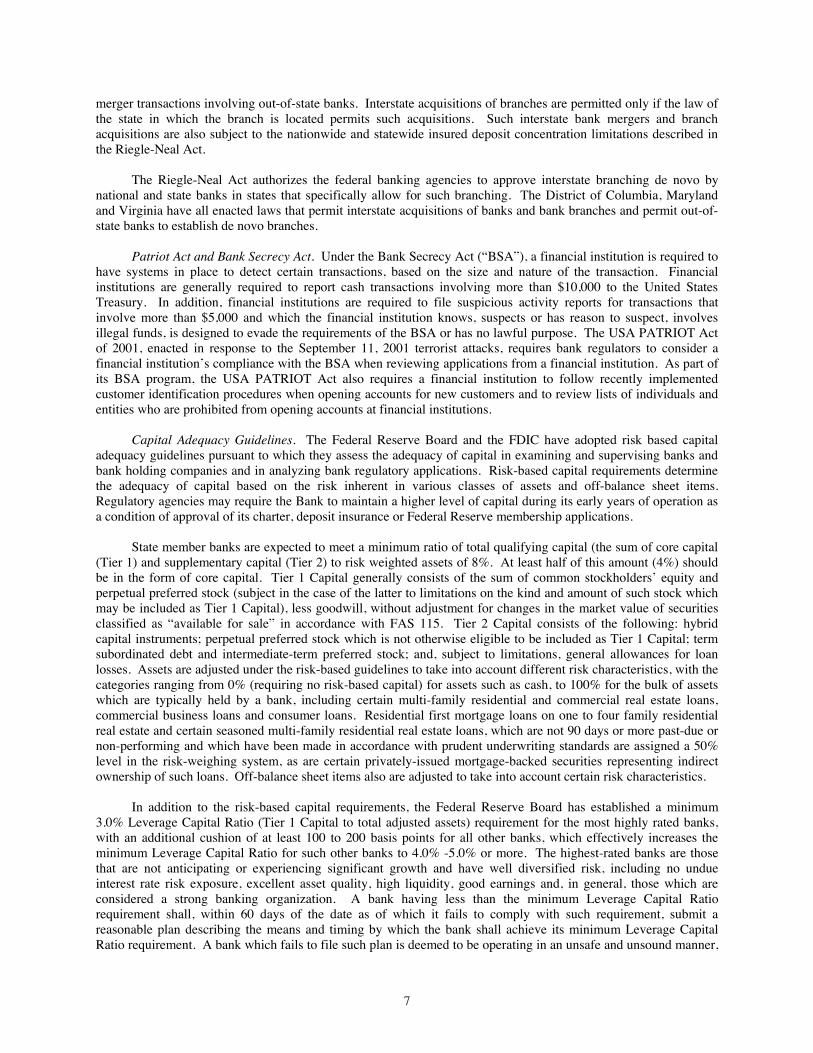
Branching and Interstate Banking. The federal banking agencies are authorized to approve an interstate bank merger transaction without regard to whether such transaction is prohibited by the law of any state, unless the home state of one of the banks has opted out of the interstate bank merger provisions of the Riegle-Neal Interstate Banking and Branching Efficiency Act of 1994 (the “Riegle-Neal Act”) by adopting a law after the date of enactment of the Riegle-Neal Act and prior to June 1, 1997 that applies equally to all out-of-state banks and expressly prohibits
77
merger transactions involving out-of-state banks. Interstate acquisitions of branches are permitted only if the law of the state in which the branch is located permits such acquisitions. Such interstate bank mergers and branch acquisitions are also subject to the nationwide and statewide insured deposit concentration limitations described in the Riegle-Neal Act.
The Riegle-Neal Act authorizes the federal banking agencies to approve interstate branching de novo by national and state banks in states that specifically allow for such branching. The District of Columbia, Maryland and Virginia have all enacted laws that permit interstate acquisitions of banks and bank branches and permit out-of-state banks to establish de novo branches.
Patriot Act and Bank Secrecy Act. Under the Bank Secrecy Act (“BSA”), a financial institution is required to have systems in place to detect certain transactions, based on the size and nature of the transaction. Financial institutions are generally required to report cash transactions involving more than $10,000 to the United States Treasury. In addition, financial institutions are required to file suspicious activity reports for transactions that involve more than $5,000 and which the financial institution knows, suspects or has reason to suspect, involves illegal funds, is designed to evade the requirements of the BSA or has no lawful purpose. The USA PATRIOT Act of 2001, enacted in response to the September 11, 2001 terrorist attacks, requires bank regulators to consider a financial institution’s compliance with the BSA when reviewing applications from a financial institution. As part of its BSA program, the USA PATRIOT Act also requires a financial institution to follow recently implemented customer identification procedures when opening accounts for new customers and to review lists of individuals and entities who are prohibited from opening accounts at financial institutions.
Capital Adequacy Guidelines. The Federal Reserve Board and the FDIC have adopted risk based capital adequacy guidelines pursuant to which they assess the adequacy of capital in examining and supervising banks and bank holding companies and in analyzing bank regulatory applications. Risk-based capital requirements determine the adequacy of capital based on the risk inherent in various classes of assets and off-balance sheet items. Regulatory agencies may require the Bank to maintain a higher level of capital during its early years of operation as a condition of approval of its charter, deposit insurance or Federal Reserve membership applications.
State member banks are expected to meet a minimum ratio of total qualifying capital (the sum of core capital (Tier 1) and supplementary capital (Tier 2) to risk weighted assets of 8%. At least half of this amount (4%) should be in the form of core capital. Tier 1 Capital generally consists of the sum of common stockholders’ equity and perpetual preferred stock (subject in the case of the latter to limitations on the kind and amount of such stock which may be included as Tier 1 Capital), less goodwill, without adjustment for changes in the market value of securities classified as “available for sale” in accordance with FAS 115. Tier 2 Capital consists of the following: hybrid capital instruments; perpetual preferred stock which is not otherwise eligible to be included as Tier 1 Capital; term subordinated debt and intermediate-term preferred stock; and, subject to limitations, general allowances for loan losses. Assets are adjusted under the risk-based guidelines to take into account different risk characteristics, with the categories ranging from 0% (requiring no risk-based capital) for assets such as cash, to 100% for the bulk of assets which are typically held by a bank, including certain multi-family residential and commercial real estate loans, commercial business loans and consumer loans. Residential first mortgage loans on one to four family residential real estate and certain seasoned multi-family residential real estate loans, which are not 90 days or more past-due or non-performing and which have been made in accordance with prudent underwriting standards are assigned a 50% level in the risk-weighing system, as are certain privately-issued mortgage-backed securities representing indirect ownership of such loans. Off-balance sheet items also are adjusted to take into account certain risk characteristics.
In addition to the risk-based capital requirements, the Federal Reserve Board has established a minimum 3.0% Leverage Capital Ratio (Tier 1 Capital to total adjusted assets) requirement for the most highly rated banks, with an additional cushion of at least 100 to 200 basis points for all other banks, which effectively increases the minimum Leverage Capital Ratio for such other banks to 4.0% -5.0% or more. The highest-rated banks are those that are not anticipating or experiencing significant growth and have well diversified risk, including no undue interest rate risk exposure, excellent asset quality, high liquidity, good earnings and, in general, those which are considered a strong banking organization. A bank having less than the minimum Leverage Capital Ratio requirement shall, within 60 days of the date as of which it fails to comply with such requirement, submit a reasonable plan describing the means and timing by which the bank shall achieve its minimum Leverage Capital Ratio requirement. A bank which fails to file such plan is deemed to be operating in an unsafe and unsound manner,

88
and could subject the bank to a cease-and-desist order. Any insured depository institution with a Leverage Capital Ratio that is less than 2.0% is deemed to be operating in an unsafe or unsound condition pursuant to Section 8(a) of the Federal Deposit Insurance Act (the “FDIA”) and is subject to potential termination of deposit insurance. However, such an institution will not be subject to an enforcement proceeding solely on account of its capital ratios, if it has entered into and is in compliance with a written agreement to increase its Leverage Capital Ratio and to take such other action as may be necessary for the institution to be operated in a safe and sound manner. The capital regulations also provide, among other things, for the issuance of a capital directive, which is a final order issued to a bank that fails to maintain minimum capital or to restore its capital to the minimum capital requirement within a specified time period. Such a directive is enforceable in the same manner as a final cease-and-desist order.
Prompt Corrective Action. Under Section 38 of the FDIA, each federal banking agency is required to implement a system of prompt corrective action for institutions which it regulates. The federal banking agencies have promulgated substantially similar regulations to implement the system of prompt corrective action established by Section 38 of the FDIA. Under the regulations, a bank shall be deemed to be: (i) “well capitalized” if it has a Total Risk Based Capital Ratio of 10.0% or more, a Tier 1 Risk Based Capital Ratio of 6.0% or more, a Leverage Capital Ratio of 5.0% or more and is not subject to any written capital order or directive; (ii) “adequately capitalized” if it has a Total Risk Based Capital Ratio of 8.0% or more, a Tier 1 Risk Based Capital Ratio of 4.0% or more and a Tier 1 Leverage Capital Ratio of 4.0% or more (3.0% under certain circumstances) and does not meet the definition of “well capitalized;” (iii) “undercapitalized” if it has a Total Risk Based Capital Ratio that is less than 8.0%, a Tier 1 Risk based Capital Ratio that is less than 4.0% or a Leverage Capital Ratio that is less than 4.0% (3.0% under certain circumstances); (iv) “significantly undercapitalized” if it has a Total Risk Based Capital Ratio that is less than 6.0%, a Tier 1 Risk Based Capital Ratio that is less than 3.0% or a Leverage Capital Ratio that is less than 3.0%; and (v) “critically undercapitalized” if it has a ratio of tangible equity to total assets that is equal to or less than 2.0%.
An institution generally must file a written capital restoration plan that meets specified requirements with an appropriate Federal banking agency within 45 days of the date the institution receives notice or is deemed to have notice that it is under-capitalized, significantly undercapitalized or critically undercapitalized. A federal banking agency must provide the institution with written notice of approval or disapproval within 60 days after receiving a capital restoration plan, subject to extensions by the applicable agency.
An institution that is required to submit a capital restoration plan must concurrently submit a performance guaranty by each company that controls the institution. Such guaranty shall be limited to the lesser of (i) an amount equal to 5.0% of the institution’s total assets at the time the institution was notified or deemed to have notice that it was undercapitalized or (ii) the amount necessary at such time to restore the relevant capital measures of the institution to the levels required for the institution to be classified as adequately capitalized. Such a guaranty shall expire after the federal banking agency notifies the institution that it has remained adequately capitalized for each of four consecutive calendar quarters. An institution that fails to submit a written capital restoration plan within the requisite period, including any required performance guaranty, or fails in any material respect to implement a capital restoration plan, shall be subject to the restrictions in Section 38 of the FDIA which are applicable to significantly undercapitalized institutions.
A “critically undercapitalized institution” is to be placed in conservatorship or receivership within 90 days unless the FDIC formally determines that forbearance from such action would better protect the deposit insurance fund. Unless the FDIC or other appropriate federal banking regulatory agency makes specific further findings and certifies that the institution is viable and is not expected to fail, an institution that remains critically undercapitalized on average during the fourth calendar quarter after the date it becomes critically undercapitalized must be placed in receivership. The general rule is that the FDIC will be appointed as receiver within 90 days after a bank becomes critically undercapitalized unless extremely good cause is shown and the federal regulators agree to an extension. In general, good cause is defined as capital that has been raised and is imminently available for infusion into the bank except for certain technical requirements that may delay the infusion for a period of time beyond the 90 day time period.
Immediately upon becoming undercapitalized, an institution shall become subject to the provisions of Section 38 of the FDIA, which (i) restrict payment of capital distributions and management fees; (ii) require that the appropriate federal banking agency monitor the condition of the institution and its efforts to restore its capital; (iii)

99
require submission of a capital restoration plan; (iv) restrict the growth of the institution’s assets; and (v) require prior approval of certain expansion proposals. The appropriate federal banking agency for an undercapitalized institution also may take any number of discretionary supervisory actions if the agency determines that any of these actions is necessary to resolve the problems of the institution at the least possible long-term cost to the deposit insurance fund, subject in certain cases to specified procedures. These discretionary supervisory actions include: requiring the institution to raise additional capital; restricting transactions with affiliates; requiring divestiture of the institution or the sale of the institution to a willing purchaser; and any other supervisory action that the agency deems appropriate. These and additional mandatory and permissive supervisory actions may be taken with respect to significantly undercapitalized and critically undercapitalized institutions.
Additionally, under Section 11(c)(5) of the FDIA, a conservator or receiver may be appointed for an institution where: (i) an institution’s obligations exceed its assets; (ii) there is substantial dissipation of the institution’s assets or earnings as a result of any violation of law or any unsafe or unsound practice; (iii) the institution is in an unsafe or unsound condition; (iv) there is a willful violation of a cease-and-desist order; (v) the institution is unable to pay its obligations in the ordinary course of business; (vi) losses or threatened losses deplete all or substantially all of an institution’s capital, and there is no reasonable prospect of becoming “adequately capitalized” without assistance; (vii) there is any violation of law or unsafe or unsound practice or condition that is likely to cause insolvency or substantial dissipation of assets or earnings, weaken the institution’s condition, or otherwise seriously prejudice the interests of depositors or the insurance fund; (viii) an institution ceases to be insured; (ix) the institution is undercapitalized and has no reasonable prospect that it will become adequately capitalized, fails to become adequately capitalized when required to do so, or fails to submit or materially implement a capital restoration plan; or (x) the institution is critically undercapitalized or otherwise has substantially insufficient capital.
Regulatory Enforcement Authority. Federal banking law grants substantial enforcement powers to federal banking regulators. This enforcement authority includes, among other things, the ability to assess civil money penalties, to issue cease-and-desist or removal orders and to initiate injunctive actions against banking organizations and institution-affiliated parties. In general, these enforcement actions may be initiated for violations of laws and regulations and unsafe or unsound practices. Other actions or inactions may provide the basis for enforcement action, including misleading or untimely reports filed with regulatory authorities.
Item 1A. Risk Factors
In analyzing whether to make or to continue an investment in our common stock, investors should consider, among other factors, the following risk factors.
The current economic environment poses significant challenges for the Bank and could adversely affect its financial condition and results of operations.
The Bank is operating in a challenging and uncertain economic environment, including generally uncertain national and local conditions. Financial institutions continue to be affected by sharp declines in the real estate market and constrained financial markets. Dramatic declines in the housing market over the past year, with falling home prices and increasing foreclosures and unemployment, have resulted in significant write-downs of asset values by financial institutions. Continued declines in real estate values, home sales volumes, and financial stress on borrowers as a result of the uncertain economic environment could have an adverse effect on the Bank’s borrowers or their customers, which could adversely affect the Bank’s financial condition and results of operations. A worsening of these conditions would likely exacerbate the adverse effects on the Bank and others in the financial services industry. For example, further deterioration in local economic conditions in the Bank’s markets could drive losses beyond that which is provided for in its allowance for loan losses. The Bank may also face the following risks in connection with these events:
Economic conditions that negatively affect housing prices and the job market have resulted, and may continue to result, in a deterioration in credit quality of the Bank’s loan portfolio, and such deterioration in credit quality has had, and could continue to have, a negative impact on the Bank’s business.
Market developments may affect consumer confidence levels and may cause adverse changes in payment
1010
patterns, causing increases in delinquencies and default rates on loans and other credit facilities.
The processes the Bank uses to estimate the allowance for loan losses may no longer be reliable because they rely on complex judgments, including forecasts of economic conditions, which may no longer be capable of accurate estimation.
The Bank’s ability to assess the creditworthiness of its customers may be impaired if the processes and approaches it uses to select, manage, and underwrite its customers become less predictive of future charge-offs.
The Bank expects to face increased regulation of its industry, and compliance with such regulation may increase its costs, limit its ability to pursue business opportunities, and increase compliance challenges.
As these conditions or similar ones continue to exist or worsen, the Bank could experience continuing or increased adverse effects on its financial condition and results of operations.
The Bank’s business is subject to various lending and other economic risks that could adversely impact the Bank’s financial condition and results of operations.
Change in economic conditions, particularly an economic slowdown, could hurt the Bank’s business. The Bank’s business is directly affected by political and market conditions, broad trends in industry and finance, legislative and regulatory changes, and changes in governmental monetary and fiscal policies and inflation, all of which are beyond the Bank’s control. A deterioration in economic conditions, in particular an economic slowdown within the Bank’s geographic region, could result in the following consequences, any of which could have a material adverse effect on the Bank’s business:
• loan delinquencies may increase;
• problem assets and foreclosures may increase;
• demand for the Bank’s products and services may decline; and
• collateral for loans made by the Bank many decline in value, in turn reducing a client’s borrowing power, and reducing the value of assets and collateral associated with the Bank’s loans held for investment.
Our future success will depend on our ability to compete effectively in the highly competitive financial services industry.
We face substantial competition in all phases of our operations from a variety of different competitors. In particular, there is very strong competition for financial services in Fairfax County, Virginia and the entire Washington, D.C. metropolitan area in which we conduct a substantial portion of our business. We compete with commercial banks, credit unions, savings and loan associations, mortgage banking firms, consumer finance companies, securities brokerage firms, insurance companies, money market funds and other mutual funds, as well as other local and community, super-regional, national and international financial institutions that operate offices in our primary market areas and elsewhere. Our future growth and success will depend on our ability to compete effectively in this highly competitive financial services environment.
Many of our competitors are well-established, larger financial institutions and many offer products and services that we do not. Many have substantially greater resources, name recognition and market presence that benefit them in attracting business. Some of our competitors are not subject to the same regulations that are imposed on bank holding companies and federally-insured national banks, including credit unions that do not pay federal income tax, and, therefore, have regulatory advantages over us in accessing funding and in providing various services. While we believe we compete effectively with these other financial institutions in our primary markets, we may face a competitive disadvantage as a result of our smaller size, smaller asset base, lack of geographic diversification and inability to spread our marketing costs across a broader market. If we have to raise interest rates

1111
paid on deposits or lower interest rates charged on loans to compete effectively, our net interest margin and income could be negatively affected. Failure to compete effectively to attract new, or to retain existing, clients may reduce or limit our net income and our market share and may adversely affect our results of operations, financial condition and growth.
Changes in interest rates may impact our net interest margin and earnings.
Our profitability depends in substantial part on our net interest margin, which is the difference between the yields we receive on loans and investments and the rates we pay for deposits and other sources of funds. Our net interest margin depends on many factors that are partly or completely outside of our control, including competition, federal economic, monetary and fiscal policies, and economic conditions generally. Our net interest income will be adversely affected if market interest rates change so that the interest we pay on deposits and borrowings increases faster than the interest we earn on loans and investments.
Changes in interest rates, particularly by the Board of Governors of the Federal Reserve System, which implements national monetary policy in order to mitigate recessionary and inflationary pressures, also affect the value of our loans. In setting its policy, the Federal Reserve may utilize techniques such as: (i) engaging in open market transactions in United States government securities; (ii) setting the discount rate on member bank borrowings; and (iii) determining reserve requirements. These techniques may have an adverse effect on our deposit levels, net interest margin, loan demand or our business and operations. In addition, an increase in interest rates could adversely affect borrowers’ ability to pay the principal or interest on existing loans or reduce their desire to borrow more money. This may lead to an increase in our nonperforming assets, a decrease in loan originations, or a reduction in the value of and income from our loans, any of which could have a material and negative effect on our results of operations. We try to minimize our exposure to interest rate risk, but we are unable to completely eliminate this risk. Fluctuations in market rates and other market disruptions are neither predictable nor controllable and may have a material and negative effect on our business, financial condition and results of operations.
Our profitability depends significantly on local economic conditions.
As a lender, we are exposed to the risk that our loan clients may not repay their loans according to their terms and any collateral securing payment may be insufficient to fully compensate us for the outstanding balance of the loan plus the costs we incur disposing of the collateral. Although we have collateral for most of our loans, that collateral can fluctuate in value and may not always cover the outstanding balance on the loan. With most of our loans concentrated in Northern Virginia, a decline in local economic conditions could adversely affect the values of our real estate collateral. Consequently, a decline in local economic conditions may have a greater effect on our earnings and capital than on the earnings and capital of larger financial institutions whose real estate loan portfolios are geographically diverse.
Our business strategy includes the continuation of our growth plans, and our financial condition and results of operations could be negatively affected if we fail to grow or fail to manage our growth effectively.
We intend to continue to grow in our existing banking markets (internally and through additional offices) and to expand into new markets as appropriate opportunities arise. Our prospects must be considered in light of the risks, expenses and difficulties frequently encountered by companies that are experiencing growth. We cannot assure you we will be able to expand our market presence in our existing markets or successfully enter new markets, or that any expansion will not adversely affect our results of operations. Failure to manage our growth effectively could have a material adverse effect on our business, future prospects, financial condition or results of operations, and could adversely affect our ability to successfully implement our business strategy. Also, if our growth occurs more slowly than anticipated or declines, our operating results could be materially affected in an adverse way.
Our ability to successfully grow will depend on a variety of factors, including the continued availability of desirable business opportunities, the competitive responses from other financial institutions in our market areas and our ability to manage our growth. While we believe we have the management resources and internal systems in place to successfully manage our future growth, there can be no assurance growth opportunities will be available or growth will be successfully managed.

1212
Our lack of a seasoned loan portfolio and increasing volume of loans could result in loan losses which, in turn, could affect the value of our common stock.
As a relatively new community bank, our loan portfolio is unseasoned and growing. While growth in earning assets is desirable in a community bank, it can have adverse consequences if it is not well managed. Loans that have not developed a level of maturity in payment and relationship between the borrower and the Bank could result in future loan losses if we fail to properly underwrite increasing volumes of loans as they are made and adequately monitor a growing loan portfolio to detect and deal with loan problems as they occur. Our business strategy calls for us to continue to grow in our existing banking markets (internally and through additional offices) and expand into new markets as appropriate opportunities arise. Because collection problems with some loans often do not arise until those loans have been in existence for some period of time, we cannot assure you that we will not have future problems collecting loans that now are performing according to their terms or loans that are made in the future as part of our expansion.
Our lending strategy and target market will involve risk.
Our loan portfolio will be made up largely of commercial business loans and commercial real estate loans for owner-occupied properties. We also offer construction loans, consumer loans and mortgage loans for owner-occupied residential properties although we currently sell most of our residential mortgage loans in the secondary market. Commercial business and commercial real estate loans generally carry a higher degree of credit risk than do residential mortgage loans because of several factors, including larger loan balances, dependence on the successful operation of a business or project for repayment, or loan terms.
Our allowance for loan losses could become inadequate and reduce our earnings and capital.
We maintain an allowance for loan losses that we believe is adequate for absorbing any potential losses in our loan portfolio. Management conducts a periodic review and consideration of the loan portfolio to determine the amount of the allowance for loan losses based upon general market conditions, credit quality of the loan portfolio and performance of our clients relative to their financial obligations with us. The amount of future losses, however, is susceptible to changes in economic and other market conditions, including changes in interest rates and collateral values that are beyond our control, and these future losses may exceed our current estimates. Although we believe the allowance for loan losses is adequate to absorb probable losses in our loan portfolio, we cannot predict such losses nor assure you that our allowance will be adequate in the future. Excessive loan losses could have a material impact on our financial performance and reduce our earnings and capital.
Our continued pace of growth may require us to raise capital in the future, but that capital may not be available when it is needed or may not be available on favorable terms.
We are required by federal and state regulatory authorities to maintain adequate levels of capital to support our operations. We may at some point need to again raise additional capital to support our continued growth. Our ability to raise additional capital, if needed, will depend on conditions in the capital markets at that time, which are outside our control, and on our financial performance. Accordingly, we cannot assure you of our ability to raise additional capital if needed on terms acceptable to us. If we cannot raise additional capital when needed, our ability to further expand our operations through internal growth and acquisitions could be materially impaired.
Item 1B. Unresolved Staff Comments
None.
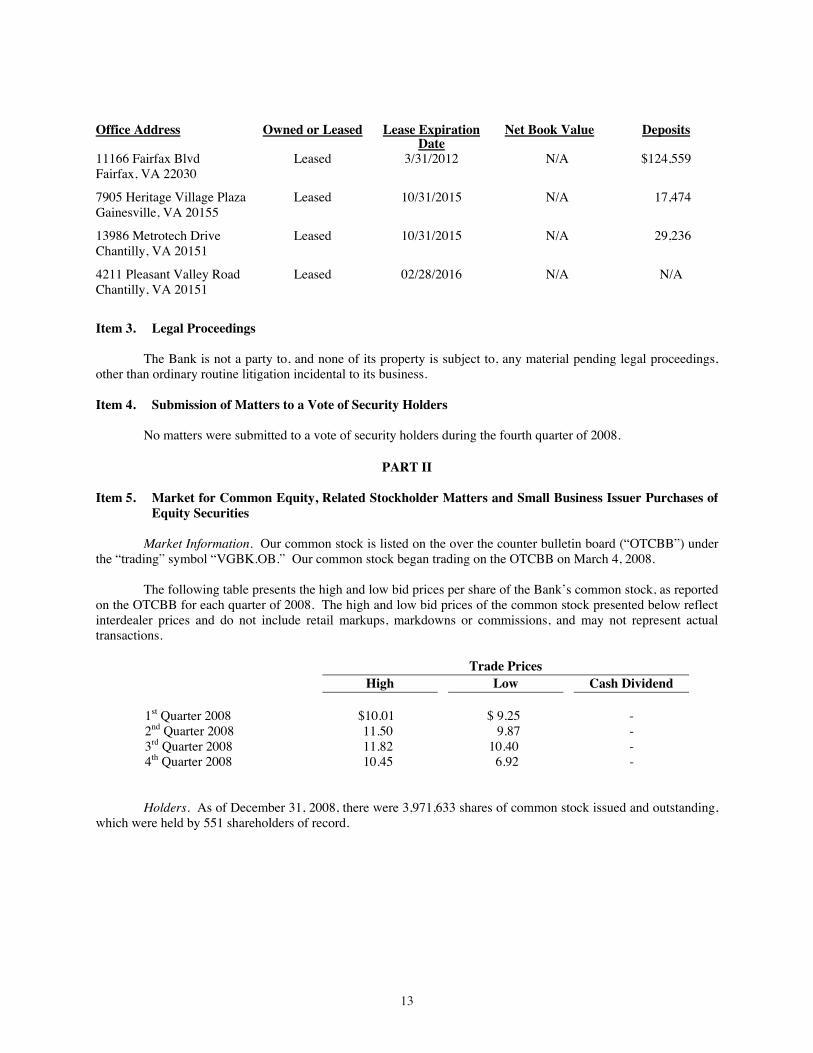
Item 2. Properties
At December 31, 2008, Virginia Heritage Bank conducted its business from its main office in Fairfax, Virginia, two branch offices and one operations/mortgage office. The following table sets forth the net book value and certain other information with respect to the offices of the Bank at December 31, 2008.
1313
Item 3. Legal Proceedings
The Bank is not a party to, and none of its property is subject to, any material pending legal proceedings, other than ordinary routine litigation incidental to its business.
Item 4. Submission of Matters to a Vote of Security Holders
No matters were submitted to a vote of security holders during the fourth quarter of 2008.
PART II
Item 5. Market for Common Equity, Related Stockholder Matters and Small Business Issuer Purchases ofEquity Securities
Market Information. Our common stock is listed on the over the counter bulletin board (“OTCBB”) under the “trading” symbol “VGBK.OB.” Our common stock began trading on the OTCBB on March 4, 2008.
The following table presents the high and low bid prices per share of the Bank’s common stock, as reported on the OTCBB for each quarter of 2008. The high and low bid prices of the common stock presented below reflect interdealer prices and do not include retail markups, markdowns or commissions, and may not represent actual transactions.
Trade Prices High Low Cash Dividend
1st Quarter 2008 $10.01 $ 9.25 - 2nd Quarter 2008 11.50 9.87 - 3rd Quarter 2008 11.82 10.40 - 4th Quarter 2008 10.45 6.92 -
Holders. As of December 31, 2008, there were 3,971,633 shares of common stock issued and outstanding, which were held by 551 shareholders of record.
Office Address Owned or Leased Lease ExpirationDate
Net Book Value Deposits
11166 Fairfax Blvd Fairfax, VA 22030
Leased 3/31/2012 N/A $124,559
7905 Heritage Village Plaza Gainesville, VA 20155
Leased 10/31/2015 N/A 17,474
13986 Metrotech Drive Chantilly, VA 20151
Leased 10/31/2015 N/A 29,236
4211 Pleasant Valley Road Chantilly, VA 20151
Leased 02/28/2016 N/A N/A

1414
The following table sets forth information as of December 31, 2008 with respect to certain compensation plans under which equity securities of the Bank are authorized for issuance.
Plan Category
Number of securities to be issued upon exercise of outstanding options,
warrants and rights
Weighted-average exercise price of
outstanding options, warrants and rights
Number of securities remaining available for future issuance under equity compensation
plans
Equity compensation plans approved by shareholders
194,578 (1) $10.09 55,422
Equity compensation plans
not approved by shareholders
- - -
Total 194,578 $10.09 55,422 (1) Reflects shares to be issued pursuant to outstanding options granted under the Bank’s 2006 Stock Option Plan.
Dividends. We may pay cash dividends out of legally available funds as and when determined by our Board of Directors after consideration of our earnings, general economic conditions, our financial condition and other factors as may be appropriate in determining dividend policy. To date, we have not been profitable and have not paid any cash dividends. At present, we intend to retain any future earnings to support our long-term growth. Holders of our common stock are entitled to receive and share equally in any dividends declared by our Board of Directors.
The Federal Reserve Board is authorized to determine under certain circumstances relating to the financial condition of a bank that the payment of cash dividends would be an unsafe and unsound practice and to prohibit payment thereof pursuant to Federal Reserve Board Regulation H. Under that regulation, a member bank may not declare or pay a dividend if the total of all dividends declared during the calendar year, including the proposed dividend, exceeds the sum of the bank’s net income during the current year and the retained net income of the prior two years, unless the dividend has been approved in advance by the Federal Reserve Board. In addition, a member bank may not declare or pay a dividend if the dividend would exceed the bank’s undivided profits as reportable on its report of condition and income, unless the bank has received the prior approval of the Federal Reserve Board and at least two-thirds of the shareholders of each class of stock outstanding.
Virginia law also restricts a bank’s ability to pay cash dividends. Virginia banking regulations prohibit the Bank from paying dividends until any deficit in capital funds originally paid in shall have been restored by earnings to their initial level, and, furthermore, no dividend can be declared by the Bank which would impair the paid-in capital. The dividend policy of the Bank is subject to the discretion of the Board of Directors and depends upon a number of factors, including earnings, financial condition, cash needs and general business conditions, as well as applicable regulatory considerations. Based on our current plans, we do not anticipate paying cash dividends in the foreseeable future.
Recent sales of unregistered securities. On December 20, 2007, the Bank consummated the sale of 2,291,633 shares of its common stock at a price of $10.00 per share to members of the general public. Commerce Street Capital, LLC served as the Bank’s placement agent for the offering. After payment of the placement agent’s commission of $388,000 and expenses of the offering of $225,000, the Bank received net proceeds of $22.3 million. The net proceeds were used to support loan and asset growth. The offering was not registered under the Securities Act of 1933, as amended (the “Securities Act”). Because it is a bank, the sale of the Bank’s common stock is exempt from registration pursuant to Section 3(a)(2) of the Securities Act.
1515
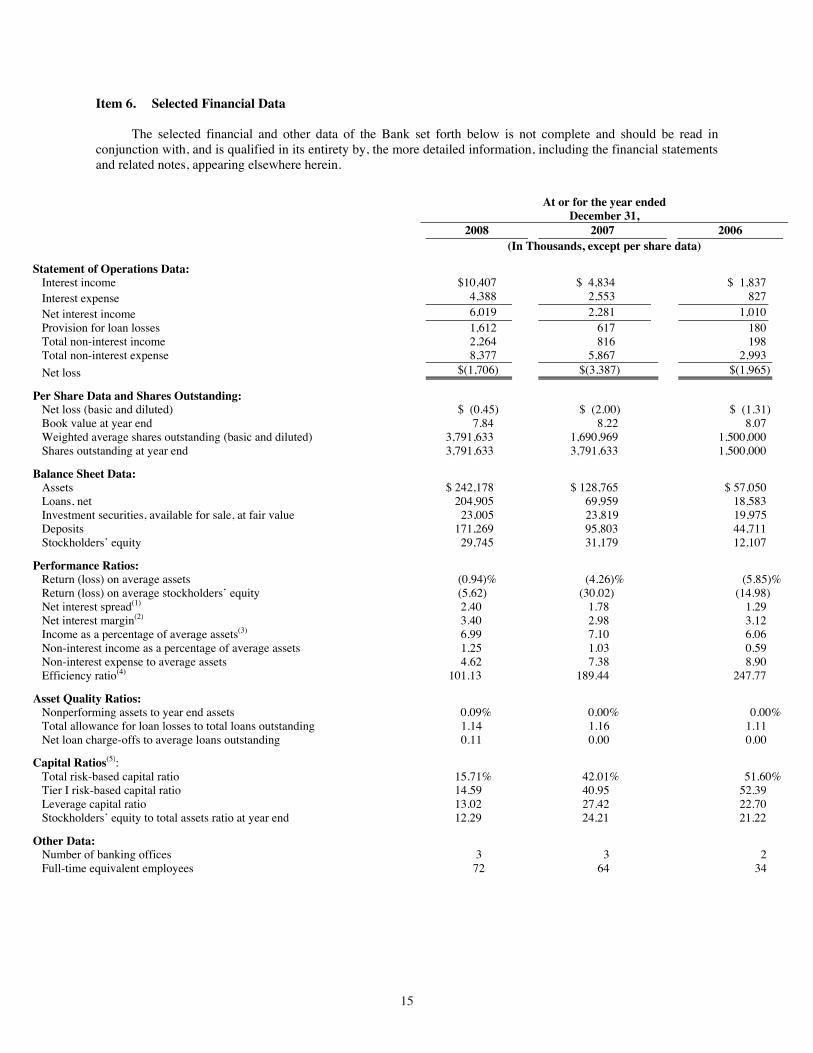
Item 6. Selected Financial Data
The selected financial and other data of the Bank set forth below is not complete and should be read in conjunction with, and is qualified in its entirety by, the more detailed information, including the financial statements and related notes, appearing elsewhere herein.
At or for the year ended December 31,
2008 2007 2006(In Thousands, except per share data)
Statement of Operations Data: Interest income $10,407 $ 4,834 $ 1,837 Interest expense 4,388 2,553 827 Net interest income 6,019 2,281 1,010 Provision for loan losses 1,612 617 180 Total non-interest income 2,264 816 198 Total non-interest expense 8,377 5,867 2,993 Net loss $(1,706) $(3,387) $(1,965)
Per Share Data and Shares Outstanding: Net loss (basic and diluted) $ (0.45) $ (2.00) $ (1.31) Book value at year end 7.84 8.22 8.07 Weighted average shares outstanding (basic and diluted) 3,791,633 1,690,969 1,500,000 Shares outstanding at year end 3,791,633 3,791,633 1,500,000
Balance Sheet Data: Assets $ 242,178 $ 128,765 $ 57,050 Loans, net 204,905 69,959 18,583 Investment securities, available for sale, at fair value 23,005 23,819 19,975 Deposits 171,269 95,803 44,711 Stockholders’ equity 29,745 31,179 12,107
Performance Ratios: Return (loss) on average assets (0.94)% (4.26)% (5.85)% Return (loss) on average stockholders’ equity (5.62) (30.02) (14.98) Net interest spread(1) 2.40 1.78 1.29 Net interest margin(2) 3.40 2.98 3.12 Income as a percentage of average assets(3) 6.99 7.10 6.06 Non-interest income as a percentage of average assets 1.25 1.03 0.59 Non-interest expense to average assets 4.62 7.38 8.90 Efficiency ratio(4) 101.13 189.44 247.77
Asset Quality Ratios: Nonperforming assets to year end assets 0.09% 0.00% 0.00% Total allowance for loan losses to total loans outstanding 1.14 1.16 1.11 Net loan charge-offs to average loans outstanding 0.11 0.00 0.00
Capital Ratios(5): Total risk-based capital ratio 15.71% 42.01% 51.60% Tier I risk-based capital ratio 14.59 40.95 52.39 Leverage capital ratio 13.02 27.42 22.70 Stockholders’ equity to total assets ratio at year end 12.29 24.21 21.22
Other Data: Number of banking offices 3 3 2 Full-time equivalent employees 72 64 34

1616
(1) Net interest spread is the difference between the average yield on interest-earning assets and the average cost of interest-bearing liabilities. (2) Net interest margin is net interest income divided by average earning assets. (3) Income consists of interest income and non-interest income. (4) Efficiency ratio is non-interest expense divided by the sum of net interest income and non-interest income. (5) Capital ratios are calculated in accordance with regulatory accounting principles specified by regulatory agencies for supervisory reporting purposes.
Item 7. Management’s Discussion and Analysis of Financial Condition and Results of Operations
Critical Accounting Estimates
The Bank’s accounting and reporting policies are in accordance with U.S. generally accepted accounting principles (“GAAP”) and conform to general practices within the banking industry. The Bank’s financial position and results of operations are affected by management’s application of accounting policies, including estimates, assumptions and judgments made to arrive at the carrying value of assets and liabilities and amounts reported for revenues, expenses and related disclosures. Different assumptions in the application of these policies could result in material changes in the Bank’s financial position and/or results of operations. The accounting policy that required management’s most difficult, subjective or complex judgments is the Bank’s allowance for loan losses, which is described below.
Allowance for Loan Losses. The allowance for loan losses is an estimate of the losses that may be sustained in the loan portfolio. The allowance is based on two basic principles of accounting: (1) Statement of Financial Accounting Standards No. 5, Accounting for Contingencies (SFAS 5), which requires that losses be accrued when occurrence is probable and estimable and (2) Statement of Financial Accounting Standards No. 114, Accounting by Creditors for Impairment of a Loan (SFAS 114), which requires that losses be accrued based on the differences between the value of collateral, present value of future cash flows or values that are observable in the secondary market and the loan balance.
The Bank’s allowance for loan losses is the accumulation of various components that are calculated based on independent methodologies. All components of the allowance represent an estimation performed pursuant to either SFAS 5 or SFAS 114. Management’s estimate of each SFAS 5 component is based on certain observable data that management believes are most reflective of the underlying credit loss being estimated. This evaluation includes credit quality trends, collateral values, loan volumes, borrower and industry concentrations, seasoning of the loan portfolio, the findings of internal credit quality assessments and results from external bank regulatory examinations. These factors, as well as historical losses and current economic and business conditions, are used in developing estimated loss factors used in the calculations.
The Bank adopted SFAS 114, which has been amended by Statement of Financial Accounting Standards No. 118, Accounting by Creditors for Impairment of a Loan – Income Recognition and Disclosures. SFAS 114, as amended, requires that the impairment of loans that have been separately identified for evaluation is to be measured based on the present value of expected future cash flows, or, alternatively, the observable market price of the loans or the fair value of the collateral. However, for those loans that are collateral dependent (that is, if repayment of those loans is expected to be provided solely by the underlying collateral) and for which management has determined foreclosure is probable, the measure of impairment is to be based on the net realizable value of the collateral. SFAS 114, as amended, also requires certain disclosures about investments in impaired loans and the allowance for loan losses and interest income recognized on loans.
The allowance for loan losses is composed of specific reserves and general unallocated reserves. Specific reserves are determined monthly for each loan based upon the loan risk rating, average advance rate, collateral type and, in the case of installment loans, past due and other performance measures.
Reserves for commercial loans are determined by applying estimated loss factors to the portfolio based on management’s evaluation and “risk rating” of the commercial loan portfolio. Reserves are provided for noncommercial loan categories using estimated loss factors applied to the total outstanding loan balance for each loan category. Specific reserves are determined on a loan-by-loan basis based on management’s evaluation of the
1717
Bank’s exposure for each credit, given the current payment status of the loan and the net market value of any underlying collateral.
There are two primary components considered in determining an appropriate level for the unallocated reserve. A portion of the unallocated reserve is established to cover the elements of imprecision and estimation risk inherent in the calculations of the specific reserves described above. The remaining portion of the unallocated reserve (inherent risk) is determined based upon management’s evaluation of various conditions that are not directly measured by any other component of the allowance for loan losses, including current general economic and business conditions affecting key lending areas, credit quality trends, collateral values, loan volumes and concentrations, and results from credit reviews or external bank regulatory reviews.
While management uses the best information available to establish the allowance for loan losses, future adjustment to the allowance may be necessary if economic conditions differ substantially from the assumptions used in making the valuations or, if required by regulators, based upon information available to them at the time of their examinations. Such adjustments to original estimates, as necessary, are made in the period in which these factors and other relevant considerations indicate that loss levels may vary from previous estimates.
Financial Condition at December 31, 2008 and December 31, 2007
Total assets at December 31, 2007 were $128.8 million and total gross loans were $69.4 million. Total assets increased to $242.2 million at December 31, 2008, a $113.4 million, or 88.04% increase over total assets at December 31, 2007. Total gross loans were $198.0 million at December 31, 2008, a $128.6 million, or 185.30% increase over total gross loans at December 31, 2007. This growth reflects our strong customer relationships and continued focus on loan production. Cash and cash equivalents and interest bearing deposits in other banks amounted to $8.3 million at December 31, 2008 compared to $32.5 million at December 31, 2007. The decrease in cash and cash equivalents and interest-bearing deposits in other banks was due to the use of the liquid assets to fund loan growth.
The allowance for loan losses was $2.3 million at December 31, 2008, or 1.14% of total loans outstanding, compared to $803,000 as of December 31, 2007, or 1.16% of total loans outstanding. The Bank had no impaired loans or loans which were over 90 days past due but still accruing interest at December 31, 2008 and 2007. At December 31, 2008, the Bank had total non-accrual loans of $44,000 and other real estate owned of $170,000. The Bank had no non-accrual loans and other real estate owned at December 31, 2007.
Total deposits were $171.3 million at December 31, 2008, which represents a 78.81% increase from $95.8 million of total deposits at December 31, 2007. Non-interest bearing deposits totaled $26.2 million or 15.29% of total deposits as of December 31, 2008 compared to $19.9 million, or 20.77% of total deposits at December 31, 2007.
Total borrowings were $40.1 million at December 31, 2008 and $1.2 million at December 31, 2007. At December 31, 2008, the Bank utilized its unsecured lines of credit with correspondent banks totaling $15.7 million. The Bank also had four advances outstanding with the Federal Home Loan Bank of Atlanta totaling $18.0 million. At December 31, 2008, the outstanding balance of repurchase agreements with customers totaled $6.4 million, a $5.2 million increase from $1.2 million at December 31, 2007. Borrowings and repurchase agreements were used to supplement deposits and fund asset growth.
Total stockholders’ equity was $29.7 million at December 31, 2008 and $31.2 million at December 31, 2007. The decrease in stockholders’ equity was directly attributable to the Bank’s net loss for 2008. The net unrealized gain on securities available for sale amounted to $311,000 and $115,000 as of December 31, 2008 and 2007, respectively. Securities available for sale are reported at market value or fair value. Any unrealized gain or loss is reported as a separate addition to or reduction from stockholders’ equity. Gains and losses arising from the sale of securities available for sale are recognized based on the specific identification method and included in results of operations.
Net interest margin was 3.40% for the year ended December 31, 2008 and 2.98% for the year ended December 31, 2007.
1818
Comparison of Results of Operations
Year Ended December 31, 2008 Compared to Year Ended December 31, 2007
For the year ended December 31, 2008, the net loss amounted to $1.7 million or a basic and diluted loss per share of $0.45. For the year ended December 31, 2007, the net loss amounted to $3.4 million or a basic and diluted loss per share of $2.00.
Net Interest Income. Net interest income represents the principal source of revenue for the Bank. Net interest income was $6.0 million and $2.3 million for the year ended December 31, 2008 and 2007, respectively. The increase in net interest income in 2008 was directly attributable to the Bank’s significant asset growth.
The average balance of the total loan portfolio was $142.8 million, with related interest income from loans of $8.9 million, for the year ended December 31, 2008. For the year ended December 31, 2007, the average balance of the total loan portfolio was $34.9 million, with related interest income from loans of $2.7 million. The average yield on loans was 6.21% and 7.69% for the year ended December 31, 2008 and 2007, respectively. The decrease in the yield in 2008 was primarily due to the Federal Reserve Bank’s rate adjustments.
Investment securities income was $903,000 and the yield on investment securities was 4.97% for the year ended December 31, 2008. Investment securities income was $515,000 and the yield on investment securities was 5.25% for the year ended December 31, 2007. The increase in income from investment securities was primarily due to an increase in the average balance of such assets in 2008 as a result of the investment of excess funds in investment securities.
Consistent with the Bank’s asset growth, average interest-bearing funding sources (deposits, FHLB advances and borrowed funds) grew to $126.0 million for the year ended December 31, 2008, compared to $56.4 million for the year ended December 31, 2007. Interest expense for all interest-bearing liabilities amounted to $4.4 million for the year ended December 31, 2008 and $2.6 million for the year ended December 31, 2007. The average cost of interest-bearing liabilities for the year ended December 31, 2008 was 3.48% compared to 4.53% for the year ended December 31, 2007 reflecting the decrease in market interest rates.
Provision for Loan Losses. We recognized a provision for possible loan losses of $1.6 million for the year ended December 31, 2008 compared to $617,000 for the year ended December 31, 2007. This was attributable to the Bank’s growth, an increase in total gross loans, and an increase in the risk profile of the loan portfolio.
Noninterest Income. Non-interest income amounted to $2.3 million for the year ended December 31, 2008 and was $816,000 for the year ended December 31, 2007. The Bank’s primary sources of non-interest income are the gain on sale of mortgage loans, service charges, and loan processing fees. The increase in gain on sale of loans of $1.1 million to $1.8 million for 2008 compared to $729,000 for 2007 was primarily due to the growth of the Bank’s mortgage unit in 2008.
Noninterest Expense. Non-interest expense for the year ended December 31, 2008 amounted to $8.4 million and was $5.9 million for the year ended December 31, 2007. The largest component of non-interest expense is salaries and benefits. Salary and benefits expense for the year ended December 31, 2008 was $5.0 million and was $3.5 million for the year ended December 31, 2007. Such increase was primarily due to increased staffing needs to support the Bank’s growth. Occupancy and furniture and equipment costs for the year ended December 31, 2008 was $1.3 million and was $1.0 million for the year ended December 31, 2007. Other operating expenses were $2.1 million for the year ended December 31, 2008 and $1.4 million for the year ended December 31, 2007. Other operating expense includes FDIC insurance expense, which totaled $95,000 and $42,000 for the years ended December 31, 2008 and 2007, respectively. Due to deposit insurance premium increases projected for 2009 and possible emergency special assessments, FDIC insurance expense will be significantly higher in 2009. See “Supervision and Regulation – Insurance of Accounts” and “– Increases in FDIC’s Assessment Rates.”
Income taxes. The Bank did not record any tax expense or benefit for either of the years ended December 31, 2008 or 2007. Currently, the Bank has a net operating loss. As and when appropriate, the Bank will begin to

1919
recognize a tax benefit and related tax asset. The Bank has a net operating loss carry forwards of approximately $5.5 million, which expires in the year 2025. See Note 8 of the Notes to Financial Statements for the year ended December 31, 2008 for further analysis of income taxes.
The following table illustrates average balances of total interest-earning assets and total interest-bearing liabilities for the years indicated, showing the average distribution of assets, liabilities, stockholders’ equity and related income, expense and corresponding weighted average yield and rates. The average balances used in these tables and other statistical data were calculated using daily average balances. The Bank had no tax exempt assets for the years presented.

2020
Average Balances, Interest Income and Expenses and Average Yield and Rates
(In Thousands) Year Ended December 31,
2008 2007 2006
Interest Interest Interest Average Income/ Yields/ Average Income/ Yields/ Average Income/ Yields/ Balances (1) Expense Rates Balances (1) Expense Rates Balances (1) Expense RatesAssets: Interest-earning assets: Loans (2) (7) $142,836 $ 8,876 6.21% $34,929 $2,687 7.69% $ 8,744 $ 633 7.24% Securities (3) 18,175 903 4.97 9,807 515 5.25 2,576 130 5.05 Federal funds sold and interest-bearing
accounts 15,970 628 3.93 31,842 1,632 5.13 21,040 1,074 5.11 Total interest-earning assets 176,981 10,407 5.88 76,578 4,834 6.31 32,360 1,837 5.68 Non-interest-earning assets: Cash and due from banks 2,573 1,510 325 Premises and equipment 1,236 1,279 802 Other assets 1,825 534 217 Less: allowance for loan losses (1,407) (327) (85)
Total non-interest-earning assets 4,227 2,996 1,260
Total assets
$181,208
$79,574 $33,619
Liabilities and Stockholders’ Equity Interest-bearing liabilities: Interest-bearing demand deposit accounts $ 3,977 $ 70 1.76% $ 2,919 $ 59 2.02% $ 1,429 $ 32 2.24% Money market deposit accounts 16,332 424 2.60 12,730 536 4.21 5,384 235 4.37 Savings accounts 20,304 560 2.76 9,602 401 4.18 4,272 190 4.45 Time deposits 72,375 3,001 4.15 31,033 1,554 5.01 7,763 370 4.77 Total interest-bearing deposits 112,988 4,055 3.59 56,284 2,550 4.53 18,848 827 4.39 FHLB advances 7,959 260 3.27 - - - - - - Federal funds and repos purchased 5,017 73 1.46 73 3 4.11 - - - Total interest-bearing liabilities 125,964 4,388 3.48 56,357 2,553 4.53 18,848 827 4.39 Non-interest-bearing liabilities: Demand deposit accounts 24,787 11,632 1,462 Other liabilities 116 303 190
Total liabilities 150,867 68,292 20,500 Stockholders’ equity 30,341 11,282 13,119
Total liabilities and stockholders’ equity $181,208 $79,574 $33,619
Interest Rate Spread (4) 2.40% 1.78% 1.29%
Net Interest Income (5) $ 6,019 $ 2,281 $ 1,010
Net Interest Margin (6) 3.40% 2.98% 3.12%
_____________ (1) Average balances are computed on a daily basis. (2) Includes non-accruing loans. (3) Includes securities, Federal Reserve Bank and federal Home Loan Bank stock. (4) Interest rate spread is the total interest income expressed as a percentage of average earning assets less total interest expense expressed as a percentage of
average interest-bearing liabilities. (5) Total interest income less total interest expense. (6) Net interest margin is net interest income, expressed as a percentage of average earning assets. (7) Interest income does not include loan fees amortization.

2121
The following table describes the extent to which changes in interest rates and changes in volume of interest-related assets and liabilities have affected the Bank’s interest income and interest expense during the periods indicated. For each category of interest-earning assets and interest-bearing liabilities, information is provided on changes attributable to (i) changes in volume (change in volume multiplied by prior year rate), (ii) changes in rate (change in rate multiplied by prior year volume), and (iii) total change in rate and volume. The combined effect of changes in both rate and volume has been allocated proportionately to the change due to rate and the change due to volume.
Year Ended December 31, 2008 vs. 2007 2007 vs. 2006
Increase (Decrease) Due To Total Increase (Decrease) Due To Total
Yield/Rate Volume Increase
(Decrease) Yield/Rate Volume Increase
(Decrease) (In Thousands)
Interest-earning assets: Loans, net $(2,112) $8,301 $6,189 $158 $1,896 $2,054 Securities (58) (148) (206) 31 883 914 Federal funds sold (174) (236) (410) (14) 43 29 Total (2,344) 7,917 5,573 175 2,822 2,997
Interest-bearing liabilities: Interest-bearing demand deposits (10) 21 11 (6) 33 27 Money market (264) 152 (112) (20) 321 301 Savings accounts (288) 447 159 (26) 237 211 Time deposits (623) 2,070 1,447 75 1,109 1,184 FHLB advances 260 - 260 - - - Federal funds and repos purchased (133) 203 70 3 - 3 Total (1,058) 2,893 1,835 26 1,700 1,726 Increase (decrease) in net interest income $(1,286) $5,024 $3,738 $149 $1,122 $1,271
Analysis of Financial Condition
Investment Securities. Investment securities available for sale amounted to $23.0 million as of December 31, 2008, an $800,000 decrease compared to the December 31, 2007 level of $23.8 million. There were no investments classified as held to maturity for any years reported.
The Bank generally classifies investment securities as available for sale under the classifications required under SFAS No. 115. The portfolio is used to manage excess liquidity and general liquidity needs as well as other rebalancing needs as required by the overall asset/liability position.
The effect of unrealized gain on the portfolio was $311,000 and $115,000 as of December 31, 2008 and December 31, 2007, respectively. Consistent with our investment and asset/liability strategies, we believe the investment portfolio is properly positioned for the current and projected near term interest rate environment.
The investment portfolio did not contain any corporate debt securities or collateralized debt obligations for any years presented.
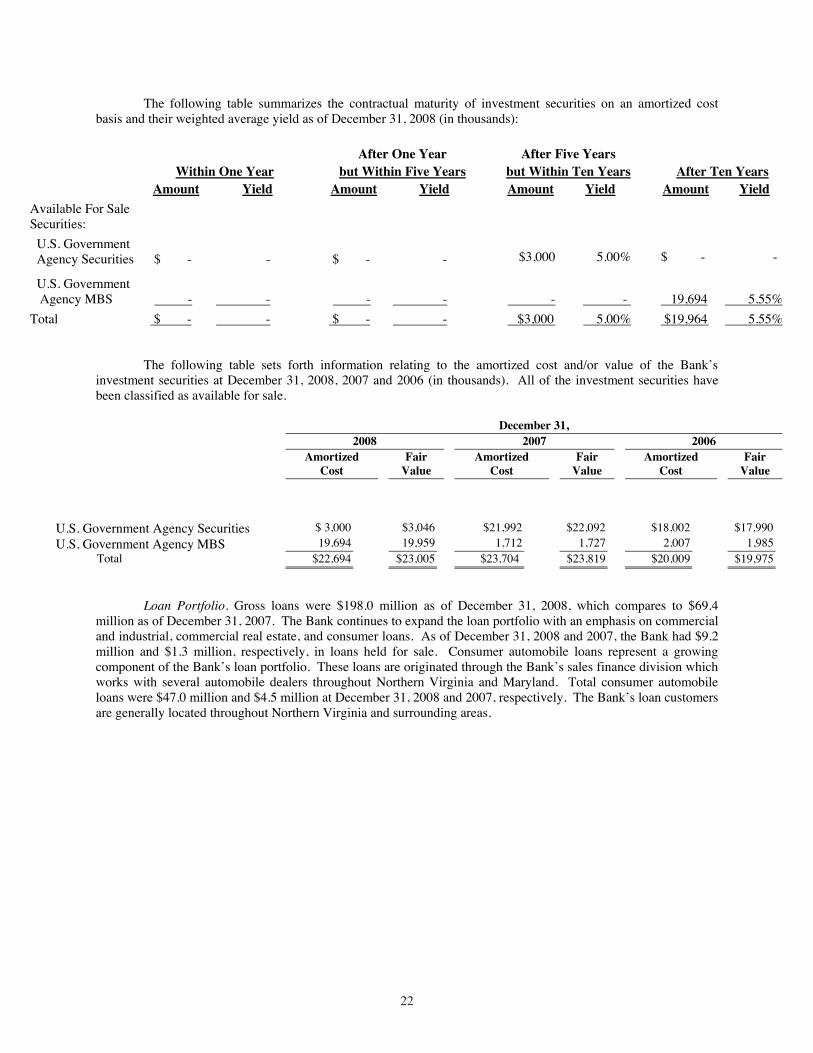
2222
The following table summarizes the contractual maturity of investment securities on an amortized cost basis and their weighted average yield as of December 31, 2008 (in thousands):
After One Year After Five Years
Within One Year but Within Five Years but Within Ten Years After Ten Years Amount Yield Amount Yield Amount Yield Amount Yield
Available For Sale Securities: U.S. Government Agency Securities $ - - $ - - $3,000 5.00% $ - -
U.S. Government Agency MBS - - - - - - 19,694 5.55% Total $ - - $ - - $3,000 5.00% $19,964 5.55%
The following table sets forth information relating to the amortized cost and/or value of the Bank’s investment securities at December 31, 2008, 2007 and 2006 (in thousands). All of the investment securities have been classified as available for sale.
December 31, 2008 2007 2006
Amortized Cost
Fair Value
Amortized Cost
Fair Value
Amortized Cost
Fair Value
U.S. Government Agency Securities $ 3,000 $3,046 $21,992 $22,092 $18,002 $17,990 U.S. Government Agency MBS 19,694 19,959 1,712 1,727 2,007 1,985 Total $22,694 $23,005 $23,704 $23,819 $20,009 $19,975
Loan Portfolio. Gross loans were $198.0 million as of December 31, 2008, which compares to $69.4 million as of December 31, 2007. The Bank continues to expand the loan portfolio with an emphasis on commercial and industrial, commercial real estate, and consumer loans. As of December 31, 2008 and 2007, the Bank had $9.2 million and $1.3 million, respectively, in loans held for sale. Consumer automobile loans represent a growing component of the Bank’s loan portfolio. These loans are originated through the Bank’s sales finance division which works with several automobile dealers throughout Northern Virginia and Maryland. Total consumer automobile loans were $47.0 million and $4.5 million at December 31, 2008 and 2007, respectively. The Bank’s loan customers are generally located throughout Northern Virginia and surrounding areas.
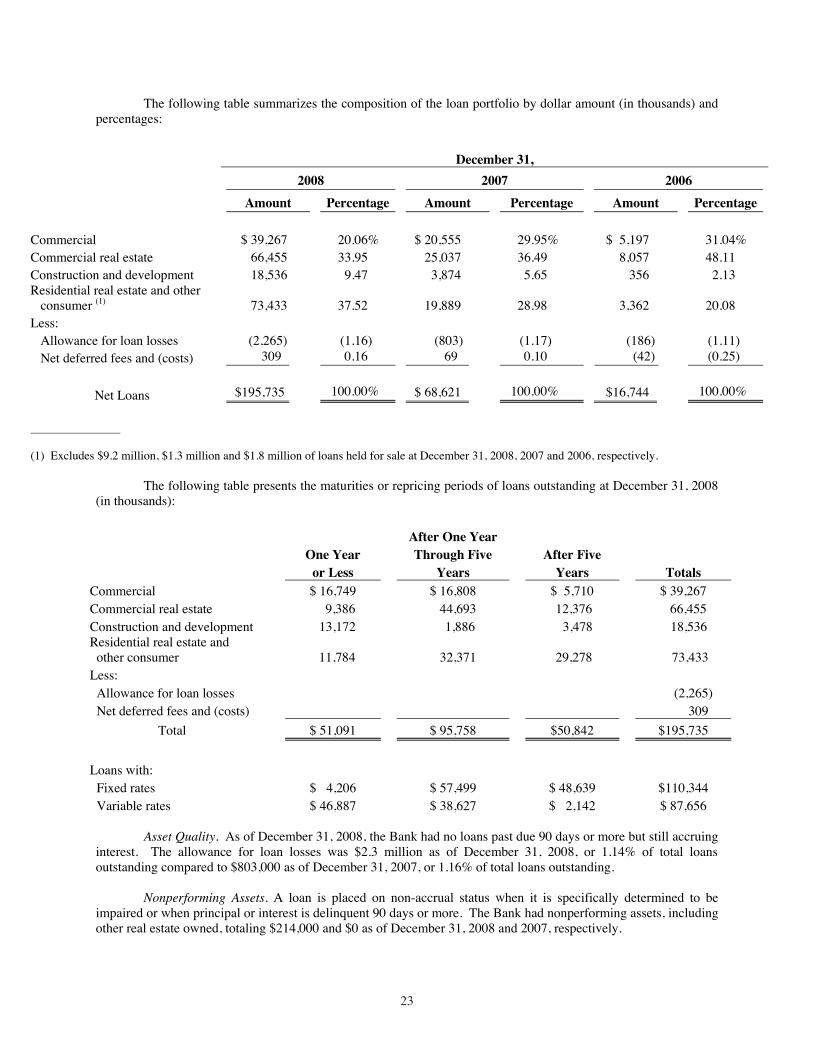
2323
The following table summarizes the composition of the loan portfolio by dollar amount (in thousands) and percentages:
December 31, 2008 2007 2006
Amount Percentage Amount Percentage Amount Percentage Commercial $ 39,267 20.06% $ 20,555 29.95% $ 5,197 31.04% Commercial real estate 66,455 33.95 25,037 36.49 8,057 48.11 Construction and development 18,536 9.47 3,874 5.65 356 2.13 Residential real estate and other consumer (1) 73,433 37.52 19,889 28.98
3,362 20.08
Less: Allowance for loan losses (2,265) (1.16) (803) (1.17) (186) (1.11) Net deferred fees and (costs) 309 0.16 69 0.10 (42) (0.25)
Net Loans $195,735 100.00% $ 68,621 100.00% $16,744 100.00%
_______________
(1) Excludes $9.2 million, $1.3 million and $1.8 million of loans held for sale at December 31, 2008, 2007 and 2006, respectively.
The following table presents the maturities or repricing periods of loans outstanding at December 31, 2008 (in thousands):
After One Year
One Year Through Five After Five or Less Years Years Totals
Commercial $ 16,749 $ 16,808 $ 5,710 $ 39,267 Commercial real estate 9,386 44,693 12,376 66,455 Construction and development 13,172 1,886 3,478 18,536 Residential real estate and other consumer 11,784 32,371 29,278 73,433 Less: Allowance for loan losses (2,265) Net deferred fees and (costs) 309
Total $ 51,091 $ 95,758 $50,842 $195,735 Loans with: Fixed rates $ 4,206 $ 57,499 $ 48,639 $110,344 Variable rates $ 46,887 $ 38,627 $ 2,142 $ 87,656
Asset Quality. As of December 31, 2008, the Bank had no loans past due 90 days or more but still accruing interest. The allowance for loan losses was $2.3 million as of December 31, 2008, or 1.14% of total loans outstanding compared to $803,000 as of December 31, 2007, or 1.16% of total loans outstanding.
Nonperforming Assets. A loan is placed on non-accrual status when it is specifically determined to be impaired or when principal or interest is delinquent 90 days or more. The Bank had nonperforming assets, including other real estate owned, totaling $214,000 and $0 as of December 31, 2008 and 2007, respectively.
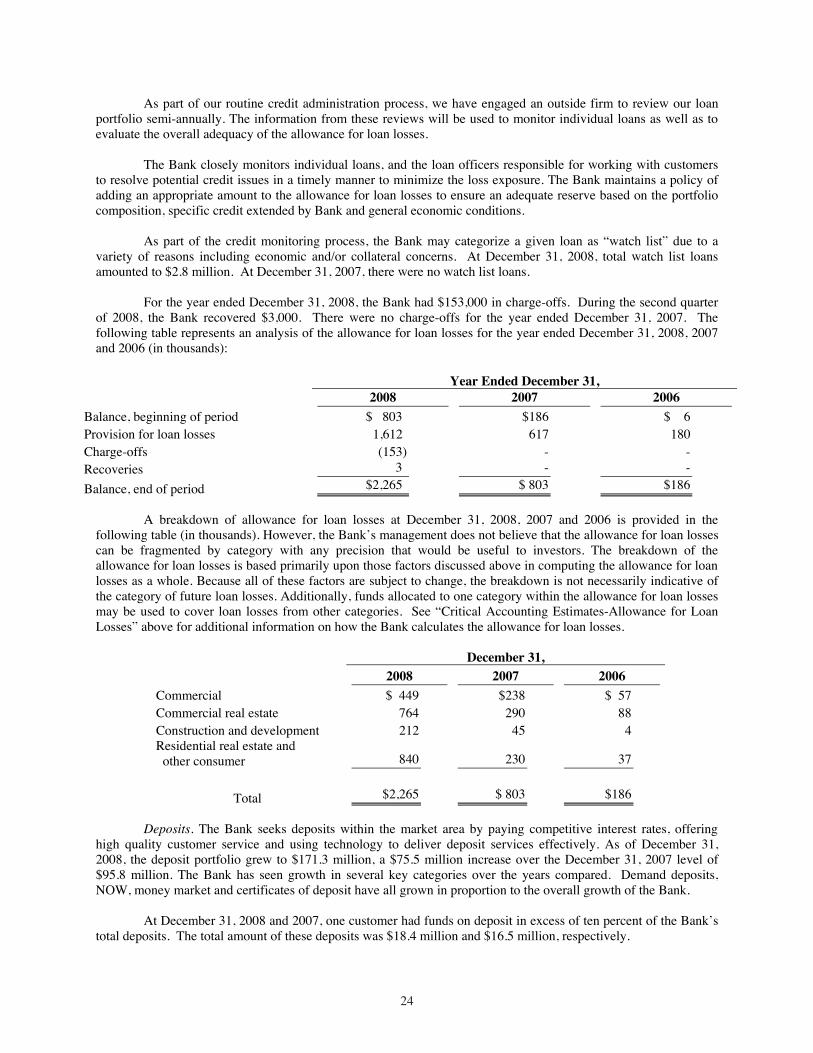
2424
As part of our routine credit administration process, we have engaged an outside firm to review our loan portfolio semi-annually. The information from these reviews will be used to monitor individual loans as well as to evaluate the overall adequacy of the allowance for loan losses.
The Bank closely monitors individual loans, and the loan officers responsible for working with customers to resolve potential credit issues in a timely manner to minimize the loss exposure. The Bank maintains a policy of adding an appropriate amount to the allowance for loan losses to ensure an adequate reserve based on the portfolio composition, specific credit extended by Bank and general economic conditions.
As part of the credit monitoring process, the Bank may categorize a given loan as “watch list” due to a variety of reasons including economic and/or collateral concerns. At December 31, 2008, total watch list loans amounted to $2.8 million. At December 31, 2007, there were no watch list loans.
For the year ended December 31, 2008, the Bank had $153,000 in charge-offs. During the second quarter of 2008, the Bank recovered $3,000. There were no charge-offs for the year ended December 31, 2007. The following table represents an analysis of the allowance for loan losses for the year ended December 31, 2008, 2007 and 2006 (in thousands):
Year Ended December 31, 2008 2007 2006
Balance, beginning of period $ 803 $186 $ 6 Provision for loan losses 1,612 617 180 Charge-offs (153) - - Recoveries 3 - -Balance, end of period $2,265 $ 803 $186
A breakdown of allowance for loan losses at December 31, 2008, 2007 and 2006 is provided in the following table (in thousands). However, the Bank’s management does not believe that the allowance for loan losses can be fragmented by category with any precision that would be useful to investors. The breakdown of the allowance for loan losses is based primarily upon those factors discussed above in computing the allowance for loan losses as a whole. Because all of these factors are subject to change, the breakdown is not necessarily indicative of the category of future loan losses. Additionally, funds allocated to one category within the allowance for loan losses may be used to cover loan losses from other categories. See “Critical Accounting Estimates-Allowance for Loan Losses” above for additional information on how the Bank calculates the allowance for loan losses.
December 31, 2008 2007 2006
Commercial $ 449 $238 $ 57 Commercial real estate 764 290 88 Construction and development 212 45 4 Residential real estate and other consumer 840 230 37
Total $2,265 $ 803 $186
Deposits. The Bank seeks deposits within the market area by paying competitive interest rates, offering high quality customer service and using technology to deliver deposit services effectively. As of December 31, 2008, the deposit portfolio grew to $171.3 million, a $75.5 million increase over the December 31, 2007 level of $95.8 million. The Bank has seen growth in several key categories over the years compared. Demand deposits, NOW, money market and certificates of deposit have all grown in proportion to the overall growth of the Bank.
At December 31, 2008 and 2007, one customer had funds on deposit in excess of ten percent of the Bank’s total deposits. The total amount of these deposits was $18.4 million and $16.5 million, respectively.

2525
The following table details the average amount of, and the average rate paid on, the following primary deposit categories for the year ended December 31, 2008, 2007 and 2006 (in thousands):
Year Ended December 31, 2008 2007 2006
Average Average Average Balance Expense Rate Balance Expense Rate Balance Expense Rate
Interest-bearing liabilities: Interest-bearing demand deposits $ 3,977 $ 70 1.76 % $ 2,919 $ 59 2.02% $ 1,429 $ 32 2.26%
Money market deposit accounts 16,332 424 2.60 12,730 536 4.21 5,384 235 4.37
Savings accounts 20,304 560 2.76 9,602 401 4.18 4,272 190 4.45 Time deposits 72,375 3,001 4.15 31,033 1,554 5.01 7,763 370 4.75 Total interest-bearing deposits 112,988 4,055 3.59 56,284 2,550 4.53 18,848 827 4.39 Non-interest-bearing liabilities 24,787 - 11,632 - 1,462 -
Total deposits $137,775 $4,055 2.94% $67,916 $2,550 3.75% $20,310 $827 4.07%
The following is a summary of the maturity distribution of certificates of deposits as of December 31, 2008 (in thousands):
December 31, 2008 Less Than Three
Months Three Months to Twelve Months
Over Twelve Months Total
Interest Interest Interest Balance Rate Balance Rate Balance Rate
Certificates of Deposit: Less than $100,000 $ 8,413 3.52% $13,537 3.29% $21,631 3.91% $ 43,581 Greater than or equal to $100,000 7,215 4.23 12,529 3.29 42,663 3.78 62,407
Total $15,628 3.85% $26,066 3.29% $64,294 3.82% $105,988
Other Borrowings. The Bank has unsecured lines of credit with correspondent banks totaling $18 million available for overnight borrowing. At December 31, 2008, the balance on these lines was $3.7 million. These lines were not utilized at December 31, 2007.
The Bank also established a Borrower-In-Custody (BIC) arrangement with the Federal Reserve Bank of Richmond in October 2008. The BIC program allows the Bank to pledge assets as collateral to secure advances from the discount window. The Bank pledged automobile loans with a collateral value of approximately $36.7 million. At December 31, 2008, the outstanding balance on this line was $12 million.
Additional credit facilities are available to the Bank through its membership in the Federal Home Loan Bank of Atlanta. Based upon the Bank’s credit standing and available collateral, which consists of certain investment securities and real estate secured loans, the Bank may borrow up to 20% of its total assets on a short term or long term basis. The Bank pledged real estate secured loans with a collateral value of approximately $29.8 million. The Bank had four advances outstanding with the Federal Home Loan Bank of Atlanta totaling $18.0 million as of December 31, 2008 and $0 as of December 31, 2007. On March 31, 2008, the Bank entered into a 2-year FRC (Fixed Rate Credit) agreement in the amount of $5.0 million. Interest accrues at the rate of 2.54% and is paid quarterly, with the principal due March 3, 2010. On September 3, 2008, the Bank entered into a 5-year FRC agreement in the amount of $5.0 million. Interest accrues at the rate of 4.10% and is paid quarterly, with the principal due September 3, 2013. On September 3, 2008, the Bank entered into a 3-year FRC agreement in the amount of $5.0 million. Interest accrues at the rate of 3.73% and is paid quarterly, with the principal due September
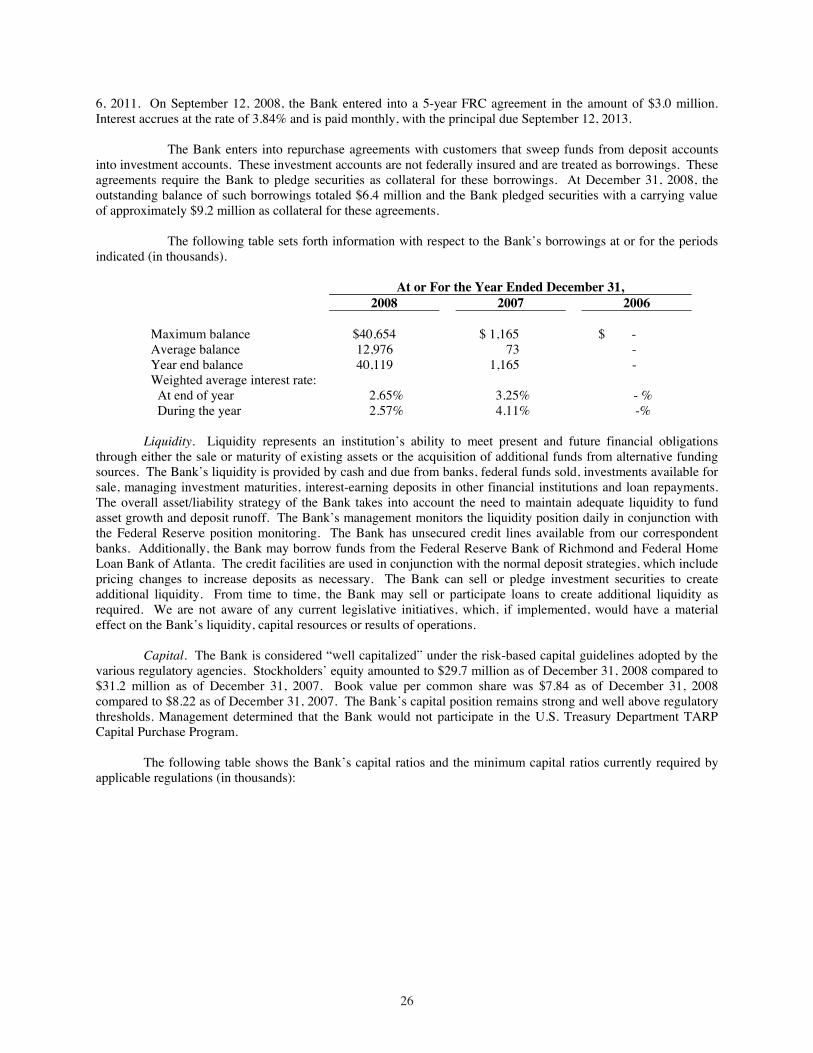
2626
6, 2011. On September 12, 2008, the Bank entered into a 5-year FRC agreement in the amount of $3.0 million. Interest accrues at the rate of 3.84% and is paid monthly, with the principal due September 12, 2013.
The Bank enters into repurchase agreements with customers that sweep funds from deposit accounts into investment accounts. These investment accounts are not federally insured and are treated as borrowings. These agreements require the Bank to pledge securities as collateral for these borrowings. At December 31, 2008, the outstanding balance of such borrowings totaled $6.4 million and the Bank pledged securities with a carrying value of approximately $9.2 million as collateral for these agreements.
The following table sets forth information with respect to the Bank’s borrowings at or for the periods indicated (in thousands).
At or For the Year Ended December 31, 2008 2007 2006
Maximum balance $40,654 $ 1,165 $ - Average balance 12,976 73 - Year end balance 40,119 1,165 - Weighted average interest rate: At end of year 2.65% 3.25% - % During the year 2.57% 4.11% -%
Liquidity. Liquidity represents an institution’s ability to meet present and future financial obligations through either the sale or maturity of existing assets or the acquisition of additional funds from alternative funding sources. The Bank’s liquidity is provided by cash and due from banks, federal funds sold, investments available for sale, managing investment maturities, interest-earning deposits in other financial institutions and loan repayments. The overall asset/liability strategy of the Bank takes into account the need to maintain adequate liquidity to fund asset growth and deposit runoff. The Bank’s management monitors the liquidity position daily in conjunction with the Federal Reserve position monitoring. The Bank has unsecured credit lines available from our correspondent banks. Additionally, the Bank may borrow funds from the Federal Reserve Bank of Richmond and Federal Home Loan Bank of Atlanta. The credit facilities are used in conjunction with the normal deposit strategies, which include pricing changes to increase deposits as necessary. The Bank can sell or pledge investment securities to create additional liquidity. From time to time, the Bank may sell or participate loans to create additional liquidity as required. We are not aware of any current legislative initiatives, which, if implemented, would have a material effect on the Bank’s liquidity, capital resources or results of operations.
Capital. The Bank is considered “well capitalized” under the risk-based capital guidelines adopted by the various regulatory agencies. Stockholders’ equity amounted to $29.7 million as of December 31, 2008 compared to $31.2 million as of December 31, 2007. Book value per common share was $7.84 as of December 31, 2008 compared to $8.22 as of December 31, 2007. The Bank’s capital position remains strong and well above regulatory thresholds. Management determined that the Bank would not participate in the U.S. Treasury Department TARP Capital Purchase Program.
The following table shows the Bank’s capital ratios and the minimum capital ratios currently required by applicable regulations (in thousands):

2727
Return on Average Assets and Average Equity
The ratios of net income (loss) to average equity and average assets and certain other ratios are as follows (in thousands):
Return on Average Assets and Average Equity
Year Ended December 31,2008 2007 2006
Average total assets $181,208 $79,574 $33,619 Average equity $ 30,341 $11,282 $13,119 Net income (loss) $ (1,706) $ (3,387) $ (1,965) Cash dividends declared Return (loss) on average assets (0.94)% (4.26)% (5.85)% Return (loss) on average equity (5.62)% (30.02)% (14.98)% Average stockholders’ equity to average total assets 16.74% 14.18% 39.02%
Risk-Based Capital Analysis
December 31, 2008 December 31, 2007 Tier I Capital: Common stock $ 15,166 $ 15,166 Capital surplus 22,408 22,332 Accumulated deficit (8,140) (6,434) Total Tier I Capital 29,434 31,064 Tier II Capital: Allowance for loan losses 2,265 803 Total Risk-Based Capital $ 31,699 $ 31,867
Risk Weighted Assets $ 201,769 $ 75,860
Quarterly Average Assets $ 226,130 $ 113,291
Capital Ratios (1): Regulatory Minimum Tier I risk-based based capital ratio 14.59% 40.95% 4.00% Total risk-based capital ratio 15.71% 42.01% 8.00% Tier I leverage ratio 13.02% 27.42% 4.00% (2)
Equity to assets ratio 12.29% 24.21% N/A ___________________
(1) Capital ratios are calculated in accordance with regulatory accounting principles specified by regulatory agencies for supervisory reporting purposes.
(2) Federal regulators have established minimum capital ratios for a bank. As a de novo institution, however, the Commonwealth of Virginia requires the Bank to maintain a leverage ratio of at least 9% during the first three years of operations.

2828
Off-Balance Sheet Activities
The Bank enters into certain off-balance sheet arrangements in the normal course of business to meet the financing needs of customers. These off-balance sheet arrangements include commitments to extend credit and standby letters of credit which would impact the overall liquidity and capital resources to the extent customers accept and or use these commitments. These instruments involve, to varying degrees, elements of credit and interest rate risk in excess of the amount recognized in the balance sheet. See Note 7 of the Notes to Financial Statements for the year ended December 31, 2008 for further discussion of the nature, business purpose and elements of risk involved with these off-balance sheet arrangements. With the exception of these off-balance sheet arrangements, we have no off-balance sheet arrangements that have or are reasonably likely to have a material current or future effect on our financial condition, changes in financial condition, revenues or expenses, results of operations, liquidity, capital expenditures or capital resources.
Contractual Obligations
We are contractually obligated to make future minimum payments as follows (in thousands):
Impact of Inflation, Changing Prices and Seasonality
The financial statement and related data presented herein have been prepared in accordance with generally accepted accounting principles which require the measurement of financial position and operating results in terms of historical dollars, without considering changes in the relative purchasing power of money over time due to inflation.
Unlike industrial companies, virtually all the assets and liabilities of a financial institution are monetary in nature. As a result, interest rates have a more significant impact on a financial institution’s performance than general levels of inflation. Interest rates do not necessarily move in the same direction or in the same magnitude as the price of goods and services, since such prices are affected by inflation.
Disclosures about Market Risk.
Concentrations. The Bank operates primarily in Northern Virginia and surrounding areas. The Bank’s overall business includes a focus on real estate activities, including title companies and real estate settlement businesses. Material changes in the economic situation of the region and/or the region’s real estate market could have an adverse impact on the Bank.
Item 7A. Quantitative and Qualitative Disclosures About Market Risk
Market risk for the Bank consists primarily of interest rate risk exposure and liquidity risk. The Bank is not subject to currency exchange risk or commodity price risk, and has no trading portfolio, and therefore, is not subject to any trading risk. In addition, the Bank does not participate in hedging transactions such as interest rate swaps and caps. Changes in interest rates will impact both income and expense recorded and also the market value of long-term interest-earning assets. Interest rate risk and liquidity risk management is performed at the Bank level. Although the Bank has a diversified loan portfolio, loans outstanding to individuals and businesses depend upon the local economic conditions in the immediate trade area.
One of the primary functions of the Bank’s asset/liability management committee is to monitor the level to which the balance sheet is subject to interest rate risk. The goal of the asset/liability committee is to manage the
Less Than More Than 1 Year 1-3 Years 3 - 5 Years 5 Years Total
Certificates of deposit maturities $ 41,694 $ 64,148 $ 146 $ - $105,988 Other borrowings $ 22,119 $ 10,000 $ 8,000 $ - $ 40,119 Lease obligations $ 546 $ 1,104 $ 788 $ 1,257 $ 3,695

2929
relationship between interest rate sensitive assets and liabilities, thereby minimizing the fluctuations in the net interest margin, which achieves consistent growth of net interest income during periods of changing interest rates.
Interest rate sensitivity is the result of differences in the amounts and repricing dates of the Bank’s rate sensitive assets and rate sensitive liabilities. These differences, or interest rate repricing “gap”, provide an indication of the extent that the Bank’s net interest income is affected by future changes in interest rates. A gap is considered positive when the amount of interest rate-sensitive assets exceeds the amount of interest rate-sensitive liabilities and is considered negative when the amount of interest rate-sensitive liabilities exceeds the amount of interest rate-sensitive assets. Generally, during a period of rising interest rates, a negative gap would adversely affect net interest income while a positive gap would result in an increase in net interest income. Conversely, during a period of falling interest rates, a negative gap would result in an increase in net interest income and a positive gap would adversely affect net interest income. The closer to zero that gap is maintained, generally, the lesser the impact of market interest rate changes on net interest income.
3030
Item 8. Financial Statements and Supplementary Data
Audited Financial Statements
At December 31, 2008 and 2007 and For the Years Ended December 31, 2008 and 2007
(Together with Independent Auditors’ Report)
30
Item 8. Financial Statements and Supplementary Data
Audited Financial Statements
At December 31, 2008 and 2007 and For the Years Ended December 31, 2008 and 2007
(Together with Independent Auditors’ Report)

3131
REPORT OF INDEPENDENT REGISTERED PUBLIC ACCOUNTING FIRM
To the Shareholders and Board of Directors Virginia Heritage Bank Fairfax, Virginia
We have audited the accompanying balance sheets of Virginia Heritage Bank as of December 31, 2008 and 2007, and the related statements of operations, changes in stockholders’ equity and cash flows for the years then ended. These financial statements are the responsibility of the Bank’s management. Our responsibility is to express an opinion on these financial statements based on our audits.
We conducted our audits in accordance with the standards of the Public Company Accounting Oversight Board (United States). Those standards require that we plan and perform the audit to obtain reasonable assurance about whether the financial statements are free of material misstatement. An audit includes examining, on a test basis, evidence supporting the amounts and disclosures in the financial statements. An audit also includes assessing the accounting principles used and significant estimates made by management, as well as evaluating the overall financial statement presentation. We believe that our audits provide a reasonable basis for our opinion.
In our opinion, the financial statements referred to above present fairly, in all material respects, the financial position of Virginia Heritage Bank as of December 31, 2008 and 2007, and the results of its operations and its cash flows for the years then ended in conformity with accounting principles generally accepted in the United States of America.
Winchester, Virginia March 27, 2009

3232
Assets 2008 2007
Cash and due from banks 1,592$ 2,289$ Federal funds sold - 16,885
Total cash and cash equivalents 1,592 19,174
Interest bearing deposits in other banks 6,672 13,310 Securities available for sale, at fair value 23,005 23,819 Loans, net of allowance for loan losses of $2,265 and $803, respectively 195,735 68,621 Loans held for sale 9,170 1,338 Premises and equipment, net 1,134 1,321 Accrued interest receivable 730 374 Federal Home Loan Bank stock 1,042 103 Federal Reserve Bank stock 891 289 Other assets 2,207 416
Total assets 242,178$ 128,765$
Liabilities and Stockholders' Equity
Liabilities:Noninterest-bearing demand deposits 26,176$ 19,942$ NOW, money-market and savings deposits 39,105 34,153 Time deposits 105,988 41,708
Total deposits 171,269 95,803
Federal funds purchased 15,717 - Federal Home Loan Bank advances 18,000 - Securities sold under agreements to repurchase 6,402 1,165 Accrued expenses and other liabilities 1,045 618
Total liabilities 212,433 97,586
Commitments and contingencies (Notes 7 and 14)
Stockholders' equity:Common stock, $4 par value, 5,000,000 shares authorized, 3,791,633
shares issued and outstanding 15,166 15,166 Additional paid-in capital 22,408 22,332 Accumulated deficit (8,140) (6,434) Accumulated other comprehensive income 311 115
Total stockholders' equity 29,745 31,179
Total liabilities and stockholders' equity 242,178$ 128,765$
See Accompanying Notes to Financial Statements.
VIRGINIA HERITAGE BANK
Balance Sheets($ in thousands, except per share amounts)
December 31,
32
Assets 2008 2007
Cash and due from banks 1,592$ 2,289$ Federal funds sold - 16,885
Total cash and cash equivalents 1,592 19,174
Interest bearing deposits in other banks 6,672 13,310 Securities available for sale, at fair value 23,005 23,819 Loans, net of allowance for loan losses of $2,265 and $803, respectively 195,735 68,621 Loans held for sale 9,170 1,338 Premises and equipment, net 1,134 1,321 Accrued interest receivable 730 374 Federal Home Loan Bank stock 1,042 103 Federal Reserve Bank stock 891 289 Other assets 2,207 416
Total assets 242,178$ 128,765$
Liabilities and Stockholders' Equity
Liabilities:Noninterest-bearing demand deposits 26,176$ 19,942$ NOW, money-market and savings deposits 39,105 34,153 Time deposits 105,988 41,708
Total deposits 171,269 95,803
Federal funds purchased 15,717 - Federal Home Loan Bank advances 18,000 - Securities sold under agreements to repurchase 6,402 1,165 Accrued expenses and other liabilities 1,045 618
Total liabilities 212,433 97,586
Commitments and contingencies (Notes 7 and 14)
Stockholders' equity:Common stock, $4 par value, 5,000,000 shares authorized, 3,791,633
shares issued and outstanding 15,166 15,166 Additional paid-in capital 22,408 22,332 Accumulated deficit (8,140) (6,434) Accumulated other comprehensive income 311 115
Total stockholders' equity 29,745 31,179
Total liabilities and stockholders' equity 242,178$ 128,765$
See Accompanying Notes to Financial Statements.
VIRGINIA HERITAGE BANK
Balance Sheets($ in thousands, except per share amounts)
December 31,

3333
2008 2007Interest income:
Interest and fees on loans 8,876$ 2,687$ Investment securities 903 515 Interest on deposits in other banks and federal funds sold 628 1,632
Total interest income 10,407 4,834
Interest expense:Interest on deposits 4,055 2,550 Interest on federal funds purchased 47 - Interest on Federal Home Loan Bank advances 260 - Interest on securities sold under agreements to repurchase 26 3
Total interest expense 4,388 2,553
Net interest income 6,019 2,281
Provision for loan losses 1,612 617
Net interest income after provision for loan losses 4,407 1,664
Noninterest income:Gain on sale of loans 1,838 729 Service charges on deposit accounts 50 9 Gain on sale of securities 19 - Other income 357 78
Total noninterest income 2,264 816
Noninterest expenses:Salaries and employee benefits 5,007 3,495 Occupancy expense 818 640 Equipment expense 482 371 Data processing 309 182 Audit expense 160 86Other information technology expense 162 130Bank franchise tax 285 240Other operating expenses 1,154 723
Total noninterest expenses 8,377 5,867
Net loss (1,706)$ (3,387)$
Loss per share:Basic and diluted (0.45)$ (2.00)$
Weighted average shares outstanding:Basic and diluted 3,791,633 1,690,969
See Accompanying Notes to Financial Statements.
December 31,Years Ended
($ in thousands, except per share amounts)
VIRGINIA HERITAGE BANK
Statements of Operations
33
2008 2007Interest income:
Interest and fees on loans 8,876$ 2,687$ Investment securities 903 515 Interest on deposits in other banks and federal funds sold 628 1,632
Total interest income 10,407 4,834
Interest expense:Interest on deposits 4,055 2,550 Interest on federal funds purchased 47 - Interest on Federal Home Loan Bank advances 260 - Interest on securities sold under agreements to repurchase 26 3
Total interest expense 4,388 2,553
Net interest income 6,019 2,281
Provision for loan losses 1,612 617
Net interest income after provision for loan losses 4,407 1,664
Noninterest income:Gain on sale of loans 1,838 729 Service charges on deposit accounts 50 9 Gain on sale of securities 19 - Other income 357 78
Total noninterest income 2,264 816
Noninterest expenses:Salaries and employee benefits 5,007 3,495 Occupancy expense 818 640 Equipment expense 482 371 Data processing 309 182 Audit expense 160 86Other information technology expense 162 130Bank franchise tax 285 240Other operating expenses 1,154 723
Total noninterest expenses 8,377 5,867
Net loss (1,706)$ (3,387)$
Loss per share:Basic and diluted (0.45)$ (2.00)$
Weighted average shares outstanding:Basic and diluted 3,791,633 1,690,969
See Accompanying Notes to Financial Statements.
December 31,Years Ended
($ in thousands, except per share amounts)
VIRGINIA HERITAGE BANK
Statements of Operations
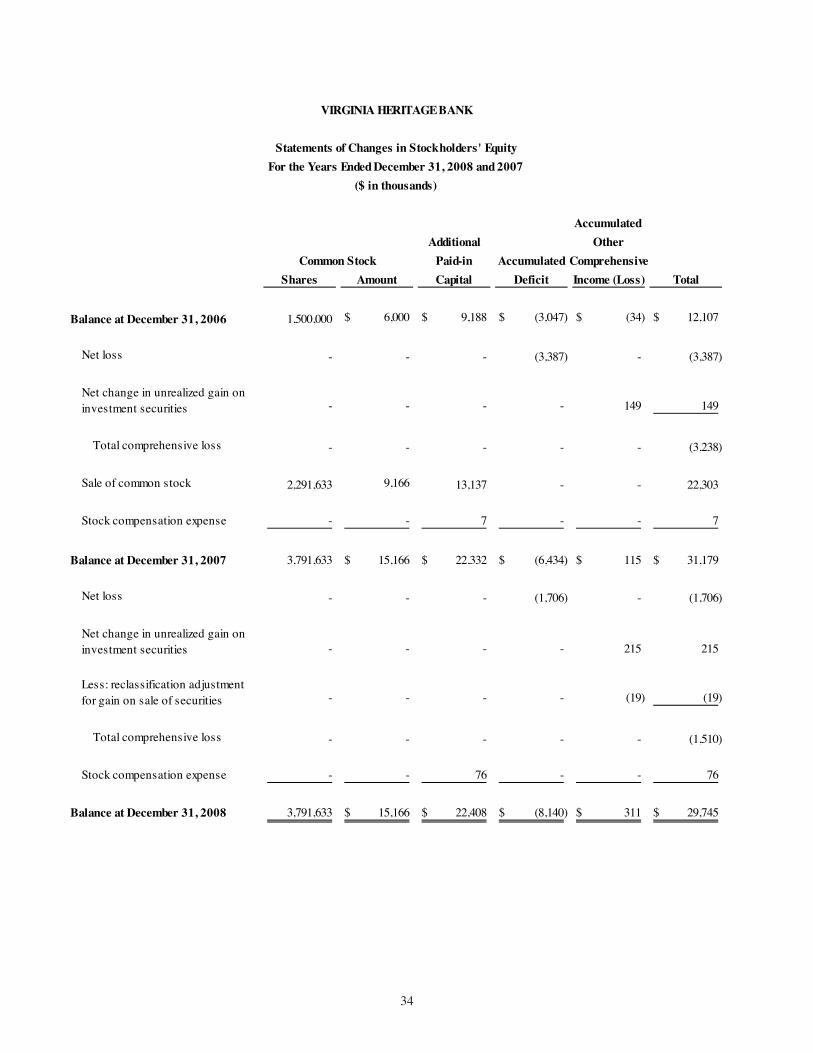
3434
Accumulated Additional Other
Paid-in Accumulated ComprehensiveShares Amount Capital Deficit Income (Loss) Total
Balance at December 31, 2006 1,500,000 6,000$ 9,188$ (3,047)$ (34)$ 12,107$
Net loss - - - (3,387) - (3,387)
Net change in unrealized gain on investment securities - - - - 149 149
Total comprehensive loss - - - - - (3,238)
Sale of common stock 2,291,633 9,166 13,137 - - 22,303
Stock compensation expense - - 7 - - 7
Balance at December 31, 2007 3,791,633 15,166$ 22,332$ (6,434)$ 115$ 31,179$
Net loss - - - (1,706) - (1,706)
Net change in unrealized gain on investment securities - - - - 215 215
Less: reclassification adjustment for gain on sale of securities - - - - (19) (19)
Total comprehensive loss - - - - - (1,510)
Stock compensation expense - - 76 - - 76
Balance at December 31, 2008 3,791,633 15,166$ 22,408$ (8,140)$ 311$ 29,745$
Common Stock
VIRGINIA HERITAGE BANK
For the Years Ended December 31, 2008 and 2007($ in thousands)
Statements of Changes in Stockholders' Equity
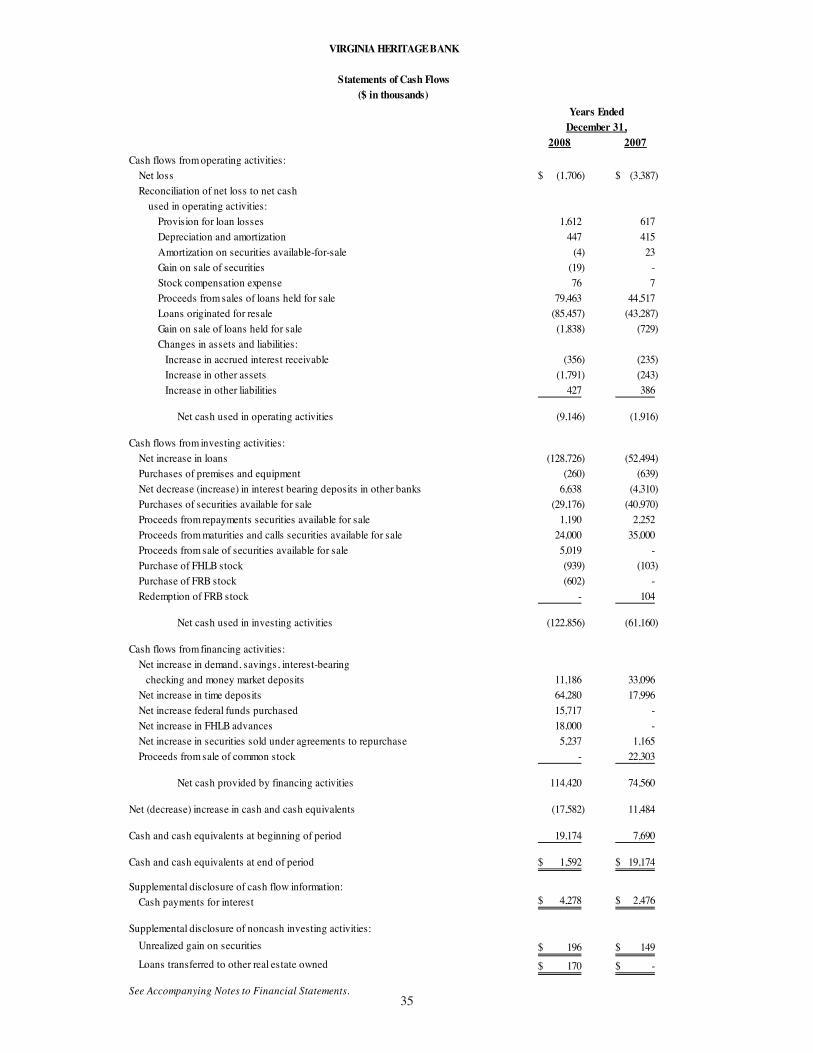
3535
2008 2007Cash flows from operating activities:
Net loss (1,706)$ (3,387)$ Reconciliation of net loss to net cash
used in operating activities:Provision for loan losses 1,612 617 Depreciation and amortization 447 415 Amortization on securities available-for-sale (4) 23 Gain on sale of securities (19) - Stock compensation expense 76 7 Proceeds from sales of loans held for sale 79,463 44,517 Loans originated for resale (85,457) (43,287) Gain on sale of loans held for sale (1,838) (729) Changes in assets and liabilities: Increase in accrued interest receivable (356) (235) Increase in other assets (1,791) (243) Increase in other liabilities 427 386
Net cash used in operating activities (9,146) (1,916)
Cash flows from investing activities:Net increase in loans (128,726) (52,494) Purchases of premises and equipment (260) (639) Net decrease (increase) in interest bearing deposits in other banks 6,638 (4,310) Purchases of securities available for sale (29,176) (40,970) Proceeds from repayments securities available for sale 1,190 2,252 Proceeds from maturities and calls securities available for sale 24,000 35,000 Proceeds from sale of securities available for sale 5,019 - Purchase of FHLB stock (939) (103) Purchase of FRB stock (602) - Redemption of FRB stock - 104
Net cash used in investing activities (122,856) (61,160)
Cash flows from financing activities:Net increase in demand, savings, interest-bearing checking and money market deposits 11,186 33,096 Net increase in time deposits 64,280 17,996 Net increase federal funds purchased 15,717 - Net increase in FHLB advances 18,000 - Net increase in securities sold under agreements to repurchase 5,237 1,165 Proceeds from sale of common stock - 22,303
Net cash provided by financing activities 114,420 74,560
Net (decrease) increase in cash and cash equivalents (17,582) 11,484
Cash and cash equivalents at beginning of period 19,174 7,690
Cash and cash equivalents at end of period 1,592$ 19,174$
Supplemental disclosure of cash flow information:Cash payments for interest 4,278$ 2,476$
Supplemental disclosure of noncash investing activities:Unrealized gain on securities 196$ 149$ Loans transferred to other real estate owned 170$ -$
See Accompanying Notes to Financial Statements.
December 31,
VIRGINIA HERITAGE BANK
Statements of Cash Flows($ in thousands)
Years Ended
35
2008 2007Cash flows from operating activities:
Net loss (1,706)$ (3,387)$ Reconciliation of net loss to net cash
used in operating activities:Provision for loan losses 1,612 617 Depreciation and amortization 447 415 Amortization on securities available-for-sale (4) 23 Gain on sale of securities (19) - Stock compensation expense 76 7 Proceeds from sales of loans held for sale 79,463 44,517 Loans originated for resale (85,457) (43,287) Gain on sale of loans held for sale (1,838) (729) Changes in assets and liabilities: Increase in accrued interest receivable (356) (235) Increase in other assets (1,791) (243) Increase in other liabilities 427 386
Net cash used in operating activities (9,146) (1,916)
Cash flows from investing activities:Net increase in loans (128,726) (52,494) Purchases of premises and equipment (260) (639) Net decrease (increase) in interest bearing deposits in other banks 6,638 (4,310) Purchases of securities available for sale (29,176) (40,970) Proceeds from repayments securities available for sale 1,190 2,252 Proceeds from maturities and calls securities available for sale 24,000 35,000 Proceeds from sale of securities available for sale 5,019 - Purchase of FHLB stock (939) (103) Purchase of FRB stock (602) - Redemption of FRB stock - 104
Net cash used in investing activities (122,856) (61,160)
Cash flows from financing activities:Net increase in demand, savings, interest-bearing checking and money market deposits 11,186 33,096 Net increase in time deposits 64,280 17,996 Net increase federal funds purchased 15,717 - Net increase in FHLB advances 18,000 - Net increase in securities sold under agreements to repurchase 5,237 1,165 Proceeds from sale of common stock - 22,303
Net cash provided by financing activities 114,420 74,560
Net (decrease) increase in cash and cash equivalents (17,582) 11,484
Cash and cash equivalents at beginning of period 19,174 7,690
Cash and cash equivalents at end of period 1,592$ 19,174$
Supplemental disclosure of cash flow information:Cash payments for interest 4,278$ 2,476$
Supplemental disclosure of noncash investing activities:Unrealized gain on securities 196$ 149$ Loans transferred to other real estate owned 170$ -$
See Accompanying Notes to Financial Statements.
December 31,
VIRGINIA HERITAGE BANK
Statements of Cash Flows($ in thousands)
Years Ended

3636
VIRGINIA HERITAGE BANK
Notes to Financial Statements
At December 31, 2008 and 2007 and for the Years Ended December 31, 2008 and 2007
Note 1. Organization and Summary of Significant Accounting Policies
Organization
Virginia Heritage Bank (the “Bank”) is a commercial bank chartered by the Commonwealth of Virginia. The Bank began operations on November 21, 2005. The Bank offers a variety of financial services to individual and corporate customers through its three full service banking branches located in Fairfax and Prince William Counties, Virginia.
The Bank is a member of the Federal Reserve System and the Federal Deposit Insurance Corporation (“FDIC”). It is subject to the regulations of the Federal Reserve System and the Bureau of Financial Institutions of the State Corporation Commission of Virginia. Consequently, it undergoes periodic examinations by these regulatory authorities.
Significant Accounting Policies
The following is a description of the significant accounting policies and practices followed by the Bank, which conform to accounting principles generally accepted in the United States of America and prevailing practices within the banking industry.
Use of Estimates
In preparing financial statements in conformity with accounting principles generally accepted in the United States of America, management is required to make estimates and assumptions that affect the reported amounts of assets and liabilities as of the date of the balance sheets and reported amounts of revenues and expenses during the reporting period. Actual results could differ from those estimates. Material estimates that are particularly susceptible to significant change in the near term relate to the determination of the allowance for loan losses and the valuation of deferred tax assets.
Cash and Cash Equivalents
For purposes of the statements of cash flows, cash and cash equivalents include cash, balances due from banks and federal funds sold. Generally, federal funds purchased and sold mature within ninety days.
The Bank is required under Federal Reserve Board regulations to maintain reserves, generally consisting of cash or noninterest-earning accounts, against its transaction deposit accounts. At December 31, 2008, these required reserves were $87,000. At December 31, 2007, the Bank was exempt from having to maintain cash reserves.
Interest Bearing Deposits
Interest bearing deposits in banks mature within one year and are carried at cost.
Securities
Securities may be classified as either trading, held to maturity or available for sale. Trading securities are held principally for resale and recorded at their fair values. Unrealized gains and losses on trading securities are included immediately in operations. Held to maturity securities are those which the Bank has the positive intent and ability to hold to maturity and are reported at amortized cost. Available for sale securities consist of securities not classified as trading securities nor as held to maturity securities.

3737
Unrealized holding gains and losses on available for sale securities are excluded from operations and reported in accumulated other comprehensive income (loss). Gains and losses on the sale of available for sale securities are recorded on the trade date and are determined using the specific identification method. Premiums and discounts on securities are recognized in interest income using the interest method over the period to maturity.
Management evaluates securities for other than temporary impairment on a quarterly basis, and more frequently when economic or market concerns warrant such evaluation. Consideration is given to (1) the length of time and the extent to which the fair value has been less than cost, (2) the financial condition and near term prospects of the issuer, and (3) the intent and ability of the Bank to retain its investment in the issuer for a period of time sufficient to allow for any anticipated recovery in fair value.
Loans
Loans that management has the intent and the Bank has the ability to hold for the foreseeable future or until maturity or pay-off are reported at their outstanding principal adjusted for any charge-offs, the allowance for loan losses, and any deferred fees or costs.
Loan origination fees are deferred and direct origination costs are capitalized.
The accrual of interest on loans is discontinued at the time the loan is ninety days delinquent unless the loan is well collateralized and in process of collection. In all cases, loans are placed on nonaccrual or charged-off at an earlier date if collection of principal or interest is considered doubtful.
All interest accrued but not collected for loans that are placed on nonaccrual or charged-off is reversed against interest income. The interest on these loans is accounted for on the cash-basis or cost-recovery method, until qualifying for return to accrual. Loans are returned to accrual status when all the principal and interest amounts contractually due are brought current and future payments are reasonably assured.
Loans Held for Sale
Loans held for sale, which are composed of residential first mortgage loans, are reported at the lower of cost or fair value on an aggregate loan portfolio basis. Gains or losses realized on the sales of loans held for sale are recognized at the time of sale and are determined by the difference between the net sales proceeds and the carrying value of the loans sold including any deferred origination fees and costs. Net unrealized losses, if any, are recognized through a market adjustment by charges to operations.
Allowance for Loan Losses
The Bank has a credit risk management strategy that includes a combination of exposure limits significantly below legal lending limits and comprehensive underwriting, documentation and collection standards. The strategy also emphasizes diversification on an industry and customer level, regular credit examinations and management reviews of large credit exposures. Even with this lending strategy, loan losses are inherent in our portfolio. The Bank maintains an allowance for loan losses to absorb estimated loan losses that may occur in the future. The allowance for loan losses is established as losses are estimated to have occurred through a provision for loan losses charged to operations. Loan losses are charged against the allowance when management believes the loan balance is uncollectible. Subsequent recoveries, if any, are credited to the allowance.
The allowance for loan losses is evaluated on a quarterly basis by management and is approved by the Board of Directors. The allowance is based upon management’s periodic review of the collectability of the loans in light of historical experience, the nature and volume of the loan portfolio, adverse situations that may affect the borrower’s ability to repay, estimated value of any underlying collateral

3838
and prevailing economic conditions. This evaluation is inherently subjective as it requires estimates that are susceptible to significant revision as more information becomes available.
The allowance consists of specific and general components. The specific component relates to loans that are considered impaired in accordance with Statement of Financial Accounting Standards (“SFAS”) No. 114, Accounting by Creditors for Impairment of a Loan as amended by SFAS No. 118, Accounting by Creditors for Impairment of a Loan-Income Recognition and Disclosures. A loan is considered impaired when, based on current information and events, it is probable that the Bank will be unable to collect the scheduled payments of principal or interest when due according to the contractual terms of the loan agreement. Factors considered by management in determining impairment include payment status, collateral value, and the probability of collecting scheduled principal and interest payments when due. Loans that experience insignificant payment delays and payment shortfalls generally are not classified as impaired. Management determines the significance of payment delays and payment shortfalls on a case-by-case basis, taking into consideration all of the circumstances surrounding the loan and the borrower, including the length of the delay, the reasons for the delay, the borrower’s prior payment record, and the amount of the shortfall in relation to the principal and interest owed. Impairment is measured on a loan-by-loan basis for commercial loans by either the present value of expected future cash flows discounted at the loan’s effective interest rate, the loan’s obtainable market price, or the fair value of the collateral if the loan is collateral dependent. Large groups of smaller-balance homogeneous loans are collectively evaluated for impairment. Accordingly, the Bank does not separately identify individual residential mortgage loans or consumer loans for impairment evaluations.
For loans considered impaired, an allowance is established when the discounted cash flows or the collateral value of the impaired loan is lower than the carrying value of that loan. A specific allowance may not be necessary if the discounted cash flows or the underlying collateral value is deemed sufficient by management to cover any estimated exposures.
The general component of the allowance covers non-impaired loans and is estimated for inherent losses within the remaining portfolio in accordance with SFAS No. 5, Accounting for Contingencies.As part of the quarterly analysis, management stratifies the loan portfolio into several categories: commercial, commercial real estate, construction & development, home equity, and other consumer loans. Loans are further segregated within these categories by risk ratings. The Bank’s credit administration process applies a risk rating to all loans at initial underwriting and upon periodic loan reviews based on a risk grading scale from one through ten. Management then applies historical loss experience adjusted for qualitative factors, such as changes in the economic conditions or other trends or uncertainties that could affect management's estimate of probable losses, to the groupings to determine general reserves for each risk-rated sub-category. Management has established six qualitative factors that are used in calculating general loan loss reserves. During the Bank’s de-novo period, there will be little charge-off history available; therefore, management determines the average loss experience for comparable banks and applies this amount in its calculation of the general allowance.
Premises and Equipment
Leasehold improvements, furniture, fixtures and equipment are stated at cost less accumulated depreciation and amortization. Depreciation and amortization expense are computed using the straight-line method over the shorter of the estimated useful life of each type of asset or lease term ranging from three to five years.
Foreclosed Properties
Assets acquired through, or in lieu of, loan foreclosure are held for sale. They are initially recorded at the lower of the Bank’s cost or the assets’ fair market value at the date of foreclosure, less estimated selling costs thus establishing a new cost basis. Subsequent to foreclosure, valuations of the assets are periodically performed by management. Adjustments are made to the lower of the carrying amount or fair market value of the assets less selling costs. Revenue and expenses from operations and valuation

3939
changes are included in net expenses from foreclosed assets. At December 31, 2008, the Bank had one foreclosed asset in the amount of $170,000. At December 31, 2007, the Bank had no foreclosed assets.
Income Taxes
Deferred taxes are provided on a liability method whereby deferred tax assets are recognized for deductible temporary differences, operating loss carry forwards, and tax credit carry forwards. Deferred tax liabilities are recognized for taxable temporary differences. Temporary differences are the differences between the reported amounts of assets and liabilities and their tax bases. Deferred tax assets are reduced by a valuation allowance when, in the opinion of management, it is more likely than not that some portion or all of the deferred tax assets will not be realized. Deferred tax assets and liabilities are adjusted for the effects of changes in tax laws and rates on the date of enactment.
When tax returns are filed, it is highly certain that some positions taken would be sustained upon examination by the taxing authorities, while others are subject to uncertainty about the merits of the position taken or the amount of the position that would be ultimately sustained. The benefit of a tax position is recognized in the financial statements in the period during which, based on all available evidence, management believes it is more likely than not that the position will be sustained upon examination, including the resolution of appeals or litigation processes, if any. Tax positions taken are not offset or aggregated with other positions. Tax positions that meet the more-likely-than-not recognition threshold are measured as the largest amount of tax benefit that is more than 50 percent likely of being realized upon settlement with the applicable taxing authority. The portion of the benefits associated with tax positions taken that exceeds the amount measured as described above is reflected as a liability for unrecognized tax benefits in the accompanying balance sheets along with any associated interest and penalties that would be payable to the taxing authorities upon examination. Interest and penalties associated with unrecognized tax benefits are classified as additional income taxes in the statements of income.
Advertising Costs
The Bank follows the policy of charging the production costs of advertising to expense as incurred. At December 31, 2008 and 2007, total advertising costs were $87,000 and $75,000, respectively.
Comprehensive Income (Loss)
Accounting principles generally require that recognized revenue, expenses, gains and losses be included in net income. Although certain changes in assets and liabilities, such as unrealized gains and losses on available for sale securities, are reported as a separate component of the equity section of the balance sheet, such items, along with net income, are components of comprehensive income (loss).
Earnings (Loss) Per Share
Basic earnings per share represent income available to common shareholders divided by the weighted-average number of common shares outstanding during the period. Diluted earnings per share reflect additional common shares that would have been outstanding if dilutive potential common shares had been issued, as well as any adjustment to income that would result from the assumed issuance. At December 31, 2008 and 2007, all stock options outstanding were not included in the calculation of diluted weighted average shares as their impact would be anti-dilutive.
Stock Compensation Plan
The Bank accounts for its stock option plans in accordance with SFAS No. 123(R), Share-Based Payment. SFAS 123(R) requires the measurement and recognition of compensation for all stock-based awards made to employees and directors, including stock options, based on estimated fair values. Under the fair value recognition provisions of SFAS 123(R), the Bank recognizes stock-based compensation in salaries and employee benefits in the statements of operations on a straight-line basis over the vesting period.

4040
The Bank uses the Black-Scholes option pricing model in order to value stock-based awards. The determination of the fair value of stock-based awards on the date of grant using an option pricing model is affected by the Bank's stock price as well as assumptions regarding a number of highly complex and subjective variables. These variables include, but are not limited to the expected life of the award, our estimated stock price volatility over the term of the award and actual and projected exercise behaviors. Although the fair value of stock-based awards is determined in accordance with SFAS 123(R), the assumptions used in calculating fair value of stock-based awards and the Black-Scholes option pricing model are highly subjective, and other reasonable assumptions could provide differing results. As a result, if factors change and the Bank uses different assumptions, stock-based compensation expense could be materially different in the future.
Off-Balance Sheet Instruments
In the ordinary course of business the Bank has entered into off-balance-sheet financial instruments consisting of commitments to extend credit, standby letters of credit, undisbursed construction loans and unused lines of credit. Such financial instruments are recorded in the financial statements when they are funded.
Fair Values of Financial Instruments
The fair value of a financial instrument is the current amount that would be exchanged between willing parties, other than in a forced liquidation. Fair value is best determined based upon quoted market prices. However, in many instances, there are no quoted market prices for the Bank's various financial instruments. In cases where quoted market prices are not available, fair values are based on estimates using present value or other valuation techniques. Those techniques are significantly affected by the assumptions used, including the discount rate and estimates of future cash flows. Accordingly, the aggregate fair value amounts presented may not be realized in an immediate settlement of the instrument or may not necessarily represent the underlying fair value of the Bank. The following methods and assumptions were used by the Bank in estimating fair values of financial instruments:
Cash and Cash Equivalents. The carrying amounts of cash and cash equivalents approximate their fair values.
Interest Bearing Deposits in Banks. The carrying amounts of interest bearing deposits maturing within ninety days approximate their fair values.
Securities. Fair values for securities are based on quoted market prices, where available. If quoted market prices are not available, fair values are based on quoted market prices of comparable instruments.
Loans. For variable-rate loans that reprice frequently and have no significant change in credit risk, fair values are based on carrying values. Fair values for fixed-rate loans are estimated using discounted cash flow analyses, applying interest rates currently being offered for loans with similar terms to borrowers of similar credit quality.
Loans Held for Sale. The fair value of loans held for sale is based on outstanding commitments from investors.
Deposits. The fair values disclosed for demand, NOW, money-market and savings deposits are, by definition, equal to the amount payable on demand at the reporting date (that is, their carrying amounts). Fair values for fixed-rate time deposits are estimated using a discounted cash flow calculation that applies interest rates currently being offered on time deposits to a schedule of aggregated expected monthly maturities on time deposits.
Federal Home Loan Bank Advances. Fair values are estimated using discounted cash flow
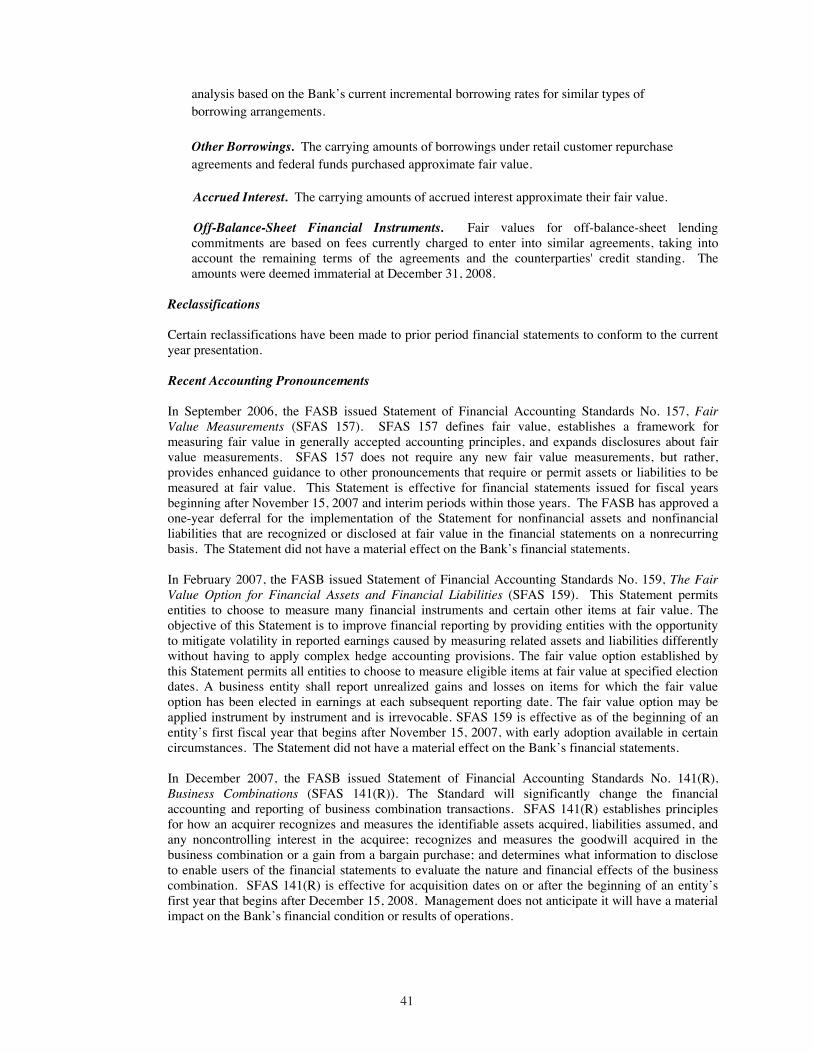
4141
analysis based on the Bank’s current incremental borrowing rates for similar types of borrowing arrangements.
Other Borrowings. The carrying amounts of borrowings under retail customer repurchase agreements and federal funds purchased approximate fair value.
Accrued Interest. The carrying amounts of accrued interest approximate their fair value.
Off-Balance-Sheet Financial Instruments. Fair values for off-balance-sheet lending commitments are based on fees currently charged to enter into similar agreements, taking into account the remaining terms of the agreements and the counterparties' credit standing. The amounts were deemed immaterial at December 31, 2008.
Reclassifications
Certain reclassifications have been made to prior period financial statements to conform to the current year presentation.
Recent Accounting Pronouncements
In September 2006, the FASB issued Statement of Financial Accounting Standards No. 157, Fair Value Measurements (SFAS 157). SFAS 157 defines fair value, establishes a framework for measuring fair value in generally accepted accounting principles, and expands disclosures about fair value measurements. SFAS 157 does not require any new fair value measurements, but rather, provides enhanced guidance to other pronouncements that require or permit assets or liabilities to be measured at fair value. This Statement is effective for financial statements issued for fiscal years beginning after November 15, 2007 and interim periods within those years. The FASB has approved a one-year deferral for the implementation of the Statement for nonfinancial assets and nonfinancial liabilities that are recognized or disclosed at fair value in the financial statements on a nonrecurring basis. The Statement did not have a material effect on the Bank’s financial statements.
In February 2007, the FASB issued Statement of Financial Accounting Standards No. 159, The Fair Value Option for Financial Assets and Financial Liabilities (SFAS 159). This Statement permits entities to choose to measure many financial instruments and certain other items at fair value. The objective of this Statement is to improve financial reporting by providing entities with the opportunity to mitigate volatility in reported earnings caused by measuring related assets and liabilities differently without having to apply complex hedge accounting provisions. The fair value option established by this Statement permits all entities to choose to measure eligible items at fair value at specified election dates. A business entity shall report unrealized gains and losses on items for which the fair value option has been elected in earnings at each subsequent reporting date. The fair value option may be applied instrument by instrument and is irrevocable. SFAS 159 is effective as of the beginning of an entity’s first fiscal year that begins after November 15, 2007, with early adoption available in certain circumstances. The Statement did not have a material effect on the Bank’s financial statements.
In December 2007, the FASB issued Statement of Financial Accounting Standards No. 141(R), Business Combinations (SFAS 141(R)). The Standard will significantly change the financial accounting and reporting of business combination transactions. SFAS 141(R) establishes principles for how an acquirer recognizes and measures the identifiable assets acquired, liabilities assumed, and any noncontrolling interest in the acquiree; recognizes and measures the goodwill acquired in the business combination or a gain from a bargain purchase; and determines what information to disclose to enable users of the financial statements to evaluate the nature and financial effects of the business combination. SFAS 141(R) is effective for acquisition dates on or after the beginning of an entity’s first year that begins after December 15, 2008. Management does not anticipate it will have a material impact on the Bank’s financial condition or results of operations.

4242
In December 2007, the FASB issued Statement of Financial Accounting Standards No. 160, Noncontrolling Interests in Consolidated Financial Statements an Amendment of ARB No. 51 (SFAS 160). The Standard will significantly change the financial accounting and reporting of noncontrolling (or minority) interests in consolidated financial statements. SFAS 160 is effective as of the beginning of an entity’s first fiscal year that begins after December 15, 2008, with early adoption prohibited. Management does not anticipate it will have a material effect on the Bank’s financial condition or results of operations.
In March 2008, the FASB issued SFAS No. 161, Disclosures about Derivative Instruments and Hedging Activities – an amendment of SFAS No. 133, (SFAS No. 161). SFAS No. 161 requires that an entity provide enhanced disclosures related to derivative and hedging activities. Management does not anticipate it will have a material effect on the Bank’s financial statements.
In May 2008, the FASB issued SFAS No. 162, The Hierarchy of Generally Accepted Accounting Principles, (SFAS No. 162). SFAS No. 162 identifies the sources of accounting principles and the framework for selecting the principles to be used in the preparation of financial statements of nongovernmental entities that are presented in conformity with generally accepted accounting principles. SFAS No. 162 is effective 60 days following the SEC’s approval of the Public Company Accounting Oversight Board amendments to AU Section 411, The Meaning of Present Fairly in Conformity With Generally Accepted Accounting Principles. Management does not anticipate it will have a material effect on the Bank’s financial statements.
In October 2008, the FASB issued FSP FAS 157-3, Determining the Fair Value of a Financial Asset When the Market for That Asset Is Not Active, (FSP 157-3). FSP 157-3 clarifies the application of SFAS No. 157 in determining the fair value of a financial asset during periods of inactive markets. The Statement did not have a material effect on the Bank’s financial statements.
In December 2008, the FASB issued FSP No. FAS 140-4 and FIN 46(R)-8, Disclosures by Public Entities (Enterprises) about Transfers of Financial Assets and Interests in Variable Interest Entities.FSP No. FAS 140-4 and FIN 46(R)-8 requires enhanced disclosures about transfers of financial assets and interests in variable interest entities. The FSP is effective for interim and annual periods ending after December 15, 2008. Since the FSP requires only additional disclosures concerning transfers of financial assets and interest in variable interest entities, adoption of the FSP will not affect the Bank’s financial condition, results of operations or cash flows.
In January 2009, the FASB reached a consensus on EITF Issue 99-20-1. This FSP amends the impairment guidance in EITF Issue No. 99-20, Recognition of Interest Income and Impairment on Purchased Beneficial Interests and Beneficial Interests That Continue to Be Held by a Transferor in Securitized Financial Assets, to achieve more consistent determination of whether an other-than-temporary impairment has occurred. The FSP also retains and emphasizes the objective of an other-than-temporary impairment assessment and the related disclosure requirements in FASB Statement No. 115, Accounting for Certain Investments in Debt and Equity Securities, and other related guidance. The FSP is effective for interim and annual reporting periods ending after December 15, 2008 and shall be applied prospectively. The Statement did not have a material effect on the Bank’s financial statements.
Note 2. Securities Available for Sale
All securities have been classified as available for sale by management. The carrying amount of securities and their approximate fair values are summarized as follows (in thousands):

4343
Gross GrossAmortized Unrealized Unrealized Fair
Cost Gains Losses Value
At December 31, 2008: U.S. Government agency securities 3,000$ 46$ -$ 3,046$
Mortgage-backed securities 19,694 265 - 19,959
Total 22,694$ 311$ -$ 23,005$
At December 31, 2007: U.S. Government agency securities 21,992$ 100$ -$ 22,092$
Mortgage-backed securities 1,712 15 - 1,727
Total 23,704$ 115$ -$ 23,819$
The scheduled maturities of securities at December 31, 2008 are as follows (in thousands):
Amortized FairCost Value
Due less than one year -$ -$ Due from one to five years - - Due from five to ten years 3,000 3,046 Mortgage-backed securities 19,694 19,959
Total 22,694$ 23,005$
Actual principal repayments could differ from scheduled maturities due to callable options held by the issuer. Management expects a portion of the securities will be called or paid down by the issuer prior to their stated maturities.
During 2008, the Bank sold $5.0 million in securities available for sale. The Bank did not have any sales of securities for the year ended December 31, 2007.
At December 31, 2008, securities with a carrying value of approximately $14.9 million were pledged as collateral for FHLB advances and other borrowings. At December 31, 2007, securities with a carrying value of approximately $3.0 million were pledged as collateral for other borrowings.
Note 3. Loans
The components of loans are as follows (in thousands):
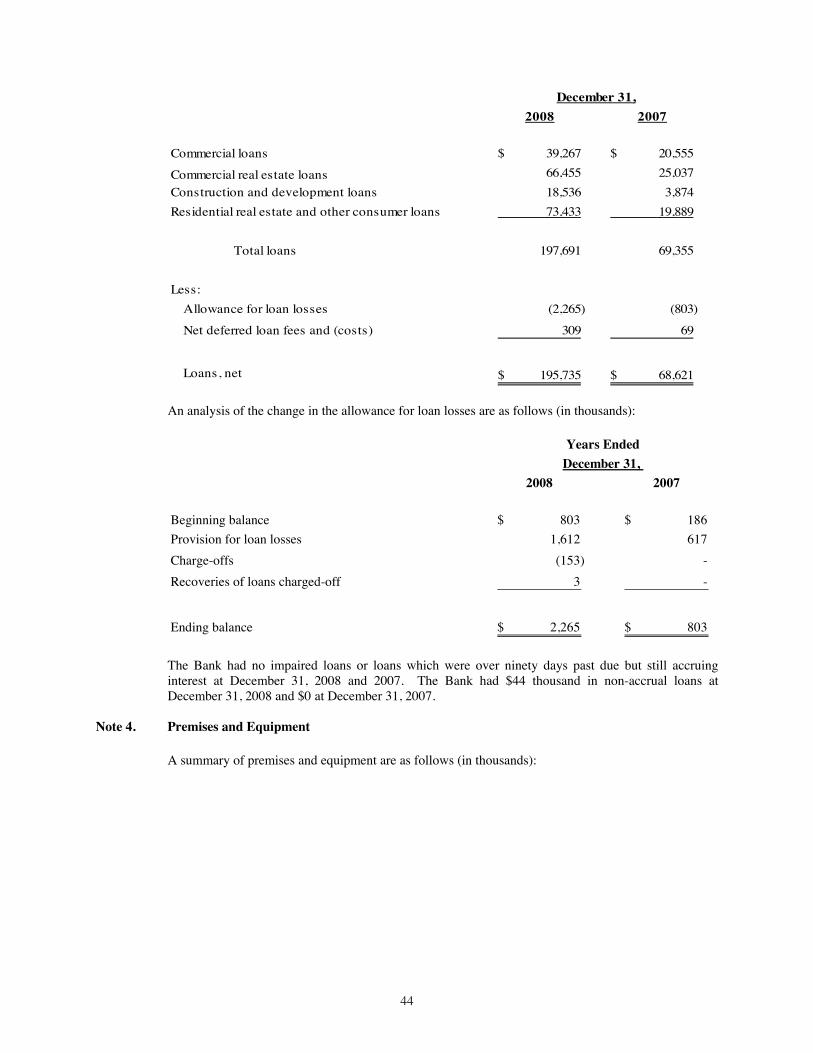
4444
2008 2007
Commercial loans 39,267$ 20,555$
Commercial real estate loans 66,455 25,037 Construction and development loans 18,536 3,874 Residential real estate and other consumer loans 73,433 19,889
Total loans 197,691 69,355
Less: Allowance for loan losses (2,265) (803)
Net deferred loan fees and (costs) 309 69
Loans, net 195,735$ 68,621$
December 31,
An analysis of the change in the allowance for loan losses are as follows (in thousands):
2008 2007
Beginning balance 803$ 186$ Provision for loan losses 1,612 617 Charge-offs (153) - Recoveries of loans charged-off 3 -
Ending balance 2,265$ 803$
Years EndedDecember 31,
The Bank had no impaired loans or loans which were over ninety days past due but still accruing interest at December 31, 2008 and 2007. The Bank had $44 thousand in non-accrual loans at December 31, 2008 and $0 at December 31, 2007.
Note 4. Premises and Equipment
A summary of premises and equipment are as follows (in thousands):

4545
2008 2007
Furniture, fixtures and equipment 1,307$ 1,082$ Leasehold improvements 824 789
Total 2,131 1,871
Less accumulated depreciation and amortization (997) (550)
Premises and equipment, net 1,134$ 1,321$
December 31,
For the years ended December 31, 2008 and 2007, depreciation expense was $447,000 and $415,000, respectively.
The Bank leases all of its offices under operating leases. These leases have terms ranging from three to nine years. Rent expense for the year ended December 31, 2008 and 2007 was approximately $601,000 and $483,000, respectively. At December 31, 2008, future minimum rental commitments under these non-cancelable leases are approximately as follows:
Years EndingDecember 31, Amount
2009 546$ 2010 562 2011 542 2012 411 2013 377
Thereafter 1,257
3,695$
Note 5. Deposits
The aggregate amount of time deposits, each with a minimum denomination of $100,000, was approximately $60.5 million and $33.7 million at December 31, 2008 and 2007, respectively.
At December 31, 2008, the scheduled maturities of time deposits are as follows (in thousands):
2009 $ 41,694 2010 53,3202011 10,8282013 146
$ 105,988

4646
At December 31, 2008 and 2007, one customer had funds on deposit with the Bank in excess of ten percent of the Bank’s total deposits. The total amount of these deposits was approximately $18.4 million and $16.5 million, respectively.
Note 6. Other Borrowings
The Bank has unsecured lines of credit with correspondent banks totaling $18 million available for overnight borrowing. At December 31, 2008, the balance on these lines was $3.7 million. These lines were not utilized at December 31, 2007.
The Bank also established a Borrower-In-Custody (BIC) arrangement with the Federal Reserve Bank of Richmond in October 2008. The BIC program allows the Bank to pledge assets as collateral to secure advances from the discount window. The Bank pledged automobile loans with a collateral value of approximately $36.7 million. At December 31, 2008, the outstanding balance on this line was $12 million.
Additional credit facilities are available to the Bank through its membership in the Federal Home Loan Bank of Atlanta. Based upon the Bank’s credit standing and available collateral, which consists of certain investment securities and real estate secured loans, the Bank may borrow up to 20% of its total assets on a short term or long term basis. The Bank pledged real estate secured loans with a collateral value of approximately $29.8 million. The Bank had four advances outstanding with the Federal Home Loan Bank of Atlanta totaling $18.0 million as of December 31, 2008 and $0 as of December 31, 2007. On March 31, 2008, the Bank entered into a 2-year FRC (Fixed Rate Credit) agreement in the amount of $5.0 million. Interest accrues at the rate of 2.54% and is paid quarterly, with the principal due March 3, 2010. On September 3, 2008, the Bank entered into a 5-year FRC agreement in the amount of $5.0 million. Interest accrues at the rate of 4.10% and is paid quarterly, with the principal due September 3, 2013. On September 3, 2008, the Bank entered into a 3-year FRC agreement in the amount of $5.0 million. Interest accrues at the rate of 3.73% and is paid quarterly, with the principal due September 6, 2011. On September 12, 2008, the Bank entered into a 5-year FRC agreement in the amount of $3.0 million. Interest accrues at the rate of 3.84% and is paid monthly, with the principal due September 12, 2013.
The Bank enters into repurchase agreements with customers that sweep funds from deposit accounts into investment accounts. These investment accounts are not federally insured and are treated as borrowings. These agreements require the Bank to pledge securities as collateral for these borrowings. At December 31, 2008 and 2007, the outstanding balance of such borrowings totaled $6.4 million and $1.2 million, respectively. The Bank pledged securities with a carrying value of approximately $9.2 million as collateral for these agreements.
Note 7. Off-Balance Sheet Financial Instruments
The Bank is a party to financial instruments with off-balance sheet risk in the normal course of business to meet the financing needs of its customers. These financial instruments are commitments to extend credit, unused lines of credit and standby letters of credit and may involve, to varying degrees, elements of credit risk in excess of the amount recognized in the balance sheet. The contract amounts of these instruments reflect the extent of involvement the Bank has in these financial instruments.
The Bank's exposure to credit loss in the event of nonperformance by the other party to the financial instrument for commitments to extend credit is represented by the contractual amount of those instruments. The Bank uses the same credit policies in making commitments as it does for on-balance-sheet instruments.
Commitments to extend credit, including lines of credit, are agreements to lend to a customer as long as there is no violation of any condition established in the contract. Commitments generally have fixed expiration dates or other termination clauses and may require payment of a fee. Since some of the commitments are expected to expire without being drawn upon, the total commitment amounts do not necessarily represent future cash requirements. The Bank evaluates each customer's credit worthiness
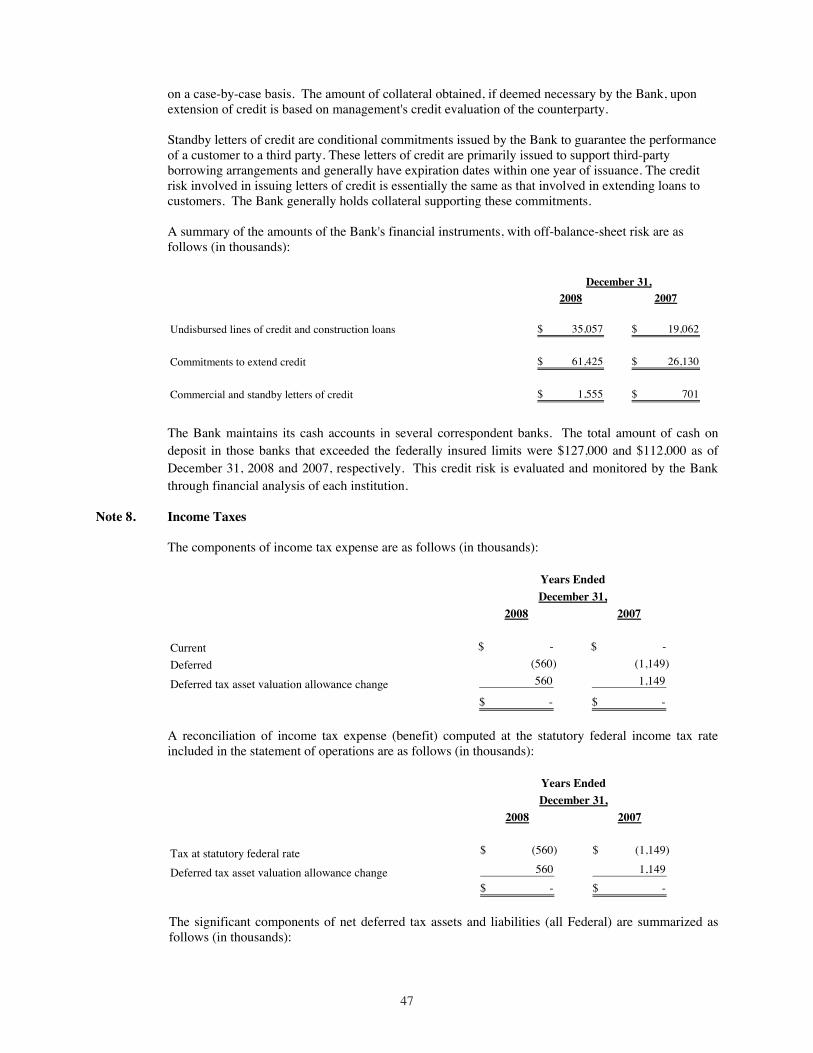
4747
on a case-by-case basis. The amount of collateral obtained, if deemed necessary by the Bank, upon extension of credit is based on management's credit evaluation of the counterparty.
Standby letters of credit are conditional commitments issued by the Bank to guarantee the performance of a customer to a third party. These letters of credit are primarily issued to support third-party borrowing arrangements and generally have expiration dates within one year of issuance. The credit risk involved in issuing letters of credit is essentially the same as that involved in extending loans to customers. The Bank generally holds collateral supporting these commitments.
A summary of the amounts of the Bank's financial instruments, with off-balance-sheet risk are as follows (in thousands):
2008 2007
Undisbursed lines of credit and construction loans 35,057$ 19,062$
Commitments to extend credit 61,425$ 26,130$
Commercial and standby letters of credit 1,555$ 701$
December 31,
The Bank maintains its cash accounts in several correspondent banks. The total amount of cash on deposit in those banks that exceeded the federally insured limits were $127,000 and $112,000 as of December 31, 2008 and 2007, respectively. This credit risk is evaluated and monitored by the Bank through financial analysis of each institution.
Note 8. Income Taxes
The components of income tax expense are as follows (in thousands):
2008 2007
Current $ - $ - Deferred (560) (1,149)
Deferred tax asset valuation allowance change 560 1,149
-$ -$
Years EndedDecember 31,
A reconciliation of income tax expense (benefit) computed at the statutory federal income tax rate included in the statement of operations are as follows (in thousands):
2008 2007
Tax at statutory federal rate (560)$ (1,149)$
Deferred tax asset valuation allowance change 560 1,149 -$ -$
Years EndedDecember 31,
The significant components of net deferred tax assets and liabilities (all Federal) are summarized as follows (in thousands):

4848
2008 2007
Deferred tax assetsNet operating losses $ 1,863 $ 1,688 Pre-opening expenses 205 222 Non-qualified stock option expense 63 51
Allowance for loan losses 697 227
Unrealized loss on securities AFS 106 -
Promotional expense for home equity loans 32 9
Contribution carryover 5 2
Deferred tax assets 2,971 2,199
Deferred tax liabilitiesAccumulated depreciation $ 27 $ 2
Discount accretion 1 2
Unrealized gain on securities AFS - 39
Net deferred fees 105 23
Deferred tax liabilities 133 66
Net deferred tax asset 2,838$ 2,133$
Deferred tax asset valuation allowance (2,838) (2,133) -$ -$
Years EndedDecember 31,
Under the provisions of the Internal Revenue Code, the Bank has approximately $5.5 million of net operating loss carry forwards which can be offset against future taxable income. The carry forwards begin to expire on December 31, 2025. The full realization of the tax benefits associated with the carry forwards depends predominately upon the recognition of ordinary income during the carry forward period.
Note 9. Stock Compensation Plan
The Shareholders approved a Stock Option Plan (the “Plan”) on June 15, 2006. The Plan reserves 250,000 shares of common stock and may grant up to 25,000 options to each of its directors, officers and key employees of the Bank in any calendar year. Both incentive stock options and non-qualified stock options may be granted under the Plan. The exercise price of each option equals the market price of the Bank’s stock on the date of grant and an option’s maximum term is ten years.
The Plan also provides for stock options to be granted to seed investors as a reward for the contribution of organizational funds which were at risk if the Bank’s organization had not been successful. The stock options granted to seed investors are fully vested upon date of grant. All shares granted in 2006 related to seed investors. A summary of stock option transactions for 2008 are as follows:

4949
Weighted WeightedAverage AverageExercise Contractual
Shares Price TermOutstanding at December 31, 2007 111,078 10.00$ Granted 84,000 10.21 Exercised - - Forfeited (500) 10.00 Outstanding at December 31, 2008 194,578 10.09$ 8.98 years
Options exercisable at end of year 96,078 10.05$ 8.78 years
There was no intrinsic value for shares outstanding and exercisable as of December 31, 2008. The fair value of each option grant is estimated on the date of grant using the Black-Scholes option-pricing model with the following weighted-average assumptions:
2008 2007
Weighted-average risk-free interest rate 2.84% 4.31%Dividend yield 0.00% 0.00%Estimated stock price volatility 15.00% 15.00%Expected life 5 years 5 yearsPer share weighted-average grant-date fair value of options issued during the period 2.26$ 2.40$
Years EndedDecember 31,
The risk-free interest rate is the weighted-average of the 5 year Treasury strip rate on the date of the grant. The dividend rate is calculated as the average quarterly dividend yield on our stock for the past five years by dividing the quarterly dividend by the average daily closing price of the stock for the period. Volatility is a measure of the standard deviation of the daily closing stock price plus the dividend yield for the same period. The expected life of options was calculated using the simplified method whereby the vesting period and the contractual period are averaged.
The Bank recognized compensation expense of $76,000 in 2008 and $7,000 in 2007 relating to employee stock options. The unrecognized compensation expense remaining at December 31, 2008 is $146,000, which will be recognized over an average remaining period of approximately three years.
Note 10. Related Party Transactions
In the ordinary course of business and on the same terms available to other customers, the Bank has granted loans to its principal officers and directors and their affiliates. These related-party transactions are summarized as follows (in thousands):

5050
2008 2007
Loan balances at the beginning of the period 991$ 890$ New loans or advances 2,667 334 Principal repayments (185) (233)
Loan balances at the end of the period 3,473$ 991$
Years EndedDecember 31,
Deposits of principal officers and directors and their affiliates totaled $1.1 million as of December 31, 2008.
Note 11. Retirement Plan
The Bank established a 401(k) retirement plan (the “Plan”) to which eligible employees may contribute a percentage of their salaries. Currently, the Bank makes matching contributions to the Plan each payroll period at an amount equal to 100% of the first 4% contributed by the employees not exceeding maximum allowances. The Bank recognized expense of $154,000 and $92,000 for the years ended December 31, 2008 and 2007, respectively.
Note 12. Dividend Restrictions
The Bank is limited in the amount of cash dividends that may be paid based on current banking regulations. However, for any dividend declaration, the Bank must consider additional factors such as the amount of current period net earnings, liquidity, asset quality, capital adequacy and economic conditions. It is likely that these factors would further limit the amount of dividends which the Bank could declare. In addition, bank regulators have the authority to prohibit banks from paying dividends if they deem such payment to be an unsafe or unsound practice. At December 31, 2008 and 2007, the Bank was prohibited from paying dividends.
Note 13. Regulatory Matters
The Bank is subject to various regulatory capital requirements administered by the banking agencies. Failure to meet minimum capital requirements can initiate certain mandatory and possibly additional discretionary actions by regulators that, if undertaken, could have a direct material effect on the Bank's financial statements. Under capital adequacy guidelines and the regulatory framework for prompt corrective action, the Bank must meet specific capital guidelines that involve quantitative measures of the Bank's assets, liabilities, and certain off-balance-sheet items as calculated under regulatory accounting practices. The Bank's capital amounts and classification are also subject to qualitative judgments by the regulators about components, risk weightings, and other factors.
Quantitative measures established by regulation to ensure capital adequacy require the Bank to maintain minimum amounts and percents (set forth in the table below) of total and Tier I capital (as defined in the regulations) to risk-weighted assets (as defined), and of Tier I capital (as defined) to average assets (as defined). Management believes, as of December 31, 2008, that the Bank meets all capital adequacy requirements to which it is subject.
As of December 31, 2008, the most recent notification from the regulatory authorities categorized the Bank as well capitalized under the regulatory framework for prompt corrective action. To be categorized as adequately capitalized the Bank must maintain minimum total risk-based, Tier I risk-based, and Tier I leverage percents as set forth in the table. There are no conditions or events since that notification that management believes have changed the Bank's category. The Bank's actual capital amounts and percentages are also presented in the following table ($ in thousands):

5151
Note 14. Legal Contingencies
Various legal claims arise from time to time in the normal course of business. In the opinion of management, none have occurred that will have a material effect on the Bank’s financial statements.
Note 15. Sale of Common Stock
During 2007, the Bank completed the sale of 2,291,633 shares of common stock at $10 per share ($4 par value). The Bank incurred approximately $613,000 in offering-related expenses in conjunction with this sale, therefore common stock was increased by $9.2 million and additional paid in capital was increased by $13.1 million.
Note 16. Fair Value Measurements
The Bank adopted SFAS No. 157, “Fair Value Measurements” (SFAS 157), on January 1, 2008 to record fair value adjustments to certain assets and liabilities and to determine fair value disclosures. SFAS 157 clarifies that fair value of certain assets and liabilities is an exit price, representing the amount that would be received to sell an asset or paid to transfer a liability in an orderly transaction between market participants.
In February of 2008, the FASB issued Staff Position No. 157-2 (FSP 157-2) which delayed the effective date of SFAS 157 for certain nonfinancial assets and nonfinancial liabilities except for those items that are recognized or disclosed at fair value in the financial statements on a recurring basis. FSP 157-2 defers the effective date of SFAS 157 for such nonfinancial assets and nonfinancial liabilities to fiscal years beginning after November 15, 2008, and interim periods within those fiscal years. Thus, the Bank has only partially applied SFAS 157. Those items affected by FSP 157-2 include other real estate owned (OREO), goodwill and core deposit intangibles.
In October of 2008, the FASB issued Staff Position No. 157-3 (FSP 157-3) to clarify the application of SFAS 157 in a market that is not active and to provide key considerations in determining the fair value of a financial asset when the market for that financial asset is not active. FSP 157-3 was effective upon issuance, including prior periods for which financials statements were not issued.
Amount Ratio Amount Ratio Amount RatioAs of December 31, 2008: Total Capital (to Risk Weighted Assets) $ 31,699 15.71% $ 16,142 8.00% $ 20,177 10.00% Tier 1 Capital (to Risk Weighted Assets) $ 29,434 14.59% $ 8,071 4.00% $ 12,106 6.00% Tier 1 Capital (to Average Assets) $ 29,434 13.02% $ 9,045 4.00% $ 11,307 5.00%
As of December 31, 2007: Total Capital (to Risk Weighted Assets) $ 31,867 42.01% $ 6,069 8.00% $ 7,586 10.00% Tier 1 Capital (to Risk Weighted Assets) $ 31,064 40.95% $ 3,034 4.00% $ 4,552 6.00% Tier 1 Capital (to Average Assets) $ 31,064 27.42% $ 4,532 4.00% $ 5,665 5.00%
Actual Capital Requirement Action Provisions
MinimumTo Be Well
Capitalized UnderMinimum Prompt Corrective

5252
SFAS 157 specifies a hierarchy of valuation techniques based on whether the inputs to those valuation techniques are observable or unobservable. Observable inputs reflect market data obtained from independent sources, while unobservable inputs reflect the Bank’s market assumptions. The three levels of the fair value hierarchy under SFAS 157 based on these two types of inputs are as follows:
Level 1 – Valuation is based on quoted prices in active markets for identical assets and liabilities.
Level 2 – Valuation is based on observable inputs including quoted prices in active markets for similar assets and liabilities, quoted prices for identical or similar assets and liabilities in less active markets, and model-based valuation techniques for which significant assumptions can be derived primarily from or corroborated by observable data in the market.
Level 3 – Valuation is based on model-based techniques that use one or more significant inputs or assumptions that are unobservable in the market.
The following describes the valuation techniques used by the Bank to measure certain financial assets and liabilities recorded at fair value on a recurring basis in the financial statements:
Securities available for sale: Securities available for sale are recorded at fair value on a recurring basis. Fair value measurement is based upon quoted market prices, when available (Level 1). If quoted market prices are not available, fair values are measured utilizing independent valuation techniques of identical or similar securities for which significant assumptions are derived primarily from or corroborated by observable market data. Third party vendors compile prices from various sources and may determine the fair value of identical or similar securities by using pricing models that considers observable market data (Level 2).
The following table presents the balances of financial assets measured at fair value on a recurring basis as of December 31, 2008:
Description
Balance as of December 31,
2008
Quoted Prices in Active
Markets for Identical
Assets (Level 1)
Significant Other
Observable Inputs
(Level 2)
Significant Unobservable
Inputs (Level 3)
Assets: Available-for-sale securities 23,005$ -$ 23,005$ -$
Fair Value Measurements at December 31, 2008 Using
Certain financial assets are measured at fair value on a nonrecurring basis in accordance with GAAP. Adjustments to the fair value of these assets usually result from the application of lower-of-cost-or-market accounting or write-downs of individual assets.
The following describes the valuation techniques used by the Bank to measure certain financial assets recorded at fair value on a nonrecurring basis in the financial statements:
Loans held for sale: Loans held for sale are carried at the lower of cost or market value. These loans currently consist of one-to-four family residential loans originated for sale in the secondary market. Fair value is based on the price secondary markets are currently offering for similar loans using observable market data which is not materially different than cost due to the short duration between origination and sale (Level 2). As such, the Bank records any fair value adjustments on a nonrecurring basis. No nonrecurring fair value adjustments were recorded on loans held for sale during the year ended December 31, 2008. Gains and losses on the sale of loans are recorded within income from mortgage banking on the Statements of Operations.

5353
Impaired Loans: Loans are designated as impaired when, in the judgment of management based on current information and events, it is probable that all amounts due according to the contractual terms of the loan agreement will not be collected. The measurement of loss associated with impaired loans can be based on either the observable market price of the loan or the fair value of the collateral. Fair value is measured based on the value of the collateral securing the loans. Collateral may be in the form of real estate or business assets including equipment, inventory, and accounts receivable. The vast majority of the collateral is real estate. The value of real estate collateral is determined utilizing an income or market valuation approach based on an appraisal conducted by an independent, licensed appraiser outside of the Bank using observable market data (Level 2). However, if the collateral is a house or building in the process of construction or if an appraisal of the real estate property is over two years old, then the fair value is considered Level 3. The value of business equipment is based upon an outside appraisal if deemed significant, or the net book value on the applicable business’ financial statements if not considered significant using observable market data. Likewise, values for inventory and accounts receivables collateral are based on financial statement balances or aging reports (Level 3). Impaired loans allocated to the Allowance for Loan Losses are measured at fair value on a nonrecurring basis. Any fair value adjustments are recorded in the period incurred as provision for loan losses on the Statements of Operations. The Bank had no impaired loans for the year ended December 31, 2008.
The estimated fair values of the Bank’s financial instruments at December 31, 2008 and 2007 are as follows (in thousands):
Carrying Fair Carrying FairAmount Value Amount Value
Financial assets: Cash and cash equivalents 1,592$ 1,592$ 19,174$ 19,174$ Interest bearing deposits in other banks 6,672 6,672 13,310 13,310 Securities available for sale 23,005 23,005 23,819 23,819 Loans 195,735 195,849 68,621 69,638 Loans held for sale 9,170 9,309 1,338 1,358 Accrued interest receivable 730 730 374 374
Financial liabilities: Deposits 171,269 172,315 95,803 93,269 Federal funds purchased 15,717 15,717 - - FHLB advances 18,000 18,584 - - Securities sold under agreements to repurchase 6,402 6,402 1,165 1,165 Accrued interest payable 241 241 130 130
December 31, 2008 2007
At December 31, 2008 and 2007, the fair value of loan commitments and stand-by letters of credit were deemed immaterial.
Item 9. Changes In and Disagreements with Accountants on Accounting and Financial Disclosure
Not applicable.
Item 9A(T). Controls and Procedures
The Bank maintains disclosure controls and procedures that are designed to ensure that information required to be disclosed in the Bank’s Exchange Act reports is recorded, processed, summarized and reported within the time periods specified in the SEC’s rules and forms, and that such information is accumulated and communicated to the Bank’s

5454
management, including its Chief Executive Officer and Chief Financial Officer, as appropriate, to allow timely decisions regarding required disclosure based closely on the definition of “disclosure controls and procedures” in Rule 13a-15(e).
There has been no change made in the Bank’s internal control over financial reporting during the quarter ended December 31, 2008 that has materially affected, or is reasonably likely to materially affect, the Bank’s internal control over financialreporting.
For the quarter ended December 31, 2008, the Bank carried out an evaluation, under the supervision and with the participation of the Bank’s management, including the Bank’s Chief Executive Officer and Chief Financial Officer, of the effectiveness of the design and operation of the Bank’s disclosure controls and procedures. Based on the foregoing, the Bank’s Chief Executive Officer and Chief Financial Officer concluded that the Bank’s disclosure controls and procedures were effective. There have been no significant changes in the Bank’s internal controls or in other factors that could significantly affect the internal controls subsequent to the date the Bank completed its evaluation.
Item 9B. Other Information
Not applicable.
PART III
Item 10. Directors, Executive Officers and Corporate Governance
The information required by this Item 10 is incorporated herein by reference to the Bank’s 2009 Proxy Statement.
Item 11. Executive Compensation
The information required by this Item 11 is incorporated herein by reference to the Bank’s 2009 Proxy Statement.
Item 12. Security Ownership of Certain Beneficial Owners and Management and Related StockholderMatters
The information required by this Item 12 is incorporated herein by reference to the Bank’s 2009 Proxy Statement.
Item 13. Certain Relationships and Related Transactions, and Director Independence
The information required by this Item 13 is incorporated herein by reference to the Bank’s 2009 Proxy Statement.
Item 14. Principal Accountant Fees and Services
The information required by this Item 14 is incorporated herein by reference to the Bank’s 2009 Proxy Statement.
Part IV
Item 15. Exhibits and Financial Statement Schedules
(a) Documents Filed as Part of this Report
(1) Financial statements have been included in Item 8.
(2) All schedules for which provision is made in the applicable accounting regulation of the SEC are omitted because of the absence of conditions under which they are required or because the required information is included in the financial statements and related notes thereto.
(b) Exhibit Index
Exhibit 3.1 Articles of Incorporation* Exhibit 3.2 Bylaws of Virginia Heritage Bank*

5555
Exhibit 4.1 Specimen Stock Certificate* Exhibit 10.1 Stock Option Plan* Exhibit 10.2 Consulting Agreement between the Bank and Douglas M. Church, Jr.* Exhibit 23.0 Consent of Yount, Hyde & Barbour, P.C.
Exhibit 31.1 Certification of Chief Executive Officer pursuant to Rule 13a-14(a) of Exchange Act, as adopted pursuant to Section 302 of the Sarbanes-Oxley Act of 2002
Exhibit 31.2 Certification of Chief Financial Officer pursuant to Rule 13a-14(a) of Exchange Act, as adopted pursuant to Section 302 of the Sarbanes-Oxley Act of 2002
Exhibit 32.1 Section 906 Certification of the CEO Exhibit 32.2 Section 906 Certification of the CFO
(*) Incorporated herein by reference from the Bank’s Form 10 filed with the FRB.

5656
SIGNATURES
In accordance with section 13 or 15(d) of the Exchange Act, the registrant caused this report to be signed on its behalf by the undersigned, thereunto duly authorized.
VIRGINIA HERITAGE BANK (Registrant)
Date: March 27, 2009 By: /s/ David P. Summers David P. Summers
Chief Executive Officer
In accordance with the Exchange Act, this report has been signed below by the following persons on behalf of the registrant and in the capacities and on the dates indicated.
NAME TITLE DATE
/s/ David P. Summers Chief Executive Officer March 27, 2009
David P. Summers (Principal Executive Officer)
/s/ Charles C. Brockett Chief Financial Officer March 27, 2009
Charles C. Brockett (Principal Financial and Accounting Officer)
/s/ Douglas M. Church Jr. Vice Chairman March 27, 2009
Douglas M. Church Jr.
/s/ Thomas P. Caldwell Director March 27, 2009
Thomas P. Caldwell
/s/ Thomas F. Dungan III Director March 27, 2009
Thomas F. Dungan III

5757
/s/ Gary L. Hall Director March 27, 2009
Gary L. Hall
/s/ Mark A. Karl Director March 27, 2009
Mark A. Karl
/s/ Joseph J. Romagnoli Director March 27, 2009
Joseph J. Romagnoli
/s/ Douglas W. Wallace Director March 27, 2009
Douglas W. Wallace
/s/ Robert P. Warhurst Director March 27, 2009
Robert P. Warhurst

Virginia Heritage Bank was founded in 2005 on the fundamental
belief that many local businesses and individuals in Northern
Virginia no longer felt they had a meaningful relationship with
their bank.
Headquartered in Fairfax, with two other branches and a fourth
planned, VHB is a full-service community bank that is locally
owned and managed and sees itself as a financial resource
center dedicated to helping customers achieve prosperity.
The bank’s Board of Directors and senior management live
and work in Northern Virginia and share with their customers
a personal interest in maintaining a strong, vibrant local
community.
The bank is optimized for the needs of individuals, families and
small businesses. Customers choose the bank because they
like the friendly, personalized service of a community bank
whose people are easy to work with, experienced, attuned
to the trends and issues of the region, empowered to make
fast, responsive decisions and accessible through strategically
located branches and online services.
The Bank supports its personal service approach with
advanced technologies. The Bank's Directors and employees
believe that building its brand based on delivery of friendly,
personalized banking services enables the Bank to develop
meaningful and long term customer relationships that, in turn,
create added value to these relationships and build market
differentiation.
w w w . v i r g i n i a h e r i t a g e b a n k . c o m
cORpORAte pROFile
VIRGINIA HERITAGE BANKBuilding Prosperity Together

VIRGINIA HERITAGE BANKBuilding Prosperity Together
FAIRFAX
GAINESVILLE
CHANTILLY
MORTGAGE AND OPERATIONS OFFICE
www.virginiaheritagebank.com