2008...2008/01/01 · business development 2008 12 people forming great nordea 22 corporate social...
TRANSCRIPT

2008Annual Report 2008

Contents
The Nordea BusinessSummary 2CEO letter 6Vision, values and strategy 8Business development 2008 12People forming Great Nordea 22Corporate Social Responsibility 24The Nordea share 26Events 2008 30
Board of Directors’ ReportFinancial Review 2008 31Customer area results 37Risk, Liquidity and Capital management 44Corporate Governance 70
Financial statements5-year overview 78Quarterly development 81Income statement 82Balance sheet 83Statement of recognised income and expense 84Cash flow statement 85Notes to the financial statements 87Proposed distribution of earnings 145Audit report 146
OrganisationLegal structure 147Board of Directors 148Group Executive Management 150Group Organisation 151
OthersRatings 151Business definitions 152Annual General Meeting 153Financial calendar 153
Corporate Governance Report
’’
This Annual Report contains forward-looking statements that reflect management’s current views with respect to certain future events and potential financial performance. Although Nordea believes that the expectations reflected in such forward-looking statements are reasonable, no assurance can be given that such expectations will prove to have been correct. Accordingly, results could differ materially from those set out in the forward-looking statements as a result of various factors. Important factors that may cause such a difference for Nordea include, but are not limited to: (i) the macroeconomic development, (ii) change in the competitive climate and (iii) change in interest rate level. This report does not imply that Nordea has undertaken to revise these forward-looking statements, beyond what is required by applicable law or applicable stock exchange regulations if and when circumstances arise that will lead to changes compared to the date when these statements were provided.
Solid result and strong position
despite financial turmoil and economic re-
cession. Nordea sticks to its organic growth
strategy, but adjusts the speed of execution.
Cost, risk and capital management receives
higher priority. Nordea will continue to focus
on supporting existing core customers and to
attract new relationship customers with solid
credit profiles. Our ambitious vision of Great
Nordea remains.Christian Clausen,
President and Group CEO
CEO letter Page 6

Well-diversified credit portfolio.
The economic slowdown has resulted in
higher net loan losses and increased impaired
loans. Impaired loans net have increased
from a low level to 0.50% of total loans and
receivables and net loan losses were 2008
EUR 466m or 19 basis points of lending.
Risk, Liquidity and
Capital management Page 44
Organic growth strategy maintained,
but the speed of implementation has
been reduced.
The organic growth strategy is maintained,
despite the much more challenging macro-
economic environment. By applying the
“middle of the road” approach, Nordea aims to
maintain high business momentum balancing
opportunities and challenges.
Vision, values and strategy Page 8
Strong income growth in 2008
– continued support to customers.
Lending growth to Nordea’s corporate cus-
tomers increased, following strong market
position and strong funding and capital posi-
tion. In the household segments, the number
of customers continued to increase.
Business development 2008 Page12

Nor
dea
Ann
ual R
epor
t 20
08
2
The Nordea Business
Summary
Nordea is the largest financial services
group in the Nordic and Baltic Sea
region with a market capitalisation of
approx. EUR 13bn, total assets of
EUR 474bn and a tier 1 capital of
EUR 15.8bn, as of end December
2008. Nordea is the region’s largest
asset manager with EUR 126bn in
assets under management.
Nordea is a universal bank with leading positions within corporate merchant banking as well as retail banking and private banking.
With approx. 1,400 branches, call centres in all Nordic countries and a highly competitive e-bank, Nordea also has the largest distribution network for customers in the Nor-
dic and Baltic Sea region, including more than 260 branches in five new European markets, Russia, Poland, Lithuania, Latvia and Estonia.
Nordea has the largest customer base of any financial services group in the Nordic region with approx. 10 million customers including new European markets, of which 7.5 million are household customers in customer programme and 0.7 million are active corporate customers.
The core in Nordea’s strategy is segmentation of custom-ers and differentiating both value proposition and resource allocation according to customer needs. Gold customers in the household segment are offered a complete range of products and services including a personal banker. Nordea has a clear emphasis on relationship banking with corpo-rate customers and aims at becoming the house bank by combining Nordic resources and competences with local presence and applying a customer team concept.
Nordea pursues an organic growth strategy, with pru-dent risk management. The lending portfolio is well diver-sified with the largest geographical market accounting for approx. one quarter of Nordea’s total income.
Nordea’s total shareholder return (TSR) was –47% in 2008, only surpassed by one other bank in the European peer group. Since end of 2000, Nordea’s accumulated TSR is 56%, exceeded by only two peer banks.
Nordea – with an outstanding starting point
A unique customer baseApprox. 10 million Household customers and 700,000 active Corporate customers
Strong distribution powerApprox, 1,400 branches
Financial strengthEUR 15.8bn in tier 1 capitalTier 1 ratio 9.3% before transi-tion rules
Economies of scaleCost base/RWA ratio 2.0%(average among Nordic peers 2.1%)
Total operating income, EURbn
Norway
1.1
Finland
1.9
Sweden
2.0
Denmark
2.0New European M
arkets
0.5
Global, Other, Group1)
0.7
1) Shipping, Oil Services & International, International Private Banking and Group functions.

Nor
dea
Ann
ual R
epor
t 20
08
3
The Nordea Business
Return on equity was 15.3% in 2008. Starting from 2006, Nordea’s long-term target is to double the risk-adjusted profit in seven years. In 2008, the risk-adjusted profit increased by 2%, and by 3.5% when excluding the Danish State guarantee fee.
Capital position and revised capital policyNordea has a strong capital position, with EUR 15.8bn in tier 1 capital, a tier 1 capital ratio before transition rules of 9.3% and a core capital ratio of 8.5% at the end of 2008.
The revised capital policy states that over a business cycle, the target for the tier 1 ratio is 9% and the target for the total capital ratio is 11.5%.
Rights offering and reduced 2008 dividend to strengthen core capital position by EUR 3bn Nordea in February announced measures to strengthen the Group’s core tier 1 capital by EUR 3bn. This will be done through an underwritten discounted issue of new ordinary shares with pre-emptive rights for existing shareholders of approx. EUR 2.5bn net and secondly by proposing to reduce the dividend payment to 19% of the net profit for 2008, which will increase core tier 1 capital by approx. EUR 0.5bn. The rights offering is subject to shareholder approval at an Extraordinary General Meeting to be held on 12 March 2009.
Nordea’s Board of Directors and Group Executive Man-agement believes it is responsible to act pro-actively to best position the bank for the risks and the opportunities aris-ing from the prevailing extraordinarily challenging market conditions.
Liquidity and fundingThe short-term liquidity risk has been held at moderate levels throughout 2008. Nordea’s liquidity buffer has been in the range EUR 20 – 40bn throughout 2008, which Nordea considers a high level reflecting the Group’s conservative attitude towards liquidity risk.
Even in the very difficult environment that the financial industry has faced, Nordea has in 2008 continued to show
funding strength and has been able to raise new funding at good prices on a relative basis. Nordea draws benefit from being a well recognised AA- rated bank, having a prudent liquidity management, with a conservative business pro-file. This, combined with the well-diversified and strong funding base, including stable household deposits and the access to two large domestic covered bond markets, have all contributed positively.
Well-diversified credit portfolioNordea has operated with a consistent and prudent credit risk management over a long time period. The Group-wide decision-making structure ensures that credit risk limits for customers and customer groups are set at the relevant credit decision authority level within the Group.
Some weakening has been seen in credit quality in the fourth quarter 2008, mainly in the corporate credit port-folio, with somewhat more customers being downrated than uprated. The total effect from rating migration on RWA was an increase by approx. 4.5% in 2008. Loan losses amounted to EUR 466m, giving a loan loss ratio of 19 basis points. Impaired loans gross increased to EUR 2,224m.
Impaired loans net, after allowances for individually assessed loans, in relation to total loans and receivables were 0.50%, up 19 basis points from 2007.
Business development and Group result 2008Total income increased 4% to EUR 8,200m and profit before loan losses increased by 1% to EUR 3,862m. Despite the financial crisis and global recession, Nordea again man-aged to produce a year with solid result.
The income growth was particularly strong within cus-tomer areas. Nordic Banking and Institutional & Interna-tional Banking reported an income growth of 10%, sup-ported by a strong underlying business momentum and successful execution of strategic investment plans.
The strong growth in net interest income continued, driven by volume growth in combination with increased lending margins, reflecting re-pricing of credit risk and to compensate for higher liquidity premiums. Due to its
%
0
2
4
6
8
10
2008200720062005
EURbn
0
5
10
15
20
25
30
35
20082007
Capital position, Tier 1 ratio before transition rules
Funding strength, total long-term funding issued
3
Nor
dea
Ann
ual R
epor
t 20
08
Nor
dea
Ann
ual R
epor
t 20
08
4
The Nordea Business
strong position, Nordea was able to conduct business with core customers as usual and respond to customer demand.
The increase in total expenses was maintained at an unchanged growth rate, 7%, compared to 2007.
For the Nordea Group, profit before loan losses was maintained at high level, EUR 3,862m, up 1% and operat-ing profit was EUR 3,396m. Risk-adjusted profit was EUR 2,459m, up 2%, and up 3.5% excluding the Danish State guarantee fee.
The sharp macroeconomic slowdown has started to affect the Nordic countries and this is likely to continue in 2009. Nordea is therefore preparing for challenging times ahead. In adapting to the new market conditions, the speed in the organic growth is reduced and the firm attention on costs, risk and capital management is further emphasised. In addition to the cost efficiency measures and new capital targets, Nordea will focus on doing more business with existing customers and selectively capture business oppor-tunities also with new customers with solid credit profiles.
Financial crisis and Government guarantee schemesThe financial crisis became critical during the autumn 2008. Many countries around the world have during the period launched systems to support the banking systems. In the US, the government announced a rescue package to the financial sector and throughout Europe, countries follow these intentions in the local efforts to stabilise the financial systems.
State schemes for financial stability and amendments to these have been presented by the governments in the Nor-dic countries during the autumn 2008 and the beginning of 2009. Generally, Nordea welcomes the State schemes for financial stability and is currently evaluating the schemes and the amendments.
DenmarkIn early October 2008, Danish Parliament agreed with banks to set up a guarantee scheme valid for two years, until end of September 2010, which guarantees the claims of unsecured senior creditors against losses in participating banks.
Nordea decided for commercial reasons that Nordea Bank Danmark A/S would participate in the scheme. Nor-dea guarantees the payment of its portion of DKK 10bn to cover any losses under the guarantee scheme and of DKK 7.5bn annually for two years in guarantee commission as well as its portion of additional losses of up to DKK 10bn, if losses exceed these amounts.
The scheme is expected to cost Nordea an annual com-mission expense of approx. EUR 180–200m, and possible additional expenses for the guarantee of at maximum approx. EUR 500m, which would be reported as loan losses.
A second Danish State guarantee scheme was launched in January 2009, aiming to ensure that there is capital
enough in the financial sector. The second scheme contains prolonged guarantees for banks’ debt securities and depos-its as well as a scheme for injections of tier 1 capital into participating and eligible banks. Nordea is evaluating whether or not to join the second scheme.
FinlandIn Finland, a new regulation has been presented, which opens the possibility for the Finnish state to provide and invest in capital instruments and grant state guarantees to the refunding of Finnish banks up to a maximum value of EUR 50bn. A market-based fee will be charged for guaran-tees. Guarantees are granted until 30 April 2009, and lim-ited to the amounts becoming due up to that date. At a later date, the Government will carry out a separate evaluation of the need to continue granting guarantees.
In February 2009, the Government will submit to Parlia-ment a proposal for state capital investment in deposit- taking banks, in the form of subordinated loans, which can be considered as core capital.
Nordea has to date not joined the Finnish scheme.
NorwayIn Norway, stabilising liquidity measures through the Nor-wegian Central Bank with a facility for banks, where gov-ernment bonds are swapped for covered bonds have been conducted.
The Norwegian Government has also, in February 2009, announced a new stability plan that aims at providing ade-quate access to financing from banks to households and corporates at an amount of NOK 100bn. The stabilising liquidity measures have also been extended.
During the fourth quarter 2008, Nordea participated in swap facilities under the present Norwegian scheme.
SwedenThe Swedish government introduced in October a support system for the banking system with mainly four parts: short-term liquidity supply through activities by the National Debt Office and the Central Bank, middle-term guarantee system for banks’ funding planned to be run-ning until April 2009, long-term solvency support system with a Stability fund and measures to ensure that support also benefits customers.
The Swedish guarantee programme has been amended in late January 2009 and in early February, a capital injec-tion programme for solid banks has been introduced, intro-ducing availability for banks to issue new shares or hybrid loans on market terms to the State, as a participant on ordi-nary terms in a new shares issue. Changes are also pro-posed in the fee structure for issues of debt securities under the State guarantee, making fees deductable from the com-pulsory fee to the Stability fund.
Nordea welcomes the amendments to the scheme, but has up to this date not joined the Swedish scheme.

Nor
dea
Ann
ual R
epor
t 20
08
5
The Nordea Business
Outlook 2009Due to the prevailing market conditions, the provided out-look is associated with an unusually high degree of uncer-tainty.
The macroeconomic development in the Nordic coun-tries has during the latter part of the autumn shown a sharp slowdown and GDP growth is in 2009 expected to be negative. Nordea is therefore preparing for a challenging year. In addition to firm attention on cost, risk and capital management, the focus in 2009 will be to continue doing more business with existing customers, and on a selective basis attracting new customers with solid credit profiles in prioritised segments. Market lending growth is expected to be lower in 2009, compared to 2008, however Nordea sees potential for growth somewhat more than the market.
Cost growth is expected to be somewhat lower than in 2008, as cost growth is managed downwards adjusting operations to the prevailing market conditions.
The high speed at which the global and Nordic econo-mies now are weakening means that the credit portfolio will be affected. Based on the current macroeconomic out-look, Nordea anticipates net loan losses in 2009 broadly in line with the annualised rate of the fourth quarter 2008. The uncertainty regarding future loan loss levels is how-ever significant.
Risk-adjusted-profit is in 2009 expected to be at approx. the same level as in 2008.
The effective tax rate is expected to be in the range of 23–25%.
Key financial figures
Business volumes, key items
2008 2007 Change, % 2006
Total operating income, EURm 8,200 7,886 4 7,365Total operating expenses, EURm –4,338 –4,066 7 –3,822Profit before loan losses, EURm 3,862 3,820 1 3,543Loan losses, EURm –466 60 257Net profit for the year, EURm 2,672 3,130 –15 3,153Loans and receivables to the public, EURbn 265.1 244.7 8 214.0Deposits and borrowings from the public, EURbn 148.6 142.3 4 126.5 – of which saving deposits 45.5 40.8 12 33.6Assets under management, EURbn 125.6 157.1 –20 158.1Technical provisions, Life, EURbn 28.3 32.1 –12 30.8Equity, EURbn 17.8 17.2 3 15.3
Total assets, EURbn 474.1 389.1 22 346.9
Ratios and key figures 2008 2007 2006
Diluted earnings per share, EUR 1.03 1.20 1.21Share price1), EUR 5.00 11.42 11.67Total shareholder return, % –46.9 6.4 32.3Proposed/actual dividend per share, EUR 0.20 0.50 0.49Equity per share1), EUR 6.84 6.58 5.89Diluted shares outstanding1), million 2,592 2,594 2,591Return on equity, % 15.3 19.7 22.9Cost/income ratio, % 53 52 52Tier 1 capital ratio, before transition rules1), % 9.3 8.3 n.a.Total capital ratio, before transition rules1), % 12.1 10.9 n.a.Tier 1 capital ratio1), % 7.4 7.0 7.1Total capital ratio1), % 9.5 9.1 9.8Tier 1 capital1), EURm 15,760 14,230 13,147Risk-weighted amounts1) 2), EURbn 213 205 185Number of employees1) (full-time equivalents) 34,008 31,721 29,248
Risk-adjusted profit, EURm 2,459 2,417 2,107Economic capital, EURbn 11.8 10.2 9.3EPS, risk-adjusted, EUR 0.95 0.93 0.81RAROCAR, % 20.8 23.6 22.7MCEV, EURm 2,624 3,189 2,8731) End of the year.2) Risk-weighted amounts according to Basel I for 2006.

Nor
dea
Ann
ual R
epor
t 20
08
6
The Nordea Business
CEO letter
Solid result and strong position
despite financial turmoil and economic
recession.
Dear Shareholder,The year 2008 is likely to always be remembered as a year of global financial crisis. Although it developed dramati-cally during 2008 the crisis goes back to 2007. Loss of confi-dence by investors in the value of securitised mortgages and other asset backed securities in the United States cre-ated a liquidity crisis. This in turn resulted in substantial loan losses and write-downs not least among investment banks. Central banks and governments reacted by provid-ing liquidity to money markets and rescue programmes for troubled financial institutions.
Nordea was hardly affected in this first phase of the financial crisis. Nordea has no direct and very little indirect exposure to the sub-prime mortgage market, structured investment vehicles or conduits.
With the bankruptcy of Lehman Brothers in September 2008 the financial crisis turned into a global systemic crisis with general lack of confidence and dysfunctional money and capital markets. In this second phase of the financial crisis a large widening of credit spreads took place, and the supply of funds to some segments of the money and capital markets dried out. With wholesale funding corresponding to an increasing part of commercial banks’ lending, many banks suddenly encountered severe funding problems. Central banks and governments once more intervened and launched financial stability programmes for the banking industry including funding guarantee schemes and buy-outs of risky assets. These programmes have led to a resumption of liquidity flows between banks and gradu-ally decreasing credit spreads.
Nordea has a well diversified and strong funding base with wholesale funding mainly long-term. Nordea has been able to continue its short-term funding normally dur-ing the crisis and has taken advantage of the large covered bond markets in Denmark and Sweden. Nordea’s average funding costs in 2008 were among the lowest of the major European banks.
We have now entered the third phase of the financial cri-sis, which is characterised by capital shortage, and which
cannot be solved by state funding guarantee programmes. Some part of the corporate customers’ security market bor-rowing is returning to the balance sheets of banks. Some international banks are deleveraging and withdrawing from the Nordic markets. And not least, the global econ-omy has shifted direction towards the most severe down-turn since the 1930’s. This will mean lower growth of some of the income sources for banks, substantially higher loan losses and – due to the changed capital adequacy regula-tions – higher risk-weighted assets because of customers being migrated to lower rating classes. Governments have started to react to the capital crisis by launching capital programmes for banks and also other industries and by massive fiscal stimulus packages. Central banks have fol-lowed suit by engaging in a series of interest rate cuts.
Nordea in general over a business cycle generates suffi-cient capital to support a 10% annual growth of its business activities. And with a tier 1 ratio of 9.3%, Nordea has a strong starting point when entering the expected very chal-lenging 2009. However, Nordea has found it appropriate to act pro-actively to best position the bank for the risks as well as opportunities arising from the prevailing extraordi-nary and challenging market conditions. The proposed strengthening of Nordea’s capital with EUR 3bn includes a reduction of dividend and a fair and transparent rights issue. The capital strengthening measures will maintain Nordea in a position as one of the strongest banks in Europe. It will establish an additional capital cushion for the uncertain business environment and provide flexibility to exploit business opportunities of high credit quality aris-ing from the market dislocation.
Nordea journey 2008Since the beginning of the journey towards Great Nordea and the launch of the organic growth strategy two years ago, Nordea has delivered strong financial results despite the global financial crisis and economic recession.
I am proud that Nordea has obtained a number-two posi-tion in the European peer group 2008 in terms of total share-holder return with a return – although negative – some 20%-points better than the average of the peer group and during three years in a row been among the top-three Euro-pean banks in terms of total shareholder return. I am also proud that Nordea in 2008 delivered a positive risk-adjusted profit growth and a fourth quarter with a record level of op-erating profit before loan losses.
Our ambition on a Great Nordea remains and with the
strengthened core capital position, we will maintain our position
as one of the strongest banks in Europe. ’’

Nor
dea
Ann
ual R
epor
t 20
08
7
The Nordea Business
The success of the organic growth strategy and the strong business momentum is also reflected in double-digit growth rates in lending and deposits and a solid income growth in customer areas. We report more customers and more income per customer than ever. Since the first quarter of 2007 Nordea has gained 113,000 or 5% new Gold customers in Nordic Banking, 5,000 or 6% new Private Banking customers, and in New European Markets we have welcomed 170,000 new customers and established 94 new branch offices.
At the same time, we have also improved customer satisfaction – in particular relative to competitors – and we have noted an increasing number of proud and confident employees. The survey results in 2008 were impressive showing positive development and, very importantly, picturing a unique, internal and external momentum.
”Middle of the road” approachThe financial crisis and global economic recession is expected to have a substantial impact on Nordea this year and possibly next year as well. Long-term funding has become more expensive. The market assessment of capital requirement has increased. The economic recession puts part of Nordea’s income at risk, increases loan losses and constrains risk-weighted asset growth.
Nordea’s response to the challenges ahead is clear. Nor-dea sticks to its organic growth strategy and keeps up the strong business momentum, but adjusts the speed of exe-cution. The way forward will follow the “middle of the road” with cost, risk and capital management receiving higher priority.
Nordea will continue to focus on supporting existing core customers and to attract new relationship customers with solid credit profiles in the Nordic markets. Margins will be increased reflecting risks and the increasing fund-ing costs, and the share of customer wallet will grow in particular through less capital consuming products. In New European Markets, Nordea will keep the strategy but adjust focus and significantly reduce speed of implementa-tion.
The priority given to cost, risk and capital management will include acceleration of ongoing efficiency programmes not least in branch offices and a general right sizing of the staffing corresponding to a 2% staff reduction during 2009. Risk management will be strengthened among other things through additional credit reviews and credit work-out teams in all markets. And finally, a firm grip will be taken on the growth of risk-weighted assets through the applica-tion of caps in business units, and the gap between lending and deposits volumes will be monitored carefully.
Ambitious vision remainsMeeting the challenges of today and those of the future is exciting, and Nordea has proven to be in a very strong
position in doing that. Nordea has a large and diversified customer base, a scalable business and operating model, a full range product offering and a strong competitive posi-tion and rating. It is therefore no surprise that our ambi-tious vision of a Great Nordea remains.
The foundation for this is our strong customer-oriented values and culture.
I would like to thank all shareholders, customers and employees for having been with us on our challenging journey last year, and I welcome you to the continuing journey towards a Great Nordea.
Best regards,
Christian Clausen

Nor
dea
Ann
ual R
epor
t 20
08
8
The Nordea Business
Vision, values and strategy
The road towards a Great Nordea:
• Ambitious vision and targets
• Strong customer oriented values
and culture
• Profit orientation – strong focus
on cost, risk and capital
• Clear growth strategy
• Integrated operating model and
operational efficiency
Ambitious vision and targetsNordea’s overall mission is to make it possible for its customers to reach their objectives.
Nordea has an ambitious vision of being the leading Nordic bank, acknowledged for its people, creating superior value for customers and shareholders.
The external financial targets of Nordea reflect the ambitious vision on value creation, which is measured by total shareholder return. The profitability dimension of value creation is measured by return on equity and the long-term growth dimension by risk-adjusted profit.
With top-three and top-two positions in the peer group, Nordea met its overall shareholder value target in 2007 and 2008. For the period as a whole, Nordea was only slightly below the trend line for its long-term risk-adjusted profit target despite the extraordinary market conditions.
Nordea has aligned its capital structure policy following implementation of the Basel II framework and raised its capital ratio targets, also reflecting the changed market perceptions.
Strong customer oriented values and cultureThe vision, targets and strategy of Nordea are supported by strong customer oriented values and culture.
The values were introduced in 2007 and are now reflected in the activities of the bank. Great customer experiences are the core value that guides the behaviour and decisions of all employees. It’s all about people under-lines that people make the difference, and recognises that business growth and growing competence of people go together. It is Nordea’s ambition that customers will experience One Nordea team working together to find the best solutions for customers. The successful implementa-tion of the values is reflected in improved customer satisfac-tion and loyalty, also relative to competitors, and in higher scores in internal employee satisfaction surveys in 2008.
Profit orientation – strong focus on cost, risk and capitalProfit orientation with a strong focus on cost, risk and capital management acts as the foundation for Nordea’s culture and is of paramount importance in the current economic downturn. The systematic approach to risk and capital management and to funding is an important factor explaining how Nordea since the summer of 2007 has man-aged to weather out the storms in the financial markets with only modest valuation losses.
Firm cost management and flexibility is a key element of Nordea’s foundation. Following a period with operational integration and an unchanged cost level, Nordea in 2007 and 2008 in a controlled and focused way increased costs reflecting the growing demand for financial services and investments in the organic growth strategy in the Nordic countries as well as the New European Markets. Going into 2009 and responding to the changed macroeconomic environment and increased uncertainty the cost growth will be managed down, in particular in New European Markets.
Nordea has developed consistent and group-wide credit processes and today has a very strong and well diversified credit portfolio. The common credit processes include Group-wide policies and strategy and uniform and consis-tent decision making and control. Exposures are consoli-
dated and industry policies and caps applied. Rating models for corporate customers and scoring models for household customers are in place. Rating and scoring migrations and every early indicators of shift in credit strength are followed care-
1) Risk-adjusted profit is defined as total income less total expenses, less expected losses and standard tax. In addition, risk-adjusted profit excludes major non-recurring items.
2) Baseline 2006 EUR 2,107m, accumulated outcome.3) Tier 1 ratios and capital ratios are calculated before
transition rules.4) Based on proposed dividend of EUR 0.20 per share.
Financial targets and capital structure policy
In the top quartile of European peer group
Double in 7 years2)
In line with top Nordic peers
9%
11.5%
>40% of net profit
no. 3 of 20 no. 2 of 20
15% 16.7%
19.7% 15.3%
8.3% 9.3%
10.9% 12.1%
42% 19%4)
TSR (%)
Risk-adjusted profit (EURm)1)
RoE (%)
Tier 1 ratio (%)
Capital ratio (%)
Dividend pay-out ratio (%)
Target
Target over a business cycle
Outcome: 2007 2008
Outcome: 20073) 20083)
Long term financial targets
Capital structure policy

Nor
dea
Ann
ual R
epor
t 20
08
9
The Nordea Business
fully and action plans developed in a dialogue with troubled customers.
Nordea’s strong focus on capital management has resulted in a rela-tively strong balance sheet and a well diversified funding platform with availability of funding also in the midst of the financial crisis and with confirmation of the long-term AA rat-ing. The focus going forward will include controlling the development of risk weighted assets and the fund-ing gap and ensuring prices and mar-gins, which reflect the true funding costs and liquidity risk.
The progress towards Nordea’s vision and targets and the success of Nordea’s strategy and values is mea-sured by a number of internal finan-cial and operational key performance indicators (KPI). These indicators are adjusted each year in order to reflect the strategic focus in the short term. In 2008 income growth and customer satisfaction were selected as common Group KPIs. For 2009 cost change and growth of risk weighted asset have been added as common Group KPIs in order to adapt to the extraordinary financial and economic circumstances and give first priority to management of costs, risks and capital. In addition, corporate lending margins and fund-ing gap have been selected as new Group KPIs in order to ensure pricing according to risks and an optimal funding structure.
Clear growth strategyNordea two years ago embarked on a clear organic growth strategy in the Nordic markets as well as the New European Markets. This new strategic direction is maintained despite the much more challenging macroeco-nomic environment, but the speed of implementation has been reduced.
Increase business with existing Nordic customers and attract new customersThe first and most important organic growth area is to increase business with existing Nordic household and corporate customers and to attract new profitable, high quality custom-ers through a pro-active relationship
CMB 3 Income potential Strategic partnership – one point of entry – tailored, individual solutions
Large 25 Income potential Partnership – one point of entry – individual solutions
Medium 70 Income potential Business relationship – individual solutions – standard pro
Small 590 Income and relation-ship potential
Personal relationship – simple service – efficient handling
Segmentation and value proposition – Corporate customers
Segment Customers, 000’s Criteria Value proposition
Private Banking 100 Assets > EUR 150k The best Nordea has to offer
Gold 2,600 Volume > EUR 30k no. of products > 5
Named advisor – priority in access – guaranteed best price
Silver 1,300 Volume > EUR 6k no. of products > 3
Personal service when needed – favourable price
Bronze 3,600 Active customer Simple service – fair price
Segmentation and value proposition – Household customers
Segment Customers, 000’s Criteria Value proposition
• Cost change • Economic profit • Growth of risk-weighted assets • Funding gap
The leading Nordic bank,acknowledged for its people, creating superior
value for customers and shareholders
• Change in number of Gold and Private Banking customers
• Employee satisfaction index
• Relative customer satisfaction improvement
• Delivery satisfaction index
• Income growth
• Increased market shares, savings
• Growth in corporate lending margins
It’s all about people One Nordea teamGreat customer experiences
Profit orientation – cost, risk and capital
Strong customer oriented values and culture and key performance indicators

Nor
dea
Ann
ual R
epor
t 20
08
10
The Nordea Business
banking strategy. In challenging markets, Nordea, which is perceived to be strong, has a unique opportunity to distin-guish itself.
Resources are prioritised to customers providing the best opportunities. Nordea proactively contacts its custom-ers to offer products from its entire product range. During the current market conditions new volumes can be attracted at prices reflecting the long-term risk level.
Household customers are divided into four segments based upon their business with Nordea.For each segment a value proposition has been developed including contact and service level, pricing and product solutions. The core philosophy of this strategy is to provide the best service and advice and the best product solutions and prices to the customers generating most business and income to Nor-dea. Prices are transparent and in general non-negotiable. This can be seen as a win-win situation for customers as well as for Nordea.
The short-term focus of the household customer strat-egy is to continue the development of the relationship with the customers in the premium segments including Private Banking and Gold, to identify and migrate customers into these segments and to improve efficiency of service in par-ticular to customers in the Silver and Bronze segments. Major transformation programmes for the branch pro-cesses have been launched aiming at a substantial freeing up of resources for customer interaction and improvement of sales efficiency by implementation of a structured sales process. Not least the number of traditional bank tellers and back-office functions is expected to be reduced.
The household relationship banking strategy is sup-ported by a focused product strategy. Nordea in general has a broad and well performing range of products, a highly skilled product organisation and a strong distribu-tion power. Product development in the current market environment will ensure a flexible range of products and favour simple savings products and products with low capital consumption rather than complex and non-trans-parent products. Nordea’s savings product offering takes
customers’ wealth, involvement level and life cycle into account in addition to their risk appetite.
Corporate customers are divided into four segments based upon their income and relationship potential for Nordea. For each segment a value proposition has been developed includ-ing contact and service level and prod-uct solutions. The corporate relation-ship strategy aims at building house-bank relations including as much of the customer’s daily and event-driven banking business as possible. Relation-ship managers having a holistic view on the customer’s business and finan-cials organise the relationship.
Pro-activity and staying close to customers are more important than
ever in the current market environment. New customers will be selected carefully and include those with high rat-ings only. Controlling the development of risk weighted assets and managing lending margins to reflect the risk level and funding costs will have a high priority in all cor-porate customer segments. Proactivity also includes the establishment of credit work-out teams in all markets.
In the corporate customer product strategy Nordea aims to make corporate risk management products and capital market transactions a natural part of the basic product offering to customers in the Large and Medium segments. This has been a major success during the last 2–3 years. Nordea will continue to strengthen its equity and corpo-rate finance functions, and the cash management services will be further developed for all corporate customer seg-ments, as cash management services are key to the custom-ers’ daily services and to customer retention. For custom-ers in the Small segment, a new advisor profile and service concept will be developed and implemented to service the group of customers with combined personal and corporate business.
The organic growth strategy in the Nordic region is sup-plemented by very selective bolt-on acquisitions support-ing the retail banking activities like the acquisition of 68 branches from Svensk Kassaservice in the summer of 2008 and the acquisition of nine branches from Roskilde Bank in Denmark in the autumn of 2008.
Supplement Nordic growth through investments in New European MarketsNew European Markets include Russia, Poland and the Baltic countries, Estonia, Latvia and Lithuania. Nordea entered this fast growing region almost 20 years ago, ini-tially primarily to service Nordic corporate customers with business in these countries. The original strategy gradually has been developed to include local customers, and today Nordea, in addition to its Nordic customers , targeting the upper segments among household customers and solid medium sized corporate customers in New European Mar-
Supplement Nordic growth through investments in New European Markets
• Continue the profitable, risk-balanced growth
• Further integrating with the rest of the Group
Clear organic growth strategy
Increase business with existing Nordic customers and attract new customers
• Strengthen position in relationship-driven customer segments
• Support the relationship banking strategy by a focused product strategy
• Strengthen the implementation of further differentiation of service levels among and within customer segments
• Enhance accessibility for all customers and secure efficient servicing - in particular, of non-relationship banking customers
Take Nordea to the next level of operational efficiency and support sustained growth
• Free up resources across the value chain - developing channels, customer service concepts and further streamline processes and IT-systems
• Invest in product development, IT-systems and IT-infrastructure• Develop employee competencies and leadership capabilities
Exploit Global and European business lines
• Continue to leverage positions within shipping and wealth management

Nor
dea
Ann
ual R
epor
t 20
08
11
The Nordea Business
kets and, in addition, in Russia the very large corporate customers. This has been a successful strategy that has led to gradual increases in income and result, while risks have been well contained. The strategy has been based on a net-work expansion that was initiated in late 2006 in the Baltic countries and especially in Poland. In Russia, a majority holding in Orgresbank was acquired in late 2006, at the same time as Nordea sold its minority holding in another larger Russian bank. In parallel with the development of distribution, a broadening of the product range and service level is taking place.
The long-term strategic direction for New European Markets is to continue the profitable growth strategy and gradually develop these operations into diversified full-scale banking businesses integrated with the rest of the Group.
The customer segmentation and value propositions used in the Nordic countries are now implemented in Poland and the Baltic countries and scheduled for Russia. Most risk management measures and procedures have been aligned with the Group, and the business operations are in the process of being aligned with the integrated Group operating model.
However, as a result of the extreme financial and macro-economic conditions and the high uncertainty and risks in the New European Markets, the speed of the development of Nordea’s business in these markets has been slowed down. The branch network expansion in Russia and the Baltic countries has been discontinued and significantly lowered in Poland. The integration with the rest of the Group, not least within risk management and product offerings, continues to prepare for a continued expansion when the business cycle turns up again.
Exploit Global and European business linesNordea has a successful track record within shipping, oil services and wealth management outside the Nordic mar-kets and the New European Markets.
Nordea is one of the leading financial institutions to the global shipping and offshore industries. Nordea’s strategy is to establish and preserve long-term partnerships with large, transparent and preferable publicly listed companies. In addition Nordea aims at maintaining a well diversified and secured lending portfolio across segments and geo-graphical regions as well as a strong syndication franchise.
The overall ambition for this business line remains and the well proven business model continues despite the downturn in the global economy, world trade and freight rates. However, a stronger focus on costs, risks and capital management will be applied in the short run including a careful customer selection and a focus on all potential ancillary business of existing customers.
Nordea’s International Private Banking & Funds is the largest Nordic private banking operation in Luxembourg and Switzerland. The operation includes private banking services and European fund distribution. Nordea’s Inter-national Private Banking pursues an organic growth strat-egy, and its European fund distribution is positioned as a multi-boutique with a range of own and in-sourced prod-ucts distributed to institutional customers. Smaller acquisi-tions and distribution agreements support the organic growth strategy.
Integrated operating model and operational efficiencyNordea’s operating model is designed to support the organic growth strategy and to ensure operational effi-ciency by improving the quality of customer relations, increasing the time spent with customers and reducing the time required to bring new products and services to mar-ket. A fundamental principle of the operating model is to ensure clear responsibilities and avoid overlapping func-tions or activities across organisational units or cross bor-der along the value chain.
The operating model is common for all Nordic markets and is gradually being implemented in New European Markets.
Integrated Group operating model
Private Banking
Institutional &International
Banking
Banking Products
Capital Markets &Savings
Group Operations
Seg
men
ts H
ouse
hold
an
d C
orpo
rate
Account Products
Transaction Products
Capital Markets Products
Savings Products & Asset Management
Nordic Banking
Customer Areas Product Areas Group Operations Service and staff units
People & Identity
Group Corporate Centre
Group Credit & Risk Control
Group Legal

Nor
dea
Ann
ual R
epor
t 20
08
12
The Nordea Business
• Strong income growth 22%
• Increased customer activity, despite
turbulent global financial markets
• Lending margins increased reflecting
re-pricing of credit risk and to com-
pensate for higher liquidity premiums
• Customer satisfaction stable, despite
decline generally in the market
Corporate segments – relationship bankingDuring 2008, Nordea’s strategy proved strong under very difficult market conditions. Diversification in terms of mar-kets, segments and products combined with proactive con-tact policies provided high income growth and modest cost growth, despite market turbulence. Relationship banking, through designated relationship managers in charge of developing and organising the customer relationship has proven successful in giving a total view of the customer’s business and financial affairs, which is beneficial both in terms of business opportunities, business development and risk overview.
Our aim is to establish strategic partnerships for the largest customers, in the segments Corporate Merchant Banking and Large corporate customers. Successful strategic partnerships develop into house bank relation-ships, comprising the full spectrum of financial services. The aim for medium and small customer segments is also to develop relationships and become the house bank.
Nordea’s strategy in time of financial crises is to back our house-bank corporate customers through difficult mar-ket conditions meeting them with a fair price reflecting increasing risk and funding cost. Following the house-bank philosophy Nordea stood firm on expecting increased wallet share as a prerequisite for continued cus-tomer relationship.
Corporate lending margins increased during the year, reflecting re-pricing of credit risk and to compensate for higher liquidity premiums.
Due to the significantly increased liquidity premiums on long-term funding, Nordea has initiated an effort to restructure the maturity profile of the corporate lending book.
Building on the relationship strategy and the well established prudent risk management policy, focus has been to realise a controlled volume growth shifting income growth components from volume to margins.
Corporate customers show high loyalty to Nordea and has appreciated the house-bank philosophy by which they have been able to count on their bank through the financial crises. Customer satisfaction was stable, while the market
in general showed a decline. Furthermore, Nordea improved the position in the corporate market by selective customer acquisition of profitable, creditworthy and high-rated corporate customers.
Nordea provided continued assistance to corporate cus-tomers hedging their market risk in volatile market condi-tions, resulting in income growth on risk management products.
Corporate Merchant BankingThe Corporate Merchant Banking organisation serves Nordea’s 1,000 largest customers in one central unit in each market. This segment accounts for approx. 27% of total income in the corporate segment.
Business developmentIn 2008, business activity was characterised by continued high business activity with 12% growth in corporate lend-ing. The reported volume growth was largely a result of international banks withdrawing from the Nordic market as well as malfunctioning corporate bond and commercial paper markets. Nordea has succeeded well in supporting its customers during these difficult market conditions. Drivers for income growth are further shifting from volumes to mar-gins, although this is taking effect with somewhat varying pace in the different countries. Income in Corporate Mer-chant Banking was EUR 1,079m, up 26% compared to 2007.
The expectation for 2009 is that corporate business will be a significant income driver, based on margin increases and volume growth.
Shipping and Oil ServicesNordea is one of the world-leading financial services pro-viders to the shipping, offshore and oil services industries. This position is maintained due to in-depth industry knowledge, second-to-none structuring capabilities, strong syndication franchise and placing power as well as size-able underwriting capacity. Nordea provides tailormade solutions and targets top-tier syndicated loan transactions.
Business developmentNordea maintained its position as leading financial ser-vices provider to the international shipping, offshore and oil services industries, as evidenced by official league tables (Dealogic) where Nordea reinforced its No 1 posi-tion as arranger of syndicated shipping loans in 2008. Nordea held a 15% market share as bookrunner. New loan transactions for an aggregate volume of more than USD 12.5bn were arranged during the year. All syndicated loan transactions were successfully closed despite challenging markets. During the year credit terms and conditions have tightened considerably and pricing of new transactions picked up. Total income amounted to EUR 306m, an increase by 29%.
In general, the shipping market started to weaken in the second half of the year with increased volatility in most segments. There was significant pressure on freight rates, especially in the container and dry bulk sectors, following
Business development 2008Corporate customer segments

Nor
dea
Ann
ual R
epor
t 20
08
13
The Nordea Business
the economic downturn and increased uncertainty about global trade. Nordea’s exposure to the shipping industry is well-diversified with an underweight towards the troubled sectors. Still, the development has affected the overall credit quality and the proactive risk management will be further strengthened in 2009.
Fewer new transactions are expected following the con-tinued financial turmoil. Demand in the oil and offshore segment remains high, as oil supply continues to be tight, but prolonged oil prices at current level could dampen spending on exploration and production investments going forward.
International networkNordea offers a broad range of financial services and prod-ucts to Nordic customers abroad through its international network with offices in New York, London, Frankfurt, Sin-gapore and Shanghai. Representative offices also operate in Beijing and Sao Paulo.
Business developmentIn April 2008, the branch in Shanghai was opened to sup-port Nordic customers’ business in the region. Representa-tive offices also operate in Beijing and Sao Paulo. The Inter-national Network performed strongly in 2008, with a high level of business activity generating income growth in excess 60%.
Large corporate customersFor the 18,000 customers in segment Large, Nordea’s com-petitive strength is based on combining local presence with the large Nordic resources and competences of the Group. Customers in this segment are served by senior relation-ship managers (SRM) in 63 corporate competence centres in the Nordic region. The SRM is the customers’ main con-tact to the bank with responsibility to create long-term banking relationships. Each SRM is supported by the team of product specialists who design solutions to fulfil cus-tomers’ needs.
Business developmentVolume growth continued in 2008. The drivers for income growth are progressively shifting from volume growth to margin increases, with greater focus on pricing of risk.
Income from Large corporate customers amounted to EUR 916m, up 22% compared to 2007.
Medium-sized and Small corporate customersNordea’s relationship managers allocated to selected branches serve 55,000 medium-sized customers. The value proposition and service concepts for medium-sized corpo-rate are focused on relationships, product range and local presence.
Nordea’s branch-based advisers serve a number of approx. 525,000 smaller customers. Significant growth opportunities arise from cross-fertilising the business opportunity by a dedicated sales force capable of handling household products as well as corporate products.
The smallest corporate customers, with less advanced financial needs receive service based on a mass-market approach, scale benefits and multi-channel competencies.
Business developmentIncome from medium-sized and small corporate customers was EUR 951m, up 3% compared to 2007, with stable vol-umes and margins.
Financial institutionsCustomers include approx. 300 Nordic and 100 interna-tional financial institutions and 750 banking groups, which are served by senior relationship managers together with teams of product specialists tailored to the respective cus-tomer needs.
Business development In the wake of continued uncertainty and volatility, Nordea was increasingly perceived as a dependable and attractive counterparty, due to its size and stability – and this is illustrated by the vast amount of capital markets transactions that were attracted.
Through proactive and diligent work involving stake-holders from across the bank, Nordea has satisfactorily handled adverse situations. Nordea’s continued strategy of close customer relations remains intact and has increas-ingly paid off during the year, as Nordea was able to attract business in an adverse environment and further strength-ened its position. Greenwich Associates’ annual customer survey verifies the strength of Nordea’s customer concept and relationship management process as well as high rank-ings of Nordea’s products and services.
High volatility made 2008 a very challenging year for financial institutions. Toward the end of the year Institu-tional clients were very active in risk management and asset-liability management products as they sought to hedge risks in their portfolios. Activity in asset products, however was subdued. Despite subdued equity markets, additional subcustody volumes were gained, with total number of transactions up 35% to 27 million in 2008.
Total income amounted to EUR 409m, up by 21%.
Baltic countriesNordea has a strong position in the Nordic-related corpo-rate customers segment and is moving ahead in other seg-ments. Additional relationship managers were recruited primarily for the small and medium-sized corporates. This effort is also supported by the expanded network of cus-tomer service units. At the end of 2008, Nordea had almost 17,000 corporate customers.
Business developmentIncome continued to grow in 2008, supported by increased business volumes in general banking products, including both deposits and lending and increased lending margins. Total income was EUR 89m, up 53%.
Lending to corporates increased by 51% to EUR 4.2bn. Following the recession in the Baltic countries, lending

Nor
dea
Ann
ual R
epor
t 20
08
14
The Nordea Business
14
Nor
dea
Ann
ual R
epor
t 20
08
growth quarter-on-quarter came down during the year and refers to Nordea’s commitment to support existing core customers, including Nordic customers, pre-empted by high attention on risk management.
The economic slowdown has affected the credit quality, especially in the Baltic countries where the average ratings of credit exposures deteriorated in the fourth quarter.
Even so, impaired loans net, after allowances for indi-vidually assessed loans, amounted to EUR 112m or 1.46% of total loans and receivables at the end of 2008.
In line with the house-bank approach, Nordea has expanded the product range and developed the cash man-agement services and enhanced the focus on advisory ser-vices, triggering significant growth of capital markets advi-sory services.
PolandThe focus on corporate customers in Poland is both on medium-sized corporates and on large and Nordic-related corporates. The expansion of the network has boosted sales capacity and will thus facilitate increased focus on the small and medium-sized corporate segment. The number of customers was more than 55,000 at the end of 2008.
Business developmentBusiness volumes have developed favourably during the year. This, in combination with average margins that held up well, has supported strong income growth. Income increased by 52% to EUR 63m. Lending and deposit vol-umes increased by 37% and 27% respectively. The number of branches has increased by 60 to 144 during 2008. The new sales capacity primarily targets affluent household customers and SMEs.
Life & Pensions has grown a successful Group Term Life business in Poland. With the launch of the Group Employee savings product PPE in 2009, corporate custom-ers are offered a competitive employee benefit product package, which in the year to come will be completed with other Western standard employee benefit products.
RussiaThe service offering toward corporate customers has been further expanded during the year and segment strategies introduced. Nordea managed to target the top-tier and large corporates in Russia. The aim is also to target Nordic corporate customers present in Russia, many of which are already customers of Nordea.
The number of customers was 7,000 at end of 2008.
Business developmentBusiness volumes showed overall strong growth in 2008. Lending volumes were EUR 3.7bn by end of 2008 and income was EUR 120m, up 171% compared to last year. Several large transactions with major Russian companies were arranged during 2008. The emphasis on Nordic cor-porates was successful and generated increased business volumes.
The trend with strong volume growth levelled off in the latter part of the year, while margins picked up reflecting scarce lending supply.
Product development capacity has been increased dur-ing the year to provide even better service to corporate cus-tomers. Focus is mainly on non-lending products such as cash management services, capital markets products and advisory services.
Products in focusCapital markets productsNordea supplies a wide range of capital markets products including various asset and risk management products as well as advisory services. Risk management products allow corporate and institutional customers to handle their balance sheet risks against market volatility, whether it be foreign exchange-, interest rate-, credit-, equity or commodity risks.
Business developmentNordea’s comprehensive risk management product offer-ing was a significant growth driver also in 2008, regarding both corporate and institutional customers.
Total
Financial institutions
New EuropeanMarkets
Other
Large
Shipping andOil Services
CorporateMerchant Banking
0 20 40 60 80 100
%
Financial institutions
New EuropeanMarkets
Other
Large
Shipping andOil Services
CorporateMerchant Banking
0 5 10 15 20 25 30
%
Income growth, corporate customers, by segment, 2008
Share of income, corporate customers, by segment, 2008

Nor
dea
Ann
ual R
epor
t 20
08
15
The Nordea Business
15
Nor
dea
Ann
ual R
epor
t 20
08
Transaction volumes increased steadily throughout the year as customers sought to hedge the effect of the market volatility. Activity in asset products was more subdued.Total income was EUR 845m, up 15% compared to last year.
Nordea was highly focused on managing risks in very illiquid markets while at the same time continuing to exe-cute customer flows.
Capital raising – debt and equityNordea Markets also provides a variety of debt and equity-related products for liquidity- and capital raising purposes, ranging from syndicated loans, bond financings, IPOs to share buy-backs.
These product areas suffered significant impact from the market turmoil and market volumes during the year were generally low. However, the syndicated loan market expe-rienced strong activity and Nordea maintained the posi-tion as the leading mandated arranger and bookrunner of syndicated loans for Nordic customers.
Nordic Bookrunner, 2008 Amount Share Pos. Bank name EURm No. %
1 Nordea 6,017 16 152 SEB 3,797 12 103 Svenska Handelsbanken 3,739 7 104 DnB NOR 2,725 12 75 RBS 2,026 4 5
Source: Dealogic. Shipping loans not included.
In the international bond markets, Nordea arranged euro benchmark transactions for issuers such as the Republic of Finland, Storebrand and others during 2008. A highlight on the equity side was the Carlsberg rights issue of EUR 4.1bn – the largest Nordic rights issue ever. Nordea also has a leading position in related equity activities such as share buy-backs, as evidenced by the 12 transactions totalling EUR 1.1bn, which Nordea executed in 2008.
Structuring and execution of mergers and acquisitions – Corporate FinanceNordea offers financial advisory services to corporate and institutional customers and governments through Corpo-rate Finance. The advisory services are an integrated part of Nordea’s customer offering, and the area was involved in many significant transactions during the year, including the announced merger between Post Danmark A/S and Posten AB and EQT’s public offer for Securitas Systems.
Cash management productsSolutions for liquidity management and handling payment transactions are offered to customers through the various cash management solutions.
Cash management also plays an important strengthen-ing role in relationship banking. Nordea has a strong posi-tion in the Cash Management area and was especially acknowledged for its customer service capabilities.
Nordea is a top provider of quality institutional cash management solutions in the region.
Securities ServicesIn 2008, Nordea divested its institutional global custody business to JPMorgan. Nordea was until then the Nordic leader in institutional global custody, but decided to prior-itise areas where long-term value can be added. The major-ity of customer transfers will take place during 2009.
Going forward, Securities Services will specialise pri-marily in sub-custody, where Nordea has a leading posi-tion in the Nordic region, which handled 27 million sub-custody transactions, up 35% in 2008, despite subdued equity markets.
Life and Pensions The offering to corporate customers covers a full range of corporate pension schemes, including everything from simplified collective schemes to complex tailor-made prod-ucts designed for corporate customers with specific risk product needs, while offering a complete product package
Mitsubishi UFG
Citi
BNP Parisbas
HSH Nordbank
Fortis
ING
DnB NOR
Nordea
0 3,000 6,000 9,000 12,000 15,000
USDm
Syndicated shipping loans, Book runner, 2008
Source: Dealogic.

Nor
dea
Ann
ual R
epor
t 20
08
16
The Nordea Business
Corporate customer segments and financial institutions, key figures
Corporate Merchant Large Medium-sized Nordic Banking corporate and Small corporate corporate customers customers customers customers
2008 2007 2008 2007 2008 2007 2008 2007
Number of customers, ’000 18 15 Income, EURm 1,079 855 916 750 951 920 2,946 2,525Volumes, EURbn1) Lending 43.2 38.6 42.0 36.6 22.9 26.7 108.2 101.9 Deposits 17.1 14.5 17.3 15.1 19.5 19.3 53.9 49.0Margins, % Lending 0.99 0.82 0.94 0.84 1.04 1.03 0.97 0.89 Deposits 0.39 0.41 0.64 0.64 1.59 1.65 0.93 0.96
New European Corporates Markets Shipping and and financial corporate Oil Services Financial institutions customers customers institutions Total
2008 20072) 2008 2007 2008 2007 2008 20072)
Number of customers, ’000 79 70 2 2 1 1Income, EURm 291 147 306 237 409 339 3,952 3,248Volumes, EURbn1)
Lending 10.7 6.8 13.8 11.1 2.0 1.9 134.7 121.7 Deposits 3.2 2.6 6.4 6.7 14.5 20.3 78.0 78.6Margins, % Lending 1.72 1.01 1.10 0.96 0.55 0.35 1.03 0.91 Deposits 1.58 1.37 0.42 0.41 0.34 0.31 0.79 0.821) Volumes are excluding reversed repurchase agreements and repurchase agreements.2) Margins for 2007 do not include Russia.
to employees. Products are offered to Nordic, Polish and Baltic customers, via Nordea’s branches, Life & Pensions sales team, and brokers or tied agent.
Business developmentFocus on sales activities and maintaining the competitive value proposition was strong during 2008 resulting in increased corporate gross written premiums up 18% to EUR 1,977m. Premium growth derived mainly from Denmark, Poland and Sweden.
Institutional asset managementNordea’s institutional asset management services include single products (funds, equity products etc.) offered globally to large sophisticated pension funds, as well as asset alloca-tion advice and balanced mandates for institutional custom-ers and fund sales via external platforms. The fund offering includes Nordea’s European Funds, which are licensed for sale in 16 European countries. Services are provided to customers by an institutional asset management sales force and the sales force of European Fund Distribution.
Business developmentDuring 2008, Nordea’s institutional sales activities proved successful and Nordea won several new mandates from both Nordic and international customers and generated additional business from existing customers, resulting in a net inflow of EUR 1.1bn. Product wise, the “Stable Equity” products, espe-cially designed for extreme market conditions, proved suc-cessful and outperformed benchmark by 5.9% in 2008. Mar-ket conditions reduced the value of institutional AuM to EUR 23.1bn and forced institutional investors to reallocate into less risky products, which for Nordea meant a less favourable asset mix in terms of income margins.
In line with the multi-boutique strategy, insourced funds distributed through the European fund distribution generated an inflow of EUR 0.3bn. Furthermore, the distri-bution of funds to third party financial institutions was successfully extended to the Nordic region.

Nor
dea
Ann
ual R
epor
t 20
08
17
The Nordea Business
Household customers
• Increased number of customers
• Lending volume up 1% and deposit
volumes up 3%
• Stable credit quality
• Customer satisfaction improved in all
markets, especially compared to peers
Household segments – leveraging the customer baseWith a clear emphasis on relationship banking and the aim of servicing 100% of the customer’s wallet as the custom-er’s lifetime financial partner, the potential in the Gold seg-ment is to be capitalised.
The aim is also to identify potential Gold customers in the lower segments – Silver and Bronze – and develop these into the premium segments using a structured approach to increase business volumes.
Cost-efficient services are offered to customers with lim-ited potential in terms of business volume growth in line with the aim of maintaining a stable income stream exceed-ing the cost of service.
Further focus on relationship banking and transaction efficiencyThe demand for manual cash transactions are steadily decreasing and as a consequence Nordea is reducing the amount of tellers in the branch network. This will reduce cost and gradually change the ratio between staff servicing daily banking needs and Personal Bank Advisors.
Branch networkNordea’s branch network has been significantly strength-ened by 68 new branches in Sweden, taken over from Svensk Kassaservice, and 9 acquired branches from Roskilde Bank. However, the total size of the branch net-work is expected to slightly decrease mainly because of closing down of very small branches.
Customer programmeThe customer programme is a value proposition compris-ing brand promise, pricing, service level and product solu-tions combined into a transparent and competitive offer.
Nordea operates with non-negotiable and transparent pricing on most products, differentiated in three levels – one for each segment.
The designated personal banker plays a proactive role in maximising growth potential from customers, who have reached the highest level in the programme (Gold).
A very attractive offer is specially designed as a fast track to attract younger customers in the 18–28 age group - young adults.
Customer satisfaction improved in all markets, espe-cially compared to peers.
Premium segments:Nordic Private BankingNordea is the largest provider of private banking services in the Nordic Region. The position varies across the Nordic markets reflecting differences in the legacy business. The approx. 83,000 Nordic Private Banking customers are served out of 73 Private Banking units (co-located with regional branches in Nordic Banking) and 7 Private Wealth Management units catering to high-net-worth customers.
Business developmentIn 2008, Nordic Private Banking capitalised on Nordea’s strong market position and the attractive Private Banking business model, demonstrated by welcoming more than 4.800 new customers, equaling a 6% increase in number of customers from 2007, and capturing a net inflow of assets of EUR 2.1bn. New customers included both internal Nordea customers now qualifying for the Private Banking offering and those acquired from competitors, and growth in the customer base was matched by an expansion in the number of employees. In 2008, the key trend in Private Banking customer activity was to decrease exposure to equity markets by moving funds into savings and transac-tion deposits and taking advantage of the attractive inter-est rates on deposits. Due to the general market deprecia-tion in 2008, Nordic Private Banking AuM decreased to EUR 36.1bn, down 21% compared to 2007. Consequently, income decreased by 15% to EUR 324m.
Gold customers – the engine for profitable growthThe income potential from developing the customer base is significant. Average income per Gold customer is twice the average from Silver customers. Approx. 55% of income from household customers derives from Gold customers.
The Gold segment in the long run achieves profitable growth by increasing sale of the entire product range by pro-actively offering customers 360-degree meetings cov-ering all aspects of their financial affairs.
Nordea’s pro-active approach and customer centric 360-degree advisory have been appreciated by our custom-ers. Also the credibility and stability of Nordea during the financial crises have boosted customer loyalty and acquisi-tion of new Gold personal customers.
Income was affected by the turmoil in the equity mar-ket, causing the sharp reduction in fee income on savings products. A successful development of the product mix to meet the increased competition in this area led to a 12% increase in volumes in savings deposits.
Customers elevated to Gold customers are offered our best services and prices. The decrease in margin from ele-vating customers to the Gold level is more than compen-sated by increased product penetration.
Business developmentThe focus on developing the potential in the customer base continues to be successful with a 5% increase in the num-ber of Gold customers, compared to last year. Approx. 20% of new Gold customers are new customers of Nordea,

Nor
dea
Ann
ual R
epor
t 20
08
18
The Nordea Business
18
Nor
dea
Ann
ual R
epor
t 20
08
thus reflecting the attractiveness of Nordea’s customer pro-gramme. As a result of the financial turmoil and especially the problems of some smaller banks, the number of new customers increased toward the end of the year.
In Sweden and Finland, mortgage margins have increased, changing years of decreasing trend. However, the reported margins on mortgages do not reflect the increased liquidity premiums. Taking the full liquidity cost into account, actual mortgage margins are lower than reported.
The activities to increase the number of proactive meet-ings with customers have continued. The focus is to increase pro-activity towards Gold customers in a market situation where customer’s financial affairs are of utmost priority.
Income from Gold customers was EUR 1,911m, up 4% compared to last year.
Baltic countriesNordea continued to build up advisory services for house-hold customers in the Baltic countries through its network of 66 branches offering a full range of products serving nearly 250,000 customers, of which 46,000 Gold customers. The improved services have resulted in a good progress in customer satisfaction as confirmed by the high ranking in the annual customer survey.
Business developmentHigher business volumes offset lower deposit margins and supported strong income growth in 2008. Income growth was 15% to EUR 39m. Strong double-digit growth in deposit volumes, of more than 50%, compensated for lower sales of investment funds. Growth in household mortgage lending continued, but at a clearly lower growth rate than in previous years. Late 2008, Nordea Life & Pen-sions entered the Baltic region with a pension fund offering to Estonian customers.
The impact on credit quality from the macroeconomic downturn in the Baltic countries is closely monitored and proactive risk management is in focus.
PolandIn line with the Turbo Plan, 60 new branches were opened 2008. Following this, Nordea has 144 branches serving approx. 458,000 household customers, of which almost 30,000 are Gold customers. Nordea has increased the num-ber of personal bank advisers, further upgraded the sales
systems and upgraded the capacity of the contact centre to provide even better services to the increasing number of cus-tomers and customer satisfaction was high.
Business developmentThe expanded branch network has supported growth in business volumes, in particular household mortgage lend-ing. Competitive pricing of savings accounts attracted addi-tional deposits volumes, while sales of investments funds declined due to the financial turbulence. Total income was EUR 60m, up 77% compared to 2007.
Nordea Life & Pensions in Poland offers life and savings products to approx. 873,000 household customers. Growth in personal gross written premiums was strong, up 46% compared to 2007. Within the attractive PTE segment, Life & Pensions is the fifth largest Polish pension provider in terms of number of customers.
RussiaOrgresbank currently has approx. 40,000 household cus-tomers being served through 53 branches centered to the Moscow and St Petersburg regions. The same customer concepts, as used in other markets, have been introduced in 2008 targeting especially affluent households and poten-tial Gold customers. Key products include mortgage loans, cards and car financing.
Business developmentIn line with the long term ambition to build a well-diversi-fied and well-balanced banking business in Russia, the number of household customers rose significantly in 2008. This development supported increased business volumes and income reached EUR 11m.
International Private BankingInternational Private Banking & Funds is responsible for the Group’s advisory services to wealthy individuals resid-ing outside Nordea’s home markets. Among the Nordic banks, Nordea is the largest private banking operator in Europe with approximately 12,000 customers based in more than 125 countries.
Business developmentIn 2008, International Private Banking customer base con-tinued to grow and customer contact frequency remained
Total
InternationalPrivate Banking
New EuropeanMarkets
Other
Gold
NordicPrivate Banking
–30 –20 –10 0 10 20 30 40 50 60
%
InternationalPrivate Banking
New EuropeanMarkets
Other
Gold
NordicPrivate Banking
0 10 20 30 40 50 60
%
Income growth, household customers, by segment, 2008
Share of income, household customers, by segment, 2008

Nor
dea
Ann
ual R
epor
t 20
08
19
The Nordea Business
high. New customers consisted of Nordic citizens living abroad and customers acquired from competitors. The value proposition was in 2008 improved by eg expanding the production of structured products and introducing new investment vehicles. AuM in 2008 were affected by market depreciation and thus reduced to EUR 6.8bn.
This development combined with a general lower level of transactions affected income negatively. Income was EUR 85m, down 21% compared to 2007.
Products in focusMortgage lendingHousing products are key for attracting and building long-term relationships with household customers. This creates possibilities for cross-selling the whole product range, cap-turing the customer’s full banking business. Nordea offers a comprehensive product range and supporting sales advice tools throughout the organisation.
Nordea has focused on extending the offering to include solutions through the customer’s entire housing life cycle, including home savings product, products to first-time buyers and home-equity products. Approx. 90% of Nordea’s Gold customers have a mortgage loan.
Business developmentMortgage lending volumes increased 4% compared to 2007. The market shares in mortgage lending were broadly unchanged compared to last year.
Consumer lendingConsumer lending enables the customers to bridge periods of lower liquidity, thereby providing financial flexibility. Nordea offers a full product range, including standard non-collateralised lending, credit card based revolving credits, overdraft facilities and standard collateralised lending and home-equity products. Focus is to increase volume of consumer loans to existing Gold customers, by advising customers to use Nordea as a full-range supplier.
Business developmentA positive trend continued in other consumer lending with 7% income growth supported by volume growth of 6%, while margins have increased.
Non-collateralised lending and home-equity products were important drivers for growth. There is still significant potential for growth.
Savings productsFinancial planning and advisory services play a central role for the total savings offering to household customers. Current financial market conditions further highlight the importance and value of Nordea’s advisory offering regarding to savings and investments. The savings prod-ucts offered cover investment funds, structured products, equities, bonds and all life and pension products as well as traditional savings deposits.
Business developmentThe end-to-end savings product portfolio allowed Nordea to cope well with the market turbulence and total house-hold net sales of savings products amounted to EUR 6.9bn.
However, the net sales product mix changed significantly as household customers were becoming more risk avert and awaiting markets to level out. The result was stagnat-ing sales of investment products and significantly increased sales of savings deposits, which became the best selling product in 2008.
Total savings volumes, personal customers Change EURbn 2008 2007 %
Retail funds 19.3 28.3 –32Life & Pensions products 15.7 17.0 –8Savings deposits 45.5 40.8 12Equities, bonds and structured products1) 23.4 33.7 –31
Total 103.9 119.8 –131) Custodian assets in Norway are not included.
Savings deposits, equity, bonds and structured productNordea has a comprehensive savings deposit offering, pro-viding both a wide range of attractively priced time depos-its and several variable interest rate products with a high degree of flexibility.
Further, Nordea offers a broad range of advisory prod-ucts and trading possibilities as concerns Nordic and inter-national equities and fixed income instruments. Such offer-ings are available both online and through personal service.
Business developmentDuring 2008, savings deposits were attractive alternatives to traditional investment products due to volatile financial mar-kets, high interest rates and the state guarantee schemes. Nordea has therefore had significant focus on product devel-opment within deposits, leading to launch of several new and innovative savings deposits products in 2008. Thus, inflow into household savings deposits was record high, amounting to EUR 8bn, up 13% compared to 2007. In 2008, the Nordic market share on savings deposits increased to 21%.
The equity business was in 2008 influenced by the very turbulent market conditions with severe decreases in share values globally. These circumstances led many personal customers to reduce their equities positions, and substitute with savings deposits or bonds. The activity in the online channel increased substantially, confirming the increasing interest for Nordea’s online trading services.
Primarily as a result of decreases in share values, net sales of bonds went up 60% compared to 2007. However, bond yields were very volatile in 2008 and by the end of the year, savings deposits were an attractive substitution to bonds.
Several theme-based structured products were intro-duced in 2008, with focus on themes like equities, com-modities and climate. However, sales of structured prod-ucts were challenged by the difficult market backdrop and competing savings deposits.
Life & Pensions productsNordea offers a full range of life insurance and pension products to household customers in the Nordic countries, the Baltic countries and Poland. All life and pension prod-ucts are based on the product groups traditional (passive), new traditional (passive), unit-linked (active), and risk

Nor
dea
Ann
ual R
epor
t 20
08
20
The Nordea Business
products. The products cover all stages of the customers’ life cycle including dissavings products and advice.
Business developmentIn 2008, total gross written premiums on life and pensions products of EUR 4,222m were record-high, up 12% com-pared to 2007 and Nordea kept the leading position within the life and pensions business with a Nordic market share of 10%, based on total gross written premiums. Negative performance in the equity markets and especially the increased credit spread affected the financial buffers (non-allocated customer bonuses) negatively. Accordingly, the level of financial buffers decreased to EUR 673m or 3% of life provisions in 2008.
Sales activities in the household segment were successful in 2008 as gross written premiums were up 6% from 2007. The strong organic growth in personal premiums was driven by sales of both traditional products and unit link products, and particularly stemming from sales in Sweden, Denmark and Poland.
Investment fundsWithin investment funds, Nordea offers a broad spectrum of funds based on traditional asset classes like fixed income, equities and balanced funds as well as alternative assets such as hedge funds and private equity. Offerings include Nordea branded funds, primarily managed inter-nally, and external funds. Both external managers and external funds are carefully selected by Nordea’s own manager selection team.
Business developmentThe relative performance of equity investment funds was strong in 2008, despite volatile equity markets and large negative absolute returns. In total, 9 out of 11 equity com-posites outperformed their benchmark. However, high risk premiums on the financial market affected 2008 investment return negatively for fixed income products with money market or credit/mortgage exposure. Thus, 43% of all com-posites outperformed benchmark in 2008. Several new funds were launched in 2008, including selected external funds to supplement the Nordea branded funds.
In 2008, Nordea increased its funds market share based on Assets under Management in Denmark, Norway and Sweden. This development did not, however, offset the fact that the 2008 financial market environment was generally not beneficial for the sales of investment funds in general, and a net outflow of EUR 4.5bn in 2008 was reported.
Assets under Management Net inflow
2008 2007 2008 2007
Nordic Retail funds 21.9 34.4 –4.5 –2.7European fund distribution 1.6 3.6 –0.8 –1.8Nordic Private Banking 36.1 45.7 2.1 3.7International Private Banking 6.8 9.6 –0.6 0.6Institutional asset management 23.1 24.9 1.1 –2.5Life & Pensions 36.1 38.8 0.6 0.3
Total 125.6 157.1 –2.0 –2.4
Household customer segments, key figures Nordic Other Nordic Private Gold household household Banking customers customers customers
2008 2007 2008 2007 2008 2007 2008 2007
Number of customers, ’000 83 78 2,510 2,397Income, EURm 324 379 1,911 1,843 999 1,008 3,234 3,230Volumes, EURbn Lending 4.5 3.6 90.5 90.6 10.9 11.1 105.9 105.3 Deposits 6.2 5.0 40.6 38.6 16.4 17.6 63.2 61.2 Assets under Management 36.1 45.6 Margins, % Lending 0.70 0.63 0.87 0.77 2.46 2.36 1.07 1.00 Deposits 0.71 0.79 1.47 1.59 2.57 2.46 1.74 1.81
New European International Household Markets household Private customers customers Banking Total
2008 2007 2008 2007 2008 2007
Number of customers, ’000 746 588 12 11 Income, EURm 108 68 85 108 3,427 3,406Volumes, EURbn Lending 4.6 3.0 0.9 1.4 111.3 109.7 Deposits 1.6 1.0 1.7 2.2 66.5 64.4 Assets under Management 6.8 9.6Margins, % Lending 1.48 1.25 0.77 0.83 1.08 1.01 Deposits 1.12 1.50 0.60 0.68 1.70 1.77

Nor
dea
Ann
ual R
epor
t 20
08
21
The Nordea Business
Market positions Lithu- Inter- Denmark Finland Norway Sweden Estonia Latvia ania Poland Russia national Total
Number of customers:, 000’sCorporate customers 47 127 84 348 10 4 3 55 7 685Household customers in customer programme 1,050 2,485 350 2,908 74 73 102 458 40 7,540Private Banking 33 26 6 17 <1 <1 12 95Net banking 864 1,476 415 2,085 48 63 96 186 5,233Shipping, oil services and international 2Financial institutions 1
Number of branches 319 345 124 341 22 22 22 144 53 1,392
Market shares ,%Corporate lending 21 37 16 14 14 12 11 3 1Corporate deposits 30 42 18 22 8 5 8 2 <1Household investment funds 16 28 10 14Life & Pensions 20 23 11 4 n.a.Brokerage 4 3 2 2Household mortgage lending 16 31 11 15 12 16 9 4 <1Consumer lending 14 30 9 9 9 2 6 <1 <1Household deposits 21 32 9 18 7 6 2 1 <1
31 Dec 31 Dec EURm 2008 % 2007 %
Banking Denmark 67,984 26 62,709 26 corporate customers 30,085 27,504 household mortgage lending 26,267 24,893 consumer lending 11,632 10,312 Banking Finland 52,055 20 47,488 19 corporate customers 26,096 23,513 household mortgage lending 20,608 19,115 consumer lending 5,351 4,860 Banking Norway 34,996 13 37,218 15 corporate customers 19,349 19,145 household mortgage lending 14,914 17,120 consumer lending 733 953 Banking Sweden 59,041 22 59,781 24 corporate customers 32,677 31,775 household mortgage lending 20,243 21,641 consumer lending 6,121 6,365 Estonia 2,228 1 1,685 1 corporate customers 1,406 1,006 household customers 822 679 Latvia 3,042 1 2,295 1 corporate customers 1,878 1,312 household customers 1,164 983
31 Dec 31 Dec EURm 2008 % 2007 %
Lithuania 2,393 1 1,481 1 corporate customers 1,686 1,049 household customers 707 432 Poland 3,818 1 2,707 1 corporate customers 2,199 1,835 household customers 1,619 872 Russia 3,714 1 1,648 1 corporate customers 3,464 1,541 household customers 250 107 Shipping, Oil Services and International 13,823 5 11,100 5Financial Institutions 2,045 1 1,900 1Reversed repurchase agreements 11,074 4 7,424 3Other 8,887 3 7,246 3
Total 265,100 100 244,682 100
of which corporate customers 134,708 51 121,680 50 of which household mortgage lending 86,594 33 85,842 35
of which other household lending 23,837 9 22,490 9
of which reversed repos and other lending 19,961 7 14,670 6
Loans and receivables to the public, by customer segment

Nor
dea
Ann
ual R
epor
t 20
08
22
The Nordea Business
Nor
dea
Ann
ual R
epor
t 20
08
22
People forming Great Nordea
Nordea’s more than 37,000 employees
continue to create great customer expe-
riences, as one team, living our vision –
making it possible.
It’s all about people and Nordea’s People StrategyWhile products and services can easily be copied, people are what ultimately distinguish us from our competitors. Consequently, our people are what will move Nordea from Good to Great. The People Strategy focuses on selected prioritised areas, namely:• Buildingthefoundation–HRBasics• Beingtheemployerofchoiceforthosewhowillmove
us from Good to Great• Staffing,ensuringwehavetherightpersonintheright
place at the right time• Mobilising,differentiatingandrewarding,thereby
securing outstanding organisational performance• Providingopportunitiesforourpeopletodevelopand
grow• Practisingtheleadershiprequiredtoenableustogo
from Good to Great.
All of these priorities shall be guided by and reinforce Nordea’s three values; Great Customer Experiences, One Nordea Team and It ’s all about People.
Building the foundation – HR BasicsHavingagoodunderstandingofthepeopleresourcesandputting solid people processes in place is an integral part of thePeopleStrategy.AprerequisiteforthisistohaveanHRinformation system enabling us to collect relevant people data. This system should also support our most important peopleprocesses,likePerformanceandTalentManage-ment. In 2008, this system was implemented in all Nordic countries.
Being the employer of choice for those who will move us from Good to GreatOur ability to realise the vision requires that Nordea has the very best employees. This applies both to the ability to attract and to retain the very best. To do this, we have worked hard in 2008 to strengthen our brand among selected target groups. Examples of initiatives are speed dating, allowing for students to meet with Nordea employees on line from all parts of the bank, and labour fairs at selected schools and universities, where we have presented the different opportunities available at Nordea. This work will continue in 2009 with the aim to be even more selective seeking to target those that can best partner with us in moving from Good to Great.
Staffing, ensuring we have the right person in the right place at the right time Going from Good to Great requires us to have the right per-sonintherightplaceattherighttime.Muchefforthasbeenmade to do just this in 2008, for example by further devel-oping the recruitment process and through the introduc-tion of an on-boarding process bringing new employees up to speed quickly. We are looking at intensifying this work even further in 2009. This will be done by strengthening our People Planning Process, translating our business plans to people needs and by further strengthening the recruitment process. In addition, we will seek to improve internal mobility, making sure that we have the right per-son in the right place at the right time, while at the same time allowing for our employees to grow through new and different experiences.
Mobilising, differentiating and rewarding, thereby securing outstanding organisational performanceNordeahasworkedhardtoimprovePerformanceMan-agement at Nordea in 2008. This work will continue in 2009 by further simplifying the process and tools, but equally if not more importantly, by continuing to build a culture where feedback and coaching is a natural part of our cul-ture.Morethan85%ofallmanagerswentthroughcoach-
0
5,000
10,000
15,000
20,000
25,000
30,000
35,000
20082007200620052004
65–60–6455–5950–5445–4940–4435–3930–3425–2920–24
–19
0 3 6 9 12 15
age
%
Number of employees (full time equivalents, FTEs)
Employees distributed by age% of employees, 31 Dec 2008

Nor
dea
Ann
ual R
epor
t 20
08
23
The Nordea Business
23
Nor
dea
Ann
ual R
epor
t 20
08
ing training in 2008, and we will continue to focus on this area in 2009.
Providing opportunities for our people to develop and growWe are proud of the improvements made in this area in 2008. For example, the introduction of a number of new academies aimed at developing for example personal bank advisers and branch managers, has led to tangible improvementsofourbusinessresults.However,wehaveno intentions to settle with this. In 2009, we must make sure to further strengthen the tie inbetween the business needs and all that we do in terms of building competencies, ultimatelymeasuringthevalueofourinvestment.Relatedto this, we must make sure to always look for the effective ways to allow for people to grow, for example by making more use of e-learning than we do today.
Practising the leadership required to enable us to go from Good to GreatAn organisation’s success is to a large degree dependent on its current and future leadership. Our ambitious vision and targets will most certainly require the same for Nordea. Hence,wemustgrowourcurrentleaderswhilemakingsure we identify and develop those that are considered to have the potential to take on greater responsibilities in the future. The foundation for this work is to agree to what leadership we shall seek to build, which was addressed in 2008, through the implementation of Nordea's leadership competencies. These leadership behaviours have served as a guide in the development of all leadership programmes in Nordea in 2008, and will continue to do so in 2009. The efforts to strengthen the leadership will continue in 2009, forexamplebyfurtherstrengtheningourTalentManage-ment process making sure we identify talents early and provide opportunities for them to realise their potential, together with us. While doing this, we will put special focus to females, aiming at increasing the percentage of females in leadership positions in 2009.
Due to the cross-border nature of the Nordea Group, special arrangements have been agreed with the unions in the Nordic countries. These agreements allow staff representatives to be involved in certain decision making processes impacting more than one country.
Employee satisfaction survey results
ESI, index 2008 2007 2006
Satisfaction and motivation 72 71 71Development 72 70 –Considered a good workplace 77 74 73ProudtotellotherswhereIwork 80 78 75Recommendotherstostartworking in Nordea 76 74 72
Number of employees, by area or function 31 Dec 2008
Full-time equivalents (FTEs)
NordicBanking 17,253– ofwhichBankingDenmark 5,149
BankingFinland 5,420 BankingNorway 1,878 BankingSweden 4,802
Institutional&InternationalBanking 5,134– ofwhichBalticcountries 1,161
Poland 1,542 Russia 1,679 Financial institutions 411 Shipping,OilServices&International 295
CapitalMarkets&Savings 4,112BankingProducts&GroupOperations 6,174People & Identity 427GroupCredit&RiskControl 376GroupCorporateCentre 255GroupLegal 150Other functions 127
Nordea Group 34,008
40–
35–39
30–34
25–29
20–24
15–19
10–14
5–9
–4
0 5 10 15 20 25 30
years
%
Employees distributed by ages in service% of employees, 31 Dec 2008

Nor
dea
Ann
ual R
epor
t 20
08
24
The Nordea Business
Corporate Social Responsibility
Corporate Social Responsibility (CSR) is
the concept Nordea applies to maintain
and enhance our relations with internal
and external stakeholders. Stakeholders
are parties who share an interest in what
we do that reaches beyond, but also
includes, financials. Reputation, trust
and good business practices are all
important end products of CSR. In times
of troubled markets, Nordea deems it
more important than ever to be a sup-
portive financial partner for our custom-
ers, and also to be a good corporate
citizen by participating in maintaining a
solid financial system in society.
CSRisanintegratedelementofNordea'sbusiness.TheCSRpoliciesandprocedureshavebeendevelopedtoreflect the Group’s business strategy and are designed to support the business objectives. A cruical factor for build-ingshareholdervalueandforbeingaleadingfinancialser-vices provider, is the management of business ethics and the various risks and opportunities related to the reputa-tion of and trust in Nordea’s business operations.
Following the introduction of new Nordea values in 2007,aprocesstocreateanewCSRstrategywasinitiated.TheproposalwaspresentedtoGroupExecutiveManage-ment in June 2008. The overall purpose of the proposed newCSRstrategyanditsrelatedactivitiesistosupporttheNordea values and the Group’s strategic move towards the creation of a Great Nordea.
Taking responsibility in financial turmoilCitizenship in general means being a responsible and active member of society. The Nordea Corporate Citizen-ship Principles have since 2002 served as the main stan-dard of our role in society, and they have been further rein-forced with the introduction of new Nordea values in 2007. It is important for Nordea to be a good corporate citizen, inspiringconfidenceandtrustinthemarketswhereweoperate, and to be perceived as a responsible and trustwor-thyfinancialpartnerforourcustomers.
We have committed ourselves to good citizenship. During thesecondhalfof2008,weexperiencedexceptionalfinan-cial turmoil that led to lack of trust in the market and tight-ened credit conditions. Nordea's credit granting principles have proved sustainable and we continue to apply them in servingthefinancialneedsofthecustomers.Inthesetimes,it is important to be proactive giving advice and support-ingcustomersintheirfinancialaffairs–torationalisetheirfinancesandsolvepotentialproblemsproactively.
We therefore conclude that corporate social responsibil-ity, during these challenging circumstances, requires us to be able to make lending facilities available to our credit-worthy customers. To achieve this, Nordea has worked and will continue to work proactively with governments andcentralbankstofacilitateacontinuedflowofsufficientcredits to customers.
We are committed to our value of creating Great Cus-tomer Experiences and we continue this endeavour during thesedifficulttimes.Ourambitionistostandbythecus-tomers,servingastheirlong-termfinancialpartnerandadviser. During 2008, we have increased the amount of loans outstanding both to corporate and household cus-tomers.
The right behaviourAcornerstoneofNordea’sCSRworkconcernsbusinessconduct and ethics. There are two reasons for this. One rea-son is that a common set of values and behavioural guide-lines constitutes a foundation for a common corporate cul-ture,andawaytofulfiloneofourNordeavalues:OneNordea Team. In Nordea, it is all for one and one for all in creating value for our customers and for society at large. Soundfinancesareaprerequisiteforallsustainabledevel-opment.
The other main reason for the emphasise on business conduct relates to risks and opportunities. Operational risk in banking, stems from human behaviour, procedures and systems.Humanbehaviouriscentraltothisbecauseitispeoplewhomakejudgementsanddecisions,defineproce-dures and make systems. In other words, appropriate human conduct is an important risk-control mechanism. Likewise, in terms of opportunities, a workforce demon-stratinggoodbusinessconductisalsobeneficialtoourcoreasset: our customers’ well-being. The foundation of this relationship lies in the positive everyday meetings taking placebetweencustomersandNordeastaff–andwecon-stantly improve and aim to excel in what can be expected from us in this regard.
Nordea has developed a groupwide standard of busi-ness ethics, the Nordea Code of Conduct and this has also beendocumentedinaGuidetoSoundBusinessRelation-ships. These apply to all employees of the Nordea Group and temporary staff working for Nordea. There are also supplementaryspecificationstotheseinstructionsthatapply within customer and product areas and group func-tions, thus producing a business conduct guidance struc-ture covering the entire group and all our activities.

Nor
dea
Ann
ual R
epor
t 20
08
25
The Nordea Business
It’s all about people;
people who care.’’The bigger pictureNordea communicates and interacts with society at large. Among other things, this means conducting an open and frequent stakeholder dialogue. Nordea also participates in industry networks and forums with other large, multina-tionalcorporationsandfinancialinstitutions,forinstancewithinCSREurope,abusinessforumforinformationexchange and cooperation with European Union institu-tions.
Nordea supports the UN Global Compact, which is a set of ten principles for conducting responsible business, and also the UN Environmental Program Finance Initiative (UNEPFI),acharterandacooperationforumwherefinan-cial institutions address environmental aspects of their businesses. Nordea supports the OECD Guidelines for MultinationalEnterprises,andisalsoasignatorytotheEquator Principles. The Equator Principles constitute a globalfinancialservicesindustrybenchmarkfordetermin-ing, assessing and managing social and environmental risksinprojectfinancing.
Nordea(SavingsandAssetManagementunits)hassignedtheUnitedNationsPrinciplesforResponsibleInvestments(UNPRI).TheUNPRIconsistsofsixgeneralprinciples through which a signatory institution commits to incorporate environmental, social and corporate gover-nance issues (ESG) into its investment analyses, decision-making processes and ownership policies and practices.
Nordea has since 2002 included environmental risk assessment in its corporate credit decision process. A spe-cifictoolkit,theEnvironmentalRiskAssessmentTool(ERAT)wasdevelopedforthispurposeandimplementedin the credit procedures. During 2007, the scope of analysis was expanded to also cover social and political risks. So, in 2008,asecondtool,theSocialandPoliticalRiskAssess-mentTool(SPRAT)wasintroducedinthecreditassess-ment process.
New initiativesInaproposalforanewCSRstrategywaspresentedtoGroupExecutiveManagement.InSeptember,theresponsi-bilityofCSRwastransferredfromtheCompliancefunc-tion and organisation to the business side of the organisa-tion.ThisinordertobringCSRclosertotheoperationsandthecustomers.InNovember,aCSRSecretariatwasorganised and the work with more detailed action plans to applytherecommendedstrategywasinitiated.Thefirsteffects of these changes are expected to emerge during the firsthalfof2009.
TransparencyNordeastrivestofulfilthereportingrequirementsoftheinternational agreements and principles to which we are a signatory. This includes an annual Communication on Progress (COP) report to the UN Global Compact and an annual status report related to the Equator Principles. Nor-dea has since 2003 issued an annual environmental report, the Nordea Environmental Footprint.
At the end of 2008, the Swedish government was the single largest shareholder in Nordea. Consequently, Nor-deaissubjecttotherequirementsfornon-financialreport-ing introduced by the Swedish government in 2007, and in order to meet these requirements, the Group introduces its firstintegratedSustainabilityReporteffectivefrom2008.
ForfurtherinformationonCSRintheNordeaGroup,please go to www.nordea.com/csr. Nordea's Corporate Citizenship Principles, the Code of Conduct and the Sus-tainabilityReport2008willbemadeavailableatNordea'sweb pages.

Nor
dea
Ann
ual R
epor
t 20
08
26
The Nordea Business
26
Nor
dea
Ann
ual R
epor
t 20
08
The Nordea share
Nordea's overall financial target is to
create value for shareholders in the top
quartile of the European peer group.
The market capitalisation of Nordea at the end of 2008 was EUR13.0bn.RankedbymarketcapitalisationNordeawasthe eighth largest company in the Nordic area and the eighthlargestamongEuropeanfinancialgroups.
TheNordeashareislistedontheNASDAQOMXNor-dic,thestockexchangesinStockholm(inSEK),Helsinki(EUR)andCopenhagen(DKK).
Share price development 2008 was characterised by the weakest equity markets since1991andtheoveralltrendforfinancialshareshavebeen sharply downwards. During the year the share price ofNordeadepreciatedby49%ontheStockholmStockExchangefromSEK108on28December2007toSEK54.70on 30 December 2008. The daily prices listed for the Nordea share during 2008 (closing prices at Stockholm Stock Exchange) ranged between SEK 108.00 and SEK 52.50.TheSX40FinancialsIndexoftheStockholmStockExchangedepreciatedby48%,theDowJonesSTOXXEuropeanbanksindexdepreciatedby64%.Since6March2000,thedateofthemergerbetweenMeritaNordbankenandUnidanmark,theNordeasharehasappreciated29%andoutperformedtheDowJonesSTOXXEuropeanbanksindex(–54%).
Nordea’s share price can be monitored at www.nordea.com, where it is also possible to compare the performance of the Nordea share with competitors and general indexes aswellastofindhistoricalpricesoftheNordeashare.
Total shareholder returnTotalshareholderreturn(TSR)isrealisedthroughmarketvalue growth per share and reinvested dividends. Total shareholderreturnin2008was–46.9%(6.4%in2007). Nordea ranked as number two among the European peer
groupbanksintermsofTSRin2008(numberthreein2007and2006.)TheaverageTSRinthepeergroupwas–67%.
LiquidityTheNordeasharewasthemostliquidNordicfinancialshare in 2008, with an average daily trading volume of approx.EUR107m,correspondingto13millionshares.Turnover on the three stock exchanges combined totaled EUR27bnin2008,whichcorrespondstomorethan3bil-lion shares. Of the total number of Nordea shares traded in 2008,approx.81%wastradedontheStockholmStockExchange,11%ontheHelsinkiStockExchangeand7%onthe Copenhagen Stock Exchange. A trading lot is equiva-lentto1shareinStockholm,CopenhagenandHelsinki.
The Nordea share is represented in a number of national indexes and it is also included in European and global indexeswithinMSCI,DowJonesSTOXX,FTSEandS&P.Withaweightof4.3%Nordeawasthefifthlargestcom-panyintheNordicOMX40indexattheendof2008.
Capital managementNordea aims at keeping capital flexibility with excess capi-tal returned to shareholders through dividends as well as repurchasesofownshares.Efficientuseofcapitalwillcon-tributetoachievingtheprofitabilitytargetandshareholdervalue creation.
Dividend policy and proposed dividendNordea pursues a policy of high dividends. The policy is thatthetotaldividendpaymentwillexceed40%ofthenetprofitfortheyear.
TheBoardofDirectorsofNordeaBankAB(publ)pro-posesadividendfor2008ofEUR0.20pershare.Thetotaldividendpaymentfor2008wouldthenbyEUR519mcor-respondingtoapayoutratiofor2008of19%ofthenetprofitaftertax.Thedividendyieldcalculatedontheshareprice30December2008isthen4.0%.
This proposed reduction of the dividend is intended as a temporary measure to, together with the rights offering, strengthen Nordea´s core capital position, and does not indicate a change in Nordea´s dividend policy.
SEK
Nordea DJ STOXX European Banks
Turnover, thousands of shares
0
100,000
200,000
300,000
400,000
500,000
20
40
60
80
100
120
200820072006200520042003200220012000
EURbn
Bank of IrelandAllied Irish Banks
SwedbankSEB
DnBNORHBOS
CommerzbankDanske
ErsteSHBKBC
LloydsNordea
BarclaysRBS
Societe GeneraleUnicredit
BNP ParibasIntesa Sanpaolo
Santander
0 10 20 30 40 50 60
Nordea share performance compared to European banks, 2000–2008 Market capitalisation, 31 Dec 2008, EURbn
Source: Reuters EcowinSource: Reuters Ecowin

Nor
dea
Ann
ual R
epor
t 20
08
27
The Nordea Business
27
Nor
dea
Ann
ual R
epor
t 20
08
ThedividendisdenominatedinEUR,althoughthecur-rency of payment depends on in which country the share are registered. Owners of shares registered in Sweden can choosebetweendividendinSEKorinEUR.Anofficialexchange rate is published. In Denmark, dividend is paid outinEUR.IftheshareholderdoesnothaveaEURaccount, the dividend is converted into local currency. Each custody institute decides their own conversion rate. In Fin-land,thedividendispaidinEUR.
ShareholdersWith approx. 480,000 registered shareholders at the end of 2008, Nordea has one of the largest shareholder bases of all Nordic companies. The number of Nordea shareholders registeredinSwedenisapprox.95,000,inDenmark190,000and in Finland the number of shareholders is approx. 195,000.
The largest among the various categories of sharehold-ersisnon-Nordicshareholders,holding22.5%ofthesharesinNordeacomparedto23.4%attheendof2007.Thelarg-est individual shareholder is the Swedish state with a hold-ingof19.9%atyearend.
Investor communication Close to 30 equity analysts cover Nordea with regular earn-ings updates and recommendations. Nordea aims at being one of the leading European companies in terms of open, clear and relevant information to shareholders and other stakeholders. Nordea has during 2008 further upgraded theGroup’sfinancialreportsandpresentations.
Nordea conducts a proactive approach in meetings with investors. CEO, CFO and other members of the Group ExecutiveManagementregularlytravelstomeetwithinvestors in Europe and US. Nordea relies to a large extent on the Internet in communication with shareholders and investors.Allsignificantfinancialinformationabout Nordea Group can be found in the Group’s web pages. Daily contact with investors and analysts is handled by Nordea’sInvestorRelationsdepartment.
%
Bank of IrelandHBOS
AIBCommerzbank
RBSLloyds TSBSwedbank
KBCUnicreditBarclays
BNP ParibasIntesa Sanpaolo
SantanderDanske
Societe GeneraleSEB
DnBNORNordea
ErsteSHB
–100 –75 –50 –25 0 25 50 75 100
Total Shareholder Return (TSR) 2000–2008
Source: Reuters Ecowin
Largest registered* shareholders in Nordea, 31 Dec 2008
Noofshares, Holdings Shareholder million %
Swedishstate 515.6 19.9Sampo Oyj 313.2 12.1Nordea-fonden 105.3 4.1SwedbankRoburFunds 81.1 3.1SHB/SPPFunds 48.3 1.9SEBFunds 34.6 1.3Nordea Funds 32.6 1.3AMFPension 31.0 1.2Fourth Swedish National Pension Fund 30.9 1.2SkandiaLifeInsurance 25.9 1.0IlmarinenMutualPensionInsurance 24.1 0.9Second Swedish National Pension Fund 23.9 0.9First Swedish National Pension Fund 23.6 0.9AMFPensionFunds 20.7 0.8VarmaMutualPensionFund 18.0 0.7Seventh Swedish National Pension Fund 16.4 0.6Alecta 14.0 0.5NordeaProfit-sharingFoundation 13.7 0.5LänsförsäkringarFunds 12.9 0.5Govt of Singapore Inv Corp 11.0 0.4
Total 1,397 53.8
Source: SIS ägarservice, Nordic Central Securities Depository, VP Online.* Excluding nominee accounts.
Nordea ranked as number
two among the European peer
group banks in terms of TSR in
2008 and has been among the
top three in 2007 and 2006.
’’

Nor
dea
Ann
ual R
epor
t 20
08
28
The Nordea Business
28
Nor
dea
Ann
ual R
epor
t 20
08
Distribution of shares, 31 Dec 2008
Number of Number of Distributionofshares shareholders Shareholders,% shares Shares,%
1–1,000 396,794 83 155,312,394 61,001–10,000 77,970 16 189,327,510 710,001–100,000 4,092 1 103,844,176 4100,001–1,000,000 586 0 242,356,235 91,000,001– 230 0 1,909,280,512 73
Total 479,672 100 2,594,108,2271) 100
Share data 5 years 2008 2007 2006 2005 2004
Shareprice SEK54.70 SEK108.00 SEK105.50 SEK82.50 SEK67.00High/Low 108.00/52.50 119.30/99.60 107.00/77.25 84.25/64.25 67.75/48.70MarketCapitalisation EUR13.0bn EUR29.6bn EUR30.3bn EUR23.7bn EUR21.2bnDividend EUR0.202) EUR0.50 EUR0.49 EUR0.35 EUR0.28Dividendyield 4.0%3) 4.9% 3.9% 4.0% 3.6%TSR –46.90% 6.39% 32.30% 27.50% 29.80%DJSTOXXEuropeanbanksindex –64.00% –16.90% 18.50% 21.60% 10.30%P/E(actual) 7.20 9.50 10.70 10.20 10.80Price-to-book 0.90 1.73 2.14 1.76 1.62Equitypershare EUR6.84 EUR6.58 EUR5.89 EUR4.98 EUR4.59Earningspershare EUR1.03 EUR1.20 EUR1.21 EUR0.86 EUR0.69Outstanding shares1) 2,594,108,227 2,594,108,227 2,594,108,227 2,594,108,227 2,734,845,2271) Excluding shares issued for the Long Term Incentive Programme.2) Proposed dividend.3) Yield calculated at starting price on payment day, for 2008 per 28 December.
Annual report The annual report is available in English and Swedish. A summary of the annual report is available in English as well as in the four Nordic languages. The full annual report and the summary will be distributed on request. The reports can be downloaded and ordered by accessing Nordea's web pages.
Share capitalIn order to implement the Long Term Incentive Pro-gramme2008inacost-efficientmanner,theAGM2008decided on an issue of 2,880,000 redeemable and convert-
ible C shares. The C shares should hedge the programme againstnegativefinancialeffectsfromsharepriceapprecia-tions. The new C shares do not entitle to any dividend. The Cshareshavebeenboughtbackandon22May2008theC shares were converted to ordinary shares. After the new issue,thesharecapitalamountstoEUR2,600,108,227.
All shares in Nordea carry voting rights, with each share entitledtoonevoteatGeneralMeetings.NordeaBankAB(publ) is not entitled to vote for own shares at General Meetings.
Further to the LTIP, there are no convertible bond loans or staff or management options in Nordea.
Shareholder structure, 31 Dec 2008 by investor category
Shareholder structure, 31 Dec 2008 by geography
International investors, 23%
Swedish institutions, 21%
Swedish state, 20%
Finnish institutions, 17%
Danish institutions, 7%
Finnish public, 6%
Danish public, 4%
Swedish public, 2%
Sweden, 43%
Finland, 23%
Denmark, 12%
United States, 11%
United Kingdom, 5%
Luxembourg, 2%
France, 1%
Other, 3%
Source: SIS ägarservice

The Nordea Business
29
Nor
dea
Ann
ual R
epor
t 20
08
Change in share capital Quota,value Number of shares Nominal change Total number Share capital Date per share1), SEK issued SEKm of shares SEKm
17Dec-97 Newissue 7.00 1,275,267,441 8,927 1,275,267,441 8,92728Jan-00 Reduction –3,188 Newissue 4.50 815,800,287 3,671 2,091,067,728 9,4102)
25Apr-00 Reduction –2,091 Newissue 3.50 869,776,488 3,044 2,960,844,216 10,36309Jun-00 Newissue 3.50 18,348,501 64 2,979,192,717 10,42729 Aug-00 New issue3) 3.50 3,006,359 11 2,982,199,076 10,43811 Dec-00 New issue3) 3.50 59,764 0 2,982,258,840 10,438
Quota,value Number of shares Nominal change Total number Share capital Date per share1),EUR issued EURm ofshares EURm
10 Jan-01 Conversion4) 0.405) 2,982,258,840 1,18220 Feb-01 New issue3) 0.40 8,408 0 2,982,267,248 1,18215May-01 Newissue3) 0.40 2,401 0 2,982,269,649 1,18214 Dec-01 New issue3) 0.40 396,441 0 2,982,666,090 1,18231May-02 Newissue3) 0.40 2,405,087 1 2,985,071,177 1,18325Sep-026) New issue3) 0.40 45,050 0 2,985,116,227 1,18307Oct-03 Reduction7) 0.40 –57,008,000 –23 2,928,108,227 1,16026Oct-04 Reduction7) 0.40 –81,608,500 –32 2,846,499,727 1,12819Sep-05 Reduction7) 0.40 –140,159,800 –56 2,706,339,927 1,07302Oct-06 Reduction7) 0.40 –112,231,700 –44 2,594,108,227 1,02811May-06 Bonusissue 1.00 1,566 2,594,108,227 2,59408 Jun-07 New issue8) 1.00 3,120,000 3 2,597,228,227 2,59715May-08 Newissue9) 1.00 2,880,000 3 2,600,108,227 2,6001) As of January 2006 nominal value has been replaced by quota value according to the new Swedish Companies Act.2) Anticipated in Balance Sheet 31 Dec 1999, registration 28 January 20003) Conversion of bonds4) From SEK to EUR5) 0.39632 EUR6) On 1 September 2002 Nordea AB (publ) redeemed the outstanding loan amount of EUR 96,928,426.28 early. Subsequently, the company has no outstanding convertible bond loans7) Retirement of shares repurchased and held by Nordea 8) C-shares issued for the Long Term Incentive Programme 2007. Converted to ordinary shares 18 June 2007.9) C-shares issued for the Long Term Incentive Programme 2008. Converted to ordinary shares 22 May 2008.

Nor
dea
Ann
ual R
epor
t 20
08
30
The Nordea Business
Events 2008
JanuaryNordea Life & Pensions receives award for risk manage-mentfromRiskMagazine.
FebruaryNordea presents strong full year result - based on growth strategy and prudent risk management.
MarchNordeasellsitsglobalcustodyoperationstoJPMorgan.
Nordea wins three international prizes from Lipper Fund Awards.
AprilNordea reports quarterly results. Growth strategy on track -incomegrowthcontinuedandprofitbeforeloanlossesincreased.
MichaelRasmussenjoinsGroupExecutiveManage-mentwhenappointedheadofBankingProducts&GroupOperations.
AriKaperijoinsGroupExecutiveManagementwhenappointedheadofInstitutional&InternationalBanking.
NordeaappointsFredrikRystedtasnewChiefFinancialOfficerandmemberofGroupExecutiveManagement.
AtNordea’sAnnualGeneralMeeting,arecordhighshareholder representation is present.
JuneNordea opens a new branch in Shanghai.
Nordea sells its shares in Nordic Central Securities Depository.
JulyNordea reports its strongest ever quarterly result in the customer areas.
In Sweden, Nordea takes over 68 branches from Svensk Kassaservice, which increases Nordea’s Swedish branch network with one third.
Nordea wins Euromoney awards as iaBestRegionalBankintheNordicandBalticregion.
Euroweek ranks Nordea as number one bookrunner for syndicated loans in the Nordic area.
AugustNordeaissuesa5-yearUSD5bnextendiblenoteintheUSmarket.
Nordea sponsors Nordic athletes, who participates in the Olympic Games in China.
SeptemberNordea acquires nine branches, in the Zealand region in Denmark,fromRoskildeBank.
Nordeaissueslowertier2capitalofEUR0.5bn.NordeaLife&PensionsexpandsintotheBalticregion
with the launch of pension funds.Nordea presents a Graduate Programme, the new
trainee programme.
OctoberNordea’s strong results for the third quarter exceeds expec-tations.
In an external customer survey, Nordea’s custody ser-vices receives top rating.
Nordea and other banks agree with the Danish govern-mentonastateguaranteeschemeforfinancialstability.
Nordea Poland is awarded prizes by Newsweek, for interbank services, and by Forbes, for general corporate services.
NovemberNordea and TrygVesta prolong the distribution agreement until 2013.
DecemberNordeareceivesapprovaltouseinternalratingbased(IRB)approach for the major part of the retail customers. Follow-ingtheapproval,Nordeahas83%ofitsexposurecoveredbytheIRBapproach.

Nor
dea
Ann
ual R
epor
t 20
08
31
Board of Directors’ Report
Financial Review 2008
Solid performance despite rapid economic slowdown• IncomeEUR8,200m(EUR7,886m2007),up4%• NetinterestincomeEUR5,093m(EUR4,282m),up19%• Expensesincreased7%• ProfitbeforeloanlossesEUR3,862m(EUR3,820m),up
1%• NetloanlossesEUR466m(positiveEUR60m),loanloss
ratioof19basispoints• OperatingprofitEUR3,396m(EUR3,883m),down13%• Risk-adjustedprofitEUR2,459m(EUR2,417m),up2%,
3.5%excludingDanishStateguaranteefee• EarningspershareEUR1.03(EUR1.20)• ProposeddividendpershareEUR0.20,(EUR0.50),cor-
respondingtoadividendpayoutratioof19%• Continuedsupportofcustomers–lendingup17%,in
localcurrencies• Totaldepositsup12%,inlocalcurrencies• Tier1ratio9.3%(8.3%),beforetransitionrules• Rightsofferingandreduced2008dividendto
strengthencorecapitalpositionbyEUR3bn• Nordeaexpectsrisk-adjustedprofitfor2009atapprox.
thesamelevelasin2008
Legal structureNordeaaimsatcontinuoussimplificationofitslegalstruc-tureandasregardstheNordicbankstheaimisthatNor-deaBankAB(publ)willbeconvertedintoaEuropeancom-pany,aSocietasEuropaea”,(“SE”),inaccordancewiththeEuropeanCompanyStatute.
Amongotherthings,aconversionisconditionalonNor-deaobtainingnecessaryapprovalsfromtherelevantauthorities.Atransformationisexpectedtoleadtoimprovedoperationalefficiency,reducedoperationalriskandcomplexityaswellasenhancedcapitalefficiency.
Nordeaisawaitingsatisfactoryregulatoryandlegisla-tivesolutions,particularlytothedepositguaranteeissue.Thefinalregulatoryresponsestothecurrentfinancialtur-moilarefurtheryettobeseenandtobeevaluated.Nordeaisfollowingupandanalysingthechangesinprocess.
Thefinalconversionprocessinitselfisestimatedtotakeuptooneyearfromstarttoexecution.
OrgresbankNordeahasinthefourthquarter2008agreedwiththeminorityshareholderstoexerciseitsrighttoacquiretheremaining17.7%ofJSBOrgresbankfromthetwomanage-mentshareholdersandtheEuropeanBankforReconstruc-tionandDevelopment.ThetransactionwiththeEuropeanBankforReconstructionandDevelopmentissubjecttoregulatoryapprovalsandisexpectedtobecompletedinthefirstquarterof2009.
NordeawillsubsequentlyincreasetheequitycapitalofJSBOrgresbankthroughanewissueofapprox.EUR100million.Followingthetransaction,Nordeawillown100%ofJSBOrgresbank,ofwhichNordeahasbeenamajorityownersince29March2007.Nordeahasalreadyconsoli-datedOrgresbankto100%intheaccounts.
Result summary for 2008Totalincomeincreasedby4%toEUR8,200mandprofitbeforeloanlossesincreasedby1%toEUR3,862m.Despitethefinancialcrisisandglobalrecession,Nordeaagainman-agedtoproduceayearwithsolidresult.
TherapideconomicslowdownhasstartedtoaffecttheNordiccountriesandthisislikelytocontinuein2009.Nor-deaisthereforepreparingforchallengingtimesahead.Inadaptingtothenewmarketconditions,thespeedintheorganicgrowthisreducedandthefirmattentiononcosts,riskandcapitalmanagementisfurtheremphasised.Inadditiontothecostefficiencymeasuresandnewcapitaltargets,Nordeawillfocusondoingmorebusinesswithexistingcustomersandwillalsoselectivelycapturebusi-nessopportunitieswithnewcustomerswithsolidcreditprofiles.
Theorganicgrowthstrategycontinuedtodeliverresultsduring2008withincreasedtotalincome,drivenbystronggrowthinnetinterestincomeandincomefromthecus-tomer-drivencapitalmarketsoperations.
Lendingvolumesincreased8%toEUR265bncomparedtooneyearago.Inlocalcurrencies,thelendingvolumegrowthwas17%.
InNewEuropeanMarkets(NEM),lendinggrowthdeclinedduringtheyearandwasinthefourthquarter15%,annualised.IncomeinNEMincreased84%in2008,withacost/incomeratioof39%.
Netinterestincomeincreasedstrongly,drivenbyhighermarginsincorporatelendingandhouseholdmortgages,andwithcontinuedvolumegrowth,althoughatalowerpacetowardstheendoftheyear.Marginshaveincreasedreflectingre-pricingofcreditriskandtocompensateforhigherliquiditypremiums.
Totalexpensesincreased7%,includingrestructuringexpensesofEUR28m.
Theeconomicslowdownhasresultedinhighernetloanlossesandincreasedimpairedloans.NetloanlossesamountedtoEUR466m,givingaloanlossratioof17basispoints,excludingthelossesrelatedtotheguaranteesintheDanishguaranteeschemes,and19basispointsincludingthese.Impairedloansgrossincreased55%toEUR2,224m.TheincreaserelatesmainlytotheNordiccountries.
Operatingprofitwasdown13%toEUR3,396m,whilerisk-adjustedprofitwasup2%toEUR2,459m.ExcludingthecommissionexpensesrelatedtotheDanishStateguar-anteeschemes,theincreaseinrisk-adjustedprofitwas3.5%.
Nordeareportsatier1ratio,beforetransitionrulesaccordingtoBaselII,of9.3%andacoretier1ratio,beforetransitionrules,of8.5%.Theseratioshavebeenimpactedbythereduceddividendratioto19%.Thecapitalpolicyhasbeenrevisedwithanewtargetforthetier1ratioof9.0%andforthetotalcapitalratioof11.5%.Bothnumbersaretargetsoverabusinesscycle.

Nor
dea
Ann
ual R
epor
t 20
08
32
Board of Directors’ Report
IncomeTotalincomeincreased4%toEUR8,200m.Incomegrowthwasparticularlystrongwithincustomerareas.NordicBankingandInstitutional&InternationalBankingreportedanincomegrowthof10%,supportedbystrongunderlyingbusinessmomentumandsuccessfulexecutionofstrategicinvestmentplans.
Net interest incomeNetinterestincomeincreased19%toEUR5,093m,drivenbyastrongincreaseinlendinganddepositvolumesandre-pricingofcreditriskmainlyoncorporatelending.
Lendingtothepublicincreased8%and17%inlocalcur-renciescomparedtooneyearago.ThegrowthratewasnegativelyaffectedbytheweakerNorwegianandSwedishcurrenciesinthefourthquarter.
Growthincorporatelendingwas11%and19%inlocalcurrencies,excludingreversedrepurchaseagreements,whichreflectsstrongdemandacrosstheNordicregionandfrommostsectors.Duringthemarketturmoil,withscarceliquidityincapitalmarkets,Nordea’sclosecustomerrela-tionshipsandstrongbalancesheethaveprovidedopportuni-tiestosupportcustomerswiththeirshortandlong-termcap-italneeds,whilestillcomplyingwiththeprudentriskman-agementpolicy.Nordeahasingeneralstrengtheneditsmar-ketpositionsintheNordicmarkets,especiallyondeposits.
Corporatelendingmarginsincreasedduringtheyear,reflectingre-pricingofcreditriskandtocompensateforincreasedliquiditypremiums.Totalincomefromcorporatecustomerswasup29%,mainlydrivenbyastrongincreaseinnetinterestincomeandalsothecustomer-drivencapitalmarketsoperations.
Bothhouseholdmortgagelendingandconsumerlend-ingincreasedby1%comparedtooneyearago.Inlocalcur-rencies,growthwas9%.However,duetopressureondepositmarginsandlowersavings-relatedfees,incomefrombusinesswithhouseholdcustomersdecreasedby6%comparedtolastyear.InNordicBanking,marginsonhouseholdmortgagelendinghaveincreasedduringthesecondhalfoftheyear,mainlytocompensatefortheGroup’sincreasedliquiditypremiums.
TotaldepositsincreasedtoEUR149bn,up4%comparedtooneyearago.Inlocalcurrencies,depositvolumesincreased12%intheGroup,andinNordicBankingby14%.Marketgrowthwas9%,whichshowsthatNordea’sstrongbrandnamehasattractedasubstantialinflowofdeposits.Nordeainparticularcontinuedtoattractlargevolumesintohouseholdsavingsaccountsandcorporatedeposits.Depositmarketshareshaveincreasedinallgeo-graphicalmarkets.Marginshavedecreasedduringthefourthquartermainlyontransactionaccountsasaconse-quenceofsignificantratecutsfromcentralbanks.
InInstitutional&InternationalBanking(IIB),solidincomeandprofitgrowthwasrecordedinalldivisions,asbusinessactivitycontinuedatahighlevel.Thetotalincomeincreaseof40%wassupportedbystronggrowthinnetinterestincome.
Net fee and commission income Netfeeandcommissionincomedecreasedby12%toEUR1,883m,withsavings-relatedcommissionincomenega-tivelyaffectedbytheweakequitymarkets.AdjustedfortheDanishStateguaranteeexpensesofEUR50m,thedecreasewas10%.
Savings-relatedcommissionsdecreasedby18%toEUR1,148m.AssetsunderManagement(AuM)decreasedtoEUR125.6bn,down20%comparedtooneyearagoanddown10%comparedtotheendofSeptember2008.Incomemarginsdecreasedasaresultofachangeinassetmixfromequitiestofixed-incomeproducts,lowertransactionincomeandachangeinsalesmix,ieashiftfromsalesofretailfundstosalesofinstitutionalproducts.Followingchallengingmarketconditions,totalnetoutflowfromAuM2008wasEUR2.0bn.Theoutflowwasprimarilycon-centratedtoretailfunds,inwhichanoutflowofEUR4.5bnwasreported.TheseoutflowswerecompensatedforbyanetincreaseinsavingsdepositsofEUR4.7bnduringtheyear.NetinflowofEUR2.1bnwasreportedinNordicPri-vateBankingandofEUR1.1bnforInstitutionalclients.
Totalpaymentcommissionsdecreasedby1%toEUR766m,howeverwithaminorincreaseincardscommis-sions.Lending-relatedcommissionscontinuedtoincrease,toEUR442m,up12%comparedtolastyear,withstrongdevelopmentinparticularwithinCorporateMerchantBankingandShipping,OffshoreandOilServices.
Net gains/losses on items at fair value Netgains/lossesonitemsatfairvaluedecreasedby15%,orEUR181m,toEUR1,028mcomparedto2007.Incus-tomerareas,netgains/losseswerelargelyunchangedatEUR1,043m(EUR1,048mlastyear).
Thecustomer-drivencapitalmarketsactivitieshaveperformedverystronglyin2008,despitetheturbulentfinancialmarkets.Arecordresultwasachieved,especiallydrivenbysignificantactivitywithinriskmanagementproductsintheinterestrateandforeignexchangeareas,resultedinastrongincreaseinnetgainsinNordicBankingandInstitutional&InternationalBanking.Thismorethancompensatedforspecificvaluationlossesfollowingthecreditmarketturmoil,whichhavebeenreportedearlierintheyear.
Thedeclineinnetgains/losseswasmainlyattributabletothestrongappreciationoflistedandnon-listedequitieslastyear,egtheOMXholding.Incomefromtheseareaswereapprox.EUR140mlowerthisyear,ofwhichtheappreciationofOMXsharesaccountedforapprox.EUR90m2007.
Secondly,thenetgains/lossesfromLife&Pensions,decreasedby33%orEUR92m,mainlyduetothefactthatrevenuesinDenmark,earlierrecognisedduringtheyearweredeferred,duetodeclineinthefinancialbuffers.Thedeferredrevenuescanbeavailableforincomerecognitionwhenthefinancialbuffershaveimproved.

Nor
dea
Ann
ual R
epor
t 20
08
33
Board of Directors’ Report
Equity methodIncomeundertheEquitymethodwasEUR24m,includinganegativeresultfromthe23%holdinginNorwegianEksportfinans,EUR–15m.
Other incomeOtherincomewasEUR172m,includingNordea’ssaleofits25%holdinginNCSDHoldingAB,whichresultedinagainofEUR85m,reportedinthefourthquarter2008,ofwhichEUR3mreportedunderequitymethod.
ExpensesTotalexpensesincreasedby7%toEUR4,338m,thesamegrowthrateasin2007,despitethenumberofemployeesbeing8%higherthanin2007.
Almosthalfofthecostincreaserelatedtoinvestmentsingrowthareas,iePrivateBanking,GrowthPlanSweden,CapitalMarketsandNewEuropeanMarkets.Staffcostsincreased8%,duetoahighernumberofemployeesfollow-ingthegrowthinvestmentsandwageinflation.
Measures to manage the costs downwardsToprepareforayearofmodestexpectedgrowth,anumberofmeasurementshavebeentakentomanagethecostgrowthdownwards.Duetomoreefficientoperations,thenumberofemployeesisestimatedtodecreaseby2%.
Also,additionalactivitiesareunderway,whichshouldincreaseefficiencyduringcomingyears,mainlyinthebranchnetwork,includingthebranchesacquiredfromRoskildeBank.Theseactivitieshaveresultedinrestructur-ingexpensesofEUR28m.Excludingrestructuringexpenses,totalexpensesincreasedby6%comparedtolastyear.
Thecost/incomeratioincreasedto53%,comparedto52%in2007.
Loan lossesNetloanlosseswereEUR466m,followingincreasedprovi-sionsbothforcollectivelyandindividuallyassessedloansaswellaslowerreversalsandrecoveries,primarilyinthefourthquarter.NetloanlossesalsoincludelossesrelatedtotheDanishguaranteeschemesofEUR44m.
Theincreases,fromverylowlevels,resultfromtheeco-nomicslowdowninallmarketswhereNordeaoperates.Typically,thereisalagbetweenthestartoftheeconomicslowdownandreportednetloanlosses,butduetotherapidslowdownintheeconomiccycle,loanlosseshaveincreasedfasterthistime.However,thereportedlosslevelsinvarioussectorsfollowNordea’smodelsforaweakeco-nomiccycle.
Theincreaseinnetloanlossesaswellasofimpairedloansstemsfromalargenumberofsmallerandmedium-sizedexposuresratherthanfromafewlargeexposures.
Newprovisionshavebeenmadeatanearlystagewhenimpairmentshavebeenidentified.Themainpartofnetloanlossesconstitutesprovisionsforperformingimpairedloans.Inaddition,newcollectiveprovisionshavebeenmadefordifferentsubsectors.
Thenetloanlossesin2008correspondtoaloanlossratioof17basispoints,excludingtheguaranteelossesinDenmark,and19basispointsincludingthese.
AlargepartofthenetloanlossesisseeninDenmark,butincreasesarereportedinallfourNordicmarketsandintheBalticcountries,howeverfromverylowlevels.
Newcollectiveprovisionsweremade,net,intheamountofEUR54m,forsomesectors,includingconstruc-tion,realestate,pigfarmingandthesegmentconsumerfinancing.ThetotalcollectiveallowancesfortheBalticcountriesattheendof2008correspondto1.42%ofthelendingportfoliointhesecountries.
TaxesTheeffectivetaxratefor2008was21%,comparedto20%lastyear.
Net profitNetprofitdecreasedby15%toEUR2,672m,whichisattributabletotheshiftinloanlosses.Thenetprofitcorre-spondstoareturnonequityof15.3%.EarningspersharewereEUR1.03(EUR1.20in2007).
Risk-adjusted profitRisk-adjustedprofitincreased2%toEUR2,459m,com-paredto2007.ExcludingtheDanishStateguaranteefee,theincreaseinrisk-adjustedprofitwas3.5%.
Financial structureTotalassetsincreasedby22%orEUR85bntoEUR474bnduring2008.AllbalancesheetitemsinforeigncurrenciesaretranslatedtoEURattheyear-endrateswhenconsoli-datedintotheNordeaGroup.SeeNote1formoreinforma-tiononaccountingpoliciesanditem27thereinforcrosscurrencyratesused.
Theincreaseintotalassetsreflectshigherbusinessvol-umesandfairvaluechanges,duetochangedinterestratesandcurrencyexchangerates.
TheEurostrengthenedstronglyagainstboththeSwed-ishandNorwegiankronaduringtheendof2008.TheDan-ishkronawasunchangedv.s.theEuro.TheneteffectofchangesincurrencyexchangeratesamountedtoatotaldecreaseinGroupassetsofEUR25bn.LiabilitiesdecreasedwithEUR24bn.
LendingThegrowthintotalassetswasdrivenbyan8%increaseinloansandreceivablestothepublic,ofEUR20bn,toEUR265bnandcalculatedinlocalcurrenciesby17%comparedtooneyearago.
SecuritiesInvestmentsininterestbearingsecuritiesandsharesincreasedbyEUR4bn,or5%,toEUR70bn.

Nor
dea
Ann
ual R
epor
t 20
08
34
Board of Directors’ Report
Deposits and funding activitiesThegrowthofthetotalassetswasfinancedbyastrongdevelopmentindepositsandborrowingsfromcreditinsti-tutionsbutalsofromthepublic,whichincreasedbyEUR22bnandEUR6bnrespectively,correspondingto73%and4%respectively.During2008,long-termissuanceunderNordeafundingprogrammesinthebankandthemort-gagecompaniesamountedtoEUR31bn.Totaldebtsecuri-tiesinissuanceaspertheendof2008amountedtoEUR109bn.
Life insurance activtitesNetpremiumsreceivedintheLifebusinessareinvestedinsecuritiesandproperties.Lowerfairvaluesontheseinvestmentswereonlypartlycompensatedbypremiumswritten,whichledtoadecreaseof“liabilitiestopolicy-holders”byEUR3bnor9%.
DerivativesThebalancesheetitem“Derivatives”reflectsthenetpres-entvalueofderivativescontracts.ThenominalvalueofderivativecontractsisdisclosedinNote44.
Thederivativesvolume,measuredinnominalterms,increasedbyEUR397bn,or12%,toEUR3,802bn.Highactivityinthecustomer-drivencapitalmarketsoperationssupportedthevolumegrowth.Theincreaseingrossmar-ketvaluesforderivativesisthoughmainlyexplainedbyvolatilityinforeigncurrenciesandinterestratesduringtheendof2008.Formoreinformationonderivatives,seetheNotes1,20and44.
Nordea’s funding operationsInthesecondhalfof2008,fundinginthemarketwasgenerallydifficult,duetoriskaversionamonginvestors.Thegovernmentpackagescametotherescueformanyfinancialinstitutions.Nordeawasabletocontinuewithitsshort-termfundingnormally.Laterintheyear,marketcon-ditionsimprovedandclosertoyear-end,themarketwasmoreliquidandissuanceactivitiesatahighlevel.Nordeawasabletosecureitsyear-endfundingingoodtime.Nor-deabenefitsfromitswellrecognisedAA-ratedbankposi-tion.Allshort-termprogrammeshavebeeninactiveuse.
IssuanceofSwedishandDanishcoveredbondswasactiveduringtheyear.Incontrasttotheinternationalcov-eredbondmarkets,boththeSwedishandtheDanishcov-eredbondmarketsremainedopenforissuance.Thesetwomarketscontinuedtosupportthebank’slong-termfund-ingissuance.
Thelending/depositratioincludingcoveredbondswas133%attheendofDecemberandexcludingcoveredbonds178%.
Credit portfolioTotallendingincreasedtoEUR265bn,up8%comparedtooneyearago.Theshareoflendingtocorporatecustomers
increasedto57%.LendingintheBalticcountriesconsti-tutes3%oftheGroup’stotallending.Lendingtocompa-niesownedbyprivateequityfundsamountstoEUR7.4bn,ofwhich99%areseniorloans.
Someweakeninghasbeenseenincreditqualityinthefourthquarter2008,mainlyinthecorporatecreditportfo-lio,withsomewhatmorecustomersbeingdownratedthanuprated.ThetotaleffectfromratingmigrationonRWAwasanincreasebyapprox.4.5%in2008inthecorporatecreditportfolio.
Theweakeconomicdevelopmenthasstartedtoaffectimpairedloansandloanlossesafterseveralyearsofsus-tainedstability.ImpairedloansgrossintheGroupincreased55%toEUR2,224mattheendoftheyearcom-paredtoEUR1,432mattheendof2007.62%ofimpairedloansgrossareperformingloansand38%arenon-per-formingloans.
Furtherinformationaboutthecreditportfolioispre-sentedunderRiskmanagementonpage46.
Hedge accountingNordeauseshedgeaccountinginordertohaveasymmet-ricalaccountingtreatmentofthechangesinfairvalueofthehedgeditemandchangesinfairvalueofthehedginginstrumentsandinordertohedgetheexposuretovariabil-ityincashflowsandnetinvestmentsinforeignoperations.MoreinformationonthehedgedrisksarefoundinNote1.
Market riskAdescriptionofMarketriskispresentedonpage56.
Capital position and revised capital policy AdescriptionoftheCapitalpositionandtherevisedcapitalpolicyispresentedunderCapitalmanagementonpage65.
Rights offering and reduced 2008 dividend to strengthen core capital position by EUR 3bnNordeaannouncesmeasurestostrengthentheGroup'scoretier1capitalbyEUR3bn.TheBoardofDirectorsofNordeahasresolvedtoincreaseNordea'ssharecapitalthroughanunderwrittendiscountedissueofnewordinaryshareswithpre-emptiverightsforexistingshareholdersofapprox.EUR2.5bnnetandsecondlybyproposingtoreducethedividendpaymentto19%ofthenetprofitfor2008,tobedecidedbythe2009AnnualGeneralMeeting,whichwillincreasecoretier1capitalbyapprox.EUR0.5bn.TherightsofferingissubjecttoshareholderapprovalatanExtraordinaryGeneralMeetingtobeheldon12March2009.
Nordea'sBoardofDirectorsandGroupExecutiveMan-agementbelievesitisresponsibletoactpro-activelytobestpositionthebankfortherisksandtheopportunitiesaris-ingfromtheprevailingextraordinarilychallengingmarketconditions.

Nor
dea
Ann
ual R
epor
t 20
08
35
Board of Directors’ Report
The Nordea ShareDuring2008,thesharepriceofNordeaontheNASDAQOMXNordicExchangedepreciatedfromSEK108toSEK54.70.Totalshareholderreturn(TSR)was–46.9%.Nordeawasnumbertwoof20intheEuropeanpeergroup,wheretheaverageTSRwas–67%.
AccordingtotheArticlesofAssociationsharesinNor-deamaybeissuedintwoclasses,ordinarysharesandC-shares.ThetotalnumberofsharesintheCompanyis2,600,108,227.On15May,2,880,000C-shareswereissuedaspartofahedgeoftheLongTermIncentiveProgramme2008.On22May2008,theC-shareswereconvertedtoordi-naryshares,whereafterthereisonlyoneclassofsharesoutstanding,namely2,600,108,227ordinaryshares,seealsonote40andatableshowingthechangeinsharecapitalisfoundonpage29.Thevotingrightsaredescribedonpage70.
Inaddition,thereareprovisionsintheArticlesofAsso-ciationwhichwillensurethatthereciprocalrightsandobligationsbetweeneachownerandeachclassremainincaseofanyissuanceofnewshares,warrantsorconvert-ibles.TherearenorestrictionsinlaworintheArticlesofAssociationregardingtherighttotransfersharesandtheCompanyisnotawareofanyagreementsbetweenshare-holdersinthisrespect.
However,sinceNordeaisacreditinstitution,adirectorindirectacquisitionofsharesinNordea,whichcausestheacquirer’stotalholdingtocompriseaqualifyingholdingoranincreaseofqualifiedholdings,mayonlytakeplacefollowingconsentbytheSwedishFinancialSupervisoryAuthorityaccordingtotheSwedishBankingandFinanc-ingBusinessAct.
The31December2008,theSwedishstatewasthelargestindividualshareholderwithaholdingof19.9%.Thesec-ondlargestwasSampoOyjwithaholdingof12.1%.Theseweretheonlyshareholderswithaholdingofmorethan10%.AtableshowingthelargestregisteredshareholdersinNordea,endof2008isfoundonpage27.
Theemployeeshaveanindirectshareholdingof0.5%intheCompanythroughNordeaProfit-sharingFoundationandaminorindirectshareholdingintheCompanythroughthepensionfoundation.Thevotingrightsareinneithercaseexerciseddirectlybytheemployees.
Holding of own shares (Treasury shares)Asof31December2008,Nordeaheld9,757,510shares(0.4%oftotalnumberofshares)inNordea.ThenominalvalueisEUR1andtheacquisitionpriceamountstoEUR32m.ThesesharesarepartlyheldfortradingpurposesandpartlyashedgesofconditionalrightsintheLong-TermIncentiveProgrammes.
DividendTheBoardofDirectorswillproposetotheAGMadividendofEUR0.20pershare(EUR0.50),correspondingtoapay-outratioof19%ofnetprofit.TotalproposeddividendamountstoEUR519m.
Theex-dividenddatefortheNordeashareis3April2009.Theproposedrecorddateforthedividendis7April,anddividendpaymentswillbemadeon16April.
Mandate to repurchase and convey of own sharesTheBoardofDirectorsreceivedattheAnnualGeneralMeeting(AGM)inApril2008amandatetorepurchaseownshares.Thismandatehasnotbeenutilisedduringtheyear,mainlyduetotheturbulenceinthefinancialmarkets.
Nonewmandatetorepurchaseandconveyofownordi-narysharesinaccordancewiththeSwedishCompaniesActhasbeenproposedtotheAGMon2April2009.
RatingInformationontheRatingsoftheNordeaGroupispre-sentedonpage151.
PersonnelPersonnelexpenses,significantagreementswithkeyman-agementpersonnelandthedistributionbycountriesandgenderaredisclosedinNote8.Moreinformationispre-sentedinPeopleformingGreatNordeaonpage22.
Profit sharing and management incentive AdescriptionoftheProfitsharingschemeandtheLongtermincentiveprogrammesinNordeaispresentedonpage74.
Life & PensionsNordeahasconductedacapitalinjectionofEUR200mintothewholly-ownedsubsidiaryNordeaLifeHolding,tostrengthenthesolvencyoftheLifesubgroup.Thecapitalinjectionisnotaffectingthetier1ratiointheNordeaGroup,buthasloweredthetotalcapitalratioby9basispoints.
Pension liabilitiesThetotalobligationinpensionplans(DefinedBenefitPlans)hasincreasedfromEUR2,775mtoEUR2,830mdur-ing2008.Theincreaseismainlyduetoasignificantincreaseinunrecognisedlosses,followinglowerdiscountrates,butalsotonewearnedpensionrights.Theincreaseistoalargeextentoffsetbychangesinexchangerates.ThefairvalueofplanassetshasdecreasedfromEUR2,407mtoEUR2,099masaconsequenceofthegeneralmarkettur-moilandchangesinexchangerates.TotalunrecognisedactuariallossesamountstoEUR559mattheendof2008,whichwillleadtoalimitedincreaseinthepensioncostasfrom2009.
Legal proceedingsWithintheframeworkofthenormalbusinessoperations,theGroupfacesclaimsincivillawsuitsanddisputes,mostofwhichinvolverelativelylimitedamounts.NoneofthesedisputesisconsideredlikelytohaveanysignificantadverseeffectontheGrouporitsfinancialposition.FurtherinformationispresentedinNote43.

Nor
dea
Ann
ual R
epor
t 20
08
36
Board of Directors’ Report
Environmental concernsInaccordancewithGroupCorporateCitizenshipPrinci-ples,Nordeaiscommittedtosustainabledevelopmentbycombiningfinancialperformancewithenvironmentalandsocialresponsibility,caringfortheenvironmentandwork-ingtoreducethenegativeenvironmentalimpactofitsbusinessactivities.TheNordeaGrouphasadoptedanenvironmentalpolicythatprovidesguidanceonhowthegroupentitiesmanageandcontrolenvironmentalissuesintheirownoperations,supportingthereductionofrelatedcostsandbusinessriskstotheGroup.
Thepolicyalsoguidespolicymakingandbusinessini-tiativesregardingfinancialinvolvementbybusinessunitsandcooperationwithsuppliers.
State schemes for financial stabilityAdescriptioninrelationtothedifferentStateschemesforfinancialstabilityintheNordiccountriesispresentedonpage4.
Foreign branchesTheparentcompanyhasforeignbranchesinNorway,Fin-land,DenmarkandShanghai.
Outlook 2009Duetotheprevailingmarketconditions,theprovidedout-lookisassociatedwithanunusuallyhighdegreeofuncer-tainty.
ThemacroeconomicdevelopmentintheNordiccountrieshasduringthelatterpartoftheautumnshown
asharpslowdownandGDPgrowthisin2009expectedtobenegative.Nordeaisthereforepreparingforachal-lengingyear.Inadditiontofirmattentiononcost,riskandcapitalmanagement,thefocusin2009willbetocontinuedoingmorebusinesswithexistingcustomers,andonaselectivebasisattractingnewcustomerswithsolidcreditprofilesinprioritisedsegments.Marketlendinggrowthisexpectedtobelowerin2009,comparedto2008,howeverNordeaseespotentialforgrowthsomewhatmorethanthemarket.
Costgrowthisexpectedtobesomewhatlowerthanin2008,ascostgrowthismanageddownwardsadjustingoperationstotheprevailingmarketconditions.
ThehighspeedatwhichtheglobalandNordicecono-miesnowareweakeningmeansthatthecreditportfoliowillbeaffected.Basedonthecurrentmacroeconomicout-look,Nordeaanticipatesnetloanlossesin2009broadlyinlinewiththeannualisedrateofthefourthquarter2008.Theuncertaintyregardingfutureloanlosslevelsishow-eversignificant.
Risk-adjusted-profitisin2009expectedtobeatapprox.thesamelevelasin2008.
Theeffectivetaxrateisexpectedtobeintherangeof23–25%.
Annual General MeetingTheAnnualGeneralMeetingofshareholderswillbeheldonThursday2April2009inStockholm.Furtherinforma-tionispresentedonpage153.

Nor
dea
Ann
ual R
epor
t 20
08
37
Board of Directors’ Report
Customer area resultsNordic Banking
• Incomegrowthof5%in2008• Expensesincreased3%in2008• Balancedgrowthwithdepositsgrowingfasterthan
lending• Risk-adjustedprofitincreased8%in2008
Result 2008In2008,incomeinNordicBankingincreased5%toEUR6,289m.Netinterestincomeincreased15%toEUR4,206m.Totalexpensesincreased3%toEUR3,107m.Inlocalcur-rencies,incomeincreasedby7%andexpenseswouldhaveincreasedby5%.
Netfeeandcommissionincomefell14%toEUR1,530m,impactedbylowerincomefromsavingsproductsandtheabove-mentionedpaymenttotheStateguaranteeschemeinDenmark.
NetloanlossesamountedtoEUR402mor17basispointsoftotalloansandreceivablesexcludingthelossesfromtheDanishguaranteeschemesand19basispointsincludingthese.
Operatingprofitwasdown8%toEUR2,780m.RAROCARdecreasedto25%(26%)andthecost/incomeratiodecreasedto49%(50%).
Banking DenmarkResult 2008TotalincomeinBankingDenmarkincreased6%comparedto2007.ThiswaspositivelyaffectedbyincreasedcorporatemarginsandthevolumegrowthinbothlendinganddepositsandnegativelyimpactedbysavingscommissionsandthepaymenttotheStateguaranteescheme.Totalexpensesincreased7%compared2007.
Profitbeforeloanlossesincreased5%fromlastyear.NetloanlossesofEUR192mwererecorded.This
includesnewcollectiveprovisionsandlossesandprovi-sionsofEUR44mconnectedtotheDanishguaranteeschemes.Thetotalnetloanlosseswerewidelyspreadgeo-graphicallyandbyindustry,withsomeconcentrationtosubsupplierstotheconstructionsectorandcollectivepro-visionsforpigfarming.Theloanlossratiowas24basispointsoflendingexcludingthelossesfromtheDanishguaranteeschemesand31basispointsincludingthese.
Operatingprofitdecreased17%comparedto2007.ComparedtotheotherNordiccountries,theeconomic
downturninDenmarkisregardedtobefurtherprogressedinthecreditcycle.
Nordic Banking, operating profit by market Nordic Total Functions
EURm 2008 2007 2008 2007
Netinterestincome 4,206 3,666 59 37Netfeeandcommissionincome 1,530 1,772 1 0Netgains/lossesonitemsatfairvalue 517 460 0 0Equitymethod 11 25 0 0Otheroperatingincome 25 40 3 5
Total income incl. allocations 6,289 5,963 63 42
Staffcosts –1,160 –1,140 –4 –25Otherexpenses –1,901 –1,836 –16 –4Depreciationsetc. –46 –26 –21 –10
Expenses incl. allocations –3,107 –3,002 –41 –39
Profit before loan losses 3,182 2,961 22 3
Loanlosses –402 55 –3 13
Operating profit 2,780 3,016 19 16
Cost/incomeratio,% 49 50 RAROCAR,% 25 26
Other information, EURbnLending 214.1 207.2 Deposits 117.1 110.1 EconomicCapital 8.1 7.4
Banking Denmark, operating profit by market Banking Denmark
EURm 2008 2007
Netinterestincome 1,192 1,036Netfeeandcommissionincome 413 489Netgains/lossesonitemsatfairvalue 173 155Equitymethod 20 25Otheroperatingincome 5 2
Total income incl. allocations 1,803 1,707
Staffcosts –376 –360Otherexpenses –497 –462Depreciationsetc. –5 –2
Expenses incl. allocations –878 –824
Profit before loan losses 925 883
Loanlosses –192 1
Operating profit 733 884
Cost/incomeratio,% 49 48RAROCAR,% 22 27
Other information, EURbnLending 68.0 62.7Deposits 33.6 31.6EconomicCapital 2.6 2.2

Nor
dea
Ann
ual R
epor
t 20
08
38
Board of Directors’ Report
Banking FinlandResult 2008TotalincomeinBankingFinlandwasunchangedcom-paredto2007.Netinterestincomeincreased8%,drivenbylendingmarginincreasesandvolumegrowth.Thisdidnotfullycompensatefortheadverseeffectonincomegrowthfromlowsavingsfeeandcommissionincome.
Totalexpensesincreasedby3%comparedtolastyear.Profitbeforeloanlossesdecreased3%fromlastyear.
NetloanlosseswereEUR65m,mostlystemmingfromthetradeandservicessector.Theloanlossratiowas14basispointsoftotallending.
Operatingprofitdecreased15%comparedto2007.
Banking NorwayResult 2008TotalincomeinBankingNorwayincreased19%,drivenbynetinterestincome,whichincreasedby26%.
Totalexpensesincreasedby4%.Profitbeforeloanlossesincreased37%comparedtolast
year.NetloanlossesincreasedtoEUR66m,bothduetoindi-
vidualprovisionsandcollectiveprovisionsforresidentialrealestate.Theloanlossratiowas18basispoints.
Operatingprofitincreased16%comparedto2007.
Banking Finland, operating profit by market Banking Finland
EURm 2008 2007
Netinterestincome 1,146 1,065Netfeeandcommissionincome 415 509Netgains/lossesonitemsatfairvalue 128 111Equitymethod –9 0Otheroperatingincome 8 11
Total income incl. allocations 1,688 1,696
Staffcosts –292 –292Otherexpenses –476 –455Depreciationsetc. –4 –2
Expenses incl. allocations –772 –749
Profit before loan losses 916 947
Loanlosses –65 60
Operating profit 851 1,007
Cost/incomeratio,% 46 44RAROCAR,% 30 38
Other information, EURbnLending 52.1 47.5Deposits 35.7 30.4EconomicCapital 2.0 1.9
Banking Norway, operating profit by market Banking Norway
EURm 2008 2007
Netinterestincome 686 544Netfeeandcommissionincome 161 170Netgains/lossesonitemsatfairvalue 95 80Equitymethod 0 0Otheroperatingincome 8 7
Total income incl. allocations 950 801
Staffcosts –170 –163Otherexpenses –291 –283Depreciationsetc. –7 –4
Expenses incl. allocations –468 –450
Profit before loan losses 482 351
Loanlosses –66 7
Operating profit 416 358
Cost/incomeratio,% 49 56RAROCAR,% 23 18
Other information, EURbnLending 35.0 37.2Deposits 17.2 18.8EconomicCapital 1.3 1.3

Nor
dea
Ann
ual R
epor
t 20
08
39
Board of Directors’ Report
Banking Sweden, operating profit by market Banking Sweden
EURm 2008 2007
Netinterestincome 1,123 984Netfeeandcommissionincome 540 604Netgains/lossesonitemsatfairvalue 121 114Equitymethod 0 0Otheroperatingincome 1 15
Total income incl. allocations 1,785 1,717
Staffcosts –318 –300Otherexpenses –621 –632Depreciationsetc. –9 –8
Expenses incl. allocations –948 –940
Profit before loan losses 837 777
Loanlosses –76 –26
Operating profit 761 751
Cost/incomeratio,% 53 55RAROCAR,% 25 24
Other information, EURbnLending 59.0 59.8Deposits 30.6 29.3EconomicCapital 2.2 2.0
Banking SwedenResult 2008Totalincomeincreasedby4%,withastrongcontributionfromnetinterestincome,whichincreasedby14%.Netfeeandcommissionincomedecreasedby11%.
Totalexpensesincreasedby1%.Profitbeforeloanlossesincreased8%comparedtolast
year.NetloanlossesincreasedtoEUR76mfollowingprovi-
sionsrelatedtocorporatecustomers.Themainincreaseswereseeninthesectorsretailtradeandconsumerdura-bles.Theloanlossratiowas13basispoints.
Operatingprofitincreased1%comparedto2007.ThenumberofFTE’sincreasedby406,mainlydueto
theintegrationofbranchesfromSvenskKassaservice.

Nor
dea
Ann
ual R
epor
t 20
08
40
Board of Directors’ Report
Result 2008ThebusinessactivitywithinIIBremainedatahighlevelduring2008andstronggrowthwasrecordedinalldivi-sions.TotalincomereachedEUR1,217m,up40%.
Higherbusinessvolumesincombinationwithincreasedlendingmarginsfuellednetinterestincome.Netgains/lossesincreasedfollowinghighcustomerdemandforcapitalmarketsproducts.TotalexpensesamountedtoEUR477min2008,up21%.ThemaindriversbehindtheincreasewerehigherinvestmentsinNewEuropeanMarketsandtheresultinghighernumberofemployees.Thenumberoffull-timeequivalents(FTEs)wasapprox.5,130bytheendof2008,agrowthofapprox.940FTEsin2008.
ProfitbeforeloanlossesamountedtoEUR740min2008,up56%.Operatingprofitincreasedby30%,includingnetloanlossesofEUR115m.Ofnetloanlosses,EUR58mwasrelatedtotheBalticcountries,includingcollectiveprovi-sionsofEUR26mintheunitIIBOther.TheloanlossratiowasforIIB47basispointsoftotallending,forShipping,OilServices&International9basispointsandforNewEuropeanMarkets47basispoints.IntheBalticcountries,theloanlossratiowas106basispoints,ofwhich48basispointsrefertocollectiveprovisionsreportedinthefirstandthirdquarterintheunitIIBOther.
RAROCARstrengthenedto42%in2008andthecost/incomeratioimprovedto39%reflectinghighincomeandimprovedoperatingefficiency.
Institutional & International Banking
Institutional & International Banking, operating profit by area
Shipping, Total Oil New Services Baltic European Financial &Inter- Total countries Poland Russia Markets Institutions national Other
EURm 2008 2007 2008 2007 2008 2007 2008 2007 2008 2007 2008 2007 2008 2007 2008 2007
Netinterestincome 656 424 100 68 94 52 149 56 336 168 73 65 221 170 26 21Netfeeandcommissionincome 287 257 39 34 16 16 22 7 75 57 146 136 51 54 15 10Netgains/lossesonitemsatfairvalue 271 178 13 5 33 21 6 –1 53 26 181 138 33 13 4 1Equitymethod –12 1 0 0 0 0 0 0 0 0 0 0 0 0 –12 1Otheroperatingincome 15 8 1 0 3 4 1 1 6 4 9 0 1 0 –1 4
Total income incl. allocations 1,217 868 153 106 146 92 178 63 470 255 409 339 306 237 32 37
Staffcosts –192 –143 –28 –21 –34 –23 –52 –26 –118 –72 –31 –31 –41 –37 –2 –3Otherexpenses –275 –243 –28 –24 –40 –28 –24 –12 –95 –67 –153 –143 –10 –13 –17 –20Depreciationsetc. –10 –8 –2 –1 –5 –4 –1 –1 –9 –7 0 0 –1 0 0 –1
Expenses incl. allocations –477 –394 –58 –46 –80 –56 –77 –39 –222 –146 –184 –174 –52 –50 –18 –24
Profit before loan losses 740 474 95 60 66 36 101 24 248 109 225 165 254 187 14 13
Loanlosses –115 5 –32 –1 –1 –1 –18 1 –46 –1 –14 0 –10 2 –45 4
Operating profit 625 479 62 59 66 35 83 25 202 108 210 165 244 189 –32 17
Cost/incomeratio,% 39 45 38 43 55 61 43 62 47 57 45 51 17 21RAROCAR,% 42 38 31 23 62 64 50 38
Other information, EURbnLending 33.1 24.6 7.7 5.5 3.8 2.7 3.8 1.6 15.3 9.8 2.0 1.9 13.8 11.1 1.9 1.8Deposits 25.7 30.9 1.8 1.4 2.0 1.7 0.9 0.6 4.7 3.7 14.5 20.3 6.4 6.7 0.1 0.1Economiccapital 1.3 1.0 0.3 0.3 0.1 0.1 0.2 0.1 0.7 0.4 0.2 0.2 0.4 0.4 0.1 0.0
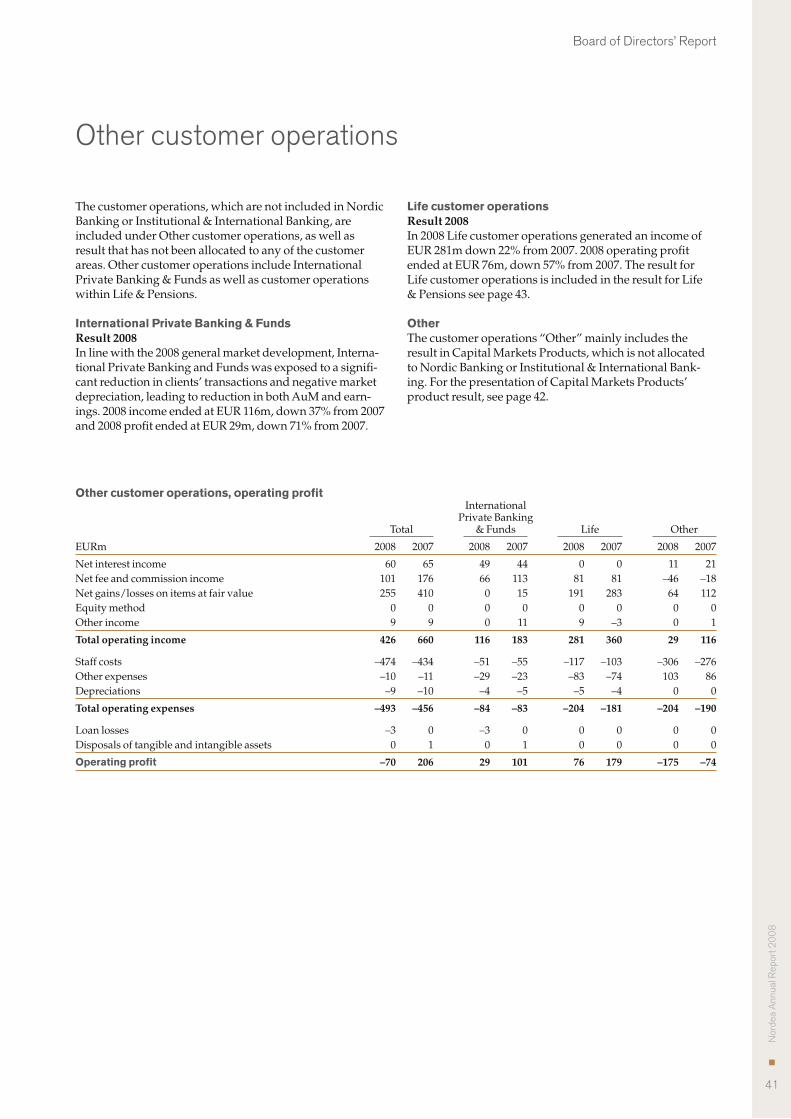
Nor
dea
Ann
ual R
epor
t 20
08
41
Board of Directors’ Report
Thecustomeroperations,whicharenotincludedinNordicBankingorInstitutional&InternationalBanking,areincludedunderOthercustomeroperations,aswellasresultthathasnotbeenallocatedtoanyofthecustomerareas.OthercustomeroperationsincludeInternationalPrivateBanking&FundsaswellascustomeroperationswithinLife&Pensions.
International Private Banking & FundsResult 2008Inlinewiththe2008generalmarketdevelopment,Interna-tionalPrivateBankingandFundswasexposedtoasignifi-cantreductioninclients’transactionsandnegativemarketdepreciation,leadingtoreductioninbothAuMandearn-ings.2008incomeendedatEUR116m,down37%from2007and2008profitendedatEUR29m,down71%from2007.
Life customer operationsResult 2008In2008LifecustomeroperationsgeneratedanincomeofEUR281mdown22%from2007.2008operatingprofitendedatEUR76m,down57%from2007.TheresultforLifecustomeroperationsisincludedintheresultforLife&Pensionsseepage43.
OtherThecustomeroperations“Other”mainlyincludestheresultinCapitalMarketsProducts,whichisnotallocatedtoNordicBankingorInstitutional&InternationalBank-ing.ForthepresentationofCapitalMarketsProducts’productresult,seepage42.
Other customer operations
Other customer operations, operating profit International PrivateBanking Total &Funds Life Other
EURm 2008 2007 2008 2007 2008 2007 2008 2007
Netinterestincome 60 65 49 44 0 0 11 21Netfeeandcommissionincome 101 176 66 113 81 81 –46 –18Netgains/lossesonitemsatfairvalue 255 410 0 15 191 283 64 112Equitymethod 0 0 0 0 0 0 0 0Otherincome 9 9 0 11 9 –3 0 1
Total operating income 426 660 116 183 281 360 29 116
Staffcosts –474 –434 –51 –55 –117 –103 –306 –276Otherexpenses –10 –11 –29 –23 –83 –74 103 86Depreciations –9 –10 –4 –5 –5 –4 0 0
Total operating expenses –493 –456 –84 –83 –204 –181 –204 –190
Loanlosses –3 0 –3 0 0 0 0 0Disposalsoftangibleandintangibleassets 0 1 0 1 0 0 0 0
Operating profit –70 206 29 101 76 179 –175 –74

Nor
dea
Ann
ual R
epor
t 20
08
42
Board of Directors’ Report
Business developmentDuringtheendoftheyear,financialmarketsexperiencedunprecedentedvolatilityasthefinancialcrisisturnedintothethirdworststockmarketdevelopmentinthelast100years.Inthisextrememarketenvironment,GroupTrea-suryhasbeenabletogenerateasolidresultfromprudentliquiditymanagement,aflexibleinvestmentapproachandfirmriskmanagement.
AttheendofDecember2008,thepriceriskonGroupTreasury’sinterestratepositions,calculatedasVaR,wasEUR38m.Theriskrelatedtoequities,calculatedasVaR,wasEUR27m.
Thestructuralinterestincomerisk(SIIR)wasEUR55massumingincreasedmarketratesby100basispointsandEUR–218massumingdecreasedmarketratesby100basispoints.
Inlinewithitsprudentliquiditymanagement,NordeahasexecutedasecuritisationtransactionofpartofitsFinn-ishhouseholdmortgageportfolio,allowingforadditionaleligibleECBcollateralwithinitsliquidityportfolio.Theportfoliorepresentshigh-qualitymortgageloans.Thecus-tomersarenotaffectedinanywaybythistransaction.ThetransactionofEUR7.5bnwasclosedon17October.
Result 2008OperatingprofitinGroupCorporateCentrewasEUR153m,up14%comparedtolastyear.ThestrongresultisaffectedbysolidperformanceinthefundingoperationsandbyEUR85mingainsfromthesaleoftheGroup’shold-inginNCSD,mainlyreportedasOtherincome.
Group Corporate Centre, operating profit
EURm 2008 2007
Netinterestincome 160 107Netfeeandcommissionincome –4 –9Netgains/lossesonitemsatfairvalue 50 156Equitymethod 0 5Otherincome 87 24
Total income 293 283
Total operating expenses –140 –149
Operating profit 153 134
Group Corporate Centre
Capital Markets ProductsResult 2008TheproductresultofEUR845mwasverysatisfactorywithanincreaseof15%comparedto2007.Thegoodresultisaresultofcontinuedstrongcustomerdemand,especiallyforcorporateriskmanagementproducts,recordtransactionvolumesandaverystrongriskmanagementfocus.
Capital Markets Products, product result
EURm 2008 2007
Netinterestincome 313 241Netfeeandcommissionincome 201 218Netgains/lossesonitemsatfairvalue 819 720Other 0 1
Total income 1,333 1,180
Staffcosts –305 –276Otherexpenses –154 –140
Operating expenses –459 –416
Distributionexpenses –18 –26Loanlosses –11 –1
Product result 845 737
Savings Products & Asset ManagementResult 2008TotalincomewasEUR626m,down27%from2007.ThedecreaseinincomewasaconsequenceofthedecreaseinAssetsunderManagementandadecreaseinincomemar-ginof11basispointscomparedto2007.Threeelementsweredrivingthedecreaseinincomemargin.Firstly,con-tinuedimbalancesinsalesmix,ieashiftinsalesfromretailfundstowardssalesofinstitutionalproducts,asmarginsonretailfundsarerelativelyhigher.Secondly,negativeequitymarketreturnsreducedtheequityassetclassby14%-pointsfromyearend2007.Areductionofthisassetclasshadanegativeimpactonincomemargin,asequitiesarearelativelyhighermarginproductcomparedtootherassettypes.Finally,thegenerallowinvestmentactivitylevelduring2008ledtoadecreaseintransactionincomemargin.
TheproductresultwasEUR194m,down52%from2007.Thedecreaseinproductresultwasadirectconse-quenceofthedecreaseinincomeascostsweredown3%comparedto2007.Reductionin2008costbasewasaresultoflowerstaffcosts.
Product groups

Nor
dea
Ann
ual R
epor
t 20
08
43
Board of Directors’ Report
Life & PensionsFinancialbufferswerein2008negativelyaffectedbytur-moilonthefinancialmarkets,resultinginmark-to-marketlossesandutilisationofpartofthebuffers.Thus,financialbufferswereEUR673mattheendof2008correspondingto3%ofthetechnicalprovisions.Comparedto2007,thefinancialbuffersweredownbyEUR1,558m.
TheproductresultwasEUR177m,down35%from2007.TheresultwasnegativelyimpactedbyareversaloftheaccruedfeeincomeintheDanishbusinessofEUR67mfromthefirstthreequartersof2008andnofeeincomerec-ognisedfromtheFinnishbusiness.Thishasbeencon-ducted,duetoconstraintsfromthelowfinancialbuffersinDenmarkandFinland,implyingatemporarilyinabilitytotakefees.Allinall,thesefactorsaffectedtheresultnega-tivelywithapprox.EUR100m.Thereversedandaccruedfeescanbeavailableforincomerecognitiononcefinancialbuffershaveimproved.
Themarketconsistentembeddedvalue(MCEV),themethodbywhichNordeameasuresvaluecreationinitsLifebusinesswasEUR2,624myearend2008,down18%from2007.ThereducedMCEVisaresultoflossesoffinan-cialbuffers.However,asaresultofarecordhighlevelofgrosswrittenpremiums,the2008newbusinessvalueofEUR227mwasverystrong.
Product result and key figures Asset Management activities
EURm 2008 2007
Netinterestincome 54 51Netfeeandcommissionincome 572 782Netgains/lossesonitemsatfairvalue 0 15Equitymethod 0 0Otherincome 0 7
Total income 626 855
Staffcosts –156 –167Otherexpenses –140 –138
Operating expenses –295 –305
EstimateddistributionexpensesinNordicBanking –137 –147
Product result 194 403ofwhichincomewithinNordicBanking 472 586
MarginsIncomemargins(%) 0.56 0.67Cost/incomeratio,% 69 53Economiccapital 244 143Numberofemployees(full–timeequivalents) 1,083 1,040
Product result and key figures Life insurance activities
EURm 2008 2007
Profit driversTraditionalinsurance: Feecontribution/profitsharing 5 173 Contributionfromcostresult –1 –3 Contributionfromriskresult 43 30 Returnonshareholders’equity/otherprofits 83 29
Total Profit Traditional 130 229
Total profit Unit–linked 59 62
EstimateddistributionexpensesinNordicBanking –12 –17
Total product result 177 274ofwhichincomewithinNordicBanking 98 124
Key figuresPremiumswritten,netofreinsurance 4,222 3,780 ofwhichfromTraditionalbusiness 2,539 2,208 ofwhichfromUnit-linkedbusiness 1,683 1,572
Total operating expenses –197 –175
Investmentassets: Bonds 18,322 15,799 Equities 1,451 4,772 Alternativeinvestments 2,513 2,788 Property 2,998 3,178 Unit-linked 6,977 7,349
Total investment assets 32,261 33,885
Investmentreturn% –1.6 3.6Technicalprovisions 28,281 32,118 ofwhichfinancialbuffers 673 2,231Economiccapital 889 1,136Numberofemployees(fulltimeequivalents) 1,353 1,252
MCEV composition of Nordea Life & Pensions
31Dec2008 Unit Traditional LinkedEURm business business1) Total
Denmark 931 109 1,040Finland 426 222 648Norway 443 115 558Sweden 34 174 208Poland 13 158 171Holding – – –
Total 1,847 777 2,6241) Includes New Traditional business

Nor
dea
Ann
ual R
epor
t 20
08
44
Board of Directors’ Report
Risk, Liquidity and Capital management
Risk, liquidity and capital management
are key success factors in the financial
services industry. Exposure to risk is
inherent in providing financial services,
and Nordea assumes a variety of risks in
its ordinary business activities, the most
significant being credit risk related to
loans and receivables.
Maintaining risk awareness in the
organisation is a key component of
Nordea’s business strategies.
Nordea has clearly defined risk,
liquidity and capital management frame-
works, including policies and instruc-
tions for different risk types and for the
capital structure.
Management principles and controlBoard of DirectorsThe Board of Directors of Nordea has ultimate responsibil-ity for limiting and monitoring the Group’s risk exposure. The Board of Directors also has ultimate responsibility for setting the targets for the capital ratios. Risk in Nordea is measured and reported according to common principles and policies approved by the Board of Directors. The Board of Directors decides on policies for credit, market, liquidity, operational risk management and the internal capital adequacy assessment process. All policies are reviewed at least annually.
In the credit instructions, the Board of Directors decides on powers-to-act for credit committees at different levels within the customer areas in Nordea. Authorisations may also vary depending on the internal rating of customers. The Board of Directors also decides on the limits for market and liquidity risk in the Group.
Board Credit CommitteeThe Board Credit Committee monitors the development of the credit portfolio on the whole as well as with respect to industry and major customer exposures. The Board Credit Committee confirms industry policies approved by the Executive Credit Committee (ECC).
CEO and GEMThe Chief Executive Officer (CEO) has overall responsibil-ity for developing and maintaining effective principles for risk, liquidity and capital management as well as internal principles and control in Nordea.

Nor
dea
Ann
ual R
epor
t 20
08
45
Board of Directors’ Report
The CEO in Group Executive Management (GEM) decides on the targets for the Group’s risk management regarding Structural Interest Income Risk (SIIR) and in accordance with the scope of resolutions adopted by the Board of Directors, allocates the market and liquidity risk limits to risk-taking units, such as Group Treasury and Markets. The setting of limits is guided by Nordea's business strate-gies, which are reviewed at least annually. The heads of the units allocate the respective limits within the unit and may introduce more detailed limits and other risk mitigating techniques such as stoploss rules.
The CEO and GEM regularly review reports on risk exposures and have established the following committees for risk, liquidity and capital management:• TheAssetandLiabilityCommittee(ALCO),chairedby
the Chief Financial Officer (CFO), prepares issues of major importance concerning the Group’s financial operations, financial risks and capital management for decision by the CEO in GEM.
• CapitalPlanningForum,chairedbytheCFO,monitorsthe development of internal and regulatory capital requirements, the capital base, and decides also upon capital planning activities within the Group.
• TheRiskCommittee,chairedbytheChiefRiskOfficer(CRO), monitors developments of risks on an aggre-gated level.
• TheExecutiveCreditCommittee(ECC)andGroupCredit Committee (GCC), chaired by the CRO, decide on major credit risk limits and industry policies for the Group. Credit risk limits are granted as individual lim-its for customers or consolidated customer groups and as industry limits for certain defined industries.
Nordea – Board of DirectorsBoard Credit Committee
Chief Financial Officer (CFO)
Group Corporate Centre(Head: CFO)
Liquidity management frameworkCapital management framework
Balance sheet management framework
Chief Risk Officer (CRO)
Group Credit and Risk Control(Head: CRO)
Risk management frameworkMonitoring and reporting
Chief Executive Officer (CEO)/Group Executive Management (GEM)
Asset and Liability
Committee, ALCO
(Chairman: CFO)
Capital Planning
Forum(Chairman: CFO)
Risk Committee
(Chairman: CRO)
Executive and Group Credit Committees, ECC and GCC
(Chairman: CRO)
Risk, Liquidity and Capital Management governance structure
Risk, Liquidity and Capital Management responsibilities
The CRO has the authority, when deemed necessary, to issue supplementary guidelines and limits.
CRO and CFOWithin the Group, two units, Group Credit and Risk Con-trol and Group Corporate Centre, are responsible for risk, capital, liquidity and balance sheet management.
Group Credit and Risk Control is responsible for the risk management framework, consisting of policies, instruc-tions and guidelines for the whole Group. Group Corpo-rate Centre is responsible for the capital management framework including required capital as well as the capital base. Group Treasury, within Group Corporate Centre, is responsible for SIIR and liquidity risk.
The CRO is head of Group Credit and Risk Control and the CFO is head of Group Corporate Centre.
The CRO is responsible for the Group’s credit, market and operational risk. This includes the development, vali-dation and monitoring of the rating and scoring systems, as well as credit policy and strategy, credit instructions, guidelines to the credit instructions and the credit decision and control processes.
The CFO is responsible for the capital planning process, which includes capital adequacy reporting, economic capi-tal and parameter estimation used for the calculation of risk-weighted amounts and for liquidity and balance sheet management.
Each customer area and product area is primarily responsible for managing the risks arising from its opera-tions. This responsibility entails identification, control and reporting, while Group Credit and Risk Control consoli-dates and monitors the risks on Group level and relevant sub levels.
Monitoring and reportingThe control environment in Nordea is based on the princi-ples of separation of duties and strict independence of organisational units. Monitoring and reporting of risk is conducted on a daily basis for market and liquidity risk, on a monthly and quarterly basis for credit risk and on a quar-terly basis for operational risk.
Risk reporting is regularly made to Group Executive Management and to the Board of Directors. The Board of Directors in each legal entity reviews internal risk report-ing covering market, credit and liquidity risk per legal entity. Within the credit risk reporting, different portfolio analyses such as credit migration, current probability of default and stress testing are included.
The internal capital reporting includes all types of risks andisreportedregularlytotheRiskCommittee,ALCO,CapitalPlanningForum,GroupExecutiveManagementand Board of Directors.
Group Internal Audit makes an independent evaluation of the processes regarding risk and capital management in accordance with the annual audit plan.

Nor
dea
Ann
ual R
epor
t 20
08
46
Board of Directors’ Report
Risk management
Credit Risk managementGroup Credit and Risk Control is responsible for the credit risk management framework, consisting of policies, instructions and guidelines for the Group.
Each customer area and product area is primarily responsible for managing the credit risks in its operations, while Group Credit and Risk Control consolidates and monitors the credit risks on both Group and sub levels.
Within the powers-to act granted by the Board of Direc-tors, credit risk limits are approved by decision-making authorities on different levels in the organisation (see fig-ure of the Credit decision process).
The responsibility for a credit exposure lies with a cus-tomer responsible unit. Customers are assigned a rating or score in accordance with the Nordea framework for quanti-fication of credit risk.
Credit risk definition and identificationCredit risk is defined as the risk of loss if counterparts fail to fulfil their agreed obligations and that the pledged col-lateral does not cover the claims.
Credit risk stems mainly from various forms of lending to the public (corporates and household customers), but also from guarantees and documentary credits, such as let-ters of credit.
The credit risk from guarantees and documentary cred-its arises from the potential claims on customers, for which Nordea has issued guarantees or documentary credits.
Credit risk may also include counterparty credit risk, transfer risk and settlement risk. Counterparty risk is the risk that a counterpart in an FX, interest, commodity, equity or credit derivatives contract defaults prior to matu-rity of the contract and that Nordea at that time has a claim on the counterpart.
Settlement risk is the risk of losing the principal on a finan-cial contract, due to a counterpart's default during the set-tlement process. Transfer risk is a credit risk attributable to the transfer of money from another country where a bor-rower is domiciled, and is affected by changes in the eco-nomic and political situation of the countries concerned.
Risks in specific industries are followed by industry monitoring groups and managed through industry poli-cies, which establish requirements and limits on the overall industry exposure. Corporate customers’ environmental risks are also taken into account in the overall risk assess-ment through the so-called Environmental Risk Assess-ment Tool (ERAT). This tool is being extended to also include assessment of social and political risk.
For larger project finance transactions, Nordea has adoptedtheEquatorPrinciples,whichisafinancialindustrybenchmark for determining, assessing and managing social and environmental risk in project financing. The Equator PrinciplesarebasedonthepoliciesandguidelinesoftheWorld Bank and International Finance Corporation (IFC).
Decisions and monitoring of credit riskThe decisions regarding credit risk limits for customers and customer groups are made by the relevant credit deci-sion authorities on different levels within the Group (see figure).
The responsibility for credit risk lies with the customer responsible unit, which on an ongoing basis assesses cus-tomers’ ability to fulfil their obligations and identifying deviations from agreed conditions and weaknesses in the customers’ performance.
In addition to building strong customer relationships and understanding each customer's financial position, monitor-ing of credit risk is based on all available information from internal systems, such as late payments data, behavioural scoring migration and macroeconomic circumstances.
If new information indicates a change in the customer's financial position, the customer responsible unit must eval-uate and, if necessary, reassess the rating to reflect whether the credit is impaired or if the customer’s repayment abil-ity is threatened.
If it is considered unlikely that the customer will be able to repay its debt obligations, for example the principal, interest or fees, and the situation cannot be satisfactorily remedied, then the exposure is regarded as defaulted.Exposures that have been past due more than 90 days are automatically regarded as defaulted.
If credit weaknesses are identified in relation to a cus-tomer exposure, that exposure is assigned special attention in terms of review of the risk. In addition to the continuous monitoring, an action plan is established outlining how to minimise a potential credit loss. If necessary, a special team is set up to support the customer responsible unit.
Individual and collective assessment of impairmentThroughout the process of identifying and mitigating credit impairments, Nordea works continuously to review the quality of the credit exposures.
Nordea – Board of Directors/Board Credit CommitteePolicy matters / Instructions / Monitoring
Nordic BankingCountry Credit Committees
RegionsDecision-making
Authorities
BranchesDecision-making
Authorities
Executive Credit Committee
Group Credit Committee
NewEuropeanMarkets
CreditCommittee
Shipping,Oil
Services&
International
CreditCommittee
FinancialInstitutions
CreditCommittee
Trade andProjectFinance
CreditCommittee
Nordea Bank Denmark
Board of Directors
Nordea Bank Finland
Board of DirectorsReporting
Nordea Bank Norway
Board of DirectorsReporting
Credit decisionmaking structure
Nor
dea
Ann
ual R
epor
t 20
08
47
Board of Directors’ Report
Weak and impaired exposures are closely and continu-ously monitored and reviewed at least on a quarterly basis in terms of current performance, business outlook, future debt service capacity and the possible need for provisions.
An exposure is impaired, and a provision is recognised, if there is objective evidence based on loss events or observable data that the customer’s future cash flow is impacted to the extent that full repayment is unlikely, col-lateral included. The size of the provision is equal to the estimated loss considering the discounted value of the future cash flow and the value of pledged collateral.
Impaired exposures can be either performing or non-performing. Impaired exposures are treated as in default when determining default probability.
In addition to individual impairment testing of all indi-vidually significant customers, collective impairment test-ing is performed for groups of customers that have not been found to be impaired on individual level.
The rationale for this two-step procedure with both individual and collective assessment is to ensure that all incurred losses are accounted for up to and including each balance sheet day. Impairment losses recognised for a group of loans represent an interim step pending the iden-tification of impairment losses for an individual customer.
Measurement methodsThe primary quantitative tools for assessing credit risk are the rating and scoring models, which lay the foundation fortheProbabilityofDefault(PD)estimation.Inaddition,there are models used to assess such prudential indicators asLossGivenDefault(LGD)andExposureatDefault(EAD). Following the rollout of risk classification methods under the Capital Requirements Directive, the internal quantification of credit risk is now being aligned with external supervisory requirements.
For Regulatory Capital purposes Nordea uses the inter-nal rating based (IRB) approach for the retail segment, ie for household and small business customers and for the corpo-rate and bank segments the IRB Foundation approach.
Rating and scoringThe common element of both rating and scoring is the abil-ity to classify and rank customers according to their default risk. They are used as integrated parts of the risk manage-ment and decision-making process, including:• thecreditapprovalprocess• calculationofRegulatoryCapital(RiskWeighted
Amount)• calculationofEconomicCapitalandExpectedLoss• monitoringandreportingofcreditrisk• performancemeasurementusingtheEconomicProfit
framework
While ratings are assigned to corporate customers, bank counterparts and sovereigns1), scoring is used for house-holds and small business customers.
A rating is an estimate that exclusively reflects the quan-tification of the repayment capacity of the customer, ie the
risk of customer default. The rating scale consists of 18 grades from 6+ to 1- for non-defaulted customers and 3 grades from 0+ to 0- for defaulted customers. The repay-ment capacity of each rating grade is quantified by a one-yearPD.
Rating grade 4– and higher are comparable to investment grade as defined by external rating agencies suchasMoody’sandS&P.Ratinggrade2+andlowerareconsidered as weak or critical, and require special atten-tion.
Ratings are assigned in conjunction with credit propos-als and the annual review of the customers, and approved by the credit committees. However, a customer is down-graded as soon as new information indicates a deteriora-tion in the customer's repayment capacity. The consistency and transparency of the ratings are ensured by the use of rating models.
A rating model is a set of specified and distinct criteria which, given a set of customer characteristics, produces a rating that ranks the customer based on its repayment capacity. Rating models are based on the principle that it is possible to derive a prediction of future customer perfor-mance from the default history of past customers on the basis of their characteristics.
In order to better reflect the risk of customers in industries with highly distinctive characteristics, Nordea has decided upon a differentiation of rating models. Aside from a general corporate model used to rate the majority of industries, a number of specific models have been developed for specific segments, such as shipping and real estate management, taking into account the unique characteristics of these segments. Moreover, in each model the development methodology may vary. These methods range from purely statistical models based on internal data to expert-based models. In general however, all rating models are based on an overall framework, in which financial and quantitative factors are combined with qualitative factors.
Scoring models are pure statistical methods used to pre-dict the probability of customer default. The models are used in the household segment as well as for small corpo-rate customers. Nordea utilises bespoke behavioural scor-ing models developed on internal data to support both the credit approval process, eg automatic approvals or deci-sion support, as well as the risk management process, where ”early warnings” can be issued for high risk custom-ers and portfolio risk levels can be closely monitored. As a supplement to the behavioural scoring models, Nordea also utilises commercial credit bureau information in the credit process.
Loss Given DefaultLossgivendefault(LGD)ismeasuredtakingintoaccountthe collateral type, the counterpart's balance sheet compo-nentsandthepresenceofanystructuralsupport.LGDmeasures the expected realised loss given the default of a customer. Exposures having the same risk characteristics are then grouped into pools.
1) Sovereigns include central governments, central banks, regional governments, local authorities and other public sector entities.

Nor
dea
Ann
ual R
epor
t 20
08
48
Board of Directors’ Report
TheLGDmodelusedisbasedonanoverallframeworkforLossGivenDefaultandisastatisticalmodelbasedonhistorical data.
For Regulatory Capital purposes Nordea uses internal estimatesofLGDfortheretailsegment,ieforhouseholdsand small corporate customers. For the corporate and banks segments, Nordea uses the IRB Foundation approach in the calculation of the Regulatory Capital. The LossGivenDefaultforanexposureisthendefinedbyreg-ulatory requirements.
Exposure at DefaultExposure at default (EAD) is an estimate of how much of an exposure that will be drawn within the period of one year prior to default. EAD is for many products equal to the utilised exposure, but for some products, such as credit lines and derivative contracts, the EAD can be higher than the utilised exposure. The setup for EAD estimation is sim-ilartothatforLGD.
EAD is measured as the sum of the utilised amount and the unutilised amount of an exposure multiplied with a Credit Conversion Factor (CCF) as defined by regulatory requirements. The CCF is estimated based on historical data and is a statistical model. Exposures of the same kind of products are then grouped into pools.
ValidationNordea has established an internal validation process in accordance with the Capital Requirements Directive with the purpose of ensuring and improving the performance of Nordea’s models, procedures and systems as well as to ensuretheaccuracyofthePD,LGDandCCFestimates.The validation is performed annually and includes both a quantitative as well as a qualitative validation.
The quantitative validation of rating and scoring mod-els composes for example statistical tests of the models' discriminatory power, ie the ability of the model to distin-guish default risk on a relative basis, as well as cardinal accuracy, ie the ability to predict the level of defaults.
Quantification of credit riskTheparametersPD,LGDandCCFareusedtoquantifyRisk-WeightedAmount(RWA),ExpectedLossandEco-nomicCapitalforcreditrisk.ExpectedLossandEconomicCapitalarealsousedinthecalculationofEconomicProfit.
Nordea calculates Economic Capital for credit risk with capital factors, which are differentiated based on combina-tionsofPDandLGD.Thecapitalfactorsareestimatedusing the output from a credit portfolio model. In addition, the portfolio model is used to assess portfolio imbalances such as concentration risk.
As a complement to the ordinary credit risk quantifica-tion, comprehensive credit risk stress testing is performed at least annually as part of Nordea’s Internal Capital Ade-quacyAssessmentProcess(ICAAP).Inordertofacilitatethe estimation of the credit risk parameters as well as to perform various portfolio analyses, a Group-wide credit database is used.
Credit risk analysisCredit risk exposure is measured and presented as the principle amount (at amortised cost) of on-balance-sheet claims, ie loans and receivables to credit institutions and the public or off-balance-sheet potential claims on custom-ers and counterparts, net after allowances. Exposure also includes the risk related to derivatives contracts and secu-rities financing. Further information on exposure, as well as a more detailed analysis of Nordea's credit risk is pre-sented in the Group's Capital adequacy and risk report (Pillar3)for2008,availableatwww.nordea.com.Allfig-uresseeninthefollowingsectionareforLoansandReceiv-ables, if not stated otherwise.
Nordea's total loans and receivables have increased by 7%toEUR289bnduring2008(EUR269bn).Duetothechanges in Swedish and Norwegian exchange rates, the increase in EUR has been reduced with almost 10 %-points. Including off-balance sheet exposures and exposures relatedtosecuritiesandLifeinsuranceoperations,thetotalcredit risk exposure at year end was EUR 488bn (EUR 445bn).
The largest credit risk exposure is loans and receivables tothepublic(lending),whichin2008increasedby8%toEUR265bn(EUR245bn).
Loansandreceivablestocorporatecustomersattheendof2008wasEUR152bn(EUR133bn),up14%,whilelend-ing to household customers increased only slightly to EUR 109bn (EUR 107bn). The portion of total lending going to corporate customers was 57% (54%) and to household cus-tomers41%(44%).Loansandreceivablestocreditinstitu-tions, mainly in the form of inter-bank deposits, remained steadyatEUR24bnattheendof2008(EUR24bn).
Rating distributionOne way in which credit quality can be assessed is through analysis of the distribution across rating grades, for rated corporate customers and institutions, as well as risk grades for scored household and small business customers, ie retail exposures.
73% (74%) of the corporate exposure is rated 4– or higher, with an average rating for this portfolio of 4+. Insti-tutions and retail customers on the other hand exhibit a distribution that is skewed towards the higher rating grades. The portion of Nordea's institutional exposure that is rated 5- or higher has remained steady at 95% (95%).
About 86% of the retail exposures are scored C– or higher, which indicates a probability of default of 1% or lower.
Loans and receivables to corporate customersReal estate remains the largest sector in Nordea’s lending portfolio, at EUR 35.5bn (EUR 36.8bn). The portfolio pre-dominantly is comprised of relatively large and financially strong companies, with 74% (74%) of the lending in rating grades 4– and higher. There is a high level of collateral cov-erage, especially for exposures which are assigned lower rating grades (3+ or lower). Nearly 40% of lending to the real estate industry (EUR 13.5bn) is to companies in Swe-

Nor
dea
Ann
ual R
epor
t 20
08
49
Board of Directors’ Report
Credit risk exposure, loans and receivables and total exposure(excluding cash and balances at central banks EUR 3,157m, 2007 EUR 5,020m, and settlement risk exposure)
Loansand Loansand receivables receivables EURm 31Dec200831Dec20071)
To credit institutions 23,903 24,262– ofwhichbanks 22,548 23,741– ofwhichothercreditinstitutions 1,355 522
To the public 265,100 244,682– ofwhichcorporate 151,711 133,321 Energy(oil,gasetc) 2,815 1,448 Metalsandminingmaterials 1,750 792 Paperandforestmaterials 2,287 1,928 Other materials (building materials etc) 5,377 3,568 Industrialcapitalgoods 3,264 3,189 Industrialcommercialservicesetc 15,482 15,403 Constructionandcivilengineering 3,671 3,243 Shippingandoffshore 11,296 7,581 Transportation 4,017 3,845 Consumerdurables(cars,appliancesetc) 2,752 2,807 Media and leisure 3,171 3,104 Retailtrade 11,020 10,190 Consumerstaples(food,agricultureetc) 12,943 11,267 Healthcareandpharmaceuticals 1,606 1,772 Financialinstitutions 16,481 12,239 Real estate 35,500 36,766 IT software, hardware and services 1,489 1,309 Telecommunicationequipment 623 641 Telecommunicationoperators 1,686 1,062 Utilities(distributionandproduction) 4,022 3,310 Other 10,462 7,855– ofwhichhousehold 108,602 107,067 – mortgagefinancing 83,974 82,893 – consumerfinancing 24,628 24,174– ofwhichpublicsector 4,787 4,294
Total loans and receivables 289,003 268,944
Unutilised portion of appr. overdraft facilities2) 49,145 43,437Other credit commitments, etc.2) 36,271 38,170Guarantees and documentary credits2) 26,249 24,202Counterparty risk exposure3) 27,887 21,225Treasurybillsandinterest-bearingsecurities 31,430 25,894Treasury bills and interest-bearing securities pledged as collateral in repurchase agreements 7,916 4,688
Total credit risk exposure in the banking operations 467,901 426,560
Lendinginthelifeinsuranceoperations 120 0Guarantees and documentary credits in thelifeinsuranceoperations 38 52Interest-bearing securities in the life insurance operations 19,945 18,081
Total credit risk exposure including life insurance operations 488,004 444,6931) The figures for 2007 are not fully comparable, due to changes in industry categorisation. 2) Of which for corporate customers: unutilised portion of approved overdraft facilities and other
credit commitments approx. 85% and guarantees and documentary credits approx. 95%. 3) After closeout netting and collateral agreements, including current market value exposure
as well as potential future exposure.
den and close to half is to companies with mainly residen-tial real estate.
LendingtoconstructionandcivilengineeringindustryintheNordicregionisEUR3.0bn(EUR2.9bn).Theport-folio quality is high with an average rating of 4+, and 68% of the exposure rated 4- or higher.
The loans and receivables to shipping and offshore increased24%toEUR11.3bn(EUR9.1bn),withthestron-gest increase in the offshore and oil service sector. The port-folio is diversified by type of vessel, has a focus on large and financially most robust industrial players and exhibits strong credit quality, with an average rating of 4+. Reflect-ing Nordea's global customer strategy, there is an even dis-tribution between Nordic and non-Nordic customers.
The distribution of loans and receivables to corporates by size of loans shows a high degree of diversification where approx. 61% of the corporate volume is for loans on a scale of up to EUR 50m per customer. This distribution has been relatively stable in recent years.
The main credit risk mitigation technique is the pledging of collateral. In corporate exposures, the main collateral types are real estate mortgages, floating charges and leasing objects. Collateral coverage is higher for exposures to finan-cially weaker customers than for those which are financially strong.
While credit risk mitigation by the use of credit default swaps has been done to a limited extent, normal syndica-tion of loans remains the primary tool for managing the size of large credit exposures.
Loans and receivables to household customersIn2008,mortgageloansandconsumerloansincreasedonlyslightlytoEUR84bnandEUR25bnrespectively.Theportion of mortgage loans out of total household loans was 77% (77%), of which the Nordic market accounts for 98%.
Of the mortgage lending to household customers, including to SMEs, 91% had a loan-to-value ratio below 80%.
Geographical distributionLendingtothepublicdistributedbyborrowerdomicileshows that the Nordic market accounts for 87% (89%). Other EU countries represent the main part of the lending outside the Nordic countries.
Though the exposure to New European Markets is small, lending in the region has increased 54%. At the end of2008,lendingtocustomersintheBalticcountrieswasEUR8.3bn(EUR6.0bn),inPolandEUR3.4bn(EUR2.4bn),and in Russia EUR 3.6bn (EUR 1.6bn).
Transfer riskThe transfer risk exposure is dominated by a few countries and is primarily short-term and trade-related. China (EUR 515m) and Brazil (EUR 509m) are the countries contributing the highest to transfer risk, reflecting the countries' importance for Nordea’s Nordic corporate cus-tomers. Exposure related to India has increased markedly to EUR 365m (EUR 115m). To recognise the risk related to

Nor
dea
Ann
ual R
epor
t 20
08
50
Board of Directors’ Report
Real estate industry, loans and receivables, by country
31 Dec 31 Dec EURbn 2008 % 2007 %
Denmark 4.8 14 4.6 12Finland 7.1 20 7.0 19Norway 7.7 22 8.6 24Sweden 13.5 38 14.9 41Balticcountries 1.2 3 1.0 3Poland 0.2 1 0.1 0Russia 0.4 1 0.1 0Other 0.5 1 0.5 1
Total 35.5 100 36.8 100
Construction and civil engineering industry, loans and receivables, by country
31 Dec 31 Dec EURbn 2008 % 2007 %
Denmark 1.1 29 1.1 35Finland 0.7 20 0.7 21Norway 0.5 13 0.6 17Sweden 0.7 19 0.5 15Balticcountries 0.4 11 0.2 6Poland 0.0 1 0.1 3Russia 0.1 4 0.1 3Other 0.1 4 0.0 0
Total 3.7 100 3.2 100
0
5
10
15
20
25
F–FF+E–EE+D–DD+C–CC+B–BB+A–AA+
%
2008 Rating grade
%
Rating gradeRating Scoring
0
5
10
15
20
25
30
1–/F–1/F
1+/F+
2–/E–
2/E2+/E+
3–/D–
3/D3+/D+
4–/C–
4/C4+/C+
5–/B–
5/B5+/B+
6–/A–
6/A6+/A+
Exposure to household and SME customers (scored customers), distributed by scoring grades, 31 Dec 2008 Probability of Default (PD) Rating and Scoring, 2008
lending to developing countries, Nordea carries transfer risk allowance and provisions for non-investment grade rated countries.
The total transfer risk allowance and provisions at the endof2008wasEUR58m,increasedfrom2007(EUR42m).
SecuritisationNordea has not securitised assets from its ordinary lending portfolio except for in connection to the establishment of theSpecialPurposeEntity(SPE)KirkasNorthernLightsLtd(Kirkas)in2008.ThisSPEisconsolidatedintotheNor-deaGroupandthebondsissuedbytheSPEareheldinfullby Nordea. Consequently there has been no transfer of risk and the transaction is eliminated in the Nordea Group. MoreinformationonKirkasandotherSPEsestablishedbyNordeacanbefoundinnote22.
Impaired loansImpairedloans,gross,haveincreasedtoEUR2,224mfromEUR1,432m,during2008asresultofthecurrentdownturnand worsened economic conditions for many customers, especiallyduringthefourthquarterof2008.AllowancesforindividuallyassessedloansincreasedtoEUR762mfromEUR 603m. The ratio of allowances to cover impaired loans, gross,was34%(42%).AllowancesforcollectivelyassessedexposureswereEUR408m(EUR354m).Provisionsforoff-balance items have increased to EUR 100m (EUR 54m).
The main increases in impaired loans were in the sectors Real estate, Consumer durables, Construction and civil engineering and Retail trade. The main increases in impaired loans by borrower domicile were in the Baltic countries, Russia, Norway and Denmark.
Pastdueloansthatarenotimpairedwereforcorporatecustomers EUR 1,586m and for household customers EUR1,323min2008.

Nor
dea
Ann
ual R
epor
t 20
08
51
Board of Directors’ Report
Loan lossesThe net loan losses in the income statement, including new provisions, were EUR 466m (positive with EUR 60m), of which EUR 330m (positive EUR 88m) relates to corporate customers,EUR103m(EUR28m)tohouseholdcustomersandEUR32mtocreditinstitutions.Thisgrowthinnetloanlosses follows increased provisions both for collectively and individually assessed loans as well as lower reversals and recoveries, primarily in the fourth quarter. Net loan losses also include losses related to the Danish guarantee scheme of EUR 44m.
The main net loan losses were in the corporate sectors Retail trade and Construction and civil engineering as well as in household consumer financing.
Gross loan losses items, ie new provisions and reversals, were partly affected by increases in individual provisions and corresponding decreases of some of collective pro-visions and a redistribution between some collective pro-visions for different groups.
0
5
10
15
20
1–11+2–22+3–33+4–44+5–55+6–66+
%
2008 2007 Rating grade
0
10
20
30
40
50
1–11+2–22+3–33+4–44+5–55+6–66+
%
2008 2007 Rating grade
Exposure to corporate customers (rated customers), distributed by rating grades, 31 Dec 2008 and 2007
Exposure to institutional customers (rated customers), distributed by rating grades, 31 Dec 2008 and 2007
Loans and receivables to corporate customers, by size of loan 31 Dec 31 Dec EURbn 2008 % 2007 %
EUR0–10m 57.3 38 55.9 42EUR10–50m 35.2 23 34.4 26EUR50–100m 18.2 12 13.9 10EUR100–250m 20.8 14 14.1 11EUR250–500m 11.2 7 8.2 6EUR 500m– 9.0 6 6.8 5
Total 151.7 100 133.3 100
Shipping, offshore and oil services industry, loans and receivables, by segment
31 Dec 31 Dec EURbn 2008 % 20071) %
Bulk carriers 1.6 15 1.3 14Producttankers 1.3 11 1.0 11Crude tankers 1.1 9 1.0 11Chemical tankers 1.0 9 0.8 9Gas tankers 0.7 6 0.5 6Othershipping 2.1 18 1.7 19OffshoreandOilservices 3.6 32 2.6 29
Total 11.3 100 9.1 1001) Lending to shipping and offshore in this table for 2007 is partly included in the industry
Shipping and offshore, and partly in other industries, such as Transportation.
Mortgage loans to household customers, by country 31 Dec 31 Dec EURbn 2008 % 2007 %
Denmark 22.4 27 20.7 25Finland 21.3 25 19.7 24Norway 15.2 18 17.5 21Sweden 20.7 25 22.0 27Balticcountries 2.7 3 2.1 3Poland 1.6 2 0.8 1Russia 0.1 0 0.1 0
Total 84.0 100 82.9 100
Loantovalue distribution
Mortgage exposure on households and SMEs (Retail portfolio)
EURbn 31Dec2008 %
<50% 29.5 3450–70% 26.0 3070–80% 23.1 2780–90% 4.8 5>90% 3.9 4
Total 87.3 100

Nor
dea
Ann
ual R
epor
t 20
08
52
Board of Directors’ Report
Loans and receivables, impaired loans and allowances, by customer type Individually impaired loans and receivables
Allowances Loansand –of forcollec- Gross in%of Net receivables which tively in % as % Specific impaired as % before not assessed of not of loans allow- loans of loans 31Dec2008,EURm allowances impaired loans impaired Gross andrec. ances gross andrec.
To credit institutions 23,926 23,893 3 0.01 33 0.14 20 61 0.05– ofwhichbanks 22,572 22,539 3 0.01 33 0.15 20 61 0.06– of which other credit institutions 1,355 1,355 0 0.00 0 0.00 0 0 0.00To the public 266,247 264,056 405 0.15 2,191 0.82 742 34 0.54– ofwhichcorporate 152,613 151,005 320 0.21 1,608 1.05 582 36 0.67 Energy(oil,gasetc) 2,816 2,816 1 0.04 1 0.02 0 46 0.01 Metalsandminingmaterials 1,752 1,750 1 0.06 2 0.14 1 29 0.10 Paperandforestmaterials 2,292 2,274 1 0.04 19 0.82 5 27 0.60 Othermaterials(buildingmaterialsetc) 5,452 5,283 27 0.52 169 3.10 48 28 2.23 Industrialcapitalgoods 3,272 3,254 2 0.06 18 0.56 6 35 0.36 Industrialcommercialservicesetc 15,570 15,427 11 0.07 143 0.92 77 54 0.43 Constructionandcivilengineering 3,749 3,613 31 0.85 136 3.62 46 34 2.38 Shippingandoffshore 11,301 11,242 1 0.01 59 0.52 5 9 0.48 Transportation 4,049 3,995 10 0.25 53 1.32 22 42 0.77 Consumerdurables(cars,appliancesetc) 2,795 2,626 4 0.17 168 6.03 38 23 4.65 Mediaandleisure 3,200 3,129 3 0.09 71 2.23 26 36 1.42 Retailtrade 11,115 10,898 14 0.13 217 1.95 81 37 1.23 Consumerstaples(food,agricultureetc) 13,054 12,917 50 0.39 136 1.04 60 44 0.58 Healthcareandpharmaceuticals 1,613 1,574 1 0.07 39 2.40 6 16 2.02 Financialinstitutions 16,497 16,442 2 0.01 56 0.34 15 26 0.25 Realestate 35,695 35,489 119 0.34 206 0.58 76 37 0.37 ITsoftware,hardwareandservices 1,498 1,476 1 0.06 21 1.43 8 37 0.90 Telecommunicationequipment 633 599 0 0.01 33 5.28 10 29 3.77 Telecommunicationoperators 1,689 1,688 3 0.20 2 0.09 0 25 0.07 Utilities(distributionandproduction) 4,024 4,022 2 0.05 3 0.07 0 16 0.06 Other 10,548 10,493 35 0.33 55 0.52 51 93 0.04– ofwhichhousehold 108,845 108,266 85 0.08 579 0.53 158 27 0.39 – mortgagefinancing 84,019 83,837 32 0.04 182 0.22 13 7 0.20 – consumerfinancing 24,826 24,429 53 0.22 397 1.60 145 37 1.01– ofwhichpublicsector 4,789 4,784 0 0.00 5 0.10 2 32 0.07
Total credit risk exposure in the banking operations 290,173 287,949 408 0.14 2,224 0.77 762 34 0.50
Lendinginthelifeinsuranceoperations 120 120
Total credit risk exposure including life insurance operations 290,293 288,069 408 0.14 2,224 0.77 762 34 0.50
Restructured loans and receivables current year EURm 31Dec2008 31Dec2007
Loansandreceivablesbefore restructuring,bookvalue 22 124Loansandreceivablesafter restructuring, book value 11 63
Assets taken over for protection of claims1)
EURm 31Dec2008 31Dec2007
Current assets, book value:Landandbuildings 0 0Shares and other participations 14 1Other assets 4 3
Total 18 41) In accordance with Nordea’s policy for taking over assets for protection of claims, which is
in compliance with the local Banking Business Acts, wherever Nordea is located. Assets, used as collateral for the loan, are generally taken over when the customer is not able to fulfill its obligations to Nordea. The assets taken over are at the latest, disposed when full recovery is reached.

Nor
dea
Ann
ual R
epor
t 20
08
53
Board of Directors’ Report
Loans and receivables, impaired loans and allowances, by customer type Individually impaired loans and receivables
Allowances Loansand –of forcollec- Gross in%of Net receivables which tively in % as % Specific impaired as % before not assessed of not of loans allow- loans of loans 31Dec2007,EURm allowances impaired loans impaired Gross andrec. ances gross andrec.
To credit institutions 24,272 24,264 2 0.01 8 0.03 8 100 0.00– ofwhichbanks 23,750 23,742 2 0.01 8 0.03 8 100 0.00– ofwhichothercreditinstitutions 522 522 0 0.00 0 0.00 0 0 0.00 To the public 245,629 244,205 352 0.14 1,424 0.58 595 42 0.34– of which corporate 134,076 133,047 294 0.22 1,029 0.77 461 45 0.42 Energy (oil, gas, etc.) 1,449 1,447 0 0.00 1 0.07 0 3 0.07 Metalsandminingmaterials 793 790 0 0.00 3 0.34 1 23 0.26 Paperandforestmaterials 1,955 1,914 0 0.00 40 2.07 26 65 0.73 Othermaterials(buildingmaterials,etc,) 3,627 3,517 19 0.52 109 3.01 39 36 1.92 Industrialcapitalgoods 3,209 3,172 7 0.21 37 1.15 13 36 0.74 Industrialcommercialservices,etc. 15,482 15,354 11 0.07 128 0.83 68 53 0.39 Constructionandcivilengineering 3,269 3,222 8 0.26 47 1.43 17 37 0.90 Shippingandoffshore 7,583 7,579 0 0.00 4 0.05 2 51 0.03 Transportation 3,870 3,810 7 0.18 60 1.54 18 30 1.08 Consumerdurables(cars,appliances,etc.) 2,845 2,785 6 0.23 60 2.11 31 52 1.02 Mediaandleisure 3,130 3,067 2 0.06 63 2.00 24 38 1.24 Retailtrade 10,254 10,121 4 0.03 132 1.29 60 45 0.71 Consumerstaples(food,agriculture,etc.) 11,350 11,251 30 0.27 100 0.88 53 53 0.41 Healthcareandpharmaceuticals 1,779 1,767 2 0.11 13 0.71 5 42 0.41 Financialinstitutions 12,246 12,213 0 0.00 33 0.27 6 20 0.21 Realestate 36,898 36,809 98 0.26 89 0.24 34 38 0.15 IT software, hardware and services 1,314 1,300 0 0.00 14 1.09 6 39 0.67 Telecommunication equipment 654 617 0 0.00 37 5.66 13 34 3.73 Telecommunicationoperators 1,062 1,061 0 0.00 1 0.11 0 24 0.09 Utilities (distribution and production) 3,311 3,308 0 0.00 3 0.09 1 40 0.05 Other 7,998 7,943 100 1.25 56 0.70 43 77 0.16
– of which household 107,258 106,864 58 0.05 394 0.37 133 34 0.24 Mortgagefinancing 82,929 82,832 23 0.03 97 0.12 12 13 0.10 Consumerfinancing 24,329 24,032 35 0.14 297 1.22 120 40 0.73
– of which public sector 4,296 4,294 0 0.01 2 0.04 1 70 0.01
Total credit risk exposure in the banking operations 269,901 268,469 354 0.13 1,432 0.53 603 42 0.31
Lendinginthelifeinsuranceoperations 0 0
Total credit risk exposure including life insurance operations 269,901 268,469 354 0.13 1,432 0.53 603 42 0.31

Nor
dea
Ann
ual R
epor
t 20
08
54
Board of Directors’ Report
Loans and receivables to the public, impaired loans and allowances, by geography domicile of customers Individually impaired loans and receivables
Allowances Loansand –of forcollec- Gross in%of Net receivables which tively in % as % Specific impaired as % before not assessed of not of loans allow- loans of loans 31Dec2008,EURm allowances impaired loans impaired Gross andrec. ances gross andrec.
Nordiccountries 230,342 228,419 262 0.11 1,923 0.83 677 35 0.54– ofwhichDenmark 73,184 72,560 81 0.11 624 0.85 309 49 0.43– ofwhichFinland 51,683 50,887 74 0.15 796 1.54 211 27 1.13– ofwhichNorway 41,744 41,493 61 0.15 251 0.60 83 33 0.40– ofwhichSweden 63,731 63,480 46 0.07 251 0.39 74 29 0.28Estonia 2,632 2,588 35 1.35 44 1.68 2 5 1.60Latvia 3,231 3,167 55 1.74 64 1.99 10 16 1.67Lithuania 2,561 2,527 18 0.71 34 1.33 18 52 0.64Poland 3,379 3,341 7 0.21 38 1.12 18 46 0.60Russia 3,558 3,541 16 0.47 17 0.49 7 40 0.29EUcountriesother 10,704 10,672 0 0.00 32 0.30 7 20 0.24USA 1,797 1,762 0 0.00 35 1.94 0 1 1.92Asia 2,656 2,655 6 0.23 1 0.02 1 80 0.00LatinAmerica 2,769 2,769 0 0.01 0 0.00 0 0 0.00OECDother 1,203 1,199 2 0.17 4 0.31 3 80 0.06Non-OECDother 1,416 1,415 2 0.17 0 0.01 0 98 0.00
Total 266,247 264,056 405 0.15 2,191 0.82 742 34 0.54
Individually impaired loans and receivables
Allowances Loansand –of forcollec- Gross in%of Net receivables which tively in % as % Specific impaired as % before not assessed of not of loans allow- loans of loans 31Dec2007,EURm allowances impaired loans impaired Gross andrec. ances gross andrec.
Nordiccountries 219,117 217,775 261 0.12 1,343 0.61 553 41 0.36– ofwhichDenmark 65,578 65,139 68 0.10 439 0.67 220 50 0.33– ofwhichFinland 47,962 47,380 78 0.16 582 1.21 176 30 0.85– ofwhichNorway 42,950 42,833 70 0.16 117 0.27 57 49 0.14– ofwhichSweden 62,626 62,422 45 0.07 204 0.33 100 49 0.17Estonia 2,033 2,023 25 1.24 10 0.48 0 2 0.47Latvia 2,391 2,381 44 1.83 10 0.42 1 7 0.39Lithuania 1,632 1,624 12 0.76 8 0.49 7 87 0.06Poland 2,341 2,301 2 0.07 40 1.70 24 60 0.68Russia 1,612 1,611 8 0.50 1 0.08 1 100 0.00EUcountriesother 8,940 8,932 0 0.00 8 0.09 7 86 0.01USA 1,917 1,916 0 0.00 1 0.05 1 100 0.00Asia 1,421 1,418 0 0.00 3 0.24 0 0 0.24LatinAmerica 1,723 1,722 0 0.00 1 0.06 0 0 0.06OECDother 923 923 0 0.00 0 0.01 0 0 0.00Non-OECD other 1,579 1,579 1 0.08 0 0.00 0 0 0.00
Total 245,629 244,205 352 0.14 1,424 0.58 595 42 0.34

Nor
dea
Ann
ual R
epor
t 20
08
55
Board of Directors’ Report
during the remaining contract lifetime, and is measured as the notional principal amount multiplied by a risk weight. The size of the risk weight depends on the contract’s remaining lifetime and the underlying asset.
The total counterparty credit risk exposure at the end of 2008wasEUR27.9bn,ofwhichthecurrentexposurerepre-sentsEUR12.2bn.47%ofthetotalexposureand35%ofthecurrent exposure was towards Financial Institutions.
To reduce the exposure towards single counterparts, risk mitigation techniques are widely used in Nordea. The most common is the use of closeout netting agreements, which allow the bank to net positive and negative replace-ment values of contracts under the agreement in the event of default of the counterpart.
Nordea also mitigates the exposure towards large banks, hedge funds and institutional counterparts by an increasing use of collateral management arrangements, where collateral on a regular – typically daily – basis is placed or received to cover the current exposure. The col-lateral is largely cash, but also government bonds and to a lesser extent mortgage bonds are accepted. The effects of closeout netting and collateral agreements are consider-able, as 85% of the current exposure (gross) was eliminated by the use of these risk mitigation techniques.
Finally, Nordea also uses a risk mitigation technique based upon a condition in some of the long-term deriva-tives contracts that provides the option to terminate con-tracts at a specific time or upon the occurrence of credit related events.
Nordea is using credit derivatives to hedge positions in traded corporate bonds and basket credit derivatives.
Past due loans, nonimpaired loans Corporate Household 31Dec2008,EURm customers customers
6–30 days 671 67331–60days 422 36961–90days 227 102>90days 266 179
Total 1,586 1,323
Pastduenon-impaired/lendingin% 1.05 1.22
Transfer risk exposure1)
EURm 31Dec2008 31Dec2007
Asia 1,512 906EasternEuropeandCIS 277 439LatinAmerica 662 570Middle East 691 397Africa 175 1481) The total transfer risk allowances and provisions at the end of 2008 were EUR 58m and at
the end of 2007 EUR 42m.
Settlement riskSettlement risk is a type of credit risk arising during the process of settling a contract or execution of a payment.
The risk amount is the principal of the transaction, and the potential loss that could occur if a counterpart were to default after Nordea has given irrevocable instructions for a transfer of a principal amount or security, but before receipt of the corresponding payment or security has been finally confirmed.
The settlement risk on individual counterparts is restricted by settlement risk limits. Each counterpart is assessed in the credit process, and clearing agents, corre-spondent banks and custodians are selected with a view of minimising settlement risk.Nordea is a shareholder of, and participant in, the global FXclearingsystemCLS(ContinuousLinkedSettlement),which eliminates the settlement risk of FX trades in those currencies and with those counterparts that are eligible for CLS-clearing.Asaresult,Nordea’ssettlementriskexpo-sure against major trading counterparts has decreased con-siderably in recent years.
Risk in derivativesDerivative contracts are financial instruments, such as futures, forwards, swaps or options that derive their value from underlying interest rates, currencies, equities, credit spreads or commodity prices. The derivative contracts are often OTC traded, ie the terms connected to the specific contract are agreed upon on an individual basis with the counterpart.
Nordea invariably enters into derivative contracts based on customer demand. This is performed either directly or in order to hedge positions in assets such as traded corpo-rate bonds, and may include basket credit derivatives. Nordea does not actively use credit derivatives in connec-tion with own credit portfolio. However, through Group Treasury, the Group uses interest rate swaps and other derivatives in its hedging activities of the assets and liabili-ties on the balance sheet.
The derivative contracts are evaluated at fair value on an ongoing basis and affect the reported result as well as the balance sheet.
Counterparty riskCounterparty credit risk is the risk that a counterpart in the derivatives contract defaults prior to maturity of the con-tract and that Nordea at that time has a contractual claim on the counterpart. Counterparty credit risk is subject to credit limits like other credit exposures and is treated accordingly. Counterparty credit risk arises mainly in the trading book, but also in the banking book as a result of active asset and liability management.
Nordea uses the transaction-based model to calculate the counterparty credit risk, ie the sum of current exposure (replacement cost) and potential future exposure. The potential future exposure is an estimate, which reflects pos-sible changes in the market value of the individual contract
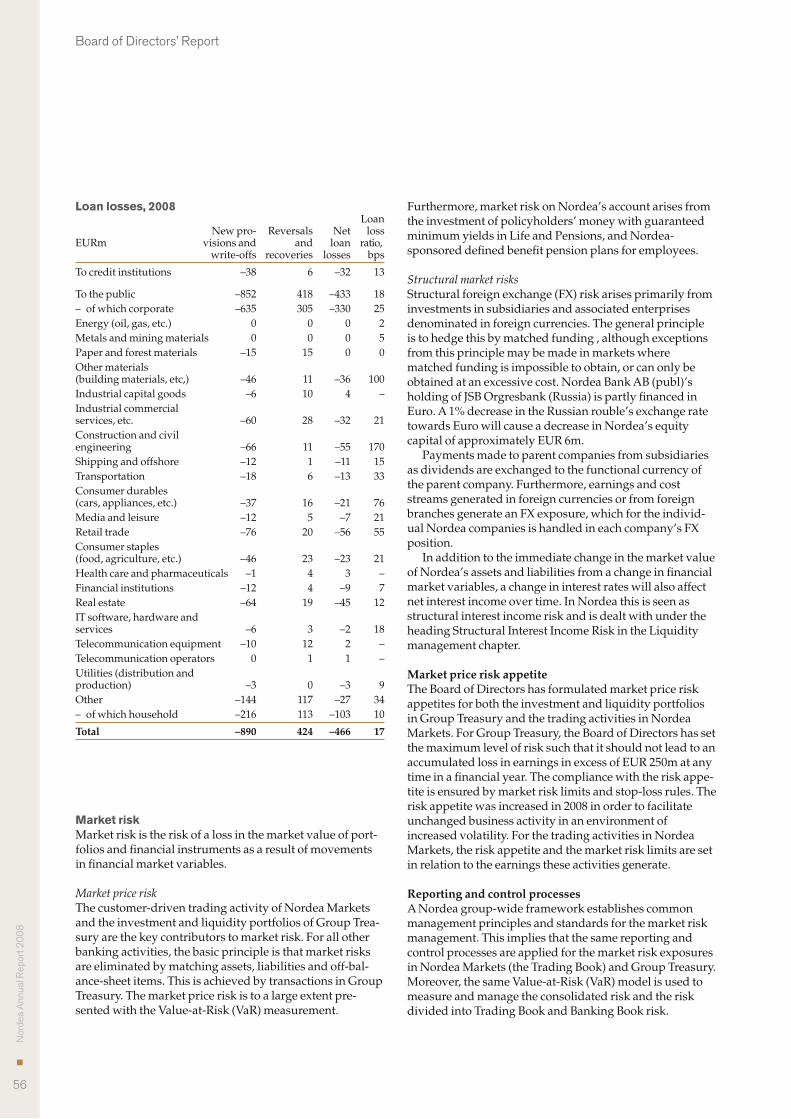
Nor
dea
Ann
ual R
epor
t 20
08
56
Board of Directors’ Report
Market riskMarket risk is the risk of a loss in the market value of port-folios and financial instruments as a result of movements in financial market variables.
Market price riskThe customer-driven trading activity of Nordea Markets and the investment and liquidity portfolios of Group Trea-sury are the key contributors to market risk. For all other banking activities, the basic principle is that market risks are eliminated by matching assets, liabilities and off-bal-ance-sheet items. This is achieved by transactions in Group Treasury. The market price risk is to a large extent pre-sented with the Value-at-Risk (VaR) measurement.
Loan losses, 2008 Loan New pro- Reversals Net loss EURm visions and and loan ratio, write-offs recoveries losses bps
Tocreditinstitutions –38 6 –32 13
Tothepublic –852 418 –433 18– ofwhichcorporate –635 305 –330 25Energy(oil,gas,etc.) 0 0 0 2Metals and mining materials 0 0 0 5Paperandforestmaterials –15 15 0 0Other materials (building materials, etc,) –46 11 –36 100Industrial capital goods –6 10 4 –Industrial commercial services,etc. –60 28 –32 21Construction and civil engineering –66 11 –55 170Shippingandoffshore –12 1 –11 15Transportation –18 6 –13 33Consumer durables (cars,appliances,etc.) –37 16 –21 76Mediaandleisure –12 5 –7 21Retailtrade –76 20 –56 55Consumer staples (food,agriculture,etc.) –46 23 –23 21Health care and pharmaceuticals –1 4 3 –Financialinstitutions –12 4 –9 7Realestate –64 19 –45 12IT software, hardware and services –6 3 –2 18Telecommunicationequipment –10 12 2 –Telecommunication operators 0 1 1 –Utilities (distribution and production) –3 0 –3 9Other –144 117 –27 34– ofwhichhousehold –216 113 –103 10
Total –890 424 –466 17
Furthermore, market risk on Nordea’s account arises from the investment of policyholders’ money with guaranteed minimumyieldsinLifeandPensions,andNordea-sponsored defined benefit pension plans for employees.
Structural market risksStructural foreign exchange (FX) risk arises primarily from investments in subsidiaries and associated enterprises denominated in foreign currencies. The general principle is to hedge this by matched funding , although exceptions from this principle may be made in markets where matched funding is impossible to obtain, or can only be obtained at an excessive cost. Nordea Bank AB (publ)’s holding of JSB Orgresbank (Russia) is partly financed in Euro. A 1% decrease in the Russian rouble’s exchange rate towards Euro will cause a decrease in Nordea’s equity capital of approximately EUR 6m.
Paymentsmadetoparentcompaniesfromsubsidiariesas dividends are exchanged to the functional currency of the parent company. Furthermore, earnings and cost streams generated in foreign currencies or from foreign branches generate an FX exposure, which for the individ-ual Nordea companies is handled in each company’s FX position.
In addition to the immediate change in the market value of Nordea’s assets and liabilities from a change in financial market variables, a change in interest rates will also affect net interest income over time. In Nordea this is seen as structural interest income risk and is dealt with under the headingStructuralInterestIncomeRiskintheLiquiditymanagement chapter.
Market price risk appetiteThe Board of Directors has formulated market price risk appetites for both the investment and liquidity portfolios in Group Treasury and the trading activities in Nordea Markets. For Group Treasury, the Board of Directors has set the maximum level of risk such that it should not lead to an accumulatedlossinearningsinexcessofEUR250matanytime in a financial year. The compliance with the risk appe-tite is ensured by market risk limits and stop-loss rules. The riskappetitewasincreasedin2008inordertofacilitateunchanged business activity in an environment of increased volatility. For the trading activities in Nordea Markets, the risk appetite and the market risk limits are set in relation to the earnings these activities generate.
Reporting and control processesA Nordea group-wide framework establishes common management principles and standards for the market risk management. This implies that the same reporting and control processes are applied for the market risk exposures in Nordea Markets (the Trading Book) and Group Treasury. Moreover, the same Value-at-Risk (VaR) model is used to measure and manage the consolidated risk and the risk divided into Trading Book and Banking Book risk.

Nor
dea
Ann
ual R
epor
t 20
08
57
Board of Directors’ Report
Counterparty risk exposure (after closeout netting and collateral agreements)
31Dec2008 31Dec2007
Potential Potential Current future Total Current future Total EURm exposure exposure credit risk exposure exposure credit risk
Publicentities 1,754 1,302 2,727 310 1,136 1,136Financialinstitutions 4,291 14,454 13,010 2,201 14,734 14,738Corporates 6,157 7,146 12,150 864 6,119 5,351
Total 12,202 22,902 27,887 3,375 21,989 21,225
Reduction in counterparty risk exposure due to closeout netting and collateral agreements
31Dec2008 31Dec2007
Current from Reduction Current Current from Reduction Current exposure closeout from held exposure exposure closeout from held exposure EURm (gross) netting collateral (net) (gross) netting collateral (net)
Total 82,203 66,364 3,637 12,202 29,800 23,979 2,446 3,375
Credit derivatives 31Dec2008
Total gross Total gross notional sold notional bought EURm protection protection
Single-name CDS, investment grade 18,399 18,335Single-nameCDS,non-investmentgrade 7,364 7,629
Multi-nameCDSindices 20,082 19,416
Total 45,845 45,380
However, certain risk exposures have special characteristics and are monitored and limited separately. For example, this is the case for commodity risk, structured equity options and fund linked derivatives in Markets and private equity funds and investments in hedge funds in Group Treasury, which are measured using scenario simulation. The scenar-ios are based on the sensitivity to changes in the underlying prices and, where relevant, their volatility. These risk fig-ures are limited and monitored in the daily reporting and control process, but not included in the VaR numbers. CDOs and CDSs are included in the VaR figures through their sensitivities to changes in interest spreads, in analogy with corporate bonds. In addition, jump-to-default expo-sures and correlation risk are limited and monitored in the daily control process.
Transparency in all elements of the risk management process is central to maintaining risk awareness and a sound risk culture throughout the organisation. This trans-parency is achieved by:• seniormanagementtakinganactiveroleintheprocess.
The CRO receives reporting on the Group’s consoli-dated market risk every day; GEM receives reports on a monthly basis, and the Board of Directors on a quarterly basis
• havingacomprehensivepolicyframework,bywhichresponsibilities and objectives are explicitly outlined. PoliciesaredecidedbytheBoardofDirectors,andarecomplemented by instructions issued by the CRO
• definingclearriskmandates(atdepartmental,deskandindividual levels), in terms of limits and restrictions on which instruments may be traded. Adherence to limits is crucial, and should a limit be breached, the decision-making body would be informed immediately
• havingdetailedbusinessproceduresthatclearlystatehow policies and instructions are to be implemented
• havingproactiveinformationsharingbetweentradingand risk control
• havingriskmodelsthatmakeriskfigureseasilydecom-posable
• havingaframeworkforapprovaloftradedfinancialinstruments and methods for the valuation of these, that requires an elaborate analysis and documentation of the instruments’ features and risk factors
• havinga“businessintelligence”typeriskITsystemthatallows all traders and controllers to easily monitor and analyse their risk figures
• havingtoolsthatallowthecalculationofVaRfiguresonthe positions that a trader, desk or department has dur-ing the day.

Nor
dea
Ann
ual R
epor
t 20
08
58
Board of Directors’ Report
0
20
40
60
80
100
120
DecNovOctSepAugJulJunMayAprMarFebJan
EURm
Total VaRInterest rate VaR
Equity VaR FX VaRCredit spread VaR
%
High Low
6
7
8
9
10
2008200720062005
0
30
60
90
120
150
DecNovOctSepAugJulyJuneMayAprMarFebJan
Market risk, VaR
–50
–40
–30
–20
–10
0
10
20
30
DecNovOctSepAugJulyJuneMayAprMarFebJan
EURm
Hypothetical p/l Low
Backtesting, oneday VaR and simulated daily profit/loss
Measurement methodsAs there is no single risk measure that captures all aspects of market risk, Nordea on a daily basis uses several risk measures including VaR models, stress testing, Jump-to-Default exposure, scenario simulation and other non-sta-tistical risk measures such as basis point values, net open positions and option key figures.
Normal market conditionsNordea’s universal VaR model is a 10-day, 99% confidence model, which uses the expected shortfall approach and is based on historical simulation on up to two years’ histori-cal changes in market prices and rates. This implies that the historical simulation VaR model uses the average of a num-ber of the most adverse simulation results as an estimate of VaR. The sample of historical market changes in the model isupdateddaily.The“squarerootoften”ruleisappliedtoscale 1-day VaR figures to 10-day figures. The model is used to limit and measure market risk at all levels both for the Trading Book and in Group Treasury.
VaR is used to measure interest rate, foreign exchange, equity and credit spread risks. A VaR measure across these risk categories, allowing for diversification among them, is also used. The VaR figures include both linear positions and options.
With the chosen characteristics of the VaR model, the VaR-figures can be interpreted as the loss that will be exceeded in only one of a hundred 10-day trading periods. However, it is important to note that, while every effort is made to make the VaR-model as realistic as possible, all VaR-models are based on assumptions and approxima-tions that have significant impact on the risk figures pro-duced. Also, it should be noted that the historical observa-tions of the market variables that are used as inputs may not give an adequate description of their behaviour in the future. In particular the historical values may fail to reflect the potential for extreme market moves.
Inthesummerof2007volatilityinthefinancialmarketsincreasedmarkedlyandinthespringof2008,thebacktest-ing indicated a need for making the model more respon-sive to changes in market volatility. As a result, in June
2008,themodelwasadjustedbyreducingthelookbackperiod, to one year, and the number of the most adverse simulation results in the estimate of the VaR (ie further out in the left-hand tail of the distribution of historical simula-tion outcomes).
The market risk due to a mismatch between the market risk exposure on policy holders’ assets and liabilities in NordeaLife&Pensionsismeasuredasthelosssensitivityfor two standard market scenarios, which represent normal and stressed market conditions, respectively.
Stress testingStress tests are used to estimate the possible losses that may occur under extreme market conditions. Nordea performs daily stress tests based on the current portfolio and using data on daily financial market developments since the beginning of 1993. In addition, Nordea’s portfolios are stress tested for subjective scenarios, which are most often based on selected historical events prior to 1993 or adverse scenarios relevant at the current state of the economic cycle or geopolitical situation. While these stress tests measure the risk over a shorter time horizon, market risk is also a partofthecomprehensiveICAAPstresstesting,whichmeasures the risk over a three year horizon.
Market risk analysisNordea's market risk analysis is based on consolidated risk arising from both Group Treasury and Nordea Markets.
Market risk associated with the mismatch between poli-cyholders’assetsandliabilitiesinNordeaLifeandPensionis analysed separately. The scenario for normal market con-ditionsshowsariskofEUR59mattheendof2008(EUR28mattheendof2007).Themarketriskfromtheinternalpension plans is also measured separately.
Total VaRThetotalVaRwasEUR86m(EUR59m)attheendof2008demonstrating a considerable diversification effect between interest rate, equity, foreign exchange and credit spread risk, as the total VaR is lower than the sum of the risk in the four categories.
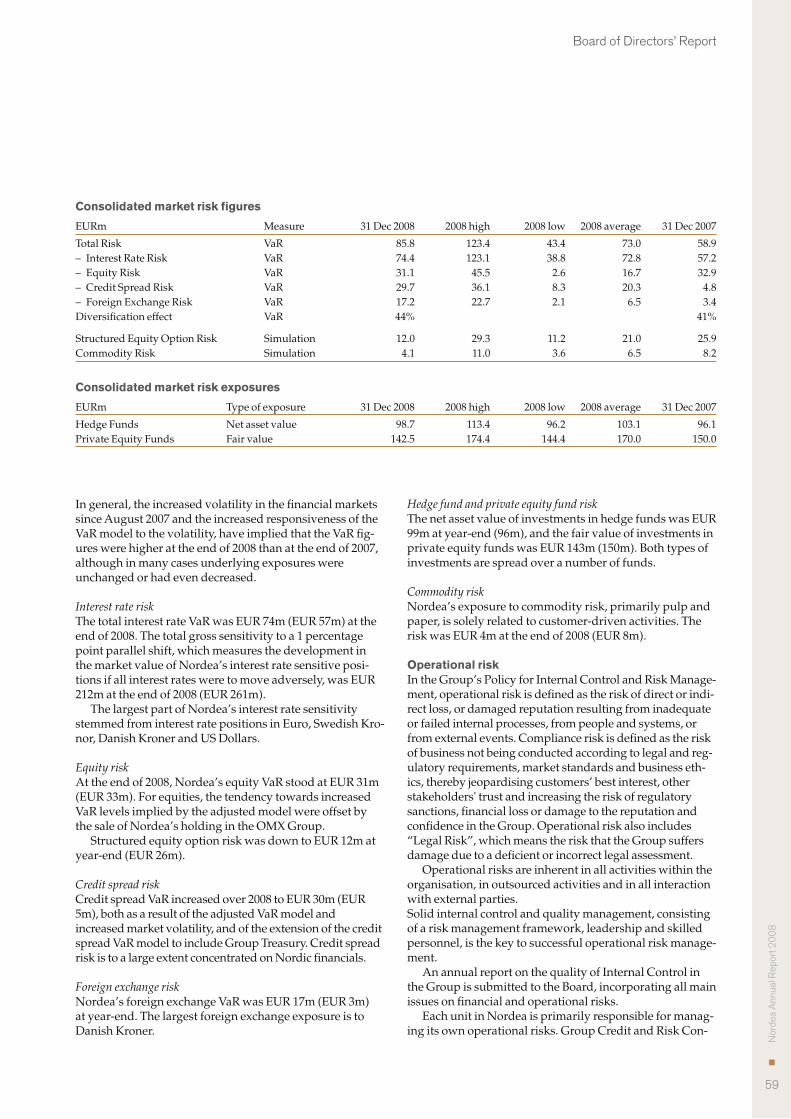
Nor
dea
Ann
ual R
epor
t 20
08
59
Board of Directors’ Report
In general, the increased volatility in the financial markets sinceAugust2007andtheincreasedresponsivenessoftheVaR model to the volatility, have implied that the VaR fig-ureswerehigherattheendof2008thanattheendof2007,although in many cases underlying exposures were unchanged or had even decreased.
Interest rate riskThe total interest rate VaR was EUR 74m (EUR 57m) at the endof2008.Thetotalgrosssensitivitytoa1percentagepoint parallel shift, which measures the development in the market value of Nordea’s interest rate sensitive posi-tions if all interest rates were to move adversely, was EUR 212mattheendof2008(EUR261m).
The largest part of Nordea’s interest rate sensitivity stemmedfrominterestratepositionsinEuro,SwedishKro-nor,DanishKronerandUSDollars.
Equity riskAttheendof2008,Nordea’sequityVaRstoodatEUR31m(EUR 33m). For equities, the tendency towards increased VaR levels implied by the adjusted model were offset by the sale of Nordea’s holding in the OMX Group.
StructuredequityoptionriskwasdowntoEUR12matyear-end(EUR26m).
Credit spread riskCreditspreadVaRincreasedover2008toEUR30m(EUR5m), both as a result of the adjusted VaR model and increased market volatility, and of the extension of the credit spread VaR model to include Group Treasury. Credit spread risk is to a large extent concentrated on Nordic financials.
Foreign exchange riskNordea’s foreign exchange VaR was EUR 17m (EUR 3m) at year-end. The largest foreign exchange exposure is to DanishKroner.
Hedge fund and private equity fund risk The net asset value of investments in hedge funds was EUR 99m at year-end (96m), and the fair value of investments in private equity funds was EUR 143m (150m). Both types of investments are spread over a number of funds.
Commodity riskNordea’s exposure to commodity risk, primarily pulp and paper, is solely related to customer-driven activities. The riskwasEUR4mattheendof2008(EUR8m).
Operational riskIntheGroup’sPolicyforInternalControlandRiskManage-ment, operational risk is defined as the risk of direct or indi-rect loss, or damaged reputation resulting from inadequate or failed internal processes, from people and systems, or from external events. Compliance risk is defined as the risk of business not being conducted according to legal and reg-ulatory requirements, market standards and business eth-ics, thereby jeopardising customers’ best interest, other stakeholders' trust and increasing the risk of regulatory sanctions, financial loss or damage to the reputation and confidence in the Group. Operational risk also includes “LegalRisk”,whichmeanstheriskthattheGroupsuffersdamage due to a deficient or incorrect legal assessment.
Operational risks are inherent in all activities within the organisation, in outsourced activities and in all interaction with external parties.Solid internal control and quality management, consisting of a risk management framework, leadership and skilled personnel, is the key to successful operational risk manage-ment.
An annual report on the quality of Internal Control in the Group is submitted to the Board, incorporating all main issues on financial and operational risks.
Each unit in Nordea is primarily responsible for manag-ing its own operational risks. Group Credit and Risk Con-
Consolidated market risk figures
EURm Measure 31Dec2008 2008high 2008low 2008average 31Dec2007
TotalRisk VaR 85.8 123.4 43.4 73.0 58.9– InterestRateRisk VaR 74.4 123.1 38.8 72.8 57.2– EquityRisk VaR 31.1 45.5 2.6 16.7 32.9– CreditSpreadRisk VaR 29.7 36.1 8.3 20.3 4.8– ForeignExchangeRisk VaR 17.2 22.7 2.1 6.5 3.4Diversification effect VaR 44% 41%
StructuredEquityOptionRisk Simulation 12.0 29.3 11.2 21.0 25.9CommodityRisk Simulation 4.1 11.0 3.6 6.5 8.2
Consolidated market risk exposures
EURm Typeofexposure 31Dec2008 2008high 2008low 2008average 31Dec2007
HedgeFunds Netassetvalue 98.7 113.4 96.2 103.1 96.1PrivateEquityFunds Fairvalue 142.5 174.4 144.4 170.0 150.0

Nor
dea
Ann
ual R
epor
t 20
08
60
Board of Directors’ Report
trol develops and maintains a framework for identifying, assessing, mitigating, monitoring, controlling and report-ing operational risks and supports the line organisation in implementing the framework.
Information security, physical security, crime preven-tion and educational and training activities are important components when managing operational risks. To cover this broad scope, the Group security and the Group com-pliance functions are included in Group Credit and Risk Control, and close cooperation is maintained with Group ITandGroupLegal,inordertoraisetheriskawarenessthroughout the organisation.
The main processes for managing operational risks are ongoing monitoring through risk self-assessment and the documenting, registering and following up activities related to incidents and quality deficiencies. The analysis of operational risk-related events, potential risk indicators and other early-warning signals are in focus when devel-oping the processes.
Special emphasis is put on quality and risk analysis in change management and product development.
The mitigating techniques consist of continuous improvement initiatives and business continuity plans together with crisis management preparedness and a broad insurance cover for handling major incidents. Miti-gation efforts target reliability and continuity in the value chains rather than focusing on single units in the organisa-tion.
The techniques and processes for managing operational risks are structured around the risk sources as described in the definition of operational risk. This approach improves the comparability of risk profiles in different areas and functions and globally throughout the organisation. It also complements the Group's focus on limiting and mitigating measures in relation to the sources, rather than the symp-toms.
Life insurance risk and market risks in the Life insurance operationsTheLifeinsurancebusinessofNordeaLifeandPensionsgenerally consists of very long-term pension savings con-tracts, with durations of more than 40 years. The two major risks in the life insurance business are life insurance risks and market risks. The majority of these risks are on policy-holders rather than on Nordea’s own account.
The life insurance risk is the risk of unexpected losses due to changes in mortality rates, longevity rates, disability rates and selection effects.
These risks are primarily controlled using actuarial methods, ie through tariffs, rules for acceptance of custom-ers, reinsurance contracts, stress tests and provisions for risks. A continuous supervision of the appropriateness of the parameters in the risk models is undertaken to ensure that changes in the underlying risks are properly taken into account.
ThemarketriskforNordea’sownaccountofLifeinsur-ance operations arises from mismatches of the market risk exposureonassetsandliabilitiesinNordeaLifeandPen-sions and is measured as a loss in operating income, due to movements in financial market prices. The income model is primarily fee-based, and contingent upon, but not directly dependent on, investment return. The figure is presented in the market risk section above.
The market risk emanating from separated equity capi-talinvestmentsforNordeaLifeandPensionsisincludedinthe Group’s consolidated market risk figure, also presented in the market risk section above.
Pillar 3 disclosure, Capital adequacy and risk managementThedisclosureinaccordancewiththePillar3requirementsaccording to the CRD in the Basel II framework is pre-sented on www.nordea.com

Nor
dea
Ann
ual R
epor
t 20
08
61
Board of Directors’ Report
Life insurance risk and market risks in the Life insurance operations
31Dec2008 31Dec2007
Effects on Effects on Effects on Effects on Sensitivities policy- Nordea’s own policy- Nordea’s own EURm holders account holders account
Mortality–increasedlivingwith1year –94.1 –7.9 –65.9 –8.2Mortality – decreased living with 1 year 80.7 7.0 50.1 7.0Disability – 10% increase –35.9 –0.4 –6.6 –1.7Disability – 10% decrease 35.4 0.4 6.1 1.7
50bpincreaseininterestrates –183.0 –1.3 –127.7 –6.150bpdecreaseininterestrates 122.4 0.1 34.1 3.6
12%decreaseinallshareprices –103.4 –7.3 –583.0 –22.08%decreaseinpropertyvalue –176.9 –28.9 –258.5 0.08% loss on counterparts –144.3 –6.1 –105.6 –7.1
Liabilities to policyholders divided in guaranty levels (technical interest rate)
31Dec2008 Over Total EURm non 0 pct. 0 to 3 pct. 3 to 5 pct 5 pct. liabilities
Technicalprovision 4,210 4,091 9,823 9,496 160 27,778
31Dec20071) Over Total EURm non 0 pct. 0 to 3 pct. 3 to 5 pct 5 pct. liabilities
Technicalprovision 7,875 4,202 7,097 10,283 199 29,6561) 2007 figures restated to include all life insurance products.
Risk profiles on insurance
Product Risktypes Materialeffect
Traditional – Mortality Yes – Disability Yes – Return guaranties Yes
Unit-Link – Mortality Yes – Disability Yes – Return guaranties No
Health and personal accident – Mortality No – Disability Yes – Return guaranties No
Financial contract – Mortality No – Disability No – Return guaranties No

Nor
dea
Ann
ual R
epor
t 20
08
62
Board of Directors’ Report
Liquidity management
Management principles and controlThe Board of Directors of Nordea has the ultimate responsi-bilityforAssetandLiabilityManagementoftheGroupielim-iting and monitoring the Group’s structural risk exposures.
Risks in Nordea are measured and reported according to common principles and policies approved by the Board. The Board of Directors also decides on policies for liquidity risk management. These policies are reviewed at least annually.
The CEO in GEM decides on the targets for the Group’s risk management regarding Structural Interest Income Risk (SIIR), as well as, within the scope of resolutions adopted by the Board of Directors, the allocation of the liquidity risk limits.
TheAssetandLiabilityCommittee(ALCO),chairedbythe CFO, prepares issues of major importance concerning the Group’s financial operations and financial risks for decision by CEO in GEM.
Group Treasury operationalises the targets and limits and develops the liquidity risk and SIIR management frameworks, which consists of policies, instructions and guidelines for the whole Group.
Liquidity risk managementLiquidityriskistheriskofbeingabletomeetliquiditycommitments only at increased cost or, ultimately, being unable to meet obligations as they fall due.
Nordea’s liquidity management is based on policy state-ments resulting in different liquidity risk measures, limits and organisational procedures.
PolicystatementsstipulatethatNordea’sliquidityman-agement reflects a conservative attitude towards liquidity risk. Nordea strives to diversify the Group’s sources of funding and seeks to establish and maintain relationships with investors in order to manage the market access.
Broad and diversified funding structure is reflected by the strong presence in the Group’s four domestic markets in the form of a strong and stable retail customer base and the variety of funding programmes.
Funding programs are both short-term (US Commercial Papers,EuropeanCommercialPapers,CommercialPapers,CertificatesofDeposits)andlong-term(Swedishand Danish Covered bonds, European Medium Term Notes, Medium Term Notes) in diverse currencies. How-ever, foreign exchange risk is covered. As of the end of 2008,thetotalvolumeofshort-termprogramswasEUR44bnwiththeaveragematurityof0.2yearsandthetotalvolume of the long-term programs is EUR 65bn with the average maturity of 9.0 years. Special focus is given for the composition of the investor base in the terms of geographi-cal range and rating sensitivity.
Nordea publishes adequate information on the liquidity situation of the Group to remain trustworthy at all times.
Nordea’s liquidity risk management includes stress test-ing and a business continuity plan for liquidity management. Stress testing is defined as the evaluation of potential effects on a bank’s liquidity situation under a set of exceptional but plausible events. The stress test should identify events or influences that could affect the funding need or the funding
price and seek to quantify the potential effects. The purpose of stress tests is to supplement the normal liquidity risk mea-surement and confirm that the business continuity plan is adequate in stressful events, and that the business continuity plan properly describes procedures to handle a liquidity cri-sis with minimal damage to Nordea. Nordea stress scenarios are based on assessment of the particular events for which Nordea is presumed to be most vulnerable to taking into account the current business structure and environment. Stress tests focus on the other hand on increased funding need and on the other hand on increased funding price.
Group Treasury is responsible for managing the liquid-ity in Nordea and for compliance with the group wide lim-itsfromtheBoardsofDirectors,CEOinGEMandALCO.
Liquidity risk measurement methodsThe liquidity risk management focuses on both short-term liquidity risk and long-term structural liquidity risk. In order to measure the exposure on both horizons, a number of liquidity risk measures have been developed covering all material sources of liquidity risk.
In order to avoid short-term funding pressures, Nordea measures the funding gap risk, which expresses the expected maximum accumulated need for raising liquidity in the course of the next 14 days. Cash flows from both on-balance sheet and off-balance sheet items are included. Funding gap risk is measured and limited for each cur-rency and as a total figure for all currencies combined. The total figure for all currencies combined is limited by the Board of Directors.
To ensure funding in situations where Nordea is in urgent need of cash and the normal funding sources do not suffice,Nordeaholdsaliquiditybuffer.LimitissetbytheBoard of Directors for the minimum size of the liquidity buffer. The liquidity buffer is set to ensure a total positive cash flow defined by the funding risk measurement and consists of high-grade liquid securities that can be sold or used as collateral in funding operations.
The structural liquidity risk of Nordea is measured and limited by the Board of Directors through the net balance of stable funding, which is defined as the difference between stable liabilities and stable assets. These liabilities primar-ily comprise retail deposits, bank deposits and bonds with a remaining term to maturity longer than 6 months, and shareholders’ equity, while stable assets primarily com-prise retail loans, other loans with a remaining term to maturity longer than 6 months and committed facilities. ALCOhassetasatargetthatthenetbalanceofstablefund-ing should be positive, which means that stable assets must be funded by stable liabilities.
Liquidity risk analysisThe short-term liquidity risk has been held at moderate lev-elsthroughout2008.Theaveragefundinggaprisk,ietheaverage expected need for raising liquidity in the course of the next 14 days, has been EUR -8.7bn (EUR –4.8bn).
Nordea’sliquiditybufferhasbeenintherangeEUR20.1–40.2bn(EUR12.5–28.3bn)throughout2008withanaverage
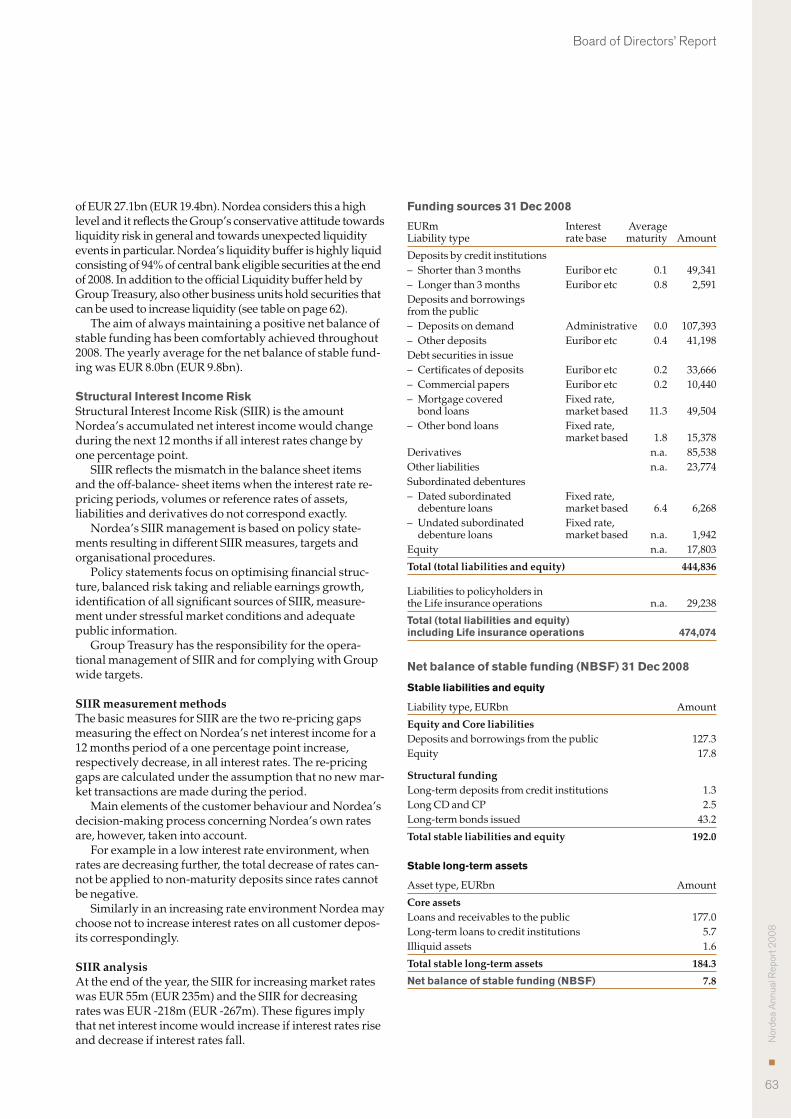
Nor
dea
Ann
ual R
epor
t 20
08
63
Board of Directors’ Report
ofEUR27.1bn(EUR19.4bn).Nordeaconsidersthisahighlevel and it reflects the Group’s conservative attitude towards liquidity risk in general and towards unexpected liquidity events in particular. Nordea’s liquidity buffer is highly liquid consisting of 94% of central bank eligible securities at the end of2008.InadditiontotheofficialLiquiditybufferheldbyGroup Treasury, also other business units hold securities that canbeusedtoincreaseliquidity(seetableonpage62).
The aim of always maintaining a positive net balance of stable funding has been comfortably achieved throughout 2008.Theyearlyaverageforthenetbalanceofstablefund-ing was EUR 8.0bn (EUR 9.8bn).
Structural Interest Income RiskStructural Interest Income Risk (SIIR) is the amount Nordea’s accumulated net interest income would change duringthenext12monthsifallinterestrateschangebyone percentage point.
SIIR reflects the mismatch in the balance sheet items and the off-balance- sheet items when the interest rate re-pricing periods, volumes or reference rates of assets, liabilities and derivatives do not correspond exactly.
Nordea’s SIIR management is based on policy state-ments resulting in different SIIR measures, targets and organisational procedures.
Policystatementsfocusonoptimisingfinancialstruc-ture, balanced risk taking and reliable earnings growth, identification of all significant sources of SIIR, measure-ment under stressful market conditions and adequate public information.
Group Treasury has the responsibility for the opera-tional management of SIIR and for complying with Group wide targets.
SIIR measurement methodsThe basic measures for SIIR are the two re-pricing gaps measuring the effect on Nordea’s net interest income for a 12monthsperiodofaonepercentagepointincrease,respectively decrease, in all interest rates. The re-pricing gaps are calculated under the assumption that no new mar-ket transactions are made during the period.
Main elements of the customer behaviour and Nordea’s decision-making process concerning Nordea’s own rates are, however, taken into account.
For example in a low interest rate environment, when rates are decreasing further, the total decrease of rates can-not be applied to non-maturity deposits since rates cannot be negative.
Similarly in an increasing rate environment Nordea may choose not to increase interest rates on all customer depos-its correspondingly.
SIIR analysisAt the end of the year, the SIIR for increasing market rates wasEUR55m(EUR235m)andtheSIIRfordecreasingrateswasEUR-218m(EUR-267m).Thesefiguresimplythat net interest income would increase if interest rates rise and decrease if interest rates fall.
Funding sources 31 Dec 2008
EURm Interest Average Liabilitytype ratebase maturity Amount
Deposits by credit institutions– Shorter than 3 months Euribor etc 0.1 49,341– Longerthan3months Euriboretc 0.8 2,591Deposits and borrowings from the public– Deposits on demand Administrative 0.0 107,393– Other deposits Euribor etc 0.4 41,198Debt securities in issue– Certificatesofdeposits Euriboretc 0.2 33,666– Commercialpapers Euriboretc 0.2 10,440– Mortgage covered Fixed rate,
bond loans market based 11.3 49,504– Other bond loans Fixed rate, market based 1.8 15,378Derivatives n.a. 85,538Otherliabilities n.a. 23,774Subordinated debentures – Dated subordinated Fixed rate, debentureloans marketbased 6.4 6,268
– Undated subordinated Fixed rate, debentureloans marketbased n.a. 1,942
Equity n.a. 17,803
Total (total liabilities and equity) 444,836
Liabilitiestopolicyholdersin theLifeinsuranceoperations n.a. 29,238
Total (total liabilities and equity) including Life insurance operations 474,074
Net balance of stable funding (NBSF) 31 Dec 2008
Stable liabilities and equity
Liabilitytype,EURbn Amount
Equity and Core liabilitiesDepositsandborrowingsfromthepublic 127.3Equity 17.8
Structural fundingLong-termdepositsfromcreditinstitutions 1.3LongCDandCP 2.5Long-termbondsissued 43.2
Total stable liabilities and equity 192.0
Stable longterm assets
Asset type, EURbn Amount
Core assetsLoansandreceivablestothepublic 177.0Long-termloanstocreditinstitutions 5.7Illiquid assets 1.6
Total stable long-term assets 184.3
Net balance of stable funding (NBSF) 7.8

Nor
dea
Ann
ual R
epor
t 20
08
64
Board of Directors’ Report
Liquidity risk, contractual maturity analysis for financial liabilities
Contractual cash flowsEURm 31Dec2008 Remainingcontractualmaturity Payableondemand Otherwithin1year 1–5year >5year Total
Liabilities 123,721 165,481 72,692 82,052 443,945
EURm 31Dec2007 Remainingcontractualmaturity Payableondemand Otherwithin1year 1–5year >5year Total
Liabilities 117,726 103,097 46,232 55,906 322,960
Interestbearing securities and treasury bills, by portfolio 31 December 2008 Other and Group Liquidity Trading Life& elimina- Group EURm buffer1) portfolio Pensions tions total
Assets at fair value and Held for trading2) 20,786 14,864 19,644 –8,289 47,005Held to maturity3) 10,684 1,544 12,228Available for sale 5 44 49
Total interest-bearing securities and treasury bills 31,475 14,864 21,188 –8,245 59,2821) The total liquidity buffer amounts to EUR 35.9bn, including also other financial instruments of EUR 4.4bn.2) Distribution by issuer type is presented in Note 48 on page 138.3) Held to maturity includes mainly Mortgage institutions and Other credit institutions.
Structural Interest Income Risk (SIIR), Gap analysis 31 Dec 2008
Repricing gap for increasing interest rates
EURm GroupBalance Within3 3–6 6–12 1–2 2–5 Non- Interest rate fixing period sheet months months months years years >5 years repricing Total
AssetsInterestbearingassets 351,451 246,780 19,326 10,296 9,045 9,169 31,797 25,037 351,451Noninterestbearingassets 122,624 0 0 0 0 0 0 122,624 122,624
Total assets 474,074 246,780 19,326 10,296 9,045 9,169 31,797 147,661 474,074
Liabilities and equityInterestbearingliabilities 317,721 233,138 19,760 10,344 11,919 14,773 25,830 1,957 317,721Non interest bearing 156,353 0 0 0 0 0 0 156,353 156,353
Total liabilities and equity 474,074 233,138 19,760 10,344 11,919 14,773 25,830 158,310 474,074
Off-balance-sheet items, net –6,060 –1,848 –870 4,538 4,539 –299
Exposure 7,582 –2,283 –918 1,664 –1,065 5,669 –10,649
Cumulative exposure 5,299 4,381 6,045 4,980 10,649 0

Nor
dea
Ann
ual R
epor
t 20
08
65
Board of Directors’ Report
Capital management
Capital managementNordea strives to attain efficient use of capital through active management of the balance sheet with respect to dif-ferent asset-, liability- and risk categories.
The goal is to enhance returns to the shareholder while maintaining a prudent risk and return relationship.
Capital governanceThe Board of Directors decides ultimately on the targets for capital ratios in Nordea.
Nordea’s ability to meet targets and to maintain mini-mum capital requirements is reviewed regularly within the ALCOandtheCapitalPlanningForum(CPF).
TheCPF,headedbytheCFOistheforumresponsiblefor coordinating capital planning activities within the Group, including regulatory, internal and available capital. Additionally,theCPFreviewsfuturecapitalrequirementsin the assessment of annual dividends, share repurchases, external and internal debt and capital injection decisions.
TheCPFconsidersinformationonkeyregulatory developments, market trends for subordinated debt and hybrid instruments and reviews the capital situation in the NordeaGroupandinkeylegalentities.IntheCPFtheCFOdecides, within the mandate given by the Group Board, on issuance of subordinated debt and hybrid capital instru-ments. Meetings are held at least quarterly and upon request by the CFO.
WiththeapprovalinDecember2008touseinternalrat-ings based approach for the major part of the retail custom-ers, Nordea had 83% of the exposure covered by IRB approachesbytheendof2008.Nordeawillcontinuetoimplement the internal ratings based approach for some remaining portfolios.
Nordea is also approved to use its own internal Value-at-Risk (VaR) models to calculate capital requirements for the major parts of the market risk in the trading books. For operational risk, the standardised approach is applied.
Capital structure policy and ICAAP Based on the EU Capital Requirements Directive (CRD)rules Nordea in the revised capital policy aims at a target total capital ratio of 11.5% and a target tier 1 ratio of 9%. Both numbers are targets over a business cycle. Nordea maintains its target capital via its dividend as well as active management of its risk profile.
The capital structure policy is related to the Internal Capi-talAdequacyAssessmentProcess(ICAAP),whichaccordingto the CRD should for each bank have the purpose to review the management, mitigation and measurement of material risks to assess the adequacy of internal capital and to deter-mine an internal capital requirement reflecting the risk appe-tite of the institution.
In2008,Nordea’stier1capitalandcapitalbaseexceeded the regulatory minimum requirements outlined in CRD. Considering results of capital adequacy stress test-ing, capital forecasting and growth expectations, Nordea assesses that the buffers held for regulatory capital pur-poses are sufficient.
Capital structure policy
20081) 2007 Policy
Dividendpay-outratio 19% 42% >40%Tier 1 ratio2) 9.3% 8.3% Target 9%3)
Total capital ratio2) 12.1% 10.9% Target11.5%3)
1) Proposal to the Annual General Meeting 2009.2) The ratios are calculated before transition rules.3) Target over a business cycle.
Capital adequacy ratios, EURbn 31 Dec 31 Dec 2008 2007
RWA Basel II (pillar 1) before transition rules 168.6 171.5 RWAwithtransitionrules 213.3 204.6Regulatory Capital requirement with transition rules 17.1 16.4EconomicCapital(ECincludingNLP) 12.8 10.9Tier1capital 15.8 14.2Capitalbase 20.3 18.7
Core tier 1 ratio before transition rules (%) 8.5 7.4 Core tier 1 ratio with transition rules (%) 6.7 6.3Tier 1 ratio before transition rules (%) 9.3 8.3 Tier 1 ratio with transition rules (%) 7.4 7.0Capitalratiobeforetransitionrules(%) 12.1 10.9Capital ratio with transition rules (%) 9.5 9.1Capitalbase/RegulatoryCapital requirement before transition rules (%) 151 136Leverageratio 26.6 22.7
Capital requirements and RWA
31Dec2008 31Dec2007
Capital Basel II Basel II EURm requirement RWA RWA
Credit risk 12,060 150,746 156,952IRBfoundation 9,537 119,207 83,865– of which corporate 6,909 86,358 73,736– ofwhichinstitutions 1,016 12,699 9,302– of which retail 1,465 18,313 –– ofwhichother 147 1,837 827Standardised 2,523 31,539 67,342– ofwhichsovereign 75 940 243– ofwhichother 2,448 30,599 67,099
Basel I reporting entities na na 5,745
Market risk 474 5,930 3,554– ofwhichtradingbook,VaR 137 1,715 527– ofwhichtradingbook,non-VaR 270 3,372 3,027– of which FX, non-VaR 67 843 0Operational risk 952 11,896 10,976Standardised 952 11,896 10,976
Sub total 13,486 168,572 171,482
Adjustment for transition rulesAdditional capital requirement according to transition rules 3,577 44,709 33,103
Total 17,062 213,281 204,585

Nor
dea
Ann
ual R
epor
t 20
08
66
Board of Directors’ Report
In addition to Nordea’s internal capital requirements, ongoing dialogues with third parties affect Nordea’s capi-tal requirements, in particular views of the external rating agencies.
Nordea uses its internal capital models, Economic Capital (EC), when considering internal capital require-ments with and without market stress. As a number of PillarIIrisksexistwithinNordea’scurrentECframework– interest rate risk in the banking book, market risk in the investment portfolios, risk in Nordea’s internal defined benefit plans, real estate risk, concentration risk and business risk – Nordea uses its existing internal capital measurements as the basis for any additional capital buffers, subject to the judgment of the aforementioned third parties.
Nordea’s policy is to ensure that the capital base exceeds the internal capital requirement as well as the regulatory capital requirement
DividendsNordea aims to ensure competitive and predictable divi-dends with a dividend payout ratio exceeding 40 per cent ofthenetprofitfortheyear.Thedividendfor2008ispro-posedtoamounttoEUR0.20persharecorrespondingtoapayout ratio of 19% of net profit, compared to 0.50 EUR per shareor42%ofnetprofitfor2007.
This proposed reduction of the dividend is intended as a temporary measure to, together with the rights offering, strengthen Nordea´s core capital position, and does not indicate a change in Nordea´s dividend policy.
The transition phase of Basel II creates a need to manage the bank using a variety of capital measurements and capi-talratios.Thetable“CapitalrequirementsandRWA”shows that the regulatory transition rules comprise a floor on Nordea’s capital requirement when compared to Basel II(Pillar1)minimumrequirements.
This difference will fluctuate through the transition period as the floor gradually decreases and Nordea receives approval for internal ratings based models for other portfolios. At present, this difference is EUR 44.7bn expressed as RWA and EUR 3.6bn expressed as regulatory capital requirement.
Attheendof2008Nordea’stier1ratiobeforetransitionruleswas9.3%andthetotalcapitalratiowas12.1%.Including transition rules, the tier 1 ratio was 7.4% and the total capital ratio was 9.5%. The core tier 1 ratio before tran-sition rules was 8.5% and including transition rules 6.7%.
In addition to regulatory requirements, Nordea has internal capital requirements based on the Economic Capi-tal framework, which includes risks in Nordea’s life insur-ance operations.
As such, the EC is compared to the capital base revers-ing the deduction for the life insurance operations.
Capital requirements – Pillar 1Thetable“CapitalrequirementsandRWA”showsanoverviewofthePillar1capitalrequirementsattheendof2008dividedontherisktypes.Thecreditriskcomprisesmorethan89%(92%)ofthepillar1requirementinNordea.Out of the total pillar 1 requirement for credit risk 79% (53%)relatetoIRBexposures,21%(43%)tostandardised
exposures and 0% (4%) to Basel I reporting entities. In the IRBapproach,72%(88%)relatetothecorporateexposureclass, which under the foundation approach has an RWA average of 57% (55%) compared with 100% under Basel I.Operational risk, calculated with the standardised approach, constitutes 7% (6%) of the total pillar 1 require-ment. Nordea benefits from the use of internal models to assessmarketrisk,whichconstitutes4%(2%)ofthetotalpillar 1 requirement.
Further information on capital requirements and the calculationofRWAareavailableinNordea’sPillar3Report2008,onwww.nordea.com.
Capital requirements for credit riskIn the standardised and IRB approach, the regulatory capital requirements for credit risk are calculated using the following formulas:
Minimum capital requirements = Risk weighted amounts x 8%Risk Weighted Amounts = Risk weight x Exposure at default
The principles for the calculation of minimum capital requirements for credit risk differ between exposure classes, which serve as the basis for the reporting of capital requirements.
The definitions of exposure classes in the standardised approach differ from the classification in accordance with the IRB approach. Some exposure classes are derived from the type of counterparty while others are based on the asset type, product type, collateral type and exposure size.
Thetable“Capitalrequirementsforcreditrisk”showsthe exposure, exposure at default (EAD), average risk weight percent, RWA and capital requirement calculated using the IRB or standardised approach.
The exposure value of an on-balance sheet exposure in the IRB approach is measured gross of adjustments, ie pro-visioning. The EAD for the on-balance sheet items, deriva-tive contracts and securities financing transactions and long settlement transactions is 100% of the original expo-sure. Off-balance sheet exposures are converted into EAD using credit conversion factors (CCF).
Capital requirements for market risks (risks in trading book)Thetable“Capitalrequirementsformarketrisk”showsrequired capital for market risk in the Nordea Group.
Of the EUR 5.9bn (3.6bn) in market risk RWA, approx. EUR 5.1bn (3.6bn) covers the trading book in Markets. Trading book VaR figures comprise general and specific interest rate risk, equity risk and foreign exchange risk for positions in those portfolios approved by the financial supervisors, for which Nordea is allowed to use its own internal Value-at-Risk (VaR) models.
PortfoliosnotreportedwithVaRmodelsarereportedaccording to the standardised approach (non-VaR figures in the table above) instead.
Capital requirements for operational riskThe capital requirement for operational risk is EUR 1.0bn (0.9bn) and is calculated using the standardised approach, in which all of the bank’s activities are divided into eight business lines: corporate finance, trading & sales, retail

Nor
dea
Ann
ual R
epor
t 20
08
67
Board of Directors’ Report
Capital requirements for credit risk 31 Dec 2008 Average Capital Exposure class, EURm Exposure EAD risk weight, % RWA requirement
IRB approachInstitutions 52,401 49,143 26 12,699 1,016Corporate 214,072 152,015 57 86,358 6,909Retail 120,390 116,045 16 18,313 1,465– ofwhichmortgage 86,788 86,236 10 8,925 714– ofwhichotherretail 28,981 25,649 31 8,065 645– ofwhichSME 4,621 4,160 32 1,323 106Othernon-creditobligationassets 2,226 1,838 100 1,837 147
Total IRB approach 389,088 319,042 37 119,208 9,537 Standardised approachCentralgovernmentsorcentralbanks 19,752 20,959 4 840 67Regionalgovernmentsandlocalauthorities 9,126 7,425 1 100 8Institution 4,310 4,624 20 903 72Corporate 30,402 20,960 99 20,719 1,658Retail 13,864 9,739 77 7,469 598Exposures secured by real estates 564 558 73 406 33Other1) 2,327 2,210 50 1,099 88
Total Standardised approach 80,346 66,476 47 31,538 2,523
Total 469,434 385,517 39 150,746 12,0601) Administrative bodies and non-commercial undertakings, multilateral developments banks, past due items, short term claims, covered bonds, and other items. Associated companies not
included in exposure.
Capital requirements for market risk 31 Dec 2008
Trading book, VaR Trading book, non-VaR Banking book, non-VaR Total
Capital Capital Capital Capital EURm RWA requirement RWA requirement RWA requirement RWA requirement
Interestraterisk 2,068 164 2,654 213 0 0 4,722 377Equity risk 171 14 668 53 0 0 839 67Foreignexchangerisk 520 42 0 0 843 67 1,363 109Commodity risk 0 0 50 4 0 0 50 4Diversification effect –1,044 –83 0 0 0 0 –1,044 –83
Total 1,715 137 3,372 270 843 67 5,930 474
banking, commercial banking, payment & settlement, agency services, asset management and retail brokerage.
The total capital requirement for operational risk is calcu-lated as the simple sum of the capital requirements for each of the business lines within each group and legal entity.The risk for each business line is the beta coefficient times gross income.
The beta coefficients differ between business lines and areintherangefrom12%to18%.
Capital requirements – Pillar 2Nordea base the internal capital requirements under the ICAAPonNordea’sEconomicCapitalframework.
EconomicCapital(EC)at31December2008iscalcu-latedtoEUR12.8bn(EUR10.9bn).ThepiechartshowECdivided by customer area and risk type and demonstrate that a majority of Nordea’s risk is held in the form of credit risk capital within Nordic corporate and personal custom-ers in the Nordic Banking.
Nordea has calculated internal capital requirements usingtheECframeworksince2001.Pillar1oftheCRDcloses the gap between regulatory capital and EC by
improving the risk sensitivity of regulatory capital mea-surement.
Nordea calculates EC for the following major risk types: credit risk, market risk, operational risk, business risk and life insurance risk. Additionally, the EC models explicitly account for interest rate risk in the banking book, market risk in the investment portfolios, risk in Nordea’s internal defined benefit plans, real estate risk and concentration risk.
Quantitative models are used to estimate the unex-pected losses for each of the risk types compiled into EC: Credit risk is calculated using a set of capital factors. The capital factors are developed for different products, cus-tomer segments and credit quality categories. The factors used for the corporate and institution segments have been estimated using a portfolio model, where probability of default, loss given default and exposure at default are inputs, and are reviewed and updated annually. This model is also used to consider Nordea’s portfolio concen-tration and counterparty risk in Nordea’s trading book. The parameter estimation framework used for EC is the foundation for the Basel II framework for IRB models for Nordea’s credit exposures.

Nor
dea
Ann
ual R
epor
t 20
08
68
Board of Directors’ Report
Market risk for the banking business is based on scenario simulation and Value-at-Risk (VaR) models scaled to the time horizon and confidence interval in place for EC. Additionally, Nordea uses VaR and simulation modelling to determine EC for interest rate risk in the banking book, market risk in investment portfolios, risk in Nordea’s inter-naldefinedbenefittplansandrealestaterisk.FortheLifeinsurance business an asset and liability management (ALM)modelisused,whichisbasedonscenariosgener-ated by Monte Carlo simulation to capture embedded options in guarantee products.
Operational risk reflects the risk of direct or indirect loss resulting from inadequate or failed internal processes.
It is calculated according to the standardised approach within Basel II.
Business risk represents the earnings volatility inherent in all businesses due to the uncertainty of revenues and costs due to changes in the economic and competitive envi-ronment.
The main risk drivers are reputation risk, strategic risk, liquidity risk and indirect effects such as structural interest income risk. Business risk is calculated based on the resid-ual volatility in historical profit and loss time series after adjustments for market, operational and credit risk.
Lifeinsuranceriskrepresentsriskintheactuarialassumptions for mortality and morbidity used to price life insurance products. It is calculated as percentages of the EU minimum solvency requirement (death and disability risk) and technical provisions (longevity risk).
In order to achieve consistent risk measurement throughout Nordea, the measurement period is set to one year and the confidence level is 99.97% for all risk types. Nordea’s total EC equals the amount needed to cover unex-pected losses during one year in 99.97% of all possible cases.
The varied operations of Nordea give rise to consider-able diversification benefits. However, when Nordea’s EC risks are considered on a standalone basis, all unexpected losses are assumed to occur simultaneously.
Thus, Nordea uses a conservative correlation matrix approach to estimate the diversification benefits arising from its operations. For instance, credit risk and market risk are both highly correlated with the development of the gen-eral economy and thus highly correlated with each other, while life insurance risks and operational risks are not corre-lated at all. In the end, the diversification effects produce an EC that is lower than the sum of the EC for each risk type.
In addition to calculating EC, Nordea conducts a com-prehensive capital adequacy stress test process to analyse the effects of a series of global and local shock scenarios. The results of stress testing are considered, along with potential management interventions, in Nordea’s internal capital requirement.
Economic Profit (EP)NordeausesEPasoneofitsfinancialperformanceindica-tors.EPiscalculatedasrisk-adjustedprofitlesscostofequity.
Risk-adjustedprofitandEParemeasuresforshare-holder value creation.
Ininvestmentdecisionsandcustomerrelationships,EPdrives and supports the right behaviour with a balanced focusonincome,costsandrisk.TheEPmodelalsocap-
tures both growth and return. EC and expected losses are used in the economic profit framework.
Expected lossesExpected losses reflect the normalised loss level of the indi-vidual credit exposure over a business cycle as well as vari-ous portfolios.
TheaverageExpectedLoss(EL)ratiousedintheeco-nomiccapitalframework,calculatedasELdividedbyexposure at default (EAD), was 17 basis points as of end of 2008(16basispointsasofendof2007)excludingthesover-eign and institution exposure classes. Nordea has the ambi-tion to use the same parameters in internal calculations of economiccapitalandELasinregulatorycapitalcalcula-tions.Therefore,theaverageELratiohasbeenrecalibratedasaconsequenceoftheIRBRetailapprovaltobe22basispointsasoftheendof2008,basedontheassumptionsabove. Going forward, this model change will affect the calculationofrisk-adjustedprofitfor2009and2008.
ItshouldbenotedthattheExpectedLossratioisamorestable measure than actual losses, but it will vary with the business cycle as a consequence of shifts in the repayment capacity(PDdimension)andcollateralcoverage(LGDdimension) distributions.
Capital baseCapital base (referred to as own funds in the CRD) is the sumoftier1capitalandtier2capitalafterdeductions.
Tier 1 capital is defined as capital of the same or close to the character of paid-up, capital-eligible reserves and a limited portion hybrid capital loan (perpetual loans) instruments(maximum30%oftier1).Profitmayonlybeincluded after deduction of proposed dividend. Goodwill and deferred tax assets are deducted from tier 1.
Tier2isdividedintoperpetualloansanddatedloans.Thetotaltier2amountmaynotexceedtier1.Datedtier2loans may not exceed half the amount of tier 1. The limits are set after deductions, i e, investment in insurance and other financial companies.
According to CRD, half of the deduction for the invest-ment in insurance should be deducted from tier 1 capital andtheremaininghalffromthesumoftier1andtier2.However,atransitionalrulevaliduntilendof2012allowstheinvestedcapitalinNordeaLifeandPensiontobedeductedfromthesumoftier1andtier2capital.
Definition of Expected Loss (EL):TheEListhenormalisedlossratecalculatedbasedonthecurrentportfolio.ELismeasuredusingtheformula:EL=PDxLGDxEAD,where• PDisameasureoftheprobabilitythatthecoun-
terpart will default.• LGDisameasureofhowmuchisexpectedtobe
lost in the event of default.• EADisameasureoftheexpectedexposureinthe
event of default.

Nor
dea
Ann
ual R
epor
t 20
08
69
Board of Directors’ Report
Thedifferencesbetweenexpectedloss(EL)andprovisionmade for the related exposures are adjusted for in the capi-talbase.Thenegativedifference(ELislargerthanprovi-sion)isknowasthe“shortfall”.
According to the CRD, the shortfall is deducted from the capital base. For the purpose of Basel II transitional rules, the shortfall is also deducted from the RWA to be neutral from a Basel I perspective.
Internal processes for capital transfer within Nordea are well-established and include the options of dividend and group contribution, subordinated and perpetual debt instruments and capital injections and issuance of shares.
In situations when the capital base needs to be increased in a subsidiary, the primary options are internal subordi-nated debt instruments or a capital injection from the par-ent company to increase the core capital.
Nordea is also defined as a financial conglomerate meaning that eg the requirements from bank (capital ade-quacy rules) and insurance (solvency rules) are added to ensure that the financial conglomerate has sufficient capi-tal. Nordea has not experienced material limitations con-cerning the financial conglomerate regulation.
The capital requirements valid for financial conglomer-atesarestatedintheSwedishlaw(Act(2006:531)onFinan-cial Conglomerates (FC), which was implemented by the 1July2006.DetailedinstructionsandrequirementsarestatedinFFFS2006:6.
Institutions and insurance companies that have been defined as a financial conglomerate are required to hold a capital base that at all times are equal or above the consoli-dated capital requirements for the financial conglomerate. The capital base of the conglomerate has in Nordea been calculated with a combination of the consolidation method and the aggregation method. This means that the capital base for the conglomerate includes the capital base for the groupofinstitutionsandNordeaLifeHoldingAB.Thecor-responding capital requirements is calculated though an aggregation of the capital requirement in the group of insti-tutions and the solvency requirement for the insurance activitieswithincompaniesunderNordeaLifeHoldingAB.
Pillar 3 disclosure, Capital adequacy and risk managementThedisclosureinaccordancewiththePillar3requirementsaccording to the CRD in the Basel II framework is pre-sented on www.nordea.com.
Summary of items included in capital base
31 Dec 31 Dec EURm 2008 2007
Calculation of total capital baseEquity 17,803 17,160Proposed/actualdividend –519 –1,300Hybrid capital loans 1,447 1,409Deferred tax assets –58 –185Intangibleassets –2,193 –2,374IRBprovisionsexcess(+)/shortfall(–) –269 –30Deduction for investments in credit institutions (50%) –87 –80Other items, net –364 –370
Tier 1 capital (net after deduction) 15,760 14,230– of which hybrid capital 1,447 1,409Tier 2 capital 6,097 6,075– of which perpetual subordinated loans 690 664IRBprovisionsexcess(+)/shortfall(–) –269 –30Deduction for investments in credit institutions (50%) –87 –80Other deduction –1,175 –1,535
Total capital base 20,326 18,660
Capital situation of the financial conglomerate
mEUR 2008 2007
Capital base (net of deductions andadjustments) 21,540 20,252Capital requirements 18,148 18,343
Excess capital 3,392 1,909
Nordic Banking, 73%
Institutional & International Banking, 12%
Capital Markets & Savings, 10%
Group Treasury, 4%
Banking Products & Group Operations, 1%
Credit risk, 70%
Market risk, 12%
Operational risk, 8%
Business risk, 9%
Life risk, 1%
Economic Capital distributed by area, 31 Dec 2008
Economic Capital distributed by risk type, 31 Dec 2008
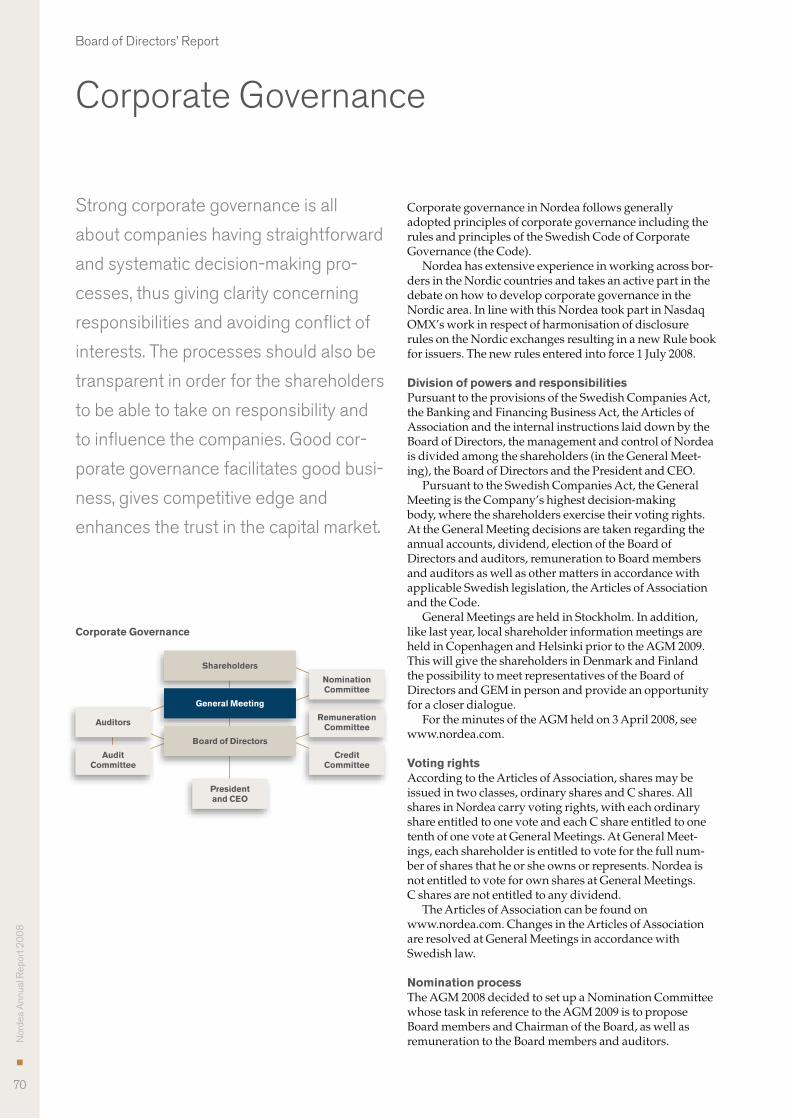
Nor
dea
Ann
ual R
epor
t 20
08
70
Board of Directors’ Report
Corporate Governance
Strong corporate governance is all
about companies having straightforward
and systematic decision-making pro-
cesses, thus giving clarity concerning
responsibilities and avoiding conflict of
interests. The processes should also be
transparent in order for the shareholders
to be able to take on responsibility and
to influence the companies. Good cor-
porate governance facilitates good busi-
ness, gives competitive edge and
enhances the trust in the capital market.
Corporate governance in Nordea follows generally adopted principles of corporate governance including the rules and principles of the Swedish Code of Corporate Governance (the Code).
Nordea has extensive experience in working across bor-ders in the Nordic countries and takes an active part in the debate on how to develop corporate governance in the Nordic area. In line with this Nordea took part in Nasdaq OMX’s work in respect of harmonisation of disclosure rules on the Nordic exchanges resulting in a new Rule book forissuers.Thenewrulesenteredintoforce1July2008.
Division of powers and responsibilitiesPursuanttotheprovisionsoftheSwedishCompaniesAct,the Banking and Financing Business Act, the Articles of Association and the internal instructions laid down by the Board of Directors, the management and control of Nordea is divided among the shareholders (in the General Meet-ing),theBoardofDirectorsandthePresidentandCEO.
PursuanttotheSwedishCompaniesAct,theGeneralMeeting is the Company’s highest decision-making body, where the shareholders exercise their voting rights. At the General Meeting decisions are taken regarding the annual accounts, dividend, election of the Board of Directors and auditors, remuneration to Board members and auditors as well as other matters in accordance with applicable Swedish legislation, the Articles of Association and the Code.
General Meetings are held in Stockholm. In addition, like last year, local shareholder information meetings are heldinCopenhagenandHelsinkipriortotheAGM2009.This will give the shareholders in Denmark and Finland the possibility to meet representatives of the Board of Directors and GEM in person and provide an opportunity for a closer dialogue.
FortheminutesoftheAGMheldon3April2008,seewww.nordea.com.
Voting rightsAccording to the Articles of Association, shares may be issued in two classes, ordinary shares and C shares. All shares in Nordea carry voting rights, with each ordinary share entitled to one vote and each C share entitled to one tenth of one vote at General Meetings. At General Meet-ings, each shareholder is entitled to vote for the full num-ber of shares that he or she owns or represents. Nordea is not entitled to vote for own shares at General Meetings. C shares are not entitled to any dividend.
The Articles of Association can be found on www.nordea.com. Changes in the Articles of Association are resolved at General Meetings in accordance with Swedish law.
Nomination processTheAGM2008decidedtosetupaNominationCommitteewhosetaskinreferencetotheAGM2009istoproposeBoard members and Chairman of the Board, as well as remuneration to the Board members and auditors.
Shareholders
General Meeting
Board of Directors
President and CEO
Corporate Governance
Auditors Remuneration Committee
Nomination Committee
Audit Committee
Credit Committee

Nor
dea
Ann
ual R
epor
t 20
08
71
Board of Directors’ Report
The Nomination Committee, established in accordance with the AGM resolution, consists of Hans Dalborg (Chair-man of the Board) and of the four largest shareholders in termsofvotingrightsasof31August2008,whowishedtoparticipate in the Committee, Viktoria Aastrup (the Swed-ishGovernment),KariStadigh(SampoPlc),MogensHugo(Nordea-fonden)andChristerElmehagen(AMFPension).Viktoria Aastrup is chairman of the Nomination Commit-tee. The appointment of members of the Nomination Com-mitteewasmadepublicon22September2008.
On12December,itwasannouncedthatAMFPensionhas appointed the newly installed managing director, Ingrid Bonde, as new member of the Nomination Commit-tee, replacing Christer Elmhagen.
The proposals of the Nomination Committee will be presented to the shareholders in the notice of the AGM 2009.AreportontheworkoftheCommittee,includingexplanation for proposals, will be available on www.nordea.com.
Nordea Board of DirectorsComposition of the Board of DirectorsAccording to the Articles of Association the Board of Direc-tors shall consist of at least six and no more than fifteen members elected by shareholders at the General Meeting. The mandate period for the Board members is one year. Nordea has no specific retirement age for Board member-ship nor is there a time limit for how long a Board member may serve on the Board.
Further, according to the Articles of Association the aim shall be that the Board, as a whole, for its operations pos-sesses the requisite knowledge and experience of the social, business and cultural conditions prevailing in the regions and market areas in which the Group’s principal opera-tions are conducted.
The Board currently consists of eleven members elected by the General Meeting. In addition three members and one deputy member are appointed by the employees. Employees have a right according to Swedish legislation to be represented in the board. The CEO of Nordea is not a member of the Board. The composition of the Board of Directors appears from the table on page 73 and further information about the Board members elected at the AGM 2008isfoundintheseparatesection“BoardofDirectors”,page 148.
Independence of the Board of DirectorsNordea complies with applicable rules regarding the inde-pendence of the Board. The Nomination Committee consid-ers all Board members elected by the shareholders, apart from Björn Wahlroos, independent of the Company’s major shareholders. Björn Wahlroos is managing director and CEO of Sampo Abp which, together with the subsidiary FörsäkringsaktiebolagetSampoLiv,ownmorethantenpercent of all shares and votes in Nordea Bank AB (publ).
All of the members elected by the shareholders are inde-pendent of the Company and its executive management, withtheexceptionofLarsGNordströmandStineBosse.
LarsGNordströmwasemployedasPresidentandCEOoftheGroupuntil13April2007.StineBosseismanagingdirectorandCEOofTrygVestaA/S.CompanieswithintheNordea Group have concluded agreements concerning sales of property general insurance products and sales of lifeandpensionproductswithTrygVestaForsikringA/S,asubsidiaryofTrygVestaA/S.Thusthemajorityoftheboard members are independent in relation to the com-pany and its management.
No Board member elected by the AGM is employed by or working in an operative capacity in the Company.
The Board members and the deputy Board member appointed by the employees are employed by the Group and therefore not independent of the Company.
The work of the Board of DirectorsThe work of the Board of Directors follows an annual plan, which also establishes the management reporting to the Board.ThestatutorymeetingfollowingtheAGM2008appointed the vice Chairman and the Board Committee members. The Board has adopted rules of procedures for the Nordea Board of Directors (the Charter), containing inter alia rules pertaining to the areas of responsibility of the Board and the Chairman, the number of meetings, doc-umentation of meetings and rules regarding conflicts of interest. Furthermore, the Board of Directors has adopted Instructions for the CEO specifying the CEO’s responsibili-ties as well as other policies, instructions and guidelines for the operations of the Group.
The Board is charged with the organisation of Nordea and the management of the Company’s operations and the overall management of the Nordea Group’s affairs in accordance with applicable rules and regulations, the Code, the Articles of Association and the Charter. The Board shall ensure that the Company’s organisation in respect of accounting, management of funds, and the Com-pany’s financial position in general includes satisfactory controls. The Board is ultimately responsible for ensuring that an adequate and effective system of internal control is established and maintained. Group Internal Audit (GIA) issues yearly to the Board an overall Assurance Statement on Nordea’s risk management control and governance pro-cess.Theassurancestatementfor2008concludesthattheinternal control system is adequate and effective. Further information about internal control within Nordea is given belowunderheading“Internalcontrol”.Atleastonceayear the Board meets the external auditors without the CEO or any other Company executive being present.
During2008theBoardheld15meetings,13inStock-holm, one in Copenhagen and one in Riga. In addition three meetings were held per capsulam. During the year the Board follows up on the strategy, the financial position and development and risks on a regular basis. The finan-cial targets and the strategy are reviewed annually. In addi-tion, the Board dealt with for example reports on and issues related to financial markets turmoil and financial stability programmes, Internal Capital Adequacy Assess-mentProcess(ICAAP),revisedoverallGrouporganisation

Nor
dea
Ann
ual R
epor
t 20
08
72
Board of Directors’ Report
and top management transition process, remuneration issues, assessment of CEO and transactions of significance.
SecretaryoftheBoardofDirectorsisLenaEriksson,HeadofGroupLegal,sinceMay2008whenshesucceededKariSuominenassecretary.
The ChairmanThe Chairman of the Board is elected by the shareholders at the AGM. According to the Charter, the Chairman shall see to that the Board work is conducted efficiently and that the Board fulfils its duties. The Chairman shall inter alia organise and lead the Board’s work, keep in regular contact with the CEO, see to that the Board receives sufficient information and supporting data, and ensure that the work of the Board is evaluated annually in the self-evaluation process.
Evaluation of the BoardThe Board of Directors annually carries out a self-evalua-tion process, through which the performance and the work of the Board is thoroughly evaluated and discussed by the Board. The evaluation is based on a methodology which includes questionnaires evaluating the Board as a whole and individual Board members as well as personal discus-sions between each Board member and the Chairman. The evaluation process is supported by an external advisory service firm.
Board CommitteesAn established principle in Nordea is that the members of the Board of Directors elected by the shareholders, in addi-tion to working in plenary meetings, conduct their respon-sibilities in separate working committees. The duties of the Board Committees, as well as working procedures, are defined in specific instructions adopted by the Board. Each Committee regularly reports on its work to the Board. The minutes are communicated to the Board.
The Audit CommitteeThe Audit Committee assists the Board in fulfilling its oversight responsibilities by reviewing the Nordea Group’s quarterly financial reporting, the external audi-tor’s observations and conclusions on the Group’s semi-annual and annual financial statements and external audit plan, as well as the systems of internal control established by the Board, the CEO and GEM, and the audit arrange-ment between Group Internal Audit (GIA) and the external auditors. The Committee is further responsible for the guidance and evaluation of GIA.
Members of the Audit Committee during 2008SveinJacobsen(Chairman,fromAGM2008)HaraldArnkværn(Chairman,untilAGM2008)MarieEhrling(fromAGM2008)BirgittaKantola(untilAGM2008)ClausHøegMadsen(untilAGM2008)TimoPeltola(fromAGM2008)Ursula Ranin
The members of the Audit Committee are independent of the Company and the executive management of the Com-pany, as well as of the Company’s major shareholders.
The CEO and the Group Chief Audit Executive (CAE) are present at meetings with the right to participate in dis-cussions, but not in decisions.
The Credit CommitteeThe Credit Committee continuously reviews and monitors adherencetotheestablishedCreditPolicyandStrategyaswell as Credit Instructions for the Nordea Group and eval-uates the overall quality of the credit portfolio.
Members of the Credit Committee during 2008Hans Dalborg (Chairman)HaraldArnkværn(untilAGM2008)StineBosse(fromAGM2008)MarieEhrling(untilAGM2008)LarsGNordström(fromAGM2008)HeidiM.Petersen(fromAGM2008)TomKnutzen(untilAGM2008)TimoPeltola(untilAGM2008)BjörnWahlroos(fromAGM2008),andChristian Clausen, CEO
The Head of Group Credit and Risk Control is present at meetings with the right to participate in discussions, but not in decisions.
The Remuneration CommitteeThe Remuneration Committee is responsible for preparing and presenting proposals to the Board of Directors on remuneration issues. This includes proposals regarding the Company’s guidelines for remuneration to the executive officers, the terms of employment for the CEO and the CAE and alterations of the terms of employment for GEM as a whole. At the request of the Board the Committee also pre-pares other issues of principle for the consideration of the Board. The CEO also consults with the Committee before determining the terms of employment of the individual members of GEM.
Members of the Remuneration Committee during 2008Hans Dalborg (Chairman)KjellAamot(untilAGM2008)TomKnutzen(fromAGM2008)TimoPeltolaBjörn Savén
The members of the Remuneration Committee are inde-pendent of the Company and the executive management of the Company, as well as of the Company’s major share-holders.
The CEO participates in the meetings without the right to vote. The CEO does not participate in considerations regarding his own employment terms and conditions.

Nor
dea
Ann
ual R
epor
t 20
08
73
Board of Directors’ Report
Meetings and attendanceThe table shows the number of meetings held by the Board of Directors and its committees as well as the attendance of the individual Board members: Audit Credit Remunera- Board of Com- Com- tion Com- Directors mittee mittee mittee
Number of meetings 18 7 5 6(of which per capsulam) (3) (–) (–) (–)Meetings attended:Elected by AGMHans Dalborg 18 5 6Timo Peltola 18 51) 22) 6Kjell Aamot3) 5 3Harald Arnkværn3) 4 2 2 Stine Bosse4) 12 3Marie Ehrling 18 51) 22) Svein Jacobsen4) 11 5 Birgitta Kantola3) 5 1Tom Knutzen 16 22) 31)
Claus Høeg Madsen3) 5 2 Lars G Nordström 18 31) Heidi M. Petersen4) 13 3 Ursula Ranin 17 6 Björn Savén 18 6Björn Wahlroos4) 13 2Christian Clausen, CEO5) 15 4 Appointed by employeesKari Ahola (deputy 1 Nov 08–30 Apr 09) 8) 16Bertel Finskas6) (deputy 1 Nov 07–30 Apr 08) 18Nils Q. Kruse 16(deputy 1 May 08–31 Oct 08) 8)
Steinar Nickelsen 17Lars Oddestad7) 1) Committee member from AGM 2008. 2) Committee member until AGM 2008.3) Board member and Committee member until AGM 2008.4) Board member and Committee member from AGM 2008.5) The CEO is not a Board member, but a member of the Credit Committee.6) Board member until 31 December 2008.7) Board member from 1 January 2009, replacing Bertel Finskas, who retired.8) Change of position as per 1 November 2008 effective following the submission
of the Annual Report.
The CEO and Group Executive ManagementNordea’s President and CEO, Christian Clausen, is charged with the day-to-day management of Nordea Bank and the Nordea Group’s affairs in accordance with laws and regu-lations, the Code, as well as instructions provided by the Board of Directors. The instructions regulate the division of responsibilities and the interaction between the CEO and the Board. The CEO works closely with the Chairman of the Board, for instance with planning of Board meetings.
The CEO is responsible to the Board for the manage-ment of the Nordea Group’s operations and he is also responsible for developing and maintaining effective sys-tems for internal control within the Group. The CEO works together with senior officers within the Group in GEM.
Presently GEM consists of seven members and the CEO. GEM has recorded weekly meetings. These meetings are chaired by the CEO, who reaches decisions after consulting with the other members of GEM. Further information about the CEO and GEM is found in the separate section “Group Executive Management”, page 150.
Remuneration to CEO and Group Executive Management including incentive systemsApproved guidelines for remuneration to the executive officers for 2008The AGM 2008 approved the following guidelines for remuneration to the executive officers.
Nordea maintains remuneration levels and other condi-tions needed to recruit and retain executive officers with competence and capacity to deliver according to Group targets. Salaries and other remuneration in line with mar-ket levels is thus the overriding principle for compensation to executive officers within Nordea. The term executive officers includes the CEO of Nordea Bank AB (publ) and the executives reporting directly to him also being mem-bers of Group Executive Management.
Fixed salaries are paid for fully satisfactory perfor-mance. In addition, variable salary can be offered to reward performance meeting agreed specific targets. The variable salary shall as a general rule not exceed 35 per cent of fixed salary, and is determined by to what extent predetermined personal objectives are met and the level of customer satis-faction, return on equity, income growth or other financial targets are reached, respectively.
The AGM 2007 decided to introduce a share- and perfor-mance-based Long Term Incentive Programme which requires an initial investment in Nordea shares by the par-ticipants. According to the programme the remuneration is proposed to be given in the form of a right to acquire Nordea shares, and requires, for full outcome, that certain predeter-mined financial targets are reached. The programme has a cap. The underlying basic principles for compensation under the Long Term Incentive Programme are that the compensa-tion shall be dependent on the creation of long term share-holder value and the fulfilment of Nordea’s financial targets, which are based on the principles of risk adjusted profit and total shareholder return. On a yearly basis the Board of Directors will evaluate whether a similar incentive pro-gramme should be proposed to the Annual General Meet-ing. The members of Group Executive Management will be invited to join the Long Term Incentive Programmes. If the Annual General Meeting does not approve a Long Term Incentive Programme, the variable cash remuneration to Group Executive Management may be increased and shall as a general rule not exceed 50 per cent of fixed salary.
Non-monetary benefits are given as a means to facilitate Group Executive Management members’ performance. The levels of these benefits are determined by what is con-sidered fair in relation to general market practise. The members of Group Executive Management shall be offered retirement benefits in accordance with market practice in the country of which they are permanent residents. Notice

Nor
dea
Ann
ual R
epor
t 20
08
74
Board of Directors’ Report
andseverancepayintotalshallnotexceed24monthsoffixed salary for members of Group Executive Management, apart from the CEO who during the first two years of his employment has an additional 6 months severance pay.
The Board of Directors may deviate from the guidelines stated above, if there in a certain case are special reasons for this.
Further information about remuneration is to be found in Note 8 on page 101.
Proposal for guidelines for remuneration to the executive officers for 2009TheBoardofDirectorswillproposethattheAGM2009,inaccordance with the Swedish Companies Act, approves the equivalent guidelines for remuneration to the executive officersfor2009aswasapprovedlastyearandisdescribedabove, with the following three amendments. Firstly, to bet-ter reflect Nordea's strategic challenges and long term financial targets the common criteria for determining the variable salary will be changed. Henceforward, the variable salary shall as a general rule not exceed 35% of fixed salary and be determined by to what extent predetermined finan-cial, customer-related and personal objectives are met. Sec-ondly, it is stated that any potential undertaking or commit-ment made by Nordea against a state or public authority in any guarantee agreement or any similar agreement which affect the remuneration of members of Group Executive Managementwillbeobserved.Thirdly,attheAGM2009,the CEO has been employed two years and will no longer have a right to an additional 6 months severance pay.
Additional information to the Board of Directors’ proposal for guidelinesPrevious undertakings not yet due:InaccordancewiththeguidelinesapprovedbyAGM2008the remuneration for the CEO and other members of GEM consists of fixed and variable salary. The CEO and the four members of Group Executive Management being Country Senior Executives have on a voluntary basis decided to abstainfromincreaseinthefixedsalaryyear2009andfromvariablesalaryfortheperiodJanuary–April2009.
Deviations from approved guidelines 2008:Nodeviationshavebeenmadeduring2008.
Estimated cost for variable remunerations in 2009:It is estimated that the total cost for variable salaries, excludingLongTermIncentiveProgrammes,forGEMcanreach a maximum of approx. EUR 1.4m.
Themaximumcost2009fortheLongTermIncentiveProgramme2007,whichwillbeexpensedduring24monthsin2007–2009,allocatedtoGEMmembers,assum-ing maximum investments by all GEM members and that allcriteriaarefullymet,willfor2009amounttoapprox.EUR 0.3m. However, the expected cost based on 50% fulfil-ment of the performance criteria for this programme amountstoapprox.EUR0.2m.Thecalculatedcostofthewhole programme for GEM is approx. EUR 1.4m.
Themaximumcost2009fortheapprovedLongTermIncentiveProgramme2008,whichwillbeexpensedduring24monthsin2008–2010,allocatedtoGEMmembers,assuming maximum investments by all GEM members andthatallcriteriaarefullymet,willfor2009amounttoapprox. EUR 0.8m. However, the expected cost based on 50% fulfilment of the performance criteria for this pro-gramme amounts to approx. EUR 0.3m. The calculated cost of the whole programme for GEM is approx. EUR 0.6m.
Themaximumcost2009fortheproposedLongTermIncentiveProgramme2009,whichwillbeexpensedduring24monthsin2009–2011,allocatedtoGEMmembers,assuming maximum investments by all GEM members andthatallcriteriaarefullymet,willfor2009amounttoapprox. EUR 0.6m. However, the expected cost based on 50% fulfilment of the performance criteria for this pro-gramme amounts to approx. EUR 0.3m. The calculated cost of the whole programme for GEM is approx. EUR 1.0m.
Incentive systemsLong term incentive programmesNordea’sLongTermIncentiveProgramme(LTIP2007)wasintroducedinMay2007,targetingupto400managersandkey employees identified as essential to the future develop-mentoftheGroup.TheLTIP2007replacedanExecutiveIncentiveProgrammewhichhadbeeninplaceasfrom2003.
A requirement for the exercise of the A-D Rights granted intheLTIP2007wasthattheparticipant,withcertainexemptions, remained employed within the Nordea Group during the initial two year vesting period and that all Nor-deashareslockedintotheLTIP2007werekeptduringthisperiod. The exercise of A Rights to acquire Matching Shares was, in addition to the conditions mentioned, not subject to any performance conditions.
TheexerciseofB-DRightstoacquirePerformanceShares was, in addition to these conditions, subject to the fulfilment of certain performance conditions. For the B Rights the performance criteria related to growth in risk adjustedprofitpershare(“RAPPS”)for2007comparedto2006.Theminimumhurdlewas2%andthestretchedtar-get15%.ThegrowthinRAPPSwas14.71%andthepartici-pants will consequently, on the conditions stipulated, have a right to exercise 97.77% of their B Rights. For the C Rights theperformancecriteriaalsorelatedtogrowthinRAPPSbutfor2008comparedto2007.Theminimumhurdlewas2%andthestretchedtarget12%.ThegrowthinRAPPS2008was1.739%andtherebybelowtheminimumhurdle,so the participants cannot exercise any of the C Rights. For the D Rights, the performance criterion was related to Nordea’sTSRduringboth2007and2008,inrelationtotheTSR of a group of Nordic and European financial com-panies. The stretched target was that Nordea’s TSR had to be at least 10 %-points better than the peer group’s TSR. Nordea’sTSR2007-2008was20.0%-pointsbetterthanthe peers. The participants will consequently, on the condi-tions stipulated, have a right to exercise 100% of their D Rights.TheLTIP2007receiveda98%participationratioamong the invited managers and key employees and the

Nor
dea
Ann
ual R
epor
t 20
08
75
Board of Directors’ Report
participants locked in 99% of the permitted maximum number of shares.
TheAGM2008approvedasimilarLongTermIncentiveProgramme(LTIP2008).Theminimumhurdlewas4%growthinRAPPSbothfortheBandCRightsandthestretchedtargetwas12%alsoforboththeBandCRights.For the D Rights the performance criteria was related to Nordea’s ranking when comparing Nordea’s TSR year 2008–2009totheTSRofthepeergroup.ThegrowthinRAPPS2008was1.739%andtherebybelowtheminimumhurdle, so the participants cannot exercise any of the B Rights.TheLTIP2008receiveda94%participationratioamong the invited managers and key employees. 85% of the participants locked in 100% of the permitted maximum number of shares and the remaining 15% locked in average 71% of the permitted maximum number of shares.
TheBoardhasdecidedtoproposeasimilarLongTermIncentiveProgramme(LTIP2009)totheAGM2009.
The Board’s main objective with the programmes is to strengthen Nordea’s capability to retain and recruit the best talent for key leadership positions. The aim is further to stimulate the managers and key employees whose efforts have direct impact on Nordea’s result, profitability and value growth, to increased efforts by aligning their interests and perspectives with those of the shareholders. TheproposalforLTIP2009willbepresentedtotheshare-holdersinthenoticeoftheAGM2009.MoreinformationontheLTIP2007andLTIP2008ispresentedinNote8.
Profit-sharing schemeThe profit sharing scheme is capped and not based on the valueoftheNordeashare.In2008,atotalofEUR73mwasprovided for under Nordea’s ordinary profit sharing schemeforallemployees.For2008,eachemployeecanreceiveamaximumofEUR3,200,ofwhichEUR2,000isbased on a pre-determined level of risk-adjusted profit, an additional EUR 600 based on the level of customer satisfac-tion and an additional EUR 600 based on Nordea’s relative performance compared to a Nordic peer group as mea-sured by return on equity.
Theprofitsharingschemefor2009hasbeenchangedinorder to better reflect Nordea's aim to strengthen the cus-tomer relation. The level of customer satisfaction will be changed to relative customer satisfaction. The possible maximum outcome for the three parameters is unchanged. If all performance criteria are met, the cost of the scheme will amount to a maximum of approx. EUR 100m.
Internal controlInternal control is a process carried out by the Board of Directors, management and other staff within Nordea, designed to provide reasonable assurance regarding the achievement of objectives in the following categories:• effectivenessandefficiencyofoperations,• reliabilityofoperationalandfinancialreporting,• compliancewithexternalandinternalregulations,and• safeguardingofassets,includingsufficientmanage-
ment of risks in operations.
Internal control is based on the control environment which includes the following elements: values and management culture, goal-orientation and follow-up, a clear and trans-parent organisational structure, segregation of duties, the four-eyes principle, quality and efficiency of internal com-munication and an independent evaluation process.
The framework for internal control aims at creating the necessary preconditions for the whole organisation to con-tribute to the effectiveness and the high quality of internal control.
The framework is based on clear definitions, assign-ments of roles and responsibilities, common tools and pro-cedures, and is expressed in a common language. The main components of the framework are:• riskmanagement,• measurementsystemsandreportingprocedures,• controlactivities,and• managementmonitoring.
Report on the key aspects of the systems for internal control and risk management regarding financial reports according to the CodeThe Board’s Report on the key aspects of the systems for internal control and risk management regarding financial reportsfortheFinancialYear2008issubmittedinasepa-ratesectionoftheCorporateGovernanceReport2008,which is attached to this annual report.
Internal auditGroup Internal Audit (GIA) is an independent function commissioned by the Board of Directors. The Audit Com-mittee is responsible for guidance on and evaluation of GIA within the Nordea Group. The Group Chief Audit Executive (CAE) has the overall responsibility for GIA. The CAE reports functionally to the Board of Directors and the Audit Committee. The CAE reports administratively to the CEO. The Board of Directors approves the appointment and dismissal of the CAE.
GIA does not engage in consulting activity unless the Audit Committee gives it special assignments. The pur-pose of GIA’s assurance activity is to add value to the organisation by assuring the quality of the risk manage-ment, control and governance process as well as promoting continuous improvement.
All activities, including outsourced activities and enti-ties of the Group fall within the scope of GIA.
GIA operates free from interference in determining the scope of internal auditing, in performing its audit work, and in communicating its results. GIA is authorised to carry out all investigations and obtain all information that is required to discharge its duties. The work of GIA shall complywiththeStandardsfortheProfessionalPracticeofInternal Auditing issued by the Institute of Internal Audi-tors and the Standards for Information Systems Auditing issued by the Information Systems Audit and Control Association. The annual audit plans are based on a com-prehensive risk assessment.
Nor
dea
Ann
ual R
epor
t 20
08
76
Board of Directors’ Report
External auditAccording to the Articles of Association one or two audi-tors shall be elected by the General Meeting of sharehold-ers for a term of four years. At the re-election of auditors the General Meeting may decide that the assignment will continueforatermofthreeyears.AttheAGM2003KPMGBohlins AB was re-elected auditor for the time period up to theendoftheAGM2007.FollowingatenderprocessKPMGBohlinsABwasre-electedauditorattheAGM2007foraperioduptotheendoftheAGM2011.Anewauditor-in-charge,CarlLindgren,wasdesignated.On25Septem-ber2008thenameofthefirmwaschangedtoKPMGAB.
Corporate Governance ReportNordea’sCorporateGovernanceReport2008isattachedtothis annual report. The report, including the Report on the key aspects of the systems for internal control and risk management regarding financial reports, has not been reviewed by the auditors.
Nor
dea
Ann
ual R
epor
t 20
08
77
Financial statements
Financial statementsContents
5-year overview . . . . . . . . . . . . . . . . . . . . . . . . . . . . . . . . . . . . . . . . . . . . . . . . . . . . . . . . . . . . . . 78Quarterly development . . . . . . . . . . . . . . . . . . . . . . . . . . . . . . . . . . . . . . . . . . . . . . . . . . . . . 81Income statement . . . . . . . . . . . . . . . . . . . . . . . . . . . . . . . . . . . . . . . . . . . . . . . . . . . . . . . . . . . 82Balance sheet . . . . . . . . . . . . . . . . . . . . . . . . . . . . . . . . . . . . . . . . . . . . . . . . . . . . . . . . . . . . . . . . 83Statement of recognised income and expense . . . . . . . . . . . . . . . . . . . . . . . 84Cash flow statement . . . . . . . . . . . . . . . . . . . . . . . . . . . . . . . . . . . . . . . . . . . . . . . . . . . . . . . . 85
Notes to the financial statements 1 Accounting policies . . . . . . . . . . . . . . . . . . . . . . . . . . . . . . . . . . . . . . . . . . . . . . . . . . 87 2 Segment reporting . . . . . . . . . . . . . . . . . . . . . . . . . . . . . . . . . . . . . . . . . . . . . . . . . . . 99
Notes to the income statement 3 Net interest income . . . . . . . . . . . . . . . . . . . . . . . . . . . . . . . . . . . . . . . . . . . . . . . . . 100 4 Net fee and commission income . . . . . . . . . . . . . . . . . . . . . . . . . . . . . . . . . 100 5 Net gains/losses on items at fair value . . . . . . . . . . . . . . . . . . . . . . . . . . 101 6 Dividends . . . . . . . . . . . . . . . . . . . . . . . . . . . . . . . . . . . . . . . . . . . . . . . . . . . . . . . . . . . . . 101 7 Other operating income . . . . . . . . . . . . . . . . . . . . . . . . . . . . . . . . . . . . . . . . . . . 101 8 Staff costs . . . . . . . . . . . . . . . . . . . . . . . . . . . . . . . . . . . . . . . . . . . . . . . . . . . . . . . . . . . . 101 9 Other expenses . . . . . . . . . . . . . . . . . . . . . . . . . . . . . . . . . . . . . . . . . . . . . . . . . . . . . 10510 Depreciation, amortisation and impairment
charges of tangible and intangible assets . . . . . . . . . . . . . . . . . . . . . 10511 Loan losses . . . . . . . . . . . . . . . . . . . . . . . . . . . . . . . . . . . . . . . . . . . . . . . . . . . . . . . . . . 10612 Appropriations . . . . . . . . . . . . . . . . . . . . . . . . . . . . . . . . . . . . . . . . . . . . . . . . . . . . . . 10613 Taxes . . . . . . . . . . . . . . . . . . . . . . . . . . . . . . . . . . . . . . . . . . . . . . . . . . . . . . . . . . . . . . . . . . 10614 Earnings per share . . . . . . . . . . . . . . . . . . . . . . . . . . . . . . . . . . . . . . . . . . . . . . . . . 108
Notes to the balance sheet and memorandum items15 Treasury bills . . . . . . . . . . . . . . . . . . . . . . . . . . . . . . . . . . . . . . . . . . . . . . . . . . . . . . . . . 10816 Loans and receivables and their impairment . . . . . . . . . . . . . . . . . . 10917 Interest-bearing securities . . . . . . . . . . . . . . . . . . . . . . . . . . . . . . . . . . . . . . . . 11118 Financial instruments pledged as collateral . . . . . . . . . . . . . . . . . . . 11119 Shares . . . . . . . . . . . . . . . . . . . . . . . . . . . . . . . . . . . . . . . . . . . . . . . . . . . . . . . . . . . . . . . . 11120 Derivatives and Hedge accounting . . . . . . . . . . . . . . . . . . . . . . . . . . . . . 11221 Fair value changes of the hedged items
in portfolio hedge of interest rate risk . . . . . . . . . . . . . . . . . . . . . . . . . . . 11522 Investments in group undertakings . . . . . . . . . . . . . . . . . . . . . . . . . . . . . . 11523 Investments in associated undertakings . . . . . . . . . . . . . . . . . . . . . . . 11724 Intangible assets . . . . . . . . . . . . . . . . . . . . . . . . . . . . . . . . . . . . . . . . . . . . . . . . . . . . 11825 Property and equipment . . . . . . . . . . . . . . . . . . . . . . . . . . . . . . . . . . . . . . . . . . . 11926 Leasing . . . . . . . . . . . . . . . . . . . . . . . . . . . . . . . . . . . . . . . . . . . . . . . . . . . . . . . . . . . . . . . 12027 Investment property . . . . . . . . . . . . . . . . . . . . . . . . . . . . . . . . . . . . . . . . . . . . . . . . 12128 Other assets . . . . . . . . . . . . . . . . . . . . . . . . . . . . . . . . . . . . . . . . . . . . . . . . . . . . . . . . . 12129 Prepaid expenses and accrued income . . . . . . . . . . . . . . . . . . . . . . . . 12130 Deposits by credit institutions . . . . . . . . . . . . . . . . . . . . . . . . . . . . . . . . . . . . 12231 Deposits and borrowings from the public . . . . . . . . . . . . . . . . . . . . . . 12232 Liabilities to policyholders . . . . . . . . . . . . . . . . . . . . . . . . . . . . . . . . . . . . . . . . . 12233 Debt securities in issue . . . . . . . . . . . . . . . . . . . . . . . . . . . . . . . . . . . . . . . . . . . . 12434 Other liabilities . . . . . . . . . . . . . . . . . . . . . . . . . . . . . . . . . . . . . . . . . . . . . . . . . . . . . . 12435 Accrued expenses and prepaid income . . . . . . . . . . . . . . . . . . . . . . . . 12436 Provisions . . . . . . . . . . . . . . . . . . . . . . . . . . . . . . . . . . . . . . . . . . . . . . . . . . . . . . . . . . . . 12437 Retirement benefit obligations . . . . . . . . . . . . . . . . . . . . . . . . . . . . . . . . . . . 12538 Subordinated liabilities . . . . . . . . . . . . . . . . . . . . . . . . . . . . . . . . . . . . . . . . . . . . 12739 Untaxed reserves . . . . . . . . . . . . . . . . . . . . . . . . . . . . . . . . . . . . . . . . . . . . . . . . . . . 12840 Equity . . . . . . . . . . . . . . . . . . . . . . . . . . . . . . . . . . . . . . . . . . . . . . . . . . . . . . . . . . . . . . . . . 12841 Assets pledged as security for own liabilities . . . . . . . . . . . . . . . . . 13042 Other assets pledged . . . . . . . . . . . . . . . . . . . . . . . . . . . . . . . . . . . . . . . . . . . . . . 13043 Contingent liabilities . . . . . . . . . . . . . . . . . . . . . . . . . . . . . . . . . . . . . . . . . . . . . . . 13044 Commitments . . . . . . . . . . . . . . . . . . . . . . . . . . . . . . . . . . . . . . . . . . . . . . . . . . . . . . . 131
Other notes45 Insurance activities . . . . . . . . . . . . . . . . . . . . . . . . . . . . . . . . . . . . . . . . . . . . . . . . . 13146 Capital adequacy . . . . . . . . . . . . . . . . . . . . . . . . . . . . . . . . . . . . . . . . . . . . . . . . . . . 13147 Classification of financial instruments . . . . . . . . . . . . . . . . . . . . . . . . . . 13248 Assets and liabilities at fair value . . . . . . . . . . . . . . . . . . . . . . . . . . . . . . . . . 13649 Assets and liabilities in foreign currencies . . . . . . . . . . . . . . . . . . . . . 14050 Obtained collaterals which are permitted
to be sold or repledged . . . . . . . . . . . . . . . . . . . . . . . . . . . . . . . . . . . . . . . . . . . . 14251 Investments, customer bearing the risk . . . . . . . . . . . . . . . . . . . . . . . . 14252 Maturity analyses for assets and liabilities . . . . . . . . . . . . . . . . . . . . . 14253 Related-party transactions . . . . . . . . . . . . . . . . . . . . . . . . . . . . . . . . . . . . . . . . 14354 Acquisitions . . . . . . . . . . . . . . . . . . . . . . . . . . . . . . . . . . . . . . . . . . . . . . . . . . . . . . . . . . 144

Nor
dea
Ann
ual R
epor
t 20
08
78
Financial statements
5-year overview – Group
Income statement
EURm 2008 2007 2006 2005 2004
Net interest income 5,093 4,282 3,869 3,663 3,495Net fee and commission income 1,883 2,140 2,074 1,935 1,794Net gains/losses on items at fair value 1,028 1,209 1,042 776 685Equity method 24 41 68 67 55Other income 172 214 312 132 98
Total operating income 8,200 7,886 7,365 6,573 6,127
General administrative expenses: Staff costs –2,568 –2,388 –2,251 –2,082 –2,021 Other expenses –1,646 –1,575 –1,485 –1,455 –1,466Depreciation, amortisation and impairment charges of tangible and intangible assets –124 –103 –86 –131 –168
Total operating expenses –4,338 –4,066 –3,822 –3,668 –3,655
Loan losses –466 60 257 137 –27Disposals of tangible and intangible assets 0 3 8 6 300
Operating profit 3,396 3,883 3,808 3,048 2,745
Income tax expense –724 –753 –655 –779 –667
Net profit for the year 2,672 3,130 3,153 2,269 2,078
Balance sheet
EURm 2008 2007 2006 2005 20041)
Treasury bills and interest-bearing securities 51,375 43,975 35,744 31,727 38,371Loans and receivables to credit institutions 23,903 24,262 26,792 31,578 24,774Loans and receivables to the public 265,100 244,682 213,985 188,460 161,060Derivatives 86,838 31,498 24,207 28,876 26,366Other assets 46,858 44,637 46,162 44,908 29,503
Total assets 474,074 389,054 346,890 325,549 280,074
Deposits by credit institutions 51,932 30,077 32,288 29,790 30,156Deposits and borrowings from the public 148,591 142,329 126,452 115,550 104,704Liabilities to policyholders 29,238 32,280 31,041 26,830 23,480Debt securities in issue 108,989 99,792 83,417 82,609 59,579Derivatives 85,538 33,023 24,939 28,602 26,675Subordinated liabilities 8,209 7,556 8,177 7,822 5,818Other liabilities 23,774 26,837 25,254 21,386 16,986Equity 17,803 17,160 15,322 12,960 12,676
Total liabilities and equity 474,074 389,054 346,890 325,549 280,0741) Reclassification of non-cash collaterals to ”Financial instruments pledged as collateral” (included in “Other assets” in the table above) from ”Treasury bills” and ”Interest-bearing securities”
have not been done for 2004.

Nor
dea
Ann
ual R
epor
t 20
08
79
Financial statements
Ratios and key figures 2008 2007 2006 2005 2004
Basic earnings per share, EUR 1.03 1.20 1.21 0.86 0.74Diluted earnings per share, EUR 1.03 1.20 1.21 0.86 0.74Share price, EUR 5.00 11.42 11.67 8.79 7.43Total shareholders’ return, % –46.9 6.4 32.3 27.5 29.8Proposed/actual dividend per share, EUR 0.20 0.50 0.49 0.35 0.28Equity per share, EUR 6.84 6.58 5.89 4.98 4.63Shares outstanding, million 2,590 2,593 2,591 2,592 2,735Diluted shares outstanding, million 2,592 2,594 2,591 2,592 2,735Return on equity, % 15.3 19.7 22.9 18.0 16.9Assets under management, EURbn 125.6 157.1 158.1 147.6 126.1Cost/income ratio, % 53 52 52 56 60Tier 1 capital ratio, before transition rules,% 9.3 8.3 Total capital ratio, before transition rules,% 12.1 10.9 Tier 1 capital ratio, % 7.4 7.0 7.1 6.8 7.3Total capital ratio, % 9.5 9.1 9.8 9.2 9.5Tier 1 capital, EURm 15,760 14,230 13,147 11,438 10,596Risk-weighted amounts1), EURbn 213 205 185 169 145Number of employees (full-time equivalents) 34,008 31,721 29,248 28,925 28,929
Risk-adjusted profit, EURm 2,459 2,417 2,107 1,783 Economic profit, EURm 1,432 1,585 1,412 1,127 Economic capital, EURbn 11.8 10.2 9.3 8.7 EPS, risk-adjusted, EUR 0.95 0.93 0.81 0.67 RAROCAR, % 20.8 23.6 22.7 20.6 MCEV, EURm 2,624 3,189 2,873 2,283 1) RWA according to Basel I for the years 2004–2006.

Nor
dea
Ann
ual R
epor
t 20
08
80
Financial statements
5-year overview – Parent company
Income statement
EURm 2008 2007 2006 2005 2004
Net interest income 523 360 365 444 470Net fee and commission income 468 463 481 432 435Net gains/losses on items at fair value –13 194 186 –38 75Dividends 2,063 1,323 4,739 1,023 1,422Other income 190 127 130 122 155
Total operating income 3,231 2,467 5,901 1,983 2,557
General administrative expenses: Staff costs –632 –596 –568 –500 –499 Other expenses –473 –514 –501 –536 –544Depreciation, amortisation and impairment charges of tangible and intangible assets –103 –101 –99 –99 –103
Total operating expenses –1,208 –1,211 –1,168 –1,135 –1,146
Loan losses –80 25 18 13 –33Impairment of securities held as financial non-current assets –26 – – –309 –111Disposals of tangible and intangible assets 0 0 – –1 –
Operating profit 1,917 1,281 4,751 551 1,267 Appropriations –40 –44 –33 595 26Income tax expense 11 –34 –76 –229 –37
Net profit for the year 1,888 1,203 4,642 917 1,256
Balance sheet
EURm 2008 2007 2006 2005 20041)
Treasury bills and interest-bearing securities 12,178 5,783 5,426 5,379 6,265Loans and receivables to credit institutions 43,855 36,824 36,970 26,638 23,749Loans and receivables to the public 29,240 26,640 21,501 19,069 17,492Investments in group undertakings 15,866 15,488 16,561 16,551 16,741Other assets 11,895 9,743 8,979 7,094 3,601
Total assets 113,034 94,478 89,437 74,731 67,848
Deposits by credit institutions 34,713 24,275 23,971 20,784 22,885Deposits and borrowings from the public 33,457 32,296 30,482 26,579 25,669Debt securities in issue 17,949 13,839 12,638 10,248 3,532Subordinated liabilities 6,829 6,151 6,397 5,540 3,526Other liabilities/untaxed reserves 7,615 6,007 3,940 3,296 3,035Equity 12,471 11,910 12,009 8,284 9,201
Total liabilities and equity 113,034 94,478 89,437 74,731 67,8481) Reclassification of non-cash collaterals to ”Financial instruments pledged as collateral” (included in “Other assets” in the table above) from ”Treasury bills” and ”Interest-bearing securities”
have not been done for 2004.
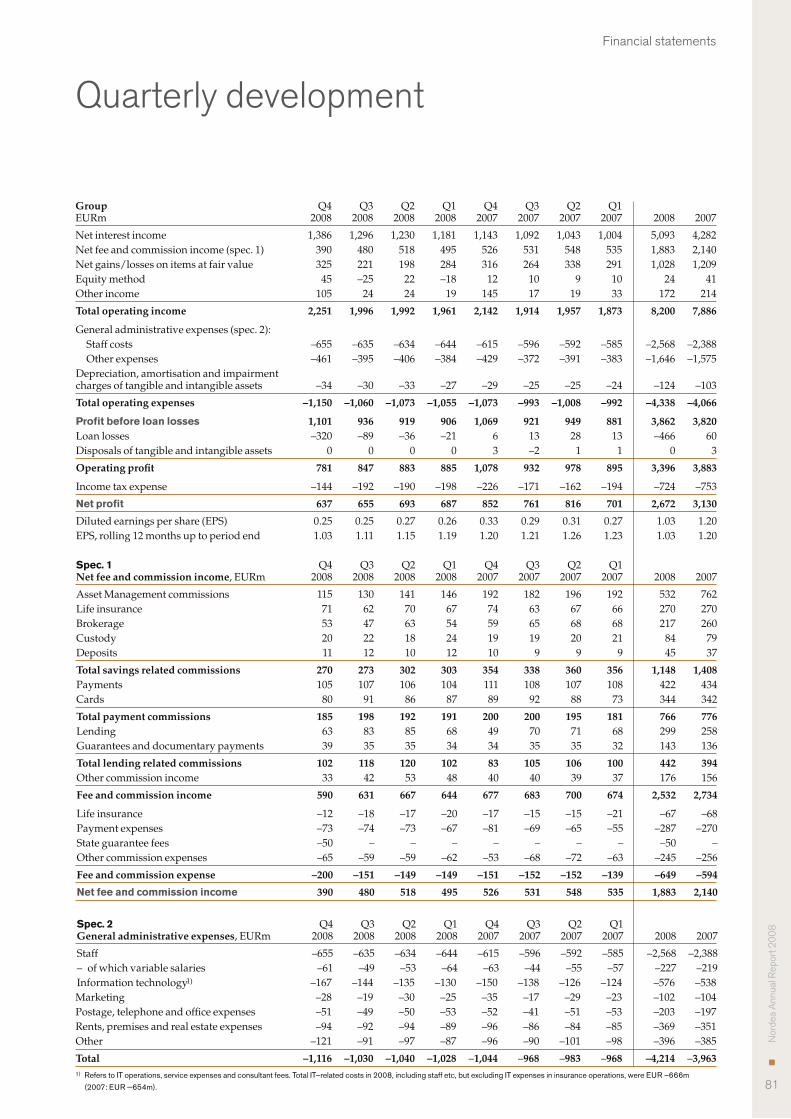
Nor
dea
Ann
ual R
epor
t 20
08
81
Financial statements
Quarterly development
Group Q4 Q3 Q2 Q1 Q4 Q3 Q2 Q1 EURm 2008 2008 2008 2008 2007 2007 2007 2007 2008 2007
Net interest income 1,386 1,296 1,230 1,181 1,143 1,092 1,043 1,004 5,093 4,282Net fee and commission income (spec. 1) 390 480 518 495 526 531 548 535 1,883 2,140Net gains/losses on items at fair value 325 221 198 284 316 264 338 291 1,028 1,209Equity method 45 –25 22 –18 12 10 9 10 24 41Other income 105 24 24 19 145 17 19 33 172 214
Total operating income 2,251 1,996 1,992 1,961 2,142 1,914 1,957 1,873 8,200 7,886
General administrative expenses (spec. 2): Staff costs –655 –635 –634 –644 –615 –596 –592 –585 –2,568 –2,388 Other expenses –461 –395 –406 –384 –429 –372 –391 –383 –1,646 –1,575Depreciation, amortisation and impairment charges of tangible and intangible assets –34 –30 –33 –27 –29 –25 –25 –24 –124 –103
Total operating expenses –1,150 –1,060 –1,073 –1,055 –1,073 –993 –1,008 –992 –4,338 –4,066
Profit before loan losses 1,101 936 919 906 1,069 921 949 881 3,862 3,820Loan losses –320 –89 –36 –21 6 13 28 13 –466 60Disposals of tangible and intangible assets 0 0 0 0 3 –2 1 1 0 3
Operating profit 781 847 883 885 1,078 932 978 895 3,396 3,883
Income tax expense –144 –192 –190 –198 –226 –171 –162 –194 –724 –753
Net profit 637 655 693 687 852 761 816 701 2,672 3,130
Diluted earnings per share (EPS) 0.25 0.25 0.27 0.26 0.33 0.29 0.31 0.27 1.03 1.20EPS, rolling 12 months up to period end 1.03 1.11 1.15 1.19 1.20 1.21 1.26 1.23 1.03 1.20
Spec. 1 Q4 Q3 Q2 Q1 Q4 Q3 Q2 Q1 Net fee and commission income, EURm 2008 2008 2008 2008 2007 2007 2007 2007 2008 2007
Asset Management commissions 115 130 141 146 192 182 196 192 532 762Life insurance 71 62 70 67 74 63 67 66 270 270Brokerage 53 47 63 54 59 65 68 68 217 260Custody 20 22 18 24 19 19 20 21 84 79Deposits 11 12 10 12 10 9 9 9 45 37
Total savings related commissions 270 273 302 303 354 338 360 356 1,148 1,408Payments 105 107 106 104 111 108 107 108 422 434Cards 80 91 86 87 89 92 88 73 344 342
Total payment commissions 185 198 192 191 200 200 195 181 766 776Lending 63 83 85 68 49 70 71 68 299 258Guarantees and documentary payments 39 35 35 34 34 35 35 32 143 136
Total lending related commissions 102 118 120 102 83 105 106 100 442 394Other commission income 33 42 53 48 40 40 39 37 176 156
Fee and commission income 590 631 667 644 677 683 700 674 2,532 2,734
Life insurance –12 –18 –17 –20 –17 –15 –15 –21 –67 –68Payment expenses –73 –74 –73 –67 –81 –69 –65 –55 –287 –270State guarantee fees –50 – – – – – – – –50 –Other commission expenses –65 –59 –59 –62 –53 –68 –72 –63 –245 –256
Fee and commission expense –200 –151 –149 –149 –151 –152 –152 –139 –649 –594
Net fee and commission income 390 480 518 495 526 531 548 535 1,883 2,140
Spec. 2 Q4 Q3 Q2 Q1 Q4 Q3 Q2 Q1 General administrative expenses, EURm 2008 2008 2008 2008 2007 2007 2007 2007 2008 2007
Staff –655 –635 –634 –644 –615 –596 –592 –585 –2,568 –2,388– of which variable salaries –61 –49 –53 –64 –63 –44 –55 –57 –227 –219Information technology1) –167 –144 –135 –130 –150 –138 –126 –124 –576 –538Marketing –28 –19 –30 –25 –35 –17 –29 –23 –102 –104Postage, telephone and office expenses –51 –49 –50 –53 –52 –41 –51 –53 –203 –197Rents, premises and real estate expenses –94 –92 –94 –89 –96 –86 –84 –85 –369 –351Other –121 –91 –97 –87 –96 –90 –101 –98 –396 –385
Total –1,116 –1,030 –1,040 –1,028 –1,044 –968 –983 –968 –4,214 –3,9631) Refers to IT operations, service expenses and consultant fees. Total IT–related costs in 2008, including staff etc, but excluding IT expenses in insurance operations, were EUR –666m
(2007: EUR –654m).

Nor
dea
Ann
ual R
epor
t 20
08
82
Financial statements
Income statement
Group Parent company
EURm Note 2008 2007 2008 2007
Operating incomeInterest income 16,753 12,909 3,646 2,741Interest expense –11,660 –8,627 –3,123 –2,381
Net interest income 3 5,093 4,282 523 360
Fee and commission income 2,532 2,734 622 618Fee and commission expense –649 –594 –154 –155
Net fee and commission income 4 1,883 2,140 468 463
Net gains/losses on items at fair value 5 1,028 1,209 –13 194Profit from companies accounted for under the equity method 23 24 41 – –Dividends 6 – – 2,063 1,323Other operating income 7 172 214 190 127
Total operating income 8,200 7,886 3,231 2,467
Operating expensesGeneral administrative expenses: Staff costs 8 –2,568 –2,388 –632 –596 Other expenses 9 –1,646 –1,575 –473 –514Depreciation, amortisation and impairment charges of tangible and intangible assets 10, 25, 26 –124 –103 –103 –101
Total operating expenses –4,338 –4,066 –1,208 –1,211
Loan losses 11 –466 60 –80 25Impairment of securities held as financial non-current assets 22 – – –26 –Disposals of tangible and intangible assets 0 3 0 0
Operating profit 3,396 3,883 1,917 1,281
Appropriations 12 – – –40 –44Income tax expense 13 –724 –753 11 –34
Net profit for the year 2,672 3,130 1,888 1,203
Attributable to:Shareholders of Nordea Bank AB (publ) 2,671 3,121 1,888 1,203Minority interests 1 9 – –
Total 2,672 3,130 1,888 1,203
Basic earnings per share, EUR 14 1.03 1.20 Diluted earnings per share, EUR 14 1.03 1.20

Nor
dea
Ann
ual R
epor
t 20
08
83
Financial statements
Balance sheet
Group Parent company
31 Dec 31 Dec 31 Dec 31 Dec EURm Note 2008 2007 2008 2007
AssetsCash and balances with central banks 3,157 5,020 276 296Treasury bills 15 6,545 5,193 2,098 567Loans and receivables to credit institutions 16 23,903 24,262 43,855 36,824Loans and receivables to the public 16 265,100 244,682 29,240 26,640Interest-bearing securities 17 44,830 38,782 10,080 5,216Financial instruments pledged as collateral 18 7,937 4,790 3,097 2,806Shares 19 10,669 17,644 1,107 2,034Derivatives 20 86,838 31,498 3,562 1,281Fair value changes of the hedged items in portfolio hedge of interest rate risk 21 413 –105 27 –4Investments in group undertakings 22 – – 15,866 15,488Investments in associated undertakings 23 431 366 2 30Intangible assets 24 2,535 2,725 757 819Property and equipment 25, 26 375 342 81 53Investment property 27 3,334 3,492 – –Deferred tax assets 13 64 191 28 34Current tax assets 13 344 142 76 52Retirement benefit assets 37 168 123 – –Other assets 28 14,604 7,724 2,099 1,940Prepaid expenses and accrued income 29 2,827 2,183 783 402
Total assets 474,074 389,054 113,034 94,478
LiabilitiesDeposits by credit institutions 30 51,932 30,077 34,713 24,275Deposits and borrowings from the public 31 148,591 142,329 33,457 32,296Liabilities to policyholders 32 29,238 32,280 – –Debt securities in issue 33 108,989 99,792 17,949 13,839Derivatives 20 85,538 33,023 2,756 1,581Fair value changes of the hedged items in portfolio hedge of interest rate risk 21 532 –323 42 –69Current tax liabilities 13 458 300 0 0Other liabilities 34 17,970 22,860 4,229 4,014Accrued expenses and prepaid income 35 3,278 2,762 465 341Deferred tax liabilities 13 1,053 703 0 2Provisions 36 143 73 3 2Retirement benefit obligations 37 340 462 118 129Subordinated liabilities 38 8,209 7,556 6,829 6,151
Total liabilities 456,271 371,894 100,561 82,561
Untaxed reserves 39 – – 2 7
Equity 40Minority interests 78 78 – –
Share capital 2,600 2,597 2,600 2,597Other reserves –888 –160 –5 5Retained earnings 16,013 14,645 9,876 9,308
Total equity 17,803 17,160 12,471 11,910
Total liabilities and equity 474,074 389,054 113,034 94,478
Assets pledged as security for own liabilities 41 95,507 79,708 3,360 3,054Other assets pledged 42 10,807 6,304 9,504 7,270Contingent liabilities 43 26,287 24,254 21,947 14,066Commitments excluding derivatives 44 88,434 87,006 24,139 29,474Derivative commitments 20, 44 3,802,101 3,405,332 104,378 299,852

Nor
dea
Ann
ual R
epor
t 20
08
84
Financial statements
Statement of recognised income and expense
Group Parent company
EURm 2008 2007 2008 2007
Currency translation differences during the year –1,233 –26 – –Currency hedging of net investment in foreign operations 691 –24 – –Available-for-sale investments: Valuation gains/losses taken to equity – 1 – 7 Transferred to profit or loss on sale for the year –6 – –7 –Cash flow hedges: Gains/losses taken to equity –7 – –7 –Group contributions – – –19 –55Tax on items taken directly to or transferred from equity –173 0 9 13
Net income recognised directly in equity –728 –49 –24 –35 Net profit for the year 2,672 3,130 1,888 1,203
Total recognised income and expense for the year 1,944 3,081 1,864 1,168
Attributable to: Shareholders of Nordea Bank AB (publ) 1,943 3,072 1,864 1,168Minority interests 1 9 – –
Total 1,944 3,081 1,864 1,168
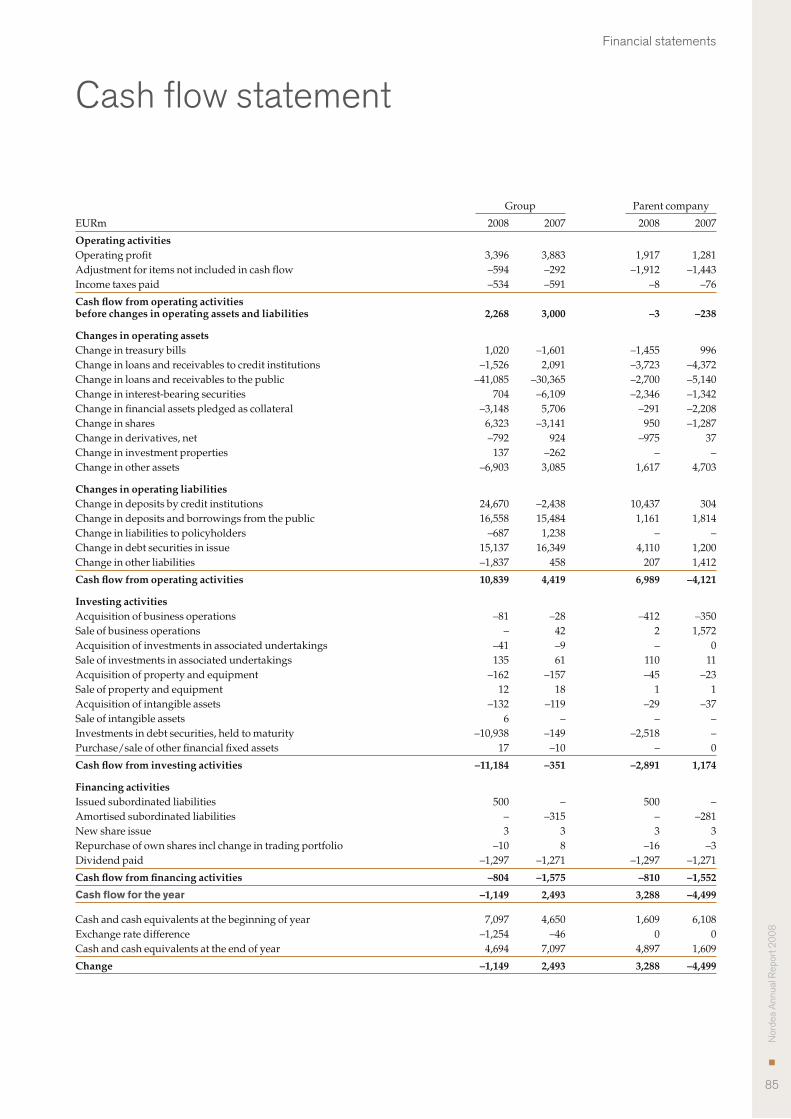
Nor
dea
Ann
ual R
epor
t 20
08
85
Financial statements
Cash flow statement
Group Parent company
EURm 2008 2007 2008 2007
Operating activitiesOperating profit 3,396 3,883 1,917 1,281Adjustment for items not included in cash flow –594 –292 –1,912 –1,443Income taxes paid –534 –591 –8 –76
Cash flow from operating activities before changes in operating assets and liabilities 2,268 3,000 –3 –238
Changes in operating assetsChange in treasury bills 1,020 –1,601 –1,455 996Change in loans and receivables to credit institutions –1,526 2,091 –3,723 –4,372Change in loans and receivables to the public –41,085 –30,365 –2,700 –5,140Change in interest-bearing securities 704 –6,109 –2,346 –1,342Change in financial assets pledged as collateral –3,148 5,706 –291 –2,208Change in shares 6,323 –3,141 950 –1,287Change in derivatives, net –792 924 –975 37Change in investment properties 137 –262 – –Change in other assets –6,903 3,085 1,617 4,703 Changes in operating liabilities Change in deposits by credit institutions 24,670 –2,438 10,437 304Change in deposits and borrowings from the public 16,558 15,484 1,161 1,814Change in liabilities to policyholders –687 1,238 – –Change in debt securities in issue 15,137 16,349 4,110 1,200Change in other liabilities –1,837 458 207 1,412
Cash flow from operating activities 10,839 4,419 6,989 –4,121
Investing activitiesAcquisition of business operations –81 –28 –412 –350Sale of business operations – 42 2 1,572Acquisition of investments in associated undertakings –41 –9 – 0Sale of investments in associated undertakings 135 61 110 11Acquisition of property and equipment –162 –157 –45 –23Sale of property and equipment 12 18 1 1Acquisition of intangible assets –132 –119 –29 –37Sale of intangible assets 6 – – –Investments in debt securities, held to maturity –10,938 –149 –2,518 –Purchase/sale of other financial fixed assets 17 –10 – 0
Cash flow from investing activities –11,184 –351 –2,891 1,174
Financing activitiesIssued subordinated liabilities 500 – 500 –Amortised subordinated liabilities – –315 – –281New share issue 3 3 3 3Repurchase of own shares incl change in trading portfolio –10 8 –16 –3Dividend paid –1,297 –1,271 –1,297 –1,271
Cash flow from financing activities –804 –1,575 –810 –1,552
Cash flow for the year –1,149 2,493 3,288 –4,499 Cash and cash equivalents at the beginning of year 7,097 4,650 1,609 6,108Exchange rate difference –1,254 –46 0 0Cash and cash equivalents at the end of year 4,694 7,097 4,897 1,609
Change –1,149 2,493 3,288 –4,499

Nor
dea
Ann
ual R
epor
t 20
08
86
Financial statements
Comments on the cash flow statementThe cash flow statement has been prepared in accordance with IAS 7. The cash flow statement shows inflows and outflows of cash and cash equivalents during the year. Nordea’s cash flow has been prepared in accordance with the indirect method, whereby operating profit is adjusted for effects of non-cash transactions such as depreciation and loan losses. The cash flows are classified by operating, investing and financing activities.
Operating activitiesOperating activities are the principal revenue-producing activities and cash flows are mainly derived from the operating profit for the year with adjustment for items not included in cash flow and income taxes paid. Adjustment for non-cash items includes:
Group Parent company
EURm 2008 2007 2008 2007
Depreciation 114 103 101 101Impairment charges 10 0 28 0Loan losses 530 24 101 1Unrealised gains/losses –973 –264 –243 –139Capital gains/losses (net) –83 –43 –88 –11Change in accruals and provisions 173 85 –269 –99Anticipated dividends – – –1,593 –1,072Group contributions – – –177 –248Translation differences 1,216 –307 –142 2Change in bonus potential to policyholders –2,033 –42 – –Other 452 152 370 22
Total –594 –292 –1,912 –1,443
Changes in operating assets and liabilities consist of assets and lia-bilities that are part of normal business activities, such as loans and receivables, deposits and debt securities in issue. Changes in derivatives are reported net.
Cash flow from operating activities includes interest payments received and interest expenses paid with the following amounts:
Group Parent company
EURm 2008 2007 2008 2007
Interest payments received 16,230 12,579 3,504 2,602Interest expenses paid 11,429 8,131 3,020 2,334
Investing activitiesInvesting activities include acquisitions and disposals of non-cur-rent assets, like property and equipment, intangible and financial assets. Aggregated cash flows arising from acquisition and sale of business operations are presented separately and consist of:
Group
EURm 2008 2007
Acquisition of business operationsCash and cash equivalents 4 218Loans and receivables to credit institutions – 31Loans and receivables to the public 394 445Interest-bearing securities – 148Shares – 1Property & equipment and intangible assets 32 330Other assets 5 1
Total assets 435 1,174
Deposits by credit institutions – –286Liabilities and borrowings from the public –340 –393Debt security in issue – –25Other liabilities and provisions –10 –224
Total liabilities –350 –928
Purchase price paid1) –85 –246Cash and cash equivalents in acquired business operations 4 218
Net effect on cash flow –81 –281) Including translation difference, see also Note 54 Acquisitions.
Group
EURm 2008 2007
Sale of business operationsCash and cash equivalents – 7Loans and receivables to the public – 89Property & equipment and intangible assets – 4Other assets – 1
Total assets – 101
Deposits by credit institutions – –59Other liabilities and provisions – –2
Total liabilities – –61
Capital gain/loss on sold business operations – 9
Purchase price received – 49Cash and cash equivalents in sold business operations – –7
Net effect on cash flow – 42
Financing activitiesFinancing activities are activities that result in changes in equity and subordinated liabilities, such as new issues of shares, divi-dends and issued/amortised subordinated liabilities.
Cash and cash equivalentsThe following items are included in Cash and cash equivalents assets: Group Parent company
31 Dec 31 Dec 31 Dec 31 Dec EURm 2008 2007 2008 2007
Cash and balances with central banks 3,157 5,020 276 296Loans and receivables to credit institutions, payable on demand 1,537 2,077 4,621 1,313
4,694 7,097 4,897 1,609
Cash comprises legal tender and bank notes in foreign currencies. Balances with central banks consist of deposits in accounts with central banks and postal giro systems under government author-ity, where the following conditions are fulfilled;– the central bank or the postal giro system is domiciled in the
country where the institution is established– the balance on the account is readily available any time.
Loans to credit institutions, payable on demand include liquid assets not represented by bonds or other interest-bearing securi-ties.

Nor
dea
Ann
ual R
epor
t 20
08
87
Financial statements
Notes to the financial statements
Note 1 Accounting policies
Table of contents 1. Basis for presentation . . . . . . . . . . . . . . . . . . . . . . . . . . . . . . . . . . . . . . . . . . . . . . 87 2. Comparative figures . . . . . . . . . . . . . . . . . . . . . . . . . . . . . . . . . . . . . . . . . . . . . . . . . . 87 3. Changed accounting policies and presentation . . . . . . . . . . . . . . . . 87 4. Critical judgements and key sources of estimation
uncertainty . . . . . . . . . . . . . . . . . . . . . . . . . . . . . . . . . . . . . . . . . . . . . . . . . . . . . . . . . . . . 88 5. Principles of consolidation . . . . . . . . . . . . . . . . . . . . . . . . . . . . . . . . . . . . . . . . . . 88 6. Recognition of operating income . . . . . . . . . . . . . . . . . . . . . . . . . . . . . . . . . . 89 7. Recognition and derecognition of financial instruments
in the balance sheet . . . . . . . . . . . . . . . . . . . . . . . . . . . . . . . . . . . . . . . . . . . . . . . . . 90 8. Translation of assets and liabilities denominated
in foreign currencies . . . . . . . . . . . . . . . . . . . . . . . . . . . . . . . . . . . . . . . . . . . . . . . . . 90 9. Hedge accounting . . . . . . . . . . . . . . . . . . . . . . . . . . . . . . . . . . . . . . . . . . . . . . . . . . . . 9010. Determination of fair value of financial instruments . . . . . . . . . . . . 9111. Cash and cash equivalents . . . . . . . . . . . . . . . . . . . . . . . . . . . . . . . . . . . . . . . . . 9112. Financial instruments . . . . . . . . . . . . . . . . . . . . . . . . . . . . . . . . . . . . . . . . . . . . . . . . 9113. Loans and receivables . . . . . . . . . . . . . . . . . . . . . . . . . . . . . . . . . . . . . . . . . . . . . . . 9314. Leasing . . . . . . . . . . . . . . . . . . . . . . . . . . . . . . . . . . . . . . . . . . . . . . . . . . . . . . . . . . . . . . . . . 9415. Intangible assets . . . . . . . . . . . . . . . . . . . . . . . . . . . . . . . . . . . . . . . . . . . . . . . . . . . . . . 9416. Property and equipment . . . . . . . . . . . . . . . . . . . . . . . . . . . . . . . . . . . . . . . . . . . . . 9517. Investment property . . . . . . . . . . . . . . . . . . . . . . . . . . . . . . . . . . . . . . . . . . . . . . . . . . 9518. Liabilities to policyholders . . . . . . . . . . . . . . . . . . . . . . . . . . . . . . . . . . . . . . . . . . . 9519. Taxes . . . . . . . . . . . . . . . . . . . . . . . . . . . . . . . . . . . . . . . . . . . . . . . . . . . . . . . . . . . . . . . . . . . . 9620. Earnings per share . . . . . . . . . . . . . . . . . . . . . . . . . . . . . . . . . . . . . . . . . . . . . . . . . . . 9621. Pensions to employees . . . . . . . . . . . . . . . . . . . . . . . . . . . . . . . . . . . . . . . . . . . . . . . 9622. Equity . . . . . . . . . . . . . . . . . . . . . . . . . . . . . . . . . . . . . . . . . . . . . . . . . . . . . . . . . . . . . . . . . . . 9623. Share-based payment . . . . . . . . . . . . . . . . . . . . . . . . . . . . . . . . . . . . . . . . . . . . . . . 9724. Related-party transactions . . . . . . . . . . . . . . . . . . . . . . . . . . . . . . . . . . . . . . . . . . 9725. Segment reporting . . . . . . . . . . . . . . . . . . . . . . . . . . . . . . . . . . . . . . . . . . . . . . . . . . . 9726. Parent company . . . . . . . . . . . . . . . . . . . . . . . . . . . . . . . . . . . . . . . . . . . . . . . . . . . . . . . 9827. Exchange rates . . . . . . . . . . . . . . . . . . . . . . . . . . . . . . . . . . . . . . . . . . . . . . . . . . . . . . . . 98
1. Basis for presentationNordea’s consolidated financial statements are prepared in accordance with International Financial Reporting Standards (IFRS) and interpretations of such standards by the International Financial Reporting Interpretations Committee (IFRIC), as endorsed by the EU Commission. In addition, certain comple-mentary rules in the Swedish Act on Annual Accounts of Credit Institutions and Securities Companies (1995:1559), the recommen-dation RFR 1.1 ”Supplementary Accounting Rules for Groups” and UFR statements issued by the Swedish Financial Reporting Board as well as the accounting regulations of the Financial Super-visory Authority (FFFS 2008:25) have also been applied.
The disclosures, required in the standards and legislation above, have been included in the notes, the Risk, Liquidity and Capital management section or in other parts of the “Financial statements”.
On 17 February 2009 the Board of Directors approved the finan-cial statements, subject to final approval of the Annual General Meeting on 2 April 2009.
2. Comparative figuresThe comparative figures for 2007 include effects of changes in the presentation described in section 3 “Changed accounting policies and presentation” below.
3. Changed accounting policies and presentationThe accounting policies, basis for calculations and presentation are, in all material aspects, unchanged in comparison with the
2007 Annual Report, except for the presentation of received divi-dends and treasury bills and other eligible bills presented sepa-rately below.
An addition to the accounting policies has furthermore been made, as an amendment to IAS 39 and IFRS 7 was published in October with effective date 1 July 2008. The impact from this amendment was that financial assets can, in rare circumstances or when the assets meet the definition of loans and receivables, be reclassified out of the fair value through profit or loss category if the assets are no longer held for the purpose of selling or repur-chasing in the near term. Nordea has made no reclassification as a consequence of this amendment.
Presentation of received dividendsReceived dividends are recognised as “Net gains/losses on items at fair value” and have therefore, to some extent, been reclassified from the item “Dividends”. The impact on the income statement in 2008 and on the comparative figures is disclosed in the table below. 2008 2007
Re- Pre policy Re- Re- EURm stated change stated ported
Net gains/losses on items at fair value 1,028 1,016 1,209 1,187Dividends – 12 – 22
Presentation of treasury bills and other eligible billsThe balance sheet line “Treasury bills and other eligible bills” has been changed to “Treasury bills”. Central- and local government securities are classified as “Treasury bills” and any other interest bearing security as “Interest-bearing securities”. The impact on the applicable balance sheet lines is described in the table below.
31 Dec 2008 31 Dec 2007
Re- Pre policy Re- Re- EURm stated change stated ported
Treasury bills 6,545 11,550 5,193 8,503Interest-bearing securities 44,830 39,825 38,782 35,472
Forthcoming changes in IFRSsIASB has revised IFRS 3 “Business Combinations”, IAS 1 “Presentation of Financial Statements”, IAS 23 “Borrowing Costs”, amended IAS 27 “Consolidated and Separate Financial Statements”, IAS 32 “Financial Instruments: Presentation”, IAS 39 “Financial instruments: Recognition and Measurement”, IFRS 2 “Share-based Payment” and published the new standard IFRS 8 “Operating segments” as well as “Improvement to IFRSs”. These new or updated standards will come into force on 1 January 2009, except for IFRS 3, parts of IAS 27 and IAS 39, which will come into force on 1 July 2009 applicable for Nordea as from 2010. It is vol-untarily to adopt these new standards already in 2008, but Nordea has chosen not to implement in advance.
If implemented in advance, IAS 23 would have had a limited impact on the valuation of developed intangible and tangible assets and IFRS 8 would have had an impact on the presentation of operating segments.
In addition to changes in these standards, new interpretations not mandatory for Nordea in 2008, but allowed to implement in advance, that are relevant for Nordea have been published (IFRIC 13, 14, 16). The assessment is that none of these interpretations would have had a significant impact on Nordea if implemented in advance.
The abovementioned new, revised and amended standards and interpretations not yet implemented would, if implemented

Nor
dea
Ann
ual R
epor
t 20
08
88
Financial statements
in 2008, have had only an insignificant impact on Nordea’s capital adequacy.
4. Critical judgements and key sources of estimation uncertaintyThe preparation of financial statements in accordance with gener-ally accepted accounting principles requires, in some cases, the use of estimates and assumptions by management. The estimates are based on past experience and assumptions that management believes are fair and reasonable. These estimates and the judge-ment behind them affect the reported amounts of assets, liabilities and off-balance sheet items, as well as income and expenses in the financial statements presented. Actual outcome can later, to some extent, differ from the estimates and the assumptions made.
Certain accounting policies are considered to be particularly important to the financial position of Nordea, since they require management to make difficult, complex or subjective judgements and estimates, the majority of which relate to matters that are inherently uncertain. These critical judgements and estimates are in particular associated with:• thefairvaluemeasurementofcertainfinancialinstruments.• theimpairmenttestingof: – goodwill and – loans and receivables.• theactuarialcalculationsofpensionliabilities.• theactuarialcalculationsofliabilitiestopolicyholders.• claimsincivillawsuits.
Fair value measurementCritical judgement is exercised when determining fair value of OTC Derivatives and other financial instruments that lack quoted prices or recently observed market prices in the following areas:• Thechoiceofvaluationtechniques.• Thedeterminationofwhenquotedpricesfailtorepresentfair
value.• Theconstructionoffairvalueadjustmentsinordertoincorpo-
rate relevant risk factors such as credit risk, model risk and liquidity risk.
• Thejudgementofwhichmarketparametersthatareobservable.
In all of these instances, decisions are based upon professional judgement in accordance with Nordea’s accounting and valuation policies.
See also the separate section 10 “Determination of fair value of financial instruments” and Note 48 “Assets and liabilities at fair value”.
Impairment testingGoodwillGoodwill is tested for impairment annually, or more frequently if events or changes in circumstances indicate that it might be impaired. This consists of an analysis to assess whether the carry-ing amount of goodwill is fully recoverable. The determination of the recoverable amount involves establishing the value in use, measured as the present value of the cash flows expected from the cash-generating unit, to which the goodwill has been allocated.
The forecasts of future cash flows are based on Nordea’s best estimates of future revenues and expenses for the cash-generating units to which goodwill has been allocated. A number of assump-tions and estimates have significant effect on these calculations and include parameters like macroeconomic assumptions, market growth, business volumes, margins and cost effectiveness. Changes to any of these parameters, following changes in market conditions, competition, strategy or other, affects the forecasted cash flows and may result in impairment charges of goodwill.
See also the separate section 15 “Intangible assets” and Note 24 “Intangible assets”.
Loans and receivablesWhen testing individual loans for impairment, the most critical judgement, containing the highest uncertainty, relates to the esti-mation of the most probable future cash flows generated from the customer.
When testing a group of loans collectively for impairment, the key aspect is to identify the events and/or the observable data that indicate that losses have been incurred in the group of loans. Assessing the net present value of the cash flows generated by the customers in the group contains a high degree of uncertainty when using historical data and the acquired experience when adjusting the assumptions based on historical data to reflect the current situation.
See also the separate section 13 “Loans and receivables” and Note 16 “Loans and receivables and their impairment”.
Actuarial calculations of pension liabilities related to employeesThe Projected Benefit pension Obligation (PBO) for major pension plans is calculated by external actuaries using demographic assumptions based on the current population. As a basis for these calculations a number of actuarial and financial parameters are used. The most important financial parameter is the discount rate. Other parameters like assumptions as to salary increases and inflation are fixed based on the expected long-term development of these parameters. The fixing of these parameters at year-end is disclosed in Note 37 “Retirement benefit obligations”.
The major part of the assets covering the pension liabilities is invested in liquid assets and valued at market price at year-end. The expected return on plan assets is fixed taking into account the asset composition and based on long-term expectations on the return on the different asset classes. The expected return is also disclosed in Note 37 “Retirement benefit obligations”.
See also the separate section 21 “Pensions to employees” and Note 32 “Liabilities to policyholders”.
Actuarial calculations for liabilities to policyholdersThe liabilities to policyholders consist of long-term obligations with some insurance contracts having long durations. A valuation of these liabilities includes estimations and assumptions, both financial and actuarial. One of the important financial assump-tions is the interest rate used for discounting future cash flows. Other important actuarial assumptions are mortality and disabil-ity assumptions, which affect the size and timing of the future cash flows. The financial and actuarial assumptions are, to a large extent, stipulated in local legislation and therefore not under Nor-dea’s discretion. Also assumptions for future administrative and tax expenses effect the calculation of policyholder liabilities.
See also the separate section 18 “Liabilities to policyholders” and Note 43 “Contingent liabilities”.
Claims in civil lawsuitsWithin the framework of the normal business operations, Nordea faces a number of claims in civil lawsuits and other disputes, most of which involve relatively limited amounts. None of these dis-putes are considered likely to have any significant adverse effect on Nordea or its financial position.
5. Principles of consolidationConsolidated entitiesThe consolidated financial statements include the accounts of the parent company Nordea Bank AB (publ), and those entities that meet the definition of a subsidiary according to IAS 27. This defi-nition is generally fulfilled when the parent company owns, directly or indirectly through group undertakings, more than 50 per cent of the voting rights or otherwise has the power to govern the financial and operating policies of the entity.
All Group undertakings are consolidated using the purchase method, except for the forming of Nordea in 1997–98 when the holding in Nordea Bank Finland Plc was consolidated using the pooling method. Under the purchase method, the acquisition is regarded as a transaction whereby the parent company indirectly acquires the subsidiary’s assets and assumes its liabilities and con-tingent liabilities. The acquisition cost to the Group is established in a purchase price allocation analysis. In such analysis, the cost of the business combination is established as the fair values of recog-nised identifiable assets, liabilities and contingent liabilities. The cost of the business combination is the aggregate of the fair values,

Nor
dea
Ann
ual R
epor
t 20
08
89
Financial statements
at the date of exchange, of assets given, liabilities incurred or assumed and equity instruments issued by the acquirer, in exchange for the net assets acquired, plus any costs directly attrib-utable to the business combination. When the cost of the business combination exceeds the net fair value of the identifiable assets, liabilities and contingent liabilities, the excess is reported as good-will. If the difference is negative, such difference is immediately recognised in the income statement.
The Group undertakings are included in the consolidated accounts as from the date on which control is transferred to Nor-dea and are no longer consolidated as from the date on which con-trol ceases.
Equity and net income attributable to minority interests are separately disclosed in the balance sheet and income statement.
In the consolidation process the reporting from the subsidiaries is adjusted to ensure consistency with IFRS principles applied by Nordea.
Investments in associated undertakingsThe equity method of accounting is used for associated undertak-ings where the share of voting rights is between 20 and 50 per cent and/or where Nordea has significant influence. Investments within Nordea’s investment activities, which are classified as a venture capital organisation within Nordea, are measured at fair value in accordance with the rules set out in IAS 28 and IAS 39.
Profits from companies accounted for under the equity method are reported post-taxes in the income statement. Consequently, the tax expense related to these profits is not included in the income tax expense for Nordea.
Special Purpose Entities (SPE)In accordance with IFRS Nordea does not consolidate SPEs’ assets and liabilities beyond its control. In order to determine whether Nordea controls an SPE or not, Nordea has to make judgements about risks and rewards and assesses the ability to make opera-tional decisions for the SPE in question.
When assessing whether Nordea shall consolidate a SPE, a range of factors are evaluated. These factors include whether the activities of the SPE are being in substance conducted on Nordea’s behalf or if Nordea has in substance the decision making powers, the rights to obtain the majority of the benefits or the majority of the residual- or ownership risks. Nordea consolidates all SPEs, where Nordea has retained the majority of the risks and rewards. For the SPEs that are not consolidated the rationale is that Nordea does not have any sig-nificant risks or rewards on these assets and liabilities.
SPEs used to allow clients to hold investments are structures that allow one or more clients to invest in an asset or set of assets (e.g. mutual funds), which are generally purchased by the SPE. The risks and rewards of the assets held by the SPE entirely reside with the clients. Typically, Nordea will receive service and commission fees for the creation of the SPE, or because it acts as investment manager, custodian or in some other function. Nordea is the investment man-ager and has sole discretion about investments and other adminis-trative decisions, but has no or only an insignificant amount of capi-tal invested. In most instances, SPEs used to allow clients to hold investments are not consolidated as Nordea’s legal and contractual rights and obligations indicate that Nordea does not have the power to govern the financial and operating policies of these enti-ties. Nordea consequently does not have the objective of obtaining benefits from its activities through such power. Nor does Nordea have the majority of the residual- or ownership risk.
The number of SPEs that Nordea has created is limited. The SPEs that are consolidated in the Group are further described in Note 22 “Investments in Group undertakings”.
Principles of eliminationIntra-group transactions and balances between the consolidated group undertakings are eliminated.
Currency translation of foreign entitiesThe consolidated financial statements are prepared in euro (EUR), the presentation currency of the parent company Nordea Bank AB (publ). The current method is used when translating the financial
statements of foreign entities into EUR from their functional cur-rency. The assets and liabilities of foreign entities have been trans-lated at the closing rates, while items in the income statements are translated at the average exchange rate for the year. Translation differences are accounted for directly in equity.
Goodwill and fair value adjustments arising from the acquisi-tion of group undertakings are treated as local currency assets and liabilities and are also translated at the closing rate.
Information on the most important exchange rates is disclosed in the separate section 27 “Exchange rates”.
Changes in Group structureThere have been no significant changes in the Group structure during the year. A business combination has, on the other hand, been effected as Nordea has acquired nine branches, which consti-tute a business under IFRS 3, from Roskilde Bank. See Note 54 “Acquisitions” for more information.
6. Recognition of operating incomeNet interest incomeInterest income and expense are calculated and recognised based on the effective interest rate method or, if considered appropriate, based on a method that results in an interest income or interest expense that is a reasonable approximation of using the effective interest rate method as basis for the calculation.
Interest income and interest expense related to all balance sheet items in Markets and Life are recognised in the income statement on the line “Net gains/losses on items at fair value”. Interest income and expense connected to internal placements by and internal funding of Markets are replaced with the related Group external interest income and interest expense.
Net fee and commission incomeNordea earns commission income from different services provided to its customers. The recognition of commission income depends on the purpose for which the fees are received. Fees are either rec-ognised as revenue when services are provided or in connection to the execution of a significant act. Fees received in connection to performed services are recognised as income in the period these services are provided. A loan syndication fee received as payment for arranging a loan as well as other fees received as payments for certain acts are recognised as revenue when the act has been com-pleted, i.e. when the syndication has been finalised.
Commission expenses are transaction based and recognised in the period when the services are received.
Income from issued financial guarantees and expenses from bought financial guarantees are amortised over the duration of the instruments and classified as “Fee and commission income” and “Fee and commission expense” respectively.
Net gains/losses on items at fair valueRealised and unrealised gains and losses, including net interest in Markets and Life, on financial instruments measured at fair value are recognised in the item “Net gains/losses on items at fair value”.
Realised and unrealised gains and losses derive from:• Shares/participationsandothershare-relatedinstruments.• Interest-bearingsecuritiesandotherinterest-relatedinstru-
ments.• Otherfinancialinstruments,whichcontaincreditderivatives
as well as commodity instruments/derivatives.• Foreignexchangegains/losses.• Investmentproperties,Life,whichincludesrealisedand
un realised income, for instance revaluation gains and losses. This line also includes realised results from divestments as well as the running property yield stemming from the holding of investment properties in Life.
Life insurance Gains and losses derived from assets in Life are split on the above-mentioned income lines in the note.
The note lines Change in technical provisions, Life and Change in collective bonus potential, Life, correspond mainly to the part

Nor
dea
Ann
ual R
epor
t 20
08
90
Financial statements
of the financial result transferred to the policyholders within Life. Nordea has disclosed these lines separately in the note. Premiums received, and repayments to policyholders, related to the financial risk are reported in the balance sheet as increases or decreases in deposits. See further information in section 18 “Liabilities to poli-cyholders”.
The insurance risk result is separated from the financial risk result and is presented separately in the note. As the net income is not material in comparison with the other income and expense lines in the income statement, this result is presented within the note as Insurance risk income, Life and Insurance risk expense, Life.
DividendsDividends received are recognised in the income statement as “Net gains/losses on items at fair value” and classified as “Shares/participations and other share-related instruments” in the note. Income is recognised in the period in which the right to receive payment is established.
Profit from companies accounted for under the equity methodThe profit from companies accounted for under the equity method is defined as the post-acquisition change in Nordea’s share of net assets in the associated companies. Profits from com-panies accounted for under the equity method are reported in the income statement post-taxes. Consequently, tax expense related to these profits is excluded from the income tax expense for Nordea.
The change in Nordea’s share of the net assets is based on the external reporting provided by the associates and affects the financial statements of Nordea in the period in which the informa-tion is available.
Other operating incomeNet gains from divestments of shares and other operating income, not related to any other income line, are generally recognised when the transactions have been finalised.
7. Recognition and derecognition of financial instruments in the balance sheetDerivative instruments, quoted securities and foreign exchange spot transactions are recognised on and derecognised from the balance sheet on the trade date. Other financial instruments are recognised on the balance sheet on settlement date.
Financial assets, other than those for which trade date account-ing is applied, are derecognised from the balance sheet when the contractual rights to the cash flows from the financial asset expire or are transferred to another party. The rights to the cash flows normally expire or are transferred when the counterpart has per-formed by e.g. repaying a loan to Nordea, i.e. on settlement date.
In some cases, Nordea enters into transactions where it trans-fers assets that are recognised on the balance sheet, but retains either all or a portion of risks and rewards of the transferred assets. If all or substantially all risks and rewards are retained, the transferred assets are reclassified to the item “Financial instru-ments pledged as collateral” in the balance sheet. Transfers of assets with retention of all or substantially all risks and rewards include e.g. security lending agreements and repurchase agree-ments.
Financial liabilities, other than those for which trade date accounting is applied, are derecognised from the balance sheet when the liability is extinguished. Normally this occurs when Nordea performs, for example when Nordea repays a deposit to the counterpart, i.e. on settlement date.
For further information, see sections “Securities borrowing and lending agreements” and “Repurchase and reverse repurchase agreements” within 12 “Financial instruments”, as well as Note 50 “Obtained collaterals which are permitted to be sold or repledged”.
8. Translation of assets and liabilities denominated in foreign currenciesThe functional currency of each entity is decided based upon the primary economic environment in which the entity operates. The parent company Nordea Bank AB (publ) uses two functional cur-
rencies for reporting in consolidated accounts, based on the differ-ent activities in the underlying business.
Foreign currency is defined as any currency other than the functional currency of the entity. Foreign currency transactions are recorded at the exchange rate on the date of the transaction. Monetary assets and liabilities denominated in foreign currencies are translated at the exchange rate on the balance sheet date.
Exchange differences arising on the settlement of transactions at rates different from those at the date of the transaction, and unrealised translation differences on unsettled foreign currency monetary assets and liabilities, are recognised in the income state-ment in the item “Net gains/losses on items at fair value”.
Translation differences on financial instruments that are desig-nated hedging instruments in a hedge of a net investment in a group undertaking are recognised in equity, to the extent the hedge is effective. This is performed in order to offset the transla-tion differences affecting equity when consolidating the group undertaking into Nordea. Any ineffectiveness is recognised in the income statement in the item “Net gains/losses on items at fair value”.
9. Hedge accountingIAS 39 includes principles and rules concerning accounting for hedging instruments and the underlying hedged item, so-called hedge accounting. All derivatives are measured at fair value. Nor-dea applies the EU carve out version of IAS 39 for portfolio hedges of both assets and liabilities.
The hedge accounting policy within Nordea has been devel-oped to fulfil the requirements set out in IAS 39. Nordea uses hedge accounting in order to have a symmetrical accounting treat-ment of the changes in fair value of the hedged item and changes in fair value of the hedging instruments and in order to hedge the exposure to variability in cash flows and net investments in for-eign operations. The overall purpose is to have a true and fair pre-sentation of Nordea’s economical hedges in the financial state-ments. The overall operational responsibility to hedge positions and for hedge accounting lies within Group Treasury.
According to IAS 39 there are three forms of hedge accounting:• Fairvaluehedgeaccounting.• Cashflowhedgeaccounting.• Hedgesofnetinvestments.
Fair value hedge accountingFair value hedge accounting is used when derivatives are hedging changes in fair value of a recognised asset or liability attributable to a specific risk. The risk of changes in fair value of assets and lia-bilities in Nordea’s financial statements originates mainly from loans, securities and deposits with a fixed interest rate, causing interest rate risk. Changes in fair value from derivatives as well as changes in fair value of the hedged item attributable to the risks being hedged will be recognised separately in the income state-ment in the item “Net gains/losses on items at fair value”. Given an effective hedge, the two changes in fair value will more or less balance, meaning the net result will be close to zero. The changes in fair value of the hedged item attributable to the risks hedged with the derivative instrument are reflected in an adjustment to the carrying amount of the hedged item, which is also recognised in the income statement. The fair value change of the hedged item in a portfolio hedge of interest rate risks is reported separately from the portfolio in “Fair value changes of the hedged items in portfolio hedge of interest rate risk” in accordance with IAS 39.
Fair value hedge accounting in Nordea is performed mainly on a portfolio basis. The effectiveness of the hedging relationships is consequently measured and evaluated so that any ineffectiveness is affecting the income statement under the item “Net gains/losses on items at fair value”.
Cash flow hedge accountingCash flow hedge accounting is used for the hedging of exposure to variations in future interest payments on asset or liabilities with variable interest rates. The portion of the gain or loss on the hedg-ing instrument, that is determined to be an effective hedge, is rec-ognised directly in equity. The ineffective portion of the gain or

Nor
dea
Ann
ual R
epor
t 20
08
91
Financial statements
loss on the hedging instrument is recognised in the item “Net gains/losses on items at fair value” in the income statement.
Gains or losses on hedging instruments recognised directly in equity are recognised in the income statement in the same period as interest income or interest expense from the hedged asset or liability.
Hedges of net investmentsSee separate section 8 “Translation of assets and liabilities denom-inated in foreign currency”.
Hedging instrumentsThe hedging instruments used in Nordea are predominantly interest rate swaps. Currency interest rate swaps and cash instru-ments are only utilised in a few transactions. Cash instruments are only used as hedging instruments when hedging currency risk.
Hedged itemsAccording to IAS 39 a hedged item can be a single asset or liability as well as a group of assets or liabilities with similar risk charac-teristics.HedgeditemsinNordeaconsistofbothindividualassetsor liabilities and portfolios of assets or liabilities.
Hedge effectivenessThe application of hedge accounting requires the hedge to be highly effective. A hedge is regarded as highly effective if at incep-tion and throughout its life it can be expected that changes in fair value of the hedged item can be essentially offset by changes in fair value of the hedging instrument. The result should be within a range of 80–125 per cent.
When assessing hedge effectiveness retrospectively Nordea measures the fair value of the hedging instruments and compares the change in fair value of the hedging instrument to the change in fair value of the hedged item. The effectiveness measurement is made on a cumulative basis.
If the hedge relationship does not fulfil the requirements, hedge accounting will be terminated. The change in the unrea-lised value of the derivatives will, prospectively from the last time it was last proven effective, be accounted for in the income state-ment at fair value through profit or loss. For fair value hedges, the change in the fair value on the hedged item, up to the point when the hedge relationship is terminated, is amortised to the income statement on a straight-line basis over the remaining maturity of the hedged item. In cash flow hedges, the cumulative gain or loss on the hedging instrument that has been recognised in other com-prehensive income from the period when the hedge was effective is reclassified from equity to “Net gains/losses on items at fair value” in the income statement.
10. Determination of fair value of financial instrumentsFinancial assets and liabilities classified as financial assets/liabili-ties at fair value through profit or loss and derivative instruments are recorded at fair value on the balance sheet with changes in fair value recognised in the income statement in the item “Net gains/losses on items at fair value”.
Fair value is defined by IAS 32 and IAS 39 as the amount for which an asset could be exchanged, or a liability settled, between knowledgeable, willing parties in an arm’s length transaction.
The existence of published price quotations in an active market is the best evidence of fair value and when they exist they are used to measure financial assets and financial liabilities. Nordea is pre-dominantly using published price quotations to establish fair value for items disclosed under the following balance sheet items:• Treasurybills.• Interest-bearingsecurities.• Shares.• Derivatives(listedderivatives).• Debtsecuritiesinissue(issuedmortgagebondsinNordea
Kredit Realkreditaktieselskab).
If quoted prices for a financial instrument fail to represent actual and regularly occurring market transactions or if quoted prices are not available, fair value is established by using an appropriate valuation technique. Valuation techniques can range from simple
discounted cash flow analysis to complex option pricing models. Valuation models are designed to apply observable market prices and rates as input whenever possible, but can also make use of unobservable model parameters. Nordea is predominantly using valuation techniques to establish fair value for items disclosed under the following balance sheet items:• Treasurybills(whenquotedpricesinanactivemarketarenot
available).• Loansandreceivablestothepublic(mortgageloansinthe
Danish subsidiary Nordea Kredit Realkreditaktieselskab).• Interest-bearingsecurities(whenquotedpricesinanactive
market are not available).• Shares(whenquotedpricesinanactivemarketarenotavail-
able).• Derivatives(OTC-derivatives).
Fair value is calculated as the theoretical net present value of the individual contracts, based on independently sourced market parameters and assuming no risks and uncertainties. This calcula-tion is supplemented by a portfolio adjustment. The portfolio adjustment covers uncertainties associated with the valuation tech-niques, model assumptions and unobservable parameters as well as the portfolio’s counter party credit risk and liquidity risk. The portfolio adjustment for model risk comprises two components:• Benchmarkingofthemodeloutput(marketvalues)against
market information or against results from alternative models, where available.
• Sensitivitycalculationswhereunobservableparametersarevaried to take other reasonable values.
For financial instruments, where fair value is estimated by a valu-ation technique, it is investigated whether the variables used in the valuation model are fully based on data from observable mar-kets. By data from observable markets, Nordea considers data that can be collected from generally available external sources and where this data is judged to represent realistic market prices. If non-observable data is used, the instrument cannot be recognised initially at the fair value estimated by the valuation technique and any upfront gains are thereby deferred and amortised through the income statement over the contractual life of the contract
The valuation models applied by Nordea are consistent with accepted economic methodologies for pricing financial instru-ments, and incorporate the factors that market participants con-sider when setting a price.
New valuation models are subject to approval by Group Credit and Risk Control and all models are reviewed on a regular basis.
For further information, see Note 48 “Assets and liabilities at fair value”.
11. Cash and cash equivalentsCash and cash equivalents consist of cash and balances with cen-tral banks where the following conditions are fulfilled:• ThecentralbankisdomiciledinacountrywhereNordeais
operating under a banking licence.• Thebalanceisreadilyavailableatanytime.
Cash and cash equivalents are financial instruments classified within the category “Loans and receivables”, see section 12 “Financial instruments”.
Loans and receivables to credit institutions payable on demand are also recognised as “Cash and cash equivalents” in the cash flow statement.
12. Financial instrumentsClassification of financial instrumentsEach financial instrument within the scope of IAS 39 has been classified into one of the following categories:
Financial assets:• Financialassetsatfairvaluethroughprofitorloss: – Heldfortrading. – Financial assets upon initial recognition designated at fair
value through profit or loss (Fair Value Option).

Nor
dea
Ann
ual R
epor
t 20
08
92
Financial statements
• Loansandreceivables.• Heldtomaturityinvestments.• Availableforsalefinancialassets.
Financial liabilities:• Financialliabilitiesatfairvaluethroughprofitorloss: – Heldfortrading. – Financial liabilities upon initial recognition designated at fair
value through profit or loss (Fair Value Option).• Otherfinancialliabilities.
All financial assets and liabilities are initially measured at fair value. The classification of financial instruments into different cat-egories forms the basis for how each instrument is subsequently measured in the balance sheet and how changes in its value are recognised. In Note 47 “Classification of financial instruments” the classification of the financial instruments in Nordea’s balance sheet is presented.
Financial assets and financial liabilities at fair value through profit or lossFinancial assets and financial liabilities at fair value through profit or loss are measured at fair value, excluding transaction costs. All changes in fair values are recognised directly in the income state-ment in the item “Net gains/losses on items at fair value”.
Thecategoryconsistsoftwosub-categories;Heldfortradingand Financial assets/financial liabilities upon initial recognition designated at fair value through profit or loss (Fair value option).
Thesub-categoryHeldfortradingmainlycontainsderivativeinstruments that are held for trading purposes, interest-bearing securities and shares within Markets and Treasury. It also contains trading liabilities such as short-selling positions.
The major parts of the sub-categories Financial assets/financial liabilities upon initial recognition designated at fair value through profit or loss are mortgage loans and related issued bonds in the Danish subsidiary Nordea Kredit Realkreditaktieselskab and inter-est-bearing securities, shares and investment contracts in Life. Assets and liabilities in Nordea Kredit Realkreditaktieselskab are classified as upon initial recognition designated at fair value through profit or loss to eliminate or significantly reduce an accounting mismatch. Interest-bearing securities, shares and invest-ment contracts in Life also belongs to this category, as a consequence of that these assets and liabilities are managed on a fair value basis.
Nordea also applies the Fair value option on certain financial assets and financial liabilities related to Markets. The classification stems from that Markets is managing and measuring all its finan-cial assets and liabilities to fair value. Consequently, all financial assets and financial liabilities in Markets are classified as Financial assets and financial liabilities at fair value through profit or loss.
Loans and receivablesLoans and receivables are non-derivative financial assets, with fixed or determinable payments, that are not quoted in an active market. These assets and their impairment are further described in the separate section 13 “Loans and receivables”.
Held to maturity investmentsHeld-to-maturityinvestmentsareinitiallyrecognisedinthebal-ance sheet at the acquisition price, including transaction costs. Subsequent to initial recognition, the instruments within this cate-gory are measured at amortised cost. In an amortised cost mea-surement, the difference between acquisition cost and redemption value is amortised in the income statement over the remaining term using the effective interest rate method.
Nordea assesses at each reporting date whether there is any objective evidence that the asset is impaired. If there is such evi-dence, an impairment loss is recorded. The loss is calculated as the difference between the carrying amount and the present value of estimated future cash flows and is recognised as “Loan losses” in the income statement. See section 13 “Loans and receivables” for more information on the identification and measurement of objec-tive evidence of impairment.
Available for sale financial assets Available for sale financial assets are measured at fair value. Changes in fair values, except for interest, foreign exchange effects and impairment losses, are recognised directly in the revaluation reserves in equity. Interest is recognised as interest income in the income statement. Foreign exchange effects and impairment losses from Available for sale financial assets are recognised in the income statement in the item “Net gains/losses on items at fair value”.
When an available for sale financial assets is disposed of, the accumulated fair value changes that previously have been recogn-ised in equity are removed from equity and recognised in the income statement in the item “Net gains/losses on items at fair value”.
Other financial liabilitiesFinancial liabilities, other than those classified as Financial liabili-ties at fair value through profit or loss, are measured at amortised cost. Interest from Other financial liabilities is recognised in the item “Interest expense” in the income statement.
Hybrid (combined) financial instrumentsHybrid(combined)financialinstrumentsarecontractscontaininga host contract and an embedded derivative instrument. Such combinations arise predominantly from the issuance of structured debt instruments, such as issued index-linked bonds.
Index-linked bonds issued by Group Treasury are considered to be part of the funding activities. The zero coupon bond, is mea-sured at amortised cost. The embedded derivatives in those instruments are separated from the host contract and accounted for as stand-alone derivatives at fair value, if the economic charac-teristics and risks of the embedded derivative are not closely related to the economic characteristics and risks of the host con-tract, and the embedded derivative actually meets the definition of a derivative instrument. Changes in fair values, of the embed-ded derivatives, are recognised in the income statement in the item “Net gains/losses on items at fair value”.
Index-linked bonds issued by Markets as part of the trading portfolioareclassifiedasHeldfortrading,andtheentirecom-bined instrument, host contract together with the embedded derivative, is measured at fair value through profit or loss. Changes in fair values are recognised in the income statement in the item “Net gains/losses on items at fair value”.
Securities borrowing and lending agreementsGenerally, securities borrowing and securities lending transac-tions are entered into on a collateralised basis. Unless the risks and rewards of ownership are transferred, the securities are not derec-ognised from or recognised on the balance sheet. In the cases where the counterpart is entitled to resell or repledge the securi-ties, the securities are recognised on the balance sheet as “Finan-cial instruments pledged as collateral”.
Borrowed securities are recognised off balance sheet in the item “Assets pledged as security for own liabilities”.
Cash collateral advanced to the counterparts is recognised on the balance sheet as “Loans and receivables to credit institutions” or as “Loans and receivables to the public”. Cash collateral received from the counterparts is recognised on the balance sheet as “Deposits by credit institutions” or as “Deposits and borrow-ings from the public”.
Interest income and expense generated from these transactions are recognised in “Net gains/losses on items at fair value”.
Repurchase and reverse repurchase agreementsSecurities delivered under repurchase agreements and securities received under reverse repurchase agreements are not derecogn-ised from or recognised on the balance sheet. In the cases where the counterpart has the right to resell or repledge the securities, the securities are recognised on the balance sheet as “Financial instruments pledged as collateral”.
Securities received under reverse repurchase agreements are recognised off-balance sheet in the item “Assets pledged as secu-rity for own liabilities”.

Nor
dea
Ann
ual R
epor
t 20
08
93
Financial statements
Cash received under repurchase agreements is recognised on the balance sheet as “Deposits by credit institutions” or as “Deposits and borrowings from the public”. Cash delivered under reverse repurchase agreements is recognised on the balance sheet as “Loans and receivables to credit institutions” or as “Loans and receivables to the public”.
Additionally, the sale of securities received in reverse repur-chase agreements trigger the recognition of a trading liability (short sale).
DerivativesAll derivatives are recognised on the balance sheet and measured at fair value. Derivatives with total positive fair values, including any accrued interest, are recognised as assets in the item “Derivatives”. Derivatives with total negative fair values, including any accrued interest, are recognised as liabilities in the item “Derivatives”.
Realised and unrealised gains and losses from derivatives are recognised in the income statement in the item “Net gains/losses on items at fair value”.
Financial guarantee contractsUpon initial recognition, the premiums received in issued finan-cial guarantee contracts are recognised as deferred income on the balance sheet. The guarantees are subsequently measured, and recognised on the balance sheet, at the higher of either the received guarantee fee less amortisation, or a provision calculated as the discounted best estimate of the expenditure required to set-tle the present obligation. Provisions and changes in provisions are recognised in the income statement in the item “Loan losses”.
The contractual amounts from financial guarantees are recogn-ised off-balance sheet in the item “Contingent liabilities”.
13. Loans and receivablesLoans and receivables not measured at fair value are measured at amortised cost (see also the separate section 7 “Recognition and derecognition of financial instruments in the balance sheet” as well as Note 47 ”Classification of financial instruments”).
Nordea monitors loans and receivables as described in the sep-arate section on Risk, Liquidity and Capital management. Loans attached to individual customers or groups of customers are iden-tified as impaired if the impairment test indicates objective evi-dence of impairment
Impairment test of loans attached to individual customersNordea tests significant loans for impairment on an individual basis. The purpose of the impairment tests is to find out if the loans have become impaired. As a first step in the identification process for impaired loans, Nordea monitors whether there are indicators for impairment (loss event) and whether these repre-sent objective evidence of impairment. More information on the identification of loss events can be found in the “Risk, Liquidity and Capital Management” section, sub-section “Credit risk”.
In the process to conclude whether there is objective evidence of impairment, an assessment is performed to estimate the most prob-able future cash flows generated by the customer. These cash flows are then discounted by the effective interest rate giving the net pres-ent value. Collaterals received to mitigate the credit risk will be assessed at fair value. If the carrying amount of the loan is higher than the net present value of the estimated future cash flows, including the fair value of the collaterals, the loan is impaired.
Loans that are not individually impaired will be transferred to a group of loans with similar risk characteristics for a collective impairment test.
Impairment test of loans attached to groups of customersAll loans not impaired on an individual basis are collectively assessed for impairment. The loans are grouped on the basis of similar credit risk characteristics that are indicative of the debtors’ ability to pay all amounts due according to the contractual terms. Nordea monitors its portfolio through rating migrations, the credit decision and annual review process supplemented by quar-terly risk reviews. Through these processes Nordea identifies loss events indicating incurred losses in a group.
Only loss events incurred up to the reporting date are included when performing the assessment of the group.
The objective for the group assessment process is to evaluate if there is a need to make a provision due to the fact that a loss event has occurred, which has not yet been identified on an individual basis. This period between the date when the loss event occurred and the date when it is identified on an individual basis is called “Emergence period”. The impairment remains related to the group of loans until the losses have been identified on an individ-ual basis. The identification is made through a default of the engagement or by other indicators.
For corporate customers and bank counterparts, Nordea uses the existing rating system as a basis when assessing the credit risk. Nordea uses historical data on probability of default to estimate the risk for a default in a rating class. These loans are rated and grouped mostly based on type of industry and/or sensitivity to certain macro parameters, e.g. dependency to oil prices etc. Per-sonal customers and small corporate customers are monitored through scoring models. These are based mostly on historical data, as default rates and loss rates given a default, and experi-enced judgement performed by management. Rating and scoring models are described in more detail in the separate section on Risk, Liquidity and Capital management.
The collective assessment is performed through a netting prin-ciple, i.e. when rated engagements are up-rated due to estimated increases in cash flows, this improvement will be netted against losses on loans that are down-rated due to estimated decreases in cash-flows. Netting is only performed within groups with similar risk characteristics where Nordea assesses that the customers’ future cash flows are insufficient to serve the loans in full.
Impairment lossIf the carrying amount of the loans is higher than the sum of the net present value of estimated cash flows, including the fair value of the collaterals and other credit enhancements, the difference is the impairment loss.
If the impairment loss is not regarded as final, the impairment loss is accounted for on an allowance account representing the accumulated impairment losses. Changes in the credit risk and accumulated impairment losses will be recorded as changes in the allowance account and as “Loan losses” in the income statement.
If the impairment loss is regarded as final, it is reported as a realised loss. A realised loss is recognised and the value of the loan and the related allowance for impairment loss are derecognised with a corresponding gain or loss recognised in the line item “Loan losses” in the income statement. An impairment loss is regarded as final when the obligor is filed for bankruptcy and the administrator has declared the economic outcome of the bank-ruptcy procedure, or when Nordea forgives its claims either through a legal based or voluntary reconstruction or when Nor-dea, for other reasons, deem it unlikely that the claim will be recovered.
Discount rateThe discount rate used to measure impairment is the original effective interest rate for loans attached to an individual customer and, if applicable, to a group of loans.
Restructured loansIn this context a restructured loan is defined as a loan where the creditor has granted concessions to the obligor due to its deterio-rated financial situation and where this concession has resulted in an impairment loss for the creditor. After a reconstruction the loan is normally regarded as not impaired if it performs according to the new conditions. Concessions made in reconstructions are regarded as final losses unless Nordea retains the possibility to regain the realised loan losses incurred. This is, in the event of a recovery, reported as recoveries of realised loan losses.
Assets taken over for protection of claimsIn a financial reconstruction the creditor may concede loans to the obligor and in exchange for this concession acquires an asset pledged for the conceded loans, shares issued by the obligor or

Nor
dea
Ann
ual R
epor
t 20
08
94
Financial statements
other assets. Financial assets that are foreclosed are classified as Available for sale (see section 12 “Financial instruments”) and any other asset is reported on the same balance sheet line as similar assets already held by Nordea. For example a property taken over, not held for Nordea’s own use, is reported together with other investments properties. At initial recognition, all assets taken over for protection of claims are valued at fair value. The fair value of the asset on the date of recognition becomes its cost or amortised cost value, as applicable. In subsequent periods, assets taken over for protection of claims are valued in accordance with the valua-tion principles for the appropriate type of asset.
Any change in value, after the initial recognition of the asset taken over, is presented in the income statement in line with the Group’s presentation policies for the appropriate asset. Conse-quently, the credit loss line is after the initial recognition of the asset taken over not affected by any subsequent remeasurement of the asset.
14. LeasingNordea as lessorFinance leasesNordea’s leasing operations mainly comprise finance leases. A finance lease is reported as a receivable from the lessee in the balance sheet item “Loans and receivables to the public” at an amount equal to the net investment in the lease. The lease pay-ment, excluding cost of services, is recorded as repayment of principal and interest income. The income allocation is based on a pattern reflecting a constant periodic return on the net investment outstanding in respect of the finance lease.
Operating leasesAssets subject to operating leases in the balance sheet are reported in accordance with the nature of the assets, in general as property and equipment. Leasing income is recognised as income on a straight-line basis over the lease term. The depreciation of the leased assets is calculated on the basis of Nordea’s depreciation policy for similar assets and reported as depreciation on property and equipment in the income statement.
Nordea as lesseeFinance leasesIn the consolidated accounts finance leases are recognised as assets and liabilities in the balance sheet at the amount equal to the fair value, or if lower, the present value of the minimum lease payments of the leased assets at the inception of the lease. The assets are reported in accordance with the nature of the assets. Lease payments are apportioned between the finance charge and the reduction of the outstanding liability. The finance charge is allocated to periods during the lease term so as to produce a con-stant periodic rate of interest on the remaining balance of the lia-bility for each period. A finance lease also gives rise to a deprecia-tion expense for the leased asset. The depreciation policy is consis-tent with that of the assets in own use. Impairment testing of leased assets is performed following the same principles as for similar owned assets.
Operating leasesFor operating leases the lease payments are recognised as expenses in the income statement on a straight-line basis over the lease term unless another systematic way better reflects the time pattern of the user’s benefit. The lease terms range between 3 to 25 years.
Operating leasing is mainly related to office premises contracts and office equipment contracts normal to the business.
The central district properties in Finland, Norway and Sweden that Nordea has divested are leased back. The duration of the lease agreements were initially 3-25 years with renewal options. The lease agreements include no transfers of ownerships of the asset by the end of the lease term, nor any economic benefits from appreciation in value of the leased property. In addition, the lease term is not for the major part of the assets’ economic life. These leases are thus classified as operating leases. The rental expense for these premises is recognised on the basis of the time-pattern of
Nordea’s economic benefit which differs from the straight-line basis and better resembles an ordinary rental arrangement.
Embedded leasesAgreements can contain a right to use an asset in return for a pay-ment, or a series of payments, although the agreement is not in the legal form of a leasing contract. If applicable, these assets are sepa-rated from the contract and accounted for as leased assets.
15. Intangible assetsIntangible assets are identifiable, non-monetary assets without physical substance. The assets are under Nordea’s control, which means that Nordea has the power and rights to obtain the future economic benefits flowing from the underlying resource. The intangible assets in Nordea mainly consist of goodwill, computer software and customer related intangible assets.
GoodwillGoodwill represents the excess of the cost of an acquisition over the fair value of Nordea’s share of net identifiable assets of the acquired group undertaking/associated undertaking at the date of acquisi-tion. Goodwill on acquisition of group undertakings is included in “Intangible assets”. Goodwill on acquisitions of associates is included in “Investments in associated undertakings”. Goodwill is tested annually for impairment, or more frequently if events or changes in circumstances indicate that it might be impaired. Good-will is carried at cost less accumulated impairment losses.
As part of its transition to IFRS, Nordea elected to restate only those business combinations that occurred on or after 1 January 2004. In respect of acquisitions prior to that date, goodwill repre-sents the amount recognised under Nordea’s previous accounting framework (Swedish generally accepted accounting principles) less any impairment losses.
Computer softwareCosts associated with maintaining computer software programs are recognised as expenses as incurred. Costs directly associated with major software development investments, with a useful life of three years or more and the ability to generate future economic benefits, are recognised as intangible assets. These costs include software development staff costs and overhead expenditure directly attributable to preparing the asset for use. Computer soft-ware includes also acquired software licenses not related to the function of a tangible asset.
Amortisation is calculated on a straight-line basis over the use-ful life of the software, generally a period of 3 to 10 years.
Customer related intangible assetsWhen acquiring customer related contracts the fair value of these contracts is recognised as customer related intangible assets. Amortisation is recognised over the expected lifetime of the con-tracts.
Other intangible assetsExpenditure on acquired patents, trademarks and licenses is capi-talised and amortised using the straight-line method over their useful lives, generally 5 years.
Impairment Goodwill and other intangible assets with indefinite useful lives are not amortised but tested for impairment annually irrespective of any indications of impairment. Impairment testing is also per-formed more frequently if required due to indication of impair-ment. The impairment charge is calculated as the difference between the carrying amount and the recoverable amount.
At each balance sheet date, all other intangible assets with defi-nite useful lives are reviewed for indications of impairment. If such indications exist, an analysis is performed to assess whether the carrying amount of the intangible asset is fully recoverable.
The recoverable amount is the higher of fair value less costs to sell and the value in use of the asset or the cash-generating unit, which is defined as the smallest identifiable group of assets that generates cash inflows in relation to the asset. For goodwill, the

Nor
dea
Ann
ual R
epor
t 20
08
95
Financial statements
cash generating units are defined as segments presented in section 25 “Segment reporting”per acquired legal entity. The value in use is the present value of the cash flows expected to be realised from the asset or the cash-generating unit. The cash flows are assessed based on the asset or cash-generating unit in its current condition and discounted at a discount rate determined as the cost of equity, estimated according to standard capital asset pricing. If the recov-erable amount is less than the carrying amount, an impairment loss is recognised.
16. Property and equipmentProperty and equipment includes own-used properties, leasehold improvements, IT equipment, furniture and other equipment. Items of property and equipment are measured at cost less accu-mulated depreciation and accumulated impairment losses. The cost of an item of property and equipment comprises its purchase price, as well as any directly attributable costs of bringing the asset to the working condition for its intended use. When parts of an item of property and equipment have different useful lives, they are accounted for as separate items.
Depreciation is calculated on a straight-line basis as follows:Buildings 30–75 years.Equipment 3–5 years.Leasehold improvements Changes within buildings the shorter
of 10 years and the remaining leasing term. New construction the shorter of the principles used for owned build-ings and the remaining leasing term. Fixtures installed in leased properties are depreciated over the shorter of 10–20 years and the remaining leasing term.
At each balance sheet date, Nordea assesses whether there is any indication that an item of property and equipment may be impaired. If any such indication exists, the recoverable amount of the asset is estimated and any impairment loss is recognised.
17. Investment propertyInvestment properties are primarily properties held to earn rent and capital appreciation. The majority of the properties in Nordea are attributable to Life. Investment properties are measured at fair value. The best evidence of a fair value is normally given by cur-rent prices on an active market for similar property in the same location and condition. In the absence of current prices on an active market, discounted cash flow projections based on reliable estimates of future cash flows are used.
Net rental income, gains and losses as well as fair value adjust-ments are recognised directly in the income statement as “Net gains/losses on items at fair value”.
18. Liabilities to policyholdersLiabilities to policyholders include obligations according to insur-ance contracts and investment contracts with policyholders.
An insurance contract is defined as “a contract under which one party (the insurer) accepts significant insurance risks from another party (the policyholder) by agreeing to compensate the policyholder if a specified uncertain future event (the insured event) adversely affects the policyholder”.
Investment contracts are contracts with policyholders that have the legal form of insurance contracts but where the insurance risk transfer has been assessed to be insignificant.
The insurance risk is generally calculated as the risk sum pay-able as a percentage of the reserve behind the contract at the beginning of the contract period. It is Nordea’s assessment that a risk percentage of five or higher is a significant insurance risk.
The contracts can be divided into the following classes:• Insurancecontracts: – Traditional life insurance contracts with and without discre-
tionary participation feature. – Unit-Linked contracts with significant insurance risk. – Healthandpersonalaccident.
• Investmentcontracts: – Investment contracts with discretionary participation
feature. – Investment contracts without discretionary participation
feature.
Insurance contracts The measurement principles under local GAAP have been main-tained consequently resulting in a non-uniform accounting poli-cies method on consolidation.
Traditional life insurance provisions represent consolidated provisions for all the companies in Nordea Life & Pensions, including companies in Sweden, Norway, Finland, Denmark, Poland, Luxembourg, Isle of Man, Estonia and Lithuania.
In Denmark, Sweden and Finland the measurements are pre-pared by calculating the present value of future benefits, to which the policyholders are entitled. The calculation includes assump-tions about market consistent discounting rates as well as expenses and life risk. The discount rate is based on the liabilities’ current term. In Denmark, the provision, in addition, includes bonus potential on paid policies and on future premiums.
The measurement of insurance contracts in Finland has during 2008 changed from a retrospective method to a market consistent prospective method similar to the method for Swedish and Dan-ish insurance contracts. The difference between the retrospective value and the prospective market value at the date of change is recognised as “Collective bonus potentials” and this has thus not had an impact on the income statement or balance sheet.
In Norway the provisions are mainly calculated on the basis of a prospective method. The discount rate used is equal to the origi-nal tariff rates and assumptions about expenses and risk.
The accounting policy for each company is based on the local structure of the business and is closely related to solvency rules, and national regulation concerning profit sharing and other requirements about collective bonus potential.
Unit-Linked contracts represent life insurance provisions relat-ing to Unit-Linked policies written either with or without an investment guarantee. Unit-Linked contracts classified as insur-ance contracts include the same insurance risk elements as tradi-tional insurance contracts. These contracts are mainly recognised and measured at fair value on the basis of: • thefairvalueoftheassetslinkedtotheUnit-Linkedcontracts,
and• theestimatedpresentvalueoftheinsuranceriskwhichiscal-
culated in the same way as traditional insurance contracts con-sidering the impact on every risk element included in the cash flows.
Healthandpersonalaccidentprovisionsincludepremiumreserves and claims outstanding. This item is recognised and mea-sured on deferred basis in the same way as general insurance con-tracts.
Investment contracts Investment contracts are contracts with policyholders, which do not transfer sufficient insurance risk to be classified as insurance contracts.
However,investmentcontractswithdiscretionaryparticipa-tion features are, in line with IFRS 4, accounted for as insurance contracts using local accounting principles. Nordea Life & Pen-sion has only a small number of these contracts.
Investment contracts without discretionary participation fea-tures are recognised and measured to fair value in accordance with IAS 39, Financial instruments, equal to fair value of the assets linked to these contracts. These assets are classified as upon initial recognition designated at fair value through profit or loss to elimi-nate or significantly reduce an accounting mismatch.
Discretionary participating features (DPF)Some traditional life insurance contracts and investment contracts include a contractual right for the policyholder to receive signifi-cant benefits in addition to guaranteed benefits. Nordea has dis-cretion to pay these additional benefits as bonus on risk result,

Nor
dea
Ann
ual R
epor
t 20
08
96
Financial statements
expense result and interest rate. These DPF-features (Collective bonus potential) are classified as liabilities in the balance sheet.
Collective bonus potential includes amounts allocated but not attributed to the policyholders. In Finland, collective bonus poten-tial includes the policyholder’s part of the total unrealised invest-ment gains and bonus potential on paid policies and future premi-ums (the difference between retrospective and market consistent prospective measurement principles of the insurance contracts). In Norway, collective bonus potential includes the policyholder’s part of both the total unrealised investment gains and additional reserves. In Sweden and Denmark, the main valuation principle is fair value (insurance contracts). The policyholder’s part of both realised and unrealised investment gains is therefore included in the balance sheet representing either Change in technical provi-sions, Life and/or Change in collective bonus potentials, Life, depending on whether the investment result is allocated or not. Both the mentioned lines are included in the balance sheet line “Liabilities to policyholders”.
Liability adequacy testThe adequacy of insurance provisions is assessed at each report-ing date to ensure that the carrying amount of the liabilities is higher than the best estimate of future cash flows discounted with current interest rates. If needed, additional provisions are accounted for and recognised in the income statement.
19. TaxesIncome tax expense comprises current and deferred tax. Income tax expense is recognised in the income statement, except to the extent that the tax effect relates to items recognised directly in equity, in which case the tax effect is recognised in equity.
Current tax is the expected tax expense on the taxable income for the year, using tax rates enacted or substantively enacted at the reporting date, and any adjustment to tax payable in respect of previous years.
Deferred tax assets and liabilities are recognised, using the bal-ance sheet method, providing for temporary differences between the carrying amounts of assets and liabilities for financial report-ing purposes and the amounts used for taxation purposes. Deferred tax assets are recognised for the carry-forward of unused tax losses and unused tax credits. Deferred tax is not recognised for temporary differences arising on initial recognition of assets or liabilities in a transaction that is not a business combination and that effects neither accounting nor taxable profit, and differences relating to investments in subsidiaries and associated companies to the extent that it is probable that they will not reverse in the foreseeable future. In addition, deferred tax is not recognised for taxable temporary differences arising on the initial recognition of goodwill.
Deferred tax is measured at the tax rates that are expected to be applied to the temporary differences when they reverse, based on the laws that have been enacted or substantively enacted at the reporting date. Deferred tax assets and liabilities are not dis-counted. A deferred tax asset is recognised to the extent that it is probable that future taxable profits will be available against which the temporary differences, tax losses carry forward and unused tax credits can be utilised. Deferred tax assets are reviewed at each reporting date and are reduced to the extent that it is no longer probable that the related tax benefit will be realised.
Current tax assets and current tax liabilities are offset when the legal right to offset exists. Deferred tax assets and liabilities are offset if there is a legally enforceable right to offset current tax lia-bilities and assets.
20. Earnings per shareBasic earnings per share is calculated by dividing the profit or loss attributable to shareholders of Nordea Bank AB by the weighted average number of ordinary shares outstanding during the period (including rights in the long term incentive programmes that are vested). Diluted earnings per share is determined by adjusting the weighted average number of ordinary shares outstanding for the effects of all dilutive potential ordinary shares, which comprise
rights to performance shares in the long term incentive pro-grammes. These rights are considered dilutive to the degree performance criteria are met at the reporting date.
21. Pensions to employeesPension plansThe companies within Nordea have various pension plans, con-sisting of both defined benefit plans and defined contribution plans, reflecting national practices and conditions in the countries where they operate. Defined benefit plans are predominantly sponsored in Sweden, Norway and Finland. The major defined benefit plans are funded schemes covered by assets in pension funds/foundations. If the fair value of plan assets, associated with a specific pension plan, is lower than the gross present value of the defined benefit obligation, the net amount is recognised as a liabil-ity (defined benefit obligation). If not, the net amount is recogn-ised as an asset (defined benefit asset). Non-funded pension plans are recognised as defined benefit obligations.
Most pensions in Denmark, but also certain Finnish plans, are based on defined contribution plans that hold no pension liability for Nordea. Nordea also contributes to public pension systems.
Pension costsThe pension calculations are carried out by country and by pen-sion plan in accordance with IAS 19.
Obligations for defined contribution pension plans are recogn-ised as an expense as the employee renders services to the entity and the contribution payable in exchange for that service becomes due. Nordea’s net obligation for defined benefit pension plans is calculated separately for each plan by estimating the amount of future benefit that employees have earned for their service in the current and prior periods. That benefit is discounted to determine its present value. Any unrecognised prior service cost and the fair value of any plan assets are deducted. Actuarial calculations, per-formed annually, are applied to assess the present value of defined benefit obligations and related costs, based on several actuarial and financial assumptions (as disclosed in Note 37 “Retirement benefit obligations”).
When establishing the present value of the obligation and the fair value of any plan assets, actuarial gains and losses may arise as a result of changes in actuarial assumptions and experience effects (actual outcome compared to assumptions). The actuarial gains and losses are not recognised immediately in the income statement. Rather, only when the net cumulative unrecognised actuarial gain or loss exceeds a “corridor” equal to 10 percent of the greater of either the present value of the defined benefit obli-gation or the fair value of the plan assets, the excess is recognised in the income statement over the expected average remaining ser-vice period of the employees participating in the plan. Otherwise, actuarial gains and losses are not recognised.
When the calculation results in a benefit to the Nordea entity, the recognised asset is limited to the net total of any unrecognised actuarial losses, unrecognised past service costs and the present value of any future refunds from the plan or reductions in future contributions to the plan.
Social security contribution is calculated and accounted for based on the net recognised surplus or deficit by plan.
22. EquityMinority interestsMinority interests comprise the portion of net assets of group undertakings not owned directly or indirectly by Nordea Bank AB (publ).
Other reservesOther reserves comprise income and expenses, net after tax effects that are reported in equity in accordance with IFRS. These reserves include revaluation reserves in accordance with IAS 39 (Fair value reserve and Cash flow hedges) as well as translation differences in accordance with IAS 21.

Nor
dea
Ann
ual R
epor
t 20
08
97
Financial statements
Retained earningsApart from undistributed profits from previous years, retained earnings include the equity portion of untaxed reserves.
Untaxed reserves according to national rules are recorded as equity net of deferred tax at prevailing tax rates in respective country.
In addition, Nordea’s share of the earnings in associated com-panies, after the acquisition date, that have not been distributed is included in retained earnings.
Treasury sharesTreasury shares are not accounted for as assets. Acquisition of treasury shares is recorded as a deduction of retained earnings. Also own shares in trading portfolios are classified as treasury shares.
Contracts on Nordea shares that can be settled net in cash are either a financial asset or financial liability.
23. Share-based paymentNordea has issued Long-Term Incentive Programmes in 2007 and 2008. Employees participating in these programmes are granted share-based and equity-settled rights, i.e. rights to acquire shares in Nordea at a significant discount to the share price at grant date. According to IFRS 2, the value of such rights is to be expensed. The expense is based on the estimated fair value of each right at grant date. The total fair value of these rights is determined based on the group’s estimate of the number of rights that will eventu-ally vest, which is reassessed at each reporting date, and is expensed on a straight-line basis over the vesting period. The vesting period is the period that the employees have to remain in service in Nordea in order for their rights to vest. Market perfor-mance conditions in D-rights are reflected as a probability adjust-ment to the initial estimate of fair value at grant date. There is no adjustment (true-up) for differences between estimated and actual vesting due to market conditions.
Social security costs are also allocated over the vesting period, in accordance with statement UFR 7 issued by the Swedish Finan-cial Reporting Board: “IFRS 2 and social security contributions for listed enterprises”. The provision for social security costs is reas-sessed on each reporting occasion to ensure that the provision is based on the rights’ fair value at the reporting date.
For more information see Note 8 “Staff costs”.
24. Related-party transactionsNordea defines related parties as:• Shareholderswithsignificantinfluence.• Groupundertakings.• Associatedundertakings.• Keymanagementpersonnel.• Otherrelatedparties.
Shareholders with significant influenceShareholders with significant influence are shareholders that, by any means, have a significant influence over Nordea. At present no shareholder in Nordea is considered having such significant influence.
Group undertakingsFor the definition of Group undertakings see section 5 “Principles of consolidation”. Further information on the undertakings included in the Nordea Group is found in Note 22 “Investments in group undertakings”.
Group internal transactions between legal entities are per-formed according to arm’s length principles in conformity with OECD requirements on transfer pricing. These transactions are eliminated in the consolidated accounts.
Associated undertakingsFor the definition of Associated undertakings see section 5 “Prin-ciples of consolidation”.
Further information on the associated undertakings included in the Nordea Group is found in notes 23 “Investments in associ-ated undertakings”
Key management personnelKey management personnel includes the following positions:• TheBoardofDirectors.• TheChiefExecutiveOfficer(CEO).• TheGroupExecutiveManagement(GEM).
For information about compensation and pensions to key man-agement personnel, see Note 8 “Staff costs”. Information concern-ing other transactions between Nordea and key management per-sonnel is found in Note 53 “Related-party transactions”.
Other related partiesOther related parties comprise companies significantly influenced by key management personnel in Nordea Group as well as com-panies significantly influenced by close family members to these key management personnel. Other related parties also include Nordea’s pension foundations.
Information concerning transactions between Nordea and other related parties is found in Note 53 “Related-party transac-tions”.
25. Segment reportingSegment reporting structureFinancial results are presented for the two main Customer areas, Nordic Banking and Institutional and International Banking. The Customer operations which are not included in Nordic Banking or Institutional and International Banking are included in Other Customer operations as well as the result that is not fully allocated to any of the customer areas. These include International Private Banking and Funds as well as customer operations within Life and Other.
In the product dimension disclosed in the Board of Directors’ Report, Savings Products & Asset Management, Life & Pensions as well as Capital Markets Products are reported separately.
Group Corporate Centre, which is reported separately, is responsible for the finance, accounting, planning and control activities. It is furthermore responsible for the capital manage-ment and treasury operations. The latter includes funding, asset and liability management as well as the Group’s own centralised market risk-taking in financial instruments.
Within Nordea, customer responsibility is fundamental. Nor-dea’s total business relations with customers are reported in the customer responsible unit’s income statement and balance sheet.
Economic CapitalCapital allocation is based on the internal framework for calculat-ing economic capital, which reflects each business unit’s actual risk exposure considering credit and market risk, insurance risk as well as operational and business risk. This framework optimises utilisation and distribution of capital between the different busi-ness areas. Standard tax is applied when calculating risk-adjusted return on economic capital (RaRoCar).
Economic Capital is allocated to business areas according to risks taken. As a part of net interest income, business units receive a capital benefit rate corresponding to the expected average medium-term risk-free return. The cost above LIBOR from issued subordinated debt is also included in the Customer areas’ net interest income based on the respective use of Economic Capital.
Economic Profit constitutes the internal basis for evaluating strategic alternatives as well as for the evaluation of financial per-formance.
Allocation principlesCosts are allocated from Group Functions and Product areas to Customer areas based on internal agreements. Income is allocated with the underlying business transactions as driver combined with the identification of the customer responsible unit.
Assets, liabilities and economic capital are allocated to the Cus-tomer areas. Group Functions and Eliminations consist of income statement and balance sheet items that are related to the unallo-cated items/units.
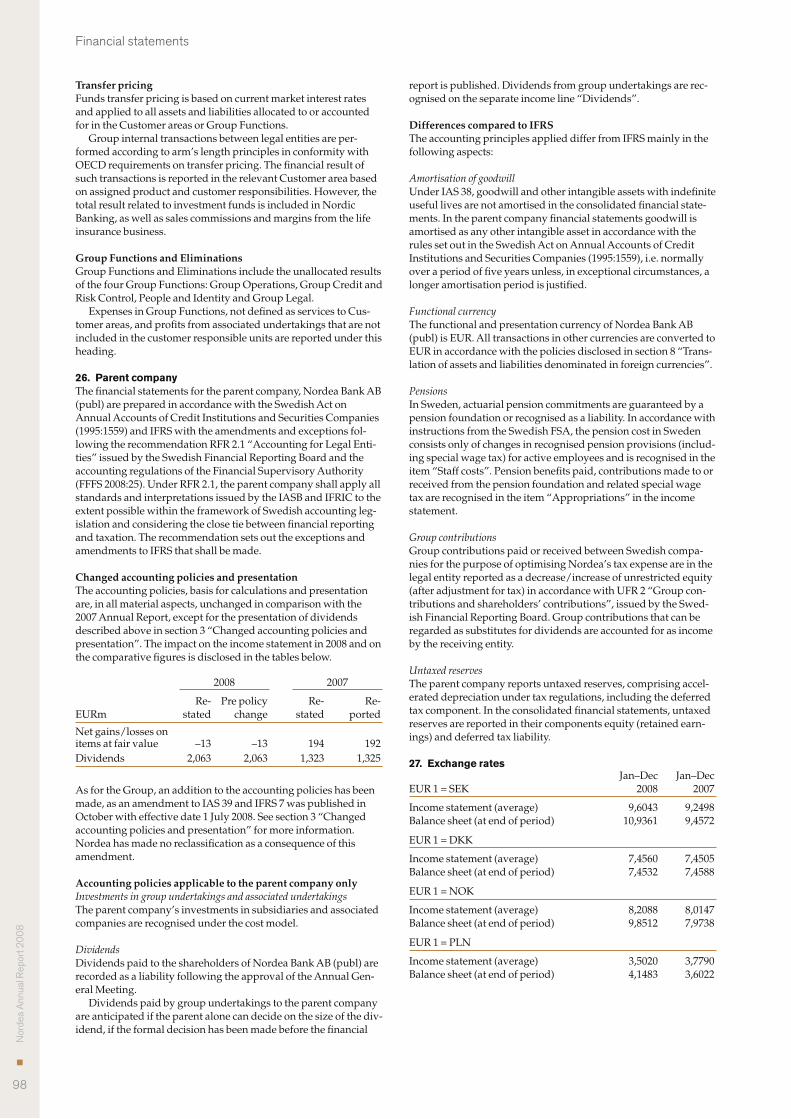
Nor
dea
Ann
ual R
epor
t 20
08
98
Financial statements
Transfer pricingFunds transfer pricing is based on current market interest rates and applied to all assets and liabilities allocated to or accounted for in the Customer areas or Group Functions.
Group internal transactions between legal entities are per-formed according to arm’s length principles in conformity with OECD requirements on transfer pricing. The financial result of such transactions is reported in the relevant Customer area based onassignedproductandcustomerresponsibilities.However,thetotal result related to investment funds is included in Nordic Banking, as well as sales commissions and margins from the life insurance business.
Group Functions and EliminationsGroup Functions and Eliminations include the unallocated results of the four Group Functions: Group Operations, Group Credit and Risk Control, People and Identity and Group Legal.
Expenses in Group Functions, not defined as services to Cus-tomer areas, and profits from associated undertakings that are not included in the customer responsible units are reported under this heading.
26. Parent companyThe financial statements for the parent company, Nordea Bank AB (publ) are prepared in accordance with the Swedish Act on Annual Accounts of Credit Institutions and Securities Companies (1995:1559) and IFRS with the amendments and exceptions fol-lowing the recommendation RFR 2.1 “Accounting for Legal Enti-ties” issued by the Swedish Financial Reporting Board and the accounting regulations of the Financial Supervisory Authority (FFFS 2008:25). Under RFR 2.1, the parent company shall apply all standards and interpretations issued by the IASB and IFRIC to the extent possible within the framework of Swedish accounting leg-islation and considering the close tie between financial reporting and taxation. The recommendation sets out the exceptions and amendments to IFRS that shall be made.
Changed accounting policies and presentationThe accounting policies, basis for calculations and presentation are, in all material aspects, unchanged in comparison with the 2007 Annual Report, except for the presentation of dividends described above in section 3 “Changed accounting policies and presentation”. The impact on the income statement in 2008 and on the comparative figures is disclosed in the tables below.
2008 2007
Re- Pre policy Re- Re- EURm stated change stated ported
Net gains/losses on items at fair value –13 –13 194 192Dividends 2,063 2,063 1,323 1,325
As for the Group, an addition to the accounting policies has been made, as an amendment to IAS 39 and IFRS 7 was published in October with effective date 1 July 2008. See section 3 “Changed accounting policies and presentation” for more information. Nordea has made no reclassification as a consequence of this amendment.
Accounting policies applicable to the parent company onlyInvestments in group undertakings and associated undertakingsThe parent company’s investments in subsidiaries and associated companies are recognised under the cost model.
DividendsDividends paid to the shareholders of Nordea Bank AB (publ) are recorded as a liability following the approval of the Annual Gen-eral Meeting.
Dividends paid by group undertakings to the parent company are anticipated if the parent alone can decide on the size of the div-idend, if the formal decision has been made before the financial
report is published. Dividends from group undertakings are rec-ognised on the separate income line “Dividends”.
Differences compared to IFRSThe accounting principles applied differ from IFRS mainly in the following aspects:
Amortisation of goodwillUnder IAS 38, goodwill and other intangible assets with indefinite useful lives are not amortised in the consolidated financial state-ments. In the parent company financial statements goodwill is amortised as any other intangible asset in accordance with the rules set out in the Swedish Act on Annual Accounts of Credit Institutions and Securities Companies (1995:1559), i.e. normally over a period of five years unless, in exceptional circumstances, a longer amortisation period is justified.
Functional currencyThe functional and presentation currency of Nordea Bank AB (publ) is EUR. All transactions in other currencies are converted to EUR in accordance with the policies disclosed in section 8 “Trans-lation of assets and liabilities denominated in foreign currencies”.
PensionsIn Sweden, actuarial pension commitments are guaranteed by a pension foundation or recognised as a liability. In accordance with instructions from the Swedish FSA, the pension cost in Sweden consists only of changes in recognised pension provisions (includ-ing special wage tax) for active employees and is recognised in the item “Staff costs”. Pension benefits paid, contributions made to or received from the pension foundation and related special wage tax are recognised in the item “Appropriations” in the income statement.
Group contributionsGroup contributions paid or received between Swedish compa-nies for the purpose of optimising Nordea’s tax expense are in the legal entity reported as a decrease/increase of unrestricted equity (after adjustment for tax) in accordance with UFR 2 “Group con-tributions and shareholders’ contributions”, issued by the Swed-ish Financial Reporting Board. Group contributions that can be regarded as substitutes for dividends are accounted for as income by the receiving entity.
Untaxed reservesThe parent company reports untaxed reserves, comprising accel-erated depreciation under tax regulations, including the deferred tax component. In the consolidated financial statements, untaxed reserves are reported in their components equity (retained earn-ings) and deferred tax liability.
27. Exchange rates Jan–Dec Jan–Dec EUR 1 = SEK 2008 2007
Income statement (average) 9,6043 9,2498Balance sheet (at end of period) 10,9361 9,4572
EUR 1 = DKK
Income statement (average) 7,4560 7,4505Balance sheet (at end of period) 7,4532 7,4588
EUR 1 = NOK
Income statement (average) 8,2088 8,0147Balance sheet (at end of period) 9,8512 7,9738
EUR 1 = PLN
Income statement (average) 3,5020 3,7790Balance sheet (at end of period) 4,1483 3,6022
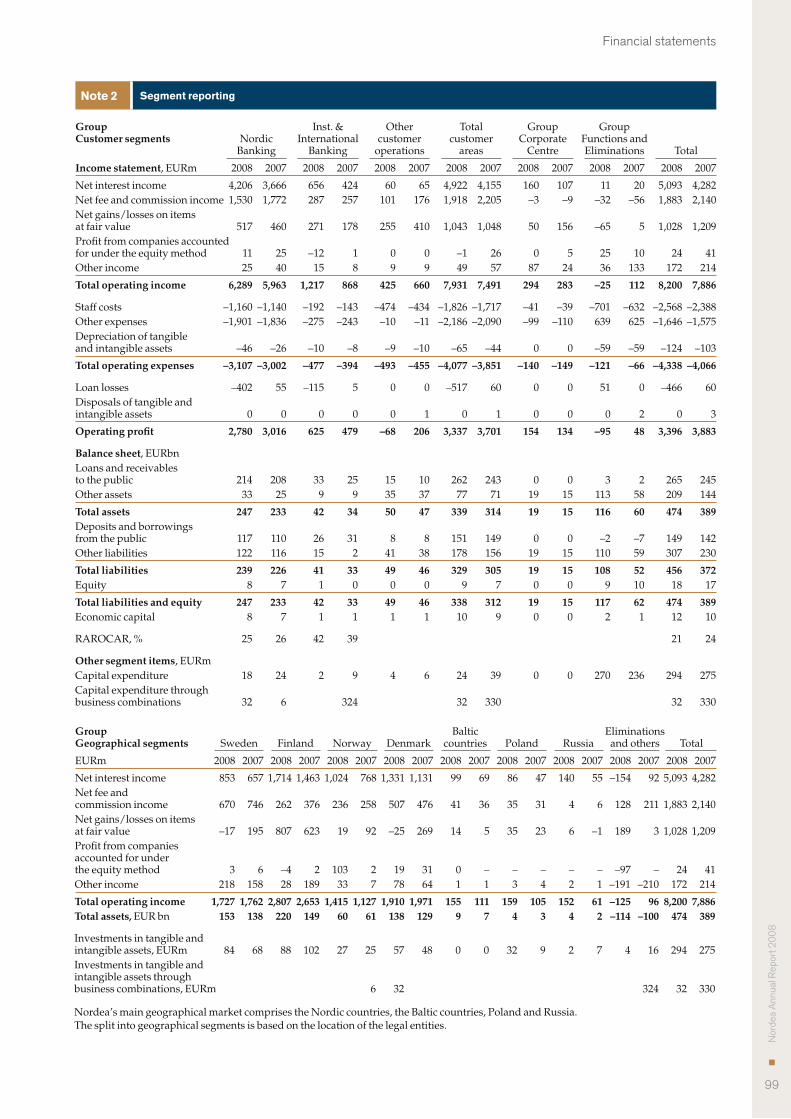
Nor
dea
Ann
ual R
epor
t 20
08
99
Financial statements
Note 2 Segment reporting
Group Inst. & Other Total Group Group Customer segments Nordic International customer customer Corporate Functions and Banking Banking operations areas Centre Eliminations Total
Income statement, EURm 2008 2007 2008 2007 2008 2007 2008 2007 2008 2007 2008 2007 2008 2007
Net interest income 4,206 3,666 656 424 60 65 4,922 4,155 160 107 11 20 5,093 4,282Net fee and commission income 1,530 1,772 287 257 101 176 1,918 2,205 –3 –9 –32 –56 1,883 2,140Net gains/losses on items at fair value 517 460 271 178 255 410 1,043 1,048 50 156 –65 5 1,028 1,209Profit from companies accounted for under the equity method 11 25 –12 1 0 0 –1 26 0 5 25 10 24 41Other income 25 40 15 8 9 9 49 57 87 24 36 133 172 214
Total operating income 6,289 5,963 1,217 868 425 660 7,931 7,491 294 283 –25 112 8,200 7,886
Staff costs –1,160 –1,140 –192 –143 –474 –434 –1,826 –1,717 –41 –39 –701 –632 –2,568 –2,388Other expenses –1,901 –1,836 –275 –243 –10 –11 –2,186 –2,090 –99 –110 639 625 –1,646 –1,575Depreciation of tangible and intangible assets –46 –26 –10 –8 –9 –10 –65 –44 0 0 –59 –59 –124 –103
Total operating expenses –3,107 –3,002 –477 –394 –493 –455 –4,077 –3,851 –140 –149 –121 –66 –4,338 –4,066
Loan losses –402 55 –115 5 0 0 –517 60 0 0 51 0 –466 60Disposals of tangible and intangible assets 0 0 0 0 0 1 0 1 0 0 0 2 0 3
Operating profit 2,780 3,016 625 479 –68 206 3,337 3,701 154 134 –95 48 3,396 3,883
Balance sheet, EURbnLoans and receivables to the public 214 208 33 25 15 10 262 243 0 0 3 2 265 245Other assets 33 25 9 9 35 37 77 71 19 15 113 58 209 144
Total assets 247 233 42 34 50 47 339 314 19 15 116 60 474 389Deposits and borrowings from the public 117 110 26 31 8 8 151 149 0 0 –2 –7 149 142Other liabilities 122 116 15 2 41 38 178 156 19 15 110 59 307 230
Total liabilities 239 226 41 33 49 46 329 305 19 15 108 52 456 372Equity 8 7 1 0 0 0 9 7 0 0 9 10 18 17
Total liabilities and equity 247 233 42 33 49 46 338 312 19 15 117 62 474 389Economic capital 8 7 1 1 1 1 10 9 0 0 2 1 12 10
RAROCAR, % 25 26 42 39 21 24
Other segment items, EURmCapital expenditure 18 24 2 9 4 6 24 39 0 0 270 236 294 275Capital expenditure through business combinations 32 6 324 32 330 32 330
Group Baltic Eliminations Geographical segments Sweden Finland Norway Denmark countries Poland Russia and others Total
EURm 2008 2007 2008 2007 2008 2007 2008 2007 2008 2007 2008 2007 2008 2007 2008 2007 2008 2007
Net interest income 853 657 1,714 1,463 1,024 768 1,331 1,131 99 69 86 47 140 55 –154 92 5,093 4,282Net fee and commission income 670 746 262 376 236 258 507 476 41 36 35 31 4 6 128 211 1,883 2,140Net gains/losses on items at fair value –17 195 807 623 19 92 –25 269 14 5 35 23 6 –1 189 3 1,028 1,209Profit from companies accounted for under the equity method 3 6 –4 2 103 2 19 31 0 – – – – – –97 – 24 41Other income 218 158 28 189 33 7 78 64 1 1 3 4 2 1 –191 –210 172 214
Total operating income 1,727 1,762 2,807 2,653 1,415 1,127 1,910 1,971 155 111 159 105 152 61 –125 96 8,200 7,886Total assets, EUR bn 153 138 220 149 60 61 138 129 9 7 4 3 4 2 –114 –100 474 389
Investments in tangible and intangible assets, EURm 84 68 88 102 27 25 57 48 0 0 32 9 2 7 4 16 294 275Investments in tangible and intangible assets through business combinations, EURm 6 32 324 32 330
Nordea’s main geographical market comprises the Nordic countries, the Baltic countries, Poland and Russia. The split into geographical segments is based on the location of the legal entities.

Nor
dea
Ann
ual R
epor
t 20
08
100
Financial statements
Note 2 Segment reporting, cont.
Parent company Inst. & Other Group Group Customer segments Nordic International customer Coporate Functions and Banking Banking operations Centre Eliminations Total
Income statement, EURm 2008 2007 2008 2007 2008 2007 2008 2007 2008 2007 2008 2007
Net interest income 1,035 824 47 23 –16 0 –332 –342 –211 –145 523 360Net fee and commission income 529 590 46 19 43 26 0 –3 –150 –169 468 463Net gains/losses on items at fair value 119 113 –24 54 –117 –47 73 77 –64 –3 –13 194Other income 4 15 –1 0 0 8 2,153 1,324 97 103 2,253 1,450
Total operating income 1,687 1,542 68 96 –90 –13 1,894 1,056 –328 –214 3,231 2,467
Parent company Geographical segments Sweden Finland Norway Denmark Others Total
EURm 2008 2007 2008 2007 2008 2007 2008 2007 2008 2007 2008 2007
Net interest income 523 360 – – – – – – – – 523 360Net fee and commission income 468 465 – – – – – –2 – – 468 463Net gains/losses on items at fair value –13 194 – – – – – – – – –13 194Other income 385 466 1,301 556 305 5 207 301 55 122 2,253 1,450
Total operating income 1,363 1,485 1,301 556 305 5 207 299 55 122 3,231 2,467
Note 3 Net interest income
Group Parent company
EURm 2008 2007 2008 2007
Interest incomeLoans and receivables to credit institutions 1,121 685 1,739 1,434Loans and receivables to the public 13,862 11,175 1,594 1,144Interest–bearing securities 1,571 1,049 308 153Other interest income 199 0 5 10
Interest income 16,753 12,909 3,646 2,741
Interest expenseDeposits by credit institutions –1,595 –1,033 –897 –748Deposits and borrowings from the public –4,398 –3,946 –892 –631Debt securities in issue –4,587 –3,218 –820 –604Subordinated liabilities –393 –399 –303 –296Other interest expenses –687 –31 –211 –102
Interest expense –11,660 –8,627 –3,123 –2,381
Net interest income 5,093 4,282 523 360
Interest income from financial instruments not measured at fair value through profit and loss amounts to EUR 14,183m (EUR 9,791m) for the Group and EUR 3,086m (EUR 2,507m) for the par-ent company. Interest expenses from financial instruments not measured at fair value through profit and loss amounts to EUR –10,521m (EUR –4,575m) for the Group and EUR –2,873m (EUR –2,287m) for the parent company. The net interest income from derivatives, measured at fair value and related to Nordea’s fund-ing, decreases the total interest expense. For further information see also Note 1.
Net interest income Group Parent company
EURm 2008 2007 2008 2007
Interest income 16,361 12,607 3,646 2,741Leasing income, net 392 302 – –Interest expense –11,660 –8,627 –3,123 –2,381
Total 5,093 4,282 523 360
Note 4 Net fee and commission income
Group Parent company
EURm 2008 2007 2008 2007
Asset Management commissions 532 762 67 90Life insurance 270 270 7 6Brokerage 217 260 61 63Custody 84 79 11 11Deposits 45 37 28 21
Total savings related commissions 1,148 1,408 174 191
Payments 422 434 139 156Cards 344 342 173 170
Total payment commissions 766 776 312 326
Lending 299 258 76 58Guarantees and documentary payments 143 136 20 11
Total lending related to commissions 442 394 96 69
Other commission income 176 156 40 32
Fee and commission income 2,532 2,734 622 618
Life insurance –67 –68 – 0Payment expenses –287 –270 –130 –124State guarantee fees –50 – – –Other commission expenses –245 –256 –24 –31
Fee and commission expense –649 –594 –154 –155
Net fee and commission income 1,883 2,140 468 463
Fee income, not included in determining the effective interest rate, from financial assets and liabilities not measured at fair value through profit or loss amount to EUR 329m ( EUR 277m) for the Group and EUR 104m (EUR 79m) for the parent company.
Fee income, not included in determining the effective interest rate, from fiduciary activities that result in the holding or invest-ing of assets on behalf of customers amount to EUR 1,019m (EUR 1,292m) for the Group and EUR 135m (EUR 158m) for the parent company. The corresponding amount for fee expenses is EUR –67m (EUR –68m) for the Group.
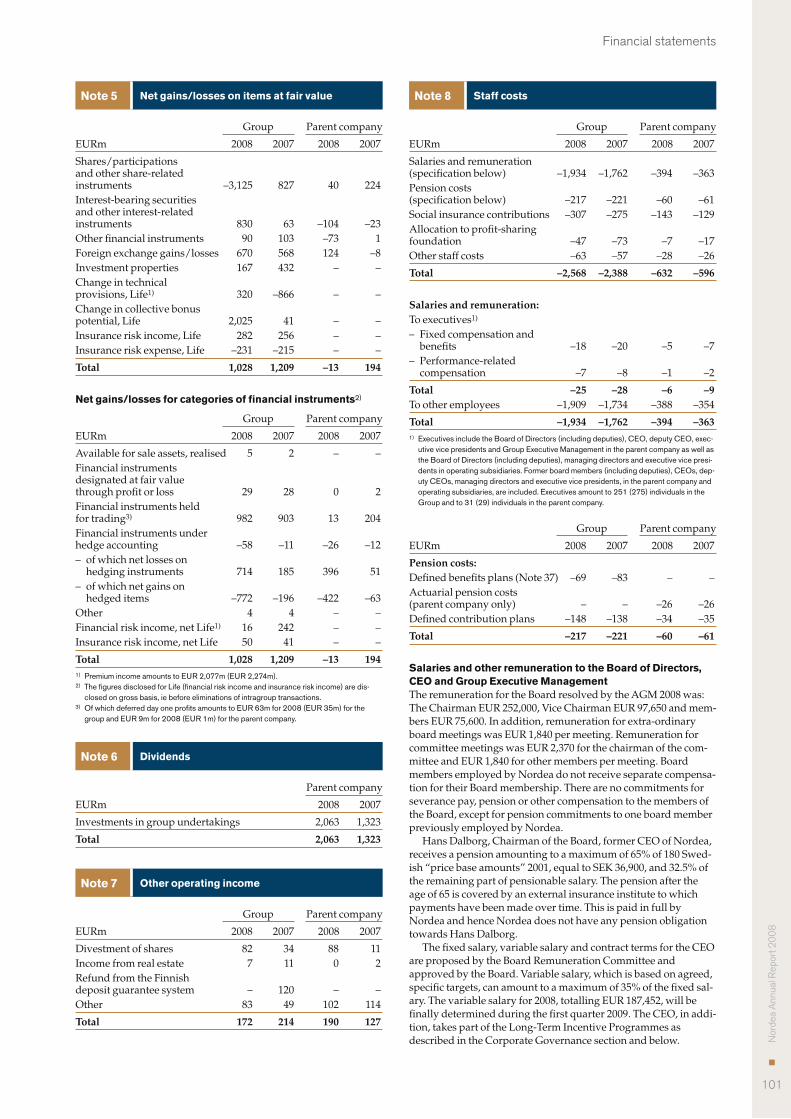
Nor
dea
Ann
ual R
epor
t 20
08
101
Financial statements
Note 5 Net gains/losses on items at fair value
Group Parent company
EURm 2008 2007 2008 2007
Shares/participations and other share-related instruments –3,125 827 40 224Interest-bearing securities and other interest-related instruments 830 63 –104 –23Other financial instruments 90 103 –73 1Foreign exchange gains/losses 670 568 124 –8Investment properties 167 432 – –Change in technical provisions, Life1) 320 –866 – –Change in collective bonus potential, Life 2,025 41 – –Insurance risk income, Life 282 256 – –Insurance risk expense, Life –231 –215 – –
Total 1,028 1,209 –13 194
Net gains/losses for categories of financial instruments2)
Group Parent company
EURm 2008 2007 2008 2007
Available for sale assets, realised 5 2 – –Financial instruments designated at fair value through profit or loss 29 28 0 2Financial instruments held for trading3) 982 903 13 204Financial instruments under hedge accounting –58 –11 –26 –12– of which net losses on
hedging instruments 714 185 396 51– of which net gains on
hedged items –772 –196 –422 –63Other 4 4 – –Financial risk income, net Life1) 16 242 – –Insurance risk income, net Life 50 41 – –
Total 1,028 1,209 –13 1941) Premium income amounts to EUR 2,077m (EUR 2,274m).2) The figures disclosed for Life (financial risk income and insurance risk income) are dis-
closed on gross basis, ie before eliminations of intragroup transactions.3) Of which deferred day one profits amounts to EUR 63m for 2008 (EUR 35m) for the
group and EUR 9m for 2008 (EUR 1m) for the parent company.
Note 6 Dividends
Parent company
EURm 2008 2007
Investments in group undertakings 2,063 1,323
Total 2,063 1,323
Note 7 Other operating income
Group Parent company
EURm 2008 2007 2008 2007
Divestment of shares 82 34 88 11Income from real estate 7 11 0 2Refund from the Finnish deposit guarantee system – 120 – –Other 83 49 102 114
Total 172 214 190 127
Note 8 Staff costs
Group Parent company
EURm 2008 2007 2008 2007
Salaries and remuneration (specification below) –1,934 –1,762 –394 –363Pension costs (specification below) –217 –221 –60 –61Social insurance contributions –307 –275 –143 –129Allocation to profit-sharing foundation –47 –73 –7 –17Other staff costs –63 –57 –28 –26
Total –2,568 –2,388 –632 –596
Salaries and remuneration: To executives1)
– Fixed compensation and benefits –18 –20 –5 –7
– Performance-related compensation –7 –8 –1 –2
Total –25 –28 –6 –9To other employees –1,909 –1,734 –388 –354
Total –1,934 –1,762 –394 –3631) Executives include the Board of Directors (including deputies), CEO, deputy CEO, exec-
utive vice presidents and Group Executive Management in the parent company as well as the Board of Directors (including deputies), managing directors and executive vice presi-dents in operating subsidiaries. Former board members (including deputies), CEOs, dep-uty CEOs, managing directors and executive vice presidents, in the parent company and operating subsidiaries, are included. Executives amount to 251 (275) individuals in the Group and to 31 (29) individuals in the parent company.
Group Parent company
EURm 2008 2007 2008 2007
Pension costs:Defined benefits plans (Note 37) –69 –83 – –Actuarial pension costs (parent company only) – – –26 –26Defined contribution plans –148 –138 –34 –35
Total –217 –221 –60 –61
Salaries and other remuneration to the Board of Directors, CEO and Group Executive ManagementThe remuneration for the Board resolved by the AGM 2008 was: The Chairman EUR 252,000, Vice Chairman EUR 97,650 and mem-bers EUR 75,600. In addition, remuneration for extra-ordinary board meetings was EUR 1,840 per meeting. Remuneration for committee meetings was EUR 2,370 for the chairman of the com-mittee and EUR 1,840 for other members per meeting. Board members employed by Nordea do not receive separate compensa-tion for their Board membership. There are no commitments for severance pay, pension or other compensation to the members of the Board, except for pension commitments to one board member previously employed by Nordea.
HansDalborg,ChairmanoftheBoard,formerCEOofNordea,receives a pension amounting to a maximum of 65% of 180 Swed-ish “price base amounts” 2001, equal to SEK 36,900, and 32.5% of the remaining part of pensionable salary. The pension after the age of 65 is covered by an external insurance institute to which payments have been made over time. This is paid in full by Nordea and hence Nordea does not have any pension obligation towardsHansDalborg.
The fixed salary, variable salary and contract terms for the CEO are proposed by the Board Remuneration Committee and approved by the Board. Variable salary, which is based on agreed, specific targets, can amount to a maximum of 35% of the fixed sal-ary. The variable salary for 2008, totalling EUR 187,452, will be finally determined during the first quarter 2009. The CEO, in addi-tion, takes part of the Long-Term Incentive Programmes as described in the Corporate Governance section and below.

Nor
dea
Ann
ual R
epor
t 20
08
102
Financial statements
Long-Term Fixed salary/ Variable Incentive Board fee1) salary Programmes3) Benefits Total
EUR 2008 2007 2008 20072) 2008 2007 2008 2007 2008 2007
Chairman of the Board:HansDalborg 283,212 268,157 – – – – – – 283,212 268,157
Vice Chairman of the Board:Timo Peltola 124,577 113,715 – – – – – – 124,577 113,715
Other Board members:4)
Marie Ehrling 89,087 60,068 – – – – – – 89,087 60,068Tom Knutzen 87,440 60,068 – – – – – – 87,440 60,068Lars G Nordström5) 82,175 352,019 – – – – – 11,163 82,175 363,182Ursula Ranin 86,973 60,026 – – – – – – 86,973 60,026Björn Savén 87,440 85,360 – – – – – – 87,440 85,360HeidiM.Petersen6) 64,357 – – – – – – – 64,357 –Svein Jacobsen6) 68,175 – – – – – – – 68,175 –Stine Bosse6) 64,357 – – – – – – – 64,357 –Björn Wahlroos6) 62,312 – – – – – – – 62,312 –Kjell Aamot7) 23,084 85,360 – – – – – – 23,084 85,360HaraldArnkværn7) 29,765 95,927 – – – – – – 29,765 95,927Gunnel Duveblad7) – 23,484 – – – – – – – 23,484ClausHøegMadsen7) 23,014 85,299 – – – – – – 23,014 85,299Birgitta Kantola7) 21,282 81,747 – – – – – – 21,282 81,747Anne Birgitte Lundholt7) – 19,932 – – – – – – – 19,932Maija Torkko7) – 23,484 – – – – – – – 23,484
CEO:Christian Clausen8) 832,960 956,646 187,452 269,671 81,624 65,136 41,087 19,463 1,143,123 1,310,916
Group Executive Management:7 (8) individuals excluding CEO9) 4,024,791 3,994,632 903,461 1,535,443 498,570 315,809 141,051 132,521 5,567,873 5,978,405
Total 6,055,001 6,365,924 1,090,913 1,805,114 580,194 380,945 182,138 163,147 7,908,246 8,715,1301) The Board fee includes fixed remuneration and meeting fees. These are booked in SEK and translated into EUR based on the average exchange rate each year.2) Includes also executive incentive payout. Restated from variable salary paid out during 2007 to variable salary earned during 2007.3) CEO and members of GEM hold 34,002 A-rights, 33,244 B-rights and 34,002 D-rights in LTIP 2007 (no C-rights can be exercised due to that performance conditions were not fulfilled), and
31,250 A-rights, 31,250 C-rights and 31,250 D-rights in LTIP 2008 (no B-rights can be exercised due to that performance conditions were not fulfilled and C-D-rights are conditional). For more information on the valuation of the Long-Term Incentive Programmes, please see below. Disclosed expense is calculated in accordance with IFRS 2 “Share-based Payment”.
4) Employee representatives excluded.5) Compensation as CEO received up until his retirement and board fee received as from his retirement.6) New member as from the Annual General Meeting 2008.7) Resigned as board member during 2008 or 2007.8) Decrease in fixed salary in 2008 due to received holiday allowance when leaving Denmark 2007, in accordance with Danish legislation. 9) GEM members included for the period they have been appointed.
Note 8 Staff costs, cont.
Benefits received by the CEO include primarily car and housing benefits.
The retirement age for the CEO is 60 and his pension amounts to 50% of the pensionable income for life. The pensionable income is maximised to 190 Swedish “income base amounts”. The portion earned as of 31 December 2008 is fully funded with plan assets. For the CEO, fixed salary and variable salary are included in pensionable income.
The Board Remuneration Committee prepares alterations in salary levels for Group Executive Management (GEM) as a whole, as well as alterations in retirement benefits, contract terms and conditions, for resolution by the Board. Following consultation with the Board Remuneration Committee, the CEO determines the salary terms for members of GEM. Variable salary, which is based on agreed, specific targets, can be a maximum of 35% of the fixed salary. The variable salary for 2008, totalling EUR 903,461, will be finally determined during the first quarter 2009. As for the CEO, GEM takes part of the Long-Term Incentive Programmes. Benefits include primarily car and/or housing benefits.
GEM members are entitled to retire with pension at the age of 60 or 62. Pension agreements are either Defined Contribution Plans
(DCP) or Defined Benefit Plans (DBP). One Danish GEM member receives 50% of the salary for life, annually adjusted by the general level of salary increases in Nordea Bank Denmark. The other Dan-ish GEM member has a DCP agreement. The Finnish members of GEM receive 50% or 60% of their pensionable income for life, annu-ally adjusted by the Finnish TyEL-index. The Norwegian member of GEM receives 70% of the pensionable income for life, annually adjusted. The Swedish members of GEM have DCP agreements. Fixed salary is pensionable income for all GEM-members. Variable salary is included for Finnish and Swedish GEM members.
In accordance with their employment contracts, Finnish, Nor-wegian and Swedish GEM members are entitled to 6 months’ sal-ary during the notice period before termination, and with regard to severance pay 18 months’ salary to be reduced by the salary that the executive receives as a result of any other employment during these 18 months. For the Danish GEM members the notice period is 12 months. One Danish GEM member has a severance pay equal to 12 months’ salary to be reduced by the salary that the executive receives as a result of any other employment during these 12 months.

Nor
dea
Ann
ual R
epor
t 20
08
103
Financial statements
Share-based payment 2008
Conditional Rights LTIP 2008 A–rights B–C–rights D–rights
Granted 502,943 1,005,886 502,943Forfeited –1,172 –504,115 –1,172
Outstanding at end of year 501,771 501,771 501,771
– of which currently exercisable – – –
2008 2007
Conditional Rights LTIP 2007 A–rights B–C–rights D–rights A–rights B–C–rights D–rights
Outstanding at the beginning of year 474,557 938,531 474,557 – – –Granted – – – 477,428 954,856 477,428Forfeited –22,311 –496,868 –22,311 –2,871 –16,325 –2,871
Outstanding at end of year 452,246 441,663 452,246 474,557 938,531 474,557
– of which currently exercisable – – – – – –
Note 8 Staff costs, cont.
Pension costs and obligations to the Board of Directors, CEO and Group Executive Management
2008 2007
Pension Pension Pension Pension EUR cost4) obligation5) cost4) obligation5)
Board members1):Lars G Nordström – 385,547 75,432 387,517
CEO:Christian Clausen2) 477,408 5,891,708 476,315 4,586,607
Group Executive Management:7 (8) individuals excluding CEO3) 917,999 10,444,859 3,236,142 19,927,951
Former Chairman of the board and CEOs:Vesa Vainio and Thorleif Krarup6) – 18,691,275 – 17,928,135
Total 1,395,407 35,413,389 3,787,889 42,830,2101) Employee representatives excluded.2) The CEO’s pension agreement is unchanged. The main reason behind the increase in
pension obligation is the lowering of the discount rate, which has given rise to significant actuarial losses, interest cost (discounting effect) and pension earned in 2008.
3) Members of GEM included for the period they have been appointed. The disclosed pen-sion obligation is the obligation towards the members of GEM as of 31 December 2008. The significant decrease in pension obligations due to the change in composition of GEM between the years.
4) Pension costs for management is related to pension premiums paid during the year in DCPs and to pension rights earned during the year in DBPs (Service cost, Past service cost and Curtailments and settlements as defined in IAS 19). Comparative information has been restated accordingly.
5) Pension obligations calculated in accordance with IAS 19. These obligations are depen-dent of changes in actuarial assumptions and inter annual variations can therefore be sig-nificant. IAS 19 includes an assumption about future increases in salary, which leads to that the pension obligations disclosed are the earned pension rights calculated using the expected salary levels at retirement (at 60 or 62 years depending on agreement). The management pension plans are funded, meaning that these obligations are backed with plan assets with fair value generally on the same level as the obligations.
6) The pension obligation for Vesa Vainio and Thorleif Krarup is mainly due to pension rights earned in, and funded by, banks forming Nordea.
Pension cost for all executives, amounted to EUR 4m (EUR 8m) and pension obligations to EUR 53m (EUR 55m). Executives include the Board of Directors (including deputies), CEO, deputy CEO, executive vice presidents and Group Executive Manage-ment in the parent company as well as the Board of Directors (including deputies), managing directors and executive vice pres-idents in operating subsidiaries. Former board members (includ-ing deputies), CEOs, deputy CEOs, managing directors and exec-utive vice presidents, in the parent company and operating sub-sidiaries, are included.
Loans and receivables to key management personnelLoans and receivables to key management personnel amounts to EUR 3m (EUR 2m) in the Group and EUR 1m (EUR 0m) in the par-ent company. Interest income on these loans amounts to EUR 0m (EUR 0m) in the Group and EUR 0m (EUR 0m) in the parent com-pany.
For key management personnel who are employed by Nordea the same credit terms apply as for other employees, except for key management personnel in Denmark whose loans are granted on the same terms as for external customers. In Norway the employee interest rate for loans and receivables is 100 basis points lower than the best corresponding interest rate for external cus-tomers, with a cap on the loan amount of 3 Norwegian income base amounts 55 plus NOK 100,000. In Finland the employee interest rate for loans and receivables corresponds to Nordea’s funding cost with a margin of 10 basis points up to EUR 400,000, and 30 basis points for loans over EUR 400,000. In Sweden the employee interest rate on fixed interest rate loans is 300 basis points lower than the corresponding interest rate for external cus-tomers (with a lower limit of 150 basis points). The discount on variable interest rate loans is somewhat lower and varies over time. There is currently a cap of 57 Swedish price base amounts both on fixed- and variable interest rate loans. Interest on loans and receivables above the defined caps are set on market terms. Loans and receivables to family members of key management personnel are granted on normal market terms, as well as loans and receivables to key management personnel who are not employed by Nordea.

Nor
dea
Ann
ual R
epor
t 20
08
104
Financial statements
Note 8 Staff costs, cont.
LTIP 2008 LTIP 2007
A–rights B–C–rights D–rights A–rights B–C–rights D–rights
Ordinary share per right 1 1 1 1 1 1Exercise price EUR 3.00 EUR 2.00 EUR 2.00 EUR 4.00 EUR 2.00 EUR 2.00Grant date 13 May 2008 13 May 2008 13 May 2008 17 May 2007 17 May 2007 17 May 2007Vesting period 24 months 24 months 24 months 24 months 24 months 24 monthsContractual life 48 months 48 months 48 months 48 months 48 months 48 monthsFirst day of exercise April 2010 April 2010 April 2010 30 april 2009 30 april 2009 30 april 2009Fair value at grant date1) EUR 7.53 EUR 8.45 EUR 4.14 EUR 8.76 EUR 10.49 EUR 7.761) The fair value is measured through the use of generally accepted valution models with the following input factors:
weighted average share price EUR 12.33 for LTIP 2007 and EUR 11.08 for LTIP 2008, right life is estimated to 3 years for LTIP 2007 and 2.5 years for LTIP 2008, expected dividends are deducted, risk free rate 4.20% for LTIP 2007 and 3.83% for LTIP 2008 and expected employee turn over in the programme is set to 3% per year for LTIP 2007 and 4% per year for LTIP 2008. Expected volatility is set to 20% for LTIP 2007 and to 21% for LTIP 2008 based on historical data. As the exercise price is significantly below the share price at grant date, the value has a lim-ited sensitivity to expected volatility and risk-free interest. The value of the D-rights is calculated based on market related conditions.
The expected expense for LTIP 2007, EUR 17m, and for LTIP 2008, EUR 8m, are expensed over a period of 24 months. The maximum expense equals approximately EUR 21m for LTIP 2007 and EUR 20m for LTIP 2008. The total expense for 2008 arising from LTIP 2007 amounts to EUR 5m (EUR 5m) and for LTIP 2008 to EUR 2m. The amounts include social charges.
For the parent company, the total expected expense for LTIP 2007 amounts to EUR 5m and for LTIP 2008 to EUR 3m, which is also expensed over a period of 24 months. The maximum cost equals approximately EUR 6m for LTIP 2007 and EUR 6m for LTIP 2008. The total expense for 2008 arising from LTIP 2007 amounts to EUR 1m (EUR 2m) and for LTIP 2008 to EUR 1m. The amounts include social charges.
Average number of employees
Group Total Men Women
2008 2007 2008 2007 2008 2007
Full-time equivalentsSweden 8,454 8,072 3,643 3,467 4,811 4,605Denmark 8,427 8,152 3,887 3,784 4,540 4,368Finland 8,311 8,162 1,742 1,618 6,569 6,544Norway 3,561 3,416 1,845 1,777 1,716 1,639Poland 1,679 1,247 518 388 1,161 859Russia 1,603 1,177 582 454 1,021 723Latvia 513 427 138 112 375 315Luxembourg 409 393 249 244 160 149Estonia 416 356 86 55 330 301Lithuania 355 259 78 49 277 210United States 70 67 37 36 33 31United Kingdom 58 57 36 32 22 25Singapore 52 49 15 14 37 35Germany 36 33 18 16 18 17
Total average 33,944 31,867 12,874 12,046 21,070 19,821
Total number of employees (FTEs), end of period 34,008 31,721
Parent company Total Men Women
2008 2007 2008 2007 2008 2007
Full-time equivalentsSweden 8,233 7,534 3,490 3,195 4,743 4,339Other countries 59 57 40 39 19 18
Total average 8,292 7,591 3,530 3,234 4,762 4,357
Long-Term Incentive ProgrammesParticipation in the Long-Term Incentive Programme (LTIP) requires that the participants take direct ownership by investing in Nordea shares. For each ordinary share the participants acquired and locked in to the LTIP 2007 and LTIP 2008, the participants were granted a con-ditional A-right to acquire one ordinary share (“Matching Share”), based on continued employment, and the conditional B-D-rights to acquire three additional ordinary shares, based on fulfilment of certain performance conditions (“Performance Shares”). The performance criteria comprise a target growth in risk adjusted profit per share (RAPPS) in 2007 (B-rights) and in 2008 (C-rights) for LTIP 2007 and in 2008 (B rights) and in 2009 (C-rights) for LTIP 2008. Should the reported EPS for 2007 (B-rights in LTIP 2007) and for 2008 (C-rights in LTIP 2007 and B rights in LTIP 2008) and for 2009 (C-rights in LTIP 2008) be lower than a predetermined level the participants are not entitled to exer-cise any B-rights or C-rights respectively. Additionally, the performance criteria for D-rights is a growth target in total shareholder return (TSR) in comparison with a peer group’s TSR during 2007 and 2008 for LTIP 2007 and during 2008 and 2009 for LTIP 2008.
Full right to exercise in LTIP 2007 was obtained if the RAPPS increased by 15% or more during 2007, and by 12% or more during 2008 and if TSR during 2007 and 2008 exceeded peer group index by 10 percentage points. Additionally, exercise right in LTIP 2007 demanded that EPS for 2007 and for 2008 equaled or exceeded 0.80. Full right to exercise in LTIP 2008 will be obtained if the RAPPS increases by 12% or more during 2008, and by 12% or more during 2009 and if TSR during 2008 and 2009 ranks as number one in the peer group. To have the right to exercise B-rights and C-rights in LTIP 2008, the EPS for 2008 and 2009 should not be lower than 0.80.

Nor
dea
Ann
ual R
epor
t 20
08
105
Financial statements
Note 8 Staff costs, cont.
Salaries and remuneration per country
Group 2008 2007
Execu- Other Execu- Other EURm tives employees tives employees
Sweden –5 –431 –7 –378Denmark –4 –641 –5 –593Finland –2 –398 –2 –369Norway –2 –276 –4 –264Poland –2 –31 –2 –25Russia –5 –39 –4 –18Latvia – –9 – –7Luxembourg –3 –44 –3 –48Estonia – –8 – –6Lithuania – –6 0 –4United States –2 –14 –1 –11United Kingdom – –5 – –5Singapore – –4 – –3Germany – –3 – –3
Total –25 –1,909 –28 –1,734
Parent company 2008 2007
Execu- Other Execu- Other EURm tives employees tives employees
Sweden –4 –377 –6 –348Other countries –2 –11 –3 –6
Total –6 –388 –9 –354
Gender distribution 31 Dec 31 Dec Per cent 2008 2007
Nordea Bank AB (publ)Board of Directors– Men 73 79– Women 27 21Other executives– Men 80 82– Women 20 18
In the Board of Directors of the Nordea Group companies, 90% (90%) were men and 10% (10%) were women. The corresponding numbers for Other executives were 84% (85%) men and 16% (15%) women. Internal Boards consist mainly of management in Nor-dea.
Sick leave1)
Parent company Sick leave as a Proportion of percentage of ordinary long-term sick working hours leave in per cent
2008 2007 2008 2007
Total 4.4 4.4 45 57Men 2.3 2.2 27 43Women 5.6 5.9 47 6118–29 3.1 2.4 30–49 3.6 3.9 50–65 5.3 5.7 1) Ordinary working hours refer to the number of hours agreed in the employment contract,
excluding overtime. Long-term sick leave refers to a continuous period of absence of 60 days or more. The sick leave of each category is stated as a percentage of the category’s ordinary working hours.
Note 9 Other expenses
Group Parent company
EURm 2008 2007 2008 2007
Information technology1) –576 –538 –172 –185Marketing –102 –104 –26 –30Postage, telephone and office expenses –203 –197 –69 –69Rents, premises and real estate –369 –351 –96 –103Divestment of shares – –3 – 0Other2) –396 –382 –110 –127
Total –1,646 –1,575 –473 –5141) Refers to IT operations, service expenses and consultant fees for the Group. Total IT-
related costs including staff etc, but excluding IT expenses in insurance operations, were EUR –666m (EUR –654m).
2) Including fees and remuneration to auditors distributed as follows.
Auditors’ fees Group Parent company
EURm 2008 2007 2008 2007
KPMGAuditing assignments –5 –4 –1 –1Other assignments incl audit-related services –2 –2 –1 –1Ernst & YoungOther assignments incl audit-related services –1 –1 –1 –1DeloitteAuditing assignments 0 0 – 0Other assignments incl audit-related services –1 0 0 0PriceWaterhouseCoopersAuditing assignments –1 0 0 0Other assignments incl audit-related services 0 –1 0 –1Other 0 –1 0 0
Total –10 –9 –3 –4
Note 10 Depreciation, amortisation and impairment charges of tangible and intangible assets
Depreciation/amortisation Group Parent company
EURm 2008 2007 2008 2007
Property and equipment (Note 25)Equipment –81 –72 –17 –17Buildings –1 –2 0 0
Intangible assets (Note 24)Goodwill – – –72 –72Internally developed software –18 –17 –7 –6Other intangible assets –14 –12 –5 –6
Total –114 –103 –101 –101
Impairment charges / Reversed impairment chargesProperty and equipment (Note 25)Equipment –3 – – –
Intangible assets (Note 24)Goodwill –1 – – –Internally developed software –6 – –2 –
Total –10 – –2 –
Total –124 –103 –103 –101

Nor
dea
Ann
ual R
epor
t 20
08
106
Financial statements
Note 11 Loan losses
Group Parent company
EURm 2008 2007 2008 2007
Loan losses divided by class, netLoans and receivables to credit institutions –14 9 0 8– of which write-offs and
provisions –16 –1 –2 0– of which reversals and
recoveries 2 10 2 8Loans and receivables to the public –401 –2 –78 –3– of which write-offs and
provisions –815 –451 –144 –86– of which reversals and
recoveries 414 449 66 83Off-balance sheet items1) –51 53 –2 20– of which write-offs and
provisions –58 –22 –3 –– of which reversals and
recoveries 7 75 1 20
Total –466 60 –80 25
Specification of Loan lossesChanges of allowance accounts in the balance sheet –442 30 –55 31– of which Loans and
receivables2) –391 –23 –53 11– of which Off-balance sheet
items1) –51 53 –2 20Changes directly recognised in the income statement –24 30 –25 –6– of which realised loan losses –89 –55 –45 –32– of which realised recoveries 65 85 20 26
Total –466 60 –80 251) Included in Note 36 Provisions.2) Included in Note 16 Loans and receivables and their impairment.
Note 12 Appropriations
Parent company
EURm 2008 2007
Pension adjustments Reversed actuarial pension costs 24 25Pension benefits paid –55 –55Allocations/compensation – 0Special wage tax/return tax –13 –12
Total –44 –42
Change in depreciation in excess of plan, equipment 4 –2
Total 4 –2
Total –40 –44
Note 13 Taxes
Income tax expense Group Parent company
EURm 2008 2007 2008 2007
Current tax1) –430 –473 17 –33Deferred tax –294 –280 –6 –1
Total –724 –753 11 –341) Of which relating to prior years (see below) 9 –8 13 12
The tax on the Group’s operating profit differs from the theoretical amount that would arise using the tax rate of Sweden as follows:
Group Parent company
EURm 2008 2007 2008 2007
Profit before tax 3,396 3,883 1,877 1,237Tax calculated at a tax rate of 28% –951 –1,087 –526 –346Effect of different tax rates in other countries 66 64 – –Tax charges not related to profit –33 –52 – 1Income from associated undertakings 6 11 – –Other direct taxes 0 1 0 –Tax-exempt income 29 83 554 328Non-deductible expenses –68 –17 –30 –29Adjustments relating to prior years 9 –8 13 12Income tax due to tax assets previously not recognised 212 236 – –Change of tax rate 16 17 – –Not creditable foreign taxes –10 –1 – –
Tax charge –724 –753 11 –34
Average effective tax rate 21% 19% –1% 3%

Nor
dea
Ann
ual R
epor
t 20
08
107
Financial statements
Deferred tax Group Parent company
EURm 2008 2007 2008 2007
Deferred tax expense (–)/ income (+)Deferred tax due to temporary differences, including tax losses carry-forward –522 –469 –6 –1Deferred tax due to change of tax rate 16 17 – –Deferred tax due to tax assets previously not recognised 212 172 – –
Income tax expense, net –294 –280 –6 –1
Deferred tax assetsDeferred tax assets due to tax losses carry-forward 100 10 – –Deferred tax assets due to temporary differences 80 181 28 34Offset against deferred tax liabilities –116 – – –
Total 64 191 28 34
– of which expected to be settled after more than 1 year 53 16
Deferred tax liabilitiesDeferred tax liabilities due to untaxed reserves 105 72 – –Deferred tax liabilities due to temporary differences 1,064 631 0 2Offset against deferred tax assets –116 – – –
Total 1,053 703 0 2
– of which expected to be settled after more than 1 year 759 0
Deferred tax assets (+)/ liabilities (–), netDeferred tax assets due to tax losses carry-forward 100 10 – –Deferred tax liabilities due to untaxed reserves –105 –72 – –Deferred tax assets/liabilities in loans and advances to the public –300 –320 – –Deferred tax assets/liabilities in derivatives –193 69 0 –4Deferred tax assets/liabilities in intangible assets –43 –18 – –Deferred tax assets/liabilities in property and equipment 1 6 – –Deferred tax assets/liabilities in investment property –50 –58 – –Deferred tax assets/liabilities in retirement benefit obligations 11 54 – –Deferred tax liability due to hedge of net investments in foreign subsidiaries –175 – – –Deferred tax assets/liabilities in liabilities/provisions –235 –183 28 36
Deferred tax assets/liabilities, net –989 –512 28 32
Movements in deferred tax assets/liabilities, net are as follows:Deferred tax relating to items recognised directly in equity –173 0 2 –2Reclassification – – – –1Translation differences –10 8 – –Acquisitions and others 0 –14 – –Deferred tax in the income statement –294 –280 –6 –1
At end of year –477 –286 –4 –4
Current and deferred tax recognised directly in equityDeferred tax relating to hedge of net investments in foreign subsidiaries –175 – – –Deferred tax relating to available-for-sale investments 0 0 0 –2Deferred tax relating to cash flow hedges 2 – 2 –
Total –173 0 2 –2
Current tax assets 344 142 76 52– of which expected to be settled after more than 1 year – –Current tax liabilities 458 300 0 0– of which expected to be settled after more than 1 year 55 –
Unrecognised deferred tax assetsUnused tax losses carry-forward 3 9 – –Unused tax credits 50 167 – –Other deductible temporary differences – 21 – –
Total 53 197 – –
Note 13 Taxes, cont.

Nor
dea
Ann
ual R
epor
t 20
08
108
Financial statements
Note 13 Taxes, cont.
Group Parent company
EURm 2008 2007 2008 2007
Expire date 2009 1 3 – –Expire date 2010 0 10 – –Expire date 2011 1 28 – –Expire date 2012 1 4 – –Expire date 2013 28 40 – –Expire date 2014 19 88 – –Expire date later than 2014 3 24 – –
Total 53 197 – –
Note 14 Earnings per share
Group 31 Dec 31 Dec 2008 2007
Profit attributable to shareholders of Nordea Bank AB (publ) (EURm) 2,671 3,121Basic weighted average number of shares outstanding (in millions) 2,593 2,591Diluted weighted average number of shares outstanding (in millions) 2,594 2,592Basic earnings per share, EUR 1.03 1.20Diluted earnings per share, EUR 1.03 1.20
Basic weighted average number of shares outstanding (in millions):Number of shares outstanding at beginning of year 2,597 2,594Adjustment for average own shares referring to Nordea Bank AB (publ)’s repurchase of own shares 3 2Adjustment for average own shares in trading portfolio –7 –5
Basic weighted average number of shares outstanding 2,593 2,591
Adjustment for diluted weighted average number of additional ordinary shares outstanding (related to Long-Term Incentive Programmes )1) 1 1
Diluted weighted average number of shares outstanding 2,594 2,5921) Contingently issuable shares not included, that can potentiallly dilute basic earnings per
share, exist in the Long-Term Incentive Progammes.
Note 15 Treasury bills
Group Parent company1)
31 Dec 31 Dec 31 Dec 31 Dec EURm 2008 2007 2008 2007
State and sovereigns 6,377 5,263 2,230 1,435Municipalities and other public bodies 168 100 – –
Total 6,545 5,363 2,230 1,4351) Of which EUR 183m (EUR 0m) held at amortised cost with a nominal amount of EUR
183m (EUR 0m).
All bills are subject to variable interest rate risk.
Maturity informationRemaining maturity (carrying amount)Maximum 1 year 1,989 1,274 1,431 401More than 1 year 4,556 4,089 799 1,034
Total 6,545 5,363 2,230 1,435
– of which Financial instruments pledged as collateral (Note 18) – 170 132 868
Total 6,545 5,193 2,098 567

Nor
dea
Ann
ual R
epor
t 20
08
109
Financial statements
Note 16 Loans and receivables and their impairment
Group Credit institutions The public1) Total
31 Dec 31 Dec 31 Dec 31 Dec 31 Dec 31 Dec EURm 2008 2007 2008 2007 2008 2007
Loans and receivables, not impaired 23,893 24,264 264,056 244,205 287,949 268,469Impaired loans and receivables 33 8 2,191 1,424 2,224 1,432– Performing 32 7 1,357 917 1,389 924– Non-performing 1 1 834 507 835 508
Loans and receivables before allowances 23,926 24,272 266,247 245,629 290,173 269,901 Allowances for individually assessed impaired loans –20 –8 –742 –595 –762 –603– Performing –19 –7 –437 –300 –456 –307– Non-performing –1 –1 –305 –295 –306 –296Allowances for collectively assessed impaired loans –3 –2 –405 –352 –408 –354
Allowances –23 –10 –1,147 –947 –1,170 –957 Loans and receivables, carrying amount 23,903 24,262 265,100 244,682 289,003 268,944
Maturity information Remaining maturity (carrying amount) Payable on demand 1,537 2,077 34,872 31,223 36,409 33,300Maximum 3 months 20,528 21,115 66,239 56,953 86,767 78,0683–12 months 820 670 18,091 18,867 18,911 19,5371–5 years 670 284 53,621 49,391 54,291 49,675More than 5 years 348 116 92,277 88,248 92,625 88,364
Total 23,903 24,262 265,100 244,682 289,003 268,944
Parent company Credit institutions The public1) Total
31 Dec 31 Dec 31 Dec 31 Dec 31 Dec 31 Dec EURm 2008 2007 2008 2007 2008 2007
Loans and receivables, not impaired 43,857 36,824 29,061 26,577 72,918 63,401Impaired loans and receivables 6 8 297 175 303 183– Performing 5 6 265 106 270 112– Non-performing 1 2 32 69 33 71
Loans and receivables before allowances 43,863 36,832 29,358 26,752 73,221 63,584 Allowances for individually assessed impaired loans –6 –8 –77 –89 –83 –97– Performing –5 –6 –53 –34 –58 –40– Non-performing –1 –2 –24 –55 –25 –57Allowances for collectively assessed impaired loans –2 0 –41 –23 –43 –23
Allowances –8 –8 –118 –112 –126 –120 Loans and receivables, carrying amount 43,855 36,824 29,240 26,640 73,095 63,464
Maturity informationRemaining maturity (carrying amount)Payable on demand 4,621 1,313 4,527 4,351 9,148 5,664Maximum 3 months 26,606 26,845 8,604 10,872 35,210 37,7173–12 months 11,280 8,135 3,101 1,759 14,381 9,8941–5 years 1,050 507 12,421 8,907 13,471 9,414More than 5 years 298 24 587 751 885 775
Total 43,855 36,824 29,240 26,640 73,095 63,4641) Finance leases, where Nordea Group is a lessor, are included in Loans and receivables to the public, see Note 26 Leasing.

Nor
dea
Ann
ual R
epor
t 20
08
110
Financial statements
Note 16 Loans and receivables and their impairment, cont.
Reconciliation of allowance accounts for impaired loans1)
Group Credit institutions The public1) Total
Indi- Collec- Indi- Collec- Indi- Collec- vidually tively vidually tively vidually tively EURm assessed assessed Total assessed assessed Total assessed assessed Total
Opening balance at 1 Jan 2008 –8 –2 –10 –595 –352 –947 –603 –354 –957Provisions –14 –3 –17 –541 –185 –726 –555 –188 –743Reversals 1 2 3 228 121 349 229 123 352Changes through the income statement –13 –1 –14 –313 –64 –377 –326 –65 –391Allowances used to cover write-offs 0 0 0 129 0 129 129 0 129Reclassification – – – 4 – 4 4 – 4Currency translation differences 1 0 1 33 11 44 34 11 45
Closing balance at 31 Dec 2008 –20 –3 –23 –742 –405 –1,147 –762 –408 –1,170
Opening balance at 1 Jan 2007 –7 –13 –20 –757 –341 –1,098 –764 –354 –1,118Provisions 0 –1 –1 –230 –166 –396 –230 –167 –397Reversals 0 10 10 238 126 364 238 136 374Changes through the income statement 0 9 9 8 –40 –32 8 –31 –23Allowances used to cover write-offs 0 0 0 150 0 150 150 0 150Reclassification – –1 –1 – 33 33 – 32 32Currency translation differences –1 3 2 4 –4 0 3 –1 2
Closing balance at 31 Dec 2007 –8 –2 –10 –595 –352 –947 –603 –354 –957
Parent company Credit institutions The public1) Total
Indi- Collec- Indi- Collec- Indi- Collec- vidually tively vidually tively vidually tively EURm assessed assessed Total assessed assessed Total assessed assessed Total
Opening balance at 1 Jan 2008 –7 –1 –8 –89 –23 –112 –96 –24 –120Provisions – –2 –2 –68 –30 –98 –68 –32 –100Reversals 1 1 2 40 6 46 41 7 48Changes through the income statement 1 –1 0 –28 –24 –52 –27 –25 –52Allowances used to cover write-offs – – – 34 – 34 34 – 34Currency translation differences 0 0 0 7 5 12 7 5 12
Closing balance at 31 Dec 2008 –6 –2 –8 –76 –42 –118 –82 –44 –126 Opening balance at 1 Jan 2007 –7 –12 –19 –91 –39 –130 –98 –51 –149Provisions 0 – 0 –43 –10 –53 –43 –10 –53Reversals – 8 8 26 30 56 26 38 64Changes through the income statement 0 8 8 –17 20 3 –17 28 11Allowances used to cover write-offs – – – 15 0 15 15 0 15Currency translation differences 0 3 3 4 –4 0 4 –1 3
Closing balance at 31 Dec 2007 –7 –1 –8 –89 –23 –112 –96 –24 –1201) See Note 11 Loan losses.
Allowances and provisions
Group Credit institutions The public Total
31 Dec 31 Dec 31 Dec 31 Dec 31 Dec 31 Dec EURm 2008 2007 2008 2007 2008 2007
Allowances for items in the balance sheet –23 –10 –1,147 –947 –1,170 –957Provisions for off balance sheet items –54 –36 –46 –19 –100 –55
Total allowances and provisions –77 –46 –1,193 –966 –1,270 –1,012
Parent company
Allowances for items in the balance sheet –8 –8 –118 –112 –126 –120Provisions for off balance sheet items –1 –2 –2 0 –3 –2
Total allowances and provisions –9 –10 –120 –112 –129 –122

Nor
dea
Ann
ual R
epor
t 20
08
111
Financial statements
Note 16 Loans and receivables and their impairment, cont.
Key ratios Group Parent company
31 Dec 31 Dec 31 Dec 31 Dec 2008 2007 2008 2007
Impairment rate, gross1), % 0.8 0.5 0.4 0.3Impairment rate, net2), % 0.5 0.3 0.3 0.1Total allowance rate3), % 0.4 0.4 0.2 0.2Allowance rate, impaired loans4), % 34.3 42.1 27.2 53.0Non-performing loans and receivables, not impaired5), EURm 142 98 – –1) Individually assessed impaired loans and receivables before allowances divided by total
loans and receivables before allowances, %.2) Individually assessed impaired loans and receivables after allowances divided by total
loans and receivables before allowances, %.3) Total allowances divided by total loans and receivables before allowances, %.4) Allowances for individually assessed impaired loans and receivables divided by individu-
ally assessed impaired loans and receivables before allowances, %.5) Past due loans and receivables, not impaired due to future cash flows (included in Loans
and receivables, not impaired).
Note 17 Interest-bearing securities
Group Parent company1)
31 Dec 31 Dec 31 Dec 31 Dec EURm 2008 2007 2008 2007
Issued by public bodies 3,120 2,945 – –Issued by other borrowers 49,626 40,354 13,045 7,154
Total 52,746 43,299 13,045 7,154 Listed securities 48,829 35,125 9,516 5,239Unlisted securities 3,917 8,174 3,529 1,915
Total 52,746 43,299 13,045 7,1541) Of which EUR 2,335m (EUR 0m) held at amortised cost with a nominal amount of EUR
2,327m (EUR 0m).
Maturity informationRemaining maturity (carrying amount)Maximum 1 year 16,509 13,036 5,161 2,173More than 1 year 36,237 30,263 7,884 4,981
Total including portfolio schemes 52,746 43,299 13,045 7,154– of which Financial
instruments pledged as collateral (Note 18) 7,916 4,517 2,965 1,938
Total 44,830 38,782 10,080 5,216
Note 18 Financial instruments pledged as collateral
Financial instruments pledged as collateralIn repurchase transactions and in securities lending transactions, non-cash assets are transferred as collateral. When the counterpart receiving the collateral has the right to sell or repledge the assets, the assets are reclassified in the balance sheet to the item Financial instruments pledged as collateral. Group Parent company
31 Dec 31 Dec 31 Dec 31 Dec EURm 2008 2007 2008 2007
Repurchase agreements 7,917 4,688 3,097 2,806Securities lending agreements 20 102 – –
Total 7,937 4,790 3,097 2,806
Transferred assets that are still recognised in the balance sheet and associated liabilitiesThe types of assets transferred and the liabilities associated with these transactions are specified in the following tables. The assets continue to be recognised on the balance sheet since Nordea is still exposed to changes in the fair value of the assets. Therefore, these assets and its associated liabilities are included in the tables below.
Group Parent company
31 Dec 31 Dec 31 Dec 31 Dec EURm 2008 2007 2008 2007
Repurchase agreementsTreasury bills – 170 132 868Interest-bearing securities 7,916 4,517 2,965 1,938Shares 1 1 – –
Securities lending agreementsShares 20 102 – –
Total 7,937 4,790 3,097 2,806
Liabilities associated with the assets
Group Parent company
31 Dec 31 Dec 31 Dec 31 Dec EURm 2008 2007 2008 2007
Repurchase agreementsDeposits by credit institutions 6,578 3,776 3,104 2,826Deposits and borrowings from the public 1,370 862 – –Other 4 139 – –
Total 7,952 4,777 3,104 2,826
Note 19 Shares
Group Parent company
31 Dec 31 Dec 31 Dec 31 Dec EURm 2008 2007 2008 2007
Shares held for trading 3,766 5,655 1,063 1,828Shares designated at fair value through profit or loss 6,917 12,076 44 199 – of which shares taken over
for protection of claims 13 0 13 –Shares available for sale 7 16 0 7
Total 10,690 17,747 1,107 2,034
Listed shares 7,742 15,766 638 2,003Unlisted shares 2,948 1,981 469 31
Total 10,690 17,747 1,107 2,034
– of which Financial instruments pledged as collateral (Note 19) 21 103 – –
Total 10,669 17,644 1,107 2,034
– of which expected to be settled after more than 1 year 313 262 44 34

Nor
dea
Ann
ual R
epor
t 20
08
112
Financial statements
Note 20 Derivatives and Hedge accounting
Group Parent company
Fair value Total nom Fair value Total nom31 Dec 2008, EURm Positive Negative amount Positive Negative amount
Derivatives held for trading
Interest rate derivativesInterest rate swaps 43,992 43,264 1,899,652 692 756 47,756FRAs 2,159 2,066 802,160 46 54 15,728Futures and forwards 13 395 65,345 1 2 20Options 6,258 6,375 171,877 42 39 3,128Other 3 0 25 – – –
Total 52,425 52,100 2,939,059 781 851 66,632 Equity derivatives Equity swaps 85 64 718 202 53 785Futures and forwards 322 60 12,632 108 18 425Options 516 581 14,035 91 24 564
Total 923 705 27,385 401 95 1,774 Foreign exchange derivatives Currency and interest rate swaps 8,002 6,542 192,133 1,626 1,385 16,566Currency forwards 18,123 17,195 453,227 357 147 11,380Options 908 866 33,622 – – –Other 4 2 7,907 – – –
Total 27,037 24,605 686,889 1,983 1,532 27,946 Credit derivatives Credit default swaps 4,631 4,584 99,208 – 10 400
Total 4,631 4,584 99,208 – 10 400 Other derivatives Swaps 1,125 1,033 10,007 – – –Futures and forwards 294 100 4,463 – – –Options 85 87 1,450 – – –Other – 63 1,626 – 63 1,626
Total 1,504 1,283 17,546 – 63 1,626
Total derivatives held for trading 86,520 83,277 3,770,087 3,165 2,551 98,378
Derivatives used for hedge accounting
Interest rate derivativesInterest rate swaps 280 202 13,940 253 32 4,229
Total 280 202 13,940 253 32 4,229
Equity derivativesOptions 1 7 69 7 7 107
Total 1 7 69 7 7 107
Foreign exchange derivativesCurrency and interest rate swaps 37 2,052 18,005 102 164 1,413Currency forwards – – – 35 2 251
Total 37 2,052 18,005 137 166 1,664
Total derivatives used for hedge accounting 318 2,261 32,014 397 205 6,000
– of which fair value hedges 288 2,114 30,403 265 58 3,991– of which cash flow hedges 30 147 1,611 132 147 2,009
Total derivatives 86,838 85,538 3,802,101 3,562 2,756 104,378

Nor
dea
Ann
ual R
epor
t 20
08
113
Financial statements
Note 20 Derivatives and Hedge accounting, cont.
Periods when hedged cashflows are expected to occur and when they are expected to affect the income statement
GroupEURm <1 year 1–3 years 3–5 years 5–10 years over 10 years
Cash inflows (assets) 436 936 164 35 235Cash outflows (liabilities) –432 –857 –82 –24 –240
Net cash flows 4 79 82 11 –5
Parent companyEURm <1 year 1–3 years 3–5 years 5–10 years over 10 years
Cash inflows (assets) 736 981 195 35 235Cash outflows (liabilities) –757 –1,077 –271 –248 –240
Net cash flows –21 –96 –76 –213 –5
Group Parent company
Fair value Total nom Fair value Total nom31 Dec 2007, EURm Positive Negative amount Positive Negative amount
Derivatives held for trading
Interest rate derivativesInterest rate swaps 16,391 16,889 1,387,471 720 771 100,317FRAs 196 190 642,258 14 12 122,946Futures and forwards 337 405 167,641 2 0 222Options 2,913 2,963 370,078 7 7 48,240Other 23 15 3,908 27 28 4,533
Total 19,860 20,462 2,571,356 770 818 276,258
Equity derivativesSwaps 57 119 1,379 44 77 111Futures and forwards 75 137 9,427 1 5 40Options 1,178 1,584 16,528 36 49 1,481
Total 1,310 1,840 27,334 81 131 1,632
Foreign exchange derivativesCurrency and interest rate swaps 2,257 2,305 170,131 211 307 12,039Currency forwards 4,826 5,012 465,014 5 54 4,624Options 282 282 32,834 – – –
Total 7,365 7,599 667,979 216 361 16,663
Credit derivativesCredit default swaps 1,163 1,115 90,476 – – 250Total rate of return swaps – – – 1 – –
Total 1,163 1,115 90,476 1 – 250
Other derivativesSwaps 1,183 1,142 9,169 – – –Futures and forwards 103 48 769 – – –Options 99 118 697 – – –
Total 1,385 1,308 10,635 – – –
Total derivatives held for trading 31,083 32,324 3,367,780 1,068 1,310 294,803

Nor
dea
Ann
ual R
epor
t 20
08
114
Financial statements
Group Parent company
31 Dec 2008, EURm Positive Negative Positive Negative
Maturity informationRemaining maturity (carrying amount)Maximum 3 months 13,844 14,584 826 3233–12 months 11,079 11,017 269 3411–5 years 27,686 26,607 1,817 1,603More than 5 years 34,229 33,330 650 489
Total 86,838 85,538 3,562 2,756
Group Parent company
31 Dec 2007, EURm Positive Negative Positive Negative
Maturity informationRemaining maturity (carrying amount)Maximum 3 months 4,587 5,185 165 1833–12 months 2,978 3,426 105 1371–5 years 9,770 9,907 590 658More than 5 years 14,163 14,505 421 603
Total 31,498 33,023 1,281 1,581
Note 20 Derivatives and Hedge accounting, cont.
Group Parent company
Fair value Total nom Fair value Total nom31 Dec 2007, EURm Positive Negative amount Positive Negative amount
Derivatives used for hedge accounting
Interest rate derivativesInterest rate swaps 252 124 32,918 48 29 3,256
Total 252 124 32,918 48 29 3,256
Equity derivativesOptions 55 73 253 73 73 342
Total 55 73 253 73 73 342
Foreign exchange derivativesCurrency and interest rate swaps 97 502 4,381 92 168 1,433Currency forwards 11 – – – 1 18
Total 108 502 4,381 92 169 1,451
Total derivatives used for hedge accounting 415 699 37,552 213 271 5,049
– of which fair value hedges 415 699 37,552 213 271 5,049
Total derivatives 31,498 33,023 3,405,332 1,281 1,581 299,852

Nor
dea
Ann
ual R
epor
t 20
08
115
Financial statements
Note 21 Fair value changes of the hedged items in portfolio hedge of interest rate risk
Assets Group Parent company
31 Dec 31 Dec 31 Dec 31 Dec EURm 2008 2007 2008 2007
Carrying amount at beginning of year –105 –37 –4 1Changes during the year Revaluation of hedged items1) 547 –71 31 –5 Translation differences –29 3 – –
Carrying amount at end of year 413 –105 27 –4
– of which expected to be settled after more than 1 year 329 23
1) A part of the portfolio hedge designation was revoked during 2007. The amortisation of the carrying amount related to the dissolved hedges is included in this line. The amortisa-tion is based on the expected relevant repricing time period.
Liabilities Group Parent company
31 Dec 31 Dec 31 Dec 31 Dec EURm 2008 2007 2008 2007
Carrying amount at beginning of year –323 –401 –69 –96Changes during the year Revaluation of hedged items1) 919 71 111 27 Translation differences –64 7 – –
Carrying amount at end of year 532 –323 42 –69
– of which expected to be settled after more than 1 year 461 23
1) A part of the portfolio hedge designation was revoked during 2007. The amortisation of the carrying amount related to the dissolved hedges are included in this line. The amorti-sation is based on the relevant repricing time period.
The carrying amount at end of year represents accumulated changes in the fair value for those repricing time periods in which the hedged item is an asset respectively a liability. When the hedged item is an asset, the change in the fair value of the hedged item is presented within assets and when the hedged item is a lia-bility, the change is presented as a liability.
Note 22 Investments in group undertakings
Parent company 31 Dec 31 Dec EURm 2008 2007
Acquisition value at beginning of year 15,953 17,615Acquisitions during the year 402 560Sales during the year – –2,084Reclassifications – –141IFRS 2 expenses1) 5 3Acquisition value at end of year 16,360 15,953
Accumulated impairment charges at beginning of year –465 –1,054Reversed impairment charges during the year – 448Impairment charges during the year –26 –Reclassifications – 141Translation differences –3 –
Accumulated impairment charges at end of year –494 –465
Total 15,866 15,488
– of which, listed shares – –
1) Allocation of IFRS 2 expenses for LTIP 2007/2008 related to the subsidiaries. For more information, see Note 8.
The total amount is expected to be settled after more than 1 year.

Nor
dea
Ann
ual R
epor
t 20
08
116
Financial statements
Note 22 Investments in group undertakings, cont.
SpecificationThis specification includes all directly owned group undertakings and major group undertakings to the directly owned companies. The full specification and statutory information are available on request from Nordea Investor Relations.
Parent company Carrying Carrying Voting amount amount power of Number 2008, 2007, holding Registration 31 Dec 2008 of shares EURm EURm % Domicile number
Nordea Bank Finland Plc 1,030,800,000 5,948 5,947 100.0 Helsinki 1680235-8 Nordea Finance Finland Ltd 100.0 Espoo 0112305-3
Nordea Bank Danmark A/S 50,000,000 3,503 3,501 100.0 Copenhagen 13522197 Nordea Finans Danmark A/S 100.0 Copenhagen 89805910 Nordea Kredit Realkreditaktieselskab 100.0 Copenhagen 15134275
Nordea Bank Norge ASA 551,358,576 2,402 2,401 100.0 Oslo 911044110 Norgreskreditt AS1) 100.0 Oslo 971227222 Nordea Finans Norge AS 100.0 Oslo 924507500 Christiania Forsikring AS 100.0 Oslo 941219349 PRIVATmegleren AS 67.0 Oslo 986386661
Nordea Bank Polska S.A. 45,070,392 262 262 99.0 Gdynia KRS0000021828
OOO Promyshlennaya Companiya Vestkon 749,991,7042) 649 451 100.0 Moscow 1027700034185 JSB Orgresbank 91.1 Moscow 1027739436955
Nordea Life Holding AB 1,000 201 0 100.0 Stockholm 556742-3305 Nordea Liv & Pension, Livforsikringsselskab A/S 100.0 Ballerup 24260577 Nordea Liv Holding Norge AS 100.0 Bergen 984739303 Livforsikringsselskapet Nordea Liv Norge AS 100.0 Bergen 959922659 Nordea Livförsäkring Sverige AB (publ) 100.0 Stockholm 516401-8508 Nordea Life Holding Finland Ltd 100.0 Espoo 1737788-3 Nordea Life Assurance Finland Ltd 100.0 Espoo 0927072-8
Nordea Hypotek AB (publ) 100,000 1,714 1,714 100.0 Stockholm 556091-5448Nordea Fonder AB 15,000 679 679 100.0 Stockholm 556020-4694Nordea Bank S.A. 999,999 323 323 100.0 Luxembourg B14157Nordea Finans Sverige AB (publ) 1,000,000 77 77 100.0 Stockholm 556021-1475Nordea Fondene Norge AS 1,200 29 29 100.0 Oslo 930954616Nordea Investment Management AB 12,600 64 64 100.0 Stockholm 556060-2301Nordea Investment Fund Company Finland Ltd 3,350 4 4 100.0 Helsinki 1737785-9Nordea Ejendomsinvestering A/S 1,000 1 1 100.0 Copenhagen 26640172Nordea Investment Funds I Company SA 38,996 0 0 100.0 Luxembourg B30550PK Properties Int’l Corp 100,000 0 0 100.0 Atlanta, USA 91-1682291Nordea Bemanning AB 510 0 0 51.0 Stockholm 556222-4336Nordea Hästen Fastighetsförvaltning AB 1,000 0 0 100.0 Stockholm 556653-6800Nordea Putten Fastighetsförvaltning AB 1,000 0 0 100.0 Stockholm 556653-5257Nordea North America Inc. 1,000 0 0 100.0 Delaware, USA 51-0276195Nordea Do Brasil Representações LTDA 300 0 0 99.0 Sao Paulo, Brasil 51-696.268/0001-40Nordic Baltic Holding (NBH) AB3) 1,000 9 34 100.0 Stockholm 556592-7950Nordea Fastigheter AB3) 3,380,000 1 1 100.0 Stockholm 556021-4917
Total 15,866 15,4881) New name is Nordea Eiendomskreditt AS as from 5 January 2009.2) Nominal value expressed in RUB, representing Nordea’s participation in Vestkon.3) Dormant.

Nor
dea
Ann
ual R
epor
t 20
08
117
Financial statements
Note 22 Investments in group undertakings, cont.
Special Purpose Entities (SPEs) – Consolidated Nordea’s EURm Purpose Duration investment Total assets
Viking ABCP Conduit1) Factoring <1 year 733 801CMO Denmark A/S2) Collateralised Mortgage Obligation >5 years 12 33Kalmar Structured Finance A/S3) Credit Linked Note >5 years 25 142Kirkas Northern Lights Ltd4) Collateralised Mortgage Obligation >5 years 8,096 8,096
Total 8,866 9,0721) The Viking ABCP Conduit (Viking) has been established with the purpose of supporting trade receivable or accounts payable securitisations to core Nordic customers. The SPEs purchase-
trade receivables from the approved sellers and fund the purchases either by issuing Commercial Papers (CP) via the established Asset Backed Commercial Papers programme or by draw-ing funds on the liquidity facilities available. Nordea has provided liquidity facilities of maximum EUR 1,122m and at year end 2008 EUR 733m were utilised. There is no outstanding CP issue at year end 2008. These SPEs are consolidated as they are closely linked to the activities within Nordea. Also, Nordea is exposed to credit risk through the liquidity facility.
2) Collateralised Mortgage Obligations Denmark A/S (CMO Denmark A/S) was established with the purpose to issue CMOs in order to meet specific customer preferences in terms of credit risk, interest rate risk, prepayment risk, maturity etc. The SPE purchased a pool of mortgage bonds and reallocated the risk through tranching a similar bond issue (CMOs). At year end 2008 the total notional of outstanding bonds were EUR 33m available to investors. Nordea holds bonds issued by CMO Denmark A/S as part of offering a secondary market for the bonds. The investment amounted to EUR 12m as of year end 2008.
3) Kalmar Structured Finance A/S was established to allow customers to invest in structured products in the global credit markets. The SPE enters into Credit Default Swaps (CDS) and hereby aquires a credit risk on an underlying portfolio of names (like corporate names) and at the same time the SPE issues Credit Linked Notes (CLN) with a similar credit risk that reflects the terms in the CDSs. Nordea is the counterpart in the derivative transactions. The total notional of outstanding CLNs in this category was EUR 142m at year end 2008. Nordea holds CLNs issued by the SPEs as part of offering a secondary market for the notes. The investment amounted to EUR 25m at year end 2008.
4) Kirkas Northern Lights Ltd (Kirkas) has been established during 2008. Assets have been sold from Nordea’s ordinary lending portfolio to Kirkas. Kirkas has used the assets as collateral for bonds issued. The total notional of bonds and subordinated loans was EUR 8,096m at year end 2008, which are held in full by Nordea. Nordea still holds the majority of the residual- and own-ership risks in the SPE, why the SPE is consolidated into the Nordea Group.
Note 23 Investments in associated undertakings
Group Parent company
31 Dec 31 Dec 31 Dec 31 Dec EURm 2008 2007 2008 2007
Acquisition value at beginning of year 376 411 30 29Acquisitions during the year 41 9 – 1Sales during the year –53 –33 –28 –Share in earnings1) 112 58 – –Dividend received –14 –48 – –Reclassifications 17 –23 – –Translation differences –38 2 – –
Acquisition value at end of year 441 376 2 30
Accumulated impairment charges at beginning of year –10 –13 – –Accumulated impairment charges on sales during the year – 3 – –Impairment charges during the year – 0 – –Translation differences – 0 – –
Accumulated impairment charges at end of year –10 –10 – –
Total 431 366 2 30
– of which, listed shares – – – –
1) Share in earnings
EURm 2008 2007 Profit from companies accounted for
under the equity method 24 41 Portfolio hedge, Eksportfinans ASA 53 –
Associated undertakings in Life, reported as Net gains/losses on items at fair value 35 17
Share in earnings 112 58
The total amount is expected to be settled after more than 1 year.
The associated undertakings’ aggregated balance sheets and income statements can be summarised as follows:
31 Dec 31 Dec EURm 2008 2007
Total assets 8,499 7,603Total liabilities 7,994 7,182Operating income 195 211Operating profit 148 43
Nordeas’ share of contingent liabilities in favour in associated undertakings amounts to EUR 249m (EUR 368m), and on behalf of associated undertaking EUR 0m (EUR 0m).

Nor
dea
Ann
ual R
epor
t 20
08
118
Financial statements
Note 23 Investments in associated undertakings, cont.
Group Registration Carrying amount, Voting power31 Dec 2008 number Domicile EURm of holding %
Eksportfinans ASA 816521432 Oslo 112 23Ejendomspartnerskabet af 1/7 2003 27134971 Ballerup 166 49Luottokunta 0201646-0 Helsinki 41 24LR Realkredit A/S 26045304 Copenhagen 1 39Oy Realinvest Ab 0680035-9 Helsinki 3 49Nymøllevej I/S 24247961 Ballerup 24 50E-nettet Holding A/S 21270776 Copenhagen 2 20Hovedbanens Forretningscenter K/S 16301671 Ballerup 14 50Ejendomsselskabet Axelborg I/S 79334413 Copenhagen 9 33Axel IKU Invest A/S 24981800 Billund 1 33Automatia Pankkiautomaatit Oy 0974651-1 Helsinki 7 33KIFU-AX II A/S 25893662 Fredriksberg 2 26KFU-AX II A/S 25894286 Fredriksberg 2 34Multidata Holding A/S 27226027 Ballerup 12 28Lautruphöj 1-3 A/S 26640172 Ballerup 6 50PBS Holding A/S 67007719 Ballerup 7 28Visa Sweden 801020-5097 Stockholm 17 23Other 5
Total 431
The statutory information is available on request from Nordea Investor Relations.
Parent company Registration Carrying amount, Voting power31 Dec 2008 number Domicile EURm of holding %
BPB Bankernas Depå AB 556695-3567 Stockholm 1 20Bankpension Sverige AB 556695-8194 Stockholm 1 40Visa Sweden 801020-5097 Stockholm 0 23Other 0
Total 2
Note 24 Intangible assets
Group Parent company
31 Dec 31 Dec 31 Dec 31 Dec EURm 2008 2007 2008 2007
Goodwill1)
Nordea Bank Danmark A/S 439 439 – –Nordea Bank Norge ASA 847 1,034 – –Nordea Bank Sverige AB (publ) 150 173 665 736Nordea Bank Polska S.A. 65 74 – –JSB Orgresbank 243 290 – –Life insurance companies 309 321 – –Other goodwill 90 77 – –
Goodwill, total 2,143 2,408 665 736
Internally developed software 303 236 80 63Other intangible assets 89 81 12 20
Total 2,535 2,725 757 8191) Excluding goodwill in associated undertakings.
Group Parent company
31 Dec 31 Dec 31 Dec 31 Dec EURm 2008 2007 2008 2007
GoodwillAcquisition value at beginning of year 2,408 2,083 1,058 1,058Acquisitions during the year 121) 303 – –Sales/disposals during the year 0 – – –Translation differences –276 22 1 –
Acquisition value at end of year 2,144 2,408 1,059 1,058
Accumulated amortisation at beginning of year – – –322 –250Amortisation according to plan for the year – – –72 –72
Accumulated amortisation at end of year – – –394 –322
Accumulated impairment charges at beginning of year – – – –Impairment charges during the year –1 – – –Translation differences 0 – – –
Accumulated impairment charges at end of year –1 – – –
Total 2,143 2,408 665 7361) Of which EUR 18m related to the acquisition of nine branch offices from Roskilde Bank.
The offsetting decrease is related to an update of the purchase price allocation covering Vestkon made (preliminary) in Q4 2007.

Nor
dea
Ann
ual R
epor
t 20
08
119
Financial statements
Note 24 Intangible assets, cont.
Group Parent company
31 Dec 31 Dec 31 Dec 31 Dec EURm 2008 2007 2008 2007
Internally developed softwareAcquisition value at beginning of year 296 146 76 35Acquisitions during the year 127 88 26 25Sales/disposals during the year –2 –10 – –Reclassifications –26 71 – 16Translation differences –16 1 – –
Acquisition value at end of year 379 296 102 76
Accumulated amortisation at beginning of year –59 –16 –13 –Amortisation according to plan for the year –18 –17 –7 –6Accumulated amortisation on sales/disposals during the year 1 10 – –Reclassifications 6 –34 – –7Translation differences –1 –2 – –
Accumulated amortisation at end of year –71 –59 –20 –13
Accumulated impairment charges at beginning of year –1 –1 – –Impairment charges during the year –6 – –2 –Translation differences 2 – – –
Accumulated impairment charges at end of year –5 –1 –2 –
Total 303 236 80 63
Group Parent company
31 Dec 31 Dec 31 Dec 31 Dec EURm 2008 2007 2008 2007
Other intangible assetsAcquisition value at beginning of year 147 88 48 37Acquisitions during the year1) 25 56 – 11Sales/disposals during the year –4 0 – – Reclassifications –2 2 –3 –Translation differences –9 1 – –
Acquisition value at end of year 157 147 45 48
Accumulated amortisation at beginning of year –66 –53 –28 –22Amortisation according to plan for the year –14 –12 –5 –6Accumulated amortisation on sales/disposals during the year 0 0 – –Reclassifications 8 0 – –Translation differences 4 –1 – –
Accumulated amortisation at end of year –68 –66 –33 –28
Total 89 81 12 201) Of which acquisitions through business combinations EUR 13m (EUR 21m).
The total amount is expected to be settled after more than 1 year.
Impairment testA cash generating unit, defined as segment per acquired legal entity, is the basis for the goodwill impairment test.
Cash flows in the near future (up to two years) are based on financial forecasts, derived from forecasted margins, volumes, sales and cost development. Longer term cash flows (more than two years) are based on estimated sector growth rates. In the Nor-dic market an average growth rate of approximately 4% has been used, while a growth rate of 5% for Poland & Baltic countries and 6% for Orgresbank has been used. Growth rates are based on his-torical data, updated to reflect the current situation.
Cash flows are risk adjusted using normalised loan losses. The derived cash flows are discounted at the Group’s defined
post-tax average cost of equity of 8.5% (equal to what is used for internal performance management purposes), except for opera-tions in Poland and the Baltics where an additional risk premium of 150 basis points has been applied.
The impairment tests conducted in 2008 did not indicate any need for significant goodwill impairment.
Note 25 Property and equipment
Group Parent company
31 Dec 31 Dec 31 Dec 31 Dec EURm 2008 2007 2008 2007
Property and equipment 375 342 81 53– of which buildings for own use 20 36 0 0
Total 375 342 81 53
EquipmentAcquisition value at beginning of year 770 1,031 164 167Acquisitions during the year1) 161 149 45 22Sales/disposals during the year –24 –312 –3 –9Reclassifications –5 –95 0 –16Translation differences –36 –3 – –
Acquisition value at end of year 866 770 206 164
Accumulated depreciation at beginning of year –453 –746 –111 –110Accumulated depreciation on sales/disposals during the year 13 303 2 9Reclassifications 5 63 0 7Depreciations according to plan for the year –81 –72 –16 –17Translation differences 18 –1 – –
Accumulated depreciation at end of year –498 –453 –125 –111
Accumulated impairment charges at beginning of year –11 –12 – –Accumulated impairment charges on sales/disposals during the year 0 0 – –Reversed impairment charges during the year 0 0 – –Impairment charges during the year –3 – – –Translation differences 1 1 – –
Accumulated impairment charges at end of year –13 –11 – –
Total 355 306 81 531) Of which acquisitions through business combinations EUR 1m (EUR 3m).

Nor
dea
Ann
ual R
epor
t 20
08
120
Financial statements
Note 25 Property and equipment, cont.
Group Parent company
31 Dec 31 Dec 31 Dec 31 Dec EURm 2008 2007 2008 2007
Land and buildingsAcquisition value at beginning of year 45 47 0 0Acquisitions during the year 1 10 – –Sales/disposals during the year – –8 – –Reclassifications –17 –5 – –Translation differences –2 1 – 0
Acquisition value at end of year 27 45 0 0
Accumulated depreciation at beginning of year –9 –13 0 0Accumulated depreciation on sales/disposals during the year – 2 – –Reclassifications 2 4 – –Depreciation according to plan for the year –1 –2 0 0Translation differences 1 0 – –
Accumulated depreciation at end of year –7 –9 0 0
Accumulated impairment charges at beginning of year 0 0 – –Reclassifications 0 – – –Translation differences 0 0 – –
Accumulated impairment charges at end of year 0 0 – –
Total 20 36 0 0
The total amount is expected to be settled after more than 1 year.
Parent companyThe parent company owns two properties outside Stockholm and two tenant rights in Stockholm with a carrying amount of EUR 0.5m (EUR 0.5m). Tax value amounts to EUR 0.6m (EUR 0.4m) with an estimated market value of EUR 0.7m (EUR 0.6m).
Note 26 Leasing
Nordea as a lessorFinance leasesNordea owns assets leased to customers under finance lease agreements. Finance lease agreements are reported as receivables from the lessee included in ”Loans and receivables to the public” (see Note 16) at an amount equal to the net investment in the lease. The leased assets mainly comprise vehicles, machinery and other equipment.
Reconciliation of gross investments and present value of future minimum lease payments: Group
31 Dec 31 Dec EURm 2008 2007
Gross investments 6,465 5,974Less unearned finance income –594 –454
Net investments in finance leases 5,871 5,520
Less unguaranteed residual values accruing to the benefit of the lessor –75 –49
Present value of future minimum lease payments receivable 5,796 5,471
Accumulated allowance for uncollectible minimum lease payments receivable 3 6
As of 31 December 2008 the gross investment at remaining matu-rity was distributed as follows: Group
31 Dec EURm 2008
2009 1,3842010 1,2722011 1,1132012 7592013 675Later years 1,262
Total gross investment 6,465
Less unearned future finance income on finance leases –594
Net investment in finance leases 5,871
Operating leasesAssets subject to operating leases mainly comprise real estate, vehicles, aeroplanes and other equipment. In the balance sheet they are reported as tangible assets. Group
31 Dec 31 Dec Carrying amount of leased assets, EURm 2008 2007
Acquisition value 178 155Accumulated depreciations –54 –43Accumulated impairment charges –13 –10
Carrying amount at end of year 111 102
– of which repossessed leased property, carrying amount 1 1
Group
Carrying amount distributed 31 Dec 31 Dec on groups of assets, EURm 2008 2007
Equipment 111 102Land and buildings – –
Carrying amount at end of year 111 102
Depreciation for 2008 amounted to EUR 17m (EUR 13m).

Nor
dea
Ann
ual R
epor
t 20
08
121
Financial statements
Note 26 Leasing, cont.
Under non-cancellable operating leases, the future minimum lease payments receivable are distributed as follows: Group
31 Dec EURm 2008
2009 192010 142011 92012 42013 1Later years 1
Total 48
Nordea as a lesseeFinance leasesNordea has only to a minor extent entered into finance lease agreements. The book value of assets subject to finance leases amounts to EUR 1m (EUR 1m).
Operating leasesNordea has entered into operating lease agreements for premises and office equipment. Group Parent company
Leasing expenses 31 Dec 31 Dec 31 Dec 31 Dec during the year, EURm 2008 2007 2008 2007
Leasing expenses during the year 253 243 84 84– of which minimum lease
payments 250 241 84 84– of which contingent rents 3 2 – – Leasing income during the year regarding sublease payments 7 6 38 18
Future minimum lease payments under non-cancellable operat-ing leases amounted to and are distributed as follows:
Parent Group company
31 Dec 31 Dec EURm 2008 2008
2009 304 1782010 230 1662011 251 2192012 100 192013 84 18Later years 466 184
Total 1,435 784
Total sublease payments expected to be received under non- cancellable subleases amounts to EUR 20m for the group and EUR 336m for the parent company. For the parent company EUR 316m of the subleases are towards group undertakings.
Note 27 Investment property
GroupMovement in the balance sheet 31 Dec 31 Dec EURm 2008 2007
Carrying amount at beginning of year 3,492 3,230Acquisitions during the year 109 253Capitalised subsequent expenditure – 1Sales/disposals during the year –19 –114Net gains or losses from fair value adjustments 18 209Transfers/reclassifications during the year 0 –96Translation differences –266 9
Carrying amount at end of year 3,334 3,492
The total amount is expected to be settled after more than 1 year.
Amounts recognised in the income statement1)
EURm 2008 2007
Rental income 233 234Direct operating expenses that generate rental income –86 –62Direct operating expenses that did not generate rental income –1 –91) Together with fair value adjustments included in Net gains/losses on items at fair value.
Note 28 Other assets
Group Parent company
31 Dec 31 Dec 31 Dec 31 Dec EURm 2008 2007 2008 2007
Claims on securities settlement proceeds 4,063 5,293 61 181Reinsurance recoverables 9 4 0 –Other 10,532 2,427 2,038 1,759
Total 14,604 7,724 2,099 1,940
– of which expected to be settled after more than 1 year 31 –
Note 29 Prepaid expenses and accrued income
Group Parent company
31 Dec 31 Dec 31 Dec 31 Dec EURm 2008 2007 2008 2007
Accrued interest income 1,964 1,563 492 350Other accrued income 425 360 11 9Prepaid expenses 438 260 280 43
Total 2,827 2,183 783 402
– of which expected to be settled after more than 1 year 360 222

Nor
dea
Ann
ual R
epor
t 20
08
122
Financial statements
Note 30 Deposits by credit institutions
Group Parent company
31 Dec 31 Dec 31 Dec 31 Dec EURm 2008 2007 2008 2007
Central banks 26,341 5,882 8,806 2,746Other banks 22,544 21,789 25,497 21,250Other credit institutions 3,047 2,406 410 279
Total 51,932 30,077 34,713 24,275
Maturity informationRemaining maturity (carrying amount)Payable on demand 14,133 6,315 7,822 7,103Maximum 3 months 35,208 19,026 21,838 12,2273–12 months 1,847 3,751 3,595 3,0591–5 years 448 639 1,366 1,810More than 5 years 296 346 92 76
Total 51,932 30,077 34,713 24,275
Note 31 Deposits and borrowings from the public
Group Parent company
31 Dec 31 Dec 31 Dec 31 Dec EURm 2008 2007 2008 2007
Deposits from the public 145,131 138,273 33,447 32,047Borrowings from the public 3,460 4,056 10 249
Total 148,591 142,329 33,457 32,296
Deposits are defined as funds in deposit accounts covered by the government deposit guarantee but also including amounts in excess of the individual amount limits. Individual pension sav-ings (IPS) are also included. Portfolio schemes in Nordea Bank Danmark A/S of EUR 3,070m (EUR 3,981m) are also included in Deposits. Group Parent company
31 Dec 31 Dec 31 Dec 31 Dec EURm 2008 2007 2008 2007
Maturity information, DepositsRemaining maturity (carrying amount) Payable on demand 101,880 107,415 26,266 28,325Maximum 3 months 30,764 20,438 7,181 3,7223–12 months 6,510 3,706 – –1–5 years 436 599 – –More than 5 years 5,541 6,115 – –
Total 145,131 138,273 33,447 32,047
Maturity information, BorrowingsRemaining maturity (carrying amount) Payable on demand 12 243 10 249Maximum 3 months 3,273 3,700 0 03–12 months 121 34 – –1–5 years 41 64 – –More than 5 years 13 15 – –
Total 3,460 4,056 10 249
Note 32 Liabilities to policyholders
GroupLiabilities to policyholders are obligations related to insurance contracts. These contracts are divided into contracts containing insurance risk and contracts without insurance risk. The latter are pure investments contracts.
Insurance contracts consists of Life insurance provisions and other insurance related items. 31 Dec 31 Dec EURm 2008 2007
Traditional life insurance provisions 20,286 20,515Unit-linked insurance provisions 3,611 4,796Insurance claims provision 363 353Provisions, Health & personal accident 173 161
Total insurance contracts 24,433 25,825
Investment contracts 4,022 4,224Collective bonus potential 783 2,231
Total 29,238 32,280
– of which expected to be settled after more than 1 year 28,802
Life insurance contracts are measured and recognised in accor-dance with IFRS 4, i.e. the measurement and recognition principle under previous GAAP has been maintained consequently result-ing in non-uniform accounting policies method on consolidation. Each market represented by Nordic and European entities meas-ure and recognises insurance contracts using local accounting policies.

Nor
dea
Ann
ual R
epor
t 20
08
123
Financial statements
Note 32 Liabilities to policyholders, cont.
Provisions, Traditional life Unit-linked Insurance Health & Investment Collective insurance insurance claims personal contracts bonus 31 Dec 2008, EURm provisions provisions provisions accident provisions potentials Total
Provisions/ bonus potentials, beginning of year 20,515 4,796 353 161 4,224 2,231 32,280Accumulated value adjustments, beginning of year – – 1 0 – 617 618
Retrospective provisions/ bonus potentials, beginning of year 20,515 4,796 354 161 4,224 2,848 32,898
Gross premiums written 1,790 586 – 5 1,315 – 3,696Transfers –336 –530 – – –299 – –1,165Addition of interest/ Investment return 1,007 –1,037 – – –560 – –590Claims and benefits –1,166 –191 20 8 –318 – –1,647Expense loading inclusive addition of expense bonus –124 –45 – – –37 – –206Change in provisions/ bonus potential – – – – – –1,983 –1,983Other –641 119 –11 –1 91 –82 –525Translation differences –759 –87 0 0 –394 0 –1,240
Provisions/ bonus potentials, end of year 20,286 3,611 363 173 4,022 783 29,238
Accumulated value adjustments, end of year – – – – – – –
Total 20,286 3,611 363 173 4,022 783 29,238
Provision relating to bonus schemes/ discretionary participation feature: 98% 41%
Provisions, Traditional life Unit-linked Insurance Health & Investment Collective insurance insurance claims personal contracts bonus 31 Dec 2007, EURm provisions provisions provisions accident provisions potential Total
Retrospective provisions/ bonus potentials, beginning of year 21,517 4,571 303 153 2,220 2,277 31,041
Gross premiums written 1,866 763 – – 874 – 3,503Transfers –1,733 –60 – – 1,793 – 0Addition of interest/ Investment return 947 82 – – 75 – 1,104Claims and benefits –1,734 –524 – – –585 – –2,843Expense loading inclusive addition of expense bonus –137 –44 – – –37 – –218Change in provisions/ bonus potential – – 49 8 –93 –44 –80Other 117 8 1 0 –23 –2 101
Provisions/ bonus potentials, end of year 20,843 4,796 353 161 4,224 2,231 32,608
Accumulated value adjustments, end of year –328 – – – – – –328
Total 20,515 4,796 353 161 4,224 2,231 32,280
Provision relating to bonus schemes/ discretionary participation feature: 95% 40%

Nor
dea
Ann
ual R
epor
t 20
08
124
Financial statements
Note 33 Debt securities in issue
Group Parent company
31 Dec 31 Dec 31 Dec 31 Dec EURm 2008 2007 2008 2007
Certificates of deposit 33,667 31,926 7,750 7,162Commercial papers 10,440 5,865 0 –Bond loans 64,753 61,780 10,074 6,474Other 129 221 125 203
Total 108,989 99,792 17,949 13,839
Maturity information, Debt securities in issueRemaining maturity (carrying amount)Maximum 1 year 56,158 48,875 11,171 11,206More than 1 year 52,702 50,696 6,653 2,430
Total 108,860 99,571 17,824 13,636
Maturity information, OtherRemaining maturity (carrying amount)Payable on demand 126 221 125 203Maximum 3 months 3 – – –
Total 129 221 125 203
Note 34 Other liabilities
Group Parent company
31 Dec 31 Dec 31 Dec 31 Dec EURm 2008 2007 2008 2007
Liabilities on securities settlement proceeds 6,110 4,970 1,785 601Sold, not held, securities 4,057 9,650 681 1,572Accounts payable 217 217 29 37Other 7,586 8,023 1,734 1,804
Total 17,970 22,860 4,229 4,014
– of which expected to be settled after more than 1 year 107 –
Note 35 Accrued expenses and prepaid income
Group Parent company
31 Dec 31 Dec 31 Dec 31 Dec EURm 2008 2007 2008 2007
Accrued interest 2,174 1,941 289 185Other accrued expenses 901 787 115 81Prepaid income 203 34 61 75
Total 3,278 2,762 465 341
– of which expected to be settled after more than 1 year 12 –
Note 36 Provisions
Group Parent company
31 Dec 31 Dec 31 Dec 31 Dec EURm 2008 2007 2008 2007
Reserve for restructuring costs 28 0 0 0Transfer risk, off-balance 55 37 2 2Individually assessed, off-balance sheet 45 18 1 –Other 15 18 – –
Total 143 73 3 2
Movement in the balance sheet Off- Restruc- Transfer balance Group turing risk sheet Other Total
At beginning of year 0 37 18 18 73New provisions made 29 22 36 2 89Provisions utilised –1 – – –4 –5Reversals – –3 –4 0 –7Reclassifications – – –4 –1 –5Discounting effect – – – 0 0Translation differences 0 –1 –1 0 –2
At end of year 28 55 45 15 143
– of which expected to be settled after more than 1 year – 55 38 10 103
Restructuring activities, which should increase efficiency during coming years, have been initiated. This is mainly related to Rosk-ilde Bank, but also to other areas. This has resulted in restructur-ing provisions of EUR 29m.
Provision for Transfer risk reserve is related to off-balance sheet items. Transfer risk reserve relating to loans and receivables is included in the item Allowances for collectively assessed impaired loans in Note 16. Provision for transfer risk is depending on the volume of business with different countries.
Loan loss provisions for individually assessed off-balance sheet items (ie Gurantees and L/C’s) amounted to EUR 45m.
Other provision refers to the following provisions: redundancy packages EUR 1m (of which EUR 1m expected to be settled dur-ing 2009), provision for disputes and pending law suites EUR 4m (of which EUR 2m expected to be settled during 2009), rent provi-sion EUR 2m (of which EUR 1m expected to be settled during 2009), provision for environmental and property-related obliga-tions of EUR 5m (not expected to be settled during 2009) and other provisions amounting to EUR 3m (of which EUR 1m expected to be settled during 2009).
The amount of any expected reimbursement for each class of provision with amount of the asset that has been recognised for the reimbursement. Off- Restruc- Transfer balance Parent company turing risks sheet Total
At beginning of year 0 2 – 2New provisions made 1 1 1 3 Provisions utilised –1 – – –1Reversals – –1 – –1Translation differences 0 0 – 0
At end of year 0 2 1 3
– of which expected to be settled after more than 1 year 0 2 1 3
Provision for Transfer risk reserve is related to off-balance sheet items. Transfer risk reserve relating to loans and receivables is included in the item Allowances for collectively assessed impaired loans in Note 16. Provision for transfer risk is depending on the volume of business with different countries.

Nor
dea
Ann
ual R
epor
t 20
08
125
Financial statements
Note 37 Retirement benefit obligations
Group 31 Dec 31 Dec EURm 2008 2007
Defined benefit plans, net 172 339
Total 172 339
Nordea has pension obligations from defined benefit plans in all Nordic countries with the predominant share in Sweden, Norway and Finland. The plans in Finland are closed to new employees and pensions for new employees are instead based on defined contribution arrangements as is also the case in Denmark. Defined contribution plans are not reflected on the balance sheet. Further-more, Nordea also contributes to public pension plans.
IAS 19 secures that the market based value of pension obliga-tions net of plan assets backing these obligations will be reflected on the Group’s balance sheet. The major plans in each country are funded schemes covered by assets in pension funds/foundations.
Funded schemes Swe Nor Fin Den
2008Members 21,545 6,061 19,873 60Average member age 54 55 59 71
2007Members 20,980 5,857 20,124 62Average member age 54 55 58 71
IAS 19 pension calculations and assumptionsCalculations on major plans are performed by external liability calculators and are based on the actuarial assumptions fixed for each of the Group’s pension plans.
Assumptions Swe Nor Fin Den
2008Discount rate 4.0% 4.5% 4.5% 4.5%Salary increase 3.5% 3.5% 3.5% 3.5%Inflation 2.0% 2.0% 2.0% 2.0%Expected return on assets before taxes 5.0% 5.5% 5.5% 5.5%
2007Discount rate 5.0% 5.0% 5.0% 5.0%Salary increase 3.5% 3.5% 3.5% 3.5%Inflation 2.0% 2.0% 2.0% 2.0%Expected return on assets before taxes 6.0% 6.0% 6.0% 6.0%
The expected return on assets is based on long-term expectations for return on the different asset classes. On bonds, this is linked to the discount rate while equities and real estate have an added risk premium.
The discount rate has the most significant impact on the obliga-tion and pension cost. If the discount rate is reduced the pension obligation will increase and vice versa. A one percentage point increase in the discount rate would lead to a decrease in pension obligation of 14% and in service cost of 20%. A one percentage point decrease in the discount rate would lead to a increase in pension obligation of 17% and in service cost of 27%.
Asset compositionThe combined return on assets in 2008 was –3.9% (3.1%) mainly reflecting the general market turmoil during the year.At the end of the year, the equity exposure in pension funds/foundations represented 13% (21%) of total assets.
Sweden Norway Finland Denmark Total Total Asset composition in funded schemes 2008 2008 2008 2008 2008 2007
Equity 15% 10% 14% 6% 13% 21%Bonds 84% 70% 77% 70% 78% 71%Real estate – 20% 6% – 6% 6%Other plan assets 1% – 3% 24% 3% 2%– of which Nordea shares – – – – – –– of which Nordea real estate – – – – – 1%
Amounts recognised in the balance sheet Sweden Norway Finland Denmark Total Total EURm 2008 2008 2008 2008 2008 2007
PBO 1,253 691 777 109 2,830 2,775Plan assets 816 402 770 111 2,099 2,407Total surplus/deficit (–) –437 –289 –7 2 –731 –368– of which unrecognised actuarial gains/losses (–) –390 –101 –59 –9 –559 –29
Of which recognised in the balance sheet –47 –188 52 11 –172 –339
Of which: – retirement benefit assets 67 – 83 18 168 123– retirement benefit obligations 114 188 31 7 340 462– related to unfunded plans (PBO) 110 133 23 7 273 302
Overview of surplus or deficit in the plans Total Total Total Total Total EURm 2008 2007 2006 2005 2004
PBO 2,830 2,775 3,004 2,910 2,675Plan Assets 2,099 2,407 2,367 2,256 2,065
Funded status – surplus/deficit (–) –731 –368 –637 –654 –610

Nor
dea
Ann
ual R
epor
t 20
08
126
Financial statements
Note 37 Retirement benefit obligations, cont.
Changes in the PBO Sweden Norway Finland Denmark Total Total EURm 2008 2008 2008 2008 2008 2007
PBO at 1 Jan 1,152 759 762 102 2,775 3,004Service cost 28 28 3 2 61 58Interest cost 55 34 37 4 130 115Pensions paid –50 –41 –41 –8 –140 –137Curtailments and settlements – 2 – – 2 2Past service cost – – 0 – 0 –1Actuarial gains(-)/losses 266 74 32 8 380 –223Effect of exchange rate changes –193 –153 –16 1 –361 –36Change in provision for SWT/SSC1) –5 –12 – 0 –17 –7
PBO at 31 Dec 1,253 691 777 109 2,830 2,7751) Provision on difference to GAAP for the Swedish special wage tax (SWT) and the social security contribution (SSC) in Norway and Denmark on recognised amounts.
Changes in the fair value of plan assets Sweden Norway Finland Denmark Total Total EURm 2008 2008 2008 2008 2008 2007
Assets at 1 Jan 968 473 856 110 2,407 2,367Expected return on assets 51 28 48 5 132 108Pensions paid 4 –25 –40 –6 –67 –63Contributions –3 61 27 1 86 60Actuarial gains/losses(-) –76 –41 –109 1 –225 –34Effect of exchange rate changes –128 –94 –12 0 –234 –31
Plan assets at 31 Dec 816 402 770 111 2,099 2,407
Actual return on plan assets –25 –13 –61 6 –93 74
Overview of actuarial gains/losses1)
Total Total Total EURm 2008 2007 2006
Effects of changes in actuarial assumptions –337 230 –15Experience adjustments –268 –41 10– of which on plan assets –225 –34 9– of which on plan liabilities –43 –7 1
Actuarial gains/losses –605 189 –51) The 5-year trend information will be built up over time.
Defined benefit pension costThe total net pension cost related to defined benefit plans recognised in the Group’s income statement (as staff costs) for the year is EUR 69m (EUR 83m). Total pension costs comprise defined benefit pension costs as well as costs related to defined contribution plans. (See specification in Note 8.) Sweden Norway Finland Denmark Total Total Recognised net defined benefit cost, EURm 2008 2008 2008 2008 2008 2007
Service cost 28 28 3 2 61 58Interest cost 55 34 37 4 130 115Expected return on assets –51 –28 –48 –5 –132 –108Curtailments and settlements – 2 – – 2 2Recognised past service cost – – 0 – 0 –1Recognised actuarial gains(-)/losses 0 – –1 0 –1 3SWT/SSC1) 8 1 – 0 9 14
Pension cost on defined benefit plans 40 37 –9 1 69 831) Cost related to the Swedish special wage tax (SWT) and the social security contribution (SSC).
The pension cost is lower than expected in the beginning of the year, to a high degree reflecting changes in exchange rates. The net pension cost on defined benefit plans is expected to increase in 2009, mainly as a consequence of higher recognition of actuarial losses, lower dis-count rates and a lower expected return on assets.
The Group expects to contribute EUR 48m to its defined benefit plans in 2009.

Nor
dea
Ann
ual R
epor
t 20
08
127
Financial statements
Note 37 Retirement benefit obligations, cont.
Key management personnelThe Group’s total pension obligations regarding key management personnel amounted to EUR 35m (EUR 43m) at the end of the year. These obligations are to a high degree covered with plan assets. Defined benefit pension costs related to key management personnel in 2008 were EUR 1m (EUR 3m). Complete information concerning key management personnel is disclosed in Note 8.
Pension provisionsParent companyThe pension liabilities of Nordea Bank AB (publ) are mainly covered by allocations to its pension foundation.
The provisions in the balance sheet pertain almost exclusively to former employees of Postgirot Bank. EUR 99m (EUR 116m) of the provisions are covered by “Tryggandelagen”.
A small percentage of the pension obligations is covered by insurance policies.
The following figures are based on calculations in accordance with Swedish rules. Foundation Pension assets obligations
31 Dec 31 Dec 31 Dec 31 Dec EURm 2008 2007 2008 2007
Nordea Bank AB (publ)Pension Foundation 828 962 750 892– of which related to the
parent company 789 916 712 848
Pension provisions
EURm 2008 2007
Balance at beginning of year 129 135New provisions made 5 2Provisions utilised – –2Other changes –16 –6
Balance at end of year 118 129
Capital value of pension commitments under own management
EURm 2008 2007
Opening balance 977 999Currency difference –131 –43Costs excl. interest charged to the result 5 2Interest expense 25 25Pension benefits paid –55 –57Acquisition/disposal of operations – 0Other increase in capital value 9 51
Balance at end of year 830 977
Actual value relating to specifically separated assets1)
Opening balance 916 951Currency difference –124 –42Yield –3 7Acquisition/disposal of operations – 0
Balance at end of year 789 916
Net reported in respect of pension commitments 41 611) For futher information see Note 1, section 24, Related Party transactions.
Costs in respect of pensions
EURm 2008 2007
Pension system under own management:Expenses excl. interest expenses 26 26Return on specifically separated assets 3 –7Result effect of redemption of commitments – 0
Costs in respect of pensions under own management 29 19
Pensioning through insurance:Insurance premiums 34 35
Subtotal 63 54Tax on returns from pension funds 5 5Special payroll tax on pension expenses 11 7
The year’s pension expenses 79 66
–/+ Expenses covered by surplus in separated assets/increase in surplus in separated assets 0 2
Reported net cost attributable to pensions 79 68
Actual value of holdings in pension foundations
EURm 2008 2007
Shares 118 272Interest-bearing securities 641 601Other assets 30 43
Total 789 916
Percentage return on specifically separated assets –0.3% 0.8%Assumptions for benefit-determined obligations:Discount rate 3.0% 3.0%The calculation is based on pay and pension levels on the accounting date Yes YesLength of life for women, years1) 82Length of life for men, years1) 79Average retirement age, years 64 641) From 2008 is the expected remaining lifetime based on DUS 2006.
Note 38 Subordinated liabilities
Group Parent company
31 Dec 31 Dec 31 Dec 31 Dec EURm 2008 2007 2008 2007
Dated subordinated debenture loans 6,267 5,626 5,423 4,825Undated subordinated debenture loans 536 604 – –Hybrid capital loans 1,406 1,326 1,406 1,326
Total 8,209 7,556 6,829 6,151
– of which expected to be settled after more than 1 year 7,339 6,804
These debenture loans are subordinated to other liabilities. Dated debenture loans entitle the lender to payment before undated sub-ordinated loans and hybrid capital loans. Within each respective category, the loans entitle lenders to equal payment rights.

Nor
dea
Ann
ual R
epor
t 20
08
128
Financial statements
Note 38 Subordinated liabilities, cont.
GroupAt 31 December no separate loan exceeds 10% of the total out-standing volume.
Parent companyAt 31 December one loan – with terms specified below – exceeded 10% of the total outstanding volume.
Carrying Interest Nominal amount rate Year of issue / maturity value EURm (coupon)
Nordea Bank AB (publ)1) MSEK 6,904 750 FRN1) Call date 20 May 2010.
Note 39 Untaxed reserves
Parent company
31 Dec 31 Dec EURm 2008 2007
Accumulated excess depreciationEquipment 2 7
Total 2 7
Note 40 Equity
Group Attributable to the share holders of Nordea Bank AB (publ)3)
Other reserves:
Available- Cash Currency Share for-sale flow translation Retained Minority Total EURm capital1) investments hedges differences earnings Total interests equity
Balance at 1 Jan 2008 2,597 6 – –166 14,645 17,082 78 17,160Available-for-sale investments: – Transfers to net profit –6 –6 –6– Tax on transfers to net profit 0 0 0Cash flow hedges: – Fair value gains –7 –7 –7– Tax on fair value gains 2 2 2Currency translation differences –717 –717 –717Net income recognised directly in equity –6 –5 –717 –728 –728Net profit for the year 2,671 2,671 1 2,672Total recognised income and expense –6 –5 –717 2,671 1,943 1 1,944Issued C shares4) 3 3 3Repurchase of C shares4) –3 –3 –3Share-based payments4) 7 7 7Dividend for 2007 –1,297 –1,297 –1,297Purchases of own shares2) –10 –10 –10Other changes 0 –1 –1
Balance at 31 Dec 2008 2,600 0 –5 –883 16,013 17,725 78 17,803
Balance at 1 Jan 2007 2,594 5 – –116 12,793 15,276 46 15,322Available-for-sale investments: – Fair value gains 1 1 1– Tax on fair value gains 0 0 0Currency translation differences –50 –50 –50Net income recognised directly in equity 1 – –50 –49 –49Net profit for the year 3,121 3,121 9 3,130Total recognised income and expense 1 – –50 3,121 3,072 9 3,081Issued C shares5) 3 3 3Repurchase of C shares5) –3 –3 –3Share-based payments5) 4 4 4Dividend for 2006 –1,271 –1,271 –1,271Divestment of own shares2) 11 11 11Other changes –10 –10 23 13
Balance at 31 Dec 2007 2,597 6 – –166 14,645 17,082 78 17,1601) Total shares registered were 2,600 million (31 Dec 2007: 2,597 million).2) Refers to the change in the trading portfolio and Nordea’s shares within portfolio schemes in Denmark. The number of own shares in the trading portfolio and in the portfolio schemes at 31
Dec 2008 was 3.8 million (31 Dec 2007: 1.6 million).3) Restricted capital was at 31 Dec 2008 EUR 2,600m (31 Dec 2007: EUR 2,603m). Unrestricted capital was 31 Dec 2008 EUR 15,125m (31 Dec 2007: EUR 14,479m).4) Refers to the Long-Term Incentive Programme (LTIP 2008). The programme was hedged by issuing 2,880,000 C shares, the shares have been bought back and converted to ordinary shares.5) Refers to the Long-Term Incentive Programme (LTIP 2007). The programme was hedged by issuing 3,120,000 C shares, the shares haven been bought back and converted to ordinary shares.

Nor
dea
Ann
ual R
epor
t 20
08
129
Financial statements
Note 40 Equity, cont.
Parent company Restricted equity Unrestricted equity2)
Other reserves:
Available-for-sale Cash flow Retained Total EURm Share capital investments hedges earnings equity
Balance at 1 Jan 2008 2,597 5 – 9,308 11,910Available-for-sale investments: 0– Fair value gains –7 –7 –14– Tax on fair value gains 2 2 4Group contribution, net1) –14 –14Net income recognised directly in equity –5 –5 –14 –24Net profit for the year 1,888 1,888Total recognised income and expense –5 –5 1,874 1,864Issued C shares3) 3 3Repurchase of C shares3) –3 –3Share-based payments3) 7 7Dividend for 2007 –1,297 –1,297Purchases of own shares –13 –13
Balance at 31 Dec 2008 2,600 0 –5 9,876 12,471 Balance at 1 Jan 2007 2,594 – – 9,415 12,009Available-for-sale investments: – Fair value gains 7 7– Tax on fair value gains –2 –2Group contribution, net1) –40 –40Net income recognised directly in equity 5 – –40 –35Net profit for the year 1,203 1,203Total recognised income and expense 5 – 1,163 1,168Issued C shares4) 3 3Repurchase of C shares4) –3 –3Share-based payments4) 4 4Dividend for 2006 –1,271 –1,271
Balance at 31 Dec 2007 2,597 5 – 9,308 11,9101) After adjustment for tax.2) Apart from retained earnings, unrestricted equity consists of a free fund to the amount of EUR 2,762m.3) Refers to the Long-Term Incentive Programme (LTIP 2008). The programme was hedged by issuing 2,880,000 C shares, the shares have been bought back and converted to ordinary shares.4) Refers to the Long-Term Incentive Programme (LTIP 2007). The programme was hedged by issuing 3,120,000 C shares, the shares have been bought back and converted to ordinary shares.
Description of items in the equity is included in Note 1 Accounting policies.
Share capital Quota value per share, EUR Total number of shares Share capital, EUR
Balance at 31 Dec 2006 1.00 2,594,108,227 2,594,108,227.00New issue1) 3,120,000 3,120,000.00Balance at 31 Dec 2007 1.00 2,597,228,227 2,597,228,227.00New issue1) 2,880,000 2,880,000.00
Balance at 31 Dec 2008 1.00 2,600,108,227 2,600,108,227.001) Refers to the Long-Term Incentive Programmes (LTIP).
Dividends per shareFinal dividends are not accounted for until they have been ratified at the Annual General Meeting (AGM). At the AGM on 2 April 2009, a dividend in respect of 2008 of EUR 0.20 per share (2007 actual dividend EUR 0.50 per share) amounting to a total of EUR 518,821,646 (2007 actual EUR 1,297,054,114) is to be proposed. The financial statements for the year ended 31 December 2008 do not reflect this resolution, which will be accounted for in equity as an appropriation of retained earnings in the year ending 31 December 2009.

Nor
dea
Ann
ual R
epor
t 20
08
130
Financial statements
Note 41 Assets pledged as security for own liabilities
Group Parent company
31 Dec 31 Dec 31 Dec 31 Dec EURm 2008 2007 2008 2007
Assets pledged for own liabilities Lease agreements1) 120 158 – –Securities etc 32,228 12,284 3,360 3,054Loans to the public 60,809 61,867 – –Other pledged assets 2,350 5,399 – –
Total 95,507 79,708 3,360 3,054
The above pledges pertain to the following liability and commitment itemsDeposits by credit institutions 10,625 8,042 3,220 3,148Deposits and borrowings from the public 6,590 4,141 140 122Debt securities in issue 51,987 50,506Other liabilities and commitments 16,027 4,830 – –
Total 85,229 67,519 3,360 3,2701) The agreements are financial lease agreements where Nordea is the lessor. The associ-
ated assets are Loans and advances to the public.
Assets pledged for own liabilities contain securities pledged as security in repurchase agreement and in securities borrowing. The transactions are conducted under standard agreements employed by financial markets participants. Counterparts in those transac-tions are credit institutions and the public. The transactions are typically short term with maturity within three months. Loans to the public have been registered as collateral for issued covered bonds and mortgage bonds. In the event of the company’s insol-vency, the holders of these bonds have prior rights to the assets registered as collateral. Other relates to a certificate of deposits pledged by Nordea to comply with authority requirements and assets funded by finance lease agreements.
Note 42 Other assets pledged
Group Parent company
31 Dec 31 Dec 31 Dec 31 Dec EURm 2008 2007 2008 2007
Other assets pledged1)
Lease agreements 1 0 – –Securities etc 10,686 6,293 9,504 7,270Other assets pledged 120 11 – –
Total 10,807 6,304 9,504 7,270
The above pledges2) pertain to the following liability and commitment itemsDeposits by credit institutions 9,210 6,147 9,211 6,147Other liabilities and commitments 15 146 293 1,123
Total 9,225 6,293 9,504 7,2701) Collaterals pledged on behalf of other items other than the company’s own liabilities, eg,
on behalf of a third party or on behalf of the company’s own contingent liabilities are accounted for under this item.
2) For undertakings of the company itself or for a third party.
Securities etc. includes interest-bearing securities pledged as secu-rity for payment settlements within the Central bank of Sweden. The terms and conditions require day to day security and relate to liquidity intraday/over night. Other pledged assets relate to pledged deposits.
Note 43 Contingent liabilities
Group Parent company
31 Dec 31 Dec 31 Dec 31 Dec EURm 2008 2007 2008 2007
Guarantees Loan guarantees 6,920 4,965 4,742 3,639 Other guarantees 15,805 16,021 17,200 10,385Documentary credits 3,203 3,052 – 7Other contingent liabilities 359 216 5 35
Total 26,287 24,254 21,947 14,066
In the normal business of Nordea, the bank issues various forms of guarantees in favour of the banks customers. Loan guarantees are given for customers to guarantee obligations in other credit- and pension institutions. Other guarantees consist mainly of com-mercial guarantees such as bid guarantees, advance payment guarantees, warranty guarantees and export related guarantees. Contingent liabilities also include unutilised irrevocable import documentary credits and confirmed export documentary credits. These transactions are part of the bank services and support the banks customers. Guarantees and documentary credits are con-sidered as off-balance sheet items, unless there is a need for a pro-vision to cover a probable loan loss that arises from the judgement that reimbursement will not be received.
In early October 2008, Danish Parliament agreed with banks to set up a guarantee scheme valid for two years, until the end of September 2010, which guarantees the claims of unsecured credi-tors, excluding covered bonds and subordinated debt, against losses in the participating banks. Nordea decided for commercial reasons that Nordea Bank Danmark A/S would participate in the scheme. Nordea guarantees the payment of its portion of DKK 10bn to cover any losses under the guarantee scheme and the pay-ment of an annual guarantee commission amounting to DKK 7.5bn annually for two years. If losses exceed these amounts, addi-tional losses of up to DKK 10bn should also be covered by further guarantee commissions. The total payments are for all participat-ing banks hence capped to DKK 35bn. Nordea´s share of the guar-antee scheme is expected to be approximately 20%. The possible additional expense for the guarantee of maximum approximately EUR 500m has been recorded as a contingent liability.
Nordea Bank AB (publ) has issued a guarantee covering all commitments in Nordea Investment Management AB, org no 556060-2301, in accordance with the Swedish Act on Annual Accounts of Credit Institutions and Securities Companies (1995:1559) (ÅRKL) chapter 7 paragraph 5.
Nordea Bank AB (publ) has undertaken in relation to certain individuals and on certain conditions to be responsible for the potential payment liability against them in their capacity as man-aging director or board director in subsidiaries of Nordea Bank AB (publ).
The Swedish tax authorities have notified Nordea that the tax-able income for Nordea’s wholly owned subsidiary Nordea Fastigheter AB will be increased by SEK 225m and SEK 2,711m, for the years 2003 and 2004, respectively. The potential tax liability, including a surcharge, amounts to approximately EUR 100m and is related to the sales gain in respect of the divestment of Nordea’s owner occupied properties in Sweden.
Nordea is of the opinion that all tax rules and regulations have been complied with in the transactions, and that the previously reported gain is correctly treated from a tax perspective. Since this divestment structure was a well established practice for many real-estate companies divesting their portfolios, Nordea strongly contest both the ordinary tax claim and the tax surcharge and have taken the decisions to the Swedish courts.
A limited number of employees are entitled to severance pay if they are dismissed before reaching their normal retirement age. For further disclosure, see Note 8.

Nor
dea
Ann
ual R
epor
t 20
08
131
Financial statements
Legal proceedingsWithin the framework of the normal business operations, the Group faces claims in civil lawsuits and other disputes, most of which involve relatively limited amounts. None of these disputes is considered likely to have any significant adverse effect on the Group or its financial position.
A writ has been served on Nordea Bank Danmark A/S on 31 January 2006 based on an avoidance claim of USD 61.2m plus interest by SAirGroup in Nachlassliquidation filed with the Com-mercial Court of Zürich. The Zürich Commercial Court dismissed the claim in April 2008. The liquidation estate has appealed the case to the Swiss Supreme Court. Nordea is contesting the claim and has made no provisions.
Note 44 Commitments
Group Parent company
31 Dec 31 Dec 31 Dec 31 Dec EURm 2008 2007 2008 2007
Future payment obligations 1,313 2,867 – –Credit commitments1) 85,416 81,607 22,831 27,696Other commitments 1,705 2,532 1,308 1,778
Commitments excluding derivatives 88,434 87,006 24,139 29,474
Derivatives 3,802,101 3,405,332 104,378 299,852
Total 3,890,535 3,492,338 128,517 329,3261) Including unutilised portion of approved overdraft facilities.
Note 45 Insurance activities1)
Group
Operating profit, insurance
EURm 2008 2007
Fee and commission income 294 291Fee and commission expense –118 –130Premium income, life insurance2) 2,359 2,530Investments, life insurance2) –2,338 1,059Change in technical provisions, life insurance2) 541 –1,002Claims paid, life insurance2) –2,529 –2,354Change in collective bonus potential, life insurance2) 2,034 42
Operating income 243 436
Operating expenses Staff costs –111 –98 Other expenses –78 –71Depreciation, amortisation and impairment charges of tangible and intangible assets –4 –5
Total operating expenses –193 –174
Operating profit, insurance 50 2621) Before allocations and elimination of intra-group transactions.2) Included in ”Net gains/losses on items at fair value” in the Group Income statement.
Balance sheet 31 Dec 31 Dec EURm 2008 2007
AssetsCash and balances with central banks 5 0Treasury bills 3,224 2,143Loans and advances to the public 1,824 857Interest-bearing securities 17,964 16,842Shares and participations 6,794 11,794Derivatives 256 36Participating interests 211 153Intangible assets 342 351Tangible assets 14 16Investment property 3,327 3,478Deferred tax assets 6 6Current tax assets 64 3Other assets 495 454Prepaid expenses and accrued income 411 357
Total assets 34,937 36,490
– of which intra-group transactions –3,157 –1,814
LiabilitiesDeposits and borrowings from the public 3,341 2,645Liabilities to Life insurance policyholders 29,238 32,280Derivatives 91 10Current tax liabilities 46 20Other liabilities 318 781Accrued expenses and deferred income 220 224Deferred tax liabilities 255 110Retirement benefit obligation 4 6Subordinated liabilities 859 –
Total liabilities 34,372 36,076
Equity 565 414
Total liabilities and equity 34,937 36,490
– of which intra-group transactions –4,077 –2,757
Note 46 Capital adequacy
The Capital Adequacy information for the Group can be found in the Risk, Liquidity and Capital management section page 44.

Nor
dea
Ann
ual R
epor
t 20
08
132
Financial statements
Note 47 Classification of financial instruments
Group Financial assets at fair value through profit or loss
Designated at fair Derivatives Non- Loans and Held to Held for value through used for Available financial 31 Dec 2008, EURm receivables maturity trading profit or loss hedging for sale assets Total
AssetsCash and balances with central banks 3,157 3,157Treasury bills 9 183 6,353 6,545Loans and receivables to credit institutions 18,731 5,172 23,903Loans and receivables to the public 217,833 11,074 36,193 265,100Interest-bearing securities 12,045 17,559 15,177 49 44,830Financial instruments pledged as collateral 7,937 7,937Shares 3,745 6,917 7 10,669Derivatives 86,520 318 86,838Fair value changes of the hedged items in portfolio hedge of interest rate risk 413 413Investments in associated undertakings 431 431Intangible assets 2,535 2,535Property and equipment 375 375Investment property 3,334 3,334Deferred tax assets 64 64Current tax assets 344 344Retirement benefit assets 168 168Other assets 5,738 8,829 37 14,604Prepaid expenses and accrued income 2,090 312 425 2,827
Total 247,971 12,228 138,672 67,116 318 56 7,713 474,074
Group Financial liabilities at fair value through profit or loss
Designated at fair Derivatives Other Non- Held for value through used for financial financial 31 Dec 2008, EURm trading profit or loss hedging liabilities liabilities Total
LiabilitiesDeposits by credit institutions 8,133 23,202 20,597 51,932Deposits and borrowings from the public 2,999 4,914 140,678 148,591Liabilities to policyholders 4,021 25,217 29,238Debt securities in issue 5,242 27,153 76,594 108,989Derivatives 83,277 2,261 85,538Fair value changes of the hedged items in portfolio hedge of interest rate risk 532 532Current tax liabilities 458 458Other liabilities 4,056 2,641 10,780 493 17,970Accrued expenses and prepaid income 614 1,763 901 3,278Deferred tax liabilities 1,053 1,053Provisions 143 143Retirement benefit obligations 340 340Subordinated liabilities 1 8,208 8,209
Total 108,343 57,910 2,261 259,152 28,605 456,271

Nor
dea
Ann
ual R
epor
t 20
08
133
Financial statements
Note 47 Classification of financial instruments, cont.
Group Financial assets at fair value through profit or loss
Designated at fair Derivatives Non- Loans and Held to Held for value through used for Available financial 31 Dec 2007, EURm receivables maturity trading profit or loss hedging for sale assets Total
AssetsCash and balances with central banks 5,020 5,020Treasury bills 10 5,183 5,193Loans and receivables to credit institutions 14,841 9,421 24,262Loans and receivables to the public 205,054 7,424 32,204 244,682Interest-bearing securities 1,632 20,674 16,426 50 38,782Financial instruments pledged as collateral 4,790 4,790Shares 5,552 12,076 16 17,644Derivatives 31,083 415 31,498Fair value changes of the hedged items in portfolio hedge of interest rate risk –105 –105Investments in associated undertakings 366 366Intangible assets 2,725 2,725Property and equipment 342 342Investment property 3,492 3,492Deferred tax assets 191 191Current tax assets 142 142Retirement benefit assets 123 123Other assets 5,345 2,342 37 7,724Prepaid expenses and accrued income 1,443 375 5 360 2,183
Total 231,608 1,632 84,502 63,053 415 66 7,778 389,054
Group Financial liabilities at fair value through profit or loss
Designated at fair Derivatives Other Non- Held for value through used for financial financial 31 Dec 2007, EURm trading profit or loss hedging liabilities liabilities Total
LiabilitiesDeposits by credit institutions 4,029 26,048 30,077Deposits and borrowings from the public 2,272 130 139,927 142,329Liabilities to policyholders 4,224 28,056 32,280Debt securities in issue 5,072 33,648 61,072 99,792Derivatives 32,324 699 33,023Fair value changes of the hedged items in portfolio hedge of interest rate risk –323 –323Current tax liabilities 300 300Other liabilities 9,650 3,330 9,563 317 22,860Accrued expenses and prepaid income 53 5 1,917 787 2,762Deferred tax liabilities 703 703Provisions 73 73Retirement benefit obligations 462 462Subordinated liabilities 7,556 7,556
Total 57,624 37,113 699 245,760 30,698 371,894

Nor
dea
Ann
ual R
epor
t 20
08
134
Financial statements
Note 47 Classification of financial instruments, cont.
Parent company Financial assets at fair value through profit or loss
Designated at fair Derivatives Non- Loans and Held to Held for value through used for Available financial 31 Dec 2008, EURm receivables maturity trading profit or loss hedging for sale assets Total
AssetsCash and balances with central banks 276 276Treasury bills 183 1,915 2,098Loans and receivables to credit institutions 36,361 7,494 43,855Loans and receivables to the public 29,240 29,240Interest-bearing securities 2,335 7,745 10,080Financial instruments pledged as collateral 3,097 3,097Shares 1,063 44 0 1,107Derivatives 3,165 397 3,562Fair value changes of the hedged items in portfolio hedge of interest rate risk 27 27Investments in group undertakings 15,866 15,866Investments in associated undertakings 2 2Intangible assets 757 757Property and equipment 81 81Deferred tax assets 28 28Current tax assets 76 76Other assets 2,025 74 0 2,099Prepaid expenses and accrued income 771 1 11 783
Total 68,700 2,518 24,480 118 397 0 16,821 113,034
Parent company Financial liabilities at fair value through profit or loss
Designated at fair Derivatives Other Non- Held for value through used for financial financial 31 Dec 2008, EURm trading profit or loss hedging liabilities liabilities Total
LiabilitiesDeposits by credit institutions 3,104 7,867 23,742 34,713Deposits and borrowings from the public 33,457 33,457Debt securities in issue 17,949 17,949Derivatives 2,551 205 2,756Fair value changes of the hedged items in portfolio hedge of interest rate risk 42 42Current tax liabilities 0 0Other liabilities 680 3,449 100 4,229Accrued expenses and prepaid income 4 346 115 465Deferred tax liabilities 0 0Provisions 3 3Retirement benefit obligations 118 118Subordinated liabilities 1 6,828 6,829
Total 6,340 7,867 205 85,813 336 100,561

Nor
dea
Ann
ual R
epor
t 20
08
135
Financial statements
Note 47 Classification of financial instruments, cont.
Parent company Financial assets at fair value through profit or loss
Designated at fair Derivatives Non- Loans and Held to Held for value through used for Available financial 31 Dec 2007, EURm receivables maturity trading profit or loss hedging for sale assets Total
AssetsCash and balances with central banks 296 296Treasury bills 567 567Loans and receivables to credit institutions 29,812 6,743 269 36,824Loans and receivables to the public 26,640 26,640Interest-bearing securities 4,378 838 5,216Financial instruments pledged as collateral 2,806 2,806Shares 1,828 199 7 2,034Derivatives 1,069 212 1,281Fair value changes of the hedged items in portfolio hedge of interest rate risk –4 –4Investments in group undertakings 15,488 15,488Investments in associated undertakings 30 30Intangible assets 819 819Property and equipment 53 53Deferred tax assets 34 34Current tax assets 52 52Other assets 1,600 340 0 1,940Prepaid expenses and accrued income 375 13 5 9 402
Total 58,719 17,404 1,651 212 7 16,485 94,478
Parent company Financial liabilities at fair value through profit or loss
Designated at fair Derivatives Other Non- Held for value through used for financial financial 31 Dec 2007, EURm trading profit or loss hedging liabilities liabilities Total
LiabilitiesDeposits by credit institutions 2,826 3,386 18,063 24,275Deposits and borrowings from the public 32,296 32,296Debt securities in issue 13,839 13,839Derivatives 1,310 271 1,581Fair value changes of the hedged items in portfolio hedge of interest rate risk –69 –69Current tax liabilities 0 0Other liabilities 1,572 320 2,044 78 4,014Accrued expenses and prepaid income 4 256 81 341Deferred tax liabilities 2 2Provisions 2 2Retirement benefit obligations 129 129Subordinated liabilities 6,151 6,151
Total 5,708 3,710 271 72,580 292 82,561
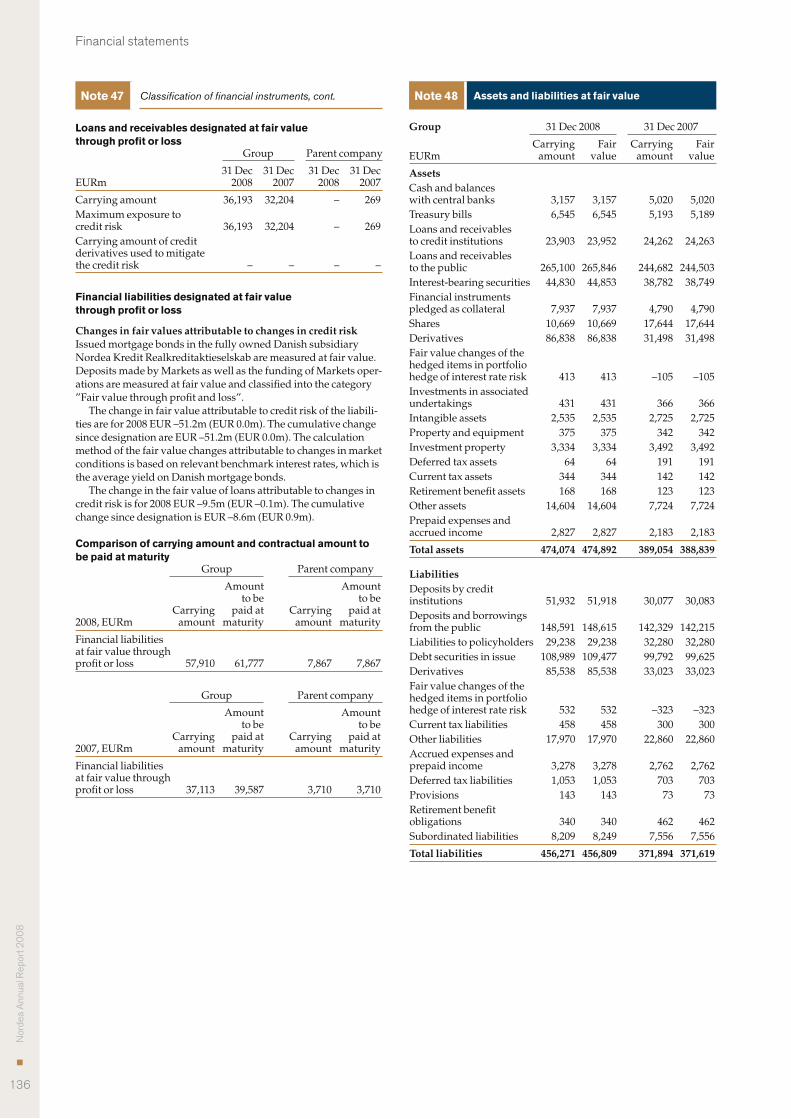
Nor
dea
Ann
ual R
epor
t 20
08
136
Financial statements
Note 47 Classification of financial instruments, cont.
Loans and receivables designated at fair value through profit or loss Group Parent company
31 Dec 31 Dec 31 Dec 31 Dec EURm 2008 2007 2008 2007
Carrying amount 36,193 32,204 – 269Maximum exposure to credit risk 36,193 32,204 – 269Carrying amount of credit derivatives used to mitigate the credit risk – – – –
Financial liabilities designated at fair value through profit or loss
Changes in fair values attributable to changes in credit riskIssued mortgage bonds in the fully owned Danish subsidiary Nordea Kredit Realkreditaktieselskab are measured at fair value. Deposits made by Markets as well as the funding of Markets oper-ations are measured at fair value and classified into the category ”Fair value through profit and loss”.
The change in fair value attributable to credit risk of the liabili-ties are for 2008 EUR –51.2m (EUR 0.0m). The cumulative change since designation are EUR –51.2m (EUR 0.0m). The calculation method of the fair value changes attributable to changes in market conditions is based on relevant benchmark interest rates, which is the average yield on Danish mortgage bonds.
The change in the fair value of loans attributable to changes in credit risk is for 2008 EUR –9.5m (EUR –0.1m). The cumulative change since designation is EUR –8.6m (EUR 0.9m).
Comparison of carrying amount and contractual amount to be paid at maturity Group Parent company
Amount Amount to be to be Carrying paid at Carrying paid at 2008, EURm amount maturity amount maturity
Financial liabilities at fair value through profit or loss 57,910 61,777 7,867 7,867
Group Parent company
Amount Amount to be to be Carrying paid at Carrying paid at 2007, EURm amount maturity amount maturity
Financial liabilities at fair value through profit or loss 37,113 39,587 3,710 3,710
Note 48 Assets and liabilities at fair value
Group 31 Dec 2008 31 Dec 2007
Carrying Fair Carrying Fair EURm amount value amount value
Assets Cash and balances with central banks 3,157 3,157 5,020 5,020Treasury bills 6,545 6,545 5,193 5,189Loans and receivables to credit institutions 23,903 23,952 24,262 24,263Loans and receivables to the public 265,100 265,846 244,682 244,503Interest-bearing securities 44,830 44,853 38,782 38,749Financial instruments pledged as collateral 7,937 7,937 4,790 4,790Shares 10,669 10,669 17,644 17,644Derivatives 86,838 86,838 31,498 31,498Fair value changes of the hedged items in portfolio hedge of interest rate risk 413 413 –105 –105Investments in associated undertakings 431 431 366 366Intangible assets 2,535 2,535 2,725 2,725Property and equipment 375 375 342 342Investment property 3,334 3,334 3,492 3,492Deferred tax assets 64 64 191 191Current tax assets 344 344 142 142Retirement benefit assets 168 168 123 123Other assets 14,604 14,604 7,724 7,724Prepaid expenses and accrued income 2,827 2,827 2,183 2,183
Total assets 474,074 474,892 389,054 388,839 Liabilities Deposits by credit institutions 51,932 51,918 30,077 30,083Deposits and borrowings from the public 148,591 148,615 142,329 142,215Liabilities to policyholders 29,238 29,238 32,280 32,280Debt securities in issue 108,989 109,477 99,792 99,625Derivatives 85,538 85,538 33,023 33,023Fair value changes of the hedged items in portfolio hedge of interest rate risk 532 532 –323 –323Current tax liabilities 458 458 300 300Other liabilities 17,970 17,970 22,860 22,860Accrued expenses and prepaid income 3,278 3,278 2,762 2,762Deferred tax liabilities 1,053 1,053 703 703Provisions 143 143 73 73Retirement benefit obligations 340 340 462 462Subordinated liabilities 8,209 8,249 7,556 7,556
Total liabilities 456,271 456,809 371,894 371,619

Nor
dea
Ann
ual R
epor
t 20
08
137
Financial statements
Note 48 Assets and liabilities at fair value, cont.
Parent company 31 Dec 2008 31 Dec 2007
Carrying Fair Carrying Fair EURm amount value amount value
Assets Cash and balances with central banks 276 276 296 296Treasury bills 2,098 2,098 567 567Loans and receivables to credit institutions 43,855 43,894 36,824 36,823Loans and receivables to the public 29,240 29,280 26,640 26,643Interest-bearing securities 10,080 10,114 5,216 5,217Financial instruments pledged as collateral 3,097 3,097 2,806 2,806Shares 1,107 1,107 2,034 2,034Derivatives 3,562 3,562 1,281 1,281Fair value changes of the hedged items in portfolio hedge of interest rate risk 27 27 –4 –4Investments in group undertakings 15,866 15,866 15,488 15,488Investments in associated undertakings 2 2 30 30Intangible assets 757 757 819 819Property and equipment 81 81 53 53Deferred tax assets 28 28 34 34Current tax assets 76 76 52 52Other assets 2,099 2,099 1,940 1,940Prepaid expenses and accrued income 783 783 402 402
Total assets 113,034 113,147 94,478 94,481 Liabilities Deposits by credit institutions 34,713 34,696 24,275 24,283Deposits and borrowings from the public 33,457 33,416 32,296 32,299Debt securities in issue 17,949 17,915 13,839 13,839Derivatives 2,756 2,756 1,581 1,581Fair value changes of the hedged items in portfolio hedge of interest rate risk 42 42 –69 –69Current tax liabilities 0 0 0 0Other liabilities 4,229 4,229 4,014 4,014Accrued expenses and prepaid income 465 465 341 341Deferred tax liabilities 0 0 2 2Provisions 3 3 2 2Retirement benefit obligations 118 118 129 129Subordinated liabilities 6,829 6,828 6,151 6,152
Total liabilities 100,561 100,468 82,561 82,573
Estimation of fair value for assets and liabilitiesFinancial assets and financial liabilities in the balance sheet are generally measured at fair value, with the exception of loans and receivables, deposits and borrowings and issued securities.
The carrying amounts on loans and receivables, deposits and borrowings and issued securities are adjusted for the value of the fixed interest term in order to estimate the fair values that are pre-sented in the tables above. The value of the fixed interest term is a result of changes in the relevant market interest rates. The dis-count rates used are based on current market rates for each term.
Fair value is estimated to be equal to the carrying amount for short-term financial assets and financial liabilities. The carrying amount is a reasonable approximation of fair value due to limited credit risk and short time to maturity.
Fair value is set to carrying amount, in the tables above, for assets and liabilities for which no reliable fair value has been pos-sible to estimate. This is valid for the line items investments in associated undertakings, investments in group undertakings, intangible assets, property and equipment and provisions.
For further information about valuation of items normally measured at fair value, see Note 1.
Fair value of financial assets and financial liabilitiesThe total effect on the income statement from financial assets and financial liabilities that are measured using valuation techniques based on assumptions not fully supported by observable market data amounted to EUR 117 m (EUR 35m) in Nordea. The effect in the parent company was EUR –9m (EUR 1m).
Deferred Day 1 profit or lossIn accordance with the Group’s accounting policy as described in Note 1, if there are significant unobservable inputs used in the val-uation technique, the financial instrument is recognised at the transaction price and any trade date profit is deferred. The table below shows the aggregate difference yet to be recognised in the income statement at the beginning and end of the period and a reconciliation of changes in the balance of this difference (move-ment of deferred Day 1 profit or loss).
Group Parent company
31 Dec 31 Dec 31 Dec 31 Dec EURm 2008 2007 2008 2007
Amount at beginning of year 105 58 17 0Deferred profit/loss on new transactions 62 82 1 18Recognised in the income statement during the year –63 –35 –9 –1
Amount at end of year 104 105 9 17

Nor
dea
Ann
ual R
epor
t 20
08
138
Financial statements
Note 48 Assets and liabilities at fair value, cont.
Determination of fair value from quoted market prices or valuation techniquesThe following table presents the valuation methods used to determine fair values of financial instruments carried at fair value1).
Group Valuation Valuation technique technique Instruments with using using non- quoted prices in – of observable – of observable – of active markets which data which data which 31 Dec 2008, EURm (Level 1)3) Life (Level 2)4) Life (Level 3)5) Life Total
AssetsInterest-bearing securities and Treasury bills2) 32,362 16,360 6,760 2,011 16 9 39,138– of which state and sovereigns 4,943 3,189 1,251 35 – – 6,194– of which municipalities and other public bodies 7,454 1,653 155 100 – – 7,609– of which mortgage institutions 10,883 6,897 608 156 – – 11,491– of which other credit institutions 4,879 821 2,192 291 – – 7,071– of which corporates 1,845 1,500 1,258 296 9 9 3,112– of which corporates, sub-investment grade 142 142 711 706 – – 853– of which other 2,216 2,158 585 427 7 – 2,808Financial instruments pledged as collateral 7,937 – – – – – 7,937Shares 7,682 4,707 848 702 2,139 1,385 10,669Derivatives 572 – 83,318 95 2,630 – 86,520
LiabilitiesDebt securities in issue 27,153 – 5,242 – – – 32,395Derivatives 728 25 79,778 59 2,771 – 83,2771) Except for mainly mortgage loans in the Danish subsidiary Nordea Kredit Realkreditselskab designated at fair value through profit and loss, overnight funding from credit institutions for Mar-
kets operation, and derivatives used for hedging.2) Of which EUR 6,353m Treasury bills and EUR 32,785m Interest-bearing securities (the portion held at fair value in Note 47).3) Level 1 consists of financial assets and financial liabilities valued using unadjusted quoted prices in active markets for identical assets or liabilities. This category includes listed bonds and
other securities, listed shares, exchange-traded derivatives as well as listed issued bonds and other securities.4) Level 2 consists of financial assets and financial liabilities which do not have quoted market prices directly available from an active market, and where fair values are estimated using valuation
techniques or models, based wherever possible on assumptions supported by observable market prices or rates prevailing at the balance sheet date. The majority of Nordea’s OTC deriva-tives and several other instruments not traded in active markets fall within this category.
5) Level 3 consists of financial instruments for which fair values cannot be obtained directly from quoted market prices or indirectly using valuation techniques or models supported by observ-able market prices or rates. This is generally the case for private equity instruments and private equity funds as well as for certain complex and/or structured financial instruments. The main increase, during 2008, in instruments categorised in level 3 relates to unlisted shares held by Nordea Life & Pensions. The nature of unobservable parameters remained broadly the same with liquidity being maintained in the majority of the markets.
Group Valuation Valuation technique technique Instruments with using using non- quoted prices in – of observable – of observable – of active markets which data which data which 31 Dec 2007, EURm (Level 1) Life (Level 2) Life (Level 3) Life Total
AssetsInterest-bearing securities and Treasury bills1) 33,285 13,120 8,977 2,489 71 64 42,333– of which state and sovereigns 5,075 3,003 8 8 – – 5,083– of which municipalities and other public bodies 3,836 1,042 209 107 – – 4,045– of which mortgage institutions 13,888 5,619 192 144 – – 14,080– of which other credit institutions 6,763 493 2,546 241 – – 9,309– of which corporates 1,931 1,193 2,266 258 – – 4,197– of which corporates, sub-investment grade 1,094 1,094 20 – – – 1,114– of which other 698 676 3,736 1,731 71 64 4,505Financial instruments pledged as collateral 4,790 – – – 4,790Shares 15,142 10,487 1,366 1,232 1,136 75 17,644Derivatives 671 4 28,320 16 2,092 – 31,083
LiabilitiesDebt securities in issue 26,616 – 12,104 – – – 38,720Derivatives 546 – 29,519 – 2,259 – 32,3241) Of which EUR 5,183m Treasury bills and EUR 37,150m Interest-bearing securities (the portion held at fair value in Note 47).

Nor
dea
Ann
ual R
epor
t 20
08
139
Financial statements
Note 48 Assets and liabilities at fair value, cont.
Parent company Instruments with Valuation Valuation quoted prices in technique using technique using active markets observable data non-observable data 31 Dec 2008, EURm (Level 1) (Level 2) (Level 3) Total
AssetsInterest-bearing securities and Treasury bills1) 3,988 5,672 – 9,660– of which state and sovereigns 699 1,216 – 1,915– of which mortgage institutions 1,075 72 – 1,147– of which other credit institutions 2,214 3,478 – 5,692– of which corporates – 906 – 906Financial instruments pledged as collateral 2,731 366 – 3,097Shares 649 – 458 1,107Derivatives 74 2,889 202 3,165
LiabilitiesDerivatives 114 2,384 53 2,5511) Of which EUR 1,915m Treasury bills and EUR 7,745m Interest-bearing securities (the portion held at fair value in Note 47).
Parent company Instruments with Valuation Valuation quoted prices in technique using technique using active markets observable data non-observable data 31 Dec 2007, EURm (Level 1) (Level 2) (Level 3) Total
AssetsInterest-bearing securities and Treasury bills1) 3,391 2,392 – 5,783– of which state and sovereigns 567 – – 567– of which mortgage institutions 2,735 414 – 3,149– of which other credit institutions 27 1,811 – 1,838– of which corporates 62 167 – 229Financial instruments pledged as collateral 2,806 – – 2,806Shares 1,177 38 819 2,034Derivatives 62 972 34 1,068
LiabilitiesDerivatives 118 1,167 25 1,3101) Of which EUR 567m Treasury bills and EUR 5,216m Interest-bearing securities (the portion held at fair value in Note 47).
Collaterised Debt Obligations (CDO) – Exposure4)
Group 31 Dec 2008 31 Dec 2007
Bought Sold Bought Sold protec- protec- protec- protec- Notionals, EURm tion tion tion tion
CDOs, gross 4,390 4,484 4,078 4,355Hedged exposures 2,883 2,883 2,588 2,588
CDOs, net1) 1,5072) 1,6013) 1,4902) 1,7673)
– of which equity 277 360 218 376– of which mezzanine 337 245 373 414– of which senior 893 996 899 9771) Net exposure disregards exposure where tranches are completely identical in terms of
reference pool attachment, detachment, maturity and currency.2) Of which investment grade EUR 1,503m (EUR 1,486m) and sub investment grade EUR
4m (EUR 4m).3) Of which investment grade EUR 1,401m (EUR 1,455m) and sub investment grade EUR
48m (EUR 73m) and not rated EUR 152m (EUR 239m).4) These instruments are classified at fair value through profit and loss.

Nor
dea
Ann
ual R
epor
t 20
08
140
Financial statements
Note 49 Assets and liabilities in foreign currencies
Group31 Dec 2008, EURbn EUR SEK DKK NOK USD Other Total
AssetsTreasury bills 3.3 2.7 0.0 0.4 0.1 0.0 6.5Loans and receivables to credit institutions 5.8 7.8 5.8 0.9 3.1 0.5 23.9Loans and receivables to the public 77.5 59.2 61.8 33.2 22.6 10.8 265.1Interest-bearing securities 14.1 6.6 16.8 3.7 3.0 0.6 44.8Other assets 83.0 16.8 9.4 9.9 9.0 5.7 133.8
Total assets 183.7 93.1 93.8 48.1 37.8 17.6 474.1
Liabilities and equityDeposits by credit institutions 17.8 4.7 5.6 1.7 19.5 2.6 51.9Deposits and borrowings from the public 47.8 32.5 34.3 19.8 9.1 5.1 148.6Debt securities in issue 30.2 17.8 25.2 1.5 27.4 6.9 109.0Provisions 0.1 0.0 0.0 0.0 0.0 0.0 0.1Subordinated liabilities 4.0 0.9 0.0 0.0 2.1 1.2 8.2Other liabilities and equity 88.7 16.4 27.2 10.7 8.9 4.4 156.3
Total liabilities and equity 188.6 72.3 92.3 33.7 67.0 20.2 474.1
Position not reported in the balance sheet 6.3 –20.4 –1.8 –14.0 28.9 2.2 1.2
Net position, currencies 1.4 0.4 –0.3 0.4 –0.3 –0.4 1.2
Group31 Dec 2007, EURbn EUR SEK DKK NOK USD Other Total
AssetsTreasury bills 3.5 1.3 0.2 0.2 0.0 0.0 5.2Loans and receivables to credit institutions 6.1 6.4 7.8 1.5 1.2 1.3 24.3Loans and receivables to the public 65.8 61.1 56.6 37.1 14.8 9.3 244.7Interest-bearing securities 9.6 4.9 16.3 5.5 2.0 0.5 38.8Other assets 35.3 12.3 10.5 9.8 5.5 2.7 76.1
Total assets 120.3 86.0 91.4 54.1 23.5 13.8 389.1
Liabilities and equityDeposits by credit institutions 7.4 3.7 2.2 2.6 9.5 4.7 30.1Deposits and borrowings from the public 40.5 32.6 30.6 23.2 9.9 5.5 142.3Debt securities in issue 20.9 22.6 25.1 1.8 22.2 7.2 99.8Provisions 0.1 0.0 0.0 0.0 – 0.0 0.1Subordinated liabilities 3.3 0.8 0.0 0.0 2.1 1.4 7.6Other liabilities and equity 50.3 15.9 24.4 10.3 5.4 2.9 109.2
Total liabilities and equity 122.5 75.6 82.3 37.9 49.1 21.7 389.1
Position not reported in the balance sheet –2.4 –9.3 –5.4 –15.2 24.5 8.3 0.5
Net position, currencies –4.6 1.1 3.7 1.0 –1.1 0.4 0.5
Note 48 Assets and liabilities at fair value, cont.
When Nordea sells protection in a CDO transaction, Nordea car-ries the risk of losses in the reference portfolio on the occurrence of a credit event. When Nordea buys protection in a CDO transac-tion, any losses in the reference portfolio, in which Nordea has not necessarily invested, triggered by a credit event is then carried by the seller of protection.
The risk from CDOs is hedged with a portfolio of CDSs. The risk positions are subject to various types of market risk limits, including VaR, and the CDO valuations are subject to fair value adjustments for model risk. These fair value adjustments are rec-ognised in the income statement.
Credit Default Swaps (CDS) – ExposureCDSs are used for hedging exposure in CDOs as well as Credit Bonds. The net position from bought protection amounts to EUR 1,333m and the net position from sold protection amounts to EUR 2,144m.

Nor
dea
Ann
ual R
epor
t 20
08
141
Financial statements
Note 49 Assets and liabilities in foreign currencies, cont.
Parent company31 Dec 2008, EURbn EUR SEK DKK NOK USD Other Total
AssetsTreasury bills 0.4 1.6 – – 0.0 – 2.0Loans and receivables to credit institutions 7.7 23.6 3.3 0.6 7.2 1.5 43.9Loans and receivables to the public 4.7 18.3 1.1 0.5 2.9 1.7 29.2Interest-bearing securities 4.8 3.5 1.0 0.1 0.7 0.0 10.1Other assets 17.3 5.9 1.9 2.3 0.3 0.1 27.8
Total assets 34.9 52.9 7.3 3.5 11.1 3.3 113.0
Liabilities and equityDeposits by credit institutions 6.8 14.5 5.0 0.3 6.8 1.3 34.7Deposits and borrowings from the public 2.6 29.8 0.2 0.2 0.5 0.2 33.5Debt securities in issue 11.7 1.0 0.0 0.0 4.2 1.0 17.9Provisions – 0.0 – – – – 0.0Subordinated liabilities 3.3 0.9 – – 1.8 0.8 6.8Other liabilities and equity 15.1 2.4 1.9 0.2 0.4 0.1 20.1
Total liabilities and equity 39.5 48.6 7.1 0.7 13.7 3.4 113.0
Position not reported in the balance sheet 4.2 –4.0 0.0 –2.8 2.6 0.0 0.0
Net position, currencies –0.4 0.3 0.2 0.0 0.0 –0.1 0.0
Parent company31 Dec 2007, EURbn EUR SEK DKK NOK USD Other Total
AssetsTreasury bills 0.3 0.2 0.0 – 0.1 – 0.6Loans and receivables to credit institutions 8.0 20.4 0.3 0.2 6.5 1.4 36.8Loans and receivables to the public 3.4 18.4 1.9 0.4 1.9 0.6 26.6Interest-bearing securities 2.5 2.3 0.1 – 0.3 – 5.2Other assets 16.0 6.0 0.7 2.5 0.1 0.0 25.3
Total assets 30.2 47.3 3.0 3.1 8.9 2.0 94.5
Liabilities and equityDeposits by credit institutions 7.9 9.0 1.9 0.6 3.8 1.1 24.3Deposits and borrowings from the public 1.2 30.1 0.1 0.1 0.6 0.2 32.3Debt securities in issue 6.5 2.1 0.0 0.0 4.7 0.5 13.8Provisions 0.0 0.0 – – – – 0.0Subordinated liabilities 2.7 0.8 0.0 – 1.8 0.9 6.2Other liabilities and equity 13.2 3.8 0.2 0.1 0.4 0.2 17.9
Total liabilities and equity 31.5 45.8 2.2 0.8 11.3 2.9 94.5
Position not reported in the balance sheet –3.8 0.0 2.6 –1.4 1.4 2.2 1.0
Net position, currencies –5.1 1.5 3.4 0.9 –1.0 1.3 1.0

Nor
dea
Ann
ual R
epor
t 20
08
142
Financial statements
Note 50 Obtained collaterals which are permitted to be sold or repledged
Nordea obtains collaterals under reverse repurchase and securi-ties borrowing agreements which, under the terms of the agree-ments, can be sold or repledged. The transactions are conducted under standard agreements employed by financial markets par-ticipants. Group Parent company
31 Dec 31 Dec 31 Dec 31 Dec EURm 2008 2007 2008 2007
Reverse repurchase agreementsReceived collaterals which can be repledged or sold 20,118 23,485 7,524 6,593– of which repledged or sold 3,377 9,191 799 1,412
Securities borrowing agreementsReceived collaterals which can be repledged or sold 1,192 1,539 1,308 1,778– of which repledged or sold 1,192 1,539 1,308 1,778
Total 21,310 25,024 8,832 8,371
Note 51 Investments, customer bearing the risk
Life Group and Nordea Bank Danmark A/S have assets and lia-bilities included in their balance sheet where customers are bear-ing the risk. Since the assets and liabilities legally belong to the entities, these assets and liabilities are included in the Group’s bal-ance sheet. A breakdown is shown below: Group
31 Dec 31 Dec EURm 2008 2007
AssetsInterest-bearing securities 1,820 2,157Shares 6,730 8,975Other assets 165 212
Total assets 8,715 11,344
LiabilitiesDeposits and borrowings from the public 3,070 3,981Insurance contracts 3,611 4,796Investment contracts 2,000 2,503Other liabilities 34 64
Total liabilities 8,715 11,344
Note 52 Maturity analyses for assets and liabilities
Group Payable More Without Remaining maturity on Maximum 3–12 1–5 than fixed 31 Dec 2008, EURm Note demand 3 months months years 5 years maturity Total
Cash and balances with central banks 3,157 3,157Treasury bills 15 102 1,887 2,610 1,946 6,545Loans and receivables to credit institutions 16 1,537 20,528 820 670 348 23,903Loans and receivables to the public 16 34,872 66,239 18,091 53,621 92,277 265,100Interest-bearing securities 17 204 7,630 7,108 13,537 16,351 44,830Financial instruments pledged as collateral 18 901 666 2,900 3,470 7,937Derivatives 20 13,844 11,079 27,686 34,229 86,838Fair value changes of the hedged items in portfolio hedge of interest rate risk 21 12 72 256 73 413
Total assets with fixed maturities 39,770 109,256 39,723 101,280 148,694 438,723
Other assets 35,351 35,351
Total assets 39,770 109,256 39,723 101,280 148,694 35,351 474,074
Deposits by credit institutions 30 14,133 35,208 1,847 448 296 51,932Deposits and borrowings from the public 31 101,892 34,037 6,631 477 5,554 148,591Liabilities to policyholders 32 352 15 69 1,257 27,545 29,238Debt securities in issue 33 128 35,541 20,618 28,777 23,925 108,989Derivatives 20 14,584 11,017 26,607 33,330 85,538Fair value changes of the hedged items in portfolio hedge of interest rate risk 21 71 358 103 532Subordinated liabilities 38 665 205 3,008 4,331 8,209
Total liabilities with fixed maturities 116,505 120,050 40,458 60,932 95,084 433,029
Other liabilities 23,242 23,242Equity 40 17,803 17,803
Total liabilities and equity 116,505 120,050 40,458 60,932 95,084 41,045 474,074

Nor
dea
Ann
ual R
epor
t 20
08
143
Financial statements
Note 53 Related-party transactions
The information below is presented from a Nordea perspective, meaning that the information shows the effect from related party transac-tions on the Nordea figures.
Group Associated Other undertakings related parties1)
31 Dec 31 Dec 31 Dec 31 Dec EURm 2008 2007 2008 2007
AssetsLoans and receivables 181 159 – –Interest-bearing securities 119 – – –Derivatives – 107 – –Investments in associated undertakings 431 366 – –
Total assets 731 632 – –
LiabilitiesDeposits 172 106 74 56Debt securities in issue – 2 – –Derivatives – 99 – –
Total liabilities 172 207 74 56
Off balance 6,113 6,042 – –
Group Associated Other undertakings related parties1)
EURm 2008 2007 2008 2007
Interest income and interest expenseInterest income 5 6 – –Interest expense –1 –1 –4 0
Net interest income and expense 4 5 –4 01) Companies significantly influenced by key management personnel in Nordea Group as
well as companies significantly influenced by close family members to these key manage-ment personnel are considered to be related parties to Nordea. Included in this group of related parties are Nokia Oyj, Posten AB, Sampo Abp, Danisco A/S, IK Investment Part-ners AB and TrygVesta A/S. Transactions with related companies are made in Nordea’s and the related companies’ ordinary course of business and on the same criteria and terms as those for comparable transactions with companies of similar standing. They did not involve more than normal risk- taking. The transactions are therefore not included in the table.
Parent company Group Associated Other undertakings undertakings related parties
31 Dec 31 Dec 31 Dec 31 Dec 31 Dec 31 Dec EURm 2008 2007 2008 2007 2008 2007
AssetsLoans and receivables 37,323 35,006 38 19 – –Interest-bearing securities 3,524 1,960 – – – –Financial instrument pledged as collateral 1,573 2,637 – – – –Derivatives 2,143 378 – – – –Investments in associated undertakings – – 2 30 – –Investments in group undertakings 15,866 15,488 – – – –Other assets 258 386 – – – –Prepaid expenses and accrued income 319 136 – – – –
Total assets 61,006 55,991 40 49 – –
LiabilitiesDeposits 22,787 17,655 1 1 21 37Debt securities in issue 14 83 – – – –Derivatives 1,904 465 – – – –Other liabilities 34 44 – – – –Accrued expenses and deferred income 56 42 – – – –
Total liabilities 24,795 18,289 1 1 21 37
Off balance 79,253 66,345 – – – –
Parent company Group Associated Other undertakings undertakings related parties
EURm 2008 2007 2008 2007 2008 2007
Interest income and interest expenseInterest income 1,790 1,346 – 1 – 0Interest expense –792 –668 0 – –2 –1
Net interest income and expense 998 678 0 1 –2 –1

Nor
dea
Ann
ual R
epor
t 20
08
144
Financial statements
Note 53 Related-party transactions, cont.
Compensation and loans and receivables to key management personnelCompensation and loans and receivables to key management personnel are specified in Note 8.
Other related-party transactionsGroupStarting in March 2008 Nordea takes part in a guarantee consor-tium to support Norwegian Eksportfinans ASA in relation to its securities portfolio. Nordea owns 23 % of the company with other owners being the Norwegian state and other Nordic banks. Nor-dea’s share of the fair value of the contract as of the balance sheet date amounts to approx. EUR 61m. The agreement’s expiring date corresponds with the maturity dates of the bonds included in the guarantee. The latest maturity is on 31 December 2011.
Note 54 Acquisitions
On September 29, 2008 Nordea Bank Danmark A/S signed an agreement to acquire nine branch offices from “Bankaktie- selskabet af 24. august 2008” (Roskilde Bank). The transaction was closed on November 3, when Nordea received final approval from the Danish regulators. November 3 is the acquisition date and the date from which the acquired assets and liabilities are recognised in Nordea. Assets and liabilities acquired are disclosed in the table below. In addition, Nordea acquired guarantees to the amount of EUR 235m.
Nordea is entitled to return lending and guarantees, which are considered unattractive, to Roskilde Bank. Nordea has returned approximately EUR 225m of loans to corporate customers during Q4 and EUR 60m of guarantees. In Q1 2009 Nordea expects to return some of the loans to household customers. The purchase price was adjusted due to the return of loans to Roskilde Bank.
The following purchase price allocation (PPA) has been estab-lished as of 3 November 2008. This PPA has been adjusted to reflect the return of loans and guarantees and the price has been adjusted due to the volumes returned. The PPA is still preliminary, and can be updated during 2009.
EURm 3 Nov 2008
Loans 476Other assets 9Deposits –343Other liabilities –10
Acquired net assets in accordance with IFRS 132
Purchase price, settled in cash 85Purchase price, to be settled in cash 78
Cost of combination 163
Surplus value 31
Allocation of surplus value:Customer related intangible asset 13Goodwill 18
Goodwill arises mainly due to the synergies Nordea expects to achieve. Integrating the nine branches into Nordea’s branch net-work will create cost synergies and more synergies will be derived from implementing Nordea’s operating model in the new branches.
A customer related intangible asset has been separated from goodwill. The part separated is related to future earnings from acquired customers. This relates, however, only to the part over which Nordea has been assessed to have sufficient control. Amor-tisation is made over 10 years.
The impact on Nordea’s net profit for the year is insignificant.

Nor
dea
Ann
ual R
epor
t 20
08
145
Financial statements
Proposed distribution of earnings
It is the assessment of the Board of Directors that the proposed dividend is justifiable considering the demands with respect to the size of the Company’s and the Group’s equity, which are imposed by the nature, scope and risks,
associated with the business, and the Company’s and the Group’s need for consolidation, liquidity and financial position in general.
The Board of Directors and the President and CEO certify that the consolidated financial statements and the annual report have been prepared in accordance with the International Reporting Standards (IFRS/IAS)
referred to in the European parliament and councils’ regulation (EC) 1606/2002, from 19 July 2002, on application of International Accounting Standards and in accordance with generally accepted accounting principles.
They give a true and fair view of the Group’s and the Company’s financial position and result. The Board of Directors’ Report for the Group and the Company gives a true and fair overview of the development
of the operations, financial position and result of the Group and the Company and describes the material risks and uncertainties that the Company and the Group companies are facing.
17 February 2009
Hans DalborgChairman
Timo Peltola Kari Ahola Stine Bosse Vice Chairman Board member1) Board member
Marie Ehrling Svein Jacobsen Tom Knutzen Board member Board member Board member
Nils Q Kruse Steinar Nickelsen Lars G Nordström Board member1) Board member1) Board member
Lars Oddestad Heidi M. Petersen Ursula Ranin Board member1) Board member Board member
Björn Savén Björn Wahlroos Board member Board member
Christian ClausenPresident and CEO
Our audit report was submitted on 18 February 2009
KPMG AB
Carl LindgrenAuthorised Public Accountant
According to the parent company’s balance sheet, the fol-lowing amount is available for distribution by the AnnualGeneral Meeting of Shareholders: EUR
Retained earnings 5,225,679,407Other free funds 2,762,284,828Net profit for the year 1,887,807,578
Total 9,875,771,813
The Board of Directors proposes that these earnings are distributed as follows:
EUR
Dividends paid to shareholders, EUR 0.20 per share 518,821,646To be carried forward 9,356,950,167
Total 9,875,771,813
1) Employee representative (see further page 73, footnote 8).

Nor
dea
Ann
ual R
epor
t 20
08
146
Financial statements
Audit report
We have audited the annual accounts, the consolidated accounts, the accounting records and the administration of the board of directors and the managing director of Nordea Bank AB (publ) for the year 2008. The annual accounts and the consolidated accounts are included in the printed version of this document on pages 31–145. The board of directors and the managing director are respon-sible for these accounts and the administration of the com-pany as well as for the application of the Annual Accounts Act of Credit Institutions and Securities Company when preparing the annual accounts and the application of inter-national financial reporting standards IFRSs as adopted by the EU and the Annual Accounts Act of Credit Institutions and Security Company when preparing the consolidated accounts. Our responsibility is to express an opinion on the annual accounts, the consolidated accounts and the administration based on our audit.
We conducted our audit in accordance with generally accepted auditing standards in Sweden. Those standards require that we plan and perform the audit to obtain high but not absolute assurance that the annual accounts and the consolidated accounts are free of material misstate-ment. An audit includes examining, on a test basis, evi-dence supporting the amounts and disclosures in the accounts. An audit also includes assessing the accounting principles used and their application by the board of direc-tors and the managing director and significant estimates made by the board of directors and the managing director when preparing the annual accounts and consolidated accounts as well as evaluating the overall presentation of information in the annual accounts and the consolidated accounts. As a basis for our opinion concerning discharge
from liability, we examined significant decisions, actions taken and circumstances of the company in order to be able to determine the liability, if any, to the company of any board member or the managing director. We also exam-ined whether any board member or the managing director has, in any other way, acted in contravention of the Com-panies Act, the Banking and Financing Business Act, the Annual Accounts Act of Credit Institutions and Securities Company or the Articles of Association. We believe that our audit provides a reasonable basis for our opinion set out below.
The annual accounts have been prepared in accordance with the Annual Accounts Act of Credit Institutions and Securities Company and give a true and fair view of the company’s financial position and results of operations in accordance with generally accepted accounting principles in Sweden. The consolidated accounts have been prepared in accordance with international financial reporting stan-dards IFRSs as adopted by the EU and the Annual Accounts Act of Credit Institutions and Securities Com-pany and give a true and fair view of the group’s financial position and results of operations. The Board of Director’s report is consistent with the other parts of the annual accounts and the consolidated accounts.
We recommend to the annual meeting of shareholders that the income statements and balance sheets of the par-ent company and the group be adopted, that the profit of the parent company be dealt with in accordance with the proposal in the Board of Director’s report and that the members of the board of directors and the managing direc-tor be discharged from liability for the financial year.
To the annual meeting of the shareholders of Nordea Bank AB (publ) Corporate identity number 516406-0120
Stockholm, 18 February 2009
KPMG AB
Carl LindgrenAuthorised Public Accountant

Nor
dea
Ann
ual R
epor
t 20
08
147
Organisation
Legal structure
Nordea BankFinland Plc
Finland
Nordea BankPolska S.A.
Poland
Nordea LifeHolding
Finland LtdFinland
Nordea Life Holding ABSweden
Nordea LivHolding
Norge ASNorway
Nordea Bank AB (publ)Sweden
Nordea BankDanmark A/S
Denmark
Varioussubsidiaries
Nordea BankNorge ASA
Norway
Varioussubsidiaries
Nordea Life AssuranceFinland Ltd
Finland
Nordea LifeAssurance
Sweden AB (publ)
Sweden
Nordea Liv & Pension
livsforsikrings-selskab A/S
Denmark
Varioussubsidiaries
Varioussubsidiaries
Varioussubsidiaries
Nordea PolskaTowarzystwo
Ubezpieczen na Zycie S.A.
Poland
Nordea PowszechneTowarzystow
Emerytalne S.A.Poland
Nordea Life& Pension S.A.
Luxemburg
NordeaPensions
Estonia AS
IPAS NordeaPensions
Latvia
Fund companiesinvestment manage-
ment companiesVarious subsidiaries
Holdingcompany
JSBOrgresbank
Russia
Main legal structure*, 31 Dec 2008
* Further information is presented in Note 22. Nordea’s businesses in the Baltic countries are operated as branches in Nordea Bank Finland Plc.

Nor
dea
Ann
ual R
epor
t 20
08
148
Organisation
Board of Directors
Hans DalborgChairmanPh.D. (Economics). Board member since 1998. Born 1941.Board Chairman of the Swedish Corporate Governance Board and Uppsala University.Board member of Axel Johnson AB, the Stockholm Institute of Transition Economics and East European Economies (SITE) and the Stockholm Institute for Financial Research (SIFR).Member of the European Round Table of Financial Services (EFR).Previous positions2005–2008 Board Chairman of the Royal Swedish Academy of Engineering Sciences (IVA) 1997–2005 Board Chairman of the Royal Swedish Opera2000 President and CEO Nordea1998–1999 President and CEO MeritaNordbanken1991–1997 President and CEO Nordbanken1989–1990 Senior Executive Vice President and Chief Operating Officer of
Skandia Group.1972–1989 Various positions within Skandia GroupShareholding in Nordea: 40,760*
Timo PeltolaVice ChairmanDr. of Economics (Hc). Board member since 1998. Born 1946.Board Chairman of Neste Oil and AW-Energy Oy.Board member of TeliaSonera AB (publ) and SAS AB.Member of the Advisory Board of CVC Capital Partners and Sveafastigheter AB.Advisor to Cap Man Plc Public Market Fund.Previous positions1971–2005 Various positions within Huhtamäki group including CEO
1988–2004.Shareholding in Nordea: 5,187*
Stine BosseMaster of Law. Board member since 2008. Born 1960.Group CEO of TrygVesta A/S.Board Chairman of Forsikring & Pension and Hjertebarnsfonden (Danish Heart Child Disease Foundation).Board member of Grundfos Management A/S and Poul Due Jensens Fond.Non-executive Director of Amlin plcPrevious positions2004–2006 Board Member of TDC2002–2005 Board Member of Flügger1987–2001 Various positions within Tryg Forsikring A/S. Senior Vice
President 1999–2002Shareholding in Nordea: 1,882*
Marie EhrlingBSc (Economics). Board member since 2007. Born 1955.Board member of Securitas AB, Oriflame SA, Schibsted ASA, Safe Gate AB, Home Maid AB, Centre for Advanced Studies of Leadership at Handels-högskolan in Stockholm, World Childhood Foundation and Business Executives Council IVA.Previous positions2003–2006 CEO TeliaSonera Sverige AB1982–2002 Deputy CEO SAS Group, Head of SAS Airline and other
executive positions within the SAS group1980–1982 Information officer at the Ministry of Finance1979–1980 Information officer at the Ministry of Education1977–1979 Financial analyst at Fourth Swedish National Pension FundShareholding in Nordea: 1,500*
Svein JacobsenMBA. Certified public accountant. Board member since 2008. Born 1951.Board Chairman of Think Global AS, Vensafe AS and Norse Cutting & Abandonment AS.Deputy Chairman of Orkla ASA and Expert AS.Member of the Advisory Board in CVC Capital Partners.Previous positions1984–1996 Various positions within Tomra Systems including CEO 1988–
1996Shareholding in Nordea: 0*
Tom KnutzenMSc (Economics). Board member since 2007. Born 1962.CEO Danisco A/SBoard member of the Confederation of Danish Industries (DI) in Copen-hagen and the Danish Academy of Technical Sciences (ATV).Previous positions2006– CEO Danisco A/S2000–2006 CEO NKT Holding A/S1996–2000 CFO NKT Holding A/S1988–1996 Various positions within Niro A/S1985–1988 Various positions within FællesbankenShareholding in Nordea: 5,000*
Lars G NordströmLaw studies at Uppsala University. Board member since 2003. Born 1943.President and Group CEO of Posten AB.Board Chairman of the Royal Swedish Opera, the Finnish-Swedish Chamber of Commerce and European Financial Management & Marketing Association (EFMA).Board member of TeliaSonera AB, Posten AB, Viking Line Abp, the Swedish-American Chamber of Commerce. Member of the Royal Swedish Academy of Engineering Sciences (IVA).
* Shareholdings also include shares held by family members.
Hans Dalborg
Svein Jacobsen
Timo Peltola
Tom Knutzen
Stine Bosse
Lars G Nordström
Marie Ehrling
Heidi M. Petersen

Nor
dea
Ann
ual R
epor
t 20
08
149
Organisation
Previous positions2002–2007 President and CEO Nordea Bank AB1993– Various executive management positions within Nordea Group1970–1993 Various positions within Skandinaviska Enskilda Banken (EVP
from 1989)Shareholding in Nordea: 15,000*
Heidi M. PetersenMaster’s degree in chemistry. Board member since 2008. Born 1958.Board Chairman of Sandefjord Lufthavn AS.Board member of Aker Kværner ASA, Norsk Hydro ASA, Calora Subsea AS, Glamox ASA, Songa Floating Production ASA, Scan Geophysical ASA, Norwegian Energy Company ASA and Arendals Fossekompani ASA.Previous positions2003–2007 Managing director of Ramböll Future AS2000–2002 Managing director of Future Engineering AS1997–2000 Vice President in Kværner Oil & Gas AS Sandefjord1995–1997 Various managerial posts with Gullfaks C oljeriggShareholding in Nordea: 0*
Ursula RaninLLM and BSc (Economics). Board member since 2007. Born 1953.Board member of Finnair Plc and UPM-Kymmene Corporation.Previous positions1984–2005 Various positions within Nokia Corporation including Vice
President, General Counsel from 1994 and secretary to the Board of Directors from 1996.
1981–1984 Served as a circuit court judgeShareholding in Nordea: 5,000*
Björn SavénEkon. dr. h.c., MBA and MSc (Econ.& Bus.). Born 1950. Board membersince 2006.Chairman of Industri Kapital since 1993.Deputy chairman of Dynea Oy and Konecranes Oyj.Board member of Attendo Care AB and Minimax AG.Chairman of the British-Swedish Chamber of Commerce.Member of the Royal Swedish Academy of Engineering Sciences (IVA).Previous positions1988–1993 Chief Executive Enskilda Ventures (SEB), London.1976–1988 General and financial management positions within the Esselte
Group in Stockholm, London and New York.1974–1976 MBA studies at Harvard Business School, Boston.1972–1974 Analyst, Gulf Oil, Stockholm.Shareholding in Nordea: 400,000*
Björn WahlroosPh.D (Econ), 1979. Board member since 2008. Born 1952.Group CEO and President of Sampo Plc.Board Chairman of UPM-Kymmene Oyj.Board member of several charities, including the Finnish Business and Policy Forum EVA/ETLA and the Mannerheim Foundation.Previous positions1998–2000 Chairman of Mandatum Bank plc1992–1997 President of Mandatum & Co Ltd1985–1992 Various positions with Union Bank of Finland including
executive vice president and member of the executive committee 1989–1992
1983–1984 Visiting associate professor in Managerial Economics and Decision Sciences at Kellogg Graduate School of Management, Northwestern University
1980–1981 Visiting assistant professor in Economics at Brown University1979–1985 Professor and acting professor of Economics at the Swedish
School of Economics1974–1979 Acting lecturer and assistant professor in Finance at the Swedish
School of EconomicsShareholding in Nordea: 0*
Kari AholaBoard member from 2006. Born 1960. Employee representative.Shareholding in Nordea: 0*
Bertel FinskasBoard member since 2000 and until 31 December 2008. Born 1948. Employee representative.Shareholding in Nordea: 1,400*
Nils Q KruseBoard member since 2004. Born 1950. Employee representative.Shareholding in Nordea: 1,849*
Steinar NickelsenBoard member since 2007. Born 1962. Employee representative.Shareholding in Nordea: 0*
Lars OddestadBoard member from 1 January 2009. Born 1950. Employee representative.Shareholding in Nordea: 0*
* Shareholdings also include shares held by family members.
Ursula Ranin
Bertel Finskas
Björn Savén
Nils Q Kruse
Björn Wahlroos
Steinar Nickelsen Lars Oddestad
Kari Ahola

Nor
dea
Ann
ual R
epor
t 20
08
150
Organisation
Group Executive Management
Christian ClausenPresident and Group CEO 2007.Born 1955.Appointed member 2001.Shareholding: 28,480 Nordea1)
Carl-Johan Granvik2)
Executive Vice President, CRO, Head of Group Credit and Risk Control.Born 1949.Appointed member 2000.Shareholding: 9,000 Nordea1)
Ari KaperiHead of Institutional & International Banking.Born 1960.Appointed member 2008.Shareholding: 3,200 Nordea1)
Frans Lindelöw2)
Head of Banking Sweden.Born 1962.Appointed member 2004.Shareholding: 18,080 Nordea1)
Michael RasmussenHead of Banking Products & Group Operations.Born 1964.Appointed member 2008.Shareholding: 7,831 Nordea1)
Fredrik RystedtExecutive Vice President, CFO, Head of Group Corporate Centre.Born 1963.Appointed member 2008.Shareholding: 5,000 Nordea1)
Peter Schütze2)
Executive Vice President, Head of Nordic Banking.Born 1948.Appointed member 2002.Shareholding: 13,646 Nordea1)
Gunn Wærsted2)
Executive Vice President, Head of Capital Markets & Savings and People & Identity.Born 1955.Appointed member 2007.Shareholding: 9,085 Nordea1)
1) Shareholdings also include shares held by family members. 2) Country Senior Executive.
Group Executive Management:Upper row from left to right: Ari Kaperi, Gunn Wærsted, Christian Clausen, Michael Rasmussen, Frans Lindelöw. Lower row from left to right: Peter Schütze, Carl-Johan Granvik, Fredrik Rystedt.

Nor
dea
Ann
ual R
epor
t 20
08
151
Organisation
Group Organisation
Capital Markets &Savings
Gunn Wærsted
Institutional &International Banking
Ari Kaperi
Nordic BankingPeter Schütze
Banking Products &Group Operations
Michael Rasmussen
Group CorporateCentre
Fredrik Rystedt
Group Credit &Risk Control
Carl-Johan Granvik
People & IdentityGunn Wærsted
Group CreditHolger Otterheim
Group RiskModelling
Louise Lindgren
Account ProductsKurt Gustafsson
Capital MarketsProducts
Peter Nyegaard
New EuropeanMarkets1)
Thomas Neckmar
Banking SwedenFrans Lindelöw
Group CreditControl
Marja Nykänen
Group TreasuryJakob Grinbaum
Transaction ProductsOssi Leikola
Savings Products &Asset Management
Allan Polack
Life & PensionsJohan Sidenmark
Nordic PrivateBanking
Henrik Priergaard
International PrivateBanking & FundsJhon Mortensen
Shipping, Oil Services & InternationalCarl E. Steen
Group CreditProcess
Stig Hansen
Group Planning& Control
Frank Söllested
Nordea FinanceJukka Salonen
Financial InstitutionsBirger Gezelius
Group OperationalRisk ManagementSigurd Carlsen
Group FinanceJohnny Backman
InformationTechnology
Tapio Saarelainen
GroupTransformation
Hans-Henrik Eigtved
Group SourcingGert Aage Nielsen
Group InternalService Centre
Per E. Berg
Group Market RiskManagementNiels N. Kjær
Investor RelationsJohan Ekwall
Group CorporateDevelopment
Jakob Grinbaum
Group HumanResources
Lars Häggström
MarketingJukka Perttula
Group Identity &Communications
Lauri Peltola
Nordic PrivateBanking
Banking DenmarkAnders Jensen
Banking FinlandPekka Nuuttila
Banking NorwayAnne Stärk-Johansen
Segment HouseholdTopi Manner
Segment CorporatePeter Lybecker
Group ManagementSecretariat & Group Strategy
Flemming Dalby JensenTorsten Hagen Jørgensen
Group Internal AuditEva-Lotta Rosenqvist
Group LegalLena Eriksson
President and Group CEO Christian Clausen
1) Russia, Poland & Baltic Countries.
Ratings
Moody’s Standard Investors Service & Poor’s Fitch DBRS
Short Long Short Long Short Long Short Long
Nordea Bank AB (publ) P–1 Aa1 A–1+ AA– F1+ AA– R–1 (high) AANordea Bank Danmark A/S P–1 Aa1 A–1+ AA– F1+ AA– R–1 (high) AANordea Bank Finland Plc P–1 Aa1 A–1+ AA– F1+ AA– R–1 (high) AANordea Bank Norge ASA P–1 Aa1 A–1+ AA– F1+ AA– R–1 (high) AANordea Hypotek AB (publ) Aaa1) A–1+ AAA1)
Nordea Kredit Realkreditaktieselskab Aaa1) AAA1) Nordea Eiendomskreditt AS P–1 A11) Covered bond rating.

Nor
dea
Ann
ual R
epor
t 20
08
152
Others
Business definitions
These definitions apply to the descriptions in the Annual Report.
Tier 1 capitalThe proportion of the capital base, which includes consoli-dated shareholders’ equity excluding investments in insur-ance companies, proposed dividend, deferred tax assets, goodwill in the banking operations and half of the expected shortfall deduction.
Subsequent to the approval of the supervisory authori-ties, Tier 1 capital also includes qualified forms of subordi-nated loans (Tier 1 capital contributions and hybrid capital loans). The Core tier 1 capital excludes these items.
Capital baseThe capital base includes the sum of the Tier 1 capital and the supplementary capital consisting of subordinated loans, after deduction of the book value of the shares in wholly owned insurance companies and the deduction for expected shortfall, the negative difference between expected losses and provisions. Insurance companies have separate capital requirements.
Risk-weighted amountsTotal assets and off-balance-sheet items valued on the basis of the credit and market risks, as well as operational risks of the Group’s undertakings, in accordance with regula-tions governing capital adequacy, excluding assets in insurance companies, book value of shares which have been deducted from the capital base and goodwill.
Tier 1 capital ratioTier 1 capital as a percentage of risk-weighted amounts. The Core tier 1 ratio is calculated as core tier 1 capital as a percentage of risk-weighted amounts.
Total capital ratioCapital base as a percentage of risk-weighted amounts.
Return on equityNet profit excluding minority interests and the period’s change in fair value related to available for sale holdings and other revaluations recognised direct in equity, as a percentage of average equity for the period. Average equity including net profit and dividend until paid, minority interests excluded.
Total shareholders return (TSR)Total shareholders return measured as growth in the value of a shareholding over a specified period, assuming the dividends are reinvested at the time of the payment to pur-chase additional shares.
Earnings per share, after full dilutionNet profit divided by the average number of outstanding shares after full dilution, minority interests excluded.
Earnings per shareNet profit divided by the average number of outstanding shares, minority interests excluded.
Equity per shareEquity as shown in the balance sheet after full dilution and minority interest excluded divided by the number of shares after full dilution.
Cost/income ratioTotal operating expenses divided by total operating income.
Risk-adjusted profitRisk-adjusted profit is defined as total income minus total operating expenses, minus Expected losses and standard tax (26 % 2008). In addition, Risk-adjusted profit excludes major non-recurring items.
Economic profitEconomic profit is derived by deducting Cost of equity from Risk-adjusted profit.
Expected lossesExpected losses reflect the normalised loss level of the indi-vidual loan exposure over a business cycle as well as vari-ous portfolios.
Cost of equityCost of equity (%) is defined as required return by inves-tors on the Nordea share, measured as the long risk free euro rate plus required average risk premium to invest in equities multiplied by Beta, which reflects the Nordea share’s volatility and correlation with market volatility.
Cost of equity in EUR is defined as Cost of equity (%) times Economic capital.
The Cost of equity is set by management once a year as a parameter to manage risk appetite and investment level.
Economic capitalEconomic Capital is Nordea’s internal estimate of required capital and measures the capital required to cover unex-pected losses in the course of its business with a certain probability. EC uses advanced internal models to provide a consistent measurement for Credit Risk, Market Risk, Operational Risk, Business Risk and Life Insurance Risk arising from activities in Nordea’s various business areas.
The aggregation of risks across the group gives rise to diversification effects resulting from the differences in risk drivers and the improbability that unexpected losses occur simultaneously.
RAROCARRAROCAR, % (Risk-adjusted return on capital at risk) is defined as Risk-adjusted profit relative to Economic capi-tal.
MCEVMCEV is an estimate of the value a shareholder would put on a portfolio of in-force life and pension business based on objective market return. No franchise value or other addi-tional value is included in MCEV.

Nor
dea
Ann
ual R
epor
t 20
08
153
Others
Annual General Meeting 2 April 2009
Financial calendar
Nordea’s Annual General Meeting (AGM) 2009 will be held on Thursday 2 April at 13.00 CET at Cirkus, Djurgårdsslätten 43–45, Stockholm.
Notification of participation etcShareholders who wish to participate in the AGM shall be entered in the share register maintained by the Swedish Securities Register Center (Euroclear Sweden AB) not later than 27 March 2009 and notify Nordea. Shareholders whose shares are held in custody therefore must tempo-rarily re-register their shares in their own names with Euroclear Sweden AB in order to be able to participate. This applies for example to holders of Finnish Depositary Receipts in Finland and holders of shares registered in Værdipapircentralen in Denmark.
Such re-registration must be effected in Euroclear Swe-den AB in Sweden on 27 March 2009. This means that the shareholder in good time prior to this date must inform the trustee about this.
Shareholders registered in Euroclear Sweden AB in SwedenNotification of participation in the AGM must be made to Nordea Bank AB (publ) at the latest on 27 March 2009 at 13.00 Swedish time at the following address:
Nordea Bank AB (publ), c/o Novator Consulting Group AB, Box 10, SE-182 11 Danderyd, Sweden, or by telephone +46 8 755 13 46, or by fax +46 8 622 63 51, or on Nordea’s web page www.nordea.com.
Holders of Finnish Depositary Receipts (FDR) in FinlandNotification of participation in the AGM and re-registra-tion of shares to Euroclear Sweden AB must be made at the latest on 26 March 2009 at 12.00 noon Finnish time to Nordea Bank AB (publ), c/o Novator Consulting Group AB, Box 10, SE-182 11 Danderyd, Sweden, or by telephone +358 9 348 9230 or fax +46 8 622 63 51, or on Nordea’s web page www.nordea.com.
Shareholders registered in Værdipapircentralen in DenmarkNotification of participation in the AGM and re-registra-tion of shares to Euroclear Sweden AB must be made at the latest on 26 March 2009 at 12.00 noon Danish time to Nordea Bank AB (publ), c/o I-NVESTOR DANMARK A/S, Kongevejen 418, DK-2480 Holte, Denmark, or by tele-phone +45 4546 0997 or fax +45 4546 0998, or on Nordea’s web page www.nordea.com.
Financial calendar 2009Annual General Meeting 2 April Ex-dividend date 3 April Record date 7 April Dividend payments 16 April 1st quarterly report 29 April 2nd quarterly report 21 July 3rd quarterly report 28 October
ContactsFredrik Rystedt, Group CFO/EVP Tel: +46 8 614 78 00
Investor RelationsJohan Ekwall, Head of Investor RelationsAndreas LarssonChristopher CasselbladAnna Halaby
SE-105 71 Stockholm, Sweden Tel: +46 8 614 92 77
WebsiteAll reports and press releases are available on the Internet at: www.nordea.com Financial reports published by the Nordea Group may be ordered via Investor Relations.
The annual reports of Nordea Bank Danmark A/S, Nordea Bank Norge ASA, Nordea Bank Finland Plc can be downloaded at www.nordea.com Nordea’s Pillar 3 dis closure, Capital adequacy and risk management, in accordance with the Pillar 3 requirements according to the EU Capital Requirements Directive in the Basel II frame-work, is presented on www.nordea.com
The Annual Report 2008This Annual Report covers Nordea Bank AB (publ) and pertains to the operations of the Nordea Group, whose main legal structure is presented on page 147. The original annual report is in Swedish. This is an English version thereof. A Swedish version may be obtained upon request.
In this Annual Report, the Nordea Group presents in come statements and other financial data quoted in euro (EUR).

Corporate Governance Report 2008according to the Swedish Code of Corporate Governance
Application by NordeaNordea Bank AB (publ) applies the Swedish Code of Corporate Governance (the Code).
A description of corporate governance in Nordea in the most recent financial year is included in the 2008 Annual Report on page 70. In this Corporate Governance Report Nordea indicates where it has departed from the rules in the Code and explains the reasons. The report also includes the Board’s annual report on the key aspects of the systems for internal control and risk management regarding finan-cial reports.
According to the Code the minutes from the last Annual General Meeting (AGM) are to be posted on the Compa-ny’s web site. Nordea did not fully comply with this rule since the minutes were posted without the appendices con-taining personal information equivalent to information in the register of voters from the meeting. Nordea has found that the integrity of the individual shareholders is best pro-tected by not posting the appendices of this kind, given that it is not necessary to report the register of voters from the meeting according to the Code. The decisions are found in the minutes.
Report on the key aspects of the systems for internal control and risk management regarding financial reports for the Financial Year 2008This report has been prepared following rules 10.5 and 11.2 on internal control reporting in the revised Code and the report is submitted as a separate section of the Corporate Governance Report 2008.
The systems for Internal control and risk management over financial reporting are designed to give reasonable assurance concerning reliability of financial reporting and the preparation of financial statements for external pur-poses in accordance with generally accepted accounting principles, applicable laws and regulations, and other requirements for listed companies. The internal control and risk management activities are included in Nordea’s planning and resource allocation processes. Internal con-trol and risk management over financial reporting in Nordea can be described in accordance with the following framework:
Control EnvironmentInternal control in Nordea is based on the control environ-ment, which includes the following elements: Values and management culture, goal-orientation and follow-up, a clear and transparent organisational structure, segregation of duties, the four-eyes principle, quality and efficiency of internal communication and an independent evaluation process. The documentation of the internal control frame-work consists of Group directives and supporting instruc-tions covering the financial and administrative business processes in Nordea.
Risk Assessment Management of risks within Nordea is proactive, empha-sising training and risk awareness. Nordea maintains a high standard of risk management, applying available techniques and methodology in a cost efficient way. Risk management is considered an integrated part of running the business.
Control ActivitiesThe control activities include general as well as more detailed controls, which aim at preventing, revealing and correcting errors and deviations. The control activities are prepared and documented at group level, at business area level as well as unit level. The procedures cover the initial registration of each transaction and the subsequent IT pro-cessing. The heads of the respective units in Nordea are primarily responsible for managing the risks associated with the operations and financial reporting processes of the unit.
Information & CommunicationThe Group Accounting Manual and the Financial Control Principles constitute the main tools for accounting and financial reporting principles in respect of providing infor-mation and instructions. In addition to this, a standard reporting package is used by all entities to ensure consis-tent use of Nordea’s principles and coordinated financial reporting.

Monitoring Nordea has established a process with the purpose of ensur-ing a proper monitoring of the quality of the financial report-ing and the follow-up regarding possible deficiencies.
The CEO annually issues a report to the Board of Direc-tors on the quality of internal control in Nordea. This report is based on, inter alia, a self-assessment process and a hierarchical reporting covering the whole organisation. Internal control over financial reporting is included as one of several processes in the self-assessment.
Group Internal Audit (GIA) is an independent function commissioned by the Board of Directors. The Audit Com-mittee is responsible for guidance and evaluation of GIA. The internal auditing work provides assurance on that part of Nordea’s control system, which is essential for the exter-nal auditors’ assessment of the financial statements. GIA annually issues an assurance statement to the Board of Directors on the risk management, control and governance processes of the Nordea Group.
The Audit Committee also assists the Board of Directors in fulfilling its oversight responsibilities by reviewing the
quarterly and annual financial reporting, the external and internal auditors’ observations and conclusions as well as the system of internal control.
Financial reporting and communication with auditorsThe manner in which the Board of Directors ensures the quality of the financial reports is presented in the section on monitoring in the Report on the key aspects of the sys-tems for internal control and risk management regarding financial reports, see above.
Furthermore, the Board of Directors reviews the exter-nal auditors’ result of their audits of the Group’s annual financial statement and the external auditors’ review of the Group’s six-month report. The Board further reviews the external audit plan and external audit results. At least once a year the Board of Directors meets the external auditors without the presence of the CEO or any other company executive. In addition the auditor in charge meets sepa-rately with the Chairman of the Board of Directors and the Chairman of the Audit Committee.
This Corporate Governance Report, including the Report on the key aspects of the systems for internal control and risk management regarding financial reports, has not been reviewed by the auditors
and it is not part of the formal financial statements.

Layout: Marketing
Production: n3 Kommunikation
Photo: Bsmart, Egon Gade and Per Myrehed
Printing: Strokirk-Landströms
Nordea Bank AB (publ) | Corporate registration no. 516406-0120 | Smålandsgatan 17 | SE-105 71 Stockholm | Tel +46 8 614 78 00 | Fax +46 8 10 50 69 | www.nordea.com

