2007-money and cre
TRANSCRIPT

Chapter 05
MONEY AND CREDIT
The role of the financial system is to intermediatebetween lenders and borrowers, providing a menuof saving vehicles with differing risk and returncharacteristics. Financial intermediaries help theinvestors find the financing they need, taking intoaccount the returns and risks on the project theywish to undertake. In carrying out their functions,financial intermediaries reduce transaction costsfor savers and investors and help reduce problemsof asymmetric information that are inherent in therelationships between investors and entrepreneurs.For a given level of saving, more efficientintermediation increases the productivity ofinvestment. It seems obvious that the moreefficient the financial system is, the stronger wouldbe the economic growth.
The global economy for some time has enjoyedgood economic growth and increasing depth infinancial markets, accompanied by the significantfinancial innovation. This growth co-existed with acombination of favorable economic indicators,with relatively benign inflation levels, low riskpremia, and an easy access to finance even in themidst of continuing global imbalances. Untilrecently, the risk associated with such developmentseemed to be contained; however gains from thebenign macroeconomic environment of the last fewyears have been dealt with a severe blow in theform of liquidity crunch triggered by the US sub-prime mortgage crisis. These events have broughtto the forefront some global economic andfinancial vulnerabilities whose prolonged impactcould pose certain risks given that the world ismore integrated today than ever before.
Pakistan has made a significant progress inimproving the health and soundness of the bankingand financial sector over the last two decades.During this period of transformation, the financialsector of Pakistan has evolved into a more
progressive and dynamic module of the economy,both in response to the financial sector reforms andto the growing financing needs of an expandingeconomy. In response to the growing demands offinancial globalization, Pakistan’s financial systemis starting to integrate with international financialmarkets. Financial integration was particularlyexpedited in FY07 in which record high foreignportfolio investment was received in stock marketas well as through the issuance of GDRs.Additionally, with the rising strength of thecorporate sector and vigorous expansion plans, thecentral bank is in the process of initiating ExternalCommercial Borrowing (ECB), which at themoment is approved on a transactional basis. Thisliberalization measure will provide an opportunityto the corporate sector to raise external loans forproject finance, bond floatation, structured financeand Islamic products.
In Pakistan, the composition of financial sectorgives credence that the overall dependence on thebanking sector has increased in the last few years.Given the scope and requirements of the privatesector, growth in the banking sector is essential.Encouragingly, the outreach of the banking sectorcontinues to improve, with diversified pattern inownership, both foreign and local, and with theexpanding network of commercial banks,microfinance institutions and Islamic banks in allparts of the country. Alongside thesedevelopments, ongoing financial sector reforms arepaving the way for a more diversified financialsector, equipped to facilitate the economic growthprocess. Financial sector assets have recorded aremarkable growth in recent years. Strong growthof mutual fund---being managed by professionaland reputable asset management firms—is largelyattributed to the improved performance of thedomestic financial markets, and points to thegradual but steadfast process of diversification of
81
Pakistan Economic Survey 2007-08
the financial sector. These developments augurwell for financial stability as well as meeting thegoal of enhancing financial services penetration.
Monetary Policy Stance
The process of tightening of monetary policybegan in FY05 from a broadly accommodative oneto more aggressive. The moderate interest rates,together with broad-based private sector creditdemand helped in raising industrial production.This has resulted in acceleration in monetaryexpansion. Therefore, heightened activity also feda gradual rise in core inflation. The government’smid December 2004 decision to lift the freeze ondomestic POL prices raised inflationaryexpectations, forcing a more aggressive tighteningof monetary policy. It was in April 2005 that theSBP raised its discount rate by 150 basis points(bps) to 9 percent, and further to 9.5 percent inJuly’06 with the same objective of controllinginflation. Demand pressures were still high, asreflected by high growth in credit to private sector,rising imports resulting in the widening of thecurrent account deficit and an expansionary fiscalpolicy envisaged in the Federal Budget 2006-07.InFY07, inflation target of 6.5 percent was surpassedby 1.3 percentage points, primarily because ofdemand pressures as reflected by widening fiscaland current account deficits and double-digit foodinflation. During FY08, the SBP continued withtight monetary policy stance, thrice raising thediscount rate and increased the Cash ReserveRequirement (CRR) and Statutory LiquidityRequirement (SLR). During H1-FY08, the SBPraised the policy rate by 50bps to 10 percenteffective from August 1st, 2007. Furthermore, theSBP zero rated the CRR for all deposits of oneyear and above maturity to encourage greaterresource mobilization of longer tenor and 7 percentCRR for other demand and time liabilities. In H2-FY08 the SBP further tightened Monetary Policyby raising discount rate by 50bps to 10.5 percent.Furthermore, the CRR was raised for deposits uptoone year maturity by 100bps to 8 percent whileleaving term deposits of over a year zero rated. Theobjective was to give incentives to commercialbanks to mobilize long term deposits. In the lightof continued inflationary buildup and increasingpressures in the foreign exchange market, the SBPannounced a package of monetary measures on82
May 21, 2008 that includes;(i) an increase of 150bps in discount rate to 12 percent; (ii) an increaseof 100 bps in CRR and SLR to 9 percent and 19percent, respectively for banking institutions (iii)introduction of a margin requirement for theopening of letter of credit for imports (excludingfood and oil) of 35 percent, and (iv) establishmentof a floor of 5 percent on the rate of return onprofit and loss sharing and saving accounts.
Monetary and Credit Development
In order to improve the effectiveness of monetarypolicy and avoid ambiguities in sending out policysignals, the SBP has abolished the Annual CreditPlan (ACP). This was a long awaited measure,following the removal of credit ceilings whichmade the Credit Plan redundant. Since broadmoney (M2) was the only intermediate target in themonetary policy framework, SBP continued toprescribe targets of NFA, NDA, governmentborrowings and private sector credit .It is expectedthat the abolishment of ACP will help remove theuncertainties emanating from multiple targets ofmonetary aggregates.
A sharp jump in monetary aggregates during thelast month of FY07 pushed the aggregate M2growth for the year to 19.3 percent. This strikinglyhigher growth in M2 was caused entirely by aphenomenal rise in NFA in FY07.For 2007-08,theSBP had assumed that with real GDP growth targetof 7.2 percent and inflation target of 6.5 percent,broad money(M2) supply growth should grow by13.7 percent. The money supply growth duringJuly- May1 of the current fiscal year slowed to 9percent compared to 14 percent during thecorresponding period of FY07 (Table-5.1). The FY08 growth in M2 is entirely attributable to a rise innet domestic assets (NDA) of the banking systemdue to high government borrowings for budgetarysupport, as the NFA registered a contraction duringthe period, mainly reflecting the weaknesses incountry’s external balance of payment. Themonetary tightening has been successful inmoderating the exceptional rise in private sectorcredit growth seen in recent years to levelsconsistent with its long term trends. However, theimpact of this desirable moderation in private
1Pertains to 10 May for FY08 and 12 May for FY07

Money and Credit
sector growth on M2 was more than offset bycontinued strong budgetary borrowings of thegovernment from the banking system. The NDA ofthe banking system registered an expansion of
Table-5.1 Profile of Monetary Indicators
Jul-May* 2006-07 185.84 212.36 -26.42 -0.09 273.98 263.43 10.40 -0.23 0.38 -64.29 395.54 14.67% 84.59 480.12 14.09%
Rs.656 billion during Jul-May FY08 comparedwith an expansion of Rs.395 billion during thecorresponding period of last year.
(Rs. billion)Jul-May* 2007-08 423.02 362.06 60.86 0.09 414.39 369.85 44.33 -0.03 0.24 -180.69 656.72 21.32% -289.84 366.89 9.03% Source:SBP
1.Net government sector Borrowing(a+b+c) a .Borrowing for budgetary support b.Commodity operations c.Others2.Credit to Non-government Sector (d+e+f+g) d.Credit to Private Sector e.Credit to Public Sector Enterprises (PSEs) f. PSEs Special Account-Debt repayment with SBP g.Other Financial Institutions(SBP credit to NBFIs)3.Other Items(net)4.Net Domestic assets (NDA)Growth5.Net Foreign Assets (NFA)6.Monetary Assets(M2)Growth*pertains to 10th May for F08 and 12th May for FY07
Analysis of Monetary Indicators
Bank Credit to Government
The net bank credit to the government forfinancing commodity operations and budgetarysupport amounted to Rs. 423 billion during July-May FY08 against Rs.185 billion during the same
Table-5.2 Monetary Indicators(Growth Rates)
Indicators
Net Bank Credit to Government SectorBank Credit to Private SectorNet Domestic Assets(NDA)Net Foreign Assets (NFA)Money Supply(M2)*pertains to 10th May for F08 and 12th May for FY07
period last year.Credit to government forcommodity operations expanded by Rs. 60 billionduring July-May FY08 as compared to contractionof Rs.26 billion during the same period last year,while credit to government for budgetary supportincreased to Rs. 362 billion.
(Percent)Jul-May* 2007-08 45.66 14.91 21.32 -29.43 9.03Source: SBP
FY 05
13.934.3622.15 9.2219.12
FY 06
11.6323.4716.0511.5215.07
FY 07
11.1417.314.2338.6519.32
Jul-May* 2006-07 22.29 12.23 14.67 11.9 14.09
In the current fiscal year, domestic and externalshocks of extra-ordinary proportions caused largeslippages on the fiscal side. The financing plan ofthe fiscal deficit also affected by these shocks. Theoverall fiscal deficit of Rs.398 billion was to befinanced by external sources(Rs.193 billion), anddomestic sources (Rs 131 billion).The remainingRs. 75 billion was to come from privatizationproceeds. Within domestic sources, Rs 81 billionfinancing was to come from banking sources while
the remaining Rs 50 billion was to come from non-banking sources. The domestic and external shocksnot only increased the size of the fiscal deficit butthey also changed the composition of financing.The borrowing requirements increased from Rs.324 billion (the net of privatization proceeds) toRs. 683.4 billion (with no privatization proceeds)-an increase of 111 percent. External resourceinflows were adversely affected by these shocksand against the budgeted level of Rs.193 billion, 83

Pakistan Economic Survey 2007-08
only Rs.119.4 billion is likely to materialize.Pakistan could not complete the transaction ofGDRs of the National bank of Pakistan and couldnot launch sovereign and exchangeable bonds.Furthermore; some of the lending from themultilateral banks could not be materialized. Thesedevelopments had adversely impacted the externalresource inflows which remained below thebudgeted level. Thus, the brunt of adjustments onthe financing side fell on domestic sources.Against the budgeted financing of Rs 131 billionfrom domestic sources, it increased to Rs 564billion. Within domestic sources, the bulk (82.2percent) of financing came from banks while theremaining Rs 100 billion or 17.8 percent camefrom non-bank sources. Most importantly, theborrowings from the State Bank of Pakistanreached at an alarming level which is posingserious complications for the conduct of monetarypolicy. On cumulative basis, as on May 10, 2008government has borrowed Rs.551 billion from SBP
Fig 5.1Government Budgetary Borrowings
600
400
Rs.billion 200
0
-200
-400
Jul-1Dec 07 Jul-12May 07 FY 07 Q1 FY 08 Jul-10May 08
98 99
-1
212
35
during the current fiscal year, which has almostdoubled the stock of MRTBs with SBP to Rs.945.9billion. To put this in perspective, the July-MayFY08 borrowings are twice the net borrowingsseen during the preceding three years (Fig 5.1).The reliance on central bank borrowing is partly anoutcome of scheduled banks’ reduced interest ingovernment papers .It may be pointed out that thegovernment had borrowed substantially from thescheduled banks during Q1-FY08. This trendhowever changed completely in subsequentquarters when scheduled banks showed littleinterest in the T-bill auctions. This probablyreflects strong seasonal demand for private sectorcredit as well as attractive returns on such loansand tight liquidity conditions in the inter-bankmarket. In addition, the expectations regardingchanges in discount rate in the monetary policystatement for H2-FY08 also limited the scheduledbanks’ participation in the auctions of thegovernment securities. (Fig 5.2)
Total borrowings
From SBP
From Scheduled banks362
551
178102
-59
161 191 170
22-189
Fig 5.2 T-bill Auctions Results
180160140120100 80 60 40 20 0
2007 2008 2007 2008 2007 2008 2007 2008 2007 2008 2007 2008 2007
Target Offered Accepted
Rs. billion
2008 2007 2008 2007 2008 2007
Jul Aug Sep Oct Nov Dec Jan Feb Mar Apr
84
2008

Money and Credit
Net Domestic Assets
Due to phenomenal rise in government sectorborrowings from the banking system, net domesticassets of the banking system registered a stronggrowth (21.32 percent) during July-May FY08compared to the growth (14.67 percent) recordedduring corresponding period of last year. The SBPhas contributed the most to the overall NDAexpansion mainly due to the strong growth in thegovernment borrowings from the Central Bank.Credit to public sector enterprises which registeredan expansion of Rs.44 billion in contrast to Rs.10billion during the corresponding period last yearalso contributed to the current rise in NDA. Thisgrowth in the credit to PSEs is attributable todelays in settlement of oil price differential claimsof one public sector oil marketing company(OMC), and the credit extension to the electricitydistribution companies.
Net Foreign Assets (NFA)
NFA of the banking system registered a netcontraction of Rs.289 billion during July-MayFY08 compared to an expansion of Rs.84billionduring the corresponding period last year. Thiscontraction in NFA is attributable to delays in
Fig 5.4 Growth of Private sector
40353025201510 5 0
312927252321191715
1991-921992-931993-941994-951995-961996-971997-981998-991999-002000-012001-022002-032003-042004-052005-062006-07
issuance of GDRs, sovereign bonds, receipts oflower-than-expected logistics support, decline inforeign investment, lower inflows from multilateraldevelopment banks, and SBP’s decision to provideforeign exchange to support a part of oil paymentseven when the oil prices are at their historic highlevels.
Fig 5.3 Net Foreign Assets
100
50
0
84.59 92.8
Rs.billion-50
-100
-150
-200
-250
-300
Jul-Dec FY07 Jul-May FY07 Jul-Jun FY07
-289.8
Jul-Dec FY08 Jul-May FY 08
-71.4 -99.9
Credit to Private Sector
Credit to private sector grew by 14.9 percentduring July-May FY08 as against 12.2 percent inthe same period of last year. Credit to privatesector as percent of GDP is continuously risingsince 2001-02 (Fig-5.5).
Fig 5.5 Credit to Private Sector/GDP(mp)
34.3 34.4
23.5
17.3
Percent
12.814.9
FY 03 FY 04 FY 05 FY 06 FY 07 FY 08
Net credit to private sector stood at Rs.369 billionduring July-May FY08 compared with Rs. 263billion in the same period last year. Private sectorcredit was growing at a slower pace till January2008 compared to previous year, gatheredmomentum thereafter. The key factors contributing
to recent acceleration in private sector creditgrowth include: (i) rise in working capitalrequirements due to higher input costs; (ii)the needfor bridge financing to settle price differentialclaims of the OMCs and IPPs; and (iii) the higherfixed investment in the month of March 2008.
85

Pakistan Economic Survey 2007-08
Table-5.3 Private sector credit (Flows)
Sectors
Overall Credit (I to V)I.Loans to Private Sector businessA.AgricultureB.Mining And QuarryingC.ManufacturingTextilesD.Electricity,gas and waterE.ConstructionF.Commerce and TradeG.Transport,storage and communicationsH.ServicesI.Other Private BusinessII.Trust funds and NPOsIII.PersonalIV.OthersV.Investment in Securities and Shares
Jul-MarFY07267.5203.210.5 0.3119.021.612.310.315.913.918.4 2.9 0.638.8 4.1 20.8
FY08368.0304.712.1 4.7193.194.237.315.028.5 4.010.0 -1.2 0.521.2 -0.642.2 Source:SBP
(Rs.billion)
A look on advances to private sector (Table 5.3)suggests that, while the increase in raw materialprices did cause acceleration in credit demand in afew industries, the increase in interest rates had putsignificant downward pressures on credit demandespecially in industries that are capable ofgenerating cash flows internally, sufficient to meetworking capital requirements. It must also be keptin mind that the credit by the banking sector is alsobeing supplemented by other sources of financing.The private sector is using non-bank finances, thusshifting part of the credit demand away from thebanking sources. In particular, besides banks, non-bank financial institutions are meeting thefinancing demand of the private sector throughtheir investment in debt instruments (TFCs andSukuk).It may be pertinent to note that most of theprivate sector TFC’s and Sukuk’s have been usedto refinance bank credit. Availability of foreigninvestment and loans has also played an importantrole in softening the demand for bank creditparticularly in telecommunication sector. It appearsthat demand for fixed investment loans hasmoderated in a number of industries. However, thisdoes not necessarily suggests a slowdown ineconomic activity as (a) the moderation in fixedinvestment demand in cement, construction andtextile is more of a reflection of the fact that theseindustries had already expanded their capacities inrecent years; and (b) some of the industries are
86
financing their expansion projects through othersources, such as foreign currency loans (e.g.,telecom), foreign investments (telecom, chemical)and floatation of debt instruments (e.g., chemical,cement, real estate and ship yard) in the domesticmarket. Further, the demand for fixed investmentis expected to grow substantially in the power andrefinery sector.
The commencement of financing private sectorpower projects will provide a boost to privatesector credit growth. It is also likely thatcompanies which met their demand from externalborrowings in earlier periods would revert todomestic markets given the expected widening ofspread overseas.Although the SBP kept theliquidity conditions tight in inter-bank marketthroughout FY08, the impact on commercialbank’s ability to lend was weaker by a number offactors such as increase in bank’s paid up capital,more than required capital adequacy of banks,increase in non-performing loans, particularly inconsumer financing, SME, corporate and internalcash generation through increased profitability, thecontinued process of mergers and acquisitions, up-gradation of the risk management systems in a fewbanks and a slight deterioration in credit qualityhave prevented a few banks from aggressivelending.

Money and Credit
Sectoral Analysis:
Manufacturing, power, and commerce made majorcontributions in the growth of net advances. Incontrast, contribution from services, construction,personal and others was significantly lower duringJul-Mar FY08 compared to the correspondingperiod of FY07.
Agriculture Sector: The gross disbursement toagri-sector grew by 24.8 percent to Rs 138.6billion) during Jul-Mar FY08 compared with 21.9percent in the same period of last year (Table-5.4).Production loans rose by 28.5 percent toRs.125.4 billion from Rs.97.6 billion last year;while the development loans declined to Rs.13.1billion from Rs.13.6 billion during the same
period. Commercial banks gross disbursementduring Jul-Mar FY07grew to Rs.95.1 billion. Anencouraging factor regarding disbursement ofagricultural credit was the increasing role ofprivate domestic banks vis-à-vis traditional lender,ZTBL. The share of private domestic banks in totaldisbursement increased from 14.5 percent (Rs 16billion) during Jul-Mar FY07 to 21.6 percent(Rs.29.9 billion) during Jul-Mar FY08.On theother hand, share of ZTBL declined from 36.8percent(Rs.40.8 billion) during Jul-Mar FY07 to28.5 percent (Rs.39.5 billion) during Jul-MarFY08.Among the major commercial banks,National Bank of Pakistan continued itsdominance, followed by Habib Bank Limited,MCB Bank, Allied Bank of Pakistan Limited, andUnited Bank Limited.
(Rs.billion)Table-5.4 Targets and Actual Disbursement of Agriculture Loans Actual Disbursement (July-March) FY 07FY 08Name Of Banks ProDevProDev Total LoansLoansLoansLoansI. Total Commercial Banks (A+B)57.27.96588.66.5A.Major Commercial Banks42.86.14961.63.51.Allied Bank of Pakistan Limited4.50.14.58.80.12.Habib Bank Limited9.3413.314.10.83.Muslim Commercial Bank Limited5.20.15.413.40.54.National Bank of Pakistan17.51.51919.41.25.United Bank Limited6.30.46.760.8B Private Domestic Banks14.31.716.1273II.Total Specialized Banks(1+2)40.45.746.236.86.61.Zarai Taraqiati Bank Limited36.9440.933.662.P.P.C.B3.61.75.33.30.7Grand Total (I+II)97.613.6111125.413.1
Total
95.1 65.1 8.8 14.9 13.9 20.6 6.9 30 43.5 39.6 3.9 138.6Source:SBP
Power Sector: The demand for advances wassignificantly higher in power sector during Jul-MarFY08. Indeed, the rise in working capital loansincorporated the impact of delays in payment fromWAPDA to IPPs, whereas growth in fixedinvestment loans reflects the impact of capacityexpansion in private sector power projects.
Manufacturing: Credit to manufacturing sectorrose to Rs.193 billion during Jul-Mar FY08compared to Rs.119 billion in Jul-Mar FY07.Thishigher growth was mainly driven by higheradvances to the textile sector (Rs.94.2 billion in theFY08as compared to Rs.21.6 billion in the same
period last year); excluding the textile industry, thegrowth in advances to manufacturing sector hasdecelerated.
Construction: Advances to construction sectorrose to Rs.15 billion during Jul-Mar FY08 Rs.10.3billion in the corresponding period last year. Theissuance of privately placed Sukuks for financingnew projects probably explains lower demand forfixed investment loans from this sector. Besidesrising housing demand, the increase in domesticraw material prices for construction mainlyexplains the higher demand for working capitalrequirement in this sector during Jul-Mar FY08.
87

Pakistan Economic Survey 2007-08
Consumer Loans: Advances to consumer loansslowed and reached to only Rs.16.6 billion duringJul-Mar FY08 from Rs.35.2 billion in thepreceding year (Table 5.5). The decline inconsumer loans is evident in all categories (exceptmortgage finance). In particular, deceleration in thegrowth of auto finance was attributed to (1) lowerdemand for automobiles due to increase in pricesof locally produced cars, and (2)risk aversions ofbanks following recovery issues(e.g., one of thebanks has even suspended auto finance scheme).
Monetary Assets
The Components of monetary assets (M2) include:Currency in Circulation, Demand Deposit, TimeDeposit, Other Deposits (Excluding IMF A/C,counterpart) and Resident’s Foreign Currency
Table-5.6 Monetary Aggregates
Items End June 20062007740,390840,181
Deposits (RFCDs). The developments in thesecomponents during the July-May FY08 of thecurrent fiscal year are presented below (Table-5.6)
Table 5.5 Consumer Financing
Consumer Financing
1.House Building2.Transport i.e purchase of cars etc3.Credit cards4.Consumer Durables5.Personal Loans6.OthersTotal
(Rs.billion)Change During Jul-MarFY 07 FY 08 910.2 7.63.4 71.8 -0.40.7 11.90.4 -0.10.1 35.216.6 Source:SBP
A. Currency in CirculationDeposit of which:B. Other Deposits with SBP4,9317,0126,1134,341C.Total Demand &Time Deposits incl.RFCDs2,661,5843,217,9623,006,7453,411,470of which RFCDs195,501207,312199,955234,882Monetary Assets Stock (M2) A+B+C3,406,9054,065,1553,887,0294,432,041Memorandum ItemsCurrency/Money Ratio21.720.722.523.2Other Deposits/Money ratio0.10.20.20.1Total Deposits/Money ratio78.179.277.477.0RFCD/Money ratio5.75.15.15.3Income Velocity of Money2.12*pertains to 10th May for F08 and 12th May for FY07Source:SBPNote: Compilation of M1 based on weekly data has been discontinued. Now M1 is being compiled on the basis ofmonthly returns and is given in Table 2.1 which would be published in the monthly Statistical Bulletin of SBP fromApril 2008 in Table 2.1.i. Excluding IMF A/c No 1 & 2 SAF Loans A/c, deposits money banks, counterpart funds, deposits of foreign central bans, foreign governments.ii. Excluding inter-bank deposits of federal and provincial governments and foreign constituents and international organizations etc.iii. Income Velocity of money is defined by the State Bank as GDP at current factor cost/quarterly average of Monetary Assets (M2)
(Rs million) July-May*2006-072007-08874,1711,026,284
Currency in Circulation
As shown in the Table 6.6, currency in circulationduring July-May FY 08 increased to Rs.186 billionfrom Rs.133 billion during the same period of lastyear. The currency in circulation constituted 23.2
88
percent of the money supply (M2) as against 22.5percent in the same period last year.
Deposits
During July-May FY08, demand and time depositshas declined to Rs.165 billion as compared to

Money and Credit
Rs.340 billion in the same period of last year. Onthe other hand, RFCDs has registered an increaseand reached to Rs. 27 billion as compared to Rs.4billion in the same period last year.
The M2/GDP ratio, which is an indicator offinancial development continued to exhibit a risingtrend since 1990-00 from 36.9 percent to 46.6percent in 2006-07.In March 2008, however, M2/GDP ratio was 42 percent as compared to 43.4percent in the corresponding period of last year(see Table 5.7).
Table-5.7 Key Indicators of Pakistan'sFinancial DevelopmentYearsM2/GDPDD+TD/M21999-0036.974.62000-0136.775.42001-0240.075.42002-0343.176.22003-0444.976.82004-0545.177.62005-0645.072.52006-0746.674.1July-March2006-0743.472.32007-0842.072.5
Source:SBP
government borrowing from SBP during currentfiscal year along with shortage in food supply,started to dilute the impact of a tight monetarypolicy stance. To contain the rising inflationarypressures in the economy, SBP therefore continuedwith a tight monetary stance during the currentfiscal year, as the risk of inflation was outweighingthe risk of economic growth. The SBP raised itspolicy rate by 250 basis points in the monetarypolicy statements and revised CRR for demand andtime liabilities and SLR in the upward direction.Complement to the tight monetary policy stance,the SBP continued recourse to Open MarketOperation (OMOs) more frequently to manageliquidity at the desired levels in the inter-bankmarket. (The SBP moped up Rs.766 billion duringJuly-Mar FY07 against the injection of Rs.118billion as compared to Rs.700billion against theinjection of Rs.72 billion in corresponding periodof last year.)
Table-5.8 Summary of OMOs(Rs.billion) InjectionAbsorption FY 07FY 08FY 07FY 08Jul133.5141.8Aug21.2105.7228.3Sep8771.3Oct40.981.3Nov61.9124.7Dec25.8117.269Jan27.560.252.3Feb11.770.9Mar2549.5542.18.1Total72118700.5766.4
Source:SBP
Monetary Management
The Money market in Pakistan has developedsubstantially since the process of liberalization ofthe financial system began in the early 1990s.Avibrant inter-bank money market not only helps totransmit monetary policy signals but also providesstability to financial institutions through meetingshort-term liquidity requirement with relative easeand at competitive rates. The focus of SBP’smonetary management in FY08 was to improve thetransmission of policy rates to the retail rates bydraining the excess liquidity from the moneymarket and keeping the overnight rates close to thediscount rate. The tight monetary stance adoptedsince April 2005, did help in containinginflationarypressuresintheeconomy.Nevertheless, high monetary growth towards theend of FY07 and substantial increase in
The impact of tight monetary stance and liquiditymanagement began to translate into a rise in otherinterest rates, with varied magnitude, at differentstages of the economy. For instance, 6 monthsT-bills cutoff witnessed an increase of 97 basispointsto9.9percentduringJul-AprFY08.Similarly, 6 months and 12-months KIBORalso increased by 77 basis points and 63 basispoints to 10.38 percent and 10.71 percentrespectively at end April 2007 in the same way,
89
Pakistan Economic Survey 2007-08
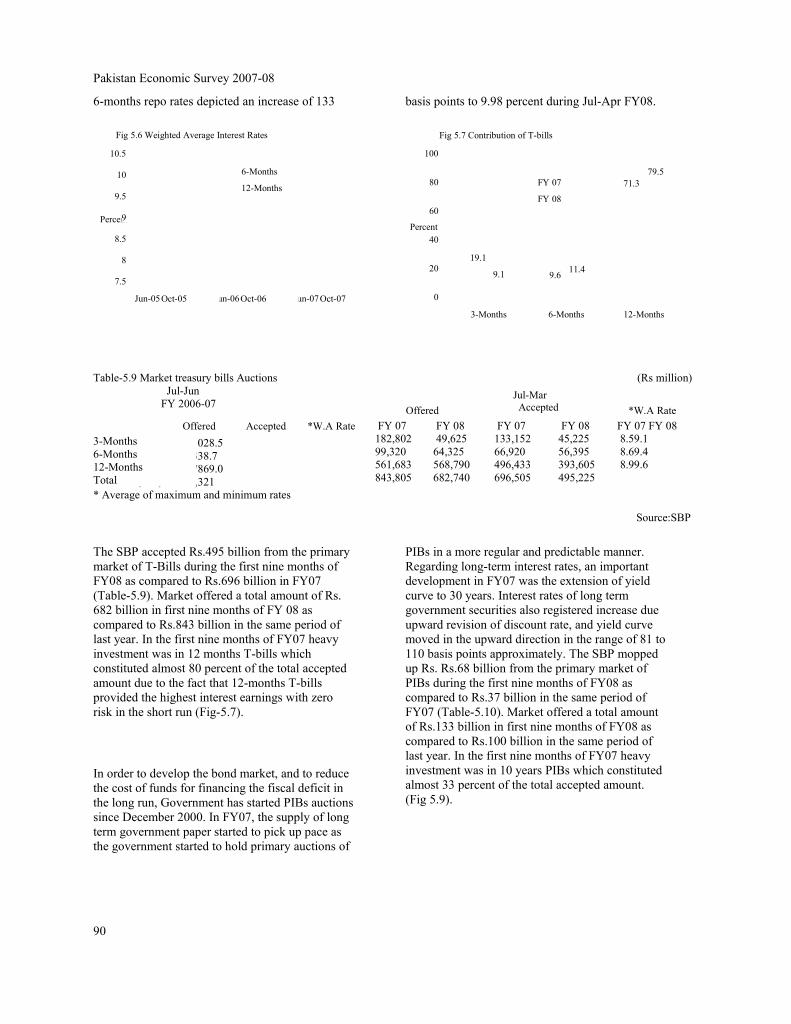
6-months repo rates depicted an increase of 133
Fig 5.6 Weighted Average Interest Rates
10.5
10
9.5
Percent9
8.5
8
7.5
Feb-06 Feb-07 Feb-08Jun-05 Jun-06 Jun-07Oct-05 Oct-06 Oct-07 0
3-Months 6-Months 12-Months
6-Months
12-Months
100
80
60
Percent40
2019.1
9.1 9.611.4
FY 07
FY 08
71.379.5
basis points to 9.98 percent during Jul-Apr FY08.
Fig 5.7 Contribution of T-bills
Table-5.9 Market treasury bills Auctions Jul-Jun FY 2006-07
Offered Accepted *W.A Rate
(Rs million)
Offered
Jul-Mar Accepted *W.A Rate
186,652136,1028.5 125,48390,4338.7 787,636661,7869.0 1,099,771888,321* Average of maximum and minimum rates
3-Months6-Months12-MonthsTotal
FY 07182,80299,320561,683843,805
FY 08 49,62564,325568,790682,740
FY 07133,15266,920496,433696,505
FY 0845,22556,395393,605495,225
FY 07 FY 08 8.59.1 8.69.4 8.99.6
Source:SBP
The SBP accepted Rs.495 billion from the primarymarket of T-Bills during the first nine months ofFY08 as compared to Rs.696 billion in FY07(Table-5.9). Market offered a total amount of Rs.682 billion in first nine months of FY 08 ascompared to Rs.843 billion in the same period oflast year. In the first nine months of FY07 heavyinvestment was in 12 months T-bills whichconstituted almost 80 percent of the total acceptedamount due to the fact that 12-months T-billsprovided the highest interest earnings with zerorisk in the short run (Fig-5.7).
In order to develop the bond market, and to reducethe cost of funds for financing the fiscal deficit inthe long run, Government has started PIBs auctionssince December 2000. In FY07, the supply of longterm government paper started to pick up pace asthe government started to hold primary auctions of
PIBs in a more regular and predictable manner.Regarding long-term interest rates, an importantdevelopment in FY07 was the extension of yieldcurve to 30 years. Interest rates of long termgovernment securities also registered increase dueupward revision of discount rate, and yield curvemoved in the upward direction in the range of 81 to110 basis points approximately. The SBP moppedup Rs. Rs.68 billion from the primary market ofPIBs during the first nine months of FY08 ascompared to Rs.37 billion in the same period ofFY07 (Table-5.10). Market offered a total amountof Rs.133 billion in first nine months of FY08 ascompared to Rs.100 billion in the same period oflast year. In the first nine months of FY07 heavyinvestment was in 10 years PIBs which constitutedalmost 33 percent of the total accepted amount.(Fig 5.9).
90

Money and Credit
Fig 5.8 Weighted Average Interest rate of 10 Years PIB
14
12
10
Percent8
6
4
2
0
Aug-02 Aug-03 Aug-04 Aug-05 Aug-06 Aug-07
Percent
40353025201510 5 0
3 Yrs 5 Yrs 10 Yrs 15 Yrs
Fig 5.9 Contribution of PIBsFY 07
FY 08
20 Yrs
Table-5.10 Pakistan Investment Bonds Auctions Jul-JunPIBsFY 2006-07 Offered Accepted *W.A Rate3 Years36,98210,8829.545 Years39,79910,1749.7710 Years65,98630,21110.3115 Years12,7509,25010.9520 Years20,20011,25011.2830 Years23,30016,10011.61Total199,01787,867* Average of maximum and minimum rates
(Rs.million)
Offered FY 07FY 08 21,77011,044 17,40721,177 26,03058,805 9,85014,876 13,1509,550 12,00017,600100,207 133,052
Jul-Mar AcceptedFY 07FY 08 3,9824,953 4,52310,77712,17023,038 4,3007,801 4,0007,850 8,00014,40036,97568,819
*W.A RateFY 07 FY 08 9.5310.11 9.8210.30 10.1810.81 11.0111.49 11.3911.69 11.6811.91
Source:SBP
Table-5.11 Lending & Deposit Rates (W.A) LRDRSpreadJun-069.92.97.0Jul-0610.23.17.2Aug-0610.63.17.5Sep-0611.03.27.8Oct-0611.13.47.7Nov-0611.03.67.4Dec-0611.23.77.5Jan-0710.73.76.9Feb-0710.53.86.7Mar-0710.63.96.6Apr-0710.63.96.7May-0710.64.06.5Jun-0710.34.06.3Jul-0710.44.06.4Aug-0710.54.16.4Sep-0710.54.16.3Oct-0711.04.16.8Nov-0710.74.16.6Dec-0711.04.16.8Jan-0810.84.26.6Feb-0810.84.26.6Mar-0810.94.26.7 Source:SBP
At the second stage of monetary transmission,changes in SBP policy rate translated into anincrease in financial institutions’ lending anddeposit rates (Table 5.11). The spread between thelending and deposit rates has also decreased from 7percent in June 2006 to 6.7 percent in March2007.However, W.A. lending rate has declined by10 basis points during December 2007 to March2008.In the Interim Monetary Policy Measuresannounced by the State Bank, all banks arerequired to pay a minimum interest rate of 5percent on saving deposit products; aimed atencouraging people to save more.
Pakistan’s Financial Sector Performance
Financial stability in Pakistan has benefited fromstructural transformation of the banking sector andwide-ranging policy initiatives of the State Bank.The country’s prudential regulatory regime hasbeen crafted to promote and preserve financialsector stability. The regulatory frameworkencourages(i)financialsectorgrowth,
91
30 Yrs
Pakistan Economic Survey 2007-08
diversification and innovation, (ii) healthycompetition and risk taking to ensure a sustainableand aggressive income stream, (iii) opportunitiesfor enhancing the franchise value of banks,(iv)prudentbehaviorandeffectiveriskmanagement and loan provisioning requirementare stringent enough to discourage infection ofloan portfolio, and (v) safeguarding socialobligations and consumer interests. Financialsector stability has been further fostered bystrengthening of bank’s system wide capital base.Financial stability will further benefit from StateBank efforts to operationalize a Real-time GrossSettlement System (RTGS) named as PRISM(Pakistan Real Time Inter-bank settlement
Mechanism) in June 2008 that will allow shift fromtraditional paper-based, end-of-the-day settlementsystem to electronic payment system for largevalue, low volume inter-bank funds’ transfers andsettlements. Financial sector is now predominantlyowned by the private sector which presents somenew challenges. The State Bank of Pakistan is nowworking to develop an adequate policy frameworkfor consumer protection, development of FinancialSafety Nets such as Deposit Insurance ,and a well-laid out ‘Lender of last resort’ procedure. Theframework would strike a balance betweenenhancing consumer protection and minimizingmoral hazard concerns.
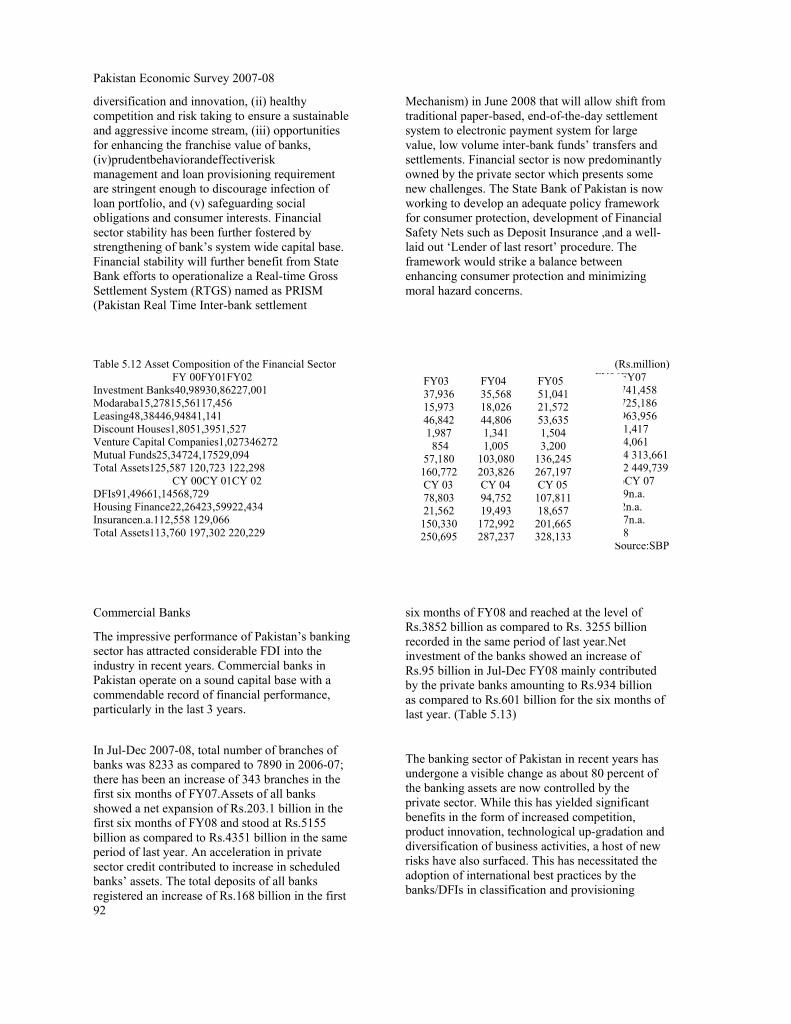
(Rs.million) FY06FY07 54,52741,458 23,92725,186 63,99963,956 1,8341,417 4,1314,061177,234 313,661325,652 449,739 CY 06CY 07116,939n.a. 19,702n.a.244,657n.a.381,298 Source:SBP
Table 5.12 Asset Composition of the Financial Sector FY 00FY01FY02Investment Banks40,98930,86227,001Modaraba15,27815,56117,456Leasing48,38446,94841,141Discount Houses1,8051,3951,527Venture Capital Companies1,027346272Mutual Funds25,34724,17529,094Total Assets125,587 120,723 122,298 CY 00CY 01CY 02DFIs91,49661,14568,729Housing Finance22,26423,59922,434Insurancen.a.112,558 129,066Total Assets113,760 197,302 220,229
FY03 37,936 15,973 46,842 1,987 854 57,180160,772 CY 03 78,803 21,562150,330250,695
FY04 35,568 18,026 44,806 1,341 1,005103,080203,826 CY 04 94,752 19,493172,992287,237
FY05 51,041 21,572 53,635 1,504 3,200136,245267,197 CY 05107,811 18,657201,665328,133
Commercial Banks
The impressive performance of Pakistan’s bankingsector has attracted considerable FDI into theindustry in recent years. Commercial banks inPakistan operate on a sound capital base with acommendable record of financial performance,particularly in the last 3 years.
In Jul-Dec 2007-08, total number of branches ofbanks was 8233 as compared to 7890 in 2006-07;there has been an increase of 343 branches in thefirst six months of FY07.Assets of all banksshowed a net expansion of Rs.203.1 billion in thefirst six months of FY08 and stood at Rs.5155billion as compared to Rs.4351 billion in the sameperiod of last year. An acceleration in privatesector credit contributed to increase in scheduledbanks’ assets. The total deposits of all banksregistered an increase of Rs.168 billion in the first92
six months of FY08 and reached at the level ofRs.3852 billion as compared to Rs. 3255 billionrecorded in the same period of last year.Netinvestment of the banks showed an increase ofRs.95 billion in Jul-Dec FY08 mainly contributedby the private banks amounting to Rs.934 billionas compared to Rs.601 billion for the six months oflast year. (Table 5.13)
The banking sector of Pakistan in recent years hasundergone a visible change as about 80 percent ofthe banking assets are now controlled by theprivate sector. While this has yielded significantbenefits in the form of increased competition,product innovation, technological up-gradation anddiversification of business activities, a host of newrisks have also surfaced. This has necessitated theadoption of international best practices by thebanks/DFIs in classification and provisioning

Money and Credit
against their loans and advances portfolio tofurther strengthen the soundness and stability of
Table-5.13 Performance of Scheduled Banks
30-Jun-07
1.No.of BranchesNationalized Commercial BanksPrivate BanksSpecialized BanksForeign Banks2.Assets (Rs.Billion)Nationalized Commercial BanksPrivate BanksSpecialized BanksForeign Banks3.Net Advances (Rs.Billion)Nationalized Commercial BanksPrivate BanksSpecialized BanksForeign Banks4.Deposits (Rs.Billion)Nationalized Commercial BanksPrivate BanksSpecialized BanksForeign Banks5.Net Investments (Rs.Billion)Nationalized Commercial BanksPrivate BanksSpecialized BanksForeign Banks
789016965625 534 354952 9643611 123 253.82498.9 464.71838.4 71.5 124.23683.7 7562745.2 13.6 168.91180.3 243.9 879.7 14.9 41.8
Jul-Dec2006-07785216905597 534 314351.9 836.23173 119 223.82427.7 429.71807.2 70.6 120.23255 665.62425.8 13.5 150.1 836.7 179.9 601.7 16.6 38.5
2007-08 8233 1715 5935 534 49 5155.1 1017.2 3845.2 119.9 172.9 2694 488.7 2044.4 72.2 88.7 3852 813.1 2907.8 13.5 117.6 1275.5 298.7 934.5 15.8 26.5Source:SBP
banking system.
The NPLs are the most important indicator ofdetermining the asset quality of any bank becausethe gross NPLs to gross advances and net NPLs tonet advances are considered as key indicators ofquality of lending. As on 30th September 2007, thegross NPLs of the banking system recorded atRs.163 billion and gross NPLs to gross advanceswere at 6.5%.For the financial results of 2008,commercial banks were needed to provide Rs 24billion excess provisioning as per SBP’s directiveregarding Forced Sales Value (FSV) of collateral.On the basis of the provision provided by thecommercial banks against non-performing loans,the net NPLs to net advances ratio rose to 2.4% .InDecember 2007, the State Bank of Pakistanwithdrew the benefit of FSV against all nonperforming loans (NPLs) for calculatingprovisioning requirement which directly hamperedthe profits of entire banking sector. Hence, the
banks have to go for 100 percent provisioningagainst the NPLs. However, liquid assets are beingsubtracted to calculate provisioning against NPLs.Therefore, the banks will show fewer profits due tohigher provisioning against their NPLs. Earlier,there was an option for the banks to shelter theactual required provisioning by showing collateralprocess higher than the actual value. Due to FSV,major impact would result in high recovery ofNPLs. The SBP further elaborated that theclassified loans and advances that have beenguaranteed by the government would not requireprovisioning. According to an analysis; privatecommercial banks will face biggest impact for SBPprovisioning policy while foreign banks wouldface the least impact. The SBP’s timely decision toeliminate the benefit of FSV of collateral will helpthe banks to improve their loan quality andrecovery rate going forward. The measure taken by
93

Pakistan Economic Survey 2007-08
SBP to streamline the financial sector is seen as apositive step and will help the banks to strengthentheir balance sheets.
Islamic banks
Initially conceived in response to a faith-basedlogic of conforming to the principles of Shariah inall spheres of life, the astounding growth of theIslamic Financial Industry also drew on the wealthaccumulation in oil-rich countries in the ensuingyears, and reflects its potential of financially viableand lucrative segment of the global financialsystem. Islamic Financial Institution (IFIs) havebeen successful in tapping the previously excludedmarket on faith-based considerations, as well as thealready included segment on preference-based
Table 5.14 Islamic Banks
FY03
Assets of the Islamic banksDeposits of the Islamic BanksShare in Banks AssetsShare in Bank Deposits
12,915 8,3970.50%0.40%
FY04
44,14330,1851.40% 1.25
FY05
71,49349,9322.10%1.90%
FY06
119,294 83,740 2.90% 2.80%
FY07
205,212146,945 4.20% 4.10%
considerations, by giving them the opportunity tochoose between the two parallel modes offinancing and investment.
The Islamic Financial industry in Pakistan hasgrown substantially since the launch of SBP’sfocused strategy to promote a parallel IslamicBanking system in 2001.This performance iscommendable for such a short period, given thatother countries have achieved similar levels ofgrowth in their respective Islamic bankingindustries after several years of existence. Besidesbanks, IFIs in Pakistan include Islamic MutualFunds, Shariah-compliant housing financeservices, takaful companies and modarabas. Sukukissuances have also attracted considerable attentionin recent years.
(Rs.million) FY08 (March) 200,415 141,933 4.10% 3.90%
The overall deposits of IBIs at the end of February2008 stood at Rs.141,933 million and reflected ashare of 3.9 percent in banks assets as compared to0.4 percent only in FY03, the downward trend inFY 08 as compared to last year was inline with thedecreasing trend in deposits of all banks that beganin January 2008. Total assets of the Islamic banksreached at Rs.200,415 million from Rs.12,915million in FY03 and contributed 4.1 percent inbanking assets till end of February 2008 (Table5.14). The industry has over the years managed to
offer a wide array of products encompassingalmost the entire range of modes of Islamicfinancing that are able to cater to the needs ofmajority of the sectors of the economy. Thesegments covered by the industry includeCorporate / Commercial, Agriculture, Consumer,Commodity financing, SME Sector, Treasury andFinancial institutions and manufacturing andServices concerns through various Shariahcomplaint modes.
Table 5.14 (a) Financing Products by Islamic banks (%age)Mode of FinancingFY03FY04FY05Murabaha79.457.444.4Ijara16.524.829.7Musharaka10.8MudarabaDiminishing Muskaraka1.25.914.8Salam1.60.71.9Istisna0.41.4Qarz/Qarz-e-hasnaOthers1.39.83
FY0648.429.7 0.8
14.8 1.9 1.4
3
FY07 38.9 25.4 0.9 0.3 25.1 1.4 0.9
7.1
FY08(March) 38.7 24.2 1.3 0.2 24.8 1.6 2.4
6.7
The highest share in financing products of Islamicbanks is contributed by Murabaha, Ijara, andDiminishing Musharaka in FY08 (March).As the
94
industry develops, SBP continues to provides anenabling environment for Islamic Banks. Work isunderway on the development of Bait-ul-Maal

Money and Credit
certificates to provide a sovereign instrument forliquidity management, and risk managementguidelines have been issued.
Microfinance Institutions
The operations of MFIs, including MicrofinanceBanks (MFBs), Non-Government Organizations(NGOs), Rural Support programs (RSPs) andCommercial Financial Institutions (CFIs) havewitnessed significant improvements, which arereflected in almost all aspects of the microfinanceindustry. Number of new MFBs branches hasgrown, total assets have increased, products arebeing gradually diversified, outreach is beingextended, branch network is being expanded andgrowth has been achieved in the total number ofborrowers and advances.
With a focus on expanding microfinance reach to 3million borrowers by 2010, a strategy forExpanding Microfinance Outreach (EMO) hasbeen developed by the SBP which was approvedby the Government in February 2007.The EMOstrategy stresses on the fact that commercializationof the sector is key to financial and socialsustainability.
Table 5.15 Disbursement of Loans by MicrofinanceBanks(Rs.million) July-MarchInstitution2006-07 2006-07 2007-08Khushali Banks3610900 2355041 2590058MicrofinanceBanks ( Others)2500968 1875405 2298604Total6111868 4230446 4888662
90% of all the enterprises in Pakistan; they employ80% of the non-agriculture labor force; and theirshare in the annual GDP is nearly 40%.DuringFY08, credit to SME sector has decreased to Rs.18billion from Rs.30 billion during FY07. Mining,Electricity, Commerce and other private businesssector registered in crease while Manufacturing,Services, Communication, Construction sectorsrecorded a substantial decrease.
Table-5.16 Credit to SME(Rs .million) StocksFlowsSector Jun-06 Jun-07 FY 07 FY 08Mining andQuarrying822790172303 153147 160791 15628 5856ManufacturingShip Breaking959539-526-284Electricity and Gas 187226818601534Commerce and 123723 126457 1599 5447Trade 23163 30831 4973 -1892ServicesTransport andCommunications97111195655372Construction12976 16370 1802 -335Other PrivateBusiness32318 34809 5032 7360Total358692 385223 30091 18059 Source:SBP
Non-Bank Financial institutions (NBFIs)
The major objective of the introduction of theconcept of NBFCs i.e. Non-Banking FinanceCompanies in 2002, was to enable the existing(mainly) single-product institutions servingspecific market niches, to offer a whole variety andrange of financial products though a one windowoperation akin to universal banking, subject tocompliance with the prescribed progressively-tiered regulatory requirements. It was expected thatconsolidation of different financial services underone umbrella would lead to the emergence ofstronger, well-capitalized entities, which willprovide a fillip for the future development of thenon-bank financial sector.
The key market players in the non-bank financialsector of Pakistan are non-banking FinanceCompanies (NBFCs), mutual funds, modarabasand Development Finance Institutions (DFIs).Thenon –bank financial sector has historically played
95
During Jul-Mar 2008, Khushali Bank, which leadsthe microfinance sector in Pakistan disbursed loansamounting Rs.2.6 billion as compared to Rs.2.3billion in the same period last year. While the shareof all other microfinance banks in loandisbursement increased to Rs. 2.3 billion inJul-Mar FY08 from Rs. 1.8 billion in the Jul-MarFY07.
Small and Medium Enterprises
The importance of the SME sector cannot beoveremphasized in the overall industrialdevelopment of a country. SMEs constitute nearly

Pakistan Economic Survey 2007-08
an important role in the mobilization andchanneling of savings in the financial system. TheNBFIs have, in recent years benefited from anenvironment of low interest rates coupled withhigh economic growth but have been unable tocreate an impact as well-functioning, specializedfinancial intermediaries.
The success story among NBFIs is that of mutualfunds. The mutual fund sector is rapidly growingin Pakistan and accounted for the largest chunk intotal assets of non-bank financial sector. BetweenFY00 to FY 07, net assets of mutual funds havegrown by more than 12 times to reach Rs.313billion from Rs.25 billion only in FY 00.
Fig 5.10 Assets of Mutual Funds
350
300
250Rs.billion
200
150
100
50
0
FY 00 FY01 FY02 FY03 FY04 FY05 FY06 FY07
25.3 24.2 29.157.2
103.1
177.2
136.2
313.7 Rs.billion
sector entities. However, with two-thirds of thepopulation living in the rural areas and low percapita income, the insurance sector faces varioushurdles in its growth.
The growth in insurance sector is reflected in theincrease in premiums and profitability, as well asassets for both life and non-life insurance. Privatesector companies have launched innovativeproducts in the recent past, such as livestock andcrop insurance, which will help promote thequality of bank’s lending to agriculture sector.
Fig 5.11 Assets of Insurance Sector
300
250
200
150
100
50
0
CY 01 CY 02 CY 03 CY 04 CY 05 CY 06
112.6129.1
150.3173.0
244.7
201.7
Insurance Sector
The role of the insurance sector is significant inpromoting the stability, not just of the financialsector, but also of the overall macroeconomicenvironment as it provides protection againstuncertainty to economic agents by an equitabletransfer of risk. Life insurance companies inparticular, due to the long –term nature of theirpremiums, are also among the large institutionalinvestors for capital and money marketinstruments.
The insurance sector in Pakistan consisting of life,non-life and the sole reinsurance company(PRCL), has seen considerable improvements since2001 on account of rise in the demand forinsurance by corporate, households and public
The low insurance penetration highlights the needfor concerted efforts to bring about reforms thatwould increase the competitiveness and outreachof Pakistan’s insurance industry. As a step in thisdirection, Insurance Ordinance 2000 has laid outtargets that will help the expansion of the industryin the coming years, for instance, the recentincrease in capital requirements will result in theemergence of stronger players in the industry.Appointment of the Insurance Ombudsman isanother measure which would also go a long wayin boosting the confidence of the public by settingcomplaints expeditiously. Other insurance sectorreforms envision the privatization of State LifeInsurance Corporation (SLIC), the largest stateowned operator in the life insurance sector.Moreover, Postal Life Insurance is planned to bebrought under the ambit of the InsuranceOrdinance 2000.Foreign investment rules in theinsurance sector have also been amended in orderto attract FDI in the sector.
96

Table 5.1
COMPONENTS OF MONETARY ASSETS
Stock Rs. in million
1.
2.
3.
4.
5.
6.
7.
8.
9.
Currency Issued
Currency held by SBP
Currency in title of Scheduled Banks
Currency in ciculation (1-2-3)
Other deposits with SBP 1
2
2001
396,548
1,905
19,178
375,465
11,292
1,139,287
154,154
1,275,615
1,526,044
9.0
2002
462,095
1,865
26,414
433,816
13,847
1,304,214
157,456
1,494,140
1,751,877
14.8
2003
527,557
2,565
30,415
494,577
3,499
1,580,399
126,138
1,797,361
2,078,475
18.6
2004
617,508
2,960
36,432
578,116
2,116
1,905,260
145,694
2,174,736
2,485,492
19.6
2005
712,480
3,107
43,472
665,901
3,335
2,291,408
180,295
2,512,214
2,960,644
19.1
2006
791,834
3,005
48,439
740,390
4,931
2,661,584
195,501
2,720,685
3,406,905
15.1
2007
901,401
3,148
58,072
840,181
7,012
3,217,962
207,312
3,155,635
4,065,155
19.3
FY 08March 07 Mar-08 (P)
887,301
3,162
49,615
834,524
5,595
2,948,582
200,484
2,896,466
3,788,701
11.2
1,048,617
2,855
63,761
982,001
3,850
3,422,237
234,882
3,365,665
4,408,088
8.4
Scheduled Banks Total Dposits
Resident Foreign CurrencyDeposits (RFCD)
MI
Monetary assets (4+5+6)
10. Growth rate (%)
Memorandum
1.
2.
3.
4.
5.
6.
Currency / Money ratio
Demand Deposits / Money ratio
Time Deposits / Money ratio
Other Deposits / Money ration
RFCD / Money ration
Income Velocity of Money 3
24.6
24.6
40.0
0.7
10.1
2.6
24.8
24.0
41.5
0.8
9.0
2.5
23.8
29.2
40.7
0.2
6.1
2.5
23.3
31.8
39.0
0.1
5.9
2.4
22.5
32.1
39.2
0.1
6.1
2.4
21.7
31.9
40.5
0.1
5.7
2.1
20.7
65.0
9.0
0.2
5.1
2.0
22.0
63.7
8.9
0.1
5.3
22.3
65.0
7.3
0.1
5.3
P : Provisional 1 Excluding IMF A/c Nos 1 & 2 SAF Loans A/c deposits money banks, counterpart funds, deposits of foreign central banks and foreign governments. 2 Excluding inter banks deposits and deposits of federal and provincial governments, foreign constituents and international organization etc. 3 Income velocity of money is taken as GDP at current factor cost / quarterly average of monetary assets (A2)
Explanatory Notes: a Data series on monetary aggregates other than M1 are based on weekly returns reported by scheduled banks to SBP.
b Data series on M1 aggregates (as Sr. # 8) is issued on monthly returns reported by scheduled banks to SBP and published is Statistical Bulletin from Aril 2008.
c The stock data of M2 has been revised since June 2002 due to treatment of privatization commission deposits with NBP as government deposits. These deposits were previously included private sector deposits which have now being included in government deposits.d Totals may not tally due to separte rounding off

TABLE 5.2
CAUSATIVE FACTORS ASSOCIATED WITH MONETARY ASSETS
(Rs million)
1991
1 Public Sector Borrowing (net) ( i + ii + iii + iv + v + vi + vii ) iNet Budgetary Support iiCommodity Operations iiiZakat Fund etc. ivUtilization of privatization proceeds by Govt./WAPDA vUse of Privatization proceeds/ NDRP Fund for Debt Retirement viPayment to HBL on A/C of HC&EB 2 Non-Government Sector iAutonomous Bodies1 iiNet Credit to Private Sector & PSCEs a. Private Sector b. Public Sector Corp. other than 2(i)3 Counterpart Funds4 Other Items (Net)5 Domestic Credit (1+2+3+4)6 Foreign Assets (Net)7 Monetary Assets (5+6)
1992 1993 1994 1995 1996 1997 1998
A. End June Stock
201174194501 18675-12002
-
-
260962 9374
251588221062
30526 -330-36857424949-24305400644
270165257074 22869 -9778
-
-
292381 10661
281720251311
30409 -151-41500520895-15326505569
345167322772 30204 -7809
-
-
352954 14594
338360309595
28765 -546-52846644729-49339595390
373433345917 36786 -9270
-
-
392820 13744
379076352363
26713 -388-46537719328-15930703398
426520382336 41519-11465
-
14130
462357 16955
445402416094
29308 -464-74705813708 11027824735
495047434062 47377-12522
-
26130
531064 20121
510943478701
32242 -617-58844966650-27971938679
574023504562 53079-15392
36434
-4660
602828 29196
573632546814
26818 -736 -616211114494 -612601053234
630745552580 63664-18518
37657
-5749 287696672 28302
668370632025
36345 -650 -452901281477 -751571206320
B. Changes over the year (July-June)
8 Public Sector Borrowing (net) ( i + ii + iii + iv + v + vi + vii ) iNet Budgetary Support iiCommodity Operations iiiZakat Fund etc. ivUtilization of privatization proceeds by Govt./WAPDA vUse of Privatization proceeds/ NDRP Fund for Debt Retirement viPayment to HBL on A/C of HC&EB9 Non-Government Sector iAutonomous Bodies1 iiNet Credit to Private Sector & PSCEs a. Private Sector b. Public Sector Corp. other than 2(i)10 Counterpart Funds11 Other Items (Net)12 Domestic Credit Expansion (8+9+10+11)13 Foreign Assets (Net)14 Monetary Expansions (13+14)
27438 238332 2-5315-5579
-
- -21702 592
2111025096
-3986 178 4362
53680 2 5712 2
59392
6899162573 4194 2224
-
- -31419 1287
3013230249
-117 179-4643
95946 8979
104925
7500265698 7335 1969
-
- -60573 3933
5664058284
-1644 -395-11346
123834-34013
89821
2826623145 6582-1461
-
- -39866 -850
4071642768
-2052 158 6309
7459933409
108008
5308736419 4733-2195
-
14130 -69537 3211
6632663731
2595 -76-28168
9438026957
121337
6852751726 5858-1057
-
12000 -63429 3166
6026357329 3
2934 -15321139 3
152942-38998
113944
8093372457 9 5702(2870)
10304
-4660 061879 4,9 -242 7
6212159907 4
2214 7,9 -119 5152 4,9
147845-33289
114556
567224801810585(3126)
1223 -1089 287 083414 * -894 *84308 *74781
9527 8626761
166983(13897)
153086(Contd.)
*

TABLE 5.2
CAUSATIVE FACTORS ASSOCIATED WITH MONETARY ASSETS
1999
1 Public Sector Borrowing (net) (i + ii + iii + iv + v + vi + vii) i Net Budgetary Support ii Commodity Operations iii Zakat Fund etc. iv Utilization of privatization proceeds by Govt./WAPDA v Use of Privatization proceeds/ NDRP Fund for Debt Retirement vi Payment to HBL on A/C of HC&EB2 Non-Government Sector i Autonomous Bodies1 ii Net Credit to Private Sector & PSCEs a. Private Sector b. Public Sector Corp. other than 2(i c. PSEs Special Account Debt Repay d. Other Financial Institutions (NBFI3 Counterpart Funds4 Other Items (Net5 Domestic Credit (1+2+3+4)6 Foreign Assets (Net)7 Monetary Assets (5+6)
2000 2001
A. Stock End June
583598505887 8 67309(21793)
37657
(5749) 287816710 41351775359
735887 43124 (3652) 0 (589) (73544)1326175 (45629)1280546
661832545850 8107403(23616)
37657
(5749) 287842752 68637774115
754190 28826 (8901) 0 (611) (59087)1444886 (44254)1400632
6018704998888 8 95311 (25524)
37657
(5749) 287902603 75240827363
750211 37036 (12241) 52357 (562) (6202)1497707 283381526046
677054567208100642(22991)
37657
(5749) 287921596 60159861437
841057 35563 (15183) 37877 (536) (67463)1530651 2307181761370
598623511186 74047(18805)
37657
(5749) 2871048162 55370 992892
949030 32386 (18802) 30278 (586)(107258)1539041 5396642078704
656729574886 65873(16224)
37657
(5749) 2871363669 342931329376
1274245 53852 (22108) 23387 (628)(116405)1903367 5831902486556
2002 2003
(Rs million)
2004
B. Changes over the year (July-June)
8 Public Sector Borrowing (net) (i+ii+iii+iv+v+vi+vii) i Net Budgetary Support ii Commodity Operations iii Zakat Fund etc. iv Utilization of privatization proceeds by Govt./WAPDA- v Use of Privatization proceeds/ NDRP Fund for Debt Retirement- vi Payment to HBL on A/C of HC&EB -9 Non-Government Sector i Autonomous Bodies1 ii Net Credit to Private Sector & PSCEs a. Private Sector b. Public Sector Corp. other than 2(i c. PSEs Special Account Debt Repay d. Other Financial Institutions (NBFI10 Counterpart Funds11 Other Items (Net)12 Domestic Credit Expansion (8+9+10+11)13 Foreign Assets (Net)14 Monetary Expansions (13+14)
(74824) #(75193) 8'#' 3645 (3275)
-
--
119214 13049106165103038 6779 (3652) 0 61 246 # 44697 29529 74226
26044 3125 7 22916 18303 9862 7 (5249) 0 (22) 14457118711 1375120086
7823439963 840094(1823)
-
--
69194 11573 57620 48633 12327 (3340) 0 49 30863 53374 72654126028
@7@@
(46731)(32315) 8@(12508) (1908)
-
--
18993(15081) 34074 52969 (1473) (2942)(14480) 26(12040) 29156206168235324
2217714313 5331 2533
-
--
148539 (4789)153328167723 (3177) (3619) (7599) (50)(61674) 8454308946317400
(78361)(55952)(26595) 4186
5810663700(8174) 2581
-
--
315407(21077)336484325215 21466 (3306) (6891) (42) (9147)364326 43526407852(Contd)
7 The difference in flow data is due to change in the composition of autonomous bodies.8 Special Account-Debt Repayment Adjusted.# Adjusted for Rs 28.5 billion on account of Adhoc Treasury Bills created to offset the government losses due to the unification of exchange rate@' The difference in flow data is due to change in the total number of PSES

TABLE 5.2
CAUSATIVE FACTORS ASSOCIATED WITH MONETARY ASSETS
End March
2005
1 Public Sector Borrowing (net) (i + ii + iii + iv + v + vi + vii) i Net Budgetary Support ii Commodity Operations iii Zakat Fund etc. iv Utilization of privatization proceeds by Govt./WAPDA v Use of Privatization proceeds/ NDRP Fund for Debt Retirement vi Payment to HBL on A/C of HC&EB2 Non-Government Sector i Autonomous Bodies1 ii Net Credit to Private Sector & PSCEs a. Private Sector b. Public Sector Corp. other than 2(i) c. PSEs Special Account Debt Repayment d. Other Financial Institutions (NBFIs)3 Counterpart Funds4 Other Items (Net5 Domestic Credit (1+2+3+4)6 Foreign Assets (Net)7 Monetary Assets (5+6)
2006 2007
A. Stock End June
752515646682 87836(14198)
37657
(5749) 2871782368 322241750144
1712093 44838 (23714) 16927 (539)(204929)2329415 6369382966352
833686708037107762(14308)
37651
(5749) 2872190769 369792153790
2113890 47237 (23225) 15889 (546)(327346)2696564 7103413406905
926530810053 98552(14269)
37657
(5749) 2872576474 581482518326
2479608 46010 (23478) 16187 (519)(422223)3080263 9849824065155
909342829901 61722(14476)
37657
(5749) 2872461120 399582421162
2385708 42756 (23446) 16144 (509)(360492)3009461 7792403788701
12387221119187 101239 (13899)
37657
(5749) 2872955791 816272874164
2832887 48427 (23504) 16353 (533)(507986)3685994 7220944408088
2007 2008 P
(Rs million)
B. Changes over the year (July-June)
8 Public Sector Borrowing (net) (i+ii+iii+iv+v+vi+vii) i Net Budgetary Support ii Commodity Operations iii Zakat Fund etc. iv Utilization of privatization proceeds by Govt./WAPDA v Use of Privatization proceeds/ NDRP Fund for Debt Retirement vi Payment to HBL on A/C of HC&EB9 Non-Government Sector i Autonomous Bodies1 ii Net Credit to Private Sector & PSCEs a. Private Sector b. Public Sector Corp. other than 2(i) c. PSEs Special Account Debt Repayment d. Other Financial Institutions (NBFIs)10 Counterpart Funds11 Other Items (Net)12 Domestic Credit Expansion (8+9+10+11)13 Foreign Assets (Net)14 Monetary Expansions (13+14)
957857179621963 2026
-
--
418699 (2069)420768437848 (9014) (1606) (6460) 88(88525)426048 53748479796
868796706319926 (110)
-
--
408401 4755403646401797 2399 489 (1038) (7)122416372857 73403446260
92844102015 (9210) 39
-
--
385705 21169364536365718 (1227) (253) 298 27(94877)383699274551658250
75656121864(46040) (168)
-
--
312191309135 2687 370
-
--
Till end June 1996 autonomous bodies consisted of WAPDA, OGDC, PTC, NFC,and PTV, thereafter1 their composition has been changed as WAPDA, OGDC, PTC, SSGC SNGPL, KESC and Pakistan Railways.
2 Adjusted for SAF loans amounting to Rs 7371 million3 Adjusted for Rs 5278 million to exclude the impact arising due to mark up debited to the borrowers account.4 Adjusted for Rs 8207million being mark up debited to the borrowers account5 Credit to NHA by commercial Banks.6 Credit to NHA and CAA by commercial banksNote: Figures in the parentheses represent negative signs.P : Provisional
270351379317 297923479267372355838271819353279 (4481)2418 (221)(25) 255166 37(14)(33147)(85763)312897605731 68899(262798)381796342934Source: State Bank of Pakistan

TABLE 5.3
SCHEDULED BANKS POSITION BASED ON WEEKLY RETURNS: LIABILITIES AND ASSETS
(Rs million)
Outstanding Amount at end June 1993 1994 1995 1996 1997 1998 1999 2000 2001
LIABILITIES 1. Capital (paid-up) and Reserves Demand liabilities in Pakistan36,011 2. Inter-banks Demand Liabilities12,822 2.1 Borrowing(1,436) 2.2 Deposits(11,386) 3. Deposits (General)217,711 4. Other Liabilities9,112 5. Total Demand Liabilities (2+3+4)239,645TIME LIABILITIES IN PAKISTAN 6. Inter-banks Time Liabilities4,937 6.1 Borrowing(3,976) 6.2 Deposits(961) 7. Time Deposits (General)270,343 8. Other Liabilities3,920 9. Total Time Libilities (6+7+8)279,20010. Total Demand and Time Liabilities518,84511. Borrowing From SBP64,57712. Borrowing from Banks Abroad14,614 6,58413. Money at Call and Short Notice in Pakistan14. Other Liabilities505,57015. Total Liabilities1,146,20116. Total Statutory Reserves26,27116.1 On Demand Liabilities(12,311)16.2 On Time Liabilities Assets(13,960)ASSETS17. Cash in Pakistan11,30118. Balances with SBP48,74519. Other Balances8,920 7,00220. Money at Call and Short Notice in Pakistan21. 17+18+19+20 as % of 1014.6FOREIGN CURRENCY22. Foreign Currency held in Pakistan2,19423. Balances with Banks Abroad6,19024. Total Foreign Currency8,384BANK CREDIT ADVANCES25. To Banks7,83026. To Others308,99227. Total Advances316,82228. Bills Purchased and Discounted44,14929. Total Bank Credit360,97130. 29 as % of 1069.6INVESTMENT IN SECURITIES AND SHARES31. Central Government Securities140,12432. Provincial Government Securities3,72733. Treasury Bills35,66034. Other Investment in Securities & Sahres31,33135. Total Investment in Securities and Shares210,84236. 35 as % of 1040.637. Other Assets490,03638 Advance Tax Paid-39 Fixed Assets-40 Total Assets1,146,20141 Excess Reserves (18-16)22,474
43,770 14,532 (2,878)(11,654)256,188 12,578283,298
7,181 (3,333) (3,848) 342,368 4,812 354,361 637,659 70,583 14,217 6,721 640,1641,413,114 32,219 (14,501) (17,718)
13,95963,74614,814 7,062 15.6
4,261 7,89912,160
8,616347,868356,484 52,483408,967 64.1
147,076 3,345 83,443 32,632 266,496 41.8 625,910 - -1,413,114 31,523
50,533 16,787 (5,104)(11,683)296,739 16,500330,026
9,059 (5,998) (3,061) 405,882 3,388 418,329 748,355 82,668 14,280 8,350 743,4301,647,616 37,835 (16,919) (20,916)
16,36378,50311,012 8,814 15.3
3,017 8,16311,180
13,482413,811427,293 59,649486,942 65.1
166,687 3,340 90,059 35,210 295,296 39.5 739,506 - -1,647,616 40,668
56,255 13,281 (115)(13,166)339,408 19,224371,913
5,509 (2,965) (2,544) 495,677 4,737 505,923 877,836 56,914 13,424 8,070 897,8921,910,391 44,295 (18,999) (25,296)
19,32863,50214,516 8,989 12.1
3,66716,54520,212
5,449474,731480,180 62,511542,691 61.8
144,922 3,338 137,110 42,512 327,882 37.4913271.0 - -1,910,391 19,207
60,935 13,722 (407)(13,315)358,457 21,654393,833
5,422 (3,618) (1,804) 571,574 5,369 582,365 976,198 77,999 14,622 5,370 993,9602,129,084 49,078 19,960 (29,118)
17,82189,75616,864 5,772 13.2
4,64710,91815,565
3,690552,522556,212 70,675626,887 64.2
134,417 2,399 167,945 39,023 343,784 35.21,012,645 - -2,129,084 40,678
91,060 10,991 (78)(10,913)411,361 25,120447,472
10,658 (7,744) (2,914) 628,076 7,141 645,8751,093,347 113,919 16,518 7,768 264,9811,587,593 55,056 (22,762) (32,294)
18,76984,74018,210 8,903 11.9
2,70621,79824,504
5,687644,049649,736 63,073712,809 65.2
123,647 2,148 235,388 40,900 402,119 36.8 254,970 49,332 13,2371,587,593 29,684
75,632 7,968 (61) (7,907)454,072 38,491500,531
8,633 (5,845) (2,788) 661,401 8,329 678,3631,178,894 142,147 22,089 17,528 298,0191,734,309 59,821 (25,903) (33,918)
18,870100,335 19,116 18,095 13.3
2,98139,01942,000
4,402725,852730,254 63,774794,028 67.4
115,671 1,969 204,160 69,069 390,869 33.2 255,378 69,564 26,0541,734,309 40,514
79,648 8,580 (43) (8,537)475,281 47,420531,281
6,300 (5,674) (626) 652,279 10,759 669,3381,200,619 141,016 16,657 42,469 321,2241,801,633 59,287 (26,135) (33,152)
19,468153,371 18,250 43,509 19.5
2,22246,61948,841
5,788801,154806,942 69,554876,496 73.0
115,536 1,730 103,790 65,993 287,049 23.9 252,114 72,941 29,5941,801,633 94,048
88,581 12,282 (34)(12,248)527,672 42,870582,824
4,705 (3,668) (1,037) 712,978 9,494 727,1771,310,001 139,367 15,169 30,293 400,5171,983,928 64,651 (28,527) (36,124)
19,178147,962 18,033 31,179 16.5
4,78870,85675,644
3,657866,490870,147 75,504945,651 72.2
101,161 1,836 123,889 70,048 296934 22.7 340,220 78,205 30,9221,983,928 83,311 Contd.

TABLE 5.3
SCHEDULED BANKS POSITION BASED ON WEEKLY RETURNS: LIABILITIES AND ASSETS
Outstanding Amount at end June200220032004LIABILITIES 1.Capital (paid-up) and Reserves Demand liabilities in Pakistan85,886112,230131225 2.Inter-banks Demand Liabilities13,2619,93720755 2.1 Borrowing(10)(1)(15) 2.2 Deposits(13,251)(9,936)(20740) 3.Deposits (General)609,657785,3331014947 4.Other Liabilities47,33353,35256532 5.Total Demand Liabilities (2+3+4)670,251848,6221092234TIME LIABILITIES IN PAKISTAN 6.Inter-banks Time Liabilities2,1043,9914806 6.1 Borrowing(659)(621)(1878) 6.2 Deposits(1,445)(3,370)(2928) 7.Time Deposits (General)803,749903,1531026919 8.Other Liabilities12,80816,02020703 9.Total Time Libilities (6+7+8)818,661923,164105242810. Total Demand and Time Liabilities1,488,9121,771,786214466211. Borrowing From SBP135,556137,88216233512. Borrowing from Banks Abroad12,64221,2439872 31,87728,5512747913. Money at Call and Short Notice in Pakistan14. Other Liabilities546,159 *468,312 *52745215. Total Liabilities2,301,0322,540,004300302516. Total Statutory Reserves73,67787,89310595516.1 On Demand Liabilities(32,850)(41,934)(53574)16.2 On Time Liabilities Assets(40,828)(45,959)(52381)ASSETS17. Cash in Pakistan26,41430,4153643218. Balances with SBP124,883140,07715140619. Other Balances27,26831,30636762 32,83128,6863044420. Money at Call and Short Notice in Pakistan21. 17+18+19+20 as % of 1014.213.012.0FOREIGN CURRENCY22. Foreign Currency held in Pakistan5,0035,435480623. Balances with Banks Abroad89,41668,5786097624. Total Foreign Currency94,41974,01365782BANK CREDIT ADVANCES25. To Banks1,6262536326. To Others894,524988,572125802227. Total Advances896,150988,825125808528. Bills Purchased and Discounted75,58880,6879992429. Total Bank Credit971,7381,069,512135800930. 29 as % of 1065.360.463.3INVESTMENT IN SECURITIES AND SHARES31. Central Government Securities154,292191,70924084232. Provincial Government Securities1,7281,2347733. Treasury Bills231,507412,44940843834. Other Investment in Securities & Sahres83,493118,23413202635. Total Investment in Securities and Shares471,020723,626781,38336. 35 as % of 1031.640.836.4 **353,84244216237. Other Assets456,37738. Advance Tax Paid64,27049,7895387939Fixed Assets31,81238,7384676640. Total Assets2,301,0322,540,004300302541. Excess Reserves (18-16)51,20652,18445451Figures in the parentheses represent negative sing, * : Contra Items, P : Provisional
2005 2006 2007
(Rs million) End March20072008 P
190,652 22,993 (99) (22,894)1,211,674 70,1071,304,774
10,756 (1,024) (9,732)1,231,745 27,2881,269,7892,574,563 185,068 6,245 22,243 645,6163,624,387 127,041 (64,089) (62,952)
43,462188,092 49,021 22,166 11.8
6,777116,627123,404
1901,680,4911,680,681 120,4801,801,161 70.0
173,788 77 415,016 140,453 729,334 28.3 563,552 42,386 61,8093,624,387 61,051
315,414 28,608 0 (28,608)1,350,011 97,2661,475,885
25,759 0 (25,759)1,490,182 34,2361,550,1773,026,061 198,725 2,953 172,893 168,0113,884,057 148,585 72,364 76,221
48,439202,501 56,460232,535 17.8
6,44993,38799,836
02,079,0562,079,056 135,9242,214,980 73.2
177,860 77 411,691 165,598 755,227 25.0 195,096 6,423 72,5603,884,057 53,916
484,296 54,796 0 54,7962,889,589 137,0893,081,474
3,861 0 3,861 512,565 69,786 586,2123,667,686 269,109 7,015 220,941 136,1194,785,167 229,338 211,867 17,471
58,072307,433 65,656239,031 18.0
7,463170,509177,972
02,379,2262,379,226 145,7072,524,932 69.0
430,537 45,472 0 45,4722,631,817 128,9302,806,219
8,775 0 8775 465,880 62,934 537,5893,343,808 252,056 6,146 135,765 148,7624,317,075 209,117 193,252 15,864
49,615254,653 49,669158,854 15.0
9,225151,551160,776
02,276,2472,276,247 142,2682,418,515 72.0
561,557 35,910 0 35,9103,139,258 163,9563,339,125
5,889 0 5,889 474,671 81,119 561,6793,900,804 234,002 9,781 196,087 200,6375,102,867 247,899 231,225 16,674
63,761293,274 43,827199,049 15.0
9,459106,365115,825
02,722,4522,722,452 128,4392,850,891 73.0
174,425166,260184,250 767676 655,921539,777598,507 235,330186,058287,2261,065,753892,171 1,070,059 29.027.027.0 211,141204,508251,006 8,1447,86616,300 127,031120,447198,8764,785,167 4,317,075 5,102,867 78,09545,53645,375 Source: State Bank of Pakistan
Note : Effective 22 July 2006, demand & time deposits have been re-classified in accordance with BSD circular no. 9 2006 dated 18 July 2006. the timedeposits of less than 6 months are included in demand deposits for for the prupose of CRR & SLR
- Definition of time & demand liabilites as mentioned in BSD circular no 9 dated 18 July 2008 have been revised. As per new definition, time liabilities willincluded deposits with tenor of one year nad above. Accordingly, time deposits with tenor of less of than one year will become part of demand deposits.

TABLE 5.4
INCOME VELOCITY OF MONEY
Naroow Money M1
73.56 80.93 96.54103.45118.97134.83159.63185.08206.36240.16265.14302.91327.82358.77423.14448.01443.55480.33643.04739.03
1275.61494.141797.362174.742512.212720.683155.63
Monetary Assets (M2) (Rs million)
104.62 116.51 146.03 163.27 183.91 211.11 240.02 269.51 290.46 341.25 400.64 505.57 595.39 703.40 824.73 938.681,053.231,206.321,280.551,400.63
1,526.041,751.882,078.482,485.492,960.643,406.914,065.16
3,788.704,408.09
GrowthPercentage
13.211.425.311.812.614.813.712.3 7.817.517.426.217.818.117.213.812.214.5 6.2 9.4
9.014.818.619.619.115.119.3
11.2 8.4
Source: State Bank of Pakistan
(Rs billion)Income Velocity of Monetary Assets (M2)
2.72.72.72.72.72.62.52.62.72.72.72.72.32.42.42.42.52.32.42.7
2.62.52.32.32.42.12.0
End June Stock
1980-811981-821982-831983-841984-851985-861986-871987-881988-891989-901990-911991-921992-931993-941994-951995-961996-971997-981998-991999-2000
2000-012001-022002-032003-042004-052005-062006-07End March2006-072007-08P:ProvisonalExplanatory Note:
a: It may be noted that data series of M1 from 2000-01 is not comparable as compilation of M1 based on weekly data has beendiscontinued by the SBP. Now M1 is being compiled on the basis of monthly returns and will be reported in the monthly statisticalBulletin of the SBP beginning from April 2008 in its table 2.1b: The stock data of M2 has been revised since June 2002 due to treatment of privatization commission deposits with NBP as
government deposits. These deposits were previously uncluded in private sector deposits which have now being included in
government deposits.

TABLE 5.5
LIST OF DOMESTIC, FOREIGN BANKS AND DFIs (As on 30-04-2008)
Public Sector Commercial Banks 1 First Women Bank Ltd. 2 National Bank of Pakistan 3 The Bank of Khyber 4 The Bank of Punjab
Specialized Scheduled Banks 1 Industrial Development Bank of Pakistan 2 The Punjab Provincial Co-operative Bank 3 SME Bank Limited 4 Zarai Taraqiati Bank Limited
Private Local Banks 1 Allied Bank Limited 2 Askari Bank Limited 3 Bank Al Falah Limited 4 Bank Al Habib Limited 5 My Bank Limited 6 Creacent Commercial Bank Limited 7 NIB Bank Limited 8 Faysal Bank Limited 9 Habib Bank Limited 10 KASB Bank Limited 11 MCB Bank Limited 12 Meezan Bank Limited 13 Atlas Bank Limited 14 Saudi Pak Commercial Bank Limited 15 Soneri Bank Limited 16 United Bank Limited 17 Arif Habib Bank Limited 18 Dubai Islamic Bank Pakistan Limited 19 Bank Islami Pakistan Limited
202122232425
ABN AMRO Bank Pakistan LimitedHabib Metropolitan Bank LimitedJS Bank LimitedStandard Chartered Bank (Pakistan) LimitedEmirates Global Islamic BankDawood Islamic Bank Limited
Foreign Banks1Al-Baraka Islamic Bank B.S.C. (E.C.)2Citibank N.A.3Deutshe Bank A.G.4The Hong Kong & Shanghai Banking Corporation Limited5Oman International Bank S.A.O.G.6The Bank of Tokyo - Mitsubishi UFJ Limited\
Development Financial Institutions1House Building Finance Corporation2Investment Corporation of Pakistan3Pak Kuwait Investment Company of Pakistan (Pvt) Limited4Pak Labya Holding Company (Pvt) Limited5Pak Oman Investment Company (Pvt) Limited6Pakistan Industrial Credit & Investment Corp. Ltd.7Saudi Pak Industrial & Agricultural Investment company (Pvt) Limited
Micro Finance Banks1Khushhali Bank2Network Micro Finance Bank Limited3The First Micro Finance Bank Limited4Rozgar Micro Finance Bank Limited5Tameer Micro Finance Bank Limited6Pak Oman Micro Finance Bank Limited
Source: State Bank of Pakistan and Finance Division.
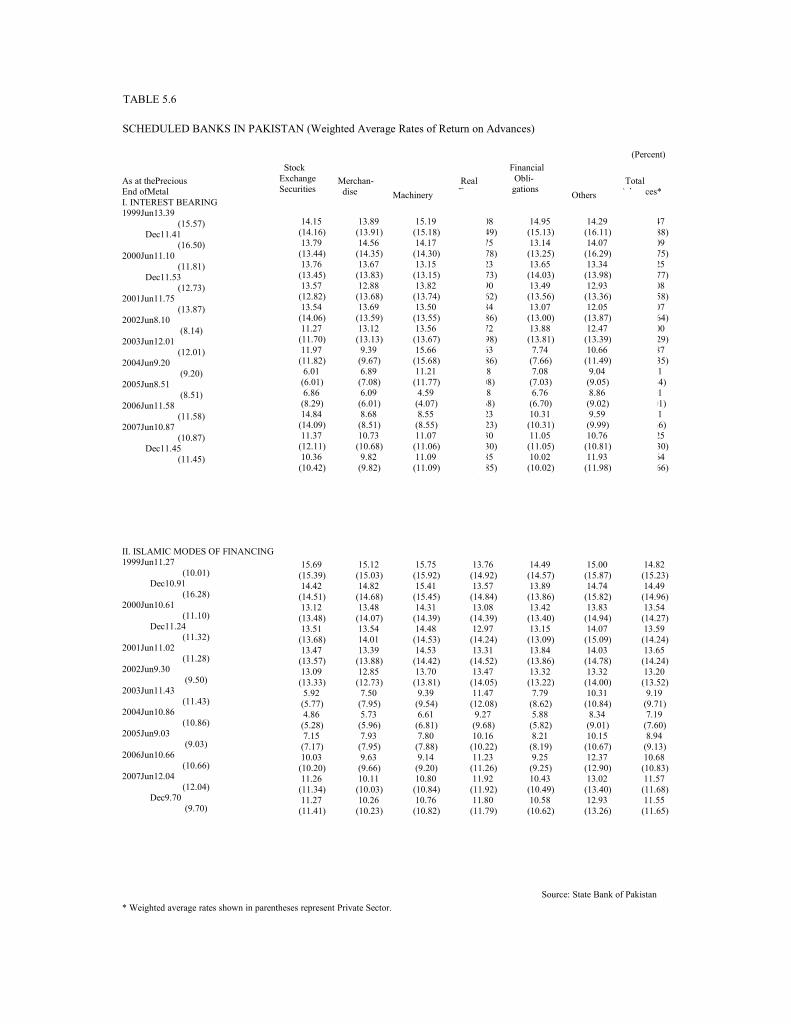
TABLE 5.6
SCHEDULED BANKS IN PAKISTAN (Weighted Average Rates of Return on Advances)
(Percent)
As at thePreciousEnd ofMetalI. INTEREST BEARING1999Jun13.39 (15.57) Dec11.41 (16.50)2000Jun11.10 (11.81) Dec11.53 (12.73)2001Jun11.75 (13.87)2002Jun8.10 (8.14)2003Jun12.01 (12.01)2004Jun9.20 (9.20)2005Jun8.51 (8.51)2006Jun11.58 (11.58)2007Jun10.87 (10.87) Dec11.45 (11.45)
II. ISLAMIC MODES OF FINANCING1999Jun11.27 (10.01) Dec10.91 (16.28)2000Jun10.61 (11.10) Dec11.24 (11.32)2001Jun11.02 (11.28)2002Jun9.30 (9.50)2003Jun11.43 (11.43)2004Jun10.86 (10.86)2005Jun9.03 (9.03)2006Jun10.66 (10.66)2007Jun12.04 (12.04) Dec9.70 (9.70)
StockExchangeSecurities
14.15(14.16) 13.79(13.44) 13.76(13.45) 13.57(12.82) 13.54(14.06) 11.27(11.70) 11.97(11.82) 6.01 (6.01) 6.86 (8.29) 14.84(14.09) 11.37(12.11) 10.36(10.42)
Merchan- dise
13.89(13.91) 14.56(14.35) 13.67(13.83) 12.88(13.68) 13.69(13.59) 13.12(13.13) 9.39 (9.67) 6.89 (7.08) 6.09 (6.01) 8.68 (8.51) 10.73(10.68) 9.82 (9.82)
RealEstate
14.08(14.49) 13.75(14.78) 12.23(13.73) 12.90(13.62) 12.84(13.86) 12.72(12.98) 12.63(12.86) 9.08 (9.08) 6.68 (6.68) 10.23(10.23) 12.30(12.30) 12.85(12.85)
Financial Obli- gations
14.95(15.13) 13.14(13.25) 13.65(14.03) 13.49(13.56) 13.07(13.00) 13.88(13.81) 7.74 (7.66) 7.08 (7.03) 6.76 (6.70) 10.31(10.31) 11.05(11.05) 10.02(10.02)
TotalAdvances*
14.47(14.88) 14.09(14.75) 13.25(13.77) 13.08(13.58) 13.07(13.64) 13.00(13.29) 11.87(12.35) 8.41 (8.54) 7.01 (7.01) 9.71 (9.66) 11.25(11.30) 11.64(11.66)
Machinery
15.19(15.18) 14.17(14.30) 13.15(13.15) 13.82(13.74) 13.50(13.55) 13.56(13.67) 15.66(15.68) 11.21(11.77) 4.59 (4.07) 8.55 (8.55) 11.07(11.06) 11.09(11.09)
Others
14.29(16.11) 14.07(16.29) 13.34(13.98) 12.93(13.36) 12.05(13.87) 12.47(13.39) 10.66(11.49) 9.04 (9.05) 8.86 (9.02) 9.59 (9.99) 10.76(10.81) 11.93(11.98)
15.69(15.39) 14.42(14.51) 13.12(13.48) 13.51(13.68) 13.47(13.57) 13.09(13.33) 5.92 (5.77) 4.86 (5.28) 7.15 (7.17) 10.03(10.20) 11.26(11.34) 11.27(11.41)
15.12(15.03) 14.82(14.68) 13.48(14.07) 13.54 14.01 13.39(13.88) 12.85(12.73) 7.50 (7.95) 5.73 (5.96) 7.93 (7.95) 9.63 (9.66) 10.11(10.03) 10.26(10.23)
15.75(15.92) 15.41(15.45) 14.31(14.39) 14.48(14.53) 14.53(14.42) 13.70(13.81) 9.39 (9.54) 6.61 (6.81) 7.80 (7.88) 9.14 (9.20) 10.80(10.84) 10.76(10.82)
13.76(14.92) 13.57(14.84) 13.08(14.39) 12.97(14.24) 13.31(14.52) 13.47(14.05) 11.47(12.08) 9.27 (9.68) 10.16(10.22) 11.23(11.26) 11.92(11.92) 11.80(11.79)
14.49(14.57) 13.89(13.86) 13.42(13.40) 13.15(13.09) 13.84(13.86) 13.32(13.22) 7.79 (8.62) 5.88 (5.82) 8.21 (8.19) 9.25 (9.25) 10.43(10.49) 10.58(10.62)
15.00(15.87) 14.74(15.82) 13.83(14.94) 14.07(15.09) 14.03(14.78) 13.32(14.00) 10.31(10.84) 8.34 (9.01) 10.15(10.67) 12.37(12.90) 13.02(13.40) 12.93(13.26)
14.82(15.23) 14.49(14.96) 13.54(14.27) 13.59(14.24) 13.65(14.24) 13.20(13.52) 9.19 (9.71) 7.19 (7.60) 8.94 (9.13) 10.68(10.83) 11.57(11.68) 11.55(11.65)
Source: State Bank of Pakistan
* Weighted average rates shown in parentheses represent Private Sector.

TABLE 5.7
SALE OF GOVERNMENT SECURITIES THROUGH AUCTION
(Rs Million)
Fiscal Year/Securities1993-94MARKET TREASURY BILLS*A. Three Months Maturity Amount Offered í) Face Value- íi) Discounted Value- Amount Accepted -í) Face Value -íi) Discounted Value Weighted Average Yield Accepted í) Minimum % p.a.- -íi) Maximum % p.a.B. Six Months Maturity Amount Offered -í) Face Value -íi) Discounted Value Amount Accepted -í) Face Value -íi) Discounted Value Weighted Average Yield Accepted -í) Minimum % p.a. -íi) Maximum % p.a.C. Twelve Months Maturity Amount Offered -í) Face Value -íi) Discounted Value Amount Accepted -í) Face Value -íi) Discounted Value Weighted Average Yield Accepted -í) Minimum % p.a. -íi) Maximum % p.a. 2 Pakistan Investment Bonds(PIBs)** A. Amount Offered 03 Years Maturities- 05 Years Maturities- 10 Years Maturities- B. Amount Accepted- a) 3 Years Maturities -i) Amount Acepted(Face Val ii) Weighted average Yield # -a) Minimum % p.a. -b) Maximum % p.a. b) 5 Years Maturities -i) Amount Acepted(Face Val ii) Weighted average Yield # -a) Minimum % p.a. -b) Maximum % p.a. c) 10 Years Maturities -i) Amount Acepted(Face Val ii) Weighted average Yield # -a) Minimum % p.a. -b) Maximum % p.a.
Note *: MTBs was introduced in 1998-99**: PIBs was introduced in 2000-01
1994-95 1995-96 1996-97 1997-98 1998-99 1999-2000 2000-01
--
--
--
--
--
--
--
--
--
--
--
--
147,735143,719
45,98544,893
6.66014.616
82,24580,670
21,08520,725
6.9318.958
107,720105,147
72,72070,984
6.84912.221
--
--
--
--
--
--
--
--
--
--
--
--
343,937322,564
102,669 96,161
10.59915.740
205,980197,165
85,51581,909
7.09210.355
115,753109,916
69,53866,066
7.13812.876
--
--
--
--
--
--
--
--
--
--
--
--
283,038247,934
78,96069,148
10.09816.000
181,014164,416
51,20046,514
7.58410.871
75,12267,584
54,01748,431
7.77712.935
58,814 8,534 6,67443,60646,123 4677
----
-
--
-
--
-
--
----
-
--
-
--
-
--
----
-
--
-
--
-
--
----
-
--
-
--
-
--
----
-
--
-
--
-
--
----
-
--
-
--
-
--
12.42712.486
5,317
12.946 13.000
36,129
13.955 14.004(Contd.)

Table 5.7
SALE OF GOVERNMENT SECURITIES THROUGH AUCTION
(Rs. million)July-March 2007-08No.
1A
Securities
Market Treasury BillsThree Month MaturityAmount Offeredi) Face valueii) Discounted value
Amount Acceptedi) Face valueii) Discounted value
Weighted Average Yieldi) Minimum % p.a.ii) Maximum % p.a.
2001-02 2002-03 2003-04 2004-05 2005-06 2006-07
128,358125,693
109,106108,332
216,637214,315
1,011,6591,002,708
389,173382,026
186,652183,039
49,62548,596
72,86271,429
29,23129,042
115,575115,174
724,359716,768
210,541206,768
136,102133,484
45,22544,288
5.36212.150
1.6585.815
0.9951.702
2.0177.479
7.5498.326
8.3158.689
8.6879.548
B Six Month MaturityAmount Offeredi) Face valueii) Discounted value
Amount Acceptedi) Face valueii) Discounted value
Weighted Average Yieldi) Minimum % p.a.ii) Maximum % p.a.
287,853276,882
747,018731,354
328,990326,114
470,885460,185
182,112173,289
125,483120,197
64,32561,426
163,665157,934
349,009341,225
158,430157,256
256,914251,166
69,75267,094
90,43386,629
56,39553,867
5.64512.555
1.63912.404
1.2122.076
2.5237.945
7.9688.487
8.4858.902
8.9029.822
C Twelve Month MaturityAmount Offeredi) Face valueii) Discounted value
Amount Acceptedi) Face valueii) Discounted value
Weighted Average Yieldi) Minimum % p.a.ii) Maximum % p.a.
202,984187,339
695,425665,337
476,719466,729
136,713128,569
555,757509,202
787,636717,951
568,790516,955
84,56878,444
264,938253,908
241,019236,421
70,68865,799
459,440422,647
661,786607,211
393,605359,740
6.38311.984
2.3566.941
1.3962.187
2.6918.401
8.4568.791
8.7869.160
9.159 10.124(Contd.)
Note *: MTBs was introduced in 1998-99**: PIBs was introduced in 2000-01

Table 5.7
SALE OF GOVERNMENT SECURITIES THROUGH AUCTION
(Rs. in million)
No.
2
A.
Securities
Pakistan Investment Bond
Amount Offered03 Years Maturity05 Years Maturity10 Years Maturity15 Years Maturity20 Years Maturity30 Years Maturity
Amount Accepted
(a) 03 Years Maturity.(i) Amount Accepted(ii) Weighted Average Yield # (1) Minimum % p.a. (2) Maximum % p.a.
(a) 05 Years Maturity.(i) Amount Accepted(ii) Weighted Average Yield # (1) Minimum % p.a. (2) Maximum % p.a.
(a) 10 Years Maturity.(i) Amount Accepted(ii) Weighted Average Yield # (1) Minimum % p.a. (2) Maximum % p.a.
(a) 15 Years Maturity. *(i) Amount Accepted(ii) Weighted Average Yield # (1) Minimum % p.a. (2) Maximum % p.a.
(a) 20 Years Maturity. *(i) Amount Accepted(ii) Weighted Average Yield # (1) Minimum % p.a. (2) Maximum % p.a.
(a) 30 Years Maturity.(i) Amount Accepted(ii) Weighted Average Yield # (1) Minimum % p.a. (2) Maximum % p.a.
238,360 46,124 47,346144,890 - - -
107,695
211,963 26,074 45,620140,268 - - -
74,848
221,291 38,514 58,840 93,041 14,316 16,579 -
107,658
8,0162,4002,6033,013 0 0 -
771
16,012 3,896 6,526 5,590 0 0 -
10,161
199017 36982 39799 65986 12750 20200 23300
87867
133,052 11,044 21,177 58,805 14,876 9,550 17600
68,818
2001-02 2002-03 2003-04 2004-05 2005-06 2006-07 July-March 2007-08
B.
24,819
8.35612.475
9,651
1.7927.952
14,533
3.7344.235
100
0.0000.000
2,846
9.1589.389
10882
9.3119.778
4,953
9.61910.604
24,382
9.39212.994
14,369
3.1198.887
27,765
4.8675.270
427
0.0000.000
4,075
9.4209.646
10174
9.52810.002
10,777
9.79610.800
58,194
10.42013.981
50,828
4.0149.587
51,606
6.1687.127
244
0.0000.000
3,240
9.80059.8454
30211
10.10610.507
23,038
10.17911.434
-
--
-
--
6,996
7.6838.994
0
0.0000.000
-
--
9250
10.8511.058
7,801
11.10311.868
-
--
-
--
6,757
8.7068.993
0
0.0000.000
-
--
11250
11.17311.392
7,850
11.37511.998
16100
---
---
---
---
---
11.54611.680
14400
11.58812.239
Note *: MTBs was introduced in 1998-99**: PIBs was introduced in 2000-01