2007 annual report and form 10-k
TRANSCRIPT

®
2007 Annual Report and Form 10-K
MORE POWER.MORE ENERGY.MORE IDEAS.

®BOOSTCAP® ULTRACAPACITORS As the leader in ultracapacitor technology, Maxwell Technologies is helping to change the way energy is stored all over the world.
Available in a range of sizes and modular confi gurations, our BOOSTCAP® products bring new levels of effi ciency and power to everything from consumer electronics to hybrid vehicles and renewable energy sources, ensuring an ideal solution for virtually any application.
Our proprietary electrode technology and global manufacturing facilities allow us to deliver unsurpassed value, keeping costs down while tailoring performance to specifi c applications.
Our ultracapacitors have a demonstrated lifespan of one million recharge cycles, even in extreme environments, reducing maintenance costs and adding value to other power sources.
CONDIS® HIGH VOLTAGE CAPACITORS Our CONDIS® high voltage grading and coupling capacitors help to ensure the safety and reliability of electric utility infrastructure and other applications involving transport, distribution and measurement of high voltage electrical energy.
Fifty years of experience in manufacturing high voltage capacitors enable us to off er equipment whose technology and quality are recognized throughout the industry. The long lifetime of our high voltage capacitors is due to rigorous quality screening during the winding and assembling process, durable materials, robust design, mechanical strength and corrosion protection.
MICROELECTRONICSWe provide radiation hardened microelectronic components and single board computers for spacecraft and satellites. We specialize in understanding the eff ects of environmental radiation on high performance commercial semiconductors, and protecting those semiconductors with our proprietary radiation mitigation technologies to provide turnkey radiation hardened product solutions to the space community.
Our radiation shielding technologies include Maxwell’s patented RAD-PAK® and XRAY-PAK® packages, which provide packaged products with integrated radiation shielding. Our patented latchup protection technology (LPT™) prevents single event latchup in sensitive components. Our proprietary triple redundant processing and advanced error detection and correction technologies provide the best single event upset performance available in single board computers.

March 31, 2008
Letter to Stockholders:
With financial markets in turmoil and conflicting signals on current and future prospects forvarious sectors of the global economy, there are still at least a couple of things on which there islittle disagreement. Demand for energy and the prices consumers are paying for it are spiralingupward with no end in sight. And hydrocarbons, the most abundant and readily available sourceof energy supply, carry negative environmental side effects. Since neither of those facts is going tochange in the near term, improving energy efficiency—getting more heat, light, propulsion, etc.,out of each molecule of hydrocarbon fuel—and harnessing more environmentally compatiblerenewable sources of energy are of immediate and growing interest. This quest for energyefficiency and greener sources is drawing increasing attention to the critical role that energystorage and power delivery technologies play in satisfying the world’s seemingly limitless appetitefor energy. For the past decade just such a technology, the ultracapacitor, has been the primaryfocus of Maxwell’s research and product development efforts.
While development and introduction of Maxwell’s BOOSTCAP® ultracapacitor products hasbeen marked by the fits and starts that most new emerging technologies encounter, the macroforces noted above and the hard work and dedication of people throughout our organization arecombining to forge tangible progress. Diverse applications ranging from wind turbines andautomated utility meters to transit buses and various forms of backup power have created growingrevenue streams, and our evangelistic efforts to educate the electrical design community arebeginning to bear fruit with an adoption curve that is taking on a life of its own. Of course eachstage in the development and commercialization of new technologies and products brings with itnew challenges, or as some sage observed, “be careful what you ask for.” For example, as interestfrom customers in the large and strategically important auto industry has advanced from curiosityto production intent, our little company has had to demonstrate to the skeptics that Maxwell haswhat it takes to play with the big boys.
Over the past year, that meant putting into place low-cost, high-volume, cell assembly capabilitiesin China, increasing production capacity for our proprietary electrode material, which will remainhere in the U.S., certifying all of our manufacturing facilities to rigorous, auto industry-specificISO TS standards and gearing up to pass factory audits conducted by global Tier 1 automotivesupplier customers such as Continental AG and Valeo. In the coming year it will mean movingthe rest of our cell assembly offshore, beefing up quality assurance processes and staffing toensure the perfect quality our customers expect, and placing additional customer supportpersonnel and facilities nearer to major customers. All of this has required and will continue torequire significant investments well in advance of an automotive revenue stream that we expect tobegin in the second half of 2009.
Continued ...

We are often asked how we expect ultracapacitors to penetrate automotive applications incompetition with improving lithium-ion battery technology. That question reflects a basic lack ofunderstanding of the properties and characteristics of two distinct technologies. In a nutshell,batteries store a lot of energy but charge and discharge slowly, while ultracapacitors have only afraction of batteries’ storage capacity but charge and discharge very quickly. Batteries also have alimited lifetime of up to a few thousand charge/discharge cycles, which is further reduced byfrequent deep discharges, while ultracapacitors last for a million or more cycles and aren’t affectedby depth of discharge. To overcome charge acceptance limitations and avoid life-shortening deepdischarges, battery packs must be oversized, which makes them uneconomical for manyapplications. The point is, each technology has its strong points and limitations, and systemdesigners are learning how to use them together to optimize system performance and cost. Takingthat concept a step further, we recently announced an alliance with Lishen Battery, China’s largestproducer of li-ion batteries, to develop hybrid energy storage devices that combine the strengths ofboth technologies in a single package. Lishen has also agreed to test battery electrode materialfabricated through Maxwell’s proprietary, solvent-free, “dry” process, which we believe canenhance battery performance, reduce manufacturing cost and eliminate environmental headachesassociated with solvent recovery. So, in addition to using Maxwell’s electrode technology to makebetter, less expensive ultracapacitors, we aim to leverage it in the much larger, more established,li-ion battery industry.
While our ultracapacitor and electrode technologies clearly are the main drivers for future growth,the company’s present stability relies heavily on significant contributions from our more maturehigh voltage capacitor and microelectronics product lines. Both continue to grow and generatecash that helps to fund our ongoing investments in high potential energy technologies, and bothare steeped in high-reliability and quality assurance processes that serve as role models for ourenergy storage products. Our high voltage capacitor group, which serves the worldwide electricutility infrastructure industry, has just been recognized as Global Supplier of the Year for the thirdtime by Siemens’ Power Transmission & Distribution unit, and our Microelectronics group hasbeen recognized as an outstanding supplier by Northrop Grumman Space Technologies, its largestcustomer for spacecraft computers. For more complete descriptions of all of our products and ourstrategies for marketing them as well as complete details on 2007 financial results, please turn tothe Annual Report on Form 10-K which immediately follows this letter.
This is an exciting and eventful juncture in Maxwell’s history. Our technologies and products aredemonstrating their ability to play an expanding role in enhancing the efficiency andenvironmental compatibility of energy generation and delivery, and we believe that our strategiesand actions are positioning us to build our business by better serving an energy-hungry world. Weappreciate your continuing interest and support.
David J. SchrammPresident & Chief Executive Officer

UNITED STATESSECURITIES AND EXCHANGE COMMISSION
Washington, D.C. 20549
FORM 10-K(Mark One)È ANNUAL REPORT PURSUANT TO SECTION 13 OR 15(d) OF THE SECURITIES EXCHANGEACT
OF1934For the fiscal year ended December 31, 2007
OR
‘ TRANSITION REPORT PURSUANT TO SECTION 13 OR 15(d) OF THE SECURITIES EXCHANGEACTOF1934
For the transition period from to
Commission file number 1-15477
MAXWELL TECHNOLOGIES, INC.(Exact name of registrant as specified in its charter)
Delaware 95-2390133(State or other jurisdiction ofincorporation or organization)
(I.R.S. EmployerIdentification No.)
9244 Balboa AvenueSan Diego, California 92123
(Address of principal executive offices) (Zip Code)
Registrant’s telephone number, including area code: (858) 503-3300
Securities registered pursuant to Section 12(b) of the Act:None
Securities registered pursuant to Section 12(g) of the Act:Common Stock, par value $0.10 per share
Indicate by check mark if the registrant is a well-known seasoned issuer, as defined in Rule 405 of the Securities Act. YES ‘ NO È
Indicate by check mark if the registrant is not required to file reports pursuant to Section 13 or Section 15(d) of the Act. YES ‘ NO È
Indicate by check mark whether the registrant: (1) has filed all reports required to be filed by Section 13 or 15(d) of the Securities ExchangeAct of 1934 during the preceding 12 months (or for such shorter period that the registrant was required to file such reports), and (2) has beensubject to such filing requirements for the past 90 days. YES È NO ‘
Indicate by check mark if disclosure of delinquent filers pursuant to Item 405 of Regulation S-K (§ 229.405 of this chapter) is not containedherein, and will not be contained, to the best of registrant’s knowledge, in definitive proxy or information statements incorporated by reference inPart III of this Form 10-K or any amendment to this Form 10-K. È
Indicate by check mark whether the registrant is a large accelerated filer, an accelerated filer, or a non-accelerated filer. See definition of“accelerated filer and large accelerated filer” in Rule 12b-2 of the Exchange Act.
Large accelerated filer ‘ Accelerated filer È Non-accelerated filer ‘ Smaller reporting company ‘
Indicate by check mark whether the registrant is a shell company (as defined in Rule 12b-2 of the Act). YES‘ NOÈ
The aggregate market value of Common Stock held by non-affiliates as of June 30, 2007 based on the closing price of the common stock onthe NASDAQ Global Market was $126,736,106.
The number of shares of the registrant’s Common Stock outstanding as of February 25, 2008 was 20,458,938 shares.
DOCUMENTS INCORPORATED BY REFERENCESpecified portions of the registrant’s definitive Proxy Statement to be issued in conjunction with the registrant’s 2008 Annual Meeting of
Stockholders, which is expected to be filed not later than 120 days after the registrant’s fiscal year ended December 31, 2007, are incorporated byreference into Part III of this Annual Report. Except as expressly incorporated by reference, the registrant’s Proxy Statement shall not be deemedto be a part of this Annual Report on Form 10-K.


MAXWELL TECHNOLOGIES, INC.
INDEX TO ANNUAL REPORT ON FORM 10-KFor the fiscal year ended December 31, 2007
Page
PART I
Item 1. Business . . . . . . . . . . . . . . . . . . . . . . . . . . . . . . . . . . . . . . . . . . . . . . . . . . . . . . . . . . . . . . . . . . . . . 2
Item 1A. Risk Factors . . . . . . . . . . . . . . . . . . . . . . . . . . . . . . . . . . . . . . . . . . . . . . . . . . . . . . . . . . . . . . . . . . 16
Item 1B. Unresolved Staff Comments . . . . . . . . . . . . . . . . . . . . . . . . . . . . . . . . . . . . . . . . . . . . . . . . . . . . . . 27
Item 2. Properties . . . . . . . . . . . . . . . . . . . . . . . . . . . . . . . . . . . . . . . . . . . . . . . . . . . . . . . . . . . . . . . . . . . . 27
Item 3. Legal Proceedings . . . . . . . . . . . . . . . . . . . . . . . . . . . . . . . . . . . . . . . . . . . . . . . . . . . . . . . . . . . . . . 27
Item 4. Submission of Matters to a Vote of Security Holders . . . . . . . . . . . . . . . . . . . . . . . . . . . . . . . . . . 28
PART II
Item 5. Market for Registrant’s Common Equity, Related Stockholder Matters and Issuer Purchases ofEquity Securities . . . . . . . . . . . . . . . . . . . . . . . . . . . . . . . . . . . . . . . . . . . . . . . . . . . . . . . . . . . . . . . 29
Item 6. Selected Financial Data . . . . . . . . . . . . . . . . . . . . . . . . . . . . . . . . . . . . . . . . . . . . . . . . . . . . . . . . . 31
Item 7. Management’s Discussion and Analysis of Financial Condition and Results of Operations . . . . 32
Item 7A. Quantitative and Qualitative Disclosures About Market Risk . . . . . . . . . . . . . . . . . . . . . . . . . . . . 46
Item 8. Financial Statements and Supplementary Data . . . . . . . . . . . . . . . . . . . . . . . . . . . . . . . . . . . . . . . 47
Item 9. Changes in and Disagreements with Accountants on Accounting and Financial Disclosure . . . . 82
Item 9A. Controls and Procedures . . . . . . . . . . . . . . . . . . . . . . . . . . . . . . . . . . . . . . . . . . . . . . . . . . . . . . . . . 82
Item 9B. Other Information . . . . . . . . . . . . . . . . . . . . . . . . . . . . . . . . . . . . . . . . . . . . . . . . . . . . . . . . . . . . . . 83
PART III
Item 10. Directors, Executive Officers and Corporate Governance . . . . . . . . . . . . . . . . . . . . . . . . . . . . . . . 85
Item 11. Executive Compensation . . . . . . . . . . . . . . . . . . . . . . . . . . . . . . . . . . . . . . . . . . . . . . . . . . . . . . . . 85
Item 12. Security Ownership of Certain Beneficial Owners and Management and Related StockholdersMatters . . . . . . . . . . . . . . . . . . . . . . . . . . . . . . . . . . . . . . . . . . . . . . . . . . . . . . . . . . . . . . . . . . . . . . 85
Item 13. Certain Relationships and Related Transactions, and Director Independence . . . . . . . . . . . . . . . . 85
Item 14. Principal Accounting Fees and Services . . . . . . . . . . . . . . . . . . . . . . . . . . . . . . . . . . . . . . . . . . . . 85
PART IV
Item 15. Exhibits and Financial Statement Schedules . . . . . . . . . . . . . . . . . . . . . . . . . . . . . . . . . . . . . . . . . 86
i

[THIS PAGE INTENTIONALLY LEFT BLANK]

SPECIAL NOTE REGARDING FORWARD-LOOKING STATEMENTS
Some of the statements contained in this Annual Report on Form 10-K and incorporated herein by referencediscuss our plans and strategies for our business or make other forward-looking statements, within the meaningof Section 27A of the Securities Act of 1933, as amended, and Section 21E of the Securities Exchange Act of1934, as amended. The words “anticipates,” “believes,” “estimates,” “expects,” “plans,” “intends,” “may,”“could,” “will,” “continue,” “seek,” “should,” “would” and similar expressions are intended to identify theseforward-looking statements, but are not the exclusive means of identifying them. These forward-lookingstatements reflect the current views and beliefs of our management; however, various risks, uncertainties andcontingencies could cause our actual results, performance or achievements to differ materially from thoseexpressed in, or implied by, our statements. Such risks, uncertainties and contingencies include the following:
• decline in the domestic and global economies that may delay development and introduction by ourcustomers of products that incorporate our products;
• our success in introducing and marketing new products into existing and new markets;
• our ability to manufacture existing and new products in volumes demanded by our customers and atcompetitive prices with adequate gross margins;
• market success of the products into which our products are integrated;
• our ability in growing markets to increase our market share relative to our competitors;
• our ability to successfully integrate our business with operations of businesses we may acquire;
• our ability to finance the growth of our business with internal resources or through outside financing atreasonable rates; and
• our ability to produce our products at quality levels demanded by our customers.
Many of these factors are beyond our control. Additionally, there can be no assurance that we will not incurnew or additional unforeseen costs in connection with the ongoing conduct of our business. Accordingly, anyforward-looking statements included herein do not purport to be predictions of future events or circumstancesand may not be realized.
For a discussion of important risks associated with an investment in our securities, including factors thatcould cause actual results to differ materially from expectations referred to in the forward-looking statements, see“Risk Factors” beginning on page 16 of this document. We do not have any obligation to update publicly anyforward-looking statements, whether as a result of new information, future events or otherwise.
1

PART I
Item 1. Business
Introduction
We develop, manufacture and market energy storage and power delivery products for transportation,industrial telecommunications and other applications and microelectronic products for space and satelliteapplications. Our products are designed and manufactured to perform reliably with minimal maintenance for thelife of the applications into which they are integrated. We believe that this “life-of-the-application” reliabilitydifferentiates our products from those of our competitors and enables them to command higher profit marginsthan commodity products. We focus on the following lines of high-reliability products:
• Ultracapacitors: Our primary focus is on ultracapacitors, energy storage devices that possess a uniquecombination of high power density, long operational life and the ability to charge and discharge veryrapidly. Our BOOSTCAP® ultracapacitor cells and multi-cell packs and modules provide highly reliableenergy storage and power delivery solutions for applications in multiple industries, includingtransportation, automotive, telecommunications, energy and consumer and industrial electronics.
• High-Voltage Capacitors: Our CONDIS® high-voltage capacitors are extremely robust devices that aredesigned and manufactured to perform reliably for decades in all climates. These products includegrading and coupling capacitors and capacitive voltage dividers that are used to ensure the safety andreliability of electric utility infrastructure and other applications involving transport, distribution andmeasurement of high-voltage electrical energy.
• Radiation-Mitigated Microelectronic Products: Our radiation-mitigated microelectronic productsinclude high-performance, high-density power modules, memory modules and single board computersthat incorporate our proprietary RADPAK® packaging and shielding technology and novel architecturesthat enable them to withstand the effects of environmental radiation and perform reliably in space.
General Overview
Each of our high-reliability electronic component product lines addresses a specific industry or, in the caseof our ultracapacitor products, several distinct industry segments.
Ultracapacitors
Ultracapacitors are used to enhance the efficiency and reliability of devices or systems that generate orconsume electrical energy. They differ from other energy storage and power delivery products in that theycombine rapid charge/discharge capabilities typically associated with film and electrolytic capacitors with energystorage capacity generally associated with batteries. Although batteries store significantly more electrical energythan ultracapacitors, they cannot deliver or absorb energy as rapidly and efficiently as an ultracapacitor.Conversely, although electrolytic capacitors can deliver bursts of high power very rapidly, they have extremelylimited energy storage capacity, and therefore cannot sustain power delivery for as much as even a full second.Also, unlike batteries, which store electrical energy by means of a chemical reaction and experience gradualdepletion of their energy storage and power delivery capability after a few thousand charge/discharge cycles,ultracapacitors’ energy storage and power delivery mechanisms involve no chemical reaction, so they can becharged and discharged hundreds of thousands to millions of times with minimal performance degradation. Thisability to store energy, deliver bursts of power and perform reliably for many years with little or no maintenancemakes ultracapacitors an attractive energy-efficiency option for a wide range of energy-consuming andgenerating devices and systems.
Based on potential volumes, we believe that the transportation industry represents the largest marketopportunity for ultracapacitors. Transportation applications include braking energy recuperation and torque-augmentation systems for hybrid-electric buses, trucks and autos and electric rail vehicles, vehicle power
2

network smoothing and stabilization and distributed power nodes to support various electronic subsystems,including power steering and brakes and electric air-conditioning.
Our ultracapacitor products have advanced to commercial production in transportation applications such ashybrid-electric transit buses and industrial electronics applications such as wind energy, telecommunications andautomated utility meter reading systems. Other applications now in development include cold starting for trucks,autos and diesel generators and electrical system stabilization systems for autos.
To reduce manufacturing cost and improve the performance of our ultracapacitor products, we havedeveloped a proprietary “particle packaging” process to produce the carbon powder-based electrode materialwhich accounts for a significant portion of the cost of an ultracapacitor cell. We believe that this process hasenabled us to become the industry’s lowest-cost producer of electrode material, and we are now marketing it toother ultracapacitor manufacturers. Although we do not intend to license this electrode technology to otherultracapacitor or electrode manufacturers, we have licensed our proprietary cell architecture to manufacturers inTaiwan and China to expand and accelerate acceptance of our technology in the large and rapidly growingChinese market.
High-Voltage Capacitors
High-voltage grading and coupling capacitors are used mainly in the electric utility industry. These devicesprevent high-voltage arcing that can damage switches, circuit breakers, step-down transformers and otherequipment that transmits, distributes or measures high-voltage electrical energy in electric utility infrastructure.The market for these products consists of expansion and upgrading of existing infrastructure and newinfrastructure in developing countries. Such installations are capital-intensive and frequently are subject toregulation, availability of government funding and general economic conditions. For example, while NorthAmerica has the world’s largest installed base of electric utility infrastructure, and is experiencing more frequentpower interruptions and supply problems, utility deregulation, government budget deficits, and other factors havelimited recent capital spending in what historically has been a very large market for utility infrastructurecomponents. However, projects to meet growing demand for electrical energy in developing countries, such asChina and India, continue to drive increasing global demand for high-voltage capacitors.
Radiation-Mitigated Microelectronics
Radiation-mitigated microelectronic products are used almost exclusively in the space and satellite industry.Because satellites and spacecraft are extremely expensive to manufacture and launch, and space missionstypically span years or even decades, and because it is impractical or impossible to repair or replacemalfunctioning parts, the industry demands electronic components that are virtually failure-free. As satellites andspacecraft routinely encounter ionizing radiation from solar flares and other natural sources, these componentsmust be able to withstand such radiation and continue to perform reliably. For that reason, suppliers ofcomponents for space applications historically used only special radiation-hardened silicon in the manufacture ofsuch components. However, since the space market is relatively small and the process of producing “rad-hard”silicon is very expensive, only a few government-funded wafer fabrication facilities are capable of producingsuch material. In addition, because it takes several years to produce a rad-hard version of a new semiconductor,components using rad-hard silicon typically are several generations behind their current commercial counterpartsin terms of density, processing power and functionality.
To address the performance gap between rad-hard and commercial silicon and provide components withboth increased functionality and much higher processing power, Maxwell and a few other specialty componentssuppliers have developed shielding, packaging, and other novel radiation mitigation techniques that allowsensitive commercial semiconductors to withstand space radiation effects and perform as reliably as rad-hardcomponents. Although this market is limited in size, the value proposition for high-performance, radiation-tolerant components enables such specialty suppliers to generate profit margins much higher than those forcommodity electronic components.
3

Business Strategy
Our primary objective is to significantly increase the company’s revenue and profit margins by creating andsatisfying demand for ultracapacitor-based energy storage and power delivery solutions. To accomplish this, weare focusing on:
Establishing and expanding market opportunities for ultracapacitors by:
• Collaborating with key existing and prospective customers in development of ultracapacitor-basedsolutions for strategic applications;
• Demonstrating the efficiency and durability of our ultracapacitor products through extensive in-houseand third party testing;
• Integrating mathematical models for ultracapacitors into simulation software used by system designers;
• Participating in a broad array of working groups, consortia and industry standards committees todisseminate knowledge of, and promote the use of, ultracapacitors; and
• Manufacturing products that contain no heavy metals and are therefore more environmentally friendlythan batteries.
Becoming a preferred ultracapacitor supplier by:
• Being a low-cost producer and demonstrating ultracapacitors’ value proposition;
• Designing and manufacturing products with “life-of-the-application” durability;
• Building a robust supply chain through global sourcing;
• Achieving superior performance and manufacturing quality while reducing product cost;
• Developing and deploying enabling technologies and systems, including cell-to-cell andmodule-to-module balancing and integrated charging systems, among others;
• Marketing high-performance, low-cost electrode material to other manufacturers; and
• Establishing and maintaining broad and deep protections of key intellectual property.
We also seek to expand market opportunities and revenue for our high-voltage capacitors and radiation-mitigated microelectronic products. While these products have highly specialized applications, we are atechnology leader in the markets they serve, and thus are able to sell our products at attractive profit margins. Tomaintain and expand this competitive position we are leveraging our technological expertise to develop newproducts that not only meet the demands of our current markets, but address additional applications. Forexample, our microelectronics group has successfully introduced a single-board computer (SBC) for the spaceand satellite market addressing an application that we did not previously serve. In March 2005, NorthropGrumman Space Technologies, prime contractor for the National Polar-orbiting Operational EnvironmentalSatellite System, the U.S. government’s next generation weather satellite constellation, has selectedthe SCS750 for spacecraft control and data management; Orbital Sciences selected the SBS 750 to managepayload data for the National Aeronautics and Space Administration’s “Glory” earth sciences mission and tookdelivery of our first space-qualified SBCs in August 2007, and in October 2007, Astrium, a subsidiary of EADS,selected the SBS750 to process images gathered by a satellite it has contracted to produce for the European SpaceAgency’s “Gaia” astonomy mission.
Products and Applications
Our products incorporate our expertise and proprietary energy storage and power delivery andmicroelectronics technologies at both the component and system levels for specialized, high-value applicationsthat demand “life-of-the-application” reliability.
4

Ultracapacitors
Ultracapacitors, also known as electrochemical double-layer capacitors (EDLC) or supercapacitors, storeenergy electrostatically by polarizing an organic salt solution within a sealed package. Although ultracapacitorsare electrochemical devices, no chemical reaction is involved in their energy storage mechanism. Thismechanism is fully reversible, allowing ultracapacitors to be rapidly charged and discharged hundreds ofthousands to millions of times with minimal performance degradation, even in the most demanding peak powerapplications.
Compared with electrolytic capacitors, which have very low energy storage capacity and discharge powertoo rapidly to be suitable for many power delivery applications, ultracapacitors have much greater energy storagecapacity and can discharge power over time periods ranging from fractions of a second to several minutes.
Compared with batteries, which require minutes or hours to fully charge or discharge, ultracapacitorsdischarge and recharge in as little as fractions of a second. Although ultracapacitors store only about one-tenth asmuch electrical energy as a battery of comparable size, they can deliver or absorb electric energy up to 100 timesmore rapidly than batteries. Because they operate reliably through hundreds of thousands to millions of deepdischarge cycles, compared with only hundreds to a few thousand equivalent cycles for batteries, ultracapacitorshave significantly higher lifetime energy throughput, which equates to significantly lower cost on a life cyclebasis.
We link our ultracapacitor cells together in packs and modules to satisfy energy storage and power deliveryrequirements of varying voltages. Both individual cells and multi-cell products can be charged from any primaryenergy source, such as a battery, generator, fuel cell, solar panel or electrical outlet. Virtually any device orsystem whose intermittent peak power demands are greater than its average continuous power requirement is acandidate for an ultracapacitor-based energy storage and power delivery solution.
Our ultracapacitor products have significant advantages over batteries, including:
• efficient delivery of up to 100 times more instantaneous power;
• significantly lower weight per unit of electrical energy stored;
• the ability to discharge much deeper and recharge much faster and more efficiently, thus losing lessenergy to heat;
• the ability to operate reliably and continuously in extreme temperatures (-40 degrees C to +65 degreesC);
• minimal to no maintenance requirements;
• “life of the application” durability; and
• minimal environmental issues associated with disposal because they contain no heavy metals.
With no moving parts and no chemical reactions involved in their energy storage mechanism,ultracapacitors provide a simple, highly reliable, solid state-like solution to buffer short-term mismatchesbetween power available and power required. Additionally, ultracapacitors offer the advantage of storing energyin the same form in which it is used, as electricity.
Emerging applications, including increasing use of electric power in vehicles, wireless communicationsystems and growing demand for highly reliable, maintenance-free, back-up power for telecommunication andindustrial installations are creating significant opportunities for more efficient and reliable energy storage andpower delivery products. In many applications, power demand varies widely from moment to moment, and peakpower demand typically is much greater than the average power requirement. For example, automobiles require10 times more power to accelerate than to maintain a constant speed, and forklifts require more power to lift aheavy pallet of material than to move from place to place within a warehouse.
5

Engineers historically have addressed such peak power requirements by over-sizing the engine, battery orother primary energy source to satisfy all of a system’s power demands, including demands that occurinfrequently and may last only fractions of a second. Sizing a primary power source to meet such transient peakpower requirements, rather than for average power requirements, is costly and inefficient. When primary energysources are coupled with ultracapacitors, which can deliver or absorb brief bursts of high power on demand forperiods of time ranging from fractions of a second to several minutes, the primary sources can be smaller, lighterand less costly.
The following diagram depicts the separation of a primary energy storage source from a peak powerdelivery component to satisfy the requirements of a particular application. Components that enable thisseparation allow designers to optimize the size, efficiency and cost of the entire electrical power system.
Peak Power Application Model
Although conventional batteries have been the most widely used component for both primary energysourcing and peak power delivery, ultracapacitors, advanced batteries and flywheels now enable systemdesigners to separate and optimize these functions. Based in part on our ultracapacitor products’ declining cost,high performance and “life-of-the-application” durability, they are becoming a preferred solution for manyenergy storage and power delivery applications.
We offer our BOOSTCAP® ultracapacitors in numerous form factors, ranging from postage stamp size4-farad small cells rated at 2.5 volts, to cylindrical, 2.7-volt, 3,000-farad large cells that measure approximatelytwo inches in diameter and six inches long. Applications such as hybrid-electric bus, truck and auto drive trains,electric rail systems and UPS systems require integrated modules consisting of up to hundreds of ultracapacitorcells. To facilitate adoption of ultracapacitors for these larger systems, we have developed integrationtechnologies, including proprietary electrical balancing and thermal management systems and interconnecttechnologies. We have applied for patents for certain of these technologies. We offer a broad range of standardmulti-cell packs and modules to provide fully integrated solutions for applications requiring up to 1,500 volts ofpower. Our current standard multi-cell products each incorporate from six to 48 of our large cells to provide“plug and play” solutions for applications requiring from 15 to 125 volts. In addition, they are designed to belinked together for higher voltage applications. Since 2005, we have introduced more than 30 new products,including several additional cell form factors and corresponding multi-cell packs and modules to better meet thediverse requirements of the automotive, transportation, industrial and consumer electronics markets.
6

The chart below describes a number of representative applications for our BOOSTCAP® ultracapacitors thatare now in commercial production or are in the field-testing or prototyping and evaluation phase.
Market Application Stage of Commercialization
Telecommunications
Uninterruptible power supplysystems (UPS)
Short-term “bridge” power inintegrated systems using fuel cells forprimary backup
Initial installations in service
Industrial Electronics
• Utility meters• Actuators• Memory boards• Telecommunications
Wireless communicationEnergy storageBack-up powerWireless base station power quality
Commercial productionCommercial productionCommercial productionCommercial production
Energy Generation
• Wind turbines Blade pitch systems to optimize windenergy generation efficiency
Commercial production
Fuel Cell Augmentation
• Stationary systems Startup, bridge power and peak loadbuffering to reduce system size andcost
Commercial production
• Forklifts and otherall-electric light mobilityvehicles
Startup, braking energyrecuperation and dynamic powerfor lifting
Commercial production
Transportation
• Hybrid-electric transit busdrive trains
Braking energy recuperation and reusefor torque augmentation
Commercial production
• Airplane door actuators Backup power for emergencydeployment if main power system fails
Commercial production
• Rail systems Braking energy recuperation and reusefor electric train and tram propulsion(both stationary and onboard)
Commercial production
Capacitive starting systems for diesellocomotives
Prototyping and evaluation bylocomotive OEMs
• Automobile systems Braking energy recuperation and reusefor torque augmentation in hybridpower trains
Prototyping and evaluation
Distributed power nodes for all-electricpower steering, braking and othersubsystems
Prototyping and evaluation by automanufacturers and Tier I subsystemOEMs
Power network buffering to preventmalfunctions due to voltage sags
Initial series production design-in for2010 model year
After-market audio systems Commercial production
• Diesel vehicles Capacitive starting Prototyping and evaluation by Tier 1integrators and truck OEMs
7

High-Voltage Capacitors
Electric utility infrastructure includes switches, circuit breakers, step-down transformers and measurementinstruments that transmit, distribute and measure high-voltage electrical energy. High-voltage capacitors are usedto protect these systems from high-voltage arcing. With operational lifetimes measured in decades, theseapplications require high reliability and durability.
Through our acquisition in 2002 of Montena Components Ltd., now known as Maxwell Technologies SA,and its CONDIS® line of high-voltage capacitor products, Maxwell has more than 20 years of experience in thisindustry, and is the world’s largest producer of such products for use in utility infrastructure. Engineers withspecific expertise in high-voltage systems develop, design and test our high-voltage capacitor products in ourdevelopment and production facility in Rossens, Switzerland. Our high-voltage capacitors are produced through aproprietary, automated, winding and assembly process to ensure consistent quality and reliability. We upgradedour high-voltage capacitor production facility in 2004 to double its output capacity and significantly shortenorder-to-delivery intervals.
We sell our high-voltage capacitor products to large systems integrators, such as Areva and Siemens AG,which install and service electrical utility infrastructure worldwide.
Radiation-Mitigated Microelectronic Products
Manufacturers of commercial and military satellites and other spacecraft require microelectroniccomponents and sub-systems that meet specific functional requirements and can withstand exposure to gammarays, hot electrons and protons and other environmental radiation encountered in space. In the past,microelectronic components and systems for such special applications used only specially fabricated radiation-hardened silicon. However, the process of designing and producing rad-hard silicon is lengthy and expensive,and there are only a few specialty semiconductor wafer fabricators, so supplies of rad-hard silicon are limited.Therefore, demand for space-qualified components made with higher-performance, lower-cost commercialsilicon, protected by shielding and other radiation mitigation techniques, is growing. Producing our componentsand systems incorporating radiation-mitigated commercial silicon requires expertise in power electronics, circuitdesign, silicon selection, radiation shielding and extensive expertise in quality assurance testing.
We design, manufacture and market radiation-mitigated microelectronic products, including powermodules, memory modules and single-board computers, for the space and satellite markets. Using highlyadaptable, proprietary, packaging and shielding technology and other radiation mitigation techniques, we customdesign products that allow satellite and spacecraft manufacturers to use powerful, low cost, commercialcomponents that are protected with the level of radiation mitigation required for reliable performance in thespecific orbit or environment in which they are to be deployed.
Manufacturing
All of our internal manufacturing operations are conducted in production facilities located in San Diego,California, and Rossens, Switzerland. In addition, we have outsourced large cell ultracapacitor assembly toBelton Technology Group (Belton), a contract manufacturer based in Shenzhen, China. Over the past severalyears, we have made substantial capital investments to outfit and expand our internal production facilities andincorporate mechanization and automation techniques and processes. We have trained our manufacturingpersonnel in advanced operational techniques. We have also added information technology infrastructure andhave implemented new business processes and systems to increase our manufacturing capacity and improveefficiency, planning and product quality. Our production facilities have been designed with flexible overheadpower grids and modular manufacturing and equipment that allow factory operations to be reconfigured atminimal expense. With the completion of certain upgrades in 2007, and other upgrades and capacity expansionscurrently underway, along with our contract manufacturing relationship with Belton in China, we believe that wehave sufficient capacity to meet near-term demand for all of our product lines.
8

Acceptance of our ultracapacitor products and high-voltage capacitor products depends in part oncompliance and certification with a number of U.S. and foreign standards for electronic components and systems.Among the entities that promulgate such standards are Underwriters Laboratories, Canadian StandardsAssociation and Committee European. We incorporate compliance with such standards into the quality assuranceprotocols we follow in manufacturing and testing these products.
Ultracapacitors
We produce ultracapacitor cells on production lines in both our San Diego and Rossens facilities, and haveoutsourced large cell ultracapacitor assembly to Belton, a contract manufacturer based in Shenzhen, China. In2005, we completed installation of our first high-volume, fully automated manufacturing line for our 350- and140-farad ultracapacitors in our Rossens facility. To reduce cost, simplify assembly and facilitate automation, wehave redesigned our ultracapacitor products to incorporate lower-cost materials and to reduce both the number ofparts in a finished cell and the number of manufacturing process steps required to produce them. Rather thanfurther expanding our current ultracapacitor cell and multi-cell module assembly lines in San Diego and Rossens,we plan to outsource future additional increments of cell and module assembly capacity to countries with lowerlabor costs.
We produce electrode material for our BOOSTCAP® products, and for sale to other ultracapacitormanufacturers, such as Yeong-Long Technologies Co., Ltd., (YEC) and Shanghai Sanjiu Electric EquipmentCompany, Ltd. (Sanjiu) at our San Diego headquarters location. In 2007, we completed installation of anadvanced carbon powder processing system as part of a major electrode capacity expansion that has enabled us tomore than double previous electrode output without additional direct labor. This expansion gives us sufficientcapacity to support both our current ultracapacitor production requirements and external electrode sales. Asdemand increases, additional increments of electrode production capacity can be added within a few months ofplacing an order with our current equipment vendor. We intend to continue producing this proprietary materialinternally, and do not contemplate licensing our particle packaging technology to ultracapacitor electrodecustomers or competing suppliers of such material.
In 2001, we installed an automated assembly line for our 4-farad and 10-farad small cell ultracapacitors inour San Diego production facility. This line can produce approximately 40,000 to 50,000 small cells per 24-hourproduction day, which is sufficient to meet our current and projected near term small cell production demand.
In 2003, we formed an ultracapacitor manufacturing and marketing alliance with YEC, a manufacturer ofelectrolytic capacitors headquartered in Taichung, Taiwan, with manufacturing and sales operations in mainlandChina. We entered into this alliance to accelerate commercialization of our proprietary BOOSTCAP®
ultracapacitors in China, and to enhance Maxwell’s capabilities as a global supplier of ultracapacitors, withproduction facilities in North America and Europe, and access to facilities in Asia. This alliance allows YEC toproduce and sell our ultracapacitor products on a royalty-bearing basis in the Chinese market. In 2006, weexpanded our relationship with YEC to include supplying ultracapacitor electrode material produced in our SanDiego manufacturing facility to YEC for incorporation into its own ultracapacitor products, and to assist YEC inestablishing worldwide distribution and marketing.
High-Voltage Capacitors
We produce our high-voltage grading and coupling capacitors in our Rossens, Switzerland facility. Webelieve we are the only high-voltage capacitor producer that manufactures its products with automated winding,stacking and assembly processes. This enables us to produce consistent, high quality and highly reliable products,and gives us sufficient capacity to satisfy growing global customer demand. Using advanced demand-basedtechniques, we upgraded the assembly portion of the process to a “cell-based,” “just-in-time” design in 2004,doubling our production capacity without adding direct labor, and significantly shortening order-to-deliveryintervals. This upgrade also enabled us to manufacture products for the capacitive voltage divider market, whichwe did not previously serve. We believe that penetrating this new market could enable us to materially increaseour High-Voltage capacitor revenue.
9

Radiation-Mitigated Microelectronics Products
We produce our radiation-mitigated microelectronics products in our San Diego production facility. Wehave reengineered our production processes for radiation-mitigated microelectronics, resulting in substantialreductions in cycle time and a significant increase in yield. In 2004, this facility earned QML-V and QML-Qcertification by the Department of Defense procurement agency, making it one of fewer than 15 QML- certifiedmicroelectronics production facilities in the world.
Our radiation-mitigated microelectronics production operations include die characterization, packaging andelectrical, environmental and life testing. As a result of manufacturing cycle time reductions and operatorproductivity increases achieved over the past several years, we believe that this facility is capable of doubling itscurrent output without additional direct labor or capital expenditure, and therefore, that we have ample capacityto meet foreseeable demand in the space and satellite markets.
Suppliers
We generally purchase components and materials, such as carbon powder, electronic components, dielectricmaterials and metal enclosures from a number of suppliers. For certain products, such as our radiation-mitigatedmicroelectronic products and our high-voltage capacitors, we rely on a limited number of suppliers or a singlesupplier. Although we believe there are alternative sources for some of the components and materials that wecurrently obtain from a single source, there can be no assurance that we will be able to identify and qualifyalternative suppliers in a timely manner. Therefore, in critical component areas, we “bank,” or store, critical highvalue materials, especially silicon die. We are working to reduce our dependence on sole and limited sourcesuppliers through an extensive global sourcing effort.
Marketing and Sales
We market and sell our products through both direct and indirect sales organizations in North America,Europe and Asia for integration by OEM customers into a wide range of end products. Because the introductionof products based on emerging technologies requires customer acceptance of new and unfamiliar technicalapproaches, and because many OEM customers have rigorous vendor qualification processes, the initial sale ofour products often takes months or even years.
Our principal marketing strategy is to cultivate long-term relationships by becoming a preferred vendor andcompeting for multiple supply opportunities with our key OEM customers. As these design-in sales tend to betechnical and engineering-intensive, we organize customer-specific teams composed of sales, engineering,research and development and other technical and operational personnel to work closely with our customersacross multiple disciplines to satisfy their requirements for form, fit, function and environmental needs. Astime-to-market often is a primary motivation for our customers to use our products, the initial sale and design-inprocess typically evolves into ongoing account management to ensure on-time delivery, responsive technicalsupport and problem-solving.
We design and conduct discrete marketing programs intended to position and promote each product line.These include trade shows, seminars, advertising, product publicity, distribution of product literature and Internetwebsites. We employ marketing communications specialists and outside consultants to develop and implementour marketing programs, design and develop marketing materials, negotiate advertising media purchases, writeand place product press releases and manage our marketing websites.
We have an alliance with YEC to manufacture and market our proprietary small cell BOOSTCAP®
ultracapacitor products in China. In addition, we sell electrode material both to YEC for incorporation into itsown ultracapacitor products, and to Shanghai Sanjiu Electric Equipment Company, which has licensed our largecell technology and is introducing its own brand of ultracapacitor products in China.
10

Competition
Each of our product lines has competitors, many of whom have longer operating histories, significantlygreater financial, technical, marketing and other resources, greater name recognition and larger installedcustomer bases than we have. In some of the target markets for our emerging technologies, we face competitionboth from products utilizing well-established, existing technologies and other novel or emerging technologies.
Ultracapacitors
Our ultracapacitor products have two types of competitors: other ultracapacitor suppliers and purveyors ofenergy storage and power delivery solutions based on other technologies. Although a number of companies aredeveloping ultracapacitor technology, our principal competitor in the supply of ultracapacitor or supercapacitorproducts is Panasonic, a division of Matsushita Electric Industrial Co., Ltd. In the supply of ultracapacitorelectrode material to other ultracapacitor manufacturers, our primary competitor is W.L. Gore & Associates, Inc.The key competitive factors in the ultracapacitor industry are price, performance (energy stored and powerdelivered per unit volume), durability and reliability, operational lifetime and overall breadth of productofferings. We believe that our ultracapacitor products and electrode material compete favorably with respect toall of these competitive factors.
Ultracapacitors also compete with products based on other technologies, including advanced batteries inpower quality and peak power applications, and flywheels, thermal storage and batteries in back-up energystorage applications. We believe that ultracapacitors’ high durability, long life, high performance and valueproposition give them a competitive advantage over these alternative choices in many applications. In addition,integration of ultracapacitors with some of these competing products may provide optimized solutions thatneither product can provide by itself. For example, combined solutions incorporating ultracapacitors withbatteries for cold starting in diesel trucks have been in development for several years, and efforts currently areunderway to standardize such systems.
High-Voltage Capacitors
Maxwell, through its acquisition in 2002 of Montena (renamed Maxwell Technologies SA) and itsCONDIS® line of high-voltage capacitor products, is the world’s largest producer of high-voltage capacitors foruse in electric utility infrastructure. Our principal competitors in the high-voltage capacitor markets are in-houseproduction groups of certain of our customers and other independent manufacturers, such as the Coil ProductDivision of Trench Limited in Canada and Europe and Hochspannungsgeräte Porz GmbH in Germany. Webelieve that we compete favorably, both as a consistent supplier of highly reliable high-voltage capacitors, and interms of our expertise in high-voltage systems design. Over the last ten years, our largest customer, hastransitioned from producing its grading and coupling capacitors internally to outsourcing substantially all of itsneeds to us.
Radiation-Mitigated Microelectronic Products
Our radiation-mitigated power modules, memory modules and single-board computers compete with theproducts of traditional radiation-hardened integrated circuit suppliers such as Honeywell Corporation, LockheedMartin Corporation and BAE Systems. We also compete with commercial integrated circuit suppliers withproduct lines that have inherent radiation tolerance characteristics, such as National Semiconductor Corporation,Analog Devices Inc. and Temic Instruments B.V. in Europe. Our proprietary radiation-mitigation technologiesenable us to provide flexible, high function, low-cost, radiation-mitigated products based on the most advancedcommercial electronic circuits and processors. In addition, we compete with component product offerings fromhigh reliability packaging houses such as Austin Semiconductor, Inc., White Microelectronics, Inc. and TeledyneMicroelectronics, a unit of Teledyne Technologies, Inc.
11

Research and Development
We maintain active research and development (“R&D”) programs to improve existing products and developnew products. For the year ended December 31, 2007, our research and development expenditures totaledapproximately $11.3 million, compared with $10.1 million and $7.2 million in the years ended December 31,2006 and December 31, 2005, respectively. In general, we focus our research and product development activitieson:
• designing and producing products that perform reliably for the life of the end products or systems intowhich they are integrated;
• making our products less expensive to produce so as to improve our profit margins and to enable us toreduce prices so that our products can penetrate new, price-enabled, markets;
• designing our products to have superior technical performance;
• designing new products that provide novel solutions to expand our market opportunities; and
• designing our products to be compact and light.
Most of our current research, development and engineering activities are focused on material science,including electrically conducting and dielectric materials, ceramics and radiation-tolerant silicon and ceramiccomposites to reduce cost and improve performance, reliability and ease of manufacture. Additional efforts arefocused on product design and manufacturing engineering and manufacturing processes for high-volumemanufacturing.
Ultracapacitors
The principal focus of our ultracapacitor development activities is to increase power and energy density,extend operational life and substantially reduce product cost. Our ultracapacitor designs focus on low-cost, high-capacity cells in standard sizes ranging from 4-farads to 3,000-farads, and corresponding multi-cell modulesbased on those form factors. Since 2005, we have introduced more than 30 new products, with a goal ofpenetrating key strategic applications at multi-million unit volumes.
In 2005, we entered into an ultracapacitor technology research and development contract with the UnitedStates Advanced Battery Consortium (USABC). The USABC operates under the auspices of the U.S. Council forAutomotive Research, an umbrella organization formed by Ford, General Motors and (formerly)DaimlerChrysler, to strengthen the technology base of the domestic auto industry through cooperative research.Over the term of this program, whose primary goal was development of low-cost, high-performance,ultracapacitor-based energy storage modules for applications in passenger vehicles, Maxwell received a total ofapproximately $3 million and $616,000 in matching funds from the U.S. Department of Energy in 2005 and2006, respectively.
High-voltage capacitors
The principal focus of our high-voltage capacitor development efforts is to enhance performance andreliability while reducing the size, weight and manufacturing cost of our products. We also are directing ourdesign efforts to develop high-voltage capacitors for additional applications.
Microelectronic products
The principal focus of our microelectronics product development activities is on circuit design and shieldingand other radiation-mitigation techniques that allow the use of powerful commercial silicon components in spaceand satellite applications that require ultra high reliability. We also focus on creating system solutions thatovercome the basic failure mechanisms of individual components through architectural approaches, includingredundancy, mitigation and correction. This involves expertise in system architecture, including algorithm andmicro-code development, circuit design and the physics of radiation effects on silicon electronic components.
12

Intellectual Property
We place a strong emphasis on inventing proprietary processes and designs that significantly increase thevalue and uniqueness of our product portfolio, and on obtaining patents to provide the broadest possibleprotection for those products and related technologies. Our ultimate success will depend in part on our ability toprotect existing patents, secure additional patent protection and develop new processes and designs not coveredby the patents of third parties. As of December 31, 2007, Maxwell and its subsidiaries held 57 issued U.S.patents, had 99 U.S. patent applications pending and numerous provisional applications in process. Of the issuedpatents, 40 relate to our ultracapacitor products and technology and 17 relate to our microelectronics productsand technology. Our subsidiary, PurePulse Technologies, Inc. (“PurePulse”), which suspended operations in2002, holds 29 issued U.S. patents and has five pending U.S. patent applications. Our issued patents have variousexpiration dates ranging from 2010 to 2025.
Our pending patent applications and any future patent applications may not be allowed. We routinely seek toprotect our new developments and technologies by applying for U.S. patents and corresponding foreign patents inthe principal countries of Europe and Asia. At present, with the exception of microcode architectures within ourradiation-mitigated microelectronics product line, we do not rely on licenses from any third parties to produce orcommercialize our products.
Our existing patent portfolios and pending patent applications covering technologies associated with ourultracapacitor and microelectronic products relate primarily to:
Ultracapacitors
• the physical composition of the electrode and its design and fabrication;
• physical cell package designs and processes used in cell assembly;
• cell-to-cell and module-to-module interconnect technologies that minimize equivalent series resistanceand enhance the functionality, performance and longevity of BOOSTCAP® products; and
• module and system designs that facilitate applications of ultracapacitor technology.
Microelectronics
• system architectures that enable commercial silicon products to be used in radiation-intense spaceenvironments;
• technologies and designs that improve packaging densities while mitigating the effect of radiation oncommercial silicon; and
• radiation-mitigation techniques that improve performance while protecting sensitive commercial siliconfrom the effects of environmental radiation in space.
Historically, our high-voltage capacitor products have been based on our know-how and trade secrets ratherthan on patents. We filed our first patent application covering our high-voltage capacitor technology in 2003, andwe continue to pursue patent protection in addition to trade secret protection of certain aspects of our products’design and production.
Establishing and protecting proprietary products and technologies is a key element of our strategy. Althoughwe attempt to protect our intellectual property rights through patents, trademarks, copyrights, trade secrets andother measures, there can be no assurance that these steps will be adequate to prevent infringement,misappropriation or other misuse by third parties, or will be adequate under the laws of some foreign countries,which may not protect our intellectual property rights to the same extent as do the laws of the U.S.
13

We use employee and third party confidentiality and nondisclosure agreements to protect our trade secretsand unpatented know-how. We require each of our employees to enter into a proprietary rights and nondisclosureagreement in which the employee agrees to maintain the confidentiality of all our proprietary information and,subject to certain exceptions, to assign to us all rights in any proprietary information or technology made orcontributed by the employee during his or her employment with us. In addition, we regularly enter intonondisclosure agreements with third parties, such as potential product development partners and customers.
Financial Information by Geographic Areas
Year ending December 31,
2007 2006 2005
Amount Percent Amount Percent Amount Percent
(Dollars in thousands)
Revenues from external customers located in:United States . . . . . . . . . . . . . . . . . . . . . . . . . . . . . $17,195 30% $18,307 34% $20,576 45%All other countries . . . . . . . . . . . . . . . . . . . . . . . . 40,166 70% 35,578 66% 24,861 55%
Total . . . . . . . . . . . . . . . . . . . . . . . . . . . . . . . . . . . $57,361 100% $53,885 100% $45,437 100%
Long-lived assets:United States . . . . . . . . . . . . . . . . . . . . . . . . . . . . . $11,715 30% $10,751 30% $10,090 32%Switzerland . . . . . . . . . . . . . . . . . . . . . . . . . . . . . . 27,676 70% 24,921 70% 21,696 68%
Total . . . . . . . . . . . . . . . . . . . . . . . . . . . . . . . . . . . $39,391 100% $35,672 100% $31,786 100%
Risks Attendant to Foreign Operations and Dependence
We derive a significant portion of our revenues from sales to customers located outside the U.S. We expectour international sales to continue to represent a significant and increasing portion of our future revenues. As aresult, our business will continue to be subject to certain risks, such as foreign government regulations, exportcontrols, changes in tax laws, tax treaties, tariffs, freight rates and timely and accurate financial reporting fromour international subsidiary. Additionally, as a result of our extensive international operations and significantrevenue generated outside the U.S., the dollar amount of our current and future revenues, expenses and debt maybe materially affected by fluctuations in foreign currency exchange rates. If we are unable to manage these riskseffectively, it could impair our ability to increase international sales.
Similarly, assets or liabilities of our consolidated foreign subsidiary that are not denominated in itsfunctional currency are subject to effects of currency fluctuations, which may affect our reported earnings.
We have substantial operations in Switzerland. Having substantial international operations increases thedifficulty of managing our financial reporting and internal controls and procedures. In addition, to the extent weare unable to respond effectively to political, economic and other conditions in the countries where we operateand do business, our results of operations and financial condition could be materially adversely affected.Moreover, changes in the mix of income from our foreign subsidiaries, expiration of tax holidays and changes intax laws and regulations could increase our tax expense.
Backlog
Backlog for continuing operations for the year ended December 31, 2007 was approximately $22.9 million,compared with $6.7 million as of December 31, 2006. Backlog consists of firm orders for products that will bedelivered within 12 months.
Significant Customers
Sales to one customer amounted to approximately $10.6 million, or 18%, and $9.7 million, or 18%, of ourtotal revenue for years ended December 31, 2007 and 2006, respectively.
14

Government Regulation
Due to the nature of our operations and the use of hazardous substances in some of our ongoingmanufacturing and research and development activities, we are subject to stringent federal, state and local laws,rules, regulations and policies governing workplace safety and environmental protection. These include the use,generation, manufacture, storage, air emission, effluent discharge, handling and disposal of certain materials andwastes. In the course of our historical operations, materials or wastes may have spilled or been released fromproperties owned or leased by us or on or under other locations where these materials and wastes have been takenfor disposal. These properties and the materials and wastes spilled, released, or disposed thereon are subject toenvironmental laws that may impose strict liability, without regard to fault or the legality of the original conduct,for remediation of contamination resulting from such releases. Under such laws and regulations, we could berequired to remediate previously spilled, released, or disposed substances or wastes, or to make capitalimprovements to prevent future contamination. Failure to comply with such laws and regulations also couldresult in the assessment of substantial administrative, civil and criminal penalties and even the issuance ofinjunctions restricting or prohibiting our activities. It is also possible that implementation of stricterenvironmental laws and regulations in the future could result in additional costs or liabilities to us as well as theindustry in general. While we believe we are in substantial compliance with existing environmental laws andregulations, we cannot be certain that we will not incur substantial costs in the future.
In addition, certain of our microelectronics products are subject to International Traffic in Arms exportregulations when they are sold to customers outside the U.S. We routinely obtain export licenses for such productshipments outside the U.S.
Employees
As of December 31, 2007, we had 302 employees, consisting of 149 full-time, 1 part-time employee and 28temporary employees in the U.S., and 111 full-time, 4 part-time and 9 temporary employees in Switzerland. Webelieve that approximately 30 percent of our employees in Switzerland are members of a labor union. Swiss lawprohibits employers from inquiring into the union status of employees. We consider our relations with ouremployees to be good.
Available Information
We file or furnish annual, quarterly and special reports, proxy statements and other information with theSecurities and Exchange Commission (SEC). Our SEC filings are available free of charge to the public over theInternet at the SEC’s website at http://www.sec.gov. Our SEC filings are also available free of charge on ourwebsite at http://www.maxwell.com as soon as reasonably practicable following the time that they are filed withor furnished to the SEC. You may also read and copy any document we file with or furnish to the SEC at theSEC’s Public Reference Room at 450 Fifth Street, NW, Washington, DC 20549. You may obtain information onthe operation of the Public Reference Room by calling the SEC at 1-800-SEC-0330. The information found onour website is not part of this or any report that we file or furnish to the SEC.
Facilities
Our San Diego headquarters and principal research, manufacturing and marketing facility occupiesapproximately 45,000 square feet under a renewable lease that expires in July 2010. We also occupy a 16,500-square-foot production annex in San Diego under a renewable lease that expires in November 2010. In addition,we lease research, manufacturing and marketing facilities occupying 68,620 square feet in Rossens, Switzerland,under a renewable lease that expires in December 2014 and we have an additional 5 year option thereafter. Webelieve that we have sufficient floor space to support forecasted increases in production volume and, therefore,that our facilities are adequate to meet our needs for the foreseeable future.
15

Item 1A. Risk Factors
An investment in our common stock involves a high degree of risk. Our business, financial condition andresults of operations could be seriously harmed if potentially adverse developments, some of which are describedbelow, materialize and cannot be resolved successfully. In any such case, the market price of our common stockcould decline and you may lose all or part of your investment in our common stock.
The risks and uncertainties described below are not the only ones we face. Additional risks anduncertainties, including those not presently known to us or that we currently deem immaterial, may also result indecreased revenues, increased expenses or other adverse impacts that could result in a decline in the price of ourcommon stock. You should also refer to the other information set forth in this Annual Report on Form 10-K,including our consolidated financial statements and the related notes.
We have a history of losses and we may not achieve or maintain profitability in the future, which maydecrease the market value of our common stock.
We have incurred net losses in our last nine fiscal years. We cannot assure you that we will becomeprofitable in the foreseeable future, if ever. Even if we do achieve profitability, we may experience significantfluctuations in our revenues and we may incur net losses from period to period as a result of a number of factors,including but not limited to the following:
• the amounts invested in developing, manufacturing and marketing our products in any period ascompared with the volume of sales of those products in the same period;
• increasing number of competitors and resulting price competition;
• inability to manufacture our products at a cost level that supports adequate profit margins;
• fluctuations in demand for our products by our OEM customers;
• the prices at which we sell our products and services compared with the prices of our competitors andour product costs;
• the timing of our product introductions may lag behind those of our competitors;
• negative impacts resulting from acquisitions we have made or may make; and
• future changes in financial accounting standards or practices.
In addition, we incur significant costs developing and marketing products based on new technologies and, inorder to increase our market share, we have sold, and may in the future sell, our products at profit margins belowthose we ultimately expect to achieve. We have in the past, and may in the future, make a strategic decision toaccept certain orders to sell products to a limited number of customers at prices below our manufacturing cost.Below-cost sales may significantly impact our operating results and cause these results to be below theexpectations of securities analysts and investors, which may result in a decrease in the market value of ourcommon stock.
We face risks selling products internationally which are or may become regulated by the US Government.
Our radiation mitigated microelectronic products are being classified as International Traffic in ArmsRegulations (ITAR) which subject them to the licensing jurisdiction of the Department of State in accordancewith the International Traffic in Arms Regulations (22 CFR 120 through 130) and are designated a defense articleunder Category XV(e) of the United States Munitions List. This means that all international sales of our radiationmitigated products require licensing, which makes our business more complex and may impact sales as follows:a) approval of the license may or may not be granted, b) the time between the receipt of an order and shipment ofproduct may be increased, and c) sales could be reduced or lost entirely due to a customers preference of usingnon-ITAR regulated products. Additionally, we may be subject to new regulations that have a potential to impactsales or our products that we sell internationally or domestically.
16

We may enter into agreements and provide services before funding is approved or obtained.
We may provide services for projects before funding for such projects is approved or received. If funds arenot received we would not recognize the revenue we anticipated to offset the expenses we incurred. We providethese goods or services knowing that there is a risk that we may not receive compensation. If funding is noteventually obtained, any capitalized expenses or inventory that is unique to the specific customer would beexpensed, which could adversely impact our consolidated financial position, results of operations and cash flows.
A small number of customers account for a significant portion of our revenues.
We expect that a small number of customers will continue to account for a large portion of our revenues forthe foreseeable future. We have one customer that accounts for more than 10% of our revenue. This customeraccounted for approximately 18% of our revenues in 2007. If our relationships with our large customers weredisrupted, we could lose a significant portion of our anticipated revenue. Factors that could influence ourrelationships with our customers include:
• our ability to sell our products at prices that are competitive with competing suppliers;
• our ability to maintain features and quality standards for our products sufficient to meet the expectationsof our customers; and
• our ability to produce and deliver a sufficient quantity of our products in a timely manner to meet ourcustomers’ requirements.
Foreign currency exchange fluctuation risk
As a result of our extensive international operations and significant revenue generated outside the U.S., thedollar amount of our current and future revenues, expenses and debt may be materially affected by fluctuations inforeign currency exchange rates. If we are unable to manage these risks effectively, it could have a substantialimpact on our consolidated financial position, results of operations and cash flow.
Our large cell ultracapacitors designed for transportation and industrial applications may not gainwidespread commercial acceptance, which would adversely impact our growth opportunities, and ouroverall business prospects.
We have designed our large cell ultracapacitor products primarily for use in transportation and industrialapplications. Currently, most of the major automotive companies are testing and developing alternative powersources to augment the current 12-volt electrical system or support the power requirements of hybrid drivesystems. We believe our ultracapacitors provide an innovative alternative power solution for both of theseapplications, and we are currently collaborating technically with several automotive suppliers and autocompanies regarding designing our ultracapacitors into their future products. However, the historic per unit costof ultracapacitors has prevented ultracapacitors from gaining widespread commercial acceptance. In addition,there are other competing technologies such as advanced batteries, compressed gas and hydrolytic fluids as wellas competing ultracapacitors. We believe that the long-term success of our ultracapacitor products will bedetermined by our ability to reduce the price of our products and outperform competing technologies, resulting inour ultracapacitors being designed into automotive electrical systems and the next generation of hybrid drivesystems. If our ultracapacitor products fail to achieve commercial acceptance in the automotive and othertransportation and industrial applications, our future revenues and growth opportunities will be adverselyimpacted and our overall business prospects will be significantly impaired.
17

We may be unable to produce our large cell ultracapacitors in commercial quantities or reduce the cost ofproduction enough to be commercially viable for widespread application, which would adversely impactour revenues, operating results and growth opportunities and our overall business prospects.
If we are not able to produce large quantities of our large cell ultracapacitor products in the near future at asignificantly lower per unit cost, our large cell ultracapacitors may not be a commercially viable alternative tocompeting energy storage and power delivery solutions. Although we have been selling BOOSTCAP® large cellultracapacitors designed for transportation and industrial applications, we have only produced these products inlimited quantities and at relatively high prices compared with traditional energy storage and power deliverydevices. We are currently investing significant resources in improving our ultracapacitor cell and multi-cellmodule designs for higher performance and lower cost, and in automating and scaling up our manufacturingcapacity to enable us to produce ultracapacitors in quantities sufficient to meet the needs of our potentialcustomers. If we are unable to continue reducing our cost of production and establishing the capability to producelarge quantities of ultracapacitors at a reduced cost, we may not be able to generate commercial acceptance of,and sufficient revenue from, these products to recover our significant investment in the development andmanufacturing scale-up, and our overall business prospects will be significantly impaired.
It may also be difficult for us to solve management, technological, engineering and other problems, whichmay arise in connection with scaling up our manufacturing processes. These problems may include productionvolumes and yields, quality assurance, adequate and timely supply of materials and components and shortages ofqualified management and other personnel. In addition, some of our products are now assembled by third parties.As we outsource assembly of our products, we face risks with respect to quality assurance, cost and the absenceof close engineering support.
We may not be able to develop and market our products successfully, and thus may not be able to achieveor maintain profitability in the future.
If we are unable to develop and market our products successfully, we may not achieve or maintainprofitability. In recent years, we have introduced many of our products into commercial markets and, upon suchintroductions, we also must demonstrate our capabilities as a reliable supplier of these products. Some of ourproducts are alternatives to established products or provide capabilities that do not presently exist in themarketplace. Our products are sold in highly competitive and rapidly changing markets. Our products’ success issignificantly affected by their cost, technology standards, performance and reliability and end-user preferences.The success of our products also depends on a number of factors, including our ability to:
• maintain engineering and marketing staffs sufficiently skilled to identify market opportunities anddesign new products;
• identify and develop attractive markets for our new products and technologies and accurately anticipatedemand;
• develop appropriate sales and distribution channels;
• develop and manufacture new products that we can sell at competitive prices, with adequate profitmargins;
• deliver products that meet our customers’ requirements for quality and reliability;
• increase our manufacturing capacity and improve manufacturing efficiency to meet our customerdemands while maintaining quality;
• successfully respond to technological changes by improving our existing products and technologies;
• demonstrate that our products have technological and/or economic advantages over competing products;
• successfully respond to competitors that are more experienced, have significantly greater resources andhave a larger base of customers; and
• secure required raw materials in sufficient quantities and at prices required to manufacture and delivercompetitive products.
18

If we are unable to secure qualified and adequate sources for our materials, components andsub-assemblies, we may not be able to make our products at competitive costs and we may have difficultymeeting customer demand, which could damage our relationships with our customers.
Our ability to manufacture products depends in part on our ability to secure qualified and adequate sourcesof materials, components and sub-assemblies at prices that enable us to make our products at competitive costs.Some of our suppliers are currently the sole source of one or more items that we need to manufacture ourproducts. Although we seek to reduce our dependence on sole and limited source suppliers, the partial orcomplete loss of these sources could have at least a temporary adverse effect on our business and results ofoperations and damage customer relationships. Upon occasion, we have experienced difficulty in obtainingtimely delivery of supplies from outside suppliers, which has delayed deliveries to our customers. There can beno assurance that such supply problems will not recur.
Our product lines may be subject to increased competition, and this may limit our ability to increase ormaintain our profit margins. If our competitors develop and commercialize products faster than we do, orcommercialize products that are superior to or lower cost than our products, our commercialopportunities may be reduced or eliminated.
Market acceptance of our products depends on competitive factors, many of which are beyond our control.Competition in our markets is intense and has been accentuated by the rapid pace of technological development.Our competitors include large fully-integrated electronics companies. We may not be able to develop, fund orinvest in one or more of our product lines to the same degree or as quickly as our competitors do. Many of ourcompetitors have substantially greater research and development capabilities and financial, manufacturing,technological, marketing and sales resources than we do, as well as more experience in research anddevelopment, product testing, manufacturing, marketing and sales. These organizations also compete with us to:
• attract parties for collaborations or joint ventures;
• license proprietary technology that is competitive with our technology; and
• attract and hire scientific, engineering and marketing talent.
Our competitors may succeed in developing and commercializing products earlier than we do. Ourcompetitors may also develop products or technologies that are superior to or lower cost than ours, thus renderingour products, product candidates or technology obsolete or non-competitive. If we cannot successfully competewith new or existing products, our sales and revenue would suffer and we may not ever become profitable.
If our OEM customers fail to purchase our components or to sell sufficient quantities of their productsincorporating our components, or if our OEM customers’ sales timing and volume fluctuates, it couldprevent us from achieving our sales and market share goals.
Sales to a relatively small number of OEM customers, as opposed to direct retail sales to end customers,make up a large portion of our revenues. For example, we have one customer that accounted for approximately18% of our revenue in 2007. Our ability to make sales to OEM customers depends on our ability to compete onprice, delivery and quality. The timing and volume of these sales depend upon the sales levels and shippingschedules for the products into which our OEM customers incorporate our products. Thus, even if we develop asuccessful component, our sales will not increase unless the product into which our component is incorporated issuccessful. If our OEM customers fail to sell a sufficient quantity of products incorporating our components, or ifthe OEM customers’ sales timing and volume fluctuate, it could prevent us from achieving our sales targets andnegatively impact our market share. Our OEM customers typically require a long development and engineeringprocess before incorporating our products into their systems and products. This period of time is in addition tothe time we spend on basic research and product development. As a result, we are vulnerable to changes intechnology or end user preferences.
19

Our opportunity to sell our products to our OEM customers typically occurs at infrequent intervals,depending on when the OEM customer designs a new product or enhances an existing one. If we are not aware ofan OEM’s product development schedule, or if we cannot provide components or technologies at the time thatthey are developing their products, we may miss sales opportunities that may not reappear for some time.
We may face product liability or warranty claims, either directly or indirectly through our customers, andwe have limited experience with some of our products as to our potential liability.
We offer our customers a warranty for our products. Any product defects could, in turn, lead to defects inour customers’ products that incorporate our products. Defects in our products could give rise to warranty claimsagainst us or to liability for damages including, in certain circumstances, liability for consequential damages. Forexample, as described elsewhere in this 10-K, in 2005 a customer brought to our attention a possible defect in aproduct that was produced for Maxwell under contract by another manufacturer and resold to the customer.Maxwell is currently a party to a legal proceeding in Germany that will determine whether or not a defectexisted. In the event that it is determined that a defect did exist, Maxwell and/or the manufacturer couldpotentially be liable to the customer for damages. Defects in our products could also impair the market’sacceptance of our products. Any of these events could have a material adverse effect on our business andfinancial condition. We have limited experience with some of our products in evaluating the potential liabilitythat could be created by claims under our warranties. If the claims made under such warranties exceed ourwarranty reserves, our results of operations and financial condition could be materially adversely affected.Additionally, warranty periods in some foreign countries are mandated by law. Changes in such laws may affectthe adequacy of our warranty reserves.
Unfavorable economic conditions in the U.S. and abroad may adversely affect our OEM customers andprevent us from achieving sales growth.
Many of our new products are components designed to be integrated into new products and systems to beintroduced to the marketplace by our OEM customers. For example, unfavorable economic conditions in 2003and 2004 resulted in reduced capital spending on U.S. electric utility infrastructure and delayed the introductionof certain new products by our OEM customers. A recurrence of such unfavorable economic conditions mayadversely affect our ability to market and sell our new products in the future.
A prolonged economic downturn could materially harm our business.
Any negative trends in the general economy, including trends resulting from actual or threatened militaryaction by the United States and threats of terrorist attacks in the United States and abroad, could cause a decreasein capital spending in the markets we serve. In particular, a downward cycle affecting the transportation andautomotive, industrial, electric utility or aerospace markets would likely result in reduced demand for ourproducts. In addition, if our customers’ own markets and financial performance decline, we may not be able tocollect outstanding amounts due to us. Any such circumstances could harm our consolidated financial position,results of operations and cash flows.
If we are unable to protect our intellectual property adequately, such as in the Peoples Republic of China(PRC), we could lose our competitive advantage in the industry segments in which we do business.
Our success depends in part on establishing and protecting our intellectual property rights. If we are unableto protect our intellectual property adequately, we could lose our competitive advantage in the industry segmentsin which we do business. Although we protect our intellectual property rights through patents, trademarks,copyrights, trade secrets and other measures, these steps may not prevent infringement, misappropriation or othermisuse by third parties. We have taken steps to protect our intellectual property rights under the laws of certainforeign countries, but our efforts may not be effective to the extent that foreign laws are not as protective as thelaws of the U.S. For example, we have licensed designs for our patented ultracapacitor products to a company
20

located in the PRC. Patent and other intellectual property rights receive substantially less protections in the PRCthan is available in the United States. In addition, we face the possibility that third parties may “reverse engineer”our products to discover how they work and introduce competing products, or that third parties mightindependently develop products and intellectual property similar to ours.
We have increased our emphasis on protecting our technologies and products through patents. Our successdepends on maintaining our patents, adding to them where appropriate, and developing products and applicationswithout infringing the patent and proprietary rights of others. The following risks, among others, are involved inprotecting our patents:
• our patents may be circumvented or challenged and held unenforceable or invalid;
• our pending or future patent applications may not be issued in a timely manner and may not provide theprotections we seek; and
• others may claim rights in the patented and other proprietary technology that we own or license.
If our patents are invalidated or if it is determined that we, or the licensor of the patent, do not hold solerights to the patent, we could lose our competitive advantage in the industry segments in which we do business.
Competing research and patent activity in our product areas is substantial. In October 2006, we filed alawsuit alleging infringement of four of our patents by NessCap, a Korean competitor, and in December 2006,NessCap filed a lawsuit alleging that one of our products infringes one of NessCap’s patents. Although we do notbelieve that our products or proprietary rights infringe third parties’ rights, this infringement claim has beenasserted against us, and additional claims could be asserted against us in the future. As in our dispute withNessCap, if we are forced to bring such claims or are subject to such claims by others, we face time-consuming,costly litigation that could potentially result in product shipment delays, damage payments or injunctions thatcould prevent us from making, using or selling infringing products. In addition, such litigation increases ouroperating expenses and adversely impacts our operating results. We may also be required to enter into royalty orlicensing agreements on unfavorable terms as part of a judgment or settlement, which could negatively impactthe amount of revenue derived from our products or proprietary rights.
Our reputation and ability to enter into alliances or other strategic arrangements may affect our success.
Our reputation is important to our growth and success. Since we have licensed our technology to others, ourreputation may be affected by the performance of the companies to which we have licensed our technology. Ourlicenses may grant exclusivity with respect to certain uses or geographic areas. For example, we have grantedlicenses to YEC in Taiwan and Shanghai Sanjiu in China to manufacture and sell products based on ourproprietary ultracapacitor designs. As a result, we will be dependent in part on the success of these licensees forsuccess in China. We anticipate that future alliances may also be with foreign partners or entities. As a result,such future alliances may be subject to the political climate and economies of the foreign countries where suchpartners reside and operate. We cannot be certain that our alliance partners will provide us with the support weanticipate, that such alliances or other relationships will be successful in developing our technology for use withtheir intended products, or that any alliances or other relationships will be successful in manufacturing andmarketing their products. Our international operations also are subject to certain external business risks such asexchange rate fluctuations, political instability or significant weakening of a local economy in which a foreignentity with which we have an affiliation operates or is located. Certain provisions of alliance agreements that arefor our benefit may be subject to restrictions in foreign laws that limit our ability to enforce such contractualprovisions. If these alliances are not successful our business and prospects could be negatively affected.
21

We face risks associated with marketing, distribution and sale of our products internationally and, if weare unable to manage these risks effectively, it could impair our ability to increase sales.
We derive a significant portion of our revenues from sales to customers located outside the U.S. We expectinternational sales to continue to represent a significant and increasing portion of our future revenue. As a result,our business will continue to be subject to certain risks, such as foreign government regulations, export controls,changes in tax laws, tax treaties, tariffs, freight rates and timely and accurate financial reporting from ourinternational subsidiary.
Additionally, as a result of our extensive international operations and significant revenue generated outsidethe U.S., the dollar amount of our current and future revenues, expenses and debt may be materially affected byfluctuations in foreign currency exchange rates. If we are unable to manage these risks effectively, it couldimpair our ability to increase international sales.
Similarly, assets or liabilities of our consolidated foreign subsidiary that are not denominated in itsfunctional currency are subject to effects of currency fluctuations, which may affect our reported earnings.
We have substantial operations in Switzerland. Having substantial international operations increases thedifficulty of managing our financial reporting and internal controls and procedures. In addition, to the extent weare unable to respond effectively to political, economic and other conditions in the countries where we operateand do business, our results of operations and financial condition could be materially adversely affected.Moreover, changes in the mix of income from our foreign subsidiaries, expiration of tax holidays and changes intax laws and regulations could increase our tax expense.
We could be subject to future audits by the Defense Department which could result in charges to ourearnings and have a negative effect on our cash position.
In the past we entered into contracts that are subject to government audits, and the outcome of such auditsmay have a negative impact on our financial results.
If we are unable to attract and retain key personnel, we could lose our technological and competitiveadvantage in some product areas and business segments.
Since many of our products employ emerging technologies, our success depends upon attracting andretaining key technical and management personnel. Some of our scientists and engineers are the key developersof our products and technologies and are recognized as leaders in their area of expertise. The loss of suchpersonnel could threaten our technological and competitive advantage in some product areas and product lines.
Our performance also depends on our ability to identify, hire, train, retain and motivate qualified personnel,especially key executives, operations staff and highly skilled engineers. The industries in which we compete arecharacterized by a high level of employee mobility and aggressive recruiting of skilled personnel in a highlycompetitive employment market. All of our employees are “at will” and thus may terminate their employmentwith us at any time.
Our ability to increase market share and sales depends on our ability to hire, train and retain qualifiedmarketing and sales personnel.
Because many of our products are new, we have limited experience marketing and selling them. To sell ourproducts, our marketing and sales personnel must demonstrate the advantages of our products over competingproducts, and we must be able to demonstrate the value of new technology in order to sell new products toexisting and new customers. The highly technical nature of the products we offer requires that we attract andretain qualified marketing and sales personnel, and we may have difficulty doing that in a highly competitiveemployment market. Also, as part of our sales and marketing strategy, we enter into arrangements with
22

distributors and sales representatives to sell our products, and it is possible that our arrangements with outsidedistributors and sales representatives may not be successful.
Our business and operations would suffer in the event of system failures.
Despite the implementation of security measures, redundancy and backup, our internal informationtechnology networking systems are vulnerable to damages from computer viruses, unauthorized access, energyblackouts, natural disasters, terrorism, war and telecommunication failures. Additionally, from time to time, weinstall new or upgraded business management systems. To the extent such systems fail or are not properlyimplemented, we may experience material disruption to our business, including our ability to report operatingresults on a timely basis.
Accounting rules for stock-based compensation may adversely affect our operating results, our stock priceand our competitiveness in the employee marketplace.
We have a history of using employee stock options and other stock-based compensation to hire, motivateand retain our workforce. In December 2004, the Financial Accounting Standards Board issued Statement ofFinancial Accounting Standards No. 123R, “Share-Based Payment,” which required us, starting in the firstquarter of fiscal year 2006, to calculate compensation costs for stock-based compensation (including stockoptions and our employee stock purchase plan) at fair value and to recognize these costs as compensationexpense in our statements of operations. Recognition of these expenses in our statements of operations will resultin larger loss per share, which could negatively impact our future stock price. In addition, if we reduce our stock-based compensation to minimize the recognition of these expenses, our ability to recruit, motivate and retainemployees may be impaired, which could put us at a competitive disadvantage in the employee marketplace.
Compliance with changing regulations of corporate governance and public disclosure may result inadditional expenses.
Changing laws, regulations and standards relating to corporate governance and public disclosure, includingthe Sarbanes-Oxley Act of 2002, new SEC regulations and NASDAQ Global Market rules, have createdsignificant additional expenses for public companies. We are committed to maintaining high standards ofcorporate governance and public disclosure. As a result, our efforts to comply with evolving laws, regulationsand standards have resulted in, and are likely to continue to result in, significantly increased general andadministrative expenses and diversion of management time to such compliance activities. Our efforts to complywith section 404 of the Sarbanes-Oxley Act of 2002 and the related regulations have required significant effortand resources, and resulted in significant cost to us. These efforts and expense are further increased because ofour substantial international operations.
Anti-takeover provisions in our certificate of incorporation and bylaws could prevent certain transactionsand could make a takeover more difficult.
Some provisions in our certificate of incorporation and bylaws could make it more difficult for a third partyto acquire control of us, even if such change in control would be beneficial to our stockholders. We have aclassified board of directors, which means that our directors are divided into three classes that are elected tothree-year terms on a staggered basis. Since the three year terms of each class overlap the terms of the otherclasses of directors, the entire board of directors cannot be replaced in any one year. Furthermore, our certificateof incorporation contains a “fair price provision” which may require a potential acquirer to obtain the consent ofour board to any business combination involving us.
We have adopted a program under which our stockholders have rights to purchase our stock directly from usat a below-market price if a company or person attempts to buy us without negotiating with the board. Thisprogram is intended to encourage a buyer to negotiate with us, but may have the effect of discouraging offersfrom possible buyers.
23

The provisions of our certificate of incorporation and bylaws could delay, deter or prevent a merger, tenderoffer, or other business combination or change in control involving us that stockholders might consider to be intheir best interests. This includes offers or attempted takeovers that could result in our stockholders receiving apremium over the market price for their shares of our common stock.
Our common stock experiences limited trading volume and our stock price has been volatile.
Our common stock is traded on the NASDAQ Global Market. The trading volume of our common stockeach day is relatively low. This means that sales or purchases of relatively small blocks of stock can have asignificant impact on the price at which our stock is traded. We believe that factors such as quarterly fluctuationsin financial results, announcements of new technologies impacting our products, announcements by competitorsor changes in securities analysts’ recommendations could cause the price of our stock to fluctuate substantially.These fluctuations, as well as general economic conditions such as recessions or higher interest rates, mayadversely affect the market price of our common stock.
We may experience difficulty manufacturing our products, which would prevent us from achievingincreased sales and market share.
We may experience difficulty in manufacturing our products in increased quantities, outsourcing themanufacturing of our products and improving our manufacturing processes. If we are unable to manufacture ourproducts in increased quantities, or if we are unable reduce manufacturing cost by outsourcing assembly of ourproducts or improve our manufacturing processes, we may be unable to increase sales and market share for ourproducts and could also lose existing customers. We have limited experience in manufacturing our products inhigh volume, and our future success will depend on our ability to:
• increase the quantity of the new products we manufacture while maintaining quality;
• reduce our manufacturing costs to a level needed to produce adequate profit margins and avoid losses oncommitted sales agreements currently priced at below our product costs; and
• design and procure additional automated manufacturing equipment.
It may also be difficult for us to solve management, technological, engineering and other problems, whichmay arise in connection with our manufacturing processes. These problems may include production volumes andyields, quality assurance, adequate and timely supply of high quality materials and components and shortages ofqualified management and other personnel. In addition, we have elected to have some of our productsmanufactured by third parties, and outsourced manufacturing involves risks with respect to quality assurance,cost and the absence of close engineering support.
If the investors in our December 2005 financing convert their notes or exercise their warrants, it will havea dilutive effect upon our stockholders.
In December 2005 we issued notes and warrants to an institutional investor. Pursuant to the terms of thenotes, the holders of such notes may convert the notes into shares of common stock at any time prior to theirmaturity at the Conversion Price, subject to adjustment upon specified events, including a price-based weightedaverage anti-dilution provision, and further subject to adjustment for stock splits, combinations or similar eventsspecified in the notes. Subject to certain conditions, we can automatically convert the notes into common stock ofthe Company at the Conversion Price. Unless our shares of common stock trade at or above a weighted-averageprice of 115% of the then effective Conversion Price, we will be obligated to repay equal portions of theprincipal amount outstanding under the notes on a quarterly basis beginning two (2) years after the date oforiginal issuance, provided that the holder may defer the receipt of any such payment for a period of up to two(2) years. As part of the transaction, we also issued to such investors warrants to purchase up to an additional419,440 shares of our common stock at the Conversion Price, subject to anti-dilution provisions similar to theprovisions set forth in the notes, and further subject to adjustment for stock splits, combinations or similar events.
24

The warrants became exercisable immediately after the closing date of the private placement and expire five(5) years from the date of issuance. If the investor converts the notes or exercises the warrants, we will issueshares of our common stock and such issuances will be dilutive to our stockholders. Because the ConversionPrice may be adjusted from time to time in accordance with the provisions of the notes and the warrants, thenumber of shares that could actually be issued may be greater than the amount described above. In addition, ifsuch institutional investors or our other stockholders sell substantial amounts of our common stock in the publicmarket during a short period of time, our stock price may decline significantly.
We substantially increased our outstanding indebtedness with the issuance of certain subordinatedconvertible notes and we may not be able to pay our debt and other obligations.
In December 2005 we issued notes in the aggregate principal amount of $25 million in a private placementto an institutional investor. The notes accrue interest at a per annum rate equal to the Federal Funds Rate (asdefined in the notes) plus 1.125%, subject to adjustment, with accrued interest payable quarterly. By issuing thenotes we increased our indebtedness substantially. In addition, the holders of the notes have imposed certainrestrictive covenants, including limits on our future indebtedness and limits on our ability to incur future liensand make certain restricted payments. Upon a change of control (as defined in the notes), the holders of the noteswill have certain redemption rights. An event of default would occur under the notes for a number of reasons,including our failure to pay when due any principal, interest or late charges on the notes, certain defaults on ourindebtedness, certain events of bankruptcy and our breach or failure to perform certain representations andobligations under the notes. Upon the occurrence of an event of default, our obligations under the notes maybecome due and payable in accordance with the terms thereof.
As a result, the issuance of the notes may or will:
• make it more difficult for us to obtain financing in the future for working capital, capital expenditures orother purposes;
• make it more difficult for us to be acquired;
• require us to dedicate a substantial portion of our cash flow from operations and other capital resourcesto debt service;
• limit our flexibility in planning for, or reacting to, changes in our business; and
• make us more vulnerable in the event of a downturn in our business or industry conditions.
If we are unable to satisfy our payment obligations under the notes or otherwise are obliged to repay thenotes prior to the due date, we could default on such notes, in which case our available cash could be depleted,and our ability to fund operations could be materially harmed.
Our credit agreements contain various restrictions and covenants that limit management’s discretion inthe operation of our business and could limit our ability to grow and compete.
The credit agreements governing our bank credit facilities contain various provisions that limit our abilityto:
• incur additional debt;
• make loans, pay dividends and make other distributions;
• create certain liens on, or sell, our assets;
• merge or consolidate with another corporation or entity, or enter into other transactions outside theordinary course of business; and
• make certain changes in our capital structure.
25

These provisions restrict management’s ability to operate our business in accordance with management’sdiscretion and could limit our ability to grow and compete. Our credit agreements also require us to comply withcertain financial covenants and ratios. If we fail to comply with any of such financial covenants or ratios, orotherwise default under our credit agreements, the lenders under such agreements could:
• accelerate and declare all amounts borrowed to be immediately due and payable, together with accruedand unpaid interest;
• terminate their commitments, if any, to make further extensions of credit to us and/or attempt to securecollateral.
In the event that amounts due under our credit agreements are declared immediately payable, we may nothave, or be able to obtain, sufficient funds to make such accelerated payments.
We may not be able to obtain sufficient capital to meet potential customer demand or corporate needs,which could require us to change our business strategy and result in decreased profitability and a loss ofcustomers.
We believe that in the future we will need a substantial amount of additional capital for a number ofpurposes, including the following:
• to meet potential production volumes for our products, particularly our ultracapacitors, which mayrequire high-speed automated production lines to achieve targeted customer volume and pricerequirements;
• to expand our manufacturing capabilities and develop viable outsource partners and other productionalternatives;
• to fund our continuing expansion into commercial markets and compete effectively in those markets;
• to develop new technology and cost effective solutions in our business; and
• to acquire new or complementary businesses, product lines and technologies.
In December 2005, we raised approximately $23.7 million (net of offering expenses) through a privateplacement of convertible debentures and warrants to purchase shares of our common stock. During 2007, wehave raised approximately $26.6 million (net of offering expenses) through the sale of our common stockpursuant to a shelf registration statement on Form S-3. However there can be no assurance that additionalfinancing will be available to us on acceptable terms or at all. If adequate funds are not available when needed,we may be required to change or delay our planned growth, which could result in decreased revenues, profits anda loss of customers. The issuance of additional shares will result in dilution of our current stockholders. Further,if additional financing is accomplished by the issuance of debt, the service cost, or interest, will reduce netincome or increase net losses and may also require the issuance of additional warrants to purchase shares ofcommon stock.
The issuance of shares of our common stock could result in the loss of our ability to use our net operatinglosses.
As of December 31, 2007, we had approximately $218.7 million of federal tax and state tax net operatingloss carryforwards. Realization of any benefit from our tax net operating losses is dependent on: 1) our ability togenerate future taxable income and 2) the absence of certain future “ownership changes” of our common stock.An “ownership change,” as defined in the applicable federal income tax rules, would place significantlimitations, on an annual basis, on the use of such net operating losses to offset any future taxable income wemay generate. Such limitations, in conjunction with the net operating loss expiration provisions, could effectivelyeliminate our ability to use a substantial portion of our net operating losses to offset any future taxable income.The issuance of shares of our commons stock could cause an “ownership change.” Such transactions include the
26

issuance of shares of common stock upon future conversion or exercise of outstanding options, warrants andconvertible preferred stock.
The costs of litigation or third-party claims of intellectual property infringement may be significant andmay negatively impact our operating results.
The company will defend its intellectual property and in doing so we may incur significant costs in suchdefense. We have in the past, and may in the future, make a strategic decision to file lawsuits against companiesthat we believe are utilizing our intellectual property without our permission. Litigation costs have been, and maycontinue to be, substantial, and if we do not prevail in our defense it may result in a decrease in the market valueof our common stock. Also, the amount spent on our defense may be greater than the judgment that we mightreceive, which could have a negative impact on our operating capital.
Item 1B. Unresolved Staff Comments
None.
Item 2. Properties
We have ongoing operations in San Diego, California and Rossens, Switzerland. Our San Diegoheadquarters and principal research, manufacturing and marketing facility occupies approximately 45,000 squarefeet under a renewable lease that expires in July 2010. We also occupy a 16,500-square-foot production annex inSan Diego under a renewable lease that expires in November 2010. In addition, we lease research, manufacturingand marketing facilities occupying 68,620 square feet in Rossens, Switzerland, under a renewable lease thatexpires in December 2014 and we have an additional 5 year option thereafter. We believe that we have sufficientfloor space to support forecasted increases in production volume and, therefore, that our facilities are adequate tomeet our needs for the foreseeable future.
Over the past several years, we have made substantial capital investments to outfit and expand our internalproduction facilities and incorporate mechanization and automation techniques and processes. We have trainedour manufacturing personnel in the necessary operational techniques including. With the completion of certainupgrades in 2007, and other upgrades and capacity expansions currently underway, along with our contractmanufacturing relationship with Belton Technology Group in China, we believe that we have sufficient capacityto meet near-term demand for all of our product lines
Item 3. Legal Proceedings
In October 2006, Maxwell filed a patent infringement lawsuit against NessCap in the United States DistrictCourt for the Southern District of California seeking monetary damages and an injunction to stop NessCap’ssales of infringing products based on four of Maxwell’s patents. In April 2007, a U.S. District judge consideredthe first of the four patents and granted a preliminary injunction to prohibit NessCap from making, using, selling,or offering for sale its “prismatic” ultracapacitor products in the United States. Subsequently, NessCap filed amotion to stay the preliminary injunction pending its appeal to the United States Court of Appeals for the FederalCircuit. The appeal court denied NessCap’s motion. Maxwell posted an injunction bond to cover possible lossessuffered by NessCap as a result of the injunction in the unlikely event that the Court renders a holding ofnon-infringement. The second, third, and fourth patent cases remain pending against NessCap’s products.
In December 2006, NessCap filed a lawsuit against Maxwell in the United States District Court in theDistrict of Delaware claiming Maxwell has infringed NessCap’s patented intellectual property. Maxwell movedfor an alternate forum and the lawsuit was transferred to the same district court in San Diego where Maxwell’sother claims are pending. Maxwell subsequently filed a motion for summary judgment assertingnon-infringement of NessCap’s patents and a hearing was held in November, 2007. In December, 2007, the
27

Court denied Maxwell’s motion for summary judgment, deciding instead to wait until the Court considersadditional briefing on the issue of patent claim interpretation. The Court set a hearing for this claim interpretationin April, 2008.
The legal expenses associated with these two lawsuits are capitalized, as management believes a favorableoutcome is probable. Additionally, Maxwell believes that final rulings in favor of Maxwell will provide anincrease in the value of the intellectual property involved substantial enough to outweigh the legal costs incurredto date. As of December 31, 2007 Maxwell has capitalized a total of $2.1 million of legal costs which is includedin intangible assets in the consolidated balance sheet.
In 2005, a customer brought to our attention a possible defect in a product that was produced for Maxwellunder contract by another manufacturer and resold to the customer. In an effort to resolve the matter, Maxwell’ssubsidiary, Maxwell Technologies SA, initiated a legal proceeding in Germany in late 2007 against the productmanufacturer. The suit is currently in the discovery phase during which time the allegedly defective product willbe analyzed by an expert who is tasked with determining: (a) if there is a defect; and (b) if there is a defect, if thedefect is one stemming from manufacturing or from operating conditions. The expert’s opinion is expected noearlier than June 2008. In the event that a determination is made that a defect exists, any potential liability woulddepend upon the nature of the defect and the actual amount of any damages would be determined in a subsequentlegal proceeding. The matter is still in its preliminary stages. As a result we have not yet been able to determinewhat, if any, warranty exposure Maxwell may have, and therefore, we have not recorded any warranty reserveprovision. We carry insurance that may cover a portion of, and up to the entire obligation that might ultimatelyarise from this matter.
In December 2007, Maxwell, along with more than 150 other defendants, was named in an environmentalsuit. The suit, Angeles Chemical Company, Inc. et al. v. Omega Chemical PRP Group, LLC, et al., was filed bythe plaintiffs in the United States District Court for the Central District of California alleging damages related tohazardous waste contamination of the plaintiffs’ land. The plaintiff alleges that a prior service provider ofMaxwell’s improperly disposed of hazardous material. In January 2008, Maxwell joined and adopted the Motionto Dismiss filed by defendants Omega Chemical PRP Group LLC and Omega Chemical PRP Group. That motionis scheduled to be heard in March 2008. In the meantime, Maxwell’s outside counsel is conferring withco-defendants’ counsel concerning a potential joint defense agreement whereby related defendants can shareinformation in an effort to reduce the cost of defending the suit.
Maxwell has been included in this suit as a result of an earlier suit that was settled in 1999. In that suit,Maxwell was a potentially responsible party (PRP) at a site a short distance from the current site. That suit wassettled by Maxwell paying approximately $37,000. While Maxwell’s legal counsel cannot provide any assuranceas to the likely outcome of this matter at this early stage, if any liability does arise out of this matter, Maxwelldoes not believe such liability would materially affect the financial position, results of operations, or cash flowsof Maxwell in an adverse manner.
Item 4. Submission of Matters to a Vote of Security Holders
No matters were submitted to stockholders during the quarter ended December 31, 2007.
28

PART II
Item 5. Market for the Registrant’s Common Equity, Related Stockholder Matters and IssuerPurchases of Equity Securities
Our common stock has been quoted on the NASDAQ Global Market under the symbol “MXWL” since1983. The following table sets forth the high and low sale prices per share of our common stock as reported onthe NASDAQ Global Market for the periods indicated.
High Low
Year Ended December 31, 2007First Quarter . . . . . . . . . . . . . . . . . . . . . . . . . . . . . . . . . . . . . . . . . . . . . . . . . . . . . . . $16.20 $10.31Second Quarter . . . . . . . . . . . . . . . . . . . . . . . . . . . . . . . . . . . . . . . . . . . . . . . . . . . . . 15.18 10.91Third Quarter . . . . . . . . . . . . . . . . . . . . . . . . . . . . . . . . . . . . . . . . . . . . . . . . . . . . . . . 16.50 10.75Fourth Quarter . . . . . . . . . . . . . . . . . . . . . . . . . . . . . . . . . . . . . . . . . . . . . . . . . . . . . . 12.24 7.46Year Ended December 31, 2006First Quarter . . . . . . . . . . . . . . . . . . . . . . . . . . . . . . . . . . . . . . . . . . . . . . . . . . . . . . . $19.70 $13.38Second Quarter . . . . . . . . . . . . . . . . . . . . . . . . . . . . . . . . . . . . . . . . . . . . . . . . . . . . . 22.21 16.88Third Quarter . . . . . . . . . . . . . . . . . . . . . . . . . . . . . . . . . . . . . . . . . . . . . . . . . . . . . . . 21.17 16.16Fourth Quarter . . . . . . . . . . . . . . . . . . . . . . . . . . . . . . . . . . . . . . . . . . . . . . . . . . . . . . 19.65 12.42
As of February 22, 2008 there were 408 holders of record of our common stock. We believe that the numberof beneficial owners of our common stock substantially exceeds this number.
Dividend Policy
We have never declared or paid cash dividends on our capital stock. We currently anticipate that anyearnings will be retained for the development and expansion of our business and, therefore, we do not anticipatepaying cash dividends on our capital stock in the foreseeable future. In addition, under our bank credit andconvertible debt agreements, neither we nor any of our subsidiaries may, directly or indirectly, pay any cashdividends to our stockholders.
Recent Sales of Unregistered Securities
None.
Equity Compensation Plans
The information required by this item will be contained in our definitive proxy statement to be filed with theSecurities and Exchange Commission in connection with the Annual Meeting of our Stockholders, which isexpected to be filed not later than 120 days after the end of our fiscal year ended December 31, 2007 (the “ProxyStatement”), and is incorporated in this report by reference.
29

Stock Performance Graph
COMPARISON OF 5 YEAR CUMULATIVE TOTAL RETURN*Among Maxwell Technologies, Inc., The NASDAQ Composite Index
And The Russell 2000 Index
$0
$50
$100
$150
$200
$250
12/02 12/03 12/04 12/05 12/06 12/07
Maxwell Technologies, Inc. NASDAQ Composite Russell 2000
* $100 invested on 12/31/02 in stock or index-including reinvestment of dividends.Fiscal year ending December 31.
30

Item 6. Selected Financial Data
The selected consolidated financial data presented below are for each fiscal year in the five-year periodended December 31. This data is derived from the Company’s audited consolidated financial statements. Duringthe year ended December 31, 2004, we completed the discontinuance of our Winding Equipment businesssegment, which we acquired in 2002. Therefore, the financial statements for fiscal 2004 and 2003 include thereclassification of the Winding Equipment business to discontinued operations. The adoption of SFAS No. 87 onJanuary 1, 2003 resulted in a cumulative effect on an accounting change, net of tax of $878,000.
Years Ended December 31,
2007 2006 2005 2004 2003
(In thousands, except per share data)
Consolidated Statement of Operations Data:Continuing Operations:
Total revenue . . . . . . . . . . . . . . . . . . . . . . . . . . . . . . . $ 57,361 $ 53,885 $45,437 $32,212 $35,166Loss from continuing operations . . . . . . . . . . . . . . . . . . . . (15,733) (16,300) (6,254) (9,808) (6,212)Income (loss) from discontinued operations, net of tax . . . — (195) (40) 733 (961)Cumulative effect of accounting change, net of tax . . . . . . — — — — 878
Net loss . . . . . . . . . . . . . . . . . . . . . . . . . . . . . . . . . . . . . . . . $ (15,733) $(16,495) $ (6,294) $ (9,075) $ (6,295)
Basic and Diluted Net Loss Per Share:Loss from continuing operations . . . . . . . . . . . . . . . . $ (0.86) $ (0.97) $ (0.39) $ (0.67) $ (0.44)Income (loss) from discontinued operations, net oftax . . . . . . . . . . . . . . . . . . . . . . . . . . . . . . . . . . . . . . — (0.01) — 0.05 (0.07)
Cumulative effect of accounting change, net oftax . . . . . . . . . . . . . . . . . . . . . . . . . . . . . . . . . . . . . . — — — — 0.06
Net loss per share . . . . . . . . . . . . . . . . . . . . . . . . . . . . . . . . $ (0.86) $ (0.98) $ (0.39) $ (0.62) $ (0.45)
As of December 31,
2007 2006 2005 2004 2003
Consolidated Balance Sheet Data:Total assets . . . . . . . . . . . . . . . . . . . . . . . . . . . . . . . . . $108,280 $ 91,669 $88,464 $67,726 $63,013Cash, cash equivalents, short-term investments inmarketable securities and restricted cash . . . . . . . . $ 30,214 $ 19,387 $34,456 $12,795 $11,307
Short-term borrowings and current portion of long-term debt . . . . . . . . . . . . . . . . . . . . . . . . . . . . . . . . . $ 16,472 $ 5,688 $ 1,695 $ 1,970 $ 1,851
Long-term debt excluding current portion . . . . . . . . . $ 13,544 $ 22,527 $22,212 $ 813 $ —Stockholders’ equity . . . . . . . . . . . . . . . . . . . . . . . . . . $ 62,112 $ 45,883 $49,851 $52,791 $47,692Shares outstanding . . . . . . . . . . . . . . . . . . . . . . . . . . . 20,417 17,261 16,600 15,695 14,339
31

Item 7. Management’s Discussion and Analysis of Financial Condition and Results of Operations
The following discussion of our financial condition and results of operations for the years endedDecember 31, 2007, 2006 and 2005 should be read in conjunction with our consolidated financial statements andthe related notes included elsewhere in this Annual Report. In addition, the discussion and the historicalinformation contain forward-looking statements that are subject to risks and uncertainties, including estimatesbased on our judgment in determining the allowance for inventory and warranty reserves, bad debt allowance,allowance for deferred tax assets and tax expenses in the future. Our estimation of liquidity for fiscal year 2008may be significantly different than our actual results. Negative changes in revenues will affect our estimation incost of sales, research and development, selling, general and administrative and other aspects of our business.
Executive Summary
We begin Management’s Discussion and Analysis of Financial Condition and Results of Operations with anoverview of our business and strategic plan. Next, we provide a summary of some of the highlights from therecently completed fiscal year, followed by a discussion of the different aspects of our business. We thenproceed, on page 35, to discuss our results of operations for the year ended December 31, 2007 compared withthe year ended December 31, 2006, and for the year ended December 31, 2006 compared with the year endedDecember 31, 2005. Thereafter, we provide an analysis of changes in our balance sheet and cash flows, anddiscuss our capital requirements and financing activities in the section entitled “Liquidity and CapitalResources.” We also provide a discussion of our critical accounting policies, the impact of inflation on ourbusiness and new accounting pronouncements.
Overview
Maxwell Technologies, Inc. is a Delaware corporation and is headquartered in San Diego, California. Weoriginally incorporated in 1965 under the name “Maxwell Laboratories, Inc.” In 1996, we changed our name toMaxwell Technologies, Inc. We develop, manufacture and market energy storage and power delivery productsfor transportation, industrial telecommunications and other applications and microelectronic products for spaceand satellite applications.
Maxwell operates as one operating segment called High Reliability, which has two manufacturing locations(San Diego, California and Rossens, Switzerland) and is comprised of three product lines:
• Ultracapacitors: Our primary focus is on ultracapacitors, energy storage devices that possess a uniquecombination of high power density, long operational life and the ability to charge and discharge veryrapidly. Our BOOSTCAP® ultracapacitor cells and multi-cell packs and modules provide highlyreliable energy storage and power delivery solutions for applications in multiple industries, includingtransportation, automotive, telecommunications, energy and consumer and industrial electronics.
• High-Voltage Capacitors: Our CONDIS® high-voltage capacitors are extremely robust devices that aredesigned and manufactured to perform reliably for decades in all climates. These products includegrading and coupling capacitors and capacitive voltage dividers that are used to ensure the safety andreliability of electric utility infrastructure and other applications involving transport, distribution andmeasurement of high-voltage electrical energy.
• Radiation-Mitigated Microelectronic Products: Our radiation-mitigated microelectronic productsinclude high-performance, high-density power modules, memory modules and single board computersthat incorporate our proprietary RADPAK® packaging and shielding technology and novelarchitectures that enable them to withstand the effects of environmental radiation and perform reliablyin space.
We aim to design and manufacture our products to perform reliably for the life of the products and systemsinto which they are integrated. We seek to achieve high reliability through the application of proprietary
32

technologies and rigorously controlled design, development, manufacturing and test processes. This highreliability strategy emphasizes the development and marketing of products that enable us to achieve higher profitmargins than commodity electronic components and systems.
2007 Highlights
For 2007, we reported revenue of $57.4 million and a net loss of $15.7 million, or $0.86 per diluted share,versus revenue of $53.9 million and a net loss of $16.5 million, or $0.98 per diluted share for fiscal 2006.
During fiscal 2007, we continued to focus on developing strategic alliances, introduced new products,increased production capacity to meet future anticipated demand, reduced product costs, funded capitalimprovements, strengthened senior management and perfected production processes. Some of these efforts aredescribed below:
• In January, Maxwell announced that it received a purchase order for 100,000 square meters of itsproprietary ultracapacitor electrode material from Shanghai Sanjiu Electric Equipment Company, Ltd.,(Sanjiu) which is preparing to introduce a line of ultracapacitor products based on Maxwell’s cellarchitecture and high-performance electrode for the Chinese transportation, electric utility andindustrial markets.
• In February, we announced that Professor Burkhard Goeschel, who retired in November 2006 as amember of the six-person Management Board of BMW Group, with overall responsibility for research,development and purchasing, had been appointed to Maxwell’s board of directors.
• In April, we announced the opening of a sales office in Shanghai, China, to market our BOOSTCAP®
ultracapacitor products, service customers and support distribution channel partners throughout Asia.
• In May, we announced that Edward B. Caudill was elected Chairman of the Company’s board ofdirectors.
• In May, we announced that we will supply ultracapacitor cells and integration kits to the U.S.Department of Energy’s Argonne National Laboratory for a collaborative research project to assembleand evaluate an integrated ultracapacitor/lithium-ion battery energy storage system for hybrid-electricand plug-in hybrid vehicles.
• In May, we announced the sale of 1.0 million shares of our common stock, with an over allotmentoption to purchase up to 150,000 additional shares in a public offering, resulting in gross proceeds tothe Company of $11.5 million, which includes the entire over-allotment option.
• In July, we announced the signing of a memorandum of understanding with Valeo, a Tier 1 supplier toautomakers worldwide, covering a development collaboration to incorporate Maxwell’s BOOSTCAP®
ultracapacitors in Valeo’s StARS+X, ‘stop-start’ and regenerative braking system.
• In July, we announced that the board of directors appointed David J. Schramm president and chiefexecutive officer, replacing Richard D. Balanson, PhD, who remains a part-time employee of theCompany, functioning as a senior technical advisor.
• In July we announced that our BOOSTCAP® ultracapacitor products have been certified by the officialtesting agency of the People’s Republic of China for energy storage applications in vehicles. Thecertification protocol included testing for electrical, mechanical, thermal, safety and lifetimeperformance.
• In August we delivered our first space-qualified SCS750 single board computers (SBC) to OrbitalSciences Corp., prime contractor for NASA’s Glory earth sciences mission. The SBCs will managepayload data for Glory, a three-year mission that will investigate the composition of greenhouse gasesand the effect of solar radiation on the earth’s environment.
33

• In September we announced that we were awarded a contract by Mercedes Car Group to design andproduce ultracapacitors for an advanced engineering hybrid-electric drive train program incorporating abraking energy recuperation system that enables it to increase fuel efficiency and reduce emissions.
• In September we introduced a 75-volt BOOSTCAP® ultracapacitor module to provide a scaleable,cost-effective, low-maintenance solution to meet the backup power and power quality requirements ofwind turbines and other renewable energy generation and industrial equipment applications.
• In September we announced that Dantherm Power A/S, a leading developer of hydrogen and fuel cell-based power supply solutions, selected Maxwell’s BOOSTCAP® ultracapacitors as the short-duration“bridge power” element of its integrated uninterruptible power supply (UPS) systems fortelecommunications and fiber broadband applications.
• In October we announced that we won a contract valued at approximately $3 million from Astrium’sUnited Kingdom-based satellite unit to supply single board computers (SBC) for the European SpaceAgency’s (ESA) “Gaia” astronomy mission to survey more than a billion stars and other celestialbodies to trace the origin and evolution of the Milky Way Galaxy.
• In October we announced the sale of 1.5 million shares of our common stock, with an over allotmentoption to purchase up to 195,000 additional shares in a public offering underwritten by UBS SecuritiesLLC. This resulted in gross proceeds to the company of approximately $15.4 million, which includesthe entire over-allotment option.
• In November we announced an alliance with Tianjin Lishen Battery Joint-Stock Co., Ltd., (Lishen)who is China’s leading producer of rechargeable lithium-ion batteries. We plan to manufacture andmarket novel “hybrid” energy storage products combining the companies’ respective ultracapacitor andlithium-ion battery technologies.
34

RESULTS OF OPERATIONS
Year Ended December 31, 2007 Compared with Year Ended December 31, 2006
The following table presents selected consolidated financial information (in thousands, except per shareamounts):
Year endedDecember 31,
2007 2006
Revenue . . . . . . . . . . . . . . . . . . . . . . . . . . . . . . . . . . . . . . . . . . . . . . . . . . . . . . . $ 57,361 $ 53,885Revenue percentage increase . . . . . . . . . . . . . . . . . . . . . . . . . . . . . . . . . . . . . . . 6% 19 %Gross profit as a percentage of revenue . . . . . . . . . . . . . . . . . . . . . . . . . . . . . . . 25 % 23 %SG&A as percentage of revenue . . . . . . . . . . . . . . . . . . . . . . . . . . . . . . . . . . . . 33 % 30 %R&D expense as percentage of revenue . . . . . . . . . . . . . . . . . . . . . . . . . . . . . . . 20% 19 %Loss from continuing operations . . . . . . . . . . . . . . . . . . . . . . . . . . . . . . . . . . . . $(15,733) $(16,300)Net loss . . . . . . . . . . . . . . . . . . . . . . . . . . . . . . . . . . . . . . . . . . . . . . . . . . . . . . . . $(15,733) $(16,495)Basic and diluted net loss per share . . . . . . . . . . . . . . . . . . . . . . . . . . . . . . . . . . $ (0.86) $ (0.98)
Revenue
Revenue for the year ended December 31, 2007 increased $3.5 million, or 6%, from the prior year. Themajority of the revenue increase came from the High-Voltage capacitors (HV) product line, which generated a17% increase in sales from 2006. This increase was due to two factors: 68% of the increase was from increasedsales of HV products, while the exchange rate from Swiss Franc to U.S. dollars represented 32% of the HVrevenue increase. We anticipate revenue for HV products will continue to increase. However, we are facingchallenges in sourcing certain raw materials necessary for production. We continue to explore various sourcingoptions for these raw materials. We are also adding production capacity in our Rossens plant in order to meetcustomer demand.
License revenue totaled $553,000 in 2007, down from $1.4 million in 2006. The reduction is due to thecompletion of the license agreement through which we provided ultracapacitor cell designs and manufacturingknow-how to Shanghai Urban Eclectic Power Investment Development Corporation. We are now fulfilling thesourcing agreement through which we supply ultracapacitor electrode material to this customer. Althoughhistorically license revenue has been sporadic, Management believes that there are significant additionalopportunities to generate revenue from our technology and know-how. The Company will continue to explorevarious opportunities in 2008, some of which include the licensing of our intellectual property unrelated toelectrode fabrication, to battery companies for improvements in production processes and battery performance.
MicroElectronics (ME) revenue increased $656,000, or 5% from the prior year. The increase was due to a$2.0 million increase in sales volume of ME components, mostly for our new single board computers, which wasoffset by a $1.3 million decrease in sales for the NPOESS project. Revenue for the NPOESS project decreaseddue to funding limitations of the program. We expect ME revenue to increase in 2008 as additional NPOESSfunding becomes available and as demand for our single board computer products continue to grow. However,accounting revenue recognition rules require deferring all revenue for shipments of single board computerproducts until the final “flight rated” boards have been shipped and acceptance from the customer is received.These revenue recognition rules will continue to make ME revenue fluctuate from period to period.
BOOSTCAP® product revenue decreased by $1.4 million, or 9% from the prior year. The decrease wasprimarily attributable to lower-than-forecasted sales during the first half of the year to our largest customer, awind turbine OEM, and lower sales than in the prior year to a power systems integrator for incorporation into atelecommunications power quality application in Europe. Sales to our wind turbine OEM customer increased tothe anticipated quarterly run rate in the second half of 2007, and are expected to continue at or above the
35

end-of-year rate, which would result in higher sales in 2008 than in 2007. We also expect additional sales in 2008for the telecommunication application described above. In addition, increased design-in activity for bus, truckand electric rail applications is expected to contribute to higher BOOSTCAP® revenue in 2008. However, in thepast we have also experienced various delays from major customer’s internal production problems or theirshortages of other key materials for their products unrelated to ultracapacitors. These and other issues are out ofour control and could have a significant impact on 2008 revenue.
We continue to work with customers who are finding various applications for our BOOSTCAP® products ina multitude of devices and systems. In most cases, our customers carry out their assessment of our productsin-house. However, in some situations, the customer contracts with Maxwell to provide that service for a fee. In2007, we recognized $1.9 million in non-recurring engineering fees. Although R&D endeavors may be specificto a particular customer application, they provide us with additional information that we can use for theutilization, construction, design and specifications of other BOOSTCAP® products along with the additionalrevenue we receive.
In 2008 we expect to realize the benefits of the past year’s changes that include the outsourcing ofultracapacitor manufacturing which will provide significant cost reductions for those products. Management hasalso reviewed the entire line of BOOSTCAP® products and has decided to discontinue production of certain lowvolume items and to increase prices of others to bring them more in line with the costs associated with a lowervolume part. We also reviewed our standard price list and, considering the value our products provide to ourcustomers, we are increasing pricing to better balance the volume/revenue equation.
Gross Profit
Gross profit for 2007 was approximately $14.4 million, or 25% of revenue, compared with $12.3 million, or23% of revenue, for the prior year. The gross profit within the BOOSTCAP® product line increased primarily asa result of the increased off shore manufacturing of those products. The cost reduction benefit of moving finishedgood manufacturing off shore began to be realized in 2007. However, the impact of those costs savings were notfully reflected in financial results until the end of 2007 as the off shore inventory took the place of the higher costinventory. As such, 2007 has been a process of implementing these efficiencies with the expectation that 2008results will reflect benefits to our gross profit from cost reductions and other value-based pricing strategy. For thepurpose of comparison to the previous year, in 2007 we had lower license revenue, while non-reoccurringengineering revenue increased, which also added to the gross profit.
Our overall gross profit for 2007 was higher than 2006, the improvement is due to increased volume and achange in the mix of products sold. The gross profit percentage increased slightly for BOOSTCAP® andMicroelectronics products while High-Voltage gross profit margin percentage declined slightly in 2007, endingthe year near an historical average. In 2008, we expect to see continued improvement in gross profit percentagefor BOOSTCAP® products as expected increased product production will be spread over a relatively consistentoverhead costs. While our two other products we anticipate to be more inline with historical averages.
For the year ended December 31, 2007 costs of sales also included $260,000 of stock compensation expenseversus $211,000 in 2006.
Selling, General & Administrative (SG&A) Expense
SG&A expenses were $18.9 million for 2007 compared with $16.4 million for 2006. The increase ispredominantly related to increased labor costs of $1.6 million, $1.1 million of which was from our increasedsales and marketing staff and $500,000 was an increase in general and administrative which stems fromexpanded management capabilities. Our sales cost increased $171,000 in 2007 due to new costs associated withthe establishment of a representation office in China. Stock compensation expense for restricted stock and stockoption awards, although they have no effect on cash, increased $180,000 in 2007 to $2.5 million. Additionally,
36

expenses for outside sales commissions increased $118,000 and the general and administrative expenses fortravel increased $53,000 and consulting and other professional services increased $195,000 in 2007 comparedwith 2006.
Research & Development (R&D) Expense
R&D expenses were $11.3 million for 2007 compared with $10.1 million for 2006. Increased R&Dspending was a result of new product development efforts for BOOSTCAP® and Microelectronics product linesas well as higher spending on intellectual property activity for patent filings. BOOSTCAP® development effortsincluded focusing on the continued improvement of the energy density of our ultracapacitor products. The goal isto evaluate and understand each fundamental component of the ultracapacitor and maximize its performance. Weare involved with R&D partnerships to provide or assist in specific research for the application, utilization,construction, design, and specifications of our BOOSTCAP® products. In the situations where we are conductinginvolved research our clients pay for all or the majority of costs. Microelectronics development efforts havefocused primarily on single board computer development.
Provision (Benefit) For Income Taxes
We recorded tax provisions during 2007 and 2006 of $65,000 and $208,000, respectively. The provisionsrecorded relate to our Swiss subsidiary. The Swiss subsidiary has a tax holiday, which was extended in 2005 foran additional five years.
We have not recorded an income tax benefit for our net loss from fiscal 2007 due to the uncertaintysurrounding the realization of the associated deferred tax asset. However, we have a recorded a deferred taxasset, of approximately $524,000, and a deferred tax liability of similar amount, for the embedded conversionrights of our convertible debentures. These amounts are netted in the balance sheet. Additionally, we haveestablished a valuation allowance against deferred tax assets.
Year Ended December 31, 2006 Compared with Year Ended December 31, 2005
Revenue
Revenue for the year ended December 31, 2006 was $53.9 million, compared with $45.4 million for the yearended December 31, 2005. Compared to 2005, total revenue increased $8.5 million, or 19%, from the prior year.Three quarters of the revenue increase came from the BOOSTCAP® product line, which experienced increaseddemand for its products as well as license revenue that totaled $1.4 million in 2006. Approximately 30% of therevenue increase came from the High-Voltage product line. Management expects High-Voltage revenue tocontinue to increase in 2007, but at a lower rate than what was experienced in 2006. Microelectronics revenue in2006 was marginally lower than in 2005. Maxwell expects Microelectronics revenue to grow in 2007 driven bythe NPOESS single board computer contract and demand for component products.
Gross Profit
Gross profit for 2006 was approximately $12.3 million, or 23% of revenue, compared with $14.0 million, or31% of revenue, for the prior year. The gross profit within the BOOSTCAP® product line decreased because ofincreased production costs associated with our ramp up and phase in of increased manufacturing capacity. Thechallenge continues to be the ability to ramp up production and keep pace with demand while simultaneouslyachieving anticipated production efficiencies. Once these efficiencies are fully in place we anticipate achievingthe required cost reductions to meet our pricing strategy. We expect to continue driving down production costs tomeet the pricing requirements of the markets in which we compete.
Although our overall gross profit for 2006 was lower, there was an improvement in the gross profit of ourHigh-Voltage products compared with 2005. High-Voltage gross profit improvements were primarily a result of
37

reduced manufacturing costs and increased volume. Additionally, gross profit for Microelectronics productsimproved compared with 2005 primarily as a result of increased single board computer demand from NPOESS.
For the year ended December 31, 2006 costs of sales also included $211,000 of stock compensation expenserelated to our adoption of SFAS 123R versus the comparable period where there was no expense for stockcompensation.
Selling, General & Administrative (SG&A) Expense
SG&A expenses were $16.4 million for 2006 compared with $14.1 million for 2005. The increase ispredominantly related to stock compensation expense for restricted stock and stock option awards of $2.3 millionrecognized in 2006 related to our adoption of SFAS 123R, compared with $361,000 for the same period in 2005.Additionally, sales expense, including labor and labor related expenses, outside commissions and advertising,increased to support significantly increased BOOSTCAP® revenue.
Research & Development (R&D) Expense
R&D expenses were $10.1 million for 2006 compared with $7.2 million for 2005. Increased R&D spendingwas a result of new product development efforts for BOOSTCAP® and Microelectronics product lines as well ashigher spending on intellectual property activity for patent filings. BOOSTCAP® development efforts includedelectrode, ultracapacitor, and module designs while Microelectronics development efforts focused on singleboard computer development. We introduced several new BOOSTCAP® products in 2006 and we anticipatecontinuing our investment in R&D at levels similar to 2007.
Provision (Benefit) For Income Taxes
We recorded a $208,000 tax provision during 2006 compared with a $49,000 tax provision during 2005. Theprovisions recorded relate to our Swiss subsidiary. The Swiss subsidiary has a tax holiday, which was extendedin 2005 for an additional five years.
We have not recorded an income tax benefit for our net loss from fiscal 2006 due to the uncertaintysurrounding the realization of the associated deferred tax asset. However, we have a recorded a deferred taxasset, of approximately $1.8 million, and a deferred tax liability of similar amount, for the embedded conversionrights of our convertible debentures. These amounts are netted in the Balance Sheet. Additionally, we haveestablished a valuation allowance against deferred tax assets other than those related to convertible debentures.
Discontinued Operations
We were named as a defendant in a suit filed on March 4, 2004 in the Superior Court of the State ofCalifornia for the County of San Luis Obispo. This suit, Edmonds vs. I-Bus/Phoenix, Inc., was filed by theplaintiff on his behalf and alleges damages concerning the repurchase of I-Bus/Phoenix, Inc. shares. OnSeptember 12, 2006 a California jury ruled in favor of the plaintiff for the amount of $231,000. The Companypaid $435,000, including interest. The expense is included in discontinued operations.
During fiscal 2006, preferred shareholders of PurePulse provided the Company with a release of liability.Accordingly, a reserve of approximately $259,000 was reversed and is included in discontinued operations.
Other Events
We assess the Company’s goodwill and intangible assets annually or as economic conditions warrant anassessment and determined that there was no impairment. Accordingly, no goodwill impairments wererecognized for the years ended December 31, 2007, 2006 and 2005.
38

Amortization of intangibles was $224,000, $76,000 and $76,000 for the years ended December 31, 2007,2006 and 2005, respectively. The increase from prior years of $148,000 relates to the amortization of thecapitalized legal costs from the patent infringement lawsuit against NessCap as discussed above in Item 3. Theremainder relates to the amortization of developed core technology acquired in conjunction with the 2002acquisition of Montena Components and the amortization of ultracapacitor intellectual property that wasrecorded in conjunction with the 2003 merger of the Electronic Components Group, a majority-ownedsubsidiary, into Maxwell after the purchase of all shares not already owned by the Company.
Net interest expense for the years ended December 31, 2007 and 2006 were $1.1 million and $431,000,respectively and net interest income of $198,000 for the year ended December 31, 2005. The transition frominterest income to expense is due to the interest payments on the convertible debenture issued in December 2005.
As a result of the registration rights on the shares acquired upon debt conversion and warrants exercised thefair value of the embedded conversion features and warrants are recorded as liabilities. The initial fair value of$9.2 million as of December 20, 2005 was treated as a discount to the $25 million debenture; in addition, therewas $1.3 million of costs related to the issuance of the convertible debt, which are also amortized over theremaining current life of the note. The term of the debenture may be adjusted based on the holder’s election toextend the payment terms. Beginning with the first payment that was due December 2007, the holder deferred theinitial payment and may elect to defer the next eight quarterly payments. Each payment can be deferred for a 24month period, as such the installment payments may be delayed with the final payment on this debt may extenduntil December 2011. The amortization of the debt discount and deferred costs totaled $3.6 million for each ofthe years ended December 31, 2007 and 2006.
The fair value calculation at December 31, 2006 and 2005 was impacted by the change in Maxwell’s stockprice and a reduction in the time which the holder has to exercise their rights. The fair value of the embeddedconversion features and warrants will be recalculated each reporting period and any difference in value from theprior period will be reflected in the Statement of Operations. The future impact of fair value recalculations willbe difficult to predict, given the historical volatility of Maxwell’s stock price, however, it is a non-cash item anddoes not impact cash flow.
Liquidity and Capital Resources
Changes in Cash Flow
For the year ended December 31, 2007, cash used in operating activities was $14.6 million compared with$14.7 million for the year ended December 31, 2006 and $5.1 million for the year ended December 31, 2005. Theuse of cash for the years ended December 31, 2007, 2006, and 2005 was primarily attributed to operating lossesfrom continuing operations, patent defense costs and to increased accounts receivable and inventory balances insupport of higher revenue.
Capital expenditures for the years ended December 31, 2007, 2006 and 2005 were $4.7 million, $6.8 millionand $3.8 million, respectively. Capital spending has been focused on automating production processes for theHigh-Voltage and BOOSTCAP® product lines. Capital expenditures for 2008 are expected to be approximately$5.7 million, which will be invested primarily in production equipment to increase capacity for the highercustomer demand of High-Voltage and BOOSTCAP® products.
The financing activities for the year ended December 31, 2007 totaled $29.8 million with the majority ofthis coming from the Company sale of $26.6 million in stock, net of offering costs. The sales were 1.15 millionshares of common stock in the second quarter of 2007 and 1.5 million shares of common stock in the fourthquarter 2007. The sale of common stock was pursuant to a Prospectus Supplement filed with the Securities andExchange Commission. The financing activities for the years ended December 31, 2006 and 2005 were increasesin cash of $6.1 million and $30.6, respectively, with the majority of the activity in 2006 coming from the
39

issuance of stock from options exercised and proceeds from long and short-term borrowings. In 2005 we soldapproximately 489,000 shares of common stock and the Company received proceeds of approximately $5.4million and placed a convertible debenture along with warrants to purchase shares of Maxwell common stockand we received net proceeds of approximately $23.7 million.
Liquidity
As of December 31, 2007, we had approximately $22.2 million in cash and cash equivalents, investment inmarketable securities with an additional $8.0 million in and restricted cash for a total of $30.2 million. The cashrestriction will be released after the convertible debenture is repaid. We have a 1 million Swiss Francs(approximately $888,000) line of credit with a Swiss bank for working capital, approximately $843,000 of theline was utilized as of December 31, 2007.
In November 2006 we filed an S-3 with the Securities and Exchange Commission to, from time to time, sellup to an aggregate of $125 million of the Company’s common stock, warrants or debt securities. During 2007 theCompany sold $26.6 million in stock. The sales were 1.15 million shares of common stock in the second quarterof 2007 and 1.5 million shares of common stock in the fourth quarter 2007. During the year ended December 31,2007 our patent defense costs totaled $1.6 million, we anticipate our expenditures for 2008 to be less than 2007.If additional funds are required we have several options to raise capital that include negotiations to eliminate thecurrent restriction on $8 million of cash, bridge financing and/or a private placement or public offering of ourcommon stock, preferred stock, or debt.
Debentures, Short-term and Long Term Borrowings
Convertible Debentures
On December 20, 2005, the Company issued $25 million in aggregate principal amount of seniorsubordinated convertible debentures (the “Debentures”) along with warrants to purchase shares of Maxwellcommon stock. The net proceeds of the issuance totaled approximately $23.7 million after direct placement costsof approximately $1.3 million. The debenture is payable in quarterly installments of $2.8 million from March2008 through December 2009, with the holder having the option to delay each installment 24 months. The holderelected to delay their first payment that was due in December 2007. The warrants initially issued were topurchase 395,000 shares of Maxwell common stock while the Debentures were convertible into 1.3 millionshares of Maxwell’s common stock, at any time at the option of the holder, at a strike price of $19.00 per share.The number of warrants, conversion shares and the strike price are subject to adjustment upon certain events suchas the sale of equity securities by Maxwell at a price below the strike price of $19.00 per share. In response to theequity sales in 2007 the number of warrants increased to 419,000 and the number of shares of common stock inthe conversion feature increased to 1.4 million shares.
Interest is due quarterly with the interest rate tied to the Federal Funds Rate plus 1.125% per annum. All or aportion of the accrued and unpaid interest may be paid in shares of Maxwell’s common stock at the Company’soption. For fiscal year ended December 31, 2007 we made interest payments of $794,000 with 65,248 shares ofCompany common stock.
After eighteen months from the issue date, Maxwell may require that a specified amount of the principal ofthe Debentures be converted if certain conditions are satisfied for a period of 20 consecutive trading days.
The change in fair value on revaluation of debenture conversion rights and warrant liabilities represents thedifference between the fair value of the warrants and debenture conversion between the two measurement datesusing a Black-Scholes calculation. The effect of the fair market value adjustment are recorded as “Gain (loss) onembedded derivative liabilities.”
The net fair value of the holder’s and Maxwell’s conversion rights at December 31, 2007 and 2006 wereliabilities of $1.3 million, and $4.6 million respectfully, these amounts are included in “Convertible debenturesand long-term debt” on the balance sheet.
40

The warrants issued in connection with the issuance of the Debentures had a fair value at December 31,2007 and 2006 was $577,000 and $1.9 million respectively and is included in “Stock warrants” on the balancesheet. The warrants are exercisable at any time through December 20, 2010. No warrants had been exercised asof December 31, 2007.
As long as the Debentures are outstanding, the Company is required to maintain a cash balance of$8.0 million. This amount is classified as restricted cash at December 31, 2007 and 2006.
Short-term borrowings
Maxwell’s European subsidiary, Maxwell Technologies SA, (Maxwell SA) has a 2.0 million Swiss Franc(approximately $1.8 million as of December 31, 2007) bank credit agreement with a Swiss bank, which renewsannually. Borrowings under the credit agreement bear interest at 4.65% with repayment terms extending beyondone month from the date of funding. Borrowings under the credit agreement are unsecured and as ofDecember 31, 2007 and 2006, the full amount available under the credit line was drawn.
Maxwell SA, has a 1.0 million Swiss Francs (approximately $888,000 as of December 31, 2007) overdraftcredit agreement with a Swiss bank, which renews annually. Borrowings under the credit agreement bear interestat 4.45%. Borrowings under the credit agreement are unsecured and as of December 31, 2007, $843,000 of theoverdraft credit line was drawn.
Maxwell SA, has a 2.0 million Swiss Francs (approximately $1.8 million as of December 31, 2007) short-term loan agreement with a Swiss bank. Borrowings under this short-term loan agreement bear interest at 4.55%with repayment terms extending beyond one month from the date of funding. Borrowings under the short-termloan agreement are unsecured and as of December 31, 2007, the full amount of the credit line was drawn.
Long-term borrowings
Maxwell SA, has a term loan with a maximum draw of 1.2 million Swiss Francs (approximately $1.0million as of December 31, 2007) for financing specific capital equipment expenditures. Borrowings under theterm loan are secured by the equipment being purchased. This credit agreement bears interest at the Swiss inter-bank borrowing rate plus 2.0%. The term loan can be borrowed in quarterly advances up to the maximum limitand repaid over one to five years. As of December 31, 2007, approximately $408,000 was outstanding. Theweighted average interest rate on the funds borrowed at December 31, 2007 was 4.2%.
In December 2006, we secured a $1.0 million credit line from a U.S. bank for capital equipment purchases,subject to a three-year repayment period. The agreement bears interest at a rate of the US government Treasurynote plus 825 basis points. As of December 31, 2007 the interest rate was 12.99% with an amount outstanding of$511,000.
In December 2006 the Company secured a loan from a U.S bank in the amount of $26,000 for a vehicle. Theloan is subject to a five year repayment period. The agreement bears interest at a rate of 4.9% and asDecember 31, 2007 $21,000 was outstanding.
Stock Sales
In November 2006 we filed an S-3 with the Securities and Exchange Commission to, from time to time, sellup to an aggregate of $125 million of the Company’s common stock, warrants or debt securities. During thefiscal year ended December 31, 2007 the Company sold $26.6 million in stock. The sales were 1.15 millionshares of common stock in the second quarter of 2007 and 1.5 million shares of common stock in the fourthquarter 2007. In each case the sale of common stock was pursuant to a Prospectus Supplement filed with theSecurities and Exchange Commission.
41

In July 2005, the Company sold 488,888 shares of its common stock at $11.25 per share pursuant to aProspectus Supplement filed with the Securities and Exchange Commission, which represented the remainingamount available for sale on the Form S-3 registration statement filed in September 2004. The Company receivedproceeds of approximately $5.4 million.
Other Events
In 2005, a customer brought to our attention a possible defect in a product that we sourced from anothermanufacturer and resold to the customer. In late 2007 Maxwell SA, initiated a proceeding in Germany against theoriginal manufacturer. This is currently in a discovery phase for analysis of Maxwell’s claim of product defectmanufactured by the source company. These products were resold by Maxwell to end customers who haveexperienced issues with the product. In November of 2007, an “expert” was appointed to performing experimentson the allegedly defective product to determine: (a) if there is a defect; and (b) if there is a defect, if the defect isone stemming from manufacturing or from operating conditions. The expert’s opinion is expected no earlier thanJune 2008. The matter has not been resolved and we have not yet been able to determine what, if any, warrantyexposure Maxwell may have, and therefore, we have not recorded any specific warranty reserve provision forthis issue. We carry insurance that we believe would cover all or a portion of any obligation that might ultimatelyarise from this matter.
Minority Equity Interests in Subsidiaries
PurePulse, which suspended operations in 2002 and is classified as discontinued operations, has minorityequity investors. These investors are former employees who were issued shares when PurePulse originally wasincorporated and former employees who have exercised stock options in that entity. As of December 31, 2007and 2006, minority investors owned approximately 11% of the outstanding stock of PurePulse.
Contractual Obligations
Payment due by period (in thousands)
Total
Lessthan1 Year
1–3Years
3–5Years
Morethan
5 Years
Operating Lease Obligations (1) . . . . . . . . . . . $ 9,172 $ 1,978 $ 4,532 $1,775 $ 887Purchase Commitments (2) . . . . . . . . . . . . . . . 6,711 6,711 — — —Debt Obligations (3) . . . . . . . . . . . . . . . . . . . . . 31,977 17,871 14,106 — —Pension benefit payments (4) . . . . . . . . . . . . . . 11,699 958 2,094 2,208 6,439
Total . . . . . . . . . . . . . . . . . . . . . . . . . . . . . . . . . $59,599 $27,518 $20,732 $3,983 $7,326
(1) Operating lease obligations represent building leases, for U.S. and Switzerland locations.(2) Purchase commitments primarily represent the value of non-cancelable purchase orders and an estimate of
purchase orders that if cancelled would result in a significant penalty to the Company.(3) Debt obligations represent long-term and short-term borrowings and current portion of long-term debt and
interest.(4) Pension benefit payments represent the expected amounts to be paid for pension benefits.
Critical Accounting Policies
This discussion and analysis of our financial condition and results of operations is based upon ourconsolidated financial statements, which are prepared in accordance with accounting principles generallyaccepted in the United States of America, which we refer to as U.S. GAAP. We have used certain assumptionsand judgments in the preparation of these financial statements, which assumptions and estimates may potentiallyaffect the reported amounts of assets and liabilities and the disclosure of contingencies as well as reported
42

amounts of revenues and expenses. The following may involve a high degree of judgment and complexity and, assuch, management assumptions and conclusions in these areas may significantly impact the results of operationsof the Company.
Revenue Recognition
We derive revenue from the sale of manufactured products directly to customers. For certain long-termcontracts revenue is recognized at the time costs are incurred and for licensing fees we recognize revenue fromthe right to manufacture products based on our proprietary ultracapacitor design. Product revenue is recognized,according to the guidelines of SEC Staff Accounting Bulletin Numbers 101 Revenue Recognition in FinancialStatements, and 104 Revenue Recognition, when title passes to the customer at either shipment from our facilitiesor receipt at the customer facility, depending on shipping terms, provided collectability is reasonably assured. If avolume discount is offered, revenue is recognized at the lowest price to the customer. This method has beenconsistently applied from period to period and there is no right of return.
Revenue on fixed price government contracts is recognized at the time costs are incurred and is calculatedon a percentage of completion basis, similar to contract accounting under Statement of Position 81-1, Accountingfor Performance of Construction-Type and Certain Production-Type Contracts and is limited by the funding ofthe prime contractor. In prior years, certain continuing and discontinued segments involved revenues from bothlong-term and short-term fixed price contracts and cost plus contracts with the U.S. Government directly orthrough a prime contractor. Those revenues, including estimated profits, were recognized at the time the costswere incurred and included provisions for any anticipated losses. These contracts are subject to rate audits andother audits, which could result in the reduction of revenue in excess of estimated provisions. In turn, this couldincrease losses for the periods in which any such reduction occurs.
We recognize revenue that relates to multiple element contracts in accordance with EITF 00-21, Accountingfor Revenue Arrangements with Multiple Deliverables. Revenue to which this guidance applies includes acontract that grants a license to manufacture and market products in Mainland China, using Maxwell’sproprietary large cell and multi-cell module technology under a separate brand. The contract, obligates themanufacturer to source ultracapacitor electrode material from Maxwell. The agreement has no general right ofreturn and allows for no refunds. Additionally, we have contracts where all the elements of the agreement need tobe delivered and accepted by the customer prior to any revenue being recognized for the deliverables.
From time to time the Company has entered into multiple-element contractual arrangements with elementsof software that are essential to the functionality of the delivered elements. The Company recognizes revenue onthe delivered elements when vendor-specific objective evidence (VSOE) of the fair value of the undeliveredelements exists in accordance with Statement of Position No. 97-2, Software Revenue Recognition, (SOP 97-2).
During fiscal 2007, the Company entered into two contracts whereby we have delivered certain elementsand VSOE of fair value of the undelivered elements does not exist. As of December 31, 2007, the Company hasrecorded approximately $574,000 of deferred revenue related to these contracts.
For contract research and development arrangements that contain up-front or milestone-based payments, werecognize revenue using the proportional performance method based on the percentage of costs incurred relativeto the total costs estimated to be incurred to complete the contract. Revenue recognition computed under thismethodology is compared with the amount of non-refundable cash payments received or contractually receivableat the reporting date and the lesser of the two amounts is recognized as revenue at each reporting date. Theproportional performance methodology applied by the Company, utilizes an input based measure, specificallycosts incurred to date, to determine proportional performance because we believe the use of an input measure is areasonable surrogate of proportional performance compared to an output based measure, such as milestones.Amounts billed in advance are recorded as deferred revenue on the balance sheet. Since payments received aregenerally non-refundable, the termination of a contract by a customer prior to its completion could result in animmediate recognition of deferred revenue relating to payments already received not previously recognized asrevenue.
43

Excess and Obsolete Inventory and Lower Cost or Market Reserves
We value inventories at the lower of cost or market. In assessing the ultimate realization of inventories, wemake judgments as to future demand requirements and compare that with current and committed inventorylevels. The markets for the Company’s products are extremely competitive and are characterized by rapidtechnological change, new product development, product obsolescence and evolving industry standards. Pricecompetition is intense and significant price erosion generally occurs over the life of a product. We have recordedsignificant charges for reserves in recent periods to reflect changes in market conditions. We believe that futureevents are subject to change and revisions in estimates may have a significant adverse impact on the balancesheet and statement of operations.
Goodwill
We account for goodwill in accordance with SFAS No. 142, “Goodwill and Other Intangible Assets.” Thisstandard requires that goodwill no longer be amortized but is subject to an annual impairment test and when anevent occurs or circumstances change such that it is reasonably possible that an impairment may exist. The firststep consists of estimating the fair value of each reporting unit and comparing those estimated fair values withthe carrying values of the reporting units, which includes the allocated goodwill. If the fair value is less than thecarrying value, a second step is performed to compute the amount of the impairment by determining an impliedfair value of goodwill. The implied fair value of goodwill is the residual fair value derived by deducting the fairvalue of a reporting unit’s assets and liabilities from its estimated fair value, which was calculated in step one.The impairment charge represents the excess of the carrying amount of the reporting unit goodwill over theimplied fair value of their goodwill. We have one reporting unit and we estimate the fair value of our reportingunit based on the market value of the Company’s outstanding common stock. The market value of theCompany’s stock at December 31, 2007 exceeded the carrying value of the reporting unit and, therefore, thesecond step calculation to determine the implied fair value of goodwill was not necessary.
We cannot say with certainty that we may not incur charges for impairment of goodwill in the future if thefair value of Maxwell Technologies and Maxwell SA decrease due to market conditions, revisions in ourassumptions or other unanticipated circumstances. Any impairment charges will adversely affect our results ofoperations.
Convertible Debentures
We account for the conversion factor of our convertible debentures and warrants in accordance with SFASNo. 133, “Accounting for Derivative Instruments and Hedging Activities.” This standard requires the conversionfeature of our convertible debt to be separated from the host contract and presented as a derivative instrument.EITF 00-19, “Accounting for Derivative Financial Instruments Indexed to and Potentially Settled in aCompany’s Own Stock” and EITF 05-2, “The Meaning of “Conventional Convertible Debt Instrument” in IssueNo. 00-19” were also analyzed to determine whether the debt instrument is to be considered a conventionalconvertible debt instrument and classified in stockholders’ equity. The convertible debentures issued onDecember 20, 2005 were evaluated and determined not to be conventionally convertible and, therefore, becauseof certain terms and provisions including liquidating damages under the associated registration rights agreementthe embedded conversion option was bifurcated and has been accounted for as a derivative liability instrument.The stock warrants issued in conjunction with the convertible debt on December 20, 2005 were also evaluatedand determined to be a derivative instrument and, therefore, classified as a liability on the balance sheet. Theaccounting guidance also requires that the conversion feature and warrants be recorded at fair value for eachreporting period with changes in fair value recorded in our Statement of Operations.
A Black-Scholes valuation calculation was applied to both the conversion features and warrants at eachperiod end date. The December 20, 2005 valuation was used for the effective debt discount that these instrumentsrepresent. The debt discount is amortized over the four-year life of the debentures using the effective interestmethod. The Company’s stock price is one input used in the Black-Scholes calculation, which has a significant
44

impact on the calculation. The change in the Company’s stock price will have an effect on the gain or loss onembedded derivative liabilities in the Statement of Operations. The volatility of the Company’s stock price islikely to generate large swings in the valuations of the conversion features and warrants in future periods.
Stock Compensation
Effective January 1, 2006 we adopted the fair value recognition provisions of revised Statement of FinancialAccounting Standards No. 123 (revised) (SFAS 123R), Share-Based Payment, which establishes accounting forshare-based awards exchanged for employee services and requires companies to expense the estimated grant datefair value of these awards over the requisite employee service period. We applied the modified prospectivemethod, which provides for certain changes to the method for valuing share-based compensation. Under themodified prospective method, prior periods are not revised for comparative purposes. The expense recognitionprovisions of SFAS 123R apply to new awards and to unvested awards that are outstanding on the effective dateand awards subsequently modified or cancelled. Estimated compensation expense for awards outstanding at theeffective date are being recognized over the remaining service period using the compensation cost calculated forpro forma disclosure purposes under SFAS No. 123, Accounting for Stock-Based Compensation.
In the prior period the we applied the disclosure only provisions of SFAS No. 123, as amended by SFASNo. 148 Accounting for Stock Based Compensation—Transitions and Disclosure. In accordance with theprovisions of SFAS No. 123, we continued with Accounting Principles Board Opinion No. 25 and relatedinterpretations in accounting for stock option plans, we recognized $361,000 of compensation expense for theyear ended December 31, 2005.
Impact of Inflation
We believe that inflation has not had a material impact on our results of operations for any of our fiscalyears in the three-year period ended December 31, 2007. However, there can be no assurance that future inflationwould not have an adverse impact on our operating results and financial condition.
Pending Accounting Pronouncements
In September 2006, the FASB issued SFAS No. 157 Fair Value Measurement. SFAS 157 provides a newsingle authoritative definition of fair value and provides enhanced guidance for measuring the fair value of assetsand liabilities and requires additional disclosures related to the extent to which companies measure assets andliabilities at fair value, the information used to measure fair value, and the effect of fair value measurements onearnings. Some provisions SFAS 157 are effective for us as of January 1, 2008. We are currently assessing theimpact, if any, of SFAS 157 on our consolidated financial statements.
In February 2007, the FASB issued SFAS No. 159, The Fair Value Option for Financial Assets andFinancial Liabilities—Including an Amendment of FASB Statement No 115 which permits entities to choose tomeasure many financial instruments and certain other items at fair value. SFAS No 159 also includes anamendment to SFAS No. 115, “Accounting for Certain Investments in Debt and Equity Securities,” whichapplies to all entities with available-for-sale and trading securities. This Statement is effective as of the beginningof an entity’s first fiscal year that begins after November 15, 2007. We do not anticipate any material impact onour consolidated financial statements upon the adoption of this standard.
Off Balance Sheet Arrangements
None.
45

Item 7A. Quantitative and Qualitative Disclosures about Market Risk
We face exposure to financial market risks, including adverse movements in foreign currency exchangerates and changes in interest rates. These exposures may change over time and could have a material adverseimpact on our financial results. We have not entered into or invested in any instruments that are subject to marketrisk, except as follows:
Foreign Currency Risk
Our primary foreign currency exposure is related to our subsidiary in Switzerland. Maxwell SA has Euroand local currency (Swiss Franc) revenue and local currency operating expenses and loans. During the yearended December 31, 2007, Maxwell SA had revenue of approximately 11.9 million Euro and 19.7 million SwissFranc. Changes in these currency exchange rates impact the U.S. dollar amount of revenue, expenses and debt.We do not hedge our currency exposures.
Interest Rate Risk
At December 31, 2007, we had approximately $30.0 million in debt, of which $13.5 million is classified aslong-term debt. We do not anticipate significant interest rate swings in the near future. However, if they occur itmay affect the consolidated balance sheet or the statement of operations. The estimated impact on earnings orcash flow during the next fiscal year from a change of 100 basis points in the interest rate would have a $300,000effect on our related interest expense.
We invest excess cash in debt instruments of the U.S. Government and its agencies, high-quality corporateissuers and money market accounts. The primary objective of our investment activities is to preserve principalwhile maximizing yields without significantly increasing risk. Our current policies do not allow the use ofinterest rate derivative instruments to manage exposure to interest rate changes. As of December 31, 2007, thirdparties manage approximately $21.4 million of the investment portfolio under guidelines approved by our Boardof Directors. The balance of our cash is invested in money market accounts with banks. A 100 basis point changein the interest rate on our marketable securities would have $214,000 effect on our interest income.
Fair Value Risk
We record an adjustment on our convertible debenture adjusting the fair value of the embedded conversionoptions and stock warrants. The change in these instruments is primarily impacted by the price of our stock at theend of each reporting period. This adjustment creates a non-cash effect on our statement of operations which mayhave a significant impact.
46

Item 8. Financial Statements and Supplementary Data
Our consolidated financial statements and notes thereto appear on pages 49 to 80 of this Annual Report onForm 10-K.
MAXWELL TECHNOLOGIES, INC. AND SUBSIDIARIESINDEX TO CONSOLIDATED FINANCIAL STATEMENTS
Page
Report of Independent Registered Public Accounting Firm, McGladrey & Pullen, LLP . . . . . . . . . . . . . . . . 48
Consolidated Balance Sheets as of December 31, 2007 and 2006 . . . . . . . . . . . . . . . . . . . . . . . . . . . . . . . . . . 49
Consolidated Statements of Operations for the Years Ended December 31, 2007, 2006 and 2005 . . . . . . . . 50
Consolidated Statements of Stockholders’ Equity and Comprehensive Loss for the Years EndedDecember 31, 2007, 2006 and 2005 . . . . . . . . . . . . . . . . . . . . . . . . . . . . . . . . . . . . . . . . . . . . . . . . . . . . . . . 51
Consolidated Statements of Cash Flows for the Years Ended December 31, 2007, 2006 and 2005 . . . . . . . . 52
Notes to Consolidated Financial Statements . . . . . . . . . . . . . . . . . . . . . . . . . . . . . . . . . . . . . . . . . . . . . . . . . . 53
Financial Statement Schedule:
Schedule II—Valuation and Qualifying Accounts . . . . . . . . . . . . . . . . . . . . . . . . . . . . . . . . . . . . . . . . . . . . . 81
47

REPORT OF INDEPENDENT REGISTERED PUBLIC ACCOUNTING FIRM
To the Board of Directors and StockholdersMaxwell Technologies, Inc.
We have audited the consolidated balance sheets of Maxwell Technologies, Inc. and subsidiaries as ofDecember 31, 2007 and 2006, and the related consolidated statements of operations, stockholders’ equity andcomprehensive loss and cash flows for each of the three years in the period ended December 31, 2007. Our auditsalso included the financial statement schedule of Maxwell Technologies, Inc. listed in Item 15(a). These financialstatements and financial statement schedule are the responsibility of the Company’s management. Ourresponsibility is to express an opinion on these financial statements and schedule based on our audits.
We conducted our audits in accordance with the standards of the Public Company Accounting OversightBoard (United States). Those standards require that we plan and perform the audit to obtain reasonable assuranceabout whether the financial statements are free of material misstatement. An audit includes examining, on a testbasis, evidence supporting the amounts and disclosures in the financial statements. An audit also includesassessing the accounting principles used and significant estimates made by management, as well as evaluatingthe overall financial statement presentation. We believe that our audits provide a reasonable basis for ouropinion.
In our opinion, the consolidated financial statements referred to above present fairly, in all material respects,the financial position of Maxwell Technologies, Inc. and subsidiaries as of December 31, 2007 and 2006, and theresults of their operations and their cash flows for each of the three years in the period ended December 31, 2007,in conformity with U.S. generally accepted accounting principles. Also, in our opinion, the related financialstatement schedule, when considered in relation to the basic consolidated financial statements taken as a whole,present fairly in all material respects the information set forth therein.
As discussed in Note 1 to the consolidated financial statements, the Company changed its method ofaccounting for stock-based compensation in 2006.
We also have audited, in accordance with the standards of the Public Company Accounting Oversight Board(United States), Maxwell Technologies, Inc.’s and subsidiaries’ internal control over financial reporting as ofDecember 31, 2007, based on criteria established in Internal Control—Integrated Framework issued by theCommittee of Sponsoring Organizations of the Treadway Commission (COSO) and our report datedFebruary 29, 2008 expressed an unqualified opinion on the effectiveness of Maxwell Technologies Inc.’s andsubsidiaries’ internal control over financial reporting.
/s/ MCGLADREY & PULLEN, LLP
San Diego, CaliforniaFebruary 29, 2008
48

MAXWELL TECHNOLOGIES, INC. AND SUBSIDIARIES
CONSOLIDATED BALANCE SHEETS(in thousands, except per share data)
December 31,
2007 2006
AssetsCurrent assets:
Cash and cash equivalents . . . . . . . . . . . . . . . . . . . . . . . . . . . . . . . . . . . . . . . . . . . . . $ 14,579 $ 8,159Investments in marketable securities . . . . . . . . . . . . . . . . . . . . . . . . . . . . . . . . . . . . . 7,635 3,228Trade and other accounts receivable, net . . . . . . . . . . . . . . . . . . . . . . . . . . . . . . . . . . 13,933 9,749Inventories, net . . . . . . . . . . . . . . . . . . . . . . . . . . . . . . . . . . . . . . . . . . . . . . . . . . . . . . 14,717 14,894Prepaid expenses and other current assets . . . . . . . . . . . . . . . . . . . . . . . . . . . . . . . . . 1,657 1,596
Total current assets . . . . . . . . . . . . . . . . . . . . . . . . . . . . . . . . . . . . . . . . . . . . . . . 52,521 37,626Property and equipment, net . . . . . . . . . . . . . . . . . . . . . . . . . . . . . . . . . . . . . . . . . . . . 14,636 13,621Intangible assets, net . . . . . . . . . . . . . . . . . . . . . . . . . . . . . . . . . . . . . . . . . . . . . . . . . . 3,154 1,395Goodwill . . . . . . . . . . . . . . . . . . . . . . . . . . . . . . . . . . . . . . . . . . . . . . . . . . . . . . . . . . . 21,183 19,786Prepaid pension asset . . . . . . . . . . . . . . . . . . . . . . . . . . . . . . . . . . . . . . . . . . . . . . . . . 8,369 10,371Restricted cash . . . . . . . . . . . . . . . . . . . . . . . . . . . . . . . . . . . . . . . . . . . . . . . . . . . . . . 8,000 8,000Other non-current assets . . . . . . . . . . . . . . . . . . . . . . . . . . . . . . . . . . . . . . . . . . . . . . . 417 870
$ 108,280 $ 91,669
Liabilities and Stockholders’ EquityCurrent liabilities:
Accounts payable and accrued liabilities . . . . . . . . . . . . . . . . . . . . . . . . . . . . . . . . . . $ 9,516 $ 9,383Accrued warranty . . . . . . . . . . . . . . . . . . . . . . . . . . . . . . . . . . . . . . . . . . . . . . . . . . . . 768 795Accrued employee compensation . . . . . . . . . . . . . . . . . . . . . . . . . . . . . . . . . . . . . . . . 2,885 2,543Short-term borrowings and current portion of long-term debt . . . . . . . . . . . . . . . . . . 16,472 5,688Deferred tax liability . . . . . . . . . . . . . . . . . . . . . . . . . . . . . . . . . . . . . . . . . . . . . . . . . . 378 392Net liabilities of discontinued operations . . . . . . . . . . . . . . . . . . . . . . . . . . . . . . . . . . — 63
Total current liabilities . . . . . . . . . . . . . . . . . . . . . . . . . . . . . . . . . . . . . . . . . . . . 30,019 18,864Deferred tax liability, long-term . . . . . . . . . . . . . . . . . . . . . . . . . . . . . . . . . . . . . . . . . . . . . 1,493 2,545Convertible debentures and long-term debt, excluding current portion . . . . . . . . . . . . . . . 13,544 22,527Stock warrants . . . . . . . . . . . . . . . . . . . . . . . . . . . . . . . . . . . . . . . . . . . . . . . . . . . . . . . . . . 577 1,850Other long-term liabilities . . . . . . . . . . . . . . . . . . . . . . . . . . . . . . . . . . . . . . . . . . . . . . . . . 535 —Commitments and contingenciesStockholders’ equity:
Common stock, $0.10 par value per share, 40,000 shares authorized; 20,417 and17,261 shares issued and outstanding at December 31, 2007 and 2006,respectively . . . . . . . . . . . . . . . . . . . . . . . . . . . . . . . . . . . . . . . . . . . . . . . . . . . . . . . 2,042 1,726
Additional paid-in capital . . . . . . . . . . . . . . . . . . . . . . . . . . . . . . . . . . . . . . . . . . . . . . . . . . 172,899 141,294Accumulated deficit . . . . . . . . . . . . . . . . . . . . . . . . . . . . . . . . . . . . . . . . . . . . . . . . . . . . . . (120,094) (104,361)Accumulated other comprehensive income . . . . . . . . . . . . . . . . . . . . . . . . . . . . . . . . . . . . 7,265 7,224
Total stockholders’ equity . . . . . . . . . . . . . . . . . . . . . . . . . . . . . . . . . . . . . . . . . 62,112 45,883
$ 108,280 $ 91,669
The accompanying notes are an integral part of these consolidated financial statements.
49

MAXWELL TECHNOLOGIES, INC. AND SUBSIDIARIES
CONSOLIDATED STATEMENTS OF OPERATIONS(in thousands, except per share data)
Years Ended December 31,
2007 2006 2005
Sales . . . . . . . . . . . . . . . . . . . . . . . . . . . . . . . . . . . . . . . . . . . . . . . . . . . . . . . . . . . . $ 54,876 $ 51,790 $42,994License fees and service revenue . . . . . . . . . . . . . . . . . . . . . . . . . . . . . . . . . . . . . 2,485 2,095 2,443
Total revenue . . . . . . . . . . . . . . . . . . . . . . . . . . . . . . . . . . . . . . . . . . . . . . . . . . . . . 57,361 53,885 45,437Cost of sales . . . . . . . . . . . . . . . . . . . . . . . . . . . . . . . . . . . . . . . . . . . . . . . . . . . . . . 43,010 41,586 31,403
Gross profit . . . . . . . . . . . . . . . . . . . . . . . . . . . . . . . . . . . . . . . . . . . . . . . . . . . . . . 14,351 12,299 14,034Operating expenses (income):
Selling, general and administrative . . . . . . . . . . . . . . . . . . . . . . . . . . . . . . . . 18,887 16,379 14,127Research and development . . . . . . . . . . . . . . . . . . . . . . . . . . . . . . . . . . . . . . 11,263 10,062 7,175Amortization of intangibles . . . . . . . . . . . . . . . . . . . . . . . . . . . . . . . . . . . . . . 224 76 76Loss (gain) on sale of equipment . . . . . . . . . . . . . . . . . . . . . . . . . . . . . . . . . . 63 (80) 40
Total operating expenses . . . . . . . . . . . . . . . . . . . . . . . . . . . . . . . . 30,437 26,437 21,418
Loss from operations . . . . . . . . . . . . . . . . . . . . . . . . . . . . . . . . . . . . . . . . . . . . . . . (16,086) (14,138) (7,384)Interest income (expense), net . . . . . . . . . . . . . . . . . . . . . . . . . . . . . . . . . . . . . . . . (1,064) (431) 198Amortization of debt discount and prepaid debt costs . . . . . . . . . . . . . . . . . . . . . (3,567) (3,616) (100)Gain on embedded derivative and warrants . . . . . . . . . . . . . . . . . . . . . . . . . . . . . 4,528 1,980 800Other income (expense), net . . . . . . . . . . . . . . . . . . . . . . . . . . . . . . . . . . . . . . . . . 521 113 281
Loss from continuing operations before income taxes . . . . . . . . . . . . . . . . . . . . . (15,668) (16,092) (6,205)Income tax provision . . . . . . . . . . . . . . . . . . . . . . . . . . . . . . . . . . . . . . . . . . . . . . . 65 208 49
Loss from continuing operations . . . . . . . . . . . . . . . . . . . . . . . . . . . . . . . . . . . . . . (15,733) (16,300) (6,254)Loss from discontinued operations . . . . . . . . . . . . . . . . . . . . . . . . . . . . . . . . . . . . — (195) (40)
Net loss . . . . . . . . . . . . . . . . . . . . . . . . . . . . . . . . . . . . . . . . . . . . . . . . . . . . . . . . . $(15,733) $(16,495) $ (6,294)
Basic and diluted net loss per share:Loss from continuing operations . . . . . . . . . . . . . . . . . . . . . . . . . . . . . . $ (0.86) $ (0.97) $ (0.39)Loss from discontinued operations . . . . . . . . . . . . . . . . . . . . . . . . . . . . — (0.01) —
Net loss per share . . . . . . . . . . . . . . . . . . . . . . . . . . . . . . . . . . . . . . . . . . . . . . . . . . $ (0.86) $ (0.98) $ (0.39)
Weighted average shares used in computing basic and diluted net loss pershare . . . . . . . . . . . . . . . . . . . . . . . . . . . . . . . . . . . . . . . . . . . . . . . . . . . . . . . . . . 18,285 16,876 16,029
The accompanying notes are an integral part of these consolidated financial statements.
50

MAXWELL TECHNOLOGIES, INC. AND SUBSIDIARIES
CONSOLIDATED STATEMENTS OF STOCKHOLDERS’ EQUITY AND COMPREHENSIVE LOSS(in thousands)
Shares Amount
AdditionalPaid-inCapital
UnearnedCompensation
AccumulatedDeficit
AccumulatedOther
ComprehensiveIncome
TotalStockholders’
Equity
ComprehensiveLoss
(revised)
Balance at December 31, 2004 . . . . . . . . . 15,695 $1,569 $126,317 $ — $ (81,306) $ 6,211 $ 52,791 $ (6,211)
Employee stock purchase and exerciseof stock options . . . . . . . . . . . . . . . . . 219 22 1,625 — — — 1,647
Proceeds from issuance of commonstock . . . . . . . . . . . . . . . . . . . . . . . . . . 489 49 5,414 — — — 5,463
Restricted stock awards . . . . . . . . . . . . . 197 20 2,779 (2,799) — — —Earned compensation . . . . . . . . . . . . . . . — — — 361 — — 361Net loss . . . . . . . . . . . . . . . . . . . . . . . . . — — — — (6,294) — (6,294) $ (6,294)
Other comprehensive income:Foreign currency translationadjustments . . . . . . . . . . . . . . . . . . . . — — — — — (4,118) (4,118) (4,118)
Unrealized gain on marketablesecurities . . . . . . . . . . . . . . . . . . . . . . — — — — — 1 1 1
Balance at December 31, 2005 . . . . . . . . . 16,600 $1,660 $136,135 $(2,438) $ (87,600) $ 2,094 $ 49,851 $(10,411)
Employee stock purchase, exercise ofstock options and share-basedcompensation expense . . . . . . . . . . . . 511 51 5,936 — — — 5,987
Restricted stock awards . . . . . . . . . . . . . 127 13 (1,451) 2,438 — — 1,000Shares issued for interest on convertibledebt . . . . . . . . . . . . . . . . . . . . . . . . . . 41 4 774 — — — 778
Retirement of shares . . . . . . . . . . . . . . . (18) (2) (100) — (266) — (368)Net loss . . . . . . . . . . . . . . . . . . . . . . . . . — — — — (16,495) — (16,495) $(16,495)Other comprehensive income . . . . . . . . — —Foreign currency translationadjustments . . . . . . . . . . . . . . . . . . . . — — — — — 2,329 2,329 2,329
Pension Adjustment . . . . . . . . . . . . . . . . — — — — — 2,801 2,801
Balance at December 31, 2006 . . . . . . . . . 17,261 $1,726 $141,294 $ — $(104,361) $ 7,224 $ 45,883 $(14,166)
Exercise of stock options . . . . . . . . . . . . 258 26 1,816 — — — 1,842Share-based compensation expense . . . . — — 1,175 — — — 1,175Proceeds from issuance of commonstock . . . . . . . . . . . . . . . . . . . . . . . . . . 2,645 264 26,383 — — — 26,647
Restricted stock awards . . . . . . . . . . . . . 212 21 1,740 — — 1,761Shares issued for interest on convertibledebt . . . . . . . . . . . . . . . . . . . . . . . . . . 65 6 788 — — — 794
Retirement of shares . . . . . . . . . . . . . . . (24) (1) (297) — — — (298)Net loss . . . . . . . . . . . . . . . . . . . . . . . . . — — — — (15,733) — (15,733) $(15,733)Other comprehensive income . . . . . . . . — —Foreign currency translationadjustments . . . . . . . . . . . . . . . . . . . . — — — — — 2,671 2,671 2,671
Pension Adjustment . . . . . . . . . . . . . . . . — — — — — (2,631) (2,631) (2,631)Unrealized gain on marketablesecurities . . . . . . . . . . . . . . . . . . . . . . — — — — — 1 1 1
Balance at December 31, 2007 . . . . . . . . . 20,417 $2,042 $172,899 $ — $(120,094) $ 7,265 $ 62,112 $(15,692)
The accompanying notes are an integral part of these consolidated financial statements.
51

MAXWELL TECHNOLOGIES, INC. AND SUBSIDIARIES
CONSOLIDATED STATEMENTS OF CASH FLOWS(in thousands)
Years Ended December 31,
2007 2006 2005
Operating activities:Net Loss . . . . . . . . . . . . . . . . . . . . . . . . . . . . . . . . . . . . . . . . . . . . . . . . . . . . . . . . . . . . . . . . $(15,733) $(16,495) $ (6,294)Adjustments to reconcile net loss to net cash used in operating activities:
Depreciation . . . . . . . . . . . . . . . . . . . . . . . . . . . . . . . . . . . . . . . . . . . . . . . . . . . . . . 4,240 3,811 3,548Amortization . . . . . . . . . . . . . . . . . . . . . . . . . . . . . . . . . . . . . . . . . . . . . . . . . . . . . . 360 206 207Amortization of debt discount and prepaid debt costs . . . . . . . . . . . . . . . . . . . . . . 3,567 3,616 100Gain on embedded derivative and warrant liabilities . . . . . . . . . . . . . . . . . . . . . . . (4,528) (1,980) (800)Pension benefit . . . . . . . . . . . . . . . . . . . . . . . . . . . . . . . . . . . . . . . . . . . . . . . . . . . . (659) (1,460) (329)Stock based compensation expense . . . . . . . . . . . . . . . . . . . . . . . . . . . . . . . . . . . . . 2,936 2,710 361Loss (gain) on sales of property and equipment . . . . . . . . . . . . . . . . . . . . . . . . . . . 63 (80) 40Shares issued for interest expense . . . . . . . . . . . . . . . . . . . . . . . . . . . . . . . . . . . . . . 794 778 —Provision for losses (recoveries) on accounts receivable . . . . . . . . . . . . . . . . . . . . 52 89 (96)Changes in operating assets and liabilities, net of effect of acquisitions anddispositions:Trade and other accounts receivable . . . . . . . . . . . . . . . . . . . . . . . . . . . . . . . . (3,645) (2,549) (489)Inventories . . . . . . . . . . . . . . . . . . . . . . . . . . . . . . . . . . . . . . . . . . . . . . . . . . . . 493 (4,708) (1,938)Prepaid expenses and other assets . . . . . . . . . . . . . . . . . . . . . . . . . . . . . . . . . . (2,046) (762) 109Deferred income taxes . . . . . . . . . . . . . . . . . . . . . . . . . . . . . . . . . . . . . . . . . . . (1,066) 268 (17)Accounts payable and accrued liabilities . . . . . . . . . . . . . . . . . . . . . . . . . . . . (180) 2,452 (18)Accrued employee compensation . . . . . . . . . . . . . . . . . . . . . . . . . . . . . . . . . . 284 (105) 1,085Net liabilities of discontinued operations . . . . . . . . . . . . . . . . . . . . . . . . . . . . (63) (464) (519)Other long-term liabilities . . . . . . . . . . . . . . . . . . . . . . . . . . . . . . . . . . . . . . . . 502 — —
Net cash used in operating activities . . . . . . . . . . . . . . . . . . . . . . . . . . . . . . . . . . . . (14,629) (14,673) (5,050)
Investing activities:Purchases of property and equipment . . . . . . . . . . . . . . . . . . . . . . . . . . . . . . . . . . . . . . . . . (4,708) (6,846) (3,809)Proceeds from sale of property and equipment . . . . . . . . . . . . . . . . . . . . . . . . . . . . . . . . . . 22 299 —Proceeds from sale of marketable securities . . . . . . . . . . . . . . . . . . . . . . . . . . . . . . . . . . . . 3,228 6,920 5,543Purchases of marketable securities . . . . . . . . . . . . . . . . . . . . . . . . . . . . . . . . . . . . . . . . . . . (7,635) (9,451) (4,135)Restricted cash . . . . . . . . . . . . . . . . . . . . . . . . . . . . . . . . . . . . . . . . . . . . . . . . . . . . . . . . . . . — — (8,000)
Net cash used in investing activities . . . . . . . . . . . . . . . . . . . . . . . . . . . . . . . . . . . . (9,093) (9,078) (10,401)
Financing activities:Principal payments on long-term debt and short-term borrowings . . . . . . . . . . . . . . . . . . . (7,817) (4,973) (3,459)Proceeds from long-term and short-term borrowings . . . . . . . . . . . . . . . . . . . . . . . . . . . . . 9,355 7,158 25,374Stock warrants . . . . . . . . . . . . . . . . . . . . . . . . . . . . . . . . . . . . . . . . . . . . . . . . . . . . . . . . . . . — — 2,900Deferred debt costs . . . . . . . . . . . . . . . . . . . . . . . . . . . . . . . . . . . . . . . . . . . . . . . . . . . . . . . — — (1,341)Retirement of shares . . . . . . . . . . . . . . . . . . . . . . . . . . . . . . . . . . . . . . . . . . . . . . . . . . . . . . (298) (368) —Proceeds from issuance of company stock . . . . . . . . . . . . . . . . . . . . . . . . . . . . . . . . . . . . . 28,489 4,277 7,110
Net cash provided by financing activities . . . . . . . . . . . . . . . . . . . . . . . . . . . . . . . . 29,729 6,094 30,584
Increase (decrease) in cash and cash equivalents from operations . . . . . . . . . . . . . . . . . . . . . 6,007 (17,657) 15,133Effect of exchange rate changes on cash and cash equivalents . . . . . . . . . . . . . . . . . . . . . . . . 413 56 (113)
Increase (decrease) in cash and cash equivalents . . . . . . . . . . . . . . . . . . . . . . . . . . . . . . . . . . 6,420 (17,601) 15,020Cash and cash equivalents at beginning of year . . . . . . . . . . . . . . . . . . . . . . . . . . . . . . . . . . . 8,159 25,760 10,740
Cash and cash equivalents at end of year . . . . . . . . . . . . . . . . . . . . . . . . . . . . . . . . . . . . . . . . $ 14,579 $ 8,159 $ 25,760
Cash paid for:Interest . . . . . . . . . . . . . . . . . . . . . . . . . . . . . . . . . . . . . . . . . . . . . . . . . . . . . . . . . . . . . . . $ 1,094 $ 463 $ 1,124Income taxes . . . . . . . . . . . . . . . . . . . . . . . . . . . . . . . . . . . . . . . . . . . . . . . . . . . . . . . . . . $ — $ 10 $ 9
Supplemental schedule of noncash investing and financing activities:Shares issued for interest payable . . . . . . . . . . . . . . . . . . . . . . . . . . . . . . . . . . . . . . . . . . . . $ 794 $ 778 $ —
The accompanying notes are an integral part of these consolidated financial statements.
52

MAXWELL TECHNOLOGIES, INC. AND SUBSIDIARIES
NOTES TO CONSOLIDATED FINANCIAL STATEMENTS
Unless the context otherwise requires, all references to “Maxwell,” the “Company,” “we,” “us,” and “our”refer to Maxwell Technologies, Inc. and its subsidiaries; all references to “Maxwell SA” refer to our EuropeanSubsidiary, Maxwell Technologies, SA, all references to “Electronic Components Group” refer to our formersubsidiary, Maxwell Electronic Components Group, Inc., which has been merged into Maxwell; all references to“I-Bus/Phoenix” refer to our subsidiary, I-Bus/Phoenix, Inc., and its subsidiaries; and all references to“PurePulse” refer to our non-operating subsidiary, PurePulse Technologies, Inc.
Note 1—Description of Business and Summary of Significant Accounting Policies
Description of Business
Maxwell Technologies, Inc. is a Delaware corporation originally incorporated in 1965 under the name“Maxwell Laboratories, Inc.” In 1996, the Company changed its name to Maxwell Technologies, Inc. and isheadquartered in San Diego, California.
Maxwell operates as a single operating segment, High Reliability, which is comprised of two manufacturinglocations (San Diego, California and Rossens, Switzerland) and three product lines:
• Ultracapacitors: Our primary focus, ultracapacitors, are energy storage devices that possess a uniquecombination of high power density, extremely long operational life and the ability to charge anddischarge very rapidly. Our BOOSTCAP® ultracapacitor cells and multi-cell packs and modulesprovide highly reliable energy storage and power delivery solutions for applications in multipleindustries, including transportation, energy, consumer and industrial electronics andtelecommunications.
• High-Voltage Capacitors: Our CONDIS® high-voltage capacitors are extremely robust devices that aredesigned and manufactured to perform reliably for decades in all climates. These products includegrading and coupling capacitors and capacitive voltage dividers that are used to ensure the safety andreliability of electric utility infrastructure and other applications involving transport, distribution andmeasurement of high-voltage electrical energy.
• Radiation-Mitigated Microelectronic Products: Our radiation-mitigated microelectronic productsinclude high-performance, high-density power modules, memory modules and single board computersthat incorporate our proprietary RADPAK® packaging and shielding technology and novelarchitectures that enable them to withstand environmental radiation effects and perform reliably inspace.
The Company’s products are designed and manufactured to perform reliably for the life of the products andsystems into which they are integrated. The Company achieves high reliability through the application ofproprietary technologies and rigorously controlled design, development, manufacturing and test processes.
Financial Statement Presentation
The consolidated financial statements include the accounts of Maxwell Technologies, Inc. and itssubsidiary. All significant intercompany transactions and account balances are eliminated in consolidation. ThePurePulse business, which was discontinued in September 2002 and was previously reported as a separatesegment, and the Winding Equipment segment, which was sold in December 2003, and which was recorded ascontinuing operations through the first quarter of fiscal year 2004, have been reclassified as discontinuedoperations. The results of operations of other business units that do not meet the criteria to be classified as adiscontinued operation and were sold or otherwise disposed of are included in continuing operations through thedate of sale. As a result of the reclassification of the Winding Equipment business, the Company is operating as asingle reportable segment.
53

The preparation of the financial statements in conformity with accounting principles generally accepted inthe United States of America requires management to make estimates and assumptions that affect reportedamounts and related disclosures. These estimates include assessing the collectability of accounts receivable, theusage and recoverability of inventories and long-lived assets, including deferred income taxes, the incurrence oflosses on warranty costs, stock compensation expense and the fair value of warrants and embedded conversionoptions related to convertible debentures. The markets for the Company’s products are extremely competitiveand are characterized by rapid technological change, new product development, product obsolescence andevolving industry standards. In addition, price competition is intense and significant price erosion generallyoccurs over the life of a product. As a result of such factors, actual results could differ from the estimates used bymanagement.
Cash and Cash Equivalents, Investments in Marketable Securities
The Company invests its excess cash in debt instruments of the U.S. Government and its agencies, bankcertificates of deposit; commercial paper and high-quality corporate issuers. All highly liquid instruments with anoriginal maturity of three months or less from purchase are considered cash equivalents, and those with originalmaturities greater than three months on the date of purchase are considered investments in marketable securities.The Company’s investments in marketable securities are classified as available-for-sale and are reported at fairvalue, with unrealized gains and losses included in stockholders’ equity as a separate component of accumulatedother comprehensive income. Realized gains or losses and other-than-temporary declines in value, if any, onavailable-for-sale securities are reported in other income or expense as incurred. The Company recognized no netrealized gains in the years ended December 31, 2007 and 2006. The Company uses the specific identificationmethod on sales of investments.
Maturities and gross unrealized gains on investments in marketable securities at December 31, 2007 and2006 are as follows (in thousands):
GrossAmortized
Cost
GrossUnrealized
Gain
EstimatedFairValue
As of December 31, 2007:Commercial Paper, Maturing within 1 year . . . . . . . . . . . . . . . . . . . . . . . . $7,635 — $7,635
Total . . . . . . . . . . . . . . . . . . . . . . . . . . . . . . . . . . . . . . . . . . . . . . . . . . . . . . . . . . $7,635 $— $7,635
Current . . . . . . . . . . . . . . . . . . . . . . . . . . . . . . . . . . . . . . . . . . . . . . . . . . . . $7,635 $— $7,635Non-current . . . . . . . . . . . . . . . . . . . . . . . . . . . . . . . . . . . . . . . . . . . . . . . . — — —
As of December 31, 2006:Bank Certificates of Deposit, Maturing within 1 year . . . . . . . . . . . . . . . . $ 550 $— $ 550U.S. Government and Agencies, Maturing within 1 year . . . . . . . . . . . . . — — —Commercial Paper, Maturing within 1 year . . . . . . . . . . . . . . . . . . . . . . . . 995 — 995Corporate Debt Securities Maturing within 1 year . . . . . . . . . . . . . . . . . . 1,682 1 1,683
Total . . . . . . . . . . . . . . . . . . . . . . . . . . . . . . . . . . . . . . . . . . . . . . . . . . . . . . . . . . $3,227 $ 1 $3,228
Current . . . . . . . . . . . . . . . . . . . . . . . . . . . . . . . . . . . . . . . . . . . . . . . . . . . . $3,227 $ 1 $3,228Non-current . . . . . . . . . . . . . . . . . . . . . . . . . . . . . . . . . . . . . . . . . . . . . . . . — — —
Restricted Cash
The Company’s convertible debentures agreement requires the Company to maintain minimum cashbalances of at least $8.0 million. This amount is classified as restricted cash at December 31, 2007, 2006 and2005.
54

Presentation of Cash Flows beginning with Net Loss
Prior to the second quarter of fiscal 2007 we had presented the consolidated statement of cash flowsbeginning with loss from continuing operations rather than net loss. SFAS 95 Statement of Cash Flows prescribesthe use of net loss. In the second quarter of fiscal 2007, we revised prior periods to be consistent with the currentyear presentation, the statement of cash flows begins with net loss, in accordance with SFAS 95.
Fair Value of Financial Instruments
The convertible debentures issued on December 20, 2005 were evaluated and determined not to beconventional convertible and, therefore, because of certain terms and provisions including liquidating damagesunder the associated registration rights agreement the embedded conversion option was bifurcated and has beenaccounted for as a derivative liability instrument. The stock warrants issued on December 20, 2005, inconjunction with the convertible debt were also evaluated and determined to be a derivative instrument and,therefore, classified as a liability on the balance sheet. The accounting guidance also requires that the conversionfeature and warrants be recorded at fair value for each reporting period with changes in fair value recorded in ourStatement of Operations. The fair value of embedded conversion options and stock warrants are based on aBlack-Scholes fair value calculation. The carrying value and the fair value of the convertible debentures atDecember 31, 2007 is approximately $22.2 million and $23.7 million, respectively. As of December 31, 2006,the carrying value and the fair value of the convertible debentures were approximately $19.0 million and $22.9million, respectively. The fair value of convertible debentures was based on discounted cash flows of principaland interest payments, the discount value determined on the issue date of December 20, 2005 is amortized overthe term of the debt. The carrying value of restricted cash and short-term borrowings approximates fair value.
Accounts Receivables
Trade receivables are stated at gross invoiced amount less discounts, other allowances and provision foruncollectible accounts.
Allowance for Doubtful Accounts
The allowance for doubtful accounts reflects management’s best estimate of probable losses inherent in theaccounts receivable balance. Management determines the allowance based on known troubled accounts,historical experience and other currently available evidence.
Inventories
Inventories are stated at the lower of cost (first-in first-out basis) or market. Finished goods andwork-in-process inventory values include the cost of raw materials, labor and manufacturing overhead. Inventorywhen written down to market value establishes a new cost basis and its value is not subsequently increased basedupon changes in underlying facts and circumstances. The Company makes adjustments to reduce the cost ofinventory to its net realizable value, if required, for estimated excess obsolete inventories. Factors influencingthese adjustments include inventories on-hand compared to estimated future usage and sales for existing and newproducts and assumptions about the likelihood of obsolescence.
Property and Equipment
Property and equipment are carried at cost and are depreciated using the straight-line method. Depreciationand amortization is provided over the estimated useful lives of the related assets (three to ten years). Leaseholdimprovements are amortized over the shorter of their estimated useful lives or the terms of the lease. Leaseholdimprovements funded by the landlord are recorded as assets and deferred liabilities are amortized over the leaseterm.
55

Long-Lived Assets
Property and equipment are reviewed for impairment whenever events and changes in businesscircumstances indicate the carrying value of the property and equipment may not be recoverable. If the Companydetermines that the carrying value of the property and equipment may not be recoverable, a permanentimpairment charge is recorded for the amount by which the carrying value of the long-lived asset exceeds its fairvalue.
Goodwill and Intangible Assets
Goodwill, which represents the excess of the cost of an acquired business over the net of the fair valueassigned to its assets acquired and liabilities assumed, is not amortized. Instead, goodwill is assessed forimpairment under Statement of Financial Accounting Standards (SFAS) No. 142, Goodwill and Other IntangibleAsset. The Company tests goodwill and has established December 31 as the annual impairment test date, using afair value approach. Intangible assets with finite lives continue to be amortized on a straight-line basis over theiruseful lives of 10 to 12 years and are evaluated for impairment whenever events, or changes in circumstances,indicate that their carrying value may not be recoverable under SFAS No. 144, Accounting for Impairment orDisposal of Long-Lived Assets.
Warranty Obligation
The Company provides product warranties in conjunction with certain product sales. The majority of theCompany’s warranties are for one to two years in the normal course of business. The Company accrues for theestimated warranty at the time of sale based on historical warranty expenses. The estimated warranty liability iscalculated based on historical warranty expenses plus any known or expected change in warranty exposure. Inaccordance with SFAS No 48 Revenue Recognition When Right of Return Exists, if historical evidence ofwarranty returns does not exists, the Company will defer revenue until the warranty costs are estimable or thewarranty period has passed.
Income Taxes
The Company accounts for income taxes in accordance with SFAS No. 109, Accounting for Income Taxes,which requires the use of the liability method of accounting for deferred income taxes. Under this method,deferred income taxes are recorded to reflect the tax consequences on future years of temporary differencesbetween the tax bases of assets and liabilities and their financial reporting amounts at each period end. If it ismore likely than not that some portion or all of a deferred tax asset will not be realized, a valuation allowance isrecognized.
In July 2006, the FASB issued Interpretation No. 48 (FIN 48), “Accounting for Uncertainty in IncomeTaxes”. FIN 48 is an interpretation of “Statement of Financial Accounting Standards No. 109”, which providescriteria for the recognition, measurement, presentation and disclosures of uncertain tax positions. A tax benefitfrom an uncertain tax position may be recognized if it is “more likely than not” that the position is sustainablebased solely on its technical merits. The Company adopted FIN 48 on January 1, 2007.
Concentration of Credit Risk
The Company maintains cash balances at various financial institutions primarily in California and suchbalances commonly exceed the $100,000 insured amount by the Federal Deposit Insurance Corporation. TheCompany has not experienced any losses in such accounts and management believes that the Company is notexposed to any significant credit risk with respect to such cash and cash equivalents.
Financial instruments, which subject the Company to potential concentrations of credit risk, consistprincipally of the Company’s accounts receivable. The Company’s accounts receivable result from product sales
56

to customers in various industries and in various geographical areas, both domestic and foreign. The Companyperforms ongoing credit evaluations of its customers and generally requires no collateral. One customer provided18% and 18% of revenue in 2007 and 2006, respectively and comprised 13% and 18% of accounts receivablebalances at December 31, 2007 and 2006, respectively.
Revenue Recognition
We derive revenue from the sale of manufactured products directly to customers. For certain long-termcontracts revenue is recognized at the time costs are incurred and for licensing fees we recognize revenue fromthe right to manufacture products based on our proprietary ultracapacitor design. Product revenue is recognized,according to the guidelines of SEC Staff Accounting Bulletin Numbers 101 Revenue Recognition in FinancialStatements, and 104 Revenue Recognition, when title passes to the customer at either shipment from our facilitiesor receipt at the customer facility, depending on shipping terms, provided collectability is reasonably assured. If avolume discount is offered, revenue is recognized at the lowest price to the customer. This method has beenconsistently applied from period to period and there is no right of return.
Revenue on fixed price government contracts is recognized at the time costs are incurred and is calculatedon a percentage of completion basis, similar to contract accounting under Statement of Position 81-1, Accountingfor Performance of Construction-Type and Certain Production-Type Contracts and is limited by the funding ofthe prime contractor. In prior years, certain continuing and discontinued segments involved revenues from bothlong-term and short-term fixed price contracts and cost plus contracts with the U.S. Government directly orthrough a prime contractor. Those revenues, including estimated profits, were recognized at the time the costswere incurred and included provisions for any anticipated losses. These contracts are subject to rate audits andother audits, which could result in the reduction of revenue in excess of estimated provisions. In turn, this couldincrease losses for the periods in which any such reduction occurs.
We recognize revenue that relates to multiple element contracts in accordance with EITF 00-21, Accountingfor Revenue Arrangements with Multiple Deliverables. Revenue to which this guidance applies includes acontract that grants a license to manufacture and market products in Mainland China, using Maxwell’sproprietary large cell and multi-cell module technology under a separate brand. The contract, obligates themanufacturer to source ultracapacitor electrode material from Maxwell. The agreement has no general right ofreturn and allows for no refunds. Additionally, we have contracts where all the elements of the agreement need tobe delivered and accepted by the customer prior to any revenue being recognized for the deliverables.
From time to time the Company has entered into multiple-element contractual arrangements with elementsof software that are essential to the functionality of the delivered elements. The Company recognizes revenue onthe delivered elements when vendor-specific objective evidence (VSOE) of the fair value of the undeliveredelements exists in accordance with Statement of Position No. 97-2, Software Revenue Recognition, (SOP 97-2).
During fiscal 2007, the Company entered into two contracts whereby we have delivered certain elementsand VSOE of fair value of the undelivered elements does not exist. As of December 31, 2007, the Company hasrecorded approximately $574,000 of deferred revenue related to these contracts.
For contract research and development arrangements that contain up-front or milestone-based payments, werecognize revenue using the proportional performance method based on the percentage of costs incurred relativeto the total costs estimated to be incurred to complete the contract. Revenue recognition computed under thismethodology is compared with the amount of non-refundable cash payments received or contractually receivableat the reporting date and the lesser of the two amounts is recognized as revenue at each reporting date. Theproportional performance methodology applied by the Company, utilizes an input based measure, specificallycosts incurred to date, to determine proportional performance because we believe the use of an input measure is areasonable surrogate of proportional performance compared to an output based measure, such as milestones.Amounts billed in advance are recorded as deferred revenue on the balance sheet. Since payments received are
57

generally non-refundable, the termination of a contract by a customer prior to its completion could result in animmediate recognition of deferred revenue relating to payments already received not previously recognized asrevenue.
Research and Development Expense
Research and development expenditures are expensed in the period incurred.
Advertising Expense
Advertising costs are expensed in the period incurred. Advertising expense was $206,000, $374,000 and$265,000 for fiscal 2007, 2006 and 2005, respectively.
Shipping and Handling
The Company recognizes shipping and handling costs as a component of cost of sales. Total shipping andhandling costs for the years ended 2007, 2006 and 2005 was $857,000, $1,044,000, and $511,000, respectively.
Patent Defense Costs
The Company capitalizes patent legal defense costs as additional cost of the patents when a successfuloutcome in the patent defense case is probable. If the Company is ultimately unsuccessful the costs would becharged to expense. The legal expenses associated with our patent infringement lawsuit against Nesscap in theUnited States District Court for the Southern District of California are capitalized. Management believes afavorable outcome is probable. Additionally, we believe the value of the intellectual property involved in thelawsuit is greater than the costs associated with this lawsuit as a result of a successful outcome. As ofDecember 31, 2007 we have capitalized a total of $2.1 million of legal costs which is included in intangibleassets in the consolidated balance sheet. The recovery of costs upon a successful outcome will reduce the assetcarrying value.
Foreign Currencies
The Company’s primary foreign currency exposure is related to its subsidiary in Switzerland. Maxwell SAhas Euro and local currency (Swiss Franc) revenue and operating expenses. Changes in these currency exchangerates impact the U.S. dollar amount of revenue and expenses. The functional currency of the Swiss subsidiary isthe Swiss Franc. Assets and liabilities of Maxwell SA are translated at year-end exchange rates, and revenues,expenses, gains and losses are translated at rates of exchange that approximate the rate in effect at the time of thetransaction. The Company does not hedge its currency exposures. The Company has certain long term contractsin a currency other than U.S. dollars. A change of 100 basis points (or 1%) in the customer local currency wouldimpact the cash flow of the contract by approximately $160,000. We do not hedge our currency exposures.
Other Comprehensive Income (Loss)
Comprehensive income (loss), as defined, includes all changes in equity during a period from non-ownersources. Net loss and other comprehensive loss, including foreign currency translation adjustments, pensionaccounting and unrealized gains and losses on investments in marketable securities are reported, net of theirrelated tax effect, to arrive at comprehensive loss. As of December 31, 2007, accumulated other comprehensiveincome consisted of $7.1 million of unrealized gain on foreign currency translation, $170,000 in Pensionadjustment, and $1,000 in unrealized gain on investments in marketable securities.
For fiscal yearend 2006 we implemented FASB Statement No. 158 Employers’ Accounting for DefinedBenefit Pension and other Postretirement Plans (SFAS 158). The effect of SFAS 158 being implemented was toshow the entire surplus of our Swiss employees retirement plan from the footnotes onto the balance sheet as an
58

additional asset. The other part of the entry should have only been a direct addition to the ending balance ofAccumulated Other Comprehensive Income. However, we also disclosed this amount as a component ofcomprehensive loss for the year ended December 31, 2006. As such our transitional implementation of SFAS 158and the disclosure are being revised to clarify the proper implementation.
The line revised in comprehensive loss in the Consolidated Statement of Stockholders’ Equity andComprehensive loss for the Year ended December 31, 2006 is shown below:
ComprehensiveLoss
As reported Revision
ComprehensiveLoss
(revised)
(in thousands)
Net loss . . . . . . . . . . . . . . . . . . . . . . . . . . . . . . . . . . . . $(16,495) $ — $(16,495)Other comprehensive income:Foreign currency translation adjustments . . . . . . . . . 2,329 — 2,329SFAS 158 Pension Adjustment . . . . . . . . . . . . . . . . . 2,801 (2,801) —
Balance at December 31, 2006 . . . . . . . . . . . . . . . . . . . . . . $(11,365) $(2,801) $(14,166)
Loss Per Share
Basic loss per share is calculated using the weighted average number of common shares outstanding.Diluted loss per share is calculated on the basis of the weighted average number of common shares outstandingplus the dilutive effect of outstanding stock options and restricted stock awards of the Company, assuming theirexercise using the “treasury stock” method. The following table sets forth the computation of basic and dilutedincome (loss) per share (in thousands, except per share data):
Years Ended December 31,
2007 2006 2005
NumeratorBasic and Diluted:
Loss from continuing operations . . . . . . . . . . . . . . . . . . . . . . . . . . . . . . $(15,733) $(16,300) $ (6,254)Income (loss) from discontinued operations, net of tax . . . . . . . . . . . . — (195) (40)
Net loss . . . . . . . . . . . . . . . . . . . . . . . . . . . . . . . . . . . . . . . . . . . . . . . . . $(15,733) $(16,495) $ (6,294)
DenominatorBasic and Diluted:
Weighted average shares outstanding . . . . . . . . . . . . . . . . . . . . . . . . . . 18,285 16,876 16,029
Basic and diluted net loss per share:Loss from continuing operations . . . . . . . . . . . . . . . . . . . . . . . . . . . . . . $ (0.86) $ (0.97) $ (0.39)Income (loss) from discontinued operations, net of tax . . . . . . . . . . . . — (0.01) —
Basic and diluted net loss per share . . . . . . . . . . . . . . . . . . . . . . . . . . . . $ (0.86) $ (0.98) $ (0.39)
For fiscal years 2007, 2006, and 2005, incremental equivalent shares under common stock options, of699,401 1,145,952, and 981,844 respectively, were not included in the computation of diluted earnings per shareas their impact would have been anti-dilutive. Shares issuable on conversion of convertible debentures of1,398,132 have also been excluded in the computation of diluted earnings per share as their impact would havebeen anti-dilutive.
59

Stock Compensation
Effective January 1, 2006 the Company adopted the fair value recognition provisions of revised Statementof Financial Accounting Standards No. 123 (revised) (SFAS 123R), Share-Based Payment, which establishesaccounting for share-based awards exchanged for employee services and requires companies to expense theestimated grant date fair value of these awards over the requisite employee service period. The Company usedthe modified prospective method, which provides for certain changes to the method for valuing share-basedcompensation. Under the modified prospective method, accordingly prior periods are not revised for comparativepurposes. The expense recognition provisions of SFAS 123R apply to new awards and to unvested awards thatare outstanding on the effective date and subsequently modified or cancelled. Estimated compensation expensefor awards outstanding at the effective date are being recognized over the remaining service period using thecompensation cost calculated for pro forma disclosure purposes under SFAS No. 123, Accounting for Stock-Based Compensation.
In 2005 the Company applied the disclosure only provisions of SFAS No. 123, as amended by SFASNo. 148 Accounting for Stock Based Compensation—Transitions and Disclosure. In accordance with theprovisions of SFAS No. 123, the Company applied Accounting Principles Board Opinion No. 25 and relatedinterpretations in accounting for its stock option plans, and recorded $361,000 compensation expense for the yearended December 31, 2005. If the Company had elected to recognize compensation cost based on the fair valuemethod prescribed by SFAS No. 123, the Company’s net loss per share would have been adjusted to the proforma amounts indicated below (in thousands, except per share amounts):
Years EndedDecember 31,
2005
Net loss as reported . . . . . . . . . . . . . . . . . . . . . . . . . . . . . . . . . . . . . . . . . . . . . . . . . . . . . . . . . . . . . . . $(6,294)Add: Stock-based compensation expense included in net loss, as reported . . . . . . . . . . . . . . . . . . . . 361Deduct: Total stock-based employee compensation expense determined under fair value basedmethod for all awards, net of related tax effects . . . . . . . . . . . . . . . . . . . . . . . . . . . . . . . . . . . . . . . (1,634)
Pro forma net loss . . . . . . . . . . . . . . . . . . . . . . . . . . . . . . . . . . . . . . . . . . . . . . . . . . . . . . . . . . . . . . . . $(7,567)
Net loss per share:Basic and diluted—as reported . . . . . . . . . . . . . . . . . . . . . . . . . . . . . . . . . . . . . . . . . . . . . . . . . . $ (0.39)
Basic and diluted—pro forma . . . . . . . . . . . . . . . . . . . . . . . . . . . . . . . . . . . . . . . . . . . . . . . . . . . $ (0.47)
Pending Accounting Pronouncements
In September 2006, the FASB issued SFAS No. 157 Fair Value Measurements (“SFAS 157”). SFAS 157provides a new single authoritative definition of fair value and provides enhanced guidance for measuring the fairvalue of assets and liabilities and requires additional disclosures related to the extent to which companiesmeasure assets and liabilities at fair value, the information used to measure fair value, and the effect of fair valuemeasurements on earnings. Some provisions of SFAS 157 are effective for the Company as of January 1, 2008.The Company is currently assessing the impact if any, on our consolidated financial statements.
In February 2007, the FASB issued SFAS No. 159, The Fair Value Option for Financial Assets andFinancial Liabilities—Including an Amendment of FASB Statement No 115 which permits entities to choose tomeasure many financial instruments and certain other items at fair value. SFAS No 159 also includes anamendment to SFAS No. 115, “Accounting for Certain Investments in Debt and Equity Securities,” whichapplies to all entities with available-for-sale and trading securities. This Statement is effective as of the beginningof an entity’s first fiscal year that begins after November 15, 2007. The Company does not anticipate anymaterial impact on its consolidated financial statements upon the adoption of this standard.
60

In December 2007, the FASB issued SFAS No. 141 (revised), Business Combinations, (“SFAS 141R”),which changes how business combinations are accounted for and will impact financial statements both on theacquisition date and in subsequent periods. SFAS 141R is effective January 1, 2009, the Company will apply thispronouncement prospectively. The impact of adopting SFAS 141R will depend on the nature and terms of anyfuture acquisitions.
Business Enterprise Information
The Company operates as one reportable operating segment, High Reliability, according to SFAS No. 131,Disclosures about Segments of an Enterprise and Related Information, which establishes standards for the waythat public business enterprises report information about operating segments in annual consolidated financialstatements. The chief operating decision maker does not regularly review discrete financial information belowthe consolidated level.
Revenue by product line is provided below (in thousands):
Year ending December 31,
2007 2006 2005
Revenues:Ultracapacitors . . . . . . . . . . . . . . . . . . . . . . . . . . . . . . . . . . . . . . . . . . $17,435 $18,482 $12,093Radiation-Mitigated Microelectronic Products . . . . . . . . . . . . . . . . . 13,360 12,703 13,188High-Voltage Capacitors . . . . . . . . . . . . . . . . . . . . . . . . . . . . . . . . . . 26,566 22,700 20,156
Total . . . . . . . . . . . . . . . . . . . . . . . . . . . . . . . . . . . . . . . . . . . . . . $57,361 $53,885 $45,437
Year ending December 31,
2007 2006 2005
Revenues from external customers located in:United States . . . . . . . . . . . . . . . . . . . . . . . . . . . . . . . . . . . . . . . . . . . $17,195 $18,307 $20,576Germany . . . . . . . . . . . . . . . . . . . . . . . . . . . . . . . . . . . . . . . . . . . . . . . 11,116 13,102 7,942China . . . . . . . . . . . . . . . . . . . . . . . . . . . . . . . . . . . . . . . . . . . . . . . . . 8,524 6,438 4,224France . . . . . . . . . . . . . . . . . . . . . . . . . . . . . . . . . . . . . . . . . . . . . . . . . 3,793 2,408 1,994Sweden . . . . . . . . . . . . . . . . . . . . . . . . . . . . . . . . . . . . . . . . . . . . . . . . 3,199 2,734 1,790Switzerland . . . . . . . . . . . . . . . . . . . . . . . . . . . . . . . . . . . . . . . . . . . . . 2,711 2,277 1,637Hong Kong . . . . . . . . . . . . . . . . . . . . . . . . . . . . . . . . . . . . . . . . . . . . . 1,819 94 773Canada . . . . . . . . . . . . . . . . . . . . . . . . . . . . . . . . . . . . . . . . . . . . . . . . 1,594 436 721United Kingdom . . . . . . . . . . . . . . . . . . . . . . . . . . . . . . . . . . . . . . . . . 1,340 52 526All other countries . . . . . . . . . . . . . . . . . . . . . . . . . . . . . . . . . . . . . . . 6,070 8,037 5,254
Total . . . . . . . . . . . . . . . . . . . . . . . . . . . . . . . . . . . . . . . . . . . . . . $57,361 $53,885 $45,437
Year ending December 31,
2007 2006 2005
(in thousands)
Long-lived assets:United States . . . . . . . . . . . . . . . . . . . . . . . . . . . . . . . . . . . . . . . . . . . $11,715 $10,751 $10,090Switzerland . . . . . . . . . . . . . . . . . . . . . . . . . . . . . . . . . . . . . . . . . . . . . 27,675 24,921 21,696
Total . . . . . . . . . . . . . . . . . . . . . . . . . . . . . . . . . . . . . . . . . . . . . . $39,390 $35,672 $31,786
61

Note 2—Balance Sheet Details (in thousands):December 31,
2007 2006
Trade and other accounts receivable, net:Accounts receivable . . . . . . . . . . . . . . . . . . . . . . . . . . . . . . . . . . . . . . . . . . . . . . . . . . . . $ 14,020 $ 9,883Allowance for doubtful accounts . . . . . . . . . . . . . . . . . . . . . . . . . . . . . . . . . . . . . . . . . . (87) (134)
$ 13,933 $ 9,749
Inventory:Raw material and purchased parts . . . . . . . . . . . . . . . . . . . . . . . . . . . . . . . . . . . . . . . . . $ 10,237 $ 10,452Work-in-process . . . . . . . . . . . . . . . . . . . . . . . . . . . . . . . . . . . . . . . . . . . . . . . . . . . . . . . 3,525 3,518Finished goods . . . . . . . . . . . . . . . . . . . . . . . . . . . . . . . . . . . . . . . . . . . . . . . . . . . . . . . . 4,025 3,709Inventory reserves . . . . . . . . . . . . . . . . . . . . . . . . . . . . . . . . . . . . . . . . . . . . . . . . . . . . . . (3,070) (2,785)
$ 14,717 $ 14,894
Property and equipment:Machinery, furniture and office equipment . . . . . . . . . . . . . . . . . . . . . . . . . . . . . . . . . . $ 30,736 $ 23,022Computer hardware and software . . . . . . . . . . . . . . . . . . . . . . . . . . . . . . . . . . . . . . . . . . 6,342 6,505Leasehold improvements . . . . . . . . . . . . . . . . . . . . . . . . . . . . . . . . . . . . . . . . . . . . . . . . 4,063 3,016Construction in Progress . . . . . . . . . . . . . . . . . . . . . . . . . . . . . . . . . . . . . . . . . . . . . . . . . 293 3,643
41,434 36,186Less accumulated depreciation and amortization . . . . . . . . . . . . . . . . . . . . . . . . . . . . . . (26,798) (22,565)
$ 14,636 $ 13,621
Accounts payable and accrued liabilitiesAccounts payable . . . . . . . . . . . . . . . . . . . . . . . . . . . . . . . . . . . . . . . . . . . . . . . . . . . . . . $ 4,640 $ 5,121Other accrued liabilities . . . . . . . . . . . . . . . . . . . . . . . . . . . . . . . . . . . . . . . . . . . . . . . . . 3,258 3,185Customer deposits . . . . . . . . . . . . . . . . . . . . . . . . . . . . . . . . . . . . . . . . . . . . . . . . . . . . . . 1,618 1,077
$ 9,516 $ 9,383
62

Warranty Reserve Analysis
Years EndedDecember 31,
2007 2006
Accrued Warranty:Beginning balance . . . . . . . . . . . . . . . . . . . . . . . . . . . . . . . . . . . . . . . . . . . . . . . . . . . . . . . . . $ 795 $ 632New product warranties . . . . . . . . . . . . . . . . . . . . . . . . . . . . . . . . . . . . . . . . . . . . . . . . . . . . . 100 1,352Settlement of warranties . . . . . . . . . . . . . . . . . . . . . . . . . . . . . . . . . . . . . . . . . . . . . . . . . . . . (169) (1,223)Other changes/adjustments to warranties . . . . . . . . . . . . . . . . . . . . . . . . . . . . . . . . . . . . . . . 42 34
Ending balance . . . . . . . . . . . . . . . . . . . . . . . . . . . . . . . . . . . . . . . . . . . . . . . . . . . . . . . . . . . $ 768 $ 795
Leasehold improvements
Certain leasehold improvements funded by the landlord are recorded as assets and deferred liabilities andare amortized over the lease term. As of December 31, 2007 and 2006 we had $679,000 and $114,000,respectively of unamortized leasehold improvements funded by the landlord. Of these amounts, $535,000 isincluded in Other long-term liabilities at December 31, 2007.
Note 3—Goodwill and Intangibles
The Company has implemented SFAS No. 142, Goodwill and Other Intangible Assets, and began applyingthe rules on accounting for goodwill and intangible assets effective January 1, 2002. The SFAS No. 142 goodwillimpairment test is a two-step process. The first step consists of estimating the fair value of each reporting unitand comparing those estimated fair values with the carrying values, which includes the allocated goodwill. If thefair value is less than the carrying value, a second step is performed to compute the amount of the impairment bydetermining an implied fair value of goodwill. The implied fair value of goodwill is the residual fair valuederived by deducting the fair value of a reporting unit’s assets and liabilities from its estimated total fair value,which was calculated in step one. The impairment charge represents the excess of the carrying amount of thereporting unit’s goodwill over the implied fair value of their goodwill. SFAS No. 142 requires goodwill to betested annually at the same time every year or when an event occurs or circumstances change such that it isreasonably possible that impairment may exist. The Company selected December 31 as its annual testing date. Asa result of the Company’s annual assessment as of December 31, 2007 and 2006, no impairment was indicated.
The change in the carrying amount of goodwill from January 1, 2006 to December 31, 2007 is as follows (inthousands):
Balance at January 1, 2006 . . . . . . . . . . . . . . . . . . . . . . . . . . . . . . . . . . . . . . . . . . . . . . . . . . . . $18,549Foreign currency translation adjustments . . . . . . . . . . . . . . . . . . . . . . . . . . . . . . . . . . . . 1,237
Balance at December 31, 2006 . . . . . . . . . . . . . . . . . . . . . . . . . . . . . . . . . . . . . . . . . . . . . . . . . 19,786Foreign currency translation adjustments . . . . . . . . . . . . . . . . . . . . . . . . . . . . . . . . . . . . 1,397
Balance at December 31, 2007 . . . . . . . . . . . . . . . . . . . . . . . . . . . . . . . . . . . . . . . . . . . . . . . . . $21,183
63
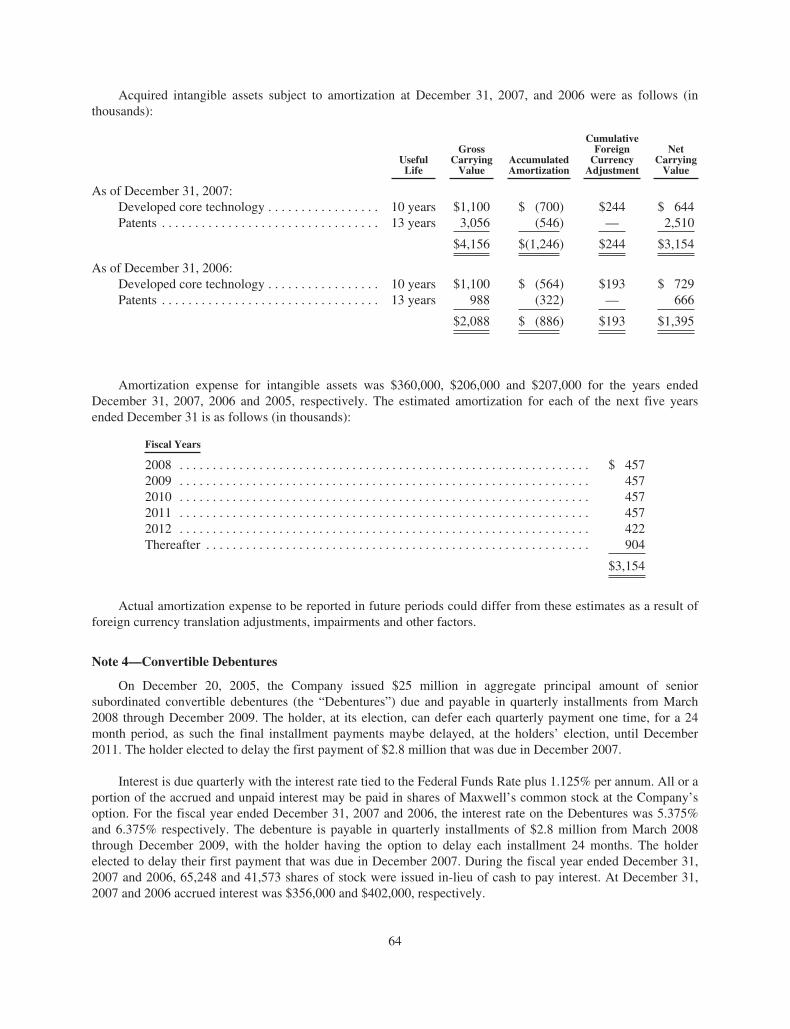
Acquired intangible assets subject to amortization at December 31, 2007, and 2006 were as follows (inthousands):
UsefulLife
GrossCarryingValue
AccumulatedAmortization
CumulativeForeignCurrencyAdjustment
NetCarryingValue
As of December 31, 2007:Developed core technology . . . . . . . . . . . . . . . . . 10 years $1,100 $ (700) $244 $ 644Patents . . . . . . . . . . . . . . . . . . . . . . . . . . . . . . . . . 13 years 3,056 (546) — 2,510
$4,156 $(1,246) $244 $3,154
As of December 31, 2006:Developed core technology . . . . . . . . . . . . . . . . . 10 years $1,100 $ (564) $193 $ 729Patents . . . . . . . . . . . . . . . . . . . . . . . . . . . . . . . . . 13 years 988 (322) — 666
$2,088 $ (886) $193 $1,395
Amortization expense for intangible assets was $360,000, $206,000 and $207,000 for the years endedDecember 31, 2007, 2006 and 2005, respectively. The estimated amortization for each of the next five yearsended December 31 is as follows (in thousands):
Fiscal Years
2008 . . . . . . . . . . . . . . . . . . . . . . . . . . . . . . . . . . . . . . . . . . . . . . . . . . . . . . . . . . . . . . $ 4572009 . . . . . . . . . . . . . . . . . . . . . . . . . . . . . . . . . . . . . . . . . . . . . . . . . . . . . . . . . . . . . . 4572010 . . . . . . . . . . . . . . . . . . . . . . . . . . . . . . . . . . . . . . . . . . . . . . . . . . . . . . . . . . . . . . 4572011 . . . . . . . . . . . . . . . . . . . . . . . . . . . . . . . . . . . . . . . . . . . . . . . . . . . . . . . . . . . . . . 4572012 . . . . . . . . . . . . . . . . . . . . . . . . . . . . . . . . . . . . . . . . . . . . . . . . . . . . . . . . . . . . . . 422Thereafter . . . . . . . . . . . . . . . . . . . . . . . . . . . . . . . . . . . . . . . . . . . . . . . . . . . . . . . . . . 904
$3,154
Actual amortization expense to be reported in future periods could differ from these estimates as a result offoreign currency translation adjustments, impairments and other factors.
Note 4—Convertible Debentures
On December 20, 2005, the Company issued $25 million in aggregate principal amount of seniorsubordinated convertible debentures (the “Debentures”) due and payable in quarterly installments from March2008 through December 2009. The holder, at its election, can defer each quarterly payment one time, for a 24month period, as such the final installment payments maybe delayed, at the holders’ election, until December2011. The holder elected to delay the first payment of $2.8 million that was due in December 2007.
Interest is due quarterly with the interest rate tied to the Federal Funds Rate plus 1.125% per annum. All or aportion of the accrued and unpaid interest may be paid in shares of Maxwell’s common stock at the Company’soption. For the fiscal year ended December 31, 2007 and 2006, the interest rate on the Debentures was 5.375%and 6.375% respectively. The debenture is payable in quarterly installments of $2.8 million from March 2008through December 2009, with the holder having the option to delay each installment 24 months. The holderelected to delay their first payment that was due in December 2007. During the fiscal year ended December 31,2007 and 2006, 65,248 and 41,573 shares of stock were issued in-lieu of cash to pay interest. At December 31,2007 and 2006 accrued interest was $356,000 and $402,000, respectively.
64

At the issuance date, the Debentures were convertible by the holder at any time into 1,315,789 commonshares. We also issued 394,737 warrants in connection with the issuance of the debentures, these had an exerciseprice of $19.00 at the issuance date. The exercise price, number of convertible shares and warrants are subject toadjustment upon certain events, such as the sale of equity securities by Maxwell at a price below the currentexercise price of $19.00 per share.
In June 2007 Maxwell sold a total 1.15 million shares and in October 2007 we sold 1.5 million of shares at aprice below $19.00 which caused an adjustment to the price and number of warrants and convertible debentureshares relating to the convertible debt. The price for the warrants was adjusted to $17.88, the number of warrantsincreased to 419,440 shares, and the convertible debenture increased to 1,398,132 shares.
The Debentures are convertible by the holder at any time into common shares however after eighteenmonths from the issue date, Maxwell may require that a specified amount of the principal of the Debentures beconverted if certain conditions are satisfied for a period of 20 consecutive trading days. To determine a fair valueof this forced conversion the Company applies a Z factor, which is a theoretical measurement of the probabilityof this occurrence. The Z factor used as of December 31, 2007 and 2006 was 0.9% and 16.6%, respectively, forforced conversion of 50% of the conversion option at 135% of the exercise price and zero and 5.6%, respectively,for forced conversion of the remaining conversion option at 175% of the exercise price. The warrants issued inconnection with the issuance of the Debentures are exercisable at any time through December 20, 2010. Nowarrants had been exercised as of December 31, 2007.
Maxwell is accounting for the conversion option in the Debentures and the associated warrants as derivativeliabilities in accordance with SFAS 133, Accounting for Derivative Instruments and Hedging Activities,EITF 00-19, Accounting for Derivative Financial Instruments Indexed to and Potentially Settled in a Company’sOwn Stock and EITF No. 05-2, The Meaning of “Conventional Convertible Debt Instrument” in Issue No. 00-19.The unamortized discount attributable to the issuance date aggregate fair value of the conversion options andwarrants, was $2.8 million and $6.0 million as of December 31, 2007 and 2006, respectively, is being amortizedusing the effective interest method over the term of the Debentures.
The change in fair value on revaluation of debenture conversion rights and warrant liabilities represents thedifference between the fair value at the end of the year and the fair value at the beginning of the year using thevalue calculated by the Black-Scholes pricing model. The fair value of the warrants at December 31, 2007 and2006 were $577,000 and $1.9 million respectively and is included in “Stock warrants” on the balance sheet. Thenet fair value of the liability to the holders and Maxwell’s conversion rights at December 31, 2007 and 2006 wereliabilities of $1.3 and $4.6 million respectively which is included in “Convertible debentures and long-term debt”on the balance sheet. The effect of the fair market value adjustment was $4.5 million and $2.0 million gains forthe fiscal year ended December 31, 2007 and 2006, respectively, which is recorded as “Gain on embeddedderivative and warrants”.
The fair value of the warrants and embedded conversion option is estimated on the balance sheet date usingthe Black-Scholes valuation model with the following assumptions:
Convertible Sharesfor the year endedDecember 31,
Warrantsyear ended
December 31,
2007 2006 2007 2006
Black-Scholes Assumptions:Conversion / Exercise Price . . . . . . . . . . . . . . . . . . . . . . . . . . . . . . . . . . . $17.88 $19.00 $17.88 $19.00Market Price . . . . . . . . . . . . . . . . . . . . . . . . . . . . . . . . . . . . . . . . . . . . . . . $ 8.27 $13.95 $ 8.27 $13.95Expected dividends . . . . . . . . . . . . . . . . . . . . . . . . . . . . . . . . . . . . . . . . . . — — — —Expected volatility . . . . . . . . . . . . . . . . . . . . . . . . . . . . . . . . . . . . . . . . . . . 57.5% 50.4% 54.0% 49.0%Average risk-free interest rate . . . . . . . . . . . . . . . . . . . . . . . . . . . . . . . . . . 3.05% 4.63% 3.07% 4.61%Expected term/life (in years) . . . . . . . . . . . . . . . . . . . . . . . . . . . . . . . . . . . 2.0 3.0 3.0 4.0
65

In the event of any default or fundamental change as defined in the Debentures, the holder will be entitled torequire Maxwell to redeem the Debentures (or any portion thereof) at a price equal to the greater of (i) theapplicable redemption premium (ranging from 103%-115%) and (ii) the product of (x) the number of shares in towhich the Debenture is convertible using the $17.88 per share conversion price and (y) the closing price ofMaxwell’s common stock on the day preceding the default or fundamental change.
The Company shall pay to each holder of registrable securities related to the embedded conversion featureand warrants liquidated damages of 1.5% of the aggregate purchase price every 30th day after a maintenancefailure of the registration of the securities. These damages continue each 30 days (pro rated) until the registrationfailure is cured. As of December 31, 2007, if the Company was not in compliance we would incur damages of$375,000 every 30 days until we cured the maintenance failure. In addition if the damages are not paid in 30 daysafter they are due the Company would incur interest of 1.0% per month on the outstanding damages.
As long as Debentures are outstanding, the Company is required to maintain a cash balance in excess of$8.0 million. This amount is classified as restricted cash at December 31, 2007 and 2006.
Note 5—Short-Term and Long-Term Borrowings
Short-term borrowings
Maxwell’s European subsidiary, Maxwell SA, has a 2.0 million Swiss Franc (approximately $1.8 million atDecember 31, 2007) bank credit agreement with a Swiss bank, which renews annually. Borrowings under thecredit agreement bear interest at 4.65% with repayment terms extending beyond one month from the date offunding. Borrowings under the credit agreement are unsecured and as of December 31, 2007 and 2006, the fullamount available under the credit line was drawn.
Maxwell SA, has a 1.0 million Swiss Francs (approximately $888,000 as of December 31, 2007) overdraftcredit agreement with a Swiss bank, which renews annually. Borrowings under the credit agreement bear interestat 4.45%. Borrowings under the credit agreement are unsecured and as of December 31, 2007, $843,000 of theoverdraft credit line was drawn.
Maxwell SA, has a 2.0 million Swiss Francs (approximately $1.8 million as of December 31, 2007) short-term loan with a Swiss bank. Borrowings under this short-term loan agreement bear interest at 4.55%.Borrowings under the short-term loan agreement are unsecured and as of December 31, 2007, the full amount ofthe credit line was drawn.
At December 31, 2007 and 2006 the Company had zero and $26,000, respectively outstanding in letters ofguarantee primarily related to customer deposits.
Long-term borrowings
Maxwell SA has a term loan with a maximum draw of 1.2 million Swiss Francs (approximately $1.0 millionas of December 31, 2007) for financing specific capital equipment expenditures. Borrowings under the term loanare secured by the equipment being purchased. This credit agreement bears interest at the Swiss inter-bankborrowing rate plus 2.0%. The term loan can be borrowed in quarterly advances up to the maximum limit andrepaid over one to five years. As of December 31, 2007, approximately $408,000 was outstanding. The weightedaverage interest rate on the funds borrowed at December 31, 2007 was 4.2%.
Maxwell, SA had a lending agreement for the acquisition of manufacturing equipment. The cost of thisfinancing was 2.22% of the acquisition price plus VAT. In July 2007 the lending arrangement converted to totalof 48 payments of 34,302 Swiss Francs each, at December 31, 2007 the balance of the obligation of $1.1 million.
66

In December 2006, the Company secured a $1.0 million credit line from a U.S. bank for capital equipmentpurchases, subject to a three-year repayment period. The agreement bears interest at a rate of the US governmentTreasury note plus 825 basis points. As of December 31, 2007 the interest rate was 12.99% with an amountoutstanding of $511,000.
In December 2006 the Company secured a loan from a U.S bank in the amount of $26,000 for a vehicle. Theloan is subject to a five year repayment period. The agreement bears interest at a rate of 4.9% and as ofDecember 31, 2007 $21,000 was outstanding.
The following table summarizes convertible debentures and debt (in thousands):
December 31,2007
December 31,2006
Maxwell SA credit agreement . . . . . . . . . . . . . . . . . . . . . . . . . . . . . . . . . . $ 1,775 $ 1,640Maxwell SA overdraft agreement . . . . . . . . . . . . . . . . . . . . . . . . . . . . . . . 843 779U.S. Vehicle loan . . . . . . . . . . . . . . . . . . . . . . . . . . . . . . . . . . . . . . . . . . . . 22 26U.S. Capital equipment loan . . . . . . . . . . . . . . . . . . . . . . . . . . . . . . . . . . . 511 1,000Maxwell SA capital expenditure loan . . . . . . . . . . . . . . . . . . . . . . . . . . . . 408 566Maxwell SA term loan . . . . . . . . . . . . . . . . . . . . . . . . . . . . . . . . . . . . . . . . 1,775 —U.S. short-term loan . . . . . . . . . . . . . . . . . . . . . . . . . . . . . . . . . . . . . . . . . . 107 —Maxwell SA lending agreement . . . . . . . . . . . . . . . . . . . . . . . . . . . . . . . . . 1,106 593Convertible debentures . . . . . . . . . . . . . . . . . . . . . . . . . . . . . . . . . . . . . . . 23,469 23,611
Total convertible debentures and long-term debt . . . . . . . . . . . . . . . . . . . 30,016 28,215Less current portion . . . . . . . . . . . . . . . . . . . . . . . . . . . . . . . . . . . . . . . . . . 16,472 5,688
Convertible debentures and long-term debt, excluding current portion . . $13,544 $22,527
Payments due on borrowings during each of the five years subsequent to December 31, 2007 are as follows,the amount for 2008 and 2009 including $11.1 and $11.1 million, respectively, for the convertible debenturespayments which may be delayed up to 24 months at the borrowers discretion, (in thousands):
2008 . . . . . . . . . . . . . . . . . . . . . $16,4722009 . . . . . . . . . . . . . . . . . . . . . 12,2872010 . . . . . . . . . . . . . . . . . . . . . 2,7832011 . . . . . . . . . . . . . . . . . . . . . 5
Subtotal payments . . . . . . . . . . 31,547Unamortized discountattributed to conversionoption and warrants . . . . . . . (2,846)
Net fair value of conversionoptions . . . . . . . . . . . . . . . . . 1,315
$30,016
Note 6—Stock Activity and Stock Plans
Stock Sales
In November 2006 the Company filed an S-3 with the Securities and Exchange Commission to, from time totime, sell up to an aggregate of $125 million of the Company’s common stock, warrants or debt securities.During the fiscal year ended December 31, 2007 the Company’s additional paid in capital increased $31.6million. The majority of this increase, $26.6 million, was from the sale of 1.15 million shares of common stock in
67

the second quarter of 2007 and 1.5 million shares of common stock in the fourth quarter 2007. These sales ofcommon stock were pursuant to a Prospectus Supplement filed with the Securities and Exchange Commission.The remainder of the increase in paid in capital was due to the sale of stock for the Company’s Employee StockPurchase Plan, the exercise of stock options and stock-based compensation and conversion of interest payable tocommon stock.
In July 2005, the Company sold 488,888 shares of its common stock at $11.25 per share pursuant to aProspectus Supplement filed with the Securities and Exchange Commission, which represented the remainingamount available for sale on the Form S-3 registration statement filed in September 2004. The Company receivedproceeds of approximately $5.4 million (net of offering expenses).
Stock Option Plans
The Company has two active share-based compensation plans as of December 31, 2007; the 2004 ESPP and2005 Omnibus Equity Incentive Plan under which incentive stock options, non-qualified stock options, EmployeeStock Purchase Plan (ESPP) and restricted stock awards have been granted to employees. Generally, stockoptions and restricted stock awards vest over periods of one to four years and have a maximum contractualperiod of ten years. Option and share award plans provide for accelerated vesting if there is a change in control.Stock options are granted at a price equal to the market price of Company stock at date of grant. The Companyhas also granted equity incentive under stock options plans which include:
• The Company’s 1999 Director Stock Option Plan, under which 75,000 shares were reserved for futuregrant, was adopted in 1999 and approved by the Company’s shareholders in January 2000.
• In December 1999, the Company granted 294,030 non-qualified options to the Company’s then newPresident and Chief Executive Officer, Mr. Eibl, outside of the Company’s other option plans.
The expense for all stock based compensation that has been charged against income for the years endedDecember 31, 2007, 2006 and 2005 is $2.9 million, $2.7 million and $361,000, respectively. For the year endedDecember 31, 2007, the tax benefits associated with the exercise of non-qualified stock options, disqualifyingdispositions of both Incentive Stock Options and stock acquired from the Company’s Employee Stock PurchasePlan was approximately $1.5 million. No tax benefit has been recognized in 2007, 2006 and 2005.
Employee Stock Option Plan
The Company’s 2005 Omnibus Equity Incentive Plan (the “Incentive Plan”), was approved by theshareholders and amended at the 2007 Annual Meeting of Stockholders at the May 3, 2007 meeting to replenishthe equity incentive pool by increasing the number of shares of Common Stock reserved for issuance under theIncentive Plan from 750,000 shares to 1,750,000 shares. The Incentive Plan, provides for the grant of stock basedawards, including incentive stock options, non-qualified stock options, stock appreciation rights, performanceawards, restricted stock, and restricted stock unit awards. This Incentive Plan shares reserved for issuance is alsoreplenished from shares forfeited, 139,000 shares cancelled from the expired 1995 stock option plan and 1,000shares from the 1999 Directors’ plan added to the total available for issuance.
The fair value of each option award granted is estimated on the date of grant using the Black-Scholesvaluation model with the following assumptions:
Fiscal YearEnded
December 31,2007
Fiscal YearEnded
December 31,2006
Fiscal YearEnded
December 31,2005
Expected dividends . . . . . . . . . . . . . . . . . . . . . . . . — — —Expected volatility range . . . . . . . . . . . . . . . . . . . . 49.5% - 52.3% 54.7% - 62.3% 55.1%Average risk-free interest rate . . . . . . . . . . . . . . . . 4.1% - 4.9% 4.4% - 5.0% 4.4%Expected term/life (in years) . . . . . . . . . . . . . . . . . 4.6 5.1 -6.2 4.0
68
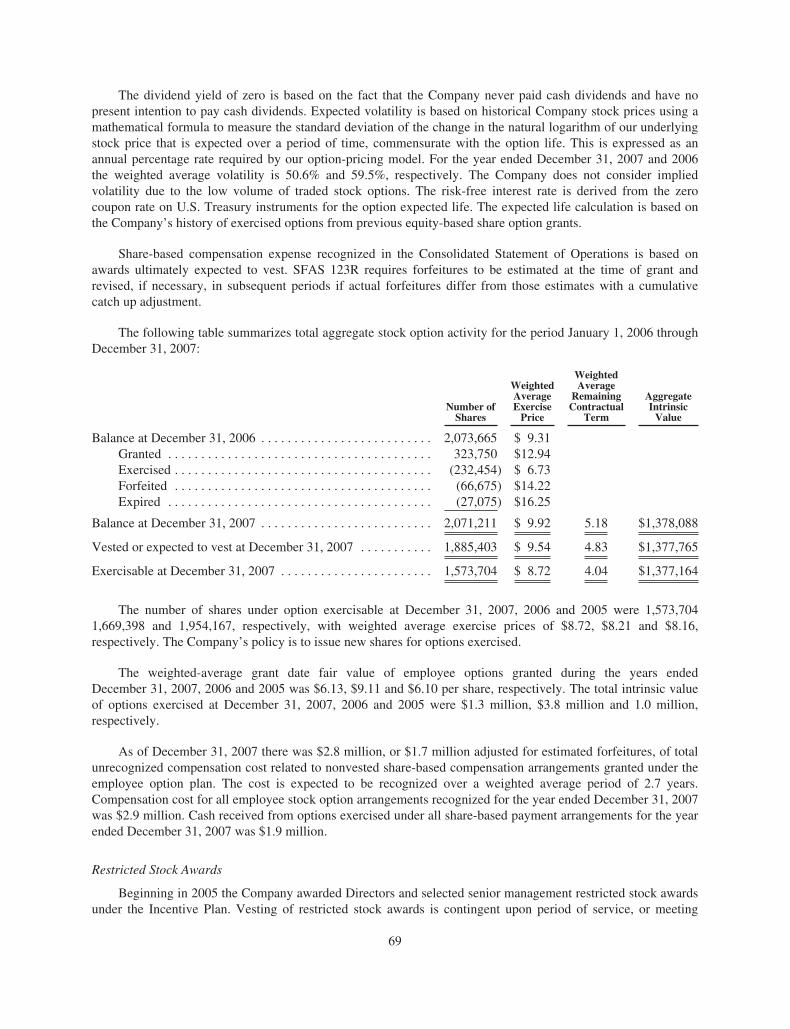
The dividend yield of zero is based on the fact that the Company never paid cash dividends and have nopresent intention to pay cash dividends. Expected volatility is based on historical Company stock prices using amathematical formula to measure the standard deviation of the change in the natural logarithm of our underlyingstock price that is expected over a period of time, commensurate with the option life. This is expressed as anannual percentage rate required by our option-pricing model. For the year ended December 31, 2007 and 2006the weighted average volatility is 50.6% and 59.5%, respectively. The Company does not consider impliedvolatility due to the low volume of traded stock options. The risk-free interest rate is derived from the zerocoupon rate on U.S. Treasury instruments for the option expected life. The expected life calculation is based onthe Company’s history of exercised options from previous equity-based share option grants.
Share-based compensation expense recognized in the Consolidated Statement of Operations is based onawards ultimately expected to vest. SFAS 123R requires forfeitures to be estimated at the time of grant andrevised, if necessary, in subsequent periods if actual forfeitures differ from those estimates with a cumulativecatch up adjustment.
The following table summarizes total aggregate stock option activity for the period January 1, 2006 throughDecember 31, 2007:
Number ofShares
WeightedAverageExercisePrice
WeightedAverage
RemainingContractual
Term
AggregateIntrinsicValue
Balance at December 31, 2006 . . . . . . . . . . . . . . . . . . . . . . . . . . 2,073,665 $ 9.31Granted . . . . . . . . . . . . . . . . . . . . . . . . . . . . . . . . . . . . . . . . 323,750 $12.94Exercised . . . . . . . . . . . . . . . . . . . . . . . . . . . . . . . . . . . . . . . (232,454) $ 6.73Forfeited . . . . . . . . . . . . . . . . . . . . . . . . . . . . . . . . . . . . . . . (66,675) $14.22Expired . . . . . . . . . . . . . . . . . . . . . . . . . . . . . . . . . . . . . . . . (27,075) $16.25
Balance at December 31, 2007 . . . . . . . . . . . . . . . . . . . . . . . . . . 2,071,211 $ 9.92 5.18 $1,378,088
Vested or expected to vest at December 31, 2007 . . . . . . . . . . . 1,885,403 $ 9.54 4.83 $1,377,765
Exercisable at December 31, 2007 . . . . . . . . . . . . . . . . . . . . . . . 1,573,704 $ 8.72 4.04 $1,377,164
The number of shares under option exercisable at December 31, 2007, 2006 and 2005 were 1,573,7041,669,398 and 1,954,167, respectively, with weighted average exercise prices of $8.72, $8.21 and $8.16,respectively. The Company’s policy is to issue new shares for options exercised.
The weighted-average grant date fair value of employee options granted during the years endedDecember 31, 2007, 2006 and 2005 was $6.13, $9.11 and $6.10 per share, respectively. The total intrinsic valueof options exercised at December 31, 2007, 2006 and 2005 were $1.3 million, $3.8 million and 1.0 million,respectively.
As of December 31, 2007 there was $2.8 million, or $1.7 million adjusted for estimated forfeitures, of totalunrecognized compensation cost related to nonvested share-based compensation arrangements granted under theemployee option plan. The cost is expected to be recognized over a weighted average period of 2.7 years.Compensation cost for all employee stock option arrangements recognized for the year ended December 31, 2007was $2.9 million. Cash received from options exercised under all share-based payment arrangements for the yearended December 31, 2007 was $1.9 million.
Restricted Stock Awards
Beginning in 2005 the Company awarded Directors and selected senior management restricted stock awardsunder the Incentive Plan. Vesting of restricted stock awards is contingent upon period of service, or meeting
69

various departmental, Company performance or market conditions and requires a one year service period. Therestricted stock awards have a contractual life of ten years.
The fair value of each restricted stock award is calculated on the date of grant using the stock price on thedate of grant. The fair value of awards with market conditions have been determined using a Monte Carlocalculation. Performance conditions have estimated achievement dates over which compensation expense isrecognized. The requisite service period is the greater of the estimated achievement date or the minimum12-month vesting period. This requisite service period is determined based on an analysis of all the terms andconditions of each grant. The Company uses the requisite service period that is most likely to occur including thelikelihood that the restricted stock award will not be earned. The initial requisite service period may be adjustedfor changes in the expected outcomes of the related service or performance conditions with such changesrecognized as a cumulative catch-up adjustment.
Based on our historical experience of pre-vesting award cancellations, management changed our assumedforfeiture rate from 5.8% to zero for restricted stock awards. Under the true-up provisions of SFAS 123R, if theactual forfeiture rate is higher than estimated, a recovery of prior expense is recorded and if the actual forfeiturerate is lower than estimated an additional expense is recorded. The Company’s forfeiture rate change and atrue-up provision was recorded that increased the share-based compensation expense for restricted awards by$103,000 for the year ended December 31, 2007.
For the year ended December 31, 2005 the Company had recognized $361,000 of compensation expense forrestricted stock awards in accordance with APB No. 25. The Company was required to calculate the restrictedstock award expense based on the market price of the Company’s stock at the end of each reporting period.Under SFAS 123R the Company determines the fair value at grant date and expenses that amount over therequisite service period. As prescribed under SFAS 123R the Company has reassessed each restricted stockaward that was active and not earned as of January 1, 2006 and determined appropriate share-based expensetreatment under SFAS 123R.
The following table summarizes the activity under the restricted stock plan (in thousands, except for pershare amounts):
Nonvested Shares Shares
Weighted AverageGrant DateFair Value
Nonvested at January 1, 2007 . . . . . . . . . . . . . . . . . . . . . . . . . . . . . . . . . . . . 193 $13.67Granted . . . . . . . . . . . . . . . . . . . . . . . . . . . . . . . . . . . . . . . . . . . . . . . . . . . . . 247 12.45Vested . . . . . . . . . . . . . . . . . . . . . . . . . . . . . . . . . . . . . . . . . . . . . . . . . . . . . . (75) 15.53Forfeited . . . . . . . . . . . . . . . . . . . . . . . . . . . . . . . . . . . . . . . . . . . . . . . . . . . . (13) 10.31
Nonvested at December 31, 2007 . . . . . . . . . . . . . . . . . . . . . . . . . . . . . . . . . 352 $12.54
The total grant date fair value of restricted stock awards granted during the year ended December 31, 2007for service and performance based awards was $1.7 million and $1.4 million, respectively. For the year endedDecember 31, 2006 service and performance based awards was zero and $1.9 million, respectively. For the yearended December 31, 2005 service and performance based awards was zero and $2.8 million, respectively.
The weighted average grant date fair value of shares granted during the years ended December 31, 2007 and2006 was $12.45 and $15.32, respectively. The fair value of nonvested shares is determined based on the closingtrading price of the Company shares on the grant date. Awards vested during the year ended December 31, 2007,2006 and 2005 were 75,000, 109,000 and zero, respectively. All awards that have vested were performance typeawards with a vest date fair value of $926,000, $906,000 and zero for the years ended December 31, 2007, 2006and 2005, respectively. As of December 31, 2007 there was $1.6 million of total unrecognized compensation costrelated to nonvested restricted stock awards granted under the plan. The cost is expected to be recognized over aweighted average period of 1.7 years.
70

Employee Stock Purchase Plan (ESPP)
In 2004, the Company established the 2004 ESPP. The aggregate number of shares of common stock, whichmay be purchased under this Plan shall not exceed five hundred thousand (500,000) shares of common stock ofthe Company. As of December 31, 2007 the Company has issued a total of 49,806 shares of common stock fromthe current ESPP. For the year ended December 31, 2007, 2006 and 2005 the Company issued 25,453, 18,239and 18,045 shares of stock for ESPP purchases, respectively.
The plan permits substantially all employees to purchase common stock through payroll deductions, at 85%of the lower of the trading price of the stock at the beginning or at the end of each six-month offering periodcommencing on January 1 and July 1. The number of shares purchased is based on participants’ contributionsmade during the offering period.
The fair value of the “look back” option of the ESPP is estimated based on the fair value of the ESPP sharesto be granted during the offering period by using the Black-Scholes valuation model for a call and a put option.The share price used for the model is a 15% discount on the stock price on the first day of the offering period; thenumber of shares to be purchased is calculated based on employee contributions; and by using the followingassumptions:
Six MonthPeriodEnded
December 31,2007
Six MonthPeriodEndedJune 30,2007
Six MonthPeriodEnded
December 31,2006
Six MonthPeriodEndedJune 30,2006
Expected dividends . . . . . . . . . . . . . . . . . . . . . . . . . . . . . . . . . — — — —Stock Price on valuation date . . . . . . . . . . . . . . . . . . . . . . . . . $14.22 $13.95 $19.63 $14.17Expected volatility . . . . . . . . . . . . . . . . . . . . . . . . . . . . . . . . . . 53% 51% 54% 43%Average risk-free interest rate . . . . . . . . . . . . . . . . . . . . . . . . . 4.93% 5.06% 5.04% 4.22%Expected life (in years) . . . . . . . . . . . . . . . . . . . . . . . . . . . . . . .5 .5 .5 .5Fair value per share . . . . . . . . . . . . . . . . . . . . . . . . . . . . . . . . . $ 4.36 $ 4.16 $ 6.06 $ 3.93
Fiscal YearEnded
December 31,2007
FiscalYear EndedDecember 31,
2006
ESPP compensation expense recognized . . . . . . . . . . . . . . . . . . . . . . . . . $117,000 $76,000Intrinsic value at respective purchase date . . . . . . . . . . . . . . . . . . . . . . . . $ 62,000 $83,000
Share-based compensation expense recognized in the Consolidated Statement of Operation:
Compensation cost for restricted stock awards, employee stock options, ESPP and non-employee stockcompensation included in Cost of sales; Selling, general and administrative; and Research and development is (inthousands):
Fiscal YearEnded
December 31,2007
FiscalYear EndedDecember 31,
2006
Cost of sales . . . . . . . . . . . . . . . . . . . . . . . . . . . . . . . . . . . . . . . . . . . . . . . $ 260 $ 211Selling, general and administrative . . . . . . . . . . . . . . . . . . . . . . . . . . . . . 2,447 2,309Research and development . . . . . . . . . . . . . . . . . . . . . . . . . . . . . . . . . . . . 229 190
Total Stock-Based Compensation Costs . . . . . . . . . . . . . . . . . . . . . . . . . $2,936 $2,710
Stockholder Rights Plan
In November 1999, the Company adopted a Stockholder Rights Plan as a successor to its previous plan,which expired in June 1999. In accordance with the plan, the Company distributed one non-voting common stock
71

purchase right (“Right”) for each outstanding share of common stock. The Rights are not exercisable and will nottrade separately from the common stock unless a person or group acquires, or makes a tender offer for, 20% ormore of the Company’s common stock. Initially, each Right entitles the registered holder to purchase one shareof Company common stock at a price of $75 per share, subject to certain anti-dilution adjustments. If the Rightsbecome exercisable and certain conditions are met, then each Right owned by someone other than the acquiringperson or group will entitle its holder to receive, upon exercise, Company common stock having a market valueof twice the exercise price of the Right. In addition, the Company may redeem the Rights at a price of $0.01 perRight, subject to certain restrictions. The Stockholder Rights Plan expires on October 21, 2009.
Share Reservations
The following table summarizes the reservation of authorized unissued shares for issuance upon exerciseand conversion of outstanding instruments:
Stock Option Plans:2005 Omnibus equity incentive plan . . . . . . . . . . . . . . . . . . . . . . . . . . . . . . . 1,457,2312004 Employee stock purchase plan . . . . . . . . . . . . . . . . . . . . . . . . . . . . . . . 450,1941999 Directors stock option plan . . . . . . . . . . . . . . . . . . . . . . . . . . . . . . . . . 35,3351999 Non-qualified stock option plan . . . . . . . . . . . . . . . . . . . . . . . . . . . . . . 283,030
Convertible debenture and warrants . . . . . . . . . . . . . . . . . . . . . . . . . . . . . . . . . . . 2,436,239
Total . . . . . . . . . . . . . . . . . . . . . . . . . . . . . . . . . . . . . . . . . . . . . . . . . . . . . . . . . . . 4,662,029
Note 7—Income Taxes
The provision (benefit) for income taxes based on loss from continuing operations is as follows (inthousands):
Years Ended December 31,
2007 2006 2005
Federal:Current . . . . . . . . . . . . . . . . . . . . . . . . . . . . . . . . . . . . . . . . . . . . . $ — $ — $ —Deferred . . . . . . . . . . . . . . . . . . . . . . . . . . . . . . . . . . . . . . . . . . . . (4,479) (5,827) (2,938)
(4,479) (5,827) (2,938)State:
Current . . . . . . . . . . . . . . . . . . . . . . . . . . . . . . . . . . . . . . . . . . . . . — — —Deferred . . . . . . . . . . . . . . . . . . . . . . . . . . . . . . . . . . . . . . . . . . . . 250 (1,372) (555)
250 (1,372) (555)Foreign:
Current . . . . . . . . . . . . . . . . . . . . . . . . . . . . . . . . . . . . . . . . . . . . . — (52) 84Deferred . . . . . . . . . . . . . . . . . . . . . . . . . . . . . . . . . . . . . . . . . . . . 65 260 (35)
65 208 49Valuation allowance . . . . . . . . . . . . . . . . . . . . . . . . . . . . . . . . . . . . . . . 4,229 7,199 3,493
$ 65 $ 208 $ 49
72

The provision (benefit) for income taxes in the accompanying consolidated statements of operations differsfrom the amount calculated by applying the statutory income tax rate to loss from continuing operations beforeincome taxes. The primary components of such difference are as follows (in thousands):
Years Ended December 31,
2007 2006 2005
Taxes at federal statutory rate . . . . . . . . . . . . . . . . . . . . . . . . . . . . . . . $(5,418) $(5,471) $(2,110)State taxes, net of federal benefit . . . . . . . . . . . . . . . . . . . . . . . . . . . . . (1,077) (895) (474)Effect of tax rate differential for foreign subsidiary . . . . . . . . . . . . . . (263) (99) (547)Tax credits . . . . . . . . . . . . . . . . . . . . . . . . . . . . . . . . . . . . . . . . . . . . . . — (200) (256)Valuation allowance, including tax benefits of stock activity . . . . . . . 7,354 6,309 3,493Other items not reflected in consolidated statements of operations . . . (531) 564 (57)
Tax provision . . . . . . . . . . . . . . . . . . . . . . . . . . . . . . . . . . . . . . . . $ 65 $ 208 $ 49
The Company has established a valuation allowance against its U.S. federal and state deferred tax assets dueto the uncertainty surrounding the realization of such assets as evidenced by the cumulative losses fromoperations through December 31, 2007. Management periodically evaluates the recoverability of the deferred taxassets. At such time as it is determined that it is more likely than not that deferred assets are realizable, thevaluation allowance will be reduced accordingly. The Company has recorded a valuation allowance of $54.6million as of December 31, 2007 to reflect the estimated amount of deferred tax assets that may not be realized.The Company increased its valuation allowance by $4.2 million for the year ended December 31, 2007.
Pursuant to Internal Revenue Code Sections 382 and 383, use of the Company’s federal net operating lossand credit carryforwards may be limited due to a cumulative change in ownership of more than 50% within athree-year period.
At December 31, 2007 the Company has federal, state and foreign tax net operating loss carryforwards ofapproximately $132.2 million, $87.0 million and $0.6 million respectively. The federal tax loss will begin toexpire in 2020 and the state tax loss carryforwards will begin to expire in 2020, and the foreign tax losscarryforward will expire in 2013. Cumulative tax benefits associated with the exercise of non-qualified stockoptions, restricted stock grants, disqualifying dispositions of both Incentive Stock Option stock and stockacquired from the Company’s Employee Stock Purchase Plan for 2007 and 2006 in the approximate amount of$1.3 million and $3.5 million, respectively, did not reduce current income taxes payable and, accordingly, it isnot included in the deferred tax asset relating to net operating loss (NOL) carryforwards, but it is included withthe federal and state NOL carryforwards disclosed in this footnote. The tax benefits associated with stock optionsdeductions from 1998 to 2005 in the approximate amount of $15.5 million were not recorded in AdditionalPaid-in Capital because their realization were not more likely than not to occur and, consequently a valuationallowance was recorded against the entire benefit. In addition, the Company has research and development andother tax credit carryforwards for federal and state income tax purposes as of December 31, 2007 of $3.8 millionand $2.8 million, respectively, which begin to expire in 2014.
Unremitted earnings of foreign subsidiary(ies) have been included in the consolidated financial statementswithout giving effect to the United States taxes that may be payable on distribution to the United States becauseit is not anticipated such earnings will be remitted to the United States. If remitted, the additional United Statestaxes paid would not be material.
73

Items that give rise to significant portions of the deferred tax accounts are as follows (in thousands):
December 31,
2007 2006
Deferred tax assets:Tax loss carryforwards . . . . . . . . . . . . . . . . . . . . . . . . . . . . . . . . . . . . . . . . $ 48,238 $ 41,800Debt conversion rights . . . . . . . . . . . . . . . . . . . . . . . . . . . . . . . . . . . . . . . . 524 1,820Research and development and other tax credit carryforwards . . . . . . . . . 3,265 6,334Uniform capitalization, contract and inventory related reserves . . . . . . . . 1,375 1,203Accrued vacation . . . . . . . . . . . . . . . . . . . . . . . . . . . . . . . . . . . . . . . . . . . . 368 305Allowance for doubtful accounts . . . . . . . . . . . . . . . . . . . . . . . . . . . . . . . . 10 16Deferred compensation . . . . . . . . . . . . . . . . . . . . . . . . . . . . . . . . . . . . . . . . 95 118Other . . . . . . . . . . . . . . . . . . . . . . . . . . . . . . . . . . . . . . . . . . . . . . . . . . . . . . 412 44
54,287 52,158Deferred tax liabilities:
Tax depreciation less than book depreciation . . . . . . . . . . . . . . . . . . . . . . 519 344Convertible debt discount, embedded conversion option . . . . . . . . . . . . . . (774) (1,626)Inventory deduction . . . . . . . . . . . . . . . . . . . . . . . . . . . . . . . . . . . . . . . . . . (204) (257)Stock based compensation . . . . . . . . . . . . . . . . . . . . . . . . . . . . . . . . . . . . . 671 174Intangible assets . . . . . . . . . . . . . . . . . . . . . . . . . . . . . . . . . . . . . . . . . . . . . (111) (146)Pension assets . . . . . . . . . . . . . . . . . . . . . . . . . . . . . . . . . . . . . . . . . . . . . . . (1,472) (2,494)Other . . . . . . . . . . . . . . . . . . . . . . . . . . . . . . . . . . . . . . . . . . . . . . . . . . . . . . (127) (141)
(1,498) (4,664)
Net deferred tax assets before valuation allowance . . . . . . . . . . . . . . 52,789 47,494Valuation allowance . . . . . . . . . . . . . . . . . . . . . . . . . . . . . . . . . . . . . . . . . . . . . . (54,660) (50,431)
Net deferred tax liabilities . . . . . . . . . . . . . . . . . . . . . . . . . . . . . . . . . . . . . . . . . $ (1,871) $ (2,937)
The Company adopted the provisions of Financial Accounting Standards Board (FASB) Interpretation No.48, “Accounting for Uncertainty in Income Taxes,” on January 1, 2007. At the date of adoption, the Companyhad $3.17 million of unrecognized tax benefits. Of the total unrecognized benefits at the adoption date, the entireamount of $3.17 million was recorded as a reduction to deferred tax assets, which caused a correspondingreduction in the Company’s valuation allowance of $3.17 million. To the extent such portion of unrecognized taxbenefits is recognized at a time such valuation allowance no longer exists, the recognition would reduce theeffective tax rate. The Company does not anticipate that the amount of unrecognized tax benefits as of December31, 2007 will significantly increase or decrease within 12 months.
The Company recognizes interest and penalties as a component of income tax expense. The interest andpenalties as of December 31, 2007 and for the years ended December 31, 2007, 2006 and 2005 were zero.
The Company’s United States federal income tax returns for tax years since 2005 are subject to examinationby the Internal Revenue Service and its state income tax returns since 2004 are subject to examination by thestate tax authorities. The Company’s foreign tax returns since 2000 are subject to examination by the foreign taxauthorities.
Net operating losses from years from which the statute of limitations have expired (2005 and prior forfederal and 2004 and prior for state) could be adjusted in the event that the taxing jurisdictions challenge theamounts of net operating loss carryforwards from such years.
74

A reconciliation of the beginning and ending amount of unrecognized tax benefits is as follows (inthousands):
Balance at January 1, 2007 . . . . . . . . . . . . . . . . . . . . . . . . . . . . . . . . . . . . . . . . . . . . . . . . . . . . . $3,200Gross increases or decreases . . . . . . . . . . . . . . . . . . . . . . . . . . . . . . . . . . . . . . . . . . . . . . . . . . . —Settlements . . . . . . . . . . . . . . . . . . . . . . . . . . . . . . . . . . . . . . . . . . . . . . . . . . . . . . . . . . . . . . . . . —Lapse of statute of limitations . . . . . . . . . . . . . . . . . . . . . . . . . . . . . . . . . . . . . . . . . . . . . . . . . . —
Balance at December 31, 2007 . . . . . . . . . . . . . . . . . . . . . . . . . . . . . . . . . . . . . . . . . . . . . . . . . . $3,200
Note 8—Commitments and Contingencies
The Company enters into indemnification agreements in the ordinary course of business in which theindemnified party is held harmless and is reimbursed for losses incurred from claims by third parties. Inconnection with divestitures of certain assets or businesses, the Company often provides indemnities to the buyerwith respect to certain matters including, for example, environmental liabilities and unidentified liabilities relatedto periods prior to the disposition. Due to the uncertain nature of the indemnities, the maximum liability cannotbe quantified. Liabilities for obligations are recorded where appropriate and when they are probable and can bereasonably estimated. Historically, the Company has not made significant payments for these obligations.
Note 9—Leases
Rental expense amounted to $1.9 million, $1.7 million and $1.5 million in the years ended December 31,2007, 2006 and 2005, respectively, and was incurred primarily for facility rental. Our San Diego headquartersand principal research, manufacturing and marketing facility occupies approximately 45,000 square feet under arenewable lease that expires in July 2010. The Company also occupies a 16,500-square-foot production annex inSan Diego under a renewable lease that expires in November 2010. In addition, the Company leases research,manufacturing and marketing facilities occupying 68,620 square feet in Rossens, Switzerland, under a renewablelease that expires in December 2014. Future annual minimum rental commitments as of December 31, 2007 areas follows (in thousands):
Fiscal Years
2008 . . . . . . . . . . . . . . . . . . . . . . . . . . . . . . . . . . . . . . . . . . . . . . . . . . . . . . . . . . . . . . $1,9772009 . . . . . . . . . . . . . . . . . . . . . . . . . . . . . . . . . . . . . . . . . . . . . . . . . . . . . . . . . . . . . . 2,0192010 . . . . . . . . . . . . . . . . . . . . . . . . . . . . . . . . . . . . . . . . . . . . . . . . . . . . . . . . . . . . . . 1,6252011 . . . . . . . . . . . . . . . . . . . . . . . . . . . . . . . . . . . . . . . . . . . . . . . . . . . . . . . . . . . . . . 8882012 . . . . . . . . . . . . . . . . . . . . . . . . . . . . . . . . . . . . . . . . . . . . . . . . . . . . . . . . . . . . . . 888Thereafter . . . . . . . . . . . . . . . . . . . . . . . . . . . . . . . . . . . . . . . . . . . . . . . . . . . . . . . . . . 1,775
$9,172
Note 10—Pension and Other Postretirement Benefit Plans
Foreign Plan
In September 2006, the FASB issued SFAS No. 158 Employers’ Accounting for Defined Benefit Pensionand Other Postretirement Plans—an amendment of FASB Statements No. 87, 88, 106, and 132(R)” (“SFAS158”). SFAS 158 requires balance sheet recognition of the total over funded or under funded status of pensionand postretirement benefit plans. Under SFAS 158, actuarial gains and losses, prior service costs or credits, andany remaining transition assets or obligations that have not been recognized under previous accounting standardsmust be recognized as a component of accumulated other comprehensive income (loss) within stockholders’equity, net of tax effects, until they are amortized as a component of net periodic benefit cost.
This plan is regulated by the Swiss Government and is funded by the employees and the Company. Thepension benefit is based on compensation, length of service and credited investment earnings. The plan
75

guarantees both a minimum rate of return as well as minimum annuity purchase rates. The Company’s fundingpolicy with respect to the pension plan is to contribute the amount required by Swiss law, using the requiredpercentage applied to the employee’s compensation. In addition, participating employees are required tocontribute to the pension plan. The Company made pension contributions of $498,000, $336,000 and, $282,000in 2007, 2006 and 2005, respectively. This plan has a measurement date of December 31.
The reported prepaid pension asset decreased from $10.4 million to $8.4 million during the year endedDecember 31, 2007. The decrease is from worse than expected asset performance and an increase in the planliabilities caused by an increase in the plan population and a change in assumptions. The Company does not haveany rights to this asset, between 45% to 50% of the contributions to the plan is made by the employees.
The following table reflects changes in pension benefits for the years ended December 31, 2007 and 2006:
Pension Benefits
Year endedDecember 31,
2007 2006
(in thousands)
Change in benefit obligation:Benefit obligation at beginning of year . . . . . . . . . . . . . . . . . . . . . . . . . . . . . . . . . . . . . . . $14,401 $11,629Service cost . . . . . . . . . . . . . . . . . . . . . . . . . . . . . . . . . . . . . . . . . . . . . . . . . . . . . . . . . . . . 314 214Interest cost . . . . . . . . . . . . . . . . . . . . . . . . . . . . . . . . . . . . . . . . . . . . . . . . . . . . . . . . . . . . 426 308Plan participant contributions . . . . . . . . . . . . . . . . . . . . . . . . . . . . . . . . . . . . . . . . . . . . . . 408 336Benefits paid . . . . . . . . . . . . . . . . . . . . . . . . . . . . . . . . . . . . . . . . . . . . . . . . . . . . . . . . . . . (996) (110)Actuarial loss (gain) . . . . . . . . . . . . . . . . . . . . . . . . . . . . . . . . . . . . . . . . . . . . . . . . . . . . . 3,147 543Administrative expenses paid . . . . . . . . . . . . . . . . . . . . . . . . . . . . . . . . . . . . . . . . . . . . . . (58) (60)Plan change . . . . . . . . . . . . . . . . . . . . . . . . . . . . . . . . . . . . . . . . . . . . . . . . . . . . . . . . . . . . — 465Special termination benefits/asset transfers in . . . . . . . . . . . . . . . . . . . . . . . . . . . . . . . . . — 108Effect of foreign currency translation . . . . . . . . . . . . . . . . . . . . . . . . . . . . . . . . . . . . . . . . 1,397 968
Projected benefit obligation at end of year . . . . . . . . . . . . . . . . . . . . . . . . . . . . . . . . . . . . . . . . 19,039 14,401
Changes in plan assets:Fair value of plan assets at beginning of year . . . . . . . . . . . . . . . . . . . . . . . . . . . . . . . . . . 24,772 21,070Actual return on plan assets . . . . . . . . . . . . . . . . . . . . . . . . . . . . . . . . . . . . . . . . . . . . . . . 703 1,482Special termination benefits/asset transfers in . . . . . . . . . . . . . . . . . . . . . . . . . . . . . . . . . — —Company contributions . . . . . . . . . . . . . . . . . . . . . . . . . . . . . . . . . . . . . . . . . . . . . . . . . . . 498 336Plan participant contributions . . . . . . . . . . . . . . . . . . . . . . . . . . . . . . . . . . . . . . . . . . . . . . 408 336Benefits paid . . . . . . . . . . . . . . . . . . . . . . . . . . . . . . . . . . . . . . . . . . . . . . . . . . . . . . . . . . . (996) (110)Administrative expenses paid . . . . . . . . . . . . . . . . . . . . . . . . . . . . . . . . . . . . . . . . . . . . . . (58) (60)Effect of foreign currency translation . . . . . . . . . . . . . . . . . . . . . . . . . . . . . . . . . . . . . . . . 2,081 1,718
Fair value of plan assets at end of year . . . . . . . . . . . . . . . . . . . . . . . . . . . . . . . . . . . . . . . . . . . 27,408 24,772
Funded status at end of year . . . . . . . . . . . . . . . . . . . . . . . . . . . . . . . . . . . . . . . . . . . . . . . . . . . $ 8,369 $10,371
Amounts recognized in the consolidated balance sheet consist of:Prepaid benefit cost . . . . . . . . . . . . . . . . . . . . . . . . . . . . . . . . . . . . . . . . . . . . . . . . . . . . . . $ 7,548 $ 5,972Foreign currency translation adjustment . . . . . . . . . . . . . . . . . . . . . . . . . . . . . . . . . . . . . . 603 418Accumulated other comprehensive income . . . . . . . . . . . . . . . . . . . . . . . . . . . . . . . . . . . 218 3,981
Net amount recognized . . . . . . . . . . . . . . . . . . . . . . . . . . . . . . . . . . . . . . . . . . . . . . . . . . . $ 8,369 $10,371
76

The components of net periodic benefit cost to the Company of the plan are as follows:Year endedDecember 31,
2007 2006 2005
(in thousands)
Components of net periodic benefit cost:Service cost . . . . . . . . . . . . . . . . . . . . . . . . . . . . . . . . . . . . . . . . . . . . . . . . . . . . . . $ 314 $ 214 $ 198Interest cost . . . . . . . . . . . . . . . . . . . . . . . . . . . . . . . . . . . . . . . . . . . . . . . . . . . . . . 426 308 343Expected return on plan assets . . . . . . . . . . . . . . . . . . . . . . . . . . . . . . . . . . . . . . . (1,257) (1,102) (858)Prior service cost (credit) amortization . . . . . . . . . . . . . . . . . . . . . . . . . . . . . . . . . 34 (10) (10)Net (gain) amortization . . . . . . . . . . . . . . . . . . . . . . . . . . . . . . . . . . . . . . . . . . . . . (176) (224) (2)Curtailments . . . . . . . . . . . . . . . . . . . . . . . . . . . . . . . . . . . . . . . . . . . . . . . . . . . . . — — —
Net periodic (income) . . . . . . . . . . . . . . . . . . . . . . . . . . . . . . . . . . . . . . . . . . . . . . . . . . $ (659) $ (814) $(329)
Pension Benefits
Year endedDecember 31,
2007 2006
Weighted-average assumptions used to determine benefit obligations:Discount rate . . . . . . . . . . . . . . . . . . . . . . . . . . . . . . . . . . . . . . . . . . . . . . . . . . . . . . . . . . 3.50% 3.00%Rate of compensation increase . . . . . . . . . . . . . . . . . . . . . . . . . . . . . . . . . . . . . . . . . . . . 2.50% 2.00%Measurement date . . . . . . . . . . . . . . . . . . . . . . . . . . . . . . . . . . . . . . . . . . . . . . . . . . . . . . 12/31/07 12/31/06
Weighted-average assumptions used to determine net periodic benefit cost:Discount rate . . . . . . . . . . . . . . . . . . . . . . . . . . . . . . . . . . . . . . . . . . . . . . . . . . . . . . . . . . 3.00% 2.60%Expected long-term return on plan assets . . . . . . . . . . . . . . . . . . . . . . . . . . . . . . . . . . . . 5.00% 5.00%Rate of compensation increase . . . . . . . . . . . . . . . . . . . . . . . . . . . . . . . . . . . . . . . . . . . . 2.00% 2.00%
Percentage of the fair value of total plan assets held in each major category of plan assets:Equity securities . . . . . . . . . . . . . . . . . . . . . . . . . . . . . . . . . . . . . . . . . . . . . . . . . . . . . . . 29% 27%Debt securities . . . . . . . . . . . . . . . . . . . . . . . . . . . . . . . . . . . . . . . . . . . . . . . . . . . . . . . . 17% 20%Real estate . . . . . . . . . . . . . . . . . . . . . . . . . . . . . . . . . . . . . . . . . . . . . . . . . . . . . . . . . . . . 49% 48%Other . . . . . . . . . . . . . . . . . . . . . . . . . . . . . . . . . . . . . . . . . . . . . . . . . . . . . . . . . . . . . . . . 5% 5%
Total . . . . . . . . . . . . . . . . . . . . . . . . . . . . . . . . . . . . . . . . . . . . . . . . . . . . . . . . . . . . . . . . 100% 100%
The Pension Plan’s overall strategy and investment policy is managed by the board of the Plan. The overalllong-term rate is based on historical information and it assumes that the rate of return is 3.2% for Swiss bonds,5.4% for unhedged foreign bonds, 5.0% for real property, 7.9% for Swiss equities and 7.5% for Global equities.Based on the target asset allocation of 10% Swiss bonds, 15% non-Swiss bonds, 14% Global equities, 45% realestate, 3% alternative investments and 5% cash and other short-term investments, the expected long-term pensionasset return is currently 5.0%.
2007
(in thousands)
Accumulated other comprehensive income consists of the following:Net transition obligation . . . . . . . . . . . . . . . . . . . . . . . . . . . . . . . . . . . . . . . . . . . . . . . . . . . . . . . $ —Net prior service (costs) . . . . . . . . . . . . . . . . . . . . . . . . . . . . . . . . . . . . . . . . . . . . . . . . . . . . . . . . (388)Net gain . . . . . . . . . . . . . . . . . . . . . . . . . . . . . . . . . . . . . . . . . . . . . . . . . . . . . . . . . . . . . . . . . . . . 606
Gross accumulated other comprehensive income . . . . . . . . . . . . . . . . . . . . . . . . . . . . . . . . . . . . $ 218
Amortization payments expected to be paid during the fiscal year ended December 31, 2008:Amortization of net transition obligation . . . . . . . . . . . . . . . . . . . . . . . . . . . . . . . . . . . . . . . . . . $ —Amortization of net prior service costs . . . . . . . . . . . . . . . . . . . . . . . . . . . . . . . . . . . . . . . . . . . . 36Amortization of net loss . . . . . . . . . . . . . . . . . . . . . . . . . . . . . . . . . . . . . . . . . . . . . . . . . . . . . . . . 0
77

The following benefit payments, which reflect expected future service, as appropriate, are expected to bepaid (in thousands):
2008 . . . . . . . . . . . . . . . . . . . . . . . . . . . . . . . . . . . . . . . . . . . . . . . . . . . . . . . . . . . . . $ 9582009 . . . . . . . . . . . . . . . . . . . . . . . . . . . . . . . . . . . . . . . . . . . . . . . . . . . . . . . . . . . . . 1,0822010 . . . . . . . . . . . . . . . . . . . . . . . . . . . . . . . . . . . . . . . . . . . . . . . . . . . . . . . . . . . . . 1,0122011 . . . . . . . . . . . . . . . . . . . . . . . . . . . . . . . . . . . . . . . . . . . . . . . . . . . . . . . . . . . . . 1,1272012 . . . . . . . . . . . . . . . . . . . . . . . . . . . . . . . . . . . . . . . . . . . . . . . . . . . . . . . . . . . . . 1,081Years 2013 through 2017 . . . . . . . . . . . . . . . . . . . . . . . . . . . . . . . . . . . . . . . . . . . . . 6,439
Total . . . . . . . . . . . . . . . . . . . . . . . . . . . . . . . . . . . . . . . . . . . . . . . . . . . . . . . . . . . . . $11,699
As noted in the table above, the projected benefit obligation was $19.0 million and $14.4 million as ofDecember 31, 2007 and 2006, respectively.
The Company expects to contribute $520,000 to its foreign pension plan in fiscal 2008.
U.S. Plan
The Company has post retirement benefit plans covering its employees in the United States. Substantially allU.S. employees are eligible to elect coverage under contributory employee savings plan which provide forCompany matching contributions based on one-half of employee contributions up to certain plan limits. TheCompany’s matching contributions under this plan totaled $197,000, $172,000 and $187,000 for the years endedDecember 31, 2007, 2006 and 2005, respectively.
Note 11—Discontinued Operations
In September 2002, the Company decided to suspend the operations of its majority owned PurePulseTechnologies, Inc. subsidiary. PurePulse had been designing and developing systems that generate extremelyintense, broad-spectrum, pulsed light to purify water and inactivate viruses and other pathogens that contaminatevaccines and products sourced from human or animal tissues, such as plasma derivatives, transfusion bloodcomponents and biopharmaceuticals. The Company plans to preserve its intellectual property and certain othertechnology assets for a possible future sale of such assets. The carrying value of the assets at December 31, 2007and 2006 was zero. Reported operating loss from discontinued operations was zero, $195,000 and $40,000 forthe years ended December 31, 2007, 2006 and 2005, respectively. Revenue from discontinued operations waszero for the years ended December 31, 2007, 2006 and 2005.
Note 12—Related Party Transactions
Montena SA, the former parent company of Montena and a significant shareholder of MaxwellTechnologies, Inc., was the lessor for the Company’s headquarters in Rossens, Switzerland until the end of 2005.During 2005, the Company paid $797,000, in rental fees to Montena SA. In January 2006, Montena SA sold thebuilding to an unrelated third party and all payments for the Rossens property lease have been made to thatunrelated party since January 1, 2006.
Note 13—Legal Proceedings
From time to time Maxwell Technologies, Inc. becomes involved in litigation arising out of its operations.
In October 2006, Maxwell filed a patent infringement lawsuit against NessCap in the United States DistrictCourt for the Southern District of California seeking monetary damages and an injunction to stop NessCap’ssales of infringing products based on four of Maxwell’s patents. In April 2007, a U.S. District Judge consideredthe first of the four patents and granted a preliminary injunction to prohibit NessCap from making, using, selling,or offering for sale its “prismatic” ultracapacitor products in the United States. Subsequently, NessCap filed a
78

motion to stay the preliminary injunction pending its appeal to the United States Court of Appeals for the FederalCircuit. The appeal court denied NessCap’s motion. Maxwell posted an injunction bond to cover any possibleloss suffered by NessCap as a result of the injunction in the unlikely event that the Court renders a holding ofnon-infringement. The second, third, and fourth patents remain pending against NessCap’s products.
In December 2006, NessCap filed a lawsuit against Maxwell in the United States District Court in theDistrict of Delaware claiming Maxwell has infringed NessCap’s patented intellectual property. Maxwell movedfor an alternate forum and the lawsuit was transferred to the same district court in San Diego where Maxwell’sother claims are pending. Maxwell subsequently filed a motion for summary judgment assertingnon-infringement of NessCap’s patents and a hearing was held in November, 2007. In December, 2007, theCourt denied Maxwell’s motion for summary judgment, deciding instead to wait until the Court considersadditional briefing on the issue of patent claim interpretation. The Court set a hearing for this claim interpretationin April, 2008.
The legal expenses associated with these two lawsuits are capitalized, as management believes a favorableoutcome is probable. Additionally, the Company believes that final rulings in favor of Maxwell will provide anincrease in the value of the intellectual property involved substantial enough to outweigh the legal costs incurredto date. As of December 31, 2007 Maxwell has capitalized a total of $2.1 million of legal costs which is includedin intangible assets in the consolidated balance sheet.
In 2005, a customer brought to our attention a possible defect in a product that the Company sourced fromanother manufacturer and resold to the customer. With no movement to a resolution of this issue Maxwell’ssubsidiary, Maxwell SA, in late 2007 initiated a proceeding in Germany against the product manufacturer. TheCompany is currently in a discovery phase and analysis of product manufactured by the product manufactured. InNovember of 2007, an “expert” was appointed to conduct analysis on the allegedly defective product todetermine: (a) if there is a defect; and (b) if there is a defect, if the defect is one stemming from manufacturing orfrom operating conditions. The expert’s opinion is expected no earlier than June 2008. The matter has not beenresolved and the Company has not yet been able to determine what, if any, warranty exposure Maxwell mayhave, and therefore, no warranty reserve provision has been recorded. The Company carries insurance that maycover a portion of, and up to the entire obligation that might ultimately arise from this matter.
In December 2007, Maxwell, along with more than 150 other defendants, was named in an environmentalsuit. The suit, Angeles Chemical Company, Inc. et al. v. Omega Chemical PRP Group, LLC, et al., was filed bythe plaintiffs in the United States District Court for the Central District of California alleging damages related tohazardous waste contamination of the plaintiffs’ land. The plaintiff alleges that a prior service provider ofMaxwell’s improperly disposed of hazardous material. Maxwell has been included in this suit as a result of anearlier suit that was settled in 1999. In that suit, Maxwell was a potentially responsible party (PRP) at a site ashort distance from the current site. That suit was settled by Maxwell paying approximately $37,000. WhileMaxwell’s legal counsel cannot provide any assurance as to the likely outcome of this matter at this early stage,if any liability does arise out of this matter, Maxwell does not believe such liability would materially affect thefinancial position, results of operations, or cash flows of Maxwell in an adverse manner. We accrue forenvironmental-related obligations when they are probable and amounts can be reasonably estimated. A feasibilitystudy has not been completed for the site therefore, no liability is known or estimable. Where the availableinformation is sufficient to estimate the amount of liability, that estimate would be used. Where the informationis only sufficient to establish a range of probable liability and no point within the range is more likely than anyother, the lower end of the range would be used.
79

Note 14—Unaudited Quarterly Results of Operations
Quarter Ended
March 31 June 30 September 30 December 31
(in thousands except per share data)
Year ended December 31, 2007:Operating: . . . . . . . . . . . . . . . . . . . . . . . . . . . . . . . . . . . . . . .
Total revenue . . . . . . . . . . . . . . . . . . . . . . . . . . . . . . . . $12,556(a)$13,622(a) $14,218 $16,965Gross profit . . . . . . . . . . . . . . . . . . . . . . . . . . . . . . . . . . 3,413 2,692 3,346 4,900Net loss . . . . . . . . . . . . . . . . . . . . . . . . . . . . . . . . . . . . . (4,048)(b) (7,968)(c) (2,611)(d) (1,106)(e)
Basic and diluted net loss per share . . . . . . . . . . . . . . . . . . . . . . . $ (0.24) $ (0.45) $ (0.13) $ (0.04)
Year ended December 31, 2006:Operating:
Total revenue . . . . . . . . . . . . . . . . . . . . . . . . . . . . . . . . $11,971 $12,763(f) $14,011(f) $15,140(f)Gross profit . . . . . . . . . . . . . . . . . . . . . . . . . . . . . . . . . . 3,512 2,361 2,740 3,686Income (Loss) from continuing operations . . . . . . . . . (7,526)(g) (4,579)(h) (4,995)(i) 800(j)Discontinued operations, net of tax . . . . . . . . . . . . . . . 75 258 (361) (167)Net loss . . . . . . . . . . . . . . . . . . . . . . . . . . . . . . . . . . . . . $ (7,451) $ (4,321) $ (5,356) $ 633
Basic and diluted net loss per share:Loss from continuing operations . . . . . . . . . . . . . . . . . $ (0.45) $ (0.27) $ (0.29) $ 0.04Discontinued operations, net of tax . . . . . . . . . . . . . . . — 0.02 (0.02) (0.01)
Net loss per share . . . . . . . . . . . . . . . . . . . . . . . . . . . . . $ (0.45) $ (0.25) $ (0.31) $ 0.03
(a) Includes license fee of $272,000, and $281,000 for the first and second quarter respectively.(b) Includes a gain on embedded derivatives of $1.5 million, a non cash expense for stock options of $1.2
million and an amortization of debt discount of $904,000.(c) Includes a loss on embedded derivatives of ($1.4) million, a non cash expense for stock options of $841,000
and an amortization of debt discount of $904,000.(d) Includes a gain on embedded derivatives of $2.1 million, a non cash expense for stock options of $544,000
and an amortization of debt discount of $904,000.(e) Includes a gain on embedded derivatives of $2.3 million, a non cash expense for stock options of $401,000
and an amortization of debt discount of $855,000.(f) Includes license fee of $615,00, $494,000 and 338,000 for the second, third and fourth quarter respectively.(g) Includes a loss on embedded derivatives of ($3.5) million, a non cash expense for stock options of $936,000
and an amortization of debt discount of $904,000.(h) Includes a gain on embedded derivatives of $400,000, a non cash expense for stock options of $693,000 and
an amortization of debt discount of $904,000.(i) Includes a gain on embedded derivatives of $50,000, a non cash expense for stock options of $710,000 and
an amortization of debt discount of $904,000.(j) Includes a gain on embedded derivatives of $5.0 million, a non cash expense for stock options of $368,000,
an amortization of debt discount of $904,000 and reversal of $464,000 contingency accrual
Note 15—Subsequent Events
None.
80

Schedule IIValuation and Qualifying Accounts (in thousands)
Balance at theBeginning ofthe Year
Charged toExpense
Acquisitions/Transfersand Other
Write-offsNet of
Recoveries
Balance atthe End ofthe Year
Allowance for Doubtful Accounts:December 31, 2005 . . . . . . . . . . . . . . . . . . . . 393 (96) (6) (235) 56December 31, 2006 . . . . . . . . . . . . . . . . . . . . 56 113 6 (41) 134December 31, 2007 . . . . . . . . . . . . . . . . . . . . 134 31 (43) (35) 87
Inventory Reserve:December 31, 2005 . . . . . . . . . . . . . . . . . . . . 4,027 1,015 (62) (1,678) 3,302December 31, 2006 . . . . . . . . . . . . . . . . . . . . 3,302 1,258 38 (1,813) 2,785December 31, 2007 . . . . . . . . . . . . . . . . . . . . 2,785 1,072 (90) (697) 3,070
Deferred Tax Asset Valuation Allowance:December 31, 2005 . . . . . . . . . . . . . . . . . . . . 39,415 — 3,816 — 43,231December 31, 2006 . . . . . . . . . . . . . . . . . . . . 43,231 — 7,200 — 50,431December 31, 2007 . . . . . . . . . . . . . . . . . . . . 50,431 — 7,937 — 58,368
81

Item 9. Changes in and Disagreements with Accountants on Accounting and Financial Disclosure
None.
Item 9A. Controls and Procedures
Evaluation of Disclosure Controls and Procedures
As of December 31, 2007, management has evaluated the effectiveness of the design and operation of ourdisclosure controls and procedures for purposes of filing reports under the Securities and Exchange Act of 1934(the “Exchange Act”). This controls evaluation was done under the supervision and with the participation ofmanagement, including our chief executive officer and our chief financial officer. Our chief executive officer andour chief financial officer have concluded that our disclosure controls and procedures (as defined in Rule 13(a)-15(e) and 15(d)-15(e) under the Exchange Act) are effective to provide reasonable assurance that informationrequired disclosed in the reports that the Company files or submit to the SEC is recorded, processed, summarizedand reported with the time periods specified in the SEC’s rules and forms.
Management’s Annual Report on Internal Control over Financial Reporting
Our management is responsible for establishing and maintaining adequate internal control over financialreporting, as such term is defined in Exchange Act Rule 13a-15(f). Under the supervision and with theparticipation of our management, including our principal executive officer and principal financial officer, weconducted an evaluation of the effectiveness of our internal control over financial reporting based on theframework in Internal Control—Integrated Framework issued by the Committee of Sponsoring Organizations ofthe Treadway Commission.
Because of its inherent limitations, internal control over financial reporting is not intended to provideabsolute assurance that a misstatement of our financial statements would be prevented or detected. Also,projections of any evaluation of effectiveness to future periods are subject to the risk that controls may becomeinadequate because of changes in conditions or because the degree of compliance with policies or proceduresmay deteriorate.
Based on our evaluation under the framework in Internal Control—Integrated Framework, our managementconcluded that our internal control over financial reporting was effective as of December 31, 2007. Theeffectiveness of our internal control over financial reporting as of December 31, 2007 has not been audited byMcGladrey & Pullen, LLP, an independent registered public accounting firm.
Changes in Internal Control Over Financial Reporting
Remediation of prior year material weakness
At December 31, 2006, there was one primary tax issue related to our Swiss pension plan that ledmanagement to conclude that a material weakness existed. Specifically, the Company did not record an incometax liability associated with an adjustment made as a result of the implementation of FAS 158 Employers’Accounting for Defined Benefit Pension and Other Postretirement Plans in the prior year’s comprehensiveincome when, in fact, an income tax liability should have been recorded.
Management concluded that the principal factors contributing to the material weakness in accounting forincome taxes related to our Swiss subsidiary were (a) inadequate consideration of the provisions of FAS No. 109Accounting for Income Taxes by our external tax service provider resulting in an error in the accounting forincome taxes and (b) insufficient or ineffective review practices by our internal personnel. This materialweakness resulted in an accounting error which was corrected prior to the issuance of the consolidated financialstatements for the year ended December 31, 2006.
82

To remediate this material weakness in internal control over financial reporting management:
• Engaged an additional outside tax advisor who is an additional resource in the review of the workprepared by our current service provider.
• Improved timing of certain tax review activities during the financial statement closing processimproved the review process.
At December 31, 2007 the remediation of the prior year material weakness of internal controls has beencompleted.
Subsequent to the evaluation and through the date of this filing of Form 10-K for fiscal year 2007, we havenot identified any significant changes in our internal controls or in other factors that are reasonably likely tomaterially affect our internal controls. The control weakness noted in our previous annual report and interimperiod SEC filings have been corrected.
Item 9B. Other Information
None.
83

REPORT OF INDEPENDENT REGISTERED PUBLIC ACCOUNTING FIRM
To the Board of Directors and StockholdersMaxwell Technologies, Inc.
We have audited Maxwell Technologies, Inc.’s and subsidiaries’ internal control over financial reporting asof December 31, 2007, based on criteria established in Internal Control—Integrated Framework issued by theCommittee of Sponsoring Organizations of the Treadway Commission (COSO). Maxwell Technologies, Inc.’smanagement is responsible for maintaining effective internal control over financial reporting and for itsassessment of the effectiveness of internal control over financial reporting included in the accompanyingManagement’s Annual Report on Internal Control over Financial Reporting. Our responsibility is to express anopinion on the company’s internal control over financial reporting based on our audit.
We conducted our audit in accordance with the standards of the Public Company Accounting OversightBoard (United States). Those standards require that we plan and perform the audit to obtain reasonable assuranceabout whether effective internal control over financial reporting was maintained in all material respects. Ouraudit included obtaining an understanding of internal control over financial reporting, assessing the risk that amaterial weakness exists, and testing and evaluating the design and operating effectiveness of internal controlbased on the assessed risk. Our audit also included performing such other procedures as we considered necessaryin the circumstances. We believe that our audit provides a reasonable basis for our opinion.
A company’s internal control over financial reporting is a process designed to provide reasonable assuranceregarding the reliability of financial reporting and the preparation of financial statements for external purposes inaccordance with generally accepted accounting principles. A company’s internal control over financial reportingincludes those policies and procedures that (1) pertain to the maintenance of records that, in reasonable detail,accurately and fairly reflect the transactions and dispositions of the assets of the company; (2) provide reasonableassurance that transactions are recorded as necessary to permit preparation of financial statements in accordancewith generally accepted accounting principles, and that receipts and expenditures of the company are being madeonly in accordance with authorizations of management and directors of the company; and (3) provide reasonableassurance regarding prevention or timely detection of unauthorized acquisition, use, or disposition of thecompany’s assets that could have a material effect on the financial statements.
Because of its inherent limitations, internal control over financial reporting may not prevent or detectmisstatements. Also, projections of any evaluation of effectiveness to future periods are subject to the risk thatcontrols may become inadequate because of changes in conditions, or that the degree of compliance with thepolicies or procedures may deteriorate.
In our opinion, Maxwell Technologies, Inc. and subsidiaries maintained, in all material respects, effectiveinternal control over financial reporting as of December 31, 2007, based on criteria established in InternalControl—Integrated Framework issued by the Committee of Sponsoring Organizations of the TreadwayCommission (COSO).
We have also audited, in accordance with the standards of the Public Company Accounting Oversight Board(United States), the consolidated balance sheets of Maxwell Technologies, Inc. and subsidiaries as ofDecember 31, 2007 and 2006, and related consolidated statements of operations, stockholders’ equity andcomprehensive loss and cash flows for each of the three years in the period ended December 31, 2007, and ourreport dated February 29, 2008 expressed an unqualified opinion.
/s/ MCGLADREY & PULLEN, LLP
San Diego, CaliforniaFebruary 29, 2008
84

PART III
Item 10. Directors, Executive Officers and Corporate Governance
The information required by this item will be set forth in the Proxy Statement and is incorporated in thisreport by reference.
Item 11. Executive Compensation
The information required by this item will be set forth in the Proxy Statement and is incorporated in thisreport by reference.
Item 12. Security Ownership of Certain Beneficial Owners and Management and Related StockholderMatters
The information required by this item will be set forth in the Proxy Statement and is incorporated in thisreport by reference.
Item 13. Certain Relationships and Related Transactions, and Director Independence
The information required by this item will be set forth in the Proxy Statement and is incorporated in thisreport by reference.
Item 14. Principal Accounting Fees and Services
The information required by this item will be set forth in the Proxy Statement and is incorporated in thisreport by reference.
85

PART IV
Item 15. Exhibits and Financial Statement Schedules
(a) Documents filed as part of this report.
1. Financial Statements. The consolidated financial statements required by this item are submitted in aseparate section beginning on page 49 of this Annual Report on Form 10-K.
2. Financial Statement Schedules. The financial statement schedule entitled “Valuation and QualifyingAccounts” required by this item is submitted in a separate section beginning on page 81 of this Annual Report onForm 10-K.
3. Exhibits.
ExhibitNumber Description of Document
2.1 Asset Purchase Agreement dated December 10, 2003 between Registrant and Metar SA enconstitution. (1)
2.2 Purchase and Sale Agreement and Joint Escrow Instructions dated August 15, 2003 by and betweenRegistrant and Horizon Christian Fellowship. (1)
2.3 First Amendment to Purchase and Sale Agreement and Joint Escrow Instructions by and betweenRegistrant and Horizon Christian Fellowship, dated September 26, 2003. (1)
2.4 Second Amendment to Purchase and Sale Agreement and Joint Escrow Instructions by and betweenRegistrant and Horizon Christian Fellowship, dated October 13, 2003. (1)
2.5 Third Amendment to Purchase and Sale Agreement and Joint Escrow Instructions by and betweenRegistrant and Horizon Christian Fellowship, dated December 23, 2003. (1)
3.1 Restated Certificate of Incorporation of Registrant. (11)
3.2 Certificate of Amendment of Restated Certificate of Incorporation of Registrant, dated November22, 1996. (7)
3.3 Certificate of Amendment of Restated Certificate of Incorporation of Registrant, dated February 9,1998. (2)
3.4 Amended and Restated Bylaws of Registrant. (3)
4.1 Rights Agreement dated November 5, 1999 between Registrant and Chase Mellon ShareholdersServices, LLC, as Rights Agent. (10)
4.2 Amendment of Rights Agreement dated as of July 5, 2002. (12)
10.1 1995 Stock Option Plan of Registrant. (8)
10.2 Amendment No. One to Registrant’s 1995 Stock Option Plan dated March 19, 1997. (7)
10.3 Amendment No. Two to Registrant’s 1995 Stock Option Plan dated February 13, 1998. (14)
10.4 Amendment No. Three to Registrant’s 1995 Stock Option Plan dated January 28, 1999. (2)
10.5 Amendment No. Four to Registrant’s 1995 Stock Option Plan dated Nov. 22, 1999. (4)
10.6 Amendment No. Five to Registrant’s 1995 Stock Option Plan dated August 14, 2000. (13)
10.7 Stock Option Agreement under 1995 Stock Option Plan by and between Registrant and KennethPotashner, dated as of May 19, 2003. (12)
86

ExhibitNumber Description of Document
10.8 1999 Director Stock Option Plan of Registrant. (4)
10.9 Registrant’s 1994 Employee Stock Purchase Plan. (8)
10.10 Amendment Number One to Registrant’s 1994 Employee Stock Purchase Plan, effective as ofApril 30, 1997. (7)
10.11 PurePulse Technologies, Inc. 1994 Stock Option Plan. (9)
10.12 Shareholder Agreement among Registrant, PurePulse Technologies, Inc., Sanyo E&E Corporationand Three Oceans Inc., dated January 28, 1999. (2)
10.13 Stock Purchase and Barter Agreement by and between Registrant and Montena SA dated May 30,2002. (5)
10.14 Amendment Number One to Stock Purchase and Barter Agreement by and between Registrant andMontena SA dated June 28, 2002. (5)
10.15 Amendment Number Two to the Stock Purchase and Barter Agreement by and between Registrantand Montena SA dated August 12, 2002. (6)
10.16 Indemnity Agreement for Directors of Registrant dated December 2004. (12)
10.17 Loan and Security Agreement (Exim Program) dated February 4, 2004 between Registrant andSilicon Valley Bank. (12)
10.18 Schedule to Loan and Security Agreement (Exim Program) dated February 4, 2004 betweenRegistrant and Silicon Valley Bank. (12)
10.19 Export-Import Bank of the United States Agreement Executed by Borrower dated February 4, 2004between Registrant, Export-Import Bank of the United States and Silicon Valley Bank. (12)
10.20 Securities Account Control Agreement dated February 4, 2004 between Registrant and SiliconValley Bank. (12)
10.21 Firm-Fixed-Price Subcontract Purchase Order dated February 14, 2005 between Registrant andNorthrop Grumman Space and Mission Systems Corp. (15)
10.22 Employment Agreement dated August 19, 2005 between Registrant and Tim Hart. (16)
10.23 Securities Purchase Agreement, dated as of December 20, 2005 between Registrant and CastleriggMaster Investments Ltd. (17)
10.24 Registration Rights Agreement, dated as of December 20, 2005 between Registrant and CastleriggMaster Investments Ltd. (17)
10.25 Employment Agreement dated December 22, 2001 between Registrant and Alain R. Riedo. (18)
10.26 Employment Agreement dated April 2, 2007 between the Registrant and George Kriegler. (19)
10.27 Registrant’s 2005 Omnibus Equity Incentive Plan, as amended through May 3, 2007. (20)
10.28 Underwriting Agreement dated May 8, 2007 between the Registrant and UBS Securities, LLC. (21)
10.29 Transition agreement effective as of July 23, 2007 between the Company and Richard D.Balanson. (22)
10.30 Employment agreement effective as of July 23, 2007 between the Company and David S.Schramm. (22)
10.31 Underwriting Agreement between the Company and UBS Securities, LLC dated October 9,2007. (23)
87

ExhibitNumber Description of Document
21.1 List of subsidiaries of Registrant. *
23.1 Consent of Independent Registered Public Accounting Firm, McGladrey & Pullen, LLP. *
31.1 Certification of Chief Executive Officer pursuant to Rule 13a-14(a) (Section 302 Certification) asadopted pursuant to Section 302 of the Sarbanes-Oxley Act of 2002. *
31.2 Certification of Chief Financial Officer pursuant to Rule 13a-14(a) (Section 302 Certification) asadopted pursuant to Section 302 of the Sarbanes-Oxley Act of 2002. *
32.1 Certification of Chief Executive Officer pursuant to 18 U.S.C. Section 1350, as adopted pursuant toSection 906 of the Sarbanes-Oxley Act of 2002. *
32.2 Certification of Chief Financial Officer pursuant to 18 U.S.C. Section 1350, as adopted pursuant toSection 906 of the Sarbanes-Oxley Act of 2002. *
* Filed herewith.(1) Incorporated herein by reference to Registrant’s Current Report on Form 8-K filed with the SEC on
January 15, 2004.(2) Incorporated herein by reference to Registrant’s Annual Report on Form 10-K for the fiscal year ended
July 31, 1999 (SEC file no. 000-10964).(3) Incorporated herein by reference to Registrant’s Quarterly Report on Form 10-Q for the quarter ended
June 30, 2003 (SEC file no. 001-15477).(4) Incorporated herein by reference to Registrant’s Transition Report on Form 10-K for the transition period
from August 1, 1999 to December 31, 1999 (SEC file no. 001-15477).(5) Incorporated herein by reference to Registrant’s Current Report on Form 8-K filed with the SEC on
July 19, 2002.(6) Incorporated herein by reference to Registrant’s Current Report on Form 8-K filed with the SEC on
September 18, 2002.(7) Incorporated herein by reference to Registrant’s Annual Report on Form 10-K for the fiscal year ended
July 31, 1997 (SEC file no. 000-10964).(8) Incorporated herein by reference to Registrant’s Annual Report on Form 10-K for the fiscal year ended
July 31, 1995 (SEC file no. 000-10964).(9) Incorporated herein by reference to Registrant’s Annual Report on Form 10-K for the fiscal year ended
July 31, 1996 (SEC file no. 000-10964).(10) Incorporated herein by reference to Registrant’s Form 8-A filed November 18, 1999 (SEC file no.
001-15477).(11) Incorporated herein by reference to Registrant’s Annual Report on Form 10-K for the fiscal year ended
July 31, 1987 (SEC file no. 000-10964).(12) Incorporated herein by reference to Registrant’s Annual Report on Form 10-K for the fiscal year ended
December 31, 2003.(13) Incorporated herein by reference to Registrant’s Annual Report on Form 10-K for the fiscal year ended
December 31, 2000.(14) Incorporated herein by reference to Registrant’s Annual Report on Form 10-K for the fiscal year ended
July 31, 1998 (SEC file no. 000-10964).(15) Incorporated herein by reference to Registrant’s Annual Reports on Form 10-K for the fiscal year ended
December 31, 2004.(16) Incorporated herein by reference to Registrant’s Current Report on Form 8-K filed with the SEC on
August 19, 2005.(17) Incorporated herein by reference to Registrant’s Current Report on Form 8-K filed with the SEC on
December 21, 2005.(18) Incorporated herein by reference to Registrant’s Current Report on Form 8-K filed with the SEC on May 9,
2006.
88

(19) Incorporated herein by reference to Registrant’s Current Report on Form 8-K filed with the SEC onApril 4, 2007.
(20) Incorporated herein by reference to Registrant’s Current Report on Form 8-K filed with the SEC on May 8,2007.
(21) Incorporated herein by reference to Registrant’s Current Report on Form 8-K filed with the SEC onMay 10, 2007.
(22) Incorporated herein by reference to Registrant’s Current Report on Form 10-Q filed with the SEC onAugust 9, 2007.
(23) Incorporated herein by reference to Registrant’s Current Report on Form 8-K filed with the SEC onOctober 10, 2007.
(b) See the exhibits required by this item under Item 15(a)(3) above.
(c) See the financial statement schedule required by this item under Item 15(a)(2) above.
89

SIGNATURES
Pursuant to the requirements of Section 13 or 15(d) of the Securities Exchange Act of 1934, the registranthas duly caused this report to be signed on its behalf by the undersigned, thereunto duly authorized, on this 29th
day of February 2008.
MAXWELL TECHNOLOGIES, INC.
By: /S/ DAVID SCHRAMM
David SchrammPresident and Chief Executive Officer
Pursuant to the requirements of the Securities Exchange Act of 1934, this report has been signed below bythe following persons on behalf of the registrant and in the capacities and on the dates indicated.
Signature Title Date
/S/ DAVID SCHRAMM
David Schramm
President, Chief Executive Officer andDirector
February 29, 2008
/S/ TIM T. HART
Tim T. Hart
Vice President, Finance, Treasurer andChief Financial Officer (PrincipalFinancial and Accounting Officer)
February 29, 2008
/S/ MARK ROSSI
Mark Rossi
Director February 29, 2008
/S/ JEAN LAVIGNEJean Lavigne
Director February 29, 2008
/S/ ROBERT L. GUYETT
Robert L. Guyett
Director February 29, 2008
/S/ JOSÉ CORTES
José Cortes
Director February 29, 2008
/S/ THOMAS RINGER
Thomas Ringer
Director February 29, 2008
/S/ EDWARD CAUDILL
Edward Caudill
Director February 29, 2008
/S/ BURKHARD GOESCHEL
Burkhard Goeschel
Director February 29, 2008
90

EXHIBIT 31.1
CERTIFICATION OFPRINCIPAL EXECUTIVE OFFICER
PURSUANT TO SECTION 302OF THE SARBANES-OXLEY ACT OF 2002
I, David Schramm, certify that:
1. I have reviewed this annual report on Form 10-K of Maxwell Technologies, Inc.;
2. Based on my knowledge, this report does not contain any untrue statement of a material fact or omit tostate a material fact necessary to make the statements made, in light of the circumstances under which suchstatements were made, not misleading with respect to the period covered by this report;
3. Based on my knowledge, the financial statements, and other financial information included in this report,fairly present in all material respects the financial condition, results of operations and cash flows of the registrantas of, and for, the periods presented in this report;
4. The registrant’s other certifying officer and I are responsible for establishing and maintaining disclosurecontrols and procedures (as defined in Exchange Act Rules 13a-15(e) and 15d-15(e)) and internal control overfinancial reporting (as defined in Exchange Act Rules 13a-15(f) and 15(d)-15(f)) for the registrant and have:
a) Designed such disclosure controls and procedures, or caused such disclosure controls and proceduresto be designed under our supervision, to ensure that material information relating to the registrant, includingits consolidated subsidiaries, is made known to us by others within those entities, particularly during theperiod in which this report is being prepared;
b) Designed such internal control over financial reporting, or caused such internal control overfinancial reporting to be designed under our supervision, to provide reasonable assurance regarding thereliability of financial reporting and the preparation of financial statements for external purposes inaccordance with generally accepted accounting principles;
c) Evaluated the effectiveness of the registrant’s disclosure controls and procedures and presented inthis report our conclusions about the effectiveness of the disclosure controls and procedures, as of the end ofthe period covered by this report based on such evaluation; and
d) Disclosed in this report any change in the registrant’s internal control over financial reporting thatoccurred during the registrant’s most recent fiscal quarter (the registrant’s fourth fiscal quarter in the case ofan annual report) that has materially affected, or is reasonably likely to materially affect, the registrant’sinternal control over financial reporting;
5. The registrant’s other certifying officer and I have disclosed, based on our most recent evaluation ofinternal control over financial reporting, to the registrant’s auditors and the audit committee of the registrant’sboard of directors (or persons performing the equivalent functions):
a) All significant deficiencies and material weaknesses in the design or operation of internal controlover financial reporting which are reasonably likely to adversely affect the registrant’s ability to record,process, summarize and report financial information; and
b) Any fraud, whether or not material, that involves management or other employees who have asignificant role in the registrant’s internal control over financial reporting.
February 29, 2008 /s DAVID SCHRAMM
David SchrammPresident and Chief Executive Officer
(Principal Executive Officer)

EXHIBIT 31.2
CERTIFICATION OFPRINCIPAL FINANCIAL OFFICER
PURSUANT TO SECTION 302OF THE SARBANES-OXLEY ACT OF 2002
I, Tim T. Hart, certify that:
1. I have reviewed this annual report on Form 10-K of Maxwell Technologies, Inc.;
2. Based on my knowledge, this report does not contain any untrue statement of a material fact or omit tostate a material fact necessary to make the statements made, in light of the circumstances under which suchstatements were made, not misleading with respect to the period covered by this report;
3. Based on my knowledge, the financial statements, and other financial information included in this report,fairly present in all material respects the financial condition, results of operations and cash flows of the registrantas of, and for, the periods presented in this report;
4. The registrant’s other certifying officer and I are responsible for establishing and maintaining disclosurecontrols and procedures (as defined in Exchange Act Rules 13a-15(e) and 15d-15(e)) and internal control overfinancial reporting (as defined in Exchange Act Rules 13a-15(f) and 15(d)-15(f)) for the registrant and have:
a) Designed such disclosure controls and procedures, or caused such disclosure controls and proceduresto be designed under our supervision, to ensure that material information relating to the registrant, includingits consolidated subsidiaries, is made known to us by others within those entities, particularly during theperiod in which this report is being prepared;
b) Designed such internal control over financial reporting, or caused such internal control overfinancial reporting to be designed under our supervision, to provide reasonable assurance regarding thereliability of financial reporting and the preparation of financial statements for external purposes inaccordance with generally accepted accounting principles;
c) Evaluated the effectiveness of the registrant’s disclosure controls and procedures and presented inthis report our conclusions about the effectiveness of the disclosure controls and procedures, as of the end ofthe period covered by this report based on such evaluation; and
d) Disclosed in this report any change in the registrant’s internal control over financial reporting thatoccurred during the registrant’s most recent fiscal quarter (the registrant’s fourth fiscal quarter in the case ofan annual report) that has materially affected, or is reasonably likely to materially affect, the registrant’sinternal control over financial reporting;
5. The registrant’s other certifying officer and I have disclosed, based on our most recent evaluation ofinternal control over financial reporting, to the registrant’s auditors and the audit committee of the registrant’sboard of directors (or persons performing the equivalent functions):
a) All significant deficiencies and material weaknesses in the design or operation of internal controlover financial reporting which are reasonably likely to adversely affect the registrant’s ability to record,process, summarize and report financial information; and
b) Any fraud, whether or not material, that involves management or other employees who have asignificant role in the registrant’s internal control over financial reporting.
February 29, 2008 /s/ TIM T. HART
Tim T. HartVice President, Finance, Treasurer and Chief Financial Officer
(Principal Financial Officer)

EXHIBIT 32.1
CERTIFICATION OFPRINCIPAL EXECUTIVE OFFICER
PURSUANT TO 18 U.S.C. SECTION 1350(SECTION 906 OF THE SARBANES-OXLEY ACT OF 2002)
In connection with the accompanying Annual Report on Form 10-K of Maxwell Technologies, Inc. for theyear ended December 31, 2007, I, David Schramm, Chief Executive Officer of Maxwell Technologies, Inc.,hereby certify pursuant to 18 U.S.C. § 1350, as adopted pursuant to Section 906 of the Sarbanes-Oxley Act of2002, that to the best of my knowledge:
(1) such Annual Report on Form 10-K of Maxwell Technologies, Inc. for the year ended December 31,2007, fully complies with the requirements of Section 13(a) or 15(d) of the Securities Exchange Act of1934, as amended; and
(2) the information contained in such Annual Report on Form 10-K of Maxwell Technologies, Inc. forthe year ended December 31, 2007, fairly presents, in all material respects, the financial condition andresults of operations of Maxwell Technologies, Inc. at the dates indicated.
This certification has not been, and shall not be deemed, “filed” with the Securities and ExchangeCommission.
February 29, 2008 /S/ DAVID SCHRAMM
David SchrammPresident and Chief Executive Officer
(Principal Executive Officer)
A signed copy of this written statement required by Section 906 has been provided to Maxwell Technologies, Inc.and will be retained by Maxwell Technologies, Inc. and furnished to the Securities and Exchange Commission orits staff upon request.

EXHIBIT 32.2
CERTIFICATION OFPRINCIPAL FINANCIAL OFFICER
PURSUANT TO 18 U.S.C. SECTION 1350(SECTION 906 OF THE SARBANES-OXLEY ACT OF 2002)
In connection with the accompanying Annual Report on Form 10-K of Maxwell Technologies, Inc. for theyear ended December 31, 2007, I, Tim T. Hart, Chief Financial Officer of Maxwell Technologies, Inc., herebycertify pursuant to 18 U.S.C. § 1350, as adopted pursuant to Section 906 of the Sarbanes-Oxley Act of 2002, thatto the best of my knowledge:
(1) such Annual Report on Form 10-K of Maxwell Technologies, Inc. for the year ended December 31,2007, fully complies with the requirements of Section 13(a) or 15(d) of the Securities Exchange Act of1934, as amended; and
(2) the information contained in such Annual Report on Form 10-K of Maxwell Technologies, Inc. forthe year ended December 31, 2007, fairly presents, in all material respects, the financial condition andresults of operations of Maxwell Technologies, Inc. at the dates indicated.
This certification has not been, and shall not be deemed, “filed” with the Securities and ExchangeCommission.
February 29, 2008 /s/ TIM T. HART
Tim T. HartVice President, Finance, Treasurer and Chief Financial Officer
(Principal Financial Officer)
A signed copy of this written statement required by Section 906 has been provided to Maxwell Technologies, Inc.and will be retained by Maxwell Technologies, Inc. and furnished to the Securities and Exchange Commission orits staff upon request.

David SchrammPresident and Chief Executive Offi cer, Maxwell Technologies, Inc.
José CortesChairman, Montena SAPrincipal, GroCor Asset Management, AG
Edward Caudill, ChairmanFormer President and Chief Executive Offi cer, Fleetwood Enterprises
Prof. Dr.-Ing. Dr.-Ing. E.h. Burkhard GoeschelCTO Vehicles & Powertrain,MAGNA International
Robert GuyettPresident and Chief Executive Offi cer,Crescent Management Enterprises
Jean LavigneRetired Vice President and Country President,Motorola, Inc., France
Thomas RingerRetired President and Chief Executive Offi cer,Fujitsu Systems of America
Mark RossiSenior Managing Director,Cornerstone Equity Investors, LLC
David SchrammPresident and Chief Executive Offi cer
Tim HartSenior Vice President and Chief Financial Offi cer
Alain RiedoSenior Vice President and General Manager,Maxwell Technologies SA
George Kreigler IIISenior Vice President, Operations
Maxwell Technologies’ common stock is traded on the Nasdaq Stock Exchange under the symbol MXWL.
Stockholders may access the Investors section of Maxwell’s website at www.maxwell.com for a stock quote, audio and slide presentations, news releases and recent Securities and Exchange Commission fi lings.
Stockholders may reach Maxwell’s Investor Relations group directly between the hours of 8:00am and 5:00pm (Pacifi c) by calling+1 858 503 3300, by fax on +1 858 503 3347, online at www.maxwell.com/investors, or by writing to:
Investor RelationsMaxwell Technologies, Inc.9244 Balboa AvenueSan Diego, CA 92123, USA
For address changes, transfer of stock or replacement of lost certifi cates, please contact Maxwell’s Registrar and Transfer Agent:
Mellon Investor Services, LLCStock Transfer DepartmentNewport Offi ce Center VII480 Washington Blvd.Jersey City, NJ 07310, USAwww.melloninvestor.com
Phone: 1 800 522 6645TDD for hearing impaired: 1 877 289 7102Foreign stockholders: +1 201 329 8660TDD for foreign stockholders: +1 201 329 8354
McGladrey & Pullen LLP, San Diego, California, USA
OFFICERS
DIRECTORS
INDEPENDENT AUDITORS
TRANSFER AGENT & REGISTRAR
STOCKHOLDER INFORMATION

NORTH AMERICA &WORLD HEADQUARTERS
Maxwell Technologies, Inc.9244 Balboa AvenueSan Diego, CA 92123
USA Phone: +1 858 503 3300 Fax: +1 858 503 3301
EUROPE
Maxwell Technologies SACH-1728 Rossens
Switzerland Phone: +41 (0)26 411 85 00 Fax: +41 (0)26 411 85 05
ASIA PACIFIC
Maxwell Technologies, Inc.Shanghai Representative Offi ce
Rm. 2104, Suncome Liauw’s Plaza738 Shang Cheng Road,
Pudong New AreaShanghai 200120, P.R. China
Phone: +86 21 5836 5733 Fax: +86 21 5836 5620
®