2006 stable value and global gic investor...
TRANSCRIPT

1
2006 Stable Value and Global GIC Investor Day
Welcome!
June 1, 2006

2
Safe Harbor Statement
These materials contain statements which constitute forward-looking statements within the meaning of the Private Securities Litigation Reform Act of 1995, including statements relating to trends in the operations and financial results and the business and the products of MetLife, Inc. and its subsidiaries (collectively, the “Company”), as well as other statements including words such as "anticipate," "believe," "plan," "estimate," "expect," "intend" and other similar expressions. Forward-looking statements are made based upon management's current expectations and beliefs concerning future developments and their potential effects on the Company. Such forward-looking statements are not guarantees of future performance.
Actual results may differ materially from those included in the forward-looking statements as a result of risks and uncertainties including, but not limited to, the following: (i) changes in general economic conditions, including the performance of financial markets and interest rates; (ii) heightened competition, including with respect to pricing, entry of new competitors and the development of new products by new and existing competitors; (iii) unanticipated changes in industry trends; (iv) MetLife, Inc.'s primary reliance, as a holding company, on dividends from its subsidiaries to meet debt payment obligations and the applicable regulatory restrictions on the ability of the subsidiaries to pay such dividends; (v) deterioration in the experience of the "closed block" established in connection with the reorganization of Metropolitan Life Insurance Company; (vi) catastrophe losses; (vii) adverse results or other consequences from litigation, arbitration or regulatory investigations; (viii) regulatory, accounting or tax changes that may affect the cost of, or demand for, the Company's products or services; (ix) downgrades in the Company's or its affiliates' claims paying ability, financial strength or credit ratings; (x) changes in rating agency policies or practices; (xi) discrepancies between actual claims experience and assumptions used in setting prices for the Company's products and establishing the liabilities for the Company's obligations for future policy benefits and claims; (xii) discrepancies between actual experience and assumptions used in establishing liabilities related to other contingencies or obligations; (xiii) the effects of business disruption or economic contraction due to terrorism or other hostilities; (xiv) the Company’s ability to identify and consummate on successful terms any future acquisitions, and to successfully integrate acquired businesses with minimal disruption, and (xv) other risks and uncertainties described from time to time in MetLife, Inc.'s filings with the Securities and Exchange Commission, including its S-1 and S-3 registration statements. The Company specifically disclaims any obligation to update or revise any forward-looking statement, whether as a result of new information, future developments or otherwise.

3
Explanatory Note on Non-GAAP Financial Information
The historical and forward-looking financial information presented at this conference and contained in the written materials provided include performance measures which are based on methodologies other than Generally Accepted Accounting Principles (“GAAP”). MetLife analyzes its performance using so-called non-GAAP measures, including operating earnings available to common shareholders, operating earnings available to common shareholders per diluted common share and operating return on common equity (“ROE”). MetLife believes these measures enhance the understanding and comparability of its performance by excluding net investment gains and losses, net of income taxes, and adjustments related to net investment gains and losses, net of income taxes, both of which can fluctuate significantly from period to period, the impact of the cumulative effect of a change in accounting, net of income taxes, and discontinued operations other than discontinued real estate, net of income taxes, thereby highlighting the results from operations and the underlying profitability drivers of the business.
Operating earnings available to common shareholders is defined as GAAP net income, excluding net investment gains and losses, net of income taxes, adjustments related to net investment gains and losses, net of income taxes, the impact of the cumulative effect of a change in accounting, net of income taxes, and discontinued operations other than discontinued real estate, net of income taxes, less preferred stock dividends which are recorded in Corporate & Other. Scheduled settlement payments on derivative instruments not qualifying for hedge accounting treatment are included in operating earnings available to common shareholders.
Operating earnings available to common shareholders per diluted common share is calculated by dividing operating earnings available to common shareholders as defined above by the number of weighted average diluted common shares outstanding for the period indicated.
Operating return on common equity is calculated by dividing operating earnings available to common shareholders as defined above by average equity for the period indicated, excluding accumulated other comprehensive income.

4
Explanatory Note on Non-GAAP Financial Information (continued)
For the historical periods presented, reconciliations of the non-GAAP measures used in this presentation to the most directly comparable GAAP measures are included at the end of this presentation and are on the Investor Relations portion of the Company’s website (www.metlife.com). Additional information about MetLife’s historical financial results is available in the Company’s Quarterly Financial Supplements which may be accessed through the Company’s Website. The non-GAAP measures used in this presentation should not be viewed as substitutes for the most directly comparable GAAP measures.
In this presentation, MetLife provides guidance on its future earnings and earnings per share on an operating, non-GAAP basis. A reconciliation of these measures to the most directly comparable GAAP measures is not accessible on a forward-looking basis because MetLife believes it is not possible to provide a reliable forecast of net investment gains and losses, which can fluctuate significantly from period to period and may have a significant impact on GAAP net income.

5
Conference Objectives
• Overview of MetLife’s stable value businesses
• Review of MET’s financial strength and performance
• Impact of the Travelers acquisition
• Dialogue with Senior Officers of MetLife

6
Agenda
Time Topic Presenter
8:30 - 9:00 a.m. Registration & Breakfast
9:00 - 9:15 a.m. Welcome & Introductory Remarks Maria R. Morris
9:15 - 9:35 a.m. MetLife Institutional Business Leland C. Launer, Jr.
9:35 - 10:20 a.m. MetLife Financial Overview William J. Wheeler
10:20 - 11:00 a.m. Investments Overview Robert W. Morgan
11:00 - 11:10 a.m. Break
11:10 - 11:40 a.m. Global GIC Portfolio Thomas E. Lenihan
11:40 - 12:00 p.m. Corporate Benefit Funding Robin F. Lenna
Andrew T. Aoyama
12:00 - 1:00 p.m. Lunch
1:00 p.m. Conclusion

©UFS
MetLife Institutional Business
Leland C. Launer, Jr.President, Institutional Business
2006 Stable Value and Global GIC Investor Day

8
2005 Highlights
• Operating Earnings up over 15%• Grew top line 12% • Record sales in several products• Persistency improvements across all channels• Improved underwriting margins in Disability and Dental • Held direct operating expenses flat to previous year• Fully integrated Travelers retirement business

9
2005 Highlights - Travelers Acquisition
• Purchased highly similar business• Increased MetLife’s retirement & savings general
account assets by $28 billion or 54%• Travelers accounts completely transferred
to MetLife systems• Providing uninterrupted service for Travelers
275,000 annuitants• Managing acquired business with little incremental cost

10
Retirement & Savings – Travelers
($ in billions)General Account Balances
at time of Acquisition (7/1/05)
Product Type MetLife Travelers TotalTraditional GICs $ 5.7 $ 5.5 $ 11.2Funding Agreements 4.2 3.9 8.1Global GICs 10.6 5.1 15.7Structured Settlements 9.3 5.3 14.6Closeouts 11.2 4.8 16.0Annuities & Other 10.0 3.1 13.1
Total $ 51.0 $ 27.7 $ 78.7

11
2005 Highlights - Key Management Actions
• Reorganized product groups to align with the buyer• Consolidated sales forces under one leader• Increased focus on “second sale” capabilities• Additional focus on service

12
Institutional Business Is The Leader
Institutional Business
(44%)
2005 Operating Earnings = $1,445 million
• Number of Companies Served = 60,500
• Covered Lives = 37.5 Million
• Number of Products = 31
• Associates = 8,000
Institutional Business
Sales*y
RankGroup Life, Health and AnnuityLife #1Disability #1Long Term Care #1Auto & Home #1Institutional Annuities #1Structured Settlements #1Stable Value & Funding Agreements #1Dental #2
MetLife Total = $3.3B* MetLife rankings include Travelers results. Life, LTC, and Dental are measured in Sales Premiums; Disability in Sales Premiums, Equivalents, and Fees.Sources: Total Group Life, Health (excludes Medical), and Annuity (AM Best 2004); Life, Disability, LTC, Institutional Annuities, Structured Settlements, Stable Value and Funding Agreements Sales (LIMRA 2004); Dental, Auto & Home (MetLife Market Research 2005)See Appendix for reconciliations.

13
2005 Institutional – Premiums, Fees & Other Revenues
($ millions)
2004 2005 GrowthGroup Life $5,943 $6,444 8%Retirement & Savings 1,554 1,938 25%Non-Medical Health 3,905 4,430 13%
$11,402 $12,812 12%

14
2005 Institutional - Operating Earnings
($ millions)
2004 2005 GrowthGroup Life $398 $400 1%Retirement & Savings 624 800 28%Non-Medical Health 227 245 8%
$1,249 $1,445 16%
See Appendix for reconciliations.

15
2006 Institutional - Premiums, Fees & Other Revenues
($ millions)
2005 2006 Plan GrowthGroup Life $6,444 $6,705 - $6,745 4% - 5%Retirement & Savings 1,938 $2,800 - $2,840 44% - 47%Non-Medical Health 4,430 $4,910 - $4,950 11% - 12%
$12,812 $14,455 - $14,495 13%

16
2006 Institutional - Operating Earnings
($ millions)
2005 2006 Plan GrowthGroup Life $400 $340 - 365 (15%) - (9%)Retirement & Savings 800 775 - 805 (3%) - 1%Non-Medical Health 245 355 - 380 45% - 55%
$1,445 $1,475 - $1,550 2% - 7%
See Appendix for reconciliations.

17
Initiatives - Group Life
• Grow market share• Improve underwriting earnings• Expand “voluntary” sales• Manage “Total Control Account”

18
Initiatives - Retirement & Savings
• Maximize Travelers business• Expand payout annuity business per
“retirement strategy”• Continue growth of structured settlements
and closeouts• Grow spread margin business• Create UK closeout infrastructure

19
Initiatives - Non-Medical Health & Other
Disability• Focus on service as a differentiator• Continuing improvement in underwriting margins • Expand market share
Dental• Expand dental network from 85,000 to 90,000• Achieve renewal increases and maintain persistency• Expand voluntary offerings
Long Term Care• Complete new Individual LTC product rollout• Invest in operating system• Expand multi-life LTC product sold through the workplace

20
Future Opportunities
• Higher participation rates in voluntary products• Market share increase in small to mid employers• Re-emergence of pension closeout business• Expand arbitrage business

©UFS
RR
©UFS
MetLife Financial Overview
Bill WheelerExecutive Vice President & CFO
2006 Stable Value and Global GIC Investor Day

23
First Quarter 2006 Financial Overview
($ millions, except per share and book value data)Three Months Ended March 31,
2005 2006 % Change
Premiums, Fees & Other Revenues $7,056 $7,934 12.4%
Operating Earnings Available to Common Shareholders per Diluted Common Share
$1.11 $1.33 19.8%
Net Income Available to Common Shareholders per Diluted Common Share
$1.33 $0.93 ( 30.1%)
Book Value per Common Share (actual common shares outstanding) (1)
$28.48 $34.21 20.1%
Operating Return on Common Equity (1)(2) 16.1% 16.1%
(1) Excluding AOCI. See Appendix for reconciliations.
(2) Based on annualized first quarter operating earnings available to common shareholders. See Appendix for reconciliations.

24
Premiums, Fees & Other Revenues
2001 2002 2003 2004 2005 Q105 Q106
CAGR 10.4%
($m
illio
ns)
* Excludes $32 million for Conning, a subsidiary which was sold in 2001. See Appendix for reconciliations.
*
12.4%
$7,056 $7,934
$20,157$22,331
$24,269$26,265
$29,9597.9% Annualized
Sequential Growth
25
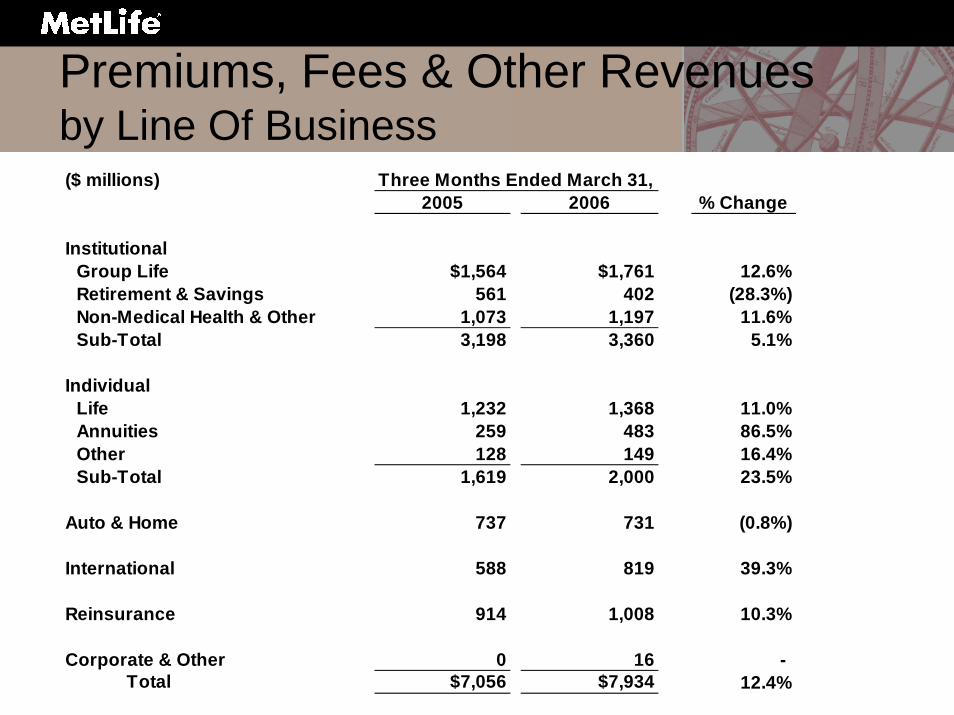
Premiums, Fees & Other Revenuesby Line Of Business($ millions)
2005 2006 % Change
InstitutionalGroup Life $1,564 $1,761 12.6%Retirement & Savings 561 402 (28.3%)Non-Medical Health & Other 1,073 1,197 11.6%Sub-Total 3,198 3,360 5.1%
IndividualLife 1,232 1,368 11.0%Annuities 259 483 86.5%Other 128 149 16.4%Sub-Total 1,619 2,000 23.5%
Auto & Home 737 731 (0.8%)
International 588 819 39.3%
Reinsurance 914 1,008 10.3%
Corporate & Other 0 16 - Total $7,056 $7,934 12.4%
Three Months Ended March 31,

26
Total Assets
$366.6$62.7 $59.7
$75.8
$132.5
$353.7
$194.3 $217.7 $251.0 $270.0
$127.9
$86.8
2001 2002 2003 2004 2005 Q106General Account Separate Account
($bi
llion
s)
CAGR 17.0%
$326.8$277.4$257.0
$356.8
$481.6 $499.1
14.5%Annualized

27
Underwriting Margins – Loss Ratios
2001 2002 2003 2004 2005 Q105 Q106
Group Term Life 92.6% 92.4% 90.8% 91.7% 92.4% 94.2% 94.2%
Group Disability 100.3% 95.5% 95.4% 91.6% 89.8% 89.5% 90.7%
Individual Life 84.8% 83.8% 87.7% 82.0% 85.4% 85.6% 94.0%
A&H Combined Ratio 106.0% 99.4% 99.7% 96.8% 96.3% 92.4% 89.6%
A&H Combined Ratio Excluding Catastrophes
102.1% 97.4% 97.1% 90.4% 86.7% 90.9% 86.6%

28
Investment Yields and Spreads
2001 2002 2003 2004 2005 Q105 Q106Average Yield on Total Invested Assets 7.56% 7.25% 6.72% 6.55% 6.21% 6.48% 6.42%
Group Life 1.59% 1.89% 2.04% 2.19% 1.98% 2.03% 1.67%
R&S 1.47% 1.44% 1.40% 1.83% 1.71% 1.65% 1.43%
Annuities 2.18% 2.07% 2.11% 2.33% 2.83% 2.68% 2.63%

29
Total Company Operating Expense Ratio
2001 2002 2003 2004 2005 Q105 Q305 Q405 Q106
Operating expense ratio is defined as expenses excluding certain items, divided by premiums, fees and other revenues. See Appendix for reconciliations.
29.5%27.8% 27.8% 28.0% 28.5% 29.0%
25.7%
30.2%32.0%

30
Operating Earnings Available to Common Shareholders Per Diluted Common Share
2001 2002 2003 2004 2005 Q105 Q106
CAGR 18.9%
Operating Earnings Available to Common Shareholders Per Diluted Common Share as presented excludes certain items. See Appendix for reconciliations.
19.8%
$1.11
$2.17
$3.36$2.83$2.59
$4.33
$1.33

31
Operating Earnings Available to Common Shareholders by Line of Business
($ millions)2005 2006 % Change
Institutional $324 $416 28.4%
Individual 321 408 27.1%
Auto & Home 76 93 22.4%
International 68 75 10.3%
Reinsurance 25 24 (4.0%)
Corporate & Other 8 9 12.5%
Total $822 $1,025 24.7%
Three Months Ended March 31,

32
GAAP Results Total Company($ millions, except per share) Three Months Ended March 31,
2005 2006
AmountDiluted
EPS AmountDiluted
EPS
Operating earnings available to common shareholders
$822 $1.11 $1,025 $1.33
Net investment gains (losses) and related adjustments, net of income taxes
15 0.02 (311) (0.40)
Discontinued operations, net of income taxes
150 0.20 0 0.00
Net income available to common shareholders $987 $1.33 $714 $0.93

33
Realized Investment Gains/Losses($ millions)
Ended March 31,2005 2006
Gross Investment Gains $373 $237Gross Investment Losses (322) (587)Writedowns (51) (22)Derivative Values (21) (252)
Net Investment Gains (Losses) (21) (624)Tax Benefit & Minority Interest 0 218
Net Investment Gains (Losses), After-Tax (21) (406)Other Offsets 36 95Impact on Net Income $15 ($311)
Gross Credit Losses ($55) ($72)Gross Non Credit Related Losses (318) (537)
Total Gross Investment Losses Including Writedowns ($373) ($609)
Three Months

34
2006 Earnings Outlook
• Strong first quarter, outlook for rest of 2006 higher
• More confidence regarding interest rates, Higher variable investment income
• Revised FY 2006 EPS guidance:– $4.55 - $4.75 per common share

35
Financial Strength Ratings –Metropolitan Life Insurance Company
Moody's Aa2 Negative Outlook
S & P AA Negative Outlook
Fitch AA Stable
A.M. Best A+ Stable

36
Travelers Execution Deliverables
Expectation Status
• Financing Risk Done
• Leverage → 25% by YE 06 On Track
• Coverage
– “Greater than” Cashflow → 5.0x On Track
– Cashflow w/Common Dividend → > 2.0x On Track
• $150MM Expense Savings by 2006 On Track
• Integration Done

37
Summary
We are running this Company for the long term:
• Top-line growth
• Underwriting margins
• Appropriate risk profile

©UFS
RR

©UFS
Investments Overview
Robert W. MorganManaging DirectorPortfolio Management
2006 Stable Value and Global GIC Investor Day

40
Investments Agenda
• Market overview• Portfolio asset allocation• Sectors:
– Credit– Residential mortgage-backed securities– Real estate and agricultural investments– Derivatives
• Investment risks

41
2006 Market View & Themes
• Economy No bias to consensus
• Inflation Inflation lower than consensus
• Fed Fed Funds may go to 5.25%
• Interest Rates Buying opportunity
• Fixed Income Sectors No longer improving
• Real Estate Mortgages Strong market fundamentals with tighter, but still attractive, spreads
• Real Estate Equity Strong market fundamentals, but abundant capital is driving rich valuations
• S&P 500 New 5-year highs in 2006

42
Travelers Portfolio
• Integrated $55 billion Travelers portfolio as of July 1st
• Managed as “One”• Travelers portfolio rebalance
– Reduced credit exposure
– Increased structured finance
– More commercial mortgages

43
Asset Category Amount ($b) Target Ranges and HoldingsU.S. Treasury/Agency $27.7 7.0% 11.0%Residential MBS 52.0 14.0% 18.0%Commercial MBS 20.0 5.0% 8.0%Asset Backed Securities 13.6 2.5% 6.5%‘A’ or Better Corporates 65.8 21.0% 25.0%‘BBB’ Corporates 45.1 14.0% 17.0%Below Invest. Grade Corps. 15.5 4.5% 6.5%Commercial Mortgages 29.7 9.0% 12.0%Agricultural Mortgages 7.7 1.0% 4.0%Real Estate Equity 9.0 1.0% 4.0%Corporate Equity 7.9 1.5% 3.5%Cash & Short Term 8.5 0.5% 3.5%
MV of Managed Asset Base $302.5Other Invested Assets 9.3Real Estate Value Adj. ($4.3)Policy Loans 10.0
Total Carrying Value $317.5
Portfolio AllocationMetLife Inc. as of March 31, 2006
NeutralMin / Max Range3/31/05 Holdings3/31/06 Holdings

44
Credit
• Investment grade credit– Total portfolio: $110.9 billion– Top 10 exposures: $6.4 billion– Largest single name: $0.9 billion
• Below investment grade credit– Total portfolio: $15.5 billion– Top 10 exposures: $1.9 billion– Largest single name: $0.3 billion
Market Value as of 3/31/06
As of 3/31/06

45
CreditQuality Profile
$ billions
3/31/05 3/31/06Credit QualityInvestment Grade
'A' or Better 47.0% 52.2%'BBB' 41.0% 35.6%
Total Investment Grade 88.0% 87.8%
Below Investment Grade'Ba' 7.2% 7.3%'B' 4.5% 4.7%'Caa and Lower' 0.3% 0.2%In or Near Default 0.0% 0.0%
Total Below Investment Grade 12.0% 12.2%Total $101.9 $126.4

46
CreditInvestment Grade
Portfolio is more diversified than overall market
MetLifeLehman
Index
Weighted average rating A3 A2
Number of issuers (ex. munis) 1,120 598
Foreign % 31.8% 27.1%
Highest single exposure 0.8% 2.9%
Top 10 exposures 5.7% 19.3%
As of 3/31/06

47
CreditBelow Investment Grade
• Higher ratings profile than overall market
• Portfolio maintains stronger position in capital structure than overall market
• Decreasing as percentage of total invested assets
– 6.09% as of 12/31/02– 5.78% as of 12/31/03 – 5.17% as of 12/31/04– 4.98% as of 12/31/05– 4.98% as of 3/31/06
MetLifeLehman
Index
NAIC 3 60% 41%NAIC 4 38% 44%NAIC 5&6 2% 15%
Secured 42% 2%Unsecured 50% 74%Subordinated 8% 24%
As of 3/31/06

48
CreditRisk Management
• Experienced risk management team
• Enhanced credit research processes
• Defensive high yield portfolio
• Active credit and exposure management
• Increased use of derivatives as a risk management tool

49
CreditActive Credit Risk Management
• Autos– Fundamental considerations– Began selling down in 2002
• LBO risk– Increased risk of LBOs and other event risk– Reduced exposure on name by name basis
• Housing– Potential residential real estate bubble– Reduced exposure in the home construction,
building materials sectors and certain niche markets

50
Residential Mortgage-Backed Securities• Portfolio composition: 98.9% rated
“AAA”• Most liquid securities in the capital
markets• RMBS offers attractive relative
value• Mitigate the volatility by:
– Match short duration RMBS with short duration liabilities
– Allocate to rate-reset or participating portfolios
– Buy CMOs that provide protection against extension and prepayments
CMOsPass
Throughs Total
Short Term 37% 22% 59%
Rate-Reset 6% 8% 14%
Participating products 6% 3% 9%
Sub-Total 49% 33% 82%
Other 12% 6% 18%
Total 61% 39% 100%
As of 3/31/06

51
Real Estate and AgriculturalInvestments• Commercial mortgages
– Total portfolio $28.3 billion– Top 10 exposures $2.2 billion– Largest single investment $0.4 billion
• Agricultural mortgages– Total portfolio $7.7 billion– Top 10 exposures $0.9 billion– Largest single investment $0.2 billion
• Real estate equity– Total portfolio $4.7 billion– Top 10 exposures $2.1 billion– Largest single investment $0.5 billion
Book Value as of 3/31/06

52
Commercial MortgagesQuality Profile
$ billions
Book Value3/31/05 3/31/06
Traditional<60% LTV $7.3 $14.061-75% LTV 12.6 10.876-80% LTV 2.7 1.5>80% LTV 1.1 0.7
Total Commercial Mortgages $23.7 $27.0High Yield Commercial Mortgages $0.9 $1.3Agricultural Loans $5.9 $7.7Consumer Loans $1.4 $1.4Total Mortgages $31.9 $37.4

53
Commercial MortgagesPortfolio Composition
AmountProperty Type ($ millions) MetLife ACLIOffice 13,636 48% 35%Retail 6,270 22% 24%Apartments 3,283 12% 17%Industrial 2,763 10% 17%Hotel 1,490 5% 3%Other 836 3% 4%Total 28,278 100% 100%
% of Portfolio
Book value as of 3/31/06

54
Real Estate EquityQuality Profile – Occupancy Rates
MetLife U.S. Market* % PortfolioOffice 88% 87% 40%Apartment 98% 94% 39%Retail 98% 93% 6%Industrial 90% 90% 4%Hotel 73% 68% 4%*Torto Wheaton Research; REIS Reports
Market value as of 3/31/06
55
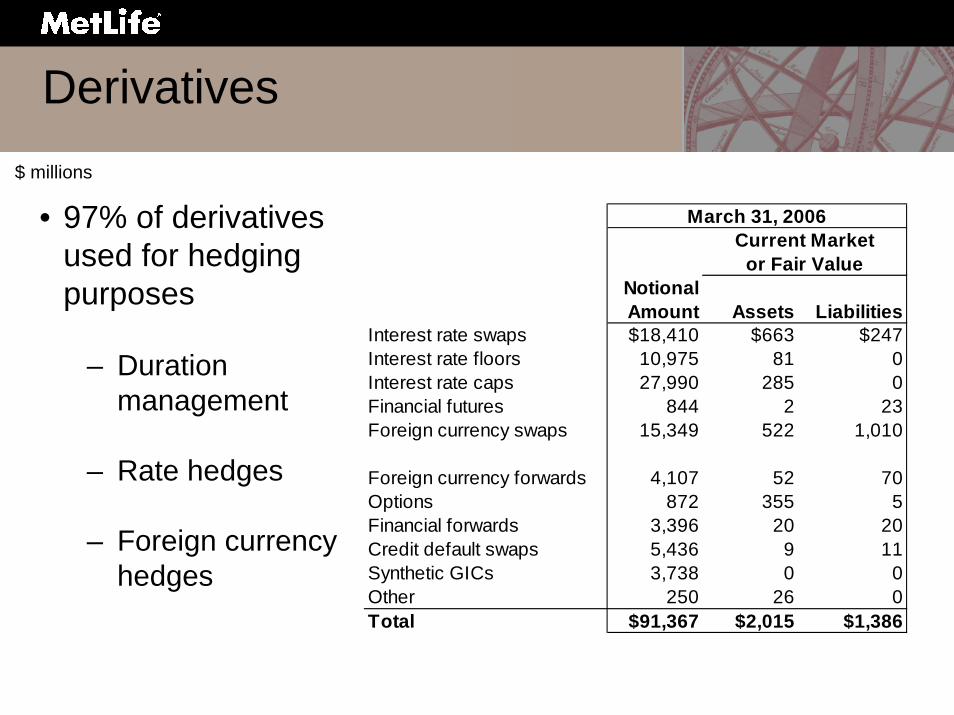
Derivatives$ millions
• 97% of derivatives used for hedging purposes
– Duration management
– Rate hedges
– Foreign currency hedges
March 31, 2006Current Market
or Fair Value Notional Amount Assets Liabilities
Interest rate swaps $18,410 $663 $247Interest rate floors 10,975 81 0Interest rate caps 27,990 285 0Financial futures 844 2 23Foreign currency swaps 15,349 522 1,010
Foreign currency forwards 4,107 52 70Options 872 355 5Financial forwards 3,396 20 20Credit default swaps 5,436 9 11Synthetic GICs 3,738 0 0Other 250 26 0Total $91,367 $2,015 $1,386

56
Investment Risks
• Low rates
• Flat curve
• Tight spreads

RR

©UFS
Capital Markets Investment Products:Global GICs
Tom LenihanManaging Director
2006 Stable Value and Global GIC Investor Day

59
Agenda
• Company Structure• 2005 Global GIC Market• Capital Markets Investment Product (CMIP) Overview• Global GIC Program Overview
– Structure of Program– Operating Paradigm– MetLife’s Global GIC Program– MetLife of Connecticut’s Global GIC Programs
• Asset/Liability Management• Summary

60
Company Structure
MetLife, Inc.(“Holding Company”)
International Subsidiaries
OtherSubsidiariesBankMet A&H MetLife of
Connecticut
Metropolitan Life Insurance Company (“Metropolitan Life” or “MLIC”)
Primary Insurance Entity - Domiciled in New York

61
2005 Global GIC MarketRecap
0.75.9
13.9
20.4
28.5 27.4
34.732.1
37.6
0
5
10
15
20
25
30
35
40
1997 1998 1999 2000 2001 2002 2003 2004 2005
$ bi
llion
• 18 programs issued a total of $32.1 billion of notes• New issue volume decreased by $5.5 billion versus 2004 due to AIG’s
departure from the market• Over $200 billion of notes have been offered since 1997 ($145 billion
currently outstanding)• Issuance through SEC-registered programs continued to expand as it
accounted for 28% of the 2005 new issue volume• With over $25 billion of maturities projected in 2006 and continued
growth expected, issuances likely to remain robust in 2006
GGIC ISSUANCE BY YEAR*
*Data published by S&P.

62
2005 Global GIC MarketBy Program
37.6
12.1 12.0 11.4 9.5 8.7 7.6 6.7 5.6 4.4
0
5
10
15
20
25
30
35
40
AIG MET ALL PFG AEGON JHF NYL PACLIF JNL PL
$ bi
llion
OUTSTANDING BALANCE BY PROGRAM*
4.0 3.8
2.8 2.5 2.5 2.3 2.0 2.0 1.71.2
0112233445
MET ALL NYL AEGON PFG AIG HFG GNW PRU PL
$ bi
llion
*Data published by S&P.
2005 GGIC ISSUANCE BY PROGRAM*

63
CMIP Overview
• MLIC’s GGICs• MetLife of Connecticut’s GGICs• Farmer Mac Guaranteed Trust Notes• Short Term Funding Agreements

64
Global GIC Program Overview
Metropolitan Life Global Funding IType: Global: 144A / Reg S
Size: US $17 Billion
Issuer: Metropolitan Life Global Funding I
Listing: Irish Stock Exchange
Ratings: Aa2 (negative outlook) / AA (negative outlook)
Maturities: Primarily Out to 10 Yrs; Longer Available
Offerings: Generally $100-$500 Million
Currencies: Various
Interest Rate: Fixed / Floating
Distribution: Syndication / Reverse Inquiry

65
Structure of ProgramStandard Global Format
Metropolitan Life Global Funding IInvestors Investment
Bank
$
Metropolitan Life**
$ $
Notes* Funding Agreement
Funding Agreement
* Notes rated Aa2/AA.** Metropolitan Life Financial Strength Ratings: Aa2/AA.
66
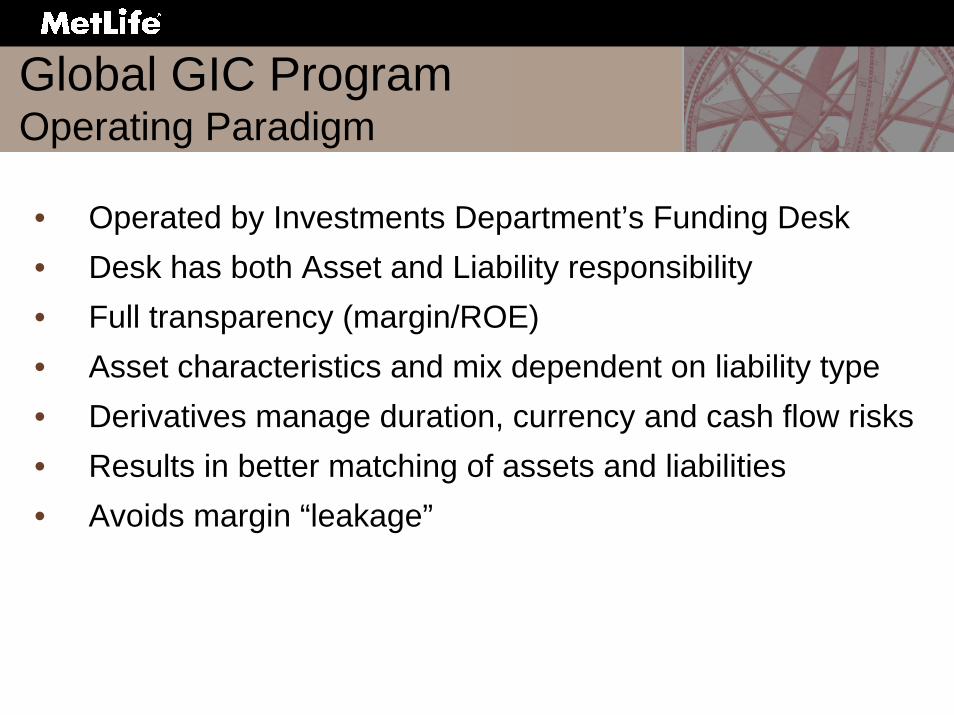
Global GIC ProgramOperating Paradigm
• Operated by Investments Department’s Funding Desk• Desk has both Asset and Liability responsibility • Full transparency (margin/ROE)• Asset characteristics and mix dependent on liability type• Derivatives manage duration, currency and cash flow risks• Results in better matching of assets and liabilities• Avoids margin “leakage”

67
MLIC’s GGIC ProgramAs of 3/31/2006
• 40 discrete transactions totaling $14 billion since program inception (June 2002)
• Outstanding balance totaled US $12.1 billion• Issuance: 73% USD/16% GBP/7% CHF/3% CAD/1% JPY• Planned annual new issuance of $3-5 billion• Diversification: markets and currencies• Utilize a broad group of bankers• Program has reached over 265 investors globally
68
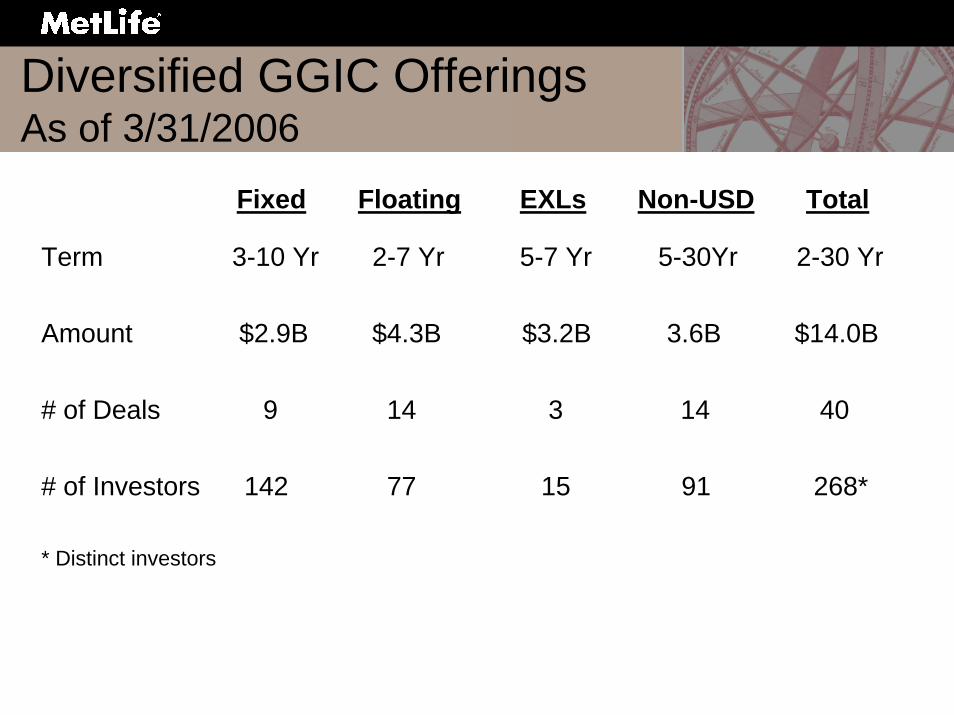
Diversified GGIC OfferingsAs of 3/31/2006
Fixed Floating EXLs Non-USD Total
Term 3-10 Yr 2-7 Yr 5-7 Yr 5-30Yr 2-30 Yr
Amount $2.9B $4.3B $3.2B 3.6B $14.0B
# of Deals 9 14 3 14 40
# of Investors 142 77 15 91 268*
* Distinct investors

69
MLIC of CT’s GGIC ProgramsAs of 3/31/2006
• EMTN Program– Established in 1998– Outstanding balance totaled US $3.8 billion– Issuance: 39% EUR/32% USD/14% GBP/9% JPY/6% AUD
• GMTN Program– Established in 2004– Outstanding balance totaled US $200 million– Issuance: 100% USD

70
Asset/Liability ManagementGGIC Program Framework
• Rating agencies require “matched book” style • Duration framework: ALM = ± 0.5 years• Diversification: broad use of asset sectors; laddered
maturities for liabilities• Securities selection/management: extensive use of
research, trading, and private market capabilities• Asset portfolio quality: “A” rated overall; economic
capital usage is less than company average

71
Summary
• Excellent Creditworthiness– Low operational leverage/solid capital position– Attractive growth and profitability prospects
• High Demand for MetLife, Inc./MLIC Names in Capital Markets– Each FA-backed note offering well-received– Successful $6.9 billion mandatory/preferred/debt offerings– MET stock trading at or near all-time high
• Capitalizes on GIC, ALM and Investments Expertise– Long history in traditional GIC/pension market– Strong ALM culture– Investor perspective

72
RR

©UFS
Corporate Benefit Funding
Robin F. LennaSenior Vice President
2006 Stable Value and Global GIC Investor Day
74
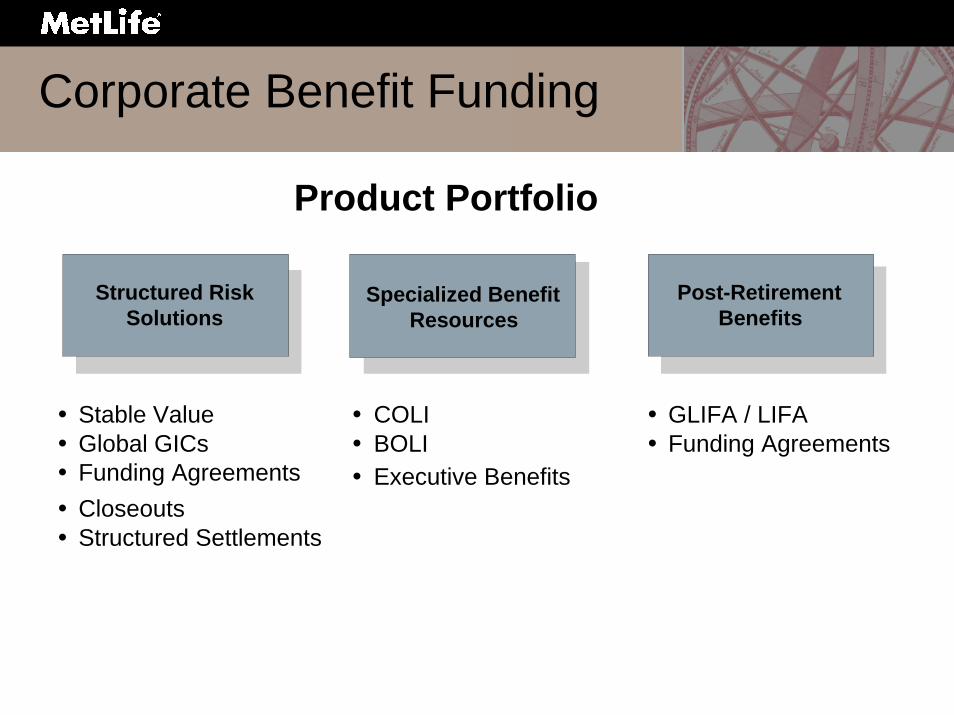
Corporate Benefit Funding
Product Portfolio
Structured RiskSolutions
Specialized BenefitResources
Post-RetirementBenefits
COLIBOLIExecutive Benefits
GLIFA / LIFAFunding Agreements
Stable ValueGlobal GICsFunding AgreementsCloseoutsStructured Settlements

75
Corporate Benefit Funding
Growth and Innovation
ProductDevelopment
Pension Risk Transfer
New Products to meetPlan Sponsor needsLiability TransferSolutions
UK Pension CloseoutMarketDevelop InfrastructureBuild Organization
Leverage Unique Strengths

76
Corporate Benefit Funding
MetLife Stable Value
• $22.0 billion in Stable Value assets1
• Over 30 years of underwriting experience
• 6 underwriters; 10 years of experience
• MetLife’s Risk Management, ALM and Investments
1 As of 3/31/06

77
Corporate Benefit Funding
MetLife’s Risk Management Culture• Risk Ownership – Risks and returns are clearly
owned and managed by the accountable business
• Independent Oversight – Corporate Risk Management, reporting to the Governance Committee of the Board, facilitates an enterprise view of risks with focus on the top risks
• Enterprise Risk Council – Risk coordination and support, integrating Corporate Risk Management, Audit, Compliance, Controller, Investments, Legal, IT Risk and Actuarial

78
Corporate Benefit Funding
Risk Management in the Business• ALM Risk – Active involvement on product level ALM
Committees – setting Investment guidelines
• Quarterly Business Reviews – Periodic reporting on key risks, and the impact on performance and results
• Process and Controls – Understanding, managing and effectively mitigating risks in the day to day activities of the business

79
Corporate Benefit Funding
2006 Growth Objectives• Grow spread businesses• Building Pension Risk Transfer• Existing product enhancements• New product innovation• Manage risk as driver of value

80
RR

©UFS
Reconciliations of Non-GAAPFinancial Information
2006 Stable Value and Global GIC Investor Day

82
Explanatory Note on Non-GAAP Financial Information
The historical and forward-looking financial information presented at this conference and contained in the written materials provided include performance measures which are based on methodologies other than Generally Accepted Accounting Principles (“GAAP”). MetLife analyzes its performance using so-called non-GAAP measures, including operating earnings available to common shareholders, operating earnings available to common shareholders per diluted common share and operating return on common equity (“ROE”). MetLife believes these measures enhance the understanding and comparability of its performance by excluding net investment gains and losses, net of income taxes, and adjustments related to net investment gains and losses, net of income taxes, both of which can fluctuate significantly from period to period, the impact of the cumulative effect of a change in accounting, net of income taxes, and discontinued operations other than discontinued real estate, net of income taxes, thereby highlighting the results from operations and the underlying profitability drivers of the business.
Operating earnings available to common shareholders is defined as GAAP net income, excluding net investment gains and losses, net of income taxes, adjustments related to net investment gains and losses, net of income taxes, the impact of the cumulative effect of a change in accounting, net of income taxes, and discontinued operations other than discontinued real estate, net of income taxes, less preferred stock dividends which are recorded in Corporate & Other. Scheduled settlement payments on derivative instruments not qualifying for hedge accounting treatment are included in operating earnings available to common shareholders.
Operating earnings available to common shareholders per diluted common share is calculated by dividing operating earnings available to common shareholders as defined above by the number of weighted average diluted common shares outstanding for the period indicated.
Operating return on common equity is calculated by dividing operating earnings available to common shareholders as defined above by average equity for the period indicated, excluding accumulated other comprehensive income.

83
Explanatory Note on Non-GAAP Financial Information(continued)
For the historical periods presented, reconciliations of the non-GAAP measures used in this presentation to the most directly comparable GAAP measures are included at the end of this presentation and are on the Investor Relations portion of the Company’s website (www.metlife.com). Additional information about MetLife’s historical financial results is available in the Company’s Quarterly Financial Supplements which may be accessed through the Company’s Website. The non-GAAP measures used in this presentation should not be viewed as substitutes for the most directly comparable GAAP measures.
In this presentation, MetLife provides guidance on its future earnings and earnings per share on an operating, non-GAAP basis. A reconciliation of these measures to the most directly comparable GAAP measures is not accessible on a forward-looking basis because MetLife believes it is not possible to provide a reliable forecast of net investment gains and losses, which can fluctuate significantly from period to period and may have a significant impact on GAAP net income.

84
Reconciliation of Book Value and ROE
1Q05 1Q06Book Value per Common ShareBook Value per Common Share (actual common shares outstanding) 31.43$ 34.98$ Accumulated Other Comprehensive Income 2.95 0.77
28.48$ 34.21$
1Q05 1Q06Operating Return on Common EquityNet Income Available to Common Shareholders 987$ 714$ Investment (gains) losses and related adjustments, net of income taxes (15) 311 Discontinued operations, net of income taxes (150) -
822$ 1,025$
1Q05 1Q06Total Equity 23,038$ 28,567$ Accumulated Other Comprehensive Income 2,156 590 Preferred Stock - 2,042
20,882$ 25,935$
Average Common Equity 20,375 25,541 Operating Return on Common Equity 16.1% 16.1%
Total Common Equity, Excluding Accumulated Other Comprehensive Income
QTD
QTD
Book Value per Common Share (actual common shares outstanding),Excluding Accumulated Other Comprehensive Income
QTD
Operating Earnings Available to Common shareholders

85
Reconciliation of Premiums, Fees & Other Revenuesand Operating Expense Ratio
($ Millions) 2001 2002 2003 2004 2005 1Q05 3Q05 4Q05 1Q06
Total Company Operating Expenses 6,522$ 6,476$ 6,706$ 7,327$ 8,550$ 1,811$ 2,408$ 2,487$ 2,297$
Other Expenses - - - - -
IRS tax audit settlement - - - 22 - - - - -
Premium tax liability - - - 49 - - - - -
MetLife Foundation contribution - - - (50) - - - - -
Race conscious underwriting (250) - 144 - - - - - -
New England Financial charge - - (48) - - - - - -
Change in reserve methodology - - (45) - - - - - -
Asbestos related litigation - (266) - - - - - - -
4th quarter 2001 charges (288) 30 - - - - - - -
Sales practice liability - 45 - - - - - - -
Conning Corporation (32) - - - - - - - -
GenAm litigation - (75) - - - - - - -
Nvest - -
Conning Corporation - -
Operating Expenses, as presented 5,952$ 6,210$ 6,757$ 7,348$ 8,550$ 1,811$ 2,408$ 2,487$ 2,297$
Premium, Fees & Other Revenues 20,189$ 22,331$ 24,269$ 26,265$ 29,959 7,056$ 7,974$ 7,781$ 7,934$ Less: Conning Corporation 32 - - - - - - - -
Premium, Fees & Other Revenues, as presented 20,157$ 22,331$ 24,269$ 26,265$ 29,959 7,056$ 7,974$ 7,781$ 7,934$
Operating Expense Ratio:Operating Expense Ratio 32.3% 29.0% 27.6% 27.9% 28.5% 25.7% 30.2% 32.0% 29.0%Operating Expense Ratio, as presented 29.5% 27.8% 27.8% 28.0% 28.5% 25.7% 30.2% 32.0% 29.0%
QTD
The operating expense ratio is calculated by dividing operating expenses by premiums, fees and other revenues. The operating expense ratio, as presented, is calculated by dividing operating expenses, as presented, by premiums, fees and other revenues, as presented.

86
Reconciliation of Net Income Available to Common Shareholders per Diluted Common Share to Operating Earnings Available to Common Shareholders per Diluted Common Share – Total Company
The operating expense ratio is calculated by dividing operating expenses by premiums, fees and other revenues. The operating expense ratio, as presented, is calculated by dividing operating expenses, as presented, by premiums, fees and other revenues, as presented.
2001 2002 2003 2004 2005 1Q05 1Q06Total CompanyNet income available to common shareholders per diluted common share 0.62$ 2.20$ 2.94$ 3.65$ 6.16$ 1.33$ 0.93$
Charge for conversion of securities - - 0.03 - - - -
Cumulative effect of a change in accounting, net of income taxes - - 0.03 0.11 - - -
Investment (gains) losses, net of income taxes 0.68 0.32 0.20 (0.21) (1.67) 0.03 0.53
Adjustments related to investment (gains) losses, net of income taxes (0.12) (0.13) (0.18) (0.04) 0.06 (0.05) (0.13)
Discontinued operations, net of income taxes (0.02) (0.01) (0.02) (0.01) (0.22) (0.20) - Operating earnings available to common shareholders per diluted common share 1.16 2.38 3.00 3.50 4.33 1.11 1.33
IRS tax audit settlement - - - (0.14) - - -
Premium tax liability - - - (0.04) - - - MetLife Foundation contribution - - - 0.04 - - -
Race conscious underwriting 0.21 - (0.13) - - - -
Merger of Mexican operations - - (0.05) - - - -
Change in reserve methodology - - (0.03) - - - -
New England Financial charge - - 0.04 - - - -
Asbestos related litigation - 0.23 - - - - -
4th quarter 2001 charges 0.53 (0.03) - - - - -
September 11th 2001 tragedies 0.27 (0.02) - - - - -
Sales practice liability - (0.04) - - - - - GenAm litigation - 0.07 - - - - -
Operating earnings available to common shareholders per diluted common share, as presented 2.17$ 2.59$ 2.83$ 3.36$ 4.33$ 1.11$ 1.33$
QTD

87
Reconciliation of Net Income to Operating Earnings Available to Common Shareholders
1Q05 1Q06InstitutionalNet income 349$ 213$
Investment (gains) losses and related adjustments, net of income taxes (25) 203
Operating earnings available to common shareholders 324$ 416$
QTD
1Q05 1Q06IndividualNet income 368$ 304$
Investment (gains) losses and related adjustments, net of income taxes (47) 104
Operating earnings available to common shareholders 321$ 408$
QTD
88
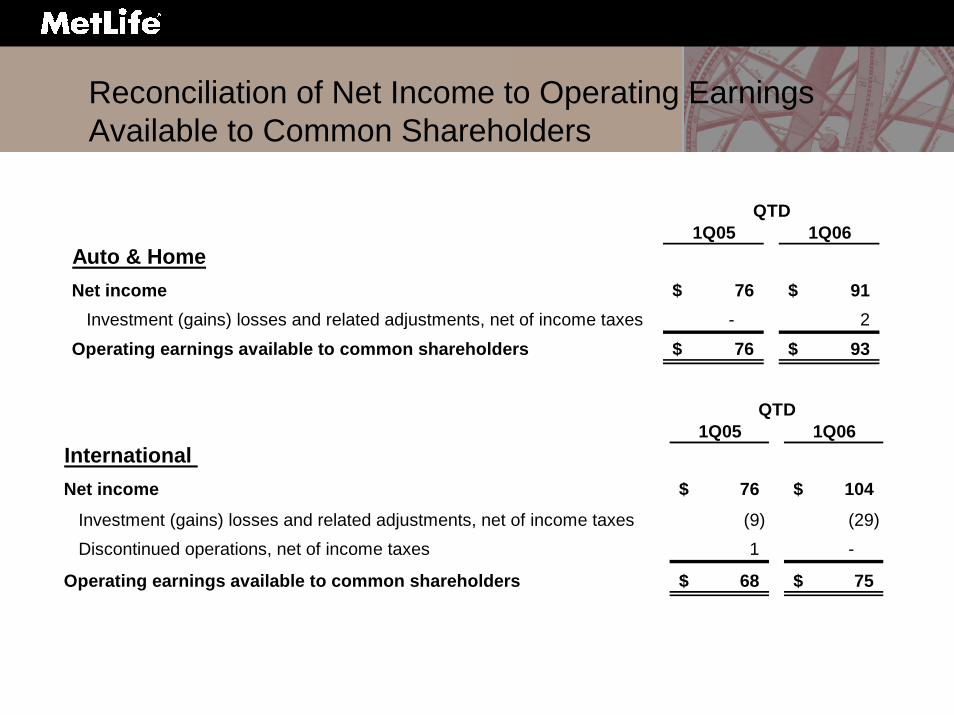
Reconciliation of Net Income to Operating Earnings Available to Common Shareholders
1Q05 1Q06Auto & HomeNet income 76$ 91$
Investment (gains) losses and related adjustments, net of income taxes - 2
Operating earnings available to common shareholders 76$ 93$
QTD
1Q05 1Q06International Net income 76$ 104$
Investment (gains) losses and related adjustments, net of income taxes (9) (29) Discontinued operations, net of income taxes 1 -
Operating earnings available to common shareholders 68$ 75$
QTD

89
Reconciliation of Net Income to Operating Earnings Available to Common Shareholders
1Q05 1Q06ReinsuranceNet income 29$ 26$
Investment (gains) losses and related adjustments, net of income taxes (4) (2)
Operating earnings available to common shareholders 25$ 24$
1Q05 1Q06Corporate, Other & EliminationsNet income 89$ 9$
Investment (gains) losses and related adjustments, net of income taxes 70 33
Discontinued operations, net of income taxes (151) - Preferred stock dividends - (33)
Operating earnings available to common shareholders 8$ 9$
QTD
QTD

90
Reconciliation of Net Income to Operating Earnings Available to Common Shareholders
2005Total MetLifeNet income 4,714$
Less: Preferred Stock Dividends 63 Net Income available to common shareholders 4,651$
Investment (gains) losses and related adjustments, net of income taxes (1,212) Discontinued operations, net of income taxes (168)
Operating earnings available to common shareholders 3,271$

91
Reconciliation of Net Income to Operating Earnings Available to Common Shareholders
2004 2005Total InstitutionalNet income 1,267$ 1,562$
Cumulative effect of a change in accounting, net of income taxes 60 - Investment (gains) losses and related adjustments, net of income taxes (78) (117)
Operating earnings available to common shareholders 1,249$ 1,445$
2004 2005Group LifeNet income 373$ 364$
Investment (gains) losses and related adjustments, net of income taxes 25 36
Operating earnings available to common shareholders 398$ 400$

92
Reconciliation of Net Income to Operating Earnings Available to Common Shareholders
2004 2005Retirement & SavingsNet income 684$ 943$
Cumulative effect of a change in accounting, net of income taxes 40 - Investment (gains) losses and related adjustments, net of income taxes (100) (143)
Operating earnings available to common shareholders 624$ 800$
2004 2005Non-Medical Health & OtherNet income 210$ 255$
Cumulative effect of a change in accounting, net of income taxes 20 - Investment (gains) losses and related adjustments, net of income taxes (3) (10)
Operating earnings available to common shareholders 227$ 245$

©UFS
RR