2006 outcome evaluation report - djj.state.fl.us
TRANSCRIPT


2006
Outcome Evaluation
Report
February 15, 2006
A Research Report Submitted to the
Florida Department of Juvenile Justice Anthony J. Schembri, Secretary

DJJ Management Report Number 06-02 Electronic copies of this document are available on the web at:
www.djj.state.fl.us/Research/index.html
Produced by
Justice Research Center, Inc. 2898 Mahan Drive, Suite 4 Tallahassee, Florida 32308
(850) 521-9900 www.thejrc.com
Kristin Parsons Winokur, Ph.D. Julia Blankenship, MSW Elizabeth Cass, Ph.D.
Gregory A. Hand Jennifer M. Zimmerman, M.S., R.D.
Ana Villar, MSW And
The DJJ Office of Research and Planning 2737 Centerview Drive
Tallahassee, FL 32399-3100 (850) 487-1566
Ted Tollett, Director Steven Chapman, Ph.D.
Mark A. Greenwald, M.J.P.M. Nathan Epps, M.S. Susan Quinn, M.S.
Stephanie Bontrager, M.S.


Outcome Evaluation Staff
Justice Research Center
Dr. Kristin Parsons Winokur is Vice-President and Director of Research for the Justice Research Center (JRC). She earned a Ph.D. in Criminology from Florida State University in 2000, with an emphasis on juvenile delinquency, statistics, and gender issues. She holds a Master of Science degree in Criminal Justice from the University of Baltimore and a Bachelor of Arts degree in Criminal Justice from the University of Florida. Prior to joining the Center, she was a faculty member at the Florida State University and has more than seven years experience teaching at the university level. She also served as the Director of the Research Unit for the Bureau of Data and Research at the Florida Department of Juvenile Justice. Dr. Winokur has more than 15 years of criminal and juvenile justice system experience and has written numerous statistical and research publications in peer-reviewed journals and monographs. Dr. Winokur is the principal analyst and author of the annual Florida Program Accountability Measures (PAM) Report.
Ms. Julia Blankenship serves as chief executive officer of the Justice Research Center. She earned a Master of Social Work Administration degree from Florida State University in 1985 and a Bachelor of Social Work degree from Southwest Missouri State University in 1983. She previously served as the Director of Data for the Florida Department of Juvenile Justice. She has twenty years of experience in data analysis and reporting, outcome measurement and evaluation, quality assurance processes and legislative reporting. Since 1992, she has co-authored and contributed to twelve reports regarding program accountability measures for juvenile justice in Florida and three in Louisiana; a dozen reports regarding outcome evaluations and recidivism; and four analyses of juvenile justice referral processing times. Since 1986, she has co-authored and contributed to 16 multi-year longitudinal analyses of various detention programs and first-time offenders in the Florida juvenile justice system.
Dr. Elizabeth S. Cass has held the position of Senior Research Analyst with the Justice Research Center since 2001. Dr. Cass received her Ph.D. in Criminal Justice from the State University of New York at Albany in 1991. She was a faculty member at the School of Criminology and Criminal Justice at Florida State University. Prior to her current position, she conducted process and outcome evaluations for the Bureau of Data and Research at the Florida Department of Juvenile Justice from 1994-2001 where she authored or contributed to more than two dozen publications and research monographs pertaining to juvenile justice including a series of evaluations on juvenile boot camps. This work has continued while at the JRC. Dr. Cass has been an invited speaker on the topic of What Works in juvenile justice at conferences across the state of Florida.
Mr. Gregory Hand serves as the Director of Data Management for the Justice Research Center. He earned a Bachelor of Science degree in Child Development from Florida State University. Mr. Hand's academic and professional work has included ten years of experience in qualitative and quantitative methods of data collection and analysis. He has co-authored or contributed to several educational research and juvenile justice research publications and has been an invited public speaker at FSU on those topics since 1994. In addition, he has extensive knowledge in programming languages, database management, and web developing. He has produced hundreds of data scripts written in c++, vb.net, SQL, SPSS, VBA, html and java that have been used by both the JRC and the Department to manage information processing and data analysis.

Florida Department of Juvenile Justice
Ted Tollett, Director, Office of Research and Planning. Mr. Tollett has worked in the juvenile justice field for 33 years, beginning with the Florida Division of Youth Services in 1972. He was Administrator of Florida’s federally funded Juvenile Justice and Delinquency Prevention program from 1988 through 1994. In 1990, he headed a team that studied the extent of over-representation of minority youth in the juvenile justice system for the Florida Supreme Court. He served as Chief of the Bureau of Data and Research for the Florida Department of Juvenile Justice (DJJ) for ten years, beginning when the agency was created in 1994. He has also served as a consultant for a number of federal agencies, private businesses, and other states, and has worked on juvenile justice issues in Europe. He serves on a number of national advisory boards in the field of juvenile justice. Mr. Tollett currently serves as the DJJ Director of the Office of Research and Planning, reporting to the Secretary of DJJ.
Dr. Steven Chapman earned his Ph.D. in Child and Family Development at the University of Georgia. He has over 30 years of experience working with youth and 15 years in research and evaluation in the Department and in the Florida Legislature. In addition to managing the What Works Initiative Residential Pilot Project, the Faith- and Community-Based Delinquency Treatment Initiative Grant, the Juvenile Accountability Block Grant Program and data outsourcing, he takes lead responsibilities for data support for Residential and Correctional Services and Probation and Community Corrections, the What Works Initiative, Strategic Planning, Program Evaluation, and inter-agency relations.
Mr. Mark A. Greenwald supervises the Research & Evaluation and Federal Programming Units within the Office of Research and Planning. His primary functions within the office include supervision of research and federal programming staff & data analysis. Additionally, Mr. Greenwald takes lead responsibilities for Detention Services data support and is the primary data analyst assigned to information system improvements and upgrades. He is a graduate of the FSU College of Criminology and holds a master's degree in Justice Policy and Management from Florida Atlantic University.
Mr. Nathan Epps has a BA in International Affairs, an MS in Criminology, and a graduate certificate in Public Administration. He has worked for DJJ in Commitment, Probation, and in Research and Planning as a program evaluator and data analyst. Mr. Epps currently produces reports for DJJ administrative staff, the Legislature, and the Governor's Office, including the Profile of Delinquency. He also conducts geomapping for DJJ personnel and providers. His latest projects include work on early-education and replicating the Perry Preschool Project via the Universal Pre-Kindergarten initiative in Florida. Mr. Epps is also involved in the "pink cell project" and is doing research on the effects of childhood trauma on delinquent behavior.
Ms. Susan Quinn is responsible for analyzing prevention data at the state and federal level. She has a master’s degree in Criminology and is currently a Ph.D. student in the College of Criminology and Criminal Justice at Florida State University. Prior to employment with DJJ, Ms. Quinn worked as a research assistant at the Commission on Capital Cases. Her research interests include juvenile justice, corrections, and criminal justice policy.
Ms. Stephanie Bontrager is responsible for managing the federal Challenge, Title II, and Title V delinquency prevention programs for the state of Florida. She has a master's degree in Criminology and is currently a Ph.D. candidate in the College of Criminology and Criminal Justice at Florida State University. Her research interests include social threat and social control, and the effects of racial and gender inequality on crime.

Foreword
On behalf of the Florida Department of Juvenile Justice (DJJ), I am pleased to present the 2006 Outcome Evaluation Report. Each year DJJ produces a comprehensive evaluation of the juvenile justice continuum of services in the state of Florida. The report contains information and outcome evaluation data for the following juvenile justice services: prevention, intake, detention, probation and community corrections, and residential commitment. Data from nearly 1,000 different programs and case management units were collected and analyzed.
Delinquency programs are designed to provide supervision and services to reduce youths’ further involvement with the juvenile justice system. Annual evaluation of these programs is critical to the implementation of effective services. A key outcome of interest to all stakeholders is recidivism following program services or program release. For more than a decade, DJJ has maintained accountability in services through its comprehensive statewide assessment of recidivism rates. DJJ has received national recognition for these outcome evaluations and continues its strong record of service assessment.
In addition to recidivism outcomes, the report presents important demographic and delinquency history information on youth completing services. This information not only aids in the interpretation of recidivism rates, but also provides a better understanding of the characteristics of juveniles entering the system. The evaluation data from this and other DJJ research reports have contributed to the What Works Strategy currently underway at DJJ. This strategy stresses the importance of implementing sound, evidence-based practices in delinquency programming. Such practices include: addressing youth risk for re-offending through the use of validated risk/needs assessment instruments, implementing cognitive-behavioral interventions demonstrated in the research to reduce recidivism, and comprehensively evaluating the implementation of services to assess their effectiveness. The 2006 Outcome Evaluation Report addresses the latter practice, while two exciting new DJJ initiatives are aimed at addressing the former practices. The first initiative is the implementation of a new evidence-based risk/needs assessment instrument known as the Positive Achievement Change Tool or PACT. This tool will provide a means to address each youth’s criminogenic risks, so that service interventions can be tailored to target the youth's risk factors associated with the likelihood of recidivating. The PACT is also an effective tool for staff to use in determining youths' readiness to return to the community. The second initiative is the What Works Residential Pilot Project which seeks to improve the effectiveness of residential programs by introducing evidence-based practices that research has shown are effective in reducing the risk of re-offending.
I firmly believe that the collection, analysis and dissemination of data provided in this report are critical to making effective management decisions. This report provides the information needed to work toward bettering the lives of Florida’s youth through the continual improvement of the juvenile justice system.
Anthony J. Schembri Secretary


TABLE OF CONTENTS
Executive Summary ........................................................................................................................i
Data Sources and Methods ............................................................................................................1
Data Sources...................................................................................................................................1 Methods .........................................................................................................................................1
Prevention and Victim Services....................................................................................................7
Profile of Prevention Programs ........................................................................................................7 Prevention Program Outcomes....................................................................................................... 12 Profile of Youth Completing Prevention Programs .......................................................................... 13 Recidivism Rates for Youth Completing Prevention Programs ......................................................... 20
Length of Service.......................................................................................................................... 33 Summary Tables ........................................................................................................................... 34 Targeting Youth and Communities................................................................................................. 42
Intake.............................................................................................................................................43
Statewide Delinquency Rates......................................................................................................... 44 Youth Referred by Offense Seriousness.......................................................................................... 45
Youth Referred by Offense Type.................................................................................................... 46 Five-Year Trends by Offense Type................................................................................................. 48 Profile of Youth Referred.............................................................................................................. 54
Detention Services........................................................................................................................57
Detention Services Outputs............................................................................................................ 57 Secure Detention ........................................................................................................................... 58
Home Detention ............................................................................................................................ 68
Probation and Community Corrections ....................................................................................73
Program Area Descriptions ............................................................................................................ 74 Probation and Community Corrections Program Outcomes.............................................................. 79 Profile of Youth Completing Probation and Community Corrections Programs ................................. 81 Recidivism Rates for Youth Completing Probation and Community Corrections Programs ................ 86
Length of Supervision ................................................................................................................. 100 Post-Commitment Probation Residential Program......................................................................... 101 Summary Tables ......................................................................................................................... 102

Residential and Correctional Facilities....................................................................................107
Profile of Programs ..................................................................................................................... 108 Residential and Correctional Facility Program Outcomes............................................................... 110 Profile of Youth Completing Residential Commitment Programs ................................................... 113 Recidivism Rates for Youth Completing Residential Commitment Programs .................................. 118
Length of Stay ............................................................................................................................ 133 Summary Tables ......................................................................................................................... 134

Executive Summary 2006 Outcome Evaluation Report
i
MISSION STATEMENT
Department of Juvenile Justice
Protect the public by reducing juvenile crime and delinquency in Florida. EXECUTIVE
SUMMARY
Each year the Department of Juvenile Justice (DJJ) produces a comprehensive evaluation of the juvenile justice continuum of services in the state of Florida. The following report contains data and information on the following branches within the system:
1. Prevention and Victim Services.
2. Detention Services.
3. Probation and Community Corrections.
4. Residential and Correctional Facilities.
Data from nearly 1,000 different programs and case management units were collected and analyzed. A key outcome of interest to all stakeholders is recidivism following program services or release. The official DJJ measure of recidivism is a delinquency adjudication, adjudication withheld or adult conviction for an offense that occurred within 12 months of supervision or program completion. Demographic characteristic s and offense histories demonstrated in the research to be associated with re-offending are important factors to consider when comparing recidivism rates among programs.
The Intake and Detention chapters present data for FY 2004-05, along with five-year
trend data. The chapters on prevention, probation and residential commitment present data on youth completing programs in FY 2003-04, to allow for a one-year follow-up period for recidivism through FY 2004-05.
Prevention and Victim Services
During FY 2003-04, a total of 35,629 youth were released from 232 prevention programs. Seventy-seven percent (n=27,315) completed their program. The majority of prevention programs are non-residential and serve youth within the community. The exceptions are a wilderness expedition program and crisis shelters. Among youth completing prevention programs, 53% were male, 58% were white, and the average age at admission was 14.1 years. Statewide, 34% (n=13,538) of all youth completing prevention programs had at least one delinquency charge prior to admission. During FY 2003-04, the recidivism rate was 12%.
Intake
Intake services are administered through the Probation and Community Corrections branch. During FY 2004-05, 95,263 youth were referred to DJJ for an offense. This represents a rate of 52.1 youth per 1,000 youth ages 10-17 years in Florida. This is an 11% decrease from the rate of 58.4 per 1,000 youth in FY 2000-01. The majority of youth were referred for misdemeanor offenses (n=51,047). Property offenses accounted for 36% of the youth referred. Over the last five years, the number of youth referred has declined 5%, with the largest decrease in

2006 Outcome Evaluation Report Executive Summary
ii
property offenses. Much of that decline is attributable to the 13% decline in misdemeanor thefts during that time.
The majority of youth referred were male (70%), white (59%), and less than 16 years of age at the time of their most serious referral.
Detention Services
Detention is used to detain and monitor youth prior to a court appearance, while awaiting residential placement, or as a sanction for contempt of court, gun law violations, or domestic violence. During FY 2004-05, there were 55,637 admissions to 26 secure detention centers in Florida. The average length of stay was 12 days.
Of the 26 secure detention centers, 14 had an annual average daily population within their operating capacity. During FY 2004-05, admissions to secure detention peaked in May with over 5,000 youth detained. Admissions to secure detention centers have increased over the last five years.
Among the youth in detention centers are those awaiting placement in a residential commitment program. Statewide, the average time spent awaiting placement was 11 days in FY 2004-05, down from 17 days in FY 2000-01. The time spent awaiting placement varied by restrictiveness level with youth waiting longer to enter a high-risk residential program than any other placement. The wait for males awaiting placement in high-risk programs, however, declined 50% since FY 2000-01.
Home detention is an alternative to secure detention for youth assessed as suitable to remain in the community. Just less than 25,000 youth were on home detention in FY 2004-05. For the five-year period between FY 2000-01 and FY 2004-05, the statewide average daily population of youth
on home detention increased by 40%, from 1,188 to 1,664.
Probation and Community Corrections
The services provided by the Probation and Community Corrections branch fall into three categories: 1) diversion services, 2) probation supervision, and 3) post-commitment services. During FY 2003-04, there were a total of 38,454 releases from non-residential Probation and Community Corrections programs. These programs included diversion, probation supervision, special intensive probation, day treatment conditional release, and post-commitment probation. In addition, there were another 61 releases from the only post-commitment probation residential program operated by the Probation and Community Corrections branch.
Diversion Programs: Two types of diversionary programs were examined in this report: Intensive Delinquency Diversion Services (IDDS) and Early Delinquency Intervention Program (EDIP). The 20 IDDS programs released the most youth (n=2,339), while the two EDIP released a total of 239 youth. In examining the data on the two types of diversion programs it is clear that youth released from IDDS and EDIP programs vary in a number of important ways. IDDS had a higher completion rate at 78% compared to 53% for EDIP. The rate of adjudicated offenses during services (ODS) for IDDS programs was 13% compared to 38% for EDIP programs. Recidivism rates also varied. with a general pattern of programs that served youth with more extensive delinquency histories having higher recidivism rates. For example, youth completing IDDS programs averaged 2.1 prior charges and their recidivism rate was 16%. Youth completing EDIP programs averaged 3.5 prior charges and their recidivism rate was 24%.

Executive Summary 2006 Outcome Evaluation Report
iii
Probation Services: The majority of youth released from Probation and Community Corrections programs received some form of probation supervision services. Youth sentenced to probation can receive one of four types of services: probation supervision, special intensive probation, MST, or day treatment. Most youth received probation supervision (n=25,061), with a few youth selected to receive special intensive probation services (n=1,512) or placed in a day treatment program (n=1,302). The ODS rate was lower for probation supervision (30%) than for special intensive probation and day treatment programs (42%). The completion rate varied from a high of 75% for probation supervision, to a low of 39% for special intensive probation. Fifty percent of the youth released from Day treatment programs completed their program in FY 2003-04.
The characteristics of the youth completing probation services did not vary much by age (approximately 16 years at admission), or gender (over 70% male). However, special intensive probation and day treatment programs served a higher proportion of black youth than probation supervision. The offense histories of youth completing the three services varied substantially. While probation supervision averaged 4.9 prior charges and an average prior seriousness index of 7.7, Special intensive probation and day treatment programs averaged over 7.0 prior charges and an average prior seriousness index of over 11.0. The average length of supervision for youth completing services was 12 months for probation supervision, nine months for special intensive probation, and approximately eight months for day treatment programs. Recidivism rates reflected the offense histories of the youth in the programs. Eighteen percent of youth completing probation supervision recidivated, compared
to 24% of special intensive probation and 28% for day treatment programs.
Post-Commitment Services: In addition to diversion and probation services, the Probation and Community Corrections branch also provides services to youth completing residential commitment programs. These youth may receive either conditional release services or post-commitment probation (PCP) services. Conditional release services include both facility-based day treatment programs and community supervision services. PCP is a statutorily defined probationary status for juveniles released from the custody of the Department but over whom the juvenile court has retained jurisdiction and must approve service termination. During FY 2003-04, there were 5,400 releases from conditional release programs, and 2,277 releases from PCP. The completion rate was 68% for conditional release services and 74% for PCP. The ODS rate for PCP (25%) was higher than the ODS rate for conditional release programs (19%). The demographic characteristics and offense histories of youth completing the two types of programs were very similar. The average length of supervision for youth completing conditional release was slightly over six months, and for PCP it was almost 15 months. The recidivism rate of 35% for conditional release programs was higher than the 25% rate for PCP.
There is one post-commitment probation residential program designed to provide vocational training to youth released from residential commitment programs. The program released 61 youth, 45 of whom completed the program. The length of stay was just under six months and the recidivism rate was 67%.

2006 Outcome Evaluation Report Executive Summary
iv
This report and other DJJ research reports can be found at the following web site:
http://www.djj.state.fl.us/Research/index.html.
Tables containing detailed information with regard to demographic and offense characteristics, as well as program outputs and outcomes, are published on the DJJ website. Any amendments or errata sheets are be published on the DJJ web
Residential and Correctional Facilities
Just over 9,800 youth were released from residential commitment programs during FY 2003-04. The rate of offenses during placement was 5%. Of the 9,842 youth released, 85% completed their program.
Forty percent of youth who completed their residential program recidivated within one year after their return to the community. Statewide, recidivism rates for residential commitment programs have exhibited a slight downward trend from 42% in FY 1999-00, to 40% in FY 2003-04. Data on recidivism rates by demographic and offense characteristics, region, and restrictiveness level are presented. As observed for youth served by the other branches, youth who recidivated had more extensive delinquency histories than non-recidivists. Male youth recidivated at higher rates than females, and black youth recidivated at higher rates than white youth. Recidivism rates declined steadily with age. In examining the time between program release and initial re-arrest, a similar pattern has repeated over the years. Among committed youth who recidivate, the majority
(53%) were re-arrested by the end of the fourth month following their release, and 79% were re-arrested by the end of the seventh month.
The length of stay in a residential program varied by restrictiveness level. Youth completing low-risk programs averaged slightly over four months, youth completing moderate-risk programs averaged eight months, and youth completing high-risk programs averaged approximately one year. There was only a five-day difference in average length of stay between recidivists and non-recidivists.

Florida Judicial Circuits 2006 Outcome Evaluation Report
v


Data Sources and Methods 2006 Outcome Evaluation Report
Data Sources and Methods 1
DATA SOURCES AND
METHODS
This chapter outlines the data sources and methods used in each of the 2006 Outcome Evaluation Report chapters: Prevention and Victim Services, Intake, Detention, Probation and Community Corrections, and Residential and Correctional Facilities. Data sources are presented by the type of information analyzed. The methods section includes the definitions of variables, time frames, and recidivism outcome measures, as well as a description of methodological differences between the chapters.
Data Sources
This report provides demographic information, delinquency referral data, detention services data, and recidivism outcomes for the continuum of juvenile justice services provided in Florida. Data sources covered for these services vary as presented below.
Demographic and Delinquency Referral Information
The primary source of data is the Department’s Juvenile Justice Information System (JJIS). JJIS contains demographic and delinquency referral information, admission and release dates, and release
reasons for most youth receiving DJJ services. There are a few exceptions. Demographic, and release data for youth released by the Florida Network prevention programs, Multisystemic Therapy (MST) programs and Early Delinquency Intervention programs (EDIP) were provided to DJJ by the providers. To match this data to additional offense-related data in the JJIS system, a matching protocol was developed based on youth names, social security numbers and dates of birth.
Recidivism Data
The primary source of subsequent delinquency referral data is JJIS. Additional recidivism outcome data are compiled from the adult system using information from the Florida Department of Law Enforcement (FDLE) and Florida Department of Corrections (DC). Arrest and disposition information for youth who reached the age of 18 years or who had cases transferred to adult court was obtained from FDLE's Florida Crime Information Center (FCIC). Information pertaining to dispositions on cases processed in adult court was obtained from DC and is limited to youth convicted of felonies and sentenced to adult probation or prison.
Methods
Each year since 1996, the Department has held a meeting to determine the methodology for defining variables and calculating outcome measures for departmental reporting. This methodology is carefully considered and developed by key juvenile justice policymakers and providers including DJJ, the Justice Research Center, the Legislature, the Governor’s Office, the Office of Program Planning and Government Accountability (OPPAGA), the Office of Economic and Demographic Research, contracted providers and other juvenile justice stakeholders. A

2006 Outcome Evaluation Report Data Sources and Methods
2 Methods
Common Definitions Report is produced documenting the agreed upon methodology.
Time Periods Covered
At the Common Definitions Meeting, fiscal years were selected as the reporting period, as they correspond with the Department's budgetary calendar. The particular fiscal year (FY) covered in each chapter is based upon the primary focus of the data presented. For the Intake and Detention chapters, the primary focus is on youth processed through intake and those placed in detention facilities. In those chapters, data for FY 2004-05 are presented.
For the Prevention, Probation, and Residential Commitment chapters the focus is on youth recidivism after release. In order to allow a follow-up period to track subsequent offending, data for youth released in FY 2003-04 are presented.
Demographic Variables
The report provides information for youth by gender, race, ethnicity, and age. Categorizations of race and ethnicity are derived from DJJ staff interviews with youth.
Race is measured as black, white or other.
Ethnicity is categorized as Hispanic and non-Hispanic.
Age is defined as the youth's age at the time of admission in each of the chapters except Intake. In the Intake chapter, the youth's age is measured on the date the juvenile's most serious offense occurred during the fiscal year.
Release and Completion Status
Identifying why youth leave a program, and the percentage that complete a program rather
than leave for other reasons is one outcome measure reported. There are a variety of reasons why youth are released from a program other than the completion of services. Identifying the reason for a release is dependent on DJJ staff's categorization from a list of release reasons in JJIS.1 To ensure the reliability of these release reasons, their accuracy is assessed in relation to subsequent placements. The definition of program completion differs slightly across program areas as described below.
Prevention and Victim Services: The release reasons in JJIS for prevention programs includes: 1) completing all services, 2) expelled from the program, 3) dropped out, 4) changed schools, 5) referred to another program/agency, 6) moved, or 7) other release. Youth are categorized in this chapter as either a "completion" (item 1 above) or an "other release" (items 2-7 above). The Florida Network uses the same categories in the dataset they provide to the Department.
Probation and Community Corrections: Completions are defined as:
• Youth who complete the individualized treatment plan or court ordered sanctions and are released from the custody of the Department.
• Youth who serve the maximum allowable time or reach the maximum allowable age over which the juvenile court retains jurisdiction.
EDIP and MST providers categorized youth as either a "completion" or "other release" in the dataset provided to DJJ.
1 Exceptions to this, as noted previously, include data received directly from the Florida Network, and MST and EDIP providers. In those instances, release reasons are determined by the staff administering these services.

Data Sources and Methods 2006 Outcome Evaluation Report
Methods 3
Residential and Correctional Facilities: Completions are defined as:
• Youth who complete the program and are assigned to a conditional release or post-commitment probation program.
• Youth who complete the program and were directly discharged.
• Youth who serve the maximum allowable time or reach the maximum allowable age over which the juvenile court retains jurisdiction.
Offenses During Services, Supervision or Placement
During the time period a youth is under DJJ supervision or custody it is possible for the youth to commit a crime. The number of youth who committed an offense during services (ODS), supervision (ODS) or placement (ODP) is a measure used to gauge the effectiveness of the programs in monitoring and guiding the behavior of the youth. The ODS/ODP rate is calculated as the percentage of youth who offended during the time they were receiving services, or under supervision or placement. Only offenses that resulted in adjudication are counted. ODS/ODP is used as an outcome measure for all youth released from a program regardless of their completion status.
Prior Delinquency Measures
Information on the offense histories for youth who completed prevention, probation, and residential commitment programs are presented in the respective chapters. Differences in prior offending by gender, race and ethnicity are discussed. Measures of prior offending include:
Percent of youth with prior charges. This measure is used in the Prevention chapter as the proportion of youth in prevention programs who have no prior involvement with DJJ varies.
Percent of youth with prior adjudicated charges. This is used in the Prevention chapter as the proportion of youth in prevention programs who have no prior adjudication varies.
Average number of prior charges per youth. This measure is used in the Probation and Residential Commitment chapters as all youth receiving these services have been referred to DJJ and adjudicated delinquent. The average number of prior charges provides a measure of the extent of the youth’s involvement in delinquency. The measure is calculated by summing the total number of charges received by all youth prior to program admission and dividing by the total number of youth completing the program during the fiscal year.
Average number of prior adjudicated charges. This measure is used in the Probation and Residential Commitment chapters as all youth receiving these servcies have been referred to DJJ and adjudicated delinquent. This is calculated only for those charges that ultimately result in an adjudication or an adjudication withheld. The measure is calculated by summing the total number of adjudications received by all youth prior to program admission and dividing by the total number of youth completing the program during the fiscal year.

2006 Outcome Evaluation Report Data Sources and Methods
4 Methods
Seriousness index of prior charges and seriousness index of prior adjudications . The seriousness indices are designed to provide an indication of the extent and seriousness of a youth’s delinquency hisotry. A prior seriousness score is calculated for each youth by assigning point values to prior charges based upon the seriousness of the charged offense. The following values are assigned for each charge:
• Violent felony – 8 points
• Property or other felony – 5 points
• Misdemeanor – 2 points
• Any other charged offense – 1 point
The average seriousness index is calculated by dividing the seriousness score for all youth by the total number of youth completing the program during the fiscal year.
In the Prevention chapter, both seriousness indices are presented. For the Probation and Residential Commitment chapters only the seriousness index for prior adjudicated charges is presented. Within the chapters this measure is referred to as the Average Prior Seriousness Index.
In addition, prior adjudications are further classified by type (violent felony, property felony, other felony, misdemeanor, or unclassified offense) of the most serious prior adjudicated charge.
Recidivism Outcome Methodology
Delinquency prevention, probation and residential commitment programs are designed to provide treatment and curb youths’ further involvement with the juvenile justice system. These programs are expected to effectively mitigate the influence of risk
factors and increase the resilience of the youth they serve. An important indicator of outcomes is the percentage of youth who recidivate.
Recidivism rates are calculated only for youth who completed a program. This is done in an effort to determine the effectiveness of the program based on youth who actually received the services offered.
Follow-up Period
At the annual Common Definitions Meeting, the duration of one-year was selected as the official follow-up period for recidivism. This necessitates that youth in the study complete services during the prior fiscal year, so that sufficient time may elapse to allow for the collection of recidivism data. Therefore, youth included in the recidivism analyses are those who completed a program between July 1, 2003 and June 30, 2004. Recidivism is then tracked for the period beginning on July 1, 2004 and ending June 30, 2005 (i.e., one-year follow-up period).
Recidivism Measures
There are numerous methods of measuring re-offending, each of which provides important yet different information. Five commonly used measures are presented in this report:
Subsequent referral/arrest and felony referral/arrest indicates a youth has been charged with another offense. An arrest does not necessarily mean that the released youth committed the offense charged, but it does provide an indication of the workload generated for the juvenile and adult systems.

Data Sources and Methods 2006 Outcome Evaluation Report
Methods 5
Subsequent juvenile adjudication or adult conviction (including adjudications withheld) provides a more substantive measure of subsequent criminal involvement. Such a disposition indicates that the youth was found to have committed the offense. This measure is used to define recidivism throughout this report.
Subsequent felony adjudication or conviction is also reported. All data on subsequent juvenile adjudications or adult convictions are based on referrals or arrests that occurred within one year of each youth's release from a program.
Subsequent sanctions , of which three are included (subsequent commitment to DJJ, sentencing to adult probation, and sentencing to adult prison), provide additional information regarding the impact of re-offending.
Length of Services
The length of time that a youth spends in a program is an indicator of the extent of services provided. An average length of service, supervision or stay (ALOS) is calculated for each program based on the average number of days of each youth was in the program. Days spent in a temporary release status are not included. Data on ALOS are presented in the Detention, Prevention, Probation, and Residential Commitment chapters for four groups of youth:
1. All youth released including those youth who did not complete the program.
2. Youth who completed the program.
3. Recidivists.
4. Non-Recidivists.
Intake Measures
The Intake chapter presents data on youth referred to DJJ in FY 2004-05. A referral is defined as all the charges received by DJJ for a youth on a given day. Data are categorized by offense seriousness (felony, misdemeanor or other), as well as by offense type (person, property, etc). Data in this chapter are presented based on the most serious offense for which a youth was referred during the fiscal year. Therefore, the data can only be used to categorize offenders, and is not appropriate for determining the number of offenses that were committed over a fiscal year. A profile of youth referred, based on gender, race, ethnicity and age, is also presented.
Detention Measures
The Detention chapter presents data on secure and home detention services. Measures of secure detention utilization including operating capacity, total service days, average daily population, average utilization rate, minimum and maximum daily population, and transfers into detention, are provided. The definitions for each of these measures is as follows:
Admissions are defined as each entry into a secure detention center. These figures may include multiple admissions for a single youth.
The Department's official definition of recidivism is the percentage of youth with a subsequent juvenile adjudication or adult conviction (including adjudications withheld) for an offense that occurred within one year of release.

2006 Outcome Evaluation Report Data Sources and Methods
6 Methods
Operating capacity is defined as the facility’s number of beds.
Total service days is measured as the sum of all youths' days in a given detention center during the fiscal year. This value is computed for each secure detention facility.
Average daily population is calculated by dividing total service days by the 365 days in the year.
Average utilization rate is the detention center’s total service days divided by the total possible service days. Total possible service days is calculated by multiplying the center's operating capacity by 365 days in a year.
Minimum and maximum daily population is calculated by examining total service days for each day of the year relative to the operating capacity and determining the lowest and highest population for a given secure detention center.
Transfers in to detentions are those youth transferred from one detention center into another.

Prevention and Victim Services 2006 Outcome Evaluation Report
Profile of Prevention Programs 7
PREVENTION AND
VICTIM SERVICES
The Florida Department of Juvenile Justice (DJJ) is charged by the legislature with providing delinquency prevention services for at-risk youth. Prevention programs are designed to address specific problems and provide interventions for at-risk youth and their families in order to reduce juvenile crime and protect public safety. These programs use the risk factors identified in the 8% Solution research, which include specific problems in the areas of family, school, substance abuse and delinquent behavior, to target high-risk youth. 2 The Department addresses these problems by contracting for services and awarding grants to community-based providers. The providers are asked to target prevention programs to geographic areas in Florida (identified by zip codes) with high numbers of at-risk youth.
Profile of Prevention Programs
During FY 2003-04, there were 35,629 releases from 232 prevention programs. The majority of prevention programs are non-residential and serve youth within the
2 Schumacher, M., and Kurz, G. (1999). The 8% Solution: Preventing Serious, Repeat Juvenile Crime. Thousand Oaks, California: Sage Publications.
community. In FY 2003-04, funding for prevention programs administered by DJJ totaled almost $60 million, representing around 10% of the Department’s total budget of $625 million for that year. Funding for prevention programs comes from a variety of different sources, including federal, state and local government agencies. In this chapter, prevention programs are classified based on their funding source: general revenue or grant monies. A description of the funding sources and different programs within each source are provided in the next section.
Section 985.02(3), Florida Statues states that “…it is the policy of the state with respect to juvenile justice and delinquency prevention to first protect the public from acts of delinquency. In addition, it is the policy of the state to:
a) Develop and implement effective methods of preventing and reducing acts of delinquency, with a focus on maintaining and strengthening the family as a whole so that children may remain in their homes or communities.
b) Develop and implement effective programs to prevent delinquency, to divert children from the traditional juvenile justice system, to intervene at an early stage of delinquency, and to provide critically needed alternatives to institutionalization and deep-end commitment.
c) Provide well-trained personnel, high-quality services, and cost -effective programs within the juvenile justice system.
d) Increase the capacity of local governments and public and private agencies to conduct rehabilitative treatment programs and to provide research, evaluation, and training services in the field of juvenile delinquency prevention.”

2006 Outcome Evaluation Report Prevention and Victim Services
8 Profile of Prevention Programs
General Revenue Programs
DJJ uses general revenue funds to contract with three agencies to provide prevention services: The Florida Network of Youth and Family Services, Inc., Outward Bound, and the Practical Academic Cultural Educational (PACE) Center For Girls, Inc. A description of each agency and the services they deliver are provided below.
The Florida Network of Youth and Family Services, Inc. (Network) Agencies. The Network is a not- for-profit statewide association of 27 agencies that includes 31 residential crisis shelters and non-residential delinquency prevention services. Counseling is provided at over 100 service sites. The population served is defined in statute as Children in Need of Services (CINS) and their families (Families in Need of Services (FINS)) as mandated by Chapter 984, Florida Statutes. Through contract with DJJ, the Network agencies serve runaway, truant, ungovernable and other troubled children and their families with a continuum of services designed to strengthen and stabilize the family unit. Services are aimed at preventing children from entering the juvenile justice and child welfare systems, thereby avoiding more costly care and custody. Youth and families may access these services on a voluntary basis or by order of the court. These services are available 24 hours a day, seven days a week and include:
• Centralized Intake: Intake functions as the initial entry into the service continuum and includes child and/or family assessment, counseling and case management.
• Screening: Each youth is screened for eligibility and referred either to emergency shelter care, non-residential
counseling, or, if not eligible for CINS/FINS services, other community services more appropriate for their needs. All CINS/FINS agencies maintain interagency agreements with other community-based service providers to connect clients with desired services and provide an effective continuum of care.
• Acceptance and assessment: The admission process provides eligible children and their families with the least restrictive services that are responsive to their individual needs. Once eligibility is determined and the youth is accepted for services, the child is assessed by a counselor to determine his or her most immediate needs and presenting problems. Within 72 hours of acceptance, a complete psychosocial assessment is conducted. The counselor develops a service plan that provides for individual, group and family counseling, as well as specialized services that may be needed from community schools, medical clinics, vocational or other programs.
• Prevention Outreach: These services increase public awareness through printed materials, web-sites, and presentations to key referral sources such as schools, law enforcement, civic groups, etc. at both the local and state level.
• Case Management: All eligible youth and families admitted may receive case management services. These services include: information gathering, supportive linking, advocacy, coordinating and monitoring services, case review and termination planning. When the agency’s short-term services have resolved the family’s immediate crisis, the family is connected with longer-term community services that will continue to build on the strengths identified while receiving CINS/FINS services.
• Non-Residential Counseling Services: If the immediate crisis in the family can

Prevention and Victim Services 2006 Outcome Evaluation Report
Profile of Prevention Programs 9
be handled, and it is safe for the child to return to or remain at home, the family is offered non-residential counseling services. These services include, but are not limited to, crisis intervention and individual, group and/or family counseling. They are provided to CINS/FINS clients in their homes, at established community locations, or at the local agency’s offices.
• Shelter Services: If it is not possible for the child to remain at home, he or she is admitted to a crisis shelter. This service is short-term, generally lasting less than two weeks. Shelter services are primarily voluntary and include crisis intervention, shelter, food, clothing, case management, and counseling. CINS/FINS shelter services are available to Florida families 24 hours a day, every day of the year. Staff-secure shelter is available for children meeting statutory criteria (Sections 316.635, 318.143, 984.09, 985.216, Florida Statutes).
Hurricane Island Outward Bound (HIOB). Hurricane Island Outward Bound provides services for CINS/FINS youth. Opened in 1983, the program consists of an 18-day wilderness expedition designed to help youth develop personal competencies in group decisions, problem solving, anger management, communication skills, leadership and service to others. Youth are referred from the court, the Department of Children and Families, schools and from DJJ. These coed programs, located in Circuits 9 and 11, accept youth 13 to 17 years of age. Following the expedition, staff members help youth apply what they have learned to their family, community and school environments through case management follow-up services.
PACE Center for Girls, Inc. PACE operates programs in 22 locations statewide that target the unique needs of females 11 to 18 years of age who are identified as dependent, truant, runaway, ungovernable, delinquent, or in need of academic skills. PACE accepts referrals from the juvenile justice system, the Department of Children and Families, school personnel, community services agencies, parents, family members, friends and self-referrals. Its purpose is to intervene and prevent school withdrawal, juvenile delinquency, teen pregnancy, substance abuse and welfare dependency. PACE programs provide the following services: academic education, individualized attention, a gender-specific life management curriculum (SPIRITED GIRLS®), therapeutic support services, parental involvement, student volunteer service projects and transition follow-up services. Every girl at PACE sets individual educational and social goals that are focused on earning a high school diploma or GED, re-entering public school, attending college, getting vocational training, joining the military or entering the private workforce. After program completion, PACE continues to monitor each girl’s educational and personal development with three years of follow-up case management. During FY 2003-04, PACE operated 19 centers throughout Florida as well as three outreach programs in Martin, Flagler and Monroe counties and a pre-teen center (girls ages 8-11) as part of the Broward Center. Since the programs’ creation in 1985, PACE has served over 15,000 girls.
Grant-Funded Programs
Monies received from both federal and state grants are used to fund prevention programs. A description of the various grant programs are described on the next page.

2006 Outcome Evaluation Report Prevention and Victim Services
10 Profile of Prevention Programs
OJJDP Grant Programs . The Office of Juvenile Justice and Delinquency Prevention (OJJDP) awards grant funds to states. DJJ is responsible for administering the federal funds for Florida. OJJDP funds a number of local delinquency prevention grants throughout the state. Grants are recommended for award by the State Advisory Group (SAG), which is appointed by the Governor. Grants are awarded to agencies and are categorized into Title II, Title V and Challenge grant awards. Title II grant awards encompass a number of different program areas with most funding going to direct service providers which serve youth, their families and communities through programming aimed at preventing juvenile delinquency. Data were available for 44 of these grants. However, only 41 programs had youth who completed the program during FY 2003-04. OJJDP grants include:
• Title II Grants: Title II grant awards are for juvenile justice and delinquency prevention programs and target youth in high-crime neighborhoods. All Title II grant recipients have a maximum of two renewals for their yearly grants (up to three years of funding). The expectation is that recipients will seek out other funding sources to enable program continuation.
• Disproportionate Minority Contact (DMC) Grants: DMC grants are funded with Title II federal money. In the JJDP Act of 2002, Congress required that states participating in the Formula Grants Program “address juvenile delinquency prevention efforts and system improvement efforts designed to reduce, without establishing or requiring numerical standards or quotas, the
disproportionate number of juvenile members of minority groups, who come into contact with the juvenile justice system” (see 42 U.S.C. §223(a)(22)). For purposes of this requirement, OJJDP has defined minority populations as American Indian and Alaska Native, Asian, Black or African-American, Hispanic or Latino, and Native Hawaiian or other Pacific Islanders. States participating in the Formula Grants Program address disproportionate minority contact on an ongoing basis by moving through the following phases:
1. Identification. To determine the extent to which disproportionate minority contact exists.
2. Assessment. To assess the reasons for disproportionate minority contact, if it exists.
3. Intervention. To develop and implement intervention strategies to address these identified reasons.
4. Evaluation. To evaluate the effectiveness of the chosen intervention strategies.
5. Monitoring. To note changes in disproportionate minority contact trends and to adjust intervention strategies as needed.
Each state must report on its progress in its comprehensive JJDP 3-year plan and subsequent plan updates (in compliance with 42 U.S.C. §223(a)(22)). OJJDP reviews the plan updates annually. Any state that fails to address the overrepresentation of minority youth in the juvenile justice system stands to lose 20% of its Formula Grants allocation for the year.
• Title V Grants: Title V grant awards are administered to local units of government to facilitate coordinated community delinquency prevention planning. This funding is targeted for cities and counties (units of local government) to form and

Prevention and Victim Services 2006 Outcome Evaluation Report
Profile of Prevention Programs 11
mobilize coalitions that take a comprehensive approach to reducing juvenile crime through programs and systemic changes. A 50% cash or in-kind match is required on the part of the government agency in order to qualify for a grant.
• Challenge Grants: Challenge grants are intended for specific purposes. Florida has designated programs and research designed to end gender bias in the placement and treatment of juvenile offenders. The latest Challenge award had two purpose areas: gender specific programs and out-of-school suspension programs. All Florida Challenge grants will expire in FY 2006-07. This federal program was terminated in 2003.
Juvenile Accountability Block Grant Programs . Block Grant programs are funded through the federal Juvenile Accountability Block Grant (JABG) program, administered by the State Relations and Assistance Division of OJJDP, Office of Justice Programs, U.S. Department of Justice. The JABG programs support state and local efforts to address juvenile crime by encouraging reforms that hold juveniles accountable for their actions. Funds may be used for specific purposes, including school safety, restorative justice, diversion and accountability-based programs for juveniles. Release data were available on 11 JABG programs, with 10 programs having at least one youth who completed the program during FY 2003-04.
Community Partnership Grant Programs . The Community Juvenile Justice Partnership Grant (CJJPG) program was established by the Legislature to actively address the problem of juvenile crime in Florida. The program encourages the development of partnerships among law enforcement, public
schools, DJJ and the Department of Children and Family Services in providing juvenile crime prevention services in Florida communities. Priority is given to programs that target at-risk youth, those between the
ages of 10 to 17 years of age, and provide services intended to reduce juvenile crime by providing direct services for at-risk and/or delinquent youth.
One dollar from the sale of every license plate in Florida is placed in the Motor Vehicle Theft Prevention Trust Fund. Forty-two cents of that dollar goes to the Department, of which thirty cents is used to fund the Community Partnership grants, and twelve cents is used to fund conditional release. Release data were available on 96 programs with combined Partnership/Invest in Children funding. However, only 92 programs had youth who completed the program. In this chapter, these programs are listed under Partnership/Invest in Children combination grants.
Invest in Children Grant Programs. Since 1994, Floridians who buy an "Invest in Children" license plate contribute directly to efforts to prevent juvenile delinquency in their home communities. Revenue from the sale of “Invest in Children” license plates, which cost consumers an additional $20 each, is spent in the county in which it is collected, minus the cost of the plates and a 7% fee that is applied towards state General Revenue funds. The remainder of the money raised through the sale of these plates is used to fund delinquency prevention efforts at the local level. The tag is available at Florida license tag offices. In this chapter, these programs are listed under Partnership/Invest in Children combination grants.

2006 Outcome Evaluation Report Prevention and Victim Services
12 Offenses During Services
Offenses During Services by Program
The ODS rates for each program can be found in the summary tables at the end of this chapter.
The ODS rate for youth released from prevention programs was 5%.
Funding SourceNumber of Releases
% Adjudicated for ODS1
Florida Network Shelters 6,793 5%Hurricane Island Outward Bound 249 2%
Total Residential 7,042 5%
Florida Network 7,536 6%Partnership/Invest in Children 11,958 4%OJJDP 6,185 4%
PACE 1,366 6%Special Member Projects 753 1%
Juvenile Accountability Block Grants 789 5%
Total Non-Residential 28,587 5%
35,629 5%
Prevention Programs FY 2003-04Offenses During Services by Funding Source
Residential
Non-Residential
1The offense occurred during services (ODS) and was subsequently adjudicated.
Total
Contracted Special Member Project Programs . Contracted Special Member Project programs are legislative initiatives designed to reduce and prevent juvenile crime. Programs were awarded funds based on the criteria that each supported the DJJ Delinquency Prevention Plan. Special Member Project programs were awarded in the following counties: Bradford, Pasco and Dade. Programs provide a variety of delinquency prevention services, including academic assistance, recreation, employment readiness, job placement, counseling, cognitive and social skills enhancement and computer training. Data were available for two programs.
Prevention Program Outcomes
Prevention programs are designed to prevent participants from entering or becoming more deeply involved in the juvenile justice system. The remaining sections of this chapter focus on outcomes for youth released from prevention programs during FY 2003-04. There were a total of 35,629 releases from 232 prevention programs. Using these data, five performance measures were examined. These include:
1. Offenses during services (for all releases).
2. Average length of services (for all releases, completions only and recidivists and non-recidivists).
3. Completion status (for all releases).
4. Re-offending within the juvenile and adult systems, within one year of release (for completions only).
5. Re-offending within the juvenile system, within six months of release is presented in appendix tables on the DJJ website.
A detailed description of the data sources and methods used in analyzing the data can be
found in the Data and Methods chapter of this report.
Offenses During Services (ODS)
Offenses during services, which result in an adjudication, (ODS) are an indicator of prevention program effectiveness in monitoring and guiding the behavior of the youth participating in their programs. Statewide, 5% of youth who were released from prevention programs were adjudicated for an offense committed while they were participating in the program. The table below presents the percent of youth adjudicated for ODS in residential and non-residential programs, as well as, by funding source and program type. The rates ranged from a high of six percent for Florida Network’s non-residential programs and PACE programs, to a low of 1% for Special Member Project programs.

Prevention and Victim Services 2006 Outcome Evaluation Report
Completion Status 13
Completion Status
There are a variety of reasons why youth exit a program. Identifying the reason is dependent on DJJ staff’s categorization from a list of release reasons in JJIS, which include:
1. Completed all services
2. Expelled from the program
3. Dropped out
4. Changed schools
5. Referred to another program/agency
6. Moved
7. Other release.
In this report, youth are classified as either a “completion” or an “other release.” The Florida Network uses the same categories in the dataset they provide.
During FY 2003-04, a total of 35,629 youth (7,042 residential and 28,587 non-residential) were released from prevention programs. Of the 35,629 youth released, 27,315 completed the prevention program services according to the provider for a completion rate of 77%. There was no difference in the completion rate between residential and non-residential programs.
Profile of Youth Completing Prevention Programs
Youth included in the recidivism analysis reported here were released from DJJ prevention programs between July 1, 2003 and June 30, 2004. Only youth who completed the program are reported in the chapter.
Using these criteria, 24,906 youth were included in the recidivism analysis. Some youth (n=2,409) completed more than one prevention program during FY 2003-04 for a total of 27,315 completions. This duplicated number of 27,315 completions is referenced throughout this section of the report.
Research indicates that demographic characteristics and offense histories are predictors of the likelihood of delinquent involvement.3 Understanding these important background characteristics of youth provides a context for interpreting recidivism rates.
3 Loeber, R., Farrington, D.P., Stouthamer-Loeber, M., and Van Kammen, W.B. (1998). Antisocial Behavior and Mental Health Problems: Explanatory Factors in Childhood and Adolescence. Mahwah, NJ: Lawrence Erlbaum Associates.
Completion Status by Program
Completion status for each program can be found in the summary tables at the end of the chapter.

2006 Outcome Evaluation Report Prevention and Victim Services
14 Demographic Characteristics
58%63%
75%
53%
70%
51%
0%
10%
20%
30%
40%
50%
60%
70%
80%
90%
100%
White Male
Distribution of Youth by Race and Gender
Prevention Programs Youth Referred Florida Juveniles (10-17 years)
Demographic Characteristics
Youth demographic characteristics are presented below for residential and non-residential programs and by funding source and program type.4 During FY 2003-04, the majority of youth served by prevention programs were white (58%) and male (53%). In comparison, the population of youth entering the juvenile justice system in
4 In reports published by the Florida Network, demographic information and individual agency performance are analyzed by admission and not individual release. A youth may be served multiple times by a particular Florida Network agency but is only reported as one release in this report.
Florida was 63% white and 70% male, while the at-risk population of youth between 10 and 17 years of age in Florida in 2003 was estimated as 75% white and 51% male.5 Thus, prevention programs serve a lower percentage of white youth (53%) than the proportion referred to DJJ (63%) or the proportion in the population (75%).
5 Florida Legislature’s Office of Economic and Demographic Research, Florida Total Population by Age, Race, and Gender: July 1, 1970-2029, Data from Demographic Estimating Conference (Updated 07/05).

Prevention and Victim Services 2006 Outcome Evaluation Report
Demographic Characteristics 15
Male Female White Black Other
Florida Network Shelters 5,232 48% 52% 55% 37% 7% 11% 15.1 Hurricane Island Outward Bound 205 63% 37% 79% 21% 0% 40% 14.8
Total Residential 5,437 48% 52% 56% 36% 6% 13% 15.0
Florida Network 5,756 52% 48% 64% 28% 6% 18% 14.2 PACE 1,050 0% 100% 65% 35% 1% 14% 15.2 Partnership/Invest in Children 9,007 60% 40% 61% 38% 1% 12% 13.7 OJJDP 4,925 56% 44% 44% 55% 1% 11% 13.2 Special Member Projects 505 62% 38% 74% 25% 1% 48% 16.6 Juvenile Accountability Block Grants 635 55% 45% 51% 48% 0% 13% 15.2
Total Non-Residential 21,878 54% 46% 58% 39% 2% 14% 13.9
27,315 53% 47% 58% 39% 3% 14% 14.1
Prevention Programs FY 2003-04Demographic Characteristics
Funding SourceNumber of
Completions
Gender Race
Average Ageat AdmissionHispanic
Residential
Non-Residential
Percentages are rounded to the nearest whole number and may not add to 100%
Total
Demographic Characteristics by Funding Source
As shown in the table below, Hispanics made up 13% of youth who completed residential prevention programs and 14% of youth who completed non-residential prevention
programs. The average age of youth at admission of youth who completed residential prevention programs was 15 years. The average age at admission of youth who completed non-residential prevention programs was a year younger at just under 14 years.

2006 Outcome Evaluation Report Prevention and Victim Services
16 Offense Histories
Approximately one-third (34%) of all prevention youth had a prior charge, and one in eight had previously been adjudicated delinquent.
Offense Histories Four measures of prior offending were calculated as described in detail in the Data and Methods chapter:
1. Percentage of youth with prior charges.
2. Percentage of youth with prior adjudicated charges.
3. Average seriousness index of prior charges.
4. Average seriousness index of prior adjudicated charges.
The index for prior adjudicated charges is comparable to the data presented in the other chapters of this report.
Youth released from prevention programs are a mix of those who have had prior contact with DJJ and those who have not. Statewide, 34% (n=9,173) of youth who completed prevention programs had at least one delinquency charge, and 12% (n=3,224) had at least one adjudicated charge prior to admission to the prevention program. Residential prevention programs served a higher percentage of youth who have already been involved in the juvenile justice system than non-residential programs (43% and 31%, respectively). For all youth who completed prevention programs, the average seriousness index of prior charges was 3.1 and 0.9 for adjudicated charges. Both indexes were higher for residential programs (4.6 and 1.5, respectively) compared to non-residential programs (2.7 and 0.8, respectively).

Prevention and Victim Services 2006 Outcome Evaluation Report
Offense Histories 17
PriorCharges
Prior Adjudicated
ChargesPrior
Charges1
Prior Adjudicated
Charges2
Florida Network Shelters 5,232 43% 19% 4.6 1.5Hurricane Island Outward Bound 205 32% 10% 3.3 0.6
Total Residential 5,437 43% 19% 4.6 1.5
Florida Network 5,756 29% 8% 2.2 0.6PACE 1,050 41% 18% 3.4 1.3Partnership/Invest in Children 9,007 31% 10% 2.7 0.7OJJDP 4,925 25% 12% 2.9 1.1
Special Member Projects 505 31% 14% 2.9 0.8Juvenile Accountability Block Grants 635 90% 4% 3.4 0.2
Total Non-Residential 21,878 31% 10% 2.7 0.8
27,315 34% 12% 3.1 0.9Total
Residential
Non-Residential
Prevention Programs FY 2003-04Offense Histories by Funding Source
Funding SourceNumber of
Completions
Percent of Completions with: Average Seriousness Index of:
1 The seriousness index is comprised of the sum of all scores for all charges. The following point values are assigned: 8 for a violent felony, 5 for a property or other felony, 2 for a misdemeanor, and 1 for any other charge. 2 The seriousness index is comprised of the sum of all scores for adjudicated charges. The following point values are assigned: 8 for a violent felony, 5 for a property or other felony, 2 for a misdemeanor, and 1 for any other charge.
Offense Histories by Funding Source
The table on the next page provides prior referral information for youth presented by funding type for both residential and non-residential programs. On average, youth who completed Florida Network residential shelter programs had more serious offense histories than youth who completed Hurricane Island Outward Bound (HIOB) programs. Forty-three percent of youth who completed Florida Network residential shelter programs had a prior charge, and their average seriousness index of prior charges was 4.6 and 1.5 for prior adjudicated charges. Thirty-two percent of youth who completed HIOB had a prior charge, and their average seriousness index of prior charges was 3.3 and 0.6 for prior adjudicated charges.
Among non-residential prevention programs, there was also considerable variation in terms of the percentage of youth who had prior charges, from a low of 25% of the youth who completed OJJDP non-residential programs to a high of 90% of the youth who completed JABG non-residential grant programs. PACE programs had the highest percentage of youth with prior adjudications (18%) while JABG had the lowest at 4%. There was also considerable variation in the average seriousness indexes for non-residential youth. The average seriousness index for prior charges ranged from a high of 3.4 for PACE and JABG programs to a low of 2.2 for Florida Network programs. Youth who completed PACE programs had higher scores on the average seriousness indices (3.4 for prior charges and 1.3 for prior adjudicated charges) than youth who completed other non-residential prevention programs.

2006 Outcome Evaluation Report Prevention and Victim Services
18 Offense Histories
PriorCharges
Prior Adjudicated
ChargesPrior
Charges1
Prior Adjudicated
Charges2
Males 2,621 50% 24% 6.3 2.1
Females 2,816 36% 13% 2.9 0.9
Total Residential 5,437 43% 19% 4.6 1.5
Males 11,792 36% 13% 3.6 1.0Females 10,086 26% 7% 1.7 0.5
Total Non-Residential 21,878 31% 10% 2.7 0.8
27,315 34% 12% 3.1 0.9
Percent of Completions with:
Number ofCompletionsGender
2 The seriousness index is comprised of the sum of all scores for adjudicated charges. The following point values are assigned: 8 for a violent felony, 5 for a property or other felony, 2 for a misdemeanor, and 1 for any other charge.
1 The seriousness index is comprised of the sum of all scores for all charges. The following point values are assigned: 8 for a violent felony, 5 for a property or other felony, 2 for a misdemeanor, and 1 for any other charge.
Prevention Programs FY 2003-04Offense Histories by Gender
Residential
Non-Residential
Total
Average Seriousness Index of:
Offense Histories by Gender
The offense histories of males and females were substantially different in terms of both extent and seriousness. Males who completed both residential and non-residential prevention programs had more serious delinquency histories than females. For
residential programs, one-half of the males had prior charges while only 36% of the females did. The same pattern is observed for non-residential programs with 36% of the males having prior charges, but only 26% of the females.

Prevention and Victim Services 2006 Outcome Evaluation Report
Offense Histories 19
Youth Profiles by Program
Demographic and offense history information for youth completing each program can be found in the summary tables at the end of this chapter.
PriorCharges
Prior Adjudicated
ChargesPrior
Charges1
Prior Adjudicated
Charges2
White 3,057 40% 17% 3.9 1.3
Black 1,976 49% 22% 5.8 1.9Other 352 38% 14% 3.9 1.1
Race Unknown 52 33% 13% 2.4 0.5
Total Residential 5,437 43% 19% 4.6 1.5
White 12,715 32% 10% 2.6 0.7Black 8,581 30% 11% 2.8 0.9
Other 473 25% 8% 1.9 0.5Race Unknown 109 21% 5% 1.1 0.3
Total Non-Residential 21,878 31% 10% 2.7 0.8
27,315 34% 12% 3.1 0.91 The seriousness index is comprised of the sum of all scores for all charges. The following point values are assigned: 8 for a violent felony, 5 for a property or other felony, 2 for a misdemeanor, and 1 for any other charge. 2 The seriousness index is comprised of the sum of all scores for adjudicated charges. The following point values are assigned: 8 for a violent felony, 5 for a property or other felony, 2 for a misdemeanor, and 1 for any other charge.
RaceNumber of
Completions
Percent of Completions with: Average Seriousness Index of:
Total
Residential
Non-Residential
Prevention Programs FY 2003-04Offense Histories by Race
Offense Histories by Race
Different patterns of offense histories by race were observed for residential as compared to non-residential programs. In residential programs, the offense histories of black and white youth were substantially different. Close to one-half (49%) of black youth who completed residential prevention programs had prior charges as compared to 40% of
white youth and 38% of other youth. For non-residential programs, the differences were much smaller. Thirty percent of black youth and 32% of white youth who completed non-residential prevention programs had prior charges.

2006 Outcome Evaluation Report Prevention and Victim Services
20 Statewide Recidivism Rates
The recidivism rate for youth who completed prevention programs during FY 2003-04 was 12%.
For Performance Based Budgeting (PB2), the measure of recidivism for prevention programs is a six-month follow-up of all releases and includes only juvenile data. The PB2 measure is available on individual prevention programs in the appendix tables for this report which are available on the Department of Juvenile Justice web site: http://www.djj.state.fl.us/Research/index.htlm
Referrals/Arrests
Felony Referrals/
ArrestsAdjudications/
Convictions
Felony Adjudications/
Convictions
CommitmentsProbationor Prison
Florida Network Shelters 5,232 36% 20% 22% 9% 10% Hurricane Island Outward Bound 205 34% 17% 17% 7% 5%
Total Residential 5,437 36% 20% 22% 9% 10%
Florida Network 5,756 24% 13% 13% 5% 4% PACE 1,050 19% 9% 10% 3% 3% Partnership/Invest in Children 9,007 18% 10% 10% 4% 3% OJJDP 4,925 15% 9% 8% 3% 3% Special Member Projects 505 14% 10% 7% 3% 2% Juvenile Accountability Block Grants 635 16% 9% 10% 4% 1%
Total Non-Residential 21,878 19% 10% 10% 4% 3%
27,315 22% 12% 12% 5% 5%
Residential
Non-Residential
Prevention Programs FY 2003-04Subsequent Delinquent or Criminal Activity
Within One Year of Completion by Funding Source
Funding SourceNumber of
Completions
Percent of Completions with Subsequent:
Total
Due to the designed differences in services and length of stay, comparisons between Florida Network Shelters and HIOB programs should be made with caution.
Recidivism Rates for Youth Completing Prevention Programs
Five commonly used measures of re-offending are presented in this chapter: subsequent referral/arrest, felony referral/arrest, adjudication/conviction, felony adjudication/conviction and subsequent sanctions (subsequent commitment to DJJ, sentencing to adult probation or prison). These recidivism measures are presented only for youth who completed a prevention program.
Statewide Recidivism Rates
Overall, the recidivism rate for youth who completed prevention programs was 12%. Twenty-two percent were re-arrested, and 5% were committed to the juvenile system or sentenced to adult probation or prison.
Recidivism by Funding Source
For youth who completed residential prevention programs, the recidivism rate was 22% while the rate for youth who completed non-residential programs was less than half that at 10%. By funding source, there were substantial differences in recidivism rates. The recidivism rate for the Florida Network Shelters was 22%, while the rate for HIOB was 17%. There were similar variations among the non-residential programs. Recidivism rates ranged from a high of 13% for Florida Network programs to a low of 7% for Special Member Project programs.

Prevention and Victim Services 2006 Outcome Evaluation Report
Recidivism by Gender 21
Referrals/Arrests
Felony Referrals/Arrests
Adjudications/Convictions
Felony Adjudications/Convictions
CommitmentsProbationor Prison
Males 2,621 43% 27% 28% 14% 14%
Females 2,816 29% 14% 16% 5% 6%
Total Residential 5,437 36% 20% 22% 9% 10%
Males 11,792 23% 14% 13% 6% 5%
Females 10,086 14% 6% 7% 2% 2%
Total Non-Residential 21,878 19% 10% 10% 4% 3%
27,315 22% 12% 12% 5% 5%
Percent of Completions with Subsequent:
Residential
Non-Residential
Prevention Programs FY 2003-04Subsequent Delinquent or Criminal ActivityWithin One Year of Completion by Gender
GenderNumber of
Completions
Total
Recidivism by Gender
Females who completed residential and non-residential prevention programs had lower recidivism rates than males regardless of the measure examined. The recidivism rate of 28% for males who completed residential programs was 12 percentage points higher than that of females, and the recidivism rate of 13% for males who completed
non-residential programs was almost twice that of females. For both residential and non-residential prevention programs, males were more likely than females to be committed, sentences to adult probation or prison for an offense after release from prevention programs during a one-year follow-up.

2006 Outcome Evaluation Report Prevention and Victim Services
22 Recidivism by Race
Referrals/Arrests
Felony Referrals/Arrests
Adjudications/Convictions
Felony Adjudications/Convictions
CommitmentsProbationor Prison
White 3,057 34% 18% 20% 20% 9% Black 1,976 41% 24% 25% 23% 12% Other 352 27% 12% 14% 15% 5%
Race Unknown 52 35% 19% 21% 24% 8%
Total Residential 5,437 36% 20% 22% 21% 10%
White 12,715 18% 9% 10% 4% 3% Black 8,581 20% 12% 11% 4% 4% Other 473 18% 9% 9% 4% 2% Race Unknown 109 16% 4% 5% 1% 1%
Total Non-Residential 21,878 19% 10% 10% 4% 3%
27,315 22% 12% 12% 5% 5%
Non-Residential
Residential
Prevention Programs FY 2003-04Subsequent Delinquent or Criminal Activity
Within One Year of Completion by Race
RaceNumber of
Completions
Percent of Completions with Subsequent:
Total
Recidivism by Race
Black youth who completed residential prevention programs had higher recidivism rates than white youth regardless of the measure examined. The recidivism rate for black youth who completed residential prevention programs was 25% compared to 20% for white youth. For youth who
completed non-residential prevention programs, there were smaller differences in subsequent offending by race. Black youth who completed non-residential prevention programs had only a slightly higher recidivism rate than white youth (11% and 10%, respectively)

Prevention and Victim Services 2006 Outcome Evaluation Report
Recidivism by Age at Admission 23
Referrals/Arrests
Felony Referrals/Arrests
Adjudications/Convictions
Felony Adjudications/Convictions
CommitmentsProbationor Prison
9 Years and Younger 8 13% 0% 0% 0% 0% 10 Years Old 63 11% 6% 3% 2% 0%
11Years Old 141 26% 13% 15% 6% 6% 12 Years Old 373 41% 21% 23% 9% 10%
13 Years Old 807 40% 23% 23% 9% 10% 14 Years Old 1,118 40% 21% 25% 11% 11% 15 Years Old 1,271 37% 22% 24% 11% 11%
16 Years Old 982 32% 16% 20% 7% 9% 17 Years Old 670 29% 21% 15% 8% 8%
18 Years and Older 4 50% 50% 25% 25% 25%
Total Residential 5,437 36% 20% 22% 9% 10%
9 Years and Younger 1,625 2% 1% 0% 0% 0% 10 Years Old 1,011 5% 3% 2% 1% 0%
11 Years Old 1,616 9% 5% 4% 2% 1% 12 Years Old 2,692 16% 8% 8% 4% 2% 13 Years Old 3,391 21% 10% 10% 4% 3%
14 Years Old 3,592 25% 13% 14% 6% 6% 15 Years Old 3,472 26% 14% 15% 5% 5%
16 Years Old 2,475 24% 13% 14% 5% 4% 17 Years Old 1,629 19% 16% 10% 4% 5% 18 Years and Older 322 17% 17% 8% 6% 7%
DOB unknown 53 0% 0% 0% 0% 0%
Total Non-Residential 21,878 19% 10% 10% 4% 3%
27,315 22% 12% 12% 5% 5%
Number of Completions
Prevention Programs FY 2003-04Subsequent Delinquent or Criminal Activity
Within One Year of Completion by Age at AdmissionPercent of Completions with Subsequent:
Total
Non-Residential
Residential
Age at Admission
Recidivism by Age at Admission
Of the youth who completed residential prevention programs, those who were 14 years of age at admission had the greatest recidivism rate (25%) followed closely by those who were 15 years of age at
admission (24%). Of the youth who completed non-residential prevention programs, those who were 15 years of age at admission had the greatest recidivism rate (15%).

2006 Outcom
e Evaluation R
eport
Prevention and V
ictim S
ervices
24
R
ecidivism by P
revention Program
Referrals/Arrests
Felony Referrals/
Arrests Adjudications/
Convictions
Felony Adjudications/
Convictions
Commitment/Probation or
Prison
ACT Corporation Beach House 185 40% 16% 21% 6% 7% Anchorage Childrens Home Hidle House 138 25% 11% 18% 5% 12% Arnette House Arnette House 207 36% 18% 25% 10% 11% Capital City Youth Services Some Place Else Youth Shelter 276 28% 14% 19% 9% 7% Center for Child and Family Enrichment CFCE - Excel Shelter Program 40 28% 10% 15% 10% 5% CHS of Florida - West Palm Beach CHS WPB - Safe Harbor Runaway Center 70 34% 19% 16% 7% 4% CHS of Treasure Coast - Wave C.R.E.S.T Shelter CHS - Wavecrest 145 34% 19% 23% 12% 17% Corner Drug Store CDS - Interface Central 215 40% 23% 22% 10% 9% Corner Drug Store CDS - Interface East 62 35% 19% 19% 11% 5% Corner Drug Store CDS - Interface Northwest - Lake City 93 31% 23% 15% 8% 6% Crosswinds Youth Services Crosswinds Youth Shelter 95 44% 22% 25% 11% 16% Family Resources Family Resources - Manatee Youth Crisis Shelter 121 32% 16% 12% 5% 5% Family Resources Family Resources - Pinellas (Clearwater) - N. Youth Shelter 189 36% 20% 26% 8% 10% Family Resources Family Resources - Pinellas (St. Pete) - S. Youth Shelter 168 46% 26% 32% 15% 10% Florida Keys Childrens Shelter Florida Keys Children's Shelter 32 44% 34% 25% 13% 22% Girls and Boys Town of Central Florida Boys Town of Central Florida 87 41% 29% 22% 10% 9% Hillsborough County Haven W. Poe Runaway Shelter 221 33% 19% 14% 10% 5%
Table continued on next page
Residential Prevention Programs FY 2003-04Subsequent Delinquent or Criminal Activity
Within One Year of Completion by Funding Source and Provider
Percent of Completions with Subsequent:
Florida Network SheltersProgram NameFunding Source/Provider
Number of Completions1
1 Italics indicate that less than 15 youth completed the program and care should be taken in interpreting the data.
Recidivism by Prevention Program
The following tables present information on re-offending for all prevention programs. Data are presented on all five measures of re-offending. Some programs had very few youth complete the program, and their rates should be interpreted with caution. Within funding sources, the variation in re-offending rates was often substantial. For example, the recidivism rates for Florida Network Shelters that had at least 15 youth complete the program, ranged from 5% to 35%. For the 20 PACE programs, recidivism rates ranged from a low of 0% to a high of 20%, and OJJDP funded programs ranged from 0% to 26%. Among the Partnership/Invest in Children programs that had at least 15 youth complete the program the recidivism rates ranged from 0% to 28%. JABG programs had recidivism rates that ranged from 4% to 23%.

Prevention and V
ictim S
ervices
2006 Outcom
e Evaluation R
eport
Recidivism
by Prevention P
rogram
25
Referrals/Arrests
Felony Referrals/
Arrests Adjudications/
Convictions
Felony Adjudications/
Convictions
Commitment/Probation or
Prison
Lutheran Services of Florida NW Currie House 203 36% 23% 29% 12% 14% Lutheran Services of Florida NW Hope House 111 30% 18% 18% 9% 13% Lutheran Services of Florida SE Lippman Youth Shelter 47 38% 13% 15% 6% 4% Lutheran Services of Florida SW Charlotte Youth Shelter 46 33% 22% 22% 13% 7% Lutheran Services of Florida SW Oasis Youth Shelter 169 31% 18% 17% 8% 9% Miami Bridge Youth & Family Services Miami Bridge - Central 85 31% 20% 22% 13% 11% Miami Bridge Youth & Family Services Miami Bridge - Homestead/South Dade 126 35% 16% 25% 8% 12% Orange County Orange County Youth Shelter 456 41% 27% 24% 7% 8% Osceola County Osceola Youth Shelter 75 36% 20% 28% 5% 5% Sarasota Family YMCA - Youth and Family Services Sarasota YMCA Youth Shelter 161 36% 22% 24% 15% 10% Youth and Family Alternatives Cornerstone Youth Shelter 143 43% 19% 30% 11% 17% Youth and Family Alternatives New Beginnings Youth Shelter 114 31% 19% 21% 9% 8% Youth and Family Alternatives Runaway Alternatives Project (RAP House) 157 39% 18% 31% 9% 13% Youth Crisis Center Youth Crisis Center - Jacksonville 975 37% 21% 20% 9% 12% Youth Crisis Center
2 Youth Crisis Center - St. Augustine 20 10% 10% 5% 0% 5%
5,232 36% 20% 22% 9% 10%
Hurricane Island Outward Bound Hurricane Island Key Largo CINS 105 29% 15% 16% 6% 3% Hurricane Island Outward Bound Hurricane Island - Scottsmoor - CINS 100 40% 18% 18% 8% 7%
205 34% 17% 17% 7% 5%
5,437 36% 20% 22% 9% 10%
2 This program closed midyear.
Total Residential Florida Network Shelters
Total Hurricane Island Outward Bound
Total Residential 1 Italics indicate that less than 15 youth completed the program and care should be taken in interpreting the data.
Florida Network Shelters (continued)
Percent of Completions with Subsequent:
Hurricane Island Outward Bound
Residential Prevention Programs FY 2003-04Subsequent Delinquent or Criminal Activity
Within One Year of Completion by Funding Source and Provider (continued)
Funding Source/Provider Program NameNumber of
Completions1

2006 Outcom
e Evaluation R
eport
Prevention and V
ictim S
ervices
26
R
ecidivism by P
revention Program
Referrals/Arrests
Felony Referrals/
Arrests Adjudications/
Convictions
Felony Adjudications/
Convictions
Commitment/Probation or
Prison
ACT Corporation ACT Corporation Non-Residential 166 36% 15% 17% 4% 4% Anchorage Childrens Home Anchorage Childrens Home Non-Residential 120 21% 8% 9% 4% 3% Arnette House Arnette House Non-Residential 212 25% 11% 12% 4% 5% Capital City Youth Services Capital City Youth Services Non-Residential 172 18% 9% 13% 6% 4% CHS of Florida - West Palm Beach CHS of Florida - West Palm Beach Non-Residential 166 30% 13% 11% 7% 3% CHS of Treasure Coast - Wave C.R.E.S.T Shelter CHS of Treasure Coast - Wave C.R.E.S.T Shelter NR 72 29% 17% 24% 13% 13% Corner Drug Store Corner Drug Store Non-Residential 260 28% 11% 12% 6% 4% Crosswinds Youth Services Crosswinds Youth Services Non-Residential 238 31% 16% 16% 10% 7% Devereux Devereux Non-Residential 23 13% 9% 9% 9% 0% Family Resources Family Resources Non-Residential 586 27% 17% 18% 9% 5% Florida Keys Childrens Shelter Florida Keys Childrens Shelter Non-Residential 178 21% 11% 12% 4% 6% Friends of Children Friends of Children Non-Residential 35 34% 26% 17% 9% 3% Girls and Boys Town of Central Florida Girls and Boys Town of Central Florida Non-Residential 104 26% 14% 11% 3% 3% Hillsborough County Hillsborough County Non-Residential 489 20% 12% 8% 4% 3% Lutheran Services of Florida NW Lutheran Services of Florida NW Non-Residential 154 12% 8% 11% 5% 5% Lutheran Services of Florida SE Lutheran Services of Florida SE Non-Residential 357 25% 13% 13% 8% 3% Lutheran Services of Florida SW Lutheran Services of Florida SW Non-Residential 354 25% 8% 14% 4% 6% Miami Bridge Youth & Family Services Miami Bridge Youth & Family Services Non-Residential 217 23% 13% 13% 8% 5% Mount Bethel Mount Bethel Non-Residential 2 0% 0% 0% 0% 0% Orange County Orange County Non-Residential 322 35% 28% 22% 6% 5% Osceola County Osceola County Non-Residential 122 18% 8% 7% 2% 0% Sarasota Family YMCA - Youth and Family Services Sarasota Family YMCA - Youth and Family Services NR 274 19% 8% 6% 3% 1% Switchboard of Miami Switchboard of Miami Non-Residential 168 11% 7% 5% 3% 2% Youth and Family Alternatives Youth and Family Alternatives Non-Residential 540 23% 8% 12% 2% 5% Youth Crisis Center Youth Crisis Center Non-Residential 425 24% 10% 10% 4% 5%
5,756 24% 13% 13% 5% 4% 1 Italics indicate that less than 15 youth completed the program and care should be taken in interpreting the data.
Total Non-Residential Florida Network
Florida Network Non-Residential Programs
Non-Residential Prevention Programs FY 2003-04Subsequent Delinquent or Criminal Activity
Within One Year of Completion by Funding Source and Provider
Funding Source/Provider Program NameNumber of
Completions1
Percent of Completions with Subsequent:

Prevention and V
ictim S
ervices
2006 Outcom
e Evaluation R
eport
Recidivism
by Prevention P
rogram
27
Referrals/Arrests
Felony Referrals/
Arrests Adjudications/
Convictions
Felony Adjudications/
Convictions
Commitment/Probation or
Prison
Pace Center For Girls of Alachua County PACE Center for Girls of Alachua 27 15% 0% 4% 0% 0% Pace Center For Girls of Broward County Broward PACE Teen Center 26 27% 8% 15% 0% 8% Pace Center For Girls of Broward County PACE Center for Girls of Broward 78 17% 10% 15% 5% 3% Pace Center For Girls of Collier At Immokalee PACE Center for Girls of Collier 21 10% 5% 0% 0% 0% Pace Center For Girls of Escambia-Santa Rosa PACE Center for Girls of Escambia-Santa Rosa 57 11% 2% 9% 0% 2% Community Drug And Alcohol Council Project Smart- Expanded 77 5% 5% 1% 0% 0% Pace Center For Girls of Jacksonville PACE Center for Girls of Jacksonville 98 17% 3% 7% 1% 3% Pace Center For Girls of Leon County PACE Center for Girls of Leon 78 13% 4% 6% 1% 0% Pace Center For Girls of Manatee County PACE Center for Girls of Manatee 78 19% 10% 12% 6% 6% Pace Center For Girls of Marion County PACE Center for Girls of Marion 53 11% 8% 9% 2% 8% PACE Center for Girls of Miami-Dade PACE Center for Girls of Miami-Dade 51 16% 8% 4% 2% 0% Pace Center For Girls of Monroe County PACE Center for Girls of Monroe/Lower Keys 15 13% 13% 0% 0% 0% Pace Center For Girls of Monroe County PACE Center for Girls of Monroe/Upper Keys 19 16% 11% 11% 0% 11% Pace Center For Girls of Orange County PACE Center for Girls of Orange 65 20% 15% 12% 2% 3% Pace Center For Girls of Palm Beach County PACE Center for Girls of Palm Beach 47 19% 9% 4% 2% 2% Pace Center For Girls of Pasco County PACE Center for Girls of Pasco 40 25% 15% 8% 3% 3% Pace Center For Girls of Pinellas PACE Center for Girls of Pinellas 94 34% 18% 20% 6% 4% Pace Center For Girls of Polk County PACE Center for Girls of Polk 60 20% 3% 12% 0% 2% Pace Center For Girls of Treasure Coast PACE Center for Girls of Treasure Coast 43 19% 12% 7% 5% 7% Pace Center For Girls of Volusia-Flagler PACE Center for Girls of Volusia 59 14% 5% 7% 0% 0%
1,050 19% 9% 10% 3% 3%
Table continued on next page
Non-Residential Prevention Programs FY 2003-04Subsequent Delinquent or Criminal Activity
Within One Year of Completion by Funding Source and Provider (continued)
Funding Source/Provider Program NameNumber of
Completions1
Percent of Completions with Subsequent:
PACE Center for Girls
Total PACE1 Italics indicate that less than 15 youth completed the program and care should be taken in interpreting the data.

2006 Outcom
e Evaluation R
eport
Prevention and V
ictim S
ervices
28
R
ecidivism by P
revention Program
Referrals/Arrests
Felony Referrals/
Arrests Adjudications/
Convictions
Felony Adjudications/
Convictions
Commitment/Probation or
Prison
Anchorage Children's Home Of Bay County Collaboration for Outreach & Suspension Avoidance (COSA) 159 7% 1% 3% 0% 0% Arnett House, Inc. Delinquency Prevention 308 25% 15% 17% 6% 7% Aspira Of Florida, Inc. ASPIRA REACT 107 10% 6% 7% 2% 0% Aspira Of Florida, Inc. ASPIRA Youth and Community Against Violence 74 0% 0% 0% 0% 0% Baker County Sheriff's Office Youth Assisting Youth 22 18% 14% 9% 9% 5% Baker County Sheriff's Office Youth Services Deputy 14 21% 21% 14% 7% 0% Bethel By The Lake, Inc. Operation 32310/32303 (Operation Zip Code) 18 0% 0% 0% 0% 0% Big Brothers Big Sisters Inside Out 12 8% 8% 8% 0% 8% Big Brothers Big Sisters Of Northwest Florida Back To Basics 58 10% 5% 5% 2% 3% Big Brothers Big Sisters Of Northwest Florida Changing Children Together 105 4% 0% 2% 0% 0% Big Brothers Big Sisters Of Southwest Florida, Inc. Student Intervention Partnership (SIP) 98 19% 7% 9% 3% 5% Big Brothers Big Sisters Of Tampa Bay, Inc Project DOVE 31 10% 6% 0% 0% 0% Big Brothers Big Sisters Of Tampa Bay, Inc. Judges In Schools 18 0% 0% 0% 0% 0% Boys & Girls Club Of Alachua County, Inc. SMART Choices 3 0% 0% 0% 0% 0% Boys & Girls Club Of St. Lucie County Youth Intervention & Diversion Program 45 22% 16% 18% 9% 9% Boys & Girls Clubs Of Northeast Florida Project Learn - An Educational Enhancement Program 1 0% 0% 0% 0% 0% Bradford County School Board The Bridge Program 50 22% 8% 8% 6% 0% Calhoun County Sheriff's Office Star - Sheriff's Truancy & Reading Prgm 37 0% 0% 0% 0% 0% Campbell Park Neighborhood Association Youth In Leadership 1 0% 0% 0% 0% 0% Charlotte County Public Schools Delinquency Prevention Program 116 27% 15% 16% 8% 5% Circles Of Care, Inc. Children First 187 4% 2% 1% 0% 0% City Of Jacksonville Community Services Department Westside Truancy Center Pilot Project 121 26% 17% 16% 8% 7% City Of Lake City/police Department Community Resource Center 42 31% 24% 14% 5% 2% City Of Pahokee Creations 4 0% 0% 0% 0% 0% Clay Behavioral Health Center Strive 49 6% 2% 4% 2% 0% Clerk Of Court Desoto County DeSoto County Teen Court 46 17% 7% 0% 0% 0% Collier County Sheriff's Office Juvenile Delinquency & Gang Prevention Program 85 21% 12% 18% 8% 11% Communities In Schools Families and Schools Together (F.A.S.T.) 1 0% 0% 0% 0% 0% Communities In Schools Of Okeechobee, Inc. Making A Difference Through Mentoring 12 17% 8% 8% 8% 0% Community Drug And Alcohol Council Project Smart- Expanded 77 5% 5% 1% 0% 0% Concerned African Women, Inc. New Dimensions in Literacy 45 0% 0% 0% 0% 0%
Table continued on next page
Partnership/Invest in Children
Non-Residential Prevention Programs FY 2003-04Subsequent Delinquent or Criminal Activity
Within One Year of Completion by Funding Source and Provider (continued)
Funding Source/Provider Program NameNumber of
Completions1
Percent of Completions with Subsequent:
1 Italics indicate that less than 15 youth completed the program and care should be taken in interpreting the data.

Prevention and V
ictim S
ervices
2006 Outcom
e Evaluation R
eport
Recidivism
by Prevention P
rogram
29
Referrals/Arrests
Felony Referrals/
Arrests Adjudications/
Convictions
Felony Adjudications/
Convictions
Commitment/Probation or
Prison
Cope, Inc. Coping With Options 96 24% 14% 13% 6% 9% Cultural Arts Research Ensemble, Inc. Project Engage 5 0% 0% 0% 0% 0% Directions For Mental Health, Inc. Partnership Program 70 9% 3% 6% 1% 0% Eckerd Youth Alternatives Eckerd Hi-Five Program at Croton Elementary 201 3% 1% 0% 0% 0% Elijah Network Family & Community Alliance, Inc. New Heights 165 7% 4% 2% 1% 0% Family Christian Association Of America, Inc. Positive Connections For Pompano Youth 33 33% 21% 15% 6% 3% Family Christian Association Of America, Inc. (fca Walking Tall Project 75 4% 1% 1% 0% 0% Family Counseling Center Of Sarasota County, Inc. Specialized Program for At-Risk Students (SPARS) 23 4% 4% 4% 4% 0% Florida Keys Children's Shelter, Inc. Truancy Intervention 63 30% 19% 19% 10% 13% Florida Ridge Big Brothers Big Sisters, Inc. One to One Mentoring 43 16% 12% 14% 9% 5% Franklin County Public Library WINGS-2003 116 4% 3% 0% 0% 0% Gilchrist County School Board Truancy and Delinquency Prevention 57 25% 14% 7% 7% 4% Girls Incorporated Of Jacksonville Florida Eastside Youth Development Program 38 0% 0% 0% 0% 0% Glades County School Board Community Intervention On Juv. Crime 1 0% 0% 0% 0% 0% Gulf County School District Mentoring To Prevent Delinquency 30 20% 7% 10% 3% 7% Hamilton County School Board Truancy Intervention Program 52 21% 15% 15% 4% 4% Hendry County Public Schools Lyda Prevention Program 71 18% 14% 10% 1% 4% Holmes County School Board Graduation Assistance Program 35 26% 14% 23% 9% 11% Infinity Schools, Inc. Infinity School Of Flagler County 11 27% 9% 9% 0% 0% Investing In Our Youth, Inc. Safe Passage (ISP) 89 19% 10% 15% 7% 3% Jackson County Teen Court Inc. Jackson County Teen Court 111 22% 14% 13% 7% 5% Jewish Family & Children's Service Of Manatee JFCS-MARC and JFCS-NPARC 172 15% 8% 6% 3% 2% Jewish Family & Children's Service Of Sarasota JFCS-LINC Lincoln Intervention Center 103 19% 7% 8% 3% 1% Lafeyette School District STEP UP Program 47 11% 6% 4% 4% 2% Levy County Extension Service Challenge to Succeed - Early Asset Development 63 6% 5% 2% 2% 2% Life Impact, Inc. Life Skills Management 65 9% 6% 2% 2% 0% Mad Dad, Inc. Intensive Delinquency Diversion Services DP-121 39 23% 21% 21% 13% 13% Mad Dad, Inc. Intensive Delinquency Diversion Services DP-122 24 21% 0% 4% 0% 0% Madison County District School Board Truant Program/Dropout Prevention 120 32% 18% 21% 4% 7% Manatee Youth For Christ Youth Guidance/8-Ball 210 24% 12% 7% 3% 3% Mental Health Care, Inc Project End Violence Early (E.V.E.) 41 32% 12% 15% 2% 5%
Table continued on next page
Partnership/Invest in Children (continued)
1 Italics indicate that less than 15 youth completed the program and care should be taken in interpreting the data.
Non-Residential Prevention Programs FY 2003-04Subsequent Delinquent or Criminal Activity
Within One Year of Completion by Funding Source and Provider (continued)
Funding Source/Provider Program NameNumber of
Completions1
Percent of Completions with Subsequent:

2006 Outcom
e Evaluation R
eport
Prevention and V
ictim S
ervices
30
R
ecidivism by P
revention Program
Referrals/Arrests
Felony Referrals/
Arrests Adjudications/
Convictions
Felony Adjudications/
Convictions
Commitment/Probation or
Prison
Office For Farmworker Ministry Strong Families Strong Futures 121 2% 1% 1% 1% 0% Okaloosa Academy, Inc. Youth, Bring a Friend of Shalimar 90 3% 2% 2% 0% 1% Pinellas County Sheriff's Office Weekend Boot Camp: About Face 293 27% 16% 20% 9% 5% Polk County Drug Court Prevention, Early Intervention and Treatment 58 26% 19% 14% 3% 9% Putnam County School District Positive Attitude Student Training (P.A.S.T. Program) 151 17% 8% 5% 1% 0% Quality United Education, Inc. Project Push Up 34 0% 0% 0% 0% 0% Regis House, Inc. Too Good Prgms Aka Family & Adol. Center 57 25% 14% 7% 5% 2% Seminole County Sheriff's Office Seminole Collaborative Youth Initiative 1,232 24% 14% 12% 4% 4% Silver River Marine Institute Marion County Collaborative Prevn Services 420 14% 7% 7% 2% 2% Sixth Judicial Circuit Pasco County Drug Court Program 195 19% 12% 15% 4% 5% South Broward Hospital District, D/b/a Memorial Health Operation Turn Around (OTA) Program 148 3% 2% 1% 1% 0% Southwest Florida Addiction Services, Inc. (SWFAS) Domestic Violence Diversion Program (DVD) 86 27% 13% 17% 6% 5% St. Johns County Sheriff's Office ACE Adolescent Character Enrichment Program 53 28% 17% 17% 13% 9% State Attorney's Office - 15th Judicial Circuit Truancy Interdiction Program 5 40% 40% 40% 0% 0% Substance Abuse Council Of Indian River County Teen STEP (Short Term Excellence Program) 75 9% 5% 7% 3% 1% Summit Behavioral Healthcare Associates, Inc. Risk To Resiliency Program For Girls 51 39% 31% 18% 6% 2% Sumter County School Board SSMS After School Alternatives Program (ASAP) 307 4% 4% 1% 1% 0% Suwannee County District School Board Douglass Center Alternative School Program 59 27% 19% 20% 10% 8% Tampa Housing Authority Tampa Housing Authority Delinquency Prevention 223 14% 8% 3% 1% 1% The House Next Door, Inc. Deltona Young Prevention Project 26 23% 4% 15% 0% 4% The Resource Room Suspension Camp 143 20% 11% 10% 4% 1% The School Board Of Highlands County Alternative Education 90 41% 16% 28% 8% 14% The School Board Of Highlands County Home/School Liaisons 73 7% 4% 1% 0% 0% Tykes & Teens, Inc. Alternative to Out of School Suspension Program 208 22% 13% 9% 4% 3% Union County School District Union County Alternative School 42 29% 10% 12% 5% 5% Wakulla County Sheriff's Office Against Crime Together ( Act Il ) 15 20% 13% 13% 13% 0% Washington County School Board Youth Delinquency Prevention Program 52 17% 8% 12% 2% 4% YMCA Of Greater St. Petersburg Safe Schools/ Youth Enhancement Skills 162 19% 9% 12% 6% 2% YMCA Of The Suncoast Y-arts: Keeping Good Kids Good 26 15% 15% 15% 12% 12% Youth Crisis Center Juvenile Assessment Center Connection Program 297 41% 26% 23% 12% 16%
9,007 18% 10% 10% 4% 3%
Table continued on next page
Partnership/Invest in Children (continued)
Total Partnership/Invest in Children
Non-Residential Prevention Programs FY 2003-04Subsequent Delinquent or Criminal Activity
Within One Year of Completion by Funding Source and Provider (continued)
Funding Source/Provider Program NameNumber of
Completions1
Percent of Completions with Subsequent:
1 Italics indicate that less than 15 youth completed the program and care should be taken in interpreting the data.

Prevention and V
ictim S
ervices
2006 Outcom
e Evaluation R
eport
Recidivism
by Prevention P
rogram
31
Referrals/Arrests
Felony Referrals/
Arrests Adjudications/
Convictions
Felony Adjudications/
Convictions
Commitment/Probation or
Prison
Academy For Better Communities Norland Partnership for Youth-Intensive Anti-Viol. Comp. 99 8% 7% 1% 0% 0% Aspira Of Florida, Inc ASPIRA Youth & Community Against Violence (WPB) 63 2% 0% 0% 0% 0% Brevard County Board Of County Commissioners BIGS in School Mentoring 1 0% 0% 0% 0% 0% Brevard County Board Of County Commissioners Classroom Based Early Interv. & Prev. - Sherwood Elem. 189 1% 0% 0% 0% 0% Children's Psychiatric Center, Inc. Functional Family Therapy 41 7% 2% 2% 0% 0% City Of Jacksonville Together We Will 125 2% 1% 0% 0% 0% City Of Miramar Miramar Community Youth Crime Watch 36 11% 6% 6% 6% 0% City Of Ocala Alliance For Youth 421 5% 2% 2% 0% 0% City Of Vero Beach Truancy Intervention Program 299 14% 8% 10% 3% 3% Comeunity, Inc. Youth Entrepreneurship Project 153 5% 0% 0% 0% 0% Crosswinds Youth Services, Inc. Domestic Violence Diversion Program 86 33% 16% 16% 2% 6% Drug Free Youth In Town (DFYIT) D-FY-IT 335 5% 3% 1% 1% 0% Escambia County Sheriff's Office J.U.S.T. Program 582 27% 15% 23% 7% 9% Florida State University, School Of Social Work The Boys' Choir of Tallahassee 121 9% 6% 6% 3% 0% Franklin County Board Of County Commissioners Franklin's Youth Enhancement Project 1 0% 0% 0% 0% 0% Girls Incorporated Of Jacksonville Action for Safety - A Self Defense & Viol. Prev. Program 133 0% 0% 0% 0% 0% Homestead Police Department Building Resilient Youth through Academic Enrichment 220 5% 3% 2% 0% 0% Human Services Associates (HAS), Inc. Bridges to Success 83 41% 29% 25% 11% 8% Infinity Schools, Inc. Infinity School of Flagler County 16 38% 19% 19% 0% 0% Informed Families Of Dade County Grandparents Raising Grandchildren (GRG) - Miami 30 13% 3% 3% 0% 0% Informed Families Of Dade County, Inc. Girl Power (Longwood) 26 0% 0% 0% 0% 0% Informed Families Of Dade County, Inc. (Orlando) Grandparents Raising Grandchildren (GRG) - Orlando 30 10% 3% 0% 0% 0% Informed Families Of Dade County, Inc. (Pensacola) Grandparents Raising Grandchildren (GRG) - Pensacola 34 6% 3% 6% 3% 3% Investing In Our Youth, Inc. Sister2Sister 51 14% 4% 6% 2% 0% Liberty County Board Of County Commissioners LIFT (Liberty Investing For Tomorrow) 201 5% 2% 3% 2% 2% Life Impact, Inc. Counseling/Anger Management/Parenting Program 2 0% 0% 0% 0% 0% Miami-Dade Empowerment Trust, Inc. The Rites of Passage Intervention & Prev. Program (ROP) 38 0% 0% 0% 0% 0% Ninth Judicial Circuit Court Pay Up 317 45% 32% 26% 7% 8% Office Of The State Attorney (Duval County) Children United with Parents (CUP) 35 0% 0% 0% 0% 0% Orange County Youth And Family Services Division Orange County Truancy Court 61 15% 8% 7% 2% 0% Pinellas County Board Of County Commissioners Project Yes (Youth Enhancement Skills) 54 19% 9% 9% 4% 0% Putnam County School District Positive Attitude Student Training (P.A.S.T. Program) 218 28% 16% 10% 4% 2%
Table continued on next page
Office of Juvenile Justice Delinquency Prevention
Non-Residential Prevention Programs FY 2003-04Subsequent Delinquent or Criminal Activity
Within One Year of Completion by Funding Source and Provider (continued)
Funding Source/Provider Program NameNumber of
Completions1
Percent of Completions with Subsequent:
1 Italics indicate that less than 15 youth completed the program and care should be taken in interpreting the data.

2006 Outcom
e Evaluation R
eport
Prevention and V
ictim S
ervices
32
R
ecidivism by P
revention Program
Referrals/Arrests
Felony Referrals/
Arrests Adjudications/
Convictions
Felony Adjudications/
Convictions
Commitment/Probation or
Prison
Southwest Florida Addiction Services, Inc. Lee County Community Assessment Center Prev. Assess. 69 25% 16% 13% 6% 7% St. Lucie County Commission St. Lucie Mental Health Collaborative 34 6% 3% 6% 3% 3% St. Paul Community Empowerment Center, Inc. Out-of-School Suspension Program 311 23% 9% 10% 2% 6% Suwannee County Board Of Commissioners Community Organizing Program 34 18% 3% 9% 3% 0% Tenth Judicial Circuit Polk County Drug Court Treatment Program 20 25% 5% 10% 0% 5% The Bridge Of Northeast Florida, Inc. The Bridge Community Outreach Program 14 0% 0% 0% 0% 0% Victim Services Center At-Risk Youth Victimization Program 55 16% 13% 7% 4% 5% Vision Of Victory Human Services Corporation Project FOCUS 179 12% 7% 4% 3% 1% YWCA Of Greater Miami YWCA Hialeah Alternative Day Program 108 13% 6% 5% 3% 3%
4,925 15% 9% 8% 3% 3%
Community Coalition, Inc. Community Coalition 288 14% 8% 7% 3% 2% Dept Of Military Affairs Youth Challenge Academy 2001 217 15% 12% 7% 2% 3%
505 14% 10% 7% 3% 2%
Bethel Community Foundation, Inc. Faith - Based Neighborhood Accountability Board 55 24% 15% 20% 7% 2% City Of Quincy Community Redevelopment Agency Quincy Neighborhood Renaissance 27 15% 7% 11% 7% 4% Community Outreach And Development Center Of Alach Neighborhood Accountability Board 43 26% 12% 23% 7% 2% Daytona Beach Police Department Neighborhood Accountability Board 38 24% 5% 13% 0% 0% Florida Faith-based Coalition, Inc. Faith-Based Neighborhood Accountability Board Project 11 9% 9% 9% 0% 0% Florida Gulf Coast University Neighborhood Accountability Board Initiative 63 13% 8% 10% 3% 2% Lee County Department Of Human Services Lee County Neighborhood Accountability Board 64 17% 8% 9% 3% 5% Ninth Judicial Circuit Court Neighborhood Restorative Justice Program 174 14% 10% 6% 5% 1% St. Paul Community Empowerment Ctr, Inc. Faith-Based Neighborhood Accountability 31 13% 6% 10% 0% 0% Thirteenth Judicial Circuit, Administrative Office Hillsborough County Neighborhood Accountability Board 129 11% 5% 4% 2% 1%
635 16% 9% 10% 4% 1%
21,878 19% 10% 10% 4% 3%
27,315 22% 12% 12% 5% 5%
1 Italics indicate that less than 15 youth completed the program and care should be taken in interpreting the data.
Office of Juvenile Justice Delinquency Prevention (continued)
Total OJJDP
Total Special Member Projects
Juvenile Accountability Block Grants
Total Juvenile Accountability Block Grant
Total Non-Residential
Total
Special Member Projects
Non-Residential Prevention Programs FY 2003-04Subsequent Delinquent or Criminal Activity
Within One Year of Completion by Funding Source and Provider (continued)
Funding Source/Provider Program NameNumber of
Completions1
Percent of Completions with Subsequent:

Prevention and Victim Services 2006 Outcome Evaluation Report
Length of Service 33
Funding Source N Days N Days N Days N Days
Florida Network Shelters 6,793 11 5,232 12 1,146 12 4,086 12 Hurricane Island Outward Bound 249 60 205 59 35 56 170 59
Total Residential 7,042 13 5,437 14 1,181 13 4,256 14
Florida Network 7,536 127 5,756 131 733 129 5,023 131 PACE 1,366 249 1,050 282 104 180 946 293 Partnership/Invest in Children 11,958 174 9,007 170 861 129 8,146 174 OJJDP 6,185 179 4,925 175 412 115 4,513 181 Special Member Projects 753 137 505 153 34 146 471 153 Juvenile Accountability Block Grants 789 130 635 137 61 130 574 138
Total Non-Residential 28,587 164 21,878 165 2,205 129 19,673 169
35,629 134 27,315 135 3,386 89 23,929 141
Prevention Programs FY 2003-04 Length of Service by Funding Source
Total
Residential
Non-Residential
Completions Recidivists Non-RecidivistsAll Releases
Length of Service
The table below presents average length of stay (ALOS) for four groups:
1. All releases, including youth who did not complete their program (35,629).
2. Youth who completed their program (27,315).
3. Recidivists (3,386).
4. Non-recidivists (23,929).
The ALOS for all youth released from prevention programs was 134 days, while the ALOS of youth who completed prevention programs was only one day longer at 135 days. There were substantial differences in the ALOS for recidivists and non-recidivists released from prevention programs. Recidivists averaged 89 days compared to 141 days for non-recidivists, a difference 52 days.
For residential programs, the ALOS for all youth released was just under 2 weeks at 13 days.
However, the ALOS varies substantially between the two types of residential programs. The Florida Network shelters are designed to provide short-term services, and as expected, the ALOS was only 11 days. Hurricane Island Outward Bound operates wilderness expeditions. The ALOS for youth participating in these expeditions was 60 days. There was little difference in the ALOS between recidivists and non-recidivists for either type of residential program.
Non-residential programs serve youth for a longer period of time. The ALOS of all youth released from non-residential programs was over five months at 164 days. There was a 40-day difference in the ALOS for recidivists and non-recidivists released from non-residential prevention programs. Recidivists averaged 129 days compared to 169 days for non-recidivists. The ALOS for youth released varied among non-residential programs. PACE programs had the longest ALOS of 249 days and non-residential Florida Network programs had the shortest ALOS at 127 days.

2006 Outcom
e Evaluation R
eport
Prevention and V
ictim S
ervices
34
S
umm
ary Tables
N2 %Prior
Charges3Adjudicated
Charges4
ACT Corporation Beach House 206 3% 185 90% 45% 23% 14% 15.1 41% 12% 4.0 1.1 21% Anchorage Childrens Home Hidle House 207 6% 138 67% 41% 20% 5% 15.3 25% 12% 3.1 1.4 18% Arnette House Arnette House 222 6% 207 93% 45% 23% 10% 14.8 42% 16% 4.2 1.5 25%
Capital City Youth Services Some Place Else Youth Shelter 317 3% 276 87% 48% 60% 1% 14.7 31% 14% 2.7 1.7 19% Center for Child and Family Enrichment CFCE - Excel Shelter Program 47 0% 40 85% 18% 53% 33% 15.2 40% 10% 3.1 0.7 15% CHS of Florida - West Palm Beach CHS WPB - Safe Harbor Runaway Center 115 3% 70 61% 30% 46% 17% 15.2 36% 11% 3.2 0.8 16% CHS of Treasure Coast - Wave C.R.E.S.T Shelter CHS - Wavecrest 167 6% 145 87% 35% 32% 10% 14.8 41% 17% 3.9 1.1 23%
Corner Drug Store CDS - Interface Central 250 4% 215 86% 54% 48% 1% 14.3 44% 19% 5.6 1.7 22% Corner Drug Store CDS - Interface East 100 4% 62 62% 31% 29% 5% 14.6 35% 18% 3.5 1.2 19% Corner Drug Store CDS - Interface Northwest - Lake City 95 2% 93 98% 41% 20% 2% 14.8 33% 10% 3.9 1.1 15%
Crosswinds Youth Services Crosswinds Youth Shelter 222 7% 95 43% 53% 24% 7% 15.3 59% 28% 8.5 2.8 25% Family Resources Family Resources - Manatee Youth Crisis Shelter 161 3% 121 75% 43% 20% 26% 15.2 39% 19% 3.8 1.1 12% Family Resources Family Resources - Pinellas (Clearwater) - N. Youth Shelter 207 6% 189 91% 50% 25% 6% 14.8 41% 24% 3.7 2.0 26% Family Resources Family Resources - Pinellas (St. Pete) - S. Youth Shelter 230 7% 168 73% 36% 41% 8% 14.8 54% 28% 4.6 2.2 32%
Florida Keys Childrens Shelter Florida Keys Children's Shelter 45 13% 32 71% 69% 13% 44% 15.1 56% 19% 6.8 1.0 25% Girls and Boys Town of Central Florida Boys Town of Central Florida 93 2% 87 94% 53% 25% 9% 15.0 46% 16% 4.8 1.1 22% Hillsborough County Haven W. Poe Runaway Shelter 272 0% 221 81% 41% 36% 18% 15.4 40% 7% 3.1 0.3 14% Lutheran Services of Florida NW Currie House 286 12% 203 71% 53% 32% 3% 14.9 40% 18% 4.3 2.4 29%
Lutheran Services of Florida NW Hope House 127 5% 111 87% 43% 22% 6% 15.4 28% 15% 2.5 1.2 18% Lutheran Services of Florida SE Lippman Youth Shelter 93 4% 47 51% 32% 40% 21% 15.2 34% 21% 2.3 1.3 15% Lutheran Services of Florida SW Charlotte Youth Shelter 68 1% 46 68% 48% 20% 17% 15.5 39% 15% 4.5 1.1 22%
Lutheran Services of Florida SW Oasis Youth Shelter 225 4% 169 75% 49% 29% 27% 15.3 33% 14% 3.3 0.9 17% Miami Bridge Youth & Family Services Miami Bridge - Central 227 5% 85 37% 48% 55% 27% 15.8 52% 28% 6.3 2.3 22% Miami Bridge Youth & Family Services Miami Bridge - Homestead/South Dade 204 5% 126 62% 48% 62% 32% 15.3 54% 29% 6.0 2.2 25% Orange County Orange County Youth Shelter 538 4% 456 85% 50% 46% 21% 15.2 50% 25% 7.2 2.0 24%
Avg. Seriousness Index of:Total AverageAge at
Admission%
Recidivism%
Male%
Hispanic%
Black
4 The seriousness index is comprised of the sum of all scores for adjudicated charges. The following point values are assigned: 8 for a violent felony, 5 for a property or other felony, 2 for a misdemeanor, and 1 for any other charge. Table continued on next page
Florida Network Shelters
3 The seriousness index is comprised of the sum of all scores for all charges. The following point values are assigned: 8 for a violent felony, 5 for a property or other felony, 2 for a misdemeanor, and 1 for any other charge.
1 ODS percentage is based on the total number of releases2 Italics indicate the program completed less than 15 youth and care should be taken in interpreting this data.
Prevention and Victim Services FY 2003-04Output Summary by Funding Source and Program
Completions
%Prior
Charges
%Prior
AdjudicationsProgram NameFunding Source/ProviderTotal
Releases
%
ODS1
Summary Tables
A summary of program outputs, including total releases, the rate of offending during supervision, completion status, demographic data, average length of supervision, and recidivism rates are presented for each program area in the following table.

Prevention and V
ictim S
ervices
2006 Outcom
e Evaluation R
eport
Sum
mary T
ables
35
N2 %Prior
Charges3Adjudicated
Charges4
Osceola County Osceola Youth Shelter 82 1% 75 91% 47% 16% 40% 14.6 41% 16% 3.2 1.1 28% Sarasota Family YMCA - Youth and Family Services Sarasota YMCA Youth Shelter 193 5% 161 83% 48% 15% 8% 14.9 42% 12% 3.1 0.8 24%
Youth and Family Alternatives Cornerstone Youth Shelter 180 15% 143 79% 42% 21% 14% 15.3 59% 26% 6.8 2.5 30% Youth and Family Alternatives New Beginnings Youth Shelter 139 2% 114 82% 40% 7% 11% 14.8 30% 12% 2.5 1.2 21% Youth and Family Alternatives Runaway Alternatives Project (RAP House) 202 14% 157 78% 43% 5% 10% 14.9 43% 25% 5.0 2.2 31% Youth Crisis Center Youth Crisis Center - Jacksonville 1,250 5% 975 78% 57% 57% 4% 15.2 51% 21% 5.3 1.4 20%
Youth Crisis Center 5 Youth Crisis Center - St. Augustine 23 9% 20 87% 60% 30% 20% 15.5 15% 10% 1.9 0.6 5%
Total Residential Florida Network Shelters 6,793 5% 5,232 77% 48% 37% 11% 15.1 43% 19% 4.6 1.5 22%
Hurricane Island Outward Bound Hurricane Island Key Largo CINS 121 1% 105 87% 65% 30% 68% 14.7 24% 10% 3.2 0.8 16% Hurricane Island Outward Bound Hurricane Island - Scottsmoor - CINS 128 2% 100 78% 61% 13% 10% 14.8 40% 9% 3.5 0.4 18%
Total Hurricane Island Outward Bound 249 2% 205 82% 63% 21% 40% 14.8 32% 10% 3.3 0.6 17%
7,042 5% 5,437 77% 48% 36% 13% 15.0 43% 19% 4.6 1.5 22%
5 This program closed midyear. Table continued on next page
1 ODS percentage is based on the total number of releases2 Italics indicate the program completed less than 15 youth and care should be taken in interpreting this data.3 The seriousness index is comprised of the sum of all scores for all charges. The following point values are assigned: 8 for a violent felony, 5 for a property or other felony, 2 for a misdemeanor, and 1 for any other charge. 4
The seriousness index is comprised of the sum of all scores for adjudicated charges. The following point values are assigned: 8 for a violent felony, 5 for a property or other felony, 2 for a misdemeanor, and 1 for any other charge.
%Prior
Adjudications
Avg. Seriousness Index of:
%Recidivism
%Black
%Hispanic
AverageAge at
Admission
%Prior
Charges
Prevention and Victim Services FY 2003-04Output Summary by Funding Source and Program (continued)
Funding Source/Provider Program NameTotal
Releases
%
ODS1
Florida Network Shelters (continued)
Hurricane Island Outward Bound
Completions
Total
%Male
Total Residential

2006 Outcom
e Evaluation R
eport
Prevention and V
ictim S
ervices
36
S
umm
ary Tables
N2 %Prior
Charges3Adjudicated
Charges4
ACT Corporation ACT Corporation Non-Residential 213 10% 166 78% 48% 23% 8% 14.7 34% 5% 2.1 0.4 17% Anchorage Childrens Home Anchorage Childrens Home Non-Residential 146 3% 120 82% 50% 14% 2% 14.6 21% 8% 1.3 0.5 9% Arnette House Arnette House Non-Residential 315 7% 212 67% 50% 21% 9% 13.1 24% 8% 1.9 0.4 12% Capital City Youth Services Capital City Youth Services Non-Residential 220 9% 172 78% 49% 52% 1% 13.5 20% 9% 1.5 0.8 13%
CHS of Florida - West Palm Beach CHS of Florida - West Palm Beach Non-Residential 200 7% 166 83% 44% 32% 20% 14.9 22% 1% 1.0 0.1 11% CHS of Treasure Coast - Wave C.R.E.S.T Shelter CHS of Treasure Coast - Wave C.R.E.S.T Shelter NR 113 9% 72 64% 40% 24% 4% 14.3 26% 1% 1.2 0.1 24% Corner Drug Store Corner Drug Store Non-Residential 323 7% 260 80% 50% 47% 2% 13.8 38% 10% 3.4 0.7 12%
Crosswinds Youth Services Crosswinds Youth Services Non-Residential 270 6% 238 88% 50% 23% 3% 14.8 42% 4% 2.6 0.2 16% Devereux Devereux Non-Residential 35 6% 23 66% 61% 70% 17% 13.1 17% 13% 2.4 0.6 9% Family Resources Family Resources Non-Residential 691 9% 586 85% 51% 20% 6% 14.2 33% 12% 2.5 0.9 18% Florida Keys Childrens Shelter Florida Keys Childrens Shelter Non-Residential 203 7% 178 88% 58% 21% 42% 14.6 33% 10% 3.3 0.9 12%
Friends of Children Friends of Children Non-Residential 50 4% 35 70% 74% 97% 0% 13.8 40% 17% 5.0 2.5 17% Girls and Boys Town of Central Florida Girls and Boys Town of Central Florida Non-Residential 124 4% 104 84% 53% 17% 19% 14.4 24% 6% 2.0 0.4 11% Hillsborough County Hillsborough County Non-Residential 636 5% 489 77% 58% 21% 36% 13.9 36% 5% 2.2 0.3 8%
Lutheran Services of Florida NW Lutheran Services of Florida NW Non-Residential 386 8% 154 40% 48% 16% 3% 14.2 27% 7% 1.3 0.3 11% Lutheran Services of Florida SE Lutheran Services of Florida SE Non-Residential 378 8% 357 94% 50% 40% 24% 14.7 32% 15% 2.3 0.8 13% Lutheran Services of Florida SW Lutheran Services of Florida SW Non-Residential 439 4% 354 81% 51% 25% 26% 14.2 25% 11% 2.1 0.6 14% Miami Bridge Youth & Family Services Miami Bridge Youth & Family Services Non-Residential 305 5% 217 71% 47% 51% 42% 14.6 28% 10% 2.0 0.5 13%
Mount Bethel Mount Bethel Non-Residential 2 0% 2 100% 50% 100% 0% 12.0 0% 0% 0.0 0.0 0% Orange County Orange County Non-Residential 402 3% 322 80% 54% 44% 28% 14.9 34% 16% 4.6 1.3 22% Osceola County Osceola County Non-Residential 159 4% 122 77% 68% 8% 58% 13.2 16% 5% 1.2 0.3 7% Sarasota Family YMCA - Youth and Family Services Sarasota Family YMCA - Youth and Family Services NR 413 7% 274 66% 50% 16% 12% 14.1 25% 4% 1.6 0.3 6%
Switchboard of Miami Switchboard of Miami Non-Residential 243 3% 168 69% 43% 30% 60% 15.0 14% 4% 0.9 0.3 5% Youth and Family Alternatives Youth and Family Alternatives Non-Residential 777 8% 540 69% 51% 10% 12% 13.5 27% 7% 1.7 0.5 12% Youth Crisis Center Youth Crisis Center Non-Residential 493 5% 425 86% 54% 46% 4% 14.1 24% 6% 1.9 0.5 10%
Total Non-Residential Florida Network 7,536 6% 5,756 76% 52% 28% 18% 14.2 29% 8% 2.2 0.6 13%
4 The seriousness index is comprised of the sum of all scores for adjudicated charges. The following point values are assigned: 8 for a violent felony, 5 for a property or other felony, 2 for a misdemeanor, and 1 for any other charge. Table continued on next page
Avg. Seriousness Index for:
%Recidivism
3 The seriousness index is comprised of the sum of all scores for all charges. The following point values are assigned: 8 for a violent felony, 5 for a property or other felony, 2 for a misdemeanor, and 1 for any other charge.
1 ODS percentage is based on the total number of releases2 Italics indicate the program completed less than 15 youth and care should be taken in interpreting this data.
%Hispanic
AverageAge at
Admission
%Prior
Charges
%Prior
Adjudications
Prevention and Victim Services FY 2003-04Output Summary by Funding Source and Program (continued)
Funding Source/Provider Program NameTotal
Releases
%
ODS1
Completions
Total
%Male
%Black
Florida Network Non-Residential Programs

Prevention and V
ictim S
ervices
2006 Outcom
e Evaluation R
eport
Sum
mary T
ables
37
N2 %Prior
Charges3Adjudicated
Charges4
Pace Center For Girls of Alachua County PACE Center for Girls of Alachua 47 2% 27 57% 0% 48% 7% 15.4 37% 11% 2.1 0.7 4% Pace Center For Girls of Broward County Broward PACE Teen Center 34 0% 26 76% 0% 42% 12% 12.3 12% 8% 0.5 0.2 15%
Pace Center For Girls of Broward County PACE Center for Girls of Broward 102 1% 78 76% 0% 38% 19% 15.6 37% 24% 3.8 2.2 15% Pace Center For Girls of Collier At Immokalee PACE Center for Girls of Collier 24 4% 21 88% 0% 5% 100% 13.6 19% 0% 0.7 0.0 0% Pace Center For Girls of Escambia-Santa Rosa PACE Center for Girls of Escambia-Santa Rosa 74 15% 57 77% 0% 33% 0% 15.2 40% 25% 2.7 1.3 9% Pace Center For Girls of Hillsborough County PACE Center for Girls of Hillsborough 64 9% 41 64% 0% 44% 15% 15.3 49% 15% 4.7 1.4 15%
Pace Center For Girls of Jacksonville PACE Center for Girls of Jacksonville 121 2% 98 81% 0% 48% 7% 15.3 39% 16% 3.2 0.9 7% Pace Center For Girls of Leon County PACE Center for Girls of Leon 79 14% 78 99% 0% 50% 6% 15.1 37% 24% 3.5 2.4 6% Pace Center For Girls of Manatee County PACE Center for Girls of Manatee 102 7% 78 76% 0% 26% 9% 14.8 32% 10% 2.2 0.6 12% Pace Center For Girls of Marion County PACE Center for Girls of Marion 54 6% 53 98% 0% 15% 11% 15.5 43% 21% 3.7 1.2 9%
PACE Center for Girls of Miami-Dade PACE Center for Girls of Miami-Dade 71 3% 51 72% 0% 78% 22% 15.4 27% 12% 2.5 0.7 4% Pace Center For Girls of Monroe County PACE Center for Girls of Monroe/Lower Keys 29 0% 15 52% 0% 20% 47% 16.1 13% 7% 0.7 0.5 0% Pace Center For Girls of Monroe County PACE Center for Girls of Monroe/Upper Keys 25 4% 19 76% 0% 5% 32% 16.0 32% 16% 2.1 0.7 11%
Pace Center For Girls of Orange County PACE Center for Girls of Orange 88 5% 65 74% 0% 49% 20% 15.4 46% 18% 3.6 1.1 12% Pace Center For Girls of Palm Beach County PACE Center for Girls of Palm Beach 63 2% 47 75% 0% 23% 47% 15.6 47% 11% 1.9 0.6 4% Pace Center For Girls of Pasco County PACE Center for Girls of Pasco 73 12% 40 55% 0% 3% 13% 15.2 38% 30% 3.6 2.0 8% Pace Center For Girls of Pinellas PACE Center for Girls of Pinellas 102 10% 94 92% 0% 16% 0% 15.3 55% 31% 4.8 2.3 20%
Pace Center For Girls of Polk County PACE Center for Girls of Polk 66 8% 60 91% 0% 42% 8% 14.8 48% 13% 3.7 1.3 12% Pace Center For Girls of Treasure Coast PACE Center for Girls of Treasure Coast 62 10% 43 69% 0% 26% 16% 15.2 53% 21% 5.1 1.6 7% Pace Center For Girls of Volusia-Flagler PACE Center for Girls of Volusia 86 6% 59 69% 0% 32% 3% 15.5 51% 15% 6.0 1.5 7%
Total PACE 1,366 6% 1,050 77% 0% 35% 14% 15.2 41% 18% 3.4 1.3 10%
Table continued on next page
%Prior
Adjudications
Avg. Seriousness Index for:
%Recidivism
%Black
%Hispanic
AverageAge at
Admission
%Prior
Charges
Prevention and Victim Services FY 2003-04Output Summary by Funding Source and Program (continued)
Funding Source/Provider Program NameTotal
Releases
%
ODS1
Completions
Total
%Male
PACE Center for Girls
1 ODS percentage is based on the total number of releases2 Italics indicate the program completed less than 15 youth and care should be taken in interpreting this data.3 The seriousness index is comprised of the sum of all scores for all charges. The following point values are assigned: 8 for a violent felony, 5 for a property or other felony, 2 for a misdemeanor, and 1 for any other charge. 4 The seriousness index is comprised of the sum of all scores for adjudicated charges. The following point values are assigned: 8 for a violent felony, 5 for a property or other felony, 2 for a misdemeanor, and 1 for any other charge.

2006 Outcom
e Evaluation R
eport
Prevention and V
ictim S
ervices
38
S
umm
ary Tables
N2 %Prior
Charges3Adjudicated
Charges4
Anchorage Children's Home Of Bay County Collaboration for Outreach & Suspension Avoidance (COSA) 209 0% 159 76% 37% 57% 0% 12.2 3% 0% 0.1 0.0 3% Arnett House, Inc. Delinquency Prevention 358 12% 308 86% 54% 32% 4% 14.1 27% 14% 4.1 1.7 17% Aspira Of Florida, Inc. ASPIRA REACT 107 5% 107 100% 74% 29% 64% 13.8 44% 8% 2.7 0.9 7%
Aspira Of Florida, Inc. ASPIRA Youth and Community Against Violence 74 0% 74 100% 19% 22% 53% 14.0 3% 0% 0.1 0.0 0% Baker County Sheriff's Office Youth Assisting Youth 53 8% 22 42% 59% 14% 0% 14.0 18% 5% 0.5 0.1 9% Baker County Sheriff's Office Youth Services Deputy 33 9% 14 42% 21% 7% 0% 13.6 0% 0% 0.0 0.0 14%
Bethel By The Lake, Inc. Operation 32310/32303 (Operation Zip Code) 26 4% 18 69% 28% 100% 0% 11.9 0% 0% 0.0 0.0 0% Big Brothers Big Sisters Inside Out 15 13% 12 80% 33% 33% 8% 10.3 17% 17% 1.0 0.4 8% Big Brothers Big Sisters Of Northwest Florida Back To Basics 61 5% 58 95% 31% 53% 3% 11.0 9% 2% 0.6 0.2 5% Big Brothers Big Sisters Of Northwest Florida Changing Children Together 111 1% 105 95% 49% 61% 1% 9.3 4% 1% 0.2 0.0 2%
Big Brothers Big Sisters Of Southwest Florida, Inc. Student Intervention Partnership (SIP) 136 2% 98 72% 59% 45% 16% 13.4 19% 8% 1.8 0.8 9% Big Brothers Big Sisters Of Tampa Bay, Inc Project DOVE 37 0% 31 84% 65% 58% 26% 12.1 16% 3% 0.9 0.2 0% Big Brothers Big Sisters Of Tampa Bay, Inc. Judges In Schools 27 4% 18 67% 67% 6% 0% 13.1 17% 6% 1.4 0.4 0%
Boys & Girls Club Of Alachua County, Inc. SMART Choices 4 0% 3 75% 67% 100% 0% 12.0 0% 0% 0.0 0.0 0% Boys & Girls Club Of St. Lucie County Youth Intervention & Diversion Program 60 3% 45 75% 47% 49% 2% 15.5 100% 11% 5.2 0.5 18% Boys & Girls Clubs Of Northeast Florida Project Learn - An Educational Enhancement Program 210 1% 1 0% 0% 0% 0% 15.5 0% 0% 0.0 0.0 0% Boys And Girls Club Of Perry And Taylor Counties Targeted Outreach 3 0% 0 0% N/A N/A N/A 0.0 N/A N/A N/A N/A N/A
Bradford County School Board The Bridge Program 62 5% 50 81% 72% 40% 2% 14.6 30% 6% 1.9 0.3 8% Calhoun County Sheriff's Office Star - Sheriff's Truancy & Reading Prgm 48 2% 37 77% 49% 54% 0% 12.8 16% 8% 0.8 0.2 0% Campbell Park Neighborhood Association Youth In Leadership 1 0% 1 100% 0% 100% 0% 11.2 0% 0% 0.0 0.0 0%
Central Florida Rc&d Lake Wales After School Program 212 0% 0 0% N/A N/A N/A 0.0 N/A N/A N/A N/A N/ACharlotte County Public Schools Delinquency Prevention Program 133 13% 116 87% 59% 5% 4% 14.8 66% 17% 5.5 1.4 16% Circles Of Care, Inc. Children First 191 1% 187 98% 56% 35% 9% 11.2 6% 1% 0.3 0.1 1%
City Of Jacksonville Community Services Department Westside Truancy Center Pilot Project 127 5% 121 95% 69% 47% 6% 15.1 26% 12% 2.7 1.0 16% City Of Lake City/police Department Community Resource Center 45 4% 42 93% 57% 100% 0% 13.7 38% 10% 2.0 0.6 14% City Of Pahokee Creations 50 0% 4 8% 50% 100% 0% 11.1 25% 0% 2.5 0.0 0% Clay Behavioral Health Center Strive 64 3% 49 77% 49% 24% 4% 11.6 6% 0% 0.1 0.0 4%
Clerk Of Court Desoto County DeSoto County Teen Court 58 5% 46 79% 54% 24% 11% 15.2 87% 2% 4.4 0.3 0% Collier County Sheriff's Office Juvenile Delinquency & Gang Prevention Program 108 5% 85 79% 66% 5% 41% 13.6 22% 5% 0.8 0.1 18% Communities In Schools Families and Schools Together (F.A.S.T.) 1 0% 1 100% 100% 100% 0% 0.0 0% 0% 0.0 0.0 0% Communities In Schools Of Okeechobee, Inc. Making A Difference Through Mentoring 36 6% 12 33% 67% 8% 8% 13.7 25% 8% 0.7 0.2 8%
Community Drug And Alcohol Council Project Smart- Expanded 103 1% 77 75% 38% 99% 0% 8.9 0% 0% 0.0 0.0 1% Concerned African Women, Inc. New Dimensions in Literacy 118 1% 45 38% 49% 100% 2% 12.6 0% 0% 0.0 0.0 0% Cope, Inc. Coping With Options 132 11% 96 73% 57% 13% 0% 15.1 47% 21% 4.3 2.0 13%
Cultural Arts Research Ensemble, Inc. Project Engage 47 2% 5 11% 60% 100% 0% 13.6 20% 0% 1.0 0.0 0% Directions For Mental Health, Inc. Partnership Program 92 5% 70 76% 70% 11% 10% 10.6 7% 1% 0.5 0.1 6% Eckerd Youth Alternatives Eckerd Hi-Five Program at Croton Elementary 250 0% 201 80% 46% 7% 6% 10.0 0% 0% 0.0 0.0 0%
Elijah Network Family & Community Alliance, Inc. New Heights 181 1% 165 91% 45% 79% 16% 14.4 5% 2% 0.4 0.1 2% Family Christian Association Of America, Inc. Positive Connections For Pompano Youth 54 19% 33 61% 76% 94% 0% 15.1 67% 15% 5.0 1.8 15% Family Christian Association Of America, Inc. (fca Walking Tall Project 104 0% 75 72% 68% 96% 4% 14.3 0% 0% 0.0 0.0 1% Family Counseling Center Of Sarasota County, Inc. Specialized Program for At-Risk Students (SPARS) 57 2% 23 40% 0% 61% 17% 17.4 35% 17% 3.7 1.3 4%
Florida Keys Children's Shelter, Inc. Truancy Intervention 72 11% 63 88% 57% 17% 25% 14.9 51% 16% 7.0 1.4 19% Florida Ridge Big Brothers Big Sisters, Inc. One to One Mentoring 43 0% 43 100% 58% 26% 35% 13.1 9% 7% 1.6 0.7 14% Franklin County Public Library WINGS-2003 140 1% 116 83% 35% 40% 0% 13.3 6% 3% 0.5 0.3 0%
Gilchrist County School Board Truancy and Delinquency Prevention 76 1% 57 75% 70% 4% 4% 13.8 33% 5% 2.6 0.6 7% Girls Incorporated Of Jacksonville Florida Eastside Youth Development Program 81 1% 38 47% 42% 100% 0% 10.4 0% 0% 0.0 0.0 0%
Table continued on next page
Partnership/Invest in Children
3 The seriousness index is comprised of the sum of all scores for all charges. The following point values are assigned: 8 for a violent felony, 5 for a property or other felony, 2 for a misdemeanor, and 1 for any other charge.
4 The seriousness index is comprised of the sum of all scores for adjudicated charges. The following point values are assigned: 8 for a violent felony, 5 for a property or other felony, 2 for a misdemeanor, and 1 for any other charge.
1 ODS percentage is based on the total number of releases2 Italics indicate the program completed less than 15 youth and care should be taken in interpreting this data.
Prevention and Victim Services FY 2003-04Output Summary by Funding Source and Program (continued)
Funding Source/Provider Program NameTotal
Releases
%
ODS1
Completions
Total
%Male
%Black
Avg. Seriousness Index of:
%Recidivism
%Hispanic
AverageAge at
Admission
%Prior
Charges
%Prior
Adjudications

Prevention and V
ictim S
ervices
2006 Outcom
e Evaluation R
eport
Sum
mary T
ables
39
N2 %Prior
Charges3Adjudicated
Charges4
Glades County School Board Community Intervention On Juv. Crime 58 3% 1 2% 0% 100% 0% 10.8 0% 0% 0.0 0.0 0% Gulf County School District Mentoring To Prevent Delinquency 41 17% 30 73% 80% 10% 3% 14.8 37% 23% 3.9 1.6 10% Hamilton County School Board Truancy Intervention Program 58 5% 52 90% 58% 67% 4% 16.0 25% 6% 2.5 0.3 15% Hendry County Public Schools Lyda Prevention Program 108 10% 71 66% 75% 32% 37% 13.4 21% 14% 2.2 1.0 10% Holmes County School Board Graduation Assistance Program 53 8% 35 66% 66% 6% 3% 15.5 34% 26% 4.8 2.7 23% Infinity Schools, Inc. Infinity School Of Flagler County 60 8% 11 18% 36% 36% 9% 16.1 91% 45% 9.4 1.5 9% Investing In Our Youth, Inc. Safe Passage (ISP) 104 9% 89 86% 93% 99% 1% 13.4 34% 25% 2.9 1.8 15% Jackson County Teen Court Inc. Jackson County Teen Court 117 2% 111 95% 68% 44% 1% 14.9 75% 8% 3.8 0.5 13% Jefferson County Teen Center Jefferson County Youth Choir 45 2% 0 0% N/A N/A N/A N/A N/A N/A N/A N/A N/AJewish Family & Children's Service Of Manatee JFCS-MARC and JFCS-NPARC 195 2% 172 88% 77% 19% 9% 13.3 12% 1% 0.4 0.0 6% Jewish Family & Children's Service Of Sarasota JFCS-LINC Lincoln Intervention Center 105 3% 103 98% 63% 36% 32% 13.4 19% 6% 1.3 0.6 8% Lafeyette School District STEP UP Program 50 0% 47 94% 60% 28% 13% 13.6 9% 4% 1.9 1.5 4% Levy County Extension Service Challenge to Succeed - Early Asset Development 67 0% 63 94% 46% 65% 0% 10.6 2% 2% 0.1 0.0 2% Life Impact, Inc. Life Skills Management 112 5% 65 58% 63% 88% 11% 11.9 14% 8% 0.6 0.3 2% Mad Dad, Inc. Intensive Delinquency Diversion Services DP-121 68 10% 39 57% 85% 0% 5% 13.5 56% 8% 3.3 0.5 21% Mad Dad, Inc. Intensive Delinquency Diversion Services DP-122 50 2% 24 48% 83% 21% 0% 14.0 79% 4% 6.0 0.3 4% Madison County District School Board Truant Program/Dropout Prevention 165 12% 120 73% 59% 85% 1% 15.9 49% 29% 5.8 2.6 21% Manatee Youth For Christ Youth Guidance/8-Ball 213 8% 210 99% 72% 48% 20% 13.4 28% 10% 2.5 0.8 7% Mental Health Care, Inc Project End Violence Early (E.V.E.) 75 8% 41 55% 73% 22% 17% 13.5 56% 5% 2.9 0.2 15% Office For Farmworker Ministry Strong Families Strong Futures 201 0% 121 60% 42% 17% 86% 12.5 2% 1% 0.0 0.0 1% Okaloosa Academy, Inc. Youth, Bring a Friend of Shalimar 92 1% 90 98% 48% 40% 8% 10.1 1% 0% 0.0 0.0 2% Pinellas County Sheriff's Office Weekend Boot Camp: About Face 293 0% 293 100% 68% 23% 6% 13.8 36% 15% 2.8 0.9 20% Polk County Drug Court Prevention, Early Intervention and Treatment 109 24% 58 53% 79% 5% 12% 16.5 90% 34% 9.3 3.3 14% Putnam County School District Positive Attitude Student Training (P.A.S.T. Program) 172 3% 151 88% 62% 28% 9% 14.5 54% 8% 4.2 1.0 5% Quality United Education, Inc. Project Push Up 57 0% 34 60% 74% 94% 9% 9.1 0% 0% 0.0 0.0 0% Regis House, Inc. Too Good Prgms Aka Family & Adol. Center 67 3% 57 85% 86% 53% 39% 13.6 23% 5% 1.3 0.1 7% Seminole County Sheriff's Office Seminole Collaborative Youth Initiative 1,232 2% 1,232 100% 69% 22% 14% 14.6 55% 15% 5.4 0.9 12% Silver River Marine Institute Marion County Collaborative Prevn Services 448 4% 420 94% 54% 59% 5% 12.7 21% 4% 1.8 0.4 7% Sixth Judicial Circuit Pasco County Drug Court Program 247 12% 195 79% 66% 2% 3% 15.9 52% 11% 2.0 0.3 15% South Broward Hospital District, D/b/a Memorial Health Operation Turn Around (OTA) Program 151 1% 148 98% 47% 43% 41% 12.6 1% 1% 0.0 0.0 1% Southwest Florida Addiction Services, Inc. (SWFAS) Domestic Violence Diversion Program (DVD) 108 6% 86 80% 66% 10% 17% 15.3 86% 16% 5.3 1.4 17% St. Johns County Sheriff's Office ACE Adolescent Character Enrichment Program 68 6% 53 78% 77% 17% 9% 15.0 66% 42% 10.4 4.4 17% State Attorney's Office - 15th Judicial Circuit Truancy Interdiction Program 31 10% 5 16% 60% 20% 40% 15.4 20% 0% 0.4 0.0 40% Substance Abuse Council Of Indian River County Teen STEP (Short Term Excellence Program) 83 1% 75 90% 55% 4% 4% 14.2 41% 9% 3.9 1.3 7% Summit Behavioral Healthcare Associates, Inc. Risk To Resiliency Program For Girls 54 4% 51 94% 0% 63% 8% 14.7 29% 10% 2.5 0.4 18% Sumter County School Board SSMS After School Alternatives Program (ASAP) 330 1% 307 93% 48% 27% 8% 12.8 7% 2% 0.5 0.1 1% Suwannee County District School Board Douglass Center Alternative School Program 100 12% 59 59% 81% 37% 8% 14.6 54% 32% 7.2 2.7 20% Tampa Housing Authority Tampa Housing Authority Delinquency Prevention 223 0% 223 100% 55% 85% 9% 13.1 9% 1% 0.5 0.1 3% The House Next Door, Inc. Deltona Young Prevention Project 61 16% 26 43% 50% 15% 8% 14.5 58% 4% 3.6 0.2 15% The Resource Room Suspension Camp 155 2% 143 92% 62% 92% 8% 16.0 15% 6% 1.8 0.4 10% The School Board Of Highlands County Alternative Education 98 10% 90 92% 76% 24% 11% 15.1 73% 33% 8.7 3.6 28% The School Board Of Highlands County Home/School Liaisons 225 8% 73 32% 45% 29% 15% 9.9 16% 1% 1.2 0.0 1% Tykes & Teens, Inc. Alternative to Out of School Suspension Program 265 1% 208 78% 73% 19% 10% 14.8 28% 6% 2.0 0.5 9% Union County School District Union County Alternative School 47 2% 42 89% 79% 17% 19% 15.0 52% 21% 5.6 0.7 12% Urban League Of Broward County, Inc. Creating Lasting Family Connections 2 0% 0 0% N/A N/A N/A N/A N/A N/A N/A N/A N/AWakulla County Sheriff's Office Against Crime Together ( Act Il ) 21 0% 15 71% 60% 33% 0% 14.4 20% 7% 1.1 0.1 13% Washington County School Board Youth Delinquency Prevention Program 54 6% 52 96% 58% 35% 0% 14.5 35% 12% 2.7 0.6 12% YMCA Of Greater St. Petersburg Safe Schools/ Youth Enhancement Skills 175 7% 162 93% 73% 22% 13% 13.6 23% 9% 2.1 0.6 12% YMCA Of The Suncoast Y-arts: Keeping Good Kids Good 43 0% 26 60% 58% 4% 8% 13.9 38% 0% 2.5 0.0 15% Youth Crisis Center Juvenile Assessment Center Connection Program 792 3% 297 38% 62% 68% 2% 15.3 57% 25% 6.2 1.6 23%
Total Partnership/Invest in Children 11,958 4% 9,007 75% 60% 38% 12% 13.7 31% 10% 2.7 0.7 10%
2 Italics indicate the program completed less than 15 youth and care should be taken in interpreting this data.3 The seriousness index is comprised of the sum of all scores for all charges. The following point values are assigned: 8 for a violent felony, 5 for a property or other felony, 2 for a misdemeanor, and 1 for any other charge. 4 The seriousness index is comprised of the sum of all scores for adjudicated charges. The following point values are assigned: 8 for a violent felony, 5 for a property or other felony, 2 for a misdemeanor, and 1 for any other charge. Table continued on next page
Avg. Seriousness Index of:
%Recidivism
1 ODS percentage is based on the total number of releases
%Hispanic
AverageAge at
Admission
%Prior
Charges
%Prior
Adjudications
Prevention and Victim Services FY 2003-04Output Summary by Funding Source and Program (continued)
Funding Source/Provider Program NameTotal
Releases%
ODS1
Completions
Total
%Male
%Black
Partnership/Invest in Children (continued)

2006 Outcom
e Evaluation R
eport
Prevention and V
ictim S
ervices
40
S
umm
ary Tables
N2 %
Prior
Charges3Adjudicated
Charges4
Academy For Better Communities Norland Partnership for Youth-Intensive Anti-Viol. Comp. 125 0% 99 79% 47% 93% 4% 12.5 3% 1% 0.2 0.1 1%
Aspira Of Florida, Inc ASPIRA Youth & Community Against Violence (WPB) 64 0% 63 98% 17% 24% 70% 15.0 2% 0% 0.0 0.0 0% Brevard County Board Of County Commissioners BIGS in School Mentoring 23 0% 1 4% 100% 0% 0% 12.5 100% 0% 5.0 0.0 0% Brevard County Board Of County Commissioners Classroom Based Early Interv. & Prev. - Sherwood Elem. 211 0% 189 90% 46% 6% 2% 9.6 1% 0% 0.0 0.0 0% Children's Psychiatric Center, Inc. Functional Family Therapy 48 4% 41 85% 59% 95% 2% 15.7 10% 5% 0.5 0.2 2% City Of Jacksonville Together We Will 162 0% 125 77% 56% 98% 6% 8.9 2% 0% 0.1 0.0 0%
City Of Madison Ican2/ Madison County Title V 21 0% 0 0% N/A N/A N/A 0.0 N/A N/A N/A N/A N/ACity Of Miramar Miramar Community Youth Crime Watch 40 0% 36 90% 39% 67% 17% 12.3 3% 0% 0.1 0.0 6% City Of Ocala Alliance For Youth 421 0% 421 100% 52% 38% 8% 12.9 3% 1% 0.3 0.1 2% City Of Vero Beach Truancy Intervention Program 320 3% 299 93% 57% 19% 13% 12.8 17% 6% 1.0 0.4 10%
Clay County Board Of County Commissioners Clay Cares(comm. Attendance Resources) 1 0% 0 0% N/A N/A N/A 0.0 N/A N/A N/A N/A N/AComeunity, Inc. Youth Entrepreneurship Project 158 0% 153 97% 48% 58% 14% 12.3 4% 0% 0.2 0.0 0% Crosswinds Youth Services, Inc. Domestic Violence Diversion Program 100 4% 86 86% 63% 21% 0% 15.1 69% 6% 5.6 0.7 16% Drug Free Youth In Town (DFYIT) D-FY-IT 381 1% 335 88% 32% 69% 30% 15.6 8% 3% 0.5 0.2 1%
Escambia County Sheriff's Office J.U.S.T. Program 588 4% 582 99% 68% 41% 2% 14.2 53% 28% 4.8 2.6 23% Florida State University, School Of Social Work The Boys' Choir of Tallahassee 121 6% 121 100% 100% 98% 1% 12.0 9% 5% 0.8 0.4 6% Franklin County Board Of County Commissioners Franklin's Youth Enhancement Project 5 0% 1 20% 0% 0% 0% 17.7 0% 0% 0.0 0.0 0% Girls Incorporated Of Jacksonville Action for Safety - A Self Defense & Viol. Prev. Program 133 0% 133 100% 0% 87% 5% 10.3 0% 0% 0.0 0.0 0%
Homestead Police Department Building Resilient Youth through Academic Enrichment 220 1% 220 100% 67% 85% 15% 12.3 10% 3% 0.8 0.2 2% Human Services Associates (HAS), Inc. Bridges to Success 106 8% 83 78% 80% 58% 14% 14.4 55% 25% 11.4 2.6 25% Infinity Schools, Inc. Infinity School of Flagler County 90 12% 16 18% 38% 25% 6% 15.7 63% 38% 7.6 2.1 19% Informed Families Of Dade County Grandparents Raising Grandchildren (GRG) - Miami 55 2% 30 55% 37% 100% 0% 11.4 7% 3% 1.6 0.3 3%
Informed Families Of Dade County, Inc. Girl Power (Longwood) 28 0% 26 93% 0% 88% 4% 10.2 0% 0% 0.0 0.0 0% Informed Families Of Dade County, Inc. (Orlando) Grandparents Raising Grandchildren (GRG) - Orlando 70 4% 30 43% 53% 97% 0% 10.4 10% 10% 1.4 0.3 0% Informed Families Of Dade County, Inc. (Pensacola) Grandparents Raising Grandchildren (GRG) - Pensacola 59 3% 34 58% 50% 82% 0% 8.3 0% 0% 0.0 0.0 6% Investing In Our Youth, Inc. Sister2Sister 58 0% 51 88% 2% 94% 6% 13.1 18% 12% 1.0 0.7 6% Liberty County Board Of County Commissioners LIFT (Liberty Investing For Tomorrow) 202 0% 201 100% 62% 45% 2% 11.4 7% 6% 0.8 0.5 3%
Life Impact, Inc. Counseling/Anger Management/Parenting Program 5 0% 2 40% 100% 100% 50% 14.8 50% 50% 5.0 2.5 0% Miami-Dade Empowerment Trust, Inc. The Rites of Passage Intervention & Prev. Program (ROP) 53 0% 38 72% 0% 100% 0% 11.0 0% 0% 0.0 0.0 0% Ninth Judicial Circuit Court Pay Up 548 20% 317 58% 71% 49% 16% 15.6 96% 72% 18.2 6.4 26%
3 The seriousness index is comprised of the sum of all scores for all charges. The following point values are assigned: 8 for a violent felony, 5 for a property or other felony, 2 for a misdemeanor, and 1 for any other charge. 4 The seriousness index is comprised of the sum of all scores for adjudicated charges. The following point values are assigned: 8 for a violent felony, 5 for a property or other felony, 2 for a misdemeanor, and 1 for any other charge. Table continued on next page
%Recidivism
1 ODS percentage is based on the total number of releases2 Italics indicate the program completed less than 15 youth and care should be taken in interpreting this data.
AverageAge at
Admission
%Prior
Charges
%Prior
Adjudications
Avg. Seriousness Index of:
Prevention and Victim Services FY 2003-04Output Summary by Funding Source and Program (continued)
Funding Source/Provider Program NameTotal
Releases%
ODS1
Completions
Total
%Male
%Black
%Hispanic
Office of Juvenile Justice Delinquency Prevention

Prevention and V
ictim S
ervices
2006 Outcom
e Evaluation R
eport
Sum
mary T
ables
41
N2 %Prior
Charges3Adjudicated
Charges4
Office Of The State Attorney (Duval County) Children United with Parents (CUP) 79 0% 35 44% 0% 49% 3% 9.8 3% 0% 0.1 0.0 0% Orange County Youth And Family Services Division Orange County Truancy Court 70 4% 61 87% 51% 34% 21% 13.4 20% 10% 2.6 1.0 7% Pinellas County Board Of County Commissioners Project Yes (Youth Enhancement Skills) 75 8% 54 72% 48% 80% 4% 12.7 28% 13% 0.9 0.4 9%
Putnam County School District Positive Attitude Student Training (P.A.S.T. Program) 247 4% 218 88% 58% 38% 7% 14.6 54% 8% 3.1 0.4 10% Santa Rosa County Board Of Commissioners T. E. A. M. U. P. 104 4% 0 0% N/A N/A N/A 0.0 N/A N/A N/A N/A N/ASouthwest Florida Addiction Services, Inc. Lee County Community Assessment Center Prev. Assess. 266 4% 69 26% 54% 4% 7% 15.8 30% 12% 2.7 0.7 13% St. Lucie County Commission St. Lucie Mental Health Collaborative 79 3% 34 43% 76% 12% 9% 11.5 24% 3% 1.8 0.3 6%
St. Paul Community Empowerment Center, Inc. Out-of-School Suspension Program 312 1% 311 100% 64% 87% 1% 13.5 24% 8% 2.3 0.5 10% Suwannee County Board Of Commissioners Community Organizing Program 45 4% 34 76% 59% 29% 3% 15.0 79% 3% 3.8 0.5 9% Tenth Judicial Circuit Polk County Drug Court Treatment Program 26 23% 20 77% 65% 35% 20% 14.1 15% 5% 0.9 0.3 10% The Bridge Of Northeast Florida, Inc. The Bridge Community Outreach Program 46 2% 14 30% 36% 100% 0% 13.2 14% 7% 0.6 0.1 0%
Victim Services Center At-Risk Youth Victimization Program 81 4% 55 68% 67% 64% 33% 14.4 38% 33% 13.7 8.0 7% Vision Of Victory Human Services Corporation Project FOCUS 216 0% 179 83% 74% 89% 11% 14.1 4% 2% 0.4 0.2 4% YWCA Of Greater Miami YWCA Hialeah Alternative Day Program 123 1% 108 88% 70% 9% 89% 13.9 7% 2% 0.5 0.1 5%
Total OJJDP 6,185 4% 4,925 80% 56% 55% 11% 13.2 25% 12% 2.9 1.1 8%
Community Coalition, Inc. Community Coalition 476 1% 288 61% 55% 24% 73% 16.1 26% 15% 3.0 0.9 7% Dept Of Military Affairs Youth Challenge Academy 2001 277 0% 217 78% 72% 27% 15% 17.3 38% 13% 2.7 0.7 7%
Total Special Member Projects 753 1% 505 67% 62% 25% 48% 16.6 31% 14% 2.9 0.8 7%
Bethel Community Foundation, Inc. Faith - Based Neighborhood Accountability Board 66 12% 55 83% 53% 91% 4% 14.8 100% 5% 3.5 0.3 20%
City Of Quincy Community Redevelopment Agency Quincy Neighborhood Renaissance 31 32% 27 87% 70% 100% 0% 15.3 48% 41% 4.7 3.4 11% Community Outreach And Development Center Of Alach Neighborhood Accountability Board 50 4% 43 86% 53% 84% 2% 15.1 100% 7% 4.6 0.3 23% Daytona Beach Police Department Neighborhood Accountability Board 40 0% 38 95% 55% 58% 11% 14.7 8% 0% 0.4 0.0 13% Florida Faith-based Coalition, Inc. Faith-Based Neighborhood Accountability Board Project 12 25% 11 92% 45% 100% 0% 15.9 100% 9% 2.9 0.4 9%
Florida Gulf Coast University Neighborhood Accountability Board Initiative 79 0% 63 80% 63% 8% 14% 15.5 98% 0% 3.9 0.0 10% Lee County Department Of Human Services Lee County Neighborhood Accountability Board 95 8% 64 67% 59% 58% 3% 15.1 98% 2% 2.9 0.0 9% Mary Mcleod Bethune Community Center, Inc. Mmbcc Neighborhood Accountability Board 1 0% 0 0% N/A N/A N/A 0.0 N/A N/A N/A N/A N/A
Ninth Judicial Circuit Court Neighborhood Restorative Justice Program 229 3% 174 76% 56% 26% 13% 15.5 96% 3% 3.4 0.2 6% St. Paul Community Empowerment Ctr, Inc. Faith-Based Neighborhood Accountability 41 0% 31 76% 42% 97% 0% 15.7 84% 0% 2.1 0.0 10% Thirteenth Judicial Circuit, Administrative Office Hillsborough County Neighborhood Accountability Board 145 1% 129 89% 52% 33% 31% 14.8 98% 0% 4.3 0.0 4%
Total Juvenile Accountability Block Grant 789 5% 635 80% 55% 48% 13% 15.2 90% 4% 3.4 0.2 10%
28,587 5% 21,878 77% 54% 39% 14% 13.9 31% 10% 2.7 0.8 10%
35,629 5% 27,315 77% 53% 39% 14% 14.1 34% 12% 3.1 0.9 12%
1 ODS percentage is based on the total number of releases2 Italics indicate the program completed less than 15 youth and care should be taken in interpreting this data.3 The seriousness index is comprised of the sum of all scores for all charges. The following point values are assigned: 8 for a violent felony, 5 for a property or other felony, 2 for a misdemeanor, and 1 for any other charge. 4 The seriousness index is comprised of the sum of all scores for adjudicated charges. The following point values are assigned: 8 for a violent felony, 5 for a property or other felony, 2 for a misdemeanor, and 1 for any other charge.
Total
Total Non-Residential
Completions
Total
%Male
%Black
%Hispanic
AverageAge at
Admission
%Prior
Charges
%Prior
Adjudications
Avg. Seriousness Index of:
%RecidivismFunding Source/Provider Program Name
Total Releases
%
ODS1
Prevention and Victim Services FY 2003-04Output Summary by Funding Source and Program (continued)
Office of Juvenile Justice Delinquency Prevention (continued)
Special Member Projects
Juvenile Accountability Block Grants

2006 Outcome Evaluation Report Prevention and Victim Services
42 Targeting Youth and Communities
Targeting Youth and Communities
The Department continues to strive to target delinquency prevention resources to youth who are most at-risk for delinquent behavior. The development of risk criteria for youth recruited for grant-funded prevention programs and the targeting of resources towards youth at-risk for delinquency by contracted prevention programs have resulted in only slightly increased recidivism rates for some programs.
The Department conducts geo-mapping and uses the technique to inform contractual and Request for Proposal (RFP) language with prevention providers. The effort towards targeting prevention resources and services is an outstanding example of true evidence-based delinquency planning.
An assessment of DJJ Prevention and Victim Services’ geo-mapping technique 6 found that the geo-mapping methods and application utilized are sound and firmly based upon the research literature on delinquency, risk and protective factors and geo-mapping hot spots.
6 Winokur, K., Blankenship, J., and Hand, G. (July 2004). Targeting Delinquency Prevention Services to High-Risk Youth and Neighborhoods: An Assessment of the Florida Department of Juvenile Justice Prevention and Victim Services’ Geo-Mapping Techniques. Tallahassee, FL: Justice Research Center and Dept of Juvenile Justice.
Targeting the youth and communities most in need of prevention services has a number of potential beneficial outcomes. First, it can result in cost savings by utilizing limited resources where they are needed most. Second, it potentially averts ‘net widening,’ which occurs when low-risk youth who could have been more effectively served in an informal manner are targeted for delinquency programs. Third, juvenile justice efforts often focus only on the offender and fail to consider underlying community problems and risk factors. The DJJ geo-mapping approach has the capacity to take these factors into account by allocating services in neighborhoods with social conditions predisposing its residents to involvement with crime and delinquency.
This prevention chapter focused on the evaluation of youth released between July 1, 2003 and June 30, 2004 from DJJ funded prevention programs. In the current age of increased accountability, government funded programs must demonstrate effectiveness in order to maintain support. The continuing effort to evaluate prevention programs demonstrates the Department’s commitment to accountability.

Intake 2006 Outcome Evaluation Report
Intake 43
Intake Process, Florida Statutes §985.21 sets forth the requirements for delinquency intake and case management in Florida. As outlined in this statute, the juvenile probation officer shall ensure that each child is screened during the intake process in order to determine:
1. Appropriateness for release, referral to a diversionary program, community arbitration, or some other program for the purpose of nonofficial handling;
2. The presence of medical, psychiatric, psychological, substance abuse, educational, or vocational problems, or other conditions that may have caused the child to come to the attention of law enforcement or DJJ. The child shall also be screened to determine whether the child poses a danger to himself or herself or others. The results of this screening shall be made available to the court. In cases where such conditions are identified, and a nonofficial handling of the case is chosen, the juvenile probation officer shall attempt to refer the child to a program/agency, together with the child's assessment information.
3. DJJ shall develop an intake and a case management system whereby a child brought into intake is assigned a juvenile probation officer if the child was not released, referred to a diversionary program, community arbitration, or some other program/agency for nonofficial handling, and shall make every reasonable effort to provide case management services for the child.
4. In addition to duties specified in other sections and through departmental rules, the assigned juvenile probation officer shall be responsible for the following:
a. Ensuring a risk assessment instrument establishing the child's eligibility for detention has been accurately completed and the appropriate recommendation was made to the court.
b. Inquiring as to whether the child understands his or her rights to counsel and against self-incrimination.
c. Performing the preliminary screening and making referrals for comprehensive assessment regarding the child's need for substance abuse treatment services, mental health services, retardation services, literacy services, or other educational or treatment services.
d. Coordinating the multidisciplinary assessment when required, which includes the classification and placement process that determines the child's priority needs, risk classification, and treatment plan. This assessment, classification, and placement process shall develop into the predisposition report.
e. Making recommendations for services and facilitating the delivery of those services to the child, including mental health, educational, family counseling, family assistance, and substance abuse services.
INTAKE
Intake is the entry point for all juveniles referred to the Florida Department of Juvenile Justice (DJJ) for delinquent acts and is a responsibility of the Probation and Community Corrections branch. A referral is similar to an arrest in the adult criminal justice system. Youth under age 18 who are charged with a crime are referred to DJJ. The purpose of the intake process is to assess a youth’s risks and needs to determine the most appropriate treatment plan and setting. Each youth referred is assigned a juvenile probation officer, who must conduct a face-to-face intake conference with the youth and his or her parents or guardian to gather information and assess the juvenile’s service needs. DJJ provides a recommendation to the state attorney and the juvenile court regarding appropriate sanctions and services. The recommendation is based on interviews and information from the arresting law enforcement officer, victim, youth and his or her family, and other sources (e.g. teachers).
Data in this chapter are presented based on the most serious offense a youth was referred for during a fiscal year. Data are categorized by offense seriousness (felony, misdemeanor or other), as well as by offense type (person, property, etc). A profile of youth referred, including gender, race, ethnicity and age breakdowns, are also presented.

2006 Outcome Evaluation Report Intake
44 Statewide Delinquency Rate
The delinquency rate for FY 2004-05 was 52.1 per 1,000 youth in the at-risk population.
5-Year2000-01 2001-02 2002-03 2003-04 2004-05 Change
Population at Risk 1,678,925 1,707,153 1,741,798 1,795,033 1,829,260 150,335 Percent Change 2% 2% 3% 2% 9%
Youths Referrals 99,767 97,408 97,756 99,692 95,263 -4,504 Percent Change -2% < 1% 2% -4% -5%
Delinquency Rate per 1,000 Population at Risk
58.4 55.9 54.5 54.5 52.1 -6
Percent Change -4% -3% < 1% -4% -11%
Fiscal Year
Delinquency Rates and Percent Change by Fiscal Year
Delinquent Rates (Per 1,000 Youth) by Fiscal Year
52.1 54.5 54.5 55.9
58.4
0.0
10.0
20.0
30.0
40.0
50.0
60.0
70.0
80.0
90.0
100.0
2000-01 2001-02 2002-03 2003-04 2004-05
Statewide Delinquency Rates
Youth between the ages of 10 and 17 are considered the population at-risk of becoming delinquent. During FY 2004-05, there were over 1.83 million youth at-risk. In this same year, 95,263 youth were referred to DJJ for a delinquent offense. This represents a delinquency rate of 52.1 youths referred per 1,000 youth in the at-risk population. The table below presents the Florida population at-risk for a delinquency referral and the number of youth referred to DJJ over the last five fiscal years.
Between FY 2000-01 and FY 2004-05, the population at-risk grew by 9% while the number of youth referred to DJJ decreased by 5%. This represents a drop in the delinquency rate from 58.4 to 52.1 youth referred per 1,000 youth at-risk in the population. Therefore, although the number of youth at-risk increased over the five-year period, the delinquency rate per 1,000 youth at-risk declined by 11%.

Intake 2006 Outcome Evaluation Report
Offense Seriousness 45
5-Year2000-01 2001-02 2002-03 2003-04 2004-05 Change
Felony Offenses 40,386 38,612 37,810 37,484 36,667 -3,719 Percent Change -4% -2% -1% -2% -9%
Misdemeanor Offenses 53,920 52,732 53,448 54,984 51,047 -2,873 Percent Change -2% 1% 3% -7% -5%
Other Offenses 5,461 6,064 6,498 7,224 7,549 2,088 Percent Change 11% 7% 11% 4% 38%
Total 99,767 97,408 97,756 99,692 95,263 -4,504
Percent Change -2% < 1% 2% -4% -5%
Offense SeriousnessFiscal Year
Youth Referred by Offense Seriousness and Fiscal Year
Youth Referred by Offense SeriousnessFY 2004-05
Misdemeanor Offenses,
54%
Felony Offenses,
38%
Other Offenses, 8%
Youth Referred by Offense Seriousness During FY 2004-05, the majority of youth (54%) referred to DJJ were referred for nothing more serious than a misdemeanor offense. Slightly more than one-third of the youth were referred for felony offenses while less than 10% were referred for other offenses. The other offenses category includes violations of probation or conditional release, cases reopened, cases transferred to other counties, and interstate compact cases. As depicted in the five-year trend table below, misdemeanor offenses have historically represented the most common offense category for which youth are referred to DJJ. Over the last five fiscal years, the number of youth referred for felony offenses and misdemeanor offenses has dropped by 9% and 5%, respectively. At the same time, the number of youth referred for other offenses has increased by 38%.

2006 Outcome Evaluation Report Intake
46 Offense Type
N % N %Murder/Attempted Murder 134 0.1% 137 0.1% Felony Sex Offenses 1,874 2.0% 1,947 1.3% Robbery 1,890 2.0% 2,041 1.4% Aggravated Assault 8,990 9.4% 10,298 6.8% Resisting Arrest with Violence 341 0.4% 403 0.3% Shoot/Throw Deadly Missile 761 0.8% 880 0.6% Misdemeanor Assault/Battery 15,623 16.4% 21,288 14.1% Misdemeanor Sex Offense 143 0.2% 193 0.1%
Subtotal 29,756 31.2% 37,187 24.7%
Burglary 9,340 9.8% 12,727 8.4% Auto Theft 1,891 2.0% 3,077 2.0% Grand Larceny 2,331 2.4% 3,029 2.0% Forgery 353 0.4% 429 0.3% Arson 330 0.3% 362 0.2% Felony Receiving Stolen Property 160 0.2% 263 0.2% Misdemeanor Theft 14,999 15.7% 18,786 12.5% Trespassing 2,686 2.8% 4,857 3.2% Vandalism 1,867 2.0% 3,013 2.0% Misdemeanor Receiving Stolen Property 0 0.0% 1 0.0%
Subtotal 33,957 35.6% 46,544 30.9%
Youth Referred and Referrals Received at Intake by Most Serious Offense FY 2004-05
Most Serious Offense
Youth Referred Referrals
Offense Type
PersonOffenses
PropertyOffenses
Table continued on next page
Youth Referred by Offense Type
Offenses for which youth are referred can be further categorized into four groups based on the type of offense rather than the seriousness:
1. Person Offenses.
2. Property Offenses.
3. Drug And Alcohol Offenses.
4. Public Order Offenses.
Each group contains both felony and misdemeanor offenses. Offenses that do not fall within the four groups are listed as unclassified offenses. The table on the next page presents both the number of youth referred and the number of referrals received within each offense type. During a fiscal year, a youth may be referred multiple times. For this report, a referral is defined as all offenses received for a youth on a single day. When a referral consists of multiple offenses, the referral is categorized based on the most serious offense. During FY 2004-05, property offenses accounted for the highest number of youth referred and referrals received.

Intake 2006 Outcome Evaluation Report
Offense Type 47
N % N %
Non-Marijuana Felonies 2,910 3.1% 4,006 2.7%
Marijuana Felonies 1,087 1.1% 1,383 0.9%
Non-Marijuana Misdemeanors 56 0.1% 86 0.1%
Marijuana Misdemeanors 5,477 5.7% 8,307 5.5%
Drug Paraphernalia 620 0.7% 982 0.7%
Alcohol Offenses 1,466 1.5% 1,802 1.2%
Subtotal 11,616 12.2% 16,566 11.0%
Secure Facility Escapes 113 0.1% 238 0.2%
Felony Concealed Firearm 191 0.2% 264 0.2%
Misdemeanor Concealed Weapon 354 0.4% 560 0.4%
Resist Arrest Without Violence 1,270 1.3% 2,685 1.8%
Loitering 724 0.8% 1,337 0.9%
Disorderly Conduct 4,816 5.1% 7,553 5.0%
Prostitution 61 0.1% 81 0.1%
Contempt 620 0.7% 2,092 1.4%
Game Laws/Ordinances 207 0.2% 323 0.2%
Traffic Offenses 143 0.2% 215 0.1%
Subtotal 8,499 8.9% 15,348 10.2%
Other Felonies 3,854 4.0% 4,769 3.2%
Other Misdemeanors 803 0.8% 1,464 1.0%
Violation of Probation/Cond.Release 3,823 4.0% 17,450 11.6%
Case Reopened/Previously Deferred 1,647 1.7% 7,112 4.7%
Transferred to Another County 728 0.8% 3,550 2.4%
Interstate Compact 580 0.6% 697 0.5%
Subtotal 11,435 12.0% 35,042 23.3%
95,263 100.0% 150,687 100.0%
UnclassifiedOffenses
Total
Drug and AlcoholOffenses
Public OrderOffenses
Youth Referred and Referrals Received at Intake by Most Serious Offense FY 2004-05 (continued)
Offense Type Most Serious Offense
Youth Referred Referrals
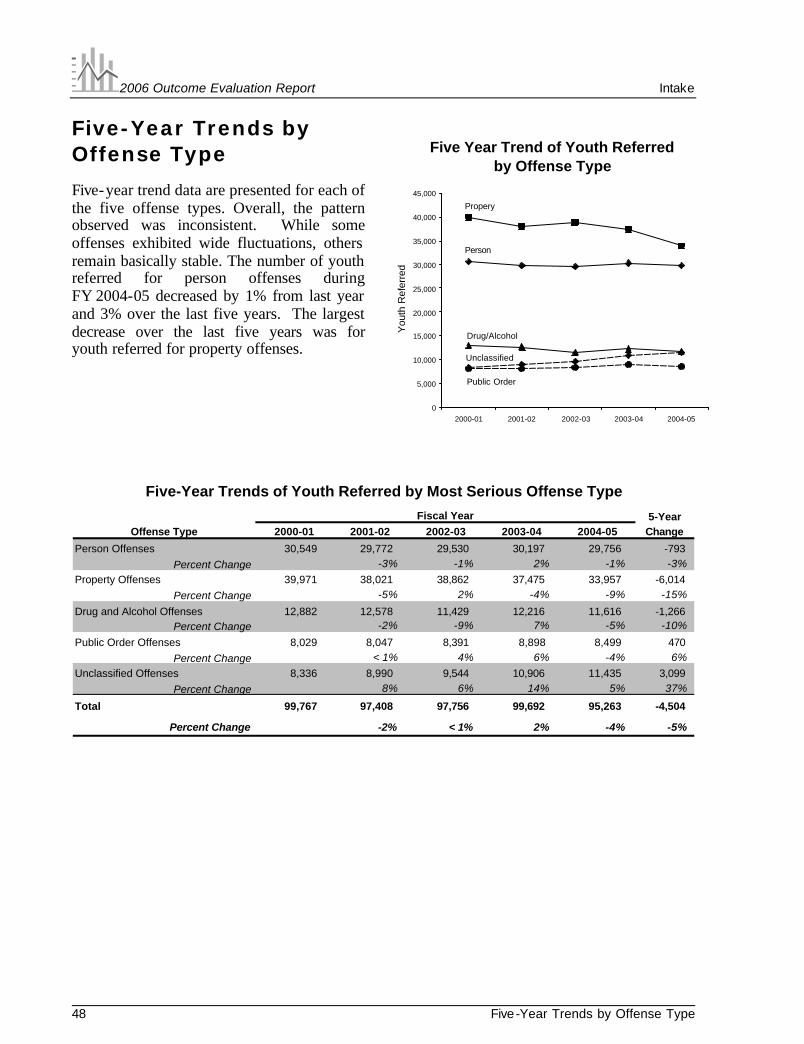
2006 Outcome Evaluation Report Intake
48 Five -Year Trends by Offense Type
Five Year Trend of Youth Referredby Offense Type
Propery
Person
Drug/Alcohol
Unclassified
Public Order
0
5,000
10,000
15,000
20,000
25,000
30,000
35,000
40,000
45,000
2000-01 2001-02 2002-03 2003-04 2004-05
You
th R
efer
red
5-YearOffense Type 2000-01 2001-02 2002-03 2003-04 2004-05 Change
Person Offenses 30,549 29,772 29,530 30,197 29,756 -793 Percent Change -3% -1% 2% -1% -3%
Property Offenses 39,971 38,021 38,862 37,475 33,957 -6,014 Percent Change -5% 2% -4% -9% -15%
Drug and Alcohol Offenses 12,882 12,578 11,429 12,216 11,616 -1,266 Percent Change -2% -9% 7% -5% -10%
Public Order Offenses 8,029 8,047 8,391 8,898 8,499 470 Percent Change < 1% 4% 6% -4% 6%
Unclassified Offenses 8,336 8,990 9,544 10,906 11,435 3,099 Percent Change 8% 6% 14% 5% 37%
Total 99,767 97,408 97,756 99,692 95,263 -4,504
Percent Change -2% < 1% 2% -4% -5%
Five-Year Trends of Youth Referred by Most Serious Offense Type
Fiscal Year
Five-Year Trends by Offense Type
Five-year trend data are presented for each of the five offense types. Overall, the pattern observed was inconsistent. While some offenses exhibited wide fluctuations, others remain basically stable. The number of youth referred for person offenses during FY 2004-05 decreased by 1% from last year and 3% over the last five years. The largest decrease over the last five years was for youth referred for property offenses.

Intake 2006 Outcome Evaluation Report
Person Offenses 49
5-YearMost Serious Offense 2000-01 2001-02 2002-03 2003-04 2004-05 Change
Murder/Attempted Murder 141 113 108 126 134 -7 Percent Change -20% -4% 17% 6% -5%
Felony Sex Offenses 1,897 1,920 1,935 1,938 1,874 -23 Percent Change 1% 1% < 1% -3% -1%
Robbery 2,165 2,087 2,047 1,858 1,890 -275 Percent Change -4% -2% -9% 2% -13%
Aggravated Assault/Battery 9,446 9,099 8,701 8,951 8,990 -456 Percent Change -4% -4% 3% < 1% -5%
Resist Arrest with Violence 424 371 332 344 341 -83 Percent Change -13% -11% 4% -1% -20%
Shoot/Throw Deadly Missile 1,163 906 946 876 761 -402 Percent Change -22% 4% -7% -13% -35%
Misdemeanor Assault/Battery 15,111 15,093 15,270 15,942 15,623 512 Percent Change < -1% 1% 4% -2% 3%
Misdemeanor Sex Offenses 202 183 191 162 143 -59 Percent Change -9% 4% -15% -12% -29%
Total 30,549 29,772 29,530 30,197 29,756 -793
Percent Change -3% -1% 2% -1% -3%
Fiscal Year
Five-Year Trends of Youth Referred by Person Offenses
Five Year Trends of Youth Referredfor Person Offenses
2000-01 2001-02 2002-03 2003-04 2004-05
Murder/ Attempted
Misd. Sex Offense
Resisting Arrest with Violence
Shoot/ Throw Deadly Missile
Felony Sex Offenses
Robbery
Aggravated Assault
Misd. Assault/ Battery
0
2,000
4,000
6,000
8,000
10,000
12,000
14,000
16,000
18,000
You
th R
efer
red
Fiscal Year
Person Offenses
During FY 2004-05, there were 29,756 youth whose most serious offense was a person offense. Overall, person offenses fell 1% during FY 2004-05 and 3% over the last five years. The majority of these offenses for FY 2004-05 were misdemeanor assaults/ battery. The largest decrease during FY 2004-05 was for shooting/throwing a deadly missile, which decreased thirteen percent, and misdemeanor sex offenses which decreased 12%. The number of youth referred increased for three offenses: murder/attempted murder (6%), robbery (2%), and aggravated assault/battery (<1%).

2006 Outcome Evaluation Report Intake
50 Property Offenses
Five-Year Trends of Youth Referred for Property Offenses
2000-01 2001-02 2002-03 2003-04 2004-05
Forgery
Arson
Vandalism
Auto Theft
Trespassing
Grand Larceny
Burglary
Misd. Theft
0
2,000
4,000
6,000
8,000
10,000
12,000
14,000
16,000
18,000
You
th R
efer
red
Fiscal Year
5-YearMost Serious Offense 2000-01 2001-02 2002-03 2003-04 2004-05 Change
Burglary 10,812 10,450 10,757 9,944 9,340 -1,472 Percent Change -3% 3% -8% -6% -14%
Auto Theft 2,337 2,259 2,113 1,943 1,891 -446 Percent Change -3% -6% -8% -3% -19%
Grand Larceny 3,223 2,961 2,627 2,551 2,331 -892 Percent Change -8% -11% -3% -9% -28%
Forgery & Uttering 476 463 384 385 353 -123 Percent Change -3% -17% < 1% -8% -26%
Arson 486 412 413 376 330 -156 Percent Change -15% < 1% -9% -12% -32%
Felony Rcv. Stolen Property 288 230 191 193 160 -128 Percent Change -20% -17% 1% -17% -44%
Misdemeanor Theft 17,191 16,354 17,363 17,125 14,999 -2,192 Percent Change -5% 6% -1% -12% -13%
Tresspassing 2,943 2,896 2,831 2,782 2,686 -257 Percent Change -2% -2% -2% -3% -9%
Vandalism 2,211 1,995 2,180 2,175 1,867 -344 Percent Change -10% 9% < -1% -14% -16%
Misd. Rcv. Stolen Property 4 1 3 1 0 -4 Percent Change -75% 200% -67% -100% -100%
Total 39,971 38,021 38,862 37,475 33,957 -6,014
Percent Change -5% 2% -4% -9% -15%
Fiscal Year
Five-Year Trends of Youth Referred by Property Offenses
Property Offenses
During FY 2004-05, there were 33,957 youth referred for property offenses. Misdemeanor theft accounts for almost one-half of that number. Youth referred for property offenses decreased by 9% from the previous year. Over the last five years, the number of youth referred for property offenses dropped for every offense by at least 9% and 15% overall. Most of the decrease is attributable to the drop in youth referred for misdemeanor theft. Offenses that had a five year change of 25% or greater, include grand larceny, forgery and uttering, arson, and felony receiving stolen property.

Intake 2006 Outcome Evaluation Report
Drug and Alcohol Offenses 51
5-YearMost Serious Offense 2000-01 2001-02 2002-03 2003-04 2004-05 Change
Non-Marijuana Felonies 2,927 2,826 2,595 2,825 2,910 -17 Percent Change -3% -8% 9% 3% -1%
Marijuana Felonies 1,063 1,048 1,121 1,142 1,087 24 Percent Change -1% 7% 2% -5% 2%
Marijuana Misdemeanors 6,089 5,540 5,109 5,736 5,477 -612 Percent Change -9% -8% 12% -5% -10%
Non-Marijuana Misdemeanors 74 84 70 72 56 -18 Percent Change 14% -17% 3% -22% -24%
Drug Paraphernalia 722 700 698 738 620 -102 Percent Change -3% < -1% 6% -16% -14%
Alcohol Offenses 2,007 2,380 1,836 1,703 1,466 -541 Percent Change 19% -23% -7% -14% -27%
Total 12,882 12,578 11,429 12,216 11,616 -1,266
Percent Change -2% -9% 7% -5% -10%
Fiscal Year
Five-Year Trends of Youth Referred for Drug and Alcohol Offenses
Five Year Trends of Youth Referred for Drug and Alcohol Offenses
2000-01 2001-02 2002-03 2003-04 2004-05
Non-Marijuana Misd.
Drug Paraphernalia
Marijuana Felonies
Alcohol Offenses
Non-Marijuana Felonies
Marijuana Misd.
0
2,000
4,000
6,000
8,000
You
th R
efer
red
Fiscal Year
Drug and Alcohol Offenses
During FY 2004-05, 11,616 youth were referred for alcohol offenses. Marijuana misdemeanor offenses account for nearly one-half of the total. The most serious type of drug offenses, non-marijuana felonies, accounted for 2,910 youth referred. Overall, during the last five years, the number of youth referred for drug and alcohol offenses has decreased 10%. Specifically, the number of youth referred for alcohol offenses decreased 27% since FY 2000-01.

2006 Outcome Evaluation Report Intake
52 Public Order Offenses
Five Year Trends of Youth Referredfor Public Order Offenses
2000-01 2001-02 2002-03 2003-04 2004-05
Contempt
Game Laws/ Ord.
Loitering
Resist Arrest w/out Viol.
Disorderly Conduct
0
2,000
4,000
6,000
8,000
You
th R
efer
red
Fiscal Year
5-YearMost Serious Offense 2000-01 2001-02 2002-03 2003-04 2004-05 Change
Secure Facility Escape 246 167 126 100 113 -133 Percent Change -32% -25% -21% 13% -54%
Contempt of Court 473 465 503 519 620 147 Percent Change -2% 8% 3% 19% 31%
Resisting Arrest w/out Violence 1,321 1,268 1,242 1,322 1,270 -51 Percent Change -4% -2% 6% -4% -4%
Concealed Weapons 454 446 433 476 545 91 Percent Change -2% -3% 10% 14% 20%
Loitering & Prowling 824 768 747 748 724 -100 Percent Change -7% -3% < 1% -3% -12%
Disorderly Conduct 3,880 4,315 4,729 5,196 4,816 936 Percent Change 11% 10% 10% -7% 24%
Prostitution 102 75 57 69 61 -41 Percent Change -26% -24% 21% -12% -40%
Game Laws/Ordinances 475 309 365 276 207 -268 Percent Change -35% 18% -24% -25% -56%
Traffic Offenses 254 234 189 192 143 -111 Percent Change -8% -19% 2% -26% -44%
Total 8,029 8,047 8,391 8,898 8,499 470
Percent Change < 1% 4% 6% -4% 6%
Fiscal Year
Five-Year Trends for Youth Referred for Public Order Offenses
Public Order Offenses
During FY 2004-05, 8,499 youth were referred for public order offenses. Over one-half were for disorderly conduct. During FY 2004-05, the number of youth referred for public order offenses decreased 4% ending a four year upward trend. The largest increase was for contempt of court charges, which rose 31% over five years. Although the number of youth referred for public order offenses decreased by 4% in FY 2004-05, over the last five years, an increase of 6% was observed.

Intake 2006 Outcome Evaluation Report
Unclassified Offenses 53
Five Year Trend for Youth Referredfor Unclassified Referrals
2000-01 2001-02 2002-03 2003-04 2004-05
Interstate Compact
Transferred Case
Other Misdemeanors
Case Reopened/Deferred
Violations of Prob.
Other Felonies
0
2,000
4,000
6,000
8,000
You
th R
efer
red
Fiscal Year
5-YearMost Serious Offense 2000-01 2001-02 2002-03 2003-04 2004-05 Change
Other Felonies 2,974 3,004 3,136 3,627 3,854 880 Percent Change 1% 4% 16% 6% 30%
Other Misdemeanors 793 688 736 784 803 10 Percent Change -13% 7% 7% 2% 1%
Violation of Probation/Cond. Release 2,525 3,050 3,058 3,575 3,823 1,298 Percent Change 21% < 1% 17% 7% 51%
Case Reopened/Previously Deferred 1,128 1,102 1,341 1,504 1,647 519 Percent Change -2% 22% 12% 10% 46%
Transferred to Another County 574 708 754 822 728 154 Percent Change 23% 6% 9% -11% 27%
Interstate Compact 342 438 519 594 580 238 Percent Change 28% 18% 14% -2% 70%
Total 8,336 8,990 9,544 10,907 11,435 3,099
Percent Change 8% 6% 14% 5% 37%
Fiscal Year
Five-Year Trends of Youth Referred for Unclassified Offenses
Unclassified Offenses
Offenses that did not fit in any of the previously defined categories are described below. During FY 2004-05, there were 11,435 youth referred for these types of offenses. The most frequently offense is violation of probation or conditional release, which comprise approximately one-third of that number. Over the last five years, there has been a 37% increase in youth referred for these types of offenses largely attributable to the 51% increase in youth referred for violation of probation or conditional release.

2006 Outcome Evaluation Report Intake
54 Profile of Youth
Fiscal Year Percentage
Gender 2004-05 of Total
Males 66,603 70%
Females 28,660 30%
Total 95,263 100%
Fiscal Year Percentage
Race 2004-05 of Total
White 56,089 59%
Black 36,565 38%
Other 2,609 3%
Total 95,263 100%
Proportion of Youth Referred by GenderFY 2004-05
Proportion of Youth Referred by RaceFY 2004-05
Males, 70%
Females, 30%
White, 59%
Other, 3%Black, 38%
Profile of Youth Referred
A profile of the 95,263 youth referred to DJJ during FY 2004-05 is presented below. The majority of youth referred were male (70%),
white (59%), and 52% were under 16 years of age. at the time of their most serious referral. The tables and charts below provide a profile of youth referred by gender, race, ethnicity and age.

Intake 2006 Outcome Evaluation Report
Profile of Youth 55
Fiscal Year Percentage
Race and Gender 2004-05 of Total
Black Females 11,137 12%
White Females 16,803 18%
Other Females 720 1%
Black Males 25,428 27%
White Males 39,286 41%
Other Males 1,889 2%
Total 95,263 100%
Fiscal Year Percentage
Ethnicity and Gender 2004-05 of Total
Non-Hispanic Males 56,403 59%
Hispanic Males 10,200 11%
Non-Hispanic Females 25,424 27%
Hispanic Females 3,236 3%
Total 95,263 100%
Proportion of Youth Referred by Ethnicity and GenderFY 2004-05
Proportion of Youth Referred by Race and GenderFY 2004-05
Other Females,
1%
White Females,
18%
White Males, 41%
Other Males, 2%
Black Females,
12%
Black Males, 27%
Non-Hispanic
Males, 59%
Hispanic Females,
3%
Non-Hispanic Females,
27%
Hispanic Males, 11%

2006 Outcome Evaluation Report Intake
56 Profile of Youth
Fiscal Year Pecentage
Race and Ethnicity 2004-05 of Total
Black Non-Hispanics 35,766 38%
White Non-Hispanics 43,541 46%
Other Non-Hispanics 2,520 3%
Black Hispanics 799 1%
White Hispanics 12,548 13%
Other Hispanics 89 <1%
Total 95,263 100%
Fiscal Year Pecentage
Age 2004-05 of Total
9 Years or Younger 855 1%
10 Years Old 897 1%
11 Years Old 1,968 2%
12 Years Old 4,549 5%
13 Years Old 8,663 9%
14 Years Old 13,822 15%
15 Years Old 18,021 19%
16 Years Old 20,903 22%
17 Years Old 22,939 24%
18 Years or Older 2,646 3%
Total 95,263 100%
Proportion of Youth Referred by Race and EthnicityFY 2004-05
Proportion of Youth Referred by AgeFY 2004-05
Black Non-Hispanics,
38%
White Non-Hispanics,
46%
White Hispanics,
13%
Black Hispanics,
1%
Other Non-Hispanics,
3%
12 Years or Under, 9%
18+ Years, 3%
13 Years, 9%17 Years,
24%14
Years, 15%
15 Years, 19%
16 Years, 22%

Detention Services 2006 Outcome Evaluation Report
Detention Services 57
DETENTION SERVICES
The detention of youth is provided for in section 985.215, Florida Statutes (2005). Criteria for detention include the following factors: current offenses, prior history, legal status, and any aggravating or mitigating factors. The Detention Risk Assessment Instrument (DRAI) is used to score each of these factors and determine whether detention is warranted, and if so, what type of detention. However, there are situations in which youth may be detained even if the score on the DRAI would not require detention. These exceptions include juveniles being placed into detention pursuant to a court order, including contempt of court, violations of juvenile gun laws, and domestic violence offenses.
When a youth is screened and the appropriate type of detention is determined, the youth may not be held for more than 24 hours without a detention review hearing. The hearing is to determine whether there is probable cause to believe that the youth committed the offense and to determine the need for continued detention. The youth may be represented by a private attorney, a court-appointed public defender or may waive the right to counsel.
Two types of detention were available to the juvenile court during FY 2004-05: home detention and secure detention. Each type features different levels of security and supervision.
Secure detention is the temporary care and custody of a youth within the physical confines of a detention center pending adjudication, disposition, or placement. The youth is held in a secure jail- like facility operated by DJJ.
Home detention is defined as the temporary custody of a youth while released to the physical custody of their parents, a guardian, or a custodian in a physically non-restrictive environment, usually their own home, while under the supervision of DJJ pending adjudication, disposition, or placement.
Detention Services Outputs
The remaining sections of this chapter focus on outputs for youth admitted to secure and home detention in FY 2004-05. Measures of detention utilization including: operating capacity, total service days, average daily population, average utilization rate, minimum and maximum daily population, and transfers into detention, are provided. A detailed description of the data sources and methods used in analyzing the data can be found in the Data and Methods chapter of this report.

2006 Outcome Evaluation Report Detention Services
58 Secure Detention
Secure Detention
Secure detention is used for three primary purposes:
1. To detain and monitor youth prior to an adjudicatory hearing. Unlike adults, juveniles in Florida have no right to bail.
2. To maintain custody of an adjudicated juvenile who is awaiting placement in a commitment program.
3. To impose sanctions for contempt of court, gun law violations and domestic violence or as otherwise allowed by state law.
Use of secure detention is based primarily upon findings that a youth:
• Presents a substantial risk of not appearing at a subsequent hearing.
• Presents a substantial risk of inflicting bodily harm on others as evidenced by recent behavior.
• Presents a history of committing a property offense prior to adjudication, disposition or placement.
• Has committed contempt of court by:
1. Intentionally disrupting the administration of the court;
2. Intentionally disobeying a court order; or
3. Engaging in a punishable act or speech in the court’s presence that shows disrespect for the authority and dignity of the court.
• Requests protection from imminent bodily harm.
During FY 2004-05, there were 26 secure detention centers with 2,057 operating beds in Florida. There were 55,637 admissions and 6,299 transfers to Florida’s 26 secure detention centers. Transfers include transfers to home detention, other detention centers and commitment programs.
In examining the demographic characteristics of admissions, gender, race and ethnicity is reported. Race is categorized as white, black and other. Ethnicity is categorized as Hispanic or non-Hispanic.
There were 43,028 male admissions accounting for 78% of all admissions, and 12,429 female admissions accounting for 22% of all admissions. White youth (both Hispanic and non-Hispanic) accounted for 49% of admissions to secure detention, while black youth accounted for 48%. The remaining 3% includes youth who are classified in the data system as Alaskan, American Indian, Asian, or Pacific Islander. Hispanic youth accounted for 13% (n=7,144) of total admissions.

Detention Services 2006 Outcome Evaluation Report
Secure Detention Demographics 59
White Black White Black Other Total
Alachua 471 850 19 4 6 1,350 Bay 424 230 20 2 7 683 Brevard 555 357 42 5 12 971 Broward 652 1,820 311 33 279 3,095 Collier 241 113 278 2 69 703 Duval 977 1,584 67 19 20 2,667 Escambia 658 839 41 19 15 1,572 Hillsborough East 492 574 236 21 18 1,341 Hillsborough West 433 1,456 266 45 29 2,229 Leon 247 601 17 2 9 876 Manatee 652 484 183 9 23 1,351 Marion 915 532 73 13 2 1,535 Miami-Dade 261 2,161 1,442 131 344 4,339
Monroe1 72 36 20 12 0 140 Okaloosa 490 205 20 2 10 727 Orange 942 2,456 655 56 118 4,227 Osceola 405 255 346 33 15 1,054 Palm Beach 603 1,163 272 19 100 2,157 Pasco 959 154 101 3 8 1,225 Pinellas 1,240 1,422 113 8 49 2,832 Polk 707 570 198 6 8 1,489 Seminole 408 471 103 24 12 1,018 St. Johns 421 326 25 1 4 777 St. Lucie 616 733 169 8 41 1,567 SW Florida 800 574 274 6 44 1,698 Volusia 867 589 117 4 8 1,585
Statewide 15,508 20,555 5,408 487 1,250 43,208
Hispanic
1 The Monroe Juvenile Detention Facility opened in July 2004.
Secure Detention Demographics FY 2004-05Male Admissions
Facility
Non-Hispanic
Secure Detention Demographics
The following tables present demographic information for males and females admitted to secure detention facilities during FY 2004-05 by race and ethnicity. During FY 2004-05,
there were 43,208 male admissions which accounted for 78% of all admissions to secure detention. Non-Hispanic black males (n=20,555) represented 48% of male admissions, and non-Hispanic white males (n=15,508) represented 36% of admissions. A total of 5,895 male admissions were classified as Hispanic (14%).

2006 Outcome Evaluation Report Detention Services
60 Secure Detention Demographics
White Black White Black Other Total
Alachua 137 210 5 0 1 353 Bay 163 102 5 2 9 281 Brevard 248 94 11 2 4 359 Broward 179 325 53 13 69 639 Collier 119 36 50 0 17 222 Duval 315 360 19 8 12 714 Escambia 235 246 12 1 10 504 Hillsborough East 154 120 34 5 1 314 Hillsborough West 165 319 58 7 2 551 Leon 70 203 9 1 0 283 Manatee 291 176 30 1 3 501 Marion 293 151 21 1 0 466 Miami-Dade 82 594 305 22 99 1,102
Monroe1 17 7 2 0 0 26 Okaloosa 153 42 3 1 3 202 Orange 301 596 140 10 30 1,077 Osceola 108 70 74 7 1 260 Palm Beach 257 363 77 1 30 728 Pasco 331 47 15 1 3 397 Pinellas 472 401 33 3 12 921 Polk 268 175 51 10 12 516 Seminole 151 109 15 5 7 287 St. Johns 95 93 3 0 2 193 St. Lucie 231 245 31 7 15 529 SW Florida 283 119 45 1 16 464 Volusia 306 193 31 8 2 540
Statewide 5,424 5,396 1,132 117 360 12,429
Hispanic
1 The Monroe Juvenile Detention Facility opened in July 2004.
Secure Detention Demographics FY 2004-05Female Admissions
Facility
Non-Hispanic
During FY 2004-05, 12,429 females were admitted to secure detention which accounted for 22% of all admissions. There were almost equal numbers of non-Hispanic white females
(n=5,424) and non-Hispanic black females (n=5,396) admitted to secure detention. A total of 1,249 female admissions were classified as Hispanic (10%).

Detention Services 2006 Outcome Evaluation Report
Secure Detention Utilization 61
Minimum MaximumAlachua 57 20,685 72 79% 32 83 1,703 243 11Bay 44 15,955 52 84% 19 68 964 189 14Brevard 58 21,186 52 112% 40 84 1,330 163 14Broward 112 40,950 109 103% 80 154 3,734 254 10Collier 31 11,264 50 62% 11 54 925 176 10Duval 98 71,844 144 68% 54 134 3,381 345 10Escambia 65 35,940 50 129% 0 95 2,076 274 10Hillsborough East 57 23,598 50 115% 37 75 1,655 392 10Hillsborough West 101 20,966 93 109% 73 126 2,780 269 12Leon 56 36,848 56 100% 34 76 1,159 101 16Manatee 68 20,464 72 95% 37 102 1,852 108 13Marion 90 24,936 88 103% 47 123 2,001 332 14Miami-Dade 197 33,011 226 87% 146 256 5,441 335 12Monroe3 6 2,028 15 37% 0 12 166 37 10Okaloosa 42 15,300 50 84% 20 58 929 246 13Orange 153 55,862 151 101% 89 206 5,304 651 9Osceola 42 15,191 50 83% 22 68 1,314 326 9Palm Beach 101 36,824 93 108% 69 141 2,885 407 11Pasco 53 19,258 57 93% 30 75 1,622 328 10Pinellas 128 46,560 120 106% 72 173 3,753 231 12Polk 74 26,954 90 82% 47 114 2,005 146 13Seminole 46 16,634 39 117% 22 71 1,305 89 12St. Johns 36 13,057 50 72% 15 56 970 124 12St. Lucie 72 26,375 78 93% 45 120 2,096 223 11SW Florida 64 23,493 60 107% 41 89 2,162 205 10Volusia 71 25,866 90 79% 48 105 2,125 105 12
Statewide 1,921 701,049 2,057 93% 1,391 2,349 55,637 6,299 12 1 Statewide average utilization rate is calculated by dividing total service days by total possible service days.
Secure Detention Utilization Rates FY 2004-05
Average Lengthof Stay2Admissions
Transfers In
Total Service
Days Daily Population
Facility
Average Daily
PopulationOperating Capacity
AverageUtilization
Rate1
3 The Monroe Juvenile Detention Facility opened in July 2004.
2 Average length of stay is computed for youth released during FY 2004-05.
Secure Detention Utilization
This section presents a variety of utilization statistics for secure detention facilities during FY 2004-05. When the utilization rate is under 100%, the center is, on average, operating below its planned capacity. When this rate is over 100%, the center is, on average, operating above its planned capacity. The consequences of over utilization include overcrowding and higher youth-to-staff ratios. The following table presents secure detention utilization figures for FY 2004-05. Only two detention centers (Duval and Monroe) did not exceed their designed capacity at any point during FY 2004-05.
Due to hurricanes, two facilities (Monroe and Escambia) were temporarily shut down and youth were transferred to other centers until these two facilities could re-open. As a result, the utilization rates for these two facilities were slightly impacted. During FY 2004-05, the average daily population in secure detention centers was 1,921 youth and the average length of stay in secure detention was 12 days.
Only two detention centers did not exceed designed capacity during FY 2004-05.

2006 Outcome Evaluation Report Detention Services
62 Secure Detention Monthly Admissions
Admissions to Secure Detention FY 2004-05 by Month
4,468
4,006
4,8404,450 4,383
4,8125,009 4,916
5,146
4,4244,5494,634
0
1,000
2,000
3,000
4,000
5,000
6,000
July
Augu
st
Septe
mber
Octobe
r
Nove
mber
Decem
ber
Janu
ary
Febru
aryMarc
hApri
lMay
June
Monthly Admissions to Secure Detention
Seasonal variance is apparent in the monthly rate of admissions to secure detention centers. Specifically, the number of admissions varies substantially from month-to-month. The following chart presents admissions to secure
detention by month for FY 2004-05. During FY 2004-05, the highest number of admissions to secure detention occurred in May and the lowest number was in September.
Admissions to secure detention peaked in May of FY 2004-05

Detention Services 2006 Outcome Evaluation Report
Secure Detention Admission and Transfer Trends 63
Facility
FY
2000-011
FY 2001-02
FY 2002-03
FY 2003-04
FY 2004-05
FY
2000-011
FY 2001-02
FY 2002-03
FY 2003-04
FY 2004-05
Alachua 2,027 1,661 1,712 1,770 1,703 447 395 313 265 243 Bay 831 842 895 1,044 964 120 167 166 191 189 Brevard 1,415 1,305 1,340 1,463 1,330 103 66 106 131 163 Broward 4,065 4,557 4,256 3,638 3,734 259 482 397 317 254 Collier
2N/A 678 731 885 925 N/A 185 224 153 176
Duval 3,721 3,428 3,295 3,324 3,381 243 169 166 215 345 Escambia 2,276 1,853 1,927 2,025 2,076 118 268 329 268 274 Hillsborough East 307 1,367 1,430 1,923 1,655 1,444 533 426 503 392 Hillsborough West 3,744 2,409 2,404 2,473 2,780 241 241 233 448 269 Leon 1,298 1,033 1,025 1,017 1,159 281 134 114 114 101
Manatee3
1,689 1,656 1,711 1,950 1,852 530 227 289 163 108 Marion
42,291 2,221 2,055 2,063 2,001 488 599 429 281 332
Miami-Dade 7,203 6,808 6,040 5,327 5,441 540 464 497 330 335
Monroe5
N/A N/A N/A N/A 166 N/A N/A N/A N/A 37 Okaloosa 1,043 851 925 1,034 929 267 407 307 270 246 Orange 4,661 4,008 4,775 4,980 5,304 615 557 1,139 667 651 Osceola 464 646 633 932 1,314 109 220 211 269 326 Palm Beach 2,901 2,574 2,537 2,772 2,885 79 418 603 366 407 Pasco 883 950 1,096 1,329 1,622 202 316 416 329 328 Pinellas 3,072 3,068 3,342 3,420 3,753 70 176 222 235 231 Polk 2,426 2,349 2,246 2,124 2,005 101 192 209 184 146 Seminole 1,188 1,157 1,111 1,345 1,305 76 120 146 129 89 St. Johns 494 494 666 791 970 222 447 264 143 124 St. Lucie 1,806 1,898 1,861 2,222 2,096 117 343 364 264 223 SW Florida 2,711 2,009 2,088 2,063 2,162 456 311 289 216 205 Volusia 2,135 1,906 2,080 1,898 2,125 226 338 249 128 105
Statewide 54,651 51,728 52,181 53,812 55,637 7,354 7,775 8,108 6,579 6,299
4 Capacity increased by 20 beds in August 2001.
5 The Monroe Juvenile Detention Facility opened in July 2004.
3 Capacity increased by 20 beds in July 2001.
1Admission and transfer figures for FY 2000-01 were calculated using information extracted from the Juvenile Justice Information System (JJIS) in October 2005. As a result of continued data verification and correction efforts, these figures may vary slightly from those presented in previous reports.
Secure Detention Admissions and Transfer Trends
Admissions Transfers
2 The Collier Regional Juvenile Detention Facility opened in September 2001.
Secure Detention Admissions and Transfer Trends
The following table provides five-year trend data of admissions and transfers for each of the detention centers between FY 2000-01 and FY 2004-05. Admissions to secure detention increased from 54,651 during FY 2000-01 to 55,637 during FY 2004-05.
Transfers decreased from 7,354 during FY 2000-01 to 6,299 during FY 2004-05. During the last five fiscal years, admissions to the Hillsborough West and Miami-Dade detention centers decreased by 26% and 24%, respectively. During the same period, admissions to the Osceola and St. Johns detention centers increased by 183% and 96%, respectively.
Admissions to secure detention centers have increased over the last five years.

2006 Outcome Evaluation Report Detention Services
64 Secure Detention Admissions and At-risk Population
At-Risk Population in Florida (Juveniles Age 10-17)
0
200000
400000
600000
800000
1000000
1200000
1400000
1600000
1800000
2000000
1991
1992
1993
1994
1995
1996
1997
1998
1999
2000
2001
2002
2003
2004
2005
1,829,109
1,249,629
Admissions to Secure Detention (FY 1991-92 to FY 2004-05)
0
10,000
20,000
30,000
40,000
50,000
60,000
1991
-92
1992-9
3
1993
-94
1994-9
5
1995
-96
1996-9
7
1997
-98
1998-9
9
1999
-00
2000-0
1
2001
-02
2002-0
3
2003
-04
2004-0
5
55,637
29,299
At-Risk Populations and Admissions to Secure Detention
Youth between the ages of 10 and 17 are considered ‘at-risk’ for delinquency. The graphs below present 15 year trends for the at-risk population, as well as admissions to secure detention. The number of at-risk youth in Florida has increased significantly since the early 1990s. Specifically, the number of at-risk youth has increased by 46% between
1991 and 2005.7 According to the Florida of Economic Office and Demographic Research, populations of 10 to 17-year-old youth are expected to rise by approximately 2% each year for the next decade.
Between 1991 and 2005, admissions to secure detention centers increased by 90%. Admissions during this period peaked at 59,622 youth during FY 1999-00.
7 Florida Office of Economic and Demographic Research

Detention Services 2006 Outcome Evaluation Report
Secure Detention Utilization Trends 65
Secure Detention Utilization (FY 1986-87 to FY 2004-05)
0%10%20%30%40%50%60%70%80%90%
100%110%120%130%140%
1986
-87
1987-8
8
1988-8
9
1989-9
0
1990-9
1
1991-9
2
1992-9
3
1993-9
4
1994-9
5
1995-9
6
1996-9
7
1997-9
8
1998-9
9
1999-0
0
2000-0
1
2001-0
2
2002
-03
2003
-04
2004
-05
93%106%
138%
Statewide Secure Detention Utilization Trends
The following graph presents secure detention utilization between FY 1986-87 and FY 2004-05. Statewide secure detention utilization peaked in the late 1990s at 138%.
With the exception of FY 2004-05, despite an increase in admissions statewide secure detention utilization have steadily decreased since FY 1999-00 indicating youth are spending less time in detention.

2006 Outcome Evaluation Report Detention Services
66 Secure Detention Trends
FacilityFY
2000-01FY
2001-02FY
2002-03FY
2003-04FY
2004-05FY
2000-011FY
2001-02FY
2002-03FY
2003-04FY
2004-05
Alachua 115% 97% 88% 82% 79% 12 12 11 11 11Bay 117% 92% 89% 94% 84% 23 18 16 15 14Brevard 121% 90% 84% 113% 112% 16 12 11 14 14Broward 129% 133% 116% 96% 103% 12 11 10 10 10Collier2 N/A 68% 66% 60% 62% N/A 12 13 11 10Duval 101% 87% 70% 64% 68% 13 13 11 10 10Escambia 130% 122% 115% 129% 129% 10 11 9 10 10Hillsborough East 96% 94% 104% 113% 115% 10 9 10 9 10Hillsborough West 105% 92% 92% 108% 109% 9 12 12 13 12Leon 132% 123% 110% 102% 100% 17 22 20 19 16
Manatee3 133% 92% 102% 96% 95% 11 13 14 12 13
Marion4 153% 118% 119% 107% 103% 14 13 15 15 14Miami-Dade 145% 135% 115% 87% 87% 16 15 15 13 12
Monroe5 N/A N/A N/A N/A 37% N/A N/A N/A N/A 10Okaloosa 110% 90% 84% 95% 84% 15 13 12 14 13Orange 133% 102% 102% 96% 101% 15 12 10 10 9Osceola 76% 78% 59% 78% 83% 16 17 13 12 9Palm Beach 127% 114% 98% 99% 108% 15 13 11 11 11Pasco 96% 89% 91% 90% 93% 18 14 13 11 10Pinellas 99% 104% 99% 104% 106% 14 14 12 12 12Polk 113% 106% 102% 90% 82% 15 14 14 13 13Seminole 105% 88% 85% 112% 117% 12 10 10 11 12St. Johns 60% 77% 66% 59% 72% 15 15 13 12 12St. Lucie 92% 92% 77% 90% 93% 14 11 10 10 11SW Florida 153% 131% 118% 101% 107% 11 12 11 10 10Volusia 109% 85% 82% 70% 79% 15 13 12 11 12Statewide 118% 104% 96% 92% 93% 15 13 13 12 12
4 Capacity increased by 20 beds in August 2001.5 The Monroe Juvenile Detention Facility opened in July 2004.
3 Capacity increased by 20 beds in July 2001.
1Admission and transfer figures for FY 2000-01 were calculated using information extracted from the Juvenile Justice Information System (JJIS) in October 2005. As a result of continued data verification and correction efforts, these figures may vary slightly from those presented in previous reports.
Secure Detention Utilization and Length of StayFY 2000-01-FY 2004-05
Average Utilization Rate Average Length of Stay
2 The Collier Regional Juvenile Detention Facility opened in September 2001.
Secure Detention Utilization and Length of Stay Trends
The following table provides longitudinal comparisons of utilization rates and average lengths of stay by detention center between FY 2000-01 and FY 2004-05. The secure detention center utilization rate rose slightly during FY 2004-05 to 93%, which is an increase of 1% over the previous fiscal year. The statewide average utilization rate decreased between FY 2000-01 and FY 2003-04. Some centers experienced substantial decreases while others experienced increases. During the last five fiscal years, the utilization rate at the
Miami-Dade and Marion detention centers decreased by 40% and 33%, respectively. During the same period, the utilization rate at the Hillsborough-East and St. Johns detention centers increased by 20% and 19%, respectively.
Utilization rates are impacted by length of stay. Over the five-year period, the statewide average length of stay decreased from 15 days during FY 2000-01 to 12 days during FY 2004-05. However, while some centers saw a decrease (i.e., Pasco by 46%), others experienced an increase (i.e., Hillsborough West by 36%).

Detention Services 2006 Outcome Evaluation Report
Secure Detention Awaiting Residential Placement 67
FY 2000-01 FY 2001-02 FY 2002-03 FY 2003-04 FY 2004-05
Male 11 11 10 11 9Female 9 10 8 10 9
All 10 10 10 11 9Male 14 14 13 13 11
Female 14 12 11 10 9All 14 13 13 12 11
Male 28 22 21 18 14Female 24 21 16 16 15
All 27 22 20 17 14Male 17 15 18 14 11
Female 43 12 4 7 10All 21 14 16 14 11
Average for All Levels 17 15 14 13 11
Average Length of Stay for Youth in Secure Detention Awaiting Residential Commitment Placement1
Low-Risk Residential
Commitment Restrictiveness Level Gender
Days
Moderate-Risk Residential
High-Risk Residential
Maximum-Risk Residential
1 Awaiting Residential Placement figures were calculated using information extracted from the Juvenile Justice Information System (JJIS) in October 2005. As a result of continued data verification and correction efforts, these figures may vary slightly from those presented in previous reports.
Youth Awaiting Residential Commitment Placement
Under section 985.125 Florida Statutes, youth committed to moderate-, high- or maximum-risk commitment programs may be held in secure detention until a placement becomes available. Youth awaiting placement in high- or maximum-risk programs may be held until the placement is accomplished. For youth awaiting moderate-risk program placement, the statute specifies:
“…. the department may seek an order from the court authorizing continued detention for a specific period of time necessary for the appropriate residential placement of the child. However, such continued detention in secure detention care may not exceed 15 days after commitment, excluding Saturdays, Sundays, and legal holidays, and except as otherwise provided in this subsection. (Section 985.215 (10) (a) 1
Once a youth is committed by the juvenile court, DJJ must determine the most appropriate placement based on safety and treatment concerns. In order to efficiently and effectively utilize the commitment beds available, a waiting list is used to prioritize
placements. Youth designated for certain specialized beds may spend more time on the waiting list, thus more time in secure detention. Statewide, the average time spent awaiting placement in FY 2004-05 was 11 days. The length of time varies by restrictiveness level from a high of 9 days for low-risk restrictiveness programs to a high of 14 days for high-risk restrictiveness programs. The Department has worked to ensure enough of the appropriate placements are available so that youth can be placed into a program as quickly as possible. This effort is evident from the reduction in the overall time youth spent in detention awaiting placement. Between FY 2000-01, and FY 2004-05, the time spent awaiting placement had decreased from 17 to 11 days, a 34% reduction. The largest reductions have occurred for youth awaiting placement in a high-risk residential program. On average, the wait time for males awaiting high-risk residential placement was reduced by 50% in the last five years. Males spent 14 fewer days awaiting placement during FY 2004-05 than they had in FY 2000-01. The wait time also decreased for females who spent 9 fewer days or 36% less time awaiting a high-risk residential placement.

2006 Outcome Evaluation Report Detention Services
68 Home Detention Demographics
White Black White Black Other Total
Alachua 168 473 6 0 3 650 Bay 190 103 9 0 3 305 Brevard 454 253 33 1 6 747 Broward 320 811 152 12 124 1,419 Collier 99 40 96 1 27 263 Duval 522 1,047 38 8 15 1,630 Escambia 542 714 19 18 13 1,306 Hillsborough East 254 227 117 10 2 610 Hillsborough West 231 759 141 21 12 1,164 Leon 102 255 4 1 4 366 Manatee 163 102 48 1 4 318 Marion 665 381 63 3 4 1,116 Miami-Dade 105 829 706 50 136 1,826
Monroe1
18 3 3 2 0 26 Okaloosa 90 32 2 2 3 129 Orange 482 1,123 334 31 65 2,035 Osceola 129 61 112 11 2 315 Palm Beach 316 444 133 5 45 943 Pasco 218 22 22 1 4 267 Pinellas 313 251 24 2 12 602 Polk 510 365 139 3 5 1,022 Seminole 369 374 107 24 9 883 St. Johns 20 12 1 0 0 33 St. Lucie 264 285 61 3 19 632 SW Florida 511 287 168 1 17 984 Volusia 205 120 28 1 2 356
Statewide 7,260 9,373 2,566 212 536 19,947
Hispanic
1 The Monroe Juvenile Detention Facility opened in July 2004.
Home Detention Demographics FY 2004-05Male Admissions
Facility
Non-Hispanic
Home Detention
Home detention is an alternative to secure detention for youth assessed as suitable to remain in the community but needing DJJ supervision. While in home detention, a youth is under the temporary legal custody of DJJ, but under the physical custody of a parent, guardian, or custodian in a physically non-restrictive environment, usually in his or her own home.
Previously, home detention figures were only reported in aggregate for the entire state. For this report, these figures have been calculated
for each center where home detention cases are tracked. Total admissions to home detention for FY 2004-05 were 24, 947.
The following tables present demographic information for males and females admitted to home detention during FY 2004-05 by race and ethnicity. During FY 2004-05, there were 19,947 male admissions which accounted for 80% of admissions to home detention. Non-Hispanic black males (n=9,373) represented 47% of male admissions, and non-Hispanic white males (n=7,260) represented 36% of admissions. A total of 2,778 male admissions were classified as Hispanic (14%).

Detention Services 2006 Outcome Evaluation Report
Home Detention Demographics 69
White Black White Black Other Total
Alachua 41 146 0 0 0 187 Bay 46 42 1 1 5 95 Brevard 147 76 10 0 2 235 Broward 47 132 15 4 26 224 Collier 51 9 19 1 9 89 Duval 109 212 5 2 12 340 Escambia 151 207 7 1 5 371 Hillsborough East 77 55 20 4 1 157 Hillsborough West 87 181 44 2 3 317 Leon 26 89 1 0 0 116 Manatee 63 41 6 1 0 111 Marion 182 122 10 2 2 318 Miami-Dade 16 186 108 6 35 351
Monroe1 1 0 1 0 0 2 Okaloosa 23 7 2 0 0 32 Orange 96 243 71 8 10 428 Osceola 20 16 22 0 2 60 Palm Beach 89 140 20 0 6 255 Pasco 62 3 3 0 1 69 Pinellas 77 31 9 1 2 120 Polk 179 107 26 7 3 322 Seminole 119 93 9 4 1 226 St. Johns 2 3 0 0 0 5 St. Lucie 69 93 10 2 9 183 SW Florida 185 46 24 2 8 265 Volusia 53 40 8 1 0 102
Statewide 2,018 2,320 451 49 142 4,980
Hispanic
1 The Monroe Juvenile Detention Facility opened in July 2004.
Home Detention Demographics FY 2004-05Female Admissions
Facility
Non-Hispanic
During FY 2004-05, 4,980 females were admitted to home detention which accounted for 20% of all admissions to home detention. Non-Hispanic black females (n=2,320) represented 50% of female admissions, and
non-Hispanic white females (n=2,018) represented 41% of admissions. A total of 500 female admissions were classified as Hispanic (10%).

2006 Outcome Evaluation Report Detention Services
70 Home Detention Utilization
Minimum MaximumAlachua 40 14,674 13 66 837 54 17 Bay 31 11,348 19 46 400 19 26 Brevard 41 15,091 26 63 982 16 14 Broward 81 29,626 35 125 1,643 28 18 Collier 16 5,822 6 31 352 15 16 Duval 209 76,219 135 273 1,970 37 35 Escambia 126 46,081 88 178 1,677 10 25 Hillsborough East 36 13,000 17 52 767 13 17 Hillsborough West 68 24,966 36 93 1,481 57 16 Leon 81 29,641 58 105 482 16 56 Manatee 24 8,793 13 38 429 6 20 Marion 156 57,081 112 192 1,434 21 39 Miami-Dade 113 41,427 65 189 2,177 81 18
Monroe2 1 324 0 6 28 2 11 Okaloosa 7 2,729 2 13 161 3 17 Orange 96 34,931 64 154 2,463 108 14 Osceola 17 6,122 5 33 375 4 16 Palm Beach 154 56,102 108 227 1,198 17 45 Pasco 19 6,796 7 34 336 0 20 Pinellas 40 14,517 14 66 722 2 19 Polk 101 36,818 68 151 1,344 30 25 Seminole 62 22,657 37 95 1,109 47 19 St. Johns 3 969 0 6 38 0 24 St. Lucie 67 24,360 47 91 815 13 30 SW Florida 52 18,913 32 75 1,249 23 16 Volusia 23 8,420 9 47 458 7 18
Statewide 1,664 607,427 1,231 1,956 24,927 629 23
Home Detention Utilization FY 2004-2005
1 Average length of stay is computed for youth released during FY 2004-05.2 The Monroe Juvenile Detention Facility opened in July 2004.
Average Lengthof Stay1Admissions Transfers In
TotalServiceDays
Daily Population Facility
Average Daily
Population
Home Detention Utilization
Examining utilization for home detention is different than examining utilization rates fo r secure detention. Whereas secure detention facilities have a fixed capacity, home detention does not. Therefore, utilization rates are not calculated for home detention. During FY 2004-05, the average daily population for home detention was 1,664
youth. During the same period, the average length of stay in home detention was 23 days. Youth on home detention status are tracked through the local (or closest) secure detention facility. Duval and Marion had the highest average daily population of youth on home detention (209 and 156, respectively). The following table presents home detention utilization figures for FY 2004-05 by secure detention facility that tracked the youth.

Detention Services 2006 Outcome Evaluation Report
Home Detention Trends 71
FacilityFY
2000-01FY
2001-02FY
2002-03FY
2003-04FY
2004-05FY
2000-01FY
2001-02FY
2002-03FY
2003-04FY
2004-05
Alachua 27 23 23 34 40 18 19 16 19 17 Bay 14 16 12 15 31 36 33 20 20 26 Brevard 42 32 33 26 41 15 11 10 10 14 Broward 61 70 10 8 81 20 25 17 21 18
Collier2 N/A 9 9 19 16 N/A 15 19 15 16 Duval 102 62 97 73 209 25 22 36 30 35 Escambia 62 51 48 52 126 22 21 21 20 25 Hillsborough East 0 15 27 29 36 18 15 14 16 17 Hillsborough West 85 54 43 56 68 14 14 13 15 16 Leon 28 37 44 42 81 26 42 60 48 56 Manatee3 38 30 7 4 24 21 17 11 7 20 Marion 95 90 104 122 156 29 32 30 34 39 Miami-Dade 161 98 20 23 113 27 22 8 7 18 Monroe N/A N/A N/A N/A 1 N/A N/A N/A N/A 11 Okaloosa 3 1 3 3 7 5 8 10 10 17 Orange 115 89 91 94 96 21 20 15 13 14 Osceola 9 17 23 19 17 18 33 41 36 16 Palm Beach 40 38 54 98 154 19 22 23 34 45 Pasco 18 14 13 10 19 22 17 15 18 20 Pinellas 47 28 3 6 40 19 16 10 11 19 Polk 37 37 35 53 101 19 20 22 19 25 Seminole 41 43 49 57 62 20 19 17 17 19 St. Johns 4 1 2 3 3 19 19 23 15 24 St. Lucie 32 27 35 55 67 27 25 29 29 30 SW Florida 52 29 27 50 52 15 14 15 14 16 Volusia 75 51 19 22 23 25 33 19 17 18
Statewide 1,188 965 829 972 1,664 21 20 19 19 23
3 The Monroe Juvenile Detention Facility opened in July 2004.
1 Figures between FY 2000-01 and 2003-04 were calculated using information extracted from the Juvenile Justice Information System (JJIS) in October 2005. As a result ofcontinued data correction efforts, these figures may vary slightly from those presented in previous reports.
Home Detention Utilization and Length of Stay1
FY 2000-01 through FY 2004-05
Average Daily Population Average Length of Stay
2 The Collier Regional Juvenile Detention Facility opened in September 2001.
Home Detention Utilization and Length of Stay Trends
For the five-year period between FY 2000-01 and FY 2004-05, the statewide average daily population of youth on home detention increased by 40%, from 1,188 to 1,664. Some centers experienced substantial increases while others experienced decreases. For example, during the last five fiscal years the average daily home detention populations tracked by the Palm Beach and Leon detention centers increased by 285% and 189%, respectively. During the same period, the average daily home detention populations tracked by the Volusia and St. Johns detention centers decreased by 69% and 25%, respectively.
Over the five-year period, the average time youth spent on home detention status increased from 21 days to 23 days. However, while some centers saw a decrease, others experienced an increase. For example, the average length of stay on home detention tracked by the Orange detention center decreased by 7 days (35%) during the last five fiscal years. During the same time period, the average length of stay for youth on home detent ion tracked by the Palm Beach detention center increased by 26 days (137%). The following table provides longitudinal comparisons of average daily populations and average lengths of stay between FY 2000-01 and FY 2004-05.

2006 Outcome Evaluation Report Detention Services
72 Home Detention Admission and Transfer Tr ends
Facility
FY 2000-011
FY 2001-02
FY 2002-03
FY 2003-04
FY 2004-05
FY 2000-01
FY 2001-02
FY 2002-03
FY 2003-04
FY 2004-05
Alachua 489 411 475 698 837 23 27 19 21 54 Bay 127 188 204 273 400 10 8 10 13 19 Brevard 1,015 984 1,107 928 982 67 45 46 15 16 Broward 1,077 1,023 180 179 1,643 48 36 8 1 28 Collier
2N/A 189 177 405 352 N/A 27 8 44 15
Duval 1,387 1,004 958 870 1,970 50 38 22 10 37 Escambia 1,029 847 778 963 1,677 56 40 31 44 10 Hillsborough East 5 365 686 658 767 2 12 13 18 13 Hillsborough West 2,093 1,511 1,161 1,279 1,481 69 36 42 82 57 Leon 329 277 281 291 482 17 9 6 5 16 Manatee
3624 613 229 216 429 55 27 7 7 6
Marion4
1,060 1,007 1,159 1,243 1,434 76 52 62 47 21 Miami-Dade 2,290 1,627 1,082 1,179 2,177 112 76 32 29 81 Monroe
5N/A N/A N/A N/A 28 N/A N/A N/A N/A 2
Okaloosa 187 56 98 109 161 21 1 2 1 3 Orange 2,003 1,612 2,030 2,603 2,463 96 65 114 166 108 Osceola 138 177 192 189 375 28 5 8 9 4 Palm Beach 711 611 732 975 1,198 12 23 57 38 17 Pasco 314 272 308 203 336 28 19 9 5 0 Pinellas 974 611 118 195 722 19 7 0 1 2 Polk 651 627 641 964 1,344 10 29 18 17 30 Seminole 682 788 1,043 1,167 1,109 45 41 19 52 47 St. Johns 80 26 27 74 38 6 1 0 2 0 St. Lucie 468 354 421 699 815 21 19 16 9 13 SW Florida 1,168 745 645 1,272 1,249 100 53 12 26 23 Volusia 1,045 552 359 478 458 79 23 9 9 7 Statewide 19,946 16,477 15,091 18,110 24,927 1,050 719 570 671 629
4 Capacity increased by 20 beds in August 2001.
5 The Monroe Juvenile Detention Facility opened in July 2004.
3 Capacity increased by 20 beds in July 2001.
1 Figures between FY 2000-01 and 2003-04 were calculated using information extracted from the Juvenile Justice Information System (JJIS) in October 2005. As a result of continued data correction efforts, these figures may vary slightly from those presented in previous reports.
Home Detention Admissions and Transfer Trends1
Admissions Transfers
2 The Collier Regional Juvenile Detention Facility opened in September 2001.
Home Detention Admissions and Transfer Trends
For two of the last five years, admissions to home detention decreased. However in the last two years, there has been a large increase. This increase in admissions is attributed in part to the discontinuation of state- funded electronic monitoring after FY 2003-04. This change resulted in youth who would otherwise have been on electronic monitoring being placed on home detention status. Transfers, which are largely due to re-assignment of case tracking from one secure detention center to another due to the youth’s geographical movement, decreased from 1,050 during FY 2000-01 to 629 during FY 2004-05.
The following table provides longitudinal comparisons of home detention admissions and transfers between FY 2000-01 and FY 2004-05 statewide, and by detention center. Admissions varied from center to center with some centers experiencing large increases while others experienced large decreases. Admissions to home detention tracked by Bay and Osceola detention centers increased by 215% and 172%, respectively, during the last five fiscal years. During the same period, admissions to home detention tracked by St. Johns and Volusia detention centers decreased by 53% and 56%, respectively.

Probation and Community Corrections 2006 Outcome Evaluation Report
Probation and Community Corrections 73
PROBATION AND
COMMUNITY CORRECTIONS
The purpose of the Probation and Community Corrections branch is to provide effective probation, diversion and conditional release services to reduce the need for commitment programs and to decrease the likelihood of repeat offenders victimizing the public. These programs provide supervision over youth to protect public safety, promote offender accountability through restorative sanctions and treatments, and to support youth in becoming responsible citizens.
By supervising and counseling juveniles in communities through diversion, probation and conditional release programs, the Probation and Community Corrections branch may be considered the most far reaching branch in the agency. The principle programming for this branch includes diversion, probation supervision, day treatment programs, conditional release services, post-commitment probation, and a post-commitment probation residential program.
Diversion is targeted towards the early and less serious offenders and includes low-cost programs that administer sanctions and treatments designed to keep offenders out of the judicial system. Services are provided through a designated chief probation office in each of the State’s judicial circuits. Outcomes for two types of diversion programs, Intensive Delinquency Diversion
Services (IDDS), and Early Delinquency Intervention Program (EDIP) services are reported in this chapter.
Probation Supervision and Special Intensive Probation programs are individualized court-ordered programs in which the youth are restricted to home or another designated placement in lieu of commitment to the Department. Juvenile probation officers supervise youth to ensure compliance with court ordered sanctions, such as restitution, community service or curfew. Special intensive probation provides more frequent face-to-face contact with youth than general probation.
Multisystemic Therapy is an intensive family-and community-based treatment that addresses serious anti-social behavior in youth.
Probation Day Treatment programs are facility-based programs targeted at youth on probation who are in need of a higher level of supervision and services. Youth participate in day treatment supervision, programming and education.
Conditional Release services are provided to youth released from residential commitment programs. These programs assist with transitioning youth back into their homes and communities. Program types include facility-based day treatment and community supervision programs.
Post-Commitment Probation (PCP) also serves youth who have been released from residential commitment programs. Youth on PCP remain under the juvenile court’s jurisdiction.
Post-Commitment Probation Residential programming is limited to a single program designed to provide vocational training to youth released from residential commitment programs.

2006 Outcome Evaluation Report Probation and Community Corrections
74 Program Area Descriptions
Program Area Descriptions
Each of the major program areas within Probation and Community Corrections are described below.
Intensive Delinquency Diversion Services
Intensive Delinquency Diversion Services (IDDS) is an alternative to formal court involvement and supervision for youth determined to be at high risk of becoming chronic offenders. The stated goals of IDDS include protecting the public, reducing recidivism and increasing responsible behavior. During FY 2003-04, IDDS programs were operated by 12 different providers within the 20 judicial circuits.
IDDS programs are designed for youth who have been identified as most at-risk for becoming serious or chronic offenders. Assessment of risk is based on the presence of at least three of the four risk factors identified in The 8% Solution: Preventing Serious Repeat Juvenile Crime.8 These factors include school behavior and performance problems; family problems; substance abuse issues, including any regular use of alcohol or drugs; and pre-delinquent behaviors, such as running away. The targeted age group is youth under 16 years of age.
IDDS programs provide intensive case management services to high-risk youth and their families. The contract with DJJ requires
8 Schumacher, M., and Kurz, G. (1999). The 8% Solution: Preventing Serious, Repeat Juvenile Crime. Thousand Oaks, California: Sage Publications.
that services be provided six days per week and include services outside the normal 8 a.m. to 5 p.m. workday to ensure that youth and families have adequate access. Case management services include the following components:
• Treatment plan supervision.
• Diagnostic evaluation services.
• Social skill enhancement.
• Life skill enhancement.
• Substance abuse counseling.
• Pre-vocational services.
• Restitution.
• Behavior management.
• Self-sufficiency skill enhancement.
• Mental health and counseling services.
• Academic assistance.
• Community service.
• Transportation.
An integral part of program service delivery is the establishment of appropriate linkages with local resources that can provide services at a reduced cost. The length of participation is designed to be between five and seven months. Release from the program is based on the youth’s performance in the program and an assessment of the potential for re-offending.

Probation and Community Corrections 2006 Outcome Evaluation Report
Program Area Descriptions 75
Statutory Criteria for EDIP (a) Any prior allegation that the child is dependent or a child in need of services. (b) The physical, emotional, and intellectual status and developmental level of the child. (c) The child's academic history, including school attendance, school achievements, grade level, and involvement in school-sponsored activities. (d) The nature and quality of the child's peer group relationships. (e) The child's history of substance abuse or behavioral problems (f) The child's family status, including the capability of the child's family members to participate in a family-centered intervention program. (g) The child's family history of substance abuse or criminal activity. (h) The supervision that is available in the child's home. (i) The nature of the relationship between the parents and the child and any siblings and the child. F.S. 985.305
Early Delinquency Intervention Programs
The Early Delinquency Intervention Program (EDIP) is a two-phase program designed for younger offenders with at least one prior referral. The program consists of intensive residential treatment in a secure facility for one to six weeks, followed by six to nine months of additional services. During the second phase of the program, youth return to their home communities, attend school and receive counseling and intensive case management services. At the discretion of the Department or its designee, or upon order of the court, a child who is 11 years of age or younger may be excused from the residential portion of treatment. Criteria for selection are set out in section 985.305, Florida Statutes (2005). The statute states that “…upon determination that a child is likely to continue to exhibit significant delinquent behavior, the department may recommend to the court that the child be placed in an early delinquency intervention program, and the court may order the program as the dispositional placement for the child.” The two EDIP programs are in Circuits 4 and 6 and are operated by daniel.
Multisystemic Therapy Services
Multisystemic Therapy (MST) is an evidence-based treatment model for juvenile delinquents.9 MST is an intensive family- and community-based treatment that addresses the multiple determinants of serious antisocial behavior in youth. MST strives to promote behavior change in the youth’s natural environment, using the strengths of each system (e.g., family, peers, school, neighborhood, existing support network) to facilitate change.
The goal of MST is to empower parents to address the difficulties that arise in raising teenagers, and to help youth cope with family, peer, school and neighborhood problems. Within a context of support and skill building, the therapist places developmentally appropriate demands on the adolescent and family for responsible behavior.
MST incorporates an intensive quality assurance process. In a number of clinical trials outside the state of Florida, in comparison to control groups, youth and families receiving MST treatment demonstrated:10
• Improved family relations and functioning.
• Increased school attendance.
• Decreased adolescent psychiatric symptoms.
• Decreased adolescent substance use.
• Decreased long-term rates of re-arrest between 25% and 70%.
9 Information on MST can be found at http://www.mstservices.com 10 Citations for numerous research studies on the MST model can be found at http://www.mstservices.com/text/pub%20list.htm

2006 Outcome Evaluation Report Probation and Community Corrections
76 Program Area Descriptions
During the time period covered by this report, the White Foundation was contracted to provide MST services in three counties: Alachua, Duval and Escambia.
Probation and Special Intensive Probation
Juvenile probation officers (JPOs) have two principle functions:
• Intake services for youth who are arrested, and
• Supervision and case management during the various phases of a youth’s involvement with the Department.
Intake services begin when the youth is brought to the JPO for a criminal history records search, screening for detention placement, a suicide risk assessment, a risk and needs assessment, and a mental health and substance abuse screening. After this initial contact with the youth, the JPO must interview the parents, the arresting officer and other parties in order to make a recommendation to the state attorney regarding whether to file a petition for court processing. The JPO must also prepare a court packet for detained youth and provide a summary to the court for the first appearance hearing. They are also responsible for keeping victims informed, receiving victim input, attending and testifying at court hearings, and preparing a predisposition report which includes information from the youth, parent, school, victims and others. The JPO has supervisory responsibility for those youth who are adjudicated delinquent but because of the minimal risk they pose to public safety are placed on probation rather than in a residential program.
Youth placed in residential commitment programs are assigned a JPO who develops a plan for transitioning the youth back into the community. In cases of long-term placements,
the JPO has the responsibility of visiting the youth on a monthly basis, to keep the court informed on progress, to keep in touch with the family and to communicate with the victim.
For both probation and committed youth, a supervision plan is developed that describes what the youth must do to earn a recommendation for termination from supervision. The plan is based upon court-ordered sanctions and the needs of the youth may also involve restitution to the victim and community service work. Supervision involves on-site contact with the youth at home, school or other venues. Contact must be maintained with family, school, school resource officers, law enforcement, and treatment programs to monitor behavior and compliance with court ordered sanctions.
Youth on probation supervision may be placed in day treatment programs designed for youth who represent a minimum risk to themselves and public safety and do not require services in a residential setting. Program groups in day treatment include vocational programs, marine programs, juvenile justice alternative schools, training and rehabilitation programs, and gender-specific programs.
The Supervision Risk Classification Instrument (SRCI) is used by the JPO to assess a youth’s needs and risk to public safety. The most appropriate level of probation supervision is determined based on 10 risk factors and the current offense. A reclassification instrument is completed every 60 days or sooner if a change in supervision is needed because of a new law violation or if the youth’s degree of compliance changes. The frequency of contact with the youth is based on the score received on the instrument.
The duration of supervision as recommended by the Department is six months. Violations of probation include both new law violations

Probation and Community Corrections 2006 Outcome Evaluation Report
Program Area Descriptions 77
Changes in the Classification of Day Treatment Programs
In recent years, a number of changes have occurred in the classification of day treatment programs. Prior to October 2000, day treatment programs served committed youth. In October 2000, the Legislature moved day treatment programs from the Residential and Correctional Services branch of DJJ to Probation and Community Corrections. Between October 2000 and July 2005, day treatment programs did not admit committed youth, but rather served youth on probation. Data on these programs are for youth that were eligible for probation and are not comparable to data on committed day treatment youth. In July 2005, day treatment programs again became available for committed youth.
and non- law or technical violations, such as chronic truancy or refusal to attend a day treatment program. The JPO may file an affidavit of violation of probation with the state attorney who will decide whether to petition for a hearing. The court approves final termination from probation. All circuits have a special intensive probation unit, and there is one private contract to The Bridge of Northeast Florida in Duval County.
The Legislature also authorized special intensive probation caseloads, which enable JPOs to provide up to five face-to-face contacts per week. All levels of supervision provide for additional contacts with individuals who are working with the youth or family. Examples of such collateral contacts include Serious Habitual Offender Corrective Active Program (SHOCAP) counselors, teachers, employers, and mentors.
Probation Day Treatment Programs
Youth on probation who are judged to be in need of more intensive supervision and services can be placed in a non-residential day treatment program. Day treatment programs provide counseling, recreation, vocational training and on-site educational programs during the day as well as evenings and weekends. Juvenile probation officers or counselors monitor progress of the youth at home, school or work and compliance with court sanctions. In addition, individual, family and small group counseling may be provided.
All day treatment programs are operated by providers under contract with the Department. Associated Marine Institutes (AMI) is the major provider of day treatment services in 19 locations across the state. Eight other providers also offer similar services.
Conditional Release Services
In order to reduce re-offending after release from residential commitment, the Department or its contractors provide treatment services and supervision to assist youth in successfully reintegrating into the community. Types of conditional release services include:
1. Contracted day treatment services.
2. Contracted community supervision services.
3. State-operated community supervision services.
4. Residential vocational training.
Day treatment programs for youth on conditional release are similar to those serving youth at the front end of the system. Activities include on-site educational services, counseling, recreation, and community service projects. Community supervision services involve a DJJ juvenile probation officer or a case manager from a contracted program monitoring the progress of youth at home, school or work and compliance with other sanctions (curfew, community service, and restitution). Although length of supervision varies widely, most programs are designed to last three to seven months.

2006 Outcome Evaluation Report Probation and Community Corrections
78 Program Area Descriptions
While 60% of youth leaving residential programs in FY 2003-04 received conditional release services, Florida law specifies services for only two groups. Youth leaving sex offender commitment programs must receive services to monitor and assist their transition back into the community. Youth leaving boot camp programs must be provided conditional release services for a period of time at least as long as the residential program.
State-Operated Post-Commitment Probation
Post-commitment probation (PCP) is a statutorily defined probationary status for juveniles released from the custody of the Department but over whom the juvenile court has retained jurisdiction. Similar to probation, the objectives of PCP are to monitor behavior, direct juveniles to community services appropriate to their needs, and aid juveniles in recognizing alternatives to crime. The court must approve termination from PCP.
While PCP youth may receive services in day treatment or community supervision programs, only youth who are served in state-operated PCP programs are reported under this category. Youth who were supervised on PCP while attending day treatment or community supervision programs are included with the conditional release youth.
Post-Commitment Probation Residential Program
Graceville Vocational Youth Center (GVYC) is the sole post-commitment probation residential vocational program. Operated by Twin Oaks Juvenile Development Inc., the program provides vocational training to youth who have completed a residential commitment program. GVYC serves males between the ages of 16 and 19 years old who are under conditional release supervision with
DJJ or on PCP. The model was designed for young men leaving commitment programs who desire vocational certification and is centered on teaching work ethics and responsibility that are important components for success in the workforce. Youths are referred to GVYC by the residential program and each youth is interviewed by a GVYC transition manager for consideration by the management team. GVYC concentrates on five primary areas:
• Vocational Training
• Employability Skills
• Independent Living Skills
• Education
• Community Service.
Youth enroll at Chipola Junior College or Washington Holmes Technical Center to pursue certifications in areas including: carpentry, commercial vehicle driving, heating/air conditioning, auto collision repair, computer technology, architectural drafting, business computer programming, computer electronic technology, heavy equipment mechanics and electrical trades. In addition to taking vocational courses on a full- time basis, youth also work on an operating farm which provides the youth with an opportunity to develop an enhanced work ethic. The length of stay at GVYC is based on individual performance. Youth are required to complete their performance goals in each of the above areas before graduating from the program.
Data on GVYC are reported separately at the end of this chapter due to its unique status as the only residential vocational program operated by the Probation and Community Corrections branch.

Probation and Community Corrections 2006 Outcome Evaluation Report
Offenses During Supervision 79
Offenses During Supervision by Program
The ODS rates for each program can be found in the summary tables at the end of this chapter.
Forty-two percent of youth on day treatment and special intensive probation were adjudicated for an offense committed during supervision.
Program AreaNumber of Releases
% Adjudicated for ODS 1,2
IDDS 2,339 13%
EDIP 293 38%
MST 120 28%
Probation 25,201 30%
Special Intensive Probation 1,517 42% Day Treatment 1,307 42% Conditional Release 5,400 19% Post-Commitment Probation 2,277 25%
Probation and Community CorrectionsFY 2003-04
Offenses During Supervisionby Program Area
1 The offense occurred during supervision and was subsequently adjudicated
2 Offenses include non-law violations of probation
Probation and Community Corrections Program Outcomes
The remaining sections of this chapter focus on the outcomes for youth released from probation and community corrections programs. Using these data, four performance measures were examined. These measures include:
1. Offenses during supervision (all releases).
2. Completion status (all releases).
3. Re-offending within one year of completion (completions only).
4. Length of stay (all releases, completions, recidivists and non-recidivists).
In addition, the demographic characteristics and offense histories of the youth in the recidivism study are provided. A detailed description of the data sources and methods used in analyzing the data can be found in the Data and Methods chapter of this report.
Offenses During Supervision
During the time period a youth is being supervised, there is an opportunity to re-offend. Offenses during supervision which result in adjudication (ODS) are a measure used to gauge the effectiveness of the Probation and Community Corrections programs in monitoring and guiding the behavior of these youth. Unlike recidivism, which is examined only for youth who completed one of the program areas, ODS is used as an outcome measure for all youth released from a program regardless of their completion status.
For youth released from Probation and Community Corrections programs during FY 2003-04, ODS rates ranged from a low of 13% in IDDS to a high of 42% in day
treatment and special intensive probation programs. Youth released from conditional release programs had an ODS rate of only 19%; six percentage points less than those released from PCP. Probation supervision releases had lower ODS rates than day treatment, special intensive probation, and EDIP.

2006 Outcome Evaluation Report Probation and Community Corrections
80 Completion Status
Completion Status by Program
Completion status for each program can be found in the summary tables at the end of the chapter.
Released Completed
IDDS 2,336 1,428 2,339 1,428 61% EDIP 293 156 293 156 53% MST 119 92 120 93 78% Probation 25,061 18,811 25,201 18,840 75% Special Intensive Probation 1,512 596 1,517 597 39% Day Treatment 1,302 651 1,307 651 50% Conditional Release 5,239 3,638 5,400 3,661 68% Post-Commitment Probation 2,271 1,681 2,277 1,681 74%
Total 35,598 26,232 38,454 27,107 70%
2 Completion rate is calculated by dividing the number of completions by the number of releases
1 The total number of unduplicated youth released/completed does not add to the sum of each of the program areas. Some youth were released/completed from more than one program area.
Probation and Community Corrections Releases FY 2003-04Completion Status
Number of Releases
Number of Completions
Completion Rate2
Number of Youth1
Program Area
Completion Status by Program Area
There are a variety of reasons why youth are released from a program. Identifying the reason is dependent on staff’s categorization of the release using a limited selection of reasons in JJIS. Based on a detailed analysis of release reasons in JJIS, along with a cross check against subsequent placements, youth were classified as either a “completion” or “other release.” Youth in probation programs who are deemed by the court as having finished their court-ordered sanctions and/or treatment plans were classified as completions.
In examining the completion rate for Probation and Community Corrections programs, it is possible to examine both the number of youth released and the number of total releases. These values differ due to youth who serve more than one term within the same Probation and Community Corrections program area during the fiscal year.
The table below presents completion status by program area. During FY 2003-04, there were a total of 35,598 youth released from Probation and Community Corrections programs accounting for 38,454 total releases in the year. Sixty-six percent of the youth released, were released from probation supervision. Statewide, 27,107 (70%) of the total releases were considered completions. Completion rates ranged from a high of 78% for MST programs to a low of 39% for special intensive probation. Probation programs had a higher completion rate (78%) than Day treatment programs (50%); while PCP (74%) had a higher completion rate than conditional release programs (68%).

Probation and Community Corrections 2006 Outcome Evaluation Report
Demographic Characteristics 81
Male Female White Black OtherNon-
Hispanic Hispanic
IDDS 1,428 71% 29% 62% 37% 0% 88% 12% 14.3 EDIP 156 72% 28% 63% 35% 3% 97% 3% 14.3 MST 93 52% 48% 38% 61% 1% 97% 3% 15.2 Probation 18,840 73% 27% 62% 37% 1% 86% 14% 16.1 Special Intensive Probation 597 75% 25% 52% 48% 0% 84% 16% 15.9 Day Treatment 651 77% 23% 54% 45% 1% 85% 15% 16.1 Conditional Release 3,661 82% 18% 54% 46% 1% 89% 11% 17.0 Post-Commitment Probation 1,681 80% 20% 60% 40% 0% 91% 9% 17.1
Total 27,107 75% 25% 61% 39% 1% 87% 13% 16.2
Probation and Community Corrections FY 2003-04Demographic Information
Program AreaNumber of
Completions
Gender Race
Average Age at Admission
Ethnicity
Profile of Youth Completing Probation and Community Corrections Programs
Youth included in the recidivism analyses reported here completed Probation and Community Corrections programs between July 1, 2003 and June 30, 2004. Only youth who completed Probation and Community Corrections programs are included in the recidivism measures that follow. This includes:
• Youth who completed the individualized treatment plans or court-ordered sanctions, and
• Youth who were released due to maximum allowable time served or maximum allowable age for juvenile court jurisdiction.
Demographic characteristics and offense histories are significant predictors of the likelihood of re-offending. Understanding these background characteristics of the youth helps in interpreting recidivism rates
Demographic Characteristics
The demographic characteristics of youth completing Probation and Community Corrections programs are presented in the following table by program area. The majority of youth who completed Probation and Community Corrections programs during FY 2003-04 were male (75%), white (61%) and non-Hispanic (87%). The average age at admission was 16.2 years. In comparing program areas, MST programs had the highest percentage of females (48%) and the highest percentage of black youth (61%) among those who completed the programs. The proportion of Hispanic youth varied from a low of 3% in MST and EDIP to a high of 16% in special intensive probation programs. The average age at admission increased along the continuum of services from Diversion, to probation to conditional release and PCP.

2006 Outcome Evaluation Report Probation and Community Corrections
82 Offense Histories
Violent Felony
Felony Property
Other Felony Misd.
Unclassified Offenses
IDDS3 1,428 2.1 0.1 0% 1% 0% 2% 2% 0.2
EDIP3 156 3.5 1.8 12% 28% 4% 36% 7% 5.4
MST 93 5.2 2.2 14% 26% 5% 47% 5% 5.6Probation 18,840 4.9 2.4 18% 23% 6% 44% 10% 7.7Special Intensive Probation 597 7.3 3.4 35% 25% 5% 28% 6% 11.6Day Treatment 651 7.5 3.5 23% 29% 7% 35% 6% 11.2Conditional Release 3,661 14.7 7.2 41% 37% 7% 14% 1% 22.0Post-Commitment Probation 1,681 14.0 6.9 37% 37% 6% 16% 4% 20.2
3 Diversion programs can serve youth who have not been adjudicated delinquent.
1 Classifications are based on the youth's most serious prior adjudicated charge. Percentages are rounded to the nearest whole number and may not add to 100.
2 The seriousness index is comprised of the sum of all scores for adjudicated charges. The following point values are assigned: 8 for a violent felony, 5 for a property or other felony, 2 for a
misdemeanor, and 1 for any other charge.
Average Prior Adjudications
Percent of Completions with a Prior Adjudication for:1
Probation and Community Corrections FY 2003-04Offense Histories by Program Area
Program AreaNumber of
Completions
Average Prior
Charges
Average Prior Seriousness
Index2
Offense Histories
Information on the offense histories for youth who completed Probation and Community Corrections programs is presented in the tables that follow by program area. This information is further broken down by gender, race and ethnicity. The following three measures of prior offending are presented (see Data and Methods chapter for a description of these measures):
1. Average number of charges.
2. Average number of charges that resulted in adjudication or adjudication withheld.
3. Average prior seriousness index.
These data are further examined by most serious prior adjudication (violent, property, other felony, misdemeanor or unclassified offense).
Offense Histories by Program Area
Given that the program areas serve a wide variety of youth, ranging from youth with no prior offense history to youth who have been committed, the substantial differences in the average prior charges, adjudications and
seriousness indices observed across the program areas are as expected. For example, youth completing IDDS, a diversion program, have the least serious delinquency histories. Youth completing conditional release and PCP have the most serious delinquency histories. Youth completing MST averaged more prior charges (5.2) than youth completing probation (4.9). Youth completing conditional release and PCP programs had generally more serious offense histories than other program areas, as is reflected in the percent of these youth with prior adjudications for violent felonies and felony property offenses. Special intensive probation is designed to target youth who need more intensive levels of supervision. It was therefore not surprising to find that their offense histories were more extensive and serious than youth on probation. However, the average number of prior adjudications for youth who completed special intensive probation was nearly identical to youth on day treatment (3.4 and 3.5, respectively).

Probation and Community Corrections 2006 Outcome Evaluation Report
Offense Histories 83
Violent Felony
Felony Property
Other Felony Misd.
Unclassified Offenses
Male 1,011 2.2 0.1 0% 1% 0% 2% 2% 0.2Female 417 1.8 0.1 0% 0% 0% 3% 2% 0.1
Subtotal 1,428 2.1 0.1 0% 1% 0% 2% 2% 0.2
Male 112 3.5 1.8 11% 31% 5% 35% 7% 5.7Female 44 3.6 1.9 14% 18% 2% 39% 7% 4.8
Subtotal 156 3.5 1.8 12% 28% 4% 36% 7% 5.4
Male 48 5.8 2.5 17% 35% 6% 38% 2% 6.7Female 45 4.6 1.9 11% 16% 4% 58% 9% 4.4
Subtotal 93 5.2 2.2 14% 26% 5% 47% 5% 5.6
Male 13,728 5.2 2.5 18% 26% 6% 41% 9% 8.3Female 5,112 4.2 2.1 16% 14% 4% 53% 13% 6.2
Subtotal 18,840 4.9 2.4 18% 23% 6% 44% 10% 7.7
Male 447 7.6 3.4 39% 28% 6% 22% 6% 12.4Female 150 6.4 3.1 26% 19% 4% 44% 7% 9.3
Subtotal 597 7.3 3.4 35% 25% 5% 28% 6% 11.6
Male 502 7.8 3.8 24% 32% 8% 31% 4% 12.1Female 149 6.4 2.8 18% 18% 5% 47% 13% 8.0
Subtotal 651 7.5 3.5 23% 29% 7% 35% 6% 11.2
Male 3,015 15.0 7.3 42% 39% 7% 11% 1% 23.1Female 646 13.3 6.4 36% 27% 8% 26% 3% 16.7
Subtotal 3,661 14.7 7.2 41% 37% 7% 14% 1% 22.0
Male 1,349 14.5 7.2 37% 40% 6% 13% 3% 21.6Female 332 11.7 5.7 34% 27% 7% 28% 5% 14.4
Subtotal 1,681 14.0 6.9 37% 37% 6% 16% 4% 20.2
Program Area
Probation and Community Corrections FY 2003-04Offense Histories by Gender
Number of Completions
Average Prior
ChargesAverage Prior Adjudications
Percent of Completions with a Prior Adjudication for:1
Average Prior Seriousness
Index 2
Gender
IDDS3
Conditional Release
Probation
Special Intensive Probation
DayTreatment
Post-Commitment
Probation
EDIP3
MST
1 Classifications are based on the youth's most serious prior adjudicated charge. Percentages are rounded to the nearest whole number and may not add to 100.2 The seriousness index is comprised of the sum of all scores for adjudicated charges. The following point values are assigned: 8 for a violent felony, 5 for a property or other felony, 2 for a misdemeanor, and 1 for any other charge.3 Diversion programs can serve youth who have not been adjudicated delinquent.
Offense Histories by Gender
For each of the program areas, males completing the programs had slightly more serious offense histories than females for most of the measures examined. In all program areas; except EDIP, males averaged a higher number of prio r charges, prior adjudications and a higher prior seriousness
index than females. The largest difference in the average prior seriousness index was among youth released from PCP (the index for males was 7.2 points higher than that for females) In general, males were also more likely to have been adjudicated for a violent felony than females. .

2006 Outcome Evaluation Report Probation and Community Corrections
84 Offense Histories
Violent Felony
Felony Property
Other Felony Misd.
Unclassified Offenses
White 892 2.1 0.1 0% 1% 0% 2% 2% 0.1Black 529 2.2 0.1 1% 1% 0% 2% 3% 0.3Other 7 1.7 0.0 0% 0% 0% 0% 0% 0.0
Subtotal 1,428 2.1 0.1 0% 1% 0% 2% 2% 0.2
White 98 3.4 1.9 9% 38% 4% 32% 9% 5.8Black 54 3.9 1.6 17% 7% 6% 43% 4% 4.6Other 4 3.0 2.5 0% 50% 0% 50% 0% 8.0
Subtotal 156 3.5 1.8 12% 28% 4% 36% 7% 5.4
White 35 4.2 2.0 14% 26% 9% 46% 3% 5.4Black 57 5.8 2.3 12% 26% 4% 49% 7% 5.6Other 1 4.0 1.0 100% 0% 0% 0% 0% 8.0
Subtotal 93 5.2 2.2 14% 26% 5% 47% 5% 5.6
White 11,762 4.7 2.4 15% 25% 6% 44% 11% 7.6Black 6,938 5.2 2.4 23% 19% 5% 44% 8% 8.0Other 140 4.1 2.6 13% 26% 6% 45% 11% 7.9
Subtotal 18,840 4.9 2.4 18% 23% 6% 44% 10% 7.7
White 309 6.7 3.2 31% 28% 5% 28% 8% 11.0Black 287 7.9 3.5 40% 22% 6% 28% 4% 12.3Other 1 8.0 6.0 0% 100% 0% 0% 0% 13.0
Subtotal 597 7.3 3.4 35% 25% 5% 28% 6% 11.6
White 351 6.9 3.5 20% 34% 7% 32% 7% 10.9Black 294 8.3 3.7 27% 23% 8% 37% 5% 11.4Other 6 5.3 4.0 17% 33% 0% 50% 0% 12.8
Subtotal 651 7.5 3.5 23% 29% 7% 35% 6% 11.2
White 1,971 13.2 6.8 34% 43% 6% 15% 2% 20.4Black 1,670 16.5 7.6 50% 30% 8% 12% 1% 23.7Other 20 12.4 6.8 25% 70% 5% 0% 0% 23.0
Subtotal 3,661 14.7 7.2 41% 37% 7% 14% 1% 22.0
White 1,001 13.0 6.8 31% 42% 5% 18% 4% 19.5Black 672 15.4 7.1 45% 30% 8% 13% 3% 21.3Other 8 10.8 6.3 38% 13% 13% 25% 13% 18.8
Subtotal 1,681 14.0 6.9 37% 37% 6% 16% 4% 20.2
Special Intensive Probation
DayTreatment
RaceProgram Area
Probation and Community Corrections FY 2003-04Offense Histories by Race
Average Prior Seriousness
Index 2Number of
Completions
Average Prior
ChargesAverage Prior Adjudications
Percent of Completions with a Prior Adjudication for:1
1 Classifications are based on the youth's most serious prior adjudicated charge. Percentages are rounded to the nearest whole number and may not add to 100.2 The seriousness index is comprised of the sum of all scores for adjudicated charges. The following point values are assigned: 8 for a violent felony, 5 for a property or other felony, 2 for a misdemeanor, and 1 for any other charge.3 Diversion programs can serve youth who have not been adjudicated delinquent.
Conditional Release
Post-Commitment
Probation
IDDS3
EDIP3
MST
Probation
Offense Histories by Race
Offense histories also varied by racial group. With the exception of youth completing EDIP, white youth completing Probation and Community Corrections programs had slightly lower average prior seriousness index scores than black youth. Like other program areas, among EDIP completions, white youth had slightly fewer charges on average (3.4)
than black youth (3.9). However, they had slightly more adjudications and a higher prior seriousness index score than black youth. In examining prior felony adjudications, white youth tended to have a higher adjudication rate for property felonies than black youth, while black youth tended to have a higher adjudication rate for violent felonies than white youth.

Probation and Community Corrections 2006 Outcome Evaluation Report
Offense Histories 85
Youth Profiles by Program
Demographic and offense history information on youth completing each program can be found in the summary tables at the end of this chapter.
Violent Felony
Felony Property
Other Felony Misd.
Unclassified Offenses
Non-Hispanic 1,252 2.1 0.1 0% 1% 0% 2% 2% 0.2Hispanic 176 2.0 0.1 0% 1% 0% 1% 2% 0.2
Subtotal 1,428 2.1 0.1 0% 1% 0% 2% 2% 0.2
Non-Hispanic 151 3.6 1.8 11% 28% 5% 36% 7% 5.4Hispanic 5 3.0 2.0 40% 20% 0% 20% 0% 7.6
Subtotal 156 3.5 1.8 12% 28% 4% 36% 7% 5.4
Non-Hispanic 90 5.3 2.2 14% 27% 6% 46% 6% 5.7Hispanic 3 2.3 1.7 0% 0% 0% 100% 0% 3.3
Subtotal 93 5.2 2.2 14% 26% 5% 47% 5% 5.6
Non-Hispanic 16,277 5.0 2.4 18% 23% 6% 45% 10% 7.8Hispanic 2,563 4.5 2.1 20% 23% 6% 39% 12% 7.3
Subtotal 18,840 4.9 2.4 18% 23% 6% 44% 10% 7.7
Non-Hispanic 501 7.3 3.3 36% 24% 5% 29% 6% 11.5Hispanic 96 7.4 3.4 32% 31% 9% 22% 6% 12.3
Subtotal 597 7.3 3.4 35% 25% 5% 28% 6% 11.6
Non-Hispanic 552 7.5 3.6 22% 28% 7% 37% 7% 11.0Hispanic 99 7.6 3.5 29% 36% 8% 22% 4% 12.3
Subtotal 651 7.5 3.5 23% 29% 7% 35% 6% 11.2
Non-Hispanic 3,257 14.7 7.2 40% 37% 7% 14% 1% 21.9Hispanic 404 14.4 6.7 45% 37% 6% 10% 2% 22.4
Subtotal 3,661 14.7 7.2 41% 37% 7% 14% 1% 22.0
Non-Hispanic 1,529 14.0 7.0 36% 37% 7% 16% 3% 20.2Hispanic 152 13.3 6.5 38% 37% 3% 17% 5% 20.1
Subtotal 1,681 14.0 6.9 37% 37% 6% 16% 4% 20.2
Number of Completions
Average Prior
Charges
Average Prior Seriousness
Index 2
IDDS3
1 Classifications are based on the youth's most serious prior adjudicated charge. Percentages are rounded to the nearest whole number and may not add to 100.2 The seriousness index is comprised of the sum of all scores for adjudicated charges. The following point values are assigned: 8 for a violent felony, 5 for a property or other felony, 2 for a misdemeanor, and 1 for any other charge.3 Diversion programs can serve youth who have not been adjudicated delinquent.
Probation
Special Intensive Probation
DayTreatment
Conditional Release
Post-Commitment
Probation
EDIP3
MST
Average Prior Adjudications
Percent of Completions with a Prior Adjudication for:1
Probation and Community Corrections FY 2003-04Offense Histories by Ethnicity
Program Area Ethnicity
Offense Histories by Ethnicity
With the exception of EDIP and MST, no substantial differences in the extent or seriousness of offense histories between Hispanic and non-Hispanic youth were observed. For youth completing EDIP, Hispanics had a slightly higher average prior
seriousness index scores than non-Hispanics. However, MST programs exhibited the opposite pattern, with Hispanics averaging a lower average prior seriousness index score than non-Hispanics.

2006 Outcome Evaluation Report Probation and Community Corrections
86 Program Area Recidivism Trends
Recidivism Rates for Youth Completing Probation and Community Corrections Programs
Five commonly used measures of re-offending are presented in this chapter: subsequent referral/arrest, felony referral/arrest, adjudication/conviction, felony adjudication/conviction and subsequent sanctions (subsequent commitment to DJJ, sentencing to adult probation or prison). These recidivism measures are presented only for youth who completed probation services and program.
Program Area Recidivism Trends
Recidivism data were available for different time frames for each of the Probation and Community Corrections program areas. The following charts show recidivism trends for each of the program areas for those years when data for applying the standard recidivism methodology were available. 11
Five years of recidivism data were available for probation, conditional release and PCP programs. For the first time in five years, the recidivism rate dropped slightly (1%) for probation programs. For conditional release programs, the rate increased by 1%. The biggest five-year decrease observed was for PCP programs, which dropped 4%. Within the one-year period FY 2002-03 to FY 2003-04 day treatment programs decreased three percentage points (31% to 28%). The largest one-year increase was for MST
11 Where fewer than five years of recidivism rates are presented, data were either unavailable or did not meet the criteria for calculating the standard recidivism measure (subsequent adjudication or adult conviction within one year of completion).
programs (34% to 37%), while the largest one-year decrease was for EDIP programs (31% to 24%).
IDDSRecidivism Rates by Fiscal Year
16%16%17%
0%
10%
20%
30%
40%
50%
60%
70%
80%
90%
100%
1999-2000 2000-2001 2001-2002 2002-2003 2003-2004
EDIPRecidivism Rates by Fiscal Year
31%24%
0%
10%
20%
30%
40%
50%
60%
70%
80%
90%
100%
1999-2000 2000-2001 2001-2002 2002-2003 2003-2004
DJJ’s official measure of recidivism is defined as a subsequent adjudication /conviction (including adjudications withheld) for an offense that occurred within one year of release.

Probation and Community Corrections 2006 Outcome Evaluation Report
Program Area Recidivism Trends 87
MSTRecidivism Rates by Fiscal Year
37%34%
0%
10%
20%
30%
40%
50%
60%
70%
80%
90%
100%
1999-2000 2000-2001 2001-2002 2002-2003 2003-2004
ProbationRecidivism Rates by Fiscal Year
18%19%19%19%19%
0%
10%
20%
30%
40%
50%
60%
70%
80%
90%
100%
1999-2000 2000-2001 2001-2002 2002-2003 2003-2004
Special Intensive ProbationRecidivism Rates by Fiscal Year
24%26%
0%
10%
20%
30%
40%
50%
60%
70%
80%
90%
100%
1999-2000 2000-2001 2001-2002 2002-2003 2003-2004
Day TreatmentRecidivism Rates by Fiscal Year
28%31%
0%
10%
20%
30%
40%
50%
60%
70%
80%
90%
100%
1999-2000 2000-2001 2001-2002 2002-2003 2003-2004
Conditional ReleaseRecidivism Rates by Fiscal Year
35%34%37%36%36%
0%
10%
20%
30%
40%
50%
60%
70%
80%
90%
100%
1999-2000 2000-2001 2001-2002 2002-2003 2003-2004
Post-Commitment ProbationRecidivism Rates by Fiscal Year
25%30%32%30%29%
0%
10%
20%
30%
40%
50%
60%
70%
80%
90%
100%
1999-2000 2000-2001 2001-2002 2002-2003 2003-2004

2006 Outcome Evaluation Report Probation and Community Corrections
88 Recidivism by Program Area
16%
24%
37%
18%
24% 28%
35%
25%
0%
10%
20%
30%
40%
50%
60%
70%
80%
90%
100%
IDDS EDIP MST Probation SpecialIntensiveProbation
DayTreatment
ConditionalRelease
Post-Commitment
Probation
Probation and Community Corrections FY 2003-04Statewide Recidivism Rates by Program Area
Referrals/ Arrests
Felony Referrals/
ArrestsCases
PendingAdjudications/ Convictions
Felony Adjudications/ Convictions
Commitments, Probation or
Prison
IDDS 1,428 26% 16% 1% 16% 6% 4% EDIP 156 35% 20% 0% 24% 10% 12% MST 93 53% 25% 3% 37% 13% 23% Probation 18,840 32% 25% 1% 18% 8% 8% Special Intensive Probation 597 42% 34% 2% 24% 11% 10% Day Treatment 651 45% 29% 3% 28% 11% 15% Conditional Release 3,661 55% 47% 2% 35% 21% 22% Post-Commitment Probation 1,681 43% 38% 1% 25% 14% 16%
Probation and Community Corrections FY 2003-04Subsequent Delinquent or Criminal Activity
Within One Year of Completion by Program Area
Program AreaNumber of
Completions
Percent of Completions with Subsequent:
Recidivism by Program Area
The following table presents all five measures of re-offending for each of the eight program areas. Both by legislative and program design, programs serve youth with widely varying delinquency histories, and supervision and service needs. These differences should be taken into account when comparing rates of recidivism.
Recidivism rates for Probation and Community Corrections programs varied by program area from 35% or higher for conditional release and MST, to less than 20% for IDDS and probation supervision.
Probation supervision had lower rates of recidivism (18%) than EDIP (24%), MST (37%), special intensive probation (24%) and day treatment (28%). While the offense histories of youth completing special intensive probation and day treatment programs were very similar, the recidivism rate for youth completing special intensive probation was 4% lower than for youth completing day treatment (24% and 28% respectively). Youth completing PCP programs had less extensive and serious offense histories than youth who completed conditional release programs. They correspondingly exhibited lower re-offending rates for all five recidivism measures.

Probation and Community Corrections 2006 Outcome Evaluation Report
Recidivism by Offense History 89
Non-Recidivists Recidivists
IDDS 0.1 0.2 16%EDIP 1.7 2.1 24%
MST 1.9 2.7 37%Probation 2.3 2.7 18%Special Intensive Probation 3.2 4.0 24%
Day Treatment 3.4 4.0 28%Conditional Release 6.8 7.8 35%Post-Commitment Probation 6.7 7.7 25%
Probation and Community Corrections FY 2003-04Average Prior Adjudicated Charges
by Recidivism Status and Program AreaAverage Number of Prior Adjudications Subsequent
Adjudication/ConvictionsProgram Area
0.1 0.2
1.7 2.1
1.9
2.7 2.3
2.7 3.2
4.0
3.4
4.0
6.8
7.8
6.7
7.7
0.0
1.0
2.0
3.0
4.0
5.0
6.0
7.0
8.0
IDDS EDIP MST Probation SpecialIntensiveProbation
Day Treatment ConditionalRelease
Post-Commitment
Probation
Probation and Community Corrections FY 2003-04Average Prior Adjudicated Charges
By Recidivism Status and Program Area
Non-Recidivists Recidivists
Recidivism by Offense History
An examination of the relationship between prior offending and recidivism revealed that, overall, recidivists had a slightly greater number of prior adjudicated charges on average than non-recidivists. This pattern was exhibited for each of the eight program
areas with recidivists consistently had an average higher number of prior adjudicated charges than non-recidivists. The largest difference between the two groups was for youth who completed conditional release and PCP programs, where recidivists had on average one prior adjudicated charge more than non-recidivists.

2006 Outcome Evaluation Report Probation and Community Corrections
90 Recidivism by Gender
Referrals/ Arrests
Felony Referrals/ Arrests
Cases Pending
Adjudications/ Convictions
Felony Adjudications/
Convictions
Commitments, Probation or
Prison
Male 1,011 29% 18% 1% 17% 7% 5% Female 417 18% 9% 1% 12% 4% 3%
Subtotal 1,428 26% 16% 1% 16% 6% 4%
Male 112 38% 21% 0% 28% 13% 15%
Female 44 30% 18% 0% 16% 5% 2%
Subtotal 156 35% 20% 0% 24% 10% 12%
Male 48 60% 33% 2% 42% 21% 35% Female 45 44% 16% 4% 31% 4% 9%
Subtotal 93 53% 25% 3% 37% 13% 23%
Male 13,728 35% 29% 1% 20% 10% 10% Female 5,112 21% 14% 1% 11% 4% 4%
Subtotal 18,840 32% 25% 1% 18% 8% 8%
Male 447 45% 38% 2% 28% 13% 12%
Female 150 30% 23% 3% 13% 5% 5%
Subtotal 597 42% 34% 2% 24% 11% 10%
Male 502 49% 33% 3% 30% 14% 18%
Female 149 32% 15% 3% 19% 4% 6%
Subtotal 651 45% 29% 3% 28% 11% 15%
Male 3,015 59% 52% 2% 39% 24% 25% Female 646 35% 25% 2% 18% 6% 8%
Subtotal 3,661 55% 47% 2% 35% 21% 22%
Male 1,349 47% 43% 1% 28% 16% 19%
Female 332 25% 19% 1% 14% 6% 7%
Subtotal 1,681 43% 38% 1% 25% 14% 16%
Probation and Community Corrections FY 2003-04Subsequent Delinquent or Criminal ActivityWithin One Year of Completion by Gender
Percent of Completions with Subsequent:
Program Area
IDDS
EDIP
MST
GenderNumber of
Completions
Post-Commitment
Probation
Probation
Special Intensive Probation
DayTreatment
Conditional Release
Recidivism by Gender
Males had higher re-offending rates than females in all program areas regardless of the measure examined. The greatest difference in re-adjudication/conviction rates was among conditional release and PCP programs where males recidivated at twice the rate of females.
In particular, there were substantial differences in subsequent placement rates between males and females. For all program areas except IDDS, males were more than twice as likely as females to be committed, placed on probation or sent to prison within one year of completion.

Probation and Community Corrections 2006 Outcome Evaluation Report
Recidivism by Race 91
Referrals/ Arrests
Felony Referrals/
ArrestsCases
PendingAdjudications/
Convictions
Felony Adjudications/
Convictions
Commitments, Probation or
Prison
White 892 25% 15% 1% 15% 6% 5% Black 529 27% 16% 1% 16% 7% 4% Other 7 29% 29% 0% 29% 14% 0%
Subtotal 1,428 26% 16% 1% 16% 6% 4%
White 98 30% 18% 0% 22% 10% 10% Black 54 48% 24% 0% 30% 11% 15% Other 4 0% 0% 0% 0% 0% 0%
Subtotal 156 35% 20% 0% 24% 10% 12%
White 35 40% 9% 0% 34% 6% 23% Black 57 60% 35% 5% 37% 18% 21% Other 1 100% 0% 0% 100% 0% 100%
Subtotal 93 53% 25% 3% 37% 13% 23%
White 11,762 28% 22% 1% 16% 7% 7% Black 6,938 38% 29% 2% 21% 10% 9% Other 140 25% 20% 1% 13% 4% 6%
Subtotal 18,840 32% 25% 1% 18% 8% 8%
White 309 35% 28% 1% 19% 8% 9% Black 287 49% 40% 4% 29% 15% 11% Other 1 100% 0% 0% 0% 0% 0%
Subtotal 597 42% 34% 2% 24% 11% 10%
White 351 36% 20% 2% 23% 8% 13% Black 294 57% 40% 4% 34% 16% 17% Other 6 0% 0% 0% 0% 0% 0%
Subtotal 651 45% 29% 3% 28% 11% 15%
White 1,971 47% 39% 1% 31% 18% 19% Black 1,670 64% 56% 3% 40% 25% 25% Other 20 50% 40% 0% 35% 25% 30%
Subtotal 3,661 55% 47% 2% 35% 21% 22%
White 1,001 38% 33% 1% 22% 11% 15% Black 672 50% 45% 1% 30% 19% 19% Other 8 25% 25% 0% 25% 13% 13%
Subtotal 1,681 43% 38% 1% 25% 14% 16%
Probation and Community Corrections FY 2003-04Subsequent Delinquent or Criminal Activity
Within One Year of Completion by Race
RaceNumber of
Completions
Percent of Completions with Subsequent:
Program Area
Special Intensive Probation
DayTreatment
Conditional Release
Post-Commitment
Probation
IDDS
EDIP
MST
Probation
Recidivism by Race
For each of the program areas examined, black youth had greater recidivism rates than white youth. In addition, black youth had greater re-arrest rates than white youth for all of the program areas. The largest difference in re-adjudication/conviction rates between black and white youth was 11 percentage points for youth completing day treatment programs. Among the youth completing special intensive probation, the re-adjudication/conviction rate for black youth was 10 percentage points higher than that for white youth.
The re-adjudication/conviction rate for black youth completing probation supervision was also slightly higher than white youth (21% and 16% respectively). The difference in re-conviction rates between black and white youth among those completing conditional release (9%) and PCP (8%) were similar. Black youth also tended to have higher rates of re-commitments or sentences to adult probation or prison in most of the program areas with the exception of MST and IDDS, where white youth had a slightly higher rate (23% vs. 21%).

2006 Outcome Evaluation Report Probation and Community Corrections
92 Recidivism by Race and Gender
Referrals/ Arrests
Felony Referrals/
ArrestsCases
PendingAdjudications/
Convictions
Felony Adjudications/
Convictions
Commitments, Probation or
Prison
White Male 614 28% 18% 1% 17% 7% 5% Black Male 390 29% 19% 1% 17% 8% 4% Other Male 7 29% 29% 0% 29% 14% 0% White Female 278 17% 10% 1% 12% 4% 3% Black Female 139 20% 8% 1% 12% 5% 2% Other Female 0 0% 0% 0% 0% 0% 0%
Subtotal 1,428 26% 16% 1% 16% 6% 4%
White Male 73 30% 16% 0% 26% 12% 12% Black Male 35 57% 31% 0% 34% 14% 23% Other Male 4 0% 0% 0% 0% 0% 0% White Female 25 28% 24% 0% 12% 4% 4% Black Female 19 32% 11% 0% 21% 5% 0% Other Female 0 0% 0% 0% 0% 0% 0%
Subtotal 156 35% 20% 0% 24% 10% 12%
White Male 15 40% 20% 0% 27% 13% 27% Black Male 32 69% 41% 3% 47% 25% 38% Other Male 1 100% 0% 0% 100% 0% 100% White Female 20 40% 0% 0% 40% 0% 20% Black Female 25 48% 28% 8% 24% 8% 0% Other Female 0 0% 0% 0% 0% 0% 0%
Subtotal 93 53% 25% 3% 37% 13% 23%
White Male 8,852 31% 25% 1% 18% 9% 8% Black Male 4,774 43% 35% 2% 25% 13% 12% Other Male 102 27% 24% 1% 15% 5% 7% White Female 2,910 19% 12% 0% 10% 3% 4% Black Female 2,164 25% 16% 1% 12% 4% 4% Other Female 38 18% 11% 0% 8% 0% 3%
Subtotal 18,840 32% 25% 1% 18% 8% 8%
Race and GenderNumber of
Completions
Percent of Completions with Subsequent:
Program Area
Probation and Community Corrections FY 2003-04Subsequent Delinquent or Criminal Activity
Within One Year of Completion by Race and Gender
IDDS
EDIP
MST
Probation
Table continued on next page.
Recidivism by Race and Gender
Black males had the highest re- adjudication/conviction rate of any group, excluding groups that had less than five completions, for all but one of the program areas examined. The exception was youth
who completed IDDS where the re-adjudication/conviction rates of white and black males were the same (17%). Additionally, black males had higher re-arrest, felony re-arrest and felony conviction rates than any other demographic group.

Probation and Community Corrections 2006 Outcome Evaluation Report
Recidivism by Race and Gender 93
Referrals/ Arrests
Felony Referrals/
ArrestsCases
PendingAdjudications/
Convictions
Felony Adjudications/
Convictions
Commitments, Probation or
Prison
White Male 234 39% 32% 1% 23% 10% 11% Black Male 213 53% 44% 3% 33% 17% 13% Other Male 0 0% 0% 0% 0% 0% 0% White Female 75 21% 15% 0% 9% 3% 4% Black Female 74 38% 31% 5% 16% 8% 5% Other Female 1 100% 0% 0% 0% 0% 0%
Subtotal 597 42% 34% 2% 24% 11% 10%
White Male 273 42% 24% 2% 26% 10% 15% Black Male 225 60% 44% 4% 36% 18% 20% Other Male 4 0% 0% 0% 0% 0% 0% White Female 78 18% 5% 3% 13% 1% 6% Black Female 69 48% 26% 3% 26% 7% 6% Other Female 2 0% 0% 0% 0% 0% 0%
Subtotal 651 45% 29% 3% 28% 11% 15%
White Male 1,616 52% 44% 1% 35% 21% 22% Black Male 1,379 68% 60% 2% 44% 29% 28% Other Male 20 50% 40% 0% 35% 25% 30% White Female 355 27% 18% 1% 17% 5% 7% Black Female 291 44% 33% 4% 21% 8% 10% Other Female 0 0% 0% 0% 0% 0% 0%
Subtotal 3,661 55% 47% 2% 35% 21% 22%
White Male 801 42% 37% 1% 24% 12% 16% Black Male 541 56% 51% 1% 34% 22% 23% Other Male 7 29% 29% 0% 29% 14% 14% White Female 200 23% 19% 1% 13% 6% 9% Black Female 131 27% 20% 1% 15% 5% 5% Other Female 1 0% 0% 0% 0% 0% 0%
Subtotal 1,681 43% 38% 1% 25% 14% 16%
Program Area
Probation and Community Corrections FY 2003-04Subsequent Delinquent or Criminal Activity
Within One Year of Completion by Race and Gender (continued)
Race and GenderNumber of
Completions
Percent of Completions with Subsequent:
Special Intensive Probation
DayTreatment
Conditional Release
Post-Commitment
Probation

2006 Outcome Evaluation Report Probation and Community Corrections
94 Recidivism by Ethnicity and Gender
Referrals/ Arrests
Felony Referrals/
ArrestsCases
PendingAdjudications/
Convictions
Felony Adjudications/
Convictions
Commitments, Probation or
Prison
Non-Hispanic Males 871 29% 18% 1% 17% 7% 4% Hispanic Males 140 26% 20% 2% 18% 9% 8% Non-Hispanic Females 381 18% 10% 1% 11% 4% 3% Hispanic Females 36 22% 3% 0% 14% 3% 3%
Subtotal 1,428 26% 16% 1% 16% 6% 4%
Non-Hispanic Males 109 36% 19% 0% 26% 11% 13% Hispanic Males 3 100% 67% 0% 100% 67% 100% Non-Hispanic Females 42 29% 19% 0% 17% 5% 2% Hispanic Females 2 50% 0% 0% 0% 0% 0%
Subtotal 156 35% 20% 0% 24% 10% 12%
Non-Hispanic Males 47 62% 34% 2% 43% 21% 36% Hispanic Males 1 0% 0% 0% 0% 0% 0% Non-Hispanic Females 43 44% 16% 5% 30% 5% 7% Hispanic Females 2 50% 0% 0% 50% 0% 50%
Subtotal 93 53% 25% 3% 37% 13% 23%
Non-Hispanic Males 11,721 36% 29% 1% 21% 10% 10% Hispanic Males 2,007 35% 28% 1% 19% 9% 8% Non-Hispanic Females 4,556 21% 14% 1% 11% 3% 4% Hispanic Females 556 19% 12% 1% 8% 4% 4%
Subtotal 18,840 32% 25% 1% 18% 8% 8%
Non-Hispanic Males 372 45% 37% 2% 28% 14% 12% Hispanic Males 75 49% 43% 1% 25% 9% 11% Non-Hispanic Females 129 29% 22% 3% 12% 5% 4% Hispanic Females 21 38% 24% 0% 14% 5% 10%
Subtotal 597 42% 34% 2% 24% 11% 10%
Non-Hispanic Males 416 51% 34% 3% 32% 14% 18% Hispanic Males 86 41% 29% 1% 23% 12% 14% Non-Hispanic Females 136 32% 16% 3% 18% 4% 5% Hispanic Females 13 23% 0% 0% 23% 0% 15%
Subtotal 651 45% 29% 3% 28% 11% 15%
Non-Hispanic Males 2,668 59% 52% 2% 39% 25% 25% Hispanic Males 347 56% 50% 1% 35% 22% 21% Non-Hispanic Females 589 35% 26% 2% 19% 7% 9% Hispanic Females 57 25% 14% 5% 9% 4% 4%
Subtotal 3,661 55% 47% 2% 35% 21% 22%
Non-Hispanic Males 1,224 47% 43% 1% 28% 17% 19% Hispanic Males 125 47% 44% 2% 24% 11% 16% Non-Hispanic Females 305 24% 18% 1% 13% 6% 7% Hispanic Females 27 33% 30% 0% 22% 7% 7%
Subtotal 1,681 43% 38% 1% 25% 14% 16%
Special Intensive Probation
DayTreatment
Conditional Release
Post-Commitment
Probation
IDDS
EDIP
MST
Probation
Probation and Community Corrections FY 2003-04Subsequent Delinquent or Criminal Activity
Within One Year of Completion by Ethnicity and Gender
Program Area Ethnicity and GenderNumber of
Completions
Percent of Completions with Subsequent:
Recidivism by Ethnicity and Gender
Improvements in the data collection system allow the reporting of ethnicity for the first time. While in almost all program areas, non-Hispanic males had greater re-conviction rates than Hispanic males, a less consistent
pattern was observed for females. For five of the eight program areas (IDDS, special intensive probation, day treatment, and PCP), Hispanic females had higher re-conviction rates than non-Hispanic females. For the other three areas (MST, probation and conditional release) the opposite pattern was observed.

Probation and Community Corrections 2006 Outcome Evaluation Report
Recidivism by Race and Ethnicity 95
Referrals/ Arrests
Felony Referrals/
ArrestsCases
PendingAdjudications/
Convictions
Felony Adjudications/
Convictions
Commitments, Probation or
Prison
White Non-Hispanic 725 25% 15% 1% 15% 5% 5% White Hispanic 167 24% 16% 2% 16% 7% 5% Black Non-Hispanic 520 27% 16% 1% 15% 7% 3% Black Hispanic 9 56% 33% 0% 44% 22% 33% Other Non-Hispanic 7 29% 29% 0% 29% 14% 0% Other Hispanic 0 0% 0% 0% 0% 0% 0%
Subtotal 1,428 26% 16% 1% 16% 6% 4%
White Non-Hispanic 94 28% 17% 0% 20% 9% 7% White Hispanic 4 75% 50% 0% 75% 50% 75% Black Non-Hispanic 53 47% 25% 0% 30% 11% 15% Black Hispanic 1 100% 0% 0% 0% 0% 0% Other Non-Hispanic 4 0% 0% 0% 0% 0% 0% Other Hispanic 0 0% 0% 0% 0% 0% 0%
Subtotal 156 35% 20% 0% 24% 10% 12%
White Non-Hispanic 32 41% 9% 0% 34% 6% 22% White Hispanic 3 33% 0% 0% 33% 0% 33% Black Non-Hispanic 57 60% 35% 5% 37% 18% 21% Black Hispanic 0 0% 0% 0% 0% 0% 0% Other Non-Hispanic 1 100% 0% 0% 100% 0% 100% Other Hispanic 0 0% 0% 0% 0% 0% 0%
Subtotal 93 53% 25% 3% 37% 13% 23%
White Non-Hispanic 9,342 27% 21% 1% 16% 7% 7% White Hispanic 2,420 31% 25% 1% 17% 8% 7% Black Non-Hispanic 6,813 38% 30% 2% 21% 10% 9% Black Hispanic 125 33% 24% 2% 14% 7% 6% Other Non-Hispanic 122 26% 21% 1% 13% 4% 6% Other Hispanic 18 17% 11% 0% 11% 0% 6%
Subtotal 18,840 32% 25% 1% 18% 8% 8%
Table continued on next page.
IDDS
EDIP
MST
Probation
Probation and Community Corrections FY 2003-04Subsequent Delinquent or Criminal Activity
Within One Year of Completion by Race and Ethnicity
Program Area Race and EthnicityNumber of
Completions
Percent of Completions with Subsequent:
Recidivism by Race and Ethnicity
The data also allow an examination of the interaction of ethnicity and race. For most of the program areas examined, excluding groups that had less than five completions and youth who completed IDDS, white Hispanics generally had greater re-conviction rates than white non-Hispanics. For the two program
areas (probation and conditional release) that had at least 15 Black Hispanic completers for comparisons, the pattern was inconsistent. Black non-Hispanics had a higher rate of re-conviction than Black Hispanics for youth completing probation. Youth completing conditional release programs exhibited the opposite pattern.

2006 Outcome Evaluation Report Probation and Community Corrections
96 Recidivism by Race and Ethnicity
Referrals/ Arrests
Felony Referrals/
ArrestsCases
PendingAdjudications/
Convictions
Felony Adjudications/
Convictions
Commitments, Probation or
Prison
White Non-Hispanic 220 30% 24% 1% 18% 9% 9% White Hispanic 89 47% 38% 1% 24% 8% 10% Black Non-Hispanic 280 49% 40% 4% 29% 15% 11% Black Hispanic 7 43% 43% 0% 14% 14% 14% Other Non-Hispanic 1 100% 0% 0% 0% 0% 0% Other Hispanic 0 0% 0% 0% 0% 0% 0%
Subtotal 597 42% 34% 2% 24% 11% 10%
White Non-Hispanic 264 35% 18% 2% 22% 7% 13% White Hispanic 87 41% 26% 1% 25% 10% 15% Black Non-Hispanic 283 58% 41% 4% 35% 16% 17% Black Hispanic 11 18% 18% 0% 9% 9% 9% Other Non-Hispanic 5 0% 0% 0% 0% 0% 0% Other Hispanic 1 0% 0% 0% 0% 0% 0%
Subtotal 651 45% 29% 3% 28% 11% 15%
White Non-Hispanic 1,597 46% 38% 1% 32% 18% 20% White Hispanic 374 50% 44% 2% 30% 17% 18% Black Non-Hispanic 1,643 63% 55% 3% 39% 25% 25% Black Hispanic 27 67% 63% 0% 52% 41% 33% Other Non-Hispanic 17 47% 41% 0% 29% 24% 29% Other Hispanic 3 67% 33% 0% 67% 33% 33%
Subtotal 3,661 55% 47% 2% 35% 21% 22%
White Non-Hispanic 864 37% 32% 0% 21% 11% 15% White Hispanic 137 46% 43% 2% 23% 11% 14% Black Non-Hispanic 660 50% 45% 1% 30% 19% 19% Black Hispanic 12 42% 33% 0% 42% 8% 25% Other Non-Hispanic 5 40% 40% 0% 40% 20% 20% Other Hispanic 3 0% 0% 0% 0% 0% 0%
Subtotal 1,681 43% 38% 1% 25% 14% 16%
Special Intensive Probation
DayTreatment
Conditional Release
Post-Commitment
Probation
Probation and Community Corrections FY 2003-04Subsequent Delinquent or Criminal Activity
Within One Year of Completion by Race and Ethnicity (continued)
Program Area Race and EthnicityNumber of
Completions
Percent of Completions with Subsequent:

Probation and Community Corrections 2006 Outcome Evaluation Report
Recidivism by Age at Admission 97
Referrals/ Arrests
Felony Referrals/
ArrestsCases
PendingAdjudications/ Convictions
Felony Adjudications/ Convictions
Commitments, Probation or
Prison
12 and Younger 377 21% 11% 1% 11% 5% 3%
13 Years Old 208 31% 16% 1% 21% 9% 4% 14 Years Old 238 26% 17% 1% 17% 7% 3%
15 Years Old 261 28% 15% 1% 20% 7% 3% 16 Years Old 190 23% 15% 1% 14% 6% 7%
17 Years Old 139 27% 27% 0% 13% 4% 9% 18 and Older 15 33% 33% 0% 20% 7% 7%
Subtotal 1,428 26% 16% 1% 16% 6% 4%
12 and Younger 24 46% 25% 0% 33% 17% 21% 13 Years Old 32 34% 19% 0% 25% 9% 9% 14 Years Old 45 36% 16% 0% 27% 9% 13%
15 Years Old 46 33% 24% 0% 22% 11% 9% 16 Years Old 9 22% 11% 0% 0% 0% 0%
17 Years Old 0 0% 0% 0% 0% 0% 0% 18 and Older 0 0% 0% 0% 0% 0% 0%
Subtotal 156 35% 20% 0% 24% 10% 12%
12 and Younger 5 60% 20% 0% 40% 20% 20% 13 Years Old 18 61% 44% 0% 44% 28% 33%
14 Years Old 20 65% 15% 0% 60% 15% 40% 15 Years Old 22 45% 27% 9% 23% 9% 14% 16 Years Old 15 53% 13% 7% 40% 7% 20%
17 Years Old 12 33% 25% 0% 8% 0% 0% 18 and Older 1 0% 0% 0% 0% 0% 0%
Subtotal 93 53% 25% 3% 37% 13% 23%
12 and Younger 974 27% 14% 2% 18% 7% 5% 13 Years Old 1,314 31% 16% 2% 20% 8% 6%
14 Years Old 2,223 30% 18% 2% 19% 8% 6% 15 Years Old 3,124 30% 19% 2% 18% 8% 6%
16 Years Old 4,072 30% 23% 1% 17% 8% 7% 17 Years Old 5,190 34% 33% 0% 17% 9% 11% 18 and Older 1,943 37% 37% 0% 18% 10% 11%
Subtotal 18,840 32% 25% 1% 18% 8% 8%
IDDS
EDIP
MST
Probation
Program Area Age at AdmissionNumber of
Completions
Percent of Completions with Subsequent:
Probation and Community Corrections FY 2003-04Subsequent Delinquent or Criminal Activity
Within One Year of Completion by Age at Admission
Table continued on next page.
Recidivism by Age at Admission
An examination of the relationship between age and recidivism revealed a general pattern of higher recidivism rates for younger youth. The pattern was less consistent for MST and special intensive probation programs. Youth
completing probation had similar recidivism rates regardless of their age. Conversely, although younger youth tended to have higher re-adjudication/conviction rates, older youth tended to have higher rates of re-arrest for felonies than younger youth.

2006 Outcome Evaluation Report Probation and Community Corrections
98 Recidivism by Age at Admission
Referrals/ Arrests
Felony Referrals/
ArrestsCases
PendingAdjudications/
Convictions
Felony Adjudications/
Convictions
Commitments, Probation or
Prison
12 and Younger 55 38% 25% 0% 31% 15% 11% 13 Years Old 46 39% 24% 2% 30% 15% 17% 14 Years Old 75 44% 33% 7% 23% 16% 11% 15 Years Old 84 33% 23% 6% 17% 8% 5% 16 Years Old 121 37% 26% 2% 21% 7% 10% 17 Years Old 140 43% 42% 0% 24% 10% 9% 18 and Older 76 57% 57% 0% 29% 16% 13%
Subtotal 597 42% 34% 2% 24% 11% 10%
12 and Younger 5 0% 0% 0% 0% 0% 0% 13 Years Old 22 68% 41% 9% 36% 23% 27% 14 Years Old 112 55% 29% 4% 39% 14% 24% 15 Years Old 149 46% 24% 5% 30% 9% 14% 16 Years Old 201 42% 26% 2% 26% 10% 13% 17 Years Old 143 38% 34% 0% 18% 11% 10% 18 and Older 19 53% 47% 0% 26% 16% 11%
Subtotal 651 45% 29% 3% 28% 11% 15%
12 and Younger 21 62% 38% 0% 48% 14% 29% 13 Years Old 71 70% 46% 3% 54% 34% 39% 14 Years Old 235 63% 43% 3% 51% 27% 36% 15 Years Old 486 57% 40% 6% 42% 22% 25% 16 Years Old 860 50% 39% 2% 34% 20% 19% 17 Years Old 1,095 51% 48% 1% 30% 20% 20% 18 and Older 893 58% 58% 0% 33% 22% 20%
Subtotal 3,661 55% 47% 2% 35% 21% 22%
12 and Younger 17 59% 47% 0% 53% 29% 24% 13 Years Old 34 44% 24% 3% 32% 9% 24% 14 Years Old 86 48% 33% 3% 30% 16% 20% 15 Years Old 184 41% 26% 2% 28% 12% 14% 16 Years Old 396 38% 32% 1% 20% 12% 11% 17 Years Old 497 42% 42% 0% 23% 14% 17% 18 and Older 467 46% 46% 0% 28% 18% 21%
Subtotal 1,681 43% 38% 1% 25% 14% 16%
Percent of Completions with Subsequent:
Probation and Community Correctionss FY 2003-04Subsequent Delinquent or Criminal Activity
Within One Year of Completion by Age at Admission (continued)
Program Area Age at AdmissionNumber of
Completions
Special Intensive Probation
Post-Commitment
Probation
Conditional Release
DayTreatment

Probation and Community Corrections 2006 Outcome Evaluation Report
Recidivism by Time to Failure 99
1st 2nd 3rd 4th 5th 6th 7th 8th 9th 10th 11th 12th
Percentage of Recidivists 1 11% 10% 10% 12% 5% 9% 8% 5% 8% 11% 4% 6%
Cumulative Percent 11% 21% 31% 43% 48% 57% 66% 71% 79% 90% 94% 100%
Percentage of Recidivists 1 26% 0% 5% 11% 3% 5% 16% 11% 5% 3% 13% 3%
Cumulative Percent 26% 0% 32% 42% 45% 50% 66% 76% 82% 84% 97% 100%
Percentage of Recidivists 1 21% 21% 12% 18% 6% 6% 3% 6% 0% 0% 0% 3%
Cumulative Percent 21% 41% 53% 71% 76% 82% 85% 91% 97% 97% 97% 100%
Percentage of Recidivists 1 12% 13% 11% 11% 9% 8% 8% 7% 6% 5% 5% 5%
Cumulative Percent 12% 25% 36% 47% 57% 64% 72% 79% 85% 90% 95% 100%
Percentage of Recidivists 1 10% 19% 10% 6% 10% 12% 8% 6% 6% 4% 3% 5%
Cumulative Percent 10% 29% 39% 45% 55% 67% 75% 81% 87% 92% 95% 100%
Percentage of Recidivists 1 17% 12% 7% 13% 12% 9% 7% 8% 4% 3% 3% 3%
Cumulative Percent 17% 29% 36% 49% 62% 71% 78% 86% 90% 93% 97% 100%
Percentage of Recidivists 1 20% 14% 13% 9% 9% 8% 7% 5% 4% 4% 3% 3%
Cumulative Percent 20% 34% 47% 57% 66% 74% 80% 85% 90% 94% 97% 100%
Percentage of Recidivists 1 17% 12% 13% 12% 9% 8% 5% 4% 4% 6% 6% 4%
Cumulative Percent 17% 28% 41% 54% 63% 71% 77% 81% 85% 91% 96% 100% 1 Percentages are rounded to the nearest whole number and may not add to 100%.
1,681
Probation and Community Corrections FY 2003-04Percentage of Recidivists by Months to First Subsequent Arrest
18,840
597
651
3,661
Number of Recidivists
1,428
156
93
Program Area
Months to First Subsequent Arrest
Special Intensive Probation
Day Treatment
Conditional Release
Post-Commitment Probation
IDDS
EDIP
MST
Probation
Recidivism by Time to Failure
An examination of the time to failure (the time between release from a Probation and Community Corrections program and the date of the first post-release arrest), revealed that the majority of youth who recidivate re-offend within six months or less of completion. For IDDS and EDIP, 50% or more of all youth who recidivated within one year had been re-arrested within six months of release. For probation, special intensive probation and day treatment over 50% had been arrested within five months, and for youth completing conditional release and PCP over 50% had been arrested by the fourth month. MST had the shortest time to failure; 53% of their youth who recidivated did so within three months post-release.
One-half or more of all youth who recidivated had been re-arrested within:
• 6 months: IDDS and EDIP
• 5 months: Probation, Probation Intensive and Day Treatment
• 4 months: Conditional Release and PCP
• 3 months: MST

2006 Outcome Evaluation Report Probation and Community Corrections
100 Length of Supervision
NAverage
Days NAverage
Days NAverage
Days NAverage
Days
IDDS 2,339 227 1,428 267 224 269 1,204 267 EDIP 293 220 156 245 38 251 118 243 MST 120 151 93 160 34 153 59 165
Probation 25,201 334 18,840 360 3,328 338 15,512 365 Special Intensive Probation 1,517 226 597 270 143 256 454 275 Day Treatment 1,307 200 651 235 180 230 471 237 Conditional Release 5,400 198 3,661 197 1,286 181 2,375 205 Post-Commitment Probation 2,277 391 1,681 440 422 286 1,259 492
Total 38,454 302 27,107 332 5,655 288 21,452 343
Probation and Community Corrections FY 2003-04Length of Supervision by Program Area
Recidivists
Program Area
All Releases Completions Non-Recidivists
Length of Supervision
The table below presents average length of supervision (ALOS) for four groups:
• All releases (38,454) including youth who did not complete Probation and Community Corrections programs.
• Youth who completed Probation and Community Corrections programs (27,107).
• Recidivists (5,655).
• Non-Recidivists (21,452).
While the ALOS of all youth released was 302 days (10 months), the ALOS for youth who completed Probation and Community Corrections programs was 30 days longer at 332 days. The shorter ALOS for the entire population of releases is due in part to youth whose stay is cut short by re-arrest, leaving the state, or transferring to commitment.
Overall, recidivists average 55 fewer days than non-recidivists. However, the direction and the magnitude of the difference in ALOS between recidivists and non-recidivists varied by program area. At the front end of the continuum (IDDS and EDIP), recidivists averaged slightly more days than non-recidivists. For all other areas, recidivists averaged fewer days than non-recidivists. Probation recidivists averaged 27 fewer days than non-recidivists. The greatest difference was for PCP programs where the ALOS for recidivists was 206 fewer days than for the non-recidivists.
Average Length of Supervision by Program
The ALOS for each program can be found in the summary tables beginning at the end of the chapter.

Probation and Community Corrections 2006 Outcome Evaluation Report
Post-Commitment Probation Residential Program 101
N %
Post-Commitment Probation Residential
Graceville Vocational Youth Center
61 7% 45 74% 100% 27% 3% 17.5 23.4 169 67%
46 4% 29 63% 100% 38% not
reported 17.5 23.1 179 17%
AverageLengthof Stay
%RecidivismProgram Area
Previous Fiscal Year
% Hispanic
Post-Commitment Probation Residential Program FY 2003-2004Program Output Summary
Program Name
AverageAge at
Admission
Completions
Total Releases
%ODS
Total %Male
%Black
AveragePrior
SeriousnessIndex
Post-Commitment Probation Residential Program
Graceville Vocational Youth Center (GVYC) is a post-commitment probation residential program. There were a total of 61 youth released from GVYC in FY 2003-04. Of those released, 7% committed an offense during placement that resulted in adjudication. Forty-five youth (74%) completed the program. All of the youth that completed the program were male and 27% were black.
The average age at admission was 17.5 years. The average prior seriousness index for youth completing GVYC was 23.4, which was comparable to youth on conditional release. The average length of stay for youth who completed the program was 169 days (5.5 months). The recidivism rate (a subsequent adjudication or conviction during a one year follow-up period) for youth completing GVYC was 67%. This rate is a substantial increase from the previous rate of 17%.

2006 Outcom
e Evaluation R
eport
Probation and C
omm
unity Corrections
102
S
umm
ary Tables
N2
%
Alachua IDDS - Henry and Rilla White Foundation 72 21% 41 57% 66% 46% 0% 14.1 0.1 312 20% Bay IDDS - University of West Florida 27 15% 15 56% 33% 47% 0% 13.0 0.0 365 20% Brevard IDDS - Crosswinds Youth Services 100 20% 49 49% 69% 18% 4% 14.5 0.0 396 16% Broward IDDS - Psychotherapeutic Juvenile Services of FL 402 8% 310 77% 79% 45% 14% 14.3 0.4 209 15% Dade IDDS - Miami-Dade County 54 13% 27 50% 74% 41% 56% 14.4 0.0 280 19% Duval IDDS - State Attorney Office 4th Judicial Circuit 155 7% 123 79% 71% 55% 1% 14.0 0.0 286 17% Escambia IDDS - University of West Florida 43 23% 20 47% 75% 50% 0% 13.3 0.0 362 15% Hillsborough IDDS - Bay Area Youth Services 187 17% 104 56% 63% 37% 23% 15.0 0.0 320 13% Lee IDDS - Juvenile Services Program - (Provider changed) 85 4% 60 71% 68% 8% 18% 14.3 0.0 245 18% Lee IDDS - Bay Area Youth Services 18 17% 15 83% 47% 27% 7% 14.6 0.4 289 33% Leon IDDS - Henry and Rilla White Foundation 51 10% 24 47% 63% 50% 0% 14.3 0.0 361 13% Marion IDDS - Mad Dads of Greater Ocala - (Provider changed) 133 10% 63 47% 81% 52% 3% 14.3 0.0 256 19% Marion IDDS - Bay Area Youth Services 3 0% 0 0% 0% 0% 0% 0.0 0.0 0 0% Martin IDDS - Human Services Associates 43 19% 23 53% 74% 26% 17% 13.7 0.0 266 4% Monroe IDDS - Monroe County Sheriffs Office 70 9% 54 77% 72% 13% 28% 15.0 0.0 265 11% Orange IDDS - First Step II 179 11% 105 59% 70% 30% 30% 14.5 0.0 228 14% Palm Beach IDDS - Juvenile Services Program 218 11% 106 49% 79% 58% 7% 13.4 0.0 268 13% Pinellas IDDS - Juvenile Services Program - (Provider changed) 129 16% 76 59% 68% 25% 4% 14.2 0.1 312 28% Pinellas IDDS - Bay Area Youth Services 22 23% 7 32% 29% 14% 0% 15.3 1.0 241 29% Polk IDDS - Bay Area Youth Services 153 24% 82 54% 59% 23% 13% 14.4 0.1 296 13% Sarasota IDDS - Bay Area Youth Services 122 10% 73 60% 68% 16% 3% 13.8 0.3 234 8% Suwannee IDDS - Henry and Rilla White Foundation 66 9% 50 76% 64% 28% 2% 15.3 1.3 246 14% Volusia IDDS - Juvenile Services Program 7 57% 1 14% 0% 0% 100% 15.6 0.0 196 100%
Subtotal 2,339 13% 1,428 61% 71% 37% 12% 14.3 0.2 267 16%
04th Circuit - daniel 137 44% 70 51% 74% 50% 3% 14.2 3.6 270 19% 06th Circuit - daniel 156 33% 86 55% 70% 22% 3% 14.4 6.9 225 29%
Subtotal 293 38% 156 53% 72% 35% 3% 14.3 5.4 245 24%
Alachua - White Foundation 15 13% 13 87% 77% 62% 8% 15.2 8.2 145 38% Duval - White Foundation 54 24% 44 81% 50% 75% 2% 15.4 4.0 148 25% Escambia - White Foundation 51 35% 36 71% 44% 44% 3% 14.9 6.6 182 50%
Subtotal 120 28% 93 78% 52% 61% 3% 15.2 5.6 160 37%
AverageLengthof Stay
1 ODS is the percent of releases adjudicated for an offense during supervision
Table continued on next page.
%Black
IDDS
Program Area
EDIP
MST
%Hispanic
Average Prior
Seriousness Index
%Recidivism
Probation and Community Corrections FY 2003-04Output Summary by Program Area
Program Name
Average Age at
Admission
Completions
Total Releases
%ODS1
Total %Male
2 Italics indicate the program completed less than 15 youth and care should be taken in interpreting this data.
Summary Tables
A summary of program outputs, including total releases, the rate of offending during supervision, completion status, demographic data, average length of supervision, and recidivism rates are presented for each program area in the following tables.

Probation and C
omm
unity Corrections
2006 Outcom
e Evaluation R
eport
Sum
mary T
ables
103
N2 %
01st Circuit Probation 1,478 42% 976 66% 68% 28% 2% 16.1 7.6 357 18% 02nd Circuit Probation 765 26% 577 75% 72% 53% 2% 16.1 8.2 387 17% 03rd Circuit Probation 270 23% 223 83% 75% 42% 2% 16.1 8.8 207 19%
04th Circuit Probation 1,618 29% 1,173 72% 72% 48% 3% 16.1 5.5 325 18% 05th Circuit Probation 1,405 28% 1,031 73% 71% 22% 6% 16.0 7.3 301 17% 06th Circuit Probation 1,811 35% 1,280 71% 73% 20% 4% 16.0 9.7 332 18% 07th Circuit Probation 1,411 31% 1,100 78% 75% 23% 6% 16.1 6.7 360 20% 08th Circuit Probation 593 31% 450 76% 76% 49% 2% 16.2 7.7 445 21%
09th Circuit Probation 1,566 32% 1,166 74% 74% 39% 23% 16.5 7.8 576 14% 10th Circuit Probation 1,401 39% 921 66% 73% 34% 9% 15.8 7.8 385 20% 11th Circuit Probation 2,654 19% 2,133 80% 74% 50% 43% 16.1 7.4 338 16% 12th Circuit Probation 780 38% 565 72% 73% 26% 13% 16.1 7.9 239 18% 13th Circuit Probation 1,352 29% 977 72% 77% 41% 20% 16.4 8.3 351 21% 14th Circuit Probation 522 27% 374 72% 63% 26% 1% 15.9 5.6 250 16%
15th Circuit Probation 1,203 39% 841 70% 75% 38% 11% 16.4 7.1 538 14% 16th Circuit Probation 69 39% 49 71% 78% 18% 31% 16.3 10.6 507 16% 17th Circuit Probation 3,075 20% 2,705 88% 74% 50% 13% 16.1 9.6 306 19% 18th Circuit Probation 984 40% 654 66% 71% 26% 7% 16.5 6.7 423 15% 19th Circuit Probation 731 33% 447 61% 71% 32% 8% 16.6 7.5 450 12%
20th Circuit Probation 1,513 27% 1,198 79% 71% 22% 19% 16.2 7.3 295 18%
Subtotal 25,201 30% 18,840 75% 73% 37% 14% 16.1 7.7 360 18%
01st Circuit Probation - Special Intensive 33 48% 6 18% 67% 50% 0% 15.9 14.3 291 67% 02nd Circuit Probation - Special Intensive 26 35% 15 58% 80% 60% 7% 15.4 11.9 369 27% 03rd Circuit Probation - Special Intensive 3 33% 1 33% 100% 0% 0% 15.7 46.0 386 100%
04th Circuit Probation - Special Intensive 90 36% 40 44% 73% 48% 5% 15.7 6.8 247 20% 05th Circuit Probation - Special Intensive 101 42% 39 39% 64% 13% 5% 14.1 5.4 242 31% 06th Circuit Probation - Special Intensive 117 70% 37 32% 78% 32% 8% 15.9 15.9 262 24% 07th Circuit Probation - Special Intensive 59 49% 24 41% 75% 71% 4% 15.4 13.6 308 42% 08th Circuit Probation - Special Intensive 7 43% 1 14% 0% 0% 0% 14.3 4.0 375 100% 09th Circuit Probation - Special Intensive 68 41% 19 28% 63% 16% 32% 16.2 11.1 333 0%
10th Circuit Probation - Special Intensive 74 45% 20 27% 60% 30% 0% 16.7 14.4 245 30% 11th Circuit Probation - Special Intensive 264 32% 168 64% 77% 57% 38% 16.5 11.9 275 23% 12th Circuit Probation - Special Intensive 33 27% 2 6% 100% 0% 0% 15.6 4.5 180 50% 13th Circuit Probation - Special Intensive 43 35% 10 23% 70% 50% 10% 15.8 8.8 158 20% 14th Circuit Probation - Special Intensive 42 40% 13 31% 69% 46% 0% 12.9 4.0 244 8%
15th Circuit Probation - Special Intensive 110 53% 39 35% 72% 59% 10% 16.0 7.7 281 23% 16th Circuit Probation - Special Intensive 10 20% 7 70% 100% 0% 29% 16.8 10.7 348 0% 17th Circuit Probation - Special Intensive 168 35% 63 38% 84% 65% 13% 16.5 20.4 293 30% 18th Circuit Probation - Special Intensive 63 54% 4 6% 75% 75% 0% 16.1 11.3 103 25% 19th Circuit Probation - Special Intensive 57 54% 15 26% 80% 13% 0% 16.1 9.8 389 20% 20th Circuit Probation - Special Intensive 70 40% 21 30% 76% 10% 10% 15.0 8.7 223 24%
The Bridge - Special Intensive 79 35% 53 67% 72% 68% 0% 16.0 8.2 216 15%
Subtotal 1,517 42% 597 39% 75% 48% 16% 15.9 11.6 270 24%
Total %Male
%Black
Average Age at
Admission
Special Intensive Probation
%Hispanic
Completions
Probation and Community Corrections FY 2003-04Output Summary by Program Area (continued)
Average Prior
Seriousness Index
Probation
Program Area Program NameTotal
Releases%
ODS1
1 ODS percentage is based on the total number of releases2 Italics indicate the program completed less than 15 youth and care should be taken in interpreting this data.Table continued on next page.
AverageLengthof Stay
%Recidivism

2006 Outcom
e Evaluation R
eport
Probation and C
omm
unity Corrections
104
S
umm
ary Tables
N2
%
AMI - Central Florida 59 42% 23 39% 83% 30% 4% 15.8 14.8 201 17% AMI - Dade North 85 25% 49 58% 82% 71% 29% 16.5 10.9 188 29% AMI - Dade South 56 38% 34 61% 88% 26% 79% 16.4 12.0 306 15% AMI - Emerald Coast 65 62% 23 35% 61% 13% 0% 16.1 17.8 279 17% AMI - Escambia 70 37% 27 39% 74% 63% 4% 16.7 8.2 189 37% AMI - Florida Ocean Sciences 76 63% 44 58% 86% 57% 14% 16.2 20.5 325 45% AMI - Gainesville 55 44% 30 55% 80% 83% 3% 15.6 11.6 258 43% AMI - Gulf Coast North 39 33% 17 44% 82% 29% 24% 15.8 7.2 180 35% AMI - Gulf Coast South 34 50% 17 50% 76% 12% 24% 16.2 9.3 189 41% AMI - Jacksonville 64 27% 26 41% 81% 81% 4% 15.9 7.1 249 27% AMI - New Port Richey 66 38% 34 52% 74% 0% 3% 16.0 10.6 214 21% AMI - Orlando 37 54% 12 32% 92% 75% 8% 16.2 9.3 185 42% AMI - Palm Beach 52 54% 26 50% 73% 58% 4% 15.9 13.1 224 19% AMI - Panama City 54 43% 21 39% 76% 24% 5% 16.5 4.6 174 10% AMI - Pinellas 99 59% 36 36% 75% 19% 3% 16.2 11.8 193 31% AMI - Silver River 45 29% 27 60% 70% 37% 7% 15.7 9.7 179 30% AMI - Southwest Florida 43 26% 29 67% 66% 10% 7% 15.9 8.7 239 17% AMI - Tallahassee 33 61% 10 30% 90% 70% 0% 15.2 12.4 296 50% AMI - Tampa 66 45% 36 55% 89% 47% 22% 15.8 8.5 275 39% Crosswinds Rainwater Center Day Treatment 17 53% 7 41% 0% 29% 14% 16.2 5.7 286 14% Eckerd Leadership Program Day Treatment 53 40% 26 49% 62% 42% 4% 15.1 8.4 255 31% Floyd North Day Treatment 55 15% 46 84% 78% 83% 13% 16.8 11.5 203 15% Floyd South Day Treatment 32 16% 26 81% 81% 50% 50% 16.3 12.1 242 27% Jacksonville Youth Center Day Treatment - SOP 10 40% 8 80% 100% 50% 13% 14.7 8.3 524 0% Pace Center for Girls - Duval Day Treatment 2 0% 2 100% 0% 100% 0% 15.5 4.5 287 0% Pace Center for Girls - Palm Beach Day Treatment 2 0% 2 100% 0% 0% 0% 15.3 9.0 144 0% Stewart Marchman Day Treatment 38 58% 13 34% 85% 15% 8% 15.9 10.8 186 38%
Subtotal 1,307 42% 651 50% 77% 45% 15% 16.1 11.2 235 28%
ACTS Intensive Supervision Condtional Release Program 41 17% 16 39% 100% 31% 25% 17.3 23.3 196 44% Advanced Aftercare - 01st Circuit 136 26% 91 67% 75% 33% 4% 16.2 23.9 172 37% AMI - Dade South 43 5% 35 81% 71% 40% 57% 17.2 23.6 177 20% AMI - Emerald Coast 6 33% 4 67% 75% 50% 25% 16.2 15.0 197 75% AMI - Escambia Bay 72 17% 53 74% 85% 57% 0% 16.7 21.5 160 53% AMI - Florida Ocean Sciences 86 24% 46 53% 93% 54% 15% 17.3 31.5 249 41% AMI - Gainesville 19 32% 10 53% 100% 80% 0% 16.5 28.5 157 60% AMI - Gulf Coast North 70 16% 52 74% 79% 46% 8% 17.1 18.4 152 44% AMI - Jacksonville 48 15% 36 75% 94% 75% 0% 17.2 16.8 147 47% AMI - New Port Richey 88 15% 71 81% 87% 6% 11% 16.3 20.8 99 39% AMI - Orlando 51 20% 29 57% 83% 66% 10% 17.5 22.9 256 28% AMI - Palm Beach 96 25% 70 73% 67% 67% 6% 17.5 22.0 275 21%
Completions
Total %Male
%Black
Average Age at
Admission
Average Prior
Seriousness Index
AverageLengthof Stay
%Recidivism
%HispanicProgram Name
Total Releases
Probation and Community Corrections FY 2003-04Output Summary by Program Area (continued)
%ODS1
Conditional Release
Day Treatment
Program Area
1 ODS percentage is based on the total number of releases2 Italics indicate the program completed less than 15 youth and care should be taken in interpreting this data.Table continued on next page.

Probation and C
omm
unity Corrections
2006 Outcom
e Evaluation R
eport
Sum
mary T
ables
105
N2
%
AMI - Panama City 40 28% 25 63% 56% 36% 0% 16.2 15.0 187 28% AMI - Pinellas 63 19% 41 65% 73% 46% 5% 16.2 25.9 137 46% AMI - Silver River 72 24% 52 72% 75% 50% 8% 16.9 17.3 223 38% AMI - Southwest Florida 49 22% 23 47% 52% 39% 4% 17.4 21.1 179 22% AMI - Tallahassee 81 19% 65 80% 80% 71% 0% 16.7 25.3 162 35% AMI - Tampa 70 23% 27 39% 74% 59% 7% 17.4 22.4 208 59% Bay Point Conditional Release 148 8% 124 84% 100% 64% 35% 17.7 23.0 253 37% Boley Young Adult Program Aftercare 131 21% 75 57% 75% 25% 5% 16.3 24.9 130 39% Collier Drill Academy Aftercare 45 11% 37 82% 100% 16% 22% 16.7 12.1 181 49% DISC Village Aftercare 57 14% 41 72% 85% 56% 2% 16.7 20.0 159 37% Eckerd Conditional Release - 05th Circuit 335 30% 231 69% 83% 23% 5% 16.8 19.6 204 28% Eckerd Conditional Release - 06th Curcuit 132 8% 109 83% 66% 17% 5% 16.5 19.2 93 30% Eckerd Conditional Release - 07th Circuit 215 24% 144 67% 79% 34% 3% 16.9 21.9 236 37% Eckerd Conditional Release - 08th Circuit 13 15% 10 77% 90% 60% 0% 17.9 16.7 165 30% Eckerd Conditional Release - 10th Circuit 68 12% 47 69% 79% 47% 4% 16.9 21.8 171 43% Eckerd Conditional Release - 11th Circuit 20 10% 17 85% 94% 65% 35% 17.9 32.3 202 18% Eckerd Conditional Release - 12th Circuit 54 13% 38 70% 61% 26% 13% 16.1 13.8 135 34% Eckerd Conditional Release - 13th Circuit 300 20% 80 27% 70% 63% 13% 17.2 22.3 230 38% Eckerd Conditional Release - 15th Circuit 286 36% 210 73% 84% 58% 10% 17.1 19.9 351 29% Eckerd Conditional Release - 16th Circuit 14 14% 9 64% 78% 0% 22% 17.5 20.8 179 22% Eckerd Conditional Release - 17th Circuit 205 18% 172 84% 81% 60% 15% 17.1 33.8 171 41% Eckerd Conditional Release - 18th Circuit 36 8% 24 67% 75% 25% 0% 17.7 26.0 116 33% Eckerd Conditional Release - 19th Circuit 175 19% 99 57% 80% 41% 8% 17.3 21.7 262 32% Eckerd Conditional Release - 20th Circuit 48 17% 36 75% 100% 39% 8% 16.9 31.1 225 36% Florida City Youth Academy 57 21% 43 75% 86% 60% 30% 17.0 26.3 242 30% Intensive Community Services - Bay Area Youth Services 230 18% 176 77% 80% 47% 6% 16.8 18.9 146 35% Jacksonville Youth Center Aftercare 258 5% 233 90% 85% 59% 2% 16.6 15.5 78 40% Law Enforcement Aftercare Program (LEAP) 51 51% 23 45% 100% 52% 26% 16.5 17.6 247 43% Liberty Wilderness Aftercare 15 20% 10 67% 100% 60% 0% 17.5 24.9 224 70% Manatee Palms Aftercare Services 154 15% 89 58% 88% 26% 10% 17.1 24.7 157 36% Martin County Boot Camp Day Treatment Aftercare 39 15% 22 56% 100% 36% 14% 17.3 23.1 173 27% Opalocka Police Department Conditional Release 140 14% 117 84% 79% 71% 28% 17.3 24.6 164 34% Pinellas Boot Camp Aftercare 37 22% 18 49% 100% 61% 0% 17.2 26.0 150 50% Polk Boot Camp Aftercare 61 15% 35 57% 86% 29% 20% 17.1 28.2 155 46% Seminole Sheriffs Intensive Community Supervision Unit 33 52% 20 61% 70% 35% 15% 17.3 19.2 330 35% State Operated - 01st Circuit 7 43% 3 43% 100% 33% 0% 17.6 24.7 38 0% State Operated - 02nd Circuit 9 0% 6 67% 100% 67% 17% 17.6 32.5 344 0% State Operated - 03rd Circuit 13 15% 10 77% 90% 20% 0% 17.2 20.1 436 30% State Operated - 04th Circuit 23 9% 21 91% 90% 48% 10% 17.3 12.7 309 33% State Operated - 05th Circuit 17 12% 11 65% 73% 9% 9% 16.8 24.4 222 18% State Operated - 07th Circuit 14 7% 13 93% 92% 54% 0% 18.3 12.5 80 31% State Operated - 08th Circuit 22 5% 20 91% 85% 75% 10% 17.3 16.9 133 20% State Operated - 09th Circuit 83 14% 54 65% 89% 59% 17% 17.5 21.7 257 37% State Operated - 10th Circuit 3 0% 1 33% 100% 0% 0% 15.7 27.0 7 0% State Operated - 11th Circuit 71 11% 60 85% 92% 50% 45% 17.3 26.2 322 28%
Table continued on next page.
Average Prior
Seriousness Index
AverageLengthof Stay
%Recidivism
Conditional Release
Probation and Community Corrections FY 2003-04Output Summary by Program Area (continued)
Program Area Program NameTotal
Releases%
ODS1
Completions
2 Italics indicate the program completed less than 15 youth and care should be taken in interpreting this data.
1 ODS percentage is based on the total number of releases
Total %Male
%Black
Average Age at
Admission%
Hispanic
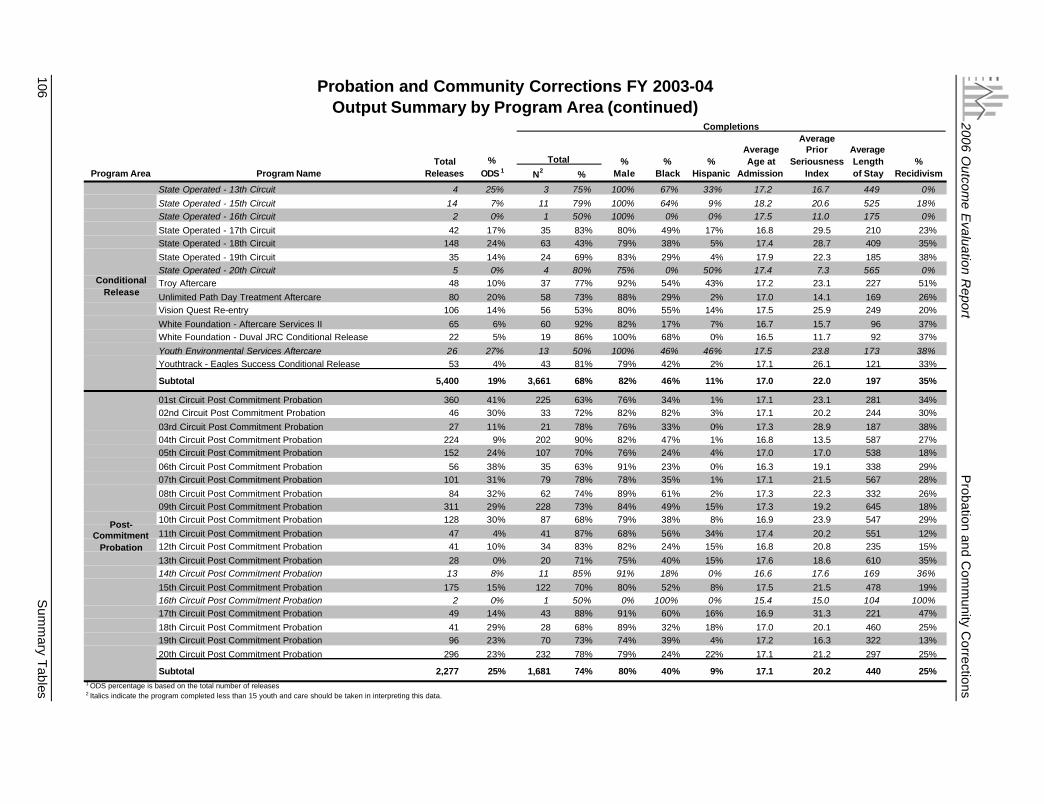
2006 Outcom
e Evaluation R
eport
Probation and C
omm
unity Corrections
106
S
umm
ary Tables
N2 %
State Operated - 13th Circuit 4 25% 3 75% 100% 67% 33% 17.2 16.7 449 0%
State Operated - 15th Circuit 14 7% 11 79% 100% 64% 9% 18.2 20.6 525 18% State Operated - 16th Circuit 2 0% 1 50% 100% 0% 0% 17.5 11.0 175 0%
State Operated - 17th Circuit 42 17% 35 83% 80% 49% 17% 16.8 29.5 210 23% State Operated - 18th Circuit 148 24% 63 43% 79% 38% 5% 17.4 28.7 409 35%
State Operated - 19th Circuit 35 14% 24 69% 83% 29% 4% 17.9 22.3 185 38% State Operated - 20th Circuit 5 0% 4 80% 75% 0% 50% 17.4 7.3 565 0% Troy Aftercare 48 10% 37 77% 92% 54% 43% 17.2 23.1 227 51%
Unlimited Path Day Treatment Aftercare 80 20% 58 73% 88% 29% 2% 17.0 14.1 169 26% Vision Quest Re-entry 106 14% 56 53% 80% 55% 14% 17.5 25.9 249 20%
White Foundation - Aftercare Services II 65 6% 60 92% 82% 17% 7% 16.7 15.7 96 37% White Foundation - Duval JRC Conditional Release 22 5% 19 86% 100% 68% 0% 16.5 11.7 92 37%
Youth Environmental Services Aftercare 26 27% 13 50% 100% 46% 46% 17.5 23.8 173 38% Youthtrack - Eagles Success Conditional Release 53 4% 43 81% 79% 42% 2% 17.1 26.1 121 33%
Subtotal 5,400 19% 3,661 68% 82% 46% 11% 17.0 22.0 197 35%
01st Circuit Post Commitment Probation 360 41% 225 63% 76% 34% 1% 17.1 23.1 281 34% 02nd Circuit Post Commitment Probation 46 30% 33 72% 82% 82% 3% 17.1 20.2 244 30%
03rd Circuit Post Commitment Probation 27 11% 21 78% 76% 33% 0% 17.3 28.9 187 38% 04th Circuit Post Commitment Probation 224 9% 202 90% 82% 47% 1% 16.8 13.5 587 27% 05th Circuit Post Commitment Probation 152 24% 107 70% 76% 24% 4% 17.0 17.0 538 18%
06th Circuit Post Commitment Probation 56 38% 35 63% 91% 23% 0% 16.3 19.1 338 29% 07th Circuit Post Commitment Probation 101 31% 79 78% 78% 35% 1% 17.1 21.5 567 28%
08th Circuit Post Commitment Probation 84 32% 62 74% 89% 61% 2% 17.3 22.3 332 26% 09th Circuit Post Commitment Probation 311 29% 228 73% 84% 49% 15% 17.3 19.2 645 18% 10th Circuit Post Commitment Probation 128 30% 87 68% 79% 38% 8% 16.9 23.9 547 29%
11th Circuit Post Commitment Probation 47 4% 41 87% 68% 56% 34% 17.4 20.2 551 12% 12th Circuit Post Commitment Probation 41 10% 34 83% 82% 24% 15% 16.8 20.8 235 15%
13th Circuit Post Commitment Probation 28 0% 20 71% 75% 40% 15% 17.6 18.6 610 35% 14th Circuit Post Commitment Probation 13 8% 11 85% 91% 18% 0% 16.6 17.6 169 36%
15th Circuit Post Commitment Probation 175 15% 122 70% 80% 52% 8% 17.5 21.5 478 19% 16th Circuit Post Commitment Probation 2 0% 1 50% 0% 100% 0% 15.4 15.0 104 100% 17th Circuit Post Commitment Probation 49 14% 43 88% 91% 60% 16% 16.9 31.3 221 47%
18th Circuit Post Commitment Probation 41 29% 28 68% 89% 32% 18% 17.0 20.1 460 25% 19th Circuit Post Commitment Probation 96 23% 70 73% 74% 39% 4% 17.2 16.3 322 13%
20th Circuit Post Commitment Probation 296 23% 232 78% 79% 24% 22% 17.1 21.2 297 25%
Subtotal 2,277 25% 1,681 74% 80% 40% 9% 17.1 20.2 440 25%
%Male
Post-Commitment
Probation
Average Prior
Seriousness Index
Completions
TotalAverage Age at
Admission
Conditional Release
Probation and Community Corrections FY 2003-04Output Summary by Program Area (continued)
1 ODS percentage is based on the total number of releases2 Italics indicate the program completed less than 15 youth and care should be taken in interpreting this data.
AverageLengthof Stay
%RecidivismProgram Area Program Name
Total Releases
%ODS 1
%Hispanic
%Black

Residential and Correctional Facilities 2006 Outcome Evaluation Report
Residential and Correctional Facilities 107
The use of the term “risk” in Florida statute has a different meaning than its use in risk assessment instruments. Risk, as measured by assessment instruments, including DJJ’s recently adopted instrument called the PACT, refers to “risk-to-re-offend,” as has been established in the research.12
RESIDENTIAL AND
CORRECTIONAL FACILITIES
Committing a youth who is adjudicated delinquent to a residential program is one of the choices available to the juvenile court under section 985.231, Florida Statutes (2005). The Residential and Correctional Facilities Branch oversees all residential commitment programs. The Branch is divided into three regions:
1. North Region: comprised of Judicial Circuits 1, 2, 3, 4, 5, 7, 8, and 14.
2. Central Region: comprised of Judicial Circuits 6, 9, 10, 12, 13 and 18.
3. South Region: comprised of Judicial Circuits 11, 15, 16, 17, 19 and 20.
Within each of the three regions, the Department of Juvenile Justice (DJJ) operates or contracts for the operation of a variety of residential programs to serve committed youth. Programs vary by restrictiveness level, defined in section 985.03, Florida Statutes (2005) as “...the level of custody provided by programs that service the custody and care needs of committed children.” Higher restrictiveness levels are characterized by tighter security, closer supervision, more intensive treatment and longer lengths of stay.
The statute designates four levels of residential commitment:
1. Low-risk restrictiveness
2. Moderate-risk restrictiveness
3. High-risk restrictiveness
4. Maximum-risk restrictiveness.
Section 985.231 of the Florida Statutes (2005) directs the juvenile courts to commit an adjudicated youth to one of the four restrictiveness levels based on the nature of the offense, security concerns and treatment issues. Within the restrictiveness level chosen by the juvenile court, DJJ personnel choose a specific program to best meet the treatment and security needs of the youth. Program types include: mental health programs, substance abuse programs, sex offender programs, and boot camps. As of FY 2003-04, DJJ had 7,206 funded residential beds for juvenile offenders.
12
12 McGuire, J. (2001). What works in correctional intervention: evidence and practice implications? In F.F. Gray Bernfeld & Alan Leschied (Ed.), Offender rehabilitation in practice: Implementing and evaluating effective programs (pp. 25-43). New York, NY: John Wiley and Sons, LTD. Sherman, L.W. et al (1998). Preventing Crime: What works what doesn’t, what’s promising. National Institute of Justice.

2006 Outcome Evaluation Report Residential and Correctional Facilities
108 Profile of Programs
Restrictiveness Level North Central South
Low-Risk 10 6 6 22 Moderate-Risk 42 35 23 100 High-Risk 14 13 10 37 Maximum-Risk 1 1 2 4
Total 67 55 41 163
Residential Commitment FY 2003-04Program Distribution by
Restrictiveness Level and Region
Number of Programs in Region
Total
Restrictiveness Level North Central South
Low-Risk 646 295 316 1,257 Moderate-Risk 2,393 2,266 1,336 5,995 High-Risk 646 720 631 1,997 Maximum-Risk 32 25 38 95
Total 3,717 3,306 2,321 9,344 1 The number of releases does not include 498 youth who were in a program that changed
providers or closed.
Residential Commitment FY 2003-04Youth Distribution by
Restrictiveness Level and Region
Number of Youth Released
Total1
Profile of Programs During FY 2003-04 youth were released from 163 residential commitment programs. The table below provides the distribution of programs within the four restrictiveness levels for each of the three regions. Overall, the majority of commitment programs (61%) were classified as moderate-risk restrictiveness. Each region had at least one program within each restrictiveness level. The North Region had the most programs overall, as well as the most low, moderate and high-risk programs.
A total of 9,842 youth were released from residential programs, including 498 who are not included in the table below because their “release” was due to a change in the contracted provider or their program closing. When the remaining 9,344 youth released are examined, the distribution of youth released mirrors the distribution of programs. The majority of youth were released from moderate-risk programs (n=5,995). The North Region accounted for the greatest number of overall releases (n=3,717). Releases from maximum-risk programs accounted for a very small proportion of youth released (n=95). Differences in the number of youth served within each restrictiveness level reflect both the availability of beds and the average length of stay. Programs with shorter lengths of stay are able to serve more youth within a shorter period of time.
Among the residential programs, there are a variety of specialty programs designed to serve specific treatment needs. The table on the next page presents the distribution of program types by region. The number of programs within each region as well as the number of youth released is presented. There are no low-risk specialty programs, and not all of the regions have programs of each type. For example, there are no high-risk mental health programs in the North Region. There are only two substance abuse programs for females in the state. Both of these programs are located in the Central Region and are only available to youth committed to a moderate-risk program.
The proportion of youth served within their home region varies by program type and region. The availability of programs within each region is important because a key consideration in placing youth is the proximity of the program to the youth’s home. The Residential and Correctional Facilities Branch operates under a regionalization concept that distributes beds among the regions in a manner designed to reduce the percentage of youth placed outside their home region.
Boot camps have the highest percentages of youth from their own region (100% for Bay Boot Camp in the North Region, and 91% for the four boot camps located in the Central

Residential and Correctional Facilities 2006 Outcome Evaluation Report
Profile of Programs 109
North Central South
North 76% 14% 11% 2 66
Central 53% 26% 21% 1 19 South 35% 21% 44% 3 157
North 87% 10% 2% 8 580 Central 18% 53% 29% 5 276
South 13% 16% 71% 3 159 North 82% 14% 3% 5 234
Central 20% 56% 23% 8 466 South 24% 28% 47% 4 163
North 78% 14% 7% 29 1,857 Central 7% 76% 17% 14 1,081
South 2% 29% 68% 15 1,001 North 43% 40% 17% 1 35
Central N/A N/A N/A 0 0 South N/A N/A N/A 0 0
North 100% 0% 0% 1 46 Central 2% 91% 6% 4 211
South 0% 0% 99% 2 115 North 79% 12% 8% 2 118
Central 16% 43% 39% 2 93 South 30% 34% 34% 1 44
North 96% 0% 0% 1 27 Central 24% 29% 46% 2 143
South N/A N/A N/A 0 0 North N/A N/A N/A 0 0
Central 23% 34% 43% 2 44 South N/A N/A N/A 0 0 North 78% 3% 18% 2 65
Central 3% 50% 47% 2 226 South 0% 8% 92% 1 13
North 64% 27% 0% 1 11 Central 0% 0% 100% 1 2
South N/A N/A N/A 0 0 North 77% 17% 5% 2 75
Central 19% 54% 26% 2 126 South 0% 0% 100% 1 7
North 79% 16% 4% 9 480 Central 18% 51% 30% 6 434
South 3% 25% 71% 4 350 North N/A N/A N/A 0 0
Central 30% 20% 50% 1 10 South 27% 21% 51% 1 70
North N/A N/A N/A 0 0 Central 23% 34% 41% 2 91
South N/A N/A N/A 0 0 North N/A N/A N/A 0 0
Central N/A N/A N/A 0 0 South 7% 32% 62% 1 60
North 78% 18% 3% 3 91 Central 34% 53% 14% 2 59
South 31% 33% 35% 3 144 North 69% 13% 16% 1 32
Central 24% 40% 36% 1 25 South 20% 28% 52% 1 25
North N/A N/A N/A 0 0 Central N/A N/A N/A 0 0
South 23% 38% 38% 1 13
High-Risk
Mental Health-Female
Moderate-Risk
Developmentally Disabled-
Male
Female
Boot Camps
Mental Health-Male
Female
Male
Male
Female
Substance Abuse-Male
Mental Health-Female
Sex Offender-Male
Number of Programs
Residential Commitment FY 2003-04Distribution of Youth Released
by Program Type and Program Region
Restrictiveness Level
Total Releases
Percentage of
Youth from Region1
Program Region
ProgramType
Maximum-Risk
Substance Abuse-Female
1 Bolded figures indicate the percentage of youth released from that program type and region who resided in that region. Percentages may not
add to 100 due to a few youth whose home region is listed as out of state.
Low-Risk
Substance Abuse-Male
Mental Health-Female
Male
Sex Offender-Male
Male
Mental Health-Male
Region). Given the large number of programs in the North Region, a high percentage of youth served by those programs reside in that region. For example, within the category of moderate-risk female programs located in the North Region, 82% of the youth served by these programs reside in that region. In contrast, only 47% of females in
moderate-risk programs in the South Region reside in the South Region. One exception to this pattern is the single program designated for developmentally disabled males. This program must serve males from across the state in order to meet the specialized needs of this particular population.

2006 Outcome Evaluation Report Residential and Correctional Facilities
110 Offenses During Placement
The ODP rates for each program can be found in the summary tables at the end of this chapter.
Restrictiveness LevelNumber of Releases
% Adjudicated for ODP
1
Low-Risk 1,258 5%Moderate-Risk 6,273 5%High-Risk 2,162 6%Maximum-Risk 149 4%
Total 9,842 5%
Previous Fiscal Year 10,001 6%1The offense occurred during placement (ODP) and was subsequently adjudicated.
Residential Commitment FY 2003-04Offenses During Placement
by Restrictiveness Level
Residential and Correctional Facility Program Outcomes
The remaining sections of this chapter focus on outcomes for youth released from residential commitment programs during FY 2003-04. Four performance measures were examined:
1. Offenses during placement (all releases).
2. Release status (all releases).
3. Re-offending within one year of release (completions only).
4. Length of stay (all releases, completions, recidivists and non-recidivists).
In addition, the demographic characteristics and offense histories of the youth in the recidivism study are provided. A detailed description of the data sources and methods used in analyzing the data can be found in the Data and Methods chapter of this report.
Offenses During Pla cement
During the time a youth is in a residential program, his or her opportunity to re-offend is reduced but not eliminated. The rate of offenses during placement that result in adjudication (ODP) is used to gauge the effectiveness of residential commitment programs in guiding the behavior of the youth while committed. Unlike recidivism, which is examined only for youth who completed a program, ODP is used as an outcome measure for all youth released from a program regardless of their completion status.
Statewide, the ODP rate for youth released from residential commitment programs was 5%, down from 6% in FY 2002-03. This is the second consecutive year the ODP rate has decreased. Across restrictiveness levels, ODP rates varied by only 2%age points, from a low of 4% in maximum-risk programs to a high of 6 in high-risk programs.

Residential and Correctional Facilities 2006 Outcome Evaluation Report
Release Status 111
Release Status
There are a variety of reasons why youth are released from a program. Identifying the reason is dependent on DJJ staff’s categorization from a list of release reasons in JJIS. Based on a detailed analysis of release reasons in JJIS, along with a cross-check against subsequent placements, the following six release status categories and subcategories were identified:
1. Program Completion.
• Completed program requirements and directly discharged.
• Completed program requirements and transferred for conditional release services.
• Completed program requirements and transferred to post-commitment probation.
• Completed program requirements and volunteered for residential vocational programs (Forestry Youth Academy or Graceville Vocational Youth Center).13
• Reached maximum age of juvenile court jurisdiction.
• Maximum sentence was served.
2. Program Change (provider changed or program closed).
3. Transfer.
• Transferred to a less restrictive program.
• Transferred to a program at the same restrictiveness level (lateral).
13 Graceville Vocational Youth Center is a probation program and is reported in the Probation and Community Corrections chapter.
• Transferred to a program at a higher restrictiveness level.
• Transferred, but never placed.
4. Court Activity.
• Released by court order.
• Re-committed to a residential program.
• Case sent to adult court or youth jailed.
5. Other Releases.
• Released to a detention or juvenile assessment center.
• Released for medical or mental health treatment.
• Other release reason not specified.
6. Escapes.14
Release Status by Restrictiveness Level
The table that follows presents release status statewide and by restrictiveness level. The release status represents the final release from each program during FY 2003-04.15 During FY 2003-04, there were a total of 9,842 releases from residential commitment programs of which 85% were categorized as program completions. Five percent of the youth were “released” from a program when it closed or changed providers. Six percent of releases were attributable to transfers from one program to another. One percent of the youth were released by court action, 2% were
14 The escape count only includes youth whose last release reason during the fiscal year was an escape and who were not returned during the remainder of the fiscal year. 15 Note that these figures cannot be used to determine the total number of youth who had an intermediate status such as escape, detention placement, or medical or mental health treatment.

2006 Outcome Evaluation Report Residential and Correctional Facilities
112 Release Status by Restrictiveness Level
In FY 2003-04, 85% of youth released from residential commitment completed the program.
Low-Risk2
Moderate-Risk2
High- Risk2
Maximum-Risk2
Directly discharged 37% 19% 21% 11% 22% 21% Released to state-operated PCP 28% 10% 7% 7% 12% 15% Released for conditional release 23% 55% 55% 33% 51% 48% Forestry Academy/Vocational Program 0% 0% 1% 0% 1% 1%
Subtotal 88% 85% 83% 51% 85% 83%
Program Change Program closed or provider changed 0% 4% 8% 36% 5% 5%
Transferred to a program of a lower restrictiveness 0% 0% 0% 1% 0% 0% Transferred to a program of the same restrictiveness 2% 5% 3% 1% 4% 4% Transferred to a program of a higher restrictivness 5% 2% 0% 0% 2% 2%
Subtotal 7% 7% 3% 2% 6% 6%
Released by court order 0% 0% 0% 1% 0% 0% Recommitted 0% 0% 0% 0% 0% 0% Case sent to adult court or youth jailed 0% 0% 2% 4% 1% 1%
Subtotal 0% 1% 2% 5% 1% 2%
Detention or Juvenile Assessment Center 2% 2% 3% 5% 2% 2% Medical or mental health treatment 1% 0% 0% 0% 0% 0% Other, not specified 0% 0% 0% 0% 0% 0%
Subtotal 3% 2% 3% 5% 3% 3%
Escape Escape 2% 1% 0% 0% 1% 1%
1,258 6,273 2,162 149 9,842 10,001
1 Reflects last exit reason as of June 30, 2004.
2 Percentages are rounded to the nearest whole number and may not add to 100%.
Residential Commitment FY 2003-04Release Status by Restrictiveness Level
PreviousFiscalYear2
Total Numbers of Releases
Restrictiveness Level
Total Releases
Transfer
Court Activity
Other Release
Program Completion
Reason For Release1
placed in a detention or juvenile assessment center, and 1% escaped. The percentage of youth who fall into each release status category differs somewhat by restrictiveness level. The completion rate ranges from 88% of the youth in low-risk programs to 51% of youth in maximum-risk programs. This difference is largely accounted for
by the high percentage of maximum-risk youth (36%) whose program closed or changed providers, and are therefore considered to have exited the initial program. Post-commitment services also differ by restrictiveness level. Youth released from low-risk programs were more likely to be directly discharged or receive services from state-operated post-commitment programs while youth from the higher restrictiveness programs were more likely to receive conditional release services.

Residential and Correctional Facilities 2006 Outcome Evaluation Report
Demographic Characteristics 113
Male Female White Black OtherNon-
Hispanic Hispanic
Low-Risk 1,104 80% 20% 44% 55% 0% 93% 7% 15.9Moderate-Risk 5,313 80% 20% 55% 44% 1% 89% 11% 16.3High-Risk 1,805 86% 14% 49% 51% 0% 90% 10% 16.7Maximum-Risk 76 91% 9% 37% 63% 0% 87% 13% 17.5
Total 8,298 82% 18% 52% 47% 0% 90% 10% 16.3
Previous Fiscal Year 8,309 82% 18% 53% 46% 0% 16.3not reported
Average Age at Admission
Number of CompletionsRestrictiveness Level
Residential Commitment FY 2003-04Demographic Characteristics By Restrictiveness Levels
Gender Race Ethnicity
Profile of Youth Completing Residential Commitment Programs
Youth considered to have completed the program include:
• Youth who completed the program and were assigned to a conditional release or post-commitment probation program.
• Youth who completed the program and were directly discharged.
• Youth released due to maximum allowable time served or maximum age of juvenile court jurisdiction.
Using these criteria, 8,268 youth were included in the recidivism analysis. Thirty youth completed more than one residential commitment program during FY 2003-04 for a total of 8,298 completions. This duplicated number of 8,298 completions is referenced throughout this section of the report.
Research indicates that demographic characteristics and offense histories are predictors of the likelihood of re-offending.16 Understanding these important background characteristics of youth provides a context for interpreting recidivism rates.
Demographic Characteristics
The demographic characteristics of the youth are presented below by restrictiveness level and by program region. Youth completing residential commitment programs in FY 2003-04 were mostly male (82%), more than half were white (52%), 10% were Hispanic, and their average age at admission was 16.3 years. The populations varied by restrictiveness level and region. The proportion of females decreased as the restrictiveness level increased. However, the proportion of black youth and Hispanics increased as the restrictiveness level increased as did the average age at admission.
16 Loeber, R., Farrington, D.P., Stouthamer-Loeber, M., and Van Kammen, W.B. (1998). Antisocial Behavior and Mental Health Problems: Explanatory Factors in Childhood and Adolescence. Mahwah, NJ: Lawrence Erlbaum Associates.

2006 Outcome Evaluation Report Residential and Correctional Facilities
114 Offense Histories
Violent Felony
Property Felony
Other Felony Misd.
Unclassified Offense
Low-Risk 1,104 8.4 5.2 22% 34% 5% 35% 4% 13.2 Moderate-Risk 5,313 11.2 6.8 33% 40% 7% 18% 2% 19.4 High-Risk 1,805 15.1 9.3 59% 32% 5% 4% 1% 30.1 Maximum-Risk 76 16.9 11.6 76% 20% 3% 1% 0% 44.0
Total 8,298 11.8 7.2 37% 37% 6% 17% 2% 21.2
Previous Fiscal Year 8,309 11.7 7.3 38% 38% 7% 16% 2% 21.5 1 Classifications are based on each youth's most serious prior adjudicated charge. Percentages are rounded to the nearest whole number and may not add to 100.
2 The seriousness index is comprised of the sum of the scores for all adjudicated charges. The following point values are assigned: 8 for a violent felony, 5 for a property or other felony, 2 for a misdemeanor, and 1 for any other charge.
Average Prior
Charges
Percent of Completions with a Prior Adjudication for: 1
AveragePrior
Adjudications
Numberof
Completions
Residential Commitment FY 2003-04Offense Histories by Restrictiveness Level
Restrictiveness Level
Average Prior Seriousness
Index2
Offense Histories
Information on the offense histories for youth who completed residential commitment programs is presented in the following tables by restrictiveness level, program region, program type, gender, race, ethnicity and age. Three measures of prior offending are calculated as described in the Data and Methods chapter:
1. Average number of charges.
2. Average number of charges that resulted in adjudication or adjudication withheld.
3. Average prior adjudicated seriousness index.
In addition, prior adjudications are further classified by the type (violent felony, property felony, other felony, misdemeanor, or unclassified offense) of the most serious prior adjudicated charge.
Statewide, youth had on average 11.8 charges and 7.2 adjudicated charges prior to program admission. Statewide, for 37% of the youth their most serious adjudicated offense was for a violent felony. For another 37% their most serious adjudicated offense was for a felony property offense. Youth whose most serious
adjudication was for a misdemeanor charge, may actually have been committed for violating a probation sentence received for the underlying misdemeanor charge.
Offense Histories by Restrictiveness Level
There is a clear relationship between the extent and seriousness of offense histories (as measured by the average prior seriousness index) and restrictiveness level. On average, youth completing the higher restrictiveness programs had more extensive offense histories than youth completing the less restrictive programs. Youth released from low-risk programs averaged 8.4 prior charges compared to youth released from maximum-risk programs that averaged 16.9 prior charges. The most serious offense for which youth were adjudicated also differed by restrictiveness level. While 76% of the youth completing maximum-risk programs had previously been adjudicated for a violent felony, this was the case for only 22% of youth completing low-risk programs. The average prior seriousness index for youth completing maximum-risk residential programs was 44.0 compared to 13.2 for youth completing low-risk residential programs.

Residential and Correctional Facilities 2006 Outcome Evaluation Report
Offense Histories 115
Violent Felony
Property Felony
Other Felony Misd.
Unclassified Offense
Female 221 6.5 4.5 26% 20% 1% 45% 8% 10.4 Male 883 8.9 5.4 20% 37% 6% 33% 4% 13.9 Female 751 8.8 5.8 64% 27% 0% 9% 0% 13.9 Male 3,496 11.9 7.1 27% 27% 7% 35% 4% 20.6 Developmentally Disabled-Male 33 19.4 10.3 34% 42% 7% 16% 1% 28.8 Boot Camps 322 11.8 7.3 30% 57% 6% 7% 1% 21.8 Mental Health-Female 236 8.2 5.2 39% 23% 10% 25% 3% 14.5 Mental Health-Male 154 10.7 6.1 42% 34% 5% 19% 1% 19.7 Substance Abuse-Female 37 8.7 5.6 19% 41% 11% 27% 3% 14.8 Substance Abuse-Male 277 11.5 7.3 24% 50% 11% 14% 1% 20.5 Sex Offender-Male 7 10.3 6.6 57% 14% 0% 29% 0% 17.3 Female 173 12.2 8.3 55% 26% 7% 9% 2% 24.0 Male 1,143 17.3 10.4 52% 40% 5% 3% 0% 33.0 Mental Health-Female 75 12.9 8.6 59% 20% 5% 16% 0% 27.4 Mental Health-Male 84 17.8 12.1 51% 38% 5% 5% 1% 38.6 Substance Abuse-Male 57 15.6 10.3 54% 33% 11% 2% 0% 34.5 Sex Offender-Male 273 7.6 4.4 91% 3% 2% 3% 1% 18.9 Male 69 16.9 11.6 75% 20% 3% 1% 0% 43.8 Mental Health-Female 7 16.4 11.7 86% 14% 0% 0% 0% 45.7
8,298 11.8 7.2 37% 37% 6% 17% 2% 21.2
8,309 11.7 7.3 38% 38% 7% 16% 2% 21.5
Restrictiveness Level
Program Type
Numberof
Completions1
AveragePrior
Adjudications
Average Prior
Charges
1 Italics indicate that less than 15 youth completed that program type and care should be taken in interpreting the data.
Residential Commitment FY 2003-04Offense Histories by Program Type
Total
Previous Fiscal Year
Maximum-Risk
3 The seriousness index is comprised of the sum of the scores for all adjudicated charges. The following point values are assigned: 8 for a violent felony, 5 for a property or other felony, 2 for a misdemeanor, and 1 for any other charge.
Percent of Completions with a Prior Adjudication for:2
Low-Risk
Moderate-Risk
2 Classifications are based on each youth's most serious prior adjudicated charge. Percentages are rounded to the nearest whole number and may not add to 100.
Average PriorSeriousness
Index4
High-Risk
Offense Histories by Program Type
The extent and seriousness of youths’ offense histories varied widely by program type.17 Youth completing the single program serving developmentally disabled males had the most extensive offense histories (an average of 19.4 prior charges), and youth completing maximum-risk programs for males had the most serious offense histories as measured by the seriousness index (an average of 43.8). The percentage of youth with prior violent felony adjudications was highest for high-risk sex offender programs due to their targeted
17 Two program types, moderate-risk sex offender programs for males and maximum-risk mental health programs for females, had too few releases (n=7) on which to base conclusions
population of youth with an adjudicated sex offense. The programs with the lowest percentage of youth with prior violent felony adjudications were low-risk male programs. The greatest gender difference in the percentage of youth with a prior violent felony adjudication was for non-specialty moderate-risk programs. Sixty-four percent of youth completing moderate-risk female programs had a prior violent felony adjudication compared to 27% of youth completing moderate-risk male programs.

2006 Outcome Evaluation Report Residential and Correctional Facilities
116 Offense Histories
Violent Felony
Property Felony
Other Felony Misd.
Unclassified Offense
Male 6,780 12.4 7.5 38% 40% 6% 15% 1% 22.4 Female 1,518 9.0 6.0 34% 26% 7% 30% 4% 15.6
Total 8,298 11.8 7.2 37% 37% 6% 17% 2% 21.2
Previous Fiscal Year 8,309 11.7 7.3 38% 38% 7% 16% 2% 21.5 1 Classifications are based on each youth's most serious prior adjudicated charge. Percentages are rounded to the nearest whole number and may not add to 100.
Violent Felony
Property Felony
Other Felony Misd.
Unclassified Offense
White 4,352 10.7 6.8 30% 43% 5% 20% 2% 19.7
Black 3,907 12.9 7.6 45% 31% 8% 15% 1% 22.8 Other 39 9.8 6.3 21% 56% 10% 13% 0% 18.9
Total 8,298 11.8 7.2 37% 37% 6% 17% 2% 21.2
Previous Fiscal Year 8,309 11.7 7.3 38% 38% 7% 16% 2% 21.5
Numberof
Completions
Average Prior
Charges
Race
Numberof
Completions
AveragePrior
Adjudications
AveragePrior
Adjudications
Average Prior
Charges
Average Prior Seriousness
Index2
Residential Commitment FY 2003-04Offense Histories by Race
1 Classifications are based on each youth's most serious prior adjudicated charge. Percentages are rounded to the nearest whole number and may not add to 100. 2 The seriousness index is comprised of the sum of the scores for all adjudicated charges. The following point values are assigned: 8 for a violent felony, 5 for a property or other felony, 2 for a misdemeanor, and 1 for any other charge.
2 The seriousness index is comprised of the sum of the scores for all adjudicated charges. The following point values are assigned: 8 for a violent felony, 5 for a property or other felony, 2 for a misdemeanor, and 1 for any other charge.
Residential Commitment FY 2003-04Offense Histories by Gender
Gender
Average Prior Seriousness
Index2
Percent of Completions with a Prior Adjudication for:1
Percent of Completions with a Prior Adjudication for:1
Offense Histories by Gender
The offense histories of males and females were substantially different in terms of both extent and seriousness. Committed males had more serious delinquency histories than committed females for most measures. There was only a small difference in the percentage of males and females whose most serious prior adjudication was for a violent felony (38% and 34%, respectively). However, the percentage of females whose most serious adjudication was a misdemeanor offense was twice that of males. There were also substantial differences in the prior seriousness index between males who averaged 22.4 and females who averaged 15.6.
Offense Histories by Race
Compared to the differences between males and females, there were smaller differences between black and white youth with regard to offense histories. Black youth averaged 12.9 prior charges as compared to 10.7 prior charges for white youth. On average, black youth had slightly more serious offense histories than white youth (prior seriousness index scores of 22.8 and 19.7, respectively). The percentage of black youth whose most serious adjudicated was for a violent felony was higher than the percentage of white youth (45% and 30%, respectively).

Residential and Correctional Facilities 2006 Outcome Evaluation Report
Offense Histories 117
Violent Felony
Property Felony
Other Felony Misd.
Unclassified Offense
White Non-Hispanic 3,612 10.7 6.9 29% 43% 5% 21% 3% 19.5 White Hispanic 740 11.0 6.6 39% 40% 5% 15% 2% 21.0
Black Non-Hispanic 3,831 13.0 7.6 45% 31% 7% 15% 1% 22.8 Black Hispanic 76 12.1 7.2 46% 36% 9% 8% 1% 21.6 Other Non-Hispanic 32 10.2 6.5 16% 63% 13% 9% 0% 19.4 Other Hispanic 7 8.3 5.7 43% 29% 0% 29% 0% 17.0
Total 8,298 11.8 7.2 37% 37% 6% 17% 2% 21.2
Previous Fiscal Year 8,309 11.7 7.3 38% 38% 7% 16% 2% 21.5 1 Classifications are based on each youth's most serious prior adjudicated charge. Percentages are rounded to the nearest whole number and may not add to 100.
Violent Felony
Property Felony
Other Felony Misd.
Unclassified Offense
Non-Hispanic Males 6,087 12.4 7.5 38% 39% 6% 15% 1% 22.5 Hispanic Males 693 11.8 6.9 40% 42% 6% 11% 1% 22.0
Non-Hispanic Females 1,388 9.2 6.0 34% 25% 7% 30% 4% 15.6 Hispanic Females 130 7.6 5.3 35% 28% 4% 29% 5% 15.4
Total 8,298 11.8 7.2 37% 37% 6% 17% 2% 21.2
Previous Fiscal Year 8,309 11.7 7.3 38% 38% 7% 16% 2% 21.5 1 Classifications are based on each youth's most serious prior adjudicated charge. Percentages are rounded to the nearest whole number and may not add to 100. 2 The seriousness index is comprised of the sum of the scores for all adjudicated charges. The following point values are assigned: 8 for a violent felony, 5 for a property or other felony, 2 for a misdemeanor, and 1 for any other charge.
Percent of Completions with a Prior Adjudication for:1
2 The seriousness index is comprised of the sum of the scores for all adjudicated charges. The following point values are assigned: 8 for a violent felony, 5 for a property or other felony, 2 for a misdemeanor, and 1 for any other charge.
Residential Commitment FY 2003-04Offense Histories by Ethnicity and Gender
Ethnicity and Gender
Numberof
Completions
Average Prior
Charges
Race and Ethnicity
Numberof
Completions
Average Prior
Charges
Average Prior Seriousness
Index2
AveragePrior
Adjudications
Average Prior Seriousness
Index2
Percent of Completions with a Prior Adjudication for:1
AveragePrior
Adjudications
Residential Commitment FY 2003-04Offense Histories by Race and Ethnicity
Offense Histories by Race and Ethnicity
Relatively few youth were classified as Hispanic. Most were classified as white Hispanic (n=740) with only a few classified as black Hispanic (n=76). The pattern of offending observed for black Hispanics was the opposite of that observed for white Hispanics. White Hispanics had slightly more prior charges on average and more prior seriousness index than white non-Hispanics. Black non-Hispanics had slightly more extensive offense histories than black Hispanics. Yet black Hispanics had more serious offense histories than black non-Hispanics. The most prior serious adjudicated offense differed by ethnicity more for white youth than for black youth. While similar percentages of black youth of both ethnicities had been adjudicated for a violent felony, white non-Hispanics were less likely than white Hispanics to have been adjudicated for a violent felony (29% and 39%, respectively).
Offense Histories by Ethnicity and Gender
For both males and females, non-Hispanics had more extensive prior offense histories than Hispanics. Hispanic females had the lowest average number of prior charges and prior adjudicated charges. Within each gender, the average prior seriousness index varied only slightly by ethnicity. There were also only small ethnicity/gender differences in the most serious offense for which youth were adjudicated. Hispanic males had the highest percentage of youth adjudicated for violent felonies.
Youth Profiles by Program
Demographic and offense history information on youth completing each program can be found in the summary tables at the end of this chapter.

2006 Outcome Evaluation Report Residential and Correctional Facilities
118 Statewide Recidivism Rates
Residential CommitmentSubsequent Adjudication and Conviction Rates
by Fiscal Year
Residential CommitmentSubsequent Rates of Re-Commitment,
Probation or Prison by Fiscal Year
Residential CommitmentSubsequent Referral and Arrest Rates
by Fiscal Year
61% 60% 60% 59% 59%
46% 45% 45% 45% 45%
0%
10%
20%
30%
40%
50%
60%
70%
80%
90%
100%
1999-00 2000-01 2001-02 2002-03 2003-04
Referrals/Arrests Felony Referrals/Arrests
42% 40% 41% 40% 40%
25% 23% 24% 22% 22%
0%
10%
20%
30%
40%
50%
60%
70%
80%
90%
100%
1999-00 2000-01 2001-02 2002-03 2003-04
Adjudications/ConvictionsFelony Adjudications/Convictions
30% 29% 29% 29% 28%
0%
10%
20%
30%
40%
50%
60%
70%
80%
90%
100%
1999-00 2000-01 2001-02 2002-03 2003-04
Recommitments/Adult Probation or Prison
Recidivism Rates for Youth Completing Residential Commitment Programs
Five commonly used measures of re-offending are presented in this chapter: subsequent referral/arrest, felony referral/arrest, adjudication/conviction, felony adjudication/conviction and subsequent sanctions (subsequent commitment to DJJ, sentencing to adult probation or prison). These recidivism measures are presented only for youth who completed a residential program and returned to the community.
Statewide Recidivism Rates
The recidivism rate for youth completing residential commitment programs during FY 2003-04 was 40% statewide. Fifty-nine percent were re-arrested, and 28% were re-committed or sentenced to adult probation or prison.
Statewide Recidivism Trends
Over the last five fiscal years, a slight downward trend was evident in four of the five measures of re-offending defined above. The charts that follow depict recidivism rates for the last five years. During FY 2003-04, the rates for four of the five measures remained the same as the previous fiscal year. There was a 1% drop in the rate at which youth were re-committed, sentenced to adult probation or prison. Please note that these figures are limited to residential commitment programs and are not comparable to figures in reports prior to 2002 when some commitment programs were non-residential.

Residential and Correctional Facilities 2006 Outcome Evaluation Report
Recidivism by Restrictiveness Level 119
Referrals/ Arrests
Felony Referrals/
ArrestsCases
PendingAdjudications/
Convictions
Felony Adjudications/
Convictions
Commitments, Probation or
Prison
Low-Risk 1,104 59% 41% 4% 43% 22% 29% Moderate-Risk 5,313 58% 43% 4% 39% 21% 27% High-Risk 1,805 61% 52% 5% 41% 25% 28% Maximum-Risk 76 49% 46% 4% 32% 21% 24%
Total 8,298 59% 45% 5% 40% 22% 28%
Previous Fiscal Year 8,309 59% 45% 5% 40% 22% 29%
Residential Commitment FY 2003-04Subsequent Delinquent or Criminal Activity
Within One Year of Completion by Restrictiveness Level
Restrictiveness Level
Number of
Completions
Percent of Completions with Subsequent:
Residential Commitment FY 2003-04Subsequent Adjudications or Convictions by
Restrictiveness Level
32%
41% 39% 43%
0%
10%
20%
30%
40%
50%
60%
70%
80%
90%
100%
Low-Risk
Moderate-Risk
High-Risk
Maximum-Risk
Recidivism by Restrictiveness Level
Recidivism rates were not consistently related to restrictiveness level. Although youth released from low-risk restrictiveness programs had less extensive and serious offense histories, these programs had the highest recidivism rate at 43%. On the other hand, while youth released from maximum-risk programs had the most extensive and serious offense histories, these programs had the lowest recidivism rate at 32%. For every measure of re-offending, youth released from maximum-risk programs had the lowest rates.
The pattern is consistent with research findings that older youth are at lower risk to re-offend then younger youth. The average age of youth admitted to maximum-risk programs was 17.5 years as compared to 15.9 for youth admitted to low-risk programs.
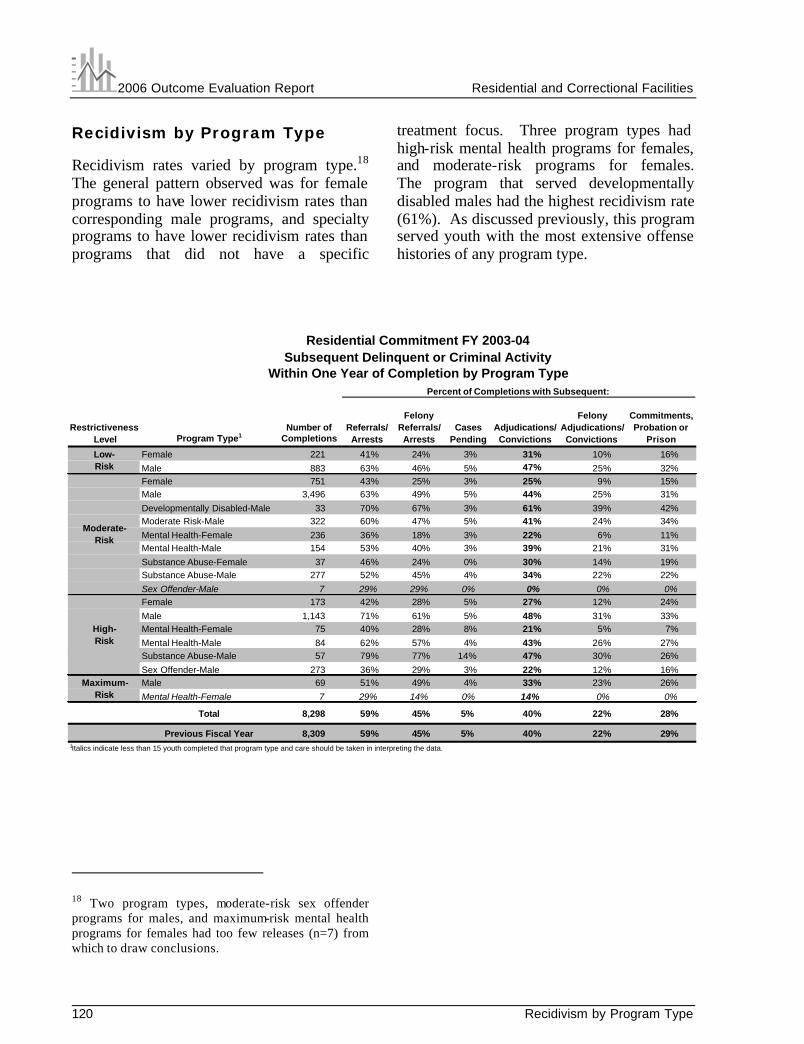
2006 Outcome Evaluation Report Residential and Correctional Facilities
120 Recidivism by Program Type
Restrictiveness Level
Referrals/Arrests
Felony Referrals/ Arrests
Cases Pending
Adjudications/ Convictions
Felony Adjudications/ Convictions
Commitments, Probation or
Prison
Female 221 41% 24% 3% 31% 10% 16% Male 883 63% 46% 5% 47% 25% 32% Female 751 43% 25% 3% 25% 9% 15% Male 3,496 63% 49% 5% 44% 25% 31% Developmentally Disabled-Male 33 70% 67% 3% 61% 39% 42% Moderate Risk-Male 322 60% 47% 5% 41% 24% 34% Mental Health-Female 236 36% 18% 3% 22% 6% 11% Mental Health-Male 154 53% 40% 3% 39% 21% 31% Substance Abuse-Female 37 46% 24% 0% 30% 14% 19% Substance Abuse-Male 277 52% 45% 4% 34% 22% 22% Sex Offender-Male 7 29% 29% 0% 0% 0% 0% Female 173 42% 28% 5% 27% 12% 24% Male 1,143 71% 61% 5% 48% 31% 33% Mental Health-Female 75 40% 28% 8% 21% 5% 7% Mental Health-Male 84 62% 57% 4% 43% 26% 27% Substance Abuse-Male 57 79% 77% 14% 47% 30% 26% Sex Offender-Male 273 36% 29% 3% 22% 12% 16% Male 69 51% 49% 4% 33% 23% 26% Mental Health-Female 7 29% 14% 0% 14% 0% 0%
Total 8,298 59% 45% 5% 40% 22% 28%
Previous Fiscal Year 8,309 59% 45% 5% 40% 22% 29% 1Italics indicate less than 15 youth completed that program type and care should be taken in interpreting the data.
High-Risk
Maximum-Risk
Low-Risk
Moderate-Risk
Residential Commitment FY 2003-04Subsequent Delinquent or Criminal Activity
Within One Year of Completion by Program Type
Program Type1Number of
Completions
Percent of Completions with Subsequent:
Recidivism by Program Type
Recidivism rates varied by program type.18 The general pattern observed was for female programs to have lower recidivism rates than corresponding male programs, and specialty programs to have lower recidivism rates than programs that did not have a specific
18 Two program types, moderate-risk sex offender programs for males, and maximum-risk mental health programs for females had too few releases (n=7) from which to draw conclusions.
treatment focus. Three program types had high-risk mental health programs for females, and moderate-risk programs for females. The program that served developmentally disabled males had the highest recidivism rate (61%). As discussed previously, this program served youth with the most extensive offense histories of any program type.

Residential and Correctional Facilities 2006 Outcome Evaluation Report
Recidivism by Offense History 121
Restrictiveness Level Non-Recidivists RecidivistsLow-Risk 4.9 5.6 43% Moderate-Risk 6.4 7.5 39% High-Risk 8.3 10.8 41% Maximum-Risk 9.7 15.9 32%
Total 6.7 8.1 40%
Previous Fiscal Year 6.8 8.0 40%
Average Number of Prior Adjudications
Residential Commitment FY 2003-04Average Prior Adjudicated Charges
by Recidivism Status and Restrictiveness LevelSubsequent
Adjudications/Convictions
Residential Commitment FY 2003-04Average Prior Adjudicated Charges
by Recidivism Status and Restrictiveness Level
6.7
4.9
6.4
8.3
9.7
5.6
7.5
10.8
15.9
8.1
0.0
2.0
4.0
6.0
8.0
10.0
12.0
14.0
16.0
18.0
Low-Risk
Moderate-Risk
High-Risk
Maximum-Risk
Total
Non-Recidivists Recidivists
Recidivism by Offense History
The relationship between prior offending and recidivism is demonstrated in the table below. Youth who recidivated had a higher average number of prior adjudicated charges at the time of commitment than non-recidivists. While this pattern was observed for all four restrictiveness levels, the largest difference was observed for maximum-risk programs.

2006 Outcome Evaluation Report Residential and Correctional Facilities
122 Recidivism by Race
Referrals/ Arrests
Felony Referrals/ Arrests
Cases Pending
Adjudications/ Convictions
Felony Adjudications/ Convictions
Commitments, Probation or
Prison
Males 6,780 63% 50% 5% 43% 25% 30% Females 1,518 41% 24% 3% 25% 9% 15%
Total 8,298 59% 45% 5% 40% 22% 28%
Previous Fiscal Year 8,309 59% 45% 5% 40% 22% 29%
Residential Commitment FY 2003-04Subsequent Delinquent or Criminal ActivityWithin One Year of Completion by Gender
Gender
Number of
Completions
Percent of Completions with Subsequent:
Residential Commitment FY 2003-04Recidivism Measures by Gender
30%
63%
50%
43%
25%
41%
24% 25%
9% 15%
0%
10%
20%
30%
40%
50%
60%
70%
80%
90%
100%
Referrals/ Arrests Felony Referrals/Arrests
Adjudications/Convictions
FelonyAdjudications/Convictions
Commitments,Probation or Prison
Males Females
Recidivism by Gender
Consistent with their more serious offense histories, males had substantially higher re-offending rates than females, regardless of the re-offending measure examined. The recidivism rate of 43% for males was 18 percentage points higher than the rate for females. The percentage of males re-committed, sentenced to adult probation or prison, was twice that of females.

Residential and Correctional Facilities 2006 Outcome Evaluation Report
Recidivism by Race 123
Referrals/Arrests
Felony Referrals/
ArrestsCases
PendingAdjudications/
Convictions
Felony Adjudications/ Convictions
Commitments, Probation or
Prison
White 4,352 51% 37% 3% 34% 18% 24% Black 3,907 68% 54% 6% 47% 27% 32% Other 39 56% 41% 5% 33% 23% 28%
Total 8,298 59% 45% 5% 40% 22% 28%
Previous Fiscal Year 8,309 59% 45% 5% 40% 22% 29%
Residential Commitment FY 2003-04Subsequent Delinquent or Criminal Activity
Within One Year of Completion by Race
Race
Number of
Completions
Percent of Completions with Subsequent:
Residential Commitment FY 2003-04Recidivism Measures by Race
56%
41%
33%
23%
28%
24%
51%
37%
34%
18%
68%
54%
47%
27%
32%
0%
10%
20%
30%
40%
50%
60%
70%
80%
90%
100%
Referrals/Arrests
Felony Referrals/Arrests
Adjudications/Convictions
FelonyAdjudications/Convictions
Commitments,Probation or
Prison
White Black Other
Recidivism by Race
Consistent with their less extensive and serious offense histories, white youth had lower offending rates than black youth for all recidivism measures examined. The recidivism rate of 34% for whites was 13 percentage points lower than the rate for black youth. White youth were also less frequently re-committed, sentenced to adult probation or prison for a crime that occurred within one year of their release.

2006 Outcome Evaluation Report Residential and Correctional Facilities
124 Recidivism by Race and Gender
Referrals/ Arrests
Felony Referrals/
ArrestsCases
PendingAdjudications/
Convictions
Felony Adjudications/
Convictions
Commitments, Probation or
Prison
White Males 3,481 54% 42% 4% 37% 20% 26% Black Males 3,267 71% 58% 6% 50% 30% 34% Other Males 32 59% 44% 3% 34% 25% 31% White Females 871 35% 20% 2% 23% 8% 13% Black Females 640 49% 29% 5% 29% 10% 18% Other Females 7 43% 29% 14% 29% 14% 14%
Total 8,298 59% 45% 5% 40% 22% 28%
Previous Fiscal Year 8,309 59% 45% 5% 40% 22% 29%
Residential Commitment FY 2003-04Subsequent Delinquent or Criminal Activity
Within One Year of Completion by Race and Gender
Race and Gender
Number of
Completions
Percent of Completions with Subsequent:
Residential Commitment FY 2003-04Subsequent Adjudications or Convictions
by Race and Gender
23%
37%
29%
50%
0%
10%
20%
30%
40%
50%
60%
70%
80%
90%
100%
Males Females
White Black
Recidivism by Race and Gender
Recidivism rates varied substantially by race and gender. Black males had greater re-offending rates than other race and gender groups regardless of the measure examined. White females were the least likely to recidivate. However, the difference between white and black females (6 percentage points) was smaller than the difference between white and black males (13 percentage points).

Residential and Correctional Facilities 2006 Outcome Evaluation Report
Recidivism by Race and Ethnicity 125
Referrals/ Arrests
Felony Referrals/
ArrestsCases
PendingAdjudications/
Convictions
Felony Adjudications/
Convictions
Commitments, Probation or
Prison
White Non-Hispanic 3,612 49% 36% 3% 34% 17% 24% White Hispanic 740 57% 43% 5% 37% 21% 24% Black Non-Hispanic 3,831 68% 54% 6% 47% 27% 32% Black Hispanic 76 59% 50% 3% 36% 21% 21% Other Non-Hispanic 32 59% 47% 6% 34% 25% 31% Other Hispanic 7 43% 14% 0% 29% 14% 14%
Total 8,298 59% 45% 5% 40% 22% 28%
Previous Fiscal Year 8,309 59% 45% 5% 40% 22% 29%
Residential Commitment FY 2003-04Subsequent Delinquent or Criminal Activity
Within One Year of Completion by Race and Ethnicity
Race and Ethnicity
Number of
Completions
Percent of Completions with Subsequent:
Residential Commitment FY 2003-04Subsequent Adjudications or Convictions
by Race and Ethnicity
34%
47%
37% 36%
0%
10%
20%
30%
40%
50%
60%
70%
80%
90%
100%
White Black
Non-Hispanic Hispanic
Recidivism by Race and Ethnicity
Improvements in the data collection system allow the reporting of ethnicity for the first time. In examining race and ethnicity, an interesting pattern is evident. White Hispanics recidivated at higher rates than white non-Hispanics, but black Hispanics did not recidivate at higher rates than black non-Hispanics. Black non-Hispanics had the highest rates of re-offending regardless of the measure used.

2006 Outcome Evaluation Report Residential and Correctional Facilities
126 Recidivism by Race and Ethnicity
Referrals/ Arrests
Felony Referrals/
ArrestsCases
PendingAdjudications/
Convictions
Felony Adjudications/
Convictions
Commitments, Probation or
PrisonNon-Hispanic Males 6,087 63% 50% 5% 44% 25% 31% Hispanic Males 693 61% 47% 5% 38% 23% 25% Non-Hispanic Females 1,388 41% 24% 3% 25% 9% 15% Hispanic Females 130 38% 25% 2% 28% 12% 16%
Total 8,298 59% 45% 5% 40% 22% 28%
Previous Fiscal Year 8,309 59% 45% 5% 40% 22% 29%
Residential Commitment FY 2003-04Subsequent Delinquent or Criminal Activity
Within One Year of Completion by Ethnicity and Gender
Ethnicity and Gender
Number of
Completions
Percent of Completions with Subsequent:
Residential Commitment FY 2003-04Subsequent Adjudications or Convictions
by Ethnicity and Gender
25%
44%
28%
38%
0%
10%
20%
30%
40%
50%
60%
70%
80%
90%
100%
Males Females
Non-Hispanic Hispanic
Recidivism by Ethnicity and Gender
The data also allow an examination of recidivism by ethnicity and gender. Again an interesting pattern appears. While non-Hispanics males recidivated at higher rates than Hispanic males (44% and 38%, respectively), the reverse is true among females. Hispanic females recidivated at higher rates than non-Hispanic females (28% and 25%, respectively).

Residential and Correctional Facilities 2006 Outcome Evaluation Report
Recidivism by Age at Admission 127
In general, recidivism rates decrease as age increases.
Referrals/ Arrests
Felony Referrals/
ArrestsCases
PendingAdjudications/
Convictions
Felony Adjudications/
Convictions
Commitments, Probation or
Prison
12 Years and Younger 164 69% 45% 2% 58% 29% 43% 13 Years Old 415 65% 40% 4% 50% 25% 37% 14 Years Old 962 66% 42% 4% 52% 26% 38% 15 Years Old 1,625 61% 40% 5% 43% 22% 30% 16 Years Old 2,071 57% 40% 4% 37% 21% 24% 17 Years Old 2,081 56% 52% 5% 36% 22% 24% 18 Years and Older 980 54% 54% 5% 32% 19% 21%
Total 8,298 59% 45% 5% 40% 22% 28%
Previous Fiscal Year 8,309 59% 45% 5% 40% 22% 29%
Residential Commitment FY 2003-04Subsequent Delinquent or Criminal Activity
Within One Year of Completion by Age at Admission
Age at Admission
Number of
Completions
Percent of Completions with Subsequent:
Residential Commitment FY 2003-04Subsequent Adjudications or Convictions
by Age at Admission
36% 32%
43%
52% 50% 58%
37%
0%
10%
20%
30%
40%
50%
60%
70%
80%
90%
100%
12 Yearsand
Younger
13 YearsOld
14 YearsOld
15 YearsOld
16 YearsOld
17 YearsOld
18 Yearsand Older
Recidivism by Age at Admission
An examination of the relationship between age and recidivism reveals a decline in recidivism as age increases, except for 13 year olds who recidivated at lower rates than 14 year olds. While the re are very few youth age 12 years or younger in the recidivism analysis (n=164), their recidivism rate was almost twice that of youth 18 years of age or older. Younger youth were more frequently convicted of felonies than older youth. Youth 12 years and younger were more than twice as likely as older youth to be re-committed or sentenced to adult probation or prison.

2006 Outcome Evaluation Report Residential and Correctional Facilities
128 Recidivism by Time to Failure
Of the youth you recidivated within one year, 53% had been rearrested within four months.
1st 2nd 3rd 4th 5th 6th 7th 8th 9th 10th 11th 12th
Percentage of Recidivists 1 10% 15% 15% 13% 10% 8% 8% 6% 4% 4% 4% 3%
Cumulative Percent 10% 25% 40% 53% 63% 71% 79% 85% 90% 94% 97% 100%
Percentage of Recidivists by Months to First Subsequent ArrestMonths to First Subsequent Arrest
100%
10%
25%
40%
53%
63%
71%
79%
85%
90%94%
97%
0%
10%
20%
30%
40%
50%
60%
70%
80%
90%
100%
1 2 3 4 5 6 7 8 9 10 11 12
Months to First Subsequent Arrest
Residential Commitment FY 2003-04Cumulative Percentage of Recidivists by
Months to First Subsequent Arrest
Recidivism by Time to Failure
In addition to examining recidivism rates, the length of time between release from a residential commitment program and the date of the first post-release arrest, also provides a measure of the effectiveness of the program.
Of the youth who recidivated within one-year, over one-half were re-arrested within four months. Seventy-one percent of those who recidivated within one year had been re-arrested within six months.

Residential and Correctional Facilities 2006 Outcome Evaluation Report
Recidivism by Program 129
Program Type Program Name 1,2Number of
CompletionsReferrals/
Arrests
Felony Referrals/
ArrestsCases
PendingAdjudications/
Convictions
Felony Adjudications/
Convictions
Commitments, Probation or
Prison
Fort Pierce Group Treatment Home (Closed) 5 20% 20% 0% 20% 0% 20%
Leaf Group Treatment Home (Closed) 27 63% 44% 11% 48% 11% 26%
Rilla White Foundation Family Homes 16 19% 6% 6% 13% 0% 0%
STEP II 47 38% 17% 2% 32% 11% 15%
Vision Quest 112 42% 25% 0% 30% 12% 18%
Visionary Adolescent Services Group Treatment Home 14 36% 14% 7% 21% 0% 7%
Subtotal 221 41% 24% 3% 31% 10% 16%
Alligator STOP Camp 117 58% 45% 4% 48% 27% 36%
Blackwater STOP Camp (CSC) 15 60% 60% 7% 47% 33% 42%
Blackwater STOP (State-Operated) (Provider changed) 31 77% 52% 3% 55% 32% 40%
Brevard Group Treatment Home 31 74% 61% 10% 58% 39% 45%
Dade Group Treatment Home 12 75% 50% 8% 67% 33% 50%
Eckerd Youth Conservation Academy 62 68% 42% 11% 45% 16% 19%
Escambia River Outward Bound 88 64% 42% 3% 53% 31% 38%
Florida Youth Academy (Closed) 36 67% 42% 3% 53% 28% 44%
Forestry Youth Academy 36 61% 56% 6% 36% 14% 19%
Jonathan Dickinson STOP Camp 69 58% 46% 3% 36% 20% 23%
Manatee Wilderness Camp (Closed) 48 71% 44% 2% 52% 27% 31%
Peace River Outward Bound 39 72% 49% 3% 67% 33% 51%
Rilla White Foundation Family Homes 53 58% 42% 0% 49% 28% 34%
South Pines 61 69% 52% 8% 43% 20% 20%
STEP I 121 60% 42% 5% 37% 20% 28%
Withlacoohee Juvenile Residential Facility 64 56% 42% 2% 41% 22% 27%
Subtotal 883 63% 46% 5% 47% 25% 32%
Low-Risk Restrictiveness Programs 1,104 59% 41% 4% 43% 22% 29%
Previous Fiscal Year 1,196 58% 37% 3% 43% 20% 30%
1Italics indicate less than 15 youth completed the program and care should be taken in interpreting the data.2Names of provider agencies are noted in parenthesis if a program has had multiple providers.
Low-RiskFemale
Low-RiskMale
Residential Commitment FY 2003-04Subsequent Delinquent or Criminal Activity Within One Year of Completion
Low-Risk Restrictiveness Programs
Percent of Completions with Subsequent:
Recidivism by Residential Commitment Program
The following tables present information on re-offending by residential commitment program for each of the four restrictiveness levels. There are a variety of specialty program types including: boot camps, mental health programs, substance abuse programs, and sex offender programs, which each serve youth with specific treatment needs. Both by legislative and program design, commitment programs serve youth with widely varying risk factors. These differences in the youth served make meaningful comparisons of
re-offending rates among programs difficult This issue is addressed in The 2006 Program Accountability Measures (PAM) Report: A Two-Year Analysis,19 which utilizes statistical techniques to control for selected risk factors.
Data are presented on all five measures of re-offending for the 163 residential commitment programs that released youth to the community during FY 2003-04, including releases to conditional release programs or post-commitment probation. Some programs had very few youth complete the program, and care should be taken in interpreting the data.
19 Winokur, K., Blankenship, J., Cass, E., Hand, G., Tollett, T., Chapman, S. and Greenwald, M. (2006). Program Accountability Measures: The 2006 PAM Report, A Two Year Analysis. Tallahassee, FL: Florida Department of Juvenile Justice.

2006 Outcome Evaluation Report Residential and Correctional Facilities
130 Recidivism by Program
Program TypeReferrals/
Arrests
Felony Referrals/
ArrestsCases
PendingAdjudications/
Convictions
Felony Adjudications/
Convictions
Commitments, Probation or
Prison
Adolescent Therapeutic Center (Closed) 51 43% 22% 6% 24% 10% 12% Alachua Halfway House (State-Operated) (Provider changed) 9 44% 33% 0% 22% 22% 22% Alachua Juvenile Residential Facility (First Step) 10 50% 30% 20% 20% 0% 10% Bowling Green Juvenile Residential Facility 41 46% 32% 0% 34% 12% 20%
Bridges Academy 29 28% 21% 0% 21% 14% 14% Camp E-Nini-Hassee 32 53% 22% 0% 31% 6% 16% First Step Girls Juvenile Residential Facility 27 56% 33% 11% 26% 7% 11% Florida Youth Academy (Closed) 24 67% 42% 0% 54% 21% 29% Kingsley Center (Closed) 115 49% 28% 1% 31% 10% 21%
Live Oak Juvenile Residential Facility 64 42% 23% 2% 23% 6% 14% Palm Beach Juvenile Residential Facility (Closed) 13 31% 15% 8% 15% 0% 8% Pines Juvenile Residential Facility 101 44% 26% 2% 27% 10% 19% Sawmill Academy (NAFI) (Provider changed) 34 29% 18% 3% 18% 9% 6% South Florida Halfway House (PJS) (Closed) 14 14% 14% 0% 0% 0% 0%
Vision Quest 82 41% 27% 2% 26% 10% 15% Wilson Academy (Fl Yth Academy) (Provider changed) 46 37% 15% 4% 24% 9% 13% WINGS 32 41% 19% 9% 13% 3% 3% YMCA Character Halfway House-Pregnancy 27 26% 19% 4% 11% 4% 4%
Subtotal 751 43% 25% 3% 25% 9% 15%
ARC Halfway House 127 70% 52% 8% 39% 17% 28% ATC Boys Halfway House (Closed) 59 69% 44% 8% 31% 15% 15%
Avon Park Youth Academy 218 59% 53% 6% 40% 26% 29% Bay Point Schools-North 25 60% 36% 16% 32% 20% 16% Bay Point Schools-West-Kennedy 195 70% 58% 11% 40% 29% 23% Big Cypress Wilderness Institute 43 53% 42% 2% 40% 21% 26% Bristol Youth Academy 81 69% 60% 4% 47% 36% 33%
Britt Halfway House 39 72% 56% 5% 51% 38% 41% Camp E-How-Kee (Closed) 31 48% 32% 0% 42% 16% 26% Camp E-Kel-Etu 34 62% 53% 6% 41% 26% 38% Camp E-Ma-Chamee 31 61% 48% 0% 58% 42% 45% Camp E-Tu-Makee 31 74% 48% 6% 65% 26% 48%
Crossroads Wilderness Institute 45 49% 38% 9% 33% 20% 22% Duval Juvenile Residential Facility 57 79% 72% 0% 65% 35% 47% Duval START Center (Closed) 7 57% 43% 0% 43% 29% 43% Eckerd "Intensive" Halfway House 20 70% 60% 25% 40% 20% 40% Eckerd Youth Challenge Program 61 49% 39% 0% 38% 21% 23%
Falkenberg Academy 153 69% 55% 9% 43% 29% 35% Florida City Youth Center 18 72% 39% 11% 56% 28% 44% Florida Environmental Institute 23 57% 57% 4% 30% 22% 22% GOALS 45 67% 51% 4% 49% 31% 29% Greenville Academy (DISC) (Provider changed) 28 61% 39% 0% 39% 25% 32%
Grove Unique Youth Services (GUYS) 25 56% 28% 8% 32% 8% 20% GATE (DISC) (Provider changed) 28 75% 43% 0% 68% 25% 57% Gulf Coast Youth Academy (Premier) 159 62% 45% 4% 48% 22% 32% Hastings Youth Academy 161 62% 50% 3% 45% 22% 28% Impact Halfway House 37 51% 32% 3% 35% 22% 32%
Jefferson Halfway House (DISC) (Provider changed) 39 41% 26% 0% 31% 8% 18% Kelly Hall Halfway House 40 43% 35% 0% 30% 15% 20% Leslie Peters Halfway House 42 64% 50% 0% 40% 17% 31% Liberty Juvenile Residential Facility 61 51% 44% 3% 36% 25% 30% MERIT (DISC) (Provider changed) 29 76% 41% 0% 66% 38% 48%
Madison Halfway House (DISC) (Provider changed) 38 71% 42% 5% 53% 21% 39% Mandala ATC Halfway House-Dual Diagnosis 49 61% 45% 2% 47% 31% 33% Marion Youth Development Center (Career Systems) (Provider changed) 104 75% 61% 1% 59% 38% 44% Marion Youth Development Center (CSC) 25 60% 40% 4% 40% 20% 20% MATS Halfway House 58 69% 50% 7% 47% 24% 36% Miami Halfway House (State-Operated) (Provider changed) 8 100% 100% 25% 38% 25% 38%
Nassau Halfway House 46 59% 43% 7% 35% 11% 17% Oaks Juvenile Residential Facility 69 61% 43% 0% 39% 19% 23% Okaloosa Halfway House 29 48% 41% 7% 31% 24% 31% Okaloosa Youth Academy 143 55% 41% 3% 38% 17% 26%
1Italics indicate less than 15 youth completed the program and care should be taken in interpreting the data.2Names of provider agencies are noted in parenthesis if a program has had multiple providers. Table continued on next page.
Moderate-Risk Female
Residential Commitment FY 2003-04Subsequent Delinquent or Criminal Activity Within One Year of Completion
Moderate-Risk Restrictiveness Programs
Program Name1,2
Moderate-RiskMale
Number of Completions
Percent of Completions with Subsequent:

Residential and Correctional Facilities 2006 Outcome Evaluation Report
Recidivism by Program 131
Program TypeReferrals/
Arrests
Felony Referrals/
ArrestsCases
PendingAdjudications/
Convictions
Felony Adjudications/
Convictions
Commitments, Probation or
PrisonOkeechobee Redirection Camp 69 68% 49% 6% 41% 23% 29%
Palm Beach Halfway House (State-Operated) (Provider changed) 3 67% 67% 0% 67% 67% 33%
Panther Success Center Halfway House 112 69% 46% 4% 51% 28% 38%
Pensacola Boys Base 49 51% 47% 2% 47% 18% 31% Polk Halfway House (State-Operated) (Provider changed) 16 69% 56% 0% 56% 31% 50%
Polk Halfway House (Sunshine Youth Services) 4 100% 50% 25% 75% 25% 75%
Price Halfway House 39 72% 49% 10% 44% 21% 28% San Antonio Boys Village 43 65% 49% 5% 44% 33% 37%
Santa Rosa Juvenile Residential Facility 41 56% 56% 2% 39% 24% 37%
Seminole Work and Learn Center 40 53% 40% 0% 38% 25% 28%
South Pines 60 68% 43% 5% 48% 22% 28% Southern Glades Youth Camp 97 75% 58% 9% 54% 29% 27%
Space Coast Marine Institute 42 60% 45% 5% 40% 21% 29%
St. Johns Juvenile Residential Facility (Closed) 10 70% 70% 10% 60% 30% 60%
Taylor Halfway House (DISC) (Provider changed) 45 64% 56% 2% 44% 20% 29% Thompson Academy (YSI) 56 61% 36% 9% 34% 16% 29%
Thompson Academy (PJS) (Provider changed) 91 71% 56% 3% 46% 26% 26%
Volusia Halfway House (State-Operated) (Provider changed) 10 70% 50% 0% 30% 30% 30% West Florida Wilderness Institute 57 56% 37% 4% 46% 23% 30%
Youth Environmental Services 51 53% 47% 2% 45% 35% 31%
Subtotal 3,496 63% 49% 5% 44% 25% 31%
RAMC-Mentally Challenged (DISC) (Provider changed) 33 70% 67% 3% 61% 39% 42%
Subtotal 33 70% 67% 3% 61% 39% 42%
Bay Boot Camp 42 69% 57% 7% 52% 31% 52% Collier Drill Academy (Closed) 56 55% 41% 7% 39% 16% 32%
Manatee Boot Camp 35 80% 66% 3% 51% 26% 46%
Martin Boot Camp 46 39% 33% 2% 20% 15% 17% Pinellas Boot Camp 49 71% 61% 4% 61% 37% 37%
Polk Boot Camp-Female (Closed) 18 39% 22% 0% 17% 11% 11%
Polk Boot Camp-Male 76 58% 41% 5% 38% 26% 34%
Subtotal 322 60% 47% 5% 41% 24% 34%
Bay Behavioral Hope 41 32% 15% 2% 15% 2% 5% Desoto Dual Diagnois 30 27% 7% 0% 20% 0% 13%
Lake Academy 56 38% 23% 4% 18% 5% 7%
Lighthouse Juvenile Residential Facility 40 48% 30% 10% 30% 13% 15%
Milton Juvenile Residential Facility 69 35% 14% 0% 25% 9% 14%
Subtotal 236 36% 18% 3% 22% 6% 11%
Desoto Juvenile Residential Facility 96 56% 43% 1% 43% 22% 32%
Gulf Academy 36 53% 36% 8% 36% 19% 31%
JUST Program (DISC) (Provider changed) 22 41% 32% 5% 27% 18% 27%
Subtotal 154 53% 40% 3% 39% 21% 31%
Francis Walker Halfway House (Center Drug Free Living) 7 71% 29% 0% 57% 14% 43%
Francis Walker Halfway House (State-Operated) (Provider changed) 5 60% 0% 0% 40% 0% 20%
Leaf Recovery (Closed) 25 36% 28% 0% 20% 16% 12%
Subtotal 37 46% 24% 0% 30% 14% 19%
ATC Substance Abuse Halfway House 45 56% 49% 7% 42% 22% 24%
Bassin House (DISC) (Provider changed) 24 42% 29% 0% 38% 21% 29%
Ft. Walton Adolescent Substance Abuse Program 40 60% 55% 3% 35% 23% 30%
Miami Halfway House (ICare Bay Point) 5 0% 0% 0% 0% 0% 0% Riverside Academy 163 52% 46% 4% 33% 23% 20%
Subtotal 277 52% 45% 4% 34% 22% 22%
Union Juvenile Residential Facility 7 29% 29% 0% 0% 0% 0%
Subtotal 7 29% 29% 0% 0% 0% 0%
5,313 58% 43% 4% 39% 21% 27%
5,306 59% 45% 5% 40% 22% 29%
1 Italics indicate less than 15 youth completed the program and care should be taken in interpreting the data.2 Names of provider agencies are noted in parenthesis if a program has had multiple providers.
Program Name 1,2Number of
Completions
Percent of Completions with Subsequent:
Moderate-Risk Restrictiveness Programs
Previous Fical Year
Residential Commitment FY 2003-04Subsequent Delinquent or Criminal Activity Within One Year of Completion
Moderate-Risk Restrictiveness Programs, continued
Developmentally Disabled
Moderate-Risk Sex Offender
Male
Moderate-RiskMale (continued)
Moderate-Risk Substance Abuse
Male
Moderate-RiskSubstance Abuse
Female
Boot Camps
Moderate-Risk Mental Health
Female
Moderate-RiskMental Health
Male

2006 Outcome Evaluation Report Residential and Correctional Facilities
132 Recidivism by Program
Program TypeReferrals/
Arrests
Felony Referrals/
ArrestsCases
PendingAdjudications/
Convictions
Felony Adjudications/
Convictions
Commitments, Probation or
Prison
Florida Youth Academy-High (Closed) 93 44% 31% 2% 28% 16% 27%
Monticello New Life 23 39% 30% 9% 22% 0% 13%
Orange Intensive Halfway House 17 53% 24% 18% 29% 0% 29%
South Florida Intensive Halfway House (Closed) 7 43% 14% 0% 43% 14% 43%
Vernon Place 33 30% 21% 3% 21% 12% 15%
Subtotal 173 42% 28% 5% 27% 12% 24%
ARC Serious Habitual Offender Program (Closed) 27 74% 67% 7% 48% 30% 26%
Bartow Juvenile Correctional Facility (Closed) 24 63% 50% 4% 54% 33% 33%
Bartow Serious Habitual Offender Program (Closed) 28 75% 68% 0% 54% 25% 39%
Broward Intensive Halfway House 31 74% 61% 6% 55% 29% 35%
Cypress Creek (Securicor) 56 71% 64% 2% 59% 38% 43%
Dozier Training School 102 71% 57% 2% 47% 31% 38%
Eckerd Youth Development Center 99 70% 60% 6% 47% 33% 28%
Everglades Youth Development Center (Premier) 91 65% 57% 7% 40% 30% 25%
Hastings Youth Academy 72 76% 74% 4% 53% 39% 42%
Hillsborough Intensive Residential Treatment 4 75% 0% 0% 25% 0% 0%
Jackson Juvenile Offender Correctional Center 60 55% 47% 5% 45% 32% 32%
Manatee Youth Academy 27 81% 67% 4% 67% 41% 52%
Marion Juvenile Correctional Facility 39 72% 62% 10% 38% 21% 31%
NAFI Intensive Halfway House 25 76% 52% 4% 60% 28% 48%
NAFI Serious Habitual Offender Program 31 58% 55% 6% 35% 32% 35%
Okaloosa Intensive Halfway House 24 58% 58% 4% 50% 42% 25%
Polk Juvenile Correctional Facility (Premier) (Provider changed) 276 71% 64% 5% 48% 29% 32%
Sago Palm Youth Development Center 104 79% 66% 10% 46% 26% 25%
Tiger SHOP (Correctional Services of Florida) 7 100% 100% 14% 57% 29% 29%
Tiger Success SHOP (Youthtrack) (Provider changed) 16 63% 63% 6% 38% 25% 38%
Subtotal 1,143 71% 61% 5% 48% 31% 33%
Desoto Juvenile Correctional Facility-Dual Diagnosis 9 11% 11% 0% 0% 0% 0%
Florida Institute For Girls (Lighthouse) (Closed) 3 33% 0% 0% 33% 0% 0%
Florida Institute For Girls (Premier) (Provider changed) 63 44% 32% 10% 24% 6% 8%
Subtotal 75 40% 28% 8% 21% 5% 7%
Desoto Juvenile Correctional Facility-Dual Diagnosis 65 65% 60% 5% 45% 29% 31%
Desoto Juvenile Correctional Facility 19 53% 47% 0% 37% 16% 16%
Subtotal 84 62% 57% 4% 43% 26% 27%
Sago Palm Pathfinders 57 79% 77% 14% 47% 30% 26%
Subtotal 57 79% 77% 14% 47% 30% 26%
Dozier Sex Offender Program 38 26% 21% 3% 18% 5% 11%
Elaine Gordon Sex Offender Program (Three Springs) 22 27% 23% 0% 23% 14% 9%
Jackson JOCC Sex Offender Program 24 33% 33% 4% 25% 25% 25%
Kissimmee Juvenile Correctional Facility 24 46% 38% 0% 33% 17% 25%
Manatee Adolescent Treatment (Premier) 26 35% 27% 0% 27% 19% 27%
Okeechobee JOCC Sex Offender Program (Securicor) 28 54% 43% 11% 11% 4% 7%
Sago Palm Sex Offender Program 88 36% 26% 3% 19% 9% 13%
Three Springs Sex Offender Program 23 30% 26% 4% 26% 13% 22%
Subtotal 273 36% 29% 3% 22% 12% 16%
1,805 61% 52% 5% 41% 25% 28%
1,702 60% 50% 5% 37% 24% 28%
1Italics indicate less than 15 youth completed the program and care should be taken in interpreting the data.2Names of provider agencies are noted in parenthesis if a program has had multiple providers.
Previous Fiscal Year
Residential Commitment FY 2003-04Subsequent Delinquent or Criminal Activity Within One Year of Completion
High-Risk Restrictiveness Programs
Program Name1,2Number of
Completions
Percent of Completions with Subsequent:
High-RiskFemale
High-RiskMale
High-Risk Sex Offender
Male
High-Risk Substance Abuse
Male
High-Risk Mental Health
Male
High-Risk Mental Health
Female
High-Risk Restrictiveness Programs
Referrals/ Arrests
Felony Referrals/
ArrestsCases
PendingAdjudications/ Convictions
Felony Adjudications/
Convictions
Commitments, Probation or
Prison
Cypress Creek (Securicor) 27 37% 37% 4% 26% 11% 19%
Okeechobee JOCC (Securicor) 18 67% 61% 6% 50% 39% 39%
Omega JOCC 24 54% 54% 4% 29% 25% 25%
Subtotal 69 51% 49% 4% 33% 23% 26%
Florida Institute for Girls (Premier) (Provider changed) 7 29% 14% 0% 14% 0% 0%
Subtotal 7 29% 14% 0% 14% 0% 0%
76 49% 46% 4% 32% 21% 24%
105 58% 55% 4% 40% 27% 28% 1 Italics indicate less than 15 youth completed the program and care should be taken in interpreting the data.
Previous Fiscal Year
Maximum-Risk Restrictiveness Programs
Maximum-RiskMale
Maximum-Risk Mental Health
Female
Number of Completions
Percent of Completions with Subsequent:
Program Type Program Name1,2
Maximum-Risk Restrictiveness Programs
Residential Commitment FY 2003-04Subsequent Delinquent or Criminal Activity Within One Year of Completion
2 Names of provider agencies are noted in parenthesis if a program has had multiple providers.

Residential and Correctional Facilities 2006 Outcome Evaluation Report
Length of Stay 133
NAverage
Days NAverage
Days NAverage
Days NAverage
Days
Low-Risk 1,258 129 1,104 132 480 138 624 128 Moderate-Risk 6,273 232 5,313 248 2,092 247 3,221 249 High-Risk 2,162 332 1,805 353 734 331 1,071 369 Maximum-Risk 149 347 76 400 24 366 52 416
Total 9,842 243 8,298 257 3,330 251 4,968 261
Previous Fiscal Year 10,001 244 8,309 255 3,288 252 5,021 257
Residential Commitment FY 2003-04Program Length of Stay by Restrictiveness Level
Restrictiveness Level
All Releases Completions Recidivists Non-Recidivists
Length of Stay
The table below presents average length of stay (ALOS) for four groups:
1. All releases (9,842), including those who did not complete their program.
2. Youth who completed their program (8,298).
3. Recidivists (3,330).
4. Non-recidivists (4,968).
ALOS figures are virtually unchanged from last year and the pattern of findings replicated what has been observed in past years. The ALOS for all youth released was 243 days, while the ALOS of youth who completed residential programs was almost two weeks longer at 257 days. Compared to youth who completed their programs, the shorter ALOS for all releases was due in part
to youth who “exited” because their program closed or because they were re-arrested or transferred.
The length of stay increased as the restrictiveness level increased. The ALOS for youth who completed low-risk programs was 132 days or approximately four months compared to 400 days or approximately 13 months for maximum-risk youth.
There was only a 10-day difference in the ALOS for recidivists and non-recidivists. Recidivists averaged 251 days compared to 261 days for non-recidivists.
Average Length of Stay by Program
The ALOS for each program can be found in the summary tables beginning at the end of the chapter.

2006 Outcom
e Evaluation R
eport
Residential and C
orrectional Facilities
134
S
umm
ary Tables
N1
% %CR % PCPRilla White Foundation Family Homes 18 0% 16 89% 56% 0% 15.9 7.9 170 19% 31% 13% STEP II 48 0% 47 98% 49% 4% 16.6 11.4 31 17% 28% 32%
Central Visionary Adolescent Services Group Treatment Home 19 16% 14 74% 71% 0% 15.6 7.4 187 21% 50% 21% Fort Pierce Group Treatment Home (Closed) 6 0% 5 83% 40% 20% 14.2 6.0 207 80% 20% 20% Leaf Group Treatment Home (Closed) 33 3% 27 82% 56% 11% 15.6 13.0 177 48% 4% 48% Vision Quest 118 6% 112 95% 61% 10% 15.7 10.1 165 36% 21% 30%
Subtotal 242 5% 221 91% 57% 8% 15.8 10.3 141 32% 23% 31%
Alligator Short-Term Offender Program Camp 123 2% 117 95% 63% 4% 16.8 11.8 50 10% 42% 48% Blackwater STOP Camp (CSC) 19 21% 15 79% 73% 0% 16.6 10.6 134 7% 27% 47% Blackwater STOP Camp (State-Operated) (Closed) 31 0% 31 100% 65% 0% 16.4 11.1 47 10% 35% 55% Escambia River Outward Bound 102 7% 88 86% 65% 1% 15.5 12.6 117 11% 50% 53%
Forestry Youth Academy 44 2% 36 82% 33% 6% 17.1 23.1 338 6% 42% 36% Rilla White Foundation Family Homes 59 5% 53 90% 58% 0% 14.4 13.8 180 30% 23% 49% STEP I 132 0% 121 92% 37% 7% 16.8 11.0 35 7% 36% 37% Withlacoohee Juvenile Residential Facility 70 0% 64 91% 53% 0% 16.9 9.4 108 11% 34% 41% Brevard Group Treatment Home 37 22% 31 84% 61% 3% 13.5 16.8 217 35% 26% 58% Eckerd Youth Conservation Academy 72 7% 62 86% 61% 15% 15.3 17.3 274 40% 45% 45% Florida Youth Academy (Closed) 40 0% 36 90% 39% 14% 13.0 15.6 176 50% 28% 53% Manatee Wilderness Camp (Closed) 74 0% 48 65% 35% 19% 16.4 12.6 124 40% 27% 52% Peace River Outward Bound 54 15% 39 72% 33% 15% 14.3 16.3 195 31% 26% 67% Dade Group Treatment Home 16 25% 12 75% 67% 25% 13.5 16.4 224 67% 0% 67% Jonathan Dickinson Short-Term Offender Program Camp 72 0% 69 96% 68% 9% 16.3 13.4 91 30% 36% 36% South Pines 71 6% 61 86% 72% 2% 15.8 19.5 164 72% 3% 43%
Subtotal 1,016 5% 883 87% 55% 6% 15.9 13.8 130 25% 34% 47%
1,258 5% 1,104 88% 55% 7% 15.9 13.1 132 26% 31% 43% 1 Italics indicate less than 15 youth completed the program and care should be taken in interpreting the data.2
Names of provider agencies are noted in parenthesis if a program has had multiple providers. 3
ODP is the percentage of releases adjudicated for an offense that occurs during placement.
Total Releases
Completions
Total
Completions Average Age at
Admission
Average Prior
Seriousness Index
AverageLengthof Stay
Post-Commitment
Services
Program Name1,2
North
South
Region%
Recidivism%
Black%
Hispanic
Central
South
Residential Commitment FY 2003-04Output Summary by Program Type and Region
Low-Risk Restrictiveness Programs
Low-RiskFemale
North
%ODP3Program Type
Low-RiskMale
Low-Risk Restrictiveness Programs
Summary Tables
Program outputs, including total releases, the percentage of youth adjudicated for offenses committed during placement (ODP), number of completions and completion rates, demographic characteristics, average length of stay, post-commitment services and recidivism rates, are presented for each program in the following tables. Summary data are presented first by program type, and second by program within program type and region.

Residential and C
orrectional Facilities
2006 O
utcome E
valuation Report
Sum
mary T
ables
135
N1 % % CR % PCP
Alachua Halfway House (State-Operated) (Provider changed) 19 11% 9 47% 33% 0% 15.8 10.7 179 78% 0% 22%
Alachua Juvenile Residential Facility (First Step) 11 9% 10 91% 20% 0% 16.7 17.0 160 30% 20% 20%
Bridges Academy 35 0% 29 83% 34% 7% 15.1 15.6 359 48% 14% 21%
Camp E-Nini-Hassee 34 9% 32 94% 22% 19% 14.8 11.5 471 44% 9% 31%
Pines Juvenile Residential Facility 103 5% 101 98% 49% 2% 16.1 12.3 187 53% 16% 27%
Sawmill Academy (NAFI) (Provider changed) 63 16% 34 54% 53% 3% 16.3 15.6 255 53% 15% 18%
Adolescent Therapeutic Center (Closed) 61 10% 51 84% 25% 20% 16.0 12.5 192 63% 29% 24%
Bowling Green Juvenile Residential Facility 49 2% 41 84% 44% 10% 15.8 13.2 237 63% 20% 34%
First Step Girls Juvenile Residential Facility 34 9% 27 79% 48% 4% 16.1 12.9 250 52% 11% 26%
Florida Youth Academy (Closed) 39 5% 24 62% 63% 13% 15.9 20.7 192 71% 4% 54%
Kingsley Center (Closed) 129 0% 115 89% 49% 6% 16.0 13.7 200 63% 16% 31%
Live Oak Juvenile Residential Facility 72 10% 64 89% 33% 9% 15.8 14.3 270 66% 8% 23%
Wilson Academy (FL Yth Academy) (Provider changed) 83 4% 46 55% 24% 9% 15.8 13.4 209 63% 13% 24%
YMCA Character Halfway House-Pregnancy 29 3% 27 93% 37% 19% 16.9 13.7 240 63% 11% 11%
Palm Beach Juvenile Residential Facility (Closed) 21 29% 13 62% 54% 31% 15.9 14.3 306 85% 0% 15%
South Florida Halfway House (PJS) (Closed) 19 16% 14 74% 57% 14% 16.6 10.7 184 64% 14% 0%
Vision Quest 88 2% 82 93% 40% 13% 16.2 13.5 221 67% 10% 26%
WINGS 35 11% 32 91% 63% 9% 16.3 14.7 252 69% 6% 13%
Subtotal 924 6% 751 81% 42% 9% 16.0 13.7 235 61% 13% 25%
Blackwater Career Development Center (Closed) 23 4% 0 0% N/A N/A N/A N/A N/A N/A N/A N/A
Bristol Youth Academy 97 4% 81 84% 56% 7% 16.3 19.9 285 64% 10% 47%
Camp E-How-Kee (Closed) 38 5% 31 82% 16% 3% 13.7 13.7 331 65% 13% 42%
Camp E-Kel-Etu 41 5% 34 83% 29% 0% 14.5 19.4 399 50% 24% 41%
Camp E-Ma-Chamee 44 20% 31 70% 52% 3% 13.9 18.6 344 29% 45% 58%
Duval Juvenile Residential Facility 61 0% 57 93% 53% 7% 15.9 16.3 151 82% 5% 65%
Duval START Center (Closed) 12 0% 7 58% 71% 0% 13.7 11.6 131 71% 29% 43%
Eckerd Youth Challenge Program 81 22% 61 75% 38% 11% 15.6 19.0 270 66% 11% 38%
Greenville Academy (DISC Village) (Provider changed) 29 0% 28 97% 39% 4% 16.7 21.7 243 61% 18% 39%
GATE (DISC Village) (Provider changed) 30 0% 28 93% 54% 0% 14.4 17.6 228 54% 25% 68%
Gulf Coast Youth Academy (Premier) 174 9% 159 91% 49% 5% 16.3 20.9 240 65% 16% 48%
Hastings Youth Academy 179 7% 161 90% 44% 5% 16.7 17.0 239 66% 6% 45%
Impact Halfway House 38 0% 37 97% 59% 3% 16.6 20.1 194 78% 5% 35%
Jefferson Halfway House (DISC Village) (Provider changed) 43 5% 39 91% 41% 8% 16.9 19.1 225 46% 23% 31%
Liberty Juvenile Residential Facility 65 0% 61 94% 52% 0% 16.5 18.2 207 48% 20% 36%
MERIT (DISC Village) (Provider 32 0% 29 91% 55% 0% 12.9 19.5 210 52% 21% 66%
Madison Halfway House (DISC Village) (Provider changed) 41 0% 38 93% 58% 3% 12.7 16.3 202 71% 13% 53%
Marion Youth Development Center (Career Systems) 209 3% 104 50% 69% 5% 16.5 20.1 206 76% 5% 59%
Marion Youth Development Center (CSC) 27 0% 25 93% 48% 8% 17.3 24.3 50 64% 20% 40%
Nassau Halfway House 51 0% 46 90% 30% 7% 16.6 15.9 172 54% 11% 35%
Oaks Juvenile Residential Facility 78 14% 69 88% 43% 6% 16.0 20.0 193 65% 13% 39% 1 Italics indicate less than 15 youth completed the program and care should be taken in interpreting the data.2 Names of provider agencies are noted in parenthesis if a program has had multiple providers. 3 ODP is the percentage of releases adjudicated for an offense that occurs during placement. Table continued on next page.
Post-Commitment
Services%
Black%
Hispanic
%
ODP3
North
South
Moderate-RiskFemale Central
NorthModerate-RiskMale
Residential Commitment FY 2003-04Output Summary by Program Type and Region
Program Type Region%
RecidivismProgram Name1,2Total
Releases
Average Age at
Admission
Average Prior
Seriousness Index
Completions
Total
Completions AverageLengthof Stay
Moderate-Risk Restrictiveness Programs

2006 Outcom
e Evaluation R
eport
Residential and C
orrectional Facilities
136
S
umm
ary Tables
N1 % % CR % PCP
Okaloosa Halfway House 32 0% 29 91% 41% 3% 15.8 25.6 333 59% 21% 31%
Okaloosa Youth Academy 161 5% 143 89% 50% 3% 16.5 18.8 255 53% 15% 38%
Panther Success Center Halfway House 116 0% 112 97% 57% 3% 16.0 18.6 153 65% 13% 51%
Pensacola Boys Base 51 0% 49 96% 59% 2% 17.3 23.4 195 33% 29% 47%
Santa Rosa Juvenile Residential Facility 47 6% 41 87% 41% 0% 17.2 16.2 141 73% 7% 39%
Seminole Work and Learn Center 45 13% 40 89% 43% 3% 16.9 13.5 186 38% 35% 38%
St. Johns Juvenile Residential Facility (Closed) 12 8% 10 83% 20% 0% 13.6 12.9 178 80% 10% 60%
Taylor Halfway House (DISC Village) (Provider changed) 48 2% 45 94% 38% 9% 16.8 16.8 202 53% 13% 44%
Volusia Halfway House (First Step) 1 0% 0 0% N/A N/A N/A N/A N/A N/A N/A N/A
Volusia Halfway House (State-Operated) (Provider changed) 15 0% 10 67% 20% 40% 16.9 15.5 119 80% 0% 30%
West Florida Wilderness Institute 57 2% 57 100% 51% 7% 16.4 16.7 251 42% 25% 46%
ARC Halfway House 136 2% 127 93% 37% 17% 16.7 18.8 204 66% 18% 39%
ATC Boys Halfway House (Closed) 80 1% 59 74% 41% 7% 16.8 20.5 240 64% 27% 31%
Avon Park Youth Academy 234 3% 218 93% 41% 13% 17.3 22.4 318 46% 9% 40%
Britt Halfway House 43 5% 39 91% 51% 3% 16.4 27.6 254 69% 3% 51% Falkenberg Academy 162 1% 153 94% 49% 12% 16.3 21.0 223 75% 6% 43%
GOALS 54 15% 45 83% 58% 11% 16.7 18.7 201 69% 11% 49%
Grove Unique Youth Services (GUYS) 34 15% 25 74% 44% 8% 16.4 20.6 245 60% 12% 32%
Leslie Peters Halfway House 45 0% 42 93% 40% 14% 16.9 20.3 233 69% 2% 40%
Mandala ATC Halfway House-Dual Diagnosis 53 8% 49 92% 6% 2% 15.6 18.5 253 82% 4% 47%
MATS Halfway House 65 6% 58 89% 26% 10% 15.7 23.3 285 71% 3% 47% Polk Halfway House (State-Operated) (Provider changed) 20 0% 16 80% 38% 6% 16.2 24.4 190 88% 0% 56%
Polk Halfway House (Sunshine Youth Services) 7 29% 4 57% 75% 0% 13.4 17.8 168 75% 0% 75%
San Antonio Boys Village 49 10% 43 88% 44% 9% 15.4 21.8 232 79% 2% 44%
Space Coast Marine Institute 46 2% 42 91% 45% 21% 16.8 21.2 267 64% 10% 40%
Youth Environmental Services 56 2% 51 91% 49% 14% 16.7 24.6 231 90% 2% 45%
Bay Point Schools-North 34 12% 25 74% 60% 24% 15.9 30.5 334 80% 4% 32% Bay Point Schools-West-Kennedy 220 2% 195 89% 72% 26% 16.7 22.9 327 87% 1% 40%
Big Cypress Wilderness Institute 46 4% 43 93% 23% 23% 16.3 20.0 289 35% 37% 40%
Camp E-Tu-Makee 39 18% 31 79% 32% 13% 14.0 22.1 365 61% 23% 65%
Crossroads Wilderness Institute 53 4% 45 85% 40% 11% 16.4 22.4 279 49% 29% 33%
Eckerd "Intensive" Halfway House 29 0% 20 69% 40% 10% 15.7 22.4 419 70% 10% 40%
Florida City Youth Center 18 0% 18 100% 72% 11% 15.7 23.3 276 78% 6% 56%
Florida Environmental Institute 27 7% 23 85% 74% 13% 17.2 30.3 324 65% 9% 30% Kelly Hall Halfway House 53 13% 40 75% 23% 18% 16.9 19.4 275 20% 45% 30%
Miami Halfway House (State-Operated) (Provider changed) 16 0% 8 50% 63% 25% 17.3 32.9 210 100% 0% 38%
Okeechobee Redirection Camp 83 4% 69 83% 52% 10% 16.6 16.7 215 65% 16% 41%
Palm Beach Halfway House (State-Operated) (Provider changed) 9 0% 3 33% 33% 33% 14.9 13.7 278 100% 0% 67%
Price Halfway House 48 8% 39 81% 51% 8% 16.6 23.4 198 56% 26% 44%
South Pines 68 1% 60 88% 48% 22% 16.4 22.9 205 83% 2% 48% Southern Glades Youth Camp 102 3% 97 95% 66% 22% 16.4 27.4 217 84% 4% 54%
Thompson Academy (YSI) 59 2% 56 95% 61% 11% 16.3 19.4 99 77% 5% 34%
Thompson Academy (PJS) (Provider changed) 181 4% 91 50% 53% 19% 16.2 23.9 194 88% 2% 46%
Subtotal 4,147 5% 3,496 84% 48% 10% 16.3 20.5 240 65% 12% 44% 1 Italics indicate less than 15 youth completed the program and care should be taken in interpreting the data.2 Names of provider agencies are noted in parenthesis if a program has had multiple providers. 3 ODP is the percentage of releases adjudicated for an offense that occurs during placement.
Table continued on next page.
Moderate-Risk Restrictiveness Programs, continued
Average Age at
Admission
Average Prior
Seriousness Index
AverageLengthof StayProgram Type
Central
South
Residential Commitment FY 2003-04Output Summary by Program Type and Region
% Recidivism
Moderate-Risk Male
(continued)
%Hispanic
%BlackRegion Program Name
1,2Total
Releases
%
ODP3
Completions
Total
Completions
Post-Commitment
Services
North(continued)

Residential and C
orrectional Facilities
2006 O
utcome E
valuation Report
Sum
mary T
ables
137
N1 % %CR % PCP
North RAMC-Mentally Challenged (DISC Village) (Provider changed) 35 3% 33 94% 76% 0% 16.1 28.8 343 67% 6% 61%
Subtotal 35 3% 33 94% 76% 0% 16.1 28.8 343 67% 6% 61%
North Bay Boot Camp 46 2% 42 91% 50% 2% 16.3 21.7 189 74% 17% 52% Manatee Boot Camp 36 0% 35 97% 66% 11% 16.1 24.9 205 97% 0% 51% Pinellas Boot Camp 59 2% 49 83% 47% 8% 16.4 22.9 268 90% 2% 61% Polk Boot Camp-Female (Closed) 24 8% 18 75% 22% 6% 16.8 19.4 316 67% 11% 17%
Polk Boot Camp 92 4% 76 83% 26% 21% 16.2 26.1 277 80% 1% 38% Collier Drill Academy (Closed) 59 2% 56 95% 20% 34% 16.3 13.4 177 96% 4% 39% Martin Boot Camp 56 0% 46 82% 39% 9% 16.9 21.7 332 91% 4% 20%
Subtotal 372 2% 322 87% 37% 15% 16.4 21.7 249 86% 5% 41%
Bay Behavioral Hope 45 9% 41 91% 32% 2% 16.0 12.3 260 49% 20% 15% Milton Juvenile Residential Facility 73 10% 69 95% 29% 6% 15.7 17.4 287 59% 19% 25%
DeSoto Juvenile Residential Facility-Dual Diagnois 30 0% 30 100% 13% 17% 16.1 13.2 299 63% 23% 20% Lake Academy 63 13% 56 89% 36% 5% 15.5 12.1 317 63% 7% 18%
South Lighthouse Juvenile Residential Facility 44 7% 40 91% 35% 18% 16.2 14.6 203 60% 28% 30%
Subtotal 255 9% 236 93% 30% 8% 15.8 14.3 277 59% 18% 22%
North JUST Program (DISC Village) (Provider changed) 27 0% 22 81% 18% 0% 15.0 13.9 300 59% 0% 27%
DeSoto Juvenile Residential Facility 103 5% 96 93% 25% 16% 16.4 21.5 307 57% 14% 43%
Gulf Academy 40 20% 36 90% 22% 17% 15.5 18.0 363 78% 6% 36%
Subtotal 170 8% 154 91% 23% 14% 16.0 19.6 319 62% 10% 39%
Francis Walker Halfway House (Center Drug Free Living) 8 13% 7 88% 0% 0% 16.9 13.4 175 29% 29% 57%
Francis Walker Halfway House (State-Operated) (Provider changed) 13 8% 5 38% 40% 20% 15.9 19.2 201 20% 40% 40%
Leaf Recovery (Closed) 40 3% 25 63% 12% 8% 16.5 13.8 270 48% 4% 20%
Subtotal 61 5% 37 61% 14% 8% 16.5 14.4 243 41% 14% 30%
Bassin House (DISC Village) (Provider changed) 24 0% 24 100% 21% 0% 16.8 15.0 192 54% 17% 38% Ft. Walton Adolescent Substance Abuse Program 41 0% 40 98% 25% 3% 17.1 18.9 322 38% 25% 35%
ATC Substance Abuse Halfway House 47 2% 45 96% 29% 24% 17.3 20.4 297 64% 11% 42% Riverside Academy 179 1% 163 91% 28% 21% 17.0 21.7 338 61% 4% 33%
South Miami Halfway House (ICare Bay Point) 5 0% 5 100% 80% 0% 17.1 16.0 128 80% 0% 0%
Subtotal 296 1% 277 94% 28% 17% 17.0 20.4 313 58% 9% 34%
North Union Juvenile Residential Facility 11 9% 7 64% 43% 0% 15.8 17.3 351 14% 14% 0%
Central Columbus Juvenile Residential Facility 2 0% 0 0% N/A N/A N/A N/A N/A N/A N/A N/A
Subtotal 13 8% 7 54% 43% 0% 15.8 17.3 351 14% 14% 0%
6,273 5% 5,313 85% 44% 11% 16.3 19.3 248 65% 12% 39% 1 Italics indicate less than 15 youth completed the program and care should be taken in interpreting the data.2 Names of provider agencies are noted in parenthesis if a program has had multiple providers. 3 ODP is the percentage of releases adjudicated for an offense that occurs during placement.
Moderate-Risk Restrictiveness Programs, continued
Moderate-RiskBoot Camps
Total Releases
%Recidivism
Total Completions
Central
Program Name1,2
Moderate-RiskMental Health
Female
Moderate-Risk Mental Health
Male
Moderate-RiskSubstance Abuse
Male
North
Central
Central
Central
North
Moderate-RiskSex Offender
Male
Moderate-RiskSubstance Abuse
Female
Central
Moderate-RiskDevelopmentally
Disabled
Moderate-Risk Restrictiveness Programs
Residential Commitment FY 2003-04Output Summary by Program Type and Region
South
Average Prior
Seriousness IndexProgram Type
%Black
%HispanicRegion
%ODP
3
Completions
AverageLengthof Stay
Post-CommitmentServices
Average Age at
Admission

2006 Outcom
e Evaluation R
eport
Residential and C
orrectional Facilities
138
S
umm
ary Tables
N1 % % CR % PCP
Monticello New Life 32 22% 23 72% 48% 4% 17.0 28.8 301 30% 13% 22%
Vernon Place 43 12% 33 77% 39% 0% 15.8 16.3 397 58% 24% 21%
Florida Youth Academy (Closed) 163 8% 93 57% 45% 11% 16.7 25.6 306 62% 8% 28%
Orange Intensive Halfway House 24 38% 17 71% 53% 6% 16.0 24.2 478 82% 6% 29%
South South Florida Intensive Halfway House (Closed) 18 6% 7 39% 43% 14% 16.4 16.4 300 71% 14% 43%
Subtotal 280 13% 173 62% 45% 8% 16.5 23.7 339 60% 12% 27%
Cypress Creek (YSI) (Provider changed) 47 0% 0 0% N/A N/A N/A N/A N/A N/A N/A N/A
Cypress Creek (Securicor) 64 2% 56 88% 39% 7% 17.2 33.9 161 66% 5% 59%
Dozier Training School 105 2% 102 97% 47% 1% 16.5 29.9 392 52% 15% 47%
Hastings Youth Academy 79 5% 72 91% 64% 7% 17.0 33.1 318 64% 11% 53%
Jackson Juvenile Offender Correctional Center 64 0% 60 94% 55% 2% 16.4 32.5 377 53% 15% 45%
Marion Juvenile Correctional Facility 46 11% 39 85% 41% 3% 17.0 24.3 302 49% 5% 38%
NAFI Intensive Halfway House 26 8% 25 96% 64% 0% 16.2 29.6 237 60% 20% 60%
NAFI Serious Habitual Offender Program 35 6% 31 89% 65% 3% 16.8 40.6 319 48% 19% 35%
Okaloosa Intensive Halfway House 32 16% 24 75% 67% 4% 16.2 36.8 405 63% 8% 50%
Tiger SHOP (Correctional Services of Florida) 7 0% 7 100% 71% 0% 17.6 16.0 40 86% 0% 57%
Tiger SHOP (Youthtrack) (Provider changed) 38 21% 16 42% 75% 0% 16.8 25.0 278 50% 6% 38%
ARC Serious Habitual Offender Program (Closed) 30 3% 27 90% 44% 19% 17.5 27.7 282 59% 11% 48%
Bartow Juvenile Correctional Facility (Closed) 25 0% 24 96% 46% 17% 16.8 27.3 222 58% 13% 54%
Bartow Serious Habitual Offender Program (Closed) 33 15% 28 85% 39% 18% 17.6 46.4 233 64% 21% 54%
Hillsborough Intensive Residential Treatment 4 25% 4 100% 50% 0% 12.8 27.8 730 100% 0% 25%
Manatee Youth Academy 29 3% 27 93% 56% 11% 16.7 29.7 265 59% 15% 67%
Polk Juvenile Correctional Facility (Premier) (Provider changed) 313 8% 276 88% 61% 11% 17.3 36.5 235 64% 4% 48%
Broward Intensive Halfway House 34 3% 31 91% 77% 19% 16.6 28.5 324 74% 10% 55%
Eckerd Youth Development Center 105 1% 99 94% 58% 17% 16.7 34.8 436 82% 5% 47%
Everglades Youth Development Center (Premier) 98 4% 91 93% 60% 11% 16.7 32.9 389 70% 5% 40%
Sago Palm Youth Development Center 113 10% 104 92% 52% 20% 16.9 29.5 345 77% 5% 46%
Subtotal 1,327 6% 1,143 86% 56% 10% 16.9 33.0 311 65% 8% 48% 1 Italics indicate less than 15 youth completed the program and care should be taken in interpreting the data.2 Names of provider agencies are noted in parenthesis if a program has had multiple providers. 3 ODP is the percentage of releases adjudicated for an offense that occurs during placement.
High-Risk Restrictiveness Programs
Residential Commitment FY 2003-04Output Summary by Program Type and Region
South
Total Releases
%ODP3
Completions
Total
Completions % BlackProgram Name 1,2
Central
High-RiskMale
Program Type Region%
Hispanic
AverageLengthof Stay
Post-Commitment
Services %Recidivism
Average Age at
Admission
Average Prior
Seriousness Index
CentralHigh-RiskFemale
North
North

Residential and C
orrectional Facilities
2006 O
utcome E
valuation Report
Sum
mary T
ables
139
N1 % % CR % PCP
Central DeSoto Juvenile Correctional Facility-Dual Diagnosis 10 0% 9 90% 0% 11% 17.0 39.2 366 44% 0% 0%
FIG (Lighthouse) (Closed) 4 0% 3 75% 33% 0% 16.3 8.0 21 67% 0% 33%
FIG (Lighthouse) (Closed) 96 7% 63 66% 57% 3% 16.4 26.6 431 68% 8% 24%
Subtotal 110 6% 75 68% 49% 4% 16.5 27.4 407 65% 7% 21%
DeSoto Juvenile Correctional Facility-Dual Diagnosis 70 3% 65 93% 18% 14% 17.1 37.5 383 51% 3% 45%
DeSoto Juvenile Correctional Facility 21 5% 19 90% 32% 5% 17.3 40.3 386 53% 5% 37%
Subtotal 91 3% 84 92% 21% 12% 17.1 38.1 384 51% 4% 43%
South Sago Palm Pathfinders 60 0% 57 95% 49% 18% 17.2 34.5 345 75% 2% 47%
Subtotal 60 0% 57 95% 49% 18% 17.2 34.5 345 75% 2% 47%
Dozier Sex Offender Program 42 2% 38 90% 29% 3% 16.6 15.3 581 53% 11% 18%
Jackson JOCC Sex Offender Program 24 0% 24 100% 42% 8% 16.4 17.8 571 50% 13% 25%
Three Springs Sex Offender Program 25 24% 23 92% 48% 4% 15.5 13.5 536 83% 4% 26%
Kissimmee Juvenile Correctional Facility (SOP) 31 6% 24 77% 42% 13% 15.5 19.0 511 88% 4% 33%
Manatee Adolescent Treatment (SOP) (Premier) 28 4% 26 93% 31% 19% 15.7 19.1 542 85% 12% 27%
Elaine Gordon Sex Offender Program (SOP) (Three Springs) 25 4% 22 88% 55% 23% 15.2 19.2 465 73% 18% 23%
Okeechobee JOCC Sex Offender Program (SOP) (Securicor) 29 3% 28 97% 43% 7% 17.2 26.3 314 75% 11% 11%
Sago Palm (SOP) 90 0% 88 98% 42% 10% 16.0 19.5 540 80% 6% 19%
Subtotal 294 4% 273 93% 41% 10% 16.1 18.8 517 74% 9% 22%
2,162 6% 1,805 83% 51% 10% 16.7 30.0 353 65% 8% 41% 1 Italics indicate less than 15 youth completed the program and care should be taken in interpreting the data.2
Names of provider agencies are noted in parenthesis if a program has had multiple providers. 3 ODP is the percentage of releases adjudicated for an offense that occurs during placement.
Completions
Total
Completions%
Black%
Hispanic
Average Age at
Admission
Average Prior
Seriousness Index
AverageLengthof Stay
Post-Commitment
Services%
RecidivismRegion Program Name1,2
Total Releases
%ODP
3
High-Risk Restrictiveness Programs
South
High-Risk Mental Health-Male
High-Risk Substance Abuse
Male
High-Risk Restrictiveness Programs
Program Type
Central
Residential Commitment FY 2003-04Output Summary by Program Type and Region
High-Risk Mental Health
Female
North
Central
South
High-Risk Sex Offender
Male

2006 Outcom
e Evaluation R
eport
Residential and C
orrectional Facilities
140
S
umm
ary Tables
N1 % % CR % PCP
Cypress Creek JOCC (Securicor) 32 0% 27 84% 52% 7% 18.0 33.6 170 59% 15% 26%
Cypress Creek JOCC (YSI) (Closed) 42 7% 0 0% N/A N/A N/A N/A N/A N/A N/A N/A
Central Omega JOCC 25 0% 24 96% 71% 13% 16.9 55.6 618 58% 21% 29%
South Okeechobee JOCC Max Risk (Securicor) 25 0% 18 72% 72% 17% 17.7 43.3 316 83% 0% 50%
Subtotal 124 2% 69 56% 64% 12% 17.5 43.8 364 65% 13% 33%
FIG (Lighthouse) (Closed) 1 0% 0 0% N/A N/A N/A N/A N/A N/A N/A N/A
FIG (Premier) (Provider changed) 24 13% 7 29% 57% 29% 17.0 45.7 757 57% 14% 14%
Subtotal 25 12% 7 28% 57% 29% 17.0 45.7 757 57% 14% 14%
149 4% 76 51% 63% 13% 17.5 44.0 400 64% 13% 32% 1 Italics indicate less than 15 youth completed the program and care should be taken in interpreting the data.2Names of provider agencies are noted in parenthesis if a program has had multiple providers.
3 ODP is the percentage of releases adjudicated for an offense that occurs during placement.
Maximum-RiskMental Health
Female
%ODP
3Region
Total Releases
South
North
Maximum-Risk Restrictiveness Programs
Residential Commitment FY 2003-04Output Summary by Program Type and Region
Average Age at
Admission
Average Prior
Seriousness Index
AverageLengthof Stay
Post-Commitment
Services
Program Name1,2
%RecidivismProgram Type
Maximum-RiskMale
Total
Completions%
Black%
Hispanic
Completions
Maximum-Risk Restrictiveness Programs