2006 annual report convenience you can count...
TRANSCRIPT

National Headquarters 5151 Corporate Drive, Troy, MI 48098 | (800) 945-7700 | www.fl agstar.com
Convenience you can count on.
2006 Annual Report
Flagstar Bancorp
2006 Annual Report

Flagstar Bancorp, (NYSE: FBC), is the holding company
for Flagstar Bank, a federally chartered stock savings
bank. Since our founding in 1987, we have experienced
exceptional growth, and today we are the largest
publicly traded savings bank headquartered in the
Midwest. We also are one of the nation’s leading
mortgage lenders.
We serve our customers through our retail banking
centers in Michigan, Indiana and Georgia and our
Internet branch at www.flagstar.com. We use customer
deposits, along with other funding sources, to invest
primarily in residential loans that we originate and
purchase nationwide.
Additionally, our product offerings include consumer
loans, which we originate principally in our banking
markets, and second mortgages and home equity lines
of credit, which we originate nationally. In 2006, we
expanded our commercial real estate lending beyond
our three banking markets to 17 other states.
We also provide warehouse lines of credit to retail
lending institutions across the country. In addition,
we service a large portfolio of mortgage loans for
other investors.
Community Bank
Flagstar is a growth-oriented community bank with 151
banking centers in Michigan, Indiana and Georgia, and
total deposits of $7.4 billion at December 31, 2006.
Home Lender
Flagstar is one of the nation’s largest single-family
residential prime mortgage originators. We lend to
homeowners in all 50 states. Between 2002 and 2006,
we originated residential mortgage loans totaling more
than $180 billion.
Mortgage Servicer
Flagstar collects mortgage payments and services the
loans of more than 193,000 homeowners across the
nation.
Company Profi le
Duluth, Georgia

2Zionsville, Indiana
Bringing community banking to your neighborhood.
Grosse Pointe, Michigan Birmingham, Michigan
West Bloomfield, Michigan

2006 was a challenging year for us. At 9.4 percent, our return
on average equity was below our historical performance.
The inverted yield curve and intense competition on deposit
pricing reduced our net interest margin. Additionally,
continued overcapacity in the mortgage banking industry —
combined with our reluctance to participate in the industry-
wide loosening of credit standards — resulted in a decline in
our origination volume. Despite these challenges, we believe
Flagstar will emerge from this phase of the business cycle as
a stronger company well positioned for continued success.
Most banks have faced challenges due to the interest rate
environment that persisted throughout 2006. During the
year, the Federal Reserve continued to raise short-term
interest rates to the point where they exceeded long-
term rates. This produced an inverted yield curve, which
significantly reduced our net interest margin on our
available-for-sale loan portfolio.
This portfolio is where we traditionally fund long-term loans
— which we typically hold on our balance sheet for only 30
to 60 days — with historically cheaper short-term funding.
At this time, the inverted yield curve continues, and it does
not appear that spreads will return to historical levels any
time soon.
In the face of these market conditions, many of our peers
have maintained or even increased their returns by taking
substantially more credit risk — a temptation that we have
largely resisted. In the past few years, we believe we have
taken a conservative and responsible stance in underwriting
our mortgage loans relative to industry standards. This has
cost us business and cost us market share. Nevertheless, we
feel the strength of our asset quality has positioned us well
for success as the mortgage industry consolidates, and we
look to profitably increase mortgage production and gain
back market share.
At Flagstar, we enjoy the benefits and stability of being a
federal savings bank with access to the Federal Home Loan
Bank system and the Federal Reserve, in addition to our
growing base of customers with whom we have deposit
relationships.
This has enabled us to avoid reliance on warehouse lines
and Wall Street funding, which can be fickle and unforgiving.
In fact, we are now seeing some of our lending competitors
who have depended on Wall Street for funding and capital
exit the industry, which should allow us to gain market share.
Additionally, we are encouraged by positive trends in
our own loan production. We have seen early, but strong
indicators that production for 2007 should exceed results
for 2006. As evidence of this, the fourth quarter of 2006 was
our highest production quarter of the year with originations
of $5.1 billion. And, as the industry consolidates, we are
augmenting our sales staff with significant numbers of
experienced account executives.
Our management team remains committed to growing our
banking franchise and, with the recent announcement that
Comerica Bank is moving its headquarters to Texas, Flagstar
is positioned to become the largest banking institution
whose parent is headquartered in Michigan.
We have continued to expand our retail banking network
by opening 14 new banking centers, including eight in
Georgia. We were pleased with the results of a recent survey
that ranked our banking centers #1 in courtesy, friendliness,
professionalism, product knowledge, sales ability and overall
perception. Other accomplishments during the year included
completing the roll out of a new deposit pricing strategy for
banking, improving our cross selling, expanding our banking
relationship with Wal-Mart and launching a new debit card
rewards program.
The progress of our banking operation in Georgia is another
positive. Deposits are growing nicely, customers are enjoying
the convenience of our seven-day banking hours and we’re
winning high praise for customer service across our growing
franchise. In Gwinnett and Cobb Counties, we’re achieving
an important critical mass, which should help drive more
growth. In 2007, we plan to open seven banking centers in
Georgia, including our first in-store branch in the state.
Letter to Stockholders
2

Commercial real estate lending also was a bright spot
in 2006. In six years, we’ve succeeded in increasing our
commercial real estate portfolio from under $200 million at
the end of 2000 to $1.3 billion. In 2006 alone, we increased
our loan portfolio by 30 percent and recently expanded our
target market to 20 states. This growth is part of a plan to
further diversify our overall loan portfolio toward higher-
yielding assets such as commercial real estate loans, asset-
backed commercial loans, small business loans and non-
residential consumer loans.
Throughout the year, we received recognition for
excellence in many areas:
• We continue to maintain an Outstanding rating — the highest
possible — for our community reinvestment activities. This
coveted rating is awarded by our primary banking regulator,
the Office of Thrift Supervision, for our performance under the
Community Reinvestment Act (CRA).
• Mortgage Technology magazine cited us as one of the Top
25 Tech-Savvy Lenders, describing our paperless back office as
“legendary in the mortgage industry” for the third year in a
row. Mortgage Technology also named us a finalist in its 2006
Technology Awards for our standards-based electronic
document exchange platform that allows partners to
exchange both credit and closing documents.
• Freddie Mac named us a Tier One Platinum level servicer for
the second consecutive year. This prestigious performance
ranking recognized companies for superior investor reporting
and default management during 2006.
• We remain on Standard & Poors’ Select Servicer list, which allows
us to operate as a servicer in the private securitization market.
• For the fifth consecutive year, the Michigan Business and
Professional Association recognized us as one of Metro Detroit’s
101 Best and Brightest Companies to Work For.
Despite the challenges of the residential real estate market
in 2006, our high credit standards helped us curb loan
delinquencies. For example, at the end of 2005 our 90-day-
plus delinquency rate was 61 basis points, and it increased
only minimally to 64 basis points at the end of 2006. Even as
we grew our balance sheet slightly in the fourth quarter, our
nonperforming assets as a percent of total assets showed a
small decline from the third quarter.
We remain vigilant on expense management while
simultaneously seeking sound revenue-enhancing
opportunities. In 2007, we are targeting $15 million in fee
enhancements and cost reductions, excluding staff related
expenses. Because of the cyclical nature of our loan business
and the sensitivity to rates, we continuously monitor staff
levels to keep them aligned with market conditions.
Historically, we have been a growth company that is an
efficient user of capital. As we move into 2007, if our stock
continues to trade at what we believe to be depressed
levels, we will likely use capital to repurchase stock and may
temporarily shrink our balance sheet. Long-term, however,
we remain committed to executing a growth-oriented
business plan that focuses on profitability, superior customer
service and ever-increasing stockholder value. We thank our
stockholders for the confidence they have placed in us and
our board members and associates for their time and efforts
on behalf of our company.
Mark T. HammondPresident, Chief Executive Officer
Thomas J. HammondChairman of the Board
3
March 20, 2007

Banking Operations
4 Increased commercial real estate loan portfolio to $1.3 billion.
4 Opened 14 new banking centers.
4 Rolled out Loyalty Program in Michigan.
4 Installed envelope-free ATMs in all new branches.
4 Introduced debit card Rewards Program.
4 Adopted efficiencies of Check 21 by capturing check
images in branches.
4 Expanded relationship with Wal-Mart.
4 Operated in environment where inverted yield curve
and competitive deposit pricing compressed net interest margin.
Home Lending4 Increased percentage of non-agency loan originations.4 Maintained stable credit quality.4 Invested in technical systems to improve productivity and customer satisfaction.4 Experienced tight gain on sale margins and lower-yielding assets as a result of overcapacity in the mortgage lending industry.
Initiatives for 2007
4 Change the mix of the balance sheet by
conservatively adding higher-yielding assets
over the next several years.
4 Open 13 new banking centers.
- 7 in Georgia (1 in-store).
- 6 in Michigan (2 in-stores).
4 Target $15 million in cost-cutting/revenue
enhancing initiatives.
4 Diversify loan portfolio into more consumer
and commercial loans.
4 Securitize with non-agency counterparties.
4 Expand and diversify commercial real estate
loan portfolio.
The Year at a Glance
Net Earnings
Earnings Per Share — Basic
Earnings Per Share — Diluted
Mortgage Loan Originations
Mortgage Loans Serviced For Others
Return On Average Assets
Return On Average Equity
Net Earnings
Earnings Per Share — Basic
Earnings Per Share — Diluted
Mortgage Loan Originations
Mortgage Loans Serviced For Others
Return On Average Assets
Return On Average Equity
Dollars in thousands, except per share data, at December 31 2005 2004 20032006
$251,986
$4.21
$3.95
$56,550,735
$30,395,079
2.50%
48.35%
$126,842
$2.17
$2.05
$43,391,116
$21,586,797
1.76%
37.61%
$142,738
$2.34
$2.22
$34,248,988
$21,354,724
1.17%
20.60%
$79,865
$1.29
$1.25
$28,244,561
$29,648,088
0.54%
10.66%
2002
$75,202
$1.18
$1.17
$18,966,354
$15,032,504
0.49%
9.42%
$405.4 $638.8 $728.9 $771.9 $812.2 $4,374 $5,680 $7,380 $7,979 $7,3792002 2003 2004 2005 2006
86 98 120 137 1512002 2003 2004 2005 20062002 2003 2004 2005 20062002 2003 2004 2005 2006
$8,196 $10,553 $13,143 $15,075 $15,497
Total Assets(In Millions)
05
1015
20
'02 '04'03 '05 '06
Stockholders' Equity(In Millions)
020
040
060
080
010
00
'02 '04'03 '05 '06
Banking Centers(At December 31)
050
100
150
200
'02 '04'03 '05 '06
Total Deposits(At December 31)
01
23
45
67
8
'02 '04'03 '05 '06

0
100
200
300
400
Dec-01 Jun-02 Dec-02 Jun-03 Dec-03 Jun-04 Dec-04 Jun-05 Dec-05 Jun-06 Dec-06
Nasdaq FinancialNasdaq BankS&P Small Cap 600Russell 2000Flagstar Bancorp
Cumulative Total Stockholder Return Compared With Performance of Selected Indices - December 31, 2001 through December 31, 2006
Dec-01 Jun-02 Dec-02 Jun-03 Dec-03 Jun-04 Dec-04 Jun-05 Dec-05 Jun-06 Dec-06Nasdaq Financial 100 107 98 109 129 132 149 145 152 158 174 Nasdaq Bank 100 114 107 119 142 145 162 155 159 167 181 S&P Small Cap 600 100 100 85 96 118 130 145 148 157 169 180 Russell 2000 100 95 80 94 117 125 139 137 145 157 172 Flagstar Bancorp 100 173 163 373 331 314 366 314 245 277 263

Snellville, Georgia
Expanding our presence
Expanding our Footprint
In banking, we significantly expanded our footprint in
Georgia by opening eight new banking centers, giving us 13
at year-end 2006. We also opened seven offices in Michigan,
branching into locations with attractive demographics
where we have an established customer base.
We expect to open 13 new banking centers in 2007 and
recently signed a new agreement with Wal-Mart to open
our first in-store branch in Georgia, plus additional in-store
branches and drive-up ATMs at Wal-Mart service stations. In
the future, we look for our banking operations to provide an
increasing source of fee and net interest income.
At year-end 2006, total banking deposits stood at $7.4 billion,
including $1.4 billion from our Public Funds Group, which has
been highly successful in attracting funds from public entities
in Michigan and Indiana. In 2006, Public Funds added almost
80 new entities to its roster of clients.
We completed the roll out of our Loyalty Program for banking
customers, which we started in 2005, by introducing it in
Michigan. The program represents an important strategic
shift for Flagstar, changing our focus from attracting
customers with high-rate certificates of deposit to
broadening and deepening relationships with customers
through multiple products.
Central to the Loyalty Program is a checking account with
an automatic, recurring monthly transaction. Customers
who qualify for the program enjoy an interest rate bonus
and other benefits, including a best rate guarantee and
fee-free use of 34,000 ATMs in the Allpoint® and Presto®
networks nationwide. At year-end 2006, customers in our
Loyalty Program had an average of 4.54 accounts with us
versus an average of 1.8 accounts for customers not in the
program. Plus, the average account balance of customers in
the program was almost twice that of other customers. Going
forward, we see the program as key to building deposits and
relationships with our customers.
6

Harrison Township, Michigan
to offer you more convenience with over 150 banking centers.
Powder Springs, Georgia

We are committed to
Lilburn, Georgia
Providing Convenience
During 2006, we improved service to our banking customers
with a host of new products and services. For example, we
introduced wireless access to online banking, added the
ability to transfer funds between banks and enhanced our
online statements by making accounts even more accessible
to our customers. Free checking, trust accounts for lawyers,
health savings accounts and variable rate CDs were other new
products launched in 2006. When we entered Georgia in 2005,
we were a pioneer in offering customers new generation,
envelope-free ATMs, and we have been installing this
technology in all our new banking centers.
We continued to offer Bank At Work, which teams Flagstar
with businesses to provide their employees with direct
deposit of their payroll checks and other benefits. In 2007,
we expect to add a bonus feature to make the program even
more attractive to employers.
Late in 2006, we made our first foray into a rewards program
with a campaign to promote our debit card. Early returns
indicate the program is a winner in boosting fee income while
acclimating customers to increased use of debit cards.
To increase interest in our banking products, we created a
fresh look for our banking centers complete with window
displays, internal posters, banners and counter cards tied
to a rotating featured product. The new look also included
revamped electronic posters offering timely tips, product
updates and ad clips, refreshed biweekly.
8

Milford, Michigan
building relationships one transaction at a time.
Indianapolis, Indiana

Say good-bye to bankers’ hours
Sterling Heights, Michigan
Expanding our Services
Throughout 2006, we continued to strengthen our alliance
with IFMG Securities, our partner in offering investment
and insurance services to our customers. IFMG financial
consultants and Flagstar’s own licensed bankers work
together to analyze customers’ needs and create a plan
to help them achieve their financial goals. In 2006, we
launched the program in the Atlanta market and now
offer it in our three banking states where we expect to see
continued growth in 2007.
We also have been an early adopter of Check 21 legislation
allowing banks to use check images in the check collection
process. Traditionally, Flagstar and other banks have
transported checks to central locations for processing.
That has required us to give our customers cut-off times
for their deposits. When we entered Georgia in 2005, we
started capturing images of checks in our banking centers.
In 2007, we will extend branch image-capture throughout
our banking network. Not only does image capture at the
branch level save us courier costs to transport paper checks,
but it also allows us to give our customers much faster
availability of their funds — virtually eliminating cut-off
times.
Also slated for 2007 is an updated package of services for
businesses, a campaign that rewards existing customers
for referring new customers to us and a credit card linked
to home equity lines of credit. Additionally, we plan a
major overhaul of our corporate Web site, making it the
gateway to a top-notch, full-service Internet bank. Our
goal is to create an attractive, robust site that is easy for our
customers to use, optimized for search engines, and able
to compete with the best in the business. The new site will
offer automated account opening and funding, self-service
applications and sophisticated cross selling and tracking.
We look for it to substantially increase both bank deposits
and mortgage sales.
10

and hello to people-friendly hours. Open 7:30 a.m. – 7:30 p.m.
Saginaw, Michigan
Kennesaw, Georgia

AngolaAvonCarmelFishers (3)Fort Wayne (2)GreenfieldIndianapolis (12)KokomoLawrenceMunciePlainfieldRichmondWarsawZionsville
INDIANA (28 total)Banking Center Locations
AcworthDuluthDunwoody (2)KennesawLawrencevilleLilburnMarietta (2)Powder Springs SmyrnaSnellvilleSuwanee
GEORGIA (13 total)Banking Center Locations
AlpenaAnn Arbor (5)Battle CreekBig RapidsBrooklynCaledoniaCaroCharlotteColdwater (2) Comstock ParkFentonGrand HavenGrand LedgeGrand Rapids (6)HillsdaleHolland (4)LudingtonMonroeMuskegon
Jackson (8)Kalamazoo (3)Lansing (4)New HudsonOkemosSaginawSouth HavenSt. JosephSturgisThree Rivers
Greater Detroit Area (56)BellevilleBeverly HillsBirminghamBloomfield HillsBrightonBrownstown TownshipCanton (3)Chesterfield Township (2)ClarkstonClinton Township (2)DearbornDearborn HeightsDetroitEastpointeFarmington Hills (3)Grosse Pointe (2)Harrison TownshipHowell
LivoniaMacomb TownshipMadison Heights (2)MilfordNoviOxfordPontiacRochester (2)RosevilleShelby Township (2)SouthgateSterling Heights (4)Taylor (2)Troy (4)Warren (2)Waterford (2)West Bloomfield (2)Westland
MICHIGAN (110 total)Banking Center Locations
Berkley (opened Feb. 2007)Commerce TownshipDetroit (opened Jan. 2007)Grand BlancGrand RapidsRochester Hills
MICHIGAN (6 total)
Alpharetta (2)AtlantaHiram (opened Jan. 2007)LawrencevilleRoswell (2)
GEORGIA (7 total)
Coming Soon
As of December 31, 2006
As of December 31, 2006

Banking Center LocationsComing Soon
MICHIGAN
566 4
8 5
12
INDIANA
GEORGIA

Consumer Lending
In 2006 we originated $1.1 billion in consumer loans,
primarily home equity loans. We are cautiously diversifying
our loan portfolio and increasing our balance of non-real
estate consumer loans. Throughout 2006, we saw excellent
results from our program of offering home equity lines
of credit through our national network of brokers and
correspondents, and we expect consumer lending growth
in 2007 will come primarily from this channel. Our indirect
lending network of boat, motorcycle and power sports
companies continued to expand geographically and in
total numbers. We signed up our first dealers in Georgia in
2006 and are currently considering additional software to
enhance customer service to the dealer group.
Commercial Real Estate Lending
The primary focus of our commercial lending is to help
businesses build, buy or refinance property. Historically,
we confined our commercial real estate lending to our
banking markets of Michigan, Indiana and Georgia. Now
we are capitalizing on our expertise in the field to offer
commercial lending in 17 additional states, largely in
the West, the Midwest and the South.
We’re already tapping into our national network of
residential mortgage lenders as a source of referrals
with excellent results — we closed over $650 million in
commercial real estate loans in 2006, bringing our total
portfolio to approximately $1.3 billion, an increase of 30
percent from year-end 2005. Originations at our Atlanta
office were particularly strong, reaching more than $170
million in 2006. We also stepped up our loan participations
with other banks. In 2007, we expect to continue our
geographic expansion and add more lenders and locations.
Expanding our Lending
14

Select Speciality® Hospital in Augusta, Georgia, financed by Flagstar Bank.
Ellard Mercantile Exchange in Roswell, Georgia, financed by Flagstar Bank.
Whether it’s a motorcycle or a shopping mall, we make financing simple.

Wholesale Lending
We are a leading mortgage wholesaler, with more than
5,000 mortgage brokers nationwide actively doing business
with us and using our funds to close loans. In addition, we
purchased loans from over 1,000 correspondent mortgage
lenders in 2006, including banks and credit unions, who close
loans with their own funds. We rank nationally as the 15th
largest wholesale lender and the 14th largest correspondent
lender in the country. In 2006, we originated $16.7 billion
in residential mortgages through wholesale lending, with
approximately 55 percent generated through our wholesale
network of mortgage brokers, and 45 percent attributable to
our correspondent partners.
Throughout the year, we continued to refine processes
and automate workflows to make it easier for our broker
and correspondent customers to do business with us. We
generally share many of these enhancements with our
brokers and correspondents so that they can achieve cost
savings and efficiencies as well. We believe this practice
strengthens our relationship with our customers and helps
them integrate Flagstar’s processes and workflows. We use
this business philosophy to differentiate ourselves in what is
all too often viewed as a commodity industry. For example,
we leveraged our nationally recognized paperless workflow
processes to allow our customers to upload electronic
closing documents. Information exchanged electronically is
faster, more reliable and more cost efficient, which improves
customer satisfaction and should build loyalty. We also
introduced a Customer For Life program that gives brokers
and correspondents tools to help them retain their customer
relationships.
A major innovation in 2006 was video underwriting, which
we made available to our brokers and home loan centers.
With this technology, our loan originators can communicate
face-to-face with our underwriters to review documents
and resolve issues, especially in challenging underwriting
situations such as government loans. Also during 2006,
we established a roadmap for eMortgage, where closing
documents and borrower signatures are all electronic.
We expect eMortgage to speed up the review of closing
documents and make our loans ready for sale more quickly.
We plan to start testing eMortgage in mid-2007.
Warehouse Lending
In order to close residential mortgage loans, lending
companies at times borrow the required funds from a
warehouse lender, such as Flagstar Bank. Our ability to
provide this specialized financing has strengthened our
relationships with our correspondent lending customers.
At December 31, 2006, we had extended credit lines of
$1.2 billion to 406 customers, with $291.7 million drawn
and outstanding versus $146.7 million at year-end 2005.
Home Lending and Direct Lending
We also originate residential mortgages under our own name
through our network of 76 home loan centers in 20 states,
plus additional offices that share space with our banking
centers. This business draws on the strength of relationships
with real estate agents and builders. In 2006, our home
lending network produced $2.3 billion in home loans. We
pride ourselves on hiring experienced loan officers and
providing them with quick-response origination technology.
Together with our competitive rates, wide array of loan
products and “anywhere, anytime” convenience, we make it
easy and attractive for consumers to choose Flagstar for their
home lending needs. Our ultimate goal is to operate home
loan centers in all major U.S. metropolitan markets.
We also provide home loans and home equity products
directly to consumers through our Web site at flagstar.com,
as well as via a toll-free number, (877) 374-3562, to our Direct
Lending department. In 2006, Direct Lending was highly
successful in attracting customers to its new business-to-
business venture, Flagstar Direct. The program leverages
our expertise in home lending and leadership in mortgage
technology to offer a no-cost employee benefit to businesses
and associations. Customers use a dedicated toll-free number
and a co-branded Web site to interact with Flagstar’s home
loan advisors and receive personalized service. In the fourth
quarter 2006, we expanded our product offering to include
a banking module as another benefit of the program.
Lending Across the Country
16

Home Loan Centers and Wholesale Locations
Scottsdale, Ariz.Tucson, Ariz. Greenbrae, Calif.Denver, Colo.Wilmington, Del.Boca Raton, Fla.Boynton Beach, Fla.Ft. Lauderdale, Fla. (2)Hudson, Fla.Pompano Beach, Fla.Satellite Beach, Fla.Tampa, Fla.Alpharetta, Ga.Dunwoody, Ga.Indianapolis, Ind.Fishers, Ind.Lexington, Ky.Fort Washington, Md.Beverly Farms, Mass.
Las Vegas, Nev.Mesquite, Nev.Pahrump, Nev.Mt. Arlington, N.J.Paramus, N.J.Sparta, N.J.Arden, N.C.Columbus, Ohio Middleburg, OhioPortland, Ore. Philadelphia, Pa.Cottonwood Hghts., UtahSalt Lake City, UtahGrand Central, W. Va.U.S. Virgin Islands
Wholesale OfficesPhoenix, Ariz.Costa Mesa, Calif.Walnut Creek, Calif.Denver, Colo.Boca Raton, Fla.Atlanta, Ga.Chicago, Ill.Wakefield, Mass.Troy, Mich.Lake Oswego, Ore.Dallas, TexasBellevue, Wash.
Home Loan Centers
Michigan — Home Loan Centers
Battle CreekCadillacFenton*FlintFort GratiotFrankenmuthGrand Haven Grand Rapids (3)*
Holland*
Houghton LakeJacksonLansing (2)LapeerMidlandMillingtonMount PleasantOkemosOscodaSaginaw
Greater Detroit Area (31)Allen Park Beverly HillsBirmingham*Bloomfield Hills*Canton*Clarkston*Clinton Township*Commerce TownshipEastpointe*Farmington Hills (4)*FerndaleHarper WoodsMacombMadison HeightsNew BaltimoreNorthville (2)Novi*Shelby Township (2)*St. Clair ShoresSterling Heights (2)* Troy (3)* Waterford* Westland*
*Loan offices sharing space with banking centers
U.S. Virgin Islands
53
Home Loan CentersWholesale Offices
31
As of December 31, 2006

Community Involvement
In 2006, Flagstar took its grassroots community sponsorships
to a new level, participating in 90 events — 50 more than
in 2005 — in Michigan, Indiana and Georgia. From the Ann
Arbor Art Fair to Fiesta Indianapolis, to the Fourth of July
Celebration in the Park in Marietta, Georgia, we are involved
and invested in our communities.
For the first time, we teamed with the March of Dimes to
sponsor 25 charity walks in our banking markets, winning
awards for Outstanding Corporate Support and the Top New
Team. And for the ninth consecutive year, we continued our
major sponsorships in Michigan — the Detroit Free Press/
Flagstar Marathon; Arts, Beats & Eats; and Arts du Jour.
Not only do these sponsorships benefit our communities,
but they also afford excellent opportunities to brand the
Flagstar name and sell our products.
As part of our commitment to our communities, we place
a special emphasis on volunteerism. That’s why we ask all
our officers and banking center employees to participate in
organizations, events and programs in their communities. In
2006 more than 250 officers volunteered over 3,500 hours,
while our banking center staff alone spent over 6,500 hours in
community service or community reinvestment activities. Our
employees served meals to the homeless, repaired homes
for low-income families and delivered food and clothing to
the needy. They mentored, taught and counseled scores of
individuals throughout their communities. This is in addition
to the financial support they provided to many causes
through fund-raisers held in various Flagstar departments
and the charity Jean Days in our banking centers.
In 2006, organizations benefiting from the generosity of our
employees included the American Cancer Society, Boys &
Girls Clubs, the Flagstar Employee Food Delivery Program,
Gleaner’s Kid Snack Program, Haven,
Lighthouse of Oakland County, the Ronald McDonald House,
Salvation Army Coats for Kids, Share A Smile, the United Way
and many others.
We also sponsored, supported or were involved in activities
relating to our responsibilities under the Community
Reinvestment Act. These included:
In Detroit, we sponsored and participated in a homeownership
workshop to inform single mothers and female heads of
households about the homebuying options available to them. We
also provided funding and volunteers for the Detroit Executive
Service Corps’ Roundtable Dialogues with the Detroit Public
Schools.
In Pontiac, Michigan, we sponsored a homeownership seminar
targeting the Hispanic community and a Back to School event
with the Pontiac School district.
In Fort Wayne, Indiana, we partnered with Lutheran Social Services
to paint the homes of low-income seniors. Also in Indiana, we
continued our contributions to the Indianapolis Local Initiatives
Support Corporation, the Indianapolis Neighborhood Housing
Partnership, ACORN, Partners in Housing, Neighborworks
Community Development and others.
In Georgia, we held Family Fun Days to celebrate the opening of
new banking centers and contributed to community organizations
to mark our entry into new counties. Since expanding into Georgia
in 2005, we have supported the following organizations:
The Impact Group, Cobb Housing, Inc., the Atlanta Neighborhood
Development Partnership, D&E Financial Education and Training
and Family Haven. We also contributed to the United Way of
Metropolitan Atlanta Individual Development Account program,
which provides matching grants to help low-income families save
to purchase a home.
Supporting our Communities
•
•
•
•
18

Arts, Beats & Eats, Pontiac, Michigan Habitat for Humanity, Macomb County, Michigan
We are involved and invested in our communities.
Detroit Free Press/Flagstar Marathon, Detroit, Michigan Arts, Beats & Eats, Pontiac, Michigan

®
DirectorsFlagstar Bancorp, Inc.
Thomas J. Hammond Chairman of the Board Mark T. Hammond Vice Chairman of the Board, Chief Executive Officer, President Kirstin A. Hammond Director, Executive DirectorRobert O. Rondeau Jr. Director, Executive Director
Charles Bazzy Director (outside) James D. Coleman Director (outside)Frank D’Angelo Director (outside)Robert W. DeWitt Director (outside)Richard S. Elsea Director (outside)Jay Hansen Director (outside)Michael Lucci, Sr. Director (outside)Brian Tauber Director (outside)
Stockholder AssistanceFor help with name, address or stock ownership changes, to report lost or stolen stock certificates or to get assistance with other shareholder issues, please contact our agent directly:
Registrar and Transfer CompanyAttention: Investor Relations10 Commerce DriveCranford, NJ 07016(800) 368-5948e-mail: [email protected] www.rtco.com
In all communication with Registrar and Transfer Company, be sure to mention Flagstar Bancorp and provide your name as it appears on your stock certificate, along with your Social Security number, daytime phone number and current address.
In addition, individual investors may report a change of address, request a shareholder account transcript, place a stop on a certificate or obtain a variety of forms by logging on to www.rtco.com and clicking Investor Services.
Dividend Reinvestment PlanUnder Flagstar Bancorp’s dividend reinvestment plan, registered stockholders may purchase additional shares of Flagstar Bancorp stock by reinvesting their cash dividends. There is no minimum investment required to participate in the plan. For more information, contact Registrar and Transfer Company.
Direct Deposit of DividendsRegistered stockholders of Flagstar Bancorp common stock may have their dividend payments deposited into their checking, savings or money market account at any financial institution in the United States that accepts electronic deposits. A brochure describing the service and an authorization form are available from the Registrar and Transfer Company.
Equal Employment OpportunityFlagstar Bancorp does not discriminate against any person on the basis of race, color, religion, national origin, sex, age, handicap, height, weight, familial status, sexual orientation, marital status, veteran disability, Vietnam veteran or other protected veteran or recently separated veteran with respect to recruiting, hiring, promoting, transferring, terminating and other terms and conditions of employment.
Management TeamFlagstar Bank, FSB
Thomas J. Hammond Chairman of the Board Mark T. Hammond Chief Executive Officer, PresidentKirstin A. Hammond Executive Director Chief Investment OfficerRobert O. Rondeau Jr. Executive Director Banking and Commercial LendingJoan H. Anderson Executive Vice President Loan AdministrationPaul D. Borja Executive Vice President Chief Financial OfficerM. David Bowers Executive Vice President Wholesale LendingW. Steven Brooks Executive Vice President Chief Operating Officer, LendingAlessandro P. DiNello Executive Vice President Banking Charles C. Kirkpatrick Executive Vice President Chief Technology OfficerRebecca A. Lucci Executive Vice President Human Resources William M. Robinson III Executive Vice President Home LendingMatthew I. Roslin Executive Vice President Chief Legal OfficerMary Kay Ruedisueli Executive Vice President AdministrationKaren F. Shreve Executive Vice President Compliance Audit
Directors and Management Team

UNITED STATESSECURITIES AND EXCHANGE COMMISSION
Washington, D.C. 20549
FORM 10-K(Mark One)
n ANNUAL REPORT PURSUANT TO SECTIONS 13 OR 15(D) OF THE SECURITIES EXCHANGE ACT OF 1933
OR¥ ANNUAL REPORT PURSUANT TO SECTION 13 OR 15(d) OF THE SECURITIES EXCHANGE ACT OF 1934
FOR THE FISCAL YEAR ENDED DECEMBER 31, 2006
ORn TRANSITION REPORT PURSUANT TO SECTION 13 OR 15(d) OF THE SECURITIES EXCHANGE ACT OF 1934
Commission File No.: 001-16577
(Exact name of registrant as specified in its charter)
Michigan 38-3150651(State or other jurisdiction ofincorporation or organization)
(I.R.S. EmployerIdentification No.)
5151 Corporate Drive, Troy, Michigan 48098-2639(Address of principal executive offices) (Zip Code)
Registrant’s telephone number, including area code: (248) 312-2000
Securities registered pursuant to Section 12(b) of the Act:
Title of each class Name of each exchange on which registered
Common Stock, par value $0.01 per share New York Stock Exchange
Securities registered pursuant to Section 12(g) of the Act: None
Indicate by check mark if the registrant is a well-known seasoned issuer, as defined in Rule 405 of the SecuritiesAct. Yes n No ¥
Indicate by check mark if the registrant is not required to file reports pursuant to Section 13 or Section 15(d) of the ExchangeAct. Yes n No ¥
Indicate by check mark whether the registrant (1) has filed all reports required to be filed by Section 13 or 15(d) of theSecurities Exchange Act of 1934 during the preceding 12 months (or for such shorter period that the registrant was required to filesuch reports), and (2) has been subject to such filing requirements for the past 90 days. Yes ¥ No n
Indicate by check mark if disclosure of delinquent filers pursuant to Item 405 of Regulation S-K is not contained herein, andwill not be contained, to the best of registrant’s knowledge, in definitive proxy or information statements incorporated by referencein Part III of this Form 10-K or any amendment to this Form 10-K. n
Indicate by check mark whether the registrant is a large accelerated filer, an accelerated filer or a non-accelerated filer. Seedefinition of “accelerated filer and large accelerated filer” in Rule 12b-2 of the Exchange Act
Large Accelerated Filer n Accelerated Filer ¥ Non-Accelerated Filer n
Indicate by check mark whether the registrant is a shell company (as defined in Exchange Act Rule 12b-2). Yes n No ¥
The estimated aggregate market value of the voting common stock held by non-affiliates of the registrant, computed byreference to the closing sale price ($15.96 per share) as reported on the New York Stock Exchange on June 30, 2006, wasapproximately $607.5 million. The registrant does not have any non-voting common equity shares.
As of February 23, 2007, 63,625,870 shares of the registrant’s Common Stock, $0.01 par value, were issued and outstanding.
DOCUMENTS INCORPORATED BY REFERENCEPortions of the registrant’s Proxy Statement relating to its 2007 Annual Meeting of Stockholders have been
incorporated into Part III of this Report on Form 10-K.

PART I . . . . . . . . . . . . . . . . . . . . . . . . . . . . . . . . . . . . . . . . . . . . . . . . . . . . . . . . . . . . . . . . . . . . . . . . . 3ITEM 1. BUSINESS . . . . . . . . . . . . . . . . . . . . . . . . . . . . . . . . . . . . . . . . . . . . . . . . . . . . . . . . . . 3ITEM 1A. RISK FACTORS . . . . . . . . . . . . . . . . . . . . . . . . . . . . . . . . . . . . . . . . . . . . . . . . . . . . . . 13ITEM 1B. UNRESOLVED STAFF COMMENTS . . . . . . . . . . . . . . . . . . . . . . . . . . . . . . . . . . . . . . 20ITEM 2. PROPERTIES . . . . . . . . . . . . . . . . . . . . . . . . . . . . . . . . . . . . . . . . . . . . . . . . . . . . . . . . 20ITEM 3. LEGAL PROCEEDINGS . . . . . . . . . . . . . . . . . . . . . . . . . . . . . . . . . . . . . . . . . . . . . . . . 20ITEM 4. SUBMISSION OF MATTERS TO A VOTE OF SECURITY HOLDERS . . . . . . . . . . . . . 20
PART II . . . . . . . . . . . . . . . . . . . . . . . . . . . . . . . . . . . . . . . . . . . . . . . . . . . . . . . . . . . . . . . . . . . . . . . . 21ITEM 5. MARKET FOR REGISTRANT’S COMMON EQUITY, RELATED STOCKHOLDER
MATTERS AND ISSUER PURCHASES OF EQUITY SECURITIES . . . . . . . . . . . . . . . 21ITEM 6. SELECTED FINANCIAL DATA . . . . . . . . . . . . . . . . . . . . . . . . . . . . . . . . . . . . . . . . . . 23ITEM 7. MANAGEMENT’S DISCUSSION AND ANALYSIS OF FINANCIAL CONDITION
AND RESULTS OF OPERATIONS . . . . . . . . . . . . . . . . . . . . . . . . . . . . . . . . . . . . . . . . 25ITEM 7A. QUANTITATIVE AND QUALITATIVE DISCLOSURES ABOUT MARKET RISK . . . . 52ITEM 8. FINANCIAL STATEMENTS AND SUPPLEMENTARY DATA. . . . . . . . . . . . . . . . . . . . 55ITEM 9. CHANGES IN AND DISAGREEMENTS WITH ACCOUNTANTS ON ACCOUNTING
AND FINANCIAL DISCLOSURE . . . . . . . . . . . . . . . . . . . . . . . . . . . . . . . . . . . . . . . . . 105ITEM 9A. CONTROLS AND PROCEDURES. . . . . . . . . . . . . . . . . . . . . . . . . . . . . . . . . . . . . . . . . 105ITEM 9B. OTHER INFORMATION . . . . . . . . . . . . . . . . . . . . . . . . . . . . . . . . . . . . . . . . . . . . . . . . 108
PART III. . . . . . . . . . . . . . . . . . . . . . . . . . . . . . . . . . . . . . . . . . . . . . . . . . . . . . . . . . . . . . . . . . . . . . . . 109ITEM 10. DIRECTORS, EXECUTIVE OFFICERS AND CORPORATE GOVERNANCE . . . . . . . . 109ITEM 11. EXECUTIVE COMPENSATION . . . . . . . . . . . . . . . . . . . . . . . . . . . . . . . . . . . . . . . . . . 109ITEM 12. SECURITY OWNERSHIP OF CERTAIN BENEFICIAL OWNERS AND
MANAGEMENT AND RELATED STOCKHOLDER MATTERS . . . . . . . . . . . . . . . . . . 109ITEM 13. CERTAIN RELATIONSHIPS AND RELATED TRANSACTIONS, AND DIRECTOR
INDEPENDENCE . . . . . . . . . . . . . . . . . . . . . . . . . . . . . . . . . . . . . . . . . . . . . . . . . . . . . 109ITEM 14. PRINCIPAL ACCOUNTING FEES AND SERVICES . . . . . . . . . . . . . . . . . . . . . . . . . . . 110
PART IV . . . . . . . . . . . . . . . . . . . . . . . . . . . . . . . . . . . . . . . . . . . . . . . . . . . . . . . . . . . . . . . . . . . . . . . . 110ITEM 15. EXHIBITS, FINANCIAL STATEMENT SCHEDULES . . . . . . . . . . . . . . . . . . . . . . . . . . 110
List of Subsidiaries of the CompanyConsent of Virchow, Krause & Company, LLPConsent of Grant Thornton LLPSection 302 Certification of Chief Executive OfficerSection 302 Certification of Chief Financial OfficerSection 906 Certification of Chief Executive OfficerSection 906 Certification of Chief Financial Officer
Cautions Regarding Forward-Looking Statements
This report contains certain forward-looking statements with respect to the financial condition; results ofoperations, plans, objectives, future performance and business of Flagstar Bancorp, Inc. (“Flagstar” or “Com-pany”) and these statements are subject to risk and uncertainty. Forward-looking statements, within the meaningof the Private Securities Litigation Reform Act of 1995, include those using words or phrases such as “believes,”“expects,” “anticipates,” “plans,” “trend,” “objective,” “continue,” “remain,” “pattern” or similar expressions orfuture or conditional verbs such as “will,” “would,” “should,” “could,” “might,” “can,” “may” or similarexpressions. There are a number of important factors that could cause our future results to differ materially fromhistorical performance and these forward-looking statements. Factors that might cause such a difference include,but are not limited to, those discussed under the heading “Risk Factors” in Part I, Item 1A of this Form 10-K.The Company does not undertake, and specifically disclaims any obligation, to update any forward-lookingstatements to reflect occurrences or unanticipated events or circumstances after the date of such statements.
2

PART I
ITEM 1. BUSINESS
Where we say “we,” “us,” or “our,” we usually mean Flagstar Bancorp, Inc. In some cases, a reference to“we,” “us,” or “our” will include our wholly-owned subsidiary Flagstar Bank, FSB, and Flagstar CapitalMarkets Corporation (“FCMC”), its wholly-owned subsidiary, which we collectively refer to as the “Bank.”
General
The Company is a Michigan-based savings and loan holding company. Our business is primarilyconducted through our principal subsidiary, Flagstar Bank, FSB (the “Bank”), a federally chartered stocksavings bank. At December 31, 2006, our total assets were $15.5 billion, making us the largest publicly heldsavings bank in the Midwest and the 17th largest savings bank in the United States.
The Bank is a member of the Federal Home Loan Bank of Indianapolis (“FHLB”) and is subject to regulation,examination and supervision by the Office of Thrift Supervision (“OTS”) and the Federal Deposit InsuranceCorporation (“FDIC”). The Bank’s deposits are insured by the FDIC through the Deposit Insurance Fund (“DIF”).
At December 31, 2006, we operated 151 banking centers located in Michigan, Indiana and Georgia (ofwhich 41 are located in retail stores such as Wal-Mart) and 76 home loan centers located in 20 states. Thisincludes an additional 14 banking centers we opened during 2006, including eight in Georgia. Our plan overthe next five years is to increase our earning asset base and banking center network. To do this, we plan tocontinue to add banking centers and grow our lending channels in an effort to expand our market share in themarkets we serve and to penetrate new markets. Toward this goal, during 2007, we expect to expand ourbanking center network by up to 13 new banking centers, with seven in Georgia.
Our earnings are from our retail banking activities, which generate net interest income, and non-interestincome from sales of residential mortgage loans to the secondary market, the servicing of loans for others, thesale of servicing rights related to mortgage loans serviced and fee-based services provided to our customers.Approximately 96% of our total loan production during 2006 represented mortgage loans and home equitylines of credit that were secured by first or second mortgages on single-family residences.
On May 30, 2006, we formed Flagstar Capital Markets Corporation (“FCMC”) as a wholly-ownedsubsidiary of the Bank. FCMC performs the capital market functions that were previously handled by theBank. These functions include holding investment loans, purchasing securities, selling and securitizingmortgage loans, maintaining and selling mortgage servicing rights, developing new loan products, establishingpricing for mortgage loans to be acquired, providing for lock-in support, and managing the interest rate riskassociated with these activities.
At December 31, 2006, we had 2,510 full-time equivalent salaried employees and 444 account executivesand loan officers.
Operating Segments
Our business is comprised of two operating segments — banking and home lending. Our bankingoperation offers a line of consumer and commercial financial products and services to individuals and to smalland middle market businesses through a network of banking centers (i.e., our bank branches) in Michigan,Indiana, and Georgia. Our home lending operation originates, acquires, sells and services mortgage loans onone-to-four family residences. Each operating segment supports and complements the operations of the other,with funding for the home lending operation primarily provided by deposits and borrowings obtained throughthe banking operation. Financial information regarding our two operating segments is set forth in Note 28 toour consolidated financial statements included in this report under Item 8. Financial Statements andSupplementary Data. A more detailed discussion of our two operating segments is set forth below.
Banking Operation. Our banking operation collects deposits and offers a broad base of banking servicesto consumer and commercial customers. We collect deposits at our 151 banking centers and via the Internet.We also sell certificates of deposit through independent brokerage firms. We borrow funds by obtaining
3

advances from the FHLB and by entering into repurchase agreements using as collateral our mortgage-backedsecurities that we hold as investments. The banking operation invests these funds in a variety of consumer andcommercial loan products.
We have developed a variety of deposit products ranging in maturity from demand-type accounts tocertificates with maturities of up to ten years, savings accounts and money market accounts. We primarily relyupon our network of strategically located banking centers, the quality and efficiency of our customer service,and our pricing policies to attract deposits.
In past years, our national accounts division garnered funds through nationwide advertising of deposit ratesand the use of investment banking firms. Since 2005, we have not solicited any funds through the division as wehave been able to access more attractive funding sources through FHLB advances, security repurchaseagreements and other forms of deposits that provide the potential for a long term customer relationship.
While our primary investment vehicle is single-family first mortgage loans originated or acquired by ourhome lending operation, our banking operation offers consumer and commercial financial products andservices to individuals and to small to middle market businesses. During the past three years, we have placedincreasing emphasis on commercial real estate lending, and on second mortgage lending as an add-on to ournational mortgage lending platform. In 2006, we expanded our commercial real estate lending to add 17 statesto diversify our lending activity beyond Michigan, Indiana, and Georgia.
We offer the following consumer loan products through our banking operation:
• second mortgage loans, including home-equity lines of credit;
• automobile loans, including loans for used cars;
• boat loans;
• student loans; and
• personal loans and lines of credit, both secured and unsecured.
During 2006, we originated a total of $1.1 billion in consumer loans versus $1.2 billion originated in2005. At December 31, 2006, our consumer loan portfolio totaled $1.1 billion or 9.0% of our investment loanportfolio, and contained $715.2 million of second mortgage loans, $284.4 million of home equity lines ofcredit, and $93.8 million of various other consumer loans.
We also offer a full line of commercial loan products and banking services especially developed for ourcommercial customers. Among the commercial loan products we offer are the following:
• business lines of credit, including warehouse lines of credit to other mortgage lenders;
• loans secured by real estate; and
• working capital loans.
Commercial loans are made on a secured or unsecured basis but a vast majority are also secured bypersonal guarantees. Assets providing collateral for secured commercial loans require an appraised valuesufficient to satisfy our loan-to-value ratio requirements. We also generally require that our commercialcustomers maintain a minimum debt-service coverage ratio. In addition, we consider the creditworthiness andmanagerial ability of our borrowers, the enforceability and collectibility of any relevant guarantees and thequality of the collateral.
At December 31, 2006, our commercial real estate loan portfolio totaled $1.3 billion, or 14.6% of ourinvestment loan portfolio, and our non-real estate commercial loan portfolio was $14.6 million, or 0.2% of ourinvestment loan portfolio. At December 31, 2005, our commercial real estate portfolio totaled $995.4 millionand our non-real estate commercial loan portfolio totaled $8.4 million, or 9.4% of our investment loanportfolio. During 2006, we originated $671.5 million of commercial loans versus $555.5 million in 2005.
4

We also offer warehouse lines of credit to other mortgage lenders. These lines allow the lender to fundthe closing of a mortgage loan. Each extension or drawdown on the line is collateralized by a mortgage loanand in many cases we subsequently acquire the mortgage loan. These lines of credit are, in most cases,personally guaranteed by a qualified principal officer of the borrower. The aggregate amount of warehouselines of credit granted to other mortgage lenders at December 31, 2006, was $1.2 billion, of which$291.7 million was outstanding at December 31, 2006. At December 31, 2005, $1.3 billion in warehouse linesof credit had been granted, of which $146.7 million was outstanding.
Our banking operation offers a variety of other value-added, fee-based banking services.
Home Lending Operation. Our home lending operation originates, acquires, sells and services single-family residential mortgage loans. The origination or acquisition of residential mortgage loans constitutes ourmost significant lending activity. At December 31, 2006, approximately 64.1% of our earning assets consistedof first mortgage loans on single-family residences.
During 2006, we were one of the country’s leading mortgage loan originators. We utilize three productionchannels to originate or acquire mortgage loans — Retail, Broker and Correspondent. Each production channelproduces similar mortgage loan products and applies, in most instances, the same underwriting standards.
• Retail. In a retail transaction, we originate the loan through our nationwide network of 76 home loancenters as well as from our 151 banking centers located in Michigan, Indiana and Georgia and ournational call center located in Troy, Michigan. When we originate loans on a retail basis, we completeall the loan paperwork and other aspects of the lending process and fund the transaction ourselves.During 2006, we closed $2.1 billion of loans utilizing this origination channel, which equaled 11.7%of total originations as compared to $4.0 billion or 14.2% of total originations in 2005 and $3.9 billionor 11.5% of total originations in 2004.
• Broker. In a broker transaction, an unaffiliated mortgage brokerage company completes all of the loanpaperwork, but we supply the funding for the loan at closing (also known as “table funding”) andbecome the lender of record. At closing, the broker may receive an origination fee from the borrowerand we may also pay the broker a fee to acquire the mortgage servicing rights on the loan. Wecurrently have active broker relationships with over 5,000 mortgage brokerage companies located inall 50 states. Brokers remain our largest loan production channel. During 2006, we closed $9.0 billionutilizing this origination channel, which equaled 48.3% of total originations, as compared to $16.1 bil-lion or 57.1% in 2005 and $19.7 billion or 57.9% in 2004.
• Correspondent. In a correspondent transaction, an unaffiliated mortgage company completes all of theloan paperwork and also supplies the funding for the loan at closing. We acquire the loan after themortgage company has funded the transaction, usually paying the mortgage company a market pricefor the loan plus a fee to acquire the mortgage servicing rights on the loan. We have activecorrespondent relationships with over 1000 mortgage companies located in all 50 states. During 2006,we closed $7.2 billion utilizing this origination channel, which equaled 40% of total originationsversus the $8.1 billion or 28.7% originated in 2005 and $10.4 billion or 30.6% originated in 2004.
We maintain 12 sales support offices that assist our brokers and correspondents nationwide. We alsocontinue to make increasing use of the Internet as a tool to facilitate the mortgage loan origination processthrough our broker and correspondent production channels. Our brokers and correspondents are able to registerand lock loans, check the status of in-process inventory, deliver documents in electronic format, generateclosing documents, and request funds through the Internet. During 2006, virtually all mortgage loans thatclosed, used the Internet in the completion of the mortgage origination or acquisition process. We expect tocontinue to utilize technology to streamline the mortgage origination process and bring service andconvenience to our correspondent partners and customers.
We offer permanent residential mortgage loans, which are either fixed-rate or adjustable-rate loans withterms ranging up to forty years. These mortgage loans originated or acquired are made either for the purposeof purchasing a one-to-four family residence or the refinancing of an existing mortgage on a one-to-fourfamily residence.
5

Underwriting. Mortgage loans acquired or originated by the home lending operation are underwritten on aloan-by-loan basis rather than on a pool basis. In general, mortgage loans produced through any of our productionchannels are reviewed by one of our in-house loan underwriters or by a contract underwriter employed by amortgage insurance company. However, certain of our correspondents have delegated underwriting authority. Anyloan not underwritten by a Flagstar employed underwriter must be warranted by the underwriter’s employer,whether it is a mortgage insurance company or correspondent mortgage brokerage company.
We believe that our underwriting process, which relies on the electronic submission of data and imagesand is based on an imaging workflow process, allows for underwriting at a higher level of accuracy andtimeliness than exists with processes that rely on paper submissions. We also provide our underwriters withintegrated quality control tools, such as automated valuation models (“AVMs”), multiple fraud detectionengines and the ability to electronically submit IRS Form 4506s, to ensure underwriters have the informationthat they need to make informed decisions. The process begins with the submission of an electronic applicationand an initial determination of eligibility. The application and required documents are then faxed or uploadedto our corporate underwriting department and all documents are identified by optical character recognition orour underwriting staff. The underwriter is responsible for checking the data integrity and reviewing credit. Thefile is then reviewed in accordance with the applicable guidelines established by us for the particular product.Quality control checks are performed by underwriting, as necessary using the tools outlined above, and adecision is made and notice communicated to the prospective borrower.
Mortgage Loans. All mortgage loans acquired or originated by our home lending operation are securedby a mortgage on a one-to-four family residential property. A large majority of our mortgage loan productsconform to the respective underwriting guidelines established by Fannie Mae, Ginnie Mae or Freddie Mac,which we collectively refer to as the “Agencies”. We generally require that any first mortgage loan with aloan-to-value ratio in excess of 80% carry mortgage insurance. A loan-to-value ratio is the percentage that theoriginal principal amount of a loan bears to the appraised value of the mortgaged property at the time ofunderwriting. In the case of a purchase money mortgage, we use the lower of the appraised value of theproperty or the purchase price of the property securing the loan in determining this ratio. We also verify thereasonableness of the appraised value of loans by utilizing an AVM. We generally require a lowerloan-to-value ratio, and thus a higher down payment, for loans on homes that are not occupied as a principalresidence by the borrower. In addition, all first mortgage loans originated are subject to requirements for title,flood, windstorm, fire, and hazard insurance. Real estate taxes are generally collected and held in escrow fordisbursement. We are also protected against fire or casualty loss on home mortgage loans by a blanketmortgage impairment insurance policy that insures us when the mortgagor’s insurance is inadequate.
Construction Loans. Our home lending operation also makes loans for the construction of one-to-fourfamily residential housing throughout the United States, with a large concentration in our southern Michiganmarket area. These construction loans usually convert to permanent financing upon completion of construction.All construction loans are secured by a first lien on the property under construction. Loan proceeds aredisbursed in increments as construction progresses and as inspections warrant. Construction/permanent loansmay have adjustable or fixed interest rates and are underwritten in accordance with the same terms andrequirements as permanent mortgages, except that during a construction period, generally up to nine months,the borrower is required to make interest-only monthly payments. Monthly payments of principal and interestcommence one month from the date the loan is converted to permanent financing. Borrowers must satisfy allcredit requirements that would apply to permanent mortgage loan financing prior to receiving constructionfinancing for the subject property. During 2006, we originated a total of $114.8 million in construction loansversus $103.9 million originated in 2005 and $112.3 million originated in 2004. At December 31, 2006, ourportfolio of loans held for investment included $64.5 million of loans secured by properties under construction,or 0.7% of total loans held for investment.
Secondary Market Loan Sales. We sell a majority of the mortgage loans we produce into the secondarymarket on a whole loan basis or by securitizing the loans into mortgage-backed securities. As a part of ouroverall mortgage banking strategy, we securitize a majority of our mortgage loans through the Agencies. Wegenerally securitize our longer-term, fixed-rate loans for sale while we hold the shorter duration and adjustablerate loans for investment. Securitization is the process by which mortgage loans are aggregated and used to
6

collateralize mortgage-backed securities that are issued or guaranteed by the Agencies or through private-labelsecuritizations. These mortgage-backed securities are generally sold to a secondary market investor. Wegenerally retain the servicing of the securitized loans, but we may also sell these mortgage servicing rights(“MSRs”) to other secondary market investors. In general, we do not sell the servicing rights to mortgageloans that we originate for our own portfolio or that we privately securitize.
When we sell mortgage loans we make customary representations and warranties to the purchasers aboutvarious characteristics of each loan, such as the manner of origination, the nature and extent of underwritingstandards applied and the types of documentation being provided. If a defect in the origination process isidentified, we may be required to either repurchase the loan or indemnify the purchaser for losses it sustainson the loan. If there are no such defects, we have no liability to the purchaser for losses it may incur on suchloan. We maintain a secondary market reserve to account for the expected losses related to loans we might berequired to repurchase (or the indemnity payments we may have to make to purchasers). The secondarymarket reserve takes into account both our estimate of expected losses on loans sold during the currentaccounting period as well as adjustments to our previous estimates of expected losses on loans sold. In eachcase, these estimates are based on our most recent data regarding loan repurchases, actual credit losses onrepurchased loans and recovery history, among other factors. Increases to the secondary market reserve forcurrent loan sales reduce our net gain on loan sales. Adjustments to our previous estimates are recorded as anincrease or decrease in our other fees and charges. The amount of our secondary market reserve equaled$24.2 million and $17.6 million at December 31, 2006 and 2005, respectively.
Loan Servicing. The home lending operation also services mortgage loans for others. Servicing residentialmortgage loans for third parties generates fee income and represents a significant business activity for us.During 2006, 2005 and 2004, we serviced portfolios of mortgage loans that averaged $20.3 billion, $26.8 billionand $26.4 billion, respectively. The servicing generated gross revenue of $82.6 million, $103.3 million and$106.2 million in 2006, 2005, and 2004, respectively. This revenue stream was offset by the amortization of$69.6 million, $94.5 million and $76.1 million in previously capitalized values of MSRs in 2006, 2005, and2004, respectively. When a loan is prepaid or refinanced, any remaining MSR for that loan is fully amortizedand therefore amortization expense in a period could increase at a greater rate than the increase in loanadministration income. During a period of falling or low interest rates, the amount of amortization typicallyincreases because of prepayments and refinancing of the underlying mortgage loans. During a period of higheror rising interest rates, payoffs and refinancing typically slows reducing the rate of amortization.
As part of our business model we occasionally sell MSRs into the secondary market if we determine thatmarket prices provide us with an opportunity for appropriate profit. Over the past five years, we sold$130.6 billion of the MSRs. During 2006, we sold $27.6 billion of the MSRs. The MSRs are sold in separatetransactions from the sale of the underlying loans. At the time of the sale we record a gain or loss on suchsale based on the selling price of the MSRs less the carrying value and transaction costs. The market price ofMSRs changes with demand and the general level of interest rates.
Other Business Activities
We conduct business through a number of wholly-owned subsidiaries in addition to the Bank.
Douglas Insurance Agency, Inc. Douglas Insurance Agency, Inc. (“Douglas”) acts as an agent for lifeinsurance and health and casualty insurance companies. Douglas’ primary purpose is to act as the agent thatprovides group life and health insurance to the Company’s employees. Douglas also acts as a broker withregard to certain insurance product offerings to employees and customers. Douglas’ activities are not materialto our business.
Flagstar Credit Corporation. Flagstar Credit Corporation (“Credit”), a wholly-owned subsidiary of theCompany, participates in private mortgage insurance operations with unaffiliated private mortgage insurers.Credit collects up to 25% of the mortgage insurance premiums paid by the borrowers in exchange forproviding certain performance guarantees on certain pools of loans underwritten and originated by our homelending operation. As such, Credit provides second tier loss protection when foreclosure losses on the pool of
7

loans exceed 5% of the original principal balances. The loans are insured for any loss greater than 10% bythird party insurance carriers.
Other Flagstar Subsidiaries. In addition to the Bank, Douglas and Credit, we have a number of wholly-owned subsidiaries that are inactive. We also own 7 statutory trusts that are not consolidated with ouroperations. For additional information, see Notes 2 and 17 of the Notes to the Consolidated FinancialStatements, in Item 8. Financial Statements and Supplemental Data, herein.
Flagstar Bank. The Bank, our primary subsidiary, is a federally chartered, stock savings bank headquar-tered in Troy, Michigan. The Bank is the sole shareholder of Flagstar Intermediate Holding Company (“IHC”).IHC is the holding company for Flagstar LLC. The Bank is also the sole shareholder of FCMC. IHC’soperations were discontinued in 2006.
Flagstar Capital Markets Corporation. FCMC is a wholly-owned subsidiary of the Bank and itsfunctions include holding investment loans, purchasing securities, selling and securitizing mortgage loans,maintaining and selling mortgage servicing rights, developing new loan products, establishing pricing formortgage loans to be acquired, providing for lock-in support, and managing interest rate risk associated withthese activities.
Flagstar ABS LLC. Flagstar ABS LLC (“ABS”) is a bankruptcy remote special purpose entity that hasbeen created to hold trust certificates in connection with our private securitization offerings.
Other Bank Subsidiaries. The Bank, in addition to IHC and FCMC, also wholly-owns several othersubsidiaries, all of which are inactive at December 31, 2006.
Regulation and Supervision
Both the Company and the Bank are subject to regulation by the OTS. Also, the Bank is a member of theFHLB and our deposits are insured by the FDIC through the DIF. Accordingly, we are subject to an extensiveregulatory framework which imposes restrictions on our activities, minimum capital requirements, lending anddeposit restrictions and numerous other requirements primarily intended for the protection of depositors,federal deposit insurance funds and the banking system as a whole, rather than for the protection ofshareholders and creditors. Many of these laws and regulations have undergone significant change in recentyears and are likely to change in the future. Future legislative or regulatory change, or changes in enforcementpractices or court rulings, may have a significant and potentially adverse impact on our operations andfinancial condition. Our non-bank financial subsidiaries are also subject to various federal and state laws andregulations.
Federal Home Loan Bank System. The primary purpose of the Federal Home Loan Banks (the“FHLBs”) is to provide funding to their members in the form of repayable advances for making housing loansas well as for affordable housing and community development lending. The FHLBs are generally able to makeadvances to their member institutions at interest rates that are lower than the members could otherwise obtain.The FHLB System consists of 12 regional FHLBs; each being federally chartered but privately owned by itsmember institutions. The Federal Housing Finance Board, a government agency, is generally responsible forregulating the FHLB System. The Bank is currently a member of the FHLB located in Indianapolis.
Holding Company Status and Acquisitions. We are a savings and loan holding company, as defined byfederal law. We may not acquire control of another savings association unless the OTS approves suchtransaction and we may not be acquired by a company other than a bank holding company unless theOTS approves such transaction, or by an individual unless the OTS does not object after receiving notice. Wemay not be acquired by a bank holding company unless the Board of Governors of the Federal ReserveSystem (the “Federal Reserve”) approves such transaction. In any case, the public must have an opportunity tocomment on any such proposed acquisition and the OTS or Federal Reserve must complete an applicationreview. Without prior approval from the OTS, we may not acquire more than 5% of the voting stock of anysavings institution. In addition, the federal Gramm-Leach-Bliley Act generally restricts any non-financial entityfrom acquiring us unless such non-financial entity was, or had submitted an application to become, a savings
8

and loan holding company on or before May 4, 1999. Also, because we were a savings and loan holdingcompany prior to that date, we may engage in non-financial activities and acquire non-financial subsidiaries.
Capital Adequacy. The Bank must maintain a minimum amount of capital to satisfy various regulatorycapital requirements under OTS regulations and federal law. There is no such requirement that applies to theCompany. Federal law and regulations establish five levels of capital compliance: well-capitalized, adequatelycapitalized, undercapitalized, significantly undercapitalized and critically undercapitalized. As of December 31,2006, the Bank met all capital requirements to which it was subject and satisfied the requirements to betreated as “well-capitalized” under OTS regulations. An institution is treated as well-capitalized if its ratio oftotal risk-based capital to risk-weighted assets is 10.0% or more, its ratio of Tier 1 capital to risk-weightedassets is 6.0% or more, its leverage ratio is 5.0% or more, and it is not subject to any federal supervisoryorder or directive to meet a specific capital level. In contrast, an institution is only considered to be“adequately capitalized” if its capital structure satisfies lesser required levels, such as a total risk-based capitalratio of not less than 8.0%, a Tier 1 risk-based capital ratio of not less than 4.0%, and (unless it is in the mosthighly-rated category) a leverage ratio of not less than 4.0%. Any institution that is neither well capitalizednor adequately capitalized will be considered undercapitalized. Any institution with a tangible equity ratio of2.0% or less will be considered critically undercapitalized.
The various U.S. banking agencies and the Basel Committee on Banking Supervision are developing anew set of regulatory risk-based capital requirements that would apply to the 20 largest banks in theUnited States initially and to us soon afterwards. The Basel Committee on Banking Supervision is a committeeestablished by the central bank governors of certain industrialized nations, including the United States. Thenew requirements are commonly referred to as Basel II or The New Basel Capital Accord. We are assessingthe potential impact that The New Basel Capital Accord may have on our business practices as well as thebroader competitive effects within the industry.
In October 2005, and subsequently revised in June 2006 and December 2006, the various U.S. bankingagencies issued an advance rulemaking notice that contemplated possible modifications to the risk-basedcapital framework applicable to those domestic banking organizations that would not be affected by Basel II.These possible modifications, known colloquially as Basel 1A, are intended to avoid future competitiveinequalities between Basel I and Basel II organizations and include: (i) increasing the number of risk-weightcategories; (ii) expanding the use of external ratings for credit risk; (iii) expanding the range of collateral andguarantors to qualify for a lower risk weight; and (iv) basing residential mortgage risk ratings on loan-to-valueratios. The banking regulators indicated an intention to publish proposed rules for implementation of Basel Iand Basel II in similar time frames, which we currently expect may occur during 2007.
Commercial Real Estate Lending Guidelines. In January 2006, federal banking regulators issued a jointinteragency proposal on lending guidelines that would apply to commercial loans secured by real estate. Underthe proposal, an institution would need to hold additional capital for regulatory purposes if its origination andholding of commercial real estate loans rise above certain asset levels and contain certain risk characteristics.In December 2006, the OTS issued its final version of those guidelines, which did not contain the asset levellimits but were otherwise substantially unchanged. We do not believe these guidelines will materially affectour current operations.
Non-Traditional Lending Guidelines. In December 2005, the federal banking agencies, including theOTS, issued proposed lending guidelines that would effectively require increased capital for holding loans inits portfolio that were considered “non-traditional.” These guidelines were finalized in 2006 in substantiallythe same form. Under these guidelines, such loans included interest-only loans and payment option adjustablerate mortgage loans which permit a borrower to make regular payments less than the amount of the scheduledprincipal amortization, thereby increasing the loan balance (known as negative amortization). At December 31,2006, approximately 47.4% of our residential mortgage loans that we held for investment were comprised ofadjustable rate loans with interest-only payments required during the first ten years. We do not anticipate thatthese guidelines will materially affect our current operations.
Payment of Dividends. The Company is a legal entity separate and distinct from the Bank and our non-banking subsidiaries. The Company’s principal sources of funds are cash dividends paid by the Bank and other
9

subsidiaries, investment income and borrowings. Federal laws limit the amount of dividends or other capitaldistributions that the Bank may pay us. The Bank has an internal policy to remain “well-capitalized” underOTS capital adequacy regulations (discussed immediately above). Accordingly, the Bank does not currentlyexpect to pay dividends to the Company if such payment would result in the Bank not being well capitalized.In addition, the Bank must file a notice with the OTS at least 30 days before it may pay a dividend to theCompany.
FDIC Assessment. The FDIC insures the deposits of the Bank and such insurance is backed by the fullfaith and credit of the United States government. Through March 31, 2006, the FDIC administered twoseparate deposit insurance funds, the Bank Insurance Fund (the “BIF”) and the Savings Association InsuranceFund (the “SAIF”). The SAIF was the deposit insurance fund for most savings associations, including theBank. In February 2006, President Bush signed into law the Federal Deposit Insurance Reform ConformingAmendments Act of 2005, which among other things allowed for the merger of the BIF and the SAIF to formthe DIF. Under FDIC guidelines issued in November 2006, the Bank’s premiums would increase, as wouldthose of other banks, to increase the capitalization of the DIF. For 2007, the assessment is currently expectedto increase to approximately $5.0 million, before any credits, as compared to $1.1 million in 2006.
If the Bank were to fail, claims for administrative expenses of the receiver and for deposits in all of ourbranches (including claims of the FDIC as subrogee) would have priority over the claims of general unsecuredcreditors and shareholders.
Affiliate Transaction Restrictions. The Bank is subject to the affiliate and insider transaction rulesapplicable to member banks of the Federal Reserve System as well as additional limitations imposed by theOTS. These provisions prohibit or limit a banking institution from extending credit to, or entering into certaintransactions with, affiliates, principal stockholders, directors and executive officers of the banking institutionand its affiliates.
Federal Reserve, Consumer and Other Regulation. Numerous regulations promulgated by the FederalReserve affect the business operations of the Bank. These include regulations relating to equal creditopportunity, electronic fund transfers, collection of checks, truth in lending, truth in savings and availability offunds.
Under Federal Reserve Board regulations, the Bank is required to maintain a reserve against itstransaction accounts (primarily interest-bearing and non-interest-bearing checking accounts). Because reservesmust generally be maintained in cash or in non-interest-bearing accounts, the effect of the reserve requirementsis to increase the Bank’s cost of funds.
The federal Gramm-Leach-Bliley Act includes provisions that protect consumers from the unauthorizedtransfer and use of their nonpublic personal information by financial institutions. In addition, states arepermitted under the Gramm-Leach-Bliley Act to have their own privacy laws, which may offer greaterprotection to consumers than the Gramm-Leach-Bliley Act. Numerous states in which we do business haveenacted such laws.
The USA PATRIOT Act, which was enacted following the events of September 11, 2001, includesnumerous provisions designed to detect and prevent international money laundering and to block terroristaccess to the U.S. financial system. We have established policies and procedures intended to fully comply withthe USA PATRIOT Act’s provisions, as well as other aspects of anti-money laundering legislation and theBank Secrecy Act.
Consumer Protection Laws and Regulations. Examination and enforcement by bank regulatory agenciesfor non-compliance with consumer protection laws and their implementing regulations have become moreintense in nature. The Bank is subject to many federal consumer protection statutes and regulations, some ofwhich are discussed below.
Federal regulations requires extra disclosures and consumer protections to borrowers for certain lendingpractices. The term “predatory lending,” much like the terms “safety and soundness” and, “unfair anddeceptive practices,” is far-reaching and covers a potentially broad range of behavior. As such, it does not lend
10

itself to a concise or a comprehensive definition. Predatory lending typically involves at least one, and perhapsall three, of the following elements:
• Making unaffordable loans based on the assets of the borrower rather than on the borrower’s ability torepay an obligation (“asset-based lending”);
• Inducing a borrower to refinance a loan repeatedly in order to charge high points and fees each timethe loan is refinanced (“loan flipping”); and/or
• Engaging in fraud or deception to conceal the true nature of the loan obligation from an unsuspectingor unsophisticated borrower.
Privacy policies are required by federal banking regulations which limit the ability of banks and otherfinancial institutions to disclose non-public information about consumers to nonaffiliated third parties. Pursuantto those rules, financial institutions must provide:
• Initial notices to customers about their privacy policies, describing the conditions under which theymay disclose nonpublic personal information to nonaffiliated third parties and affiliates;
• Annual notices of their privacy policies to current customers; and
• A reasonable method for customers to “opt out” of disclosures to nonaffiliated third parties.
These privacy protections affect how consumer information is transmitted through diversified financialcompanies and conveyed to outside vendors.
The Fair Credit Reporting Act, as amended by the Fair and Accurate Credit Transactions Act, orFACT Act, requires financial firms to help deter identity theft, including developing appropriate fraud responseprograms, and gives consumers more control of their credit data. It also reauthorizes a federal ban on statelaws that interfere with corporate credit granting and marketing practices. In connection with FACT Act,financial institution regulatory agencies proposed rules that would prohibit an institution from using certaininformation about a consumer it received from an affiliate to make a solicitation to the consumer, unless theconsumer has been notified and given a chance to opt out of such solicitations. A consumer’s election to optout would be applicable for at least five years.
The Check Clearing for the 21st Century Act, or Check 21, facilitates check truncation and electroniccheck exchange by authorizing a new negotiable instrument called a “substitute check,” which is the legalequivalent of an original check. Check 21 does not require banks to create substitute checks or accept checkselectronically; however, it does require banks to accept a legally equivalent substitute check in place of anoriginal. In addition to its issuance of regulations governing substitute checks, the Federal Reserve has issuedfinal rules governing the treatment of remotely created checks (sometimes referred to as “demand drafts”) andelectronic check conversion transactions (involving checks that are converted to electronic transactions bymerchants and other payees).
The Equal Credit Opportunity Act, or ECOA, generally prohibits discrimination in any credit transaction,whether for consumer or business purposes, on the basis of race, color, religion, national origin, sex, maritalstatus, age (except in limited circumstances), receipt of income from public assistance programs, or good faithexercise of any rights under the Consumer Credit Protection Act.
The Truth in Lending Act, or TILA, is designed to ensure that credit terms are disclosed in a meaningfulway so that consumers may compare credit terms more readily and knowledgeably. As a result of the TILA,all creditors must use the same credit terminology to express rates and payments, including the annualpercentage rate, the finance charge, the amount financed, the total of payments and the payment schedule,among other things.
The Fair Housing Act, or FH Act, regulates many practices, including making it unlawful for any lenderto discriminate in its housing-related lending activities against any person because of race, color, religion,national origin, sex, handicap or familial status. A number of lending practices have been found by the courts
11

to be, or may be considered illegal under the FH Act, including some that are not specifically mentioned inthe FH Act itself.
The Home Mortgage Disclosure Act, or HMDA, grew out of public concern over credit shortages incertain urban neighborhoods and provides public information that will help show whether financial institutionsare serving the housing credit needs of the neighborhoods and communities in which they are located. TheHMDA also includes a “fair lending” aspect that requires the collection and disclosure of data about applicantand borrower characteristics as a way of identifying possible discriminatory lending patterns and enforcinganti-discrimination statutes. In 2004, the Federal Reserve Board amended regulations issued under HMDA torequire the reporting of certain pricing data with respect to higher-priced mortgage loans. This expandedreporting is being reviewed by federal banking agencies and others from a fair lending perspective.
The Real Estate Settlement Procedures Act, or RESPA, requires lenders to provide borrowers withdisclosures regarding the nature and cost of real estate settlements. Also, RESPA prohibits certain abusivepractices, such as kickbacks, and places limitations on the amount of escrow accounts.
Penalties under the above laws may include fines, reimbursements and other penalties. Due to heightenedregulatory concern related to compliance with the FACT Act, ECOA, TILA, FH Act, HMDA and RESPAgenerally, the Bank may incur additional compliance costs or be required to expend additional funds forinvestments in its local community.
Community Reinvestment Act. The Community Reinvestment Act (“CRA”) requires the Bank toascertain and help meet the credit needs of the communities it serves, including low- to moderate-incomeneighborhoods, while maintaining safe and sound banking practices. The primary federal regulatory agencyassigns one of four possible ratings to an institution’s CRA performance and is required to make public aninstitution’s rating and written evaluation. The four possible ratings of meeting community credit needs areoutstanding, satisfactory, needs to improve and substantial noncompliance. In 2006, the Bank received an“outstanding” CRA rating from the OTS.
Regulatory Enforcement. The OTS and the FDIC may take regulatory enforcement actions against anyof their regulated institutions that do not operate in accordance with applicable regulations, policies anddirectives. Proceedings may be instituted against any banking institution, or any “institution-affiliated party,”such as a director, officer, employee, agent or controlling person, who engages in unsafe and unsoundpractices, including violations of applicable laws and regulations. Both the OTS and the FDIC have authorityunder various circumstances to appoint a receiver or conservator for an insured institution that it regulates toissue cease and desist orders, to obtain injunctions restraining or prohibiting unsafe or unsound practices, torevalue assets and to require the establishment of reserves. The FDIC has additional authority to terminateinsurance of accounts, after notice and hearing, upon a finding that the insured institution is or has engaged inany unsafe or unsound practice that has not been corrected, is operating in an unsafe or unsound condition orhas violated any applicable law, regulation, rule, or order of, or condition imposed by, the FDIC.
Environmental Regulation
Our business and properties are subject to federal and state laws and regulations governing environmentalmatters, including the regulation of hazardous substances and wastes. For example, under the federalComprehensive Environmental Response, Compensation, and Liability Act and similar state laws, owners andoperators of contaminated properties may be liable for the costs of cleaning up hazardous substances withoutregard to whether such persons actually caused the contamination. Such laws may affect us both as an owneror former owner of properties used in or held for our business, and as a secured lender on property that isfound to contain hazardous substances or wastes. If we foreclose on a defaulted mortgage loan to recover ourinvestment in such mortgage loan, we may be subject to environmental liabilities in connection with theunderlying real property. We may also have to pay for the entire cost of any removal and clean up without thecontribution of any other third parties. These liabilities and costs could exceed the fair value of the realproperty and may make the property impossible to sell. Our general policy is to obtain an environmentalassessment prior to foreclosing on commercial property. We may elect not to foreclose on properties that
12
contain such hazardous substances or wastes, thereby limiting, and in some instances precluding, theliquidation of such properties.
Competition
We face substantial competition in attracting deposits and making loans. Our most direct competition fordeposits has historically come from other savings institutions, commercial banks and credit unions in our localmarket areas. Money market funds and full-service securities brokerage firms also compete with us fordeposits. We compete for deposits by offering high quality and convenient banking services at a large numberof convenient locations, including longer banking hours and “sit-down” banking in which a customer is servedat a desk rather than in a teller line. We also compete by offering competitive interest rates on our depositproducts.
From a lending perspective, there are a large number of institutions offering mortgage loans, consumerloans and commercial loans, including many mortgage lenders that operate on a national scale, as well as localsavings institutions, commercial banks, and other lenders. We compete by offering competitive interest rates,fees and other loan terms and by offering efficient and rapid service.
Additional information
Our executive offices are located at 5151 Corporate Drive, Troy, Michigan 48098, and our telephonenumber is (248) 312-2000. Our stock is traded on the New York Stock Exchange under the symbol “FBC”.
We make our annual reports on Form 10-K, quarterly reports on Form 10-Q, current reports on Form 8-Kand amendments to those reports filed or furnished pursuant to Section 13(a) or 15(d) of the Exchange Actavailable free of charge on our website at www.flagstar.com as soon as reasonably practicable after weelectronically file such material with the Securities and Exchange Commission. These reports are alsoavailable without charge on the SEC website, at www.sec.gov.
ITEM 1A. RISK FACTORS
Our financial condition and results of operations may be adversely affected by various factors, many ofwhich are beyond our control. These risk factors include the following:
General business, economic and political conditions may significantly affect our earnings.
Our business and earnings are sensitive to general business and economic conditions in the United States.These conditions include short-term and long-term interest rates, inflation, recession, unemployment, realestate values, fluctuations in both debt and equity capital markets, the value of the U.S. dollar as compared toforeign currencies, and the strength of the U.S. economy, as well as the local economies in which we conductbusiness. If any of these conditions worsen, our business and earnings could be adversely affected. Forexample, business and economic conditions that negatively impact household incomes could decrease thedemand for our home loans and increase the number of customers who become delinquent or default on theirloans; or, a rising interest rate environment could decrease the demand for loans.
In addition, our business and earnings are significantly affected by the fiscal and monetary policies of thefederal government and its agencies. We are particularly affected by the policies of the Federal Reserve, whichregulates the supply of money and credit in the United States. The Federal Reserve’s policies influence thesize of the mortgage origination market, which significantly impacts the earnings of our mortgage lendingoperation and the value of our investment in MSRs and other retained interests. The Federal Reserve’s policiesalso influence the yield on our interest-earning assets and the cost of our interest-bearing liabilities. Changesin those policies are beyond our control and difficult to predict and could have a material adverse effect onour business, results of operations and financial condition.
13

If we cannot effectively manage the impact of the volatility of interest rates, our earnings could be adverselyaffected.
Our main objective in managing interest rate risk is to maximize the benefit and minimize the adverseeffect of changes in interest rates on our earnings over an extended period of time. In managing these risks,we look at, among other things, yield curves and hedging strategies. As such, our interest rate riskmanagement strategies may result in significant earnings volatility in the short term because the market valueof our assets and related hedges may be significantly impacted either positively or negatively by unanticipatedvariations in interest rates.
Our profitability depends in substantial part on our net interest margin, which is the difference betweenthe rates we receive on loans made to others and investments and the rates we pay for deposits and othersources of funds. Our profitability also depends in substantial part on the volume of loan originations and therelated fees received in our mortgage banking operations. Our net interest margin and our volume of mortgageoriginations will depend on many factors that are partly or entirely outside our control, including competition,federal economic, monetary and fiscal policies, and economic conditions generally. Historically, net interestmargin and the mortgage origination volumes for the Bank and for other financial institutions have widenedand narrowed in response to these and other factors. Our goal has been to structure our asset and liabilitymanagement strategies to maximize the benefit of changes in market interest rate on our net interest marginand revenues related to mortgage origination volume. However, we can not give any assurance that a suddenor significant change in prevailing interest rates will not have a material adverse effect on our operatingresults.
Since June 30, 2004, the U.S. Federal Reserve has increased short-term interest rates significantly, whilelong-term rates have increased more moderately, resulting in a flattened and then inverted yield curve. Ourprofitability levels on loan sales have been adversely affected by the rapidly rising interest rate environment.We manage the strategic interest rate risk in our home lending operation primarily through the naturalcounterbalance of our loan production and servicing operations. Increasing interest rates may decrease ourmortgage loan originations and sales. Generally, the volume of mortgage loan originations is inversely relatedto the level of long-term interest rates. During periods of low interest rates, a significant number of ourcustomers may elect to refinance their mortgages (i.e., pay off their existing higher rate mortgage loans withnew mortgage loans obtained at lower interest rates). Our profitability levels and those of others in themortgage banking industry have generally been strongest during periods of low and/or declining interest rates,as we have historically been able to sell the resulting increased volume of loans into the secondary market at again. We have also benefited from periods of wide spreads between short and long term interest rates. Ifinterest rates rise after we fix a price for a loan or commitment but before we close or sell such loan, thevalue of the loan will decrease and the amount we receive from selling the loan may be less than its cost tooriginate.
When interest rates fluctuate, repricing risks arise from the timing difference in the maturity and/orrepricing of assets, liabilities and off-balance sheet positions. While such repricing mismatches are fundamen-tal to our business, they can expose us to fluctuations in income and economic value as interest rates vary. Ourinterest rate risk management strategies do not completely eliminate repricing risk. A significant amount ofour deposit liabilities are higher-priced jumbo accounts which we attribute to the current highly competitivemarket for deposits and, in part, to our practice of using attractive deposit rates when we open new bankingcenters in new markets. These account holders are more sensitive to the interest rate paid on their accountthan most depositors. There is no guarantee that in a changing rate environment we will be able to retain all ofthese depositors’ accounts. We also call on local municipal agencies as another source for deposit funding.While a valuable source of liquidity, we believe that municipal deposits are usually extremely rate sensitiveand, therefore, prone to withdrawal if higher interest rates are offered elsewhere. Because of the interest ratesensitivity of these depositors, there is no guarantee that in a changing rate environment we will be able toretain all funds in these accounts.
Changes in interest rates may cause a mismatch in our mortgage origination flow of loans, or “pipeline”and adversely affect our profitability. In our mortgage banking operation, we are exposed to interest rate risk
14

from the time we commit to an interest rate on a mortgage loan application through the time we sell orcommit to sell the mortgage loan. On a daily basis, we analyze various economic and market factors toestimate the percentage of mortgage loans we expect to sell for delivery at a future date. The amount of loansthat we commit to sell is based in part on our expectation of the pull-through percentage, which is the ratio ofmortgage loans closed divided by the number of mortgage loans on which we have issued bindingcommitments (and thereby locked in the interest rate) but have not yet closed (“pipeline loans”) . If interestrates change in an unanticipated fashion, the actual percentage of pipeline loans that close may differ from theprojected percentage. A mismatch of commitments to fund mortgage loans and commitments to sell mortgageloans may have an adverse effect on the results of operations in any such period. For instance, we may nothave made commitments to sell these additional pipeline loans and therefore may incur significant losses upontheir sale if the market rate of interest is higher than the mortgage interest rate to which we committed onsuch additional pipeline loans. Alternatively, we may have made commitments to sell more loans than actuallyclosed or at prices that are no longer profitable to us. Our profitability may be adversely affected to the extentour economic hedging strategy for pipeline loans is not effective.
Our allowance for possible loan losses may be insufficient.
We maintain an allowance for possible loan losses, which is a reserve established through a provision forpossible loan losses charged to expense, that represents management’s best estimate of probable losses thathave been incurred within the existing portfolio of loans. The allowance, in the judgment of management, isnecessary to reserve for estimated loan losses and risks inherent in the loan portfolio. The level of theallowance reflects management’s continuing evaluation of industry concentrations; specific credit risks; loanloss experience; current loan portfolio quality; present economic, political and regulatory conditions andunidentified losses inherent in the current loan portfolio. The determination of the appropriate level of theallowance for possible loan losses inherently involves a high degree of subjectivity and requires us to makesignificant estimates of current credit risks and future trends, all of which may undergo material changes.Changes in economic conditions affecting borrowers, new information regarding existing loans, identificationof additional problem loans and other factors, both within and outside our control, may require an increase inthe allowance for possible loan losses. In addition, bank regulatory agencies periodically review our allowancefor loan losses and may require an increase in the provision for possible loan losses or the recognition offurther loan charge-offs, based on judgments different than those of management. In addition, if charge-offs infuture periods exceed the allowance for possible loan losses we will need additional provisions to increase theallowance for possible loan losses. Any increases in the allowance for possible loan losses will result in adecrease in net earnings and, possibly, capital, and may have a material adverse effect on our financialcondition and results of operations.
Our secondary market reserve for losses on repurchased loans could be insufficient.
We currently maintain a secondary market reserve, which is a liability on our statement of financialcondition, to reflect our best estimate of expected losses that we have incurred on loans that we have sold orsecuritized into the secondary market and must subsequently repurchase or with respect to which we mustindemnify the purchasers because of violations of customary representations and warranties. Increases to thisreserve for current loan sales reduce our net gain on loan sales, with adjustments to our previous estimatesrecorded as an increase or decrease to our other fees and charges. The level of the reserve reflectsmanagement’s continuing evaluation of loss experience on repurchased loans, recovery history, and presenteconomic conditions, among other things. The determination of the appropriate level of the secondary marketreserve inherently involves a high degree of subjectivity and requires us to make significant estimates ofrepurchase risks and expected losses. Both the assumptions and estimates used could change materially,resulting in a level of reserve that is less than actual losses. Further, our bank regulators periodically review usand may, in their discretion and based on their own judgment, which may differ from that of management,require us to increase the amount of the reserve through additional provisions. Such increases will result in areduction in net earnings and could have an adverse effect on our statement of financial condition and resultsof operations.
15

The value of our mortgage servicing rights varies with changes in interest rates.
The market value of, and earnings from, our mortgage loan servicing portfolio may be adversely affectedby declines in interest rates. When mortgage rates rise we would generally expect payoffs in our servicingportfolio to decline, which increases the fair value of our MSR. When mortgage interest rates declinemortgage loan prepayments tend to increase as customers refinance their loans. When this happens, the incomestream from our current mortgage loan servicing portfolio may decline. In that case, we may be required toamortize the portfolio over a shorter period of time or reduce the carrying value of our mortgage loanservicing portfolio.
Our home lending profitability could be significantly reduced if we are not able to resell mortgages.
Currently, we sell a substantial portion of the mortgage loans we originate. The profitability of ourmortgage banking operations depends in large part upon our ability to aggregate a high volume of loans and tosell them in the secondary market at a gain. Thus, we are dependent upon (1) the existence of an activesecondary market and (2) our ability to profitably sell loans or securities into that market.
Our ability to sell mortgage loans readily is dependent upon the availability of an active secondary marketfor single-family mortgage loans, which in turn depends in part upon the continuation of programs currentlyoffered by Fannie Mae, Freddie Mac, Ginnie Mae and other institutional and non-institutional investors. Theseentities account for a substantial portion of the secondary market in residential mortgage loans. Some of thelargest participants in the secondary market, including Fannie Mae, Freddie Mac and Ginnie Mae, aregovernment-sponsored enterprises whose activities are governed by federal law. Any future changes in lawsthat significantly affect the activity of such government-sponsored enterprises could, in turn, adversely affectour operations.
In addition, our ability to sell mortgage loans readily is dependent upon our ability to remain eligible forthe programs offered by Fannie Mae, Freddie Mac, Ginnie Mae and other institutional and non-institutionalinvestors. We expect to remain eligible to participate in such programs but any significant impairment of oureligibility could materially and adversely affect our operations. Further, the criteria for loans to be acceptedunder such programs may be changed from time to time by the sponsoring entity. The profitability ofparticipating in specific programs may vary depending on a number of factors, including our administrativecosts of originating and purchasing qualifying loans.
There are increased risks involved with commercial real estate and commercial business lending activities.
In recent years, we have emphasized the origination of commercial real estate and commercial businessloans. At December 31, 2006, our balance of commercial loans was $1.3 billion, which was 14.7% of loansheld for investment and 8.4% of total assets. Loans collateralized by commercial real estate generally involvea greater degree of credit risk than single-family residential mortgage loans and carry larger loan balances.This increased credit risk is a result of several factors, including the concentration of principal in a limitednumber of loans and borrowers, the effects of general economic conditions on income-producing properties,and the greater difficulty of evaluating and monitoring these types of loans.
Furthermore, the repayment of loans collateralized by commercial real estate is typically dependent uponthe successful operation of the related real estate property. If the cash flow from the project is reduced, theborrower’s ability to repay the loan may be impaired. Other commercial business loans generally have agreater credit risk than residential mortgage loans as well. Conversely residential mortgage loans are generallymade on the basis of the borrower’s ability to make repayment from his or her employment or other income,and are secured by real property whose value tends to be more easily ascertainable.
As a result, the availability of funds for the repayment of commercial business loans may dependsubstantially on the success of the business itself. Further, any collateral securing the loans may depreciateover time, may be difficult to appraise and may fluctuate in value.
16

We have substantial risks in connection with securitizations and loan sales.
Securitization and loan sale transactions comprise a significant source of our overall funding. Our saleschannels include whole loan sales, sales to government-sponsored enterprises and sales through private-labelsecuritizations. Private-label securitizations, sponsored by us, involve transfers of loans to off-balance sheetqualifying special purpose entities who in turn issue securities to third parties. Residuals, which are retainedinterests created in a mortgage loan securitization, typically represent the first loss position and are nottypically rated by a nationally recognized rating agency. If we hold the residuals, we are at risk for the initiallosses that might occur with these securitizations.
In a securitization transaction, we may recognize a gain on sale resulting from related residuals and/orservicing rights in the securitized pool of loans when we sell or securitize the assets. The values assigned to theresiduals and/or servicing assets depends upon certain assumptions that we make about the future performance ofthe securitized loan portfolio, including the level of credit losses and the rate of prepayments. If actual creditlosses or prepayment rates differ from the original assumptions, the value of the residuals and/or servicing assetsmay decrease materially, possibly resulting in a charge against earnings. The value of the residuals and/orservicing assets may also decrease materially as a result of changes in market interest rates.
Changes in the volume of assets securitized or sold due to our inability to access the asset-backedsecuritization markets or other funding sources could have a material adverse effect on our business, financialcondition and results of operations. Decreases in the value of the residuals and/or servicing assets in securitizationsthat we have completed due to market interest rate fluctuations or higher than expected credit losses onprepayments also could have a material adverse effect on our business, financial condition and results of operations.
In addition, we retain limited contractual exposure from the sale of mortgage loans. We make standardrepresentations and warranties to the transferee in connection with all such dispositions. These representationsand warranties do not insure the transferee against credit risk associated with the transferred loans, but ifindividual mortgage loans are found not to have complied with the associated representations and warranties,we may be required to repurchase the loans from the transferee or to indemnify the transferee against anylosses on the loans. We have established a secondary market reserve for losses that arise in connection withrepresentations and warranties for loans sold.
Our ability to borrow funds and raise capital could be limited, which could adversely affect our earnings.
Our ability to make mortgage loans depends largely on our ability to secure funds on terms acceptable tous. Our primary sources of funds to meet our financing needs include loan sales and securitizations, deposits,borrowings from the FHLB, borrowings from investment and commercial banks through repurchase agree-ments, and capital-raising activities. Our ability to maintain borrowing facilities is subject to renewal of thesefacilities. If we are unable to renew any of these financing arrangements or arrange for new financing on termsacceptable to us, or if we default on any of the restrictions imposed upon us by our borrowing facilities, thenwe may have to reduce the number of loans we are able to originate for sale in the secondary market or forour own investment. A sudden and significant reduction in loan originations that occurs as a result couldadversely impact our earnings. There is no guarantee that we will be able to adequately access capital marketswhen or if a need for additional capital arises.
Certain changes in the economy could effect our financial, funding, and liquidity risks.
Management of liquidity and related risks is a key function for our business. Our funding requirementscurrently are met principally by deposits, financing from the FHLB and other financial institutions, andfinancing using capital markets. In general, the costs of our funding directly impact our costs of doing businessand, therefore, can positively or negatively affect our financial results.
A number of factors could make such funding more difficult, more expensive, or unavailable onaffordable terms, including, but not limited to, our financial results, organizational changes, adverse impactson our reputation, changes in the activities of our business partners, disruptions in the capital markets, specificevents that adversely impact the financial services industry, counterparty availability, changes affecting ourloan portfolio or other assets, changes affecting our corporate and regulatory structure, interest rate
17

fluctuations, ratings agency actions, general economic conditions, and the legal, regulatory, accounting and taxenvironments governing our funding transactions. In addition, our ability to raise funds is strongly affected bythe general state of the U.S. and world economies and financial markets, and may become increasinglydifficult due to economic and other factors.
Regulatory laws or rules that establish minimum capital levels, regulate deposit insurance, and governrelated funding matters for banks could be changed in a manner that could increase our overall cost of capitaland thus reduce our earnings.
We may not be able to replace key members of senior management or attract and retain qualifiedrelationship managers in the future.
We depend on the services of existing senior management to carry out our business and investmentstrategies. As we expand and as we continue to refine our business model, we will need to continue to attractand retain additional senior management and to recruit qualified individuals to succeed existing key personnelthat leave our employ. In addition, as we continue to grow our business and plan to continue to expand ourlocations, products and services, we will need to continue to attract and retain qualified banking personnel.Competition for such personnel is especially keen in our geographic market areas and competition for the bestpeople in most businesses in which we engage can be intense. If we are unable to attract and retain talentedpeople our business could suffer. The loss of the services of any senior management personnel, or the inabilityto recruit and retain qualified personnel in the future, could have an adverse effect on our results of operations,financial conditions and prospects.
The network and computer systems on which we depend could fail or experience a security breach.
Our computer systems could be vulnerable to unforeseen problems. Because we conduct part of ourbusiness over the Internet and outsource several critical functions to third parties, operations will depend onthe ability, as well as that of third-party service providers, to protect computer systems and networkinfrastructure against damage from fire, power loss, telecommunications failure, physical break-ins or similarcatastrophic events. Any damage or failure that causes interruptions in operations could have a materialadverse effect on our business, financial condition and results of operations.
In addition, a significant barrier to online financial transactions is the secure transmission of confidentialinformation over public networks. Our Internet banking system relies on encryption and authenticationtechnology to provide the security and authentication necessary to effect secure transmission of confidentialinformation. Advances in computer capabilities, new discoveries in the field of cryptography or otherdevelopments could result in a compromise or breach of the algorithms our third-party service providers use toprotect customer transaction data. If any such compromise of security were to occur, it could have a materialadverse effect on our business, financial condition and results of operations.
Market acceptance of Internet banking depends substantially on widespread adoption of the Internet forgeneral commercial and financial services transactions. If another provider of commercial services through theInternet were to suffer damage from physical break-in, security breach or other disruptive problems caused bythe Internet or other users, the growth and public acceptance of the Internet for commercial transactions couldsuffer. This type of event could deter our potential customers or cause customers to leave us and therebymaterially and adversely affect our business, financial condition and results of operations.
Our business is highly regulated.
The banking industry in general is extensively regulated at the federal and state levels. Insured depositoryinstitutions and their holding companies are subject to comprehensive regulation and supervision by financialregulatory authorities covering all aspects of their organization, management and operations. The OTS is theprimary regulator of the Bank and its affiliated entities. In addition to its regulatory powers, the OTS also hassignificant enforcement authority that it can use to address unsafe and unsound banking practices, violations oflaws, and capital and operational deficiencies. Such regulation and supervision are intended primarily for theprotection of the insurance fund and for our depositors and borrowers, and are not intended to protect theinterests of investors in our common stock. Further, the Bank’s business is affected by consumer protection
18

laws and regulation at the state and federal level, including a variety of consumer protection provisions, manyof which provide for a private right of action and pose a risk of class action lawsuits. Accordingly, the actionsof governmental authorities responsible for regulatory, fiscal and monetary affairs can have a significant andimmediate impact on the activities of financial services firms such as ours. See further information in “Item 1.Business — Regulation and Supervision.”
Our business has volatile earnings because it operates based on a multi-year cycle.
The home lending segment of our business is a cyclical business that generally performs better in a lowinterest rate environment with a yield curve that is lower at the shorter time frames and higher at the longertime frames. In addition, other external factors, including tax laws, the strength of various segments of theeconomy and demographics of our lending markets, could influence the level of demand for mortgage loans.Gain on sale of loans is a large component of our revenue and would be adversely impacted by a significantdecrease in the volume of our mortgage loan originations.
Geographic concentrations pose a higher risk of loan losses.
A significant portion of our mortgage loan portfolio is geographically concentrated in certain states,including California, Michigan, Florida, Washington, Colorado, Texas and Arizona, which collectivelyrepresent approximately 65.4% of our mortgage loans held for investment balance at December 31, 2006. Inaddition, 76.9% of our commercial real estate loans are in Michigan. Any adverse economic conditions inthese markets could cause the number of loans originated to decrease, likely resulting in a correspondingdecline in revenues and an increase in credit risk. Also, we could be adversely affected by business disruptionstriggered by natural disasters, or acts of war or terrorism.
A large percentage of our loans are collateralized by real estate, and an adverse change in the real estatemarket may result in losses and adversely affect our portfolio.
Approximately 79.7% or our investment loan portfolio as of December 31, 2006, was comprised of loanscollateralized by real estate. The collateral in each case provides an alternate source of repayment if theborrower defaults and may deteriorate in value during the time the credit is extended. An adverse change inthe economy affecting real estate values generally or in our primary markets specifically could significantlyimpair the value of our collateral and our ability to sell the collateral upon foreclosure. In the event of adefault with respect to any of these loans, amounts received upon sale of the collateral may be insufficient torecover outstanding principal and interest on the loan. As a result, our profitability could be negativelyimpacted by an adverse change in the real estate market.
A significant part of our business strategy involves adding new branch locations, and our failure to growmay adversely affect our business, prospects, results of operations and financial condition.
Our expansion strategy consists principally of adding new branch locations in Michigan, Indiana andGeorgia growth areas that complement our existing branch network. While we anticipate that this expansionstrategy will enhance long-term shareholder value, it is possible that our branch expansion strategy may notbecome accretive to our earnings over the short term. New branches generally require a significant initialcapital investment and take several years to become profitable. New branches require a significant upfrontinvestment for land and building expenses. Accordingly, we anticipate that, in the short term, net income willbe negatively affected as we incur significant capital expenditures and noninterest expense in opening andoperating new branches before the new branches can produce sufficient net interest income to offset theincreased expense. In addition, the need to use capital to fund de novo branching may limit our ability to payor increase dividends on our common stock. There also is implementation risk associated with new branches.Numerous factors will determine whether our branch expansion strategy will be successful, such as our abilityto select suitable branch locations, real estate acquisition costs, competition, interest rates, managerialresources, our ability to hire and retain qualified personnel, the effectiveness of our marketing strategy and ourability to attract deposits.
19

The state income tax structure in Michigan or other states could change significantly causing a reductionin our profitability.
A significant portion of our business is conducted in Michigan and we are likely to continue to have asignificant portion of our business in Michigan. During 2006, the Michigan legislature repealed the singlebusiness tax that served as a significant source of revenue for the state. It is currently unknown as to what typeof taxing structure will replace Michigan’s single business tax. As such, should the replacement to the singlebusiness tax be less favorable to companies like ours, our profitability could be adversely impacted. Similarly,the taxing structure or the interpretation of other state regulation concerning tax could change in a manner thatwould be less favorable to us and therefore adversely impact our profitability.
We are subject to heightened regulatory scrutiny with respect to bank secrecy and anti-money launderingstatutes and regulations.
Recently, regulators have intensified their focus on the USA PATRIOT Act’s anti-money laundering andBank Secrecy Act compliance requirements. There is also increased scrutiny of our compliance with the rulesenforced by the Office of Foreign Assets Control. In order to comply with regulations, guidelines andexamination procedures in this area, we have been required to adopt new policies and procedures and to installnew systems. We can not be certain that the policies, procedures and systems we have in place are flawless.Therefore, there is no assurance that in every instance we are in full compliance with these requirements.
Other Risk Factors.
The above description of risk factors is not exhaustive. Other risk factors are described elsewhere hereinas well as in other reports and documents that we file with or furnish to the SEC. Other factors that could alsocause results to differ from our expectations may not be described in any such report or document. Each ofthese factors could by itself, or together with one or more other factors, adversely affect our business, resultsof operations and/or financial condition.
ITEM 1B. UNRESOLVED STAFF COMMENTS
None.
ITEM 2. PROPERTIES
At December 31, 2006, we operated from the headquarters in Troy, Michigan, a regional office inJackson, Michigan, and a regional office in Atlanta, Georgia, 151 banking centers in Michigan, Indiana andGeorgia and 76 home lending centers in 20 states. We also maintain 12 wholesale lending offices. Our bankingcenters consist of 76 free-standing office buildings, 41 in-store banking centers and 35 centers in buildings inwhich there are other tenants, typically strip malls and similar retail centers.
We own the buildings and land for 75 of our offices, own the building but lease the land for one of ouroffices, and lease the remaining 163 offices. The offices that we lease have lease expiration dates ranging from2007 to 2017.
ITEM 3. LEGAL PROCEEDINGS
From time to time, we are party to legal proceedings incident to our business. However, at December 31,2006, there were no legal proceedings that we anticipate will have a material adverse effect on us. See Notes 3 and21 of the Notes to Consolidated Financial Statements in Item 8. Financial Statements and Supplementary Data.
ITEM 4. SUBMISSION OF MATTERS TO A VOTE OF SECURITY HOLDERS
No items were submitted during the fourth quarter of the year covered by this Report to be voted on bysecurity holders through a solicitation of proxies or otherwise.
20

PART II
ITEM 5. MARKET FOR THE REGISTRANT’S COMMON EQUITY, RELATED STOCKHOLDERMATTERS AND ISSUER PURCHASES OF EQUITY SECURITIES
Our common stock trades on the New York Stock Exchange under the trading symbol FBC. AtDecember 31, 2006, there were 63,604,590 shares of our common stock outstanding held by approximately18,300 shareholders of record.
Dividends
The following table shows the high and low closing prices for the Company’s common stock during eachcalendar quarter during 2006 and 2005, and the cash dividends per common share declared during each suchcalendar quarter. We declare dividends on our common stock on a quarterly basis and currently expect tocontinue to do so. However, the amount of and nature of any dividends declared on our common stock in thefuture will be determined by our Board of Directors in their sole discretion.
Quarter Ending
HighestClosingPrice
LowestClosingPrice
DividendsDeclared
In thePeriod
December 31, 2006 $15.46 $14.31 $0.15
September 30, 2006 $16.29 $14.01 $0.15
June 30, 2006 $16.96 $14.67 $0.15
March 31, 2006 $15.60 $14.08 $0.15
December 31, 2005 $16.07 $12.69 $0.15
September 30, 2005 $19.26 $16.00 $0.25
June 30, 2005 $20.39 $18.10 $0.25
March 31, 2005 $22.69 $19.18 $0.25
Equity Compensation Plan Information
The following table sets forth certain information with respect to securities to be issued under theCompany’s equity compensation plans as of December 31, 2006.
Plan Category
Number ofSecurities to Be
Issued UponExercise of
Outstanding Options
Weighted-AverageExercise Price of
OutstandingOptions
Number of SecuritiesRemaining Availablefor Future Issuance
Under EquityCompensation Plans
Equity Compensation Plans approved bysecurity holders(1) 3,029,737 $13.79 5,289,094
Total 3,029,737 $13.79 5,289,094
(1) Consists of our 2006 Equity Incentive Plan, which provides for the granting of stock options, incentivestock options, cash-settled stock appreciation rights, restricted stock units, performance shares and perfor-mance units and other awards. The 2006 Equity Incentive Plan consolidated, merged, amended andrestated our 1997 Employees and Directors Stock Option Plan, 2000 Stock Incentive Plan, and 1997 Incen-tive Compensation Plan. Awards still outstanding under any of the prior plans will continue to be governedby their respective terms. Under the 2006 Equity Incentive Plan, the exercise price of any option grantedmust be at least equal to the fair value of our common stock on the date of grant. Non-qualified stockoptions granted to directors expire five years from the date of grant. Grants other than non-qualified stockoptions have term limits set by the board of directors in the applicable agreement. Stock appreciationrights expire seven years from the date of grant. All securities remaining for future issuance representoption and stock awards available for award under the 2006 Equity Incentive Plan.
21

Sale of Unregistered Securities
The Company made no unregistered sales of its common stock during the quarter ended December 31,2006.
Issuer Purchases of Equity Securities
The following table shows shares of our common stock that we purchased in the fourth quarter of 2006.
Period
Total Number ofShares
Purchased(a)
Average PricePaid Per
Share
Total Number ofShares Purchasedas Part of Publicly
Announced Plans orPrograms
MaximumApproximateDollar Value(in millions)
of Sharesthat May YetBe Purchased
Under the Plansor Programs (b)
October 2006 — — — —
November 2006 240 $14.76 — —
December 2006 — — — —
Total 240 $14.76 — —
(a) All of the shares purchased by the Company during the fourth quarter of 2006 were related to awards ofour common stock our employees in recognition of their 10th anniversary with the Company.
(b) On January 31, 2007, the Company announced that our board of directors adopted a Stock RepurchaseProgram under which we are authorized to repurchase up to $40.0 million worth of our outstanding com-mon stock. On February 27, 2007, the Company announced that the board of directors had increased theauthorized repurchase amount from $40.0 million to $50.0 million. This program expires in twelve monthsfrom January 31, 2007. No shares have been repurchased under this plan.
22

ITEM 6. SELECTED FINANCIAL DATA
2006 2005 2004 2003 2002For the Years Ended December 31,
(In thousands, except per share data)
Summary of ConsolidatedStatements of Earnings:
Interest income $800,866 $708,663 $563,437 $503,068 $441,796
Interest expense 585,919 462,393 340,146 308,482 263,880
Net interest income 214,947 246,270 223,291 194,586 177,916
Provision for loan losses 25,450 18,876 16,077 20,081 27,126
Net interest income after provision for loanlosses 189,497 227,394 207,214 174,505 150,790
Other income 202,161 159,448 256,121 465,877 242,737
Operating and administrative expenses 275,637 262,887 243,005 252,915 226,121
Earnings before federal income tax provision 116,021 123,955 220,330 387,467 167,406
Provision for federal income taxes 40,819 44,090 77,592 135,481 59,280
Earnings before a change in accountingprinciple 75,202 79,865 142,738 251,986 108,126
Cumulative effect of a change in accountingprinciple — — — — 18,716
Net earnings $ 75,202 $ 79,865 $142,738 $251,986 $126,842
Earnings per share before a change inaccounting principle
Basic $ 1.18 $ 1.29 $ 2.34 $ 4.21 $ 1.85
Diluted $ 1.17 $ 1.25 $ 2.22 $ 3.95 $ 1.75
Earnings per share from cumulative effect of achange in accounting principle
Basic — — — — $ 0.32
Diluted — — — — $ 0.30
Net earnings per share — basic $ 1.18 $ 1.29 $ 2.34 $ 4.21 $ 2.17
Net earnings per share — diluted $ 1.17 $ 1.25 $ 2.22 $ 3.95 $ 2.05
Dividends per common share $ 0.60 $ 0.90 $ 1.00 $ 0.50 $ 0.12
Dividend payout ratio 51% 70% 43% 11% 7%
23

2006 2005 2004 2003 2002At or for the Years Ended December 31,
(In thousands, except per share data)
Summary of Consolidated Statements ofFinancial Condition:Total assets $15,497,205 $15,075,430 $13,143,014 $10,553,246 $ 8,195,840
Mortgage-backed securities held tomaturity 1,565,420 1,414,986 20,710 30,678 39,110
Loans receivable 12,128,480 12,349,865 12,065,465 9,599,803 7,287,338
Mortgage servicing rights 173,288 315,678 187,975 260,128 230,756
Total deposits 7,379,295 7,979,000 7,379,655 5,680,167 4,373,889
FHLB advances 5,407,000 4,225,000 4,090,000 3,246,000 2,222,000
Security repurchase agreements 990,806 1,060,097 — — —
Stockholders’ equity 812,234 771,883 728,954 638,801 405,430
Other Financial and Statistical DataTangible capital ratio 6.37% 6.26% 6.19% 7.34% 6.61%
Core capital ratio 6.37% 6.26% 6.19% 7.34% 6.61%
Total risk-based capital ratio 11.55% 11.09% 10.97% 13.30% 11.81%
Equity-to-assets ratio (at the end of theperiod) 5.24% 5.12% 5.54% 6.05% 4.95%
Equity-to-assets ratio (average for theperiod) 5.29% 5.07% 5.68% 5.17% 4.68%
Book value per share $ 12.77 $ 12.21 $ 11.88 $ 10.53 $ 6.85
Shares outstanding 63,605 63,208 61,358 60,675 59,190
Average shares outstanding 63,588 62,128 61,057 59,811 58,350
Mortgage loans originated or purchased $18,966,354 $28,244,561 $34,248,988 $56,550,735 $43,391,116
Other loans originated or purchased 1,241,588 1,706,246 995,429 609,092 388,006Loans sold 16,370,925 23,451,430 28,937,576 51,922,757 40,495,894
Mortgage loans serviced for others 15,032,504 29,648,088 21,354,724 30,395,079 21,586,797
Capitalized value of mortgage servicingrights 1.15% 1.06% 0.88% 0.86% 1.07%
Interest rate spread — consolidated 1.42% 1.74% 1.87% 2.01% 2.76%
Net interest margin — consolidated 1.54% 1.82% 1.99% 2.16% 2.80%
Interest rate spread — bank only 1.41% 1.68% 1.85% 1.91% 2.68%
Net interest margin — bank only 1.63% 1.88% 2.08% 2.40% 3.00%
Return on average assets 0.49% 0.54% 1.17% 2.50% 1.76%
Return on average equity 9.42% 10.66% 20.60% 48.35% 37.61%
Efficiency ratio 66.1% 64.8% 50.7% 38.3% 53.8%
Net charge off ratio 0.20% 0.16% 0.16% 0.35% 0.51%
Ratio of allowance to investment loans 0.51% 0.37% 0.36% 0.55% 0.99%
Ratio of non-performing assets to total assets 1.03% 0.98% 0.99% 1.01% 1.51%
Ratio of allowance to non-performingloans 80.2% 60.7% 67.2% 64.9% 57.9%
Number of banking centers 151 137 120 98 86
Number of home loan centers 76 101 112 128 92
Note: All per share data has been restated for the 2 for 1 stock split on May 15, 2003, and for the 3 for 2 stock splitcompleted on May 31, 2002.
24

ITEM 7. MANAGEMENT’S DISCUSSION AND ANALYSIS OF FINANCIAL CONDITION ANDRESULTS OF OPERATIONS
Overview
Operations of the Bank are categorized into two business segments: banking and home lending. Eachsegment operates under the same banking charter, but is reported on a segmented basis for financial reportingpurposes. For certain financial information concerning the results of operations of our banking and homelending operations, see Note 28 of the Notes to Consolidated Financial Statements, in Item 8, FinancialStatements, herein.
Banking Operation. We provide a full range of banking services to consumers and small businesses inMichigan, Indiana and Georgia. Our banking operation involves the gathering of deposits and investing thosedeposits in duration-matched assets consisting primarily of mortgage loans originated by our home lendingoperation. The banking operation holds these loans in its loans held for investment portfolio in order to earnincome based on the difference, or “spread,” between the interest earned on loans and investments and theinterest paid for deposits and other borrowed funds. At December 31, 2006, we operated a network of 151banking centers and provided banking services to approximately 143,000 customers. We continue to focus onexpanding our branch network in order to increase our access to retail deposit funding sources. As we opennew branches, we believe that the growth in deposits will continue over time. During 2006, we opened 14banking centers, including eight banking centers in Georgia. During 2007, we expect to open seven additionalbranches in the Atlanta, Georgia area and six branches in Michigan.
Home Lending Operation. Our home lending operation originates, securitizes and sells residentialmortgage loans in order to generate transactional income. The home lending operation also services mortgageloans on a fee basis for others and sells mortgage servicing rights into the secondary market. Funding for ourhome lending operation is provided primarily by deposits and borrowings obtained by our banking operation.
The following tables present certain financial information concerning the results of operations of ourbanking operation and home lending operation during the past three years.
BANKING OPERATION
2006 2005 2004At or for the Years Ended December 31,
(In thousands)
Net interest income $ 159,255 $ 185,276 $ 175,403
Net gain on sale revenue — — —
Other income 31,353 55,813 63,227Earnings before federal taxes 59,728 123,726 135,080
Identifiable assets 14,939,341 14,176,340 12,136,082
HOME LENDING OPERATION
2006 2005 2004At or for the Years Ended December 31,
(In thousands)
Net interest income $ 55,692 $ 60,994 $ 47,888
Net gain on sale revenue 135,002 81,737 169,559
Other income 35,806 21,898 23,335
Earnings before federal taxes 56,293 229 85,250
Identifiable assets 3,597,864 2,379,090 2,245,932
25

Net Earnings Summary
Our net earnings for 2006 of $75.2 million ($1.17 per diluted share) represents a 5.9% decrease from the$79.9 million ($1.25 per diluted share) we achieved in 2005 and a decrease of 47.3% from the $142.7 million($2.22 per diluted share) earned in 2004. The net earnings during 2006 were affected by the following factors:
• Lower net interest income due to the increase in the average interest rate that we paid on our depositsand interest-bearing liabilities offset by average higher interest rate that we earned on our interest-earning assets.
• A decrease in loan fees and charges which was a result of a reduction in loan originations. During theyear ended December 31, 2006, loan originations were down 35.3% compared to 2005. To a largedegree, the decrease in loan originations during 2006 was attributable to a decline in mortgagerefinancings in the overall market as a result of stabilizing or increasing interest rates on single familymortgage loans.
• Higher gain on sales of MSRs due to higher volume of sales and improved pricing.
• Lower gain on loan sales due to decreased volume and more competitive pricing.
• Higher overhead costs in our banking group attributable in part to the 14 additional banking centersthat were opened during the year.
• A reduction in overhead costs in our home lending operation due to reduction in the number ofsalaried and commissioned personnel in response to decreased loan demand.
See “Results of Operations,” below.
Critical Accounting Policies
Our consolidated financial statements are prepared in accordance with U.S. GAAP and reflect generalpractices within our industry. Application of these principles requires management to make estimates orjudgments that affect the amounts reported in the consolidated financial statements and accompanying notes.These estimates are based on information available to management as of the date of the consolidated financialstatements. Accordingly, as this information changes, future financial statements could reflect differentestimates or judgments. Certain policies inherently have a greater reliance on the use of estimates, and as suchhave a greater possibility of producing results that could be materially different than originally reported. Themost significant accounting policies followed by us are presented in Note 2 to the consolidated financialstatements included in Item 8 herein. These policies, along with the disclosures presented in the other financialstatement notes and other information presented herein, provide information on how significant assets andliabilities are valued in the consolidated financial statements and how these values are determined. Manage-ment views critical accounting policies to be those that are highly dependent on subjective or complexjudgments, estimates or assumptions, and where changes in those estimates and assumptions could have asignificant impact on our consolidated financial statements. Management currently views the determination ofthe allowance for loan losses, the valuation of MSRs, the valuation of residuals, the valuation of derivativeinstruments, and the determination of the secondary market reserve to be our critical accounting policies.
Allowance for Loan Losses. The allowance for loan losses represents management’s estimate of probablelosses that are inherent in our loans held for investment portfolio, but which have not yet been realized as ofthe date of our consolidated statement of financial condition. We recognize these losses when (a) availableinformation indicates that it is probable that a loss has occurred and (b) the amount of the loss can bereasonably estimated. We believe that the accounting estimates related to the allowance for loan losses arecritical because they require us to make subjective and complex judgments about the effect of matters that areinherently uncertain. As a result, subsequent evaluations of the loan portfolio, in light of the factors thenprevailing, may result in significant changes in the allowance for loan losses. Our methodology for assessingthe adequacy of the allowance involves a significant amount of judgment based on various factors such asgeneral economic and business conditions, credit quality and collateral value trends, loan concentrations,recent trends in our loss experience, new product initiatives and other variables. Although management
26

believes its process for determining the allowance for loan losses adequately considers all of the factors thatcould potentially result in loan losses, the process includes subjective elements and may be susceptible tosignificant change. To the extent actual outcomes differ from management estimates, additional provision forloan losses could be required that could adversely affect earnings or financial position in future periods.
Valuation of Mortgage Servicing Rights. When our home lending operation sells mortgage loans in thesecondary market it usually retains the right to continue to service these loans and earn a servicing fee. At thetime the loan is sold on a servicing retained basis, we record the mortgage servicing right as an asset at its fairvalue. Determining the fair value of MSRs involves a calculation of the present value of a set of market drivenand MSR specific cash flows. MSRs do not trade in an active market with readily observable market prices.However, the market price of MSRs are generally a function of demand and interest rates. When mortgageinterest rates decline, mortgage loan prepayments usually increase as customers refinance their loans. Whenthis happens, the income stream from a MSR portfolio will decline. In that case, we may be required toamortize the portfolio over a shorter period of time or reduce the carrying value of our MSR portfolio.Accordingly, we must make assumptions about future interest rates and other market conditions in order toestimate the current fair value our MSR portfolio. On an ongoing basis, we compare our fair value estimatesto observable market data where available. On an annual basis, the value of our MSR portfolio is reviewed byan outside valuation expert. MSRs are recorded at the lower of carrying cost or fair market value.
From time to time, we sell some of these MSRs to unaffiliated purchasers in transactions that are separatefrom the sale of the underlying loans. At the time of the sale, we record a gain or loss based on the sellingprice of the MSRs less our carrying value and associated transaction costs.
Valuation of Residuals. Residuals are created upon the issuance of private-label securitizations. Residualsrepresent the first loss position and are not typically rated by the nationally recognized agencies. The value ofresiduals represents the present value of the future cash flows expected to be received by us from the excesscash flows created in the securitization transaction. In general, future cash flows are estimated by taking thecoupon rate of the loans underlying the transaction less the interest rate paid to the investors, less contractuallyspecified servicing and trustee fees adjusting for the effect of estimated prepayments and credit losses.
Cash flows are also dependent upon various restrictions and conditions specified in each transaction. Forexample, residual securities are not typically entitled to any cash flows unless over-collateralization hasreached a certain level. The over-collateralization represents the difference between the bond balance and thecollateral underlying security. A sample of an over-collateralization structure may require 2% of the originalcollateral balance for 36 months. At month 37, it may require 4%, but on a declining balance basis. Due toprepayments, that 4% requirement is generally less than the 2% required on the original balance. In addition,the transaction may include an over-collateralization “trigger event,” the occurrence of which may require theover-collateralization to be increased. An example of such trigger event is delinquency rates or cumulativelosses on the underlying collateral that exceed stated levels. If over-collateralization targets were not met, thetrustee would apply cash flows that would otherwise flow to the residual security until such targets are met. Adelay or reduction in the cash flows received will result in a lower valuation of the residual.
Residuals are designated as available-for-sale securities at the time of securitization and are periodicallyevaluated for impairment. These residuals are marked to market with changes in the value recognized in othercomprehensive income net of tax. If the security is deemed to be impaired and the impairment isother-than-temporary, the impairment is recognized in the current period earnings. We use an internallydeveloped model to value the residuals. The model takes into consideration the cash flow structure specific toeach transaction (such as over-collateralization requirements and trigger events). The key valuation assump-tions include credit losses, prepayment rates and, to a lesser degree, discount rates. On an annual basis, thevalue of our residuals is reviewed by an outside valuation expert.
Valuation of Derivative Instruments. We utilize certain derivative instruments in the ordinary course ofour business to manage our exposure to changes in interest rates. These derivative instruments include forwardsale commitments and interest rate swaps. We also issue interest rate lock commitments to borrowers inconnection with single family mortgage loan originations. We recognize all derivative instruments on ourconsolidated statement of financial position at fair value. The valuation of derivative instruments is considered
27

critical because many are valued using discounted cash flow modeling techniques in the absence of marketvalue quotes. Therefore, we must make estimates regarding the amount and timing of future cash flows, whichare susceptible to significant change in future periods based on changes in interest rates. Our interest rateassumptions are based on current yield curves, forward yield curves and various other factors. Internallygenerated valuations are compared to third party data where available to validate the accuracy of our valuationmodels.
Derivative instruments may be designated as either fair value or cash flow hedges under hedge accountingprinciples or may be undesignated. A hedge of the exposure to changes in the fair value of a recognized asset,liability or unrecognized firm commitment is referred to as a fair value hedge. A hedge of the exposure to thevariability of cash flows from a recognized asset, liability or forecasted transaction is referred to as a cashflow hedge. In the case of a qualifying fair value hedge, changes in the value of the derivative instruments thatare highly effective are recognized in current earnings along with the changes in value of the designatedhedged item. In the case of a qualifying cash flow hedge, changes in the value of the derivative instrumentsthat are highly effective are recognized in accumulated other comprehensive income until the hedged item isrecognized in earnings. The ineffective portion of a derivative’s change in fair value is recognized throughearnings. Derivatives that are non-designated hedges are adjusted to fair value through earnings. AtDecember 31, 2005, and throughout 2006, we had no derivatives designated as fair value hedges.
Secondary Market Reserve. We sell most of the residential mortgage loans that we originate into thesecondary mortgage market. When we sell mortgage loans we make customary representations and warrantiesto the purchasers about various characteristics of each loan, such as the manner of origination, the nature andextent of underwriting standards applied and the types of documentation being provided. If a defect in theorigination process is identified, we may be required to either repurchase the loan or indemnify the purchaserfor losses it sustains on the loan. If there are no such defects, we have no liability to the purchaser for losses itmay incur on such loan. We maintain a secondary market reserve to account for the expected credit lossesrelated to loans we may be required to repurchase (or the indemnity payments we may have to make topurchasers). The secondary market reserve takes into account both our estimate of expected losses on loanssold during the current accounting period, as well as adjustments to our previous estimates of expected losseson loans sold. In each case, these estimates are based on our most recent data regarding loan repurchases,actual credit losses on repurchased loans and recovery history, among other factors. Increases to the secondarymarket reserve for current loan sales reduce our net gain on loan sales. Adjustments to our previous estimatesare recorded as an increase or decrease in our other fees and charges.
Results of Operations
Net Interest Income
2006. During 2006, we recognized $214.9 million in net interest income, which represented a decrease of12.7% compared to the $246.3 million reported in 2005. Net interest income represented 51.5% of our totalrevenue in 2006 as compared to 60.7% in 2005. Net interest income is primarily the dollar value of theaverage yield we earn on the average balances of our interest-earning assets, less the dollar value of theaverage cost of funds we incur on the average balances of our interest-bearing liabilities. At December 31,2006, we had an average balance of $14.0 billion of interest-earning assets, of which approximately$12.2 billion were loans receivable. Interest income recorded on these loans included the amortization of netpremiums and net deferred loan origination costs. Partially offsetting the increase in earning assets was anincrease in our cost of funds. Our interest-earning assets are funded with deposits and other short-termliabilities, primarily borrowings from the FHLB and security repurchase agreements. Typically, there is aspread between the long-term rates we earn on these mortgage loans and the short-term rates we pay on ourfunding sources. During 2006, the spread between these interest rates narrowed and then inverted, as short-term rates increased faster than the increase in long-term rates. The average cost of interest-bearing liabilitiesincreased 23.8%, from 3.49% during 2005 to 4.32% in 2006, while the average yield on interest-earning assetsincreased only 9.8%, from 5.23% during 2005 to 5.74% in 2006. As a result, our interest rate spread during2006 was 1.42% at year-end. The compression of our interest rate spread during the year caused our interestrate margin for 2006 to decrease to 1.54% from 1.82% during 2005. The adverse effect of the spread
28

compression was offset in part by the increase in our ratio of interest-earning assets to interest-bearingliabilities, from 102% in 2005 to 103% in 2006. The Bank recorded an interest rate margin of 1.68% in 2006,as compared to 1.88% in 2005.
2005. During 2005, we recognized $246.3 million in net interest income, which represented an increaseof 10.3% compared to the $223.3 million reported in 2004. Net interest income represented 60.7% of our totalrevenue in 2005 as compared to 46.6% in 2004. Net interest income is primarily the dollar value of theaverage yield we earn on the average balances of our interest-earning assets, less the dollar value of theaverage cost of funds we incur on the average balances of our interest-bearing liabilities. At December 31,2005, we had an average balance of $13.6 billion of interest-earning assets, of which approximately$13.1 billion were loans receivable. Interest income recorded on these loans included the amortization of netpremiums and net deferred loan origination costs. Partially offsetting the increase in earning assets was anincrease in our cost of funds. Our interest-earning assets are funded with deposits and other short-termliabilities, primarily borrowings from the FHLB and security repurchase agreements. Typically, there is aspread between the long-term rates we earn on these mortgage loans and the short-term rates we pay on ourfunding sources. During 2005, the spread between these interest rates narrowed as short-term rates increased.The average cost of interest-bearing liabilities increased 10.4% from 3.16%, during 2004 to 3.49% in 2005,while the average yield on interest-earning assets increased only 4.0%, from 5.03% during 2004 to 5.23% in2005. As a result, our interest rate spread during 2005 was 1.74% at year-end. The compression of our interestrate spread during the year caused our interest rate margin for 2005 to decrease to 1.82% from 1.99% during2004. This is also reflected in the decline in our ratio of interest-earning assets to interest-bearing liabilities,from 104% in 2004 to 102% in 2005. The Bank recorded an interest rate margin of 1.88% in 2005, ascompared to 2.08% in 2004.
29
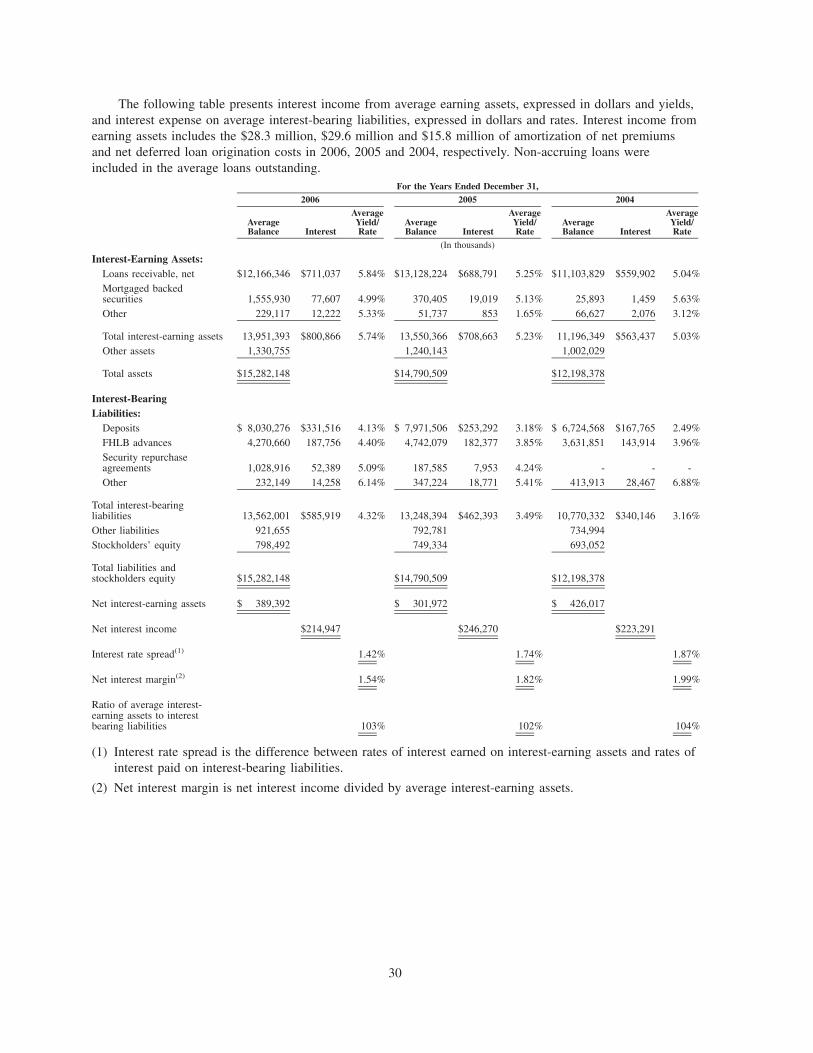
The following table presents interest income from average earning assets, expressed in dollars and yields,and interest expense on average interest-bearing liabilities, expressed in dollars and rates. Interest income fromearning assets includes the $28.3 million, $29.6 million and $15.8 million of amortization of net premiumsand net deferred loan origination costs in 2006, 2005 and 2004, respectively. Non-accruing loans wereincluded in the average loans outstanding.
AverageBalance Interest
AverageYield/Rate
AverageBalance Interest
AverageYield/Rate
AverageBalance Interest
AverageYield/Rate
2006 2005 2004For the Years Ended December 31,
(In thousands)
Interest-Earning Assets:Loans receivable, net $12,166,346 $711,037 5.84% $13,128,224 $688,791 5.25% $11,103,829 $559,902 5.04%Mortgaged backedsecurities 1,555,930 77,607 4.99% 370,405 19,019 5.13% 25,893 1,459 5.63%Other 229,117 12,222 5.33% 51,737 853 1.65% 66,627 2,076 3.12%
Total interest-earning assets 13,951,393 $800,866 5.74% 13,550,366 $708,663 5.23% 11,196,349 $563,437 5.03%Other assets 1,330,755 1,240,143 1,002,029
Total assets $15,282,148 $14,790,509 $12,198,378
Interest-BearingLiabilities:
Deposits $ 8,030,276 $331,516 4.13% $ 7,971,506 $253,292 3.18% $ 6,724,568 $167,765 2.49%FHLB advances 4,270,660 187,756 4.40% 4,742,079 182,377 3.85% 3,631,851 143,914 3.96%Security repurchaseagreements 1,028,916 52,389 5.09% 187,585 7,953 4.24% - - -Other 232,149 14,258 6.14% 347,224 18,771 5.41% 413,913 28,467 6.88%
Total interest-bearingliabilities 13,562,001 $585,919 4.32% 13,248,394 $462,393 3.49% 10,770,332 $340,146 3.16%Other liabilities 921,655 792,781 734,994Stockholders’ equity 798,492 749,334 693,052
Total liabilities andstockholders equity $15,282,148 $14,790,509 $12,198,378
Net interest-earning assets $ 389,392 $ 301,972 $ 426,017
Net interest income $214,947 $246,270 $223,291
Interest rate spread(1) 1.42% 1.74% 1.87%
Net interest margin(2) 1.54% 1.82% 1.99%
Ratio of average interest-earning assets to interestbearing liabilities 103% 102% 104%
(1) Interest rate spread is the difference between rates of interest earned on interest-earning assets and rates ofinterest paid on interest-bearing liabilities.
(2) Net interest margin is net interest income divided by average interest-earning assets.
30

Rate/Volume Analysis
The following table presents the dollar amount of changes in interest income and interest expense for thecomponents of interest earning assets and interest-bearing liabilities that are presented in the preceding table.The table below distinguishes between the changes related to average outstanding balances (changes in volumewhile holding the initial rate constant) and the changes related to average interest rates (changes in averagerates while holding the initial balance constant). Changes attributable to both a change in volume and a changein rates were included as changes in rate.
Rate Volume Total Rate Volume Total
2006 Versus 2005 Increase(Decrease) Due to:
2005 Versus 2004 Increase(Decrease) Due to:
For the Years Ended December 31,
(In millions)
Interest-Earning Assets:Loans receivable, net $ 72.7 $(50.5) $ 22.2 $ 26.9 $102.0 $128.9
Mortgage-backed securities (2.2) 60.8 58.6 (1.9) 19.4 17.5
Other 8.4 2.9 11.3 (0.6) (0.6) (1.2)
Total $ 78.9 $ 13.2 $ 92.1 $ 24.4 $120.8 $145.2
Interest- BearingLiabilities:Total deposits $ 76.4 $ 1.8 $ 78.2 $ 54.5 $ 31.0 $ 85.5
FHLB advances 23.5 (18.2) 5.3 (5.5) 44.0 38.5
Security repurchase agreements 8.8 35.6 44.4 — 7.9 7.9
Other 1.7 (6.2) (4.5) (5.1) (4.6) (9.7)
Total $110.4 $ 13.0 $123.4 $ 43.9 $ 78.3 $122.2
Change in net interest income $ (31.5) $ 0.2 $ (31.3) $(19.5) $ 42.5 $ 23.0
The rate/volume table above indicates that, in general, interest rates on deposits and other liabilitiesincreased to a greater extent than interest rates on our loan products and securities during the year endedDecember 31, 2006. The adverse impact of these rate changes on our net interest margin for the periods wereoffset in part by the effect of the increase in interest-earning assets over interest-bearing liabilities.
Our interest income on loans increased as a result of increased yields on new loan production. Thisincrease offset the decline in interest income attributable to a reduced volume of loans, which declined ascertain loans were pooled and exchanged for mortgage-backed securities that we hold on our balance sheet asan investment. Similarly, the increase in interest income arising from mortgage-backed securities held-to-ma-turity related principally to the increase in the volume of such securities created using our investment loans.
During 2006, the decrease in net interest income was primarily due to the 28 basis point decrease in netinterest margin, partially offset by the effect of the increase in interest earning assets over interest-bearingliabilities. Net interest margin continued to experience compression due to the lag in the repricing of theBank’s loan portfolio compared to the increase in the cost of its interest-bearing liabilities.
During 2005, the increase in the net interest income was primarily due to the increase in the interestearnings assets of $2.4 billion, partially offset by the 17 basis point decrease in net interest margin. Netinterest margin experienced compression because the increase in interest rates on our liabilities increased muchmore than the rates on our loan production.
Provision for Loan Losses
During 2006, we recorded a provision for loan losses of $25.4 million as compared to $18.9 millionrecorded during 2005 and $16.1 million recorded in 2004. The provisions reflect our estimates to maintain the
31

allowance for loan losses at a level to cover probable losses in the portfolio for each of the respective periods.Net charge-offs in 2006 totaled $18.8 million compared to $18.1 million and $15.6 million in 2005 and 2004,respectively. Net charge-offs in 2006 totaled 0.20% of average investment loans compared to 0.16% and0.16% in 2005 and 2004, respectively. See the section captioned “Allowance for Loan Losses” in thisdiscussion for further analysis of the provision for loan losses.
Non-Interest Income
Our non-interest income consists of (i) loan fees and charges, (ii) deposit fees and charges, (iii) loanadministration fees, (iv) net gains from loan sales, (v) net gains from sales of MSRs, (vi) net loss on securitiesavailable for sale and (vii) other fees and charges. Our total non-interest income equaled $202.2 million during2006, which was a 26.8% increase from the $159.4 million of non-interest income that we earned in 2005.The primary reason for the increase was the increase in 2006 of net gains from sales of MSRs.
Loan Fees and Charges. Both our home lending operation and banking operation earn loan originationfees and collect other charges in connection with originating residential mortgages and other types of loans. Ineach period, we recorded fee income net of any fees deferred for the purposes of complying with Statement ofFinancial Accounting Standard (“SFAS”) 91, “Accounting for Non-Refundable Fees and Costs Associated withOriginating or Acquiring Loans and Initial Direct Costs of Leases.” During 2006, we recorded gross loan feesand charges of $50.9 million, a decrease of $20.7 million from the $71.6 million recorded in 2005 and the$83.0 million recorded in 2004. The decline in loan fees and charges resulted from a reduction in the volumeof loans originated during 2006 compared to 2005 and 2004. To a large degree, the decrease in loanoriginations during 2006 was attributable to a continuing decline in mortgage refinancings in the overallmarket as a result of stabilizing or increasing interest rates on single-family mortgage loans.
In accordance with SFAS 91, certain loan origination fees are capitalized and added as an adjustment tothe basis of the individual loans originated. These fees are accreted into income as an adjustment to the loanyield over the life of the loan or when the loan is sold. During 2006, we deferred $43.4 million of fee revenuein accordance with SFAS 91, compared to $59.0 million and $65.0 million, respectively, in 2005 and 2004.
Deposit Fees and Charges. Our banking operation collects deposit fees and other charges such as feesfor non-sufficient funds checks, cashier check fees, ATM fees, overdraft protection, and other account fees forservices we provide to our banking customers. The amount of these fees tends to increase as a function of thegrowth in our deposit base. Total deposit fees and charges increased 23.7% during 2006 to $20.9 millioncompared to $16.9 million during 2005 and $12.1 million during 2004. During that time, total customeraccounts grew from 196,000 at January 1, 2004 to over 277,900 at December 31, 2006.
Loan Administration Fees. When our home lending operation sells mortgage loans in the secondarymarket, it usually retains the right to continue to service these loans and earn a servicing fee. When anunderlying loan is prepaid or refinanced, the mortgage servicing right for that loan is fully amortized as nofurther fees will be earned for servicing that loan. During periods of falling interest rates, prepayments andrefinancings generally increase and, unless we provide replacement loans, it will usually result in a reductionin loan servicing fees and increases in amortization recorded on the MSR portfolio.
Our loan administration fees and MSR amortization can fluctuate significantly. Such fees are affected bythe size of our loans serviced for others portfolio, which is affected by sales of MSRs, subservicing fees, latefees and ancillary income and past due status of serviced loans. When loans serviced for others become ninetydays or more past due we cease accruing servicing fees on such loans. Amortization of MSRs can be affectedby sales of MSRs and changes in interest rates that cause changes in prepayments of the underlying loans.Changes in loan administration fees and changes in amortization of MSRs will not necessarily occur inproportion.
During 2006, the volume of loans serviced for others averaged $20.3 billion, which represented a 24.3%decrease from the $26.8 billion serviced during 2005. During 2006, we recorded $82.6 million in servicing feerevenue. The fee revenue recorded in 2006 was offset by $69.6 million of MSR amortization. During 2006,the amount of loan principal payments and payoffs received on serviced loans equaled $3.1 billion, a 26.2%
32

decrease over the 2005 total of $4.2 billion. The decrease was primarily attributable to the continuing increasein interest rates and the related decline in mortgage loan refinancing in 2006.
During 2005, the volume of loans serviced for others averaged $26.8 billion, which represented a 1.5%increase from the $26.4 billion during 2004. During 2005, we recorded $103.3 million in servicing feerevenue. The fee revenue recorded in 2005 was offset by $94.5 million of MSR amortization. During 2005,the amount of loan principal payments and payoffs received on serviced loans equaled $4.2 billion, a 40.0%decrease over the 2004 total of $7.0 billion. The decrease was primarily attributable to the continuing increasein interest rates and the related decline in mortgage loan refinancing in 2005.
Net Gain on Loan Sales. Our home lending operation records the transaction fee income it generatesfrom the origination, securitization and sale of mortgage loans in the secondary market. The amount of netgain on loan sales recognized is a function of the volume of mortgage loans sold and the gain on sale spreadachieved, net of related selling expenses. Net gain on loan sales is also increased or decreased by any mark tomarket pricing adjustments on loan commitments and forward sales commitments in accordance withSFAS No. 133, “Accounting for Derivative Instruments” (“SFAS 133”), increases to the secondary marketreserve related to loans sold during the period, and related administrative expenses. The volatility in the gainon sale spread is attributable to market pricing, which changes with demand and the general level of interestrates. Generally, we are able to sell loans into the secondary market at a higher margin during periods of lowor decreasing interest rates. Typically, as the volume of acquirable loans increases in a lower or falling interestrate environment, we are able to pay less to acquire loans and are then able to achieve higher spreads on theeventual sale of the acquired loans. In contrast, when interest rates rise, the volume of acquirable loansdecreases and therefore we may need to pay more in the acquisition phase, thus decreasing our net gainachievable. Our net gain was also affected by declining spreads available from securities we sell that areguaranteed by Fannie Mae and Freddie Mac, and by an over-capacity in the mortgage business that has placedcontinuing downward pressure on loan pricing opportunities for conventional residential mortgage products.
The following table provides a reconciliation of our net gain on loan sales reported in our consolidatedfinancial statements to our total gain on loans sold within the period (in thousands):
2006 2005 2004For the Years Ended December 31,
Net gain on loan sales $ 42,381 $ 63,580 $ 77,819
Add: SFAS 133 adjustments (4,498) 2,902 357
Add: LOCOM adjustments 2,011 87 —
Add: provision to secondary market reserve 5,897 5,328 5,932
Total gain on loans sold $ 45,791 $ 71,897 $ 84,108
Loans sold and securitized $16,370,925 $23,451,430 $28,937,576
Spread achieved 0.28% 0.31% 0.29%
2006. Net gains on loan sales totaled $42.4 million during 2006, a 33.3% decrease from the $63.6 millionrealized during 2005. During 2006, the volume of loans sold and securitized totaled $16.4 billion, a 30.2%decrease from the $23.5 billion of loan sales in 2005. We received an average gain on sale spread of 0.28% in2006 compared to 0.31% in 2005. During 2006, we recorded a provision of $5.9 million against gain on loansales relating to our secondary market reserve for loans sold in the current year.
2005. Net gains on loan sales totaled $63.6 million during 2005, an 18.3% decrease from the $77.8 mil-lion realized during 2004. During 2005, the volume of loans sold and securitized totaled $23.5 billion, a18.7% decrease from the $28.9 billion of loan sales in 2004. Notwithstanding the lower volume of loans soldin 2005, we received an average gain on sale spread of 0.31% in 2005 compared to 0.29% in 2004. During2005, we recorded a provision of $5.3 million to our secondary market reserve for loans sold in the currentyear.
Net Gain on Mortgage Servicing Rights Sales. As part of our business model, our home lendingoperation occasionally sells MSRs in transactions separate from the sale of the underlying loans. At the time
33

of the MSR sale, we record a gain or loss based on the selling price of the MSRs less our carrying value andtransaction costs. Accordingly, the amount of net gains on MSR sales depends upon the gain on sale spreadand the volume of MSRs sold. The spread is attributable to market pricing, which changes with demand, andthe general level of interest rates. In general, if an MSR is sold on a “flow basis” shortly after it is acquired,little or no gain will be realized on the sale. MSRs created in a lower interest rate environment generally willhave a higher market value because the underlying loan is less likely to be prepaid. Conversely, an MSRcreated in a higher interest rate environment will generally sell at a market price below the original fair valuerecorded because of the increased likelihood of prepayment of the underlying loans, resulting in a loss.
2006. During 2006, the net gain on the sale of MSRs totaled $92.6 million compared to a net gain of$18.2 million in 2005. The $74.4 million increase in net gain on the sale of MSRs is primarily due to asignificant increase in the volume of MSRs sold in 2006. Throughout 2006, we believed that the currentmarket price accurately reflected the MSR value. As a result, we sold more MSRs in 2006 than prior periods.We sold $2.3 billion in loans on a servicing released basis and $25.2 billion in bulk servicing sales in 2006.
2005. During 2005, the net gain on the sale of MSRs totaled only $18.2 million compared to a net gainof $91.7 million in 2004. The $73.5 million decrease in net gain on the sale of MSRs is primarily due to asignificant reduction in the volume of MSRs as sold in 2005. Throughout most of 2005, we believed that thecurrent market for these MSRs did not fully reflect their value. Accordingly, we retained more MSRs in 2005than in prior periods. We sold $1.9 billion of MSRs on a servicing released basis and $7.2 billion in bulkservicing sales in 2005.
Net Loss on Securities Available for Sale. Securities classified as available for sale are comprised ofresidual interests from private securitizations and mortgage-backed and collateralized mortgage obligationsecurities. Net loss on securities available for sale is the result of a reduction in the estimated fair value of thesecurity when that decline has been deemed to be an other-than-temporary impairment.
During 2006, we recognized a $6.1 million other-than-temporary impairment on our residual interest thatarose from a securitization completed in 2005. Although the residual interest is accounted for as an availablefor sale asset, we determined that this impairment was other-than-temporary and therefore a loss should beprovided for.
Other Fees and Charges. Other fees and charges include certain miscellaneous fees, including dividendsreceived on FHLB stock and income generated by our subsidiaries Flagstar Credit Corporation and DouglasInsurance Agency, Inc. Flagstar Title Insurance Company also earned fees in 2004 prior to its closing.
During 2006, we recorded $14.7 million in dividends on an average outstanding balance of FHLB stockof $284.2 million as compared to $11.1 million and $9.9 million in dividends on an average balance of FHLBstock outstanding of $264.2 million and $225.1 million in 2005 and 2004, respectively. During 2006, FlagstarCredit earned fees of $4.8 million versus $4.9 million and $5.0 million in 2005 and 2004, respectively. Theamount of fees earned by Flagstar Credit varies with the volume of loans that were insured during therespective periods. Flagstar Title reported revenues of $108,000 in 2004.
34

Non-Interest Expense
The following table sets forth detailed information regarding our non-interest expenses during the pastthree years.
NON-INTEREST EXPENSES
2006 2005 2004For the Years Ended December 31,
(In thousands)
Compensation and benefits $157,751 $ 150,738 $ 154,111
Commissions 74,208 87,746 105,607
Occupancy and equipment 70,319 69,121 66,233
Advertising 9,394 7,550 10,174
FDIC assessments 1,115 1,146 1,050
Communication 6,190 7,181 6,975
Other taxes 320 10,127 12,999
Other 49,824 46,362 39,926
Total 369,121 379,971 397,075Less: capitalized direct costs of loan closings, in accordancewith SFAS 91 (93,484) (117,084) (154,070)
Total, net $275,637 $ 262,887 $ 243,005
Efficiency ratio(1) 66.1% 64.8% 50.7%
(1) Total operating and administrative expenses divided by the sum of net interest income and non-interestincome.
2006. Non-interest expenses, before the capitalization of direct costs of loan closings, totaled $369.1 mil-lion in 2006 compared to $380.0 million in 2005. The 2.9% decrease in non-interest expense in 2006 waslargely due to lower commissions resulting from a decrease in the volume of loan originations in our homelending operations and from our general cost containment efforts. Offsetting the savings in our home lendingoperation were certain expenses associated with the increase in the number of banking centers operated by ourbanking operation. During 2006, we opened 14 banking centers, which brings the banking center network totalto 151. As we shift our funding sources to more of those that are retail in nature and increase the size of thebanking center network, we expect that the operating expenses associated with the banking center networkwill continue to increase.
Our gross compensation and benefit expense, before the capitalization of direct costs of loan closings,totaled $157.8 million. The 4.7% increase from 2005 is primarily attributable to normal salary increases andthe employees hired at the new banking centers. Our full-time equivalent (“FTE”) salaried employeesincreased by 105 to 2,510 at December 31, 2006. Commission expense, which is a variable cost associatedwith loan production, totaled $74.2 million, equal to 37 basis points (0.37 %) of total loan production in 2006.Occupancy and equipment totaled $70.3 million during 2006, which reflects the continuing expansion of ourdeposit banking center network, offset in part by the closing of various non- profitable home loan centers.Advertising expense, which totaled $9.4 million at December 31, 2006, increased $1.8 million, or 24.4%, fromthe $7.6 million reported in 2005. Our FDIC assessment remained the same at $1.1 million as compared to2005. We paid $6.2 million in communication expense for the year-ended December 31, 2006. These expensestypically include telephone, fax and other types of electronic communication. The decrease in communicationexpenses is reflective of fewer home loan centers. We pay taxes in the various states and local communities inwhich we are located and/or do business. For the year ended December 31, 2006 our state and local taxestotaled $0.3 million, a decrease of $9.8 million, which is the result of a restructuring of our corporate
35

operations that better aligned our core functions in separate entities. Other expense totaled $49.8 millionduring 2006. The fluctuation in other expenses is reflective of the varied levels of loan production, theexpansion undertaken in our banking operation offset by the closing of the non-profitable home loan centersand the dismissal of our lawsuit against an insurance company in a coverage dispute that resulted in a chargein November 2006, of $8.7 million, before taxes.
2005. Non-interest expenses, before the capitalization of direct costs of loan closings, totaled $380.0 mil-lion in 2005 compared to $397.1 million in 2004. The 4.3% decrease in non-interest expense in 2005 was dueto lower compensation expense and lower commissions resulting from a decrease in the volume of loanoriginations in our home lending operations and from our general cost containment efforts. Offsetting thesavings in our home lending operation were certain expenses associated with the increase in the number ofbanking centers operated by our banking operation. During 2005, we opened 17 banking centers, whichbrought the banking center network total to 137. As we shift our funding sources to more those retail in natureand increase the size of the banking center network, we expect that the operating expenses associated with thebanking center network will continue to increase.
Our gross compensation and benefit expense, before the capitalization of direct costs of loan closings,totaled $150.7 million. The 2.2% decrease from 2004 is primarily attributable to the staff reductions due to thedecrease in loan production offset with normal salary increases and the employees hired at the new bankingcenters. Our full-time equivalent (“FTE”) employees only increased by nine to 2,405 at December 31, 2005.Commission expense, which is a variable cost associated with loan production, totaled $87.7 million, equal to29 basis points (0.29%) of total loan production in 2005. Occupancy and equipment totaled $69.1 millionduring 2005, which reflects the continuing expansion of our deposit banking center network, offset in part bythe closing of various non- profitable home loan centers. Advertising expense, which totaled $7.6 million atDecember 31, 2005, decreased $2.5 million, or 25.7%, from the $10.1 million reported in 2004. Our FDICassessment remained the same at $1.1 million as compared to 2004. The calculation of the premiums is basedon our deposit portfolio and escrow accounts. We paid $7.2 million in communication expense for the year-ended December 31, 2005. These expenses typically include telephone, fax and other types of electroniccommunication. The slight increase in communication expenses is reflective of additional branch locations.We pay taxes in the various states and local communities in which we are located and do business. For theyear ended December 31, 2005 our state and local taxes totaled $10.1 million, a decrease of $1.9 million,which is the result of a decrease in taxable earnings. Other expense totaled $46.4 million during 2005. Thefluctuation in the expenses is reflective of the varied levels of loan production, the expansion undertaken inour banking operation offset by the closing of the non-profitable home loan centers.
SFAS 91
Certain loan origination fees and costs are capitalized and recorded as an adjustment to the basis of theindividual loans originated. These fees and costs are amortized or accreted into income as an adjustment to theloan yield over the life of the loan or expensed when the loan is sold. Accordingly, during 2006, we deferred$93.5 million of gross loan origination costs, while during 2005 and 2004 the deferred expenses totaled$117.1 million and $154.1 million, respectively. These costs have not been offset by the revenue deferred forSFAS 91 purposes. During the year to date in 2006 and the years 2005, and 2004, we deferred $43.4 million,$59.0 million, and $65.0 million in qualifying loan fee revenue, respectively. For further information, see“Loan Fees and Charges,” above.
On a per loan basis, the cost deferrals totaled $992, $816, and $815 during 2006, 2005, and 2004,respectively. Net of deferred fee income, the cost deferred per loan totaled $531, $405, and $471 for years2006, 2005, and 2004, respectively. While revenue per loan has remained somewhat constant on a per loanbasis, our loan origination costs have increased over the three-year period. Inflationary increases and theincreased costs associated with our shift to retail and correspondent funding versus wholesale funding are themajor reasons for these increases. This shift can also be seen in the cost of commissions, which is a deferrableitem. On a per loan basis, the cost deferrals for commissions totaled $788, $566, and $559 during 2006, 2005,and 2004, respectively.
36

Provision for Federal Income Taxes
For the year ended December 31, 2006, our provision for federal income taxes as a percentage of pretaxearnings was 35.2% compared to 35.6% in 2005 and 35.2% in 2004. For each period, the provision for federalincome taxes varies from statutory rates primarily because of certain non-deductible corporate expenses. Referto Note 18 of the Notes to the Consolidated Financial Statements, in Item 8. Financial Statements andSupplementary Data herein for further discussion of our federal income taxes.
Analysis of Items on Statement of Financial Condition
Mortgage-Backed Securities Held to Maturity. Mortgage-backed securities held to maturity increasedfrom $1.4 billion at December 31, 2005 to $1.6 billion at December 31, 2006. The increase was due to therecharacterization of certain mortgage loans held for investment to mortgage-backed securities throughguaranteed mortgage securitizations. This allowed us to obtain credit enhancement on these loans and therebyreduce our credit risk. During 2006, we converted $558.7 million of mortgage loans in our portfolio tomortgage-backed securities through a combination or government sponsored entities and the completion of aprivate securitization.
At December 31 2006 and 2005, approximately $1.0 billion and $1.2 billion, respectively, of thesemortgage-backed securities were pledged as collateral under security repurchase agreements. This allowed usto obtain funds at a lower cost than our FHLB advances. In addition, at December 31, 2005, $2.9 million ofthe mortgage-backed securities were pledged as collateral for interest rate swap agreements.
Securities Available for Sale. Securities available for sale, which are comprised of mortgage-backedsecurities, collateralized mortgage obligations and residual interests from securitizations of mortgage loanproducts increased from $26.1 million at December 31, 2005, to $617.5 million at December 31, 2006. Theincrease was due to the purchase of $574.9 million in mortgage-backed and collateralized mortgage obligationsecurities and completion of two additional private securitizations during the year of fixed second mortgageloans and home equity revolving lines of credit loans, that resulted in residual interests of $21.7 million, offsetby a $6.1 million reduction in fair value of the residual interest related to our December 2005 securitization.
Other Investments. Our investment portfolio increased from $22.0 million at December 31, 2005 to$24.0 million at December 31, 2006. Investment securities consist of contractually required collateral,regulatory required collateral, and investments made by our non-bank subsidiaries.
Loans Available for Sale. We sell a majority of the mortgage loans we produce into the secondarymarket on a whole loan basis or by securitizing the loans into mortgage-backed securities. We generally sell orsecuritize our longer-term, fixed-rate mortgage loans, while we hold the shorter duration and adjustable ratemortgage loans for investment. At December 31, 2006, we held loans available for sale of $3.2 billion, whichwas an increase of $1.4 billion from $1.8 billion held at December 31, 2005. Our loan production is typicallyinversely related to the level of long-term interest rates. As long-term rates decrease, we tend to originate anincreasing number of mortgage loans. A significant amount of the loan origination activity during periods offalling interest rates is derived from refinancing of existing mortgage loans. Conversely, during periods ofincreasing long-term rates increase, loan originations tend to decrease.
37

The following table shows the activity in our portfolio of loans available for sale during the past fiveyears:
LOANS AVAILABLE FOR SALE ACTIVITY SCHEDULE
2006 2005 2004 2003 2002For the Years Ended December 31,
(In thousands)
Balance, beginning of year $ 1,773,394 $ 1,506,311 $ 2,759,551 $ 3,302,212 $ 2,746,791Loans originated, net 18,013,671 25,172,510 31,891,486 55,866,218 43,703,804Loans sold servicing retained, net (13,974,425) (21,608,937) (27,749,138) (49,681,387) (39,261,704)Loans sold servicing released, net (2,395,466) (1,855,700) (1,352,789) (2,461,326) (1,297,372)Loan amortization/ prepayments (1,246,419) (1,040,315) (1,745,708) (1,652,811) (461,983)Loans transferred from (to) variousloan portfolios, net 1,018,040 (400,475) (2,297,091) (2,613,355) (2,127,324)
Balance, end of year $ 3,188,795 $ 1,773,394 $ 1,506,311 $ 2,759,551 $ 3,302,212
Loans Held for Investment. Our largest category of earning assets consists of our loans held forinvestment portfolio. Loans held for investment consists of residential mortgage loans that we do not hold forresale (usually shorter duration and adjustable rate loans and second mortgages), other consumer loans,commercial real estate loans, construction loans, warehouse loans to other mortgage lenders, and various typesof commercial loans such as business lines of credit, working capital loans and equipment loans. Loans heldfor investment decreased from $10.6 billion in December 2005, to $8.9 billion in December 2006. Mortgageloans held for investment decreased $2.0 billion to $6.2 billion, second mortgage loans increased $14.7 millionto $715.2 million, commercial real estate loans increased $0.3 billion to $1.3 billion and consumer loansdecreased $70.7 million to $340.2 million. The following table sets forth a breakdown of our loans held forinvestment portfolio at December 31, 2006:
LOANS HELD FOR INVESTMENT, BY RATEFixedRate
AdjustableRate
RateTotal
(In thousands)
Mortgage loans $ 713,529 $5,498,236 $6,211,765
Second mortgage loans 594,237 120,917 715,154
Commercial real estate loans 616,012 685,807 1,301,819
Construction loans 22,508 42,020 64,528Warehouse lending - 291,656 291,656
Consumer 94,593 245,564 340,157
Non-real estate commercial loans 4,167 10,439 14,606
Total $2,045,046 $6,894,639 $8,939,685
38

The two tables below provide detail for the activity and the balance in our loans held for investmentportfolio over the past five years.
LOANS HELD FOR INVESTMENT
2006 2005 2004 2003 2002At December 31,
(In thousands)
Mortgage loans $6,211,765 $ 8,248,897 $ 8,693,768 $5,478,200 $2,579,448
Second mortgage loans 715,154 700,492 196,518 141,010 214,485
Commercial real estate loans 1,301,819 995,411 751,730 549,456 445,668
Construction loans 64,528 65,646 67,640 58,323 54,650
Warehouse lending 291,656 146,694 249,291 346,780 558,782
Consumer loans 340,157 410,920 591,107 259,656 124,806
Non-real estate commercial loans 14,606 8,411 9,100 8,638 8,912
Total loans held for investmentportfolio 8,939,685 10,576,471 10,559,154 6,842,063 3,986,751
Allowance for loan losses (45,779) (39,140) (38,318) (37,828) (39,389)
Total loans held for investmentportfolio, net $8,893,906 $10,537,331 $10,520,836 $6,804,235 $3,947,362
LOANS HELD FOR INVESTMENT PORTFOLIO ACTIVITY SCHEDULE
2006 2005 2004 2003 2002For the Years Ended December 31,
(In thousands)
Balance, beginning of year $10,576,471 $10,559,154 $ 6,842,063 $ 3,986,751 $ 3,166,732
Loans originated 2,406,068 5,101,206 4,840,028 1,901,105 586,809
Change in lines of credit (244,666) 186,041 (189,696) 1,267,338 331,826
Loans transferred (to) fromvarious portfolios, net (1,018,040) 400,475 2,297,091 2,613,355 2,127,324
Loan amortization / prepayments (2,696,441) (5,622,989) (3,190,640) (2,890,680) (2,177,918)
Loans transferred to repossessedassets (83,707) (47,416) (39,692) (35,806) (48,022)
Balance, end of year $ 8,939,685 $10,576,471 $10,559,154 $ 6,842,063 $ 3,986,751
39

Quality of Earning Assets
The following table sets forth certain information about our non-performing assets as of the end of thelast five years. As of December 31, 2006, we had no other loans outstanding where known information aboutpossible credit problems of borrowers caused management concern regarding the ability of the same borrowersto comply with the loan repayment terms.
NON-PERFORMING LOANS
2006 2005 2004 2003 2002At December 31,
(In thousands)
Non-accrual loans $ 57,071 $ 64,466 $ 57,026 $ 58,334 $ 68,032
Repurchased non-performing assets, net 22,096 34,777 35,013 11,956 10,404
Real estate and other repossessed assets, net 80,995 47,724 37,823 36,778 45,094
Total non-performing assets, net $160,162 $146,967 $129,862 $107,068 $123,530
Ratio of non-performing assets to total assets 1.03% 0.98% 0.99% 1.01% 1.51%
Ratio of non-performing loans to loans held forinvestment 0.64% 0.61% 0.54% 0.85% 1.71%
Ratio of allowance to non-performing loans 80.21% 60.71% 67.19% 64.85% 57.90%
Ratio of allowance to loans held for investment 0.51% 0.37% 0.36% 0.55% 0.99%
Ratio of net charge-offs to average loans heldfor investment 0.20% 0.16% 0.16% 0.35% 0.51%
Delinquent Loans. Loans are considered to be delinquent when any payment of principal or interest ispast due. While it is the goal of management to work out a satisfactory repayment schedule with a delinquentborrower, we will undertake foreclosure proceedings if the delinquency is not satisfactorily resolved. Ourprocedures regarding delinquent loans are designed to assist borrowers in meeting their contractual obligations.We customarily mail several notices of past due payments to the borrower within 30 days after the due date,and late charges are assessed in accordance with certain parameters. Our collection department makestelephone or personal contact with borrowers after a 30-day delinquency. In certain cases, we recommend thatthe borrower seek credit-counseling assistance and may grant forbearance if it is determined that the borroweris likely to correct a loan delinquency within a reasonable period of time. We cease the accrual of interest onloans that we classify as “non-performing” because they are more than 90 days delinquent. Such interest isrecognized as income only when it is actually collected. At December 31, 2006, we had $119.4 million inloans that were determined to be delinquent. Of those delinquent loans, $57.1 million of loans were non-performing, of which $51.8 million, or 90.7%, were single-family residential mortgage loans.
The following table sets forth information regarding delinquent loans as of the end of the last three years(in thousands):
DELINQUENT LOANS
Days Delinquent 2006 2005 2004At December 31,
30 $ 40,140 $ 30,972 $ 34,346
60 22,163 20,456 13,247
90 57,071 64,466 57,026
Total $119,374 $115,894 $104,619
We currently calculate our delinquent loans using a method required by the Office of Thrift Supervision,when we prepare regulatory reports that we submit to the OTS each quarter. This method also called the “OTS
40

Method”, considers a loan to be delinquent if no payment is received after the first day of the month followingthe month of the missed payment. Other companies with mortgage banking operations similar to ours usuallyuse the Mortgage Bankers Association Method (“MBA Method”) which considers a loan to be delinquent ifpayment is not received by the end of the month of the missed payment. The key difference between the twomethods is that a loan considered “delinquent” under the MBA Method would not be considered “delinquent”under the OTS Method for another 30 days. Under the MBA Method of calculating delinquent loans, 30 daydelinquencies equaled $117.6 million, 60 day delinquencies equaled $40.1 million and 90 day delinquenciesequaled $80.2 million at December 31, 2006. Total delinquent loans under the MBA Method total $237.9 mil-lion or 2.66% of loans held for investment at December 31, 2006. By comparison, delinquent loans at year-end 2005 totaled $252.0 million, or 2.38% of total loans held for investment at December 31, 2005.
The following table sets forth information regarding non-performing loans as to which we have ceasedaccruing interest (in thousands):
NON-ACCRUAL LOANS
InvestmentLoan
Portfolio
Non-Performing
Loans
As a % ofLoan
SpecifiedPortfolio
As a % ofNon-
PerformingLoans
At December 31, 2006
Mortgage loans $6,211,765 $47,582 0.77% 83.4%
Second mortgages 715,154 497 0.07% 0.8%
Commercial real estate 1,301,819 5,132 0.39% 9.0%
Construction 64,528 1,474 2.28% 2.6%
Warehouse lending 291,656 — 0.00% 0.0%
Consumer 340,157 2,386 0.70% 4.2%
Commercial non-real estate 14,606 — 0.00% 0.0%
Total loans 8,939,685 $57,071 0.64% 100.0%
Less allowance for loan losses (45,779)
Total investment loans (net of allowance) $8,893,906
Allowance for Loan Losses. The allowance for loan losses represents management’s estimate of probablelosses in our loans held for investment portfolio as of the date of the consolidated financial statements. Theallowance provides for probable losses that have been identified with specific customer relationships and forprobable losses believed to be inherent in the loan portfolio, but that have not been specifically identified.
We perform a detailed credit quality review annually on large commercial loans as well as on selectedother smaller balance commercial loans and may allocate a specific portion of the allowance to such loansbased upon this review. Commercial and commercial real estate loans that are determined to be substandardand exceed $1.0 million are treated as impaired and individually evaluated to determine the necessity of aspecific reserve in accordance with the provisions of SFAS 114, Accounting by Creditors for Impairment of aLoan. This pronouncement requires a specific allowance to be established as a component of the allowance forloan losses when it is probable all amounts due will not be collected pursuant to the contractual terms of theloan and the recorded investment in the loan exceeds its fair value. Fair value is measured using either thepresent value of the expected future cash flows discounted at the loan’s effective interest rate, the observablemarket price of the loan, or the fair value of the collateral if the loan is collateral dependent, reduced byestimated disposal costs. In estimating the fair value of collateral, we utilize outside fee-based appraisers toevaluate various factors, such as occupancy and rental rates in our real estate markets and the level ofobsolescence that may exist on assets acquired from commercial business loans.
A portion of the allowance is also allocated to the remaining commercial loans by applying projected lossratios, based on numerous factors identified below, to the loans within the different risk ratings.
41

Additionally, management has sub-divided the homogeneous portfolios, including consumer and residen-tial mortgage loans, into categories that have exhibited a greater loss exposure (such as sub-prime loans andloans that are not salable on the secondary market because of collateral or documentation issues). The portionof the allowance allocated to other consumer and residential mortgage loans is determined by applyingprojected loss ratios to various segments of the loan portfolio. Projected loss ratios incorporate factors such asrecent charge-off experience, current economic conditions and trends, trends with respect to past due and non-accrual amounts, and are supported by underlying analysis.
Management maintains an unallocated allowance to recognize the uncertainty and imprecision underlyingthe process of estimating expected loan losses. Determination of the probable losses inherent in the portfolio,which are not necessarily captured by the allocation methodology discussed above, involve the exercise ofjudgment.
As the process for determining the adequacy of the allowance requires subjective and complex judgmentby management about the effect of matters that are inherently uncertain, subsequent evaluations of the loanportfolio, in light of the factors then prevailing, may result in significant changes in the allowance for loanlosses. In estimating the amount of credit losses inherent in our loan portfolio, various assumptions are made.For example, when assessing the condition of the overall economic environment, assumptions are maderegarding current economic trends and their impact on the loan portfolio. In the event the national economywere to sustain a prolonged downturn, the loss factors applied to our portfolios may need to be revised, whichmay significantly impact the measurement of the allowance for loan losses. For impaired loans that arecollateral dependent, the estimated fair value of the collateral may deviate significantly from the proceedsreceived when the collateral is sold.
The allowance for loan losses totaled $45.8 million at December 31, 2006, an increase of $6.7 million, or17.1% from the $39.1 million at December 31, 2005. The allowance for loan losses as a percentage of non-performing loans was 80.2% and 60.7% at December 31, 2006 and 2005, respectively. During 2006, werecorded a provision for loan losses of $25.4 million compared to a provision of $18.9 million recorded in2005 and $16.1 million in 2004. Net charge-offs in 2006 equaled $18.8 million compared to $18.1 million in2005 and $15.6 million in 2004. Net charge-offs in 2006 equaled 0.20% of average investment loans comparedto 0.16% and 0.16% in 2005 and 2004, respectively.
The following tables set forth certain information regarding our allowance for loan losses as ofDecember 31, and activity in the allowance for loan losses during the past five years:
ALLOWANCE FOR LOAN LOSSES
InvestmentLoan
Portfolio
Percentof
PortfolioReserveAmount
Percentageto TotalReserve
At December 31, 2006
(Dollars in thousands)
Mortgage loans $6,211,765 69.5% $16,355 35.7%
Second mortgages 715,154 8.0 6,627 14.5
Commercial real estate 1,301,819 14.5 7,748 16.9
Construction 64,528 0.7 762 1.7
Warehouse lending 291,656 3.3 672 1.5
Consumer 340,157 3.8 11,091 24.2
Commercial non-real estate 14,606 0.2 362 0.8
Unallocated — 0.0 2,162 4.7
Total $8,939,685 100.0% $45,779 100.0%
42

ALLOCATION OF THE ALLOWANCE FOR LOAN LOSSES
ReserveAmount
LoansTo
TotalLoans
ReserveAmount
LoansTo
TotalLoans
ReserveAmount
LoansTo
TotalLoans
ReserveAmount
LoansTo
TotalLoans
ReserveAmount
LoansTo
TotalLoans
(Dollars in thousands)
2006 2005 2004 2003 2002At December 31,
Mortgage loans $16,355 69.5% $20,466 78.0% $17,304 82.0% $20,347 80.1% $26,008 64.7%
Second mortgages 6,627 8.0% 7,156 6.6% 3,318 1.9% 2,129 2.1% 3,502 5.4%
Commercial real estate 7,748 14.5% 5,315 9.4% 2,319 7.1% 7,532 8.0% 2,823 11.2%
Construction 762 0.7% 604 0.6% 3,538 0.6% 2,380 0.8% 2,852 1.4%
Warehouse lending 672 3.3% 334 1.4% 5,167 2.4% 273 5.1% 385 14.0%
Consumer 11,091 3.8% 3,396 3.9% 4,924 5.9% 3,710 3.8% 2,571 3.1%
Commercial non- realestate 362 0.2% 729 0.1% 1,748 0.1% 1,457 0.1% 1,248 0.2%
Unallocated 2,162 — 1,140 — — — — — — —
Total $45,779 100.0% $39,140 100.0% $38,318 100.0% $37,828 100.0% $39,389 100.0%
ACTIVITY IN THE ALLOWANCE FOR LOAN LOSSES
2006 2005 2004 2003 2002For the Years Ended December 31,
(Dollars in thousands)
Beginning balance $ 39,140 $ 38,318 $ 37,828 $ 39,389 $ 29,417
Provision for loan losses 25,450 18,876 16,077 20,081 27,126
Charge-offs
Mortgage loans (9,833) (11,853) (14,629) (20,455) (14,263)
Consumer loans (7,806) (4,713) (1,147) (881) (1,234)
Commercial loans (1,414) (3,055) (680) (1,048) (1,067)
Construction loans — — (2) (313) (5)
Other (2,560) (286) (717) (298) (1,078)
Total charge offs (21,613) (19,907) (17,175) (22,995) (17,647)
Recoveries
Mortgage loans 665 1,508 1,081 641 5
Consumer loans 1,720 247 242 393 78
Commercial loans 40 98 265 114 410
Construction loans — — — — —
Other 377 — — 205 —
Total recoveries 2,802 1,853 1,588 1,353 493
Charge-offs, net of recoveries (18,811) (18,054) (15,587) (21,642) (17,154)
Ending balance $ 45,779 $ 39,140 $ 38,318 $ 37,828 $ 39,389
Net charge-off ratio 0.20% 0.16% 0.16% 0.35% 0.51%
Repossessed Assets. Real property that we acquire as a result of the foreclosure process is classified as“real estate owned” until it is sold. Our foreclosure committee decides whether to rehabilitate the property orsell it “as is” and whether to list the property with a broker. Generally, we are able to dispose of a substantialportion of this type of real estate and other repossessed assets during each year, but we invariably acquire
43

additional real estate and other assets through repossession in the ordinary course of business. At December 31,2006, we had $81.0 million of repossessed assets compared to $47.7 million at December 31, 2005.
The following schedule provides the activity for repossessed assets during each of the past five years:
NET REPOSSESSED ASSET ACTIVITY
2006 2005 2004 2003 2002(In thousands)
Beginning balance $ 47,724 $ 37,823 $ 36,778 $ 45,094 $ 38,868
Additions 83,707 48,546 42,668 38,991 45,488
Disposals (50,436) (38,645) (41,623) (47,307) (39,262)
Ending balance $ 80,995 $ 47,724 $ 37,823 $ 36,778 $ 45,094
Repurchased Assets. We sell a majority of the mortgage loans we produce into the secondary market ona whole loan basis or by securitizing the loans into mortgage-backed securities. When we sell or securitizemortgage loans, we make customary representations and warranties to the purchasers about various character-istics of each loan, such as the manner of origination, the nature and extent of underwriting standards appliedand the types of documentation being provided. When a loan that we have sold or securitized fails to performaccording to its contractual terms, the purchaser will typically review the loan file to determine whetherdefects in the origination process occurred and if such defects constitute a violation of our representations andwarranties. If there are no such defects, we have no liability to the purchaser for losses it may incur on suchloan. If a defect is identified, we may be required to either repurchase the loan or indemnify the purchaser forlosses it sustains on the loan. Loans that are repurchased and that are performing according to their terms areincluded within our loans held for investment portfolio. Repurchased assets are loans we have reacquiredbecause of representation and warranties issues related to loan sales or securitizations and that are non-performing. During 2006 and 2005, we repurchased $68.4 million and $56.5 million in non-performing loans,respectively. The principal balance of these repurchased assets totaled $9.6 million and $13.6 million atDecember 31, 2006 and 2005, respectively, and is included within other assets in our consolidated statementsof financial condition.
The following table sets forth the amount of non-performing loans we have repurchased during the pastfive years, organized by the year of origination:
REPURCHASED ASSETS
YearTotal Loan Sales
and Securitizations
TotalNon-performing
RepurchasedLoans
% ofSales
(Dollars in thousands)
2002 $ 40,495,894 $ 50,529 0.12%
2003 51,922,757 29,214 0.06%
2004 28,937,576 35,469 0.12%
2005 24,703,575 18,539 0.08%
2006 16,968,994 452 0.00%
Totals $163,028,796 $134,203 0.08%
Accrued Interest Receivable. Accrued interest receivable increased from $48.4 million at December 31,2005 to $52.8 million at December 31, 2006 as our total earning assets increased. We typically collect interestin the month following the month in which it is earned.
FHLB Stock. Holdings of FHLB stock decreased from $292.1 million at December 31, 2005, to$277.6 million at December 31, 2006. This decrease was the result of the redemption of a portion of our
44

FHLB stock by the FHLB. As a member of the FHLB, we are required to hold shares of FHLB stock in anamount at least equal to 1% of the aggregate unpaid principal balance of our mortgage loans, home purchasecontracts and similar obligations at the beginning of each year, or 1/20th of our FHLB advances, whichever isgreater. Management believes that the volume of our holdings of FHLB stock do not constitute a controllingor significant interest in the FHLB. As such, management does not believe that the FHLB is an affiliate or canin any other way be deemed to be a related party.
Premises and Equipment. Premises and equipment, net of accumulated depreciation, totaled $219.2 mil-lion at December 31, 2006, an increase of $18.4 million, or 9.2%, from $200.8 million at December 31, 2005.During 2006, we added 14 additional banking centers and continued to invest in computer equipment. Inaddition, we acquired land for future bank expansion.
Mortgage Servicing Rights. Mortgage servicing rights totaled $173.3 million at December 31, 2006, adecrease of $142.4 million, from $315.7 million at December 31, 2005. The decrease reflects our capitalizationof $223.9 million of MSRs, sales of $296.2 million of MSRs and amortization of $69.6 million of MSRs. Therecorded amount of the MSR portfolio at December 31, 2006 and 2005 as a percentage of the unpaid principalbalance of the loans we are servicing was 1.15% and 1.06%, respectively. When our home lending operationsells mortgage loans in the secondary market, it usually retains the right to continue to service the mortgageloans for a fee. The weighted average service fee on loans serviced for others is currently 0.37% of the loanprincipal balance outstanding. The amount of MSRs initially recorded is based on the fair value of the MSRsdetermined on the date when the underlying loan is sold. Our determination of fair value, and thus the amountwe record (i.e., the capitalization amount) is based on estimated values paid by third party buyers in recentservicing rights sale transactions, internal valuations, and market pricing. Estimates of fair value reflect thefollowing variables:
• Anticipated prepayment speeds (also known as the Constant Prepayment Rate)
• Product type (i.e., conventional, government, balloon)
• Fixed or adjustable rate of interest
• Interest rate
• Term (i.e. 15 or 30 years)
• Servicing costs per loan
• Discounted yield rate
• Estimate of ancillary income such as late fees, prepayment fees, etc.
The most important assumptions used in the MSR valuation model are anticipated annual loanprepayment speeds. During 2006, these speeds ranged between 15% and 30% on new production loans. Thefactors used for those assumptions are selected based on market interest rates and other market assumptions.Their reasonableness is confirmed through surveys conducted with independent third parties.
On an ongoing basis, the MSR portfolio is internally valued to assess any impairment in the asset. Theseimpairment analyses consider the same variables that we address in determining the value of the portfolio atthe financial statement date. In addition, a third party valuation of the MSR portfolio is obtained annually toconfirm the reasonableness of the value generated by the internal valuation model.
At December 31, 2006 and 2005, the fair value of the MSR portfolio was $197.6 million and$421.1 million, respectively. At December 31, 2006, the fair value of each MSR was based upon the followingweighted-average assumptions: (1) a discount rate of 10.3%; (2) an anticipated loan prepayment rate of 28.5%CPR; and (3) servicing costs per conventional loan of $42 and $45 for each government or adjustable-rateloan, respectively.
45

The following table sets forth activity in loans serviced for others during the past five years (inthousands):
LOANS SERVICED FOR OTHERS ACTIVITY SCHEDULE
2006 2005 2004 2003 2002For the Years Ended December 31,
Balance, beginning of year $ 29,648,088 $21,354,724 $ 30,395,079 $ 21,586,797 $ 14,222,802
Loans servicing originated 16,370,925 21,595,729 27,584,787 49,461,431 39,198,521Loan amortization /prepayments (3,376,219) (4,220,504) (6,985,894) (9,982,414) (3,329,825)Loan servicing sales (27,610,290) (9,081,861) (29,639,248) (30,670,735) (28,504,701)
Balance, end of year $ 15,032,504 $29,648,088 $ 21,354,724 $ 30,395,079 $ 21,586,797
Other Assets. Other assets decreased $69.2 million, or 35.4%, to $126.5 million at December 31, 2006,from $195.7 million at December 31, 2005. The majority of this decrease was attributable to a paymentsreceived on receivables recorded in conjunction with MSR sales transacted during the latter part of 2005.Upon the sale of MSRs, we typically receive a down payment from the purchaser equivalent to approximately20% of the total purchase price and record a receivable account for the balance of the purchase price due.This recorded receivable is typically collected within a six-month time frame.
Liabilities
Deposits. Deposit accounts decreased $0.6 billion, or 7.5%, to $7.4 billion at December 31, 2006, from$8.0 billion at December 31, 2005. We believe that this decrease reflects, in part, our decision to adhere to apricing discipline on deposits in highly competitive markets to control our cost of funds. We increased thenumber of banking centers from 137 at December 31, 2005 to 151 at December 31, 2006.
Our deposits can be subdivided into three areas: the retail division, the municipal division, and thenational accounts division. Retail deposits accounts increased $0.1 billion, or 2.1% to $4.9 billion atDecember 31, 2006, from $4.8 billion at December 31, 2005. Saving and checking accounts totaled 10.71% oftotal retail deposits. In addition, at December 31, 2006, retail certificates of deposit totaled $3.8 billion, withan average balance of $25,200 and a weighted average cost of 4.86% while money market deposits totaled$608.3 million, with an average cost of 4.04%. Overall, the retail division had an average cost of deposits of4.38%.
We call on local municipal agencies as another source for deposit funding. Although these depositaccounts remained stable at $1.4 billion as of December 31, 2006 and 2005, they fluctuate during the year asthe municipalities collect semi-annual assessments and make necessary disbursements over the following six-months. These deposits had a weighted average cost of 5.33% at December 31, 2006. These deposit accountsinclude $1.3 billion of certificates of deposit with maturities typically less than one year and $87.3 million inchecking and savings accounts.
In past years, our national accounts division garnered funds through nationwide advertising of depositrates and the use of investment banking firms. Since 2005, we have not solicited any funds through thedivision as we have been able to access more attractive funding sources through FHLB advances, securityrepurchase agreements and other forms of deposits that provide the potential for a long term customerrelationship. These deposit accounts decreased $0.7 billion, or 38.9%, to $1.1 billion at December 31, 2006,from $1.8 billion at December 31, 2005. These deposits had a weighted average cost of 3.66% at December 31,2006.
46

The deposit accounts are as follows at December 31, (in thousands):
2006 2005At December 31,
Demand accounts $ 380,162 $ 374,816
Savings accounts 144,460 239,215
MMDA 608,282 781,087
Certificates of deposit(1) 3,763,781 3,450,450
Total retail deposits 4,896,685 4,845,568
Municipal deposits 1,419,964 1,353,633National accounts 1,062,646 1,779,799
Total deposits $7,379,295 $7,979,000
(1) The aggregate amount of certificates of deposit with a minimum denomination of $100,000 was approxi-mately $2.6 billion and $2.4 billion at December 31, 2006 and December 31, 2005, respectively.
Interest Rate Swaps. In October 2003, we entered into a series of interest rate swaps to offset ourexposure to rising rates on a portion of our certificates of deposit portfolio. The notional amount of theseswaps totaled $500 million. Contractually, we receive a floating rate tied to LIBOR and pay a fixed rate. Theswaps are categorized in two groups: the first receiving one-month LIBOR and the second receiving three-month LIBOR. These swaps have maturities ranging from three to five years. These interest rate swapseffectively act as a cash flow hedge against a rise in the cost of our deposits. On December 30, 2004, weextinguished $250 million of the swaps for an after-tax gain of $2.6 million. This gain was deferred and isbeing reclassified into earnings from accumulated other comprehensive income over three years, which is theoriginal duration of the extinguished swaps.
On December 19, 2002, we, through our subsidiary Flagstar Statutory Trust II, completed a privateplacement sale of trust-preferred securities. As part of the transaction, we entered into an interest rate swapagreement with the placement agent in which we pay a fixed rate of 6.88% on a notional amount of$25.0 million and receive a floating rate equal to that being paid on the Flagstar Statutory Trust II securities.
On September 22, 2005, we, through our subsidiary Flagstar Statutory Trust VIII, completed a privateplacement sale of trust-preferred securities. As part of the transaction, we entered into an interest rate swapwith the placement agent in which we are required to pay a fixed rate of 4.33% on a notional amount of$25.0 million and will receive a floating rate equal to that being paid on the Flagstar Statutory Trust VIIIsecurities. The swap matures on October 7, 2010. The securities are callable after October 7, 2010.
FHLB Advances. FHLB advances increased $1.2 billion, or 28.6%, to $5.4 billion at December 31, 2006,from $4.2 billion at December 31, 2005. We rely upon advances from the FHLB as a source of funding for theorigination or purchase of loans for sale in the secondary market and for providing duration-specific short-term and medium-term financing. The outstanding balance of FHLB advances fluctuates from time to timedepending upon our current inventory of mortgage loans available for sale and the availability of lower costfunding from our retail deposit base, the escrow accounts we hold, or alternative funding sources such asrepurchase agreements. See Note 15 of the Notes to the Consolidated Financial Statements, in Item 8.Financial Statements and Supplemental Data, herein for additional information on FHLB advances.
The portfolio of putable FHLB advances we hold, which matures in 2011, may be called by the FHLBbased on FHLB volatility models. If these advances are called, we will be forced to find an alternative sourceof funding, which could be at a higher cost and, therefore, negatively impact net earnings.
Security Repurchase Agreements. Security repurchase agreements declined $0.1 billion to $1.0 billion atDecember 31, 2006, from $1.1 billion at December 31, 2005. Securities sold under agreements to repurchaseare generally accounted for as collateralized financing transactions and are recorded at the amounts at whichthe securities were sold plus accrued interest. Securities, generally mortgage backed securities, are pledged ascollateral under these financing arrangements. The fair value of collateral provided to a party is continually
47

monitored, and additional collateral is obtained or requested to be returned, as appropriate. See Note 16 of theNotes to the Consolidated Financial Statements, in Item 8. Financial Statements and Supplemental Data,herein, for additional information on security repurchase agreements.
Long-Term Debt. As part of our overall capital strategy, we may raise capital through the issuance oftrust-preferred securities by our special purpose financing entities formed for the offerings. The trust preferredsecurities outstanding mature 30 years from issuance, are callable after five years, pay interest quarterly, andthe interest expense is deductible for federal income tax purposes. The majority of the net proceeds from theseofferings was contributed to the Bank as additional paid in capital and subject to regulatory limitations, isincludable as regulatory capital.
On April 27, 1999, we, through our subsidiary Flagstar Trust, completed the sale of 2.99 million sharesof 9.50% trust preferred securities, providing gross proceeds totaling $74.8 million. On April 30, 2004, theCompany redeemed the preferred securities. Flagstar Trust is currently inactive.
On December 19, 2002, we, through our subsidiary Flagstar Statutory Trust II, completed a privateplacement sale of trust-preferred securities, providing gross proceeds totaling $25.0 million. The securities payinterest at a floating rate of three-month LIBOR plus 3.25%, adjustable quarterly, after an initial rate of4.66%. As part of the transaction, we entered into an interest rate swap agreement with the placement agent inwhich we pay a fixed rate of 6.88% on a notional amount of $25.0 million and receive a floating rate equal tothat being paid on the Flagstar Statutory Trust II securities.
On February 19, 2003, we, through our subsidiary Flagstar Statutory Trust III, completed a privateplacement sale of trust-preferred securities, providing gross proceeds totaling $25.0 million. The securitieshave an effective cost for the first five years of 6.55% and a floating rate thereafter equal to the three-monthLIBOR rate plus 3.25% adjustable quarterly.
On March 19, 2003, we, through our subsidiary Flagstar Statutory Trust IV, completed a privateplacement sale of trust-preferred securities, providing gross proceeds totaling $25.0 million. The securitieshave an effective cost for the first five years of 6.75% and a floating rate thereafter equal to the three-monthLIBOR rate plus 3.25% adjustable quarterly.
On December 29, 2004, we, through our subsidiary Flagstar Statutory Trust V, completed a privateplacement sale of trust-preferred securities, providing gross proceeds totaling $25.0 million. The securitieshave a floating rate that reprices quarterly thereafter at three-month LIBOR plus 2.00%.
On March 30, 2005, we, through our subsidiary Flagstar Statutory Trust VI, completed a privateplacement sale of trust-preferred securities, providing gross proceeds totaling $25.0 million. The securitieshave a floating rate that reprices quarterly at three-month LIBOR plus 2.00%.
On March 31, 2005, we, through our subsidiary Flagstar Statutory Trust VII, completed a privateplacement sale of trust-preferred securities, providing gross proceeds totaling $50.0 million. The securitieshave an effective cost for the first five years of 6.47% and a floating rate thereafter equal to the three-monthLIBOR rate plus 2.00% adjustable quarterly.
On September 22, 2005, we, through our subsidiary Flagstar Statutory Trust VIII, completed a privateplacement sale of trust-preferred securities, providing gross proceeds totaling $25.0 million. The securitieshave a floating rate that reprices quarterly at three-month LIBOR plus 1.50%.
Accrued Interest Payable. Accrued interest payable increased $5.0 million, or 12.1%, to $46.3 million atDecember 31, 2006 from $41.3 million at December 31, 2005. These amounts represent interest payments thatare payable to depositors and other entities from which we borrowed funds. These balances fluctuate with thesize of our interest-bearing liability portfolio and the average cost of our interest-bearing liabilities. Theinterest-bearing liability portfolio increased 2.4% during the period and we had an 83 basis points increase inthe average cost of liabilities.
Undisbursed Payments. Undisbursed payments on loans serviced for others decreased $259.7 million, or63.8%, to $147.4 million at December 31, 2006, from $407.1 million at December 31, 2005. These amounts
48

represent payments received from borrowers for interest, principal and related loan charges, which have notbeen remitted to loan investors. These balances fluctuate with the size of the servicing portfolio and thetransferring of servicing to the purchaser in connection with servicing sales. Loans serviced for others atDecember 31, 2006, including subservicing of $0.2 billion, equaled $15.2 billion versus $34.6 billion atDecember 31, 2005.
Escrow Accounts. The amount of funds in escrow accounts decreased $74.5 million, or 34.0%, to$144.5 million at December 31, 2006, from $219.0 million at December 31, 2005. These accounts aremaintained on behalf of mortgage customers and include funds collected for real estate taxes, homeowner’sinsurance, and other insurance product liabilities. These balances fluctuate with the amount of loans serviced.The balances also fluctuate during the year depending upon the scheduled payment dates for the relatedliabilities. Total residential mortgage loans serviced at December 31, 2006, equaled $27.2 billion versus$41.8 billion at December 31, 2005, a 34.9% decrease.
Federal Income Taxes Payable. Income taxes payable decreased $45.6 million, or 60.6%, to $29.7 millionat December 31, 2006, from $75.3 million at December 31, 2005. See Note 18 of the Notes to theConsolidated Financial Statements, in Item 8. Financial Statements and Supplementary Data, herein.
Secondary Market Reserve. We sell most of the residential mortgage loans that we originate into thesecondary mortgage market. When we sell mortgage loans we make customary representations and warrantiesto the purchasers about various characteristics of each loan, such as the manner of origination, the nature andextent of underwriting standards applied and the types of documentation being provided. If a defect in theorigination process is identified, we may be required to either repurchase the loan or indemnify the purchaserfor losses it sustains on the loan. If there are no such defects, we have no liability to the purchaser for losses itmay incur on such loan. We maintain a secondary market reserve to account for the expected losses related toloans we might be required to repurchase (or the indemnity payments we may have to make to purchasers).The secondary market reserve takes into account both our estimate of expected losses on loans sold during thecurrent accounting period, as well as adjustments to our previous estimates of expected losses on loans sold.In each case these estimates are based on our most recent data regarding loan repurchases, actual credit losseson repurchased loans and recovery history, among other factors. Increases to the secondary market reserve forcurrent loan sales reduce our net gain on loan sales. Adjustments to our previous estimates are recorded as anincrease or decrease in our other fees and charges. The amount of the secondary market reserve equaled$24.2 million and $17.6 million at December 31, 2006 and 2005, respectively. See Note 19 of the Notes to theConsolidated Financial Statements, in Item 8. Financial Statements and Supplemental Data, herein.
Contractual Obligations and Commitments
We have various financial obligations, including contractual obligations and commercial commitments,which require future cash payments. Refer to Item 8. Financial Statements and Supplemental Data Notes 2, 12,14, 15, 16 and 17. The following table presents the aggregate annual maturities of contractual obligations(based on final maturity dates) at December 31, 2006 (in thousands):
Less than1 Year 1-3 Years 3-5 Years
More than5 Years Total
Deposits without stated maturities $1,220,216 $ — $ — $ — $ 1,220,216
Certificates of deposits 4,944,416 1,103,849 98,906 11,908 6,159,079
FHLB advances 2,757,000 1,250,000 1,150,000 250,000 5,407,000
Trust preferred securities — — — 206,197 206,197
Operating leases 5,911 7,300 3,464 1,983 18,658
Security repurchase agreements 990,806 — — — 990,806
Other debt 25 50 50 1,150 1,275
Total $9,918,374 $2,361,199 $1,252,420 $471,238 $14,003,231
49

Liquidity and Capital Resources
Our principal uses of funds include loan originations, operating expenses, the payment of dividends andstock repurchases. At December 31, 2006, we had outstanding rate-lock commitments to lend $1.8 billion inmortgage loans, along with outstanding commitments to make other types of loans totaling $160.4 million.These commitments may expire without being drawn upon and, therefore, do not necessarily represent futurecash requirements. Total commercial and consumer unused collateralized lines of credit totaled $1.6 billion atDecember 31, 2006.
Our operating expenses increase as we continue to expand our banking operations in Michigan, Indianaand Georgia. We generally do not expect new banking centers to operate profitably for 18 to 24 months,thereby requiring additional funding to cover their initial operating deficits.
We paid a total cash dividend of $38.1 million on our common stock during 2006. Any payment ofdividends in the future is subject to the determination of our board of directors. On January 30, 2007, ourboard of directors adopted a Stock Repurchase Program under which we are authorized to repurchase up to$40.0 million worth of our outstanding common stock. On February 27, 2007, the Company announced thatthe board of directors had increased the authorized repurchase amount from $40.0 million to $50.0 million.This program expires in twelve months from January 31, 2007. No shares have been repurchased under thisplan.
The Bank is subject to various regulatory capital requirements administered by the federal bankingagencies. Under capital adequacy guidelines and the regulatory framework for prompt corrective action, theBank must meet specific capital guidelines that involve quantitative measures of the Bank’s assets, liabilities,and certain off-balance-sheet items as calculated under regulatory accounting practices. The Bank’s capitalamounts and classification are also subject to qualitative judgments by regulators about components, riskweightings, and other factors.
Our primary sources of funds are customer deposits, loan repayments and sales, advances from the FHLB,repurchase agreements, cash generated from operations, and customer escrow accounts. Additionally, we haveissued trust preferred securities in seven separate offerings to the capital markets. We believe that these sourcesof capital will continue to be adequate to meet our liquidity needs for the foreseeable future. The followingsets forth certain additional information regarding our sources of liquidity.
Deposits. The following table sets forth information relating to our total deposit flows for each of theyears indicated:
2006 2005 2004 2003 2002For the Years Ended December 31,
(In thousands)
Beginning deposits $7,979,000 $7,379,655 $5,680,167 $4,373,889 $3,608,103
Interest credited 331,516 253,292 167,765 138,625 126,977
Net deposit increase (decrease) (931,221) 346,053 1,531,723 1,167,653 638,809
Total deposits, end of the year $7,379,295 $7,979,000 $7,379,655 $5,680,167 $4,373,889
Our decrease in net deposits in 2006 reflects the heightened competition for deposits in the Michigan andIndiana markets, which contain most of our banking centers.
Borrowings. The FHLB provides credit for savings institutions and other member financial institutions.We are currently authorized through a board resolution to apply for advances from the FHLB using ourmortgage loans as collateral. The FHLB generally permits advances up to 50% of a company’s “adjustedassets,” which are defined as assets reduced by outstanding advances. At December 31, 2006, our advancesfrom the FHLB totaled $5.4 billion, or 53.6% of adjusted assets. Through January 2007, we had authority andapproval from the FHLB to utilize up to $6.75 billion in collateralized borrowings. Beginning in February2007, we have authority and approval from the FHLB to utilize up to $7.5 billion in collateralized borrowings.
50

Security Repurchase Agreements. Securities sold under agreements to repurchase are generally accountedfor as collateralized financing transactions and are recorded at the amounts at which the securities were soldplus accrued interest. Securities, generally mortgage backed securities, are pledged as collateral under thesefinancing arrangements. The fair value of collateral provided to a party is continually monitored and additionalcollateral is obtained or requested to be returned, as appropriate. At December 31, 2006, security repurchaseagreements amounted to $1.0 billion. Also at December 31, 2006, security repurchase agreements weresecured by $1.0 billion of mortgage-backed securities held to maturity.
Loan Sales. Our home lending operation sells a significant portion of the mortgage loans that itoriginates. Sales of loans totaled $16.4 billion, or 87% of originations in 2006, compared to $23.5 billion, or78.3% of originations, in 2005. The reduction in sales during 2006 was attributable to the decrease inoriginations and the increased amount of loans retained by us for our own portfolio. As of December 31,2006, we had outstanding commitments to sell $2.2 billion of mortgage loans. Generally, these commitmentsare funded within 120 days.
Loan Principal Payments. In our capacity as an investor in loans, we derive funds from the repayment ofprincipal on the loans we hold in portfolio. Payments totaled $7.3 billion during 2006, an increase of$0.2 billion, or 2.7%, when compared with the $7.1 billion received in 2005. This large amount of principalrepayments was attributable to the increased loan portfolio offset somewhat from 2005 by the increase in theinterest rate environment.
LOAN REPAYMENT SCHEDULE
Within1 Year
1 Year to2 Years
2 Years to3 Years
3 Years to5 Years
5 Years to10 Years
10 Years to15 Years
Over15 Years Totals
At December 31, 2006
(In thousands)
Mortgage loans $ 90,022 $ 88,706 $ 87,408 $172,260 $418,053 $387,482 $4,911,279 $6,155,210
Second mortgage 22,560 21,845 21,154 40,969 95,938 80,754 429,483 712,703
Commercial real estate 138,400 123,729 110,613 197,774 389,607 183,100 162,347 1,305,570
Construction 64,878 — — — — — — 64,878
Warehouse lending 291,656 — — — — — — 291,656
Consumer 21,150 19,824 18,580 34,829 76,150 52,268 114,393 337,194
Commercial non-realestate 2,075 1,780 1,527 2,621 4,690 1,359 555 14,607
Total $630,741 $255,884 $239,282 $448,453 $984,438 $704,963 $5,618,057 $8,881,818
Escrow Funds. As a servicer of mortgage loans, we hold funds in escrow for investors, various insuranceentities, or for the government taxing authorities. At December 31, 2006, we held $144.5 million in theseescrows.
Impact of Off-Balance Sheet Arrangements
Financial Interpretation (“FIN”) FIN 46R requires us to separately report, rather than include in ourconsolidated financial statements, the separate financial statements of our wholly-owned subsidiaries FlagstarTrust, Flagstar Statutory Trust II, Flagstar Statutory Trust III, Flagstar Statutory Trust IV, Flagstar StatutoryTrust V, Flagstar Statutory Trust VI, Flagstar Statutory Trust VII and Flagstar Statutory Trust VIII. We did thisby reporting our investment in these entities under “other assets.”
Asset Securitization. The Bank, in its efforts to diversify its funding sources, occasionally transfers loansto a qualifying special purpose entity (“QSPE”) in a process known as a securitization in exchange for asset-backed securities. A QSPE is generally a trust that is severely limited in permitted activities, assets it mayhold, sell, exchange or distribute. When a company transfers assets to a QSPE, the transfer is generally treatedas a sale and the transferred assets are no longer recognized on the transferor’s balance sheet. The QSPE inturn will offer the sold loans to investors in the form of a security. The proceeds the QSPE receives from
51

investors are used to pay the company for the loans sold. The company will usually recognize a gain or losson the transfer. Statements of Financial Accounting Standards (SFAS) 140, Accounting for the Transfers andServicing of Financial Assets and Extinguishments of Liabilities, provides specific criteria to meet thedefinition of a QSPE. QSPE’s are required to be legally isolated from the transferor and bankruptcy remote,insulating investors from the impact of creditors of other entities, including the transferor, and are notconsolidated within the financial statements.
When a company sells or securitizes loans it generally retains the servicing rights of those loans and mayretain senior, subordinated, residual interests all of which are considered retained interest on the loans sold.Retained interests in securitizations were $42.5 million and $26.1 million at December 31, 2006 and 2005,respectively. Additional information concerning securitization transactions is included in Note 9 in the Notesto our Consolidated Financial Statements, in Item 8 Financial Statements and Supplemental Data, herein.
Impact of Inflation and Changing Prices
The Consolidated Financial Statements and Notes thereto presented herein have been prepared inaccordance with U.S. GAAP, which requires the measurement of financial position and operating results interms of historical dollars without considering the changes in the relative purchasing power of money overtime due to inflation. The impact of inflation is reflected in the increased cost of our operations. Unlike mostindustrial companies, nearly all of our assets and liabilities are monetary in nature. As a result, interest rateshave a greater impact on our performance than do the effects of general levels of inflation. Interest rates donot necessarily move in the same direction or to the same extent as the prices of goods and services.
Accounting and Reporting Developments
See Note 2 of the Notes to the Consolidated Financial Statements, Item 8 Financial Statements andSupplementary Data, herein for details of recently issued accounting pronouncements and their expectedimpact on our consolidated financial statements.
ITEM 7A. QUANTITATIVE AND QUALITATIVE DISCLOSURES ABOUT MARKET RISK
Market risk is the risk of loss arising from adverse changes in the fair value of financial instruments dueto changes in interest rates, currency exchange rates, or equity prices. We do not have any material foreigncurrency exchange risk or equity price risk. Interest rate risk is our primary market risk and results fromtiming differences in the repricing of assets and liabilities, changes in the relationships between rate indices,and the potential exercise of explicit or embedded options.
Interest rate risk is managed by the Executive Investment Committee (“EIC”), which is composed ofseveral of our executive officers and other members of management, in accordance with policies approved byour board of directors. The EIC formulates strategies based on appropriate levels of interest rate risk. Indetermining the appropriate level of interest rate risk, the EIC considers the impact projected interest ratescenarios have on earnings and capital, potential changes in interest rates, the economy, liquidity, businessstrategies, and other factors. The EIC meets monthly or as deemed necessary to review, among other things,the sensitivity of assets and liabilities to interest rate changes, the book and fair values of assets and liabilities,unrealized gains and losses, purchase and sale activity, loans available for sale and commitments to originateloans, and the maturities of investments, borrowings and time deposits. Any decision or policy change thatrequires implementation is directed to the Asset and Liability Committee (“ALCO”). The ALCO implementsany directive from the EIC and meets weekly to monitor liquidity, cash flow flexibility and deposit activity.
Financial instruments used to manage interest rate risk include financial derivative products such asinterest rate swaps and forward sales commitments. Further discussion of the use of and the accounting forderivative instruments is included in Notes 2 and 26 to the consolidated financial statements in Item 8 of thisreport. All of our derivatives are accounted for at fair market value. Although we have and will continue toeconomically hedge a portion of our mortgage loans available for sale, on October 1, 2005, for financialreporting purposes, we dedesignated all fair value hedges that solely related to our mortgage lending operation.This means that changes in the fair value of our forward sales commitments will not necessarily be offset bycorresponding changes in the fair value of our mortgage loans available for sale because the mortgage loans
52

available for sale are recorded at the lower of cost or market. In the future, additional volatility may beintroduced into our consolidated financial statements.
To effectively measure and manage interest rate risk, we use sensitivity analysis to determine the impacton net market value of various interest rate scenarios, balance sheet trends, and strategies. From thesesimulations, interest rate risk is quantified and appropriate strategies are developed and implemented.Additionally, duration and net interest income sensitivity measures are utilized when they provide added valueto the overall interest rate risk management process. The overall interest rate risk position and strategiesreviewed by our executive management and our board of directors on an ongoing basis. We have traditionallymanaged our business to reduce our overall exposure to changes in interest rates. However, management hasthe latitude to increase our interest rate sensitivity position within certain limits if, in management’s judgment,the increase will enhance profitability. We manage our exposure to interest rates by hedging ourselvesprimarily from rising rates.
In the past, the savings and loan industry measured interest rate risk using gap analysis. Gap analysis isone indicator of interest rate risk; however it only provides a glimpse into expected asset and liability repricingin segmented time frames. Today the thrift industry utilizes the concept of Net Portfolio Value (“NPV”). NPVanalysis provides a fair value of the balance sheet in alternative interest rate scenarios. The NPV does not takeinto account management intervention and assumes the new rate environment is constant and the change isinstantaneous.
The following table is a summary of the changes in our NPV that are projected to result fromhypothetical changes in market interest rates. NPV is the market value of assets, less the market value ofliabilities, adjusted for the market value of off-balance sheet instruments. The interest rate scenarios presentedin the table include interest rates at December 31, 2006 and 2005 and as adjusted by instantaneous parallelrate changes upward to 300 basis points and downward to 200 basis points. The 2006 and 2005 scenarios arenot comparable due to differences in the interest rate environments, including the absolute level of rates andthe shape of the yield curve.
The positive effect of a decline in market interest rates is reduced by the estimated effect of prepaymentson the value of single-family loans and MSRs. Further, this analysis is based on our interest rate exposure atDecember 31, 2006 and 2005, and does not contemplate any actions that we might undertake in response tochanges in market interest rates, which could impact NPV. Each rate scenario shows unique prepayment,repricing, and reinvestment assumptions. Management derives these assumptions by considering publishedmarket prepayment expectations, the repricing characteristics of individual instruments or groups of similarinstruments, our historical experience, and our asset and liability management strategy. Further, this analysisassumes that certain instruments would not be affected by the changes in interest rates or would be partiallyaffected due to the characteristics of the instruments.
There are limitations inherent in any methodology used to estimate the exposure to changes in marketinterest rates. It is not possible to fully model the market risk in instruments with leverage, option, orprepayment risks. Also, we are affected by basis risk, which is the difference in repricing characteristics ofsimilar term rate indices. As such, this analysis is not intended to be a precise forecast of the effect a changein market interest rates would have on us.
53

While each analysis involves a static model approach to a dynamic operation, the NPV model is thepreferred method. If NPV rises in an up or down interest rate scenario, that would dictate an up direction forthe margin in that hypothetical rate scenario. The same would be seen in a falling scenario. A perfectlymatched balance sheet would possess no change in the NPV, no matter what the rate scenario. The followingtable presents the NPV in the stated interest rate scenarios (in millions):
Scenario NPV NPV% $ Change % Change Scenario NPV NPV% $ Change % Change
2006 2005At December 31,
300 $ 908 6.19% $(428) (32.0)% 300 $1,022 7.10% $(288) (22.0)%
200 1,099 7.32 (237) (17.7) 200 1,166 7.93 (144) (11.0)
100 1,257 8.19 (79) (5.9) 100 1,278 8.54 (32) (5.2)
Current 1,336 8.56 — — Current 1,310 8.64 — —
�100 1,281 8.14 (55) (4.1) �100 1,192 7.83 (118) (9.0)
�200 1,206 7.62 (130) (9.8) �200 1,053 6.90 (257) (19.7)
54

ITEM 8. FINANCIAL STATEMENTS AND SUPPLEMENTARY DATA
Index to Consolidated Financial Statements
Management’s Report 56
Reports of Independent Registered Public Accounting Firms 57
Consolidated Statements of Financial Condition as of December 31, 2006 and 2005 59
Consolidated Statements of Earnings for the years ended December 31, 2006, 2005 and 2004 60
Consolidated Statements of Stockholders’ Equity and Comprehensive Income for the years endedDecember 31, 2006, 2005 and 2004 61
Consolidated Statements of Cash Flows for the years ended December 31, 2006, 2005 and 2004 62
Notes to Consolidated Financial Statements 63
55
February 26, 2007
Management’s Report
Flagstar Bancorp’s management is responsible for the integrity and objectivity of the informationcontained in this document. Management is responsible for the consistency of reporting this information andfor ensuring that accounting principles generally accepted in the United States of America are used.
In discharging this responsibility, management maintains a comprehensive system of internal controls andsupports an extensive program of internal audits, has made organizational arrangements providing appropriatedivisions of responsibility and has established communication programs aimed at assuring that its policies,procedures and principles of business conduct are understood and practiced by its employees.
The consolidated financial statements as of and for the years ended December 31, 2006 and 2005included in this document have been audited by Virchow, Krause & Company, LLP, an independent registeredpublic accounting firm. The consolidated financial statements for the year ended December 31, 2004 wereaudited by Grant Thornton LLP, an independent registered public accounting firm. All audits were conductedusing standards of the Public Company Accounting Oversight Board (United States) and the independentregistered public accounting firms’ reports and consents are included herein.
The Board of Directors’ responsibility for these consolidated financial statements is pursued mainlythrough its Audit Committee. The Audit Committee is composed entirely of directors who are not officers oremployees of Flagstar Bancorp, Inc., and meets periodically with the internal auditors and independentregistered public accounting firm, both with and without management present, to assure that their respectiveresponsibilities are being fulfilled. The internal auditors and independent registered public accounting firmhave full access to the Audit Committee to discuss auditing and financial reporting matters.
/s/ Mark T. HammondMark T. HammondPresident and Chief Executive Officer
/s/ Paul D. BorjaPaul D. BorjaExecutive Vice-President and Chief Financial Officer
56

Report of Independent Registered Public Accounting Firm
Board of Directors and ShareholdersFlagstar Bancorp, Inc.
We have audited the accompanying consolidated statements of financial condition of Flagstar Bancorp,Inc. and subsidiaries (the Company) as of December 31, 2006 and 2005, and the related consolidatedstatements of earnings, stockholders’ equity and comprehensive income, and cash flows for the years thenended. These financial statements are the responsibility of the Company’s management. Our responsibility isto express an opinion on these financial statements based on our audits.
We conducted our audits in accordance with the standards of the Public Company Accounting OversightBoard (United States). Those standards require that we plan and perform the audit to obtain reasonableassurance about whether the financial statements are free of material misstatement. An audit includesexamining, on a test basis, evidence supporting the amounts and disclosures in the financial statements. Anaudit also includes assessing the accounting principles used and significant estimates made by management, aswell as evaluating the overall financial statement presentation. We believe that our audits provide a reasonablebasis for our opinion.
In our opinion, the financial statements referred to above present fairly, in all material respects, theconsolidated financial position of Flagstar Bancorp, Inc. and subsidiaries as of December 31, 2006 and 2005,and the consolidated results of their operations and their cash flows for the years then ended in conformitywith U.S. generally accepted accounting principles.
We also have audited, in accordance with the standards of the Public Company Accounting OversightBoard (United States), the effectiveness of Flagstar Bancorp, Inc.’s internal control over financial reporting asof December 31, 2006, based on criteria established in Internal Control — Integrated Framework issued by theCommittee of Sponsoring Organizations of the Treadway Commission and our report dated February 26, 2007expressed an unqualified opinion thereon.
/s/ Virchow, Krause & Company, LLPSouthfield, MichiganFebruary 26, 2007
57

Report of Independent Registered Public Accounting Firm
Board of Directors and StockholdersFlagstar Bancorp, Inc.
We have audited the accompanying consolidated statements of earnings, stockholders’ equity andcomprehensive income, and cash flows of Flagstar Bancorp, Inc. and Subsidiaries for the year endedDecember 31, 2004. These financial statements are the responsibility of the Company’s management. Ourresponsibility is to express an opinion on these financial statements based on our audit.
We conducted our audit in accordance with the standards of the Public Company Accounting OversightBoard (United States). Those standards require that we plan and perform the audit to obtain reasonableassurance about whether the financial statements are free of material misstatement. An audit includesexamining, on a test basis, evidence supporting the amounts and disclosures in the financial statements. Anaudit also includes assessing the accounting principles used and significant estimates made by management, aswell as evaluating the overall financial statement presentation. We believe that our audit provides a reasonablebasis for our opinion.
In our opinion, the consolidated financial statements referred to above present fairly, in all materialrespects, the consolidated results of operations and cash flows of Flagstar Bancorp, Inc. and Subsidiaries forthe year ended December 31, 2004, in conformity with accounting principles generally accepted in the UnitedStates of America.
/s/ Grant Thornton LLPSouthfield, MichiganMarch 21, 2005
58
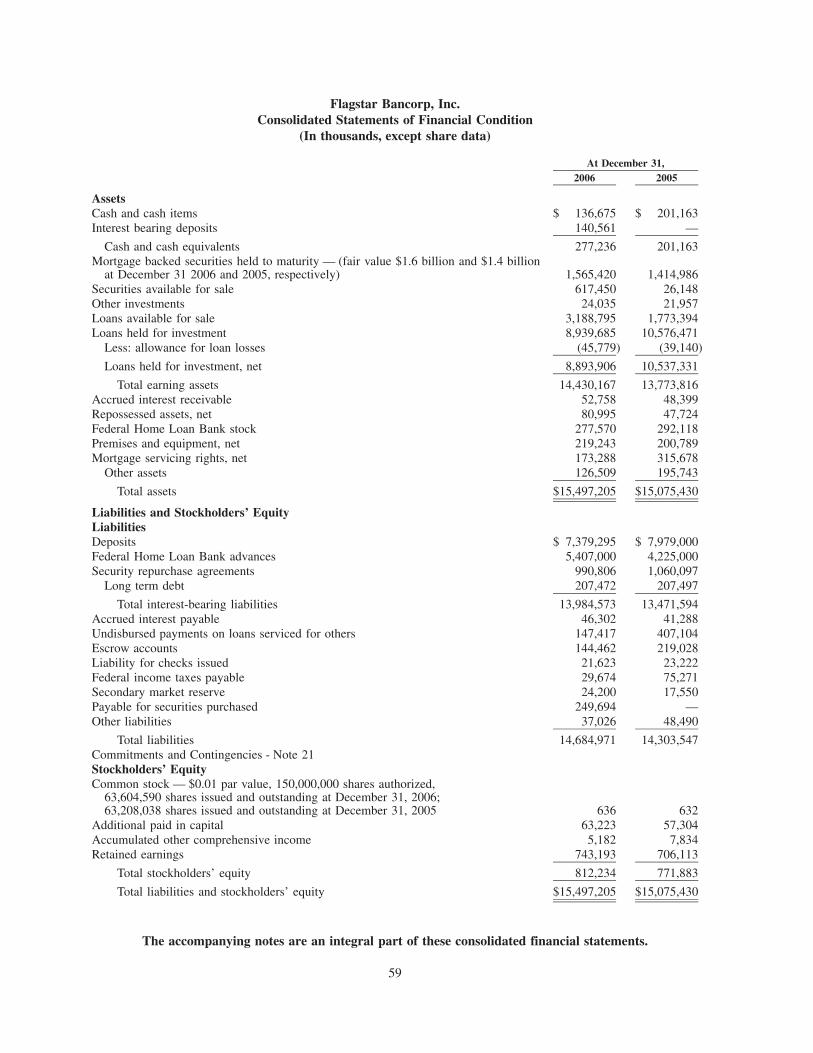
Flagstar Bancorp, Inc.Consolidated Statements of Financial Condition
(In thousands, except share data)
2006 2005At December 31,
AssetsCash and cash items $ 136,675 $ 201,163Interest bearing deposits 140,561 —
Cash and cash equivalents 277,236 201,163Mortgage backed securities held to maturity — (fair value $1.6 billion and $1.4 billion
at December 31 2006 and 2005, respectively) 1,565,420 1,414,986Securities available for sale 617,450 26,148Other investments 24,035 21,957Loans available for sale 3,188,795 1,773,394Loans held for investment 8,939,685 10,576,471
Less: allowance for loan losses (45,779) (39,140)
Loans held for investment, net 8,893,906 10,537,331
Total earning assets 14,430,167 13,773,816Accrued interest receivable 52,758 48,399Repossessed assets, net 80,995 47,724Federal Home Loan Bank stock 277,570 292,118Premises and equipment, net 219,243 200,789Mortgage servicing rights, net 173,288 315,678
Other assets 126,509 195,743
Total assets $15,497,205 $15,075,430
Liabilities and Stockholders’ EquityLiabilitiesDeposits $ 7,379,295 $ 7,979,000Federal Home Loan Bank advances 5,407,000 4,225,000Security repurchase agreements 990,806 1,060,097
Long term debt 207,472 207,497
Total interest-bearing liabilities 13,984,573 13,471,594Accrued interest payable 46,302 41,288Undisbursed payments on loans serviced for others 147,417 407,104Escrow accounts 144,462 219,028Liability for checks issued 21,623 23,222Federal income taxes payable 29,674 75,271Secondary market reserve 24,200 17,550Payable for securities purchased 249,694 —Other liabilities 37,026 48,490
Total liabilities 14,684,971 14,303,547Commitments and Contingencies - Note 21Stockholders’ EquityCommon stock — $0.01 par value, 150,000,000 shares authorized,
63,604,590 shares issued and outstanding at December 31, 2006;63,208,038 shares issued and outstanding at December 31, 2005 636 632
Additional paid in capital 63,223 57,304Accumulated other comprehensive income 5,182 7,834Retained earnings 743,193 706,113
Total stockholders’ equity 812,234 771,883
Total liabilities and stockholders’ equity $15,497,205 $15,075,430
The accompanying notes are an integral part of these consolidated financial statements.
59

Flagstar Bancorp, Inc.Consolidated Statements of Earnings(In thousands, except per share data)
2006 2005 2004For the Years Ended December 31,
Interest IncomeLoans $711,037 $688,791 $559,902Mortgage-backed securities 77,607 19,019 1,459Interest-bearing deposits 4,183 — —Securities available for sale 3,041 — —Other 4,998 853 2,076
Total interest income 800,866 708,663 563,437
Interest ExpenseDeposits 331,516 253,292 167,765FHLB advances 187,756 182,377 143,914Security repurchase agreements 52,389 7,953 —Other 14,258 18,771 28,467
Total interest expense 585,919 462,393 340,146
Net interest income 214,947 246,270 223,291Provision for loan losses 25,450 18,876 16,077
Net interest income after provision for loan losses 189,497 227,394 207,214
Non-Interest IncomeLoan fees and charges 7,440 12,603 18,003Deposit fees and charges 20,893 16,918 12,125Loan administration 13,032 8,761 30,097Net gain on loan sales 42,381 63,580 77,819Net gain on sales of mortgage servicing rights 92,621 18,157 91,740Net loss on securities available for sale (6,163) — —Other fees and charges 31,957 39,429 26,337
Total non-interest income 202,161 159,448 256,121
Non-Interest ExpenseCompensation and benefits 140,438 126,139 112,512Occupancy and equipment 70,225 69,007 64,692Communication 4,320 4,840 6,975Other taxes 320 7,844 12,999General and administrative 60,334 55,057 45,827
Total non-interest expense 275,637 262,887 243,005
Earnings before federal tax provision 116,021 123,955 220,330Provision for federal income taxes 40,819 44,090 77,592
Net Earnings $ 75,202 $ 79,865 $142,738
Earnings per shareBasic $ 1.18 $ 1.29 $ 2.34
Diluted $ 1.17 $ 1.25 $ 2.22
The accompanying notes are an integral part of these consolidated financial statements.
60

Flagstar Bancorp, Inc.Consolidated Statements of Stockholders’ Equity and Comprehensive Income
(In thousands, except per share data)
CommonStock
AdditionalPaid inCapital
AccumulatedOther
ComprehensiveIncome
RetainedEarnings
TotalStockholders’
Equity
Balance at January 1, 2004 $607 $35,394 $ 2,173 $600,627 $638,801
Net earnings — — — 142,738 142,738
Net realized gain on swap extinguishment — — 2,650 — 2,650
Change in net unrealized gain on swaps used incash flow hedges — — 520 — 520
Total comprehensive income — — — — 145,908
Stock options exercised and grants issued, net 7 3,311 — — 3,318Tax benefit from stock-based compensation — 2,049 — — 2,049
Dividends paid ($1.00 per share) — — — (61,122) (61,122)
Balance at December 31, 2004 614 40,754 5,343 682,243 728,954
Net earnings — — — 79,865 79,865
Reclassification of gain on swap extinguishment — — (1,335) — (1,335)
Change in net unrealized gain on swaps used incash flow hedges — — 3,328 — 3,328
Change in net unrealized gain on securitiesavailable for sale — — 498 — 498
Total comprehensive income — — — — 82,356
Stock options exercised 18 7,426 — — 7,444
Stock-based compensation — 745 — — 745
Tax benefit from stock-based compensation — 8,379 — — 8,379
Dividends paid ($0.90 per share) — — — (55,995) (55,995)
Balance at December 31, 2005 632 57,304 7,834 706,113 771,883
Net earnings — — — 75,202 75,202
Reclassification of gain on swap extinguishment — — (1,167) — (1,167)
Change in net unrealized loss on swaps used incash flow hedges — — (1,874) — (1,874)
Change in net unrealized gain on securitiesavailable for sale — — 389 — 389
Total comprehensive income — — — — 72,550
Stock options exercised 4 2,201 — — 2,205
Stock-based compensation — 2,718 — — 2,718
Tax benefit from stock-based compensation — 1,000 — — 1,000
Dividends paid ($0.60 per share) — — — (38,122) (38,122)
Balance at December 31, 2006 $636 $63,223 $ 5,182 $743,193 $812,234
The accompanying notes are an integral part of these consolidated financial statements.
61

Flagstar Bancorp, Inc.Consolidated Statements of Cash Flows
(In thousands)
2006 2005 2004
For the Years Ended December 31,
Operating ActivitiesNet earnings $ 75,202 $ 79,865 $ 142,738Adjustments to net earnings to net cash used in operating activities
Provision for loan losses 25,450 18,876 16,077Depreciation and amortization 100,710 125,978 106,124Increase in valuation allowance in mortgage servicing rights 599 — —FHLB stock dividends — (5,035) (9,909)Stock-based compensation expense 2,718 745 —Net gain on the sale of assets (2,328) (1,623) (2,608)Net gain on loan sales (42,381) (63,580) (77,819)Net gain on sales of mortgage servicing rights (92,621) (18,157) (91,740)Net loss on securities available for sale 6,163 — —Proceeds from sales of loans available for sale 16,386,194 23,445,645 29,497,773Origination and repurchase of mortgage loans available for sale, net of principal repayments (16,807,310) (24,558,415) (30,463,805)Increase in accrued interest receivable (4,359) (13,352) (7,013)Decrease (increase) in other assets 66,348 45,379 (117,956)Increase in accrued interest payable 5,014 13,143 7,817Net tax benefit for stock grants issued (1,000) — —Increase (decrease) liability for checks issued (1,599) 4,281 (8,555)(Decrease) increase in federal income taxes payable (44,367) 49,696 (39,780)Increase in payable for securities purchased 249,694 — —(Decrease) increase in other liabilities (4,814) (16,656) 12,099
Net cash used in operating activities (82,687) (893,210) (1,036,557)
Investing ActivitiesNet change in other investments (2,078) (3,566) (4,247)Repayment of mortgage backed securities held to maturity 404,073 71,478 9,968Purchase of mortgage backed securities held to maturity (118,025) — —Purchase of investment securities available for sale (574,999) — —Origination of portfolio loans, net of principal repayments 119,263 (666,145) (1,476,858)Purchase of Federal Home Loan Bank stock (6,762) (52,238) (26,580)Redemption of Federal Home Loan Bank stock 21,310 — —Investment in unconsolidated subsidiary — 3,095 3,102Proceeds from the disposition of repossessed assets 52,812 39,078 42,845Acquisitions of premises and equipment, net of proceeds (45,493) (51,337) (49,112)Decrease in mortgage servicing rights (223,934) (328,954) (318,028)Proceeds from the sale of mortgage servicing rights 388,784 124,860 405,864
Net cash provided by (used in) investing activities 14,951 (863,729) (1,413,046)
Financing ActivitiesNet (decrease) increase in deposit accounts (599,705) 599,345 1,699,488Net (decrease) increase in security repurchase agreements (69,291) 1,060,097 —Issuance of junior subordinated debt — 100,000 25,000Redemption of preferred securities — — (74,750)Net increase in Federal Home Loan Bank advances 1,182,000 135,000 844,000Payment on other long term debt (25) (25) (25)Net (disbursement) receipt of payments of loans serviced for others (259,687) (89,106) 20,949Net (disbursement) receipt of escrow payments (74,566) 24,521 2,224Proceeds from the exercise of stock options 2,205 7,444 3,318Net tax benefit for stock grants issued 1,000 8,379 2,049Dividends paid to stockholders (38,122) (55,995) (61,122)
Net cash provided by financing activities 143,809 1,789,660 2,461,131
Net increase in cash and cash equivalents 76,073 32,721 11,528Beginning cash and cash equivalents 201,163 168,442 156,914
Ending cash and cash equivalents $ 277,236 $ 201,163 $ 168,442
Supplemental disclosure of cash flow information:Loans held for investment transferred to repossessed assets $ 102,446 $ 47,416 $ 39,692
Total interest payments made on deposits and other borrowings $ 580,905 $ 449,250 $ 347,964
Federal income taxes paid $ 86,953 $ — $ 119,500
Recharacterization of loans held for investment to mortgage-backed securities held to maturity $ 558,732 $ 1,466,477 $ —
Mortgage loans held for investment transferred to available for sale $ 1,329,032 $ 452,949 $ —
Mortgage loans available for sale transferred to held for investment $ 354,662 $ 883,119 $ 2,297,091
The accompanying notes are an integral part of these consolidated financial statements.
62

Flagstar Bancorp, Inc.Notes to the Consolidated Financial Statements
Note 1 — Nature of Business
Flagstar Bancorp, Inc. (“Flagstar” or the “Company”), is the holding company for Flagstar Bank, FSB(the “Bank”), a federally chartered stock savings bank founded in 1987. With $15.5 billion in assets atDecember 31, 2006, Flagstar is the largest savings institution and second largest banking institution headquar-tered in Michigan.
The Company’s principal business is obtaining funds in the form of deposits and borrowings and investingthose funds in single-family mortgages and other types of loans. The acquisition or origination of single-familymortgage loans is the Company’s primary lending activity. The Company also originates consumer loans,commercial real estate loans, and non-real estate commercial loans.
The Company sells or securitizes most of the mortgage loans that it originates. The Company generallyretains the right to service the mortgage loans that it sells. These mortgage-servicing rights (“MSRs”) areoccasionally sold by the Company in transactions separate from the sale of the underlying mortgages. TheCompany may also invest in a significant amount of its loan production in order to maximize the Company’sleverage ability and to receive the interest spread between earning assets and paying liabilities. The Companyalso acquires funds on a wholesale basis from a variety of sources and services a significant volume of loansfor others.
The Bank is a member of the Federal Home Loan Bank System (“FHLB”) and is subject to regulation,examination and supervision by the Office of Thrift Supervision (“OTS”) and the Federal Deposit InsuranceCorporation (“FDIC”). The Bank’s deposits are insured by the FDIC through the Deposit Insurance Fund(“DIF”).
Note 2 — Summary of Significant Accounting Policies
The following significant accounting policies of the Company, which are applied in the preparation of theaccompanying consolidated financial statements, conform to accounting principles generally accepted in theUnited States of America (“U.S. GAAP”).
Basis of Presentation and Consolidation
The consolidated financial statements include the accounts of the Company and its consolidatedsubsidiaries. All significant intercompany balances and transactions have been eliminated. In accordance withcurrent accounting principles, our trust subsidiaries are not consolidated. Certain prior period amounts havebeen reclassified to conform to the current period presentation.
Accounting Research Bulletin 51 (“ARB 51”), Consolidated Financial Statements, requires a company’sconsolidated financial statements to include subsidiaries in which the company has a controlling financialinterest. This requirement usually has been applied to subsidiaries in which a company has a majority votinginterest. Currently, all of the Company’s subsidiaries are wholly-owned.
The voting interest approach defined in ARB 51 is not applicable in identifying controlling financialinterests in entities that are not controllable through voting interests or in which the equity investors do notbear the residual economic risks. In such instances, Financial Accounting Standards Board Interpretation 46(“FIN 46”), Consolidation of Variable Interest Entities (“VIE”) and FIN 46R — “Implicit Variable Interestsunder FIN 46, Consolidation of Variable Interest Entities” , provide guidance on when a company shouldinclude in its financial statements the assets, liabilities, and activities of another entity. In general, a VIE is acorporation, partnership, trust, or any other legal structure used for business purposes that either does not haveequity investors with voting rights or has equity investors that do not provide sufficient financial resources forthe entity to support its activities. FIN 46R requires a VIE to be consolidated by a company if that company issubject to a majority of the risk of loss from the VIE’s activities or entitles it to receive a majority of the
63

entity’s residual returns or both. A company that consolidates a VIE is called the primary beneficiary of thatentity. The Company has no consolidated VIE’s.
The Company uses special-purpose entities (“SPE’s”), primarily securitization trusts, to diversify itsfunding sources. SPE’s are not operating entities, generally have no employees, and usually have a limitedlife. The basic SPE structure involves the Bank transferring assets to the SPE. The SPE funds the purchase ofthose assets by issuing asset-backed securities to investors. The legal documents governing the SPE describehow the cash received on the assets held in the SPE must be allocated to the investors and other parties thathave rights to these cash flows.
The Bank structures these SPEs to be bankruptcy remote, thereby insulating investors from the impact ofthe creditors of other entities, including the transferor of the assets.
Where the Bank is a transferor of assets to an SPE, the assets sold to the SPE generally are no longerrecorded on the statement of financial condition and the SPE is not consolidated when the SPE is a qualifyingspecial-purpose entity (“QSPE”). Statement of Financial Accounting Standards (“SFAS”) 140, Accounting forTransfers and Servicing of Financial Assets and Extinguishments of Liabilities, provides specific criteria fordetermining when an SPE meets the definition of a QSPE. In determining whether to consolidate non-qualifying SPEs where assets are legally isolated from the Bank’s creditors, the Company considers suchfactors as the amount of third-party equity, the retention of risks and rewards, and the extent of controlavailable to third parties. The Bank currently services certain home equity loans and lines that were sold tosecuritization trusts.
Use of Estimates
The preparation of consolidated financial statements in conformity with U.S. GAAP requires managementto make estimates and assumptions that affect reported amounts of assets and liabilities and the disclosure ofcontingent assets and liabilities at the date of the financial statements and the reported amounts of revenuesand expenses during the reporting period. Actual results could materially differ from those estimates.
Cash and Cash Equivalents
Cash on hand, cash items in the process of collection, and amounts due from correspondent banks and theFederal Reserve Bank are included in cash and cash equivalents and overnight deposits.
Securities
Investments in debt securities and certain equity securities with readily determinable fair values areaccounted for under SFAS 115, Accounting for Certain Investments in Debt and Equity Securities. SFAS 115requires investments to be classified within one of three categories, trading, held to maturity or available forsale based on the type of security and management’s intent with regards to selling the security.
Certain mortgage-backed securities are classified as held to maturity because management has the positiveintent and ability to hold these securities to maturity. Securities held to maturity are carried at amortized cost.Unrealized losses that are deemed to be other-than-temporary are reported in the consolidated statement ofearnings.
Securities available for sale are carried at fair value with unrealized gains and unrealized losses deemedto be temporary being reported in other comprehensive income, net of tax. Any gains or losses realized uponthe sale of a security or unrealized losses that are deemed to be other-than-temporary are reported in theconsolidated statement of earnings. The securities available for sale represent certain mortgage-backedsecurities and the non-investment grade residual interests in the Company’s private securitizations.
64
Flagstar Bancorp, Inc.Notes to the Consolidated Financial Statements - continued

Other investments, which include certain investments in mutual funds that by their nature cannot be heldto maturity, are carried at fair value. Increases or decreases in fair value are recorded in earnings.
Interest on securities, including the amortization of premiums and the accretion of discounts using theeffective interest method over the period of maturity, is included in interest income. Realized gains and losseson the sale of securities and other-than-temporary impairment charges on securities are determined using thespecific-identification method.
Loans
Loans are designated as held for investment or available for sale or securitization during the originationprocess. Loans held for investment are carried at amortized cost. The Company has both the intent and theability to hold all loans held for investment for the foreseeable future. Loans available for sale are carried atthe lower of aggregate cost or estimated market value. Loans are stated net of deferred loan origination fees orcosts. Interest income on loans is recognized on the accrual basis based on the principal balance outstanding.Loan origination fees and certain direct origination costs associated with loans are deferred and amortized overthe expected life of the loans as an adjustment to the yield using the interest method. Net unrealized losses onloans available for sale are recognized in a valuation allowance that is charged to earnings. Gains or lossesrecognized upon the sale of loans are determined using the specific identification method.
Delinquent Loans
Loans are placed on non-accrual status when any portion of principal or interest is 90 days delinquent, orearlier when concerns exist as to the ultimate collection of principal or interest. When a loan is placed on non-accrual status, the accrued and unpaid interest is reversed and interest income is recorded as collected. Loansreturn to accrual status when principal and interest become current and are anticipated to be fully collectible.
Loan Sales and Securitizations
Our recognition of gain or loss on the sale or securitization of loans is accounted for in accordance withSFAS 140. SFAS 140 requires that a transfer of financial assets in which we surrender control over the assetsbe accounted for as a sale to the extent that consideration other than beneficial interests in the transferredassets is received in exchange. The carrying value of the assets sold is allocated between the assets sold andthe retained interests based on their relative fair values.
SFAS 140 requires, for certain transactions, a “true sale” analysis of the treatment of the transfer understate law if the company was a debtor under the bankruptcy code. The “true sale” analysis includes severallegal factors including the nature and level of recourse to the transferor and the nature of retained servicingrights. The “true sale” analysis is not absolute and unconditional but rather contains provisions that make thetransferor “bankruptcy remote”. Once the legal isolation of financial assets has been met and is satisfied underSFAS 140, other factors concerning the nature of the extent of the transferor’s control over the transferredfinancial assets are taken into account in order to determine if the de-recognition of financial assets iswarranted, including whether the special purpose entity (“SPE”) has complied with rules concerning qualifyingspecial purpose entities.
The Bank is not eligible to become a debtor under the bankruptcy code. Instead, the insolvency of theBank is generally governed by the relevant provisions of the Federal Deposit Insurance Act and the FDIC’sregulations. However, the “true sale” legal analysis with respect to the Bank is similar to the “true sale”analysis that would be done if the Bank were subject to the bankruptcy code.
The Bank obtains a legal opinion regarding the legal isolation of the transferred financial assets as part ofthe securitization process. The “true sale” opinion provides reasonable assurance that the transferred assetswould not be characterized as property of the transferor in the event of insolvency and also states the
65
Flagstar Bancorp, Inc.Notes to the Consolidated Financial Statements - continued

transferor would not be required to substantively consolidate the assets and liabilities of the purchaser SPEwith those of the transferor upon such event.
The securitization process involves the sale of loans to our wholly-owned bankruptcy remote specialpurpose entity which then sells the loans to a separate, transaction-specific trust in exchange for considerationsgenerated by the sale of the securities issued by the securitization trust. The securitization trust issues and sellsdebt securities to third party investors that are secured by payments on the loans. We have no obligation toprovide credit support to either the third party investors or the securitization trust. Neither the third partyinvestors nor the securitization trust generally have recourse to our assets or us and have no ability to requireus to repurchase their securities other than through enforcement of the standard representations and warranties.We do make certain representations and warranties concerning the loans, such as lien status, and if we arefound to have breached a representation and warranty, we may be required to repurchase the loan from thesecuritization trust. We do not guarantee any securities issued by the securitization trust. The securitizationtrust represents a “qualifying special purpose entity”, which meets the certain criteria of SFAS 140, andtherefore is not consolidated for financial reporting purposes.
In addition to the cash we receive from the sale or securitization of loans, we retain certain interests inthe securitized assets. The retained interests include mortgage servicing rights (“MSR’s”), residual interest andan over collateralization account. The residuals are included in securities available for sale on the consolidatedstatement of financial condition.
We retain the servicing function for securitized loans. As a servicer, we are entitled to receive a servicingfee equal to a specified percentage of the outstanding principal balance of the loans. We may also be entitledto receive additional servicing compensation, such as late payment fees.
Transaction costs associated with the securitization process are recognized as a component of the gain orloss at the time of sale.
Allowance for Loan Losses
The allowance for loan losses represents management’s estimate of probable losses inherent in theCompany’s loans held for investment portfolio as of the date of the consolidated financial statements. Theallowance provides for probable losses that have been identified with specific customer relationships and forprobable losses believed to be inherent in the loan portfolio but that have not been specifically identified.
The Company performs a detailed credit quality review annually on large commercial loans as well asselected other smaller balance commercial loans and may allocate a specific portion of the allowance to suchloans based upon this review. Commercial and commercial real estate loans that are determined to besubstandard and exceed $1.0 million are treated as impaired and given an individual evaluation to determinethe necessity of a specific reserve in accordance with the provisions of SFAS 114, Accounting by Creditors forImpairment of a Loan. This pronouncement requires an allowance to be established as a component of theallowance for loan losses when it is probable that all amounts due will not be collected pursuant to thecontractual terms of the loan and the recorded investment in the loan exceeds its fair value. Fair value ismeasured using either the present value of the expected future cash flows discounted at the loan’s effectiveinterest rate, the observable market price of the loan, or the fair value of the collateral if the loan is collateraldependent, reduced by estimated disposal costs. In estimating the fair value of collateral, we typically utilizeoutside fee-based appraisers to evaluate various factors such as occupancy and rental rates in our real estatemarkets and the level of obsolescence that may exist on assets acquired from commercial business loans.
A portion of the allowance is allocated to the remaining commercial loans by applying projected lossratios, based on numerous factors identified below, to the loans within the different risk ratings.
Additionally, management has sub-divided the homogeneous portfolios, including consumer and residen-tial mortgage loans, into categories that have exhibited greater loss exposure (such as sub-prime loans and
66
Flagstar Bancorp, Inc.Notes to the Consolidated Financial Statements - continued

loans that are not salable on the secondary market because of collateral or documentation issues). The portionof the allowance allocated to other consumer and residential mortgage loans is determined by applyingprojected loss ratios to various segments of the loan portfolio. Projected loss ratios incorporate factors such asrecent charge-off experience, current economic conditions and trends, and trends with respect to past due andnonaccrual amounts, and are supported by underlying analysis.
Management maintains an unallocated allowance to recognize the uncertainty and imprecision underlyingthe process of estimating expected loan losses.
As the process for determining the adequacy of the allowance requires subjective and complex judgmentby management about the effect of matters that are inherently uncertain, subsequent evaluations of the loanportfolio, in light of the factors then prevailing, may result in significant changes in the allowance for loanlosses. In estimating the amount of credit losses inherent in the Company’s loan portfolio, various assumptionsare made. For example, when assessing the condition of the overall economic environment, assumptions aremade regarding current economic trends and their impact on the loan portfolio. In the event the nationaleconomy were to sustain a prolonged downturn, the loss factors applied to our portfolios may need to berevised, which may significantly impact the measurement of the allowance for loan losses. For impaired loansthat are collateral dependent, the estimated fair value of the collateral may deviate significantly from theproceeds received when the collateral is sold.
Repossessed Assets
Repossessed assets include one-to-four family residential property, commercial property, and one-to-fourfamily homes under construction that were acquired through foreclosure. Repossessed assets are initiallyrecorded at estimated fair value, less estimated selling costs. Subsequently, properties are evaluated and anyadditional declines in value are recorded in current period earnings. The amount the Company ultimatelyrecovers on repossessed assets may differ substantially from the net carrying value of these assets because offuture market factors beyond the Company’s control.
Federal Home Loan Bank Stock
The Bank owns stock in the Federal Home Loan Bank (“FHLB”). No ready market exists for the stockand it has no quoted market value. The stock is redeemable at par and is carried at cost. The investment isrequired to permit the Bank to borrow from the Federal Home Loan Bank of Indianapolis (“FHLBI”).
Premises and Equipment
Premises and equipment are stated at cost less accumulated depreciation. Land is carried at historicalcost. Depreciation is calculated on the straight-line method over the estimated useful lives of the assets asfollows:
Office buildings — 31.5 yearsComputer hardware and software — 3 to 5 yearsFurniture, fixtures and equipment — 5 to 7 yearsAutomobiles — 3 years
Repairs and maintenance costs are expensed in the period they are incurred, unless they are covered by amaintenance contract, which is expensed equally over the stated term of the contract. Repairs and maintenancecosts are included as part of occupancy and equipment expenses.
Mortgage Servicing Rights
In March 2006, FASB issued SFAS 156, Accounting for Servicing of Financial Assets an amendment ofFASB Statement 140. SFAS 156 requires an entity to recognize a servicing asset or liability each time it
67
Flagstar Bancorp, Inc.Notes to the Consolidated Financial Statements - continued

undertakes an obligation to service a financial asset by entering into a servicing contract. It requires allseparately recognized servicing assets and servicing liabilities to be initially measured at fair value and permitsan entity to choose either an amortization or fair value measurement method for each class of separatelyrecognized servicing assets and servicing liabilities. It also permits a one-time reclassification of availa-ble-for-sale securities to trading securities by entities with recognized servicing rights. Lastly, it requiresseparate presentation of servicing assets and servicing liabilities subsequently measured at fair value andadditional disclosures for all separately recognized servicing assets and servicing liabilities. Effective January 1,2006, the Company adopted SFAS 156, as permitted. Adoption of this pronouncement allowed the Companyto initially recognize its MSRs at fair value. The Company elected to retain the amortization method forsubsequently accounting for the MSRs. There was no material effect on the Company’s consolidated financialstatements from the adoption of this pronouncement.
The Company purchases and originates mortgage loans for sale to the secondary market and sells theloans on either a servicing-retained or servicing-released basis. MSRs are recognized as assets at the time aloan is sold on a servicing-retained basis. The capitalized cost of retained MSRs is amortized in proportion to,and over the period of, estimated net future servicing revenue. The expected period of the estimated netservicing income is based, in part, on the expected prepayment period of the underlying mortgages.
MSRs are periodically evaluated for impairment. For purposes of measuring impairment, MSRs arestratified based on predominant risk characteristics of the underlying serviced loans. These risk characteristicsinclude loan type (fixed or adjustable rate), term (15 year, 20 year, 30 year or balloon) and interest rate.Impairment represents the excess of amortized cost of an individual stratum over its estimated fair value, andis recognized through a valuation allowance.
Fair values for individual stratum are based on the present value of estimated future cash flows using adiscount rate commensurate with the risks involved. Estimates of fair value include assumptions aboutprepayment, default and interest rates, and other factors, which are subject to change over time. Changes inthese underlying assumptions could cause the fair value of MSRs, and the related valuation allowance, tochange significantly in the future.
The Company occasionally sells a certain portion of its MSRs to investors. At the time of the sale theCompany records a gain or loss on such sale based on the selling price of the MSRs less the carrying valueand transaction costs. The MSRs are sold in separate transactions from the sale of the underlying loans.
Financial Instruments and Derivatives
In seeking to protect its financial assets and liabilities from the effects of changes in market interest rates,the Company has devised and implemented an asset/liability management strategy that seeks, on an economicand accounting basis, to mitigate significant fluctuations in our financial position and results of operations.Loans held for investment generate interest income and MSRs generate fee income. With regard to thepipeline of mortgage loans held for sale, in general, the Company hedges these assets with forwardcommitments to sell Fannie Mae or Freddie Mac securities with comparable maturities and weighted- averageinterest rates. Further, the Company occasionally enters into swap agreements to hedge the cash flows oncertain liabilities.
SFAS 133, Accounting for Derivative Instruments and Hedging Activities, as amended and interpreted,requires that we recognize all derivative instruments on the statement of financial condition at fair value. Ifcertain conditions are met, special hedge accounting may be applied and the derivative instrument may bespecifically designated as:
(a) a hedge of the exposure to changes in the fair value of a recognized asset, liability orunrecognized firm commitment, referred to as a fair value hedge, or
68
Flagstar Bancorp, Inc.Notes to the Consolidated Financial Statements - continued

(b) a hedge of the exposure to the variability of cash flows of a recognized asset, liability orforecasted transaction, referred to as a cash flow hedge.
In the case of a qualifying fair value hedge, changes in the value of the derivative instruments that arehighly effective (as defined in SFAS 133) are recognized in current earnings along with the changes in valueof the designated hedged item. In the case of a qualifying cash flow hedge, changes in the value of thederivative instruments that are highly effective are recognized in accumulated other comprehensive income(“OCI”), until the hedged item is recognized in earnings. The ineffective portion of a derivative’s change infair value is recognized through earnings. Upon the occasional termination of a cash flow hedge, the remainingcost of the hedge is amortized over the remaining life of the hedged item in proportion to the change in thehedged forecasted transaction. We have derivatives in place to hedge the exposure to the variability in futurecash flows for forecasted transactions. Derivatives that are non-designated hedges, as defined in SFAS 133 areadjusted to fair value through earnings. We formally document all qualifying hedge relationships, as well asour risk management objective and strategy for undertaking each hedge transaction. We are not a party to anyforeign currency hedge relationships. During the fourth quarter of 2005, we derecognized all fair value hedgesand have no fair value hedges outstanding at either December 31, 2006 or 2005.
Security Repurchase Agreements
Securities sold under agreements to repurchase are generally accounted for as collateralized financingtransactions and are recorded at the amounts at which the securities were sold plus accrued interest. Securities,generally mortgage-backed securities, are pledged as collateral under these financing arrangements. The fairvalue of collateral provided to a party is continually monitored and additional collateral is obtained orrequested to be returned, as appropriate.
Trust Preferred Securities
As of December 31, 2006, the Company sponsored seven trusts, of which 100% of the common equity isowned by the Company. Each of the trusts has issued trust preferred securities to third party investors andloaned the proceeds to the Company in the form of junior subordinated notes, which are included in long termdebt in these consolidated financial statements. The notes held by each trust are the sole assets of that trust.Distributions on the trust preferred securities of each trust are payable quarterly at a rate equal to the interestbeing earned by the trust on the notes held by these trusts.
The trust preferred securities are subject to mandatory redemption upon repayment of the notes. TheCompany has entered into agreements which, taken collectively, fully and unconditionally guarantee the trustpreferred securities subject to the terms of each of the guarantees. The securities are not subject to a sinkingfund requirement and are not convertible into any other securities of the Company.
The trusts are VIEs under U.S. GAAP (i.e., FIN 46R) and are not consolidated. The Company’sinvestment in the common stock of these trusts is included in other assets in the Company’s consolidatedstatement of financial condition. The trust preferred securities held by the trusts qualify as Tier 1 capital undercurrent banking regulations.
Income Taxes
The Company accounts for income taxes on the asset and liability method. Deferred tax assets andliabilities are recorded based on the difference between the tax bases of assets and liabilities and their carryingamounts for financial reporting purposes. Current taxes are measured by applying the provisions of enacted taxlaws to taxable income to determine the amount of taxes receivable or payable. The Company files aconsolidated federal income tax return on a calendar year basis.
69
Flagstar Bancorp, Inc.Notes to the Consolidated Financial Statements - continued

Secondary Market Reserve
We sell most of the residential mortgage loans that we originate into the secondary mortgage market.When we sell mortgage loans we make customary representations and warranties to the purchasers aboutvarious characteristics of each loan, such as the manner of origination, the nature and extent of underwritingstandards applied and the types of documentation being provided. If a defect in the origination process isidentified, we may be required to either repurchase the loan or indemnify the purchaser for losses it sustainson the loan. If there are no such defects, we have no liability to the purchaser for losses it may incur on suchloan. We maintain a secondary market reserve to account for the expected losses related to loans we might berequired to repurchase (or the indemnity payments we may have to make to purchasers). The secondarymarket reserve takes into account both our estimate of expected losses on loans sold during the currentaccounting period, as well as adjustments to our previous estimates of expected losses on loans sold. In eachcase these estimates are based on our most recent data regarding loan repurchases, actual credit losses onrepurchased loans and recovery history, among other factors. Increases to the secondary market reserve forcurrent loan sales reduce our net gain on loan sales. Adjustments to our previous estimates are recorded as anincrease or decrease in our other fees and charges.
Advertising Costs
Advertising costs are expensed in the period they are incurred and are included as part of general andadministrative expenses. Advertising expenses totaled $9.4 million, $7.5 million, and $10.2 million for theyears ended December 31, 2006, 2005 and 2004, respectively.
Stock-Based Compensation
On January 1, 2006, the Company adopted SFAS 123R, Accounting for Stock-Based Compensation(“SFAS 123R”). SFAS 123R requires all share-based payment to employees, including grants of employeestock options, to be recognized as expense in the statement of earnings based on their fair values. Prior toSFAS 123R, only certain pro forma disclosures of fair value were required. The amount of compensation ismeasured at the fair value of the options when granted and this cost is expensed over the required serviceperiod, which is normally the vesting period of the options. SFAS 123R applies to awards granted or modifiedafter January 1, 2006 or any unvested awards outstanding at December 31, 2005. The effect of the adoption ofthe new accounting principle on results of operations depends on the level of option grants, the vesting periodfor those grants, and the fair value of the options granted at such date. Existing options that vested after theadoption date resulted in additional compensation expense of approximately $1.2 million in 2006. TheCompany utilized the disclosure requirements permitted by SFAS 123, Accounting for Stock-Based Compensa-tion (“SFAS 123”), for transactions entered into during 1996 and thereafter. For the periods prior to January 1,2006, the Company elected to remain with the former method of accounting under Accounting PrinciplesBoard Opinion 25 (“APB 25”) and has made the pro forma disclosures in Note 30 of net earnings and earningsper share as if the fair value method provided for in SFAS 123 had been adopted.
At December 31, 2006, the Company has a stock-based employee compensation plan, which is describedmore fully in Note 30.
Recently Issued Accounting Standards
In February 2006, the FASB issued SFAS 155 Accounting for Certain Hybrid Financial Instruments.SFAS 155 amends SFAS 133, Accounting for Derivative Instruments and Hedging Activities and SFAS 140,Accounting for Transfers and Servicing of Financial Assets and Extinguishments of Liabilities. SFAS 155permits the fair value remeasurement for any hybrid financial instrument that contains an embedded derivativethat would otherwise require bifurcation. Further, it clarifies which interest-only strips and principal-only stripsare not subject to SFAS 133 requirements. It also establishes a requirement to evaluate interests in securitized
70
Flagstar Bancorp, Inc.Notes to the Consolidated Financial Statements - continued

financial assets to identify interest in freestanding derivatives and clarifies that concentrations of credit risk inthe form of subordination are not embedded derivatives. Last, it eliminates the prohibition on a qualifyingspecial purpose entity from holding a derivative financial instrument pertaining to a beneficial interest otherthan another derivative financial instrument. The Company will be required to adopt this standard in 2007.The adoption of SFAS 155 is not expected to have a material impact on the Company’s financial condition,results of operations or liquidity.
In June 2006, the FASB issued FASB Interpretation 48, “Accounting for Uncertainty in Income Taxes —an interpretation of FASB Statement 109,” (“FIN 48”). FIN 48 clarifies the accounting for uncertainty inincome taxes recognized in a company’s financial statements in accordance with SFAS 109, “Accounting forIncome Taxes.” This Interpretation prescribes a recognition threshold and measurement attribute for thefinancial statement recognition and measurement of a tax position taken or expected to be taken in a taxreturn. The Interpretation also provides guidance on derecognition, classification, interest and penalties,accounting in interim periods, disclosure and transition. FIN 48 is required to be adopted by the Company onJanuary 1, 2007. Management does not expect that the impact of this Interpretation will be material to theCompany’s financial condition, results of operation or liquidity.
In September 2006, the FASB issued SFAS 157 “Fair Value Measurements.” SFAS 157 defines fair value,establishes a framework for measuring fair value in accordance with U.S. GAAP, and expands disclosuresabout fair value measurements. SFAS 157 clarifies that the exchange price is the price in an orderly transactionbetween market participants to sell an asset or transfer a liability at the measurement date. SFAS 157emphasizes that fair value is a market-based measurement and not an entity-specific measurement. It alsoestablishes a fair value hierarchy used in fair value measurements and expands the required disclosures ofassets and liabilities measured at fair value. The Company will be required to adopt this statement beginningin 2008. The adoption of this standard is not expected to have a material impact on the Company’s financialcondition, results of operation or liquidity.
In September 2006, the FASB issued SFAS 158 “Employers’ Accounting for Defined Benefit Pension andOther Postretirement Plans.” SFAS 158 amends SFAS Statements 87, 88, 106 and 132». SFAS 158 requiresemployers to recognize in their statement of financial position an asset for a plan’s overfunded status or aliability for a plan’s underfunded status. Secondly, it requires employers to measure the plans assets andobligations that determine its funded status as of the end of the fiscal year. Lastly, employers are required torecognize changes in the funded status of a defined benefit postretirement plan in the year that the changesoccur with the changes reported in comprehensive income. SFAS 158 is required to be adopted by entitieshaving fiscal years ending after December 15, 2006. Because the Company does not have any defined benefitplans or other post retirement plans this standard is not expected to have an impact on the Company’s financialcondition, results of operation or liquidity.
In September 2006, the Securities and Exchange Commission (“SEC”) issued Staff Accounting Bulle-tin 108 (“SAB 108”). SAB 108 expresses the views of the SEC regarding the process of quantifying financialstatement misstatements to determine if any restatement of prior financial statements is required. SAB 108addresses the two techniques commonly used in practice in accumulating and quantifying misstatements, andrequires that the technique with the most severe result be used in determining whether a misstatement ismaterial. SAB 108 was adopted by the Company on December 31, 2006. The adoption of SAB 108 did nothave a material impact on the Company’s financial condition, results of operation or liquidity.
In February 2007, the FASB issued SFAS 159 “The Fair Value Option for Financial Assets and FinancialLiabilities”. SFAS 159 permits entities to choose to measure financial instruments and certain other items atfair value that are not currently required to be measured at fair value. The decision to elect the fair valueoption may be applied instrument by instrument, is irrevocable and is applied to the entire instrument and notto only specified risks, specific cash flows or portions of that instrument. An entity is restricted in choosingthe dates to elect the fair value option for an eligible item. Adoption of SFAS 159 is effective for the
71
Flagstar Bancorp, Inc.Notes to the Consolidated Financial Statements - continued

Company on January 1, 2008. Early adoption is permitted, provided the entity also elects to apply theprovisions of SFAS 157 “Fair Value Measurements”. Management of the Company is currently evaluating thepotential impact of SFAS 159 on the Company’s financial condition, results of operation or liquidity.
Note 3 — Fourth Quarter Event
In the fourth quarter of 2006, the Company recorded an $8.7 million charge, before taxes, as a result of afederal judge’s dismissal of the Company’s lawsuit against an insurance company in a fidelity bond coveragedispute. In March 2004, the Company discovered that a series of warehouse loans it made totaling$22.4 million to two related borrowers were fraudulently obtained. Upon discovery of the fraud and throughsubsequent collections activities, the Company seized cash and real property with an estimated value of$12.7 million. The cash, real property and other assets are the subject of competing claims from anothermortgage company that was also defrauded and from the United States Government through a forfeitureaction. The Company had filed a fidelity bond claim that we maintain would cover losses from fraud.
In 2004, the Company reclassified the loans to other assets. The Company believed, in conjunction withexternal counsel, that the portion of the receivable that would not have been liquidated with the cash and realproperties that were held in escrow would be collected through the fidelity bond claim and no loss wasprobable. Upon dismissal of the lawsuit, the Company believed it appropriate to write off the portion of thereceivable related to the fidelity bond coverage. The charge was recorded to general and administrativeexpense.
Note 4 — Mortgage-Backed Securities Held to Maturity
The following table summarizes the amortized cost and estimated fair value of mortgage-backed securitiesclassified as held to maturity (in thousands):
2006 2005December 31,
Amortized cost $1,565,420 $1,414,986
Gross unrealized holding gains 17,382 —
Gross unrealized holding losses (4,420) (4,346)
Estimated fair value $1,578,382 $1,410,640
The mortgage-backed securities have contractual maturities ranging from 2007 through 2036. Actualmaturities will differ from contractual maturities because the underlying mortgages may be prepaid withoutpenalties.
At December 31, 2006 and 2005, no securities had been in a continuous unrealized loss position for morethan a twelve month period.
At December 31, 2006 and 2005, $1.0 billion and $1.2 billion of these mortgage-backed securities werepledged as collateral for interest rate swaps and security repurchase agreements.
72
Flagstar Bancorp, Inc.Notes to the Consolidated Financial Statements - continued

Note 5 — Securities Available for Sale
Securities available for sale were comprised of the following (in thousands):
2006 2005December 31,
AAA-rated non-agency securities $497,089 $ —
AAA-rated agency securities 77,910 —
Non-investment grade residual securities 42,451 26,148
Total Securities available for sale $617,450 $26,148
Contractual maturities of the securities generally range from 2035 to 2037. Expected weighted averagelives of these securities generally range from several months to six years due to borrower prepaymentsoccurring prior to the contractual maturity.
The following table summarizes the amortized cost and estimated fair value of securities classified asavailable for sale (in thousands):
2006 2005December 31,
Amortized cost $615,878 $25,381
Gross unrealized holding gains 1,572 767
Gross unrealized holding losses — —
Estimated fair value $617,450 $26,148
At December 31, 2006 and 2005, no securities had been in a continuous unrealized loss position duringthe year.
As a result of our periodic reviews for impairment in accordance with EITF 99-20, “Recognition ofInterest Income and Impairment on Certain Investments” (“EITF 99-20”), during the year ended December 31,2006 the Company recorded $6.1 million in impairment charges on residual securities.
The fair value of residual securities is determined by discounting estimated net future cash flows usingdiscount rates that approximate current market rates and expected prepayment rates. Estimated net future cashflows include assumptions related to expected credit losses on these securities. The Company maintains amodel that evaluates the default rate and severity of loss on the residual securities’ collateral, considering suchfactors as loss experience, delinquencies, loan-to-value ratio, borrower credit scores and property type.
The fair value of all other non-agency and agency mortgage-backed securities is estimated based onmarket information.
Note 6 — Other Investments
Other investments are summarized as follows (in thousands):
TypeAmortized
CostFair
ValueAmortized
CostFair
Value
2006 2005December 31,
Mutual Funds $23,320 $23,320 $21,328 $21,328
U.S. Treasury Bonds 715 715 629 629
Total $24,035 $24,035 $21,957 $21,957
73
Flagstar Bancorp, Inc.Notes to the Consolidated Financial Statements - continued

The Company has invested in these securities because of interim investment strategies in trust subsidiar-ies, collateral requirements required in swap and deposit transactions, and Community Reinvestment Actinvestment requirements. U.S. Treasury bonds in the amount of $517,000 and $529,000 are pledged ascollateral in association with the issuance of certain trust preferred securities at December 31, 2006 and 2005,respectively.
Note 7 — Loans Available for Sale
The following table summarizes loans available for sale (in thousands):
2006 2005December 31,
Mortgage loans $3,146,943 $1,658,175
Consumer loans 41,050 114,772
Second mortgage loans 802 447
Total $3,188,795 $1,773,394
These loans had a fair value that approximates their recorded amount for each year presented. Themajority of these loans were originated or acquired in the fourth quarter of the respective year.
Note 8 — Loans Held for Investment
Loans held for investment are summarized as follows (in thousands):
2006 2005December 31,
Mortgage loans $6,211,765 $ 8,248,897
Second mortgage loans 715,154 700,492
Commercial real estate loans 1,301,819 995,411
Construction loans 64,528 65,646
Warehouse lending 291,656 146,694
Consumer loans 340,157 410,920
Commercial loans 14,606 8,411
Total 8,939,685 10,576,471
Less allowance for loan losses (45,779) (39,140)
Total $8,893,906 $10,537,331
Activity in the allowance for loan losses is summarized as follows (in thousands):
2006 2005 2004For the Years Ended December 31,
Balance, beginning of period $ 39,140 $ 38,318 $ 37,828
Provision charged to earnings 25,450 18,876 16,077
Charge-offs, net of recoveries (18,811) (18,054) (15,587)
Balance, end of period $ 45,779 $ 39,140 $ 38,318
Loans on which interest accruals have been discontinued totaled approximately $57.1 million atDecember 31, 2006 and $64.5 million at December 31, 2005. Interest on these loans is recognized as incomewhen collected. Interest that would have been accrued on such loans totaled approximately $3.8 million,
74
Flagstar Bancorp, Inc.Notes to the Consolidated Financial Statements - continued

$4.1 million, and $3.7 million during 2006, 2005, and 2004, respectively. There are no loans greater than90 days past due still accruing interest at December 31, 2006 and 2005.
A loan is impaired when it is probable that payment of interest and principal will not be made inaccordance with the contractual terms of the loan agreement.
Impaired loans are as follows (in thousands):
2006 2005 2004December 31,
Impaired loans with no allowance for loan losses allocated $15,228 $27,876 $5,811
Impaired loans with allowance for loan losses allocated 10,934 6,556 708
Total impaired loans $26,162 $34,432 $6,519
Amount of the allowance allocated to impaired loans $ 1,119 $ 1,618 $ 691
Average investment in impaired loans 28,469 27,048 5,903
Cash-basis interest income recognized during impairment 1,792 2,099 —
No additional funds are committed to be advanced in connection with impaired loans. Those impairedloans not requiring an allowance represent loans for which the fair value of the collateral exceeded therecorded investments in such loans. At December 31, 2006, substantially all of the total impaired loans wereevaluated based on fair value of related collateral.
Note 9 — Securitization Activity
The Company recorded $26.1 million in residual interests as of December 31, 2005, as a result of its non-agency securitization of $600 million in home equity line of credit loans (the “HELOC Securitization”). Inaddition, each month draws on the home equity lines of credit in the trust established in the HELOCSecuritization are purchased from the Company by the trust, resulting in additional residual interests to theCompany. These residual interests are recorded as securities available for sale and are therefore recorded atfair value. Any gains or losses realized on the sale of such securities or any unrealized losses that are deemedto be other-than-temporarily impaired (“OTTI”) are reported in the consolidated statement of earnings. Allunrealized gains or losses that are deemed to be temporary are reported in the consolidated statement ofstockholders’ equity and comprehensive income under accumulated other comprehensive income.
On April 28, 2006, the Company completed a guaranteed mortgage securitization transaction ofapproximately $400 million of fixed second mortgage loans that the Company held at the time in itsinvestment portfolio (the “Second Mortgage Securitization”). The transaction was treated as a recharacteriza-tion of loans held for investment to mortgage-backed securities held to maturity and, therefore, no gain on salewas recorded. The securitization resulted in the Company recording a residual interest of approximately$9.9 million that is carried as a security available for sale.
On December 31, 2006, the Company recorded $11.2 million in residual interests as a result of its non-agency securitization of $302 million in home revolving equity line of credit loans (the “HELOC RevolvingSecuritization”). In addition, each month draws on the revolving home equity lines of credit in the trustestablished in the HELOC Revolving Securitization are purchased from the Company by the trust, resulting inadditional residual interests to the Company. These residual interests are recorded as securities available forsale and are therefore recorded at fair value. Any gains or losses realized on the sale of such securities or anyunrealized losses that are deemed to be OTTI are reported in the consolidated statement of earnings. Allunrealized gains or losses that are deemed to be temporary are reported in the consolidated statement ofstockholders’ equity and comprehensive income under accumulated other comprehensive income.
75
Flagstar Bancorp, Inc.Notes to the Consolidated Financial Statements - continued

At December 31 2006, key assumptions used in determining the value of residual interests resulting fromthe securitizations were as follows:
PrepaymentSpeed
ProjectedCredit Losses
Annual DiscountRate
Home Equity:Flagstar Home Equity Loan Trust 2005-1 42% 1.25% 15%
Flagstar GMS Trust 2006-1 25% 1.50% 15%Flagstar Home Equity Loan Trust 2006-2 42% 1.25% 15%
Certain cash flows received from the securitization trusts were as follows (in thousands):
2006 2005
For the Years EndedDecember 31,
Proceeds from new securitizations $302,182 $600,000
Proceeds from collections reinvested in securitizations 73,122 —
Servicing fees received 2,259 —
Loan repurchases for representations and warranties (752) —
76
Flagstar Bancorp, Inc.Notes to the Consolidated Financial Statements - continued

The tables below set forth key economic assumptions and the hypothetical sensitivity of the fair value ofresidual interests to an immediate adverse change in any single key assumption. Changes in fair value basedon 10% and 20% variations in assumptions generally cannot be extrapolated because the relationship of thechange in assumption to the change in fair value may not be linear. The effect of a variation in a particularassumption on the fair value of the residual interest is calculated without changing any other assumptions. Inpractice, changes in one factor may result in changes in other factors, such as increases in market interest ratesthat may magnify or counteract sensitivities.
FairValue
PrepaymentSpeed
ProjectedCreditLosses
DiscountRate
(Dollars in thousands)
HELOC SecuritizationResidual asset as of December 31, 2006 $20,745 42% 1.25% 15%
Impact on fair value of 10% adverse change in assumption $ 928 $ 574 $ 510
Impact on fair value of 20% adverse change in assumption 1,717 1,148 1,002
Servicing asset as of December 31, 2006 $ 1,705 42% 1.25% 15%
Impact on fair value of 10% adverse change of assumptions $ 201 — $ 20
Impact on fair value of 20% adverse change of assumptions 378 — 40
Second Mortgage SecuritizationResidual asset as of December 31, 2006 $10,522 25% 1.50% 15%
Impact on fair value of 10% adverse change in assumption $ 78 $ 415 $ 542
Impact on fair value of 20% adverse change in assumption 158 828 1,047
Servicing asset as of December 31, 2006 $ 3,485 25% 1.50% 15%
Impact on fair value of 10% adverse change of assumptions $ 213 — $ 58
Impact on fair value of 20% adverse change of assumptions 420 — 112
HELOC RevolvingResidual asset as of December 31, 2006 $11,184 42% 1.25% 15%
Impact on fair value of 10% adverse change of assumptions $1,038 $ 184 $ 344
Impact on fair value of 20% adverse change of assumptions 1,932 369 674
Servicing asset as of December 31, 2006 $ 1,656 42% 1.25% 14%
Impact on fair value of 10% adverse change of assumptions $ 164 — $ 26
Impact on fair value of 20% adverse change of assumptions 305 — 52
Note 10 — FHLB Stock
The Company’s investment in FHLB stock totaled $277.6 million and $292.1 million at December 31,2006 and 2005, respectively. As a member of the FHLB, the Company is required to hold shares of FHLBstock in an amount at least equal to 1% of the aggregate unpaid principal balance of its mortgage loans, homepurchase contracts and similar obligations at the beginning of each year, or 1/20th of its FHLB advances,whichever is greater. Dividends received on the stock equaled $13.7 million, $10.7 million, and $9.9 millionfor the years ended December 31, 2006, 2005 and 2004, respectively. These dividends were recorded in theconsolidated statement of earnings as other fees and charges.
77
Flagstar Bancorp, Inc.Notes to the Consolidated Financial Statements - continued

Note 11 — Repossessed Assets
Repossessed assets include the following (in thousands):
2006 2005December 31,
One-to-four family properties $74,548 $40,687
Commercial properties 6,447 7,037
Repossessed assets $80,995 $47,724
Note 12 — Premises and Equipment
Premises and equipment balances are as follows (in thousands):
2006 2005December 31,
Land $ 70,437 $ 56,646
Office buildings 135,186 120,406
Computer hardware and software 130,574 123,598
Furniture, fixtures and equipment 72,173 61,314
Automobiles 285 294
Total 408,655 362,258
Less accumulated depreciation (189,412) (161,469)
$ 219,243 $ 200,789
Depreciation expense amounted to approximately $26.9 million, $30.7 million, and $30.1 million, for theyears ended December 31, 2006, 2005 and 2004, respectively.
The Company conducts a portion of its business from leased facilities. Such leases are considered to beoperating leases based on their lease terms. Lease rental expense totaled approximately $8.7 million,$9.8 million, and $9.9 million for the years ended December 31, 2006, 2005 and 2004, respectively.
The following outlines the Company’s minimum contractual lease obligations as of December 31, 2006(in thousands):
2007 $ 5,911
2008 4,242
2009 3,058
2010 2,367
2011 1,097
Thereafter 1,983
Total $18,658
78
Flagstar Bancorp, Inc.Notes to the Consolidated Financial Statements - continued

Note 13 — Mortgage Servicing Rights
Mortgage loans serviced for others are not included in the accompanying consolidated financialstatements. The unpaid principal balances of these loans are summarized as follows (in thousands):
2006 2005December 31,
Mortgage loans serviced for:FHLMC and FNMA $12,566,869 $27,941,451
FHLBI 272,273 303,807
GNMA 1,224,010 821,947
Flagstar Trusts 968,423 579,752
Other investors 928 1,131
Total $15,032,503 $29,648,088
Not included in the above totals are $229.4 million and $5.0 billion of mortgage loans at December 31,2006 and December 31, 2005, respectively, that are being serviced on a temporary basis in connection withthe sale of mortgage servicing rights.
Mortgage loans serviced for others were geographically disbursed throughout the United States. As ofDecember 31, 2006, approximately 21.2% of these properties are located in Michigan (measured by principalbalance), and another 27.4% were located in the states of Texas (10.1%), Florida (10.0%), California (7.3%)and Washington (4.4%). No other state contains more than 4% of the properties collateralizing these servicedloans.
Custodial accounts maintained in connection with the above mortgage servicing rights (including theabove mentioned subservicing) were approximately $237.0 million and $537.7 million at December 31, 2006and December 31, 2005 respectively. These amounts include payments for principal, interest, taxes, andinsurance collected on behalf of the individual investor.
The following is an analysis of the changes in the recorded value of the Company’s mortgage servicingrights (in thousands):
2006 2005 2004For the Years Ended December 31,
Balance, beginning of period $ 315,678 $ 187,975 $ 260,128
Capitalization 223,934 328,954 318,028
Sales (296,163) (106,703) (314,124)
Amortization (69,562) (94,548) (76,057)
Valuation allowance (599) — —
Balance, end of period $ 173,288 $ 315,678 $ 187,975
At December 31, 2006 and 2005, the estimated fair value of the mortgage loan-servicing portfolio was$197.6 million and $421.1 million, respectively. At December 31, 2006, the fair value of each MSR was basedupon the following weighted-average assumptions: (1) a discount rate of 10.3%; (2) an anticipated loanprepayment rate of 28.5% (i.e. CPR); and (3) servicing costs per conventional loan of $42 and $45 for eachgovernment or adjustable-rate loan.
79
Flagstar Bancorp, Inc.Notes to the Consolidated Financial Statements - continued

Changes in the valuation allowance for impairment of MSRs are as follows (in thousands):
2006 2005 2004
For the Years EndedDecember 31,
Balance, beginning of period $ — $— $—
Provision for valuation 599 — —
Permanent impairment — — —
Balance, end of period $599 $— $—
Note 14 — Deposit Accounts
The deposit accounts are as follows (in thousands):
2006 2005December 31,
Demand accounts $ 380,162 $ 374,816
Savings accounts 144,460 239,215
Money market demand accounts 608,282 781,087
Certificates of deposit 3,763,781 3,450,450
Total retail deposits 4,896,685 4,845,568
Municipal deposits 1,419,964 1,353,633
National accounts 1,062,646 1,779,799
Total deposits $7,379,295 $7,979,000
At December 31, 2006, municipal deposits included $1.3 billion of certificates of deposit with maturitiestypically less than one year and $87.3 million in checking and savings accounts. At December 31, 2005,municipal deposits included $1.3 billion of certificates of deposit and $70.7 million in checking and savingsaccounts.
Non-interest-bearing deposits included in the demand accounts and money market demand accountsbalances at December 31, 2006 and 2005, were approximately $0.9 billion and $1.1 billion, respectively.
The aggregate amount of certificates of deposit with a minimum denomination of $100,000 wasapproximately $2.6 billion and $2.4 billion at December 31, 2006 and 2005, respectively. The following tableindicates the scheduled maturities for certificates of deposit with a minimum denomination of $100,000 (inthousands):
2006 2005December 31,
Three months or less $1,268,286 $1,222,304
Over three months to six months 601,625 406,848
Over six months to twelve months 429,199 422,837
One to two years 179,393 190,948
Thereafter 120,305 168,267
Total $2,598,808 $2,411,204
80
Flagstar Bancorp, Inc.Notes to the Consolidated Financial Statements - continued

The following table indicates the scheduled maturities of the Company’s certificates of deposit byacquisition channel as of December 31, 2006 (in thousands):
ConsumerDirect Municipal
NationalAccounts Total
Twelve months or less $2,963,733 $1,294,508 $ 686,175 $4,944,416
One to two years 473,756 36,996 250,416 761,168
Two to three years 215,578 1,048 126,055 342,681
Three to four years 64,687 100 — 64,787
Four to five years 34,119 — — 34,119
Thereafter 11,908 — — 11,908
Total $3,763,781 $1,332,652 $1,062,646 $6,159,079
Note 15 — FHLB Advances
The portfolio of FHLB advances includes floating rate daily adjustable advances, fixed rate putableadvances and fixed rate term advances. The following is a breakdown of the advances outstanding (dollars inthousands):
Amount
WeightedAverage
Rate Amount
WeightedAverage
Rate
2006 2005December 31,
Floating rate daily advances $ — —% $ 766,000 4.18%
Fixed rate putable advances 500,000 4.24% 700,000 4.49%
Fixed rate term advances 4,907,000 4.66% 2,759,000 3.69%
Total $5,407,000 4.62% $4,225,000 3.91%
The portfolio of putable FHLB advances held by the Company matures in 2011 and may be called by theFHLB based on FHLB volatility models.
The following indicates certain information related to the FHLB advances (dollars in thousands):
2006 2005 2004For the Years Ended December 31,
Maximum outstanding at any month end $5,407,000 $5,373,279 $4,097,000
Average balance 4,270,660 4,742,079 3,631,851
Average interest rate 4.40% 3.85% 3.96%
The following outlines the Company’s FHLB advance maturity dates as of December 31, 2006 (inmillions):
2007 $2,757
2008 750
2009 500
2010 400
2011 750
Thereafter 250
Total $5,407
81
Flagstar Bancorp, Inc.Notes to the Consolidated Financial Statements - continued

The Company has the authority and approval from the FHLB to utilize a total of $6.75 billion incollateralized borrowings. Pursuant to collateral agreements with the FHLB, advances are collateralized bynon-delinquent single-family residential mortgage loans.
Note 16 — Security Repurchase Agreements
The following table presents security repurchase agreements outstanding (dollars in thousands):
Amount
WeightedAverage
Rate Amount
WeightedAverage
Rate
2006 2005December 31,
Security repurchase agreements $990,806 5.31% $1,060,097 4.32%
These repurchase agreements have maturities of less than six months. At December 31, 2006 and 2005,security repurchase agreements were collateralized by $1.0 billion and $1.2 billion of mortgage-backedsecurities held to maturity, respectively.
The following table indicates certain information related to the security repurchase agreements (dollars inthousands):
2006 2005 2004For the Years Ended December 31,
Maximum outstanding at any month end $1,259,812 $1,101,242 $—
Average balance 1,065,458 899,488 —
Average interest rate 5.01% 4.17% —
Note 17 — Long Term Debt
The following table presents long-term debt (in thousands):
2006 2005December 31,
Junior subordinated notes related to trust preferred securities
Floating 3 month LIBOR plus 3.25%(1) (8.62% and 7.40% at December 31, 2006and 2005, respectively), matures 2032 $ 25,774 $ 25,774
Fixed 6.55%(2), matures 2033 25,774 25,774
Fixed 6.75%(2), matures 2033 25,780 25,780
Floating 3 month LIBOR plus 2.00% (7.37% and 6.15% at December 31, 2006 and2005, respectively), matures 2035 25,774 25,774
Floating 3 month LIBOR plus 2.00% (7.37% and 6.15% at December 31, 2006 and2005, respectively), matures 2035 25,774 25,774
Fixed 6.47%(3), matures 2035 51,547 51,547
Floating 3 month LIBOR plus 1.50%(4) (6.87% and 4.15% at December 31, 2006and 2005, respectively), matures 2035 25,774 25,774
Subtotal 206,197 206,197
Other Debt
Fixed 7.00% due 2013 1,275 1,300
Total long-term debt $207,472 $207,497
82
Flagstar Bancorp, Inc.Notes to the Consolidated Financial Statements - continued

(1) As part of the transaction, the Company entered into an interest rate swap with the placement agent underwhich the Company is required to pay 6.88% fixed rate on a notional amount of $25 million and willreceive a floating rate equal to three month LIBOR plus 3.25%. The swap matures on December 26, 2007.The securities are callable after December 26, 2007.
(2) In 2008, the callable date, the rate converts to a variable rate equal to three month LIBOR plus 3.25%,adjustable quarterly. The securities are callable after February 26, 2008 and March 26, 2008.
(3) In 2010, the callable date, the rate converts to a variable rate equal to three month LIBOR plus 2.00%adjustable quarterly. The securities are callable after March 31, 2010.
(4) As part of the transaction, the Company entered into an interest rate swap with the placement agent, underwhich the Company is required to pay 4.33% fixed rate on a notional amount of $25 million and willreceive a floating rate equal to three month LIBOR. The swap matures on October 7, 2010. The securitiesare callable after October 7, 2010.
The following presents the aggregate annual maturities of long term-debt obligations (based on finalmaturity dates) as of December 31, 2006 (in thousands):
2007 $ 25
2008 25
2009 25
2010 25
2011 25
Thereafter 207,347
Total $207,472
Note 18 — Federal Income Taxes
Total federal income tax provision (benefit) is allocated as follows (in thousands):
2006 2005 2004For the Years Ended December 31,
Income from operations $40,819 $44,090 $77,592
Stockholders’ equity, for the tax benefit from stock-based compensation (999) (8,379) (2,049)
Stockholders’ equity, for the tax effect of other comprehensive income (1,222) 1,340 1,779
$38,598 $37,051 $77,322
Components of the provision for federal income taxes from operations consist of the following (inthousands):
2006 2005 2004For the Years Ended December 31,
Current provision (benefit) $ 93,634 $(12,342) $ 99,462
Deferred provision (benefit) (52,815) 56,432 (21,870)
$ 40,819 $ 44,090 $ 77,592
83
Flagstar Bancorp, Inc.Notes to the Consolidated Financial Statements - continued

The Company’s effective tax rate differs from the statutory federal tax rate. The following is a summaryof such differences (in thousands):
2006 2005 2004For the Years Ended December 31,
Provision at statutory federal income tax rate $40,607 $43,384 $77,115
Increase resulting from other, net 212 706 477
Provision at effective federal income tax rate $40,819 $44,090 $77,592
The details of the net tax liability are as follows (in thousands):
2006 2005December 31,
Deferred tax assets:Allowance for loan and other losses $ 32,891 $ 26,293
Premises and equipment 3,509 —
Accrued vacation pay 1,605 1,386
Non-accrual interest revenue 1,068 1,101
HELOC securitization 723 —
Deferred gain on termination of hedge — 683
State income taxes — 3,168
Restatement of accrued interest — 5,931
Other 995 1,301
40,791 39,863
Deferred tax liabilities:Mortgage loan servicing rights (59,491) (109,523)
Federal Home Loan Bank stock dividends (8,543) (7,533)
Deferred loan costs and fees (4,837) (5,693)
Mark-to-market adjustments — forward commitments (2,880) (1,306)
Mark-to-market adjustments — loans available for sale (969) (3,164)Mark-to-market adjustments — available for sale securities (362) —
Mark-to-market adjustments-HELOCS (189) (268)
Unrealized hedging gains (2,258) (4,669)
State income taxes (2,545) —
Premises and equipment — (5,131)
HELOC securitization — (4,473)
Other (224) (19)
(82,298) (141,779)
Net deferred tax liability (41,507) (101,916)
Current federal income taxes receivable 11,833 26,645
Income taxes payable $(29,674) $ (75,271)
The Company has not provided deferred income taxes for the Bank’s pre-1988 tax bad debt reserves ofapproximately $4 million because it is not anticipated that this temporary difference will reverse in theforeseeable future. Such reserves would only be taken into taxable income if the Bank, or a successor
84
Flagstar Bancorp, Inc.Notes to the Consolidated Financial Statements - continued

institution, liquidates, redeems shares, pays dividends in excess of earnings and profits, or ceases to qualify asa bank for tax purposes.
Note 19 — Secondary Market Reserve
The following table shows the activity in the secondary market reserve (in thousands):
2006 2005 2004For the Years Ended December 31,
Balance, beginning of period, $ 17,550 $ 19,002 $ 10,254
Provision
Charged to gain on sale for current loan sales 5,897 5,328 5,932
Charged to other fees and charges for changes in estimates 14,312 7,156 18,105
Total 20,209 12,484 24,037
Charge-offs, net (13,559) (13,936) (15,289)
Balance, end of period $ 24,200 $ 17,550 $ 19,002
Reserve levels are a function of expected losses based on actual pending and expected claims andrepurchase requests, historical experience and loan volume. While the ultimate amount of repurchases andclaims is uncertain, management believes that reserves are adequate. We will continue to evaluate theadequacy of our reserves and may continue to allocate a portion of our gain on sale proceeds to these reservesgoing forward.
Note 20 — Employee Benefit Plans
The Company maintains a 401(k) plan for its employees. Under the plan, eligible employees maycontribute up to 60% of their annual compensation, subject to a maximum amount proscribed by law. Themaximum annual contribution was $15,000 for 2006, $14,000 for 2005 and $13,000 for 2004. Participantswho were 50 years old or older prior to the end of the year could make additional “catch-up” contributions ofup to $5,000, $4,000, and $3,000 for 2006, 2005, and 2004, respectively. The Company currently provides amatching contribution up to 3% of an employee’s annual compensation up to a maximum of $6,600. TheCompany’s contributions vest at a rate such that an employee is fully vested after five years of service. TheCompany’s contributions to the plan for the years ended December 31, 2006, 2005, and 2004 wereapproximately $3.1 million, $3.3 million, and $3.2 million, respectively. The Company may also makediscretionary contributions to the plan; however, none have been made.
Prior to March 31, 2005, the Company offered a deferred compensation plan to employees. The deferredcompensation plan allowed employees to defer up to 25% of their annual compensation and directors to deferall of their compensation. Funds deferred remained the property of the Company. The Company discontinuedthis compensation plan March 31, 2005.
Note 21 — Contingencies and Commitments
The Company is involved in certain lawsuits incidental to its operations. Management, after review withits legal counsel, is of the opinion that resolution of such litigation will not have a material effect on theCompany’s financial condition, results of operations, or liquidity.
A substantial part of the Company’s business has involved the origination, purchase, and sale of mortgageloans. During the past several years, numerous individual claims and purported consumer class action claimswere commenced against a number of financial institutions, their subsidiaries and other mortgage lendinginstitutions generally seeking civil statutory and actual damages and rescission under the federal Truth in
85
Flagstar Bancorp, Inc.Notes to the Consolidated Financial Statements - continued

Lending Act, as well as remedies for alleged violations of various state unfair trade practices laws restitutionor unjust enrichment in connection with certain mortgage loan transactions.
The Company has a substantial mortgage loan-servicing portfolio and maintains escrow accounts inconnection with this servicing. During the past several years, numerous individual claims and purportedconsumer class action claims were commenced against a number of financial institutions, their subsidiariesand other mortgage lending institutions generally seeking declaratory relief that certain of the lenders’ escrowaccount servicing practices violate the Real Estate Settlement Practices Act and breach the lenders’ contractswith borrowers. Such claims also generally seek actual damages and attorney’s fees.
In addition to the foregoing, mortgage lending institutions have been subjected to an increasing numberof other types of individual claims and purported consumer class action claims that relate to various aspects ofthe origination, pricing, closing, servicing, and collection of mortgage loans that allege inadequate disclosure,breach of contract, or violation of state laws. Claims have involved, among other things, interest rates and feescharged in connection with loans, interest rate adjustments on adjustable rate loans, timely release of liensupon payoffs, the disclosure and imposition of various fees and charges, and the placing of collateralprotection insurance.
While the Company has had various claims similar to those discussed above asserted against it,management does not expect that the ultimate resolution of these claims will have a material adverse effect onthe Company’s financial condition, results of operations, or liquidity.
A summary of the contractual amount of significant commitments is as follows (in thousands):
2006 2005December 31,
Commitments to extend credit:
Mortgage Loans $1,779,000 $1,644,000
Commercial 134,000 185,000
Other 30,000 60,000
Commitments to extend credit are agreements to lend. Since many of these commitments expire withoutbeing drawn upon, the total commitment amounts do not necessarily represent future cash flow requirements.Certain lending commitments for commercial and mortgage loans to be sold in the secondary market areconsidered derivative instruments in accordance with SFAS 133. Changes to the fair value of thesecommitments as a result of changes in interest rates are recorded on the statement of financial condition aseither an other asset or other liability. The commitments related to mortgage loans and commercial real estateloans are included in mortgage loans and commercial loans in the above table.
The credit risk associated with loan commitments is essentially the same as that involved in extendingloans to customers and is subject to normal credit policies. Collateral may be obtained based on management’scredit assessment of the customer.
Note 22 — Regulatory Capital Requirements
The Bank is subject to various regulatory capital requirements administered by the federal bankingagencies. Failure to meet minimum capital requirements can initiate certain mandatory, and possibly additionaldiscretionary actions by regulators that, if undertaken, could have a direct material effect on the Company’sconsolidated financial statements. Under capital adequacy guidelines and the regulatory framework for promptcorrective action, the Bank must meet specific capital guidelines that involve quantitative measures of theBank’s assets, liabilities, and certain off-balance-sheet items as calculated under regulatory accountingpractices. The Bank’s capital amounts and classification are also subject to qualitative judgments by regulatorsabout components, risk weightings, and other factors.
86
Flagstar Bancorp, Inc.Notes to the Consolidated Financial Statements - continued

Quantitative measures that have been established by regulation to ensure capital adequacy require theBank to maintain minimum capital amounts and ratios (set forth in the table below). The Bank’s primaryregulatory agency, the OTS, requires that the Bank maintain minimum ratios of tangible capital (as defined inthe regulations) of 1.5%, core capital (as defined) of 3.0%, and total risk-based capital (as defined) of 8.0%.The Bank is also subject to prompt corrective action capital requirement regulations set forth by the FDIC.The FDIC requires the Bank to maintain a minimum of Tier 1 total and core capital (as defined) to risk-weighted assets (as defined), and of core capital (as defined) to adjusted tangible assets (as defined).Management believes, as of December 31, 2006, that the Bank meets all capital adequacy requirements towhich it is subject.
As of December 31, 2006 and 2005, the most recent guidelines from the OTS categorized the Bank as“well capitalized” under the regulatory framework for prompt corrective action. To be categorized as “wellcapitalized,” the Bank must maintain minimum total risk-based, Tier 1 risk-based, and Tier 1 leverage ratios asset forth in the table below. There are no conditions or events since that notification that management believeshave changed the Bank’s category.
Amount Ratio Amount Ratio Amount RatioActual
For CapitalAdequacy Purposes
Capitalized UnderPrompt CorrectiveAction Provisions
(Dollars in thousands)
As of December 31, 2006Tangible capital (to tangible assets) $ 984,981 6.4% $231,901 1.5% N/A N/A
Core capital (to adjusted tangible assets) 984,981 6.4% 463,802 3.0% $773,005 5.0%
Tier I capital (to risk weighted assets) 957,388 11.0% N/A N/A 520,502 6.0%
Total capital (to risk weighted assets) 1,001,937 11.6% 693,996 8.0% 867,494 0.0%
As of December 31, 2005Tangible capital (to tangible assets) $ 941,457 6.3% $225,670 1.5% N/A N/A
Core capital (to adjusted tangible assets) 941,457 6.3% 451,340 3.0% $752,333 5.0%
Tier I capital (to risk weighted assets) 924,461 10.7% N/A N/A 520,301 6.0%
Total capital (to risk weighted assets) 961,864 11.1% 693,727 8.0% 867,159 10.0%
Note 23 — Accumulated Other Comprehensive Income
The following table sets forth the ending balance in accumulated other comprehensive income for eachcomponent (in thousands):
2006 2005 2004December 31,
Net gain on interest rate swap extinguishment $ 101 $1,268 $2,650
Net unrealized gain on derivatives used in cashflow hedges 4,193 6,068 2,693
Net unrealized gain on securities available for sale 888 498 —
Ending balance $5,182 $7,834 $5,343
87
Flagstar Bancorp, Inc.Notes to the Consolidated Financial Statements - continued

The following table sets forth the changes to other comprehensive income and the related tax effect foreach component (in thousands):
2006 2005 2004For the Years Ended December 31,
Gain (reclassified to earnings) on interest rate swap extinguishment $(1,795) $(2,054) $ 4,077
Related tax (expense) benefit 628 719 (1,427)Unrealized gain (loss) on derivatives used in cashflow hedges (2,628) 5,119 872
Related tax (expense) benefit 754 (1,792) (352)
Unrealized gain on securities available for sale 805 767 —
Related tax expense (416) (268) —
Change $(2,652) $ 2,491 $ 3,170
On December 30, 2004, the Company extinguished $250.0 million of interest rate swaps. These swapswere eliminated at an after-tax gain of $2.6 million. This gain was deferred and is being reclassified intoearnings from accumulated other comprehensive income over three years, which is the original duration of theextinguished swaps. The Company will reclassify into earnings after-tax $0.1 million in 2007.
Note 24 — Concentrations of Credit
Properties collateralizing mortgage loans held for investment were geographically disbursed throughoutthe United States. As of December 31, 2006, approximately 13.1% of these properties are located in Michigan(measured by principal balance), and another 52.3% were located in the states of California (23.1%), Florida(12.6%), Washington (5.0%), Colorado (4.5%), Texas (4.1%) and Arizona (3.0%). No other state containsmore than 3% of the properties collateralizing these loans.
A substantial portion of the Company’s commercial real estate loan portfolio (76.9%) is collateralized byproperties located in Michigan.
Additionally, the following loan products contractual terms may give rise to a concentration of credit riskand increase the Company’s exposure to risk of nonpayment or realization:
a. Hybrid or ARM loans that are subject to future payment increases
b. Option power ARM loans that permit negative amortization
c. Loans under a. or b. above with loan-to-value ratios above 80%
88
Flagstar Bancorp, Inc.Notes to the Consolidated Financial Statements - continued

The following table details the unpaid principal balance of these loans at December 31, 2006:
Held for InvestmentPortfolio Loans(In thousands)
Amortizing hybrid ARMs
3/1 ARM $ 729,158
5/1 ARM 1,437,021
7/1 ARM 85,117
Interest only hybrid ARMs
3/1 ARM 908,534
5/1 ARM 1,798,121
7/1 ARM 6,853
Option power ARMs 13,707
All other ARMs 469,666
$5,448,177
Of the loans listed above, the following have original loan-to-value ratios exceeding 80%.
Principal OutstandingAt December 31, 2006
(In thousands)
Loans with original loan-to-value ratios above 80%
� 80%� = 90% $335,809
� 90%� = 100% 282,749
�100% 17,492
$636,050
As of December 31, 2006, the aggregate amount of the securities from each of the following issuers weregreater than 10% of the Company’s shareholders’ equity. These issuers include qualifying special-purposeentities created by the Company in conjunction with a securitization transaction with the objective torecharacterize loans as securities for the purposes of (1) lower our cost of funds, (2) improve our liquidityprofile, and (3) improve our risk profile through the use of bond insurance.
Name of IssuerAmortized
CostFair Market
Value(In thousands)
Chase Mortgage Financial Corporation $ 99,330 $ 99,884
JP Morgan Mortgage Trust 100,000 100,000
Flagstar Home Equity Loan Trust 2006-1 332,362 329,979
Total $531,692 $529,863
Note 25 — Related Party Transactions
The Company has and expects to have in the future, transactions with certain of the Company’s directorsand principal officers. Such transactions were made in the ordinary course of business and included extensionsof credit and professional services. With respect to the extensions of credit, all were made on substantially thesame terms, including interest rates and collateral, as those prevailing at the same time for comparabletransactions with other customers and did not, in management’s opinion, involve more than normal risk ofcollectibility or present other unfavorable features. At December 31, 2006, the balance of the loans attributable
89
Flagstar Bancorp, Inc.Notes to the Consolidated Financial Statements - continued

to directors and principal officers totaled $6.9 million, with the unused lines of credit totaling $11.5 million.At December 31, 2005, the balance of the loans attributable to directors and principal officers totaled$4.5 million, with the unused lines of credit totaling $10.3 million. During 2006 and 2005, the Companypurchased $96.1 million and $35.8 million in mortgage loans from correspondents and brokers affiliated withdirectors and executive officers, during the ordinary course of business.
Note 26 — Derivative Financial Instruments
We follow the provisions of SFAS 133, as amended, for our derivative instruments and hedging activities,which require us to recognize all derivative instruments on the consolidated statements of financial conditionat fair value. The following derivative financial instruments were identified and recorded at fair value as ofDecember 31, 2006 and 2005:
FNMA, FHLMC and other forward contractsRate lock commitmentsInterest rate swap agreements
Generally speaking, if interest rates increase, the value of our rate lock commitments and funded loansdecrease and loan sale margins are adversely impacted. We hedge the risk of overall changes in fair value ofloans held for sale and rate lock commitments generally by selling forward contracts on securities of FannieMae, Freddie Mac and Ginnie Mae. Under SFAS 133, certain of these positions may qualify as a fair valuehedge of a portion of the funded loan portfolio and result in adjustments to the carrying value of designatedloans through gain on sale based on value changes attributable to the hedged risk. The forward contracts usedto economically hedge the loan commitments are accounted for as non-designated hedges and naturally offsetrate lock commitment mark-to-market gains and losses recognized as a component of gain on sale. The Bankrecognized pre-tax gains of $4.5 million for the year ended December 31, 2006, and pre-tax losses of$2.9 million and $357,000 for the years ended December 31, 2005 and 2004, respectively, on our hedgingactivity.
We use interest rate swap agreements to reduce our exposure to interest rate risk inherent in a portion ofthe current and anticipated borrowings and advances. A swap agreement is a contract between two parties toexchange cash flows based on specified underlying notional amounts and indices. Under SFAS 133, the swapagreements used to hedge our anticipated borrowings and advances qualify as cash flow hedges. As ofDecember 31, 2006 and 2005, the net fair market value adjustment on our interest rate swap agreements on anafter-tax basis was $3.6 million and $5.4 million, respectively, which was recorded as a component ofaccumulated other comprehensive income. Future effective changes in fair value on these interest rate swapagreements will be adjusted through OCI as long as the cash flow hedge requirements continue to be met.
On December 30, 2004, the Company extinguished $250.0 million of interest rate swaps. These swapswere eliminated at an after-tax gain of $2.6 million. This gain was deferred and is being reclassified intoearnings from accumulated other comprehensive income over three years, which is the original duration of theextinguished swaps. During 2006 and 2005, $1.2 million and $1.3 million was recognized in earnings,respectively.
The Company recognizes ineffective changes in hedge values resulting from designated SFAS 133 hedgesdiscussed above in the same statement of earnings captions as effective changes when such materialineffectiveness occurs. The Company has not recognized gains or losses due to ineffectiveness in earnings dueto immateriality.
90
Flagstar Bancorp, Inc.Notes to the Consolidated Financial Statements - continued

We had the following derivative financial instruments (dollars in thousands):
NotionalAmounts
FairValue
ExpirationDates
December 31, 2006
Mortgage Banking Derivatives:
Rate lock commitments $1,720,879 $3,819 2007
Forward agency and loan sales 2,156,566 4,409 2007
Borrowings and advances hedges:
Interest rate swaps (LIBOR) 300,000 6,452 2007-2010
NotionalAmounts
FairValue
ExpirationDates
December 31, 2005
Mortgage Banking Derivatives:
Rate lock commitments $1,342,000 $ 8,362 2006
Forward agency and loan sales 1,643,620 (4,145) 2006
Borrowings and advances hedges:
Interest rate swaps (LIBOR) 300,000 9,599 2006-2010
Counterparty Credit Risk
The Bank is exposed to credit loss in the event of non-performance by the counterparties to its variousderivative financial instruments. The Company manages this risk by selecting only well-established, financiallystrong counterparties, spreading the credit risk among such counterparties, and by placing contractual limits onthe amount of unsecured credit risk from any single counterparty.
Note 27 — Fair Value of Financial Instruments
The Company is required to disclose the fair value information about financial instruments, whether ornot recognized in the consolidated statement of financial condition, where it is practicable to estimate thatvalue. In cases where quoted market prices are not available, fair values are based on estimates using presentvalue or other valuation techniques. Because assumptions used in these valuation techniques are inherentlysubjective in nature, the estimated fair values cannot always be substantiated by comparison to independentmarket quotes and, in many cases; the estimated fair values could not necessarily be realized in an immediatesale or settlement of the instrument.
The fair value estimates presented herein are based on relevant information available to management asof December 31, 2006 and 2005, respectively. Management is not aware of any factors that would significantlyaffect these estimated fair value amounts. As these reporting requirements exclude certain financial instrumentsand all non-financial instruments, the aggregate fair value amounts presented herein do not represent
91
Flagstar Bancorp, Inc.Notes to the Consolidated Financial Statements - continued

management’s estimate of the underlying value of the Company. Additionally, such amounts exclude intangibleasset values such as the value of core deposit intangibles.
The following methods and assumptions were used by the Company to estimate the fair value of eachclass of financial instruments and certain non-financial instruments for which it is practicable to estimate thatvalue:
Cash and cash equivalents. Due to their short term nature, the carrying amount of cash and cashequivalents approximates fair value.
Securities available for sale. The carrying amount of the securities available for sale approximates fairvalue. Fair value is estimated using quoted market prices or by discounting future cash flows usingassumptions for prepayment rates, market yield requirements and credit losses.
Other investments. The carrying amount of other investments approximates fair value.
Loans receivable. Mortgage loans available for sale and held for investment are valued using fair valuesattributable to similar mortgage loans. The fair value of the other loans and mortgage-backed securities isbased on the fair value of obligations with similar credit characteristics.
FHLB stock. No secondary market exists for FHLB stock. The stock is bought and sold at par by theFHLB. The recorded value, therefore, is the fair value.
Deposit Accounts. The fair value of demand deposits and savings accounts approximates the carryingamount. The fair value of fixed-maturity certificates of deposit is estimated using the rates currently offeredfor certificates of deposits with similar remaining maturities.
FHLB Advances. Rates currently available to the Company for debt with similar terms and remainingmaturities are used to estimate the fair value of the existing debt.
Security Repurchase Agreements. Due to their short term nature, the carrying amount of the repurchaseagreements approximates fair value.
Long Term Debt. The fair value of the long-term debt is estimated based on a discounted cash flowmodel that incorporates the Company’s current borrowing rates for similar types of borrowing arrangements.
Payables for Securities Purchased. Due to their short term nature, the carrying amount of the payablesfor securities purchased approximates fair value.
Derivative Financial Instruments. The fair value of forward sales contracts, interest rate swaps andfixed-rate commitments to extend credit are based on observable market prices or cash flow projection modelsacquired from third parties.
92
Flagstar Bancorp, Inc.Notes to the Consolidated Financial Statements - continued

The following tables set forth the fair value of the Company’s financial instruments (in thousands):
CarryingValue
FairValue
CarryingValue
FairValue
2006 2005December 31,
Financial instruments:Assets:
Cash and cash equivalents $ 277,236 $ 277,236 $ 201,163 $ 201,163
Securities available for sale 617,450 617,450 26,148 26,148
Other investments 24,035 24,035 21,957 21,957
Loans available for sale 3,188,795 3,212,824 1,773,394 1,780,258
Loans held for investment and mortgage-backedsecurities 10,505,105 10,555,375 11,991,457 11,950,105
FHLB stock 277,570 277,570 292,118 292,118
Liabilities:Retail deposits:
Demand deposits and savings accounts (1,132,904) (1,132,904) (1,395,118) (1,395,118)
Certificates of deposit (3,763,781) (3,752,959) (3,450,450) (3,429,063)
Municipal deposits (1,419,964) (1,414,362) (1,353,633) (1,351,218)
National certificates of deposit (1,062,646) (1,046,768) (1,779,799) (1,748,185)
FHLB advances (5,407,000) (5,365,825) (4,225,000) (4,181,458)
Security repurchase agreements (990,806) (990,806) (1,060,097) (1,060,049)Long term debt (207,472) (205,860) (207,497) (207,497)
Payables for securities purchased (249,694) (249,694) — —
Derivative Financial Instruments:Forward delivery contracts 4,409 4,409 (4,145) (4,145)
Commitments to extend credit 3,819 3,819 8,362 8,362
Interest rate swaps 6,452 6,452 9,599 9,599
Note 28 — Segment Information
The Company’s operations are broken down into two business segments: banking and home lending. Eachbusiness operates under the same banking charter but is reported on a segmented basis for this report. Each ofthe business lines is complementary to each other. The banking operation includes the gathering of depositsand investing those deposits in duration-matched assets primarily originated by the home lending operation.The banking group holds these loans in the investment portfolio in order to earn income based on thedifference or “spread” between the interest earned on loans and the interest paid for deposits and otherborrowed funds. The home lending operation involves the origination, packaging, and sale of loans in order toreceive transaction income. The lending operation also services mortgage loans for others and sells MSRs intothe secondary market. Funding for the lending operation is provided by deposits and borrowings garnered bythe banking group. All of the non-bank consolidated subsidiaries are included in the banking segment. Nosuch subsidiary is material to the Company’s overall operations.
93
Flagstar Bancorp, Inc.Notes to the Consolidated Financial Statements - continued

Following is a presentation of financial information by business segment for the period indicated (inthousands):
BankingOperation
HomeLending
Operation Eliminations Combined
As of or for the Year Ended December 31, 2006
Net interest income $ 159,255 $ 55,692 $ — $ 214,947
Net gain on sale revenue — 135,002 — 135,002
Other income 31,353 35,806 — 67,159
Total net interest income and non-interestincome 190,608 226,500 — 417,108
Earnings before federal income taxes 59,728 56,293 — 116,021
Depreciation and amortization 10,143 86,323 — 96,466
Capital expenditures 43,652 1,704 — 45,356
Identifiable assets 14,939,341 3,597,864 (3,040,000) 15,497,205
Inter-segment income (expense) 80,100 (80,100) — —
BankingOperation
HomeLending
Operation Eliminations Combined
As of or for the Year Ended December 31, 2005
Net interest income $ 185,276 $ 60,994 $ — $ 246,270
Net gain on sale revenue — 81,737 — 81,737
Other income 55,813 21,898 — 77,711
Total net interest income and non-interestincome 241,089 164,629 — 405,718
Earnings before federal income taxes 123,726 229 — 123,955
Depreciation and amortization 10,139 115,112 — 125,251
Capital expenditures 32,764 18,633 — 51,397
Identifiable assets 14,176,340 2,379,090 (1,480,000) 15,075,430
Inter-segment income (expense) 42,375 (42,375) — —
BankingOperation
HomeLending
Operation Eliminations Combined
As of or for the Year Ended December 31, 2004
Net interest income $ 175,403 $ 47,888 $ — $ 223,291
Net gain on sale revenue — 169,559 169,559
Other income 63,227 23,335 — 86,562
Total net interest income and non-interestincome 238,630 240,782 — 479,412
Earnings before federal income taxes 135,080 85,250 — 220,330
Depreciation and amortization 6,810 99,303 — 106,113
Capital expenditures 18,431 30,664 — 49,095
Identifiable assets 12,136,082 2,245,932 (1,239,000) 13,143,014
Inter-segment income (expense) 25,475 (25,475) — —
94
Flagstar Bancorp, Inc.Notes to the Consolidated Financial Statements - continued

Revenues are comprised of net interest income (before the provision for loan losses) and non-interestincome. Non-interest expenses are fully allocated to each business segment. The intersegment income(expense) consists of interest expense incurred for intersegment borrowing.
Note 29 — Earnings Per Share
Basic earnings per share excludes dilution and is computed by dividing earnings available to commonstockholders by the weighted average number of common shares outstanding during the period. Dilutedearnings per share reflects the potential dilution that could occur if securities or other contracts to issuecommon stock were exercised and converted into common stock or resulted in the issuance of common stockthat could then share in the earnings of the Company.
The following are reconciliations of the numerator and denominator of the basic and diluted earnings pershare calculation (dollars in thousands, except per share data):
Earnings(Numerator)
Average Shares(Denominator)
Per ShareAmount
For the Year Ended December 31, 2006
Basic earnings $75,202 63,504 $ 1.18
Effect of options — 824 (0.01)
Diluted earnings $75,202 64,328 $ 1.17
In 2006, the Company had 820,582 options that were classified as anti-dilutive and were excluded fromthe EPS calculations.
Earnings(Numerator)
Average Shares(Denominator)
Per ShareAmount
For the Year Ended December 31, 2005
Basic earnings $79,865 62,128 $ 1.29
Effect of options — 1,882 (0.04)
Diluted earnings $79,865 64,010 $ 1.25
In 2005, the Company had 837,449 options that were classified as anti-dilutive and were excluded fromthe EPS calculations.
Earnings(Numerator)
Average Shares(Denominator)
Per ShareAmount
For the Year Ended December 31, 2004
Basic earnings $142,738 61,057 $ 2.34
Effect of options — 3,115 (0.12)
Diluted earnings $142,738 64,172 $ 2.22
In 2004, the Company had 501,300 options that were classified as anti-dilutive and were excluded fromthe EPS calculations.
Note 30 — Stock-Based Compensation
In 1997, Flagstar’s board of directors adopted resolutions to implement various stock option and purchaseplans and incentive compensation plans in conjunction with the public offering of common stock.
95
Flagstar Bancorp, Inc.Notes to the Consolidated Financial Statements - continued

On May 26, 2006, the Company’s shareholders approved the Flagstar Bancorp, Inc. 2006 Equity IncentivePlan (the “2006 Plan”). The 2006 Plan consolidates, amends and restates the Company’s 1997 Employees andDirectors Stock Option Plan, its 2000 Stock Incentive Plan, and its 1997 Incentive Compensation Plan (each, a“Prior Plan”). Awards still outstanding under any of the Prior Plans will continue to be governed by theirrespective terms. Under the 2006 Plan, key employees, officers, directors and others expected to providesignificant services to the Company and its affiliates are eligible to receive awards. Awards that may begranted under the 2006 Plan include stock options, incentive stock options, cash-settled stock appreciationrights, restricted stock units, performance shares and performance units and other awards.
Under the 2006 Plan, the exercise price of any award granted must be at least equal to the fair marketvalue of the Company’s common stock on the date of grant. Non-qualified stock options granted to directorsexpire five years from the date of grant. Grants other than non-qualified stock options have term limits set bythe board of directors in the applicable agreement. Stock appreciation rights expire seven years from the dateof grant unless otherwise provided by the Compensation Committee of the board of directors.
In December 2004, the FASB issued SFAS 123R (revised 2004), “Share-Based Payment,” (“SFAS 123R”)which requires that compensation costs related to share-based payment transactions be recognized in financialstatements. SFAS 123R eliminated the alternative to use the intrinsic method of accounting previously allowedunder APB 25, “ Accounting for Stock Issued to Employees,” which generally did not require any compensa-tion expense to be recognized in the financial statements for the grant of stock options to employees if certainconditions were met. Only certain pro forma disclosures of share-based payments were required.
On January 1, 2006, the Company adopted SFAS 123R using the modified prospective method.SFAS 123R requires all share-based payments to employees, including grants of employee stock options, to berecognized as expense in the consolidated statement of earnings based on their fair values. The amount ofcompensation expense is determined based on the fair value of the options when granted and is expensed overthe required service period, which is normally the vesting period of the options. SFAS 123R applies to awardsgranted or modified on or after January 1, 2006, and to any unvested awards that were outstanding atDecember 31, 2005. Consequently, compensation expense is recorded for prior option grants that vest on orafter January 1, 2006, the date of adoption.
Prior to the adoption of SFAS 123R, the Company accounted for its Prior Plans under the recognition andmeasurement principles of APB 25. The Company reported all tax benefits resulting from the exercise of stockoptions as financing cash flows in the consolidated statements of cash flows. In accordance with SFAS 123R, forthe period beginning January 1, 2006, only the excess tax benefits from the exercise of stock options are presentedas financing cash flows. The excess tax benefits totaled $1.0 million for the year ended December 31, 2006.
The fair value concepts were not changed significantly in SFAS 123R; however, in adopting this standard,companies must choose among alternative valuation models and amortization assumptions. The Company haselected to continue to use both the Black-Scholes option pricing model and the straight-line method ofamortization of compensation expense over the requisite service period of the grant. The Company willreconsider use of the Black-Scholes model if additional information in the future indicates another modelwould be more appropriate at that time or if grants issued in future periods have characteristics that could notbe reasonably estimated using this model.
During 2006, compensation expense recognized related to the 2006 Plan totaled $2.2 million.
Stock Option Plan
The Company used the following weighted average assumptions in applying the Black-Scholes model todetermine the fair value of options it issued during the years ended December 31, 2005 and 2004: dividendyield of 4.80% and 4.89%; expected volatility of 45.28% and 28.33%; and a risk-free rate of 3.80% and
96
Flagstar Bancorp, Inc.Notes to the Consolidated Financial Statements - continued

3.16%; and respectively an expected life of five years for both 2005 and 2004. There were no options grantedduring the year ended December 31, 2006.
The following tables summarize the activity that occurred in the years ended December 31:
2006 2005 2004Number of Shares
Options outstanding, beginning of year 3,417,366 4,961,529 5,425,870
Options granted — 372,792 332,920
Options exercised (359,503) (1,788,354) (686,117)
Options canceled, forfeited and expired (28,126) (128,601) (111,144)
Options outstanding, end of year 3,029,737 3,417,366 4,961,529
Options exercisable, end of year 2,885,787 2,861,884 2,914,871
The total intrinsic value of options exercised during the years ended December 31, 2006, 2005 and 2004was $3.2 million, $23.9 million and $12.1 million, respectively. Additionally, the aggregate intrinsic value ofoptions outstanding and exercisable at December 31, 2006 was $9.1 million and $8.7 million, respectively.
2006 2005 2004Weighted Average Exercise Price
Options outstanding, beginning of year $13.02 $ 9.34 $ 7.87
Options granted — 20.50 22.55
Options exercised 6.13 4.17 4.19
Options canceled, forfeited and expired 18.30 15.64 11.59
Options outstanding, end of year $13.79 $13.02 $ 9.34
Options exercisable, end of year $13.86 $13.20 $ 6.94
The following information pertains to the stock options issued pursuant to the Prior Plans but notexercised at December 31, 2006:
Range of Grant Price
Number ofOptions
Outstanding atDecember 31,
2006
WeightedAverage
RemainingContractualLife (Years)
WeightedAverage
Exercise Price
NumberExercisable
at December 31,2006
WeightedAverage Exercise
Price
Options Outstanding Options Exercisable
$ 1.76 - 1.96 139,099 3.50 $ 1.78 139,099 $ 1.78
4.32 - 4.77 15,000 1.29 4.48 15,000 4.48
5.01 - 6.06 181,676 3.32 5.20 181,676 5.20
11.80 - 12.27 1,873,380 4.27 11.99 1,736,930 11.97
15.23 11,000 7.55 15.23 3,500 15.23
19.35 - 19.42 18,429 6.17 19.38 18,429 19.38
20.02 - 20.73 357,863 6.51 20.69 357,863 20.69
22.68 - 24.72 433,290 6.87 23.38 433,290 23.38
3,029,737 $13.79 2,885,787 $13.86
At December 31, 2006, options available for future grants were 2,293,514.
97
Flagstar Bancorp, Inc.Notes to the Consolidated Financial Statements - continued

The following table illustrates the effect on net earnings and earnings per share as of and for the yearsended December 31, 2005 and 2004 as if the Company had applied the fair value recognition provision ofSFAS No. 123R to stock-based employee compensation (in thousands except per share data):
2005 2004
For the Years EndedDecember 31,
Net earnings $79,865 $142,738
Deduct: Total stock-based employee compensation expense determined under fairvalue based method for all awards, net of related tax effects 4,540 2,885
Pro forma net earnings $75,325 $139,853
Basic earnings per share
As reported $ 1.29 $ 2.34
Pro forma $ 1.21 $ 2.29
Diluted earnings per share
As reported $ 1.25 $ 2.22
Pro forma $ 1.18 $ 2.18
The fair value of each option grant is estimated using the Black-Scholes options-pricing model with thefollowing weighted average assumptions used for grants in 2005 and 2004, respectively: dividend yield of4.80% and 4.89%; expected volatility of 45.28% and 28.33%; a risk-free rate of 3.80% and 3.16%; anexpected life of 5 years; and a fair value per option of $5.86 and $9.79.
During the fourth quarter of 2005, the Company accelerated the vesting of its unvested and “out-of-the-money” stock options awarded to its employees, executive members and board members under its stock optionplan. The acceleration applied only to unvested options with an exercise price of $19.35 per share or higher.The options considered to be “out-of-the-money” had exercise prices greater than the Company’s stock closingsales price on November 29, 2005, which was $15.20 per share. Outstanding unvested options that were“in-the-money” were not subject to acceleration and will continue to vest on their normal schedule. As a resultof the acceleration, options to purchase 829,899 shares of Flagstar common stock, which would otherwisehave vested over the next four years, became fully vested. These options represented approximately 24% ofthe then total options outstanding. The total weighted average exercise price per share was $22.16 for theseoptions.
Cash-settled Stock Appreciation Rights
The Company used the following weighted average assumptions in applying the Black-Scholes model todetermine the fair value of the cash-settled stock appreciation rights it issued during the year endedDecember 31, 2006: dividend yield of 3.68%; expected volatility of 21.98%; a risk-free rate of 4.99%; and anexpected life of five years.
98
Flagstar Bancorp, Inc.Notes to the Consolidated Financial Statements - continued

The following table presents the status and changes in cash-settled stock appreciation rights issued underthe 2006 Plan:
Stock Appreciation Rights Awarded: Shares
WeightedAverage
Exercise Price
Non-vested balance at December 31, 2005 and prior — $ —
Granted 328,873 16.28
Vested — —
Forfeited — —
Non-vested balance at December 31, 2006 328,873 $16.28
Restricted Stock Units
The Company issues restricted stock units to officers, directors and key employees in connection withyear-end compensation. Restricted stock units generally vest as outlined in the applicable restricted stock unitagreements and are delivered shortly after the grant date. The Company incurred expenses of approximately$446,000, $2.9 million, and $750,000 with respect to restricted stock units, during 2006, 2005 and 2004,respectively. As of December 31, 2006, restricted stock units had a market value of $1.5 million.
Stock Purchase Plan
Under the Employee Stock Purchase Plan (“Purchase Plan”), eligible participants, upon providingevidence of a purchase of the Company’s common shares from any third party on the open market, receive apayment from the Company equal to 15% of the share price. The Purchase Plan includes limitations on themaximum reimbursement to a participant during a year. The Purchase Plan has not been designed to complywith the requirements of the Internal Revenue Code with respect to employee stock purchase plans. During2005 and 2004, respectively, the Company incurred expenses of approximately $82,100, and $81,200 under thePurchase Plan. This Purchase Plan was terminated as of December 31, 2005.
Incentive Compensation Plan
The Incentive Compensation Plan (“Incentive Plan”) is administered by the compensation committee ofthe board of directors. Each year the committee decides which employees of the Company will be eligible toparticipate in the Incentive Plan and the size of the bonus pool. During 2006, 2005 and 2004 all members ofthe executive management team were included in the Incentive Plan. The Company incurred expenses of$2.2 million, $2.2 million, and $3.7 million on the Incentive Plan for the years ended December 31, 2006,2005 and 2004, respectively.
99
Flagstar Bancorp, Inc.Notes to the Consolidated Financial Statements - continued

Note 31 — Quarterly Financial Data (Unaudited)
The following table represents summarized data for each of the quarters in 2006, 2005, and 2004 (inthousands, except earnings per share data) certain per share results have been adjusted to conform to the 2006presentation:
FirstQuarter
SecondQuarter
ThirdQuarter
FourthQuarter
2006
Interest income $191,299 $192,648 $205,557 $211,362
Interest expense 132,624 141,910 151,929 159,456
Net interest income 58,675 50,738 53,628 51,906
Provision for loan losses 4,063 5,859 7,291 8,237
Net interest income after provision for loan losses 54,612 44,879 46,337 43,669
Loan administration 4,355 309 7,766 602
Net gain on loan sales 17,084 9,650 (8,197) 23,844Net gain on MSR sales 8,586 34,932 45,202 3,901
Other non-interest income 12,596 16,681 9,567 15,283
Non-interest expense 68,070 62,354 68,853 76,360
Earning before federal income tax provision 29,163 44,097 31,822 10,939
Provision for federal income taxes 10,253 15,457 11,070 4,039
Net earnings $ 18,910 $ 28,640 $ 20,752 $ 6,900
Basic earnings per share $ 0.30 $ 0.45 $ 0.33 $ 0.11
Diluted earnings per share $ 0.29 $ 0.44 $ 0.32 $ 0.11
100
Flagstar Bancorp, Inc.Notes to the Consolidated Financial Statements - continued

FirstQuarter
SecondQuarter
ThirdQuarter
FourthQuarter
2005
Interest income $163,125 $166,111 $185,391 $194,035
Interest expense 97,916 107,670 124,617 132,191
Net interest income 65,209 58,441 60,774 61,844
Provision for loan losses 6,246 2,903 3,690 6,036
Net interest income after provision for loan losses 58,963 55,538 57,084 55,808
Loan administration 5,945 1,669 (1,913) 3,060
Net gain on loan sales 9,577 32,348 3,426 18,229
Net gain on MSR sales 4,248 2,262 492 11,155
Other non-interest income 15,792 18,590 18,763 15,806
Non-interest expense 63,723 67,074 63,229 68,862
Earnings before federal income tax provision 30,802 43,333 14,623 35,196
Provision for federal income taxes 11,024 15,533 5,163 12,369
Net earnings $ 19,778 $ 27,800 $ 9,460 $ 22,827
Basic earnings per share $ 0.32 $ 0.45 $ 0.15 $ 0.36
Diluted earnings per share $ 0.31 $ 0.43 $ 0.15 $ 0.36
FirstQuarter
SecondQuarter
ThirdQuarter
FourthQuarter
2004
Interest income $130,841 $140,214 $140,818 $151,564
Interest expense 79,864 80,893 84,914 94,475
Net interest income 50,977 59,321 55,904 57,089
Provision for losses 9,302 3,603 3,172 —
Net interest income after provision for losses 41,675 55,718 52,732 57,089
Loan administration 8,232 5,589 9,760 6,516
Net gain on loan sales 38,633 11,705 25,989 1,492
Net gain on MSR sales 21,785 37,248 15,734 16,973
Other non-interest income 9,431 16,497 16,883 13,654
Non-interest expense 62,769 63,728 59,900 56,608
Earnings before federal income tax provision 56,987 63,029 61,198 39,116
Provision for federal income taxes 20,284 22,093 21,461 13,754
Net earnings $ 36,703 $ 40,936 $ 39,737 $ 25,362
Basic earnings per share $ 0.60 $ 0.68 $ 0.65 $ 0.42
Diluted earnings per share $ 0.57 $ 0.65 $ 0.62 $ 0.40
101
Flagstar Bancorp, Inc.Notes to the Consolidated Financial Statements - continued
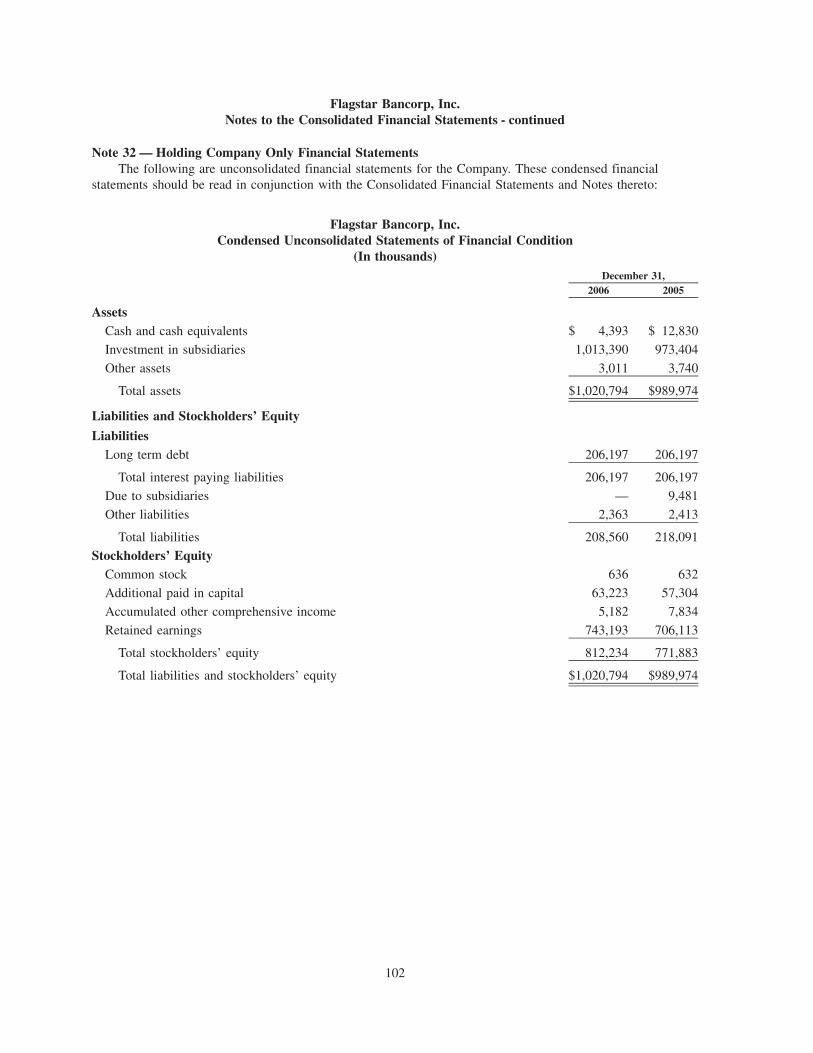
Note 32 — Holding Company Only Financial StatementsThe following are unconsolidated financial statements for the Company. These condensed financial
statements should be read in conjunction with the Consolidated Financial Statements and Notes thereto:
Flagstar Bancorp, Inc.Condensed Unconsolidated Statements of Financial Condition
(In thousands)
2006 2005December 31,
AssetsCash and cash equivalents $ 4,393 $ 12,830
Investment in subsidiaries 1,013,390 973,404
Other assets 3,011 3,740
Total assets $1,020,794 $989,974
Liabilities and Stockholders’ Equity
LiabilitiesLong term debt 206,197 206,197
Total interest paying liabilities 206,197 206,197
Due to subsidiaries — 9,481
Other liabilities 2,363 2,413
Total liabilities 208,560 218,091
Stockholders’ EquityCommon stock 636 632
Additional paid in capital 63,223 57,304
Accumulated other comprehensive income 5,182 7,834
Retained earnings 743,193 706,113
Total stockholders’ equity 812,234 771,883
Total liabilities and stockholders’ equity $1,020,794 $989,974
102
Flagstar Bancorp, Inc.Notes to the Consolidated Financial Statements - continued

Flagstar Bancorp, Inc.Condensed Unconsolidated Statements of Earnings
(In thousands)
2006 2005 2004For the Years Ended December 31,
Income
Dividends from subsidiaries $46,250 $22,200 $136,900
Interest 450 335 1,430
Total 46,700 22,535 138,330
Expenses
Interest 13,833 10,662 8,835
Other taxes (179) — —
General and administrative 1,981 2,015 3,707
Total 15,635 12,677 12,542
Earnings before undistributed earnings of subsidiaries 31,065 9,858 125,788
Equity in undistributed earnings of subsidiaries 38,822 65,695 13,061
Earnings before federal income tax benefit 69,887 75,553 138,849
Federal income tax benefit (5,315) (4,312) (3,889)
Net earnings $75,202 $79,865 $142,738
103
Flagstar Bancorp, Inc.Notes to the Consolidated Financial Statements - continued

Flagstar Bancorp, Inc.Condensed Unconsolidated Statements of Cash Flows
(In thousands)
2006 2005 2004For the Years Ended December 31,
Operating ActivitiesNet earnings $ 75,202 $ 79,865 $ 142,738
Adjustments to reconcile net earnings to net cash provided by operatingactivities
Equity in undistributed earnings of subsidiaries (38,822) (65,695) (13,061)
Stock-based compensation 2,718 745
Change in other assets 669 (667) 2,815
Provision for deferred tax benefit (120) — 4
Change in other liabilities (9,412) 11,043 52
Net cash provided by operating activities 30,235 25,291 132,548
Investing ActivitiesNet change in other investments 11 11 11
Net change in investment in subsidiaries (3,766) (77,719) (25,667)
Net cash used in investment activities (3,755) (77,708) (25,656)
Financing ActivitiesProceeds from the issuance of junior subordinated debentures — 103,095 25,774
Redemption of junior subordinated debentures — — (77,062)
Proceeds from exercise of stock options and grants issued 2,205 7,444 3,318Tax benefit from stock options exercised 1,000 8,379 2,049
Dividends paid (38,122) (55,995) (61,122)
Net cash provided by (used in) financing activities (34,917) 62,923 (107,043)
Net increase (decrease) in cash and cash equivalents (8,437) 10,506 (151)
Cash and cash equivalents, beginning of year 12,830 2,324 2,475
Cash and cash equivalents, end of year $ 4,393 $ 12,830 $ 2,324
104
Flagstar Bancorp, Inc.Notes to the Consolidated Financial Statements - continued

ITEM 9. CHANGES IN AND DISAGREEMENTS WITH ACCOUNTANTS ON ACCOUNTING ANDFINANCIAL DISCLOSURES
The information regarding our change in accountants during 2005 was previously reported on our CurrentReport on Forms 8-K dated June 15, 2005 and August 8, 2005.
ITEM 9A. CONTROLS AND PROCEDURES
Disclosure Controls and Procedures
We are responsible for establishing and maintaining disclosure controls and procedures, as defined inRule 13a-15(e) under the Securities Exchange Act of 1934 as amended (the Exchange Act), that are designedto ensure that information required to be disclosed by us in the reports that we file or submit under theExchange Act is: (a) recorded, processed, summarized and reported within the time periods specified in theSEC’s rules and forms; and (b) accumulated and communicated to our management, including our principalexecutive and principal financial officers, to allow timely decisions regarding required disclosures. In designingand evaluating our disclosure controls and procedures, we recognize that any controls and procedures, nomatter how well designed and implemented, can provide only reasonable assurance of achieving the desiredcontrol objectives, and that our management’s duties require it to make its best judgment regarding the designof our disclosure controls and procedures.
As of December 31, 2006, we conducted an evaluation, under the supervision (and with the participation)of our management, including our Chief Executive Officer and Chief Financial Officer, of the effectiveness ofthe design and operation of our disclosure controls and procedures pursuant to the Exchange Act. Based onthat evaluation, our Chief Executive Officer and Chief Financial Officer concluded that our disclosure controlsand procedures were operating effectively.
Management’s Report on Internal Control Over Financial Reporting
Our management, under the supervision of our Chief Executive Officer and Chief Financial Officer, isresponsible for establishing and maintaining adequate internal control over financial reporting, as defined inRule 13a-15(f) under the Exchange Act. Internal control over financial reporting is a process designed toprovide reasonable assurance regarding the reliability of financial reporting and the preparation of financialstatements for external purposes in accordance with U.S. GAAP. Internal control over financial reportingincludes policies and procedures that:
(i) pertain to the maintenance of records that, in reasonable detail, accurately and fairly reflect thetransactions and dispositions of the assets of the Company;
(ii) provide reasonable assurance that transactions are recorded as necessary to permit preparation ofthe financial statements in accordance with U.S. GAAP, and that receipts and expenditures of theCompany are being made only in accordance with authorizations of management and directors ofthe Company; and
(iii) provide reasonable assurance regarding prevention or timely detection of unauthorized acquisition,use, or disposition of the Company’s assets that could have a material effect on the financialstatements.
Because of its inherent limitations, internal control over financial reporting may not prevent or detectmisstatements. Also, projections of any evaluation of effectiveness to future periods are subject to the risk thatcontrols may become inadequate because of changes in conditions, or that the degree of compliance withexisting policies or procedures may deteriorate.
Under the supervision of our Chief Executive Officer and Chief Financial Officer, our managementconducted an assessment of our internal control over financial reporting as of December 31, 2006, based onthe framework and criteria established in Internal Control-Integrated Framework, issued by the Committee ofSponsoring Organizations of the Treadway Commission (COSO).
105

Based on this assessment, we assert that, as of December 31, 2006 and based on the specific criteria, theCompany maintained effective internal control over financial reporting, involving the preparation and reportingof the Company’s consolidated financial statements presented in uniformity with U.S. GAAP.
Management’s assessment of the effectiveness of our internal control over financial reporting as ofDecember 31, 2006, has been audited by Virchow, Krause & Company, LLP, our independent registered publicaccounting firm, as stated in their report, which is included herein.
Changes in Internal Control Over Financial Reporting
Prior Year Material Weakness. As of December 31, 2005, we did not maintain effective controls overfinancial reporting because of a material weakness relating to the accuracy and completeness of the filing ofstate tax returns, the accrual for state taxes and the related state tax expense.
Additional Controls and Enhanced Procedures. During 2006, we implemented a number of remediationmeasures to address the material weakness described above. These measures included the following:
• Designed and implemented procedures to ensure appropriate recording of tax expense;
• Hired an experienced Chief Tax Officer;
• Hired additional personnel in the tax department;
• Continued to utilize an independent accounting firm to assist in the preparation of tax returns and toassist with the determination of the effective tax rate; and
• Filed all delinquent returns.
Management believes that implementation of these measures have remediated the material weaknessdescribed above.
Other than as described above, there have not been any changes in our internal control over financialreporting during the fourth quarter of 2006 that have materially affected, or are reasonably likely to materiallyaffect, our internal control over financial reporting.
106

Report of Independent Registered Public Accounting FirmBoard of Directors and ShareholdersFlagstar Bancorp, Inc.
We have audited management’s assessment, included in the accompanying Management’s Report onInternal Control over Financial Reporting, that Flagstar Bancorp, Inc. (the “Company”) maintained effectiveinternal control over financial reporting as of December 31, 2006, based on criteria established in InternalControl — Integrated Framework issued by the Committee of Sponsoring Organizations of the TreadwayCommission (“the COSO criteria”). Flagstar Bancorp, Inc.’s management is responsible for maintainingeffective internal control over financial reporting and for its assessment of the effectiveness of internal controlover financial reporting. Our responsibility is to express an opinion on management’s assessment and anopinion on the effectiveness of the Company’s internal control over financial reporting based on our audit.
We conducted our audit in accordance with the standards of the Public Company Accounting OversightBoard (United States). Those standards require that we plan and perform the audit to obtain reasonableassurance about whether effective internal control over financial reporting was maintained in all materialrespects. Our audit included obtaining an understanding of internal control over financial reporting, evaluatingmanagement’s assessment, testing and evaluating the design and operating effectiveness of internal control,and performing such other procedures as we considered necessary in the circumstances. We believe that ouraudit provides a reasonable basis for our opinion.
A company’s internal control over financial reporting is a process designed to provide reasonableassurance regarding the reliability of financial reporting and the preparation of financial statements for externalpurposes in accordance with generally accepted accounting principles. Because management’s assessment andour audit were conducted to also meet the reporting requirements of Section 112 of the Federal DepositInsurance Corporation Improvement Act (FDICIA), management’s assessment and our audit of FlagstarBancorp, Inc.’s internal control over financial reporting included controls over the preparation of financialstatements in accordance with the Office of Thrift Supervision Instructions for Thrift Financial Reports. Acompany’s internal control over financial reporting includes those policies and procedures that (1) pertain tothe maintenance of records that, in reasonable detail, accurately and fairly reflect the transactions anddispositions of the assets of the company; (2) provide reasonable assurance that transactions are recorded asnecessary to permit preparation of financial statements in accordance with generally accepted accountingprinciples, and that receipts and expenditures of the company are being made only in accordance withauthorizations of management and directors of the company; and (3) provide reasonable assurance regardingprevention or timely detection of unauthorized acquisition, use, or disposition of the company’s assets thatcould have a material effect on the financial statements.
Because of its inherent limitations, internal control over financial reporting may not prevent or detectmisstatements. Also, projections of any evaluation of effectiveness to future periods are subject to the risk thatcontrols may become inadequate because of changes in conditions, or that the degree of compliance with thepolicies or procedures may deteriorate.
In our opinion, management’s assessment that Flagstar Bancorp, Inc. maintained effective internal controlover financial reporting as of December 31, 2006, is fairly stated, in all material respects, based on the COSOcriteria. Also, in our opinion, Flagstar Bancorp, Inc. maintained, in all material respects, effective internalcontrol over financial reporting as of December 31, 2006, based on the COSO criteria.
We also have audited, in accordance with standards of the Public Company Accounting Oversight Board(United States), the consolidated statements of financial condition of Flagstar Bancorp, Inc. and subsidiaries asof December 31, 2006 and 2005, and the related consolidated statements of earnings, stockholders’ equity andcomprehensive income, and cash flows for the years then ended and our report dated February 26, 2007expressed and unqualified opinion on those consolidated financial statements.
/s/ Virchow, Krause & Company, LLPSouthfield, MichiganFebruary 26, 2007
107

ITEM 9B. OTHER INFORMATION
On February 28, 2007, the Company entered into amended and restated employment agreements (the“agreements”) with Thomas J. Hammond, as Chairman, Mark T. Hammond, as President, Chief ExecutiveOfficer and Vice-Chairman, Paul D. Borja, as Executive Vice-President and Chief Financial Officer, Kirstin A.Hammond, as Executive Director, and Robert O. Rondeau, Jr., as Executive Director (each a “named executiveofficer”) to be effective as of January 1, 2007. The agreements were primarily amended to reflect recent legaland regulatory developments, such as the enactment of Section 409A of the Internal Revenue Code and, in thecase of Thomas J. Hammond, to reflect changes in the scope of his duties to the Company since the prioragreement was executed in 1997.
The initial term of the agreements is three years. On January 1 of each year, the term of the agreementsmay be extended for an additional one-year period upon approval of our board of directors. The base salaryin 2007 for each of the named executive officers is $625,000 for Thomas J. Hammond, $840,000 for Mark T.Hammond, $435,000 for Paul D. Borja, $390,000 for Kirstin A. Hammond, and $360,000 for Robert O.Rondeau. The agreements also provide that the base salary may not be less than the 2007 base salary duringthe term of the agreements. The base salaries will be reviewed annually, and the named executive officersmay participate in any plan the Company maintains for the benefit of its employees, including discretionarybonus plans, profit-sharing plan, retirement and medical plans, customary fringe benefits and paid time off.
The agreements terminate upon the named executive officer’s death or disability, and are terminable bythe Company for “just cause” as defined in the agreements. In the event of termination for just cause ordisability, no severance benefits are available. If the Company terminates the named executive officer withoutjust cause or constructively terminates the named executive officer, such officer will be entitled to a lump sumpayment equal to twelve months salary, the amount of incentive compensation that would have been payableassuming that the Company achieved 100% of its target goals during the year terminated, and the continuationof benefit plans through the expiration date of the agreement. “Constructive termination” includes thefollowing events that have not been consented to in advance by the named executive officer in writing: (i) therequirement that the named executive officer perform his or her principal executive functions more than 50miles from his or her primary office; (ii) a reduction in the named executive officer’s base compensation asthen in effect; (iii) the failure of the Company to continue to provide the named executive officer withcontractual compensation and benefits, including material vacation, fringe benefits, stock option and retirementplans; (iv) the assignment to the named executive officer of duties and responsibilities which are other thanthose normally associated with his or her position with the Company; and (v) a material reduction in thenamed executive officer’s authority and responsibility (including, solely in the context of a change-in-control,performing such responsibilities solely for a subsidiary of the controlling entity). In the event of the namedexecutive officer’s death during the term of the agreement, the named executive officer’s estate will be entitledto six months base salary, accrued and unpaid discretionary bonuses, and a six month continuation of benefits.The named executive officer is able to terminate voluntarily the agreement by providing 60 days’ writtennotice to the board of directors, in which case such officer is entitled to receive only the compensation, vestedrights and benefits up to the date of termination.
The agreements also contain provisions stating that in the event of the named executive officer’sinvoluntary termination of employment in connection with, or within one year after, any change in control ofthe Company, other than for “just cause,” such officer will be paid cash in an amount equal to the differencebetween (i) 2.99 times his or her “base amount,” as defined in Section 280G(b)(3) of the Internal RevenueCode, and (ii) the sum of any other parachute payments, as defined under Section 280G(b)(2) of the InternalRevenue Code, that the named executive officer receives on account of the change in control. The namedexecutive officer will also receive health insurance for six months. “Control” generally refers to theacquisition, by any person or entity, of the ownership or power to vote more than 50% of the Company’svoting stock, the control of the election of a majority of the Company’s directors, or the exercise of acontrolling influence over the management or policies of the Company. In addition, under the agreements, achange in control occurs when, during any consecutive two-year period, directors of the Company at thebeginning of such period cease to constitute at least a majority of our board of directors. The change in
108

control payment would also be paid in the event of the named executive officer’s constructive terminationwithin one year following a change in control.
The foregoing description of the amended and restated employment agreements is qualified in its entiretyby the terms of such agreements, which are filed as Exhibits 10.1 through 10.5 to this Form 10-K and areincorporated herein by reference.
PART III
ITEM 10. DIRECTORS AND EXECUTIVE OFFICERS OF THE REGISTRANT
The information required by this Item 10 is hereby incorporated by reference to the Company’s ProxyStatement for the Company’s 2007 Annual Meeting of Stockholders (the “Proxy Statement”), to be filedpursuant to Regulation 14A within 120 days after the end of our 2006 fiscal year.
We have adopted a Code of Business Conduct and Ethics that applies to our employees, officers anddirectors, including our principal executive officer, principal financial officer, and principal accounting officer.Our Code of Business Conduct and Ethics can be found on our web site, which is located at www.flagstar.com.We intend to make all required disclosures concerning any amendments to, or waivers from, our Code ofBusiness Conduct and Ethics on our website.
We have also adopted Corporate Governance Guidelines and charters for the Audit Committee, CompensationCommittee, and Nominating Corporate Governance Committee and copies are available at http://www.flagstar.comor upon written request for stockholders to Flagstar Bancorp, Inc., Attn: Paul Borja, CFO, 5151 Corporate Drive,Troy, MI 48098. None of the information currently posted, or posted in the future, on our website is incorporatedby reference into this Form 10-K.
In 2006, the Company’s Chief Executive Officer provided to the NYSE the Annual CEO Certificationregarding the Company’s compliance with the NYSE’s corporate governance listing standards as required bySection 303A-12(a) of the NYSE Listed Company Manual. In addition, the Company has filed as exhibits tothis annual report on Form 10-K for the year ended December 31, 2006, the applicable certifications of itsChief Executive Officer and its Chief Financial Officer required under Section 302 of the Sarbanes-Oxley Actof 2002 regarding the quality of the Company’s public disclosures.
ITEM 11. EXECUTIVE COMPENSATION
The information required by this Item 11 is hereby incorporated by reference to the Company’s ProxyStatement, to be filed pursuant to Regulation 14A within 120 days after the end of our 2006 fiscal year.
ITEM 12. SECURITY OWNERSHIP OF CERTAIN BENEFICIAL OWNERS AND MANAGEMENTAND RELATED STOCKHOLDER MATTERS
The information required by this Item 12 is hereby incorporated by reference to the Company’s ProxyStatement, to be filed pursuant to Regulation 14A within 120 days after the end of our 2006 fiscal year.Reference is also made to the information appearing in “Market for the Registrant’s Common Equity, RelatedStockholder Matters and Issuer Purchases of Equity Securities,” under Item 5 of this Form 10-K, which isincorporated herein by, reference.
ITEM 13. CERTAIN RELATIONSHIPS, RELATED TRANSACTIONS, AND DIRECTORINDEPENDENCE
The information required by this Item 13 is hereby incorporated by reference to the Company’s ProxyStatement, to be filed pursuant to Regulation 14A within 120 days after the end of our 2006 fiscal year.
109

ITEM 14. PRINCIPAL ACCOUNTING FEES AND SERVICES
The information required by this Item 14 is hereby incorporated by reference to the Company’s ProxyStatement, to be filed pursuant to Regulation 14A within 120 days after the end of our 2006 fiscal year.
PART IV
ITEM 15. EXHIBITS, FINANCIAL STATEMENT SCHEDULES
(a)(1) and (2) — Financial Statements and Schedules
The information required by these sections of Item 15 are set forth in the Index to Consolidated FinancialStatements under Item 8 of this annual report on Form 10-K.
(3) — Exhibits
The following documents are filed as a part of, or incorporated by reference into, this report:
Exhibit No. Description
3.1* Second Restated Articles of Incorporation of the Company (previously filed as Exhibit 3.1 to theCompany’s Quarterly Report on Form 10-Q, dated August 4, 2006, and incorporated herein byreference).
3.2* Second Amended and Restated Bylaws of the Company (previously filed as Exhibit 3.2 to theCompany’s Quarterly Report on Form 10-Q, dated August 4, 2006, and incorporated herein byreference).
10.1+ Employment Agreement, dated as of February 28, 2007, between the Company, Flagstar Bank,FSB, and Thomas J. Hammond.
10.2+ Employment Agreement, dated as of February 28, 2007, between the Company, Flagstar Bank,FSB, and Mark T. Hammond.
10.3+ Employment Agreement, dated as of February 28, 2007, between the Company, Flagstar Bank,FSB, and Paul D. Borja.
10.4+ Employment Agreement, dated as of February 28, 2007, between the Company, Flagstar Bank,FSB, and Kirstin A. Hammond.
10.5+ Employment Agreement, dated as of February 28, 2007, between the Company, Flagstar Bank,FSB, and Robert O. Rondeau, Jr.
10.6*+ Employment Agreement, dated July 6, 2004 between Flagstar Bank, FSB and Joel D. Murray(previously filed as Exhibit 10.1 to the Company’s Current Report on Form 8-K, dated August 2,2005, and incorporated herein by reference).
10.7*+ Flagstar Bancorp, Inc. 1997 Employees and Directors Stock Option Plan as amended (previouslyfiled as Exhibit 4.1 to the Company’s Form S-8 Registration Statement (No. 333-125513), datedJune 3, 2005, and incorporated herein by reference).
10.8*+ Flagstar Bank 401(k) Plan (previously filed as Exhibit 4.1 to the Company’s Form S-8Registration Statement (No. 333-77501), dated April 30, 1999, and incorporated herein byreference).
10.9*+ Flagstar Bancorp, Inc. 2000 Stock Incentive Plan as amended (previously filed as Exhibit 4.1 tothe Company’s Form S-8 Registration Statement (No. 333-125512), dated June 3, 2005, andincorporated herein by reference).
10.10*+ Flagstar Bancorp, Inc. Incentive Compensation Plan (previously filed as Exhibit 10.4 to theCompany’s Form S-1 Registration Statement (No. 333-21621) and incorporated herein byreference).
10.11*+ Flagstar Bancorp, Inc. 2006 Equity Incentive Plan (previously filed as Exhibit 10.1 to theCompany’s Current Report on Form 8-K, dated March 26, 2006, and incorporated herein byreference).
11 Statement regarding computation of per share earnings incorporated by reference to Note 29 of theNotes to Consolidated Financial Statements of this report.
110

Exhibit No. Description
14* Flagstar Bancorp, Inc. Code of Business Conduct and Ethics (previously filed as Exhibit 14 to theCompany’s Annual Report on Form 10-K, dated March 16, 2006, and incorporated herein byreference)
21 List of Subsidiaries of the Company.
23 Consent of Virchow, Krause & Company, LLP
23.1 Consent of Grant Thornton LLP
31.1 Section 302 Certification of Chief Executive Officer
31.2 Section 302 Certification of Chief Financial Officer
32.1 Section 906 Certification, as furnished by the Chief Executive Officer pursuant to SEC ReleaseNo. 34-47551
32.2 Section 906 Certification, as furnished by the Chief Financial Officer pursuant to SEC ReleaseNo. 34-47551
* Incorporated herein by reference
+ Constitutes a management contract or compensation plan or arrangement
Flagstar Bancorp, Inc., will furnish to any stockholder a copy of any of the exhibits listed above uponwritten request and upon payment of a specified reasonable fee, which fee shall be equal to the Company’sreasonable expenses in furnishing the exhibit to the stockholder. Requests for exhibits and informationregarding the applicable fee should be directed to “Paul Borja, CFO” at the address of the principal executiveoffices set forth on the cover of this Annual Report on Form 10-K.
(b) — Exhibits. See Item 15(a)(3) above.
(c) — Financial Statement Schedules. See Item 15(a)(2) above.
[Remainder of page intentionally left blank.]
111

SIGNATURES
Pursuant to the requirements of Section 13 or 15(d) of the Securities Exchange Act of 1934, the registranthas duly caused this report to be signed on its behalf by the undersigned, thereunto duly authorized, onFebruary 28, 2007.
FLAGSTAR BANCORP, INC.
By: /s/ MARK T. HAMMOND
Mark T. HammondPresident and Chief Executive Officer
Pursuant to the requirements of the Securities Exchange Act of 1934, this report has been signed belowby the following persons on behalf of the registrant and in the capacities indicated on February 28, 2007.
SIGNATURE TITLE
By: /s/ THOMAS J. HAMMOND
Thomas J. Hammond
Chairman of the Board
By: /s/ MARK T. HAMMOND
Mark T. Hammond
Vice Chairman of the Board, President, and ChiefExecutive Officer (Principal Executive Officer)
By: /s/ PAUL D. BORJAPaul D. Borja
Executive Vice-President and Chief Financial Officer(Principal Financial and Accounting Officer)
By: /s/ KIRSTIN A. HAMMOND
Kirstin A. Hammond
Executive Director and Director
By: /s/ ROBERT O. RONDEAU, JR.
Robert O. Rondeau, JR.
Executive Director and Director
By: /s/ CHARLES BAZZY
Charles Bazzy
Director
By: /s/ JAMES D. COLEMAN
James D. Coleman
Director
By: /s/ RICHARD S. ELSEA
Richard S. Elsea
Director
By: /s/ MICHAEL LUCCI SR
Michael Lucci Sr.
Director
By: /s/ ROBERT W. DEWITT
Robert W. Dewitt
Director
By: /s/ FRANK D’ANGELO
Frank D’Angelo
Director
By: /s/ B. BRIAN TAUBER
B. Brian Tauber
Director
By: /s/ JAY J. HANSEN
Jay J. Hansen
Director
112

Flagstar Bancorp, (NYSE: FBC), is the holding company
for Flagstar Bank, a federally chartered stock savings
bank. Since our founding in 1987, we have experienced
exceptional growth, and today we are the largest
publicly traded savings bank headquartered in the
Midwest. We also are one of the nation’s leading
mortgage lenders.
We serve our customers through our retail banking
centers in Michigan, Indiana and Georgia and our
Internet branch at www.flagstar.com. We use customer
deposits, along with other funding sources, to invest
primarily in residential loans that we originate and
purchase nationwide.
Additionally, our product offerings include consumer
loans, which we originate principally in our banking
markets, and second mortgages and home equity lines
of credit, which we originate nationally. In 2006, we
expanded our commercial real estate lending beyond
our three banking markets to 17 other states.
We also provide warehouse lines of credit to retail
lending institutions across the country. In addition,
we service a large portfolio of mortgage loans for
other investors.
Community Bank
Flagstar is a growth-oriented community bank with 151
banking centers in Michigan, Indiana and Georgia, and
total deposits of $7.4 billion at December 31, 2006.
Home Lender
Flagstar is one of the nation’s largest single-family
residential prime mortgage originators. We lend to
homeowners in all 50 states. Between 2002 and 2006,
we originated residential mortgage loans totaling more
than $180 billion.
Mortgage Servicer
Flagstar collects mortgage payments and services the
loans of more than 193,000 homeowners across the
nation.
Company Profi le
Duluth, Georgia

National Headquarters 5151 Corporate Drive, Troy, MI 48098 | (800) 945-7700 | www.fl agstar.com
Convenience you can count on.
2006 Annual Report
Flagstar Bancorp
2006 Annual Report