2005_annual_report
DESCRIPTION
2005 SWA Annual Report 2005 SWA Annual Report 2005 SWA Annual ReportTRANSCRIPT

�
2005 SWA Annual Report

2005 SWA Annual Report
�

�
2005 SWA Annual Report
Table of Contents
Table of Contents .............................................�Organizational Chart ........................................�Southwest Water Authority Board Members ...3ND State Water Commission Members ...........3Southwest Water Authority Staff .....................4Another Important Milestone in �006 ..............5Becoming the Change We Wish to See ............6Unique Agreements Contribute to Project Growth .......................................8�005 Construction Summary .........................�0Introduction ....................................................��SWA Service Area - �� Counties ...................�3Service �005 ...................................................�4Independent Auditor’s Report ........................�5SWA Board of Directors Education ...............�3Potable Water Usage ......................................�4Rates �005 ......................................................�5
Rates �006 .................................................�6Water Service Contracts ............................�8Rural Water Usage History .....................�9Rate History ..............................................30Capital Repayment ....................................3�Replacement and Extraordinary Maintenance Fund ...............................3�Phased Development Plan .........................33SWPP Funding Sources ............................33Electric Power Usage ................................34SWPP Construction Map ..........................35SWPP Timeline .........................................36
2005 SWA Annual Report
�
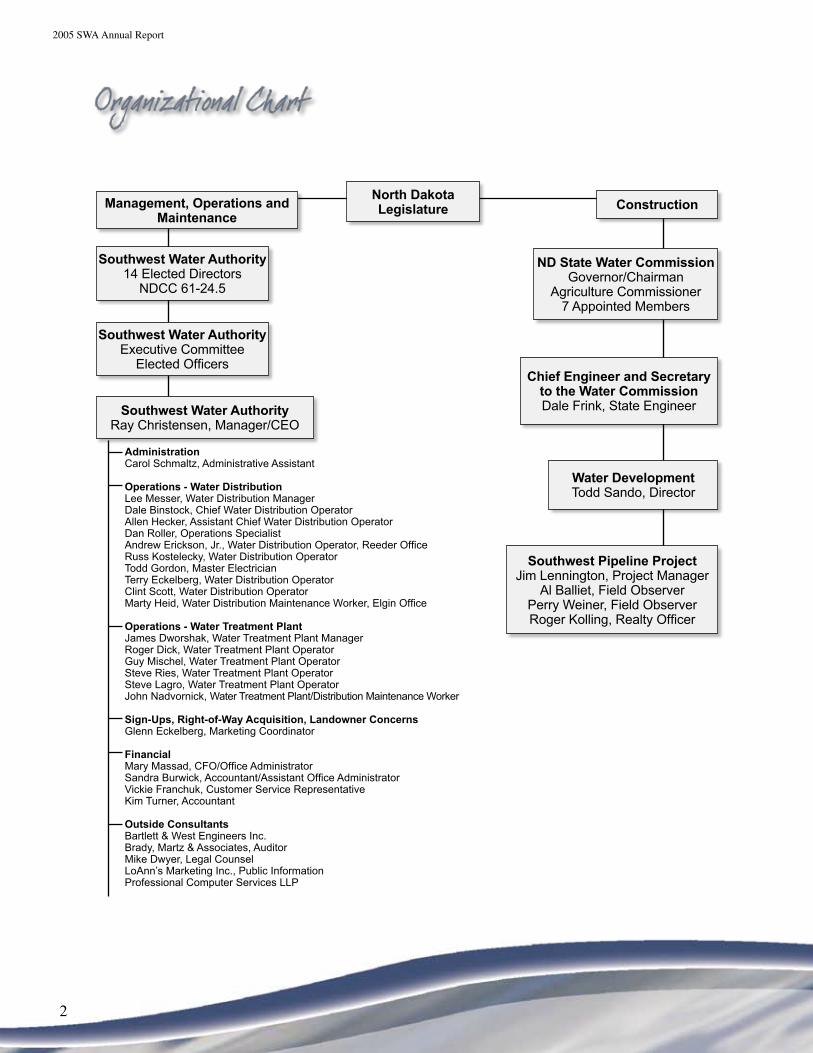
Organizational Chart
North Dakota LegislatureManagement, Operations and
MaintenanceConstruction
ND State Water CommissionGovernor/Chairman
Agriculture Commissioner7 Appointed Members
Water DevelopmentTodd Sando, Director
Southwest Pipeline ProjectJim Lennington, Project Manager
Al Balliet, Field ObserverPerry Weiner, Field ObserverRoger Kolling, Realty Officer
Southwest Water AuthorityExecutive Committee
Elected Officers
Southwest Water Authority14 Elected Directors
NDCC 61-24.5
Southwest Water AuthorityRay Christensen, Manager/CEO
Chief Engineer and Secretary to the Water CommissionDale Frink, State Engineer
AdministrationCarol Schmaltz, Administrative Assistant
Operations - Water DistributionLee Messer, Water Distribution ManagerDale Binstock, Chief Water Distribution OperatorAllen Hecker, Assistant Chief Water Distribution OperatorDan Roller, Operations SpecialistAndrew Erickson, Jr., Water Distribution Operator, Reeder OfficeRuss Kostelecky, Water Distribution OperatorTodd Gordon, Master ElectricianTerry Eckelberg, Water Distribution OperatorClint Scott, Water Distribution OperatorMarty Heid, Water Distribution Maintenance Worker, Elgin Office
Operations - Water Treatment PlantJames Dworshak, Water Treatment Plant ManagerRoger Dick, Water Treatment Plant OperatorGuy Mischel, Water Treatment Plant OperatorSteve Ries, Water Treatment Plant OperatorSteve Lagro, Water Treatment Plant OperatorJohn Nadvornick, Water Treatment Plant/Distribution Maintenance Worker
Sign-Ups, Right-of-Way Acquisition, Landowner ConcernsGlenn Eckelberg, Marketing Coordinator
FinancialMary Massad, CFO/Office AdministratorSandra Burwick, Accountant/Assistant Office AdministratorVickie Franchuk, Customer Service RepresentativeKim Turner, Accountant
Outside ConsultantsBartlett & West Engineers Inc.Brady, Martz & Associates, AuditorMike Dwyer, Legal CounselLoAnn’s Marketing Inc., Public InformationProfessional Computer Services LLP
3
2005 SWA Annual Report
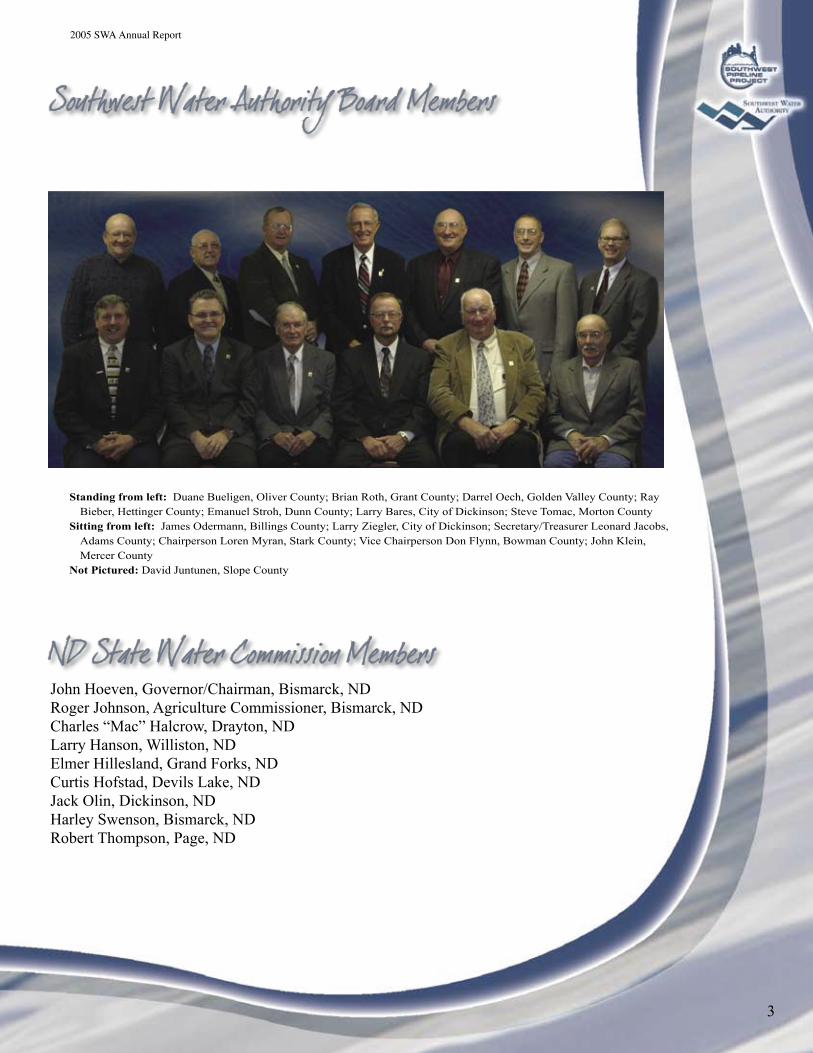
Southwest Water Authority Board Members
Standing from left: Duane Bueligen, Oliver County; Brian Roth, Grant County; Darrel Oech, Golden Valley County; Ray Bieber, Hettinger County; Emanuel Stroh, Dunn County; Larry Bares, City of Dickinson; Steve Tomac, Morton County
Sitting from left: James Odermann, Billings County; Larry Ziegler, City of Dickinson; Secretary/Treasurer Leonard Jacobs, Adams County; Chairperson Loren Myran, Stark County; Vice Chairperson Don Flynn, Bowman County; John Klein, Mercer County
Not Pictured: David Juntunen, Slope County
John Hoeven, Governor/Chairman, Bismarck, NDRoger Johnson, Agriculture Commissioner, Bismarck, NDCharles “Mac” Halcrow, Drayton, NDLarry Hanson, Williston, NDElmer Hillesland, Grand Forks, NDCurtis Hofstad, Devils Lake, NDJack Olin, Dickinson, NDHarley Swenson, Bismarck, NDRobert Thompson, Page, ND
ND State Water Commission Members
2005 SWA Annual Report
4
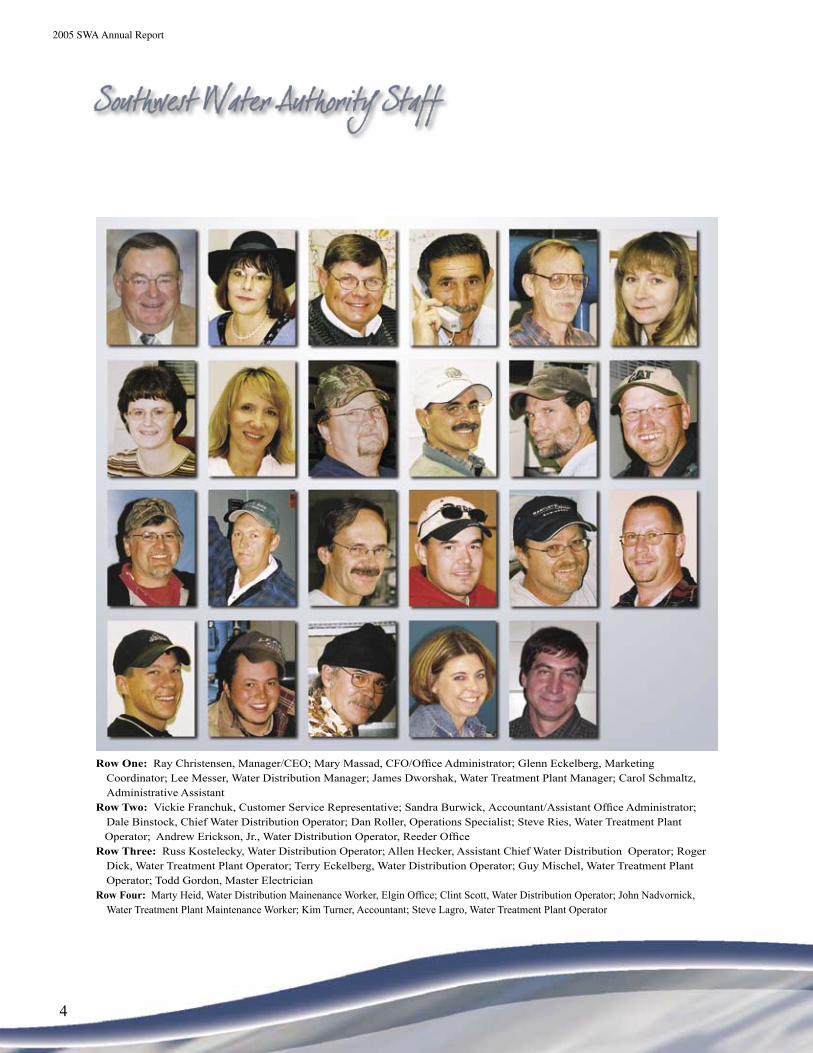
Southwest Water Authority Staff
Row One: Ray Christensen, Manager/CEO; Mary Massad, CFO/Office Administrator; Glenn Eckelberg, Marketing Coordinator; Lee Messer, Water Distribution Manager; James Dworshak, Water Treatment Plant Manager; Carol Schmaltz, Administrative Assistant
Row Two: Vickie Franchuk, Customer Service Representative; Sandra Burwick, Accountant/Assistant Office Administrator; Dale Binstock, Chief Water Distribution Operator; Dan Roller, Operations Specialist; Steve Ries, Water Treatment Plant
Operator; Andrew Erickson, Jr., Water Distribution Operator, Reeder OfficeRow Three: Russ Kostelecky, Water Distribution Operator; Allen Hecker, Assistant Chief Water Distribution Operator; Roger
Dick, Water Treatment Plant Operator; Terry Eckelberg, Water Distribution Operator; Guy Mischel, Water Treatment Plant Operator; Todd Gordon, Master Electrician
Row Four: Marty Heid, Water Distribution Mainenance Worker, Elgin Office; Clint Scott, Water Distribution Operator; John Nadvornick, Water Treatment Plant Maintenance Worker; Kim Turner, Accountant; Steve Lagro, Water Treatment Plant Operator

5
2005 SWA Annual Report
Another Important Milestone in 2006
The Southwest Pipeline Project (SWPP) will accomplish another long-term objective in �006 - the delivery of water to rural Golden Valley County and two pockets in Morton County. All of the original cities that signed up for water were served by �004 and the majority of the original rural water areas will have SWPP water by the end of �006. I congratulate the Southwest Water Authority and all those who contributed to this great feat.
Looking ahead, we still have some work to do. There are current needs in the Oliver, Mer-cer, North Dunn Service Areas. In addition, there are a couple of pocket areas with sign-up and other issues that could become feasible in the future.
Funding has always been the greatest chal-lenge for SWPP. Originally, the concept was for the state, through the Resources Trust Fund, to fund �00 percent of the mainline transmission system and for rural water systems to be con-structed separately and independently using a combination of funding sources. When oil prices and, thus, funding for the Resources Trust Fund dropped in the mid-�980s, it was obvious that alternative funding sources would be needed.
Through �005, about $�5� million has been spent on the project from a number of funding sources. The United States Bureau of Reclamation’s Mu-nicipal, Rural and In-dustrial water supply program has provided about $70 million dollars. State funds total about $60 mil-lion, mostly from the Resources Trust Fund. The United States De-partment of Agriculture, Rural Development, has contributed $�9 million through a combi-nation of grants and loans. The United States Natural Resources Conservation Service con-tributed $� million - mostly in the Richardton/Taylor areas. Thank you to all who contributed to this wonderful project.
By: Dale Frink, State Engineer, ND State Water Commission
Dale Frink, State Engineer,ND State Water Commission
2005 SWA Annual Report
6
Becoming the Change We Wish to See
By: Loren Myran, SWA Chairperson
Each year, drafting this article provides the opportunity to reflect on the significant events of the year, as well as those major events that, through the course of time, positively advance water development in southwest North Dakota.
The significant changes I recall mostly relate to the process of funding acquisition. For ex-ample, utilizing grant/loan programs from the United States Department of Agriculture - Rural Development (USDA - RD) has created a con-sistent stream of federal funding for construc-tion of water projects. Over the years, the water systems in North Dakota have become a unified voice through the North Dakota Water Coalition speaking out for the water needs of the state. This has at least preserved, if not increased, state funding.
Those changes, set in motion many years ago, play a major role in construction today. Through federal and state funding, the Southwest Pipe-line Project (SWPP) began construction of Phase II of the Medora-Beach Service Area, in-cluding portions of Morton County. Due to the progress made in �005 on rural water construc-tion in this area, approximately 90 customers in Medora-Beach and 70 customers in Morton County are slated for connection in �006. With adequate funding, construction could be com-plete on Phase III of the Medora-Beach Service
Area as early as the end of �007.
Legislative changes now allow the SWPP to serve large industrial us-ers, provided system ca-pacity could adequately serve their needs and those of current custom-ers. Thus, the SWPP anticipates delivery of both raw and potable wa-ter to Red Trail Energy LLC (RTE), an ethanol plant near Richardton. Due to the large water requirements of RTE, they probably would not exist without the avail-ability of an adequate supply of quality water from the SWPP.
Finally, a significant change in management at the ND State Water Commission (SWC) oc-curred in December, with the resignation of SWPP Project Manager James Lennington. Mr. Lennington has been an asset to the SWPP. With a meticulous and open-minded approach to managing the project, he leaves large shoes to fill. We are committed to maintaining the strong,
Loren Myran, SWA Chairpserson
7
2005 SWA Annual Report
positive relationship established with the SWC and we look forward to working with the new project manager to complete the SWPP.
With all of these changes, it is comforting to know that some things remain unchanged, such as our philosophy of maintaining water rates. For the fourth consecutive year, the SWA board has not increased water rates.
Also, our commitment to completely finish the SWPP remains strong. SWA board members, management, staff, stakeholders and partners know that the road ahead will have challenges, particularly as funding becomes strained and construction prices increase. We will overcome these challenges by carefully exploring all op-tions that facilitate or even expedite project completion.
Mahatma Gandhi once said, “You must be the change you wish to see in the world.” Through the hard work and vision of many, real change
has occurred in southwest North Dakota. Where once there were families drinking wa-ter as black as coffee, there are now families enjoying clear, quality water from the SWPP. I applaud the men and women of southwest North Dakota who envisioned an adequate supply of quality water delivered to homes, businesses, farms and ranches. I respect the tremendous effort that has made that vision a reality.
With the help of our stakeholders and part-ners, state and federal government, funding agencies, and customers, we will continue to foster the change we wish to see in the world - people and business succeeding with quality water.
2005 SWA Annual Report
8
On behalf of the Southwest Water Author-ity (SWA) board of directors, management and staff, I thank our customers for another ban-ner year. Water sales once again exceeded one billion gallons as we continued our mission of “providing quality water for southwest North Dakota.” Sales were slightly below projections due to a much needed increase in precipitation.
Our �0th year of construction for the South-west Pipeline Project (SWPP) was somewhat disappointing as funding uncertainties delayed construction until September. The good news is that adequate funding was received to com-plete construction on a significant portion of the Medora-Beach Service Area. While contractors got a late start in 2005, we expect a significant amount of progress in �006.
SWA board members envision “people and business succeeding with quality water.” It has been said that with ordinary talents, extraordi-nary perseverance and a willingness to work to-gether, all things are attainable. Such is the case with unique water purchase agreements made with both the Missouri West Water System (MWWS) and the city of Beulah. These agree-ments allow SWA to serve additional custom-ers by utilizing alternative water sources. While the MWWS agreement provides a permanent water source for several customers in Morton
Unique Agreements Contribute to Project Growth
County, the city of Beu-lah agreement provides for an interim source of water for custom-ers that will eventually receive water from the proposed Zap Regional Water Treatment Plant. That plant will ulti-mately provide water for the Oliver, Mercer, North Dunn (OMND) Service Area, the final phase of construction for the SWPP.
For �5 years, residents of OMND have pa-tiently waited for water service from the SWPP. Therefore, it is very gratifying to be able to provide service to the city of Zap, Beulah’s Country Club Estates and several customers along the service line to Zap as early as fall �006. It is our sincere hope, dependent upon funding, that we will be able to begin construc-
By: Ray Christensen, SWA Manager/CEO
Ray Christensen, SWA Manager/CEO

9
2005 SWA Annual Report
tion on the remaining portions of the OMND phase during the �007-�009 biennium.
Our ability to advance SWPP development is directly related to funding. Grassroots sup-port, along with our ability to work with the North Dakota Water Coalition and other state-wide water interests, will ultimately determine our future. SWA strongly supports this united approach to adequately fund the state’s critical water needs. We commend our customers, both current and future, for the unified “grassroots” support of this project. Through continued co-operation and support from Governor Hoeven, the Congressional Delegation, North Dakota Legislature, ND State Water Commission, North Dakota Rural Water Systems Association and numerous federal, state and local agencies, we are determined and committed to complet-ing the SWPP.
I am fortunate to work for a board of direc-tors that is committed to excellence. I am also very proud of my staff and their daily contri-butions that ensure our customers receive a quality product at an affordable cost. Through the collective efforts of the board, manage-ment and staff, SWA rates will not increase in 2006. This marks the fifth year that rates have remained constant. With new regulatory issues and rising costs, it will be a challenge to keep rates stable. Rest assured the SWA board and staff alike look forward to meeting these new challenges while continuing to provide quality service.

2005 SWA Annual Report
�0
2005 Construction Summary
By: Jim Lennington, Former SWPP Project Manager
A highlight of this past construction season was beginning construction on Phase II of the Medora-Beach Regional Service Area. At its August 30th meeting, the ND State Water Com-mission (SWC) approved Contract 7-8B, the rural water distribution system that serves the city of Golva and �36 users in western Stark, Billings and Golden Valley Counties. The trans-mission pipeline, tanks and booster pump sta-tions for the area were completed in �004.
SWC also authorized Contract 7-8C. This ru-ral water distribution system serves �3� users in parts of Morton County that were unable to be served by the Missouri West Water System. The SWC-approved funding package for Phase II of Medora-Beach totaled $9,8�3,000. This includes $6,300,000 in state funding through the Resources Trust Fund, a $�,999,000 loan from USDA secured by a revenue bond and a $�,5�4,000 grant from USDA.
Work on these two rural water contracts be-gan in September. By the end of the construc-tion season, around Thanksgiving, approxi-mately 74 out of 44� miles of pipeline had been installed. In all, about $�.3 million was spent on construction of the Southwest Pipeline Project (SWPP) in 2005. This includes final payments on the five contracts making up Phase I con-struction, plus the work on Contracts 7-8B and 7-8C mentioned previously. Work on these two rural water projects will be substantially com-plete by late �006, adding 367 rural water users to the project. By the end of �006 nearly �,973 miles of rural water pipeline will be installed on the project. The two contracts in Medora-Beach Phase II should also bring the total number of rural users to approximately �,8�0.
On a more personal note, this is the last time I will contribute to this annual report as the SWPP Project Manag-er, having resigned my position with the SWC at the end of �005. As project manager since �998, I have seen dra-matic progress on the project. From �998 to the end of �005 rural users increased from �,�60 to �,450 and the number of cities and other bulk users increased from �3 to 4�. The total amount spent on construction contracts during that same period exceeded $33 million. It has been quite a ride and I’ve enjoyed every minute of it. This tremendous project is a testament to the efforts of the Southwest Wa-ter Authority board, staff and its many support-ers - the people of southwestern North Dakota. Congratulations on all you’ve achieved and best wishes in the future.
Jim Lennington, Former SWPP Project Manager
��
2005 SWA Annual Report
Introduction
The project pumped a total of �,�56,448,000 gallons of water from Lake Sakakawea in �005. This is a decrease of 473,000 gallons over �004. Potable water delivered in �005 was �,�33,5��,300 gal-lons. Contract users consumed 976,6�5,300 gallons and �56,887,000 gallons were used by rural customers. Total raw water delivered in �005 was �,�36,650 gallons. Potable water used by contractors during construction totaled �,�6�,��0 gallons. The water delivered to the end user was 98.3 percent of the total water pumped from Lake Sakakawea by SWPP.
For the fourth year in a row SWA Directors voted to absorb the required Consumer Price In-dex increasing capital repayment fees for both contract and rural customers. This action is con-sistent with the board’s goal of stabilizing rates for customers, and it’s philosophy that SWA’s objective is to manage, operate and maintain the pipeline while covering costs.
To educate youth on the importance of qual-ity water, SWA held its sixth annual “Make A Splash” Water Festival, September ��-�3. Fifth
The Southwest Water Authority (SWA), a political subdivision, was established by the North Dakota State Legislature in �99� to man-age, operate and maintain the Southwest Pipe-line Project (SWPP). The SWA is governed by a �4-member board of directors. One director represents each county within the SWPP Ser-vice Area and two directors represent the city of Dickinson. The counties include: Adams, Bill-ings, Bowman, Dunn, Golden Valley, Grant, Hettinger, Mercer, Morton, Oliver, Slope and Stark.
The SWPP, a state-owned project, admin-istered by the ND State Water Commission (SWC) and operated and maintained by SWA, transports raw water from Lake Sakakawea to Dickinson where it is treated and delivered to the project’s customers in southwest North Da-kota and Perkins County, South Dakota.
For �0 years, SWPP has been constructing an efficient network of pipelines, pump sta-tions, reservoirs and treatment facilities to bring southwest North Dakota an adequate supply of quality water. To date, �6 communities, approx-imately �,500 rural service locations, �0 con-tract customers, five raw water customers and Perkins County Rural Water are served by the pipeline.

2005 SWA Annual Report
��
grade students throughout SWA’s ��-county ser-vice area were invited to attend the event held at the Dickinson Recreation Center. A special Thursday evening session, “Family Night,” was open to the public, attracting over 500 partici-pants in �005.
A bulk water purchase agreement between the SWC, SWA and Missouri West Water Systems (MWWS) will be necessary to cooperatively serve portions of Morton County. Under the agreement, SWPP will tie into existing MWWS infrastructure and the SWC will oversee con-struction, bringing service to approximately �3� customers. When complete, SWA will purchase water from MWWS to serve those customers.
On August 3�, �005, the United States De-partment of Agriculture approved the funding necessary ($�.� million) to construct the Beulah Interim Project. Contingent upon meeting the
requirements included in the letter of conditions, the project will deliver water from the city of Beulah to Country Club Estates, the city of Zap and several rural customers from Beulah to Zap. Although funding is available, construction is still contingent upon obtaining necessary con-tracts and agreements from the cities of Beulah, Zap and potential rural customers. Construction is expected to begin in �006.
Introduction, continued

�3
2005 SWA Annual Report
Southwest Water Authority Service Area - 12 Counties
2005 SWA Annual Report
�4
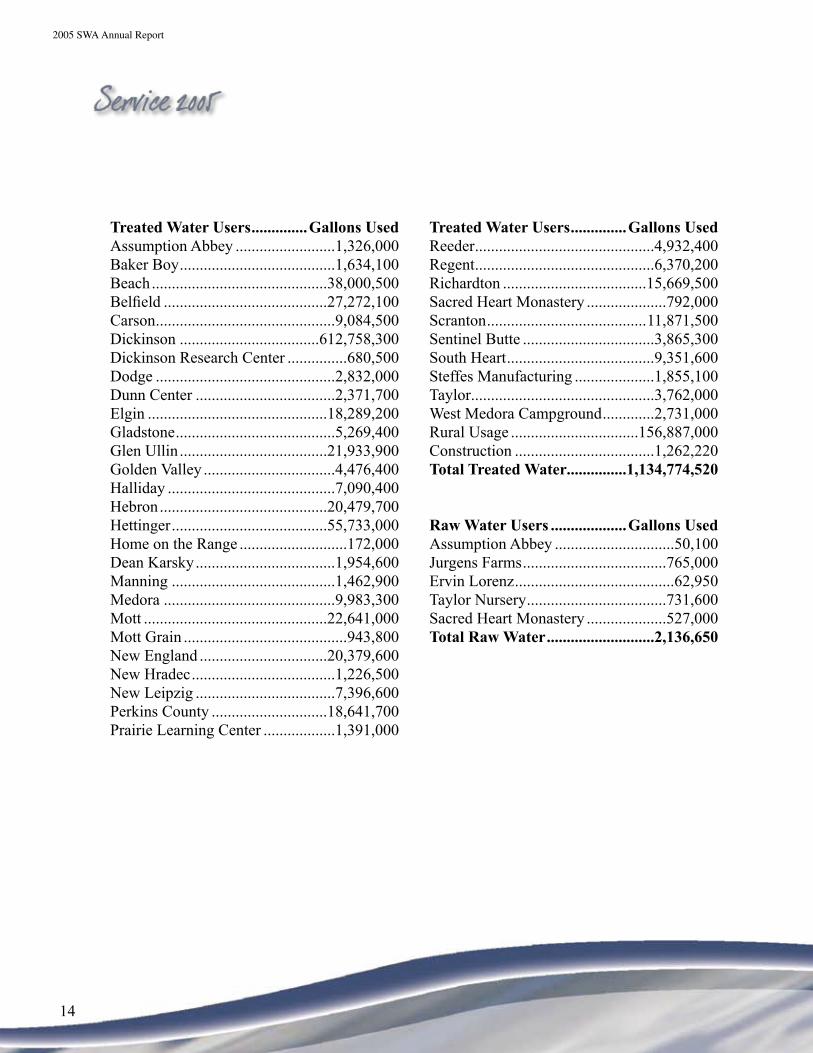
Service 2005
Treated Water Users ..............Gallons UsedAssumption Abbey .........................�,3�6,000Baker Boy .......................................�,634,�00Beach ............................................38,000,500Belfield .........................................�7,�7�,�00Carson .............................................9,084,500Dickinson ...................................6��,758,300Dickinson Research Center ...............680,500Dodge .............................................�,83�,000Dunn Center ...................................�,37�,700Elgin .............................................�8,�89,�00Gladstone ........................................5,�69,400Glen Ullin .....................................��,933,900Golden Valley .................................4,476,400Halliday ..........................................7,090,400Hebron ..........................................�0,479,700Hettinger .......................................55,733,000Home on the Range ...........................�7�,000Dean Karsky ...................................�,954,600Manning .........................................�,46�,900Medora ...........................................9,983,300 Mott ..............................................��,64�,000Mott Grain .........................................943,800New England ................................�0,379,600New Hradec ....................................�,��6,500New Leipzig ...................................7,396,600Perkins County .............................�8,64�,700Prairie Learning Center ..................�,39�,000
Treated Water Users ..............Gallons UsedReeder .............................................4,93�,400Regent .............................................6,370,�00Richardton ....................................�5,669,500Sacred Heart Monastery ....................79�,000Scranton ........................................��,87�,500Sentinel Butte .................................3,865,300South Heart .....................................9,35�,600Steffes Manufacturing ....................�,855,�00Taylor ..............................................3,76�,000West Medora Campground .............�,73�,000Rural Usage ................................�56,887,000Construction ...................................�,�6�,��0Total Treated Water ...............1,134,774,520
Raw Water Users ...................Gallons UsedAssumption Abbey ..............................50,�00Jurgens Farms ....................................765,000Ervin Lorenz ........................................6�,950Taylor Nursery ...................................73�,600Sacred Heart Monastery ....................5�7,000Total Raw Water ...........................2,136,650
�5
2005 SWA Annual Report
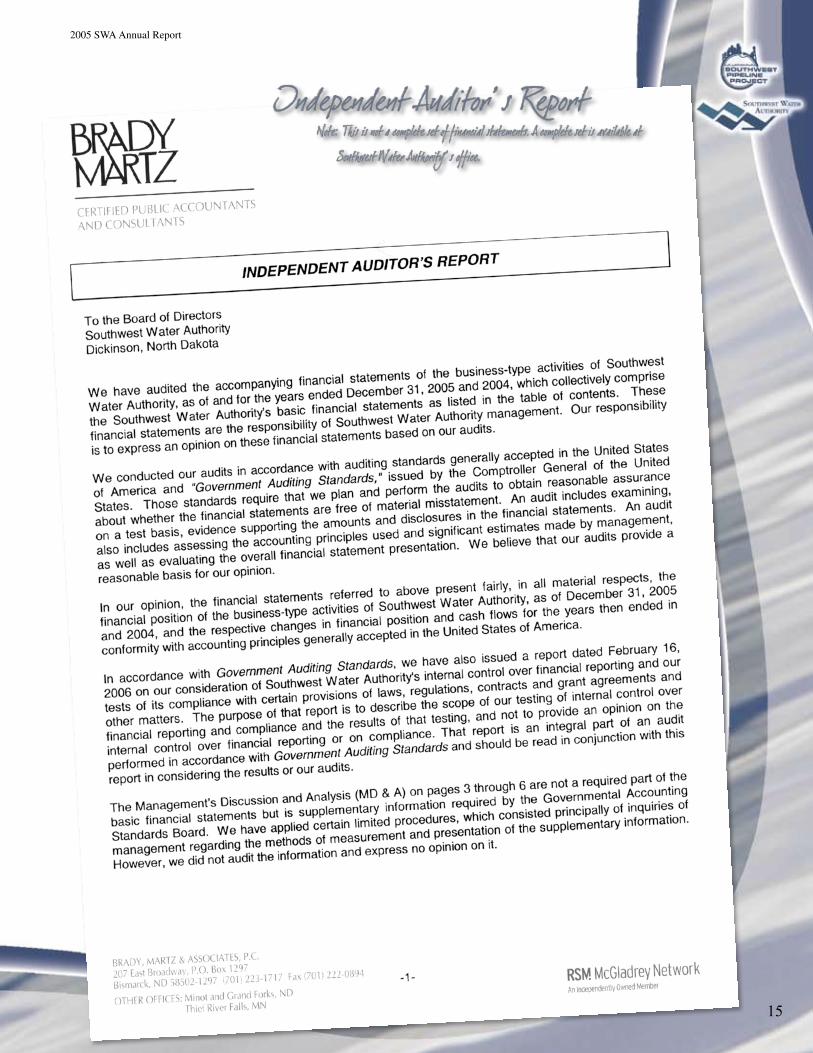
Independent Auditor’s ReportNote: This is not a complete set of financial statements. A complete set is available at
Southwest Water Authority’s office.
2005 SWA Annual Report
�6
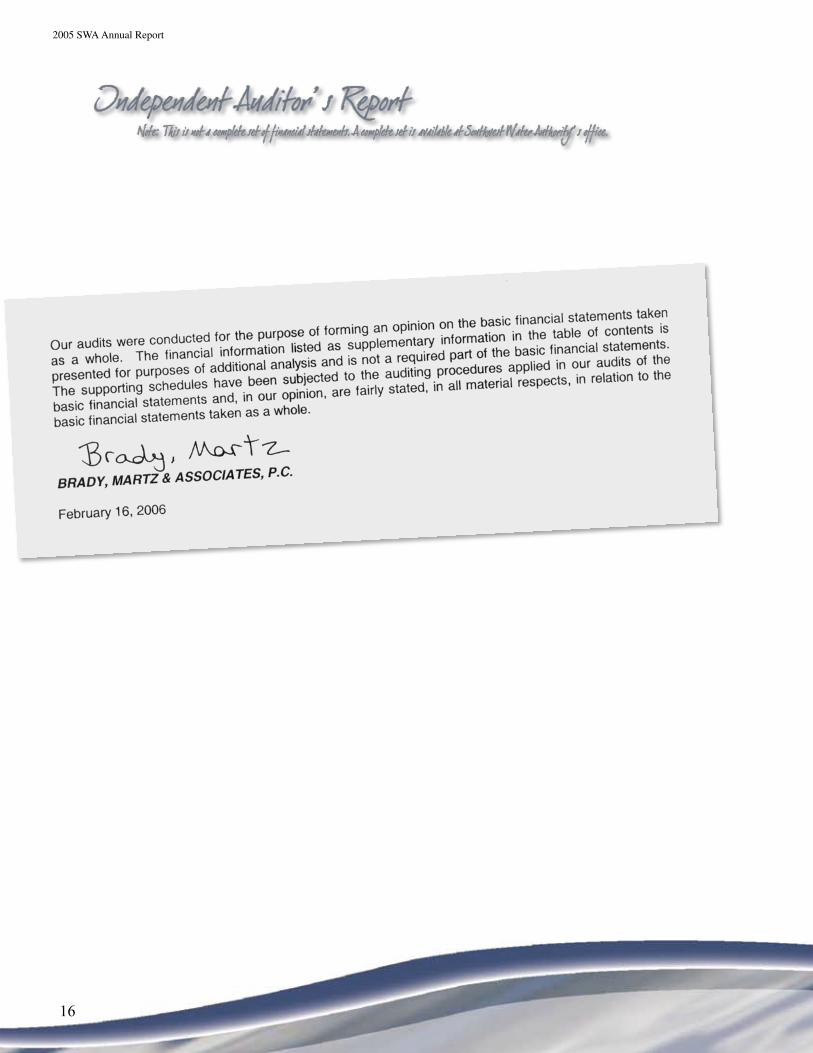
Independent Auditor’s ReportNote: This is not a complete set of financial statements. A complete set is available at Southwest Water Authority’s office.

�7
2005 SWA Annual Report
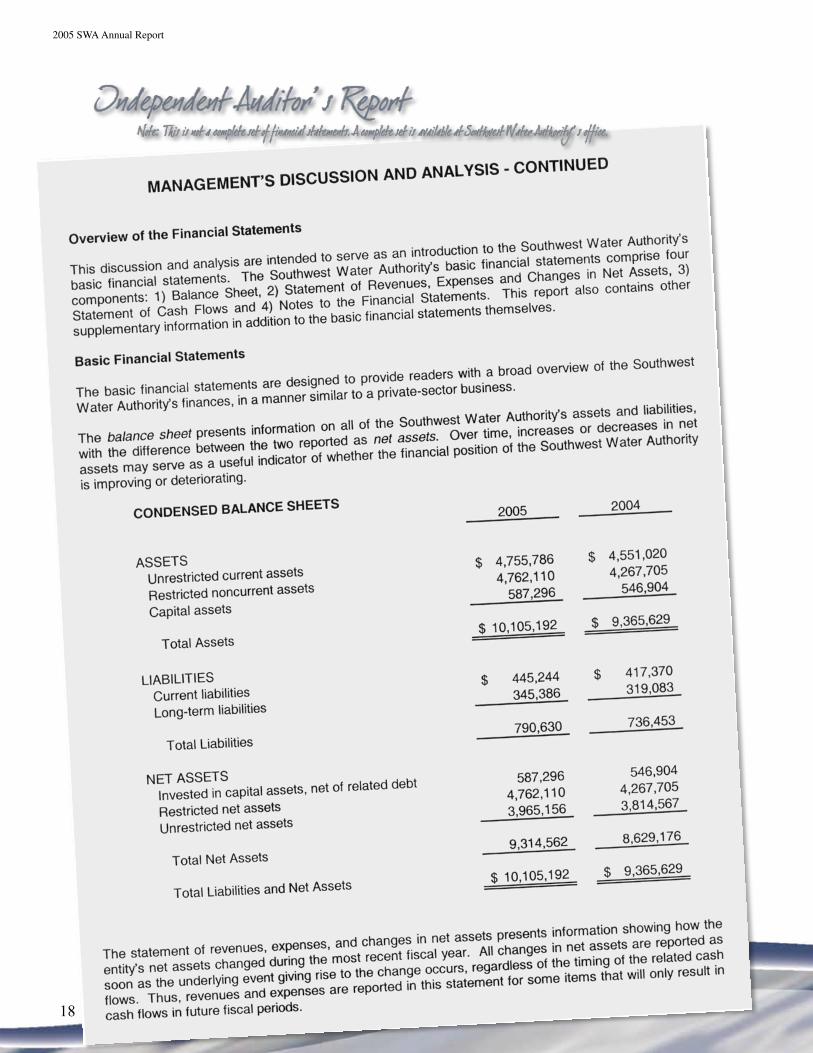
Independent Auditor’s ReportNote: This is not a complete set of financial statements. A complete set is available at Southwest Water Authority’s office.
2005 SWA Annual Report
�8
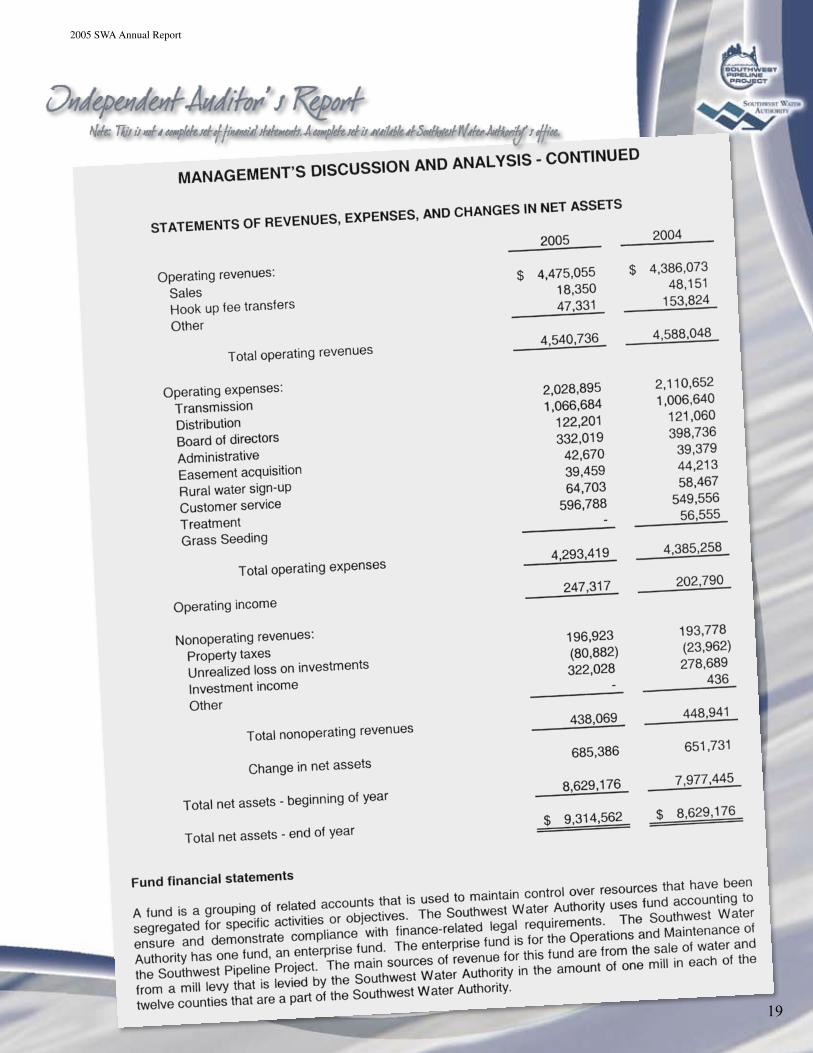
Independent Auditor’s ReportNote: This is not a complete set of financial statements. A complete set is available at Southwest Water Authority’s office.
�9
2005 SWA Annual Report
Independent Auditor’s ReportNote: This is not a complete set of financial statements. A complete set is available at Southwest Water Authority’s office.

2005 SWA Annual Report
�0
Independent Auditor’s ReportNote: This is not a complete set of financial statements. A complete set is available at Southwest Water Authority’s office.

��
2005 SWA Annual Report
Independent Auditor’s ReportNote: This is not a complete set of financial statements. A complete set is available at Southwest Water Authority’s office.

2005 SWA Annual Report
��
Independent Auditor’s ReportNote: This is not a complete set of financial statements. A complete set is available at Southwest Water Authority’s office.
�3
2005 SWA Annual Report
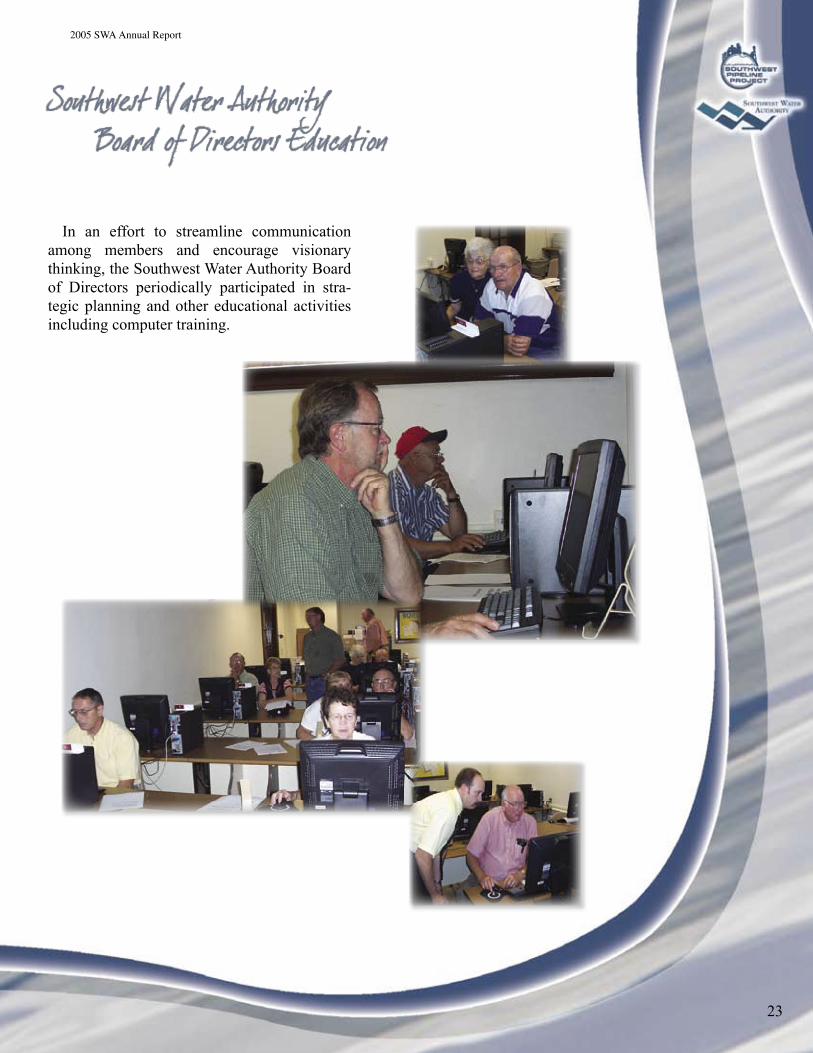
In an effort to streamline communication among members and encourage visionary thinking, the Southwest Water Authority Board of Directors periodically participated in stra-tegic planning and other educational activities including computer training.
Southwest Water Authority Board of Directors Education

2005 SWA Annual Report
�4
Potabl
e Wate
r Usag
eTot
al From
Potab
le Wate
r Cont
racts -
Per 1,
000 Ga
llons
Use
rJa
n.F
eb.
Mar
chA
pril
May
June
July
Aug
.Se
pt.
Oct
.N
ov.
Dec
.U
ser
Tota
lA
ssum
ptio
n A
bbey
81.0
80.0
96.0
114.
010
1.0
113.
014
5.0
191.
014
6.0
85.0
88.0
86
.01,
326.
0B
aker
Boy
41.6
43.7
39.1
45.1
62.7
88.1
59.1
300.
430
8.5
302.
717
7.0
166.
11,
634.
1B
each
2,87
4.3
3,62
8.3
2,25
8.3
2,89
8.4
2,93
1.8
3,07
1.2
5,24
0.2
3,80
8.9
4,15
6.7
2,38
4.6
2,33
7.8
2,41
0.0
38,0
00.5
Bel
field
2,08
9.5
2,44
7.0
1,34
3.2
2,01
4.1
1,88
7.7
2,40
3.6
3,25
7.8
3,61
2.2
2,90
3.6
1,86
9.3
1,82
4.7
1,61
9.4
27,2
72.1
Car
son
577.
563
6.9
551.
777
0.9
738.
573
3.8
1,03
0.3
834.
31,
074.
270
2.1
616.
981
7.4
9,08
4.5
Dic
kins
on38
,835
.741
,216
.536
,512
.750
,493
.543
,401
.946
,482
.274
,071
.275
,493
.077
,412
.045
,345
.742
,235
.341
,258
.661
2,75
8.3
Dic
kins
on R
esea
rch
32.7
26.5
22.3
26.9
46.3
107.
924
.86.
630
2.0
26.9
24.7
32.9
680.
5D
odge
199.
020
1.0
196.
025
9.0
213.
024
4.0
279.
030
7.0
293.
022
1.0
207.
021
3.0
2,83
2.0
Dun
n C
ente
r17
9.9
167.
914
6.7
196.
417
5.9
188.
623
5.8
250.
126
4.4
184.
119
2.0
189.
92,
371.
7E
lgin
1,25
4.7
1,33
8.7
1,17
6.6
1,58
7.4
1,46
3.7
1,48
4.3
2,15
2.9
1,81
8.8
2,08
5.6
1,33
7.0
1,34
4.7
1,24
4.8
18,2
89.2
Gla
dsto
ne47
6.1
373.
334
1.1
445.
539
2.3
428.
754
1.5
518.
254
9.3
457.
836
9.3
376.
35,
269.
4G
len
Ulli
n1,
546.
71,
588.
81,
403.
52,
206.
81,
754.
01,
843.
22,
447.
22,
085.
02,
237.
01,
643.
51,
530.
51,
647.
721
,933
.9G
olde
n V
alle
y26
9.9
302.
826
6.1
379.
832
0.6
399.
948
8.6
561.
356
5.5
324.
330
6.1
291.
54,
476.
4H
allid
ay50
0.4
454.
644
0.9
581.
862
8.1
558.
370
3.2
712.
277
6.5
580.
061
3.7
540.
77,
090.
4H
ebro
n1,
391.
61,
433.
71,
368.
01,
758.
71,
571.
91,
699.
72,
489.
72,
063.
22,
171.
11,
578.
81,
484.
91,
468.
420
,479
.7H
ettin
ger
3,42
0.7
3,54
5.4
3,39
9.8
4,46
0.9
4,41
5.3
4,72
8.9
7,51
6.4
5,96
0.2
6,78
6.7
4,07
9.3
3,61
8.2
3,80
1.2
55,7
33.0
Hom
e O
n T
he R
ange
34.3
44.7
49.3
43.7
172.
0K
arsk
y D
airy
157.
815
4.7
155.
517
7.8
156.
616
9.2
174.
116
8.0
190.
714
3.5
164.
714
2.0
1,95
4.6
Man
ning
72.0
78.6
81.0
91.4
80.2
99.1
161.
922
9.4
270.
312
6.4
84.2
88.4
1,46
2.9
Med
ora
160.
325
2.6
424.
51,
110.
61,
875.
02,
064.
22,
336.
291
3.4
565.
428
1.1
9,98
3.3
Mot
t1,
606.
01,
703.
01,
506.
32,
002.
41,
927.
52,
068.
42,
230.
42,
093.
92,
120.
21,
995.
81,
748.
91,
638.
222
,641
.0M
ott G
rain
250.
623
6.9
193.
077
.215
5.6
26.9
3.6
943.
8N
ew E
ngla
nd1,
286.
21,
292.
61,
300.
81,
817.
01,
616.
92,
110.
42,
082.
72,
259.
52,
323.
91,
409.
71,
435.
91,
444.
020
,379
.6N
ew H
rade
c93
.610
0.3
88.5
116.
710
0.4
108.
814
2.0
116.
211
1.5
85.8
84.2
78.5
1,22
6.5
New
Lei
pzig
595.
655
0.3
503.
762
2.8
575.
078
9.2
864.
159
7.0
809.
353
7.8
455.
249
6.6
7,39
6.6
Perk
ins
Co.
Rur
al W
a-te
r Sy
st.
438.
839
9.4
362.
251
7.4
485.
456
5.0
996.
786
0.2
3,22
2.0
3,87
1.6
3,54
5.8
3,37
7.2
18,6
41.7
Prai
rie
Lea
rnin
g C
ente
r14
8.0
74.0
107.
013
4.0
146.
591
.510
6.9
126.
111
9.8
140.
297
.010
0.0
1,39
1.0
Ree
der
428.
934
1.5
359.
945
2.2
306.
649
8.3
640.
441
3.4
459.
433
7.5
373.
932
0.4
4,93
2.4
Reg
ent
424.
334
7.6
318.
253
1.8
616.
469
8.9
554.
770
5.0
657.
358
4.8
515.
641
5.6
6,37
0.2
Ric
hard
ton
1,12
6.7
1,11
6.1
964.
01,
360.
01,
123.
61,
296.
01,
704.
71,
793.
11,
670.
81,
173.
81,
168.
41,
172.
315
,669
.5Sa
cred
Hea
rt62
.069
.066
.077
.062
.060
.058
.059
.082
.062
.071
.064
.079
2.0
Scra
nton
776.
672
1.4
588.
51,
138.
61,
041.
91,
307.
71,
258.
91,
174.
81,
451.
892
7.8
744.
173
9.4
11,8
71.5
Sent
inel
But
te66
0.8
773.
345
2.0
363.
032
5.4
230.
719
6.2
185.
315
5.5
135.
422
7.7
160.
03,
865.
3So
uth
Hea
rt65
1.8
654.
059
7.6
795.
365
7.5
639.
81,
151.
71,
104.
61,
168.
370
9.4
596.
662
5.0
9,35
1.6
Stef
fes
234.
718
5.4
187.
121
8.6
100.
49.
829
2.9
158.
488
.011
7.1
141.
312
1.4
1,85
5.1
Tayl
or24
1.0
256.
023
7.0
320.
032
4.0
271.
047
9.0
470.
039
8.0
254.
027
6.0
236.
03,
762.
0W
est M
edor
a C
amp-
grou
nd20
.011
3.0
557.
078
5.0
723.
047
9.0
22.0
19.0
13.0
2,73
1.0
Mon
thly
Tot
al62
,776
.166
,302
.357
,597
.679
,247
.870
,539
.177
,493
.711
6,63
1.0
113,
900.
712
0,33
6.0
74,7
41.7
69,3
38.6
67,7
20.7
976,
625.
3

�5
2005 SWA Annual Report
The water rate for rural customers in �005 consisted of a minimum payment of $38.�5 per month, including �,000 gallons of water. The rate for water use in excess of the �,000 gal-lons was $3.60 per thousand gallons. On July �, �00�, SWA implemented a volume discount for rural customers, reducing water rates from $3.60 to $�.60 on usage over �0,000 gallons. Also, customers with pasture taps received a rate reduction from $3.60 to $�.60 on water usage in excess of 60,000 gallons, billed annually.
The standard rural minimum fee ($38.�5) is broken into three separate components: meter fee, capital repayment, operations and mainte-
Rural Customers Under 10,000 GallonsTreatment ...............................................$0.55Transmission O&M* .............................$�.05Transmission Replacement ....................$0.35Distribution O&M* ...............................$�.�8Distribution Replacement ......................$0.�0Distribution Reserve ..............................$0.�5Transmission Reserve ............................$0.��Total ......................................................$3.60
Rates 2005nance. The capital repayment ($�7.79) and meter fee ($5.00) portions of the minimum are used to pay the interest and principal on the Series A and B bonds, with the re-maining balance paid to the Resources Trust Fund. These bonds help fund construction. After two years, the meter fee is paid to the Operations and Maintenance Fund, covering capital and routine operations and mainte-nance costs. The final portion of the monthly minimum ($5.46) is for the Operations and Maintenance Fund to cover fixed costs.
Rural Customers Over 10,000 GallonsTreatment .............................................$0.55Transmission O&M* ...........................$0.7�Transmission Replacement ..................$0.35Transmission Reserve ..........................$0.08Distribution O&M* .............................$0.90Total ....................................................$2.60
O&M* stands for Operations and Maintenance
The �005 rate for demand contract customers was $3.83 per �,000 gallons of potable water.
Demand Contract CustomersTreatment ...............................................$0.55Transmission O&M* .............................$�.05Transmission Replacement and Extraordinary Maintenance .................$0.35Capital Repayment ................................$0.9�Demand Charge .....................................$0.9�Transmission Reserve ............................$0.06Total ......................................................$3.83
The �005 rate for contract customers was $�.98 per �,000 gallons of potable water.
Contract CustomersTreatment . . . . . . . . . . . . . . . . . . . $0.55Transmission O&M* . . . . . . . . . . . $�.05Transmission Replacement and Extraordinary Maintenance . . . $0.35Capital Repayment . . . . . . . . . . . . $0.9�
Transmission Reserve . . . . . . . . $0.��Total . . . . . . . . . . . . . . . . . . . . . $2.98
The raw water contract rate was $�.45 per �,000 gallons of water. Raw water customers do not pay for the cost of treatment.

2005 SWA Annual Report
�6
Rates 2006
The rural water rates for �006 will remain the same for the fifth consecutive year. The mini-mum fee of $38.�5 includes �,000 gallons of water. This also includes capital repayment, me-ter fee, operations and maintenance. The capi-tal repayment amount is tied to the Consumer Price Index and adjusted annually by the ND State Water Commission. Capital repayment was increased by $�.0�. Southwest Water Au-thority has agreed to absorb the increase, thus stabilizing rates.
The standard rural minimum fee ($38.�5) is broken into three separate components: meter
Rural Customers Under 10,000 GallonsTreatment ...............................................$0.55Transmission O&M* .............................$�.05Transmission Reserve ............................$0.09Transmission Replacement ....................$0.35Distribution O&M* ...............................$�.3�Distribution Replacement ......................$0.�0Distribution Reserve ..............................$0.�5Total ......................................................$3.60
Rural Customers Over 10,000 GallonsTreatment .......................................$0.55Transmission O&M* ......................$0.7�Transmission Replacement ............$0.35Distribution O&M* ........................$0.88
Distribution Replacement ...........$0.�0Total ...........................................$2.60
fee, capital repayment, operations and mainte-nance. The capital repayment ($�8.80) and me-ter fee ($5.00) portions of the minimum are used to pay the interest and principal on the Series A and B Bonds, with the remaining balance paid to the Resources Trust Fund. The bonds help fund construction. After two years, the meter fee is paid to the Operations and Maintenance Fund, covering capital and routine operations and maintenance costs. The final portion of the monthly minimum ($4.45) is for the Operations and Maintenance Fund to cover fixed costs.
O&M* stands for Operations and Maintenance

�7
2005 SWA Annual Report
Demand Contract CustomersTreatment ..................................................$0.55Transmission O&M* .................................$�.05Transmission Replacement and Extraordinary Maintenance .................$0.35Capital Repayment ....................................$0.94Demand Charge.........................................$0.94Total ..........................................................$3.83
Contract CustomersTreatment ........................................... $0.55Transmission O&M* .......................... $�.05Transmission Replacement and Extraordinary Maintenance .......... $0.35Capital Repayment ............................. $0.94Transmission Reserve ........................ $0.09Total ................................................... $2.98
Currently, the raw water contract rate is $�.45 per �,000 gallons of water.
The cost of treatment goes to a treatment fund. Operations and maintenance fees are paid to the Operations and Maintenance Fund. This fund is used to cover the following costs: Wheeling and Western Area Power Association, electric-ity costs for cathodic protection and booster stations, telephones, natural gas, fuel, salaries, travel, insurance, supplies, equipment, vehicles and their maintenance, legal fees, building, transmission and distribution equipment repair and maintenance, as well as customer service
expenses. Replacement fees are paid to the Replacement and Extraordinary Maintenance Fund. Capital repayment fees are used to pay the interest and principal on the Series A and B Bonds with the balance paid to the Resources Trust Fund. The North Dakota Legislature has authorized the fees contributed to the Resources Trust Fund to further fund Southwest Pipeline Project construction and other statewide water projects.
Rates 2006
O&M* stands for Operations and Maintenance

2005 SWA Annual Report
�8
Use
rB
illed
*O
&M
**T
reat
men
tR
eser
veR
epla
cem
ent
Cap
ital
R
epay
men
tD
eman
dTo
tal
Ass
umpt
ion
Abb
ey1,
326.
00$1
,392
.27
$729
.30
$79.
56
$464
.10
$1,2
06.6
6 $1
,206
.66
$5,0
78.5
5 B
aker
Boy
1,93
6.11
$2,0
32.8
5 $1
,064
.91
$232
.31
$677
.67
$1,7
61.8
7 $5
,769
.61
Bea
ch37
,800
.50
$39,
690.
55
$20,
790.
30
$4,5
36.0
7 $1
3,23
0.20
$3
4,39
8.45
$1
12,6
45.5
7 B
elfie
ld27
,272
.10
$28,
635.
73
$14,
999.
68
$3,2
72.6
4 $9
,545
.26
$24,
817.
62
$81,
270.
93
Car
son
9,08
4.50
$9,5
38.7
7 $4
,996
.52
$1,0
90.1
5 $3
,179
.63
$8,2
66.9
0 $2
7,07
1.97
D
icki
nson
612,
758.
30$6
43,3
96.2
5 $3
37,0
17.1
1 $7
3,53
0.98
$2
14,4
65.4
2 $5
57,6
10.0
7 $1
,826
,019
.83
Dic
kins
on R
esea
rch
1,20
0.00
$1,2
60.0
3 $6
60.0
3 $7
2.00
$4
20.0
3 $1
,092
.01
$1,0
92.0
0 $4
,596
.10
Dod
ge2,
832.
00$2
,973
.60
$1,5
57.6
0 $3
39.8
4 $9
91.2
0 $2
,577
.12
$8,4
39.3
6 D
unn
Cen
ter
2,37
1.70
$2,4
90.3
2 $1
,304
.47
$284
.61
$830
.13
$2,1
58.2
5 $7
,067
.78
Elg
in18
,289
.20
$19,
203.
69
$10,
059.
09
$2,1
94.7
0 $6
,401
.25
$16,
643.
19
$54,
501.
92
Gla
dsto
ne5,
269.
40$5
,532
.92
$2,8
98.2
2 $6
32.3
4 $1
,844
.34
$4,7
95.1
5 $1
5,70
2.97
G
len
Ulli
n21
,933
.90
$23,
030.
62
$12,
063.
67
$2,6
32.0
6 $7
,676
.89
$19,
959.
87
$65,
363.
11
Gol
den
Val
ley
4,47
6.40
$4,7
00.2
6 $2
,462
.06
$537
.18
$1,5
66.7
8 $4
,073
.54
$13,
339.
82
Hal
liday
7,09
0.40
$7,4
44.9
5 $3
,899
.75
$850
.84
$2,4
81.6
8 $6
,452
.27
$21,
129.
49
Heb
ron
20,4
79.7
0$2
1,50
3.72
$1
1,26
3.87
$2
,457
.55
$7,1
67.9
3 $1
8,63
6.54
$6
1,02
9.61
H
ettin
ger
55,7
33.0
0$5
8,51
9.68
$3
0,65
3.18
$6
,687
.96
$19,
506.
57
$50,
717.
02
$166
,084
.41
Hom
e on
the
Ran
ge70
0$7
35.0
1 $3
85.0
1 $4
2.00
$2
45.0
1 $6
37.0
0 $6
37.0
0 $2
,681
.03
Kar
sky
Dai
ry1,
954.
60$2
,052
.36
$1,0
75.0
6 $2
34.5
4 $6
84.1
4 $1
,778
.71
$5,8
24.8
1 M
anni
ng1,
462.
90$1
,536
.06
$804
.61
$87.
76
$512
.03
$1,3
31.2
1 $1
,331
.22
$5,6
02.8
9 M
edor
a14
,955
.48
$15,
703.
28
$8,2
25.5
1 $1
,794
.65
$5,2
34.4
5 $1
3,60
9.48
$4
4,56
7.37
M
ott
22,6
41.0
0$2
3,77
2.99
$1
2,45
2.57
$2
,716
.93
$7,9
24.3
7 $2
0,60
3.30
$6
7,47
0.16
M
ott G
rain
1,20
0.00
$1,2
60.0
2 $6
60.0
1 $1
43.9
9 $4
20.0
1 $1
,092
.01
$3,5
76.0
4 N
ew E
ngla
nd20
,379
.60
$21,
398.
61
$11,
208.
81
$2,4
45.5
5 $7
,132
.89
$18,
545.
45
$60,
731.
31
New
Hra
dec
1,22
6.50
$1,2
87.8
5 $6
74.6
0 $7
3.59
$4
29.3
0 $1
,116
.13
$1,1
16.1
3 $4
,697
.60
New
Lei
pzig
7,39
6.60
$7,7
66.4
5 $4
,068
.15
$887
.59
$2,5
88.8
4 $6
,730
.91
$22,
041.
94
Perk
ins
Cou
nty
Rur
al W
ater
Sy
stem
18,6
41.7
0$1
9,57
3.79
$1
0,25
2.94
$2
,237
.02
$6,5
24.6
0 $0
.00
$38,
588.
35
Prai
rie
Lea
rnin
g C
ente
r1,
391.
00$1
,460
.39
$765
.07
$166
.92
$486
.87
$1,2
65.8
2 $4
,145
.07
Ree
der
4,86
1.80
$5,1
04.9
2 $2
,674
.02
$583
.43
$1,7
01.6
6 $4
,424
.24
$14,
488.
27
Reg
ent
6,37
0.20
$6,6
88.7
3 $3
,503
.63
$764
.43
$2,2
29.5
9 $5
,796
.89
$18,
983.
27
Ric
hard
ton
15,6
69.5
0$1
6,45
3.00
$8
,618
.25
$1,8
80.3
4 $5
,484
.34
$14,
259.
25
$46,
695.
18
Sacr
ed H
eart
792
$831
.60
$435
.60
$47.
52
$277
.20
$720
.72
$720
.72
$3,0
33.3
6 Sc
rant
on11
,871
.50
$12,
465.
11
$6,5
29.3
5 $1
,424
.59
$4,1
55.0
5 $1
0,80
3.08
$3
5,37
7.18
Se
ntin
el B
utte
3,76
5.30
$3,9
53.5
9 $2
,070
.94
$451
.84
$1,3
17.8
8 $3
,426
.42
$11,
220.
67
Sout
h H
eart
9,29
6.40
$9,7
61.2
4 $5
,113
.04
$1,1
15.5
8 $3
,253
.76
$8,4
59.7
3 $2
7,70
3.35
St
effe
s1,
855.
10$1
,947
.86
$1,0
20.3
3 $2
22.6
2 $6
49.3
1 $1
,688
.13
$5,5
28.2
5 Ta
ylor
3,76
2.00
$3,9
50.0
9 $2
,069
.10
$451
.44
$1,3
16.7
0 $3
,423
.42
$11,
210.
75
Wes
t Med
ora
Cam
pgro
und
2,73
1.00
$2,8
67.5
5 $1
,502
.05
$163
.86
$955
.85
$2,4
85.2
1 $2
,485
.21
$10,
459.
73
Tota
ls98
2,77
7.39
1,03
1,91
6.71
540,
528.
4111
7,36
6.98
343,
972.
9387
7,36
3.64
8,58
8.94
2,91
9,73
7.61
* pe
r th
ousa
nd g
allo
ns b
illed
** O
pera
tions
and
Mai
nten
ance
Water
Servi
ce Con
tracts
Total F
rom Po
table W
ater C
ontrac
ts

�9
2005 SWA Annual Report
Rural Water Usage History Gallons Billed
Month 1995 1996 1997 1998 1999 2000Jan. 638,000 2,674,000 4,508,000 5,213,600 5,627,700 7,567,600Feb. 722,000 2,513,000 4,513,300 5,108,300 5,355,100 7,178,100Mar. 797,000 3,001,000 3,876,400 4,694,500 4,912,600 6,538,000April 841,000 3,096,000 4,383,300 4,889,400 6,081,700 7,618,300May 934,000 2,994,000 4,642,000 5,105,200 5,589,900 7,979,600June 1,282,000 3,537,000 5,516,800 7,228,400 6,078,700 8,979,700July 1,601,000 4,435,000 6,041,300 5,945,000 7,307,200 8,886,400Aug. 1,708,000 4,829,000 6,136,200 7,279,200 8,430,100 9,147,300Sept. 1,822,000 5,598,000 5,623,200 6,742,300 7,579,700 10,089,100Oct. 1,531,000 4,342,000 6,124,000 6,672,900 7,742,800 10,638,200Nov. 1,839,000 4,026,400 4,679,100 6,136,000 6,717,200 7,627,100Dec. 2,130,000 5,328,000 4,853,000 4,776,100 7,047,500 7,166,100Total 15,845,000 46,373,400 60,896,600 69,790,900 78,470,200 99,415,500
Month 2001 2002 2003 2004 2005Jan. 7,566,100 8,803,100 9,747,700 10,499,300 10,438,000Feb. 7,182,800 7,351,300 9,030,800 9,838,200 9,806,900Mar. 6,803,000 7,367,300 8,645,200 8,627,700 9,593,300April 7,199,700 8,452,700 8,999,500 9,678,100 11,043,100May 7,890,200 8,591,300 10,030,800 11,882,600 11,416,100June 9,377,700 11,816,800 12,353,200 12,985,500 13,780,800July 8,687,300 12,067,400 12,869,800 15,676,800 13,786,700Aug. 8,853,700 12,878,000 14,851,300 14,729,100 14,552,400Sept. 10,633,300 11,186,900 14,823,500 14,405,200 16,177,400Oct. 10,084,400 16,109,900 19,743,800 19,217,100 24,084,600Nov. 7,364,200 9,111,700 10,257,100 10,106,100 11,281,500Dec. 7,860,900 8,463,100 9,372,700 9,765,600 10,926,200Total 99,503,300 122,199,500 140,725,400 147,411,300 156,887,000
Water Service ContractsTotal From Raw Water Contracts
User Billed* O&M** Treatment ReserveAbbey 100 $105.02 N/A $14.01 Jurgens Farm 765 $803.25 N/A $107.10 Lorenz Farm 100 $105.00 N/A $14.00 Sacred Heart 527 $553.35 N/A $73.78 Taylor Nursery 731.6 $768.20 N/A $102.42 Totals 2,223.60 $2,334.82 N/A $311.31
User Replacement Capital Repayment Demand Total
Abbey $35.02 $90.99 N/A $245.04 Jurgens Farm $267.75 $696.15 N/A $1,874.25 Lorenz Farm $35.00 $90.99 N/A $244.99 Sacred Heart $184.45 $479.57 N/A $1,291.15 Taylor Nursery $256.08 $665.76 N/A $1,792.46 Totals $778.30 $2,023.46 N/A $5,447.89
* per thousand gallons billed** Operations and Maintenance

2005 SWA Annual Report
30
Rate
Histor
yC
ontr
act W
ater
Rat
e19
9219
9319
9419
9519
9619
9719
9819
99O
pera
tions
& M
aint
enan
ce$0
.80
$0.5
0$0
.60
$0.6
7$0
.81
$0.8
5$0
.83
$0.8
8T
reat
men
t$0
.56
$0.6
4$0
.69
$0.6
5$0
.55
$0.5
5$0
.52
$0.5
6R
epla
cem
ent &
Ext
raor
dina
ry
Mai
nten
ance
$0.3
0$0
.30
$0.3
0$0
.30
$0.3
0$0
.30
$0.3
0$0
.35
Cap
ital R
epay
men
t$0
.62
$0.6
8$0
.70
$0.7
2$0
.74
$0.7
6$0
.78
$0.7
9R
eser
ve F
und
$0.0
5To
tal C
ontr
act
Rat
es$2
.28
$2.1
2$2
.29
$2.3
4$2
.40
$2.4
6$2
.43
$2.6
3
Pota
ble
Wat
er**
655,
640.
052
3,30
8.0
612,
163.
069
7,41
1.2
806,
175.
382
6,58
9.8
908,
168.
282
3,33
9.9
Dis
trib
utio
n W
ater
Rat
eR
ural
Mon
thly
Min
imum
*$2
5.00
$25.
00$2
5.00
$26.
95$2
8.00
$33.
90$3
3.90
$35.
10R
ural
Wat
er R
ate
$2.5
0$2
.50
$2.5
0$2
.50
$2.5
5$2
.55
$2.5
9$3
.05
Con
trac
t Wat
er R
ate
2000
2001
2002
2003
2004
2005
2006
Ope
ratio
ns &
Mai
nten
ance
$0.9
1$1
.05
$1.0
5$1
.05
$1.0
5$1
.05
$1.0
5T
reat
men
t$0
.53
$0.5
3$0
.53
$0.5
3$0
.55
$0.5
5$0
.55
Rep
lace
men
t & E
xtra
ordi
nary
M
aint
enan
ce$0
.35
$0.3
5$0
.35
$0.3
5$0
.35
$0.3
5$0
.35
Cap
ital R
epay
men
t$0
.80
$0.8
3$0
.85
$0.8
7$0
.89
$0.9
1$0
.94
Res
erve
Fun
d$0
.15
$0.2
0$0
.20
$0.1
8$0
.14
$0.1
2$0
.09
Tota
l Con
trac
t R
ates
$2.7
4$2
.96
$2.9
8$2
.98
$2.9
8$2
.98
$2.9
8
Pota
ble
Wat
er**
1,00
1,66
91,
030,
755
1,06
6,53
71,
119,
869
1,11
3,08
81,
133,
512
Dis
trib
utio
n W
ater
Rat
eR
ural
Mon
thly
Min
imum
*$3
5.80
$37.
55$3
8.25
$38.
25$3
8.25
$38.
25$3
8.25
Rur
al W
ater
Rat
e$3
.15
$3.6
0$3
.60
$3.6
0$3
.60
$3.6
0$3
.60
Sinc
e Ju
ly, 2
002,
rur
al u
sage
gre
ater
than
10,
000
gallo
ns p
er m
onth
is b
illed
at a
rat
e of
$2.
60 p
er th
ousa
nd g
allo
ns.
* in
clud
es 2
,000
gal
lons
of
wat
er f
rom
199
7 th
roug
h 20
06.
**H
isto
ry o
f Po
tabl
e W
ater
Del
iver
ed to
End
Use
rs d
oes
not i
nclu
de c
onst
ruct
ion
wat
er. A
mou
nts
abov
e ar
e lis
ted
in 1
,000
gal
lons
.
3�
2005 SWA Annual Report
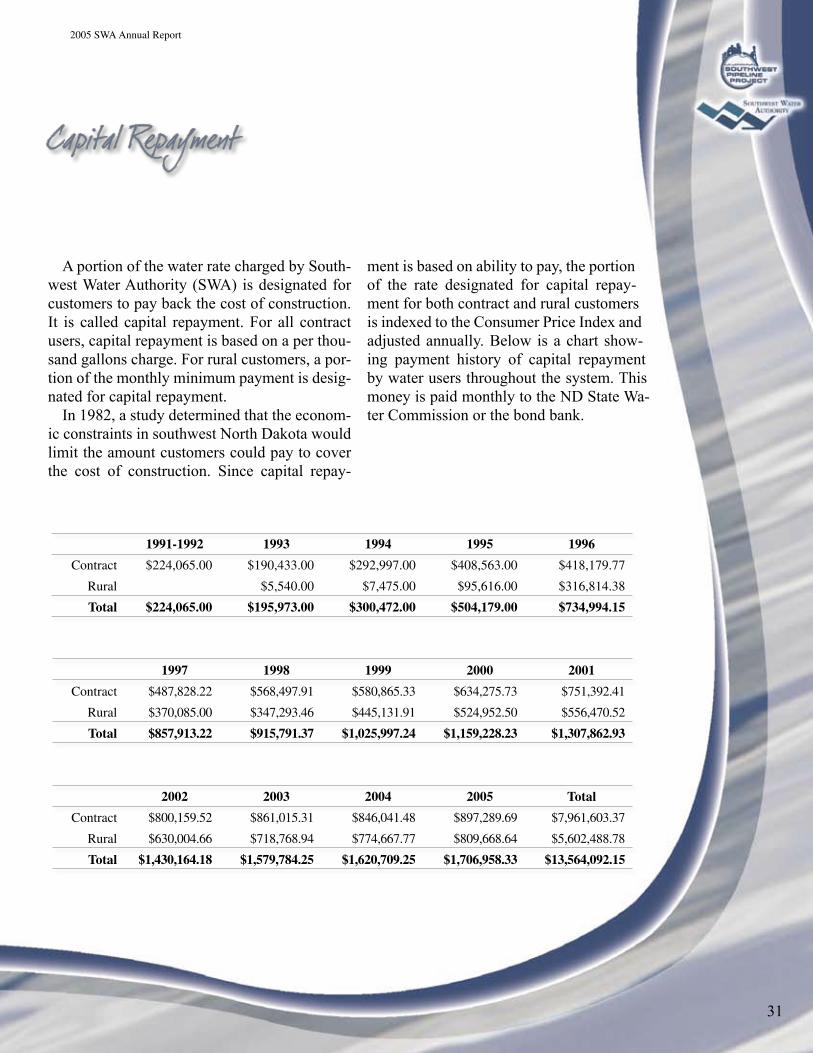
Capital Repayment
A portion of the water rate charged by South-west Water Authority (SWA) is designated for customers to pay back the cost of construction. It is called capital repayment. For all contract users, capital repayment is based on a per thou-sand gallons charge. For rural customers, a por-tion of the monthly minimum payment is desig-nated for capital repayment.
In �98�, a study determined that the econom-ic constraints in southwest North Dakota would limit the amount customers could pay to cover the cost of construction. Since capital repay-
ment is based on ability to pay, the portion of the rate designated for capital repay-ment for both contract and rural customers is indexed to the Consumer Price Index and adjusted annually. Below is a chart show-ing payment history of capital repayment by water users throughout the system. This money is paid monthly to the ND State Wa-ter Commission or the bond bank.
1991-1992 1993 1994 1995 1996
Contract $224,065.00 $190,433.00 $292,997.00 $408,563.00 $418,179.77
Rural $5,540.00 $7,475.00 $95,616.00 $316,814.38
Total $224,065.00 $195,973.00 $300,472.00 $504,179.00 $734,994.15
1997 1998 1999 2000 2001
Contract $487,828.22 $568,497.91 $580,865.33 $634,275.73 $751,392.41
Rural $370,085.00 $347,293.46 $445,131.91 $524,952.50 $556,470.52
Total $857,913.22 $915,791.37 $1,025,997.24 $1,159,228.23 $1,307,862.93
2002 2003 2004 2005 Total
Contract $800,159.52 $861,015.31 $846,041.48 $897,289.69 $7,961,603.37
Rural $630,004.66 $718,768.94 $774,667.77 $809,668.64 $5,602,488.78
Total $1,430,164.18 $1,579,784.25 $1,620,709.25 $1,706,958.33 $13,564,092.15
2005 SWA Annual Report
3�
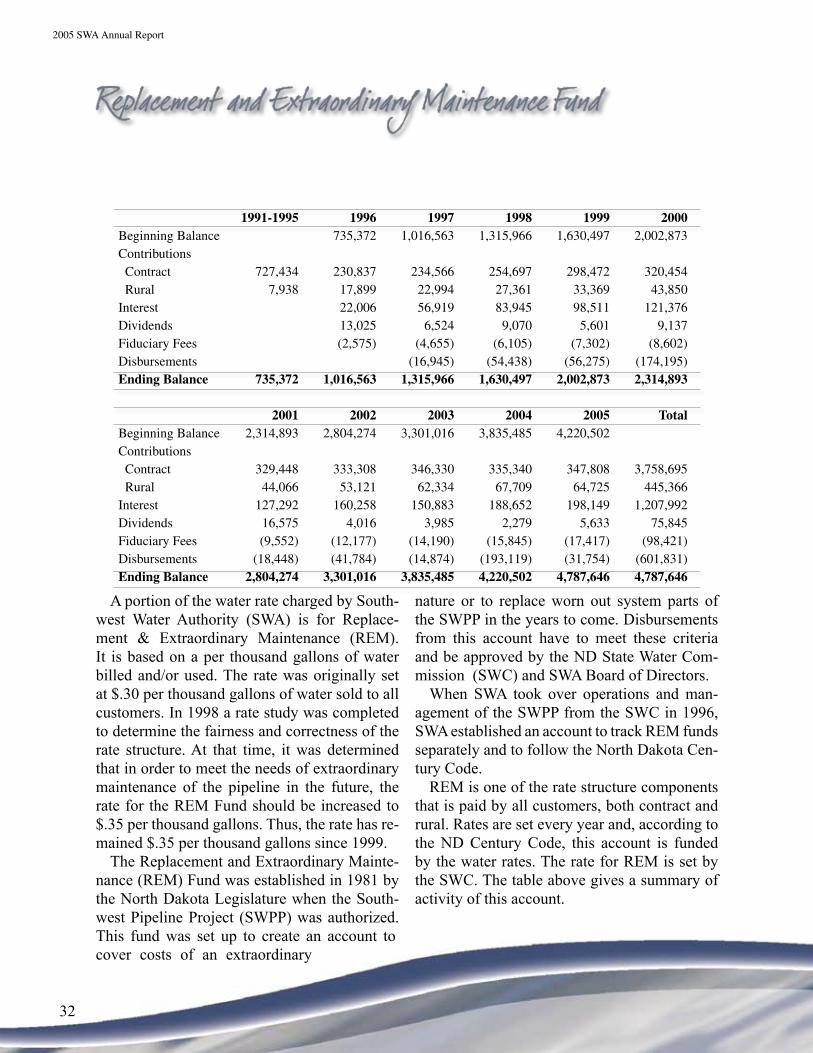
Replacement and Extraordinary Maintenance Fund
A portion of the water rate charged by South-west Water Authority (SWA) is for Replace-ment & Extraordinary Maintenance (REM). It is based on a per thousand gallons of water billed and/or used. The rate was originally set at $.30 per thousand gallons of water sold to all customers. In �998 a rate study was completed to determine the fairness and correctness of the rate structure. At that time, it was determined that in order to meet the needs of extraordinary maintenance of the pipeline in the future, the rate for the REM Fund should be increased to $.35 per thousand gallons. Thus, the rate has re-mained $.35 per thousand gallons since �999.
The Replacement and Extraordinary Mainte-nance (REM) Fund was established in �98� by the North Dakota Legislature when the South-west Pipeline Project (SWPP) was authorized. This fund was set up to create an account to cover costs of an extraordinary
nature or to replace worn out system parts of the SWPP in the years to come. Disbursements from this account have to meet these criteria and be approved by the ND State Water Com-mission (SWC) and SWA Board of Directors.
When SWA took over operations and man-agement of the SWPP from the SWC in �996, SWA established an account to track REM funds separately and to follow the North Dakota Cen-tury Code.
REM is one of the rate structure components that is paid by all customers, both contract and rural. Rates are set every year and, according to the ND Century Code, this account is funded by the water rates. The rate for REM is set by the SWC. The table above gives a summary of activity of this account.
1991-1995 1996 1997 1998 1999 2000Beginning Balance 735,372 1,016,563 1,315,966 1,630,497 2,002,873 Contributions Contract 727,434 230,837 234,566 254,697 298,472 320,454 Rural 7,938 17,899 22,994 27,361 33,369 43,850 Interest 22,006 56,919 83,945 98,511 121,376 Dividends 13,025 6,524 9,070 5,601 9,137 Fiduciary Fees (2,575) (4,655) (6,105) (7,302) (8,602)Disbursements (16,945) (54,438) (56,275) (174,195)Ending Balance 735,372 1,016,563 1,315,966 1,630,497 2,002,873 2,314,893
2001 2002 2003 2004 2005 TotalBeginning Balance 2,314,893 2,804,274 3,301,016 3,835,485 4,220,502 Contributions Contract 329,448 333,308 346,330 335,340 347,808 3,758,695 Rural 44,066 53,121 62,334 67,709 64,725 445,366 Interest 127,292 160,258 150,883 188,652 198,149 1,207,992 Dividends 16,575 4,016 3,985 2,279 5,633 75,845 Fiduciary Fees (9,552) (12,177) (14,190) (15,845) (17,417) (98,421)Disbursements (18,448) (41,784) (14,874) (193,119) (31,754) (601,831)Ending Balance 2,804,274 3,301,016 3,835,485 4,220,502 4,787,646 4,787,646

33
2005 SWA Annual Report
Phased Development Plan
State Funding (in millions of dollars)Resources Trust Fund .....................................................................................................$ 45.45Water Development Trust Fund .....................................................................................$ 7.30Subtotal ..........................................................................................................................$ 52.75
GrantsGarrison Diversion Conservancy DistrictMunicipal Rural & Industrial Fund ................................................................................$ 69.70USDA-Rural Development ............................................................................................$ 10.50Natural Resources Conservation Service PL566 ...........................................................$ 0.90Subtotal ..........................................................................................................................$ 81.10
State Bonds Repaid by UsersPublic Revenue Bonds ...................................................................................................$ 7.00USDA-Rural Development ............................................................................................$ 8.80ND Drinking Water Revolving Loan Fund ....................................................................$ 1.50Subtotal ..........................................................................................................................$ 17.30
Total Funding ..............................................................................................................$151.15
Southwest Pipeline Project Funding Sources
Current Development Phase: Medora, Beach, Morton Phase ...............West
Next Development Phase: Oliver, Mercer, North Dunn Phase ....... North
2005 SWA Annual Report
34
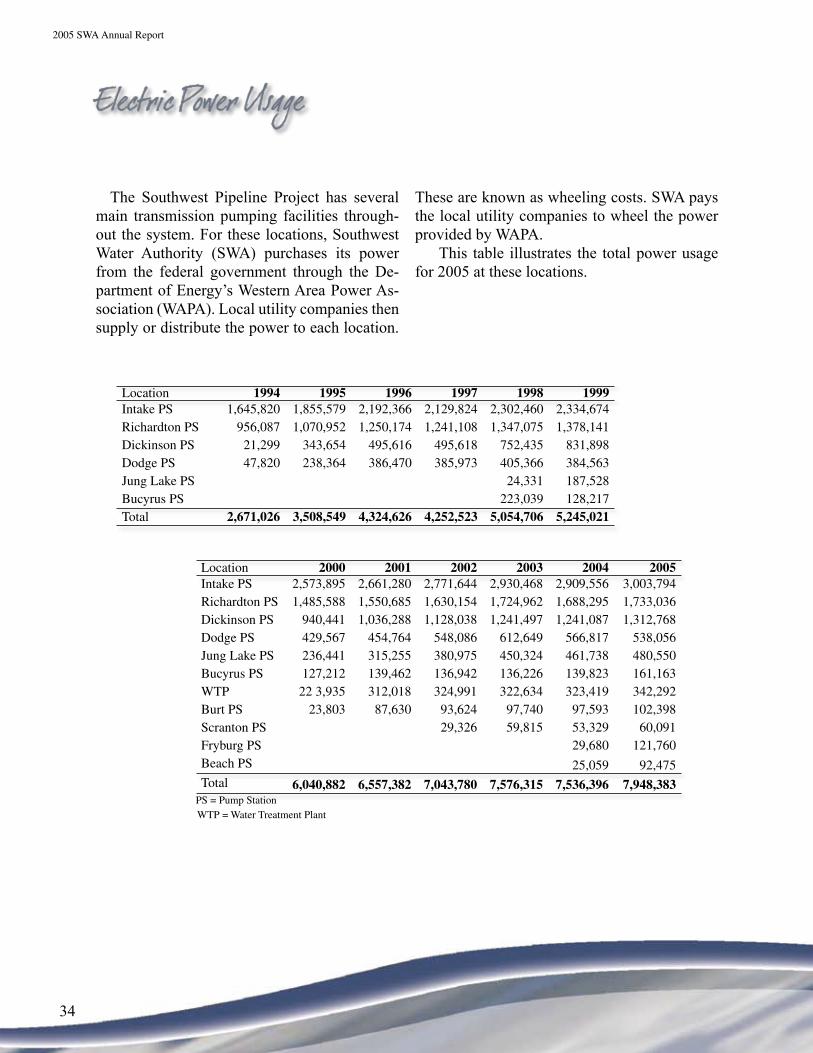
The Southwest Pipeline Project has several main transmission pumping facilities through-out the system. For these locations, Southwest Water Authority (SWA) purchases its power from the federal government through the De-partment of Energy’s Western Area Power As-sociation (WAPA). Local utility companies then supply or distribute the power to each location.
Electric Power Usage
Location 2000 2001 2002 2003 2004 2005Intake PS 2,573,895 2,661,280 2,771,644 2,930,468 2,909,556 3,003,794Richardton PS 1,485,588 1,550,685 1,630,154 1,724,962 1,688,295 1,733,036Dickinson PS 940,441 1,036,288 1,128,038 1,241,497 1,241,087 1,312,768Dodge PS 429,567 454,764 548,086 612,649 566,817 538,056Jung Lake PS 236,441 315,255 380,975 450,324 461,738 480,550Bucyrus PS 127,212 139,462 136,942 136,226 139,823 161,163WTP 22 3,935 312,018 324,991 322,634 323,419 342,292Burt PS 23,803 87,630 93,624 97,740 97,593 102,398Scranton PS 29,326 59,815 53,329 60,091Fryburg PS 29,680 121,760Beach PS 25,059 92,475Total 6,040,882 6,557,382 7,043,780 7,576,315 7,536,396 7,948,383
PS = Pump StationWTP = Water Treatment Plant
Location 1994 1995 1996 1997 1998 1999Intake PS 1,645,820 1,855,579 2,192,366 2,129,824 2,302,460 2,334,674Richardton PS 956,087 1,070,952 1,250,174 1,241,108 1,347,075 1,378,141Dickinson PS 21,299 343,654 495,616 495,618 752,435 831,898Dodge PS 47,820 238,364 386,470 385,973 405,366 384,563Jung Lake PS 24,331 187,528Bucyrus PS 223,039 128,217Total 2,671,026 3,508,549 4,324,626 4,252,523 5,054,706 5,245,021
These are known as wheeling costs. SWA pays the local utility companies to wheel the power provided by WAPA.
This table illustrates the total power usage for �005 at these locations.

35
2005 SWA Annual Report
Southw
est Pi
peline
Projec
t Con
struct
ion M
ap

2005 SWA Annual Report
36
Southw
est Pi
peline
Projec
t Tim
eline 19
7119
7219
7319
7419
7519
7619
7719
7819
7919
8019
8119
8219
8319
8419
8519
8619
8719
8819
8919
9019
9119
9219
9319
9419
9519
9619
9719
9819
9920
0020
0120
0220
0320
0420
05To
tal
PR
OJE
CT
S
Wes
t Riv
er D
iver
sion
SW A
rea
Wat
er S
uppl
y
Sout
hwes
t Pip
elin
e Pr
ojec
t
OR
GA
NIZ
AT
ION
S
Wes
t Riv
er W
ater
Sup
ply
Dis
tric
t
Wes
t Riv
er J
oint
Boa
rd
Sout
hwes
t Wat
er A
utho
rity
(N
onpr
ofit)
Sout
hwes
t Wat
er A
utho
rity
(Po
litic
al S
ubdi
visi
on)
FU
ND
ING
(In
Mill
ions
)
Stat
e R
esou
rces
Tru
st F
und
——
—
—
—
—
—23
.6—
—
—
——
—
—0.
040.
060.
680.
771.
461.
771.
180.
71.
344.
210.
830.
333.
062.
383.
0545
.45
Gar
riso
n D
iver
sion
MR
&I
7.38
8.33
6.67
2.65
5.32
6.87
5.3
10.1
7.77
5.41
0.18
2.47
1.24
69.7
Nat
ural
Res
ourc
es C
onse
rvat
ion
Serv
ice
0.13
0.41
0.39
0.9
Rev
enue
Bon
ds3.
963.
087
USD
A -
Rur
al D
evel
opm
ent (
Loa
ns)
3.5
0.02
1.38
0.5
0.23
1.63
1.54
8.8
USD
A -
Rur
al D
evel
opm
ent (
Gra
nts)
1.04
1.54
1.59
2.48
0.92
1.04
0.56
1.3
10.5
Dri
nkin
g W
ater
Sta
te R
evol
ving
Loa
n Fu
nd1
0.5
1.5
1.5
Wat
er D
evel
opm
ent T
rust
Fun
d
1.45
5.17
0.26
0.45
7.3
TO
TAL
23.6
7.38
8.33
6.67
2.65
5.36
6.93
5.98
119.
647.
575.
3210
.79
4.14
8.18
5.76
6.65
5.99
4.93
4.35
151.
15
SWPP
Au
thor
ized
SWPP
Fin
al
Des
ign
Auth
oriz
ed
SWPP
Fin
al
Con
stru
ctio
n Au
thor
ized
Firs
t R
ural
W
ater
Se
rvic
e (R
osha
u)
Serv
ice
Beyo
nd
Dic
kins
on Full
Scal
e R
ural
Se
rvic
e
USD
A-R
ural
D
ev. F
unds
an
d R
ev.
Bond
s
Stat
e Fu
ndin
g Bo
wm
an-
Scra
nton
Pha
se
Stat
e Fu
ndin
g M
edor
a-Be
ach
Phas
eC
onst
ruct
ion
Begi
ns
Gar
rison
MR
&I
Fund
ing
Rur
al W
ater
In
tegr
atio
n
Serv
ice
to
Dic
kins
on
Loca
tion
of W
ater
Tr
eatm
ent P
lant
Tran
sfer
of
Ope
ratio
ns
to S
WA
Gar
rison
M
R&I
Fu
ndin
g
SB 2
188
Pass
ed
Stat
e &
USD
A Fu
ndin
g M
edor
a-Be
ach
Phas
e II

37
2005 SWA Annual Report

2005 SWA Annual Report
38