2005 medical malpractice claims annual report...companies writing medical malpractice insurance in...
TRANSCRIPT

2010 Medical Malpractice
Claims Report
Department of Commerce & Insurance
November 1, 2010

Table of Contents
2010 Tennessee Medical Malpractice Report INTRODUCTION…………………………………………………………………………… 2 I. REPORTING ENTITIES………………………………………………………………… 3 II. REPORTING PERIOD…………………………………………………………………… 3 III. CLAIMS CLOSED AND PENDING …………………………………………………. 3-4
A. Claims Closed 3-4 B. Claims Pending 4
IV. DAMAGES AND COSTS……………………………………………………………… 5-9
A. Damages Asserted by Claimants 5 B. Damages Paid to Claimants 5-6 C. Judgments 7 D. Fees Paid to Claimants’ Counsel 8 E. Total Defense Costs and Expenses Paid on Claims 8-9
V. CLAIM CHARACTERISTICS OF CLAIMS CLOSED IN 2009…………………….... 10-19
A. Reason for Medical Malpractice Claim 10-12 B. Age and Sex of Claimant 12 C. Severity of Injury 13-14 D. Geographic Location 14-15 E. Providers 15-17 F. Facilities 18-19
VI. 2009 DIRECT PREMIUM WRITTEN……………………………………………………. 19 VII. NEXT STEPS……………………………………………………………………………… 20

INTRODUCTION
In 2004, the Tennessee General Assembly enacted 2004 Tenn. Pub. Acts ch. 902 which established medical professional liability claims reporting obligations for various reporting entities. This law was codified at Tenn. Code Ann. § 56-54-101. Pursuant to Tenn. Code Ann. § 56-54-101(a), “reporting entities” was defined to include insurance companies and risk retention groups that provide medical malpractice or professional liability insurance, as well as health care professionals and facilities lacking medical malpractice insurance. This law was passed after months of testimony and research by the Joint Tort Reform Subcommittee chaired by State Representative Rob Briley and Senator David Fowler. The Final Report prepared by the Subcommittee recommended passage of legislation that would “provide the committee with a clearer picture of the litigation and claim trends in Tennessee…” The Department of Commerce and Insurance (the “Department”) provided testimony to the Subcommittee and actively participated in the development of legislation implementing the Subcommittee’s recommendations.
In general, Tenn. Code Ann. § 56-54-101 required reporting entities, on or before April 1 of each year, to provide information to the Department concerning the number of medical malpractice or professional liability claims asserted, the amount of damages alleged, any damages paid, the types of paid damages, and legal fees paid. The reporting requirements, as originally enacted, focused on the claims that were closed and pending during each calendar year.
Tenn. Code Ann. § 56-54-101 required the Department to prepare an annual report for the Speakers of the Senate and House of Representatives summarizing this data each year. The statute prescribed that the report may only contain aggregate data.
As a result of the information submitted by the reporting entities for the 2004 calendar year, the
Department issued its first report in November of 2005. The report identified several issues relating additional information that should be reported and the General Assembly modified the reporting requirements in the 2006 legislative session. On May 23, 2006 Tenn. Pub. Acts ch. 744 was enacted which amended Tenn. Code Ann. § 56-54-101 to attempt to refine the information to be collected. In general, the amendment added a requirement that reporting entities report on the cumulative amount of costs and expenses spent on pending and closed claims from the “inception date of the claim to the end of the preceding calendar year.”
In 2008, the Tennessee General Assembly enacted 2008 Tenn. Pub. Acts ch. 1009, effective January 1,
2009, which replaced Tennessee Code Annotated Title 56 (Insurance) Chapter 54 (Reports on Medical or Professional Malpractice Claims) with the Tennessee Medical Malpractice Reporting Act. It sets out largely the same reporting requirements, makes the reporting entities’ reports due March 1 of each year, and adds, among other things, information to be collected in a manner consistent with the National Practitioner Data Bank. It defines a claim as, “A demand for monetary damages for injury or death caused by medical malpractice; or a voluntary indemnity payment for injury or death caused by medical malpractice.”
Where useful, this report provides not only the aggregate information for 2009, but also shows the information reported for 2005, 2006, 2007 and 2008 as a convenience to the reader.
2

I. REPORTING ENTITIES
The information provided by this report is primarily comprised of information obtained from insurance companies writing medical malpractice insurance in this state. It is important to note that the top ten (10) medical malpractice insurance carriers account for over eighty-six percent (86%) of the total medical malpractice direct premiums written in Tennessee in 2009. To date, the Department has identified one (1) insurance company that failed to comply with the statute’s reporting obligations. The 2009 malpractice premiums for the one (1) company whose claim data is not included in this report totaled $1,188,000 or four tenths of one percent (.40%) of the total direct written premiums for medical malpractice insurance in this state. In addition to requiring insurance companies to report the information enumerated in Tenn. Code Ann. § 56-54-105, those health care facilities and professionals that are uninsured are required to report information about their medical malpractice claim experience. Only four (4) health care professionals that are uninsured reported in 2009. As identified in the previous reports, the Department remains unable to confirm that the information from this group is complete as it has no information concerning which facilities or professionals are, in fact, uninsured. Thus, while the Department has received information from health care facilities and professionals and has included that information in this report, it cannot be determined whether the Department has received information from all of them. As such, there may be claims and costs incurred in this state that are not included in this report.1
II. REPORTING PERIOD
The period on which this report focuses is the 2009 calendar year. The Department required reporting entities to complete two (2) separate forms to meet their obligations under 2008 Tenn. Pub. Acts ch. 1009. One reporting form solicited information regarding all medical malpractice claims closed or otherwise resolved in 2009. The second form solicited information concerning medical malpractice claims that were still considered pending as of December 31, 2009.2 Claims identified in the information submitted related to incidents occurring between 1978 and 2009. However, only 197 of the 7,876 claims reported (2.43%) arose out of an incident that occurred prior to 2000.3
III. CLAIMS CLOSED AND CLAIMS PENDING
A. Claims Closed
The total number of medical malpractice claims reported as closed in 2009 was 2,846 (two thousand eight-hundred and forty-six). This total represents claims resolved through the entry of a final court judgment, settlement with the claimant, by alternative dispute resolution (ADR) mediation, and ADR by arbitration, private trial and other common dispute resolution methods, dismissed without action, or otherwise resolved by the reporting entity.
1The Department received claims information from compliant health care facilities and uninsured health care professionals. Until the Department is given an ability to identify the uninsured health care facilities and professionals, as well as compel risk retention groups to report their information, the Department will remain unable to confirm the completeness of the information contained in these reports. Still, it is estimated that the total number of claims for this category is relatively minor compared to those that were insured during the reporting period. 2 The Department made the forms available to reporting entities on its web site for ease of access. 3 Two (2) of the reported claims arise from events occurring in the 1970’s, five (5) of the claims occurred in the 1980’s, and one hundred ninety-seven (197) of the claims occurred in the 1990’s.
3

The following table demonstrates the comparative number of claims reported as closed in each of the five (5) categories:
Table 1 – Claims Closed through Settlement, Adjudication, Alternative Dispute Resolution (ADR) or Other
Resolution
2005 Totals
2005 %
2006 Totals
2006 %
2007 Totals
2007 %
2008 Totals
2008 %
2009 Totals
2009 %
Claims Resolved Through
Judgment4
5
0.18
6
0.20
313
10.28
425
13.48
177
6.22
Claims Resolved Through
Settlement
461
16.31
453
15.24
492
16.17
459
14.55
504
17.71
Claims Resolved Through
ADR5
N/A
N/A
N/A
N/A
N/A
N/A
43
1.36
281
9.87
Claims Otherwise Resolved
2,361
83.52
2,514
84.56
2,238
73.55
2,227
70.61
1,884
66.20
Total Number of
Claims Closed
2,827
100.00
2,973
100.00
3,043
100.00
3,154
100.00
2,846
100.00
Table 2 – Paid and Unpaid Claims Closed in 2009
Totals Percentages Paid Closed Claims 543 19.00 Unpaid Closed Claims 2,303 81.00 Total Closed Claims 2,846 100.00
B. Claims Pending
Pending claims are claims filed in 2009 or in prior years which were still unresolved as of December 31, 2009. It was reported that there were 5,030 claims pending as of December 31, 2009.
4 This figure includes judgments for the defendant. The corresponding number in the reports for previous years did not include judgments for the defendant. Note also that beginning in 2007, these numbers do not include claims which went to trial and ended in judgments, but where the parties later resolved the matter and payment was handled through settlements. 5 This figure includes two claims which went to trial and yielded a judgment for the plaintiff, later the defendants appealed the verdict. The claim eventually settled through an alternative dispute resolution this year, for an amount different than what had been awarded at trial.
4

IV. DAMAGES AND COSTS
A. Damages Asserted by Claimants Claimants asserted a total of $6,041,301,6526 (six billion, forty-one million, three hundred and one
thousand, six hundred and fifty-two dollars) in damages for medical malpractice related injuries for the claims reported as having been closed in the 2009 reporting year. In the 2009 reporting year, claimants were paid damages totaling $110,716,509 (one hundred and ten million, seven hundred and sixteen thousand, five hundred and nine dollars) by way of judgments, traditional settlements, and alternative dispute resolution methods. That total in damages paid during 2009 represents 1.83% of the damages that were asserted.
Claimants who had their claims disposed of in 2009 (closed without further payment to be made) were
paid a total of $139,494,210 (one hundred and thirty-nine million, four hundred and ninety-four thousand, two hundred and ten dollars) from the inception of their claims through December 31, 2009, or 2.3% of the damages that were asserted in those claims.
There were 5,030 (five thousand and thirty) claims filed but still pending (without final resolution) as of
December 31, 2009. The damages asserted by those claimants total $16,951,930,381 (sixteen billion, nine hundred and fifty-one million, nine hundred and thirty thousand, three hundred and eighty-one dollars). Of those asserted damages, $17,961,347 (seventeen million, nine hundred and sixty-one thousand, three hundred and forty-seven dollars) have been paid to date.
B. Damages Paid to Claimants The first table on the following page demonstrates the reported damages paid, broken down by payments made as a result of adjudication, settlement, or alternative dispute resolution.
6 This number includes all claims reported as closed during the 2009 reporting year regardless of when the claim was opened or lawsuit filed and whether or not any payments were made in 2009. Therefore this number includes damages that were asserted in years prior to 2009.
5
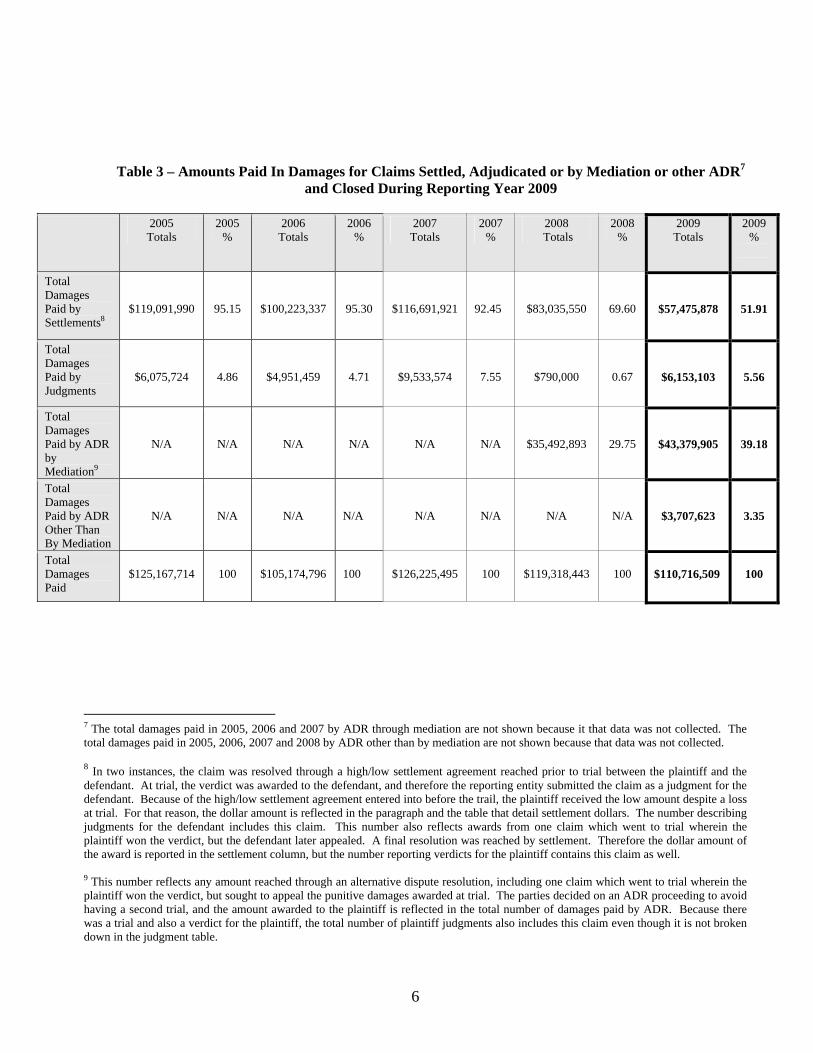
Table 3 – Amounts Paid In Damages for Claims Settled, Adjudicated or by Mediation or other ADR7 and Closed During Reporting Year 2009
2005
Totals 2005
% 2006
Totals 2006
% 2007
Totals 2007
% 2008
Totals 2008
% 2009
Totals 2009
%
Total Damages Paid by Settlements8
$119,091,990
95.15
$100,223,337
95.30
$116,691,921
92.45
$83,035,550
69.60
$57,475,878
51.91
Total Damages Paid by Judgments
$6,075,724
4.86
$4,951,459
4.71
$9,533,574
7.55
$790,000
0.67
$6,153,103
5.56
Total Damages Paid by ADR by Mediation9
N/A
N/A
N/A
N/A
N/A
N/A
$35,492,893
29.75
$43,379,905
39.18
Total Damages Paid by ADR Other Than By Mediation
N/A
N/A
N/A
N/A
N/A
N/A
N/A
N/A
$3,707,623
3.35
Total Damages Paid
$125,167,714
100
$105,174,796
100
$126,225,495
100
$119,318,443
100
$110,716,509
100
7 The total damages paid in 2005, 2006 and 2007 by ADR through mediation are not shown because it that data was not collected. The total damages paid in 2005, 2006, 2007 and 2008 by ADR other than by mediation are not shown because that data was not collected. 8 In two instances, the claim was resolved through a high/low settlement agreement reached prior to trial between the plaintiff and the defendant. At trial, the verdict was awarded to the defendant, and therefore the reporting entity submitted the claim as a judgment for the defendant. Because of the high/low settlement agreement entered into before the trail, the plaintiff received the low amount despite a loss at trial. For that reason, the dollar amount is reflected in the paragraph and the table that detail settlement dollars. The number describing judgments for the defendant includes this claim. This number also reflects awards from one claim which went to trial wherein the plaintiff won the verdict, but the defendant later appealed. A final resolution was reached by settlement. Therefore the dollar amount of the award is reported in the settlement column, but the number reporting verdicts for the plaintiff contains this claim as well. 9 This number reflects any amount reached through an alternative dispute resolution, including one claim which went to trial wherein the plaintiff won the verdict, but sought to appeal the punitive damages awarded at trial. The parties decided on an ADR proceeding to avoid having a second trial, and the amount awarded to the plaintiff is reflected in the total number of damages paid by ADR. Because there was a trial and also a verdict for the plaintiff, the total number of plaintiff judgments also includes this claim even though it is not broken down in the judgment table.
6

C. Judgments In all, it was reported that there were one hundred and seventy-seven (177) court judgments in 2009. It
was reported that one hundred and sixty-five (165) of these judgments resulted in favorable rulings for the defendant where no damages were awarded to the claimant. Twice a judgment was entered for the defendant, but payments were made to the claimant in accordance with settlements entered into prior to trial.10 Ten (10) judgments were entered in favor of the plaintiff. The following table details those and the types of damages awarded in each case:
Table 4 – Total Damages Awarded By Final Court Judgment Paid in 2009.11
Judgment Amount
Date of
Occurrence
Damages Claimed
Type of
Provider/Specialty/Facility
Economic Damages
Non-
Economic Damages
Severity of
Injury
$21,243
07/05/2005
$275,000
Dentist/ General Practice/
Dentist Office
$6,368
$14,875
Minor Temporary
Injury
$37,500
11/06/2002
$7,500,000 Medical Doctor/ Orthodontics
and Dentofacial/ Operating Room
$37,500
$0
Major Temporary
Injury
$37,500
11/06/2002
$7,500,000
Unreported
$37,500
$0 Major
Temporary Injury
$90,930
11/06/2002
$7,500,000
Medical Doctor/ Orthodontics and Dentofacial/ Operating
Room
$90,930
$0
Major Temporary
Injury
$90,930
11/06/2002
$7,500,000
Unreported
$90,930
$0 Major
Temporary Injury
$295,000
09/22/2008
$0
Assisted Care Living Facility
$0
$295,000
Major Temporary
Injury
$1,000,000
12/17/1997
$15,000,000
Obstetrics/ Hospital/ Labor
and Delivery Room
$1,000,000
$0
Grave Permanent
Injury
$1,000,000
11/15/2001
$7,000,000
Medical Doctor/ Radiology
$652,953
$347,047
Grave Permanent
Injury
$1,780,000
11/15/2001
$7,000,000
Medical Doctor/ Radiology
$652,953
$1.127,047
Grave Permanent
Injury
$1,800,000
10/30/2004
$5,000,000
Medical Doctor
$513,242
$1,286,758 Grave
Permanent Injury
10 See Footnote 8. 11 Some of the judgments in this table represent separate judgments entered in favor of plaintiffs against multiple defendants of the same medical incident. Judgments 2 – 5 as well as judgments 8 and 9 of this table are awards which were made to one plaintiff who sued multiple providers for injuries arising out of the same injury. These claims were reported as having identical docket numbers.
7

D. Fees Paid to Claimants’ Counsel
Tenn. Code Ann. § 56-54-105 requires counsel for claimants asserting medical malpractice claims to report their fee arrangements. The attorneys reported having received fees in the amount of $47,191,183 (forty seven million, one hundred and ninety-one thousand, one hundred and eighty-three dollars) in 2009. This includes referral fees received. The fees that claimants’ attorneys reported receiving in 2009 are approximately forty-three percent (43%) of the total amount reported to have been paid in damages to the claimants. The following table details the monies paid to claimants’ counsel:
Table 5 – Total Fees Paid to Claimants’ Counsel on Claims in 200912
Fees Paid to
Claimants’ Counsel for Closed Claims
Average Amount of Fees Paid to
Claimants’ Counsel for Settlements
Average Amount of Fees Paid to
Claimants’ Counsel for Judgments
Average Amount of Fees Paid to
Claimants’ Counsel for Mediations
Average Amount of Fees Paid to
Claimants’ Counsel for Other ADRs
2007 $34,925,167 29.77% 14.23% N/A13 N/A 2008 $38,802,022 23.09% 26.50% 25.19% N/A 2009 $47,919,183 35.37% 3.75% 41.03% 3.84%
Of the reported claims, the majority of attorneys reported contingency agreements of thirty-three percent
(33%) or less of the total damages. However, the range for fee agreements was from zero percent (0%) to sixty-seven percent (67%).
E. Total Defense Costs and Expenses Paid on Claims The total defense costs reported to have been paid during 2009 was $84,724,702 (eighty-four million,
seven hundred and twenty-four thousand, seven hundred and two dollars). The total amount reported to have been paid to defense counsel in 2009 was $68,646,01714. The following table details the defense costs paid in 2009 on closed and pending claims:
12 The numbers used for this table are completely derived from numbers reported by claimants’ counsel. Despite efforts by the Department to encourage the reporting by claimants’ counsel, not all such attorneys filed reports with the Department. According to the insurance reporting entities, approximately 349 lawyers represented claimants that received money in 2009. Only 274 attorneys reported receiving fees in 2009. 13 Data was not collected during those years and is therefore not available. 14 For purposes of comparison, the total defense fees reported as being paid in 2005, 2006, 2007, and 2008 was $61.7 million, $67 million, $78.6 million and $73.5 million, respectively.
8

Table 6 – Total Amounts Paid in Defense Costs in 2009
Fees Paid to Defense Counsel
Expert Witness Fees
Court Costs
Deposition Costs
Other Legal Fees
Pending Claims $51,653,868 $5,401,807 $78,787 $1,169,502 $3,593,731 Closed Claims $17,841,822 $2,129,609 $73,295 $363,819 $2,418,462 Total
$69,495,690
$7,531,416
$152,082
$1,533,321
$6,012,193
Table 7 – Total Amounts Paid in Defense Costs During the 2009 Reporting Year
Broken Down by Paid and Unpaid Claims
# of Claims
Fees Paid to Defense Counsel
Expert Witness Fees
Court Costs
Deposition Costs
Other Legal Fees
Paid Claims
543
$9,588,785
$1,384,407
$48,267
$230,080
$1,563,083
Unpaid Claims
2303
$8,263,501
$745,203
$24,778
$133,739
$855,380
Total
2846
$17,852,286
$2,129,610
$73,045
$363,819
$2,418,463
The total defense costs paid on closed and pending claims as of December 31, 2009, since the inception of such claims, was $222,539,301 (two hundred and twenty-two million, five hundred and thirty-nine thousand, three hundred and one dollars). The following table details these defense costs:
Table 8 – Total Amounts Paid in Defense Costs on Claims from Inception through End of 2009 Reporting Year
Fees Paid to
Defense Counsel Expert Witness
Fees Court Costs Deposition Costs Other Legal
Fees Pending Claims $123,027,841 $11,746,603 $197,325 $2,632,841 $8,085,099 Closed Claims $63,633,612 $6,417,547 $148,505 $1,453,281 $5,196,647 Total
$186,661,453
$18,164,150
$345,830
$4,086,122
$13,281,746
9

V. CLAIM CHARACTERISTICS OF CLAIMS CLOSED IN 200915
2008 Tenn. Pub. Acts ch. 1009, effective January 1, 2009, sets out additional and more claim-specific
reporting requirements, including details on: the injured person’s sex and age on the incident date, the severity of the injury, the reason for medical malpractice claim, and the geographic location where the incident occurred. More specific information about the health care facilities and health care providers against whom the claims were made was also required. The tables and charts that follow provide descriptions of such information as reported regarding claims closed in 2009.16
A. Reason for Medical Malpractice Claim
Tenn. Code Ann. § 56-54-106(12) requires insuring entities, self-insurers, facilities and providers to report the reason for the medical malpractice claim using the same allegation group and specific allegation codes that are used for mandatory reporting to the National Practitioner Data Bank. The following tables and charts show the top ten types of medical malpractice and the top ten types of injury which led to payments to claimants during the reporting year 2009 and the amount paid to such claimants from the inception of the claim.
Table 9 – Top Ten Types of Medical Malpractice During Reporting Year 2009 Ranked by Frequency17
Type of Medical Malpractice
Number of Claims
Amount Paid Since Inception of Claim
Monitoring Related 116 $17,865,752 Surgery Related 115 $26,093,488
Treatment Related 81 $11,557,652 Diagnosis Related 75 $18,902,610
Medication Related 40 $12,395,186 Obstetrics Related 30 $7,451,533
IV and Blood Products Related 17 $4,232,979 Anesthesia Related 10 $8,365,100
Behavioral Health Related 7 $1,404,500 Equipment/Product Related 5 $351,066
Totals 531 $108,619,866
15 The report is formatted to collect data from the insurers of the providers and facilities in a medical malpractice claim. For that reason, several companion claims in the reported data will together represent a single malpractice related injury for a single claimant, but are reported as several claims filed against multiple providers. It is important to remember this when considering claims characteristics, these tables do not reflect the number of injuries, but the number of providers accused of causing that particular type of injury. 16 The data included here about the age, severity of injury, and geographic location is specific to the claimant and therefore does not include data on companion claims to the extent that they can be identified. The data included here about the facilities, providers and the reasons for the medical malpractice claims is derived from all of the claim reports including those about companion claims. 17 Tables 9 and 10 represent the top ten classifications of types medical malpractice in paid, closed claims during 2009. Forty-five (45) claims were classified by reporting entities as “other/ miscellaneous”.
10

Table 10 -- Top Ten Types of Medical Malpractice During Reporting Year 2009 Ranked by Amount in Damages Paid to Claimant
Table 11 -- Top Ten Causes of Injury During Reporting Year 2009
Ranked by Frequency18
Type of Medical Malpractice
Amount Paid Since Inception of Claim
Number of Claims
Surgery Related $26,093,488 115 Diagnosis Related $18,902,610 75
Monitoring Related $17,865,752 116 Medication Related $12,395,186 40 Treatment Related $11,557,652 81 Anesthesia Related $8,365,100 10 Obstetrics Related $7,451,533 30
IV and Blood Products Related $4,232,979 17 Behavioral Health Related $1,404,500 7 Equipment/Product Related $351,066 5
Totals $108,619,866 531
Cause of Injury
Number of Claims
Amount Paid Since Inception of Claim
Failure to Monitor 73 $13,829,892 Failure to Diagnose 34 $7,498,591
Improper Performance 31 $2,731,483 Failure to Ensure Patient Safety 29 $3,132,822
Improper Management 19 $3,927,917 Failure to Treat 18 $7,647,658
Surgical or Other Foreign Body Retained 18 $1,119,000 Delay in Treatment 15 $5,686,510 Improper Technique 15 $3,122,522 Delay in Diagnosis 13 $2,530,500
Total 265 $51,226,895
18 Tables 11 and 12 represent the top ten classifications of causes of injury in paid, closed claims during 2009. One hundred and seventeen (117) claims were classified by reporting entities as “cannot be determined from available records” or “allegation – not otherwise classified”.
11

Table 12 -- Top Ten Causes of Injury During Reporting Year 2009
Ranked by Amount in Damages Paid to Claimant
Cause of Injury
Amount Paid Since Inception of Claim
Number of Claims
Failure to Monitor $13,829,892 73 Failure to Treat $7,647,658 18
Failure to Diagnose $7,498,591 34 Delay in Treatment $5,686,510 15
Improper Management $3,927,917 19 Failure to Ensure Patient Safety $3,132,822 29
Improper Technique $3,122,522 15 Improper Performance $2,731,483 31
Delay in Diagnosis $2,530,500 13 Surgical or Other Foreign Body Retained $1,119,000 18
Total $51,226,895 265
B. Age and Sex of Claimant
Tenn. Code Ann. § 56-54-106 requires insuring entities, self-insurers, facilities and providers to report the injured person’s age on the date of the medical incident. The following table shows the number of claims which were closed in 2009 in each claimant age group19:
Table 13 – Number of Claims Closed in 2009 Broken Down by Age of Claimant20
Age Range
Number of Claimants
0-13 years 170 14-20 years 64 21-35 years 265 36-49 years 388 50-64 years 514 65+ years 528
Based on the data submitted for claims reported to have been closed in 2009; one thousand two hundred and eleven (1,211) incidents of alleged medical malpractice involved females and seven hundred and ninety-seven (797) involved males. Four (4) times, reporting entities submitted that the claimant’s sex was unknown.
19 This table represents all claims closed in 2009, whether paid or unpaid. 20 Eighty-three (83) claimants’ ages were reported as “unknown” or left blank.
12

C. Severity of Injury Tenn. Code Ann. § 56-54-106 requires insuring entities, self-insurers, facilities and providers to report
the severity of the malpractice injury using the National Practitioner Data Bank severity scale. The classifications available to demonstrate severity of injury include: emotional injury only, insignificant injury, minor temporary injury, major temporary injury, minor permanent injury, significant permanent injury, major permanent injury, grave permanent injury, and death. The following table breaks down those levels of severity by the number of claims closed and how many of those claims were paid versus unpaid at each level of severity21.
Table 14 – Severity of Injury in Claims Closed During Reporting Year 2009
Table 15 – Severity of Injury in Claims Closed and Amounts Paid in
Damages During Reporting Year 200922
Severity of Injury
Number of
Claims
Number of Claims Paid During 2009
Number of Claims Not
Paid Emotional Only 115 18 97
Insignificant 56 13 43 Minor Temporary 367 80 287 Major Temporary 335 74 261 Minor Permanent 87 22 65
Significant Permanent 144 29 115 Major Permanent 100 27 73 Grave Permanent 104 20 84
Death 537 140 397
Severity of Injury
Amount Paid in Damages in 2009
Emotional Only $391,082 Insignificant $780,732
Minor Temporary $5,024,369 Major Temporary $11,205,714 Minor Permanent $3,105,846
Significant Permanent $10,001,714 Major Permanent $14,329,357 Grave Permanent $22,681,999
Death $41,904,667
21 The table referenced in this paragraph does not include companion claims, where those can be identified. The table detailing severity of injury is specific to the claimant, and therefore the numbers represented are based on the number of injured claimants and not the number of providers that injuries were alleged against. 22 Claimants were paid a total of $1,291,029 in 2009 and $1,396,029 for claims in which the severity of the injury was either unknown or where it could not be determined by available records.
13

Table 16 – Severity of Injury in Claims Closed Ranked by Amounts Paid in
Damages from Inception of Claim through Reporting Year 2009
Severity of Injury
Amount Paid in Damages For
Life of the Claim Emotional Only $435,082
Insignificant $828,315 Minor Temporary $5,570,780 Major Temporary $15,529,572 Minor Permanent $3,308,255
Significant Permanent $14,179,785 Major Permanent $17,730,495 Grave Permanent $28,006,999
Death $52,508,898
D. Geographic Location Tenn. Code Ann. § 56-54-106 requires insuring entities, self-insurers, facilities and providers to report the geographic location, by city and county, where the medical malpractice incident occurred. Only eighty-three (83) counties were reported to have been the geographic location of an incident giving rise to a claim closed in 2009. Of the 2816 claims reported with a Tennessee geographic location the total payment reported to have been made during reporting year 2009 is $110,101,509 (one hundred and ten million, one hundred and one thousand, five hundred and nine dollars).
The following table shows statistics for the ten (10) counties with the highest incidence of medical malpractice. These percentages are based on the total number of medical malpractice incidents reported to have occurred in Tennessee counties.
Table 17 – Top Ten Counties Ranked by Number of Claims During Reporting Year 200923
County Name
Number of
Claims
Percentages of Total Claims
Amounts Paid to
Claimants Shelby 846 30.04 $30,315,356
Davidson 387 13.74 $24,483,718 Knox 239 8.49 $9,461,343
Hamilton 221 7.85 $4,394,155 Sullivan 103 3.66 $2,142,360
Washington 101 3.59 $8,396,011 Madison 89 3.16 $2,231,000
Williamson 54 1.92 $1,868,666 Rutherford 53 1.88 $414,500
Maury 44 1.56 $2,015,000 23 Tables 17 and 18 include data reported on companion claims.
14
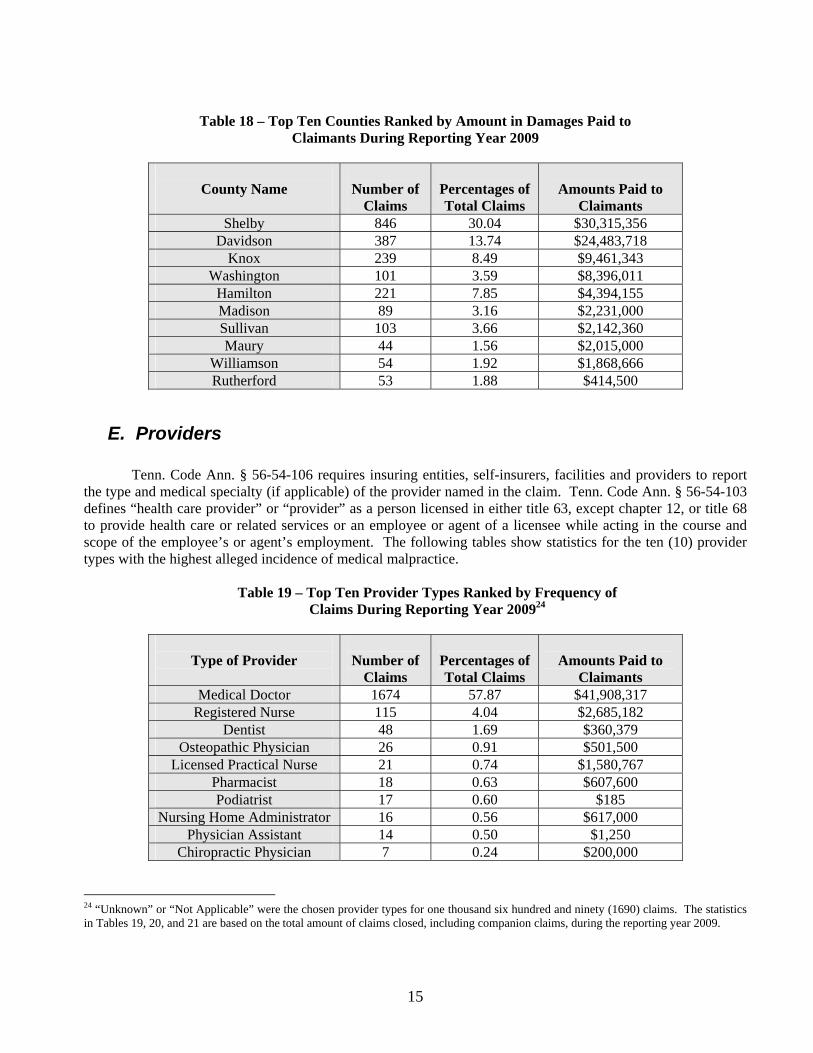
Table 18 – Top Ten Counties Ranked by Amount in Damages Paid to
Claimants During Reporting Year 2009
County Name
Number of
Claims
Percentages of Total Claims
Amounts Paid to
Claimants Shelby 846 30.04 $30,315,356
Davidson 387 13.74 $24,483,718 Knox 239 8.49 $9,461,343
Washington 101 3.59 $8,396,011 Hamilton 221 7.85 $4,394,155 Madison 89 3.16 $2,231,000 Sullivan 103 3.66 $2,142,360 Maury 44 1.56 $2,015,000
Williamson 54 1.92 $1,868,666 Rutherford 53 1.88 $414,500
E. Providers
Tenn. Code Ann. § 56-54-106 requires insuring entities, self-insurers, facilities and providers to report the type and medical specialty (if applicable) of the provider named in the claim. Tenn. Code Ann. § 56-54-103 defines “health care provider” or “provider” as a person licensed in either title 63, except chapter 12, or title 68 to provide health care or related services or an employee or agent of a licensee while acting in the course and scope of the employee’s or agent’s employment. The following tables show statistics for the ten (10) provider types with the highest alleged incidence of medical malpractice.
Table 19 – Top Ten Provider Types Ranked by Frequency of
Claims During Reporting Year 200924
Type of Provider
Number of
Claims
Percentages of Total Claims
Amounts Paid to
Claimants Medical Doctor 1674 57.87 $41,908,317
Registered Nurse 115 4.04 $2,685,182 Dentist 48 1.69 $360,379
Osteopathic Physician 26 0.91 $501,500 Licensed Practical Nurse 21 0.74 $1,580,767
Pharmacist 18 0.63 $607,600 Podiatrist 17 0.60 $185
Nursing Home Administrator 16 0.56 $617,000 Physician Assistant 14 0.50 $1,250
Chiropractic Physician 7 0.24 $200,000
24 “Unknown” or “Not Applicable” were the chosen provider types for one thousand six hundred and ninety (1690) claims. The statistics in Tables 19, 20, and 21 are based on the total amount of claims closed, including companion claims, during the reporting year 2009.
15

Table 20 – Top Ten Provider Types Ranked by Amounts in Damages Paid to Claimants During Reporting Year 2009
Type of Provider
Amounts Paid to
Claimants
Number of
Claims
Percentages of Total Claims
Medical Doctor $41,908,317 1674 57.87 Registered Nurse $2,685,182 115 4.04
Licensed Practical Nurse $1,580,767 21 0.74 Nursing Home Administrator $617,000 16 0.56
Pharmacist $607,600 18 0.63 Osteopathic Physician $501,500 26 0.91
Dentist $360,379 48 1.69 Chiropractic Physician $200,000 7 0.24
Physician Assistant $1,250 14 0.50 Podiatrist $185 17 0.60
Table 21 – Top Ten Provider Types Ranked by Damages Paid to Claimants from Inception of Claim Through Reporting Year 2009
Type of Provider
Amounts Paid to
Claimants
Number of
Claims
Percentages of Total Claims
Medical Doctors $59,524,316 1674 57.87 Registered Nurse $2,935,182 115 4.04
Nursing Home Administrator $1,679,500 16 0.56 Licensed Practical Nurse $1,580,767 21 0.74
Pharmacist $634,275 18 0.63 Osteopathic Physician $501,500 26 0.91
Dentist $360,379 48 1.69 Physician Assistant $279,375 14 0.50
Chiropractic Physician $200,000 7 0.24 Podiatrist $75,184 17 0.60
16

The following tables show statistics for the ten (10) provider specialty types with the highest alleged incidence of medical malpractice.
Table 22 – Top Ten Provider Specialty Types Ranked by Frequency of
Claims During Reporting Year 200925
Type of Specialty
Number of
Claims
Percentages of Total Claims
Amounts Paid to
Claimants Internal Medicine 158 5.56 $2,258,014
Radiology 126 4.43 $2,422,935 Emergency Medicine 118 4.15 $3,604,499
Obstetrics and Gynecology 117 4.11 $3,651,000 Family Practice 111 3.90 $1,620,389 General Surgery 95 3.34 $2,385,000
Orthodontics and Dentofacial 79 2.78 $600,771 Cardiovascular Diseases 54 1.90 $383,000
Anesthesiology 48 1.69 $2,027,250 General Practice 48 1.69 $1,162,010
Pediatrics 48 1.69 $1,251,500
Table 23 – Top Ten Provider Specialty Types Ranked by Amounts in Damages Paid to Claimants During Reporting Year 2009
Type of Specialty
Amounts Paid to
Claimants
Number of
Claims
Percentages of Total Claims
Obstetrics and Gynecology $3,651,000 117 4.11 Emergency Medicine $3,604,499 118 4.15
Radiology $2,422,935 126 4.43 General Surgery $2,385,000 95 3.34
Internal Medicine $2,258,014 158 5.56 Anesthesiology $2,027,250 48 1.69 Family Practice $1,620,389 111 3.90
Pediatrics $1,251,500 48 1.69 General Practice $1,162,010 48 1.69
Orthodontics and Dentofacial $600,771 79 2.78 Cardiovascular Diseases $383,000 54 1.90
25 “Unknown”, “Unspecified”, or “Not Applicable” were the chosen provider specialty types for two thousand five hundred and forty-six (2546) claims. The statistics in Tables 22, 23, and 24 are based on the total amount of claims closed, including companion claims, during the reporting year 2009.
17
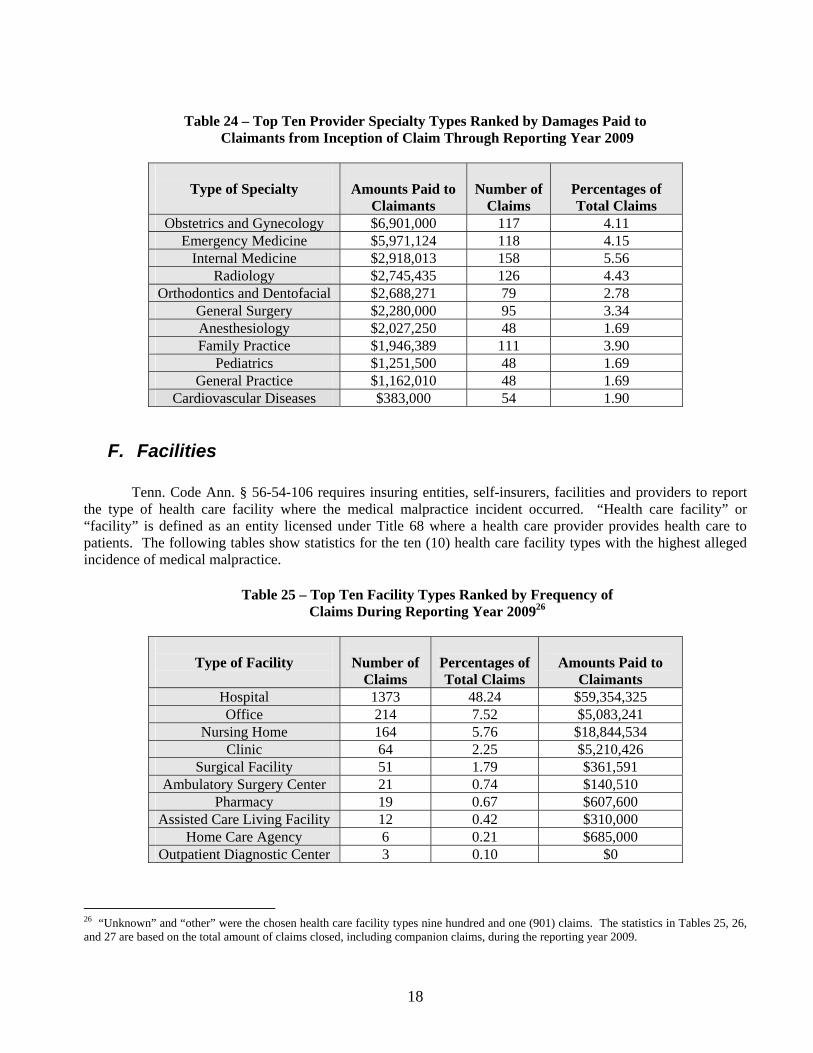
Table 24 – Top Ten Provider Specialty Types Ranked by Damages Paid to
Claimants from Inception of Claim Through Reporting Year 2009
Type of Specialty
Amounts Paid to
Claimants
Number of
Claims
Percentages of Total Claims
Obstetrics and Gynecology $6,901,000 117 4.11 Emergency Medicine $5,971,124 118 4.15
Internal Medicine $2,918,013 158 5.56 Radiology $2,745,435 126 4.43
Orthodontics and Dentofacial $2,688,271 79 2.78 General Surgery $2,280,000 95 3.34 Anesthesiology $2,027,250 48 1.69 Family Practice $1,946,389 111 3.90
Pediatrics $1,251,500 48 1.69 General Practice $1,162,010 48 1.69
Cardiovascular Diseases $383,000 54 1.90
F. Facilities
Tenn. Code Ann. § 56-54-106 requires insuring entities, self-insurers, facilities and providers to report the type of health care facility where the medical malpractice incident occurred. “Health care facility” or “facility” is defined as an entity licensed under Title 68 where a health care provider provides health care to patients. The following tables show statistics for the ten (10) health care facility types with the highest alleged incidence of medical malpractice.
Table 25 – Top Ten Facility Types Ranked by Frequency of Claims During Reporting Year 200926
Type of Facility
Number of
Claims
Percentages of Total Claims
Amounts Paid to
Claimants Hospital 1373 48.24 $59,354,325 Office 214 7.52 $5,083,241
Nursing Home 164 5.76 $18,844,534 Clinic 64 2.25 $5,210,426
Surgical Facility 51 1.79 $361,591 Ambulatory Surgery Center 21 0.74 $140,510
Pharmacy 19 0.67 $607,600 Assisted Care Living Facility 12 0.42 $310,000
Home Care Agency 6 0.21 $685,000 Outpatient Diagnostic Center 3 0.10 $0
26 “Unknown” and “other” were the chosen health care facility types nine hundred and one (901) claims. The statistics in Tables 25, 26, and 27 are based on the total amount of claims closed, including companion claims, during the reporting year 2009.
18

Table 26 – Top Ten Facility Types Ranked by Amounts in Damages Paid to Claimants During Reporting Year 2009
Type of Facility
Amounts Paid to
Claimants
Number of
Claims
Percentages of Total Claims
Hospital $59,354,325 1373 48.24 Nursing Home $18,844,534 164 5.76
Clinic $5,210,426 64 2.25 Office $5,083,241 214 7.52
Home Care Agency $685,000 6 0.21 Pharmacy $607,600 19 0.67
Surgical Facility $361,591 51 1.79 Assisted Care Living Facility $310,000 12 0.42 Ambulatory Surgery Center $140,510 21 0.74
Outpatient Diagnostic Center $0 3 0.10
Table 27 – Top Ten Facility Types Ranked by Damages Paid to Claimants from Inception of Claim Through Reporting Year 2009
Type of Facility
Amounts Paid to
Claimants
Number of
Claims
Percentages of Total Claims
Hospital $72,913,090 1373 48.24 Nursing Home $22,881,208 164 5.76
Office $7,328,240 214 7.52 Clinic $6,780,426 64 2.25
Home Care Agency $1,400,000 6 0.21 Surgical Facility $671,263 51 1.79
Assisted Care Living Facility $660,000 12 0.42 Pharmacy $607,600 19 0.67
Ambulatory Surgery Center $205,510 21 0.74 Outpatient Diagnostic Center $0 3 0.10
VI. 2009 DIRECT PREMIUM WRITTEN The total direct medical malpractice premium written in 2009 in Tennessee by insurance companies and risk retention groups was $254,131,000 (two hundred and fifty-four million, one hundred and thirty-one thousand dollars). This total was determined from their 2009 annual financial statements. This premium was for policies that may produce claim payments of unknown amounts in the future. Claim payments made during 2009 usually relate to policies and the corresponding premium from previous years.
19

VII. NEXT STEPS
The Department will work with the insurance industry and the other reporting entities as it relates to their 2011 reporting obligations.
20