2005-2010 transportation improvement program
TRANSCRIPT

2005-2010
Transportation
Improvement
Program
2005-2010
Transportation
Improvement
Program
2005-2010
Transportation
Improvement
Program
2005-2010
Transportation
Improvement
Program
2005-2010
Transportation
Improvement
Program
2005-2010
Transportation
Improvement
Program
2005-2010
Transportation
Improvement
Program
2005-2010
Transportation
Improvement
Program

This page intentionally left blank

2005-2010 TRANSPORTATION IMPROVEMENT PROGRAM
Adopted March 17, 2004
Denver Regional Council of Governments 4500 Cherry Creek Drive South, Suite 800
Denver, Colorado 80246
Preparation of this report has been financed in part through grants from the U.S. Department of Transportation, Federal Transit Administration
and Federal Highway Administration

ii

iii
ABSTRACT
TITLE: 2005-2010 Transportation Improvement Program
AUTHOR: Denver Regional Council of Governments SUBJECT: Six-year multimodal transportation program DATE: Adopted March 17, 2004 SOURCE OF COPIES: Public Information and Communications DRCOG 4500 Cherry Creek Drive South Suite 800 Denver, Colorado 80246 (303) 455-1000 NUMBER OF PAGES: 190 ABSTRACT: The Transportation Improvement Program
identifies all federally-funded transportation projects anticipated for funding in the Denver metropolitan area during fiscal years 2005-2010. This multimodal program includes highway, high-occupancy vehicle, transit, travel demand management and nonmotorized facilities and services.

iv

v
TABLE OF CONTENTS
I. INTRODUCTION .................................................................................................. 1
Regional Needs................................................................................................ 1 Federal Requirements ..................................................................................... 8 Investment Decision Process ....................................................................... 10
II. REGIONAL PRIORITIES ................................................................................... 17
Metro Vision ................................................................................................... 17 Metro Vision Implementation Criteria - TIP Input ........................................ 18 Metro Vision Implementation - TIP Outcome............................................... 20 Major Transportation Issues - TIP Response .............................................. 20
III. FINANCIAL PROGRAMMING ........................................................................... 25 IV. THE 2005-2010 PROGRAM............................................................................... 53
Project Descriptions...................................................................................... 53 Regionally Significant Projects Included in the 2005-2010 TIP ................. 54 Regionally Significant Projects Not Supported by Federal Funds............ 54
APPENDIX A LOOKUP LIST OF PROJECTS .................................................... 167 APPENDIX B STP ENHANCEMENT POOL........................................................ 181 APPENDIX C WAITING LIST .............................................................................. 185

vi
LIST OF TABLES Table 1 Transportation Improvement Program Project List .............................. 5 Table 2 2005-2010 Transportation Improvement Program Project Funding
Summary ................................................................................................ 27 Table 3 Estimated 2005-2010 Revenues for DRCOG TIP Region .................... 49 Table 4 Major 2003-2008 Transportation Improvement Program Projects
Obligated or Delayed............................................................................. 50 Table 5 Rollover Projects ................................................................................... 51
LIST OF EXHIBITS Exhibit 1 Metro Vision Implementation Criteria .................................................. 19 Exhibit 2 Project Descriptions.............................................................................. 57
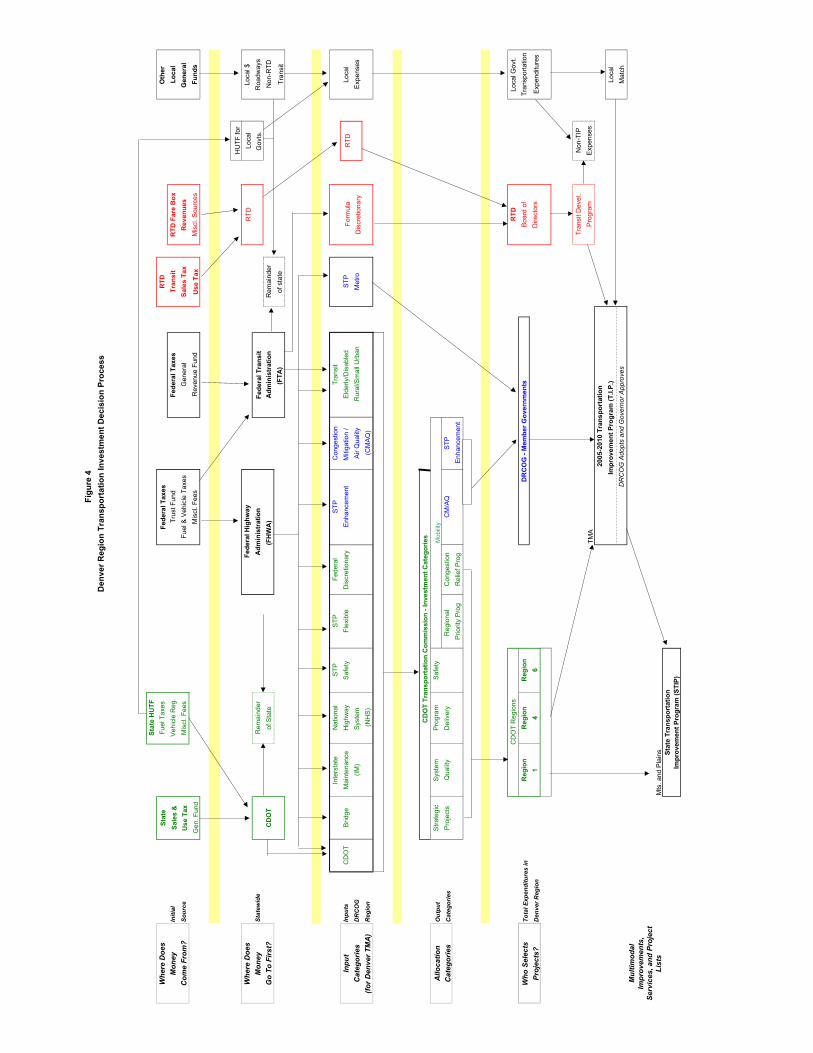
LIST OF FIGURES Figure 1 Geographic Area of the TIP..................................................................... 2 Figure 2 Draft 2005-2010 Transportation Improvement Program Project Locations ..................................................................... 3 Figure 3 DRCOG Plan Relationships to Transportation Improvement Program............................................................................. 9 Figure 4 Denver Area Transportation Investment Decision Process............... 11 Figure 5 Funding for a Balanced, Multimodal Transportation System ............ 21

1
I. INTRODUCTION This Transportation Improvement Program (TIP) identifies federally funded surface transportation projects to be implemented in the Denver region from fiscal years 2005 through 2010. Transportation projects support Metro Vision 2020 (Metro Vision), the regional vision to address future growth, by providing a regional multimodal transportation system that provides mobility and accessibility for people and goods. TIP projects help to (1) maintain the system; (2) improve safety; (3) reduce congestion; and (4) enhance the transportation system. At the same time, TIP projects support the other elements of Metro Vision. All projects included in this TIP are consistent with the currently adopted long-range Regional Transportation Plan (RTP). The Denver Regional Council of Governments (DRCOG), the region’s Metropolitan Planning Organization (MPO), is responsible for the preparation of the TIP in cooperation with local governments, the Colorado Department of Transportation (CDOT) and the Regional Transportation District (RTD). The geographic area covered by the TIP includes all or portions of Adams, Arapahoe, Boulder, Broomfield, Denver, Jefferson and Douglas Counties as shown on the shaded portions of Figure 1. Project selection is a cooperative process with submittals from local governments, CDOT and RTD. A further description of how TIP projects are selected is presented later, in the Investment Decision Process section. Regional policy1 provides a basis for the evaluation and ranking of DRCOG projects. The 2005-2010 TIP was approved by the DRCOG Board of Directors on March 17, 2004. Each TIP project is described in Exhibit 2, in Section IV of this TIP document. The projects are organized chronologically by TIP number from the lowest TIP number to the highest TIP number. There are several other ways to find a TIP project in this document: • Geographically-specific projects are shown by location on a regional map (Figure 2). • All projects except those in the STP-Enhancement pool are listed in alphabetical order
in Table 1 and by funding source in Table 2. • Appendix B lists the projects in the STP-Enhancement pool. • Appendix A lists projects by county, municipality and project type. Regional Needs Metro Vision is the Denver region’s plan for addressing future growth in the metropolitan area. Adopted by the DRCOG Board of Directors in 1997 and amended several times since, it outlines six core elements to provide guidance for the development pattern of the region, the necessary transportation system, and actions needed to improve air quality. The six elements are: (1) planning the extent of development in the region; (2) preserving open space; (3) maintaining freestanding communities; (4) providing a
1 Policy on Transportation Improvement Program Preparation, Adopted August 20, 2003 by the Denver Regional Council of Governments Board of Directors and amended on January 21, 2004.


��������
��������
��������
��������
��������
��������
������
��������
��������
��������
��������
�������
�������
����������������
��������
��������
��������
��������
��������
��������
��������
��������
��������
�������
�������
��������
��������
��������
���������������
��������
��������
����������������
��������
�������
����������������
��������
��������
��������
����������������
��������
��������
��������
��������
��������
�������
�������
��������
��������
��������
��������
�������
�������
�������
�������
�������
��������
�������
��������
��������
��������
��������
�������
��������
��������
��������
��������
��������
��������
���������������
��������
��������
��������
�������� ��������
��������
�������
�������
��������������
�������
��������
��������
�0 2 4 6 81
Miles
March 19, 2004
Figure 22005-2010 TIP Project Map
Municipal Areas
PROJECT TYPE:
Air Quality Improvement
Capacity Access-WideningNew Bus Service
New Interchange
New Roadway
Operational Improvement-Highway
Rapid Transit
Reconstruct/Rehabilitation-Highway
Safety
Studies
Transit Passenger Facilities
Bicycle and PedestrianBridge

4

Table 1: Transportation Improvement Program
Project ListTIP-ID Facility Name & Limit Page #
2005-2010
2003-037 3rd Ave Entryway Bike Trail: Martin Street to Ken Pratt Blvd. 1092003-015 28th Street Pedestrian Crossings: Three Points from Pearl to Iris Ave. 1042005-004 30th Street Bikelanes: Arapahoe to Pearl 1282005-003 72nd Avenue: Ward Road Operational Improvements 1272005-010 95th/96th Street Transit Service: Longmont to Flatiron Crossing 1342003-039 120th Avenue: Holly St. to Quebec St. Widening 1112001-217 Acquisition for DUS 931997-033 Arapahoe (SH-7): Cherryvale Road to N 75th Street 632003-011 Arapahoe (SH-7): Foothills Parkway (SH157) Operational Improvements 1012005-002 Arapahoe County: Replace Sanding Spreader Control Units 1262001-168 Arapahoe Rd./Clinton St./Boston St. intersection 862001-162 Arapahoe Road/University Boulevard Operational Improvements 852001-158 Arapahoe Road: Colorado Blvd. to Holly Street Reconstruction 842003-092 Arvada call-n-Ride Transit Service 1202005-036 Big Clean Trucks: Acquisition of Leasing Program CNG Trucks 1572005-007 Boulder Transit Real-time Solutions 1312003-013 Broadway Bike Lane: Iris to Norwood 1022003-027 Broadway: 16th Avenue to 20th Avenue Reconstruction 1082005-008 Broadway: Pine Street to Iris Avenue 1322005-015 Buckley Rd: 136th Avenue to Bromley Lane 1391999-055 CASTA Adams County, Purchase Vehicles 751999-115 CASTA Senior Resources, Purchase Vehicles 811999-054 CASTA Special Transit, Purchase Vehicles 742005-016 Castle Rock: Street Sweeping Service Expansion 1402005-034 Clean Yellow Fleets for Blue Skies 1552003-111 C-Line Light Rail Operating Service 1232005-022 CMAQ Reserves 1462005-029 Colfax Avenue: Simms Street Operational Improvements 1502003-066 Colfax Avenue: Simms Street Signal Improvement 1152003-018 Conformity Finding Mitigation Program 1052003-099 Denver Traffic Signal Upgrades 1222003-002 Dry Creek Road Pedestrian Bridge at I-25 982005-035 E85 Hangtag Program 1562001-195 Elk Creek and Clear Creek Bridge 902003-093 Englewood Shuttle Bus Service 1212003-041 Federal Blvd.: 80th Ave. Operational Improvements 1122003-043 Federal Blvd.: Lakewood Gulch (FasTrack) 1132003-025 Federal Boulevard/Speer Boulevard Intersection 1072001-169 Federal Boulevard: Alameda Avenue to 6th Avenue 872001-156 I- 25: 120th Avenue (Bridge / Sidewalks) 832005-020 I- 25: Lincoln Avenue Station Pedestrian Overpass 1442005-027 I- 25: Orchard Road Station Pedestrian Overpass 1492003-067 I- 70: Colfax Avenue Signal Improvement 116
5

Table 1: Transportation Improvement Program
Project ListTIP-ID Facility Name & Limit Page #
2005-2010
1999-008 I- 70: SH-58 Interchange 681999-006 I-225: 6th Ave. to Parker Road 671999-009 I-25: Broadway Bridge 692005-039 IMC Consolidated Service Center: Natural Gas Fueling Station 1602003-065 Kipling Street: US-6 North Service Road Signal Improvement 1142005-038 Metro North Transportation Management Organization 1592003-007 Mississippi Avenue/Havana Street Operational Improvements 1002003-014 Operational Improvements on US-36, SH-7 and SH-93 for Transit 1032005-044 Parker Rd./Arapahoe Rd. New Interchange 1652001-182 Parker Rd./Arapahoe Rd. New Interchange 882005-037 Pearl Street: 30th Boulder Village Transit Center 1581997-084 Preventive Maintenance: Transit Vehicle Overhaul and Maintenance 662003-001 Quebec Street: Iliff Ave. to 0.1 mile S. of Iowa Ave. Widening 972003-023 Quincy Avenue Bikeway 1062001-228 R1 TIP Area Signing Pool 952003-087 Region 1 PM10 Service Expansion Mechanical Street Sweepers (2) 1192001-198 Region 1 TIP Area Safety Pool 911995-178a Region 6 Bridge Scoping Activities 591999-060b Region 6 Courtesy Patrol 772001-225 Region 6 Hot Spot 941999-060a Region 6 Intelligent Transportation System (ITS) Pool 761999-065 Region 6 Intersection Reconstruction 791999-064 Region 6 Roadway Reconstruction 782001-214 Region 6 Surface Treatment Project - Various 922005-026 Regional Intelligent Transportation System Pool 1481997-045 Regional Traffic Signal System Improvement Program 651999-097 Regional Transportation Demand Management Program 801997-044 RideArrangers Program: Denver Transportation Management Area 641999-052 RTD Fixed Guideway Improvements, Upgrades and Maintenance 721995-178j SH- 2 (Colorado Blvd): 0.8 mi N/o I-70 602005-033 SH- 42/96th Street Corridor Study 1542005-011 SH-119: 63rd Street Operational Improvements 1352003-038 SH-119: Longmont to Boulder Transit Service 1102005-041 Sheridan Boulevard: 104th Avenue Operational Improvements 1622005-018 Smart Sign Air Quality Program 1421999-027a Southeast Corridor: I-25 from Broadway to Lincoln Avenue and I-225 (LRT) 701999-027b Southeast Corridor: I-25/Broadway to Lincoln Ave; I-225 from I-25 to Parker Rd. 712005-023 STP Enhancement Pool: 05-10 TIP 1472005-021 STP Metro Reserves 1451999-053 Transit Vehicles: Purchase Vehicles 732005-031 Union Boulevard: 4th to 6th Street Operational Improvements 1522001-261 US- 36 at Box Elder Creek in Watkins 961997-006 US- 36: At Cherryvale Road & 88th Street 61
6

Table 1: Transportation Improvement Program
Project ListTIP-ID Facility Name & Limit Page #
2005-2010
1997-009 US- 36: At North St. Vrain Creek 622001-154 US- 85: C-470 to Castle Rock (I-25) 822003-124 US-285: Foxton Road to Jefferson County Line Widening 1242003-068 US-285:Kipling Parkway Signal Improvement 1172005-032 US-287: Quebec to Ken Pratt Boulevard Reconstruction 1532005-043 Wadsworth Blvd: Ohio Avenue Operational Improvements 1642003-003 Wadsworth Bypass @ BNSFRR Grade Separation 992003-070 Wadsworth Parkway:120th Avenue Intersection Improvement 1182005-042 Wheat Ridge De-Icing Equipment 1632005-045 ZIP Shuttle System: Purchase Vehicles 1662001-185 ZIP Shuttle System: US 36 and 96th Street Bus Service 89
7

8
balanced, multimodal transportation system; (5) establishing urban centers; and (6) sustaining environmental quality. Transportation projects in the 2005-2010 TIP support the six Metro Vision core elements. TIP projects also address other transportation issues including congestion management, safety, and facility restoration and maintenance. Metro Vision’s transportation element is the preferred long-range regional transportation plan and identifies projects based on the views of local governments, RTD, CDOT and the public. The Metro Vision 2025 Interim Regional Transportation Plan, the Fiscally Constrained Element (2025 RTP), was adopted by the DRCOG Board of Directors in April 2002, and amended in August 2003. For inclusion in the RTP, projects must be identified in Metro Vision, and there must be a reasonable expectation that funds will be available for project implementation. The 2005-2010 TIP is the six-year implementation program. For projects to be included in the TIP, they must be identified in the 2025 RTP and fiscally constrained by regional revenues. Figure 3 graphically shows the relationship between the Metro Vision 2020 Plan, the RTP, and the TIP. A further discussion of how the TIP supports the 2025 RTP and Transportation Issues is presented in Section II. Federal Requirements Conformity Finding The 2005-2010 TIP project selection process ensures consistency with the air quality conformity requirements by limiting capacity project eligibility to the 2013 staging projects in the adopted 2025 RTP. The TIP’s project selection did not violate this specification. The technical report Conformity of the 2005-2010 Transportation Improvement Program with the State Implementation Plan for Air Quality (Conformity document) presents the conformity finding. Financial Constraint This TIP is prioritized and financially constrained. Projects promote the goals of the fiscally constrained RTP. A list of projects to be undertaken during the six TIP years from 2005 to 2010 is included in Table 2, presented in Section III. As discussed subsequently, the last three years of the TIP (2008-2010) are mostly unprogrammed. Table 2 is organized by project name within each funding source and includes the TIP project number, project name, and total federal, state and local project costs. Some projects with multiple funding sources are listed with each funding source. Projects funded by the STP-Enhancement pool are specifically identified in Appendix B. Table 3, presented in Section III, demonstrates that projects listed from 2005 to 2007 can be implemented using anticipated revenues; i.e., they are within the committed or reasonably expected federal funding levels.

9
Figure 3
DRCOG Plan Relationships to Transportation Improvement Program
Preferred Plan Metro Vision2020 Plan
Fiscally 2025 Interim RegionalConstrained Transportation
Plan Plan (2025 RTP)
6-Year Program of 2005-2010Funded Projects Transportation Improvement
Program (TIP)
Project Management The implementation status of projects in the 2003-2008 TIP is presented in Section III. Public Involvement Public involvement is a continuous process, which ensures that project selection considers the concerns of affected citizens. Public participation is generated at both local and regional levels. Citizen involvement begins when local agencies develop project lists for submittal to DRCOG for regional review. Local governments empower citizens in the selection of transportation projects through their public involvement process. In shaping public involvement programs, local governments often consider the size of their community, level of public awareness about transportation issues, and involvement of community based organizations. Setting realistic goals and ensuring accountability between local officials and community organizations promotes successful public involvement activities.

10
A public hearing was conducted on TIP project selection on February 18, 2004. Citizens had the opportunity to testify verbally and in writing and be heard by the DRCOG Board. No written or verbal comments were made at or as part of the hearing. Investment Decision Process Investment decisions for spending transportation funds on transportation projects are made by CDOT, RTD and local agencies through the MPO planning process. Figure 4 describes the process beginning with where the money comes from, identifying where the money first goes to, what categories the money is divided into, who allocates the funds, who submits the projects, and concluding with the TIP and its inclusion in the State Transportation Improvement Program (STIP). Decisions begin by identifying federal, state, and local revenue sources available in specific funding categories (Figure 4). Local and state agencies follow their own project selection procedures and federal guidelines in making investment decisions about projects to be included in the regional TIP. Revenues come from federal, state and local sources. The Federal Transportation Trust Fund and General Revenue Funds are appropriated by Congress and distributed to either the Federal Highway Administration (FHWA) or the Federal Transit Administration (FTA). FHWA allocates funding to CDOT in the Bridge, Interstate Maintenance, National Highway System, Surface Transportation Program (STP-Flexible, STP-Safety, and STP-Enhancement), and Congestion Mitigation/Air Quality funding categories. In turn, CDOT provides the STP-Enhancement and Congestion Mitigation/Air Quality (CMAQ) funds to DRCOG to distribute. FHWA allocates STP-Metro funds directly to DRCOG, based on population. FTA allocates a small portion of its funds to CDOT for transit service projects for elderly individuals and individuals with disabilities, and for transit projects in rural and small urban areas. The Colorado General Revenues flow to CDOT. Colorado Highway Users Tax Fund revenues flow to CDOT and local governments. The CDOT Transportation Commission combines state and federal revenue sources into five investment categories: Strategic Projects, System Quality, Safety, Program Delivery, and Mobility. CDOT regions submit selected projects to DRCOG for inclusion in the TIP in the following investment categories or program areas: Strategic Projects, Regional Priority Programs, Congestion Relief Program, Bridge, Safety, and Discretionary. Surface Treatment is listed in the TIP as a pool. Most FTA funds are allocated to the Regional Transportation District (RTD) through formula grants and discretionary new start, new bus and fixed guideway categories. Other sources of RTD funds are sales and use taxes, fare box collection, and miscellaneous revenues. The RTD Board of Directors, through the adoption of the annual six-year Transit Development Program, sets priorities for RTD capital improvements. RTD submits the selected projects to DRCOG for inclusion in the TIP. DRCOG selects projects through its MPO committee process for STP-Enhancement, STP-Metro and CMAQ federal funding categories. DRCOG also lists local government funded projects that require a federal approval in the TIP.
���������������� ����������� ��
������� ������
����������
�����
�����
�����
���������
������������
���
������
���
� � �
����� ��
��� �������
���������
������������
���� �
�����������
����
���
���
���
������
�� �����
�� ������
���������� �������
�������
���� ����
����� �
!�������
���������
�� ������
������������
� �����
�� ������� �
� ��
��������
�����
�����
�����������"�#
���
�� ��
�� ���
���
���
���
��
��!������
$��� �����
������������ �
�����
����"�#
����
���
����
%���
��������
&��'$(�
$��� �����
��!������
$��%���
&��$(�
�������
������
&��������
$�������
��'
��'
�������
��'
(��������
������
����
�����
(�)�
*�����
��������� �
����"�#
�����#
�����+��
�� ��������#
,���� �!���
�����������-�
,�����#-���+���
��'
���!
���
���
�� ��
����
��� ��
��
��
�.&�/
�#��!�
0���1�����#
�����-�!������+��
�����
�� ��������#
,�2���
!����
�"����
#$
��� �
.$��/
.(�01/
%�������� �������%�� ��)����� ��
����%������
#������ �
����
��
��������
�#��!
'�����!
�����#
����
��� ��
����
��� ��
'��3� �
1�����#
�������#
����������
(��������
(�-01
��'
'������#�'���
�������'���
,���� �!���
(�)��������
���
�� ��������
�����
���
���
����
��%&��� ����
��
����
����
����
��%�!�)�*��+���!��������
*�������
����2��������
'��
(����
��
�"����
�� �
,
-.
���� ���
,�2��������
�������������
$��%�&'
��0�
'�����!
,�2���
�� ��
��� �
��� �
����
�����
"��
���
)
���"
���)����'
��(�
��
* �
����������'���� ���������� ������
������������������&����(
������������������&�/�/�/(��
����������� ���������������
0112)01,1����� ������
�� ���-
��+����#

12
The Regional Transportation Committee recommended that the three agencies endeavor, to the extent possible, not to program the last three years of the TIP (2008-2010) to preserve flexibility for the next TIP (2007-2012) to address the new 2030 Regional Transportation Plan (expected to be adopted in late 2004). For the most part, all three agencies did so. DRCOG TIP Selection Process In selecting projects, DRCOG committees follow eligibility standards and ranking criteria included in the Policy on Transportation Improvement Program Preparation, adopted by the Board of Directors on August 20, 2003 (Preparation Policy) and amended January 21, 2004. The Preparation Policy document is available on the DRCOG Web site at www.drcog.org. In August 2003, DRCOG requested projects for the 2005-2010 TIP. Application forms were available through the DRCOG website, and DRCOG staff provided data and assistance to local governments. Project sponsors submitted applications to DRCOG in October 2003. Projects for which DRCOG has selection responsibility were reviewed for eligibility, scored, and ranked based on the Preparation Policy. Potential new funds were included in the list of available resources. The primary selection phase utilized scores and rankings to identify projects for the first 85 percent of the available funds (including resubmitted projects). The Preparation Policy established funding targets for the primary selection as derived from the 2025 RTP. This action provides for each aspect of the RTP to be implemented over the plan’s time period. A secondary selection phase, considering equity, cost saving, synergy, and readiness, was used to identify the remaining 15 percent. Reserve projects were created to hold reserves (mostly for 2008-2010) for future allocation. STP-Metro The available federal funding is estimated to be about $64.8 million for resubmitted and new projects in 2005-2007. This estimate includes about $63.9 million for the basic allocation for the three years and an additional $0.9 million as reallocated resources from fiscal year 2004. The STP-Metro program may fund projects from seven project types - roadway reconstruction, roadway operational improvements, roadway widening, new roadway, new interchange, interchange reconstruction, and studies. In the primary phase, four projects were selected (two reconstruction, two roadway operational improvements). The cost of resubmitted projects left no funds available in primary selection for roadway capacity projects (new roadway, widening, interchanges) or studies. In secondary selection, one new roadway project, one new interchange project (partial funding), four more roadway operational projects, and one study were selected.

13
Congestion Mitigation/Air Quality The available federal funding is estimated to be $49.0 million for resubmitted and new projects in 2005-2007. All of this is basic allocation for the three years. Through the adopted Preparation Policy, CMAQ funds are first allocated for the RideArrangers Program, three congestion management pools (Transportation Demand Management Program, Traffic Signal System Improvement Program, and a newly-established Intelligent Transportation System Pool), and one air quality improvement pool (Conformity Finding Mitigation Program), in addition to resubmitted projects. CMAQ is then used to fund projects in four project types--rapid transit (none submitted), new bus service, transit passenger facilities, and other air quality improvement projects. Funds available in the primary selection phase were sufficient to fund all 12 of the submitted projects in these project types. Because all of the submitted projects were selected in the primary phase, secondary selection focused on “other” CMAQ-eligible project types (bicycle/pedestrian and roadway operational improvements). In all, one resubmitted bicycle/pedestrian project was changed from STP-Enhancement to CMAQ, one primary selected bicycle/pedestrian project was changed from STP-Enhancement to CMAQ, and two new bicycle/pedestrian projects were selected to use the secondary CMAQ funds. STP-Enhancement The available federal funding is estimated to be $8.3 million for resubmitted and new projects in 2005-2007. This estimate includes $7.7 million for the basic allocation for the three years and an additional $0.6 million as reallocated resources from fiscal year 2004. Six enhancement projects were initially selected in the primary phase. As noted above, one of these was later changed to CMAQ, and six additional projects were selected in the secondary phase. This required programming approximately $0.7 million of fiscal year 2008 enhancement funds. As a “best practices” test, the enhancement program is shown in the TIP table (Table 2) as a pool except for resubmitted projects. New enhancement projects are separately listed in Appendix B. In Exhibit 2, the funding source for these projects is shown as the STP-Enhancement pool. Potential Additional Funds Additional STP-Metro, CMAQ, or STP-Enhancement funds may become available to DRCOG for programming in fiscal year 2005 and 2006, for example through project close-out or a new federal surface transportation act. In that event, projects currently identified in Table 1 and Appendix B will be advanced (funding moved forward), with the concurrence of the sponsor, to the extent practical. This will be done in order--first by year (TIP) of initial selection for resubmitted projects, and second by score for new 2005-2010 projects. There may be circumstances in which the additional funds exceed the ability of those projects to move forward. In those instances, “new” projects may be selected from among those on waiting lists. The waiting lists and the protocol for use are shown in Appendix C. None of the waiting list projects is for additional roadway capacity;

14
therefore, conformity would not be affected if any of them were added into the TIP in the future. Advancement of funding for current projects or addition of a new project from the waiting list would be done by means of administrative amendment. CDOT TIP Selection Process CDOT has primary responsibility for selecting projects that use federal National Highway System, Bridge, Interstate Maintenance, and Transit Small Urban and Transit Elderly/Disabled funds. CDOT also has primary responsibility for selecting projects to be funded through the Colorado Transportation Commission’s “Regional Priority Programs” and “Congestion Relief Program,” which include state funds and some of Colorado’s share of federal surface transportation funds. Because the amount of transportation funding available to the CDOT regions in the DRCOG area was sharply reduced, and because the regions adhered to the Regional Transportation Committee request not to program fiscal year 2008 to 2010 funds, essentially no new CDOT projects are shown in the 2005-2010 TIP. While CDOT did hold the county hearings per the Project Priority Programming Process, where initiation of new projects and resumption of deferred projects were requested, each region’s decision was fundamentally which 2003-2008 TIP projects to continue within the 2005-2010 TIP, and which ones to defer to later years. Projects selected for retention typically completed a project or a logical phase of a project. RTD TIP Selection Process The Regional Transportation District (RTD) has primary responsibility for selecting projects in the Transit Formula and Discretionary Grants (Fixed Guideway, New Bus and New Starts) federal funding categories. RTD ensures that all projects are in the Transit Development Program (TDP) and have fiscal support. The TDP is a six-year overview of the operating and capital improvement program for RTD. It is updated and published annually and is fiscally constrained. RTD includes projects in the TDP by considering current and future service needs and the capital improvements required to sustain those needs, and the revenue resources available. The TDP is developed with input from RTD departments and local governments. In the final stage of adoption, the TDP is approved by the RTD Board in an open meeting process. As with CDOT, RTD’s anticipated revenues decreased substantially; the 2003-2008 TDP totaled $397 million, but the 2004-2009 TDP (the basis for RTD’s submittals for the 2005-2010 TIP) totaled only $164 million. The majority of this decrease is in local (non-federal) revenues. The TIP reflects TDP projects pursued with federal funding. Historically, $100 million to $150 million of the projects in the TDP are eligible for federal funding, and RTD receives about $30 million in federal formula funding each year. To identify projects for inclusion in the TIP, RTD considers both TDP project priority and estimates of historical federal funding levels. RTD submits projects that further its future transportation goals. RTD does not submit for inclusion in the TIP other construction or operational projects which are funded

15
with locally derived revenues. As such, the reader is encouraged to contact RTD directly for a copy of its TDP in order to gain a complete picture of public transit expenditures. Interagency Coordination While the three agencies’ selection processes are independent, the three agencies took appropriate steps to ensure coordination: • RTD and DRCOG actively participated in CDOT’s county hearings. • RTD’s TDP development is a public process. • DRCOG’s Preparation Policy is reviewed by MPO committees (on which RTD and
CDOT serve) before adoption by the DRCOG Board. • The entire DRCOG selection process is transparent, with monthly briefings of MPO
committees on progress and tentative decisions. In addition, an interagency meeting was held to review and comment on each other’s preliminary project recommendations. Synergies and conflicts, between not only selected projects but also those not selected, were considered. Because of the limited amount of CDOT and RTD funds, and thus projects, no conflicts and only a few synergies were identified.

16

17
II. REGIONAL PRIORITIES Metro Vision Metro Vision 2020 is the Denver region’s plan for managing the challenges of growth by integrating plans for development, transportation and environmental quality. The following pages briefly define the Metro Vision core elements and demonstrate how the 2005-2010 TIP supports Metro Vision. The core elements of Metro Vision are (1) extent of urban development; (2) preserving open space; (3) maintaining freestanding communities; (4) providing a balanced, multimodal transportation system; (5) establishing urban centers; and (6) sustaining environmental quality. Extent of Urban Development The plan defines a 747-square-mile area within which urban growth will take place. Projects in the TIP usually are located within this “urban growth boundary/area” unless they connect the urban areas to each other or to other regions. Open Space Open space is a limited natural resource of great importance to the region. Metro Vision 2020 identifies several types of open space and parks and encourages the acquisition and protection of these areas. Transportation projects can support open space by design and provide access to active parks. Freestanding Communities Metro Vision 2020 sees benefits for the entire region by having certain communities grow but remain freestanding. The outlying communities of Boulder, Brighton, Castle Rock and Longmont are, by choice, geographically separated from the larger urbanized Denver area. A freestanding community is expected to have an internal transportation system. Such transportation improvements support the economy and vitality of these communities. Balanced, Multimodal Transportation System A multimodal transportation system includes roadways, bus and rail transit systems, transportation demand management services, on-street bicycle accommodations, sidewalks and multi-use trails. Urban Centers Urban centers serve as transit origins and destinations that support retail, employment and housing, and contain higher densities than average that encourage pedestrian-

18
oriented travel. The future development of urban centers can result in reduced land consumption, the preservation of open space, and increased opportunities for walking and bicycling trips. The Denver Central Business District is identified in the Metro Vision plan as the major urban center of the region. Environmental Quality Population and employment growth, land development, and transportation facilities are closely related and have significant effects on air and water quality in the Denver region. Metro Vision Implementation Criteria - TIP Input For DRCOG-selected projects, the adopted Preparation Policy awards up to 16 (of 100 total) points to projects/sponsors for sponsor actions implementing Metro Vision. A total of 16 criteria that implement the five non-transportation Metro Vision core elements are identified, each of which is worth two points, such that sponsors must have or be implementing at least eight of them to receive the maximum number of points. Exhibit 1 identifies the criteria. Of the 22 local governments that submitted TIP applications: • Three indicated they were implementing 12 of the criteria. • Seventeen indicated they were implementing eight to 11 of the criteria. • Two indicated they were implementing fewer than eight of the criteria. In addition, the Preparation Policy awards up to five points if the sponsor has met its PM10 conformity commitments (pertinent to the Environmental Quality core element). To promote a balanced, multimodal transportation system, the Preparation Policy established funding targets for primary selection (of DRCOG-selected projects) of: • 52 percent for roadway projects (operational, reconstruction, capacity) • 10 percent for transit capacity projects (new bus service, transit facilities) • 31 percent for congestion management and air quality improvements • 7 percent for bicycle, pedestrian, and other enhancement projects To further promote a balanced, multimodal system, the Preparation Policy: • Awards roadway projects up to five points for including transportation system
management elements in the project. • Awards roadway and rapid transit projects up to five or 10 points for including
multimodal connectivity elements in the project (including bicycle/pedestrian, transit, and management features).

20
Metro Vision Implementation - TIP Outcome Some relevant outcomes of the 2005-2010 TIP development process are: • Of the 32 new local government-sponsored projects selected by DRCOG, 26 are
located in counties/communities that have incorporated the Urban Growth Boundary/Area (UGB/A) into their comprehensive plan and are using the UGB/A in development decisions.
• Of those 32 projects, eight are located in and sponsored by freestanding communities, and one (sponsored by a county) serves a freestanding community. The new RTD-sponsored CMAQ project is located in a freestanding community as well.
• Ten new air quality improvement projects and one new water quality project were selected by DRCOG.
• Project funding allocated to the various transportation modes through the 2005-2010 TIP is shown in Figure 5. As discussed in Section I, all eligible air quality improvement projects submitted were selected by DRCOG and the funds remaining were directed to submitted transit and bicycle/pedestrian projects. Thus, transit and bicycle/pedestrian mode allocations exceed the Preparation Policy targets.
Major Transportation Issues - TIP Response Major transportation issues in the Denver region include: (1) congestion management; (2) safety; and (3) restoration and maintenance of existing facilities. This section discusses how the TIP projects and programs respond to these transportation issues. Managing Traffic Congestion Traffic congestion and delays faced by drivers, passengers, and freight carriers can be reduced in many ways. These include building new roadways, adding new lanes to the existing system of roadways, reconfiguring and improving roadways, adding HOV lanes, improving traffic signal synchronization, adding park-n-Ride improvements, light rail facilities and stations, intermodal projects, bus service, transportation demand management programs, bicycle trails and pedestrian facilities, and promoting alternative travel modes. The vast majority of projects within the TIP either directly address congestion or provide options or alternatives to travel in congested corridors. Notable projects of this nature include: • T-REX (Southeast Corridor) highway and light rail transit construction • I-25/Broadway and I-25/120th Avenue bridges • Denver Union Station and Boulder Village Transit Center • Arvada call-n-Ride, Englewood Shuttle bus, and SH-119 Diagonal transit service • Boulder Transit Real-time Solutions • Pedestrian overpasses to T-REX light rail at Orchard, Dry Creek, and Lincoln Stations • Regional Intelligent Transportation System (ITS) Pool, Region 6 ITS Pool, and
Traffic Signal System Improvement Program • Regional Transportation Demand Management Program and DRCOG
RideArrangers Program

19
Exhibit 1 Metro Vision Implementation Criteria
• Incorporating the Urban Growth Boundary/Area (UGB/A) map into the
comprehensive plan and using the UGB/A in development decisions • Signing the Mile High Compact • Protecting an amount of open space in the past two years equal to one percent of
the area of the jurisdiction or 160 acres of open space, whichever is less • Protecting open space within one of the DRCOG Open Space Preservation Focus
Areas within the past two years • Approving a development plan for a redevelopment project in the past two years
(Infill) • Approving a development plan for a redevelopment project in the past two years
within one mile of the proposed transportation project (Infill) • Allowing accessory dwelling units in Single Family Districts of the Zoning code (Infill) • Exceeding the regional average for multi-family percentage of building permits for
the past two years (Mix of land use) • Moving the ratio of employment to housing closer to the regional average since 1997
(Mix of land use) • Approving a development plan for a mixed-use project in the past two years within
one mile of the proposed transportation project (Mix of land use) • Adopting a Mixed-use district in the jurisdiction’s zoning code (Mix of land use) • Having completed a major streetscape project in the past two years (Neighborhood
Preservation) • Adopting architectural design guidelines (Regional Aesthetics) • Creating a stormwater utility (Water Quality) • Including the project as part of a corridor rehabilitation or design consistency effort

Figure 5Funding for a Balanced, Multimodal Transportation System
Total Funding = $976 Million
Notes: (1) Includes years 2005-2007 only (2008-2010 not currently fully programmed). Many projects include elements of other categories. For example, sidewalks and bike accomodations may be included on a roadway project. (2) Transit includes only project funds in the 2005-2010 TIP. The TIP does not include all RTD operations and capital expenditures.
Federal Funding + Match = $195 Million
2005-2010 TIP DRCOG Selected Surface Transportation Program Metro, Enhancement and CMAQ Expeditures (1)
(includes resubmitted projects)
Transit 17.7%
Roadway60.6%
TDM/Air Quality5.9% Bicycle/Pedestrian
15.9%
2005-2010 TIP Total Project Expenditures by Category (1)
Roadway39.5%
TDM/Air Quality1.2%
Transit (2)56.1%
Bicycle/Pedestrian3.2%

22
• 120th Avenue, Federal Boulevard, Quebec Street, US-85, and US-285 widening • SH-7 (Arapahoe Road) improvements • Wadsworth bypass grade separation at BNSF railroad • Parker/Arapahoe interchange • Region 6 Courtesy Patrol • Mississippi/Havana, Arapahoe/Foothills, Arapahoe/Boston/Clinton,
Arapahoe/University, Colfax/Simms, Federal/Speer, Federal/80th, SH-119 Diagonal/63rd, Sheridan/104th, Union/4th and 6th, and Wadsworth/Ohio intersection operational improvements
• Broadway bike lane, Cherry Creek/12th Avenue bike ramp, and SH-119 Diagonal bikeway connections
Improving Safety Reducing the likelihood or severity of traffic crashes is the goal of specific “safety” projects and safety elements of larger-scale projects. The majority of projects funded in this TIP will contain some elements to improve safety even if the project is not specifically identified as a Surface Transportation Program (STP) Safety project. Safety improvements include pedestrian elements such as sidewalks, medians, and crosswalks; rail crossing protection; adding turn lanes and acceleration and deceleration lanes; reconstructing interchanges; and constructing roadway overpass and pedestrian bridges. Selection of STP Safety projects is a separate process from the DRCOG TIP selection process. CDOT is the lead transportation agency that selects safety projects. As the selection process is conducted, STP Safety projects will be added to the 2005-2010 TIP. Hazard Elimination Projects that address at-grade rail and highway safety concerns will also be added to the TIP when selected. The 2005-2010 TIP does show resubmitted STP Safety projects carried over from the 2003-2008 TIP. For DRCOG-selected projects, safety is explicitly considered in evaluating the following project types, per TIP Policy: roadway reconstruction, roadway operation, roadway widening, and bicycle/pedestrian. There are a number of non-STP Safety TIP projects that should provide significant safety benefits. TIP projects that received at least half of the possible safety points in the TIP project evaluation process (original process for resubmitted projects or 2005-2010 process for new projects) are listed below: Roadway Operational Projects • Wadsworth/Ohio • Arapahoe/University • Arapahoe/Boston/Clinton • Mississippi Avenue/Havana Street • US-36: Baseline to Jay Road, SH-7: SH-157 to 63rd Street, and SH-93 at Table
Mesa Drive

23
Roadway Widening Projects • Federal: Alameda to 6th Avenue • Wadsworth Bypass at BNSF Railroad grade separation Roadway Reconstruction Projects • Broadway: Pine to Iris Bicycle/Pedestrian Projects • SH-119 Diagonal Bikeway connections • Colorado Avenue bike lanes and sidewalk • 30th Street bike lanes • Wadsworth/Weir Gulch grade separation • I-25/Lincoln Station overpass • Elmers Path grade separation • SH-170 bike lanes • 28th Street pedestrian crossings: Pearl Street to Iris Avenue • Broadway bike lane: Iris to Norwood • I-25/Dry Creek Station overpass • 3rd Avenue Entryway bike trail: Martin Street to Ken Pratt Boulevard Restoring and Maintaining Existing Transportation Systems Restoring and maintaining the existing roadway system is done through resurfacing, roadway reconstruction, and bridge replacement and maintenance. Roadway widening or operational projects often also reconstruct/rehabilitate existing infrastructure. Replacement of older RTD buses is also critical to maintaining efficient transit service. Sample TIP projects restoring and maintaining the existing transportation system follow: • T-REX (Southeast Corridor) • I-25/Broadway and I-25/120th Avenue bridges • Elk Creek/Clear Creek, Federal/Lakewood Gulch, Colorado north of I-70, and US-
36/Box Elder Creek bridges • Region 6 intersection reconstruction, roadway reconstruction, and surface treatment • Federal Boulevard, Quebec Street, US-85, and US-285 widening • RTD preventive vehicle maintenance, and fixed guideway maintenance • Arapahoe Road, Broadway/16th to 20th, Broadway/Pine to Iris, and US-287
reconstruction projects

24

25
III. FINANCIAL PROGRAMMING The financial programming section presents the TIP projects and funding sources. Table 2 presents TIP projects grouped by funding categories. Excluding resubmitted projects, funding for STP-Enhancement is shown as a “pool” in Table 2. The individual STP-Enhancement projects listed in Appendix B have been selected as the projects to be funded with this pool; any can proceed forward as readiness permits to the limit of the annual funds in the pool. Table 2 shows funding for the programmed projects over the six years of the TIP (by individual years for 2005, 2006, and 2007; collectively from 2008-2010). Previous, future (after 2010), and total funding is also displayed. The totals for each funding source are shown for comparison with available resources. Additional information on the projects is available in Section IV, which includes project descriptions. As these funds are programmed by the respective agencies, DRCOG is responsible for assuring the projects meet Metro Vision 2020 objectives, are consistent with the RTP, and that the program is fiscally constrained. The DRCOG Board of Directors then adopts the TIP document and the projects are implemented. Table 3 presents the available financial resources by funding category and year. The resource estimates are based on the CDOT November 24, 2003 Resource Allocation by category and year, prepared by the Office of Financial Management and Budget (OFMB). The 2005 estimates for STP-Metro and STP-Enhancement were adjusted by 2004 “reserves” assumed carried forward to 2005. CDOT Regions 1 and 4 include areas outside the DRCOG TIP area as well as areas within. CDOT region expenditures are fiscally constrained across their entire region each year of the six-year STIP, and the regions treat the resource allocations to the DRCOG portions of their regions as targets to achieve over that six-year (or longer) period. Thus, the amount Regions 1 and 4 program in the DRCOG TIP in any three-year period may be more or less than the OFMB-developed resource allocations. For the 2005-2010 TIP, CDOT Region 4 is programming substantially more to the DRCOG portion of its region in 2005-2007 to complete a project. This expenditure is consistent with targeted amounts from prior TIPs, and reflects advancing expenditures in the DRCOG area from 2008 and beyond. With this clarification, Table 3 shows that the amounts programmed in the TIP from 2005-2007 do not exceed available resources during that time period, and therefore the first three years of the 2005-2010 TIP are fiscally constrained. Since most of the funds for the last three years of the TIP are unprogrammed, the entire 2005-2010 TIP is fiscally constrained. Reserve projects are shown for the STP-Metro and CMAQ categories. “Reserve” projects are used to handle the ebb and flow of resources available, which may come from project closeouts, obligation limitation revisions, etc. At this time, reserves reflect mostly the “unprogrammed” funds in 2008-2010, although there is a small amount of CMAQ “reserve” in 2007. As reserves accumulate in 2005-2006, they will be allocated to projects by the “potential additional funds” methodology identified in Section I and the

26
waiting lists and associated protocols in Appendix C. Reserves that accumulate for 2007 and beyond will be programmed through the next TIP. The TIP document also serves as a means to convey information on the implementation status of projects programmed in the 2003-2008 TIP. To date, the 2003-2008 TIP has been amended more than 25 times. Table 4 shows major projects (total cost greater than $5 million) anticipated in the originally adopted 2003-2008 TIP to be completed in 2003 or 2004, for which funds have been obligated but construction is not yet substantially complete (in other words, the project is “underway”). Table 4 also lists major projects from the originally adopted 2003-2008 TIP that have been substantially delayed such that major elements have been moved back to the 2005-2010 TIP horizon, or deferred to a time period beyond 2005-2010. Table 5, which will be prepared after the end of the fiscal year, will list projects that were originally scheduled to be obligated as part of the 2003-2008 TIP, but did not meet that timeline. While these projects were not obligated, CDOT will reserve past obligation authority for them. The other projects from the originally adopted 2003-2008 TIP (i.e., those not listed in Tables 4 or 5) have been implemented in 2003 and 2004.

Table 2: 2005-2010 Transportation Improvement Program
--
Project Funding
Summary
TIP-ID
Sponsor
Project Name
Future
Funding
Total
Funding
Prior
Funding
Funding (in
$1,000s of Dollars)
2005
2006
2007
2008-10
STP Metro
330
333
00
00
033
0334
066
0667
0
Arvada
72nd Avenue: Ward Road Operational
Improvements
2005-003
733
00
State
Local
Total
Federal
Report Page #
127
01,845
00
460
00
0115
461
00
575
2,306
00
Thornton
120th Avenue: Holly St. to Quebec St.
Widening
2003-039
2,881
00
State
Local
Total
Federal
Report Page #
111
1,246
00
0625
00
0622
00
02,493
00
0
Boulder
Arapahoe (SH-7): Foothills Parkway
(SH157) Operational Improvements
2003-011
2,793
300
0
State
Local
Total
Federal
Report Page #
101
1,401
00
00
00
0600
00
02,001
00
0
Greenwood
Village
Arapahoe Rd./Clinton St./Boston St.
intersection
2001-168
2,630
629
0
State
Local
Total
Federal
Report Page #
860
04,095
00
0350
00
01,112
00
05,557
0
Centennial
Arapahoe Road/University Boulevard
Operational Improvements
2001-162
5,557
00
State
Local
Total
Federal
Report Page #
850
02,044
00
00
00
0511
00
02,555
0
Centennial
Arapahoe Road: Colorado Blvd. to Holly
Street Reconstruction
2001-158
2,555
00
State
Local
Total
Federal
Report Page #
84
27Note: Some projects have multiple funding sources and the project is listed for each funding source. As such, the prior funding, future funding
and project total cost, which are not funding source specific, are duplicated.

Table 2: 2005-2010 Transportation Improvement Program
--
Project Funding
Summary
TIP-ID
Sponsor
Project Name
Future
Funding
Total
Funding
Prior
Funding
Funding (in
$1,000s of Dollars)
2005
2006
2007
2008-10
3,202
00
00
00
0800
00
04,002
00
0
Denver
Broadway: 16th Avenue to 20th Avenue
Reconstruction
2003-027
4,819
817
0
State
Local
Total
Federal
Report Page #
108
500
470
5,507
00
00
0500
470
3,887
01,000
940
9,394
0
Boulder
Broadway: Pine Street to Iris Avenue
2005-008
11,334
00
State
Local
Total
Federal
Report Page #
132
3,090
3,000
00
00
00
3,090
3,000
00
6,180
6,000
00
Brighton
Buckley Rd: 136th Avenue to Bromley
Lane
2005-015
12,180
00
State
Local
Total
Federal
Report Page #
139
224
674
673
00
00
0224
225
224
0448
899
897
0
Lakewood
Colfax Avenue: Simms Street Operational
Improvements
2005-029
2,244
00
State
Local
Total
Federal
Report Page #
150
450
1,788
00
180
238
00
270
357
00
900
2,383
00
Westminster
Federal Blvd.: 80th Ave. Operational
Improvements
2003-041
3,629
346
0
State
Local
Total
Federal
Report Page #
112
742
00
0125
00
061
00
0928
00
0
Denver
Federal Boulevard/Speer Boulevard
Intersection
2003-025
2,321
1,393
0
State
Local
Total
Federal
Report Page #
107
28Note: Some projects have multiple funding sources and the project is listed for each funding source. As such, the prior funding, future funding
and project total cost, which are not funding source specific, are duplicated.

Table 2: 2005-2010 Transportation Improvement Program
--
Project Funding
Summary
TIP-ID
Sponsor
Project Name
Future
Funding
Total
Funding
Prior
Funding
Funding (in
$1,000s of Dollars)
2005
2006
2007
2008-10
1,094
3,455
3,454
0312
662
1,281
0156
484
483
01,562
4,601
5,218
0
Denver
Federal Boulevard: Alameda Avenue to
6th Avenue
2001-169
13,827
2,446
0
State
Local
Total
Federal
Report Page #
87913
00
00
00
0914
00
01,827
00
0
Boulder
Operational Improvements on US-36, SH-
7 and SH-93 for Transit
2003-014
5,827
4,000
0
State
Local
Total
Federal
Report Page #
103
734
0856
00
00
0318
0372
01,052
01,228
0
Arapahoe CountyParker Rd./Arapahoe Rd. New
Interchange
2005-044
2,280
00
State
Local
Total
Federal
Report Page #
165
3,319
00
0869
00
01,794
00
05,982
00
0
Arapahoe CountyQuebec Street: Iliff Ave. to 0.1 mile S. of
Iowa Ave. W
idening
2003-001
8,149
2,167
0
State
Local
Total
Federal
Report Page #
9775
00
00
00
025
00
0100
00
0
Louisville
SH- 42/96th Street Corridor Study
2005-033
100
00
State
Local
Total
Federal
Report Page #
154
300
02,417
00
0150
0150
01,284
0450
03,851
0
Boulder County
SH-119: 63rd Street Operational
Improvements
2005-011
4,301
00
State
Local
Total
Federal
Report Page #
135
29Note: Some projects have multiple funding sources and the project is listed for each funding source. As such, the prior funding, future funding
and project total cost, which are not funding source specific, are duplicated.

Table 2: 2005-2010 Transportation Improvement Program
--
Project Funding
Summary
TIP-ID
Sponsor
Project Name
Future
Funding
Total
Funding
Prior
Funding
Funding (in
$1,000s of Dollars)
2005
2006
2007
2008-10
341
01,191
00
00
0435
01,002
0776
02,193
0
Westminster
Sheridan Boulevard: 104th Avenue
Operational Improvements
2005-041
2,969
00
State
Local
Total
Federal
Report Page #
162
00
074,901
00
00
00
00
00
074,901
DRCOG
STP
Metro Reserves
2005-021
74,901
00
State
Local
Total
Federal
Report Page #
145
00
372
00
00
00
59100
00
59472
0
Lakewood
Union Boulevard: 4th to 6th Street
Operational Improvements
2005-031
531
00
State
Local
Total
Federal
Report Page #
152
100
01,618
00
00
025
0405
0125
02,023
0
Longmont
US-287: Quebec to Ken Pratt Boulevard
Reconstruction
2005-032
2,148
00
State
Local
Total
Federal
Report Page #
153
369
00
00
00
0158
00
0527
00
0
Lakewood
Wadsworth Blvd: Ohio Avenue
Operational Improvements
2005-043
527
00
State
Local
Total
Federal
Report Page #
164
2,800
10,120
00
00
00
700
2,531
00
3,500
12,651
00
Arvada
Wadsworth Bypass @ BNSFRR Grade
Separation
2003-003
19,171
3,020
0
State
Local
Total
Federal
Report Page #
99
30Note: Some projects have multiple funding sources and the project is listed for each funding source. As such, the prior funding, future funding
and project total cost, which are not funding source specific, are duplicated.

Table 2: 2005-2010 Transportation Improvement Program
--
Project Funding
Summary
TIP-ID
Sponsor
Project Name
Future
Funding
Total
Funding
Prior
Funding
Funding (in
$1,000s of Dollars)
2005
2006
2007
2008-10
20,933
21,352
22,560
74,901
2,571
900
1,781
010,990
7,587
9,714
034,494
29,839
34,055
74,901
188,407
15,118
0
State
Local
Total
Federal
STP Metro Project Allocation Totals
STP Enhancement
300
00
00
00
0479
00
0779
00
0
Longmont
3rd Ave Entryway Bike Trail: Martin
Street to Ken Pratt Blvd.
2003-037
1,203
424
0
State
Local
Total
Federal
Report Page #
109
395
00
00
00
0395
00
0790
00
0
Boulder
28th Street Pedestrian Crossings: Three
Points from Pearl to Iris Ave.
2003-015
990
200
0
State
Local
Total
Federal
Report Page #
104
550
00
00
00
0954
00
01,504
00
0
Boulder
Broadway Bike Lane: Iris to Norwood
2003-013
1,604
100
0
State
Local
Total
Federal
Report Page #
102
600
00
00
00
0639
00
01,239
00
0
Denver
Quincy Avenue Bikeway
2003-023
1,309
700
State
Local
Total
Federal
Report Page #
106
1,177
2,579
2,703
8,847
9835
3570
1,079
2,474
2,158
714
2,354
5,088
4,896
9,631
DRCOG
STP
Enhancement Pool: 05-10 TIP
2005-023
21,969
00
State
Local
Total
Federal
Report Page #
147
31Note: Some projects have multiple funding sources and the project is listed for each funding source. As such, the prior funding, future funding
and project total cost, which are not funding source specific, are duplicated.

Table 2: 2005-2010 Transportation Improvement Program
--
Project Funding
Summary
TIP-ID
Sponsor
Project Name
Future
Funding
Total
Funding
Prior
Funding
Funding (in
$1,000s of Dollars)
2005
2006
2007
2008-10
3,022
2,579
2,703
8,847
9835
3570
3,546
2,474
2,158
714
6,666
5,088
4,896
9,631
27,075
794
0
State
Local
Total
Federal
STP Enhancement Project Allocation Totals
Congestion Mitigation / Air Quality
0300
2,978
00
00
00
300
800
00
600
3,778
0
Boulder
30th Street Bikelanes: Arapahoe to Pearl
2005-004
4,378
00
State
Local
Total
Federal
Report Page #
128
0637
638
00
00
00
637
638
00
1,274
1,276
0
Boulder County
95th/96th Street Transit Service:
Longmont to Flatiron Crossing
2005-010
2,550
00
State
Local
Total
Federal
Report Page #
134
4,353
00
00
00
07,500
00
011,853
00
0
R T D
Acquisition for DUS
2001-217
43,450
31,597
0
State
Local
Total
Federal
Report Page #
930
750
00
00
00
500
00
125
00
Arapahoe CountyArapahoe County: Replace Sanding
Spreader Control Units
2005-002
125
00
State
Local
Total
Federal
Report Page #
126
197
138
142
00
00
050
3435
0247
172
177
0
Arvada
Arvada call-n-Ride Transit Service
2003-092
596
00
State
Local
Total
Federal
Report Page #
120
32Note: Some projects have multiple funding sources and the project is listed for each funding source. As such, the prior funding, future funding
and project total cost, which are not funding source specific, are duplicated.

Table 2: 2005-2010 Transportation Improvement Program
--
Project Funding
Summary
TIP-ID
Sponsor
Project Name
Future
Funding
Total
Funding
Prior
Funding
Funding (in
$1,000s of Dollars)
2005
2006
2007
2008-10
0165
00
00
00
0191
00
0356
00
R A Q C
Big Clean Trucks: Acquisition of Leasing
Program
CNG Trucks
2005-036
356
00
State
Local
Total
Federal
Report Page #
157
0200
00
00
00
0241
00
0441
00
Boulder
Boulder Transit Real-time Solutions
2005-007
441
00
State
Local
Total
Federal
Report Page #
131
110
00
00
00
040
00
0150
00
0
Castle Rock
Castle Rock: Street Sweeping Service
Expansion
2005-016
150
00
State
Local
Total
Federal
Report Page #
140
950
00
00
00
0390
00
01,340
00
0
R A Q C
Clean Yellow Fleets for Blue Skies
2005-034
1,340
00
State
Local
Total
Federal
Report Page #
155
404
404
00
00
00
101
101
00
505
505
00
R T D
C-Line Light Rail Operating Service
2003-111
8,402
7,392
0
State
Local
Total
Federal
Report Page #
123
00
150
31,430
00
00
00
00
00
150
31,430
DRCOG
CMAQ Reserves
2005-022
31,580
00
State
Local
Total
Federal
Report Page #
146
33Note: Some projects have multiple funding sources and the project is listed for each funding source. As such, the prior funding, future funding
and project total cost, which are not funding source specific, are duplicated.

Table 2: 2005-2010 Transportation Improvement Program
--
Project Funding
Summary
TIP-ID
Sponsor
Project Name
Future
Funding
Total
Funding
Prior
Funding
Funding (in
$1,000s of Dollars)
2005
2006
2007
2008-10
996
629
625
1,875
00
00
249
161
160
470
1,245
790
785
2,345
DRCOG
Conformity Finding Mitigation Program
2003-018
5,165
00
State
Local
Total
Federal
Report Page #
105
0600
00
00
00
03,000
00
03,600
00
Arapahoe CountyDry Creek Road Pedestrian Bridge at I-25
2003-002
3,600
00
State
Local
Total
Federal
Report Page #
980
199
00
00
00
0175
00
0374
00
R A Q C
E85 Hangtag Program
2005-035
374
00
State
Local
Total
Federal
Report Page #
156
221
229
00
00
00
5558
00
276
287
00
Englewood
Englewood Shuttle Bus Service
2003-093
828
265
0
State
Local
Total
Federal
Report Page #
121
0600
00
00
00
02,300
00
02,900
00
Douglas County
I- 25: Lincoln Avenue Station Pedestrian
Overpass
2005-020
2,900
00
State
Local
Total
Federal
Report Page #
144
0600
00
00
00
02,849
00
03,449
00
Greenwood
Village
I- 25: Orchard Road Station Pedestrian
Overpass
2005-027
3,449
00
State
Local
Total
Federal
Report Page #
149
34Note: Some projects have multiple funding sources and the project is listed for each funding source. As such, the prior funding, future funding
and project total cost, which are not funding source specific, are duplicated.

Table 2: 2005-2010 Transportation Improvement Program
--
Project Funding
Summary
TIP-ID
Sponsor
Project Name
Future
Funding
Total
Funding
Prior
Funding
Funding (in
$1,000s of Dollars)
2005
2006
2007
2008-10
0170
00
00
00
0170
00
0340
00
Thornton
IMC Consolidated Service Center: Natural
Gas Fueling Station
2005-039
340
00
State
Local
Total
Federal
Report Page #
160
0163
134
00
00
00
70134
278
0233
268
278
Thornton
Metro North Transportation Management
Organization
2005-038
779
00
State
Local
Total
Federal
Report Page #
159
02,730
5,010
00
00
00
1,360
2,490
00
4,090
7,500
0
R T D
Pearl Street: 30th Boulder Village Transit
Center
2005-037
11,590
00
State
Local
Total
Federal
Report Page #
158
108
00
027
00
00
00
0135
00
0
CDOT Region 1
Region 1 PM10 Service Expansion
Mechanical Street Sweepers (2)
2003-087
270
135
0
State
Local
Total
Federal
Report Page #
119
750
750
750
2,250
00
00
190
190
190
570
940
940
940
2,820
DRCOG
Regional Intelligent Transportation
System Pool
2005-026
5,640
00
State
Local
Total
Federal
Report Page #
148
3,900
4,100
4,250
13,550
00
00
00
00
3,900
4,100
4,250
13,550
DRCOG
Regional Traffic Signal System
Improvement Program
1997-045
52,445
26,645
0
State
Local
Total
Federal
Report Page #
65
35Note: Some projects have multiple funding sources and the project is listed for each funding source. As such, the prior funding, future funding
and project total cost, which are not funding source specific, are duplicated.

Table 2: 2005-2010 Transportation Improvement Program
--
Project Funding
Summary
TIP-ID
Sponsor
Project Name
Future
Funding
Total
Funding
Prior
Funding
Funding (in
$1,000s of Dollars)
2005
2006
2007
2008-10
473
750
750
2,250
00
00
118
188
188
563
591
938
938
2,813
DRCOG
Regional Transportation Demand
Management Program
1999-097
10,471
5,191
0
State
Local
Total
Federal
Report Page #
801,731
1,802
1,875
6,087
00
00
00
00
1,731
1,802
1,875
6,087
DRCOG
RideArrangers Program: Denver
Transportation Management Area
1997-044
26,941
15,446
0
State
Local
Total
Federal
Report Page #
641,068
1,018
00
00
00
1,175
1,175
00
2,243
2,193
00
Longmont
SH-119: Longmont to Boulder Transit
Service
2003-038
9,604
5,168
0
State
Local
Total
Federal
Report Page #
110
750
00
00
00
126
00
0201
00
0
Denver
Smart Sign Air Quality Program
2005-018
201
00
State
Local
Total
Federal
Report Page #
142
0116
00
00
00
029
00
0145
00
Wheat Ridge
Wheat Ridge De-Icing Equipment
2005-042
145
00
State
Local
Total
Federal
Report Page #
163
15,336
16,375
17,302
57,442
270
00
9,994
13,279
4,635
1,881
25,357
29,654
21,937
59,323
228,110
91,839
0
State
Local
Total
Federal
Congestion Mitigation / Air Quality Project
Allocation Totals
Bridge
Discretionary
36Note: Some projects have multiple funding sources and the project is listed for each funding source. As such, the prior funding, future funding
and project total cost, which are not funding source specific, are duplicated.

Table 2: 2005-2010 Transportation Improvement Program
--
Project Funding
Summary
TIP-ID
Sponsor
Project Name
Future
Funding
Total
Funding
Prior
Funding
Funding (in
$1,000s of Dollars)
2005
2006
2007
2008-10
4,858
4,858
00
00
00
00
00
4,858
4,858
00
CDOT Region 6
I-25: Broadway Bridge
1999-009
131,000
47,134
45,815
State
Local
Total
Federal
Report Page #
694,858
4,858
00
00
00
00
00
4,858
4,858
00
131,000
47,134
45,815
State
Local
Total
Federal
Bridge
Discretionary Project Allocation Totals
Congestion Relief
00
00
00
1,600
4,800
00
00
00
1,600
4,800
CDOT Region 6
Region 6 Courtesy Patrol
1999-060b
12,200
2,600
0
State
Local
Total
Federal
Report Page #
770
00
00
0400
1,200
00
00
00
400
1,200
CDOT Region 6
Region 6 Intelligent Transportation
System (ITS) Pool
1999-060a
13,100
10,700
0
State
Local
Total
Federal
Report Page #
760
00
00
0159
3,583
00
00
00
159
3,583
CDOT Region 6
Region 6 Intersection Reconstruction
1999-065
9,242
4,113
0
State
Local
Total
Federal
Report Page #
790
00
00
02,159
9,583
00
00
00
2,159
9,583
34,542
17,413
0
State
Local
Total
Federal
Congestion Relief Project Allocation Totals
37Note: Some projects have multiple funding sources and the project is listed for each funding source. As such, the prior funding, future funding
and project total cost, which are not funding source specific, are duplicated.

Table 2: 2005-2010 Transportation Improvement Program
--
Project Funding
Summary
TIP-ID
Sponsor
Project Name
Future
Funding
Total
Funding
Prior
Funding
Funding (in
$1,000s of Dollars)
2005
2006
2007
2008-10
Regional Priority Projects
00
00
2,340
3,107
15,411
00
00
02,340
3,107
15,411
0
CDOT Region 4
Arapahoe (SH-7): Cherryvale Road to N
75th Street
1997-033
26,615
5,757
0
State
Local
Total
Federal
Report Page #
630
00
011,000
00
00
00
011,000
00
0
CDOT Region 6
I- 25: 120th Avenue (Bridge / Sidewalks)
2001-156
20,000
9,000
0
State
Local
Total
Federal
Report Page #
830
00
0300
300
00
00
00
300
300
00
CDOT Region 6
I- 70: SH-58 Interchange
1999-008
58,000
8,320
49,080
State
Local
Total
Federal
Report Page #
680
00
0500
00
00
00
0500
00
0
CDOT Region 6
I-225: 6th Ave. to Parker Road
1999-006
34,567
34,067
0
State
Local
Total
Federal
Report Page #
670
00
06,706
2,300
19,329
00
00
06,706
2,300
19,329
0
CDOT Region 6
I-25: Broadway Bridge
1999-009
131,000
47,134
45,815
State
Local
Total
Federal
Report Page #
690
00
0433
00
0121
00
0554
00
0
Aurora
Mississippi Avenue/Havana Street
Operational Improvements
2003-007
860
306
0
State
Local
Total
Federal
Report Page #
100
38Note: Some projects have multiple funding sources and the project is listed for each funding source. As such, the prior funding, future funding
and project total cost, which are not funding source specific, are duplicated.

Table 2: 2005-2010 Transportation Improvement Program
--
Project Funding
Summary
TIP-ID
Sponsor
Project Name
Future
Funding
Total
Funding
Prior
Funding
Funding (in
$1,000s of Dollars)
2005
2006
2007
2008-10
00
00
2,050
3,500
00
00
00
2,050
3,500
00
CDOT Region 6
Parker Rd./Arapahoe Rd. New
Interchange
2001-182
5,750
200
0
State
Local
Total
Federal
Report Page #
880
00
0400
200
200
00
00
0400
200
200
0
CDOT Region 1
Region 1 TIP Area Safety Pool
2001-198
1,880
480
600
State
Local
Total
Federal
Report Page #
910
00
01,600
1,600
00
00
00
1,600
1,600
00
CDOT Region 6
Region 6 Courtesy Patrol
1999-060b
12,200
2,600
0
State
Local
Total
Federal
Report Page #
770
00
0400
400
00
00
00
400
400
00
CDOT Region 6
Region 6 Intelligent Transportation
System (ITS) Pool
1999-060a
13,100
10,700
0
State
Local
Total
Federal
Report Page #
760
00
01,000
387
00
00
00
1,000
387
00
CDOT Region 6
Region 6 Intersection Reconstruction
1999-065
9,242
4,113
0
State
Local
Total
Federal
Report Page #
790
00
06,000
00
00
00
06,000
00
0
CDOT Region 6
Region 6 Roadway Reconstruction
1999-064
30,750
24,750
0
State
Local
Total
Federal
Report Page #
78
39Note: Some projects have multiple funding sources and the project is listed for each funding source. As such, the prior funding, future funding
and project total cost, which are not funding source specific, are duplicated.

Table 2: 2005-2010 Transportation Improvement Program
--
Project Funding
Summary
TIP-ID
Sponsor
Project Name
Future
Funding
Total
Funding
Prior
Funding
Funding (in
$1,000s of Dollars)
2005
2006
2007
2008-10
00
00
7,700
0500
00
00
07,700
0500
0
CDOT Region 1
US- 85: C-470 to Castle Rock (I-25)
2001-154
76,000
20,800
47,000
State
Local
Total
Federal
Report Page #
820
00
010,000
200
00
00
00
10,000
200
00
CDOT Region 1
US-285: Foxton Road to Jefferson County
Line Widening
2003-124
15,000
1,000
3,800
State
Local
Total
Federal
Report Page #
124
00
00
50,429
11,994
35,440
0121
00
050,550
11,994
35,440
0434,964
169,227
146,295
State
Local
Total
Federal
Regional Priority Projects Project Allocation
Totals
Section 5307
35,000
35,000
35,000
105,000
00
00
8,750
8,750
8,750
26,250
43,750
43,750
43,750
131,250
R T D
Preventive Maintenance: Transit Vehicle
Overhaul and Maintenance
1997-084
420,908
158,408
0
State
Local
Total
Federal
Report Page #
6635,000
35,000
35,000
105,000
00
00
8,750
8,750
8,750
26,250
43,750
43,750
43,750
131,250
420,908
158,408
0
State
Local
Total
Federal
Section 5307 Project Allocation Totals
Section 5309 Fixed
Guideway
40Note: Some projects have multiple funding sources and the project is listed for each funding source. As such, the prior funding, future funding
and project total cost, which are not funding source specific, are duplicated.

Table 2: 2005-2010 Transportation Improvement Program
--
Project Funding
Summary
TIP-ID
Sponsor
Project Name
Future
Funding
Total
Funding
Prior
Funding
Funding (in
$1,000s of Dollars)
2005
2006
2007
2008-10
3,007
3,007
3,007
9,021
00
00
752
752
752
2,256
3,759
3,759
3,759
11,277
R T D
RTD
Fixed Guideway Improvements,
Upgrades and Maintenance
1999-052
35,059
12,505
0
State
Local
Total
Federal
Report Page #
723,007
3,007
3,007
9,021
00
00
752
752
752
2,256
3,759
3,759
3,759
11,277
35,059
12,505
0
State
Local
Total
Federal
Section 5309 Fixed
Guideway Project Allocation
Totals
Section 5309 New
Bus
00
440
00
00
00
110
00
550
R T D
CASTA
Adams County, Purchase Vehicles
1999-055
563
508
0
State
Local
Total
Federal
Report Page #
75224
9380
00
00
056
2316
0280
116
960
R T D
CASTA
Senior Resources, Purchase
Vehicles
1999-115
797
305
0
State
Local
Total
Federal
Report Page #
811,040
534
480
00
00
0260
133
120
01,300
667
600
0
R T D
CASTA
Special Transit, Purchase
Vehicles
1999-054
4,489
1,922
0
State
Local
Total
Federal
Report Page #
74290
26,457
27,862
26,116
00
00
736,614
6,965
6,528
363
33,071
34,827
32,644
R T D
Transit Vehicles: Purchase Vehicles
1999-053
161,444
60,539
0
State
Local
Total
Federal
Report Page #
73
41Note: Some projects have multiple funding sources and the project is listed for each funding source. As such, the prior funding, future funding
and project total cost, which are not funding source specific, are duplicated.

Table 2: 2005-2010 Transportation Improvement Program
--
Project Funding
Summary
TIP-ID
Sponsor
Project Name
Future
Funding
Total
Funding
Prior
Funding
Funding (in
$1,000s of Dollars)
2005
2006
2007
2008-10
457
1,600
392
00
00
0114
400
980
571
2,000
490
0
R T D
ZIP Shuttle System: Purchase Vehicles
2005-045
3,061
00
State
Local
Total
Federal
Report Page #
166
2,011
28,684
28,858
26,116
00
00
503
7,170
7,210
6,528
2,514
35,854
36,068
32,644
170,354
63,274
0
State
Local
Total
Federal
Section 5309 New
Bus
Project Allocation Totals
Section 5309 New
Start
72,890
72,890
72,890
72,890
00
00
25,750
25,750
25,750
25,750
98,640
98,640
98,640
98,640
R T D
Southeast Corridor: I-25 from Broadway
to Lincoln Avenue and I-225 (LRT)
1999-027a
733,713
339,153
0
State
Local
Total
Federal
Report Page #
7072,890
72,890
72,890
72,890
00
00
25,750
25,750
25,750
25,750
98,640
98,640
98,640
98,640
733,713
339,153
0
State
Local
Total
Federal
Section 5309 New
Start Project Allocation Totals
7th Pot
00
00
57,337
00
00
00
057,337
00
0
CDOT Region 6
Southeast Corridor: I-25/Broadway to
Lincoln Ave; I-225 from
I-25 to Parker Rd.
1999-027b
804,421
747,084
0
State
Local
Total
Federal
Report Page #
71
42Note: Some projects have multiple funding sources and the project is listed for each funding source. As such, the prior funding, future funding
and project total cost, which are not funding source specific, are duplicated.

Table 2: 2005-2010 Transportation Improvement Program
--
Project Funding
Summary
TIP-ID
Sponsor
Project Name
Future
Funding
Total
Funding
Prior
Funding
Funding (in
$1,000s of Dollars)
2005
2006
2007
2008-10
00
00
57,337
00
00
00
057,337
00
0804,421
747,084
0
State
Local
Total
Federal
7th Pot Project Allocation Totals
Surface Treatment
00
00
20,718
33,525
24,778
70,501
00
00
20,718
33,525
24,778
70,501
CDOT Region 6
Region 6 Surface Treatment Project -
Various
2001-214
285,078
135,556
0
State
Local
Total
Federal
Report Page #
920
00
020,718
33,525
24,778
70,501
00
00
20,718
33,525
24,778
70,501
285,078
135,556
0
State
Local
Total
Federal
Surface Treatment Project Allocation Totals
Bridge
00
00
2,300
00
00
00
02,300
00
0
CDOT Region 1
Elk Creek and Clear Creek Bridge
2001-195
2,700
400
0
State
Local
Total
Federal
Report Page #
900
00
00
3,000
00
00
00
03,000
00
CDOT Region 6
Federal Blvd.: Lakewood Gulch (FasTrack)
2003-043
3,000
00
State
Local
Total
Federal
Report Page #
113
43Note: Some projects have multiple funding sources and the project is listed for each funding source. As such, the prior funding, future funding
and project total cost, which are not funding source specific, are duplicated.

Table 2: 2005-2010 Transportation Improvement Program
--
Project Funding
Summary
TIP-ID
Sponsor
Project Name
Future
Funding
Total
Funding
Prior
Funding
Funding (in
$1,000s of Dollars)
2005
2006
2007
2008-10
00
00
5050
50150
00
00
5050
50150
CDOT Region 6
Region 6 Bridge Scoping Activities
1995-178a
6,540
6,240
0
State
Local
Total
Federal
Report Page #
590
00
05,051
00
00
00
05,051
00
0
CDOT Region 6
SH- 2 (Colorado Blvd): 0.8 mi N/o I-70
1995-178j
15,520
10,469
0
State
Local
Total
Federal
Report Page #
600
00
0540
3,250
00
00
00
540
3,250
00
CDOT Region 1
US- 36 at Box Elder Creek in Watkins
2001-261
3,790
00
State
Local
Total
Federal
Report Page #
960
00
00
00
600
00
00
00
60
CDOT Region 4
US- 36: At Cherryvale Road & 88th Street
1997-006
9,334
4,903
4,371
State
Local
Total
Federal
Report Page #
610
00
00
04,825
00
00
00
04,825
0
CDOT Region 4
US- 36: At North St. Vrain Creek
1997-009
5,416
591
0
State
Local
Total
Federal
Report Page #
620
00
07,941
6,300
4,875
210
00
00
7,941
6,300
4,875
210
46,300
22,603
4,371
State
Local
Total
Federal
Bridge
Project Allocation Totals
Safety
44Note: Some projects have multiple funding sources and the project is listed for each funding source. As such, the prior funding, future funding
and project total cost, which are not funding source specific, are duplicated.

Table 2: 2005-2010 Transportation Improvement Program
--
Project Funding
Summary
TIP-ID
Sponsor
Project Name
Future
Funding
Total
Funding
Prior
Funding
Funding (in
$1,000s of Dollars)
2005
2006
2007
2008-10
00
00
200
00
00
00
0200
00
0
Lakewood
Colfax Avenue: Simms Street Signal
Improvement
2003-066
225
250
State
Local
Total
Federal
Report Page #
115
00
00
314
00
00
00
0314
00
0
Denver
Denver Traffic Signal Upgrades
2003-099
2,100
1,786
0
State
Local
Total
Federal
Report Page #
122
00
00
360
00
00
00
0360
00
0
Lakewood
I- 70: Colfax Avenue Signal Improvement
2003-067
400
400
State
Local
Total
Federal
Report Page #
116
00
00
200
00
00
00
0200
00
0
Lakewood
Kipling Street: US-6 North Service Road
Signal Improvement
2003-065
225
250
State
Local
Total
Federal
Report Page #
114
00
00
200
00
00
00
0200
00
0
CDOT Region 1
R1 TIP Area Signing Pool
2001-228
4,000
03,800
State
Local
Total
Federal
Report Page #
950
00
0350
374
395
1,311
00
00
350
374
395
1,311
CDOT Region 6
Region 6 Hot Spot
2001-225
4,148
1,718
0
State
Local
Total
Federal
Report Page #
94
45Note: Some projects have multiple funding sources and the project is listed for each funding source. As such, the prior funding, future funding
and project total cost, which are not funding source specific, are duplicated.

Table 2: 2005-2010 Transportation Improvement Program
--
Project Funding
Summary
TIP-ID
Sponsor
Project Name
Future
Funding
Total
Funding
Prior
Funding
Funding (in
$1,000s of Dollars)
2005
2006
2007
2008-10
00
00
360
00
00
00
0360
00
0
Lakewood
US-285:Kipling Parkway Signal
Improvement
2003-068
400
400
State
Local
Total
Federal
Report Page #
117
00
00
898
00
00
00
0898
00
0
Broomfield
County
Wadsworth Parkway:120th Avenue
Intersection Improvement
2003-070
998
100
0
State
Local
Total
Federal
Report Page #
118
00
00
2,882
374
395
1,311
00
00
2,882
374
395
1,311
12,496
3,734
3,800
State
Local
Total
Federal
Safety Project Allocation Totals
Local governm
ent (without federal)
00
00
00
00
974
974
00
974
974
00
Broomfield
County
ZIP Shuttle System: US 36 and 96th
Street Bus Service
2001-185
5,844
2,435
0
State
Local
Total
Federal
Report Page #
890
00
00
00
0974
974
00
974
974
00
5,844
2,435
0
State
Local
Total
Federal
Local governm
ent (without federal) Project
Allocation Totals
46Note: Some projects have multiple funding sources and the project is listed for each funding source. As such, the prior funding, future funding
and project total cost, which are not funding source specific, are duplicated.

Table 2: 2005-2010 Transportation Improvement Program
--
Project Funding
Summary
TIP-ID
Sponsor
Project Name
Future
Funding
Total
Funding
Prior
Funding
Funding (in
$1,000s of Dollars)
2005
2006
2007
2008-10
Grand
Totals of Revenues
157,057
184,745
182,320
354,217
142,003
53,128
69,463
81,675
61,380
66,736
58,969
63,379
360,440
304,609
310,752
499,271
3,558,271
1,826,277
200,281
State
Local
Total
Federal
47Note: Some projects have multiple funding sources and the project is listed for each funding source. As such, the prior funding, future funding
and project total cost, which are not funding source specific, are duplicated.

48

������������
����
����
����
�������
������������
����������
�������
��������
����� ��!!������������ ��"�
������
��
�����
����
�����
��
������
�����
�����������������
��
��
������
����
����������� �!���
��
�� ��
�� ��
����
�����
����
�����"!�#��������#��$�%���&�'
����
�� �
������
�����
�����
�������
���
�"�����&�(%!)�����*"�����"�%�'
����
����
�����
������
��
����
�����
+��%������"���&��%!)�����,�����'�& '
���
�����
�����
������
���
�����
�����
�)��"%��-��"�����
����
������
�����
�����
�����
�����
��� �
��.�#��
��� �
�� �
���
��� �
����
�����
��#�����
"��$���
�%$�%�
"""$���
&��$�''
��'$""�
"$���$��&
�%(�)
�*��+������������������������ ��"��'�
�-#�*�����&�'
����
�� ��
�����
�����
�����
������
�����
�-#�/�."�%������&'
����
�����
����
�� ��
�� ��
����
���
�����������*����"�����0�1���2)"!���
��
� ��
�� ��
����
����
���
� � �
��#�����
&%$�%"
'�$&��
'�$���
"��$"��
"��$"��
"��$�"�
��(')
�����������,������� ���������� ��'����
��%������ ��
�����
�����
�����
������
������
��%������ ���3�(���4)���5"�
����
����
����
����
����
��%������ ���6�5��)�
���
�����
������
�����
�����
��%������ ���6�5���"��
������
������
������
�����
�����
��#�����
""�$%��
"&%$��"
"&%$���
&%�$�''
&%�$�''
+���������*�-����
&�%$��"
��%$��'
�%&$���
�%�$'��
���$��"
"$'�"$"�%
.�� /
'���)�%�7��+�-��3*��6�8��,���������� ��1!!�%"������"��������)"�"������"��)����
�'�#����"�����"��)����(%�����"!!�%"��������"!�,�%")����+�-� ������������(9�����������
��������)�%����."��"!!�%"��������.��+ ��4�"��"�����.������������9���������%��9!����"�9��$�%��
'�+�9����������"%�)"!�"!!�%"�����������������������!���9��$�%��9����"�����"���.���������
�������!�%�����"��"��)����%�����)"�����������%������"����)����������"�����������9��$�%��
�'�/(%!)�����"�%.�����)����
�'�:�%!)����;� <�%"����8��������3=������3=���
'�:�%!)����;���<�%"����8��������3=������3=���
�'�3)�����.�5��"�����>)������"��)�����"%�)"!�"5"����"����"���"�����-:#���8�!�9�����
�'�����%"��������),���"!�����-",!�����6���7�������+�-�%������������!����&;� <'�"���
����������"!�9��������9��$�%���&; ��<'��)����"��������������"���"�%.������-#�*�����9��$�%���
�*��+���0 �
���
��#���&
1 ��!���������������*�-���� �2��*��+��0 �*����
&��!!"�������.�)�"���'
�0 � ��!!���
��������

50
Tab
le 4
20
03-2
008
Tra
nspo
rtat
ion
Impr
ovem
ent P
rogr
am
Maj
or P
roje
cts
Obl
igat
ed b
ut n
ot y
et C
ompl
eted
, and
Maj
or P
roje
cts
Sub
stan
tially
Del
ayed
M
ajor
Pro
ject
s w
ith C
ompl
etio
n Fu
nds
Obl
igat
ed, b
ut C
onst
ruct
ion
not S
ubst
antia
lly C
ompl
eted
bef
ore
2005
-201
0 T
IP
Ado
ptio
n T
IP ID
P
roje
ct T
itle
Pro
ject
Des
crip
tion
(sco
pe)
Pro
ject
Spo
nsor
19
97-0
03
C-4
70: I
-70
to U
S-6
Ext
ensi
on, P
hase
II
Add
ram
ps s
outh
boun
d to
wes
tbou
nd a
nd
east
boun
d to
nor
thbo
und
CD
OT
Reg
ion
6
2001
-172
N
orth
I-25
: Bus
/HO
V A
cces
s to
US
-36
Rel
ocat
e H
OV
Lan
e no
rther
n ac
cess
/egr
ess
CD
OT
Reg
ion
6 20
01-2
02
120t
h A
venu
e: U
S-8
5 to
Que
bec
Stre
et
New
road
/wid
enin
g A
dam
s C
ount
y
Maj
or P
roje
cts
Del
ayed
; M
ajor
Ele
men
ts In
clud
ed in
200
5-20
10 T
IP
TIP
ID
Pro
ject
Titl
e P
roje
ct D
escr
iptio
n (s
cope
) P
roje
ct S
pons
or
2001
-162
A
rapa
hoe
Roa
d/U
nive
rsity
Bou
leva
rd
Ope
ratio
nal i
mpr
ovem
ents
C
ente
nnia
l
Maj
or P
roje
cts
Del
ayed
; M
ajor
Ele
men
ts n
ot In
clud
ed in
200
5-20
10 T
IP
TIP
ID
Pro
ject
Titl
e P
roje
ct D
escr
iptio
n (s
cope
) P
roje
ct S
pons
or
1999
-001
I-2
5: L
inco
ln A
venu
e to
MP
179
W
iden
to 6
/8 la
nes,
add
fron
tage
road
C
DO
T R
egio
n 1
1999
-006
I-2
25: 6
th A
venu
e to
Par
ker R
oad
Wid
en to
6 la
nes
CD
OT
Reg
ion
6 20
01-2
52
SH
-119
: at S
H-5
2 (M
iner
al R
oad)
N
ew in
terc
hang
e C
DO
T R
egio
n 4
2001
-153
S
H-8
3/P
arke
r Roa
d: 1
mile
sou
th o
f A
rapa
hoe
to L
inco
ln
Whi
te-to
ppin
g C
DO
T R
egio
n 1
Not
e: M
ajor
pro
ject
s to
tal c
ost i
s gr
eate
r th
an $
5 m
illio
n. L
ist d
oes
not i
nclu
de c
ontin
uing
poo
l pro
ject
s. B
asel
ine
is th
e or
igin
al 2
003-
2008
TIP
ad
opte
d M
ay 1
5, 2
002.

51
Table 5 Rollover Projects
This table to be completed after the end of the fiscal year

52

53
IV. THE 2005-2010 PROGRAM Project Descriptions Exhibit 2, at the end of this section, includes descriptions for all projects included in the 2005-2010 TIP, including those in the STP-Enhancement pool. Exhibit 2 descriptions are in order by TIP project number. See Table 1, Table 2, Appendix A, or the Figure 2 map to find the project number for specific projects. Descriptive information on project scope, location, support of Metro Vision 2020 goals, and other transportation issues is included. Larger TIP projects include a detailed project description indicating the current status and when the project will be open to the public, a map showing the project location, funding (past, present and future programming), and project support for Metro Vision 2020 core elements or other transportation issues. The upper portion of each description sheet includes a project title, TIP and State TIP identification numbers, sponsor, project type, project scope, and location map as appropriate. The title is a brief descriptor of the project location. For DRCOG-selected projects, the scope identifies all elements for which points were awarded. Each project is identified in terms of the project functions it fulfills: 1. Maintain Existing System: highway reconstruction and resurfacing, transit vehicle
rehabilitation and replacement, and bridge reconstruction and replacement projects. 2. Air Quality: projects that support air quality such as PM10 reduction measures and
other CM/AQ funded projects. 3. Mobility Management: projects that relieve traffic congestion by reducing travel
demand, encouraging alternative forms of transportation, and making traffic operation improvements.
4. New System Capacity: roadway and transit projects that provide a continuous
network including roadway widening, new roads, new interchanges, and new transit facilities.
5. System Enhancement: nonmotorized travel modes such as bicycle and pedestrian
trails, and projects that enhance aesthetics and scenic values, historic preservation and archaeology and water quality.
The center of each project description page indicates the Metro Vision core elements and responses to other Transportation Issues that the project supports. Projects may support one or more of the six core elements of Metro Vision and one or more of the

54
three responses to Transportation Issues. This information is included to show the relationship of the project to Metro Vision. Funding sources are listed at the bottom of each project description page. The total project funding is the sum of funds previously programmed before fiscal 2005, plus funding shown for fiscal 2005 through 2010 in this TIP, plus projected future funding beyond that shown in this TIP (Previously Programmed + TIP Funding + Future Funding = Total Project Funding)2. The most likely federal funding source applied to each project is identified. Regionally Significant Projects Included in the 2005-2010 TIP The following projects included in the 2005-2010 TIP are considered regionally significant and are so noted on the project description sheets: 1999-066 I-225: 6th Avenue to Parker Road 1999-008 I-70: SH-58 Interchange 1999-009 I-25: Broadway Bridge 1999-027a Southeast Corridor (LRT) 1999-027b Southeast Corridor (Roadway Widening) 2001-154 US-85: C-470 to Castle Rock 2001-156 I-25: 120th Avenue Bridge 2001-169 Federal Boulevard: Alameda Avenue to 6th Avenue 2001-182 Parker Road/Arapahoe Road New Interchange 2001-217 Acquisition for DUS 2003-001 Quebec Street: Iliff Avenue to Iowa Avenue 2003-003 Wadsworth Bypass @ BNSFRR Grade Separation 2003-039 120th Avenue: Holly Street to Quebec Street 2003-124 US-285: Foxton Road to County Line 2005-015 Buckley Road: 136th Avenue to Bromley Lane 2005-037 Pearl Street: 30th Boulder Village Transit Center 2005-044 Parker Road/Arapahoe Road New Interchange The roadway and rapid transit projects are included on the project list in Appendix A of the Conformity document, and all projects are part of the conformity network. Regionally Significant Projects Not Supported by Federal Funds Locally funded regionally significant projects that are included in the conformity network (Appendix A of the Conformity document) are listed below for information purposes. These projects have not been adopted as part of this 2005-2010 TIP, no funding has been assigned, and they are not supported by federal transportation funds. An FHWA approval is required for new interchange projects. Capacity Access - Widening Projects: • 6th Avenue: Airport Boulevard to Tower Road 2 Previously programmed means funds from 1993 through 2004.

55
• 56th Avenue: Quebec Street to Monaghan Road • 64th Avenue: Terry Street to Indiana Street • 86th Parkway: Indiana Street to Alkire Street • 104th Avenue: Colorado Boulevard to South Platte River • 120th Avenue: Union Pacific Railroad to Garfield Street (plaza) • 136th Avenue: I-25 to Colorado Boulevard • 144th Avenue: 120th Street to Zuni Street • 152nd Avenue: Washington Street to York Street • Arapahoe Parkway: Smoky Hill Road to Powhaton Road • Arapahoe Road: 1 mile east of Liverpool to Smoky Hill Road • Arapahoe Road: Waco to Himalaya Street • Bromley Lane: Sable Boulevard to I-76 • Broncos Parkway: Peoria Street/Easter Avenue to Jordan Road • Chambers Road: Lincoln Avenue to E-470 • Colorado Boulevard: 136th Avenue to 140th Avenue • Colorado Boulevard: 150th Avenue to SH-7 • Easter Avenue: Havana Street to Peoria Street • Jewell Avenue: Tower Road to Himalaya Road • Jordan Road: County Line to Arapahoe Road • McCaslin Boulevard: Coalton Road to Rock Creek Parkway • McIntyre Street: SH-58 to .03 miles north of 44th Avenue • Peña Boulevard: E-470 to Jackson Gap Street • Peoria Street: Sand Creek Bridge • Quincy Avenue: Reservoir Road to E-470 • SH-7: Weld County Road 11 to East (Boulder) County Line Road • Sheridan Boulevard: 136th Avenue to 144th Avenue • Smoky Hill Road: E-470 to Arapahoe Road • Thornton Parkway: Steele Street to Colorado Boulevard • Tower Road: 6th Avenue to 48th Avenue • Washington Street: 152nd Avenue to 136th Avenue • York Street: 144th Avenue to E-470 New Interchanges: • C-470 at Yale Avenue • C-470: Alameda Avenue • E-470 at Valley Highway Road • E-470: I-70 • I-25 at 136th Avenue • I-25 at 144th Avenue • I-25: Douglas Lane, approximately mile post 179 • I-70: Approximately Havana Street/Yosemite Street • US-36: McCaslin Boulevard (new ramps) • Wadsworth Boulevard: Bowles Avenue • E-470/Potomac/Chambers Road • I-25: Ridgegate

56