2004 operations, maintenance, and monitoring report1.pdfsoutheasterly winds, sediment-rich waters...
TRANSCRIPT

State of Louisiana Department of Natural Resources Coastal Restoration Division and Coastal Engineering Division
2004 Operations, Maintenance, and Monitoring Report for Little Vermilion Bay Sediment Trapping State Project Number TV-12 Priority Project List 5 May 2004 Vermilion Parish Prepared by: David Castellanos, Biological Monitoring Section (CRD) and Stan Aucoin, Field Engineering Section (CED) LDNR/Coastal Restoration and Management Lafayette Field Office 635 Cajundome Boulevard Lafayette, LA 70506
ii
2004 Operations, Maintenance, and Monitoring Report for Little Vermilion Bay Sediment Trapping (TV-12)
LDNR/CRD Biological Monitoring Sectionand LDNR/CED Field Engineering Section
Suggested Citation: Castellanos, D. and S. Aucoin 2004. 2004 Operations, Maintenance, and Monitoring Report for Little Vermilion Bay Sediment Trapping (TV-12), Louisiana Department of Natural Resources, Coastal Restoration Division, Lafayette, Louisiana.

iii
2004 Operations, Maintenance, and Monitoring Report for Little Vermilion Bay Sediment Trapping (TV-12)
LDNR/CRD Biological Monitoring Sectionand LDNR/CED Field Engineering Section
2004 Operation, Maintenance and Monitoring Report for
Little Vermilion Bay Sediment Trapping (TV-12)
Table of Contents
I. Introduction....................................................................................................................1 II. Maintenance Activity.....................................................................................................4 a. Project Feature Inspection Procedures ................................................................................. 4 b. Inspection Results .....................................................................................................4 c. Maintenance Recommendations ...............................................................................4
i. Immediate/Emergency .........................................................................................4 ii. Programmatic/Routine........................................................................................4
III. Operation Activity .........................................................................................................5 a. Operation Plan...........................................................................................................5 b. Actual operations ......................................................................................................5 IV. Monitoring Activity .......................................................................................................6 a. Monitoring Goals ......................................................................................................6 b. Monitoring Elements ................................................................................................7 c. Preliminary Monitoring Results and Discussion ....................................................11 V. Conclusions..................................................................................................................17 a. Project Effectiveness..............................................................................................17 b. Recommended Improvements ................................................................................17 c. Lessons Learned......................................................................................................17

1
2004 Operations, Maintenance, and Monitoring Report for Little Vermilion Bay Sediment Trapping (TV-12)
LDNR/CRD Biological Monitoring Sectionand LDNR/CED Field Engineering Section
0BI. Introduction
Little Vermilion Bay is a shallow western extension of Vermilion Bay, located in south-central Vermilion Parish, Louisiana (figure 1). Prior to 1900, marshes surrounding Little Vermilion Bay were brackish or saline. By 1952, fresh water from the Atchafalaya Basin began reaching Atchafalaya Bay and reduced salinities in the area. With strong southeasterly winds, sediment-rich waters from Atchafalaya Bay reach Little Vermilion Bay and deposit sediments in the project area. Perhaps the most important hydrologic change within this region was the dredging of the Gulf Intracoastal Waterway (GIWW). Construction of the GIWW was authorized by the Rivers and Harbors Act of 1925. Recent studies, involving satellite imagery and turbidity meters, indicate that northwest winds (resulting from cold fronts) are largely responsible for re-suspending sediments in LittleVermilion Bay and that the GIWW and Freshwater Bayou are significant sources of fresh water and sediment into the area. Sediment availability is of fundamental importance to the project. The recognition of the potential for subaerial development in Little Vermilion Bay stimulated interest in designing a plan to enhance this development. At mean tide levels, water depth in Little Vermilion Bay ranges from 1 to 3 ft (0.3 - 0.9 m). Soil types surrounding Little Vermilion Bay are classified as Clovelly-Lafitte. Clovelly soils consist of continuously flooded, very poorly drained, and very slowly permeable organic matter formed in moderately thick accumulations of herbaceous plant material, overlying very fluid clayey alluvium. Lafitte soils consist of mostly flooded, very poorly drained, and moderately rapidly permeable, organic matter from herbaceous plant material, overlying clayey alluvium. Marshes surrounding Little Vermilion Bay have been classified as brackish. Primary plant species include Phragmites australis (roseau cane), Spartina patens (saltmeadow cordgrass), S. alterniflora (smooth cordgrass), Sagittaria sp. (arrowhead), Schoenoplectus californicus (giant bulrush), Typha sp. (cat-tail), Juncus romerianus (needle rush), and Cladium jamaicense (sawgrass). At present, no documented studies of wetland change nor coastal restoration activities have been conducted within Little Vermilion Bay. However, Vermilion Land Corporation constructed spoil terraces adjacent to the project area as a pilot study. Unpublished results indicated that after 13 months, while the unvegetated terraces eroded away, those that were vegetated actually were improving through growth and colonization of additional plants. The Little Vermilion Bay Sediment Trapping Project area will affect 964 ac (390 ha), of which 67 ac (27 ha) are intermediate marsh and 897 ac (363 ha) are open water (figure 1). It is located in the northwestern corner of Little Vermilion Bay at its intersection with Freshwater Bayou.

2
2004 Operations, Maintenance, and Monitoring Report for Little Vermilion Bay Sediment Trapping (TV-12)
LDNR/CRD Biological Monitoring Sectionand LDNR/CED Field Engineering Section
The project includes multiple features that classify it not only as a sediment trapping project but also a vegetative planting and shoreline protection project. Construction was completed in September 1999. The features include: 1. Dredging approximately 14,000 to 19,900 linear feet (4,267 - 6,065 m) of distributary channels 100 ft (30.5 m) wide and 10 ft (3.0 m) deep.
2. Creating approximately 68 acres (8.9 - 12.5 ha) of terraces. 3. Planting gallon containers and sprigs of S. alterniflora at the base of terraces and
along the existing shoreline.

3
2004 Operations, Maintenance, and Monitoring Report for Little Vermilion Bay Sediment Trapping (TV-12)
LDNR/CRD Biological Monitoring Sectionand LDNR/CED Field Engineering Section
Figure 1. TV-12 project and reference area boundaries including location of terraces and shoreline position in 1999.

4
2004 Operations, Maintenance, and Monitoring Report for Little Vermilion Bay Sediment Trapping (TV-12)
LDNR/CRD Biological Monitoring Sectionand LDNR/CED Field Engineering Section
Maintenance Activity
a. 1BProject Feature Inspection Procedures The purpose of the annual inspection of the Little Vermilion Bay Sediment Trapping Project (TV-12) is to evaluate the constructed project features to identify any deficiencies and prepare a report detailing the condition of project features and recommended corrective actions needed. Should it be determined that corrective actions are needed, LDNR shall provide, in the report, a detailed cost estimate for engineering, design, supervision, inspection, and construction contingencies, and an assessment of the urgency of such repairs. An inspection of the Little Vermilion Bay Sediment Trapping Project (TV-12) was held on March 29, 2004 under partly cloudy skies and mild temperatures. In attendance was Stan Aucoin, Dewey Billodeau, Mel Guidry, and Pat Landry from LDNR, Brad Sticker representing NRCS (for other inspections), and John Foret of NOAA Fisheries. All parties met at the Lafayette Field Office of CED and traveled to Intracoastal City in Vermilion Parish, LA. The annual inspection began at approximately 12:10 p.m. at the convergence of Freshwater Bayou and Little Vermilion Bay. The field inspection included a complete visual inspection of the entire project site. Staff gauge readings were used to determine approximate elevations of water and earthen terraces. Photographs were taken at each project feature and Field Inspection notes were completed in the field to record measurements and deficiencies.
2Bb. Inspection Results
5BUSite 1—Earthen terraces The terraces appear to be in excellent condition. Some slight erosion has taken place on the southern most terraces but not nearly as severe as anticipated. No sections on the excavated channels to determine sediment deposited were taken on this inspection. No maintenance needed at this time. USite 2—Vegetation plantings Vegetation has spread throughout the terraces. No maintenance needed at this time.

5
2004 Operations, Maintenance, and Monitoring Report for Little Vermilion Bay Sediment Trapping (TV-12)
LDNR/CRD Biological Monitoring Sectionand LDNR/CED Field Engineering Section
II. 3BMaintenance Activity (continued) c. Maintenance Recommendations
i. Immediate/ Emergency Repairs None
ii. Programmatic/ Routine Repairs None
III. Operation Activity
a. Operation Plan There are no active operations associated with this project.
b. Actual Operations
N/A

6
2004 Operations, Maintenance, and Monitoring Report for Little Vermilion Bay Sediment Trapping (TV-12)
LDNR/CRD Biological Monitoring Sectionand LDNR/CED Field Engineering Section
IV. Monitoring Activity
a. Monitoring Goals The objectives of the Little Vermillion Bay Sediment Trapping Project are to: 1. Enhance the amount of wetlands created by natural sediment deposition where confined
flow of Atchafalaya River water enters the project area through the dredging of distributary channels.
2. Protect the existing wetlands of the project area by reducing wave energy through the
creation of terraces. 3. Create emergent marsh on terraces along distributary channels and on newly deposited
soils. 4. Encourage colonization by submerged aquatic vegetation between and around terraces The following goals will contribute to the evaluation of the above objectives: 1. Increase sediment deposition in the project area conducive to the establishment of
emergent vegetation. 2. Create and enhance emergent marsh by planting on terraces and along suitable existing
shorelines. 3. Increase the occurrence of submerged aquatic vegetation in shallow open water within
the project area. 4. Reduce shore erosion rate in the project area.

7
2004 Operations, Maintenance, and Monitoring Report for Little Vermilion Bay Sediment Trapping (TV-12)
LDNR/CRD Biological Monitoring Sectionand LDNR/CED Field Engineering Section
b. Monitoring Elements
UAerial Photography U: To document marsh to open-water ratios and marsh loss rates, color infrared aerial photography (1:12,000) was obtained in 2000 (2 months after construction), and postconstruction in 2002, and will be obtained in 2009, and 2017. Imagery was delineated to classify all land in the project and reference areas as either (1) preexisting wetlands, (2) terraces, and (3) non-terrace, newly developed wetlands called mudflat (i.e., those that develop in open water areas between the terraces or adjacent to the preexisting shoreline). The original photography was checked for flight accuracy, color correctness, and clarity and was subsequently archived. Aerial photography was scanned, mosaicked, and georectified by USGS/NWRC personnel according to standard operating procedures. UHydrophytic ClassificationU: The vascular plants that were planted and naturally colonized the terraces were evaluated and classified into a wetland indicator status based on a plant species frequency of occurrence in wetlands. The status is from the “National List of Wetland Plant Species That Occur in Wetlands: Louisiana”. The five classifications used and their prevalence index values are obligate wetland (OBL=1), facultative wetland (FACW=2), facultative plants (FAC=3), facultative upland (FACU=4), and obligate upland (UPL=5). Data were collected using line intercept methodology on a minimum of two and a maximum of four transects per terrace (dependent upon length), with samples taken at 3.28 ft (1 m) intervals (figure 2). All plants that were in the vertical plane of the line were identified, assigned a prevalence index number, and averaged for each 3.28 ft (1 m) segment. The number of segments with prevalence index values of 1, 2 or 3 on each terrace was determined and a percentage of the total calculated. Measurements were taken across the terraces from vegetated edge to vegetated edge and differential Global Positioning System (dGPS) readings were recorded for consistency of sampling area location for each sampling date. Hydrophytic classification was determined in 2002 on 43 transects that tracked the elevation survey cross section lines. The area will be sampled again in 2004. USubmerged Aquatic VegetationU: To document changes in the frequency of occurrence of submerged aquatic vegetation (SAV), a modification of the rake method was employed. The project and reference area were monitored along 5 transects (figure 3). Each transect had a minimum of 50 sampling stations. At each station, aquatic vegetation was sampled by dragging a garden rake on the pond bottom for about 1 second. The presence of vegetation was recorded to determine the frequency of aquatic plant occurrence (frequency = number of occurrences/number of stations x 100). When vegetation was present, the species present were recorded in order to determine the frequencies of individual species. SAV abundance was sampled in 1999 (pre-construction) and post-construction in 2003. UBathymetry/Topography U: Sediment deposition was monitored along existing transects used in bathymetry map creation (for engineering purposes). Several transects encompassing an array of terrace and channel

8
2004 Operations, Maintenance, and Monitoring Report for Little Vermilion Bay Sediment Trapping (TV-12)
LDNR/CRD Biological Monitoring Sectionand LDNR/CED Field Engineering Section
formations were selected for development of elevation change profiles (figure 2). Elevations of the water bottom, terrace, and channels were determined along each transect in a similar fashion to that in the initial survey. Surveys were conducted by a professional engineering firm in 1999 (as built), in 2003, and will be conducted in 2005, and 2009. Survey years may change to gather additional information earlier in the project life. UShoreline Change: U To document shoreline change in the project area, GPS surveys were conducted at the vegetative edge of the bank to document the position of the shoreline before construction in 1999 and after construction in 2003. A similar survey was conducted in the reference area. GPS shoreline positions were mapped and will be used to measure shoreline movement in the next report.

9
2004 Operations, Maintenance, and Monitoring Report for Little Vermilion Bay Sediment Trapping (TV-12)
LDNR/CRD Biological Monitoring Sectionand LDNR/CED Field Engineering Section
Figure 2. TV-12 project area with project boundary and locations of elevation survey cross sections and emergent vegetation transects.
X-3
X-8
X-11
A
C
B
E
X-16
X-25
X-19
X-31
F
G
O
P
I
K
L
RS
D
H
N
J
Q

10
2004 Operations, Maintenance, and Monitoring Report for Little Vermilion Bay Sediment Trapping (TV-12)
LDNR/CRD Biological Monitoring Sectionand LDNR/CED Field Engineering Section
Figure 3. TV-12 project and reference areas with locations of SAV transects and dGPS mapped shoreline in 1999.

11
2004 Operations, Maintenance, and Monitoring Report for Little Vermilion Bay Sediment Trapping (TV-12)
LDNR/CRD Biological Monitoring Sectionand LDNR/CED Field Engineering Section
IV. Monitoring Activity (continued)
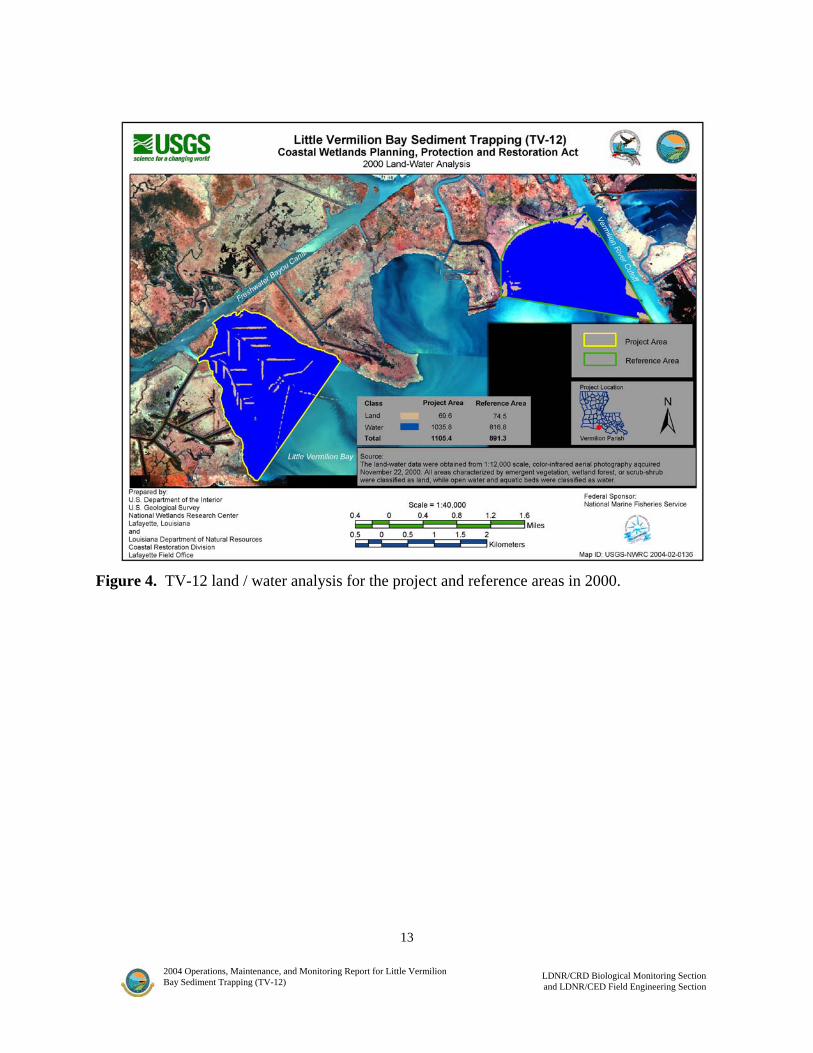
c. Preliminary Monitoring Results and Discussion UAerial Photography U: According to the year 2000 photography analysis, the project area consisted of 68 ac (27.5 ha) of land and the reference area had 74 ac (29.9 ha) (figure 4). Of the total land in the project area, 56.2 ac (22.7 ha) were constructed terraces (figure 5). The 2002 land-water analysis determined that the land portion of the project area consisted of 62.7 ac (25.4 ha) and the reference area had 73.5 ac (29.7 ha) of land (figure 6). The change from the 2000 amounts is a loss of 5.3 ac (2.1 ha) of land in the project area and a loss of 0.5 ac (0.2 ha) in the reference area. The project area was further analyzed to identify areas of loss and gain (figure 7). There was no pattern, but gains were limited to a few terraces, whereas losses were distributed among the edges of all terraces. In addition to the land and water classes, a mud flat class was added to describe areas of very shallow water mostly in between terraces and in some places in the reference area. In 2002, the project area had 199.5 ac (80.7 ha) of mud flat area and the reference area had 111.6 ac (45.1 ha) of mud flat. The periodically exposed mudflats are apparently building up from sediment deposition and may eventually become permanently subaerial and contribute to the land component of the analysis. It is interesting to note that mudflat developed around natural features in the reference area, yet in the project area, all sediment deposition appears to be near the project features, indicating the utility of the terraces. UHydrophytic classification: U In 1999 immediately after construction, the terraces were obviously bare except for the Spartina alterniflora plantings (figures 8 and 9). By 2000, the Spartina alterniflora plantings covered much of the edges of the terraces with thick, tall vegetation (figure 10). Planted and natural vegetation cover increased and completely covered parts of some terraces by 2001 (figure 11). In summer 2002, the emergent vegetation on the terraces was sampled. S. alterniflora plantings grew well, and on most terraces they remained dominant on the edges. Many other species have colonized and covered the terraces (figure 12). Of the approximately 42 species found, 22 are obligate wetland, 15 are facultative wetland, 4 are facultative, and 1 is facultative upland (table 1). These plants and the plantings have covered all but the highest elevations in the middle of a few terraces where some bare ground remains. One hundred percent of the total 488 segments with some vegetation have an average prevalence index value of 1, 2, or 3, which corresponds to the wetland classifications obligate wetland, facultative wetland, and facultative respectively. Also, 98% of all the segments had average index values that were 2 or less, indicating that the vast majority of vegetation on the terraces is ideally suited for emergent marsh habitat. USubmerged Aquatic Vegetation: U Significant amounts of SAV were not collected with rake samples at construction or nearly three years later (spring 2003). The mean % cover for all SAV in the reference area in 1999 was 5.4% and less than 1% in the project area (figure 13). In 2003, the mean % cover of SAV was less than 3% in the reference area and less than 1% in the project area. SAV is generally most abundant in late summer or fall; therefore it may have been underestimated in the 2003 spring

12
2004 Operations, Maintenance, and Monitoring Report for Little Vermilion Bay Sediment Trapping (TV-12)
LDNR/CRD Biological Monitoring Sectionand LDNR/CED Field Engineering Section
sampling. The 2003 SAV sampling was conducted in spring because of the imminent construction of the TV-18 project in the area between Little White Lake and Vermilion River Cutoff which has since effectively eliminated the reference area (figure 1). SAV was also found at some of the terrace edges during the emergent vegetation survey completed in summer 2002, indicating benefit from the increased elevation and protection from the terraces. An expected increase in bottom elevation between the terraces should also facilitate SAV growth assuming there is a viable seed or plant fragment source in the area. UBathymetry/Topography: U An elevation survey was conducted immediately after construction in September 1999. A postconstruction elevation survey of a subset of the original transects was completed in August 2003. It appears that there has been substantial sediment deposition. The mean channel bottom elevation in 2003 was 1.37 ft higher than in 1999 (figure 14). Bay bottom in the vicinity of the terraces, had a mean elevation increase of 0.5 ft. During the same period, the average terrace elevation loss was only 0.018 ft. All cross sections showed some elevation increases on bottoms or in channels (figures 15 – 20). Most channels filled in more by 2003, but a few apparently were scoured to a greater depth since 1999 (figures 15, 17, and 20). Aerial photography (figure 21) and the presence of mudflats with sprouting vegetation between terraces (figure 22) offer additional proof that sediment deposition has begun. The source of the sediments may be from Freshwater Bayou, regularly resuspended bay bottom, Hurricane Lili, sloughed terrace material, or some combination of all four. It seems unlikely that all the sedimentation could be from only shed terrace materials. The other three are naturally occurring and expected to continue, so we anticipate further substantial sediment deposition. UShoreline Change: Baseline shoreline postion using DGPS was collected in 1999 and overlaid on aerial photography (figure 1). A repeat shoreline GPS survey was conducted in spring 2003. The two survey lines from 1999 and 2003 will be analyzed for acreage gain or loss for the next report.
13
2004 Operations, Maintenance, and Monitoring Report for Little Vermilion Bay Sediment Trapping (TV-12)
LDNR/CRD Biological Monitoring Sectionand LDNR/CED Field Engineering Section
Figure 4. TV-12 land / water analysis for the project and reference areas in 2000.

14
2004 Operations, Maintenance, and Monitoring Report for Little Vermilion Bay Sediment Trapping (TV-12)
LDNR/CRD Biological Monitoring Sectionand LDNR/CED Field Engineering Section
Figure 5. TV-12 project area with existing land and created terraces in 2000.

15
2004 Operations, Maintenance, and Monitoring Report for Little Vermilion Bay Sediment Trapping (TV-12)
LDNR/CRD Biological Monitoring Sectionand LDNR/CED Field Engineering Section
Figure 6. 2002 land / water analysis for the TV-12 project and reference areas.

16
2004 Operations, Maintenance, and Monitoring Report for Little Vermilion Bay Sediment Trapping (TV-12)
LDNR/CRD Biological Monitoring Sectionand LDNR/CED Field Engineering Section
Figure 7. Map showing specific areas of land loss / gain in the project area from 2000 to 2002.
17
2004 Operations, Maintenance, and Monitoring Report for Little Vermilion Bay Sediment Trapping (TV-12)
LDNR/CRD Biological Monitoring Sectionand LDNR/CED Field Engineering Section
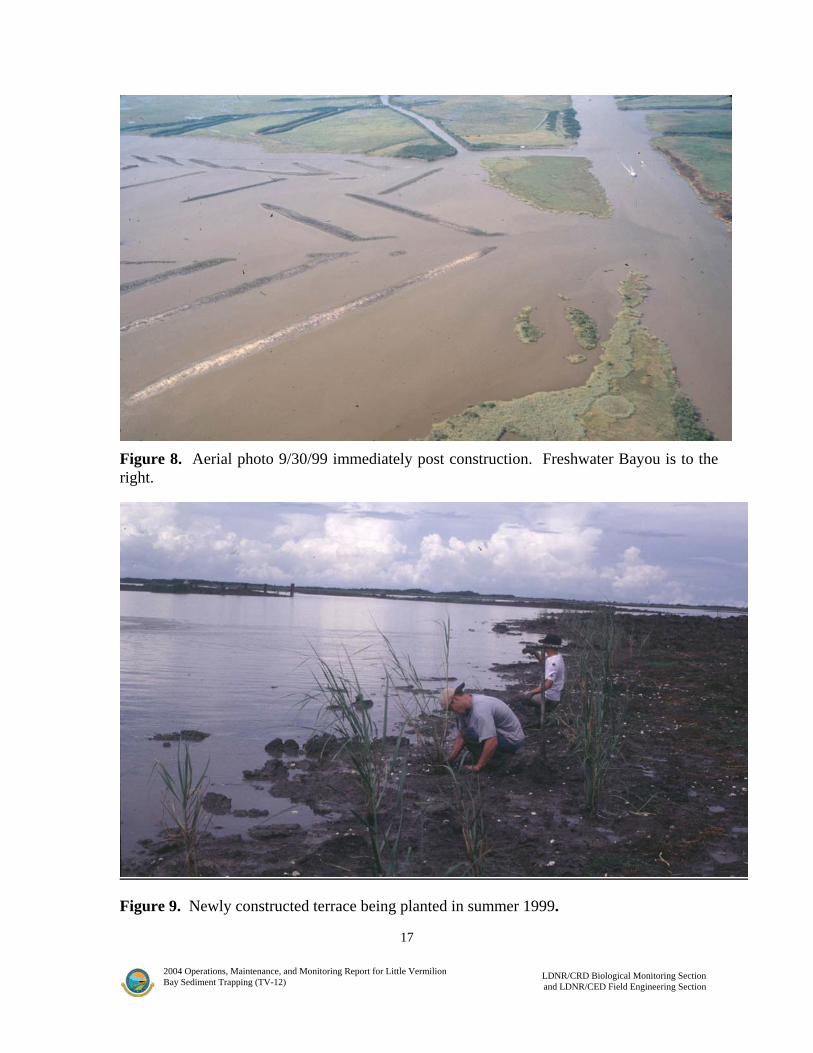
Figure 8. Aerial photo 9/30/99 immediately post construction. Freshwater Bayou is to the right.
Figure 9. Newly constructed terrace being planted in summer 1999.

18
2004 Operations, Maintenance, and Monitoring Report for Little Vermilion Bay Sediment Trapping (TV-12)
LDNR/CRD Biological Monitoring Sectionand LDNR/CED Field Engineering Section
Figure 10. View from middle of a terrace in June 2000 one year after construction and planting, showing growth of planted Spartina alterniflora on either side.
Figure 11. Planted and natural vegetation growth on a terrace in August 2001.

19
2004 Operations, Maintenance, and Monitoring Report for Little Vermilion Bay Sediment Trapping (TV-12)
LDNR/CRD Biological Monitoring Sectionand LDNR/CED Field Engineering Section
Figure 12. Vegetation on a terrace photographed during emergent vegetation survey in August 2002.

20
2004 Operations, Maintenance, and Monitoring Report for Little Vermilion Bay Sediment Trapping (TV-12)
LDNR/CRD Biological Monitoring Sectionand LDNR/CED Field Engineering Section
Table 1. Vegetation species collected on the terraces of the TV-12 project during summer 2002 sampling with the corresponding wetland indicator status and common name. SAV and floating aquatic species are included, but did not affect the outcome of the segment means of the prevalence indicator scores. Taxa Score Indicator Abbreviation Common name Alternanthera philoxeroides 1 Obligate Wetland OBL alligatorweed Amaranthus australis 1 Obligate Wetland OBL southern amaranth Baccharis halimifolia 3 Facultative FAC eastern baccharis Bacopa monnieri 1 Obligate Wetland OBL coastal waterhyssop Cephalanthus occidentalis 1 Obligate Wetland OBL common buttonbush **Ceratophyllum demersum 1 Obligate Wetland OBL coontail Colacasia esculenta 1 Obligate Wetland OBL coco yam Cuscuta indecora NA NA NA bigseed alfalfa dodder Cyperus odoratus 2 Facultative Wetland FACW fragrant flatsedge Cyperus oxylepis 2 Facultative Wetland FACW sharpscale flatsedge Cyperus sp. 2 Facultative Wetland FACW flatsedge Distichlis spicata 2 Facultative Wetland FACW+ seashore saltgrass Echinochloa walteri 1 Obligate Wetland OBL coast cockspur Eclipta prostrata 2 Facultative Wetland FACW- false daisy Eleocharis albida 1 Obligate Wetland OBL white spikerush Eleocharis parvula 1 Obligate Wetland OBL dwarf spikesedge Eupatorium capillifolium 4 Facultative Upland FACU dogfennel
Eupatorium serontinum 3 Facultative FAC lateflowering thoroughwort
Hibiscus moscheutos L. ssp. lasiocarpos 1 Obligate Wetland OBL marshmallow Hydrocotle verticillata 1 Obligate Wetland OBL whorled marshpennywort Ipomoea sagittata 2 Facultative Wetland FACW saltmarsh morning glory Iris virginica 1 Obligate Wetland OBL Virginia iris Iva frutescens 2 Facultative Wetland FACW+ bigleaf sumpweed Juncus roemerianus 1 Obligate Wetland OBL needlegrass rush Kosteletskya virginica 1 Obligate Wetland OBL Virginia saltmarsh mallow *Lemna sp. 1 Obligate Wetland OBL duckweed Lilaeopsis sp. 1 Obligate Wetland OBL grasswort Lythrum lineare 1 Obligate Wetland OBL wand lythrum Mikania scandens 2 Facultative Wetland FACW+ climbing hempvine Panicum dichotomiflorum 2 Facultative Wetland FACW fall panicgrass Panicum repens 2 Facultative Wetland FACW- torpedograss Paspalum vaginatum 1 Obligate Wetland OBL seashore paspalum Phragmites australlis 2 Facultative Wetland FACW common reed Pluchea odorata 2 Facultative Wetland FACW sweetscent Polygonum hydropiperoides 1 Obligate Wetland OBL swamp smartweed Sagittaria lancifolia 1 Obligate Wetland OBL bulltongue *Salvinia minima 1 Obligate Wetland OBL water spangles Schoenoplectus americanus 1 Obligate Wetland OBL Olney bulrush Schoenoplectus maritimus 1 Obligate Wetland OBL cosmopolitan bulrush Sesbania drummondii 2 Facultative Wetland FACW poisonbean Solidago sempervirens 2 Facultative Wetland FACW seaside goldenrod

21
2004 Operations, Maintenance, and Monitoring Report for Little Vermilion Bay Sediment Trapping (TV-12)
LDNR/CRD Biological Monitoring Sectionand LDNR/CED Field Engineering Section
Spartina alterniflora 1 Obligate Wetland OBL smooth cordgrass Taxa Score Indicator Abbreviation Common name Spartina patens 2 Facultative Wetland FACW marshhay cordgrass Symphyotrichum tenuifolium 1 Obligate Wetland OBL perennial saltmarsh aster Triadica sebifera 3 Facultative FAC tallowtree **Vallisneria americana 1 Obligate Wetland OBL American eelgrass Vigna luteola 2 Facultative Wetland FACW hairypod cowpea
OBL FACW FAC FACU SAV Floating Aq. Total Total emergent 22 16 3 1 2 2 47 43
*Floating aquatic vegetation found among stems of emergent vegetation on terraces at the extreme ends of vegetation transects **Submerged aquatic vegetation found among stems of emergent vegetation on terraces at the extreme ends of vegetation transects

22
2004 Operations, Maintenance, and Monitoring Report for Little Vermilion Bay Sediment Trapping (TV-12)
LDNR/CRD Biological Monitoring Sectionand LDNR/CED Field Engineering Section
TV-12 SAV Cover 1999 and 2003
0123456
Reference1999
Project Reference2003
Project
Area
% C
over
SA
V an
d al
gae
Ceratophyllum demersum algae Utricularia foliosa
Figure 13. SAV cover in the TV-12 project and reference areas in 1999 and 2003.
-6
-5
-4
-3
-2
-1
0
1
2
3
Bay Bottom Channel Terrace
Location
Mea
n El
evat
ion
(ft. N
AVD
)
1999 elevation2003 elevationn = 22
n = 26n = 21
Figure 14. Mean elevation of three major project area locations from the 1999 and 2003 elevation surveys. Each location mean was calculated from 21 to 26 points that were measured in the same place in both surveys.

23
2004 Operations, Maintenance, and Monitoring Report for Little Vermilion Bay Sediment Trapping (TV-12)
LDNR/CRD Biological Monitoring Sectionand LDNR/CED Field Engineering Section
bot bot
chan
TerATerA
botedge
bot
chan
chan chanchan chan
bot
-12.00
-10.00
-8.00
-6.00
-4.00
-2.00
0.00
2.00
4.00El
evat
ion
(ft. N
AVD
)
2003 elevation1999 elevation
Figure 15. Elevations of selected paired points along cross section 3 from the 1999 and 2003 surveys. Bot = Bay Bottom, Ter = terrace, chan = channel, and edge = edges between terraces, channels, and bottoms. Points are equidistant along the x axis on the chart and the distance between them does not reflect the true physical distance.
bot bot bot bot
TerFTerF
TerFTerF
botedge
edge-8.00
-6.00
-4.00
-2.00
0.00
2.00
4.00
Elev
atio
n (f
t. N
AVD
)
2003 elevation1999 elevation
Figure 16. Elevations of selected paired points along cross section 11 from the 1999 and 2003 surveys. Bot = Bay Bottom, Ter = terrace, chan = channel, and edge = edges between terraces, channels, and bottoms. Points are equidistant along the x axis on the chart and the distance between them does not reflect the true physical distance.

24
2004 Operations, Maintenance, and Monitoring Report for Little Vermilion Bay Sediment Trapping (TV-12)
LDNR/CRD Biological Monitoring Sectionand LDNR/CED Field Engineering Section
botTer O
Ter O
Ter O
edge
chanchan
Ter PTer Pedge
edge
chan
chanchanchan
edge
-10.00
-8.00
-6.00
-4.00
-2.00
0.00
2.00
4.00
6.00El
evat
ion
(ft. N
AVD
)
2003 elevation1999 elevation
Figure 17. Elevations of selected paired points along cross section 16 from the 1999 and 2003 surveys. Bot = Bay Bottom, Ter = terrace, chan = channel, and edge = edges between terraces, channels, and bottoms. Points are equidistant along the x axis on the chart and the distance between them does not reflect the true physical distance.
bottom
chan
chanTer Kbot
chanedge
bot
Ter LTer L
Ter L
edge bot bot
-8.00
-6.00
-4.00
-2.00
0.00
2.00
4.00
6.00
Elev
atio
n (ft
. NA
VD)
2003 elevation1999 elevation
Figure 18. Elevations of selected paired points along cross section 19 from the 1999 and 2003 surveys. Bot = Bay Bottom, Ter = terrace, chan = channel, and edge = edges between terraces, channels, and bottoms. Points are equidistant along the x axis on the chart and the distance between them does not reflect the true physical distance.

25
2004 Operations, Maintenance, and Monitoring Report for Little Vermilion Bay Sediment Trapping (TV-12)
LDNR/CRD Biological Monitoring Sectionand LDNR/CED Field Engineering Section
botbot
botTer R
Ter RTer R
Ter S Ter S edge
chan
-6.00
-5.00
-4.00
-3.00
-2.00
-1.00
0.00
1.00
2.00
3.00
4.00El
evat
ion
(ft. N
AVD)
2003 elevation1999 elevation
Figure 19. Elevations of selected paired points along cross section 25 from the 1999 and 2003 surveys. Bot = Bay Bottom, Ter = terrace, chan = channel, and edge = edges between terraces, channels, and bottoms. Points are equidistant along the x axis on the chart and the distance between them does not reflect the true physical distance.
bot
Ter I edge
chan
chanchan chan
chan bot
-10.00
-8.00
-6.00
-4.00
-2.00
0.00
2.00
4.00
Elev
atio
n (ft
. NA
VD)
2003 elevation1999 elevation
Figure 20. Elevations of selected paired points along cross section 31 from the 1999 and 2003 surveys. Bot = Bay Bottom, Ter = terrace, chan = channel, and edge = edges between terraces, channels, and bottoms. Points are equidistant along the x axis on the chart and the distance between them does not reflect the true physical distance.

26
2004 Operations, Maintenance, and Monitoring Report for Little Vermilion Bay Sediment Trapping (TV-12)
LDNR/CRD Biological Monitoring Sectionand LDNR/CED Field Engineering Section
Figure 21. Aerial photograph of TV-12 project area taken in April 2003 showing exposed mudflat areas.

27
2004 Operations, Maintenance, and Monitoring Report for Little Vermilion Bay Sediment Trapping (TV-12)
LDNR/CRD Biological Monitoring Sectionand LDNR/CED Field Engineering Section
Figure 22. Close up view of a mudflat between terraces of the TV-12 project with sprouting vegetation.

28
2004 Operations, Maintenance, and Monitoring Report for Little Vermilion Bay Sediment Trapping (TV-12)
LDNR/CRD Biological Monitoring Sectionand LDNR/CED Field Engineering Section
V. 4BConclusions a. Project Effectiveness The terraces were very effective at creating emergent marsh habitat. The speed at which the terraces vegetated, including coverage from natural emergent species was impressive. As expected, sedimentation has also increased as a result of the terraces construction. Whether the result of sediment input from nearby Freshwater Bayou, Hurricane Lili, or some combination of both, many acres could become emergent marsh in the near future. SAV establishment has yet to be a proven benefit. There are several reasons why this may not have occurred: no viable seed bank or feeder populations, high water velocity, high turbidity, low elevation (with the increased deposition, this seems unlikely to be an impediment now).
b. Recommended Improvements Assessment surveys by a licensed engineering/land surveying firm will be performed within five years or sooner (depending on results of annual inspection) to assess post construction settlement data for comparison to the anticipated settlement outlined in the Geotechnical Report.
c. Lessons Learned Terraces, when constructed with the proper material, can create almost instant emergent marsh in previously open water habitat. Although beneficial to this project, the growth of vegetation from species not specifically planted may not always be expected. The existence of a good seed bank or other natural seeding may not always occur in other areas where terraces may be constructed. Terrace elevation was crucial to the success of this project, but elevation of the terraces is only important relative to the elevation of the surrounding water. Without any water level measuring instruments in or near the project area, we could not determine the influence of the hydroperiod on the success of the vegetation growth. A continuous recorder would have allowed us to evaluate the impact of the duration of inundation and draining, a factor especially important for wetland vegetation species. Sediment deposition has increased in the project area since the construction of the project. Although we cannot separate out the possible sediment deposition from Hurricane Lili for the 2000 – 2002 period, we assume that the area is also constantly fed by sediment laden water from Freshwater Bayou and ultimately from the Atchafalaya River. Regardless of the sediment source, it is clear that the presence of the terraces enhanced deposition in the project area. Therefore, we conclude that location choice for projects is very important and in this case was accurate and contributed to the overall effectiveness of the project.