2004 in situ monitoring techniques for concentration polarization and fouling phenomena in membrane...
DESCRIPTION
aTRANSCRIPT

Advances in Colloid and Interface Science 107(2004) 83–108
0001-8686/04/$ - see front matter� 2004 Elsevier B.V. All rights reserved.doi:10.1016/j.cis.2003.10.018
In situ monitoring techniques for concentration polarization and foulingphenomena in membrane filtration
Jim C. Chen, Qilin Li, Menachem Elimelech*
Department of Chemical Engineering, Environmental Engineering Program, Yale University, P.O. Box 208286, New Haven,CT 05620-8286, USA
Abstract
Membrane fouling and subsequent permeate flux decline are inevitably associated with pressure-driven membrane processes.Despite the myriad of studies on membrane fouling and related phenomena—concentration polarization, cake formation and poreplugging—the fundamental mechanisms and processes involved are still not fully understood. A key to breakthroughs inunderstanding of fouling phenomena is the development of novel, non-invasive, in situ quantification of physico-chemicalprocesses occurring during membrane filtration. State-of-the-art in situ monitoring techniques for concentration polarization, cakeformation and fouling phenomena in pressure-driven membrane filtration are critically reviewed in this paper. The review addressesthe physical principles and applications of the techniques as well as their strengths and deficiencies. Emphasis is given totechniques relevant to fouling phenomena where particles and solutes accumulate on the membrane surface such that poreplugging is negligible. The relevance of the techniques to specific processes and mechanisms involved in membrane fouling isalso elaborated and discussed.� 2004 Elsevier B.V. All rights reserved.
Keywords: Concentration polarization; Membrane fouling; Cake formation; In situ monitoring techniques; Permeate flux decline; Membranefiltration; Fouling mechanisms
Contents
1. Introduction ............................................................................................................................................ 842. Overview of concentration polarization and cake formation................................................................................ 853. In situ monitoring techniques for concentration polarization............................................................................... 863.1. Light deflection techniques................................................................................................................... 863.1.1. Shadowgraphy............................................................................................................................ 863.1.2. Refractometry............................................................................................................................. 89
3.2. Magnetic resonance imaging(MRI) ....................................................................................................... 913.3. Radio isotope labeling......................................................................................................................... 943.4. Electron diode array microscope............................................................................................................ 953.5. Direct pressure measurements............................................................................................................... 96
4. In situ monitoring techniques for cake formation and membrane fouling............................................................... 964.1. Particle deposition and cake layer formation............................................................................................. 964.1.1. Direct observation through the membrane.......................................................................................... 974.1.2. Direct visualization above the membrane........................................................................................... 984.1.3. Laser triangulometry..................................................................................................................... 994.1.4. Optical laser sensor.................................................................................................................... 100
*Corresponding author. Tel.:q1-203-432-2789; fax:q1-203-432-2881.E-mail address: [email protected](M. Elimelech).

84 J.C. Chen et al. / Advances in Colloid and Interface Science 107 (2004) 83–108
4.1.5. Ultrasonic time-domain reflectometry(UTDR) ................................................................................. 1024.1.6. Electrical impedance spectroscopy................................................................................................. 103
4.2. Pore blockage................................................................................................................................. 1034.2.1. Small-angle neutron scattering(SANS) ........................................................................................... 103
4.3. Characterization of cake structure........................................................................................................ 1045. Concluding remarks................................................................................................................................ 106Acknowledgements..................................................................................................................................... 106References................................................................................................................................................ 106
1. Introduction
Pressure-driven membrane filtration processes havesteadily gained importance in industrial separations overthe past three decades. Numerous improvements in thetechnology—for instance, development of highly selec-tive and permeable membranesw1,2x, efficient moduledesign w1–3x and several improvements in peripheraltechnology (e.g. Ref. w4x)—have spurred widespreadadaptation of this process in chemical, environmental,pharmaceutical and biomedical applications. There are,however, several aspects of this constantly evolvingtechnology that have not yet been addressed conclusive-ly and still pose a formidable obstacle toward its wideacceptance.One of these important aspects is the understanding
of membrane fouling and subsequent permeate fluxdecline, which is inevitably associated with membraneprocessesw2,5–7x. Typical observations of permeate fluxover time reveal a rapid initial decline followed by amore gradual long-term declinew8x. Traditionally, theinitial decline is attributed to concentration polarization,a rapid buildup of solute particle concentration near themembrane surface, while the long-term decline is attrib-uted to various modes of membrane foulingw1,2,9x. Inultrafiltration and microfiltration processes, fouling bycolloidal particles is usually attributed to the build-upof a gel or a cake layerw1,2,10–13x.The emphasis in existing studies is to analyze the
long-term flux decline mechanisms, in which case theconcentration polarization ceases to be the dominantcause of flux declinew1,2,9–13x, and the cake filtrationtheory viewpoint is often sufficient for modeling pur-poses. It is, however, important to note that concentra-tion polarization initiates cake formationw5–7,13x.Hence, fundamental understanding of the dynamics ofconcentration polarization can lead to a clearer micro-scopic view of the mechanisms of cake formation andits subsequent growth.Theories of concentration polarization, cake formation
and permeate flux decline have been reviewed in detailover the recent yearsw1,2,5x. In general, the currenttheories are based on hypotheses of assumed behaviorand are validated by a priori or post-experimentalmeasurements. Most experimental work on concentra-
tion polarization and fouling phenomena focused onmeasurement of macroscopic, indirect, gross parame-ters—such as channel-averaged permeate flux, soluterejection and pressure drop—which limits our ability toelucidate the microscopic processes involved and tovalidate pertinent mechanistic theories. Very few studieshave aimed to observe the microscopic processes occur-ring in situ during filtration. Direct and rigorous obser-vation of processes occurring during membrane filtrationis necessary to truly substantiate current theories andmodels. Novel non-invasive, in situ and rigorous quan-tification of processes occurring during membrane filtra-tion is the key to breakthroughs in our understanding offouling phenomena.In this review, we present the state-of-the-art of
available in situ monitoring techniques for concentrationpolarization and fouling phenomena in membrane filtra-tion. The critical review addresses strengths and defi-ciencies in the current techniques and points out therelevance to our understanding of membrane fouling.The review is organized as follows. We start with anoverview of basic principles and terminologies pertinentto concentration polarization and cake formation inpressure-driven membrane processes. Later, we describeavailable techniques relevant to concentration polariza-tion phenomena, namely, light deflection techniques,magnetic resonance imaging(MRI), radio isotope label-ing, electronic diode array microscope and direct pres-sure measurements. Following the techniques forconcentration polarization, methods and instrumentationfor observation of particle deposition, cake formationand membrane fouling are described. The descriptionstarts with optical techniques that monitor particle dep-osition onto membrane surfaces—direct observationthrough a membrane and direct visualization above themembrane. This is followed by techniques that monitorthe cake layer thickness and the dynamics of cake layerbuildup, such as optical laser sensor and ultrasonic time-domain reflectometry(UTDR). The next techniques thatwe describe deal with real time characterization of poreblockage by small-angle neutron scattering(SANS) andcake layer structure characterization using static lightscattering(SLS), SANS, small-angle X-ray scattering(SAXS) and local birefringence techniques. The review

85J.C. Chen et al. / Advances in Colloid and Interface Science 107 (2004) 83–108
ends with conclusions and implications for membraneprocesses.
2. Overview of concentration polarization and cakeformation
In this section we present a short overview on theprinciples of concentration polarization and cake for-mation. We emphasize the distinction between these twophenomena and their underlying thermodynamic andhydrodynamic principles. The overview is not intendedto be extensive, but rather it sets the terminologies andphysical principles relevant to concentration polarizationand cake formation, prior to describing the techniquesfor in situ monitoring of these phenomena.Reverse osmosis, nanofiltration and some ultrafiltra-
tion processes are characterized by the use of membraneshaving pores that can retain solute particles rangingfrom a few angstroms to several nanometers in diameter.Solutes in this size range include small molecules,simple ions and macromolecules. Filtration of suchsolutes from their aqueous solutions generally does notlead to formation of a cake layer on the membranesurface. Thus, these membrane filtration processes aretraditionally explained using the concept of concentra-tion polarization, employing thermodynamic principlesgoverning true solution behaviorw5,14,15x.An alternative approach for describing flux decline
during membrane separation processes is based on thefiltration theory w16,17x. Filtration or hydrodynamictheories assume that a distinct cake(or gel) layer formson the membrane surface, which exerts hydrodynamicresistance to permeate flow. Filtration theory is adequatefor modeling membrane filtration of colloidal and non-Brownian particles because the cake layer forms instan-taneously on the membrane surface. Since cakes arerarely formed during membrane filtration of very smallsolutes, application of filtration theories to membraneprocesses where solely concentration polarization occurshas been debatedw7,18x. Considerable debate existsregarding the suitable theoretical framework to describethese processesw19–21x. This dichotomy often leads toconfusion regarding the domains of validity of thethermodynamic and hydrodynamic models.A more proper approach toward unified treatment of
membrane filtration processes is emerging over therecent yearsw13,20,22–24x. These new theories presumethat above a critical solute or particle concentration atthe membrane surface, a filter cake(gel) layer formson the membrane as a result of phase transition. Whenan assemblage of solute particles in a solution is com-pressed by extracting the solvent molecules from theassemblage, the solutes lose their degrees of freedom,and the retained solution tends to become more struc-tured w25,26x. Beyond a critical concentration and pres-sure, the fluid forms a separate phase where the
Brownian motion of the solute molecules is frozenw26x.This phase transition point differentiates between thetrue solution behavior(disordered phase) and a caketype behavior(ordered phase) w26x. In classical studieson ultrafiltration, the solute concentration at this pointis often termed the ‘gel concentration’w14,18,27x. Fur-thermore, in the mathematical formulation of the emerg-ing modern theories, the formation of a cake is initiatedwhen this concentration is attainedw13,20,23,24x. Belowthis concentration, the permeate flux is considered to begoverned by the solution thermodynamicsw13,20,23,24x.Song and Elimelechw13x and Elimelech and Bhatta-
charjeew24x have quantified the thermodynamic condi-tions that demarcate pure concentration polarizationfrom cake formation. It was shown that, for hardspherical (non-interacting) particles, a dimensionlessparameter—the so-called filtration number,N —can beF
used to determine whether a cake layer would form atgiven thermodynamic conditions:
3 34pa DPyDP ymR vŽ .p b m 4pa DPp pN s s (1)F 3kT 3kT
Here,a is the particle radius,DP the applied pressure,p
DP the osmotic pressure difference between theb
membrane surface and permeate,m the solvent viscosity,R the membrane resistance,v the permeate flux,k them
Boltzmann constant andT the absolute temperature.Note that the expression in parentheses is equal to thepressure drop across the cake layer(if cake has formed)or the osmotic pressure drop across the concentrationpolarization layer(in the absence of cake formation).A critical filtration number,N , can be identified,Fc
above which a cake layer would formw13,24x. For hardspherical particles and when neglecting the pressuredrop across the membrane(so-called ‘ideal filter’assumption), it was shown thatN f15 w13x. WhenFc
considering the pressure drop on the membrane, thecritical filtration number can be found by an iterativetechniquew24x. A schematic diagram depicting concen-tration polarization and cake formation in crossflowmembrane filtration and their relation to the filtrationnumber is shown in Fig. 1.Alternatively, when the critical filtration number is
known, Eq. (1) can be used to estimate the criticalpressure,DP , above which a cake layer would form:c
3kTDP fN (2)c Fc 34pap
In this equation,DP can be considered as the osmoticc
pressure corresponding to maximum concentration ofthe solute particles involved(usually a volume fractionof 0.64 for random packing of hard spheres). Belowthis critical pressure, a cake will never form in

86 J.C. Chen et al. / Advances in Colloid and Interface Science 107 (2004) 83–108
Fig. 1. Schematic description of concentration polarization and cake formation over a membrane surface in crossflow filtration.(a) Below thecritical filtration number,N , a pure concentration polarization layer exists.(b) Above the critical filtration number,N , particles accumulateFc Fc
and form a cake layer. Adapted from Song and Elimelechw13x.
membrane filtration. One should note the strong depend-ence of the critical filtration number or critical pressureon particle size(Aa ). This explains why cake layers3
p
would readily form for suspensions containing particlesas small as a few tens of nanometers.
3. In situ monitoring techniques for concentrationpolarization
During the past few decades, various experimentaltechniques have been developed for in situ monitoringof concentration polarization in order to better under-stand the physico-chemical processes governing thedevelopment of a polarized layer of solutes near amembrane surface. Such techniques enable the testingof theoretical models and, more importantly, providevaluable information on the mechanisms governing thedevelopment of concentration polarization in membranefiltration.
3.1. Light deflection techniques
One important optical property of a solution is thatits refractive index changes with concentration. Thus,the change in deflection when light passes through asolution provides information about the concentration
gradient along the light pathway. Two methods thatmake use of light deflection by the concentration polar-ization layer are shadowgraphy and refractometry.
3.1.1. ShadowgraphyShadowgraphy is based on the principle that light is
deflected when passing through a medium of continu-ously varying refractive index, with the deflection pat-terns determined by the gradient of the refractive index.The extent of light deflection and the trajectory of thelight path through the medium can be calculated by ray-tracing algorithms where the refractive index of themedium along the pathway is the prime governing factor.Having measured the amount of light deflection as aresult of traversing through the medium, the refractiveindex within the test section is extracted as an inverseproblem of the ray-tracing algorithm.The refractive index of a medium is a function of a
myriad of physico-chemical parameters, one of which isthe concentration of constituents within the test section.At given constant operating conditions, with only vari-ations of the concentration, the change in the lightdeflection and, thus, the refractive index is an indicationof the change in concentration within the test section.Shadowgraphy thus offers a method for measurement of

87J.C. Chen et al. / Advances in Colloid and Interface Science 107 (2004) 83–108
Fig. 2. Typical light paths(solid lines) for a collimated beam normally incident on the glass window of an unstirred ultrafiltrationyoptical celland the refractive index profileh(y) (dashed line) generated by solute rejection at the membrane surface(ys0). The refractive index of glass isrepresented byh and that of the solution byh . Adapted from Vilker et al.w19xg i
concentration profiles within a medium by exploitingthis light deflection phenomenon.Vilker et al. w6,19x utilized a shadowgraph optical
method to measure solute(bovine serum albumin)concentration profiles in the polarization layer adjacentto an ultrafiltration membrane during dead-end filtration.During filtration, the induced concentration polarizationlayer creates a one-dimensional refractive index gradientabove the membrane. A schematic of the refractiveindex profile in the unstirred ultrafiltration cell used forthe experiment and the resulting deflection of light pathare shown in Fig. 2.The ultrafiltration cell is constructed with two glass
windows, and the front glass window is illuminated bya collimated beam normal to the surface. A representa-tive light ray is shown to enter the cell at the positionY . Due to the refractive index gradient within the cell,0
the light ray is deflected continuously towards themembrane surface. The light ray emerging from the cellis then imaged onto an image plane. The refractiveindex is determined by measuring the light deflectionand performing numerical ray-tracing calculations. Theconcentration of albumin in this study is shown toexhibit a linear correlation to the refractive index. In theshadowgraphy technique developed by Vilker et al.w19x,an image of a reticle pattern was placed on the entryglass surface and was projected through the ultrafiltra-tion cell onto the frosted glass surface of the imageplate located in the back of the cell. The refractive indexgradient in the concentration polarization layer causesdistortion of the image that directly correlates to theextent of light deflection.The unstirred ultrafiltration cell used by Vilker et al.
w6,19x was fabricated from two pieces of invar metalwith glass windows of 19 mm . The membrane was2
placed between the top and bottom sections of the cell.The two sections were sloped at 158 from the horizontalplane to facilitate unhindered path length of even themost deflected light ray near the membrane surface. Thefiducial marks were shown on the right and form a lineimage reticle. Flexibility in the choice of medium wasallowable and, in general, the solvent within the testsection was water. Within the solvent, the constituentscan be proteins, macromolecules, small colloidal parti-cles or emulsions. It is required that the refractive indicesof the solvent and constituents be different such thatappreciable deflection of light will result from thepresence of the constituent.The optical setup consisted of a 15-mW He–Ne laser
as the source of illumination that was converted into anexpanded beam of 45-mm diameter for illumination ofa 19 mm square aperture within the cell. The line imageof the reticle pattern was projected through the ultrafil-tration cell onto the frosted surface of a glass fiducialplate that was located approximately 0.25 m behind thecell. The fiducial plate was inscribed with a 9=5 matrixof fiducial marks whose positions relative to one anotherwere known to be within"0.0014 cm. The fiducialplate and its marks served to delineate a coordinatesystem for the measurement of light deflections. Theimages of the distorted reticle pattern and the fiducialmarks were captured by a Graflex camera with PolaroidType 55 PyN sheet film. Details of the optical andfiltration experimental setup are given by Vilker et al.w19x.The extent of light deflection in shadowgraphy may
be correlated to the concentration within the medium bya variety of methods. One common practice is tocalibrate the system using known concentrations of theconstituent to determine the light deflection as a function

88 J.C. Chen et al. / Advances in Colloid and Interface Science 107 (2004) 83–108
Fig. 3. Comparison of theoretical predictions(-Ø-Ø-) and experimental measurements(—) of albumin concentration profiles in the concentrationpolarization layer at different applied pressures and pH. Experiment D: pH 4.5,DPs276 kPa; Experiment B: pH 4.5,DPs70 kPa; ExperimentK: pH 7.4, DPs70 kPa. The symbolC next to each curve represents the albumin membrane surface concentration in the corresponding*
experiment. After Vilker et al.w6x.
of concentration. The experimental measurements ofdeflection can then be directly related to concentrationby the calibration. Vilker et al.w6x, however, utilized apreviously derived correlation between the concentrationof BSA and its refractive index. In this case, therefractive index was derived from the ray-tracing algo-rithm and the concentration was directly computed fromthe result. The concentrations were measured in theconcentration polarization layer near the membrane sur-face where BSA accumulate due to rejection by themembrane.Fig. 3 compares the theoretical predictions of BSA
concentration profiles in the polarization layer with thoseexperimentally determined using shadowgraph measure-ments. The theoretical predictions were based on solu-tion of the convective-diffusion equation with anosmotic pressure governed permeate flux as presentedby Vilker et al. w6x. Experimental conditions are givenin Table 1 of Vilker et al.w6x. The linear correlationbetween the refractive index and the BSA concentrationis found to be valid up to 580 gyl, which sets an upperlimit for the maximum measurable concentration. The
magnitude of the deflection of light near the membranesurface limited the concentration profile measurementsto 200 mm above the surface. Extrapolation of theconcentration profile allowed determination of the con-centration values at distances less than 200mm fromthe membrane surface. Due to the high concentrationsof BSA expected near the membrane surface, suchextrapolations may be inaccurate. The measurement ofconcentration was also tested against theoretical predic-tions that the membrane surface concentration remainsinvariant with time and that the polarization layer growswith t . The results of experimental measurements at1y2
two elapsed times did indeed show that the surfaceconcentration is independent of elapsed time of experi-ment and that the ratio of polarization layer thickness atthe two subsequent times follows at dependence.1y2
There are, however, a few limitations for the shad-owgraph technique. The experimental measurements inthis study were limited to filtration conditions resultingin concentration polarization only. This study does notconsider the polarization layer profile in the presence ofgelycake formation. The operating pressures and solu-

89J.C. Chen et al. / Advances in Colloid and Interface Science 107 (2004) 83–108
tion chemistry were adjusted to ensure the absence ofgel formation. An additional constraint is that the tech-nique is limited to binary systems, wherein the refractiveindex is directly related to a single concentration. Fur-thermore, although the agreement between the experi-mental measurements and theoretical prediction appearsto be good in Fig. 3, it should be noted that thediffusivity of BSA molecules was used as a fittingparameter in the theoretical model. The fitted diffusivityvalues showed vast deviations from calculated values atthe specified concentrations. The deviations betweenpredicted and calculated diffusivities were one order ofmagnitude and greater. Vilker et al.w6x attributed thediscrepancy to the uncertainties of the true diffusivityvalues. Another limitation of the method’s capability isthat it can only measure concentrations beyond 200mmabove the membrane surface. The reason for this dis-advantage is that the deflection of light in the testsection is bent towards the membrane surface. At highconcentrations due to polarization near the membranesurface, the deflection may be severe to the point thatthe light path is directed into the membrane surface.The ray is then unable to emerge from the test section.Possible remedies for this predicament include shorten-ing the light path length across the membrane surfaceto provide easier clearance or adjusting operating con-ditions such that the concentration near the membranedoes not cause excessive light deflection. The latterapproach, however, may not be viable, as the phenomenaof interest in membrane filtration, such as concentrationpolarization and gel formation, occur at high membraneconcentrations.
3.1.2. RefractometryRefractometry is, in principle, similar to shadowgra-
phy in that the refractive index gradient within the cellcauses deflection of light, which is related to theconcentration gradient in the polarized layer. Ethier andLin w28x utilized a differential refractometric method formeasuring the concentration profile in unstirred ultrafil-tration of hyaluronic acid(HA). In this study, theconcentration was determined from calibration withknown samples. However, calibration for the concentra-tion gradient measurement was not obtained directly dueto difficulties in producing a known concentration gra-dient. Instead, the calibration was performed by plottingthe spatial integral of the X-deflection data againstknown concentrations of HA. The slope of this lineyielded the necessary conversion between the X-deflec-tion data and the concentration gradient. This experi-mental system was improved by Gowman and Ethierw29,30x to feature automated dual concentration andconcentration gradient measurements.Details of the modified experimental setup are given
by Gowman and Ethierw29x. The filtration cell consistedof two chambers that were adjacent but hydraulically
independent. The walls of the chambers were BK7 plateglass to allow illumination. One of the chambersreceived a reference solution that contains no HA, whilethe filtration of the HA solution occurred in the otherchamber. A schematic of the experimental setup isshown in Fig. 4. Light from a 10-mW He–Ne laser wasproperly collimated and filtered to produce a beamdiameter of 127mm and a depth of field of 34.9mm atthe center of the flow cell. The appropriate optics wereused to align the beam path parallel to the surface ofthe membrane. A system of mirrors mounted on com-puter-controlled stepper-motor-driven translation stageswas installed to enable movement of the laser beamvertically through the concentration polarization layer at5-mm increments.The light traversing through the cell is deflected in
two directions, X and Y as shown in Fig. 4. The X-deflection results from the presence of a vertical con-centration gradient within the concentration polarizationlayer, while the Y-deflection is caused by the differencein the concentrations between the reference chamberand the polymer-containing chamber. Thus, the systemexhibits the feature of dual concentration and concentra-tion gradient measurement capabilities. The beamemerging from the flow cell was directed onto a quad-rature position detector mounted on two orthogonalcomputer-controlled stepper-motor-driven translationstages. The quadrature detector served to measure theamount of beam deflection at a given vertical locationwithin the concentration polarization layer.Since the experimental setup was susceptible to errors
due to optical drift, proper corrections for optical driftwere made by running experiments in absence of HAunder similar experimental conditions. The HA-freesolution allowed measurements to be made under iden-tical conditions as the actual experiments using HA. Incontrast, the calibrations could not be performed underthe same experimental conditions, as the filtration pro-cess would immediately alter the known concentrationin the filtration cell. Uncertainty in positioning theexperimental stages could also introduce errors. Theminimum possible uncertainty from positioning errorswere found to be"5 mm. Additional uncertaintiesincluded the location of the membrane("200 mm),which would affect the coordinate values of measure-ments. The spatial resolution of measurements throughthe polarization layer was 5mm and the closest meas-urable distance from the membrane surface was 200mm. The maximum allowable operating pressure was500 mmHg. Concentrations were measurable up to 1.2%mass HA.Results of concentration and concentration gradient
measurements given by Gowman and Ethierw30x dem-onstrated that development of the concentration polari-zation layer with time and its general profile wascorrectly depicted. The experimental measurements also

90 J.C. Chen et al. / Advances in Colloid and Interface Science 107 (2004) 83–108
Fig. 4. Schematic of the automated, laser-based refractometric system for measurement of concentration and concentration gradient in the con-centration polarization layer developed by Gowman and Ethierw29x. The refractive index gradient(due to the concentration gradient) in thevertical direction causes the beam to deflect toward the membrane: X-deflection. The Y-deflection, parallel to the membrane, is due to therefractive index difference(concentration difference) between the reference and polymer sides. Both pressure transducers are well upstream ofthe flow cell and are located at the same elevation as the membrane. Translating optics are located within the dot-dashed box. Adapted fromGowman and Ethierw29x.
showed that a decrease in the initial concentration ofHA led to a thinner concentration polarization layerwith a lower steady-state concentration at the membranesurface. In addition, they showed that a higher permeateflux contributed to a greater membrane resistance. Anincrease in ionic strength of the solution was also shownto suppress the polarization layer thickness, while con-versely increasing the membrane concentration due tomitigation of repulsive electrostatic forces between mac-romolecules. However, different ionic species were usedin aqueous solutions(NaCl vs. phosphate buffer), whichmay contribute to the difference in the thickness of thepolarization layer and the membrane concentration.The experimental measurements of Gowman and
Ethier w30x were compared to the theoretical predictionusing the models of Ethierw31x, Lam and Bertw32x,Peitzsch and Reedw33x and Johnsonw34x. These theor-etical models are based on Darcy’s law for dead-endfiltration with a zero pressure gradient within the polar-ized layer. The permeate flux is modeled as beingosmotic pressure-driven using empirical coefficients tocalculate the osmotic pressure. The studies of Ethierw31x, Lam and Bertw32x, Peitzsch and Reedw33x and
Johnsonw34x provided values of various parameter forcomputing the osmotic pressure.The models were found to yield different shapes of
the steady-state concentration profile from the experi-mental results. The membrane concentration was consis-tently over-predicted compared to the measured value.Depending on which measured parameter was used asthe constraint, total mass of HA or the final thicknessof the polarization layer, the predicted final layer thick-ness or the total HA mass in the experiment and thefinal membrane concentrations do not correspond wellto the actual values. Several reasons for the disagreementwere proposed. First, the theoretical model might not beapplicable to the experimental conditions of this study.Assumptions for the theoretical model included nomechanical stress between the macromolecules in thepolarized layer, which might not be valid for HAmolecules due to their large size and randomly coilingstructure. Second, the physico-chemical parameters forthe models, osmotic pressure and permeability, were notdetermined under the same conditions as in the experi-ments of Gowman and Ethierw30x. Reasonable adjust-ment of the parameters resulted in better agreement

91J.C. Chen et al. / Advances in Colloid and Interface Science 107 (2004) 83–108
between theoretical prediction and experimental results.Furthermore, some experimental errors also contributedto the discrepancies. For example, the initial HA con-centration loaded into an experiment might be less thanthe nominal concentration due to the errors causedduring the weighing and mixing process. Also, themembrane concentration could not be directly measurednear the membrane due to experimental constraints, andso it was extrapolated from the concentration profile.The extrapolation is subject to error as the concentrationnear the membrane is expected to be high.One key issue of concern that presented a source of
error was the loss of HA through the membrane. Themembranes were assumed to reject HA completely.However, post-experimental mass conservation calcula-tions indicated approximately 20% loss of HA. The lossof mass was attributed to HA being entrained inmembrane pores. The loss of mass was considered acontributing factor to the disagreement between experi-ment data and model predictions. Such pore blockagemay significantly alter the permeate flux and the polar-ization layer formation behavior and thus should beadequately accounted.The experimental measurements assumed the case of
concentration polarization only and did not account forpossible formation of a gel layer. Likewise, the theor-etical models were derived on the basis of the conceptof an equivalence of osmotic and filtration theoryw24x,which is applicable only to instances with solely con-centration polarization. However, with the high molec-ular weight of HA(MWs605,000 Da), the system wassusceptible to the formation of a gel layer, in whichcase the filtration process becomes gel layer governedw24x. For both the experimental measurements and thetheoretical models to be applicable, it is therefore imper-ative to ensure that operating conditions do not incurgel formation. This constraint was further complicatedby the limitation of the flow cell design such thatasymmetric membranes could not be used, as they couldnot be sealed to provide independent flow in the refer-ence and polymer chambers. As a result, only track-etched membranes with a large nominal diameter of0.015 mm were used, thus limiting the technique toinvestigations of ultrafiltration of large macromoleculessuch as HA. The filtration of large macromolecules ishighly susceptible to gel formation as may be realizedby calculating the filtration number from Eq.(1) inSection 2.
3.2. Magnetic resonance imaging (MRI)
MRI is a technique that has the potential of becomingan important tool for in situ monitoring of a variety ofchemical and particulate processes, such as concentra-tion polarization in membrane filtration. It is an exten-
sively employed diagnostic tool in clinical radiology forgenerating high-resolution images of internal anatomy.Images are obtained by placing the test section in a
powerful, highly uniform, static magnetic field. Mag-netized protons(hydrogen nuclei) within the samplealign and behave as magnets in this field. Radio fre-quency pulses are then utilized to create an oscillatingmagnetic field perpendicular to the main field, fromwhich the nuclei absorb energy and move out of align-ment with the static field, in an excited statew35,36x.As the nuclei return from excitation to the equilibriumstate, a signal induced in the receiver coil of theinstrument by the nuclear magnetization can then betransformed by a series of algorithms into diagnosticimages. H nuclear magnetic resonance(NMR) images1
are generated from the distribution of mobile protons inthe sample weighted by the corresponding spin–spin(T ) and spin-lattice(T ) relaxation functionsw35,36x.2 1
Images of different components within the test sectioncan be obtained by varying the number and sequence ofpulsed radio frequency fields based on magnetic relax-ation properties of the individual constituent. The tech-nique allows imaging of any selected plane within acomplex sample by slicing the radio frequency throughthe designated location and can image samples that areoptically opaque. Additional advantages include a spatialresolution down to 10mm or lower. Details of thephysical principles of NMR imaging are given elsewherew35,36x.An important remark regarding the studies to be
reviewed below is that the authors of these studiesclassify their work as investigations on concentrationpolarization. However, their definition of concentrationpolarization refers only to the general phenomena ofparticle accumulation at the membrane surface. Theexperimental conditions employed, such as particle size,and the experimental observations that result, such as astagnant polarization layer, strongly suggest that a cakelayer of maximum packing formed in their systems.Thus, based on our discussion in Section 2, the classicaldefinition of concentration polarization depicting thedevelopment of a disordered solute layer above themembrane surface is not suitable for these studies. Thus,in the discussions below, the term polarization layerrefers to a cake layer of maximum packing density. Inthis sense, cake formation is treated as a special case ofconcentration polarization.Yao et al. w37x utilized NMR micro-imaging tech-
niques in a non-invasive study of flow and concentrationpolarization in hollow fiber membrane filtration. Themembrane module consisted of an inner tube containingthe membrane fibers and an outer envelope, and wasfabricated from glass to facilitate micro-imaging. Theflow was fed to the shell side of the fibers in the innerglass tube and the retentate was recirculated through theouter envelope. The permeate was collected at one end

92 J.C. Chen et al. / Advances in Colloid and Interface Science 107 (2004) 83–108
Fig. 5. Flow of doped water through a hollow fiber membrane module containing five fibers(packing density 18%). (a) NMR image obtainedwith the bipolar flow encoded gradient turned off to show the disposition of the hollow fiber membranes in the module.(b) Flow velocity imagepresented as a gray scale contour plot; bright areas represent regions where the flow velocity is positive(outflows), while dark areas correspondto inflow of the feedstock around the outside of the fibers.(c) Velocity image showing the negative velocity components(flow of feedstock onthe shell side of the fiber) in the form of a stackplot.(d) Stackplot showing the positive velocity components(flow of filtrate in the inner lumensof the hollow fiber membranes and return flow of the filtrate in the outer annular space). All images are 1-mm slice thickness, 10-mm field ofview and 256=256 pixels. The maximum flow velocities are 21.3 mmys for positive flows and 17.5 mmys for negative flows. Figures from Yaoet al. w37x.
of the inner lumens of the fibers, while the other endwas sealed. More details of the experimental setup aregiven by Yao et al.w37x.Oil emulsions of 5% vyv (Caltex Trusol DD oil in
water) doped with 0.6 mM CuSO with average droplet4
diameter of 0.3mm were tested in this study. With suchlarge droplet sizes, formation of a cake layer of maxi-mum packing is certain, as can be inferred from thehigh filtration number discussed in Section 2. The bulkflow within the membrane module was measured by thedynamic NMR microscopy techniquew38,39x. This tech-nique obtained a map of the distribution of velocitiesover the test section by varying the amplitude of theradio frequency excitation pulses over a range of valuesand Fourier transforming the response signal withrespect to a velocity dimensionw38,39x. The velocitymaps obtained by Yao et al.w37x with a modulecontaining five fibers are shown in Fig. 5. The flow
direction of the permeate through the lumens and thefeedstock through the outer annulus were defined posi-tive and that of the feedstock was negative. Comparisonsof volumetric flow rates calculated from the NMRimages and those determined by direct measurement inboth positive and negative directions showed excellentagreement. Therefore, NMR imaging proved to be aneffective technique to achieve flow velocity maps withina membrane filtration module.Images of oil polarization layers were also obtained
by Yao et al.w37x using chemical shift selective imaging.The oil polarization layer was found to be the thickestin regions of low feedstock velocity shear, such as wherethe fiber was close to the inner tube wall and betweentwo fibers that lay close to each other. Change offeedstock pressure showed no significant effects on theoil polarization layer thickness because both the trans-membrane pressure and the crossflow velocity increased

93J.C. Chen et al. / Advances in Colloid and Interface Science 107 (2004) 83–108
with increasing feed pressure. When the velocity mapswere combined with the polarization layer images, noaxial flow was found in the polarization layers. More-over, the water velocity fell to 0 at the polarization layerboundary instead of the membrane surface, indicating astationary polarization layer. Using the ‘resistance inseries’ model, the resistance of the polarization layerwas found to be the dominant flux limiting factor.Pope et al.w40x and Airey et al.w41x extended the
work of Yao et al.w37x to achieve quantitative measure-ments of the concentration polarization layer thicknessin membrane filtration of oil–water emulsions andcolloidal silica particles, respectively, using NMR imag-ing. The experimental filtration modules of Pope et al.w40x and Airey et al.w41x were similar to that of Yao etal. w37x, with the exception that a single sheet tubularmembrane is housed within the filtration module ratherthan a bundle of hollow fibers. The flows in thesestudies were from the lumen side towards the shell side.Pope et al.w40x utilized 5% vyv Caltex Trusol DD oilemulsions doped in CuSO with a resulting average4
droplet diameter of 0.3mm, while Airey et al. w41xperformed filtrations with colloidal silica suspensions(Dupont LUDOX HS—40 wt.%) with an average par-ticle size of 12 nm. The size of the silica colloids issignificantly smaller than the membrane pore size; how-ever, Airey et al.w41x noted that 99.9% rejection of theparticles was achieved. Therefore, it is likely that a cakelayer formed resulting in retention of the silica particles.The use of silica particles in the work of Airey et al.w41x also required some modification of the experimentalprocedure as silica particles do not contribute to theproton ( H) NMR signal. This limitation can be over-1
come because the concentration of silica particles hasbeen shown to alter the relaxation times(both T and1
T ) of the solvent water protons substantially. Airey et2
al. w41x exploited this property of silica particles andobtained a series ofT weighted NMR images during1
filtration. The T weighted images do provide clear1
details of the formation of the silica polarization layer.Details of experimental conditions are given by Pope etal. w40x and Airey et al.w41x.Results of images of polarization layer development
are shown by Airey et al.w41x. Pope et al.w40x inputthe results of measured polarization layer thickness intoDarcy’s Law to extract the specific resistance of thepolarizationycake layer. The measured polarization layerthickness agreed with predicted behavior from Darcy’sLaw of increased resistance resulting from increasedapplied pressure. The specific resistance of the polari-zation layer was calculated and revealed that significantresistance, on the order of 145 times the clean membraneresistance, resulted from the development of the polari-zationycake layer. This calculation is subject to error asthe average measured thickness is inputted into themodel. If the oil polarization layer exhibits significant
non-uniformities, the use of an average thickness for theoil layer can result in underestimation of the specificresistance. However, it does demonstrate an insightfulapplication for the measured polarization layer thickness.Furthermore, the measured polarization layer thicknesswas inputted into mass transfer concentration polariza-tion models, and the results showed good agreementbetween observed flux behavior and that predicted bytheory when Brownian diffusion is taken as the dominantback-transport mechanism. The observation techniqueemployed in this study thus shows the added benefit ofdeciphering the presence and form of the back-transportmechanisms. From the results of Airey et al.w41x, theacquired images confirmed expectations of a growingpolarizationycake layer with time that reached a steadythickness. The polarization layer also increased in thedownstream direction of the membrane module. Themeasurements of Pope et al.w40x and Airey et al.w41xdemonstrated the flexibility of NMR techniques to imageboth oil emulsions and colloidal suspensions. The polar-izationycake layer was clearly discernible and its thick-ness was readily measurable.Beyond the polarization layer thickness, an additional
useful application of NMR techniques is that it enablesthe measurement of colloidal suspension concentrations.Airey et al. w41x showed that both theT and T1 2
relaxation times of the colloidal silica suspension arestrong linear functions of the concentration of particles.Therefore, a calibration curve of known concentrationsof silica particle suspensions and their relaxation timescan be obtained from NMR measurements. The concen-tration of a given suspension is then readily determinedfrom the calibration curve. However, the applications inthese studies only yielded measurements of the polari-zation layer thickness and did not attempt to measurethe concentration and concentration gradient profileswithin the polarization layer. Indications are that aconcentration corresponding to maximum packing ispresent within the investigated polarization layer.Airey et al. w41x and Yao et al.w42x utilized dynamic
NMR microscopy and chemical selective NMR flowimaging, respectively, to investigate the fluidity of thepolarization layer. Chemical selective NMR imagingsignifies a mode of operation with a designated sequenceof radio frequency pulse excitations. Details of theprinciples of chemical selective NMR are given else-where w35,36x. Airey et al. w41x performed filtration ofcolloidal silica particles(12 nm diameter), while Yao etal. w42x studied polarization effects of 20% vyv oil–water emulsions of 300-nm-diameter droplets. Theexperimental filtration module is again the same as thatdescribed in Airey et al.w41x. The results of Airey etal. w41x indicate that the motion of particles within thepolarization layer is clearly discernible up to approxi-mately half of the layer thickness. Under the operatingconditions ofDPs75 kPa and a crossflow Reynolds
94 J.C. Chen et al. / Advances in Colloid and Interface Science 107 (2004) 83–108
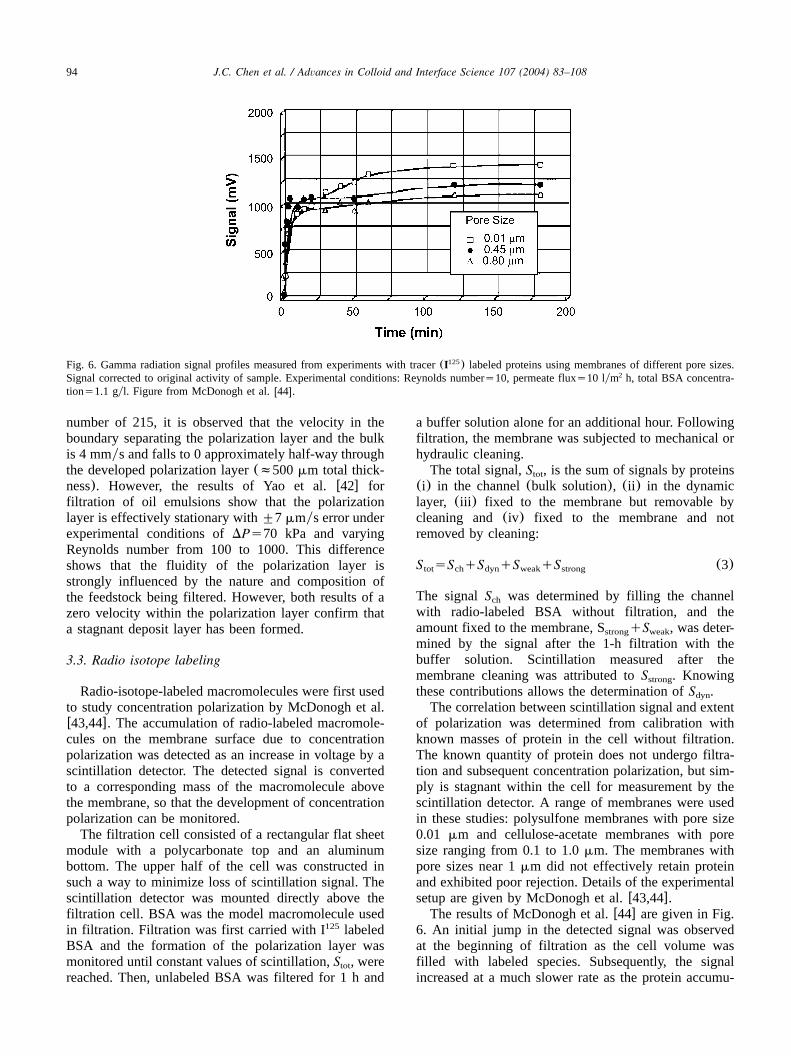
Fig. 6. Gamma radiation signal profiles measured from experiments with tracer(I ) labeled proteins using membranes of different pore sizes.125
Signal corrected to original activity of sample. Experimental conditions: Reynolds numbers10, permeate fluxs10 lym h, total BSA concentra-2
tions1.1 gyl. Figure from McDonogh et al.w44x.
number of 215, it is observed that the velocity in theboundary separating the polarization layer and the bulkis 4 mmys and falls to 0 approximately half-way throughthe developed polarization layer(f500mm total thick-ness). However, the results of Yao et al.w42x forfiltration of oil emulsions show that the polarizationlayer is effectively stationary with"7 mmys error underexperimental conditions ofDPs70 kPa and varyingReynolds number from 100 to 1000. This differenceshows that the fluidity of the polarization layer isstrongly influenced by the nature and composition ofthe feedstock being filtered. However, both results of azero velocity within the polarization layer confirm thata stagnant deposit layer has been formed.
3.3. Radio isotope labeling
Radio-isotope-labeled macromolecules were first usedto study concentration polarization by McDonogh et al.w43,44x. The accumulation of radio-labeled macromole-cules on the membrane surface due to concentrationpolarization was detected as an increase in voltage by ascintillation detector. The detected signal is convertedto a corresponding mass of the macromolecule abovethe membrane, so that the development of concentrationpolarization can be monitored.The filtration cell consisted of a rectangular flat sheet
module with a polycarbonate top and an aluminumbottom. The upper half of the cell was constructed insuch a way to minimize loss of scintillation signal. Thescintillation detector was mounted directly above thefiltration cell. BSA was the model macromolecule usedin filtration. Filtration was first carried with I labeled125
BSA and the formation of the polarization layer wasmonitored until constant values of scintillation,S , weretot
reached. Then, unlabeled BSA was filtered for 1 h and
a buffer solution alone for an additional hour. Followingfiltration, the membrane was subjected to mechanical orhydraulic cleaning.The total signal,S , is the sum of signals by proteinstot
(i) in the channel(bulk solution), (ii) in the dynamiclayer, (iii ) fixed to the membrane but removable bycleaning and(iv) fixed to the membrane and notremoved by cleaning:
S sS qS qS qS (3)tot ch dyn weak strong
The signalS was determined by filling the channelch
with radio-labeled BSA without filtration, and theamount fixed to the membrane, S qS , was deter-strong weak
mined by the signal after the 1-h filtration with thebuffer solution. Scintillation measured after themembrane cleaning was attributed toS . Knowingstrong
these contributions allows the determination ofS .dyn
The correlation between scintillation signal and extentof polarization was determined from calibration withknown masses of protein in the cell without filtration.The known quantity of protein does not undergo filtra-tion and subsequent concentration polarization, but sim-ply is stagnant within the cell for measurement by thescintillation detector. A range of membranes were usedin these studies: polysulfone membranes with pore size0.01 mm and cellulose-acetate membranes with poresize ranging from 0.1 to 1.0mm. The membranes withpore sizes near 1mm did not effectively retain proteinand exhibited poor rejection. Details of the experimentalsetup are given by McDonogh et al.w43,44x.The results of McDonogh et al.w44x are given in Fig.
6. An initial jump in the detected signal was observedat the beginning of filtration as the cell volume wasfilled with labeled species. Subsequently, the signalincreased at a much slower rate as the protein accumu-

95J.C. Chen et al. / Advances in Colloid and Interface Science 107 (2004) 83–108
Fig. 7. Observed time-dependent concentration polarization profiles.(a) No crossflow;(b) crossflow at Reynolds number of 10. Experimentalconditions: cuprophan membrane, 2 gyl dextran blue in water,DPs1 bar. Figure from McDonogh et al.w44x.
lated above the membrane due to concentration polari-zation. Such behavior is indicative of concentrationpolarization without cake layer formation.The radio isotope labeling technique described by
McDonogh et al. w44x did not provide quantitativemeasures of the polarization layer thickness or theconcentration profile within it. It provided limited infor-mation regarding the extent of polarization in terms oftotal mass accumulated above and within the membrane.
3.4. Electron diode array microscope
McDonogh et al. w43,44x presented a method forobserving concentration polarization in ultra- and micro-filtration of BSA and dextran blue solutions by use ofan electron diode array microscope(EDAM). A colli-mated, near infrared light parallel to the membranesurface, but perpendicular to the flow direction, waschanneled through the filtration cell to a photodetectorby microscopic lenses. Owing to absorption of theincident light, the concentration gradient in the polari-zation layer resulted in an intensity pattern on thedetector, which was monitored by an oscilloscope. Theoptical setup of the system allows sampling within a 2-mm zone above the membrane surface with a resolutionof 2 mm. Details of the experimental setup are given byMcDonogh et al.w44x.The system requires calibrations to determine the
distance from the membrane surface and to translate theintensity signal to concentration. The distance from themembrane can be determined by introducing a machinedposition mark on the channel wall and measuring thesignal when placing an object of known dimensionabove the position mark. McDonogh et al.w44x used ahair as the reference object; such an approach may notprovide an accurate calibration of the system. Calibration
of solute concentration can be achieved from signalsdetected when the cell is filled with solute of knownconcentrations but with no pressure applied. However,when pressure is applied for filtration, there is anapparent deflection in the membrane peak possibly dueto a downward shift of the membrane position by 5–10mm. This variability was not controllable and moreovershowed time dependence. As such, measurements wereonly considered up to 20mm above the original locationof the membrane surface. One alternative is to use thesignal immediately after the introduction of pressure,but the filtration process will instantaneously alter thesolute concentration in the cell. Thus, for such a tech-nique, a better calibration method should be developed.Results of McDonogh et al.w44x are given in Fig. 7,
where the growth of the concentration polarization layerof dextran blue is demonstrated. The concentrationwithin the layer increased and approached a quasi-steadystate with time. The results also depict the influence ofcrossflow. The quasi-steady state was reached morequickly and the thickness of the polarization layer wassmaller in the presence of a tangential flow. As expected,the applied pressure was shown to increase themembrane concentration and the polarization layerthickness. Furthermore, the concentration polarizationlayer thickness and the membrane concentration wereboth shown to increase with increasing feed concentra-tion. Comparisons of filtration behavior of BSA anddextran blue solutions indicated that under the sameoperating conditions, dextran blue exhibits a markedlygreater extent of concentration polarization as reflectedby the membrane concentration. This difference is attrib-utable to the higher diffusivity of BSA that functions tomitigate concentration polarization effects by aidingback-transport of the protein. The observations thereforeconfirm the expected effects of diffusivities on concen-

96 J.C. Chen et al. / Advances in Colloid and Interface Science 107 (2004) 83–108
tration polarization. McDonogh et al.w44x did not,however, present validation of the experimental resultswith theoretical predictions. And so, although the exper-imental observations are in agreement with expectedqualitative trends, accurate quantitative confirmation wasnot available.McDonogh et al.w44x identified the possible sources
of error in their experiments to be from uncertainties inthe applied pressure, membrane position, solution con-centration, flow conditions, concentration calibration,optical setup, data plotting and data reading. The esti-mated total error was 23%. However, the lack ofsignificant scatter of the experimental data suggests thatthe error was overestimated.An important attribute of the EDAM technique is that
the concentrations within the polarization layer aremeasurable as close as 20mm from the membranesurface. This method thus exhibits a vastly superiormeasurable distance above the membrane over shadowg-raphy and refractometry, which only allow for measure-ments beyond 200mm from the surface.
3.5. Direct pressure measurements
In addition to solute concentration, knowing the pres-sure distribution across the concentration polarizationlayer can shed light on the physico-chemical transportprocesses governing concentration polarization. Adichotomy exists regarding the nature of the pressureprofile with opposing views of a constant pressureprofile and a non-zero pressure gradient. Detailed dis-cussions of the nature of the pressure profile within thepolarization layer are given by Elimelech and Bhatta-charjeew24x and Peppin and Elliottw45x. Seeking forexperimental verification of the proposed theories,Zhang and Ethierw46x developed a system that candirectly measure both pressure and concentration profilesof the polarization layer during unstirred ultrafiltration.The experimental apparatus is similar to that of Ethier
and Lin w28x with the addition of a miniature pressuresensor on the inner wall of the polymer-containingchamber. Concentration profiles of HA were measuredusing the refractometric technique described previously.The pressure sensor was situated to a suture thread thatfacilitated upward and downward movements for meas-urement at various locations within the cell. The spatialresolution was 0.2 mm. Details of the experimentalsetup are given by Zhang and Ethierw46x.Pressure measurements were made within the polari-
zation layer once the system reached steady state assignaled by a constant feed pressure and concentrationprofile. A slight pressure drop of 7.9 mmHg within thesolute polarization layer was found as compared to 400mmHg pressure drop across the membrane, with thehighest gradient within 2 mm above the membranesurface. Thus, it is clear that the pressure gradient within
the polarization layer was insignificant, yet appreciablydifferent from zero. The concentration polarizationdeveloped under operating conditions used in this studywas not as severe as typically would be encountered inultrafiltration. With higher permeate flux and the con-comitant increase in membrane concentration, the pres-sure drop across the polarization layer is expected to behigher. Zhang and Ethierw46x commented that the non-zero pressure gradient measured in their study contra-dicts previous results from Kim et al.w47x of a constantpressure profile, but is in agreement with theoreticalpredictions of Peppin and Elliottw45x. However, theyexplained that the BSA solution used by Kim et al.w47xexhibits a much more compact structure than HA, thesolute used in their study. The comparison is thereforenot under equal terms.One disadvantage of this technique is that the pressure
sensor disturbs the concentration polarization layer. Theentry of the pressure sensor into the polarized layercauses constriction to the flow in that vicinity. Thisdeficiency was detected when pressure measurementswere taken at a fixed location with elapsed time. Resultsindicated a time-dependent pressure profile at a fixedlocation under steady state conditions. Such transientbehavior when steady state conditions are expected doespose as a source of inaccuracy to the measurement.Also, the measurements obtained may not be represen-tative of an unperturbed system. The intrusive nature ofthe technique also requires a long duration for experi-ments to allow for steady state to be reached upondisplacing the pressure sensor to its designated location.The lengthy time scale of experiments(f10 h for onetraverse) introduced additional sources of error includingdrift in the pressure measurement caused by fluctuationsin atmospheric pressure. In the study by Zhang andEthier w46x, the local atmospheric pressure was contin-ually monitored to account for any fluctuations. Theintrusive nature of the technique hampers the experi-mental process with requiring cumbersomeaccommodations.
4. In situ monitoring techniques for cake formationand membrane fouling
Membrane fouling is generally associated with a cakeor gel formation on the membrane surface, or theplugging of membrane pores by macromolecules, col-loids or particulate matter. At present, the mechanismsof cake formation and fouling are relatively poorlyunderstood. Thus, in situ measurements of fouling anddirect observation of cake layer formation are of para-mount importance in our efforts to understand thefundamental processes governing membrane fouling.
4.1. Particle deposition and cake layer formation
The techniques described in this section were devel-oped to visualize or monitor the depositionyaccumula-

97J.C. Chen et al. / Advances in Colloid and Interface Science 107 (2004) 83–108
Fig. 8. Particle deposition images taken during filtration of 11.9-mm diameter latex particles. Images from Li et al.w48x. Crossflow velocity wasfixed at 0.375 mys, while permeate fluxes were as follows:(a) 35 lym h, (b) 45 lym h, (c) 51 lym h and(d) 51 lym h.2 2 2 2
tion of particles onto a membrane surface and thedynamics of cake layer buildup as fouling progresses.
4.1.1. Direct observation through the membraneThe most straightforward method to directly observe
particle deposition is visualization by an optical micro-scope. One of the first applications of this techniquewas developed by Li et al.w48x and was termed directobservation through the membrane(DOTM). In thismethod, a microscope objective was positioned at thepermeate side of a transparent membrane and particledeposition was observed in real time by the microscope.A key to this technique is the use of an appropriatemembrane. Li et al.w48x used an Anopore(Whatman,UK) anodized aluminum membrane with high porosity(60%) and straight through pores. When wet, themembrane is transparent and thus facilitates observationof the membrane surface from the permeate side. Themembrane module was fabricated from Perspex, whichallows the transmission of light from the feed side.Images of particle deposition were recorded by a videocamera. Details of the experimental setup are given byLi et al. w48x.Examples of images acquired by Li et al.w48x using
11.9-mm diameter latex particles are given in Fig. 8.Using the DOTM technique, the authors were able toestimate the critical flux, the lowest permeate flux for
the onset of cake formation. Above the critical flux,rapid particle deposition was observed. In contrast, veryfew particles were found when the flux was below thecritical value. The deposition of particles was found tobe reversible upon reduction of flux or increase ofcrossflow shear. The observations also showed that themotion of particles near the membrane surface subse-quent to deposition was dependent upon the crossflowvelocity, the particle size and the particle size distribu-tion. Adjustment of operating variables such as flux andcrossflow could induce particle motion along themembrane surface. The DOTM technique can also yieldthe size distribution of the deposited particles. Compar-ison of particle size distributions of deposited particlesunder various operating conditions showed that underhigh crossflow velocity the deposited particles weresmaller than those deposited under low crossflow con-ditions. This observation supports the theory that cross-flow shear forces deter the deposition of large particlesand thus the cake layer that formed under high crossflowconditions has a compact structure consisting of smallparticles. Furthermore, results from this study are alsoin qualitative agreement with theoretical model predic-tions that the critical flux increases with increasingcrossflow velocity and particle size.A simplified way to explain the critical flux is to
assume that, at the critical flux, particle convection by

98 J.C. Chen et al. / Advances in Colloid and Interface Science 107 (2004) 83–108
Fig. 9. Schematic diagram of the direct visual observation system used by Kang et al.w50x. See description in text.
the permeate flow is balanced by the particle back-transport away from the membrane. Assessment of thecritical flux can therefore be used to ascertain the natureof back-transport mechanisms. Li et al.w49x utilized theDOTM technique discussed above to compare experi-mentally measured critical flux values with predictionsby models that incorporate back-transport mechanisms.Back-transport mechanisms employed by the modelswere either inertial lift or shear-induced diffusion. Theinertial lift model was found to give much lower criticalflux values than those measured by DOTM, whereas theshear-induced diffusion model showed better agreementwith experimental measurements. The model calcula-tions, however, were quite simplified as colloidal inter-actions and the two-dimensional nature of the flow incrossflow filtration were not considered.
4.1.2. Direct visualization above the membraneThe major drawbacks of the DOTM technique
described above are the need to use a transparentmembrane and the positioning of the microscope objec-tive below the membrane at the permeate side. The firstrequirement is a major disadvantage as it confines theuse of the technique to only a limited number ofinorganic porous membranes, mostly microfiltrationmembranes. The second limitation does not allow theobservation of particle accumulation beyond a monolay-er as observation through the deposited particle layer isnot readily attained. To overcome these constraints,Kang et al.w50x and Mores and Davisw51x constructeda rectangular membrane channel where the microscopeobjective is mounted above the membrane to viewparticle deposition from the feed side.Kang et al.w50x constructed a rectangular crossflow
membrane cell from polycarbonate and glass. The
dimensions of the flow channel were 1 mm(height) by25.4 mm (width) by 76.2 mm(length). The cell wasmounted on the stage of a phase contrast microscope(Olympus, BX-51) to allow direct observation of parti-cle deposition by light and fluorescence microscopy(Fig. 9). A CCD camera (5= magnification) wasmounted on the microscope and images were download-ed in real time to a laboratory PC for post-processingand image analysis.In order to operate at common applied pressures for
MF and UF membranes, two ‘interchangeable parallelplates’ were fused to the top and bottom cell plates andreinforced as needed. The membrane sample was placedbetween the two plates with a permeate spacer beneathit. Applied pressure was maintained constant by con-necting the flow cell to a pressure vessel(the feed tank)through a closed line loop. Peristaltic pumps were usedfor both retentate and permeate flows, which allowedfor accurate control of the crossflow and permeationvelocities. The retentate and permeate flows weremerged and sent back to the feed tank. Such a config-uration enabled extremely stable feed pressure and flowrates within the crossflow filtration cell.Kang et al. w50x used a polyacrylonitrile UF
membrane and a polysulfone MF membrane to observein real time the deposition of microbial and syntheticparticles. The deposition of synthetic particles—fluores-cent blue carboxylate-modified latex—were observed byfluorescence microscopy. The microbial particles—Sac-charomyces cerevisiae and Pesudomonas capaciacells—were stained and the deposition was observed bylight microscopy. Using this setup, Kang et al.w50xinvestigated the influence of various physico-chemicalparameters(ionic strength, permeate flux and crossflowrate) on the rate of particle deposition on the membrane

99J.C. Chen et al. / Advances in Colloid and Interface Science 107 (2004) 83–108
Fig. 10. Steps of image analysis to determine the area covered by cells deposited on a membrane. Images were taken from Kang et al.w50x.
surface. In addition, the system was used to studypatterns of particle deposition onto the membrane.Images obtained from the CCD camera were trans-
ferred to an image processing program(NIH image J).Each pixel in the image holds 256 steps of the integergray-level value(Fig. 10a), which describes the intensityof the light (0sblack, 255swhite) in the gray-scaleimage. After selecting the adherent cell found at thesame position in consecutive images, the contrast andbrightness were adjusted to obtain a clear image of thecells as shown in Fig. 10b. The distribution of the gray-level was then analyzed to determine the threshold valuefor conversion of gray-scale images to black and whiteimages.A somewhat similar direct visualization technique
was used by Mores and Davisw51x to investigatecleaning of fouled microfiltration membranes by back-washing and backpulsing. In their study, the foulant wasa dyed yeast(Saccharomyces cerevisiae), and the MFmembranes used in the crossflow experiments were apolymeric cellulose-acetate membrane and an Anoporeanodized-aluminum disk membrane. Two different meth-ods of cleaning were carried out—backwashing andsingle backpulses of duration 0.2 or 0.5 s. The directvisualization results showed that the yeast particlesdeposited less uniformly on the surface of the cellulose-acetate membrane than that on the inorganic aluminummembrane. Foulant was shown to be removed by reverseflow in clumps. The time constant for foulant removaland the efficiency of membrane cleaning were deter-mined from the obtained photomicrographs. The resultsof Mores and Davisw51x provided valuable insights intothe mechanisms of MF membrane cleaning, an area thatsurprisingly received little attention so far.
4.1.3. Laser triangulometryIn laser triangulometry, a laser beam is directed onto
a surface of varying elevation, such as a developingparticle cake layer. The reflection of the laser beam offthe surface is captured by a CCD camera. As the
elevation of the surface changes, the location where thereflected beam is imaged by the CCD array will shift.Measurement of the shift can then be directly related tothe displacement of the elevation of the surface. Duringmembrane filtration, laser triangulometry can be used totrack the growth of a particle cake layer and to measurethe thickness of the cake layer.Altmann and Rippergerw52x studied the development
of a particle cake layer on a membrane surface usinglaser triangulometry. The filtration system investigatedwas a crossflow microfiltration unit. Details on theexperimental setup are given in the original article. Awindow on the top of the membrane unit allows entryof the laser beam from the laser triangulometer as wellas in-line observation of particle deposition. Diatoma-ceous earth with variable particle size distributions andmonodisperse silica particles of variable sizes in therange of 0.24–1.5mm diameter were filtered in inde-pendent experiments. The feed volume fraction of par-ticles in all experiments was 0.3%.Results of experimental observations by Altmann and
Rippergerw52x are shown in Fig. 11. The data indicatethat a particle cake layer formed rapidly at the initialstage of filtration and gradually progressed towards asteady thickness. The formation of the cake layeroccurred concurrently with a decrease in the permeateflux. The resistance of the cake layer is therefore evident.The thickness of the cake layer, however, increased at afaster rate than the decrease in permeate flux during theinitial stage of filtration. Furthermore, after a steadystate cake thickness was reached, the permeation fluxcontinued to decline. Therefore, a direct link betweencake layer thickness and rate of flux decline wasambiguous and additional factors such as changes incake structure might be contributing to the observedflux behavior.Incremental computations of the cake layer resistance
during the filtration process revealed that the top portionof the cake layer exerts a considerably higher resistancethan the bottom portion. Hence, it indicates that the

100 J.C. Chen et al. / Advances in Colloid and Interface Science 107 (2004) 83–108
Fig. 11. Comparison of theoretical calculations and experimental results of changes in cake layer thickness and filtration rate with time. Theconditions used in the microfiltration experiments are(a) top figure: applied pressure of 1.0 bar and a crossflow velocity of 1.5 mys; (b) bottomfigure: applied pressure of 1.5 bar and a crossflow velocity of 1.5 mys. Figures from Altmann and Rippergerw52x.
cake structure varied during the filtration process, withsmaller particles depositing in greater proportions at thetop of the cake layer leading to the increased resistance.The experimental observations in Fig. 11 were com-
pared with theoretical predictions of cake growth.Details of the theoretical model for cake growth aregiven by Altmann and Rippergerw52x. Results showedgood agreement between experimental data and modelpredictions. However, it should be noted that the cakeporosity was assumed to be 0.4 in the theoretical model,which may not be representative of the actual cakelayer. Pressure relaxation experiments were also per-formed to investigate the reversibility of cake layerformation. Upon pressure relaxation, the deposited cakelayer persisted on the membrane and did not reentraininto the bulk. This finding is consistent with theoreticalmodel predictions that the adhesive forces among parti-cles in the cake layer exceeded the drag force from thecrossflow under the operating conditions used.
4.1.4. Optical laser sensorHamachi and Mietton-Peuchotw53,54x developed an
optical laser sensor method for investigating the thick-ness of the cake layer during microfiltration of bentonitesuspensions. The principle of this technique is that theformation of the deposit layer will absorb light from abypassing laser beam. The variation of the signal inten-sity detected after the laser beam has traversed throughthe cake layer will correspond to the deposit thickness.A calibration procedure with known values of cake layerthickness is performed to extract the correlation.The experimental apparatus consists of one tubular
membrane module with two optical windows throughwhich the laser beam traverses tangentially over themembrane surface. Upon passing through the membranemodule, the light source is captured by a photomultiplierthat converts the intensity of light into an equivalentvoltage. Operating conditions during filtration werecrossflow velocities from 0.05 to 0.5 mys and transmem-

101J.C. Chen et al. / Advances in Colloid and Interface Science 107 (2004) 83–108
Fig. 12. Cake layer thickness as a function of cumulative permeate volume.(a) Effect of crossflow velocity(applied pressures110 kPa, particleconcentrations0.375 gyl). (b) Effect of particle concentration(applied pressures110 kPa, crossflow velocitys0.055 mys). Figures from Hamachiand Mietton-Peuchotw53x.
brane pressures of 110–210 kPa. Bentonite particleswith average size 2.45mm were filtered. Details of theexperimental setup are given by Hamachi and Mietton-Peuchotw53,54x.Calibration was conducted using a micrometric screw
device that probes the gap distance between the cakesurface and the membrane surface. The measured gapdistance was then correlated to its corresponding signalintensity from the optical laser sensor. Details of thecalibration procedure can be found in Hamachi andMietton-Peuchotw54x.Examples of experimental measurements of cake layer
thickness with respect to variation in operating condi-tions are shown in Fig. 12. As expected, the cakethickness was shown to increase with increasing trans-membrane pressure, increasing bulk concentration anddecreasing crossflow velocity. Thicker cake layers wereformed with more concentrated bulk suspensions for thesame volume of filtrate. Further analysis was performedby using Darcy’s law to calculate cake layer resistance.The specific cake layer resistance of the deposit wasshown to be higher when filtering more dilute suspen-sions. One proposed reason for this observation is thatdilute particle suspensions contain fewer large particlesand thus form less permeable deposits. At a given
deposit thickness, the resistance of the cake layer wasalso found to increase with increasing transmembranepressure, which was attributed to cake compaction. TheCarman–Kozeny equation was utilized to calculate thecake layer porosity. The porosity was shown to increasewith increasing cake thickness as larger particles beginto deposit during the development of the deposit layer.The porosity also was shown to decrease with increasingtransmembrane pressure, which, as described earlier, isattributed to cake compaction. It is to be noted that thecake layer structure depicted by Hamachi and Mietton-Peuchotw53x is in disagreement with the conclusion byAltmann and Rippergerw52x, which indicated a decreasein porosity with the development of the cake layer,using laser triangulometry(Section 4.1.3).The maximum concentration that can be filtered in
the studies described above was 375 mgyl, above whichthe turbidity of the suspension obstructs the photodetec-tion. However, this limitation can be extended with useof a more powerful laser. A He–Ne laser with powerrating of 0.2 mW was employed in these experiments.In addition, the maximum cake thickness that could bemeasured was 30mm. This restriction is due to thedimensions of the membrane channel and the choice ofcalibration procedure. However, this restriction can be

102 J.C. Chen et al. / Advances in Colloid and Interface Science 107 (2004) 83–108
circumvented with adjustment of the experimentalapparatus.
4.1.5. Ultrasonic time-domain reflectometry (UTDR)UTDR is a technique that uses sound waves to
measure the location of a moving or stationary interfaceand can provide information on the physical character-istics of the media through which the waves travel.When ultrasonic waves encounter an interface betweentwo media, energy will generally be partitioned suchthat a reflected wave occurs, which can be detected byan ultrasonic transducer. The amplitude of the reflectedwave relative to the incident wave is determined by theacoustic impedance difference between the two mediaas well as the topography of the interface. The timeinterval between the initiation of the incident wave andthe detection of the reflected wave can be used tomeasure the distance between interfaces. Detailed theo-ries of UTDR are given by Ensmingerw55x.Mairal et al. w56x used the UTDR technique for in
situ measurement of membrane fouling during reverseosmosis of calcium sulfate solutions. Their experimentalapparatus consisted of a stainless steel rectangular ROcell with dimensions 60 cm(L)=6 cm (W)=0.2 cm(H). Six ultrasonic measurement ports were situated onthe top plate where ultrasonic transducers were mounted.The axial velocity used ranged from 0 to 4.6 cmys andthe transmembrane pressure was 4.14 MPa. During themembrane filtration, the incident wave reflects off boththe membrane and fouling layer surfaces. Therefore, thedifference in signal delay between the two reflectedwaves is a measure of the cake fouling layer thickness.The results of the filtration experiments by Mairal et
al. w56x showed that the development of the foulinglayer was insufficient to produce two separate reflectedwaves from which the cake thickness could be deter-mined. However, the development of the cake layer wasshown to be closely related to the decline of theamplitude of the reflected wave. The amplitude of thereflected wave was thus taken to be the indicator andgauge of cake formation. The attenuation of the ampli-tude of the reflected wave does correlate well with themeasured flux decline. Therefore, detection of the ampli-tude of the reflected wave does provide indication ofthe formation of the cake layer. The actual quantitativethickness of the cake layer, however, could not beobtained from the amplitude measurements. The ampli-tude measurements provided only qualitative character-ization of the cake formation process that may not besufficiently specific.The major drawback of the study is that the desired
method of measuring the cake thickness by creating tworeflected waves and measuring the difference in theirtime delay of signals could not be achieved. Theamplitude measurement was taken as a substitute tech-nique to solve the predicament; however, it is neither
quantitative nor qualitatively specific. It is also likelythat the choice of the foulant, calcium sulfate, did notresult in classical cake layer but rather scale on themembrane surface with limited thickness. Mairal et al.w56x stated that further investigation is necessary to fullydocument the quantitative capabilities of this technique.Reinsch et al.w57x applied UTDR to investigate the
effects of membrane compaction on flux decline duringgas separation. As compaction proceeds upon the appli-cation of pressure, the change in the location of themembrane surface leads to shifts in the arrival time ofthe reflected wave. The displacement of the membranesurface due to compaction can then be calculated fromthe measured time shift. The experimental setup in thisstudy was in principle similar to that used by Mairal etal. w56x, except that the medium was gas.The use of time-domain reflectometry by Reinsch et
al. w57x achieved the desired measurement of changesin arrival time of the reflected signal without having toresort to amplitude attenuation approaches as a substi-tute. The resolution of the method was"18 mm fordetection of the change in location of the membranesurface. This method shows promising outlook for aidingpreviously mentioned techniques where the location ofthe membrane varies during experimentation and is asource of error. The extension of the medium from gasto liquid is required. However, liquid phases generallyare better suited for propagation of mechanical waveswith less amplitude attenuation than that of gas phases.The resolution of the method does incur a limitationthat the observed strain could not be specifically attrib-uted to the membrane skin layer or the porous substruc-ture. Such definition of the location of strain wouldrequire resolution on the scale of nanometers. This maybe attainable with more sophisticated hardwarecomponents.Recent developments in ultrasonic reflectometry are
beginning to approach the sought-after measurable dif-ference in arrival times for the reflected waves in aliquid medium. Li and Sandersonw58x present an UTDRtechnique that effectively detects separate signals fromthe surfaces of the membrane and particle deposit in thefiltration of a liquid suspension. From the difference inarrival times, the thickness of the deposit layer can bereadily determined by a simple relationship between thespeed of the waves and their traversed displacement inthe time interval. The experimental setup is similar tothat of Mairal et al. w56x with the exception thatrelatively large kaolin particles of size 2mm were usedin microfiltration (Pall nylon membranes of pore size0.2 mm and applied pressure of 100 kPa). This maythen point to a key element for successful UTDR,namely, an adequate particle size and correspondinglythick cake layer. The possibility of obtaining a detectablesignal difference appears to be influenced by the particlesize of the deposit with larger particles allowing for

103J.C. Chen et al. / Advances in Colloid and Interface Science 107 (2004) 83–108
improved measurements. However, Li and Sanderson donot analyze the effects of particle size and cake layerthickness in their experiments.The experimental results of Li and Sandersonw58x
show definitively that the formation of a deposit layerhas been captured by the UTDR technique. Comparisonsof the UTDR measurements with post-experimentalSEM images affirm that the realized signal differencesdo reflect the formation of an appreciable deposit layer.However, Li and Sanderson do not proceed from theirqualitative findings and perform quantitative computa-tions of the deposit layer thickness and rate of cakegrowth. Rather, they only validate the qualitative cor-rectness of their method but not its quantitative accuracy.The contribution of Li and Sanderson offers promisingpotential for the UTDR technique from which morerigorous applications should be added.
4.1.6. Electrical impedance spectroscopyChilcott et al.w59x and Gaedt et al.w60x proposed the
possible use of electrical impedance spectroscopy(EIS)for characterizing membrane properties and investigatingmembrane fouling. This was an attempt to extend earlierwork where this technique was applied to probe biolog-ical membranes and interfacesw61x. Unlike typical EISmethods, which require electrodes in the feed andpermeate solutions, an alternating current is injecteddirectly into the membrane via external electrical con-tacts with the edges of the membrane. A metal layersputtered onto the membrane surface is used to enhanceconduction properties. The flow of the current acrossthe membrane surface leads to dispersion of the currentinto the bulk solution and the membrane pores. Thisdispersion phenomenon is characterized by the capaci-tance and conductance of various components of thesystem, such as the membrane material and the bulksolution, and possible polarization or fouling layer. Thedispersion of the current changes as foulants accumulateon the membrane surface leading to alteration of thecapacitive and conductive properties of the membraneinterfacial region. Measuring the changes in the capaci-tance dispersion of the system therefore becomes ameans of monitoring in situ accumulation of particulatesthat could potentially foul the membrane. Characteriza-tion of the dispersion behavior of the clean membranecould also yield information pertaining to membraneproperties, such as porosity. The system was modeledby the Maxwell–Wagner equation that characterizes theimpedance as a function of the capacitance and conduc-tance of the components of the system. Details of theexperimental setup and the mathematical formulation ofthe analysis are given by Chilcott et al.w59x and Gaedtet al. w60x.The method introduced in these studies, however, was
not applied to measurement of fouling behavior inmembrane filtration. It was presented only as a technique
with the potential of achieving such measurements. Theactual performance of the method was cited to beincluded in subsequent publications. One major limita-tion of the proposed method is that it requires thesurface of the membrane to be coated with thin metalfilms. The coating of the membrane surface not onlydeparts from a true representation of the system but mayalso occlude membrane pores and alter the experimentalconditions. Thus, while the technique may be used toevaluate properties of fouled membranes, its applicationfor in situ observation of the dynamics of foulingbehavior is questionable.
4.2. Pore blockage
Although most fouling studies focus on foulant dep-osition on the membrane surface and the ensuing dynam-ics of the foulant(deposit) layer, internal fouling causedby blockage of membrane pores is important for micro-filtration and ultrafiltration, at least at the initial stagesof filtration. More importantly, fouling by pore blockageis often irreversible and very difficult to clean. Anaccurate description of the foulant layer structure andidentification of the foulant location in the membranesystem, i.e. in membrane pores or on the membranesurface, is thus very important for understanding foulingmechanisms, developing low fouling membranes orcreating favorable hydrodynamic conditions to minimizefouling.
4.2.1. Small-angle neutron scattering (SANS)Su et al.w62–64x utilized SANS to carry out in situ
studies of membrane pore blockage during ultrafiltrationof protein solutions by alumina membranes. SANS isan established technique for investigating the structureand distribution of aggregates in suspensions as well asthe surface layer structure in some porous media. Detailson the basic principles of SANS are given by Su et al.w62–64x. For porous media, the neutron scattering inten-sity can be related to the media structure, includingvolume fraction of the pores, relative location of thepores and geometrical structure of the pores. Therefore,changes in membrane pore structure caused by foulantdeposition within membrane pores can be monitored bydetecting changes in SANS intensity with time.A schematic of the experimental setup used by Su et
al. w62x to study protein fouling using SANS is shownin Fig. 13. The membrane cell consists of two quartzwindows that are transparent to neutron beams. Aneutron beam is passed perpendicularly through themembrane and captured by a detector. The membranemodule was operated in crossflow mode at a flow rateof 10 mlymin, corresponding to a Reynolds number of24. The pressure within the module was maintained at0.5 bar. BSA solutions in buffered D O at concentrations2
ranging from 0.1 to 1 gycm were filtered. More details3

104 J.C. Chen et al. / Advances in Colloid and Interface Science 107 (2004) 83–108
Fig. 13. Schematic diagram of(a) the filtration system and(b) the traverse of the neutron scattering beam through the filtration cell. Underoperational and scattering conditions, the alumina membrane is fully immersed in D O solution. Adapted from Su et al.w62x.2
of the experimental conditions are given by Su et al.w62–64x.The results of the studies described above revealed
that adsorption of foulant proteins on the wall ofmembrane pores caused greater diffusion of the neutronsfrom their intended path than that in the case of thebare alumina wall. The result was then a faster decay inscattering intensity for the blocked membrane pores.Therefore, the variation of SANS intensity was used tomonitor pore blockage by the foulant protein. By usinga simple model, the authors were able to estimate thethickness of the adsorbed layer in membrane pores andthe percentage of the pore surface area that is coveredby the foulant. More importantly, it was found that cakelayer of BSA formed at the front surface of themembrane had no effect on the measured neutronscattering intensity. This finding indicates that thechange in measured scattering intensity is only attribut-
able to pore blockage and that SANS can quantitativelydescribe foulant deposit in membrane pores. It alsosuggests that combination of SANS measurement withpermeate flux data can provide information on foulingmechanisms and ascertain the location of foulants, sinceflux decline is caused by fouling both at the frontmembrane surface and within the membrane pores.
4.3. Characterization of cake structure
Pignon et al. w65x presented static light scattering(SLS), SANS and local birefringence techniques toquantify the inner structure of deposited colloid foulinglayers on the membrane surface. In SLS and SANS,incident light or neutrons were directed through the cakelayer resulting in scattering through the deposit. Thescattering intensity was then related to the fractal dimen-sion of the deposit. In local birefringence measurements,

105J.C. Chen et al. / Advances in Colloid and Interface Science 107 (2004) 83–108
Fig. 14. Schematic diagram of the local birefringence measuring appa-ratus. Adapted from Pignon et al.w65x.
a laser beam traverses through the deposited cake layerand the intensity of the transmitted light was analyzedby lock-in amplifiers to determine the optical anisotropyof the deposit. The optical anisotropy was related to thelocal birefringence and was used to interpret the orien-tation of the particles within the deposit. The principlesof SLS, SANS and local birefringence techniques aredescribed in Pignon et al.w65x.The filtration cell used by Pignon et al.w65x consists
of two bottomless rectangular quartz cells located aboveand below the membrane. The unit was operated infrontal (dead-end) filtration mode. The incident light orneutron beam traverses through the deposit layer abovethe membrane surface and is captured by a detector. Inthe local birefringence setup, additional optical devicesare required. A schematic of the birefringence setup isshown in Fig. 14. The incident beam is polarized andthen crosses a photo-elastic modulator(PEM) set at 458to the polarizer. The PEM consists of a birefringentblade-optic and piezoelectric plate, a quarter wave plateand a converging lens. Upon transmission through thesample, the beam traverses through a circular polarizerconsisting of a quarter wave plate and a straight polarizerat 458 to each other. Finally, the transmitted beam iscaptured by a detector.Suspensions of polydisperse disc-shaped laponite clay
particles with a diameter of approximately 30 nm and athickness of 1 nm were used in the membrane filtrationexperiments. A stabilizing chemical agent(peptizer)(tetrasodium pyrophosphate) is added in some experi-mental runs to alter the rheology of the suspension. Thepeptizer has been shown to convert the suspension froma gel state to a liquid suspension(sol). Details of theexperimental setup are given by Pignon et al.w65x.In SLS and SANS measurements, the scattering
behaviors display a power law relationship from whichthe fractal dimension can be derived. The fractal dimen-sion provides useful insight into the structure of thecolloid deposit layer above the membrane. The deposit
of the clay suspension without peptizer exhibited afractal dimension of 2 according to the slope of theintensity profile. With the addition of the peptizer, thedeposit exhibited a fractal dimension of 1.3. A morecompact structure of deposit as indicated by a higherfractal dimension was obtained when filtering a well-structured gel suspension. Integration of the intensityprofile along two directionsy and z reveals that theintensity decays much less along they direction thanthe z. Such anisotropy implies that the short axes of theclay discs are oriented along they direction. Therefore,the orientation of particles within the deposit may bederived from SANS and SLS measurements. Fitting theintensity data to Guinier’s law also yields the half-dimension of the clay discs, which is its thickness. Inthis case, the fitting produced a value of 1.21 nm forthe thickness of the clay platelets, in good agreementwith the nominal value of 1 nm.For both cases, with and without the peptizer, consid-
erable birefringence was found near the membrane,which decreased with increasing distance from themembrane surface and became 0 at a certain distancethat is roughly equal to the thickness of the colloiddeposit layer. This signals that the deposit is moreanisotropic near the membrane surface. The birefrin-gence profile of the suspension without peptizer fluctu-ated, indicating a random structure for the deposit. Theresults show that a thicker deposit layer was formedwhen filtering suspensions containing no peptizer. Thisis expected as the peptizer induces a more compact andordered structure within the deposit.Pignon et al.w66x have advanced their previously
described observation techniquesw65x with a combina-tion of small angle X-ray scattering(SAXS) and mag-netization application to simultaneously characterize thestructure of particle deposits during ultrafiltration,manipulate the particle orientations and enhance filtra-tion performance. The general approach remains thesame as the case of SANS, with SAXS used in its place.The innovation of this latest method is the applicationof a magnetic field to the filtration cell that functions toeffectively alter the orientation of particles within thedeposits.The underlying theory of this technique relies on the
capability of the applied magnetic field to create adirectional anisotropy in the deposit such that particleswithin the deposit become predominantly oriented in apreferred direction. This process facilitates formation ofdeposits of higher compactness that translates toincreased concentration of particles in the deposit. Con-currently, the compactness is of an orderly nature andso flow channels for the permeate are less tortuous thanthe less compact but random deposits. This results in anincrease in permeability even for the more concentrated,compact deposit. Control of particle orientation inducesthe surprising, antithetical coincidence of a more con-

106 J.C. Chen et al. / Advances in Colloid and Interface Science 107 (2004) 83–108
centrated particle deposit while gaining improved filtra-tion performance and lower deposit specific resistance.The observation technique by SAXS competently cap-tures these phenomena and specifically quantifies themin terms of scattering intensities and an anisotropyparameter. Thus, SAXS not only proves to be capableof quantifying the thickness and compactness of particledeposits, but also extends its application to attaining thedeposit anisotropy and exploiting this property toachieve optimized membrane operations.The experimental setup is similar to the previous
work of Pignon et al.w65x with the exception of X-raybeing the probing beam. The filtration cell is made frompolycarbonate, and its dimensions are 4=1=38 mm .3
Amicon Millipore asymmetric polysulfone organic ultra-filtration membranes, with an average pore size of 50nm, were used in the filtration process with montmoril-lonite particles of radius 500 nm. The montmorilloniteparticles are saturated with Fe by ion exchange to2q
enhance their responsiveness to a magnetic field. Detailsof the conditioning of the particles with Fe are given2q
by Pignon et al.w66x.The filtration cell is flanked by the magnetic setup
consisting of two stacks of five magnetic elementsmounted on a motorized jaw. The flow is positioned atthe center of the generated magnetic fields. The mag-netic setup is capable of delivering field strength of upto 1.43 T over 1 cm . Scattering measurements by3
SAXS and ultra-SAXS(USAX) are performed. Thedata acquisition apparatus consists of a two-dimensionaldetector and a Bonse-Hart camera for SAXS and USAX,respectively.The observation technique of Pignon et al.w66x does
impose certain restrictive conditions. First, the particlesmust be preconditioned with Fe to be responsive to2q
the magnetic field. Experiments conducted with Fe2q
free particles show greatly reduced effects from themagnetic field. The ion-exchange process with Fe2q
causes the experiments to deviate from real conditionsof interest. However, the preconditioning with Fe may2q
also be regarded as a form of proposed pretreatment ofparticles to enhance filtration performance. Second, themagnetic field can only generate a preferred directionalanisotropy for non-spherical particles, for instance ellip-soids. The re-orientation of particles would not exhibita preferable direction of alignment in cases where theyare spherically shaped.
5. Concluding remarks
Laboratory-scale in situ techniques for probing con-centration polarization and fouling phenomena in pres-sure-driven membrane filtration can provide valuableinsights into the mechanisms controlling these phenom-ena. Such techniques can provide detailed informationon changes in local(i.e. along a filtration channel) and
transverse(i.e. perpendicular to the membrane surface)properties of the solute polarization layer or cake. Theobtained information will enable assessment and refine-ment of current models and theories for concentrationpolarization and cake formation. A mechanistic under-standing of fouling phenomena will lead to refinementof strategies to control and minimize fouling inmembrane systems as well as development of chemicaland physical cleaning techniques for fouled membranes.Despite the enormous potential of in situ monitoring
techniques to advance our quantitative understanding ofmembrane filtration, it is quite surprising that the avail-able investigations are quite limited in scope. Thereviewed studies provided only qualitative or perhapssemi-quantitative information on concentration polari-zation, cake formation and fouling phenomena. Severalof the techniques need refinements to improve accuracyand resolution. The latter is quite important as manytransport processes within the concentration polarizationlayer vary over a short length scale(on the order of afew micrometers) near the membrane surface. The latestadvancements in the fields of nanotechnology, micro-fluidics, optics, spectroscopy and sensors offer vastopportunities for development of robust in situ monitor-ing techniques in membrane filtration.
Acknowledgments
The work was supported by the National ScienceFoundation(Grant BES 0114527).
References
w1x L.J. Zeman, A.L. Zydney, Microfiltration and Ultrafiltration:Principles and Applications, Marcel Dekker, New York, 1996.
w2x G. Belfort, R.H. Davis, A.L. Zydney, The behavior of suspen-sions and macromolecular solutions in crossflow microfiltra-tion, J. Membrane Sci. 96(1994) 1–58.
w3x M.G. van der Waal, I.G. Racz, Mass transfer in corrugated-plate membrane modules. I. Hyperfiltration experiments, J.Membrane Sci. 40(1989) 243–260.
w4x R. van Reis, S. Gadam, L.N. Frautschy, et al., High perform-ance tangential flow filtration, Biotechnol. Bioeng. 56(1997)71–82.
w5x G.B. van den Berg, C.A. Smolders, Flux decline in ultrafiltra-tion processes, Desalination 77(1990) 101–133.
w6x V.L. Vilker, C.K. Colton, K.A. Smith, Concentration polariza-tion in protein ultrafiltration. Part II: theoretical and experi-mental study of albumin ultrafiltered in an unstirred batch cell,AIChE. J. 27(1981) 637–645.
w7x J.G. Wijmans, S. Nakao, C.A. Smolders, Flux limitation inultrafiltration-osmotic pressure model and gel layer model, J.Membrane Sci. 20(1984) 115–124.
w8x E.S. Tarleton, R.J. Wakeman, Understanding flux decline incrossflow microfiltration. 1. Effects of particle and pore size,Chem. Eng. Res. Design 71(A4) (1993) 399–410.
w9x L.F. Song, Flux decline in crossflow microfiltration and ultra-filtration-mechanisms and modeling of membrane fouling, J.Membrane Sci. 139(1998) 183–200.

107J.C. Chen et al. / Advances in Colloid and Interface Science 107 (2004) 83–108
w10x R.S. Faibish, M. Elimelech, Y. Cohen, Effect of interparticleelectrostatic double layer interactions on permeate flux declinein crossflow membrane filtration of colloidal suspensions—anexperimental investigation, J. Colloid Interface Sci. 204(1998)77–86.
w11x C.A. Romero, R.H. Davis, Global-model of cross-flow micro-filtration based on hydrodynamic particle diffusion, J.Membrane Sci. 39(1988) 157–185.
w12x C.A. Romero, R.H. Davis, Transient model of cross-flowmicrofiltration, Chem. Eng. Sci. 45(1990) 13–25.
w13x L.F. Song, M. Elimelech, Theory of concentration polarizationin crossflow filtration, J. Chem. Soc. Faraday Trans. 91(1995)3389–3398.
w14x M. Mulder, Basic Principles of Membrane Technology, seconded., Kluwer Academic, Dordrecht, The Netherlands, 1996.
w15x M.C. Porter, Concentration polarization with membrane ultra-filtration, Ind. Eng. Chem. Prod. Res. Dev. 11(3) (1972)234–248.
w16x W.B. Russel, The Dynamics of Colloidal Systems, Universityof Wisconsin Press, Madison, WI, 1987.
w17x M.R. Mackley, N.E. Sherman, Cross-flow cake filtration mech-anisms and kinetics, Chem. Eng. Sci. 47(1992) 3067–3084.
w18x D.R. Trettin, M.R. Doshi, Pressure independent ultrafiltration—is it gel limited or osmotic pressure limited? In: A.F. Turbak(Ed.), Synthetic Membranes: Hyper and Ultrafiltration Uses,vol II, P 373, ACS Symp. Ser. 154, 1981.
w19x V.L. Vilker, C.K. Colton, K.A. Smith, Concentration polariza-tion in protein ultrafiltration. Part I: An optical shadowgraphtechnique for measuring concentration profiles near a solution–membrane interface, AIChE. J. 27(1981) 632–637.
w20x S. Bhattacharjee, A. Sharma, P.K. Bhattacharya, A unifiedmodel for flux prediction during batch cell ultrafiltration, J.Membrane Sci. 111(1996) 243–258.
w21x W.R. Bowen, F. Jenner, Theoretical descriptions of membranefiltration of colloids and fine particles: an assessment andreview, Adv. Colloid Interface Sci. 56(1995) 141–200.
w22x D.N. Petsev, V.M. Starov, I.B. Ivanov, Concentrated dispersionsof charged colloidal particles: sedimentation, ultrafiltration anddiffusion, Colloid. Surf. A 81(1993) 65–81.
w23x S. Bhattacharjee, A.S. Kim, M. Elimelech, Concentrationpolarization of interacting solute particles in crossflowmembrane filtration, J. Colloid Interface Sci. 212(1999)81–99.
w24x M. Elimelech, S. Bhattacharjee, A novel approach for modelingconcentration polarization in crossflow membrane filtrationbased on equivalence of osmotic pressure model and filtrationtheory, J. Membrane Sci. 145(1998) 223–241.
w25x J. Happel, H. Brenner, Low Reynolds Number Hydrodynamics,Kluwer, Dordrecht, 1991.
w26x W.B. Russel, D.A. Saville, W.R. Schowalter, Colloidal Disper-sions, Cambridge University Press, Cambridge, 1989.
w27x A.A. Kozinski, E.N. Lightfoo, Protein ultrafiltration: a generalexample of boundary-layer filtration, AIChE. J. 18(1972)1030–1038.
w28x C.R. Ethier, D.C. Lin, Refractometric measurement of polarizedlayer structure: studies of hyaluronic acid ultrafiltration, J.Membrane Sci. 68(1992) 249–261.
w29x L.M. Gowman, C.R. Ethier, Concentration and concentrationgradient measurements in an ultrafiltration concentration polar-ization layer. Part I: A laser-based refractometric experimentaltechnique, J. Membrane Sci. 131(1997) 95–105.
w30x L.M. Gowman, C.R. Ethier, Concentration and concentrationgradient measurements in an ultrafiltration concentration polar-ization layer. Part II: Application to hyaluronan, J. MembraneSci. 131(1997) 107–123.
w31x C.R. Ethier, The hydrodynamic resistance of hyaluronic acid:estimates from sedimentation studies, Biorheology 23(1986)99–113.
w32x L.S. Lam, J.L. Bert, Hydraulic flow conductivity of hyaluronicacid solutions: effects of concentration and molecular weight,Biorheology 27(1990) 789–795.
w33x R.M. Peitzsch, W.F. Reed, High osmotic stress behavior ofhyaluronate and heparin, Biopolymers 32(1992) 219–238.
w34x M. Johnson, Transport through the aqueous outflow system ofthe eye, Ph.D. thesis, Massachusetts Institute of Technology,Cambridge, MA, 1987.
w35x S.W. Young, Magnetic Resonance Imaging: Basic Principles,second ed., Raven Press, NewYork, 1988.
w36x M.T. Vlaadingerbroek, J.A. den Boer, Magnetic ResonanceImaging: Theory and Practice, Second Review, Springer, NewYork, 1999.
w37x S. Yao, M. Costello, A.G. Fane, J.M. Pope, Non-invasiveobservation of flow profiles and polarisation layers in hollowfibre membrane filtration modules using NMR micro-imaging,J. Membrane Sci. 99(1995) 207–216.
w38x P.T. Callaghan, Y. Xia, Veloctiy and diffusion imaging indynamic NMR microscopy, J. Magn. Reson. 91(1991)326–352.
w39x P.T. Callaghan, C.D. Eccles, Y. Xia, NMR microscopy ofdynamic displacements: k-space and q-space imaging, J. Phys.Part E. Sci. Intrum. 21(1991) 820–822.
w40x J.M. Pope, S. Yao, A.G. Fane, Quantitative measurements ofthe concentration polarisation layer thickness in membranefiltration of oil–water emulsion using NMR micro-imaging, J.Membrane Sci. 118(1996) 247–257.
w41x D. Airey, S. Yao, J. Wu, V. Chen, A.G. Fane, J.M. Pope, Aninvestigation of concentration polarization phenomena inmembrane filtration of colloidal silica suspensions by NMRmicro-imaging, J. Membrane Sci. 145(1998) 145–158.
w42x S. Yao, A.G. Fane, J.M. Pope, An investigation of the fluidityof concentration polarisation layers in crossflow membranefiltration of an oil–water emulsion using chemical shift selec-tive flow imaging, Magn. Reson. Imaging 15(2) (1997)235–242.
w43x R.M. McDonogh, H. Bauser, N. Stroh, d.H. Chmiel, Separationefficiency of membrane in biotechnology: an experimental andmathematical study of flux control, Chem. Eng. Sci. 47(1)(1992) 271–279.
w44x R.M. McDonogh, H. Bauser, N. Stroh, U. Grauschopf, Exper-imental in situ measurement of concentration polarisationduring ultra- and micro-filtration of bovine serum albumin anddextran blue solutions, J. Membrane Sci. 104(1995) 51–63.
w45x S.S.L. Peppin, J.A.W. Elliott, Non-equilibrium thermodynamicsof concentration polarization, Adv. Colloid Interf. Sci. 92(2001) 1–72.
w46x W. Zhang, C.R. Ethier, Direct pressure measurements in ahyaluronan ultrafiltration concentration polarization layer, Col-loid. Surface. A: Physicochem. Eng. Aspects 180(2001)63–73.
w47x A. Kim, C.H. Wang, M. Johnson, R. Kamm, The specifichydraulic conductivity of bovine serum-albumin, Biorhelogy28 (5) (1991) 401–419.
w48x H. Li, A.G. Fane, H.G.L. Coster, S. Vigneswaran, Directobservation of particle deposition on the membrane surfaceduring crossflow microfiltration, J. Membrane Sci. 149(1998)83–97.
w49x H. Li, A.G. Fane, H.G.L. Coster, S. Vigneswaran, An assess-ment of depolarisation models of crossflow microfiltration bydirect observation through the membrane, J. Membrane Sci.172 (2000) 135–147.

108 J.C. Chen et al. / Advances in Colloid and Interface Science 107 (2004) 83–108
w50x S. Kang, E.M.V. Hoek, M.A. Deshusses, M. Matsumoto, Anovel quantification method for the initial deposition of micro-organisms onto a membrane surface, Water Sci. Technol., inpress.
w51x W. Mores, R.H. Davis, Direct visual observation of yeastdeposition and removal during microfiltration, J. MembraneSci. 189(2001) 217–230.
w52x J. Altmann, S. Ripperger, Particle deposition and layer forma-tion at the crossflow microfiltration, J. Membrane Sci. 124(1997) 119–128.
w53x M. Hamachi, M. Mietton-Peuchot, Experimental investigationof cake characteristics in crossflow microfiltration, Chem. Eng.Sci. 54(1999) 4023–4030.
w54x M. Hamachi, M. Mietton-Peuchot, Cake thickness measure-ment with an optical laser sensor, Chem. Eng. Res. Des. 79(A2) (2001) 151–155.
w55x D. Ensminger, Ultrasonics, Marcel Dekker, New York, 1988.w56x A.P. Mairal, A.R. Greenberg, W.B. Krantz, L.J. Bond, Real-
time measurement of inorganic fouling of RO desalinationmembranes using ultrasonic time-domain reflectometry, J.Membrane Sci. 159(1999) 185–196.
w57x V.E. Reinsch, A.R. Greenberg, S.S. Kelley, R. Peterson, L.J.Bond, A new technique for the simultaneous, real-time meas-urement of membrane compaction and performance duringexposure to high-pressure gas, J. Membrane Sci. 171(2000)217–228.
w58x J. Li, R.D. Sanderson, In situ measurement of particle deposi-tion and its removal in microfiltration by ultrasonic time-domain reflectometry, Desalination 146(2002) 169–175.
w59x T.C. Chilcott, M. Chan, L. Gaedt, T. Nantawisarakul, A.G.Fane, H.G.L. Coster, Electrical impedance spectroscopy char-acterisation of conducting membranes I. Theory, J. MembraneSci. 195(2002) 153–167.
w60x L. Gaedt, T.C. Chilcott, M. Chan, T. Nantawisarakul, A.G.Fane, H.G.L. Coster, Electrical impedance spectroscopy char-acterisation of conducting membranes II. Experimental, J.Membrane Sci. 195(2002) 169–180.
w61x H.G.L. Coster, T.C. Chilcott, A.C.F. Coster, Impedance spec-troscopy of interfaces, membranes and ultrastructures, Bioelec-tochem. Bioenerg. 40(2) (1996) 79–98.
w62x T.J. Su, J.R. Lu, Z.F. Cui, R.K. Thomas, R.K. Heenan,Application of small angle neutron scattering to the in situstudy of protein fouling on ceramic membranes, Langmuir 14(1998) 5517–5520.
w63x T.J. Su, J.R. Lu, Z.F. Cui, B.J. Bellhouse, R.K. Thomas, R.K.Heenan, Identification of the location of protein fouling onceramic membranes under dynamic filtration conditions, J.Membrane Sci. 163(1999) 265–275.
w64x T.J. Su, J.R. Lu, Z.F. Cui, R.K. Thomas, Fouling of ceramicmembranes by albumins under dynamic filtration conditions,J. Membrane Sci. 173(2000) 167–178.
w65x F. Pignon, A. Magnin, J.M. Piau, et al., Structural characteris-ation of deposits formed during frontal filtration, J. MembraneSci. 174(2000) 189–204.
w66x F. Pignon, A. Alemdar, A. Magnin, T. Narayanan, Small-angleX-ray scattering studies of Fe-montmorillonite deposits duringultrafiltration in a magnetic field, Langmuir 19(2003)8638–8645.