2004 edition world investment prospects - eiugraphics.eiu.com/files/ad_pdfs/wip_2004.pdf2004 edition...
TRANSCRIPT

2004 edition
World investment prospectsThe revival ofglobalisation?
LONDON
15 Regent Street
London
SW1Y 4LR
United Kingdom
Tel: (44.20) 7830 1000
Fax: (44.20) 7499 9767
E-mail: [email protected]
NEW YORK
111 West 57th Street
New York
NY 10019
United States
Tel: (1.212) 554 0600
Fax: (1.212) 586 1181/2
E-mail: [email protected]
HONG KONG
60/F, Central Plaza
18 Harbour Road
Wanchai
Hong Kong
Tel: (852) 2585 3888
Fax: (852) 2802 7638
E-mail: [email protected]

For further information: JETRO Invest Japan Business Support Center Akasaka Twin Tower Bldg. • 2-17-22, Akasaka, Minato-ku • Tokyo 107-0052Tel:+81-3-3584-6042 • Fax:+81-3-3584-6024 • E-mail: [email protected]
Visit our web site now!www.investjapan.org
Thinking about Japan?“Japan is a country rich in assets, with ready access to capital, state-of-the-art technology, an excellent infrastructure, government by law, and a dedicated, high-quality work force.”
Carlos Ghosn, President and CEONissan Motor Co., Ltd.
Call on JETRO. In Japan, the manekineko,
beckoning cat, is a symbol that
welcomes customers and brings
good luck in business. JETRO has
been helping businesses for over
forty years, and can be your sym-
bol of welcome in Japan. The
Japan External Trade Organiza-
tion (JETRO) is a Japanese
government-funded organization
that provides a full range of
information and support services
to those who would like to set
up business operations in Japan
through a worldwide network
of 79 overseas offices and 38
local offices.
One of JETRO’s main facili-
ties is the Invest Japan Business
Support Center (IBSC)—a one-
stop service center providing free
investment information and
consulting by English-speaking
specialists. In addition, potential
investors can use free temporary
offices at IBSC which is conven-
iently located in central Tokyo.
Whatever your business needs
are, calling on JETRO is the smart
way to invest in Japan.

© The Economist Intelligence Unit 3
WORLD INVESTMENT PROSPECTS
The editors:
Laza Kekic, Gareth Lofthouse, Dafne Ter-Sakarian,
Philip Whyte
Introduction:
Daniel Franklin, Editorial Director, Economist
Intelligence Unit
Global foreign direct investment: trends and forecasts:
Laza Kekic, Director, Country Forecasting Services,
Economist Intelligence Unit
Global foreign direct investment: the investor
perspective:
Gareth Lofthouse, Director, Executive Services Europe,
Economist Intelligence Unit
This report drew on the work of the Economist
Intelligence Unit’s large team of country economists
and regional specialists, in particular the following
analysts who regularly produce Country Forecast
reports.
North America
Robin Bew Gerard Walsh
Western Europe
Robert O’Daly Jan Friedrich
Ania Thiemann Charles Jenkins
Stefan Wesiak Dan O’Brien
Neil Prothero
Eastern Europe & the former Soviet Union
Leila Butt Stuart Hensel
James Owen Joan Hoey
Mark Katzman Matthew Sherwood
Asia
Leo Abruzzese Kate Allard
Caroline Bain David Webb
Graham Richardson Kilbinder Dosanjh
Robert Ward Paul Cavey
Danny Richards
Latin America & the Caribbean
Justine Thody Robert Wood
John Bowler Mary Stanier
Emily Morris Martin Pickering
Middle East & Africa
David Cowan Ben Faulks
Pratibha Thaker Hania Farhan
Keren Uziyel James Reeve
Neil Partrick
We would also like to thank the following people, all of
whom were instrumental in ensuring that this report
was produced: John Andrew, Mark Bennet, David
Calver, Anwen John, Mike Kenny, Gareth Owen and
Alex Selby-Boothroyd.
The authors
TThe Nhe NetheretherlandslandsWHERE BUSINESS BLOOMS
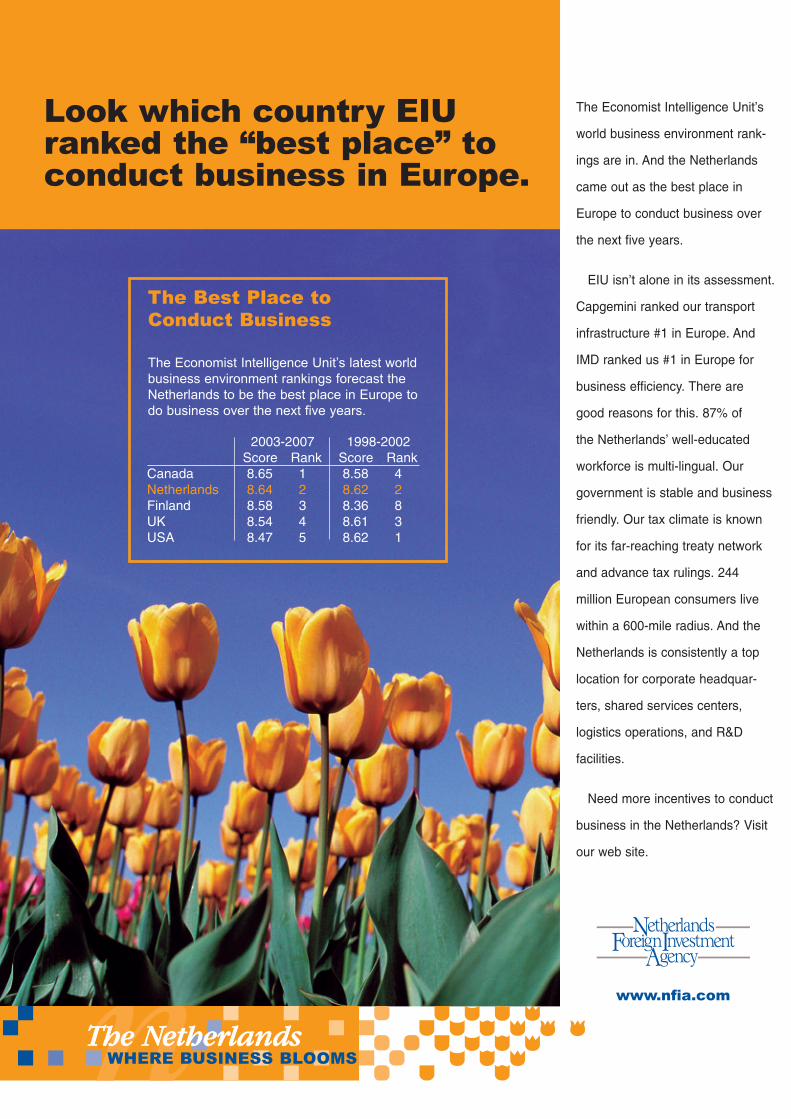
The Economist Intelligence Unit’s
world business environment rank-
ings are in. And the Netherlands
came out as the best place in
Europe to conduct business over
the next five years.
EIU isn’t alone in its assessment.
Capgemini ranked our transport
infrastructure #1 in Europe. And
IMD ranked us #1 in Europe for
business efficiency. There are
good reasons for this. 87% of
the Netherlands’ well-educated
workforce is multi-lingual. Our
government is stable and business
friendly. Our tax climate is known
for its far-reaching treaty network
and advance tax rulings. 244
million European consumers live
within a 600-mile radius. And the
Netherlands is consistently a top
location for corporate headquar-
ters, shared services centers,
logistics operations, and R&D
facilities.
Need more incentives to conduct
business in the Netherlands? Visit
our web site.
Look which country EIUranked the “best place” toconduct business in Europe.
The Best Place to Conduct Business
The Economist Intelligence Unit’s latest worldbusiness environment rankings forecast theNetherlands to be the best place in Europe todo business over the next five years.
2003-2007 1998-2002Score Rank Score Rank
Canada 8.65 1 8.58 4Netherlands 8.64 2 8.62 2Finland 8.58 3 8.36 8UK 8.54 4 8.61 3USA 8.47 5 8.62 1
www.nfia.com
© The Economist Intelligence Unit 5
WORLD INVESTMENT PROSPECTS
Introduction
By Daniel Franklin, Editorial Director,
Economist Intelligence Unit
This is the fourth edition of the Economist Intelligence
Unit's World investment prospects, and regular
readers will notice a few changes. The report has a
livelier look, thanks to a new design and a fresh cover.
For the first time, it also has advertising, which has
helped to fund an extra layer of research: a global
survey of 500 senior executives, exploring corporate
expectations for foreign direct investment (FDI). This
adds a new dimension to the analysis and provides an
additional fix on future trends.
The tricky business of trying to forecast foreign
investment has become an exercise in triangulation.
We can now map FDI’s expected course by the
combined means of the global survey, our five-year
economic forecast and our systematic assessment of
the likely evolution of business environments across
60 countries that collectively account for more than
95% of the world’s GDP and crossborder investment.
Reassuringly, all the indicators point in the same
broad direction: towards a rebound in FDI, after three
years of decline during which the troubles of
recession, terrorism and war took a heavy toll.
In 2003, global FDI of some US$575bn was almost
60% below its dizzy peak of US$1.4trn in 2000.
However, a broad-based economic recovery is now
under way, and, despite protectionist temptations,
business environments around the world will for the
most part become more conducive to foreign
investment over the coming years. Investor
confidence is returning. Our global survey of
executives shows an overwhelming 77% of companies
planning to increase the level of FDI over the next five
years compared with 1999-2003, with more than one
in four expecting the increase to be over 50%. We
forecast that global FDI will bounce back to US$755bn
in 2004, 31% higher than in 2003. By 2008, the end of
our forecast period, we expect the worldwide total to
have climbed back to US$1.2trn, higher than in any
year except top-of-the-boom 2000.
Our benign baseline scenario is, however, subject
to an array of significant risks. Among the many
threats to the resumed vigour of FDI—ranging from US
imbalances to Chinese bubbles, and from terrorist
bombs to anti-globalist bluster—the geopolitical risks
loom largest. After the fall of the Berlin Wall and the
collapse of Soviet communism, international political
co-operation helped to fuel a decade of growth in
foreign investment. The co-operative spirit has wilted
in the aftermath of the Iraq war. The deepening of
globalisation, with FDI to the fore, could be at risk if
the tensions over the Middle East and other arguments
result in a retreat into regionalism or, worse, outright
protectionism.
As it is, many governments’ poor economic policies
already keep FDI well below its full potential, its
benefits unevenly spread around the world. The US, we
predict, will attract about one-fifth of all inward
investment over the next five years. Although our
survey shows enthusiasm among executives about the
prospects for investment into developing countries,
we expect a revival in merger and acquisition (M&A)
activity to boost the developed-country share of
global FDI back above 70%. Among the developing
countries themselves, FDI flows are also highly
concentrated in just a few places. China, Mexico,
Brazil, Russia and India will account for the lion’s (and
the tiger’s) share.
It is no surprise to see China viewed in the executive
survey as the top emerging market for FDI; investment
into China is likely to be some US$58bn in 2004
(roughly half the flow into the US), growing to nearly
US$80bn by 2008. More intriguing is India’s rise up
the scale of attraction for global executives; in
corporate perceptions, other big emerging markets
pale by comparison with the two Asian giants. Yet
© The Economist Intelligence Unit 6
WORLD INVESTMENT PROSPECTS INTRODUCTION
India still has a long way to go: we predict that its
inward FDI will rise from US$5bn last year to US$13bn
in 2008—not in the same league as China, and still
behind Brazil.
Neither the survey nor our own analysis points to a
post-enlargement surge of investment into eastern
Europe. For most of these countries, the EU-related
FDI boom is already behind them, as most of the
benefits of joining the European club are offset by the
costs of membership and a possible slowdown in
reform momentum. FDI into the east European new EU
member countries more than halved in 2003; it is
likely to recover, but not spectacularly. The new EU
members will learn that competition for investment
around the world—not least, from cheaper-labour
places further east in Europe and from Asia—is
intense.
One country that has lately been losing out in the
competition for FDI is the UK. In the 1990s it was
Europe’s star, and it still accounts for nearly one-
quarter of the total stock of FDI in the EU. However,
with the collapse of the M&A boom, flows of
investment into the UK have dwindled—to US$14.5bn
in 2003, just 5% of the EU total and less than went to
Italy. The UK’s share of EU investment has fallen in
every single year since 1999, the year the euro was
launched. According to statistical analysis of the
determinants of FDI by Laza Kekic, this report’s main
editor, staying outside the euro zone may cost EU
members at least one-third of potential annual FDI
flows. Joining the single currency is off the UK’s
agenda for now, and our survey of executives reveals
poor perceptions of the country’s attractiveness for
investors in several vital areas.
So this report should concentrate the minds of
policymakers and investment agencies in the UK, as
well as those in the other 59 countries for which it
provides succinct FDI profiles. For corporate
executives, the report points to where the
opportunities (and problems) lie, and captures the
views of their peers around the world on investment
trends. Those involved in appraising FDI will find an
abundance of fresh data and analysis—valuable inputs
into the risk assessment and rigorous market research
that, our survey suggests, are essential for successful
foreign investment. In short, these pages are for all
those preparing to compete in the coming era of FDI
growth.

© The Economist Intelligence Unit 8
WORLD INVESTMENT PROSPECTS
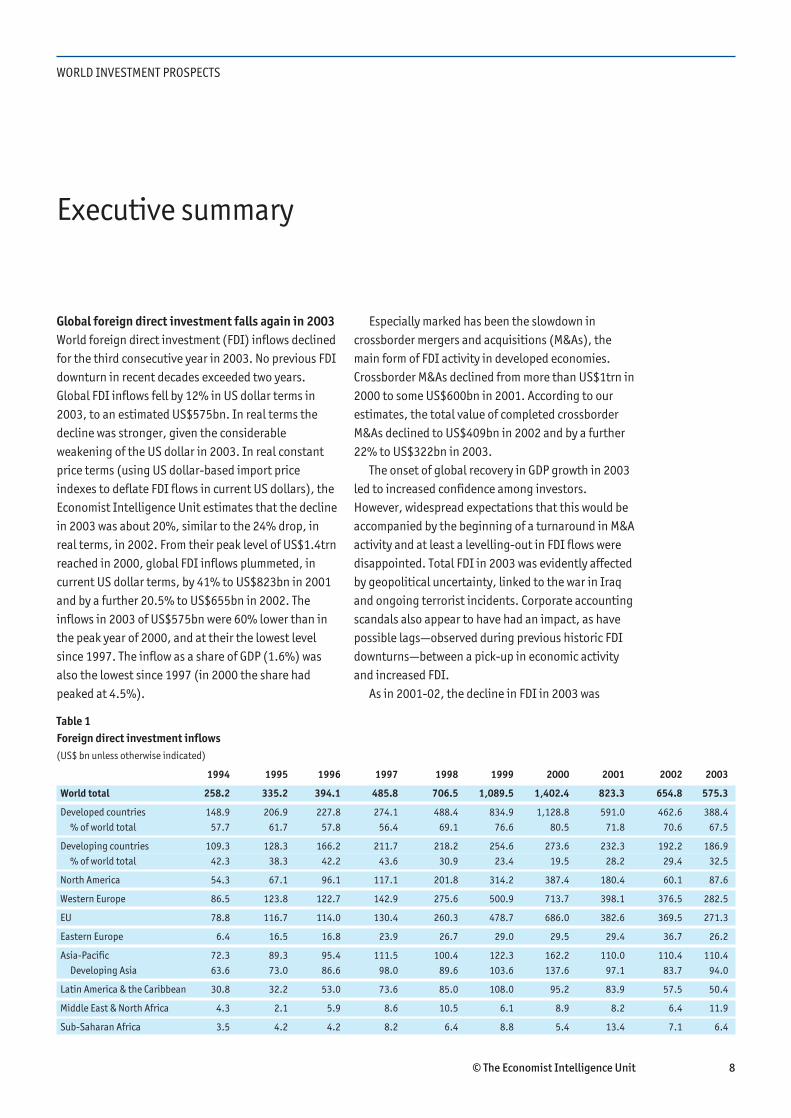
Global foreign direct investment falls again in 2003
World foreign direct investment (FDI) inflows declined
for the third consecutive year in 2003. No previous FDI
downturn in recent decades exceeded two years.
Global FDI inflows fell by 12% in US dollar terms in
2003, to an estimated US$575bn. In real terms the
decline was stronger, given the considerable
weakening of the US dollar in 2003. In real constant
price terms (using US dollar-based import price
indexes to deflate FDI flows in current US dollars), the
Economist Intelligence Unit estimates that the decline
in 2003 was about 20%, similar to the 24% drop, in
real terms, in 2002. From their peak level of US$1.4trn
reached in 2000, global FDI inflows plummeted, in
current US dollar terms, by 41% to US$823bn in 2001
and by a further 20.5% to US$655bn in 2002. The
inflows in 2003 of US$575bn were 60% lower than in
the peak year of 2000, and at their the lowest level
since 1997. The inflow as a share of GDP (1.6%) was
also the lowest since 1997 (in 2000 the share had
peaked at 4.5%).
Especially marked has been the slowdown in
crossborder mergers and acquisitions (M&As), the
main form of FDI activity in developed economies.
Crossborder M&As declined from more than US$1trn in
2000 to some US$600bn in 2001. According to our
estimates, the total value of completed crossborder
M&As declined to US$409bn in 2002 and by a further
22% to US$322bn in 2003.
The onset of global recovery in GDP growth in 2003
led to increased confidence among investors.
However, widespread expectations that this would be
accompanied by the beginning of a turnaround in M&A
activity and at least a levelling-out in FDI flows were
disappointed. Total FDI in 2003 was evidently affected
by geopolitical uncertainty, linked to the war in Iraq
and ongoing terrorist incidents. Corporate accounting
scandals also appear to have had an impact, as have
possible lags—observed during previous historic FDI
downturns—between a pick-up in economic activity
and increased FDI.
As in 2001-02, the decline in FDI in 2003 was
Executive summary
Table 1
Foreign direct investment inflows
(US$ bn unless otherwise indicated)
1994 1995 1996 1997 1998 1999 2000 2001 2002 2003
World total 258.2 335.2 394.1 485.8 706.5 1,089.5 1,402.4 823.3 654.8 575.3
Developed countries 148.9 206.9 227.8 274.1 488.4 834.9 1,128.8 591.0 462.6 388.4
% of world total 57.7 61.7 57.8 56.4 69.1 76.6 80.5 71.8 70.6 67.5
Developing countries 109.3 128.3 166.2 211.7 218.2 254.6 273.6 232.3 192.2 186.9
% of world total 42.3 38.3 42.2 43.6 30.9 23.4 19.5 28.2 29.4 32.5
North America 54.3 67.1 96.1 117.1 201.8 314.2 387.4 180.4 60.1 87.6
Western Europe 86.5 123.8 122.7 142.9 275.6 500.9 713.7 398.1 376.5 282.5
EU 78.8 116.7 114.0 130.4 260.3 478.7 686.0 382.6 369.5 271.3
Eastern Europe 6.4 16.5 16.8 23.9 26.7 29.0 29.5 29.4 36.7 26.2
Asia-Pacific 72.3 89.3 95.4 111.5 100.4 122.3 162.2 110.0 110.4 110.4
Developing Asia 63.6 73.0 86.6 98.0 89.6 103.6 137.6 97.1 83.7 94.0
Latin America & the Caribbean 30.8 32.2 53.0 73.6 85.0 108.0 95.2 83.9 57.5 50.4
Middle East & North Africa 4.3 2.1 5.9 8.6 10.5 6.1 8.9 8.2 6.4 11.9
Sub-Saharan Africa 3.5 4.2 4.2 8.2 6.4 8.8 5.4 13.4 7.1 6.4

© The Economist Intelligence Unit 9
WORLD INVESTMENT PROSPECTS EXECUTIVE SUMMARY
concentrated in the developed world. FDI inflows in
the developed world fell by an estimated 16% in 2003
to US$388bn. The weaker US dollar, as well as strong
GDP growth, led to the expected recovery of FDI into
the US in 2003. By contrast, FDI into the EU fell by
27%, to US$271bn. In the developing world, the
decline in FDI inflows in 2001-03 was more modest—
FDI inflows declined by only 2.8% to US$187bn in
2003, compared with an average annual drop of some
16% in 2001-02. This was thanks to a strong recovery
in FDI into developing Asia in 2003, led by China. Latin
America experienced yet another year of decline, and
FDI into the east European transition economies also
fell, whereas previously it had held up well during the
slump.
FDI is set to recover
Following the sharp post-2000 decline, FDI flows
appear to have reached a nadir in 2003. We expect
global FDI inflows to bounce back by some 30% in US
dollar terms in 2004 (a weak US dollar will mean that
the increase in real terms is less pronounced, just as
the decline in 2003 was understated when expressed
in current US dollar terms). Strengthened economic
growth and a pick-up in fixed capital spending, as well
as improved confidence with regard to M&As, will
underpin a recovery in FDI. After three lean years,
however, the expected recovery in FDI will be modest:
the forecast total in global FDI inflows in 2004 of some
US$755bn will scarcely be much more than half the
total recorded in the peak year of 2000.
Between 2005 and 2008 global FDI inflows are
projected to grow at an average annual rate of 11%.
Despite an array of global risks, on baseline
assumptions the world economic recovery is set to
continue into the medium term, and this will underpin a
robust recovery in global FDI, which will again exceed
the rate of growth in world output and trade. Other
reasons to expect continued growth in FDI over the
medium term include: the ongoing global trend
towards better business environments (as measured by
our cross-country business environment rankings),
including ever more open policies towards FDI; progress
0 50 100 150 200 250
India
Singapore
Russia
Finland
Mexico
Sweden
Hong Kong
Switzerland
Brazil
Italy
Spain
Ireland
Germany
Canada
Netherlands
UK
France
China
USA
Belgium-Lux
Leading FDI recipients, 2004-08 average
US$ bn
Table 2
Foreign direct investment projections
(US$ bn unless otherwise indicated)
1999 2000 2001 2002 2003 2004 2005 2006 2007 2008
World FDI inflows 1,089.5 1,402.4 823.3 654.8 575.3 754.8 883.7 991.6 1,079.6 1,165.7
Rate of growth (%) 54.2 28.7 -41.3 -20.5 -12.1 31.2 17.1 12.2 8.9 8.0
% of GDP 3.6 4.5 2.6 2.0 1.6 1.8 2.1 2.3 2.4 2.5
FDI inflows to developed countries 834.9 1,128.8 591.0 462.6 388.4 525.2 628.7 710.4 773.8 835.5
Rate of growth (%) 71.0 35.2 -47.6 -21.7 -16.0 35.2 19.7 13.0 8.9 8.0
% of GDP 3.5 4.7 2.5 1.9 1.4 1.7 1.9 2.1 2.3 2.4
% of world total 76.6 80.5 71.8 70.6 67.5 69.6 71.1 71.6 71.7 71.7
FDI inflows to developing countries 254.6 273.6 232.3 192.2 186.9 229.6 255.0 281.2 305.8 330.2
Rate of growth (%) 16.7 7.5 -15.1 -17.3 -2.8 22.8 11.1 10.3 8.7 8.0
% of GDP 3.9 3.8 3.3 2.6 2.3 2.6 2.7 2.8 2.8 2.8
% of world total 23.4 19.5 28.2 29.4 32.5 30.4 28.9 28.4 28.3 28.3
© The Economist Intelligence Unit 10
WORLD INVESTMENT PROSPECTS EXECUTIVE SUMMARY
in regional integration; technological change and the
search for competitively priced skills; sharper global
competition pushing companies to seek lower-cost
destinations; and opportunities in emerging markets.
A new global survey of 500 senior executives that
we conducted as part of the research for this report
confirms that FDI is back on the corporate agenda.
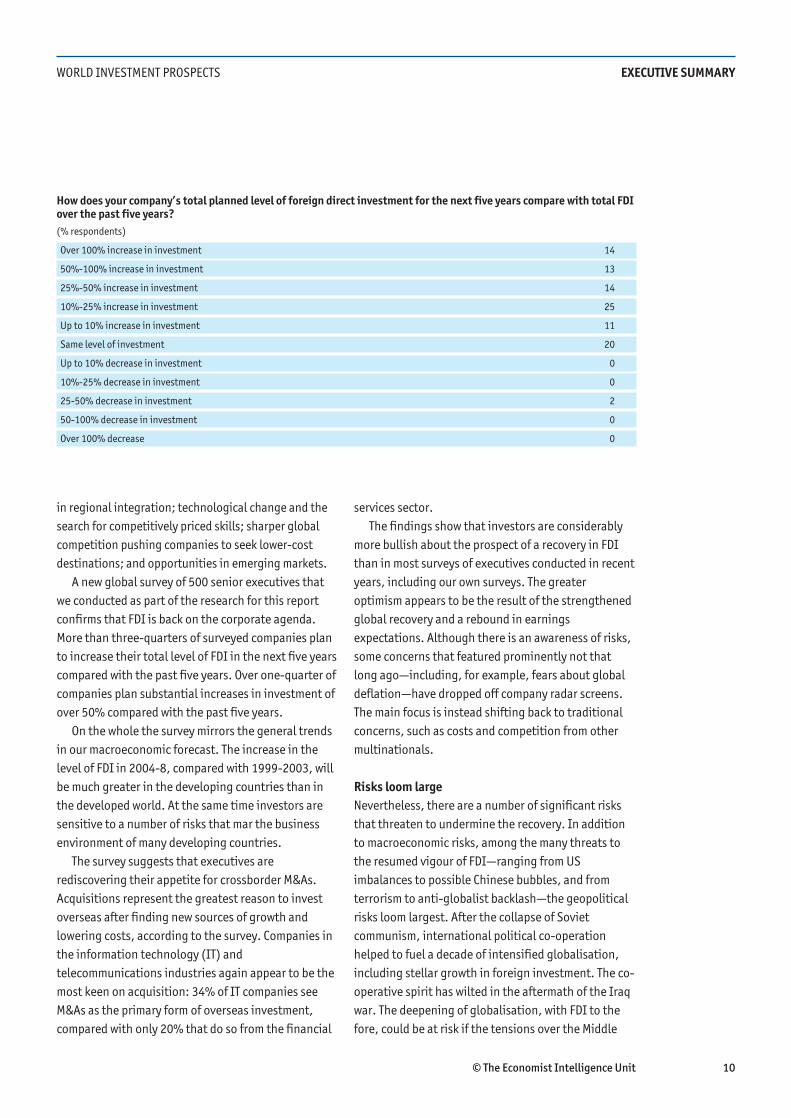
More than three-quarters of surveyed companies plan
to increase their total level of FDI in the next five years
compared with the past five years. Over one-quarter of
companies plan substantial increases in investment of
over 50% compared with the past five years.
On the whole the survey mirrors the general trends
in our macroeconomic forecast. The increase in the
level of FDI in 2004-8, compared with 1999-2003, will
be much greater in the developing countries than in
the developed world. At the same time investors are
sensitive to a number of risks that mar the business
environment of many developing countries.
The survey suggests that executives are
rediscovering their appetite for crossborder M&As.
Acquisitions represent the greatest reason to invest
overseas after finding new sources of growth and
lowering costs, according to the survey. Companies in
the information technology (IT) and
telecommunications industries again appear to be the
most keen on acquisition: 34% of IT companies see
M&As as the primary form of overseas investment,
compared with only 20% that do so from the financial
services sector.
The findings show that investors are considerably
more bullish about the prospect of a recovery in FDI
than in most surveys of executives conducted in recent
years, including our own surveys. The greater
optimism appears to be the result of the strengthened
global recovery and a rebound in earnings
expectations. Although there is an awareness of risks,
some concerns that featured prominently not that
long ago—including, for example, fears about global
deflation—have dropped off company radar screens.
The main focus is instead shifting back to traditional
concerns, such as costs and competition from other
multinationals.
Risks loom large
Nevertheless, there are a number of significant risks
that threaten to undermine the recovery. In addition
to macroeconomic risks, among the many threats to
the resumed vigour of FDI—ranging from US
imbalances to possible Chinese bubbles, and from
terrorism to anti-globalist backlash—the geopolitical
risks loom largest. After the collapse of Soviet
communism, international political co-operation
helped to fuel a decade of intensified globalisation,
including stellar growth in foreign investment. The co-
operative spirit has wilted in the aftermath of the Iraq
war. The deepening of globalisation, with FDI to the
fore, could be at risk if the tensions over the Middle
How does your company’s total planned level of foreign direct investment for the next five years compare with total FDIover the past five years?
(% respondents)
Over 100% increase in investment 14
50%-100% increase in investment 13
25%-50% increase in investment 14
10%-25% increase in investment 25
Up to 10% increase in investment 11
Same level of investment 20
Up to 10% decrease in investment 0
10%-25% decrease in investment 0
25-50% decrease in investment 2
50-100% decrease in investment 0
Over 100% decrease 0

© The Economist Intelligence Unit 11
WORLD INVESTMENT PROSPECTS EXECUTIVE SUMMARY
East and other disputes sour further the international
climate, and also result in a worsening of trends
towards regionalism and protectionism and away from
globalisation and multilateral liberalisation.
Our central forecast implies robust global growth
over the next five years. However, important risks
stem from large economic imbalances in key countries.
The huge US current-account deficit poses a threat.
The size of private-sector debt in the US, and to a
lesser extent in Europe, is also a cause for concern, as
are public-debt burdens in a number of OECD
countries. Balance sheets look stretched and savings
could increase markedly in many countries. This would
result in declines in spending and an economic
slowdown. A connected threat is that of another
downward turn in the equities market, which would
put paid to any revival in M&As. The widespread
assumption is that the declines in stock prices are
over. Yet the ratio of US stock prices to earnings is still
at least 50% above its historic average.
Three types of, in part inter-related, geopolitical
risks pose a threat to our baseline scenario of robust FDI
recovery: disruptions and costs to business associated
with terrorist attacks and the threat to personal
security; the potential adverse impact on global
business of the unsettled international political climate,
which is linked in large part to the continuing fallout
from the war in Iraq; and the threat to globalisation
from strengthened protectionist sentiment.
With respect to security risks, at present only a
small number of investment projects are being delayed
or cancelled. However, any increase in the intensity
and scope of attacks would have a more serious impact
on business. This would dampen long-term growth
prospects in the worst-affected countries, reducing
businesses' returns on investment, and bias
investment location decisions towards countries or
regions where security risks are perceived to be lower.
The forthcoming US presidential election, the large US
current-account deficit and the perceived
undervaluation of Asian currencies is increasing the
risk of trade protectionism. The prospects for reviving
World Trade Organisation (WTO) negotiations,
following the collapse of talks in Cancun in September
2003, appear very uncertain.
The Asian challenge
Developing Asia bucked the trend of FDI decline in
2003. FDI flows to China increased in 2003 to a record
total of US$53.5bn. High FDI flows to China will be
sustained in the coming years. According to our
survey, in regional terms, Asian countries will be the
Which of the following countries/regions are most attractive as targets for FDI based on the following criteria? Pleasechoose one country/region for each criterion.
(% respondents)
China Euro area Japan Russia USA UK India New EU Brazil
entrants
New consumer markets 49 9 2 5 7 2 9 15 4
Low-cost labour 50 2 0 3 1 0 29 12 3
New partnership possibilities 20 22 5 5 14 4 12 14 3
New corporate markets 23 22 3 5 17 3 7 15 4
Access to highly skilled labour force 6 22 7 3 14 6 30 10 2
New opportunities in outsourcing 16 9 1 3 7 2 46 12 4
Acquisition opportunities 15 20 2 5 13 5 8 22 9
Research and development activities 11 20 5 4 22 7 24 6 3
Greater efficiencies in supply chain 17 26 6 2 22 5 10 9 3
The survey explored the views of investors on the relative strengths and weaknesses of key countries and regions
as targets for FDI. Executives were asked to select the most attractive destination out of a number of key markets
against eight investment criteria, including labour skills and costs, market opportunities, R&D activities, and
outsourcing and acquisition opportunities.

© The Economist Intelligence Unit 12
WORLD INVESTMENT PROSPECTS EXECUTIVE SUMMARY
main beneficiaries of the upturn in FDI. The survey
results indicate that China will continue to be the top
emerging market for FDI, but India is also becoming
very attractive to global investors (and not just for
outsourcing).
The survey confirms China as the leading
destination for investment on most criteria, especially
for companies seeking new consumer and corporate
markets and those sensitive to labour costs. China also
rates very well on the criteria of location of research
and development (R&D) activities, partnership (behind
only the euro zone) and outsourcing opportunities
(behind only India). Investor confidence in China
seems undiminished, despite fears that the Chinese
economy is at risk of overheating. China's powerful
attraction reaches across industries: manufacturing
and services sector companies (including IT and
financial services firms) are equally attracted by the
country's rapid growth and low-cost environment.
More surprising is India's performance as one of
the most attractive destinations for FDI based on
several criteria, given that the Indian authorities'
commitment to attract more FDI is yet to be fully
matched by more investment-friendly policies, which
may now be even less likely under the new Congress-
led government. No other country in the survey comes
close as a destination for outsourcing, thanks to the
country's skilled but low-cost English-speaking labour
force. India's technology revolution has also been
noted by investors, with companies from a range of
industries—including IT and financial services—citing
India as the world's top target for R&D investments.
The country offers attractive new consumer markets,
and better opportunities than other large emerging
markets for business partnerships.
The UK is losing its edge
FDI inflows into the UK plummeted in 2003 to
US$14.5bn—half the total of US$29.2bn recorded in
2002, which was in turn less than half the inflows of
US$61.5bn in 2001. Furthermore, the 2001 total was
almost half the peak inflow of US$119.9bn in 2000.
FDI inflows into the UK have now declined as a share of
EU FDI in every year since 1999. The UK's share of
EU15 FDI flows has declined steadily and
precipitously, from 29% in 1998 to 5% in 2003.
We have found strong econometric evidence for the
proposition that the UK's position outside the euro
Table 3
Foreign direct investment inflows in the EU
1998 1999 2000 2001 2002 2003
Inflows (US$ m)
EU15 260,322 478,659 686,012 382,638 369,544 271,285
UK 74,650 89,540 119,940 61,530 29,180 14,542
Sweden 19,413 59,385 22,124 13,084 11,829 3,576
Denmark 6,675 16,076 35,847 10,237 6,411 2,623
% share in EU total
UK 28.7 18.7 17.5 16.1 7.9 5.4
Sweden 7.5 12.4 3.2 3.4 3.2 1.3
Denmark 2.6 3.4 5.2 2.7 1.7 1.0
0
5
10
15
20
25
30
19
98
99
20
00
01
02
03
UK
Sweden
Denmark
Share of total FDI inflows into EU15
%

© The Economist Intelligence Unit 13
WORLD INVESTMENT PROSPECTS EXECUTIVE SUMMARY
zone is deterring foreign investors. The survey results
also cast strong doubt on whether the UK can
recapture its lost share of global FDI, with the UK
performing particularly poorly on key measures of
attractiveness as a location to invest. The UK stands
out as the least attractive of the major markets for
offering new consumer and corporate markets, and
only Japan is perceived as having higher labour costs
out of nine key markets assessed by the respondents.
The UK even fails to impress in areas where
traditionally it would be expected to perform relatively
well, such as skill levels and R&D.
US investors, traditionally an important source of
investment for the UK, rank the country well below the
euro zone for attractiveness on most investment
criteria. The UK also receives a particularly critical
assessment from manufacturing companies. The
survey shows that executives see currency volatility as
one of the greatest risks to their overseas investments.
Asian investors are especially sensitive to this.
In our survey, UK companies appeared especially
bullish about their outward investment—30% said
that they would increase their FDI by over 50% in the
next five years compared with the previous five-year
total, compared with only 11% from euro zone
countries. Combined with the weak prospect for a
strong revovery in inward FDI, this suggests that net
FDI outflows from the UK are to increase.
New EU entrants will struggle to maintain FDI
attractiveness
Contrary to widespread expectations, the EU's
enlargement will not lead to a new surge in FDI into
the eight east European new member states. These
countries have already largely achieved the main
benefits of integration for investment. Further
positive changes to business environments associated
with EU membership will be small. Some possible
further improvement in risk perceptions and the
impact on FDI of fully joining the single market will
largely be offset by the effects of higher wages, the
adoption of business-inhibiting aspects of EU rules,
and the possibility of a post-accession slowdown in
reform momentum.
A sharp decline in FDI inflows to the new EU member
states in 2003 can be seen as the harbinger of a trend
that will lead to a lasting shift in the geographic
distribution of FDI in eastern Europe. FDI inflows over
the medium term into the new EU member states are
expected to recover from those recorded in 2003.
However, the danger of diversion of cost-sensitive
forms of FDI to even cheaper destinations looms larger
than any promise of much more relocation to these
countries of investment from the West.
Average annual FDI inflows into the new EU
members in eastern Europe are forecast at some
US$20bn in 2004-08. FDI inflows are expected to
peak in 2005-06, with the completion of some major
outstanding privatisations. After that investment will
be dominated by re-invested earnings and follow-on
investment by existing FDI ventures. The share of the
new EU members in the east European regional total
is expected to decline to below 50%, compared with
the share of almost two-thirds in the pre-2003
period. Economies in the Balkans and the
Commonwealth of Independent States (CIS), such as
Ukraine and, especially, Russia, will increase their
share of regional FDI.
Our survey results confirm that the prospects for
the new EU entrants appear less promising than is
Which of the following outsourcing activities have you made a direct overseas investment in?
(% respondents)
Already invested Planning to invest No plans to invest
Call centres 17 17 65
Research and development 36 24 40
Distribution and logistics 38 33 29
Treasury and finance 25 18 58
IT 36 29 35
HR/Payroll 19 25 56
© The Economist Intelligence Unit 14
WORLD INVESTMENT PROSPECTS EXECUTIVE SUMMARY
often expected. The lure to investors of alternative
destinations in Asia appears to be very strong.
Investors find that the new EU entrants offer attractive
new consumer markets and interesting M&A oppor-
tunities. However, the new EU members compare
badly with Asia on labour costs, and are likely to lose
out on outsourcing opportunities not only to India but
to China as well. The survey offers little support for the
theory that EU enlargement will lead to a new surge of
FDI inflows into the new entrants; if anything, the
results suggest that it will become harder for the
region to attract investment against increasingly
tough competition from Asia, in particular.
There is also no support in the survey for the oft-
repeated proposition that small companies may be
more willing to invest in the region following EU
membership, as opposed to large companies that had
already taken this into account in earlier decision-
making.
Offshoring is here to stay
Offshoring has become an important driver for FDI.
According to our survey, the outsourcing trend is
extending far beyond call centres to affect most areas
of business. In fact, call centres make up a relatively
small proportion of offshoring activity in the survey:
only 17% of companies have overseas call centres,
compared with over one-third that already offshore
R&D, distribution and logistics, and IT, and 25% of
companies that offshore treasury and finance
operations. US companies are the largest investors in
outsourcing and offshoring, and UK companies are
more likely to offshore than companies from other EU
countries.
The offshoring boom looks set to continue, despite
the backlash in countries such as the US. Of
respondents to our survey, 17% are planning future
investments in offshore call centres, 24% plan to
invest in R&D, 33% in distribution and logistics, and
29% in IT.
US primacy
FDI inflows into the US recovered to US$82bn in
2003, up from US$39.6bn in 2002. The recovery was
the result of strengthened economic growth, and the
weaker US dollar clearly also made US assets more
attractive to foreign buyers. Nevertheless, inflows of
FDI into the US in 2003 were almost 90% below the
2000 peak of US$321bn. FDI outflows from the US
were US$154.8bn in 2003, up from US$137.8bn in
2002.
Increased exposure to the risk of terrorism, allied to
deteriorating trade relations and an imbalanced
economy, is expected to lead to some fall in the
attractiveness of the US's business environment.
Although the economy is recovering strongly from the
downturn in 2001, economic imbalances, including
high levels of personal debt and a large current-
account deficit, mean that the recovery is not without
risks. However, we still expect the US economy to
outperform both the EU and Japanese economies over
the coming five years. Medium-term growth, although
lower than during the second half of the 1990s, will
still be high by historic standards. Confidence in the
US business model should improve now that the
economic recovery is more firmly established and the
perceived incidence of corporate malfeasance is
starting to decline.
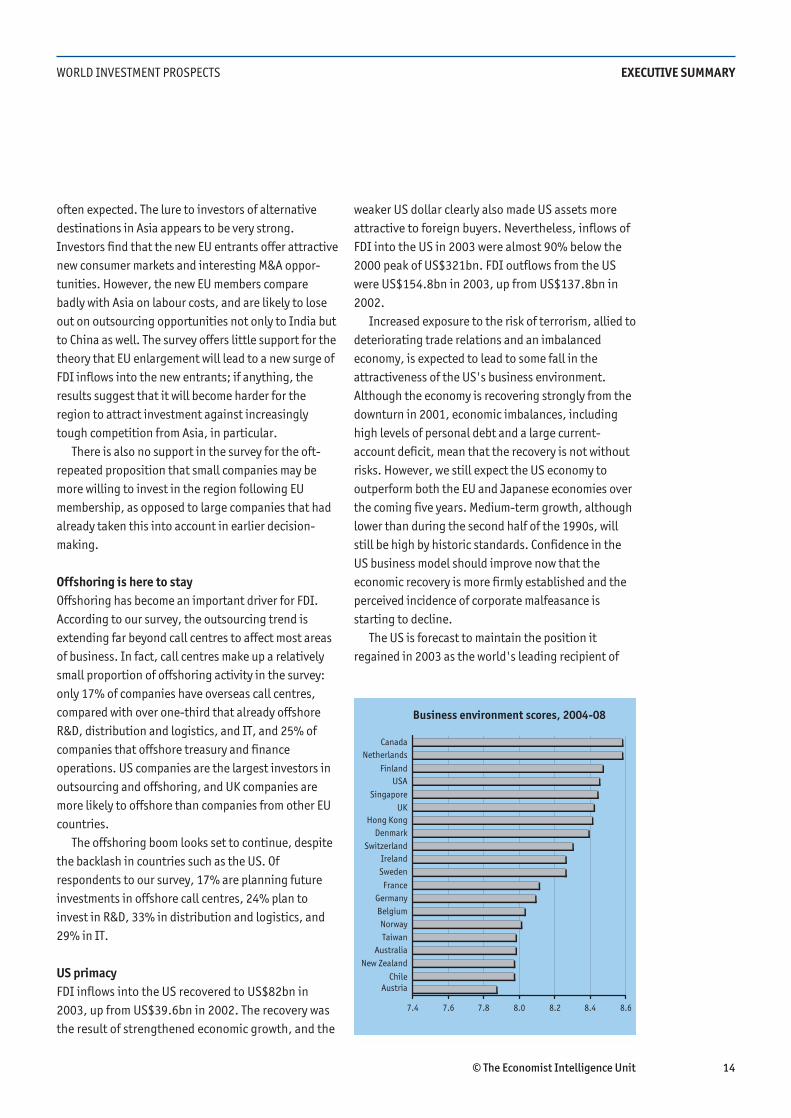
The US is forecast to maintain the position it
regained in 2003 as the world's leading recipient of
7.4 7.6 7.8 8.0 8.2 8.4 8.6
Austria
New Zealand
Chile
Taiwan
Norway
Australia
Belgium
Germany
France
Sweden
Ireland
Denmark
Hong Kong
Switzerland
UK
Singapore
USA
Finland
Netherlands
Canada
Business environment scores, 2004-08
© The Economist Intelligence Unit 15
WORLD INVESTMENT PROSPECTS EXECUTIVE SUMMARY
FDI. Despite some deterioration in its high business
environment rating (it slips to fourth position for
2004-08), the US has clear potential for continued
large-scale inflows in the medium term. In addition to
the appeal of the vast size of the domestic market, the
US is the global technology leader and has
demonstrated an ability to increase productivity much
faster than most other developed countries. Foreign
companies view having operations in the US as a way
of gaining access to the technology and processes that
have made this productivity growth possible, and
subsequently applying them to other operations
around the world.
Challenges for the US emerging from our survey of
investors include concerns over currency volatility, in
the light of the weakening of the US dollar, and the
US's macroeconomic imbalances.
Investor motives and concerns
In developed countries, high costs present the
greatest risk to investments. Sluggish market growth
and currency volatility follow closely behind. In
emerging markets, foremost among the perceived
risks are political instability and corruption. Red tape
and the lack of rule of law serve to hamper business
further and increase uncertainty.
UK investors and those from other EU countries
register higher levels of concern about risks in
developing countries than their US counterparts,
whereas the situation is reversed when assessing risk
in developed countries.
The survey confirms that our ten categories of the
business environment are all highly rated as important
for investment. This means that countries need to
satisfy across the full range of business environment
issues. This is also the reason why developed countries
have the best business environments—taking into
account their performance across the board.
Specific policies towards foreign investment have a
moderately high influence on executive decisions, but
again less so than the broad business climate in a
country. Specific pro-FDI policies can have a
significant but rarely decisive influence on companies'
decisions to invest in a country.
As far as particular factors are concerned, the
survey confirms some well-known findings. Special tax
incentives are considered much less important than
other features of the investment climate; local
financing opportunities are of low importance for
direct investors.


© The Economist Intelligence Unit 17
WORLD INVESTMENT PROSPECTS
Business survey results
Section 1: Demographics
Which of the following titles best describes your job?
(% respondents)
Manager 35
CEO/COO/Chief executive/Managing director 22
SVP/VP 18
CFO/Treasurer/Comptroller 6
CKO/CIO/Technology director 3
Board member 3
Other 13
UK 12
Other developed 6
Where is your company located?
(% respondents)
EU 21
Asia 14
Eastern Europe 5
Other developing 13
US 29

© The Economist Intelligence Unit 18
WORLD INVESTMENT PROSPECTS BUSINESS SURVEY RESULTS
What industry are you in?
(% respondents)
Automotive 7
Chemicals 4
Consumer goods (includes also consumer durables and retailing) 12
Healthcare, pharmaceuticals and biotechnology 3
Manufacturing (heavy equipment) 4
Other (includes aerospace, agribusiness, and "other") 12
Energy 3
Construction and real estate 4
Entertainment, media and publishing 3
Financial services (non-insurance plus insurance) 16
IT services 4
Professional services 14
Technology 4
Telecoms 4
Travel, tourism and transport 3
Government public sector 3
What is your organisation’s annual turnover?
(% respondents)
Under US$250m 48
US$250m – US$500m 10
US$500m – US$1bn 9
US$1bn – US$8bn 17
Over US$8bn 16
What percentage of your organisation’s total revenues comes from its home market
and what percentage comes from overseas markets?
(% respondents)
Overseas market 40
Home market 60
© The Economist Intelligence Unit 19
WORLD INVESTMENT PROSPECTS BUSINESS SURVEY RESULTS
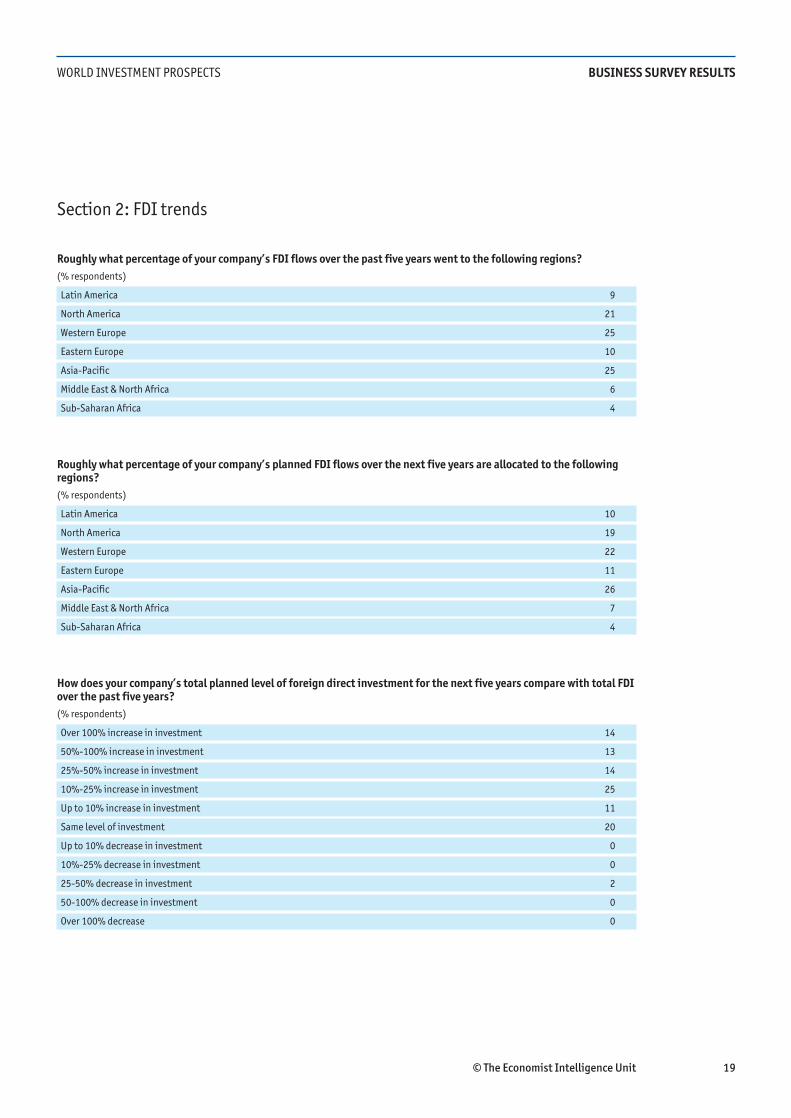
Section 2: FDI trends
Roughly what percentage of your company’s FDI flows over the past five years went to the following regions?
(% respondents)
Latin America 9
North America 21
Western Europe 25
Eastern Europe 10
Asia-Pacific 25
Middle East & North Africa 6
Sub-Saharan Africa 4
Roughly what percentage of your company’s planned FDI flows over the next five years are allocated to the followingregions?
(% respondents)
Latin America 10
North America 19
Western Europe 22
Eastern Europe 11
Asia-Pacific 26
Middle East & North Africa 7
Sub-Saharan Africa 4
How does your company’s total planned level of foreign direct investment for the next five years compare with total FDIover the past five years?
(% respondents)
Over 100% increase in investment 14
50%-100% increase in investment 13
25%-50% increase in investment 14
10%-25% increase in investment 25
Up to 10% increase in investment 11
Same level of investment 20
Up to 10% decrease in investment 0
10%-25% decrease in investment 0
25-50% decrease in investment 2
50-100% decrease in investment 0
Over 100% decrease 0

© The Economist Intelligence Unit 20
WORLD INVESTMENT PROSPECTS BUSINESS SURVEY RESULTS
Sales operation 29
Outsourcing/
offshoring 12
What percentage of your company’s planned FDI flows over the next five years
are allocated to the following activities?
(% respondents)
Research and development 13
Supply-chain management
and logistics 11
Regional headquarters 8
Other 5
Production and manufacturing activities 21
Which of the following outsourcing activities have you made a direct overseas investment in?
(% respondents)
Already invested Planning to invest No plans to invest
Call centres 17 17 65
Research and development 36 24 40
Distribution and logistics 38 33 29
Treasury and finance 25 18 58
IT 36 29 35
HR/Payroll 19 25 56
Which will be the main forms of investment activity for your company in the next five years? Please rank each in order,1 being the primary form of activity.
(% respondents)
1 2 3 4 5
Follow-on investment in existing operations 42 21 15 14 9
Joint ventures 21 37 26 13 2
Mergers and acquisitions 18 21 32 19 10
Greenfield investment 15 14 14 31 27
Franchising 4 7 14 23 52

© The Economist Intelligence Unit 21
WORLD INVESTMENT PROSPECTS BUSINESS SURVEY RESULTS
Which of the following countries/regions are most attractive as targets for FDI based on the following criteria? Pleasechoose one country/region for each criterion.
(% respondents)
China Euro area Japan Russia USA UK India New EU Brazil
entrants
New consumer markets 49 9 2 5 7 2 9 15 4
Low-cost labour 50 2 0 3 1 0 29 12 3
New partnership possibilities 20 22 5 5 14 4 12 14 3
New corporate markets 23 22 3 5 17 3 7 15 4
Access to highly skilled labour force 6 22 7 3 14 6 30 10 2
New opportunities in outsourcing 16 9 1 3 7 2 46 12 4
Acquisition opportunities 15 20 2 5 13 5 8 22 9
Research and development activities 11 20 5 4 22 7 24 6 3
Greater efficiencies in supply chain 17 26 6 2 22 5 10 9 3
© The Economist Intelligence Unit 22
WORLD INVESTMENT PROSPECTS BUSINESS SURVEY RESULTS
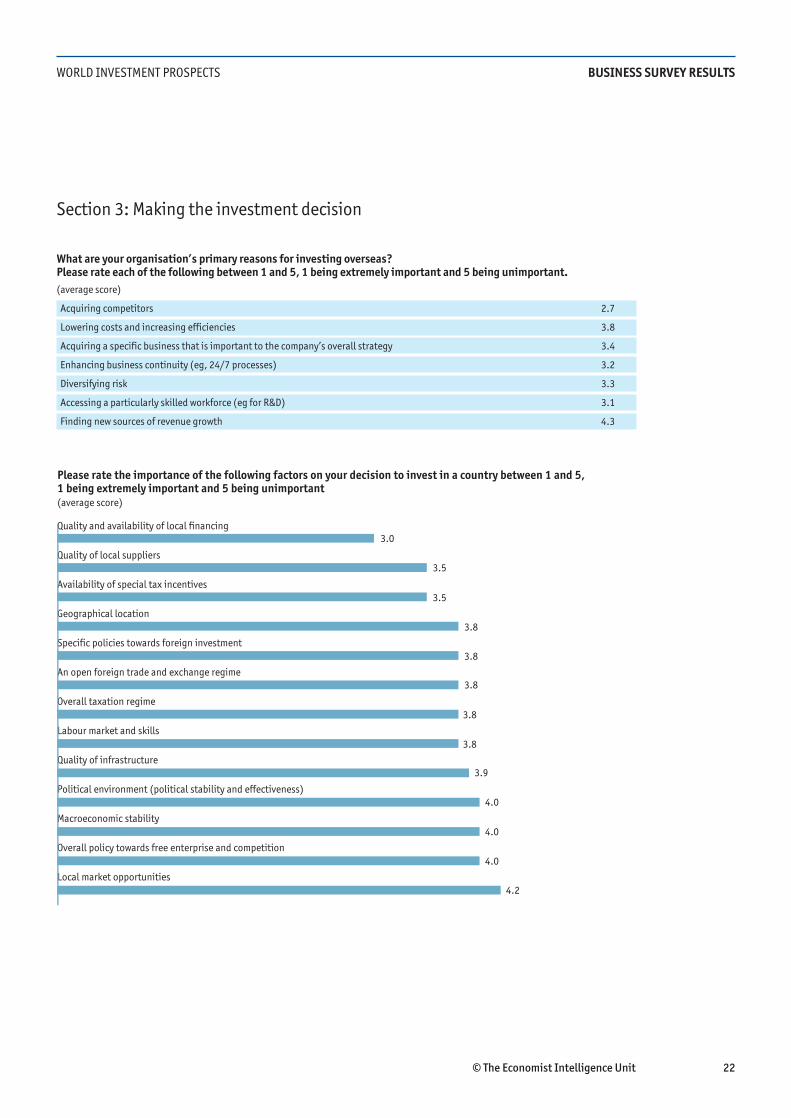
Section 3: Making the investment decision
What are your organisation’s primary reasons for investing overseas? Please rate each of the following between 1 and 5, 1 being extremely important and 5 being unimportant.
(average score)
Acquiring competitors 2.7
Lowering costs and increasing efficiencies 3.8
Acquiring a specific business that is important to the company’s overall strategy 3.4
Enhancing business continuity (eg, 24/7 processes) 3.2
Diversifying risk 3.3
Accessing a particularly skilled workforce (eg for R&D) 3.1
Finding new sources of revenue growth 4.3
Please rate the importance of the following factors on your decision to invest in a country between 1 and 5, 1 being extremely important and 5 being unimportant
Quality and availability of local financing
Quality of local suppliers
Availability of special tax incentives
Geographical location
Specific policies towards foreign investment
An open foreign trade and exchange regime
Overall taxation regime
Labour market and skills
Quality of infrastructure
Political environment (political stability and effectiveness)
Macroeconomic stability
Overall policy towards free enterprise and competition
Local market opportunities
(average score)
3.0
3.5
3.5
3.8
3.8
3.8
3.8
3.8
3.9
4.0
4.0
4.0
4.2
© The Economist Intelligence Unit 23
WORLD INVESTMENT PROSPECTS BUSINESS SURVEY RESULTS
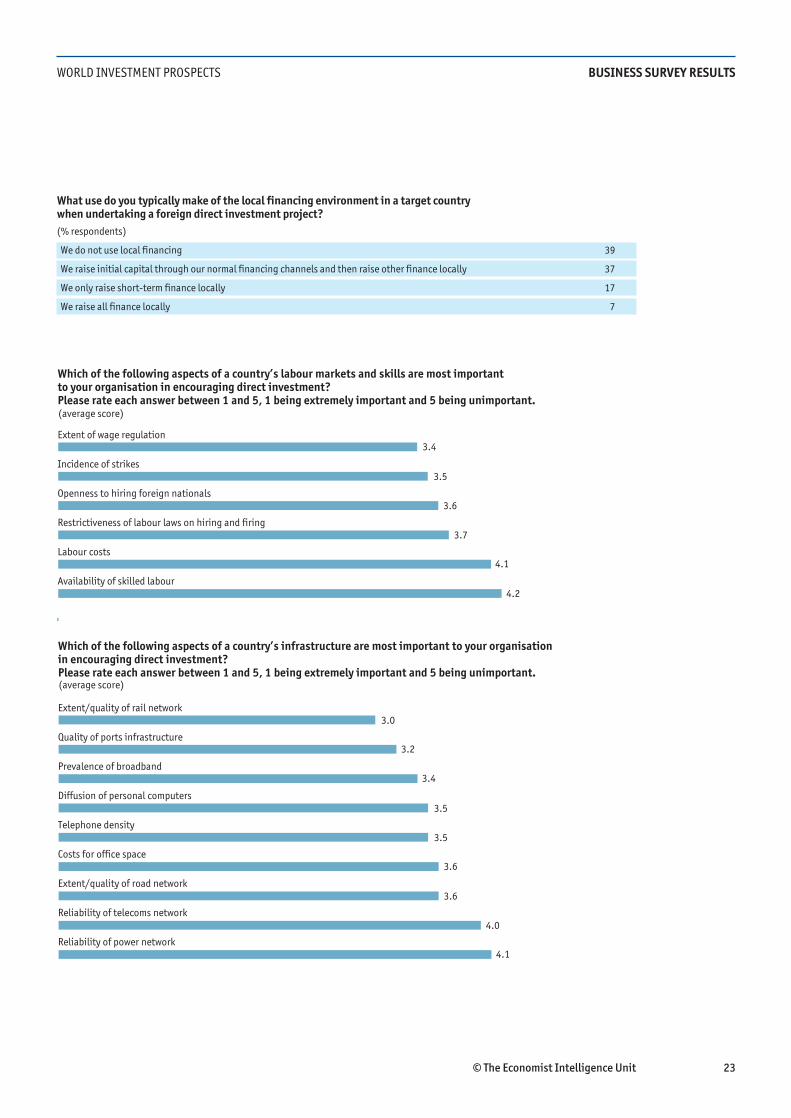
Which of the following aspects of a country’s labour markets and skills are most important to your organisation in encouraging direct investment? Please rate each answer between 1 and 5, 1 being extremely important and 5 being unimportant.
Extent of wage regulation
Incidence of strikes
Openness to hiring foreign nationals
Restrictiveness of labour laws on hiring and firing
Labour costs
Availability of skilled labour
(average score)
3.4
3.5
3.6
3.7
4.1
4.2
Which of the following aspects of a country’s infrastructure are most important to your organisation in encouraging direct investment? Please rate each answer between 1 and 5, 1 being extremely important and 5 being unimportant.
Extent/quality of rail network
Quality of ports infrastructure
Prevalence of broadband
Diffusion of personal computers
Telephone density
Costs for office space
Extent/quality of road network
Reliability of telecoms network
Reliability of power network
(average score)
3.0
3.2
3.4
3.5
3.5
3.6
3.6
4.0
4.1
What use do you typically make of the local financing environment in a target country when undertaking a foreign direct investment project?
(% respondents)
We do not use local financing 39
We raise initial capital through our normal financing channels and then raise other finance locally 37
We only raise short-term finance locally 17
We raise all finance locally 7
© The Economist Intelligence Unit 24
WORLD INVESTMENT PROSPECTS BUSINESS SURVEY RESULTS
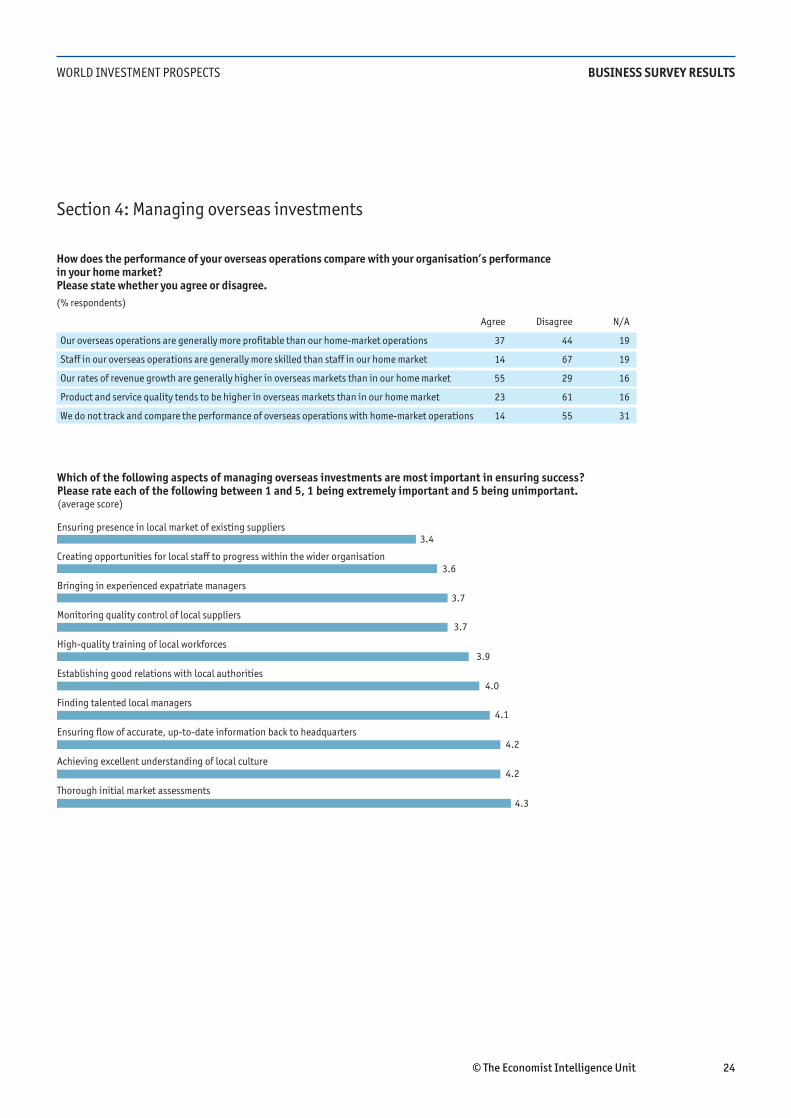
Section 4: Managing overseas investments
How does the performance of your overseas operations compare with your organisation’s performance in your home market? Please state whether you agree or disagree.
(% respondents)
Agree Disagree N/A
Our overseas operations are generally more profitable than our home-market operations 37 44 19
Staff in our overseas operations are generally more skilled than staff in our home market 14 67 19
Our rates of revenue growth are generally higher in overseas markets than in our home market 55 29 16
Product and service quality tends to be higher in overseas markets than in our home market 23 61 16
We do not track and compare the performance of overseas operations with home-market operations 14 55 31
Which of the following aspects of managing overseas investments are most important in ensuring success? Please rate each of the following between 1 and 5, 1 being extremely important and 5 being unimportant.
Ensuring presence in local market of existing suppliers
Creating opportunities for local staff to progress within the wider organisation
Bringing in experienced expatriate managers
Monitoring quality control of local suppliers
High-quality training of local workforces
Establishing good relations with local authorities
Finding talented local managers
Ensuring flow of accurate, up-to-date information back to headquarters
Achieving excellent understanding of local culture
Thorough initial market assessments
(average score)
3.4
3.6
3.7
3.7
3.9
4.0
4.1
4.2
4.2
4.3
© The Economist Intelligence Unit 25
WORLD INVESTMENT PROSPECTS BUSINESS SURVEY RESULTS
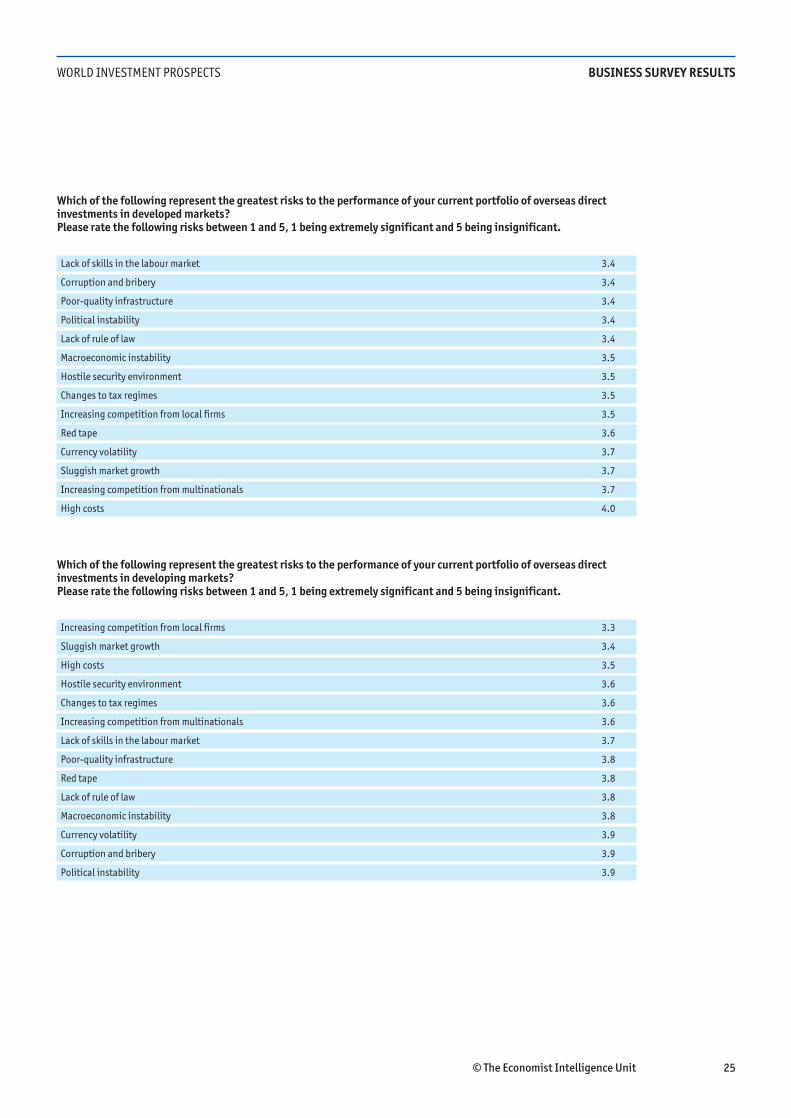
Which of the following represent the greatest risks to the performance of your current portfolio of overseas directinvestments in developed markets? Please rate the following risks between 1 and 5, 1 being extremely significant and 5 being insignificant.
Lack of skills in the labour market 3.4
Corruption and bribery 3.4
Poor-quality infrastructure 3.4
Political instability 3.4
Lack of rule of law 3.4
Macroeconomic instability 3.5
Hostile security environment 3.5
Changes to tax regimes 3.5
Increasing competition from local firms 3.5
Red tape 3.6
Currency volatility 3.7
Sluggish market growth 3.7
Increasing competition from multinationals 3.7
High costs 4.0
Which of the following represent the greatest risks to the performance of your current portfolio of overseas directinvestments in developing markets? Please rate the following risks between 1 and 5, 1 being extremely significant and 5 being insignificant.
Increasing competition from local firms 3.3
Sluggish market growth 3.4
High costs 3.5
Hostile security environment 3.6
Changes to tax regimes 3.6
Increasing competition from multinationals 3.6
Lack of skills in the labour market 3.7
Poor-quality infrastructure 3.8
Red tape 3.8
Lack of rule of law 3.8
Macroeconomic instability 3.8
Currency volatility 3.9
Corruption and bribery 3.9
Political instability 3.9

© The Economist Intelligence Unit 26
WORLD INVESTMENT PROSPECTS BUSINESS SURVEY RESULTS
How reliant is your organisation on local suppliers in your overseas investments?
Please choose the statement with which you most agree.
(% respondents)
Other 13.8
We rely on a mixture of local suppliers
and international suppliers,
depending on the country 57.9We rely on local
suppliers 16.6
We rely on
international
suppliers 11.7
What proportion of your organisation’s new products and services are developed overseas?
None 17.8
Under 10% 28.3
Between 10 and 25% 26.7
Between 25% and 50%
13.6
Between 50% and 75%
8.0
Over 75% 4.0
All of it 1.6

2004 edition
World investment prospectsThe revival ofglobalisation?
LONDON
15 Regent Street
London
SW1Y 4LR
United Kingdom
Tel: (44.20) 7830 1000
Fax: (44.20) 7499 9767
E-mail: [email protected]
NEW YORK
111 West 57th Street
New York
NY 10019
United States
Tel: (1.212) 554 0600
Fax: (1.212) 586 1181/2
E-mail: [email protected]
HONG KONG
60/F, Central Plaza
18 Harbour Road
Wanchai
Hong Kong
Tel: (852) 2585 3888
Fax: (852) 2802 7638
E-mail: [email protected]