2004-05_fnl-rpt-jun07l
TRANSCRIPT

7/27/2019 2004-05_fnl-rpt-jun07l
http://slidepdf.com/reader/full/2004-05fnl-rpt-jun07l 1/10
1
Integration of Satellite Imagery with Surface CurrentMapping Radar in Near Real Time
Program supported with funding from California Department of Fish and Game, Office
of Spill Prevention and Response:
Scientific Study and Evaluation Program #P0375048
Final Report
June 2007
Project PIs:
Newell Garfield Jeffrey D. PaduanSan Francisco State University Naval Postgraduate School
With
Michael Cook David Foley Bruce Lipphardt Dale Robinson
Naval Postgraduate
School
NOAA/Coastwatch Univ. of Delaware San Francisco State
University
Background
High Frequency (HF) radar measurements afford oceanographers and resource managers
unprecedented synoptic views of coastal surface currents. This technology generates highspatial resolution hourly maps of the surface velocity field. Previous studies have
illustrated the ability to delineate very complex circulation patterns. In California, a broadnetwork of coastal HF radar systems is being implemented to monitor coastal currents as
part of the Coastal Ocean Currents Monitoring Program (COCMP)http://www.cocmp.org. Real-time availability of data from those systems will enable
improved tracking of buoyant drifting particles, including hazardous materials andmissing persons.
This OSPR-sponsored project took advantage of the existing HF radar coverage areas
around Monterey Bay and San Francisco Bay to develop methodologies and data formatsfor real-time tracking of drifting material. In turn, these techniques are being made
available to the larger statewide monitoring network. Steps involved in creating these
capabilities include filling gaps in the hourly HF radar-derived surface current maps andcomputing particle trajectories based on the evolving, two-dimensional velocity fields. Inaddition, short-term (24 hour) predictions of the particle trajectories are routinely
produced based on a constantly updating analysis of the velocity data during the past 48hours. Finally, work was initiated to standardize data structures and availability that
match the requirements for a number of potential users, including the spill response teamswithin California Fish and Game Office of Spill Prevention and Response (OSPR) and
the NOAA/HAZMAT.

7/27/2019 2004-05_fnl-rpt-jun07l
http://slidepdf.com/reader/full/2004-05fnl-rpt-jun07l 2/10
2
Objectives
To develop the methods for correlating satellite imagery with surface current velocity
vectors in near real time to produce a tool for improved understanding of surface
circulation. This program will advance fulfillment of three of the OSPR Scientific Studyand Evaluation Program (SSEP) intents: a) investigation and evaluation of applied prevention and response programs and technologies; d) best achievable protection
strategies; i) baseline monitoring information.
The State COCMP program is using voter-approved (Propositions 40 & 50) bond fundsto develop the COCMP Surface Current Mapping (SCM) arrays covering the entire
California coast. These funds are restricted to infrastructure development only and theresearchers have sought other funds to develop products that are useful to regulators and
managers. This SSEP contract provided essential funds for product development.
The primary goal of this research is to provide OSPR with new tools, based on the fusionof emerging capabilities, to respond to oil spills and to use the products for training and
prediction. In addition, development of these products now based on the existing SCMarrays will insure that the proposed COCMP SCM network is developed and
implemented with OSPR needs in mind.
Project Accomplishments
In order to promote a central access point to reaching ocean related data, all of the work and products that have been accomplished in this program are hosted on the Central and
Northern California Ocean Observing System (CeNCOOS) web site;http://www.cencoos.org. Data are also accessible at a number of other sites, but the intent
of the investigators is to promote the development of an accessible Regional Associationfor the general access of ocean related data and products. The data and products
developed through this SSEP contract are hosted on the CeNCOOS site. Futuredevelopments will also occur on this site.
Gap-Filling
In working with OSPR and NOAA/HAZMAT it became clear that an important need for
their spill preparation and response strategies is surface current maps that cover the wholearea of interest without gaps from missing data. Therefore, considerable effort has gone
into developing tools for taking real-time data, which by nature is “gappy,” and creatingcurrent vector maps with complete fields of evenly spaced surface current vectors. This is
the first step in any analyses and product development for OSPR and NOAA/HAZMAT.
The availability and spatial coverage of HF radar-derived surface current maps depend ona number of environmental factors. In all cases, the resulting maps contain spatial gaps.
For many of the derived products, such as particle trajectory estimates, these gaps must be filled using the best available techniques. This project has taken advantage of, and

7/27/2019 2004-05_fnl-rpt-jun07l
http://slidepdf.com/reader/full/2004-05fnl-rpt-jun07l 3/10
3
expanded on, a series of experiments to develop a spatial mapping technique that takesadvantage of the combination of densely sampled velocity and known coastal boundary
shapes. The technique in use has evolved from what is known as Normal Mode Analysis(NMA; Lipphardt et al., 2000) into an augmented version known as Open Modal
Analysis (OMA; Lekien et al., 2004; Kaplan and Lekien, 2007). The latter
implementation has several advantages, including: 1) use of a finite element, triangle gridto define mode structures that better follow the coastal boundary, 2) use of independent boundary modes constrained by the observed interior velocities that eliminate the need to
specify normal flow values along the open boundaries, 3) specification of modeamplitudes based on HF radar-derived radial velocity components directly, which
eliminates errors introduced in the radial-to-total vector mapping step, 4) use of a penaltyfunction that keeps solution values from growing unrealistically large in areas away from
observations, and 5) propagation of errors that provide error maps along with every OMAvelocity map.
This project also contributed to the creation of a new, open-source, MATLAB-based
toolbox to process HF radar data, including the latest OMA procedures. The toolbox iscalled HFR_Progs and is the focal point for community development going forward. The
software toolbox is based on an earlier toolbox known as HFRadarmap, which wasdeveloped by Michael Cook at the Naval Postgraduate School. The new toolbox includes
contributions from Mr. Cook and Dr. Lipphardt, although the primary author andmaintainer of the new toolbox is Dr. David Kaplan of UC Santa Cruz, a member of the
COCMP science team. The new toolbox can be downloaded at:https://erizo.pmc.ucsc.edu/COCMP-wiki/index.php/HFR_Progs_download_page. This
toolbox contains all the programs and steps necessary to go from the radial surface speedestimates for each antenna system to the filled surface velocity fields needed for particle
tracking and spill response. It also includes the routines to output the data fields informats that are immediately readable by the programs used by OSPR and
NOAA/HAZMAT.
Integration of HF radar surface current vectors with satellite imagery
The integration of HF radar-derived velocity maps with other mapping data, such assatellite-derived sea surface temperatures (SSTs), is a natural goal of the overall
development of the HF radar network. In this project, the investigators partnered with thewest coast Node of the NOAA CoastWatch program to create demonstration products for
the area of central California. The demonstration integrated the various data streamsusing a three-stage process:
• Establish access to surface current data. This step was accomplished for the
Monterey Bay and San Francisco Bay arrays using simple, automated filetransfers. Follow-on projects will incorporate OPeNDAP servers on the various
data nodes to provide a truly distributed system.
• Serve the surface current data together with satellite data using protocols
compliant with IOOS Data Management and Communication recommendations.CoastWatch and its host institution, the Environmental Research Division (ERD)
of NOAA’s Southwest Fisheries Science Center, have long maintained Live

7/27/2019 2004-05_fnl-rpt-jun07l
http://slidepdf.com/reader/full/2004-05fnl-rpt-jun07l 4/10
4
Access Servers, which are recommended by the IOOS DMAC for data browsing.Similarly, Coastwatch and ERD maintain the OPeNDAP servers recommended
for data sharing. Through this demonstration, surface current data have beenincorporated in the Live Access Server.
• Develop a suite of satellite products relevant to specific regions. A number of
multi-platform data products can now be accessed through CeNCOOS at:http://oceanwatch.pfeg.noaa.gov/CeNCOOS/.
Standardized File-Handling Procedures
A major requirement for exporting any mapping or prediction technique is the
development of standard file-handling procedures. The data are collected from multiplesites by many different groups and they may be used in different applications. This means
that their usefulness depends on their accessibility and readability. This project hasworked to increase access to HF radar-derived products by: 1) insuring that the data are
continuously available online, 2) documenting and publicizing the data formats, and 3)
creating dedicated file formats that match the existing data requirements for OSPR andfor NOAA/HAZMAT. The data are hosted on servers at the regional operating nodes,which for this demonstration project includes the central California node at:
http://www.cencoos.org/currents and http://cencalcurrents.org. Vector current data filesare updated hourly at the sites. In addition, special-purpose versions of the data are
produced to support spill response agencies. A complete procedure has been establishedto supply data formatted for use by the NOAA spill response model called GNOME.
These files are in netCDF format using structure and variable names specified by the NOAA team and ready for direct ingestion into GNOME. The files are updated every
hour. But each file includes the observations for the past 48 hours plus predictions for theupcoming 24 hours as described below. As an example, the GNOME-formatted files for
the test region offshore San Francisco can be downloaded from:http://www.cencalcurrents.org/Data/SFB1/GNOME/.
A second, critical formatting effort was begun under this project to automate the
production of Graphical Information System (GIS)-readable data files. These “shapefiles” are used by OSPR and other management groups to display environmental data.
However, GIS routines have not commonly been available to display vectors or other velocity related data. A test version of a GIS vector representation was created using
scalable symbols to represent the vectors. A sample plot for the San Francisco area can beseen in Figure 1. This file took a great deal of time for one individual to generate the file.
Optimization and automation of a true vector shape file format procedure will becompleted as part of the NOAA follow-on project described below.
The latest version of ArcGIS (9.2) now has the capability to import netCDF files and to
create animations from these imported files. This capability was added toArcGIS/ArcView after the work period of this contract. Future collaboration between
OSPR and CeNCOOS will ensure that these files are created as needed by OSPR. A testcase clearly demonstrated the ease of loading the netCDF vector files into an ArcGIS
display.

7/27/2019 2004-05_fnl-rpt-jun07l
http://slidepdf.com/reader/full/2004-05fnl-rpt-jun07l 5/10
5
Standardized Web Displays
In addition to standard and specially formatted data access, several derived products are being automatically produced based on the HF radar observations. A subset of those
products have been standardized across several regional nodes. They are displayedthrough the Central and Northern California Ocean Observing System (CeNCOOS) web
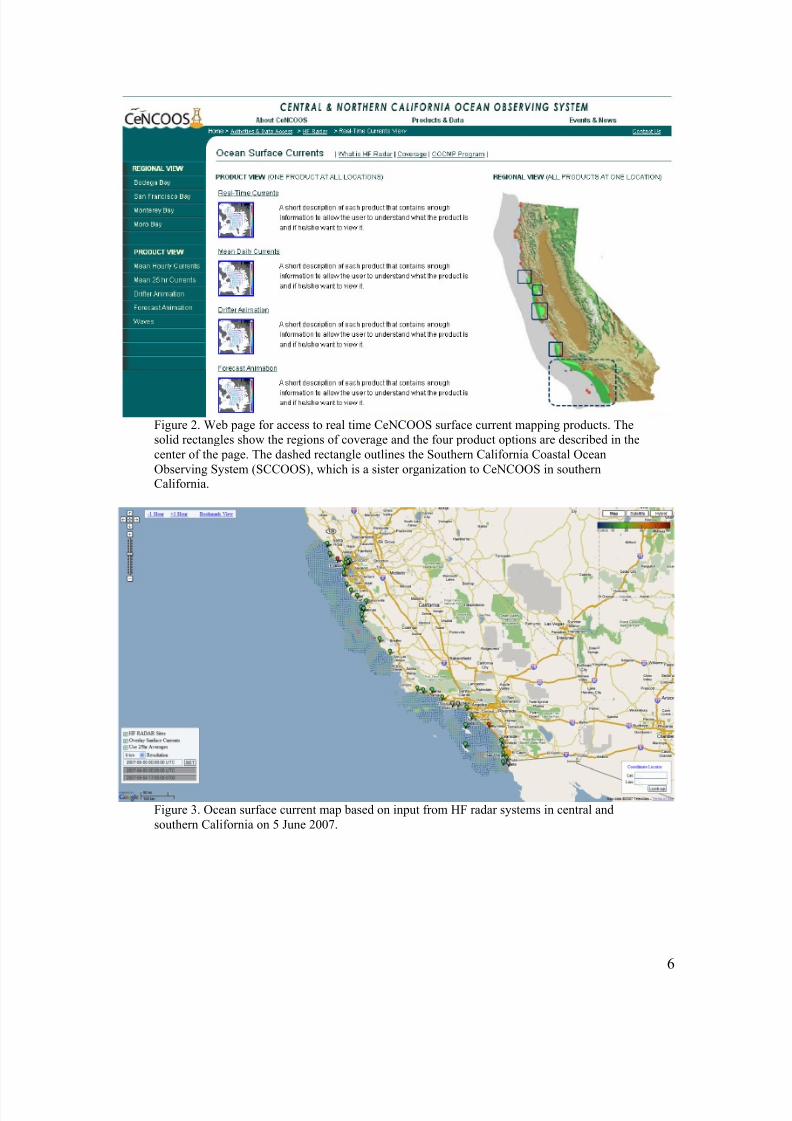
site: http://www.cencoos.org/currents/. Figure 2 illustrates the geographically based webinterface, which leads to standard products such as hourly surface current maps and error
maps, daily averaged surface current maps, hourly OMA surface current maps and error maps, observed 24-hour particle trajectories based on the OMA results, and predicted
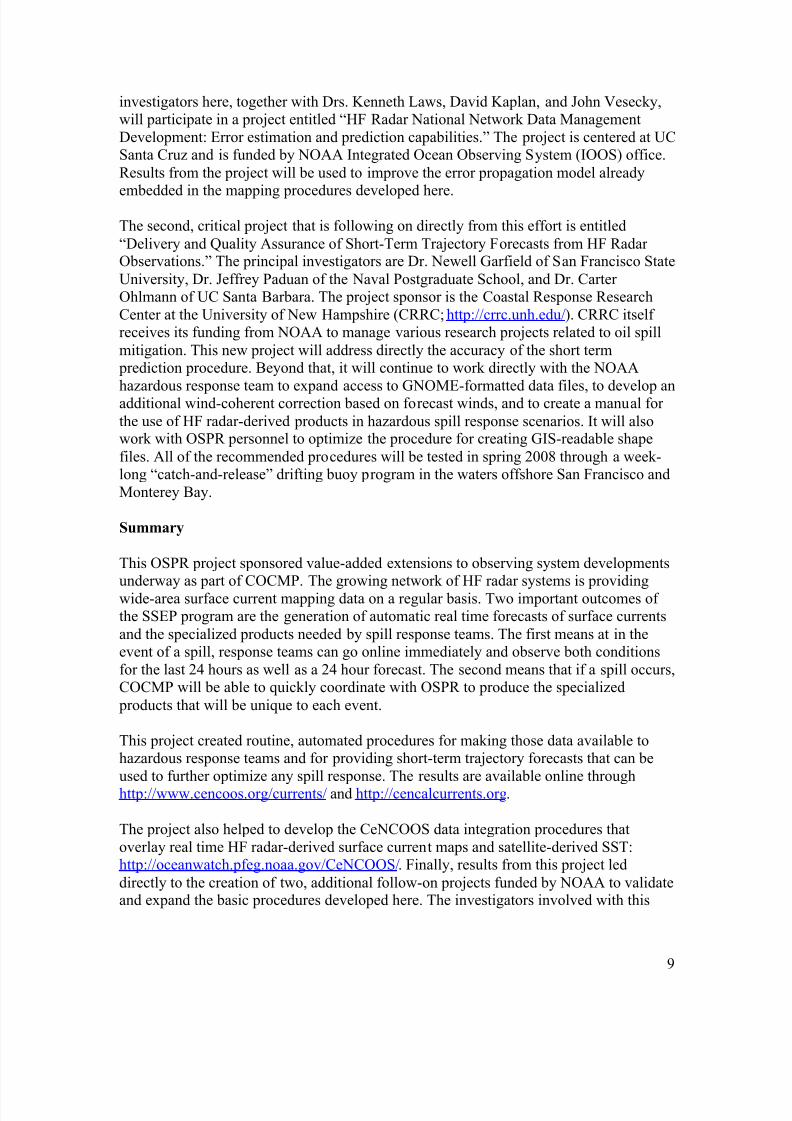
surface current trajectories produced by the short term forecast system described below.On an even larger scale, the HF radar observations from the central California test region
are transferred in real time to the nation-wide data server in San Diego and they appear inscalable, Google Maps-based displays at: http://cordc.ucsd.edu/projects/mapping/maps/.
At this time, the number of derived products available through the national server islimited. However, over time more sophisticated products, such as those now available
through the CeNCOOS web site, will be ported to the national site making for better one-stop access to surface current mapping products through national interface pages, such as:
http://oceancurrents.us. An example of the California surface current mapping capabilityestablished under COCMP as of the time of this report is shown in the national data
server surface current map in Figure 3.
Figure 1. Example GIS image showing
HF radar-derived ocean surface current
vectors offshore San Francisco (the
radiating lines represent major shipping
lanes into San Francisco Bay). The
velocity layer was created using symbols
positioned at the locations of the velocityobservations and scaled and rotated
according to the velocity speed and
direction, respectively.
7/27/2019 2004-05_fnl-rpt-jun07l
http://slidepdf.com/reader/full/2004-05fnl-rpt-jun07l 6/10
6
Figure 2. Web page for access to real time CeNCOOS surface current mapping products. The
solid rectangles show the regions of coverage and the four product options are described in the
center of the page. The dashed rectangle outlines the Southern California Coastal Ocean
Observing System (SCCOOS), which is a sister organization to CeNCOOS in southernCalifornia.
Figure 3. Ocean surface current map based on input from HF radar systems in central and
southern California on 5 June 2007.

7/27/2019 2004-05_fnl-rpt-jun07l
http://slidepdf.com/reader/full/2004-05fnl-rpt-jun07l 7/10
7
Short Term Forecasts and NOAA/HAZMAT Support
The core of this project has been to establish routine and automated procedures based onreal time data from the HF radar network to inform hazardous spill response teams. The
data access and formatting procedures described above have been part of the effort. In
addition, procedures have been developed to create short term predictions of wheresurface drifting particles will move within the area monitoring by the HF radar array. The basis for the predictions is the assumption that future surface currents can be modeled by
the observed tidal-period fluctuations plus sub-tidal-period mean currents. To that end, a procedure was created that takes continually analyzes data from the processed surface
current maps based on time series observations. At each mapping location, velocityobservations for the past 48 hours are subjected to a harmonic analysis for the major tidal
constituents. Those results, plus the sub-tidal residual currents, are used to predict thetime varying velocity at the mapping location for the subsequent 24 hours. The entire
procedure is updated every hour for each mapping location.
The short-term prediction system allows for the production of forecast particletrajectories as one of the critical HF radar-based products. An example for the region
offshore San Francisco Bay from the period of NOAA's Safe Seas 2006 oil spill exerciseis shown in Figure 4. Quantifying the accuracy of the short-term predictions under
various wind conditions will be the focus of the NOAA follow-on study described below.
Figure 4. Observed (left) and predicted (right) surface particle trajectories for the period 7
August 2006 at 2100GMT to 8 August 2006 at 2100GMT. Initial (x) and final (•) locations are
also shown.

7/27/2019 2004-05_fnl-rpt-jun07l
http://slidepdf.com/reader/full/2004-05fnl-rpt-jun07l 8/10
8
In addition to the trajectory forecasts available through the CeNCOOS web site, the shortterm forecast data are routinely incorporated within the netCDF data files produced for
ingestion within ArcGIS or the GNOME model. In this way, the HF radar-derived products are made available each hour to the NOAA hazardous spill response team, as
well as all other potential users. The netCDF file naming convention is:
GNOME_SSSS_yyyy_mm_dd_hh00.ncwhere:
SSSS is the site designator yyyy_mm_dd_hh00 is the year_month_day_hour of the last actual
surface current field.
An example of the use of HF radar-derived velocity data within GNOME is shown inFigure 5 for the area of Monterey Bay. Real time GNOME support was implemented for
the region offshore San Francisco as part of this project for the Safe Seas 2006 exercise.Support for that region is being continued via the web data page shown above. Support
for other regions within California will be implemented as part of COCMP and thefollow-on NOAA project described below.
Figure 5. Screen shots from two different times in the evolution of a simulated oil spill for the
region of Monterey Bay using the NOAA/HAZMAT GNOME model. The model was run
with only the current field and without bathymetry or the coastal boundary.
Follow-On Projects
As described throughout, this project has been highly integrated with ongoing efforts of
the State of California's COCMP and CeNCOOS. Those efforts will continue to develop products from the HF radar observations. They will also continue to work to standardize product design and to centralize product delivery through the national HF radar demonstration projects headed up by SCCOOS.
In addition to those regional and national efforts, two important areas of related follow-on
activities have been supported by NOAA. These include a project to improve qualitycontrol-quality assurances practices related to HF radar data. In that project, the
7/27/2019 2004-05_fnl-rpt-jun07l
http://slidepdf.com/reader/full/2004-05fnl-rpt-jun07l 9/10
9
investigators here, together with Drs. Kenneth Laws, David Kaplan, and John Vesecky,will participate in a project entitled “HF Radar National Network Data Management
Development: Error estimation and prediction capabilities.” The project is centered at UCSanta Cruz and is funded by NOAA Integrated Ocean Observing System (IOOS) office.
Results from the project will be used to improve the error propagation model already
embedded in the mapping procedures developed here.
The second, critical project that is following on directly from this effort is entitled
“Delivery and Quality Assurance of Short-Term Trajectory Forecasts from HF Radar Observations.” The principal investigators are Dr. Newell Garfield of San Francisco State
University, Dr. Jeffrey Paduan of the Naval Postgraduate School, and Dr. Carter Ohlmann of UC Santa Barbara. The project sponsor is the Coastal Response Research
Center at the University of New Hampshire (CRRC; http://crrc.unh.edu/). CRRC itself receives its funding from NOAA to manage various research projects related to oil spill
mitigation. This new project will address directly the accuracy of the short term prediction procedure. Beyond that, it will continue to work directly with the NOAA
hazardous response team to expand access to GNOME-formatted data files, to develop anadditional wind-coherent correction based on forecast winds, and to create a manual for
the use of HF radar-derived products in hazardous spill response scenarios. It will alsowork with OSPR personnel to optimize the procedure for creating GIS-readable shape
files. All of the recommended procedures will be tested in spring 2008 through a week-long “catch-and-release” drifting buoy program in the waters offshore San Francisco and
Monterey Bay.
Summary
This OSPR project sponsored value-added extensions to observing system developmentsunderway as part of COCMP. The growing network of HF radar systems is providing
wide-area surface current mapping data on a regular basis. Two important outcomes of the SSEP program are the generation of automatic real time forecasts of surface currents
and the specialized products needed by spill response teams. The first means at in theevent of a spill, response teams can go online immediately and observe both conditions
for the last 24 hours as well as a 24 hour forecast. The second means that if a spill occurs,COCMP will be able to quickly coordinate with OSPR to produce the specialized
products that will be unique to each event.
This project created routine, automated procedures for making those data available tohazardous response teams and for providing short-term trajectory forecasts that can be
used to further optimize any spill response. The results are available online throughhttp://www.cencoos.org/currents/ and http://cencalcurrents.org.
The project also helped to develop the CeNCOOS data integration procedures that
overlay real time HF radar-derived surface current maps and satellite-derived SST:http://oceanwatch.pfeg.noaa.gov/CeNCOOS/. Finally, results from this project led
directly to the creation of two, additional follow-on projects funded by NOAA to validateand expand the basic procedures developed here. The investigators involved with this
7/27/2019 2004-05_fnl-rpt-jun07l
http://slidepdf.com/reader/full/2004-05fnl-rpt-jun07l 10/10
10
project will continue to work with OSPR to ensure that the necessary products are easilyaccessible by OSPR personnel.
References
Kaplan, D.M., and F. Lekien, 2007: Spatial interpolation and filtering of surface currentdata. J. Geophys. Res., Submitted.
Lekien, F., C. Coulliette, R. Bank, and J. Marsden, 2004: Open-boundary modal analysis:Interpolation, extrapolation, and filtering. J. Geophys. Res., 109, C12004, doi:
10.1029/2004JC002323.
Lipphardt, B. L., Jr., A. D. Kirwan Jr., C. E. Grosch, J. K. Lewis, J. D. Paduan, 2000:Blending HF radar and model velocities in Monterey Bay through normal mode analysis,
J. Geophys. Res., 105, 3425-3450.